APPENDIX E- HSEQ CONTRACT REQUIREMENTS - DalSpace
85
Demulsification of Water in Crude Oil by Aljilani Ali Amter Submitted in partial fulfilment of the requirements for the degree of Master of Applied Science at Dalhousie University Halifax, Nova Scotia July 2014 © Copyright by Aljilani Ali Amter, 2014
-
Upload
khangminh22 -
Category
Documents
-
view
0 -
download
0
Transcript of APPENDIX E- HSEQ CONTRACT REQUIREMENTS - DalSpace

Demulsification of Water in Crude Oil
by
Aljilani Ali Amter
Submitted in partial fulfilment of the requirements
for the degree of Master of Applied Science
at
Dalhousie University
Halifax, Nova Scotia
July 2014
© Copyright by Aljilani Ali Amter, 2014
ii
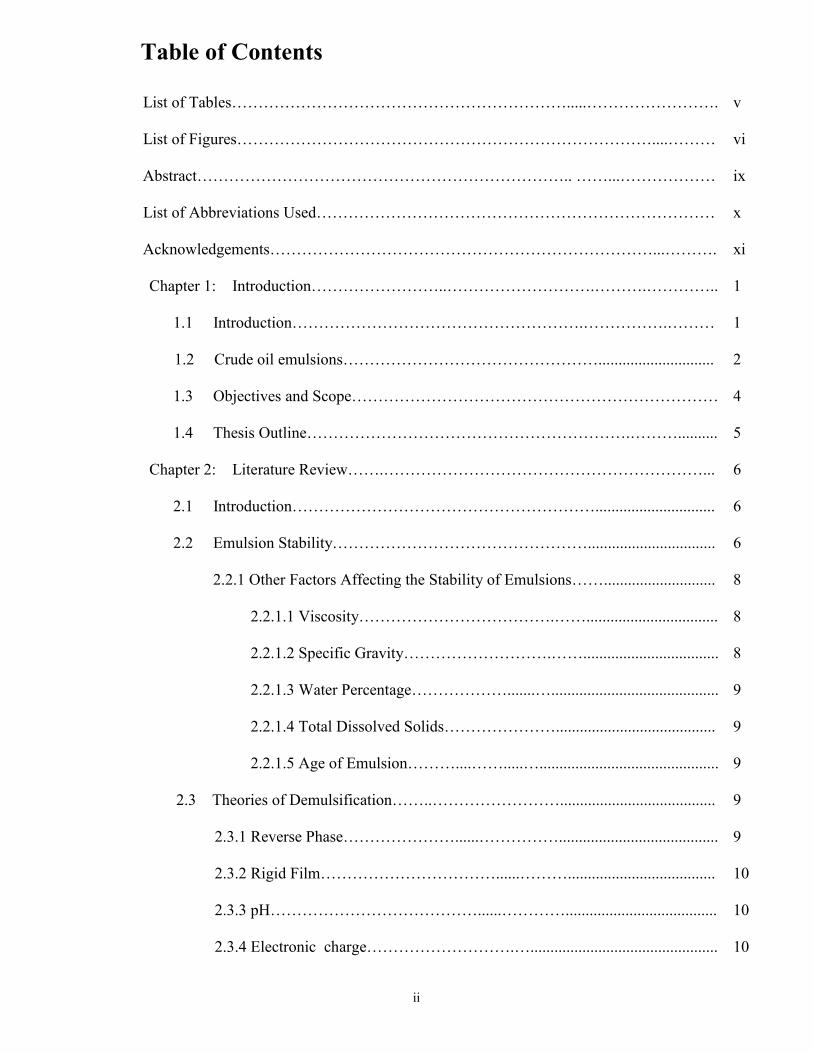
Table of Contents
List of Tables……………………………………………………….....…………………….
List of Figures……………………………………………………………………....………
Abstract…………………………………………………………….. ……...………………
List of Abbreviations Used…………………………………………………………………
Acknowledgements………………………………………………………………...……….
Chapter 1: Introduction……………………..……………………….……….…………..
1.1 Introduction……………………………………………….…………….………
1.2 Crude oil emulsions………………………………………….............................
1.3 Objectives and Scope……………………………………………………………
1.4 Thesis Outline…………………………………………………….………..........
Chapter 2: Literature Review…….……………………………………………………...
2.1 Introduction…………………………………………………..............................
2.2 Emulsion Stability…………………………………………................................
2.2.1 Other Factors Affecting the Stability of Emulsions……............................
2.2.1.1 Viscosity……………………………….…….................................
2.2.1.2 Specific Gravity……………………….……..................................
2.2.1.3 Water Percentage……………….......…..........................................
2.2.1.4 Total Dissolved Solids…………………........................................
2.2.1.5 Age of Emulsion………....…….....….............................................
2.3 Theories of Demulsification……..…………………….......................................
2.3.1 Reverse Phase…………………......……………........................................
2.3.2 Rigid Film……………………………......……….....................................
2.3.3 pH…………………………………......…………......................................
2.3.4 Electronic charge……………………….…...............................................
v
vi
ix
x
xi
1
1
2
4
5
6
6
6
8
8
8
9
9
9
9
9
10
10
10
iii
2.3.5 Temperature……………………………………….….................;............
2.3.6 Surface Tension……………………………….……….............................
2.4 Mechanism of Demulsification Process……………………...............................
2.5 Classification of Demulsifiers………………………………..............................
2.6 Demulsifier Preparation………………………………………………..……….
Chapter 3: Mabruk Field System………………………………………………………...
3.1 Introduction……………………………………………........................................
3.2 System Overview……………………………..………………………….............
3.3 Establishing Mabruk Field Conditions…………………………………………..
3.4 System and Current Treatment…………………………………………………...
3.4.1 Wet Crude Oil Treatment………………………………………..…............
3.4.2 Produced Water Treatment and Disposal……...........................................
3.4.2.1 Performance Evaluation of the Oily
Water Treatment Package…………….………............................................
3.4.2.2 Produced Water Disposal…………….............................................
3.4.3 Product Specifications………………………..............................................
3.5 Key Design Data…………………………………………………………………
3.6 Fluid Physical and Chemical Properties…………….............................................
3.6.1 Oil Properties…………………………….....................................................
3.6.2 Water Properties……………….……………………………………….......
3.7 Wax Appearance Temperature and Pour Point….……........................................
Chapter 4: Experimental Materials and Methods…….………………………...................
4.1 .. Introduction…………………………………………….……..............................
4.2 Experimental Methods………………………………..………….……..……….
10
10
11
14
14
16
16
17
19
20
20
24
25
27
28
29
29
29
30
32
33
33
33
iv
4.2.1 Bottle-Testing History…………………………………………...………...
4.2.2 Bottle-Test…………………………………………………….….………..
4.2.3 Bottle-Test Procedure………………………….………………..…............
4.2.4 Establishing Test Conditions………………...….........................................
4.3 Preparation for the Bottle test…………………….………....................................
4.4 The Experiment.......................................................................................................
Chapter 5: Results and Discussions……………………….…….......................................
5.1 Introduction…………………………….…………………………………………
5.2 Effects of Various Concentrations……………………..................…....................
5.3 Demulsifiers Screening Process..............................................................................
5.3.1 3-Phase Separator Actual Performance........................................................
5.3.2 3-Phase Separator Simulated Performance……........................……...........
5.3.3 Visual Methods............................................................................................
Chapter 6: Conclusions and Recommendations………………….....................................
6.1 Conclusions……………..………………………………....................................
6.2 Recommendation for Future Study……………..…………................................
Appendix A: Material safety data sheet. ……………………….……...................................
Material Safety Data Sheet (MSDS) for Demulsifier
CH 2137-T……………………………………………....................................
Appendix B: Mabruk/Dahra/Garian Process Train Design Cases…….....................….........
Table 1: Mabruk Process Train Design Cases…………......................…........
Table 2: Dahra / Garian Process Train Design Cases …......................…........
References……………………………………………………………….....................….........
33
35
36
36
37
40
52
52
52
53
54
54
55
57
57
57
59
60
68
69
71
73
v
List of Tables
Table 1.1. Multiple emulsions existing in the oil field and their
occurrences………………………........................................................................................................3
Table 2.1. Emulsion stabilizing agents………………………………….…………………..………...7
Table 2.2. The development of chemical demulsifiers……………………………………................14
Table 3.1. BS&W% and process parameters for 3-phase separator and
dehydrator……………………………………………………………………....................................19
Table 3.2. The test results of total and free-separable oil contents for the
oil-water separator in/out streams………………………………........................................................26
Table 3.3. Produced water characteristics………………………………….......................................27
Table 3.4. Treated crude oil specifications…………………………………......................................28
Table 3.5. Key design data of the existing oil production process at GOSP…...................................29
Table 3.6. Mabruk crude oil physical properties………………….……............................................30
Table 3.7. Water composition for Mabruk reservoir………………….……......................................31
Table 3.8. Water compositions for Dahra and Garian reservoirs………….……...............................31
Table 3.9. Pour point and (WAT) for each reservoir………………….……......................................32
Table 4.1. Equivalent concentrations (μl) in a 100 ml crude oil sample to
provide the desired equivalent demulsifier dose concentration in units of ppm.................................43
Table 4.2. Water dropping rates for 2137-T……………………………............................................44
Table 4.3. Water dropping rates for Blend-X………………………..……………………................46
Table 4.4. Water dropping rates for (2137-T) at selected concentrations...........................................49
Table 4.5. Water cut results out of the centrifuge for (2137-T)..........................................................50

vi
List of Figures
Figure 1.1. The two simplest kinds of emulsion………………………….………………………......2
Figure 1.2. Water-in-Oil emulsions……………………………………..……………………............3
Figure 1.3. Oil-in-Water emulsions………………………...…………..….........................................4
Figure 2.1. Composition of the stabilizing film……………………………........................................8
Figure 2.2. The process of flocculation and coalescence…………………........................................12
Figure 2.3. The separation mechanism of regular emulsion……………….......................................12
Figure 2.4. The effects of injecting not injecting any demulsifier,
wrong demulsifier and injecting the right demulsifier………..…………………….………….........13
Figure 3.1. Mabruk field location….…….……….............................................................................16
Figure 3.2. Flow diagram of Gas, Oil & Water Separation Plant….…….….....................................17
Figure 3.3. Chemical injection & Flow Diagram of Gas-Oil & Water
Separation Plant (GOSP)…………………………………………………….....................................18
Figure 3.4. GOSP feed preheating train (E-05 and E-06)……………………………………...........21
Figure 3.5. GOSP three phase separator (D-05)……………………………………………..……....21
Figure 3.6. GOSP-feed heat exchanger (E-07) and de-salter (D-06)……….………………..……...22
Figure 3.7. GOSP-stripper (C-10)……………………………………………………...……………22
Figure 3.8. GOSP-oil storage tank (Tk-312)……………………………………………..………….23
Figure 3.9. Water content at the Separator outlet………………………………………..…………..23
Figure 3.10. Water content at the Dehydrator outlet for June 2012…………………….…...............24
Figure 3.11. GOSP-oily water treatment package……………………….…………………………..24
Figure 3.12. Free and separable oil content at the inlet/outlet of the oil-
water separator (D 351-A)………….…………..……………………………………………………26
Figure 3.13. Produced water disposal network………………………………………………............28
Figure 4.1. Previous bottle-test results performed in Mabruk field dated
November-2008………………………………………………………………………………...........34
vii
Figure 4.2. The main parameters monitored to evaluate the efficiency
of the emulsion breakers……………………………………………………......................................35
Figure 4.3. Standard bottle-test kit………………………………………..........................................38
Figure 4.4. Fume hood………...………………………………...………......................................….38
Figure 4.5. Standard demulsifier bottle…………………………………….......................................38
Figure 4.6. Preparing the demulsifiers samples…………….………………......................................39
Figure 4.7. Preparing 2137-T demulsifier sample………….………………………………..............39
Figure 4.8. Mabruk field’s laboratory…..………………………………….......................................40
Figure 4.9. Collecting fresh crude oil samples………..…………………..............................……....40
Figure 4.10. Heating up the fresh crude oil samples………………………………..….…................40
Figure 4.11. Heating up empty bottle-test kit……………………………......................................…41
Figure 4.12. Fresh crude oil sample after heating up……………………..........................................41
Figure 4.13. Freeing the gases out of crude oil sample.…………………..........................................41
Figure 4.14. Filling the prescription bottles with fresh crude oil…………........................................42
Figure 4.15. Heating up the 4 prescription bottles using the water bath….........................................42
Figure 4.16. The 4 prescription bottles out of the water bath……………….....................................42
Figure 4.17. Adding 10 ppm dosage of 2137-T to 3 prescription bottles….......................................43
Figure 4.18. Shaking the treated prescription bottles………………………......................................43
Figure 4.19 The treated prescription bottles in the water bath………….......................................…44
Figure 4.20. The treated prescription bottles out of the water bath for
monitoring………………………………………………………………….......................................44
Figure 4.21. The 3- prescription bottles treated with 10 ppm dosage of
2137-T, after 7 minutes (blank sample-left)………………………………........................................45
Figure 4.22. The 3-prescription bottles treated with 15 ppm dosage of
2137-T, after 7 minutes (blank sample-left)………………………………........................................45
Figure 4.23. The 3-prescription bottles treated with 20 ppm dosage of
2137-T, after 7 minutes (blank sample-left)………………………………........................................45
viii
Figure 4.24. 3-prescription bottles treated with 10 ppm of blend-X after
7 minutes (blank sample-left)……………………………………………......................................…46
Figure 4.25. 3-prescription bottles treated with 15 ppm dosage of
blend-X after 7 minutes (blank sample-left)………………….…………...........................................46
Figure 4.26. Fresh crude oil samples………………………………………………..….........………47
Figure 4.27. Adding different dosages of 2137-T to fresh crude oil
samples (blank sample-left)…………..……………………………….…...............................……...48
Figure 4.28. Heating up the treated and blank samples……………………………………...............48
Figure 4.29. The heated bottles out of the water bath for shaking………......................................…48
Figure 4.30. After shaking, the bottles again in the water bath for
heating…………………………………………………………………..…………………................49
Figure 4.31. Adding 10, 12.5 and 15 ppm dosages of 2137-T to fresh
crude oil samples (blank sample-left)……………………….…………..................................……...49
Figure 4.32. Sub-sampling the treated bottles
(10, and 12.5 ppm. of 2137-T)…………………………………..………….......................................50
Figure 4.33. Centrifuging the sub-samples (10, 12.5 ppm. f 2137-T
and blank sample).............……………………………………………...............................................50
Figure 4.34. The centrifuged sub-samples treated with 2137-T
(10 ppm-right versus 12.5 ppm-left)……………………………………................................………51
Figure 5.1. Separated water volumes (ml) versus time at different
demulsifiers and dosages………………………………………………….........................................53
Figure 5.2. Polygons of the main visual parameters for both
demulsifiers (2137-T and Blend-X)…………………………............………………………..……...56
ix
Abstract
The aim of this thesis was to optimize the concentration of demulsifier required to remove water from water-
in-oil emulsions in the crude oil from Mabruk oil field, Libya. This was achieved by conducting a series of
industrial standard Bottle-Test’s on the crude oil emulsions from Mabruk oil field. Mabruk oil field is located in
Libya's Sirte basin. Mabruk’s crude oil has a moderate emulsion tendency easily treated by injecting an
emulsion breaker (EB) into the inlet crude oil of the separation plant, to enhance oil-water separation by
weakening the rigid film existing between the water and the oil that prevents the drops from coalescing.
Optimizing the EB dosage in the field was a field trial based method, with dosages ranging from 5 – 100 ppm
depending on emulsion stability and hardness.
The processing plant at Mabruk was the focus of the thesis. The Mabruk processing plant treats wet crude by
removing gas and water out of the oil. By knowing the system characteristics, starting from the separation
technology used, the fluid flow rates, the vessels retention times, the physical and chemical properties, will lead
to much better screening results when selecting the demulsifier.
Experimental work is based on an industrial standard “Bottle-Test”, where two blends of demulsifiers were
tested against each other. The bottle test was performed on site where fresh crude oil samples were collected.
The test resulted in validating the candidate demulsifier (2137-T), while the new blend was eliminated. Visual
inspections methods were used to determine the performance of the different demulsifier agents in terms of
water volume separated, the quality of the oil-water interface, water drop rate and oily water quality.
In conclusion, crude oil emulsions were treated using the EB chemicals, to enhance oil-water separation
performance. Optimization of chemical treatment is generally accomplished in the field, by bottle testing the
existing demulsifier against other demulsifier(s). The goal of this thesis was to use the bottle test technique to
select the most appropriate demulsifier to reduce water-in-oil emulsions. This was achieved by using different
blend(s) formulation(s) and concentrations of demulsifier.
x
List of Abbreviations Used
BS&W
O/W
W/O
O/W/O
W/O/W
MSDS
EB
TDS
ppm
mg/l
µg/l
Bbl/d
OWT
RVP
H2S
CO2
pH
WAT
pCFI
RPM
GOSP
T/h
Bar.g
Basic sediment and water
Oil-in-water emulsion
Water-in-oil emulsion
Oil-in-water-in-oil emulsion
Water-in-oil-in-water emulsion
Material Safety Data Sheet
Emulsion Breaker
Total Dissolved Solids
Part per million
Milligram per liter
Microgram per liter
Barrels per day
Oily Water Treatment
Reid Vapor Pressure
Hydrogen Sulfide
Carbon dioxide
Hydrogen Number
Wax Appearance Temperature
Pressurized Cross Flow Interceptor
Revolution per minute
Gas, Oil, and Water Separation Plant
Ton per hour
Bar gauge

xi
Acknowledgements
I would love to submit my thesis to my parents, my father in particular. He was my professor of my
entire life. Also, I would present it to my beloved wife who supported me at all times. Without the God’s
support, I would not be here today. So, I am heartily thankful to my supervisor, Dr. Michael Pegg.
1
Chapter 1
Introduction
1.1 Introduction
Crude oil is a mixture of liquid and gaseous hydrocarbons mixed with water. This mixture is in the form of
water-in-oil emulsion, where natural surfactants stabilize these emulsions (Al-Sabagh et al., 2011). The crude
oil passes from the reservoir via the wellhead then to the processing facilities along flow lines. As the crude oil
flows, significant pressure drop can be encountered, the temperature changes, and accompanied with
considerable agitation. This can cause emulsions within the crude oil flow that impact the efficiency of the
overall water-oil separation process.
Emulsions are stabilized by a wide range of natural materials that are found in crude oil, such as sediments,
asphaltenes, natural surfactants, asphaltenes, resins, carboxylic acids, and solids such as clay and waxes (Al-
Sabagh et al., 2011). To remove water from oil and oil traces from the waste water, destabilization of the
emulsion is essential. Demulsification is the chemical process that leads to the partial or total removal of the
dispersed phase from the continuous phase. Moreover, it can be achieved mechanically, electrically or
chemically. Chemical treatments based on the addition of chemical demulsifiers are the most widely used
method (Bin Mat et al., 2008).
Over the past years, lots of demulsifiers have been developed. Since the 1930s, non-ionic surfactants have
been introduced and have found wide application as demulsifiers. These non-ionic surfactants contain two
different groups of active materials, hydrophilic and hydrophobic. Currently, in the oil industry, the selection of
a demulsifier is still based mainly on trial and error, after some screening such as bottle testing. This is known in
crude oil processing as chemical field trials, which are usually carried out on site whether onshore or offshore.
Successful demulsifier formulations are able to drop water amounts rapidly, provide relatively clean interfaces,
and produce dry, saleable oil (Ben Mahmud, 2012).
2
1.2 Crude oil emulsions
There are four types of emulsions that are readily distinguished in principle, these are Oil-in-Water (O/W) and
Water-in-Oil (W/O), Oil-in-Water-in-Oil (O/W/O) and Water-in-Oil-in-Water (W/O/W) emulsions. The
majority of crude oil emulsion is of the Water-in-Oil (W/O) emulsion type and this will be the focus of this
thesis (Bin Mat et al., 2008).
In the petroleum industry the usual emulsions encountered are water droplets dispersed in the oil phase,
termed water-in-oil emulsion (W/O), conversely, if the oil is the dispersed phase, it is termed oil-in-water (O/W)
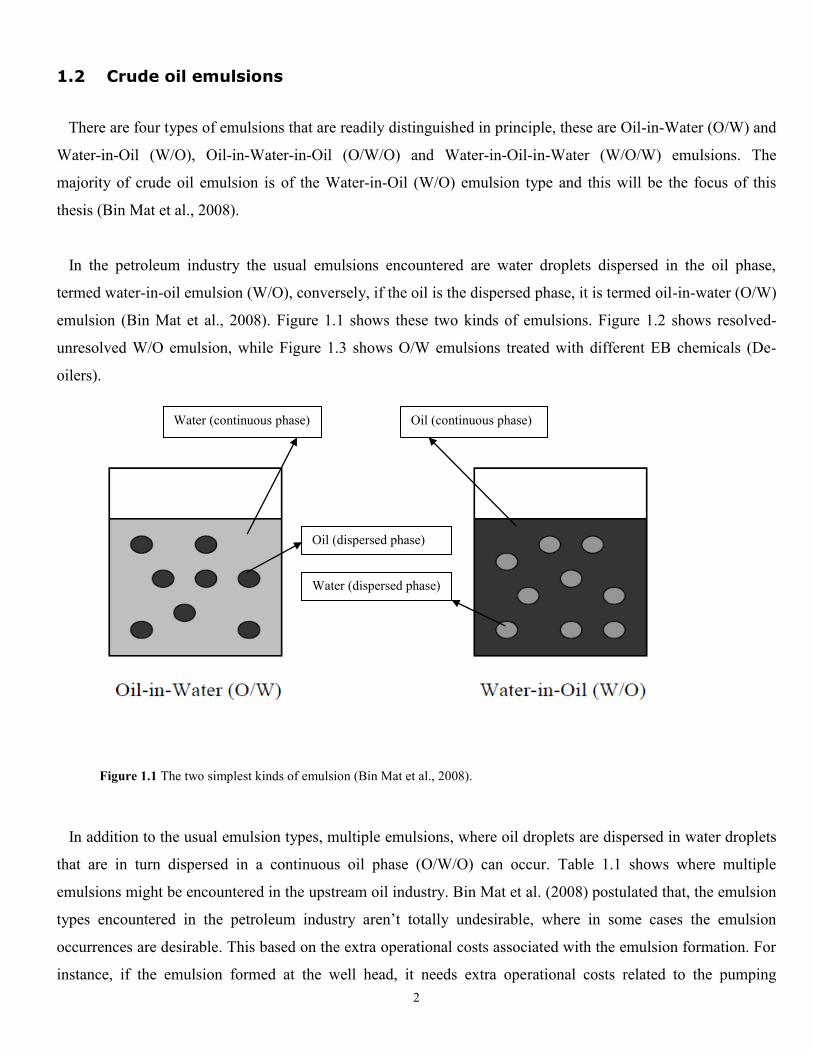
emulsion (Bin Mat et al., 2008). Figure 1.1 shows these two kinds of emulsions. Figure 1.2 shows resolved-
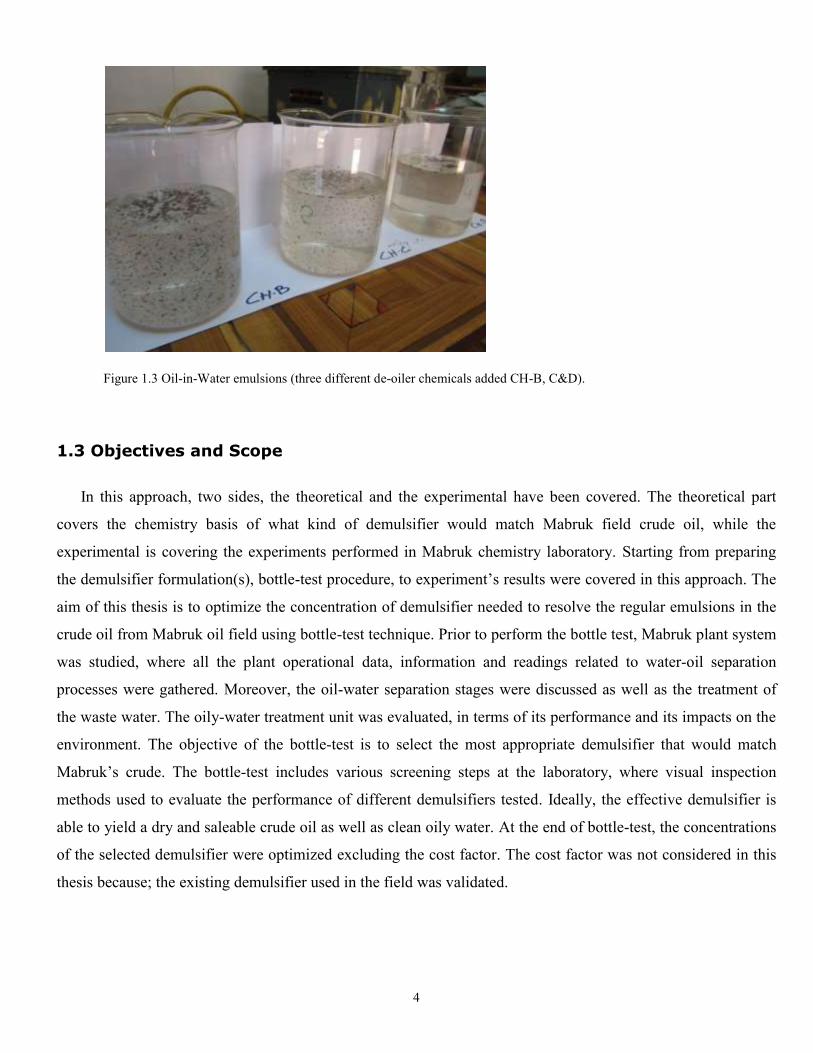
unresolved W/O emulsion, while Figure 1.3 shows O/W emulsions treated with different EB chemicals (De-
oilers).
Figure 1.1 The two simplest kinds of emulsion (Bin Mat et al., 2008).
In addition to the usual emulsion types, multiple emulsions, where oil droplets are dispersed in water droplets
that are in turn dispersed in a continuous oil phase (O/W/O) can occur. Table 1.1 shows where multiple
emulsions might be encountered in the upstream oil industry. Bin Mat et al. (2008) postulated that, the emulsion
types encountered in the petroleum industry aren’t totally undesirable, where in some cases the emulsion
occurrences are desirable. This based on the extra operational costs associated with the emulsion formation. For
instance, if the emulsion formed at the well head, it needs extra operational costs related to the pumping
Water (continuous phase) Oil (continuous phase)
Oil (dispersed phase)
Water (dispersed phase)
3
capacity from the well head to the plant. In contrast, if the emulsion formed at heavy oil pipeline, it will reduce
the operational costs, where the emulsion will probably reduce the overall bulk density and the drag force as
well.
Table 1.1 Multiple emulsions existing in the oil field and their occurrences (Bin Mat et al., 2008).
Occurrence Usual Type
Undesirable Emulsions
Well-head emulsions
Fuel oil emulsions (marine)
Oil sand flotation process, froth
Oil sand flotation process, diluted
froth
Oil spill mousse emulsions
Tanker bilge emulsions
Desirable Emulsions
Heavy oil pipeline emulsion
Oil sand flotation process slurry
Emulsion drilling fluid, oil-emulsion
mud
Emulsion drilling fluid, oil-base mud
Asphalt emulsion
Enhance oil recovery in situ emulsions
W/O
W/O
W/O or O/W
O/W/O
W/O
O/W
O/W
O/W
O/W
W/O
O/W
O/W
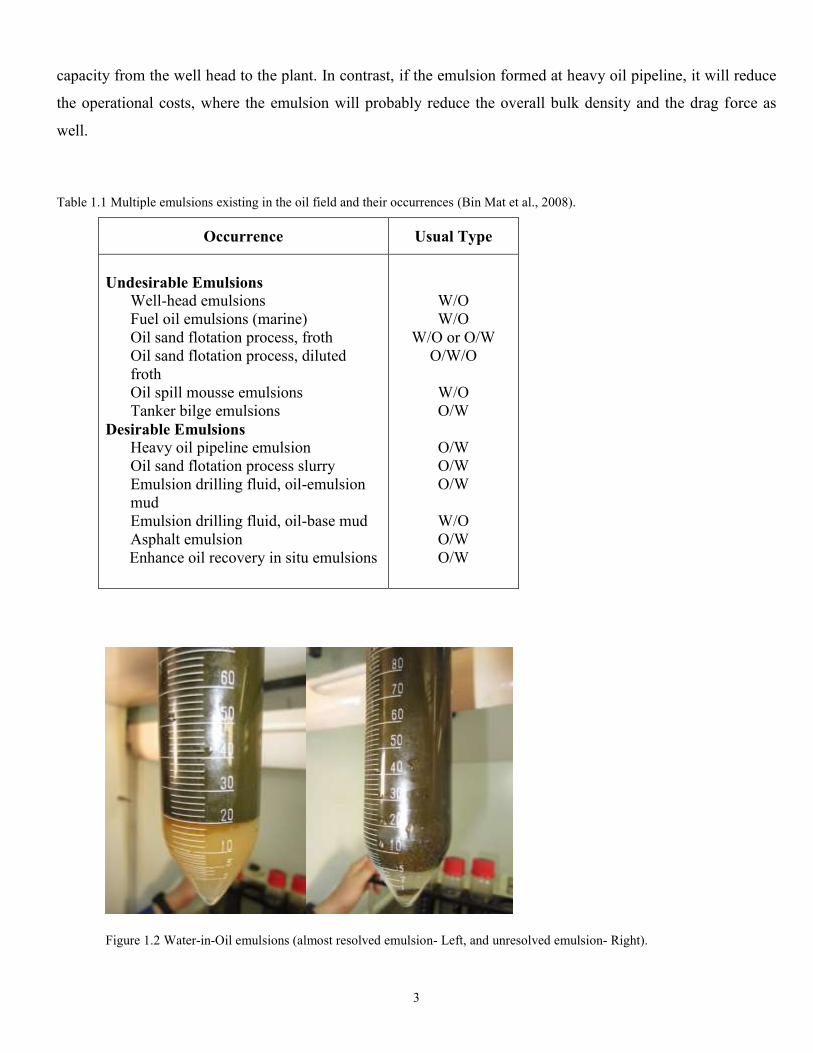
Figure 1.2 Water-in-Oil emulsions (almost resolved emulsion- Left, and unresolved emulsion- Right).
4
Figure 1.3 Oil-in-Water emulsions (three different de-oiler chemicals added CH-B, C&D).
1.3 Objectives and Scope
In this approach, two sides, the theoretical and the experimental have been covered. The theoretical part
covers the chemistry basis of what kind of demulsifier would match Mabruk field crude oil, while the
experimental is covering the experiments performed in Mabruk chemistry laboratory. Starting from preparing
the demulsifier formulation(s), bottle-test procedure, to experiment’s results were covered in this approach. The
aim of this thesis is to optimize the concentration of demulsifier needed to resolve the regular emulsions in the
crude oil from Mabruk oil field using bottle-test technique. Prior to perform the bottle test, Mabruk plant system
was studied, where all the plant operational data, information and readings related to water-oil separation
processes were gathered. Moreover, the oil-water separation stages were discussed as well as the treatment of
the waste water. The oily-water treatment unit was evaluated, in terms of its performance and its impacts on the
environment. The objective of the bottle-test is to select the most appropriate demulsifier that would match
Mabruk’s crude. The bottle-test includes various screening steps at the laboratory, where visual inspection
methods used to evaluate the performance of different demulsifiers tested. Ideally, the effective demulsifier is
able to yield a dry and saleable crude oil as well as clean oily water. At the end of bottle-test, the concentrations
of the selected demulsifier were optimized excluding the cost factor. The cost factor was not considered in this
thesis because; the existing demulsifier used in the field was validated.
5
1.4 Thesis Outline
Each chapter of this thesis is linked to one objective of the research, which is described in section 1.3. There
are six chapters; each chapter contains its own introduction and description of the relative topics in order to
achieve the objectives of the research.
Chapter I provides a general background, objectives and scope of this study and thesis outline. The
background of crude oil emulsions and emulsion types encountered in the petroleum industry are covered.
In chapter II, the topics of emulsion stability, demulsifier characteristics, classification and formulations as
well as theories and mechanism of demulsification process are discussed. Further, the factors affecting emulsion
stability are illustrated. In chapter III, the Mabruk field system was studied including two main oil-water
separation techniques used. In particular, wet crude oil and oily water treatment processes occurring at the gas,
oil and water separation plant (GOSP) were examined. Crude oil treatment starts by receiving fresh crude oil
from oil wells at GOSP inlet, and then the crude passes through various separations before transfer into storage
tanks. Then, the produced dry and saleable crude oil is pumped into the export line for shipping. Further, the
performance of 3-phase separator and dehydrator units was examined as well as oily water package. The oily
water treatment starts at the oil-water separator, where all produced water enters, then it passes through various
separation stages before disposal. The performance of the oily water treatment package was evaluated based on
field reports. The treated oily-water is injected into the water disposal well, where every possible impact of the
disposal process on the environment was considered.
In chapter IV, experimental and analytical procedures used in this study are presented and discussed with
more details. The bottle-test is discussed in detail, where the test preparation, procedure, steps and results were
explained. In the light of this, previous bottle-tests performed in Mabruk field are also discussed and analyzed.
Visual techniques were used to examine the performance of two demulsifiers. The bottle-test is performed on
site under the supervision of chemical specialist to accredit and validate the test results. The discussion of
experimental results, which are based on the combination of the theories from the literature review and the
results obtained from this research, are mentioned in Chapter V. The conclusions of this thesis are based on the
demulsifier performance analysis on treating Mabruk’s W/O emulsion and remarks were discussed in Chapter
VI. Besides that, the recommendations for future study are also included.
6
Chapter 2
Literature Review
2.1 Introduction
The basic target in any oilfield is to separate water and all other undesired materials such as sand, salts, resins
and others from the oil. Water is present as dispersed droplets and this is generally termed “water in oil
emulsion”. The breaking of this emulsion is the main target in today’s oil producing industry. Two conditions
are needed to formation of stable emulsions. These conditions are: the presence of natural emulsifier species in
the crude oil and the presence of emulsifying process such as the turbulence due to transfer pump, electric
submersible pump, or gas lift system.
2.2 Emulsion Stability
The stability of water-oil emulsions relies on interfacial layers, which mainly consist of colloids present in the
crude oil-asphaltenes, waxes and resins. Waxes and water particles, such as clays can contribute to the stability
of water-in-oil emulsions, but cannot by themselves produce stable emulsions. Besides asphaltenes, resins and
waxes, emulsion stability is strongly influenced by solvents, temperature, the pH of the water phase, and the
presence of solid particles such as clays and sand. Bin Mat et al. (2008) reported that the drivers of the
formation of stable water-in-oil emulsion are the presence of polar compounds, e.g. nickel porphyrins, found in
the asphaltenes and resins of crude. If these polar compounds are not present in the oil, then the presence of
waxes and other particles will not lead to formation of stable emulsions. The most common method of
determining relative emulsion stability for laboratory scale is the simple test termed bottle test (Bin Mat et al.,
2008).
Ben Mahmud (2009) reported that water-soluble demulsifiers work differently from water-soluble
demulsifiers, where the first displace stabilizers and the second displace colloids present at the interface.
Further, water-soluble demulsifiers displace the original emulsion stabilizers exist at the interface, and make a
change in wetting by creating inactive complexes. He added, “oil-soluble demulsifiers displace the colloids
originally present, and neutralize the stabilization effect of additional emulsion breakers and the breakup

7
resulting from interface film eruptions”. Table 2.1 summarizes the emulsion stabilizers that can typically occur
in oilfield environment.
Table 2.1 Emulsion stabilizing agents (Ben Mahmud, 2009).
Emulsion Stabilizer
Naturally
Occurring
asphaltenes
solid paraffins
resins
organic acid, bases as naphthenic acids and naphthenates
External
Agents
drilling fluids
stimulating chemicals
corrosion inhibitors or scale inhibitor chemicals
Fine Solids
clay particles
sand
rust
small aggregates of asphaltenes and waxes
corrosion products
mineral scales
drilling mud
Ben Mahmud (2009) reports that emulsion stabilizers operate in two ways:
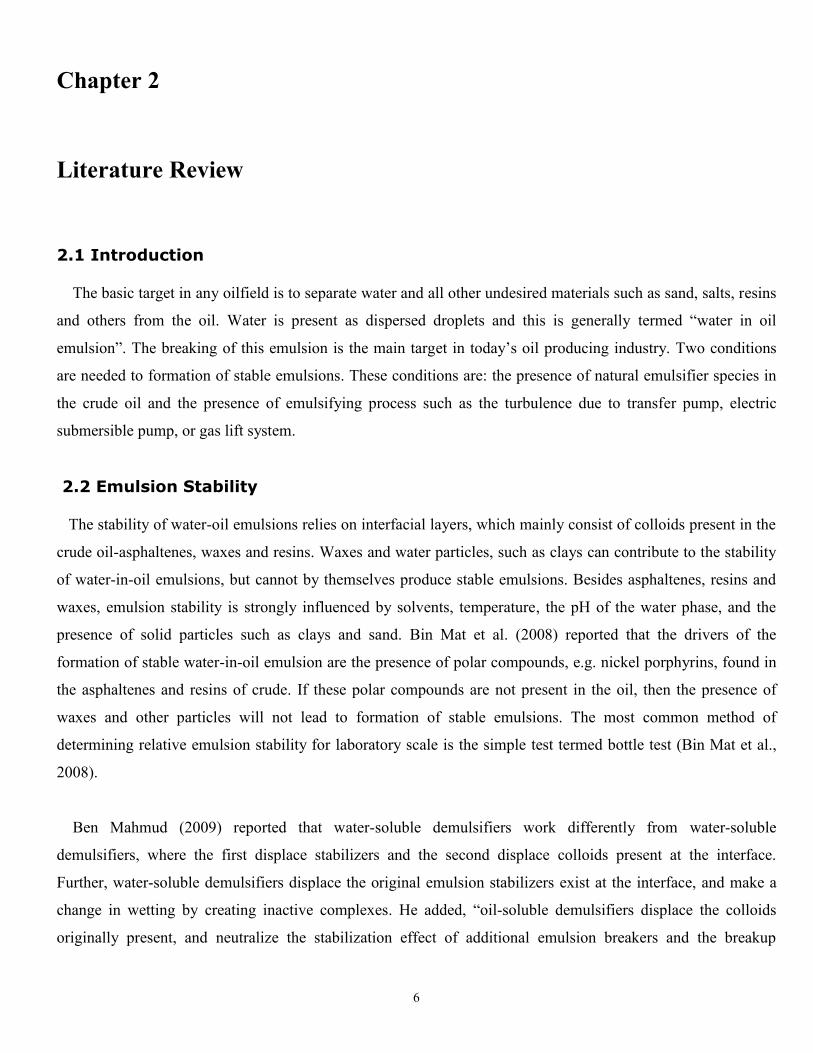
Organic molecules, such as asphaltenes or resins that consist of a polar “head” and non-polar “tail” are able
to interact both with water and paraffin in the oil matrix. Based on the electronic charge theory which will
be discussed later, these molecules orient the head toward the water creating a surrounding layer (film) and
use a non-polar tail to fluctuate in the paraffinic matrix. This mechanism creates the water dispersion as
described in Figure 2.1.
Fine solids such as paraffinic compounds are able to promote a more rigid film that prevents water droplets
coalescing. This is the basis of the water separation mechanism. Ben Mahmud (2009) highlighted, in fact,
water can separate only when the drops are big enough, such that the gravity force overcomes the strong
bonds of the W/O emulsion.
8
Figure 2.1 Composition of the stabilizing film (Electronic Charge Theory) (Ben Mahmud, 2009).
2.2.1 Other Factors Affecting the Stability of Emulsions
Other factors that can affect the stability of emulsions are: viscosity, specific gravity, water percentage, total
dissolved solids, and age of emulsion. Ben Mahmud (2012) has described each of these factors in the following
subsections.
2.2.1.1 Viscosity
An emulsion of oil of low viscosity tends to be easier to resolve than highly viscous oil. The mobility of the
water droplets of high viscosity oil is much less than that for oil of high viscosity. Further, the water droplets
require more time to coalesce and settle down than does an oil of low viscosity. The water droplets with higher
mobility can move rapidly through low viscosity oil.
2.2.1.2 Specific Gravity
The difference between the specific gravity values of water brine and oil has a bearing on the emulsion
Stability. The specific gravity of a liquid substance is defined as the weight of a given amount of that liquid at a
given temperature compared to the weight of an equal volume of water at the same temperature. Faster water
9
dropping could be possibly achieved when greater difference in specific gravities presents. Heating the emulsion
increases the specific gravity difference between the oil and water, where the specific gravity of the oil
decreases as well as its viscosity.
2.2.1.3 Water Percentage
The emulsifying tendency of water and oil is affected by the relative quantities of produced oil and water. This
is possibly applicable till a certain degree. An emulsion of large amount of water exist is usually much easier
that with too little amount of water present. The small percentage of water present, the much harder to resolve
that emulsion. Ben Mahmud (2012) said, “The severity of an emulsion problem usually will diminish when the
quantity of water produced by a well approaches or exceeds the quantity of oil produced”.
2.2.1.4 Total Dissolved Solids
The settling rates of brines are affected by total dissolved solids amount (TDS). It has been reported that,
brackish water is faster to settle down than fresh water. More, fresh water emulsion tends to be more difficult to
treat.
2.2.1.5 Age of Emulsion
Crude oil emulsions are systems attempt to attain equilibrium by time. Emulsions are usually become more
stabilized with age. As a result, different chemical or extra dosing might be required to resolve such an aged
emulsion. In general, fresh emulsion is easier to dehydrate than aged stabilized emulsion.
2.3 Theories of Demulsification
Many theories have been introduced concerning the problem of resolving crude oil emulsions. However, so
far, there is no theory that is applicable to all kinds of emulsion. The following are the most applicable theories:
reverse phase, rigid film, pH, electronic charge, temperature and surface tension (Ben Mahmud, A., 2012)
2.3.1 Reverse Phase
This theory is based on the hypothesis, that by adding a demulsifier to the water in oil emulsion, it is possible
to achieve a complete reversing and produce an oil-in-water emulsion. This could be applicable to some
emulsions but it is not always the case, where some emulsions are not easy to break completely and reversed to
the desirable reverse emulsion.

10
2.3.2 Rigid Film
The principle of this theory is that, the emulsion breaking reagent is weakening or lowering the relative
expansion coefficient of the rigid film. So, when the envelope surrounding the encapsulated water droplets
expands due to the effect of heat, it is shattered allowing the water droplets to coalesce and settle down. In some
cases, where the heating factor is absent, this mechanism might not be possibly applied.
2.3.3 pH
Another school believes that, it is not possible to resolve an emulsion without a change in the emulsifier
characteristics, such as pH, neutralization, or loss of solubility. This could be possibly applied to oil-in-water
emulsions, where most of the demulsifiers are cationic. However, most of water-in-oil emulsions are treated
with noninonics. Ben Mahmud (2012) said, “Reverse emulsions especially may be treated by charge
neutralization or pH change. Most regular emulsions are treated with non-ionics”.
2.3.4 Electronic Charge
This theory is based on the assumption that says, the emulsifying agents are polar bodies and they function
because of their electronic charges. So, making any disturbance of these charges will result in breaking the
emulsion. Ben Mahmud (2012) highlighted, this is especially applicable to O/W emulsions. On the top of that, it
is believed, the polar components are commonly found in asphaltenes and resin materials. Therefore, this theory
might not be applicable to non-asphaltenic oils, where no polar bodies are exist.
2.3.5 Temperature
Some researchers thought, a small temperature increase causes a great change of state in the film of the
interface. This could convert the film from a solid to a liquid and thereby affect its stability greatly. This might
be true to a certain degree, but many demulsifiers work in the absence of added heat. Increasing the emulsion
temperature would probably affect the demulsification process but it is not enough, where many other factors
should be taken into consideration.
2.3.6 Surface Tension
This is the most common theory, that resolving the emulsion is accomplished by lowering the surface tension
of the inner or the continuous phase or both. In emulsions, it is recognized that the encapsulated fluid tends to
have a higher surface tension. More, the reagent reduces the surface tension of either the water or the oil or both.
In general, the reagent adsorbed at the interface between the dispersed and the continuous component modifies

11
the interfacial surface in some manner. Hence, a change in the interface rheology properties could result in
resolution. Yet, the action of lowering the surface tension should stop at some point shortly allowing the
emulsion to reverse.
The most applicable theories were discussed in details however some of them are not applicable to water- in-
oil emulsions, such as pH theory. Nowadays, the most common demulsification theory is “surface tension
theory “, which is applicable to both kinds of crude oil emulsions, the regular and the reverse emulsion (Ben
Mahmud, 2012).
2.4 Mechanism of Demulsification Process
Generally, demulsification can be defined as a phenomenon that occurs under non-equilibrium conditions,
resulting in breaking up emulsions. Emulsions tend to seek stability by time until equilibrium state is reached.
Chemical demulsification is mainly based on the addition of a chemical that able to accelerate the coalescence
process and rapturing the thin film between the dispersed droplets. Bin Mat et al. (2008) said, “More important
characteristics of a good demulsifier are sufficient surface pressure and good partition between the two phases”.
He added “The role of the demulsifier, therefore, is the suppression of the interfacial tension gradient in addition
to the lowering of interfacial shear viscosity, thus causing accelerated film drainage and coalescence”. In the
light of this, injecting an improper demulsifier into W/O emulsion will result in bad water-oil interface and poor
oily water quality. Figure 2.4 shows the effect of not injecting any demulsifier at all, injecting the wrong
demulsifier, and the effect of injecting the right demulsifier.
The mechanism of demulsification and the principal role of the active material to destabilize the emulsion
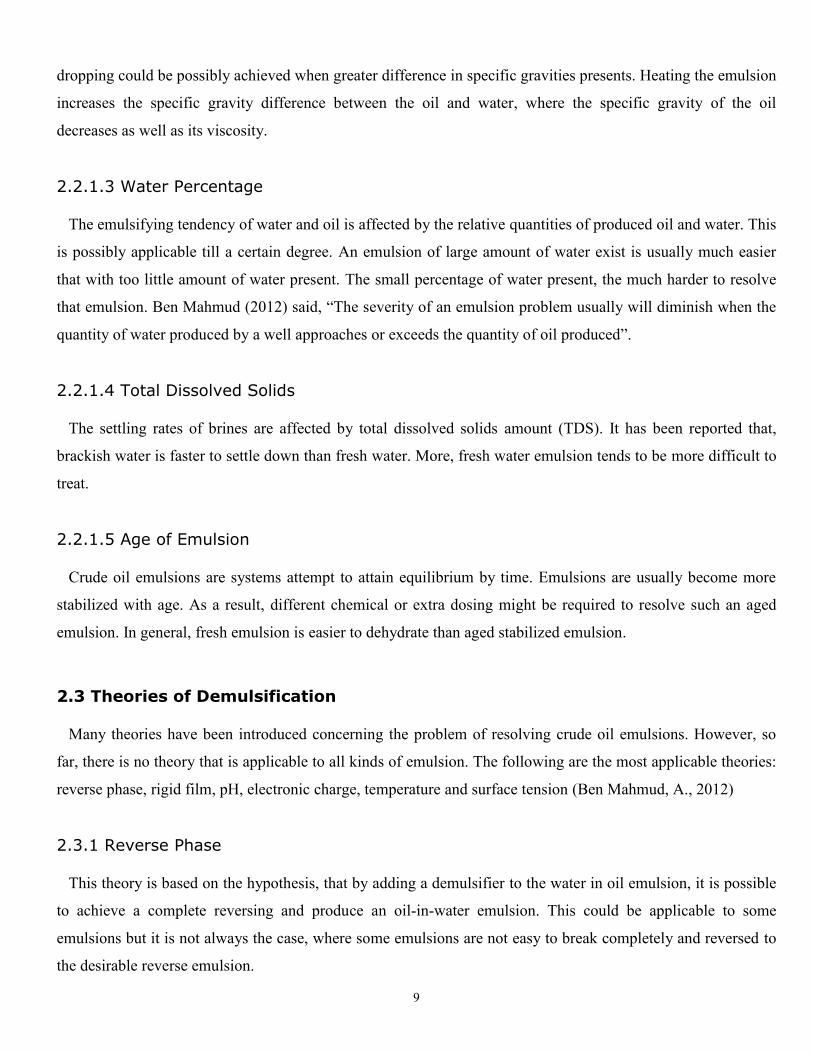
have been studied by many researchers. The separation mechanism of the regular emulsion is simplified in
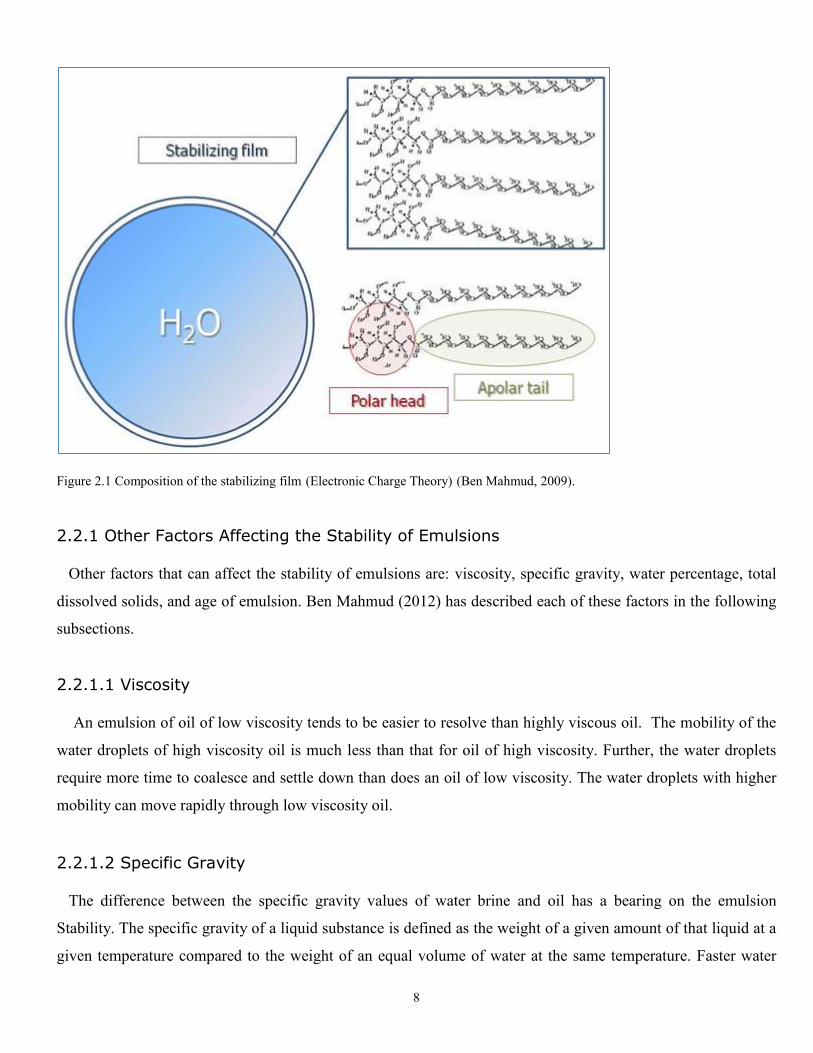
Figure 2.3. Further, it is found that the demulsification process can be divided into two or three main steps
depending on the demulsification efficacy of the used demulsifier. The two main processes, flocculation and
coalescence, occurred during demulsification process are described below in Figure 2.2:
(A) Adsorption and flocculation, in which the demulsifiers adsorb and displace the natural surfactant existing on
the W/O interface.
(B) Coalescence, in which each two neighbor water droplets being in contact to form micro-clusters with low
interfacial tension on their W/O interface.
(C) Channel formation followed by separation, in which the formed micro-clusters are collected to form macro-
clusters, and then channels are formed followed by complete water separation by gravity force (Ben Mahmud,
2009).
12
Figure 2.2 The process of flocculation and coalescence (Ben Mahmud, 2009).
Figure 2.3 The separation mechanism of regular emulsion (Ben Mahmud, 2009)

13
Figure 2.4 The effects of injecting not injecting any demulsifier (left), wrong demulsifier (middle), and
injecting the right demulsifier (right) (Institut français du pétrole, IFP Training, 2009).
In demulsification process of W/O emulsion, the reagent accelerates the coalescence of water droplets as well
as the film rupture process. Bin Mat et al. (2008) claimed “The tendency for the drops to coalesce will be the
van der Waals forces when the lamellae are thin enough, and the restoring forces will be the Gibbs-Marangoni
effect”. He added, the effect Gibbs-Marangoni operates because of the distortion and increase in surface area of
the water drops when they get close to each other. Therefore, it can be argued that the stability of emulsions is
mainly affected by the nature of the interfacial film and the reagent efficacy.
Although the mechanisms of the demulsification process are not totally understood, the selected demulsifier
must be able to weaken the rigid film, and accelerate the coalescence process. The three main parameters that
affect the volume and speed of water separation are:
1. Settling time: In a steady state condition as it is at Mabruk’s plant at normal operation condition, the
water separates along the time. This time is related to the stability of the emulsion.
2. Temperature: if the temperature of the emulsion rises, its viscosity decreases and the mobility of the
water increase. In this condition, the water drops can coalesce and separate easily.
14
3. Usage of demulsifier: it is a chemical able to weaken the rigid film existing between the water and
the oil that prevents the drops coalescence. It acts displacing the film stabilizer and the fine particles
to create a less rigid film easy to break.
The best results are achievable by selecting a demulsifier able to work at the operational system parameters
such as residence time, temperature and turbulence. The demulsifier dosage is usually in the range of 5 – 100
ppm, depending on the hardness of the emulsion (Ben Mahmud, 2009).
2.5 Classification of Demulsifiers
The chemicals used as demulsifiers can be classified according to their chemical structure, their application, or
according to the oil type used. Two major groups of chemicals are used, non-ionic demulsifiers and ionic
demulsifiers. The formulation of the demulsifier is based on a blend of different active materials in organic
solvent, where a typical composition contains surfactants, flocculants and wetting agents (Ben Mahmud, A.,
2009). Al-Sabagh et al. (2011) mentioned, there are also anionic, cationic, nonionic and amphoteric surfactants
that have been used as demulsifiers. Emulsion breakers are typically tailored for site or crude oil type. The most
effective demulsifier formulations were achieved by the combining of all four types of demulsifiers. The history
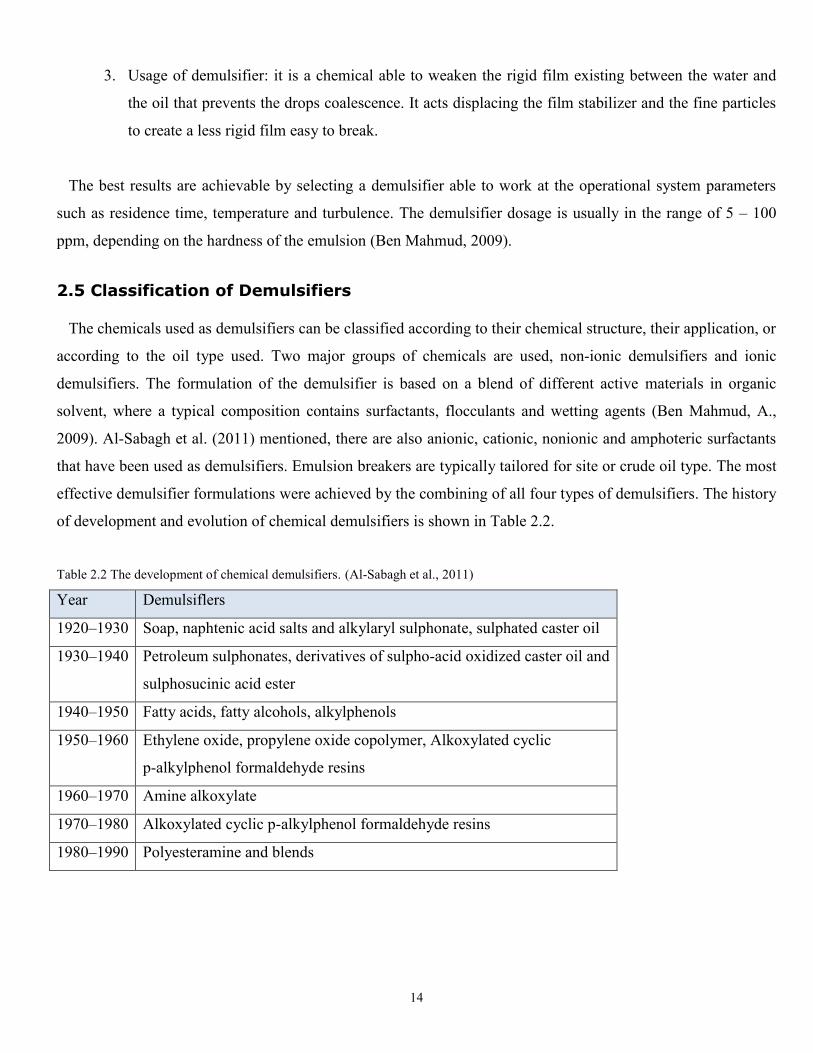
of development and evolution of chemical demulsifiers is shown in Table 2.2.
Table 2.2 The development of chemical demulsifiers. (Al-Sabagh et al., 2011)
Year Demulsiflers
1920–1930 Soap, naphtenic acid salts and alkylaryl sulphonate, sulphated caster oil
1930–1940 Petroleum sulphonates, derivatives of sulpho-acid oxidized caster oil and
sulphosucinic acid ester
1940–1950 Fatty acids, fatty alcohols, alkylphenols
1950–1960 Ethylene oxide, propylene oxide copolymer, Alkoxylated cyclic
p-alkylphenol formaldehyde resins
1960–1970 Amine alkoxylate
1970–1980 Alkoxylated cyclic p-alkylphenol formaldehyde resins
1980–1990 Polyesteramine and blends
15
2.6 Demulsifier Preparation
The preparation of a new potential demulsifier is based on either the chemistry laboratory or some analysis
software. However, the common way to prepare a new formulation is the laboratory based method, where
different blends are formulated. Al-Sabagh et al. (2011) reported that the combination of oil-soluble
demulsifiers and water-soluble demulsifiers produced great result in water separation.
The prepared blends aimed to be tested in the laboratory during the bottle testing or later in the field during
field trials. The candidate product 2137-T used in Mabruk field is a blend of polymeric compounds in heavy
aromatic solvent based on the product’s material safety data sheet (Appendix-A). More, the formulation of the
other product Blend-X isn’t known (Allegrucci, A., personal communication, June, 2012). Demulsifiers can be
used singularly or in combinations of two or more. According to the material safety data sheet of the product
2137-T, the following is the composition of the candidate demulsifier 2137-T:
1- 1,2,4-Trimethylbenzene: < 5 % (vol.)
2- Aromatic solvent (high boiling point): 10 - 20 % (vol.)
3- Heavy aromatic solvent: 725 mg
Bin Mat et al. (2008) reported, “The best polymeric surfactants used nowadays throughout the world are
alkoxylated material derivatives. Because they are alkoxylated, they are considered as nonionic polymers”. The
oil characteristics including physical and chemical properties are very important factor that should be taken into
consideration when preparing a blend of demulsifier. Sometimes, singular formulation is not effective enough to
resolve a certain petroleum emulsion. Further, mixtures of nonionic, cationic or anionic materials are used
together.
Bin Mat et al. (2008) stated that the commercial demulsifiers used to break up W/O emulsion are blends of oil
soluble and water soluble demulsifiers. However, the most effective demulsifiers to resolve W/O emulsions are
oil-soluble (hydrophobic). It is common to formulate the oil soluble demulsifiers in organic solvent alone. Such
as, xylene, tetrahydrofuran, dioxane, lower alcohols and light gasoline fractions are also used as a solvent.
The most used polymer in the demulsification industry is reagent that contains both groups, hydrophilic and
hydrophobic. Upon adding the polymeric surfactant to the crude oil emulsion, it mobilizes itself and moves
towards the interface between water and oil phase molecules. The hydrophilic groups orient themselves towards
water while the hydrophobic groups orient themselves towards the oil phase (Ben Mahmud, 2009).
16
Chapter 3
Mabruk Field System
3.1 Introduction
The most important objective of any oil production facility is the separation of water and other undesired
materials from the produced crude oil. The breaking of crude oil emulsions is/still considered one of the more
challenging problems in today’s petroleum industry. Produced water became the problem number one in
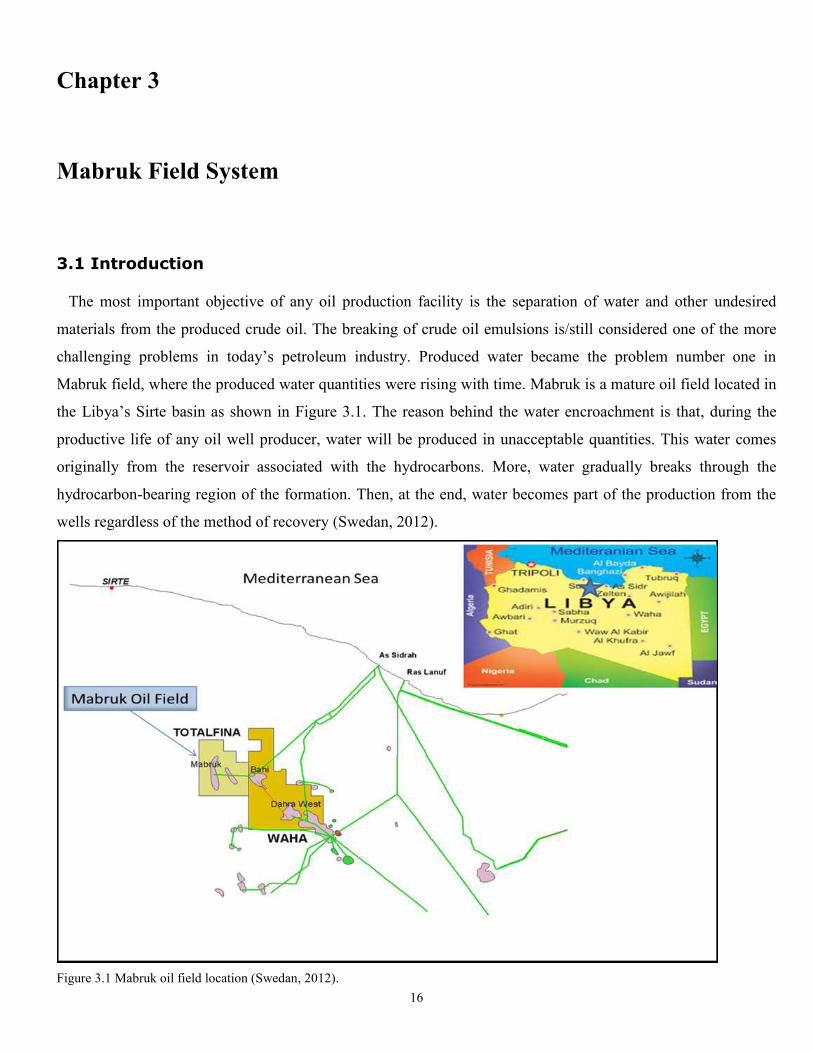
Mabruk field, where the produced water quantities were rising with time. Mabruk is a mature oil field located in
the Libya’s Sirte basin as shown in Figure 3.1. The reason behind the water encroachment is that, during the
productive life of any oil well producer, water will be produced in unacceptable quantities. This water comes
originally from the reservoir associated with the hydrocarbons. More, water gradually breaks through the
hydrocarbon-bearing region of the formation. Then, at the end, water becomes part of the production from the
wells regardless of the method of recovery (Swedan, 2012).
Figure 3.1 Mabruk oil field location (Swedan, 2012).
17
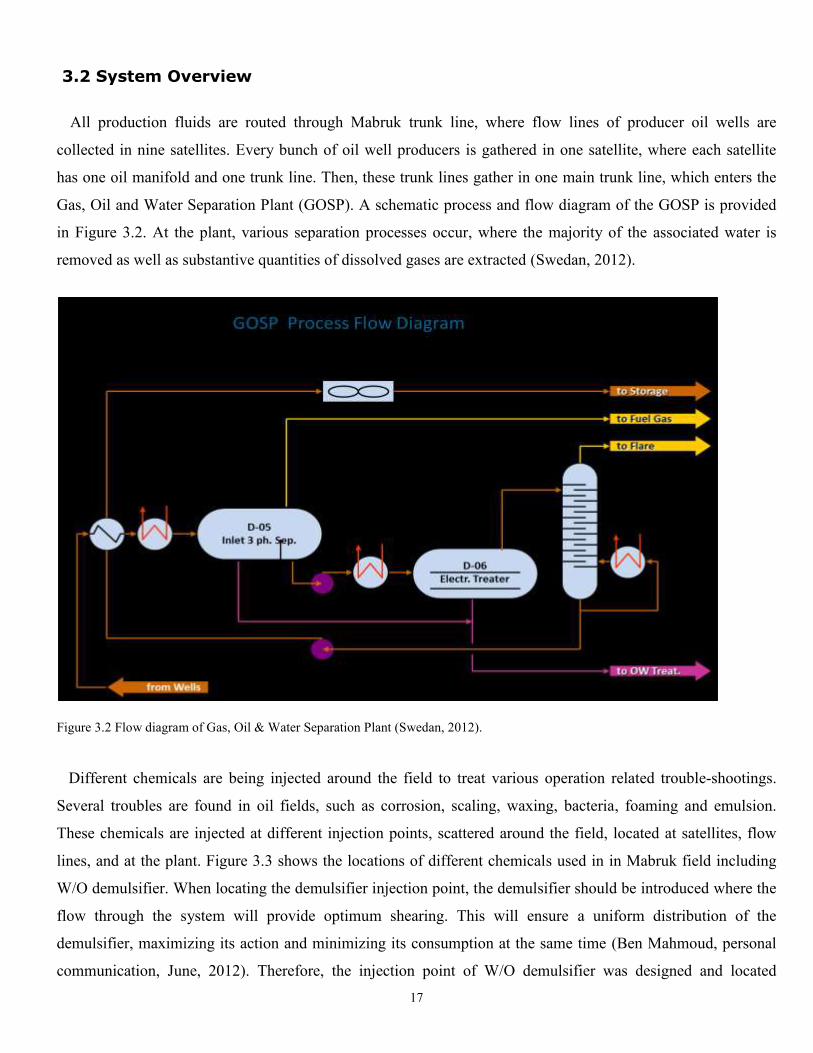
3.2 System Overview
All production fluids are routed through Mabruk trunk line, where flow lines of producer oil wells are
collected in nine satellites. Every bunch of oil well producers is gathered in one satellite, where each satellite
has one oil manifold and one trunk line. Then, these trunk lines gather in one main trunk line, which enters the
Gas, Oil and Water Separation Plant (GOSP). A schematic process and flow diagram of the GOSP is provided
in Figure 3.2. At the plant, various separation processes occur, where the majority of the associated water is
removed as well as substantive quantities of dissolved gases are extracted (Swedan, 2012).
Figure 3.2 Flow diagram of Gas, Oil & Water Separation Plant (Swedan, 2012).
Different chemicals are being injected around the field to treat various operation related trouble-shootings.
Several troubles are found in oil fields, such as corrosion, scaling, waxing, bacteria, foaming and emulsion.
These chemicals are injected at different injection points, scattered around the field, located at satellites, flow
lines, and at the plant. Figure 3.3 shows the locations of different chemicals used in in Mabruk field including
W/O demulsifier. When locating the demulsifier injection point, the demulsifier should be introduced where the
flow through the system will provide optimum shearing. This will ensure a uniform distribution of the
demulsifier, maximizing its action and minimizing its consumption at the same time (Ben Mahmoud, personal
communication, June, 2012). Therefore, the injection point of W/O demulsifier was designed and located
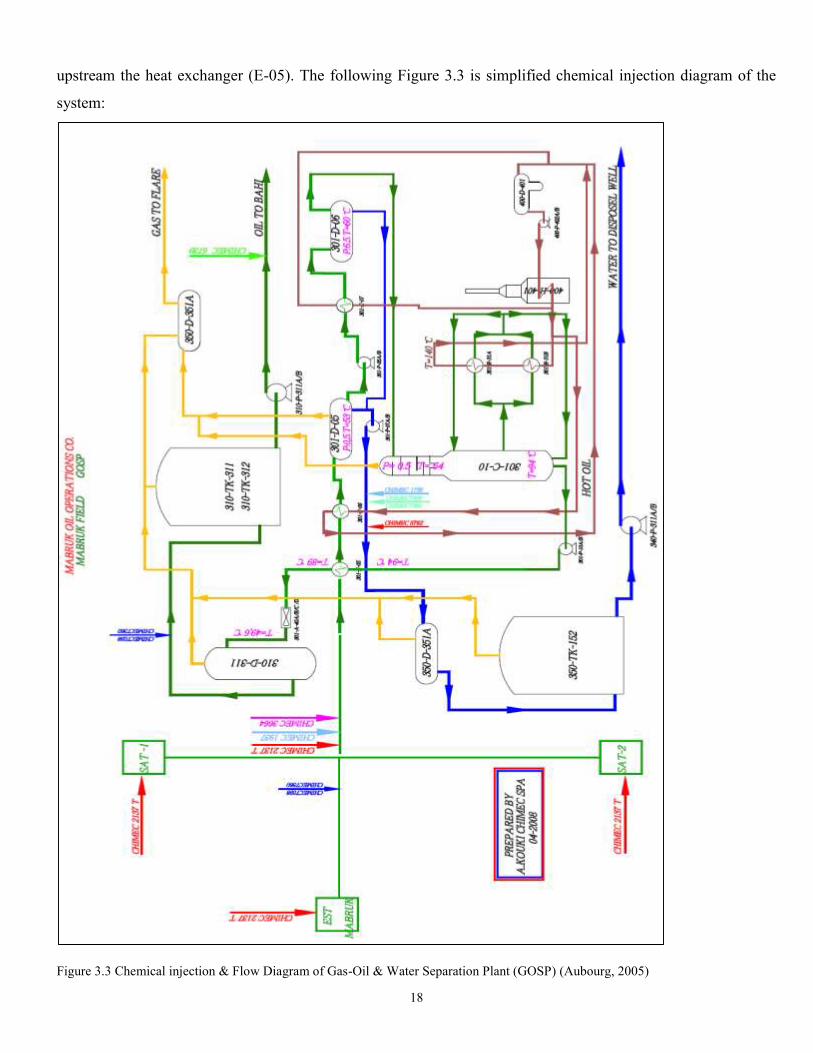
18
upstream the heat exchanger (E-05). The following Figure 3.3 is simplified chemical injection diagram of the
system:
Figure 3.3 Chemical injection & Flow Diagram of Gas-Oil & Water Separation Plant (GOSP) (Aubourg, 2005)

19
3.3 Establishing Mabruk Field Conditions
Mabruk’s crude oil has a moderate emulsion tendency that is easily treated. The main influencing factors for a
proper water-oil separation at the plant (GOSP) are the increasing levels of water from oil wells, and the low
retention time due to the size of the separation units (Aubourg, 2005).
Aubourg (2005) reported, the treatment is aimed at obtaining good separation at GOSP resulting in:
Base sediments and water (BS&W) < 0.20 % at oil export line (shipping), oil-in-water quality on separated
water < 40 ppm. The injection points for the treatment as currently performed in Mabruk field are at the Gas,
Oil, and Separation Plant (GOSP) inlet on continuous treatment basis. Moreover, the proposed demulsifier
dosage is ranging from 6-8 ppm (based on seasonal variances –winter/summer).
Table 3.1 shows the BS&W% data for the period of June 1st – June 23rd, 2012 with an ideal average BS&W of
0.3% (< 0.5%) out of the dehydrator (de-salter) going to the stripper. The remaining water content can be
extracted easily in the storage tanks down to < 0.2% as required (the shaded row is for the bottle-testing date
June 22, 2012) (Swedan, 2012).
Table 3.1 BS&W% and process parameters for 3-phase separator and dehydrator.
Date
(2012)
Total
Yield
Bbl/d
Chem.
Dosage
(ppm)
Sep.
Pressure
(bar)
Sep.
Temp.
(ᴼC)
Dehyd
.Press.
( bar)
BS&W
%
Pro.Sep
inlet
BS&W
%
Sep.
outlet
BS&W
%
Hyd.
outlet
01/06 35155 8 1 59 6 20.08 3.00 0.22
02/06 34700 8 1 59 6 16.00 1.80 0.50
03/06 34060 8 1 60 6 19.59 5.67 0.45
04/06 34655 8 1 60 6 18.90 1.90 0.32
05/06 34561 8 1 60 6 19.33 2.20 0.43
06/06 33548 8 1 60 6 17.93 2.03 0.38
07/06 34423 8 1 60 6 17.36 2.20 0.18
08/06 34861 8 1 60 6 19.74 2.33 0.30
09/06 34403 8 1 60 6 19.36 2.33 0.22
10/06 33415 8 1 60 6 15.43 2.40 0.40
11/06 32568 8 1 60 6 16.33 1.60 0.15
12/06 31564 8 1 61 6 13.33 1.40 0.15
13/06 33036 8 1 61 6 19.92 1.70 0.18
14/06 34258 8 1 60 6 20.79 1.80 0.15

20
Continued Table 3.1,
Date
(2012)
Total
Yield
Bbl/d
Chem.
Dosage
(ppm)
Sep.
Pressure
(bar)
Sep.
Temp.
(ᴼC)
Dehyd.
Press.
( bar)
BS&W%
Pro.Sep
inlet
BS&W
%
Sep.
outlet
BS&
W%
Hyd.
outlet
15/06 34992 8 1 60 6 21.48 1.60 0.17
16/06 35087 8 1 60 6 22.41 2.40 0.13
17/06 34649 8 1 60 6 23.47 2.53 0.20
18/06 34708 8 1 60 6 23.25 1.73 0.27
19/06 34536 8 1 60 6 21.99 1.70 0.20
20/06 34489 8 1 60 6 21.16 1.53 0.35
21/06 35738 8 1 60 6 21.74 1.87 0.13
22/06 34128 8 1 60 6 23.38 2.80 0.25
23/06 34166 8 1 60 6 24.65 2.67 0.20
Legend: The shaded row stands for the bottle-test day.
3.4 System and Current Treatment
The treatment of fresh crude oil and produced oily water were described in the following subsections in detail.
Further, the performance of 3-phase separator, dehydrator and oily-water package were examined.
3.4.1 Wet Crude Oil Treatment
All production fluids flowing from the oil-wells are routed through the plant trunk line to the plant. At the
Gas, Oil and Water Separation plant (GOSP), most of the gas and water are removed from the wet crude oil.
The fluids are passed through a heat exchanger (E-05) where they are heated by hot crude oil from an upstream
stripper (C-10). It is then passed through a second heat exchanger (E-06) which uses a hot oil supply as the
heating medium as shown in Figure 3.4 (Aubourg, 2005).
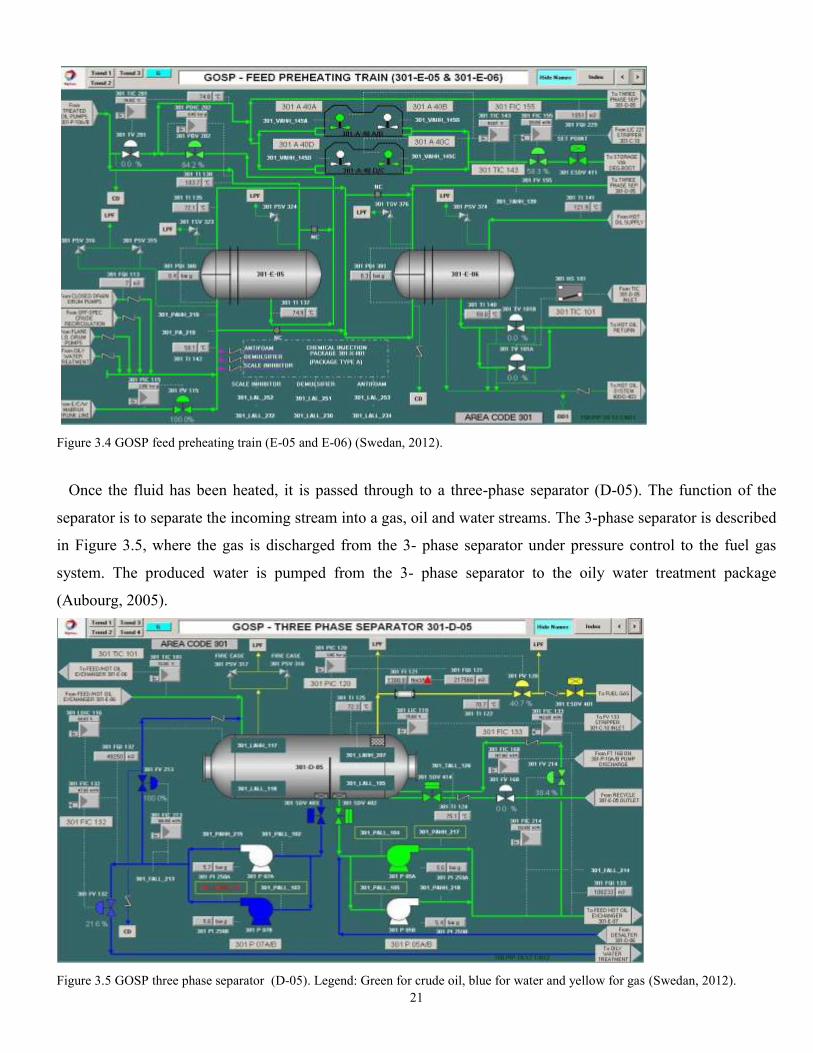
21
Figure 3.4 GOSP feed preheating train (E-05 and E-06) (Swedan, 2012).
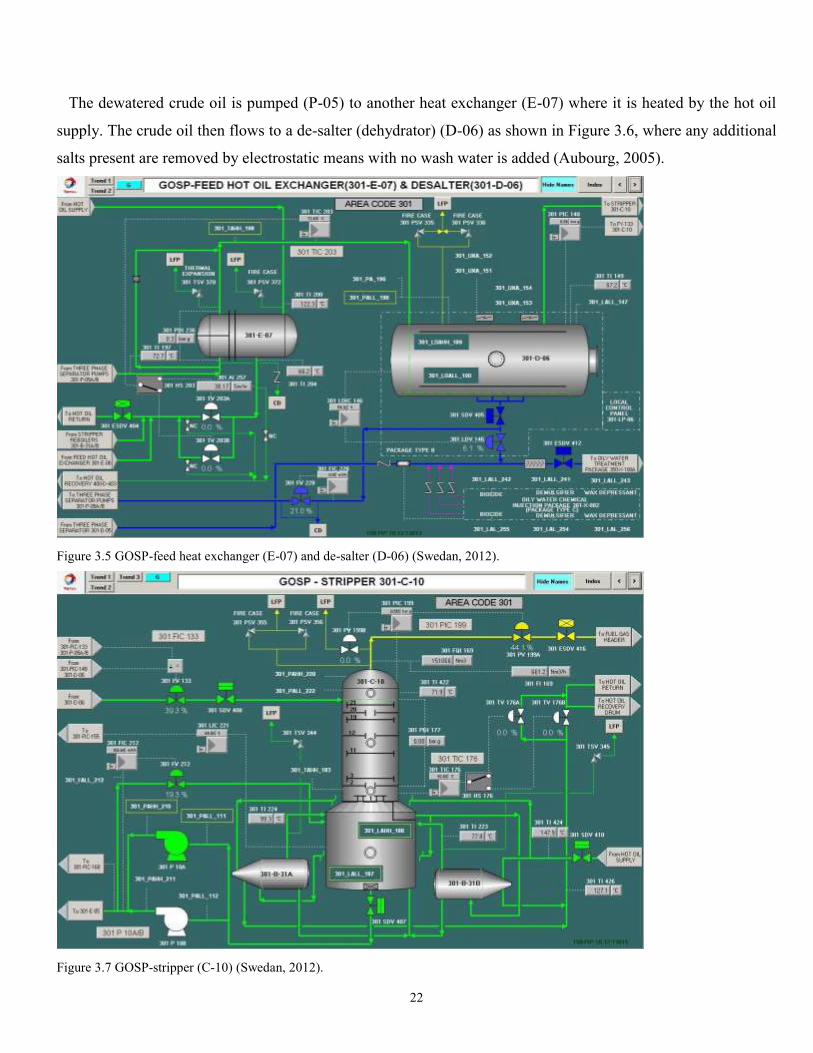
Once the fluid has been heated, it is passed through to a three-phase separator (D-05). The function of the
separator is to separate the incoming stream into a gas, oil and water streams. The 3-phase separator is described
in Figure 3.5, where the gas is discharged from the 3- phase separator under pressure control to the fuel gas
system. The produced water is pumped from the 3- phase separator to the oily water treatment package
(Aubourg, 2005).
Figure 3.5 GOSP three phase separator (D-05). Legend: Green for crude oil, blue for water and yellow for gas (Swedan, 2012).
22
The dewatered crude oil is pumped (P-05) to another heat exchanger (E-07) where it is heated by the hot oil
supply. The crude oil then flows to a de-salter (dehydrator) (D-06) as shown in Figure 3.6, where any additional
salts present are removed by electrostatic means with no wash water is added (Aubourg, 2005).
Figure 3.5 GOSP-feed heat exchanger (E-07) and de-salter (D-06) (Swedan, 2012).
Figure 3.7 GOSP-stripper (C-10) (Swedan, 2012).
23
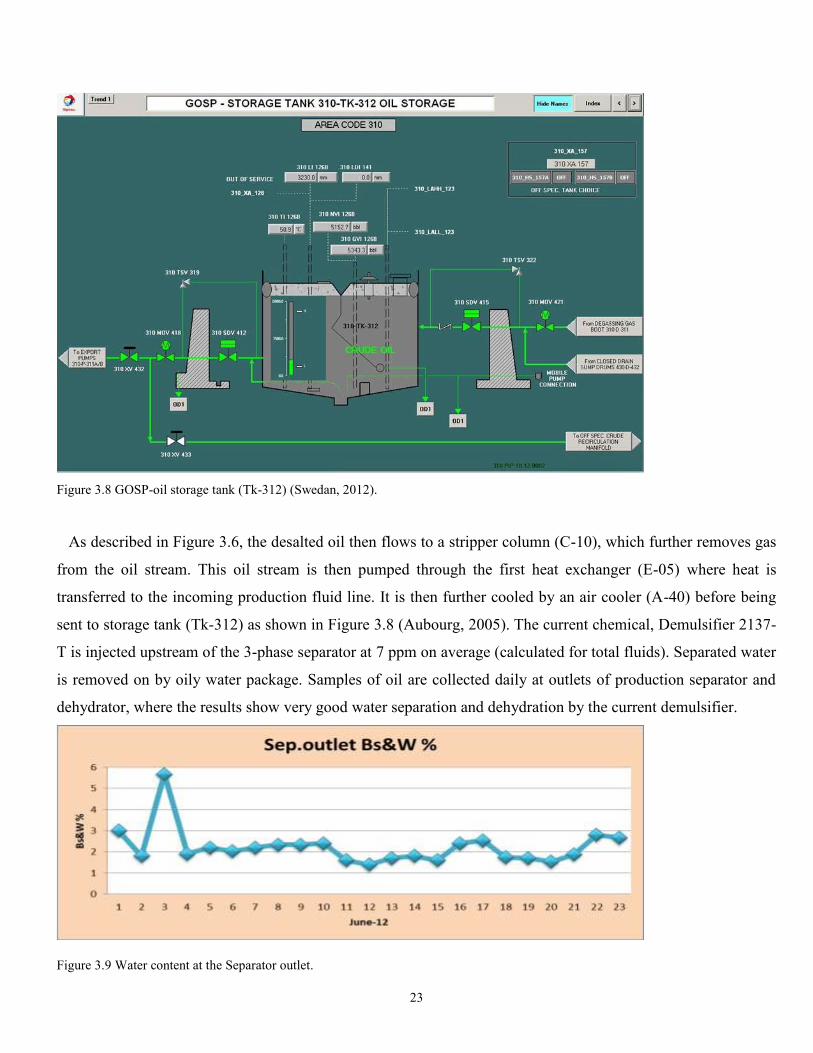
Figure 3.8 GOSP-oil storage tank (Tk-312) (Swedan, 2012).
As described in Figure 3.6, the desalted oil then flows to a stripper column (C-10), which further removes gas
from the oil stream. This oil stream is then pumped through the first heat exchanger (E-05) where heat is
transferred to the incoming production fluid line. It is then further cooled by an air cooler (A-40) before being
sent to storage tank (Tk-312) as shown in Figure 3.8 (Aubourg, 2005). The current chemical, Demulsifier 2137-
T is injected upstream of the 3-phase separator at 7 ppm on average (calculated for total fluids). Separated water
is removed on by oily water package. Samples of oil are collected daily at outlets of production separator and
dehydrator, where the results show very good water separation and dehydration by the current demulsifier.
Figure 3.9 Water content at the Separator outlet.
24
Figure 3.10 Water content at the dehydrator outlet for June 2012.
As stated above in figures 3.9 and 3.10, the separation process is working at good conditions and indicates high
performance, where the target of less 0.5% water content out of the dehydrator is achieved (Aubourg, 2005).
3.4.2 Produced Water Treatment and Disposal
The water separated out at the demulsification stage at the plant-processing facilities contains residual oil and
finely dispersed solids. The oil is present as dispersion in water or oil-in-water emulsion, termed reverse
emulsion. The concentration of residual oil is usually too high for discharge into the environment. In addition,
the residual oil also has economic value (Aubourg, 2005).
Figure 3.11 GOSP-oily water treatment package (Swedan, 2012).
25
Aubourg (2005) reported, the demulsifier chemical used to treat O/W emulsion is also termed coagulant or
flocculent. Coagulation and flocculation treatment is a method to separate fine solids and colloids dispersed in
water phase. He added, prior to disposal, the oily water is treated to remove residual oil in an Oily Water
Treatment (OWT) unit (350-X-351A/B), which is described in Figure 3.11. The purpose of the oily water
treatment package is to produce de-oiled waste water suitable to be discharged according to the local regulations
or suitable for the use in water flooding system. Discharging oily water with high oil content could possibly lead
to big environmental impact. As water includes many kinds of dissolved solids, suitable water treatment
methods have been selected according to the water quality. As per Mabruk plant design, the oily water unit is a
compact oil/water separator of the Pressurized Cross Flow Interceptor (PCFI) type.
3.4.2.1 Performance Evaluation of the Oily Water Treatment Package
In August, 2008, the performance of the oily water treatment separator has been evaluated at normal and
steady state operations. The average residual free and separable oil content of the separator discharge has been
determined, taking into consideration all recorded lab results.
Osenga et al. (2008) reported that, it has been found that, the oily water separator is performing according to
the contract design value which is <40 mg/l free and separable oil in the treated discharge stream as described in
Figure 3.12. The average of the total oil discharged out of the oily water treatment package into the disposal
system is less than 40 mg/l that the Libyan regulations are strict to 40 mg/l maximum allowed discharge limit
(onshore).
26
Figure 3.12 Free and separable oil content at the inlet/outlet of the oil-water separator (D 351-A) (Osenga, et al., 2008).
Table 3.2 The test results of total and free-separable oil contents for the oil-water separator in/out streams (Osenga et al., 2008).
There was another technical report issued by another contractor, concerning the water-oil package’s
performance as shown in Table 3.3. The two Tables (3.2) and (3.3) summarize the water quality entering and

27
exiting the water-oil separator D-351 as well as, the water quality of the buffer tank outlet stream (TK-352). The
buffer tank is the last separation stage for oily-water before it is pumped into the disposal well (Osenga et al.,
2008) (Sewdan, 2012).
Table 3.3 Produced water characteristics (Sewdan, 2012).
Parameter CFI (D-351A) Inlet,
GOSP
CFI (D-351A)
Outlet, GOSP
Buffer Tank (TK-352) Outlet,
GOSP
Temperature, 0C 50.8 50.6 51.9
Specific Gravity @ 20 0C 1.0340 1.0341 1.0341
Total Dissolved Solids,
mg/l
50,465 50,731 50,771
Dissolved Carbon Dioxide,
mg/l
128 163 165
Dissolved H2S, mg/l 3.5 3.5 6
Dissolved Oxygen, µg/l 10 15 10
Total Suspended Solids, mg/l 5.1 4.3 6.3
Oil In Water, ppm 117.5 41 10
Based on the two technical reports issued by different contractor companies (summarized above), both show
the oil content (free and separable) at the buffer tank outlet is below the allowed limit as planned. Specification
of maximum oil content of produced water is 40 ppm. This limit was set by reservoir geophysical properties in
order to maintain the disposal well injectivity index at the required level. Therefore, by abiding such a crucial
environmental regulation, it is now possible to argue that oily-water treatment package is running in
environmentally friendly manner.
3.4.2.2 Produced Water Disposal
The treated water from the oily water treatment separator units enters the water buffer tank 350-TK-352. The
treated water from the buffer tank is normally continuously disposed through the water disposal network as
described in Figure 3.13, where, the treated oily water is disposed into a disposal well (A-22i) as per Mabruk
plant’s design. Further, the disposal well is a part of the water flooding system, where the treated water is being

28
injected into water injection wells to recover more oil quantities produced from the reservoir (Secondary
recovery phase) (Aubourg, 2005).
Figure 3.12 Produced water disposal network (Swedan, 2012).
3.4.3 Product Specifications
The following, Table 3.4, shows the specifications of the produced crude oil. These specifications must be
achieved by the field operator to produce dry and saleable crude oil accepted in the petroleum market. The
treatment of dissolved gases as well as salts was not discussed in this thesis. However, the specifications related
to associated gases and salts were not difficult to achieve (A. Ben Mahmoud, personal communication, June,
2012).
Table 3.4 Treated crude oil specifications (Aubourg, 2005).
Legend: RVP, Reid Vapor Pressure. PTB, Pound per Ton Barrels. ppm wt., part per million (weight basis). psia, pound per square
inch (absolute)

29
3.5 Key Design Data
The following table shows the key design data for main equipment at the existing oil production process units:
Table 3.5 Key design data of the existing oil production process at GOSP (Aubourg, 2005).
D-05 Three Phase Separator
Duty 1 x 100%
Operating Pressure Barg 1
Operating Temp. oC 60
Inlet Flow Rate T/h 236
D-06 De-salter
Duty 1 x 100%
Operating Pressure Barg 5
Operating Temp oC 65
Inlet Flow Rate T/h 149
C-10 Stripper
Duty 1 x 100%
Operating Pressure Barg 0.5 – 0.8
Operating Temp oC 92
3.6 Fluid Physical and Chemical Properties
3.6.1 Oil Properties
Mabruk’s crude oil is a mix of three different reservoirs, Mabruk, Dahra and Garian. At the inlet of the
separation plant, all the trunk lines are gathered in one trunk line. The stability of emulsions is largely affected
by the presence of fine solids or external agents. The physical properties of Mabruk crude are given in Table
3.6, where it is readily noticeable that the 3 reservoirs are paraffinic. Therefore, it is recommended to study the
chemical and physical properties of these reservoirs when selecting the demulsifier.
30
Table 3.6 Mabruk crude oil physical properties (Aubourg, 2005).
Oil Properties
Parameter Mabruk Dahra Garian
Density @ 15oC, kg/m3 851 (WM)
855 (ECM)
830 (DSE)
857 (DN) 824 (GN)
Viscosity @ Reservoir
conditions, cP
2.6 (WM) @
59C/1200 psi
2.1 (ECM) @
58C/1200 psi
0.72 (DN) @
77C/1500 psi
1.3 (DSE) @
68C/1250 psi
0.95 (GN) @
102C/2400 psi
Wax Appearance
Temperature, oC 30 33 27
Wax Composition n/a n/a n/a
Pour Point, oC -6 -3 -12
GOR (Sm3,Sm3) 5.4 (WM)
12.5 (ECM)
78 (DN)
6 (DSE) 2 (GN)
Legend: WM (West Mabruk), ECM (East Central Mabruk), DN (Dahra North), DSE (Dahra South East), GN (Garian North)
GOR (gas oil ratio), cP ( centi- Poise), n/a ( not available)
The Chemical properties of the feed crude oil is provided for the 3 crude oils ( Mabruk, Dahra and Garian) are
given in the attached appendix-B (Table-1 and Table-2). These tables contain the feed compositions for Mabruk
crude oil, and (Dahra & Garian ) crude oils respectively. The simulations were carried out to predict the feed
flow rates for the incoming years using PRO/II software (Aubourg, 2005).
3.6.2 Water Properties
Wet crude oils are pumped from producer oil wells to separation plant (GOSP), where the majority of water
and gas quantities are removed. The feeding fluid contains dissolved gas and water. Further, water content of
the inlet stream exceeds the average of 20% in most cases. The inlet water cut value is ranging from 20 to 35%,
depends on several operational conditions related to the feeding oil wells, where more than 60 oil wells are
feeding Mabruk plant, working ideally 24/7. Water properties of the 3 reservoirs are given below in tables 3.7
and 3.8 (Aubourg, 2005).
31
Table 3.7 Water composition for Mabruk reservoir (Aubourg, 2005)
The following are dissolved gases values and the water characteristics for Mabruk reservoir (water)
Dissolved Gas: CO2: 42 ppm mol.
H2S: 200 mg/l
Water characteristics: pH: min: 6, max: 7.3, density @ 20°C: 1040 kg/m3 and conductivity @ 20 °C: 80.35
μS/cm.
Table 3.8 Water compositions for Dahra and Garian reservoirs (Aubourg, 2005).
The following are dissolved gases values and the water characteristics for Dahra/Garian reservoir (water)
Dissolved Gas: CO2: 32 ppm mol (max 150 mg/l), H2S: 200 mg/l and water pH: min.: 6, max.: 7.3
32
3.7 Wax Appearance Temperature and Pour Point
Mabruk oil is characterized as a waxy crude oil, where its pour point ranges from -12 to -6 ᴼC. More, Mabruk
crude oil is a mix of three different crude oils. These crude oils are originally come from three reservoirs,
Mabruk, Dahra and Garian. As per Table 3.9 given below, the three crude oils show waxing tendency at
different temperatures. Although, the presence of waxy or paraffinic materials could possibly increase the
emulsion stability, Mabruk oil has a moderate emulsion tendency, not difficult to treat. Table 3.9 given below
shows the pour point and the wax appearance temperature (WAT) for each reservoir.
Table 3.9 Pour point and (WAT) for each reservoir (Aubourg, 2005).
Reservoir WAT, °C Pour Point, °C
MABRUK crude
30 -6°C
DAHRA crude
33.5 -3°C (Well A4)
GARIAN crude
27.3 -12°C (Well A1)
The melting and crystallization points of the waxes are important for stabilizing the properties of waxes. If the
melting point is exceeded at the oil-water separation facilities, the waxes will mainly act as a component in the
crude oil bulk. Hence, their activities at the oil-water interface are normally substantially decreased. Aubourg
(2005) stated, according to the field’s operation database of Mabruk field, there is no report available to check
the possibilities of asphaltenes or naphthanes crystallization occurrence. Also, referring to the current
operational parameters applied at the oil-water separation facilities, there is no concern in relation to the above
(Ben Mahmoud, personal communication, June, 2012)
.
33
Chapter 4
Experimental Materials and Methods
4.1 Introduction
To achieve the outlines of the objectives and the scope of the research, several materials, experimental and
analytical procedures used in this study are presented and discussed with more details in the following sections.
The chemicals and methods used in this study depend exactly on the research needed by considering all factors
except cost saving. This is because the existing chemical used to treat the water-in-oil emulsion in Mabruk field
was validated (Ben Mahmoud, personal communication, June, 2012).
4.2 Experimental Methods
Ben Mahmud (2012) reports that the Bottle Test procedure allows the identification of the best combination of
active demulsifying agents depending on the crude characteristics and system parameters. The best active
materials combination is the one that breaks the emulsion and balances the following parameters: higher water
drop, lower residual salt content, best interface quality, low interface volume with tin shape, best quality of
separated water and lowest residual emulsion content. Once the oil achieves the specification required (salt
content, residual BS&W, T.V.R.) it is ready to be shipped to the terminal (exporting line). This study was
carried out on site by using two types of demulsifiers, where bottle test method was used. The two demulsifiers
were screened at different concentrations to determine the most effective demulsifier as discussed in section
4.2.2.
4.2.1 Bottle-Testing History
In November-2008, a survey carried out in Mabruk field by the chemical contractor company, and the
efficiency of the current chemical used in the field as emulsion breaker has been verified. The current emulsion
breaker CH 2137-T is a product formulated for Mabruk field and used as demulsifier. This chemical is giving
high performances, allowing the complete water separation according to operating conditions. The efficiency
34
was found to be very high. The good results have been compared to some newly developed products with the
aim of determining further improvements to its performance. CH-2137-T remains efficient among all tested
products. The parameters monitored to evaluate the efficiency of the emulsion breakers for the crude oil, have
been:
• Volume of separated water;
• Water separation rate;
• Sharp interface;
• Quality of separated water (oil in water);
• No over-dosage effects encountered.
According to the system characteristics, such as short residence time (approx. 4 min.) and high turbulence,
2137-T has been chosen. To evaluate the performance of the chemicals during the first 10 minutes, all the
products selected and fit on the Figure 4.1 have reached at least the 70% of the theoretical performance where
the test crude has 32-33% water cut at that time (Laura et al., 2009).
Figure 4.1 Previous bottle-test results performed in Mabruk field dated November-2008 (Laura et al., 2009).
Laura et al. (2009) explained, in the figure 4.1, each curve is relative to a different chemical, including the
incumbent 2137T. Further, a rank has been coupled to each of the main parameters using a number between 0
and 6. Figure 4.2 describes the overall performance of the tested demulsifiers.
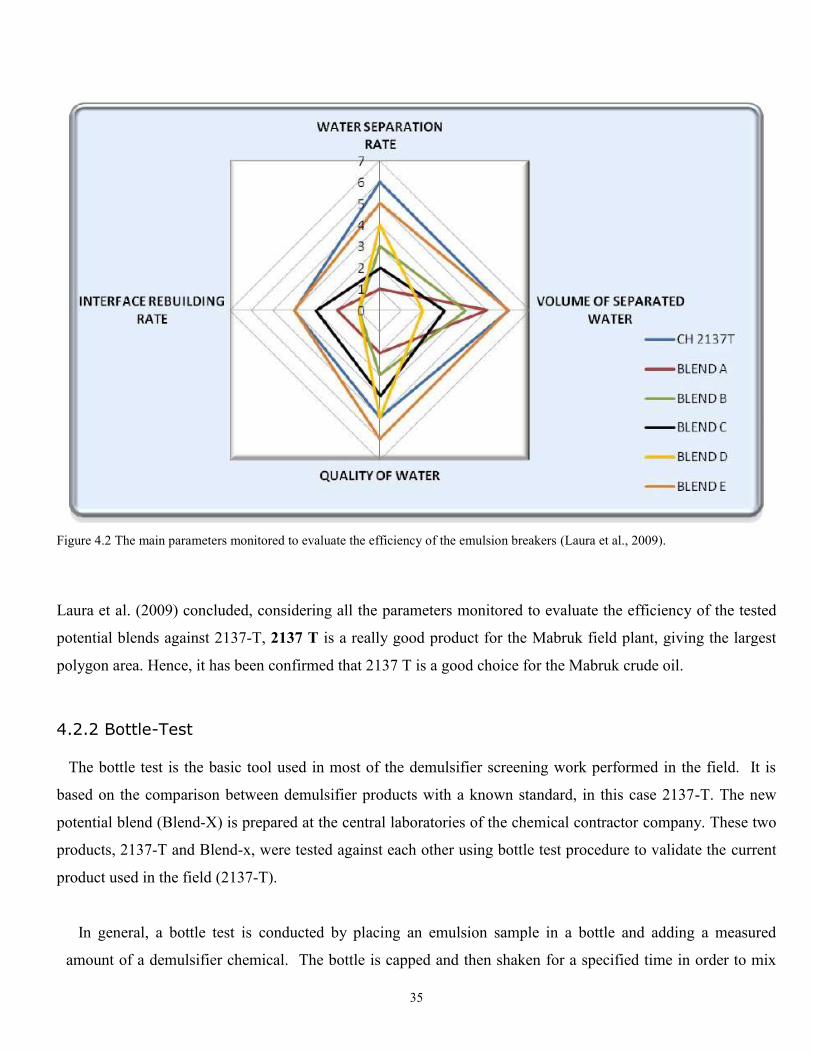
35
Figure 4.2 The main parameters monitored to evaluate the efficiency of the emulsion breakers (Laura et al., 2009).
Laura et al. (2009) concluded, considering all the parameters monitored to evaluate the efficiency of the tested
potential blends against 2137-T, 2137 T is a really good product for the Mabruk field plant, giving the largest
polygon area. Hence, it has been confirmed that 2137 T is a good choice for the Mabruk crude oil.
4.2.2 Bottle-Test
The bottle test is the basic tool used in most of the demulsifier screening work performed in the field. It is
based on the comparison between demulsifier products with a known standard, in this case 2137-T. The new
potential blend (Blend-X) is prepared at the central laboratories of the chemical contractor company. These two
products, 2137-T and Blend-x, were tested against each other using bottle test procedure to validate the current
product used in the field (2137-T).
In general, a bottle test is conducted by placing an emulsion sample in a bottle and adding a measured
amount of a demulsifier chemical. The bottle is capped and then shaken for a specified time in order to mix
36
the contents. The bottle is set aside and the water drop is observed for few minutes (1, 2, 3, 5, 10 &15 min).
A sample of the oil layer is then obtained and centrifuged to determine the quantity of water, emulsion and
solids (in case) remaining. In this experimental work the water drop has been observed at 1, 3, 5, 7 minutes
that it is been noticed that after 7 minutes, the oil/water level is stabilized (Korosoglou et al., 2010).
4.2.3 Bottle-Test Procedure
The bottle test is the basic tool used in most of the demulsifier screening work performed in the field. It is
based on the comparison of demulsifier products with a known standard, in this case 2137-T.
A- Ratio Test
Bottle test the candidate demulsifier (2137-T) over a range of concentrations to obtain optimum volume.
B- Elimination Test
• Prepare the new blend that will be tested against the existing demulsifier. In this work, Blend-X is the
new blend which has been already prepared at the central laboratory and ready to be tested against 2137-
T (Allegrucci, personal communication, June, 2012).
• The two blends are ready to be tested at the chemistry Mabruk field laboratory.
• Test the new product at the same dosages that the candidate demulsifier was tested on and record your
observations.
• Make a comparison and decide which one is the best.
C- Confirmation Test
Test the optimum blend over a range of treatment rates to identify any over or under treatment characteristics
(Korosoglou et al., 2010).
4.2.4 Establishing Test Conditions
The conditions of the individual bottle test are modified according to the individual system. The following
test conditions and variables were investigated:
Representativeness of sample
The samples were taken from the GOSP inlet trunk line where all the production lines gather and the sample
point was 15:00 o’clock positioned (0ᴼ degree angle).
Treating temperature(s) effects
The tests were carried out at the system temperature (60ᴼC).
Agitation/shake time effects
37
The prescription bottles were shaken 100 times (at least), which is usually enough to disperse the chemical
into the crude oil.
Settling time required
The time given was similar to the residence time in the system (2-5 min at the 3-phase separator), where 4
minutes was considered for this test (Allegrucci, personal communication, June, 2012).
Sample ageing effects
Fresh emulsion samples were taken for the test.
Taking the above criteria into consideration, the following method was used:
Tests run at 60oC, the temperature in the system.
Demulsifier added to each bottle at required dosage.
Bottles agitated to disperse demulsifier and replicate shear in the system (simulation).
Water drop rate (volume versus time) recorded for each bottle.
At the end of each test, a sub-sample of the top oil is taken and centrifuged to determine the BS&W.
This corresponds to the expected BS&W going from the 3-phase separator to the to the next treatment
unit which is the de-salter, where further water separated from the crude oil. A composite BS&W was
not taken because the water/emulsion interface was not there (no emulsion observed and clear interface
for 2137-T) (Allegrucci, personal communication, June, 2012).
4.3 Preparation for the Bottle Test
Prepare the chemistry Laboratory; materials, machines, and tools needed for the test, such as;
- Packers 100, 200, 500, 1000 ml
- Pipettes ( ±20)
- Microliter syringes (adjustable)
- Centrifuge (adjustable speed RPM, temperature & timing)
- Crude oil sampling bottles (potable water bottles, 1.5 liters)
- Water bath (adjustable temperature)
- Standard bottle-test kit (4 prescription bottles, 100 ml each, test tube rack)

38
Figure 4.3 Standard bottle-test kit.
- Fume hood
Figure 4.4 Fume hood.
- Emulsion Breaker ( Demulsifiers ) samples;
100 ml 2137 T and 100 ml Blend-X
- A standard demulsifier bottle ( 1 liter)
Figure 4.5 Standard demulsifier bottle.
39
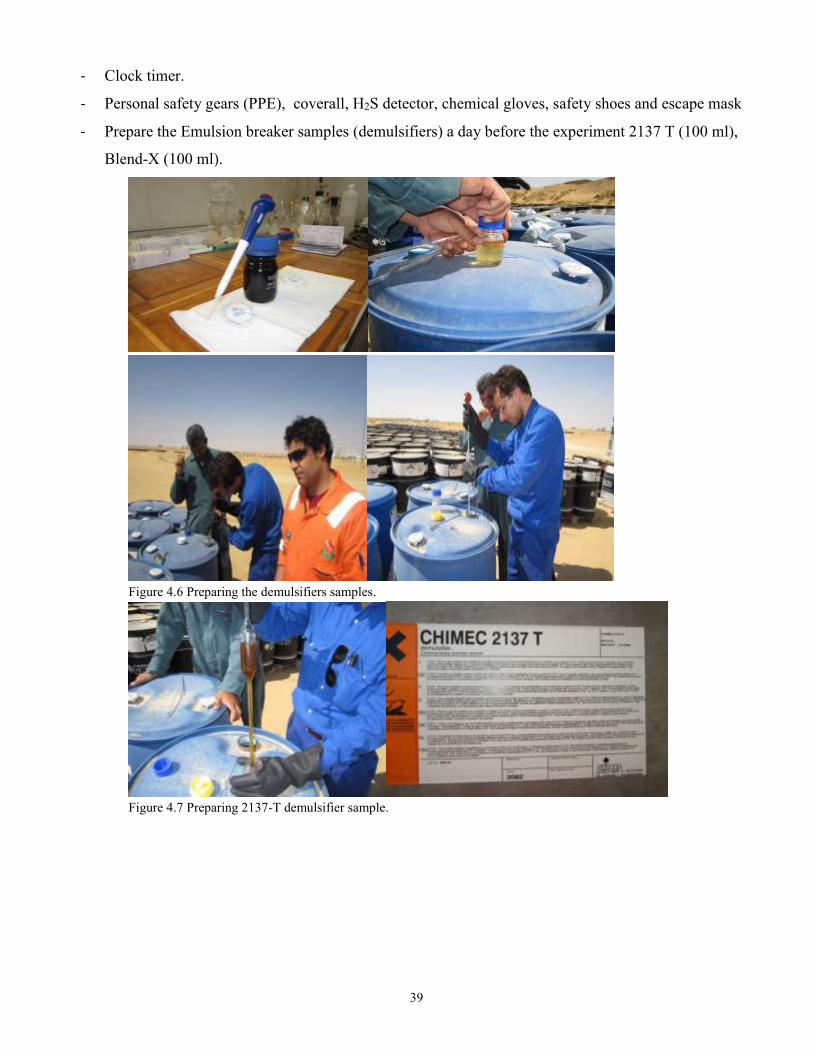
- Clock timer.
- Personal safety gears (PPE), coverall, H2S detector, chemical gloves, safety shoes and escape mask
- Prepare the Emulsion breaker samples (demulsifiers) a day before the experiment 2137 T (100 ml),
Blend-X (100 ml).
Figure 4.6 Preparing the demulsifiers samples.
Figure 4.7 Preparing 2137-T demulsifier sample.

40
- Prepare the laboratory/ machines/ tools and materials a day before.
Figure 4.8 Mabruk field’s laboratory.
4.4 The Experiment
1- Collect chemical free samples of the crude (located at the plant inlet) 4-5 bottles, 1500 ml each.
Figure 4.9 Collecting fresh crude oil samples.
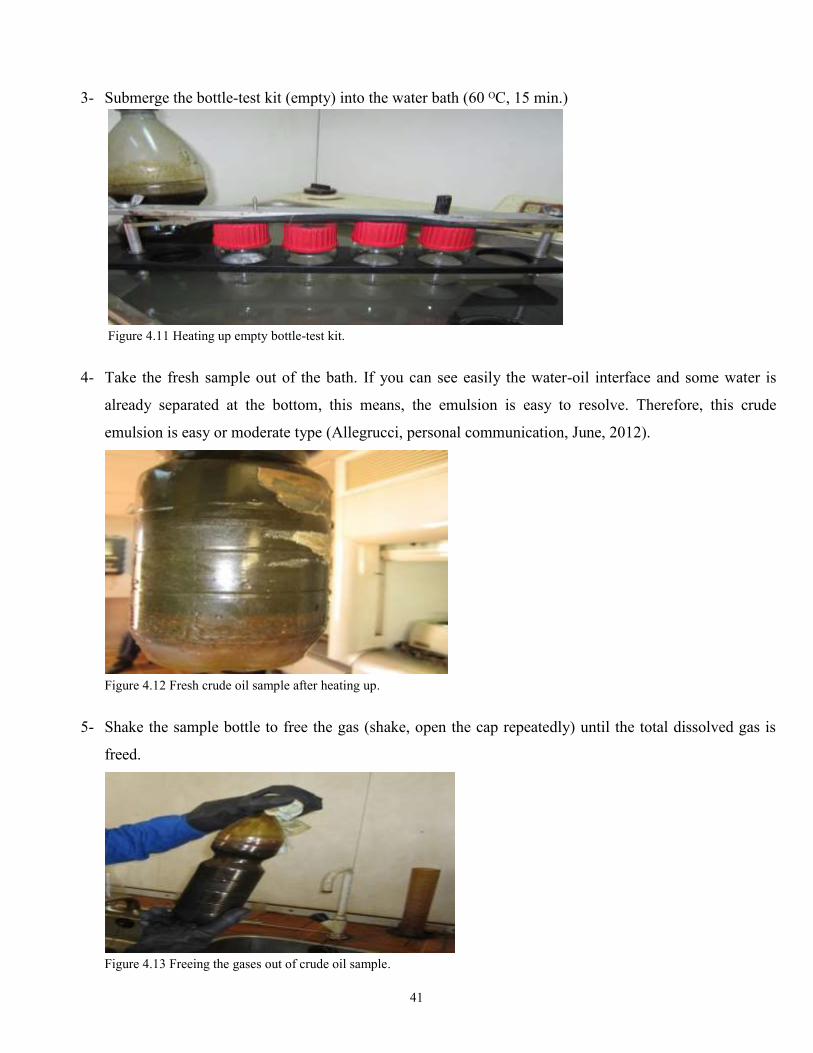
2- Submerge 1 bottle of fresh crude oil into water bath (60ᴼC, 15 min)
Figure 4.10 Heating up the fresh crude oil samples.
41
3- Submerge the bottle-test kit (empty) into the water bath (60 ᴼC, 15 min.)
Figure 4.11 Heating up empty bottle-test kit.
4- Take the fresh sample out of the bath. If you can see easily the water-oil interface and some water is
already separated at the bottom, this means, the emulsion is easy to resolve. Therefore, this crude
emulsion is easy or moderate type (Allegrucci, personal communication, June, 2012).
Figure 4.12 Fresh crude oil sample after heating up.
5- Shake the sample bottle to free the gas (shake, open the cap repeatedly) until the total dissolved gas is
freed.
Figure 4.13 Freeing the gases out of crude oil sample.

42
6- Shake the sampling bottle then fill the prescription bottles (100 ml mark).
Figure 4.14 Filling the prescription bottles with fresh crude oil.
7- Put the bottles inside the water bath for 2-3 minutes.
Figure 4.15 Heating up the 4 prescription bottles using the water bath.
8- Take the bottles out of water bath and remove the lids.
Figure 4.16 The 4 prescription bottles out of the water bath.

43
9- Calculate the demulsifier dosage (to be added to each bottle). What is the equivalent amount of 10 ppm
(demulsifier) in 100 ml crude oil sample?
(10× 10^ − 6)/(100 × 10^ − 3) = 1 × 10^ − 4 Liter
So, 10 ppm = 100 μl.
Therefore, a volume of the stock 2137-T was added to the crude oil sample to achieve the desired
demulsifier concentration dose. Table 4.1 provides the volumes of the 2137-T (or Blend-X) added to the
crude oil to provide the desired demulsifier concentration dose.
Table 4.1 Equivalent concentrations (μl) in a 100 ml crude oil sample to provide the desired equivalent demulsifier dose
concentration in units of ppm.
Equivalent volume per 100 ml crude, μl Equivalent demulsifier concentration in crude oil sample,
ppm
50 5
100 10
150 15
200 20
250 25
10- Add 10 ppm of 2137 T to 3 bottles using the syringes (very quick & keep one bottle blank).
Figure 4.17 Adding 10 ppm dosage of 2137-T to 3 prescription bottles.
11- Lid the bottles and shake them hard (100 times). This simulates the agitation occurring inside the 3-
phase separator.
Figure 4.18 Shaking the treated prescription bottles.
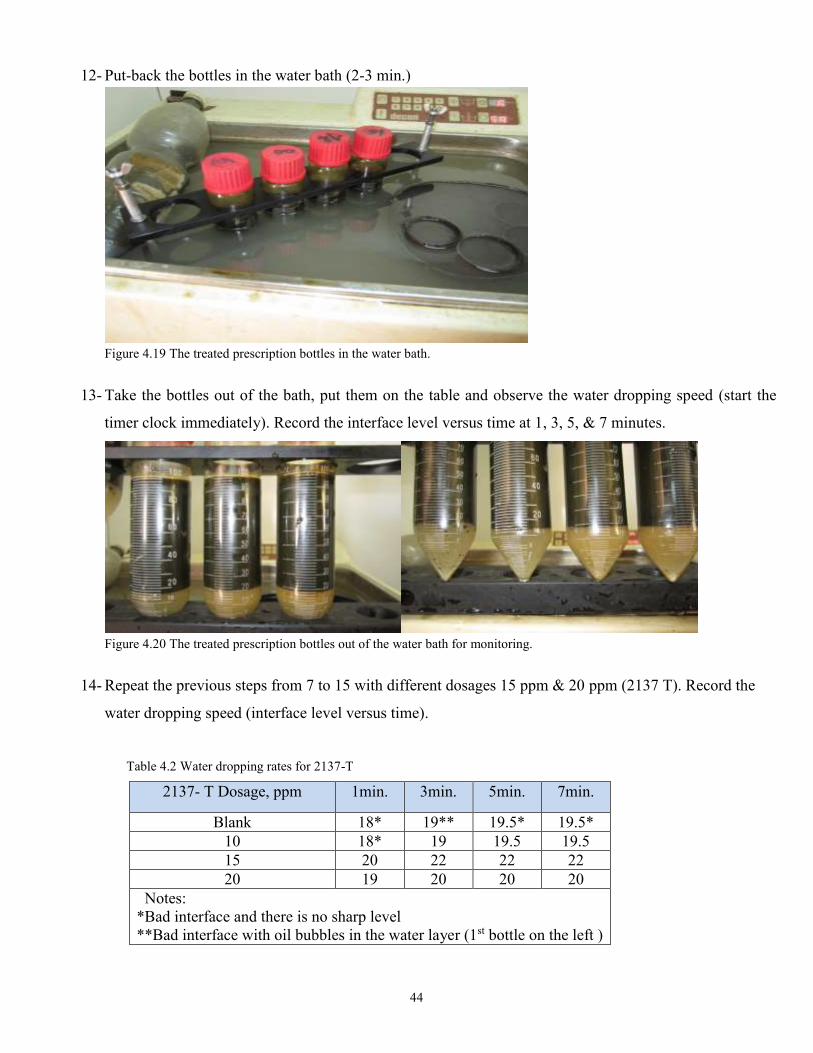
44
12- Put-back the bottles in the water bath (2-3 min.)
Figure 4.19 The treated prescription bottles in the water bath.
13- Take the bottles out of the bath, put them on the table and observe the water dropping speed (start the
timer clock immediately). Record the interface level versus time at 1, 3, 5, & 7 minutes.
Figure 4.20 The treated prescription bottles out of the water bath for monitoring.
14- Repeat the previous steps from 7 to 15 with different dosages 15 ppm & 20 ppm (2137 T). Record the
water dropping speed (interface level versus time).
Table 4.2 Water dropping rates for 2137-T
2137- T Dosage, ppm 1min. 3min. 5min. 7min.
Blank 18* 19** 19.5* 19.5*
10 18* 19 19.5 19.5
15 20 22 22 22
20 19 20 20 20
Notes:
*Bad interface and there is no sharp level
**Bad interface with oil bubbles in the water layer (1st bottle on the left )
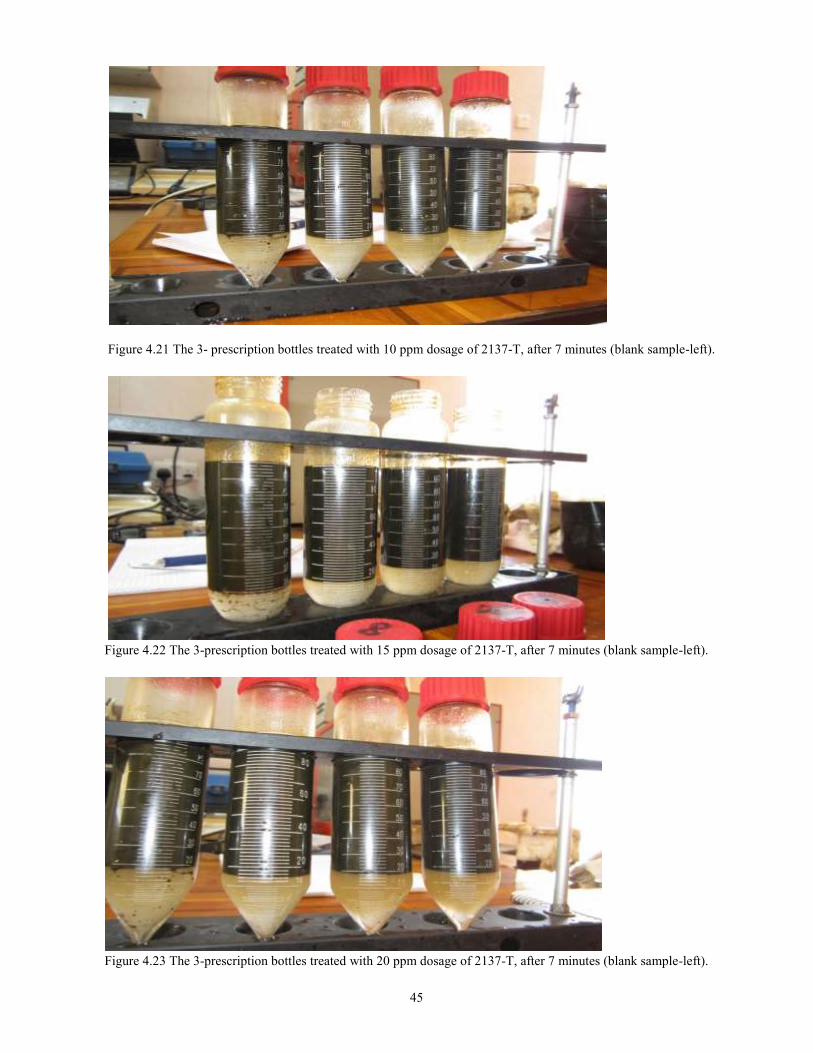
45
Figure 4.21 The 3- prescription bottles treated with 10 ppm dosage of 2137-T, after 7 minutes (blank sample-left).
Figure 4.22 The 3-prescription bottles treated with 15 ppm dosage of 2137-T, after 7 minutes (blank sample-left).
Figure 4.23 The 3-prescription bottles treated with 20 ppm dosage of 2137-T, after 7 minutes (blank sample-left).
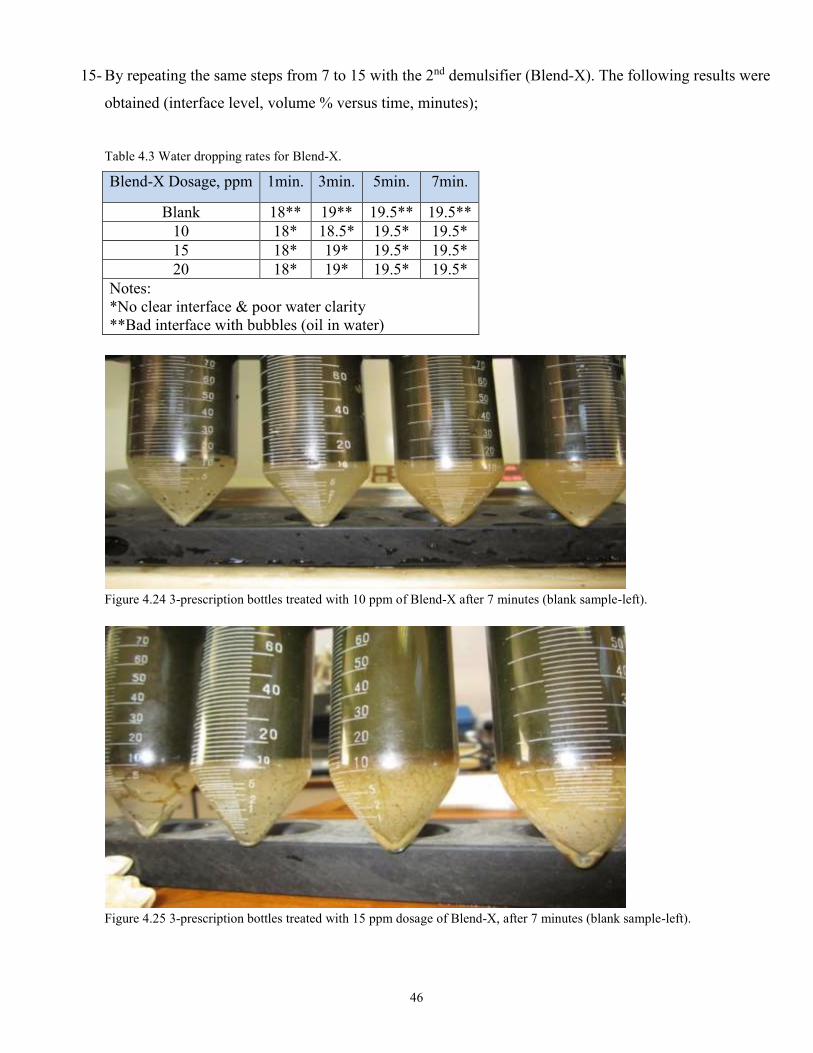
46
15- By repeating the same steps from 7 to 15 with the 2nd demulsifier (Blend-X). The following results were
obtained (interface level, volume % versus time, minutes);
Table 4.3 Water dropping rates for Blend-X.
Blend-X Dosage, ppm 1min. 3min. 5min. 7min.
Blank 18** 19** 19.5** 19.5**
10 18* 18.5* 19.5* 19.5*
15 18* 19* 19.5* 19.5*
20 18* 19* 19.5* 19.5*
Notes:
*No clear interface & poor water clarity
**Bad interface with bubbles (oil in water)
Figure 4.24 3-prescription bottles treated with 10 ppm of Blend-X after 7 minutes (blank sample-left).
Figure 4.25 3-prescription bottles treated with 15 ppm dosage of Blend-X, after 7 minutes (blank sample-left).
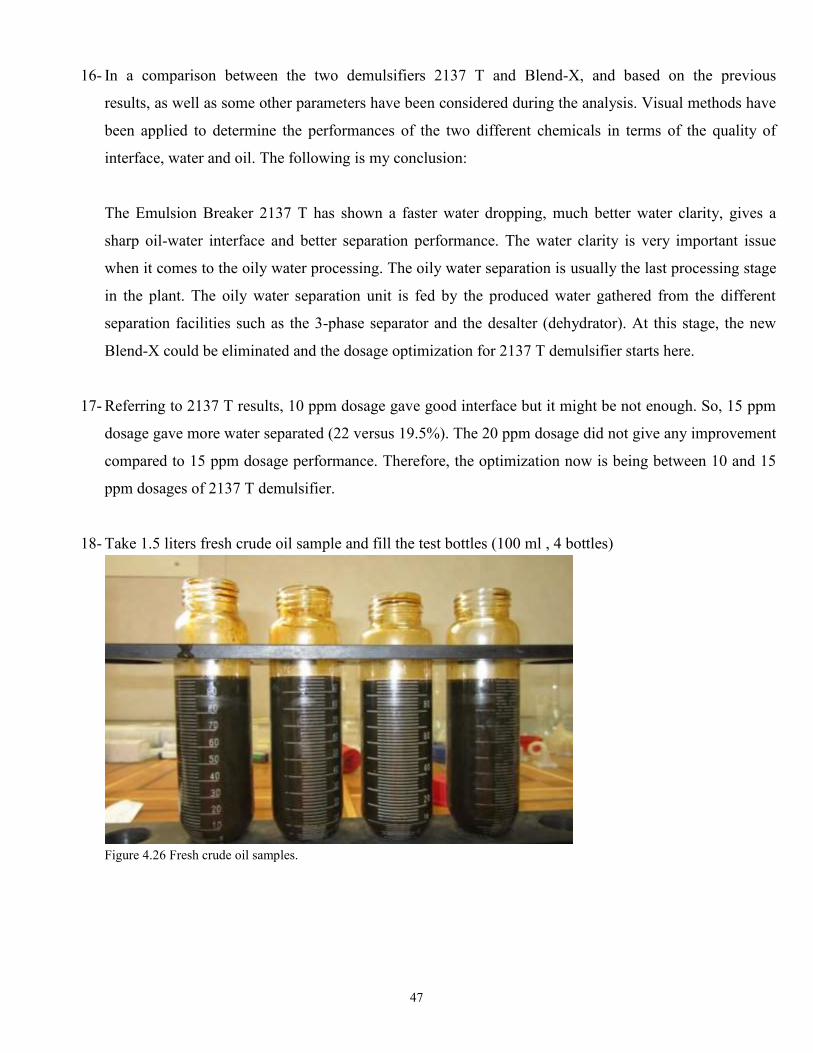
47
16- In a comparison between the two demulsifiers 2137 T and Blend-X, and based on the previous
results, as well as some other parameters have been considered during the analysis. Visual methods have
been applied to determine the performances of the two different chemicals in terms of the quality of
interface, water and oil. The following is my conclusion:
The Emulsion Breaker 2137 T has shown a faster water dropping, much better water clarity, gives a
sharp oil-water interface and better separation performance. The water clarity is very important issue
when it comes to the oily water processing. The oily water separation is usually the last processing stage
in the plant. The oily water separation unit is fed by the produced water gathered from the different
separation facilities such as the 3-phase separator and the desalter (dehydrator). At this stage, the new
Blend-X could be eliminated and the dosage optimization for 2137 T demulsifier starts here.
17- Referring to 2137 T results, 10 ppm dosage gave good interface but it might be not enough. So, 15 ppm
dosage gave more water separated (22 versus 19.5%). The 20 ppm dosage did not give any improvement
compared to 15 ppm dosage performance. Therefore, the optimization now is being between 10 and 15
ppm dosages of 2137 T demulsifier.
18- Take 1.5 liters fresh crude oil sample and fill the test bottles (100 ml , 4 bottles)
Figure 4.26 Fresh crude oil samples.
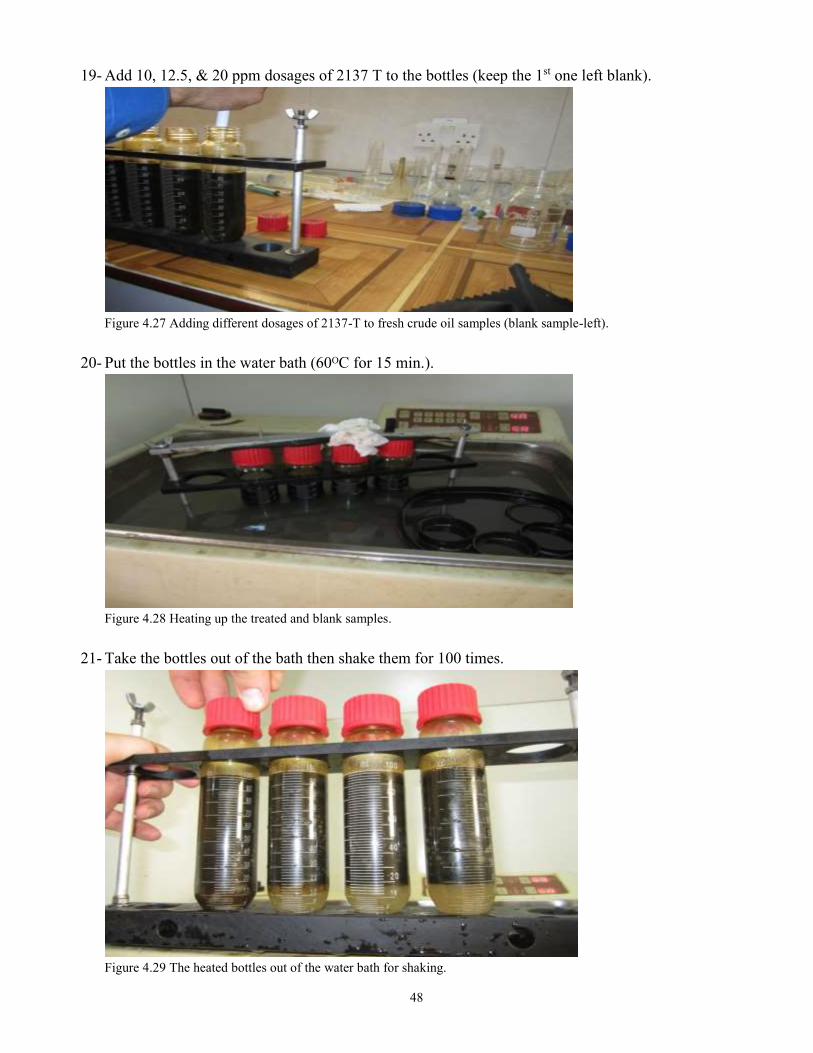
48
19- Add 10, 12.5, & 20 ppm dosages of 2137 T to the bottles (keep the 1st one left blank).
Figure 4.27 Adding different dosages of 2137-T to fresh crude oil samples (blank sample-left).
20- Put the bottles in the water bath (60ᴼC for 15 min.).
Figure 4.28 Heating up the treated and blank samples.
21- Take the bottles out of the bath then shake them for 100 times.
Figure 4.29 The heated bottles out of the water bath for shaking.
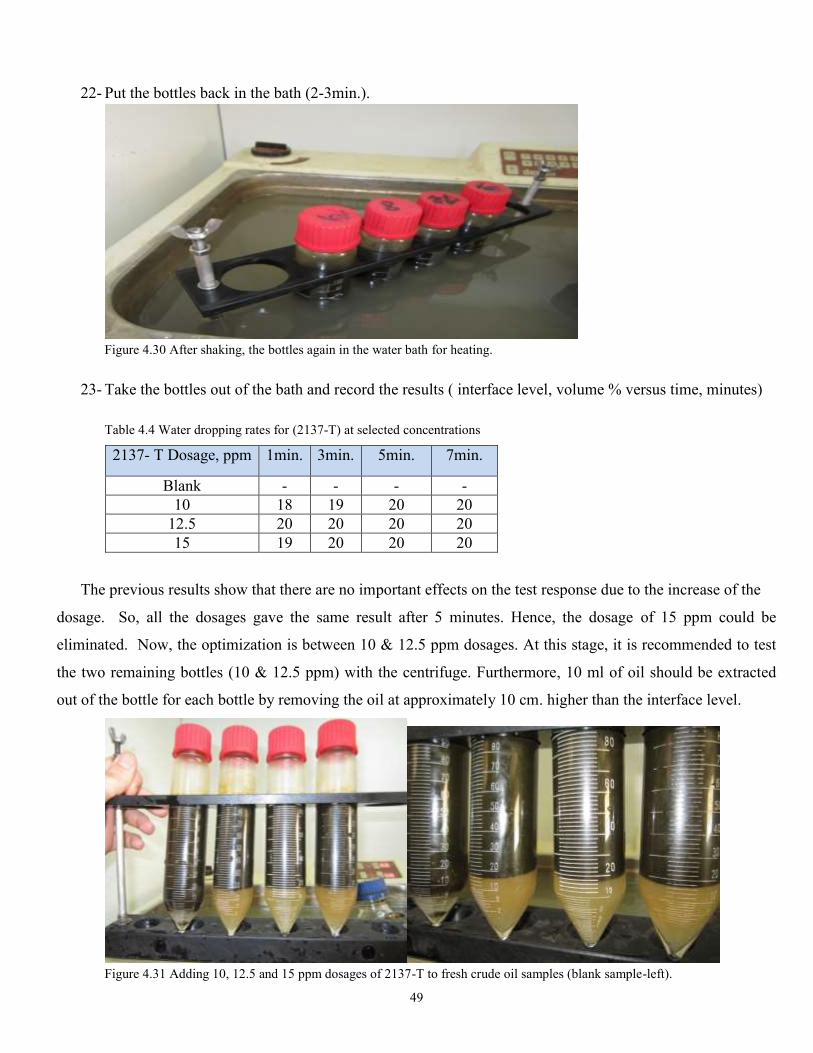
49
22- Put the bottles back in the bath (2-3min.).
Figure 4.30 After shaking, the bottles again in the water bath for heating.
23- Take the bottles out of the bath and record the results ( interface level, volume % versus time, minutes)
Table 4.4 Water dropping rates for (2137-T) at selected concentrations
2137- T Dosage, ppm 1min. 3min. 5min. 7min.
Blank - - - -
10 18 19 20 20
12.5 20 20 20 20
15 19 20 20 20
The previous results show that there are no important effects on the test response due to the increase of the
dosage. So, all the dosages gave the same result after 5 minutes. Hence, the dosage of 15 ppm could be
eliminated. Now, the optimization is between 10 & 12.5 ppm dosages. At this stage, it is recommended to test
the two remaining bottles (10 & 12.5 ppm) with the centrifuge. Furthermore, 10 ml of oil should be extracted
out of the bottle for each bottle by removing the oil at approximately 10 cm. higher than the interface level.
Figure 4.31 Adding 10, 12.5 and 15 ppm dosages of 2137-T to fresh crude oil samples (blank sample-left).
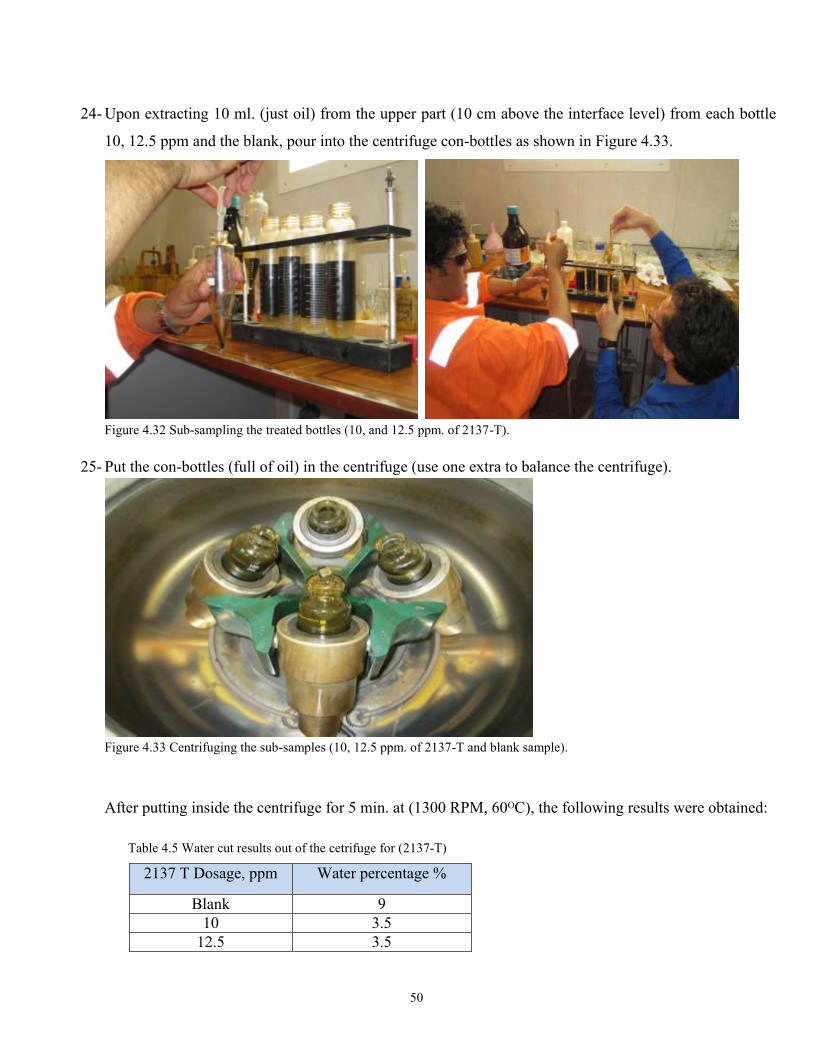
50
24- Upon extracting 10 ml. (just oil) from the upper part (10 cm above the interface level) from each bottle
10, 12.5 ppm and the blank, pour into the centrifuge con-bottles as shown in Figure 4.33.
Figure 4.32 Sub-sampling the treated bottles (10, and 12.5 ppm. of 2137-T).
25- Put the con-bottles (full of oil) in the centrifuge (use one extra to balance the centrifuge).
Figure 4.33 Centrifuging the sub-samples (10, 12.5 ppm. of 2137-T and blank sample).
After putting inside the centrifuge for 5 min. at (1300 RPM, 60ᴼC), the following results were obtained:
Table 4.5 Water cut results out of the cetrifuge for (2137-T)
2137 T Dosage, ppm Water percentage %
Blank 9
10 3.5
12.5 3.5

51
Figure 4.34 The centrifuged sub-samples treated with 2137-T (10 ppm-right versus 12.5 ppm-left).
Both centrifuged sub-samples, 10 and 12.5 ppm show that the water cut resulted is less than 4% as shown in
picture 4.36. This result has to be compared to the maximum water cut that the de-salter could handle, which is
6% (inlet) according to the operational philosophy of Mabruk plant (GOSP) (Aubourg, 2005). Therefore, both
dosages gave water level less than 4% which is still acceptable as the output of the three-phase separator (D-05)
and the inlet water cut entering the de-salter (D06). At the end of the test, a sub-sample of the top oil is taken out
of 10 ppm and 12.5 ppm samples and centrifuged. The sub-samples give < 4% BS&W, which corresponds to
the expected BS&W going to the de-salter (out of the 3-phase separator).
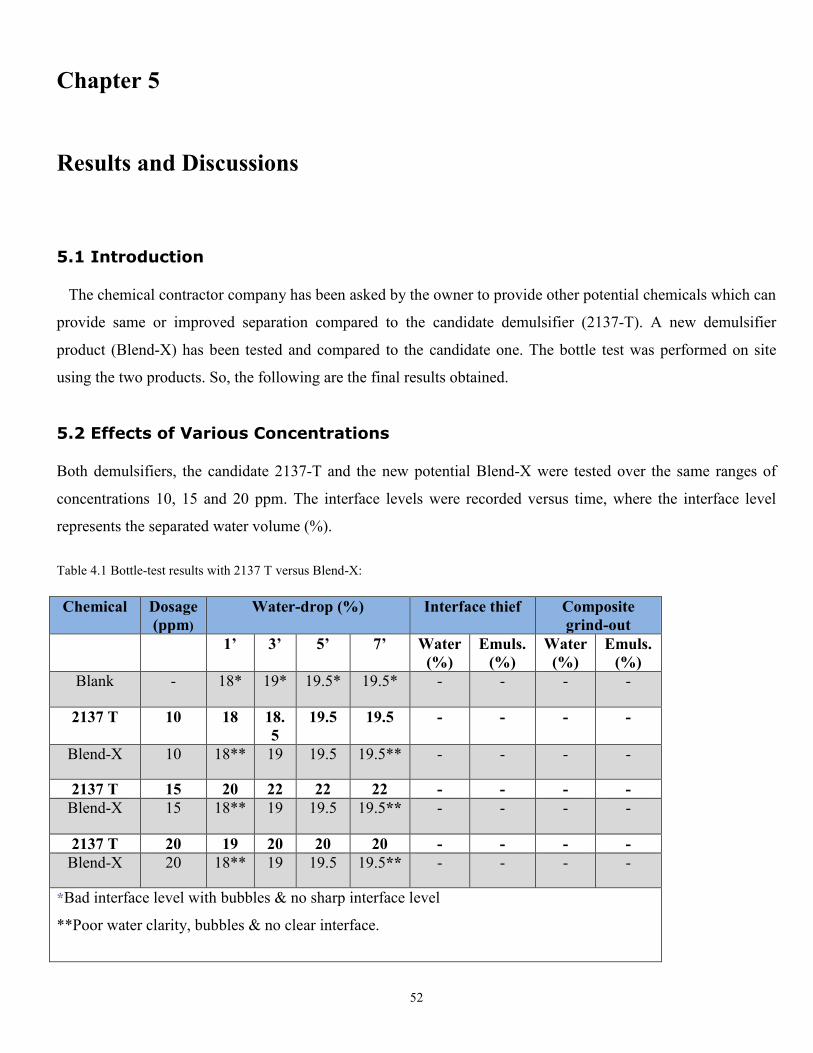
52
Chapter 5
Results and Discussions
5.1 Introduction
The chemical contractor company has been asked by the owner to provide other potential chemicals which can
provide same or improved separation compared to the candidate demulsifier (2137-T). A new demulsifier
product (Blend-X) has been tested and compared to the candidate one. The bottle test was performed on site
using the two products. So, the following are the final results obtained.
5.2 Effects of Various Concentrations
Both demulsifiers, the candidate 2137-T and the new potential Blend-X were tested over the same ranges of
concentrations 10, 15 and 20 ppm. The interface levels were recorded versus time, where the interface level
represents the separated water volume (%).
Table 4.1 Bottle-test results with 2137 T versus Blend-X:
Chemical Dosage
(ppm)
Water-drop (%) Interface thief Composite
grind-out
1’ 3’ 5’ 7’ Water
(%)
Emuls.
(%)
Water
(%)
Emuls.
(%)
Blank - 18* 19* 19.5* 19.5* - - - -
2137 T 10 18 18.
5
19.5 19.5 - - - -
Blend-X 10 18** 19 19.5 19.5** - - - -
2137 T 15 20 22 22 22 - - - -
Blend-X 15 18** 19 19.5 19.5** - - - -
2137 T 20 19 20 20 20 - - - -
Blend-X 20 18** 19 19.5 19.5** - - - -
*Bad interface level with bubbles & no sharp interface level
**Poor water clarity, bubbles & no clear interface.
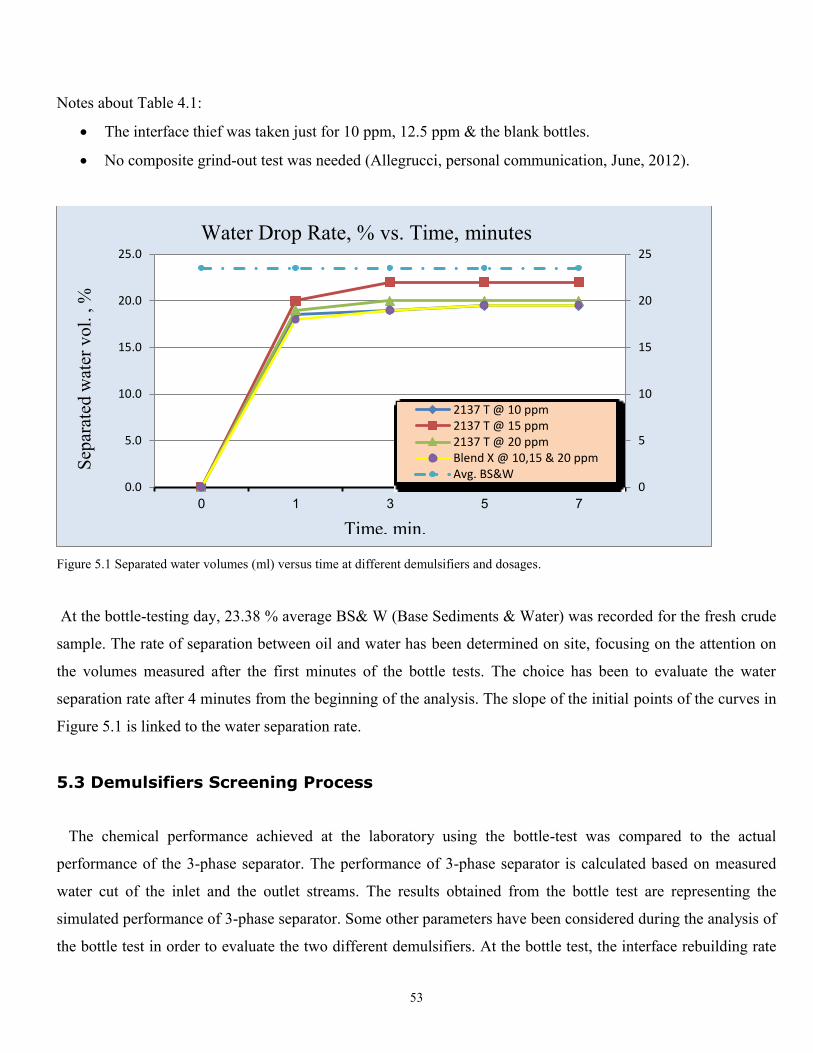
53
Notes about Table 4.1:
The interface thief was taken just for 10 ppm, 12.5 ppm & the blank bottles.
No composite grind-out test was needed (Allegrucci, personal communication, June, 2012).
Figure 5.1 Separated water volumes (ml) versus time at different demulsifiers and dosages.
At the bottle-testing day, 23.38 % average BS& W (Base Sediments & Water) was recorded for the fresh crude
sample. The rate of separation between oil and water has been determined on site, focusing on the attention on
the volumes measured after the first minutes of the bottle tests. The choice has been to evaluate the water
separation rate after 4 minutes from the beginning of the analysis. The slope of the initial points of the curves in
Figure 5.1 is linked to the water separation rate.
5.3 Demulsifiers Screening Process
The chemical performance achieved at the laboratory using the bottle-test was compared to the actual
performance of the 3-phase separator. The performance of 3-phase separator is calculated based on measured
water cut of the inlet and the outlet streams. The results obtained from the bottle test are representing the
simulated performance of 3-phase separator. Some other parameters have been considered during the analysis of
the bottle test in order to evaluate the two different demulsifiers. At the bottle test, the interface rebuilding rate
0
5
10
15
20
25
0.0
5.0
10.0
15.0
20.0
25.0
0 1 3 5 7
2137 T @ 10 ppm2137 T @ 15 ppm2137 T @ 20 ppmBlend X @ 10,15 & 20 ppmAvg. BS&W
Water Drop Rate, % vs. Time, minutes
Sep
arat
ed w
ater
vo
l. , %
Time, min.
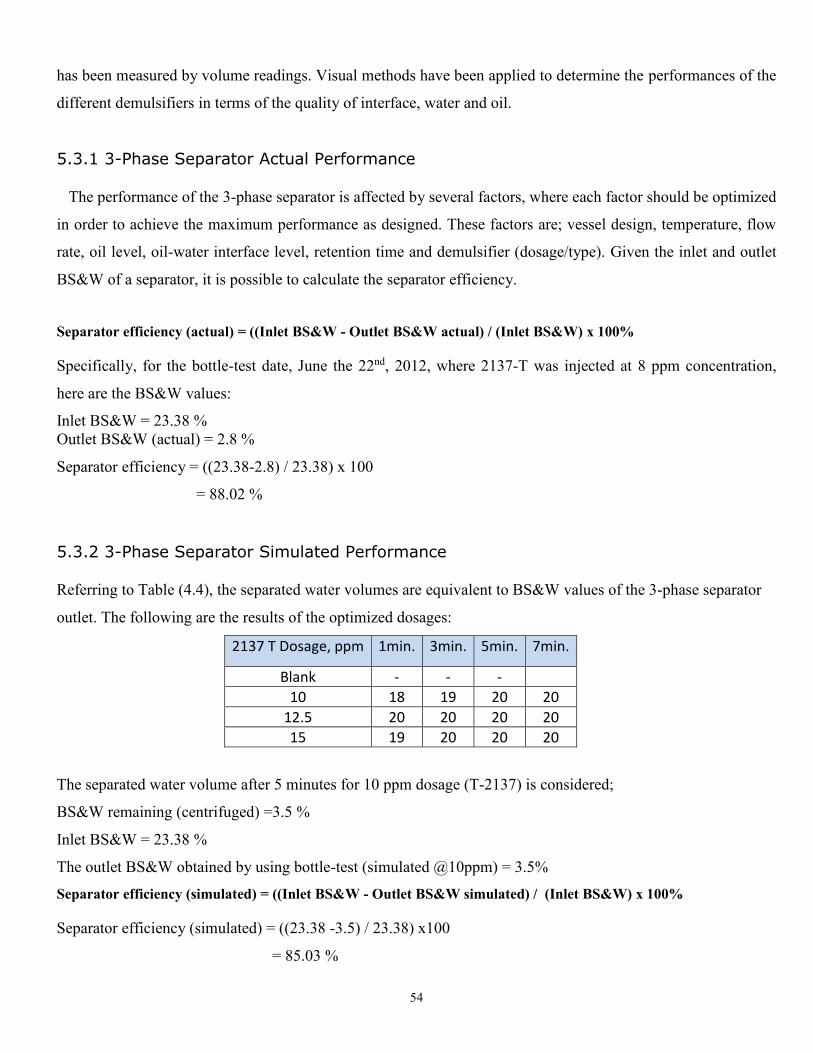
54
has been measured by volume readings. Visual methods have been applied to determine the performances of the
different demulsifiers in terms of the quality of interface, water and oil.
5.3.1 3-Phase Separator Actual Performance
The performance of the 3-phase separator is affected by several factors, where each factor should be optimized
in order to achieve the maximum performance as designed. These factors are; vessel design, temperature, flow
rate, oil level, oil-water interface level, retention time and demulsifier (dosage/type). Given the inlet and outlet
BS&W of a separator, it is possible to calculate the separator efficiency.
Separator efficiency (actual) = ((Inlet BS&W - Outlet BS&W actual) / (Inlet BS&W) x 100%
Specifically, for the bottle-test date, June the 22nd, 2012, where 2137-T was injected at 8 ppm concentration,
here are the BS&W values:
Inlet BS&W = 23.38 %
Outlet BS&W (actual) = 2.8 %
Separator efficiency = ((23.38-2.8) / 23.38) x 100
= 88.02 %
5.3.2 3-Phase Separator Simulated Performance
Referring to Table (4.4), the separated water volumes are equivalent to BS&W values of the 3-phase separator
outlet. The following are the results of the optimized dosages:
2137 T Dosage, ppm 1min. 3min. 5min. 7min.
Blank - - -
10 18 19 20 20
12.5 20 20 20 20
15 19 20 20 20
The separated water volume after 5 minutes for 10 ppm dosage (T-2137) is considered;
BS&W remaining (centrifuged) =3.5 %
Inlet BS&W = 23.38 %
The outlet BS&W obtained by using bottle-test (simulated @10ppm) = 3.5%
Separator efficiency (simulated) = ((Inlet BS&W - Outlet BS&W simulated) / (Inlet BS&W) x 100%
Separator efficiency (simulated) = ((23.38 -3.5) / 23.38) x100
= 85.03 %
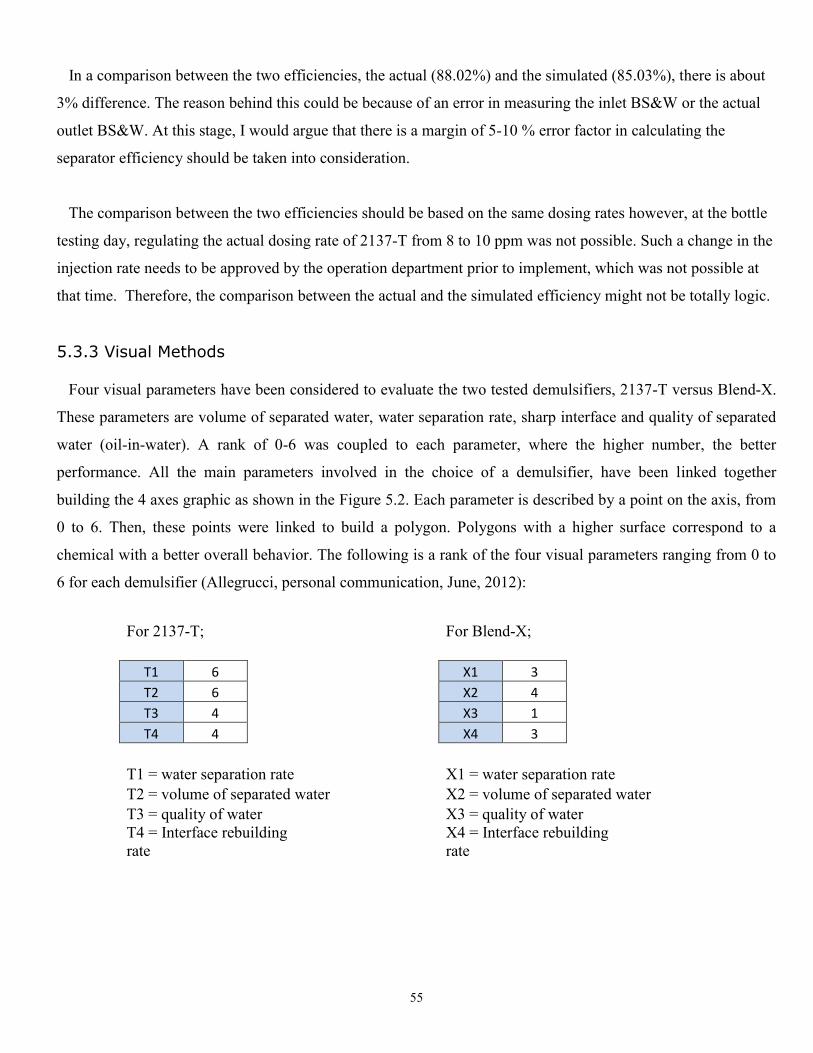
55
In a comparison between the two efficiencies, the actual (88.02%) and the simulated (85.03%), there is about
3% difference. The reason behind this could be because of an error in measuring the inlet BS&W or the actual
outlet BS&W. At this stage, I would argue that there is a margin of 5-10 % error factor in calculating the
separator efficiency should be taken into consideration.
The comparison between the two efficiencies should be based on the same dosing rates however, at the bottle
testing day, regulating the actual dosing rate of 2137-T from 8 to 10 ppm was not possible. Such a change in the
injection rate needs to be approved by the operation department prior to implement, which was not possible at
that time. Therefore, the comparison between the actual and the simulated efficiency might not be totally logic.
5.3.3 Visual Methods
Four visual parameters have been considered to evaluate the two tested demulsifiers, 2137-T versus Blend-X.
These parameters are volume of separated water, water separation rate, sharp interface and quality of separated
water (oil-in-water). A rank of 0-6 was coupled to each parameter, where the higher number, the better
performance. All the main parameters involved in the choice of a demulsifier, have been linked together
building the 4 axes graphic as shown in the Figure 5.2. Each parameter is described by a point on the axis, from
0 to 6. Then, these points were linked to build a polygon. Polygons with a higher surface correspond to a
chemical with a better overall behavior. The following is a rank of the four visual parameters ranging from 0 to
6 for each demulsifier (Allegrucci, personal communication, June, 2012):
For 2137-T;
For Blend-X;
T1 6
X1 3
T2 6
X2 4
T3 4
X3 1
T4 4
X4 3
T1 = water separation rate
X1 = water separation rate
T2 = volume of separated water
X2 = volume of separated water
T3 = quality of water
X3 = quality of water
T4 = Interface rebuilding
rate
X4 = Interface rebuilding
rate
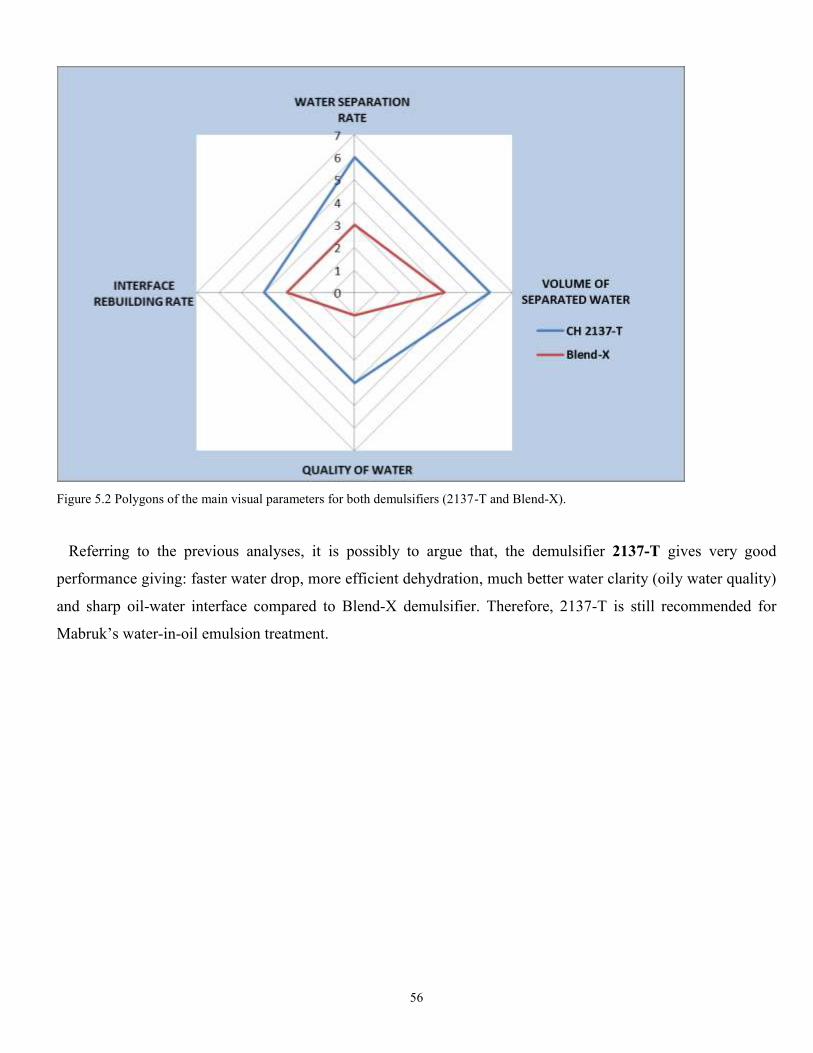
56
Figure 5.2 Polygons of the main visual parameters for both demulsifiers (2137-T and Blend-X).
Referring to the previous analyses, it is possibly to argue that, the demulsifier 2137-T gives very good
performance giving: faster water drop, more efficient dehydration, much better water clarity (oily water quality)
and sharp oil-water interface compared to Blend-X demulsifier. Therefore, 2137-T is still recommended for
Mabruk’s water-in-oil emulsion treatment.
57
Chapter 6
Conclusions and Recommendations
6.1 Conclusions
In conclusion, the bottle-test has been carried out on two kinds of demulsifiers, the new demusifier Blend-X
against the candidate 2137-T. Based on the results obtained, it is confirmed that the demulsifier 2137 T is
working and giving very good interface quality, fast water dropping and very good water clarity. At the
laboratory dosage 10 ppm, there is 3.5% residual of water, which is good for the de-salter (dehydrator) that there
is no fresh water added. If a decision is made to inject fresh water, it is possible to increase the dosage between
10 and 12.5 ppm, which is good to be injected at GOSP plant inlet.
The candidate 2137-T was validated as the most suitable demulsifier using a bottle-test, and the minimum
ratio has been determined for Mabruk treatment plant which is 10 ppm (total liquid). Upon completing the
bottle-test, the field trial might be started by injecting the selected demulsifier into the plant inlet stream, where
the optimum dosage would be possibly determined.
6.2 Recommendation for Future Study
The field trails are usually performed during the start-up of oil field however it is recommended to implement
bottle testing and field trials once every 2-3 years. In case, there is a major change in crude oil properties or any
substantive operational parameter such as, the retention time in 3-phase separator, bottle testing and field trials
are highly recommended (Ben Mahmoud, personal communication, June, 2012). Further, increasing the
demulsifier dosage might be needed or sometimes even replacing the demulsifier by another potential
demulsifier.
As soon as the bottle-test is completed, the field trial could be possibly started. The field trials usually take up
to 2-4 weeks, keeping in mind that the starting injection rate should be a bit lower than the lowest bottle test
treating ratio (10 ppm). In the light of this, in order to ensure a gradual decrease and system stability throughout
the plant test, it is recommended to reduce the chemical injection rate by about 10% each time and check the
system stability simultaneously. Continue reducing the chemical rate following this procedure until the
58
minimum amount of the chemical required has been determined (Shirley, 2008). For Mabruk oil field, it is
recommended to tailor different demulsifier for each reservoir whenever that is possible. In addition, the
injection points could possibly be relocated at the satellites instead of the plant inlet. Extensive chemical
injection facilities could be provided at each oil wellhead and GOSP process train that will probably overcome
any potential emulsion problem in the future.
There were some challenges encountered my thesis approach, such as the confidential nature of some
information and the availability of oily-water analyzer instrument. Firstly, the confidential nature of the
information related to demulsifier blend(s) formulation(s) was one of the most serious challenges encountered
the experimental work of this thesis. To overcome this challenge, there are two ways to know the unknown
formulation(s), either by using certain software to prepare such a blend(s) or by using chemical analysis to
analyze these unknown blends, e.g. by using a gas-chromatography-mass spectrometry (GC-MS). GC-MS
analysis of the demulsifier would have provided further insight into its chemical composition which would have
enriched the thesis data analysis, discussion and conclusions.
Secondly, the oil in water analyzer used in Mabruk field was Horiba, Model (OCMA-310), Oil Content
Analyzer which is an infra-red absorbance analyzer. This analyzer used to measure the free and separable oil
content existing in the produced oily water. The results obtained compared to the standard value of the allowed
oil in water according to the Libyan environmental regulations. At the bottle-test day, Horiba instrument was
out of service due to a technical problem. Further, the calibration trial for this machine was not success at that
time. As a result, the oily water resulted from bottle-testing the Blend-X was not tested by Horiba analyzer. For
further studies, it is highly recommended to prepare and calibrate Horiba analyzer days before the planned
bottle-test day.

59
Appendix A
Material Safety Data Sheet

60
Material Safety Data Sheet (MSDS) for Demulsifier CH 2137-T
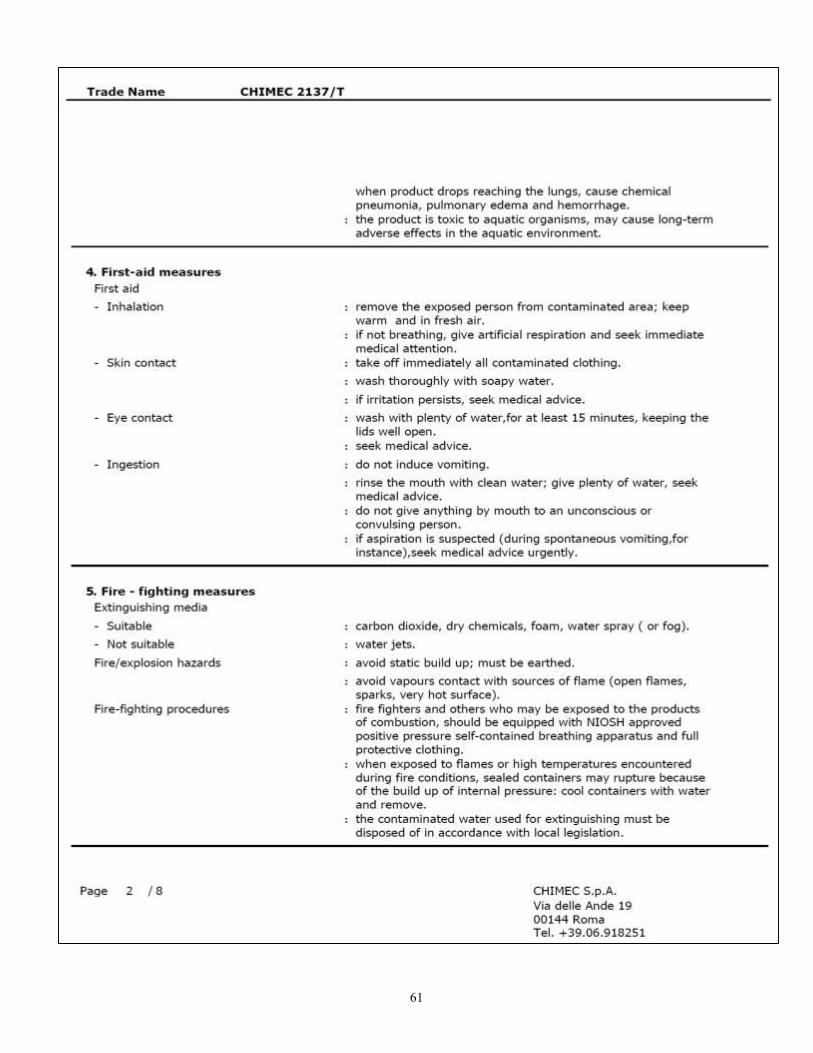
61
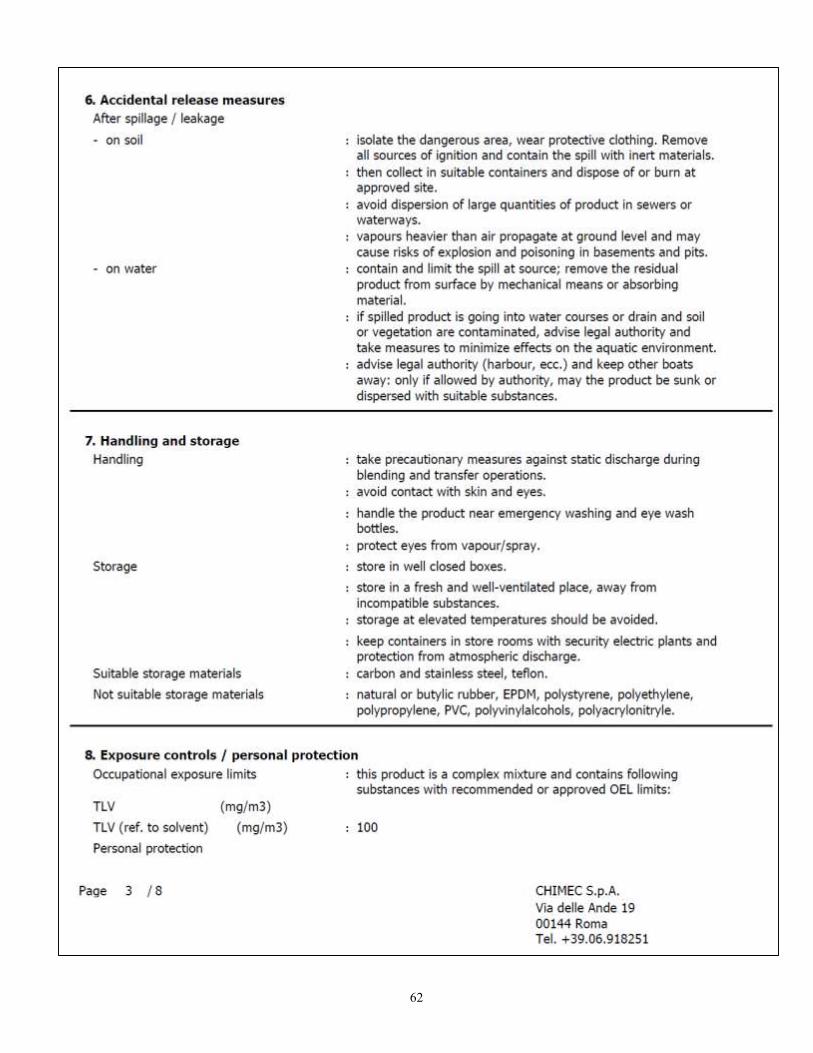
62
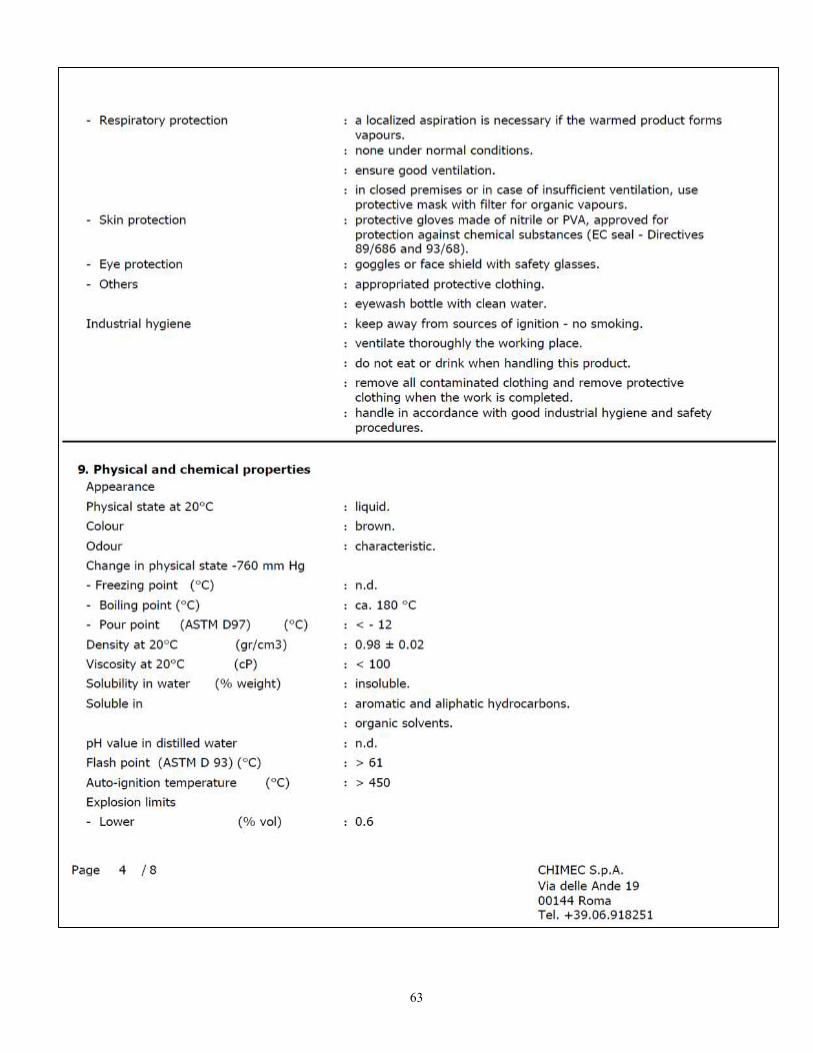
63
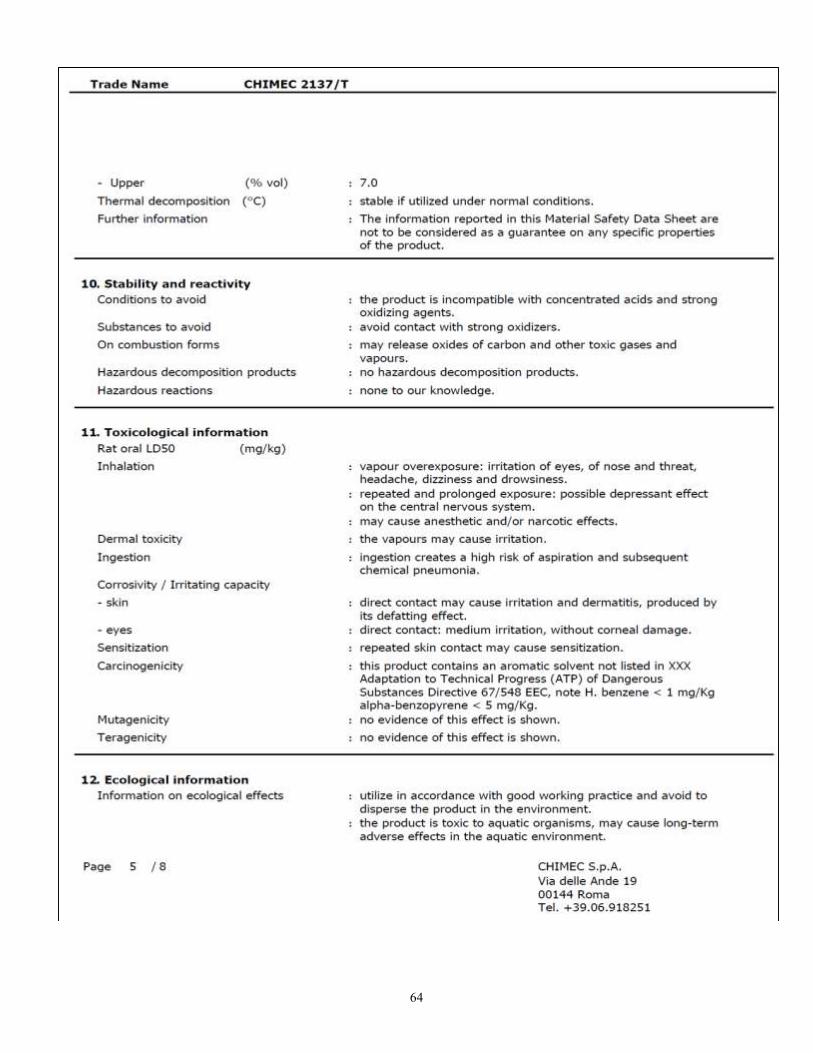
64
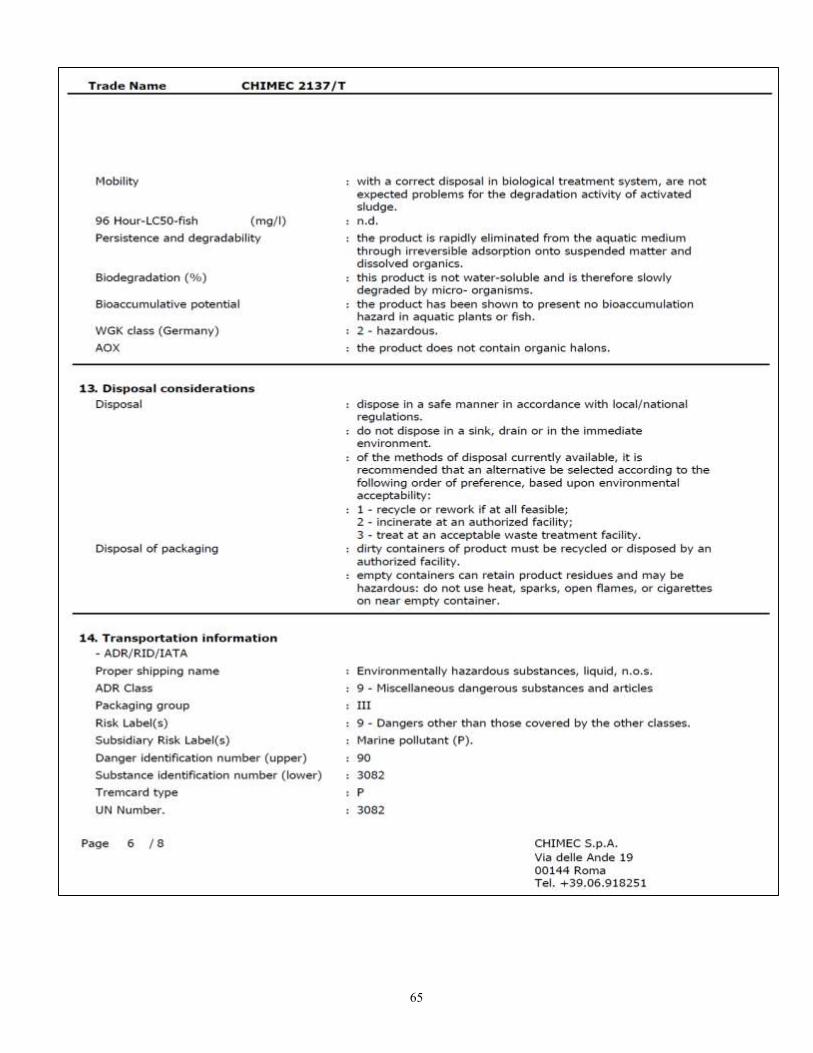
65

66
67

68
Appendix B
Mabruk/Dahra/Garian Process Train Design Cases
69
Table 1: Mabruk Process Train Design Cases
70
Continued Table-1,
Notice:
*Viscosity corresponds to oil only
** Fluid data given at 12 barg for liquid stream – Operating pressure at inlet of GOSP will be controlled at
4 barg and therefore the stream will be partially vaporized.
*** The global H2S content in the production stream is such that the free water phase H2S content
reaches 200 mg/l at the reservoir conditions (1200 psia & 135°F).
**** The inlet temperature refers to summer conditions.
71
Table 2: Dahra / Garian Process Train Design Cases
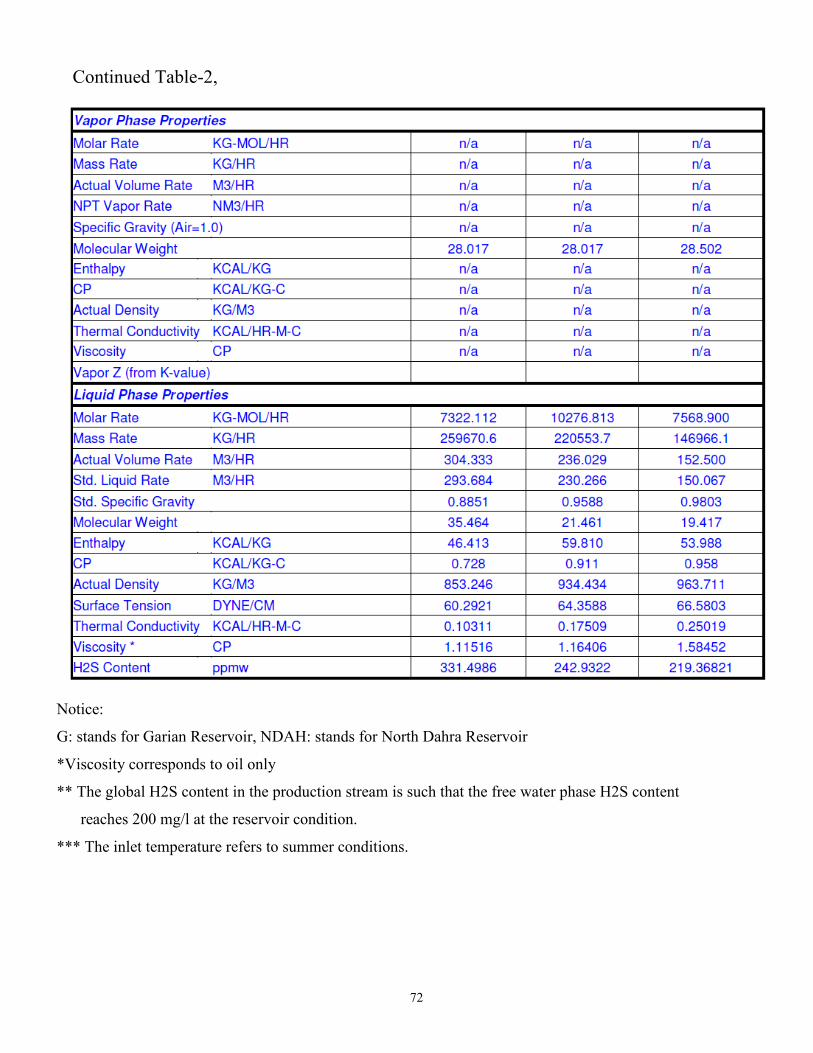
72
Continued Table-2,
Notice:
G: stands for Garian Reservoir, NDAH: stands for North Dahra Reservoir
*Viscosity corresponds to oil only
** The global H2S content in the production stream is such that the free water phase H2S content
reaches 200 mg/l at the reservoir condition.
*** The inlet temperature refers to summer conditions.
73
References
1- Al-Sabagh, A. M., Kandile, N. G. & Noor El-Din, M. R. (2011). Functions of demulsifiers in the
petroleum industry. Retrieved June/ 28, 2011, from http://dx.doi.org/10.1080/01496395.2010.550595
2- Aubourg, P. (2005). Process design basis and GOSP philosophy (2nd ed.). (Technical No. JP152-800-
PCS-10.65-00400). Tripoli, Libya: Joannou & Paraskevaides.
3- Ben Mahmud, A. (2009). Basics on demulsifiers and deoilers (Technical. Tripoli, Libya: Mabruk Oil
Operations.
4- Ben Mahmud, A. (2012). Oil field chemicals training manual. Unpublished manuscript.
5- Bin Mat, H., Samsuri, A., wan Abdul Rahman, W. A. & Ilyani Rani, S. (2008). Study on demulsifier
formulation for treating malaysian crude oil emulsion
. Retrieved June/15, 2011, from http://eprints.utm.my/2768/1/74004.pdf
6- Institut français du pétrole, IFP Training. (2009). In Ben Mahmud A. (Ed.), Treatment of produced
water. Paris, France: Compagnie Des Petroles Total France.
7- Kelland, M. A. (2009). In Press C. (Ed.), Production chemicals for the oil and gas industry. New York,
NY: Taylor & Francis Group.
8- Korosoglou, E., & D’Emidio, G. P. (2010). EMULSION BREAKER treatment at mabruk field " bottle
test" (Technical. Tripoli, Libya: Nalco Company,Libyan Branch.
9- Laura, C., & Antonio, D. T. (2009). Oilfield revalidation treatments (Technical. Tripoli, Libya:
CHIMEC S.p.A. – Oilfield Technological Unit.
10- Osenga, W. A., Kok, J. B., & Nikolopoulos, S. C. (2008). Performance evaluation of the cptl oily
water treatment package 350-x-iooa (Technical No. 05.048/wo/3). Tripoli, Libya: Compagnie Des
Petroles Total Libye;Rossmark Waterbehandeling.
11- Shirley, M. (2008). Emulsion treating manual (Technical. Tripoli, Libya: Veba Oil Operations.

74
12- Swedan, O. (2012). Operational GOSP readings, daily reports and field's data (Technical. Mabruk
Field, Libya: Field operations department, Mabruk Oil Operations.