
D5.2 Procedure for WUI scenarios 3D modelling - WUIVIEW
42
Wildland‐Urban Interface Virtual Essays Workbench Funded by European Union Civil Protection WUIVIEW GA number 826522 Deliverable D5.2 Procedure for WUI scenarios 3D modelling WP ‐ Task WP5 – Task 5.2 Version (1) Final Code (file name) WUIVIEW_D5.2_F_WUI_scenarios_3D _Modelling Dissemination level (2) Public Programmed delivery date 31/10/2019 Actual delivery date 02/12/2019 Document coordinator David Caballero (PCF) Contact [email protected] Authors David Caballero (PCF), Luis Mario Ribeiro (ADAI) Reviewed by Elsa Pastor (UPC) Abstract This document D5.2 provides a brief insight into 3D scenarios modelling and suggests a practical workflow for the data gathering, objects and scenarios generation to be used in FDS fire simulations. Several approaches and involved technologies are presented and discussed. Some preliminary examples of application are also included. The resulting method will be further tested and fine‐tuned in the selected study cases in WP7. (1) Draft / Final (2) Public / Restricted / Internal
-
Upload
khangminh22 -
Category
Documents
-
view
4 -
download
0
Transcript of D5.2 Procedure for WUI scenarios 3D modelling - WUIVIEW
Wildland‐Urban Interface Virtual Essays Workbench
Funded by European Union
Civil Protection
WUIVIEW
GA number 826522
Deliverable D5.2 Procedure for WUI scenarios 3D modelling
WP ‐ Task WP5 – Task 5.2 Version (1) Final
Code (file name)
WUIVIEW_D5.2_F_WUI_scenarios_3D_Modelling
Dissemination level (2)
Public
Programmed delivery date
31/10/2019 Actual delivery date
02/12/2019
Document
coordinator
David Caballero (PCF)
Contact [email protected]
Authors David Caballero (PCF), Luis Mario Ribeiro (ADAI)
Reviewed by Elsa Pastor (UPC)
Abstract This document D5.2 provides a brief insight into 3D scenarios modelling and
suggests a practical workflow for the data gathering, objects and scenarios
generation to be used in FDS fire simulations. Several approaches and involved
technologies are presented and discussed. Some preliminary examples of
application are also included. The resulting method will be further tested and
fine‐tuned in the selected study cases in WP7.
(1) Draft / Final
(2) Public / Restricted / Internal

WUIVIEW – GA #826544 – D5.2 Procedure for WUI scenarios 3D modelling
2

WUIVIEW – GA #826544 – D5.2 Procedure for WUI scenarios 3D modelling
3
Disclaimer
The content of this publication represents the views of the authors only and is their sole responsibility.
The European Commission does not accept any responsibility for use that may be made of the information
it contains.
WUIVIEW – GA #826544 – D5.2 Procedure for WUI scenarios 3D modelling
4
Table of Contents
1. About this deliverable 7
2. Introduction 7
2.1 What is a 3D WUI scenario? 7
2.2 Suggested approaches 8
2.3 Setting spatial boundaries, resolution and scale 9
3. Description of idealized scenarios by catalogue entries 10
3.1 Use of catalogue entries 10
3.2 Placing and orienting objects. Creating idealised 3D scenarios 11
4. Description of real scenarios by 3D data gathering 14
4.1 Use of high‐resolution LIDAR 14
Selecting LAS data sets 14
Processing 15
Results and discussion 17
4.2 Photogrammetry 18
4.3 Airborne photogrammetry. Use of RPAS 20
Advantages of airborne photogrammetry 20
Adequacy of RPAS for WUI microscale 21
Design of flight patterns 22
Systematic grids 23
Orbital patterns 23
Geo‐referencing 29
Photographs processing 30
Placing and simplification of the 3D obtained scenarios 32
Observed limitations and discussion 34
5. Spatial segmentation and FDS parsing 35
5.1 Voxelization 35
5.2 Assigning properties and cleaning 38
5.3 Parsing voxels into FDS files 40
Parsing OBJ format 40
Mesh size and resolution 40

WUIVIEW – GA #826544 – D5.2 Procedure for WUI scenarios 3D modelling
5
Obstructions 41
Bounding surfaces 41
6. Concluding remarks 41
7. References 42
WUIVIEW – GA #826544 – D5.2 Procedure for WUI scenarios 3D modelling
6
Acronyms used in this document
CFD Computational Fluid Dynamics
DTM Digital Terrain Model
FDS Fire Dynamics Simulator
FOV Field Of View
GPU Graphics Processing Unit
GPS Global Positioning System
HFOV Horizontal field of view
HRRPUA Heat Release Rate Per Unit Area
LIDAR Light Detection And Ranging
MTOW Maximum Take‐Off Weight
PBD Performance Based Design
RPAS Remotely Piloted Aircraft System
SDK Software Development Kit
SFM Structure From Motion
SIFT Scale‐Invariant Feature Transform
VFOV Vertical Field Of View
VLOS Visual Line Of Sight
WUI Wildland‐Urban Interface
File formats
FBX Used to provide interoperability between digital content creation applications.
FDS Used by fire dynamics simulator as input, includes information on geometry, material properties and combustion characteristics.
LAS Used for the interchange and archiving of LIDAR point cloud data.
OBJ Used for the easy interchange of the geometry of 3D models.
WUIVIEW – GA #826544 – D5.2 Procedure for WUI scenarios 3D modelling
7
1. About this deliverable
WUIVIEW stands for Wildland‐Urban Interface Virtual Essays Workbench, and it is a project funded by the
Directorate General for European Civil Protection and Humanitarian Aid Operations (DG ECHO) and
coordinated by the Universitat Politècnica de Catalunya (Spain). The project objective is to develop a
‘virtual laboratory’ based on Performance Based Design (PBD) and Computational Fluid Dynamics (CFD)
models for the analysis and assessment of the processes and factors driving structure damage in forest
fires. The results will serve as guidelines and recommendations of good practices for the protection and
prevention of forest fires in European communities inserted in forested lands. The project is divided into
8 work packages, out of which work package 5 is devoted to the definition, design and setting of WUI fire
microscale scenarios typical of European WUI realities.
This document D5.2 provides a brief insight into 3D scenarios modelling and suggests and explores a
practical workflow for the data gathering, objects and scenarios generation to be used in FDS fire
simulations. Several approaches and involved technologies are presented, tested and discussed. Some
preliminary examples of application are also included. The resulting method will be further used and fine‐
tuned in the selected study cases in WP07.
2. Introduction
2.1 What is a 3D WUI scenario?
Lessons learnt in recent forest fires affecting WUI areas show the importance of the type and the spatial
arrangement of the elements involved, particularly in the immediate environment surrounding the
houses.
A 3D WUI scenario is a digital instance of the geometry and materials of the different objects present in
the WUI microscale, including buildings and their constructive elements, vegetation, other installations,
garden furniture, secondary structures such as garages, warehouses and sheds, and other materials and
elements which may eventually participate in the combustion and damage in a forest fire. This scenario is
composed, therefore, by objects digitally represented by 3D meshes at a given degree of detail, placed in
a spatial region delimited by a bounding box. Each object maybe compound of elements, each one with
different material properties and, in general, of different colours and other surface parameters. Colour is
relevant as it may be used as a key parameter for the identification of objects and materials in the real
world, so the management of colour (capture, processing, and identification) is duly considered.
In existing approaches and solutions for the risk assessment in the WUI microscale, little focus has been
given to the spatial dimension of the factors and processes involved. Indeed, in such detailed scales, the
vertical dimension (Z) is relevant and so it must be considered in the data gathering, scenarios description
and modelling. Vegetation structure, understood as a set of interrelated layers (grass, shrubs, young trees,
trees canopy etc.), strongly conditions the way the fire starts and builds up; besides, the three‐
WUIVIEW – GA #826544 – D5.2 Procedure for WUI scenarios 3D modelling
8
dimensional relationship between vegetation and nearby structures (houses, installations etc.), that is the
relative spatial distances and orientations, conditions the way the heat sources affect the building
elements.
Today there is a good number of software applications which provide functionality for the gathering of
3D data sets, the building of 3D digital objects, the design, manipulation and arrangement of such objects
into 3D scenarios, the assignment of object surface properties and, finally, the generation of the files
including 3D information for the simulation into FDS fire simulation model.
2.2 Suggested approaches
This document explores and describes approaches for the data capture, setting and modelling of 3D WUI
scenarios, giving particular focus on the approaches of gathering information from real world and
obtaining a 3D digital instance to be used in FDS fire simulator. The two suggested lines of work differ in
the way the 3D representation of objects and their arrangement into 3D scenarios is achieved.
On one hand, the use of catalogue entries of the different existing objects is suggested. This is possible
thanks to the pleiade of existing repositories of digitized 3D objects in common universal exchange
formats (OBJ, FBX etc.), mainly due to their use in the game and advertisement industries, but also the
existing CAD datasets of buildings and installations widely used in engineering and architecture. The
obtained objects can then be arranged in 3D scenarios in some of the existing 3D editors (Maya, Blender,
3DS Max just to mention a few), according to position and orientation observed in the real world. This is
a rather straightforward process and interestingly cheap and fast (detailed 3D modelling of new objects
is well known to be a time‐consuming process). A main drawback is that these objects, particularly
buildings, do not represent in detail the existing reality of specific locations, instead they just give a general
representation of average models.
On the other hand an approach for the elaboration of accurate, realistic 3D scenarios is presented. This
approach is strongly based on procedures and solutions for 3D data gathering, as existing today in the
market, such as photogrammetry and LIDAR‐based modelling. While the first one will render 3D digital
instances of all objects surveyed over a 3D micro scale WUI scenario, including colour of their surfaces,
the second one will provide a point cloud which will serve as baseline for the 3D spatial segmentation of
objects occupation. Both techniques are adequate to quickly and relatively accurately gather the position,
orientation and type of objects present in a WUI micro scale scenario. As seen in the next points, the
photogrammetry approach provides a more flexible, simple and cheap workflow to gather 3D information
at different levels, while LIDAR approach is more adequate for large extensions. Both of them are explored
and discussed in this document.
The main workflow which is presented has the following general steps:
‐ Data gathering (catalogues, photography, LIDAR)
‐ 3D objects modelling (meshes of triangular facets)
WUIVIEW – GA #826544 – D5.2 Procedure for WUI scenarios 3D modelling
9
‐ Spatial segmentation (voxelization)
‐ Surface properties assignment
‐ Parsing voxels and properties into FDS scenarios
Some of the steps of this workflow may be skipped depending on the approach selected, in particular:
Approach 1. From catalogue 3D objects (no modelling needed), based on aerial orthophotography, placing
elements in an idealised 3D scenario, assignment of surface properties, then proceed with voxelization
and parsing into FDS files.
Approach 2. From airborne and ground photo sets, proceed with photogrammetric modelling of 3D
objects and scenarios, including simplification and cleaning of the obtained objects, assignment of
surface properties (based on the observed colour), proceed with voxelization and finally parsing into
FDS files.
Approach 3. From LIDAR datasets, proceed with a spatial segmentation of the obtained returns, including
the observed colour, assignment of surface properties (based on colour) and proceed to parsing FDS
files. In this case no extra voxelization is required.
As seen, a type or other of spatial segmentation of properties is needed at a certain degree of detail,
depending on the spatial scope and resolution of the simulation. In all three cases, a spatial segmentation
is obtained, in terms of occupation of each of the discrete x,y,z positions within the spatial region
considered (voxels). Out of this voxelization, obstruction nodes (OBST) are automatically obtained, so to
be used in FDS model, each one with its correspondent surface properties.
2.3 Setting spatial boundaries, resolution and scale
The first step in describing a 3D scenario is to identify the spatial boundaries (bounding box) in which all
elements will be included and in which all the processes to be simulated will take place. This must be
consistent with the bounding box and mesh division finally used in the FDS simulations. In order to ensure
consistency, the 3D scenarios in WUIVIEW include two small objects (cubes) located precisely in the initial
(xi, yi, zi) and final (xf, yf, zf) coordinates defining the bounding box. In doing so all the processes described
in this document will refer to that bounding box and the spatial segmentation will take place along such
dimensions in a robust way (divisions of the same size, regardless of the dimensions of the scene).
The second step is setting the resolution and level of detail required in the objects to properly describe
the phenomena which is subject of simulation, which is directly related to the scale of the scenario.
Indeed, most of the described scenarios in deliverable D5.1 take place in a spatial region of a few meters;
while some others, in particular those referring to glazing and gutters or roofing, take place along a few
centimetres. In the description of 3D scenarios in this document, the procedures, techniques and tools
will be mostly focusing on the first class, typically happening in the area corresponding to the garden and
the immediate surroundings of an average size house. For these scenario sizes (of around 100 to 400 m2
of layout surface) a resolution of 20 cm is suggested as reference (thus, a scenario spanning 20 m in a
given axis will give 1000 divisions). As discussed in the following sections, this resolution will determine
WUIVIEW – GA #826544 – D5.2 Procedure for WUI scenarios 3D modelling
10
the maximum distance of data gathering (i.e. photograph) according to the capacities of the sensors used
(i.e. photographic sensor resolution), hence the design of the mission (i.e. RPAS flight pattern).
3. Description of idealized scenarios by catalogue entries
3.1 Use of catalogue entries
The first and perhaps the most straightforward method for a quick setup of a 3D scenario is the use of
existing 3D models which reflect the objects and elements present in the WUI microscale. There are
several repositories of 3D models in several interchange formats (OBJ, FBX etc.) classified by types.
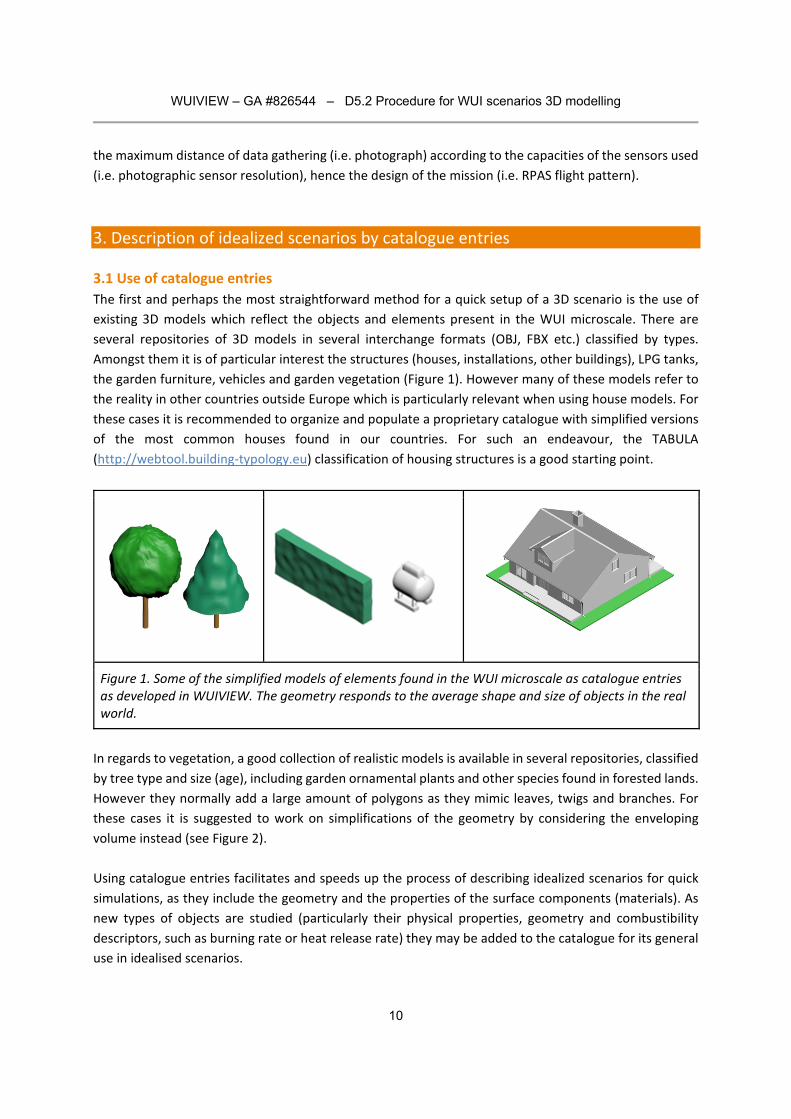
Amongst them it is of particular interest the structures (houses, installations, other buildings), LPG tanks,
the garden furniture, vehicles and garden vegetation (Figure 1). However many of these models refer to
the reality in other countries outside Europe which is particularly relevant when using house models. For
these cases it is recommended to organize and populate a proprietary catalogue with simplified versions
of the most common houses found in our countries. For such an endeavour, the TABULA
(http://webtool.building‐typology.eu) classification of housing structures is a good starting point.
Figure 1. Some of the simplified models of elements found in the WUI microscale as catalogue entries as developed in WUIVIEW. The geometry responds to the average shape and size of objects in the real world.
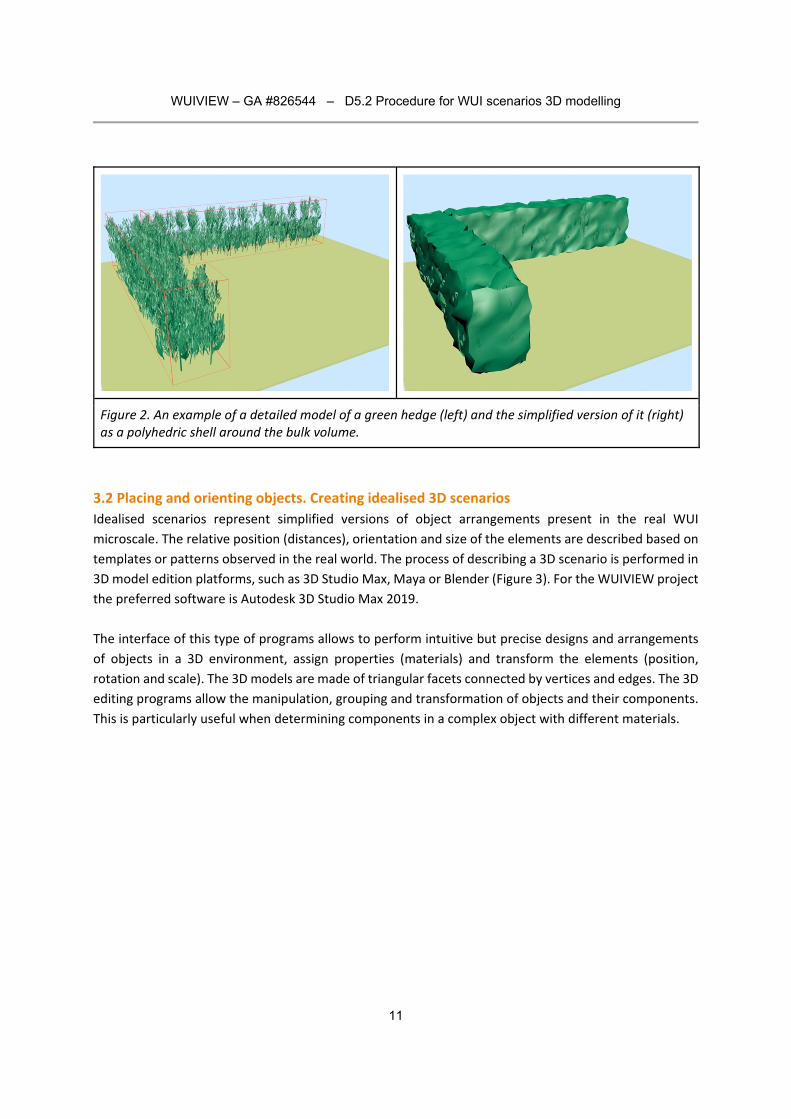
In regards to vegetation, a good collection of realistic models is available in several repositories, classified
by tree type and size (age), including garden ornamental plants and other species found in forested lands.
However they normally add a large amount of polygons as they mimic leaves, twigs and branches. For
these cases it is suggested to work on simplifications of the geometry by considering the enveloping
volume instead (see Figure 2).
Using catalogue entries facilitates and speeds up the process of describing idealized scenarios for quick
simulations, as they include the geometry and the properties of the surface components (materials). As
new types of objects are studied (particularly their physical properties, geometry and combustibility
descriptors, such as burning rate or heat release rate) they may be added to the catalogue for its general
use in idealised scenarios.
WUIVIEW – GA #826544 – D5.2 Procedure for WUI scenarios 3D modelling
11
Figure 2. An example of a detailed model of a green hedge (left) and the simplified version of it (right) as a polyhedric shell around the bulk volume.
3.2 Placing and orienting objects. Creating idealised 3D scenarios
Idealised scenarios represent simplified versions of object arrangements present in the real WUI
microscale. The relative position (distances), orientation and size of the elements are described based on
templates or patterns observed in the real world. The process of describing a 3D scenario is performed in
3D model edition platforms, such as 3D Studio Max, Maya or Blender (Figure 3). For the WUIVIEW project
the preferred software is Autodesk 3D Studio Max 2019.
The interface of this type of programs allows to perform intuitive but precise designs and arrangements
of objects in a 3D environment, assign properties (materials) and transform the elements (position,
rotation and scale). The 3D models are made of triangular facets connected by vertices and edges. The 3D
editing programs allow the manipulation, grouping and transformation of objects and their components.
This is particularly useful when determining components in a complex object with different materials.
WUIVIEW – GA #826544 – D5.2 Procedure for WUI scenarios 3D modelling
12
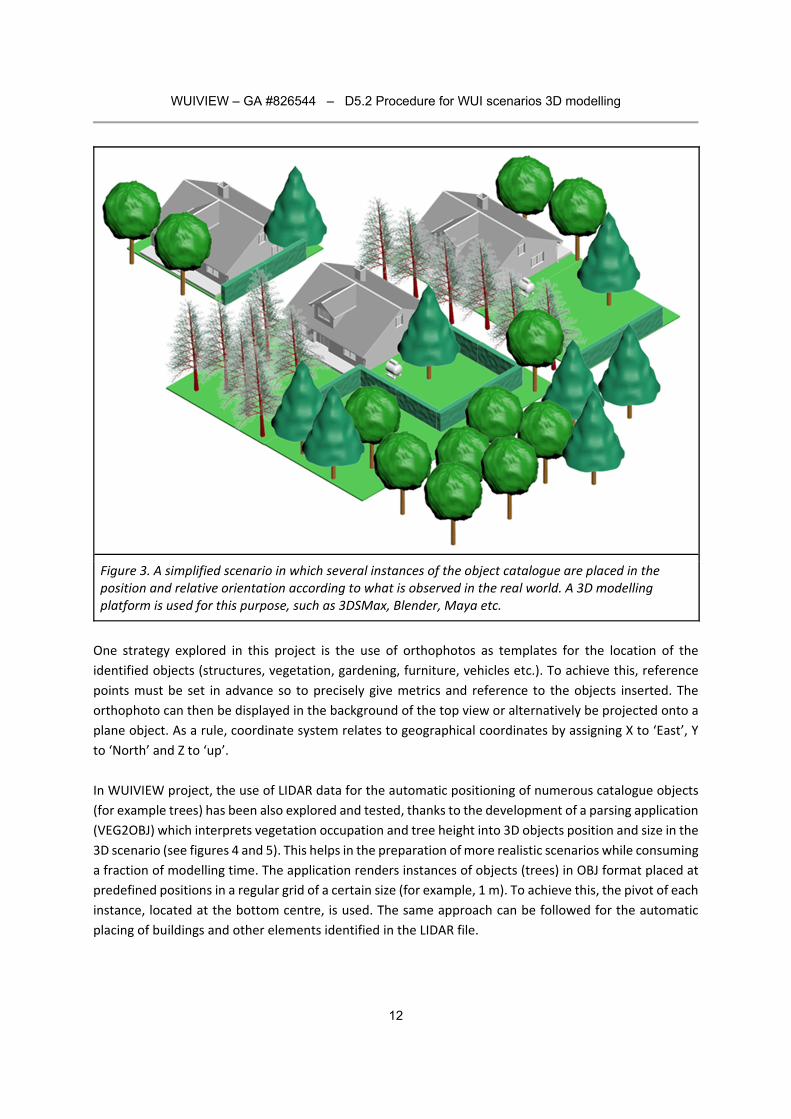
Figure 3. A simplified scenario in which several instances of the object catalogue are placed in the position and relative orientation according to what is observed in the real world. A 3D modelling platform is used for this purpose, such as 3DSMax, Blender, Maya etc.
One strategy explored in this project is the use of orthophotos as templates for the location of the
identified objects (structures, vegetation, gardening, furniture, vehicles etc.). To achieve this, reference
points must be set in advance so to precisely give metrics and reference to the objects inserted. The
orthophoto can then be displayed in the background of the top view or alternatively be projected onto a
plane object. As a rule, coordinate system relates to geographical coordinates by assigning X to ‘East’, Y
to ‘North’ and Z to ‘up’.
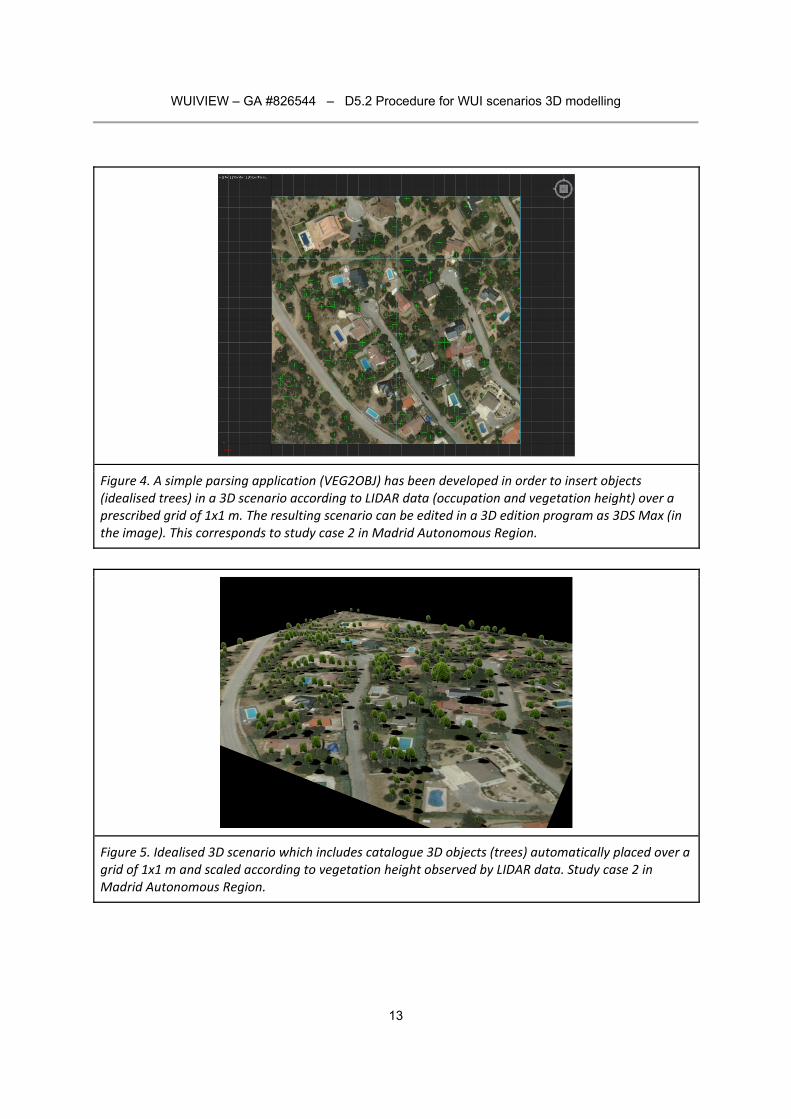
In WUIVIEW project, the use of LIDAR data for the automatic positioning of numerous catalogue objects
(for example trees) has been also explored and tested, thanks to the development of a parsing application
(VEG2OBJ) which interprets vegetation occupation and tree height into 3D objects position and size in the
3D scenario (see figures 4 and 5). This helps in the preparation of more realistic scenarios while consuming
a fraction of modelling time. The application renders instances of objects (trees) in OBJ format placed at
predefined positions in a regular grid of a certain size (for example, 1 m). To achieve this, the pivot of each
instance, located at the bottom centre, is used. The same approach can be followed for the automatic
placing of buildings and other elements identified in the LIDAR file.
WUIVIEW – GA #826544 – D5.2 Procedure for WUI scenarios 3D modelling
13
Figure 4. A simple parsing application (VEG2OBJ) has been developed in order to insert objects (idealised trees) in a 3D scenario according to LIDAR data (occupation and vegetation height) over a prescribed grid of 1x1 m. The resulting scenario can be edited in a 3D edition program as 3DS Max (in the image). This corresponds to study case 2 in Madrid Autonomous Region.
Figure 5. Idealised 3D scenario which includes catalogue 3D objects (trees) automatically placed over a grid of 1x1 m and scaled according to vegetation height observed by LIDAR data. Study case 2 in Madrid Autonomous Region.
WUIVIEW – GA #826544 – D5.2 Procedure for WUI scenarios 3D modelling
14
4. Description of real scenarios by 3D data gathering
Besides to idealised versions of the real world, the interest in WUIVIEW project gravitates mostly towards
the description of 3D scenarios which reflect accurately what is actually in the territory, particularly in the
WUI microscales. To achieve this, two strategies are presented and explored: the use of LIDAR data and
the application of photogrammetric techniques.
4.1 Use of high‐resolution LIDAR
One of the most interesting data sources for 3D WUI scenarios modelling is the telemetry provided by
LIDAR sensors. These include one or several returns of a laser beam indicating the heights of the terrain,
vegetation and structures. Initially designed for the extraction of digital terrain models (DTM), this product
gained popularity in other domains, particularly for the applications in forestry management. In Spain, as
well in other EU countries, official LIDAR datasets are freely available, under the open data policy and
INSPIRE directives. Recently some autonomic regions in Spain have programmed flights with airborne
LIDAR sensors, rendering high resolution products. Navarra autonomous region has released this type of
products and WUIVIEW project has performed a detailed exploration of its suitability for the purposes
presented in this document. To achieve this, a portion of one of the most severe WUI areas has been
selected, within the area of Estella city (Figure 6).
Selecting LAS data sets LIDAR data is generally stored in files under LAS format specification. This format includes information of
all returns of each pulse and a generic classification of the land use. Returns provide telemetry about the
absolute height. Real heights of objects must be derived by subtracting the corresponding value for the
terrain (DTM). For the purposes of WUI microscale modelling, a resolution has to be established in
advance. One limitation is that official LIDAR LAS datasets provide between 0.5 to 2 pulses per square
meter, which is way below what is needed for a detailed 3D modelling. For this reason, an exploration of
one of the datasets is performed, and a methodology applied to test to which extent the results are usable
within WUIVIEW scope is developed.
The mentioned dataset includes a classification of the land uses, based on the returned colour of each
pulse. Out of the classes described in the LAS specification, the class 2 (ground), 4 (medium vegetation),
5 (high vegetation) and 6 (buildings) are used. In order to avoid too much noise in the statistic calculations,
just the first and second returns of each pulse are considered. With these considerations, a collection of
x,y,z are obtained, expressing the spatial occupation of vegetation, buildings and terrain. The selected
LIDAR dataset has been downloaded from the SDI service for Navarra (SITNA) with LAS 1.4 specification
and ETRS89/ UTM 30N coordinate system. Given that many of the processes presented here are
performed under LAS1.2 specification, a conversion is needed.

WUIVIEW – GA #826544 – D5.2 Procedure for WUI scenarios 3D modelling
15
Figure 6. A portion of the LAS file in Estella, in Autonomous Region of Navarra, Spain, showing the returns 1 and 2 for class 4 (medium vegetation), 5 (high vegetation) and 6 (buildings). Overimposed a grid of 2x2 m so to check available data density for classification.
Processing All the processing of the LAS file has been performed with LasTools, a set of freeware applications for the
manipulation, transformation, calculation and display of LIDAR datasets. The conversion into LAS1.2
specification took place with the modifier:
‐set_version_minor 2
To select specific returns (1 and 2) and classes (4, 5 and 6), the following modifiers are used:
‐keep _return 1
‐keep_return_2
‐keep_classification 4
‐keep_classification 5
‐keep_classification 6
LasTools allows to directly generate a voxelization of the selected points, with the command ‘LasVoxel’.
The size of the voxels (in meters) is then specified with the modifiers ‐stepxy and ‐stepz, both of them
have been set to 2 meters in this example. For the purposes of 3D modelling it is required to have the
occupation of each x,y,z position (voxel centroid), and LasTools allows the generation of such coordinates
with the modifier ‘voxels as points’. Given that further processing is performed in other platforms (such
WUIVIEW – GA #826544 – D5.2 Procedure for WUI scenarios 3D modelling
16
as ArcGIS), the modifier ‘output format txt’ is used, to have the list of voxels and attributes in ASCII format
easily readable by other platforms.
Once generated, the segmented LAS file into voxelized space, it can be imported into ArcGIS or other
geographical information platform. In ArcGIS, the generated x,y,z list in ASCII format is loaded as table.
Then the command Display XY Data is used over the generated table. Finally, a conversion of the
generated point features (one per voxel) can be converted into a raster file with the option Conversion
Tools/To Raster/Feature to Raster.
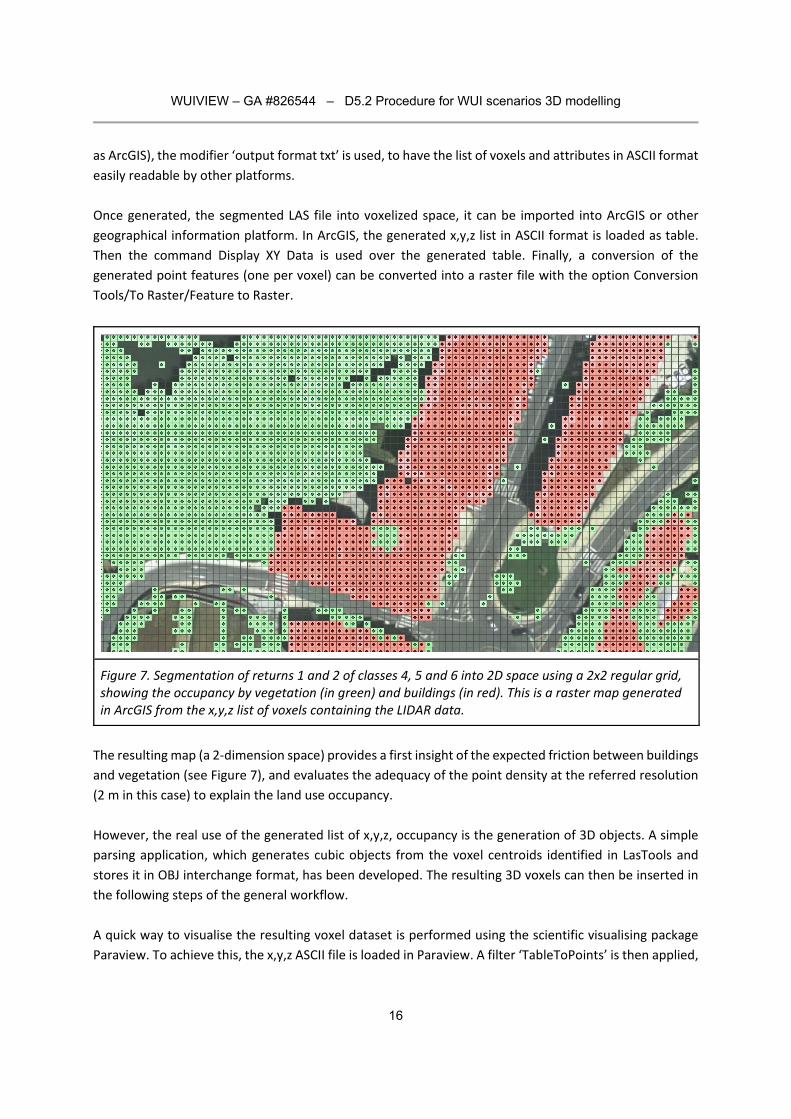
Figure 7. Segmentation of returns 1 and 2 of classes 4, 5 and 6 into 2D space using a 2x2 regular grid, showing the occupancy by vegetation (in green) and buildings (in red). This is a raster map generated in ArcGIS from the x,y,z list of voxels containing the LIDAR data.
The resulting map (a 2‐dimension space) provides a first insight of the expected friction between buildings
and vegetation (see Figure 7), and evaluates the adequacy of the point density at the referred resolution
(2 m in this case) to explain the land use occupancy.
However, the real use of the generated list of x,y,z, occupancy is the generation of 3D objects. A simple
parsing application, which generates cubic objects from the voxel centroids identified in LasTools and
stores it in OBJ interchange format, has been developed. The resulting 3D voxels can then be inserted in
the following steps of the general workflow.
A quick way to visualise the resulting voxel dataset is performed using the scientific visualising package
Paraview. To achieve this, the x,y,z ASCII file is loaded in Paraview. A filter ‘TableToPoints’ is then applied,
WUIVIEW – GA #826544 – D5.2 Procedure for WUI scenarios 3D modelling
17
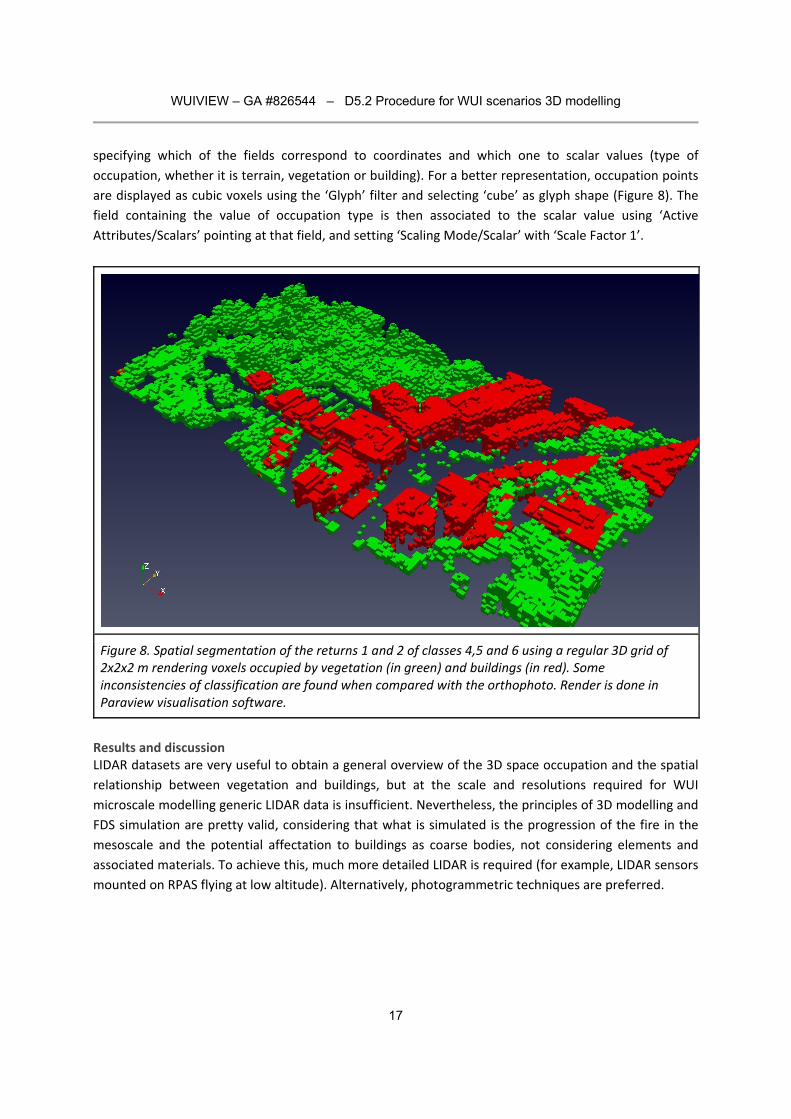
specifying which of the fields correspond to coordinates and which one to scalar values (type of
occupation, whether it is terrain, vegetation or building). For a better representation, occupation points
are displayed as cubic voxels using the ‘Glyph’ filter and selecting ‘cube’ as glyph shape (Figure 8). The
field containing the value of occupation type is then associated to the scalar value using ‘Active
Attributes/Scalars’ pointing at that field, and setting ‘Scaling Mode/Scalar’ with ‘Scale Factor 1’.
Figure 8. Spatial segmentation of the returns 1 and 2 of classes 4,5 and 6 using a regular 3D grid of 2x2x2 m rendering voxels occupied by vegetation (in green) and buildings (in red). Some inconsistencies of classification are found when compared with the orthophoto. Render is done in Paraview visualisation software.
Results and discussion LIDAR datasets are very useful to obtain a general overview of the 3D space occupation and the spatial
relationship between vegetation and buildings, but at the scale and resolutions required for WUI
microscale modelling generic LIDAR data is insufficient. Nevertheless, the principles of 3D modelling and
FDS simulation are pretty valid, considering that what is simulated is the progression of the fire in the
mesoscale and the potential affectation to buildings as coarse bodies, not considering elements and
associated materials. To achieve this, much more detailed LIDAR is required (for example, LIDAR sensors
mounted on RPAS flying at low altitude). Alternatively, photogrammetric techniques are preferred.
WUIVIEW – GA #826544 – D5.2 Procedure for WUI scenarios 3D modelling
18
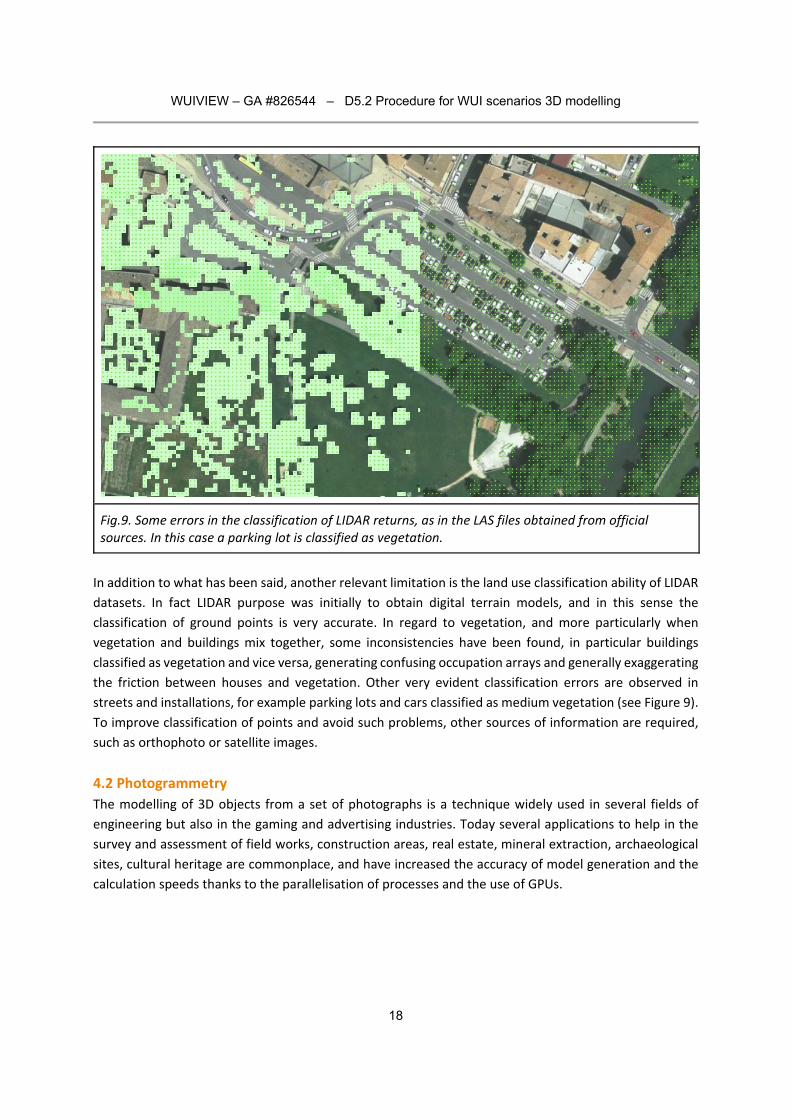
Fig.9. Some errors in the classification of LIDAR returns, as in the LAS files obtained from official sources. In this case a parking lot is classified as vegetation.
In addition to what has been said, another relevant limitation is the land use classification ability of LIDAR
datasets. In fact LIDAR purpose was initially to obtain digital terrain models, and in this sense the
classification of ground points is very accurate. In regard to vegetation, and more particularly when
vegetation and buildings mix together, some inconsistencies have been found, in particular buildings
classified as vegetation and vice versa, generating confusing occupation arrays and generally exaggerating
the friction between houses and vegetation. Other very evident classification errors are observed in
streets and installations, for example parking lots and cars classified as medium vegetation (see Figure 9).
To improve classification of points and avoid such problems, other sources of information are required,
such as orthophoto or satellite images.
4.2 Photogrammetry
The modelling of 3D objects from a set of photographs is a technique widely used in several fields of
engineering but also in the gaming and advertising industries. Today several applications to help in the
survey and assessment of field works, construction areas, real estate, mineral extraction, archaeological
sites, cultural heritage are commonplace, and have increased the accuracy of model generation and the
calculation speeds thanks to the parallelisation of processes and the use of GPUs.
WUIVIEW – GA #826544 – D5.2 Procedure for WUI scenarios 3D modelling
19
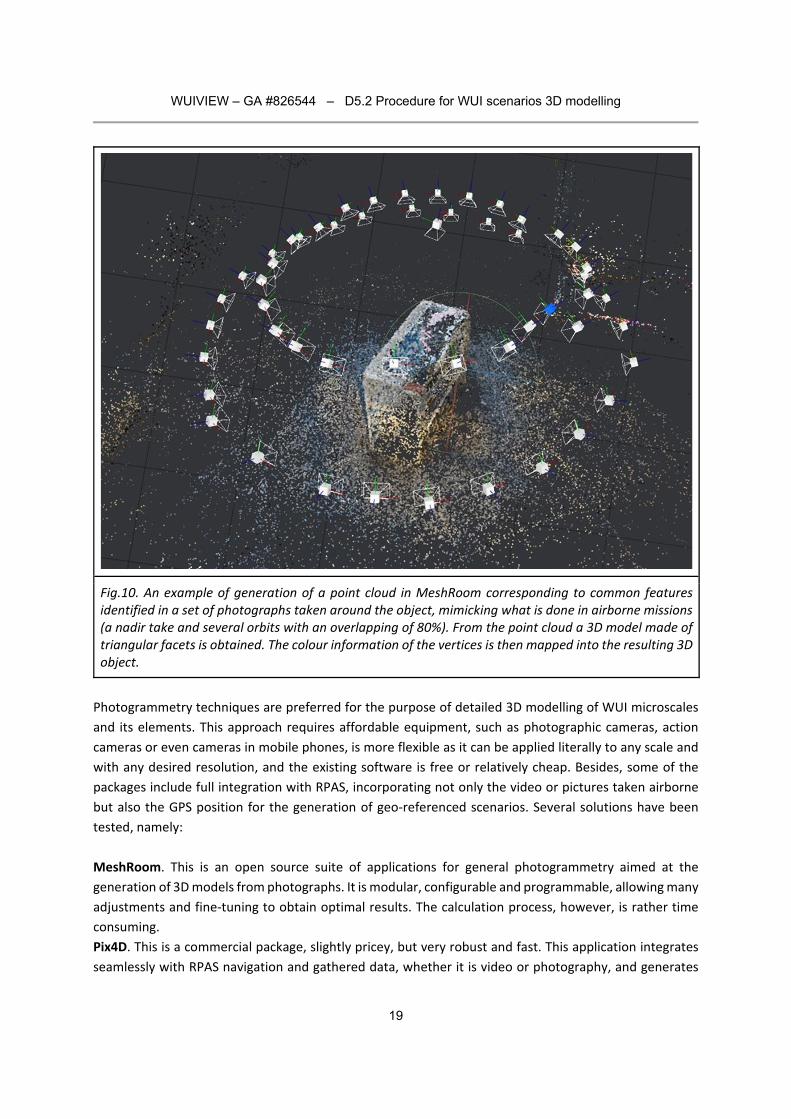
Fig.10. An example of generation of a point cloud in MeshRoom corresponding to common features identified in a set of photographs taken around the object, mimicking what is done in airborne missions (a nadir take and several orbits with an overlapping of 80%). From the point cloud a 3D model made of triangular facets is obtained. The colour information of the vertices is then mapped into the resulting 3D object.
Photogrammetry techniques are preferred for the purpose of detailed 3D modelling of WUI microscales
and its elements. This approach requires affordable equipment, such as photographic cameras, action
cameras or even cameras in mobile phones, is more flexible as it can be applied literally to any scale and
with any desired resolution, and the existing software is free or relatively cheap. Besides, some of the
packages include full integration with RPAS, incorporating not only the video or pictures taken airborne
but also the GPS position for the generation of geo‐referenced scenarios. Several solutions have been
tested, namely:
MeshRoom. This is an open source suite of applications for general photogrammetry aimed at the
generation of 3D models from photographs. It is modular, configurable and programmable, allowing many
adjustments and fine‐tuning to obtain optimal results. The calculation process, however, is rather time
consuming.
Pix4D. This is a commercial package, slightly pricey, but very robust and fast. This application integrates
seamlessly with RPAS navigation and gathered data, whether it is video or photography, and generates
WUIVIEW – GA #826544 – D5.2 Procedure for WUI scenarios 3D modelling
20
3D models in several interchange formats and digital terrains and maps. Works much better with a
generous photo overlapping or 4K videos.
Autocad Recap. This is a generic purpose application for 3D models generation from photographs or map
mosaic production from airborne data. This application sits and operates in the cloud, making use of its
calculation potential. Photos must be uploaded and the process queued for calculation. The educational
license has the limitation of 100 pictures per project.
Zephyr. This is another robust application at a reasonable price (particularly the license admitting up to
500 pictures per project) and fast in processing images. Renders results in several interchange formats
such as OBJ.
In WUIVIEW project, several tests have been made and the software packages evaluated, as part of the
service workflow in the future. All of the solutions follow a similar approach for the identification of
features, the calculation of camera positions, the pairing of photographs and the derivation of coordinates
of intermediate 3D points, and the generation of the 3D meshes out of the point cloud. In all of them
some artefacts are unavoidable generated and has been observed that a large number of pictures, with
generous overlapping (over 80%) diminishes the presence of these artefacts and model errors. Preliminary
tests were made in ground with photo cameras and mobile phones, mimicking the orbits of an airborne
survey. The same procedure has been completed for the generation of 3D models of common objects
found in the WUI microscale. Handheld, ground photo gathering is rather easy and straightforward
process, some of which can be taken in the photo studio. Position and camera consistency render a robust
point cloud and hence a realistic 3D model (see Figure 10). Generally speaking, photogrammetry for 3D
model generation is based on a widely accepted method called Structure From Motion (SFM), which
identifies objects from photographs. The general process is based in finding matching features (corners,
edges, patterns etc.) based on Scale‐Invariant Feature Transform (SIFT) algorithms. This is a globally used
method for the detection of features in an image and widely used in artificial vision. The SIFT key points
are extracted from a series of reference images and stored in a database. Given a new image, the features
are compared with those existing in the database, so creating a list of pairing photos based on the
Euclidean distance calculated for the vectors associated to the identified features. In this way, SFM finds
matching features in sequential images (video frames or photos), for which is very important to keep
consistency in the camera properties (same camera for all pictures) and camera movement (continuous
trajectory, such as orbits). This SFM approach was originally designed to work with video streaming in real
time for artificial vision and object recognition.
4.3 Airborne photogrammetry. Use of RPAS
Advantages of airborne photogrammetry Airborne photogrammetry is specially suitable for the modelling of geographical features, such as
structures and buildings. A camera mounted in an aircraft provides the advantage of an oblique view from
above under different angles, which strongly completes the on‐ground images for photogrammetric
restitution. The idea underlying airborne photogrammetry is designing flights in such a way that it covers
a large area, ensures images overlapping and provides different angles of observation, ideally at different
WUIVIEW – GA #826544 – D5.2 Procedure for WUI scenarios 3D modelling
21
heights. This can be hardly achieved in the case of houses and other buildings just by taking on ground
photographs, which is why airborne cameras are a good solution. Today the use of drones (RPAS) allow
to take airborne photos with built‐in cameras mounted in stabilisers and gimbals, or action cameras
attached to the drone body. These are cheap and portable solutions, allowing a broad range of
applications in a wide number of situations. In the case of WUI microscale, drones are particularly useful,
due to their flight flexibility (they sneak through narrow spaces), their portability, the short deployment
and flight preparation time (just minutes), the lack of intrusiveness (they are tiny and quiet) and the less
restrictive regulations on aeronautics safety and operation.
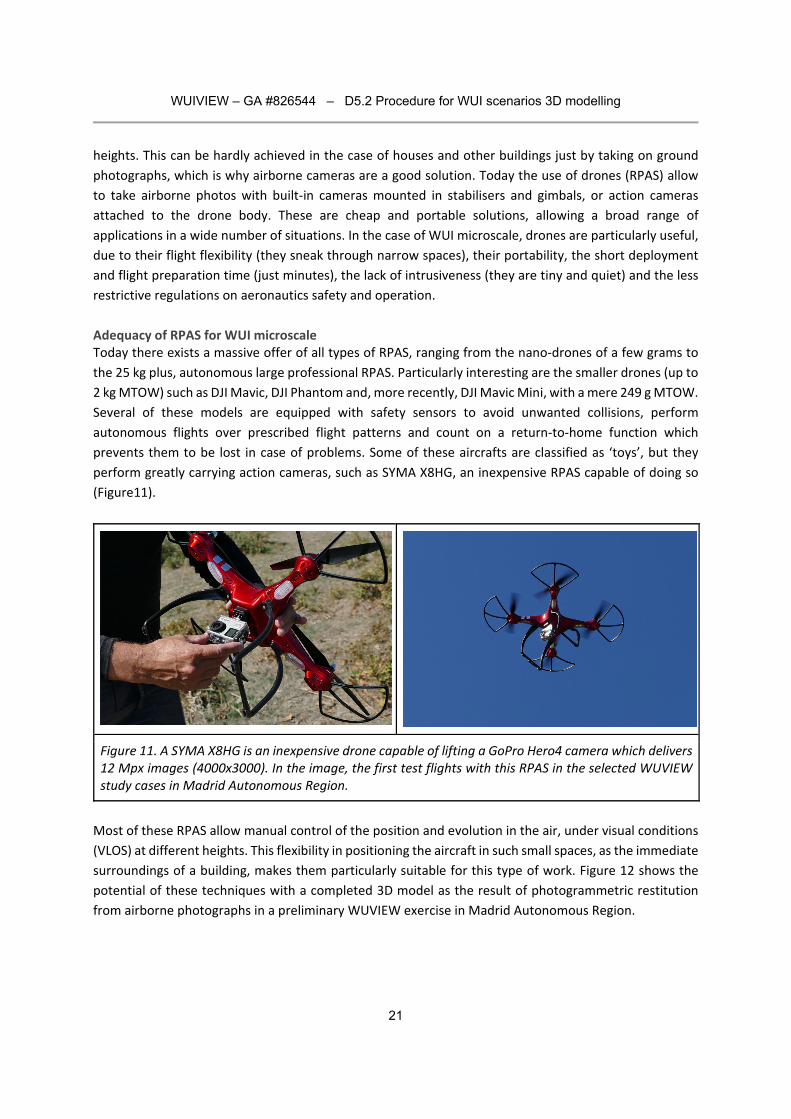
Adequacy of RPAS for WUI microscale Today there exists a massive offer of all types of RPAS, ranging from the nano‐drones of a few grams to
the 25 kg plus, autonomous large professional RPAS. Particularly interesting are the smaller drones (up to
2 kg MTOW) such as DJI Mavic, DJI Phantom and, more recently, DJI Mavic Mini, with a mere 249 g MTOW.
Several of these models are equipped with safety sensors to avoid unwanted collisions, perform
autonomous flights over prescribed flight patterns and count on a return‐to‐home function which
prevents them to be lost in case of problems. Some of these aircrafts are classified as ‘toys’, but they
perform greatly carrying action cameras, such as SYMA X8HG, an inexpensive RPAS capable of doing so
(Figure11).
Figure 11. A SYMA X8HG is an inexpensive drone capable of lifting a GoPro Hero4 camera which delivers 12 Mpx images (4000x3000). In the image, the first test flights with this RPAS in the selected WUVIEW study cases in Madrid Autonomous Region.
Most of these RPAS allow manual control of the position and evolution in the air, under visual conditions
(VLOS) at different heights. This flexibility in positioning the aircraft in such small spaces, as the immediate
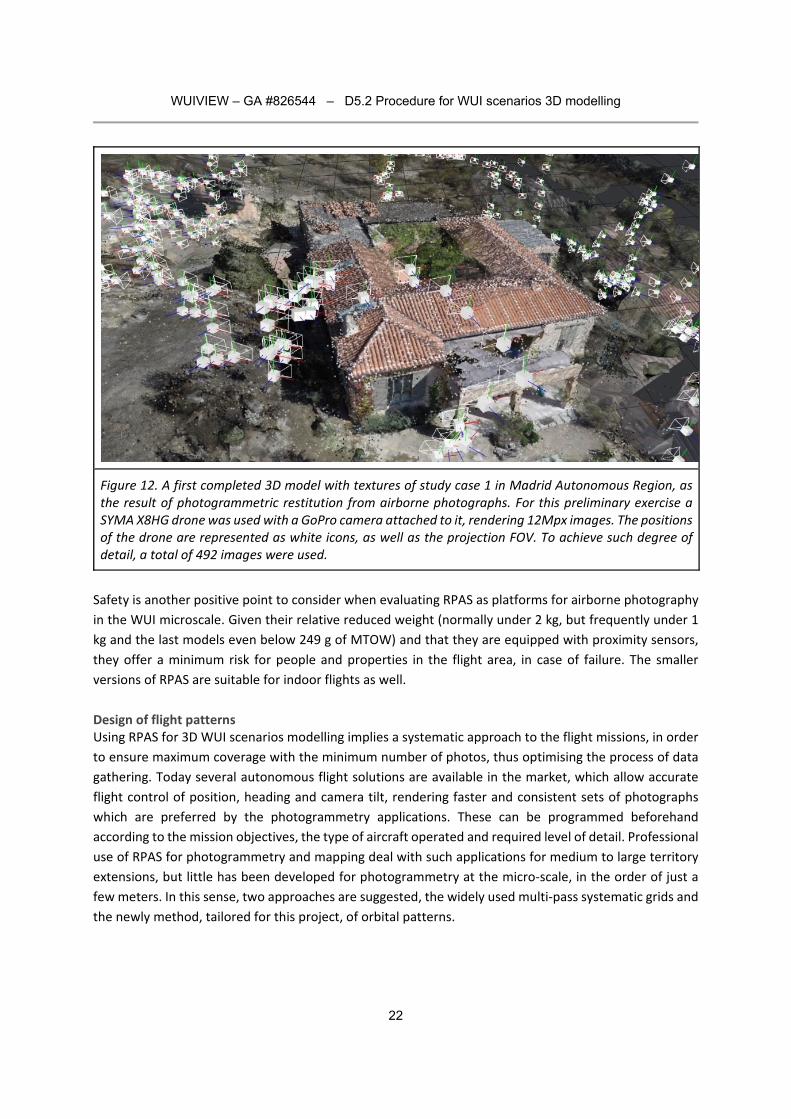
surroundings of a building, makes them particularly suitable for this type of work. Figure 12 shows the
potential of these techniques with a completed 3D model as the result of photogrammetric restitution
from airborne photographs in a preliminary WUVIEW exercise in Madrid Autonomous Region.
WUIVIEW – GA #826544 – D5.2 Procedure for WUI scenarios 3D modelling
22
Figure 12. A first completed 3D model with textures of study case 1 in Madrid Autonomous Region, as the result of photogrammetric restitution from airborne photographs. For this preliminary exercise a SYMA X8HG drone was used with a GoPro camera attached to it, rendering 12Mpx images. The positions of the drone are represented as white icons, as well as the projection FOV. To achieve such degree of detail, a total of 492 images were used.
Safety is another positive point to consider when evaluating RPAS as platforms for airborne photography
in the WUI microscale. Given their relative reduced weight (normally under 2 kg, but frequently under 1
kg and the last models even below 249 g of MTOW) and that they are equipped with proximity sensors,
they offer a minimum risk for people and properties in the flight area, in case of failure. The smaller
versions of RPAS are suitable for indoor flights as well.
Design of flight patterns Using RPAS for 3D WUI scenarios modelling implies a systematic approach to the flight missions, in order
to ensure maximum coverage with the minimum number of photos, thus optimising the process of data
gathering. Today several autonomous flight solutions are available in the market, which allow accurate
flight control of position, heading and camera tilt, rendering faster and consistent sets of photographs
which are preferred by the photogrammetry applications. These can be programmed beforehand
according to the mission objectives, the type of aircraft operated and required level of detail. Professional
use of RPAS for photogrammetry and mapping deal with such applications for medium to large territory
extensions, but little has been developed for photogrammetry at the micro‐scale, in the order of just a
few meters. In this sense, two approaches are suggested, the widely used multi‐pass systematic grids and
the newly method, tailored for this project, of orbital patterns.
WUIVIEW – GA #826544 – D5.2 Procedure for WUI scenarios 3D modelling
23
Systematic grids
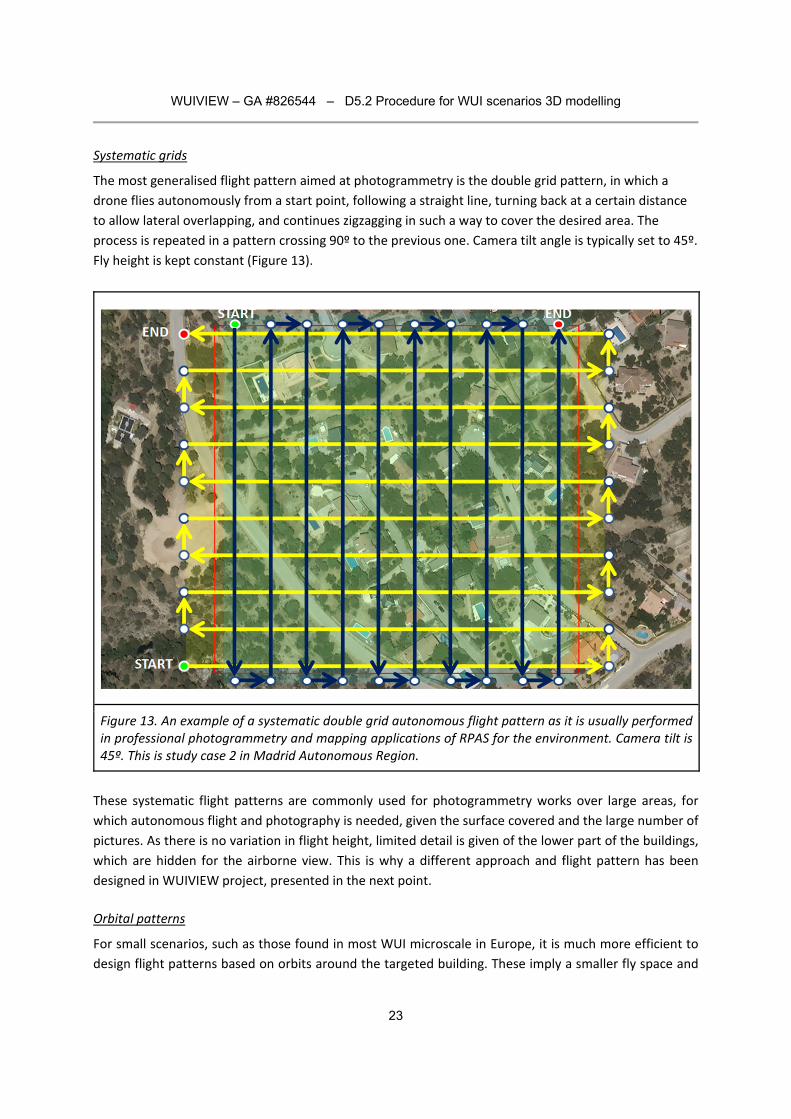
The most generalised flight pattern aimed at photogrammetry is the double grid pattern, in which a
drone flies autonomously from a start point, following a straight line, turning back at a certain distance
to allow lateral overlapping, and continues zigzagging in such a way to cover the desired area. The
process is repeated in a pattern crossing 90º to the previous one. Camera tilt angle is typically set to 45º.
Fly height is kept constant (Figure 13).
Figure 13. An example of a systematic double grid autonomous flight pattern as it is usually performed in professional photogrammetry and mapping applications of RPAS for the environment. Camera tilt is 45º. This is study case 2 in Madrid Autonomous Region.
These systematic flight patterns are commonly used for photogrammetry works over large areas, for
which autonomous flight and photography is needed, given the surface covered and the large number of
pictures. As there is no variation in flight height, limited detail is given of the lower part of the buildings,
which are hidden for the airborne view. This is why a different approach and flight pattern has been
designed in WUIVIEW project, presented in the next point.
Orbital patterns
For small scenarios, such as those found in most WUI microscale in Europe, it is much more efficient to
design flight patterns based on orbits around the targeted building. These imply a smaller fly space and
WUIVIEW – GA #826544 – D5.2 Procedure for WUI scenarios 3D modelling
24
generally optimise the time of photo gathering. Following, the principles for orbital flight design, based
on the characteristics of the used RPAS in WUIVIEW project, is presented.
For such a smaller spaces, consequently smaller RPAS are preferred, due to their flexibility, reduced legal
restrictions (particularly with MTOW below 250 g), ease of use and better safety flight conditions. In
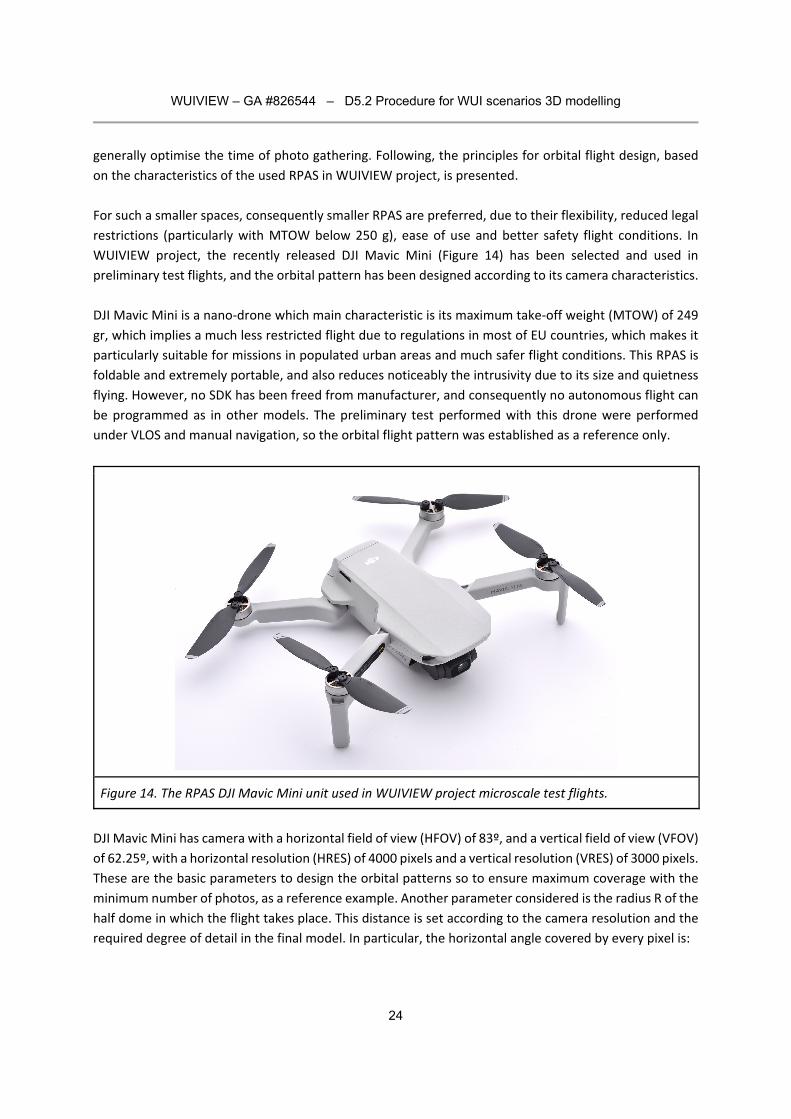
WUIVIEW project, the recently released DJI Mavic Mini (Figure 14) has been selected and used in
preliminary test flights, and the orbital pattern has been designed according to its camera characteristics.
DJI Mavic Mini is a nano‐drone which main characteristic is its maximum take‐off weight (MTOW) of 249
gr, which implies a much less restricted flight due to regulations in most of EU countries, which makes it
particularly suitable for missions in populated urban areas and much safer flight conditions. This RPAS is
foldable and extremely portable, and also reduces noticeably the intrusivity due to its size and quietness
flying. However, no SDK has been freed from manufacturer, and consequently no autonomous flight can
be programmed as in other models. The preliminary test performed with this drone were performed
under VLOS and manual navigation, so the orbital flight pattern was established as a reference only.
Figure 14. The RPAS DJI Mavic Mini unit used in WUIVIEW project microscale test flights.
DJI Mavic Mini has camera with a horizontal field of view (HFOV) of 83º, and a vertical field of view (VFOV)
of 62.25º, with a horizontal resolution (HRES) of 4000 pixels and a vertical resolution (VRES) of 3000 pixels.
These are the basic parameters to design the orbital patterns so to ensure maximum coverage with the
minimum number of photos, as a reference example. Another parameter considered is the radius R of the
half dome in which the flight takes place. This distance is set according to the camera resolution and the
required degree of detail in the final model. In particular, the horizontal angle covered by every pixel is:
WUIVIEW – GA #826544 – D5.2 Procedure for WUI scenarios 3D modelling
25
𝛼 𝐻𝐹𝑂𝑉/𝐻𝑅𝐸𝑆 0.02075º
According to this, the object resolution at a distance of R meters is approximately:
𝑑 ≃ 𝑅 𝛼 1000 0.02075 20.75 𝑐𝑚
Given that it is preferred to include the whole building in each of the photos, the distance R is to some
extent subject to the size of the building to be modelled. This also implies that the obtained object
resolution is subject to the size of the building, in particular for R equal 10 m and a HRES of 4000 pixels, a
maximum of 20.75 cm of object resolution is obtained. For larger buildings it is preferred to use the
systematic grids as presented in the previous points, but consequently coarser object resolutions will be
obtained as distances are larger.
In professional fora of photogrammetry, it is strongly suggested to keep a constant and generous
overlapping, both horizontally and vertically, between consecutive photos, ranging between 60 and 80%.
Taking as a reference a 80% overlapping, let's find the angle increment to optimally cover the whole orbits,
and hence derive the design of the orbital pattern. In fact, to ensure an 80% overlapping over a HRES 4000
means displacing the next take position just 800 pixels, meaning 16.6º (at 0.02075 º/pixel) of horizontal
displacement between consecutive photos. This implies taking 36/16.6=21.68 photos to cover a full orbit
of radius R.
To facilitate the understanding and use of this orbital pattern, nominal values (based on the calculated
ones) are used instead. In fact, if a photo is taken every 15º (similar to the 16.6º obtained), a total of 24
photos are needed to cover a full orbit of radius R. These 15º are equivalent to 722.89 pixels which means
81.92% overlapping. Nominal values (15º and 24 photos) are the reference to design the full set of orbits,
each one at a vertical distance of 15º from each other, so to complete half dome with six orbits and a
nadir photo in the very top. To obtain the radius of each orbit, the associated angle to the orbit is
considered. In order to obtain consistent results, the number of photos in every orbit (at different radius)
is such that the overlapping of 81.92% is ensured. That means that the RPAS, in every orbit, will move the
same arc length which is approximately R/4.
These are simplified rules that establish a semi‐spherical mesh of locations from which the RPAS will take
photos. Camera tilt angle is set in every orbit in such a way that the centre of the image is looking at the
centre of the half dome in which the building is inserted. That means that in nadir take the camera tilt
angle is 90º (looking downwards); in the first orbit the angle will be 90‐15=75º; in the second 90‐30=60º;
in the third 90‐45=45º, and so on. The last one will be at ground level with an angle of 0º for which it is
suggested to perform photo taking just walking around the house with the drone handheld (same camera)
to ensure photography consistency. This is preferred to fly the drone so close to the ground with the
potential danger of crashing the aircraft. The following table summarizes the values obtained for the
design of each orbit with R set at 10 m, and the following illustrations (Figures 15‐17) show the visual look
of the proposed pattern:
WUIVIEW – GA #826544 – D5.2 Procedure for WUI scenarios 3D modelling
26
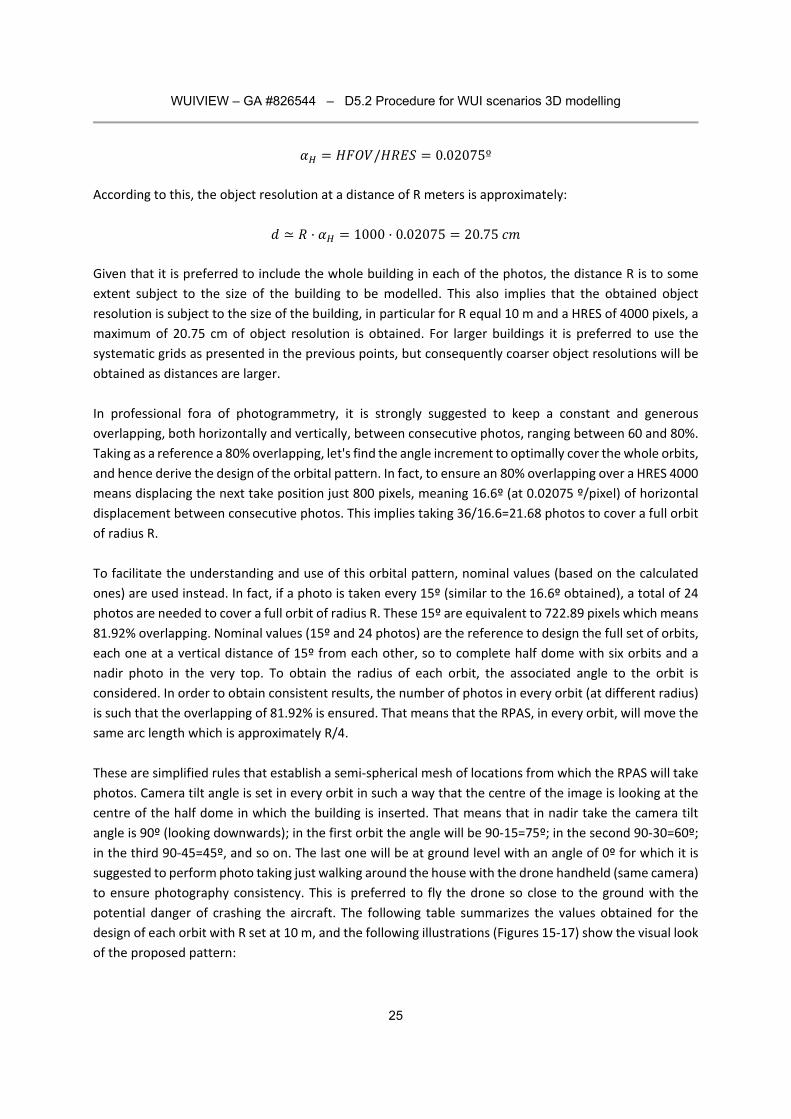
Orbit Angle º Radius m Height m Camera tilt º Nº of takes
0 0 (nadir) 0 10 90 1
1 15 2.58 9.65 75 6
2 30 5 8.66 60 12
3 45 7 7 45 17
4 60 8.66 5 30 20
5 75 9.65 2.58 15 23
6 90 (ground) 10 0 0 24
Figure 15. Diagram showing the designed orbital patterns over a building of 5x5 m. Radius of flight half dome is 10 m. The little balls represent the 103 suggested drone positions to ensure 82% photo overlapping.
WUIVIEW – GA #826544 – D5.2 Procedure for WUI scenarios 3D modelling
27
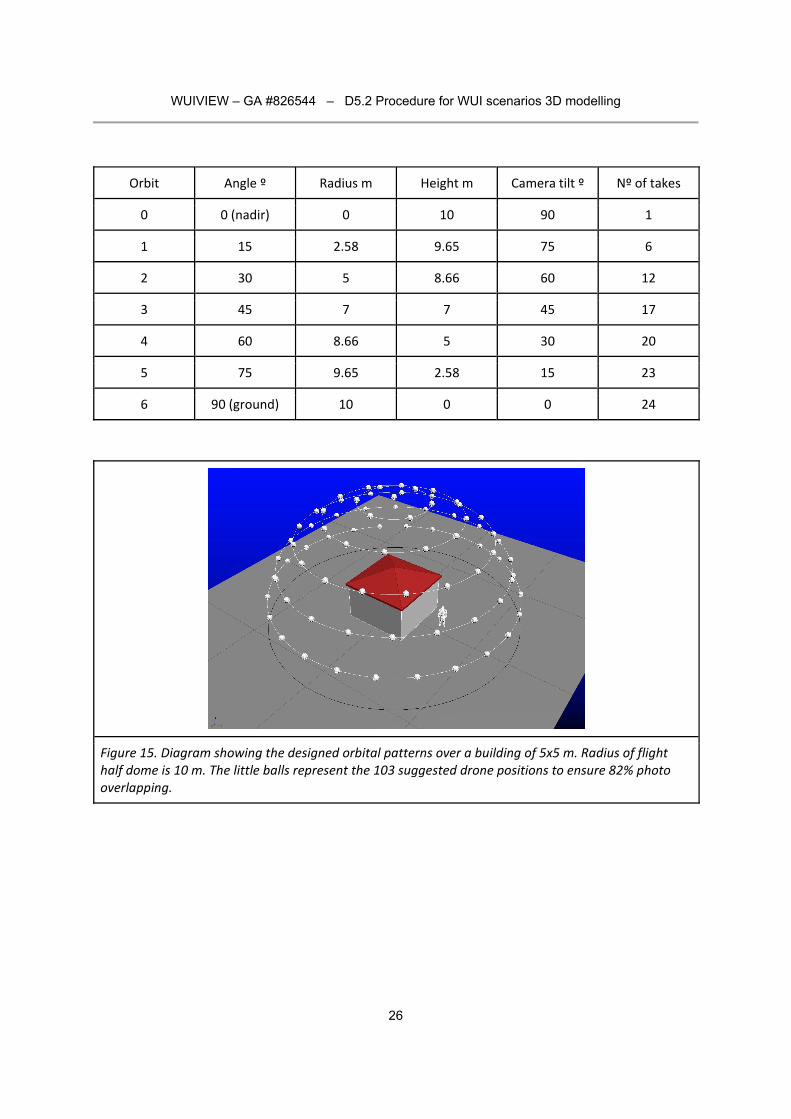
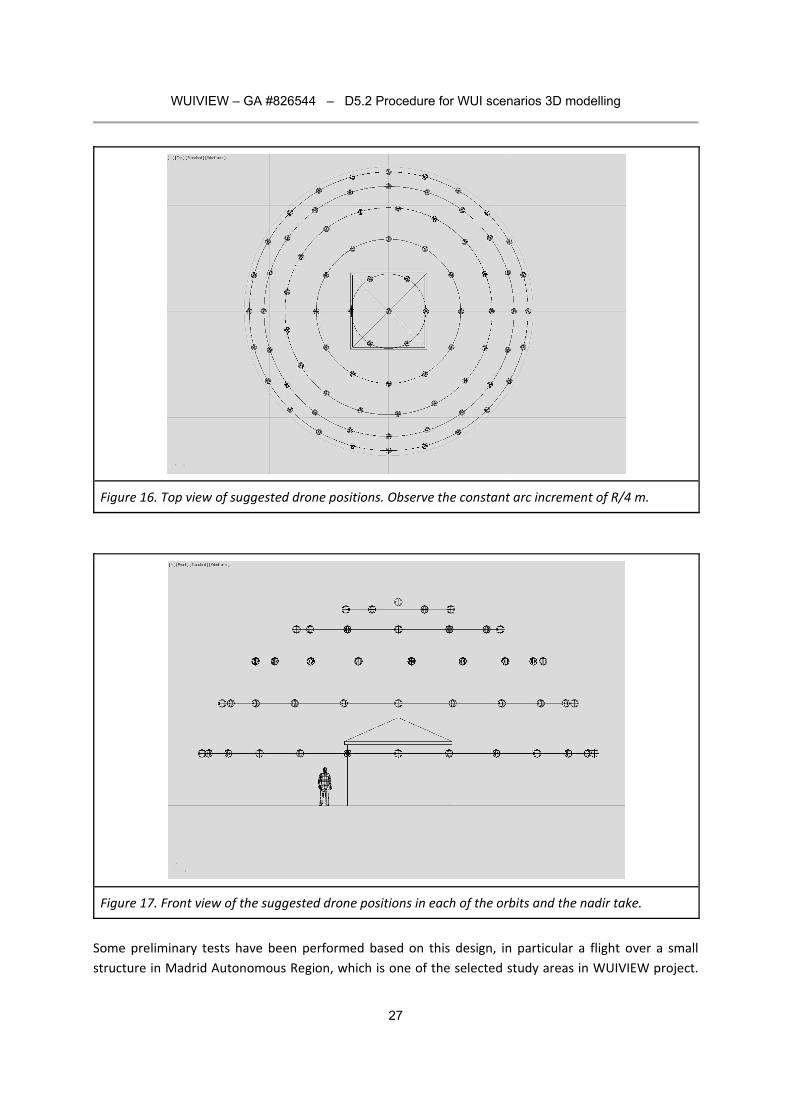
Figure 16. Top view of suggested drone positions. Observe the constant arc increment of R/4 m.
Figure 17. Front view of the suggested drone positions in each of the orbits and the nadir take.
Some preliminary tests have been performed based on this design, in particular a flight over a small
structure in Madrid Autonomous Region, which is one of the selected study areas in WUIVIEW project.
WUIVIEW – GA #826544 – D5.2 Procedure for WUI scenarios 3D modelling
28
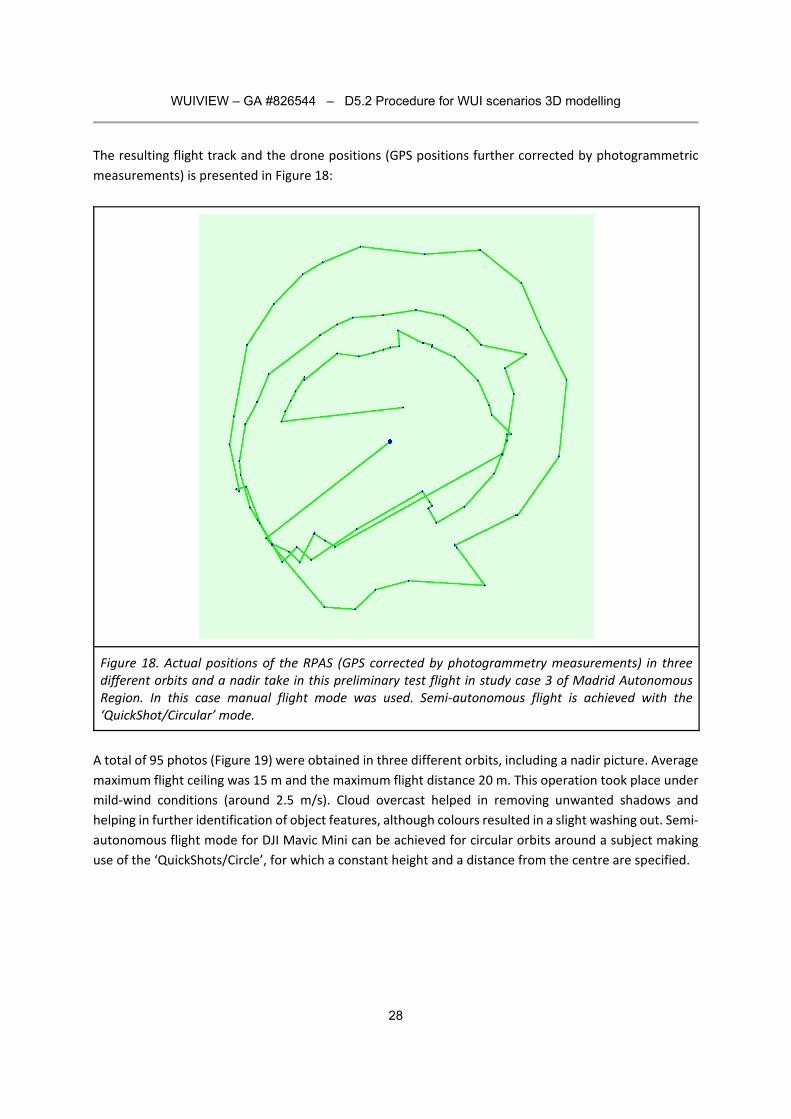
The resulting flight track and the drone positions (GPS positions further corrected by photogrammetric
measurements) is presented in Figure 18:
Figure 18. Actual positions of the RPAS (GPS corrected by photogrammetry measurements) in three different orbits and a nadir take in this preliminary test flight in study case 3 of Madrid Autonomous Region. In this case manual flight mode was used. Semi‐autonomous flight is achieved with the ‘QuickShot/Circular’ mode.
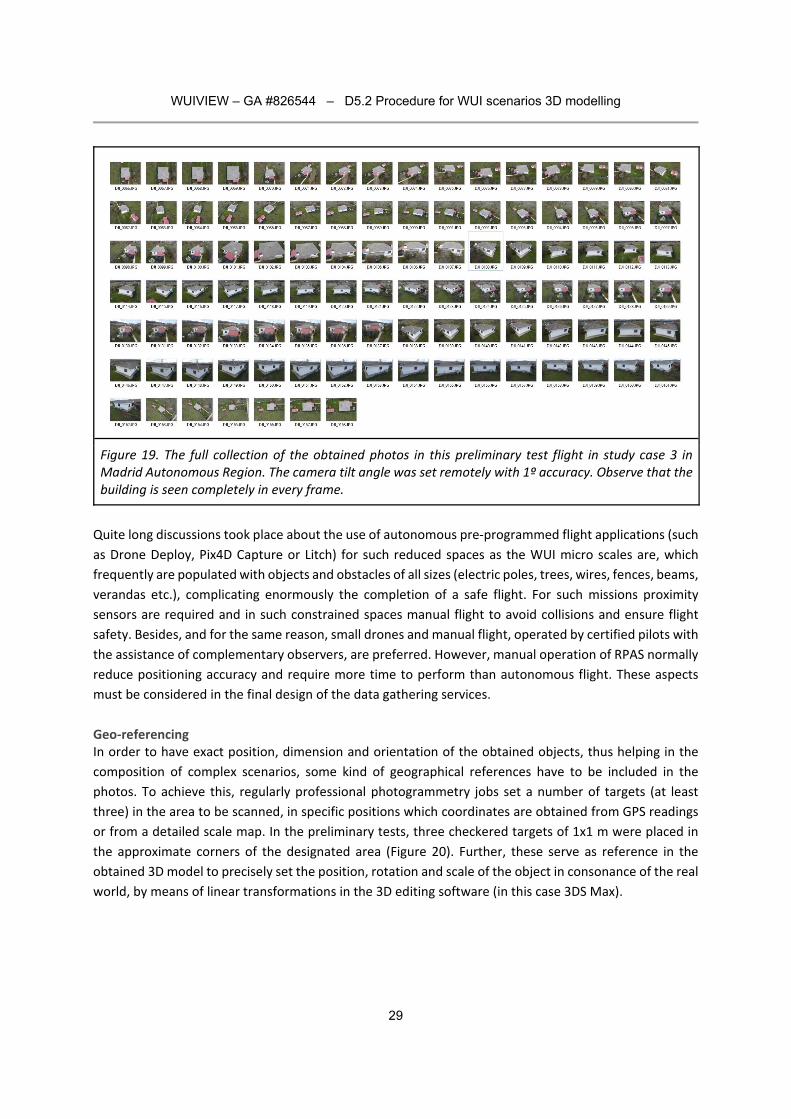
A total of 95 photos (Figure 19) were obtained in three different orbits, including a nadir picture. Average
maximum flight ceiling was 15 m and the maximum flight distance 20 m. This operation took place under
mild‐wind conditions (around 2.5 m/s). Cloud overcast helped in removing unwanted shadows and
helping in further identification of object features, although colours resulted in a slight washing out. Semi‐
autonomous flight mode for DJI Mavic Mini can be achieved for circular orbits around a subject making
use of the ‘QuickShots/Circle’, for which a constant height and a distance from the centre are specified.
WUIVIEW – GA #826544 – D5.2 Procedure for WUI scenarios 3D modelling
29
Figure 19. The full collection of the obtained photos in this preliminary test flight in study case 3 in Madrid Autonomous Region. The camera tilt angle was set remotely with 1º accuracy. Observe that the building is seen completely in every frame.
Quite long discussions took place about the use of autonomous pre‐programmed flight applications (such
as Drone Deploy, Pix4D Capture or Litch) for such reduced spaces as the WUI micro scales are, which
frequently are populated with objects and obstacles of all sizes (electric poles, trees, wires, fences, beams,
verandas etc.), complicating enormously the completion of a safe flight. For such missions proximity
sensors are required and in such constrained spaces manual flight to avoid collisions and ensure flight
safety. Besides, and for the same reason, small drones and manual flight, operated by certified pilots with
the assistance of complementary observers, are preferred. However, manual operation of RPAS normally
reduce positioning accuracy and require more time to perform than autonomous flight. These aspects
must be considered in the final design of the data gathering services.
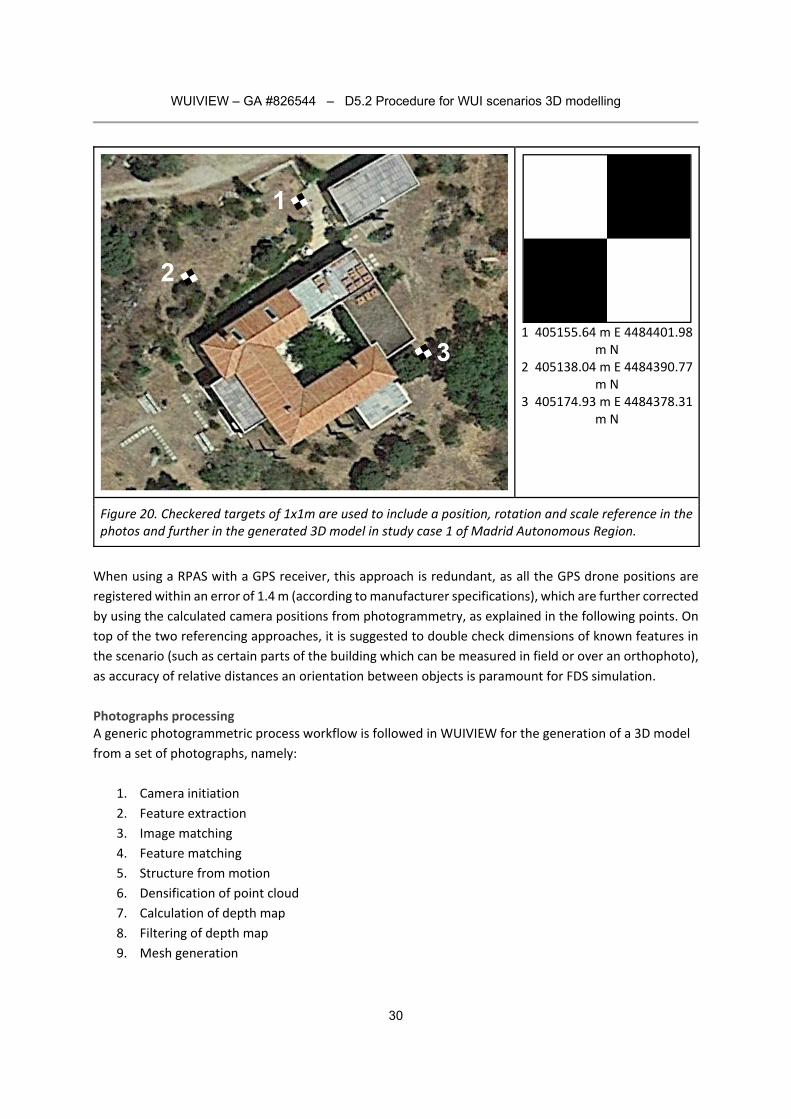
Geo‐referencing In order to have exact position, dimension and orientation of the obtained objects, thus helping in the
composition of complex scenarios, some kind of geographical references have to be included in the
photos. To achieve this, regularly professional photogrammetry jobs set a number of targets (at least
three) in the area to be scanned, in specific positions which coordinates are obtained from GPS readings
or from a detailed scale map. In the preliminary tests, three checkered targets of 1x1 m were placed in
the approximate corners of the designated area (Figure 20). Further, these serve as reference in the
obtained 3D model to precisely set the position, rotation and scale of the object in consonance of the real
world, by means of linear transformations in the 3D editing software (in this case 3DS Max).
WUIVIEW – GA #826544 – D5.2 Procedure for WUI scenarios 3D modelling
30
1 405155.64 m E 4484401.98
m N 2 405138.04 m E 4484390.77
m N 3 405174.93 m E 4484378.31
m N
Figure 20. Checkered targets of 1x1m are used to include a position, rotation and scale reference in the photos and further in the generated 3D model in study case 1 of Madrid Autonomous Region.
When using a RPAS with a GPS receiver, this approach is redundant, as all the GPS drone positions are
registered within an error of 1.4 m (according to manufacturer specifications), which are further corrected
by using the calculated camera positions from photogrammetry, as explained in the following points. On
top of the two referencing approaches, it is suggested to double check dimensions of known features in
the scenario (such as certain parts of the building which can be measured in field or over an orthophoto),
as accuracy of relative distances an orientation between objects is paramount for FDS simulation.
Photographs processing A generic photogrammetric process workflow is followed in WUIVIEW for the generation of a 3D model
from a set of photographs, namely:
1. Camera initiation
2. Feature extraction
3. Image matching
4. Feature matching
5. Structure from motion
6. Densification of point cloud
7. Calculation of depth map
8. Filtering of depth map
9. Mesh generation
WUIVIEW – GA #826544 – D5.2 Procedure for WUI scenarios 3D modelling
31
10. Mesh filtering
11. Texturing
The photogrammetric procedure first extracts the information from the EXIF data in each image, to gather
the camera properties (focal length, type etc.) and geographic position (GPS data if available). The second
process is the identification of features in each of the photos. For this reason, contrasted pictures with
details in the surfaces are preferred to uniform, flat materials. A list of features is created for each image.
After, the process orders images and creates a list of candidates for pairing, so to identify consecutive
photos which overlap. The process continues with the identification of common features in consecutive
photos (feature matching) and exclude those features which cannot be found in several.
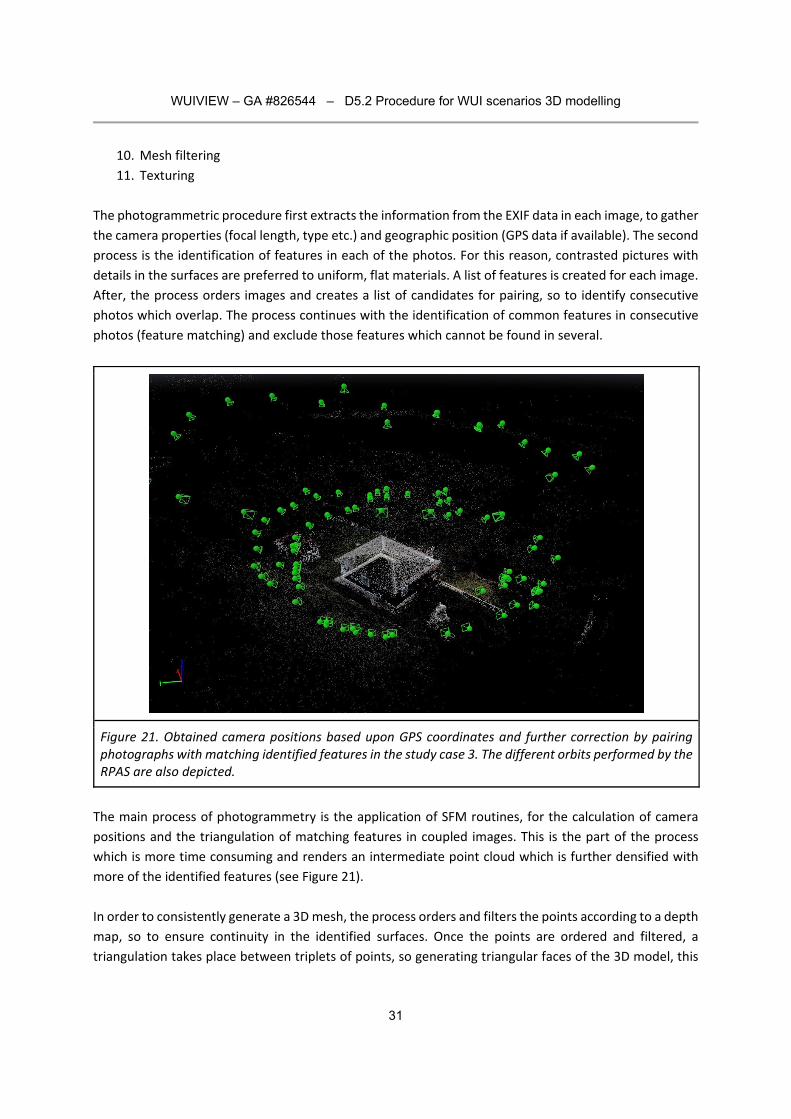
Figure 21. Obtained camera positions based upon GPS coordinates and further correction by pairing photographs with matching identified features in the study case 3. The different orbits performed by the RPAS are also depicted.
The main process of photogrammetry is the application of SFM routines, for the calculation of camera
positions and the triangulation of matching features in coupled images. This is the part of the process
which is more time consuming and renders an intermediate point cloud which is further densified with
more of the identified features (see Figure 21).
In order to consistently generate a 3D mesh, the process orders and filters the points according to a depth
map, so to ensure continuity in the identified surfaces. Once the points are ordered and filtered, a
triangulation takes place between triplets of points, so generating triangular faces of the 3D model, this
WUIVIEW – GA #826544 – D5.2 Procedure for WUI scenarios 3D modelling
32
is the mesh generation step. Further filtering of the generated triangular facets is applied so to discard
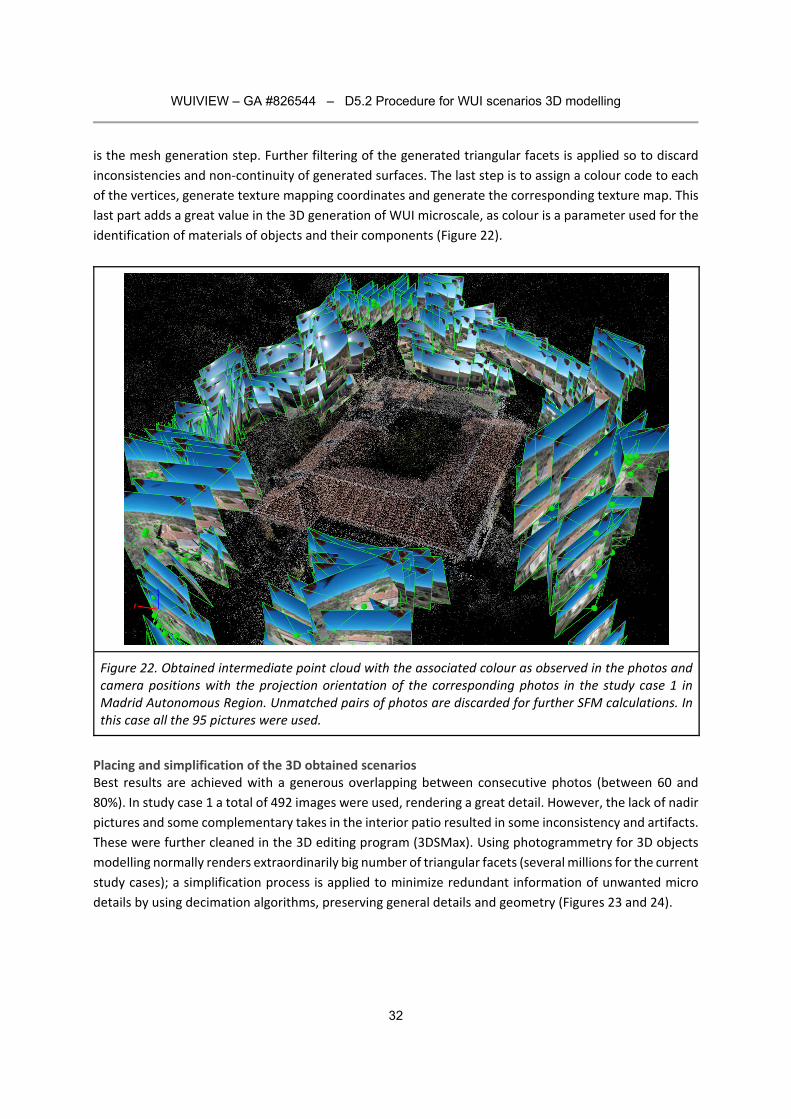
inconsistencies and non‐continuity of generated surfaces. The last step is to assign a colour code to each
of the vertices, generate texture mapping coordinates and generate the corresponding texture map. This
last part adds a great value in the 3D generation of WUI microscale, as colour is a parameter used for the
identification of materials of objects and their components (Figure 22).
Figure 22. Obtained intermediate point cloud with the associated colour as observed in the photos and camera positions with the projection orientation of the corresponding photos in the study case 1 in Madrid Autonomous Region. Unmatched pairs of photos are discarded for further SFM calculations. In this case all the 95 pictures were used.
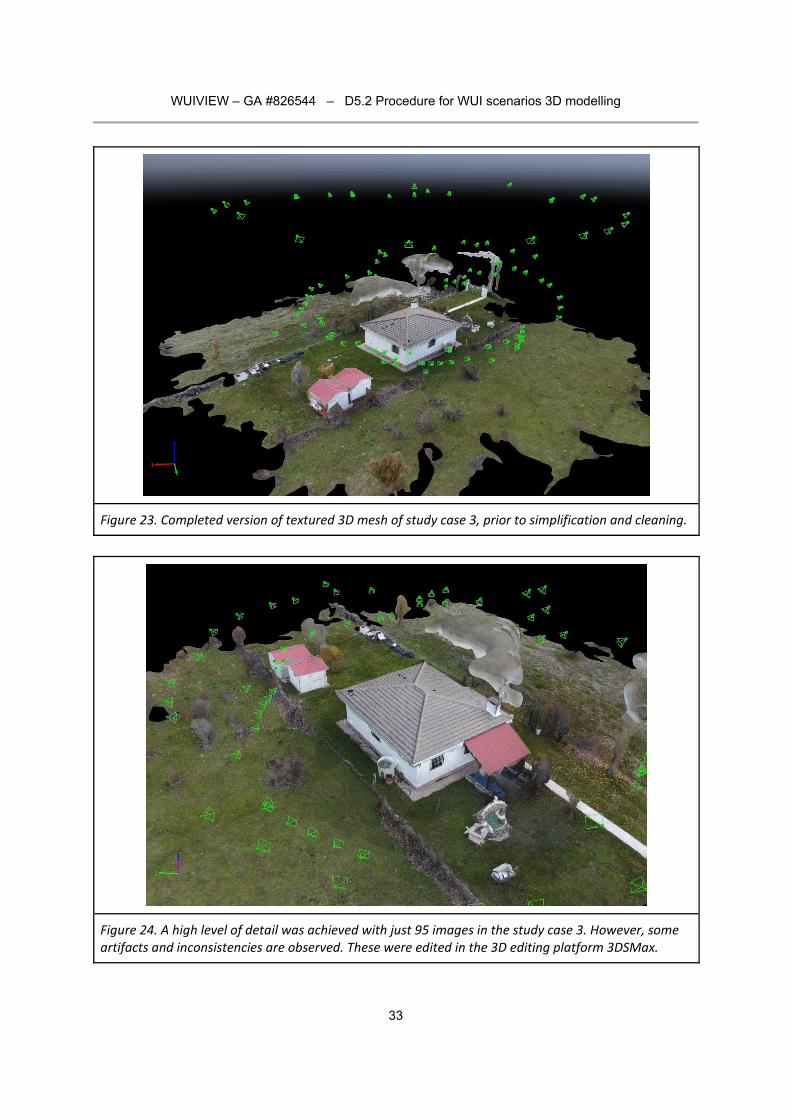
Placing and simplification of the 3D obtained scenarios Best results are achieved with a generous overlapping between consecutive photos (between 60 and
80%). In study case 1 a total of 492 images were used, rendering a great detail. However, the lack of nadir
pictures and some complementary takes in the interior patio resulted in some inconsistency and artifacts.
These were further cleaned in the 3D editing program (3DSMax). Using photogrammetry for 3D objects
modelling normally renders extraordinarily big number of triangular facets (several millions for the current
study cases); a simplification process is applied to minimize redundant information of unwanted micro
details by using decimation algorithms, preserving general details and geometry (Figures 23 and 24).
WUIVIEW – GA #826544 – D5.2 Procedure for WUI scenarios 3D modelling
33
Figure 23. Completed version of textured 3D mesh of study case 3, prior to simplification and cleaning.
Figure 24. A high level of detail was achieved with just 95 images in the study case 3. However, some artifacts and inconsistencies are observed. These were edited in the 3D editing platform 3DSMax.
WUIVIEW – GA #826544 – D5.2 Procedure for WUI scenarios 3D modelling
34
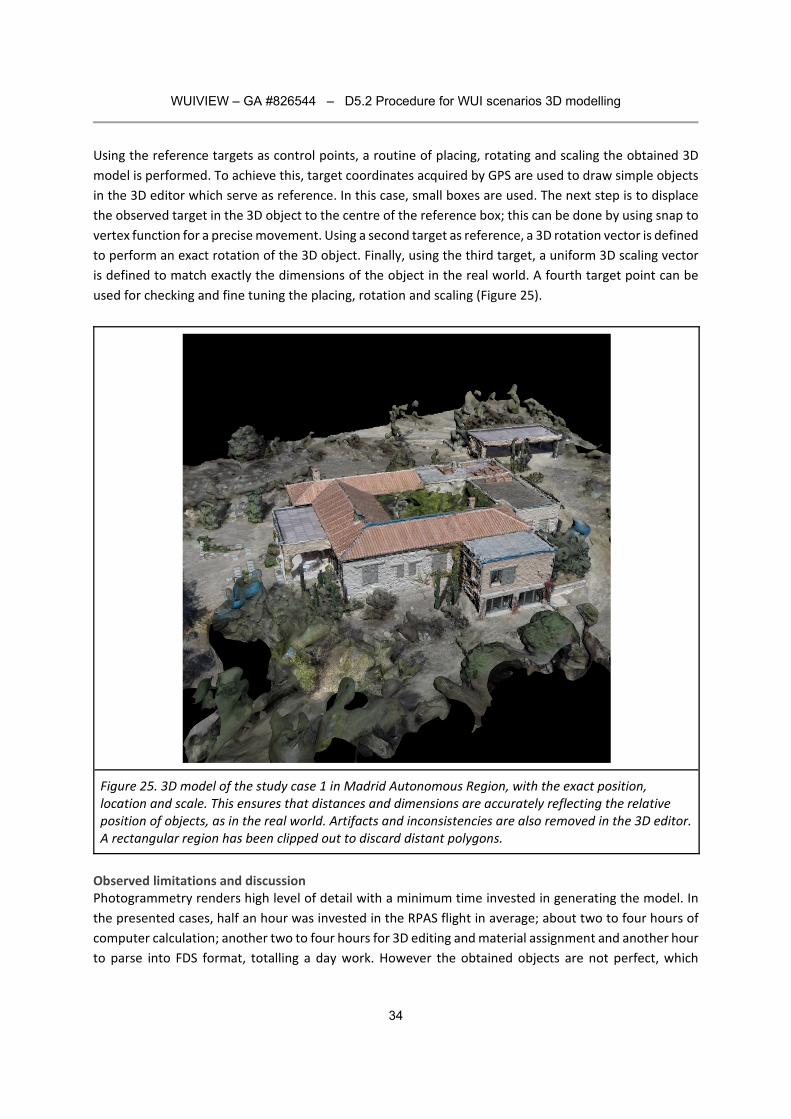
Using the reference targets as control points, a routine of placing, rotating and scaling the obtained 3D
model is performed. To achieve this, target coordinates acquired by GPS are used to draw simple objects
in the 3D editor which serve as reference. In this case, small boxes are used. The next step is to displace
the observed target in the 3D object to the centre of the reference box; this can be done by using snap to
vertex function for a precise movement. Using a second target as reference, a 3D rotation vector is defined
to perform an exact rotation of the 3D object. Finally, using the third target, a uniform 3D scaling vector
is defined to match exactly the dimensions of the object in the real world. A fourth target point can be
used for checking and fine tuning the placing, rotation and scaling (Figure 25).
Figure 25. 3D model of the study case 1 in Madrid Autonomous Region, with the exact position, location and scale. This ensures that distances and dimensions are accurately reflecting the relative position of objects, as in the real world. Artifacts and inconsistencies are also removed in the 3D editor. A rectangular region has been clipped out to discard distant polygons.
Observed limitations and discussion Photogrammetry renders high level of detail with a minimum time invested in generating the model. In
the presented cases, half an hour was invested in the RPAS flight in average; about two to four hours of
computer calculation; another two to four hours for 3D editing and material assignment and another hour
to parse into FDS format, totalling a day work. However the obtained objects are not perfect, which
WUIVIEW – GA #826544 – D5.2 Procedure for WUI scenarios 3D modelling
35
require further editing and refining. Uniform light conditions in the acquisition process normally render
worse results. Cloud overcast, nevertheless, avoid casting hard shadows and helps obtaining more
uniform textures. The process presented is not very effective in modelling trees and other plants,
particularly if the leaves are not in place. Under wind conditions, leaves and branches move between
takes, rendering poorer results as they do not refer to the same locations. Clouds and other distant objects
appear as artifacts that need to be removed. Concave spaces, particularly below terraces and porches,
are difficult to acquire, and ground photography is needed to complement the data gathering. Large
buildings and installations (several hundreds of meters) need to be acquired in sections and then
integrated in the 3D editor.
5. Spatial segmentation and FDS parsing
5.1 Voxelization
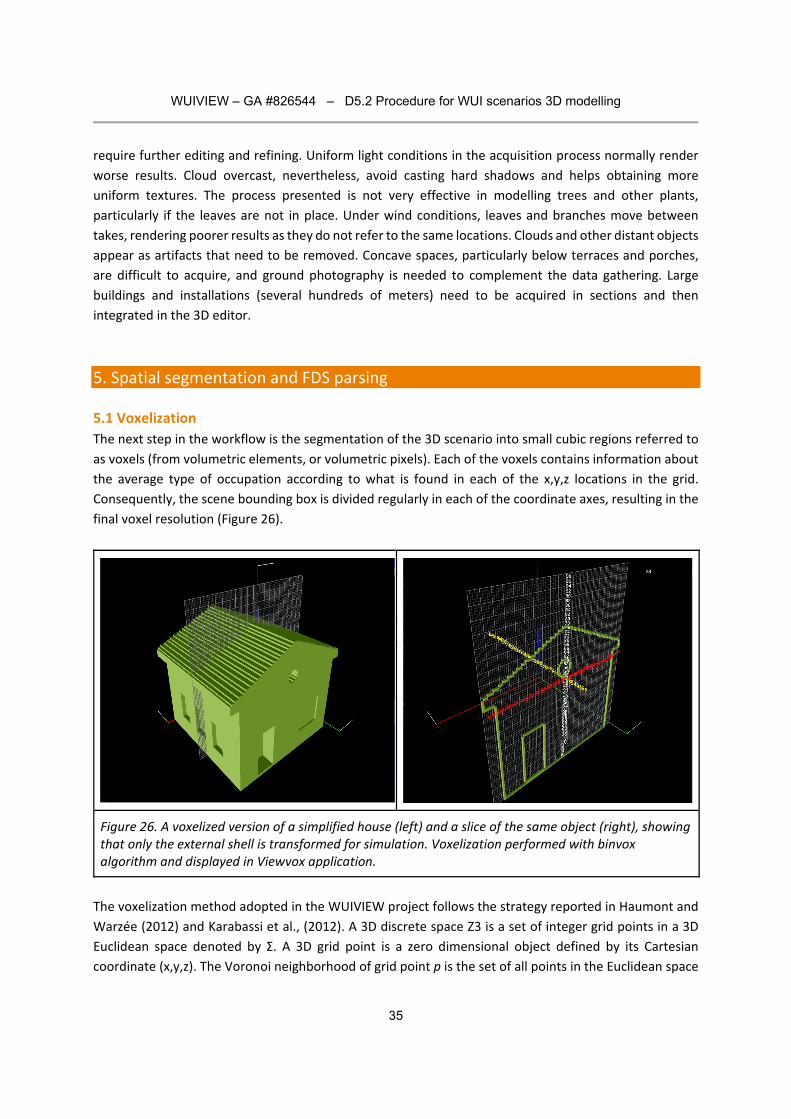
The next step in the workflow is the segmentation of the 3D scenario into small cubic regions referred to
as voxels (from volumetric elements, or volumetric pixels). Each of the voxels contains information about
the average type of occupation according to what is found in each of the x,y,z locations in the grid.
Consequently, the scene bounding box is divided regularly in each of the coordinate axes, resulting in the
final voxel resolution (Figure 26).
Figure 26. A voxelized version of a simplified house (left) and a slice of the same object (right), showing that only the external shell is transformed for simulation. Voxelization performed with binvox algorithm and displayed in Viewvox application.
The voxelization method adopted in the WUIVIEW project follows the strategy reported in Haumont and
Warzée (2012) and Karabassi et al., (2012). A 3D discrete space Z3 is a set of integer grid points in a 3D
Euclidean space denoted by Σ. A 3D grid point is a zero dimensional object defined by its Cartesian
coordinate (x,y,z). The Voronoi neighborhood of grid point p is the set of all points in the Euclidean space
WUIVIEW – GA #826544 – D5.2 Procedure for WUI scenarios 3D modelling
36
that are closer to p than to any other grid point. The Voronoi neighborhood of a 3D grid point is a unit
cube around it, known also as a voxel. The aggregate of all voxels is a tessellation of 3D Euclidean space.
A voxel’s value is mapped into the set {0,1}: voxels assigned the value ‘1’' are called ‘black’' or ‘non‐empty’'
voxels, while those assigned the value ‘0’ are called ‘white’' or ‘empty’ voxels. Two voxels are 26‐adjacent
if they share a vertex or an edge or a face. Every voxel has 26 such neighbours. Eight of the 26 neighbours
share a vertex (corner) with the centre voxel, twelve of the 26 neighbours share an edge with the centre
voxel, and six of the 26 neighbours share a face with the centre voxel. Accordingly, the face‐sharing voxels
are defined as 6‐adjacent, and the voxels that are both edge‐sharing and face‐sharing are defined as 18‐
adjacent.
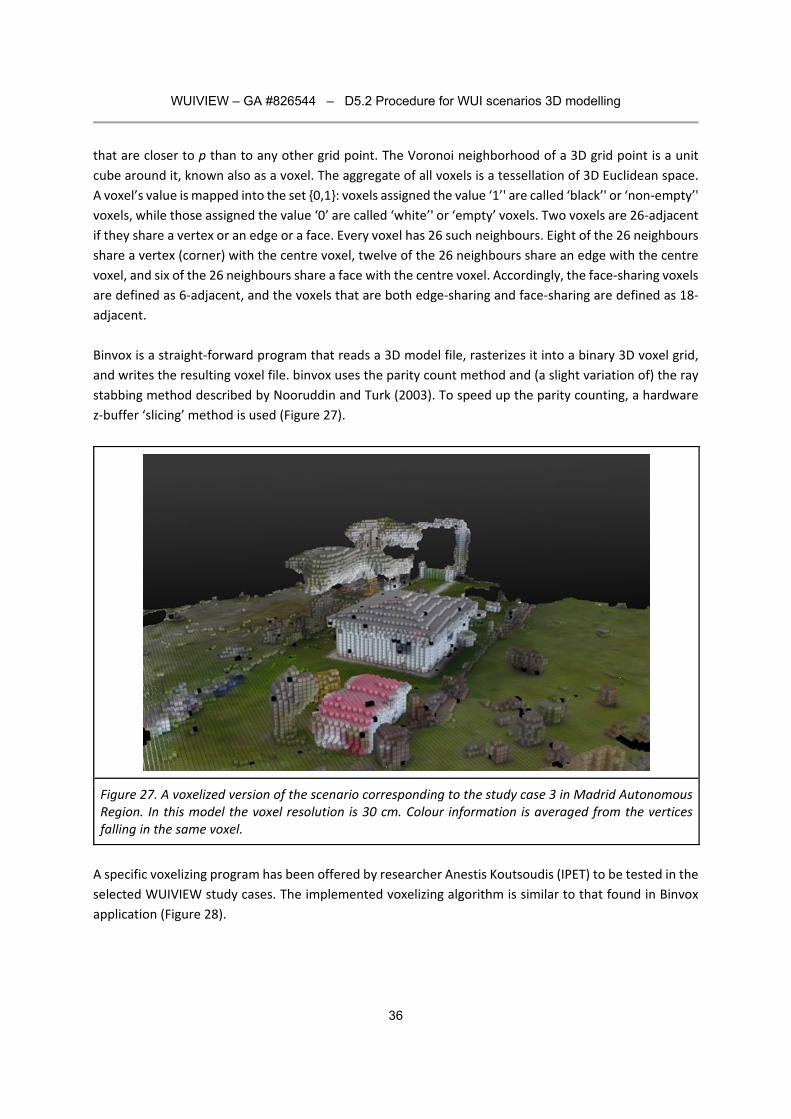
Binvox is a straight‐forward program that reads a 3D model file, rasterizes it into a binary 3D voxel grid,
and writes the resulting voxel file. binvox uses the parity count method and (a slight variation of) the ray
stabbing method described by Nooruddin and Turk (2003). To speed up the parity counting, a hardware
z‐buffer ‘slicing’ method is used (Figure 27).
Figure 27. A voxelized version of the scenario corresponding to the study case 3 in Madrid Autonomous Region. In this model the voxel resolution is 30 cm. Colour information is averaged from the vertices falling in the same voxel.
A specific voxelizing program has been offered by researcher Anestis Koutsoudis (IPET) to be tested in the
selected WUIVIEW study cases. The implemented voxelizing algorithm is similar to that found in Binvox
application (Figure 28).
WUIVIEW – GA #826544 – D5.2 Procedure for WUI scenarios 3D modelling
37
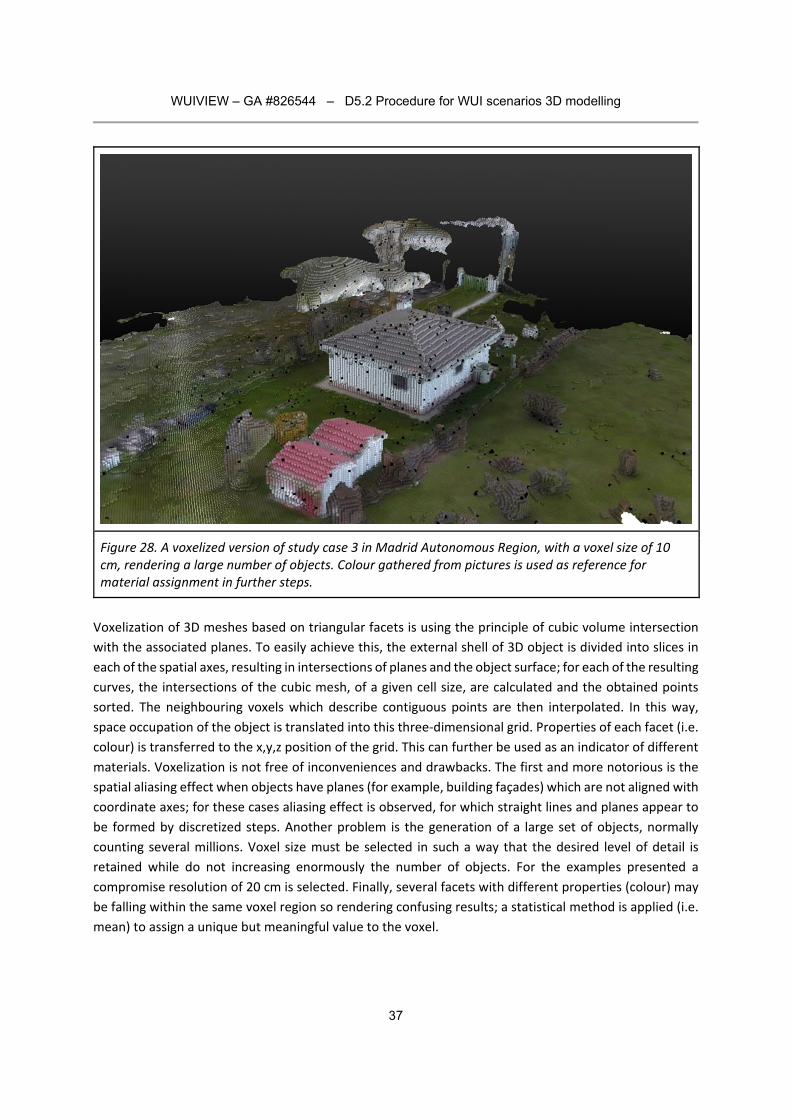
Figure 28. A voxelized version of study case 3 in Madrid Autonomous Region, with a voxel size of 10 cm, rendering a large number of objects. Colour gathered from pictures is used as reference for material assignment in further steps.
Voxelization of 3D meshes based on triangular facets is using the principle of cubic volume intersection
with the associated planes. To easily achieve this, the external shell of 3D object is divided into slices in
each of the spatial axes, resulting in intersections of planes and the object surface; for each of the resulting
curves, the intersections of the cubic mesh, of a given cell size, are calculated and the obtained points
sorted. The neighbouring voxels which describe contiguous points are then interpolated. In this way,
space occupation of the object is translated into this three‐dimensional grid. Properties of each facet (i.e.
colour) is transferred to the x,y,z position of the grid. This can further be used as an indicator of different
materials. Voxelization is not free of inconveniences and drawbacks. The first and more notorious is the
spatial aliasing effect when objects have planes (for example, building façades) which are not aligned with
coordinate axes; for these cases aliasing effect is observed, for which straight lines and planes appear to
be formed by discretized steps. Another problem is the generation of a large set of objects, normally
counting several millions. Voxel size must be selected in such a way that the desired level of detail is
retained while do not increasing enormously the number of objects. For the examples presented a
compromise resolution of 20 cm is selected. Finally, several facets with different properties (colour) may
be falling within the same voxel region so rendering confusing results; a statistical method is applied (i.e.
mean) to assign a unique but meaningful value to the voxel.
WUIVIEW – GA #826544 – D5.2 Procedure for WUI scenarios 3D modelling
38
5.2 Assigning properties and cleaning
The generated voxelized scenario can be easily edited in a 3D editor such as 3DSMax or Blender. This
includes the removal of unwanted voxels, the inclusion of missing ones, the correction of artifact which
may be generated in the voxelizing process and the association of material properties to the objects and
the components in the scenario.
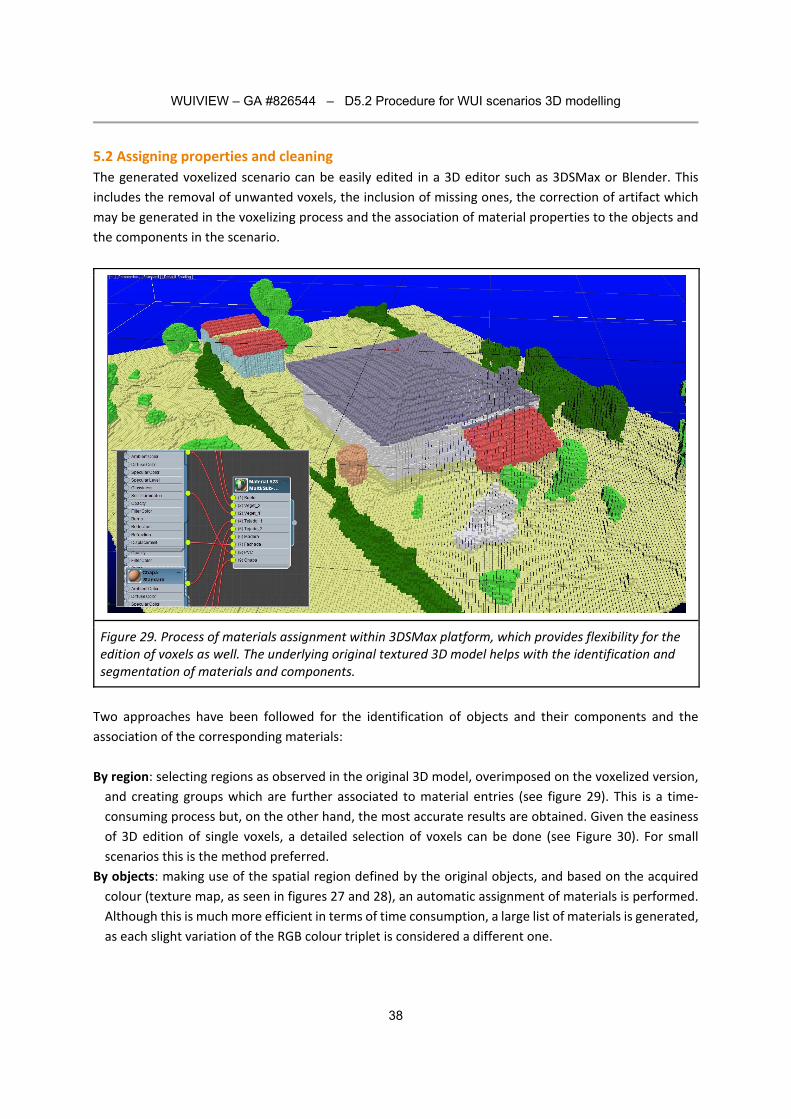
Figure 29. Process of materials assignment within 3DSMax platform, which provides flexibility for the edition of voxels as well. The underlying original textured 3D model helps with the identification and segmentation of materials and components.
Two approaches have been followed for the identification of objects and their components and the
association of the corresponding materials:
By region: selecting regions as observed in the original 3D model, overimposed on the voxelized version,
and creating groups which are further associated to material entries (see figure 29). This is a time‐
consuming process but, on the other hand, the most accurate results are obtained. Given the easiness
of 3D edition of single voxels, a detailed selection of voxels can be done (see Figure 30). For small
scenarios this is the method preferred.
By objects: making use of the spatial region defined by the original objects, and based on the acquired
colour (texture map, as seen in figures 27 and 28), an automatic assignment of materials is performed.
Although this is much more efficient in terms of time consumption, a large list of materials is generated,
as each slight variation of the RGB colour triplet is considered a different one.
WUIVIEW – GA #826544 – D5.2 Procedure for WUI scenarios 3D modelling
39
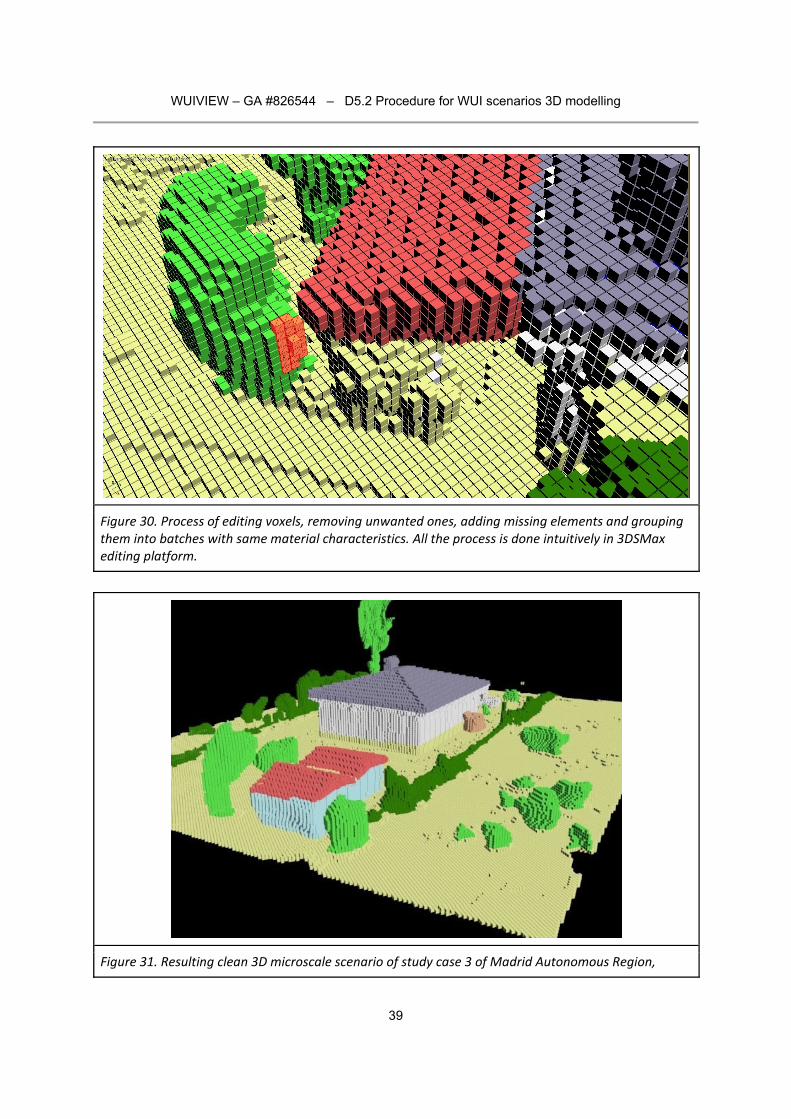
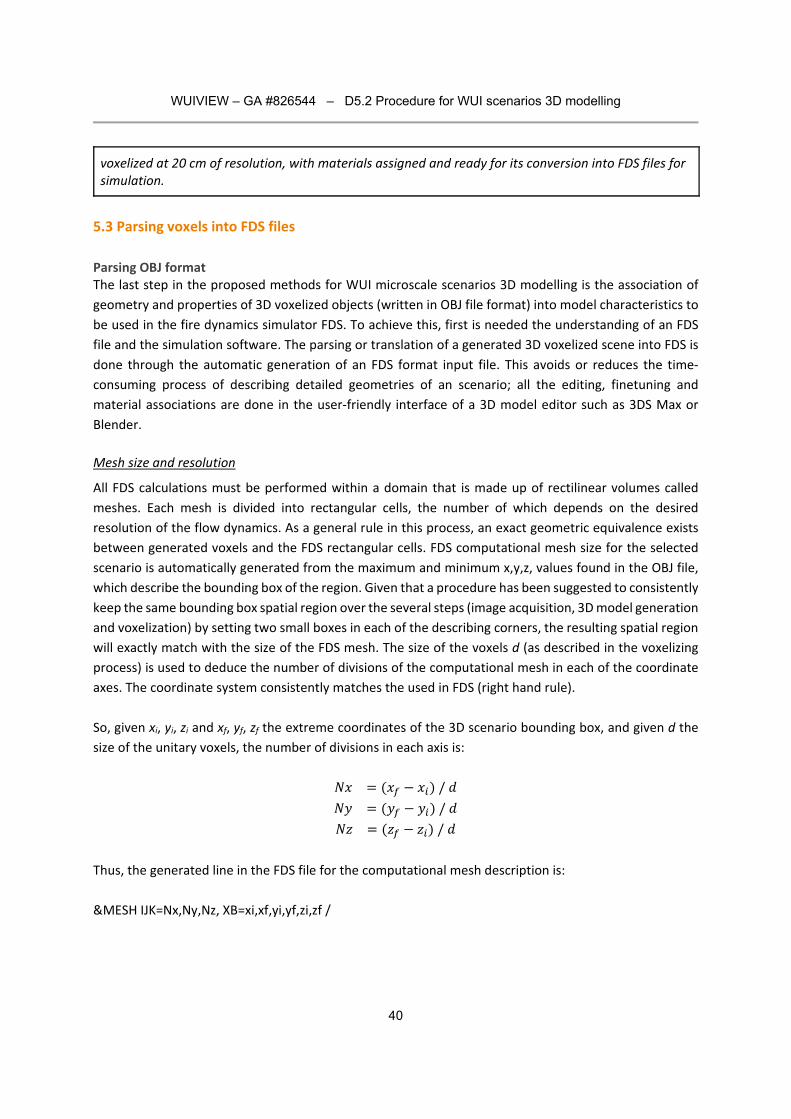
Figure 30. Process of editing voxels, removing unwanted ones, adding missing elements and grouping them into batches with same material characteristics. All the process is done intuitively in 3DSMax editing platform.
Figure 31. Resulting clean 3D microscale scenario of study case 3 of Madrid Autonomous Region,
WUIVIEW – GA #826544 – D5.2 Procedure for WUI scenarios 3D modelling
40
voxelized at 20 cm of resolution, with materials assigned and ready for its conversion into FDS files for simulation.
5.3 Parsing voxels into FDS files
Parsing OBJ format The last step in the proposed methods for WUI microscale scenarios 3D modelling is the association of
geometry and properties of 3D voxelized objects (written in OBJ file format) into model characteristics to
be used in the fire dynamics simulator FDS. To achieve this, first is needed the understanding of an FDS
file and the simulation software. The parsing or translation of a generated 3D voxelized scene into FDS is
done through the automatic generation of an FDS format input file. This avoids or reduces the time‐
consuming process of describing detailed geometries of an scenario; all the editing, finetuning and
material associations are done in the user‐friendly interface of a 3D model editor such as 3DS Max or
Blender.
Mesh size and resolution
All FDS calculations must be performed within a domain that is made up of rectilinear volumes called
meshes. Each mesh is divided into rectangular cells, the number of which depends on the desired
resolution of the flow dynamics. As a general rule in this process, an exact geometric equivalence exists
between generated voxels and the FDS rectangular cells. FDS computational mesh size for the selected
scenario is automatically generated from the maximum and minimum x,y,z, values found in the OBJ file,
which describe the bounding box of the region. Given that a procedure has been suggested to consistently
keep the same bounding box spatial region over the several steps (image acquisition, 3D model generation
and voxelization) by setting two small boxes in each of the describing corners, the resulting spatial region
will exactly match with the size of the FDS mesh. The size of the voxels d (as described in the voxelizing
process) is used to deduce the number of divisions of the computational mesh in each of the coordinate
axes. The coordinate system consistently matches the used in FDS (right hand rule).
So, given xi, yi, zi and xf, yf, zf the extreme coordinates of the 3D scenario bounding box, and given d the
size of the unitary voxels, the number of divisions in each axis is:
𝑁𝑥 𝑥 𝑥 / 𝑑
𝑁𝑦 𝑦 𝑦 / 𝑑
𝑁𝑧 𝑧 𝑧 / 𝑑
Thus, the generated line in the FDS file for the computational mesh description is:
&MESH IJK=Nx,Ny,Nz, XB=xi,xf,yi,yf,zi,zf /
WUIVIEW – GA #826544 – D5.2 Procedure for WUI scenarios 3D modelling
41
Obstructions
The entire geometry of an FDS model is described using rectangular solids within the flow domain called
obstructions (OBST). It is defined by two points (x1,y1,z1) and (x2, y2, z2) as the opposite vertices in the
parallelepiped. The translation of the obtained voxels (in the OBJ file), of uniform size and regular spacing,
into obstructions is immediate, generating as many obstructions as occupied voxels in the simulation
space. To achieve this, given that in the OBJ file the vertex list is generated sequentially so every 8 lines a
voxel is described, the first and last vertices of each group of 8 corresponds to the extreme vertices
(x1,y1,z1) and (x2, y2, z2) of the cubic voxels. Thus, reading these, the generated line in the FDS file for every
voxel is:
&OBST XB=x1,x2,y1,y2,z1,z2, SUF_ID=’MATj’ /
Where MATj refers to the associated voxel material which is described in the corresponding line in the
SURF namelist group of bounding surfaces as described below.
Bounding surfaces
In FDS simulations, definition of the structure of all solid surfaces is required and specified through the
SURF identifier for each obstruction in the corresponding SURF line. The assignment of surface properties
for each voxel surface is performed using the material file (MTL) associated to the OBJ file. In this, each
facet compounding each of the voxels has a unique material assigned, is such a way that every voxel has
only a material value associated. This simplifies the translation into surface properties in FDS, as just one
surface ID is used for every voxel (SURF_ID, for all facets in a voxel), as seen in the previous point. In the
OBJ file each material is specified, first, by the name (MATj) and the red, green, blue triplet (RGB) of the
associated colour, following other parameters such as texture and reflection map which are not used. The
material name used in the previous step is inherited in the corresponding SURF section of the FDS file, so
to explicitly refer to real materials which properties are tabulated. Besides, the colour RGB triplet, as
described in OBJ file, is directly used in FDS format to ensure consistency in the representation of the
scenario. The corresponding line in the FDS file is:
&SURF ID=’MATj’
6. Concluding remarks
This document describe the procedure to obtain WUI microscale scenarios using existing 3D data
gathering and 3D modelling tools that will feed FDS scenarios in WUIVIEW study cases. The proposed
method is based on airborne photogrammetry and includes several key steps: design of flight patterns,
geo‐referencing, photo‐processing to obtain an initial 3D model. Following, the 3D model is converted
into FDS compatible data through a process of voxelization, properties assignment and cleaning.
The methodology has successfully been developed and tested in one of the WUIVEIW preselected study
areas of Madrid Autonomous Region. The final steps of 3D model transferring and adaptation to FDS
compatible scenarios will be further detailed in future WP7 deliverables.

WUIVIEW – GA #826544 – D5.2 Procedure for WUI scenarios 3D modelling
42
7. References
Haumont, D., and Warzée, N. (2012) Complete Polygonal Scene Voxelization. Journal of Graphics Tools,
vol. 7, (3), 27‐41.
Karabassi, E.A., Papaioannou, G. and Theoharis, T. (2012) A Fast Depth‐Buffer‐Based Voxelization
Algorithm. Journal of Graphics Tools, 4 (4). https://doi.org/10.1080/10867651.1999.10487510
Noorunddin, S. and Turk G. (2003). Simplification and repair of polygonal models using volumentric
techniques. IEEE Transactions on Visualization and Computer Graphics, 9 (2), 191‐205.