D2.7 EGTN Transport Data and Knowledge Models v1
70
This project has received funding from the European Union’s Horizon 2020 research and innovation programme under the Grant Agreement No 860274. Progress towards Federated Logistics through the Integration of TEN-T into A Global Trade Network D2.7 EGTN Transport Data and Knowledge Models v1 Document Summary Information Grant Agreement No 860274 Acronym PLANET Full Title Progress towards Federated Logistics through the Integration of TEN-T into A Global Trade Network Start Date 01/06/2020 Duration 36 months Project URL www.planetproject.eu Deliverable D2.7 EGTN Transport Data and Knowledge Models v1 Work Package WP2 Contractual due date 31 October 2021 Actual submission date 29 October 2021 Nature Other Dissemination Level Public Lead Beneficiary SIR Responsible Author Andrey Tagarev, SIR Contributions from Vladimir Alexiev, SIR
-
Upload
khangminh22 -
Category
Documents
-
view
0 -
download
0
Transcript of D2.7 EGTN Transport Data and Knowledge Models v1
This project has received funding from the European Union’s Horizon 2020 research and innovation programme under the Grant Agreement No 860274.
Progress towards Federated Logistics through the Integration of TEN-T into A Global Trade Network
D2.7 EGTN Transport Data and Knowledge Models v1
Document Summary Information
Grant Agreement No 860274 Acronym PLANET
Full Title Progress towards Federated Logistics through the Integration of TEN-T into A Global Trade Network
Start Date 01/06/2020 Duration 36 months
Project URL www.planetproject.eu
Deliverable D2.7 EGTN Transport Data and Knowledge Models v1
Work Package WP2
Contractual due date 31 October 2021 Actual submission date 29 October 2021
Nature Other Dissemination Level Public
Lead Beneficiary SIR
Responsible Author Andrey Tagarev, SIR
Contributions from Vladimir Alexiev, SIR
D2.7 EGTN Transport Data and Knowledge Models v1
© PLANET, 2020 Page | 2
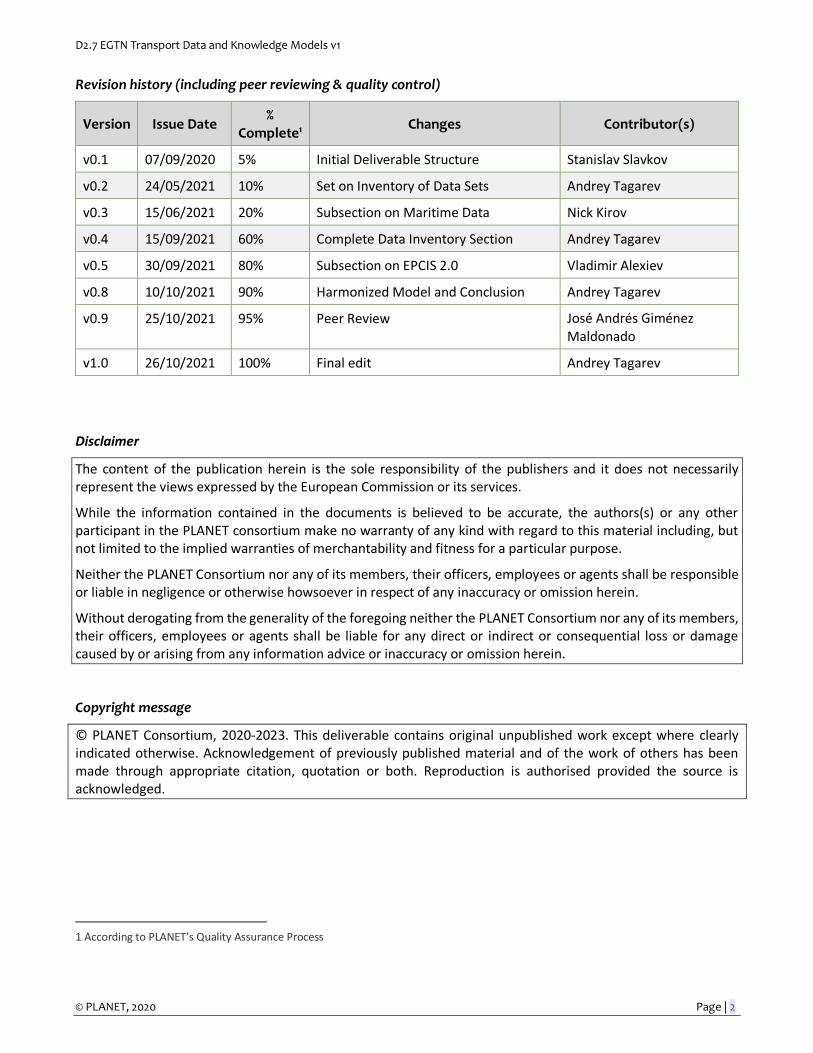
Revision history (including peer reviewing & quality control)
Version Issue Date %
Complete1 Changes Contributor(s)
v0.1 07/09/2020 5% Initial Deliverable Structure Stanislav Slavkov
v0.2 24/05/2021 10% Set on Inventory of Data Sets Andrey Tagarev
v0.3 15/06/2021 20% Subsection on Maritime Data Nick Kirov
v0.4 15/09/2021 60% Complete Data Inventory Section Andrey Tagarev
v0.5 30/09/2021 80% Subsection on EPCIS 2.0 Vladimir Alexiev
v0.8 10/10/2021 90% Harmonized Model and Conclusion Andrey Tagarev
v0.9 25/10/2021 95% Peer Review José Andrés Giménez Maldonado
v1.0 26/10/2021 100% Final edit Andrey Tagarev
Disclaimer
The content of the publication herein is the sole responsibility of the publishers and it does not necessarily represent the views expressed by the European Commission or its services.
While the information contained in the documents is believed to be accurate, the authors(s) or any other participant in the PLANET consortium make no warranty of any kind with regard to this material including, but not limited to the implied warranties of merchantability and fitness for a particular purpose.
Neither the PLANET Consortium nor any of its members, their officers, employees or agents shall be responsible or liable in negligence or otherwise howsoever in respect of any inaccuracy or omission herein.
Without derogating from the generality of the foregoing neither the PLANET Consortium nor any of its members, their officers, employees or agents shall be liable for any direct or indirect or consequential loss or damage caused by or arising from any information advice or inaccuracy or omission herein.
Copyright message
© PLANET Consortium, 2020-2023. This deliverable contains original unpublished work except where clearly indicated otherwise. Acknowledgement of previously published material and of the work of others has been made through appropriate citation, quotation or both. Reproduction is authorised provided the source is acknowledged.
1 According to PLANET’s Quality Assurance Process
D2.7 EGTN Transport Data and Knowledge Models v1
© PLANET, 2020 Page | 3
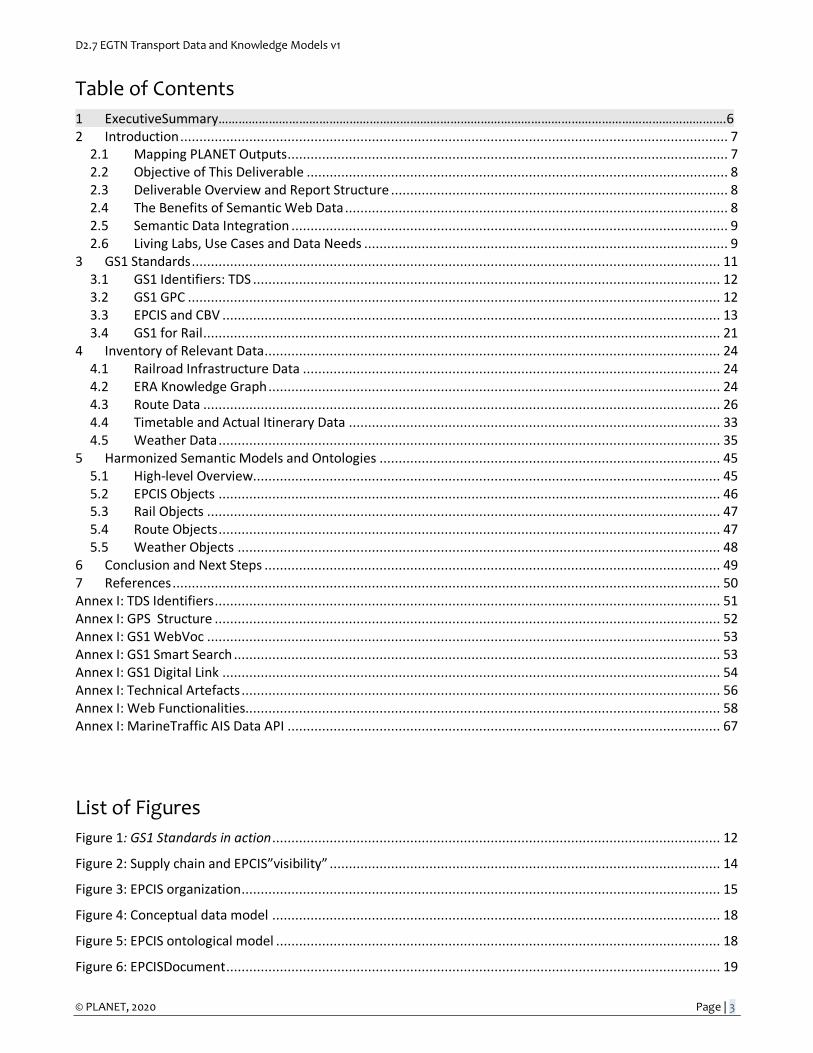
Table of Contents
1 ExecutiveSummary…………………………………………………………………………………………………………………………………….6 2 Introduction ............................................................................................................................................... 7
2.1 Mapping PLANET Outputs................................................................................................................... 7 2.2 Objective of This Deliverable .............................................................................................................. 8 2.3 Deliverable Overview and Report Structure ........................................................................................ 8 2.4 The Benefits of Semantic Web Data .................................................................................................... 8 2.5 Semantic Data Integration .................................................................................................................. 9 2.6 Living Labs, Use Cases and Data Needs ............................................................................................... 9
3 GS1 Standards .......................................................................................................................................... 11 3.1 GS1 Identifiers: TDS .......................................................................................................................... 12 3.2 GS1 GPC ........................................................................................................................................... 12 3.3 EPCIS and CBV .................................................................................................................................. 13 3.4 GS1 for Rail ....................................................................................................................................... 21
4 Inventory of Relevant Data ....................................................................................................................... 24 4.1 Railroad Infrastructure Data ............................................................................................................. 24 4.2 ERA Knowledge Graph ...................................................................................................................... 24 4.3 Route Data ....................................................................................................................................... 26 4.4 Timetable and Actual Itinerary Data ................................................................................................. 33 4.5 Weather Data ................................................................................................................................... 35
5 Harmonized Semantic Models and Ontologies ......................................................................................... 45 5.1 High-level Overview.......................................................................................................................... 45 5.2 EPCIS Objects ................................................................................................................................... 46 5.3 Rail Objects ...................................................................................................................................... 47 5.4 Route Objects ................................................................................................................................... 47 5.5 Weather Objects .............................................................................................................................. 48
6 Conclusion and Next Steps ....................................................................................................................... 49 7 References ............................................................................................................................................... 50 Annex I: TDS Identifiers .................................................................................................................................... 51 Annex I: GPS Structure .................................................................................................................................... 52 Annex I: GS1 WebVoc ...................................................................................................................................... 53 Annex I: GS1 Smart Search ............................................................................................................................... 53 Annex I: GS1 Digital Link .................................................................................................................................. 54 Annex I: Technical Artefacts ............................................................................................................................. 56 Annex I: Web Functionalities............................................................................................................................ 58 Annex I: MarineTraffic AIS Data API ................................................................................................................. 67
List of Figures
Figure 1: GS1 Standards in action ..................................................................................................................... 12
Figure 2: Supply chain and EPCIS”visibility” ...................................................................................................... 14
Figure 3: EPCIS organization ............................................................................................................................. 15
Figure 4: Conceptual data model ..................................................................................................................... 18
Figure 5: EPCIS ontological model .................................................................................................................... 18
Figure 6: EPCISDocument ................................................................................................................................. 19
D2.7 EGTN Transport Data and Knowledge Models v1
© PLANET, 2020 Page | 4
Figure 7: ObjectEvent, AggregationEvent ......................................................................................................... 19
Figure 8: QuantityElement, SourceOrDestination ............................................................................................. 20
Figure 9: Sensor Data Representation .............................................................................................................. 20
Figure 10: Standard Rail journey diagram ......................................................................................................... 22
Figure 11: ERA vocabulary ................................................................................................................................ 25
Figure 12: RINF and ERATV comparison ........................................................................................................... 25
Figure 13: Query example flow ........................................................................................................................ 26
Figure 14: Data sample Spire aviation solutions ............................................................................................... 31
Figure 15: Field Descriptive data part 1 ............................................................................................................ 31
Figure 16: Field Descriptive data part 2 ............................................................................................................ 32
Figure 17: China Poland Route visualization ..................................................................................................... 35
Figure 18: Ontology visualization ..................................................................................................................... 36
Figure 19: Histogram - Precipitation ................................................................................................................. 39
Figure 20: Time series options ......................................................................................................................... 40
Figure 21: Annual cycles................................................................................................................................... 40
Figure 22: PRCP anomalies ............................................................................................................................... 41
Figure 23: Precipitation Valencia ...................................................................................................................... 41
Figure 24: Sample of historical weather data ................................................................................................... 43
Figure 25: Example thunderstorm data ............................................................................................................ 44
Figure 26: Semantic object model example ...................................................................................................... 45
Figure 27: EPCIS object example ...................................................................................................................... 46
Figure 28: Rail object example ......................................................................................................................... 47
Figure 29: Route Objects .................................................................................................................................. 47
Figure 30: Weather object example ................................................................................................................. 48
Figure 31: RDF graph about SIR (Ontotext AD) generated with GS1 Web Markup Tool ..................................... 54
Figure 32: GS1 Link demo................................................................................................................................. 55
Figure 33: Sensor Data Example ....................................................................................................................... 57
Figure 34: Sensor Data Example - part 2 ........................................................................................................... 58
Figure 35: Route Sofia-Varna-Burgas ................................................................................................................ 58
Figure 36: Excel example of export................................................................................................................... 59
Figure 37: Visual representation of RINF data .................................................................................................. 59
Figure 38: Visual representation of RINF data .................................................................................................. 60
Figure 39: Operational point in Bulgaria(freight terminals) ............................................................................... 61
Figure 40: Result from the search .................................................................................................................... 61
Figure 41: GET BorderPoints Example .............................................................................................................. 63
D2.7 EGTN Transport Data and Knowledge Models v1
© PLANET, 2020 Page | 5
Figure 42: GET Routes from-to example ........................................................................................................... 64
Figure 43: Get Routes Localize Example ........................................................................................................... 65
Figure 44: GET Sections Of Line example .......................................................................................................... 66
Figure 45: Get Dataset Import by ID example ................................................................................................... 66
Figure 46: Output example XML format ........................................................................................................... 67
Figure 47: Example call Nika Fortune Ship (IMO:8933095) ............................................................................... 68
Figure 48: ETA to Port example ........................................................................................................................ 68
Figure 49: Example call for the ship “Sider Bilbao” ........................................................................................... 69
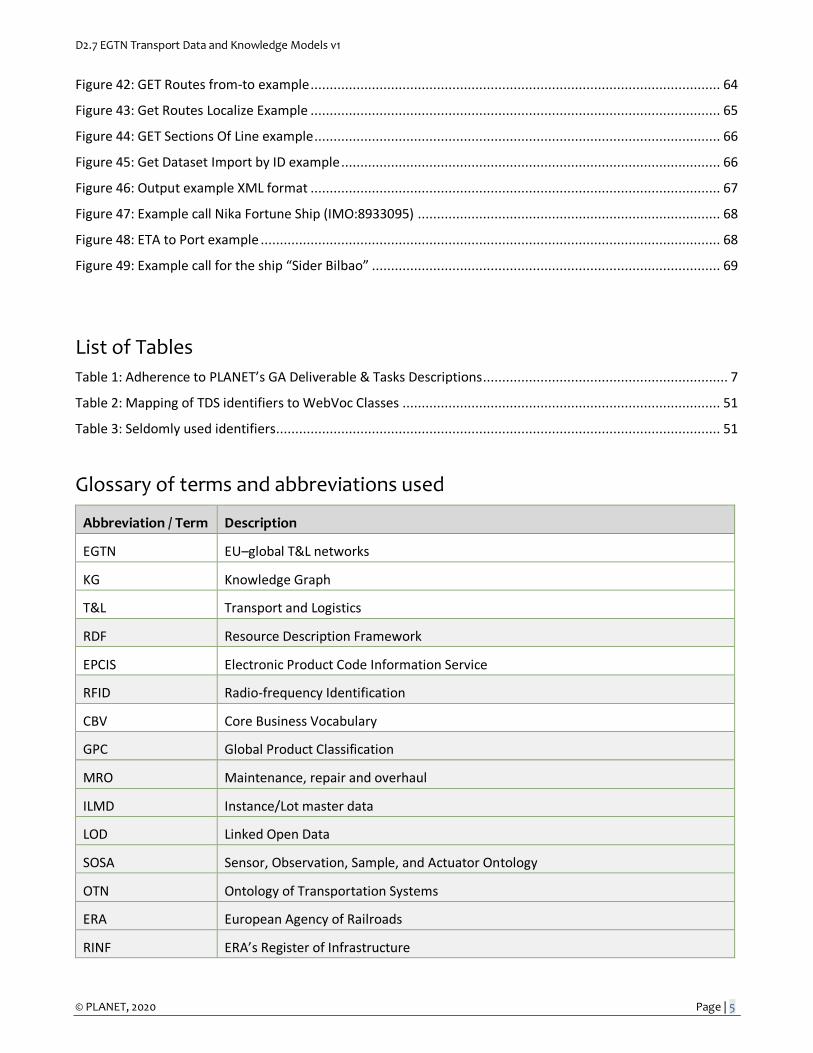
List of Tables
Table 1: Adherence to PLANET’s GA Deliverable & Tasks Descriptions ................................................................ 7
Table 2: Mapping of TDS identifiers to WebVoc Classes ................................................................................... 51
Table 3: Seldomly used identifiers .................................................................................................................... 51
Glossary of terms and abbreviations used
Abbreviation / Term Description
EGTN EU–global T&L networks
KG Knowledge Graph
T&L Transport and Logistics
RDF Resource Description Framework
EPCIS Electronic Product Code Information Service
RFID Radio-frequency Identification
CBV Core Business Vocabulary
GPC Global Product Classification
MRO Maintenance, repair and overhaul
ILMD Instance/Lot master data
LOD Linked Open Data
SOSA Sensor, Observation, Sample, and Actuator Ontology
OTN Ontology of Transportation Systems
ERA European Agency of Railroads
RINF ERA’s Register of Infrastructure
D2.7 EGTN Transport Data and Knowledge Models v1
© PLANET, 2020 Page | 6
1. Executive Summary
This deliverable presents the work done towards developing a harmonized semantic model for a global transport data knowledge graph to be delivered in the EGTN Connectivity Infrastructure. It consists primarily of an inventory of relevant data types. For each data type of interest, there is an exploration of relevant ontologies and analysis of likely data sources focusing on aspects such as data availability, accessibility, format consistency, coverage, reusability and quality. Where relevant, there is a comparative analysis of the alternative data sources, a consideration of their respective advantages and shortcomings and a recommendation for which one would be most useful to the EGTN Cloud Infrastructure as a whole and best meets the needs of identified partner business cases.
The final section is related to the presentation of the initial version of the harmonized data model to be used in the EGTN Connectivity Infrastructure. While it is fully expected that this model will be greatly expanded and improved by the inclusion of additional data sources over time, it sets a groundwork for the minimum contents expected to be available in the Connectivity knowledge graph.
The primary innovation achieved in this subtask lies in the development and expansion of this harmonized data model. It defines the process of transforming individual partner and external data sources into a single knowledge graph that enables exploration and analysis of the data on all levels of interest to the project. On the micro level it defines the representation of individual data points such as a vehicle’s current location or the offloading of a container from a ship. On the meso level it enables the inferring and storing of answers to specific partner data needs for analysis, decision-making and visualization. On a macro level it represents global transport corridors in a deeply enriched state that integrates a variety of informational aspects. Most importantly, it provides seamless querying of data between these levels of abstraction.
D2.7 EGTN Transport Data and Knowledge Models v1
© PLANET, 2020 Page | 7
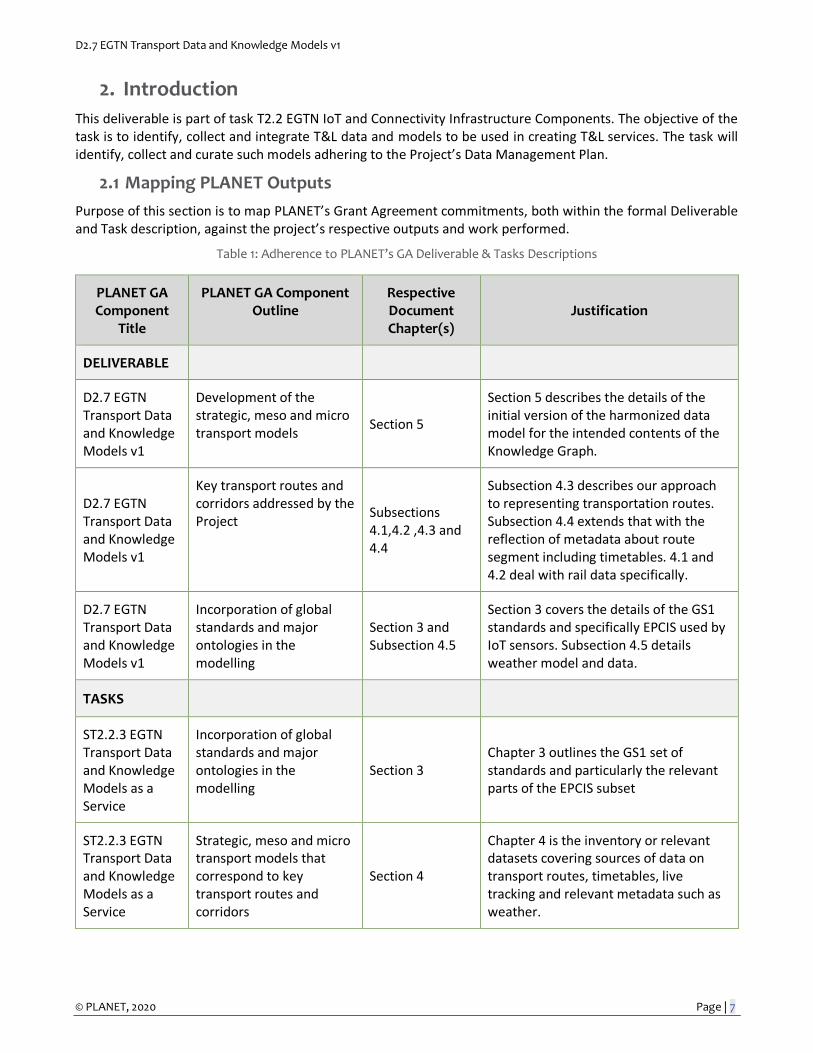
2. Introduction
This deliverable is part of task T2.2 EGTN IoT and Connectivity Infrastructure Components. The objective of the task is to identify, collect and integrate T&L data and models to be used in creating T&L services. The task will identify, collect and curate such models adhering to the Project’s Data Management Plan.
2.1 Mapping PLANET Outputs
Purpose of this section is to map PLANET’s Grant Agreement commitments, both within the formal Deliverable and Task description, against the project’s respective outputs and work performed.
Table 1: Adherence to PLANET’s GA Deliverable & Tasks Descriptions
PLANET GA Component
Title
PLANET GA Component Outline
Respective Document Chapter(s)
Justification
DELIVERABLE
D2.7 EGTN Transport Data and Knowledge Models v1
Development of the strategic, meso and micro transport models
Section 5
Section 5 describes the details of the initial version of the harmonized data model for the intended contents of the Knowledge Graph.
D2.7 EGTN Transport Data and Knowledge Models v1
Key transport routes and corridors addressed by the Project
Subsections 4.1,4.2 ,4.3 and 4.4
Subsection 4.3 describes our approach to representing transportation routes. Subsection 4.4 extends that with the reflection of metadata about route segment including timetables. 4.1 and 4.2 deal with rail data specifically.
D2.7 EGTN Transport Data and Knowledge Models v1
Incorporation of global standards and major ontologies in the modelling
Section 3 and Subsection 4.5
Section 3 covers the details of the GS1 standards and specifically EPCIS used by IoT sensors. Subsection 4.5 details weather model and data.
TASKS
ST2.2.3 EGTN Transport Data and Knowledge Models as a Service
Incorporation of global standards and major ontologies in the modelling
Section 3 Chapter 3 outlines the GS1 set of standards and particularly the relevant parts of the EPCIS subset
ST2.2.3 EGTN Transport Data and Knowledge Models as a Service
Strategic, meso and micro transport models that correspond to key transport routes and corridors
Section 4
Chapter 4 is the inventory or relevant datasets covering sources of data on transport routes, timetables, live tracking and relevant metadata such as weather.
D2.7 EGTN Transport Data and Knowledge Models v1
© PLANET, 2020 Page | 8
ST2.2.3 EGTN Transport Data and Knowledge Models as a Service
Single data-sharing intelligence space in the Cloud Section 5
Section 5 describes the initial version of the harmonized data model which controls data access to the Knowledge Graph through the GraphQL API endpoint
2.2 Objective of This Deliverable
The deliverable is an outcome of subtask ST2.2.3 EGTN Transport Data and Knowledge Models as a Service. The purpose of the task is to develop strategic, meso and micro transport models that correspond to key transport routes and corridors addressed by the Project, provided as a single data-sharing intelligence space in the Cloud ("data as a service").
This deliverable covers the semantic models for describing T&L data, whereas deliverable 2.5 focuses on describing "data as a service" aspects such as processing, storage, reasoning, querying and APIs. The two are very closely tied together as the data analysis and model definition considered here are then implemented in the services and for the needs of the users of the EGTN Connectivity Infrastructure.
This is an evolving document that will be elaborated in two increments. An initial version supplied at M17 and a final version supplied at M30.
2.3 Deliverable Overview and Report Structure
This deliverable covers in detail the work done on examining and utilizing widely-used standards, analyzing and selecting data sources and combining and extending existing ontologies into a single harmonized data model.
• Section 3 explores the GS1 sets of standards focusing on the EPCIS subset with specific attention paid to the recent extension EPCIS 2.0 for the support of IoT sensors
• Section 4 is an inventory of explored data types covering route and infrastructure for rail, air, sea and vehicle transport. In addition, it covers weather and live tracking data sources.
• Section 5 presents the first version of the harmonized data model that combines the examined standards and ontologies.
• Section 6 summarizes the report and looks towards the next steps to expanding the data model
2.4 The Benefits of Semantic Web Data
The Semantic Web data model (RDF) is a simple graph data model that can be used with or without schema. This makes it very flexible and easy to use in cross-enterprise data integration scenarios. In particular, it makes the extension and iterative improvements of the collected data with new datasets very straightforward.
RDF can cover all levels of interest to the project. From the micro level of representing individual sensor readings and EPCIS events through the meso level of inferring and storing average time to offload a ship at a given port to the macro level of representing global transport route connections. More importantly, there is seamless integration to querying data between the levels to, for example, locate all sensors currently traveling along a given route that covers thousands of kilometers.
Semantic Web Data also identifies each object with a unique URI which allows making various connections between heterogeneous datasets and publishing information in web-native formats.
D2.7 EGTN Transport Data and Knowledge Models v1
© PLANET, 2020 Page | 9
2.5 Semantic Data Integration
Semantic data integration is the process of creating a single harmonized data model that describes the desired shape of the knowledge graph and defining processes for transforming heterogeneous source datasets into the desired format.
To break the above down into steps, first comes the task of data modeling. Based on the understanding of the business needs of the use cases, we determine the required contents of the knowledge graph and model them in a way that would make querying and analysis as straightforward as possible. This model can be formalized as diagrams, RDF examples or in other ways. It is then used as a reference and target for the next steps.
The second step is dataset identification and analysis. Based on the analysis of the use case needs and defined model, we know the kinds of data we are looking for and this is the step that identifies all possible sources and then subjects them to rigorous analysis- accessibility, quality, coverage, stability, update speed and so on. The goal is to select the minimal set of sources that can cover all use case needs and fill out the model defined in the previous step. The section on the inventory of relevant data that makes up the bulk of this deliverable is focused on this task.
Once an initial list of datasets is identified, the next step is to define the process for transformation. Further details on the semantic integration pipeline services are available in D2.5 but it is important to note that the specific transformation procedure is different and unique for each dataset. The differences can vary from transforming two nearly identical csv tables where one just has a few extra columns (that get mapped to the model) to extracting meaning and information from documents of free text or structured databases. The effect is that whatever form the initial dataset had, the output is data conforming to the harmonized model of the KG we are building.
Finally comes the step of data fusion. This requires at least two different datasets already ingested into the graph and can be thought of as the process of connecting the disparate pieces into a single knowledge graph. In rare cases this is very straightforward as both datasets have entities with shared identifiers but is typically more complex. It can be reconciliation such as where both datasets contain mentions of people but names are not unique identifiers so we need to be careful about what connections we build and what identifiers we actually give to them. It can be semantic enrichment and entity linking such as when we identify the gps coordinates of a sensor as the location of a specific warehouse and thus a node on our global transport route. There are other forms it can take as well but fundamentally in each case we are building connections between datasets.
As should be clear from the description, semantic data integration is an iterative process. We start with a minimal version of the model, identify data sets that meet our needs to fill the graph with such knowledge, collect further requirements from users and extend the model with objects and connections that support the new requirements.
2.6 Living Labs, Use Cases and Data Needs
Each standard, ontology and data set analyzed and described within this deliverable was a potential solution to the data needs of a use case defined in conjunction with a PLANET Living Lab partner. To go over where each one is applicable:
The GS1 standards with a focus on EPCIS are a requirement for all tracking and tracing solutions in global transport and specifically for working with sensor readings supplied by the EGTN IoT Infrastructure. At minimum, sensors providing readings will be deployed on trucks traveling from Valencia to the Spanish hinterlands and containers shipped by train from China to Poland.
Global weather data is also applicable in a global transport setting. Historical data is of particular interest as training input to the predictive analytics and optimization solutions. Current and forecast data is equally important once these analytics services are deployed and applied to make real decisions. Similarly, severe
D2.7 EGTN Transport Data and Knowledge Models v1
© PLANET, 2020 Page | 10
weather alerts and forecasts are important support for decision-making by route planners using the HMI interface.
The railroad route and timetable dataset was developed in conjunction with RSUUS as part of the use case on train transport from China to Poland. The dataset is actually based on their historical records and feedback from their local shipping agents.
The European Railway Agency datasets are relevant not only for train transportation throughout the European Union but also as a valuable simulation tool in the China-Poland use case. Since no public data exists for locomotive and train compositions in several countries along that route, we can simulate compositions along those route segments by approximately similar engines used in Europe.
Marine traffic is of interest for goods arriving at Port of Valencia as part of Living Lab 1. There are also plans to include maritime data in the generic use case simulation.
Air freight was recently added as a requirement based on the changed delivery model by Polish Post. It was confirmed that they are now shipping goods from China exclusively by air so there is a need to understand and support that mode of transportation as well.
D2.7 EGTN Transport Data and Knowledge Models v1
© PLANET, 2020 Page | 11
3. GS1 Standards
GS1 is the global standard-setting organization for logistics, commerce and supply chain. It:
• Standardizes the issuance of various identifiers (for products and goods, palettes and containers, locations and organizations, etc)
• Organizes the allocation of identifiers (barcodes and RFIDs)
• Defines product classifications
• Creates data models for events in supply chains, and for describing products
GS1 standards cover the following areas:
• Identify
• Capture
• Share
They are of interest to us as the global standard for T&L tasks and specifically because the EPCIS sub-family of standard are used to track shipments and describe sensor readings as supplied by the EGTN IoT Infrastructure from sensors deployed by project partners.
The following materials provide useful introductions to GS1 standards:
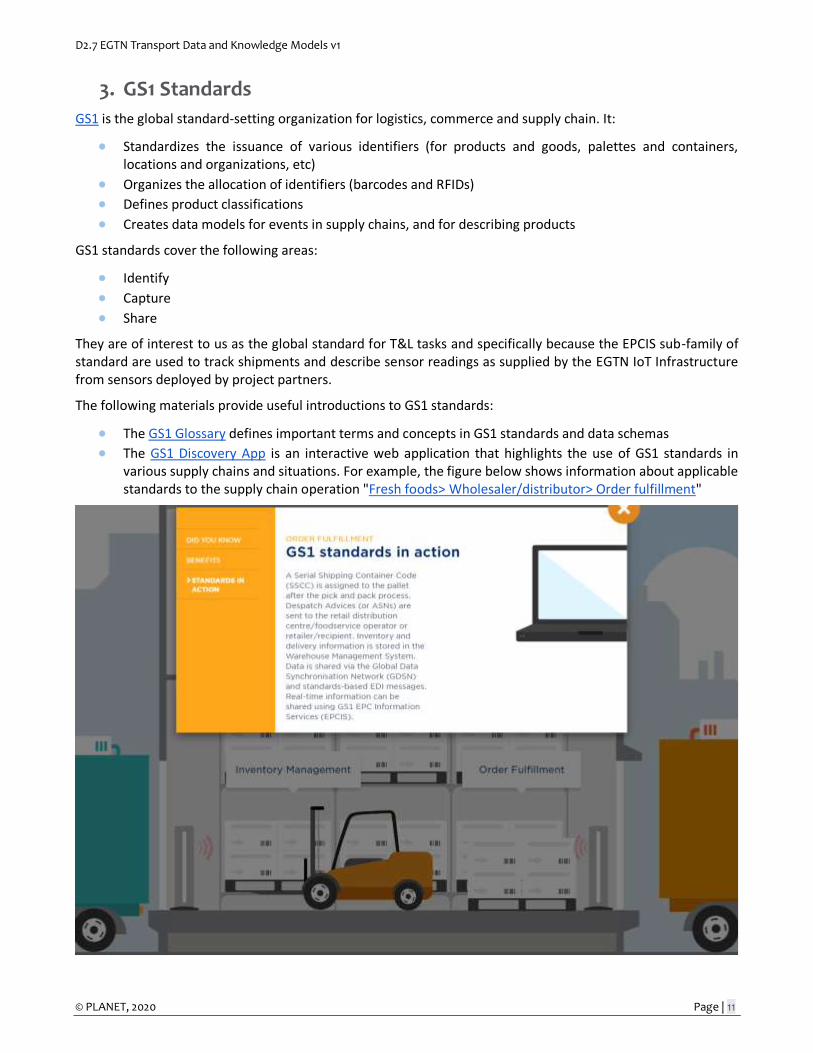
• The GS1 Glossary defines important terms and concepts in GS1 standards and data schemas
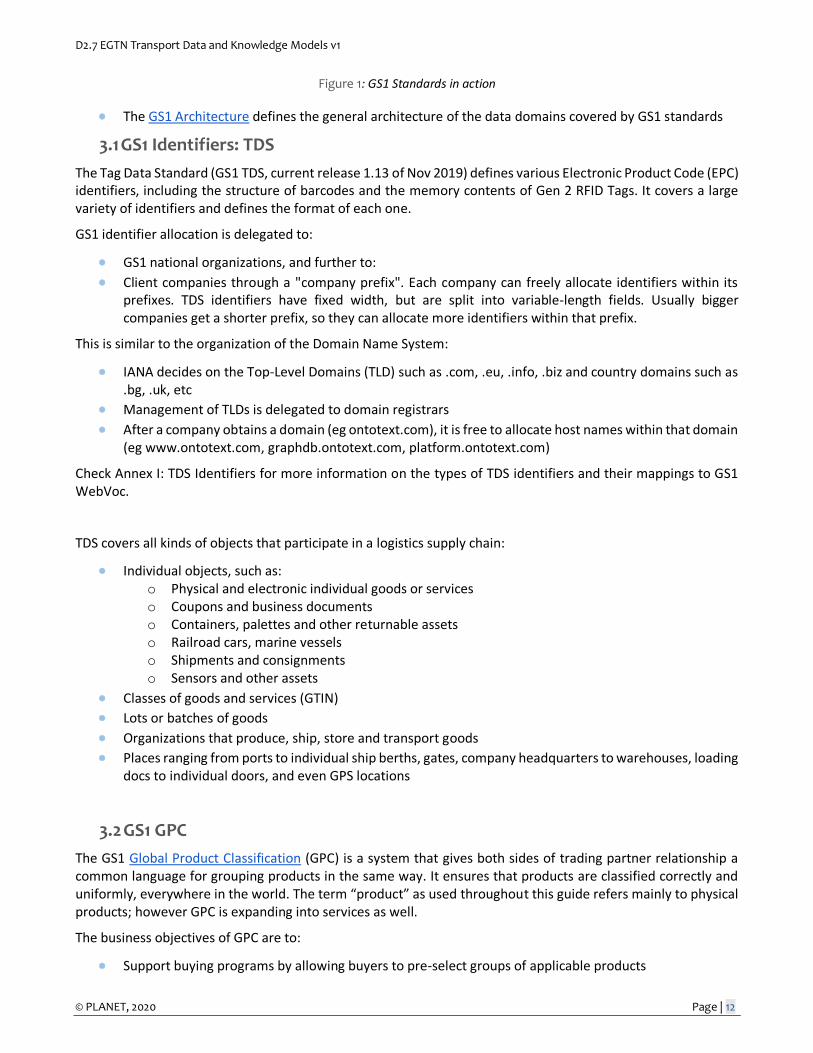
• The GS1 Discovery App is an interactive web application that highlights the use of GS1 standards in various supply chains and situations. For example, the figure below shows information about applicable standards to the supply chain operation "Fresh foods> Wholesaler/distributor> Order fulfillment"
D2.7 EGTN Transport Data and Knowledge Models v1
© PLANET, 2020 Page | 12
Figure 1: GS1 Standards in action
• The GS1 Architecture defines the general architecture of the data domains covered by GS1 standards
3.1 GS1 Identifiers: TDS
The Tag Data Standard (GS1 TDS, current release 1.13 of Nov 2019) defines various Electronic Product Code (EPC) identifiers, including the structure of barcodes and the memory contents of Gen 2 RFID Tags. It covers a large variety of identifiers and defines the format of each one.
GS1 identifier allocation is delegated to:
• GS1 national organizations, and further to:
• Client companies through a "company prefix". Each company can freely allocate identifiers within its prefixes. TDS identifiers have fixed width, but are split into variable-length fields. Usually bigger companies get a shorter prefix, so they can allocate more identifiers within that prefix.
This is similar to the organization of the Domain Name System:
• IANA decides on the Top-Level Domains (TLD) such as .com, .eu, .info, .biz and country domains such as .bg, .uk, etc
• Management of TLDs is delegated to domain registrars
• After a company obtains a domain (eg ontotext.com), it is free to allocate host names within that domain (eg www.ontotext.com, graphdb.ontotext.com, platform.ontotext.com)
Check Annex I: TDS Identifiers for more information on the types of TDS identifiers and their mappings to GS1 WebVoc.
TDS covers all kinds of objects that participate in a logistics supply chain:
• Individual objects, such as: o Physical and electronic individual goods or services o Coupons and business documents o Containers, palettes and other returnable assets o Railroad cars, marine vessels o Shipments and consignments o Sensors and other assets
• Classes of goods and services (GTIN)
• Lots or batches of goods
• Organizations that produce, ship, store and transport goods
• Places ranging from ports to individual ship berths, gates, company headquarters to warehouses, loading docs to individual doors, and even GPS locations
3.2 GS1 GPC
The GS1 Global Product Classification (GPC) is a system that gives both sides of trading partner relationship a common language for grouping products in the same way. It ensures that products are classified correctly and uniformly, everywhere in the world. The term “product” as used throughout this guide refers mainly to physical products; however GPC is expanding into services as well.
The business objectives of GPC are to:
• Support buying programs by allowing buyers to pre-select groups of applicable products
D2.7 EGTN Transport Data and Knowledge Models v1
© PLANET, 2020 Page | 13
• Provide a common language for category management, thus speeding up reaction to consumer needs
• Be a key enabler of the Global Data Synchronisation Network
• To be a Pivotal classification system between the information exchange parties
The GPC Schema Principles include:
• The GPC schema provides an optional four-tier hierarchy; segment, family, class and brick (GPC bricks may be used independently without the hierarchy). The hierarchy should be easy to understand/follow and balanced in order to facilitate search.
• Each level of the schema is determined by rules and/or principles, and also industry decision. However, the rules applied differ depending on the hierarchy level.
• The business rules apply to all levels or entities of the schema.
• Each brick may be assigned one or more attributes; in turn each brick attribute has a set of associated mutually-exclusive brick attribute values.
Resources:
● Homepage: https://www.gs1.org/standards/gpc ● Standard: https://www.gs1.org/sites/default/files/gpc_development_and_implementation_1.pdf ● Browser: https://www.gs1.org/gpc/browser/
Details on the GPC structure are available in Annex I: GPS Structure.
To learn more about other potentially useful aspects of the GS1 standard, check:
● GS1 WebVoc in Annex I: GS1 WebVoc
● GS1 Smart Search in Annex I: GS1 Smart Search
● GS1 Digital Link in Annex I: GS1 Digital Link
3.3 EPCIS and CBV
EPCIS and CBV are complementary specifications that enable trading partners to share information about the physical movement and status of products as they travel throughout the supply chain – from business to business and ultimately to consumers. They help answer the “what, where, when and why” questions to meet consumer and regulatory demands for accurate and detailed product information.
● EPCIS defines supply chain events, enabling disparate applications to create and share visibility event data, both within and across enterprises
● CBV provides definitions of data values to be used to populate the data structures defined in EPCIS
EPCIS and Core Business Vocabulary Implementation Guideline provides an introduction to these standards and how to implement them
D2.7 EGTN Transport Data and Knowledge Models v1
© PLANET, 2020 Page | 14
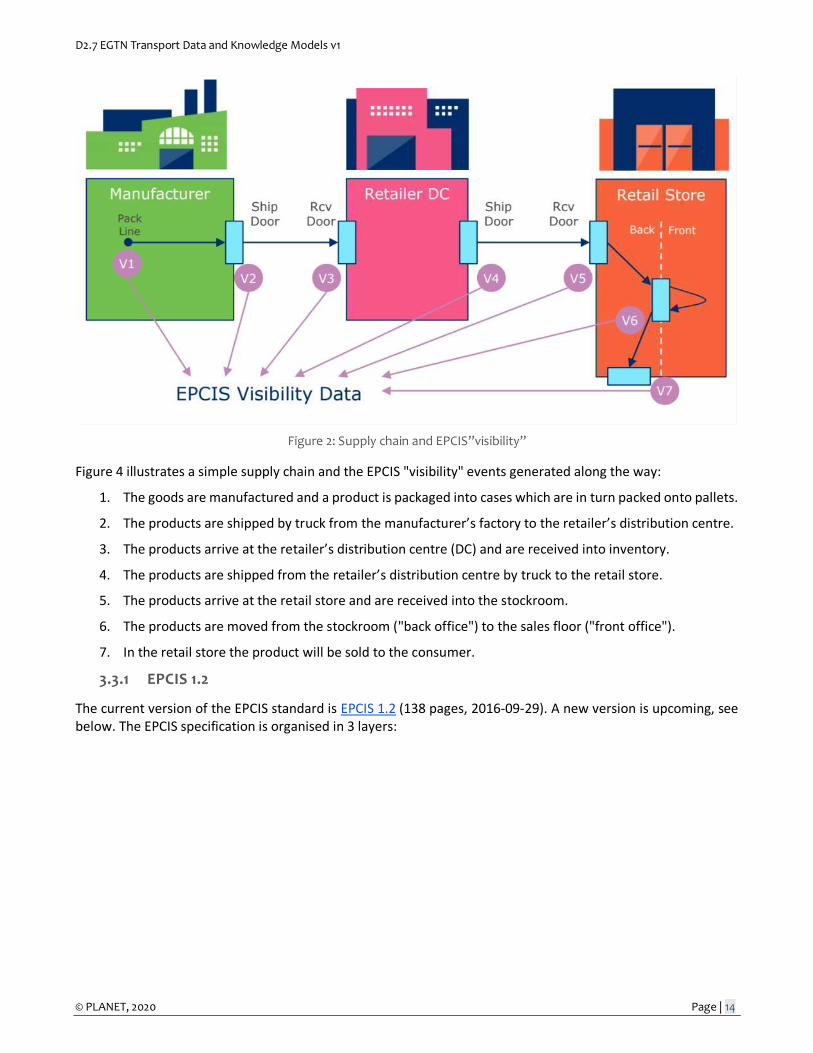
Figure 2: Supply chain and EPCIS”visibility”
Figure 4 illustrates a simple supply chain and the EPCIS "visibility" events generated along the way:
1. The goods are manufactured and a product is packaged into cases which are in turn packed onto pallets.
2. The products are shipped by truck from the manufacturer’s factory to the retailer’s distribution centre.
3. The products arrive at the retailer’s distribution centre (DC) and are received into inventory.
4. The products are shipped from the retailer’s distribution centre by truck to the retail store.
5. The products arrive at the retail store and are received into the stockroom.
6. The products are moved from the stockroom ("back office") to the sales floor ("front office").
7. In the retail store the product will be sold to the consumer.
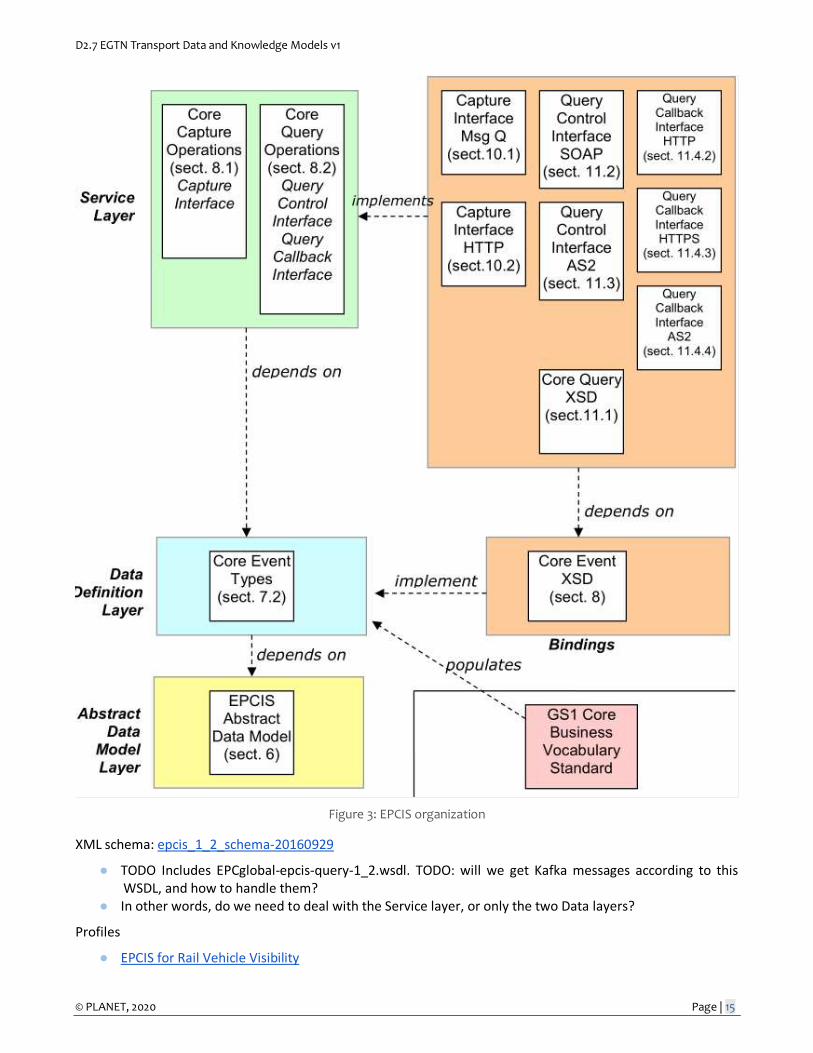
3.3.1 EPCIS 1.2
The current version of the EPCIS standard is EPCIS 1.2 (138 pages, 2016-09-29). A new version is upcoming, see below. The EPCIS specification is organised in 3 layers:
D2.7 EGTN Transport Data and Knowledge Models v1
© PLANET, 2020 Page | 15
Figure 3: EPCIS organization
XML schema: epcis_1_2_schema-20160929
● TODO Includes EPCglobal-epcis-query-1_2.wsdl. TODO: will we get Kafka messages according to this WSDL, and how to handle them?
● In other words, do we need to deal with the Service layer, or only the two Data layers?
Profiles
● EPCIS for Rail Vehicle Visibility
D2.7 EGTN Transport Data and Knowledge Models v1
© PLANET, 2020 Page | 16
● EPCIS for Fighting Illicit Trade
Case Studies:
● How EPCIS enables product visibility from source to shelves ● How EPCIS is improving the safety of healthcare supply chains ● Messaging Document: EPCIS - Improving traceability, security, and regulatory compliance ● Case Study: GS1 application standard for visibility in rail ● EPCIS: Enabling visibility with real time information on supply chain events
3.3.2 CBV 1.2
The Core (or Comprehensive) Business Vocabulary (CBV) specifies the set of vocabularies and vocabulary values for all elements to be used in EPCIS standard. The latest version is release 1.2.2 of Oct 2017 (a new release 2.0 is upcoming shortly).
CBV covers the following vocabularies:
● All kinds of GS1 identifiers (see section TDS above) and in which fields they are used, e.g. readPoint and bizLocation should be SGLN (place), whereas "source" and "destination" can be SGLN or PGLN (organization)
● Logistics business vocabularies: BizStep, Disp (disposition), BTT (Business Transaction Type), ErrorReason, SDT (source or destination type)
3.3.3 EPCIS 2.0 and CBV 2.0
EPCIS and CBV 2.0 are a major update of the 1.2 versions that include the following important features (amongst others):
● Add JSON, JSONLD and RDF (linked data) renditions in addition to the existing XML rendition ● Add a section on EPCIS Semantics to clarify the meaning of various identifiers and constructs, and what
extra semantic data can be attached to such identifiers. Eg PGLN corresponds to a semantic URL of type gs1:Organization and can have all properties relevant to that class.
● Promote the use of HTTPS URLs by using GS1 Digital Link instead of or in addition to the existing URIs ● Improve the XML schema and add JSON schema and RDF SHACL shapes. ● Add Sensor data including measurements and alerts. ● Add PersistentDispositions that are multivalued and are set/unset explicitly, rather than with each new
event. ● Add CertificationInfo of certificates relevant to an EPCIS event.
EPCIS 2.0 is very important for the needs of PLANET because it focuses on expanding the standard to support IoT devices and sensors much more fully. The EGTN IoT Infrastructure will lean heavily on it as will all future communication involving mobile sensors and real-time tracking in transportation and logistics [1] .
D2.7 EGTN Transport Data and Knowledge Models v1
© PLANET, 2020 Page | 17
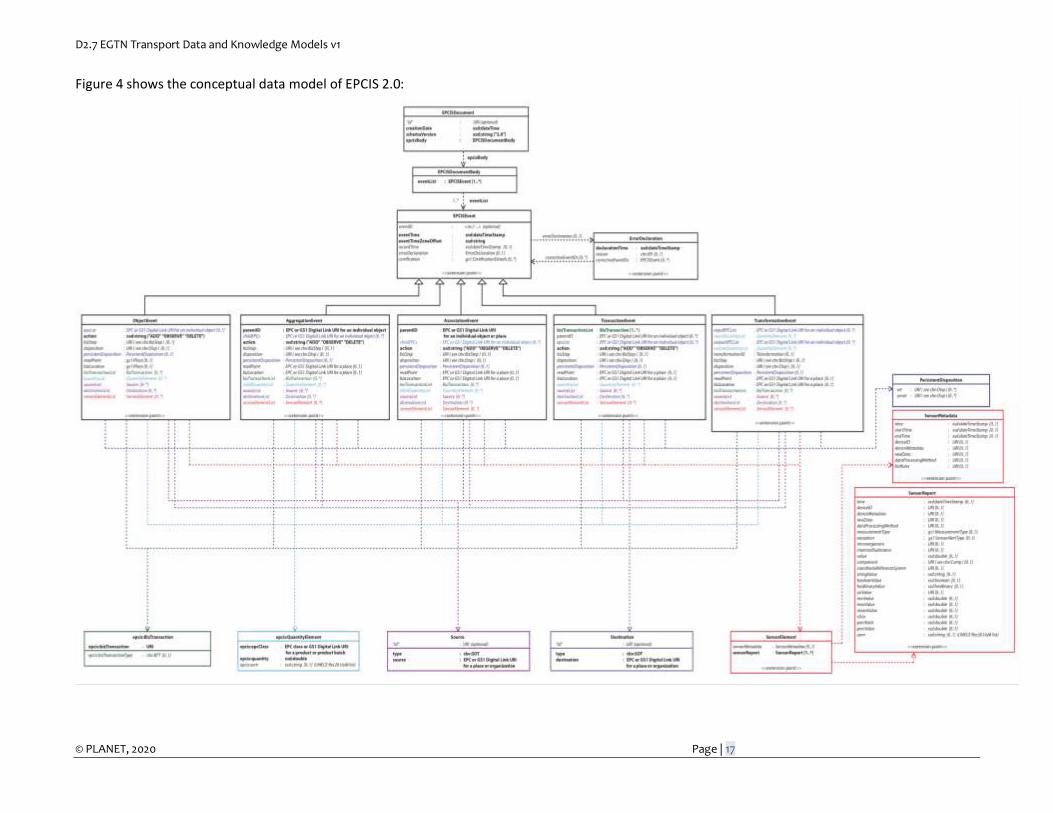
Figure 4 shows the conceptual data model of EPCIS 2.0:
D2.7 EGTN Transport Data and Knowledge Models v1
© PLANET, 2020 Page | 18
Figure 4: Conceptual data model
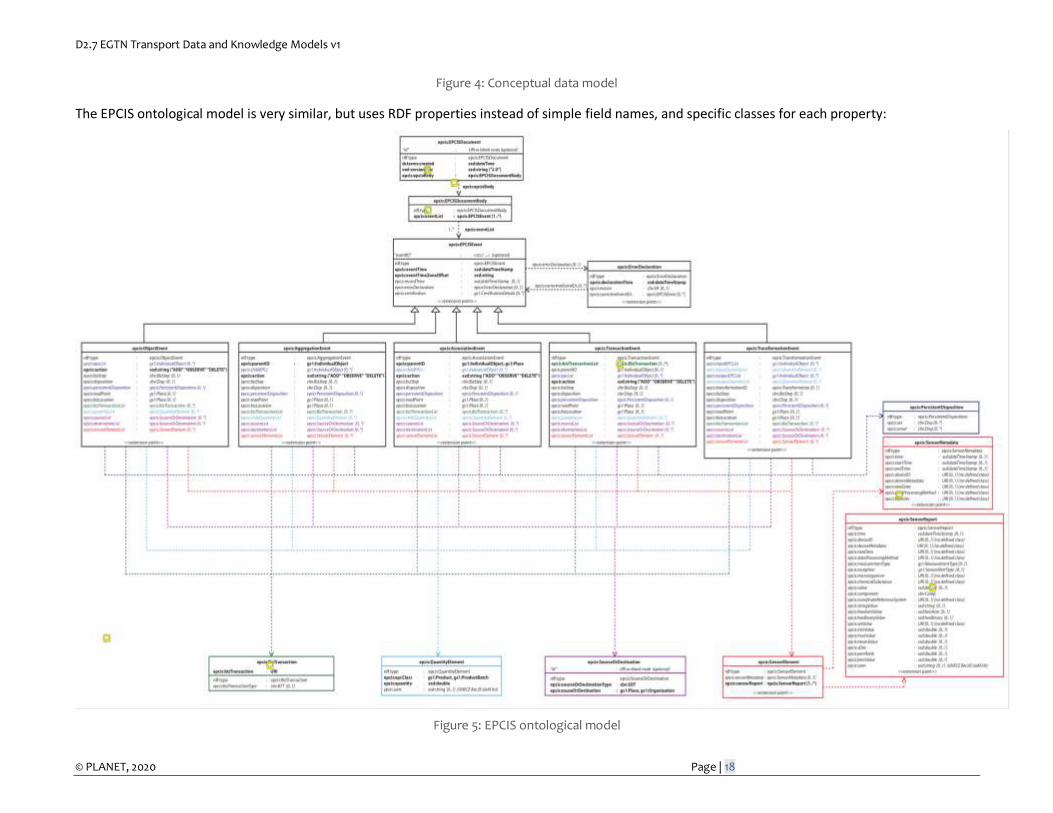
The EPCIS ontological model is very similar, but uses RDF properties instead of simple field names, and specific classes for each property:
Figure 5: EPCIS ontological model
D2.7 EGTN Transport Data and Knowledge Models v1
© PLANET, 2020 Page | 19
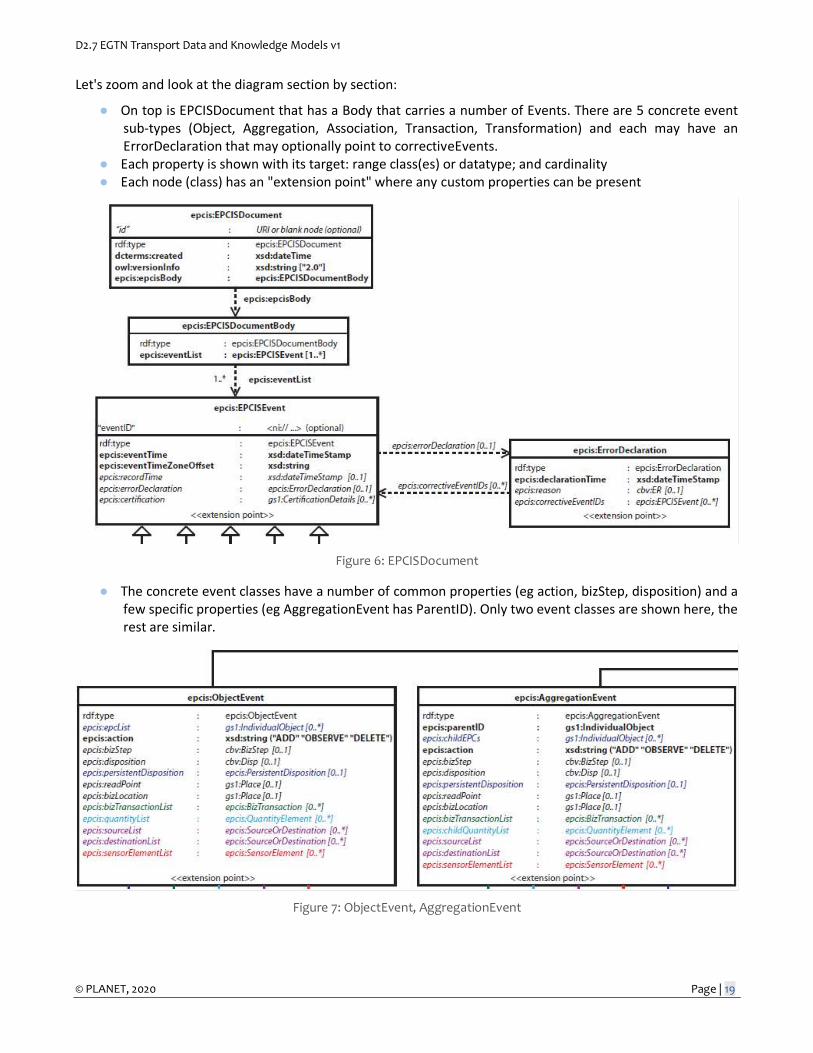
Let's zoom and look at the diagram section by section:
● On top is EPCISDocument that has a Body that carries a number of Events. There are 5 concrete event sub-types (Object, Aggregation, Association, Transaction, Transformation) and each may have an ErrorDeclaration that may optionally point to correctiveEvents.
● Each property is shown with its target: range class(es) or datatype; and cardinality ● Each node (class) has an "extension point" where any custom properties can be present
Figure 6: EPCISDocument
● The concrete event classes have a number of common properties (eg action, bizStep, disposition) and a few specific properties (eg AggregationEvent has ParentID). Only two event classes are shown here, the rest are similar.
Figure 7: ObjectEvent, AggregationEvent
D2.7 EGTN Transport Data and Knowledge Models v1
© PLANET, 2020 Page | 20
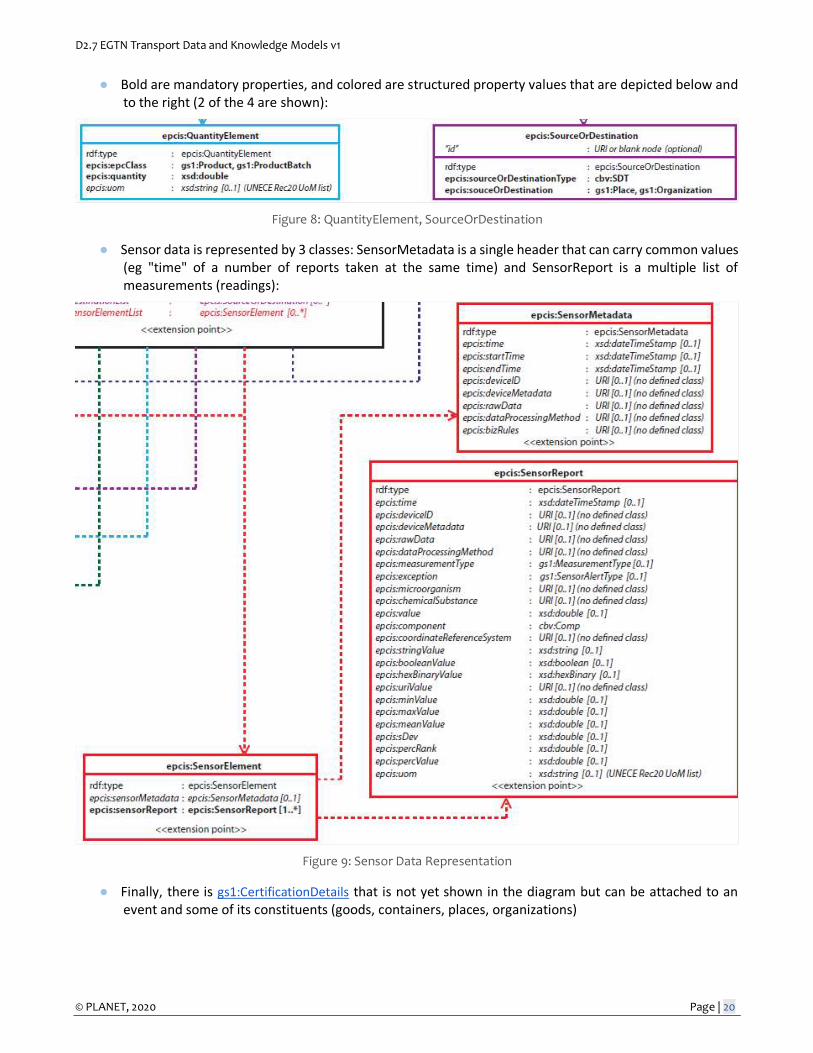
● Bold are mandatory properties, and colored are structured property values that are depicted below and to the right (2 of the 4 are shown):
Figure 8: QuantityElement, SourceOrDestination
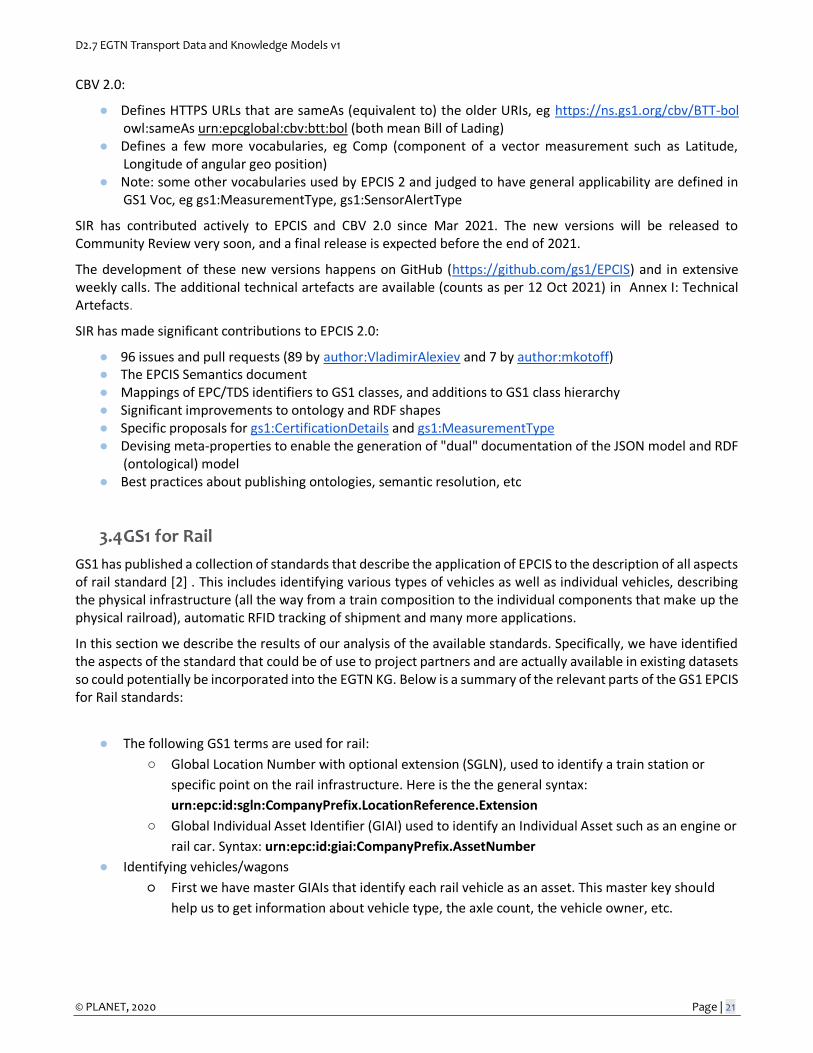
● Sensor data is represented by 3 classes: SensorMetadata is a single header that can carry common values (eg "time" of a number of reports taken at the same time) and SensorReport is a multiple list of measurements (readings):
Figure 9: Sensor Data Representation
● Finally, there is gs1:CertificationDetails that is not yet shown in the diagram but can be attached to an event and some of its constituents (goods, containers, places, organizations)
D2.7 EGTN Transport Data and Knowledge Models v1
© PLANET, 2020 Page | 21
CBV 2.0:
● Defines HTTPS URLs that are sameAs (equivalent to) the older URIs, eg https://ns.gs1.org/cbv/BTT-bol owl:sameAs urn:epcglobal:cbv:btt:bol (both mean Bill of Lading)
● Defines a few more vocabularies, eg Comp (component of a vector measurement such as Latitude, Longitude of angular geo position)
● Note: some other vocabularies used by EPCIS 2 and judged to have general applicability are defined in GS1 Voc, eg gs1:MeasurementType, gs1:SensorAlertType
SIR has contributed actively to EPCIS and CBV 2.0 since Mar 2021. The new versions will be released to Community Review very soon, and a final release is expected before the end of 2021.
The development of these new versions happens on GitHub (https://github.com/gs1/EPCIS) and in extensive weekly calls. The additional technical artefacts are available (counts as per 12 Oct 2021) in Annex I: Technical Artefacts.
SIR has made significant contributions to EPCIS 2.0:
● 96 issues and pull requests (89 by author:VladimirAlexiev and 7 by author:mkotoff) ● The EPCIS Semantics document ● Mappings of EPC/TDS identifiers to GS1 classes, and additions to GS1 class hierarchy ● Significant improvements to ontology and RDF shapes ● Specific proposals for gs1:CertificationDetails and gs1:MeasurementType ● Devising meta-properties to enable the generation of "dual" documentation of the JSON model and RDF
(ontological) model ● Best practices about publishing ontologies, semantic resolution, etc
3.4 GS1 for Rail
GS1 has published a collection of standards that describe the application of EPCIS to the description of all aspects of rail standard [2] . This includes identifying various types of vehicles as well as individual vehicles, describing the physical infrastructure (all the way from a train composition to the individual components that make up the physical railroad), automatic RFID tracking of shipment and many more applications.
In this section we describe the results of our analysis of the available standards. Specifically, we have identified the aspects of the standard that could be of use to project partners and are actually available in existing datasets so could potentially be incorporated into the EGTN KG. Below is a summary of the relevant parts of the GS1 EPCIS for Rail standards:
● The following GS1 terms are used for rail:
○ Global Location Number with optional extension (SGLN), used to identify a train station or
specific point on the rail infrastructure. Here is the the general syntax:
urn:epc:id:sgln:CompanyPrefix.LocationReference.Extension
○ Global Individual Asset Identifier (GIAI) used to identify an Individual Asset such as an engine or
rail car. Syntax: urn:epc:id:giai:CompanyPrefix.AssetNumber
● Identifying vehicles/wagons
○ First we have master GIAIs that identify each rail vehicle as an asset. This master key should
help us to get information about vehicle type, the axle count, the vehicle owner, etc.
D2.7 EGTN Transport Data and Knowledge Models v1
© PLANET, 2020 Page | 22
○ Multiple EPC/RFID tags should be placed on the vehicles, so we can identify the side or end of
the wagons. We may have cases where some of the wagons are not tagged and they will not
appear in the epcList.
● Location identification:
○ Read point - specific place where EPCIS event happened and it’s identified with the SGLN. This
event should give us information about geographical location (geo coordinates), line name or
ID
○ Business location - location where the rail vehicle is assumed to be following the event, until a
new event takes place that indicates otherwise. Place can be track section, station, shunting
yard, or specific shunting yard location.
● Train direction is determined by values in the range between 0-2, meaning:
○ 0 = indicates that the direction was not detected
○ 1 = indicates one direction in the rail network
○ 2 = indicates the opposite direction in the rail network
● Besides these indicators, the data may optionally contain compass directions (N, S, W, E, NW, NE, SE,
SW)
● Rail vehicle orientation can be determined by combining the information about the observed tag and
the train direction
● EPCIS event data for rail have two event types and actions:
○ ObjectEvent (action OBSERVE) - observation of a uniquely identified rail vehicle in passage
along its journey, or upon its arrival at or departure from a terminus
○ TransactionEvent (action ADD) - summary event following the observation of a passing train’s
trailing vehicle
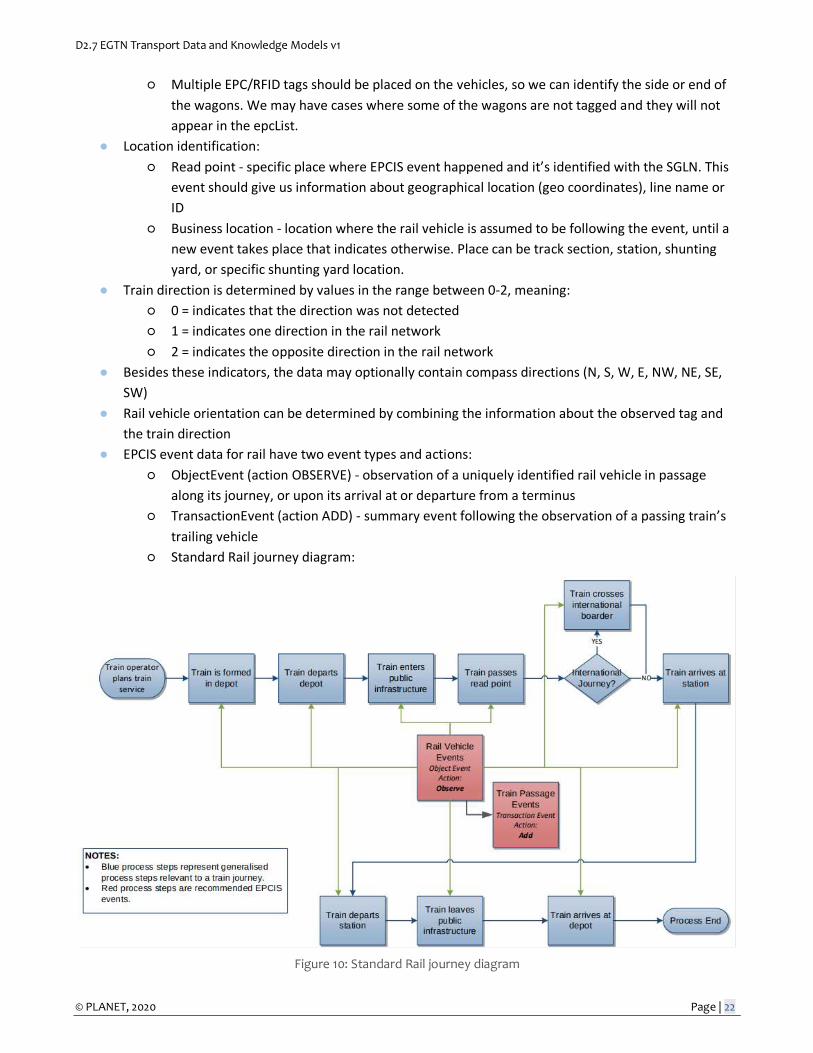
○ Standard Rail journey diagram:
Figure 10: Standard Rail journey diagram
D2.7 EGTN Transport Data and Knowledge Models v1
© PLANET, 2020 Page | 23
● This data also contains four dimensions: what,where, when and why.
○ What - indicates the objects to which the EPCIS event pertains. Each observed rail vehicle
should be captured in a separate ObjectEvent. The epcList element should contain only the
master GIAI of the observed vehicle
○ Where - should give us information about where EPCIS event happened eg. read point and/or
business locations
○ When - show us the time when the event has been created and recorded. Note: There is a
difference between when an event is created and when is recorded. Example:
<eventTime>2014-10-18T12:00:22.000+02:00</eventTime> <recordTime>2014-10-
18T12:01:00.000+02:00</recordTime>
○ Why - reflects the business context (“Business Step”) or the status of the event (“Disposition”)
D2.7 EGTN Transport Data and Knowledge Models v1
© PLANET, 2020 Page | 24
4. Inventory of Relevant Data
This section describes all relevant standards, ontologies and datasets that have been positively identified as requirements for living lab use cases.
4.1 Railroad Infrastructure Data
4.1.1 RINF (Registers of Infrastructure)
RINF ‘specifications concern data about the following structural subsystems of the Union rail system [3] :
● the infrastructure subsystem,
● the energy subsystem,
● the trackside control-command and signaling subsystem.
4.1.1.1 Feature of the RINF
● ‘Operational Point’ - means any location for train service operations, where train services may begin
and end or change route, and where passenger or freight services may be provided; ‘operational point’
means also any location at boundaries between Member States or infrastructure managers;
● ‘Section of line’ (SoL) means the part of line between adjacent operational points and may consist of
several tracks;
● ‘Running track’ means any track used for train service movements;
● ‘Siding’ means any track within an operational point, which is not used for operational routing of a
train.
● ‘Location point’ (LP) is a specific point on a track of a SoL (not permitted for OP) where value of a
parameter changes. The use of LP is non mandatory.
Details on the web functionalities of the RINF, check Annex I: Web Functionalities.
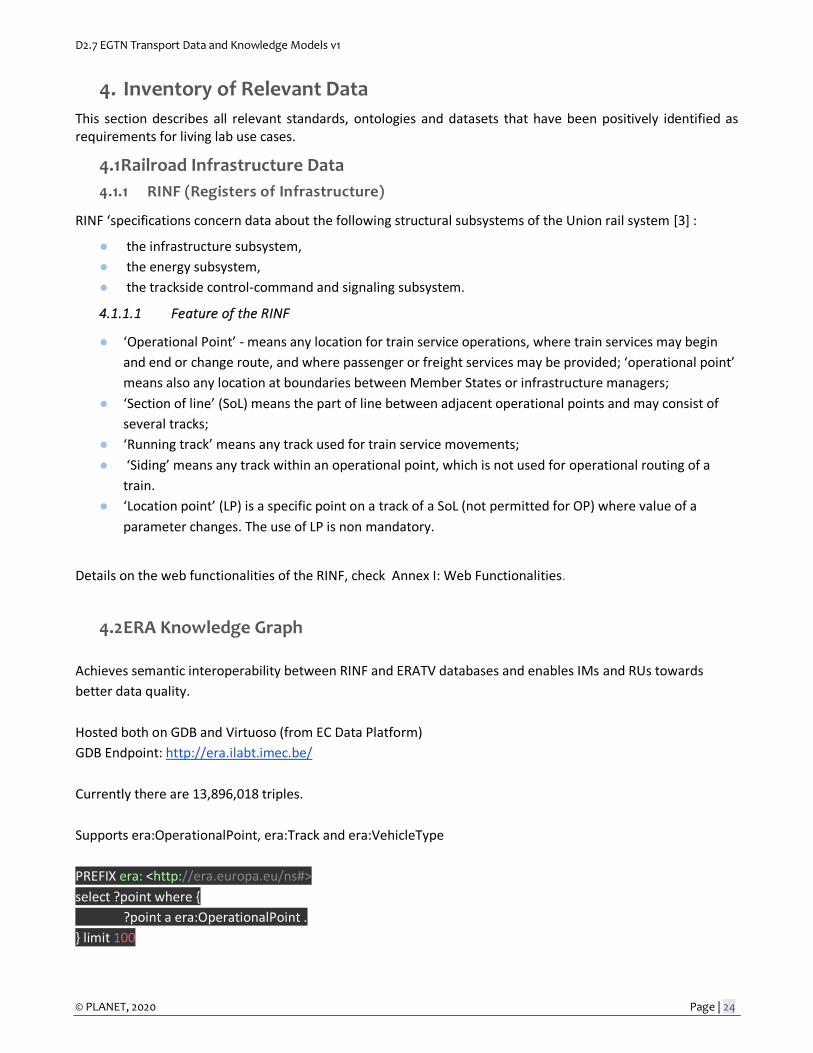
4.2 ERA Knowledge Graph
Achieves semantic interoperability between RINF and ERATV databases and enables IMs and RUs towards
better data quality.
Hosted both on GDB and Virtuoso (from EC Data Platform)
GDB Endpoint: http://era.ilabt.imec.be/
Currently there are 13,896,018 triples.
Supports era:OperationalPoint, era:Track and era:VehicleType
PREFIX era: <http://era.europa.eu/ns#>
select ?point where {
?point a era:OperationalPoint .
} limit 100
D2.7 EGTN Transport Data and Knowledge Models v1
© PLANET, 2020 Page | 25
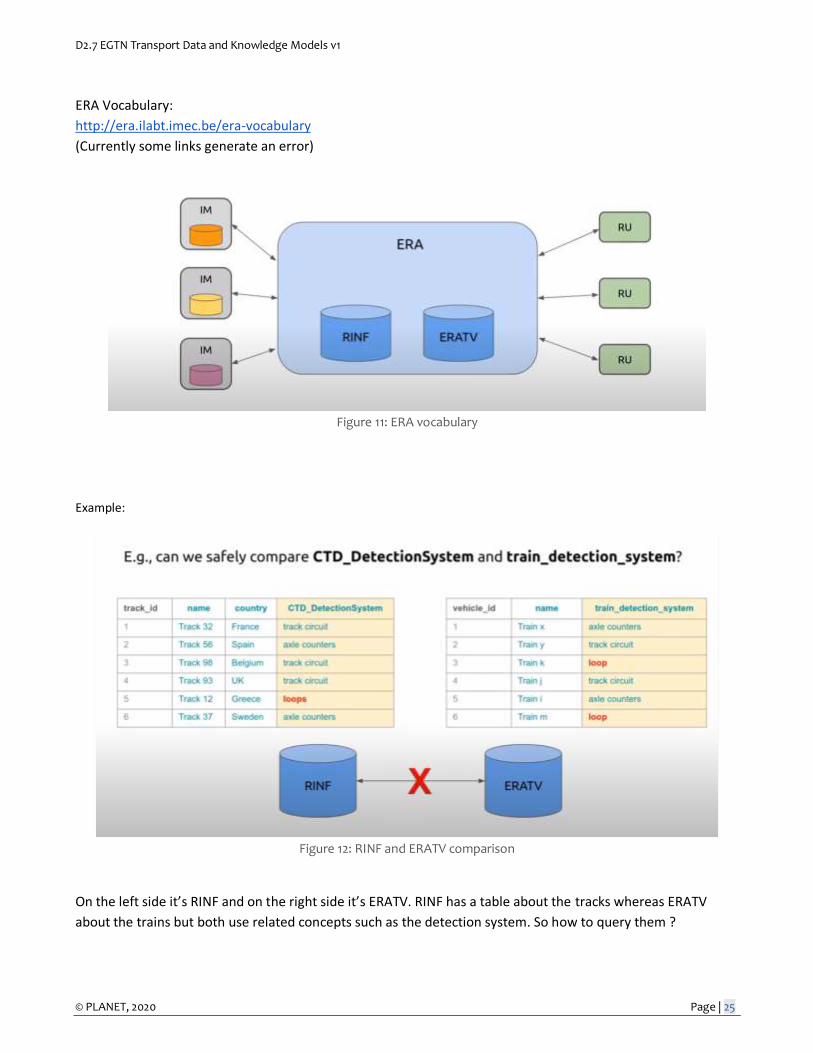
ERA Vocabulary:
http://era.ilabt.imec.be/era-vocabulary
(Currently some links generate an error)
Figure 11: ERA vocabulary
Example:
Figure 12: RINF and ERATV comparison
On the left side it’s RINF and on the right side it’s ERATV. RINF has a table about the tracks whereas ERATV
about the trains but both use related concepts such as the detection system. So how to query them ?
D2.7 EGTN Transport Data and Knowledge Models v1
© PLANET, 2020 Page | 26
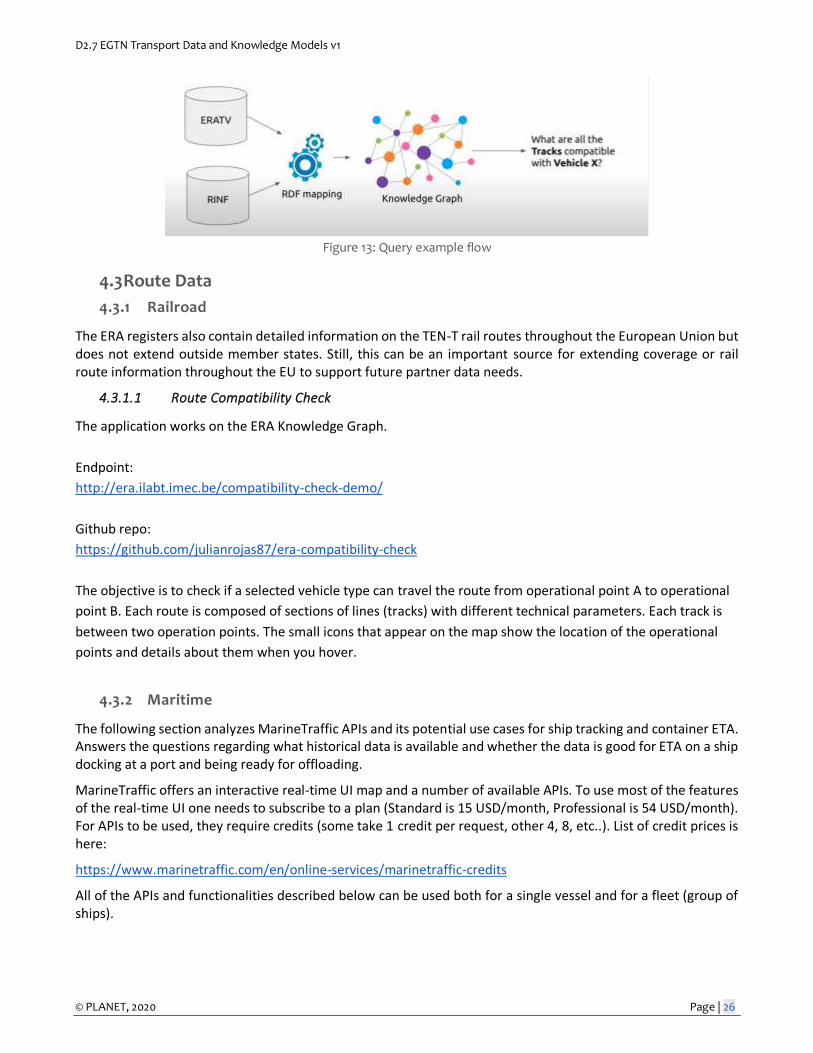
Figure 13: Query example flow
4.3 Route Data
4.3.1 Railroad
The ERA registers also contain detailed information on the TEN-T rail routes throughout the European Union but does not extend outside member states. Still, this can be an important source for extending coverage or rail route information throughout the EU to support future partner data needs.
4.3.1.1 Route Compatibility Check
The application works on the ERA Knowledge Graph.
Endpoint:
http://era.ilabt.imec.be/compatibility-check-demo/
Github repo:
https://github.com/julianrojas87/era-compatibility-check
The objective is to check if a selected vehicle type can travel the route from operational point A to operational
point B. Each route is composed of sections of lines (tracks) with different technical parameters. Each track is
between two operation points. The small icons that appear on the map show the location of the operational
points and details about them when you hover.
4.3.2 Maritime
The following section analyzes MarineTraffic APIs and its potential use cases for ship tracking and container ETA. Answers the questions regarding what historical data is available and whether the data is good for ETA on a ship docking at a port and being ready for offloading.
MarineTraffic offers an interactive real-time UI map and a number of available APIs. To use most of the features of the real-time UI one needs to subscribe to a plan (Standard is 15 USD/month, Professional is 54 USD/month). For APIs to be used, they require credits (some take 1 credit per request, other 4, 8, etc..). List of credit prices is here:
https://www.marinetraffic.com/en/online-services/marinetraffic-credits
All of the APIs and functionalities described below can be used both for a single vessel and for a fleet (group of ships).
D2.7 EGTN Transport Data and Knowledge Models v1
© PLANET, 2020 Page | 27
We can manage fleets (add, remove or add terrestrial/satellite tracking for a vessel) via an API (Change Fleet API). We can also see all of our fleets or all vessels within a fleet. An API for checking the remaining credits is also available.
You are granted 100 free credits after registration. For details on the MarineTraffic AIS Data API, check Annex I: MarineTraffic AIS Data API.
4.3.2.1 MarineTraffic Online Services
The UI (Interactive real-time map) allows everything that is available from the APIs, plus:
We can create notifications for a vessel or a fleet that are triggered when:
● Standard Periodic Reports
○ Midnight position
○ Noon position
● Post-Related Events
o Arrival o Departure o Docked o Undocked o ETA
● Area-Related Events
o Crossed Strait or Passage o Entered Area of Interest o Left Area of Interest o Custom Area – Crossed
● Vessel Movement Status Updates
o Speed below minimum o Speed above maximum o Stopped o Average speed below minimum o Changed course o Underway
● Vessel AIS Data Update
o AIS Destination Changed o AIS Draught Changed o AIS ETA Changed o AIS Flag Changed o AIS Status Changed o AIS Name Changed
● MarineTraffic System-Related Events
o In Terrestrial Range o Out of Terrestrial Range
● Vessel-To-Vessel events
o Tug operation
D2.7 EGTN Transport Data and Knowledge Models v1
© PLANET, 2020 Page | 28
o Pilot Event o Bunkering o Vessel to Vessel Proximity o Ship-to-Ship Transfer(STS)
● Special events
o New Photo Uploaded o Sailing in high winds o Vessel Changed Time Zone
Some of the most interesting notifications that we can create are when the vessel has changed its destination, when the ETA reported by the vessel's AIS has changed, when a vessel has arrived/departed/docked/undocked or when its status has changed.
The amount of credits indicated will be charged each time a notification is generated (per vessel, every time a condition is met, etc).
4.3.2.2 Conclusion:
The data is definitely good for tracking a ship and making ETA whether looking at historical data or using the built-in ETA API. What is also good is that MarineTraffic offers many alert events. Although there isn’t an alert that fires when a cargo ship is ready to be offloaded, there is a docking/undocking alert that can be used for estimating when the ship is ready to be offloaded.
4.3.3 Air Freight
The section explores 4 sources of data related to Air Freight. The data is diverse, depending on the use case.
4.3.3.1 AIr Cargo World
Website: https://aircargoworld.com/
To have access to the datasets, one must have a premium subscription which costs $0 upon activation and has a 10 days trial period. $270 dollars a year after that.
Datasets include:
● Carrier statistics - shows cargo revenue, pax revenue, FTKs and cargo yields of different airlines that are in the cargo business for the period 2019-2021
● Freight 50 for 2021 - ranks the top 50 cargo airlines taking into account several parameters.
● The power 25 - ranks the largest forwarders by airfreight metric tonnage
● Change in global cargo traffic - for six regions
● Jet fuel spot price chart from 2008
● Business directory where one can search for companies/businesses associated with aircrafts/equipments, carriers, consulting, logistics, technology, forwarders, etc
Summary:
The data in those datasets is mostly for ranking purposes and for this reason it's not so historical - most datasets contain rankings for the last 1-2 years. Maybe suitable for choosing most the best cargo related stuff companies (e.g. forwarders, equipment providers) but not useful for tracking packages shipped by our partners.
D2.7 EGTN Transport Data and Knowledge Models v1
© PLANET, 2020 Page | 29
4.3.3.2 IATA - International Air Transport Association
Website: https://www.iata.org/en/services/statistics/cargo-data/
Datasets include:
● Cargo Country Statistics
○ Country pair segment data for cargo between 1000 country pairs and 192 countries
■ e.g. how much Freight (in tonnes) were carried from Afghanistan to United Arab Emirates
■ Note: No data for China-Poland in the sample dataset
○ Updated monthly
○ Historical data from 2013, broken down by month
○ Available as an excel file
○ Sample data available for download
○ 12 month subscription costs $10000
● Monthly Traffic Statistics
○ Statistics calculated from a sample representing approx. 93% of global traffic – to ensure an accurate reflection of the entire industry, including full-service and low-cost carriers, IATA member and non-member airlines, mixed and cargo-only operators, global and regional carriers
○ Global coverage of both passenger and cargo traffic, available in a variety of datasets – to provide you with the information you need
○ Data delivered in user-friendly Excel format – to give you the flexibility you need to build your own reports
○ No sample data available for download
○ 12-month subscription ranges from $5k to $14,4k
● CargoIS
○ IATA’s Cargo Accounts Settlement System (CASS) This is a global billing system operated by IATA where airlines and freight forwarders settle their transactions. This data source leverages billing data validated by both airlines and freight forwarders and is therefore more accurate and reliable than any other data source.
○ CargoIS Direct Data The CargoIS Direct Data (CDD) complements the information received from CASS. CDD consists of data received directly from participating airlines. It was designed together with a working group comprising 30 of the world’s largest cargo carriers and a growing number of airlines are contributing their data, every month, ever since. The two data sources are fully consolidated in CargoIS so that you can access all data in a single database.
○ No sample available
○ No subscription data and data format available

D2.7 EGTN Transport Data and Knowledge Models v1
© PLANET, 2020 Page | 30
● Global Data Products (GDP)
○ Global System Solution
■ Global System Solutions is a subscription service to the complete database of Agencies under IATA Passenger and Cargo Programs, including their IATA Numeric Code, accreditation details and business profile. Delivered electronically with updates either Daily, Weekly, Twice-Monthly or Monthly.
■ Features:
● Create and maintain a customer database of over qualified 120,000 records
● Schedule and perform automated agency information updates in your systems
● Reconcile booking information with the selling agents using the IATA Numeric Code
● Improve your commission payment and back-office operations
● Perform targeted communication and business development activities
■ Pricing and sample data: https://store.iata.org/IEC_ProductDetail?id=00000000751934&_ga=2.170252640.1558083621.1631692467-1393256900.1631692467
Summary: A lot of features as well as transaction info. Good place to start depending on the use case. However, the only dataset that provided a sample does not cover the region we are interested in. The others are quite expensive to access and are not guaranteed to cover our needs either.
4.3.3.3 Cargo Facts Consulting Insights
Website: https://cfcinsights.com/
At first glance the data that they claim to have seems to be useful for our cases however there is no sample data and no trial to experiment with the tool. The subscription costs $5k a year.
Summary: Worth possibly keeping in mind but not immediately clear if they can be useful.
4.3.3.4 Spire Aviation Solutions
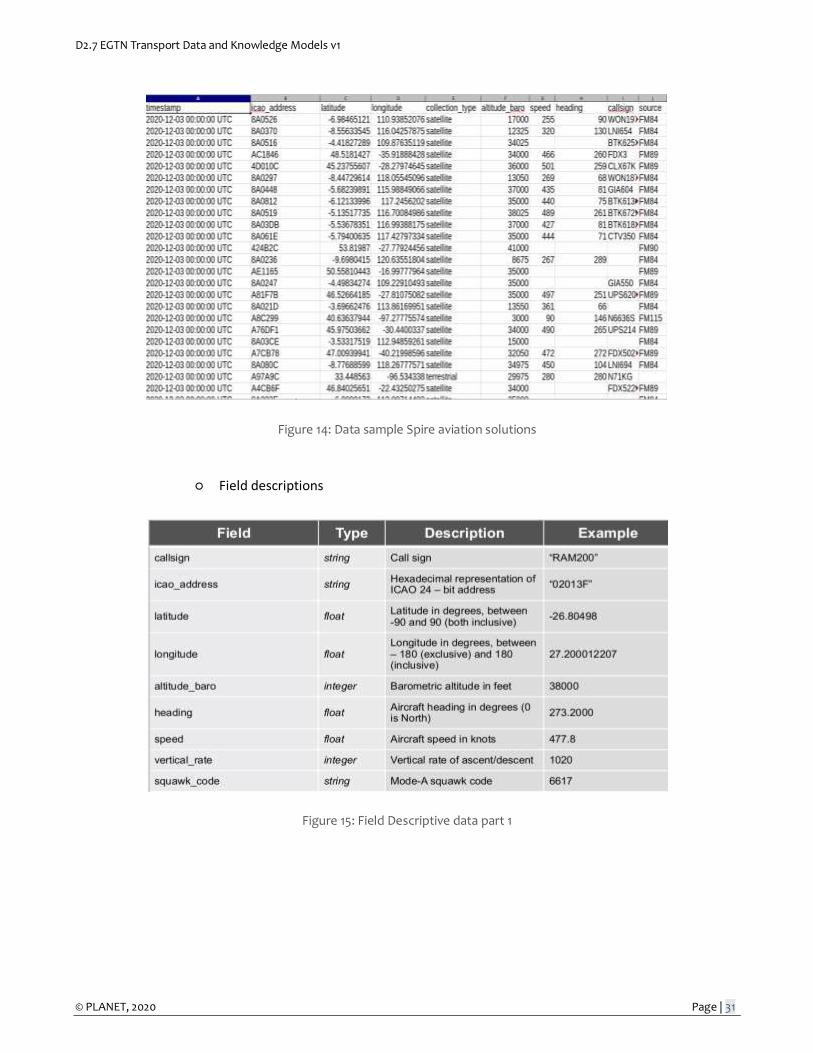
Website: https://spire.com/aviation/get-started/
● Worldwide flights
○ 24-hour period – global coverage
○ Satellite and terrestrial based tracking
○ Downsampled to 15 mins between position updates
○ Data Sample:
D2.7 EGTN Transport Data and Knowledge Models v1
© PLANET, 2020 Page | 31
Figure 14: Data sample Spire aviation solutions
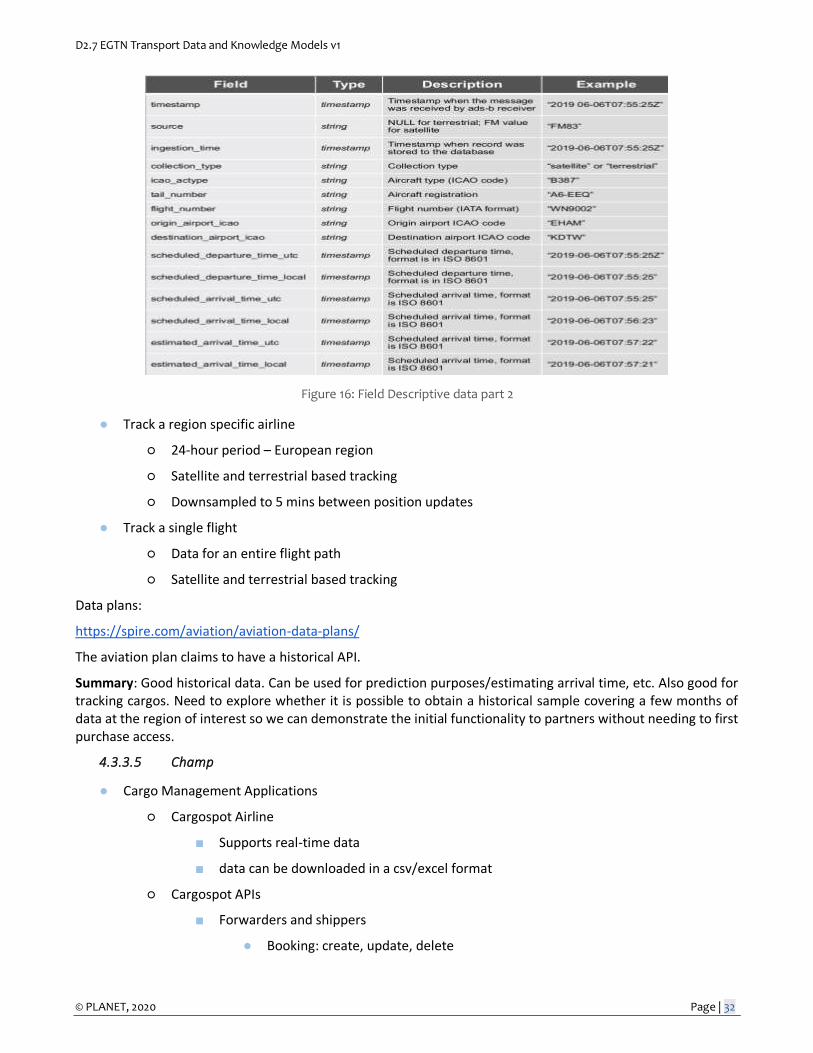
○ Field descriptions
Figure 15: Field Descriptive data part 1
D2.7 EGTN Transport Data and Knowledge Models v1
© PLANET, 2020 Page | 32
Figure 16: Field Descriptive data part 2
● Track a region specific airline
○ 24-hour period – European region
○ Satellite and terrestrial based tracking
○ Downsampled to 5 mins between position updates
● Track a single flight
○ Data for an entire flight path
○ Satellite and terrestrial based tracking
Data plans:
https://spire.com/aviation/aviation-data-plans/
The aviation plan claims to have a historical API.
Summary: Good historical data. Can be used for prediction purposes/estimating arrival time, etc. Also good for tracking cargos. Need to explore whether it is possible to obtain a historical sample covering a few months of data at the region of interest so we can demonstrate the initial functionality to partners without needing to first purchase access.
4.3.3.5 Champ
● Cargo Management Applications
○ Cargospot Airline
■ Supports real-time data
■ data can be downloaded in a csv/excel format
○ Cargospot APIs
■ Forwarders and shippers
● Booking: create, update, delete
D2.7 EGTN Transport Data and Knowledge Models v1
© PLANET, 2020 Page | 33
● Compute shipment price
● view agent invoice
● List allotments
● List contracts
● Print barcode label
● Track & Trace
■ Warehouse
● Check-in shipment
● Pick-up shipment from warehouse
● Accept shipment
● Offload container
● Buildup flight
● Manifest flight
● Accept container
● Check-in container
The APIs provide data for the air cargo supply chain.
● Weight & Balance
○ A powerful tool for advanced load planning. Designed with a freighter aircraft in mind to make your aircraft loading more efficient, cut costs and make maximum use of available space.
● Cargospot Revenue
○ Cargo revenue accounting system that’s fully integrated with our other solutions to help you enhance productivity, improve cash flow and boost billing performance.
Summary:
The data seems to be very promising and offers every single step related to the whole supply chain. However in order for data samples and pricing to be received/estimated, one should contact and negotiate with the sales team. Good place to start if looking for a specific movement from the supply chain or the whole.
4.3.3.6 Conclusion
There’s plenty of resources for different use cases. Probably the best overall is ‘Champ’ and one should start with it since it offers data for operations about the whole supply chain. However, regarding historical and forecast data, Spire is also a very good resource offering plane tracking and ETAs. Another useful source is IATA, where you can find data about the cargo import and export between countries.
4.4 Timetable and Actual Itinerary Data
As identified by multiple use cases, there is a need to model available transportation routes in order to support decision making for routing and planning. This allows the kind of analysis
D2.7 EGTN Transport Data and Knowledge Models v1
© PLANET, 2020 Page | 34
4.4.1 Relevant Standards and Ontologies
Semantic representation of route data is a common challenge that has been implemented with a large selection of ontologies. There are many aspects of the problem and some ontologies go into great detail and support routing decisions on the micro level. Some noteworthy ontologies are briefly discussed below:
● SWEET (Semantic Web for Earth and Environmental Terminology) ○ an ontology for Earth system science ○ includes several thousand terms, spanning a broad extent of Earth system science ○ too large and specific for our identified use case
● Towntology ○ a project started in 2002, including two French laboratories named LIRIS and EDU ○ focused on urban planning which is not actually relevant to PLANET use cases
● Open GIS Consortium (OGC) ontology ○ basis for the GeoSPARQL standard which is the preferred way for querying geospatial data in
semantic formats ○ definitely want to use it for location and area representation
● Geographic Data Format (GDF) standard ○ file exchange format for geographic data ○ alternative to GIS ○ used in automotive navigation systems, fleet management, dispatch management, road traffic
analysis, traffic management, and automatic vehicle location ○ very promising but need to identify a small subset to integrate in our model
● Ontology of Transportation Systems (OTN) ○ formalized ontology based on GDF standard ○ explicitly models railways, airports and other modes of interest ○ support for tying in weather data and possibly extreme weather events
The conclusion of the analysis of available datasets is that OTN present the best fit to our current needs. It is capable of covering at least rail and air transport which are the two currently confirmed use cases for route modeling. There is also an opportunity to extend coverage to marine, road and even micro-level city route descriptions.
4.4.2 China-Poland Route
The rail corridor for transporting goods from China to Poland is one of the major use case focuses of Living Lab 3. Extensive exploration of available datasets confirmed that unfortunately not only is there no single dataset that covers the whole desired area but actually there is virtually no public information for several countries that the corridor passes through.
Instead of trying to combine a large number of individual sources into a single dataset that only partially and imperfectly covers the requirements of the use case, we decided to work on building our own. To that end through significant assistance from our partners at RSUUS, we created a description of the China-Poland route with corresponding approximations for transit time, timetables and train composition.
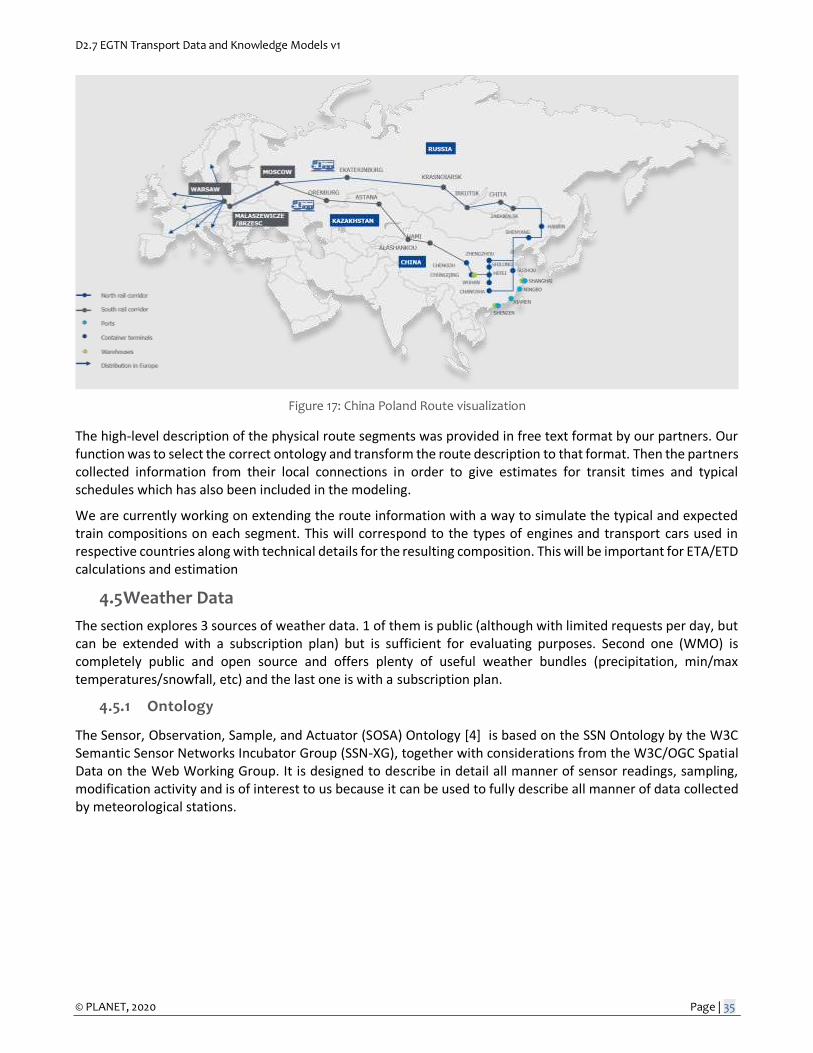
D2.7 EGTN Transport Data and Knowledge Models v1
© PLANET, 2020 Page | 35
Figure 17: China Poland Route visualization
The high-level description of the physical route segments was provided in free text format by our partners. Our function was to select the correct ontology and transform the route description to that format. Then the partners collected information from their local connections in order to give estimates for transit times and typical schedules which has also been included in the modeling.
We are currently working on extending the route information with a way to simulate the typical and expected train compositions on each segment. This will correspond to the types of engines and transport cars used in respective countries along with technical details for the resulting composition. This will be important for ETA/ETD calculations and estimation
4.5 Weather Data
The section explores 3 sources of weather data. 1 of them is public (although with limited requests per day, but can be extended with a subscription plan) but is sufficient for evaluating purposes. Second one (WMO) is completely public and open source and offers plenty of useful weather bundles (precipitation, min/max temperatures/snowfall, etc) and the last one is with a subscription plan.
4.5.1 Ontology
The Sensor, Observation, Sample, and Actuator (SOSA) Ontology [4] is based on the SSN Ontology by the W3C Semantic Sensor Networks Incubator Group (SSN-XG), together with considerations from the W3C/OGC Spatial Data on the Web Working Group. It is designed to describe in detail all manner of sensor readings, sampling, modification activity and is of interest to us because it can be used to fully describe all manner of data collected by meteorological stations.
D2.7 EGTN Transport Data and Knowledge Models v1
© PLANET, 2020 Page | 36
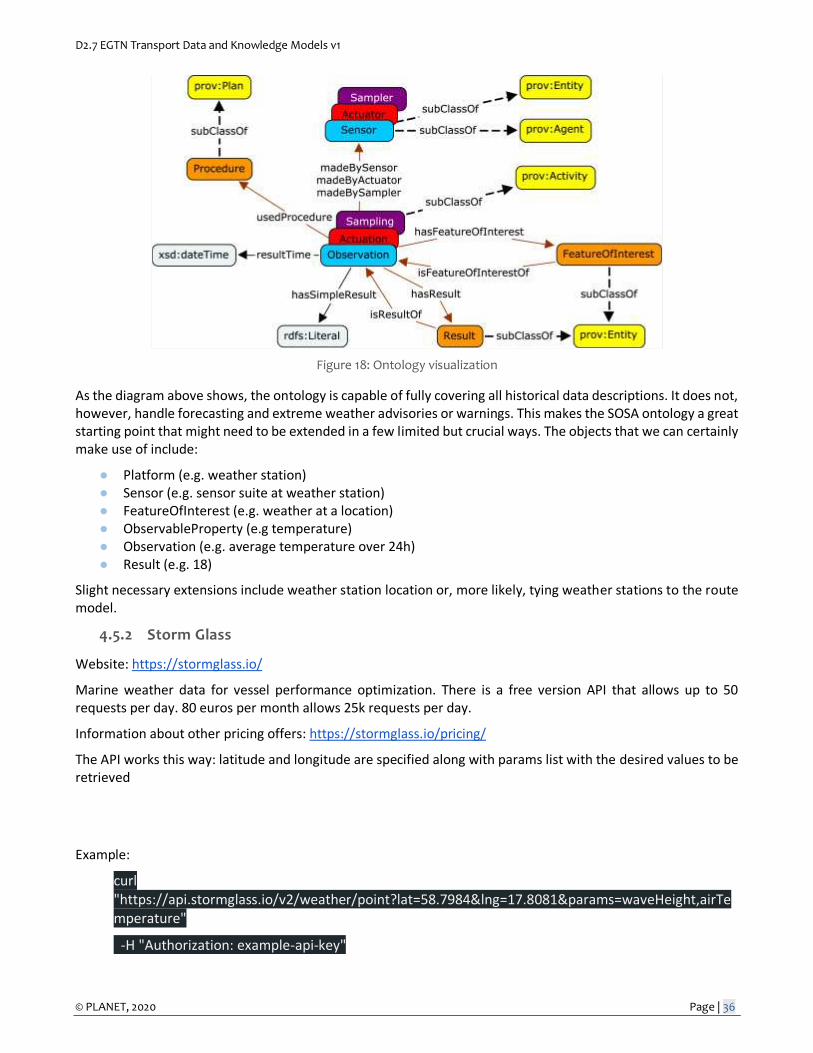
Figure 18: Ontology visualization
As the diagram above shows, the ontology is capable of fully covering all historical data descriptions. It does not, however, handle forecasting and extreme weather advisories or warnings. This makes the SOSA ontology a great starting point that might need to be extended in a few limited but crucial ways. The objects that we can certainly make use of include:
● Platform (e.g. weather station) ● Sensor (e.g. sensor suite at weather station) ● FeatureOfInterest (e.g. weather at a location) ● ObservableProperty (e.g temperature) ● Observation (e.g. average temperature over 24h) ● Result (e.g. 18)
Slight necessary extensions include weather station location or, more likely, tying weather stations to the route model.
4.5.2 Storm Glass
Website: https://stormglass.io/
Marine weather data for vessel performance optimization. There is a free version API that allows up to 50 requests per day. 80 euros per month allows 25k requests per day.
Information about other pricing offers: https://stormglass.io/pricing/
The API works this way: latitude and longitude are specified along with params list with the desired values to be retrieved
Example:
curl "https://api.stormglass.io/v2/weather/point?lat=58.7984&lng=17.8081¶ms=waveHeight,airTemperature"
-H "Authorization: example-api-key"
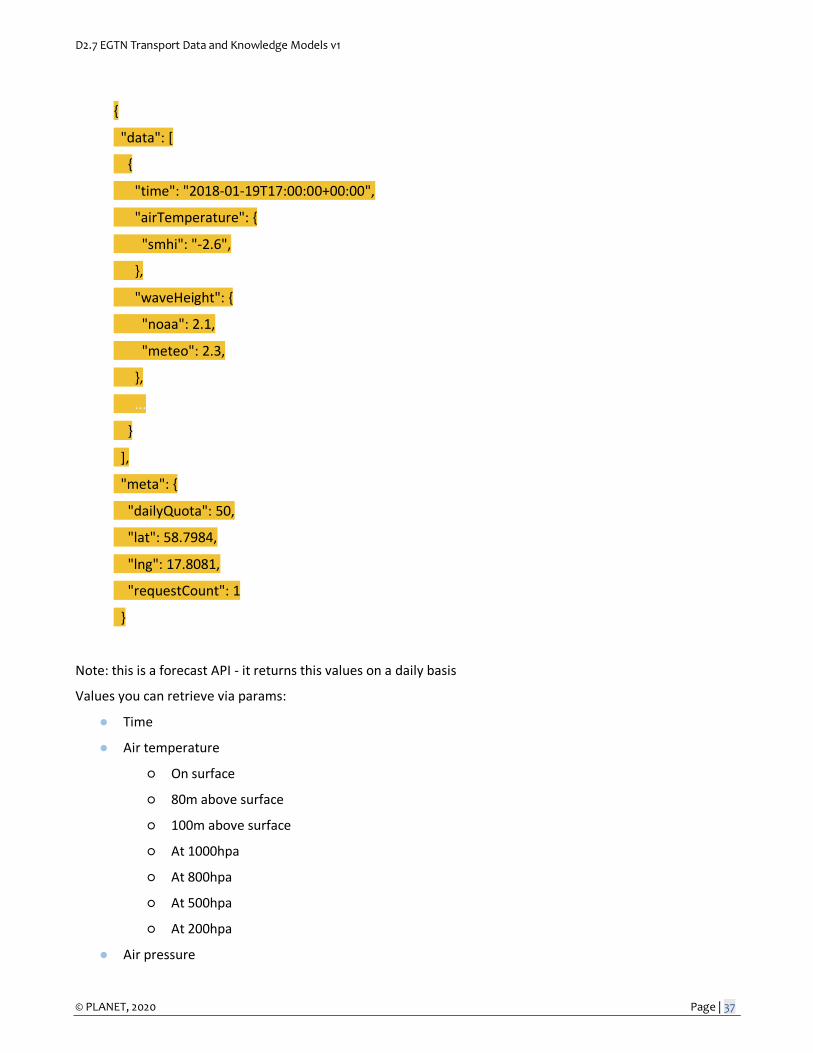
D2.7 EGTN Transport Data and Knowledge Models v1
© PLANET, 2020 Page | 37
{
"data": [
{
"time": "2018-01-19T17:00:00+00:00",
"airTemperature": {
"smhi": "-2.6",
},
"waveHeight": {
"noaa": 2.1,
"meteo": 2.3,
},
...
}
],
"meta": {
"dailyQuota": 50,
"lat": 58.7984,
"lng": 17.8081,
"requestCount": 1
}
Note: this is a forecast API - it returns this values on a daily basis
Values you can retrieve via params:
● Time
● Air temperature
○ On surface
○ 80m above surface
○ 100m above surface
○ At 1000hpa
○ At 800hpa
○ At 500hpa
○ At 200hpa
● Air pressure
D2.7 EGTN Transport Data and Knowledge Models v1
© PLANET, 2020 Page | 38
● Cloud cover
● Current direction
● Current speed
● Wind gust
● Humidity
● Ice cover
● Precipitation
● Snow Depth
● Sea level
● Swell
○ Height
○ Period
○ Secondary Period
○ Secondary Direction
○ Secondary Height
● Visibility
● Water Temperature
● Wave
○ Direction
○ Height
○ Period
○ Wind wave direction, height and period
● Wind direction
○ At ground level
○ At 20m height
○ At 30m height
○ At 40m height
○ At 50m height
The same data providers also offer a historical API - just set the start and end parameter but the maximum length of the response will be 10 days from start.
Summary: The API is rich enough with many parameters. It is free and for forecast data it is a good place to start. Maybe the forecast period (10 days) will be insufficient for some purposes but it depends on the use case.
4.5.3 World Meteorological Organization
Source: https://climatedata-catalogue.wmo.int/explore

D2.7 EGTN Transport Data and Knowledge Models v1
© PLANET, 2020 Page | 39
Station data and climate indices available on a daily/monthly/annual time series.
Variables available:
● precipitation ● average/minimum/maximum temperature ● snowfall ● snow depth
The search works by providing ‘station with a name containing’. Stations nearby and in the region can also
be filtered. After that, a number of years of historical data is selected.
Example:
Searching for stations that contain ‘Valencia’ as a name with a precipitation having at least 1 year if historical data, this can be found:
VALENCIA (Spain)
coordinates: 39.48N, 0.37E, 11.0m
GHCN-D station code: SP000008416
WMO station: 8285
Found 85 years of data in 1937-2021
Figure 19: Histogram - Precipitation
A histogram showing precipitation [mm/day] for the range of years specified.
The time series can be manipulated:
D2.7 EGTN Transport Data and Knowledge Models v1
© PLANET, 2020 Page | 40
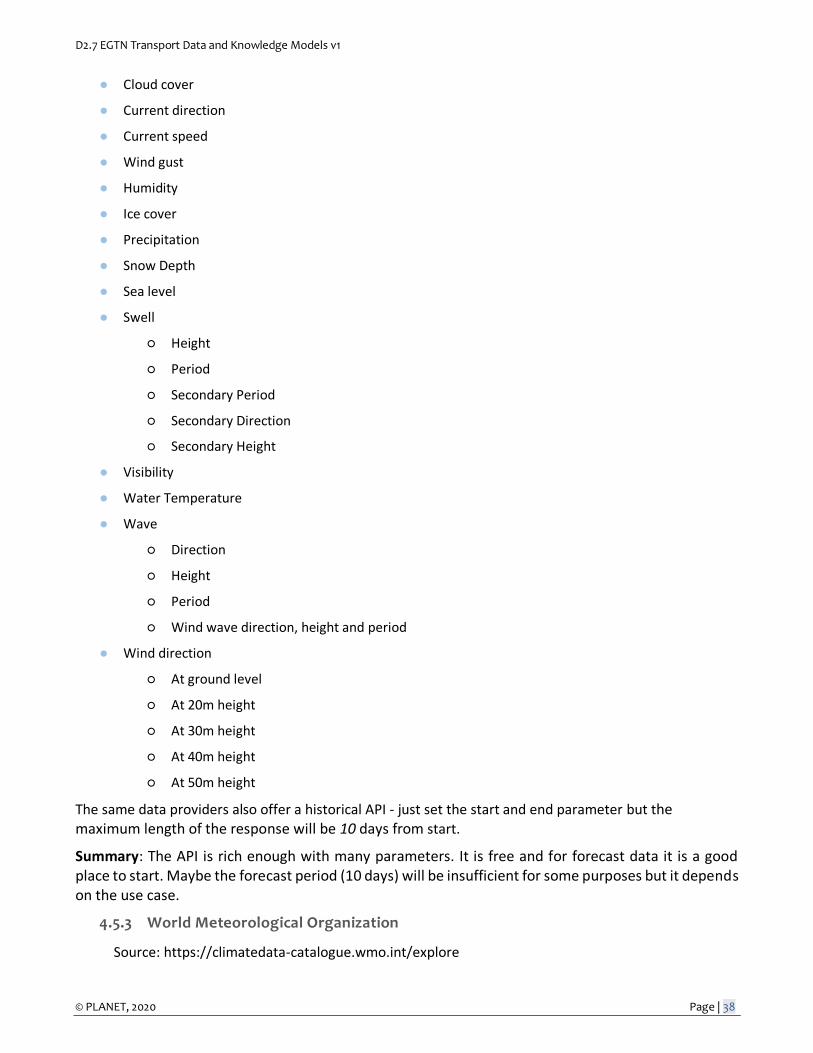
Figure 20: Time series options
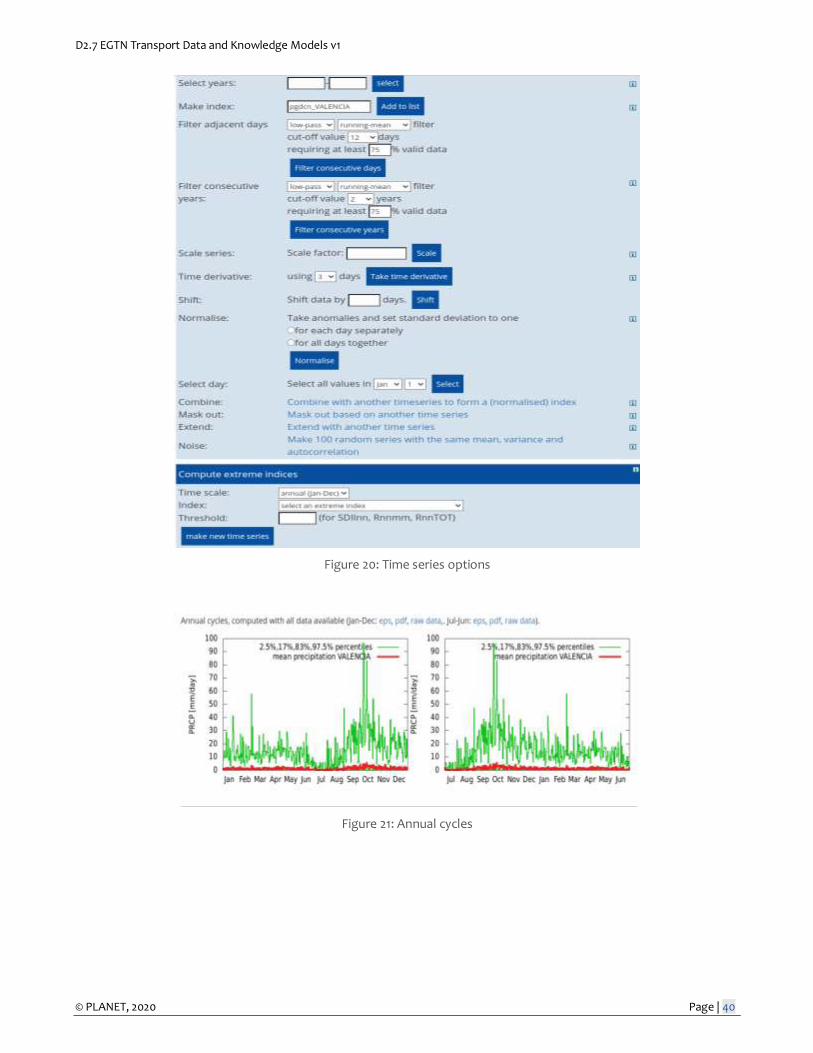
Figure 21: Annual cycles
D2.7 EGTN Transport Data and Knowledge Models v1
© PLANET, 2020 Page | 41
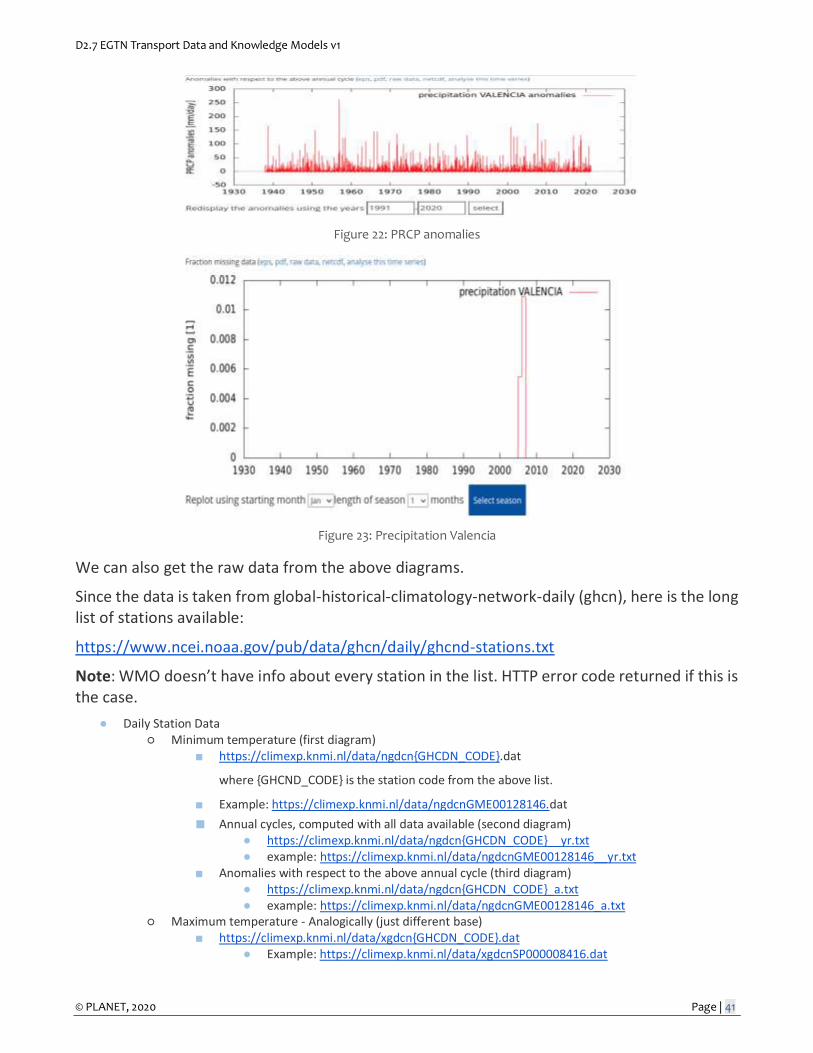
Figure 22: PRCP anomalies
Figure 23: Precipitation Valencia
We can also get the raw data from the above diagrams.
Since the data is taken from global-historical-climatology-network-daily (ghcn), here is the long list of stations available:
https://www.ncei.noaa.gov/pub/data/ghcn/daily/ghcnd-stations.txt
Note: WMO doesn’t have info about every station in the list. HTTP error code returned if this is the case.
● Daily Station Data ○ Minimum temperature (first diagram)
■ https://climexp.knmi.nl/data/ngdcn{GHCDN_CODE}.dat
where {GHCND_CODE} is the station code from the above list.
■ Example: https://climexp.knmi.nl/data/ngdcnGME00128146.dat
■ Annual cycles, computed with all data available (second diagram) ● https://climexp.knmi.nl/data/ngdcn{GHCDN_CODE}__yr.txt ● example: https://climexp.knmi.nl/data/ngdcnGME00128146__yr.txt
■ Anomalies with respect to the above annual cycle (third diagram) ● https://climexp.knmi.nl/data/ngdcn{GHCDN_CODE}_a.txt ● example: https://climexp.knmi.nl/data/ngdcnGME00128146_a.txt
○ Maximum temperature - Analogically (just different base) ■ https://climexp.knmi.nl/data/xgdcn{GHCDN_CODE}.dat
● Example: https://climexp.knmi.nl/data/xgdcnSP000008416.dat

D2.7 EGTN Transport Data and Knowledge Models v1
© PLANET, 2020 Page | 42
■ Annual cycles, computed with all data available (second diagram) ● https://climexp.knmi.nl/data/xgdcnSP000008416__yr.txt
■ Anomalies with respect to the above annual cycle (third diagram) ● https://climexp.knmi.nl/data/xgdcnSP000008416_a.txt
○ Precipitation ■ https://climexp.knmi.nl/data/pgdcn{CHCND_CODE}.dat
● https://climexp.knmi.nl/data/pgdcnRSM00027612.dat ■ https://climexp.knmi.nl/data/pgdcn{CHCND_CODE}_yr.txt
● https://climexp.knmi.nl/data/pgdcnRSM00027612__yr.txt ■ https://climexp.knmi.nl/data/pgdcn{CHCND_CODE}_a.txt
● https://climexp.knmi.nl/data/pgdcnRSM00027612_a.txt
Other Variables - Analogically
Summary: This is a good source overall. Many parameters, variables and options are available. Queries can be automated using the links above. A good place to start if we are looking for particular historical data.
4.5.4 Spire
Spire leverages satellite technology to forecast the weather and track maritime and aviation related operations.
In particular, Spire provides the following weather bundles:
● Core variables
○ Temperature
○ Dew Point temperature
○ Relative humidity
○ Wind speed & direction
○ Wind gust speed
○ Maximum Wind Gust Speed
○ Mean sea-level pressure
○ Total Precipitation
○ Min and Max temperature
○ Cloud cover
● Precipitation Variables:
○ Precipitation Type
○ Maximum Precipitation Rate
○ Total Snowfall
○ Snow Depth
● Thunderstorm Variables
○ CAPE
○ CIN
Data Formats: GRIB (for global or large areas) and JSON (for specific coordinates or small areas)
Offers both Historical & Forecast data
D2.7 EGTN Transport Data and Knowledge Models v1
© PLANET, 2020 Page | 43
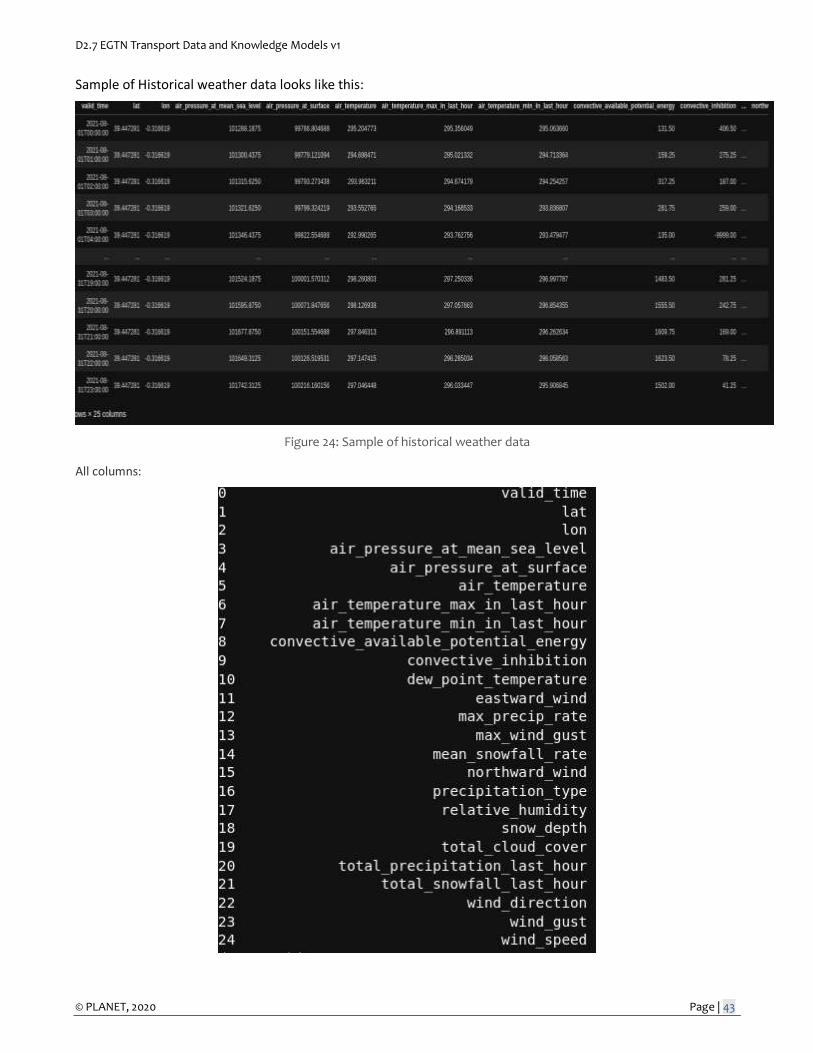
Sample of Historical weather data looks like this:
Figure 24: Sample of historical weather data
All columns:
D2.7 EGTN Transport Data and Knowledge Models v1
© PLANET, 2020 Page | 44
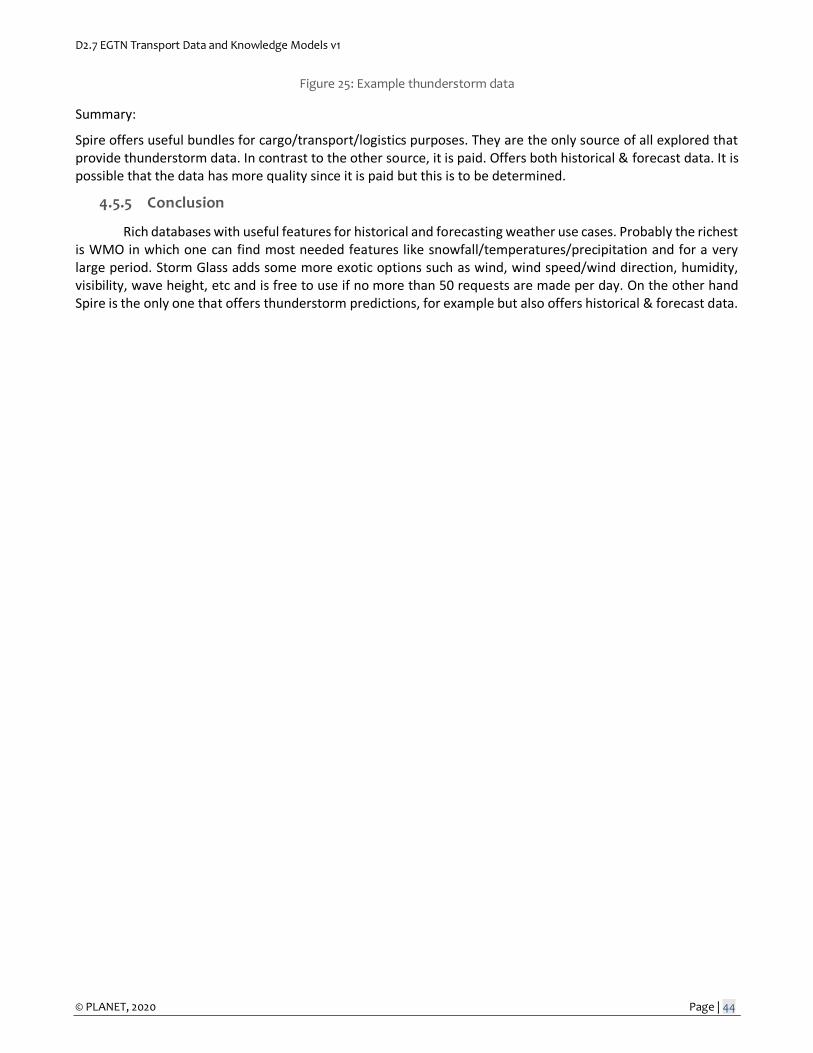
Figure 25: Example thunderstorm data
Summary:
Spire offers useful bundles for cargo/transport/logistics purposes. They are the only source of all explored that provide thunderstorm data. In contrast to the other source, it is paid. Offers both historical & forecast data. It is possible that the data has more quality since it is paid but this is to be determined.
4.5.5 Conclusion
Rich databases with useful features for historical and forecasting weather use cases. Probably the richest is WMO in which one can find most needed features like snowfall/temperatures/precipitation and for a very large period. Storm Glass adds some more exotic options such as wind, wind speed/wind direction, humidity, visibility, wave height, etc and is free to use if no more than 50 requests are made per day. On the other hand Spire is the only one that offers thunderstorm predictions, for example but also offers historical & forecast data.
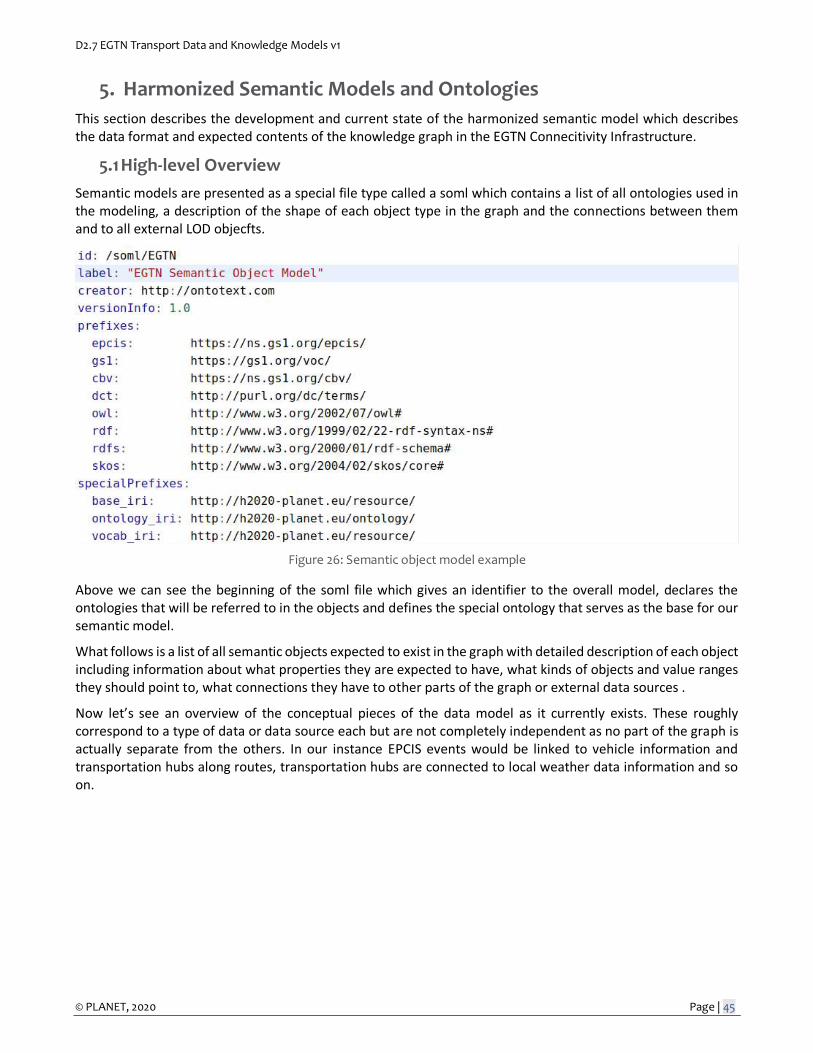
D2.7 EGTN Transport Data and Knowledge Models v1
© PLANET, 2020 Page | 45
5. Harmonized Semantic Models and Ontologies
This section describes the development and current state of the harmonized semantic model which describes the data format and expected contents of the knowledge graph in the EGTN Connecitivity Infrastructure.
5.1 High-level Overview
Semantic models are presented as a special file type called a soml which contains a list of all ontologies used in the modeling, a description of the shape of each object type in the graph and the connections between them and to all external LOD objecfts.
Figure 26: Semantic object model example
Above we can see the beginning of the soml file which gives an identifier to the overall model, declares the ontologies that will be referred to in the objects and defines the special ontology that serves as the base for our semantic model.
What follows is a list of all semantic objects expected to exist in the graph with detailed description of each object including information about what properties they are expected to have, what kinds of objects and value ranges they should point to, what connections they have to other parts of the graph or external data sources .
Now let’s see an overview of the conceptual pieces of the data model as it currently exists. These roughly correspond to a type of data or data source each but are not completely independent as no part of the graph is actually separate from the others. In our instance EPCIS events would be linked to vehicle information and transportation hubs along routes, transportation hubs are connected to local weather data information and so on.
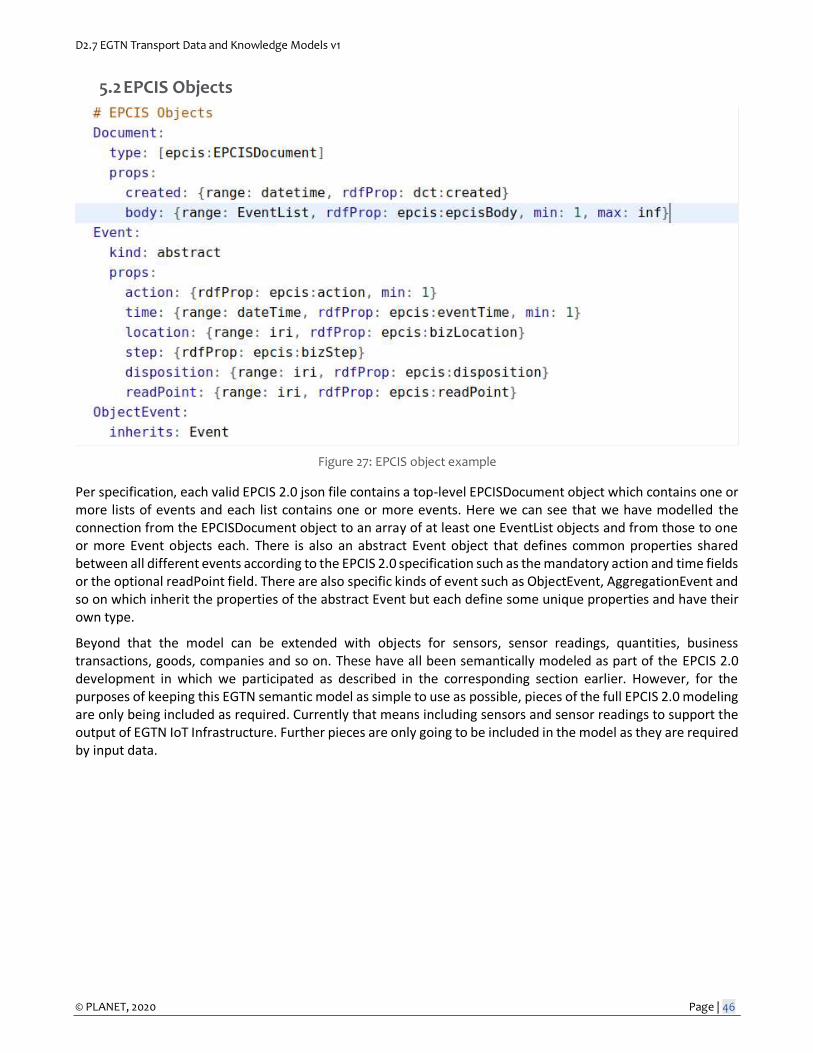
D2.7 EGTN Transport Data and Knowledge Models v1
© PLANET, 2020 Page | 46
5.2 EPCIS Objects
Figure 27: EPCIS object example
Per specification, each valid EPCIS 2.0 json file contains a top-level EPCISDocument object which contains one or more lists of events and each list contains one or more events. Here we can see that we have modelled the connection from the EPCISDocument object to an array of at least one EventList objects and from those to one or more Event objects each. There is also an abstract Event object that defines common properties shared between all different events according to the EPCIS 2.0 specification such as the mandatory action and time fields or the optional readPoint field. There are also specific kinds of event such as ObjectEvent, AggregationEvent and so on which inherit the properties of the abstract Event but each define some unique properties and have their own type.
Beyond that the model can be extended with objects for sensors, sensor readings, quantities, business transactions, goods, companies and so on. These have all been semantically modeled as part of the EPCIS 2.0 development in which we participated as described in the corresponding section earlier. However, for the purposes of keeping this EGTN semantic model as simple to use as possible, pieces of the full EPCIS 2.0 modeling are only being included as required. Currently that means including sensors and sensor readings to support the output of EGTN IoT Infrastructure. Further pieces are only going to be included in the model as they are required by input data.
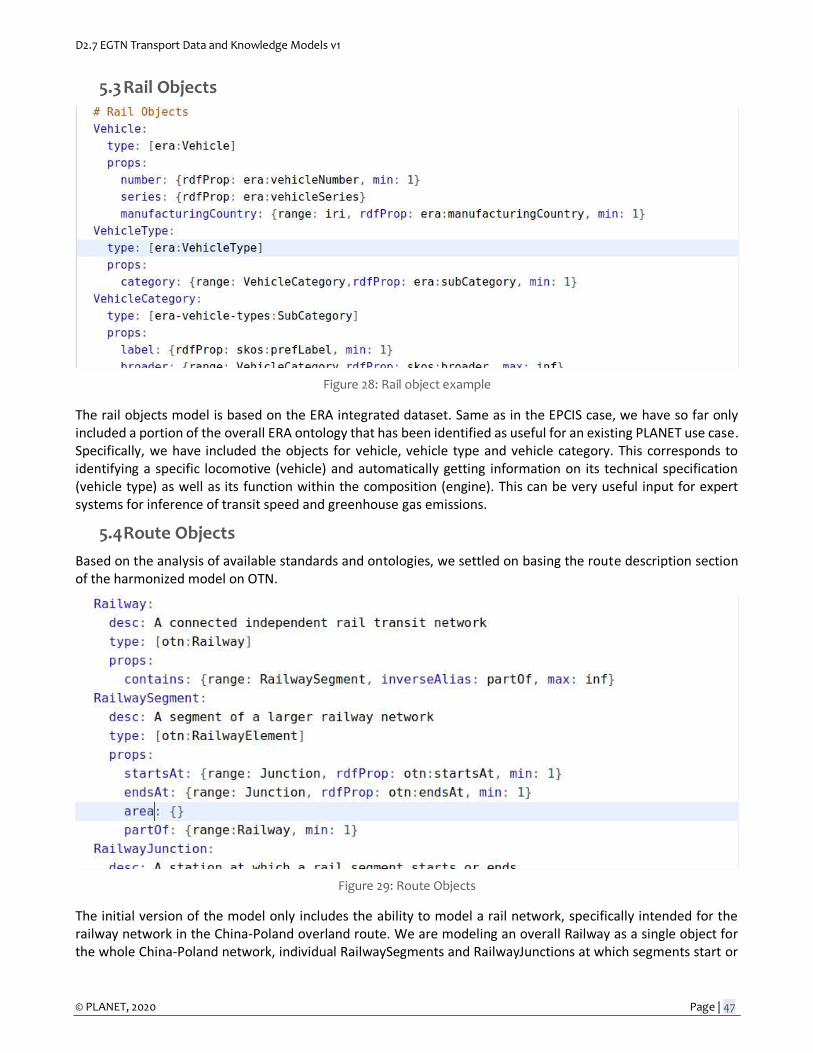
D2.7 EGTN Transport Data and Knowledge Models v1
© PLANET, 2020 Page | 47
5.3 Rail Objects
Figure 28: Rail object example
The rail objects model is based on the ERA integrated dataset. Same as in the EPCIS case, we have so far only included a portion of the overall ERA ontology that has been identified as useful for an existing PLANET use case. Specifically, we have included the objects for vehicle, vehicle type and vehicle category. This corresponds to identifying a specific locomotive (vehicle) and automatically getting information on its technical specification (vehicle type) as well as its function within the composition (engine). This can be very useful input for expert systems for inference of transit speed and greenhouse gas emissions.
5.4 Route Objects
Based on the analysis of available standards and ontologies, we settled on basing the route description section of the harmonized model on OTN.
Figure 29: Route Objects
The initial version of the model only includes the ability to model a rail network, specifically intended for the railway network in the China-Poland overland route. We are modeling an overall Railway as a single object for the whole China-Poland network, individual RailwaySegments and RailwayJunctions at which segments start or
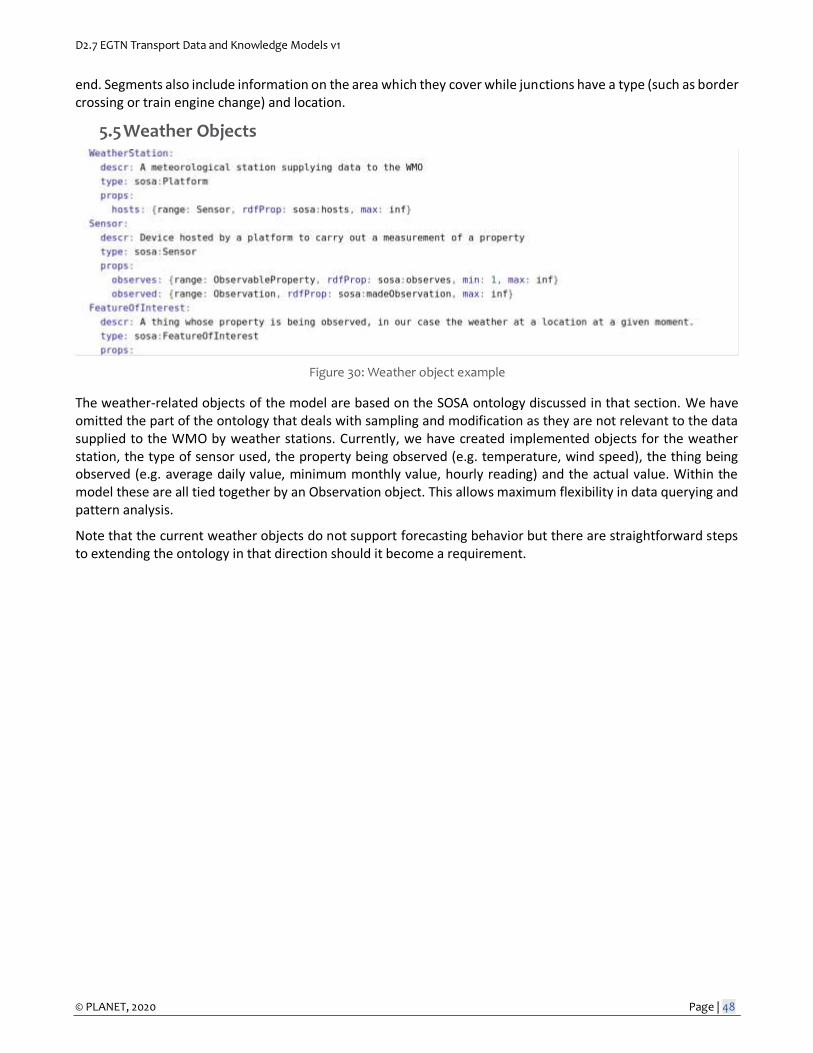
D2.7 EGTN Transport Data and Knowledge Models v1
© PLANET, 2020 Page | 48
end. Segments also include information on the area which they cover while junctions have a type (such as border crossing or train engine change) and location.
5.5 Weather Objects
Figure 30: Weather object example
The weather-related objects of the model are based on the SOSA ontology discussed in that section. We have omitted the part of the ontology that deals with sampling and modification as they are not relevant to the data supplied to the WMO by weather stations. Currently, we have created implemented objects for the weather station, the type of sensor used, the property being observed (e.g. temperature, wind speed), the thing being observed (e.g. average daily value, minimum monthly value, hourly reading) and the actual value. Within the model these are all tied together by an Observation object. This allows maximum flexibility in data querying and pattern analysis.
Note that the current weather objects do not support forecasting behavior but there are straightforward steps to extending the ontology in that direction should it become a requirement.
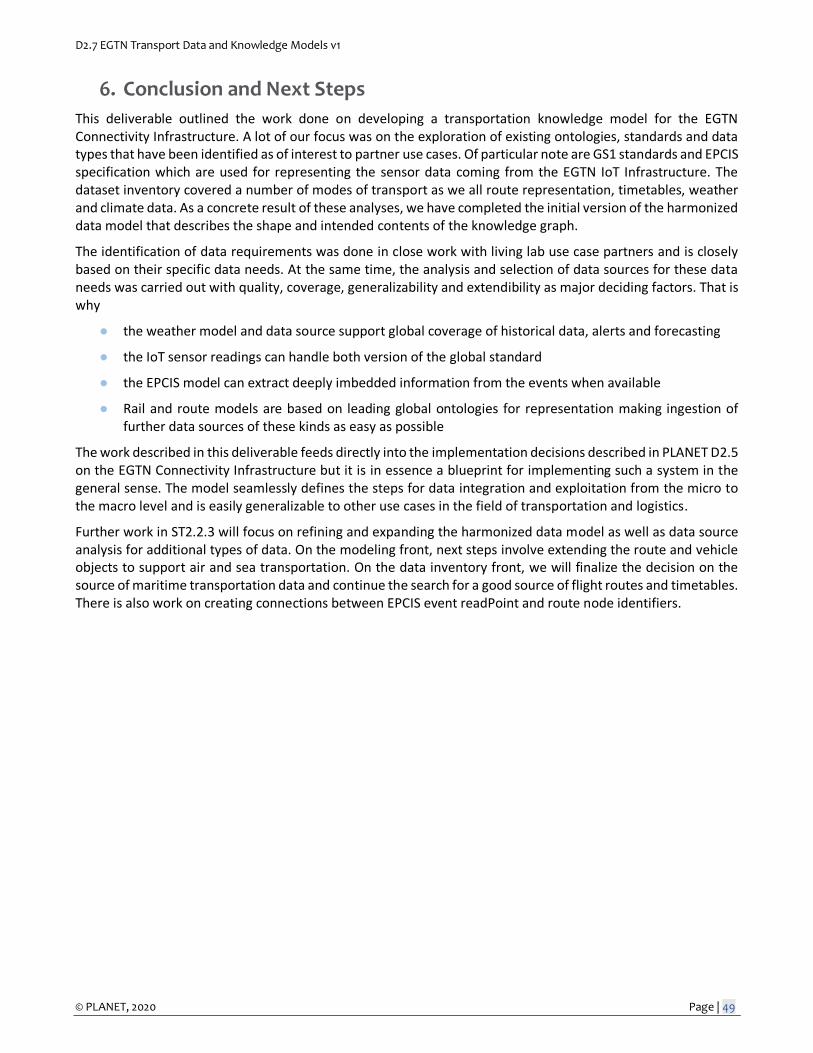
D2.7 EGTN Transport Data and Knowledge Models v1
© PLANET, 2020 Page | 49
6. Conclusion and Next Steps
This deliverable outlined the work done on developing a transportation knowledge model for the EGTN Connectivity Infrastructure. A lot of our focus was on the exploration of existing ontologies, standards and data types that have been identified as of interest to partner use cases. Of particular note are GS1 standards and EPCIS specification which are used for representing the sensor data coming from the EGTN IoT Infrastructure. The dataset inventory covered a number of modes of transport as we all route representation, timetables, weather and climate data. As a concrete result of these analyses, we have completed the initial version of the harmonized data model that describes the shape and intended contents of the knowledge graph.
The identification of data requirements was done in close work with living lab use case partners and is closely based on their specific data needs. At the same time, the analysis and selection of data sources for these data needs was carried out with quality, coverage, generalizability and extendibility as major deciding factors. That is why
● the weather model and data source support global coverage of historical data, alerts and forecasting
● the IoT sensor readings can handle both version of the global standard
● the EPCIS model can extract deeply imbedded information from the events when available
● Rail and route models are based on leading global ontologies for representation making ingestion of further data sources of these kinds as easy as possible
The work described in this deliverable feeds directly into the implementation decisions described in PLANET D2.5 on the EGTN Connectivity Infrastructure but it is in essence a blueprint for implementing such a system in the general sense. The model seamlessly defines the steps for data integration and exploitation from the micro to the macro level and is easily generalizable to other use cases in the field of transportation and logistics.
Further work in ST2.2.3 will focus on refining and expanding the harmonized data model as well as data source analysis for additional types of data. On the modeling front, next steps involve extending the route and vehicle objects to support air and sea transportation. On the data inventory front, we will finalize the decision on the source of maritime transportation data and continue the search for a good source of flight routes and timetables. There is also work on creating connections between EPCIS event readPoint and route node identifiers.
D2.7 EGTN Transport Data and Knowledge Models v1
© PLANET, 2020 Page | 50
7. References
[1] Efficient and privacy-enhanced object traceability based on unified and linked EPCIS events https://www.sciencedirect.com/science/article/abs/pii/S016636151630135X
[2] RFID in Rail: European Guideline for the Identification of Railway Assets using GS1 Standards
[3] European Union Agency for Railways Report: Data and digitalization Phase 2 - Linked data mainstreaming
[4] SOSA: A lightweight ontology for sensors, observations, samples, and actuatorshttps://www.sciencedirect.com/science/article/abs/pii/S1570826818300295
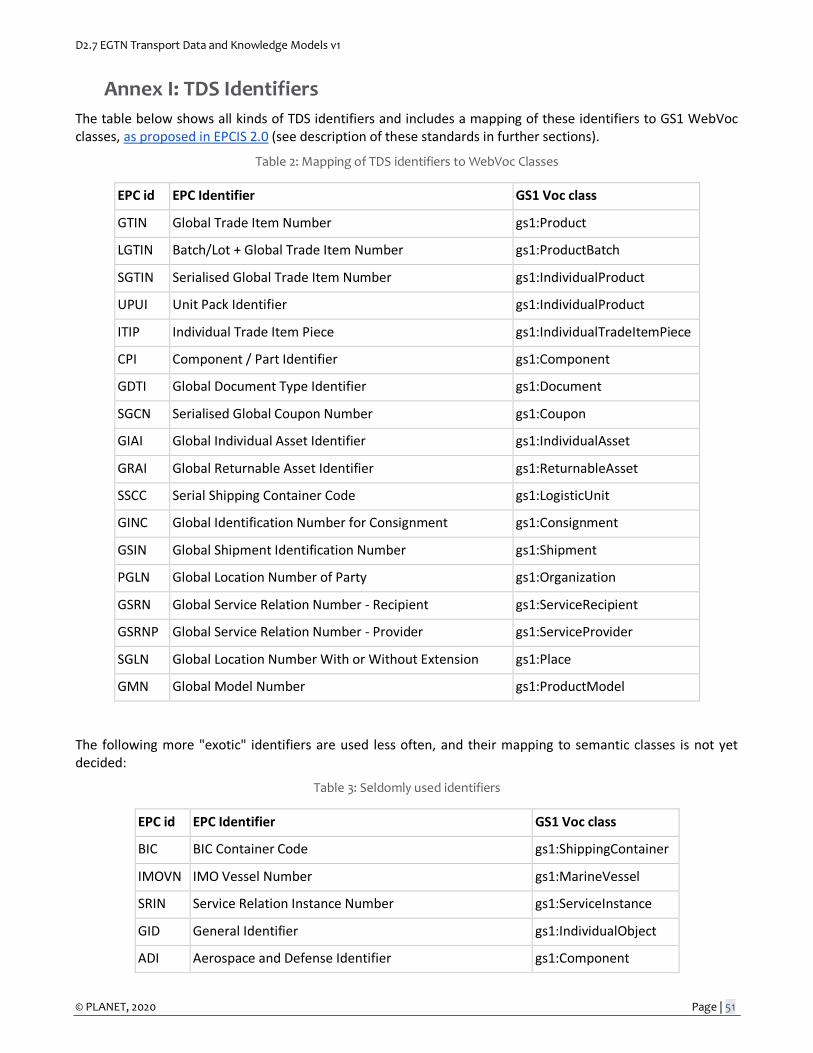
D2.7 EGTN Transport Data and Knowledge Models v1
© PLANET, 2020 Page | 51
Annex I: TDS Identifiers
The table below shows all kinds of TDS identifiers and includes a mapping of these identifiers to GS1 WebVoc classes, as proposed in EPCIS 2.0 (see description of these standards in further sections).
Table 2: Mapping of TDS identifiers to WebVoc Classes
EPC id EPC Identifier GS1 Voc class
GTIN Global Trade Item Number gs1:Product
LGTIN Batch/Lot + Global Trade Item Number gs1:ProductBatch
SGTIN Serialised Global Trade Item Number gs1:IndividualProduct
UPUI Unit Pack Identifier gs1:IndividualProduct
ITIP Individual Trade Item Piece gs1:IndividualTradeItemPiece
CPI Component / Part Identifier gs1:Component
GDTI Global Document Type Identifier gs1:Document
SGCN Serialised Global Coupon Number gs1:Coupon
GIAI Global Individual Asset Identifier gs1:IndividualAsset
GRAI Global Returnable Asset Identifier gs1:ReturnableAsset
SSCC Serial Shipping Container Code gs1:LogisticUnit
GINC Global Identification Number for Consignment gs1:Consignment
GSIN Global Shipment Identification Number gs1:Shipment
PGLN Global Location Number of Party gs1:Organization
GSRN Global Service Relation Number - Recipient gs1:ServiceRecipient
GSRNP Global Service Relation Number - Provider gs1:ServiceProvider
SGLN Global Location Number With or Without Extension gs1:Place
GMN Global Model Number gs1:ProductModel
The following more "exotic" identifiers are used less often, and their mapping to semantic classes is not yet decided:
Table 3: Seldomly used identifiers
EPC id EPC Identifier GS1 Voc class
BIC BIC Container Code gs1:ShippingContainer
IMOVN IMO Vessel Number gs1:MarineVessel
SRIN Service Relation Instance Number gs1:ServiceInstance
GID General Identifier gs1:IndividualObject
ADI Aerospace and Defense Identifier gs1:Component
D2.7 EGTN Transport Data and Knowledge Models v1
© PLANET, 2020 Page | 52
USDOD US Department of Defense Identifier gs1:IndividualObject
Annex I: GPS Structure
GPC has a comprehensive structure consisting of:
● A 4-level hierarchical thesaurus where the levels are named Segment> Family> Class> Brick, consisting of 6,073 items
● An attribute-value system consisting of 13284 items that further qualifies product classes
By using both of these mechanisms we can describe goods or services in a very precise way. For example, "dried and aged testicles of wild Bison" can be described using the following 10 GPC codes:
Segment 50000000 Food/Beverage/ Tobacco Family 50240000 Meat/Poultry/Other Animals Class 50240100 Meat/Poultry/Other Animals - Prepared/Processed Brick 10005768 Bison/Buffalo – Prepared/Processed Attribute Type 20002688 Anatomical Form: Attribute Value 30002433 TESTICLES Attribute Type 20002677 Non-Thermal Preservation: Attribute Value 30013615 DRY AGED Attribute Type 20000163 Source: Attribute Value 30013603 WILD/WILD CAUGHT
SIR has promoted the importing and coreferencing of GPC into Wikidata:
● Property proposal with detailed explanation with examples: https://www.wikidata.org/wiki/Wikidata:Property_proposal/GS1_GPC_brick_code#GPC_Scope_and_Structure
● Wikidata property: https://www.wikidata.org/wiki/Property:P8957 ● Counts as of 18 December 2020:
○ 6,073, applies to part "thesaurus" ○ 13,284, applies to part "Attribute-value system"
● Property examples illustrating all data elements: https://www.wikidata.org/wiki/Property:P8957#P1855 ○ thesaurus (e.g. "television set" that is represented by several thesaurus elements), ○ attributes (e.g. gender, is a remote control included), ○ attribute values (e.g. Baden (geography), female, unisex (gender), etc)
● Conversion script to Wikidata Mix-n-Match TSVs: https://github.com/VladimirAlexiev/gs1-gpc ● Mix-n-Match catalogs:
○ Hierarchical thesaurus: https://mix-n-match.toolforge.org/#/catalog/4062 ○ Attribute Values: https://mix-n-match.toolforge.org/#/catalog/4063
Because Wikidata is an encyclopedic dataset whereas GPC is intended to also represent various trade items (eg "variety packs" and "other" modifications, the mapping is not one-to-one. E.g. all the GPC codes below are mapped to the same Wikidata item television set (Q8075):
68010100 Televisions (GPC class) 10001400 Televisions (GPC brick) 10001405 Televisions Other (GPC brick) 10001403 Televisions Variety Packs (GPC brick)
D2.7 EGTN Transport Data and Knowledge Models v1
© PLANET, 2020 Page | 53
Annex I: GS1 WebVoc
The GS1 Web Vocabulary standard is an ontology with namespace and Linked Data representation at https://www.gs1.org/voc/ (available as RDF Turtle and JSON-LD), usually prefixed as gs1:. The current version is 1.5.1 of 2021-09-22. It is strongly inspired by schema.org (see blog GS1 Web vocabulary: welcoming the first schema.org external extension of 2016-02) and extends it with a large number of trade-specific terms:
● 44 classes such as Product (with subclasses such as Seafood and WearableProduct), Organization, Place, Country, and a number of code lists
● 251 object and 164 datatype properties, such as acceptedPaymentMethod, expirationDate, additionalOrganizationIdentificationTypeValue
● 47 type codes (code lists) such as AllergenTypeCode (for food), UpperTypeCode (for footwear) ● 60 link types for GS1 Digital Link
WebVoc is used by application standards described in further sections: Smart Search, Digital Link, and EPCIS 2.0. It is used in EPCIS 2.0 for the following:
● Semantic classes that correspond to various TDS identifier types ● Enriched CertificationDetails and related properties ● Particular code lists such as MeasurementType (eg Temperature, Mass: for sensor readings) or
NutrientBasisQuantityCode (By Serving, By Measure) ● Master data served as a particular Digital Link type: gs1:masterData
WebVoc issues and suggestions can be made at https://github.com/gs1/WebVoc. SIR has contributed a significant number of issues (see issues created by Vladimir Alexiev), as well as to the first three items in the list above.
Annex I: GS1 Smart Search
GS1 Smart Search is a way to make products and locations visible in search engines. It uses JSONLD markup using WebVoc, allowing search engines to recognize the trade-specific elements of web pages.
● The current version is GS1 SmartSearch standards 1.6. ● The GS1 SmartSearch Implementation Guideline provides best practices for exposing GTIN (product) and
GLN (organization) info on the web. ● The GS1 Web Markup tool is a Smart Search demo that generates JSONLD about retailers, manufacturers
and their products, based on a simple form, using the GS1 WebVoc e.g. below is a simple RDF graph about SIR (Ontotext AD) generated with this tool; the diagram itself is made with SIR's rdfpuml2 tool.
2 RDF by Example: rdfpuml for True RDF Diagrams, rdf2rml for R2RML Generation. Alexiev, V. In Semantic Web in Libraries 2016 (SWIB 2016), Bonn, Germany, November 2016. slides html video
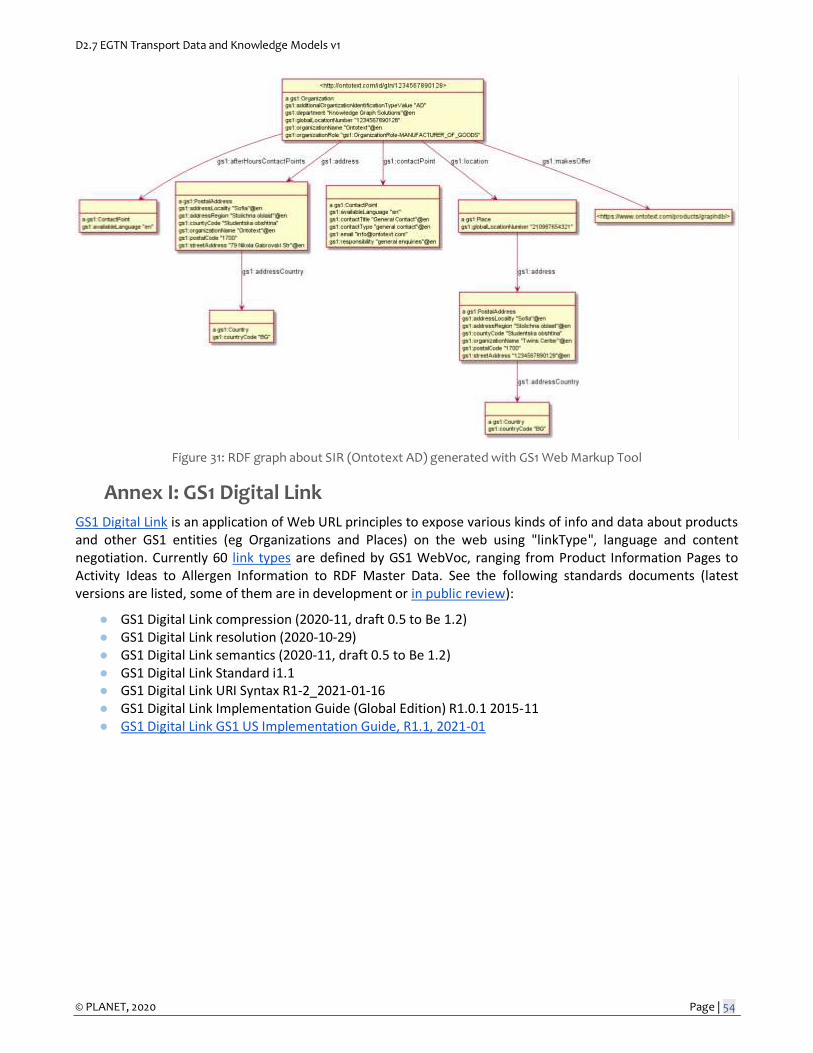
D2.7 EGTN Transport Data and Knowledge Models v1
© PLANET, 2020 Page | 54
Figure 31: RDF graph about SIR (Ontotext AD) generated with GS1 Web Markup Tool
Annex I: GS1 Digital Link
GS1 Digital Link is an application of Web URL principles to expose various kinds of info and data about products and other GS1 entities (eg Organizations and Places) on the web using "linkType", language and content negotiation. Currently 60 link types are defined by GS1 WebVoc, ranging from Product Information Pages to Activity Ideas to Allergen Information to RDF Master Data. See the following standards documents (latest versions are listed, some of them are in development or in public review):
● GS1 Digital Link compression (2020-11, draft 0.5 to Be 1.2) ● GS1 Digital Link resolution (2020-10-29) ● GS1 Digital Link semantics (2020-11, draft 0.5 to Be 1.2) ● GS1 Digital Link Standard i1.1 ● GS1 Digital Link URI Syntax R1-2_2021-01-16 ● GS1 Digital Link Implementation Guide (Global Edition) R1.0.1 2015-11 ● GS1 Digital Link GS1 US Implementation Guide, R1.1, 2021-01
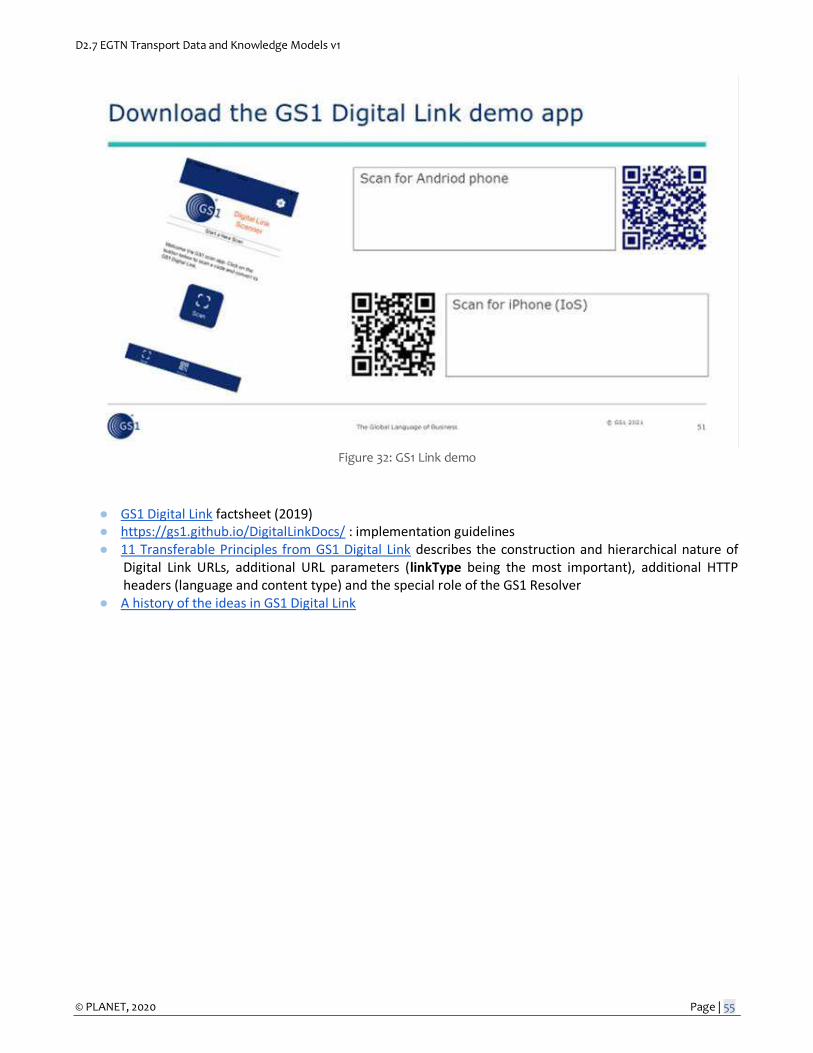
D2.7 EGTN Transport Data and Knowledge Models v1
© PLANET, 2020 Page | 55
Figure 32: GS1 Link demo
● GS1 Digital Link factsheet (2019) ● https://gs1.github.io/DigitalLinkDocs/ : implementation guidelines ● 11 Transferable Principles from GS1 Digital Link describes the construction and hierarchical nature of
Digital Link URLs, additional URL parameters (linkType being the most important), additional HTTP headers (language and content type) and the special role of the GS1 Resolver
● A history of the ideas in GS1 Digital Link
D2.7 EGTN Transport Data and Knowledge Models v1
© PLANET, 2020 Page | 56
Annex I: Technical Artefacts ● The formal text of the standards ● Document EPCIS 2.0 Semantics that describes the EPCIS and CBV ontologies as the vocabularies defining
allowed classes and properties and their meaning (definitions, domains, ranges). It covers the following topics:
○ Availability of these ontologies in various formats through content negotiation ○ An EPCIS ontology diagram ○ The EPCIS and CBV ontologies, in particular class hierarchy and property lists ○ The use of RDFS (Resource Description Framework Schema), OWL (Web Ontology Language),
and schema.org constructs in these ontologies ○ Mapping of different TDS identifier kinds to RDF classes ○ EPCIS interplay with other GS1 semantic standards: GS1 Web Vocabulary and GS1 Digital Link ○ Special semantic topics: validation, inference, named graphs
● A sheet with proposed: ○ Mapping of EPC/TDS identifiers to GS1 WebVoc classes ○ Additions to GS1 class hierarchy
● GitHub resources: ○ XSD: XML schema ○ XSL: up-conversion from 1.2 to 2.0 and down-conversion from 2.0 to 1.2 ○ XML: 36 XML examples ○ REST Bindings: EPCIS service APIs using the OpenApi Specifications 3.01 ○ JSON-Schema: to check validity of JSON files ○ epcis-context.jsonld and epcis-context-simple.jsonld: JSONLD context to convert JSON to RDF:
two independently developed variants, allowing cross-check of context quality, will be merged later
○ JSON, JSON-simple-context: 54 JSON examples (pairs that use the two context variants) ○ Ontology: EPCIS and CBV ontologies and RDF SHACL shapes (the latter are still in development) ○ Turtle, Turtle-simple-context: 49 RDF Turtle examples made automatically from the JSON
examples (pairs that use the two context variants) ○ Turtle-diff: difference ○ Diagrams: 56 example RDF diagrams automatically generated from JSON-simple-context, then
Turtle-simple-context, using SAI's rdfpuml tool (part of https://github.com/VladimirAlexiev/rdf2rml). Some sensor examples:
● SensorDataExample17.png shows readings of 3 Mass values (in KGM), further qualified by a custom property "feature", eg product (net) vs packaging (tare) vs total (gross) weight
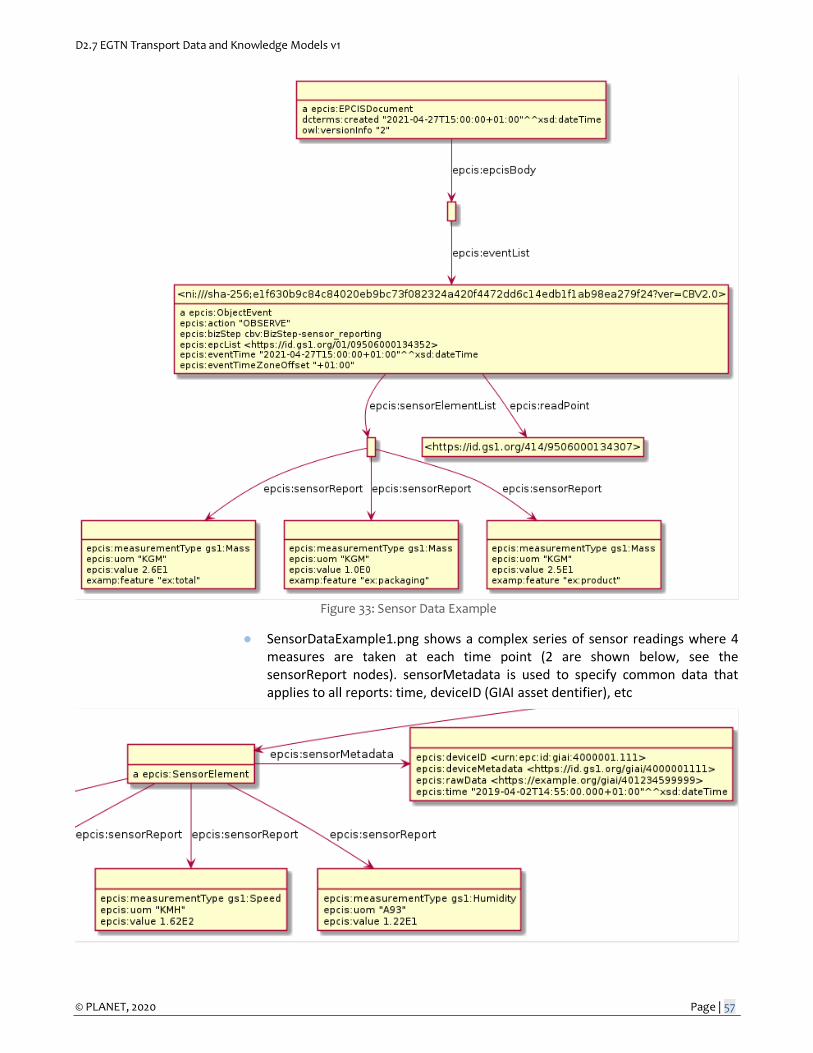
D2.7 EGTN Transport Data and Knowledge Models v1
© PLANET, 2020 Page | 57
Figure 33: Sensor Data Example
● SensorDataExample1.png shows a complex series of sensor readings where 4 measures are taken at each time point (2 are shown below, see the sensorReport nodes). sensorMetadata is used to specify common data that applies to all reports: time, deviceID (GIAI asset dentifier), etc
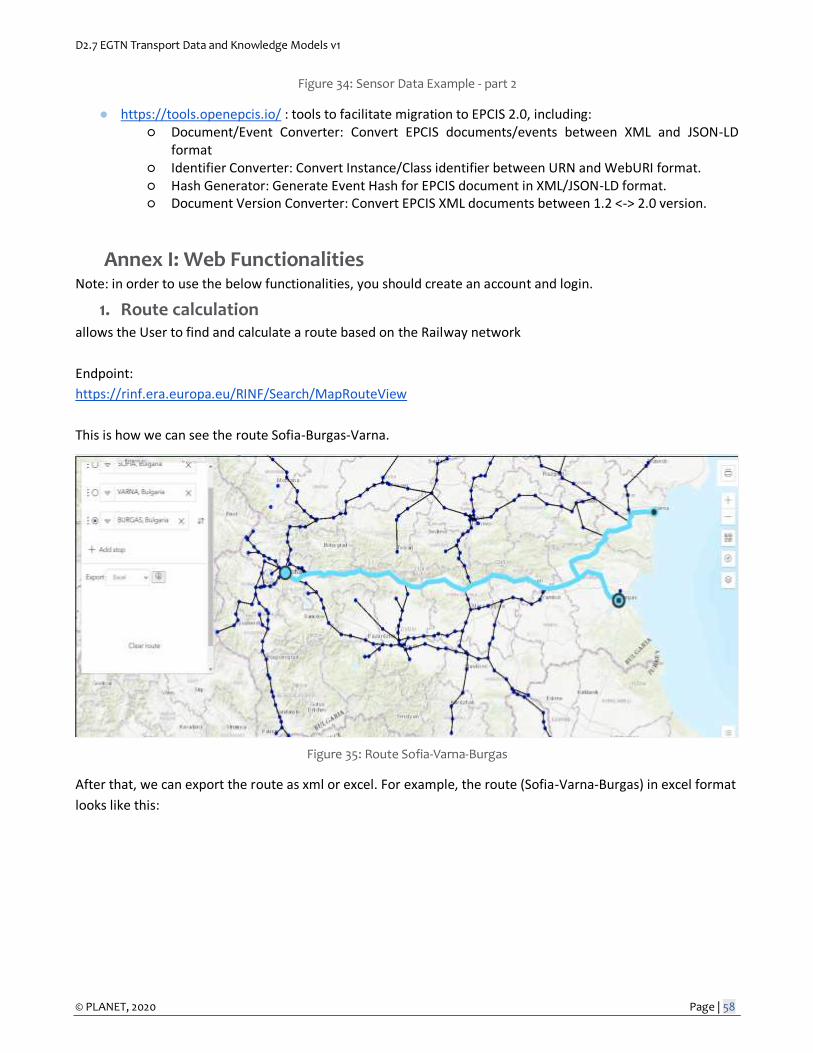
D2.7 EGTN Transport Data and Knowledge Models v1
© PLANET, 2020 Page | 58
Figure 34: Sensor Data Example - part 2
● https://tools.openepcis.io/ : tools to facilitate migration to EPCIS 2.0, including: ○ Document/Event Converter: Convert EPCIS documents/events between XML and JSON-LD
format ○ Identifier Converter: Convert Instance/Class identifier between URN and WebURI format. ○ Hash Generator: Generate Event Hash for EPCIS document in XML/JSON-LD format. ○ Document Version Converter: Convert EPCIS XML documents between 1.2 <-> 2.0 version.
Annex I: Web Functionalities Note: in order to use the below functionalities, you should create an account and login.
1. Route calculation allows the User to find and calculate a route based on the Railway network
Endpoint:
https://rinf.era.europa.eu/RINF/Search/MapRouteView
This is how we can see the route Sofia-Burgas-Varna.
Figure 35: Route Sofia-Varna-Burgas
After that, we can export the route as xml or excel. For example, the route (Sofia-Varna-Burgas) in excel format
looks like this:
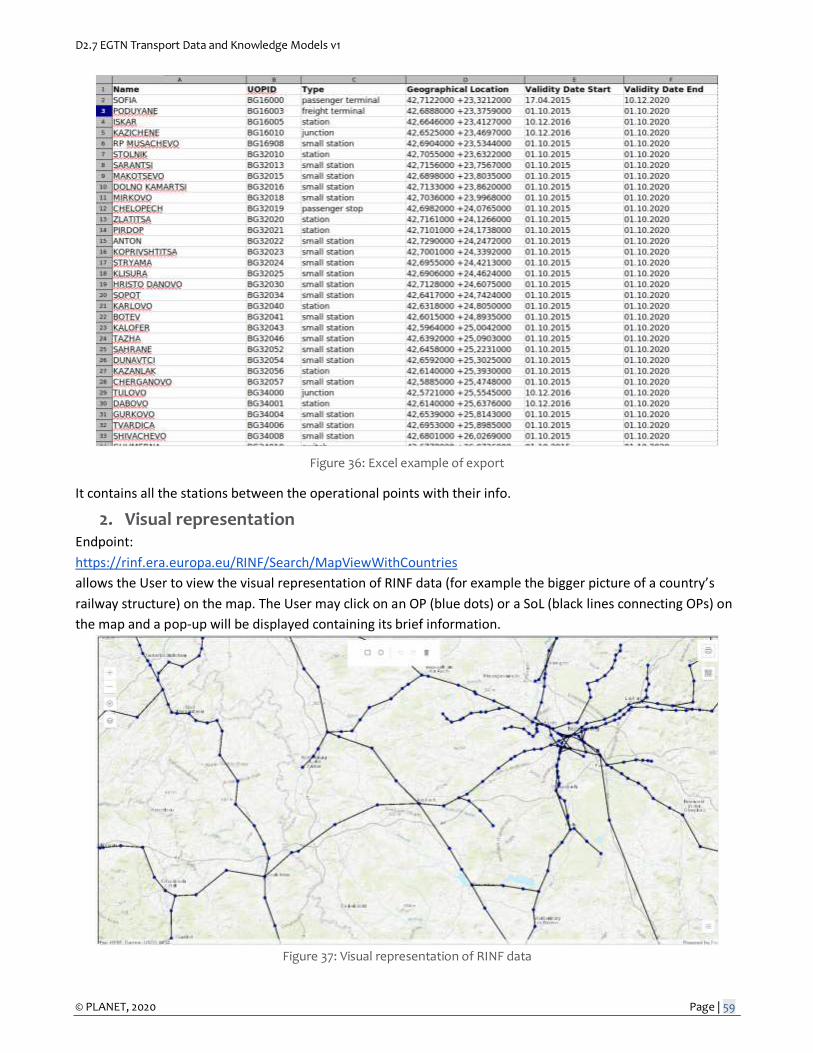
D2.7 EGTN Transport Data and Knowledge Models v1
© PLANET, 2020 Page | 59
Figure 36: Excel example of export
It contains all the stations between the operational points with their info.
2. Visual representation Endpoint:
https://rinf.era.europa.eu/RINF/Search/MapViewWithCountries
allows the User to view the visual representation of RINF data (for example the bigger picture of a country’s
railway structure) on the map. The User may click on an OP (blue dots) or a SoL (black lines connecting OPs) on
the map and a pop-up will be displayed containing its brief information.
Figure 37: Visual representation of RINF data
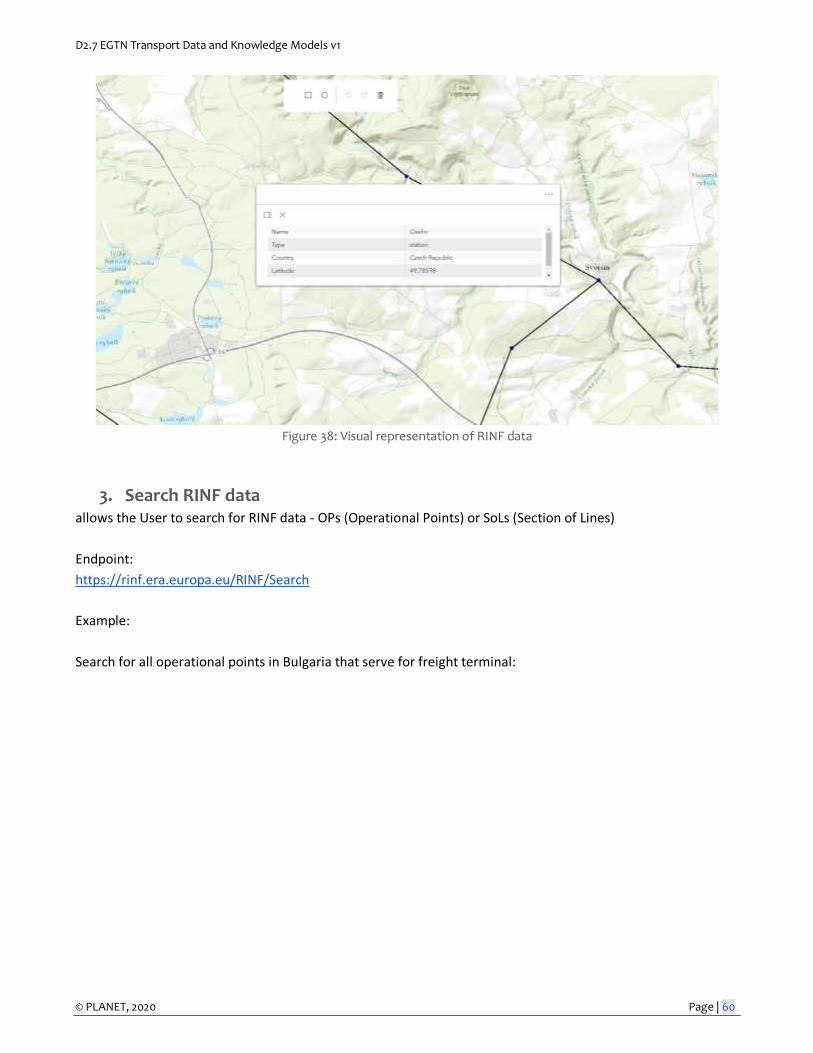
D2.7 EGTN Transport Data and Knowledge Models v1
© PLANET, 2020 Page | 60
Figure 38: Visual representation of RINF data
3. Search RINF data allows the User to search for RINF data - OPs (Operational Points) or SoLs (Section of Lines)
Endpoint:
https://rinf.era.europa.eu/RINF/Search
Example:
Search for all operational points in Bulgaria that serve for freight terminal:
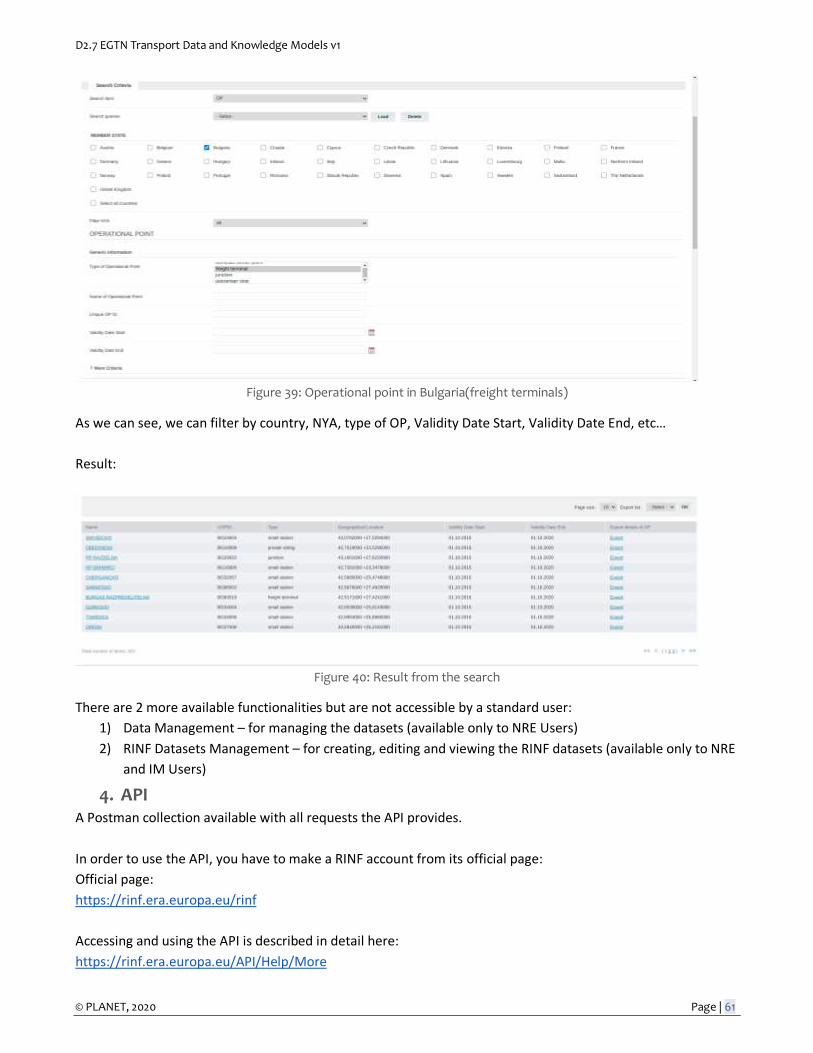
D2.7 EGTN Transport Data and Knowledge Models v1
© PLANET, 2020 Page | 61
Figure 39: Operational point in Bulgaria(freight terminals)
As we can see, we can filter by country, NYA, type of OP, Validity Date Start, Validity Date End, etc…
Result:
Figure 40: Result from the search
There are 2 more available functionalities but are not accessible by a standard user:
1) Data Management – for managing the datasets (available only to NRE Users)
2) RINF Datasets Management – for creating, editing and viewing the RINF datasets (available only to NRE
and IM Users)
4. API A Postman collection available with all requests the API provides.
In order to use the API, you have to make a RINF account from its official page:
Official page:
https://rinf.era.europa.eu/rinf
Accessing and using the API is described in detail here:
https://rinf.era.europa.eu/API/Help/More
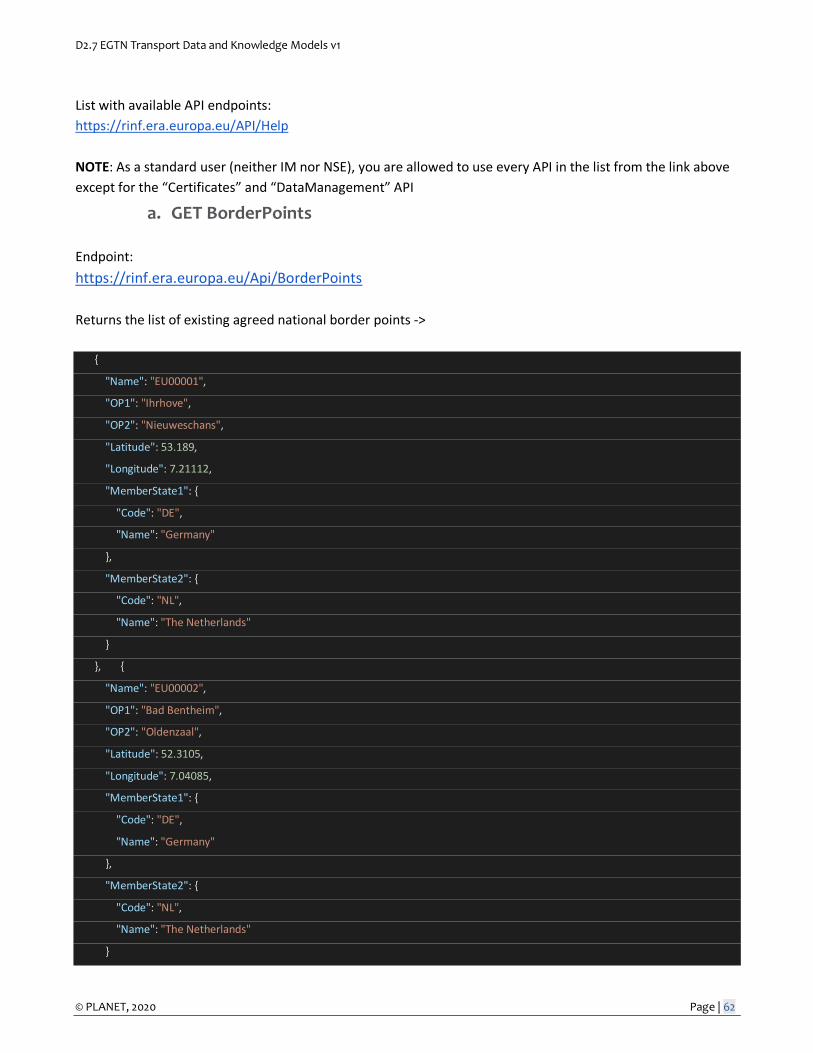
D2.7 EGTN Transport Data and Knowledge Models v1
© PLANET, 2020 Page | 62
List with available API endpoints:
https://rinf.era.europa.eu/API/Help
NOTE: As a standard user (neither IM nor NSE), you are allowed to use every API in the list from the link above
except for the “Certificates” and “DataManagement” API
a. GET BorderPoints
Endpoint:
https://rinf.era.europa.eu/Api/BorderPoints
Returns the list of existing agreed national border points ->
{
"Name": "EU00001",
"OP1": "Ihrhove",
"OP2": "Nieuweschans",
"Latitude": 53.189,
"Longitude": 7.21112,
"MemberState1": {
"Code": "DE",
"Name": "Germany"
},
"MemberState2": {
"Code": "NL",
"Name": "The Netherlands"
}
}, {
"Name": "EU00002",
"OP1": "Bad Bentheim",
"OP2": "Oldenzaal",
"Latitude": 52.3105,
"Longitude": 7.04085,
"MemberState1": {
"Code": "DE",
"Name": "Germany"
},
"MemberState2": {
"Code": "NL",
"Name": "The Netherlands"
}
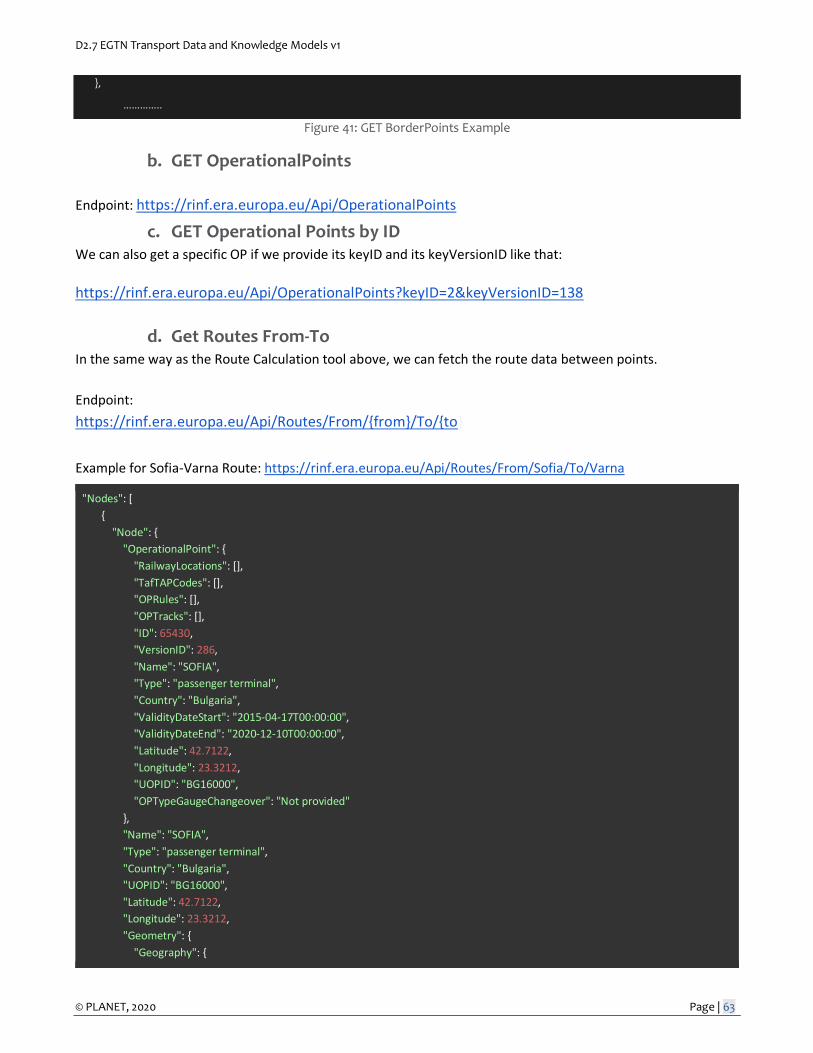
D2.7 EGTN Transport Data and Knowledge Models v1
© PLANET, 2020 Page | 63
},
…………..
Figure 41: GET BorderPoints Example
b. GET OperationalPoints
Endpoint: https://rinf.era.europa.eu/Api/OperationalPoints
c. GET Operational Points by ID We can also get a specific OP if we provide its keyID and its keyVersionID like that:
https://rinf.era.europa.eu/Api/OperationalPoints?keyID=2&keyVersionID=138
d. Get Routes From-To In the same way as the Route Calculation tool above, we can fetch the route data between points.
Endpoint:
https://rinf.era.europa.eu/Api/Routes/From/{from}/To/{to}
Example for Sofia-Varna Route: https://rinf.era.europa.eu/Api/Routes/From/Sofia/To/Varna
"Nodes": [
{
"Node": {
"OperationalPoint": {
"RailwayLocations": [],
"TafTAPCodes": [],
"OPRules": [],
"OPTracks": [],
"ID": 65430,
"VersionID": 286,
"Name": "SOFIA",
"Type": "passenger terminal",
"Country": "Bulgaria",
"ValidityDateStart": "2015-04-17T00:00:00",
"ValidityDateEnd": "2020-12-10T00:00:00",
"Latitude": 42.7122,
"Longitude": 23.3212,
"UOPID": "BG16000",
"OPTypeGaugeChangeover": "Not provided"
},
"Name": "SOFIA",
"Type": "passenger terminal",
"Country": "Bulgaria",
"UOPID": "BG16000",
"Latitude": 42.7122,
"Longitude": 23.3212,
"Geometry": {
"Geography": {
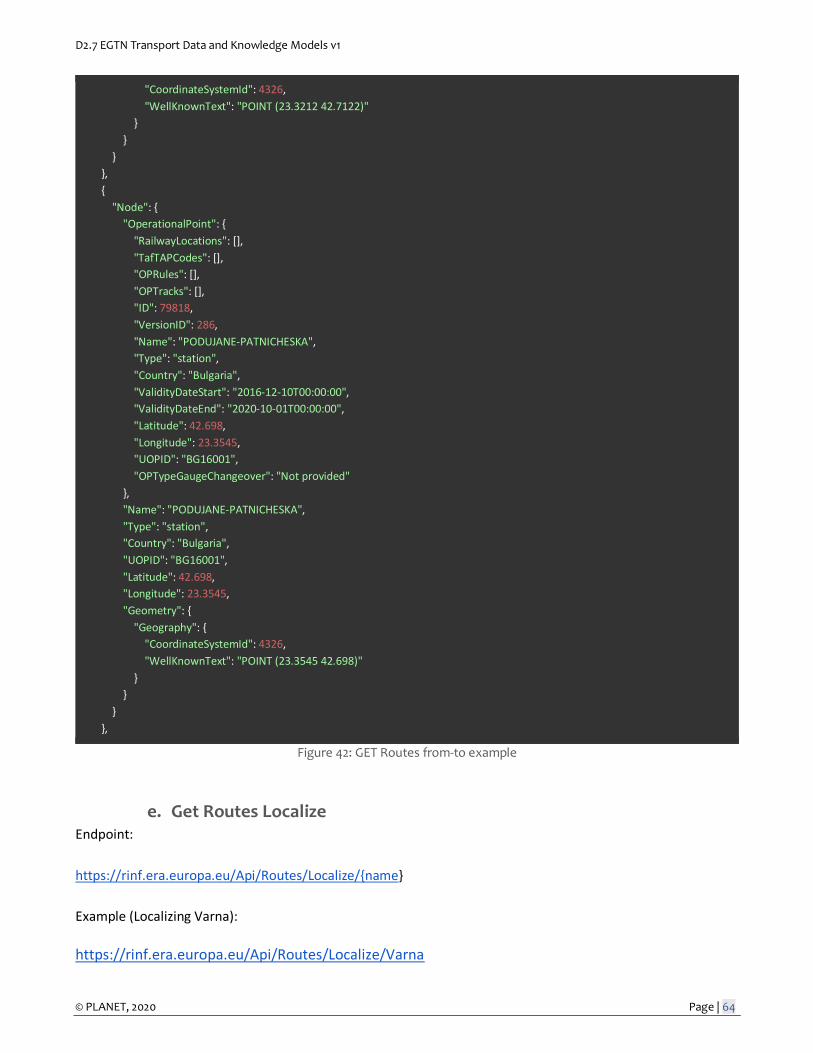
D2.7 EGTN Transport Data and Knowledge Models v1
© PLANET, 2020 Page | 64
"CoordinateSystemId": 4326,
"WellKnownText": "POINT (23.3212 42.7122)"
}
}
}
},
{
"Node": {
"OperationalPoint": {
"RailwayLocations": [],
"TafTAPCodes": [],
"OPRules": [],
"OPTracks": [],
"ID": 79818,
"VersionID": 286,
"Name": "PODUJANE-PATNICHESKA",
"Type": "station",
"Country": "Bulgaria",
"ValidityDateStart": "2016-12-10T00:00:00",
"ValidityDateEnd": "2020-10-01T00:00:00",
"Latitude": 42.698,
"Longitude": 23.3545,
"UOPID": "BG16001",
"OPTypeGaugeChangeover": "Not provided"
},
"Name": "PODUJANE-PATNICHESKA",
"Type": "station",
"Country": "Bulgaria",
"UOPID": "BG16001",
"Latitude": 42.698,
"Longitude": 23.3545,
"Geometry": {
"Geography": {
"CoordinateSystemId": 4326,
"WellKnownText": "POINT (23.3545 42.698)"
}
}
}
},
Figure 42: GET Routes from-to example
e. Get Routes Localize Endpoint:
https://rinf.era.europa.eu/Api/Routes/Localize/{name}
Example (Localizing Varna):
https://rinf.era.europa.eu/Api/Routes/Localize/Varna
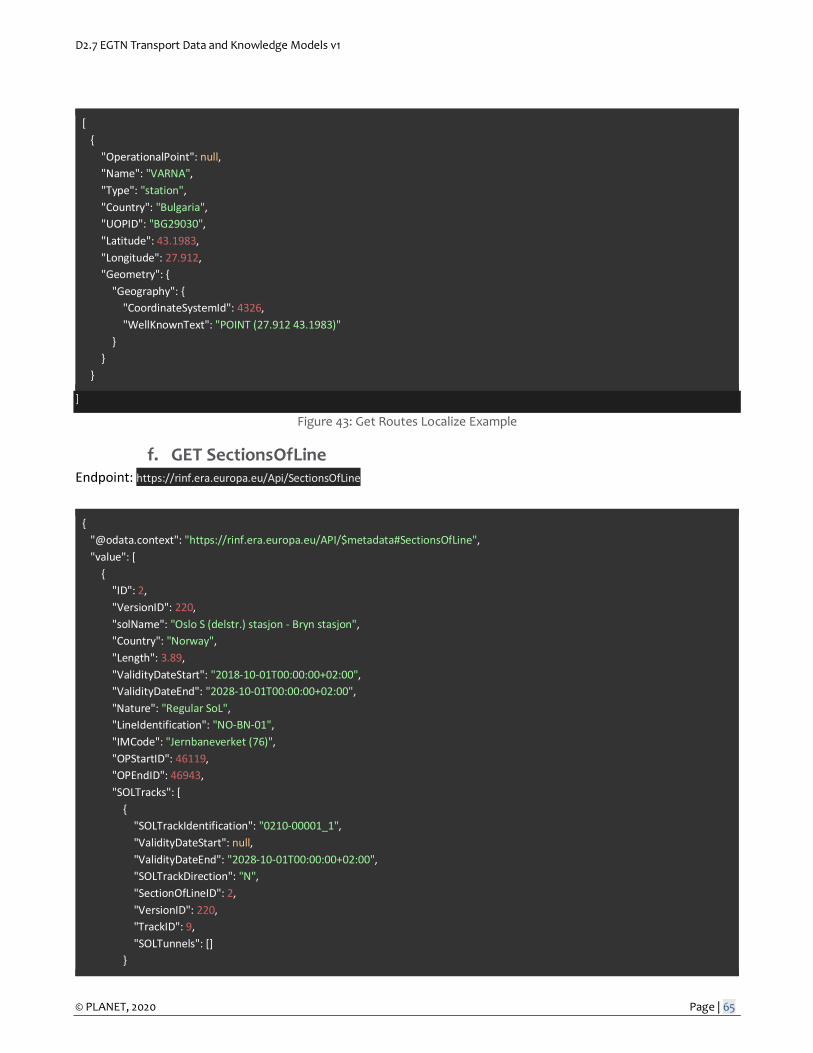
D2.7 EGTN Transport Data and Knowledge Models v1
© PLANET, 2020 Page | 65
[
{
"OperationalPoint": null,
"Name": "VARNA",
"Type": "station",
"Country": "Bulgaria",
"UOPID": "BG29030",
"Latitude": 43.1983,
"Longitude": 27.912,
"Geometry": {
"Geography": {
"CoordinateSystemId": 4326,
"WellKnownText": "POINT (27.912 43.1983)"
}
}
}
]
Figure 43: Get Routes Localize Example
f. GET SectionsOfLine Endpoint: https://rinf.era.europa.eu/Api/SectionsOfLine
{
"@odata.context": "https://rinf.era.europa.eu/API/$metadata#SectionsOfLine",
"value": [
{
"ID": 2,
"VersionID": 220,
"solName": "Oslo S (delstr.) stasjon - Bryn stasjon",
"Country": "Norway",
"Length": 3.89,
"ValidityDateStart": "2018-10-01T00:00:00+02:00",
"ValidityDateEnd": "2028-10-01T00:00:00+02:00",
"Nature": "Regular SoL",
"LineIdentification": "NO-BN-01",
"IMCode": "Jernbaneverket (76)",
"OPStartID": 46119,
"OPEndID": 46943,
"SOLTracks": [
{
"SOLTrackIdentification": "0210-00001_1",
"ValidityDateStart": null,
"ValidityDateEnd": "2028-10-01T00:00:00+02:00",
"SOLTrackDirection": "N",
"SectionOfLineID": 2,
"VersionID": 220,
"TrackID": 9,
"SOLTunnels": []
}
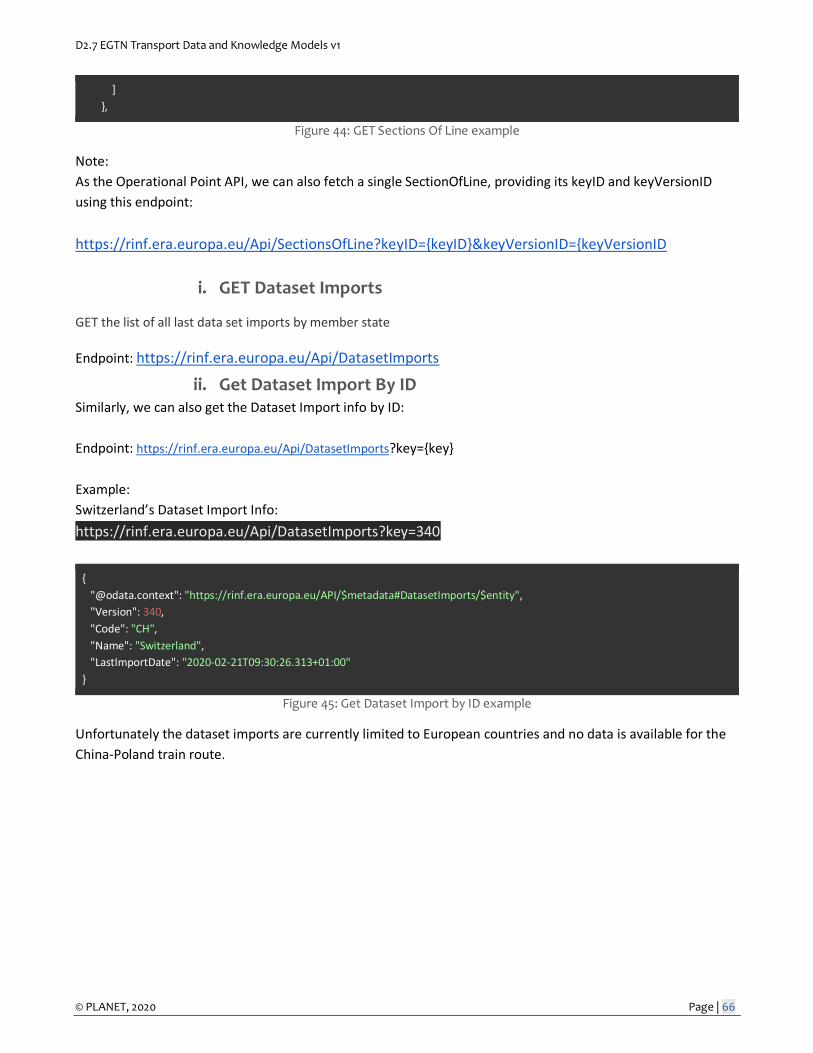
D2.7 EGTN Transport Data and Knowledge Models v1
© PLANET, 2020 Page | 66
]
},
Figure 44: GET Sections Of Line example
Note:
As the Operational Point API, we can also fetch a single SectionOfLine, providing its keyID and keyVersionID
using this endpoint:
https://rinf.era.europa.eu/Api/SectionsOfLine?keyID={keyID}&keyVersionID={keyVersionID}
i. GET Dataset Imports
GET the list of all last data set imports by member state
Endpoint: https://rinf.era.europa.eu/Api/DatasetImports
ii. Get Dataset Import By ID Similarly, we can also get the Dataset Import info by ID:
Endpoint: https://rinf.era.europa.eu/Api/DatasetImports?key={key}
Example:
Switzerland’s Dataset Import Info:
https://rinf.era.europa.eu/Api/DatasetImports?key=340
{
"@odata.context": "https://rinf.era.europa.eu/API/$metadata#DatasetImports/$entity",
"Version": 340,
"Code": "CH",
"Name": "Switzerland",
"LastImportDate": "2020-02-21T09:30:26.313+01:00"
}
Figure 45: Get Dataset Import by ID example
Unfortunately the dataset imports are currently limited to European countries and no data is available for the
China-Poland train route.
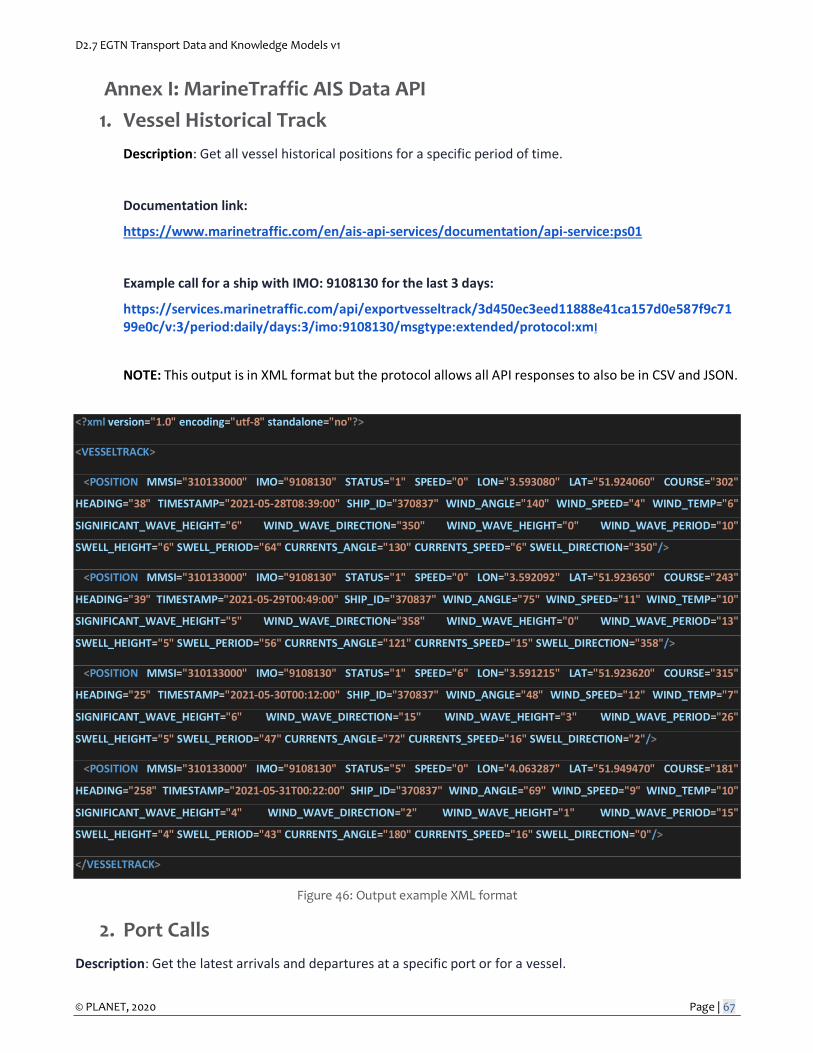
D2.7 EGTN Transport Data and Knowledge Models v1
© PLANET, 2020 Page | 67
Annex I: MarineTraffic AIS Data API
1. Vessel Historical Track
Description: Get all vessel historical positions for a specific period of time.
Documentation link:
https://www.marinetraffic.com/en/ais-api-services/documentation/api-service:ps01
Example call for a ship with IMO: 9108130 for the last 3 days:
https://services.marinetraffic.com/api/exportvesseltrack/3d450ec3eed11888e41ca157d0e587f9c7199e0c/v:3/period:daily/days:3/imo:9108130/msgtype:extended/protocol:xml
NOTE: This output is in XML format but the protocol allows all API responses to also be in CSV and JSON.
<?xml version="1.0" encoding="utf-8" standalone="no"?>
<VESSELTRACK>
<POSITION MMSI="310133000" IMO="9108130" STATUS="1" SPEED="0" LON="3.593080" LAT="51.924060" COURSE="302"
HEADING="38" TIMESTAMP="2021-05-28T08:39:00" SHIP_ID="370837" WIND_ANGLE="140" WIND_SPEED="4" WIND_TEMP="6"
SIGNIFICANT_WAVE_HEIGHT="6" WIND_WAVE_DIRECTION="350" WIND_WAVE_HEIGHT="0" WIND_WAVE_PERIOD="10"
SWELL_HEIGHT="6" SWELL_PERIOD="64" CURRENTS_ANGLE="130" CURRENTS_SPEED="6" SWELL_DIRECTION="350"/>
<POSITION MMSI="310133000" IMO="9108130" STATUS="1" SPEED="0" LON="3.592092" LAT="51.923650" COURSE="243"
HEADING="39" TIMESTAMP="2021-05-29T00:49:00" SHIP_ID="370837" WIND_ANGLE="75" WIND_SPEED="11" WIND_TEMP="10"
SIGNIFICANT_WAVE_HEIGHT="5" WIND_WAVE_DIRECTION="358" WIND_WAVE_HEIGHT="0" WIND_WAVE_PERIOD="13"
SWELL_HEIGHT="5" SWELL_PERIOD="56" CURRENTS_ANGLE="121" CURRENTS_SPEED="15" SWELL_DIRECTION="358"/>
<POSITION MMSI="310133000" IMO="9108130" STATUS="1" SPEED="6" LON="3.591215" LAT="51.923620" COURSE="315"
HEADING="25" TIMESTAMP="2021-05-30T00:12:00" SHIP_ID="370837" WIND_ANGLE="48" WIND_SPEED="12" WIND_TEMP="7"
SIGNIFICANT_WAVE_HEIGHT="6" WIND_WAVE_DIRECTION="15" WIND_WAVE_HEIGHT="3" WIND_WAVE_PERIOD="26"
SWELL_HEIGHT="5" SWELL_PERIOD="47" CURRENTS_ANGLE="72" CURRENTS_SPEED="16" SWELL_DIRECTION="2"/>
<POSITION MMSI="310133000" IMO="9108130" STATUS="5" SPEED="0" LON="4.063287" LAT="51.949470" COURSE="181"
HEADING="258" TIMESTAMP="2021-05-31T00:22:00" SHIP_ID="370837" WIND_ANGLE="69" WIND_SPEED="9" WIND_TEMP="10"
SIGNIFICANT_WAVE_HEIGHT="4" WIND_WAVE_DIRECTION="2" WIND_WAVE_HEIGHT="1" WIND_WAVE_PERIOD="15"
SWELL_HEIGHT="4" SWELL_PERIOD="43" CURRENTS_ANGLE="180" CURRENTS_SPEED="16" SWELL_DIRECTION="0"/>
</VESSELTRACK>
Figure 46: Output example XML format
2. Port Calls
Description: Get the latest arrivals and departures at a specific port or for a vessel.
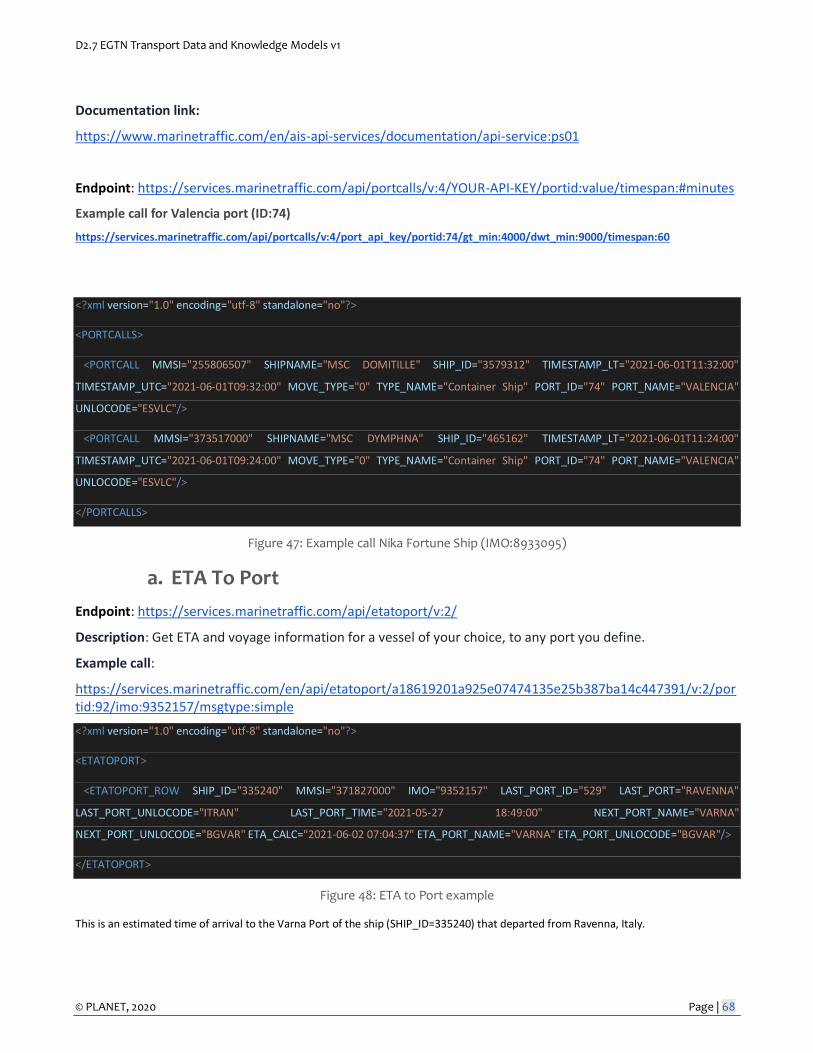
D2.7 EGTN Transport Data and Knowledge Models v1
© PLANET, 2020 Page | 68
Documentation link:
https://www.marinetraffic.com/en/ais-api-services/documentation/api-service:ps01
Endpoint: https://services.marinetraffic.com/api/portcalls/v:4/YOUR-API-KEY/portid:value/timespan:#minutes
Example call for Valencia port (ID:74)
https://services.marinetraffic.com/api/portcalls/v:4/port_api_key/portid:74/gt_min:4000/dwt_min:9000/timespan:60
<?xml version="1.0" encoding="utf-8" standalone="no"?>
<PORTCALLS>
<PORTCALL MMSI="255806507" SHIPNAME="MSC DOMITILLE" SHIP_ID="3579312" TIMESTAMP_LT="2021-06-01T11:32:00"
TIMESTAMP_UTC="2021-06-01T09:32:00" MOVE_TYPE="0" TYPE_NAME="Container Ship" PORT_ID="74" PORT_NAME="VALENCIA"
UNLOCODE="ESVLC"/>
<PORTCALL MMSI="373517000" SHIPNAME="MSC DYMPHNA" SHIP_ID="465162" TIMESTAMP_LT="2021-06-01T11:24:00"
TIMESTAMP_UTC="2021-06-01T09:24:00" MOVE_TYPE="0" TYPE_NAME="Container Ship" PORT_ID="74" PORT_NAME="VALENCIA"
UNLOCODE="ESVLC"/>
</PORTCALLS>
Figure 47: Example call Nika Fortune Ship (IMO:8933095)
a. ETA To Port
Endpoint: https://services.marinetraffic.com/api/etatoport/v:2/
Description: Get ETA and voyage information for a vessel of your choice, to any port you define.
Example call:
https://services.marinetraffic.com/en/api/etatoport/a18619201a925e07474135e25b387ba14c447391/v:2/portid:92/imo:9352157/msgtype:simple
<?xml version="1.0" encoding="utf-8" standalone="no"?>
<ETATOPORT>
<ETATOPORT_ROW SHIP_ID="335240" MMSI="371827000" IMO="9352157" LAST_PORT_ID="529" LAST_PORT="RAVENNA"
LAST_PORT_UNLOCODE="ITRAN" LAST_PORT_TIME="2021-05-27 18:49:00" NEXT_PORT_NAME="VARNA"
NEXT_PORT_UNLOCODE="BGVAR" ETA_CALC="2021-06-02 07:04:37" ETA_PORT_NAME="VARNA" ETA_PORT_UNLOCODE="BGVAR"/>
</ETATOPORT>
Figure 48: ETA to Port example
This is an estimated time of arrival to the Varna Port of the ship (SHIP_ID=335240) that departed from Ravenna, Italy.
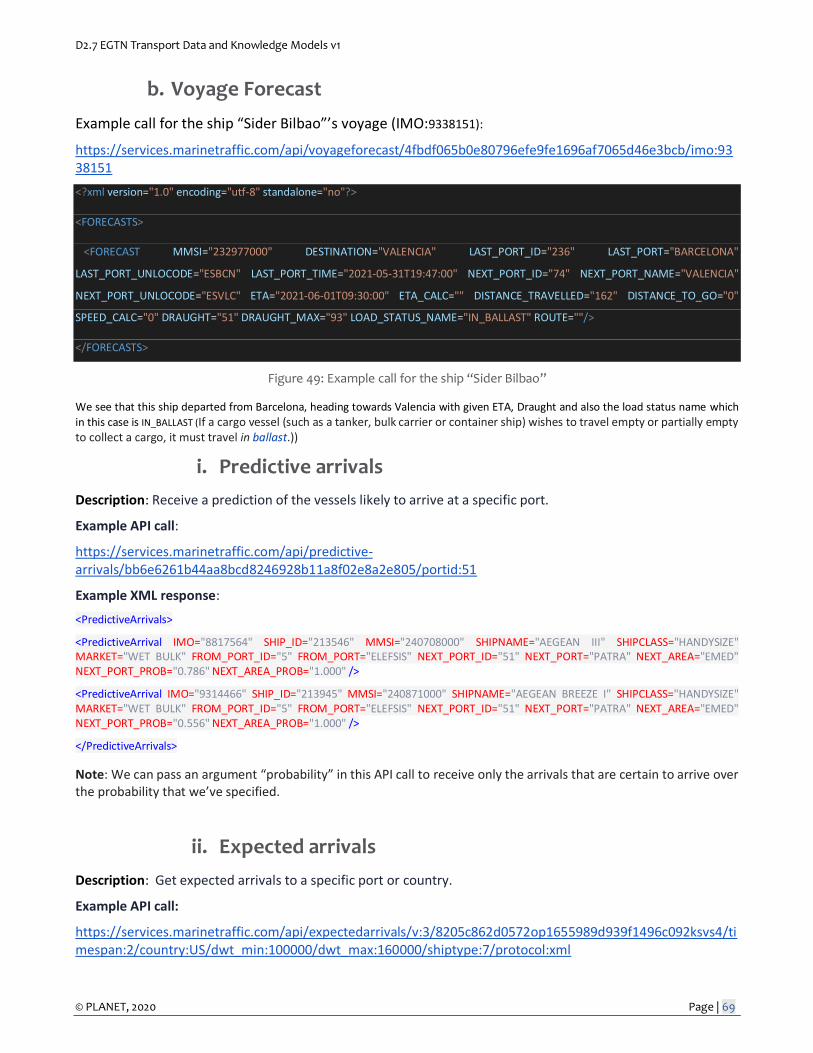
D2.7 EGTN Transport Data and Knowledge Models v1
© PLANET, 2020 Page | 69
b. Voyage Forecast
Example call for the ship “Sider Bilbao”’s voyage (IMO:9338151):
https://services.marinetraffic.com/api/voyageforecast/4fbdf065b0e80796efe9fe1696af7065d46e3bcb/imo:9338151
<?xml version="1.0" encoding="utf-8" standalone="no"?>
<FORECASTS>
<FORECAST MMSI="232977000" DESTINATION="VALENCIA" LAST_PORT_ID="236" LAST_PORT="BARCELONA"
LAST_PORT_UNLOCODE="ESBCN" LAST_PORT_TIME="2021-05-31T19:47:00" NEXT_PORT_ID="74" NEXT_PORT_NAME="VALENCIA"
NEXT_PORT_UNLOCODE="ESVLC" ETA="2021-06-01T09:30:00" ETA_CALC="" DISTANCE_TRAVELLED="162" DISTANCE_TO_GO="0"
SPEED_CALC="0" DRAUGHT="51" DRAUGHT_MAX="93" LOAD_STATUS_NAME="IN_BALLAST" ROUTE=""/>
</FORECASTS>
Figure 49: Example call for the ship “Sider Bilbao”
We see that this ship departed from Barcelona, heading towards Valencia with given ETA, Draught and also the load status name which
in this case is IN_BALLAST (If a cargo vessel (such as a tanker, bulk carrier or container ship) wishes to travel empty or partially empty to collect a cargo, it must travel in ballast.))
i. Predictive arrivals
Description: Receive a prediction of the vessels likely to arrive at a specific port.
Example API call:
https://services.marinetraffic.com/api/predictive-arrivals/bb6e6261b44aa8bcd8246928b11a8f02e8a2e805/portid:51
Example XML response:
<PredictiveArrivals>
<PredictiveArrival IMO="8817564" SHIP_ID="213546" MMSI="240708000" SHIPNAME="AEGEAN III" SHIPCLASS="HANDYSIZE" MARKET="WET BULK" FROM_PORT_ID="5" FROM_PORT="ELEFSIS" NEXT_PORT_ID="51" NEXT_PORT="PATRA" NEXT_AREA="EMED" NEXT_PORT_PROB="0.786" NEXT_AREA_PROB="1.000" />
<PredictiveArrival IMO="9314466" SHIP_ID="213945" MMSI="240871000" SHIPNAME="AEGEAN BREEZE I" SHIPCLASS="HANDYSIZE" MARKET="WET BULK" FROM_PORT_ID="5" FROM_PORT="ELEFSIS" NEXT_PORT_ID="51" NEXT_PORT="PATRA" NEXT_AREA="EMED" NEXT_PORT_PROB="0.556" NEXT_AREA_PROB="1.000" />
</PredictiveArrivals>
Note: We can pass an argument “probability” in this API call to receive only the arrivals that are certain to arrive over the probability that we’ve specified.
ii. Expected arrivals
Description: Get expected arrivals to a specific port or country.
Example API call:
https://services.marinetraffic.com/api/expectedarrivals/v:3/8205c862d0572op1655989d939f1496c092ksvs4/timespan:2/country:US/dwt_min:100000/dwt_max:160000/shiptype:7/protocol:xml
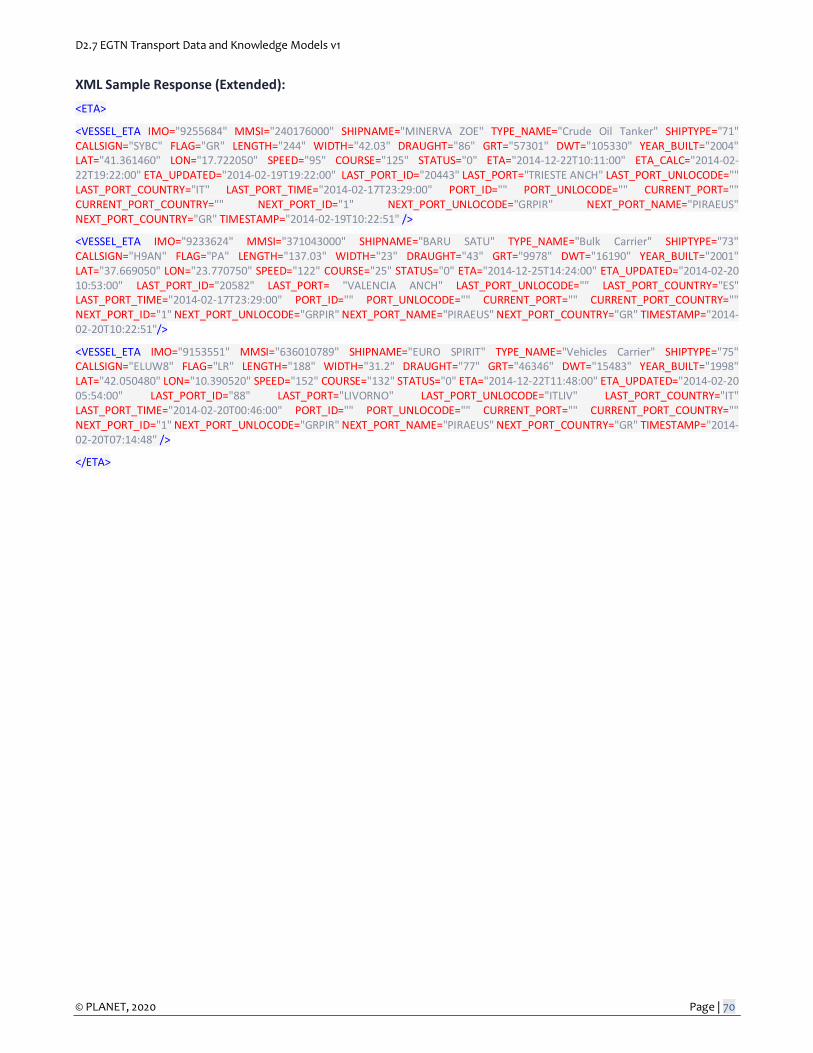
D2.7 EGTN Transport Data and Knowledge Models v1
© PLANET, 2020 Page | 70
XML Sample Response (Extended):
<ETA>
<VESSEL_ETA IMO="9255684" MMSI="240176000" SHIPNAME="MINERVA ZOE" TYPE_NAME="Crude Oil Tanker" SHIPTYPE="71" CALLSIGN="SYBC" FLAG="GR" LENGTH="244" WIDTH="42.03" DRAUGHT="86" GRT="57301" DWT="105330" YEAR_BUILT="2004" LAT="41.361460" LON="17.722050" SPEED="95" COURSE="125" STATUS="0" ETA="2014-12-22T10:11:00" ETA_CALC="2014-02-22T19:22:00" ETA_UPDATED="2014-02-19T19:22:00" LAST_PORT_ID="20443" LAST_PORT="TRIESTE ANCH" LAST_PORT_UNLOCODE="" LAST_PORT_COUNTRY="IT" LAST_PORT_TIME="2014-02-17T23:29:00" PORT_ID="" PORT_UNLOCODE="" CURRENT_PORT="" CURRENT_PORT_COUNTRY="" NEXT_PORT_ID="1" NEXT_PORT_UNLOCODE="GRPIR" NEXT_PORT_NAME="PIRAEUS" NEXT_PORT_COUNTRY="GR" TIMESTAMP="2014-02-19T10:22:51" />
<VESSEL_ETA IMO="9233624" MMSI="371043000" SHIPNAME="BARU SATU" TYPE_NAME="Bulk Carrier" SHIPTYPE="73" CALLSIGN="H9AN" FLAG="PA" LENGTH="137.03" WIDTH="23" DRAUGHT="43" GRT="9978" DWT="16190" YEAR_BUILT="2001" LAT="37.669050" LON="23.770750" SPEED="122" COURSE="25" STATUS="0" ETA="2014-12-25T14:24:00" ETA_UPDATED="2014-02-20 10:53:00" LAST_PORT_ID="20582" LAST_PORT= "VALENCIA ANCH" LAST_PORT_UNLOCODE="" LAST_PORT_COUNTRY="ES" LAST_PORT_TIME="2014-02-17T23:29:00" PORT_ID="" PORT_UNLOCODE="" CURRENT_PORT="" CURRENT_PORT_COUNTRY="" NEXT_PORT_ID="1" NEXT_PORT_UNLOCODE="GRPIR" NEXT_PORT_NAME="PIRAEUS" NEXT_PORT_COUNTRY="GR" TIMESTAMP="2014-02-20T10:22:51"/>
<VESSEL_ETA IMO="9153551" MMSI="636010789" SHIPNAME="EURO SPIRIT" TYPE_NAME="Vehicles Carrier" SHIPTYPE="75" CALLSIGN="ELUW8" FLAG="LR" LENGTH="188" WIDTH="31.2" DRAUGHT="77" GRT="46346" DWT="15483" YEAR_BUILT="1998" LAT="42.050480" LON="10.390520" SPEED="152" COURSE="132" STATUS="0" ETA="2014-12-22T11:48:00" ETA_UPDATED="2014-02-20 05:54:00" LAST_PORT_ID="88" LAST_PORT="LIVORNO" LAST_PORT_UNLOCODE="ITLIV" LAST_PORT_COUNTRY="IT" LAST_PORT_TIME="2014-02-20T00:46:00" PORT_ID="" PORT_UNLOCODE="" CURRENT_PORT="" CURRENT_PORT_COUNTRY="" NEXT_PORT_ID="1" NEXT_PORT_UNLOCODE="GRPIR" NEXT_PORT_NAME="PIRAEUS" NEXT_PORT_COUNTRY="GR" TIMESTAMP="2014-02-20T07:14:48" />
</ETA>


![1¤]#v1!+ - Kurtzman Carson Consultants LLC](https://static.fdokumen.com/doc/165x107/633bb1444e0eba8d290dad24/1v1-kurtzman-carson-consultants-llc.jpg)