D-Glucose Acts via Sodium/Glucose Cotransporter 1 to Increase NHE3 in Mouse Jejunal Brush Border by...
18
D-Glucose Acts via SGLTI to Increase NHE3 in Mouse Jejunal Brush Border by a NHERF2-Dependent Process Rong Lin a,b,+ , Rakhilya Murtazina a , Boyoung Cha a , Molee Chakraborty a , Rafiquel Sarker a , Tian-e Chen a , Zhihong Lin a , Boris M. Hogema c , Hugo R. de Jonge c , Ursula Seidler d , Jerrold R. Turner e , Xuhang Li a , Olga Kovbasnjuk a , and Mark Donowitz a,f a Department of Medicine, Division of Gastroenterology, Johns Hopkins University School of Medicine, Baltimore, Maryland, USA b GI Division, Wuhan Union Hospital, Tongi Medical School, Huazhong University of Science and Technology, 1277 Jiefang Road, Wuhan, China c Department of Biochemistry, Erasmus University Medical Center, Rotterdam, Netherlands d Department of Gastroenterology, Hannover Medical School, Hannover, Germany e Department of Pathology, The University of Chicago, Chicago, Illinois, USA f Department of Physiology, Division of Gastroenterology, Johns Hopkins University School of Medicine, Baltimore, Maryland, USA Abstract Background & Aims—Oral rehydration solutions (ORS) reduce diarrhea-associated mortality by unclear mechanisms. Sodium absorption is mediated by the Na + /H + hydrogen exchanger NHE3 and is increased by Na + -glucose co-transport in vitro, but the mechanisms of this process are only partially understood and its in vivo relevance has not been determined. Methods—Intracellular pH was measured in jejunal enterocytes of wild-type mice and mice with disrupted Na+/H+ exchange regulatory co-factor 2 (NHERF2−/− mice) by multi-photon microscopy. Diarrhea was induced by cholera toxin. Caco-2BBe cells that express NHE3 and the sodium/glucose cotransporter (SGLT)1 were studied by fluorometery, before and after siRNA- mediated knockdown of NHERF1 or NHERF2. NHE3 distribution was assessed by cell-surface biotinylation and confocal microscopy. Brush border mobility was determined by fluorescence recovery after photobleaching and confocal microscopy. Results—The non-metabolized SGLT1 substrate α-methyl-D-Glu (α-MD-G) activated jejunal NHE3; this process required Akt and NHERF2. α-MD-G normalized NHE3 activity after cholera toxin-induced diarrhea. α-MD-G–stimulated jejunal NHE3 activity was: defective in NHERF2−/− mice and cells with NHERF2 knockdown, but occurred normally with NHERF1 knockdown; associated with increased NHE3 surface expression in Caco-2 cells, which was also NHERF2- dependent; associated with dissociation of NHE3 from NHERF2 and an increase in the NHE3 Address for correspondence: Mark Donowitz and Rong Lin, Johns Hopkins University School of Medicine, 720 Rutland Avenue, 925 Ross Research Building, Baltimore, MD 21205. Phone: 410-955-9675; fax: 410-955-9677. [email protected]. + Current address: GI Division, Wuhan Union Hospital, Tongi Medical School, 1277 Jiefang Road, Wuhan, China Author Contributions: RL designed and performed all studies. Others assisted in: RM, ZL, OK multiphoton microscopy. BC FRAP studies. RS, TC and MC gradient centrifugation studies. BH, HJ, US, JT and MD supervision and discussions of the strategies and writing of manuscript. No author has a conflict of interest. Publisher's Disclaimer: This is a PDF file of an unedited manuscript that has been accepted for publication. As a service to our customers we are providing this early version of the manuscript. The manuscript will undergo copyediting, typesetting, and review of the resulting proof before it is published in its final citable form. Please note that during the production process errors may be discovered which could affect the content, and all legal disclaimers that apply to the journal pertain. NIH Public Access Author Manuscript Gastroenterology. Author manuscript; available in PMC 2012 February 1. Published in final edited form as: Gastroenterology. 2011 February ; 140(2): 560–571. doi:10.1053/j.gastro.2010.10.042. NIH-PA Author Manuscript NIH-PA Author Manuscript NIH-PA Author Manuscript
-
Upload
johnshopkins -
Category
Documents
-
view
5 -
download
0
Transcript of D-Glucose Acts via Sodium/Glucose Cotransporter 1 to Increase NHE3 in Mouse Jejunal Brush Border by...
D-Glucose Acts via SGLTI to Increase NHE3 in Mouse JejunalBrush Border by a NHERF2-Dependent Process
Rong Lina,b,+, Rakhilya Murtazinaa, Boyoung Chaa, Molee Chakrabortya, RafiquelSarkera, Tian-e Chena, Zhihong Lina, Boris M. Hogemac, Hugo R. de Jongec, UrsulaSeidlerd, Jerrold R. Turnere, Xuhang Lia, Olga Kovbasnjuka, and Mark Donowitza,f
a Department of Medicine, Division of Gastroenterology, Johns Hopkins University School ofMedicine, Baltimore, Maryland, USA b GI Division, Wuhan Union Hospital, Tongi Medical School,Huazhong University of Science and Technology, 1277 Jiefang Road, Wuhan, China cDepartment of Biochemistry, Erasmus University Medical Center, Rotterdam, Netherlands dDepartment of Gastroenterology, Hannover Medical School, Hannover, Germany e Department ofPathology, The University of Chicago, Chicago, Illinois, USA f Department of Physiology, Divisionof Gastroenterology, Johns Hopkins University School of Medicine, Baltimore, Maryland, USA
AbstractBackground & Aims—Oral rehydration solutions (ORS) reduce diarrhea-associated mortalityby unclear mechanisms. Sodium absorption is mediated by the Na+/H+ hydrogen exchanger NHE3and is increased by Na+-glucose co-transport in vitro, but the mechanisms of this process are onlypartially understood and its in vivo relevance has not been determined.
Methods—Intracellular pH was measured in jejunal enterocytes of wild-type mice and mice withdisrupted Na+/H+ exchange regulatory co-factor 2 (NHERF2−/− mice) by multi-photonmicroscopy. Diarrhea was induced by cholera toxin. Caco-2BBe cells that express NHE3 and thesodium/glucose cotransporter (SGLT)1 were studied by fluorometery, before and after siRNA-mediated knockdown of NHERF1 or NHERF2. NHE3 distribution was assessed by cell-surfacebiotinylation and confocal microscopy. Brush border mobility was determined by fluorescencerecovery after photobleaching and confocal microscopy.
Results—The non-metabolized SGLT1 substrate α-methyl-D-Glu (α-MD-G) activated jejunalNHE3; this process required Akt and NHERF2. α-MD-G normalized NHE3 activity after choleratoxin-induced diarrhea. α-MD-G–stimulated jejunal NHE3 activity was: defective in NHERF2−/−mice and cells with NHERF2 knockdown, but occurred normally with NHERF1 knockdown;associated with increased NHE3 surface expression in Caco-2 cells, which was also NHERF2-dependent; associated with dissociation of NHE3 from NHERF2 and an increase in the NHE3
Address for correspondence: Mark Donowitz and Rong Lin, Johns Hopkins University School of Medicine, 720 Rutland Avenue, 925Ross Research Building, Baltimore, MD 21205. Phone: 410-955-9675; fax: 410-955-9677. [email protected].+Current address: GI Division, Wuhan Union Hospital, Tongi Medical School, 1277 Jiefang Road, Wuhan, ChinaAuthor Contributions: RL designed and performed all studies. Others assisted in: RM, ZL, OK multiphoton microscopy. BC FRAPstudies. RS, TC and MC gradient centrifugation studies. BH, HJ, US, JT and MD supervision and discussions of the strategies andwriting of manuscript.No author has a conflict of interest.Publisher's Disclaimer: This is a PDF file of an unedited manuscript that has been accepted for publication. As a service to ourcustomers we are providing this early version of the manuscript. The manuscript will undergo copyediting, typesetting, and review ofthe resulting proof before it is published in its final citable form. Please note that during the production process errors may bediscovered which could affect the content, and all legal disclaimers that apply to the journal pertain.
NIH Public AccessAuthor ManuscriptGastroenterology. Author manuscript; available in PMC 2012 February 1.
Published in final edited form as:Gastroenterology. 2011 February ; 140(2): 560–571. doi:10.1053/j.gastro.2010.10.042.
NIH
-PA Author Manuscript
NIH
-PA Author Manuscript
NIH
-PA Author Manuscript
mobile fraction from the brush border; and accompanied by a NHERF2 ezrin-radixin-moesin–binding domain-dependent increase in co-precipitation of ezrin with NHE3.
Conclusions—SGLT1-mediated Na-glucose co-transport stimulates NHE3 activity in vivo byan Akt- and NHERF2-dependent signaling pathway. It is associated with increased brush borderNHE3 and association between ezrin and NHE3. Activation of NHE3 corrects cholera toxin-induced defects in Na absorption and might mediate efficacy of ORS.
KeywordsIntestinal Na absorption; cholera toxin; trafficking; Exocytosis; Ezrin; NHERF2
INTRODUCTIONThe human small intestine absorbs approximately 7.5 liters of water and 650 mEq of Nadaily. Most of this is accomplished by cotransport of Na and nutrients, particularly D-glucose, and neutral NaCl absorption which is the BB Na/H exchanger 3 (SLC9A3) linkedto a Cl/HCO3 exchanger, either SLC26A3 or A6 [1]. These two processes were assumed tobe separate until recent in vitro studies using polarized intestinal epithelial cell monolayersdemonstrated enhanced NHE3 activity and surface expression following SGLT1-mediatedNa-glucose cotransport [2–5]. However, whether SGLT1-dependent NHE3 activation occursin vivo under basal or pathologic conditions has not been explored. If present in vivo, thisNHE3 activation may represent a mechanism by which ORS stimulates intestinal Na andwater absorption.
In vitro studies suggested that SGLT1-dependent NHE3 activation occurs via sequentialactivation of p38 MAP kinase/MAPKAPK2, Akt2 and ezrin. NHE3 regulation involvessignaling complexes that form on the NHE3 C-terminus, many of which are scaffolded byNHERF proteins, a multi-PDZ domain containing gene family [9]. It is unknown whetherNHERF proteins are necessary for the SGLT1-NHE3 linkage. The studies presented hereused mouse jejunum with NHERF2 KO and Caco-2/SGLT1/HA-NHE3 cells with NHERF2KD to explore whether α-MD-G stimulates NHE3 in intact tissue and whether the effectrequires NHERF2, as well as the mechanism involved in these effects. These results suggestthat optimization of the physiologic NHE3 regulatory pathway identified may increase theutility of ORS solutions for severe diarrheal diseases.
Materials and MethodsAnimals
Male NHERF2−/− mice bred into the C57BL/6 background (Charles River Laboratories,Inc. Wilmington, MA) for at least six generations were produced from heterozygotes andwith wild type male C57BL/6 mice were studied between 10–12 weeks of age. These micewere initially produced by a retroviral trapping method by Lexicon Pharmaceuticals usingOmnibank clone OST2298[10]. Protocols used were approved by the JHU Animal UseCommittee.
NHE3 Activity Determination by Two-Photon MicroscopyNa+/H+ Exchange Activity in intact mouse jejunum was determined as rates of Na+-dependent alkalinization using a two-photon microscope (MRC-1024MP, Bio-Rad,Hercules, CA) and the pH sensitive dye, SNARF-4F as we have described [11] with minormodifications. Details are provided in Supplementary Methods. Full thickness jejunum wasstudied starting I cm distal to the ligament of Treitz.
Lin et al. Page 2
Gastroenterology. Author manuscript; available in PMC 2012 February 1.
NIH
-PA Author Manuscript
NIH
-PA Author Manuscript
NIH
-PA Author Manuscript
Cholera Toxin-Induced Acute Watery Diarrhea ModelAn acute watery diarrhea model using purified holo-cholera toxin (CT, Sigma, St. Louis,MO) was standardized in vivo, as previously described [12]. Mice were gavaged withcholera toxin (10 μg in 7% NaHCO3) through an oro-gastric feeding tube, with NaHCO3 ascontrol. 6 hours later, mice were sacrificed and fluid was collected by gravity from the entiresmall intestine.
Measurement of NHE3 Activity in Caco-2/bbe CellsCaco-2 cells stably transfected with SGLT1[3] were infected with HA-NHE3 adenovirus(see Supplementary Methods), grown on pieces of polycarbonate membranes (0.4-μm poresize, called ”flilterslips”) and NHE3 activity determined using the intracellular pH-sensitivedye BCECF-AM (2′,7′-Bis(2-carboxyethyl) -5(6)-carboxy fluorescein acetoxymethyl ester,InVitrogen, Carlsbad, CA) and a computerized fluorometer, as described [13]. Na+/H+exchange rates (H+ efflux) were calculated as the initial rates of Na+-dependent change inpHi over ~1 min (ΔpH/Δmin) [13]. Means ± SE were determined from at least threeindependent experiments.
Apical Cell Surface Biotinylation of NHE3 in Caco-2/bbe CellsThe Caco-2/bbe cell surface biotinylation protocol was modified from the protocol forPS120 cell surface biotinylation published previously using NHS-SS biotin (PierceChemicals) [14]. The details are proved in Supplementary Methods. The immunoblotsproduced were probed with a monoclonal anti-HA antibody (Covance 16B12, Princeton,NJ), with normalization to β-actin using monoclonal anti-β-actin antibody (Sigma A2228)
Immunoprecipitation and co-precipitation and Immunofluorescence techniques aredescribed in Supplementary Methods.
Fluorescence recovery after photobleaching/confocal microscopy was performed asdescribed [10] and is detailed in Supplementary Methods.
StatisticsResults were expressed as mean ± S.E.M. Statistical evaluation was performed by analysisof variance (ANOVA) or Student’s t test.
Resultsα-MD-G stimulates NHE3 activity in mouse jejunum via SGLT-1
NHE3 activity in intact mouse jejunum was measured by two-photon microscopy using thepH sensitive dual emission dye, SNARF-4F [11,15]. Because the fluorescence ofSNARF-4F in different solutions and intracellular conditions often differs, the PKa ofSNARF-4F in jejunum was measured by the K+/nigericin(10 mM) method [11].Supplementary Fig. 1 shows the jejunal calibration of the pH response. Jejunum wassequentially perfused with TMA (20 min) and then Na buffer containing either D-mannoseor α-MD-G (25 mM) (Fig 1A). α-MD-G is a non-metabolized analogue of D-glucose and isspecifically transported by SGLT1. Fig. 1B shows the pH-dependent emission shifts fromacidic to basic, comparing conditions before and after Na+ treatment. Compared with the D-mannose group, α-MD-G significantly stimulates NHE3 activity (0.45 ± 0.03 ΔpH/min(n=9) vs. 0.31±0.03 ΔpH/min (n=5), p<0.01) (Fig. 1C). The specific SGLT1 inhibitorphloridzin (1 mM) abolished the α-MD-G induced stimulation (0.45±0.03 ΔpH/min (n=9),α-MD-G/no phloridzin vs. 0.21±0.02 (n=3), α-MD-G/phloridzin, p<0.01). These results
Lin et al. Page 3
Gastroenterology. Author manuscript; available in PMC 2012 February 1.
NIH
-PA Author Manuscript
NIH
-PA Author Manuscript
NIH
-PA Author Manuscript
demonstrate that luminal α-MD-G stimulates NHE3 activity in intact mouse jejunum by amechanism involving SGLT1.
Akt is an intermediate in D-Glucose stimulation of jejunal NHE3 activityWe next tested the hypothesis that Akt signaling was involved in α-MD-G/SGLT1dependent NHE3 stimulation in vivo. The Akt inhibitor viii (10 μM) was used, whichselectively inhibits Akt 1 and 2 without effects on other closely related AGC kinases [16].Preincubation with the Akt inhibitor (90 min exposure) caused a slight but non-significantdecrease in basal NHE3 activity in the presence of mannose (0.31 ± 0.03 ΔpH/min without(n=4) vs. 0.26 ± 0.03 ΔpH/min with Akt inhibitor (n=3), N.S.) (Fig. 1C). In contrast, the Aktinhibitor prevented the α-MD-G stimulation of NHE3 activity (0.45±0.03 ΔpH/min (n=9)without vs. 0.27 ± 0.03 ΔpH/min (n=4) with Akt inhibitor, p<0.05). Note, that α-MD-Gstimulated NHE3 activity in the presence of Akt inhibitor viii, was not significantly higherthan in the presence of phloridzin.
α-MD-G reverses the inhibition of NHE3 activity in an acute cholera toxin-diarrhea modelWhether cholera toxin (CT)-induced inhibition of NHE3 activity could be reversed by α-MD-G was determined. Small intestinal water output was increased 6 h after CT gavage (Fig2A) (control, 0.86 ± 0.25 ml/mouse (n=3) vs. CT, 2.05 ± 0.25 ml/mouse (n=4), p <0.05).With mannose (Fig. 2B), NHE3 activity was significantly decreased in the CT-treated group(control, 0.30 ± 0.04 ΔpH/min (n=5) vs. CT, 0.17 ± 0.01 ΔpH/min (n=3) p<0.05). However,α-MD-G increased NHE3 activity in both groups, and NHE3 activity with CT was returnedentirely to the level in the control group (control, 0.44 ± 0.02 ΔpH/min (n=5) vs. CT, 0.38 ±0.05 ΔpH/min (n=4), N.S.). Boiled CT did not alter jejunal NHE3 activity when mannosewas present. The increment of NHE3 activity caused by α-MD-G was larger in the CTexposed than in the control group (112% increment in CT vs 56% in control group),consistent with there being reversal of the cholera toxin-induced inhibition of NHE3 activityby α-MD-G.
α-MD-G stimulation of NHE3 is associated with shifting of NHE3 into smaller complexesThe mechanism of α-MD-G stimulation of jejunal NHE3 was examined by determiningwhether this effect was associated with changes in the size of NHE3 containing complexes.Changes in NHE3 activity due to altered signaling are often associated with changes inNHE3 complex size due to changes in NHE3 associating proteins [8]. Total jejunalmembranes exposed to mannose vs α-MD-G were solubilized in 1% Triton X-100 andplaced on 5–30% discontinuous sucrose density gradients. NHE3 complex size wasdetermined by immunoblotting. α-MD-G stimulation of NHE3 activity was associated withshifting of NHE3 into smaller sized complexes (Supplementary Fig. 2), consistent withchanges in NHE3 associating proteins. This is the first model of NHE3 regulation in whichNHE3 complex size is decreased.
α-MD-G stimulation of NHE3 activity is NHERF2 dependent in Caco-2/SGLT1 cells andintact mouse jejunum
NHERF1 and 2 have been shown to be necessary for multiple aspects of NHE3 regulationand complex formation. Given the change in NHE3 complex size caused by α-MD-G, weevaluated the role of NHERF1 and 2 in α-MD-G stimulated NHE3 activity. LentiviralshRNA-puromycin vectors were used to knock down NHERF1 and NHERF2 in Caco-2cells. Stable cells lines were established in which the expression of the knockdownconstructs and the effects of the knockdowns lasted > ten passages. Fig. 3A demonstrates thesuccessful KD of NHERF1 and NHERF2 by 70–80%.
Lin et al. Page 4
Gastroenterology. Author manuscript; available in PMC 2012 February 1.
NIH
-PA Author Manuscript
NIH
-PA Author Manuscript
NIH
-PA Author Manuscript
α-MD-G caused similar NHE3 stimulation in Caco-2 cells expressing the control (GFPoligomers) and NHERF1 KD constructs (Figs. 3B left and middle, respectively). However,in NHERF2 KD cells, α-MD-G did not significantly alter NHE3 activity (Fig. 3B, right). Ofnote, NHE3 activity in NHERF1 KD cells (0.14 ± 0.01 ΔpH/min n=4) was significantlydecreased compared to control cells (0.25 ± 0.02 ΔpH/min, n=12 (p<0.05)), while NHE3activity was significantly increased in NHERF2 KD cells (0.33 ± 0.02 ΔpH/min, n=5,(p<0.05); all these results from Fig 3B were in the presence of mannose).
The NHERF2 dependence of α-MD-G-induced NHE3 stimulation on NHE3 was alsoconfirmed using NHERF2 knock out mouse jejunum. Shown in Fig. 3C, NHE3 activity wasnot significantly altered in D-mannose vs. α-MD-G perfused jejunum in these NHERF2 KOmice (0.36 ± 0.03 ΔpH/min (n=6) vs. 0.39 ± 0.02 ΔpH/min (n=5)). These results show thatα-MD-G stimulation of NHE3 is NHERF2-dependent in both intact small intestine andCaco-2 cells.
NHERF2 is necessary for α-MD-G stimulated NHE3 activity by regulating its plasmamembrane trafficking
To determine the basis of the α-MD-G stimulation of NHE3 activity, the amount of BBNHE3 was determined using cell surface biotinylation. α-MD-G increased the amount ofNHE3 on the cell surface in Caco-2 control cells (intensity of NHE3 on cell surfacenormalized with β-actin, 0.46 ± 0.03), compared with D-mannose conditions (0.32 ± 0.04,p<0.05) (Fig 4). In contrast, in Caco-2-NHERF2 KD cells, with or without the presence ofα-MD-G, the surface NHE3/actin was similar (0.50 ± 0.03 vs. 0.48 ± 0.6, NS). This resultsuggests that NHERF2 is involved in α-MD-G stimulated NHE3 activity by affectingtrafficking to increase the amount of BB NHE3.
The surface NHE3/actin under D-mannose conditions was increased in the NHERF2 KDcompared to D-mannose conditions in Caco-2 control cells (0.48 ± 0.01 vs. 0.32 ± 0.04,p<0.05, Fig. 4A). This is consistent with the increased NHE3 activity seen under theseconditions (see Fig. 3B, D-mannose-shRNAi-GFP vs. NHERF2 KD). We will speculate onthe explanation below.
To investigate further whether NHERF2-dependent trafficking is involved in α-MD-Gdependent stimulation of NHE3, confocal microscopic XZ images were generated. Weconfirmed that α-MD-G increased the percentage of NHE3 localized to the apical domain ofCaco-2 cells as indicated by co-localization with wheat-germ agglutinin (WGA), whichstains only the apical membranes of confluent monolayers at 4°C. Under basal conditions(mannose), 57.8 ± 4.0% of NHE3 co-localized with WGA (n=21) in the plasma membraneof Caco-2/HA-NHE3 cells, and this percent overlap increased to 82.4 ± 4.0% 5 min after α-MD-G treatment (n=14) (Figs. 5A and 5B, left). In contrast, the stimulation of NHE3translocation to the plasma membrane by α-MD-G was abolished when NHERF2 wasknocked down in Caco-2 cells (overlap of WGA/NHE3 with mannose exposure 74.7 ± 3.0%(n=17) vs. α-MD-G 74.2 ± 5.2% (n=16), NS) (Figs. 5A and 5B, right).
α-MD-G-induced stimulation of NHE3 is associated with dissociation of NHE3 fromNHERF2
In mannose conditions in Caco-2/NHERF2 KD cells, there was more NHE3 co-localizedwith apical WGA compared to the control cells (Fig. 5B). This result suggests that the α-MD-G regulation of NHE3 trafficking involves dissociation of NHE3 from this pool ofNHERF2. This finding was confirmed using double immunofluorecence staining of NHE3and NHERF2 in Caco-2 cells (Figs. 6A,B). The colocalization of NHE3 and NHERF2 wasdecreased from 62.8 ± 1.7% (n=4) to 53.4 ± 1.4% (n=4,) (p<0.05) by α-MD-G treatment.
Lin et al. Page 5
Gastroenterology. Author manuscript; available in PMC 2012 February 1.
NIH
-PA Author Manuscript
NIH
-PA Author Manuscript
NIH
-PA Author Manuscript
Co-immunoprecipitation studies were performed to further demonstrate the dissociation ofNHE3 and NHERF2 (Fig. 6C). Caco-2/NHERF2 KD cells were transfected with Flag-NHERF2 full length and Flag-NHERF2 Δ30 separately. In Caco-2 cells expressing Flag-NHERF2, after α-MD-G there was less FLAG-NHERF2 co-immunoprecipitated withNHE3. This further confirmed the α-MD-G-induced NHERF2-NHE3 dissociation. Incontrast, in Caco-2 cells expressing Flag-NHERF2Δ30, which lacks the NHERF2 ezrinbinding domain, α-MD-G did not decrease NHE3-NHERF2 binding. Moreover, α-MD-Gfailed to stimulate NHE3 activity in Caco-2 cells expressing NHERFΔ30 (Fig. 6D). Thisindicates that ezrin binding to NHERF2 is required for α-MD-G-induced NHERF2-NHE3dissociation, which is needed for α-MD-G to increase NHE3 activity.
Stimulatory effect of α-MD-G on NHE3 mobile fraction is dependent on NHERF2We have previously reported there are two different pools of apical domain NHE3; a mobileand an immobile pool under basal conditions, with stimulation of NHE3 associated with anincrease in the mobile BB pool [17]. FRAP/confocal microscopy was used to determinewhether the α-MD-G stimulation of NHE3 was associated with a dynamic effect on themobile fraction of apical NHE3, and whether NHERF2 was required for this effect. Caco-2cells transiently expressing NHE3-GFP with endogenesis NHERF2 or with NHERF2 KDwere used to perform FRAP. 5 mins after mannose or α-MD-G treatment, images wererecorded before and every 30 seconds after bleach for up to 20 mins. Supplementary Fig 3Ashows a representative experiment and Supplementary Fig 3B shows means +/−SEM withfluorescent intensity determined before and after photobleaching of NHE3. The mobilefraction of NHE3 under basal conditions in the presence of mannose was ~10% (obtained bycurve-fitting), which was dramatically enhanced to ~30% with α-MD-G exposure. Caco-2/NHERF2 KD cells with mannose exposure exhibited an increased NHE3 mobile fractioncompared with Caco-2 cells expressing NHERF2 (21.4±3.2 vs. 9.7±1.2 (%)). Importantly,α-MD-G did not increase the NHE3 mobile fraction in these Caco-2/NHERF2 KD cells(21.4±3.2 vs. 20.1±4.1 (%)). These results show that α-MD-G stimulates the NHE3 mobilefraction in the Caco-2 apical domain by a NHERF2 dependent process.
α-MD-G-induced NHE3 stimulation is associated with increased phosphorylation of ezrinat a step prior to NHERF2
As shown above, ezrin binding to NHERF2 is necessary for α-MD-G stimulation of NHE3(Fig. 6D). The mechanism of ezrin’s role was studied. α-MD-G increased ezrinphosphorylation in all of the cell lines in Fig. 7A, including those with NHERF2 KD andwith NHERF2Δ30. This also occurred in both WT and NHERF2 null jejunum (Fig 7B).These results indicate α-MD-G initiated ezrin phosphorylation occurs prior to/independentlyof the NHERF2 role in NHE3 stimulation.
α-MD-G increases co-precipitation of NHE3 and ezrin, which is NHERF2 dependantThe functional significance of the α-MD-G induced increase in p-ezrin was studied inCaco-2 WT and NHERF2 KD cells. IP NHE3 co-precipitated ezrin the amount of which wasincreased by treatment with α-MD-G in WT but not NHERF2 null jejunum (Fig 7C) and inCaco-2 cells expressing NHERF2 but not when NHERF2 was KD (Fig. 7D).
Direct ezrin-NHERF2 binding is required for α-MD-G-induced stimulation of NHE3-ezrinassociation
To determine whether NHERF2-ezrin binding was necessary for the NHE3-ezrinassociation, as it was necessary for α-MD-G stimulation of NHE3 activity (Fig 6D), Caco-2/WT NHERF2 vs. NHERF2 Δ30 cells were compared for the magnitude of the α-MD-Gincrease in NHE3 co-precipitation of ezrin. NHE3 co-precipitation of ezrin was increased by
Lin et al. Page 6
Gastroenterology. Author manuscript; available in PMC 2012 February 1.
NIH
-PA Author Manuscript
NIH
-PA Author Manuscript
NIH
-PA Author Manuscript
α-MD-G when the Caco-2 cells expressed NHERF2 but not when they expressed NHERF2Δ30 (Fig 7E). These results show that NHERF2 binding to ezrin is necessary for the α-MD-G stimulation of the NHE3-ezrin association as well as for the stimulation of NHE3 activity.
DiscussionThis study revealed 1) α-MD-G stimulates NHE3 activity and increases BB NHE3 amountin mouse jejunum via SGLT1 which a pathway that involves Akt, NHERF2, and ezrin. 2) α-MD-G entirely reversed the inhibition of NHE3 in an acute cholera toxin diarrhea model. 3)NHERF2 is involved in α-MD-G-initiated NHE3 stimulation through regulation of NHE3trafficking and distribution of NHE3 over the microvillus. 4) Separate ezrin pools participatein two steps of α-MD-G-induced NHE3 stimulation.
This study provides insights in how D-glucose stimulates Na and water absorption fromORS and is relevant to the longstanding observations that the stoichiometry of Na+absorption from ORS seems to exceed that predicted from the amount of substrate absorbed[18]. Previous explanations implicated solvent drag and included a controversial observationthat these solutions altered tight junction permeability/permselectivity [18]. Our studyconfirmed that in intact jejunum, luminal α-MD-G increased NHE3 activity and this effectoccurred entirely via SGLT1, since it was phloridzin inhibitable.
Since diarrheal diseases are almost always at least partially due to inhibition of smallintestinal brush border NHE3 activity, often but not always along with stimulation of Clsecretion via CFTR, we tested the hypothesis that stimulation of NHE3 induced by D-glucose would reverse the changes in Na absorption in a diarrheal disease model which actsby elevation of adenylate cyclase-cAMP. α-MD-G totally reversed the CT inhibition ofNHE3. Stimulation of NHE3 activity in the CT-exposed intestine exceeded the NHE3stimulation in control intestine which resulted in the NHE3 activity in the presence of α-MD-G being the same in CT-exposed and control small intestine. This is the first reportshowing that an agonist which is effective in regulating normally functioning NHE3, is alsoable to stimulate cAMP-inhibited NHE3 activity. This not only provides insights into themechanism by which ORS increases water absorption in diarrhea but also has implicationsfor strategies for development of improved treatment of acute diarrheal diseases.
The NHERF family has been reported to be present in and/or close to the BB and to scaffolda variable series of proteins in forming NHE3 complexes in a dynamic manner, which oftenaffect NHE3 activity[7,19]. siRNA knockdown was used to explore which NHERF subtypewas involved, revealing a role for NHERF2 but not NHERF1 in α-MD-G stimulation ofNHE3 in Caco-2 cells, a dependence that was confirmed by studies in the NHERF2 nullmouse jejunum. NHERF2 is present in the apical domain of intestinal Na+ absorptive cellsand renal proximal tubules in the mid to lower microvillus, intervillus cleft area and sub-apically, as well as having a cytosolic component [19]. We identified two roles for NHERF2in α-MD-stimulation of NHE3. It is necessary for 1) the increase in BB NHE3 amount andactivity and 2) the increase in the BB mobile fraction of NHE3, which we have suggested isinvolved in distributing NHE3 over the microvilli [17,20]. The latter correlates withdissociation of NHE3-NHERF2. Under basal conditions, NHERF2 maintains NHE3 in aninactive pool (Fig 3C compared to Fig 3A) that is not in the BB (not being accessible toapically added WGA and biotin (Figs 4 and 5)). We suggest that this pool of NHE3 is in thesubapical domain and represents a storage pool for NHE3 from which it is initiallymobilized by α-MD-G. Freeing NHE3 from this pool by reducing NHERF2 allows at leastsome of this NHE3 to redistribute to the BB. In interpreting the mechanism of these effects,we assume that WGA and biotin fully label the Caco-2 BB [21,22], although if that is notcorrect, our interpretation would have to be modified to include the intervillus clefts or
Lin et al. Page 7
Gastroenterology. Author manuscript; available in PMC 2012 February 1.
NIH
-PA Author Manuscript
NIH
-PA Author Manuscript
NIH
-PA Author Manuscript
lower microvilli as potential storage pools for NHE3. This model is similar to insulinregulation of GLUT4 in identifying a pool of a transporter that is separated from the moregeneral recycling pool and is used for its initial stimulation by insulin [23]. Theidentification of an intestinal pool of NHE3 that is inactive under basal conditions is similarto the model described for proximal tubule [24], although that location is thought to be in themicrovilli above the intervillus clefts and likely involves association with megalin [24–27].This suggests a similar mechanism of regulation in proximal tubule and intestine, but withdifferences in location of the storage pool.
Ezrin, which was shown to be needed for α-MD-G stimulation of NHE3 in Caco-2 cells byTurner et al [2–4], also appears to have at least two roles in this stimulation. The α-MD-G–induced increase in p-ezrin occurs similarly in the presence and absence of NHERF2 or itsERM domain (ie, is NHERF2 independent). However, the α-MD-G stimulation of NHE3activity and amount requires NHERF2 and its ERM domain. We suggest that ezrin alongwith NHERF2 is involved in holding NHE3 in the apical storage pool from which it isreleased by α-MD-G. However, ezrin also appears to be taking part in a second aspect of α-MD-G stimulation. After α-MD-G, ezrin continues to be associated with NHE3 at a timethat NHERF2 dissociates from NHE3. This is, therefore, likely to involve direct binding ofezrin to NHE3, as we described [14], and probably occurs along the microvilli. It thus islikely to be involved in dispersing NHE3 over the microvilli. We favor this interpretation,since attachment of ezrin to NHERF1 in the microvilli, an alternate role for this ezrin pool,was shown by knockdown in Caco-2 cells (Fig 3) not to be necessary for α-MD-Gstimulation of NHE3.
In conclusion, α-MD-G stimulates intestinal NHE3 activity under both basal conditions andin an acute cholera-toxin-induced watery diarrhea model. Both Akt and NHERF2 arerequired for this regulation. Regulation seems to occur by similar mechanisms in the mousejejunum and in Caco-2 Na+ absorptive cells. NHERF2 allows α-MD-G stimulation of NHE3activity through changing NHE3 complexes and regulating NHE3 trafficking, includingreleasing NHE3 from a storage pool. Two different pools of BB ezrin participate instimulation of NHE3. These studies have added new insights into how NHE3 is regulatedunder basal and α-MD-G stimulated conditions which appears relevant for how ORSstimulates intestinal Na absorption and which should be helpful in developing improvedtherapies for diarrheal diseases.
Supplementary MaterialRefer to Web version on PubMed Central for supplementary material.
AcknowledgmentsSupported, in whole or in part, NIH Grants R01-DK26523, R01-DK61765, PO1-DK72084, and R24-DK64388
References1. Zachos NC, Tse M, Donowitz M. Molecular physiology of intestinal Na+/H+ exchanger. Annu Rev
Physiol 2005;67:411–443. [PubMed: 15709964]2. Hu Z, Wang Y, Graham WV, Su L, et al. MAPKAPK-2 is a critical signaling intermediate in NHE3
activation following Na+-glucose cotransport. J Biol Chem 2006;281:24247–24253. [PubMed:16793766]
3. Turner JR, Black ED. NHE3-dependent cytoplasmic alkalinization is triggered by Na(+)-glucosecotransport in intestinal epithelia. Am J Physiol Cell Physiol 2001;281:C1533–C1541. [PubMed:11600416]
Lin et al. Page 8
Gastroenterology. Author manuscript; available in PMC 2012 February 1.
NIH
-PA Author Manuscript
NIH
-PA Author Manuscript
NIH
-PA Author Manuscript
4. Zhao H, Shiue H, Palkon S, et al. Ezrin regulates NHE3 translocation and activation after Na+-glucose cotransport. Proc Natl Acad Sci U S A 2004;101:9485–9490. [PubMed: 15197272]
5. Shiue H, Musch MW, Wang Y, et al. Akt2 phosphorylates ezrin to trigger NHE3 translocation andactivation. J Biol Chem 2005;280:1688–1695. [PubMed: 15531580]
6. Donowitz M, Cha B, Zachos N, et al. NHERF Family and NHE3 regulation. J Physiol 2005;567:3–11. [PubMed: 15905209]
7. Donowitz M, Li X. Regulatory binding partners and complexes of NHE3. Physiol Rev2007;87:825–872. [PubMed: 17615390]
8. Li X, Zhang H, Cheong A, et al. Carbachol regulation of rabbit ileal brush border Na+-H+exchanger 3 (NHE3) occurs through changes in NHE3 trafficking and complex formation and is Srcdependent. J Physiol 2004;556:791–804. [PubMed: 14978207]
9. Li X, Donowitz M. Fractionation of subcellular membrane vesicles of epithelial and nonepithelialcells by OptiPrep density gradient ultracentrifugation. Methods Mol Biol 2008;440:97–110.[PubMed: 18369940]
10. Broere N, Hillesheim J, Tuo B, et al. Cystic fibrosis transmembrane conductance regulatoractivation is reduced in the small intestine of Na+/H+ exchanger 3 regulatory factor 1 (NHERF-1)-but not NHERF-2-deficient mice. J Biol Chem 2007;282:37575–37584. [PubMed: 17947234]
11. Murtazina R, Kovbasnjuk O, Zachos NC, et al. Tissue-specific regulation of sodium/protonexchanger isoform 3 activity in Na(+)/H(+) exchanger regulatory factor 1 (NHERF1) null mice.cAMP inhibition is differentially dependent on NHERF1 and exchange protein directly activatedby cAMP in ileum versus proximal tubule. J Biol Chem 2007;282:25141–25151. [PubMed:17580307]
12. Ma T, Thiagarajah JR, Yang H, et al. Verkman Thiazolidinone CFTR inhibitor identified by high-throughput screening blocks cholera toxin–induced intestinal fluid secretion. J Clin Invest2002;110:1651–1658. [PubMed: 12464670]
13. Sarker R, Grønborg M, Cha B, et al. Casein kinase 2 binds to the C terminus of Na+/H+ exchanger3 (NHE3) and stimulates NHE3 basal activity by phosphorylating a separate site in NHE3. MolBiol Cell 2008;19:3859–3870. [PubMed: 18614797]
14. Cha B, Tse M, Yun C, et al. The NHE3 juxtamembrane cytoplasmic domain directly binds ezrin:dual role in NHE3 trafficking and mobility in the brush border. Mol Biol Cell 2006;17:2661–2673.[PubMed: 16540524]
15. Peti-Peterdi J, Toma I, Sipos A, et al. Multiphoton imaging of renal regulatory mechanisms.Physiology (Bethesda) 2009;24:88–96. [PubMed: 19364911]
16. Barnett SF, Defeo-Jones D, Fu S, et al. Identification and characterization of pleckstrin-homology-domain-dependent and isoenzyme-specific akt inhibitors. Biochem J 2005;385:399–408.[PubMed: 15456405]
17. Cha B, Kenworthy A, Murtazina R, et al. The lateral mobility of NHE3 on the apical membrane ofrenal epithelial OK cells is limited by the PDZ domain proteins NHERF1/2, but is dependent on anintact actin cytoskeleton as determined by FRAP. J Cell Sci 2004;117:3353–3365. [PubMed:15226406]
18. Madara JL, Pappenheimer JR. Structural basis for physiological regulation of paracellularpathways in intestinal epithelia. J Membr Biol 1987;100:149–164. [PubMed: 3430571]
19. Wade JB, Welling PA, Donowitz M, Shenolikar S, Weinman EJ. Differential renal distribution ofNHERF isoforms and their colocalization with NHE3, ezrin, and ROMK. Am J Physiol CellPhysiol 2001;280:C192–C198. [PubMed: 11121391]
20. Cha B, Zhu XC, Chen W, Jones M, Ryoo S, Zachos NC, Chen TE, Lin R, Sarker R, KenworthyAK, Tse M, Kovbasnjuk O, Donowitz M. NHE3 mobility in brush borders increases uponNHERF2-dependent stimulation by lyophosphatidic acid. J Cell Sci 2010;123:2434–2443.[PubMed: 20571054]
21. Akhter S, Kovbasnjuk O, Li X, et al. Na(+)/H(+) exchanger 3 is in large complexes in the center ofthe apical surface of proximal tubule-derived OK cells. Am J Physiol Cell Physiol2002;283:C927–C940. [PubMed: 12176749]
Lin et al. Page 9
Gastroenterology. Author manuscript; available in PMC 2012 February 1.
NIH
-PA Author Manuscript
NIH
-PA Author Manuscript
NIH
-PA Author Manuscript
22. Malyukova I, Murray KF, Zhu C, et al. Macropinocytosis in Shiga toxin 1 uptake by humanintestinal epithelial cells and transcellular transcytosis. Am J Physiol Gastrointest Liver Physiol2009;296:G78–G92. [PubMed: 18974311]
23. Xiong W, Jordens I, Gonzalez E, McGraw TE. GLUT4 is sorted to vesicles whose accumulationbeneath and insertion into the plasma membfrne are differentially regulated by insulin andselectively affected by insulin resistance. Mol Biol Cell 2010;21:1375–1386. [PubMed: 20181829]
24. Biemesderfer D, DeGray B, Aronson PS. Active (9.6 s) and inactive (21 s) oligomers of NHE3 inmicrodomains of the renal brush border. J Biol Chem 2001;276:10161–10167. [PubMed:11120742]
25. McDonough AA, Biemesderfer D. Does membrane trafficking play a role in regulating thesodium/hydrogen exchanger isoform 3 in the proximal tubule? Curr Opin Nephrol Hypertens2003;12:533–541. [PubMed: 12920402]
26. McDonough AA. Mechanisms of proximal tubule sodium transport regulation that linkextracellular fluid volume and blood pressure. Am J Physiol Regul Integr Comp Physiol2010;298:R851–R861. [PubMed: 20106993]
27. Riquier AD, Lee DH, McDonough AA. Renal NHE3 and NaPi2 partition into distinct membranedomains. Am J Physiol Cell Physiol 2009;296:C900–C910. [PubMed: 19158399]
Lin et al. Page 10
Gastroenterology. Author manuscript; available in PMC 2012 February 1.
NIH
-PA Author Manuscript
NIH
-PA Author Manuscript
NIH
-PA Author Manuscript
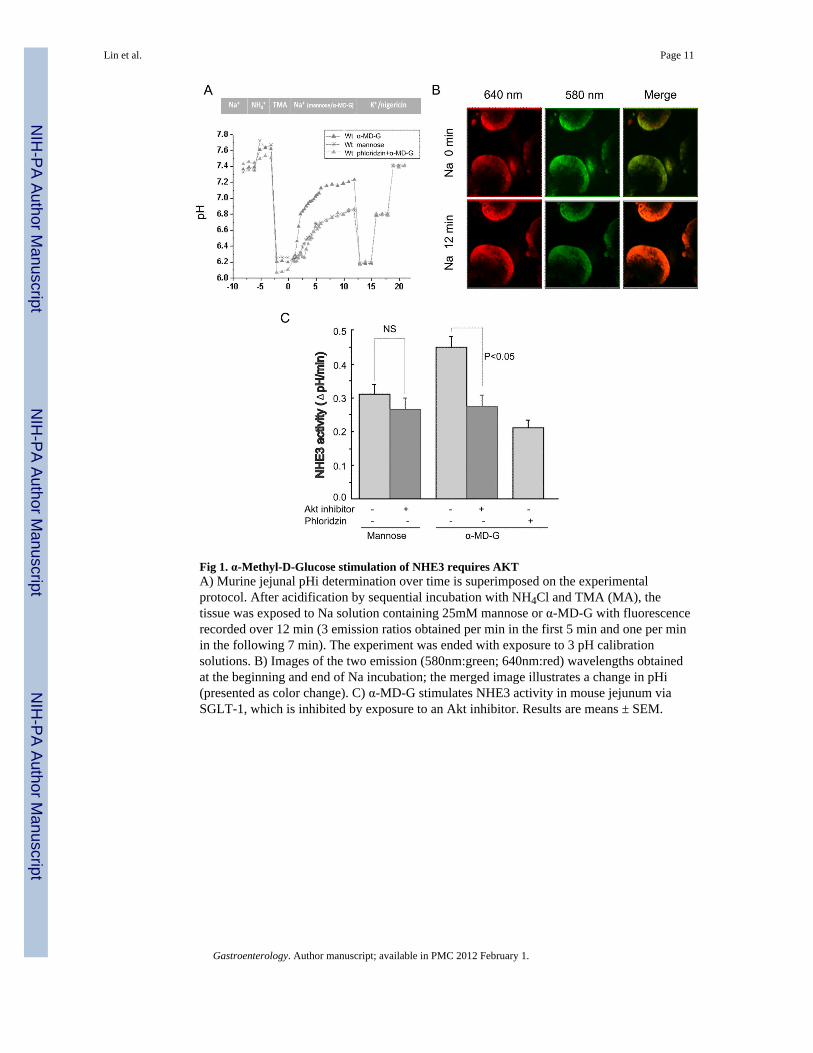
Fig 1. α-Methyl-D-Glucose stimulation of NHE3 requires AKTA) Murine jejunal pHi determination over time is superimposed on the experimentalprotocol. After acidification by sequential incubation with NH4Cl and TMA (MA), thetissue was exposed to Na solution containing 25mM mannose or α-MD-G with fluorescencerecorded over 12 min (3 emission ratios obtained per min in the first 5 min and one per minin the following 7 min). The experiment was ended with exposure to 3 pH calibrationsolutions. B) Images of the two emission (580nm:green; 640nm:red) wavelengths obtainedat the beginning and end of Na incubation; the merged image illustrates a change in pHi(presented as color change). C) α-MD-G stimulates NHE3 activity in mouse jejunum viaSGLT-1, which is inhibited by exposure to an Akt inhibitor. Results are means ± SEM.
Lin et al. Page 11
Gastroenterology. Author manuscript; available in PMC 2012 February 1.
NIH
-PA Author Manuscript
NIH
-PA Author Manuscript
NIH
-PA Author Manuscript
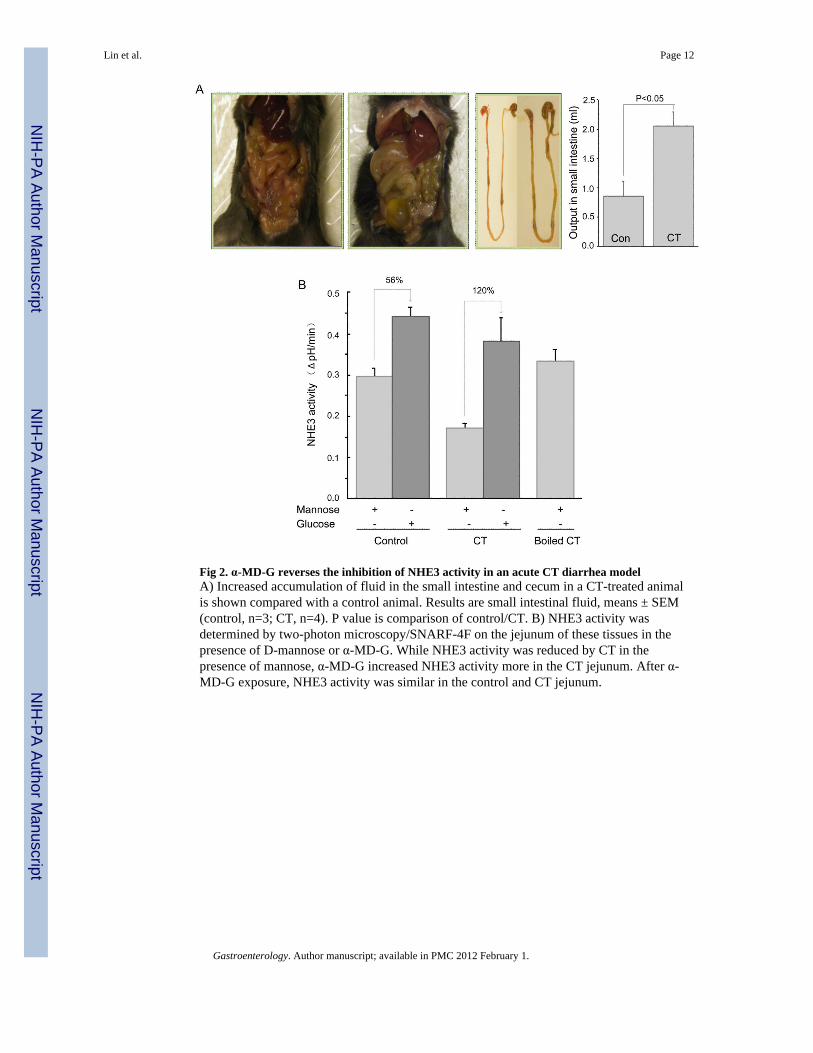
Fig 2. α-MD-G reverses the inhibition of NHE3 activity in an acute CT diarrhea modelA) Increased accumulation of fluid in the small intestine and cecum in a CT-treated animalis shown compared with a control animal. Results are small intestinal fluid, means ± SEM(control, n=3; CT, n=4). P value is comparison of control/CT. B) NHE3 activity wasdetermined by two-photon microscopy/SNARF-4F on the jejunum of these tissues in thepresence of D-mannose or α-MD-G. While NHE3 activity was reduced by CT in thepresence of mannose, α-MD-G increased NHE3 activity more in the CT jejunum. After α-MD-G exposure, NHE3 activity was similar in the control and CT jejunum.
Lin et al. Page 12
Gastroenterology. Author manuscript; available in PMC 2012 February 1.
NIH
-PA Author Manuscript
NIH
-PA Author Manuscript
NIH
-PA Author Manuscript
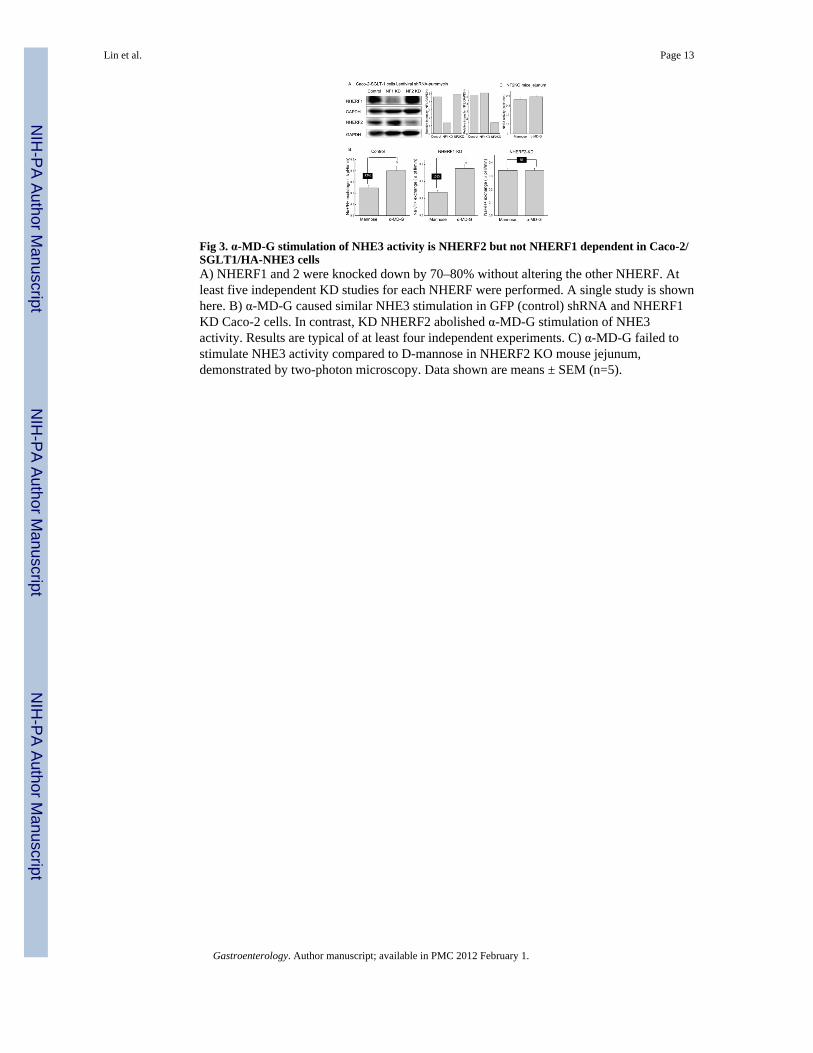
Fig 3. α-MD-G stimulation of NHE3 activity is NHERF2 but not NHERF1 dependent in Caco-2/SGLT1/HA-NHE3 cellsA) NHERF1 and 2 were knocked down by 70–80% without altering the other NHERF. Atleast five independent KD studies for each NHERF were performed. A single study is shownhere. B) α-MD-G caused similar NHE3 stimulation in GFP (control) shRNA and NHERF1KD Caco-2 cells. In contrast, KD NHERF2 abolished α-MD-G stimulation of NHE3activity. Results are typical of at least four independent experiments. C) α-MD-G failed tostimulate NHE3 activity compared to D-mannose in NHERF2 KO mouse jejunum,demonstrated by two-photon microscopy. Data shown are means ± SEM (n=5).
Lin et al. Page 13
Gastroenterology. Author manuscript; available in PMC 2012 February 1.
NIH
-PA Author Manuscript
NIH
-PA Author Manuscript
NIH
-PA Author Manuscript
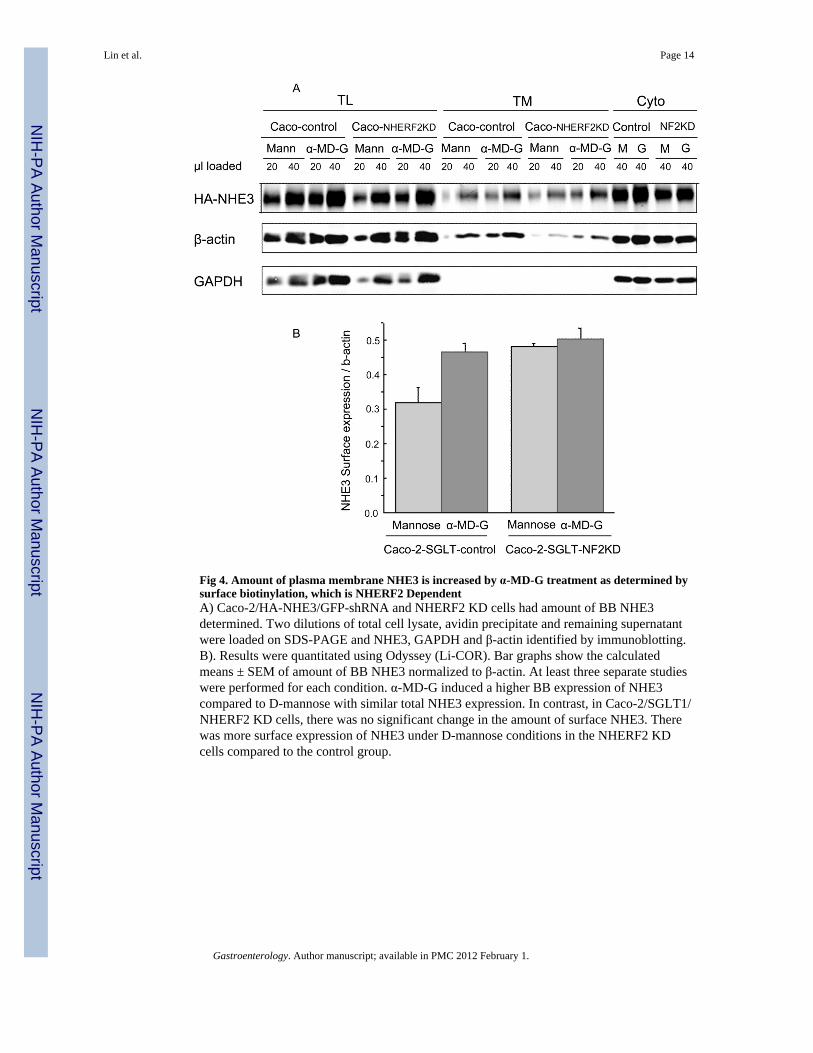
Fig 4. Amount of plasma membrane NHE3 is increased by α-MD-G treatment as determined bysurface biotinylation, which is NHERF2 DependentA) Caco-2/HA-NHE3/GFP-shRNA and NHERF2 KD cells had amount of BB NHE3determined. Two dilutions of total cell lysate, avidin precipitate and remaining supernatantwere loaded on SDS-PAGE and NHE3, GAPDH and β-actin identified by immunoblotting.B). Results were quantitated using Odyssey (Li-COR). Bar graphs show the calculatedmeans ± SEM of amount of BB NHE3 normalized to β-actin. At least three separate studieswere performed for each condition. α-MD-G induced a higher BB expression of NHE3compared to D-mannose with similar total NHE3 expression. In contrast, in Caco-2/SGLT1/NHERF2 KD cells, there was no significant change in the amount of surface NHE3. Therewas more surface expression of NHE3 under D-mannose conditions in the NHERF2 KDcells compared to the control group.
Lin et al. Page 14
Gastroenterology. Author manuscript; available in PMC 2012 February 1.
NIH
-PA Author Manuscript
NIH
-PA Author Manuscript
NIH
-PA Author Manuscript
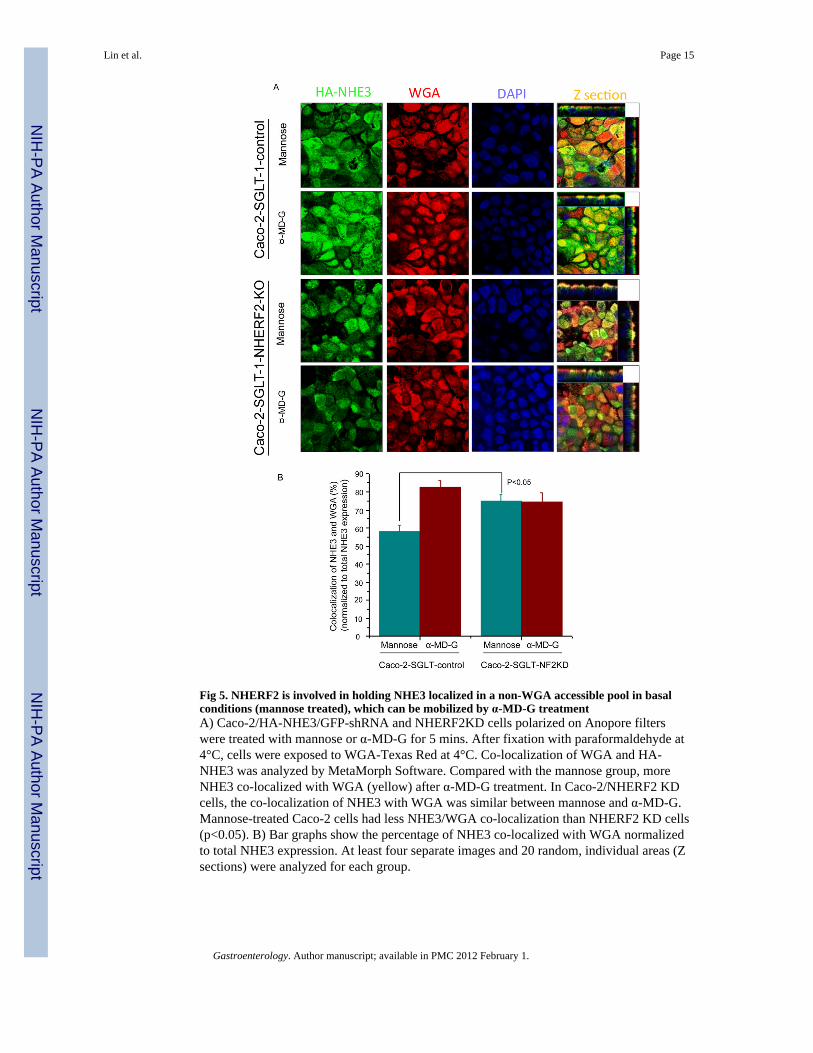
Fig 5. NHERF2 is involved in holding NHE3 localized in a non-WGA accessible pool in basalconditions (mannose treated), which can be mobilized by α-MD-G treatmentA) Caco-2/HA-NHE3/GFP-shRNA and NHERF2KD cells polarized on Anopore filterswere treated with mannose or α-MD-G for 5 mins. After fixation with paraformaldehyde at4°C, cells were exposed to WGA-Texas Red at 4°C. Co-localization of WGA and HA-NHE3 was analyzed by MetaMorph Software. Compared with the mannose group, moreNHE3 co-localized with WGA (yellow) after α-MD-G treatment. In Caco-2/NHERF2 KDcells, the co-localization of NHE3 with WGA was similar between mannose and α-MD-G.Mannose-treated Caco-2 cells had less NHE3/WGA co-localization than NHERF2 KD cells(p<0.05). B) Bar graphs show the percentage of NHE3 co-localized with WGA normalizedto total NHE3 expression. At least four separate images and 20 random, individual areas (Zsections) were analyzed for each group.
Lin et al. Page 15
Gastroenterology. Author manuscript; available in PMC 2012 February 1.
NIH
-PA Author Manuscript
NIH
-PA Author Manuscript
NIH
-PA Author Manuscript

Fig 6. α-MD-G regulation of NHE3 trafficking requires dissociation from NHERF2A) Caco-2//HA-NHE3 cells were treated with 25 mM D-mannose or α-MD-G and then werefixed and labeled by anti-HA-NHE3 (monoclonal) and anti-NHERF2 (polyclonalantibodies), followed by anti-mouse-FITC and anti-rabbit-Cy3. All images were recordedwith the same settings. Co-localization between NHE3/NHERF2 was quantitated byMetaMorph software. A) Typical images of NHE3 (green) and NHERF2 (red) doublestaining in both D-mannose or α-MD-G treatment. Yellow color shows the co-localizationof these two proteins. B) The co-localization of NHE3 and NHERF2 was decreased from62.8±1.7% to 53.4±1.4% by α-MD-G treatment (p<0.05). Bar graphs show the percentage ofNHE3 co-localized with NHERF2 compared with total NHE3. C) Dissociation of NHERF2and NHE3 with short term α-MD-G treatment was demonstrated by co-immunoprecipitationin the Caco-2/NHERF2 but not the NHERF2 Δ30 cell models. α-MD-G treatment reducedthe amount of FLAG-NHERF2 co-precipitated when NHE3 was IP. This did not occur whenthe Caco-2 cells expressed FLAG-NHERFΔ30. Similar results were obtained with 3duplicate experiments. D) Caco-2/SGLT-1 cells with NHERF2 KD and expressingNHERF2Δ30 were examined for α-MD-G stimulation of NHE3 activity. α-MD-G failed tostimulate NHE3 activity in these cells. N=6.
Lin et al. Page 16
Gastroenterology. Author manuscript; available in PMC 2012 February 1.
NIH
-PA Author Manuscript
NIH
-PA Author Manuscript
NIH
-PA Author Manuscript
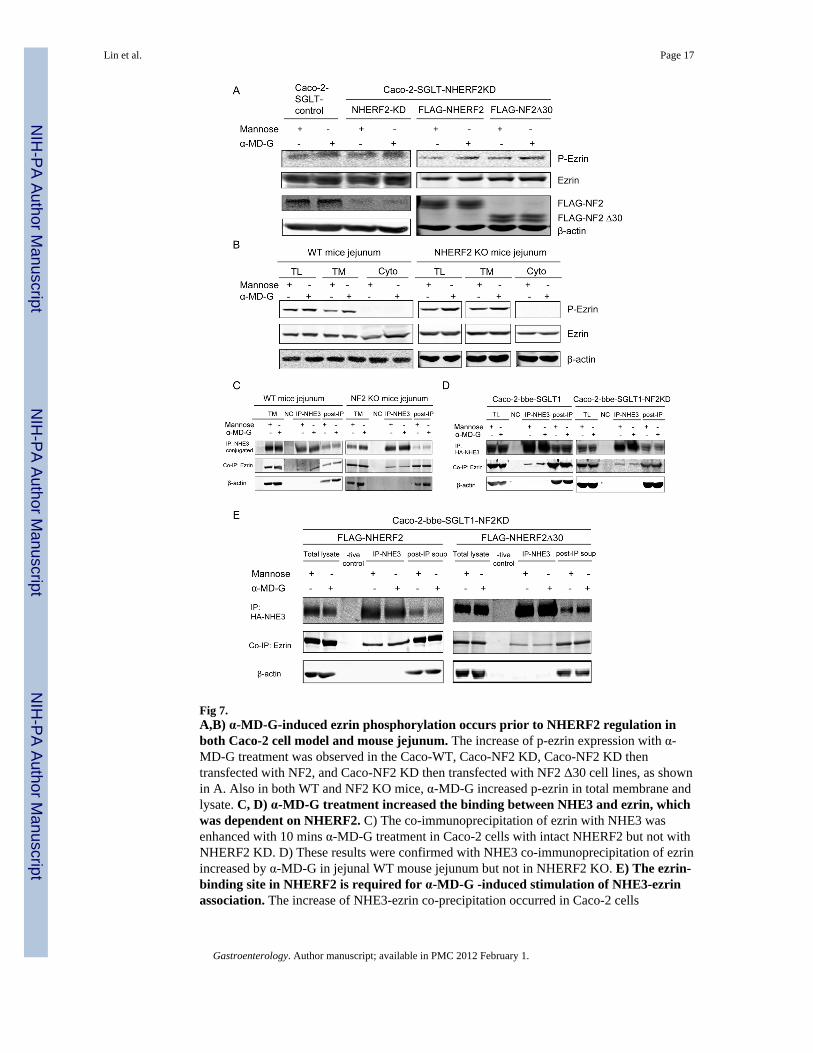
Fig 7.A,B) α-MD-G-induced ezrin phosphorylation occurs prior to NHERF2 regulation inboth Caco-2 cell model and mouse jejunum. The increase of p-ezrin expression with α-MD-G treatment was observed in the Caco-WT, Caco-NF2 KD, Caco-NF2 KD thentransfected with NF2, and Caco-NF2 KD then transfected with NF2 Δ30 cell lines, as shownin A. Also in both WT and NF2 KO mice, α-MD-G increased p-ezrin in total membrane andlysate. C, D) α-MD-G treatment increased the binding between NHE3 and ezrin, whichwas dependent on NHERF2. C) The co-immunoprecipitation of ezrin with NHE3 wasenhanced with 10 mins α-MD-G treatment in Caco-2 cells with intact NHERF2 but not withNHERF2 KD. D) These results were confirmed with NHE3 co-immunoprecipitation of ezrinincreased by α-MD-G in jejunal WT mouse jejunum but not in NHERF2 KO. E) The ezrin-binding site in NHERF2 is required for α-MD-G -induced stimulation of NHE3-ezrinassociation. The increase of NHE3-ezrin co-precipitation occurred in Caco-2 cells
Lin et al. Page 17
Gastroenterology. Author manuscript; available in PMC 2012 February 1.
NIH
-PA Author Manuscript
NIH
-PA Author Manuscript
NIH
-PA Author Manuscript
overexpressing NHERF2, but not in those overexpressing NHERF2 Δ30. Similar resultswere seen in 3 identical experiments.
Lin et al. Page 18
Gastroenterology. Author manuscript; available in PMC 2012 February 1.
NIH
-PA Author Manuscript
NIH
-PA Author Manuscript
NIH
-PA Author Manuscript