Current knowledge about ideal protein for growing pigs
200
HAL Id: hal-01210553 https://hal.archives-ouvertes.fr/hal-01210553 Submitted on 3 Jun 2020 HAL is a multi-disciplinary open access archive for the deposit and dissemination of sci- entific research documents, whether they are pub- lished or not. The documents may come from teaching and research institutions in France or abroad, or from public or private research centers. L’archive ouverte pluridisciplinaire HAL, est destinée au dépôt et à la diffusion de documents scientifiques de niveau recherche, publiés ou non, émanant des établissements d’enseignement et de recherche français ou étrangers, des laboratoires publics ou privés. Current knowledge about ideal protein for growing pigs Jaap van Milgen, Nathalie Le Floc’H, Etienne Corrent, Mathieu Gloaguen To cite this version: Jaap van Milgen, Nathalie Le Floc’H, Etienne Corrent, Mathieu Gloaguen. Current knowledge about ideal protein for growing pigs. ASAS/ADSA Midwest meeting, Mar 2014, Des Moines, United States. Journal of Animal Science, 92 (suppl. 2), 2014, Journal of Animal Science. hal-01210553
-
Upload
khangminh22 -
Category
Documents
-
view
0 -
download
0
Transcript of Current knowledge about ideal protein for growing pigs
HAL Id: hal-01210553https://hal.archives-ouvertes.fr/hal-01210553
Submitted on 3 Jun 2020
HAL is a multi-disciplinary open accessarchive for the deposit and dissemination of sci-entific research documents, whether they are pub-lished or not. The documents may come fromteaching and research institutions in France orabroad, or from public or private research centers.
L’archive ouverte pluridisciplinaire HAL, estdestinée au dépôt et à la diffusion de documentsscientifiques de niveau recherche, publiés ou non,émanant des établissements d’enseignement et derecherche français ou étrangers, des laboratoirespublics ou privés.
Current knowledge about ideal protein for growing pigsJaap van Milgen, Nathalie Le Floc’H, Etienne Corrent, Mathieu Gloaguen
To cite this version:Jaap van Milgen, Nathalie Le Floc’H, Etienne Corrent, Mathieu Gloaguen. Current knowledge aboutideal protein for growing pigs. ASAS/ADSA Midwest meeting, Mar 2014, Des Moines, United States.Journal of Animal Science, 92 (suppl. 2), 2014, Journal of Animal Science. �hal-01210553�

Abstracts
ASAS Midwestern Section andADSA® Midwest Branch
March 17-19, 2014Des Moines, Iowa
American Society of Animal ScienceJournal of Animal ScienceVolume 92, Supplement 2
American Dairy Science AssociationJournal of Dairy ScienceVolume 97, Supplement 1

Officers and Directors of the American Society of Animal Science
G. P. Lardy, PresidentD. K. Aaron, President-ElectJ. L. Sartin, Past PresidentM. Wulster-Radcliffe, Chief Executive OfficerD. E. Hawkins, Program Chair and Director-at-LargeD. P. Casper, Foundation Trustee ChairJ. C. Weigel, ASAS Representative to FASS
Application for membership in the American Society of Animal Science (ASAS) is invited from persons with interest in animal science and livestock production. In 2014, annual dues including access to the electronic version of the Journal of Animal Science are $135 in the United States, Canada, and Mexico and in other countries. For those in the United States, Canada, or Mexico who wish to receive a paper copy of the journal, the additional fee is $200; for those in other countries, the additional fee is $300. Student affiliate membership is granted to those who are certified by a professional member as a regularly enrolled college student who does not hold a full-time position at the time of application for, or annual renewal of, membership. Graduate student memberships ($20 annually) and undergraduate student memberships (free) include access to the electronic version of the Journal of Animal Science. Postdoctoral fellows’ membership dues are $65. An institutional subscription ($599 annually) entitles an institution Internet access to e-JAS within appropriate IP addresses. For an additional $125 fee, institutions within the United States, Canada, and Mexico will receive a paper copy of the journal (an additional $150 fee for all other countries). For corporate subscriptions, please contact the ASAS office for pricing. Individual sustaining membership, $375 per year. Applications for membership with remittance should be mailed to the ASAS Business Office.
ASAS Business Office, PO Box 7410, Champaign, IL 61826 Telephone: 217-356-9050; Fax: 217-689-2436; E-mail: [email protected] Office hours: 8:00 a.m.–5:00 p.m.
American Society of Animal Science World Wide Web address: http://www.asas.org
Calendar of American Society of Animal Science Upcoming Meetings
Midwestern Section (with ADSA) March 16–18, 2014 Des Moines, IAWestern Section June 24–26, 2014 San Angelo, TXNortheast Section July 20–24, 2014 Kansas City, MONational Annual Meeting (with ADSA) July 20–24, 2014 Kansas City, MO
Manuscript Submission. Information about manuscript submission is given in Style and Form published on the journal website (http://jas.fass.org). All manuscripts submitted to the Journal of Animal Science must be accompanied by the JAS manuscript submission form certifying that any re-search that involves animals has followed established standards for the humane care and use of animals. Manuscripts should be submitted online via http://mc.manuscriptcentral.com/jas.
Address Change and Missing Copies. Notice of change in address should be received by the ASAS Business Office 60 days in advance of change. A claim for a missing copy of the Journal of Animal Science should be received within 30 days (90 days foreign) after publication date to ensure replacement at no additional charge. The current policy is one replacement per monthly issue of the Journal of Animal Science. If additional replace-ments are requested beyond that, a single-issue price of $60 per issue domestic and $65 per issue foreign shall be charged. These prices reflect the current single issue pricing structure.
Journal of Animal Science (ISSN 0021-8812) is published 12 times per year (monthly) by the American Society of Animal Science. Periodicals post-age paid at 201 W. Springfield, Ste 1202, Champaign, IL 61820 and at additional mailing offices. Form 3579 to be returned to the ASAS Business Office. Postmaster: Send change of address to American Society of Animal Science, PO Box 7410, Champaign, IL 61826.
Copyright 2014 by the American Society of Animal Science. Printed in USA. All rights reserved. Reproduction in part or whole is prohibited.
E. B. Kegley, Recording Secretary and Director-at-LargeG. S. Lewis, Editor-in-ChiefN. R. Merchen, Midwestern Director T. A. Hoagland, Northeastern DirectorR. B. Muntifering, Southern DirectorJ. C. Whittier, Western DirectorJ. Hemmelgarn, Chief Operations Officer
S. L. Archibeque Director-at-Large T. A. Armstrong, Director-at-LargeW. L. Flowers, Director-at-LargeH. C. Freetly, Director-at-LargeC. K. Larson, Director-at-LargeE. Lonergan, Director-at-LargeL. C. Martin, Director-at-LargeC. L. Maxwell, Graduate DirectorW. B. Smith, Graduate Director
Journal of Animal ScienceEditor-in-Chief: Gregory S. Lewis
Animal Genetics: M. D. MacNeil (2014), Division Editor Molecular Genetics D. Berry (2016), Associate Editor Quantitative Genetics M. Gonda (2015), Associate Editor C. Li (2016), Associate Editor D. Nonneman (2014), Associate Editor L. Varona (2014), Associate Editor B. Weaber (2014), Associate Editor
Animal Physiology: S. Johnson (2014), Division Editor Cell Biology T. Brandebourg (2015), Associate Editor Growth and Developmental Biology K. Govoni (2016), Associate Editor R. Rhoads (2014), Associate Editor Physiology, Endocrinology, and Reproduction L. Spicer (2014), Associate Editor
Animal Nutrition: S. W. Kim (2016), Division Editor Nonruminant Nutrition J. Caton (2016), Division Editor Ruminant Nutrition S. Baidoo (2016), Associate Editor T. Crenshaw (2015), Associate Editor J. Patience (2016), Associate Editor C. Reinhardt (2014), Associate Editor B. Rude (2016), Associate Editor C. Stahl (2016), Associate Editor P. Thacker (2015), Associate Editor E. Titgemeyer (2016), Associate Editor Y. Wang (2016), Associate Editor
Animal Production: J. Villalba (2016), Division Editor Behavior R. Anderson (2014), Associate Editor Environmental Impact T. Devries (2014), Associate Editor Feedstuff Evaluation J. Klotz (2014), Associate Editor Health and Well-Being A. Leytem (2014), Associate Editor Management K. Soder (2016), Associate Editor Pharmacology and Toxicology B. Taylor (2014), Associate Editor Rangeland, Pasture, and Forage Utilization
Animal Products: S. Lonergan (2016), Division Editor Meat Science and Muscle Biology R. Mancini (2014), Associate Editor Pre- and Postharvest Product Safety S. P. Suman (2016), Associate Editor D. VanOverbeke (2016), Associate Editor
Special Topics: R. Dailey (2015), Division Editor Biographical/Historical Sketches Contemporary Issues Teaching
Symposia M. Mirando (2015), Editor
ACSESS Editorial and Production Staff: Mark Mandelbaum Emily Mueller ([email protected]) Brett Holte Karen Brey
Editorial Board
Terms expire on July 15 of the year indicated
Gbola Adesogan (2013)Jason Ahola (2013)Shawn Archibeque (2013)Paul Beck (2014)Giuseppe Bee (2016)Werner Bergen (2016)Donagh Berry (2014)Mario Binelli (2016)Dustin Boler (2016)Barry Bradford (2013)Christy Bratcher (2017)Andre Brito (2013)David Buchanan (2016)Kristi Cammack (2015)Kasey Carlin (2017)Dale Coleman (2014)Reinaldo Cooke (2014)Robert Cushman (2016)Jared Decker (2016)Robert Delmore (2016)Anna Dilger (2016)Ryan Dilger (2016)Roberto Distel (2016)Jean-Yves Dourmad (2014)Susan Duckett (2014)Min Du (2013)Ted Elsasser (2014)Shelby Filley (2014)Mark Froetschel (2013)Rick Funston (2016)John B. Gaughan (2016)Elizabeth Gilbert (2014)Cecile Ginane (2016)
Robert Goodband (2014)John Gonzalez (2014)Pablo Gregorini (2016)Tanya Gressley (2014)Jesse Grimes (2016)
Kevin Harvatine (2013)Ben Hayes (2015)
Shanna Ivey (2016)Tim Keady (2013)
Beob Gyun Kim (2016)Jan Kotwica (2016)
Scott Kronberg (2016)Ilias Kyriazakis (2014)G. Cliff Lamb (2016)
James Lauderdale (2013)Laurie Lawrence (2014)
Jerrad Legako (2018)Clay Lents (2016)
Gustavo J. M. M. Lima (2016)Julie Long (2014)
Peadar Lowlor (2016)Elizabeth Maga (2014)
Raluca Mateescu (2016)José F. M. Menten (2016)
Phil Miller (2016)Frank Monahan (2017)
Christopher Mortensen (2016)Rainer Mosenthin (2016)Raphael Mrode (2014)
Gordon Murdoch (2013)Kiyoshi Okuda (2016)Robert Payne (2014)James Pfister (2016)
Xiangshu Piao (2016)A. Radunz (2013)
Ravi Ravindran (2014)Sarah Reed (2014)
Charlotte Rehfeldt (2016)Leah Rempel (2016)
Peter Ryan (2013)Guillermo Scaglia (2016)
Chris Schauer (2014)Jason Scheffle (2016)
Gerald Shurson (2016)Jeff Sindelar (2016)Burt Staniar (2014)Juan Steibel (2014)
Alex Stelzleni (2015)Gary Sullivan (2018)
Robert Tempelman (2014)David Townson (2013)Jesse Trushenski (2016)
Keith Underwood (2013)Kristine Urschel (2016)
Eugene Ungar (2016)Alison Van Eenennaam (2015)
Judson Vasconcelos (2014)Kimberly Vonnahme (2016)
Terry Ward (2014)Amanda Weaver (2017)
Robert Wettemann (2016)Matt Wilson (2014)
Paul Wistuba (2014)Aimee Wurtz (2014)Janeal Yancey (2016)

Journal of Dairy Science® since 1917
1800 S. Oak St., Ste 100, Champaign, IL 61820Phone 217/356-5146 | Fax 217/378-4083 | [email protected] | http://www.journalofdairyscience.org
EDITOR-IN-CHIEFRoger D. Shanks (14)University of Illinois217/[email protected]
DAIRY FOODSMary Anne Drake, Senior Editor (15)North Carolina State [email protected] Tong, Editor (16)Cal Poly State [email protected] McKillip, Editor (16)Ball State [email protected]
PHYSIOLOGY AND MANAGEMENTGeoff Dahl, Senior Editor (14)University of [email protected] Bruckmaier, Editor (14)University of [email protected] Stelwagen, Editor (14)[email protected] Sauerwein, Editor (14)University of [email protected] Beede, Editor (15)Michigan State [email protected], FEEDING, AND CALVESJohn Vicini, Senior Editor (14)Monsanto [email protected] Roche, Editor (15)Dairy [email protected] Kononoff, Editor (16)University of [email protected] Oba, Editor (16)University of [email protected]
GENETICS AND BREEDINGGeorgios Banos, Senior Editor (14)Aristotle University of [email protected] Kuhn, Editor (15)Res. Inst. Biol. Farm [email protected] Pryce, Editor (14)Department of Primary Industries, [email protected]
INVITED REVIEWSFilippo Miglior, Editor (15)Agriculture and Agri-Food [email protected]
JOURNAL MANAGEMENT COMMITTEEP. Kononoff, Chair (14)University of NebraskaRoger D. ShanksUniversity of IllinoisR. Jimenez-Flores, Board LiaisonCal Poly State University
R. M. Akers (15)Virginia TechM. J. Miller (16)University of IllinoisE. E. Connor (17)USDA, Beltsville, MD
S. Pollock (ex officio)American Dairy Science AssociationL. Adam (ex officio)American Dairy Science AssociationP. Studney (ex officio)American Dairy Science Association
EDITORIAL BOARD
R. M. Akers (15) VA (PM)H. G. Bateman II (13) OH (NFC)J. Blum (14) Switzerland (PM)B. Bradford (13) KS (NFC)W. Chen (14) China (DF)E. Connor (13) MD (PM)B. Corl (15) VA (PM)H. M. Dann (14) NY (NFC)T. Druet (14) Belgium (GB)T. Duong (13) TX (DF)L. Goddik (14) OR (DF)T. Gressley (13) DE (PM)M. Gunderson (13) IN (PM)H. Hammon (15) Germany (PM)
F. Harte (15) TN (DF)A. Hassan (13) SD (DF)S. Hiss-Pesch (15) Germany (PM)J. Jamrozik (15) Canada (GB)I. Kanevsky-Mullarky (15) VA (PM)A. F. Kertz (15) MO (NFC)K. Krishnamurthy (14) IL (DF)J. Loor (13) IL (PM)J. Lucey (14) WI (DF)J. McKillip (15) IN (DF)E. Memili (14) MS (GB)L. Metzger (15) SD (DF)M. Miller (15) IL (DF)K. Moyes (15) MD (PM)
N. Odongo (13) Canada (NFC)K. O’Driscoll (13) England (PM)O. Østerås (13) Norway (PM)S. Pyörälä (13) Finland (PM)P. Rezamand (14) ID (NFC)T. Schoenfuss (15) MN (DF)X. Sun (15) IN (GB)E. Titgemeyer (14) KS (NFC)R. L. Vallejo (13) WV (GB)E. Wall (14) VT (PM)W. Weiss (15) OH (NFC)T. Wright (13) Canada (NFC)
ADSA OFFICERSPresidentS. RankinUniversity of WisconsinVice PresidentAl KertzANDHIL LLCTreasurerM. SchutzPurdue UniversityPast PresidentR. K. McGuffeyMcGuffey Dairy Consulting
DirectorsS. Duncan (14)Virginia TechG. Dahl (14)University of FloridaL. Armentano (15)University of WisconsinR. Jimenez-Flores (15)Cal Poly State UniversityL. Timms (16)Iowa State University
K. Schmidt (16)Kansas State UniversityExecutive DirectorP. StudneyChampaign, IL
ADSA FOUNDATIONC. Luhman (13), ChairLand O’LakesM. Socha (13), Vice ChairZinpro CorporationM. Hanigan (13), SecretaryVirginia Tech
M. Schutz (13), TreasurerPurdue UniversityTrustees:D. McCoy (13)Dairy Research Inst.
S. Boucher (14)Hubbard FeedsV. Mistry (14)South Dakota State UniversityK. Schmidt (15)Kansas State University
FASS PUBLICATIONS [email protected]
Susan Pollock, Managing EditorLouise AdamJorge CazaresChris Davies
Sharon FrickGayle GleichmanArmgard HakenChristine Horger
Ron KellerLisa KrohnShauna Miller
Journal of Dairy Science (ISSN 0022-0302) is published monthly on behalf of the American Dairy Science As-sociation® by the Federation of Animal Science Societies, Champaign, IL, and Elsevier Inc., 360 Park Avenue South, New York, NY 10010-1710. Business and Editorial Office: 1600 John F. Kennedy Blvd., Ste. 1800, Philadelphia, PA 19103-2899. Customer Services Office: 3251 Riverport Lane, Maryland Heights, MO 63043. Periodicals postage paid at New York, NY, and additional mailing offices. The electronic edition of the journal (ISSN 1525-3198) is published online at http://www.journalofdairyscience.org.

Postmaster: Send address changes to Journal of Dairy Science, Elsevier Health Sciences Division, Subscription Customer Service, 3251 Riverport Lane, Maryland Heights, MO 63043.
Customer Service (orders, claims, back volumes, online access, change of address): Elsevier Health Sciences Division, Subscription Customer Service, 3251 Riverport Lane, Maryland Heights, MO 63043. Telephone: 800.654.2452 (US and Canada), 314.447.8871 (outside US and Canada); fax: 314.447.8029; e-mail: [email protected] (for print support) or [email protected] (for online support). Allow 4 to 6 weeks for the change of address to be implemented.
Institutional Subscription Rates: For institutions in the United States and possessions: $949 for print. For institutions in all other countries (prices include airspeed delivery): $1070 for print. Current prices are in effect for back volumes and back issues. Electronic access is additional. Please contact customer service for pricing.
ADSA Membership Rates: For individual membership, contact the ADSA office ([email protected]) to pay dues and obtain access to the journal. For professional members: $110 per year, graduate student membership: $10, undergraduate student affiliate membership: $5. Membership includes electronic version of the journal; additional $61.50 for paper copy in US, and additional $91.50 for paper copy in all other countries). Membership in the ADSA is on a calendar year basis from January through December.
Advertising Information: To advertise a position announcement in the News and Announcements section of the journal, please use the FASS Job Resource Center (http://www.fass.org/job.asp); e-mail [email protected] if you have questions. For display advertising orders and inquiries please contact Ken Senerth at 609.577.0916; by fax at 212.633.3980; or by e-mail at [email protected]. For non-recruitment classified advertising orders and inquiries please contact John Marmero at 212.633.3657; by fax at 212.633.3820; or by e-mail at [email protected].
Author Inquiries: For inquiries relating to the submission of articles, complete Instructions for Authors can be found online at http://www.journalof-dairyscience.org. Manuscripts submitted for consideration should be submitted electronically at http://mc.manuscriptcentral.com/jds in accordance with the Instructions for Authors. Need help? Contact [email protected]. Authors may place orders for offprints when proof corrections are sent to the editorial office (before the journal is sent for printing). For queries about offprints or order status, e-mail [email protected]; fax 217.378.4083. Reprints. To order author reprints after the issue has been printed, e-mail [email protected]. To order 100 or more reprints for educational, commercial, or promotional use, contact the Commercial Reprints Department, Elsevier Inc., 360 Park Avenue South, New York, NY 10010-1710; fax: 212.633.3820; e-mail: [email protected]. Access to single articles available online may be obtained by purchasing Pay-Per-View access on the journal website (http://www.journalofdairyscience.org).
© 2014 American Dairy Science Association®. All rights reserved. This journal and the individual contributions contained in it are protected under copyright by the American Dairy Science Association and the following terms and conditions apply to their use:
Photocopying: Single photocopies of single articles may be made for personal use as allowed by national copyright laws. Permission of the Publisher and payment of a fee is required for all other photocopying, including multiple or systematic copying, copying for advertising or promotional purposes, resale, and all forms of document delivery. Special rates are available for educational institutions that wish to make photocopies for non-profit educational classroom use. Permissions may be sought directly from Elsevier’s Rights Department in Oxford, UK. Telephone: 215.238.7869 or +44 (0) 1865 843830; fax: +44 (0) 1865 853333; e-mail: [email protected]. Requests may also be completed online via the Elsevier homepage (http://www.elsevier.com/locate/permissions). In the United States, users may clear permissions and make payments through the Copyright Clearance Center Inc., 222 Rosewood Drive, Danvers, MA 01923. Telephone: 978.750.8400; fax: 978.750.4744; and in the UK through the Copyright Licensing Agency Rapid Clearance Service (CLARCS), 90 Tottenham Court Road, London W1P 0LP, UK. Telephone: +44 20 7631 5555; fax: (+44) 20 7631 5500. Other countries may have a local reprographic rights agency for payments.
Derivative Works: Subscribers may reproduce tables of contents or prepare lists of articles including abstracts for internal circulation within their institu-tions. Permission of the Publisher is required for resale or distribution outside the institution. Permission of the Association and Publisher is required for all other derivative works, including compilations and translations.
Electronic Storage or Usage: Permission of the Publisher is required to store or use electronically any material contained in this journal, including any article or part of an article. Except as outlined above, no part of this publication may be reproduced, stored in a retrieval system, or transmitted in any form or by any means, electronic, mechanical, photocopying, recording, or otherwise, without prior written permission of the Publisher. Address permissions requests to Elsevier Rights Department at the fax and e-mail addresses noted above.
Notice: No responsibility is assumed by the Association, the Federation of Animal Science Societies, or the Publisher for any injury and/or damage to persons or property as a matter of product liability, negligence or otherwise, or from any use or operation of any methods, products, instructions, or ideas contained in the material herein. Because of rapid advances in the medical sciences, in particular, independent verification of diagnoses and drug dosages should be made. Mention of any trademark or proprietary product in works published in the Journal of Dairy Science does not constitute a guarantee or warranty of the product by the American Dairy Science Association and does not imply its approval to the exclusion of other products that may also be suitable. Although all advertising material is expected to conform to ethical (medical) standards, inclusion in this publication does not constitute a guarantee or endorsement of the quality or value of such product or of the claims made of it by its manufacturer.
Journal of Dairy Science® since 1917
1800 S. Oak St., Ste 100, Champaign, IL 61820Phone 217/356-5146 | Fax 217/378-4083 | [email protected] | http://www.journalofdairyscience.org

i
TA B L E O F C O N T E N T S
SYMPOSIUM & ORAL ABSTRACTS
SECTION ABSTRACT PAGE
Animal Behavior, Housing, & Well-Being Symposium: What Does This Study Say About Well-Being? Caveats and Considerations . . . . . . . . . . . . . . . . . . . . . . . . . . . . . . . . . . . . . . . . . . . . . . . . . . . . . . . . . . . . 001-005 . . . . . . . . . . . . . . . . . . . . . . 1
Animal Behavior, Housing, & Well-Being I . . . . . . . . . . . . . . . . . . . . . . . . . . . . . . . . . . . . . . . . . . . . . . . . . . . . . . . . . . . . . . . . . . . . . . . . . . . . . . 006-013 . . . . . . . . . . . . . . . . . . . . . . 2Breeding and Genetics I . . . . . . . . . . . . . . . . . . . . . . . . . . . . . . . . . . . . . . . . . . . . . . . . . . . . . . . . . . . . . . . . . . . . . . . . . . . . . . . . . . . . . . . . . . . . . . . . . . . . . . . . . 014-019 . . . . . . . . . . . . . . . . . . . . . . 6Breeding and Genetics Symposium:
Analysis of Next Generation Sequencing (NGS) Data . . . . . . . . . . . . . . . . . . . . . . . . . . . . . . . . . . . . . . . . . . . . . . . . . . . . . . . . . . 020-023 . . . . . . . . . . . . . . . . . . . . . . 9Breeding and Genetics II . . . . . . . . . . . . . . . . . . . . . . . . . . . . . . . . . . . . . . . . . . . . . . . . . . . . . . . . . . . . . . . . . . . . . . . . . . . . . . . . . . . . . . . . . . . . . . . . . . . . . . . . 024-033 . . . . . . . . . . . . . . . . . . . . . 10David Baker Amino Acids Symposium . . . . . . . . . . . . . . . . . . . . . . . . . . . . . . . . . . . . . . . . . . . . . . . . . . . . . . . . . . . . . . . . . . . . . . . . . . . . . . . . . . . . 034-039 . . . . . . . . . . . . . . . . . . . . . 15David Schingoethe Symposium: Heifer Nutrition and the Future . . . . . . . . . . . . . . . . . . . . . . . . . . . . . . . . . . . . . . . . . . . . . . . . . 040-044 . . . . . . . . . . . . . . . . . . . . . 17Equine . . . . . . . . . . . . . . . . . . . . . . . . . . . . . . . . . . . . . . . . . . . . . . . . . . . . . . . . . . . . . . . . . . . . . . . . . . . . . . . . . . . . . . . . . . . . . . . . . . . . . . . . . . . . . . . . . . . . . . . . . . . . . . . . . 045-049 . . . . . . . . . . . . . . . . . . . . . 19Extension – Dairy Symposium: Strategies To Increase Fiber Digestibility
In Lactating Dairy Cows . . . . . . . . . . . . . . . . . . . . . . . . . . . . . . . . . . . . . . . . . . . . . . . . . . . . . . . . . . . . . . . . . . . . . . . . . . . . . . . . . . . . . . . . . . . . . . . . . . 050-053 . . . . . . . . . . . . . . . . . . . . . 21Extension – Swine . . . . . . . . . . . . . . . . . . . . . . . . . . . . . . . . . . . . . . . . . . . . . . . . . . . . . . . . . . . . . . . . . . . . . . . . . . . . . . . . . . . . . . . . . . . . . . . . . . . . . . . . . . . . . . . . 054-059 . . . . . . . . . . . . . . . . . . . . . 23Gary Allee Symposium: Feeding Sick Pigs . . . . . . . . . . . . . . . . . . . . . . . . . . . . . . . . . . . . . . . . . . . . . . . . . . . . . . . . . . . . . . . . . . . . . . . . . . . . . . . 060-063 . . . . . . . . . . . . . . . . . . . . . 25Graduate Student Oral Competition: Master Oral I . . . . . . . . . . . . . . . . . . . . . . . . . . . . . . . . . . . . . . . . . . . . . . . . . . . . . . . . . . . . . . . . . . . . 064-072 . . . . . . . . . . . . . . . . . . . . . 27Graduate Student Oral Competition: Master Oral II . . . . . . . . . . . . . . . . . . . . . . . . . . . . . . . . . . . . . . . . . . . . . . . . . . . . . . . . . . . . . . . . . . . 073-082 . . . . . . . . . . . . . . . . . . . . . 31Graduate Student Oral Competition: PhD Oral I . . . . . . . . . . . . . . . . . . . . . . . . . . . . . . . . . . . . . . . . . . . . . . . . . . . . . . . . . . . . . . . . . . . . . . . . 083-092 . . . . . . . . . . . . . . . . . . . . . 36Graduate Student Oral Competition: PhD Oral II . . . . . . . . . . . . . . . . . . . . . . . . . . . . . . . . . . . . . . . . . . . . . . . . . . . . . . . . . . . . . . . . . . . . . . . 093-101 . . . . . . . . . . . . . . . . . . . . . 41Growth, Development, Muscle Biology, and Meat Science Symposium:
Insulin Revisited . . . . . . . . . . . . . . . . . . . . . . . . . . . . . . . . . . . . . . . . . . . . . . . . . . . . . . . . . . . . . . . . . . . . . . . . . . . . . . . . . . . . . . . . . . . . . . . . . . . . . . . . . . . . . 102-107 . . . . . . . . . . . . . . . . . . . . . 45Growth, Development, Muscle Biology, and Meat Science . . . . . . . . . . . . . . . . . . . . . . . . . . . . . . . . . . . . . . . . . . . . . . . . . . . . . . . . . 108-116 . . . . . . . . . . . . . . . . . . . . . 47Nonruminant Nutrition: Grow-Finish Management and Nutrition . . . . . . . . . . . . . . . . . . . . . . . . . . . . . . . . . . . . . . . . . . . . . . . . 117-128 . . . . . . . . . . . . . . . . . . . . . 51Nonruminant Nutrition: Nursery Management and Nutrition . . . . . . . . . . . . . . . . . . . . . . . . . . . . . . . . . . . . . . . . . . . . . . . . . . . . . . . 129-141 . . . . . . . . . . . . . . . . . . . . . 57Nonruminant Nutrition: Sow Management and Nutrition . . . . . . . . . . . . . . . . . . . . . . . . . . . . . . . . . . . . . . . . . . . . . . . . . . . . . . . . . . . . 142-146 . . . . . . . . . . . . . . . . . . . . . 63Nonruminant Nutrition: Feed Processing, Ingredients, and Additives . . . . . . . . . . . . . . . . . . . . . . . . . . . . . . . . . . . . . . . . . . . 147-160 . . . . . . . . . . . . . . . . . . . . . 65Nonruminant Nutrition:
Gut Health and Disease: Nutritional and Metabolic Impacts . . . . . . . . . . . . . . . . . . . . . . . . . . . . . . . . . . . . . . . . . . . . . . . . . 161-170 . . . . . . . . . . . . . . . . . . . . . 71Nonruminant Nutrition: Co-Products . . . . . . . . . . . . . . . . . . . . . . . . . . . . . . . . . . . . . . . . . . . . . . . . . . . . . . . . . . . . . . . . . . . . . . . . . . . . . . . . . . . . . . . 171-182 . . . . . . . . . . . . . . . . . . . . . 76Nonruminant Nutrition: Minerals and Vitamins . . . . . . . . . . . . . . . . . . . . . . . . . . . . . . . . . . . . . . . . . . . . . . . . . . . . . . . . . . . . . . . . . . . . . . . . . 183-191 . . . . . . . . . . . . . . . . . . . . . 81Physiology Symposium: A Lifetime of Metabolites . . . . . . . . . . . . . . . . . . . . . . . . . . . . . . . . . . . . . . . . . . . . . . . . . . . . . . . . . . . . . . . . . . . 192-197 . . . . . . . . . . . . . . . . . . . . . 85Physiology . . . . . . . . . . . . . . . . . . . . . . . . . . . . . . . . . . . . . . . . . . . . . . . . . . . . . . . . . . . . . . . . . . . . . . . . . . . . . . . . . . . . . . . . . . . . . . . . . . . . . . . . . . . . . . . . . . . . . . . . . . . 198-204 . . . . . . . . . . . . . . . . . . . . . 88Ruminant Nutrition: Co-Products . . . . . . . . . . . . . . . . . . . . . . . . . . . . . . . . . . . . . . . . . . . . . . . . . . . . . . . . . . . . . . . . . . . . . . . . . . . . . . . . . . . . . . . . . . . . 205-213 . . . . . . . . . . . . . . . . . . . . . 91Ruminant Nutrition: General . . . . . . . . . . . . . . . . . . . . . . . . . . . . . . . . . . . . . . . . . . . . . . . . . . . . . . . . . . . . . . . . . . . . . . . . . . . . . . . . . . . . . . . . . . . . . . . . . . 214-224 . . . . . . . . . . . . . . . . . . . . . 95Ruminant Nutrition Symposium: Amino Acids . . . . . . . . . . . . . . . . . . . . . . . . . . . . . . . . . . . . . . . . . . . . . . . . . . . . . . . . . . . . . . . . . . . . . . . . . 225-227 . . . . . . . . . . . . . . . . . . . . . 99Undergraduate Student Competition Oral I . . . . . . . . . . . . . . . . . . . . . . . . . . . . . . . . . . . . . . . . . . . . . . . . . . . . . . . . . . . . . . . . . . . . . . . . . . . . . . . 228-236 . . . . . . . . . . . . . . . . . . . 101Undergraduate Student Competition Oral II . . . . . . . . . . . . . . . . . . . . . . . . . . . . . . . . . . . . . . . . . . . . . . . . . . . . . . . . . . . . . . . . . . . . . . . . . . . . . . 237-245 . . . . . . . . . . . . . . . . . . . 105
ii
POSTER ABSTRACTS
SECTION ABSTRACT PAGE
Animal Behavior, Housing, & Well-Being: Nonruminant Nutrition - Supplements and Alternative Feedstuffs . . . . . . . . . . . . . . . . . . . . . . . . . . . . . . . . . . . . . . . . . . 246-259 . . . . . . . . . . . . . . . . . . . 109
Animal Behavior, Housing, & Well-Being . . . . . . . . . . . . . . . . . . . . . . . . . . . . . . . . . . . . . . . . . . . . . . . . . . . . . . . . . . . . . . . . . . . . . . . . . . . . . . . . 260-269 . . . . . . . . . . . . . . . . . . . 115Breeding and Genetics . . . . . . . . . . . . . . . . . . . . . . . . . . . . . . . . . . . . . . . . . . . . . . . . . . . . . . . . . . . . . . . . . . . . . . . . . . . . . . . . . . . . . . . . . . . . . . . . . . . . . . . . . . . 270-277 . . . . . . . . . . . . . . . . . . . 119Extension – Beef/Small Ruminant . . . . . . . . . . . . . . . . . . . . . . . . . . . . . . . . . . . . . . . . . . . . . . . . . . . . . . . . . . . . . . . . . . . . . . . . . . . . . . . . . . . . . . . . . . . 278-283 . . . . . . . . . . . . . . . . . . . 123Extension – Swine . . . . . . . . . . . . . . . . . . . . . . . . . . . . . . . . . . . . . . . . . . . . . . . . . . . . . . . . . . . . . . . . . . . . . . . . . . . . . . . . . . . . . . . . . . . . . . . . . . . . . . . . . . . . . . . . 284-291 . . . . . . . . . . . . . . . . . . . 125Growth, Development, Muscle Biology, and Meat Science . . . . . . . . . . . . . . . . . . . . . . . . . . . . . . . . . . . . . . . . . . . . . . . . . . . . . . . . . 292-312 . . . . . . . . . . . . . . . . . . . 129Nonruminant Nutrition: Amino Acids . . . . . . . . . . . . . . . . . . . . . . . . . . . . . . . . . . . . . . . . . . . . . . . . . . . . . . . . . . . . . . . . . . . . . . . . . . . . . . . . . . . . . . 313-316 . . . . . . . . . . . . . . . . . . . 138Nonruminant Nutrition: Feed Additives and Ingredients . . . . . . . . . . . . . . . . . . . . . . . . . . . . . . . . . . . . . . . . . . . . . . . . . . . . . . . . . . . . . 317-330 . . . . . . . . . . . . . . . . . . . 140Nonruminant Nutrition: Nutritional Technologies and Feeding Strategies . . . . . . . . . . . . . . . . . . . . . . . . . . . . . . . . . . . . . 331-336 . . . . . . . . . . . . . . . . . . . 146Nonruminant Nutrition: Grow-Finish Nutrition and Management . . . . . . . . . . . . . . . . . . . . . . . . . . . . . . . . . . . . . . . . . . . . . . . . 337-345 . . . . . . . . . . . . . . . . . . . 149Nonruminant Nutrition: Nutrition and Management of Sows . . . . . . . . . . . . . . . . . . . . . . . . . . . . . . . . . . . . . . . . . . . . . . . . . . . . . . . 346-350 . . . . . . . . . . . . . . . . . . . 153Nonruminant Nutrition: Weaned Pig Nutrition and Management . . . . . . . . . . . . . . . . . . . . . . . . . . . . . . . . . . . . . . . . . . . . . . . . . 351-360 . . . . . . . . . . . . . . . . . . . 155Odor and Nutrition Management . . . . . . . . . . . . . . . . . . . . . . . . . . . . . . . . . . . . . . . . . . . . . . . . . . . . . . . . . . . . . . . . . . . . . . . . . . . . . . . . . . . . . . . . . . . . . . . . 361 . . . . . . . . . . . . . . . . . . . . . . 159Physiology . . . . . . . . . . . . . . . . . . . . . . . . . . . . . . . . . . . . . . . . . . . . . . . . . . . . . . . . . . . . . . . . . . . . . . . . . . . . . . . . . . . . . . . . . . . . . . . . . . . . . . . . . . . . . . . . . . . . . . . . . . . 362-372 . . . . . . . . . . . . . . . . . . . 160Ruminant Nutrition . . . . . . . . . . . . . . . . . . . . . . . . . . . . . . . . . . . . . . . . . . . . . . . . . . . . . . . . . . . . . . . . . . . . . . . . . . . . . . . . . . . . . . . . . . . . . . . . . . . . . . . . . . . . . . . 373-403 . . . . . . . . . . . . . . . . . . . 164Teaching . . . . . . . . . . . . . . . . . . . . . . . . . . . . . . . . . . . . . . . . . . . . . . . . . . . . . . . . . . . . . . . . . . . . . . . . . . . . . . . . . . . . . . . . . . . . . . . . . . . . . . . . . . . . . . . . . . . . . . . . . . . . . . 404-407 . . . . . . . . . . . . . . . . . . . 177
Author Index . . . . . . . . . . . . . . . . . . . . . . . . . . . . . . . . . . . . . . . . . . . . . . . . . . . . . . . . . . . . . . . . . . . . . . . . . . . . . . . . . . . . . . . . . . . . . . . . . . . . . . . . . . . . . . . . . . . . . . . . . . . . . . . . . . . . . . . . . . . . . . . . . . . . . . . 180Keyword Index . . . . . . . . . . . . . . . . . . . . . . . . . . . . . . . . . . . . . . . . . . . . . . . . . . . . . . . . . . . . . . . . . . . . . . . . . . . . . . . . . . . . . . . . . . . . . . . . . . . . . . . . . . . . . . . . . . . . . . . . . . . . . . . . . . . . . . . . . . . . . . . . . . . . 187
1
ANIMAL BEHAVIOR, HOUSING, AND WELL-BEING SYMPOSIUM: WHAT DOES THIS STUDY SAY ABOUT WELL-BEING?
CAVEATS AND CONSIDERATIONS
001 The science of animal welfare. D. C. Lay Jr.*, U.S. Dept. of Agriculture, West Lafayette, IN.
People differ in their culture, education, economic status, and values; thus, they may view an animal’s welfare status as good or poor based on their individuality. However, regardless of these human differences in perception, the actual state of wel-fare for the animal does exist in a range from good to poor; it is our difficulty to scientifically quantify this state, which underlies our global debate on animal welfare. The science of animal welfare is one of collaboration and dependence of many sciences. Simply using one scientific discipline cannot ensure an adequate assessment of the state of welfare for any animal. An animal may be well fed, productive, free of dis-ease, and in a state of physiologic homeostasis yet suffer from poor welfare. It is the objective of the research, that is, to solve a welfare problem and its basis on sound scientific measures of welfare that defines it as Animal Welfare Science. Solid animal welfare research should measure those parameters that have real meaning to an animal’s state of welfare given the specific welfare problem at hand and should strive to include the affective state of the animals in question. Our challenge is in assessing a subjective state; we have done quite well in assessing subjective states in humans and I believe we can be successful in nonhuman animals as well. An animal welfare scientist needs to be able to interpret data from multiple disci-plines in an objective manner. The state of an animal’s welfare relies on complex interactions from many biological systems. Similar to the theory of Gestalt, an animal’s welfare is greater than the sum of its parts; therefore, measuring random parts will not provide the whole picture.
Key Words: livestock, welfare, well-being
002 Scientifically evaluating the impact of nutritional management on animal welfare. T. DeVries*, Uni-versity of Guelph, Kemptville, ON, Canada.
A search of the empirical literature yields numerous citations on the impact of nutritional management on the welfare of production animals. While much advancement in this area has been made, a closer look at this literature often reveals that the full impact on animal welfare has not been completely ad-
dressed. Animal welfare science must focus on assessing three overlapping ethical concerns related to the quality of life of animals: 1) ability to live natural lives through the develop-ment and use of their natural behaviors, 2) freedom from pro-longed and intense fear, pain, and other negative states, and 3) ability to function well. This review will, therefore, provide several examples, primarily of dairy cattle, on the need for appropriate scientific assessment of the impact of nutrition-al management on animal welfare. For example, bucket-fed dairy calves may be provided adequate quantities of milk to grow well and remain healthy. However, they may experience decreased welfare as result of a deprived and frustrated natural desire to suck. Similarly, replacement dairy heifers provided a nutrient dense diet in a limited quantity may consume suf-ficient nutrients to grow at a specific rate and remain healthy while experiencing hunger and frustration due to inability to express natural foraging activity. In many cases, nutritional practices may be perceived as acceptable if no immediate impacts on biological functioning are observed. However, long-term effects of alterations in feeding behavior or motiva-tion may, in time, impact normal functioning. For example, increasing competition for feed access for dairy cows has of-ten been associated with no immediate change in feed intake or production level. Unfortunately, such situations may also lead to less desirable patterns and timing of feed consumption, which, when sustained, may be linked to negative production and health outcomes. Thus, it is apparent that proper identifi-cation and integration of findings in all three areas of animal welfare science are needed to interpret the true welfare impact of nutritional management.
Key Words: behavior, nutrition, welfare
003 Considerations for applying electronic measure-ments in animal welfare research. A. R. Green*, University of Illinois at Urbana-Champaign, Urbana.
Technology has shown the potential to advance animal wel-fare research. As technology improves, more opportunities arise for electronic measurement of animal responses and other characteristics of housing and husbandry. Electronic measures can provide valuable insight, but careful consider-ation must be given to ensure appropriate application of the technology. Electronic measurements should be validated to be trusted. Two types of validation should be considered: 1) reliability of the technology to adequately capture the animal response being measured and 2) reliability of the electronic signal representing the response. Measurements should reflect the animal perspective, and interpretations should be within the realm of animal welfare science. Technology should be
S Y M P O S I U M A N D O R A L A B S T R A C T S

2
applied as a tool within a broader suite of welfare indicators. For reliability of the animal response being measured, the technology should not interfere with the animal or alter its responses. Before a new technology is implemented, it should be verified that the response being measured does not change when the technology is introduced. This validation is typically done with a comparison to some manually recorded measure-ment. For reliability of the electronic signal representing the response, a calibration procedure should be completed before use of the equipment and at relevant intervals with contin-ued use of the equipment. Electronic devices may not per-form as expected within harsh animal environments, and their performance may change over time. Calibration of electronic instruments is typically done with a comparison to some stan-dard measurement. For welfare considerations, measurements should be taken at the level of the animal, to represent the ani-mal’s experience. Previous research has shown, for example, that the temperature in the micro-environment of a laying hen in commercial cages may be several degrees warmer than the temperature in the aisle where the fan control sensor is typi-cally located. Other measures of welfare may be similarly im-pacted by proximity to the animals. Measures should be inter-preted within the bounds of welfare considerations and should be a part of a suite of welfare indicators. Electronic measures can offer insight to a wide range of animal management pa-rameters. Within the context of animal welfare research, they should be considered with respect to quality of life encom-passing physical health, normal behavior, and affective states. Not all measures are indicative of welfare, and not all impor-tant measures may be taken electronically.
Key Words: reliability, sensor, technology
004 Where’s Waldo? Using sickness behavior to find the sick animal in the crowd. A. L. Stanton*, University of Wisconsin-Madison, Madison.
The ability to find sick animals in a group can be challenging for people in charge of caring for animals. Specifically, in food animal agriculture sick animals are frequently recognized as ill by vague signs of physical and behavioral changes that are de-scribed as animals being dull or off. While some people can use these signs effectively, these signs are difficult to quantify and are difficult to train people unfamiliar with “normal” animals to identify. To better identify sick animals in groups sickness be-havior represents an avenue to facilitate early disease detection, animal handlers can be trained in detection sooner, and environ-ments can be designed to improve recovery through supporting animals’ natural defenses against disease during convalescence. Hart first described sickness behavior as a strategic evolved re-sponse rather than a maladaptive response to infection in 1988. In this paper Hart described characteristics that were consistent across species as indicators of illness—lethargy, anorexia, de-pression, and febrile. The next great leap forward in occurred in 1999 when Aubert published his hypothesis that the behaviors
described by Hart and other researchers were motivational in nature and, as such, could be suspended in cases where sickness behavior conflicts with activities that are essential for short-term survival, care of offspring, and in some cases reproduction. Since 1999, there has been continued research into increasing our knowledge of the function and causation of sickness be-haviors. However, aspects of this information are only recently being used on farms to identify sick animals in a group. The lack of species-specific indicators of these behaviors has lim-ited the use of sickness behavior for disease detection. While sickness impacts similar changes in the motivation to perform behavior across species, the species-specific indicators of how these changes can be identified is still in its infancy. As animal agriculture has expanded the more obvious behavior changes of decreased feed and water intake become more difficult to de-tect at the individual level. By understanding sickness behavior and identifying species-specific behaviors, sick animals can be identified sooner, appropriate technology can be used to mea-sure changes, training of animal handlers can be improved, and housing environments can be altered to suit the needs of the animals during convalescence.
Key Words: health, management, sickness behavior
005 Relating economics to animal welfare. G. T. Tonsor*, Kansas State University, Manhattan.
This presentation will overview how economic research and concepts apply to animal welfare discussions, debates, and policies in the United States. The presentation will pro-vide views from an economic perspective as a contribution towards the session’s range of disciplines and approaches. Planned issues to discuss include the role of production costs and exercised product demand in shaping animal welfare out-comes, the divergence of voting and purchasing behavior that has occurred in the United States, and the distinction between scientific feasibility and social acceptance.
Key Words: animal welfare, economics, policy, unintended consequences
ANIMAL BEHAVIOR, HOUSING, AND WELL-BEING I
006 Integrating technology and animal welfare: Space and resource use of individual noncage laying hens. C. L. Daigle*, D. Banerjee, R. A. Montgomery, P. Thompson, J. C. Swanson, S. K. Biswas, J. M. Siegford, Michigan State University, East Lansing.
Little is known about individual behavior and resource use of laying hens housed in noncage systems. As more hens are housed in large groups and their welfare assessed accordingly, understanding individual hen behavior and resource use is

3
paramount. Therefore, a wireless body-mounted sensor system was developed to track the location of individual laying hens in a noncage environment. The ethics of technology development stimulated discussion with regards to animal welfare assess-ment through a Philosophy of Technology lens. Investigations illustrated that wearing the sensor had a minimal negative long-term effect on resource use or agonistic behavior, suggesting that hens habituated to wearing the sensor. Furthermore, two parsimonious sampling strategies were identified for monitor-ing the behavior of individually identifiable hens to facilitate further data collection. Using this newly identified sampling strategy, individual hen behavior and sensor data were collect-ed at 19, 28, 48, and 66 wk along with physical assessments as described in the Welfare Quality® Assessment Protocol for Poultry. Mean differences in the amount of time hens per-formed different behaviors and differences in the variability of behavior performance were assessed. These results highlighted that although group averages may not change, individual hens may vary in their physical condition and behavioral repertoire. We synced spatially explicit locational information from the hen-worn sensor system with video-based behavioral obser-vations. We digitally recreated the hen enclosure in ArcMap 10.0 to develop a Geographic Information System (GIS) to model hen behavior in noncage environments. By combining behavior and sensor data in GIS, we developed a spatiotem-poral representation of individual hen behavior. Data from 48 and 66 wk was used to characterize individual hen behavior through utilization distributions, hot spot mapping, and con-specific ranging overlap calculations. Feeding and foraging were specifically targeted to identify spatiotemporal patterns in appetitive behaviors that were or were not constrained by the location of the resource for its performance. Preening was targeted as a grooming and social behavior that could indi-cate a hen’s affective state. These results provide new insight into individual hen behavior and present a platform for a new type of agricultural research. Yet technology in agriculture is a double-edged sword, especially as regards animal welfare, and should be used when appropriate and relinquished when necessary. Integrating wildlife tracking techniques within ag-ricultural management research may provide insight into hen welfare and can be used when developing best practices or de-signing new housing environments.
Key Words: animal behavior, animal welfare, laying hen
007 Timing of ration delivery regulates periprandial eating behavior of dairy cows. A. Nikkhah*, Univer-sity of Zanjan, Zanjan, Iran.
Chronophysiology of eating behavior and feed intake control is a state-of-the-art science. The objective was to determine ef-fects of feeding time and dietary forage to concentrate ratio on periprandial and 24-h patterns of feed intake in lactating cows. Four tie stall-housed multiparous (body weight = 652 ± 14 kg,
body condition score = 2.87 ± 0.14, and days in milk = 83 ± 22) and 4 primiparous (body weight = 667 ± 110 kg, body condi-tion score = 3.19 ± 0.66, and days in milk = 81 ± 23; mean ± SD) Holstein cows were used in a 4 × 4 Latin square design with a 2 × 2 factorial arrangement of feeding time and diet type. A higher (HC, forage to concentrate ratio = 38.5:61.5) or a lower (LC, forage to concentrate ratio = 50.6:49.4) concen-trate total mixed ration (TMR) was delivered at either 2100 or 0900 h. The study consisted of four 21-d periods, each with 14 d of adaptation and 7 d of sampling. A metabolic acquisition system was used to monitor continuous feed intake electroni-cally. Mixed Models was used to analyze the data included fixed effects of feeding time, diet, parity, and their interactions and random effects of period and cow within parity plus re-siduals. Provision of the TMR at 2100 vs. 0900 h increased feed intake within 3 h postfeeding, from 26 to 37% of total daily intake (P < 0.05). In cumulative terms, the amounts con-sumed between 0 and 6 h and 0 and 9 h postfeeding were simi-lar between the 2 groups. Parity and diet did not interact with feeding time on circadian patterns of feed intake (P > 0.10). Despite altering the postfeeding patterns of intake, provision of TMR at 2100 vs. 0900 h did not affect total daily dry matter intake (19 kg/d). Findings demonstrate that altering eating time can alter periprandial patterns of feed intake in lactating cows. Feeding time is established as a management orchestrator of periprandial feeding behavior in once-daily fed dairy cows.
Key Words: dairy cow, eating time, intake pattern
008 Beta-agonist supplementation does not affect move-ment, signs of lameness, or animal welfare measures of finished steers at the feedyard or packing plant. B. P. Holland*, M. Corrigan, J. L. Finck, J. M. Hod-gen, J. P. Hutcheson, W. T. Nichols, M. N. Streeter, D. A. Yates, Merck Animal Health, DeSoto, KS.
Market-ready steers (n = 793; BW = 633 kg) were evaluated for movement and lameness at both the feedyard and at the packing plant. Twelve pens of cattle (n = 66 steers/pen) were used in a randomized complete block design. Treatments were no β-agonist (CON), zilpaterol HCl (8.33 mg/kg; ZH) fed for 20 d and withdrawn from feed for 3 d before slaughter, or rac-topamine HCl (30.09 mg/kg; RH) fed for 28 d before slaugh-ter. Steers were fed a high-concentrate diet for an average of 202 d before shipping 301 km to a commercial packing plant. The evaluator was certified to conduct animal welfare audits (Professional Animal Auditor Certification Organization) and blinded to treatment. Evaluation was conducted in November 2011 using American Meat Institute guidelines. Beta-agonist supplementation did not affect any variables measured (P ³ 0.19). At the feedyard, cattle were evaluated at a known point of balking in the alley and as they exited a platform scale; at both locations, speed of movement (1 = walk, 2 = trot, and 3 = run) was rated Acceptable ( > 75% walk or trot) for all treatments. Slips (0.30%) and Falls (0.0%) were minimal at
4
the feedyard. Signs of lameness were observed in 1.50% for CON, 0.37% for ZH, and 0% for RH steers during weigh-ing. While average speed of movement was not different when cattle were unloaded at the packing plant, RH cattle were rated Not Acceptable with only 60.5% walking or trot-ting (39.5% running). In addition, Slips and Falls were 13.38 and 0.39, 15.31 and 0.90, and 13.39 and 0.55% for CON, ZH, and RH steers, respectively, during unloading at the pack-ing plant. Similarly, slightly more cattle were observed with signs of lameness at the packing plant (1.85, 0.48, and 1.15% for CON, ZH, and RH, respectively). Prod use was deemed acceptable ( < 25%) for all treatments. Vocalization at stun-ning and inability to render an animal insensible with the first shot can be indicative of poor humane handling procedure and agitated animals. Vocalization ( < 3%) and first stun ef-ficacy ( > 95%) were observed to be Acceptable for all treat-ments. Treatment did not affect movement although more RH pens were scored as running at the packing plant. In addition, β-agonist supplementation did not affect signs of lameness or other animal welfare measures at the time of shipment from the feedyard or after arrival at the packing plant.
Key Words: animal welfare, β-agonist, cattle
009 Heat stress in utero affects piglets later in life. B. L. Lynch1,*, J. N. Rhoades2, M. C. Lucy2, T. J. Safranski2, 1College of Wooster, Wooster, OH, 2University of Missouri, Columbia.
Heat stress is currently an issue in the swine industry, having been shown to decrease reproductive performance of boars and sows as well as alter growth and composition of grow-ing pigs. Climate change and leaner production pigs, which are naturally more susceptible to heat stress, may accentuate this issue. These factors make it important to study heat stress in an attempt to quantify the production stages most vulnerable, allowing the industry to make adjustments accordingly. The objective of this study was to measure postnatal effects of in utero heat stress on thermal properties of growing pigs. Preg-nant sows were placed in the Brody Environmental Chambers under either heat stressed (28–34°C: gestational heat stress [GHS]) or thermoneutral (18–22°C: gestational thermoneutral [GTN]) conditions throughout gestation. At 110 d of gestation they were moved to the same farrowing facility and housed under thermoneutral conditions. Gilt progeny (n = 165) from these sows were weaned and moved to mechanically ventilat-ed, fully slatted rooms at the University of Missouri Swine Re-search Finisher where the current work was conducted. Rectal, ear, and rump temperatures and respiration rate (RR) were re-corded twice weekly from 3 to 6 mo of age. Room temperature was recorded each time pig temperatures were taken, and they ranged over time and time of day from 23.01 to 29.78°C. Body weights were recorded every 3 wk from 2 to 6 mo of age. Data were analyzed using mixed model procedures (Proc Mixed; SAS Inst.). Temperatures were similar for GHS and GTN pigs
overall (39.11, 35.61, and 35.56°C for rectal, ear, and rump temperatures, respectively). Increasing respiration rate is one of the major mechanisms used by pigs to regulate temperature, and it appears GHS pigs were able to maintain the body tem-perature with less effort, having lower RR (15.04 ± 0.13 vs. 15.83 ± 0.15 breaths per min for GHS and GTN, respectively; P < 0.001). Higher room temperatures at the time of measure-ment were associated with increased RR (12.28 ± 0.49 to 19.62 ± 0.49 breaths per min; P < 0.001) although this did not dif-fer by treatment. These data imply that metabolic differences exist between the two treatment groups whereby greater or lesser respiration rate is needed to maintain similar body tem-peratures. This could have implications on feed intake and effi-ciency although housing both gilt groups together prevented us from collecting such data. Further quantification of treatment differences will allow producers to more accurately determine the value of cooling for pregnant sows.
Key Words: heat stress, in utero, pigs
010 Associations between sow body lesions with body condition and reproductive performance. M. Bryan*, M. Knauer, North Carolina State University, Raleigh.
The objective of this study was to determine the association between vulva and shoulder lesions with body condition and reproductive performance for sows housed in gestation pens. Whiteline sows (n = 87) were measured before farrowing and at breeding for the next reproductive cycle in a commercial farm in eastern North Carolina. Following weaning, sows were housed in gestation stalls for 40 d and then allocated to pens of 4 to 5 sows (1.49 or 1.86 m2 per sow, respectively). Vulva le-sions were scored 0 (no lesion) or 1 (lesion present). Shoulder lesions were scored 0 (no lesion), 1 (abrasion), or 2 (open). Sow body condition measures included a Knauer sow caliper (CS), weight (WT), body condition score (BCS), backfat (BF), and longissimus muscle area (LMA). Backfat and LMA were measured from a 10th rib cross-sectional image by a Real-Time ultrasound technician. Visual BCS was scored on a 1 to 5 scale by an experienced technician. Sow production traits in-cluded number born alive, litter birth weight, number weaned, litter weaning weight, piglet survival (number weaned/(total number born + net transfer)) and wean-to-conception interval. Data were analyzed in SAS using PROC GLM for continu-ous traits and PROC GLIMMIX for categorical traits. Vulva lesions were recorded on 17.6% of sows at farrowing and 0% of sows at breeding. No shoulder lesions, abrasions, and open wounds were recorded on 100, 0, and 0%, respectively, of sows at farrowing and 73, 21, and 6% of sows at breeding, re-spectively. The incidence of vulva lesions at farrowing was as-sociated (P < 0.05) with a lower CS, WT, BCS, BF, and LMA at farrowing, reduced (P < 0.05) piglet survival (4.3%), and a lower (P < 0.05) BCS at breeding. Sows with a lower CS at farrowing had a greater (P < 0.05) incidence of shoulder abra-
5
sions and open lesions at breeding. Backfat at farrowing had a curvilinear association (P < 0.05) with open shoulder lesions at breeding with a BF of ³ 3.3 cm minimizing open lesions. Body condition score at farrowing had a curvilinear relation-ship (P < 0.05) with shoulder abrasions at breeding with a BCS of ³ 3.9 minimizing abrasions. As WT and LMA at breeding decreased the occurrence of abrasions tended to increase (P < 0.10) and open shoulder lesions increased (P < 0.05). Results showed vulva and shoulder lesions were generally associated with thinner sows but had little impact on reproductive per-formance. Although statistically significant, body condition measures explained little variation in lesion scores (r2 £ 0.05).
Key Words: lesion, reproduction, sow
011 Effect of the farm system on the behavioral re-sponse preslaughter and on meat quality variation in pigs. L. M. Rocha1, 2,*, A. Dalmau3, A. Velarde3, L. Saucier1, L. Faucitano1, 2, 1Université Laval, Quebec, QC, Canada, 2Agriculture & Agri-Food Canada, Sher-brooke, QC, Canada, 3IRTA, Animal Welfare Group, Monells, Spain.
The objective of this study was to assess the impact of the farm system on the behavior response at the plant and on meat quality variation in pigs. A total of 24 loads and 4679 animals from 12 farms, 5 animal welfare certified farms (n = 1936; WEL) and 7 conventional (n = 2743; CON), farms were as-sessed at unloading (UN) and in the lairage alley (LA) at the plant. The assessment was conducted using an audit protocol, where criteria of the Welfare Quality® and American Meat In-stitute protocols were merged. Pigs were loaded onto a two identical pot-belly trailers driven by two drivers (A and B) who were rotated between types of farms each week. A sub-sample of 1440 pigs (60 pigs/2 farms) was randomly chosen at the plant for meat quality evaluation. Meat quality was as-sessed in the Longissimus thoracis (LT) muscle at 24 h post-mortem by measuring ultimate pH (pHu), color, and drip loss. Meat quality and behavior data were analyzed by the GLIM-MIX and MIXED procedure of SAS. Spearman correlations were performed to determine the relationship between the swine behavior and meat quality variation using SAS. When transported by driver B, pigs from WEL farms were harder to unload than pigs from CON farms as shown by the greater percentage of turn-back (3.13 vs. 1.12%; P = 0.01) and slips (8.5 vs. 1.92%; P < 0.001). The WEL pigs also presented a greater (6.09 vs. 1.19%; P = 0.02) number of falls in the LA compared to CON. Overall, turn-back attempts and reluctance to move, both indicators of a fear response, appear to contrib-ute to slips at UN (r = 0.52, P < 0.05 and r = 0.60, P < 0.05, respectively). When compared to CON pigs, the LT muscle of WEL pigs presented greater drip loss (3.4 vs. 4.5%; P = 0.003). The greater number of slips at UN and in the LA ap-pears to contribute to a greater drip loss (r = 0.63, P < 0.05 and r = 0.74, P < 0.001, respectively). The results of this study
show that the effect of the farm of origin on meat quality vari-ation can be explained by its impact on the behavior of pigs in response to the preslaughter handling procedures.
Key Words: behavior, farm, meat quality
012 The impact of pellet quality on production effi-ciency and pig behavior in heat-stressed and ther-moneutral environments. J. M. Langdon II1,*, E. van Heugten1, A. C. Fahrenholz1, C. R. Stark1, C. E. Phil-lips2, M. Knauer1, 1North Carolina State University, Raleigh, 2Murphy-Brown LLC, Rose Hill, NC.
Two studies evaluated the impact of pellet quality on produc-tion efficiency and pig behavior in differing environments. Pigs (n = 180) were housed in one of two adjacent environ-mental rooms, heat-stressed (HS) or thermoneutral (TN). Both the HS and TN environments were replicated 3 times. Aver-age daily highs and lows for HS were 32° and 23°C and for TN were 14° and 11°C. Pigs were housed individually in pens (1.5 m2) with woven wire flooring, cup waters, and open-faced feeders. Corn–soy diets were manufactured at the NCSU Feed Mill to contain 1 of 5 levels of pellet fines: 0, 15, 30, 45, or 60%. Different levels of pellet fines were created by separating the pellets from the fines and then adding the fines back to the pellets at the desired ratio. At an average weight of 112.5 ± 5.9 kg, barrows and gilts were randomly assigned to treatments for 21 d. Weekly pig weights, feed consumption, pig behav-ior, respiration rate (breaths per min), and rectal temperature (RT) were collected. Pig behavior was categorized as drinking, eating, standing, or resting. Statistical analysis was performed using analysis of variance. Pen was the experimental unit when evaluating pellet fines and room was the experimental unit when comparing HS and TN environments. Level of pel-let fines was not associated (P ³ 0.35) with ADFI or ADG in either HS or TN. A 10% increase in pellet fines numerically reduced (P ³ 0.14) G:F in HS and TN by 0.007 ± 0.005 and 0.003 ± 0.006, respectively. A 10% increase in pellet fines was associated with lower (P < 0.05) RT for both HS and TN on d 0 (-0.038°C ± 0.018 and -0.039°C ± 0.019, respectively) and d 14 (-0.092°C ± 0.021 and -0.038°C ± 0.016, respectively). Level of pellet fines did not impact (P < 0.05) behavior. How-ever, a 10% increase in pellet fines numerically increased (P ³ 0.35) the percentage of time observed eating in HS and TN by 0.3 ± 0.4 and 0.4% ± 0.5, respectively. Heat stress had similar (P = 0.44) ADFI (2.87 vs. 3.01 kg), tended (P = 0.08) to have lower ADG (0.95 vs. 1.07 kg), and had similar (P = 0.35) G:F (0.336 vs. 0.366) in comparison to TN. Respiration rate and RT were greater (P < 0.05) for HS in comparison to TN on d 7 (95 vs. 34 and 39.5°C vs. 38.8°C, respectively) and d 14 (71 vs. 30 and 39.3°C vs. 38.7°C, respectively). Results are in disagree-ment with previous findings associating pellet quality and pig performance. Differences in experimental design, specifically housing and feeder type, may have contributed to the results.
Key Words: growth, heat stress, pellet

6
013 Identifying characteristics of slow-growing pigs from birth to 9 wk of age and growth performance responses to feeder space postweaning. Y. He1,*, J. Deen1, G. C. Shurson2, Y. Li3, 1University of Min-nesota, St. Paul, 2University of Minnesota, Saint Paul, 3University of Minnesota, West Central Research and Outreach Center, Morris.
Slow-growing (SG) pigs can be characterized as those that have less BW per day of age than their contemporaries and negatively affect profitability and animal well-being in pork production systems. Limited feeder space allowance may fur-ther suppress growth of SG pigs after weaning. The objectives of this study were to identify characteristics and investigate the effect of feeder space allowance on growth performance of SG pigs during the nursery period. Pigs (n = 592) were weighed individually at birth and weaning at 4 wks of age and categorized as slow (the lightest 30%), fast (the heaviest 30%), and normal (the middle 40%) growth based on BW/day of age at nursery exit (9 wks of age). Pigs were randomly allotted to pens (8 pigs/pen; 0.3 m2/pig) with 1 of 2 feeder-space treatments: 1) 5 feeder spaces/pen (5SP) or 2) 2 feeder spaces/pen (2SP) by covering 3 of the 5 spaces. Pigs were weighed individually at 1, 3, and 5 wks after weaning. Focal pigs (n = 96) consisting of 48 slow and 48 fast growing pigs were used to determine rate of feed consumption at 55 d of age. Data were analyzed using the Mixed Procedure of SAS with repeated measures. Slow-growing pigs provided 5SP had greater ADG during wk 1 to 3 (0.285 vs. 0.248 ± 0.011 kg/d, respectively; P < 0.01), wk 3 to 5 (0.553 vs. 0.537 ± 0.005 kg/d, respectively; P = 0.02), and the overall 5-wk nursery period (0.303 vs. 0.293 ± 0.002 kg/d, respectively; P < 0.01) than those provided 2SP. Compared with fast-growing pigs, SG pigs had lighter birth weight (1.4 vs. 1.7 ± 0.02 kg, re-spectively; P < 0.01) and lower ADG (0.441 vs. 0.659 ± 0.003 kg/d, respectively; P < 0.01) during the nursery period and slower growth rate (0.298 vs. 0.450 ± 0.002 kg/d; P < 0.01) by nursery exit. Slow-growing pigs ate slower (14.2 vs. 20.4 ± 0.85 g/min; P < 0.01) than fast-growing pigs. These results suggest that SG pigs have low birth weight and lower feed consumption rates and, consequently, have reduced growth rates during the nursery period. Providing more feeder space improved growth rate of SG pigs during the nursery period.
Key Words: feed consumption rate, feeder space, slow-growing pigs
BREEDING AND GENETICS I
014 Improving accuracies of genomic predictions by enriching 50K genotypes with markers from 770K genotypes at QTL regions. M. Saatchi*, D. J. Garrick. Iowa State University, Ames.
More accurate genomic predictions were expected using high-density marker panels such as Illumina BovineHD BeadChip (770K) rather than Illumina BovineSNP50 BeadChips (50K) due to greater linkage disequilibrium between markers and quantitative trait loci (QTL). Results from field data showed little advantage for 770K panels in dairy cattle populations. We compared accuracies of genomic predictions for birth, wean-ing, and yearling weights in Hereford cattle using 50K, im-puted 770K, or enriched 50K genotypes (50K genotypes plus imputed 770K genotypes at locations of the largest QTL). A total of 2980 animals were genotyped with the 50K panel. For these animals, genotypes for about 770,000 markers were im-puted using BEAGLE software from 136 Irish and 228 U.S. Hereford cattle genotyped with 770K. Only those markers im-puted 770K genotypes located at 106 Mb on BTA5, 38 Mb on BTA6, 93 Mb on BTA7, and 4 Mb on BTA20 and their two 1 Mb flanking windows (USDA_AIPL assembly) were added to 50K genotypes to make enriched 50K genotypes (3004 addi-tional markers). Six-fold cross-validation was performed using five groups for training and the sixth group for validation using either 50K, imputed 770K, or enriched 50K genotypes. Der-egressed estimated breeding values were used as observations in a weighted analysis that estimated marker effects to derive molecular breeding values (MBV). Bivariate animal models were used for each trait to estimate the genetic correlation be-tween trait and MBV as a measurement of the accuracy of ge-nomic prediction. The accuracies of MBV for birth, weaning, and yearling weights were 0.670, 0.527, and 0.605 using 50K genotypes, 0.671, 0.526, and 0.590 using 770K genotypes, and 0.670, 0.550, and 0.619 using enriched genotypes, respective-ly. These correlations are equivalent to proportionate increases in the additive genetic variance explained for these traits of 0, 9, and 5% using enriched 50K genotypes, respectively. These results show that the accuracies of genomic predictions can be increased for some traits by using just those markers from higher density genotypes at QTL regions.
Key Words: accuracy, genomic breeding values, genomic selection
015 Haplotype diversity analysis in ten U.S. cattle breeds. H. Su*, J. E. Koltes, M. Saatchi, J. Lee, R. L. Fernando, D. J. Garrick, Iowa State University, Ames.
Linkage disequilibrium (LD) between SNP markers is com-monly reported in scientific publications because it may reflect

7
the extent of linkage phase between QTL and SNP marker, which is fundamental information for association studies and genomic selection. Some studies have demonstrated that SNP in strong LD are organized into discrete blocks or haplotypes, which may be separated by recombination hot spots. Haplo-types are of direct scientific interest as they may be in perfect LD with QTL alleles, and they cause the observed LD between SNP markers. In this study, we reconstructed haplotypes with-in each 1-Mb SNP window for 10 U.S. cattle breeds genotyped with the Illumina BovineSNP50K. Then, we investigated the diversity of common haplotypes, which we defined as those that were observed at a frequency of at least 1 in 100 in each breed. The average number of common haplotypes across the entire genome was 18 and ranged from 15 to approximately 25 in individual breeds. Some specific windows showed consis-tent increased or decreased haplotype diversity in all breeds. Low haplotype diversity was observed in some windows of most chromosomes for all the breeds. This information pro-vides direction for future studies to characterize haplotype diversity in relation to annotated gene-rich regions, published QTL, selection signals, and loss-of-function mutations.
Key Words: beef cattle, haplotype diversity, linkage disequilibrium
016 Comparison of genomic breeding values based on single or multiple breed reference populations in U.S. Maine-Anjou beef cattle. J. Lee*, M. Saatchi, D. J. Garrick, Iowa State University, Ames.
The efficiency and advantage of predictors that use genomic information have been identified through previous papers that reported accuracy when the training sets comprised individu-als from their own purebreds. Several U.S. beef cattle breed associations have been making an effort to take advantage of genomic predictors in their cattle evaluations. The objective of this study was to estimate accuracies of genomic breed-ing values using Illumina BovineSNP50 genotypes for the three growth traits (birth, yearling, and carcass weights) in U.S. Maine-Anjou beef cattle using single or multiple breed training populations. In single breed analyses, only Maine-Anjou animals were used in training. Maine-Anjou animals were clustered into five groups using K-means clustering for cross-validation for the purpose of reducing the relationships between training and test populations. In multiple breed analy-ses, direct genomic values (DGV) of the growth traits for about 570 Maine-Anjou animals were estimated using phenotype and genotype data that, in addition to Maine-Anjou, includ-ed about 9500 animals from nine other breeds (AAN, RAN, BRG, SIM, GVH, RDP, BSH, CHA, and HER) in the training population. Accuracies of genomic breeding values were cal-culated as simple correlations between deregressed estimated breeding values (DEBV) used as observation data and DGV. The accuracies of direct genomic values were 0.23 (0.21), 0.38 (0.34), and 0.31 (0.27) for birth, yearling, and carcass weight
traits when the training sets comprised single (or multiple) breeds, respectively. These results demonstrate the feasibility of developing DGV for U.S. Maine-Anjou beef cattle. Also, the accuracies of DGV were slightly lower when multiple other unrelated breeds were added to the training population for Main-Anjou animals. To strengthen the advantages through a multiple breed training population, further studies to detect common QTL segregating in Maine-Anjou and to find better markers with greater LD across multiple breeds is required.
Key Words: genomic breeding values, single or multiple breed, U.S. Maine-Anjou beef cattle
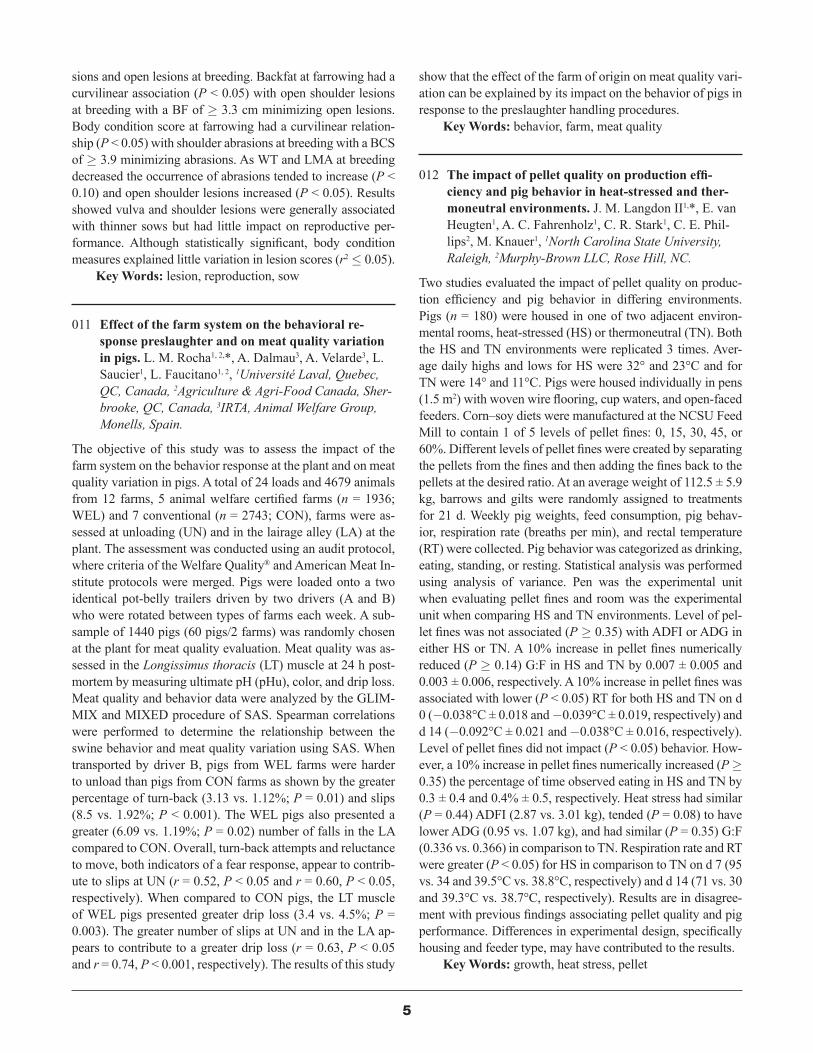
017 Improving the accuracy of genomic prediction of milk fat yield in the New Zealand Holstein Friesian population. M. K. Hayr1,*, M. Saatchi1, D. Johnson2, D. J. Garrick1, 1Iowa State University, Ames, 2LIC, Hamilton, New Zealand.
This study investigated the effect of including a QTL for milk traits, DGAT1, in calculating direct genomic values (DGVs). Illumina SNP50 (50K) genotypes and deregressed estimated breeding values (DEBVs) for fat yield were provided by LIC for 5661 Holstein Friesian cows and 2287 bulls. DGAT1 genotypes were provided for 1133 cows and 655 bulls, with DGAT1 genotype imputed for the remaining cattle using BEAGLE. Four models were run in GenSel using Bayes B method and fivefold cross-validation with 2.5% of SNPs as-sumed to have an effect on the trait: 1) a model relying on linked 50K markers to pick up the effect of DGAT1, 2) a model with 50K markers and DGAT1 dosage fit as a random covariate, 3) a model with 50K markers and DGAT1 geno-type fit as a fixed class, and 4) a model with 50K markers and DGAT1 dosage fit as a fixed covariate. These models were run separately for males and females and each sex was run twice, once with only animals with DGAT1 directly genotyped and then with all animals. Accuracy was defined as the correlation
Table 017. Regression coefficients and correlations between DEBV and DGV
Sex Model
Direct DGAT1
Direct and imputed DGAT1
b r b rMales 50K 1.246 0.553 1.012 0.697
5 0K + DGAT1 (Random Covariate)
1.246 0.552 1.010 0.696
5 0K + DGAT1 (Fixed Class)
1.191 0.660 1.007 0.737
5 0K + DGAT1 (Fixed Covariate)
1.055 0.536 1.008 0.737
Females 50K 1.141 0.399 1.048 0.3855 0K + DGAT1 (Random Covariate)
1.140 0.400 1.045 0.384
5 0K + DGAT1 (Fixed Class)
1.083 0.503 1.039 0.453
5 0K + DGAT1 (Fixed Covariate)
1.038 0.463 1.040 0.455

8
between DEBV and DGV while bias was represented in terms of the regression coefficient of DEBV on DGV. Performance was very similar in models 1 and 2 while results for models 3 and 4 were also very similar. Models 3 and 4 performed better than models 1 and 2. When all animals were included, the models with 50K markers plus DGAT1 as a fixed class or a fixed covariate performed equivalently. When only animals directly genotyped for DGAT1 were analyzed the model with 50K markers plus DGAT1 as a fixed covariate had the low-est bias while the model with 50K markers plus DGAT1 as a fixed class had the highest accuracy. These results were con-sistent across both sexes. These results suggest that including DGAT1 genotype as a fixed class or a fixed covariate when calculating DGVs both increases accuracy and reduces bias.
Key Words: dairy, DGAT1, genomic prediction
018 Heritability estimation for Escherichia coli O157:H7 vaccine response in beef cattle. K. Mar-ley1,*, L. A. Kuehn2, J. Keele2, B. Wileman3, 4, M. G. Gonda1, 1South Dakota State University, Brookings, 2USDA-ARS, Clay Center, NE, 3Epitopix LLC, Willmar, MN, 4Kansas State University, Manhattan.
Humoral vaccine response has been shown to be heritable for several bovine vaccines. However, heritability for response to an E. coli O157 vaccine in cattle has not been estimated. Our objective was to estimate the heritability of humoral response to a commercially available E. coli O157 vaccine. Crossbred cattle from various proportions of 16 different breeds (Angus, Hereford, Red Angus, Shorthorn, Brahman, Brangus, Beef-master, Santa Gertrudis, Braunvieh, Charolais, Chiangus, Gelbvieh, Maine Anjou, Limousin, Salers, and Simmental) in the USMARC Germplasm Evaluation Program (n = 677) were vaccinated with a commercially available E. coli O157 vaccine (Epitopix, LLC, Willmar, MN) and then received a booster shot 1 mo after the initial vaccination. Three blood samples were collected: 1) time of initial vaccination (d 0), 2) time of booster vaccination (d 30), and 3) approximately 1 mo following booster vaccination (d 60). Antibodies present in plasma that were specific for the siderophore receptor and po-rin (SRP) proteins used in the vaccine were measured with an enzyme-linked immunosorbent assay (ELISA) in parallel with positive and negative controls. Sample-to-positive (S/P) ratios were calculated from ELISA optical densities for each sample. Of the 677 calves included in the study, 166 had antibodies circulating in their blood at time of initial vaccination (S/P > 0.14). These 166 animals were not analyzed further because the presence of circulating antibodies at initial vaccination could have interfered with vaccine response. Vaccine response was defined as the difference between 1) antibodies present at time of booster shot minus antibodies present at time of ini-tial vaccination (initial response), 2) antibodies present 1 mo after booster vaccination minus antibodies present at time of booster vaccination (booster response), and 3) antibodies pres-
ent 1 mo after booster vaccination minus antibodies present at time of initial vaccination (overall response). The estimated heritability of initial response to the vaccine was 0.29 ± 0.121 at time of initial vaccination (P = 0.0028). However, we did not find evidence that the booster or overall response to the vaccine was heritable (h2 = 0.05 ± 0.084 for booster and h2 = 0.03 ± 0.078 for overall response; P < 0.05). We conclude that the initial humoral response to this E. coli O157:H7 vaccine is moderately heritable. If vaccine response is heritable, we may be able to identify cattle that are genetically predisposed towards mounting a more protective immune response.
Key Words: Escherichia coli O157:H7, heritability, vaccine response
019 Genotype × environment interaction in Red Angus cattle in the United States. W. R. Lamberson1, D. Fennewald2,*, R. L. Weaber3, M. Kaps4, 1University of Missouri, Columbia, 2Univeristy of Missouri, Colum-bia, 3Kansas State University, Manhattan, 4University of Zagreb, Zagreb, Croatia.
Genotype × environment interaction (G×E) can be defined as a reranking of genetic merit estimates of parents when prog-eny are produced in different environments. Increasing use of artificial insemination in the beef industry broadens the use of bulls across production environments. One approach to mea-suring G×E is to consider different production environments as separate traits and estimate genetic correlations between traits defined in this way. Previous researchers have suggested that a genetic correlation between environments of greater than 0.80 indicates little evidence of G×E. The objective of this study was to estimate the magnitude of G×E by estimat-ing genetic correlations across production environments. Data for birth weight, weaning weight (n = 74,681), postweaning gain (n = 39,104), and stayability (n = 28,895) were provided by the Red Angus Association of America. Records were as-signed to nine regions: Corn Belt, desert, Gulf Coast, lower plains, mountains, Northeast, Pacific Northwest, south, and upper plains. To be included in the analysis, bulls had to pro-duce at least 50 calves in at least two regions. Each region was considered a separate trait and genetic correlations were estimated by using ASReml. For the three growth traits there was no evidence of G×E. Genetic correlations between pairs of regions were all 0.95 or greater. However, for stayability, genetic correlations were lower ranging from 0.24 (between the lower plains and Pacific) to 0.86 (between the desert and upper plains). Averaged across regions, the upper plains was mostly highly genetically correlated with other regions, with an average genetic correlation of 0.73, the average genetic cor-relation of the desert, Gulf Coast, and south with other regions was intermediate, ranging from 0.57 to 0.60, and the lowest average genetic correlations ranged from 0.40 to 0.50 for the Corn Belt, lower plains, mountains, Northeast, and Pacific. In general, genetic correlations were highest between similar re-

9
gions, mountains and upper plains, and hot regions including the desert, gulf, and southeast. In conclusion, there is little evidence for G×E for growth traits, but stronger evidence for G×E exists for stayability suggesting that care should be taken when selecting sires to produce replacement heifers.
Key Words: cattle, genetic correlation, genotype × environment interaction, stayability
BREEDING AND GENETICS SYMPOSIUM: ANALYSIS OF NEXT GENERATION
SEQUENCING (NGS) DATA
020 Utilization of sequence on relatives to improve analysis of individuals’ low-coverage NGS data. R. M. Thallman1,*, T. S. Kalbfleisch2, 1USDA, Agricultural Research Service, U.S. Meat Animal Research Center, Clay Center, NE, 2Intrepid Bioinformatics, Louisville, KY.
Low-coverage sequence data is expected to have low call rates under the prevailing paradigm under which genotypes are first “called” from sequence data of each individual in-dependently and subsequent analyses (including determi-nation of haplotypes) are dependent on those called geno-types. However, provided 200+ individuals are sequenced, the number of haplotypes present in the region surrounding a gene should typically be considerably smaller than the num-ber of individuals, so the effective sequence coverage per haplotype should be considerably higher than the coverage per individual, especially for the most heavily represented haplotypes. Given a set of haplotypes spanning the popula-tion for a defined genomic region, the likelihood of each se-quencing read of an individual (that has been mapped to that region) having originated from each of the haplotypes can be computed. Pooling those likelihoods over the reads of each individual provides the likelihood of each individual having each haplotype, and conditioning on the pedigree through a peeling algorithm provides the probability distribution for each individual’s paternal and maternal haplotypes. Provided an individual has 100+ sequencing reads and there is suffi-cient pedigree structure, these distributions should often be relatively unambiguous. The probabilities of assigning hap-lotypes to each individual are combined with the likelihoods of the reads to compute posterior probabilities that assign reads to haplotypes. For individuals whose haplotypes are determined unambiguously, there are three possible cases: the read is assigned unambiguously to the haplotype if the individual is homozygous, the read will usually be assigned unambiguously if the individual has two haplotypes with dif-ferent sequences corresponding to the read, and the read will be assigned with equal probability to two haplotypes with identical sequences corresponding to the read. The reads as-signed (probabilistically) to each haplotype are pooled over individuals and assembled to improve its sequence, aided by
the generally deeper coverage and the homogeneous, haploid nature of haplotypes as compared to individuals. An itera-tive algorithm to take advantage of these concepts has been developed and is being tested on a 13 kb region surrounding the myostatin gene on 268 beef bulls (including 80 sire–son pairs) of seven breeds and their crosses that have genomic sequence at an average depth of approximately 2X. This al-gorithm is based on the alternative paradigm of determining the underlying haplotypes directly from the sequence data and pedigree and then deriving genotypes (if needed) and performing other analyses subsequently. USDA is an equal opportunity provider and employer.
Key Words: low-coverage NGS data
021 Applications of high-throughput sequencing for fertility, demography, and genome improvement. J. E. Decker*, R. D. Schnabel, J. F. Taylor, University of Missouri, Columbia.
New sequencing technologies have allowed researchers to tackle new problems and revisit old ones. At the University of Missouri we are using Illumina sequencing to identify loss-of-function mutations in 150 influential artificial insemination sires. We are sequencing each bull to high coverage (approxi-mately 30X) to accurately call homozygous and heterozygous genotypes within individual animals. Using this information we can identify variants that are predicted to have deleteri-ous effects on gene products or are never observed as homo-zygotes. Many of these will be embryonic lethals, which are reducing fertility rates in beef cattle. We are also using whole-genome sequences to infer the effective population sizes of cattle over time. This will allow us to identify the changes that have altered the genomes within and among breeds of cattle. Perhaps most importantly, we are using new sequenc-ing technologies to improve the assembly for the cattle refer-ence genome. In addition to existing Sanger data, the bovine genomics community is generating Illumina and PacBio data that will be used to close gaps and more accurately scaffold the reference genome sequence. Each sequencing technology has its own strengths and weaknesses. By combining different sequencing technologies we harness a technology’s strength and use complimentary technologies to overcome its weak-nesses. We are also working to annotate regulatory elements throughout the bovine genome, as nearly three quarters of causal mutations for quantitative traits seem to lie within non-coding regulatory elements. These improvements will allow researchers to more easily identify important variants.
Key Words: assembly, genome, sequencing
10
022 HMM-ASE: A hidden Markov algorithm for ascer-taining cSNP genotypes from RNA sequence data in presence of allelic imbalance. H. Wang*, Michigan State University, East Lansing.
RNA-seq is a revolutionizing technology for transcriptome analysis, which is being increasingly used for nucleotide-centric inference. Allelic specific expression provides promis-ing information on relating gene expression with phenotypic variation. The commonly used ASE testing requires a prior ascertainment of the cSNP genotypes for all individuals. In realizing these needs, we propose a hidden Markov method (HMM-ASE) to call SNPs from RNA sequence data. The proposed method can accommodate ASE in the RNA data. Simulation and real data applications results demonstrate that our proposed HMM-ASE has an improved accuracy and sen-sitivity in SNP calling. Moreover, HMM-ASE is advanced in calling cSNP from low-coverage RNA-seq data comparing to some existing methods.
Key Words: hidden Markov model, RNA-seq, SNPs
023 Computational resources to facilitate variant dis-covery and analysis. J. M. Reecy1,*, C. Baes2, 3, E. Fritz-Waters1, J. E. Koltes1, M. Dolezal4, B. Bapst3, C. Flury2, H. Signer-Hasler2, C. Stricker5, R. L. Fernando1, D. J. Garrick1, F. Schmitz-Hsu6, B. Gredler2, M. Vaugh7, 1Iowa State University, Ames, 2Bern University of Ap-plied Sciences, Zollikofen, Switzerland, 3Qualitas AG, Zug, Switzerland, 4Università degli Studi di Milano, Milano, Italy, 5agn Genetics GmbH, Davos, Switzerland, 6Swissgenetics, Zollikofen, Switzerland, 7Texas Advance Computing Center, University of Texas, Austin.
Next generation sequencing has facilitated the sequencing of large numbers of individuals for variant detection. A challenge facing the livestock industry is the establishment of efficient workflows to process raw sequence data to accurate variant data such that implementation of whole genome sequence information in livestock breeding programs can be accom-plished. Within the iPlant infrastructure, we have implement-ed currently available variant calling techniques and have ap-plied them to a dairy cattle data set. The Burrows-Wheeler aligner (BWA) was used to align paired end Illumina reads from 66 bulls to the Bos taurus UMD3.1 reference assembly. A pipeline, integrating data preparation, insertion and deletion realignment, base quality score recalibration, and variant call-ing, was created to manage variant calling comparisons. Vari-ant calling was done using three different calling methods: UnifiedGenotyper of the Genome Analysis Tool Kit, SAM-Tools Mpileup, and Platypus. A total of nine different options were compared with these methods. Significant variation in the ability of the different methods calling of variants was ob-served. Furthermore, tremendous variation in the concordance of variant calling and SNPchip genotyping were observed as
well. These results indicate that a more detailed analysis and/or the use of a combination of callers are necessary if the live-stock industry is to fully utilize genome resequencing infor-mation to improve livestock breeding. The authors gratefully acknowledge financial support from the Swiss Cattle Breeders Association (ASR) and the Swiss Commission for Technology and Innovation (CTI), and USDA-NIFA project 2013–01001.
Key Words: next generation sequencing
BREEDING AND GENETICS II
024 Validation of the effects of a SNP on SSC4 associated with viral load and weight gain in piglets experimentally infected with PRRS virus. A. Hess1,*, N. Boddicker2, R. R. R. Rowland3, J. K. Lunney4, J. C. M. Dekkers1, 1Iowa State University, Ames, 2Genesus, Oakville, MB, Canada, 3Kansas State University, Manhattan, 4USDA, ARS, BARC, APDL, Beltsville, MD.
Porcine reproductive and respiratory syndrome (PRRS) is the most costly disease to the U.S. pork industry, and vac-cines, biosecurity measures, and proposed methods for eradi-cation have had limited success. The aim of the PRRS Host Genetics Consortium (PHGC) is to identify genomic markers and pathways associated with host response to PRRS virus (PRRSV), which could potentially be used for genetic selec-tion of pigs for increased resistance or reduced susceptibility to the virus. Boddicker et al. (2012) identified a SNP on SSC4 (WUR10000125) for which the favorable allele (B) was as-sociated with reduced viral load (VL) and increased weight gain (WG) under infection with the NVSL-97–7895 PRRSV isolate. The objective of this study was to test the effects of this SNP when infecting pigs with a genetically different iso-late of PRRSV (KS-2006–72109), which has 89% amino acid sequence identity with NVSL-97–7895 in GP5. Following the same experimental design, approximately 200 commer-cial crossbred piglets per trial for a total of 5 trials were ex-perimentally infected with PRRSV at 28 to 35 d of age. Blood samples and weights were collected periodically for up to 42 d postinfection (dpi). Viremia was measured using a qPCR assay for PRRSV RNA, and VL was defined as the area under the curve of Log viremia from 0 to 21 dpi. WG was defined as weight gain from 0 to 42 dpi. Analyses were performed using PROC MIXED in SAS (v9.2), with trial nested with parity and the number of B alleles for the SSC4 SNP as fixed effects, weight and age at infection as covariates, and litter and pen nested within trial as random effects. Consistent with previ-ous findings, individuals that were heterozygous for the SSC4 SNP had greater WG (0.95 ± 0.32 kg; P = 0.0031, nAA = 682, nAB = 167) and lower VL (-3.89 ± 0.78 units; P < 0.0001, nAA = 431, nAB = 86) compared to their AA counterparts. The size of the effect for the SSC4 SNP was approximately half the
11
reported value for the NVSL-97–7895 isolate for WG (0.95 ± 0.32 vs. 2.0 ± 0.4 kg) but comparable for VL (-3.89 ± 0.78 vs. -4.1 ± 0.6 units). These results suggest this SSC4 marker may be useful for genetic selection of pigs for increased resis-tance or reduced susceptibility to PRRSV isolates that differ genetically and possibly in pathogenicity. This work was sup-ported by Genome Canada, USDA ARS, and breeding compa-nies of the PHGC and PigGen Canada.
Key Words: genetic selection, PRRS, SSC4
025 Identification of genomic regions associated with sow lactation performance in Yorkshire pigs. D. M. Thekkoot1,*, R. A. Kemp2, M. F. Rothschild1, G. Plas-tow3, J. C. M. Dekkers1, 1Iowa State University, Ames, 2Genesus Inc, Oakville, MB, Canada, 3University of Alberta, Edmonton, AB, Canada.
Lactation is an energy demanding process for sows. The ob-jective of this study was to identify genomic regions in sows related to lactation and litter growth through a genomewide association study (GWAS). Data from 868 litters from 531 Yorkshire sows that were genotyped using the Illumina por-cine 60K Bead chip were used. The sows were weighed and scanned for back fat and loin depth before farrowing and at weaning and piglets were weighed at birth, weaning, and death. The GWAS focused on total weaning weight (TWW), litter weight gain (LWG), sow weight loss (WL), back fat loss (BFL), and loin loss (LL). Estimates of heritability were mod-erate (0.24) for WL but low for all other traits (0.11–0.14). The GWAS was implemented separately for parity 1 (N = 414) and parity 2 (N = 340) trait phenotypes using the BayesB method in the GENSEL software. A 1 Mb region on chromosome 2, which exhibited strong linkage disequilibrium, explained 59% of the genetic variance for TWW and 48% for LWG for parity 2 phenotypes but less than 0.1% of genetic variation for parity 1 records. The same region explained the highest proportion of variance for BFL for parity 2 records (0.33%) but less than 0.2% of genetic variance for LL and WL in both parities. The favorable allele of the most significant SNP in this region had a frequency of 0.6 and the genotypes were in Hardy Weinberg equilibrium. To further evaluate the effects of this SNP, it was included as a fixed class effect in an animal model analysis of parity 1, 2, and 3 records as an interaction with parity. Geno-type effects for parities 2 and 3 were significant for LWG, TWW, LL (P < 0.001), and BFL (P = 0.01 and 0.09) but were not significant for parity 1 (P > 0.32). For TWW, estimates of allele substitution effects were 0.6, 5.6, and 1.7 kg for parities 1, 2, and 3, respectively, and 0.4, 5.3, and 2.6 kg for LWG. Positional candidate genes for this region are associated with monosaccharide metabolic processes. It can be concluded that this region on SCC2 had a significant impact on litter growth traits for Yorkshire sows in parity 2 and later. These results can aid in marker assisted selection but need further validation in other samples and breeds. Funding from Genome Alberta,
Alberta Livestock and Meat Agency, Genesus Inc., and State of Iowa and Hatch funds is appreciated.
Key Words: lactation, GWAS, sow
026 Meta-analysis genomewide association of pork quality traits: Ultimate pH and shear force. Y. L. Bernal Rubio1, 2,*, J. L. Gualdrón Duarte2, R. O. Bates1, C. W. Ernst1, D. Nonneman3, G. A. Rohrer4, A. King3, S. D. Shackelford3, T. L. Wheeler3, R. J. C. Cantet2, J. P. Steibel1, 1Michigan State University, East Lansing, 2Department of Animal Science, University of Buenos Aires, Buenos Aires, Argentina, 3USDA/ARS, Clay Center, NE, 4USDA, ARS, U.S. Meat Animal Research Center, Clay Center, NE.
It is common practice to perform genomewide association analysis (GWA) using a genomic evaluation model of a single population. However, the joint analysis of several populations is more difficult. An alternative to joint analysis could be the meta-analysis (MA) of several GWA from independent ge-nomic evaluations, which allows combining results from in-dividual studies, so as to account for population substructure. The objectives of this research were 1) to produce GWA from genomic evaluations for pork quality traits in three popula-tions and 2) to implement a MA searching for significant asso-ciations across pig populations. Data from two U.S. Meat Ani-mal Research Center populations (Commercial and MARC) and one Michigan State University population (MSU) were used. Population-specific GWA were performed by fitting ge-nomic evaluation models to each population for ultimate pH (n = 1857 Commercial, n = 530 MARC, and n = 904 MSU) and shear force (SF; n = 1892 Commercial, n = 1234 MARC, and n = 911 MSU). A MA was implemented by combining z-scores derived for each SNP in every population using two dif-ferent weighting schemes: 1) sample size (N) and 1) estimated variance of SNP effects. One peak at SSC15 was identified for pH in MSU and in the Commercial populations (135 Mb, p-value < 1.21e-11 for MSU and 134 MB, p-value < 9.26e-11 for Commercial). In the N-weighted MA, a peak was detected on SSC15 at position 134 Mb (p-value < 2.13e-13). A virtual-ly identical result was obtained using variance-weighted MA: a peak on SSC15 at 135 Mb, p-value < 5.18e-11. For SF, GWA for MSU showed one peak on SSC15 (135 Mb, p-value < 1.48e-8) and another peak on SSC2 (2.9 Mb, p-value < 2.88e-8). GWA detected peaks for SF on SSC2 at positions 109 Mb for Commercial (p-value < 1.83e-7) and at 5.5 Mb for MARC population (p-value < 1.64e-7). The variance-weighted MA detected one peak on SSC2 (6.3 Mb, p-value < 7.82e-11) and another one on SSC15 (135 Mb, p-value < 2.14e-7). In con-trast, N-weight MA yielded two peaks on SSC2, at 5.9 Mb and at 105 Mb (p-value < 6.73e-12 and 1.23e-6, respectively). Based on our results, selecting a weighting scheme for MA-GWA is very important because it may influence the results. Regardless of the approach used, MA-GWA revealed peaks
12
that were present in at least two populations. Thus, MA-GWA methodology is an attractive alternative to synthesize results from multiple GWA derived from genomic evaluations and it can be used to elucidate the genetic architecture of economi-cally relevant traits, when several populations are available.
Key Words: genomewide association, meta-analysis, pork quality
027 AVPR1A alleles are pleiotropic sources of variation in age at puberty and reproductive longevity in sows. M. D. Trenhaile1,*, K. L. Lucot1, J. K. Tart1, J. W. Bundy1, J. F. Thorson2, E. M. Keuter1, J. R. Wood1, M. F. Rothschild3, G. A. Rohrer2, P. S. Miller1, M. L. Spangler1, C. A. Lents2, R. K. Johnson4, S. D. Kachman4, D. C. Ciobanu1, 1University of Nebraska, Lincoln, 2USDA, ARS, U.S. Meat Animal Research Center, Clay Center, NE, 3Iowa State University, Ames, 4University of Nebraska-Lincoln, Lincoln.
Age at puberty is a moderately heritable trait and an early indicator of sow reproductive longevity. Gilts that express first estrus early are characterized by improved reproductive longevity and lifetime productivity. These traits are depen-dent on the function of the hypothalamic–pituitary–gonadal axis, and their variation is expected to be affected by the same genes. Genomewide association analyses uncovered a region on SSC5 (27–28 Mb) that partially explained the phenotypic variation of age at puberty and lifetime number of parities. The main candidate gene in this region, arginine vasopressin receptor 1A (AVPR1A), involved in biological processes as-sociated with reproductive and social behavior, was character-ized to assess its efficiency as a selection marker for early age at puberty and increased reproductive longevity. The GG gen-otype of a nonsynonymous SNP located in AVPR1A (G31E) was associated with a 4.6 d earlier expression of first estrus compared with genotype AA (P < 0.05) and a 3.0 d earlier expression than genotype AG (P < 0.08). The GG genotype was also associated with 0.51 more lifetime parities than AA (P < 0.006) and 0.31 more than AG (P < 0.06). Irrespective of age at puberty, sows with the GG genotype had a higher prob-ability of generating first and second parities than sows with AA and AG genotypes (P < 0.05). AVPR1A is expressed in the pituitary, granulosa cells, and ovarian cortex. Sequencing AVPR1A in gilts exhibiting puberty early (134–149 d, n = 8) and late (219–243 d, n = 8) uncovered two novel nonsynony-mous SNPs (G256D and K377Q). SNP G256D is located in the third intracellular loop of AVPR1A and was in complete linkage disequilibrium with G31E, located in the extracel-lular NH2–terminus, which has a role in agonist binding and intracellular signaling. The SNP K377Q is located at the C terminus, involved in coordinating protein interactions with AVPR1A. A 0.19 difference in allelic frequency was observed between gilts that expressed puberty early and late for G31E and G256D compared to 0.06 for K377Q. The frequency of
the favorable allele A from G31E increased from 0.42 in gilts unable to generate a parity to 0.54 in sows that generated 3 parities. These differences suggest that selection based on SNPs such as G31E and G256D have the potential to reduce age at puberty and improve reproductive longevity, leading to an increase in sow net values in commercial herds. USDA is an equal opportunity provider and employer.
Key Words: AVPR1A, longevity, swine
028 Variation in host genetics influences PCVAD susceptibility. T. B. Engle1,*, E. E. Jobman1, T. W. Moural1, A. M. McKnite1, S. Y. Barnes1, E. H. Davis1, J. W. Bundy2, T. P. Johnson1, J. K. Qiu1, J. A. Galeota1, S. P. Harris1, M. F. Rothschild3, R. K. Johnson1, G. S. Plastow4, S. D. Kachman1, D. C. Ciobanu2, 1University of Nebraska-Lincoln, Lincoln, 2University of Nebraska, Lincoln, 3Iowa State University, Ames, 4University of Alberta, Edmonton, AB, Canada.
Porcine Circovirus type 2 (PCV2), the causative agent of Por-cine Circovirus Associated Diseases (PCVAD), affects growth and can lead to mortality. Host genetics influences susceptibil-ity and plays a role in PCVAD progression. The objective of this research was to identify major genetic variants and genes that influence immune response and PCVAD susceptibility. Various crossbred lines were experimentally infected with a PCV2b strain similar to a cluster of PCV2b strains known to induce clinical signs of PCVAD and high mortality. During a 28-d experimental challenge, weekly measurements of aver-age daily gain (ADG), viremia, and PCV2-specific antibodies were profiled. Common sources of variation were evaluated by estimating pairwise correlations between phenotypic and genomic prediction values and by genomewide associations across traits. Viremia was the best indicator of decreased ADG following infection; moderate phenotypic correlations between viremia and ADG were observed starting with vire-mia at 14 d postinfection (dpi) and ADG during the last 2 wk of challenge (r = -0.31 to -0.39; P < 0.001). The correlation between overall ADG (0–28 d) and viral load was -0.36. In contrast, the correlation between ADG and PCV2-specific an-tibodies, IgM (-0.12 to 0.05) and IgG (-0.02 to 0.11), were weak. Correlations between genomic prediction values were the largest between viremia at 21 dpi and ADG during the last 3 wk of challenge (-0.27 to -0.33; P < 0.0001). A genome-wide association study that included 56,433 SNPs uncovered two major SNPs that explain 12.4 (ALGA0110477, SSC12) and 3.7% (ALGA0039682, SSC7, 29.3 Mb), respectively, of the genetic variation for viral load. The SNP ALGA0039682 is located next to the SLA II complex of genes known for their role in immune response. These SNPs partially explained the negative correlations between viremia and ADG. The geno-type CC of ALGA0110477 was associated with lower viral load (58.6) compared to genotype TT (74.0; P < 0.0001) and genotype CT (67.3; P < 0.0001). Genotype CC was also asso-
13
ciated with higher overall ADG (0.50 kg) compared to geno-type TT (0.45 kg; P < 0.001) and genotype CT (0.47 kg; P < 0.05). These results could lead to increased knowledge of the swine immune system and identification of genes involved in PCVAD susceptibility. Selection of parent stock based on DNA markers associated with PCVAD has the potential to re-duce economic losses, improve animal welfare, and provide alternatives to vaccination.
Key Words: genetics, PCVAD, swine
029 Genomic prediction of age at puberty in sows using Bayesian methods. K. L. Lucot*, M. L. Spangler, S. D. Kachman, D. C. Ciobanu, University of Nebraska, Lincoln.
Including DNA markers in selection programs is potentially more efficient than traditional selection for improving traits that are expensive or difficult to measure. The challenge of genomics is the lack of robustness of marker effects across populations and over time (generations) and the cost to com-mercial producers of high-density arrays. The objective of this study was to analyze differences in the proportion of pheno-typic variation explained by different fractions of major 1 Mb windows and SNPs. Using a population of Nebraska Index Line and commercial Large White × Landrace females (n = 1234) generated in 11 batches, we conducted a genomewide association analysis for age at puberty (AP) using a Bayes B algorithm with a pi value of 0.99 and the concatenation of diet and batch fitted as a fixed effect. A total of 56,424 SNPs explained 0.28 of the phenotypic variation for AP. Analysis of the genetic variance explained by 1 Mb windows across the genome uncovered major regions associated with AP. The proportion of the phenotypic variation explained by all SNPs within the top 1, 5, 10, and 20% windows varied from 0.22 (1% windows; 645 SNPs) to 0.39 (10% windows; 19,362 SNPs). In contrast, the proportion of the phenotypic variation explained by the most informative SNP from these windows varied from 0.18 (1% windows; 24 SNPs) to 0.48 (20% win-dows; 259 SNPs). Different pi values (0, 0.25, 0.50, 0.75, and 0.99) had a limited effect on the proportion of phenotypic variation explained by the top 1 (0.20 to 0.23) and 10% (0.36 to 0.37) windows. The first seven batches were used as train-ing data (B1–B7, n = 822) to evaluate the ability of major SNPs and windows to predict AP in subsequent batches. The pooled simple correlation between genomic prediction values (GPV) and adjusted AP phenotypes was 0.18 in B8 through B11 (n = 412) when 56,424 SNPs were used. When GPV were derived using the most informative SNP from each of the top 10% windows or all SNPs from the top 10% windows identi-fied in training, rGPV,AP was 0.18 and 0.12, respectively. Weaker correlations were obtained when the most informative SNP or all of the SNPs from the top 1% windows were used for prediction (0.01 and 0.06, respectively). These results showed that a limited number of SNPs were able to explain propor-
tions of phenotypic variation similar to that obtained from high-density SNP panels.
Key Words: genomic prediction, puberty, swine
030 Variance component estimates for alternative litter size and piglet mortality traits. A. M. Putz1,*, K. A. Gray2, M. Knauer1, 1North Carolina State University, Raleigh, 2Smithfield Premium Genetics, Rose Hill, NC.
The objective of this study was to estimate variance compo-nents for litter size and mortality traits at different time points. Traits analyzed included number born alive (NBA), litter size at d 2 (LS2), litter size at d 5 (LS5), litter size at d 30 (LS30), piglet mortality at d 5 (MortD5), and piglet mortality at d 30 (MortD30). Day 30 was chosen for two reasons: 1) The aver-age wean age over the 4 yr was 23.5 d and 2) it is important to include mortalities from early docking in the nursery phase. Data were obtained on 8653 Large White litters from Smith-field Premium Genetics collected from June 2009 through May 2013. Data management and phenotypic analyses were completed with the R statistical environment. Litter size traits were the number of pigs alive on the respective number of days postfarrowing. All mortality traits were calculated as percent-age of dead pigs from TNB on each of the respective days post-farrowing, including stillborn piglets. Genetic analyses were completed using the BLUPF90 family of programs. A basic animal model was fit with fixed effects of parity, year–sea-son, and farm and random effect of permanent environment. Two-trait models were fit between all combinations of traits. Heritability estimates of traits were averaged over the models in which they were involved. All traits were treated as traits of the birth sow, ignoring cross-fostering effects. Heritability estimates for NBA, LS2, LS5, LS30, MortD5, and MortD30 were 0.094, 0.082, 0.097, 0.088, 0.089, and 0.104, respective-ly. Phenotypic variance estimates for NBA, LS2, LS5, LS30, MortD5, and MortD30 were 12.11, 10.93, 9.74, 8.87, 0.033, and 0.024, respectively. Phenotypic and genetic correlations between LS2 with NBA, LS5, LS30, MortD5, and MortD30 were 0.92, 0.95, 0.83, -0.23, and -0.09 and 0.95, 0.98, 0.89, -0.47, and -0.34, respectively. Phenotypic and genetic corre-lations between LS5 with NBA, LS30, MortD5, and MortD30 were 0.86, 0.90, -0.38, and -0.23 and 0.87, 0.96, -0.55, and -0.46, respectively. LS2 or LS5 could be used as alternatives to NBA as the main component trait of maternal line breeds to increase NBA and decrease preweaning mortalities.
Key Words: genetic correlation, litter size, piglet mortality
031 Divergent selection for age at puberty impacts sow reproduction. C. L. Ferring*, M. Knauer, North Caro-lina State University, Raleigh.
The objective of the study was to associate selection for age at puberty with first litter reproductive performance. Estrous data

14
was collected from a cohort of PIC Landrace × Large White gilts (n = 393) at the NCDA Tidewater Research Station. Gilts were placed in curtain-sided buildings on fully slotted floors in groups of 15 (0.84 m2 per pig). Fans and timed misters were used for cooling once temperatures reached 27°C. Starting at 130 d of age, each group of gilts was penned with three mature boars for 7 min daily and estrous behavior recorded. Puberty was defined as the first observed standing reflex to the back-pressure test. Both a young and an old age at puberty group of gilts (average age at puberty 171 and 241 d, respectively) were kept for breeding. Both groups of gilts were mated to the same 12 boars and farrowed during the same month. Sow reproduc-tive traits measured included number born alive, average birth weight, litter birth weight, number weaned, average weaning weight, litter weaning weight, and whether a sow exhibited estrus by 7 d after weaning (W2E_7). Analysis of variance was used to analyze continuous reproductive traits and a chi-squared analysis was used for the categorical trait, W2E_7. Table 1 shows the first litter reproductive performance of the young and old age at puberty groups. Of the first litter reproductive traits measured, only W2E_7 differed (P < 0.01) between puberty groups. The current study found a younger age at puberty did not impact litter traits but had a substantial impact on postweaning expression of estrus. Results suggest that selection for a younger age at puberty would improve an important component trait of sow longevity, W2E_7.
Key Words: gilt, puberty, reproduction
032 Estimates of variance components for swine litter quality traits. E. B. Cook1,*, M. T. See1, K. A. Gray2, M. Knauer1, 1North Carolina State University, Raleigh, 2Smithfield Premium Genetics, Rose Hill, NC.
The objective of the study was to estimate variance compo-nents for swine litter quality traits, including three new litter traits: number of piglets weaned weighing ³ 3.2 kg (QWP), CV for piglet birth weight (CV_BWT), and CV for piglet weaning weight (CV_WWT). Reproductive data and pedi-gree information were obtained for Landrace (n = 5407) and Large White (n = 5825) litters from Smithfield Premium Ge-netics. Litter traits included total number born (TNB), num-
ber born alive (NBA), litter birth weight (BWT), CV_BWT, number weaned (NW), QWP, litter weaning weight (WWT), and CV_WWT. Variance components and genetic correla-tions were estimated with ASReml using two trait models. All models included fixed effects of contemporary group (herd × year × month) and parity, a covariate of age at first farrowing, and a random effect of sow. Models for BWT and WWT also included NBA and NW, respectively, as a covariate. Heritabil-ity estimates for TNB, NBA, BWT, CV_BWT, NW, QWP, WWT, and CV_WWT for Landrace were 0.11, 0.11, 0.17, 0.05, 0.09, 0.11, 0.26, and 0.08, respectively, and for Large White were 0.14, 0.09, 0.11, 0.01, 0.08, 0.11, 0.12, and 0.03, respectively. Phenotypic variance estimates for TNB, NBA, BWT, CV_BWT, NW, QWP, WWT, and CV_WWT for Land-race were 9.56, 8.77, 47.2, 34.2, 15.51, 5.95, 757.0, and 42.6, respectively, and for Large White were11.55, 11.87, 49.7, 35.92, 10.26, 7.99, 967.8, and 45.0, respectively. Genetic cor-relations between litter quality traits for both Landrace and Large White are shown in Table 1. Results suggest that selec-tion for TNB may increase litter variation in birth and wean-ing weight. However, selection for QWP may decrease litter variation in birth weight for Landrace and reduce litter varia-tion in weaning weight for both Landrace and Large White.
Key Words: genetic, reproduction, sow
033 Genetic relationships and inbreeding coefficients of swine breeds. K. Roberts*, W. R. Lamberson, Univer-sity of Missouri, Columbia.
Genetic diversity allows adaptation to environmental changes and varied disease resistance. Without such diversity, a popu-lation could be decimated by disease or environmental fluc-tuations. Swine breeds facing extinction share characteristics such as small size, slow growth rate, and high fat percentage, which eliminate them from the high-input high-output busi-ness of commercial production. Small populations and lack of genetic information increases the chance that producers are breeding closely related individuals, which ultimately eliminates genetic diversity by increasing levels of homo-zygosity in subsequent generations. By making genetic data available, producers can make more educated breeding deci-
Table 031. First litter reproductive performance for gilts diver-gently selected for age at puberty
Trait
Genetic Line
SE P-valueYoung age at puberty
Old age at puberty
Number born alive 11.2 11.6 0.90 0.64Average birth weight, kg 1.17 1.15 0.05 0.67Litter birth weight, kg 12.7 12.9 0.92 0.78Number weaned 9.7 9.9 0.60 0.71Average weaning weight, kg 5.2 5.1 0.15 0.43Litter weaning weight, kg 51.2 49.6 2.89 0.57E xhibited estrous by 7 d after
weaning, %88 58 – 0.01
Table 032. Genetic correlations between litter quality traits for Landrace (above diagonal) and Large White (below diagonal).
TNB NBA BWTCV_BWT NW QWP WWT
CV_WWT
TNB 0.87 -0.22 0.29 0.27 0.47 0.10 0.12
NBA 0.95 0.52 0.20 0.45 0.67 -0.03 0.09
BWT -0.67 0.64 -0.24 -0.04 0.16 0.50 -0.23
CV_BWT 0.29 0.01 -0.39 0.14 -0.07 0.14 0.31
NW 0.51 0.96 -0.04 0.39 0.99 0.61 -0.46
QWP 0.54 0.99 0.02 0.23 0.98 0.68 -0.29
WWT -0.25 0.05 0.68 -0.37 0.98 0.95 -0.44
CV_WWT 0.04 -0.15 -0.10 -0.28 -0.53 -0.66 -0.89

15
sions to preserve genetic diversity in future generations. Hair samples were collected from Guinea, Ossabaw Island, Red Wattle, American Saddleback, and Mulefoot pigs and geno-typed with the Porcine 60K SNP chip. Publicly available ge-notyping data were obtained for British Saddleback, Duroc, Landrace, Large White, Pietrain, and Tamworth pigs. PLINK was used to construct a genomic relationship matrix and to calculate inbreeding coefficients. The following table summa-rizes average relationships (R) between individuals (n) within a breed, and average inbreeding coefficient (F) of individu-als within a breed. American Saddleback and British Saddle-back showed relatedness across the two breeds, so they were combined. The model was significant (P-value < 0.0001) and significant differences across breeds are indicated by super-scripts (α £ 0.05). Popular breeds (Landrace, Large White, and Duroc) exhibit lower levels of R between individuals, on average, as compared to R between individuals of endangered breeds, especially Ossabaw Island, Red Wattle, Mulefoot, and Tamworth. Following a similar pattern, F is high for Ossabaw Island, Tamworth, and Mulefoot and low for Large White and Landrace. While less common in the United States, Pietrain is a popular breed in Europe, which likely accounts for low R and F values. Having complete pedigrees and large popu-lations allows commercial breeds to maintain low levels of R and F within a population. For heritage type breeds, lack of popularity means fewer individuals to select among, and, within a viable populous, even fewer have known pedigrees. This research is the first step toward preserving genetic diver-sity by providing producers with accurate genetic information.
Key Words: swine genetics
DAVID BAKER AMINO ACIDS SYMPOSIUM
034 A short history of ideal protein. N. R. Augspurger*, JBS United, Inc., Sheridan, IN.
The Ideal Protein concept, defined as an ideal pattern of ami-no acids is one that meets requirements for the sum of meta-bolic processes with minimal excesses, is applied in much of
the monogastric feed formulation done today. This concept, however, is rooted in close to 80 yr of research, with work and debate continuing today. The initial concepts of an ideal protein, a profile of amino acids that most closely resembled an intact protein such as whole egg, were revised to a profile of amino acids that most closely met the requirements of an animal for maintenance and growth through construction of a purified crystalline amino acid diet for young chicks. The elucidation of nonspecific amino nitrogen requirements, in-terconversion among amino acids, and antagonisms between amino acids further refined the ideal protein concept. The ini-tial implementation of the Ideal Protein for commercial live-stock production occurred in 1981, when the British Agricul-ture Research Council proposed an ideal protein for swine that presented essential amino acids requirements as a percentage of lysine, with is first-limiting amino acid for protein depo-sition in most swine diets. From this point, much work was done to estimate the ratios of essential amino acids relative to lysine that maximized performance. Much work has continued to focus across multiple physiological states, from growth to pregnancy and lactation. The impact of immune challenge and nutrient composition of diets have been studied to determine their role in ideal protein requirements. This concept has been applied across livestock species as well as companion animals.
Key Words: history, ideal protein, pigs
035 Current knowledge about ideal protein for growing pigs. J. van Milgen1,*, N. Le Floc’h1, E. Corrent2, M. Gloaguen1, 1INRA, Saint Gilles, France, 2Ajinomoto Eurolysine, Paris, France.
Improving the efficiency of nitrogen use and maintaining per-formance can be achieved by reducing the crude protein con-tent of diet while ensuring that amino acid requirements, de-fined as the minimum amino acid supply required to obtain a maximum response, are met. The use of synthetic amino acids and analogues allows formulating diets where 7 amino acids are co-limiting for performance (i.e., Lys, Met, Met+Cys, Thr, Trp, Val, and a seventh amino acid). Knowledge of the require-ments of these amino acids has been a limiting factor for the further reduction of protein content in the diet and thus for im-proving the efficiency of nitrogen utilization. Dose–response experiments are usually performed to estimate the amino acid requirement. The experimental design, the mode of express-ing the amino acid supply, the response criterion used, and the statistical analysis method affect the amino acid requirement estimates. Very little experimental evidence exists for the re-quirements of amino acids such as Val, Ile, Leu, His, Phe, and Tyr. Our group has performed an experimental research pro-gram to study the response of piglets to the supply of these amino acids. In addition, meta-analyses were used to analyze the existing body of literature. Based on current knowledge and expressed on a standardized ileal digestible basis relative to Lys, our recommended ideal amino acid profile for grow-
Table 033.
Breed n R FGuinea 14 0.16a 0.26a
Ossabaw Island 10 0.37b 0.47b
Red Wattle 5 0.49bc 0.28a
Saddleback 22 0.14a 0.15d
Mulefoot 4 0.69d 0.39ab
Duroc 20 0.21a 0.25a
Landrace 20 0.03e 0.15c
Large White 20 0.05ef 0.15c
Pietrain 20 0.07f 0.12c
Tamworth 20 0.46c 0.41b
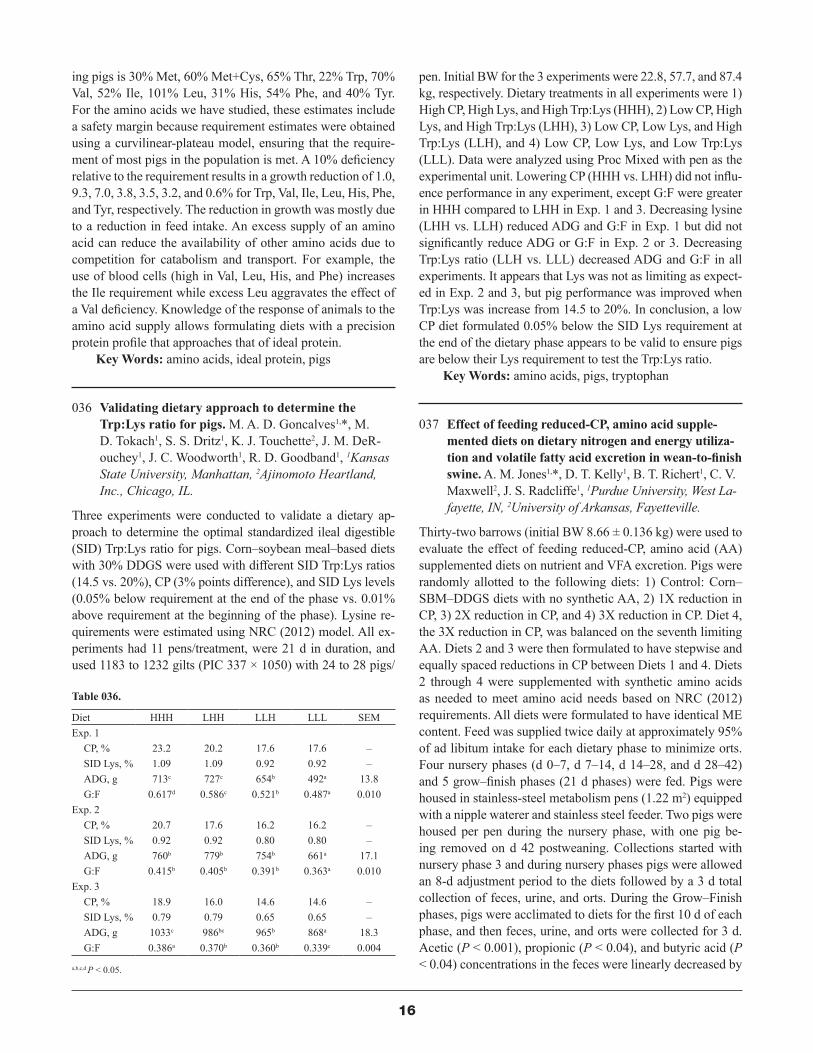
16
ing pigs is 30% Met, 60% Met+Cys, 65% Thr, 22% Trp, 70% Val, 52% Ile, 101% Leu, 31% His, 54% Phe, and 40% Tyr. For the amino acids we have studied, these estimates include a safety margin because requirement estimates were obtained using a curvilinear-plateau model, ensuring that the require-ment of most pigs in the population is met. A 10% deficiency relative to the requirement results in a growth reduction of 1.0, 9.3, 7.0, 3.8, 3.5, 3.2, and 0.6% for Trp, Val, Ile, Leu, His, Phe, and Tyr, respectively. The reduction in growth was mostly due to a reduction in feed intake. An excess supply of an amino acid can reduce the availability of other amino acids due to competition for catabolism and transport. For example, the use of blood cells (high in Val, Leu, His, and Phe) increases the Ile requirement while excess Leu aggravates the effect of a Val deficiency. Knowledge of the response of animals to the amino acid supply allows formulating diets with a precision protein profile that approaches that of ideal protein.
Key Words: amino acids, ideal protein, pigs
036 Validating dietary approach to determine the Trp:Lys ratio for pigs. M. A. D. Goncalves1,*, M. D. Tokach1, S. S. Dritz1, K. J. Touchette2, J. M. DeR-ouchey1, J. C. Woodworth1, R. D. Goodband1, 1Kansas State University, Manhattan, 2Ajinomoto Heartland, Inc., Chicago, IL.
Three experiments were conducted to validate a dietary ap-proach to determine the optimal standardized ileal digestible (SID) Trp:Lys ratio for pigs. Corn–soybean meal–based diets with 30% DDGS were used with different SID Trp:Lys ratios (14.5 vs. 20%), CP (3% points difference), and SID Lys levels (0.05% below requirement at the end of the phase vs. 0.01% above requirement at the beginning of the phase). Lysine re-quirements were estimated using NRC (2012) model. All ex-periments had 11 pens/treatment, were 21 d in duration, and used 1183 to 1232 gilts (PIC 337 × 1050) with 24 to 28 pigs/
pen. Initial BW for the 3 experiments were 22.8, 57.7, and 87.4 kg, respectively. Dietary treatments in all experiments were 1) High CP, High Lys, and High Trp:Lys (HHH), 2) Low CP, High Lys, and High Trp:Lys (LHH), 3) Low CP, Low Lys, and High Trp:Lys (LLH), and 4) Low CP, Low Lys, and Low Trp:Lys (LLL). Data were analyzed using Proc Mixed with pen as the experimental unit. Lowering CP (HHH vs. LHH) did not influ-ence performance in any experiment, except G:F were greater in HHH compared to LHH in Exp. 1 and 3. Decreasing lysine (LHH vs. LLH) reduced ADG and G:F in Exp. 1 but did not significantly reduce ADG or G:F in Exp. 2 or 3. Decreasing Trp:Lys ratio (LLH vs. LLL) decreased ADG and G:F in all experiments. It appears that Lys was not as limiting as expect-ed in Exp. 2 and 3, but pig performance was improved when Trp:Lys was increase from 14.5 to 20%. In conclusion, a low CP diet formulated 0.05% below the SID Lys requirement at the end of the dietary phase appears to be valid to ensure pigs are below their Lys requirement to test the Trp:Lys ratio.
Key Words: amino acids, pigs, tryptophan
037 Effect of feeding reduced-CP, amino acid supple-mented diets on dietary nitrogen and energy utiliza-tion and volatile fatty acid excretion in wean-to-finish swine. A. M. Jones1,*, D. T. Kelly1, B. T. Richert1, C. V. Maxwell2, J. S. Radcliffe1, 1Purdue University, West La-fayette, IN, 2University of Arkansas, Fayetteville.
Thirty-two barrows (initial BW 8.66 ± 0.136 kg) were used to evaluate the effect of feeding reduced-CP, amino acid (AA) supplemented diets on nutrient and VFA excretion. Pigs were randomly allotted to the following diets: 1) Control: Corn–SBM–DDGS diets with no synthetic AA, 2) 1X reduction in CP, 3) 2X reduction in CP, and 4) 3X reduction in CP. Diet 4, the 3X reduction in CP, was balanced on the seventh limiting AA. Diets 2 and 3 were then formulated to have stepwise and equally spaced reductions in CP between Diets 1 and 4. Diets 2 through 4 were supplemented with synthetic amino acids as needed to meet amino acid needs based on NRC (2012) requirements. All diets were formulated to have identical ME content. Feed was supplied twice daily at approximately 95% of ad libitum intake for each dietary phase to minimize orts. Four nursery phases (d 0–7, d 7–14, d 14–28, and d 28–42) and 5 grow–finish phases (21 d phases) were fed. Pigs were housed in stainless-steel metabolism pens (1.22 m2) equipped with a nipple waterer and stainless steel feeder. Two pigs were housed per pen during the nursery phase, with one pig be-ing removed on d 42 postweaning. Collections started with nursery phase 3 and during nursery phases pigs were allowed an 8-d adjustment period to the diets followed by a 3 d total collection of feces, urine, and orts. During the Grow–Finish phases, pigs were acclimated to diets for the first 10 d of each phase, and then feces, urine, and orts were collected for 3 d. Acetic (P < 0.001), propionic (P < 0.04), and butyric acid (P < 0.04) concentrations in the feces were linearly decreased by
Table 036.
Diet HHH LHH LLH LLL SEMExp. 1
CP, % 23.2 20.2 17.6 17.6 –SID Lys, % 1.09 1.09 0.92 0.92 –ADG, g 713c 727c 654b 492a 13.8G:F 0.617d 0.586c 0.521b 0.487a 0.010
Exp. 2CP, % 20.7 17.6 16.2 16.2 –SID Lys, % 0.92 0.92 0.80 0.80 –ADG, g 760b 779b 754b 661a 17.1G:F 0.415b 0.405b 0.391b 0.363a 0.010
Exp. 3CP, % 18.9 16.0 14.6 14.6 –SID Lys, % 0.79 0.79 0.65 0.65 –ADG, g 1033c 986bc 965b 868a 18.3G:F 0.386a 0.370b 0.360b 0.339c 0.004
a,b,c,d P < 0.05.

17
26.5, 11.0, and 14.8%, respectively, as dietary CP was reduced from control to 3X. Calculated DE and ME values based on analyzed GE content of feed, feces, and urine were linearly reduced (P < 0.05) with increasing reductions in dietary CP (DE: 3736, 3658, 3662, and 3526 kcal/kg; ME: 3694, 3612, 3616, and 3499 kcal/kg). A tendency (P = 0.08) for a linear reduction in dietary N intake (25.2% lower in 3X vs. Control) was observed, which was partially responsible for the 36.5% linear reduction (P < 0.05) in N excretion (28.1, 21.3, 17.9, and 17.8 g/d). In conclusion, low CP diets with synthetic AA result in lower DE and ME values for the diet but significantly reduce N and VFA excretion.
Key Words: nitrogen retention, swine
038 Novel approaches to estimating amino acid require-ments and amino acid ratios in diets fed to gestating sows. S. Moehn*, R. O. Ball, University of Alberta, Edmonton, AB, Canada.
Nutrition of pregnant sows has received little attention in the recent past, in part because of the time needed to conduct con-ventional experiments in sows. We conducted experiments specifically designed to determine requirements in early (EG) and late gestation (LG) for amino acids (AA), using the indi-cator AA oxidation technique, and for energy using indirect calorimetry. Because the indicator AA oxidation technique only needs 2 to 3 d of adaptation, 6 × 6 Latin square experi-ments to determine AA requirements could completed within a 3-wk period, and the same animals could be tested in EG and LG. The implantation of subcutaneous vascular access ports allowed the study of protein turnover and metabolomic pro-files in the same sows in consecutive parities.
New models for pregnant sow requirements add up the AA and energy deposition in body components, together with estimates of maintenance, and then apply estimates of the ef-ficiency of AA and energy utilization to calculate require-ments. These models can calculate requirements for a wide range of physical and performance characteristics of sows. Although there is some disagreement among models and em-pirical data regarding the absolute values of requirements, the core results are similar. In agreement with our empirical data, these models predict much greater requirements for AA in LG vs. EG and a decrease in AA requirements with increas-ing parity number. Models and empirical data indicate that the changes in requirements from EG to LG and with sow age differ among AA, so that the ideal AA pattern changes throughout a sows’ reproductive life. While the ideal protein for pregnant gilts resembles that for growing pigs, it will be closer to that needed for maintenance for adult sows in EG. Therefore, the same diet may be first limiting in different AA in EG vs. LG and in gilts vs. adult sows.
Experiments manipulating AA and/or energy allowances showed that optimal subsequent sow and piglet performance is likely achieved by feeding pregnant sows close to requirements
modeled or determined based on the growth of the sow-fetal unit. Therefore, pregnant sows should be fed to their changing individual needs throughout their reproductive to achieve opti-mal performance return from both sows and offspring.
Key Words: amino acids, pig, pregnancy
039 Abstract withdrawn
DAVID SCHINGOETHE SYMPOSIUM: HEIFER NUTRITION AND THE FUTURE
040 Future perspective on accelerated milk replacer feeding. J. G. Linn*, N. B. Litherland, University of Minnesota, St. Paul.
Accelerated milk replacer feeding can be defined as feeding a high enough plane of nutrition from liquid feeding to meet maintenance requirements and provide nutrients to support the genetic potential for growth rate. Traditional milk replacer feeding practices have focused on meeting maintenance re-quirements and modest growth rates early in the liquid feeding phase followed by starter grain intake for enhanced growth late in the liquid feeding phase and before weaning. Data clearly support advantages to increasing the plane of nutrition early in the calf’s life to support growth rates that double birth body weight by weaning. Enhanced early life stage nutrition likely induces cellular changes and hormonal signaling that prepare the calf to take advantage of a nutrient rich environment later in life for expression of true genetic lactation potential.
Implementation of feeding a higher plane of nutrition during the liquid feeding phase has been met with some chal-lenges in the field. Not all calves have accepted the higher nu-trient intake well and the greater amounts of nutrient delivery through liquid feeding have reduced starter grain intake and delayed rumen development. The introduction of automated calf feeding systems or feeding liquids more than twice daily through traditional methods may be ways to avoid the sati-ety effects. Additionally, precision feeding programs, such as feeding on a percentage of body weight, can potentially op-timize nutrient intake per individual calf and help reduce the risk of over- or underfeeding. Balancing nutrient intake from both liquid and solid feeds during the liquid feeding phase will likely be the best way of achieving desired growth rates, optimizing efficiency of growth, and consistently producing a healthy replacement heifer.
Historically all milk protein milk replacers have been used in accelerated calf feeding programs. Alternative non-milk proteins are likely to replace some of the milk protein in accelerated milk replacers as the cost of whey protein and other milk proteins increase and the use of whey in human protein supplements and food products increases. Addition-
18
ally, as dairy herds have become larger the use of pasteurized nonsaleable milk in replacement of a milk replacer increases. Programs designed to optimize milk solids intake to achieve success as an accelerated calf feeding program are needed.
Key Words: calves, milk replacer
041 Nutrition and management of automatic calf feeding systems. T. Earleywine*, Land O’Lakes Animal Milk Products, Cottage Grove, WI.
Since dairy calves are the only mammalian neonates that are limit-fed milk, producers have been challenged to find ways to keep them alive, healthy, and growing. Automatic calf feeding equipment has been around for decades but due to improvements in technology and the desire to “find a better way” their popularity has increased. Seven years of research on over 2100 calves at our facility as well as research done at academic institutions will be covered. The positives such as the appearance of improved welfare, potential labor savings/flexibility, higher nutrition levels provided, and more frequent meals will be discussed. The negatives such as maintenance and cleaning, biosecurity, and potential increase in respiratory challenge will also be reviewed.
Key Words: automatic calf feeding equipment, dairy calves
042 Formulating starter diets to meet nutrient requirements of dairy calves during rapid early growth. J. K. Drackley and S. Y. Morrison*, University of Illinois, Urbana.
The importance of calf starters in enabling calves to make the transition from milk to solid feeds is well known. Starters must be palatable to encourage intake, must contain easily fer-mentable and digestible ingredients, and must provide a bal-anced profile of absorbed nutrients. With the renewed interest in providing increased nutrients from milk or milk replacer early in life, however, the optimal formulation of starters to enable calves to make the transition without slumps in growth remains controversial. The largest uncertainties lie in predict-ing rates of ruminal carbohydrate fermentation and the result-ing microbial protein synthesis. Demonstrations of the ben-efits of fermentable nonstarch polysaccharides such as soluble fiber have created opportunities for blends of carbohydrates beyond traditional cereal starches and forage or cellulosic by-product ingredients. Increasing metabolizable protein supply has shown promise in helping calves maintain high prewean-ing growth rates as they transition to solid feed diets. The most important advances likely will be made by changing the focus from product formulation to formulating diets that support a defined level of performance. Further progress in modeling would be complemented by additional research to define ru-minal dynamics in young calves.
Key Words: calves, growth, starter
043 How much dietary fat should growing prepubertal dairy heifers be fed? J. L. Anderson* South Dakota State University, Brookings.
Diets for growing dairy heifers have, historically, been for-age based with very low fat concentrations. Supplemental fat has been considered uneconomical to feed to dairy heifers, and therefore, it has become an often overlooked nutrient in dairy heifer rations. However, with the increased interest in the use of biofuel coproducts, which are higher in fat content than traditional feeds, and the high price of corn, this nutrient deserves a second look. Additionally, dietary energy sources need to be reconsidered when heifers are fed using alterna-tive feeding strategies, such as precision feeding. Literature searches on feeding dietary fat to dairy heifers yield very lim-ited findings. These findings often lead to more questions than answers on how fat will affect growth and development of growing heifers. In contrast, there is a relative abundance of research on feeding fat to mature dairy cows, dairy calves, and beef cattle, on which most of the current recommendations for heifers are based. This presentation will describe key findings from research and suggest how to best utilize dietary fat as a nutrient for growing dairy heifers. Positive effects of feed-ing fat such as increased feed efficiency, changes in metabolic profile, and reproductive performance will be weighed against the negative effects such as overconditioning and decreased fiber utilization. From this literature review, recommendations on feeding fat will be made and potential areas for future re-search will be discussed.
Key Words: dairy heifers, dietary fat
044 Finding the future now– Health, genomics, and calves. A. L. Stanton*, University of Wisconsin-Madison, Madison.
The rearing of replacement heifers and breeding of cattle has become much more complicated due to the increase in knowl-edge about the longer term impacts of calf care in the first 90 d on lifetime productivity and the ability to genomically predict genetic production potential. The health of heifers under 90 d of age has been shown to have long-term impacts on their future productivity. This has resulted in increased focus on prevention of calfhood illness. However, the question of what to do with animals that have become ill is still unclear.
The guidelines on calf nutrition have also been altered and appear to have long-term impact on the productivity of these calves as adults. There have been several studies that have shown that improved growth due to feeding biologically appropriate milk levels in the first 60 d are beneficial to the calf’s future milk production. Ollivett and colleagues (2012) found a positive impact of increasing energy allotments to calves on the duration of clinical signs of diarrhea. However, the mechanism of this change is still unknown. Further re-search is needed to determine how genetics and epigenetics
19
interact with health status and increased nutritional planes.Genomics is changing the dairy industry and future
implications are unknown. One potential role of genetics is management and selection of future generations of breeding animals. Genomics allows for improved knowledge of the animal genetics at an earlier age. Questions on reliability of the results and the impact of other calf factors, such as health and phenotype, are still being expressed by producers and have anecdotally led to reluctance of producers to use this information. For genomics to be fully integrated into the de-cision making at the farm level more research is needed on the economic concerns of testing animals genomically, the reliability of it to find the best cows and the worst cows, and a decision model that includes not only genetic factors but also phenotypic factors that increase the reliability of not just future generations of animals but also those in the current herd and increased education of the strengths and weaknesses of these tools.
Knowledge of genetics and calf health has evolved and will continue to do so. Understanding of the commercial applications and scientific principles that underline these changes and how they interact will be essential for producers and scientists in the future.
Key Words: genomics, health, management
EQUINE
045 Developing equine professionals in the 21st century. K. D. Bump*, Cazenovia College, Cazenovia, NY; National Association of Equine Affiliated Academics, Cazenovia, NY.
Developing students for careers in the equine industry can be considered within the three themes of student background, industry need, and changing environment. Industry need has always been part of the equation but until recently there was limited focus on the idea that student background should be considered in this process. In addition, the work environment for equine professionals was much more static. Curriculums were designed on experiences and perceptions of faculty that had typically grown up around horses, and coursework was geared toward students arriving on campus with an agricul-ture background. Today this is dramatically different and data from NAEAA studies [1] indicate that many students enter with limited hands-on equine and/or agricultural background. Given this, approaches to developing equine professionals no longer start with the premise that students arrive at college with a developed understanding of equines and the equine industry. Coupled with this is the reality that the equine in-dustry has entered a dramatically different time where even the notion of what it means to own and care for a horse is less clear. As society moves farther from agriculture and farther
from viewing horses as farm animals, the concept of “equine professional” becomes both complex and ambiguous. While the equine industry continues with needs and expectations for hands-on and support work, it also calls for professionals with new and emerging knowledge, skill sets, and approaches. Whether a curriculum focuses on the science of horse care or the business components of the horse industry, successful preparation for the 21st century hinges on preparing profes-sionals to work in an environment filled with VUCA: volatility, uncertainty, complexity, and ambiguity. This term, coined in the late 1990s, reflects the reality of a rapidly changing global environment that is both highly connected and largely dispa-rate. Equine professionals will be best served by recognizing the critical importance of thinking beyond the day-to-day re-sponsibilities of horse care and embracing the importance of advocacy and broad interconnectedness. As educators, it is our job to assess the backgrounds, interests, and perceptions of our students and develop curriculums that address current and future industry needs and to do so within an expanded view of the equine industry and the broader mindsets critical to growth and success.
[1] Bump, K.D., Livermore, J, Williams, T.S. National Trends: The entering “equine” student population. Journal of Equine Veterinary Science 33 (2013) 386
Key Words: career preparation, education, equine
046 Development of an undergraduate online horse management course. K. L. Martinson*, M. Palmer, M. Hathaway, E. Glunk, University of Minnesota, Saint Paul.
Online college courses can improve student academic expe-riences by increasing accessibility, accommodating various learning approaches, and deepening student mastery of the subject matter. The purpose of this abstract is to outline the development of an undergraduate online horse management course. In the fall of 2013, a horse management course was offered online to non-Animal Science majors. A concurrent in-class section was offered to majors. Twenty-two students enrolled in the online section while 29 students enrolled in the in-class section. The course aimed to provide an introduction to the horse industry and careers, breeds, behavior, weight esti-mation, body condition scoring, liability and insurance, forage utilization, poisonous plants, pasture management, manure management, facility management, grooming, safe ground handling, assessing vitals, colic, hoof care, vaccinations, and genetics. Each week, two lectures were recorded using UM-Connect and posted on the course Moodle website along with a PDF handout of the lecture slides. The instructor recorded most lectures; however, prerecorded guest lectures were used periodically. Extension factsheets and journal articles were also posted as supporting learning materials, and a graduate student assisted with course management. Each week, students were responsible for completing either a quiz, discussion, or
20
exam. Throughout the 15-wk semester, 6 quizzes, 6 discus-sions, and 3 exams were posted. Quizzes consisted of 10 one-point multiple-choice or true/false questions that were avail-able for 22 h on Moodle. Students had a maximum of 30 min to complete each quiz and results were automatically graded and recorded in the grade book. Discussions were worth 20 points and were available for 48 h on Moodle. To start the discussion, two to three questions pertaining to the discussion topic were posted by the instructor. Students were responsible for posting at least three comments or questions during the specified time. Points were manually assigned after evaluating student responses in report logs on Moodle. The three exams consisted of 50 multiple-choice and true/false questions each worth 2 points. Exams were available for 22 h and students were given a maximum of 90 min to complete each exam on Moodle. Exam results were automatically graded and record-ed in the grade book. Students were reminded each week of pending assignments via email. Although student evaluations are not yet available, offering an online undergraduate horse management course appears to be a successful method for de-livering material to nonmajors while providing flexibility and an alternative learning approach to students.
Key Words: online teaching, horse
047 Comparative analysis of state 4-H horse programs. F. C. Camargo1,*, A. Lawyer1, C. Willis1, R. C. Bott2, 1University of Kentucky, Lexington, 2South Dakota State University, Brookings.
4-H is a national youth development program, which is gov-erned by land grant institutions that are given the liberty to tailor their program to the individual needs of states. This al-lows for programs to grow according to the interests of youth in that area. However, this system means that there is little communication between states about how common issues are handled and avoided. Specifically, the 4-H Horse Program is continually faced with challenges in the horse industry such as animal welfare and compliance with regulations. This study was designed to gather information from state 4-H Horse Pro-grams to help each program recognize common issues and initiate collaborative approaches to develop solutions. A sur-vey was distributed to 4-H horse contacts representing all 50 states. Completed surveys were returned from 24 states, yield-ing a response rate of 48%. Of those states that responded, the average number of youth enrolled in the 4-H Horse Pro-gram was 4218, with enrollment ranging from 150 to 25,483 youth. All but one state have a state 4-H horse show and 91% of the states require youth to wear helmets at least in certain events. Thirty-nine percent of respondents (9 states) do not require youth to qualify to participate in the state 4-H horse shows. Participation in the state shows varied from 40 youth to 875 youth with a mean of 393 youth. Thus, slightly over 9% of youth enrolled in state 4-H Horse Programs nationwide are participating in the state 4-H horse shows. Participation
in knowledge contests at 4.8% is even lower, especially con-sidering that states self-reported that youth may have been double counted if they competed in more than one knowledge contest. Interestingly, 2 states require participation in knowl-edge contests for youth to compete in the state show. Sixty-two percent of the states reported that low body condition scores is one of the welfare issues they encounter while 56% of the states reported that they encounter too much roughness/yanking/overchecking on the reins. 4-H is well positioned to develop educational programs to teach youth proper horse welfare and responsible ownership, yet only five states (21%) have an equine welfare educational program within 4-H. This information can be helpful to leaders of these programs when looking for fresh ideas or possible collaborations and can im-prove the quality of 4-H Horse Programs.
Key Words: 4H horse program
048 Influence of weight loss on skeletal muscle mito-chondrial function and metabolism in the mature horse. J. L. Zambito1,*, H. S. Spooner2, C. E. Nichols1, R. M. Hoffman2, J. M. Hollander1, K. M. Barnes1, 1West Virginia University, Morgantown, 2Middle Ten-nessee State University, Murfreesboro.
Obesity causes a multitude of metabolic issues in horses, yet stepwise alterations in glucose and lipid metabolic capability, mitochondrial capacity, and oxidant status during weight loss have not been evaluated. We hypothesized that horses would display improvements in morphometric measurements, circu-lating metabolic markers, minimal model estimates of glucose tolerance, and insulin sensitivity during weight loss over 96 d from an obese (7 to 8) to moderate (5) body condition score (BCS). Furthermore, skeletal muscle contains subsarcolemmal (SSM) and interfibrillar (IFM) mitochondria, which respond differently to physiological stimuli; therefore, we hypoth-esized horses would display improvements in mitochondrial subpopulation function and reductions in circulating oxidant status markers during weight loss sampled every other week. Horses displayed significant decreases in all morphometric measurements (P £ 0.04) except for abdominal circumference (P = 0.08). A decrease in rump fat thickness from 11.5 ± 1.2 to 6.1 ± 1.1 mm reflected decreasing body fat mass (P < 0.0001). Weight loss had no effect on circulating concentrations of glu-cose or insulin measured every other week. Insulin sensitivity increased from 1.08 ± 0.27 to 4.32 ± 1.59 × 10⁻⁴ L∙mU–1∙min-1 with both reduction in BCS and weight loss (P £ 0.04). The disposition index, an assessment of β-cell function, tended to increase with percent weight loss (P = 0.09) but not lower BCS. Plasma nitrate trended to decrease in response to BCS reduction and percent weight loss (P £ 0.06) whereas erythro-cyte total glutathione (P = 0.06) concentration increased with decreasing BCS. Mitochondrial electron transport chain com-plexes I and IV displayed greater activity in SSM than IFM (P £ 0.03) while all complexes in IFM had decreased activity

21
due to both weight parameters P £ 0.01). Interactions between subpopulation complex IV activity and weight loss markers (P < 0.05) were displayed. Citrate synthase activity, indicat-ing mitochondrial number, was greater in SSM than IFM (P < 0.0001) but was unaffected with weight loss. Lipid peroxida-tion was decreased with BCS change (P = 0.01) and weight loss (P = 0.02), displaying greater amounts in SSM than IFM (P £ 0.02). Few changes in circulating markers along with minute alterations in minimal model parameters suggest that while horses were obese, metabolic function was conserved. Complex activity and lipid peroxidation alterations suggest IFM are more affected by weight loss, with large contribu-tions from complex IV byproducts. Mitochondrial component flexibility may contribute individually to disease development along with athletic performance in the horse.
Key Words: mitochondria, muscle, obesity
049 The interaction of grazing muzzle use and grass species on forage intake of horses. E. Glunk*, C. C. Sheaffer, M. Hathaway, K. L. Martinson, University of Minnesota, Saint Paul.
Excessive pasture intakes have been linked to the increased incidence of equine obesity and pasture-associated laminitis. Previous research found that grazing muzzles reduced pasture intake by 83%. However, horses are selective grazers, and forage grasses have different growth morphologies. Both fac-tors could impact the effectiveness of grazing muzzles; how-ever, this has not been investigated. Therefore, the objective of this research was to determine the effectiveness of grazing muzzles at reducing forage intake when horses were allowed access to different grass species. The study was conducted in 2012 and 2013. Four horses were grazed in 2012 while three horses were grazed in 2013. Before grazing, horses were ac-climated to wearing a grazing muzzle and grazing for 4 h. Four species of perennial, cool-season grasses were grazed in 2012 including: Kentucky bluegrass (KB; prostrate growth habit, preferred by horses), meadow fescue (MF; upright, pre-ferred), perennial ryegrass (PR; prostrate, less preferred), and reed canarygrass (RC; upright, less preferred). In 2013, only KB and RC were grazed due to winter kill of PR and MF. Horses were allowed to graze a small pasture (4.5 by 9.9 m) seeded with one of the individual grass species for 4 h each day for 4 consecutive days in June and August of 2012 and August and September of 2013. Horses grazed the same grass species for 2 consecutive days, 1 d with the muzzle and 1 d without. Before each grazing event, a 0.9 by 3.3 m strip was mechanically harvested from the pasture to determine avail-able initial herbage mass. Postgrazing, an adjacent 0.9 by 3.3 m strip was harvested to determine residual forage mass. The difference (on a dry matter basis) was used to estimate horse forage intake. Data were analyzed using the PROC MIXED procedure of SAS, with statistical significance set at P £ 0.05. The effectiveness of a grazing muzzle was not affected by for-
age species (P ³ 0.05). Use of a grazing muzzle decreased the amount of forage consumed by an average of 30% across species and years (P < 0.0001). These results will aid horse owners and professionals in estimating forage intake and bal-ancing rations of muzzled horses on pasture.
Key Words: grazing, intake, muzzle
EXTENSION – DAIRY SYMPOSIUM: STRATEGIES TO INCREASE FIBER
DIGESTIBILITY IN LACTATING DAIRY COWS
050 Agronomic practices that impact the digestibility of fiber by lactating cows. F. N. Owens*, DuPont Pioneer, Johnston, IA.
Ruminal bulk fill limits intake of forage-rich diets early in lactation with coarse fiber being the primary contributor to ruminal fill. This ceiling on feed and energy intake can be lift-ed either by reducing the dietary concentration of NDF or by increasing the fermentation rate of NDF (NDFD). Numerous genetic (BMR) and environmental factors can alter NDF con-tent and NDFD of forages. With most grasses and legumes, NDF content increases and NDFD decreases as plants ma-ture, largely due to a decreased leaf:stem ratio. Consequently, earlier harvest, more erect plant stature, harvesting plants at greater height, and minimizing leaf loss all can increase for-age quality. With most forages, yield increases as temperature, light intensity, nitrogen fertility, and water supply increase. However, by accelerating maturation, higher temperatures in-crease NDF content and lignification; factors that retard plant development help maintain forage quality. Unlike other tropi-cal plants, maize harvested as silage is immature and NDF digestibility will not decline if plant health is maintained dur-ing kernel development. Restricting supply of irrigation water increases NDFD of maize plants probably through increasing the leaf:stalk ratio. Changes in NDF and NDFD (48 h) di-gestibility of various plant parts was measured for two non-BMR hybrids harvested across a range in plant DM from 28 to 39%. At all DM contents, maize cobs and husks had the highest NDF content; as plant DM increased, NDF content only for husks increased. NDF content of maize stalks at vari-ous heights did not differ, but NDF digestibility always was less for the lower stalk portions. NDFD was greatest for husks and leaves; NDFD of cobs and leaves dropped as plant DM increased. Plant NDFD dropped from 43 to 42% as plant DM increased from 28 to 40%. As lignin content increased, NDFD dropped for stalks. For the other plant parts, NDFD was not altered by the fractional percentages of hemicellulose, cellu-lose, or lignin in NDF nor was it altered by ratios among these components. As maize kernels matured from half-milk line to black line, kernel weight increased by over 20%. Based on

22
Milk 2006 equations and analysis of plant nutrients at harvest, milk yield per metric ton harvested or per hectare should peak at 33.2 and 34.3% DM, respectively, for unprocessed maize silage. Delaying harvest to 40.5 and 37.2% DM, respectively, should give peak milk yield per ton or per hectare for pro-cessed maize silage.
Key Words: maize, maturity, NDF
051 TTNDFD: A new approach to evaluate forage fiber digestibility. D. K. Combs*, F. Lopes, University of Wisconsin, Madison.
We hypothesize that an estimate of total tract NDF digest-ibility (TTNDFD) can provide useful information about fi-ber utilization. Our objective is to present an approach for predicting in vivo total tract NDF digestibility from in vitro NDF digestibility measurements. The parameters needed to estimate TTNDFD include the proportion of potentially di-gestible fiber (pdNDF), the digestion rate of the pdNDF (kd), the ruminal passage rate of pdNDF (kp), and postruminal di-gestion of NDF. The in vitro TTNDFD approach accounts for ruminal and postruminal fiber digestion and can be adjusted for changes in fiber passage as size or intake of the animal changes. The TTNDFD method has been validated with in vivo experiments. In one study, Lopes et al. (2013) compared estimates of TTNDFD as predicted by the in vitro model to in vivo measurements in lactating dairy cows. Cows were fed diets that varied in proportions of corn silage and alfalfa. The diets contained 55% forage and the dietary NDF concentra-tion was similar across treatments. Milk yields were similar amongst diets. The observed (in vivo) TTNDFD values were calculated from feed and fecal samples. Cows consuming the diet with alfalfa as the only forage had higher NDF digestibil-ity than cows on the diets that contained corn silage. The NDF digestibility coefficients predicted by the in vitro TTNDFD method were similar to the in vivo values. The TTNDFD analysis can provide important insights into fiber utilization by dairy cattle. The rates of fiber degradation determined from the in vitro NDFD assays appear to be consistent with what
have been measured in vivo feeding studies. The pdNDF, kd, and kp and parameters predicted by the TTNDFD model ap-pear to be consistent with in vivo measures.
Key Words: dairy, fiber, NDF digestibility
052 Measuring forage quality of corn silage and un-derstanding the impacts on rumen fermentation in lactating dairy cattle. P. J. Kononoff*, University of Nebraska-Lincoln, Lincoln.
Last year the USDA estimated that 113 million tons of corn silage was produced. This was up 4% from the previous year and was also the highest production in the United States since 1982. Given that corn silage is commonly included in diets for dairy cattle at 30 to 50% of the DM, this crop represents an im-portant feedstuff to the dairy industry. Additionally, given that the chemical composition and nutrient availability of this feed may vary, quality of this feedstuff is central to dairy production and profitability. The term forage quality is often defined by the extent to which the forage elicits a productive response. Fun-damentally speaking the nature of this response is dependent on the availability of forage nutrients to rumen microorganism. Plant factors that affect this availability include maturity, hy-brid, and growing conditions. Additionally, harvesting and en-siling practices may also affect nutrient availability and these include the method of chopping, length of cut, extent of kernel processing, and time of ensiling. Lastly, a number of animal factors may also influence nutrient availability including level of intake, nutrient demands, behavioral patterns, and animal health. Attributes of good quality forage usually include a high intake potential, high nutrient concentration, and high digest-ibility or nutrient availability. Forage quality is commonly as-sessed through chemical and physical analysis and near-infrared spectroscopy as well as using a number of in vivo and in vitro methods. The purpose of this presentation is to review how for-age quality affects rumen fermentation, microbial digestion, and how factors that affect forage quality may be manipulated to ultimately contribute to greater milk production.
Key Words: corn silage, forage quality, rumen fermentation, dairy production
053 The impact of nonforage fiber sources on fiber digestibility. B. Bradford*, Kansas State University, Manhattan.
Nonforage fiber sources (NFFS) have been used in ruminant diets for many years. However, some dairy operations are now reaching inclusion rates of these feedstuffs that substantially greater than the traditional target of 10 to 15% of dry matter. Heavy reliance on feedstuffs with high NDF content but small particle size could potentially have major impacts on kinet-ics of both fiber digestion and passage. Furthermore, when such ingredients are used to partially replace starch sources, there is potential for positive associative effects on forage fi-
Table 051. Effect of changing ratios of corn silage to alfalfa on intake, production, and fiber digestion in dairy cows.
Corn silage (CS): alfalfa (AS) ratio
100CS 0AS
67CS 33AS
33CS 67AS
0CS 100AS
Corn silage, % of TMR 56 37 18 0 Alfalfa silage, % of TMR 0 19 37 55 Concentrate mix, % of TMR 44 44 45 45 Diet NDF, % of DM 24.9 25.5 24.6 25.5 SE
DMI, kg/d 25.2ab 25.3a 24.3b 21.9c 0.84% FCM, kg/d 36.2 35.4 35.2 35.6 0.9O bserved TTNDFD,
in vivo 38.3a 40.9ab 39.4ab 43.8c 1.9
P redicted TTNDFD, in vitro
38.0 41.0 41.0 45.0 2.1
a,b,c Values within row with different superscripts differ, P < 0.05.

23
ber digestion. Critical impediments to a clearer understand-ing of NFFS-reliant diets include the lack of relevant data on digestion kinetics and, more importantly, the great diversity in composition and characteristics of different NFFS. Neverthe-less, several studies have investigated the effects of common NFFS on ruminal fermentation characteristics, microbial pop-ulations, and total-tract nutrient digestion. In general, NFFS-reliant diets that are formulated to support high levels of milk production do not appear to provide an associative benefit for forage fiber digestibility, nor have consistent increases in ruminal pH or shifts in rumen microbial populations been observed. Although empirical data are limited, sufficient physically effective forage NDF is likely critical for efficient ruminal digestion of NDF from NFFS, both by maintaining ruminal pH and by providing a fiber mat to slow passage of the small particles. Determining the ideal forage NDF level in low-starch, high-NFFS diets is key to allowing increased dry matter intake while maintaining high digestive efficiency.
Key Words: byproducts, digestion, fiber, ruminal kinetics
EXTENSION — SWINE
054 Effects of Skycis® and Stafac® on growth and carcass performance of finishing pigs– A meta-analysis. R. A. Arentson1,*, J. J. Chewning2, S. N. Carr3, G. L. Allee4, M. C. Brumm5, E. G. McMillan6, 1Elanco, Greenfield, IN, 2Swine Research Services, Inc., Springdale, AR, 3Elanco Animal Health, Greenfield, IN, 4Pork Tech, LLC, Columbia, MO, 5Brumm Swine Consultancy, Inc., Mankato, MN, 6Nutreco Canada Agresearch, Burford, ON, Canada.
The purpose of this meta-analysis was to summarize the effects of 0 vs. 15 ppm of narasin (NAR; Skycis®, Elanco Animal Health, Greenfield, IN; 4 studies located in Arkansas [AR], Ontario, CA [ON], Missouri [MO], and Minnesota) and the effects of 0 or 15 ppm NAR or 11 ppm of virginiamycin (VIR; Stafac®, Phibro Animal Health, Teaneck, NJ; 2 studies locat-ed in AR and ON) on the growth and harvest performance of pigs during the grow–finish period. Pigs were blocked by gen-der and weight and then treatments were randomly assigned to pens. Diet treatments consisted of a sequence of three to six diets containing corn, SBM, and DDGS (except ON and MO) with the appropriate amount of antimicrobial premix added. Pigs were weighed to determine initial BW, phase weights, and ADG. Feed issuance and weigh backs were recorded to determine ADFI and G:F. When pigs reached harvest BW, they were transported to food companies to measure HCW, fat depth, and loin depth. From 33.1 to 68.0 kg, pigs fed di-ets containing NAR had a faster ADG (0.981 vs. 0.962 kg/d; P = 0.0012) and a higher G:F (0.457 vs. 0.452; P = 0.0098)
versus CON. From 68 kg to harvest, pigs fed diets containing NAR had a higher G:F (0.346 vs. 0.337; P = 0.0033) than those fed CON diets. Overall, pigs fed diets containing NAR had a faster ADG (0.985 vs. 0.970 kg/d; P = 0.0131) and an increased G:F (0.397 vs. 0.390; P = 0.0011) versus CON. Pigs fed diets containing NAR had a higher carcass weight (98.49 vs. 97.44 kg; P = 0.0069) than pigs fed CON. In the two-study analysis, pigs fed NAR from 27.3 to 68.0 kg (0.472 vs. 0.466 or 0.467; P < 0.05) and 68 kg to harvest (0.343 vs. 0.335 or 0.336; P < 0.05) had a higher G:F than those fed CON or VIR, respectively. From 27.3 kg to harvest, pigs fed diets contain-ing NAR had a higher G:F (0.402 vs. 0.394 or 0.395; P < 0.05) than CON or VIR. Overall, pigs fed NAR had a higher ADG, G:F, and HCW than those fed CON and a higher G:F than those fed VIR.
Key Words: narasin, pigs, virginiamycin
055 The effect of regrinding DDGS and SBM on pellet quality in swine finishing diets. W. J. Pacheco1,*, M. Knauer1, E. van Heugten1, C. R. Stark1, A. C. Fahren-holz1, C. E. Phillips2, 1North Carolina State University, Raleigh, 2Murphy-Brown LLC, Rose Hill, NC.
The objective of the current study was to evaluate the effect of regrinding major feed ingredients on pellet quality in swine fin-isher diets. Feed was produced at the NCSU Feed Mill Educa-tional Unit. Corn–soy diets contained 69.4% corn, 22.3% soy-bean meal (SBM), and 6.5% poultry fat (PF). Diets containing corn distillers dried grains with solubles (DDGS) comprised 53% corn, 30% DDGS, 8.0% SBM, and 6.5% PF. Of the 6.5% PF in each diet, 1.5% was added in the mixer and 5.0% was added postpelleting. Six dietary treatments consisted of two lev-els of DDGS (0 and 30%), two particle sizes of DDGS (677 and 483 µm), and two particle sizes of SBM (1070 and 467 µm). All diets were steam conditioned with the same retention time and a temperature of 82°C. A 4.4 by 31.8 mm pellet die was used during pelleting. Each diet was replicated 4 times. Data were analyzed using PROC GLM in SAS. Batch was the experimen-tal unit. Models for pellet durability index (PDI) and modified PDI included fixed effects of diet and time of day. Contrasts were used to evaluate DDGS inclusion and regrinding DDGS and SBM on pellet quality. Across all diets, average PDI and modified PDI was 90.4 (SD = 2.15) and 68.2 (SD = 6.81), re-spectively. Diets containing DDGS had greater (P < 0.05) PDI and modified PDI in comparison to diets without DDGS (1.6 and 9.5%, respectively). Regrinding DDGS had no effect (P > 0.05) on PDI or modified PDI. Regrinding SBM in diets without DDGS tended (P £ 0.07) to improve PDI and modified PDI (2.3 and 5.8%, respectively). Within DDGS diets, regrinding SBM did not improve (P = 0.19) PDI but improved (P £ 0.05) modi-fied PDI by 4.3%. Across all diets, regrinding SBM improved (P < 0.05) both PDI and modified PDI (1.5 and 4.7%, respec-tively). Batches pelleted in the morning had greater (P < 0.05) PDI and modified PDI in comparison to those pelleted in the
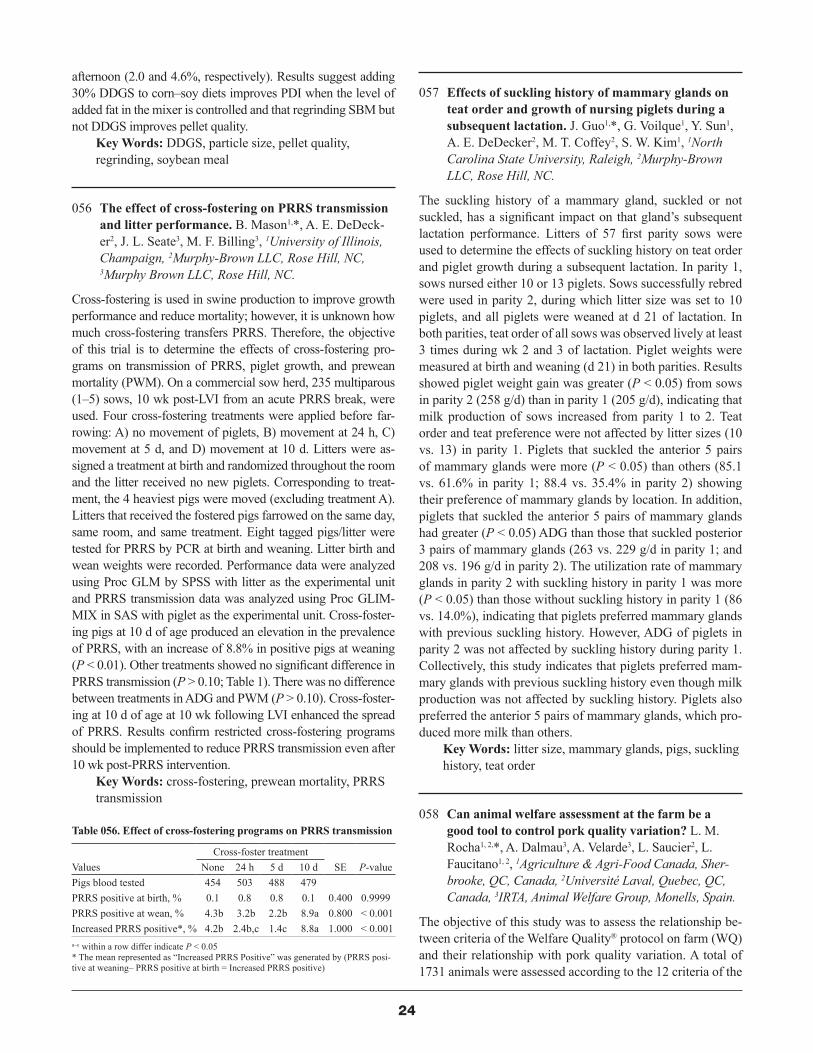
24
afternoon (2.0 and 4.6%, respectively). Results suggest adding 30% DDGS to corn–soy diets improves PDI when the level of added fat in the mixer is controlled and that regrinding SBM but not DDGS improves pellet quality.
Key Words: DDGS, particle size, pellet quality, regrinding, soybean meal
056 The effect of cross-fostering on PRRS transmission and litter performance. B. Mason1,*, A. E. DeDeck-er2, J. L. Seate3, M. F. Billing3, 1University of Illinois, Champaign, 2Murphy-Brown LLC, Rose Hill, NC, 3Murphy Brown LLC, Rose Hill, NC.
Cross-fostering is used in swine production to improve growth performance and reduce mortality; however, it is unknown how much cross-fostering transfers PRRS. Therefore, the objective of this trial is to determine the effects of cross-fostering pro-grams on transmission of PRRS, piglet growth, and prewean mortality (PWM). On a commercial sow herd, 235 multiparous (1–5) sows, 10 wk post-LVI from an acute PRRS break, were used. Four cross-fostering treatments were applied before far-rowing: A) no movement of piglets, B) movement at 24 h, C) movement at 5 d, and D) movement at 10 d. Litters were as-signed a treatment at birth and randomized throughout the room and the litter received no new piglets. Corresponding to treat-ment, the 4 heaviest pigs were moved (excluding treatment A). Litters that received the fostered pigs farrowed on the same day, same room, and same treatment. Eight tagged pigs/litter were tested for PRRS by PCR at birth and weaning. Litter birth and wean weights were recorded. Performance data were analyzed using Proc GLM by SPSS with litter as the experimental unit and PRRS transmission data was analyzed using Proc GLIM-MIX in SAS with piglet as the experimental unit. Cross-foster-ing pigs at 10 d of age produced an elevation in the prevalence of PRRS, with an increase of 8.8% in positive pigs at weaning (P < 0.01). Other treatments showed no significant difference in PRRS transmission (P > 0.10; Table 1). There was no difference between treatments in ADG and PWM (P > 0.10). Cross-foster-ing at 10 d of age at 10 wk following LVI enhanced the spread of PRRS. Results confirm restricted cross-fostering programs should be implemented to reduce PRRS transmission even after 10 wk post-PRRS intervention.
Key Words: cross-fostering, prewean mortality, PRRS transmission
057 Effects of suckling history of mammary glands on teat order and growth of nursing piglets during a subsequent lactation. J. Guo1,*, G. Voilque1, Y. Sun1, A. E. DeDecker2, M. T. Coffey2, S. W. Kim1, 1North Carolina State University, Raleigh, 2Murphy-Brown LLC, Rose Hill, NC.
The suckling history of a mammary gland, suckled or not suckled, has a significant impact on that gland’s subsequent lactation performance. Litters of 57 first parity sows were used to determine the effects of suckling history on teat order and piglet growth during a subsequent lactation. In parity 1, sows nursed either 10 or 13 piglets. Sows successfully rebred were used in parity 2, during which litter size was set to 10 piglets, and all piglets were weaned at d 21 of lactation. In both parities, teat order of all sows was observed lively at least 3 times during wk 2 and 3 of lactation. Piglet weights were measured at birth and weaning (d 21) in both parities. Results showed piglet weight gain was greater (P < 0.05) from sows in parity 2 (258 g/d) than in parity 1 (205 g/d), indicating that milk production of sows increased from parity 1 to 2. Teat order and teat preference were not affected by litter sizes (10 vs. 13) in parity 1. Piglets that suckled the anterior 5 pairs of mammary glands were more (P < 0.05) than others (85.1 vs. 61.6% in parity 1; 88.4 vs. 35.4% in parity 2) showing their preference of mammary glands by location. In addition, piglets that suckled the anterior 5 pairs of mammary glands had greater (P < 0.05) ADG than those that suckled posterior 3 pairs of mammary glands (263 vs. 229 g/d in parity 1; and 208 vs. 196 g/d in parity 2). The utilization rate of mammary glands in parity 2 with suckling history in parity 1 was more (P < 0.05) than those without suckling history in parity 1 (86 vs. 14.0%), indicating that piglets preferred mammary glands with previous suckling history. However, ADG of piglets in parity 2 was not affected by suckling history during parity 1. Collectively, this study indicates that piglets preferred mam-mary glands with previous suckling history even though milk production was not affected by suckling history. Piglets also preferred the anterior 5 pairs of mammary glands, which pro-duced more milk than others.
Key Words: litter size, mammary glands, pigs, suckling history, teat order
058 Can animal welfare assessment at the farm be a good tool to control pork quality variation? L. M. Rocha1, 2,*, A. Dalmau3, A. Velarde3, L. Saucier2, L. Faucitano1, 2, 1Agriculture & Agri-Food Canada, Sher-brooke, QC, Canada, 2Université Laval, Quebec, QC, Canada, 3IRTA, Animal Welfare Group, Monells, Spain.
The objective of this study was to assess the relationship be-tween criteria of the Welfare Quality® protocol on farm (WQ) and their relationship with pork quality variation. A total of 1731 animals were assessed according to the 12 criteria of the
Table 056. Effect of cross-fostering programs on PRRS transmission
ValuesCross-foster treatment
SE P-valueNone 24 h 5 d 10 dPigs blood tested 454 503 488 479 PRRS positive at birth, % 0.1 0.8 0.8 0.1 0.400 0.9999PRRS positive at wean, % 4.3b 3.2b 2.2b 8.9a 0.800 < 0.001Increased PRRS positive*, % 4.2b 2.4b,c 1.4c 8.8a 1.000 < 0.001a–c within a row differ indicate P < 0.05* The mean represented as “Increased PRRS Positive” was generated by (PRRS posi-tive at weaning– PRRS positive at birth = Increased PRRS positive)

25
WQ protocol based on four principles: good feeding, hous-ing (GH), health (HC), and appropriate behavior in twelve finishing farms, five Welfare Certified (WCE; n = 698) and seven conventional (CON; n = 1033) farms. A subsample of 1440 pigs (60 pigs/farm) was randomly chosen out of 24 loads (2 loads/farm) at the abattoir. Meat quality was assessed us-ing the Longissimus thoracis (LT) muscle at 24 h postmor-tem by measuring pH (pHu), color, and drip loss. Data for each variable, within the 12 criteria assessed, were analyzed by MIXED and WILCOXON procedure of SAS. Spearman correlations were performed to determine the relationship be-tween on-farm animal welfare scores and meat quality traits. WCE farms showed greater scores for GH and HC, indicat-ing better animal welfare conditions, compared to CON farms (67.9 vs. 39.4; P = 0.001 and 62.9 vs. 50.6; P = 0.006, respec-tively). The greater scores for WCE farms are explained by a trend for greater space allowance (1.09 vs. 0.74 m2; P = 0.08) and a lower presence of bursitis (25.0 vs. 38.6%; P = 0.07) and percentage of pneumonia occurrence (2.8 vs. 16.5%; P = 0.09). The LT muscle of WCE pigs tended to present a slightly lower pHu (5.64 vs. 5.67; P = 0.07) and a greater drip loss (4.54 vs. 3.41%; P = 0.003) compared to loins from CON pigs. Only GH was correlated with meat quality variation. The greater pHu and lower drip loss in the LT muscle of CON pigs may be mostly explained by the poor housing (GH) condi-tions of these farms (r = -0.75; P = 0.01), especially in terms of low space allowance (r = -0.86; P < 0.001). GH was also related to drip loss variation (r = 0.71; P = 0.004), with high-est correlations being found between this meat quality trait and GH criteria such as the body weight (r = 0.71; P < 0.001) and the incidence of bursitis (r = 0.67; P = 0.01). These results demonstrate that the implementation of the WQ criteria to as-sess on-farm animal welfare may help control the variation of important pork meat quality traits.
Key Words: pork, welfare
059 Relationships between sow body condition with subsequent reproductive performance. M. Bryan*, M. Knauer, North Carolina State University, Raleigh.
The objective was to quantify relationships between sow body condition with subsequent reproduction. Sows were measured at breeding (n = 1571) and before farrowing (n = 887) at a commercial farm. Body condition measures included a Knau-er sow caliper (CS), weight (WT), 10th rib backfat (BF),10th rib LM area (LMA), and body condition score (BCS) scored on a 1 to 5 scale by a technician. Sow traits were number born alive (NBA), litter birth weight (BW), number weaned (NW), piglet survival (PS), which was NW divided by total born, litter weaning weight (WW), and wean-to-conception inter-val (WCI). Data were analyzed in SAS using PROC GLM. Breeding CS had a curvilinear relationship (P < 0.05) with NBA, BW, NW, PS, and WCI with a CS of 15 being opti-mal for NBA, NW, and PS and 14 ideal for BW and WCI. A
1-score increase in breeding BCS decreased (P < 0.05) WW by 1.98 kg. Breeding BCS had a curvilinear relationship (P < 0.05) with NBA, BW, NW, PS, and WCI with 3.2 being optimal for NBA, BW, NW, and WCI and 3.0 ideal for PS. A 10-kg increase in breeding WT decreased (P < 0.05) PS and WW by 0.8% and 0.67 kg, respectively, and increased (P < 0.05) WCI by 0.23 d. A millimeter increase in breeding BF de-creased (P < 0.05) NBA, BW, and WW by 0.04, 0.06 kg, and 0.17 kg, respectively, and increased (P < 0.05) WCI by 0.07 d. Breeding LMA had a curvilinear relationship (P < 0.05) with PS, with 52.5 cm2 being optimal. A 1-score increase in farrow-ing CS decreased (P < 0.05) NBA and BW by 0.16 and 0.3 kg, respectively. Farrowing CS had a curvilinear relationship (P < 0.05) with NW and PS with 15 being optimal. A 1-score increase in farrowing BCS decreased (P < 0.05) BW by 0.97 kg. Farrowing BCS had a curvilinear relationship (P < 0.05) with NW and PS with 3.6 being ideal. A 10-kg increase in far-rowing WT decreased (P < 0.05) NBA and NW by 0.11 and 0.09, respectively. Farrowing WT had a curvilinear relation-ship (P < 0.05) with WW and PS with an adjusted WT of 220 and 210 kg, respectively, being ideal. A millimeter increase in farrowing BF decreased (P < 0.05) NBA by 0.03 and a square centimeter increase in LMA decreased (P < 0.05) NBA by 0.04, respectively. Farrowing LMA had a curvilinear relation-ship (P < 0.05) with WCI with 51.6 cm2 being ideal. Results suggest sow body condition explains variation in subsequent reproductive performance. Producers should use CS or WT instead of a subjective BCS to manage gestating sows and maximize subsequent reproduction.
Key Words: body condition, reproduction, sow
GARY ALLEE SYMPOSIUM: FEEDING SICK PIGS
060 The longitudinal impact of PRRS on metabolism, whole body protein accretion, and feed efficiency in grow–finisher pigs. N. K. Gabler*, Iowa State University, Ames.
Health challenges in nursery–finisher pig production will sig-nificantly affect the economic return for pork producers and is a constant issue our industry faces. While significant advances in molecular and quantitative genetics, clinical diagnostics, and virology have been made to enhance our understanding of swine health and important pathogens such as porcine re-productive and respiratory syndrome virus (PRRS), we are still unsure on how to best feed and manage poor-health pigs. By understanding the longitudinal impact PRRS virus and its associated inflammation has on digestibility, metabolism, protein accretion, and feed efficiency, insights into nutritional requirements and management strategies can be developed to improve poor-health pig production. Recent data we have
26
generated indicates that PRRS infection alone significantly reduces ADG, ADFI, and FE (up to 50, 32, and 25%, respec-tively) over the peak viremia and sera conversion periods in gilts compared to their PRRS naïve littermates. Furthermore, on top of this attenuated feed intake, apparent total tract di-gestibility of energy and nitrogen were reduced. Intriguingly, these impacts on total tract digestibility may be long lasting while ADG and ADFI have recovered to comparable to that of healthy pigs. Longitudinal whole body composition analy-sis also clearly showed that PRRS infection attenuated lean, protein, fat, and bone accretion rates compared to uninfected littermates. These data, together with blood metabolite and hormone analysis, suggests that there is a major catabolic cost, particularly to skeletal muscle, to support the energetic and protein synthesis needs of immune system response. Al-together, this paper will discuss the metabolic and physiologi-cal response to PRRS infection and inflammation in grow–finisher pigs and potential nutrition management strategies to support the immune response and recovery.
Key Words: feed efficiency, pig, PRRS, tissue accretion
061 Managing disease in commercial swine production: Costs and possible nutritional and management practices to reduce losses. T. J. Loula*, Swine Vet Center, Saint Peter, MN.
Managing disease is easiest if you don’t ever allow it in. Bios-ecurity measures have been taken to a new level with the in-troduction of PEDv into the United States in April 2013. But disease will still have a major influence on production and costs in the future. Diseases have changed in my 30+ years of prac-tice to be more acute/less chronic. Also, more major diseases are viral. Viral diseases such as influenza, PRRS, PCV2, and now PED dominate the industry. Influenza, PED, and occasion-ally PRRS seem to move/transfer “at will.” Although PCV2 is well controlled with vaccine, it is the most expensive vaccine to date that has ever been routinely administered to U.S. swine. PRRS and now PED have added cost to the industry with add-ed biosecurity procedures and infrastructure such as filtration, truck washes, etc. Disease and nutrition are very interrelated and I feel fortunate that in most of the systems that we work with, there is a “team” approach to health and production. There is a long list of diseases/syndromes that a team of production specialists, nutritionists, and veterinarians work together on to find solutions, such as postweaning diarrhea, ear necrosis, sow lameness, grow–finish ulcers, and tail biting. Performance, effi-ciency, death loss, labor management, throughput, and cost are always barometers. When I graduated from veterinary college, the major swine diseases were atrophic rhinitis, swine dysen-tery, T.G.E., salmonellosis, pseudorabies, Actinobacillus pleu-ropneumoniae, and sarcoptic mange. Disease is still a major limiter of production and the ability to manage disease deter-mines level of success and profitability for today’s producers.
Key Words: swine diseases
062 Metabolic and physiological ramifications of immune activation. R. N. Dilger*, University of Illinois, Urbana.
Activation of the immune system by bacterial and viral patho-gens elicits a coordinated set of metabolic, physiological, and behavioral events, all of which result in reduced animal growth. During an acute infection, proinflammatory cytokines (e.g., tumor necrosis factor-α [TNF-α], interleukin-1 [IL-1]) are produced by activated monocytes and macrophages in pe-ripheral tissues, and these proteins serve as central mediators to induce coordinated events through mechanisms in the brain. Collectively referred to as “sickness behavior,” the nonspecific symptoms of infection include fever, fatigue, alteration of sleep patterns, social isolation, decreased food and water intake, and weight loss. Beyond the outward signs of clinical infection, animals experience a repartitioning of body nutrients (espe-cially amino acids and some minerals) designed to support the immune response while making the host environment incom-patible with pathogen survival. A major challenge for nutri-tionists is that nutrient priorities are first for maintenance and second for growth (i.e., lean tissue accretion), and maintenance requirements for energy and specific nutrients are elevated during an active infection, which reduces availability of nu-trients for growth. For example, the febrile response harnesses metabolic inefficiency to produce heat and raise the core body temperature while production of cytokines and immune cells requires significant resources (e.g., amino acids) to allow the host to mount an effective immune response. Therefore, from a nutritional perspective, managing sick pigs involves delivery of nutrient profiles that support an appropriate level of immune reactivity while minimizing growth depression, and this must occur while the pig is experiencing a reduction in voluntary feed intake. Finding ways to manage the magnitude and dura-tion of an acute inflammatory response is key to maximizing productive performance and profitability, but eliminating the proinflammatory response altogether is not an option because it is an important part of host immune defenses. Current evi-dence suggests that genetic selection for growth potential may negatively affect the ability for animals to cope with an infec-tion, but this effect is likely most pronounced when animals are exposed to dietary nutrient deficiencies. To that end, a signifi-cant gap in knowledge exists regarding how to optimize nutri-ent profiles before and during an active infection. The classic nutritional approach has been the addition of specific nutrients or bioactive compounds to elicit immunomodulatory effects, but significant progress in this area is more likely to occur us-ing a “systems” approach to better understand the interaction of nutrition and immunology.
Key Words: immunology, metabolism, pig

27
063 Managing systemic disease stress in commercial pig production: Cost and possible nutritional practices to reduce performance loss. R. D. Boyd*, C. E. Zier-Rush, The Hanor Company, Inc., Franklin, KY.
This paper presents estimated cost to growth, feed ef-ficiency, and financial outcome for pigs that have been naturally challenged by viral diseases. A second purpose is to provide evidence that certain nutrients or bioactive com-ponents dampen the severity of response to immune stress. Finally, we discuss how this knowledge is applied in prac-tice. Specific ingredients are used to manage disease stress in practice; fish meal and animal plasma are among the most noted. Our portfolio has enlarged to include soybean meal (SBM). Ingredients bring nutrients that are important to modulate disease effects but also bioactive substances such as anti-inflammatory components and immunoglobulins. We measured G:F deviation during a 55 d period in pigs chal-lenged with influenza. We estimated feed cost to be increased by at least $1.50/pig (Boyd et al., 2010); however, this could double depending on ingredient price, how late the infection occurred, and how long it remains. Although mortality and medical treatment accompany disease stress, they are beyond the scope of this paper. In an earlier study, we observed that a mix of pro-inflammatory viruses (PRRS, PCVAD, and S. suis) during the finish phase severely reduced rate and ef-ficiency of growth. Mortality and morbidity was 6 times nor-mal for a 16-wk period. Growth and G:F ratio were depressed in a 21 d test, but growth was much improved if pigs were fed a relatively high level of SBM (HI-SBM) compared to LO-SBM. Respective whole-body (WB) and carcass growth was observed (LO-SBM: 902 and 608 g/d vs. HI-SBM: 989 and 686 g/d). G:F ratio also improved on a WB and carcass basis (0.337 and 0.215 vs. 0.365 and 0.240). The modulating effect of SBM was evident when CP level was equal for LO- and HI-SBM (16.0%) treatments, but relative improvement ap-peared to increase as the difference in SBM content (and CP) progressively diverged.
The modulating effect of SBM on systemic disease may be due to nonnutritive, anti-inflammatory isoflavones (Grein-er et al., 2001), but CP level may be additive to bioactive components. Proof of concept has been extended to weaned pigs (Rochell et al., 2013). Immune modulation with high quality fish meal was an early innovation for weaned pigs. Commercial application through feeding requires intervals of weeks not days; however, precise timing is improved if water administered.
Key Words: immune stress, growth, soya
GRADUATE STUDENT ORAL COMPETITION: MASTER ORAL I
064 Efficacy of yeast cell wall based feed additive in prevention of mycotoxicoses in pigs fed a diet with aflatoxin under the EU regulatory levels. Y. Sun*, J. Guo, I. Park, S. W. Kim, North Carolina State University, Raleigh.
This study was to investigate the effect of corn naturally con-taminated with aflatoxin at the EU’s regulatory level on the growth performance of nursery pigs and the efficiency of a yeast cell wall based feed additive (Mycosorb A+, Alltech, Lexington, KY) in prevention of mycotoxicoses. Pigs (60 barrows and 60 gilts at 6.02 ± 0.83 kg BW) were randomly allotted to 4 treat-ments (2 × 2 factorial) with 10 pens (5 barrow and 5 gilt pens) per treatment and 3 pigs per pen and fed experimental diets for 5 wk. Diets included NC (a control diet without aflatoxin and Mycosorb A+), NCA (NC + 2 g/kg of Mycosorb A+), PC (NC + 20 µg/kg of aflatoxin), and PCA (PC + 2 g/kg of Mycosorb A+). Feed intake and body weight were measured weekly, and one pig representing an average body weight of each pen was bled to measure the numbers of blood cells, immunological vari-ables including IgG and TNF-α, oxidative damage status, and serological evaluation related to liver health. Mycosorb A+ in-creased (P < 0.05) ADG (493 to 524 g/d) and ADFI (796 to 846 g/d) of pigs whereas G/F was not affected. Aflatoxin decreased (P < 0.05) the number of platelet count (193.5 to 247.4 × 10³/μL). Interactions (P < 0.05) between treatment factors on hemo-globin, hematocrit, and platelet count indicate that Mycosorb A+ further increased their levels when feed were contaminated with aflatoxin. Aflatoxin tended to increase the level of albumin (P = 0.055; 3.46 to 3.63 g/dL), albumin:globulin ratio (P = 0.050; 2.09 to 2.37), and Ca (P = 0.080; 10.79 to 10.97 mg/dL). My-cosorb A+ tended to increase (P = 0.055) albumin level (3.46 to 3.63 g/dL). Interactions (P < 0.05) between treatment factors on blood urea N and blood urea N:creatinine indicate that Myco-sorb A+ further decreased their levels when feed were contami-nated with aflatoxin. Collectively, diets with Mycosorb A+ (2 g/kg) can improve pigs’ growth performance by increasing ADG and ADFI whereas low level aflatoxin (20 µg/kg) had minor ef-fects on hematology without affecting growth performance.
Key Words: aflatoxin, pigs, yeast cell wall

28
065 Expression of cationic amino acid transporters mRNA in the jejunum of high and low efficiency steers. H. C. Cunningham1,*, Z. T. L. Gray1, S. I. Pais-ley1, K. J. Austin1, K. M. Cammack1, A. M. Meyer2, 1Department of Animal Science, University of Wyo-ming, Laramie, 2Division of Animal Sciences, Univer-sity of Missouri, Columbia.
We hypothesize that small intestinal expression of nutrient transport-related genes, such as cationic AA (CAA) transport-ers, may contribute to differences in metabolic efficiency of finishing cattle. The objective of this study was to investigate jejunal expression of CAA transporters in steers classified as high and low efficiency based on residual feed intake (RFI). Hereford-Angus crossbred steers (yr 1: n = 59, 461 ± 4.5 kg initial BW; yr 2: n = 75, 412 ± 3.8 kg initial BW) from a single contemporary group in each year (birth through slaughter) were used. Steers were fed a finishing diet (yr 1: 11.4% CP, 2.0 Mcal NEm/kg, and 1.35 Mcal NEg/kg; yr 2: 13.2% CP, 1.8 Mcal NEm/kg, and 1.19 Mcal NEg/kg; DM basis) for 57 (yr 1) or 80 d (yr 2), and individual feed intake was monitored using the GrowSafe system. Residual feed intake was calculated as the difference between actual and expected feed intake of each individual, where expected intake was determined by regress-ing ADG and metabolic midweight on actual intake. At the end of the feeding period in each year, the 20% most efficient (low RFI, n = 8/yr) and 20% least efficient (high RFI, n = 8/yr) steers with 12th rib fat thickness ³ 1.02 cm were selected for slaughter between 5 and 8 d after the end of the feed in-take test. Jejunal mucosa was collected and flash-frozen. Real-time RT-PCR was performed to determine jejunal expression of 7 cationic AA transporters in 4 different transport systems: cationic AA transporter-1 (CAT-1, system y+), ATB0,+ (system B0,+), b0,+AT and rBAT (system b0,+), and y+LAT1, y+LAT2, and 4F2hc (system y+L). Data were analyzed with PROC MIXED in SAS 9.2 using RFI class (high vs. low efficiency), year, and their interaction as fixed effects. Expression of y+LAT2 tended to be affected (P = 0.07) by the RFI class × year interaction. Low efficiency steers had greater (P = 0.05) expression of y+LAT2 than high efficiency steers in yr 2 whereas there was no difference (P = 0.61) in yr 1. Jejunal expression of the other 6 CAA transporters was not affected (P ³ 0.17) by RFI class; however, expression of y+LAT1 was affected (P £ 0.01) by year. Data suggest jejunal expression of y+LAT2, part of the y+L basolateral transport system of the small intestine, may contribute to differences in metabolic efficiency of cattle.
Key Words: amino acid, feed efficiency, small intestine
066 Effects of calcium oxide treatment of dry and modi-fied wet distillers grains with solubles on econom-ics, feed intake pattern, and growth and carcass performance of feedlot steers. A. R. Schroeder1,*, M. J. Duckworth1, D. W. Shike1, J. P. Schoonmaker2, T. L. Felix1, 1University of Illinois at Urbana-Champaign, Urbana, 2Purdue University, West Lafayette, IN.
Objectives of this study were to determine the interaction of feed-ing dry (DDGS) or modified wet (MDGS) distillers grains with solubles with or without CaO treatment to steers on growth per-formance, feed intake patterns, economics of gain, and USDA carcass grades. Steers (n = 139; initial BW = 336 ± 75 kg) were blocked by BW and allotted to 20 pens. Pens were randomly as-signed to 1 of 4 dietary treatments arranged in a 2 × 2 factorial: 1) 50% DDGS untreated, 2) 48.8% DDGS treated with 1.2% CaO, 3) 50% MDGS untreated, or 4) 48.8% MDGS treated with 1.2% CaO. The remainder of the diets were husklage, dry rolled corn, and vitamin and mineral supplement. There was no interaction (P ³ 0.14) of distillers grains (DGS) type and CaO treatment on DMI, ADG, final BW, or USDA carcass grades. However, steers fed CaO-treated DGS ate 6.6% less (P < 0.01) DM. Because CaO treatment decreased DMI without affecting (P = 0.66) ADG, steers fed CaO treated DGS had a 5% increase (P < 0.01) in G:F. Cattle fed DDGS tended (P = 0.06) to increase DMI; however, this tendency did not equate to a difference (P = 0.56) in G:F. There was an interaction (P < 0.01) of CaO treatment and DGS type on pattern of intake. Treatment with CaO reduced the per-centage of meals consumed from 0 to 3 h postfeeding in cattle fed DDGS; however, there was no effect on cattle fed MDGS. Steers fed MDGS spent less (P = 0.05) time at the bunk and ate smaller (P < 0.01) meals but consumed more (P = 0.01) meals per day when compared to steers fed DDGS. Steers fed CaO treated DGS ate a similar number of meals (P = 0.36) but ate smaller meals (P < 0.01) than steers fed 0% CaO. While CaO treatment increased the ration cost $3.50 per metric ton of DM, improved G:F in steers fed CaO treated DGS resulted in a 6% decrease (P < 0.01) in cost of gain. Furthermore, feeding MDGS reduced (P < 0.01) cost of gain by $0.09 per kg and total feed cost by $25.78. Therefore, this trial supports previous research that suggests feeding MDGS can be advantageous when compared to feeding DDGS and provides new information that treating DGS with CaO can further reduce cost of gain and improve feed efficiency.
Key Words: beef cattle, calcium oxide, distillers grains
067 Rumen measurements in periruminant Holstein bull calves fed a fermentation extract of Aspergillus oryzae. T. T. Yohe*, E. M. Dudash, R. M. Townsley, Y. Roman Garcia, A. R. Gibson, K. M. O’Diam, K. M. Daniels, Department of Animal Sciences, The Ohio State University, Wooster.
Age and diet can affect morphological development of the ru-men, which mainly refers to organ size and papillae charac-

29
teristics. A fermentation extract of Aspergillus oryzae can be used as a direct fed microbial to alter ruminal VFA concentra-tions in mature ruminants. Dietary inclusion of a fermentation extract of A. oryzae on growing calves is not well studied. The objective was to determine effects of age and dietary inclusion of an extract of A. oryzae on morphological development of the rumen. Individual calves (n = 52) were randomly assigned to a slaughter age, 4 wk (n = 16) or 8 wk (n = 36), and treat-ment, control (CON; n = 27) or direct fed microbial (DFM; n = 25). Calves were housed and fed individually; no bedding was used. Liquid DFM was delivered in milk replacer (2 g per d) for the first 4 wk of the trial; solid DFM (2 g per d) was top-dressed on grain thereafter. Calves were fed nonmed-icated milk replacer twice daily (22.0% CP, 20.0% fat DM basis; 680 g/d) and were weaned on consumption of 0.91 kg of texturized grain (20% CP, 2.0% fat) for 3 consecutive days or on d 45 of the study, whichever came first. Calves had ad libitum access to grain and water throughout the trial. Treat-ment and the interaction of treatment and age did not affect full or empty rumen weights. However, full and empty rumen weights at 8 wk (5.29 ± 0.21 and 1.31 ± 0.04 kg, respectively) were greater than 4 wk (1.81 ± 0.30 and 0.52 ± 0.06 kg, re-spectively). At each slaughter point, punch biopsies (2.54 cm internal diameter) were obtained from 4 regions within each rumen (cranial dorsal, cranial ventral, caudal dorsal, and cau-dal ventral). Biopsy samples were weighed and separated into 2 fractions: epithelium and rumen wall. Biopsy results were similar to full and empty rumen weight results, as expected. An age by region effect was noted for both epithelium and rumen wall. Lastly, within the cranial ventral region of the rumen of 8-wk-old calves (4 wk samples not measurable), treatment had no effect on papillae area (6.52 ± 0.39 mm2, CON; 6.65 ± 0.41 mm2 DFM). Results here are perhaps not surprising given that no differences in final BW, DM intake, or gain to feed ratio were observed for these same calves (data in companion abstract). Study of VFA and microbial profiles in these calves may add further information on the use of this DFM in periruminant calf diets.
Key Words: dairy calf, direct fed microbial, rumen development
068 Effect of α-galactosidase and citric acid on nursery pig growth performance. E. K. Pegg*, P. J. Lammers, Illinois State University, Normal.
Soybean meal contains nonstarch polysaccharides, which low-er the feed’s digestibility and can limit inclusion of soybean meal in nursery pig diets. Addition of exogenous enzymes, such as α-galactosidase, may increase nutrient digestibility of corn–soybean meal diets by hydrolyzing bonds between nonstarch polysaccharides that are not usually severed by endogenous enzymes. Addition of an acidifier, such as citric acid, may decrease diet pH thereby increasing α-galactosidase activity. In addition, citric acid may have direct effects on im-
proving growth performance. The purpose of this study was to examine the effect of supplementing nursery diets with α-galactosidase, citric acid, or both. Weaned pigs (29 ± 2 d, 8.5 ± 1.7 kg) were sorted into 20 pens (1.75 × 1.19 m, 6 pigs/pen) in an environmentally controlled nursery at the Illinois State University Farm, Lexington, IL. Pens were balanced for weight (51.5 ± 0.3 kg) and gender (3 barrows and 3 gilts). Corn–soybean meal diets, formulated to meet or exceed NRC requirements, were fed in-phase for 21 d. Alpha-galactosidase (AlphaGalTM 145 Pc, Kerry Inc) was added to selected di-ets at a rate of 0.3 g/kg soybean meal (SBM). Dietary treat-ments were Control (corn–soybean meal), Enzyme (Control + at least 75 ppm α-galactosidase), Citric (control + 5% citric acid), and Dual (Control + at leaset 75 ppm α-galactosidase + 5% citric acid). Feed disappearance and pig BW were mea-sured weekly to calculate pen ADFI, ADG, and G:F. Analy-sis of variance was performed using SAS (SAS Institute Inc., Cary, NC). Means were compared using Tukey’s HSD. Pen was the experimental unit, but results are presented on an indi-vidual pig basis. Pigs fed Citric or Dual diets were more effi-cient (P < 0.05) than pigs fed Enzyme. However, pigs fed En-zyme had significantly higher (P < 0.05) ADFI than pigs fed Citric and Dual diets (767.2 vs. 616.7 and 610.4 g/d) as well as significantly higher (P < 0.05) ADG than pigs fed Con-trol and Citric diets (520.0 vs. 457.6 and 453.7 g/d). Pigs fed enzyme gained weight faster than pigs fed Control or Citric diets but were less efficient than pigs fed Citric or Dual diets. Improving ADG in nursery pigs is generally more beneficial than improving G:F. For improved weight gain and feed in-take, α-galactosidase supplementation of nursery diets should be considered. Inclusion of 5% citric acid does not improve efficacy of α-galactosidase in the aforementioned diets.
Key Words: α-galactosidase, citric acid, nursery pig
069 Fat quality of pigs is altered when 20% DDGS are fed over three industry standard marketing cuts. K. E. Shircliff1,*, Z. D. Callahan1, T. A. Wilmoth1, R. C. Johnson2, B. R. Wiegand1, 1University of Missouri, Columbia, 2Farmland Foods, Denison, IA.
Fat quality is important in meat products as it can influence further processing characteristics and pork export potential. The use of nontraditional fat sources such as dried distillers grain with solubles (DDGS) changes pork fat quality and has created challenges for end users of pork chain products. An experiment was designed to evaluate the effects of DDGS and split marketing cuts in a commercial swine facility on growth performance, fat quality, and the relationship between iodine value (IV) determined by three methods in two fat depots. Pen (n = 40) was the experimental unit with 20 replications per treatment and 22 pigs per pen. Pigs were randomly allotted to dietary treatments in a 2 × 3 factorial arrangement with two levels of DDGS (0 or 20%) and chosen for one of three mar-keting cuts removing 4, 8, and 10 head from each pen. Fat

30
tissue samples were removed from the anterior tip of the jowl and posterior to the sternum on the belly edge 1 d postmortem. Fatty acid composition was determined via the Folch method and IVs were calculated from chemical titrations, fatty acid profile (GC IV), and in-plant Bruker® near infrared (NIR) spectroscopy. Correlations between IV determination meth-ods were calculated. Inclusion of 20% DDGS did not change (P > 0.05) growth performance while marketing cut affected performance with the second cut producing the heaviest and most efficient hogs (P < 0.01). Total SFA and MUFA con-centrations were higher (P < 0.01) in belly and jowl fat from hogs fed 0% DDGS. Total PUFA and the PUFA:SFA in belly and jowl fat was higher (P < 0.01) when 20% DDGS was fed. DDGS inclusion increased IV in belly and jowl fat regardless of IV determination method. Regardless of dietary treatment or fat depot, Pearson Correlation Coefficients between titra-tion and GC IV, titration and NIR, and GC IV and NIR were 0.46 (P < 0.01), 0.68 (P < 0.01), and 0.43 (P < 0.01), respec-tively. These correlations suggest methods may rank samples equally but do not provide the same absolute IV. Belly fat had a lower IV (P < 0.01) compared to jowl fat using titration or GC IV methods suggesting pigs have varied degrees of physi-ological maturity at specific fat depots during the finishing phase. In conclusion, feeding 20% DDGS negatively affected fat quality but not growth performance and marketing time changed growth performance.
Key Words: DDGS, fat quality, iodine value, pork
070 Validation of ME prediction equations and the impact of feeding diets containing corn distillers dried grain with solubles (DDGS) with variable oil content on growth performance of growing–finish-ing pigs. F. Wu1,*, L. J. Johnston2, P. E. Urriola1, A. M. Hilbrands2, G. C. Shurson1, 1Department of Animal Science, University of Minnesota, St. Paul, 2West Cen-tral Research and Outreach Center, University of Min-nesota, Morris.
Previous studies have demonstrated that ether extract (EE) concentration poorly predicts ME content among DDGS sources. Equations to predict ME content in DDGS have been developed and published but not validated. The objective of this experiment was to determine growth performance and
carcass composition responses of growing–finishing pigs fed diets containing DDGS with similar predicted ME concentra-tions but variable concentrations of EE (% as fed basis). Pigs (n = 432) were blocked by initial BW (25.8 ± 0.4 kg) and, within blocks, pens were allotted randomly to 1 of 4 diets (9 pigs/pen, 12 replicates/treatment) in a 4-phase feeding pro-gram. Dietary treatments consisted of 1) corn–soybean meal (CON), 2) 40% low-oil DDGS (5.9% EE; LOW), 3) 40% medium-oil DDGS (9.9% EE; MED), and 4) 40% high-oil DDGS (14.2% EE; HIGH). Diets contained similar standard-ized ileal digestible AA and digestible P within phase, but ME content of CON diets was higher than LOW, MED, and HIGH diets. Data for ADFI, ADG, and G:F were analyzed as repeat-ed measures using MIXED procedure of SAS, with pen and block as random effects and diet as the fixed effect. Overall ADFI of pigs fed CON was greater (P < 0.05) than MED and HIGH but not different from LOW. Overall ADG of pigs fed LOW, MED, and HIGH was not different but lower (P < 0.05) than pigs fed CON. However, pigs fed LOW had reduced (P < 0.05) G:F compared with the other treatments. Pigs fed CON had greater (P < 0.05) HCW, dressing percentage, backfat depth, and loin muscle area than those fed the DDGS diets, but there were no differences among DDGS treatments. No treatment differences were observed for percentage of carcass fat-free lean. In conclusion, DDGS EE content did not affect growth performance and carcass composition of growing–fin-ishing pigs, but the ME prediction equation overestimated ME content of low-oil DDGS based on reduced G:F compared with the medium and high-oil DDGS sources.
Key Words: distillers dried grains with solubles, ME prediction, pigs
071 Effects of dietary calcium and phosphorus on reproductive performance and bone turnover of sows housed in stalls or group. F. P. Tan1, 2,*, A. D. Beaulieu1, 1Prairie Swine Centre Inc., Saskatoon, SK, Canada, 2Department of Animal & Poultry Science, University of Saskatchewan, Saskatoon, SK, Canada.
Weight-bearing exercise combined with adequate calcium (Ca) and phosphorus (P) intake is known to improve bone
Table 070.
CON40% DDGS
SEMLOW MED HIGHP redicted ME in DDGS,
kcal/kg13346 3422 3319
ADFI, kg 2.72a 2.65ab 2.61b 2.60b 0.029ADG, kg 0.97a 0.92b 0.92b 0.93b 0.009G:F 0.368a 0.356b 0.365a 0.367a 0.0031 Predicted ME (kcal/kg, DM basis) = -261 + 1.05 DE– 7.89 CP + 2.47 NDF– 4.99 EE. DE = -2,161 + 1.39 GE– 20.7 NDF– 49.3 EE. GE = 4583 + 50.61 EE– 0.12 × Particle Size.
Table 071. The effect of dietary Ca:P and housing on number of piglets born and growth rate
Stalls (Ca:P%) Group (Ca:P%)0.60: 0.47
0.70: 0.55
0.81: 0.63
0.60: 0.47
0.70: 0.55
0.81: 0.63
Live born n 14ᵃ 14ᵃ 14ᵃ 15ᵇ 15ᵇ 16ᵇTotal born n 15 16 16 16 15 17B irth
weightkg 1.52ᵃ 1.46ᵃ 1.48ᵃ 1.62ᵇ 1.54ᵇ 1.59ᵇ
W eaning weight
kg 6.57 6.56 6.57 6.74 6.60 6.84
ADG1 kg∙d–1 0.22 0.23 0.23 0.24 0.23 0.23
ᵃ,ᵇMeans in the same row with different superscripts differ (P < 0.05)1Average daily gain of piglets from farrowing to weaning

31
strength. The objective of this experiment was to determine if the recommended levels of dietary Ca and P are adequate for group-housed sows that have a potential for increased mobil-ity. A total of 180 multiparous sows and gilts were used to determine the effects of dietary Ca and P on reproductive per-formance and bone turnover when housed in stalls or groups. Treatments, arranged as a 3 × 2 factorial, included main ef-fects of dietary Ca:P—0.70:0.55 (Control), 0.60:0.47 (-15% 1998 NRC), and 0.81:0.63 (+ 15% 1998 NRC)—and housing: stalls or groups (10–14 per group, modified free access). Di-etary treatments began at 4 wk postbreeding (d 0). Sows were fed 2.3 kg∙d–1 from d 0 until 2 wk before farrowing when the allotment was increased to 3.0 kg∙d–1. Serum samples were collected on d 0 and 70 (14 wk gestation), mid lactation, and 1 d before weaning (25 d postfarrowing). No differences were seen in total number of piglets born, ADG from birth to wean-ing, or weaning weight (P > 0.05). The number of piglets born live and birth weight were unaffected by diet (P > 0.05) but improved in group housing (P < 0.03). In late gestation, group-housed sows fed the low Ca diet had reduced serum Ca (diet by housing; P < 0.02) while lower serum P levels were seen in group compared to stall-housed sows, regardless of diet (P < 0.03). Osteocalcin (OC) and pyridinoline (PYD) markers of bone formation and resorption, respectively, were unaffected by diet or housing (P > 0.05). Results from this study suggest that the recommended level of dietary Ca and P as prescribed by NRC 1998 and thus for NRC 2012 is ad-equate for high-producing sows of modern genetics, whether housed in stalls or groups.
Key Words: calcium, gestation, group housing
072 Assessing the interaction of stocking density and di-etary energy concentration on finishing pig perfor-mance. G. N. Rozeboom1, 2,*, D. Gillis2, D. Beaulieu2, 1University of Saskatchewan, Saskatoon, SK, Canada, 2Prairie Swine Centre Inc., Saskatoon, SK, Canada.
The objective of this study was to determine if the dietary en-ergy that maximizes performance is dependent on stocking density. A total of 932 pigs (PIC Camborough Plus × 327) were used within three replications of 18 trt. Treatments ar-ranged as a 2 × 3 × 3 factorial included gender (barrows and gilts), dietary energy (2.15, 2.3, and 2.45 Mcal NE/kg), and stocking density (14, 17, or 20 pigs/pen providing 0.92, 0.76, and 0.65 m2 per pig, respectively). Pigs were randomized to pens within gender and pens were balanced for initial BW (75 kg/pig). Wheat and barley based diets were formulated to meet or exceed the pigs’ nutrient requirements (NRC 2012) and were fed in three phases within gender for each energy concentration. Dietary energy was varied using tallow and oat hulls. The SID lysine/NE ratios were constant within each phase and energy concentration. Pigs were weighed weekly, feed was weighed daily, and pigs were marketed at 120 kg BW. Overall, as the dietary energy increased from 2.15 to 2.45
Mcal NE/kg, feed intake decreased from 3.98 to 3.69 kg/d, ADG increased from 1.20 to 1.26 kg/d, G:F improved from 0.31 to 0.34, and caloric intake increased from 8.50 to 9.11 Mcal NE/d (P < 0.05). Increasing stocking density from 14 to 20 pigs/pen decreased ADG (1.25 to 1.20 kg/d), ADFI (3.98 to 3.69 kg/d), and caloric intake (9.11 to 8.50 Mcal NE/d) (P < 0.05). There was no effect of dietary energy concentration or stocking density on caloric efficiency (Mcal NE/kg gained; P > 0.05). The improvement in ADG with increasing dietary energy was greater for barrows (dietary energy by gender; P < 0.05). The dietary energy concentration that maximized growth was not affected by stocking density (stocking density by dietary energy; P > 0.05). In conclusion, the performance of growing finishing pigs was improved by increasing the di-etary energy and decreasing stocking density, but an interac-tion was not observed.
Key Words: dietary energy, stocking density, swine
GRADUATE STUDENT ORAL COMPETITION: MASTER ORAL II
073 Translactational analgesia technology for the improvement of swine welfare during castration and tail docking. J. L. Bates1,*, L. A. Karriker1, J. F. Coetzee2, M. L. Stock3, K. M. Pertzborn1, L. G. Baldwin1, 1Swine Medicine Education Center, Iowa State University College of Veterinary Medicine, Ames, 2Pharmacology Analytical Support Team, Iowa State University College of Veterinary Medicine, Ames, 3Iowa State University College of Veterinary Medicine, Department of Veterinary Diagnostic and Production Animal Medicine, Ames.
Oral meloxicam was administered to sows postfarrowing to in-vestigate a novel route of providing analgesia to processed pig-lets via translactational transfer. Physiologic indicators of piglet pain were analyzed to determine the effects on pain control.
Ten sows were selected, based on farrowing date, to receive either meloxicam (30 mg/kg) or equivalent volume of whey protein placebo in their daily feedings starting 4 d postfarrowing and continuing for 3 consecutive days. Blood and milk samples were taken from the sows at 12-h intervals beginning directly before feeding through the end of the study. On d 5 postfarrowing, three boars and three gilts from each litter were castrated or sham castrated, tail docked, and given an iron injection. Piglet blood samples were collected im-mediately before processing and then at predetermined times over an 84-h period until the end of the study. Additionally, infrared thermography (IRT) images were captured at each piglet blood collection point. Eight days postfarrowing, tissue samples were collected at necropsy from sows and piglets.
Piglet plasma from each litter was tested to confirm the
32
presence of meloxicam using a validated HPLC-MS tech-nique. Meloxicam was found in all of the litters in the treat-ment group (mean ± SEM: 285 ± 61 ng/mL). Levels reached concentrations known to be effective in equine (EC50) in 4 of the 5 treatment litters (Fig. 1).This value was extrapolated because the level in swine in currently unknown.
No adverse clinical effects were noted in meloxicam-treated sows and piglets. On histopathology, subacute gastri-tis was noted in 2/5 meloxicam treated sows. Similar lesions and gross button ulcers were seen in 10/11 of those same sows’ piglets.
IRT demonstrated significant differences in cranial tem-perature between treatment and control piglets (P < 0.0001). There was a time × treatment interaction for percent change in piglet serum cortisol (P < 0.0001). Meloxicam treated piglets had lower cortisol change at 1 h postcastration those treated with whey (P < 0.0001). Measurement of Substance P indicated no difference between control and meloxicam treated groups (P = 0.8685).
This study demonstrates the successful transfer of meloxicam in sow’s milk and description of physiologic pain indicators. It provides the foundation for future research into refining a novel, efficacious, and practically administered an-algesia method.
Key Words: castration, lactation, welfare
074 Surface enlargement factor of rumen papillae and expression of genes involved in dermatological diseases and their relationships with feed intake in beef steers. R. J. Kern1,*, A. K. Lindholm-Perry2, H. C. Freetly2, W. M. Snelling2, J. R. Miles2, P. A. Ludden1, 1University of Wyoming, Laramie, 2USDA, ARS, US MARC, Clay Center, NE.
Feed costs make up the largest portion of the total cost to pro-duce beef. One way to reduce this cost, thereby increasing profitability of beef production, is to improve feed efficiency. The rumen is responsible for digestion and absorption of nutri-ents and microbial byproducts and may play a significant role in feed efficiency of beef cattle. The objectives of this study were to determine if variation in rumen papillae morphology and dispersion plays a role in feed efficiency of beef steers and to identify candidate genes for genetic markers of feed ef-ficiency traits. Feed efficiency phenotypes were collected on a cross-bred population of steers. Steers were divided into four groups (2 × 2 factorial): high intake and high gain, low intake and low gain, high intake and low gain, and low intake and high gain. Four of the most extreme steers from each group were selected for harvest (n = 16). Rumen wall samples were taken from three locations in the rumen. Length and width were measured on 30 papillae from each sample site using digital calipers, and papillae density was counted for one square centimeter of each sample. Surface enlargement fac-tor was also calculated for each rumen sample site and was
found to vary with feed intake (P = 0.04). Length, width, and density were not found to vary with feed efficiency traits (P > 0.12). RNA was extracted from papillae from the caudal ventral sac, and transcripts were sequenced to assess gene ex-pression. Sequences were aligned to the annotated reference genome. Eight genes were differentially expressed between high and low gain and fifteen between high and low intake (false discovery rate < 0.05). Genes identified were validated against either or both expression values or expression patterns identified by association using quantitative real-time PCR (P < 0.1). One gene associated with gain and nine genes asso-ciated with feed intake validated. Pathway analysis of genes associated with feed intake revealed a pathway related to der-matological diseases, conditions, and inflammation. Several genes (CYP1A2, MYL1, KLK10, and KLK12) were previously associated with either feed efficiency traits or important rumi-nal functions. These data indicate that there is a relationship between the surface enlargement factor and feed intake and that genes involved in epithelial disease and inflammation in rumen papillae are differentially expressed in animals with extreme feed intake phenotypes.
Key Words: feed efficiency RNA-Seq
075 The effect of cross-fostering on PRRS transmission and litter performance. B. Mason1,*, A. E. DeDecker2, J. L. Seate3, M. F. Billing3, 1University of Illinois, Champaign, 2Murphy-Brown LLC, Rose Hill, NC, 3Murphy Brown LLC, Rose Hill, NC.
Cross-fostering is used in swine production to improve growth performance and reduce mortality; however, it is unknown how much cross-fostering transfers PRRS. Therefore, the ob-jective of this trial was to determine the effects of cross-fos-tering programs on transmission of PRRS, piglet growth, and prewean mortality (PWM). On a commercial sow herd, 235 multiparous (1–5) sows, 10 wk post-LVI from an acute PRRS break, were used. Four cross-fostering treatments were ap-plied before farrowing: A) no movement of piglets, B) move-ment at 24 h, C) movement at 5 d, and D) movement at 10 d. Litters were assigned a treatment at birth and randomized throughout the room and the litter received no new piglets. Corresponding to treatment, the 4 heaviest pigs were moved (excluding treatment A). Litters that received the fostered pigs
Table 075. Effect of cross-fostering programs on PRRS transmission
ValuesCross-foster treatment
SE P-valueNone 24 h 5 d 10 dPigs blood tested 454 503 488 479PRRS positive at birth, % 0.1 0.8 0.8 0.1 0.400 0.9999PRRS positive at wean, % 4.3b 3.2b 2.2b 8.9a 0.800 < 0.001I ncreased PRRS positive*, %
4.2b 2.4b,c 1.4c 8.8a 1.000 < 0.001
a–c within a row differ indicate P < 0.05*The mean represented as “Increased PRRS Positive” was generated by (PRRS posi-tive at weaning– PRRS positive at birth = Increased PRRS positive)
33
farrowed on the same day, same room, and same treatment. Eight tagged pigs/litter were tested for PRRS by PCR at birth and weaning. Litter birth and wean weights were recorded. Performance data were analyzed using Proc GLM by SPSS with litter as the experimental unit and PRRS transmission data was analyzed using Proc GLIMMIX in SAS with piglet as the experimental unit. Cross-fostering pigs at 10 d of age produced an elevation in the prevalence of PRRS, with an in-crease of 8.8% in positive pigs at weaning (P < 0.01). Other treatments showed no significant difference in PRRS trans-mission (P > 0.10; Table 1). There was no difference between treatments in ADG and PWM (P > 0.10). Cross-fostering at 10 d of age at 10 wk following LVI enhanced the spread of PRRS. Results confirm restricted cross-fostering programs should be implemented to reduce PRRS transmission even after 10 wk post-PRRS intervention.
Key Words: cross-fostering, prewean mortality, PRRS transmission
076 Effect of feeding ractopamine hydrochloride (Optaflexx) with or without supplemental zinc and chromium propionate on growth performance, carcass characteristics, and LM quality of finish-ing steers. B. M. Bohrer1,*, B. M. Edenburn2, S. C. Loerch3, D. D. Boler1, A. C. Dilger2, T. L. Felix2, 1The Ohio State University, Columbus, 2University of Illi-nois at Urbana-Champaign, Urbana, 3The Ohio State University, Wooster.
Objectives of this study were to determine the effects of feeding ractopamine hydrochloride (Optaflexx; Elanco Animal Health) with or without supplemental Zn-propionate and Cr-propionate (Kemin Industries Inc.) to finishing steers on growth perfor-mance, carcass characteristics, and LM quality. Angus-cross steers (n = 142; BW = 527 ± 6 kg) were blocked by BW into 4 blocks (6 pens/block, 5 to 6 head/pen). Steers were randomly assigned to 1 of 3 dietary supplements for the final 35 d before slaughter, targeted at an average of 0.9 cm 12th rib backfat, by block, via ultrasound: 1) no supplementation (CONT), 2) 300 mg ractopamine hydrochloride steer–1·d-1 (RAC), or 3) 300 mg ractopamine hydrochloride, 1.0 g Zn-propionate, and 3 mg Cr-propionate steer–1·d-1 (RAC+TM). All steers were fed a similar basal diet of 20% corn silage, 20% dried distillers grains, 50% corn, and 10% mineral/vitamin supplement (DM basis). Data were analyzed as a randomized complete block design with a fixed effect of treatment and a random effect of block. There were no differences (P ³ 0.09) between steers fed RAC when compared to steers fed RAC+TM; therefore, data are presented as the contrast of steers fed the average of these 2 treatments versus CONT. Steers fed RAC and RAC+TM had 15% greater (P < 0.01) ADG and G:F compared to steers fed CONT. Dry matter intake did not differ (P = 0.89) between steers fed RAC and RAC+TM compared to steers fed CONT. Carcasses from steers fed RAC and RAC+TM were 6.23 kg
heavier (P = 0.02) than carcasses from steers fed CONT. Fur-thermore, 12th rib fat thickness was 0.13 cm greater (P = 0.03) and calculated yield grade was 0.18 units greater (P = 0.04) for steers fed RAC and RAC+TM than for steers fed CONT. Warner-Bratzler shear force was 0.39 kg greater (tougher; P = 0.01) for steers fed RAC and RAC+TM when compared with steers fed CONT. However, loin quality, as measured by pH, color, and moisture composition, did not differ (P ³ 0.19) when steers fed RAC and RAC+TM were compared to steers fed CONT. While steers fed RAC had improved feed efficien-cy, ADG, and HCW in this study, feedlot growth performance and carcass characteristics were not further improved by ad-ditional supplemental dietary zinc and chromium.
Key Words: chromium, ractopamine, zinc
077 Influence of early gestational nutrient restriction on vascularity of beef cow placentomes. B. Mord-horst1,*, L. E. Camacho1, C. O. Lemley2, D. A. Red-mer1, K. A. Vonnahme1, 1North Dakota State Univer-sity, Fargo, 2Mississippi State University, Mississippi State.
Previously we demonstrated that cows nutrient restricted from d 30 to 85 had greater placentome mass and a tendency for larg-er fetuses in comparison with adequately fed cows; however, umbilical blood flows were similar between treatments. We hy-pothesized that nutrient restriction would enhance placentome vascularity in cows compared to control. To examine the ef-fects of maternal nutrient restriction on cotyledonary (COT) and caruncular (CAR) capillary vascularity during early gestation, multiparous beef cows were randomly assigned to either 100% (CON; n = 6) or 60% NRC requirements (RES; n = 6) from d 30 to 85 of gestation. At d 85, placentomes were fixed in formalin, embedded with paraffin, cut at 5 µm, and stained for platelet endothelial cell adhesion molecule-1, rhodamine labeled lectin, and DAPI. Photomicrographs were taken with a Zeiss Imager M2 epifluorescent upright microscope with Axiovision 4.8 soft-ware. Vascularity measurements were taken using Image Pro Plus Premier software and means were separated using GLM procedure of SAS for effect of maternal diet (RES vs. CON) as well as effect of tissue (CAR vs. COT). While maternal diet did not impact the area of COT and CAR tissues, there was more (P < 0.01) COT vs. CAR tissue per placentome section analyzed (47.26 vs. 13.72 ± 0.57 of 60.99 cm2 total). Maternal diet did not impact (P > 0.24) any measure of CAR capillary develop-ment. In COT, capillary size was greater (P = 0.04) in CON vs. RES (136.21 vs. 82.98 ± 16.21 µm). Moreover, capillary surface density, a measurement of potential nutrient exchange, tended to be greater (P = 0.08) in CON vs. RES cows (0.014 vs. 0.011 ± 0.001 µm). Capillary number and surface densities were greater (P < 0.01) in CAR vs. COT (669.45 vs. 271.24 ± 58.53 and 0.021 vs. 0.012 ± 0.002 µm, respectively) whereas capillary size was smaller in CAR vs. COT (55.58 vs. 109.60 ± 10.43 µm). We reject our hypothesis that vascularity was enhanced in the

34
RES cows. Perhaps the overall increased placental surface area negated the stimulus to enhance angiogenesis. This may help explain why umbilical blood flow was similar between RES and CON fetuses on d 85 of gestation. Funded by USDA grant num-ber 2009–65203–05812.
Key Words: gestation, placentome, vascularity
078 Effects of dietary melatonin supplementation dur-ing late gestation on uterine artery hemodynamics in Holstein heifers. K. E. Brockus*, C. G. Hart, L. J. Grossner, S. H. Ward, J. E. Larson, C. O. Lemley, Mis-sissippi State University, Mississippi State.
The objective was to examine the effects of melatonin supple-mentation during late gestation on uterine artery hemodynam-ics in Holstein heifers. Before d 170 of pregnancy, heifers were trained to acquire feed from the Calan feeding system. On d 190 of gestation, heifers (n = 20) were blocked by BW and then randomly assigned to one of two dietary treatments: 1) 20 mg of dietary melatonin per day (MEL) or 2) no melato-nin supplementation (CON). At 0800 h, MEL heifers received 0.7 kg of grain top dressed with 2 mL of 10 mg/mL melato-nin in ethanol while CON heifers received 0.7 kg of grain top dressed with 2 mL of ethanol alone. A TMR was provided after grain consumption. Supplementation ceased on d 262 of gestation for both treatment groups. Uterine artery hemody-namics, contralateral and ipsilateral to the conceptus, were ob-tained on d 180 (baseline), 210, 240, and 262 of gestation via Doppler ultrasonography and included resistance index (RI), pulsatility index (PI), and blood flow (BF). Dependent vari-ables were analyzed using repeated-measures ANOVA of the mixed procedure of SAS with the model statement containing dietary treatment, gestational day, and their respective interac-tion. Main effects of dietary treatment or gestational day are discussed in the absence of significant (P < 0.05) treatment × day interactions. Contralateral RI (P = 0.43), PI (P = 0.29), and BF (P = 0.74) were not different between dietary treat-ments. Contralateral RI (P = 0.11) and PI (P = 0.09) were not different among gestational days; however, contralateral BF increased (P < 0.001) from d 180 to d 240 of gestation. Ipsilat-eral RI (P = 0.18) and PI (P = 0.25) were not different between dietary treatments; however, ipsilateral BF was increased (P = 0.01) in MEL vs. CON. Ipsilateral RI (P = 0.04) and PI (P < 0.01) decreased while BF (P < 0.001) increased as gestation proceeded. Total uterine artery BF (summation of ipsilateral and contralateral) was increased (P < 0.01) in MEL vs. CON. Maternal heart rate was increased (P = 0.04) in MEL vs. CON while maternal mean arterial pressure was not different (P > 0.06). In conclusion, dietary melatonin supplementation dur-ing late gestation increased uterine artery BF. Therefore, mel-atonin could be used to potentially increase uterine BF during a compromised pregnancy.
Key Words: melatonin, pregnancy, uterine blood flow
079 Yield, forage nutritive value, and preference of spring planted annual grasses under horse grazing. A. M. Grev*, K. L. Martinson, C. C. Sheaffer, Univer-sity of Minnesota, Saint Paul.
Spring-planted annual grasses can serve as emergency forage but have yet to be evaluated under horse grazing. The objec-tives of this study were to evaluate annual grasses for yield, forage nutritive value, and preference under horse grazing. On May 8, 2013, winter wheat, annual ryegrass, barley, spring wheat, and oat were planted at 101, 39, 95, 135, and 90 kg/ha, respectively, in a completely randomized block design with eight replicates. Plot size was 1.8 by 6.7 m. Yield and forage nutritive value was determined by hand harvesting duplicate 51 cm2 areas to an 8 cm height. Three adult horses grazed four replicates at a time for 4 h on June 18 (onset of stem elongation) and June 25, 2013 (boot stage). Horse preference was determined by visually assessing percentage of forage re-moval on a scale of 0 (no grazing activity) to 100 (100% of vegetation grazed). After grazing was completed, manure was removed and all plots were mowed to an 8 cm height. Time was allowed for regrowth and grazing was repeated when forages reached onset of stem elongation and boot stage on July 9 and July 11, 2013, respectively. Yield is presented as the sum of both grazing events. Oat and spring wheat yielded the highest with ³ 3.91 t ha-1 while winter wheat yielded the least at 1.91 t ha-1 (P < 0.001). Only the preference of spring wheat was affected by plant maturity with less mature forage resulting in greater horse preference (P < 0.001). On aver-age, winter wheat was the most preferred grass with a visual removal of 93% while oat was least preferred with a visual removal of 22%. Maturity did not affect ADF content. Spring wheat had the highest amount of ADF at 32% while winter wheat was lowest at 25% (P < 0.001). Maturity affected the CP content of all species with less mature forage resulting in greater amounts of CP (P < 0.001). On average, winter wheat had the greatest amount of CP at 24% while oat was lowest at 16%. With the exception of barley, NSC content was not affected by maturity (P < 0.001). On average, annual ryegrass had the greatest amount of NSC at 18% while spring wheat had the least at 11%. Spring wheat grazed at the onset of stem elongation appears to present a viable option for horse owners in need of emergency pasture forage.
Key Words: forage, grazing, horse
080 Effect of maternal nutrition and regrouping on lamb behavior. N. Chapel*, M. Orr, S. Wagner, North Dakota State University, Fargo.
A study was performed to measure the effects of uterine en-vironment during gestation on regrouping on lamb behavior. Healthy twin and singleton lambs born to dams that received either a control (CON; n = 9) diet meeting NRC requirements or restricted (RES; n = 19) diet at 60% of NRC requirements.
35
Lambs were removed from dams and placed into 5 group pens. At 38 ± 7 d of age, the lambs were blocked by treatment and randomly regrouped into new pens. Lamb behavior was recorded using a digital camera for 30 h across 3 d. Each pen contained a raised platform (61 by 122 cm). Using the digital recordings, individual lamb behaviors were evaluated every 3 min and recorded. Lambs spent more time ingesting creep feed on d 3 than on d 2 (P = 0.02) or d 1 (P = 0.03). Lambs spent more time lying alone at the end of the observation pe-riod than in the beginning (P < 0.01). A treatment × day effect was present for time spent interacting with other lambs; those born to the RES dams decreased more in time spent interact-ing with other lambs than those lambs born to CON dams from d 1 to d 2 (P < 0.01) and from d 1 to d 3 (P = 0.01). All lambs significantly decreased the amount of time spent interacting with other lambs throughout the study (P < 0.01). Restricted lambs spent more time lying alone when compared to those born to CON. Although amount of time spent inter-acting with the platform decreased with time for all lambs (P < 0.01), the proportion of time spent alone while interacting with the platform increased (P < 0.01). In summary, creep feed intake and time spent alone increased in all lambs over time. Time spent alone was greater in lambs born to RES ewes than in those born to CON ewes. Adaptation over time after the stress of social regrouping was associated with increased feed intake, decreased time spent interacting with other lambs, and increased time spent lying alone. Lambs born to under-nourished ewes spent more time alone and decreased time spent interacting with other lambs more quickly than lambs born to adequately fed ewes. The uterine environment during gestation may affect the ways that lambs interact with each other and their environment.
Key Words: behavior, lamb, undernourishment
081 Small intestinal morphological integrity in horses suffering from pituitary pars intermedia dysfunc-tion. J. L. De Vries1,*, H. C. Schott II1, J. Lubitz1, D. Chamberlin1, L. A. Huber2, N. L. Trottier1, 1Michigan State University, East Lansing, 2University of Guelph, Guelph, ON, Canada.
The hypothesis of this study was that the morphological integ-rity of the small intestine is reduced in horses affected with pi-tuitary pars intermedia dysfunction (PPID) compared to non-PPID horses of similar age. The objective was to determine the morphological integrity of the proximal, mid, and distal small intestinal mucosa in PPID and non-PPID horses of simi-lar age. Fifteen horses, 11 PPID and 4 non-PPID (control), were donated for this study. Horses were of multiple breeds and genders (mare and gelding) across groups and were es-timated to be over 25 yr of age. Horses were fed second cut-ting grass hay and senior feed at 1.8 and 0.5% of their BW, respectively, and monitored for medical stability for a period of 5 d before being subjected to an overnight dexamethasone
suppression test (DST) to confirm the presence and assess the severity of the PPID condition. Horses were euthanized, the entire gastrointestinal tract was removed, and tissue samples were collected from the duodenum at 25 and 50 cm distal to the pyloric sphincter, the mid jejunum and the ileum. Samples were prepared for histological visualization and morphomet-ric analysis of the intestinal mucosa. Histological visualiza-tion of the intestinal mucosa was performed at 20× magni-fication and measurements of mucosal structures completed using a microscope imaging software at 10× magnification. For each segment, a minimum of 10 villi and associated crypts were measured for height, width, and crypt depth, respective-ly. Compared to control, villus height of PPID was lower in the 25 cm duodenum (P = 0.046) and tended to be lower in the 50 cm duodenum (P = 0.153) and mid jejunum (P = 0.179). Villus height did not differ between treatments in the ileum. Villus crypt depth did not differ between PPID and control in the 25 cm duodenum and ileum and was greater in the mid je-junum (P = 0.027) and tended to be greater in the 50 cm duo-denum (P = 0.092) in PPID compared to control. Villus width did not differ between PPID and control across any segment. In conclusion, the small intestinal integrity of PPID horses is reduced compared to non-PPID horses of similar age, with a more pronounced effect in the proximal versus distal region of the small intestine.
Key Words: horse, intestinal morphology, pituitary pars intermedia dysfunction
082 PRRSv reduces feed efficiency and tissue accretion rates in grow–finisher pigs. W. P. Schweer1,*, J. F. Patience1, L. A. Karriker2, J. C. Sparks3, G. G. Gourley4, M. FitzSimmons5, K. Schwartz6, T. E. Burkey7, N. K. Gabler1, 1Iowa State University, Ames, 2Swine Medicine Education Center, Iowa State University College of Veterinary Medicine, Ames, 3Choice Genetics, Alden, IA, 4Swine Graphics Enterprises, Webster City, IA, 5MAF Veterinary Services, Mapleton, MN, 6Veterinary Diagnostic & Production Animal Medicine, Iowa State University College of Veterinary Medicine, Ames, 7University of Nebraska, Lincoln.
Porcine reproductive and respiratory syndrome virus (PRRSv) is a major swine virus that causes reproductive impairment in sows as well as respiratory disease, reduction in growth rates, and increased mortality in all ages of pigs. The objective of this study was to quantify the impact of PRRSv on grow–finisher pig feed efficiency and tissue accretion rates. Thirty PRRSv naïve, littermate pairs of maternal line Choice Genet-ics gilts (33 ± 3 kg BW) were selected and pairs split across two barns consisting of five pens (n = 6 pigs/pen/barn). Pigs in both barns were fed typical Midwest corn–soybean–DDGS diets. All pigs had ad libitum feed and free access to water. One barn was inoculated (CHAL) via an I.M. injection of a
36
live PRRSv strain isolated from the region (0 d postinocula-tion [dpi]) while pigs in the other barn were given a saline control injection (CONT). Pig performance (ADG, ADFI, and G:F) in both barns was assessed over an 80 dpi period. Ad-ditionally, longitudinal body composition was assessed using dual-energy X-ray absorptiometry on d -1 and 80 dpi, and lean, protein, fat, and bone accretion rates calculated. Sero-logical data showed that the CHAL pigs PRRSv titers peaked 7 dpi and these pigs seroconverted by 35 dpi. According to both genomic and protein PRRSv titers, CONT pigs were na-ïve to PRRSv throughout the study. Compared to the CONT, CHAL pigs had decreased ADG (0.72 vs. 0.90 kg/d; P < 0.001), ADFI (1.85 vs. 1.98 kg/d; P < 0.001), and GF (0.39 vs. 0.46 kg/d; P < 0.001) over the 80-d test period. Further-more, CHAL pigs had attenuated whole body lean (547 vs. 633 g/d; P = 0.001), protein (109 vs. 126 g/d; P = 0.001), and fat (169 vs. 205 g/d; P = 0.001) accretion rates compared to their CONT counterparts. The data clearly demonstrate that PRRSv infection reduces feed efficiency and protein accretion rates in grow–finisher pigs. We estimate this to cost produc-ers $6 to $12 per head depending on management style. Sup-ported by the National Pork Board #12–162.
Key Words: PRRSv, tissue accretion
GRADUATE STUDENT ORAL COMPETITION: PhD ORAL I
083 Effects of microbial phytase on apparent and standardized total tract digestibility of calcium in calcium supplements fed to growing pigs. J. C. Gonzalez-Vega1,*, C. L. Walk2, H. H. Stein1, 1University of Illinois at Urbana-Champaign, Urbana, 2AB Vista Feed Ingredients, Marlborough, United Kingdom.
An experiment was conducted to determine the apparent total tract digestibility (ATTD) and standardized total tract digest-ibility (STTD) of Ca in different Ca supplements and the ef-fect of microbial phytase on the ATTD and STTD of Ca. One hundred four growing barrows (initial BW: 17.73 ± 2.53 kg) were allotted to a randomized complete block design with a 2 × 6 factorial arrangement. There were 13 dietary treatments and 8 replicate pigs per treatment. A basal diet containing corn, cornstarch, potato protein isolate, soybean oil, calcium carbonate, monosodium phosphate, vitamins, and minerals was formulated to contain 0.33% Ca. Five additional diets were similar to the basal diet, but monocalcium phosphate (MCP), dicalcium phosphate (DCP), calcium carbonate, Vis-tacal, or Limex were included in each diet at the expense of cornstarch to increase the concentration of Ca by 0.3 to 0.4% units. Six additional diets were similar to the previous 6 diets with the exception that they also contained 500 units per ki-
logram of microbial phytase. To determine basal endogenous losses of Ca, a Ca-free diet was used. Feces were collected using the marker-to-marker approach. Results indicated that regardless of inclusion of microbial phytase, the greatest (P < 0.05) ATTD of Ca was observed in MCP diets and the great-est (P < 0.05) STTD of Ca was observed in basal and MCP diets. The DCP diets had greater (P < 0.05) ATTD and STTD of Ca than calcium carbonate, Vistacal, or Limex diets, but no differences were observed among the ATTD and STTD of Ca in calcium carbonate, Vistacal, or Limex diets. Inclusion of microbial phytase increased (P < 0.001) the ATTD and STTD of Ca in the calcium carbonate diet only. Regardless of Ca source, inclusion of microbial phytase increased (P < 0.001) the ATTD of P in all diets. Regardless of phytase inclusion, the ATTD of P was greater (P < 0.05) by pigs fed basal, MCP, or DCP diets than by pigs fed calcium carbonate, Vistacal, or Limex diets. Pigs fed calcium carbonate had greater (P < 0.05) ATTD of P than pigs fed Vistacal or Limex diets. In con-clusion, diets supplemented with MCP had the greatest ATTD and STTD of Ca followed by DCP diets. Inclusion of micro-bial phytase in the diets increased the ATTD and STTD of Ca only if calcium carbonate was used.
Key Words: apparent digestibility, calcium supplements, standardized digestibility
084 Effects of dietary soybean meal concentration on growth performance and immune response of pigs during a porcine reproductive and respiratory syn-drome virus challenge. S. J. Rochell1,*, L. S. Alexan-der1, R. D. Boyd2, W. G. Van Alstine3, J. Pettigrew1, R. N. Dilger1, 1University of Illinois, Urbana, 2The Hanor Company, Inc., Franklin, KY, 3Purdue University, West Lafayette, IN.
Soybean meal (SBM) contains naturally occurring isofla-vones that may exert antiviral activity. An experiment was conducted to determine the effects of dietary SBM concentra-tion on the growth performance and immune response of pigs infected with porcine reproductive and respiratory syndrome virus (PRRSV). Four experimental treatments included a 2 × 2 factorial arrangement of 2 dietary SBM concentrations, 17.5 (LSBM) and 29% (HSBM), and 2 PRRSV infection states, uninfected and PRRSV infected. The 2 experimental diets were formulated to be isocaloric and contain similar digestible concentrations of Lys, Met, Trp, Thr, and Val. Total isoflavone contents of the LSBM and HSBM diets were 700 and 1246 mg/kg, respectively. Weanling pigs (32 barrows and 32 gilts, 7.14 ± 0.54 kg) were individually housed in disease contain-ment chambers and provided a common diet for 1 wk before being allotted to 4 treatment groups (n = 16). Pigs were fed experimental diets for 1 wk before receiving either a sham inoculation (sterile PBS) or a 1 × 10⁵ 50% tissue culture in-fective dose of PRRSV at 35 d of age (0 d postinoculation [DPI]). Growth performance was recorded weekly, and rectal

37
temperatures were measured daily beginning on 0 DPI. Blood was collected on 0, 3, 7, and 14 DPI for determination of dif-ferential complete blood cell counts, serum PRRSV load, and haptoglobin and cytokine concentrations. Infection with PRRSV increased (P < 0.01) rectal temperatures and sup-pressed (P < 0.01) the growth of pigs from 0 to 14 DPI. In the uninfected group, growth performance of pigs fed LSBM was generally greater than pigs fed HSBM. However, in the PRRSV-infected group, pigs fed HSBM had improved (P < 0.05) ADG compared with pigs fed LSBM from 7 to 14 DPI. Average daily gain of pigs fed LSBM and HSBM from 0 to 14 DPI was 608 and 576 g/d for uninfected pigs and 314 and 374 g/d for PRRSV-infected pigs, respectively. At 14 DPI, PRRSV-infected pigs fed HSBM had higher (P < 0.05) he-matocrit values and a tendency for lower (P = 0.06) serum PRRSV load compared with pigs fed LSBM. Serum haptoglo-bin and tumor necrosis factor-α concentrations were lower (P < 0.05) at 3 and 14 DPI, respectively, in PRRSV-infected pigs fed HSBM than in pigs fed LSBM. In conclusion, increas-ing the dietary SBM concentration modulated the immune response and improved the growth performance of weanling pigs during a PRRSV infection.
Key Words: pig, PRRS, soybean meal
085 Impacts of high nursing intensity on sow perfor-mance during a subsequent lactation. J. Guo1,*, G. Voilque1, Y. Sun1, A. E. DeDecker2, M. T. Coffey2, S. W. Kim1, 1North Carolina State University, Raleigh, 2Murphy-Brown LLC, Rose Hill, NC.
One hundred fifty gilts were used to determine the effects of nursing intensity on performance of sows during the subse-quent lactation. The experiment was based on a 2 × 2 factorial arrangement with varied litter sizes (10 and 13 piglets: L10 and L13) and durations of lactation (21 and 27 d: D21 and D27) in parity 1. Sows rebred successfully were used in parity 2, during which litter size was set to 10 piglets, and all pig-lets were weaned at d 21 of lactation. Sow and litter weights were recorded at farrowing and weaning for both parities. Colostrum (within 24 h of parturition) and milk (at d 17 of lactation) samples were collected. Data were analyzed with General Linear Model procedure in SAS software (SAS Inst. Inc., Cary, NC). In parity 1, litter weight gain of L10 was less
(P < 0.05) than L13 and sows in L10 tended (P = 0.095) to have less BW loss than sows in L13, correspondingly due to difference in litter size. Duration of lactation did not affect (P > 0.10) sow weight loss. The ADFI of sows did not differ (P > 0.10) among treatments for both parities. In parity 2, sow culling rate increased in D21 (35.7%) than D27 (24.4%) and also in L13 (38.9%) than L10 (25.9%) due to conception, heat intolerance, and lameness. Sow weight loss during subsequent lactation was the lowest (P < 0.05) in L13 and D27 (0.69 kg) compared to the other three treatments (7.27, 7.27, and 10.74 kg). Sows in L13 had less (P < 0.05) backfat loss than L10 in parity 2 (0.5 vs. 2.7 mm). Litter weight gain as well as pig weight gain did not differ (P > 0.10) among treatments in par-ity 2. Litter size and the duration of lactation during parity 1 did not affect (P > 0.10) the composition of colostrum and milk in parity 2. Collectively, the performance of sows and lit-ters were not negatively affected by nursing intensity of a pre-vious parity. Interestingly, sows with a high nursing intensity in parity 1 maintained their body condition better than sows with a lower nursing intensity during the subsequent parity.
Key Words: duration of lactation, litter size, nursing intensity, sows
086 Effects of withdrawing high-fiber ingredients before market on finishing pig growth performance, car-cass characteristics, intestinal weights, and carcass fat quality. K. F. Coble1,*, J. M. DeRouchey1, M. D. Tokach1, R. D. Goodband1, S. S. Dritz1, T. A. Houser1, B. Goehring1, M. J. Azain2, 1Kansas State University, Manhattan, 2Rhodes Center for Animal & Dairy Sci-ence, Athens, GA.
A total of 288 pigs (initially 38.4 kg) were used in an 88-d study to determine the timing of high-fiber ingredient removal from the diet before marketing to optimize growth perfor-mance, carcass characteristics (yield), and carcass fatty acid composition. Two diet types were used: 1) corn–soybean meal control diet (9.3% NDF) and 2) high-fiber diet (19% NDF) containing 30% dried distillers grains with solubles (DDGS) and 19% wheat middlings. Pens of pigs were randomly allot-ted to 1 of 6 dietary feeding strategies with 8 pigs per pen and 6 replications per treatment. The 6 strategies consisted of the corn–soy control or high-fiber diet fed throughout or the high-
Table 086.
Item Control
High fiber withdrawal before market, d
Probability, P < Control vs. Duration
20 15 10 5 0 0 withdrawal Linear QuadADG, kg 1.00 0.98 1.00 0.99 0.99 0.99 0.61 0.71 0.65ADFI, kg 2.79 2.85 2.93 2.92 2.95 2.90 0.07 0.33 0.20G:F 0.348 0.340 0.340 0.339 0.336 0.335 0.01 0.29 0.15HCW, kg 92.2 91.1 91.4 91.0 90.7 89.3 0.11 0.29 0.47Yield, % 72.7 72.5 72.5 72.2 72.0 71.1 0.01 0.01 0.03Jowl IV 66.8 72.6 73.3 73.2 73.8 74.5 0.01 0.01 0.651SEM was 0.014, 0.043, 0.003, 1.31, 0.201, and 0.350, respectively.
38
fiber diet fed 20, 15, 10, or 5 d before harvest, after which pigs were switched to the control diet. Diets were not balanced for energy. Overall, pigs continuously fed the high-fiber diet tended (P < 0.07) to have increased ADFI and decreased (P < 0.01) G:F compared to pigs fed the control diet. Withdrawal strategy did not significantly influence growth performance. Carcass yield decreased (P < 0.01) in pigs fed the high-fiber diet compared with those fed the control and increased (qua-dratic; P < 0.03) as days of withdrawal increased. Jowl iodine value (IV) increased (P < 0.01) in pigs fed the high-fiber diet compared with those fed the control and decreased (linear; P < 0.01) as withdraw time increased (due to reduction in DDGS before market). Pigs continuously fed the high-fiber diet had heavier (P < 0.01) full large intestine weight than pigs fed the control. Full large intestine weight decreased (linear; P < 0.02) as withdrawal time increased. In summary, pigs fed the high-fiber diet had decreased G:F and carcass yield and switching pigs to a corn–soy diet restored carcass yield when done for the last 15 to 20 d before harvest.
Key Words: finishing pig, withdrawal, yield
087 Energy values of bermudagrass, forage sorghum, and sweet sorghum to pigs and the use of carbohy-drases to enhance energy utilization. A. A. Passos1,*, C. Andrade1, 2, M. Veal1, C. E. Phillips3, M. T. Coffey3, S. W. Kim1, 1North Carolina State University, Raleigh, 2Sao Paulo State University, Piracicaba, Brazil, 3Mur-phy-Brown LLC, Rose Hill, NC.
This study was to determine DE and ME of ground bermudag-rass, forage sorghum, and sweet sorghum fed to pigs and the supplemental effects of carbohydrases (Allzyme SSF, Alltech, Nicholasville, KY) on energy utilization of these feedstuffs. The study had 4 sets of quadruplicated 2 × 2 Latin square design using 32 barrows (38.7 ± 11.9 kg). Each Latin square consisted of 2 treatments and 2 periods. Each period was 14 d (10 d adjustment and 4 d collection). Particle size was 400 to 600 μm for forages and corn. Basal diet contained 94% corn with 4% amino acids, minerals, and vitamins. Test diets contained 85% BA + 15% Bermuda grass, forage sorghum, or sweet sorghum. For the basal diet and each test diet, carbo-hydrases were supplemented (0 or 200 mg/kg). Pigs received experimental diets twice daily (0700 and 1700 h) at a fixed amount based on BW of pigs (0.09 × BW0.75 kg). On d 10, chromium oxide (0.5%) was added to the evening meal as an external marker to indicate initiation of fecal collection. Fecal and urine samples were collected during 4 consecutive days. Gross energy of feed, urine, and feces was measured using a bomb calorimeter (IKA, Wilmington, NC) to calculate DE and ME. Basal diet contained 3427 kcal DE/kg and 3354 kcal ME/kg, which were not affected by enzyme supplementation. Bermudagrass contained 856 kcal DE/kg and 810 kcal ME/kg, which tended to be increased by enzyme supplementation to 1154 kcal DE/kg (P = 0.099) and 1129 kcal ME/kg (P =
0.081). Forage sorghum contained 1057 kcal DE/kg and 1042 kcal ME/kg, which were not affected by enzyme supplemen-tation. Sweet sorghum contained 1035 kcal DE/kg and 1011 kcal ME/kg, which were not affected by enzyme supplemen-tation. In conclusion, pigs could utilize nutrients in bermu-dagrass, forage sorghum, and sweet sorghum to obtain energy indicating that these feedstuffs could potentially be used in feeding pigs. Use of Allzyme SSF benefited pigs providing more energy from bermudagrass. This study provides energy values for alternative feedstuffs that can be used in a least cost formulation software to feed pigs.
Key Words: bermudagrass, enzyme, forage sorghum, pigs, sweet sorghum
088 Impact of reduced crude protein diets on lactating sow nitrogen utilization and piglet performance. L. A. Huber1,*, C. F. M. de Lange2, U. Krogh3, D. Cham-berlin4, N. L. Trottier4, 1University of Guelph, Guelph, ON, Canada, 2Department of Animal and Poultry Science, University of Guelph, Guelph, ON, Canada, 3Aarhus University, Foulum, Denmark, 4Michigan State University, East Lansing.
Forty lactating multiparous Yorkshire sows were used to de-termine if reducing dietary crude protein (CP) and supple-menting with crystalline amino acids (CAA) increases piglet performance and maternal N utilization during early and peak lactation. Sows were assigned to 1 of 4 diets: 1) 16.0% CP (as-fed; analyzed contents; HCP), 2) 15.7% CP (MHCP), 3) 14.3% CP (MLCP), or 4) 13.2% CP (LCP); diet HCP was for-mulated using soybean meal and corn as the only Lys sources. Across diets standardized ileal digestible (SID) content of Lys was 0.86%, based on analyzed content and estimated SID. Other essential AA were included to exceed requirements. Sow and piglet BW were measured on d 1, 3, 7, 14, 18, and 21 of lactation. Sow N balances were conducted between d 3 and 7 (early) and d 14 and 18 (peak). Milk N output was cal-culated from estimated milk yield and analyzed true protein concentration. Sow BW change and litter ADG did not differ between diets (mean: -248 and 2259 g/d, respectively) nor did sow average daily DM intake (mean: 4.05 and 6.12 kg/d; early and peak lactation, respectively) or fecal N digestibility (mean: 88.6%). Nitrogen intake decreased as dietary CP de-creased (114.3, 106.0, 107.4, and 99.0 ± 5.29 g/d and 169.5, 168.3, 161.2, and 145.1 ± 5.29 g/d for HCP, MHCP, MLCP, and LCP in early and peak lactation, respectively; linear (L) P < 0.05 and quadratic (Q) effects of diet CP content: P > 0.10). In early lactation, N retention (N intake– N excretion with feces and urine) and milk N output were not affected by diet (P > 0.10), and N retained as percentage of N intake tended to increase as dietary CP decreased (L: P = 0.09). In peak lacta-tion, N retention decreased (122.5, 123.8, 121.2, and 109.0 ± 4.88 g/d for HCP, MHCP, MLCP, and LCP, respectively;
39
L: P < 0.05 and Q: P = 0.16), N retained as percentage of in-take tended to increase (L: P = 0.11), and estimated efficiency of using retained N for milk N output increased (51.0, 55.2, 57.1, and 66.3 ± 8.43% for HCP, MHCP, MLCP, and LCP, respectively; L: P < 0.05). Feeding lactating diets reduced in CP from 16.0 to 14.3% with CAA inclusion as partial replace-ment for limiting AA maintains piglet performance and im-proves N utilization efficiency, but at the lowest dietary CP N retention during peak lactation was reduced.
Key Words: amino acid intake, lactating sows, nitrogen retention
089 Dietary peroxidized corn oil reduces growth per-formance of nursery pigs. A. R. Hanson1,*, P. E. Urriola1, L. J. Johnston2, S. Baidoo3, C. Chen1, B. J. Kerr4, G. C. Shurson1, 1University of Minnesota, Saint Paul, 2University of Minnesota, West Central Research and Outreach Center, Morris, 3Southern Research and Outreach Center, University of Minnesota, Waseca, 4USDA- ARS, Ames, IA.
The dietary concentration at which peroxidized lipids impair growth of pigs is unknown. Weaned barrows (n = 128; initial BW = 6.3 ± 0.6 kg) were used to evaluate the effects of increas-ing dietary peroxidized corn oil on growth performance and serum and liver α-tocopherol (α-T) and Se status. Pigs were blocked by initial BW and assigned to 1 of 32 pens (4 pigs/pen). Corn oil was heated for 7 h at 185°C (air flow rate = 12 L/min) to yield oxidized oil (Ox-O; peroxide value = 5.7 mEq O2/kg; thiobarbituric acid reactive substances = 26.7 mg malondialde-hyde Eq/kg). Pens were assigned to 1 of 4 diets containing 9% unheated oil + 0% Ox-O, 6% unheated oil + 3% Ox-O, 3% un-heated oil + 6% Ox-O, or 0% unheated oil + 9% Ox-O. Diets were fed in 3 phases: d 1 to 4, d 5 to 14, and d 15 to 35 post-weaning. Pig BW and pen feed disappearance were determined by phase. Serum was collected on d 0, 14, and 35 from 1 pig per pen that was subsequently harvested to obtain liver and heart tis-sue. Serum and liver samples were analyzed for concentrations of α-T and Se. Data were analyzed with the MIXED procedure of SAS to evaluate linear, quadratic, and cubic effects of Ox-O, with block as a random effect. Serum data were evaluated as repeated measures. Gain:feed declined linearly (P = 0.03) from 0.73 for pigs fed 0% Ox-O to 0.72, 0.70, and 0.71 ± 0.01 for pigs fed 3, 6, and 9% Ox-O, respectively. Pigs fed Ox-O tended to have reduced ADG (377.5, 375.7, 369.4, and 347.0 ± 13.6 g/d for 0, 3, 6, and 9% Ox-O, respectively; P = 0.10), but ADFI was not affected by Ox-O (P > 0.05). In the liver, concentrations of α-T were not affected by increasing Ox-O, but concentrations of Se tended to decline cubically (P = 0.09) with increasing Ox-O. Regardless of sampling day, the concentration of α-T declined cubically (0.80, 0.56, 0.62, and 0.36 ± 0.04 μg/mL for 0, 3, 6, and 9% Ox-O, respectively; P = 0.005), and Se (P = 0.11) tended to decline linearly in serum of pigs fed increasing Ox-O. These results indicate that dietary inclusion of peroxidized corn oil re-
duces growth performance of nursery pigs linearly, with variable effect on α-tocopherol and Se status.
Key Words: antioxidant, nursery pigs, peroxidized corn oil
090 Nutrient digestibility of solvent-extracted B. napus and B. juncea canola meals and their air-classified fractions fed to ileal-cannulated grower pigs. X. Zhou1,*, R. T. Zijlstra1, E. Beltranena1, 2, 1University of Alberta, Edmonton, AB, Canada, 2Alberta Agriculture and Rural Development, Edmonton, AB, Canada.
Energy and nutrient digestibility of solvent-extracted canola meal (CM) is limited in pigs by its relatively high fiber content. The fiber-rich seed hull is denser than the oil-free cotyledons. By using streams of air, air classification partially separates these seed components based on their different density and size to produce a low-fiber, light-particle fraction and a high-fiber, heavy-particle fraction. Compared with parent CM, ADF and NDF were reduced by 31.9 and 29.5% in the light-particle fraction and enriched by 16.5 and 9.0% in the heavy-particle fraction, respectively (DM basis). Mean particle size of parent CM and light- and heavy-particle fraction was 638, 18.9, and 76.1 µm, respectively. To determine the nutrient digestibility of CM and their air-classified fractions, Brassica napus and B. juncea CM and their 2 air-classified fractions were evaluated in a 2 × 3 factorial arrangement together with a basal diet and an N-free diet. The experiment was conducted as an 8 × 8 Lat-in square feeding diets containing 40% B. napus or B. juncea CM or their air-classified fractions and 60% basal diet. The N-free diet served to subtract basal endogenous AA losses. Eight ileal-cannulated barrows (32 kg) were fed the 8 diets at 2.7 × maintenance DE for eight 11-d periods. Feces and ileal digesta were collected sequentially for 2 d each at the end of each period. The apparent total tract digestibility (ATTD) of GE and predicted NE value was 7.8 and 10.0% greater (P < 0.001) for B. juncea than B. napus CM (8.0 MJ/kg NE), 5.3 and 10.8% greater (P < 0.001) for the light-particle fraction than parent CM (8.3 MJ/kg NE), and 3.8 and 7.2% lower (P < 0.001) for the heavy-particle fraction than parent CM, respec-tively. The standardized ileal digestibility (SID) of His, Ile, Val, Asp, and Tyr were greater (P < 0.05) for B. juncea than B. napus CM. The SID of Trp, Glu, Pro, and Tyr were greater (P < 0.05) in light-particle fraction than parent CM. The SID of Arg and Lys was lower (P < 0.05) in heavy-particle frac-tion than parent CM. In conclusion, B. juncea CM had greater dietary energy and AA digestibility than B. napus CM due to the reduced fiber content. Air classification of CM increased its dietary energy and AA digestibility in pigs due to reduced fiber content and decreased particle size.
Key Words: air classification, canola meal, digestibility, pig

40
091 Optimum sulfur amino acid to lysine ratio for weaner pigs infected with enterotoxigenic E. coli. M. M. Capozzalo1,*, J. W. Resink2, J. K. Htoo3, J. C. Kim4, C. F. M. de Lange5, C. F. Hansen6, B. Mullan4, J. Pluske1, 1Murdoch University, Western Australia, Australia, 2Nutreco, Boxmeer, Netherlands, 3Evonik Industries AG, Hanau-Wolfgang, Germany, 4Department of Agriculture and Food, Western Australia, Australia, 5Department of Animal and Poultry Science, University of Guelph, Guelph, ON, Canada, 6Department of Large Animal Sciences, University of Copenhagen, Copenhagen, Denmark.
This experiment tested the hypothesis that pigs challenged with an enterotoxigenic strain of E. coli (ETEC) have higher requirements for sulfur amino acids (SAA). Pigs (n = 120) weighing 7.4 ± 0.05 kg (mean ± SE) weaned at 27 d (Top-PIE genotype, mixed sex) were stratified into one of 6 treatments (n = 20). Five diets were formulated with increasing ratios of standardized ileal digestible (SID) SAA:Lys (analyzed levels 0.47, 0.55, 0.61, 0.68, and 0.76). Pigs were housed in pens of 4 during an adaptation period of 6 d after which time pigs were housed individually. Pigs fed different SAA:Lys levels were infected with ETEC (5 mL, 1.13 × 10⁸ CFU/mL, serotype O149:K91:K88) on d 8, 9, and 10 after weaning. One group of pigs fed the diet containing 0.55 SAA:Lys, which is indicative of current NRC (2012) recommendations, was not infected. Pigs were fed Phase 1 diets (10.2 MJ NE and 1.2% SID Lys) ad libitum until d 15 after weaning. Phase 2 diets (10.2 MJ NE and 1.1% SID Lys) were fed ad libitum for the following 3 wk. Diets did not contain any antimicrobials. Data were ana-lyzed using GLM procedures (SPSS v. 20) with BW at d 6 in-cluded as a covariate. Data for uninfected pigs were combined with infected pigs fed the same level of SAA:Lys, as both groups succumbed equally to edema disease. Average daily gain (ADG) was lower in pigs fed 0.47 SAA:Lys than pigs fed higher ratios for d 7 through 15 (P = 0.028). Pigs fed 0.47 SAA:Lys had lower ADG during d 30 through 36 than pigs fed SAA:Lys greater than 0.61 (P = 0.033). Positive linear effects were found for ADG during d 30 through 36 (P = 0.009) and d 7 through 36 (P = 0.011), and a quadratic effect was found for ADG during d 7 through 15 (P = 0.012) and d 7 through 36 (P = 0.008). There were no differences (P > 0.05) in feed intake. Feed efficiency (FE) was poorer in pigs fed 0.47 SAA:Lys than pigs fed higher ratios for d 7 through 15 (P < 0.007) and d 7 through 36 (P < 0.001). The FE improved with increasing SAA:Lys both linearly and quadratically for d 7 through 15 (P < 0.05) and d 7 through 36 (P < 0.005). These results suggest that for optimum production in disease-challenged pigs after weaning, the SID SAA:Lys requirement is likely to be above the current NRC (2012) recommendation of 0.55.
Key Words: E. coli, pig, sulfur amino acid, weaner
092 Effect of dried distiller grains with solubles (DDGS) feeding strategies on growth and feed intake re-sponses of immunologically castrated pigs harvest-ed at 9, 7, or 5 wk post–second Improvest dose. E. K. Harris1,*, M. A. Mellencamp2, L. J. Johnston3, G. C. Shurson1, 1University of Minnesota, St. Paul, 2Zoetis, Inc, Florham Park, NJ, 3West Central Research and Outreach Center, University of Minnesota, Morris.
Few studies have evaluated growth performance responses when feeding DDGS diets to immunologically castrated pigs. To determine ADG, ADFI, and G:F during the growing–fin-ishing period, entire male pigs (n = 863; initial BW = 21.5 kg) were weighed at 8 wk of age (WOA), randomly assigned to dietary treatments, and harvested at 9 (TD9), 7 (TD7), or 5 (TD5) wk post–second dose of Improvest (gonadotropin releasing factor analog– diphtheria toxoid conjugate; Zoetis, Inc., Florham Park, NJ) in a 4 × 3 factorial arrangement (n = 8 pens/treatment). A 4-phase feeding program (phase 1 = 3 wks, phases 2 and 3 = 4 wks each, and phase 4 = 5 wks) was used for each dietary treatment: positive control (PCon; 0% DDGS in all dietary phases), DDGS step down (SD; 40, 30, 20, and 10% DDGS in the 4 dietary phases, respectively), DDGS withdrawal (WD; 40% DDGS in phases 1 to 3 and 0% DDGS in phase 4), and negative control (NCon; 40% DDGS in all dietary phases). The first subcutaneous Improvest in-jection was administered at 11 WOA followed by the second dose at 15, 17, or 19 WOA. All pigs were harvested at 24 WOA. Pig BW and feed disappearance were determined at the beginning and end of each dietary phase and after 2 wk in phases 2 to 4. Overall, ADFI tended to be greater (P £ 0.10) in WD-TD9 and PCon-TD9 pigs compared with NCon-TD9 pigs (2.44 and 2.45 vs. 2.31 ± 0.08 kg/d). Overall G:F was improved (P £ 0.05) in pigs fed PCon and SD compared with pigs fed WD and NCon (0.427 and 0.424 vs. 0.414 and 0.413 ± 0.005). For all TD treatments, ADFI increased (P £ 0.05) rapidly post–second Improvest dose and was greater (P £ 0.05) in TD9 compared with TD5 pigs during the 17 to 19 (2.95 vs. 2.48 ± 0.10 kg/d) and during the 19 to 21 (3.25 vs. 2.84 ± 0.10 kg/d) WOA intervals. Overall G:F was improved (P £ 0.05) in TD5 pigs compared with TD9 pigs (0.428 vs. 0.413 ± 0.005). Among all TD treatments, G:F was not dif-ferent between the 2-wk periods before and after the second Improvest dose. Effects of diet and harvest time post–second dose of Improvest acted independently to influence G:F. Us-ing the SD feeding strategy resulted in similar G:F compared with pigs fed PCon.
Key Words: DDGS, growth, Improvest

41
GRADUATE STUDENT ORAL COMPETITION: PhD ORAL II
093 Stimulation of estrus and ovulation in lactating sows.H. L. Frobose*, K. M. Gourley, M. D. Tokach, J. M. DeRouchey, S. S. Dritz, R. D. Goodband, J. L. Nelssen, D. L. Davis, Kansas State University, Manhattan.
Practical methods for inducing estrus and conception in lac-tating sows have been a goal of researchers since the 1950s. In this experiment, we used a modified litter separation and boar exposure treatment for inducing lactational estrus. A total of 36 multiparous and 17 primiparous sows were assigned to either control (n = 25) or altered sucking (ALT; n = 28) treat-ments. Litter size was equalized within parity (multiparous or primiparous) to 11.6 ± 1.2 pigs at d 2 postfarrowing. At d 18 of lactation (this and subsequent days are averages), sows were allotted to treatments and the ALT sows were penned in adjacent pairs within parity so that pigs could be moved between litters by temporarily lifting the divider between the two litters. On d 18, all but the 5 lightest pigs from each ALT litter were weaned. The 5 lightest pigs for each pair of litters formed a combined litter that nursed each sow of the pair 12 h/d from d 18 to 25. Therefore, pigs had nursing access 24 h/d, but each ALT sow was only suckled 12 h/d. Boar exposure was provided only to ALT sows for 15 min/d by moving sows to a pen outside the farrowing room. Control and ALT sows were weaned at d 21 and d 25, respectively. Sow weights and litter performance during lactation were similar between treat-ments although ALT sows had 16% greater total feed intake (138 vs. 116 kg; P < 0.01) due to the 4 d extended lactation period. Primiparous sows lost a greater percentage (7.4 vs. 3.4%) of BW and consumed less feed (P < 0.01) than mul-tiparous sows. A total of 26 ALT sows (93%) were detected in estrus and inseminated in lactation. Although the interval from initiating ALT to estrus was greater (P < 0.001) than the wean-to-estrus interval for controls, ALT sows were in estrus earlier postfarrowing (23.0 vs. 24.6 d; P < 0.001) than con-trols. Primiparous sows exhibited estrus later (5.4 vs. 3.8 d; P < 0.01) than multiparous sows for both treatments. Pregnancy rate and subsequent reproductive performance were similar between treatments. The ALT treatment is unique in that nurs-ing is by a combined litter of light-weight pigs. Whether this contributed to the high incidence of lactational estrus is not known; however, our results provide evidence that the ALT treatment can induce estrus in lactating sows at rates compa-rable to conventionally weaned sows and with similar repro-ductive performance.
Key Words: boar exposure, lactational estrus, split weaning
094 Predicting swine MHC haplotypes from high-density SNP genotypes. J. Dunkelberger*, Iowa State University, Ames.
The major histocompatibility complex (MHC) region in swine, the swine leukocyte antigen (SLA) complex, is rich in genes associated with disease resistance. Many of these genes have haplotype-specific expression. There are various ways to determine MHC haplotypes, including wet lab assays such as using PCR-sequence-specific primers (PCRSSP) for low-resolution (Lr) SLA haplotyping, which can be time intensive and costly. Alternatively, high-density single nucleotide poly-morphism (SNP) panels can be used to infer haplotypes in a genomic region. The objective of this study was to determine whether SNP genotypes from a commercial high-density SNP chip can be used to predict haplotypes within the MHC region of the swine genome.
A total of 140 pigs from four PRRS Host Genetics Con-sortium trials were haplotyped using the PCRSSP method. Pigs were selected, in roughly equal numbers per trial, based on extreme (high/low) viremia and growth after inoculation with the NVSL 97–7985 PRRS strain.
All pigs were genotyped using the Illumina SNP60 Bead-Chip. Seventy-five SNPs located within the 23 through 27 Mb SLA I region and 64 SNPs within the 29 through 31 Mb SLA II region of chromosome 7 were used to analyze MHC class I and II, respectively. SNP genotypes in each region were phased into haplotypes using BEAGLE software. Resulting haplotypes in the 23 through 27 Mb window (the entire win-dow used for phasing) or the 24 Mb window were analyzed for SLA class I. Similarly, SNP haplotypes in either the 29 through 31 Mb window or 29 Mb window were analyzed for SLA class II. Identical SNP haplotypes for a given window were grouped to determine which Lr SLA haplotype they shared. Accuracy of prediction was calculated as the percentage of SNP haplo-types that could be assigned to a Lr SLA haplotype.
When analyzing SNP haplotypes using the entire win-dow used for phasing to group haplotypes, accuracy of pre-diction was 85% for class I and 88% for class II. Greater haplotype prediction accuracy was obtained when grouping SNP haplotypes using the 1 Mb approach (91 and 95% for class I and II, respectively).
In conclusion, BEAGLE software can be used to predict MHC haplotypes from high-density SNP genotype data with fairly high accuracy. These results indicate that the Illumina SNP60 BeadChip can be used to predict SLA haplotypes as an alternative to wet lab methods. This will enable us to in-vestigate the role of SLA class I and II genes in PRRS resis-tance/susceptibility.
Key Words: swine leukocyte antigen

42
095 Effects of in utero heat stress and core body temperature on tissue accretion during the growing phase (30 to 60 kg) in pigs. J. S. Johnson1,*, M. V. Sanz Fernandez1, J. F. Patience1, J. W. Ross1, N. K. Gabler1, M. C. Lucy2, T. J. Safranski2, R. P. Rhoads3, L. H. Baumgard1, 1Iowa State University, Ames, 2University of Missouri, Columbia, 3Virginia Tech, Blacksburg.
Environmentally induced heat stress (HS) negatively influences production variables. However, the extent to which in utero HS affects tissue deposition during the rapid lean tissue accretion phase of postnatal growth is unknown. Study objectives were to compare the future tissue accretion rates in pigs exposed to differing in utero and postnatal thermal environments when lean tissue deposition is likely maximized. Pregnant gilts were ex-posed to thermal neutral (TN; cyclical 15°C nighttime and 22°C daytime; n = 9) or HS (cyclical 27°C nighttime and 37°C day-time; n = 12) conditions during their entire gestation. Twenty-four offspring from gestational TN (GTN; n = 6 gilts and 6 bar-rows; 30.8 ± 0.2 kg BW) and gestational HS (GHS; n = 6 gilts and 6 barrows; 30.3 ± 0.2 kg BW) gilts were euthanized as an initial slaughter group (ISG). Following the ISG, 48 pigs from GTN (n = 12 gilts and 12 barrows; 34.1 ± 0.5 kg BW) and GHS (n = 12 gilts and 12 barrows; 33.3 ± 0.3 kg BW) were exposed to constant HS (34.1 ± 2.4°C) or TN (21.5 ± 2.0°C) conditions un-til they reached 61.5 ± 0.4 kg BW, when they were sacrificed and body composition determined. Homogenized carcasses were analyzed for N, crude fat, ash, water, and gross energy content. Data were analyzed using PROC MIXED in SAS 9.3. Rectal temperature (Tre) and respiration rates increased during postnatal HS compared to TN (39.4 vs. 39.0°C and 94 vs. 49 bpm, respec-tively; P < 0.01). Regardless of in utero environment, postnatal HS reduced (P < 0.01) feed intake (2.06 vs. 2.37 kg/d) and ADG (0.86 vs. 0.98 kg/d) compared to TN conditions. Postnatal HS did not alter water, protein, and ash tissue accretion rates but reduced adipose tissue accretion rates (198 vs. 232 g/d; P < 0.04) compared to TN-reared pigs. Gestational environment had no effect on tissue deposition. Regardless of prenatal or postnatal treatment, a post hoc analysis indicated that pigs with chroni-cally elevated Tre (39.3 ± 0.1°C) consumed more feed (2.27 vs. 2.15 kg/d; P > 0.11) and had similar rates of protein accretion (169 vs. 170 g/d; P > 0.40) but had increased adipose deposition (232 vs. 193 g/d; P < 0.01) compared to those with a sustained lower Tre (39.0 ± 0.1°C). In summary, postnatal HS reduces lipid accretion rates, but prenatal HS does not appear to effect tissue accretion during this specific growth phase.
Key Words: epigenetics, heat stress, tissue accretion
096 Impact of oral meloxicam on circulating physiological biomarkers of stress and inflammation in beef steers after long distance transportation. N. Van Engen* M. L. Stock, T. Engelken, R. Vann, L. W. Wulf, L. A. Karriker, W. D. Busby, J. Lakritz, B. Bradford, W. Hsu, C. Wang, J. F. Coetzee, Iowa State University, Ames.
Transportation stress can result in significant economic losses to producers due to decreased animal productivity and increased medication costs associated with sickness such as bovine respi-ratory disease (BRD). Meloxicam (MEL) provides pain relief and anti-inflammatory effects in cattle for several days after a single oral treatment. Our hypothesis was that MEL administra-tion before shipping would reduce the impact of long distance transportation on circulating physiological biomarkers of stress and inflammation in beef steers. Ninety-seven beef steers were blood sampled for baseline biomarker determination and then randomly assigned to receive either 1 mg/kg MEL (n = 49) or a placebo (CONT) (n = 48) per os before a 1316 km transporta-tion event lasting approximately 16 h. Calves were then blood sampled on arrival and 5 d later. Changes in the hemogram, circulating plasma proteins, total carbon dioxide (TCO2), fi-brinogen, substance P (SP), cortisol, haptoglobin (Hp)-matrix metalloproteinase-9 (MMP-9) complexes, and tumor necrosis factor α (TNFα) between treatment groups over time were com-pared using a Mixed Effects Model with statistical significance designated as P < 0.05. ANCOVA was conducted to assess the relationship between circulating MEL concentrations and bio-marker changes over time. An increase in neutrophil, platelet, monocyte, white blood cell, and red blood cell counts occurred after transportation (P < 0.0001) and a decrease in lymphocyte count was observed (P < 0.0001). MEL treatment reduced the stress-induced neutrophilia (P = 0.0072) and circulating mono-cyte count (P = 0.013) on arrival. Mean corpuscle hemoglobin (P = 0.05), mean corpuscle volume (P = 0.05), and lymphocyte count (P = 0.05) was also greater in the CONT calves compared with MEL calves after transportation. Furthermore, HP-MMP-9 complexes, TCO2, TNFa, plasma proteins, and SP. increased and cortisol decreased after shipping (P < 0.01). MEL treat-ment tended to reduce serum cortisol concentrations (P = 0.08). There was a time × treatment interaction on serum cortisol con-centrations (P = 0.04). An inverse relationship between plasma MEL concentrations and circulation cortisol concentrations (P = 0.002) and neutrophil (P = 0.04) and basophil counts (P = 0.03) was also observed. The results suggest that MEL administration may reduce the impact of long-distance transportation on circu-lating physiological biomarkers of stress and inflammation in beef calves.
Key Words: inflammation, meloxicam, transportation

43
097 Comparison of four perennial forage finishing systems and a limit-fed corn-based finishing system on lamb growth and carcass characteristics. J. S. McCutcheon1,*, H. N. Zerby2, S. C. Loerch3, F. L. Fluharty3, 1The Ohio State University, Mount Gilead, 2The Ohio State University, Columbus, 3The Ohio State University, Wooster.
The objective for the study was to compare four perennial forage finishing systems and a limit-fed corn-based finishing system on lamb growth and carcass characteristics. Each treatment consisted of 3 replicate fields/pens of 6 lambs per field/pen blocked by gen-der and initial starting weight. The finishing systems were grazed alfalfa (ALF), grazed ryegrass (RG), and grazed alfalfa for 56 d followed by grazed ryegrass for the remainder of the finishing period (ALF/RG), grazed ryegrass for 56 d followed by grazed alfalfa for the remainder of the finishing period (RG/ALF), and limit-fed, corn-based diet fed to achieve a similar rate of gain as the grazed alfalfa treatment (CONC). Lambs were slaughtered when the field/pen average reached the target BW of 58 kg or if forage became limiting. It was hypothesized that lamb growth and carcass characteristics would be similar for concentrate feeding and alfalfa but greater than alfalfa/ryegrass combinations and rye-grass. Predetermined contrasts between ALF and the other treat-ments were conducted using LSMESTIMATE in PROC MIXED. Lamb ADG LSM was not different between ALF (0.22 kg/d) and CONC (0.21 kg/d) (P > 0.05), but ALF was greater than RG/ALF (0.18 kg/d), ALF/RG (0.17 kg/d), and RG (0.14 kg/d) (P < 0.05). Carcass weight was lower for ALF (27.33 kg) than CONC (30.89 kg) but ALF was heavier than RG (21.96 kg) (P < 0.05) and not different from ALF/RG (24.87 kg) and RG/ALF (25.72 kg) (P > 0.05). Loin eye area was smaller for ALF (14.07 cm2) than CONC (16.96 cm2), but ALF was larger than ALF/RG (12.07 cm2) and RG (12.41 cm2) (P < 0.05) and not different than RG/ALG (13.07 cm2) (P > 0.05). Back fat was less for ALF (0.44 cm) than CONC (0.57 cm) (P < 0.05), but ALF was not different than RG (0.33 cm), ALF/RG (0.35 cm), or RG/ALF (0.39 cm) (P > 0.05). Body wall was thinner for ALF (1.59 cm) than CONC (2.17 cm) (P < 0.05), but ALF was not different than RG (1.31 cm), ALF/RG (1.53 cm), or RG/ALF (1.49 cm) (P > 0.05). Limit-fed corn re-sulted in heavier carcasses, with greater muscling and back fat than grazing alfalfa. Grazing alfalfa produced heavier carcasses, with greater loin eye muscle than grazing ryegrass alone. Leaner carcasses were produced from the grazing programs.
Key Words: lambs grazing alfalfa
098 Interactive effects of zinc and zilpaterol hydrochloride on the bovine β-adrenergic receptors. J. E. Hergenreder1,*, J. O. Baggerman1, A. D. Hosford1, M. E. Branine2, B. J. Johnson1, 1Texas Tech University, Lubbock, 2Zinpro Corporation, Eden Prairie, MN.
Beta-adrenergic receptors (β-AR) are a member of the G-coupled protein receptor family and are responsible for bind-
ing endogenous catecholamines and synthetically produced β-adrenergic agonists (β-AA). These β-AAs are established growth promoters that increase muscle accretion via hyper-trophy of the muscle fiber, decrease lipogenesis, and improve feed efficiency when fed to finishing cattle. Zinc (Zn) has been shown to have allosteric binding sites on β2–ARs, enhancing agonist affinity and inhibiting antagonist binding. Zilpaterol hydrochloride (ZH) is a β-AA shown to have a high affinity for β2–ARs, which are the predominant receptor on skeletal muscle and adipocytes in cattle. The objective of this study was to determine if utilizing Zn in combination with ZH af-fected the interaction of ZH with the β2–AR by altering cAMP production, mRNA quantity, and protein abundance. Cultures of bovine satellite cells were established and treated at 120 h with 1) 0 µM Zn/ZH, 2) 0 µM Zn/10 µM ZH, 3) 1 µM Zn/0 µM ZH, and 4) 1 µM Zn/10 µM ZH in differentiation media for 0, 6, 24, 48, and 96 h. Protein and mRNA were measured at 24 and 96 h, and cAMP was measured at 0, 6, 24, 48, and 96 h. At 0, 24, 48, and 96 h, no differences (P > 0.05) were detected in cAMP production. At 6 h, 1 µM Zn had the greatest concen-tration of cAMP (P < 0.05) compared to ZH treatments. Using RT-QPCR analysis, no differences (P > 0.05) were detected in mRNA abundance between any of the treatments for the genes evaluated at 24 h. Genes of interest included β1–AR, β2–AR, AMPKα, IGF-I, myosin heavy chain (MHC)-I, MHC-IIA, MHC-IIX, GPR43, SCD, CEBPβ, and PPARγ. At 96 h, 10 µM ZH cells had an increased quantity of MHC-I mRNA (P < 0.05) compared to 0 µM Zn/ZH and a greater abundance of MHC-IIX mRNA (P < 0.05) and a tendency for higher lev-els of IGF-I mRNA (P < 0.15) compared to 0 µM Zn/ZH and 1 µM Zn/10 µM ZH. Furthermore, at 96 h, 1 µM Zn/10 µM ZH cells tended to express more GPR43 and PPARγ mRNA (P < 0.15) compared to 0 µM Zn/ZH. Protein quantification was performed via western blotting procedures to assess the abundance of the β1–AR and the β2–AR; however, no differ-ences (P > 0.05) were detected. These results indicated that Zn and ZH in combination decreased myogenic gene expression.
Key Words: β-adrenergic receptor, zilpaterol hydrochloride, zinc
099 Effect of a supplemental zinc complex and ractopamine hydrochloride on blood markers of the immune and β-adrenergic responses in beef steers. O. N. Genther1,*, M. E. Branine2, S. L. Hansen1, 1Iowa State University, Ames, 2Zinpro Corporation, Eden Prairie, MN.
Forty-one crossbred steers (380 ± 5.3 kg) were used to de-termine the effect of supplementing a zinc (Zn) amino-acid complex (ZnC; Availa®Zn) to steers fed diets with or without ractopamine hydrochloride (RAC) on blood markers of the immune and β-adrenergic responses. All steers consumed a dry-rolled corn-based diet supplemented with 60 mg Zn/kg DM as ZnSO4. Steers were assigned to one of four supple-

44
mental ZnC treatments for 86 d: Zn0: 0 mg Zn/kg DM (n = 6), Zn30: 30 mg Zn/kg DM (n = 12), Zn60: 60 mg Zn/kg DM (n = 12), and Zn90: 90 mg Zn/kg DM (n = 11). Blood samples were taken on d -4 and 78. Data were analyzed using the MIXED procedure of SAS, steer was the experimental unit, and ini-tial period values were used as covariates in analysis. Total white blood cell (WBC), lymphocyte, and basophil counts were lesser in Con than ZnC-supplemented steers (P < 0.05). Plasma cyclic adenosine monophosphate (cAMP) and WBC counts tended to increase linearly with increasing dietary Zn (P < 0.10). There was a quadratic response within serum inter-leukin-8 (IL-8) where Zn60 steers had the least concentrations (P = 0.05). On d 86 one of the two pens of supplemental ZnC steers was randomly selected to receive RAC at 300 mg∙steer–
1∙d-1 for 29 d before harvest, creating 7 final treatments: Con: 0 mg/kg DM of Zn from ZnC and no RAC (n = 6), Zn30: 30 mg/kg DM of Zn from ZnC and no RAC (n = 6), Zn30R: 30 mg/kg DM of Zn from ZnC + RAC (n = 6), Zn60: 60 mg/kg DM of Zn from ZnC and no RAC (n = 6), Zn60R: 60 mg/kg DM of Zn from ZnC + RAC (n = 6), Zn90: 90 mg/kg DM of Zn from ZnC and no RAC (n = 5), and Zn90R: 90 mg/kg DM of Zn from ZnC + RAC (n = 6). Blood samples were taken on d 112 and d 78 values were used as covariates in analysis. Supplementation of RAC increased WBC counts (P < 0.05), specifically lymphocytes, monocytes, eosinophils, and baso-phils (P < 0.05). Increasing ZnC within RAC-supplemented treatments tended to linearly decrease serum haptoglobin con-centrations (P = 0.07), and Zn supplementation without RAC tended to increase plasma cAMP compared with Con (P = 0.09). Further research is required to define the potential im-mune response to RAC in cattle.
Key Words: cattle, ractopamine HCl, zinc
100 Growth performance, carcass characteristics, and serum cholesterol and progesterone concentrations of heifers fed different energy sources on pasture. C. H. Pereira1, 2,*, H. O. Patino3, J. B. S. Borges2, K. C. Swanson4, F. A. L. González2, D. M. Z. Vargas2, D. M. Panazzolo2, L. L. Cardoso2, J. U. Tarouco2, 1North Dakota State University, Fargo, 2Universidade Federal do Rio Grande do Sul, Porto Alegre, Brazil, 3Universidade Federal do Rio Grande Do Sul, Porto Alegre, Brazil, 4North Dakota State University, Fargo.
Twenty-four Brangus heifers (average BW = 317 kg and BCS = 5.4) on winter pasture (Lolium multiflorum) were used in a completely randomized design to evaluate the effect of feed-ing different energy supplements on growth performance (BW, ADG, and BCS), carcass ultrasound characteristics (rump fat thickness [RFT], subcutaneous fat thickness [SFT], and LM area), and serum concentrations of cholesterol and progesterone. The treatments were 1) Control (70 g trace-mineralized salt), 2) Corn (1.2% of BW; 3.8 kg cracked corn, 46 g urea, and 70 g trace-mineralized salt), 3) PPUFA
(polyunsaturated fatty acids protected from rumen degrada-tion; 0.071% of BW; 150 g of PPUFA, 10 g urea, and 70 g trace-mineralized salt), and 4) Corn+PPUFA (1.2% of BW; 3.7 kg of cracked corn, 150 g of PPUFA, 52 g of urea, and 70 g trace-mineralized salt). Heifers were supplemented 2 times a day in individual stalls (08:00 and 14:00) and were subjected to fixed time AI at the end of the supplementation period (d 40). Forage availability was greater (d 28; P = 0.007 and d 40; P = 0.10) in Corn+PPUFA (d 28, 1845 kg/Ha and d 40, 2348 kg/ha) than the other treatments (average = d 28, 1253 kg/Ha and d 40, 1641 kg/Ha). Body weight and BCS were greater in supplemented animals than Control (373 vs. 347 kg and 6.3 vs. 2.7; d 40; P = 0.05). Average daily gain was greater for supplemented animals than Control (Corn+PPUFA = 1.19 kg ³ Corn = 1.10 kg ³ PPUFA = 0.90 kg > Control = 0.73 kg; P = 0.004). Rump fat thickness was greater for Corn+PPUFA (8.72 mm) than the other treatments (average = 5.04 mm; d 30; P = 0.03). Subcutaneous fat thickness was greater in Corn+PPUFA (6.76 mm) and Corn (5.21 mm) than the others treatments (average = 3.49 mm; d 28; P £ 0.07). However, there was no differences in serum cholesterol (aver-age = 201.9 mg/dL; d 40; P = 0.52), progesterone (average = 3.23 ng/mL; d 47; P = 0.52), and pregnancy rates (58%; P = 0.52) between treatments. Supplementation to heifers on winter pasture with PPUFA and Corn could improve growth performance and carcass characteristics but may not affect se-rum cholesterol and progesterone concentrations.
Key Words: energy supplementation, growth performance, protected polyunsaturated fatty acids
101 Effects of calf age at weaning on cow and calf performance and feed utilization in an intensive production system. J. M. Warner1,*, K. H. Jenkins2, R. J. Rasby1, M. K. Luebbe2, G. E. Erickson3, T. J. Klopfenstein3, 1University of Nebraska, Lincoln, 2University of Nebraska, Scottsbluff, 3University of Nebraska-Lincoln, Lincoln.
This research compared the feed utilization of producing a weaned calf to 205 d of age between early and normal wean-ing in an intensive production system. Multiparous, crossbred (Red Angus × Red Poll × Tarentaise × South Devon × Devon), lactating beef cows (n = 84) with summer-born calves at side were blocked by prebreeding BW (H, M, and L), stratified by calf age, and randomly assigned to 1 of 4 treatments within strata. The experiment was a randomized complete block design with a 2 × 2 factorial arrangement of treatments with three replications. Cow–calf pairs at 1 of 2 locations in eastern (ARDC) or western (PHREC) Nebraska were weaned at 90 (EW) or 205 (NW) d of calf age. Regardless of location, EW cows and calves and NW pairs were fed a common diet (60:40 distillers grains:crop residue, DM) from the time of early to normal weaning. EW cows were limit fed (6.8 kg DM/cow/d) while EW calves were fed ad libitum. NW pairs were limit
45
fed the equivalent amount of DM consumed by EW cows and calves. All cattle were managed in earthen feedlot pens, and pen was the experimental unit. Cow BW and BCS at early weaning were similar (P = 0.56) between EW and NW cows. At normal weaning, EW cows had greater (P = 0.05) BW than NW cows. Body weight change from early to normal wean-ing was 21 kg greater (P £ 0.01) for EW than NW. Cow BCS at normal weaning was not impacted (P = 0.23) by weaning regimen or location. Calf BW at early weaning was not differ-ent (P = 0.85) between EW or NW calves. EW calves gained 10 kg less than NW from early to normal weaning. EW cows and calves consumed 10.7 kg DM total/d while NW pairs consumed 10.3 kg DM/pair/d and performance between treat-ments was similar implying comparable feed utilization. Data suggest weaned cows and calves require the same amount of feed as pairs together and early weaning does not reduce the feed energy needed to support the pair.
Key Words: cow–calf pairs, feed utilization, production system
GROWTH, DEVELOPMENT, MUSCLE BIOLOGY, AND MEAT SCIENCE
SYMPOSIUM: INSULIN REVISITED
102 Insulin: Secretagogues and nutrient partitioning. M. V. Sanz Fernandez, L. H. Baumgard*, Iowa State University, Ames.
Insulin is the primary anabolic coordinator of nutrient par-titioning, and it plays a critical role on carbohydrate, lipid, and protein metabolism. Insulin regulates cellular glucose up-take, stimulates glycolysis, and promotes hepatic and muscle glycogen, adipose triglyceride, and skeletal muscle protein synthesis while simultaneously preventing their degradation. Hyperglycemia increases glucose uptake and metabolism by pancreatic β-cells, and this has traditionally been thought of as the main stimulant of insulin secretion. However, other sig-nals are capable of initiating and amplifying this response. For example, nutrients such as specific amino acids, fatty acids, and keto acids can potentiate pancreatic insulin release. It was thought that internalization and metabolism of these nutrients was required for insulin secretion; however, the recent discov-ery of fatty acids acting through β-cell surface receptors has challenged this dogma. Interestingly, sustained high glucose and fatty acid concentrations result in pancreatic gluco- and lipotoxicity, with detrimental effects on β-cell function and viability. Hormones can also modulate insulin secretion. For example, incretins (glucagon-like peptide-1 and gastric in-hibitory peptide) are intestinal hormones with insulinotropic activity, secreted in response to food ingestion, thus integrat-ing diet chemical composition into the regulatory mechanism of insulin release. In addition, prolactin is required for proper islet development and it stimulates β-cell proliferation and in-
creases insulin secretion. This is perplexing as prolactin typi-cally facilitates lactation (although species dependent) while increased systemic insulin action is associated with metabolic adaptions that prevent maximum milk yield. Also counter intuitively, bacterial components might be additional sig-nals influencing insulin secretion. In vivo lipopolysaccharide (LPS) infusion acutely increases circulating insulin, which is paradoxical as endotoxemia is a potent catabolic condi-tion accompanied by severe pyrexia and marked hypophagia. Understanding how and why LPS induces hyperinsulinemia remains to be elucidated, but the practical implications to this phenomenon are numerous. In summary, insulin secretion re-sults from the integration of multiple signals in addition to hyperglycemia. Insulin is a potent anabolic orchestrator of nutrient partitioning; therefore, it is critical to understand the regulatory mechanisms of insulin secretion. Furthermore, we need to better understand insulin’s role during certain physi-ological and pathological conditions to maximize productivity and efficiency in animal agriculture.
Key Words: insulin, LPS, nutrient partitioning
103 The influence of insulin on adipose tissue differentiation, metabolism, and adipokine secretion. G. J. Hausman*,University of Georgia, Athens, GA.
Insulin is a key regulator of glucose homeostasis and stimu-lates glucose transport into fat cells by translocation of glu-cose transporters from inside the cell to the cell surface. In-sulin stimulates lipid accretion in a dose-dependent manner during preadipocyte differentiation in adipose tissue–derived stromal-vascular (SV) cell cultures used to study porcine pre-adipocyte differentiation. During differentiation, CCAAT/enhancing binding protein (C/EBP) α expression confers the development of insulin-sensitive glucose transport in pre-adipocytes. In SV cell culture studies, crosstalk between C/EBPα and insulin–stimulated phosphatidylinositol 3–kinase (PI3K)/protein kinase B (Akt) pathways were involved in Akt2 and sirtuin-1 regulation of preadipocyte adipogenesis. In other SV studies, insulin-induced hypertrophy of porcine preadipocytes was accompanied by increases in fatty acid synthesis (FAS) activity and sterol regulatory element binding transcription factor-1 gene expression. Other evaluations of insulin responsiveness in SV cell culture studies will also be reviewed. Metabolism studies of adipose tissue from grow-ing and market-weight pigs have produced very inconsistent responses to insulin. For instance, studies of isolated adipo-cytes from 55 or 80 kg pigs demonstrated insulin stimulated lipogenesis and FAS activity in a dose-dependent manner in subcutaneous (SQ) and perirenal depots. In contrast, studies of adipose tissue slices from 20 to 60 kg pigs showed little to no effects of insulin on lipogenesis. In older pigs (80 to 127 kg), a 50% stimulation of lipogenesis by insulin was demonstrated. A study of isolated adipocytes from market-

46
weight pigs demonstrated that neutralization of endogenous adenosine and pertussistoxin-sensitive G protein Gi decreased basal rates of lipogenesis and increased the insulin response to 160% above basal. Evidence of multiple intracellular sig-nal pathways for insulin influence on adipose tissue will be reviewed. An exaggerated rate of glucose metabolism in basal conditions may contribute to inconsistent insulin responses of pig adipose tissue lipogenesis. Studies of intracellular signal pathways involved in insulin inhibition of lipolysis will also be reviewed. A number of adipokines are expressed by por-cine adipose tissue including adiponectin and leptin but stud-ies of adipokine and insulin interaction are few. One interac-tion included leptin reduction of insulin-mediated inhibition of lipolysis in porcine SV cultures. Insulin has a major role in porcine adipose tissue metabolism and development.
Key Words: development, insulin, metabolism, porcine adipose tissue
104 Mechanisms underlying insulin supported skeletal muscle growth. R. P. Rhoads1,*, L. H. Baumgard2, 1Virginia Tech, Blacksburg, 2Iowa State University, Ames.
Basic principles governing skeletal muscle growth and devel-opment, from a cellular point of view, have been realized for several decades. Skeletal muscle is marked by the capacity for rapid hypertrophy and increases in protein content. Ultimately, skeletal muscle growth is controlled by two basic means: myo-nuclear accumulation stemming from cellular proliferation and the balance between cellular protein synthesis and degradation. Each process underlies the rapid changes in lean tissue accretion evident during neonatal growth and is particularly sensitive to nutritional manipulation. Although multiple signals converge to alter skeletal muscle mass, postprandial changes in the anabolic hormone, insulin, link feed intake with enhanced rates of protein synthesis in the neonate. Indeed, a consequence of insulin-defi-cient states such as diabetes or malnutrition is a net loss of body protein. A prominent mechanism mediating the anabolic effect of insulin is the phosphatidylinositol 3-kinase (PI3K) mamma-lian target of rapamycin (mTOR) signaling pathway. Activation of mTOR leads to control of translation initiation via the phos-phorylation of downstream targets. Modulation of this pathway by insulin as well as other hormones and nutrients accounts for enhanced protein synthesis leading to efficient lean tissue accre-tion and rapid skeletal muscle gain in the growing animal.
Key Words: growth, insulin, skeletal muscle
105 Effects of heat stress on postabsorptive metabolism. M. V. Sanz Fernandez1,*, J. S. Johnson1, R. P. Rhoads2, L. H. Baumgard1, 1Iowa State University, Ames, 2Virginia Tech, Blacksburg.
Heat stress (HS) jeopardizes livestock health and compromises animal productivity. Traditionally, the detrimental effects of HS
have been attributed to inadequate intake. However, we have demonstrated that, given the same plane of nutrition (using a pair-fed thermoneutral model [PFTN]), production responses differ between thermoneutral and HS conditions in both rumi-nants and swine. Differences between environments indicate that HS alters postabsorptive metabolism and nutrient partition-ing independently of intake. Surprisingly, despite marked hypo-phagia, plasma nonesterified fatty acids (NEFA) are reduced in a variety of HS models and we have shown that heat-stressed ru-minants and pigs have decreased sensitivity to lipolytic signals. Furthermore, HS consistently increases basal insulin (a potent antilipolytic hormone), which might explain why heat-stressed animals do not mobilize NEFA. Interestingly, glucose stimu-lated insulin response differs between ruminants and swine, as they require more and less insulin, respectively, to dispose of glucose compared to PFTN counterparts. Reasons for such variation are not clear but might include species differences in insulin sensitivity and variations in environmental/experimen-tal protocols. Regardless, using the glucose tolerance test as a proxy for insulin sensitivity is not ideal and further research is needed to elucidate the effects of HS on insulin responsiveness. The mechanisms responsible for heat-induced changes in posta-bsorptive metabolism are unknown; however, they might be me-diated by HS effects on intestinal health. During HS, blood flow is diverted to the periphery in an attempt to dissipate heat, lead-ing to intestinal hypoxia and ultimately reduced intestinal barrier function and increased leakage of luminal content (e.g., bacte-rial components). In agreement, in vivo lipopolysaccharide infu-sion results in increased plasma insulin. Additionally, prolactin might have a role on the metabolic changes observed during HS. Prolactin stimulates pancreatic β-cell proliferation and increases insulin secretion, and heat-induced hyperprolactinemia occurs in multiple species, including pigs. Finally, hyperinsulinemia and the blunted NEFA response might be the result of decreased energetic requirements during HS. Environmental hyperthermia is thought to elevate maintenance requirements due to increased energy utilization in heat dissipation and greater chemical reac-tion rates. However, we observed an immediate and sustained decrease in thyroid hormones in heat-stressed pigs, which might indicate a decrease in energy expenditure/heat production. In summary, HS alters postabsorptive metabolism and nutrient partitioning independently of nutrient intake. Understanding the biology of how HS compromises animal agriculture is critical to develop mitigating strategies to overcome the production losses experienced during the hot summer months.
Key Words: heat stress, nutrient partitioning
106 Impact of insulin on ovarian function. A. F. Keating*, Iowa State University, Ames.
The ovary is the female gonad responsible for gamete pro-duction as well as 17β-estradiol and progesterone synthesis. A finite number of primordial follicles are present at of birth, and these serve as the follicular pool. The number of follicles

47
decline over the female’s lifetime and once depleted, follicles cannot be replaced because the process of follicular growth is irreversible; once follicles are recruited from the dormant phase into the growing pool they either undergo cell death or they are selected for further growth and eventually ovulation. Unlike the cyclic recruitment of follicles to ovulation, initial primordial follicular activation is independent of pituitary go-nadotropins. Several lines of evidence have identified phos-phatidylinositol-3 kinase (PI3K) as a locally produced ovarian factor regulating individual primordial follicle activation. An overall balance among dormancy, activation, and death of pri-mordial follicles is a major determining factor contributing to the duration of a female’s reproductive lifespan. Insulin can influence the rate at which primordial follicles are activated and can regulate steroidogenesis through PI3K. Hyperinsu-linemia is a biological link between two major physiological conditions in which compromised reproduction is a pheno-type: obesity and heat stress. Our work uses three models of hyperinsulinemia to study the impact of elevated insulin on ovarian signaling pathways that contribute to reproduc-tive success: 1) high fat diet obesity induced mice, 2) lethal yellow genetic mouse model of obesity, and 3) heat-stressed gilts. We show that the insulin receptor is localized to the oo-cyte, granulosa, and theca cells. We have also demonstrated altered ovarian PI3K and steroidogenic pathway signaling in these three physiological models. In addition, we have dis-covered that metabolism of reproductive toxicants is affected by hyperinsulinemia and that low levels of DNA damage are induced in the ovary of obese hyperinsulinemic females. In summary, during hyperinsulinemia, the ovary remains insulin sensitive and we hypothesize that this sensitivity contributes to compromised reproductive capacity in females.
Key Words: insulin, oocyte, ovary
107 Insulin/IGF action in the mammary gland revisited. W. S. Cohick*, Rutgers University, New Brunswick, NJ.
In the dairy cow, there is an increased demand for nutrients required for milk protein and lipid synthesis as the mammary gland undergoes functional differentiation from late preg-nancy to early lactation. Insulin resistance in insulin-sensitive peripheral tissues channels nutrients to the mammary gland for milk synthesis in early lactation. Glucose uptake by the mammary gland is insulin independent, with insulin showing little effect on mRNA expression of glucose transporters. In contrast, it has long been known that the lactogenic hormones hydrocortisone, insulin, and prolactin are required for maxi-mum expression of milk protein genes in the bovine gland. Recently it has been recognized that the regulation of protein translation may play a central role in determining milk protein production in dairy cows. The mammalian target of rapamy-cin (mTOR) signal transduction pathway has been identified as a master regulator of protein translation. Data indicating that hormones (i.e., insulin and IGF-I), nutrients (i.e., amino
acids), and intracellular energy status interact to regulate the mTOR signaling pathway and thus protein synthesis in the bovine mammary gland will be presented.
Key Words: IGF-I, insulin, mammary gland, milk production, mTOR, protein synthesis
GROWTH AND DEVELOPMENT, MUSCLE BIOLOGY, AND MEAT SCIENCE
108 Contribution of the calpain system to muscle protein accretion and growth in cattle and swine models. S. M. Cruzen*, Iowa State University, Ames.
The calpain system plays a regulatory role in skeletal muscle proteolysis in the live animal under normal conditions. Reduced muscle proteolysis as a result of decreased calpain activity or increased calpastatin activity will result in less net protein turn-over, all other factors being equal. This may lead to an animal that is more efficient, grows faster, is more heavily muscled, or simply better maintains its current muscle size (i.e., preven-tion of atrophy). The objective of this work was to examine the skeletal muscle calpain system in two growth models. The first model compared the longissimus, triceps brachii, and semimem-branosus muscles from young, growing cattle (7.3 ± 0.5 mo) and older, mature cows (106.7 ± 43.1 mo; n = 6). Calpains and calpastatin were isolated from prerigor sarcoplasmic extracts at 0 d postmortem using ion exchange chromatography and as-sayed for activity using casein as a substrate. Calpastatin activity was also determined from a crude heated extract at 0, 1, and 6 d postmortem. Muscle from mature cattle tended to have a lower calpain-1:calpastatin activity ratio (P = 0.08). Additionally, less calpastatin activity was lost during postmortem aging of ma-ture muscle, indicating that some mechanism exists that keeps calpastatin more stable in these animals. Overall, the calpain system is more conducive to protein turnover in young, grow-ing cattle compared to older, mature cows. The second model compared growing gilts (68.4 ± 3.5 kg, n = 11) selected for re-duced or increased residual feed intake (RFI). More efficient low RFI animals typically have greater lean accretion during growth compared to their less efficient high RFI counterparts. Calpain and calpastatin were isolated from prerigor longissi-mus and red and white semitendinosus muscle and assayed as described above. In our study, muscle from low RFI pigs had less (P = 0.04) calpastatin activity and a lower (P = 0.04) cal-pain-1:calpastatin activity ratio. These activities indicate less potential protein degradation in muscle from low RFI animals, which could explain increased lean accretion and some of the in-creased efficiency observed in low RFI pigs. These data indicate that, based on the relative activities of skeletal muscle calpains and calpastatin, it is likely that more proteolysis occurs during growth as compared to a mature state. However, given similar growth stage, greater calpastatin activity may be more condu-

48
cive to lean accretion and efficiency. Supported by Wise Bur-roughs Memorial Endowment in Animal Sciences and USDA AFRI Grant no. 2010–65206–20670.
Key Words: calpain, calpastatin, growth
109 Investigating the role of reactive oxygen species and mitochondria protein profile differences in pigs divergently selected for residual feed intake. J. K. Grubbs*, Iowa State University, Ames.
Understanding the molecular mechanisms and the important role mitochondria play in swine feed efficiency is paramount to improving the efficiency of pork production. The objective of these projects was to characterize mitochondria protein profile and reactive oxygen species (ROS) differences between pigs divergently selected for residual feed intake (RFI). Pigs (n = 16–18) divergently selected for RFI were used in these studies. Mi-tochondria were isolated from the liver, longissimus dorsi (LD), and the red and white portions of the semitendinosus (RST and WST, respectively). Cellular ROS production was determined using the dichlorofluorescein assay and mitochondrial protein profile differences were determined using 2-dimensional differ-ence in gel electrophoresis. Phosphorylations were determined via two dimensional SDS-PAGE and staining for phosphopro-teins. Mitochondria from the WST pigs in the more efficient, low-RFI line produced 15 to 23% less ROS (P < 0.05) using glutamate as an electron donor for complex I of electron trans-port. Compared to high RFI, a similar trend (P < 0.1) in liver mi-tochondria ROS production was also seen in low-RFI pigs (30–34% reduction). Positive Pearson correlations (r2 = 0.493–0.423; P £ 0.1), dependent on the complex and electron donor source, for RFI and ROS production were observed. These ROS differ-ences may be explained by alterations in mitochondrial protein profile and differences in posttranslational modifications, such as phosphorylations. Mitochondria specific isoforms of heat shock proteins 60 and 70 were determined to be increased in the low-RFI line (9–50%; P < 0.05). Protein spots identified as heat shock proteins were phosphorylated, indicating posttranslational modifications may play a role in mitochondria function between RFI lines. Heat shock proteins have been shown to play a role in mitigating cellular stress. In addition to changes in cellular stress pathways, a general increase in the abundance of glyco-lytic enzymes was observed in the more efficient low-RFI line, indicating potential changes in ATP production between the high and low RFI lines. Evidence of this shift was seen with the in-crease in ATP synthase β subunit in the low-RFI line (23–37%; P < 0.05). This increase could indicate either an increase in ATP production or the ability to produce more ATP. Altogether, these data show that selection for low RFI and improved feed efficien-cy may partially be explained by differences in ROS production, ATP synthesis efficiencies, and the mitochondria protein profile. Supported by USDA AFRI grant no. 2010–65206–20670
Key Words: 2D-DIGE, protein profile, residual feed intake
110 Gene expression profiling of longissimus dorsi and adipose tissue in pigs with differing postweaning growth rate. C. M. Pilcher*, C. K. Jones, M. Schroyen, A. J. Severin, J. F. Patience, C. K. Tuggle, J. E. Koltes, Iowa State University, Ames.
Weaning transition is a stressful event in the pig’s life. While most pigs recover rapidly from this stressor, a portion of the population lags behind their contemporaries in growth perfor-mance. The underlying biological and molecular mechanisms involved in postweaning differences in growth performance are poorly understood. The objective of this experiment was to use transcriptional profiling of skeletal muscle and adipose tissue to develop an understanding of the possible metabol-ic basis for poor weaned-pig transition. A total of 1054 pigs were reared in commercial conditions and weighed at birth, weaning, and 3 wk postweaning. Transition ADG (tADG) was calculated as the average daily gain for the 3-wk period postweaning. Nine pigs from the lowest 10th percentile (low tADG) and the 60th to 70th percentile (high tADG) were harvested at 3 wk postweaning. Total RNA was extracted from longissimus dorsi muscle (LM) and subcutaneous adi-pose tissue and transcriptional profiles of both tissues were developed using RNaseq. Statistical analysis of RNaseq read counts were performed using the QuasiSeq package in R. The model included the effects of tADG, parity, and birth weight. The Storey-Tibshirani method was used to correct for mul-tiple testing and to calculate a q-value estimating false dis-covery rate. In LM, 622 genes were differentially expressed (317 with higher expression in low tADG and 305 with higher expression in high tADG pigs; q £ 0.10, fold change ³ 1.2). There were no differentially expressed transcripts in adipose tissue. To identify biological functions potentially underly-ing the effects of tADG on skeletal muscle metabolism and physiology, functional annotation analysis of the differentially expressed genes was conducted using DAVID analytic tools. Genes with higher expression in low tADG LM produced 3 enriched clusters of biological function terms including pro-tein catabolic processes, ubiquitin-dependent protein catabo-lism, and regulation of translational initiation (enrichment score ³ 1.3; P < 0.05). Genes with higher expression in LM of high tADG pigs produced 6 significant annotation clusters related to muscle contraction, the glycolysis pathway, cyto-skeleton organization, muscle development, and blood vessel development (enrichment score ³ 1.3; P < 0.05). These re-sults indicate a shift to decreased protein synthesis, increased protein degradation, and reduced glucose metabolism in the LM of low tADG. Many of the gene expression differences between poor transitioning pigs and their contemporaries may be related to low availability of energy and amino acids in low tADG pigs.
Key Words: pig, postweaning growth, RNaseq
49
111 Dietary L-arginine supplementation enhance myofiber hyperplasia. G. Bee1,*, C. E. Pardo1, M. Kreuzer2, 1Agroscope, Posieux, Switzerland, 2ETH Zurich, Zurich, Switzerland.
Supplementing the gestation diet with L-arginine positively affects primary myofiber hyperplasia in the semitendinosus muscles (STM) of 75-d-old fetuses. Because primary fibers serve as a scaffold for secondary fiber formation, we hypoth-esized that offspring from sows fed extra arginine bare the potential for greater secondary fiber hyperplasia. Impaired fiber hyperplasia is observed especially in piglets subjected to intrauterine growth retardation and/or intrauterine crowd-ing. Therefore, the goal of this experiment was to establish if arginine supplementation of the dams has a positive effect on muscle development of their low birth weight offspring. For the experiment 5 intact (I), 5 unilaterally hysterectomized–ovariectomized (HO), and 5 unilaterally ovariectomized (OL) sows were subjected to a crossover design in terms of diets (parities 5 and 6). From d 14 to 28 of gestation they were either offered 25 g/d of L-arginine (Arg) in addition to the standard gestation diet or they received the corresponding control diet (C). At farrowing, from each litter, 2 female and 2 male piglets with the lowest and medium birth weight were sacrificed. Internal organs and the STM were collected and weighed. Histological analyses of muscles were performed using mATPase staining after preincubation at pH 4.5 and 10.2. Compared to OL, progeny from OH and I sows had lower (P < 0.05) relative weights of liver (2.90 vs. 2.33; 2.30), kidney (0.84 vs. 0.73; 0.72), and STM (2.30 vs. 2.09; 1.95) and a greater (P < 0.05) brain-to-liver ratio (0.80 vs. 1.25; 1.46). The latter is also known as brain sparing and is indica-tive of intrauterine growth retardation. Independent of the sow group, brain-to-liver ratios (1.12 vs. 1.22) tended (P < 0.08) to be lower in offspring from Arg compared to C sows, which suggest that L-arginine supplementation alleviated the effect of intrauterine growth retardation. Supplying Arg to I and OL but not OH sows instead of C resulted in greater myofiber hyperplasia and larger muscle area. These differences resulted mainly from a greater myofiber number in the light portion (3.50 vs. 3.24 × 10⁵; P < 0.05) of the muscle. The current find-ing confirms previous assumptions that arginine supply dur-ing early gestation positively affects muscle formation.
Key Words: L-arginine, myofiber hyperplasia, pig
112 Effects of feeding distillers grains in a yearling beef system on meat quality. K. M. Sudbeck1,*, J. C. MacDonald1, C. R. Calkins2, G. E. Erickson1, T. P. Carr1, K. Varnold2, 1University of Nebraska-Lincoln, Lincoln, 2University of Nebraska, Lincoln.
Distillers grains fed in a yearling beef production system were evaluated to determine the effects of lifetime exposure to distillers grains on meat quality characteristics. Crossbred
heifers (n = 229; initial BW = 225 ± 2 kg) were used in a randomized block design in a 2 × 2 × 2 factorial arrangement of treatments. Factors included winter supplementation while grazing corn stalks with modified distillers grains (MDGS) at either 0.91 kg (LW) or 2.3 kg (HW) on a DM basis, sum-mer grazing supplementation with dry distillers grains at 0.6% BW (SS) on a DM basis daily or no supplementation (NS), and finishing diet containing either 40% Sweet Bran (SBF) or 40% MDGS (DGF) on a DM basis. Heifers were strati-fied by BW and randomly assigned to treatment before start of each phase within previous treatments. Choice grade strip loins (n = 12) were collected from each of the 8 treatments. After 7 d postmortem aging, strip loins were fabricated into 2.5 cm thick steaks. Discoloration scores were determined during 7 d retail display by a 5-member panel. The remaining strip loin was aged an additional 14 d before fabrication was repeated. The HW supplementation increased discoloration 15% compared to LW supplementation (P < 0.01). Summer supplementation interacted with finishing diet (P = 0.01), with SS increasing discoloration by 30% within SBF (P = 0.01) but no differences between SS or NS in steaks from DGF cattle (P = 0.95). Finishing diet had no effect (P > 0.10) on discoloration scores for retail d 1 through 5 and d 1 through 3 for steaks aged 7 and 21 d, respectively; however, scores increased for the DGF (P < 0.01) compared to SBF on d 6 through 7 and d 4 through 6 for steaks aged 7 and 21 d, respec-tively. Winter supplementation interacted with finishing diet within SBF, with HW causing fatty acid 18:2 and total poly-unsaturated fatty acids concentrations on a weight percentage basis to increase 21% and to increase 19% (P = 0.02 and 0.01, respectively) but no observed differences in DGF steaks (P = 0.43 and 0.33, respectively). Supplementing with DGS before finishing was not additive in impacting the color stability and overall shelf life of retail beef when finished using MDGS; however, polyunsaturated fatty acids from MDGS fed during the backgrounding phase can affect beef quality.
Key Words: beef, distillers grains, shelf life
113 Differential expression of Cyclin G2, Cyclin dependent kinase inhibitor 2C, and peripheral myelin protein 22 genes during adipogenesis. J. Zhang*, Y. Suh, Y. M. Choi, M. E. Davis, K. Lee, The Ohio State University, Columbus.
Increasing numbers of fat cells in adipose tissue are attributed to proliferation of preadipocytes or immature adipocytes in the early stages as well as adipogenic differentiation in the later stages of adipogenesis. Although both events are in-volved in the increase in fat cell numbers, they are contrary to each other in that the former requires cell cycle activity whereas the latter requires cell cycle withdrawal. Therefore, appropriate regulation of cell cycle inhibition is critical to adi-pogenesis. To explore the important cell cycle inhibitors and study their expression in adipogenesis, a strategy was adopted
50
that combined the Gene Expression Omnibus (GEO) database on the NCBI website and the results of quantitative real-time PCR (qPCR) analysis of porcine adipose tissue. Three cell cycle inhibitors—Cyclin G2 (CCNG2), Cyclin-dependent ki-nase inhibitor 2C (CDKN2C), and Peripheral Myelin Protein (PMP22)—were selected for study because they are relatively highly expressed in adipose tissue compared to muscle, heart, lung, liver, and kidney in humans and mice based on 2 Gene Expression Omnibus Datasets (GDS596 and GDS3142). These genes were found to be more highly expressed in dif-ferentiating/differentiated preadipocytes than in undifferen-tiated preadipocytes in humans and mice as shown by the GDS2366 and GDS2743 datasets, respectively. In addition, the GDS2659 dataset also suggested increasing expression of the 3 cell cycle inhibitors during differentiation of 3T3-L1 cells. Further study with qPCR in Landrace pigs did not confirm the high expression of these genes in adipose tissue compared to other tissues in market-age pigs but confirmed greater expression of these genes in fat cells than in the stro-mal vascular fraction as well as increasing expression of these genes during in vitro adipogenic differentiation and in vivo development of adipose tissue. Moreover, the expression of all 3 genes was reduced by short-term fasting in market-age pigs but was not restored by short-term refeeding. Based on the analysis of the GEO datasets and qPCR results, we con-clude that all 3 cell cycle inhibitors may inhibit adipocyte proliferation but promote adipocyte differentiation and hold a differentiated state by inducing and maintaining cell cycle inhibition. Therefore, their expression in adipose tissue is positively correlated with age and number of mature fat cells. By regulating expression of these genes, we may be able to control the number of fat cells and, thus, reduce excessive fat tissue in animals and humans.
Key Words: adipogenesis, cell cycle inhibitors, gene expression
114 Lysozyme as an alternative to antibiotics improves growth performance and tumor necrosis factor-α levels during an indirect immune challenge. W. T. Oliver1,*, J. E. Wells1, C. V. Maxwell2, 1USDA/ARS U.S. Meat Animal Research Center, Clay Center, NE, 2University of Arkansas, Fayetteville.
Lysozyme is a 1,4-β-N-acetylmuramidase that has antimicro-bial properties. The objective of this study was to determine the effect of lysozyme and antibiotics on growth performance and immune response during an indirect disease challenge. Two replicates of 720 pigs each were weaned from the sow at 24 d of age, blocked by litter and gender, and then ran-domly assigned to one of 24 pens in either a nursery room that had been fully disinfected or a nursery room left unclean since the previous group of pigs. Within a room, pigs were randomly assigned to either control diets (C; 2 phase nurs-ery regime), control diets + antibiotics (A; chlorotetracycline/
Denegard), or control diets + lysozyme (L; 500 mg/kg diet). Pig weights and feed disappearance were measured and blood was collected on d 0, 14, and 28 of treatment. A group of 20 pigs were killed at 24 d of age for initial body composition analysis and 10 pigs of median weight were killed per diet room combination for body composition analysis after 28 d of treatment. A and L fed pigs grew at a faster rate for the 28 d study (318 ± 14 and 320 ± 15 vs. 288 ± 15 g/d, respectively; P < 0.05), regardless of immune status (P > 0.05). The indirect immune challenge did not alter growth performance from d 0 to 14 of treatment but decreased ADG from d 14 to 28 of the study (415 ± 15 vs. 445 ± 13; P < 0.05). Feed intake was not altered by the immune challenge (P > 0.61) or dietary treat-ments (P > 0.10), but feed efficiency was worsened by the indirect immune challenge (P < 0.05) and improved by both A and L diets (P < 0.01). The immune challenge did not alter body composition (P > 0.68), but both A and L decreased, as a proportion, the amount of whole-body lipid (P < 0.01). How-ever, diet did not affect whole body protein composition (P = 0.19). Interleukin-6 was not altered by dietary treatment (P > 0.14) or immune status (P > 0.51) at the initiation of treatment and was undetectable on d 14 and 28. However, TNFα was increased in the immune challenged pigs (166 ± 8 vs. 135 ± 7 pg/mL; P < 0.01). TNFα was similar at d 0 of treatment but lower in both A and L fed pigs on d 14 (P < 0.01) and 28 (P < 0.01) of treatment. Thus, lysozyme or antibiotics improve pig performance during an indirect immune challenge. USDA is an equal opportunity provider and employer.
Key Words: antibiotics, lysozyme, swine
115 Interactive effects of gestational heat stress, Paylean, and lysine improve carcass and pork quality. Z. D. Callahan*, T. A. Wilmoth, M. C. Shane, T. J. Safranski, B. R. Wiegand, University of Missouri, Columbia.
In utero heat stress is known to alter postnatal growth perfor-mance; however, little is known about its effects on carcass and pork quality. Therefore, the objective was to determine the effects of in utero heat stress, excess lysine, and Paylean on carcass and pork qualities of barrows. At 25 kg, barrows of control (TN; n = 40) or heat-stressed (HS; n = 40) dams were individually housed and fed a corn–soybean meal diet. At this time, barrows were equally and randomly assigned to receive a diet that met (100%; n = 20) or exceeded (110%; n = 20) NRC lysine requirements. In the last 30 d of finishing, barrows were again equally and randomly assigned to a diet containing 0 (CTL; n = 10) or 7.4 ppm Paylean (PAY; n = 10). Diets were fed until 121 kg of weight was attained. Carcass quality measures were recorded and a chop was used to de-termine pork quality measures. PAY increased HCW (100.24 ± 1.19 vs. 99.36 ± 1.18 kg; P = 0.02), LEA (54.89 ± 1.05 vs. 48.85 ± 1.04 cm2; P < 0.01), pH (5.62 ± 0.02 vs. 5.56 ± 0.01; P = 0.01), LEAN (53.82 ± 0.48 vs. 53.56 ± 0.49%; P = 0.01),

51
and SF (4.73 ± 0.16 vs. 3.94 ± 0.16 kg; P < 0.01) and reduced b* (8.15 ± 0.19 vs. 8.66 ± 0.18; P = 0.05). HS barrows tended to have increased LEA (53.07 ± 1.06 vs. 50.66 ± 1.04 cm2; P = 0.10) and lighter subjective color scores (2.10 ± 0.09 vs. 2.35 ± 0.09; P = 0.06). PAY 110% barrows had reduced 10th rib back fat (P = 0.04) compared to CTL 110% barrows (20.16 ± 1.26 vs. 23.94 ± 1.23). 110% PAY barrows had greater LEAN compared to 100% CTL, 110% CTL, and 100% PAY barrows (54.61 ± 0.71 vs. 52.16 ± 0.69, 51.48 ± 0.69, and 52.51 ± 0.69%; P < 0.05). Pork chops from HS 100% barrows had less (P = 0.02) cook loss than chops from TN 100% barrows (21.64 ± 0.94 vs. 24.85 ± 0.94%). HS 100 PAY barrows were firmer (P = 0.05) than HS 110 PAY barrows (2.50 ± 0.22 vs. 1.89 ± 0.23). Heat stress during gestation, Paylean, and lysine have little impact on quality measures alone. However, the interactive effects of the treatments improved quality, reduc-ing 10th rib back fat and increasing LEAN and firmness and reducing cook loss of pork chops.
Key Words: carcass quality, heat stress, pork quality, ractopamine
116 In utero heat stress negatively affects the growth performance of barrows. T. A. Wilmoth*, Z. D. Callahan, M. C. Shane, T. J. Safranski, B. R. Wiegand, University of Missouri, Columbia.
In utero heat stress can alter fetal development and postna-tal growth. Heat stress has been known to affect piglet birth weight, which can affect growth performance, resulting in more days on feed and lighter weights at slaughter. Therefore, the objectives of this work were to determine the effects of in utero heat stress and excess dietary lysine and Paylean on growth performance of barrows. At 25 kg, barrows of con-trol (TN; n = 40) or heat-stressed (HS; n = 40) dams were individually housed and fed a corn–soybean meal diet. At this time, barrows were equally and randomly assigned to receive a diet that met (100% NRC; n = 20) or exceeded (110% NRC; n = 20) NRC lysine requirements. In the last 30 d of finish-ing, barrows were again equally and randomly assigned to a diet containing 0 (CTL; n = 10) or 7.4 ppm Paylean (PAY; n = 10). Diets were fed until 121 kg of weight was attained. Weight, average daily gain (ADG), feed disappearance (FD), feed efficiency (G:F), and liver weight were recorded. At 1 wk of age, HS barrows were heavier (2183.00 ± 60.48 vs. 1999.01 ± 59.66 g; P = 0.03). In the late finisher phase, PAY barrows were heavier (125.96 ± 0.89 vs. 129.00 ± 0.89 kg; P = 0.05). In both the grower (P = 0.04) and finisher (P = 0.05) phases, FD was greater in HS barrows (2.22 ± 0.05 vs. 2.08 ± 0.05 and 3.29 ± 0.08 vs. 3.00 ± 0.08, respectively). In the grower phase, G:F tended to be greater (P = 0.08) in TN bar-rows (0.40 ± 0.01 vs. 0.38 ± 0.01) and was greater (P = 0.003) in 100% NRC barrows (0.40 ± 0.01 vs. 0.38 ± 0.01) while FD was reduced (P = 0.02) in 110% NRC barrows (2.07 ± 0.05 vs. 2.23 ± 0.05). In the finisher phase, PAY barrows had
improved (P < 0.0001) G:F (0.36 ± 0.01 vs. 0.28 ± 0.01) and (P < 0.0001) ADG (0.96 ± 0.04 vs. 0.75 ± 0.04 kg/d). Liver weight was increased (P = 0.05) in 110% NRC barrows (1.49 ± 0.02 vs. 1.42 ± 0.02 kg). Barrows exposed to heat stress during gestation have increased FD but reduced weight at fin-ishing. Supplementation with excess lysine and Paylean offer benefits during finishing and may help overcome the negative effects of gestational heat stress.
Key Words: growth performance, heat stress, ractopamine
NONRUMINANT NUTRITION: GROW–FINISH MANAGEMENT AND NUTRITION
117 Comparison of the lysine requirement of immunologically versus physically castrated male pigs. A. J. Elsbernd1,*, C. F. M. de Lange2, K. J. Stalder1, J. F. Patience1, 1Iowa State University, Ames, 2University of Guelph, Guelph, ON, Canada.
Replacement of physical castrates (PC) with immunological castrates (IC) requires review of feeding programs for male pigs, especially amino acid requirements. The objective of this study was to compare the SID lysine requirement of IC versus PC during three growth phases. One hundred fifty IC and PC (PIC 359 × C29) were allotted based on initial BW to one of six blocks. Initial BW for each phase were 30.0 ± 0.8, 64.7 ± 1.4, and 111.9 ± 1.9 kg for IC and 32.4 ± 0.6, 69.8 ± 1.0, and 114.5 ± 1.3 kg for PC. Phase performance was monitored during a 5 wk period for phases 1 and 3 and a 4 wk period for phase 2. Pens always remained at the same SID lysine treat-ment percentage throughout each of the three phases. Injec-tions of a GnRF analog (Improvest®, Zoetis Inc., Florham Park, NJ) were administered at 11.5 and 19 wk of age; phase 3 commenced 2 wk after the second injection to avoid the pe-riod of rapidly changing feed intake. Diets were based on corn, soybean meal, and synthetic amino acids to meet the projected lysine requirement and 5% above requirement of other essen-tial amino acids. Treatment SID lysine levels were set at 80, 90, 100, 110, and 120% of the projected requirement for each gender, based on previous performance and the NRC (2012) modeling program. The relative lysine contributions of lysine from soybean meal and synthetic lysine were held constant within each dietary phase for each gender. A one slope broken line regression model was used to determine lysine require-ment, based on breakpoint analyses. The SID lysine require-ment of IC for phases 1, 2, and 3 based on ADG were 1.03, 0.89, and 0.55% and based on GF were 0.99, 0.72, and 0.55%. The SID lysine requirement of PC for phases 1, 2, and 3 based on ADG were 0.85, 0.62, and 0.47% and based on GF were 0.86, 0.58, and 0.47%. Averaging these data, the SID lysine requirement of IC are 1.01, 0.81, and 0.55% and of PC 0.86,

52
0.60, and 0.47% for phases 1, 2, and 3, respectively. In conclu-sion, the lysine requirements of IC are greater than PC (117, 135, and 117% for phases 1, 2, and 3, respectively), even af-ter the second injection, when IC pigs are believed to become physiologically similar to PC pigs.
Key Words: immunological castration, lysine, pigs
118 Effects of reducing the particle size of corn on growth performance and carcass characteristics of growing–finishing pigs. O. J. Rojas*, H. H. Stein, University of Illinois at Urbana-Champaign, Urbana.
In a previous experiment it was shown that the ME of corn in-creases linearly as the particle size of corn is decreased from 865 to 339 µm and it was hypothesized that addition of dietary lipids can be reduced if corn particle size is reduced without affecting growth performance and carcass characteristics of growing–fin-ishing pigs. Seventy-two individually housed pigs, 36 gilts and 36 barrows (initial BW: 32.00 ± 1.58 kg), were allotted to 4 di-etary treatments in a 2 × 4 factorial design with sex (gilts and barrows) and corn particle size (i.e., 339, 485, 677, and 865 µm) as factors. There were 18 pigs per treatment. Pigs were fed a 3 phase program with phase 1 diets being offered from 32 to 62 kg, phase 2 diets from 62 to 94 kg, and phase 3 diets from 94 to 130 kg. Within each phase, 4 corn–soybean meal based diets were formulated, and the only difference among diets was that the corn that was used was ground to the 4 specified particle siz-es and soybean oil was added to the diets in increasing amounts to compensate for the reduction of ME in corn with greater par-ticle size. Within each phase, all diets were formulated to con-tain equal quantities of ME per kilogram. Results indicated that initial BW, final BW, ADFI, and ADG were not different among treatments. For barrows, no differences in G:F were observed, but for gilts, the G:F increased (linear, P < 0.05) as the particle size increased (sex × particle size interaction: P < 0.05). Hot car-cass weight, back fat, loin eye area, and lean percentage were not different among treatments, but dressing percentage decreased (linear, P < 0.01) as particle size increased. The pH in contents of the cecum and the colon decreased (linear, P < 0.01) but con-centration of short chain fatty acids in colon contents increased (linear, P < 0.01) as corn particle size increased. In conclusion, by using corn ground to a smaller particle size, the amount of added fat can be reduced in the diets without affected ADFI, ADG, or G:F for barrows, but dressing percentage will increase if diets containing corn ground to a smaller particle size are used.
Key Words: corn, particle size, pigs
119 Prediction of loin, belly and jowl IV based on diet composition versus daily fatty acid intake. T. A. Kellner*, K. J. Prusa, J. F. Patience, Iowa State University, Ames.
Iodine value product (IVP) is used to predict carcass fat io-dine value (CIV). When higher fat diets are used, IVP tends to
emphasize the quantity of fat more than its composition. The objective of this experiment was to compare the effectiveness in predicting CIV by IVP vs. individual fatty acid content in the diet or their daily intake. Forty-two gilts and 21 barrows (PIC 337 × C22/29) with an average initial weight of 77.8 ± 0.38 kg were allotted based on sex and weight across 7 treat-ments: 3 or 6% of each of tallow (iodine value (IV) = 41.9), choice white grease (IV = 66.5), or corn oil (IV = 123.1) and a control corn–soy based with no added fat. Pigs were housed in-dividually to measure daily fatty acid intake. Adipose samples were collected from the jowl, loin, and belly at slaughter (d 55). Iodine value was determined using GC on diet and carcass lipid samples and averaged across the three locations. Data were analyzed using PROC MIXED (SAS 9.3) with treatment and sex as fixed effects and replicate as a random effect. PROC REG was used to compare the relationship between individual intakes of fatty acids and CIV and to compare the analyzed diet IVP vs. daily fatty acid intake on CIV. Increased daily intake of palmitic acid (CIV = 72.94– [0.06 × palmitic acid intake/d (g)]; R2 = -0.08, RMSE = 4.98) and stearic acid (CIV = 72.13– [0.14 × steraic acid intake/d (g)]; R2 = -0.12, RMSE = 5.07) were negatively correlated with CIV but with weak coefficients of determination (P < 0.05). Increased daily intake of oleic acid (CIV = 66.30 + [0.085 × oleic acid intake/d (g)]; R2 = 0.08, RMSE = 4.97) and linolenic acid (CIV = 62.55 + [3040.4 × linolenic acid intake/d (g)]; R2 = 0.26, RMSE = 4.45) were positively correlated with CIV but also had weak coef-ficients of determination (P < 0.05). Increased linoleic acid in-take (LAI) was positively correlated with CIV and generated a strong coefficient of determination (CIV = 60.58 + [0.121 × LAI/d (g)]; R2 = 0.611, P < 0.05, RMSE = 3.24). IVP of the experimental diets was approximately equal (CIV = 58.10 + (0.215 × IVP); R2 = 0.93, P < 0.05, RMSE = 1.45) to the treatment means of LAI (CIV = 58.57 + [0.139 × linoleic acid intake/d (g)]; R2 = 0.94, P < 0.05, RMSE = 1.37) as a predictor of CIV. Under these conditions, a CIV standard of 74 g/100 g can be met by limiting LAI to less than 111 g/d. Linoleic acid is clearly the fatty acid that most affects CIV, but LAI offers no significant improvement over IVP in predicting CIV.
Key Words: fat quality, iodine value, linoleic acid, swine
120 Regression analysis to predict growth performance from dietary net energy in growing–finishing pigs. S. Nitikanchana*, S. S. Dritz, M. D. Tokach, J. M. DeRouchey, R. D. Goodband, B. J. White, J. L. Nelssen, Kansas State University, Manhattan.
Dietary energy concentration is often altered to optimize pig growth performance and feed cost; therefore, an accu-rate prediction of growth performance as affected by feeding different energy concentrations is crucial. Data from 41 tri-als with multiple energy levels over pig’s average BW from 33 to 128 kg, extracted from 17 journal articles, 10 technical

53
memos, and a thesis, resulting in 285 observations were used in a meta-analysis. Nutrient and energy levels in all diets were estimated using the NRC (2012) ingredient library. A mixed model using experiment within trial as a random effect was used to develop a regression equations to predict ADG or G:F. Predictor variables examined for best fit models using AIC criteria included linear and quadratic terms of NE, average BW, CP, standardized ileal digestible (SID) Lys, crude fiber, NDF, ADF, fat, and ash, including their interactions. Initial best fit models included interactions between NE and CP or SID Lys. After removal of the observations (181) that fed SID Lys below the suggested requirement, these terms were no longer significant. Resulting best fit prediction equation for ADG was ADG (g) = [0.1135 × NE (kcal/kg)] + [8.8142 × average BW (kg)]– [0.05068 × average BW (kg) × average BW (kg)] + 276. Including dietary fat in the model with NE and average BW significantly improved G:F prediction model (-601 vs. -576 AIC) resulting in the best fit equation for G:F whereas G:F = [0.000096 × NE (kcal/kg)]– [0.0025 × average BW (kg)] + [0.003071 × Fat (%)] + 0.3257. The meta-analysis indicated that, as long as diets were adequate for other nutri-ents (i.e., Lys), dietary NE was adequate to predict changes in ADG across a wide variety of trials with different dietary ingredients and under different environmental conditions. The analysis indicated that ADG increased by 11 g/d for ev-ery 100 kcal/kg increase in dietary NE. Also, ADG increased with heavier average BW but decreased when average BW was above 87 kg. Furthermore, G:F improved with increasing dietary NE and fat and decreased with increasing BW. Includ-ing dietary fat improved the fit of the equation indicating that NE may underestimate the influence of fat on feed efficiency.
Key Words: growth performance, net energy, pig
121 Effect of two net energy feeding programs in combination with ractopamine on grow–finish pig growth performance and carcass characteristics. W. Steyn1,*, E. C. Allen2, C. A. P. Garbossa3, A. P. Schinckel2, J. M. Eggert4, B. T. Richert2, 1TOPIGS, Helvoirt, Netherlands, 2Purdue University, West Lafayette, IN, 3Federal University of Lavras, Lavras, Brazil, 4TOPIGS USA, Demotte, IN.
A total of 200 crossbred barrows (TOPIGS Tempo × TOPIGS 20) were blocked by BW (28.4 ± 0.02 kg), housed 5 barrows/pen, and randomly allocated to 1 of 4 treatments (10 pens/treatment) in a 2 × 2 factorial arrangement, with 2 net energy (NE) levels (Control vs. Low) and with or without 7.5 ppm ractopamine hydrochloride (RAC) during the last 21 d of a 105-d feeding trial. The objective was to evaluate pig perfor-mance to a decreasing net energy (NE) diet over the grow–fin-ish period to validate TOPIGS feeding models. Diets were fed in five 21-d phases. Control diets were corn–soybean meal–corn DDGS based and Low NE diets were created by adjust-ing inclusion rates of soybean hulls and wheat midds; ingre-
dient NE values were from NRC. Control NE levels (Mcal/kg) were 2.46, 2.45, 2.47, 2.50, 2.54, and 2.64 and Low NE levels were 2.46, 2.39, 2.37, 2.34, 2.32, and 2.39 (phase 1–5 and 5+RAC, respectively). Diets were formulated on an equal SID Lys:NE basis within phase and phase 5 RAC diets had increased amino acids compared to non-RAC diets. From d 0 through 84, Control fed pigs had great ADG (1.024 vs. 0.983 kg/d; P < 0.001), G:F (0.362 vs. 0.354; P < 0.009), and BW (114.4 vs. 111.0 kg; P < 0.001) than pigs fed Low NE diets but ADFI was similar (P < 0.14). During d 84 through 105, RAC increased (P < 0.0001) ADG and G:F whereas ADFI increased (P < 0.008) and G:F decreased (P < 0.03) in pigs fed Low NE diets. Overall, d 0 through 105, RAC increased (P < 0.001) ADG, G:F, and final BW whereas feeding Low NE decreased (P < 0.015) ADG, G:F, and final BW. Feeding RAC increased (P < 0.0001) carcass weight and carcass yield and Low NE diets decreased (P < 0.0003) carcass weights (100.6, 104.8, 95.3, and 101.0 kg; Control, Control+RAC, LowNE, and LowNE+RAC, respectively) and yields (75.2, 76.1, 73.8, and 74.6%; Control, Control+RAC, LowNE, and LowNE+RAC, respectively). Both RAC and Low NE diets increased (P < 0.006) carcass belly iodine values. Overall NE utilization efficiency for live BW gain was greater for Low NE (P < 0.04) and RAC (P < 0.0001) diets (0.1374, 0.1444, 0.1402, and 0.1471 kg/Mcal; Control, Control+RAC, LowNE, and LowNE+RAC, respectively). However, NE ef-ficiency to carcass weight was only improved (P < 0.0001) by RAC (0.1029, 0.1102, 0.1023, and 0.1092 kg/Mcal; Control, Control+RAC, LowNE, and LowNE+RAC, respectively). Low NE diets reduced growth and carcass performance, but feeding RAC improved performance regardless of dietary NE, and NE conversion to carcass weight was similar between NE diets and was improved by feeding RAC.
Key Words: grow–finish pig, net energy, ractopamine
122 Effect of β-mannanase and lysine level during ractopamine feeding 35 d before marketing on growth performance and carcass characteristics of finishing pigs. M. D. Asmus1,*, K. D. Haydon2, T. A. Marsteller2, J. E. Ferrel2, B. T. Richert1, 1Purdue University, West Lafayette, IN, 2Elanco Animal Health, Greenfield, IN.
Crossbred pigs (343) were blocked by ancestry, sex, and ini-tial BW (97.3 kg) and allocated to mixed gender pens (5 or 6 pigs/pen) to 5 treatments with 10 or 12 pens/treatment. Di-etary treatments included 1) low lysine (0.80% SID Lys; LL), 2) LL+mannanase (0.08 MU/kg), 3) high lysine (0.95% SID Lys; HL), 4) HL+mannanase (0.08 MU/kg), and 5) As treat-ment 3 + 3% CWG (CWG). Diets were corn–soy based (LL and HL = 3335 and CWG = 3517 kcal ME/kg) and contained 7.5 ppm ractopamine. One pig/pen was harvested on d 7 and 21, with remaining pigs harvested on d 35. For d 0 through 7, 7 through 21, and 0 through 35, pigs fed the HL diets tended
54
(P < 0.10) to have greater G:F than pigs fed LL diets. For d 21 through 35 (P < 0.09) and 0 through 35 (P < 0.04), pigs fed LL diets had greater ADFI than pigs fed HL diets. Pigs fed enzyme had increased ADFI (P < 0.05) d 21 through 28 and tended (P < 0.10) to have improved ADG (984 vs. 937 g/d) from d 21 through 35. For all time periods, pigs fed the CWG diet had greater G:F (P < 0.02), during d 21 through 35 and 0 through 35 had greater ADG (P < 0.04), and for periods 7 through 21 (P < 0.01) and 0 through 35 (P < 0.07) had reduced ADFI compared to pigs fed the HL diet. Pigs harvested on d 7 fed enzyme diets had increased (P < 0.02) carcass yield and tended to have increased (P < 0.06) loin depth. Pigs fed LL diets had increased (P < 0.05) backfat (BF) depth compared to pigs fed HL diets on d 7. Pigs fed HL diets harvested on d 21 had reduced (P < 0.01) BF depth and increased (P < 0.02) percent lean versus pigs fed LL diets; pigs fed CWG had in-creased (P < 0.02) BF depth d 21 and d 35 and reduced (P < 0.03) percent lean d 21 compared to pigs fed the HL diet. Overall, pigs fed HL diets had reduced (P < 0.03) BF depth and increased (P < 0.06) percent lean when compared to pigs fed LL and CWG diets. In conclusion, pigs fed HL diets had reduced ADFI but improved G:F compared to pigs fed LL di-ets, which was further enhanced by addition of fat to treatment 3. Pigs fed mannanase numerically improved growth rate by 5% and G:F by 3% the last 2 wk of the study, with a greater response in the low lysine diets (ADG: 7.8%, d 21–35, 3.1% overall and G:F: 5.5%, d 21–35), which may warrant further study in ractopamine diets.
Key Words: lysine, mannanase, ractopamine
123 Effects of corn particle size and diet form on finishing pig growth performance and carcass characteristics. J. E. Nemechek1,*, M. D. Tokach1, K. F. Coble1, C. W. Hastad2, J. M. DeRouchey1, S. S. Dritz1, R. D. Goodband1, 1Kansas State University, Manhattan, 2New Fashion Pork, Jackson, MN.
A total of 960 pigs (PIC TR4 × Fast Genetics York-AND × PIC Line 02; initially 34.3 kg BW) were used in a 101-d trial to determine the effect of corn particle size and diet form on finishing pig growth performance and carcass characteristics. There were 8 pens per treatment and 20 pigs per pen. Treat-ments were arranged in a 2 × 3 factorial with main effects of diet form and particle size. Diet forms were meal or pellet.
Particle sizes were 650 µ, 350 µ, or an equal blend of the 650 µ and 350 µ ground corn. Diets were fed in 4 phases with the same corn–soybean meal–based diet containing 30% dried distillers grains with solubles (DDGS) (Phases 1 to 3) or 15% DDGS (Phase 4) used for all treatments. Overall (d 0 to 101), linear diet form × particle size interactions were observed (P < 0.02) for ADFI and G:F due to ADFI decreasing and G:F increasing as particle size was reduced for pigs fed meal diets but not for pigs fed pelleted diets. Pigs fed pelleted diets had increased (P < 0.001) ADG, G:F, and HCW compared with pigs fed meal diets. As corn particle size decreased, ADG and ADFI decreased (linear, P < 0.02). Carcass yield, backfat, and loin depth were not influenced (P > 0.26) by particle size or diet form. In summary, pigs fed pelleted diets had improved growth performance compared with those fed meal diets, with the greatest improvement in G:F observed when diets con-tained the coarsest ground (650 µ) corn. Feed efficiency im-proved as corn particle size decreased for pigs fed meal diets but not for those fed pelleted diets.
Key Words: particle size, pig, pellets
124 In utero heat stress alters body composition during the early finishing phase (60 to 80 kg) in pigs. J. S. Johnson1,*, M. V. Sanz Fernandez1, J. F. Patience1, J. W. Ross1, N. K. Gabler1, M. C. Lucy2, T. J. Safranski2, R. P. Rhoads3, L. H. Baumgard1, 1Iowa State University, Ames, 2University of Missouri, Columbia, 3Virginia Tech, Blacksburg.
The detrimental effects of heat stress (HS) on animal produc-tivity have been well documented. However, whether gesta-tional HS interacts with a future environmental insult to alter tissue deposition during the early finishing phase in pigs is unknown. Study objectives were to compare the subsequent rate and quantity of tissue accretion in finisher pigs exposed to differing in utero and postnatal thermal environments. Pregnant gilts were exposed to thermal neutral (TN; cycli-cal 15°C nighttime and 22°C daytime; n = 9) or HS (cyclical 27°C nighttime and 37°C daytime; n = 11) conditions during the entire gestation. Twenty-four offspring from gestational TN (GTN; n = 6 gilts and 6 barrows; 62.4 ± 0.7 kg BW) and gestational HS (GHS; n = 6 gilts and 6 barrows; 61.9 ± 0.8 kg BW) gilts were euthanized as part of an initial slaughter group (ISG). After the ISG, 48 pigs from GTN (n = 12 gilts and 12
Table 123.
Diet form: Meal Pellet
SEMParticle size: 650 µ50% 650 µ + 50% 350 µ 350 µ 650 µ
50% 650 µ + 50% 350 µ 350 µ
ADG, kg 0.90 0.89 0.86 0.94 0.93 0.92 0.010ADFI, kg 2.41 2.37 2.26 2.35 2.37 2.35 0.030G:F 0.372 0.375 0.382 0.399 0.392 0.391 0.003HCW, kg 88.6 89.5 87.7 93.1 92.3 90.4 0.915Yield, % 74.1 74.3 74.6 74.5 74.4 74.3 0.402Backfat, mm 15.7 15.8 15.8 16.4 15.7 16.4 0.411Loin depth, mm 66.6 65.5 66.1 66.3 67.2 65.3 1.037Lean, % 55.6 55.2 55.3 55.2 55.9 55.1 0.326
55
barrows; 66.1 ± 1.0 kg BW) and GHS (n = 12 gilts and 12 bar-rows; 63.4 ± 0.7 kg BW) were exposed to constant HS (34.4 ± 1.8°C) or TN (22.7 ± 2.5°C) conditions until they reached 80.5 ± 1.5 kg BW, at which point they were sacrificed and chemical body composition determined. Homogenized carcasses were analyzed for N, crude fat, ash, water, and gross energy con-tent. Data were analyzed using PROC MIXED in SAS 9.3. Rectal temperature and respiration rates were increased dur-ing postnatal HS compared to TN (39.6 vs. 39.3°C and 92 vs. 58 bpm, respectively; P < 0.01). Postnatal HS decreased (P < 0.01) feed intake (19.4%) and ADG (0.70 vs. 0.94 kg/d) com-pared to TN conditions, but neither variable was influenced by gestational environment. Protein and adipose tissue accretion rates were reduced in HS pigs compared to TN controls (126 vs. 164 g/d and 218 vs. 294 g/d, respectively; P < 0.04). In utero HS independently reduced protein accretion (16%; P < 0.01) and increased adipose accretion rates (292 vs. 220 g/d; P < 0.07) compared to GTN in the finisher phase. The ratio of adipose to protein accretion rates increased (95%; P < 0.01) in pigs experiencing GHS compared to GTN. In summary, pigs from GHS use epigenetic mechanisms that impact the future hierarchy of tissue accretion and this altered nutrient partition-ing favors adipose tissue deposition at the expense of skeletal muscle during this phase of growth.
Key Words: epigenetics, heat stress, tissue accretion
125 Evaluation of prediction equations to estimate the concentration of GE, DE, and ME content of corn dried distillers grains with solubles (DDGS) based on variable chemical composition for growing pigs. P. E. Urriola1,*, M. Li1, B. J. Kerr2, G. C. Shurson1, 1University of Minnesota, Saint Paul, 2USDA- ARS, Ames, IA.
The objective of this study was to cross-validate prediction equations developed to estimate the concentration of GE, DE, and ME for growing pigs among sources of corn distillers dried grains with solubles (DDGS) with variable chemical composi-tion. Concentrations (DM basis) of GE, CP, ether extract (EE), NDF, and total dietary fiber (TDF) along with particle size (PS; µm), bulk density (BD; g/cm3), and in vivo determinations of DE and ME from 45 sources of DDGS samples were obtained from 5 published studies. Prediction equations for GE (5 equa-tions), DE (20 equations), and ME (19 equations) from these 5 studies were used to calculate the concentration of GE, DE, and ME among DDGS sources and compare these estimates with experimentally determined in vivo values. Each equation was evaluated using the entire data set, and data sets that excluded data from which the equations were developed (cross-valida-tion). Equations were compared for their overall variance (R2), precision based on reduced prediction error (PE), and accuracy based on deviation of predicted means from overall observed means (bias). Prediction of GE concentration among DDGS sources was poor (PE < 200 kcal/kg DM and biases > 150 kcal/
kg DM), despite a moderate explanation of the variance (R2 < 0.6). Therefore, we tested DE and ME equations that included GE as an input using actual GE values. Under this condition, the most precise (PE = 144 kcal/kg DM) and accurate (bias = 19 kcal/kg DM) DE equation was DE = -2,161 + (1.39 × GE)– (20.7 × NDF)– (49.3 × EE). The most precise (PE = 149 kcal/kg DM) and accurate (bias = -82 kcal/kg DM) ME equa-tion was ME = -261 + (1.05 × GE)– (7.89 × CP) + (2.47 × NDF)– (4.99 × EE). Predicting GE with equation GE = 4583 + (50.6 × EE)– (0.1 × PS), and using this estimate in the equation of ME = -261 + (1.05 × GE)– (7.89 × CP) + (2.47 × NDF)– (4.99 × EE) resulted in moderate precision (PE = 134 kcal/kg DM) and accuracy (bias = 48 kcal/kg DM). Cross-validation of equations that require PS, BD, or TDF as inputs was not pos-sible because these variables were only measured in 1 of the 5 published studies used in this evaluation.
Key Words: distillers dried grains with solubles, energy, prediction equations
126 Effect of wheat middling and multiple enzyme products on growth performance and carcass characteristics in nursery and finisher pigs. T. C. Tsai1,*, H. J. Kim1, J. R. Bergstrom2, J. J. Chewning3, J. K. Apple1, C. V. Maxwell1, 1University of Arkansas, Fayetteville, 2DSM Nutritional Products, North America, Marshall, MO, 3Swine Research Services, Inc., Springdale, AR.
Nursery (Exp. 1; n = 288) and Grower (Exp. 2; n = 216) pigs, with an average BW of 6.39 ± 0.43 and 21.9 ± 0.8 kg), were blocked by initial BW and assigned to sex-balanced pens. Pens within a block were assigned randomly to 1 of 4 treat-ments with two basal diets (corn–SBM [CSBM] vs. corn–SBM–wheat middling [CSWM] with or without supplemental multiple enzyme products [MEP]). Dietary ME was greater in CSBM than CSWM diets (3.44 vs. 3.42, 3.32 vs. 3.28, and 3.33 vs. 3.27 kcal/kg for nursery phases [NP] 1, 2, and 3, re-spectively, 3.34 vs. 3.28 kcal/kg for grower phases [GP] 1 and 2, and 3.35 vs. 3.29 kcal/kg for finisher phases [FP] 1, 2, and 3) whereas dietary fat and SID lysine were constant within feeding phase. MEP (Roxazyme G2G [0.011%] + Ronozyme VP [0.017%] in NP; Ronozyme WX [0.017%] + Ronozyme VP [0.011%] in G; Ronozyme WX [0.028%] + Ronozyme A [0.028%] in F) were added at expense of corn. In NP-1, ADG and ADFI were 14 and 12% greater (P < 0.02) in CSWM- than CSBM-fed pigs whereas feeding nursery pigs MEP increased ADG and ADFI by 11 and 8% (P = 0.06). MEP improved G:F (12.5%) in CSBM-fed pigs but not in CSWM-fed pigs (MEP × base diet, P = 0.05). Conversely, MEP decreased ADG in CSBM-fed pigs and increased ADG in CSWM-fed pigs dur-ing NP-3 (MEP × base diet, P < 0.04) whereas ADG was less (P < 0.05) in CSWM-fed than CSBM-fed pigs during the GP. Supplemental MEP mitigated the effect of the CSWM diet on ADG during the FP (MEP × base diet, P £ 0.05), but ADFI
56
and G:F were similar among treatments during the FP. Feed-ing CSWM-based diets reduced (P < 0.05) dressing percent by 1.5% whereas MEP increased (P < 0.10) dressing percent by 0.7%. Also, MEP reduced (P < 0.02) fat depth by 8% and tended to increase (P < 0.10) carcass lean by 2%. Lastly, MEP improved LM depth 4.3% in CSWM-fed pigs but did not af-fect LM depth of CSBM-fed pigs (MEP × base diet, P < 0.10). Thus, supplemental MEP tended to mitigate the negative ef-fect of high dietary levels of wheat middling on ADG during the NP and FP but minimally affected the performance and carcass traits of CSBM-fed pigs.
Key Words: multiple enzyme products, pigs, wheat middling
127 Effect of Bacillus spp. direct-fed microbials on fecal VFA concentrations, growth performance, and carcass characteristics of growing–finishing pigs. N. W. Jaworski1,*, A. Owusu-Asiedu2, A. A. Awati2, H. H. Stein1, 1University of Illinois at Urbana-Champaign, Urbana, 2DuPont Industrial Biosciences- Danisco Animal Nutrition, Marlborough, Wiltshire, United Kingdom.
An experiment was conducted to determine effects of Bacil-lus spp. direct-fed microbials (DFM) on fecal VFA concen-trations, growth performance, and carcass characteristics of growing–finishing pigs. A total of 256 pigs (initial BW: 35.0 ± 3.7 kg) were randomly allotted to 1 of 4 dietary treatments in a randomized complete block design with 4 diets and 16 rep-licate pens per treatment. There were 3 experimental periods: grower, early finisher, and late finisher. Diets were based on corn, soybean meal, distillers dried grains with solubles, wheat middlings, corn germ, and soybean hulls and were formulated to be isocaloric and isonitrogenous (ME = 3116, 3143, and 3151 kcal/kg and SID Lys = 0.98, 0.85, and 0.67% for grower, early finisher, and late finisher diets, respectively). The 4 di-etary treatments were the control diet with no DFM and 3 ad-ditional diets containing 250 or 500 g/MT Bacillus spp. DFM or 500 g/MT of a different Bacillus spp. DFM (BAC). Pigs and feed were weighed at the start and end of each growing period, and ADG, ADFI, and G:F were determined. Fecal samples were collected at the end of the grower and late fin-isher periods and analyzed for VFA. At the end of the experi-ment, back-fat depth and loin eye area (LEA) were measured using ultrasound on pigs within the final 9 replicate pens per treatment and fat free lean (FFL) was calculated. Data were analyzed using the Mixed procedure of SAS. During the grow-ing period, pigs fed DFM containing diets had greater (P < 0.05) total fecal VFA concentrations (422.0, 457.4, 466.3, and 481.3 μg/g in diets 1–4, respectively) compared with pigs fed the control diet. Pigs fed the diet containing 250 g/MT BAC had greater (P < 0.05) ADG and final BW during the growing period compared with pigs fed the control diet. During the ear-ly finishing period pigs fed DFM containing diets had greater
(P < 0.05) ADG (0.87, 0.89, 0.90 and 0.91 kg/d in diets 1–4, respectively) and G:F (0.30, 0.31, 0.31, and 0.32 kg/kg in di-ets 1–4, respectively) compared with pigs fed the control diet. Pigs fed diets containing DFM had a 5.4 and 4.2% larger (P < 0.05) LEA and greater (P = 0.06) FFL, respectively, compared with pigs fed the control diet. In conclusion, Bacillus spp. DFM supplementation enhances fecal VFA concentrations, ADG, and G:F as well as increases carcass LEA and FFL in pigs fed diets containing multiple fiber sources.
Key Words: direct-fed microbials, lean accretion, pigs
128 Effect of dietary supplementation of the osmolyte betaine on growing pig performance and metabolic status during thermoneutral and heat-stressed conditions. S. M. Mendoza1,*, E. van Heugten1, R. D. Boyd2, 1North Carolina State University, Raleigh, 2The Hanor Company, Inc., Franklin, KY.
The present study was designed to evaluate the effects of di-etary supplementation of natural betaine on pig performance and metabolic status during thermoneutral and heat-stressed conditions. Pigs (n = 64; BW 39.0 ± 1.5) were assigned within weight blocks and sex to 1 of 8 treatments and housed in indi-vidual pens. Treatments consisted of 2 environmental temper-atures (thermoneutral conditions or heat stressed) and 4 lev-els of betaine (0, 0.10, 0.15, and 0.20%). Room temperatures followed a daily pattern with a low of 14 and a high of 21°C for the thermoneutral environment and a low of 28 and high of 35°C for the heat-stressed environment. Diets were corn–DDGS–soybean meal based (2.96 g SID lysine/Mcal ME) and were fed for 7 d (constant 21°C) before imposing temperature treatments. Respiration rate and rectal temperature were mea-sured on d 1, 2, 3, 7, 14, 21, and 28. Data were analyzed as a split plot design with weight block within temperature envi-ronment as whole plot and diet as split plot. Repeated mea-sures were analyzed as a split-split plot. Heat stress reduced ADG (0.710 vs. 0.822 kg/d; P = 0.005) for the 28-d period. During d 1 to 14, ADFI was decreased in pigs exposed to heat (1.718 vs. 2.250 kg/d; P < 0.001). During d 15 to 28, there was a quadratic effect of betaine on ADFI (1.998, 2.035, 2.160, and 1.964 kg/d for 0, 0.10, 0.15, and 0.20% betaine, respec-tively; P = 0.034) and ADFI was greater under heat-stressed conditions (2.093 vs. 1.985 kg/d; P = 0.044). Gain:feed was greater under heat-stressed conditions during d 1 to 14 (0.433 vs. 0.382; P = 0.018) and lower during d 15 to 28 (0.338 vs. 0.416; P = 0.02). Heat stress increased respiration rate and rectal temperature throughout the study (22 vs. 49 breaths/30 s; P £ 0.001 and 38.93 vs. 39.51°C; P = 0.015). Heat stress increased creatine phosphokinase (CPK), creatinine, hemo-globin, and hematocrit on d 3 and reduced urea N, BUN/cre-atinine ratio, P, Mg, amylase, monocytes, and eosinophils (P < 0.05). On d 28, heat stress increased globulin, CPK, creatine, Mg, amylase, monocytes, and eosinophils and reduced albu-min/globulin ratio, hemoglobin, and hematocrit (P < 0.05).
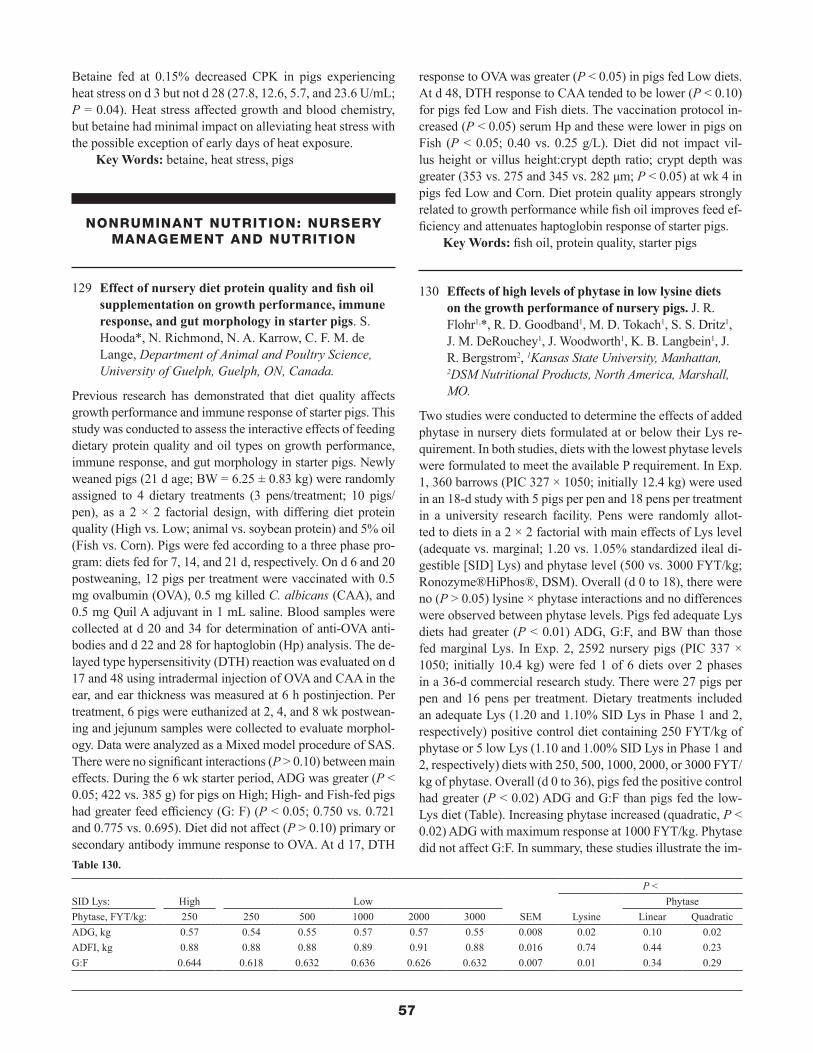
57
Betaine fed at 0.15% decreased CPK in pigs experiencing heat stress on d 3 but not d 28 (27.8, 12.6, 5.7, and 23.6 U/mL; P = 0.04). Heat stress affected growth and blood chemistry, but betaine had minimal impact on alleviating heat stress with the possible exception of early days of heat exposure.
Key Words: betaine, heat stress, pigs
NONRUMINANT NUTRITION: NURSERY MANAGEMENT AND NUTRITION
129 Effect of nursery diet protein quality and fish oil supplementation on growth performance, immune response, and gut morphology in starter pigs. S. Hooda*, N. Richmond, N. A. Karrow, C. F. M. de Lange, Department of Animal and Poultry Science, University of Guelph, Guelph, ON, Canada.
Previous research has demonstrated that diet quality affects growth performance and immune response of starter pigs. This study was conducted to assess the interactive effects of feeding dietary protein quality and oil types on growth performance, immune response, and gut morphology in starter pigs. Newly weaned pigs (21 d age; BW = 6.25 ± 0.83 kg) were randomly assigned to 4 dietary treatments (3 pens/treatment; 10 pigs/pen), as a 2 × 2 factorial design, with differing diet protein quality (High vs. Low; animal vs. soybean protein) and 5% oil (Fish vs. Corn). Pigs were fed according to a three phase pro-gram: diets fed for 7, 14, and 21 d, respectively. On d 6 and 20 postweaning, 12 pigs per treatment were vaccinated with 0.5 mg ovalbumin (OVA), 0.5 mg killed C. albicans (CAA), and 0.5 mg Quil A adjuvant in 1 mL saline. Blood samples were collected at d 20 and 34 for determination of anti-OVA anti-bodies and d 22 and 28 for haptoglobin (Hp) analysis. The de-layed type hypersensitivity (DTH) reaction was evaluated on d 17 and 48 using intradermal injection of OVA and CAA in the ear, and ear thickness was measured at 6 h postinjection. Per treatment, 6 pigs were euthanized at 2, 4, and 8 wk postwean-ing and jejunum samples were collected to evaluate morphol-ogy. Data were analyzed as a Mixed model procedure of SAS. There were no significant interactions (P > 0.10) between main effects. During the 6 wk starter period, ADG was greater (P < 0.05; 422 vs. 385 g) for pigs on High; High- and Fish-fed pigs had greater feed efficiency (G: F) (P < 0.05; 0.750 vs. 0.721 and 0.775 vs. 0.695). Diet did not affect (P > 0.10) primary or secondary antibody immune response to OVA. At d 17, DTH
response to OVA was greater (P < 0.05) in pigs fed Low diets. At d 48, DTH response to CAA tended to be lower (P < 0.10) for pigs fed Low and Fish diets. The vaccination protocol in-creased (P < 0.05) serum Hp and these were lower in pigs on Fish (P < 0.05; 0.40 vs. 0.25 g/L). Diet did not impact vil-lus height or villus height:crypt depth ratio; crypt depth was greater (353 vs. 275 and 345 vs. 282 μm; P < 0.05) at wk 4 in pigs fed Low and Corn. Diet protein quality appears strongly related to growth performance while fish oil improves feed ef-ficiency and attenuates haptoglobin response of starter pigs.
Key Words: fish oil, protein quality, starter pigs
130 Effects of high levels of phytase in low lysine diets on the growth performance of nursery pigs. J. R. Flohr1,*, R. D. Goodband1, M. D. Tokach1, S. S. Dritz1, J. M. DeRouchey1, J. Woodworth1, K. B. Langbein1, J. R. Bergstrom2, 1Kansas State University, Manhattan, 2DSM Nutritional Products, North America, Marshall, MO.
Two studies were conducted to determine the effects of added phytase in nursery diets formulated at or below their Lys re-quirement. In both studies, diets with the lowest phytase levels were formulated to meet the available P requirement. In Exp. 1, 360 barrows (PIC 327 × 1050; initially 12.4 kg) were used in an 18-d study with 5 pigs per pen and 18 pens per treatment in a university research facility. Pens were randomly allot-ted to diets in a 2 × 2 factorial with main effects of Lys level (adequate vs. marginal; 1.20 vs. 1.05% standardized ileal di-gestible [SID] Lys) and phytase level (500 vs. 3000 FYT/kg; Ronozyme®HiPhos®, DSM). Overall (d 0 to 18), there were no (P > 0.05) lysine × phytase interactions and no differences were observed between phytase levels. Pigs fed adequate Lys diets had greater (P < 0.01) ADG, G:F, and BW than those fed marginal Lys. In Exp. 2, 2592 nursery pigs (PIC 337 × 1050; initially 10.4 kg) were fed 1 of 6 diets over 2 phases in a 36-d commercial research study. There were 27 pigs per pen and 16 pens per treatment. Dietary treatments included an adequate Lys (1.20 and 1.10% SID Lys in Phase 1 and 2, respectively) positive control diet containing 250 FYT/kg of phytase or 5 low Lys (1.10 and 1.00% SID Lys in Phase 1 and 2, respectively) diets with 250, 500, 1000, 2000, or 3000 FYT/kg of phytase. Overall (d 0 to 36), pigs fed the positive control had greater (P < 0.02) ADG and G:F than pigs fed the low-Lys diet (Table). Increasing phytase increased (quadratic, P < 0.02) ADG with maximum response at 1000 FYT/kg. Phytase did not affect G:F. In summary, these studies illustrate the im-
Table 130.
SID Lys: High LowSEM
P < Phytase
Phytase, FYT/kg: 250 250 500 1000 2000 3000 Lysine Linear QuadraticA DG, kg 0.57 0.54 0.55 0.57 0.57 0.55 0.008 0.02 0.10 0.02A DFI, kg 0.88 0.88 0.88 0.89 0.91 0.88 0.016 0.74 0.44 0.23G:F 0.644 0.618 0.632 0.636 0.626 0.632 0.007 0.01 0.34 0.29

58
portance of feeding adequate Lys to optimize ADG and G:F. Additionally, the trials show a difference between university and commercial settings because only the commercial study yielded a detectable phytase response, where pigs fed the low-Lys diet with 1000 FYT/kg phytase had performance similar to pigs fed high Lys diets containing 250 FYT/kg phytase.
Key Words: nursery pigs, phosphorus, phytase
131 Effects of diet complexity, antibiotics, and benzoic acid on nursery pig growth performance. J. E. Nemechek1,*, M. D. Tokach1, J. R. Bergstrom2, J. M. DeRouchey1, S. S. Dritz1, R. D. Goodband1, 1Kansas State University, Manhattan, 2DSM Nutritional Products, North America, Marshall, MO.
Two 28-d experiments were used to determine the effects of diet complexity, antibiotics, and benzoic acid on nursery pig (PIC 327 × 1050) growth performance. Both experiments were arranged as 2 × 2 factorials with main effects of benzoic acid (Vevovitall, DSM Nutritional Products, Parsippany, NJ) and diet complexity (Exp. 1) or antibiotics (Exp. 2). Each ex-periment had 6 or 7 pigs per pen and 10 pens per treatment. In Exp. 1, 280 pigs (initially 7.0 kg) were used. Benzoic acid levels were 0 or 0.5% fed from d 0 to 28. Diet complexities (simple or complex) were fed from d 0 to 14 followed by a 14-d common diet. Complex diets contained 10% dried whey, 1.25% select menhaden fish meal, 1.25% spray-dried blood cells, and 0.25% zinc oxide and simple diets did not contain lactose, zinc oxide, or specialty protein sources. No interac-tions were detected between diet complexity and benzoic acid and no benzoic acid main effects were observed. From d 0 to 14, pigs fed simple diets had decreased (P < 0.001) ADG (186 vs. 277 g), ADFI (304 vs. 381 g), and G:F (0.612 vs. 0.726). From d 14 to 28, pigs previously fed simple diets tended to have increased (P < 0.06) ADG (585 vs. 567 g) and increased (P < 0.003) G:F (0.679 vs. 0.651). Overall (d 0 to 28), pigs fed simple diets had decreased (P < 0.001) ADG (386 vs. 417 g) and ADFI (581 vs. 626 g). In Exp. 2, 240 pigs (initially 7.3 kg) were used. Benzoic acid levels were 0 or 0.5% fed from d 0 to 28. Antibiotic (carbadox) levels were 0 or 55 ppm from d 0 to 14 and 0 or 27.5 ppm from d 14 to 28. From d 0 to 14, pigs fed diets without antibiotic tended to have increased (P < 0.07) G:F (0.736 vs. 0.710). From d 14 to 28, pigs fed diets without antibiotic had decreased (P < 0.01) ADG (553 vs. 603 g), ADFI (857 vs. 903 g), and G:F (0.646 vs. 0.668). Overall (d 0 to 28), pigs fed diets without antibiotic had decreased (P < 0.02) ADG (422 vs. 449 g) and ADFI (626 vs. 662 g). No main effects of benzoic acid were observed. In conclusion, pigs fed complex diets or antibiotics had improved growth performance, but no differences were observed from includ-ing benzoic acid in the diets.
Key Words: benzoic acid, diet complexity, pig
132 Soluble fiber and insoluble fiber sources added to enterotoxigenic Escherichia coli–challenged pigs after weaning influence production and β-hemolytic E. coli excretion. J. Pluske1,*, J. C. Kim2, 1Murdoch University, Western Australia, Australia, 2Department of Agriculture and Food, Western Australia, Australia.
Different dietary and/or feeding strategies to ameliorate the postweaning malaise are being examined given increased scrutiny of the use of antimicrobial agents in diets. The ex-tent to which dietary fiber and the balance between soluble and insoluble fiber might modify gastrointestinal tract struc-ture and function to influence performance and health after weaning in the absence of dietary antimicrobials has not been fully established. An experiment using 96 individually housed male pigs was conducted having a 2 × 4 factorial ar-rangement of treatments, with factors being added (mostly) soluble fiber (approximately 8 versus 48 g/kg) and four lev-els of high insoluble fiber (added as wood cellulose; 0, 30, 60, and 90 g/kg). Ground white rice was used as the cereal. Antimicrobial-free diets were fed for 2 wk after weaning, after which time all surviving pigs were fed a commercial diet for another week. All pigs were orally inoculated with an enterotoxigenic E. coli strain (0149:K91:F4) on d 5, 6, and 7 after arrival to induce diarrhea. On d 8 and 9 after wean-ing, a subsample of pigs from each treatment was humanely euthanized. There were positive linear effects (P = 0.046 and P = 0.019) of wood cellulose inclusion level on bodyweight at d 14 and d 21, respectively. In the first 14 d after weaning, each 10 g/kg increase in the analyzed dietary NDF content (to approximately 100 g/kg) increased average daily gain (ADG) and average daily feed intake (ADFI) by 6.4 and 8.1 g/d (R2 = 0.84, P = 0.085 and R2 = 0.89, P = 0.056, respectively) whilst each 10 g/kg increase in the analyzed dietary ADF content (to approximately 50 g/kg) increased ADG and ADFI by 10.6 and 13.3 g/d (R2 = 0.89, P = 0.058 and R2 = 0.95, P = 0.027, respectively). There were significant main effects of wood cellulose level on the feed conversion ratio (FCR) in the first 7 (P = 0.018) and 14 (P = 0.028) d after weaning, but FCR from d 15 through 21 and over the entire 21-d period was determined by an interaction between soluble and insoluble fiber sources (P = 0.035 and P = 0.038, respectively). At d 9 postweaning, increasing amounts of insoluble fiber linearly decreased (P = 0.010) the fecal excretion of β-hemolytic E. coli; however, there were no differences (P > 0.05) between fiber treatments for the diarrhea index or the number of thera-peutic antibiotic treatments given.
Key Words: diarrhea, fiber, weaning
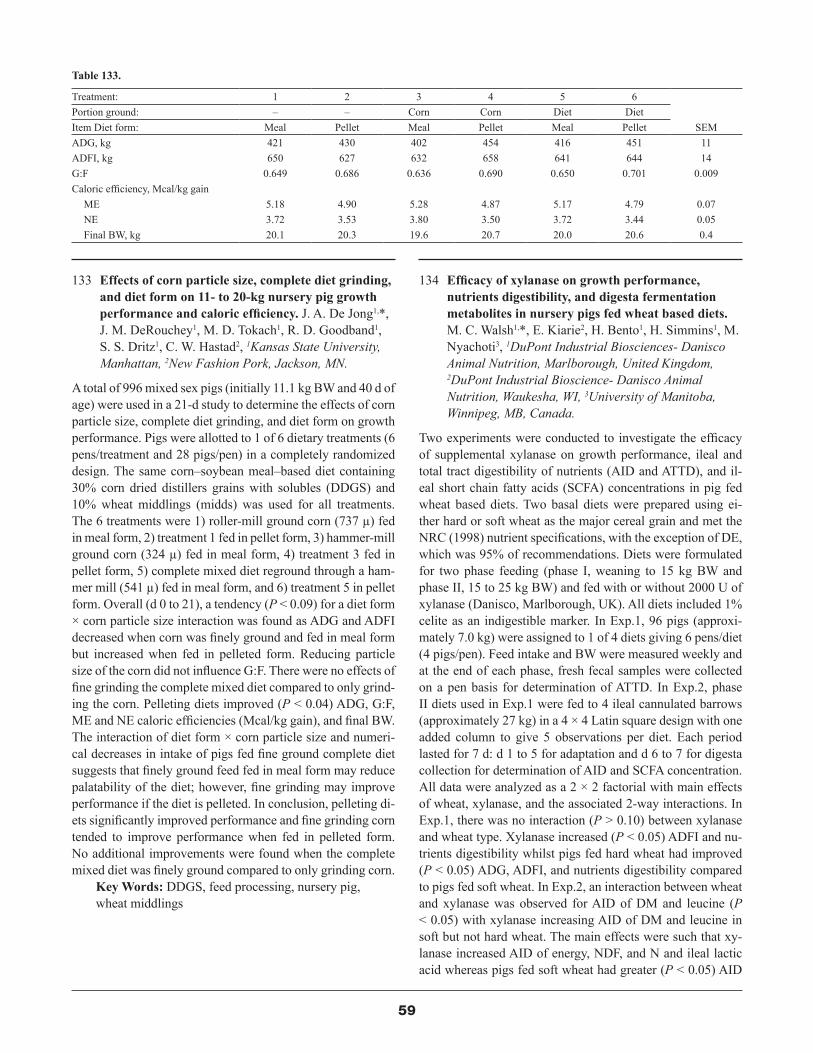
59
133 Effects of corn particle size, complete diet grinding, and diet form on 11- to 20-kg nursery pig growth performance and caloric efficiency. J. A. De Jong1,*, J. M. DeRouchey1, M. D. Tokach1, R. D. Goodband1, S. S. Dritz1, C. W. Hastad2, 1Kansas State University, Manhattan, 2New Fashion Pork, Jackson, MN.
A total of 996 mixed sex pigs (initially 11.1 kg BW and 40 d of age) were used in a 21-d study to determine the effects of corn particle size, complete diet grinding, and diet form on growth performance. Pigs were allotted to 1 of 6 dietary treatments (6 pens/treatment and 28 pigs/pen) in a completely randomized design. The same corn–soybean meal–based diet containing 30% corn dried distillers grains with solubles (DDGS) and 10% wheat middlings (midds) was used for all treatments. The 6 treatments were 1) roller-mill ground corn (737 µ) fed in meal form, 2) treatment 1 fed in pellet form, 3) hammer-mill ground corn (324 µ) fed in meal form, 4) treatment 3 fed in pellet form, 5) complete mixed diet reground through a ham-mer mill (541 µ) fed in meal form, and 6) treatment 5 in pellet form. Overall (d 0 to 21), a tendency (P < 0.09) for a diet form × corn particle size interaction was found as ADG and ADFI decreased when corn was finely ground and fed in meal form but increased when fed in pelleted form. Reducing particle size of the corn did not influence G:F. There were no effects of fine grinding the complete mixed diet compared to only grind-ing the corn. Pelleting diets improved (P < 0.04) ADG, G:F, ME and NE caloric efficiencies (Mcal/kg gain), and final BW. The interaction of diet form × corn particle size and numeri-cal decreases in intake of pigs fed fine ground complete diet suggests that finely ground feed fed in meal form may reduce palatability of the diet; however, fine grinding may improve performance if the diet is pelleted. In conclusion, pelleting di-ets significantly improved performance and fine grinding corn tended to improve performance when fed in pelleted form. No additional improvements were found when the complete mixed diet was finely ground compared to only grinding corn.
Key Words: DDGS, feed processing, nursery pig, wheat middlings
134 Efficacy of xylanase on growth performance, nutrients digestibility, and digesta fermentation metabolites in nursery pigs fed wheat based diets. M. C. Walsh1,*, E. Kiarie2, H. Bento1, H. Simmins1, M. Nyachoti3, 1DuPont Industrial Biosciences- Danisco Animal Nutrition, Marlborough, United Kingdom, 2DuPont Industrial Bioscience- Danisco Animal Nutrition, Waukesha, WI, 3University of Manitoba, Winnipeg, MB, Canada.
Two experiments were conducted to investigate the efficacy of supplemental xylanase on growth performance, ileal and total tract digestibility of nutrients (AID and ATTD), and il-eal short chain fatty acids (SCFA) concentrations in pig fed wheat based diets. Two basal diets were prepared using ei-ther hard or soft wheat as the major cereal grain and met the NRC (1998) nutrient specifications, with the exception of DE, which was 95% of recommendations. Diets were formulated for two phase feeding (phase I, weaning to 15 kg BW and phase II, 15 to 25 kg BW) and fed with or without 2000 U of xylanase (Danisco, Marlborough, UK). All diets included 1% celite as an indigestible marker. In Exp.1, 96 pigs (approxi-mately 7.0 kg) were assigned to 1 of 4 diets giving 6 pens/diet (4 pigs/pen). Feed intake and BW were measured weekly and at the end of each phase, fresh fecal samples were collected on a pen basis for determination of ATTD. In Exp.2, phase II diets used in Exp.1 were fed to 4 ileal cannulated barrows (approximately 27 kg) in a 4 × 4 Latin square design with one added column to give 5 observations per diet. Each period lasted for 7 d: d 1 to 5 for adaptation and d 6 to 7 for digesta collection for determination of AID and SCFA concentration. All data were analyzed as a 2 × 2 factorial with main effects of wheat, xylanase, and the associated 2-way interactions. In Exp.1, there was no interaction (P > 0.10) between xylanase and wheat type. Xylanase increased (P < 0.05) ADFI and nu-trients digestibility whilst pigs fed hard wheat had improved (P < 0.05) ADG, ADFI, and nutrients digestibility compared to pigs fed soft wheat. In Exp.2, an interaction between wheat and xylanase was observed for AID of DM and leucine (P < 0.05) with xylanase increasing AID of DM and leucine in soft but not hard wheat. The main effects were such that xy-lanase increased AID of energy, NDF, and N and ileal lactic acid whereas pigs fed soft wheat had greater (P < 0.05) AID
Table 133.
Treatment: 1 2 3 4 5 6
SEMPortion ground: – – Corn Corn Diet DietItem Diet form: Meal Pellet Meal Pellet Meal PelletADG, kg 421 430 402 454 416 451 11ADFI, kg 650 627 632 658 641 644 14G:F 0.649 0.686 0.636 0.690 0.650 0.701 0.009Caloric efficiency, Mcal/kg gain
ME 5.18 4.90 5.28 4.87 5.17 4.79 0.07NE 3.72 3.53 3.80 3.50 3.72 3.44 0.05Final BW, kg 20.1 20.3 19.6 20.7 20.0 20.6 0.4
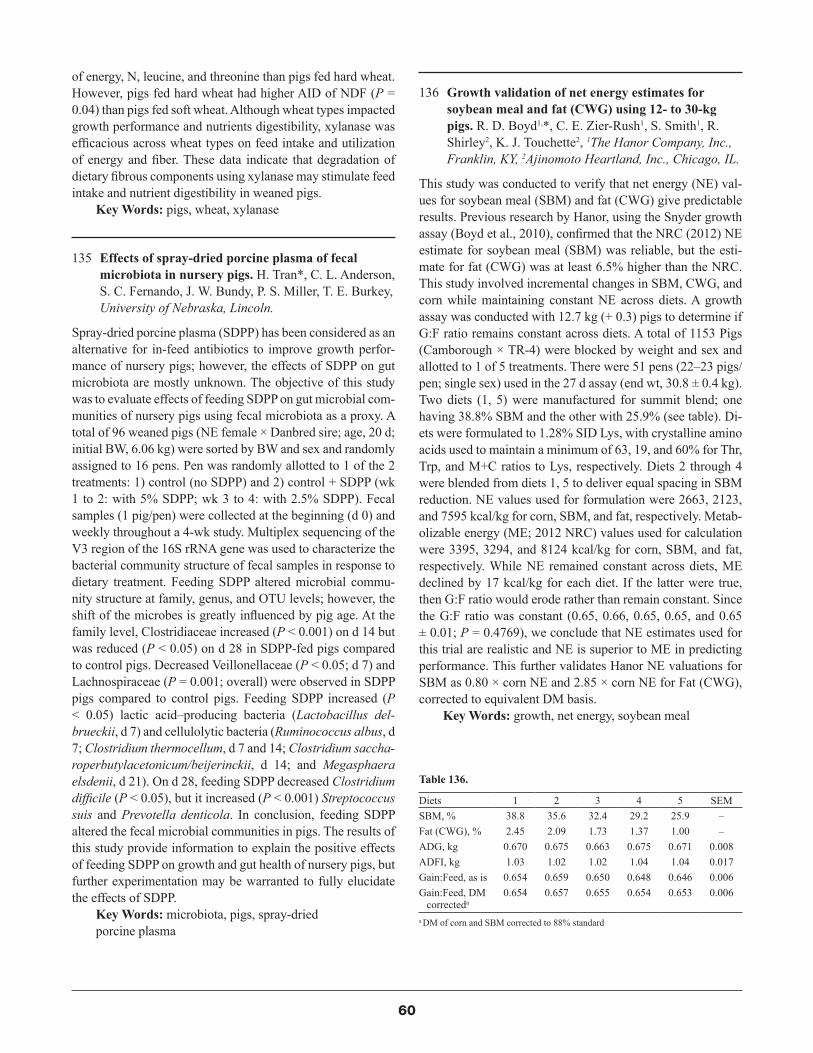
60
of energy, N, leucine, and threonine than pigs fed hard wheat. However, pigs fed hard wheat had higher AID of NDF (P = 0.04) than pigs fed soft wheat. Although wheat types impacted growth performance and nutrients digestibility, xylanase was efficacious across wheat types on feed intake and utilization of energy and fiber. These data indicate that degradation of dietary fibrous components using xylanase may stimulate feed intake and nutrient digestibility in weaned pigs.
Key Words: pigs, wheat, xylanase
135 Effects of spray-dried porcine plasma of fecal microbiota in nursery pigs. H. Tran*, C. L. Anderson, S. C. Fernando, J. W. Bundy, P. S. Miller, T. E. Burkey, University of Nebraska, Lincoln.
Spray-dried porcine plasma (SDPP) has been considered as an alternative for in-feed antibiotics to improve growth perfor-mance of nursery pigs; however, the effects of SDPP on gut microbiota are mostly unknown. The objective of this study was to evaluate effects of feeding SDPP on gut microbial com-munities of nursery pigs using fecal microbiota as a proxy. A total of 96 weaned pigs (NE female × Danbred sire; age, 20 d; initial BW, 6.06 kg) were sorted by BW and sex and randomly assigned to 16 pens. Pen was randomly allotted to 1 of the 2 treatments: 1) control (no SDPP) and 2) control + SDPP (wk 1 to 2: with 5% SDPP; wk 3 to 4: with 2.5% SDPP). Fecal samples (1 pig/pen) were collected at the beginning (d 0) and weekly throughout a 4-wk study. Multiplex sequencing of the V3 region of the 16S rRNA gene was used to characterize the bacterial community structure of fecal samples in response to dietary treatment. Feeding SDPP altered microbial commu-nity structure at family, genus, and OTU levels; however, the shift of the microbes is greatly influenced by pig age. At the family level, Clostridiaceae increased (P < 0.001) on d 14 but was reduced (P < 0.05) on d 28 in SDPP-fed pigs compared to control pigs. Decreased Veillonellaceae (P < 0.05; d 7) and Lachnospiraceae (P = 0.001; overall) were observed in SDPP pigs compared to control pigs. Feeding SDPP increased (P < 0.05) lactic acid–producing bacteria (Lactobacillus del-brueckii, d 7) and cellulolytic bacteria (Ruminococcus albus, d 7; Clostridium thermocellum, d 7 and 14; Clostridium saccha-roperbutylacetonicum/beijerinckii, d 14; and Megasphaera elsdenii, d 21). On d 28, feeding SDPP decreased Clostridium difficile (P < 0.05), but it increased (P < 0.001) Streptococcus suis and Prevotella denticola. In conclusion, feeding SDPP altered the fecal microbial communities in pigs. The results of this study provide information to explain the positive effects of feeding SDPP on growth and gut health of nursery pigs, but further experimentation may be warranted to fully elucidate the effects of SDPP.
Key Words: microbiota, pigs, spray-dried porcine plasma
136 Growth validation of net energy estimates for soybean meal and fat (CWG) using 12- to 30-kg pigs. R. D. Boyd1,*, C. E. Zier-Rush1, S. Smith1, R. Shirley2, K. J. Touchette2, 1The Hanor Company, Inc., Franklin, KY, 2Ajinomoto Heartland, Inc., Chicago, IL.
This study was conducted to verify that net energy (NE) val-ues for soybean meal (SBM) and fat (CWG) give predictable results. Previous research by Hanor, using the Snyder growth assay (Boyd et al., 2010), confirmed that the NRC (2012) NE estimate for soybean meal (SBM) was reliable, but the esti-mate for fat (CWG) was at least 6.5% higher than the NRC. This study involved incremental changes in SBM, CWG, and corn while maintaining constant NE across diets. A growth assay was conducted with 12.7 kg (+ 0.3) pigs to determine if G:F ratio remains constant across diets. A total of 1153 Pigs (Camborough × TR-4) were blocked by weight and sex and allotted to 1 of 5 treatments. There were 51 pens (22–23 pigs/pen; single sex) used in the 27 d assay (end wt, 30.8 ± 0.4 kg). Two diets (1, 5) were manufactured for summit blend; one having 38.8% SBM and the other with 25.9% (see table). Di-ets were formulated to 1.28% SID Lys, with crystalline amino acids used to maintain a minimum of 63, 19, and 60% for Thr, Trp, and M+C ratios to Lys, respectively. Diets 2 through 4 were blended from diets 1, 5 to deliver equal spacing in SBM reduction. NE values used for formulation were 2663, 2123, and 7595 kcal/kg for corn, SBM, and fat, respectively. Metab-olizable energy (ME; 2012 NRC) values used for calculation were 3395, 3294, and 8124 kcal/kg for corn, SBM, and fat, respectively. While NE remained constant across diets, ME declined by 17 kcal/kg for each diet. If the latter were true, then G:F ratio would erode rather than remain constant. Since the G:F ratio was constant (0.65, 0.66, 0.65, 0.65, and 0.65 ± 0.01; P = 0.4769), we conclude that NE estimates used for this trial are realistic and NE is superior to ME in predicting performance. This further validates Hanor NE valuations for SBM as 0.80 × corn NE and 2.85 × corn NE for Fat (CWG), corrected to equivalent DM basis.
Key Words: growth, net energy, soybean meal
Table 136.
Diets 1 2 3 4 5 SEMSBM, % 38.8 35.6 32.4 29.2 25.9 –Fat (CWG), % 2.45 2.09 1.73 1.37 1.00 –ADG, kg 0.670 0.675 0.663 0.675 0.671 0.008ADFI, kg 1.03 1.02 1.02 1.04 1.04 0.017Gain:Feed, as is 0.654 0.659 0.650 0.648 0.646 0.006G ain:Feed, DM
correcteda0.654 0.657 0.655 0.654 0.653 0.006
a DM of corn and SBM corrected to 88% standard

61
137 Evaluation of dietary acidifiers on growth performance of nursery pigs. J. E. Nemechek1,*, M. D. Tokach1, J. R. Bergstrom2, J. M. DeRouchey1, S. S. Dritz1, R. D. Goodband1, 1Kansas State University, Manhattan, 2DSM Nutritional Products, North America, Marshall, MO.
Three 28-d experiments evaluated dietary acidifiers on the growth performance of nursery pigs housed under both uni-versity and field conditions. All diets were corn–soybean meal–based and fed in meal form. Each experiment consisted of a 2-phase diet series. The same 4 dietary treatments were evaluated in all 3 experiments, including a control with 1) no acidifier, 2) 0.5% Vevovitall (DSM Nutritional Products, Parsippany, NJ), 3) 0.2% Kem-Gest (Kemin Americas, Des Moines, IA), or 4) 0.05% ButiPearl (Kemin Americas). In Exp. 1, 280 weanling pigs (PIC 327 × 1050, initially 7.3 kg, 3 d postweaning) were used with 7 pigs per pen and 10 pens per treatment. From d 0 to 14, pigs fed Kem-Gest tended to have increased (P < 0.07) ADG (245, 236, 263, and 240 g, respec-tively) compared with pigs fed other treatments. From d 14 to 28 and overall (d 0 to 28), no differences were observed in ADG, ADFI, or G:F among treatments. In Exp. 2, 1728 nurs-ery pigs (PIC 327 × 1050, initially 5.8 kg, 10 d postweaning) were used with 48 pigs per feeder (24 pigs per pen) and 9 feeders (replications) per treatment. Treatment diets were fed from d 0 to 14, and a common diet was fed from d 14 to 28. From d 0 to 14, pigs fed the control diet had decreased (P < 0.001) ADG (299, 367, 354, and 363 g, respectively) and G:F (0.733, 0.810, 0.813, and 0.825, respectively) compared with pigs fed diets with acidifiers. From d 14 to 28, there were no differences in performance between treatments. Overall (d 0 to 28), there were no differences in ADG, ADFI, or G:F but pigs fed diets containing acidifiers were approximately 0.95 kg heavier at the conclusion of the trial. In Exp. 3, 1800 nurs-ery pigs (PIC 327 × 1050, initially 7.4 kg, 13 d postweaning) were used with 50 pigs per feeder (25 pigs per pen) and 9 rep-lications per treatment. Treatment diets were fed throughout the entire trial (d 0 to 28), with no differences in ADG, ADFI, or G:F observed. In conclusion, the responses to dietary acidi-fication were inconsistent across experiments with pigs fed acidifiers having improved growth performance in Exp. 2 but not Exp. 1 and 3. More research is needed to fully elucidate the acidifier response for weanling pigs.
Key Words: acidifiers, benzoic acid, pig
138 Evaluation of feeding a Bacillus-based probiotic with Rhizopus oligosporus biomass in nursery pigs. D. M. van Sambeek1,*, B. J. Kerr2, J. van Leeuwen1, D. C. Beitz1, N. K. Gabler1, 1Iowa State University, Ames, 2USDA- ARS, Ames, IA.
High grain prices, biofuels, and severe weather events are de-fining how we use crops used for livestock production. The
need for alternative feed sources and resource conservation (water, energy, etc.,) has become more apparent. Previously, our group has shown that fungal biomass produced by grow-ing Rhizopus microsporus var. oligosporus (RO) on thin still-age leftovers from the ethanol process can be used as an alter-native feed source in nursery pigs. Digestibility was decreased at 20% inclusion and lysine availability of RO biomass was 54%. However, the limitation in nutrient digestibility may be due to the presence of chitin, a nonstarch polysaccharide. The objective of this project was to examine the use of the pro-biotic (Pr) Bacillus subtilis (chitinase producer) to increase digestibility of RO biomass in nursery pigs. Using a 2 × 2 factorial arrangement, 40 barrows (10.6 ± 1.52 kg BW) were assigned to four corn–SBM based diets containing the di-gestibility marker titanium dioxide (n = 10/trt): 0%ROPr–, 0%ROPr+, 20%ROPr–, or 20%ROPr+. Pigs were fed ad libi-tum and performance was recorded weekly for 28 d and ADG, ADFI, and G:F calculated. Body composition was assessed using a serial slaughter technique. Four additional barrows of the same initial BW were euthanized to establish the initial body composition. Total tract fecal collections were taken in the final week. Thereafter, pigs were euthanized for distal il-eum contents and whole body composition. Digesta and fecal samples were analyzed for DM, N, energy, and titanium di-oxide. Initial and final slaughter group body composition was assessed using dual X-ray absorptiometry and tissue accretion rates calculated. Data were analyzed with a mixed model with fixed effects RO, Pr, and their interaction, with ADFI as a co-variate. There was no significant RO × Pr interaction observed in any parameters assessed. However, Pr+ increased ADG (0.47 vs. 0.45 kg/d) and G:F (0.61 vs. 0.57) compared to the Pr– treatments (P < 0.05). Additionally, Pr+ increased AID of energy (59 vs. 53%; P < 0.10) and N (71 vs. 55%; P < 0.01). RO treatments decreased AID of N (57 vs. 69%; P < 0.01). Compared to 0%RO treatment, energy (86 vs. 79%), N (84 vs. 74%), and DM (88 vs. 82%) ATTD coefficients decreased due to RO inclusion (P < 0.01). Probiotic diets had little effect on ATTD. Together these data suggest probiotic modification of RO biomass had negligible effects on digestibility, tissue accretion, and growth performance; however, probiotic alone did improve AID.
Key Words: Bacillus subtilis, pig, Rhizopus microsporus
139 Effects of high-protein canola meals fed to weanling pigs on growth performance, organ weights, bone ash, and blood parameters. C. K. Parr*, Y. Liu, C. M. Parsons, H. H. Stein, University of Illinois at Urbana-Champaign, Urbana.
An experiment was conducted to evaluate the effects of 2 high protein canola meals (CM-A and CM-B, respectively) and a conventional canola meal (CM-CV) on growth performance, organ weights, bone ash, and blood parameters of weanling

62
pigs. Inclusion rates of canola meal in the diets were 10, 20, 30, or 40% for CM-A and CM-CV and 10, 20, or 30% for CM-B. A control diet containing corn and soybean meal and no canola meal was also used. A total of 420 pigs (initial BW: 9.8 ± 1.1 kg) were divided into 3 blocks and randomly allotted to 1 of the 12 diets with 8 replicate pens per treatment and 4 or 5 pigs per pen. At the conclusion of the 3-wk experiment, one pig per pen was sacrificed to measure organ weights, blood parameters, and bone ash. Results indicate that ADFI was lin-early (P < 0.05) reduced as CM-A, CM-B, or CM-CV were included in the diets, and ADG for pigs fed CM-A tended to increase quadratically if 10 or 20% canola meal was used (P = 0.06). However, G:F was linearly increased (P < 0.05) by adding CM-A or CM-CV to the diets. Liver weights were lin-early increased (P < 0.05) when pigs were fed diets contain-ing CM-B, but kidney weights were linearly decreased (P < 0.05) if CM-CV was used. Thyroid gland weights increased (linear, P < 0.05) for pigs fed diets containing CM-A, but heart and bone weights were not influenced by canola meal. Addition of any of the 3 canola meals to the diets increased (linear, P < 0.05) bone ash percentage. Inclusion of CM-A or CM-CV decreased (linear, P < 0.05) serum triiodothyronine, and the inclusion of CM-A also decreased (P < 0.05) serum thyroxine concentrations. No differences were observed for complete blood counts and blood urea nitrogen when canola meal was added to the diets. In conclusion, conventional or high-protein canola meals can be included by at least 20% in diets for weanling pigs without reducing growth performance or negatively affecting organ, bone, or blood parameters, but greater inclusion levels may result in reduced performance.
Key Words: canola meal, growth performance, pigs
140 Protease supplementation improved growth performance and profitability of nursery pigs consuming a corn–soybean meal based diet. Y. Ma*, N. Odetallah, M. Vazquez-Anon, J. Escobar, Novus International Inc., St. Charles, MO.
Dietary protease (NZ) supplementation is a viable solution to reduce diet cost by increasing amino acid digestibility from various ingredients. The objective of this study was to evalu-ate the effect of protease supplementation (500 ppm of Ciben-za® DP100, Novus International Inc., St. Charles, MO) on growth performance of nursery pigs consuming corn–soybean meal based diets. Dietary treatments included positive (POS) diet that meet or exceed NRC (2012) nutrient recommenda-tions and NZ diet that was formulated to have similar nutrient profiles as POS diet using improved digestibility coefficients obtained from previous digestibility trials. A negative (NEG) control diet was obtained by replacing 500 ppm of NZ with an equal amount of ground corn. A total of 990 pigs (BW: 6.0 ± 0.7 kg; 37 × C-22, PIC, Hendersonville, TN) weaned at 21 d of age were housed (22 pigs per pen, half barrows and half gilts) in a commercial research facility and fed common phase
1 diet for 7 d. Phase 2 and 3 were fed from d 7 through 21 and 21 through 42 after weaning, respectively, and constituted the experimental period. Body weight and feed intake were deter-mined at 21 and 42 d postweaning. A complete randomized block design with 15 replicate pens per treatment was used and data were analyzed using the mixed procedure (SAS® Institute, Cary, NC). Inclusion of NZ significantly improved growth performance compared to NEG on final BW (21.1 vs. 20.1 kg; +5.2%; P < 0.001), ADG (390 vs. 362 g/d; +7.7%; P < 0.001), ADFI (582 vs. 553 kg/d; +5.2%; P = 0.003), and GF (670 vs. 655 g/kg feed; +2.3%; P = 0.02). No statistical difference was determined between POS and NZ on final BW (21.2 vs. 21.1 kg; P = 0.81), ADG (397 vs. 390 g/d; P = 0.46), ADFI (589 vs. 582 g/d; P = 0.57), and G:F (674 vs. 670 g/kg feed; P = 0.57). Supplementing NZ considerably reduced the cost of diet per kg BW gain (0.59 vs. 0.55 $/kg gain; -6.6%; P < 0.001), which is an indicator of profitability. In conclu-sion, the result validated that protease supplementation can improve the digestibility and bioavailability of nutrients in a corn–soybean meal based diet and therefore reduce diet cost and maintain growth performance.
Key Words: growth performance, pigs, protease
141 Pharmacological ZnO dose and superdoses of phytase on piglet growth performance and cost of gain from d 0 to 21 postweaning. C. L. Bradley*, C. L. Walk, G. Cordero, P. Wilcock, AB Vista Feed Ingredients, Marlborough, United Kingdom.
Feeding piglets pharmacological doses of zinc oxide (ZnO) has been shown to reduce fecal scours and improves ADG and FCR. However, the level of ZnO necessary to elicit a response may be reduced in the presence of superdoses of a novel third generation microbial phytase (Quantum Blue). An experiment was conducted to evaluate 4 doses of pharmacological ZnO (1250, 1750, 2500, or 3500 ppm) with or without 2000 FTU/kg of phytase on piglet performance and cost per/kilogram of gain from d 0 to 21 postweaning. Diets were arranged as a 2 × 4 factorial and fed to 720 pigs, weaned at approximately 18 to 21 d of age, with 10 pigs/pen and 9 replicate pens/treat-ment. Diets were adequate in all nutrients, including avail-able phosphorus (0.45%) and calcium (0.79%, NRC, 1998), and fed as one diet from weaning to 21 d postweaning. When means were significantly different (P < 0.10), the main effect of ZnO or phytase or the interaction was separated using t tests. Feeding ZnO at 3500 ppm decreased ADFI (P < 0.001) and ADG (P < 0.01) compared to pigs fed all other ZnO doses from d 0 to 7. From d 14 to 21, ZnO supplementation at 1750 ppm increased ADG (P < 0.05) compared to pigs fed ZnO at 2500 or 3500 ppm, but this was not different from pigs fed 1250 ppm ZnO. Overall (d 0 to 21), supplementation of ZnO at 1750 ppm tended to increase ADFI (P = 0.07) and ADG (P = 0.06) compared to pigs fed 2500 or 3500 ppm ZnO but not pigs fed 1250 ppm ZnO. Phytase supplementation increased

63
ADG (P < 0.001) from d 7 to 14 and tended to increase ADG (P = 0.10) from d 0 to 21. From d 7 to 14, there was a tendency for a phytase × ZnO interaction on FCR (P = 0.07) whereas phytase improved FCR, especially in pigs fed 3500 ppm ZnO compared to all other treatments. Overall (d 0 to 21), phytase supplementation improved FCR (P < 0.03) from 1.12 to 1.09. Phytase supplementation improved ADG and FCR, which re-sulted in extra gain (0.26 kg) at the same cost/kilogram of gain as the nonphytase supplemented diets. In conclusion, ADFI and ADG were highest in pigs fed ZnO below 3500 ppm and phytase improved ADG and FCR from d 0 to 21 postweaning.
Key Words: phytase, piglets, zinc oxide
NONRUMINANT NUTRITION: SOW MANAGEMENT AND NUTRITION
142 Determination of the impact of housing system on the determination of apparent total tract digestibility of energy and dry matter. C. L. Holloway*, J. F. Patience, Iowa State University, Ames.
Swine digestibility trials are primarily performed in metab-olism crates, which provide the most accurate data on total input and output. However, this limits research to having access to crates and the facilities to maintain them, in addi-tion to studying a relatively small group of pigs. If research-ers were able to run digestibility studies on a larger scale, the data would be more applicable to producers and more reflec-tive of a commercial setting. The objective of this experiment was to determine if apparent total tract digestibility (ATTD) outcomes would be similar among 3 different fecal collec-tion housing systems: group pen (GP; n = 8 with 20 pigs per pen), individual pen (IP; n = 8), or metabolism crate (MC; n = 8). One hundred seventy-six gilts (PIC 337 × C22/29) with an average initial weight of 48.5 ± 0.3 kg were assigned to penning treatment according to body weight and received a standard grower diet for 7 d with titanium dioxide added at 0.4%. Fresh fecal samples were collected in the morning and late afternoon on each of Days 5, 6, and 7, immediately fro-zen, and later homogenized within pen and assayed for dry matter, gross energy, and titanium dioxide content. Data were analyzed according to the randomized complete block design using PROC MIXED (SAS 9.3) with pen as the experimental unit. Housing system did not impact body weight (P = 0.58) or average daily feed intake (P = 0.15). ATTD of DM increased as pen size decreased (MC = 83.53%, IP = 80.40%, GP = 79.13%; P < 0.01). Similarly, ATTD of GE matched this trend, increasing as pen size decreased (MC = 84.08%, IP = 81.29%, GP = 79.96%; P < 0.01). However, DE was different between MC and IP/GP (3.71 vs. 3.56/3.53 Mcal/kg as fed; P < 0.01). ADG was greater in GP compared to IP or MC (1.06 vs. 0.88 vs. 0.90 kg/d; P < 0.01), but there was no significant differ-
ence between IP and MC (P > 0.10). These data indicate that collecting feces in pens, either group or individual, will result in lower estimates of the ATTD of energy and dry matter and of DE than in MC. This means that it may be advantageous for applied research to be done in both metabolism crates and group penning to have the most accurate assessment of ATTD of a diet before applying it to a commercial setting.
Key Words: digestibility, housing, methodology, swine
143 Supplementing sows or their litters with a direct-fed microbial feed additive decreases fecal shedding of bacterial pathogens and increases litter performance in sows naturally infected with porcine reproductive and respiratory syndrome virus (PRRS). P. K. Brown*, D. A. Spangler, K. M. Foerder, J. C. Coomer, D. F. Jones, R. J. Hall, Agri-King, Inc., Fulton, IL.
Data from a previous study indicated that fecal shedding of pathogens by sows was reduced and the number of pigs weaned per litter was increased when Tri-Lution (T-L; Ag-ri-King, Inc.), a synbiotic blend of pre- and probiotics, was fed to PRRS-negative sows. The two studies reported herein were conducted to further evaluate the effects of feeding T-L to sows or their litters. Both studies occurred during naturally occurring PRRS outbreaks. The first study was conducted to determine whether a daily top-dress of 60 g T-L onto pig creep mats during lactation would 1) reduce fecal shedding of bacterial pathogens in piglets and 2) increase the number of pigs weaned per litter. At farrowing, a total of 78 individually housed litters were blocked by their dam’s parity and allotted randomly to 1 of 2 treatments (negative control or T-L). Fecal samples were collected from a subset of 36 litters (19-d-old pigs) and cultured for bacterial pathogens (cfu/g feces). Treat-ment of litter creep mats with T-L increased (P < 0.01) the number of pigs weaned per litter (10.46 vs. 8.74) and reduced (P < 0.01) fecal shedding of coliforms (log 9.25 vs. 10.01) and E. coli (log 9.13 vs. 9.92) and tended (P < 0.06) to re-duce fecal populations of Clostridia (log 6.54 vs. 7.14). In the second study, third-trimester, parity-one and parity-two sows (n = 160) were blocked by parity and randomly assigned to 1 of 2 daily treatments to determine the effect of T-L on 1) the number of pigs weaned per litter and 2) serum concentrations of neutralizing antibodies against PRRS. From d 84 of gesta-tion until weaning, treatments to sows consisted of either a negative control or a daily, 30-gram oral dose of T-L. All sows were fed the same basal diet. Serum was collected from a sub-set of 32 sows following natural exposure to the farm’s circu-lating PRRS virus and subsequent vaccination with live PRRS virus. The number of pigs weaned per sow was increased (P < 0.02) in sows fed T-L (7.40 vs. 5.81). Neutralizing antibody ti-ter against PRRS was not increased (P < 0.27) in sows treated with T-L (95.9 negative control vs. 137.6 T-L). In summary, these results indicate that feeding T-L during a PRRS outbreak

64
reduced fecal shedding of bacterial pathogens and improved piglet survivability. It is hypothesized that favorable modi-fications to the gastrointestinal microbiota from feeding T-L strengthened the intestinal immune response against micro-bial pathogens, leading to improved piglet survivability.
Key Words: probiotic, PRRS
144 Response of sow and progeny to supplementation of dietary essential fatty acids during lactation. D. S. Rosero Tapia1,*, E. van Heugten1, J. Odle1, M. McCulley,2 R. D. Boyd2, 1North Carolina State University, Raleigh, 2The Hanor Company, Inc., Franklin, KY.
The objective of this study was to determine the effects of differ-ent levels of EFA on sow and progeny performance. Data were collected from 459 sows (PIC Camborough) from July to Oc-tober in a 2600-sow commercial unit in Oklahoma. Sows were balanced by parity, with 226 and 233 sows representing parities 1 and 3 to 5 (P3+), respectively. Sows were assigned randomly within parity to a 3 × 3 factorial arrangement and a control diet without added fat. Factors included 1) linoleic acid levels (6.1, 7.9, and 9.7 g/Mcal ME) and 2) α-linolenic acid levels (0.43, 0.78, and 1.14 g/Mcal ME). In this arrangement we obtained 9 different n-6:n-3 fatty acids ratios, ranging from 5.2 to 22.8. The different levels of EFA were obtained by adding to diets 4% of different mixtures of canola (oleic acid = 75%), corn (lin-oleic acid = 55%), and flaxseed oils (α-linolenic acid = 43%). Diets were corn–soybean meal based with 12.0% wheat mid-dlings and contained 3.38 Mcal ME/kg and 3.29 g standardized ileal digestible lysine/Mcal ME. Litters were standardized to 12 ± 0.03 pigs within the first 24 h of birth to begin the test. Animal performance data were collected at d 21 of lactation. Daily feed intake of sows was not affected by addition of oils to diets (P = 0.986; 5.12 and 5.15 kg/d for control and oil supplemented di-ets, respectively), nor was it impacted by linoleic (P = 0.215) or α-linolenic acid (P = 0.739). There was no effect of linoleic (P = 0.424) or α-linolenic acid (P = 0.287) on sow BW change. Sows weaned more full-value pigs (healthy pigs with BW greater than 3.6 kg) when they were fed oil-supplemented diets (P = 0.052; 11.0 weaned pigs) than those fed control diet (10.6). Moreover, litter growth rate was improved (P = 0.048) when oil was sup-plemented to diets (2.39 and 2.52 kg/d for control and oil supple-mented diets, respectively), but it was not affected by linoleic (P = 0.992) or α-linolenic acid (P = 0.228). Efficiency of feed utilization (G:F; sow and litter gain relative to feed intake) was improved (P = 0.003) with higher levels of α-linolenic acid in the diet (0.478, 0.466, and 0.488, for 0.43, 0.78, and 1.14 g/Mcal ME, respectively). In conclusion, there was a modest improve-ment in lactation performance due to oil supplementation, with improved feed efficiency due to α-linolenic acid. However, the impact of n6:n3 ratio on subsequent reproductive performance is not yet known.
Key Words: fatty acids, lactation, sows
145 The impact of supplemental choice white grease on sows and litter performance when fed during lactation. C. R. Little*, T. N. Kessie, R. Hinson, JBS United Inc., Sheridan, IN.
Four hundred and fourteen sows (PIC-C29) were blocked by parity (range of 1–5, avg 2.7 ± 0.7), breeding group, and body weight to determine the impact of increased dietary energy (ME) fed through supplemental choice white grease (CWG) on lac-tating sow and litter performance. Treatments consisted of 0%, 2%, 4%, or 6% added CWG (8124 kcal/kg ME), respectively. Diets were formulated to a standardized ileal digestible (SID) lysine to ME ratio of 3.34 g/Mcal with 1.05%, 1.08%, 1.11%, 1.15% SID lysine, respectively, and contained 20% corn dis-tillers dried grain solubles (DDGS). Litters were standardized within rep by 24 h postfarrow (12.6 ± 0.6 pigs). Lactation length averaged 19 d. Trial was conducted from May to September. No treatment × parity interactions (P > 0.05) were observed in this trial. Sow weaning weight (233.1, 233.3, 237.5, and 242.8 kg, respectively) and lactation weight change (9.5, 12.0, 14.2, and 17.9 kg, respectively) increased linearly (P < 0.001) and total weight change (-11.6, -11.6, -6.4, and -4.7 kg, respectively) decreased linearly (P = 0.001) with increasing levels of added fat. Average daily feed intake (7.1, 7.3, 7.2, and 7.3 kg/d, respec-tively) and wean-to-estrus interval (4.98, 4.96, 5.00, and 5.01 d, respectively) were not impacted (P > 0.50) by added fat level. The number of pigs weaned/litter (12.0, 11.9, 12.0, and 12.0, re-spectively), piglet weaning weight (6.3, 6.4, 6.4, 6.5 kg, respec-tively), piglet ADG (251, 250, 252, 259 g/d, respectively), and prewean mortality (4.3%, 5.1%, 4.2%, and 4.9%, respectively) were not impacted (P > 0.35) by the level of added fat in the sow diet. Sow G:F [defined as (sow lactation weight change + litter gain)/total sow feed intake] increased linearly (0.52, 0.52, 0.54, and 0.57, respectively; P < 0.001) with increasing level of added fat in the diet. Conversely, litter G:F [defined as litter gain/total sow feed intake] was not impacted (P = 0.82) by added fat level. These data would suggest that in high feed intake sows, the ad-dition of added fat to the diet does not affect sow feed intake or piglet performance. It would appear that the additional energy intake is utilized by the sow to increase weight gain during lac-tation and is not partitioned toward increased milk production.
Key Words: fat, lactation, sow
146 The impact of feeding natural betaine to lactating sows during periods of heat stress. L. Greiner1,*, J. Remus2, D. D. Hall2, R. D. Boyd3, R. J. Harrell,4 J. Connor5, 1Carthage Innovative Swine Solutions, Carthage, IL, 2Dupont, St. Louis, MO, 3The Hanor Company, Inc., Franklin, KY, 4Professional Swine Management, Carthage, IL, 5Carthage Veterinary Service, Ltd., Carthage, IL.
Two studies were conducted over a period of 2 yr to evalu-ate the impact of feeding natural betaine (Betafin®) during

65
summer months on reducing the impact of heat stress during lactation. In both studies, PIC Camborough 1050 sows were blocked by parity and randomly allotted to one of two experi-mental diets containing either no betaine or 0.2% of betaine in diets containing corn, soybean meal, and 20% corn dried dis-tillers grain with solubles. All diets were formulated to have 3.2 Mcal ME/kg, 1.05% SID lysine and contained vitamins and minerals that exceeded recommendations (NRC, 1998). Sows were allowed ad libitum access to food and water and remained on respective treatments until breeding (sows on the betaine diet received the product for a minimum of 23 d). In study one, 80 primiparous and multiparous sows were evalu-ated in a study to determine the impact of natural betaine in reducing the impact of heat stress in lactating sows. The study was conducted during July of 2012 with seasonal tempera-tures in the farrowing house ranging from 25.5 to 34.5°C in the daytime to 21.1 to 26.7°C in the nighttime. Average daily feed intake was not significantly different between the con-trol and natural betaine diets (5.12 vs. 5.25 kg/day, P > 0.52, respectively). Sow wean to estrus was significantly reduced (7.91 vs. 4.88 d, P < 0.02) when natural betaine was included in the diet. Sow weight loss was not significantly different (4.43 vs. 4.72 kg, P > 0.93). There were no differences in litter gain (2.30 vs. 2.26 kg/day, P > 0.69) or the percent of piglet removals (8.76 vs. 6.58%, P < 0.43). Subsequent total born tended to be improved with the addition of natural betaine (9.78 vs. 12.57 pigs/sow, P > 0.06). In study 2, 200 multipa-rous sows were evaluated during the summer of 2013. The feeding of natural betaine did not improve sow feed intake (5.48 vs. 5.62 kg, P > 0.34), sow weight loss (3.28 vs. 2.47 kg, P > 0.74), or wean to estrus (4.45 vs. 5.10 d, P > 0.48). The feeding of natural betaine tended to improved total litter gain (44.91 vs. 48.14 kg, P < 0.07). In conclusion, the feeding of natural betaine did significantly improve sow wean to estrus during periods of reduced feed intake but did not improve sow performance when feed intake was adequate.
Key Words: Betafin, lactation, natural betaine, sow
NONRUMINANT NUTRITION: FEED PROCESSING, INGREDIENTS,
AND ADDITIVES
147 Effects of different feed enzyme combinations on apparent total tract digestibility of DM, N, phytate, DE, and ME in corn-soybean meal-DDGS based diets fed to pigs. A. A. Passos*, S. W. Kim, North Carolina State University, Raleigh.
This study was to determine apparent total tract digestibility (ATTD) of DM, N, phytate, DE, and ME in a diet (54% corn, 21% soybean meal, 20% DDGS, and 2% poultry fat, 3% oth-ers) fed to 16 barrows (27.5 ± 4.7 kg). Diets were mixed with 3 enzymes individually or in combinations. Enzymes were
phytase (Ronozyme HiPhos, DSM, Parsippany, NJ), xylanase (Ronozyme WX), and protease (Ronozyme ProAct). Treat-ments were CON (no enzyme), Phy (phytase, 1000 FYT/kg), Xyl (xylanase, 200 FXU/kg), Pro (protease, 15,000 PRO/kg), Phy+Xyl, Phy+Pro, Pro+Xyl, and Phy+Pro+Xyl. Pigs were individually housed in metabolic cages and assigned to treatment diets based on repeated 4 × 4 Latin square designs with 4 treatment diets and 4 periods. Each period consisted of 4 d adaptation and 3 d collection. Chromium oxide was used to indicate the beginning and the end of collection. Dai-ly feed allowance was 0.09 × BW0.75 kg divided to 2 equal amounts of meals fed at 0700 and 1700 h. Gross energy in diet, feed, and urine was measured using a bomb calorimeter (IKA, Wilmington, NC) and protein by a combustion method (LECO, St Joseph, MI) to calculate ME and ATTD of N. Use of enzymes did not affect ME and ATTD of DM. The DE tended to be greater for Pro+Xyl (P = 0.074; 3552 Mcal/kg) and Phy+Pro+Xyl (P = 0.083; 3566 Mcal/kg) compared with CON (3512 kcal/kg). The ND of Phy+Pro+Xyl was greater (P < 0.05, 86.4%) than CON (83.7%). The PD of Phy (2835 μg/g), Xyl (2827 μg/g), Phy+Xyl (2830 μg/g), Phy+Pro (2832 μg/g), and Pro+Xyl (2821 μg/g) were greater (P < 0.05) than CON (2814 μg/g). Overall, a combinational use of enzymes (Phy+Pro+Xyl) improved DE and ATTD of N in corn-soy-bean meal-DDGS based diets. Phy, Xyl, and their combina-tions increased phytate degradation.
Key Words: phytase, pigs, protease, xylanase
148 Commercial xylanase products appear to be more efficient toward degradation of arabinoxylan in wheat than in rye. H. N. Lærke1,*, S. Arent2, K. E. B. Knudsen,1 S. Dalsgaard2, 1Department of Animal Science, Aarhus University, Tjele, Denmark, 2Dupont, Industrial Biosciences, Brabrand, Denmark.
To study the effect of a combination of endo-xylanases from Trichoderma reesei and Bacillus subtilis on ileal viscosity, degradation of fiber, and apparent ileal digestibility (AID) of nutrients in finely ground rye (FR), finely ground (FW), and coarsely ground wheat (CW) without (-) or with (+) enzyme, an experiment with 6 ileum-cannulated pigs (initial BW 33.6 ± 0.5 kg) was performed using a 6 × 6 Latin square design. The cereals were supplemented with vitamins, minerals, 500 FTU Phyzyme® XP/kg feed, dust-binder, and chromic oxide (2 g/kg). Each pig was fed each diet 3 times daily for 1 wk, and ileal content was collected for 8 h on d 5 and 7. For each pig per week samples were pooled and analyzed for viscosity, concentration, and composition of solubilized high molecular weight (HMW) and low molecular weight (LMW) arabinox-ylan, OM, crude protein, starch, and marker. Data were ana-lyzed as a Latin square design with a 2 × 3 factorial arrange-ment of treatment with enzyme, cereal source, and their inter-action as sources of variation and pig and period as random effects. For statistical analysis, viscosity data were subjected to logarithmic transformation, and results were reported as

66
geometric means. Enzyme addition reduced intestinal viscos-ity in the pigs from 2.1 to 1.5 mPa·s (P = 0.012) when FW was fed, from 3.2 to 1.7 mPa·s for CW (P < 0.0001), and from 9.7 to 7.6 mPa·s (P = 0.04) for FR. Enzyme addition increased concentrations of soluble arabinoxylan from 5.7 mg/mL with FW- to 10.4 mg/mL with FW+ (P = 0.0019) and from 8.5 mg/mL with CW- to 12.4 mg/mL with CW+ (P = 0.0055), where-as no effect was seen for FR (10.8 mg/mL in FR- vs. 10.2 mg/mL in FR+, P = 0.59). Concentrations of LMW-arabinoxylan increased from 0.2 to 2.9 mg/mL in FW (P = 0.0002) and from 0.4 to 5.7 mg/mL in CW (P < 0.0001) and were 0.8 to 1.6 mg/mL in FR- and FR+, respectively (P = 0.29). Enzyme addition overall increased AID of HMW-arabinoxylan (P < 0.0001) with an increase in AID of FW from 14% to 29% (P = 0.0001) and of CW from 18% to 31% (P = 0.0013), while it increased from 11% to 21% in FR (P = 0.0021). Enzyme addition did not affect AID of OM and crude protein but overall increased AID of starch (P = 0.031). However, by pairwise comparison this was only significant for FW (P = 0.015). Collectively, the results suggest that the xylanase preparations were more ef-ficient in degrading arabinoxylan from wheat than from rye.
Key Words: enzymes, nutrient digestibility, viscosity
149 Efficacy of a NSP enzyme blend Easyzyme to improve pig performance depends on dietary ME concentration. V. G. Perez*, K. T. Soltwedel, T. R. Radke, D. P. Holzgraefe, ADM Alliance Nutrition Inc., Quincy, IL.
To determine whether the efficacy of EasyzymeTM (EZ) on improving pig performance depends on dietary ME concen-tration, a completely randomized block design experiment was conducted with 6 treatments in a 2 (EZ 0 vs. 0.05%) × 3 (added fat 0, 2, or 4%) factorial arrangement. Each treat-ment had 8 block replicates (2 BW × 2 rooms × 2 sexes) of 2 pigs/pen. All diets included corn, soybean meal, and 30% dry distiller’s grains with solubles (3.9% fat; DDGS) and met or exceeded the requirements calculated with Swine NRC model (2012). Feeding program had 4 phases of 14, 14, 21, and 21 d each, respectively. Across phases, calculated ME in diets with 0, 2, or 4% fat was about 3256, 3354, and 3452 kcal/kg, respectively. Standardized ileal digestible Lys was 0.93, 0.84,
0.78, and 0.96% in phases 1 through 4, respectively. Other amino acids were provided as a ratio to Lys. Phase 4 included ractopamine (0.05% Paylean). Data were analyzed using the MIXED procedure of SAS. Block was used as a random effect in the model. Linear and quadratic polynomial analyses were conducted to assess added fat dose effect by EZ interaction, as well as across and within EZ treatments. ADG at d 28 in-creased 3.7% by EZ (P = 0.06) and by fat addition in a linear fashion (P < 0.05). No differences were detected on final BW (121.5 ± 2.0 kg). The G:F improved (P < 0.05) as more fat was added in the absence but not in the presence of EZ (table). Within pigs fed 0% fat diets, G:F was greater (P < 0.05) in those fed EZ. In conclusion, the efficacy of EZ to improve pig performance depends on dietary ME concentration.
Key Words: DDGS, enzyme, pigs
150 Effects of dietary supplementation of xylanase on apparent ileal digestibility of ADF and NDF and viscosity of digesta in nursery pigs fed corn and soybean meal based diets. A. A. Passos*, S. W. Kim, North Carolina State University, Raleigh.
This study was to determine apparent ileal digestibility of ADF and NDF, digesta viscosity, and gut morphology in nursery pigs fed diets containing xylanase (Lohmann Animal Health GmbH, Cuxhaven, Germany). The diet (61% corn, 35% soybean meal, 1% poultry fat, and 3% minerals and vita-mins) was mixed with 3 levels of xylanase (0, 700, and 1400 LXU/kg). Thirty-six barrows (17.6 ± 3.3 kg) received one of 3 treatment diets based on a randomized complete block design with the initial BW as a block. Pigs were individually housed and received experimental diets twice daily (0800 and 1700 h) at a fixed amount based on BW of pigs (0.09 × BW0.75 kg). Pigs were fed diets for 10 d, and chromium oxide (0.3%) was added to the diets from d 6 as an indigestible external marker. Pigs were euthanized at the end of d 10 for the collection of di-gesta and tissues. Jejunal digesta were centrifuged to measure viscosity using a viscometer (Brookfield Engineering Labo-ratories, Stoughton, MA). Diets and freeze-dried ileal digesta were used to measure ADF, NDF, and chromium to calculate apparent ileal digestibility of ADF and NDF. Villus height and crypt depth of jejunum were measured using a microscope
Table 149. Dietary effect of Easyzyme (EZ) and added fat on pig performance*
ItemEZ 0% EZ 0.05%
SEM0% fat 2% fat 4% fat 0% fat 2% fat 4% fatADG 0–28 d, g/da 944 956 999 962 1002 1043 35G:F 0–28, g/kgb 391 427 453 418 441 436 9ADG 0–49 d, g/d 935 947 980 969 981 981 26G:F 0–49, g/kgb 363 396 417 386 400 399 9ADG 0–70 d, g/d 978 1008 1034 1028 1017 1017 23G:F 0–70, g/kgb 372 407 428 399 399 398 9
* Initial BW was 50.4 ± 0.9 kg.a Main effects EZ (P = 0.06) and Fat (linear, P = 0.02).b Interaction EZ×Fat linear, P < 0.05.
67
(Fisher Scientific, Hampton, NH). Data were analyzed using polynomial contrasts in the MIXED procedure of SAS Soft-ware (Cary, NC). Morphological measurements and ileal ADF digestibility were not affected by increasing xylanase. How-ever, increasing xylanase supplementation from 0 to 1400 LXU/kg enhanced (P < 0.05, linear) ileal NDF digestibility from 27.9 to 40.3% and decreased (P < 0.05) viscosity of jeju-nal digesta in a quadratic manner from 2.9 to 2.5 centipoises. In conclusion, the usage of xylanase in corn and soybean meal based pig diets enhanced utilization of NDF and affected vis-cosity of digesta.
Key Words: NDF, pigs, viscosity, xylanase
151 Effects of microbial phytase on apparent and standardized total tract digestibility of calcium in calcium supplements fed to growing pigs. J. C. Gonzalez-Vega1,*, C. L. Walk2, H. H. Stein1, 1University of Illinois, Urbana, 2AB Vista Feed Ingredients, Marlborough, United Kingdom.
An experiment was conducted to determine the apparent total tract digestibility (ATTD) and standardized total tract digest-ibility (STTD) of Ca in different Ca supplements and the ef-fect of microbial phytase on the ATTD and STTD of Ca. One hundred and four growing barrows (initial BW: 17.73 ± 2.53 kg) were allotted to a randomized complete block design with a 2 × 6 factorial arrangement. There were 13 dietary treat-ments and 8 replicate pigs per treatment. A basal diet con-taining corn, cornstarch, potato protein isolate, soybean oil, calcium carbonate, monosodium phosphate, vitamins, and minerals was formulated to contain 0.33% Ca. Five additional diets were similar to the basal diet, but monocalcium phos-phate (MCP), dicalcium phosphate (DCP), calcium carbonate, Vistacal, or Limex were included in each diet at the expense of cornstarch to increase the concentration of Ca by 0.3–0.4% units. Six additional diets were similar to the previous 6 diets with the exception that they also contained 500 units per ki-logram of microbial phytase. To determine basal endogenous losses of Ca, a Ca-free diet was used. Feces were collected using the marker-to-marker approach. Results indicated that regardless of inclusion of microbial phytase, the greatest (P < 0.05) ATTD of Ca was observed in MCP diets, and the great-est (P < 0.05) STTD of Ca was observed in basal and MCP diets. The DCP diets had greater (P < 0.05) ATTD and STTD of Ca than calcium carbonate, Vistacal, or Limex diets, but no differences were observed among the ATTD and STTD of Ca in calcium carbonate, Vistacal, or Limex diets. Inclu-sion of microbial phytase increased (P < 0.001) the ATTD and STTD of Ca in the calcium carbonate diet only. Regardless of Ca source, inclusion of microbial phytase increased (P < 0.001) the ATTD of P in all diets. Regardless of phytase inclu-sion, the ATTD of P was greater (P < 0.05) in pigs fed basal, MCP, or DCP diets than in pigs fed calcium carbonate, Vista-cal, or Limex diets. Pigs fed calcium carbonate had greater
(P < 0.05) ATTD of P than pigs fed Vistacal or Limex diets. In conclusion, diets supplemented with MCP had the greatest ATTD and STTD of Ca, followed by DCP diets. Inclusion of microbial phytase in the diets increased the ATTD and STTD of Ca only if calcium carbonate was used.
Key Words: apparent digestibility, calcium supplements, standardized digestibility
152 The effects of feeding diets supplemented with β-mannanase or β-mannanase and 1,3-glucanase on apparent total tract and apparent ileal digestibilities in pigs. J. S. Radcliffe1,*, B. T. Richert,1 J. E. Ferrel2, 1Purdue University, West Lafayette, IN, 2Elanco Animal Health, Greenfield, IN.
Eight crossbred barrows (BW = 23.3 kg ± 0.22), fitted simple T-cannulas, were used to investigate the effects of Hemicell® HT1.5x (heat tolerant b-mannanase) and Zymannase® (b-1,3 glucanase and native b-1,4 mannanase) on apparent total tract digestibilities (ATTD) of energy, dry matter (DM), and ap-parent ileal digestibilities (AID) of DM and amino acids. Di-ets were corn-soybean meal-based containing 22% CP, 3395 kcal/kg of ME, and 0.95% SID Lys. Pigs were fed 1) control (CTL), 2) CTL + 0.04 MU/kg Hemicell® HT1.5x, 3) CTL + 0.06 MU/kg Hemicell® HT1.5x, or 4) CTL + Zymannase® (0.08 MU/kg glucanase + 0.112 MU/kg native mannanase). Pigs were randomly allotted to the four dietary treatments in a 4 × 4 Latin square. Pigs were housed individually in meta-bolic pens (1.2 m2) with ad libitum access to water. Feed was supplied at 9% of metabolic BW (BW0.75) in two daily meals (0700 and 1600 h). Each 2-wk period consisted of a 7-d ad-justment period, followed by a 7-d collection period that in-cluded a 3-d total collection, a 12-h ileal collection, a 3-d ad-justment, and then a second 12-h ileal collection. There were no effects (P = 0.40) of diet on DM ATTD. Based on analysis of the total collection DE was higher (P = 0.05) for 0.06 MU/kg Hemicell HT1.5x versus the CTL diet and intermediate for 0.04 MU/kg Hemicell HT 1.5x (3244, 3271, 3283, and 3225 kcal/kg for pigs fed diets 1, 2, 3, and 4, respectively). Addi-tion of Hemicell® HT1.5x at 0.04 MU/kg of diet increased DM AID (P < 0.05) compared to the Zymannase® treatment, but neither 0.04 nor 0.06 MU/kg Hemicell® HT1.5x was different (P > 0.10) than CTL fed pigs. Although numerical means favored both concentrations of Hemicell® HT1.5x, differences were not significant (P > 0.05) for AID of amino acids versus CTL fed pigs. Adding 0.04 MU/kg Hemicell® HT1.5x improved (P < 0.05) the AID of Val, Ile, Leu, and Phe compared to Zymannase® fed pigs. Based on the results of this study, Hemicell® HT1.5x may be a useful feed additive for increasing energy availability in corn-soybean meal-based diets fed to pigs.
Key Words: amino acids, digestibility, energy, Hemicell HT1.5x, pigs, Zymanase

68
153 Impact of level of soybean meal and β-mannanase in nursery diets on two genetic populations of pigs selected for soybean meal allergic response. M. Ferreira1,2, A. P. Schinckel3, J. E. Ferrel4, B. T. Richert3, J. S. Radcliffe3,*, T. S. Stewart3, 1Department of Veterinary Medicine, Federal University of Larvas, Larvas, Brazil, 2CAPES Foundation, Brasilia, Brazil, 3Purdue University, West Lafayette, IN, 4Elanco Animal Health, Greenfield, IN.
A trial was conducted to evaluate 14 and 28% soybean meal (SBM) inclusion, with or without β-mannanase (Hemicell-HT® 1.5x, 0.08 MU/kg mannanase) enzyme on nursery pigs from two genetic lines selected for high (HL) and low (LL) sensitiv-ity to soy proteins. Forty-eight pigs (initial BW = 6.35 kg (SD = 0.86); 23 d age) were weaned into group pens with free access to a soy-free corn-milk product based diet. After a 4-d adapta-tion, pigs were allocated in a randomized complete block design into individual pens, blocked by ancestry and BW, assigned to one of four treatments in a 2 × 2 × 2 factorial arrangement. Ex-perimental diets consisted of 28% SBM; 28% SBM + enzyme; 14% SBM; 14% SBM + enzyme. Feed intake and BW were re-corded at d7 and d13. Data were analyzed using PROC MIXED in SAS. Interactions were removed from the model at P > 0.20. Feed efficiency was not normally distributed, so it was analyzed by logistic regression. For week 1, there were no differences between SBM levels for ADG, ADFI, or G:F (P > 0.5). Pigs fed mannanase had greater (P < 0.01) ADG (181 vs. 113 g/d) and G:F (0.585 vs. 0.363). During week 2, pigs fed 28% SBM had greater (P < 0.02) ADFI than pigs fed 14% SBM (500 vs. 382 g/d). During week 2 there was no difference for ADG (P > 0.05) for mannanase-fed pigs. The HL pigs had a 22% lower (P < 0.05) ADFI for the second week (0.463 vs. 0.566 g/d). Overall, there was no effect of SBM (P > 0.3) on ADG or G:F, and 28% SBM tended to have greater ADFI (P = 0.07). Mannanase-fed pigs had a tendency for greater final BW (P < 0.06), ADG (P = 0.08), ADFI (P = 0.10), and G:F (P = 0.12) d 0–13. Overall, the LL pigs tended to have greater BW and ADG than the HL pigs (P = 0.09); however, LL pigs had ADFI of 389 vs. 326 g/d for HL (P = 0.05). Hemicell HT 1.5x had a positive effect on growth performance of weaned pigs fed soybean based diets, regardless of genetic sensitivity or level of SBM in the diet from Day 4 to 17 postweaning.
Key Words: allergy, genetic lines, mannanase, pigs, soybean
154 The effect of β-mannanase and a β-glucanase combined with β-mannanase in corn-soybean meal-DDGS diets on grower pig growth, feed intake, and feed efficiency performance in a commercial setting. J. E. Ferrel*, D. M. Anderson, Elanco Animal Health, Greenfield, IN.
Nine-hundred fifty-five pigs (initial BW = 26.08, SEM 0.14 kg; 66 d age) were used to evaluate the effect of β-mannanase
(Hemicell®: HM) and β-glucanase plus β-mannanase (Zyman-nase®: Zym) enzymes in a corn-soybean meal-dried distillers grains with soluble (DDGS) diet on grower pig performance. Pigs were allocated in a randomized complete block design into mixed gender pens, with 11 replicates per treatment, 22 pigs per pen. Pigs were fed 3 dietary phases, Phase 1 (d 0–21), Phase 2 (d 21–42), and Phase 3 (d 42–72). Dietary treatments were T1, Positive Control (3450, 3436, and 3435 kcal/kg ME; by phase, respectively); T2, Negative Control (3333, 3320, and 3319 kcal/kg ME; by phase, respectively); T3, T2+HM (0.10 MU/kg mannanase); T4, T2+ZYM (0.08 MU/kg glucanase, 0.10 MU/kg mannanase). Diets contained 20, 30, and 30% corn DDGS by phase, respectively. Individual weights were recorded on d 0, and pen BW and feed disappearance were recorded on d 21, 42, and 72. Data were analyzed using GLM procedure in SAS. For Phase 1 ADG, G:F and BW improved (P < 0.05) for T1 versus all other treatments. Phase 2 ADFI increased (P < 0.05) for T2 and T4 versus T1 (1896, 1996, 1946, 1996 g/d, T1–T4, respectively), with G:F being numerically improved (P = 0.12) for T1 and T3 versus T2 and T4 (0.442, 0.438, 0.452, 0.425, T1–T4, respectively). There were no differences for Phase 3 ADG among treatments (P = 0.75). ADFI was numerically different (P = 0.11) for T2 versus all other treatments (2273, 2381, 2282, 2273 g/d, T1–T4, respectively). G:F increased (P < 0.05) for T1, T3, and T4 versus T2 (0.417, 0.395, 0.412, 0.420, T1–T4, re-spectively). Overall, there was no difference in ADG (P = 0.14) or final BW (P = 0.34) among treatments. ADFI increased (P < 0.05) for T2 versus T1 and T3, while T4 was intermediate. G:F improved (P < 0.05) for T1 versus T2, while T3 and T4 were intermediate (0.459, 0.435, 0.448, 0.443, T1–T4, respectively). While performance to exogenous enzyme application of Hemi-cell® and Zymannase® in the d 21 to d 72 period is promising, additional work is needed to understand implementation and the induction period due to the lack of response for the first 21 d.
Key Words: Hemicell®, swine, Zymannase®
155 Concentrations of digestible and metabolizable and net energy in soybean meal produced throughout the United States and fed to pigs. K. M. Sotak*, H. H. Stein, University of Illinois at Urbana-Champaign, Urbana.
An experiment was conducted to measure the in vivo digest-ibility of energy and concentrations of DE and ME in soy-
Table 155. Concentrations of DE, ME, and NE and ATTD in corn and soybean meal (DM basis)
Item CornSBM Zone1
SEM1 2 3 4ATTD of GE, % 86.10b 91.76a 91.63a 89.34ab 90.84ab 3.94DE, kcal/kg 3834c 4343a 4319a 4135b 4248ab 121.01ME, kcal/kg 3699c 4098a 4117a 3926bc 4039ab 135.62NE, kcal/kg 2699b 2939a 2951a 2815b 2895ab 98.46a–dMeans within a row lacking a common superscript are different (P < 0.05).1Zones = 1: Northern U.S.; 2: Eastern U.S.; 3. Western U.S.; 4: Illinois.

69
bean meal (SBM) fed to growing pigs. Twenty-three growing barrows (initial BW: 26.4 ± 1.8 kg) were allotted to a 23 × 8 Youden square design with pigs and period as the 2 block-ing criteria. Twenty-two sources of SBM were procured from crushing facilities throughout the Midwest. For analysis, the crushing plant locations were separated into 4 zones: 1) North-ern U.S., 2) Eastern U.S., 3) Western U.S., and 4) Illinois. The dietary treatments included a corn-based diet and 22 diets based on a mixture of corn and each source of SBM. The ATTD of GE in SBM from Zones 1 and 2 were greater (P £ 0.05) than the ATTD of GE in corn but were not different from the ATTD of GE from Zones 3 and 4. The DE in SBM from Zones 1 and 2 were greater (P £ 0.05) than the DE in corn. The DE in SBM from Zones 3 and 4 were not different from the DE in corn or SBM from Zones 1 and 2. The ME in SBM from Zones 1 and 2 were greater (P £ 0.05) than the ME in SBM from Zone 3 and corn. The ME of SBM from Zone 4 was not different from the ME of SBM from Zones 1–3. Net energy in SBM from Zones 1 and 2 was greater (P £ 0.05) than the NE in SBM from Zone 2 and corn. Net energy in SBM from Zone 4 was greater (P £ 0.05) than corn but not different from other zones. Overall, GE, DE, ME, and NE were similar for SBM from the Northern, Eastern, and Southern United States, but DE, ME, and NE were decreased for SBM from the Western United States.
Key Words: energy, pigs, soybean meal
156 Corn grown under drought-stressed conditions does not have lower energy content than corn grown in a previous “normal” year. M. A. Newman*, C. R. Hurburgh, J. F. Patience, Iowa State University, Ames.
Record-breaking heat and lack of rainfall during the 2012 growing season resulted in drought-stressed growing condi-tions. An experiment was conducted to investigate the impact of these conditions on nutrient composition and apparent total tract digestibility (ATTD) of energy in corn and determine if relationships exist among corn quality measurements, nutrient content, and digestibility of energy. Twenty-eight samples of corn from the 2012 crop were collected across the Midwest using yield as an initial screen for drought impact; 2 samples from 2011 served as a control. Yields ranged from < 3.1 to > 15.7 t/ha ( < 50 to > 250 bu/acre). Each sample was graded by an official U.S. grain inspection agency and also analyzed for ether extract and crude protein content (dry matter basis). Diets were formulated using each of the 30 corn samples plus vitamins, minerals, and 0.4% titanium dioxide as an indigest-ible marker. Diets were fed at a level of approximately 2.6 times the estimated energy required for maintenance (NRC 2012) based on the average initial BW of the pigs at the begin-ning of 4 collection periods. Each of the 4 collection periods consisted of 6 d of adjustment to the test diet followed by 3 d of fecal sample collection followed by 5 d of feeding a fully balanced grower diet; the latter was fed to ensure that the low amino acid test diets did not impair digestive function in sub-
sequent collection periods. Sixty individually housed barrows (PIC 359 × C29; initial BW = 34.2 ± 0.2 kg) were randomly allotted in an incomplete crossover design with 30 diets and 4 periods. Diet and fecal samples were analyzed for dry matter (DM), titanium dioxide, and gross energy (GE). ATTD coef-ficients were then determined. Mean ATTD coefficients of GE between the 2011 and 2012 corn samples were not different (84.3% vs. 83.1%, respectively; P > 0.10). Comparing 2011 with 2012, there were no differences in ether extract (4.07% vs. 3.96%; P > 0.10) or crude protein content (8.56% vs. 9.19%; P > 0.10) of corn samples. There were no differences in physical characteristics, except for 1000 kernel weight, which varied among samples by 220% (176 to 386 g). No re-lationships were found between any single corn quality mea-surement, physical or chemical, and digestibility of energy (P > 0.10). In conclusion, ATTD of the energy of corn grown under drought-stressed conditions was not different from corn grown in the previous year under “normal” conditions.
Key Words: corn, digestibility, drought, pig
157 Effects of conditioning motor speed and diet form on growth performance of 12–21 kg nursery pigs. L. L. Lewis1,*, C. K. Jones1, A. C. Fahrenholz2, C. R. Stark1, M. A. Goncalves1, J. M. DeRouchey1, 1Kansas State University, Manhattan, 2North Carolina State University, Raleigh.
A total of 180 nursery pigs (PIC 327 × 1050; initially 12.6 kg) were used in an 18-d study to determine the effects of condi-tioning parameters and feed form on pig performance. Diets, either pelleted or mash form, were conditioned by slowing or speeding conditioner rotations per minute (rpm), where higher rpm equates to faster conditioning. All diet formulations were similar. Treatments included 1) negative control mash diet, 2) positive control pelleted diet conditioned at 60 rpm, 3) pelleted diet conditioned at 30 rpm and reground, 4) pelleted diet condi-tioned at 60 rpm and reground, and 5) pelleted diet conditioned at 90 rpm and reground. The differing rpm values among treat-ments represent the time in the conditioner during processing. Pigs were weaned and fed a common acclimation diet for 21 d before the start of the experiment. Average daily gain and G/F did not differ (P > 0.12) between treatments overall, but ADFI was decreased (P = 0.03) for pigs fed the pelleted, positive control diet compared to all other diets. Although no overall treatment effects were significant for ADG or G/F, the experi-ment was designed more specifically to evaluate treatment dif-ferences using preplanned comparisons. When considering preplanned contrasts, we observed that pigs fed mash diets tended to have greater (P = 0.10) ADG compared to those fed pelleted and reground diets, suggesting that processing may have had a negative influence on feed utilization, which is a hypothesis that is further supported because pigs fed mash di-ets tended to have greater (P = 0.06) ADG compared to those

70
fed diets that were heat processed, regardless of regrinding. Considering these results, it was not surprising that pigs fed mash diets had greater (P = 0.05) ADG and ADFI (P = 0.01) than those fed pelleted diets. When directly comparing diets conditioned at 60 rpm, fed either as whole pellets or reground to mash consistency, pigs fed pelleted diets had improved (P = 0.01) G/F due to lower ADFI (P = 0.004) but similar ADG (P = 0.60). This unexpected negative impact of pelleting on ADG may be due to a negative influence of heat treatment on palatability. The expected improvement in G/F from pelleting (6.8%) was observed but was lost when diets were reground to near original mash particle size. This may indicate that diet form (high quality pellets vs. mash) impacts G/F more than degree of starch gelatinization or other intrinsic factors associ-ated with conditioning ingredients.
Key Words: gelatinization, pelleting, starch
158 Effects of corn particle size and diet form on growth performance of 6–22 kg nursery pigs. G. E. Bokelman*, C. K. Jones, J. R. Kalivoda, M. D. Tokach, J. M. DeRouchey, C. R. Stark, Kansas State University, Manhattan.
A total of 192 pigs (PIC 1050, initially 6.7 kg and 31 d of age) were used in a 35-d study. Pigs were allotted to 1 of 4 dietary treatments (6 pigs/pen and 8 pens/treatment). The 4 nutrition-ally similar diets were arranged in a 2 × 2 factorial consisting of 1) corn ground to ~387 µm in meal form, 2) corn ground to ~703 µm in meal form, 3) treatment 1 in pellet form, and 4) treatment 2 in pellet form. Data were analyzed using the GLIM-MIX procedure of SAS. Overall (d 0 to 35), there were no ef-fects of corn particle size (P > 0.24). However, pigs fed mash diets had improved overall ADG compared to those fed pelleted diets (P = 0.01; 0.43 vs. 0.39 kg/d), which was primarily driven by greater ADFI. In fact, pigs fed mash diets had greater ADFI during all periods (P < 0.02). Still, feed efficiency was improved by pigs consuming mash diets compared to those consuming pelleted diets from d 0 to 14 (P < 0.0001; 0.57 vs. 0.68), but there were no differences from d 14 to 35 or overall. There was no corn particle size × feed form interaction on ADG or ADFI (P > 0.17), but pigs fed pelleted diets from 700 µm corn had improved overall feed efficiency compared to pigs fed any of the other three treatments (P < 0.05), including those fed pelleted diets from 400 µm corn. As expected, the diet manufactured in mash form from the 700 µm corn resulted in the poorest feed ef-ficiency numerically. This research suggests that feed efficiency is slightly improved by feeding 400 vs. 700 µm corn in mash di-ets, but pelleting does not further improve feed efficiency when corn is ground to a fine particle size. Interestingly, pelleting diets manufactured from larger particle size corn improved feed ef-ficiency more than those made with smaller particle size in this experiment. More research is needed to confirm and explain this finding.
Key Words: nursery pig, particle size, pelleting
159 Influence of the zinc to phytate ratio and superdoses of phytase on piglet growth performance. C. L. Walk1,*, J. J. Chewning2, P. Wilcock1, 1AB Vista Feed Ingredients, Marlborough, United Kingdom, 2Swine Research Services, Inc., Springdale, AR.
Previous in vitro data indicates zinc (Zn) may bind to phytate at a Zn to phytate ratio of 4 to 1, which reduces Zn absorption. Phy-tase improves Zn absorption through the hydrolysis of phytate. An experiment was conducted to evaluate the Zn to phytate ratio and phytase supplementation (Quantum Blue) on piglet perfor-mance from weaning (d 0) to d 21. Pigs (5.2 ± 0.9 kg; n = 1280) were housed at 10 pigs/pen with 8 replicate pens/diet. Diets were arranged as a 2 × 4 × 2 factorial with 2 levels of phytate (ana-lyzed at normal, 0.50%, or high, 0.67%), 4 levels of Zn from zinc oxide (ZnO; 0, 1000, 2000 or 3000 ppm) and 2 levels of phytase (0 or 2500 FTU/kg). Phytate was increased by the inclusion of 2.5% full fat rice bran, and diets were formulated to meet the nutrient requirements of the pig (NCR, 1998), including calcium (0.86%) and available phosphorus (0.52%). This resulted in a Zn to phytate ratio ranging from < 1.0 to > 4.0 in the normal and high phytate diets as ZnO increased. Data were analyzed as a facto-rial in JMP, and significant means were separated using contrasts. There was no effect of Zn to phytate ratio on performance from d 0 to 21. ZnO supplementation increased ADFI from d 0 to 7 (quadratic P = 0.05) and decreased ADFI from d 14 to 21 (linear P < 0.02). ADG increased as Zn supplementation increased from d 0 to 7 (quadratic P < 0.04). Zn supplementation improved FCR from d 0 to 7 (quadratic P = 0.02) and from d 0 to 21 (linear P < 0.03). Pigs fed high phytate tended to gain less than pigs fed normal phytate from d 7 to 14 (P < 0.07) and d 0 to 21 (P < 0.09). In addition, pigs fed high phytate were less efficient than pigs fed normal phytate from d 0 to 7 (P < 0.03). Phytase improved ADG and FCR from d 0 to 7 (P < 0.05), d 7 to 14 (P < 0.05), and d 0 to 21 (P < 0.05). In conclusion, small increases in phytate resulted in decreases in piglet ADG and FCR, thereby highlighting the antinutritive effect of phytate. Zn supplementation improved per-formance with a peak around 2000 ppm. However, there was no significant effect of Zn to phytate ratio on performance or phytase efficacy and phytase significantly improved ADG and FCR re-gardless of the level of phytate or Zn supplemented.
Key Words: phytase, phytate, piglet
160 The effect of feeding β-mannanase in starter diets on nursery pig growth, feed intake, and feed efficiency performance in a commercial wean-finish setting. S. A. Crowder1,*, T. L. Weeden1, W. I. Snyder1, T. A. Meyer1, C. C. Hankins1, R. A. Arentson2, J. E. Ferrel2, 1Purina Animal Nutrition LLC, Shoreview, MN, 2Elanco Animal Health, Greenfield, IN.
Nine hundred weanling pigs (initial BW = 7.59 ± 0.012kg; 21 d age) were used to evaluate the effect of a commercially available enzyme Hemicell HT®1.5x (HT) in corn-soybean meal-dried

71
distillers grains with solubles diet on nursery pig growth per-formance. Pigs were allotted in a randomized complete block design into mixed gender pens, with 15 replicates per treatment, 20 pigs per pen, and were fed 1 of 3 dietary treatments. Dietary treatments were T1, Positive Control (3362, 3362, 3362, 3362 kcal/kg ME; by phase, respectively); T2, Negative Control (3362, 3252, 3252, 3252 kcal/kg ME; by phase, respectively); T3, T2+HT (0.08 MU/kg mannanase). Pigs were fed by budget in 3 dietary phases, 0.91, 2.27, and 5.44 kg, respectively, and phase 4 to conclusion. A common Phase 1 diet was fed to T1 and T2; T3 differed by enzyme inclusion. Diets contained 2.5, 5, 10, 20% corn DDGS by phase, respectively. Pen BW and feed disappearance were recorded on d 5, 12, 19, 26, and 43. BW on d5 was similar (P = 0. 67) for all treatments. Period 2 (d 5–12) ADG (319, 305, 313 g/d, T1–T3, respectively) was not signifi-cantly different (P = 0.383). There was no significant difference (P = 0.329) in Period 2 G:F (0.935, 0.899, 0.917, T1–T3, respec-tively). Period 3 (d 12–19) ADG was increased (P < 0.05) for T2 versus T3, while T1 was intermediate (0.989, 1.04, 0.951 g/d, T1–T3, respectively), and G:F increased (P < 0.05) for T1 and T2 versus T3 (0.666, 0.677, 0.619, T1–T3, respectively). Pe-riod 4 (d 19–26) ADG improved (P = 0.017; 530, 514, 579 g/d, T1–T3, respectively) and G:F increased (P < 0.05; 0.732, 0.720, 0.775, T1–T3, respectively) for T3 versus T1 and T2. Period 5 (d 26–43) ADG tended to be increased (P = 0.060) for T1 versus T2, while T3 was intermediate (568, 508, 540 g/d, T1–T3, re-spectively). Period 5 G:F was increased (P < 0.05) for T1 versus T2 and T3 (0.661, 0.607, 0.615, T1–T3, respectively). Final BW tended to be increased (P = 0.078) for T3 versus T2, while T1 was intermediate (26.08, 25.21, 26.24 kg, T1–T3, respectively). Overall ADG (434, 413, 433 g/d, T1–T3, respectively) was not significantly different (P = 0.254). Overall G:F was greater (P < 0.05) for T1 versus T2, while T3 was intermediate (0.718, 0.691, 0.700, T1–T3, respectively). Supplementation of Hemi-cell HT®1.5x to nursery pigs resulted in intermediate overall feed conversion and tended to improve final body weight.
Key Words: β-mannanase, Hemicell HT®1.5x, swine
NONRUMINANT NUTRITION: GUT HEALTH AND DISEASE: NUTRITIONAL
AND METABOLIC IMPACTS
161 Effect of Bacillus-based direct-fed microbial feed supplementation on growth performance, carcass characteristics, and fecal microbial enumeration of wean to finish pigs. H. Manu*, X. Yang, D. P. Pangeni, P. Ren, W. Meried, S. Baidoo, Southern Research and Outreach Center, University of Minnesota, Waseca.
Calsporin® is a biotechnical feed additive based on viable spores of Bacillus subtilis C-3102. An experiment was con-ducted to evaluate the effect of Calsporin® on growth perfor-
mance, microbial population, and carcass characteristics of wean to finish pigs. One hundred and ninety-two (Topigs 20 × Compart Duroc;18 d, initial body weight (6.7 ± 0.27 kg)) crossed bred piglets were selected, weighed, and distributed evenly by origin, sex, and initial body weight into two treat-ment groups of 12 pens (4 gilts and 4 barrows per pen) each in a randomized complete block design. Pigs were fed a control diet (-ve Calsporin®) and the experimental diet (+ve Calspo-rin, 1.5 × 10⁵ CFU/kg). Blood and fresh fecal samples were collected on d 84 from 1 pig/pen for determination of blood urea nitrogen (BUN) concentration and microbial popula-tion enumeration. Pen was the experimental unit. Data were analyzed by the MIXED procedure of SAS, with treatment and sex as fixed effects and block as a random effect. Data were expressed as means ± SE. Significant level was set at the level of 0.05. The results showed that Calsporin® did not influence (P > 0.05) average daily feed intake (ADFI) and feed conversion efficiency in all the growth phases. Pigs fed a diet containing Calsporin® had higher average daily gain ADG (P = 0.032) for the d 29–57 period and lower ADFI (P = 0.036) for the d 129–141 period than those fed the control diet. The measured carcass characteristics, including hot car-cass weight, yield percentage, back fat depth, loin depth, and lean percentage, were not affected (P > 0.05) by the dietary treatments. Supplementation of Calsporin® did not affect (P > 0.05) BUN concentration. Inclusion of Calsporin® in the diet did not significantly affect (P > 0.05) the total counts of Enterobacteriaceae, Bifidobacteria, and total anaerobes in the feces. In conclusion, Calsporin® did not affect growth perfor-mance and carcass characteristics of wean to finish pigs at an inclusion rate of 1.5 × 10⁵CFU/g.
Key Words: Calsporin, carcass traits, growth performance, microbial enumeration, pigs
162 Diet complexity affects postweaning performance and immune response to porcine circovirus 2 (PCV2) infection in nursery pigs. G. A. Mastromano*, Y. S. Li, H. Tran, J. W. Bundy, D. C. Ciobanu, P. S. Miller, T. E. Burkey, University of Nebraska, Lincoln.
To investigate the effects of complex and prebiotic diets on nursery pigs inoculated for or vaccinated against PCV2 on growth performance and immune parameters, 96 weaned barrows (age 27 to 40 d; BW 7.1 kg) were housed (4 pigs/pen) in an environmentally controlled nursery with ad libi-tum access to feed and water over a 28-d study. Forty-eight pigs were vaccinated (VAC) for PCV2 prior to arrival, while remaining pigs (PCV) were inoculated for PCV2 on d 0. Pigs were randomly assigned to 1 of 3 diets: complex (CO; lactose, spray-dried plasma, spray-dried whey), simple (SI; corn and SBM), or simple + 2.5% Grobiotic-S (GS). Blood samples were obtained twice per week (d -2 to 28) for serum cytokine and PCV2-specific immunoglobulin (Ig) G and M quantifi-
72
cation. No significant time, diet, or PCV-status interactions were observed for growth performance. Body weight tended (P < 0.06; d 14 to 28) to be greater in VAC (11.1 to 18.4 kg) compared to PCV (10.3 to 16.7 kg) pigs, and overall ADG (P < 0. 04) and ADFI (P < 0.03) were greater in VAC (0.40 and 0.68 kg, respectively) compared to PCV (0.35 and 0.61 kg, respectively) pigs. Overall, pigs fed CO (0.71 kg) had greater (P < 0.02) ADFI compared to GS (0.61 kg) pigs and tended (P < 0.08) to be greater than SI (0.63 kg) pigs. Pigs fed CO (0.60) had greater (P < 0.05) G:F (d 0 to 7) compared to GS (0.46) and SI (0.51); however, G:F (P < 0.05; d 21 to 28) was decreased in CO (0.59) pigs compared to SI (0.67) pigs. For IgG, a diet × PCV-status interaction was observed (P < 0.04); PCV pigs fed SI and GS had increased PCV2-specific IgG (P < 0.05) compared to CO pigs. No effects of PCV-status or diet were observed with respect to IL-12p40,6 IL-6, IL-8, IL-10, or TNF-α; however, main effects of PCV status (IFN-α; P < 0.01) and diet (IL-1β; P < 0.03) were observed. Specifi-cally, greater IFN-α was observed for PCV compared to VAC pigs on d 11 (P < 0.02) and 14 (P < 0.02), and pigs fed CO had greater overall IL-1β compared to GS (P < 0.04) and SI (P < 0.02). Results indicate a complex nursery diet may im-prove postweaning growth performance and affect immune response to PCV2 infection.
Key Words: health, PCV2, pig
163 Effect of deoxynivalenol (DON) ingestion on expression of genes involved in intestinal integrity and immune response. M. Lessard1,*, K. Deschêne1, C. Savard2, F. Guay3, J. Lapointe1, Y. Chorfi2, 1Agriculture and Agri-Food Canada, Sherbrooke, Canada, 2Faculté de médecine vétérinaire, Université de Montréal, St-Hyacinthe, Canada, 3Université Laval, Quebec, Canada.
The effects of feeding DON contaminated grain to pigs are very diverse, ranging from reduced growth performances to symptoms like immune suppression and diarrhea. Although the gastrointestinal tract represents the first barrier met by ex-ogenous food/feed contaminants such as mycotoxins, little is known about the effect of DON on intestinal health. The pur-pose of this study was to evaluate the influence of DON inges-tion on intestinal gene expression involved in the barrier and immune functions in growing pigs. Sixteen 4-week-old pigs were randomly allocated to two dietary treatments for 35 days: control diet ( < 0.5 ppm) or diets contaminated with 3.5 ppm DON. Each group of pigs was housed in a different pen located in the same room. Feed and water were provided ad libitum. Growth performances were recorded weekly, and at the end of the trial, all pigs were euthanized. Samples from mid-jejunum and ileum were collected for measurements of the expression of genes involved in epithelium integrity and barrier functions, inflammatory reaction, and oxidative stress. Ingestion of 3.5 ppm DON diet reduced average daily gain of pigs compared
to control diet (P < 0.05). In pigs fed 3.5 ppm DON diet, sev-eral genes involved in intestinal integrity and barrier function (claudins, occludins, BCL-2, and vimentin) in the ileum were down-regulated (P < 0.05) compared to pigs fed the control diet. Results also revealed that expression of two chemokines (IL-8, CXCL10), interferon-γ, and major antioxidant gluta-thione peroxidase 2 (GPX-2) were up-regulated (P < 0.05), whereas expression of other genes encoding enzymatic anti-oxidants such as GPX-3, GPX-4, and superoxide dismutase-3 (SOD-3) were down-regulated in pigs fed a DON-contam-inated diet. In the jejunum, only the expression of CXCL10 and IL-4 genes was significantly up-regulated (P < 0.05) in pigs fed a DON-contaminated diet. In conclusion, these results provide strong evidence that ingestion of DON-contaminated feed significantly altered the expression of genes involved in intestinal barrier and immune functions, which may predispose animals to infections by enteric pathogens.
Key Words: deoxynivalenol, immune response, intestine
164 Characterization of PRRS progression in growing gilts using metabolic, cytokine, and complete blood count data. N. V. L. Serão1,*, T. E. Burkey2, G. Gourley3, T. E. Weber4, M. FitzSimmons3, K. Schwartz1, C. Sparks5, J. Odle6, N. K. Gabler1, J. C. M. Dekkers1, 1Iowa State University, Ames, 2University of Nebraska, Lincoln, 3Swine Graphics Enterprises, Webster City, IA, 4Elanco Animal Health, Greenfield, IN, 5Choice Genetics, Ames, IA, 6North Carolina State University, Raleigh.
The metabolic and immune responses of pigs inoculated with porcine reproductive and respiratory syndrome (PRRS) were assessed using canonical discriminant analysis (CDA) of multiple blood parameters. Twenty-four gilts (BW 16 ± 4.4 kg) were selected based on high versus low growth rate over 56 days following an I.M. PRRS virus challenge in a com-mercial setting. Blood samples were collected on 0, 7, 14, and 28 days postinoculation (dpi) for measurement of 52 me-tabolites (via 1H-NMR), 17 complete blood count (CBC), and inflammatory traits (ELISA). Prior to the CDA, traits were analyzed in a univariate manner in order to identify traits that could potentially discriminate the different phases of PRRS progression at 7, 14, and 28 dpi. The univariate analysis sta-tistical model included the fixed effects of growth rate group, infection status (infected [dpi 0] vs. uninfected [dpi 7, 14, and 21] pigs), dpi, and their interactions, age at dpi 0 as covariate, and pen as a random effect. Thirty-three traits were included for CDA based on having P < 0.1 for the effects of dpi or its interactions. The first (CAN1) and second (CAN2) canonical variables were significant (P < 0.01 and P = 0.02, respec-tively) and showed squared canonical correlations of 0.95 and 0.86, respectively. While CAN1 discriminated dpi 7 and 14 from dpi 28, CAN2 discriminated dpi 7 from 14. The best
73
discriminators were alkaline phosphatase (ALP) and hap-toglobin for CAN1 and C-reactive protein (CRP), glucose, and insulin for CAN2. However, samples from 7 dpi had low values of CRP, glucose, and insulin compared to dpi 14. Ad-ditionally, urea showed potential discriminating power, with high values on dpi 7 and 14 compared to 28 (CAN1), whereas the amino acids alanine, proline, and threonine were good discriminators of dpi 7 and 14 (CAN2). We infer that during early stages of PRRS infection (dpi 7 and 14), amino acid mobilization is increased (CAN2) for immune protein syn-thesis and energy requirements, whereas protein catabolism is increased in later stages (dpi 28; CAN1). Altogether, these results indicate dynamic changes in immune and energy re-quirements for pigs growing through a PRRS challenge. Sup-ported by the IPPA grant 12-113.
Key Words: canonical discriminant analysis, porcine reproductive and respiratory syndrome, residual gain
165 Effects of dietary soybean meal concentration on growth performance and immune response of pigs during a porcine reproductive and respiratory syndrome virus challenge. S. J. Rochell1,*, L. S. Alexander1, R. D. Boyd2, W. G. Van Alstine3, J. Pettigrew1, R. N. Dilger1, 1University of Illinois, Urbana, 2The Hanor Company, Inc., Franklin, KY, 3Purdue University, West Lafayette, IN.
Soybean meal (SBM) contains naturally occurring isofla-vones that may exert antiviral activity. Thus, the effects of di-etary SBM concentration on the growth performance and im-mune response of pigs infected with porcine reproductive and respiratory syndrome virus (PRRSV) were evaluated. Four experimental treatments included a 2 × 2 factorial arrange-ment of 2 dietary SBM concentrations, 17.5% (LSBM) and 29% (HSBM), and 2 PRRSV infection states, uninfected and PRRSV infected. The 2 experimental diets were formulated to be isocaloric and contain similar digestible concentrations of Lys, Met, Trp, Thr, and Val. Total isoflavone contents of the LSBM and HSBM diets were 700 and 1246 mg/kg, respec-tively. Weanling pigs (32 barrows and 32 gilts, 7.14 ± 0.54 kg) were individually housed and provided a common diet for 1 wk before being allotted to 4 treatment groups (n = 16). After receiving experimental diets for 1 wk, pigs received a sham inoculation (sterile PBS) or a 1 × 10⁵ 50% tissue culture infec-tive dose of PRRSV at 35 d of age (0 d postinoculation, DPI). Growth performance was recorded weekly, and rectal temper-atures were measured daily beginning on 0 DPI. Blood was collected on 0, 3, 7, and 14 DPI for determination of blood cell counts, serum PRRSV load, and haptoglobin and cytokine concentrations. Infection with PRRSV increased (P < 0.01) rectal temperatures and suppressed (P < 0.01) the growth of pigs. From 7 to 14 DPI, ADG of pigs fed LSBM was greater (P < 0.05) than that of pigs fed HSBM in the uninfected group, but in the PRRSV-infected group, ADG of pigs fed HSBM
was greater (P < 0.05) than that of pigs fed LSBM. Overall (0 to 14 DPI) ADG was similar for pigs fed HSBM (576 g/d) and LSBM (608 g/d) in the uninfected group and tended to be greater (P = 0.06) for pigs fed HSBM (374 g/d) than for pigs fed LSBM (314 g/d) in the PRRSV-infected group. At 14 DPI, PRRSV-infected pigs fed HSBM had higher (P < 0.05) hematocrit values and a tendency for lower (P = 0.06) serum PRRSV load compared with pigs fed LSBM. Serum haptoglo-bin and tumor necrosis factor-α concentrations were lower (P < 0.05) at 3 and 14 DPI, respectively, in PRRSV-infected pigs fed HSBM compared with LSBM. In conclusion, increasing the dietary SBM concentration modulated the immune re-sponse and tended to improve the growth performance of pigs during a PRRSV infection.
Key Words: pig, PRRS, soybean meal
166 Relations among enterotoxigenic Escherichia coli, net fluid absorption, and cytokine expression in piglet jejunal segments infused with customized glycans. A. D. Woodward*, X. Chen, M. G. Gänzle, R. T. Zijlstra, University of Alberta, Edmonton, Canada.
Adherence of enterotoxigenic Escherichia coli (ETEC) to small intestine mucosa produces toxins that cause diarrhea and intestinal inflammation. Lactobacillus reuteri produce gly-cans that may reduce ETEC-associated disturbances in swine; however, benefits of such glycans to prevent pathogen adhe-sion in vivo have not been proven. We hypothesized that cus-tomized functional glycans obtained from lactic acid bacteria production reduce intestinal incidence of ETEC-derived fluid loss and expression of inflammatory cytokines (interleukin (IL)-1β and IL-6) in piglets. Weanling gilts (5-wk-old; 10.2 ± 1.8 kg BW; n = 11) were surgically prepared with 10 jejunal segments using small intestinal perfusion in 2 Exp. In each pig, 5 segments were infected with ETEC K88 (5 × 10⁹ CFU/mL); remaining segments were flushed with saline (PBS). Five pairs of segments, 1 ETEC and 1 non-ETEC infected, were infused with customized glycans or saline as control for 8 h. Glycans infused in Exp. 1 were dextran, inulin, levan, and reuteran; in Exp. 2, galactooligosaccharide (GOS), chitosan-oligosaccharide (COS), galactosylated COS (Gal-COS), and a negative control containing glucose and galactose were used. After infusion, segments were removed, net fluid absorption (NFA) and loss (NFL) per surface area, and expression of IL-1β and IL-6 were determined, and differences were analyzed using ANOVA. Principal component (PC) analyses showed infection with ETEC had a strong negative relation with NFA and a strong positive relation with cytokine expression. Com-pared to saline, NFL was decreased in COS, dextran, levan, and reuteran (57, 59, 40, and 49, respectively, vs. 105 ± 20 mL cm-2; P < 0.05). Although ETEC increased (P < 0.05) IL-1β in all segments, the difference of fold change in IL-1β between ETEC and PBS was decreased in GOS compared to saline (0.1 vs. 2.5; P < 0.05). There was no difference in fold
74
change in IL-6 expression due to ETEC infection between treatments. In conclusion, customized glycans may reduce net fluid loss and some markers of intestinal inflammation related to ETEC adherence in the small intestine.
Key Words: diarrhea, enterotoxigenic Escherichia coli, inflammation
167 Effect of yeast rare earth on growth performance, nutrient digestibility, blood profiles, meat quality, and fecal microbiota in finishing pigs. S. D. Upadhaya, L. Cai, I. H. Kim*, Dankook University, Cheonan, South Korea.
Yeast rare earth (YRE) is a new alternative to antibiotics, which can improve growth performance and fecal microbiota in livestock. It contained 2.82% lanthanum and 4.71% ce-rium in this study. A total of 100 finishing pigs [(Landrace × Yorkshire) × Duroc, BW = 51.1 ± 2.12 kg] were used in a 70-d study to evaluate effects of YRE on growth performance, nutrient digestibility, blood profiles, meat quality, and fecal shedding. Pigs were randomly assigned to 1 of 5 treatments with 5 pens per treatment and 4 pigs per pen by BW and sex. Treatments were corn soybean meal based diets supplemented with 0, 0.05, 0.10, or 0.15% YRE and 0.05% tiamulin. Experi-ment was separated into 2 phases, from d 0 to 35 and from d 36 to 70. All diets were formulated to meet or exceed the nu-trient requirements recommended by the NRC (2012). During d 36 to 70 and d 0 to 70, dietary YRE improved average daily gain (linear, P = 0.007, 0.007, respectively) and gain/feed (G/F; linear, P = 0.018, 0.030, respectively) as dietary YRE increased in the diet. From d 0 to 35, pigs fed 0.1 and 0.15% YRE had a higher G/F (P = 0.036) than pigs fed 0.05% tiamu-lin. At the end of the experiment, pigs fed 0.1% YRE had a higher digestibility of dry matter (P = 0.012) than pigs fed control diet. The digestibility of energy (P = 0.011) increased with increasing YRE levels in the diet, and the greatest value was observed in pigs fed 0.1% of YRE. At the end of 10th week, red blood cells (linear, P = 0.035) and longissimus mus-cle color (linear, P = 0.044) increased with increasing amount of YRE in the diet. The values of fecal E. coli (P = 0.047) and Lactobacillus (P = 0.002) in pigs fed 0.15% YRE were significantly lower than in pigs fed other diets. E. coli (linear, P = 0.004) and Lactobacillus (linear, P = 0.048; quadratic, P = 0.023) were also decreased with the increasing YRE levels in the diet. In conclusion, results indicate that YRE supplemen-tation can improve growth performance, digestibility, and gut health and can be considered a good alternative to antibiotics in finishing pigs.
Key Words: finishing pig, growth performance, yeast rare earth
168 Immune system stimulation of finishing pigs is positively altered with vitamin E and polyunsaturated fatty acid supplements. S. D. Upadhaya1, J. C. Kim2, J. Pluske3, I. H. Kim1,*, 1Dankook University, Cheonan, South Korea, 2Department of Agriculture and Food, Western Australia, Australia, 3Murdoch University, Murdoch, Western Australia, Australia.
During lipopolysaccharide (LPS) challenge, nutrients are partitioned away from animal growth toward the response of acute phase proteins. One strategy to modify animal’s response to LPS challenge is to supplement the animal with a diet that minimizes the partitioning of nutrients. Vitamin E and poly-unsaturated fatty acid have been reported to have an active role toward the host’s response to infection. This study was conducted to investigate the effects of dietary supplementation of vitamin E and PUFA on the growth performance and im-munological response of finishing pigs challenged with LPS. A total of 80 pigs [(Landrace × Yorkshire) × Duroc] with an initial BW of 50.7 ± 3.0 kg were used in a 6-wk trial. Pigs were randomly assigned to 1 of 4 treatments. Treatments were 1) CON, basal diet; 2) V, basal diet + 0.06% vitamin E; 3) P, basal diet + 0.75% PUFA; and 4) VP, basal diet + 0.06% vitamin E + 0.75% PUFA. Each treatment consisted of 4 replications with 5 pigs per pen. LPS injection was administered to all pigs twice a week throughout the experimental period. Supplementation of vitamin E and PUFA in the diet led to a significant increase (P < 0.05) in average daily gain (758 vs. 618 g) during a 4- to 6-wk trial compared to CON. Pigs fed the VP diet had a lower (P < 0.05) concentration of cortisol (2nd wk, 2.75 vs. 4.06 μg/dL; 4th wk, 2.08 vs. 3.04 μ/dL; 6th wk, 4.43 vs. 5.59 μg/dL) and white blood cells (4th wk, 16.37 vs. 20.29 × 10³/μL) com-pared with those fed the basal diet. Pigs fed the basal diet had a higher (P < 0.05) concentration of tumor necrosis factor-α (2nd wk, 39.1 vs. 31.2, 28.3, 24.4 pg/mL; 6th wk, 74.4 vs. 70.9, 70.9, 68.0 pg/mL) and Prostaglandin E2 (PGE2; 2nd wk, 91.69 vs. 80.96, 73.21, 72.97 pg/mL) than those in treatments V, P, and VP. The PGE2 concentration was reduced by supplemen-tation of PUFA or PUFA with vitamin E (4th wk, 15.7%; 6th wk, 34.8%). The difference of lean percentage between the ini-tial day and the final day was higher (P < 0.05; 1.2, 1.5, 2.1 vs. 0.3) in treatments V, P, and VP in CON. Results indicate that an interactive combination of vitamin E and PUFA has a positive influence on average daily gain and immune response in LPS challenged finishing pigs.
Key Words: finishing pigs, polyunsaturated fatty acid, vitamin E

75
169 Effects of dietary fermented aged garlic supplementation on growth performance, digestibility, blood profiles, gas emissions, and microbiota in weanling pigs. M. M. Hossain, J. H. Cho, I. H. Kim*, Dankook University, Cheonan, South Korea.
Garlic possesses antibacterial, antifungal, antiparasitic, anti-viral, and antioxidant activities but would reduce feed intake because of the pungent smell, which is not contained in fer-mented aged garlic (FG) because of the aging process. Pigs [(Duroc×Yorkshire)×Landrace; BW = 5.74 ± 1.15 kg; weaned at d 21 after birth] were assigned to 1 of 5 dietary treatments (6 pens/treatment, 5 pigs/pen) by BW and sex (2 barrows and 3 gilts) for a 6-wk experiment. The pen was considered the experimental unit in the statistical model. Treatments were corn soybean meal based diets supplemented with 0.0033% tiamulin, 0, 0.05, 0.10, or 0.20% FG. The average daily gain (ADG), average daily feed intake (ADFI), and gain/feed (G/F) were linearly (P < 0.05) increased by FG in the diet during d 21 to 42 and 0 to 42. Dietary supplementation of FG linearly increased (P < 0.05) the coefficient of total tract apparent digestibility of dry matter (DM), nitrogen (N), and gross energy (GE) as well as blood IgG concentration during the 6th wk. The fecal NH3 and total mercaptans emissions as well as fecal E. coli counts were linearly (P < 0.05) reduced by FG in the diet. Dietary supplementation of FG increased (P < 0.05) ADFI during d 21 to 42 and d 0 to 42 and reduced (P < 0.05) fecal NH3 emissions compared to pigs fed tiamulin. In conclusion, results indicate that FG can enhance growth performance and digestibility and reduce fecal E. coli counts and fecal gas emissions in weanling pigs.
Key Words: fermented aged garlic, growth performance, weanling pig
170 Evaluation of lactulose on growth performance, nutrient digestibility, hematological characteristics, targeted E. coli colony, fecal score, moisture, and noxious gas emissions in weaning pigs. M. M. Hossain, J. H. Cho, I. H. Kim*, Dankook University, Cheonan, South Korea.
Lactulose (LAC; a synthetic disaccharide) is widely used in human medicine for dietetic purposes (laxation, reduced am-monia absorption, increased counts of bifidobacteria and lac-tobacilli as well as reduced counts of clostrids, Salmonella, or E. coli in gastrointestinal contents). A total of 210 weaning pigs [(Yorkshire × Duroc) × Landrace, BW = 5.77 ± 1.22 kg] were used to evaluate the effects of LAC. Pigs were assigned to 1 of 3 dietary treatments (14 pens/treatment, 5 pigs/pen) by BW and sex (2 barrows and 3 gilts). Treatments were corn soybean meal based diets supplemented with 0, 0.1, or 0.2% LAC. The white blood cells, lymphocyte counts, and hapto-globin concentration in the whole blood were determined us-ing an automatic blood analyzer (ADVIA 120, Bayer, NY), and fecal Lactobacillus and E. coli shedding were measured by using MacConkey agar plates and lactobacilli medium III agar plates. During d 1 to 14, pigs fed LAC0.1 and LAC0.2 had greater (P < 0.05) ADFI and ADG than those fed the CON diet. The ADG (kg/d) was significantly improved in the LAC0.1 diet compared to CON (0.674 vs. 0.649; P = 0.024) from d 15 to 42. Pigs fed with LAC0.1 (0.821) and LAC0.2 (0.812) showed higher feed efficiency that was followed by CON (0.780) during the last 28 d (P < 0.05). During the entire experimental period, 0.1% and 0.2% LAC supplementation improved ADG (kg/d) and feed efficiency compared to CON (0.562, 0.814 and 0.558, 0.810 vs. 0.538, 0.779; P = 0.013). In this study, nitrogen and DM digestibility was improved in LAC0.2 compared to the CON diet (P < 0.05) at 2 wk. Likewise, at 6 wk, pigs fed with LAC0.1 and LAC0.2 had higher revelatory nitrogen and energy digestibility than those fed the CON diet (P < 0.05). At d 42, LAC0.1 and LAC0.2 supplementation revealed higher fecal lactobacillus and lower E. coli counts (log10 cfu/g) compared to CON (7.41, 7.15 and 5.35, 5.49 vs. 6.83, 5.62; P < 0.05). Ammonia gas emissions
Table 169. Effect of fermented aged garlic on performance in weanling pigs
Items PC NC FG1 FG2 FG3 SE Linear FG vs. PCd 21 to 42 ADG, g 578 527 559 589 599 11 < 0.01 0.77
ADFI, g 856 853 861 859 862 1 < 0.01 < 0.01G/F 0.675 0.618 0.649 0.686 0.695 0.013 < 0.01 0.94
d 0 to 42 ADG, g 471 438 459 477 481 8 < 0.01 0.89ADFI, g 679 677 682 681 683 1 0.01 0.04G/F 0.694 0.647 0.672 0.700 0.705 0.012 < 0.01 0.92
wk 6 DM 0.801 0.792 0.800 0.813 0.811 0.006 0.02 0.14N 0.800 0.786 0.796 0.815 0.813 0.005 0.02 0.49GE 0.807 0.787 0.803 0.814 0.816 0.005 < 0.01 0.08
d 42 IgG, mg/dL 333.5 318.5 345.3 348.5 361.0 4.35 0.01 0.16NH3, ppm 26.9 28.2 24.5 21.0 20.4 1.9 0.02 < 0.01E. coli, log10cfu/g 5.98 6.22 5.97 5.87 5.89 0.10 0.03 0.50
76
were reduced in LAC0.1 and LAC0.2 diets over CON (P < 0.05) at d 5 and 7. Moreover, at d 7, hydrogen sulfide pro-duction was reduced in LAC0.2 compared to CON (2.79 vs. 2.98 ppm; P = 0.025). In conclusion, results demonstrated that supplementation of 0.1 or 0.2% LAC can amend growth per-formance, nutrient digestibility, and fecal lactobacillus count but reduce fecal E. coli, ammonia, and hydrogen sulfide gas emissions in weaning pigs.
Key Words: fecal microbiota, lactulose, weaning pig
NONRUMINANT NUTRITION: CO-PRODUCTS
171 Effect of corn ethanol co-products in a liquid feed system on growth performance of wean to finish pigs. W. G. Meried1,*, D. Hansen2, P. Ren1, H. Manu1, D. P. Pangeni1, X. Yang1, S. Baidoo1, 1Southern Research and Outreach Center, University of Minnesota, Waseca, 2Big Dutchman, Inc., Holland, MI.
The objective of the current study was to determine the ra-tio of wet distiller’s grains (WDG) to condensed distiller’s solubles (CDS) on the performance of wean to finish pigs fed via a computer-based automatic liquid feeding system. Early weaned pigs (18-d old; Topigs 20 × Compart Duroc (n = 280)) were allotted randomly to 1 of 4 dietary treatments (10 pigs/pen, 7 pens/treatment). The dietary treatments were 1) corn-soybean meal basal diet (CSBM) with 20% dried distiller’s grain with solubles (DDGS), 2) CSBM with 20% WDG (WDG), 3) CSBM with 17% WDG plus 3% CDS (WDG-CDS-1), and 4) CSBM with 14% WDG plus 6% CDS (WDG-CDS-2). Pigs were blocked by initial BW (11 ± 1.6 kg), and the experiment began 2 wk postweaning to finishing (126 d on trial) using a 5-phase feeding program. Pen was the experimental unit. Data were analyzed by the MIXED procedure of SAS, with treatment as a fixed effect and block as a random effect. Data were expressed as means ± SE. Significance level was set at P £ 0.05. The overall ADG was 0.912, 0.934, 0.957, and 0.937 kg/d, ADFI on a dry matter basis was 2.81, 2.50, 2.55, and 2.54 kg/d, and G:F was 0.370, 0.427, 0.426, and 0.417 for treatments 1 to 4, respectively. Overall ADG was higher (P = 0.05) in the WDG-CDS-1 treatment compared with the DDGS treat-ment, but there was no difference (P > 0.05) in ADG among DDGS, WDG, and WDG-CDS-2 treatments. Additionally, WDG, WDG-CDS-1, and WDG-CDS-2 had lower (P = 0.001) overall ADFI than DDGS fed pigs. Overall G:F of DDGS- fed pigs was less (P = 0.001) than pigs fed the other 3 dietary treatments. Final BW of WDG-CDS-1 fed pigs was greater (P = 0.02) than that of pigs fed DDGS. Dietary treatments did not influence (P > 0.05) BUN concentration. Thus, WDG and the combinations of WDG and CDS have
a beneficial effect on growth performance compared with DDGS.
Key Words: growth performance, liquid feeding, pigs
172 Feeding dried distillers grains with solubles (DDGS) to immunologically castrated pigs. E. K. Harris1,*, C. Calhoun2, M. A. Mellencamp2, R. Cox1, L. J. Johnston3, G. C. Shurson1, 1University of Minnesota, St. Paul, 2Zoetis, Inc., Florham Park, NJ, 3West Central Research and Outreach Center, University of Minnesota, Morris.
Improvest (gonadotropin releasing factor analog-diphtheria toxoid conjugate; Zoetis Inc., Florham Park, NJ) is a tempo-rary method of immunological castration (IC) in pigs, which captures advantages of lean gain efficiency of boars while eliminating boar taint in carcasses. Feeding diets high in DDGS to barrows and gilts generally reduces pork fat quality with minimal effects on growth performance. Studies evalu-ating feeding DDGS to IC pigs are limited. At 8 wk of age (WOA), entire male pigs (n = 863; initial BW = 21.5 kg) were weighed and randomly assigned to dietary treatments and har-vested at 9 (TD9), 7 (TD7), or 5 (TD5) weeks after the sec-ond dose of Improvest in a 4 × 3 factorial arrangement (n = 8 pens per treatment). A 4-phase feeding program (phase 1 = 3 wk, phases 2 and 3 = 4 wk each, phase 4 = 5 wk) was used for each dietary treatment: positive control (PCon; 0% DDGS in all phases), DDGS step down (SD; 40%, 30%, 20%, and 10% DDGS in each phase, respectively), DDGS withdrawal (WD; 40% DDGS in phases 1 to 3 and 0% DDGS in phase 4), negative control (NCon; 40% DDGS in all phases). The first Improvest dose was administered at 11 WOA, while the sec-ond Improvest dose was administered at 15, 17, or 19 WOA. All pigs were harvested at 24 WOA. A subsample of pigs (n = 2/pen) were selected for harvest and lean and fat quality assessment. Overall G:F was improved (P £ 0.05) in TD5 pigs compared with TD9 pigs (0.428 vs. 0.413 ± 0.005). Pigs fed PCon and SD had improved (P £ 0.05) G:F compared with WD and NCon (0.427 and 0.424 vs. 0.414 and 0.413 ± 0.005). Back fat thickness at the 10th rib was greater (P £ 0.05) in TD9 and TD7 pigs compared with TD5 pigs (1.83 and 1.82 vs. 1.67 ± 0.05 cm, respectively). Harvest time after the second Improvest dose did not affect lean quality of the longissimus muscle. However, subjective firmness scores of loins from pigs fed PCon were greater (P £ 0.05) compared with loins from pigs fed WD and NCon (2.60 vs. 2.28 and 2.24 ± 0.12, respectively). Improvement in G:F occurred in-dependently of diet and harvest time after the second dose of Improvest, and diet and harvest time after the second dose of Improvest had minimal effects on lean quality.
Key Words: dried distillers grains with solubles, growth, Improvest

77
173 Identifying dietary fiber components that best predict nutrient digestibility and energy content in 9 corn co-products fed to growing pigs. N. A. Gutierrez1,*, N. V. L.-Serão1, B. J. Kerr2, R. T. Zijlstra3, J. F. Patience1, 1Iowa State University, Ames, 2USDA-ARS, Ames, IA, 3University of Alberta, Edmonton, Canada.
An experiment was conducted to determine the best-fitting di-etary fiber (DF) assay to estimate the effect of DF concentration and to predict the digestibility of energy, DF, and AA of 9 corn co-products: conventional corn bran, corn bran with solubles, corn distillers dried grains with solubles (DDGS) convention-ally produced, reduced oil DDGS, uncooked DDGS, high-pro-tein distillers dried grains, dehulled, degermed corn, corn germ meal, and corn gluten meal. A total of 20 growing pigs (initial BW: 25.9 ± 2.5 kg) were fitted with a T-cannula in the distal ileum and allotted to 10 dietary treatment groups in a 4-peri-od incomplete block design with 8 observations per treatment. Treatments included a corn soybean meal-based basal diet and 9 diets obtained by mixing 70% of the basal diet with 30% of the test ingredient. The 9 ingredients were analyzed for the con-centration of NDF, TDF, total nonstarch polysaccharides (NSP), and 5 constituent monosaccharides of NSP, namely, arabinose (Ara), xylose (Xyl), mannose (Man), glucose (Glc), and galac-tose (Gal). The apparent ileal (AID) and total tract digestibility (ATTD) of GE, DM, and NDF and the AID of AA of ingredients were measured. A single best-fitting DF assay was assessed and ranked for each trait, showing that total NSP concentration best explained the variance of AID of GE (R2 = 0.65; cubic, P = 0.02) and DM (R2 = 0.67; cubic, P = 0.04). The xylose concentration in NSP best explained the variance in ATTD of GE (R2 = 0.80; cubic, P < 0.01), DM (R2 = 0.78; cubic, P < 0.01), and NDF (R2 = 0.63; cubic, P < 0.01); AID of Met (R2 = 0.40; cubic, P = 0.02), Met+Cys (R2 = 0.44; cubic, P = 0.04), and Trp (R2 = 0.11; cubic, P = 0.04); and DE (R2 = 0.66; linear, P = 0.02) and ME (R2 = 0.71; cubic, P = 0.01) values. The AID of Lys was not predictable (P > 0.05) from the DF concentration. In conclusion, the total NSP or xylose in NSP were the DF assays that best ex-plained variation due to DF concentration and, with the excep-tion of AID of Lys, can be used to explain digestibility traits and energy values in corn co-products.
Key Words: corn co-products, dietary fiber, digestibility, energy, pig
174 Digestible energy, ME, and DM and CP digestibility values of dried distillers grains with solubles (DDGS) estimated from corn-soybean meal or barley-canola meal basal diets and using different collection methods. Y. S. Li1,*, G. A. Mastromano1, H. Tran1, J. W. Bundy1, T. E. Burkey1, B. J. Kerr2, M. K. Nielsen1, P. S. Miller1, 1University of Nebraska, Lincoln, 2USDA-ARS, Ames, IA.
To determine the effects of collection method and basal diet on
estimating digestibility of DDGS, 24 barrows in 2 replicates (BW = 90.3 and 90.9 kg, respectively) were individually fed 1 of 4 diets: corn-soybean meal (CSBM, basal-1), barley-canola meal (BCM, basal-2), and 20% of basal-1 or basal-2 replaced by DDGS (10% EE; total-1 and total-2). Time-based (Day) and marker-to-marker (MM) collection methods were employed for each pig using separated fecal collections. Diets contained 0.5% titanium dioxide (TiO2) to estimate digestibility using the index method (IN). Data were analyzed as a 4 × 3 or 2 × 3 factorial in a split-plot design for comparisons of diet or DDGS digestibility, respectively. There were interactions (P < 0.05) for estimating dietary digestibility between diet and method for all variables. The apparent total tract digestibility (ATTD) of DM and CP, DE, and ME were not affected (P > 0.10) by method in CSBM-based diets. However, for the basal-2 diet, all estimates were greater (P < 0.05) when calculated using Day vs. MM or IN. Using the MM method, the ATTD of DM and CP were greater (P < 0.05) than IN, and DE and ME tended to be greater (P < 0.10) using MM vs. IN. For the total-2 diet, all estimates calculated using Day and MM were not different (P > 0.10) and were greater (P < 0.05) than those using IN. Digestibility estimates of DDGS were not affected (P > 0.10) by basal diet. The ATTD of DM, DE (%), and ME (kcal/kg) of DDGS using MM were greater (P < 0.05) than IN, and ATTD of CP tended to be greater (P < 0.10) using MM vs. IN, whereas estimates using the Day method were not different (P > 0.10) from MM or IN. Digestible energy (kcal/kg) of DDGS was greater (P < 0.05) using Day or MM vs. IN. The mean DE and ME (DM basis) of DDGS were 4374 and 4037 and 4215 and 3884 kcal/kg estimated using basal-1 and basal-2 diets, respectively. In conclusion, digestibility estimates of BCM-based diets and DDGS were lower using IN vs. total collection (Day and MM) methods. Except for basal BCM diet, digestibility estimates for DDGS and complete diets were not different using Day and MM methods. Basal diet does not ap-pear to affect digestibility estimates of DDGS.
Key Words: collection method, digestibility, pig
175 Evaluation of different corn oil sources on nursery pig growth performance. K. E. Jordan*, M. A. Goncalves, M. D. Tokach, R. D. Goodband, S. S. Dritz, J. M. DeRouchey, J. C. Woodworth, Kansas State University, Manhattan.
A total of 350 pigs (PIC 1050; initially 12 ± 0.04 kg and 45 d of age) were used in a 21-d study to compare the effects of soybean oil and 2 sources of corn oil on nursery pig growth performance with 5 pigs per pen and 10 replications per treat-ment. The 7 dietary treatments consisted of a corn-soybean meal-based control diet with no added oil or with 2.5 or 5% soybean oil (NE = 7545 kcal/kg) or corn oil from 2 sources (NE = 7459 kcal/kg for both sources). Corn oil sources were derived from postfermentation extraction from ethanol pro-duction. Diets were formulated to have similar standardized ileal digestible Lys:NE ratios (5.09 g/Mcal). Free fatty acid
78
levels were 0.16%, 4.1%, and 11.8% and initial peroxide val-ues were 47.6, 1.0, and 5.6 meq/kg for the soybean oil and corn oils 1 and 2, respectively. Increasing corn or soybean oil increased (linear; P < 0.02) ADG, G:F, and final (d 21) BW. However, a source × level interaction was observed (P < 0.05) for ADG, G:F, and caloric efficiency (CE; caloric in-take/total BW gain). For ADG, increasing soybean oil or corn oil source 1 from 2.5 to 5% increased ADG, while increasing corn oil source 2 from 2.5 to 5% decreased ADG. Gain:feed increased at a greater rate for pigs fed corn oil source 1 com-pared to the other oil sources. For CE, pigs fed soybean oil or corn oil source 2 had poorer CE as level increased from 2.5 to 5%, whereas pigs fed source 1 had improved CE as level increased. In conclusion, soybean or corn oil increased ADG and G:F when compared to the control as expected; however, growth performance varied among the 3 oil sources.
Key Words: corn oil, growth performance, nursery pig
176 Digestibility of energy and nitrogen retention of diets with increasing proportions of co-product ingredients and formulated using the NE system. J. A. Acosta Camargo1,*, R. D. Boyd2, J. F. Patience1, 1Iowa State University, Ames, 2The Hanor Company, Inc., Franklin, KY.
Rising feed costs demand that our industry pursue strategies to lower the cost of production. One option is the adoption of the net energy system (NE), although many producers are hes-itant to proceed without more definitive data. The objective of this experiment was to compare the ATTD of energy and the nitrogen retention (NR) of diets formulated using the NE sys-tem with increasing quantities of co-product ingredients. The 5 dietary treatments included a control corn-soy based control diet (CTL), a diet similar to the CTL but containing 6% each of corn DDGS, corn germ meal, and wheat middlings with NE constant relative to CTL (18NE-CON) or allowed to decline (18NE-DEC), or similar diets but with 12% each of the same co-products and NE held constant (36NE-CON) or allowed to decline (36NE-DEC). Constant NE in the CON treatments was achieved by adding fat. Diets were formulated for both growing (40 to 70 kg; GP) and finishing (70 to 110 kg; FP) periods. Forty gilts (PIC 337 sires × C22 or C29; initial BW = 38.5 ± 0.4 kg) were randomly assigned to treatment, receiving fed and water ad libitum throughout the experiment (69 d). For the last 13 d of the GP and FP, pigs were transferred to metabolism crates, where two total urine and fecal collections
(d 4 to 6; d 11 to 13) were performed. Data were analyzed using the MIXED procedure of SAS. In GP, ATTD of GE decreased in all co-product diets compared to the CTL (85.3 vs. 79.9% for average of 18NE and 36NE; P < 0.01). There were no differences between NE-CON and NE-DEC (80.5 vs. 79.3%; P > 0.05). In FP, ATTD of GE also decreased in co-product diets compared to the CTL (87.1 vs. 82.6% for aver-age of 18NE and 36NE; P < 0.01). Unlike GP, the 18NE diets had a higher ATTD of GE compared to 36NE diets (P < 0.05). There were no differences between NE-CON and NE-DEC (82.7 vs. 82.5%; P > 0.05). NR declined on all co-product di-ets in the GP (40.6 vs. 35.5% for average of 18NE and 36NE; P = 0.01) and tended to decline in the FP (35.0 vs. 30.2% for average of 18NE and 36NE; P = 0.08). There were no differ-ences between CON and DEC diets at 18NE or 36NE (P > 0.05). In conclusion, diets containing up to 36% co-products and formulated using NE resulted in poorer NR than a simple corn-soybean meal control diet.
Key Words: corn germ meal, DDGS, net energy, nitrogen retention, pigs, w heat middlings
177 Effects of condensed distillers solubles to wet distillers grains ratio on the growth performance and carcass characteristics of growing-finishing pigs. S. Baidoo, X. Yang*, J. Jendza, D. Hansen, Southern Research and Outreach Center, University of Minnesota, Waseca.
The objective of this study was to determine the effect of condensed distiller’s solubles (CDS) to wet distillers grains (WDG) ratio on growth performance and carcass characteris-tics of growing-finishing pigs fed by a liquid feeding system. A total of 280 pigs were blocked by initial BW (30.1 ± 5.1 kg) and gender, and pens of pigs (10 pigs/pen) were allocated randomly to 1 of 4 dietary treatments (7 pens/treatment): 1) 30% DDGS, 2) 30% WDG, 3) 25% WDG plus 5% CDS, or 4) 20% WDG plus 10% CDS. The Big Dutchman auto-mated liquid feeding system recorded daily pen feed intake, which was automatically adjusted, based on a reference feed intake curve during the 90-d and three-phase trial. Pen was the experimental unit. Data were analyzed by the MIXED procedure of SAS, with treatment as a fixed effect and block as a random effect. Significant level was set at the level of 0.05.The overall ADG was 0.911, 0.923, 0.968, and 0.971 kg/d, ADFI on a dry matter basis was 2.34, 2.18, 2.38, and 2.31 kg/d, and gain to feed ratio was 0.392, 0.425, 0.408, and
Table 175.
ItemControl Soybean oil Corn oil source 1 Corn oil source 2
SEM0% 2.5% 5% 2.5% 5% 2.5% 5%ADG, g 633 682 693 662 673 661 655 12.8ADFI, g 1011 1026 1008 978 943 981 946 20.5G:F 0.627 0.666 0.689 0.677 0.714 0.675 0.693 0.01CE1 3837 3776 3806 3708 3666 3723 3778 63.91Caloric efficiency, Mcal NE/kg of gain.
79
0.424, for treatments 1 to 4, respectively. Pigs fed 25% WDG plus 5% CDS had greater (P < 0.05) ADG than those fed 30% DDGS between 60 and 90 kg, but ADG was not affected (P > 0.05) by dietary treatment during the other feeding phases or across the entire trial. No difference (P > 0.05) in ADFI on a dry matter basis was observed across the treatments in all phases. Pigs fed 30% WDG had greater (P < 0.05) G:F than those fed 30% DDGS between 30 and 60 kg, but G:F was similar (P > 0.05) across treatments during the other periods. Dressing percent, back fat depth, and lean percentage were not (P > 0.05) affected by dietary treatment. However, LM depth was increased (P < 0.05) by the inclusion of CDS when compared with diets excluding CDS. The results indicate that the ratio of WDG to CDS may affect growth performance under our experimental conditions.
Key Words: corn ethanol co-products ratio, liquid feeding, pig
178 Effects of potato chip co-product on starter pig growth. D. Chamberlin*, N. Martinec, A. Rogers, E. L. Karcher, D. W. Rozeboom, S. N. Woodruff, C. Ylioja, C. V. Vanderson, E. First, K. M. Trottier, A. L. Meyers, B. C. Oglesby, J. M. Lubbers, A. J. Anderson, N. L. Trottier, Michigan State University, East Lansing.
With rising feed costs, inclusion of by-products and co-prod-ucts has become increasingly used in commercial swine diets. The hypothesis of this study was that potato chip co-products (PC) partially replace corn, fat, and salt in nursery swine diets with no detrimental impact on growth performance param-eters. The objective was to measure growth performance of nursery pigs fed diets containing PC. Thirty-six weaned pigs (21 d of age) were blocked by litter of origin (12 sows with 3 male pigs per sow) and allocated to one of three dietary treat-ments: control (corn-soy based), replacement of 20% of corn with PC (PC20), and replacement of 40% of corn with PC (PC40; 9 pigs per diet). Treatments were imposed in three nursery dietary phases over a 5-wk period (phase 1 = wk 1, phase 2 = wk 2–3, phase 3 = wk 3–5). Within each phase, diets were formulated to be isonitrogenous and isocaloric and to contain the same levels of fat and standardized ileal digestible lysine, methionine, and threonine. All diets were formulated to contain 0.3% supplemental salt (either as NaCl or from PC) and 0.1% titanium oxide as an indigestible marker. Piglets were housed in individual pens and fed twice daily to provide
ad libitum access to feed. Feed intake was monitored daily, weight change was assessed weekly, and fecal grab sampling was performed once daily during the second week of phase 3 to estimate whole tract nitrogen digestibility. Data were analyzed using a mixed model with diet, week, and litter of origin (i.e., dam) as fixed effects and pig as random. Data are reported as least squares means and the standard error of mean (SEM). Across phases, daily weight gain, daily feed intake, and feed efficiency of pigs fed PC20 and PC40 compared to control did not differ. Nitrogen digestibility during phase 3 (week 5) did not differ. In conclusion, weaned pigs fed di-ets containing PC at 20 and 40% of the corn inclusion rate maintained growth performance. Results imply that PC may be used in part as an economical dietary replacement for corn, supplemental fat, and salt in the nursery phase.
Key Words: nursery digestibility co-products
179 Effect of feeding increasing inclusion of extruded-pressed Brassica juncea canola meal on growth performance and diet nutrient digestibility in weaned pigs. A. M. H. Le1,*, J. L. Landero1, E. Beltranena1,2, R. T. Zijlstra1, 1University of Alberta, Edmonton, Canada, 2Alberta Agriculture and Rural Development, Edmonton, Canada.
The feed value of extruded-pressed (EP) Brassica (B.) juncea canola meal (CM) was evaluated with 240 weaned pigs (ini-tial BW 7.6 kg), starting 1 wk after weaning at 19 d of age in a randomized-complete block design. The EP B. juncea CM contained 34.4% CP (as fed), 1.72% Lys, 16.9% ether extract, 12.7% ADF, 19.5% NDF, and 10.9 µmol/g total glucosino-lates. Pigs were fed 5 pelleted wheat-based diets including 0, 6, 12, 18, and 24% EP B. juncea CM in substitution of SBM and acid-insoluble ash as a marker. Pigs were fed Phase 1 test diets for 2 wk (d 0–14; 2.39 Mcal NE/kg, 4.9 g standardized ileal digestible (SID) Lys/Mcal NE) and Phase 2 for 3 wk (d 15–35; 2.31 Mcal NE/kg, 4.4 g SID Lys/Mcal NE). Diets were balanced for SID AA by increasing crystalline AA and for NE by decreasing canola oil. Feces were collected by grab sam-pling, and digestibility was analyzed using the indicator meth-od. Data were analyzed as repeated measures using MIXED procedure and orthogonal contracts. Increasing inclusion of EP B. juncea CM linearly reduced (P < 0.001) apparent total tract digestibility of diet DM, GE, and CP and diet DE values for Phases 1 and 2. For d 0–35, increasing inclusion of EP B. juncea CM did not affect G:F but quadratically increased (P < 0.01) ADFI and ADG, which corresponded to a quadratic in-crease (P < 0.01) in intake of NE and g SID Lys. On d 35, pigs fed 6, 12, 18, and 24% EP B. juncea CM were 1.1, 1.5, 1.5, and 1.1 kg heavier (P < 0.05), respectively, than pigs fed 0% EP B. juncea CM. Feed energy values may explain the achieved performance. For diet formulation, we used 5.37 Mcal NE/kg for canola oil (NRC, 1998), but this value was increased after-ward to 7.55 Mcal/kg (NRC, 2012). Using the revised oil NE
Table 178.
ItemsDiet
SEM P-valueControl PC20 PC40ADG (g) 502.5 489.9 476.3 22.0 0.69ADFI (g) 681.3 640.0 666.2 27.2 0.55Efficiency (gain/feed) 0.692 0.747 0.714 0.033 0.49N itrogen
Digestibility (%)86.7 84.0 85.3 1.3 0.37

80
values, predicted diet NE values (as fed) decreased from 2.52 to 2.46 in Phase 1 and from 2.37 to 2.32 Mcal NE/kg in Phase 2 diets for pigs fed 0 to 24% EP B. juncea CM. In conclusion, increased ADFI did increase NE and g SID Lys intake, which consequently increased ADG. A linear increase of growth per-formance up to 24% EP B. juncea CM may have been halted at the highest inclusion level of EP B. juncea CM by increased dietary glucosinolates that reduced ADFI.
Key Words: extruded-pressed Brassica juncea canola meal, performance, weaned pig
180 Swine energy value of corn germ meal and hominy feed increased in the presence of liquid ingredient corn steep liquor. V. G. Perez*, T. R. Radke, D. P. Holzgraefe, ADM Alliance Nutrition Inc., Quincy, IL.
A metabolism study with 24 barrows (74.6 ± 0.8 kg BW) was performed to determine whether DE and ME in fibrous ingredi-ents corn germ meal (CGM) and hominy feed (HF) increase in the presence of liquid ingredient corn steep liquor (49.8% mois-ture; CSL). The experiment had a randomized complete block design with 6 dietary treatments: 1) basal diet with 97.3% corn + vitamins and minerals, 2) as 1 + 20% CSL replacing corn, 3) as 1 + 40% CGM replacing corn, 4) as 2 + 40% CGM replacing corn, 5) as 1 + 40% HF replacing corn, and 6) as 2 + 40% HF replacing corn. Each treatment had 8 block replicates; blocks were 4 BW categories × 2 consecutive collection periods. Pigs were housed in metabolic cages and allowed 14 and 7 d of adap-tation in periods 1 and 2, respectively. Total collection lasted 4 d in each period. Feed offer was set to provide 2.5 times their ME maintenance requirement. Ingredient DE and ME values were calculated by the difference procedure. Data were analyzed us-ing the PROC GLM procedure of SAS. Pairwise comparisons were used for treatment means separation. Calculated ME in corn was 3743 kcal/kg DM, and in CSL it was 3088 kcal/kg DM. The ME values in CGM and HF were enhanced in the presence of CSL (Table 1). Similarly, DE was 13% greater (P = 0.117) in CGM and 11% greater (P = 0.150) in HF in the presence of CSL. Enhanced energy values of CGM and HF in the presence vs. absence of CSL were supported by a greater (P £ 0.096) di-gestibility of GE, DM, N, Ca, and P. In conclusion, swine energy value of fibrous ingredients CGM and HF were enhanced in the presence of liquid ingredient CSL.
Key Words: energy, fiber, pigs
181 Diet nutrient digestibility and growth performance of weaned pigs fed field pea. J. L. Landero1, E. Beltranena1,2, R. T. Zijlstra1,*, 1University of Alberta, Edmonton, Canada, 2Alberta Agriculture and Rural Development, Edmonton, Canada.
Increasing costs of soybean meal (SBM) and cereal grains make pulse seeds attractive alternative feedstuffs. However, formulators place unjustified restrictions on pulse seed inclu-sion in diets, especially for young pigs. To explore, young pigs were fed pelleted wheat-based diets including 0, 10, 20, 30, and 40% yellow field pea (Pisum sativum L.) in substitu-tion of up to 30% SBM and 10% wheat. Starting 1 wk after weaning at 19 d of age, 260 pigs (BW 8.5 kg) were housed in pens of 4. Pigs were fed Phase 1 test diets for 2 wk (d 0–14; 2.45 Mcal NE/kg, 5.0 g standardized ileal digestible (SID) Lys/Mcal NE) and Phase 2 diets for 3 wk (d 15–35; 2.35 Mcal NE/kg, 4.2 g SID Lys/Mcal NE). Diets were bal-anced for NE by reducing canola oil and for SID AA by in-creasing crystalline AA. Data were analyzed as a repeated measures using MIXED procedure and orthogonal contracts; pen was the experimental unit. Increasing inclusion of field pea linearly reduced (P < 0.001) apparent total tract digest-ibility (ATTD) of GE from 87 to 85% and of CP from 83 to 77% in Phase 1 diets and linearly reduced (P < 0.05) ATTD of CP from 84 to 83% in Phase 2 diets. Increasing inclusion of field pea quadratically reduced (P < 0.001) diet NE values from 2.47 to 2.36 Mcal/kg as fed in Phase 1 and linearly re-duced (P < 0.001) diet NE values from 2.39 to 2.34 Mcal/kg as fed in Phase 2 diets. For d 0 to 7, increasing inclusion of field pea linearly reduced (P < 0.01) ADG from 174 to 125 g and G:F from 0.63 to 0.45 but did not affect (P > 0.05) ADFI. Growth performance was not affected for d 8 to 14 and 15 to 21. Increasing inclusion of field pea quadratically increased (P < 0.05) ADG from 680 to 720 g and ADFI from 1116 to 1158 g for d 22 to 28. For d 29 to 35, increasing inclusion of field pea linearly increased (P < 0.05) ADG from 737 to 793 g but did not affect (P > 0.05) ADFI or G:F. Overall (d 0 to 35), increasing dietary inclusion of field pea did not affect (P > 0.05) ADG, ADFI, or G:F. In conclusion, up to 40% field pea can entirely replace SBM in nursery diets formulated to equal NE value and SID AA content without reducing growth performance after a 7-d adaptation.
Key Words: field pea, growth performance, weaned pig
182 Evaluation of in vitro dry matter digestibility (IVDMD) of high-fiber feed ingredients for monogastrics. Z. Huang*, I. J. Salfer, P. E. Urriola, M. D. Stern, G. C. Shurson, University of Minnesota, Saint Paul.
The IVDMD of feed ingredients can be used to rapidly esti-mate the amount of energy and nutrients that will disappear in vivo during digestion in the stomach and small intestine and
Table 180. Calculated swine ME (kcal/kg DM) in CGM and HF in the absence vs. presence of CSL*
IngredientIn absence of
CSLIn presence
of CSL Difference SEM P = CGM 2874 3359 + 485 (17%) 240 0.077HF 3391 3791 + 400 (12%) 240 0.141
*Reported energy values of CGM and HF do not consider any energy contribution from CSL.

81
during large intestinal fermentation in monogastric animals. Digestible DM variability after hydrolysis with pepsin and pancreatin has been published for cereal grains and oilseed meals but not for high-fiber feed ingredients. Therefore, the objective of this experiment was to measure IVDMD of mul-tiple sources of distillers dried grains with solubles (DDGS, n = 16), soybean hulls (SBH, n = 16), and wheat straw (WS, n = 16) using a modified pepsin and pancreatin hydrolysis procedure. Gastric hydrolysis was set for 2 h at pH 2.0 in a pepsin solution (400 mg/mL). Small intestinal hydrolysis was set for 4 h at pH 6.8 in a pancreatin solution (400 mg/mL). After hydrolysis, residues were filtered into nylon bags (pore size 50 μm) and sequentially washed twice with 95% ethanol and 99.5% acetone. The IVDMD was calculated as disappearance of DM from initial sample weight. All samples of each source were analyzed in 6 batches, and the mean, SD, and CV were calculated among replicates within each ingre-dient source. Repeatability of measurements was considered acceptable when CV was < 3% for DDGS and < 4% for SBH and WS. Data were analyzed using the GLM procedure of SAS with sample source as a fixed effect. The IVDMD in DDGS (55.6%) was greater (P < 0.01) than SBH (20.0%) and WS (14.6%), and IVDMD in SBH was also greater (P < 0.01) than WS. There were also differences in IVDMD among sources of each ingredient. The IVDMD varied among DDGS sources (P < 0.01) from 45.6 to 61.9%, among SBH sources (P < 0.01) from 17.2 to 23.2%, and among WS sources (P < 0.01) from 11.6 to 18.2%. In conclusion, the extent and vari-ability of IVDMD among DDGS sources is greater than for SBH and WS, and differences in IVDMD observed among sources of each ingredient were large enough to impact the concentration of digestible energy and nutrients in the small intestine of monogastric animals. Further fermentation of hy-drolyzed residues will allow us to measure the concentration of fermentable nutrients.
Key Words: high-fiber ingredients, in vitro dry matter digestibility, monogastrics
NONRUMINANT NUTRITION: MINERALS AND VITAMINS
183 Effect of zinc amino acid complex and ractopamine on skeletal muscle gene and protein expression. Z. J. Rambo1,2,*, M. Ferreira3,4, B. T. Richert2, J. Waddell2, M. E. Wilson1, J. L. Torrison1, 1Zinpro Corporation, Eden Prairie, MN, 2Purdue University, West Lafayette, IN, 3Department of Veterinary Medicine, Federal University of Larvas, Larvas, Brazil, 4CAPES Foundation, Brasilia, Brazil.
A study was conducted to evaluate the effect of 50 ppm supplemental Zn amino acid complex (Availa Zinc®, AZ)
and ractopamine (RAC) on the growth performance, car-cass composition, blood metabolites, and muscle gene and protein expression in finishing gilts. Twenty-four crossbred gilts were individually housed, blocked by ancestry and BW (108.5 ± 1.7 kg) into 6 blocks, and assigned to 1 of 4 dietary treatments: A) Control (50 ppm Zn from ZnO), B) A + RAC, C) A + 50 ppm AZ, and D) B + 50 ppm AZ. The Control diet was formulated to 1.10% TID Lys. RAC was fed at 5 ppm from d 0 to 7 and 10 ppm from d 7 to 14. Individual BW and feed disappearance were evaluated on d 0, 7, and 14. Lon-gissimus dorsi (LD) and semimembranosis (SMB) muscle samples were collected immediately after exsanguination for analysis of myosin heavy chain (MyHC) gene expression and phosphorylation (p-) state of AKT, S-6, and 4E-BP1 proteins. Expression of MyHC I, IIa, IIx, and IIb were quantified using real-time PCR; p-AKT, p-S6, and p-4E-BP1 were determined using Western blot technique. Growth and carcass data were analyzed using the GLM procedure of SAS, and data for pro-tein and gene expression were analyzed using the mixed pro-cedure. RAC increased (P < 0.01) d 0–14 ADG (25.7%), G:F (20.5%), and LEA (10%) and tended (P < 0.08) to increase primal ham weight. RAC decreased expression of MyHC IIa in the LD (P < 0.01) and SMB (P < 0.03) and increased (P < 0.05) expression of MyHC IIb in the LD. Feeding AZ alone tended to decrease expression of IIx in the LD; however, IIx expression tended to increase (P < 0.07) when AZ was fed with RAC. Both RAC and AZ increased (P < 0.05) p-AKT in the LD. Feeding RAC or AZ, but not RAC + AZ, tended to increase p-4E-BP1 (P < 0.07) in the LD. Feeding RAC + AZ tended (P < 0.06) to increase p-4E-BP1 in the SMB. These data indicate that RAC-induced hypertrophy may be regu-lated partially by AKT in swine. Feeding AZ appears to have influenced the phosphorylation state of proteins regulated by mTOR, though this did not result in a biologically measur-able growth effect in this short-term study.
Key Words: protein synthesis, ractopamine, zinc
184 Effects of added Zn in diets with ractopamine HCl on growth performance, carcass characteristics, Zn concentrations in plasma, loin, and liver, and ileal mucosal inflammation mRNA expression of finishing pigs. C. B. Paulk1,*, M. D. Tokach1, J. L. Nelssen1, J. M. Gonzalez1, J. M. DeRouchey1, R. D. Goodband1, S. S. Dritz1, G. M. Hill2, K. D. Haydon3, 1Kansas State University, Manhattan, 2Michigan State University, East Lansing, 3Elanco Animal Health, Greenfield, IN.
A total of 320 pigs (PIC 327 × 1050; 98 kg BW) were used in a 35-d study to determine the effects of added Zn on growth per-formance, carcass characteristics, plasma and tissue Zn concen-trations, and ileal mucosal mRNA expression of finishing pigs fed ractopamine HCl (RAC; Elanco Animal Health, Greenfield, IN). Pens were randomly allotted to diets with 2 pigs per pen and

82
20 pens per treatment. Treatments included a corn-soybean meal diet (0.66% SID Lys), a diet (0.92% SID Lys) with 10 ppm RAC, or the RAC diet plus 75, 150, and 225 ppm added Zn from ZnO or Availa-Zn (Zinpro, Eden Prairie, MN). All diets contained 55 ppm Zn from ZnSO4. Mucosal swabs were collected (16 pigs/treatment) to determine mRNA expression of inflammatory cy-tokines. Pigs fed the RAC diet had increased (P < 0.05) ADG, G:F, HCW, loin depth, percentage lean, and liver weights com-pared with pigs fed the control diet. No Zn level or source ef-fects or level × source interactions were observed for growth performance. However, pigs fed RAC diets with added Zn from ZnO had numerically heavier (P = 0.09) liver weights than pigs fed added Zn from Availa-Zn. A Zn level × source interaction (quadratic, P = 0.02) was observed in liver Zn concentrations, resulting from liver Zn concentrations plateauing at 150 ppm of added Zn from ZnO, but a linear increase when adding Zn from Availa-Zn. There was no difference in Zn concentrations in the loin. The only difference for plasma Zn was that pigs fed RAC diets with added Zn had increased (linear, P < 0.02) plasma Zn levels on d 18 and 32. The expression of IL-1β was increased (P = 0.01) in mucosa of pigs fed the RAC diet compared to those fed the control diet. Expression of IL-1β decreased (linear; P = 0.03) in the mucosa of pigs fed increasing levels of added Zn. There were no differences in IL-8 or TNF-α relative expression. In conclusion, additional Zn increased plasma Zn and reduced IL-1β but did not improve growth performance of pigs fed diets containing RAC.
Key Words: finishing pigs, ractopamine HCl, zinc
185 The effects of copper source (tribasic copper chloride or copper sulfate) on growth performance, carcass characteristics, and pen cleanliness in finishing pigs. K. F. Coble1,*, S. S. Dritz1, M. D. Tokach1, J. M. DeRouchey1, J. L. Usry2, R. D. Goodband1, 1Kansas State University, Manhattan, 2Micronutrients, Social Circle, GA.
A total of 1143 pigs (initial BW 25.1 kg) were used in a 111-d study to determine the effects of tribasic copper chloride (TBCC, IntelliBond C; Micronutrients, Indianapolis, IN) or copper sul-fate (CuSO4) on growth performance, carcass characteristics, and pen cleanliness. Pens of pigs were allotted to 1 of 6 dietary treatments, balanced on average pen weight in a completely ran-domized design with 25 to 28 pigs per pen and 7 replications per treatment. Treatments included a corn-soybean meal posi-tive control diet, a high by-product diet with 30% dried distill-ers grain with solubles (DDGS) and 15% bakery meal (nega-tive control), or the negative control diet with 75 or 150 ppm added Cu from CuSO4 or TBCC. All diets were formulated at 0.05% below the SID Lys requirement. Pigs fed the negative control diet had decreased (P < 0.01) G:F and tended to have increased (P < 0.08) ADFI compared to those fed the positive control. No Cu source × level interactions were observed. Pigs fed increasing CuSO4 had increased (linear; P < 0.05) ADFI and final BW with a tendency (linear; P < 0.10) for increased ADG and lower G:F. Pigs fed increasing TBCC had increased (linear; P < 0.01) ADG, ADFI, final BW, and HCW. Wash time (s/pen) increased (P < 0.01) by 64% for negative control pens compared to positive control pens; however, wash time was not influenced by Cu. In summary, increasing dietary CuSO4 or TBCC in high by-product diets increased growth and feed intake, resulting in increased final BW for pigs fed both copper sources and HCW for pigs fed TBCC without influencing pen wash time.
Key Words: copper, finishing pig, wash time
Table 185. Effects of CuSO4 and TBCC on growth, carcass characteristics, and wash time
ItemPositive Control
Negative Control
CuSO4 TBCCProbability, P < 1
Pos. vs. Neg.CuSO4 TBCC2
75 150 75 150 linear lineard 111 BW, kg 124.5 124.2 127.6 127.5 128.4 130.0 0.87 0.05 0.01ADG, kg 0.90 0.91 0.94 0.93 0.94 0.95 0.76 0.08 0.01ADFI, kg 2.28 2.34 2.44 2.44 2.46 2.45 0.08 0.02 0.01G:F 0.40 0.39 0.39 0.38 0.38 0.39 0.01 0.10 0.99HCW, kg 92.5 91.8 93.3 93.1 93.6 95.3 0.59 0.29 0.01Wash time, s/pen 268 417 413 383 373 389 0.01 0.27 0.361SEM was 2.04, 0.011, 0.043, 0.004, 1.19, and 21.5 for d 111 BW, ADG, ADFI, G:F, HCW, and wash time, respectively.2Quadratic response (P < 0.05) for ADFI.
Table 184.
Item Control RACZnO, ppm Zn Availa-Zn, ppm Zn
SEM75 150 225 75 150 225ADG, kg 1.04 1.15 1.16 1.17 1.17 1.15 1.14 1.12 0.03G:F 0.311 0.365 0.373 0.371 0.369 0.373 0.365 0.367 0.014HCW, kg 99.0 101.7 102.5 101.7 102.8 101.9 101.7 101.0 1.3
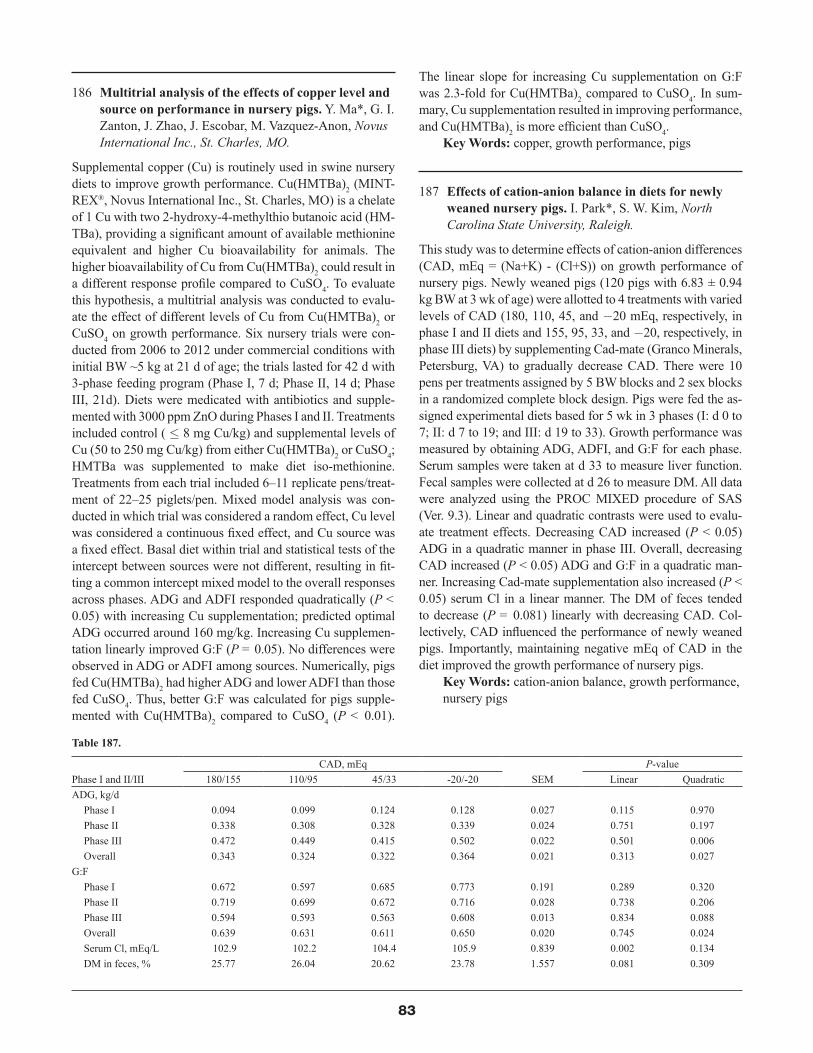
83
186 Multitrial analysis of the effects of copper level and source on performance in nursery pigs. Y. Ma*, G. I. Zanton, J. Zhao, J. Escobar, M. Vazquez-Anon, Novus International Inc., St. Charles, MO.
Supplemental copper (Cu) is routinely used in swine nursery diets to improve growth performance. Cu(HMTBa)2 (MINT-REX®, Novus International Inc., St. Charles, MO) is a chelate of 1 Cu with two 2-hydroxy-4-methylthio butanoic acid (HM-TBa), providing a significant amount of available methionine equivalent and higher Cu bioavailability for animals. The higher bioavailability of Cu from Cu(HMTBa)2 could result in a different response profile compared to CuSO4. To evaluate this hypothesis, a multitrial analysis was conducted to evalu-ate the effect of different levels of Cu from Cu(HMTBa)2 or CuSO4 on growth performance. Six nursery trials were con-ducted from 2006 to 2012 under commercial conditions with initial BW ~5 kg at 21 d of age; the trials lasted for 42 d with 3-phase feeding program (Phase I, 7 d; Phase II, 14 d; Phase III, 21d). Diets were medicated with antibiotics and supple-mented with 3000 ppm ZnO during Phases I and II. Treatments included control ( £ 8 mg Cu/kg) and supplemental levels of Cu (50 to 250 mg Cu/kg) from either Cu(HMTBa)2 or CuSO4; HMTBa was supplemented to make diet iso-methionine. Treatments from each trial included 6–11 replicate pens/treat-ment of 22–25 piglets/pen. Mixed model analysis was con-ducted in which trial was considered a random effect, Cu level was considered a continuous fixed effect, and Cu source was a fixed effect. Basal diet within trial and statistical tests of the intercept between sources were not different, resulting in fit-ting a common intercept mixed model to the overall responses across phases. ADG and ADFI responded quadratically (P < 0.05) with increasing Cu supplementation; predicted optimal ADG occurred around 160 mg/kg. Increasing Cu supplemen-tation linearly improved G:F (P = 0.05). No differences were observed in ADG or ADFI among sources. Numerically, pigs fed Cu(HMTBa)2 had higher ADG and lower ADFI than those fed CuSO4. Thus, better G:F was calculated for pigs supple-mented with Cu(HMTBa)2 compared to CuSO4 (P < 0.01).
The linear slope for increasing Cu supplementation on G:F was 2.3-fold for Cu(HMTBa)2 compared to CuSO4. In sum-mary, Cu supplementation resulted in improving performance, and Cu(HMTBa)2 is more efficient than CuSO4.
Key Words: copper, growth performance, pigs
187 Effects of cation-anion balance in diets for newly weaned nursery pigs. I. Park*, S. W. Kim, North Carolina State University, Raleigh.
This study was to determine effects of cation-anion differences (CAD, mEq = (Na+K) - (Cl+S)) on growth performance of nursery pigs. Newly weaned pigs (120 pigs with 6.83 ± 0.94 kg BW at 3 wk of age) were allotted to 4 treatments with varied levels of CAD (180, 110, 45, and -20 mEq, respectively, in phase I and II diets and 155, 95, 33, and -20, respectively, in phase III diets) by supplementing Cad-mate (Granco Minerals, Petersburg, VA) to gradually decrease CAD. There were 10 pens per treatments assigned by 5 BW blocks and 2 sex blocks in a randomized complete block design. Pigs were fed the as-signed experimental diets based for 5 wk in 3 phases (I: d 0 to 7; II: d 7 to 19; and III: d 19 to 33). Growth performance was measured by obtaining ADG, ADFI, and G:F for each phase. Serum samples were taken at d 33 to measure liver function. Fecal samples were collected at d 26 to measure DM. All data were analyzed using the PROC MIXED procedure of SAS (Ver. 9.3). Linear and quadratic contrasts were used to evalu-ate treatment effects. Decreasing CAD increased (P < 0.05) ADG in a quadratic manner in phase III. Overall, decreasing CAD increased (P < 0.05) ADG and G:F in a quadratic man-ner. Increasing Cad-mate supplementation also increased (P < 0.05) serum Cl in a linear manner. The DM of feces tended to decrease (P = 0.081) linearly with decreasing CAD. Col-lectively, CAD influenced the performance of newly weaned pigs. Importantly, maintaining negative mEq of CAD in the diet improved the growth performance of nursery pigs.
Key Words: cation-anion balance, growth performance, nursery pigs
Table 187.
Phase I and II/IIICAD, mEq
SEMP-value
180/155 110/95 45/33 -20/-20 Linear QuadraticADG, kg/d
Phase I 0.094 0.099 0.124 0.128 0.027 0.115 0.970Phase II 0.338 0.308 0.328 0.339 0.024 0.751 0.197Phase III 0.472 0.449 0.415 0.502 0.022 0.501 0.006Overall 0.343 0.324 0.322 0.364 0.021 0.313 0.027
G:F Phase I 0.672 0.597 0.685 0.773 0.191 0.289 0.320Phase II 0.719 0.699 0.672 0.716 0.028 0.738 0.206Phase III 0.594 0.593 0.563 0.608 0.013 0.834 0.088Overall 0.639 0.631 0.611 0.650 0.020 0.745 0.024Serum Cl, mEq/L 102.9 102.2 104.4 105.9 0.839 0.002 0.134DM in feces, % 25.77 26.04 20.62 23.78 1.557 0.081 0.309

84
188 Effect of reduced dietary level of available phosphorus on performance and bone parameters in growing pigs. B. B. Pokharel1,*, C. M. Nyachoti1, W. K. Kim2, 1Department of Animal Science, University of Manitoba, Winnipeg, Canada, 2Department of Poultry Science, University of Georgia, Athens, GA.
A 3-wk experiment was conducted with growing pigs to in-vestigate the effects of different dietary concentrations of available phosphorus (aP) on performance and bone param-eters. Fifty-four growing pigs (19.5 ± 1.11 kg BW) housed in groups of three per pen were randomly allotted to three exper-imental diets formulated to contain 0.23% (control), 0.17%, and 0.11% aP. Feed and water were provided on an ad libitum basis throughout the experiment. Body weight and feed in-take were measured on d 0, 7, 14, and 21. At the end of each week, one pig per pen was sacrificed to obtain the third (MC3) and fourth (MC4) metacarpals for determining bone mineral density (BMD) and bone mineral content (BMC) using the dual energy X-ray absorptiometry. The data were subjected to GLM procedure of Statistical Analysis System (SAS), and significant difference was accepted if P < 0.05. There was no effect of diet on performance in wk 1; however, reducing aP in diet reduced (P < 0.05) ADG in wk 2 and 3. Pigs fed the diet with the aP content of 0.11% had the lowest (P < 0.05) BMD of MC3 compared with those fed the control or the intermedi-ate aP content (0.17%) in wk 1 and 2 but not in wk 3. BMC in the MC3 was significantly lower (P < 0.05) in pigs fed diets with reduced aP (0.17% and 0.11%) in wk 1 and 3, but in wk 2 only lowest aP diet (0.11%) resulted in reduced BMC com-pared to control. In the MC4, BMD and BMC were not differ-ent among diets in wk 1. However, BMD was reduced in pigs fed lower aP diets (0.17% and 0.11%) in wk 2 (P < 0.05) and wk 3 (P < 0.001) compared with control. Similarly, BMC was reduced (P < 0.05) in lower aP diets in wk 2 and 3 compared to control. In conclusion, growing pigs are highly sensitive to dietary aP level as they displayed reduced ADG and bone pa-rameters for low aP diets, and these aP effects were profound when age increased.
Key Words: bone mineral content, bone mineral density, phosphorus, pig
189 The effects of dietary supplementation with a stabilized form of vitamin C (Rovimix® Stay-C® 35) on the growth performance and concentrations of plasma ascorbate and serum vitamin D3 metabolites of nursery pigs. J. R. Bergstrom1,*, M. S. Edmonds2, 1DSM Nutritional Products, North America, Marshall, MO, 2Kent Nutrition Group Inc., Muscatine, IA.
A total of 488 pigs (6.1 kg and 21-d of age) were used in a 34-d experiment to evaluate the effects of supplementation with stabilized vitamin C (Rovimix® Stay-C® 35) on perfor-
mance and concentrations of plasma ascorbate and serum vitamin D3 metabolites of nursery pigs. After weaning (d 0), pigs were sorted by BW into 56 nursery pens of 8 or 9 pigs each. Additionally, 8 pairs of littermate gilts were identified before weaning for collection of blood samples on d 0, 11, and 34 postweaning. The littermates were separated at weaning, and each was randomly assigned to 1 of 2 nursery pens within 8 BW blocks. Pens within each block were randomly allotted to 1 of 2 dietary treatments, and there were 28 pens per treat-ment. Pen served as the experimental unit for evaluation of growth and economic criteria in a RCBD, but individual pigs served as the experimental unit for comparison of blood mea-surements. Dietary treatments consisted of 1) Control (NC), a 3-phase starter program (d 0 to 10, d 10 to 20, and d 20 to 34), and 2) Vitamin C supplemented (VC), same as treatment 1, but with 300 ppm added vitamin C from d 0 to 10 and 150 ppm added vitamin C from d 10 to 34. Response criteria were ADG, ADFI, G:F, and concentrations of plasma ascorbate and serum 25(OH)D3; 1,25(OH)2D3; and 24,25(OH)2D3 on d 11 and d 34 postweaning. Value of BW gain was determined us-ing $1.32/kg, and performance, diet costs, and value of gain were used to determine feed cost per kg of gain ($/kg gain) and income-over-feed cost (IOFC). Overall ADG, G:F, and IOFC were improved (9%, 4%, and $0.73/pig, respectively; P < 0.05), and there were tendencies (P < 0.10) for greater ADFI (5%) and reduced $/kg gain ($0.02) for pigs fed VC. On d 11, plasma ascorbate (1.16 vs. 0.76 mg/dL), serum 25(OH)D3 (10.02 vs. 7.24 ng/mL), and serum 1,25(OH)2D3 (41.36 vs. 36.27 pg/mL) were numerically greater and serum 24,25(OH)2D3 tended (P < 0.10) to be greater (1.97 vs. 1.35 ng/mL) for pigs fed VC. On d 34, only serum 1,25(OH)2D3 (48.83 vs. 43.91 pg/mL) and 24,25(OH)2D3 (2.06 vs. 1.74 ng/mL) were numerically greater for pigs fed VC. In conclu-sion, supplementation with stabilized vitamin C improved the growth, nutritional status, and economic performance of nurs-ery pigs in this experiment.
Key Words: pigs, postweaning performance, vitamin C
190 Effect of phosphorus and calcium depletion and repletion sequences on growth performance, bone mineralization, and endogenous phosphorus losses in pigs. E. Gonzalo1,*, M. P. Létourneau Montminy2, A. Narcy3, J. F. Bernier2, C. Pomar1, 1Agriculture and Agri-Food Canada, Sherbrooke, Canada, 2Université Laval, Québec, Canada, 3INRA, Tours, France.
The impact of dietary calcium (Ca) and phosphorus (P) defi-ciency (depletion) and following recovery (repletion) was fur-ther studied in 60 castrated pigs from 14 ± 1.6 to 132 ± 10.3 kg BW during four 28-d feeding phases. Pigs received a reple-tion control diet (C) fulfilling the estimated nutrient require-ments or a depletion diet (L) providing 60% of the required digestible P and total Ca in six dietary sequences randomly

85
assigned: CCCC, CCCL, CCLC, CLCC, LCLC, and LLLL. Growth performance was measured, and bone mineral content of total body (BMCb) and lumbar vertebrae (L2-L4, BMCv) were estimated by dual X-ray absorptiometry (DXA) in each phase. Additionally, two P-free balance trials were performed on 8 animals during the first (C vs. L) and 8 others during the second (CC vs. LC) phases to estimate basal endogenous P losses (EPL). Depletion diets reduced average daily gain during the first (L vs. C, -7%; P = 0.05) and second (CL vs. CC, -7%; linear effect: P = 0.01) feeding phases. Repletion did not entail pigs performing as control ones during the sec-ond (LC vs. CC, -5%; P = 0.08) and fourth phases (CCCC vs. CCLC vs. CLCC vs. LCLC; Linear effect: P = 0.05). The decreased BMCb and BMCv observed in depleted pigs were proportional to the number of depletion phases (linear effect: P < 0.001). During the following repletion phases, these pigs retained dietary P more efficiently. Depletion and repletion ef-fects were both more marked in vertebrae than in total body, indicating that vertebrae is more sensitive to dietary Ca and P supply. Thereby, BMCv in repleted animals (CCCC, CCLC, CLCC, and LCLC) were not different at the end of the ex-periment, whereas a linear effect (P = 0.01) was observed for BMCb. The P-free balance trial showed that EPL were not modified during depletion or repletion periods. Average EPL were of 77.4 ± 3.8 and 132.8 ± 2.2 mg/kg DMI in the first two growing phases, respectively. Depleted pigs used dietary Ca and P more efficiently than control pigs, allowing them during the subsequent repletion phases to fully recover BMCv losses at the end of the third phase but just partially BMCb losses at the end of the experiment.
Key Words: depletion-repletion, phosphorus, pigs
191 Effects of increasing the dietary level of vitamin E, without and with a low inclusion level of aspirin, on systemic responses of weaned pigs challenged with haemolytic E. coli. J. C. Kim1, B. Mullan1, J. Pluske2,*, 1Department of Agriculture and Food, Western Australia, Australia, 2Murdoch University, Murdoch, Western Australia, Australia.
This experiment was conducted to examine the main and in-teraction effects of aspirin as a nonsteroidal anti-inflammatory drug, and vitamin E as an intracellular antioxidant, on systemic responses in weaned pigs challenged with an enterotoxigen-ic strain of E. coli. A total of 192 individually housed male weaner pigs (Landrace × Large White) weighing 6.6 ± 0.04 kg (mean ± SEM) were allocated to a 2 × 3 factorial experiment with the respective factors being without and with 125 ppm aspirin (acetylsalicylic acid; Bayer) and three levels of vita-min E supplementation (50, 100, and 200 IU, dl-a-tocopheryl acetate; DSM). All pigs were challenged with E. coli serotype O149:K91:K88 at 7, 8, and 9 d after weaning (6–9 mL of 1.54 × 10⁸ CFU/mL), and blood samples were collected on 0, 7, 10, 14, and 21 d after weaning. Plasma vitamin E content, hapto-
globin, and plasma urea content were measured on all mea-surement days, while blood cell count was measured from ran-domly selected pigs (n = 8) on 10 d after weaning. Data were analyzed using two-way analysis of variance. Plasma urea, haptoglobin, and vitamin E contents measured at the start of experiment (0 d) were used as covariates for statistical analysis on subsequent measurement days. Increasing the dietary vita-min E content increased (P < 0.001) plasma vitamin E contents on all measured days. Increasing vitamin E supplementation significantly decreased plasma haptoglobin content after E. coli infection (2.51, 2.26, and 1.99 mg/mL, respectively, on d 10, P < 0.01; 2.36, 1.8, and 1.78 mg/L, respectively, on d 14, P < 0.001), while aspirin supplementation had no effect on plasma haptoglobin content. Increasing dietary vitamin E con-tent increased the number of platelets without aspirin supple-mentation (447, 488, and 569 × 109/L) but decreased the num-ber of platelets with aspirin supplementation (549, 598, and 435 × 109/L, respectively; interaction P = 0.058). Vitamin E supplementation increased (P = 0.017) white blood cell num-bers (19.4 × 10⁹/L vs. 17.6 × 10⁹/L). Aspirin supplementation significantly decreased plasma urea content after oral E. coli infection (5.0 vs. 4.3 mmol/L on d 10, P < 0.001; 5.1 vs. 4.7 mmol/L on d 14, P = 0.072), while vitamin E supplementation had no effect on plasma urea content. Results indicate that vi-tamin E supplementation reduced immune responses, whereas aspirin supplementation minimized infection-associated nitro-gen waste in E. coli-challenged weaned pigs.
Key Words: aspirin, vitamin E, weaner pigs
PHYSIOLOGY SYMPOSIUM: A LIFETIME OF METABOLITES
192 Energy dynamics during fetal to neonatal transition and the influence of perinatal energy stores on early neonatal survival. J. R. Miles*, USDA, ARS, USMARC, Clay Center, NE.
In the pig, the neonatal mortality rates are approximately 13.5% in commercial herds, which has a significant impact on the production efficiency of pork. The majority of the piglet mortality occurs within the first 3 d of life and is significantly influenced by birth weight and within-litter birth weight vari-ability. Given that smaller piglets are the most susceptible for mortality, this illustrates a potential developmental abnor-mality for these piglets. Mammalian offspring experience a dramatic metabolic and environmental transition during the perinatal period. During pregnancy, the fetus is completely dependent on maternal energy substrates that are generally classified as high carbohydrate (i.e., glucose and lactate) and low fat. Under normal conditions, the mammalian uterine en-vironment is maintained at a steady temperature and lower oxygen tension. At birth, the offspring immediately undergoes
86
a period of starvation that ranges from minutes to hours before transitioning to exogenous ingestion of colostrum and milk that is higher in protein and fat and lower in carbohydrates. During the period of starvation, newborn offspring must uti-lize body reserves, primarily glycogen and fat, which were accumulated during prenatal development. In addition, the offspring is typically exposed to a sudden decrease in thermal temperature and rapid increase in oxygen tension, which in-fluence the metabolic state of the newborn. This presentation will provide a comparative review of energy dynamics during fetal to neonatal transition in a variety of species (i.e., humans and domestic animals) and how perinatal energy stores influ-ence early neonatal survival. Finally, this presentation will provide evidence that the Meishan piglet can serve as an ef-fective model for survivability of small piglets. USDA is an equal opportunity provider and employer.
Key Words: metabolism, neonatal, survival
193 Nutriphysiogenomics of dairy cattle: A step toward integrative systems physiology. J. J. Loor*, University of Illinois, Urbana.
The advent and application of genome- and metabolome-enabled technologies (e.g., microarrays, next-generation se-quencing) constituted a setback to the widespread use of the reductionist approach in livestock research. Those tools along with bioinformatics analyses of the resulting data are the foun-dation of modern systems physiology. Systems physiology is a field of study widely used in model organisms (e.g., rodents, humans) to enhance understanding of the complex biological interactions occurring within cells and tissues at the gene, pro-tein, and metabolite level. Application of systems physiology concepts is ideal for the study of interactions between nutri-tion and physiological state with tissue and cell metabolism and function during key life stages of mammalian organisms including the transition from pregnancy to lactation (i.e., the peripartal period). In modern dairy cattle in particular, the nature of the physiologic and metabolic adaptations during this period is multifaceted and involves multiple tissues and cell types. Within that framework, the use of a single time point to study NutriPhysioGenomics is reductive and insuf-ficient to capture the dynamism of the underlying biological adaptations; therefore, implementation of time-course experi-ments must be undertaken. We have developed and validated a bioinformatics approach for “omics” data termed Dynamic Impact Approach (DIA) to help interpret longitudinal physi-ological adaptations to lactation occurring in liver, adipose, and mammary tissue. This tool along with gene and metabo-lite network analyses is ideally suited for understanding high-throughput datasets arising from transcriptome, proteome, and metabolome studies. Results demonstrate that the DIA is a suitable tool for physiological systems analysis of com-plex genome- and metabolome-wide datasets. Furthermore, the systems approach allowed simultaneous visualization of
the complex inter-tissue adaptations to physiological state and nutrition. The knowledge generated from this integrative ap-proach provides a more holistic understanding of the complex dynamic physiological adaptations of tissues and in the future may prove useful for fine-tuning nutritional management of dairy cattle. An important goal during this process is to un-cover key molecular players involved in the tissue’s adapta-tions to physiological state or nutrition.
Key Words: bioinformatics, metabolomics, physiology, transcriptomics
194 Metabolic inflammation and immunomodulation in transition dairy cows. K. Yuan*, B. Bradford, Kansas State University, Manhattan.
The transition period in dairy cows is characterized by dra-matic increases in nutrient requirements for lactation and substantial metabolic stress. The disturbed metabolic balance, coupled with suppressed immune function, contributes to markedly elevated incidence of health disorders. Several lines of evidence suggest that increased inflammation is common during the transition period. Unlike the classical inflammation associated with acute infection, the postpartum inflammatory state is low-grade and often of metabolic origin. This metabol-ic inflammation plays a key role in numerous disorders; an im-proved understanding of inflammatory pathways in transition cows may improve our ability to predict and prevent disor-ders. To mimic metabolic inflammation, we administered low concentrations of recombinant bovine tumor necrosis factor-α (rbTNFα), a pro-inflammatory cytokine, to early lactation cows and evaluated whether rbTNFα affects milk production, metabolism, and health. We found that rbTNFα administration increased plasma concentrations of TNFα and haptoglobin, indicating increased systemic inflammation. As a family of molecules produced by fatty acid oxidation, eicosanoids play key roles in inflammatory signaling. We found that although most plasma eicosanoids were not affected by rbTNFα admin-istration, 6 out of 16 measured eicosanoids changed over the first week of lactation, reflecting elevated pro-inflammatory mediators in the days immediately following parturition. Dry matter and water intake, milk yield, and milk fat and protein yields were all decreased by rbTNFα treatments by 15 to 18%. Administration of rbTNFα did not affect energy balance or markers of glucose and lipid metabolism but increased the incidence of ketosis by threefold in the first week of lacta-tion. These data suggest that low-grade inflammation may impair production independent of altering systemic metabo-lism. Conversely, preventing excessive inflammation has the potential to improve productivity and health of dairy cows. To identify nutritional strategies that could enhance metabolism and immunity, we have also evaluated the efficacy of several feed additives, including niacin, chromium propionate, and yeast, in early lactation. Overall, a greater understanding of the role of metabolic inflammation in early lactation and the
87
nutritional strategies that could modulate these signals may improve the production and health of dairy cows.
Key Words: inflammation, metabolism, transition dairy cow
195 Impact of two heat stress models on performance and immune parameters of weaned pigs. B. E. Bass1,*, M. Bandrick2, J. W. Frank1, T. Looft2, H. K. Allen2, T. Casey2, T. B. Stanton2, 1Diamond V, Cedar Rapids, IA, 2USDA National Animal Disease Center, Ames, IA.
A study was conducted to compare the impact of 2 heat stress models on weaned pig performance. A total of 38 pigs were ranked by litter and weight at weaning, randomly assigned to 3 individual rooms (2 pens/room, 6–7 pigs/pen), and provided a common nursery diet for 4 wk. Pigs were then subjected to 1 of 3 thermal treatments: 1) thermoneutral (TN; 25°C), 2) constant heat (CH, 35°C), or 3) variable heat (VH, 40°C 5h, 25°C 19h) for 7 cycles (d 1 to 7). Pigs and feeders were weighed weekly before and daily during heat stress to determine ADG, ADFI, and G:F. Rectal temperature, thermal images to determine skin surface temperature, and respiration rate were recorded daily during heat stress. Fecal samples were collected on d -1, 1, 3, and 7, and blood and intestinal tissue were collected on d 1, 3, and 7 in relation to the start of heat stress. Body weight was similar on d -1 among treatment groups but was decreased 9% in VH by the end of the study (P = 0.04). During the 7 d heat stress ADG was highest in TN (750.0, 508.6, and 491.7 g/d in TN, CH, and VH, respectively; P = 0.04), ADFI was reduced in both CH and VH (P = 0.001), but G:F was similar among treatments. Rectal and skin surface temperatures and respiration rate were elevated in both heat stress groups com-pared to TN, and VH was higher than CH during heat stress (P < 0.0001). Fecal propionic acid was lower overall (P = 0.001), and butyrate was decreased on d 1 in CH and VH compared to TN (6.2, 3.8, and 3.8% in TN, CH, and VH, respectively; P = 0.04). Plasma cortisol was highest in VH, intermediate in CH, and lowest in TN on d 7 of heat stress (P = 0.01). Desquama-tion was observed in the jejunum of VH pigs on d 3 of heat stress. Additionally, jejunal villus height was reduced on d 1 and 3 of heat stress, and villus height:crypt depth ratio was lower in VH and CH on d 3 of heat stress compared to TN (P = 0.05). In conclusion, both CH and VH were acceptable mod-els to negatively impact measures of health and performance; however, the response to VH was more severe and better repre-sents the type of stress found in a production setting.
Key Words: heat stress, pig
196 Impact of disease on metabolism. T. E. Burkey*, P. S. Miller, University of Nebraska, Lincoln.
The physiologic mechanisms for metabolic response to in-fection are not fully understood; however, a “stereotypical”
response to infection or noninfectious inflammatory stress is obvious. Clinically, the most prominent metabolic response during infection is body tissue mobilization. Additional “ste-reotypical” metabolic changes also occur during infection that alter host nutritional status including changes in metabolism of all major nutrients and include both catabolic as well as anabolic responses. The interpretation of the biochemical and physiologic changes that occur in the face of infection/stress are complicated by many factors, including 1) preexisting host genetic, immunologic, microbiological, and nutritional factors; 2) severity and duration of infection/stress; 3) direct and secondary effects of immunologic, neural, cardiovascular, and nutritional manifestations; 4) kinetics of individual host metabolic changes; and 5) circadian rhythms. It is apparent that the relationship between nutrient metabolism and disease is important, and a greater understanding of the physiologic changes that take place before, during, and after a disease/stress event takes place is warranted. Greater understanding of the impact of disease on metabolism will allow us to develop practical mitigation strategies in domestic livestock species. Therefore, the objectives of this presentation are as follows: 1) review important molecular mechanisms that underlie me-tabolism and disease, 2) discuss potential implications for host-microbial interactions in management of disease, and 3) describe what we have learned with respect to changes in im-mune biomarkers, digestion, metabolism, and tissue accretion in disease-challenged pigs.
Key Words: disease, nutrient metabolism, physiology
197 Vitamin E metabolism in poultry. M. P. Richards1,*, D. Perez1, R. S. Parker2, M. E. Berres1, M. Sifri3, 1University of Wisconsin-Madison, Madison, 2Cornell, Ithaca, NY, 3ADM, Quincy, IL.
Dietary vitamin E accumulates poorly in the muscle of tur-keys compared to chickens. This is likely one of the reasons oxidative rancidity is more of a problem in turkey compared to chicken meat. Enhanced metabolism of vitamin E isomers to water soluble degradation products may be responsible for diminished vitamin E levels in turkey muscle. Cytochrome P450 hydroxylases have been shown to initiate this type of vi-tamin E metabolism in humans and rodents, yet little work has been done in agricultural animals. We have investigated the hydroxylase-mediated metabolism pathway in bile from tur-keys and chickens receiving equivalent levels of dietary vita-min E isomers. Metabolites of α tocopherol (aT) and γ tocoph-erol (gT) were enhanced up to eightfold in turkey compared to chicken bile. This suggested that enhanced metabolism of vitamin E in turkeys can partly explain the poor accumulation in muscle. We also utilized RNA Seq to characterize transcrip-tion levels of genes in liver tissue of the chickens and turkeys. Gene expression of four cytochrome P450s were up-regulated in turkey compared to chicken (3.5 to 10.3-fold). One of these P450s may be a tocopherol hydroxylase. Gene expression of
88
a P450 associated with cholesterol synthesis was elevated 3.5-fold in turkey liver which may explain our observation of elevated cholesterol in turkey bile. Cholesterol concentration in bile has relevance in regard to vitamin E uptake in the intes-tine since cholesterol in the intestinal lumen has been shown to block vitamin E absorption by enterocytes. Bile containing cholesterol dumps into the intestinal lumen during feeding. Gene expression of a P450 associated with bile salt synthesis was elevated 10.3-fold in turkey liver. Excess bile salt produc-tion in the liver may facilitate transfer of hepatic cholesterol to the bile by forming a colloidal interaction with the sterol. We observed gT was up to 9.7-fold higher in turkey bile which may also be mediated by excess bile salts in liver that are ex-ported to the bile and carry gT as cargo. Gene expression of UDP-glucuronyl transferase (UGT) was up-regulated 3.3-fold in turkey liver which presents an additional mechanism that may limit vitamin E accumulation in turkey muscle. Sequence variation in the α tocopherol transfer protein (ATTP) is noted between turkey and chicken at sites known to affect its trans-fer function. Thus, the interplay between bile salts, choles-terol, ATTP, UGT, and tocopherol hydroxylases can influence vitamin E transport and metabolism in poultry.
Key Words: metabolism, poultry, tocopherol
PHYSIOLOGY
198 Impacts of beef cow nutrition on conceptus development. L. E. Camacho1,*, C. O. Lemley2, K. C. Swanson1, K. A. Vonnahme1, 1North Dakota State University, Fargo, 2Mississippi State University, Mississippi State.
Two experiments were conducted to determine the effect of maternal nutrient restriction followed by realimentation dur-ing early to mid-gestation on uterine blood flow (BF), mater-nal performance, and conceptus development in pregnant beef cows. In Experiment 1, effects of maternal nutrient restriction followed by realimentation during mid-gestation on uterine BF of lactating, multiparous cows were evaluated. Nutrient restriction from d 30 until 140 of gestation did not alter to-tal uterine BF. However, on realimentation (from d 140 to 198 of gestation), there was enhanced ipsilateral uterine BF compared to adequately fed cows. In Experiment 2, effects of maternal nutrient restriction followed by realimentation dur-ing early to mid-gestation on late gestation uterine BF, mater-nal performance, and conceptus development was evaluated using nonlactating, multiparous cows. Slaughters were per-formed at d 85, 140, and 254 of gestation. During late gesta-tion when all cows were receiving similar nutrition (100% of the NRC requirements), ipsilateral uterine BF and total BF were increased in cows that were previously nutrient restrict-ed in early gestation compared to adequately fed cows during
the same time. Therefore, results from both experiments sug-gest that the bovine placenta may be programmed to function differently after a period of nutrient restriction. Duration of restriction or realimentation impacted maternal performance and organ weights. The dam might become more efficient in the utilization of nutrients after being realimented as gestation advances. Nutrient restriction during early pregnancy tended to increase fetal and placental size by d 85. However, when cows were restricted longer or when realimented, there were no observable differences in placental or fetal growth. The maternal system may adapt to allow for fetal catch up growth during later gestation by enhancing uteroplacental nutrient transport capacity or placental function. From the results ob-tained in these 2 experiments we can conclude that maternal nutrient restriction during early gestation enhances conceptus growth and uterine BF later in pregnancy compared to cows not experiencing any restriction. Perhaps, timely management strategies might result in enhanced conceptus development. Even though more research is necessary, opportunities to in-tervene appear to be available during times of poor nutrition in beef cow/calf systems.
Key Words: beef cattle, pregnancy, uterine blood flow
199 Physiological response of beef heifers after receiving a reused CIDR processed with different heat-treating methods. C. R. Dahlen1,*, S. I. Klein1, G. C. Lamb2, V. R. G. Mercadante3, P. L. Steichen1, 1North Dakota State University, Fargo, 2University of Florida, Marianna, 3NFREC, University of Florida, Gainesville.
Eighty-one prepubertal beef heifers were used to evaluate effects of used CIDR heating methods on concentrations of progesterone after CIDR reinsertion. Used CIDRs were previ-ously in beef cows for 7 d. Heifers were stratified by weight and birth date, then assigned to receive a new CIDR (New, n = 10) or one of eight used CIDR treatments: 1) no processing (Used, n = 10), 2) autoclaved (Autoclaved, n = 8), 3) pro-cessed in dishwasher (Dishwasher, n = 8), 4) processed in mi-crowave for 30 s (Microwave, n = 10), 5) processed in toaster oven (Oven, n = 9), 6) processed in clothes dryer (Dryer, n = 10), 7) processed in boiling water (Boiled, n = 8). or 8) stored outdoors for 60 d (Outside, n = 8). Used CIDRs were pro-cessed at 121°C for 30 min for autoclaved and oven treat-ments, at 121°C for boiled treatment, and for 30 min for dryer and dishwasher treatments. Blood samples were collected on d -10, immediately before CIDR insertion (d 0), 3 h after CIDR insertion (3 h), daily while CIDR was in place (d 1 to 11), and 24 h after CIDR removal (d 12) for analysis of con-centrations of progesterone. A treatment × time interaction (P < 0.0001) was present for concentrations of progesterone. No differences (P > 0.10) in concentrations of progesterone were present for heifers receiving a used CIDR compared with heif-ers receiving CIDRs processed in a dishwasher, microwave,

89
oven, dryer, or boiling water (collectively reported as “Pro-cessed”). However, heifers receiving autoclaved CIDRs had greater (P < 0.05) concentrations of progesterone from 3 h to d 3 but similar (P > 0.10) concentrations of progesterone from d 4 to d 11 compared with heifers receiving used or processed CIDRs. From d 1 to d 11 heifers receiving outside CIDRs had decreased (P < 0.05) concentrations of progesterone com-pared with all other treatments. Heifers receiving autoclaved CIDRs had greater (P < 0.05) concentrations of progesterone compared with all other treatments at 3 h and 1 d, whereas heifers receiving new CIDRs had greater (P < 0.05) concen-trations of progesterone from d 6 to d 11 compared with all other treatments. Processing used CIDRs with a dishwasher, microwave, oven, clothes dryer, or boiling water did not result in a pattern of concentrations of progesterone similar to that of autoclaved or new CIDRs.
Key Words: heifers, progesterone, reused CIDR
200 Global changes in uterine protein secretion are associated with differences in the number of antral follicles in heifers. J. L. Vallet1,*, R. A. Cushman1, A. K. McNeel1, E. C. Wright1, E. Larimore2, J. R. Miles1, C. C. Chase1, C. A. Lents1, J. R. Wood3, A. S. Cupp3, G. A. Perry2, 1USDA, ARS, U.S. Meat Animal Research Center, Clay Center, NE, 2South Dakota State University, Brookings, 3University of Nebraska, Lincoln.
The numbers of antral follicles on the ovary have been re-ported to be associated with differences in beef cattle fertility. To further explore potential mechanisms for these differences, an experiment was undertaken to determine the association between numbers of antral follicles and differences in uterine protein secretion in beef heifers. Using ultrasonography, the number of antral follicles was determined twice (March and April 2013) in beef heifers (n = 104; 10–12 mo of age), which had been developed from weaning on a standard USMARC heifer development diet (65% mature weight by breeding). From the heifers determined to be cycling in April (presence of a corpus luteum at ultrasound), 10 heifers with the greatest and 10 heifers with the least antral follicles were identified. These heifers were synchronized with two injections of pros-taglandin F2α given 11 d apart and slaughtered on Day 15–16 of the estrous cycle. After slaughter, the uterus was flushed with 20 mL 0.9% saline. Uterine flushings were measured for total uterine protein using a bicinchoninic acid procedure. Flushings were dialyzed (10 mM Tris, pH 8.0), and then ali-quots were lyophilized and subjected to SDS-PAGE (0.5 mL) and 2D-PAGE (1 mL). Gels were stained with Coomassie and imaged, and protein bands or spots were quantified using den-sitometry. Of the 10 heifers in each group, 7 high and 8 low group heifers responded appropriately to estrous synchroni-zation and were in diestrus. Retrospectively, the number of antral follicles determined by ultrasound differed between the
high and low groups (33 ± 2.1 and 15.2 ± 1.9, respectively; P < 0.01). Total uterine protein concentration also differed between high and low groups (524 ± 47 and 293 ± 44 µg/ml, respectively; P < 0.05). After SDS-PAGE, densitometry was measured on 11 protein bands. All but one band (serum albumin) differed between high and low groups (high group 39–71% greater than low group; P < 0.05). After 2D-PAGE, densitometry was measured on 223 spots. Of these, 66 spots were greater (P < 0.05) in high compared to low groups; no spots were greater in low compared to high groups. These re-sults suggest a generalized increase in uterine protein secre-tion in heifers with greater numbers of antral follicles. Pos-sible mechanisms for this increase include greater prepubertal uterine gland development or increased stimulation of uterine protein secretion during the estrous cycle. Greater uterine protein secretion could contribute to the previously reported increased fertility of beef heifers with more antral follicles. USDA is an equal opportunity provider and employer.
Key Words: endometrium, follicle, proteome
201 Dietary bacitracin (Albac® and BMD®) improves ADG and FE in pigs in routine production environments (subjected to mixing and crowding stress). A. J. Moeser1,*, L. L. Edwards1, D. A. Nelson2, 1North Carolina State University, Raleigh, 2Zoetis, Howard Lake, MN.
The primary objective of this study was to determine the ef-fects of dietary Albac (bacitracin zinc) and BMD (bacitracin methylene disalicylate) on performance (ADG/FE) of pigs subjected to mixing and crowding stressors (MCS) seen in routine production. In addition, changes in intestinal integ-rity and immunology were examined. Ninety-six Yorkshire-cross barrows (~20 kg) were randomly assigned to 1 of 4 experimental diets: nonmedicated (Control); nonmedicated + MCS, 27.5 ppm bacitracin from Albac + MCS, or 33.0 ppm bacitracin from BMD + MCS. Pigs were acclimated to di-ets and rooms for 7 d, followed by 7 d of MCS. The MCS protocol included reducing pen size to 0.33 m2 per pig and co-mingling with unfamiliar pigs. Feed and water were pro-vided ad libitum, and body weights and feed intake were re-corded over the 7 d experiment. On d 7, a subset (n = 7–8 pigs/treatment group) of pigs within each experimental group was euthanized for intestinal tissue collection and intestinal function and cytokine analyses. Ileum and proximal colon samples were collected and mounted on Ussing chambers to measure permeability via transepithelial electrical resistance (TER) and mucosal-to-serosal flux of FITC-Dextran, 4 kDa (FD-4 flux). Cytokines TNFα, IL-1β, and IL-8 were measured in ileal mucosal homogenates. Pigs subjected to MCS exhib-ited reduced (P < 0.05) ADG, but MCS had no effect on feed intake. Pigs fed BMD had greater ADG compared with MCS controls (ADG = 0.726 ± 0.03 kg/d and 0.895 ± 0.05 kg/d for control MCS and MCS+BMD, respectively). Pigs subjected

90
to MCS had reduced (P < 0.05) ileal TER (TER, Ω·cm2 = 46 ± 2.9 and 35 ± 2 for control and MCS controls pigs, respec-tively) and increased (P < 0.01) FD-4 flux (μg·cm2·min FD-4 flux = 0.005 ± 0.0005 and 0.01 ± 0.001 for control and MCS, respectively). Pigs fed either Albac or BMD had higher (P < 0.05) ileal TER than MCS control pigs (TER, Ω·cm2 = 35 ± 2, 47 ± 2, and 46 ± 3 for MCS control, Albac and BMD, respectively). Pigs fed BMD had lower (P < 0.05) intestinal FD-4 flux (μg·cm2·min FD-4 flux = 0.01 ± 0.001 and 0.006 ± 0.0006 for MCS and MCS+BMD, respectively). lleal con-centrations of TNFα, IL-1β, and IL-8 were reduced following MCS. Feeding Albac and BMD treatment prevented/restored MCS-induced suppression of TNFα (P < 0.05). These data demonstrate that Albac and BMD reduce the deleterious in-fluence of MCS on pig ADG. In addition, pigs subjected to MCS and consuming bacitracin exhibited improved intestinal barrier integrity. Albac® and BMD® are registered trademarks of Zoetis Florham Park, NJ.
Key Words: bacitracin, gut health, production stress
202 Combined effect of sow deep intrauterine insemination and boar frozen semen on economic indicators. D. Gonzalez-Peña Fundora*, R. V. Knox, J. Pettigrew, S. L. Rodriguez Zas, University of Illinois, Urbana.
Boar sperm count can be negatively affected by reproduc-tive technologies such as frozen semen preparation (FRO), sex-sorted sperm, and sperm mediated gene transfer. Deep intrauterine (DUI) insemination technique enables the effec-tive use of semen doses with lower sperm count compared to conventional (CON) and intrauterine (IUI) insemination. The widespread use of DUI and frozen semen preparation depends on the impact of these technologies on the profit at the com-mercial level. The goal of the study was to compare the effect of the three insemination techniques on the financial indica-tors of a pig crossbreeding system. A three-tier system starting with the cross of nucleus lines B and A to generate 200,000 BA sows at the multiplier level was simulated in ZPLAN. At the commercial level, the BA sows were inseminated (CON, IUI, or DUI) using FRO from nucleus line C boars. The insemina-tion techniques were differentiated by distinct sow:boar ratios in the C × BA cross. In addition, a range of farrowing rates (60% to 90%) and litter sizes (8 to 14 liveborn pigs) were test-ed. The differences in profit between the insemination tech-niques were driven by differences in costs (P-value < 0.0001). The use of DUI resulted in higher variable costs with relatives differences (RD = [(DUI- CON)/max(DUI,CON)]) of 14.3% relative to CON and 12.9% relative to IUI. However, the use of DUI resulted in substantially lower fixed costs with RD of -7.4% relative to CON and -2.4% relative to IUI. The RD of DUI for total costs were -5.4% for CON and -0.7% for IUI. In terms of gross returns the three insemination technologies had similar outputs (RD < 1%) and consequently, DUI had
the highest profit among the technologies studied (RD of DUI was 4% relative to CON and 0.8% relative to IUI). This study demonstrated the relative advantage of DUI that stemmed from the lower sow population size and higher efficiency of boar use resulting in lower fixed costs and higher profit.
Key Words: deep intrauterine, frozen semen, simulation
203 Single fixed-time insemination following OvuGel® administration in postpartum sows. D. K. Bishop1,*, M. E. Johnston2, S. G. Buysse2, M. E. Swanson2, S. K. Webel3, 1Pike Pig Systems, Pittsfield, IL, 2JBS United, Inc., Sheridan, IN, 3JBS United, Baylis, IL.
The objective was to determine the effect of a single, fixed-time insemination 24 h after OvuGel® (OG) administration on subsequent farrowing rate and litter size. Weaned PIC sows (n = 359) were blocked by parity and body condition score and allocated to one of two treatments: Control (179) and OG (180). All sows were observed daily for behavioral estrus starting on d 4 postweaning and continuing until sows no longer expressed estrus or until d 7 after weaning. Con-trols were inseminated the first day in estrus and 24 h later if still in estrus. OG sows were treated with OvuGel® on d 4 after weaning and were inseminated once approximately 24 h post-OvuGel® treatment, regardless of estrus status. Control sows averaged 2.0 inseminations per sow while all OG sows had 1 insemination per sow (P < 0.01). Of the 179 Control sows, 163 (91.1%) expressed estrus and were bred by d 7 postweaning. All 180 OG sows were mated even though only 159 (88.3%) expressed estrus. There was no difference (P > 0.89) in percentage pregnant ([number of pregnant sows/weaned sows to breed] × 100) at 30 d of gestation (Control 88.3, OG 87.8). Percentage farrowed ([number of sows far-rowed/weaned sows to breed] × 100) was also not different between Control and OG sows (P > 0.67; Control 84.5, OG 82.8). Gestation length was shorter (P < 0.01) for OG sows (115.7 d) compared to Control sows (116.3 d). Total pigs born per litter averaged 14.2 and 14.5 for Control and OG sows, respectively (P < 0.48). Of the 21 OG sows that were not expressing estrus when inseminated, eight farrowed (38.1%) and had 13.3 total pigs per litter. Total pigs born per semen dose was 6.7 vs. 12.0 (P < 0.01) for Control and OG sows, respectively. These data indicate that treating sows with Ovu-Gel® followed by one insemination approximately 24 h later results in farrowing rates and litter sizes comparable to sows receiving multiple inseminations during behavioral estrus. The possibilities of improving utilization of weaned sows, in-creasing the effectiveness of timed inseminations, and equal fertility from fewer semen doses offer increased returns from superior boars, programmed gilt insertions, better utilization of breeding technicians, and older pigs at weaning from all in: all out flows.
Key Words: sow, reproduction, OvuGel®

91
204 Use of PG-600 and OvuGel in summer-weaned first-parity sows. B. L. Allen*, M. R. Ellersieck, T. J. Safranski, University of Missouri, Columbia.
Modern swine production relies on sows returning to estrus within 7d postweaning, and OvuGel, a vaginally delivered triptorelin acetate, can lead to synchrony in time of ovulation for these sows and facilitate timed AI. Parity one sows, those weaning large litters, and those lactating under high thermal load are less likely to return to estrus in a timely fashion and, therefore, might be expected to have an inferior response to Ovugel. PG-600 is used to treat anestrus sows, including par-ity one females lactating under thermal load. At weaning in August 2013, 544 parity one sows were divided into two ex-perimental groups, Control and PG-600. Control sows (n = 270) were treated with OvuGel per label instructions at 96 h postweaning and mated using postcervical AI with 3 × 10⁶ cells 22–24 h later. PG-600 sows (n = 274) were treated the same as Control sows except they were first given PG-600 IM at weaning according to label instructions. Detection of estrus was performed daily for 8 wk following weaning. A row by column Chi Square test was used to evaluate proportion of sows returning to estrus and proportion of irregular returns ( < 18 or > 24 d). A higher percentage of Control sows returned to estrus after their first mating than PG-600 sows (24.81% vs. 12.04%, respectively; P < 0.0001), but of those the percent-age of irregular returns did not differ by treatment (35.82% vs. 27.27%; P < 0.3927). Given that sows weaned large lit-ters (12.62 ± 0.09 and 12.55 ± .09 for Control and PG-600, respectively) during August, a large proportion of sows ex-periencing delayed postweaning estrus was expected. If these sows responded to PG-600 the wean-to-estrus interval would be shortened, and a higher proportion should have become pregnant to the timed AI, which they did. Sows not conceiv-ing, however, would have been expected to exhibit different patterns of return to estrus, and they did not.
Key Words: OvuGel, ovulation, PG-600
RUMINANT NUTRITION: CO-PRODUCTS
205 Effects of feeding dry or modified wet distillers grains with solubles with or without supplemental calcium oxide on ruminal metabolism and microbial enzymatic activity in beef cattle. A. R. Schroeder*, M. Iakiviak, I. K. O. Cann, T. L. Felix, University of Illinois at Urbana-Champaign, Urbana.
Objectives were to determine the interaction of feeding dry (DDGS) or modified wet (MDGS) distillers grains with solu-bles with or without supplemental CaO on apparent DM and NDF digestibility; in situ DM and NDF disappearance; ru-minal pH, VFA, and methane concentrations; and cellulase
and xylanase activity. Fistulated steers (n = 8; initial BW = 540 ± 250 kg) were used in a replicated 4 × 4 Latin square design. Treatments were arranged in a 2 × 2 factorial and steers were randomly allotted to 1 of 4 dietary treatments: (1) 50% DDGS with 0% CaO, (2) 48.8% DDGS supplemented with 1.2% CaO, (3) 50% MDGS with 0% CaO, or (4) 48.8% MDGS supplemented with 1.2% CaO. The remainder of the diets were husklage, dry rolled corn, and vitamin and mineral supplement. There were no interactions (P ≥ 0.12) of distill-ers grains (DGS) type and CaO supplementation on any vari-ables; therefore, main effects are presented. Steers fed DDGS increased (P < 0.01) DMI by 17% when compared to steers fed MDGS; however, CaO supplementation reduced (P = 0.03) DMI. Supplemental CaO elevated (P < 0.01) dietary pH by 1.82 pH units. This caused a time post-feeding by CaO addition interaction (P = 0.05) for ruminal pH. Steers supple-mented with CaO tended (P = 0.09) to have elevated ruminal pH at 1.5 h and had elevated (P = 0.03) ruminal pH at 3 h post-feeding; however, ruminal pH did not differ (P ≥ 0.24) the remainder of the day. There was no difference (P = 0.46) in ruminal cellulase activity when comparing type of DGS fed. There was a time by CaO supplementation interaction (P < 0.01). Cattle fed 1.2% supplemental CaO had greater (P = 0.02) ruminal cellulase activity than cattle fed 0% CaO only at 0 h post-feeding. Furthermore, feeding supplemental CaO increased (P = 0.04) the acetate to propionate ratio, but did not affect (P ≥ 0.07) other VFA concentrations. Supplemental CaO did not increase (P ≥ 0.48) in situ NDF disappearance or apparent NDF digestibility. However, cattle fed MDGS had increased (P < 0.01) NDF digestibility. There were no dif-ferences (P ≥ 0.48) in ruminal methane concentration when comparing DGS type or supplemental CaO. In conclusion, despite the fact that CaO increased ruminal pH and cellulase activity at certain times, it did not increase fiber digestibility in this study.
Key Words: beef cattle, calcium oxide, distillers grains, rumen metabolism
206 Optimum inclusions of alkaline treated cornstalks and distillers grains fed to calf-fed steers. S. J. Peterson*, B. L. Nuttelman, C. J. Schneider, D. B. Burken, J. C. MacDonald, G. E. Erickson, University of Nebraska, Lincoln.
A 180-d finishing study examined the effect of level of calci-um oxide treated corn stalks (TS) in diets containing separate levels of modified distillers grains with solubles (MDGS). Crossbred steer calves (n = 378; BW = 320 ± 7 kg) were separated into 2 BW blocks, stratified by BW within block, and assigned randomly to pens. Pens were assigned randomly to one of seven treatments, with six pens per treatment and nine steers per pen. Treatments were designed as a 2x3 facto-rial design, with diets containing either 20 or 40% MDGS fed with 10, 20, or 30% TS. In addition, a dry rolled corn,

92
20% MDGS, and 5% untreated stalks control (CON) was fed. All diets contained 4% supplement. An interaction was observed for G:F on a carcass (P < 0.10) and live BW basis (P < 0.05); therefore, simple effects of TS inclusion within each MDGS in-clusions will be presented. However, no significant interaction was observed between TS and MDGS inclusion for DMI (P = 0.47), ADG (P = 0.21), and carcass characteristics (P > 0.21). Intakes were not impacted by treatment (P > 0.18). Gain de-creased linearly (P < 0.01) with increasing TS inclusion in the 20% MDGS diets. However, ADG decreased quadratically (P < 0.01) when TS were added to the 40% MDGS diets with ADG equivalent between 10 and 20% and decreasing at 30% inclu-sion. Similar to ADG, G:F decreased linearly (P < 0.01) when TS were increased from 10 to 30% in diets with 20% MDGS, but decreased quadratically (P < 0.01) when TS increased in di-ets with 40% MDGS with equal G:F being observed for the 10 and 20% TS diets then decreasing when TS increases to 30%. Dressing percentage decreased linearly when TS were included in the 40% MDGS diets and decreased quadratically when fed with 20% MDGS. A linear decrease in fat depth was observed as TS increased in both 20 and 40% MDGS based diets. Within 20% MDGS, steers fed CON had the greatest final BW, ADG, and G:F compared to any TS inclusion. Previous research evalu-ated alkaline treated stalks in diets containing greater than 35% distillers. These data suggest that 10 or 20% TS can be fed with 40% distillers included in the diet without negatively impacting ADG and G:F. However, if only 20% distillers is fed, then 10% or less TS should be fed.
Key Words: calcium oxide, distillers, finishing
207 Effect of distillers grains on average daily gain of cattle grazing corn residue. M. Jones*, J. C. MacDonald, T. J. Klopfenstein, G. E. Erickson, A. K. Watson, University of Nebraska-Lincoln, Lincoln
There is significant potential for grazing corn residues due to the acres of corn planted annually. Grazing residues increases the length of the grazing season, allowing producers to feed less har-vested feeds thereby reducing annual feed costs. The objective of this trial was to compare two types of distillers grains (DGS) at three levels of supplementation for calves grazing irrigated or non-irrigated corn residue. One hundred twenty crossbred steers were backgrounded on corn residue from November to the end of December 2012 at the University of Nebraska- Lin-coln Agricultural Research and Development Center near Mead, Neb. Treatments were arranged in a 2 × 2 × 3 factorial design, with two types of DGS (modified and dried), two types of corn residue (irrigated and non-irrigated) and three levels of inclusion (0.3%, 0.7% and 1.1% body weight). Stocking rate was calculat-ed based on grain yield of the field at harvest, grazing efficiency factor (100% for non-irrigated, 85% for irrigated) and number of hectares available for grazing. Steers were randomly assigned to treatment. Each type of DGS was fed daily through the Calan System. Diet samples were collected four times throughout the
trial and were analyzed for in vitro organic matter disappear-ance (IVOMD). Daily gain improved quadratically for calves supplemented at 0.3, 0.7 and 1.1% of body weight at an average of 0.77, 0.92 and 0.96 kg/day (P < 0.0001). Some feed refusals were found for steers receiving the highest levels of supplemen-tation. Steers grazing non-irrigated residue gained an average of 0.92 kg/day in comparison to steers grazing irrigated residue at 0.80 kg/day (P = 0.0002). The IVOMD calculation showed a decline in quality of the diet samples throughout the grazing pe-riod. Steers grazing irrigated or non-irrigated corn residue while receiving supplementation at 0.7% BW show optimal perfor-mance with minimum feed refusals.
Key Words: corn residue, grazing, stocker cattle
208 Feeding elevated levels of corn silage and MDGS in finishing diets. D. B. Burken*, B. L. Nuttelman, C. J. Bittner, G. E. Erickson, T. J. Klopfenstein, University of Nebraska-Lincoln, Lincoln
In periods of high priced corn, corn silage may be an economical alternative in combination with distillers grains in finishing diets. A finishing experiment evaluated the substitution of corn with corn silage and modified distillers grains with solubles (MDGS). Steers (n = 225; BW = 348 ± 27 kg) were separated into three BW blocks and assigned randomly to one of 25 pens (9 steers/pen). Dietary treatments were arranged as a 2 × 2 + 1 factorial with factors including corn silage (15 or 45%) and MDGS (20 or 40%) inclusion plus a control diet with 40% MDGS and 5% cornstalks. Elevated levels of corn silage and MDGS replaced a 1:1 blend of dry-rolled corn and high-moisture corn. Steers were on feed for 133 or 147 d depending on BW block. Performance measures were calculated from HCW adjusted to a common dressing percentage (63%). Marbling score, 12th rib fat thick-ness, and LM area were recorded after a 48-hr chill. There were no interactions between corn silage and MDGS inclusion (P > 0.12). As corn silage was increased, DMI increased (P = 0.08) and ADG decreased (P = 0.01) equating to a 5.0% decrease in G:F (0.171 vs. 0.180; P < 0.01). As corn silage inclusion in-creased, final BW, live final BW, and HCW were decreased (P < 0.03), with no effect on dressing percentage (P = 0.52). There was no difference in DMI (P = 0.86) for cattle fed either 20 or 40% MDGS in corn silage diets. There were improvements in ADG (P = 0.06) and G:F (0.178 vs. 0.174; P = 0.09) for cattle fed 40% MDGS compared to 20% MDGS in corn silage di-ets. Cattle fed the control diet had similar DMI and ADG to all other treatments (P > 0.11). Cattle fed 15% corn silage and 40% MDGS had superior G:F to cattle fed the control diet (P < 0.01); however cattle fed the control diet had similar G:F compared to all other treatments (P > 0.16). In general, increasing corn silage in place of corn in finishing diets containing distillers grains re-sults in a modest reduction in performance, and replacing corn with MDGS in corn silage diets results in improvements in feed-lot performance.
Key Words: corn silage, cattle, distillers grains
93
209 Energy value of de-oiled modified distillers grains plus solubles in a forage-based diet. M. L. Bremer*, D. B. Burken, A. K. Watson, J. C. MacDonald and G. E. Erickson, University of Nebraska-Lincoln, Lincoln
An 84-d growing study was conducted utilizing 60 crossbred yearling steers (initial BW = 299 ± 25kg) to determine the en-ergy value of de-oiled modified distillers grains plus solubles (MDGS) using a 2 × 2+1 factorial arrangement of treatments. Factors were concentration of distillers grains (20 or 40%) and oil content (7.2%, for de-oiled vs. 12.0% for normal). The re-mainder of the diet was comprised of baled corn residue ground through a 2.54-cm screen. A control diet of 40% dry rolled corn (DRC) was also included. Both de-oiled and normal MDGS were produced at the same plant, and oil was removed by cen-trifugation of thin stillage. Cattle were fed in an individual Calan gate system once daily with orts collected weekly. There was no MDGS inclusion by fat content interaction between de-oiled and normal MDGS (G:F; P = 0.98). As expected, feeding 40% MDGS resulted in greater ending BW, DMI, ADG, and G:F (P < 0.01) compared to inclusion of 20% MDGS. Steers receiving diets containing de-oiled MDGS had a greater DMI than those fed normal MDGS, 12.7 vs. 11.9 for de-oiled and normal, re-spectively; (P = 0.05). Ending BW (P = 0.39) were similar for steers fed de-oiled or normal MDGS diets, but steers fed diets containing normal MDGS numerically gained less than those consuming de-oiled MDGS (P = 0.26) diets causing G:F to be unaffected (P = 0.85). Steers consuming the 40% DRC control diet tended to be lighter at the conclusion of the study compared to the those cattle receiving 40% MDGS (P = 0.08). Steers fed 40% DRC had similar DMI compared to steers receiving either 40% de-oiled or normal MDGS (P = 0.28 and P = 0.81 respec-tively). At 20% inclusion in the diet, steers performed 29.0% less efficiently when compared to the control (P < 0.01) while steers fed 40% MDGS performed 7.9% more efficiently than the control (P < 0.01). The energy value of MDGS relative to corn was calculated to be 124% for these growing calves. The results of this study suggest that removing oil from thin stillage to create MDGS with a fat content of 7.2% vs. 12.0% does not alter cattle performance in forage based diets.
Key Words: corn residue, distillers grains, oil removal
210 Digestion of finishing diets containing modified distillers grains plus solubles and condensed distillers solubles with and without oil extraction. M. L. Jolly*, A. L. Shreck, J. L. Harding, G. E. Erickson, J. C. MacDonald, T. J. Klopfenstein, University of Nebraska-Lincoln, Lincoln
Ethanol plants are currently removing a portion of corn oil, via centrifugation, from condensed distillers solubles (CDS) resulting in reduced fat distillers byproducts. Our objective was to determine the effect of reduced oil content on digest-ibility and rumen pH. Six ruminally fistulated steers (BW =
449 ± 20 kg) were utilized in a 5 × 5 Latin Square designed, 112-d metabolism study. Diets consisted of de-oiled and nor-mal CDS fed at 27% inclusion, de-oiled and normal modified distillers grains plus solubles (MDGS) fed at 40% inclusion, and a corn-based control (CON). All diets contained a 1:1 blend of high-moisture and dry-rolled corn, 12% corn silage and 5% supplement. The fat content was 8.7% for de-oiled CDS, 15.4% for normal CDS, 9.2% for de-oiled MDGS, and 12.3% for normal MDGS. Therefore, dietary fat was 5.2% for de-oiled CDS, 7.0% for normal CDS, 5.9% for de-oiled MDGS, and 7.2% for normal MDGS compared to 4.0% for CON. Period length was 21 d which consisted of 16 d adap-tation and 5 d fecal collection. Titanium dioxide was dosed intraruminally on d 10 to 20 as a marker to determine digest-ibility. Ruminal pH was measured continuously from d 17 to 21 with submersible, wireless pH probes. An oil concentra-tion by byproduct type interaction was observed for fat in-take (P = 0.07) and total tract fat digestibility (P = 0.03). Fat intake was the greatest for normal MDGS, intermediate for de-oiled CDS and normal MDGS, and the least for de-oiled CDS. Total tract fat digestibility was greater for normal CDS, intermediate for de-oiled and normal MDGS, and the least for de-oiled CDS. Greater oil concentration increased total tract fat digestibility for CDS (P = 0.02) but not for MDGS (P = 0.68). Treatment had no effect on DMI, OMI, and DM digestibilities (P > 0.27). No treatment difference was ob-served for total tract NDF digestibility (P = 0.11). There were no differences between feeding de-oiled and normal CDS for average pH (P = 0.74); however, feeding normal MDGS re-sulted in greater rumen pH than de-oiled MDGS (P = 0.06). Steers fed CDS or CON spent more time and area with a pH below 5.6 than steers fed MDGS (P < 0.02). Removing a portion of corn oil from CDS resulted in decreased fat digest-ibility in diets containing CDS, however this decrease was not observed in diets containing MDGS.
Key Words: centrifugation, de-oiled byproducts, digestibility
211 Energy value of de-oiled modified distillers grains plus solubles in beef feedlot diets. M. L. Bremer*, B. L. Nuttelman, C. J. Bittner, D. B. Burken, G. E. Erickson, J. C. MacDonald, T. J. Klopfenstein, University of Nebraska-Lincoln, Lincoln
A 153-d finishing trial was conducted utilizing 378 calf-fed steers (initial BW = 363 ± 17 kg) to evaluate the effects of feeding modified distillers grains plus solubles (MDGS) at in-creasing levels in the diet on cattle performance and carcass characteristics. De-oiled MDGS (7.2% fat) was included in the diet at 0, 15, 30, 45 or 60% on a DM basis. In addition, 15 or 30% normal (12.0% fat) MDGS from the same plant was also fed and analyzed as a separate 2 × 2 factorial arrangement of treatments using 15 or 30% inclusion and MDGS being either de-oiled or normal. The remainder of all diets consisted of 12%

94
corn silage, 5% supplement, and a 1:1 blend of high moisture and dry rolled corn, with corn replaced by MDGS. Cattle were limit fed for 5 d and weighed on two consecutive days. Steers were blocked by BW into three blocks (heavy, medium and light) with 9 head per pen. Treatments were assigned randomly to pens and balanced within block. Steers were implanted with Revalor-XS implants on d 1. Final BW, DMI, and ADG did not differ significantly when de-oiled MDGS was increased in the diet (P > 0.19). However, G:F increased linearly as inclusion of de-oiled MDGS increased (P < 0.01). Hot carcass weight and LM area did not differ significantly between treatments, but 12th-rib fat thickness increased quadratically (P = 0.02) along with marbling (P < 0.01) as de-oiled MDGS was added to the diet. For the 2 × 2 factorial with 15 or 30% inclusion of each type of MDGS, no MDGS concentration by oil content interaction existed for gain (P = 0.28), but an interaction did exist for G:F (P = 0.07). Feeding 30% MDGS increased fat thickness (P < 0.01) when compared to cattle fed 15% MDGS in their diet. Feeding de-oiled or normal MDGS did not af-fect G:F(P = 0.48), but at 30% inclusion, steers fed normal MDGS had improved performance compared to those fed de-oiled MDGS (G:F, P = 0.07). This study suggests that increas-ing de-oiled MDGS increases G:F similar to previous work on distillers grains. The impact of oil removal from MDGS is impacted by dietary inclusion. At 30% inclusion of MDGS, decreasing the fat content from 12.0% to 7.2% decreased steer performance by 3.4%.
Key Words: distiller grains plus solubles, feedlot cattle, oil removed
212 Energy value of de-oiled wet distillers grains plus solubles relative to corn processing method of steam-flaked or dry-rolled. M. L. Bremer1*, M. K. Luebbe2, K. H. Jenkins2, G. E. Erickson1, 1University of Nebraska-Lincoln, Lincoln, 2University of Nebraska, Scottsbluff
As ethanol plants have begun removing oil from thin stillage during the ethanol production process, fat content of distill-ers grains has decreased. The objective of this study was to evaluate the energy value of de-oiled wet distillers grains plus solubles (WDGS) when fed with either dry-rolled corn (DRC) or steam-flaked corn (SFC). A 128-d finishing trial was con-ducted utilizing 320 yearling steers (initial BW = 397 ± 38kg) with 8 treatments (5 pens/treatment). Data were analyzed as 2 separate factorials. The first factorial was a 2 × 3 with factors of de-oiled WDGS in the diet at 0, 17.5, or 35% (DM basis) fed with DRC or SFC. The other was a 2 × 2 factorial by using two additional diets containing 35% normal WDGS with ei-ther DRC or SFC compared to 35% de-oiled WDGS fed with both corns. Normal and de-oiled WDGS were received from two different plants for this study. Steers were blocked by BW, stratified within block, and pens were assigned randomly to treatments within block. No WDGS concentration by corn
processing method interaction existed when evaluating the 2 × 3 factorial (G:F, P = 0.15). Steers fed DRC had greater DMI compared to steers fed SFC (P = 0.02), similar ADG (P = 0.23); however, G:F was improved in steers fed SFC (P = 0.01). Increasing the concentration of WDGS in the diet lin-early increased final BW, ADG, G:F, HCW and fat depth (P < 0.01). Increasing the concentration of WDGS from 0 to 17.5% caused a 5.0% improvement in G:F and increasing from 17.5 to 35% caused a 3.4% improvement in G:F. Marbling scores increased quadratically (P = 0.01) with increasing concentra-tions of WDGS. When comparing 35% de-oiled WDGS to 35% normal WDGS, there were no corn processing method by WDGS type interactions (P ≥ 0.29). Type of WDGS did not significantly impact G:F (P = 0.14) but normal was 2.4% numerically greater in DRC diets and 5.2% numerically great-er in SFC-based diets. Steers fed SFC had greater G:F (P = 0.05) than those fed DRC as expected. This study suggests that increasing the concentration of de-oiled WDGS in the diet while feeding either SFC or DRC improves G:F. Remov-ing a portion of the oil did not significantly impact G:F but feeding normal WDGS numerically improved G:F suggesting oil removal may have a small effect on energy value.
Key Words: corn processing, distillers grains plus solubles, oil removal
213 Influence of prepartum dietary protein concentration on beef cow performance and calf growth, carcass characteristics, and plasma glucose and insulin concentrations. T. B. Wilson1*, N. M. Long2, D. B. Faulkner1, D. W. Shike1, 1University of Illinois at Urbana-Champaign, Urbana, 2Clemson University, Clemson, SC.
Objectives of this study were to investigate the effects of pre-partum dietary protein concentration on cow performance, lactation, and reproduction, as well as calf growth, carcass characteristics, and plasma glucose and insulin concentrations. Spring-calving, multiparous cows (n = 49; BW = 657 ± 70 kg) were blocked by BW and allotted to 2 dietary treatments: (1) 19% modified wet distillers grains plus solubles (MDGS), 54% oatlage, and 27% corn silage (REQ), or (2) 39% MDGS, 41% oatlage, and 20% corn silage (HP). Treatment diets were formulated to be isocaloric, and REQ and HP provided 100% and 128% of CP requirement, respectively. Cows were limit-fed from 90 d prepartum to calving. All cows were fed a com-mon diet postpartum. Cow BW and BCS were recorded at 90 d prepartum and 24 h post-calving. Milk production was es-timated by the weigh-suckle-weigh technique at 69 ± 11 d of age. Calf BW was measured at birth and weaning (121 ± 11 d of age). Calves (n = 42) were fed a common feedlot diet after weaning and individual DMI was recorded using GrowSafe. Plasma glucose and insulin concentrations were analyzed on a subset of calves (n = 12/treatment) 90, 120, 150, 180, 210, and 240 min post-feeding, 1 d before slaughter. All calves
95
were slaughtered 221 d post-weaning at a target 12th rib fat thickness (BF) of 1.4 cm, determined via ultrasound. Dietary treatment had no effect (P ≥ 0.31) on cow BW or BCS change from 90 d prepartum to calving. Prepartum treatment did not affect (P = 0.51) calf BW at birth. There was no effect (P ≥ 0.32) of prepartum treatment on cow milk production, con-ception rates, or calf weaning BW. Feedlot DMI, ADG, G:F, and final BW were not affected (P ≥ 0.32) by treatment. No differences (P ≥ 0.31) in HCW, marbling score, or LM area were detected. Calves from cows fed HP had greater BF (P < 0.01) and yield grades (P < 0.01), and tended to have more KPH (P = 0.08) than calves from cows fed REQ. Calves from cows fed HP had decreased (P < 0.01) plasma glucose and insulin concentrations but increased (P < 0.01) glucose to in-sulin ratios when compared to calves from cows fed REQ. Although feeding cows 128% of CP requirement from 90 d prepartum to calving did not affect cow performance or calf growth, it increased calf carcass adiposity.
Key Words: beef cow, fetal programming, protein
RUMINANT NUTRITION: GENERAL
214 Use of long-chain saturated fatty acid supplements in lactating dairy cows. P. Piantoni*, A. L. Lock M. S. Allen, Michigan State University, East Lansing
Long-chain saturated fatty acid (LCSFA) supplements are used to increase energy density of diets and milk fat yield or energy balance in dairy cows. However, production responses to LC-SFA vary greatly, which could be from differences in fat type, diets, and physiological states of cows. Supplements of LC-SFA are comprised primarily of stearic and (or) palmitic acids. In cows past peak lactation, palmitic acid (99% purity), com-pared with a control diet with no supplemental fat, increased yields of milk (46.0 vs. 44.9 kg/d, P = 0.04), milk fat (1.53 vs. 1.45 g/d, P < 0.01), and 3.5% fat-corrected milk (3.5% FCM; 44.6 vs. 42.9 kg/d, P < 0.01) with a similar response for cows across a wide range in milk yield. In a similar experiment, stea-ric acid (98% purity) increased DMI (26.1 vs. 25.2 kg/d, P = 0.01) and yields of milk (40.2 vs. 38.5 kg/d, P = 0.02), milk fat (1.42 vs. 1.35 g/d, P < 0.01), and 3.5% FCM (40.5 vs. 38.6 kg/d, P < 0.01), with a greater response for high yielding cows (linear interaction P < 0.10). However, recovery of additional fatty acids consumed as additional yield of milk fatty acids was only 11.7% for palmitic acid and 13.3% for stearic acid supple-mentation. Supplementation of LCSFA ( > 85% saturated, 46% stearic acid and 37% palmitic acid) increased DMI (23.6 vs. 22.2 kg/d, P = 0.04) and tended to decrease milk yield (46.6 vs. 49.7 kg/d, P = 0.10), improving energy balance (-12.0 vs. -17.3 Mcal/d, P = 0.01) and BCS (3.0 vs. 2.7, P = 0.02) when fed during the first 4 wk postpartum in 20% and 26% forage NDF diets. However, postpartum supplementation of LCSFA
interacted (P < 0.10) with forage NDF concentration for 3.5% FCM yield when cows were fed a common diet from 5 to 10 wk postpartum: LCSFA decreased 3.5% FCM yield in the 20% forage NDF diet (51.1 vs. 58.7 kg/d), but not in the 26% for-age NDF diet (58.5 vs. 58.0 kg/d). Supplementation of LCSFA might benefit lactating dairy cows in some cases but results are dependent on fat supplements fed, diet, stage of lactation, and milk yield of cows. Further work is needed to clarify these situations as well as the marginal economic return, if any, of specific LCSFA supplements under different situations.
Key Words: milk fat, prilled fat, saturated fatty acids
215 Effects of rumen-protected choline on plasma, milk yield and composition of middle and late lactation Holstein cows. A. Pineda*, P. Cardoso, University of Illinois at Urbana-Champaign, Urbana
Rumen-protected choline (RPC) has become common in the dairy industry; questions regarding its benefits remain prevalent. The objective of this study was to assess the effects of RPC on milk yield and milk composition. Fifty (n = 50) lactating multip-arous Holstein cows over 100 d in milk were randomly assigned to one of two treatments. Dietary treatments were: 1) control diet (CON, n = 25), not supplemented with RPC and 2) supplement-ed diet (RPCt, n = 25), supplemented with RPC (115 g/cow/day). Control and supplemented diets were fed ad libitum once daily. Basal diet was formulated according to NRC, 2001 rec-ommendations to meet or exceed nutrient requirements. Body weight (BW) and BCS were measured weekly. Milk produc-tion and DMI were recorded daily. Milk samples were collected twice weekly on weeks 3, 6, and 9. Milk samples were analyzed for fat, protein, lactose, urea nitrogen (MUN), somatic cell count (SCC), fatty acid (FA) composition, and choline concentration. Plasma from blood samples were obtained on weeks 1, 3, 4, 6, 7, and 9 and analyzed for NEFA and choline concentrations. Cows remained in the experiment for 9 wk. Data were analyzed using the MIXED procedure of SAS (v9.4). Dry matter intake, BW, and BCS were not affected (P > 0.05) by RPC supplementa-tion. Cows supplemented with RPCt did not have greater milk yield, 3.5% FCM, ECM, or milk components than control cows (P > 0.05). While concentration of de novo and mixed (16:0 + cis-9 16:1) FA were greater in CON; preformed FA had greater concentration in RPCt (P < 0.05). Total saturated FA (P < 0.001) concentration was higher in CON cows than RPCt. Total MUFA and cis PUFA concentration were greater in RPCt cows (P < 0.05) than CON. Yield of cis PUFA tended to increase (P = 0.08) in RPCt cows. Omega-3 and omega-6 FA had greater yield in RPCt when compared to CON. Higher choline concentration in plasma (P < 0.05) indicated intake and absorption of RPC by supplemented cows. Cows in RPCt had their milk fat composi-tion enriched by long chain PUFA such as LA, ALA, DHA, and EPA either in middle or late lactation.
Key Words: choline supplementation, dairy cow, milk fatty acids
96
216 Understanding phage-bacterial interactions and their role in the rumen. C. Anderson, M. L. Jolly, G. E. Erickson, T. J. Klopfenstein, S. C. Fernando*, University of Nebraska, Lincoln
Diverse viral communities (especially bacteriophages) are found in all ecosystems and are considered the most abundant biologi-cal entity on earth. Although viruses are commonly found in all ecosystems, the roles of viruses within these ecosystems are poorly understood, partly because no conserved gene common to all viruses exists and less than 1% of the bacterial hosts can be cultivated. As a first attempt to better understand the role and functional relationships of viruses, in particular how prophages influence rumen bacterial communities, we have investigated viral and bacterial community relationships under different di-etary conditions (55% corn silage, 27% condensed distillers plus solubles (CDS), 40% modified distillers grains plus solu-bles (MDGS), corn based control diet) in a Latin-square design using 4 fistulated steers using a metagenomics approach. Ru-men samples were collected after a 21-d adaptation period after total rumen evacuation and mixing. A total rumen evacuation was performed via the rumen cannula and samples were col-lected after mixing the contents. Tangential flow filtration was performed to isolate viral particles from the rumen sample. In addition to the bacterial 16S gene, the viral and bacterial metage-nomes were sequenced using the Ion Torrent personnel genome machine (PGM) to identify species composition, interactions between viruses and bacteria, and to identify differences in met-abolic potential under different dietary conditions. Our analysis of the rumen microbial community demonstrates intra-individ-ual structuring of microbial communities based on diet. How-ever, the metagenomes sequence analysis for metabolic profiles (function) exhibited a more constant pattern. Furthermore, each dietary treatment produced a unique virome, consistent with previous research on human gut environments. The rumen vi-rome was dominated by ss DNA viruses, mainly Microviridae, Circoviridae, and unclassified ss DNA viruses. Currently, we are applying ecological theory to understand the ecological role of viruses within the gut environment in controlling bacterial diversity and maintaining ecosystem function. Improving the understanding of viral-bacterial dynamics and the impact on metabolic profiles remains important, not only for cattle health, productivity, and feed efficiency, but these models also have the potential to elicit patterns pertinent to ecological theory.
Key Words: metagenome, viral-bacterial interaction, virome
217 Optimizing design for gut microbe identification by sequencing. T. M. Taxis1*, G. C. Conant1, K. M. Cammack2, W. R. Lamberson1, 1University of Missouri, Columbia, 2Department of Animal Science, University of Wyoming, Laramie
The microbiome plays an important role in the physiology of
animals across all species. Gut microbes assist with digestion, and the population is dependent on the animal’s diet, genet-ics, and environmental conditions. Sequencing data from raw environmental samples has provided insight into the taxa that are present in collected samples. Metagenomic studies aim to identify the most complete set of microbes for optimal results. The 16S rDNA gene of prokaryotic organisms is a univer-sal gene that has been used to identify microbes present in a metagenomic studies. Because the gene is universal, PCR primers can be used to amplify multiple taxa in a single reac-tion, however this technique may introduce PCR-biased arti-facts. Recently, raw metagenomic samples have been directly amplified via shotgun sequencing. This allows researchers to avoid any PCR-bias, and allows for maximum microbial population data. The objective of this study is to characterize the range in depth of coverage as affected by replication and extent of multiplexing. Rumen fluid samples were collected on 16 crossbred ewes divergent in residual feed intake which had been fed forage (n = 8) or concentrate (n = 8) diets. DNA was extracted and genomic libraries were created from each animal. Libraries, multiplexed 4 per lane, were diluted and sequenced using Illumina’s HiSeq 2000. Resulting reads were quality filtered and aligned to two distinct reference databases of 16S rDNA genes. Reads with a ≥97% sequence identity to the 16S rDNA genes in the databases were used to classify taxa present in each sample. The distributions of taxa pres-ent were used to calculate the probability that a particular microbial taxa would be represented when varying the extent of multiplexing. For calculation purposes, library preparation costs of $300.00 per sample, and sequencing costs of $800.00 per lane were assumed. When libraries were multiplexed 4 per lane, a total of 349 taxa were represented across the 16 animals. On average, each animal aligned to 37%, or 129 of the total taxa represented. If multiplexing was increased to 8 libraries per lane, the resulting data would be one less taxa represented, and a return of $800.00. Alternatively, libraries multiplexed with 2 libraries per lane, provide a higher repre-sentation of total taxa, gaining 10 more taxa than 4 libraries per lane, and an added expense of $800.00.
Key Words: metagenomics, multiplexing, replication
218 Evaluating two rates of monensin fed during the grain adaptation period on cattle performance and carcass characteristics. M. E. Harris1*, G. E. Erickson2, K. H. Jenkins3, M. K. Luebbe3, 1University of Nebraska, Lincoln, 2University of Nebraska-Lincoln, Lincoln, 3University of Nebraska, Scottsbluff
Performance and carcass characteristics were evaluated using two rates of monensin (Rumensin) during an 18-d grain adap-tation period using 198 cross-bred steers (BW = 415 ± 17 kg). Monensin was supplemented at rates of either 360 (LOW) or 480 (HIGH) mg/steer daily. Cattle were adapted to increasing levels of dry-rolled corn and decreasing levels of wheat straw

97
and corn silage. All diets contained the same basal diet of 10% wet distillers grains with solubles, 10% corn condensed dis-tillers solubles, and 5% liquid supplement (DM basis). Urea and soybean meal were included in all diets to meet or exceed NRC requirements for MP. Steers were utilized in a random-ized block design, blocked by BW, stratified by BW within block, and assigned randomly to pens. Pens were assigned randomly to treatments within blocks with 9 pens/treatment and 11 steers/pen. Interim performance was determined at d 25, after being on a common finishing diet for 7 d which pro-vided 360 mg/steer of monensin daily. After the grain adapta-tion period, steers fed HIGH had lower (P < 0.01) interim BW compared with steers fed LOW. Dry matter intake was less (P = 0.01) when LOW was fed compared to HIGH. An improve-ment (P ≤ 0.02) was observed in ADG and G:F with the LOW rate of monensin during the 18-d adaptation period. However, no differences (P ≥ 0.17) were observed for DMI, ADG, or G:F during the subsequent 100-d feeding period. Additionally, HCW, marbling, 12th rib fat, LM area, calculated YG, dress-ing percent, and overall liver scores were not affected (P ≥ 0.18) by rate of monensin fed during adaptation. Steers fed the HIGH rate of monensin tended (P = 0.09) to have a lower percentage of “A” liver scores. This study suggests feeding the LOW versus HIGH rate of monensin during the adaption period has little to no effect on overall performance of the cattle. These data indicate that the LOW rate may be more advantageous with the steers being more efficient during the adaptation period. However, they do not maintain that effi-ciency through the entire finishing period.
Key Words: adaptation, additive, monensin
219 Effects of monensin supplementation on forage intake and performance of steers grazing smooth bromegrass. T. L. Hasenauer*, T. J. Klopfenstein, G. E. Erickson, J. C. MacDonald, University of Nebraska-Lincoln, Lincoln
Two experiments were conducted to determine the effects of monensin supplementation on steers grazing smooth brome-grass pastures. In Exp. 1, crossbred yearling steers (n = 60; BW = 335 ± 32 kg) were utilized in a completely randomized design and assigned to one of 8 treatments. The treatments were arranged in a 2 × 4 factorial arrangement with one factor being inclusion or absence of monensin and the other factor being daily supplementation of modified distiller grains plus solubles (MDGS) at.05, 0.4, 0.6, and 0.8% of BW. Cattle were managed in an intensive rotational smooth bromegrass graz-ing system, and were rotated through 4 paddocks every 4 to 6 d from April 27, 2012 through August 24, 2012 (119 d). Steers were limit fed and weighed at the beginning and the end of the trial with intermediate weights taken on Days 24, 60, and 90. In Exp. 2, cannulated steers (n = 6; BW = 394 kg) were utilized in a switch back design experiment to deter-mine the effects of monensin supplementation on forage dry
matter intake (FDMI) of grazing steers. The steers were as-signed randomly to one of 2 treatments: supplementation with or without monensin. Steers were individually supplemented with 3 lb MDGS DM (0.3% BW). Steers were bolused 200 mg monensin daily via bolus inserted into the rumen. Tita-nium dioxide was used as a marker to estimate fecal output and was ruminally dosed daily at 10 g. There were six, 21- day grazing periods from May 3, 2013 to September 13, 2013. At the end of each period fecal samples, rumen samples, and diet samples were collected to estimate fecal output, VFA ratios, and digestibily. Estimated fecal output and smooth brome-grass IVDMD was used to calculate FDMI. In Exp. 1, mo-nensin supplementation had no effect on ADG (P = 0.56). In Exp. 2, steers receiving monensin had an estimated average forage intake of 6.29 kg (SE 0.25). Steers not supplemented with monensin had an estimated average forage intake of 6.77 kg (SE 0.25). While supplementation of monensin decreased FDMI 7%, it was not detected (P = 0.19).
Key Words: forage, intake, monensin
220 Effects of diet on methane, VFAprofile, and performance of growing calves. A. C. Pesta*, A. K. Watson, S. C. Fernando, G. E. Erickson, University of Nebraska, Lincoln
An 84-d growing study evaluated forage quality (high-quality (HQ) vs. low-quality (LQ)), inclusion of modified distillers grains plus solubles (MDGS; 0 or 40% de-oiled, 20 or 40% normal), and presence (200 mg daily) or absence of monen-sin on methane to carbon dioxide ratio (CH4:CO2), ruminal acetate to propionate ratio (A:P), and performance of grow-ing calves. Steers (n = 120; initial BW = 300 ± 25 kg) were individually fed in Calan gates. Steers were stratified by initial BW and assigned randomly to one of ten treatments. Factors were compared and main or simple effects presented, based on significance of an interaction (P < 0.10). Expired breath samples were collected from cattle throughout the study at feeding using an automated gas collection system and ana-lyzed for CH4:CO2. Rumen fluid collected via esophageal tub-ing on d 21 and 63, before feeding, was analyzed for VFA profile and microbial community analysis. A forage quality × monensin interaction existed for CH4:CO2 (P = 0.02), as monensin decreased CH4:CO2 in LQ diets (P < 0.01), but had no effect in HQ diets (P > 0.77). Inclusion and fat content of MDGS did not impact CH4:CO2(P > 0.43). For A:P, a fat content × level of MDGS interaction existed (P = 0.01) as A:P was greater for 40% compared to 20% normal MDGS (P < 0.01) but unchanged for de-oiled MDGS (P > 0.72). Cattle fed 40% de-oiled MDGS (P < 0.01) and monensin (P = 0.06) had lower A:P in HQ diets compared to normal MDGS or no monensin. A forage quality × monensin interaction existed for ADG (P = 0.07), with steers fed monensin having 9% greater ADG in HQ diets, but ADG decreased by 4.2% in LQ diets when monensin was fed compared to none. MDGS level ×
98
monensin interactions existed for ADG and G:F (P < 0.05). Feeding monensin increased ADG in diets with 40% MDGS (P = 0.02) and had no effect in diets with no MDGS (P = 0.33). Feeding monensin decreased G:F of cattle fed diets with no MDGS but had no impact when fed diets with 40% MDGS. Cattle fed HQ were 23% more efficient (P < 0.01) compared to LQ. Feeding MDGS impacted performance, but not methane, while forage quality impacted both performance and methane production of growing cattle.
Key Words: feedlot, growing cattle, methane
221 Growth adjustment to diet improves profitability within the feedlot. N. O. Minton*, W. J. Sexten, M. Kerley, University of Missouri, Columbia
Feed efficiency improvement can increase beef production profitability. Our objective was to compare feeding system (SYS) effect on efficiency, carcass composition and feedlot profitability. We hypothesized sorting cattle by initial ADG and feeding subsequent diets formulated to match growth po-tential would increase gain efficiency and profitability com-pared with traditional feeding programs. Heifers (n = 287; 224.70 ± 1.4kg) purchased through livestock markets were fed a diet formulated to meet effective energy (EE) and AA requirements for 2.1 kg ADG over 42 d following a 14 d re-ceiving period. From the 42-d ADG, heifers were blocked as high (1.98 to 2.71 ± 0.18 kg/d), mid (1.67 to 1.97 ± 0.08 kg/d) and low (0.54 to 1.70 ± 0.22 kg/d) ADG and were stratified across SYS. Diets were formulated without forage inclusion for matched (M) and nontraditional (NTRAD) SYS. High (HM), mid (MM) and low (LM) blocks within the M SYS were formulated to meet EE and AA requirements. High, mid and low blocks were not separated in either traditional (TRAD) or NTRAD SYS. The TRAD SYS was fed a diet formulated to meet NRC requirements, while the NTRAD SYS was fed the MM diet. Diets were fed from Day 43 un-til slaughter, however, HM and MM SYS were transitioned as needed to the LM diet to adjust for decreasing finishing period nutrient requirements. Heifers were slaughtered when gain cost exceeded value of gain, visually-assessed back fat ≥ 0.76 cm, and estimated HCW ≥ 243.2 kg. Final BW and ADG were not different (P > 0.10) among SYS. Additionally, HCW, LM area, back fat thickness, yield grade and quality grade were not different (P > 0.10) among SYS. Nontradi-tional and M SYS had less DMI (7.32 and 7.40 vs. 8.36 kg ± 0.30; P ≤ 0.001) and feed conversion ratios (5.97 and 5.86 vs. 6.59 ± 0.30; P ≤ 0.001) than TRAD. Diet cost for TRAD was less ($0.327/kg; P ≤ 0.001) than both NTRAD ($0.347/kg) and M ($0.346/kg) SYS. No SYS resulted in profit; however, loss per heifer was less (P = 0.02) for M (-$6.20) compared with TRAD (-$51.88), where loss per heifer for NTRAD was
not different (P ≥ 0.10) from either M or TRAD. In conclu-sion, forage removal combined with balancing for EE and AA growth performance requirements can increase feedlot effi-ciency and profitability.
Key Words: beef, feed efficiency
222 Effects of feeding NEXT ENHANCE in finishing diets on performance and carcass characteristics. C. J. Bittner1*, G. E. Erickson1, K. H. Jenkins2, M. K. Luebbe2, M. A. Andersen3, 1University of Nebraska-Lincoln, Lincoln, 2University of Nebraska, Scottsbluff, 3Novus International, Inc., St. Charles, MO
A feedlot study evaluated the effects of increasing NEXT ENHANCE (NEXT) essential oils in finishing diets contain-ing monensin and tylosin on animal performance and carcass characteristics. Three hundred and sixty calf-fed steers (BW = 301 ± 28 kg) were utilized in a randomized block design (n = 3 BW blocks) experiment. Treatments consisted of feed-ing NEXT at rates of 0, 75, 150, 225, and 300 mg/steer daily. Monensin and tylosin were provided in all treatments at 360 and 90 mg/steer daily, respectively. A common basal diet con-sisted of 65% dry-rolled corn, 25% wet distillers grains plus solubles, 5% wheat straw, and 5% supplement (DM basis). Steers were fed for 141, 169, or 174 d, depending on BW block. Animal performance and carcass characteristics were analyzed using the MIXED procedure of SAS with pen as the experimental unit. As rate of NEXT in the diet increased, DMI decreased linearly (P = 0.04). Greatest reductions in intake were observed when steers were fed NEXT at 225 and 300 mg/steer daily, which resulted in a 4.6% and 2.8% reduction in DMI, respectively, compared to cattle fed 0 NEXT. Feeding increasing rates of NEXT did not affect ADG (P = 0.77; lin-ear) or final BW (P = 0.75; linear). Feed efficiency increased linearly (P < 0.02) as rate of NEXT in the diet increased. Compared to the 0 treatment, feeding NEXT at 225 and 300 resulted in 4.4% and 3.8% improvement in G:F, respectively. Hot carcass weight, dressing percent, marbling score, and LM area were not different (P > 0.18; linear or quadratic) among treatments. A trend was observed for calculated yield grade to decrease linearly (P = 0.11) as rate of NEXT increased due to a linear (P = 0.02) decrease in 12th rib fat. There was also a trend for an increased (P = 0.11; linear) incidence of liver abscesses with increasing rates of NEXT. These data suggest feeding NEXT ENHANCE decreases DMI without impacting ADG, resulting in improved G:F. Greatest improvements in G:F were observed when NEXT was included at 225 and 300 mg/steer daily in feedlot finishing diets containing monensin and tylosin.
Key Words: beef cattle, essential oil, feedlot performance
99
223 Effect of feeding Enspira on fiber digestibility. J. L. Harding*, A. L. Shreck, M. L. Jolly, J. C. MacDonald, G. E. Erickson, University of Nebraska-Lincoln, Lincoln
Two studies were conducted to evaluate the impact of treat-ing feeds with a fibrolytic enzyme (Enspira). The first experi-ment (Exp. 1) evaluated the effect of treating feedstuffs with Enspira on in vitro dry matter digestibility (DMD) and gas production. Twelve feeds were treated with 4 levels of the en-zyme (0, 125, 250, or 375 mg/kg of DM). Experiment 2 (Exp. 2) evaluated the effect of treating a feedlot diet with Enspira on in vivo DM, OM, NDF, ADF, and hemicellulose digest-ibility. In Exp. 2, 4 ruminally cannulated steers were utilized in a 3 period switchback design. Treatments consisted of a basal diet treated with the enzyme (enzyme), and the same basal diet without the enzyme treatment (control). Enspira was added to the total mixed ration at a rate of 125 mg/kg of DM. In situ bags containing corn bran, high moisture corn (HMC), corn residue, and corn silage were incubated for 0, 6, 12, 16, 24, 48, 96 h in each steer. Data from both experiments were analyzed using the mixed procedures of SAS. In Exp. 1, enzyme treatment increased in vitro DMD of HMC, wet dis-tillers grains plus solubles (WDGS), corn bran, and husks (P < 0.05). There was a quadratic increase in gas production for corn leaves, as well as a linear increase in gas production for corn bran treated with increasing levels of Enspira (P < 0.05). In Exp. 2, no differences (P > 0.25) in NDF digestion rates were observed between the control and enzyme treatment for corn bran (6.42 vs. 5.61%/h, respectively), HMC (2.20 vs. 2.20%/h, respectively), or corn residue (2.26 vs. 2.16%/h, respectively). The control had a higher NDF digestion rate (5.22%/h) than the enzyme (1.74%/h) for corn silage (P < 0.01). There were no differences (P > 0.40) in in vivo digest-ibility of OM (82.3 vs. 80.2%), NDF (63.5 vs. 55.2%), ADF (56.3 vs. 51.2%), or hemicellulose (70.7 vs. 63.0%) between the control and enzyme treatment. Total VFA concentrations (113.0 vs. 113.3 mMol; control vs. enzyme) were not different (P = 0.72). Feeding Enspira showed some improvements on in vitro DMD and gas production, but when used in an in vivo digestion study no differences in digestibility, NDF digestion rate, or rumen fermentation were observed.
Key Words: cattle, enzyme, fiber
224 Evaluation of changes in nutritional quality of corn residue throughout grazing period. M. Jones*, J. C. MacDonald, T. J. Klopfenstein, G. E. Erickson, K. Glewen, A. K. Watson, University of Nebraska-Lincoln, Lincoln
Residues of corn (Zea mays) have successfully been utilized as an economical roughage and energy source for ruminants. Corn plants from two hybrids (102 and 119 d maturity) were planted at two different planting dates (April 27 and May 27)
and harvested at periodic intervals from September 2012 to December 2012 to determine changes in quality and propor-tion of corn residue as the plant dries and is exposed to effects of weathering. Plants were separated into stem, blade/sheath, husk/shank, cob and grain, and analyzed for dry matter (DM), neutral detergent fiber (NDF) and total digestible nutrients (TDN). Estimates of TDN were derived from NDF and in situ NDF digestibility assuming 100% digestibility from the soluble fraction and 12% metabolic loss. Hybrid did not in-fluence the proportion of plant components (P > 0.40) even though it tended to influence the NDF and TDN of the residue (P < 0.10). Percentage of DM in each plant part increased until the November sampling date for both hybrids and plant-ing dates and then began to decline (P < 0.01). Grain, as a percentage of the total plant DM, tended to increase to ap-proximately 60% where it then remained relatively constant for both planting dates and hybrids (P < 0.15). Proportions of stem, blade/sheath, husk/shank and cob made up smaller com-ponents of total plant DM as it matured with the largest rela-tive reduction occurring in the blade/sheath or stem. A linear increase over time for NDF was observed for both hybrids in the May-planted plot (P < 0.01) whereas NDF content of the stem and husk/shank decreased in the April-planted plot (P < 0.01). Hybrid had an impact on TDN values (P < 0.01) pri-marily because the 119 d hybrid was less mature at the early sampling dates. In both plots, TDN of husk/shank remained constant (P > 0.40) while cob decreased (P < 0.10). Corn hy-brid, planting date and plant component affect the quality of residue ruminants will be consuming at a certain time point during the grazing season. However, plant maturity appears to be the largest factor in determining residue quality.
Key Words: corn residue, plant components, forage quality
RUMINANT NUTRITION SYMPOSIUM: AMINO ACIDS
225 Rumen protected amino acids for dairy cows: past, present and future. C. G. Schwab*, Schwab Consulting, LLC, Boscobel, WI
Considerable progress has been made in balancing dairy cow rations for amino acids (AA). Research conducted over 40 yr ago demonstrated that some AA (notably lysine and me-thionine) were more limiting than others. The same research indicated that while selective protein supplementation would be important, rumen protected forms of these AA would also be needed as a first step to AA balancing. Shortly after those findings, rumen protected Met (RP-Met) supplements became available and commercial usage started. While sales of RP-Met supplements continued to increase in North America ever since, it wasn’t until more recently that RP-Lys supplements

100
became available. Their availability, in conjunction with im-proved guidelines for AA balancing and the higher value of milk protein, has been a boost for the sales of both supple-ments. Coupled with continuing government pressure to re-duce its environmental impact and the economic benefit of reduced protein feeding, the dairy industry is increasingly embracing AA balancing. Implementation requires selective use of RP-AA, and there is every reason to believe their use will continue to increase and that other RP-AA (e.g., histidine) will also become available. The benefits of AA balancing are well documented. These include: 1) increased milk and milk component yields, 2) increased milk component percentages, 3) increased conversion of feed N to milk protein, 4) reduced need for supplemental rumen undegraded protein, and 5) in-creased herd profitability. Of considerable interest are recent findings of AA balancing with transition cows. The impact on early lactation performance has often been striking, and new research findings are starting to reveal why the responses are sometimes as profound as they are. For example, some recent findings with RP-Met supplementation include: 1) a faster re-covery to energy balance, 2) increased serum glucose levels, 3) reduced inflammatory signaling, 4) increased antioxidant capability, and 5) positive effects on embryonic development. There is also evidence that increasing Lys and Met supplies could increase the capacity of the liver to export fat. More research is needed to support these findings, but these results confirm the fact that most aspects of intermediary metabolism are impacted by protein synthesis and that alleviating an AA deficiency, particularly one like Met which has metabolic functions in addition to those of protein synthesis, is impor-tant to the health and performance of transition cows. A bet-ter understanding of the AA requirements of transition cows would be helpful to obtaining a full appreciation of the impact of AA balancing.
Key Words: amino acids, dairy cows
226 Varied effects of multifunctional amino acids on reproduction in lactating dairy cows. M. C. Wiltbank1*, M. Z. Toledo1, P. D. Carvalho1, A. H. Souza2, F. Peñagaricano1, G. M. Baez1, R. V. Barletta1, H. Khatib1, D. Luchini3,R. D. Shaver1, 1University of Wisconsin- Madison, Madison, 2University of California, Agriculture and Natural Resources, Tulare, 3Adisseo, Naperville, IL
In addition to being the basic building blocks for proteins, many amino acids have recently been classified as “func-tional amino acids” due to their effects on physiologic, metabolic, epigenetic, and nutritional properties. Function-al actions of amino acids are being actively researched in many species and have important implications for health, productivity, cellular function, and reproduction in lactat-ing dairy cows. Two examples of functional amino acids, methionine (Met) and arginine (Arg), will be discussed.
Met, along with lysine, and histidine are considered the first rate-limiting amino acids for milk production in high-producing dairy cows fed diets based on corn silage or alfalfa haylage. Early bovine embryo development until the blastocyst stage appears morphologically normal dur-ing in vitro culture with physiological concentrations of Met. However, deficiencies of Met caused by incubation with the Met antagonist, ethionine, inhibited the transition from morula to blastocyst during the first 7 d of gestation. In addition, recent data from our laboratory demonstrated that supplementation of lactating dairy cows with rumen-protected Met increased milk protein yield and altered gene expression in the early embryo, although gross morphology of the early embryo was unchanged. Gene expression was mostly inhibiting by Met supplementation, as might be ex-pected due to Met-facilitated DNA methylation in the early embryo. Later embryonic development may also be inhib-ited by insufficient circulating Met in lactating dairy cows, based on studies using cultures of rat embryos in bovine serum. The effects of Arg supplementation on reproduction, particularly in gestating sows, ewes, and rats, have been ex-tensively researched. Dietary requirements for Arg increase during gestation due to placental development during early gestation (Days 30–60 in pigs) and fetal growth during later gestation ( > 60 d of gestation). In addition, Arg increases production of polyamines (essential for implantation) and nitric oxide (increases utero-placental blood flow due to va-sodilation and angiogenesis), and activates the mTOR cell signaling pathway (increasing protein synthesis and cell proliferation). Under practical conditions, supplementa-tion with ~0.8% arginine between d 14 to 25 or 30 to 114 increased litter size or reduced embryonic death in sows. Nevertheless, Arg supplementation during the first few d after breeding reduced litter size, highlighting the impor-tance of targeting Arg supplementation to the proper win-dow of pregnancy. In addition, stressful conditions, such as virus infection, dramatically increased pregnancy loss, and supplementation with Arg or glutamine prevented these pregnancy losses, possibly due to enhanced immune func-tion. Intravenous infusion of late pregnant ewes with Arg (last 21 d of pregnancy) increased percentage of lambs born alive and enhanced birth weights. In summary, current re-search supports the idea that reproduction may be enhanced by supplementation of Met and Arg. Some of these effects may be due to improved efficiency of protein production in animals with subtle amino acid deficiencies. In addition, other physiological effects may also be critical for enhanc-ing fertility, such as improved utero-placental blood flow due to Arg supplementation or superior regulation of gene expression due to Met-enhanced DNA methylation of the early embryo. Further research is needed to define the ap-propriate dose and timing of amino acid supplementation to enhance reproductive efficiency of lactating dairy with Met, Arg, or other functional amino acids.
Key Words: amino acids, dairy cows

101
227 Rumen protected methionine and the genome: nutrigenomics and beyond. J. J. Loor*, Universty of Illinois, Urbana
The importance of methionine (Met) as one of the most-lim-iting amino acids for milk protein synthesis in dairy cows is well-established. Positive effects of supplementation of Met also have been observed in terms of milk production and milk fat yield. Recent work has revealed that the benefits of rumen-protected methionine (RPM) during the transition period are not only a function of greater voluntary dry matter intake post-partum but also a better immune-metabolic status, i.e., lower concentrations of inflammation markers and better antioxidant capacity. Several of these molecules circulating in the blood are synthesized in liver, which readily utilizes exogenous Met in the 1-carbon metabolism cycle leading to the synthesis of key intermediates such as S-adenosylmethionine (SAM), phosphatidylcholine (PC), and glutathione. These intermedi-ates play crucial roles in liver lipid metabolism, e.g., PC is es-sential for synthesis of very-low density lipoproteins (VLDL) which help export triacylglycerol from liver, thus, reducing the likelihood of the cow developing fatty liver and ketosis. The molecule SAM is extremely important as a methyl donor, not only for intermediary metabolites but also for the process of DNA methylation which is a fundamental process occur-ring in mammalian cells. Methylation of DNA alters gene ex-pression in cells, and is one of the main causes of epigenetic modifications. Therefore, besides its well-established role in milk protein synthesis and liver lipid metabolism, the impact of an optimal level of RPM fed to dairy cattle could have im-plications at the gene level; not only on the cow but also on the developing calf. The advent and application of genome-enabled technologies such as “transcriptomics” and “metabo-lomics” along with “bioinformatics” analyses are widely-recognized as tools that have helped advance the knowledge of animal function. Application of these tools is ideal for the study the effects of RPM on tissue/cell metabolism/function during key life stages of dairy cattle such as the transition pe-riod. The aims of this presentation is to provide an overview of the effects of RPM in dairy cattle at the molecular level including epigenetics, nutrigenomics, and metabolomics. Em-phasis will be placed on physiological interpretation of these types of data in the context of RPM nutrition. Examples of nutrigenomics and metabolomics work conducted with RPM in terms of liver metabolism and function will be highlighted. Use of these data for identification of biomarkers with poten-tial for use as predictors for animal at greater risk of develop-ing metabolic disorders postpartum will be discussed.
Key Words: genomics, period, transition nutrition
UNDERGRADUATE STUDENT COMPETITION ORAL I
228 Performance and carcass measurements by fall-born calves weaned in the morning or evening using either fenceline or traditional weaning methods. H. L. Bar-timus1*, J. D. Caldwell1, B. C. Shanks1, K. P. Coffey2, D. S. Hubbell, III3, J. D. Tucker3, C. R. Krehbiel4, C. L. Maxwell4, 1Department of Agriculture and Environmental Sciences, Lincoln University, Jefferson City, MO, 2Depart-ment of Animal Science, University of Arkansas Division of Agriculture, Fayetteville, 3Livestock and Foresty Re-search Station, University of Arkansas Division of Agricul-ture, Batesville, 4Oklahoma State University, Stillwater
Weaning management is important in the beef industry, es-pecially considering the stress, health issues, and weight loss associated with this practice. Previous work has reported that weaning distress can be reduced by fenceline weaning and producer testimonies have suggested that evening weaning may be more favorable compared with typical morning wean-ing. Our objective was to evaluate post-weaning performance and carcass measurements by fall-born calves weaned in the morning or evening using fenceline or traditional weaning methods. Fall-born crossbred calves (n = 94; 222 ± 4.2 kg body weight) were stratified by body weight, age, sex, and age of dam and were allocated randomly to 1 of 8 groups, 2 wk be-fore weaning. Groups were then assigned randomly to 1 of 4 treatments: 1) Traditional AM (2 replications); 2) Traditional PM (2 replications); 3) Fenceline AM (2 replications); or 4) Fenceline PM (2 replications). Following the 14-d weaning period, all calves were comingled and grazed together. At the end of the backgrounding period, steer calves (n = 48; 237 ± 6.1 kg body weight) were transported, finished at the Okla-homa State University Willard Sparks Beef Research Center, and were harvested at a commercial slaughter facility. Wean-ing weight, 14-d, 49-d, and 79-d post-weaning weight, 79-d gain, 79-d ADG, final weight, final ADG, and final weight gain did not differ (P ≥ 0.37) across treatments. Average daily gain (14-d) and calf gain (14-d) through the weaning period were greater (P ≤ 0.05) from PM compared with AM and tended (P = 0.10) to be greater from fenceline compared with tradi-tional weaning methods. At 49 d, ADG and gain were greater (P ≤ 0.05) from fenceline compared with traditional weaning methods; however, there were no differences (P ≥ 0.78) be-tween AM and PM. Hot carcass weight, backfat thickness, rib eye area, KPH percentage, yield grade, marbling, and quality grade did not differ (P ≥ 0.13) across treatments. Therefore, there may be advantages in performance when weaning in the evening using the fenceline method, but these differences may not persist during the post-weaning and finishing periods.
Key Words: AM weaning, calves, fenceline weaning, PM weaning, traditional weaning,

102
229 Performance by Dorper-Katahdin crossbred lambs weaned using two different weaning methods. J. K. Hanlin1*, J. D. Caldwell1, B. C. Shanks1, T. Wuliji1, E. A. Backes2, A. L. Bax1, 1Department of Agriculture and Environmental Sciences, Lincoln University, Jefferson City, MO, 2University of Arkansas, Fayetteville
Weaning can be stressful on young animals and commonly results in decreased performance. However, alternative wean-ing methods have been advocated as management practices to reduce stress and increase performance, particularly in cattle; although, little research has been published on their effective-ness in hair sheep. The objective of this study was to evalu-ate the effects of traditional compared with fenceline weaning methods on the performance and behavior of Dorper-Katah-din crossbred lambs. Over 2 consecutive y, Dorper-Katahdin crossbred lambs (n = 168; 74 ± 4.4 d of age) were stratified within litter, weight, BCS, and sex and were allocated ran-domly to 1 of 12 groups, 7 d before weaning. Groups were then assigned randomly to treatments consisting of 1) fence-line weaning (6 replications) or 2) traditional weaning (6 rep-lications). Fenceline weaned lambs were placed in 37.2 m2 drylots adjacent to their dams while traditional weaned lambs were placed in the same size drylots away from their dams. All groups had ad libitum access to endophyte-infected tall fescue [Lolium arundinaceum (Schreb.) Darbysh] hay, water, mineral, and were offered a grain supplement at 1% of BW (as-fed). Weaning weight, 14-d post-weaning weight, ADG, gain (14-d), total ADG, and total gain (43-d) did not differ (P ≥ 0.70) across treatments. Also, the percentage of lambs walk-ing rapidly, running, standing, and lying down did not differ (P ≥ 0.28) across treatments. However, a weaning method × time interaction (P ≤ 0.05) was observed for percentage of lambs vocalizing, with more lambs vocalizing in the fenceline treatment at 12 h. A time effect (P ≤ 0.05) was detected for percentage of lambs running, standing, and lying down with the highest percentage of lambs running at 12 h compared with 24, 48, or 72 h, a lower percentage of lambs standing at 24 h compared with 12, 48, or 72 h and a lower percentage of lambs lying down at 12 h compared with 24, 48, or 72 h af-ter weaning. Although well established using cattle, fenceline weaning of lambs may not improve performance or behavior.
Key Words: fenceline, lambs, weaning
230 Growth of periruminant Holstein bull calves fed a fermentation extract of Aspergillus oryzae. E. M. Dudash*, T. T. Yohe, R. M. Townsley, Y. Roman Garcia, A. R. Gibson, K. M. O’Diam, K. M. Daniels, Department of Animal Sciences, The Ohio State University, Wooster
A fermentation extract of the fungus Aspergillus oryzae can be utilized as a direct fed microbial. The objective was to de-termine if dietary inclusion of an extract of A. oryzae would
improve the growth of Holstein bull calves from birth thru 1wk post weaning; it was hypothesized that it would. Bull calves (n = 52) were used in this experiment. Calves were randomly assigned to a slaughter age, 4 wk (n = 16) or 8 wk (n = 36) and treatment, control (CON; n = 27) or direct fed microbial (DFM; n = 25). Calves averaged 43.2 ± 1.0 kg BW and 2.8 ± 0.3 d of age at the beginning of the experiment. Calves were housed and fed individually; no bedding was used. Calves as-signed to DFM were fed 2 g of DFM daily. Liquid DFM was delivered in milk replacer for the first 4 wk of the trial; solid DFM was top-dressed on texturized grain thereafter. Calves were fed non-medicated milk replacer twice daily (22.0% CP, 20.0% fat DM basis; 680 g/d) and were weaned on consump-tion of 0.91 kg of grain (20% CP, 2.0% fat; medicated with decoquinate) for 3 consecutive days or on d 45 of the study, whichever came first. Calves had ad libitum access to grain and water throughout the trial. Feed intake was recorded daily. Body weight (BW) was recorded weekly. There was no effect of treatment on BW; 8 wk BW was 74.5 ± 1.9 kg for CON and 74.6 ± 1.9 kg for DFM. Total dry matter intake per calf did not differ: from 0 thru 4wk (19.48 ± 0.67 kg of DM), 5 thru 8wk (39.44 ± 2.05 kg of DM), or for the whole trial (58.70 ± 3.30 kg of DM). Lastly, the gain to feed ratio did not differ by treat-ment: from 0 thru 4wk (0.59 ± 0.05), 5 thru 8wk (0.53 ± 0.03), or for the whole trial (0.56 ± 0.04). Here, dietary inclusion (2 g/d) of an extract of A. oryzae did not result in improved calf growth when supplemented animals were compared to cohorts not fed the direct fed microbial. It is possible that the dose used here was not high enough to elicit treatment effects. Given that effects have been noted in other species, a follow-up dose ti-tration study with similar diets as used here seems warranted.
Key Words: dairy calf, direct fed microbial, growth
231 Health of Holstein bull calves fed a fermentation extract of Aspergillus oryzae. R. M. Townsley*, T. T. Yohe, E. M. Dudash, Y. Roman Garcia, A. R. Gibson, K. M. O’Diam, K. M. Daniels, Department of Animal Sciences, The Ohio State University, Wooster
The objective was to determine whether dietary inclusion of a fermentation extract of the fungus Aspergillus oryzae, com-monly used as a direct fed microbial, would improve mea-sures of health in Holstein bull calves (n = 52) from birth thru 1wk post weaning. Calves were randomly assigned to a slaughter age, 4 wk (n = 16) or 8 wk (n = 36) and treatment, control (CON; n = 27) or direct fed microbial (DFM; n = 25). Calves averaged 43.2 ± 1.0 kg BW and 2.8 ± 0.3 d of age at the beginning of the experiment. Calves were housed and fed individually; no bedding was used. Calves assigned to DFM were fed 2 g of DFM daily. Liquid DFM was delivered in milk replacer for the first 4 wk of the trial; solid DFM was top-dressed on texturized grain thereafter. Calves were fed non-medicated milk replacer twice daily (22.0% CP, 20.0% fat DM basis; 680 g/d) and were weaned on consumption of
103
0.91 kg of grain (20% CP, 2.0% fat; medicated with decoqui-nate) for 3 consecutive days or on d 45 of the study, whichever came first. Calves had ad libitum access to grain and water throughout the trial. Calf fecal scores were recorded daily then averaged across treatment. On a weekly basis, DFM calves scoured more frequently than CON. All medical interventions (including oral electrolytes) were recorded. Treatment for respiratory ailments were more frequent in CON than DFM. Medical costs were calculated on a calf basis then averaged by treatment. Medical costs for calves from 0 thru 4wk ($43.01 ± 2.40) and 5 thru 8wk ($11.18 ± 2.40) did not differ by treat-ment. For 8wk calves, jejunal lymph nodes were collected on slaughter for flow cytometric analysis; CD4 and CD8 T cell populations as a measure of immune function. The CD4 cell population as a percentage of total observed cells was greater in DFM calves. Treatment did not affect CD8 cell popula-tion as a percentage of total observed cells. Flow cytometric results indicate that DFM may affect the adaptive immune system through effects mediated by CD4 positive cells. In conclusion, calves fed DFM scoured more frequently, but a lesser percentage of DFM calves were treated for respiratory ailments leading to no effect on medical costs. Interestingly, CD4 cell population of jejunal lymph nodes was greater in DFM calves, which warrants further research.
Key Words: dairy calf, direct fed microbial, T cells
232 In utero heat stress alters body temperature and loin eye area in barrows. M. C. Shane*, T. A. Wilmoth, Z. D. Callahan, T. J. Safranski, B. R. Wiegand, University of Missouri, Columbia
In utero heat stress has been shown to alter the thermoregula-tion of the postnatal animal, altering heat tolerance and po-tentially growth performance. Therefore, the objective here was to determine how in utero heat stress, excess lysine and Paylean altered body temperature, lean tissue accretion, and fat deposition in barrows throughout the finishing phase. At 25 kg, barrows of control (TN; n = 40) or heat stressed (HS; n = 40) dams were individually housed and fed a corn soy-bean meal diet. At this time, barrows were equally and ran-domly assigned to receive a diet that met (100%; n = 20) or exceeded (110%; n = 20) NRC lysine requirements. In the last 30 d of finishing, barrows were again equally and randomly assigned to a diet containing 0 (CTL; n = 10) or 7.4 ppm Pay-lean (PAY; n = 10). Diets were fed until 121 kg of weight was attained. During both finishing phases, skin temperatures of the ear (ETEMP) and body (BTEMP) were obtained twice daily 2 d per week and ultrasound was performed to determine loin eye area (LEA) and back fat depth (BF). Temperatures and ultrasound data are reported according to which finishing phase measures were taken, either first finish phase (F1) or second finish phase (F2). In F2, HS caused reduced (P < 0.05) ETEMP (35.07 ± 0.14 vs. 35.54 ± 0.14°C) and greater LEA (P = 0.03; 40.13 ± 0.66 vs. 38.15 ± 0.65 cm2); 110 caused higher
BTEMP (P < 0.05; 32.77 ± 0.34 vs. 33.76 ± 0.33°C); and Pay-lean increased ETEMP and BTEMP (P < 0.05; 34.54 ± 0.26 vs. 33.51 ± 0.26; 33.44 ± 0.28 vs. 32.31 ± 0.28°C) and LEA at slaughter (54.89 ± 1.06 vs. 48.85 ± 1.04 cm2). HS PAY pigs had higher temperatures (P < 0.05) than HS CTL pigs (33.96 ± 0.41 vs. 32.1 ± 0.40°C), but not TN CTL pigs (33.96 ± 0.41 vs. 32.52 ± 0.40°C). HS CTL had larger (P = 0.02) LEA in F2 than TN CTL (44.01 ± 0.89 vs. 40.97 ± 0.89 cm2). ETEMP was inversely related (P < 0.05) to LEA in F1 (r = -0.20). HS barrows maintain lower temperatures, which were increased by 110% lysine and Paylean, indicating that HS barrows have the potential to maintain lower body temperatures and pro-duce greater LEA at slaughter.
Key Words: heat stress, loin eye area, ractopamine, temperature
233 The effects of glucuronic acid and N-acetyl-D-glucosamine on the in vitro fertilization of pigs. C. L. Durfey1*, K. Schmidt1 and B. D. Whitaker2, 1The University of Findlay, Findlay, OH, 2University of Findlay, Findlay, OH
High incidences of polyspermic penetration in porcine oo-cytes during in vitro fertilization (IVF) continue to challenge researchers. The objective of this study was to reduce the inci-dence of polyspermic penetration by supplementing glucuron-ic acid (GA) and N-acetyl-D-glucosamine (GlcNAc) during maturation of the oocytes. Oocytes (n = 1000) were supple-mented during the last 24 h of maturation with either 0.01 mM GA, 0.01 mM GlcNAc, 0.01 mM GA and GlcNAc, or 0.005 mM GA and GlcNAc and then evaluated for perivitel-line space thickness. Using a portion of the oocytes (n = 330), intracellular glutathione (GSH) concentrations were deter-mined after maturation. The remaining oocytes were fertilized and either evaluated 12 h after IVF for cortical granule release and fertilization kinetics or they were cultured as embryos. The PVS thickness was significantly thicker (P < 0.05) in all treatments compared to the control (4.45 ± 0.71 mm). Oocytes supplemented with 0.01 mM GA had significantly lower (P < 0.05) intracellular GSH concentrations (4.16 ± 0.13 pmol/oocyte) compared to oocytes without supplementation (5.86 ± 0.09 pmol/oocyte). Oocytes supplemented with 0.005 mM GA and GlcNAc had significantly higher (P < 0.05) intracel-lular GSH concentrations (11.79 ± 2.06 pmol/oocyte) com-pared to oocytes that were not supplemented. Oocytes supple-mented with 0.01 mM GA or 0.01 mM GA and GlcNAc had significantly more cortical granule exocytosis (P < 0.05) com-pared to the other treatments. Oocytes supplemented with GA had significantly lower incidences (P < 0.05) of polyspermic penetration compared to the control (32.00 ± 4.80%) or 0.01 mM GlcNAc (40.00 ± 7.93%) and significantly higher rates (P < 0.05) of cleavage and blastocyst formation by 48 and 144 h post-fertilization. These results indicate that supplementing GA during oocyte maturation decreases the incidence of poly-
104
spermic penetration by increasing PVS thickness and cortical granule exocytosis in pigs.
Key Words: glutathione, polyspermic penetration, oocyte penetration
234 Effects of drought-affected corn and non-starch polysaccharide enzymes on nursery pig performance. E. L. Frantz1*, H. L. Frobose1, J. M. DeRouchey1, R. D. Goodband1, J. R. Bergstrom2, C. K. Jones1, 1Kansas State University, Manhattan, 2DSM Nutritional Products, North America, Marshall, MO
A total of 360 barrows (PIC 1050 × 337, initially 6.71 kg BW) were used to determine the effects of Roxazyme G2G and/or Ronozyme VP on growth performance and nutrient digestibil-ity of nursery pigs fed normal or drought-stressed corn. Initial-ly, corn samples were collected from 34 separate lots and ana-lyzed to find representatives of normal and drought-stressed corn. These same lots were also used in a separate experiment measuring the impact of drought stress on diet manufacturing characteristics. The lot selected to represent the normal corn had a test weight of 25.35 kg/bu, < 5 ppb aflatoxin, 15.0% moisture, and contained 0.77% b-glucan. The lot selected to represent drought-stressed corn had a test weight of 24.63, 6 ppb aflatoxin, 14.3% moisture, and 0.83% b-glucan. Pigs were allotted to pens at weaning (d 0) and were acclimated to a com-mon diet for 10 d before the start of this experiment. On d 10 post-placement, pigs were weighed and pens randomly allotted to 1 of 8 dietary treatments in a completely randomized design. Treatments were arranged in a 2 × 4 factorial with main effects of corn (normal vs. drought-stressed) and enzyme inclusion (none vs. 100 ppm Roxazyme G2G vs. 250 ppm Ronozyme VP vs. 100 ppm Roxazyme G2G + 250 ppm Ronozyme VP). Pigs were fed experimental treatments from d 10 to 35 post-weaning in two phases. Feed and fecal samples were collected on d 30 postweaning and analyzed to determine apparent total tract digestibility of nutrients. The nutrient concentrations of normal and drought-stressed corn were similar, which resulted in few treatment or main effects differences of corn type or enzyme inclusion. No interactions were observed (P > 0.24) between corn source and enzyme inclusion. Overall (d 10 to 35), there was no effect on ADG or ADFI, but enzyme inclu-sion tended to improve (P = 0.09; 0.74 vs. 0.69) G:F, which was primarily driven by the improved (P = 0.04; 0.76 vs. 0.72) feed efficiency of pigs fed Roxazyme G2G in Phase 1 (d 10 to 25 postweaning). In conclusion, drought stress did not alter the non-starch polysaccharide concentration of corn. Because non-starch polysaccharide substrates were similar across treat-ments, it was not surprising that enzyme inclusion showed little benefit to nursery pig growth performance; however, improved feed efficiency of pigs fed diets containing Roxazyme G2G from d 10 to 25 postweaning warrants further investigation.
Key Words: drought, enzymes, nursery pig
235 The effects of an altered suckling treatment on piglet performance during late lactation and the nursery period. K. M. Gourley*, H. L. Frobose, M. D. Tokach, J. M. DeRouchey, S. S. Dritz, R. D. Goodband, J. L. Nelssen, D. L. Davis, Kansas State University, Manhattan
Societal concerns regarding sow housing have renewed inter-est in lactational estrus stimulation. As manipulation of suck-ling pressure is a critical component of stimulating estrus in sows during lactation, the effects of an altered suckling treat-ment (ALT) on nursery pig growth were also studied in a 14-d experiment encompassing late lactation and the early nursery period. A total of 611 pigs (PIC 327 × 1050) nursing 54 sows were used over two farrowing groups. Sows were allotted to treatments on d 18 of lactation when all but the 5 lightest weight pigs from each ALT litter were split-weaned (SW) and moved to a nursery. Pairs of ALT litters were established within parity and the light pigs in these litters combined. Combined litters rotationally suckled each sow of the pair for 12 h/d from d 18 until weaning on d 25 (RS). Control litters were weaned on d 21. At weaning, pigs were randomly assigned to pens (7 pigs/pen). After weaning, pigs were fed a common feed budget of 1.8 kg/pig for Phase 1 followed by a Phase 2 diet until experi-ment completion. Pigs were weighed on d 18, 21, 25, 28, and 32 of age. Differences in weight gain, litter weight variation, and the association between pig weight category ( < 4.5, 4.5 to 5.4, 5.4 to 6.4, and > 6.4 kg) on d 18 and treatment effects were evaluated. For the overall treatment comparison, growth to d 32 was similar (3.30 vs. 3.27 kg) between ALT and controls. An initial weight × treatment interaction (P < 0.01) was detect-ed for weight gain from d 18 to 32 because the RS pigs gained 15% more than lightweight controls while SW pigs were 15% lighter than heavyweight controls on d 32. The ALT litters had 50% less (P < 0.01) variation from d 18 to 32 as measured by change in CV (-4.2 vs. -1.9) and SD (0.43 vs. 0.92) com-pared to control litters. When pig weight groups at treatment initiation were compared, the ALT treatment benefited (3.04 vs. 2.59 kg; P < 0.001) growth of light ( < 4.5 kg) pigs but reduced (3.43 vs. 3.70 kg; P < 0.01) the weight gain of heavy ( > 6.4 kg) pigs versus controls. While the ALT treatment used to stimulate lactational estrus improved litter variation without negatively impacting piglet growth, additional investigation is needed to determine the effects of the ALT treatment on ulti-mate market weight and economic implications.Key Words: intermittent suckling, nursery pig, split weaning
236 Effect of diet choices on feed consumption behavior of cattle. E. VenJohn*, K. A. Miller, C. L. Van Bibber-Krueger, J. S. Drouillard, Kansas State University, Manhattan
Cattle are by nature discriminatory in their eating behavior, often selecting some plant species or parts of plants over oth-

105
ers. In feedlot production systems cattle typically are present-ed homogeneous diet mixtures, thus minimizing opportunity for them to make choices. We hypothesized that simultaneous presentation of two diets would lead to greater feed intakes for cattle fed in confinement. Forty crossbred heifers (354 ± 5.43 kg initial BW) were used in an experiment to test this hypothesis, and to determine if cattle exhibit preferences for total mixed diets made from sorghum or corn. Heifers were stratified by initial BW and randomly allocated, within strata, to one of 4 dietary treatments. Cattle were individually housed in partially covered, concrete-surfaced pens (1.5 m × 6.5 m) and fed for a total of 21 d. Treatments consisted of total mixed rations containing corn, sorghum, or a 50:50 mixture of corn and sorghum as the predominant energy source (CORN, SORGHUM, and MIX, respectively). These were compared to a fourth treatment for which cattle were presented with ad libitum amounts of both CORN and SORGHUM (CHOICE). Diets all contained 60% concentrate, 25% ground alfalfa hay, and 15% ground prairie hay. Grains were dry rolled to achieve a targeted mean geometric particle size of 1000 m. Cattle were fed ad libitum once daily at approximately 1730 h. Orts were collected daily and a 10% sample was retained for determina-tion of DM content, thus making it possible to calculate actual daily DMI for each animal. Of the 840 animal-days, cattle consumed 100% of their 24-h feed allocation in 64 instances, most of which occurred during the first week of the experi-ment. Dry matter intakes of cattle fed CHOICE (10.7 kg/d) were greater (P < 0.05) than those of cattle fed other diets (9.3, 9.3, and 9.1 for CORN, SORGHUM, and MIX, respec-tively). Differences among treatments with respect to ADG and gain efficiency were commensurate with changes in DMI, but were not significant (P > 0.24). Over the 21-d feeding pe-riod, proportions of CORN and SORGHUM consumed by the CHOICE group were 55.9 and 44.1%, respectively. Cattle fed CHOICE exhibited preference for CORN on d 2, 14, 15, 16, 17, 18, 20, and 21 (P < 0.05), but differences in proportions of the two diets consumed were not otherwise different. Si-multaneous presentation of dissimilar diets may increase feed intake of cattle fed in confinement.
Key Words: corn, feeding behavior, sorghum
UNDERGRADUATE STUDENT COMPETITION ORAL II
237 Effect of human interaction on standing behavior and health parameters of individually-housed dairy calves. T. M. Ray1*, J. D. Allen2, 1Northwest Missouri State University, Maryville, 2Northwest Missouri State, Maryville
The purpose of this study was to determine behavioral patterns and health parameters of 2 groups of individually-housed pre-
weaned dairy calves (n = 7) that had minimal or increased daily human interaction. Seven (n = 7) calves were randomly assigned to 1 of 2 groups: no human interaction above normal operation handling during a 13-d trial (n = 4; NON) and 30 min of human interaction above normal operation handling for 9 d of the 13-d trial (n = 3; INT). Postural data was col-lected utilizing HOBO Pendant G data loggers (Onset Com-puters, Bourne, MA) fitted on the rear leg of each calf and set to record every minute. Health (1 = normal to 4 = poor) and fecal (1 = normal to 4 = watery) scores were also collected daily. Data was analyzed as a completely randomized design, with calf the experimental unit. No difference (P > 0.10) was observed between INT and NON calves for fecal and health scores. Daily standing time was greater (P < 0.01) for NON calves compared to INT calves (397.3 versus 326.6 ± 15.09 min/d, respectively). Also, NON calves had more standing bouts per day (P < 0.01) than INT calves (23.4 versus 20.2 ± 0.86 bouts/d, respectively); however, standing bout dura-tions were greater (P < 0.01) in INT calves than NON calves (20.4 versus 14.6 ± 0.85 min/bout, respectively). Contrarily, there was no difference (P > 0.10) in daily lying bouts and lying bout durations between calf groups. No difference was observed (P > 0.10) in hourly standing time between treat-ment. However, standing time did change (P < 0.01) across hour regardless of treatment. Results indicate that increased human interaction may alter dairy calf behavior but may not affect calf health.
Key Words: behavior, dairy calves, health parameters, human interaction
238 An investigation of Cryptosporidium parvum and Giardia lamblia and environmental stressors in dairy calves. S. M. Waibel*, F. D. McCarthy, B. Henderson-Dean The University of Findlay, Findlay, OH
Cryptosporidium parvum and Giardia lamblia are protozoal parasites that can cause gastroenteritis in dairy calves and are zoonotic diseases causing intestinal enteritis in humans. The objective of this study was to determine if environmental stressors promote oocyst shedding of C. parvum or G. lam-blia in male dairy calves. The environmental stressors con-sidered were arrival to the facility, transfer from isolation to the main barn, and processing (castration, dehorning, vaccina-tion). Calves (n = 18) were 3–5 d of age and were obtained from local producers. The calves remained in isolation for 21 d post arrival before transfer to the main barn and were kept in individual 1 × 2 m pens. Fecal samples were collected via rectum with an eSwab® or Para-Pak® vial. Fecal collections were taken within 24 h on calf arrival, 24 h before the envi-ronmental stressor, and between 44 and 52 h after the environ-mental stressor. To determine the presence of C. parvum or G. lamblia, feces were analyzed using rapid immunochromato-graphic assay. Results indicated that no calves were positive for C. parvum or G. lamblia on arrival to the facility. Three

106
weeks later, testing detected 18% of the calves had C. parvum and 6% had G. lamblia before removal from isolation. When examined 44 to 52 h after removal from isolation 29% of the calves were positive for C. parvum and 24% for G. lamblia. Of samples collected 4 h before processing, C. parvum and G. lamblia were present in 6% and 47% of calves. When tested 44 to 52 h after processing no cases of C. parvum and 6 cases of G. lamblia were detected. The paired student t test conduct-ed before isolation removal (BIR) and after isolation removal (AIR) indicated no statistical significance for C. parvum (P = 0.2908) and G. lamblia (P = 0.1671). Samples collected before processing (BP) and after processing (AP) indicated no statistical significance for C. parvum (P = 0.1661) and G. lamblia (P = 0.2481). Based on the data G. lamblia was more prevalent than C. parvum. The data also indicates isolation may not be effective given the increased prevalence of infec-tion from C. parvum and G. lamblia before removal from iso-lation. Processing also showed no increased prevalence of C. parvum or G. lamblia. Through monitoring the calves during isolation this procedure appears ineffective at reducing the prevalence of infection from C. parvum or G. lamblia.
Key Words: Cryptosporidium, Giardia, Immunochromatography
239 The effects of socializing piglets before weaning on lactating sows. C. Shilling*, N. Diefenbacher, B. P. Bennett, K. Ledergerber, B. D. Whitaker, University of Findlay, Findlay, OH
Socializing piglets from different litters before weaning has shown to have positive effects on piglet performance with minimal consideration of the lactating sows. This study was conducted to determine if piglet socialization before weaning had any effect on the behavior, stress, or re-breeding of lactat-ing sows. An environmentally controlled farrowing room with 6 pens was used and data were obtained from 23 sows. The solid barriers between 3 farrowing pens were removed on d 14 after farrowing to permit co-mingling of piglets and the barri-ers remained separating the other 3 farrowing pens until wean-ing of all piglets on d 21 after birth. Saliva was collected from each sow twice daily using medical absorbent cotton from d 12 through d 21 after farrowing. Cortisol levels were determined after extraction from the salivary samples using an enzyme im-munoassay. Sow activity was continually recorded using sur-veillance video from d 12 to d 21 after farrowing. The behavior of each sow (standing, sitting, nursing, lying, restlessness) was recorded by 10 observers using digital video playback. The du-ration of a behavior was timed and recorded when the sow was engaging a specific behavior during the elapsed time period. Sows experiencing piglet socializing had significantly higher levels of cortisol (P < 0.05) on d 1 (797.3 ± 89.1 pg/mL) and d 2 (448.0 ± 33.1 pg/mL) of barrier removal compared to all other times. Sows not experiencing piglet socializing also had significantly higher levels of cortisol (P < 0.05) on d 1 (850.2
± 50.1 pg/mL) of barrier removal compared to all other times. Sows had a significantly longer (P < 0.05) amount of restless-ness during the first 2 d following barrier removal compared to all other times. There was a significant decrease (P < 0.05) in restlessness between d 1 (1.93 ± 0.04 h) and d 2 (0.80 ± 0.04 h) following barrier removal. Sows spent significantly less time (P < 0.05) lying down (15.22 ± 0.66 h) during d 1 following barrier removal compared to all other times. Socializing litters 7 d before weaning did not significantly affect the sows’ return to estrus, conception rates, and number of piglets born alive. The results of this study suggest that socializing piglets 14 d after birth leads to an increase in temporary restlessness and stress in lactating sows, but does not affect their subsequent reproductive performance after weaning.
Key Words: lactating sow, socializing, stress
240 The effects of environmental enrichments on behavior and performance of weanling pigs. N. Diefenbacher*, C. Shilling, B. P. Bennett, K. Ledergerber, B. D. Whitaker, University of Findlay, Findlay, OH
Newly weaned pigs are exposed to multiple stressors which could cause a decrease in performance. To reduce the stress associated with weaning, this study evaluated the effects of adding environmental enrichments to the nursery pens. Wean-ling pigs (n = 193), that were either socialized for 7 d before weaning or not, were randomly assigned to nursery pens (2.5 × 1.25 m) that contained either environmental enrichments or no environmental enrichments. All nursery pens were located in an environmentally controlled room and all pigs received the same diets, which met or exceeded NRC requirements. Each pig was weighed daily from d 21 to d 35 after birth and activity continually recorded using surveillance video from d 21 to d 35 after birth. The behavior of pigs (lying, active, feeding, ago-nistic) was recorded by 10 observers using digital video play-back. The duration of a behavior was timed and recorded when 75% or more of the pigs were engaging in a specific behavior during the elapsed time period. The ADG of pigs with envi-ronmental enrichments was not different than the pigs without environmental enrichments. The ADG of pigs that were social-ized before weaning (0.48 ± 0.02 kg) was significantly higher (P < 0.05) compared to those that were not socialized before weaning (0.39 ± 0.03 kg). There were no differences in ADG between the treatments from weaning to d 3 after weaning. Pens with environmental enrichments contained significantly fewer (P < 0.05) pigs displaying aggressive behavior (50.0 ± 4.5%) compared to pens without environmental enrichments (60.0 ± 4.5%) during 6 h after weaning. Similarly, pens with environmental enrichments contained significantly fewer (P < 0.05) pigs displaying aggressive behavior (20.0 ± 4.5%) compared to pens without environmental enrichments (30.0 ± 4.5%) from 6 h to 12 h after weaning. There were no differ-ences in the rate of aggressive behavior between pens at any
107
other times during the study. The results of this study suggest that environmental enrichments can be effective in reducing unwanted agonistic behavior, as well as increasing ADG of pigs that were socialized before weaning.
Key Words: behavior, environmental enrichment, performance
241 Nonstructural carbohydrate content of weeds commonly found in drylots. D. L. Gunder1*, J. Wilson2, K. L. Martinson3, 1University of Minnesota, St. Paul, 2Turner Wilson Equine Consulting LLC., Stillwater, MN, 3University of Minnesota, Saint Paul
Diets high in carbohydrates are a known trigger for laminitis. One of the most effective management tools for limiting carbo-hydrate intake is confining a horse to a drylot and feeding a diet low in non-structural carbohydrates (NSC). A diet ≤ 12% NSC is recommended for horses diagnosed with laminitis, obesity, or equine metabolic syndrome. Recent reports from horse owners indicated laminitic horses housed in weedy drylots and fed low NSC diets were still experiencing recurring bouts of laminitis. The objective of this research was to determine NSC content of weeds commonly found in drylots housing laminitic horses. Ten horse farms in central Minnesota and western Wisconsin were enrolled in the study during spring and summer 2013. Study re-quirements included at least one horse with a history of laminitis housed in a weedy dry lot with restricted pasture access. Evi-dence of horse ingestion of the weeds was also required. Farm owners committed to providing access to the horse(s) and weedy drylot on three occasions during the 2013 grazing season. Dur-ing each visit, weeds in the drylot were identified, and up to four of the most common weed species were harvested, frozen, and later sent to a commercial laboratory for nutrient analysis. Weed species harvested from the first farm visits were analyzed for forage nutritive values and results are presented on a dry matter basis. Weeds species collected during the second and third farm visits are currently being analyzed. Data were analyzed with the Proc Mixed procedure of SAS and reported as leas squares means. The four most common weeds collected during the first farm visits were prostrate knotweed (n = 8), broadleaf plantain (n = 4), purslane (n = 3), and redroot pigweed (n = 3). NSC content was different among the weeds (P < 0.001). Mean NSC content was 10.7, 10.7, 8.5, and 5.7 for purslane, redroot pig-weed, broadleaf plantain, and prostrate knotweed, respectively. NSC content of all weed species was below the recommended 12% threshold. Acid detergent fiber (ADF) and neutral detergent fiber (NDF) content were not different among the weed species (P = 0.09). ADF ranged from 22 to 33% and NDF ranged from 32 to 45%. The relatively low ADF and NDF levels may explain why the weed species were palatable to the horses. Although laminitic horses grazed weed species in a drylot, the low NSC content proves an unlikely connection between the weed species and the onset of laminitis.
Key Words: equine, laminitis, weeds
242 Effect of weight loss on markers of oxidant status in the mature horse. E. H. Hoblitzell1*, J. L. Zambito1, H. S. Spooner2, K. M. Barnes1, 1West Virginia University, Morgantown, 2Middle Tennessee State University, Murfreesboro
Obesity causes an increase in inflammation and the production of reactive oxygen species (ROS) in human and rodent models but this has not been assessed in the horse. Weight loss is consid-ered to improve oxidant status but a stepwise evaluation of the effect of weight loss has yet to be completed. We hypothesized that horses transitioning from an obese (7–8) to a moderate (5) body condition score (BCS) would show improvements in oxi-dant status. An obese BCS was maintained for a period of 2 wk in eight light-type horses of mature age (5–19 yr) and mixed sex for baseline sampling, then placed on a weight loss plan of a 30% caloric restriction and light exercise, with sampling every other week. The oxidant status of each horse was determined by analysis of erythrocyte lysate for total glutathione (GSH) concentration and glutathione peroxidase (GPx) activity, which work together to scavenge ROS. Nitric oxide (NO), a readily degrading free radical linked to oxidative damage due to inter-actions with superoxide radicals, was also evaluated in plasma via measurement of nitrate, an inert end product of NO degrada-tion. Data were analyzed by ANOVA with repeated measures, testing for the effect of change in BCS and percent weight loss, with gender and age as covariate s. GSH concentrations tended to be increased by change in BCS (P = 0.07) but not percent weight loss. GPx activity, however, was not altered. GSH con-centration was negatively correlated (r = -0.23, P = 0.05) with GPx activity. Plasma nitrate tended to be decreased in response to both change in BCS (P = 0.06) and percent weight loss (P = 0.08). Therefore, we did observe improvements in oxidant status (ie. increased GSH and decreased nitrate) as horses lost weight but the small magnitude of the changes indicated that, while obese, the horses may not have been experiencing in-creased inflammation and ROS production.
Key Words: horse, obesity, oxidant status
243 Implications of drought stress on corn or sorghum utilization in broiler chicks. A. D. Yoder*, C. W. Ross, C. K. Jones, A. C. Bingham, R. S. Beyer, G. Aldrich, Kansas State University, Manhattan
A total of 512 broiler chicks (Cobb × Cobb, 46.7 ± 0.10 g) were fed 1 of 8 dietary treatments to determine the effects of environmental conditions, grain type, and/or carbohydrase in-clusion on starter broiler chick growth and mortality. Chicks were hatched and allotted to battery cages (8 birds/cage, 8 cages/treatment) for an 18-d experiment. Birds were weighed and feed disappearance measured to determine ADG, ADFI, and G:F. Daily mortality was accounted for, and data were log transformed to normalize distribution. Treatments were arranged in a 2 × 2 × 2 factorial (drought vs. normal condi-
108
fect of gestational day (P < 0.05) was observed for total serum antioxidant capacity, which was increased on d 210, 240, and 262 compared to d 180 of gestation. In addition, a main effect of dietary treatment (P < 0.001) was observed for total serum antioxidant capacity, which was increased by 40% in MEL vs. CON. Dietary melatonin supplementation during late gesta-tion increased total antioxidant capacity in the blood while no effect was observed on total serum nitrites. In conclusion, dietary melatonin supplementation may be used to decrease oxidative stress during late pregnancy, which may improve fetal development and placental functional capacity.
Key Words: antioxidant, melatonin, pregnancy
245 Development of a scholarship program to support future swine professionals. C. Hostetler1, A. R. Clements2*, 1National Pork Board, Des Moines, IA, 2University of Tennessee, Knoxville
Development of the next generation of swine leaders is critical to the continued success of the US swine industry. The pur-pose of the National Pork Board’s Pork Industry Scholarship program is to provide assistance to individuals who have made a commitment to the swine industry and who intend to con-tinue their education through attainment of an advanced degree either through enrollment in a graduate program or a school of veterinary medicine. Since its inception in 2006 there have been 99 scholarships awarded to students from 23 different institutions. To assess the success of this program, a survey was conducted of recipients from 2006 and 2008 during the summer of 2013. The interview was conducted via email with follow-up via telephone. Respondents filled out and returned a questionnaire; the answers to that questionnaire were used to update contact information and record their accomplishments and involvement in the pork production industry. In 2006 there were a total of 25 scholarships awarded to students from 12 different institutions of higher education. There were a total of 20 respondents to the survey (80%) with one receiving DVM, five completing MS and seven completing or working towards completion of their PhD. All of the respondents (100%) are directly involved in agriculture as either a career or field of study with 86% being specifically involved in some facet of the pork production industry. In 2008 there were a total of 19 scholarships awarded to students representing 10 different in-stitutions of higher education. A total of 13 recipients respond-ed to the survey (68% response rate) with two DVM, three MS and one PhD. All of the respondents from the 2008 class (100%) remain involved in agriculture and 53% of respondents are specifically involved in the pork production industry. The results of this survey indicate that this program is successful in identifying and supporting individuals who will be in leader-ship positions in the pork production industry. The scholarship database will be updated annually through this survey tool so that the success of this program can continue to be assessed.
Key Words: Pork Industry Scholarship
tions, corn vs. sorghum, and commercial carbohydrase vs. no enzyme) and data were analyzed with the MIXED procedure of SAS. Feeding chicks grains raised in drought conditions did not affect (P > 0.22) final body weight, ADG, ADFI, or mortal-ity. However, chicks used grain more efficiently if it was raised in normal vs. drought conditions as evidenced by G:F (P = 0.02; 1.29 ± 0.011 vs. 1.32 ± 0.012, respectively). This was due to greater feed efficiency in the normal corn diets compared to drought-stressed corn diets (1.26 vs. 1.33, P = 0.01) as there was no significant difference in sorghum diets (1.31 vs. 1.32, P = 0.80). Interestingly, there were no main effect differences (P > 0.20) between grain type or enzyme inclusion for any measured variable, which suggests that poultry producers may substitute sorghum for corn, and that carbohydrase inclusion is not beneficial during the first 18-days after hatching. However, nutrients from drought-stressed corn are converted less effi-ciently by broiler chicks in the starter period.
Key Words: carbohydrase, drought, sorghum
244 Effects of dietary melatonin supplementation on total serum nitrites and antioxidant capacity of late gestating Holstein heifers. B. O. Fleming*, K. E. Brockus, C. G. Hart, C. O. Lemley, Mississippi State University, Mississippi State
Previous studies have shown that dietary melatonin supple-mentation increased total placental nitrites and placental an-tioxidant capacity in ewes, while limited data exists in cattle. Therefore, our objective was to determine the effects of dietary melatonin supplementation on total serum nitrites and total serum antioxidant capacity in late gestating Holstein heifers. Dairy heifers were artificially inseminated with sex-sorted se-men in January of 2013. Before d 170 of pregnancy, heifers (n = 20) were trained to acquire feed from the Calan feeding system. On d 190 of gestation, heifers were blocked by BW and randomly assigned to one of two dietary treatments con-sisting of 20 mg of dietary melatonin per day (MEL) or no melatonin supplementation (CON). At 0800 h, MEL heifers received 0.7 kg of grain top dressed with 2 mL of 10 mg/mL melatonin in ethanol while CON heifers received 0.7 kg of grain top dressed with 2 mL of ethanol alone. After consum-ing the grain all heifers were provided a TMR. Blood samples were collected from the tail via venipuncture of the coccygeal vein on d 180 (baseline), 210, 240, and 262 of gestation. Se-rum samples were analyzed for total nitrites and total antioxi-dant capacity using commercially available colorimetric kits. Data were evaluated using repeated-measures ANOVA of the MIXED procedure of SAS with the model statement contain-ing dietary treatment, gestational day, and their respective in-teraction. Main effects of dietary treatment or gestational day are discussed in the absence of significant (P < 0.05) treatment by day interactions. Total serum nitrites were increased (P < 0.001) with increasing gestational age while no difference (P = 0.73) was observed between dietary treatments. A main ef-

109
P O S T E R A B S T R A C T S
ANIMAL BEHAVIOR, HOUSING, & WELL-BEING: NONRUMINANT
NUTRITION- SUPPLEMENTS AND ALTERNATIVE FEEDSTUFFS
246 The effect of fermented soybean meal supplementation on nutrient apparent total tract digestibility and ileal digestibility in weanling pigs. H. L. Li, D. Jung, I. H. Kim*, Dankook University, Cheonan, South Korea
Fermentation processes have been used to prepare traditional soybean foods, making them highly digestible and nutritious. Five pigs [(Landrace × Yorkshire) × Duroc, BW = 17.0 ± 0.3 kg] were used in a 5 × 5 Latin square design with 5 diets and 5 periods to evaluate the effect of fermented soybean meal on apparent total tract digestibility (ATTD) and apparent ileal digestibility (AID). Dietary treatments were: SBM, soybean meal; CJY, fermented soybean meal by yeast; CJYB, ferment-ed soybean meal by yeast and Bacillus; CJC, canola meal; and FSBM, Soytide, fermented soybean meal by Bacillus subtil-lis. Pigs fed with CJYB or FSBM had higher ATTD and AID of nitrogen (P < 0.05) than those fed CJC, and pigs fed with CJYB or FSBM had higher (P < 0.05) AID of nitrogen than those fed with SBM. Pigs fed FSBM and CJYB had higher (P < 0.05) ATTD of leucine, lysine, phenylalanine, glutamic acid, tyrosine and total essential amino acids (EAA) compared with those fed CJC. The AID of total EAA of CJYB and FSBM were higher (P < 0.05) than CJC, and the AID of lysine and phenylalanine in FSBM was higher (P < 0.05) than that in CJC or SBM. The AID of glutamic acid, serine and total non-
essential AA of CJYB and FSBM treatments were higher (P < 0.05) than CJC treatment. Pigs fed with FSBM had higher (P < 0.05) AID of asparatic acid and glycine compared with those fed with CJY or CJC. Overall, the AID of total AA in CJYB and FSBM treatments were higher (P < 0.05) than that of CJC treatment. In conclusion, results indicate that compared with canola meal, fermented soybean meal by yeast and Bacillus or Bacillus subtillis can improve AID and ATTD of nitrogen, increase ATTD of EAA and AID of total AA in weanling pigs.
Key Words: digestibility, fermented soybean meal, weanling pig
247 Evaluation of extruded rice as a replacement for dried whey in weanling pigs. Y. Lei, S. Kim, I. H. Kim*, Dankook University, Cheonan, South Korea
Rice is one of the most important food crops worldwide for human consumption. Extruded rice, byproduct obtained after processing of rice, is a rich source of carbohydrate. It has been reported to protect young pigs against diarrhea, increase nutri-ent digestibility, and improve average daily gain. A total of 120 weaning pigs [(Landrace × Yorkshire) × Duroc, 21 d of age] with an average initial body weight of 6.52 × 0.22 kg were selected to investigate the effects of extruded rice prod-uct as a replacement to dried whey on growth performance, nutrient digestibility, blood profiles, fecal shedding of Lacto-bacillus and E. coli, and fecal scores in weanling pigs. Pigs were randomly allotted into 1 of 4 dietary treatments, with 6 replicates per treatment and 5 pigs per pen. Pigs in control group were fed a diet based on corn, soybean and 20% dried whey. Experimental groups received the same diet as the con-trol group, but 3, 6, and 9% of the dried whey was replaced by the same percentage of extruded rice. Throughout the experi-mental periods, no differences were observed on the average daily gain, average daily feed intake, and gain/feed ratio. The diet containing 9% extruded rice had a lower dry matter (78.8 vs. 81.2%, P < 0.05), crude protein (72.3 vs. 78.8%, P < 0.05) and gross energy (80.2 vs. 88.1%, P < 0.05) digestibility than pigs fed control diet on d 14. The blood creatinine concentra-tion of pigs fed 9% extruded rice was higher (1.23 vs. 1.13 mg/dL, P < 0.05) than pigs in control group on d 42. Pigs fed the diets with 6% and 9% extruded rice had decreased (P < 0.05) fecal E. coli counts on d 14 compared with the control diet. The current results indicate that 3% and 6% of the dried whey can be replaced by the same percentage of extruded rice, which can decrease fecal E. coli counts without negative ef-fects on growth performance in weanling pigs.
Key Words: digestibility, extruded rice, weanling pig
Table 246. Effect of fermented soybean meal on digestibility in weanling pigs
Item SBM CJY CJYB CJC FSBMATTD Nitrogen 78.80ab 80.40ab 81.39a 77.82b 81.75a
Leucine 85.82ab 86.23ab 88.40a 84.06b 87.41a
Lysine 78.71bc 81.28ab 82.38a 76.88c 82.69a
Phenylalanine 80.86ab 81.03ab 84.97a 79.38b 84.69a
Glutamic acid 86.74ab 87.15ab 88.30a 84.06b 88.66a
Tyrosine 86.48ab 84.67ab 87.66a 83.49b 87.21a
AID Nitrogen 74.34b 75.76ab 77.15a 73.95b 77.25a
Lysine 77.75bc 78.79ab 79.89ab 76.35c 80.73a
Phenylalanine 76.25bc 78.35ab 79.54ab 74.72c 80.63a
Asparatic acid 79.35abc 78.06bc 81.47ab 76.90c 81.63a
Glutamic acid 81.23ab 81.92ab 83.47a 79.54b 83.22a
Glycine 78.45abc 77.70bc 80.50ab 75.20c 83.09a
Serine 78.49ab 77.25ab 80.82a 75.30b 81.83a
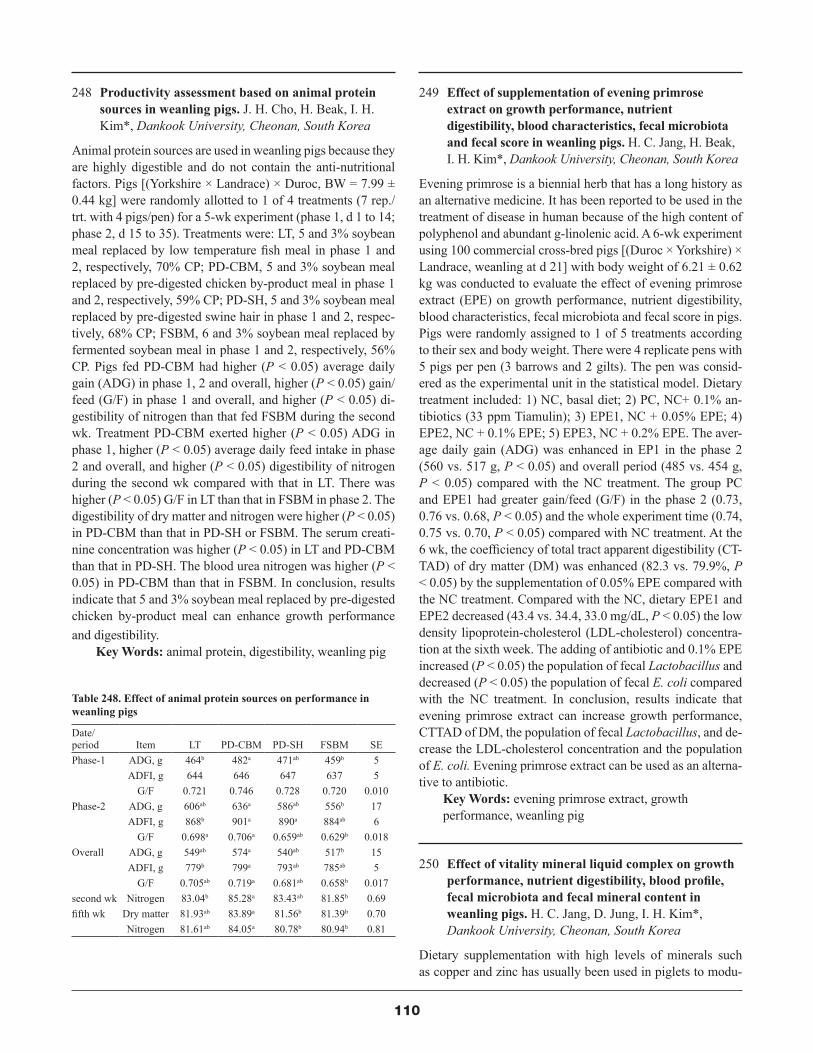
110
249 Effect of supplementation of evening primrose extract on growth performance, nutrient digestibility, blood characteristics, fecal microbiota and fecal score in weanling pigs. H. C. Jang, H. Beak, I. H. Kim*, Dankook University, Cheonan, South Korea
Evening primrose is a biennial herb that has a long history as an alternative medicine. It has been reported to be used in the treatment of disease in human because of the high content of polyphenol and abundant g-linolenic acid. A 6-wk experiment using 100 commercial cross-bred pigs [(Duroc × Yorkshire) × Landrace, weanling at d 21] with body weight of 6.21 ± 0.62 kg was conducted to evaluate the effect of evening primrose extract (EPE) on growth performance, nutrient digestibility, blood characteristics, fecal microbiota and fecal score in pigs. Pigs were randomly assigned to 1 of 5 treatments according to their sex and body weight. There were 4 replicate pens with 5 pigs per pen (3 barrows and 2 gilts). The pen was consid-ered as the experimental unit in the statistical model. Dietary treatment included: 1) NC, basal diet; 2) PC, NC+ 0.1% an-tibiotics (33 ppm Tiamulin); 3) EPE1, NC + 0.05% EPE; 4) EPE2, NC + 0.1% EPE; 5) EPE3, NC + 0.2% EPE. The aver-age daily gain (ADG) was enhanced in EP1 in the phase 2 (560 vs. 517 g, P < 0.05) and overall period (485 vs. 454 g, P < 0.05) compared with the NC treatment. The group PC and EPE1 had greater gain/feed (G/F) in the phase 2 (0.73, 0.76 vs. 0.68, P < 0.05) and the whole experiment time (0.74, 0.75 vs. 0.70, P < 0.05) compared with NC treatment. At the 6 wk, the coefficiency of total tract apparent digestibility (CT-TAD) of dry matter (DM) was enhanced (82.3 vs. 79.9%, P < 0.05) by the supplementation of 0.05% EPE compared with the NC treatment. Compared with the NC, dietary EPE1 and EPE2 decreased (43.4 vs. 34.4, 33.0 mg/dL, P < 0.05) the low density lipoprotein-cholesterol (LDL-cholesterol) concentra-tion at the sixth week. The adding of antibiotic and 0.1% EPE increased (P < 0.05) the population of fecal Lactobacillus and decreased (P < 0.05) the population of fecal E. coli compared with the NC treatment. In conclusion, results indicate that evening primrose extract can increase growth performance, CTTAD of DM, the population of fecal Lactobacillus, and de-crease the LDL-cholesterol concentration and the population of E. coli. Evening primrose extract can be used as an alterna-tive to antibiotic.
Key Words: evening primrose extract, growth performance, weanling pig
250 Effect of vitality mineral liquid complex on growth performance, nutrient digestibility, blood profile, fecal microbiota and fecal mineral content in weanling pigs. H. C. Jang, D. Jung, I. H. Kim*, Dankook University, Cheonan, South Korea
Dietary supplementation with high levels of minerals such as copper and zinc has usually been used in piglets to modu-
248 Productivity assessment based on animal protein sources in weanling pigs. J. H. Cho, H. Beak, I. H. Kim*, Dankook University, Cheonan, South Korea
Animal protein sources are used in weanling pigs because they are highly digestible and do not contain the anti-nutritional factors. Pigs [(Yorkshire × Landrace) × Duroc, BW = 7.99 ± 0.44 kg] were randomly allotted to 1 of 4 treatments (7 rep./trt. with 4 pigs/pen) for a 5-wk experiment (phase 1, d 1 to 14; phase 2, d 15 to 35). Treatments were: LT, 5 and 3% soybean meal replaced by low temperature fish meal in phase 1 and 2, respectively, 70% CP; PD-CBM, 5 and 3% soybean meal replaced by pre-digested chicken by-product meal in phase 1 and 2, respectively, 59% CP; PD-SH, 5 and 3% soybean meal replaced by pre-digested swine hair in phase 1 and 2, respec-tively, 68% CP; FSBM, 6 and 3% soybean meal replaced by fermented soybean meal in phase 1 and 2, respectively, 56% CP. Pigs fed PD-CBM had higher (P < 0.05) average daily gain (ADG) in phase 1, 2 and overall, higher (P < 0.05) gain/feed (G/F) in phase 1 and overall, and higher (P < 0.05) di-gestibility of nitrogen than that fed FSBM during the second wk. Treatment PD-CBM exerted higher (P < 0.05) ADG in phase 1, higher (P < 0.05) average daily feed intake in phase 2 and overall, and higher (P < 0.05) digestibility of nitrogen during the second wk compared with that in LT. There was higher (P < 0.05) G/F in LT than that in FSBM in phase 2. The digestibility of dry matter and nitrogen were higher (P < 0.05) in PD-CBM than that in PD-SH or FSBM. The serum creati-nine concentration was higher (P < 0.05) in LT and PD-CBM than that in PD-SH. The blood urea nitrogen was higher (P < 0.05) in PD-CBM than that in FSBM. In conclusion, results indicate that 5 and 3% soybean meal replaced by pre-digested chicken by-product meal can enhance growth performance and digestibility.
Key Words: animal protein, digestibility, weanling pig
Table 248. Effect of animal protein sources on performance in weanling pigs
Date/period Item LT PD-CBM PD-SH FSBM SEPhase-1 ADG, g 464b 482a 471ab 459b 5
ADFI, g 644 646 647 637 5G/F 0.721 0.746 0.728 0.720 0.010
Phase-2 ADG, g 606ab 636a 586ab 556b 17ADFI, g 868b 901a 890a 884ab 6
G/F 0.698a 0.706a 0.659ab 0.629b 0.018Overall ADG, g 549ab 574a 540ab 517b 15
ADFI, g 779b 799a 793ab 785ab 5G/F 0.705ab 0.719a 0.681ab 0.658b 0.017
second wk Nitrogen 83.04b 85.28a 83.43ab 81.85b 0.69fifth wk Dry matter 81.93ab 83.89a 81.56b 81.39b 0.70
Nitrogen 81.61ab 84.05a 80.78b 80.94b 0.81

111
late intestinal microbiota and improve gastrointestinal health. A total of 150 pigs [(Landrace × Yorkshire) × Duroc, BW = 7.00 ± 1.58 kg] were used in a 5-wk trial to investigate the effect of dietary vitality mineral liquid complex in water on growth performance, nutrient digestibility, blood profile, fecal microbiota and fecal mineral content in weanling pigs. Pigs were assigned to 1 of 3 dietary treatments (10 pens/treatment, 5 pigs/pen) by BW and sex (2 barrows and 3 gilts). Treatments were: NC, no mineral in water; TRT1, 0.96% minerals (JINO Biotech co. ltd) in water; TRT2, 0.55% minerals (JINO Bio-tech co. ltd) in water. Growth performance was measured on d 14 and 35. Pigs in TRT1 and TRT2 had higher gain/feed (P < 0.05) compared with those in CON during d 0 to 14 (0.842, 0.834 vs. 0.804) and 0 to 35 (0.733, 0.728 vs. 0.700). The average daily gain of pigs was higher (P < 0.05; 474 vs. 454 g) in TRT1 than that in CON. The digestibility of dry matter in TRT1 was higher (P < 0.05; 85.64 vs. 82.63%) than that in CON. The calcium (17.60 vs. 12.48 mg/dL) and phospho-rus (12.68 vs. 8.80 mg/dL) concentration was increased (P < 0.05) by 0.96% minerals in water compared with that in CON on d 35. The iron concentration on d 35 (96.50, 92.25 vs. 58.50 g/dL), and copper concentration on d 14 (94.53, 104.17 vs. 55.08 g/dL) and 35 (121.96, 109.12 vs. 68.34 g/dL) were higher (P < 0.05) in TRT1 and TRT2 than that in CON. The fecal E. coli counts were lower (P < 0.05) in TRT1 than that in CON on d 14 (6.10 vs. 6.59, log10cfu/g) and 35 (6.20 vs. 6.54, log10cfu/g). In conclusion, results indicate that supplementa-tion minerals in water can improve growth performance, cal-cium, phosphorus, iron and copper concentration, and reduce the E. coli counts.
Key Words: growth performance, mineral water, weanling pig
251 Dietary supplementation of Curcuma longa by bioconversion technology improved growth performance and digestibility in weanling pigs. Y. Lei, J. H. Cho, I. H. Kim*, Dankook University, Cheonan, South Korea
Bioconversion technology is a unique processing technology, by which immune activity is dramatically increased. A total of 150 weanling pigs [(Yorkshire × Landrace) × Duroc, BW = 8.48 ± 1.65 kg] were used in a 5-wk trial to investigate the effect of supplements of Curcuma longa L and mulberry leaves pro-duced by bioconversion technology on growth performance, digestibility, blood characteristics, fecal microbiota, fecal pH, fecal moisture, and serum FMD antibody. All these weanling pigs were randomly allotted into 1 of the 6 experimental di-ets according to their initial BW and sex (6 replicate pens per treatment and 5 pigs per pen). Dietary treatments are as follow-ing: NC: basal diet; PC1: NC + 0.1% Doctor immune 1 (a bio-conversion product of naturally-sourced rice bran and cultured mycelia of medicinal mushrooms); PC2: NC + 0.1% bonvital (Enterococcus faecium DSM 7134, 1.0 × 10¹⁰cfu/g; Morning-
bio Co., Ltd., Cheonan, Korea); STR1–1, NC + 0.1% Devel-opment material 1–1 (the bioconversion of the cultured Tilia taquetii celia product of Phellinus linteus, which is cultured with naturally-sourced leaves of Tilia taquetii); STR1–2, NC + 0.1% Development material 1–2 (the bioconversion of the cul-tured mycelia product of Phellinus linteus, which is cultured with naturally-sourced roots of Curcuma longa L.); STR2, NC + 0.1% Development material 2 (Benelenti-CCL, made from the bioconversion product of naturally-sourced, Curcuma longa L. and cultured mycelia of medicinal mushrooms). Pigs fed STR2 diet had higher average daily gain (ADG; P < 0.05; 307 vs. 267 g) and gain/feed (G/F; 0.903 vs. 0.809) during d 1 to 14, and higher ADG (P < 0.05; 429 vs. 373 g) during d 1 to 35 than those fed NC diet. Dietary supplementation in the STR2 diet increased digestibility of dry matter (P < 0.05; 83.35 vs. 80.53%) compared with NC diet during the second wk. In conclusion, results indicate that supplementation of Curcuma longa L. produced by bioconversion technology can improve growth performance and digestibility in weanling pigs.
Key Words: bioconversion technology, growth performance, weanling pig
252 Effect of bioconversion natural complex on growth performance, nutrient digestibility, blood characteristics, and fecal microbiota in weanling pigs. S. Kim, D. Jung, I. H. Kim*, Dankook University, Cheonan, South Korea
Bioconversion technology is a unique processing technology, by which immune activity is dramatically increased. A total of 140 weanling pigs [(Yorkshire × Landrace) × Duroc] with an average BW of 6.37 ± 1.14 kg were used in a 42-d trial to investigate the effect of bioconversion natural complex (BNC) on growth performance, nutrient digestibility, blood characteristics, fecal moisture and pH and fecal microbiota in weanling pigs. Pigs were randomly allotted to 4 experimen-tal diets according to their initial BW and sex (7 replications/trt., 5 pigs/pen). Dietary treatment included PC: basal diet + antibiotics (39 ppm Tiamulin); NC: basal diet; STR1: basal diet + 0.1% Dr. Immune1 (bioconversion product of natu-rally-sourced low-activity, rice bran and cultured mycelia of medicinal mushrooms) + Antibacterial peptide (fermentation products derived from Bacillus sp. TWNS); STR2: basal diet + 0.1% Dr. Immune2 (bioconversion product of naturally-sourced high-activity, rice bran and cultured mycelia of me-dicinal mushrooms). On 1–7d, pigs fed STR1 and STR2 treat-ments had higher ADG than NC treatments (257 and 258 vs. 222 g; P < 0.05) and the G/F in STR2 treatment was higher than NC treatment (0.806 vs. 0.675 g; P < 0.05). Pigs fed NC treatment had lower ADG than PC, STR1 and STR2 treat-ments from 22d-42d (578 vs. 624 and 618 and 610 g; P < 0.05) and the G/F in PC treatment was significantly higher than NC treatment (0.886 vs. 0.811 g; P < 0.05). During the overall period, pigs fed PC, STR1 and STR2 treatments had
112
higher ADG than NC treatment (494 and 492 and 495 vs. 458 g; P < 0.05) and the G/F in PC and STR2 treatment was higher than NC treatment (0.800 and 0.823 vs. 0.739 g; P < 0.05). However, the dry matter in STR1 treatment was higher than NC treatment on wk6 (82.05 vs. 80.98%; P < 0.05). Pigs fed STR2 treatment had higher Lactobacillus population than PC and NC treatments (6.70 vs. 6.30 log10cfu/g; P < 0.05). In conclusion, supplementation of BNC may be helpful to im-prove the growth performance and increase Lactobacillus concentrations of weanling pigs.
Key Words: bioconversion natural complex, growth performance, weanling pig
253 Effects of probiotics supplementation on growth performance, nutrient digestibility, blood profiles, fecal noxious gas emission in growing pigs. J. Li, H. L. Li, I. H. Kim*, Dankook University, Cheonan, South Korea
Application of probiotics, which are live nonpathogenic organ-isms, has been shown to improve performance and diet digest-ibility, as well as intestinal micro ecosystem in weanling pigs, but the effects of probiotics differ in different genera, species, and are strain specific. The objective of this experiment was to evaluate the effect of probiotics on growth performance, nutri-ent digestibility, blood profiles, and fecal noxious gas emis-sion in growing pigs. A total of 150 [(Landrace × Yorkshire) × Duroc] pigs with an average initial BW of 25.50 ± 2.50 kg were used in this experiment. Pigs were randomly assigned to 1 of 5 dietary treatments (6 replicate pens per treatment with 5 pigs per pen). The experiment was separated into 3 phases, d 0 to 14, 15 to 28, and 29 to 42. Dietary treatments were as follows: 1) NC: basal diet; 2) PC: NC + 33 ppm tiamulin; 3) P1: NC + 0.05% probiotics (L. plantarum NLRI1201, 3.0 × 10⁸cfu/g; Saccharomyces cerevisiae, 7.9 × 10⁷cfu/g; Bacillus licheniformis DK42, 8.0 × 10⁸cfu/g); 4) P2: NC + 0.10% pro-biotics; 5) P3: NC + 0.20% probiotics. From d 15 to 28, aver-age daily gain (ADG; 717 vs. 677 g) and gain/feed (0.453 vs. 0.424) in P3 were higher (P < 0.05) compared with NC. From d 29 to 42, ADG (759, 770, 749 vs. 707 g) in P2, P3, and PC was enhanced (P < 0.05) and gain/feed (0.345 vs. 0.321) in P3 improved (P < 0.05) compared with NC. Overall, ADG (703 vs. 656 g) and gain/feed (0.409 vs. 0.383) in P3 increased (P < 0.05) compared with NC. At the end of the experiment, di-gestibility of dry matter (81.71 vs. 78.14%) was increased (P < 0.05) in the diet containing 0.20% probiotics compared with NC. Dietary supplementation of 0.20% probiotics reduced (P < 0.05) fecal ammonia (18.8 vs. 22.9 ppm) and total mercap-tans (1.0 vs. 2.2 ppm) emissions compared with that in NC. Results indicate that feeding 0.20% probiotics can improve growth performance, nutrient digestibility, and reduce fecal noxious gas emission in growing pigs.
Key Words: growing pig, growth performance, probiotics
254 Effect of Phaffia rhodozyma on performance, nutrient digestibility, blood characteristics, and meat quality in finishing pigs. Y. J. Jang, Y. Lei, I. H. Kim*, Dankook University, Cheonan, South Korea
The red yeast Phaffia rhodozyma (PR) has possible applica-tion as a component of diets for use in the animal industry. Its primary value lies in its astaxanthin content, which has been proven to be a free-radical antioxidant several times more effective than vitamin E. A total of 96 crossbred [(Landrace × Yorkshire) × Duroc)] pigs with an initial BW of 58.61 ± 3.05 kg were used in this 10-wk feeding trial to determine the effects of PR on performance, nutrient digestibility, blood characteristics, and meat quality in finishing pigs. Pigs were randomly allotted to 1 of 3 corn-soybean meal based diets supplemented with 0, 0.1 or 0.2% PR. There were 8 replicate pens per treatment with 4 pigs per pen (2 barrows and 2 gilts). The inclusion of PR linearly improved gain/feed (G/F) in the phase 1 (0.377, 0.381 vs. 0.355; P = 0.02), phase 2 (0.322, 0.321 vs. 0.309; P = 0.02) and during the overall experimen-tal period (0.344, 0.346 vs. 0.329; P < 0.01). The dry matter digestibility was improved in the 0.1% PR treatment in phase 2 (74.65 vs. 70.87, 73.68%, quadratic: P = 0.01). The WBC concentration was increased in 0.1% PR group during the phase 1 (22.27 vs. 16.47, 19.52 ×10³/ml; quadratic: P < 0.01) and phase 2 (18.34 vs. 16.39, 17.18 ×10³/ml; quadratic: P = 0.04). The inclusion of graded levels of PR linearly increased (5.42, 5.51 vs. 5.35; P < 0.01) the pH of Longissimus muscle. The 2-thiobarbituric acid reactive substances was linearly de-creased (0.020, 0.019 vs. 0.023 mgMDA2/kg; P = 0.03) by the supplementation of PR. In conclusion, the inclusion of PR can improve feed efficiency, dry matter digestibility and meat quality of finishing pig.
Key Words: finishing pig, meat quality, Phaffia rhodozyma
255 Effect of supplementary feeding of Italian ryegrass on reproductive performance, blood profiles, and rectum temperature in the second parity sows. M. Mohammadi Gheisar, J. P. Lee, I. H. Kim*, Dankook University, Cheonan, South Korea
Attempts have been made to change the feed composition and increase bulk of pregnancy diets and thereby reducing hun-ger and improve welfare. Dietary fiber from plants provides metabolizable energy to the pig. A total of 80 pregnant sows (Landrace × Yorkshire; parity = 2) from the third week after pregnancy to 1 wk before delivery were used to evaluate the effect of supplementary feeding of Italian ryegrass on repro-ductive performance, blood profiles, and rectum temperature. Sows were randomly distributed into 1 of 2 dietary treatments, and each treatment had 40 replicate pens with 1 sow per pen. Dietary treatments were: 1) CON, basal diet; 2) F, basal diet, adding enough Italian ryegrass (IRG) in another feeder (sows

113
can access to IRG ad libitum). Piglets were weaned at d 28. At the end of experiment, reproductive performance and rectum temperature were measured and recorded. Cortisol, epineph-rine and norepinephrin levels were assessed. Supplementary feeding of fiber reduced (P < 0.05) body weight loss during delivery to weanling and also back fat thickness loss during delivery to weanling. Sows fed Italian ryegrass had lower (P < 0.05) level of cortisol and norepinephrin at d 50 of gesta-tion than those fed CON diet. At d 108 of gestation, the level of epinephrine was significantly (P < 0.05) lower than CON. In conclusion, results indicate that supplementary feeding of extra Italian ryegrass can improve reproductive performance on the second parity sows.
Key Words: Italian Ryegrass, reproductive performance, sow
256 Effects of supplementary feeding of Italian ryegrass on the reproductive performance, levels of stress hormones, body temperature, fecal score and fecal microbiota in primiparous sows and in piglets. E. Balolong Jr., S. D. Upadhaya, I. H. Kim*, Dankook University, Cheonan, South Korea
The supply of a fiber diet during the gestation period has been known to prepare pregnant animals to ad libitum feeding dur-ing lactation to meet nutrient requirements for maintenance and milk production. This study was conducted to evaluate the effect of dietary Italian ryegrass supplementation on the re-productive performance, levels of stress hormones, body tem-perature, fecal score and gut microbial shedding in primipa-rous sows and piglets. Three week after pregnancy, a total of 80 sows (Landrace × Yorkshire; parity = 1) were randomly allocated to two treatments (40 sows per treatment): 1) CON, basal diet; 2) F, basal diet, adding enough Italian ryegrass (IRG) in another feeder (sows can access to IRG ad libitum). Dietary treatments were fed until 1 wk before farrowing. Pig-lets were weaned at d 28. Results showed that supplementa-
tion of dietary fiber did not affect reproductive performance of sows. During d 14 to 21 after farrowing, the ADG of the piglets from sows supplemented fiber was higher (P < 0.05) than that from CON. Norepinephrine levels were lower (P < 0.05) in sows with IRG supplementation at d 50 and 108 of gestation compared to those in the CON, while cortisol levels were observed to be lower only during d 108 of gestation in IRG supplemented sows (P < 0.05). No effect was observed on the rectal temperatures of the gestating sows and piglets. No effect was further observed on the stress hormone levels, fecal scores and microbial shedding in piglets. In conclusion, dietary supplementation of extra IRG to primiparous sows be-fore delivery may reduce the stress level of primiparous sows during the first trimester of gestation and contribute to im-proving growth performance of piglets.
Key Words: Italian ryegrass, reproductive performance, sow
257 (UGS) The effects of socializing piglets before weaning on nursery performance and behavior. B. P. Bennett*, K. Ledergerber, C. Shilling, N. Diefenbacher, B. D. Whitaker, University of Findlay, Findlay, OH
This study was conducted to determine if socializing piglets during lactation improved their performance after weaning. A farrowing room with 6 pens was used and piglets (n = 193) were obtained from 23 sows over four replications. The solid barriers between 3 farrowing pens were removed on d 12 after birth and the barriers remained separating the other 3 farrowing pens until weaning of all piglets on d 21 after birth. Weanling pigs that were either socialized or not, were assigned to nursery pens (2.5 × 1.25 m) located in an envi-ronmentally controlled room and all pigs received the same diets, which met or exceeded NRC requirements. Each pig was weighed daily from d 21 to d 35 after birth and their ac-tivity was continually recorded using surveillance video from d 21 to d 35 after birth. The behavior of pigs (lying, active, feeding, agonistic) was recorded by 10 observers using digi-tal video playback. The duration of a behavior was timed and recorded when 75% or more of the pigs were engaging in a specific behavior during the elapsed time period. The ADG in
Table 255. Effect of feeding supplementation of Italian Ryegrass on performance in sows and piglets
Items Date/period CON F SELitter size At birth 11.2 11.8 1.1
At weaning 10.8 11.3 1.0Piglet average BW, kg At birth 1.43 1.47 0.04
At weaning 7.88b 8.15a 0.18Sow BW loss, kg From farrowing
to weaning11.5a 9.7b 1.1
S ow backfat thickness loss, mm
From farrowing to weaning
4.1a 3.0b 0.4
Piglet ADG, kg D 21 to 28 258b 268a 8D 0 to 21 230b 239a 6
Sow cortisol, µg/dL D 50 of gestation 3.3a 2.4b 0.4S ow norephineprin,
pg/mLD 50 of gestation 93.0a 82.7b 6.7
S ow norephineprin, pg/mL
D 108 of gestation 33.7a 24.7b 3.6
Table 256. Effect of feeding supplementation of Italian Ryegrass on performance in sows and piglets
Items Date/Period CON F SELitter size At birth 10.7 11.0 1.0 At weaning 10.2 10.6 0.9Piglet average BW, kg At birth 1.41 1.43 0.06 At weaning 7.47 7.71 0.20Piglet ADG, kg D 14 to 21 0.236b 0.248a 0.008S ow norephineprin,
pg/mLD 50 of gestation 87.3a 79.1b 7.0
D 108 of gestation 76.3a 64.7b 5.9Sow cortisol, µg/dL D 108 of gestation 2.4a 1.8b 0.3
114
the nursery of pigs that were socialized before weaning (0.48 ± 0.02 kg) was significantly higher (P < 0.05) compared to those that were not socialized before weaning (0.39 ± 0.03 kg). However, there were no differences in ADG between the treatments from weaning to d 3 after weaning. Nursery pigs that were socialized before weaning had a significantly lower occurrence (P < 0.05) of aggressive behavior (30.0 ± 2.5%) during the first 6 h after weaning compared to those pigs that were not socialized (85.0 ± 3.5%). Similarly, nursery pigs that were socialized before weaning had a significantly lower oc-currence (P < 0.05) of aggressive behavior from 6 h to 36 h after weaning compared to those pigs that were not social-ized. There were no significant behavior differences between groups for all other times. The results of this study suggest that socializing piglets from different litters before weaning reduces stress and improves performance in the nursery.
Key Words: behavior, socializing, weanling pigs
258 (UGS) The effects of socializing piglets before weaning on piglet performance. K. Ledergerber*, B. P. Bennett, N. Diefenbacher, C. Shilling, B. D. Whitaker, University of Findlay, Findlay, OH
The mixing of piglets from different litters after weaning causes aggression and a reduction in potential piglet perfor-mance levels. This study sought to reduce piglet aggression due to mixing of litters by evaluating the effects of socializ-ing piglets before weaning on average daily gain (ADG) and piglet behavior. A farrowing room with 6 pens was used and data was obtained from 23 sows and their litters. The solid barriers between 3 farrowing pens were removed on d 12 af-ter farrowing and the barriers remained separating the other 3 farrowing pens until weaning of all piglets on d 21 after birth. Each piglet (n = 240) was weighed daily from d 14 to d 21 after birth and activity continually recorded using surveil-lance video from d 12 to d 21 after birth. The behavior of piglets (lying, active, suckling, and agonistic) was recorded by 10 observers using digital video playback. The duration of a behavior was timed and recorded when 75% or more of the piglets were engaging in a specific behavior during the elapsed time period. The ADG of socialized piglets at d 14 after birth (0.25 ± 0.01 kg) was not different than those piglets that were not socialized until weaning at d 21 after birth (0.23 ± 0.01 kg). Socialized piglets spent a significantly shorter (P < 0.05) amount of time lying down (17.51 ± 0.29 h) during the first 24 h following barrier removal compared to all other times. There was a significant increase (P < 0.05) in agonistic behavior between piglets during the first 2 d following barrier removal compared to all other times. There was no significant difference between the amount of agonistic behavior recorded in piglets between d 1 (0.06 ± 0.01 h) and d 2 (0.05 ± 0.01 h) of barrier removal. The results of this study suggest that socializing piglets beginning at d 14 after birth leads to an in-
crease in temporary aggressive behavior in piglets; however, this behavior does not affect the performance of the piglets by d 21 after birth.
Key Words: behavior, piglets, socializing
259 (UGS) Gilt approachability to a human when selected for feed efficiency. J. F. Shola1*, J. D. Colpoys1, N. K. Gabler1, A. F. Keating1, S. T. Millman1, J. M. Siegford2, A. K. Johnson1, 1Iowa State University, Ames, 2Michigan State University, East Lansing
As feed efficiency is becoming more of a priority to produc-ers, our objective was to determine if divergent selection for residual feed intake (RFI) alters gilt approachability behavior. Twenty low-RFI (more feed efficient) and 20 high-RFI (less feed efficient) gilts 36 ± 5.7 kg BW from the ninth genera-tion of the ISU Yorkshire RFI selection lines were randomly selected and evaluated once over a 2 wk period using a hu-man approach test (HAT). The HAT arena measured 4.9 m long × 2.4 m wide, with black corrugated plastic walls 1.2 m. The arena floor was divided into four zones; zone 1 be-ing the position of the human, with zone 4 being the furthest from the human, containing the door and where the pigs enter the arena. Each gilt was moved from its home pen between 1300 and 1900 h into a weigh scale for 1 min. They then en-tered the HAT arena and their behavior was video recorded at 10 frames per sec for 10 min. The video was continuously scored by one observer for latency, duration and total number of escape attempts (defined as front two legs off the ground, possibly including a jump), freezing postures (defined as the whole body remaining still for ≥3 sec), and zone visits. Data were analyzed with PROC Glimmix and the experimental unit was the gilt. Compared to high-RFI gilts, low-RFI gilts tended to take longer to display the first escape attempt (P = 0.07), tended to spend less time attempting to escape (P = 0.08) and had fewer total escape attempts (P = 0.02). No dif-ferences were observed between lines for latency and duration across zones, or total number of freezing postures. Compared to high-RFI, low-RFI gilts tended to spend a shorter duration within zone 1 (P = 0.07), however there was no difference by genetic line for all other zones (P ≥ 0.47). Additionally, genet-ic line did not impact frequency of zone visits (P ≥ 0.26). In conclusion, low-RFI gilts tended to spend a shorter duration interacting with the human, but engaged in fewer total escape attempts compared to high-RFI gilts. These data suggest that while there are differences in approach behavior to a novel human between low- and high-RFI selection lines, selecting for improved feed efficiency did not adversely affect the pig-human interaction.
Key Words: human-approach, pig, residual feed intake

115
ANIMAL BEHAVIOR, HOUSING AND WELL-BEING
260 Impact of management systems on reproductive performance, hematological profiles, rectum temperature, fecal score and fecal microbiota in primiparous sows. M. Begum, J. W. Park, I. H. Kim*, Dankook University, Cheonan, South Korea
Management system can have a significant impact on the wel-fare of sows, especially the primiparous sows. A total of 90 sows (Landrace × Yorkshire; parity = 1) were used to assess the effect of management systems on reproductive performance, hematological profiles, rectum temperature, fecal score and fecal microbiota in pigs. Sows were managed from the third week after pregnancy to 1 wk before delivery and distributed into 1 of 3 management systems. Management systems were: CON, stall management system; GM, group management sys-tem; SM, shoulder management system. Results showed that the number of primary survival piglets and weaned survival piglets per sow were higher in GM and SM compared to CON (P < 0.05). Moreover, body weight loss (kg) from farrowing to weanling was meaningfully (P < 0.05) reduced in GM and SM than that in CON (9.6, 10.0 vs. 12.6). Still birth in terms of percentage was significantly higher (P < 0.05) in CON than that in GM and SM. In addition, in sows at d 50 of gestation, blood cortisol (4.1 vs. 2.6, 2.2 mg/dL), epinephrine (47.4 vs. 24.5, 27.5 pg/mL) and norepinephrine (98.0 vs. 84.5, 78.1 pg/mL) were increased (P < 0.05) in CON compared with that in GM and SM. In the same way, group management and shoul-der management reduced (P < 0.05) the blood cortisol (2.2, 2.4 vs. 4.3 mg/dL), epineprine (30.9, 28.4 vs. 50.2 pg/mL) and norepinephrine (76.2, 86.5 vs. 106.6 pg/mL) at d 108 of gesta-tion compared to that in CON. In conclusion, results implied that stall management and shoulder management system im-proved the litter size and decreased the still birth of suckling piglets from primiparous sows. It also indicated that GM and SM involved in lowering the blood parameters without any changes in the rectal temperature and fecal characteristics.
Key Words: blood, management, sow
261 Impact of management systems on reproductive performance, hematological profiles, rectum temperature, fecal score and fecal microbiota in the second parity sows. A. Hosseindoust, B. R. Lee, I. H. Kim*, Dankook University, Cheonan, South Korea
Sow welfare in different housing systems may greatly impact the reproductive performance. A total of 90 sows (Landrace × Yorkshire; parity = 2) were used to assess the effect of housing systems. Pigs were managed from the third week after preg-nancy to 1 wk before delivery and distributed into 1 of 3 hous-
ing systems (30 rep./trt. with 1 sow/rep. pen). Housing sys-tems were: CON, stall management system; GM, group man-agement system; SM, shoulder management system. Results showed that the number of primary survival piglets per sow and weaned survival piglets per sow were higher (P < 0.05) in GM and SM compared to CON. Moreover, BW loss from farrowing to weanling was reduced (P < 0.05) in GM and SM than CON. Stall management system occurred involved with higher backfat thickness loss which was followed by SM and GM (P < 0.05). Body weight of weaning pigs at weaning and third week after farrowing was significantly higher in CON than that in GM and SM (P < 0.05). Overall and from second week to weanling, ADG of weaning pigs was significantly higher in GM and SM compared to that in CON (P < 0.05). In addition, blood cortsol, and norephineprin were increased (P < 0.05) in CON compared with that in GM and SM sows at d 50 of gestation. At the same time, blood ephineprine was higher in GM compared to that in CON (P < 0.05). In addi-tion, group management and shoulder management reduced the blood cortsol, ephineprone and norephineprin at d 108 of gestation compared to that in CON (P < 0.05). Blood cortisol value was also lower (P < 0.05) in SM compared to CON. In conclusion, results implied that stall management and shoul-der management system improved reproductive performance in the second parity sows. It also indicated that GM and SM involved in lowering the blood parameters without any chang-es in the rectal temperature and fecal characteristics.
Key Words: management, sow, welfare
262 Effects of social rank on agonistic behaviors and associated injuries of gestating sows at mixing. L. Wang, L. J. Johnston, Y. Li*, University of Minnesota, West Central Research and Outreach Center, Morris
Group housing systems present challenges to low ranking sows because they suffer more injuries associated with ag-gress ion than higher ranking pen-mates. It is not clear how sows of differing rank are involved in fights and get injured. This study was conducted to investigate the relationship be-tween the social rank of sows and their injuries associated with agonistic behaviors. Sows (n = 150, parity 1 to 9) were mixed in pens of 15 sows after weaning, with the frequency
Table 261. Effect of housing systems on performance in sows
Items Date/period CON GM SM SELitter size At birth 10.3b 11.7a 11.5a 1.1
Weaning 9.8b 11.5a 11.2a 1.0Sow BW, kg After farrowing 196.2 198.3 195.8 2.5
Weanling 183.0 197.5 184.5 2.1Sow BW loss, kg From farrowing
to weaning13.2a 10.8b 11.3b 1.1
S ow backfat thickness, mm
After farrowing 24.5 23.5 24.5 0.4
Weaning 19.2 20.3 21.0 0.3S ow backfat
thickness loss, mmFrom farrowing
to weaning4.8a 3.2b 3.5b 0.3

116
composition by parity remaining consistent across pens. All sows were video-recorded for 48 h immediately after mixing. Aggressive interactions were classified as parallel pressing, knocking, and threatening. The number and outcomes (won, lost, and unsolved) of each fight, and the sows involved in were registered during the first 4 h after mixing. A rank index (RI) was calculated for each sow according to outcomes of aggressive interactions. Based on RI, sows in each pen were categorized as high (ranked 1 to 5), middle (ranked 6 to 10), and low rank (ranked 11 to 15). Injuries caused by fighting were assessed for each sow 48 h after mixing. Data were ana-lyzed using the Glimmix procedure of SAS with sow rank-ing, parity and their interaction as fixed effects. Compared to middle and low ranking sows, high ranking sows fought more frequently (15.3 vs. 9.8 and 8.6 fights/h/sow, SE = 1.33; P < 0.01), and won more fights (13.0 vs. 3.2 and 0.6 fights/h/sow, SE = 1.32; P < 0.01). Of the total fighting events, 77% were knocking, 21% were threatening, and 2% were parallel press-ing. Compared to low and middle ranking sows, high ranking sows were involved in more knocking fights (12.2 vs. 6.8 and 7.3 fights/h/sow, SE = 0.77; P < 0.01) and threatening encoun-ters (2.7 vs. 1.7 and 2.1 events/h/sow; SE = 0.63; P = 0.04). High-ranking sows tended to have lower injury scores (6.47 vs. 7.63 and 7.66; SE = 0.51; P = 0.07), with fewer injuries on the rear parts of body than middle and low ranking sows (1.50 vs. 1.89 and 2.04; SE = 0.18; P < 0.01), respectively. These results indicate that high ranking sows fought more frequently and injured less than low ranking sows. The involvement and outcomes of knocking fights contributed to the difference in fighting frequency and aggression-induced injuries between high and low ranking sows.
Key Words: injuries, social ranking, sows
263 What determines the social rank of a sow in a group-housing system? L. Wang, L. J. Johnston, Y. Li*, University of Minnesota, West Central Research and Outreach Center, Morris
The welfare of a sow in a group housing system depends on her social rank, with low ranking sows sustaining more skin lesions than high ranking sows. This study was designed to investigate what makes a sow high or low ranking and how social rank affects reproductive performance of sows. Sows (n = 150, parity 1 to 9) were mixed in pens of 15 sows after weaning, with the frequency composition by parity remain-ing consistent across pens. Aggressive interactions were vid-eo-recorded during the first 4 h after mixing. Among the 15 sows in each pen, three groups of 5 were classified as high, middle and low ranking based on outcomes (won, lost, and unsolved) of aggressive interactions that each sow involved in. Individual weight, body condition, and backfat thickness of sows were recorded before mixing and before farrowing. Heart rate and fear response of sows were measured 5 to 6 wk after mixing. A fear score was given to each sow based on
her response to approach of a human, with a score of 0 indi-cating the most fearful and 6 the lest fearful. Litter size and individual weight of piglets were recorded at farrowing and at weaning in a group-farrowing/lactation system. Data were analyzed using the Glimmix and Mixed procedures of SAS with sow ranking, parity, and their interaction as fixed effects. Compared to low ranking sows, higher-ranking sows were greater in parity (3.86 vs. 1.56, SE = 0.22; P < 0.01), heavier (257 vs. 205 kg, SE = 6.1; P < 0.01) at mixing, and less fear-ful (3.74 vs. 2.08, SE = 0.52; P < 0.01). High ranking sows had more total pigs born per litter (13.5 vs. 11.9 piglets, SE = 0.58; P = 0.04), more stillborn pigs (0.7 vs. 0.2 pigs/litter, SE = 0.23; P < 0.01), higher pre-weaning mortality of piglets (35.9 vs. 21.0%; Odds Ratio = 2.10, CI = 1.57 to 2.81), and smaller litter size at weaning (8.1 vs. 9.3 pigs/litter, SE = 0.48; P = 0.07). High and low ranking sows were not different in body condition, backfat thickness, heart rate, or body weight of piglets farrowed or weaned. These results suggest that par-ity, body weight, and fear response collectively determine the social rank of a sow. The effect of social rank on reproductive performance was confounded with sow parity, and the poor reproductive performance of high ranking sows as indicated by smaller litter size weaned was associated with greater par-ity than low ranking sows in the current study.
Key Words: group-housing, social rank, sows
264 (UGS) Evaluating changes to lying and standing in lame sows administered flunixin meglumine. M. M. Righi, M. D. Pairis-Garcia, S. T. Millman, A. K. Butters-Johnson, Iowa state University, Ames
Lameness in breeding swine has a large negative economic impact and is a welfare concern. In the US, flunixin meglu-mine (FM) is labeled for the control of pyrexia associated with swine respiratory disease. Pain-related behavior, such as postural changes can inform evaluation of presence and sever-ity of pain. The objective of this work was to determine the ef-fects of FM on postural changes in lame sows. Lameness was induced in mature sows (241.4 ± 15.5 kg) using a chemical sy-novitis model. Two treatments were compared: FM (2.2 mg/kg; n = 24) and sterile saline (S; n = 24), administered IM 24 and 48 h after lameness induction. Behavioral data was col-lected in the home pen during 12 h periods (0600-1800) using two 12 V color Close Circuit Television (CCTV) Panasonic cameras. Postures were quantified using 15 min scan sampling methods by two observers, on the day prior to (-24h) through +168 h post lameness induction and analyzed using PROC Glimmix of SAS. There were no observed differences in be-haviors between treatment groups -24h prior to lameness in-duction and 24-29h after lameness induction (Pre-treatment). Differences were observed for lying lateral (LL), lying sternal (LS) and standing (ST) behavioral postures when comparing baseline data to +24 h post lameness induction regardless of treatment (P < 0.001). Flunixin treated sows demonstrated
117
a lower probability of LL between 30-36h (Flunixin: 51% ± 0.02; Saline: 66% ± 0.02) and 53-60h (Flunixin: 46% ± 0.02; Saline: 53% ± 0.02) compared to saline treated sows (P < 0.02). Flunixin treated sows also demonstrated a greater prob-ability of ST between 30-36h (Flunixin: 14% ± 0.01; Saline: 8% ± 0.01) and 53-60h (Flunixin: 16% ± 0.01; Saline: 11% ± 0.01) compared to saline treated sows (P < 0.001). However, +168 h post induction, saline treated sows performed more ST (Flunixin: 23% ± 0.01 Saline: 28% ± 0.01; P < 0.004). Flu-nixin treated sows demonstrated a greater probability of LS between 30-36 h (Flunixin: 21% ± 0.02; Saline: 14% ± 0.02; P < 0.001), but saline treated sows demonstrated a greater prob-ability of LS after 53 hours post lameness induction (Flunixin: 18-19% ± 0.02; Saline: 22-25% ± 0.02; P < 0.01). Although further research is needed to determine if these postures corre-late with pain sensitivity and lameness, our research suggests that behavioral evaluation may be an effective and economic way to evaluate lameness on farm and assess drug therapy.
Key Words: analgesia pain, Flunixin meglumine, lameness, sows
265 Method of sprinkling trailers during hot weather and effects on transport losses of market weight pigs. R. K. Kephart1, A. K. Butters-Johnson1*, K. J. Stalder1, T. W. Huiatt1, A. Sapkota2, J. J. McGlone3, 1Iowa State University, Ames, 2Purdue University, West Lafayette, IN, 3Texas Tech University, Lubbock
The objective was to determine the effects of 3 sprinkling methods on transport losses. A total of 53 trailers (n = 9016 pigs) were used in a randomized design, over 3 wk in July 2012 in Iowa. Treatment 1: pigs only (dry bedding and pigs being sprinkled for 6 to 8 min after loading completed); treat-ment 2: bedding only (bedding already damp or sprinkled for 4 to 6 before the start of loading); treatment 3: pigs + bedding (both pigs and bedding sprinkled as previously described). A non-wetting treatment was not included due to pig well-being concerns. At loading, ambient temperature (T) and relative humidity (RH) were collected. Temperature humidity index (THI; average 22.4 ± 1.6) was then calculated using the fol-lowing equation: T– {[0.55– (0.0055 * RHdecimal)](T– 14.5)}. Pigs/trailer and average weight of pigs on that trailer were used to calculate density of pigs on the trailer: (average 289.9 ± 22.1 kg/m2): [(pigs/trailer)(average weight)]/(m2 floor space in trailer). The interval from the first pig stepping onto the trailer until the last pig stepped onto the trailer was defined as
load time. Wait at the farm was defined as the end of loading to the trailer leaving the farm. Stress signs (open mouth breath-ing, red blotchy skin, and muscle tremors) were counted from a randomly selected group of 100 pigs/trailer during loading. At the plant, number of non-ambulatory (NA; sum of fatigued and injured) and dead (sum of dead on- and euthanized on arrival) were recorded. Total losses (TL) were summed from dead and NA pigs. Data were analyzed using PROC GLIM-MIX of SAS where a Poisson distribution was noted; trailer of pigs was the experimental unit. Sprinkling treatment was the variable of interest and covariates were: THI, density, load time, wait time, and stress signs. Farm, transporter, and re-searcher at loading were used as random effects. Sprinkling methods used in this study in Iowa of July 2012 did not impact transport losses for market weight pigs.
Key Words: market-weight pig, sprinkling, transport losses
266 Effects of ractopamine level on the growth performance, carcass and meat quality, and blood acid-base and catecholamine responses to handling and transport procedures in finishing pigs. C. L. Puls1*, M. Ellis1, M. J. Ritter2, W. E. Trout2, S. N. Carr2, 1University of Illinois, Urbana, 2Elanco Animal Health, Greenfield, IN
This study was performed to evaluate the effect of feeding ractopamine (RAC) on growth performance, carcass and meat quality, and blood acid-base and catecholamine responses to handling and transport in finishing pigs. The study used a RCBD with 2 RAC levels (0 vs. 10 mg/kg) and involved 144 crossbred pigs housed in single-gender pens (barrows or gilts) of 3 pigs with 24 pens/RAC level. The study was per-formed over a 28-d period from initial BW 104.0 ± 5.99 kg to final BW of 142.8 ± 8.66 kg. Diets were formulated to meet the requirements of pigs fed 10 mg/kg RAC. Feed and water were available ad libitum. At the end of the growth study, pigs were subjected to handling and transport procedures. The han-dling model involved an initial aggressive handling procedure (pigs moved a distance of 50 m with 8 shocks from an electric prod), followed by 30 min transport on a standard livestock trailer at a floor space of 0.46 m2/pig, after which pigs were subjected to a final gentle handling procedure (pigs moved a distance of 100 m using sort boards and slap paddles). A blood sample was taken and rectal temperature was measured 2 h before (baseline) and immediately after the final handling procedure (final). Pigs were harvested and carcass and meat quality were measured. Feeding RAC increased (P < 0.05) ADG (19.6%), ADFI (4.2%), G:F (14.8%), and carcass yield (1.4% units). Minolta a* and b* were lower (P < 0.05) and ultimate pH (0.05 units) and Warner-Bratzler shear force (0.43 kg) were greater (P < 0.05) for pigs fed 10 compared to 0 mg/kg RAC. The increase in plasma epinephrine levels from baseline to final was greater (P < 0.05) for pigs fed RAC,
Table 265.
HOT weather, transport losses, pigs/trailer
Sprinkling Treatment
P– value R2
Pigs only
n = 31
Bedding only n = 9
Pigs and bedding n = 13
NA 0.01 ± 0.01 0.00 ± 0.00 0.00 ± 0.01 0.47 0.37Dead 0.35 ± 0.12 0.18 ± 0.11 0.20 ± 0.11 0.39 0.35TL 0.38 ± 0.14 0.16 ± 0.10 0.22 ± 0.12 0.25 0.41
118
however, there were no differences (P > 0.05) between treat-ments for changes in rectal temperatures, or plasma acid-base and norepinephrine levels from baseline to final. In addition, the incidence of non-ambulatory, non-injured pigs during the handling and transport procedures was similar (P > 0.05) for the 0 and 10 mg/kg RAC treatments (2.8 vs. 1.4%, respec-tively). The results of this study confirm the substantial im-provement in growth performance and carcass measures from feeding RAC at 10 ppm and suggest relatively limited effects of feeding this level of RAC on pork quality and responses to handling and transport.
Key Words: handling, pigs, ractopamine
267 Impact of providing shade on the growth performance of grazing dairy heifers. M. W. Sahar*, T. S. Dennis, J. E. Tower, A. M. Mosiman, T. D. Nennich, Purdue University, West Lafayette, IN
Shade is recommended and often considered important for the wellbeing and productivity of animals. However, limited in-formation is available on the growth performance of grazing dairy heifers when they are provided shade. The objective of this study was to determine the effects of shade on the growth performance of grazing Holstein dairy heifers throughout the summer months. Thirty-two heifers were randomly as-signed to 1 of 4 groups according to BW (163.8 ± 7.27 kg, 150.6 ± 8.5 d of age). The groups were assigned to 1 of 2 treatments: no shade (NOSHADE) or 2.3 m2 shade per heif-er (SHADE). Body weight, hip height (HH), withers height (WH), hip width (HW), body condition score (BCS), heart girth (HG), and rectal temperature were collected every 4 wk from May until September 2013. Blood samples were col-lected for plasma urea nitrogen (PUN) analysis. Temperature and relative humidity were recorded hourly both in the pasture and under the shade structures using HOBO data loggers, and temperature-humidity indices (THI) were calculated. Data were analyzed using PROC MIXED in SAS. Growth data were analyzed by heifer within paddock as repeated records and environmental data were analyzed by location (pasture or under shade). Daily high temperatures averaged 26.4°C and daytime temperatures (1200 to 1500 h) ranged from 13.5°C to 38.2°C during the study. There were no significant differ-ences (P = 0.60) in ADG (0.84 and 0.89 kg/d for NOSHADE and SHADE, respectively) or BW at the end of the study with NOSHADE heifers averaging 220.6 kg and SHADE heifers averaging 224.3 kg (P = 0.35). Hip height (118.0 and 118.4 cm for NOSHADE and SHADE, respectively) were similar between treatments (P = 0.32), but WH (116.7 and 118.7 cm, respectively, for NOSHADE and SHADE) were greater (P = 0.001) for SHADE at the end of the study. Heart girth (P = 0.80), HW (P = 0.52), and BCS (P = 0.53) were similar be-tween treatments. Also, PUN values were similar (P = 0.66) for heifers with SHADE compared to NOSHADE (11.9 and 10.8 mg/dl, respectively). Rectal temperatures during sam-
pling were 39.6°C for both treatments (P = 0.64). Providing shade did not improve the growth performance of Holstein dairy heifers in this study.
Key Words: dairy heifer, grazing, shade
268 Drylot vs. pasture beef cow/calf production. V. L. Anderson1*, B. Ilse2 and C. L. Engel3, 1North Dakota State University, Carrington, 2Big Horn County Extension, Montana State University, Hardin, 3Carrington Research Extension Center, North Dakota State University, Carrington
This is a progress report on the first 3 yr of a six year study comparing biological performance and production costs for drylot (DRLT) vs. pasture (PAST) beef cow/calf production systems. Mature spring calving crossbred beef cows (n = 80) were randomly allotted to DRLT or PAST treatments after calving in year 1. Cows were kept in their respective groups throughout the trial with replacements added to maintain 40 pairs per treatment. PAST cows grazed mixed native grasses (2.43 ha. per pair) from late May until late November. DRLT cows were kept in dirt pens with approximately 45 sq. m per pair. Lactating DRLT cows were fed to meet NRC (2000) re-quirements for average milking cows with some variation in the ration ingredients by year. The lactation ration was mixed and fed daily in fenceline bunks with large round bales of crop residue (wheat straw or corn stover) offered free choice. Con-ception rates varied little at 84.2% for DRLT and 85.2% for PAST cows after a 45 d natural service breeding season. Cow weight varied with season and by year with PAST cows gain-ing 18 kg ± 50.64 more than DRLT cows during the grazing season. PAST calves also gained 18 kg ± 26.98 more than drylot calves from turn-out in late May to late Sep when DRLT calves were weaned at 168 d of age. PAST calves were weaned at 206 d of age. Calves in both systems were offered creep feed with DRLT calves consuming 306 kg while PAST calves ate 365 kg, having access to creep feed for 38 d longer. The actual cost of DRLT cow ration, yardage, and creep feed averaged $1.72 per pair per day. The cost for PAST pairs was $1.00 per day which included pasture rent at $61.75/ha., salt and mineral, creep feed, fence maintenance, and management. The cost for DRLT pairs was equivalent to $106/ha. pasture rent. Manure produced by DRLT pairs was credited to the enterprise for its fertilizer value of $67.13. The higher costs and lower weaning weight for DRLT calves resulted higher production costs of $2.25/kg of weaning weight compared to $1.74/kg for the PAST calves. Lighter calves from DRLT may bring a higher price per kg potentially offsetting some of the increased costs. Additional research is needed on man-agement practices that would lower costs and increase calf performance.
Key Words: beef, calf, cow, drylot, pasture

119
269 (UGS) Effects of repeated electroejaculation on bull behavior and serum cortisol concentrations. E. J. Navis*, A. R. Green, C. F. Shipley, J. L. Stewart, S. C. Jimenez, F. A. Ireland, D. W. Shike, T. L. Felix, University of Illinois at Urbana-Champaign, Urbana
Negative perceptions surrounding the use of electroejacula-tion for semen collection of bulls have led to animal welfare concerns. Therefore, objectives of this experiment were to de-termine impacts of repeated electroejaculation of bulls on be-havior and serum cortisol concentrations. Angus×Simmental crossbred bulls (n = 23; average initial BW = 796 ± 160 kg) were electroejaculated once a wk for 10 wk. Bulls were blocked into 2 barns, each with their own handling equipment. Bulls were assigned temperament scores during loading, chute restraint, and electroejaculation (1 to 5 scale; 1 = most ideal, 5 = least ideal); and chute exit (1 to 3 scale; 1 = most ideal, 3 = least ideal). Vocalization scores (1 to 5 scale; 1 = no vocaliza-tion, 5 = more than 10 vocalizations) were assigned before, during, and after electroejaculation. Blood was collected from the tail vein following electroejaculation to measure cortisol concentrations. Handlers and bull order were consistent each wk. Behavioral data were analyzed with the GENMOD pro-cedures of SAS with repeated measures. Cortisol concentra-tions were analyzed with the CORR procedures of SAS. Bulls became easier (P < 0.01) to load into the chute over time, ini-tial score was 1.6 and final score was 1.1. Furthermore, bulls became less (P < 0.01) agitated while restrained in the chute over time, initial score 1.4 and final score 1.1. Vocalization scores before, during, and after electroejaculation did not dif-fer (P ≥ 0.62) over time. Bull behavior during electroejacula-tion procedure and when exiting the chute after the procedure did not differ (P ≥ 0.49) over time. Serum concentrations of cortisol were not correlated (P = 0.12) to week. Behavior scores and serum cortisol concentrations either did not change or improved over time, suggesting repeated electroejaculation can be used to collet semen on bulls with no adverse effects on temperament or stress. Data collected from this study further implies animal welfare concerns surrounding electroejacula-tion procedure for semen collection are unfounded.
Key Words: behavior, bulls, electroejaculation
BREEDING AND GENETICS
270 (GS-MS) The effect of initial assignment of parent population Boer does into high and low parasite resistance groups on subsequent doe parasite resistance, survival rate, reproductive efficiency, and kid performance and survival rates– 2 year summary. C. L. Thomas*, B. C. Shanks, J. D. Caldwell, L. S. Wilbers, K. L. Basinger, Department of Agriculture and Environmental Sciences, Lincoln University, Jefferson City, MO
In the United States, goat numbers have increased by about one-third in the past decade because of their economic val-ue as efficient converters of low-quality forages into quality meat, milk, and hides for specialty markets. However, goats are more susceptible to internal parasites than other types of livestock. Therefore, the objective of this study was to evalu-ate the effect of initial assignment of parent population Boer does into high and low parasite resistance groups on subse-quent doe parasite resistance, survival rate, and reproductive efficiency, and kid performance and survival rates. Parasite resistance Expected Progeny Differences were used to rank and sort mixed age Boer does (n = 146) into one of two selec-tion lines: 1) high line (HL; n = 74) to be selected for high resistance to internal parasites or 2) low line (LL; n = 72) to be selected for low resistance to internal parasites. High line and LL Boer does were mated to corresponding HL and LL Kiko bucks to produce crossbred Kiko × Boer progeny for two consecutive y. After initial allocation, fecal egg counts, FAMACHA scores, and packed cell volumes were measured periodically on all does and were utilized to determine if an animal required deworming. For does, number of times de-wormed, survival rate, kidding date, litter size, and kid wean-ing weights were similar (P ≥ 0.27) across lines. Kidding rates and kid birth weights were greater (P ≤ 0.04) for LL compared with HL; however, HL does weaned more kids (P ≤ 0.05) compared with LL does. A sex effect (P ≤ 0.01) was observed for kid birth and weaning weights, where male kids weighed more compared to female kids. Therefore, after two y, initial assignment of parent population Boer does to high and low parasite resistance lines had no effect on subsequent doe parasite resistance or survival rate, but mixed effects on doe reproductive efficiency, kid performance, and kid surviv-al rates; however, these findings represent short-term effects from an ongoing, long-term selection study.
Key Words: Boer, Kiko, parasite resistance

120
271 Characterization of the endometrial transcriptome in pregnant and non-pregnant sows. D. Gonzalez-Peña Fundora*, K. Caetano-Anollés, M. B. Wheeler, S. L. Rodriguez Zas, University of Illinois at Urbana-Champaign, Urbana
Up to 30% of early conceptus losses in the sow occur between 12 and 30 d of gestation and have a major impact on the pro-ductivity and profitability of the swine industry. The maternal environment plays a critical role on the ability of the embryo to implant and survive until delivery. The objective of this study was to identify the genes that are differentially expressed be-tween the endometrium of pregnant and non-pregnant sows us-ing next generation RNA sequencing. The endometrial mRNA from three pregnant and four non-pregnant cycling German Landrace gilts was profiled on Day 14 after insemination. The RNA-Seq analysis used the Illumina Genome Analyzer II plat-form. Single-end reads were mapped to the Sus scrofa refer-ence genome Sscrofa10.2/susScr3. In total, 4921 transcripts pertaining to 4068 genes were tested and 916 transcripts from 853 genes were found to be differentially expressed (False Discovery Rate adjusted P-value < 0.05). Among these, S100 calcium binding protein A9 and indoleamine 2,3-dioxygenase 1 (IDO1) were overexpressed while C1q, tumor necrosis factor related protein 3 and anterior gradient 2 homolog were under-expressed in pregnant relative to non-pregnant sows. IDO1 has been associated with allogeneic fetal rejection. Functional analysis of the differentially expressed genes using DAVID identified two category clusters (enrichment score > 2 equiva-lent to average category P-value < 0.01). These categories in-cluded immune response processes, graft-versus-host disease, allograft rejection, and antigen processing and presentation pathways. These functional categories confirm the develop-ment of embryo-maternal interactions early in the pregnancy. Our results point to maternal pathways that could be key to embryo implantation and survival.
Key Words: endometrium, RNA-seq, swine
272 Effect of feeding level on the growth performance of growing-finishing pigs from two genetic lines. N. Grohmann1*, B. Peterson2, B. F. Wolter2, M. Ellis1, 1University of Illinois, Champaign-Urbana, 2The Maschhoffs, Carlyle, IL
The evaluation of genetic lines of pigs for growth perfor-mance is typically conducted under ad libitum feeding over the growing-finishing period. There is limited data, however, on the impact of restricting the amount of feed given to grow-ing-finishing pigs on growth performance of different genetic lines. This study was performed from 36.2 ± 0.47 kg to 129.4 ± 2.20 kg BW as a RCBD with a 2 × 2 factorial arrangement of treatments: 1) Sire line [Blue (Landrace ancestry, low feed intake) vs. White (Yorkshire ancestry, high feed intake)]; and 2) Feeding level (Ad libitum vs. Restricted). Crossbred bar-
rows from the two sire lines (n = 40; 20/line and feeding level) were individually housed and fed. Pigs on the restricted level were fed at approximately 94% of the intake of pigs on the ad libitum level with feed being offered once/day. Diets were formulated to meet the energy and amino acid requirements of the restricted fed pigs and to meet or exceed the require-ments for other nutrients proposed by NRC (1998). As ex-pected, under ad libitum feeding, ADFI was lower (P = 0.03) for the Blue line compared to the White line (2.63 vs. 2.81 kg, respectively; SEM 0.079). There was a sire line by feed-ing level interaction (P ≤ 0.05) for overall ADG. Under ad libitum feeding, there was no difference (P > 0.05) between the lines (952 vs. 989 g for the Blue and White line, respec-tively; SEM 24.5), however, under restrict feeding, Blue line pigs grew faster (P ≤ 0.05) than the White line pigs (916 vs. 844 g, respectively; SEM 24.5). Compared to the Blue line, the White line had lower G:F (0.362 vs. 0.341, respectively; SEM 0.0056; P = 0.01) and Longissimus muscle area (47.2 vs. 44.6 cm2, respectively; SEM 1.02; P = 0.05) and greater backfat depth at the 10th rib (21.3 vs. 28.4 mm, respectively; SEM 1.12; P < 0.001). Pigs on the Restricted compared to the Ad libitum treatment had similar G:F (0.345 vs. 0.357, respectively; SEM 0.0055, P > 0.05). These results suggest that when evaluating genetic lines for differences in growth performance, the ranking of the lines can be influenced by the feeding level used to test the animals.
Key Words: feeding level, growth, pigs
273 (GS-PHD) Combined effect of sow deep intrauterine insemination and boar frozen semen on economic indicators. D. Gonzalez-Peña Fundora*, R. V. Knox, J. Pettigrew, S. L. Rodriguez Zas, University of Illinois at Urbana-Champaign
Boar sperm count can be negatively affected by reproduc-tive technologies such as frozen semen preparation (FRO), sex-sorted sperm, and sperm mediated gene transfer. Deep intrauterine (DUI) insemination technique enables the effec-tive use of semen doses with lower sperm count compared to conventional (CON) and intrauterine (IUI) insemination. The widespread use of DUI and frozen semen preparation depends on the impact of these technologies on the profit at the com-mercial level. The goal of the study was to compare the effect of the 3 insemination techniques on the financial indicators of a pig crossbreeding system. A three-tier system starting with the cross of nucleus lines B and A to generate 200,000 BA sows at the multiplier level was simulated in ZPLAN. At the commercial level, the BA sows were inseminated (CON, IUI, or DUI) using FRO from nucleus line C boars. The insemina-tion techniques were differentiated by distinct sow:boar ratios in the C × BA cross. In addition, a range of farrowing rates (60% to 90%) and litter sizes (8 to 14 liveborn pigs) were test-ed. The differences in profit between the insemination tech-niques were driven by differences in costs (P-value < 0.0001).

121
The use of DUI resulted in higher variable costs with relatives differences (RD = [(DUI- CON)/max(DUI,CON)]) of 14.3% relative to CON and 12.9% relative to IUI. However, the use of DUI resulted in substantially lower fixed costs with RD of -7.4% relative to CON and -2.4% relative to IUI. The RD of DUI for total costs were -5.4% for CON and -0.7% for IUI. In term of gross returns the three insemination technologies had similar outputs (RD < 1%) and consequently, DUI had the highest profit among the technologies studied (RD of DUI was 4% relative to CON and 0.8% relative to IUI). This study demonstrated the relative advantage of DUI that stemmed from the lower sow population size and higher efficiency of boar use resulting in lower fixed costs and higher profit.
Key Words: Deep intrauterine, frozen semen, simulation
274 Prediction of porcine reproductive and respiratory syndrome virus serum viral level phenotype from gene expression profiles. D. Velez-Irizarry1*, C. W. Ernst1, J. K. Lunney2, N. E. Raney1,J. P. Steibel1, 1Michigan State University, East Lansing, 2USDA, ARS, BARC, APDL, Beltsville, MD
Porcine reproductive and respiratory syndrome (PRRS) has been elusive to eradicate. The high morbidity and mortality associated with PRRSV infections has estimated associated annual costs over $664 million. Viral resistance has been documented in some pig breeds, however the genetic mecha-nisms involved are not fully understood. The objective of this study was to use gene expression profile data for prediction of animal-specific virus resistance status at early stages of devel-opment. Predictive ability of models that estimate viral load as a function of gene expression was evaluated using crossbred pigs infected with PRRS virus from the PRRS Host Genet-ics Consortium (PHGC). RNA and serum viral levels were obtained for 109 PHGC pigs at 4 and 7 d post infection (DPI). Transcriptional profiling was performed using the 70-mer 20K Pigoligoarray. The 4 and 7 DPI serum viral level phenotypes were regressed on genomic markers using three prediction methods: 1) a whole transcriptome linear method (genomic best linear unbiased prediction; GBLUP), 2) a linear regres-sion method using forward stepwise variable selection with cross validation (FSVS) across all genes on the microarray (19,947 transcripts), and 3) a FSVS based only on significant genes from a previous differential expression analysis (518 transcripts for 4 DPI and 424 transcripts for 7 DPI). The GB-LUP prediction accuracy was extremely low under fivefold and 109-fold cross validation at 4 DPI (r = 0.09 to r = 0.14), and 7 DPI (r = 0.03 to r = 0.02). This contrasts with the pre-dictive ability of genome-wide SNP markers used in genomic selection likely because correlation between gene expression profiles of genes is very different from correlation due to link-age disequilibrium between markers and QTL. The FSVS method resulted in high prediction accuracy. With fivefold
cross validation, the FSVS selected 20 variables and resulted in correlations of 0.87 and 0.92 at 4 and 7 DPI, respectively. Restricting the set of genes to the subset of genes differentially expressed in response to viral infection as a new set of predic-tors using the FSVS method reduced prediction accuracy (r = 0.71 at 4 DPI and r = 0.55 at 7 DPI). The unrestricted selection under cross validation of genes for a liner predictor shows the best predictive accuracy, and further evaluation of this method is warranted to improve predictive ability of PRRS phenotype using high-throughput gene-expression profiling.
Key Words: Pig, PRRS, Prediction
275 (UGS) Effect of pre-breeding boar exposure on gilt estrus. T. Kelsay*, M. D. Lindemann, H. J. Monegue, J. S. Monegue, University of Kentucky, Lexington
Current research suggests that boar habituation reduces the frequency and length of estrus in sows. Similar studies utiliz-ing gilts have had inconsistent results. A trial was proposed to evaluate the effect of boar habituation on breeding gilts. A to-tal of 22 gilts (Yorkshire; Yorkshire × Landrace) were blocked by age, breeding, and litter. Gilts were allotted to one of two treatments resulting in three replicates. Eleven gilts were di-vided into three pens (3–4 gilts each) and housed adjacent to a boar (contact group). The remaining 11 gilts were divided into three pens (3–4 gilts each) and housed in a room isolated from the boars (isolation group). Gilts were heat checked for 23 consecutive days in their pens using a teaser boar. All gilts in both treatments were moved to a breeding pen when estrus was detected and again exposed to a teaser boar for artificial insemination. At the time of insemination (Day 1) all gilts were scored (1 = excellent, 2 = moderate, and 3 = poor) based on; initial standing reflex, maintaining standing reflex, and se-men acceptance. All gilts were then re-bred approximately 24 h later (Day 2). Estrus expression was more prevalent in the isolation group (91% vs. 64%, P > 0.13). Initial reflex had a tendency to be stronger (1.42 vs. 2.17, P = 0.09) in gilts housed in isolation on Day 1. Day 1 maintenance of reflex was unaffected by treatment but semen acceptance had a tendency to be stronger in the contact group (1.17 vs. 1.97, P = 0.07). The isolation group had a higher rate of gilts that would not produce a standing reflex on the second day, 27% versus 9% in the contact group. Both the initial reflex (2.33 vs. 1.00, P = 0.013) and maintenance of reflex (2.00 vs. 1.00, P = 0.045) were stronger in the isolation group. Day 2 semen acceptance was unaffected by treatment (P = 0.59). Breeding scores were not different between age groups (P > 0.15) nor was there an interaction between treatment and age (P > 0.46). The iso-lation group only achieved a 70% conception rate versus an 83% conception rate for the contact group (P = 0.55). These results show that boar habituation does have the potential to negatively affect some aspects of estrus expression in gilts.
Key Words: estrus, gilts, habituation

122
276 Factors associated with digestibility in nursery pigs under PRRS infection. L. C. Hardie1*, N. V. L. Serão1, R. R. R. Rowland2, J. F. Patience1, J. C. M. Dekkers1, N. K. Gabler1, 1Iowa State University, Ames, 2Kansas State University, Manhattan
Much work is ongoing to understand the impact of the por-cine reproductive and respiratory syndrome (PRRS) on grow-ing pigs. A region on pig chromosome 4, with single nucleo-tide polymorphism (SNP) WUR10000125 (WUR), has been shown to be associated with host response to PRRS infection, based on weight gain and serum viremia. However, little is known about the association this SNP has with energy and dry matter digestibility in PRRS infected pigs. Therefore, the ob-jective of this study was to characterize total tract digestibil-ity in pigs infected with PRRS and to assess the effect of the WUR SNP, weight gain (WG), and viremia on digestibility traits. A total of 107 commercial pigs (7.6 ± 1.42 kg BW) from two trials of the PRRS Host Genetics Consortium (PHGC) were infected with PRRS isolate KS 06–72109 between 24 and 45 d of age. Blood samples and body weights were col-lected weekly through 42 d post infection (dpi). Pigs were fed ad libitum a standard corn-soy diet containing the digestibility marker titanium dioxide. Viral load (VL) was calculated as area under the curve for q-PCR viremia through 21 dpi. Fecal grab samples were collected individually during peak viremia, 9–16 dpi, and pooled within pig, with at least 3 samples per pool. These pooled samples were used to determine appar-ent total tract digestibility coefficients for dry matter (DM%) and energy (En%). Traits were analyzed with a mixed model, with fixed effects of trial, parity (1–8), WUR SNP genotype (AA and AB), covariates of initial age, VL, and 0–21 dpi WG (WG21), and dam and pen(trial) as random effects. Pheno-typic correlations of WG21 with DM% (-0.03) and En% (-0.04), and of VL with DM% (-0.01) and En% (-0.11) were not significant, nor were the effects of WG21 and VL in the models for DM% and En% (P > 0.05). WUR geno-type showed a significant association with En% (P = 0.043), but not with DM% (P > 0.05). The AA genotype had greater En% (83.8%) than AB (82.9%). This work indicates that the genotype at the WUR SNP may be associated with feed en-ergy digestibility. However, the impact of reduced feed intake during a PRRS challenge on apparent total tract digestibility and post-absorptive feed utilization must be considered in fu-ture studies. This work was supported by PRRS Cap, USDA National Needs Graduate Fellowship Competitive Grant no. 2013–38420–20496, National Pork Board (12–151), and the PRRS host Genetics Consortium.
Key Words: gain, WUR, viremia
277 Effect of low energy, high fiber diets on divergent residual feed intake lines in swine. E. D. Mauch*, J. M. Young, J. F. Patience, N. K. Gabler, J. C. M. Dekkers, Iowa State University, Ames
Residual feed intake (RFI), a measure of feed efficiency, is the difference between an individual’s observed and expected feed intake based on growth and maintenance requirements. Barrows and gilts from generation 8 (G8, n = 168) and 9 (G9, n = 166) of the Iowa State RFI swine lines, which were select-ed for high (HRFI) and low RFI (LRFI) under a standard corn-soybean diet, were utilized to evaluate their performance on a low energy, high fiber diet (LEHF) compared to a traditional corn-soybean diet that was high energy, low fiber (HELF), in two replicates. Littermate gilts and barrows from the two lines were split between the two diets and grown out from ~40 to 118 kg in 12 pens with a single-space electronic feeder (FIRE) to record individual feed intake. Body weight was recorded every 2 wk and ultrasound scans for backfat depth (BF) and loin muscle area (LMA) were taken at off-test. Average daily feed intake (ADFI), average daily gain (ADG), gain to feed ratio (G:F), BF and LMA for the test period were evaluated. Consistent with previous studies under the HELF diet, com-pared to the HRFI line, the LRFI line had similar ADG (P > 0.05), lower ADFI (G8: P < 0.01, G9: P < 0.1) and BF (G8: P < 0.01, G9: P < 0.1), and greater G:F (P < 0.05) and LMA (G8: P < 0.01, G9: P = 0.45). The effect of the LEHF diet dif-fered between generations and lines. Compared to the HELF diet, pigs on the LEHF diet had similar ADFI in G8 (P = 0.37) but greater ADFI in G9 (P < 0.01), lower ADG, BF, and G:F (P < 0.03), and greater LMA in G8 (P < 0.01) but lower LMA in G9 (P < 0.01). Within line, the LEHF diet resulted in lower ADG (P < 0.01), lower G:F (P < 0.01 except G8 HRFI: P = 0.13), and BF (P < 0.0001 except G9 HRFI: P < 0.1). Un-der the LEHF diet, compared to the HRFI line, the LRFI line had similar ADG (P > 0.05), lower ADFI (G8: P = 0.14, G9: P = 0.03) and BF (G8: P < 0.1, G9: P < 0.01), and greater LMA (G8: P < 0.05, G9: P < 0.1). For G:F, the LRFI line had significantly greater feed efficiency than the HRFI line in G9 (P < 0.01) but only marginally in G8 (P = 0.06). In conclu-sion, response to selection for feed efficiency under standard corn-soybean diets may not result in similar increases in feed efficiency under a LEHF diet although selected pigs are still expected to be at least as efficient as non-efficient pigs. Fund-ing provided by AFRI-NIFA grant #2011–68004–30336.
Key Words: feed efficiency, RFI, swine

123
EXTENSION – BEEF/SMALL RUMINANT
278 (GS-MS) The North Dakota Beef Industry Survey I. Demographics, challenges, and opportunities. D. N. Black1*, M. R. Schook1, J. C. Hadrich2, G. P. Lardy1,C. R. Dahlen1, 1North Dakota State University, Fargo, 2Colorado State University, Fort Collins
The North Dakota Beef Industry Survey was developed to determine how producers perceive the future direction of the industry. This report reviews responses related to producer demographics, challenges and opportunities in the industry, and succession planning of producers’ operations. Of the 2500 surveys mailed out, 527 responses were received (21.1% re-sponse rate), and 436 (82.7% of surveys returned) respondents indicated that they were active beef producers. In a question where respondents could select each sector of the indus-try they were involved in, commercial cow-calf production (94.5%) was present on a majority of operations, followed by backgrounding (37.8%), purebred/seedstock (14.2%), stock-er (8.9%), and feedlot (6.4%) operations. Seventy-two per-cent of principal operators indicated they were over the age of 50, and 62.3% of respondents indicated they had been a beef producer for more than 30 yr. Beef production accounted for 49.1% of gross revenue, followed by cash grain farming (31.3%), other off-farm work (16.0%), secondary businesses (2.9%), and custom harvesting (0.7%). In addition, 59.8% of respondents reported off-farm income from a spouse. Chang-ing environmental regulations (35.2%), animal welfare/ani-mal rights (28.1%), and input costs (27.8%) were the factors reported most frequently that ‘may cause exit from industry’, whereas land (49.4%) and pasture (50.1%) availability and input costs (38.4%) were the factors most frequently viewed as a ‘barrier to expansion’. On a scale of 1–5 (1 = obstacle to entering the beef industry, 5 = attraction), producers perceived self-employment (4.3), rural lifestyle (4.0), working with fam-ily (4.0), and working with livestock (4.0) as the greatest at-tractions for future generations entering the industry, whereas environmental regulations (1.8), input costs (1.8), and labor availability (2.1) were perceived as the greatest obstacles. Within 10 yr, 48.2% of principal operators plan to exit the beef industry; 4.4% within 2 yr, 17.0% in 2–5, and 26.8% in 6–10 yr. More than half (64.6%) of operators are encouraging an heir to take over their operation, and 61.6% of respondents would be willing to work with non-family members interested in entering the beef industry. However, 53.9% of respondents have not discussed a succession plan for their operation. Sur-vey results highlight challenges our current producers are fac-ing and also provide insight regarding opportunities for future generations of producers.
Key Words: beef industry, challenges, opportunities
279 (GS-MS) The North Dakota Beef Industry Survey II. Comparing herd management and production practices among producers planning to exit the industry and producers planning to remain in production. M. R. Schook1*, D. N. Black1, J. C. Hadrich2, G. P. Lardy1,C. R. Dahlen1, 1North Dakota State University, Fargo, 2Colorado State University, Fort Collins
A survey was conducted to determine producer perceptions of the future direction of the North Dakota beef industry. Sur-veys were sent to 2500 randomly selected beef producers with 527 surveys returned (21.1%), of which 82.7% (436 of 527) of respondents were self-identified as active beef producers. For-ty-eight percent of respondents indicated that they plan to exit the industry within the next 10 yr. To gain insight into future demographic, herd management, and production practices we compared answers to survey questions from producers that in-tend to exit the industry within the next 10 yr (Exiting; n = 207) with answers from producers that plan to remain in production for at least 10 yr (Staying; n = 220). A greater proportion (P < 0.01) of Exiting producers (97.6%), raised commercial cow-calf pairs compared with Staying producers (91.4%), whereas more (P < 0.05) Staying producers raised feedlot cattle (9.0%) compared with Exiting producers (3.9%). Though a similar proportion (P > 0.10) of gross income came from beef pro-duction, Exiting producers received more (P < 0.05) income from cash grain farming (35.3%) compared with Staying pro-ducers (28.2%). In contrast, Staying producers (17.9%) had a greater proportion (P < 0.05) of gross income generated from off-farm work compared with Exiting producers (12.3%). A greater proportion (P < 0.05) of Staying producers indicated they would use electronic ID (39 vs. 20.9%), obtain carcass data from calves (49.7 vs. 29.5%), artificially inseminate fe-males (51.0 vs. 29.1%), and use scales to monitor feed deliv-ery (50.4 vs. 29.5%) within the next 1 to 5 yr compared with Exiting producers. Staying producers were more willing (P < 0.05) to hire qualified personnel from outside of their opera-tion to formulate rations (63.3 vs. 50.5%), test feedstuffs (70.5 vs. 60.9%), and AI females (42.0 vs. 30.4%) compared with Exiting producers, whereas Exiting producers indicated more willingness (P < 0.05) to hire qualified personnel to vaccinate (40.8 vs. 22.7%), deworm (15.2 vs. 8.7%), and brand cattle (16.8 vs. 7.7%) compared with Staying producers. Producers planning to remain in the North Dakota beef industry beyond 10 yr plan to implement more progressive techniques within the next 1–5 yr compared with producers planning to exit the industry. Producers who plan to exit the industry within the next 10 yr relied more on cash grain farming than operators who plan to remain in the industry.Key Words: beef industry, future, production practices

124
280 Ohio livestock producer perceptions of producing and marketing of grass-based beef and lamb. J. S. McCutcheon1*, L. W. Morton2, H. N. Zerby3, S. C. Loerch4, L. Miller5, F. L. Fluharty4, 1The Ohio State University, Mount Gilead, 2Iowa State University, Ames, 3The Ohio State University, Columbus, 4The Ohio State University, Wooster, 5Small Farm Institute, Millersburg, OH
Ohio was used for a case study to explore supply issues as-sociated with the grass-based livestock value chain and the potential for local direct markets. Fifty-four percent of Ohio’s 26 million acres are in farms, and the livestock sector is an important component of Ohio’s agriculture. Growing con-sumer interest in localized food production, and Ohio’s strong agricultural base combined with a population of more than 11.5 million people provides livestock producers opportuni-ties to diversify production and marketing strategies. In 2010, a survey was mailed to 921 beef and sheep farmers, identified from county-level Extension producer lists. Returned surveys were 418 or 45% of the mailed surveys. The means from re-spondents were; 230 owned acres, managed 34 beef cows and 68 ewes, 56.7 yr old and 93.6% male. Beef producers reported 32.9 mean years of experience raising beef cattle; and sheep producers reported 34.0 mean years of experience. Several respondents (n = 46 or 13%) reported raising both beef and sheep in 2010. There were 17.8% of respondents reported that grass-based best described their livestock management system and 19% described their management system as grain-based. The remaining 63.2% of respondents described their livestock management system as a hybrid of the two, grass with some grain. Four questions were analyzed to discover the underly-ing dimensions of the decision to convert to a grass-based sys-tem and direct market meat and meat products. Principal com-ponent analysis was used to identify the underlying structure of each of the four questions and confirm (or not) conceptual factors posited to influence decisions to convert (or not) to a grass-based system. Those factor scores were then analyzed using PROC GLM between the self-described management groups. Factors that influenced the decision to convert a live-stock management system to a grass-base include available infrastructure, knowledge and technical skills, financial costs and a desire to change their system (P < 0.05). Producers who classified their livestock management system as either grass with grain or grass-based, rated both pasture infrastructure and management of higher importance than grain systems (P < 0.05). Respondents’ perceptions of regulatory and logisti-cal aspects of marketing were found to be significantly differ-ent between the 2 systems using grass and those identified as grain-based systems (P < 0.05). These findings demonstrate that there are production and marketing issues that influence producer decisions to change an existing management system.
Key Words: beef, grass-based, lamb
281 Effects of internal parasite infection at feedlot arrival on performance and carcass characteristics in beef steers. C. A. Clark1*, B. J. Dedrickson2, J. L. Sorensen2, P. J. Gunn3, 1Armstrong Memorial Research and Demonstration Farm, Iowa State University, Lewis, 2Merial, Duluth, GA, 3Iowa State University, Ames
Forty-three cross-bred steers from the Southeastern United States (239.74 ± 35.15 kg initial BW; 3.95 ± 0.50 initial BCS; 387.86 ± 131.69 d initial age) were used to examine the impact of internal parasite infections of beef steers at feedlot arrival on subsequent feedlot performance and carcass characteristics. Upon arrival at a SW Iowa feedlot, fecal samples were ob-tained and cattle were dewormed with a label dose of eprino-mectin. Fecal samples were obtained 24 d later for repeat anal-ysis. Cattle were fed as a singular pen and were harvested on 2 different dates based on estimated carcass composition. Serial weights and carcass data were collected by Tri-County Steer Carcass Futurity. Total fecal egg count (FEC) on d 0 was 92.07 ± 109.50 eggs per gram (EPG) with a range from 0 to 466 EPG. Parasite population was 92.35% strongyles and coproculture revealed strongyle population was 58% Cooperia, 14% Hae-monchus, and 28% Ostertagia. Fecal exams performed on d 24 detected 0 parasites. For post hoc statistical analysis, steers were categorized into 2 groups based on FEC at processing (≤99 EPG, LO; ≥ 100 EPG, HI). Data were analyzed using the MIXED procedure of SAS, with REPEATED measures used where appropriate. The HI cattle were younger than LO cattle (P = 0.02; 317.69 d vs. 418.27 d); therefore, age at arrival was used as a covariate when significant (P ≤ 0.10). Over the dura-tion of the feeding period, HI cattle had lesser BW than LO cattle (P = 0.03). When compared to LO, HI had reduced ADG during the first 24 d on feed (P = 0.05; 1.60 kg vs. 1.86 kg); however, overall ADG for the feeding period did not differ be-tween groups (P = 0.62; 1.61 kg vs. 1.64 kg). When compared to LO, HI tended to have lesser marbling scores (P = 0.08; 1063.85 vs. 1112.33), dressing percentages (P = 0.09; 60.45% vs. 61.32%), KPH (P = 0.07; 2.15% vs. 2.42%), and back fat (P = 0.07; 1.08 cm vs. 1.21 cm) at harvest. Rib eye area, yield grade, and hot carcass weight did not differ between classifica-tion groups (P ≥ 0.15). In summary, although steers with fecal egg counts above 100 eggs per gram at feedlot arrival effec-tively responded to anthelmintic intervention, they had lesser BW throughout the feedlot phase and tended to have altered carcass composition and reduced marbling scores at slaughter.
Key Words: beef, feedlot, parasite
282 (GS-PHD) Impact of oral meloxicam on circulating physiological biomarkers of stress and inflammation in beef steers after long distance transportation. N. Van Engen*, Iowa State University, Ames
Transportation stress can result in significant economic losses to producers due to decreased animal productivity, and in-

125
creased medication costs associated with sickness such as bo-vine respiratory disease (BRD). Meloxicam (MEL) provides pain relief and anti-inflammatory effects in cattle for several days after a single oral treatment. Our hypothesis was that MEL administration before shipping would reduce the impact of long distance transportation on circulating physiological biomarkers of stress and inflammation in beef steers. Ninety-seven beef steers were blood sampled for baseline biomarker determination and then randomly assigned to receive either 1 mg/kg MEL (n = 49) or a placebo (CONT) (n = 48) per os before a 1316 km transportation event lasting approximately 16 h. Calves were then blood sampled on arrival and 5 d later. Changes in the hemogram, circulating plasma proteins, total carbon dioxide (TCO2), fibrinogen, substance P (SP), corti-sol, haptoglobin (Hp)-matrix metalloproteinase-9 (MMP-9) complexes and tumor necrosis factor α (TNFa) between treat-ment groups over time were compared using a Mixed Effects Model with statistical significance designated as P < 0.05. ANCOVA was conducted to assess the relationship between circulating MEL concentrations and biomarker changes over time. An increase in neutrophil, platelet, monocyte, white blood cell and red blood cell counts occurred after transporta-tion (P < 0.0001) and a decrease in lymphocyte count was observed (P < 0.0001). MEL treatment reduced the stress-induced neutrophilia (P = 0.0072) and circulating monocyte count (P = 0.013) on arrival. Mean corpuscle hemoglobin (P = 0.05), mean corpuscle volume (P = 0.05) and lymphocyte count (P = 0.05) was also greater in the CONT calves com-pared with MEL calves after transportation. Furthermore, HP-MMP-9 complexes, TCO2, TNFa, plasma proteins and SP. in-creased and cortisol decreased after shipping (P < 0.01). MEL treatment tended to reduce serum cortisol concentrations (P = 0.08). There was a time-by-treatment interaction on serum cortisol concentrations (P = 0.04). An inverse relationship between plasma MEL concentrations and circulation cortisol concentrations (P = 0.002), neutrophil (P = 0.04) and basophil counts (P = 0.03) was also observed. The results suggest that MEL administration may reduce the impact of long-distance transportation on circulating physiological biomarkers of stress and inflammation in beef calves.
Key Words: inflammation, meloxicam, steers, stress, transportation
283 An economic analysis of conventional and alternative cow-calf production systems. J. M. Warner1 *, K. H. Jenkins2, R. J. Rasby1, K. Brooks1,T. J. Klopfenstein1, 1University of Nebraska, Lincoln, 2University of Nebraska, Scottsbluff.
Profitability through weaning of four cow-calf production sys-tems was modeled under current forage and feed prices. Two systems represent conventional Nebraska sandhills production with either March (MA, n = 88/yr) or June-calving (JU, n = 74/yr) cowherds each with 4 yr of previously reported data.
MA cows grazed summer range, winter cornstalks on October weaning, and were fed hay (12.5 kg DM/cow/d) at calving. JU cows grazed range from early-spring through fall, followed by cornstalks, and were not fed hay. JU cow-calf pairs were supplemented (0.45 kg DM/pair/d) with distillers grains from August through weaning (April). JU calves were 77 d older and 16 kg heavier (P ≤ 0.01) at weaning than MA calves. Two other July-calving cowherds represent alternative intensive and crop residue based systems (1 yr of data not previously reported). In one system, cows were in intensive management year-round with January weaning (INT, n = 84). The final sys-tem included intensive management from April through Octo-ber, and cornstalk grazing with supplementation (1.36 kg DM/pair/d distillers grains) all winter until April weaning (INTSG). In INT and INTSG systems, a common diet (60:40 distillers grains:crop residue, DM) was fed while cows were intensively managed and amounts varied with production stage. Unit cost of production (UCOP) for producing a weaned calf was calcu-lated using actual weaning weights adjusted to a common % weaned/pregnant. October 2013 base prices used for analysis included: grass $1.33/pair/d, cornstalk grazing $0.60/d, distill-ers grains $0.247/kg DM, hay $0.165/kg DM, harvested crop residue $0.104/kg DM, and mineral supplement $10/cow/yr. Other assumptions were: yardage $0.10/d ($0.45/d for cows in intensive management), and cow ownership $250/cow/yr. UCOP was $3.28 and $2.98/kg for conventional MA and JU systems, respectively. Not feeding hay and increased calf weaning weights decreased UCOP for the JU system. For alternative systems, UCOP was $4.89 and $3.06/kg for INT and INTSG, respectively. Cornstalk grazing and increased calf weight due to greater weaning age improved the profitability of the INTSG system. Data indicate alternative production methods utilizing corn residues can be economically competi-tive with conventional management strategies.
Key Words: beef cow, economics, system
EXTENSION – SWINE
284 Influence of storage bin design on flowability of DDGS-based pig diets. A. M. Hilbrands1,*, K. A. Rosentrater2, G. C. Shurson3, L. J. Johnston4, 1University of Minnesota, Morris, 2Iowa State University, Ames, 3University of Minnesota, Saint Paul, 4University of Minnesota, West Central Research and Outreach Center, Morris.
Two experiments were conducted to evaluate the effects of feed bin design and passive agitator use on flowability of feed containing 40% dried distillers grains with solubles (DDGS). The experiments used 6 bins of 3 different styles (2 bins per style) all equipped with round discharge cones. Bin styles in-cluded: a galvanized steel, seamless bin with a 60 degree cone
126
(Steel60; Dealers Livestock, Glenwood, MN), a galvanized, corrugated steel bin with a 67 degree cone (Steel67; PigTek, Milford, IN), and a white, poly bin with a 60 degree cone (Poly60; Prairie Pride, Winnipeg, MB). At the beginning of both experiments, about 2700 kg of a 40% DDGS commer-cial finishing diet (particle size of 736 to 1015 microns) were delivered to each bin. Laboratory measures for angle of repose (range = 49 to 70 degrees), packed bulk density (range = 678 to 707 kg/m3), and compressibility (range = 20.9 to 24.4%) of experimental feed indicated probable reduced flowability under commercial conditions. In experiment 1, the rate of feed flow from each bin was assessed on d 3, 7, and 21 post-feed delivery using the time required for all feed to flow from the open slide at the bottom of the cone. Feed flow rate from Poly60 (736.8 kg/min) was faster (P < 0.05; SE = 141.1) than Steel60 (602.9 kg/min) with Steel67 intermediate (663.3 kg/min). In experiment 2, passive feed flow agitators (Sure Flo Agitator, Farmer Boy Ag Supply, Myerstown, PA) were in-stalled in one bin of each style (3 bins contained agitators and 3 did not). Feed flow was evaluated on d 2, 3, 6, 7, 20, and 21 after feed delivery. Feed flow rate from Poly60 (900.7 kg/min) was greater (P < 0.05: SE = 183.8) than flow from ei-ther Steel60 (826.7 kg/min) or Steel67 (843.8 kg/min). Inclu-sion of the passive agitator increased feed flow in Poly60 (P < 0.05; SE = 184.0; 970.0 vs. 831.4 kg/min), and tended to im-prove feed flow in Steel67 (P < 0.07; 880.2 vs. 807.4 kg/min) but had no effect in Steel60 (826.8 vs. 826.7 kg/min). Results indicate that feed bin design can influence flowability of feed containing 40% DDGS. Of the bins tested, Poly60 produced the highest flow rate of feed once feed flow was established. Installation of passive agitators appeared to improve feed flow in some, but not all bin styles.
Key Words: DDGS, feed bin, flowability, passive agitator
285 Stocking density and feeder space effects on growth and carcass quality of PIC359 sired pigs. S. Jungst1,*, D. Hanson2, B. Fields1, J. N. Matthews1, M. Semler1, C. Booher1, T. Dreadin1, A. Sosnicki1, C. R. Neill2, S. Dee2, B. Kerkaert2, L. Minion2, J. Nerem2, 1Genus PIC, Hendersonville, TN, 2Pipestone Systems, Pipestone, MN.
A grow–finish trial using 1895 PIC359×Camborough pigs was conducted to investigate the effects of varying stocking densities and feeder space allowances on growth rate, feed conversion, and carcass quality. Seventy pens with 17.13 m2 of floor space were stocked with 23, 26, or 29 pigs at 56.6 d of age. Floor space allowances were 0.75, 0.66, or 0.59 m2/pig at placement. Each pen had two cup waterers and a four-hole dry feeder that was 142.2 cm long. Custom-built steel plates were used to block pig access to 2 holes on 36 feed-ers. Pigs were marketed at an average weight of 132.8 kg at a commercial pork processing plant. Carcass backfat thickness
and loin depth were measured with an optical probe. Carcass lean percentage was estimated from the backfat and loin depth measurements. Average daily gain was 0.042 kg/d (0.76 vs. 0.802) and 0.06 kg/d (0.76 vs. 0.82) slower for pens with 29 pigs compared to pens with 26 or 23 pigs (P < 0.05). Daily feed intake was 0.08 kg/d (2.0 vs. 2.08) and 0.11 kg/d (2.0 vs. 2.11) lower for pens stocked with 29 pigs compared to pens with 26 or 23 pigs, respectively (P < 0.05). Pens of pigs with two feeder holes grew 0.024 kg/d (0.782 vs. 0.806) slower than pigs from pens with four feeder holes (P < 0.03). Daily feed intake was 0.04 kg/d (2.04 vs. 2.08) lower for pens of pigs allowed access to only two feeder holes (P < 0.06). Pigs sold as light-weight culls was 1.4% higher for the two feeder hole treatment (3.0% vs. 1.6%; P < 0.05). Carcass lean was 0.5% higher when 29 pigs were placed in a pen compared to 23 pigs per pen (56.0% vs. 55.5%; P < 0.02). The feeder hole treatment was not different for any of the carcass traits (P > 0.60). A floor space by feeder space interaction was detected for gain: feed and kg of gain: Kcals ME (P < 0.05). Restriction of feed intake by restricting floor space/pig or reducing cm of feeder space/pig adversely affected growth rate and feed intake, but not feed conversion. Restricting floor space im-proved carcass lean via a reduction in feed intake.
Key Words: pigs, growth feed intake
286 Changes on intestinal microbial fermentation pattern of piglets fed diets including different components. K. Escobar1,*, T. Reis 1, G. Mariscal2, A. Aguilera1, G. Bernal1, S. Rubio1, J. Gómez1, S. Correa3, 1Universidad Autónoma de Querétaro, Querétaro, Mexico, 2Instituto Nacional de Investigación Forestal, Agrícola y Pecuaria, Querétaro, Mexico, 3synBios SA de CV, Querétaro, Mexico.
Low digestibility plant protein sources fed to weaned piglets, coupled with their low digestive capacity, favors fermentation of undigested protein by opportunistic bacteria, producing branched chain fatty acids (BCFA) and ammonia, which are toxic for gastrointestinal mucosa thus causing digestive disor-ders. Post-weaning diarrhea syndrome has been associated to high protein diets, which together with banning of antibiotics use in feeds, worsens the problem. One alternative is to reduce the level of dietary protein to decrease substrate availability for bacterial fermentation. Another is the use of probiotics. This study consisted of two experiments to evaluate the effect of feeding piglets two levels of dietary protein, and the addi-tion of antibiotics or probiotics, on intestinal microbial fer-mentation. One included 72 piglets weaned at 20 d old distrib-uted into three treatments (diets): 1) high protein (20%) with antibiotics (HCPa); 2) high protein (20%) without antibiotics (HCP) and 3) low protein (16%) without antibiotics (LCP). Second included 90 piglets weaned at 19 d old distributed into three treatments (diets): 1): high protein (20%) with antibiot-ics (HCPa); 2) high protein (20%) without antibiotics (HCP)
127
and low protein (16%) without antibiotics but with probiotics (LCPpb). In both experiments, on Day 21 post-weaning, three piglets per treatment were slaughtered to obtain individual il-eum and proximal colon, and their contents analyzed for to-tal VFAs, short chain fatty acids (SCFA), BCFA and lactic acid (LA) and ammonia (AM). Experiments were statistically analyzed as completely randomized designs. First experiment showed that use of antibiotics limited total microbial fermen-tation in the gut (38 vs. 114 and 96 μmol·g-1 VFAs in HCPa, HCP and LCP, respectively) (P < 0.01), but its absence in HCP resulted in 60% of total VFAs as BCFA (P < 0.01) and increased in AM concentration (515 vs. 290 and 200 mg·kg-1 in HCP, HCPa and LCP respectively)(P < 0.01). When protein level was reduced, a high fermentation was observed, but now 95% of total VFAs were SCFA (P < 0.01) and LA production increased (37 vs. 30 and 15 μmol ·g-1in LPC, HCP and HCPa respectively) (P < 0.01). In the second experiment, inclusion of probiotics to LCP resulted in an increase of fermentation, but concentration of SCFA was higher in comparison to ani-mals receiving an LCP diet. Changes in dietary components modified intestinal environment. Moreover the use of a low protein diet with or without probiotics promoted a healthy in-testinal environment through the production of SCFA.
Key Words: piglets, fermentation, SCFA
287 (GS-MS) The effect of cross fostering on PRRS transmission and litter performance. B. Mason1,*, J. L. Seate 2, A. E. DeDecker 2, M. F. Billing 2, 1University of Illinois, Champaign, 2Murphy Brown LLC, Rose Hill, NC.
Cross fostering is used in swine production to improve growth performance and reduce mortality; however, it is unknown how much cross-fostering transfers PRRS. Therefore, the ob-jective of this trial is to determine the effects of cross-foster-ing programs on transmission of PRRS, piglet growth, and pre-wean mortality (PWM). On a commercial sow herd, 235 multiparous (1–5) sows, 10 wk post-LVI from an acute PRRS break, were utilized. Four cross-fostering treatments were ap-plied before farrowing: A) no movement of piglets, B) move-ment at 24 h, C) movement at 5 d, and D) movement at 10 d. Litters were assigned a treatment at birth and randomized throughout the room and the litter received no new piglets. Corresponding to treatment, the 4 heaviest pigs were moved (excluding treatment A). Litters that received the fostered pigs
farrowed on the same day, same room, and same treatment. Eight tagged pigs/litter were tested for PRRS by PCR at birth and weaning. Litter birth and wean weights were recorded. Performance data were analyzed using Proc GLM by SPSS with litter as the experimental unit and PRRS transmission data was analyzed using Proc GLIMMIX in SAS with pig-let as the experimental unit. Cross fostering pigs at 10 d of age produced an elevation in the prevalence of PRRS, with an increase of 8.8% in positive pigs at weaning (P < 0.01). Other treatments showed no significant difference in PRRS transmission (P > 0.10; Table 1). No difference between treat-ments in ADG and PWM (P > 0.10). Cross-fostering at 10 d of age at 10 wk following LVI enhanced the spread of PRRS. Results confirm restricted cross fostering programs should be implemented to reduce PRRS transmission even after 10 wk post PRRS intervention.
Key Words: cross fostering, PRRS transmission, pre-wean mortality
288 Effect of artificial insemination method and semen dose volume on reproductive performance of multiparous sows. L. M. Gesing1,*, J. E. Estrada1, B. A. Peterson2, D. Hentges2, M. Ellis1, 1University of Illinois, Urbana-Champaign, 2The Maschhoffs, Carlyle, IL.
The effects of artificial insemination method and semen dose volume on farrowing rate and litter size was evaluated in a study involving 2000 multiparous sows (parities 1–7). The study was performed in a commercial facility using a CRD with a 2 × 2 factorial arrangement of treatments: 1) Insemi-nation Method (intra-cervical or post-cervical) and 2) semen dose volume (75 mL semen [3.0 billion total sperm cells] or 40 mL semen [1.6 billion total sperm cells]). Ejaculates from 3 to 5 boars were pooled, extender was added, and an equal number of doses were made for each semen dose volume. All ejaculates were evaluated for motility and morphology and random samples from each pooled batch were selected for fur-ther evaluation of sperm cell concentration. Only sows that ex-hibited estrus within 10 d of weaning were used and on detec-tion of estrus these sows were randomly allotted to treatment within parity. Each sow was inseminated once/day until the sow was no longer in behavioral estrus using the same insemi-nation method and semen dose volume. Overall, the sperm cell concentration for all pooled batches was within 3.3 and 6.3% of the target (3.1 and 1.7 billion sperm cells, respectively) for each of the semen dose volume treatments. There was no ef-fect (P > 0.05) of Artificial Insemination Method on farrowing rate (90.9 vs. 89.9% for intra- and post-cervical insemination, respectively; SEM 0.17), total number of pigs born (13.4 vs. 13.4, respectively; SEM 0.17), number born alive (12.6 vs. 12.6, respectively; SEM 0.21), number born dead (0.4 vs. 0.4, respectively; SEM 0.04), or number mummified (0.3 vs. 0.3, respectively; SEM 0.02). There was also no effect (P > 0.05) of semen dose volume on farrowing rate (90.0 vs. 90.8%, for
Table 287. Effect of cross-fostering programs on PRRS transmission
ValuesCross-foster treatment
SE P-valueNone 24 h 5 d 10 dPigs blood tested 454 503 488 479PRRS positive at birth, % 0.1 0.8 0.8 0.1 0.400 0.9999PRRS positive at wean, % 4.3b 3.2b 2.2b 8.9a 0.800 < 0.001Increased PRRS positive*, % 4.2b 2.4b,c 1.4c 8.8a 1.000 < 0.001a-c within a row differ indicate P < 0.05 *The mean represented as “Increased PRRS Positive” was generated by (PRRS positive at weaning- PRRS positive at birth = Increased PRRS positive)

128
75 mL and 40 mL semen treatments, respectively; SEM 0.17), total number of pigs born (13.5 vs. 13.3, respectively; SEM 0.17), number born alive (12.7 vs. 12.5, respectively; SEM 0.21), number born dead (0.4 vs. 0.4, respectively; SEM 0.04), or number mummified (0.3 vs. 0.3, respectively; SEM 0.02). In conclusion, even at relatively low semen dose volumes, intra-cervical and post-cervical insemination gave similar results in terms of farrowing rate and litter size.
Key Words: artificial insemination, pig, semen dose volume
289 Evaluation of the growth performance, feeding and activity patterns, and aggressive behavior of barrows mixed twice during the finishing period. L. E. Ochoa1,*, L. M. Gesing1, B. Peterson2, M. Ellis1, 1The University of Illinois, Urbana-Champaign, 2The Maschhoffs, Carlyle, IL.
The effect of mixing pigs twice during finishing on growth performance, feeding and activity patterns, and aggressive be-havior was investigated in a study involving 48 barrows. The study was performed over a 10-wk period (65.3 ± 4.4 kg to 136.5 ± 7.6 kg BW) as a generalized randomized block de-sign (blocking factor day of start on test) with 2 treatments: 1) Control (not-mixed); 2) Mixed (mixed at start and at wk 5 of the study). The study involved 4 pens of 12 pigs; pens were equipped with an electronic feed station that recorded the time and duration of visits and the weight of feed consumed/visit for each animal in the group. For the first mixing event, the 12 pigs in the 2 pens on the Mixed treatment were divided into 2 sub-groups of 6 pigs with the same mean and variation in BW and one subgroup from each pen was exchanged with a subgroup from the other pen. For the second mixing event, the subgroups of 6 that were mixed had not previously been mixed together. Activity (numbers lying, standing, eating, and drinking) and aggressive interactions (number of bites and fights of greater than 3 s duration) were recorded on the d before and d of mix-ing, and d 1, 2, and 3 post-mixing. During the recording period, activity was recorded every 10 min and aggressive interactions were recorded continuously. There was no effect (P > 0.05) of mixing on growth performance or feeding patterns for the pe-riods immediately after mixing or for the overall study period. Mixing increased (P £ 0.05) the percent of pigs standing (6.9 vs. 9.7% for Control and Mixed, respectively) and reduced (P £ 0.05) the percent of pigs lying (85 vs. 82%, respectively) for the 3 d following the first, but not the second (P > 0.05), mix-ing event. Mixing increased (P £ 0.05) the number of fights/pig (0.0 vs. 1.8, for Control and Mixed, respectively) on the d of mixing of the first mixing event, but not on the following days or for any day after the second mixing event (P > 0.05). These results suggest that mixing pigs in the finishing period can increase the level of aggression for a short period of time, with no impact on growth performance or feeding patterns.
Key Words: behavior, mixing, pigs
290 Performance evaluation of barrows and gilts of three different sire lines. C. A. P. Garbossa1, 2,*, A. P. Schinckel2, B. T. Richert2, R. L. Cutshaw Jr.2, B. Zhou2, E. C. Allen2, W. Steyn3, J. M. Eggert4, 1Federal University of Lavras, Lavras, Brazil, 2Purdue University, West Lafayette, IN, 3TOPIGS, Helvoirt, Netherlands, 4TOPIGS USA, Demotte, IN.
Barrows and gilts from three sire lines (n = 240) were measured to evaluate their BW growth, daily feed intake (DFI) and feed conversion. Pigs were weaned at 21 d of age with 8 pigs per pen during the nursery and 4 pigs per pen (1.12 m2/pig) in grow-fin-ishing phase. The first 3 nursery diets were fed on a feed budget with nursery phase 4 diet fed to d 35 post-weaning. Grow-finish diets were fed in 6 phases with the first 5 phases fed for 21 d each and the final diet fed until marketing. Pigs were weighed at 21, 28, 35, 49, 56, 77, 98, 119, 140, and 161 d of age and at close to target final BW of 145 kg. A Generalized Michaelis-Menten function was fitted to the BW data with 2 pig specific random ef-fects. The Bridges function was fitted to the DFI data as a func-tion of BW with pen as a random effect. Data were analyzed using Proc GLM and NLMIXED of SAS. Sire line (SL) and sex by SL interactions were significant (P < 0.03) for nursery ADG and DFI. Sire line 1 (SL1) and 2 (SL2) pigs had similar d 35 BW (27.9 and 28.5 kg) which were greater (P < 0.001) than sire line 3 (SL3) pigs (26.0 kg) due to differences in ADG (603, 615, and 555 g/d, respectively). Sire line differences existed (P < 0.001) for grow-finish ADG (1005, 968, and 840 g/d respec-tively), DFI (2.73, 2.66, and 2.27 kg/d respectively), and final BW. Pigs of SL1 and SL2 had similar ADG and final BW that were greater (P < 0.001) than SL3 pigs. Gilts had lower (P < 0.001) ADG (919 versus 956 g/d), DFI (2.46 versus 2.64 kg/d) and greater gain:feed (0.373 vs. 0.362) than barrows. Overall, ADG increased from weaning to about 122 d of age and then slowly decreased. The SL3 pigs achieved their maximal ADG at lower BW than SL1 and SL2 pigs. The ADG had a great in-crease from weaning to 75 d of age, slowly increased to maxi-mal ADG at about 104 d of age, and then slowly decreased. Pigs from difference sire lines have substantial differences in growth performance which need to be evaluated relative to the type of production and marketing system.
Key Words: growth functions, pig growth, feed intake
291 Evaluation of the compositional growth and predicted lysine requirements of pigs by three sire lines. C. A. P. Garbossa1,*, A. P. Schinckel2, B. T. Richert2, R. L. Cutshaw Jr.2, B. Zhou2, E. C. Allen2, W. Steyn3, J. M. Eggert4, 1Federal University of Lavras, Lavras, Brazil, 2Purdue University, West Lafayette, IN, 3TOPIGS, Helvoirt, Netherlands, 4TOPIGS USA, Demotte, IN.
Barrows and gilts (n = 240) from three sire lines were collected to parameterize their BW and compositional growth and pre-
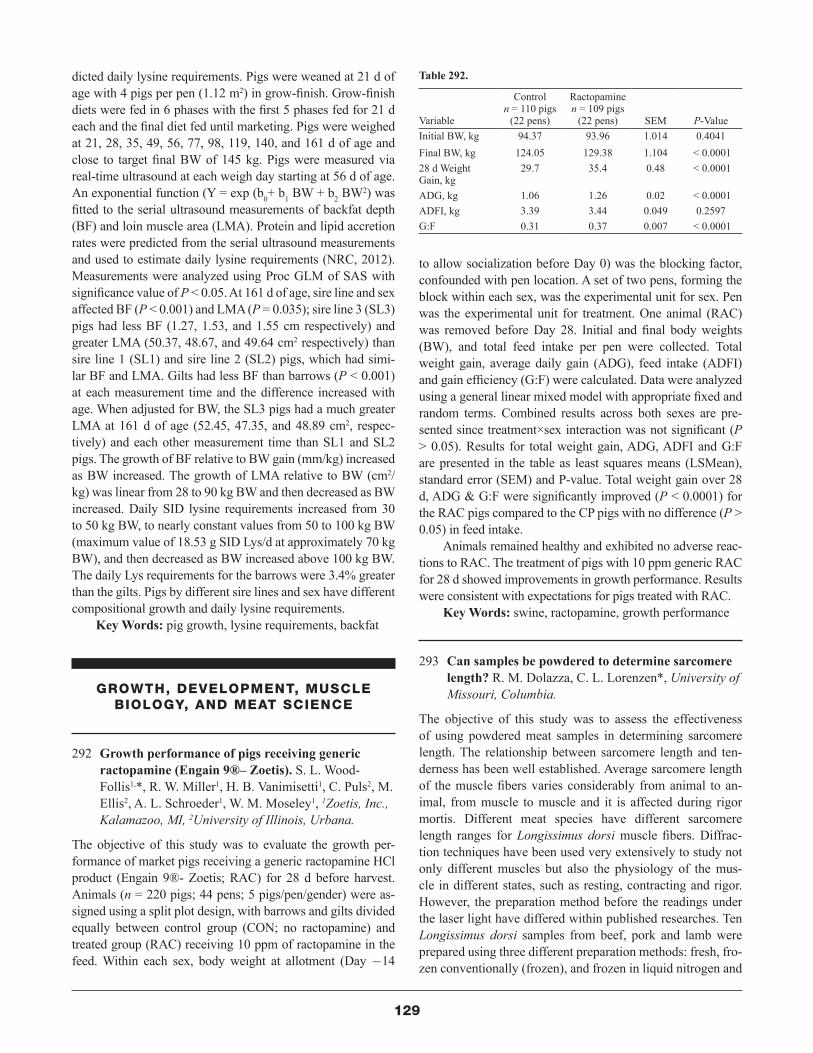
129
dicted daily lysine requirements. Pigs were weaned at 21 d of age with 4 pigs per pen (1.12 m2) in grow-finish. Grow-finish diets were fed in 6 phases with the first 5 phases fed for 21 d each and the final diet fed until marketing. Pigs were weighed at 21, 28, 35, 49, 56, 77, 98, 119, 140, and 161 d of age and close to target final BW of 145 kg. Pigs were measured via real-time ultrasound at each weigh day starting at 56 d of age. An exponential function (Y = exp (b0+ b1 BW + b2 BW2) was fitted to the serial ultrasound measurements of backfat depth (BF) and loin muscle area (LMA). Protein and lipid accretion rates were predicted from the serial ultrasound measurements and used to estimate daily lysine requirements (NRC, 2012). Measurements were analyzed using Proc GLM of SAS with significance value of P < 0.05. At 161 d of age, sire line and sex affected BF (P < 0.001) and LMA (P = 0.035); sire line 3 (SL3) pigs had less BF (1.27, 1.53, and 1.55 cm respectively) and greater LMA (50.37, 48.67, and 49.64 cm2 respectively) than sire line 1 (SL1) and sire line 2 (SL2) pigs, which had simi-lar BF and LMA. Gilts had less BF than barrows (P < 0.001) at each measurement time and the difference increased with age. When adjusted for BW, the SL3 pigs had a much greater LMA at 161 d of age (52.45, 47.35, and 48.89 cm2, respec-tively) and each other measurement time than SL1 and SL2 pigs. The growth of BF relative to BW gain (mm/kg) increased as BW increased. The growth of LMA relative to BW (cm2/kg) was linear from 28 to 90 kg BW and then decreased as BW increased. Daily SID lysine requirements increased from 30 to 50 kg BW, to nearly constant values from 50 to 100 kg BW (maximum value of 18.53 g SID Lys/d at approximately 70 kg BW), and then decreased as BW increased above 100 kg BW. The daily Lys requirements for the barrows were 3.4% greater than the gilts. Pigs by different sire lines and sex have different compositional growth and daily lysine requirements.
Key Words: pig growth, lysine requirements, backfat
GROWTH, DEVELOPMENT, MUSCLE BIOLOGY, AND MEAT SCIENCE
292 Growth performance of pigs receiving generic ractopamine (Engain 9®– Zoetis). S. L. Wood-Follis1,*, R. W. Miller1, H. B. Vanimisetti1, C. Puls2, M. Ellis2, A. L. Schroeder1, W. M. Moseley1, 1Zoetis, Inc., Kalamazoo, MI, 2University of Illinois, Urbana.
The objective of this study was to evaluate the growth per-formance of market pigs receiving a generic ractopamine HCl product (Engain 9®- Zoetis; RAC) for 28 d before harvest. Animals (n = 220 pigs; 44 pens; 5 pigs/pen/gender) were as-signed using a split plot design, with barrows and gilts divided equally between control group (CON; no ractopamine) and treated group (RAC) receiving 10 ppm of ractopamine in the feed. Within each sex, body weight at allotment (Day -14
to allow socialization before Day 0) was the blocking factor, confounded with pen location. A set of two pens, forming the block within each sex, was the experimental unit for sex. Pen was the experimental unit for treatment. One animal (RAC) was removed before Day 28. Initial and final body weights (BW), and total feed intake per pen were collected. Total weight gain, average daily gain (ADG), feed intake (ADFI) and gain efficiency (G:F) were calculated. Data were analyzed using a general linear mixed model with appropriate fixed and random terms. Combined results across both sexes are pre-sented since treatment×sex interaction was not significant (P > 0.05). Results for total weight gain, ADG, ADFI and G:F are presented in the table as least squares means (LSMean), standard error (SEM) and P-value. Total weight gain over 28 d, ADG & G:F were significantly improved (P < 0.0001) for the RAC pigs compared to the CP pigs with no difference (P > 0.05) in feed intake.
Animals remained healthy and exhibited no adverse reac-tions to RAC. The treatment of pigs with 10 ppm generic RAC for 28 d showed improvements in growth performance. Results were consistent with expectations for pigs treated with RAC.
Key Words: swine, ractopamine, growth performance
293 Can samples be powdered to determine sarcomere length? R. M. Dolazza, C. L. Lorenzen*, University of Missouri, Columbia.
The objective of this study was to assess the effectiveness of using powdered meat samples in determining sarcomere length. The relationship between sarcomere length and ten-derness has been well established. Average sarcomere length of the muscle fibers varies considerably from animal to an-imal, from muscle to muscle and it is affected during rigor mortis. Different meat species have different sarcomere length ranges for Longissimus dorsi muscle fibers. Diffrac-tion techniques have been used very extensively to study not only different muscles but also the physiology of the mus-cle in different states, such as resting, contracting and rigor. However, the preparation method before the readings under the laser light have differed within published researches. Ten Longissimus dorsi samples from beef, pork and lamb were prepared using three different preparation methods: fresh, fro-zen conventionally (frozen), and frozen in liquid nitrogen and
Table 292.
Variable
Control n = 110 pigs
(22 pens)
Ractopamine n = 109 pigs
(22 pens) SEM P-ValueInitial BW, kg 94.37 93.96 1.014 0.4041Final BW, kg 124.05 129.38 1.104 < 0.000128 d Weight Gain, kg
29.7 35.4 0.48 < 0.0001
ADG, kg 1.06 1.26 0.02 < 0.0001ADFI, kg 3.39 3.44 0.049 0.2597G:F 0.31 0.37 0.007 < 0.0001

130
powdered (powdered). Samples were then homogenized in a 0.25 M sucrose, 0.002 M potassium chloride, and 0.005 M sodium iodoacetate solution at pH 7.0. Light diffraction using a Helium-Neon laser was used to measure sarcomere lengths. Data was analyzed using PROC MIXED procedure from SAS 9.3 (2011) program. Sarcomere lengths (Table 1) differed (P < 0.05) by species, as expected. No differences between prepa-ration methods (P > 0.05) were found for pork and lamb. The frozen preparation method resulted in shorter sarcomeres (P < 0.05) for beef samples. These results indicate that any of the methods used for sample preparation can be used as far as results are concerned, but laboratory work, time and expenses can be shortened by using the powdering method to prepare muscle samples for sarcomere length measurement.
Key Words: sarcomere, research method, beef, pork, lamb
294 Carcass and meat quality characteristics of pigs receiving generic ractopamine (Engain 9®– Zoetis). S. L. Wood-Follis1,*, R. W. Miller1, H. B. Vanimisetti1, R. Herrick2, A. C. Dilger2, A. L. Schroeder1, W. M. Moseley1, 1Zoetis, Inc., Kalamazoo, MI, 2University of Illinois, Urbana-Champaign.
The objective of this study was to evaluate carcass and meat quality characteristics of market pigs receiving a generic rac-topamine HCl product (Engain 9® – Zoetis; RAC) for 28 d before slaughter. Animals (n = 220 pigs; 44 pens) were as-signed to the study using a split plot design, with barrows and gilts fed separately and divided equally between control group (CON; no ractopamine) and treated group (RAC) fed at 10 ppm for 28 d. All animals (n = 219) were harvested after ap-proximately 16 h feed removal. Eighty eight (88) carcasses (2 per pen) were selected closest to the pen mean to evalu-ate pork meat quality and carcass cutting yields. Data were analyzed using a general linear mixed model with appropriate fixed and random terms. Pen was the experimental unit. Re-sults for dressing percent are presented by sex as the treat-ment by sex interaction was significant (P < 0.05); all other results are presented by treatment. Treatment of pigs with 10 ppm generic RAC showed minimal changes in meat quality
but showed improvements in carcass cutting, lean cutting and boneless lean cutting yields. Results were consistent with ex-pectations for pigs treated with RAC.
Key Words: swine, ractopamine, carcass
295 Effect of gender/castration status on color and lipid oxidation stability of long-term chilled lamb muscles. Y. H. B. Kim1, 2,*, A. Stuart3, G. Maclennan4, 1AgResearch Ltd, Hamilton, New Zealand, 2Purdue University, West Lafayette, IN, 3AgResearch Ltd., Hamilton, New Zealand, 4Alliance Group Ltd., Invercargill, New Zealand.
Fresh meat color is one of the most important quality attri-butes that impact consumers’ meat purchasing decisions. The New Zealand meat industry questions whether differences in gender/castration status influence the color and color stability of long-term chilled lamb meat. The objective of the present study was to determine the effect of different gender/castration status (ewe, wether, ram and cryptorchid) on the color and lip-id oxidation stabilities of individual loin and leg muscles from the lambs. Seventy-six lambs (ewe = 18, wether = 18, ram = 20 and cryptorchid = 20; 11 mo old) were slaughtered, and then loins and legs were excised from carcasses at 24 h post mortem, vacuum packed and then transported to AgResearch. Following storage at -1.5°C for 8 wk, subsamples were taken from each loin (M. longissimus dorsi (LD) and leg muscles (Mm. semimembranosus (SM), semitendinous (ST) and bi-ceps femoris (BF)) and re-packaged into high-oxygen modi-fied atmosphere (80% O2/20% CO2) and displayed for 7 d at 4°C under light. Lipid oxidation, pH, myoglobin content and color stability were determined. Data were analyzed using the ANOVA directive of GenStat. Results indicate that different gender/castration status influenced the chemical attributes
Table 294. Results are presented as least squares mean (LSMean) ± standard error and P-value.
Variable CON RAC P-ValueHCW, kg 93.1 ± 0.69 98.2 ± 0.69 < 0.0001Dressing Percent, Barrows, % 77.8 ± 0.33 78.9 ± 0.33 < 0.0001Dressing Percent, Gilts, % 78.2 ± 0.3 78.7 ± 0.3 0.0586Carcass Lean, % 54.2 ± 0.35 55.5 ± 0.35 0.0002Loin Depth, mm 64.3 ± 0.47 69.1 ± 0.47 < 0.0001Loin Eye Area, cm2 51.1 ± 0.98 56.1 ± 0.98 < 0.0001Backfat Thickness 10th rib, mm 19.3 ± 0.55 17.7 ± 0.55 0.0070Minolta L* 48.8 ± 0.4 48.7 ± 0.4 0.7932Minolta a* 8.9 ± 0.15 7.8 ± 0.15 < 0.0001Minolta b* 4.0 ± 0.30 3.2 ± 0.30 < 0.0001Warner-Bratzler Shear Force, kg 3.26 ± 0.16 3.62 ± 0.17 0.0238Carcass Cutting Yield, % 77.2 ± 0.29 78.3 ± 0.29 0.0001Lean Cutting Yield, % 62.5 ± 0.37 63.9 ± 0.37 0.0010Boneless Lean Cutting Yield, % 40.5 ± 0.30 42.4 ± 0.30 < 0.0001
No differences were observed in (P > 0.05; CON vs. RAC) last rib fat thickness (22.4 vs. 22.3 mm), pH (5.52 vs. 5.53), drip loss % (4.79 vs. 4.62), belly flop (21.2 vs. 21.1 cm) and belly thickness (3.62 vs. 3.73 cm). The 14 d post mortem loin chop Warner-Bratzler Shear Force was increased, similar to values reported in previous RAC studies.
Table 293. Sarcomere lengths for livestock species using three dif-ferent sample preparation methods (n = 10 samples/species and preparation method)
Least Square Mean Estimates
SpeciesPreparation Method
Fresh Frozen PowderBeef 1.46a 1.41b 1.44a
Lamb 1.32c 1.33c 1.31c
Pork 1.48d 1.49d 1.46d
LSD within column = 0.045 (P < 0.05)LSD within row = 0.042 (P < 0.05)M eans lacking a common superscript with row and column differ (P <
0.05)
131
and color stability of the long-term chilled lamb loin and leg muscles. In general, the loin and leg muscles from ram and cryptorchid lambs had higher pH and less myoglobin contents (P < 0.05), and consequently resulted in less lipid and myo-globin oxidation (less discolored) than the muscles from ewe and wether lambs at the end of display (d 7). The individual muscle types revealed different myoglobin contents and dif-ferent color stability, where ST was the most color stable (least discoloration) followed by LD, BF and with SM be-ing the least color stable (most discoloration). These results suggest that different gender/castration status of lambs could affect to some extent the color and lipid oxidation stability of lamb meat when displayed longer than 4 d. Furthermore, the results of this study indicated that the physiological difference in lamb muscle types played a more substantial role in meat color and lipid oxidation stabilities than the gender/castration did. Therefore, taking into account the difference in the color stability of muscles, while developing new packaging strate-gies, would be beneficial to maximize the color shelf-life of long-term chill-stored lamb muscles.
Key Words: lamb, gender/castration, oxidation
296 Effects of breed on chemical composition, quality attributes and texture characteristics of one-humped camel meat. A. N. Al-Owaimer*, G. M. Suliman, E. S. O. S. Hussein, King Saud University, Riyadh, Saudi Arabia.
This study was conducted to evaluate effects of breed on qual-ity parameters and texture indices of one-humped camel meat. Thirty two (32) Longissimus dorsi and Semimembranosus mus-cles were taken equally from sixteen (16) one-humped camels of two breeds (domestic Saudi and imported Somali) with a live weight of approximately 140–150 kg, at approximately 12–15 mo of age. The experiment followed a (2 × 2) factorial (two breeds × two muscles), in a completely randomized design and the statistical analysis was performed using SPSS (ver. 18) software program. The results showed that only moisture and crude fat of the chemical composition were significantly (P < 0.05) different between the treatments. The Semimembrano-sus muscle of the domestic camel breed composed the high-est (3.24%) fat content. While the highest (77.27%) moisture content was attained by the Semimembranosus muscle of the imported breed. Shearing force was significantly (P < 0.05) different between the treated camel groups. The Longissimus muscle for both breeds were more tender than their counterparts Semimembranosus muscles. Contrary to the context, the Semi-membranosus muscle of the imported breed attained the highest myofibril fragmentation index (MFI) value. Although the tested groups were statistically significant (P < 0.05). It is also noticed that the Longissimus and Semimembranosus muscles for the domestic breed showed the least MFI values. Cooking loss and water-holding capacity (WHC) were significantly different (P < 0.05) between the muscles of the two breeds. The Longissi-
mus muscle of the imported breed showed the highest cooking loss (32.83%) compared to that of the domestic breed which revealed the lowest value (28.15%) of cooking loss. Coincid-ing with its cooking loss value, the Longissimus muscle of the domestic breed had the lowest value of WHC. The Longissimus muscle of the domestic breed tended to be more red in color than that of the imported breed, while the Semimembranosus muscle of the domestic breed tended to be lighter than that of the imported breed. The treatment groups also showed signifi-cant (P < 0.05) differences between them in hardness, chewi-ness and cohesiveness. On the other hand, they did not differ significantly (P > > 0.05) in springiness. It is concluded that meats from both the domestic and imported camels differ in fat content and quality characteristics.
Key Words: breed, camel, meat
297 Precision of dual-energy X-ray absorptiometry measurements obtained on pork half-carcasses. M. Kipper1, 2, C. Pomar2,*, M. Marcoux2, 1Universidade Federal de Santa Maria, Santa Maria, Brazil, 2Agriculture and Agri-Food Canada, Sherbrooke, QC, Canada.
This study was conducted to investigate the repeatability and reproducibility of dual-energy X-ray absorptiometry (DXA) measurements taken in 9 pork half-carcasses with moder-ate weight (38.5 to 53.1 kg) and backfat thickness (14 to 21.5 mm) variability. A Lunar Prodigy Advance (software version 13.40.038) device was configured in the total body reading and standard mode. Repeatability conditions were created by scan-ning each carcass 10 times in the same position. Repeatability measures the error inherent to DXA readings. Reproducibility conditions were created by scanning each carcass once in 10 different positions. Reproducibility conditions include the re-peatability and reproducibility sources of variation. Reproduc-ibility measures the variation inherent to carcass positioning on DXA table. These 10 positions were obtained by turning the carcass (skin up vs. down), changing the scanning direction (head-to-hind foot vs. hind foot-to-head), the carcass alignment (straight vs. diagonal) and belly position (extended vs. folded). After the scans, the images were analyzed using either a rectan-gular custom region of interest (ROI) or using as reference the standard grid for human body by placing the carcass within the arm ROI. These two region analyses were performed for all the images obtained in both repeatability and reproducibility con-ditions. The coefficients of variation (CV) were computed for each carcass individually and then combined assuming a nor-mal variance distribution. DXA bone mineral density (BMD, g/cm2), bone mineral content (BMC, g), soft tissue (g), and fat (%) were considered in this study. Repeatability and reproduc-ibility for custom ROI were of 0.61 vs. 0.88% for BMD, of 0.68 vs. 3.65% for BMC, of 0.07 vs. 0.29% for soft tissue, and of 0.81 vs. 2.44% for fat. Repeatability and reproducibility for arm ROI were of 0.53 vs. 0.85% for BMD, of 0.56 vs. 0.76% for
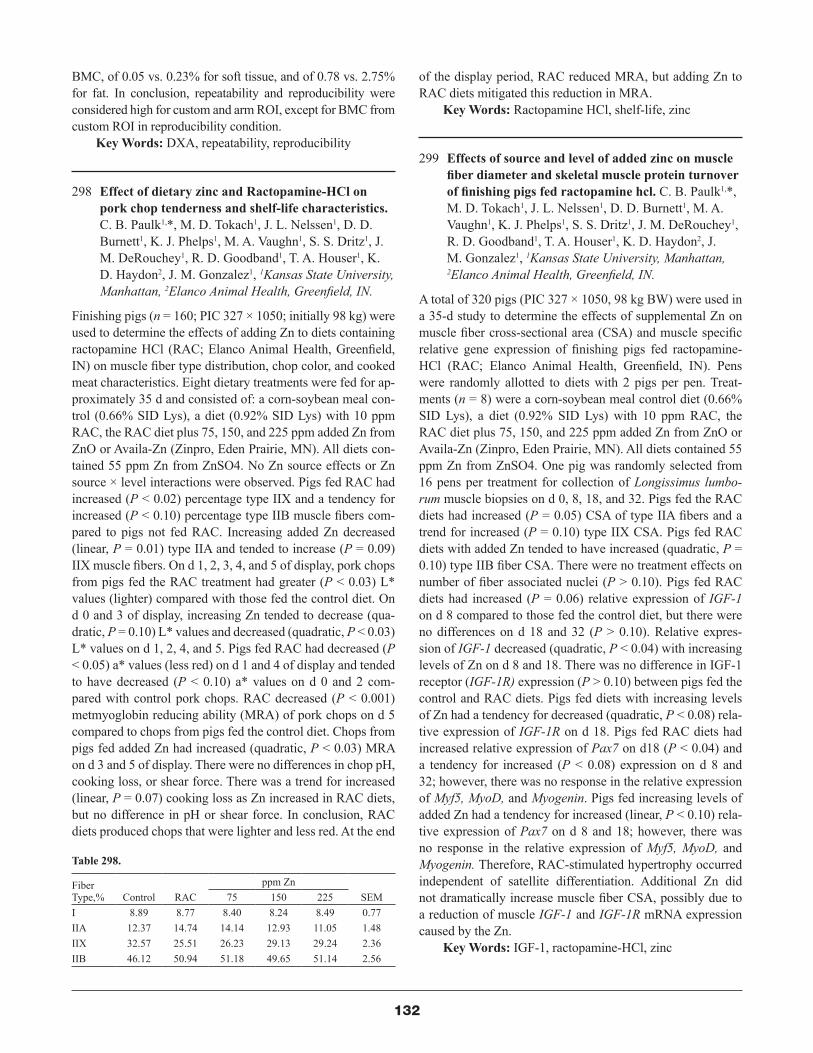
132
BMC, of 0.05 vs. 0.23% for soft tissue, and of 0.78 vs. 2.75% for fat. In conclusion, repeatability and reproducibility were considered high for custom and arm ROI, except for BMC from custom ROI in reproducibility condition.
Key Words: DXA, repeatability, reproducibility
298 Effect of dietary zinc and Ractopamine-HCl on pork chop tenderness and shelf-life characteristics. C. B. Paulk1,*, M. D. Tokach1, J. L. Nelssen1, D. D. Burnett1, K. J. Phelps1, M. A. Vaughn1, S. S. Dritz1, J. M. DeRouchey1, R. D. Goodband1, T. A. Houser1, K. D. Haydon2, J. M. Gonzalez1, 1Kansas State University, Manhattan, 2Elanco Animal Health, Greenfield, IN.
Finishing pigs (n = 160; PIC 327 × 1050; initially 98 kg) were used to determine the effects of adding Zn to diets containing ractopamine HCl (RAC; Elanco Animal Health, Greenfield, IN) on muscle fiber type distribution, chop color, and cooked meat characteristics. Eight dietary treatments were fed for ap-proximately 35 d and consisted of: a corn-soybean meal con-trol (0.66% SID Lys), a diet (0.92% SID Lys) with 10 ppm RAC, the RAC diet plus 75, 150, and 225 ppm added Zn from ZnO or Availa-Zn (Zinpro, Eden Prairie, MN). All diets con-tained 55 ppm Zn from ZnSO4. No Zn source effects or Zn source × level interactions were observed. Pigs fed RAC had increased (P < 0.02) percentage type IIX and a tendency for increased (P < 0.10) percentage type IIB muscle fibers com-pared to pigs not fed RAC. Increasing added Zn decreased (linear, P = 0.01) type IIA and tended to increase (P = 0.09) IIX muscle fibers. On d 1, 2, 3, 4, and 5 of display, pork chops from pigs fed the RAC treatment had greater (P < 0.03) L* values (lighter) compared with those fed the control diet. On d 0 and 3 of display, increasing Zn tended to decrease (qua-dratic, P = 0.10) L* values and decreased (quadratic, P < 0.03) L* values on d 1, 2, 4, and 5. Pigs fed RAC had decreased (P < 0.05) a* values (less red) on d 1 and 4 of display and tended to have decreased (P < 0.10) a* values on d 0 and 2 com-pared with control pork chops. RAC decreased (P < 0.001) metmyoglobin reducing ability (MRA) of pork chops on d 5 compared to chops from pigs fed the control diet. Chops from pigs fed added Zn had increased (quadratic, P < 0.03) MRA on d 3 and 5 of display. There were no differences in chop pH, cooking loss, or shear force. There was a trend for increased (linear, P = 0.07) cooking loss as Zn increased in RAC diets, but no difference in pH or shear force. In conclusion, RAC diets produced chops that were lighter and less red. At the end
of the display period, RAC reduced MRA, but adding Zn to RAC diets mitigated this reduction in MRA.
Key Words: Ractopamine HCl, shelf-life, zinc
299 Effects of source and level of added zinc on muscle fiber diameter and skeletal muscle protein turnover of finishing pigs fed ractopamine hcl. C. B. Paulk1,*, M. D. Tokach1, J. L. Nelssen1, D. D. Burnett1, M. A. Vaughn1, K. J. Phelps1, S. S. Dritz1, J. M. DeRouchey1, R. D. Goodband1, T. A. Houser1, K. D. Haydon2, J. M. Gonzalez1, 1Kansas State University, Manhattan, 2Elanco Animal Health, Greenfield, IN.
A total of 320 pigs (PIC 327 × 1050, 98 kg BW) were used in a 35-d study to determine the effects of supplemental Zn on muscle fiber cross-sectional area (CSA) and muscle specific relative gene expression of finishing pigs fed ractopamine-HCl (RAC; Elanco Animal Health, Greenfield, IN). Pens were randomly allotted to diets with 2 pigs per pen. Treat-ments (n = 8) were a corn-soybean meal control diet (0.66% SID Lys), a diet (0.92% SID Lys) with 10 ppm RAC, the RAC diet plus 75, 150, and 225 ppm added Zn from ZnO or Availa-Zn (Zinpro, Eden Prairie, MN). All diets contained 55 ppm Zn from ZnSO4. One pig was randomly selected from 16 pens per treatment for collection of Longissimus lumbo-rum muscle biopsies on d 0, 8, 18, and 32. Pigs fed the RAC diets had increased (P = 0.05) CSA of type IIA fibers and a trend for increased (P = 0.10) type IIX CSA. Pigs fed RAC diets with added Zn tended to have increased (quadratic, P = 0.10) type IIB fiber CSA. There were no treatment effects on number of fiber associated nuclei (P > 0.10). Pigs fed RAC diets had increased (P = 0.06) relative expression of IGF-1 on d 8 compared to those fed the control diet, but there were no differences on d 18 and 32 (P > 0.10). Relative expres-sion of IGF-1 decreased (quadratic, P < 0.04) with increasing levels of Zn on d 8 and 18. There was no difference in IGF-1 receptor (IGF-1R) expression (P > 0.10) between pigs fed the control and RAC diets. Pigs fed diets with increasing levels of Zn had a tendency for decreased (quadratic, P < 0.08) rela-tive expression of IGF-1R on d 18. Pigs fed RAC diets had increased relative expression of Pax7 on d18 (P < 0.04) and a tendency for increased (P < 0.08) expression on d 8 and 32; however, there was no response in the relative expression of Myf5, MyoD, and Myogenin. Pigs fed increasing levels of added Zn had a tendency for increased (linear, P < 0.10) rela-tive expression of Pax7 on d 8 and 18; however, there was no response in the relative expression of Myf5, MyoD, and Myogenin. Therefore, RAC-stimulated hypertrophy occurred independent of satellite differentiation. Additional Zn did not dramatically increase muscle fiber CSA, possibly due to a reduction of muscle IGF-1 and IGF-1R mRNA expression caused by the Zn.
Key Words: IGF-1, ractopamine-HCl, zinc
Table 298.
Fiber Type,% Control RAC
ppm ZnSEM75 150 225
I 8.89 8.77 8.40 8.24 8.49 0.77IIA 12.37 14.74 14.14 12.93 11.05 1.48IIX 32.57 25.51 26.23 29.13 29.24 2.36IIB 46.12 50.94 51.18 49.65 51.14 2.56

133
300 Influence of Rendement Napole (RN) genotype on growth performance and expression of metabolic genes in crossbred Ossabaw pigs fed different levels of dietary fat. H. Lu*, M. G. Ward, T. S. Stewart, L. Adeola, K. M. Ajuwon, Purdue University, West Lafayette, IN.
The study was conducted to investigate the effects of Rende-ment Napole (RN) genotype on growth performance and key metabolic markers in crossbred Ossabaw pigs fed diets with different levels of dietary fat. Thirty two crossbred Ossabaw pigs were used for the study with equal number of animals (n = 16) belonging to either the wild-type (WT, rn+/rn+) or carrier (CAR, RN-/rn+) genotypes. Pigs in each genotype were divid-ed into two dietary groups (n = 8) and fed either a high fat (HF, 4026 kcal/kg ME) or low fat (LF, 3364 kcal/kg ME) diet for 12 wk after which pigs were killed for gene expression analy-sis by RT-PCR. There was a significant diet×genotype interac-tion (P < 0.05) for final BW, ADG and Gain: Feed. Wild-type pigs on LF diet had lower final BW than WT pigs on HF diet. However, the final BW of carrier pigs was not affected by diet. Feed efficiency (Gain: Feed) and ADG were lower (P < 0.05) in WT pigs on LF diet compared to WT pigs on HF diet and all carriers pigs, irrespective of their diets. There was a trend (P < 0.08) for a higher feed consumption in pigs on the LF diet compared to HF. Backfat thickness was higher (P < 0.01) in pigs on the HF diet vs. LF. Serum triglyceride was higher (0.62 vs. 0.33 mg/dL, P < 0.01) in pigs on HF diet compared to those on LF. However, there was no effect of genotype on serum metabolite concentrations. Expression of carnitine pal-mitoyl transferase 1-α (CPT1α) was higher (P < 0.05) in the longissimus dorsi (LD) and semitendinosus (STD) muscles of pigs on HF diet relative to those on LF diet. Acyl-CoA oxidase (ACO) was also elevated (P < 0.05) in the liver of pigs on HF diet compared to those on the LF diet. Fatty acid synthase (FAS) was lower in the LD muscle, liver and mesenteric fat (P < 0.05) of carrier pigs compared to WT. Overall, the RN geno-type had no significant effects on the growth performance of crossbred Ossabaw pigs, but may result in suppression of fatty acid synthesis through downregulation of FAS.
Key Words: RN, Ossabaw pigs, growth performance, fatty acid metabolite
301 (UGS) Expression patterns of ABLIM1 and ATF4 during skeletal muscle development of Yorkshire-Landrace Crossbred Pigs. M. A. Woodward*, K. R. Perry, N. E. Raney, Y. L. Bernal Rubio, V. D. Rilington, C. W. Ernst, Michigan State University, East Lansing.
Fetal myogenesis and postnatal skeletal muscle hypertrophy in growing pigs are critical yet poorly understood processes. Global gene expression analyses can help to identify key genes and pathways controlling skeletal muscle development.
The objective of this study was to determine patterns of gene expression in skeletal muscle of pigs at different developmen-tal stages. A transcriptional profiling study was previously performed using the 70-mer Pigoligoarray microarray to iden-tify genes differentially expressed during fetal and postnatal development of longissimus dorsi (LD) muscle in Yorkshire-Landrace (YL) crossbred pigs. Pathway analyses revealed one of the top functional pathways to be Cellular Function and Maintenance. Specifically, two differentially expressed genes in this pathway were actin binding LIM protein 1 (ABLIM1) and activating transcription factor 4 (ATF4), which function in cytoskeleton organization and gene transcription, respec-tively. Results from the microarray indicated that transcript abundance of ABLIM1 was lower in postnatal LD samples (FDR < 0.01) as compared to fetal samples, whereas transcript abundance of ATF4 was higher in postnatal than in fetal LD samples (FDR < 0.01). The specific aim of this study was to confirm the expression patterns for ABLIM1 and ATF4 in LD muscle of YL pigs at 57, 70, 90, and 105 d of gestation, and at birth, 7 and 35 d postnatal. Total LD RNA isolated from fetuses or piglets of gilts at each developmental stage (n = 5–6 per stage) was used in qPCR assays with TaqMan chemistry to evaluate expression patterns for ABLIM1 and ATF4. The gene peptidylprolyl isomerase A (PPIA) was used as the control for normalization. Results of qPCR analyses confirmed the ex-pression patterns for both ABLIM1 and ATF4. Abundance of ABLIM1 mRNA was lower in postnatal LD muscle versus fetal (P < 0.01), whereas ATF4 mRNA abundance was higher postnatally (P < 0.001). While little is known about the role of ABLIM1 in skeletal muscle, the ATF4 protein has been shown to be involved in transcription of amino acid transporters and to play a role in protein synthesis. Thus, increased expression of ATF4 in postnatal LD muscle may support a role for this gene in muscle hypertrophy. This study provides new infor-mation regarding ABLIM1 and ATF4 expression during pig skeletal muscle development.
Key Words: myogenesis, pig, qPCR
302 Comparison of red meat versus high carbohydrate diet using the gilt biomedical model: liver and muscle energy use. C. H. Pereira1,2*, K. R. Wellnitz1, L. Prezotto1, F. E. Doscher1, E. P. Berg1, K. C. Swanson1, 1North Dakota State University, Fargo, 2Universidade Federal do Rio Grande do Sul, Porto Alegre, Brazil.
Twenty-one Yorkshire × Duroc × Hampshire gilts born over a 5-d period and sired by a common boar were selected for use at approximately 90 d of age. Before being allotted to di-ets, gilts were housed in individual pens (1.22 × 2.44 m) in a thermo-neutral and environmentally controlled room. Gilts were fed a common lysine-deficient diet (Lys < 0.45%) once daily to promote hyperphagia and adiposity until they reached 3 cm subcutaneous backfat (BF; 10/11th rib interface). When
134
the first gilts reached 3 cm of subcutaneous backfat by ultra-sound they are allocated to either a ground beef (GB; n = 5) or control (CON; n = 5) diets. The GB was 99.9% cooked ground beef (65:35 lean:fat) plus 0.1% calcium carbonate while CON comprised 83% ground corn, 10% distillers dried grains plus solubles, and 5% soybean meal. Both rations met NRC requirements for gilts of this size and weight. Gilts were humanely slaughtered on d 85 and tissues were collected. The liver was weighed and samples of liver and sternomandiubu-laris muscle were immediately collected for in vitro O2 con-sumption analyses. Duplicate tissue samples (200 mg) were placed into test chambers containing 3 mL of buffer and a Clarke polariographic electrode and O2 consumption mea-sured for 5 min. Liver mass (g and g/kg BW) did not differ (P = 0.52 and P = 0.27) between treatments. Oxygen con-sumption (µmol/min/g) in liver was greater (P = 0.04) in gilts fed the GB diet compared to CON. However, O2 consumption (µmol/min/g) in muscle did not differ (P = 0.28) between the treatments. Feeding ground beef increased O2 consumption of liver tissue, potentially because of the increased workload as-sociated with the metabolism of excess dietary protein.
Key Words: ground beef, liver, O2 consumption
303 Comparison of red meat versus high carbohydrate diet using the gilt biomedical model: Body composition. K. R. Wellnitz *, J. D. Crosswhite, E. P. Berg, North Dakota State University, Fargo.
The objective of this study was to determine differences in body composition, blood chemistry, and insulin receptor den-sity of adipocyte and muscle fibers associated with a high cal-orie, high glycemic diet. Yorkshire×Duroc×Hampshire gilts (N = 21) born over a 5-d period from a common sire were fed ad libitum a low lysine diet (Lys < 0.45%) to promote hyperphagia and adiposity. Upon reaching 3 cm subcutane-ous backfat (10BF; 10/11th rib interface), dietary treatments were allocated across BW and BF to either a ground beef (GB; n = 5) or control (CON; n = 5) treatment. The GB diet was 99.9% cooked ground beef (65:35 lean:fat) plus 0.1% calci-um carbonate while CON comprised 83% ground corn, 10% distillers dried grains plus solubles, and 5% soybean meal. Both rations met NRC requirements for gilts of this size and weight. Intake and orts were recorded daily. Body weights (BW) and blood draws were collected on d0, 28, 56, and 84. Gilts were humanely euthanized on d85 for tissue collections and body composition analysis. One gilt was removed from the GB due to foot infection. The CON gilts gained 0.77 while GB gilts gained 0.61. kg/d (P = 0.02). Estimated kilocalorie consumption/d was less (P = 0.01) for CON (14,322 kcals/d) versus GB (17,896 kcals/d) from d 35 to 84. The percentage change of 10BF and BW from d0 were calculated as [(d28, 56 or 84– d0)/d0] and evaluated as repeated measure for the interaction of treatment by day. The GB gilts had a greater
percent change in BW (P = 0.002) and 10BF (P < 0.02). Con-trol gilts had more (P = 0.04) perirenal fat than GB (5.05 vs. 5.50 Kg, respectively). No differences were observed (P ³ 0.25) for adrenal, liver, or spleen weights, however the hearts of the CON gilts tended (P = 0.08) to be heavier compared to the GB gilts. Gilts in the GB treatment consumed 1.25 times more caloric energy than CON and gained less body fat.
Key Words: gilts, body composition, biomedical
304 (GS-MS) Comparison of red meat versus high carbohydrate diet using the gilt biomedical model: Blood chemistry. L. L. Baranko*, K. R. Wellnitz, K. A. Vonnahme,E. P. Berg, North Dakota State University, Fargo.
The objective of this study was to determine differences in body composition, blood chemistry, and insulin receptor density of adipocyte and muscle fibers are associated with a high calorie, high glycemic diet. Yorkshire×Duroc×Hampshire gilts (N = 21) born over a 5-d period from a common sire were fed ad libitum a low lysine diet (Lys < 0.45%) to promote hyperphagia and adiposity. Upon reaching 3 cm subcutaneous backfat (10BF; 10/11th rib interface), dietary treatments were allocated across BW and BF to either a ground beef (GB; n = 5) or control (CON; n = 5) treatment. The GB diet was 99.9% cooked ground beef (65:35 lean:fat) plus 0.1% calcium carbonate while CON com-prised 83% ground corn, 10% distillers dried grains plus solu-bles, and 5% soybean meal. Both rations met NRC requirements for gilts of this size and weight. Intake and orts were recorded daily. Body weights (BW) and blood draws were collected on d0, 28, 56, and 84. Gilts were humanely slaughtered on d85 for tissue collections and body composition analysis. One gilt was removed from the GB due to foot infection. Blood analysis was conducted using an iSTAT point of care device (Abaxis, Inc.) which measured sodium, potassium, ion calcium, glucose, he-matocrit, hemoglobin, pH, PCO2, PO2, TCO2, HCO3, base ex-cess, and SO2. Blood lipid panel was assayed for total choles-terol (CHOL), LDL, HDL, and Triglycerides. The GB gilts had a higher percent change in BW (P = 0.002) and 10BF (P < 0.02). Control gilts had more (P = 0.04) perirenal fat than GB (5.05 vs. 5.50 Kg, respectively). The GB gilts had higher circulating LDL (P = 0.015), CHOL (P = 0.02), and glucose (P = 0.04) and lower HCO3 (P = 0.023) and TCO2 (P = 0.018) than CON. Gilts from GB tended to have a higher LDL:CHO ratio (P = 0.052) and HDL:LDL ratio (P = 0.079), and lower sodium (P = 0.107), PCO2 (P = 0.078), and base excess (P = 0.087) than CON. Top, middle, and bottom heart ventricular thickness recorded on the right and left sides did not differ (P > 0.10) across treatments. The lower adiposity of GB versus CON gilts over 84 d did not result in blood lipid panel improvements as GB gilts recorded a higher circulating cholesterol concentration, however these lev-els were very low (GB = 116.09 mg/dL vs. CON = 91.04 mg/dL) relative to human biomedical standards.
Key Words: gilts, biomedical, cholesterol

135
305 Effects of dietary forage concentration in finishing diets on growth and carcass characteristics of beef steers. K. L. Sorensen1,*, V. L. Anderson2, K. R. Maddock-Carlin1, C. L. Engel2, C. S. Schauer3, K. C. Olson4, R. J. Maddock1, 1North Dakota State University, Fargo, 2Carrington Research Extension Center, North Dakota State University, Carrington, 3Hettinger Research Extension Center, North Dakota State University, Hettinger, 4South Dakota State University, Rapid City.
The objective of this study was to evaluate the effect of feed-ing different levels of forage during the finishing phase of beef production on steer performance, meat quality traits, and pro-duction costs. Angus influenced yearling steers (n = 120) were fed finishing diets consisting of three forage levels (20, 30, or 40% of the total ration DM). The concentrate portion of each ration was corn, barley, and modified distillers grains. For-ages included corn silage and prairie hay. All steers were fed a 40% forage diet for the first 28-d period and then assigned to one of three treatments: 1) 40% forage, 2) 30% forage, or 3) 20% forage after 30% forage for 28 d. Steers were blocked by weight and randomly allotted to pen within weight block, with 10 head per pen and four pens per treatment. Performance data collected included ADG, DMI, and G:F. Finished steers were slaughtered on the same day. The following carcass attributes were collected; HCW, LMA, 12th rib fat, marbling score, KPH, and final yield grade. Beef strip loins were obtained from the carcasses, vacuum-packaged, and aged for 10 d at 4°C. At d 10, steaks (~2.5 cm thick) were fabricated from each loin. Tender-ness was analyzed using Warner-Bratzler shear force (WBSF). Retail shelf-life display was conducted over a 10 d period and two lights sources compared (fluorescent lighting or LED light-ing) with muscle lightness (L*), muscle redness (a*), and mus-cle yellowness (b*) color scores recorded. Body weight gains, ADG, DMI, and G:F were not different (P > 0.14) among treat-ments. Additionally, carcass traits of HCW, LMA, 12th rib fat thickness, marbling score, final yield grades, and WBSF were not different (P > 0.26) among treatments. Shelf life evaluations showed that loin steak lightness (L*; P > 0.70), redness (a*; P > 0.62), and yellowness (b*; P > 0.86) were not different among treatments. Light source did not impact (P > 0.96) L*, a*, or b* color scores. The cost of producing a kg of gain was not different between treatments. Feeding higher forage content during fin-ishing of beef steers appears to have no effect on performance, meat quality or production costs.
Key Words: steers, feedlot, forage level
306 Fatty acid composition and iodine value of pork fat from 3 sampling locations in the carcass. J. E. Estrada1,*, M. Ellis1, S. J. Hardman1, A. M. Gaines2, B. A. Peterson2, O. F. Mendoza2, 1University of Illinois, Urbana, 2The Maschhoffs, Carlyle, IL.
The effect of sampling location (belly, jowl, and backfat) on fat-
ty acid composition and iodine value (IV) of pork fat was evalu-ated in 90 pigs (barrows and gilts) that had been fed diets with a range of DDGS inclusion levels (0, 20, 40, 60%) from 23.4 ± 1.14 kg to 128.3 ± 2.15 kg BW. At the end of the growth period, pigs were harvested at a commercial plant and fat samples were collected from the belly (posterior to sternum), jowl (anterior end), and backfat (third thoracic vertebra). Fatty acid profile of fat samples from individual pigs was measured using gas chro-matography (GC) and IV was predicted with an equation from AOCS (1998) based on unsaturated fatty acid content; IV was also measured using near infrared spectroscopy (NIR). The con-centration of total saturated fatty acids (33.9, 30.0, and 33.3% for belly, jowl, and backfat, respectively; SEM 0.35), total monoun-saturated fatty acids (43.1, 44.2, and 41.0%, respectively; SEM 0.28), total polyunsaturated fatty acids (23.0, 25.9, and 25.7%, respectively; SEM 0.52), and GC IV (74.9, 80.2, and 77.6 g/kg, respectively; SEM 0.71) differed (P < 0.05) between locations. Pearson correlations between GC IV for the 3 locations were be-tween 0.80 to 0.90. The IV values measured using either GC or NIR were similar (P > 0.05) for all locations (e.g., IV of backfat sample was 77.6 and 77.6 g/kg for GC and NIR measurements, respectively) and the Pearson correlation between GC and NIR IV values were between 0.95 to 0.97 for the 3 locations. The results of this study, which was performed with fat samples from pigs that had been reared under commercial conditions and fed a wide range of DDGS levels, suggest a relatively large effect of sampling location on fatty acid profile and IV, and that using NIR to measure IV gives comparable values to GC analysis.
Key Words: fat, IV, NIR
307 Comparison of red meat versus high carbohydrate diet using the gilt biomedical model: Myofiber and adipocyte molecular biology. M. Alkhuriji*, P. P. Borowicz, L. L. Baranko, K. R. Wellnitz, E. P. Berg, North Dakota State University, Fargo.
The objective of this study was to determine if differences in body composition, blood chemistry, and insulin receptor (IR) density of adipocyte and muscle fibers are associated with a high calorie, high glycemic diet. Yorkshire×Duroc×Hampshire gilts (N = 21) born over a 5-d period from the same sire were provided ad libitum access to a low lysine diet (Lys = 0.45%) to promote hyperphagia and adiposity. Upon reaching 3 cm subcutaneous backfat (10BF; 10/11th rib interface), dietary treatments were allocated across BW and BF to either a ground beef (GB; n = 5) or control (CON; n = 5) treatment. The GB diet was 99.9% cooked ground beef (65:35 lean:fat) plus 0.1% calcium carbonate while CON comprised 83% ground corn, 10% distillers dried grains plus solubles, and 5% soybean meal. Both rations met NRC requirements for gilts of this size and weight. Intake and orts were recorded daily. Body weights (BW) and blood draws were collected on d0, 28, 56, and 84. Gilts were humanely slaughtered on d85 for tissue collections and body composition analysis. One gilt was
136
removed from the GB due to foot infection. Samples of lon-gissimus thoracis muscle (LT; 10/11th rib interface), gracilis muscle (GM), 10BF, and liver tissues were snap frozen for IR qPCR analysis, and fixed in formalin for immunohisto-chemical evaluation of IR density. The GB gilts had a greater percent change in BW (P = 0.002) and 10BF (P < 0.02). Con-trol gilts had more (P = 0.04) perirenal fat than GB (5.05 vs. 5.50 Kg, respectively). Image analyses of photomicrographs of tissues stained for IR did not differ between treatments for IR density in 10BF or pooled muscle, however GB GM IR density was significantly greater (P = 0.04) than CON GM, CON LT, and GB LT. No differences were observed for qPCR analysis for expression of IR in the LT, GM, 10BF, and liver (P = 0.43, 0.2, 0.13, and 0.19, respectively). Despite the CON (high carbohydrate) gilts gaining more 10BF and BW, no sig-nificant differences were observed between the treatments for IR density and IR expression.
Key Words: gilts, Insulin receptor, biomedical
308 Effects of feeding dried distiller grains with solubles (DDGS) to immunologically castrated pigs harvested at 5, 7, or 9 wk post-second dose of Improvest on lean quality. E. K. Harris1,*, C. Calhoun2, L. J. Johnston3, R. Cox1, G. C. Shurson1, 1University of Minnesota, St. Paul, 2Zoetis, Inc, Florham Park, NJ, 3West Central Research and Outreach Center, University of Minnesota, Morris.
Studies have shown feeding diets containing DDGS to grow-ing-finishing pigs has minimal effects on lean quality of bar-rows and gilts, but lean quality of immunologically castrated pigs fed DDGS (10.4% crude fat) has not been evaluated. En-tire male pigs were weighed at 8 wk of age (WOA), assigned randomly to dietary treatments, and harvested at 9 (TD9), 7 (TD7), or 5 (TD5) weeks post-second dose of Improvest (go-nadotropin releasing factor analog- diphtheria toxoid con-jugate; Zoetis, Inc., Florham Park, NJ) in a 4 × 3 factorial arrangement. A 4-phase feeding program (phase 1 for 3 wk, phases 2 and 3 for 4 wk each, and phase 4 for 5 wk) was used for each dietary treatment: positive control (PCon; 0% DDGS in all dietary phases), DDGS step down (SD; 40%, 30%, 20%, and 10% DDGS in the 4 dietary phases, respec-tively), DDGS withdrawal (WD; 40% DDGS in phases 1 to 3, and 0% DDGS in phase 4), and negative control (NCon; 40% DDGS in all dietary phases). All pigs received the first sub-cutaneous injection of Improvest at 11 WOA, and the second Improvest dose at 15, 17, or 19 WOA. At 13 WOA, 2 pigs/pen (n = 8 pens/treatment) were randomly selected for har-vest at 24 WOA for carcass lean quality measurements at the University of Minnesota Meat Science Laboratory. Harvest day post-second Improvest dose did not affect pH at 48-hour postmortem, objective Hunter color, and subjective lean color scores of the longissimus muscle (LM). Pigs fed PCon tended (P < 0.10) to have lower LM pH at 45-min (6.15 vs. 6.29 ± 0.06) than pigs fed NCon, but by 48-h postmortem, pH was
not different among dietary treatments. Drip loss of loin chops and purge loss of loin roasts were not different among dietary treatments. Dietary treatment had no effect on LM L*, but pigs fed PCon had higher (P £ 0.05) LM a*(-1.51 vs. -2.02 ± 0.12), and tended (P £ 0.10) to have higher LM b* (5.60 vs. 5.13 ± 0.68) compared with pigs fed NCon. Subjective firm-ness score of loins from pigs fed PCon was greater (P £ 0.05) compared with loins from pigs fed WD and NCon (2.60 vs. 2.28 and 2.24 ± 0.12, respectively). Dietary treatment and day of harvest post-second dose of Improvest had minimal effects on lean quality of pork, except for subjective LM firmness.
Key Words: DDGS, Improvest, lean quality
309 (UGS) Temporal postmortem RNA degradation in subcutaneous adipose tissue in swine. E. K. Hogan, D. L. Clark, A. C. Dilger, University of Illinois, Urbana-Champaign.
When collecting tissues for RNA analysis, it is generally ac-cepted that samples should be preserved immediately postmor-tem to limit RNA degradation. However, this often is challeng-ing in practical situations. While RNA degradation in many tissues has been previously investigated, RNA degradation in postmortem adipose tissue is less understood. The objective of this study was to characterize qualitative and quantitative changes in RNA from adipose tissue with increasing time post-mortem. Subcutaneous adipose samples were obtained from five pigs at nine time points, ranging from immediately after exsanguination to 6 d postmortem. Samples were flash frozen in liquid nitrogen, then stored at -80°C until RNA extraction. An Agilent Bioanalyzer and Nanodrop spectrophotometer were used to determine RNA quality. Expression of key adipo-genic genes including stearoyl-coA desaturase (SCD), peroxi-some proliferator-activated receptor γ (PPARγ), adiponectin (ADIPOQ), and glyceraldehyde-3-phosphate dehydrogenase (GAPDH) were quantified by qPCR. Data were analyzed as repeated measures using the mixed procedure of SAS. The 260/280 ratio was unaffected (P = 0.41) by time postmortem. RNA integrity number (RIN) decreased (P < 0.01) over time, with samples collected at 2 h postmortem similar (P > 0.05) to samples collected immediately after exsanguination. Addition-ally, cycles to threshold (CT) increased (P > 0.01) for all genes over time, an indication of increased RNA degradation over time. However, for each gene, CT of samples collected at 0 min, 30 min, and 2 h after exsanguination were not different (P > 0.05). When PPARγ was normalized to GAPDH, ΔCT val-ues were unaffected by time (P > 0.05). However, normalized to GAPDH, both SCD and ADIPOQ ΔCT values increased (P < 0.01) over time, indicating that SCD and ADIPOQ degrade at a faster rate than GAPDH. For SCD, ΔCT increased (P < 0.01) at 24 h compared to the sample taken immediately af-ter exsanguination while samples taken before this time were all similar (P > 0.05). For ADIPOQ, ΔCT was increased (P < 0.05) at 5 h compared to the initial time point, while samples
137
taken before 5 h were similar (P > 0.05) to the initial sam-ple. Therefore, while subcutaneous adipose samples collected within 2 h postmortem are optimal, samples could be collected up to 5 h postmortem and avoid biases in RNA degradation with respect to genes evaluated in this study.
Key Words: adipose, RNA, swine, postmortem degradation, SCD, PPARγ, ADIPOQ, GAPDH
310 Effect of the porcine IGF2 intron3-G3072A substitution on carcass cutability and meat quality. D. L. Clark*, J. E. Beever, A. C. Dilger, University of Illinois, Urbana-Champaign.
A single-nucleotide polymorphism (SNP) in a regulatory re-gion of intron 3 within the IGF2 gene (IGF2 G3072A) ac-counts for 4–5% of the variability in loin eye area and 7–21% of the variability in back fat thickness in pigs. However, data are limited regarding carcass composition and fresh meat quality characteristics of pigs with differing paternally ex-pressed alleles for this IGF2 variant. A single heterozygote (AG) Berkshire boar was bred to homozygous (AA) commer-cial Yorkshire-cross sows producing an F1 generation from which approximately 50% of possessed a paternal G allele and 50% possessed a paternal A allele. These offspring, bar-rows and gilts, were group housed, fed ad libitum a diet that met or exceeded NRC nutrient recommendations, and were slaughtered at 176 d (± 4) of age. Pig was treated as the ex-perimental unit. Lean cutting yield determination was com-pleted on the right side of chilled carcasses approximately 24 h after slaughter. Fresh loin quality was assessed on the left side of the carcass at the level of the 10th rib. Quality analyses included 24-hour pH, drip loss, objective color (Minolta L*, a*, and b*), subjective color, marbling and firmness, cook-ing loss, and shear force at 1, 3, 7, 14, and 21 d after slaugh-ter. Ending live weight and hot carcass weights were not af-fected by IGF2 allele; however, tenth rib back fat thickness decreased by approximately 0.4 cm (P < 0.05), loin eye area increased by approximately 4.0 cm2 (P < 0.05), and predicted fat free lean increased over 2% units (P < 0.05) in pigs that possessed paternal A alleles compared to G alleles. Further-more, boneless lean cuts from the shoulder, loin and ham were heavier (P < 0.05) in pigs with paternal A alleles compared to G alleles. In general, IGF2 allele had minimal effects on fresh loin quality as 24-hour pH, drip loss, and objective color were not different (P > 0.05) in the IGF2 variants. Minolta L* value was increased by approximately 2.5 L* units (P < 0.05), and cooking loss was increased by approximately 1.5% units (P < 0.05) in pigs carrying the paternal A allele compared to the G allele. Together these data suggest that the IGF2 G3072A mutation is responsible for a significant increase in lean meat yield with little impact on fresh meat quality.
Key Words: insulin growth factor 2, IGF2 G3072A, SNP, cutting yield
311 Pork quality characteristics of loins from pigs divergently selected for residual feed intake on high or low energy diets. E. K. Arkfeld1,*, J. E. Berger1, E. R. Hamman1, J. M. Young1, R. C. Johnson2, J. F. Patience1, J. C. M. Dekkers1, N. K. Gabler1, S. M. Lonergan1, E. Huff-Lonergan1, 1Iowa State University, Ames, 2Farmland Foods, Denison, IA.
The objective was to determine the effect of feeding a high energy, low fiber (HELF) or a low energy, high fiber (LEHF) diet on pork quality of loins from pigs divergently selected for residual feed intake (RFI). RFI is the difference in ob-served and expected feed intake of an animal given growth and backfat. The low RFI (LRFI) line is generally more effi-cient than the divergently selected high RFI (HRFI) line. Pigs (LRFI [80 barrows,75 gilts], HRFI [76 barrows, 77 gilts]) from generations 8 and 9 of the ISU RFI selection project were randomly assigned to 12 mixed line and sex pens per generation. Each generation, 6 pens were placed on the HELF diet (3.32 Mcal ME/kg; 9.5% NDF) and 6 pens onto the LEHF diet (2.87 Mcal ME/kg; 25.9% NDF). Pigs were slaughtered at mean BW of 122.5 ± 8.0 kg (generation 8) and 128.4 ± 8.0 kg (generation 9). Boneless loins were removed 24 h postmortem. Day 2 postmortem, chops were cut 2.54 cm thick. Ultimate pH was determined 48 h postmortem. One chop was homogenized 2 d postmortem for proximate analy-sis. Lean color was determined using a Hunter Labscan XE with a D75 light source and 1.27 cm aperture. Color, mar-bling and firmness scores were assigned at 2 d postmortem. Drip loss was determined 3 d postmortem as [(initial weight-final weight)/initial weight]x100. Data were analyzed using the mixed procedure of SAS with fixed effects of line, diet, sex, generation, and line*diet; random effects of slaughter group, pen, litter, and sire; and covariate of live weight. Per-cent moisture (P < 0.01; 73.3% v. 73.7%) was higher, and drip loss (P < 0.01; 1.60% v. 1.34%), color score (P < 0.01; 2.3 v. 2.0), a* (P < 0.01; 3.46 v. 2.64), b* (P < 0.01; 11.28 v.10.73), marbling score (P < 0.05; 1.4 v. 1.3), and percent lipid (P < 0.01; 1.70% v. 1.30%) were lower in chops from LRFI pigs than HRFI. Pigs fed the HELF diet had loins with greater L* (P < 0.05; 51.53 v. 50.78) and lower percent mois-ture (P < 0.01; 73.3% v. 73.7%) than loins from pigs fed the LEHF diet. Chops from LRFI pigs fed the LEHF diet had the lowest firmness scores (P < 0.05). Selection for LRFI im-pacted percent lipid and color score, although unlikely to be detected by consumers. Diet affected lines in the same man-ner; loins from animals fed the HELF diet were more pale in color and had less percent moisture. USDA-AFRI Grant #2011–68004–30336.
Key Words: energy, pork quality, residual feed intake

138
312 Effects of time from second Improvest dose to end of growth period on growth performance of immunologically-castrated barrows in comparison to physically-castrated barrows and gilts. C. L. Puls1,*, M. Ellis1, M. A. Mellencamp2, W. Beckman2, A. L. Schroeder2, F. K. McKeith1, B. A. Peterson3, A. M. Gaines3, C. F. Shipley1, 1University of Illinois, Urbana, 2Zoetis, Kalamazoo, MI, 3The Maschhoffs, Carlyle, IL.
This study evaluated the effect of time from second Improvest dose to end of growth period on the growth performance and carcass characteristics of immunologically-castrated barrows (IC) in comparison to physically-castrated barrows (PC) and gilts (G). The study was performed as an RCBD with 12 treatments: Treatment 1) to 4) IC given second Improvest dose at wk 14, 16, 18, and 20 of age, respectively; end of growth period = wk 24 of age, Treatment 5) and 6) IC given second dose at wk 20 of age; end of growth period = 26 and 28 wk of age, Treatment 7) to 9) PC; end of growth period = wk 24, 26, and 28 of age, respectively, and Treatment 10) to 12) G; end of growth period = wk 24, 26, and 28 of age, respectively. A total of 288 pigs were housed in groups of 3 (8 groups/treatment). Diets were formulated for requirements of intact males; pigs had ad libitum access to feed. Results for growth performance are from start (29.3 ± 3.30 kg BW) to respective end of test (134.3 ± 10.4, 144.3 ± 12.1, and 153.7 ± 11.9 kg BW for wk 24, 26, and 28 of age, respectively). G had lower (P £ 0.05) ADG and ADFI, and greater (P £ 0.05) G:F than the other genders. Overall ADG was greater (P £ 0.05) for all IC treatments than PC treatments (1023, 1015, 1003, 1048, 1039, 975, 971, 958, and 921 g for Treatments 1 to 9, respectively; SEM 15.4). Overall ADFI was lower (P £ 0.05) for Treatment 3 and 4 than the other IC and PC treat-ments (2.93, 2.97, 2.77, 2.77, 2.93, 2.93, 2.89, 2.98, and 2.96 kg for Treatments 1 to 9, respectively; SEM 0.054). Overall G:F was greatest (P £ 0.05) for Treatment 4 compared to the other IC and PC treatments (0.350, 0.343, 0.363, 0.378, 0.355, 0.333, 0.336, 0.323, 0.311 for Treatments 1 to 9, re-spectively; SEM 0.0051). These results suggest that for IC the greatest growth performance was achieved by Treatment 4 (i.e., giving the second Improvest dose at wk 20, and end-ing the growth period after 4 wk). Also, extending the time between second Improvest dose and end of the growth pe-riod, either by giving the second dose earlier in the growth period or harvesting pigs later, reduced the growth perfor-mance advantages of IC compared to PC.
Key Words: immunological castration, Improvest, pigs
NONRUMINANT NUTRITION: AMINO ACIDS
313 Effect of surplus L-Ile plus L-Val in a wheat-based diet with excess Leu on performance and serum concentration of amino acids of growing pigs. N. Arce1, A. Morales1, H. García1, B. A. Araiza1, J. K. Htoo2*, M. Cervantes1, 1ICA, Universidad Autónoma de Baja California, Mexicali, Mexico, 2Evonik Industries AG, Hanau-Wolfgang, Germany.
A dietary Leu excess can reduce feed intake and performance of pigs. The objective was to evaluate the effect of excess di-etary supply of Leu alone or together with Ile and Val on pig growth performance and serum concentrations (SC) of AA. A 21-d experiment was conducted using 24 crossbred pigs (Large White × Duroc × Landrace; initial BW of 31.8 ± 1.2 kg) with 8 pig replicates (4 barrows and 4 gilts) per treatment. A basal diet was formulated based on wheat, cornstarch and AA (L-Lys.HCl, L-Thr, DL-Met, L-Trp, L-Leu, L-Ile, L-His, and L-Val) to meet requirement of Lys [0.90% standardized il-eal digestible (SID) Lys] and other AA were balanced to meet the ideal protein ratio. The ratios of SID Ile, Leu and Val to Lys in the basal diet were 58, 100, and 73%, respectively. L-Leu (0.43%) alone or together with L-Ile (0.20%) and L-Val (0.35%) were added to the basal diet replacing cornstarch to create a Leu-excess diet and a branched-chain AA (BCAA)-excess diet, respectively. To avoid the confounding effect of excess Leu on feed intake, pigs were fed semi-restricted on average at 1.7 kg/d. The ADG and FCR of pigs fed the bas-al, excess Leu or excess BCAA were 682, 685, 730 g/d, and 2.33, 2.39, 2.25, respectively. Excess Leu did not affect ADG or FCR (P > 0.10). However, excess BCAA increased ADG (P < 0.05) compared with the basal or excess Leu diet and tended to have a better FCR than those fed the excess Leu (P = 0.05). Blood samples were collected from all pigs 2.5 h post-prandial on d 21 via jugular vein venipuncture. Excess Leu decreased SC of Ile and Val (P < 0.05). Excess BCAA in-creased SC of Ile and Val but decreased SC of Leu (P < 0.05) compared with the Leu diet. The SC of Ile and Val were not different (P > 0.10) among pigs fed the basal or excess BCAA diet, but SC of Leu was lower (P < 0.05) in pigs fed the ex-cess BCAA diet. The SC of the other AA were not affected (P > 0.10) by the treatments. These data suggest that additional supplementation of Ile and Val to a high Leu diet may amelio-rate the growth-depressing effect in growing pigs.
Key Words: pigs, Isoleucine, Valine

139
314 Supplementation of L-methionine has beneficial effects on intestinal morphology, redox status, and growth performance of broiler chicks compared with DL-methionine. Y. Shen*, P. Ferket, I. Park, R. D. Malheiros, S. W. Kim, North Carolina State University, Raleigh.
To evaluate the relative bioavailability (RBA) and functional differences of L-methionine (LM, 99%) to DL-methionine (DLM, 99%), a total of 888 (half male and half female) 1-d-old Ross 308 broiler chicks in 84 cages were weighed and randomly allotted to 7 dietary treatments in a randomized complete block design: basal diet (BD) with 0, 0.095, 0.190, or 0.285% LM or DLM (representing 60, 70, 80, or 90% of Ross nutrient recom-mendations, respectively). Chicks were reared in cages in 2 win-dowless air-conditioner controlled houses for 21 d. Body weight and feed disappearance were recorded on d 0, 7, 14, and 21 for computing growth performance. On d 0, 7, and 21, 1 bird repre-senting the average weight of each cage from BD, BD + 0.285% LM, and BD + 0.285% DLM treatments were selected and killed to assess mucosal morphology, antioxidants, and oxidative stress in duodenum and liver. Data for each response were analyzed using MIXED model of SAS. A mutilinear regression analysis was used to evaluate the RBA of LM to DLM. Throughout ex-perimental period, chicks fed diets supplemented with LM had greater (P < 0.05) ADG and gain:feed ratio than chicks fed diets supplemented with DLM. The RBA of LM to DLM for ADG and gain:feed ratio was 138.2% and 140.7%, respectively. On d 7, chicks fed a diet supplemented with 0.285% LM had greater (P < 0.05) villus width compared with chicks fed a diet supple-mented with 0.285% DLM. Chicks fed a diet supplemented with 0.285% LM had lower (P < 0.05) crypt depth and greater (P < 0.05) villus height:crypt depth ratio as compared to chicks fed a diet supplemented with 0.285% DLM. On d 21, chicks fed a diet supplemented with 0.285% LM had greater (P < 0.05) concentrations of GSH and TAC but less (P < 0.05) protein car-bonyl content in duodenum mucosa as compared to chicks fed a diet supplemented with 0.285% DLM. Overall, chicks fed diets supplemented with LM had better growth response than chicks fed diets with DLM. Dietary supplementation of LM resulted in better redox status and gut mucosal development of chicks than those supplemented with DLM.
Key Words: broiler chicken, DL-methionine, gut development, L-methionine, redox status
315 Dynamic estimation of digestible lysine levels to maximize weight gain and protein deposition in two lines of growing-finishing pigs. L. Cloutier1, 2*, M. P. Létourneau Montminy3, J. F. Bernier2, J. Pomar4, C. Pomar1, 1Agriculture and Agri-Food Canada, Sherbrooke, QC, Canada, 2Université Laval, Québec, QC, Canada, 3Université Laval, Quebec, QC, Canada, 4Universitat de Lleida, Lleida, Spain.
The objective of this study was to validate the method of esti-mating real-time lysine (Lys) requirements required for preci-
sion feeding systems in which pigs are fed individually with daily tailored diets. One-hundred-forty-seven pigs of two ge-netic types, namely 75 of a terminal cross and 72 of a mater-nal cross, were used in two 28-days experimental phases, one beginning at 25.8 ± 2.5 kg live weight and the other at 73.3 ± 5.2 kg live weight. The treatments were randomly assigned to the pigs according to a 2 × 4 factorial design with two genetic lines and four Lys levels (70, 85, 100, and 115% of estimated requirements). Individual pigs’ lysine requirements were estimated daily on the basis of their intake and weight gain (Hauschild et al., 2010). The two genetic lines did not differ significantly in terms of ADG, protein deposition, pro-tein mass, or lipid mass, and therefore, only main factors av-erage values are presented. From 25 to 50 kg live weight, this method underestimated the pigs’ Lys requirements, given that maximum protein deposition and weight gain were achieved at 115% of Lys requirements. In terms of feed efficiency, maximum performance seemed to be achieved at a lower Lys level. From 70 to 100 kg, the method adequately estimated the pigs’ requirements, given that maximum performance was achieved at 100% of Lys requirements. The results of this study show that the method of estimating Lys require-ments used for precision feeding slightly underestimates the requirements of pigs from 25 to 50 kg but adequately esti-mates those of pigs from 70 to 100 kg.
Key Words: precision feeding, real-time lysine requirements, growing pigs
316 Phase feeding of lactating sow on ideal amino acid basis. D. P. Pangeni*, J. Kim, X. Yang, S. Baidoo, Southern Research and Outreach Center, University of Minnesota, Waseca, MN.
The objective of this study was to investigate sow perfor-mance as affected by phase feeding versus conventional feed-ing during the lactation period. A total of 132 mixed parity (1 to 7) sows were assigned to two dietary treatments on d 109 of pregnancy. Sows were blocked by parity and had similar BW and backfat (BF). Sows in treatment 1 (n = 66, BW = 268.4 ± 22.63 kg, BF = 20.8 ± 4.71 mm) were fed a conventional lac-tation diet (1.0% SID Lysine, 18% CP) throughout lactation. Sows in treatment 2 (n = 66, BW = 266.4 ± 23.56 kg, BF = 20.6 ± 4.53 mm) were phase-fed in three different periods 1 (d 0–6), 2 (d 6–12) and 3 (d 12- d 18 (weaning)). SID lysine was 0.8%, 1.0%, and 1.2%, and CP was 16%, 18%, and 20% for phases 1, 2, and 3 diets, respectively. Ratio of lysine to other amino acids for lactating sows of mixed parity was according to NRC (2012) and kept similar across the dietary treatments. Sow BW and BF were measured during the start and end of each period. Total litter weight and individual piglet’s weight for 9 litters from each treatment was also measured during those periods. During the overall lactation period total litter wt. gain, BW loss and BF loss were 49.7 kg, 4.07 kg and 1.63 mm for the control group, and 50.8 kg, 3.23 kg and 1.63 mm

140
for phase feeding group, respectively. Dietary treatments did not affect (P > 0.05) litter weight gain, sow BW loss and BF loss during all three phases and the overall period of lacta-tion. Although the feed intake during phase 1 was numerically higher (control = 23.6 kg, phase feeding = 25.1 kg; P = 0.098) in phase feeding regimen, total feed intake during lactation was not different (control = 107.2 kg, phase feeding = 111.9 kg; P = 0.214) among the treatments. Coefficient of variation of piglet weight was similar across the treatment for all phas-es. Average daily weight gain of nursing pigs was also similar between the treatments across the phases. Our results indicate that phase feeding, based on ideal amino acids bases during lactation does not affect sow performance.
Key Words: lactation, sow, phase feeding
NONRUMINANT NUTRITION: FEED ADDITIVES AND INGREDIENTS
317 Docosahexaenoic acid (DHA) algal supplement for newly weaned pigs. R. S. Samuel1,*, B. W. James2, R. A. Timmons1, 1Alltech, Inc., Nicholasville, KY, 2Kalmbach Feeds, Inc., Upper Sandusky, OH.
Alltech SP1TM (Alltech, Inc.) is a natural, pure and sustain-able algal source of fatty acids, including 27% DHA. Ome-ga-3 fatty acids, such as DHA, have demonstrated anti-in-flammatory and immune modulation properties which may improve the health and growth performance of newly weaned pigs. The objective of this experiment was to measure the growth performance of newly weaned pigs fed diets supple-mented with SP1. Diets were formulated to provide the nutri-ent requirements according to NRC (2012) in 3 diet phases. Diets with SP1 were fed for only the first 7 d post-weaning (Phase 1). All pigs were fed complex nursery diets in Phases 2 (7 to 21 d) and 3 (21 to 42 d). Pigs (n = 270) were weaned into pens of 10 pigs/pen and fed one of three diets contain-ing 0, 0.5, or 1.0% SP1 added to the diets at the expense of an inert material. Pigs were provided ad libitum access to feed and water in a commercial research facility. Means were compared between treatments according to one-way analysis of variance procedures. Feeding SP1 did not affect Phase 1 ADG, ADFI or feed efficiency of piglets (P > 0.05). In Phase 2, pigs previously fed diets containing 0.5 or 1.0% SP1 had
greater ADG (P = 0.04) compared to the pigs not fed SP1. However, there were no differences in ADG during weeks 4 to 6 or overall. ADFI was greater (P = 0.04) in Phase 2 when Phase 1 diets contained 1% SP1 and ADFI of pigs fed 0.5% SP1 in Phase 1 was also numerically greater compared to di-ets without SP1. The feed-to-gain ratio in Phase 2 was im-proved (P = 0.03) when pigs were previously fed 0.5% SP1 compared to pigs previously fed 1.0% SP1 (1.31 vs. 1.40); the feed-to-gain ratio when pigs were fed diets without SP1 and was intermediate (P > 0.05; 1.38). Diets including 0.5% SP1 for 7 d immediately after weaning improved the perfor-mance of pigs from d 7 to 21, but not overall, compared to pigs weaned onto a complex nursery diet.
Key Words: swine, docosahexaenoic acid, algae
318 Influence of increasing pharmacological ZnO dose to 2500 ppm and superdoses of phytase on piglet growth performance from d 0 to 21 post-weaning. I. J. Wellock1,*, P. Wilcock2, P. Toplis1, J. J. Chewning3, C. L. Walk2, 1Primary Diets, Melmerby, United Kingdom, 2AB Vista Feed Ingredients, Marlborough, United Kingdom, 3Swine Research Services, Inc., Springdale, AR.
Pharmacological zinc oxide (ZnO) is widely used to reduce fecal scours in piglets at levels varying between 2000 and 4000 ppm depending on country, piglet age and veterinary restrictions. One experiment was conducted to evaluate phar-macological ZnO with various doses of phytase (Quantum Blue). This abstract is 1 of 2 and will focus on ZnO levels typically fed in the European market (2500 ppm). Piglets (n = 640) were weaned at 18 to 21 d of age and allocated at 10 pigs/pen and 8 pens/treatment. Piglets were fed 1 of 8 diets formulated to be adequate in all nutrients, including calcium and phosphorus (NRC, 2012). The 8 diets and the results are listed in Table 1. ADFI tended (P < 0.10) to be lowest in pigs fed 0 ppm Zn, 0 ppm Zn plus 3750 phytase or 1250 ppm Zn compared to pigs fed 2500 ppm Zn and 2500 ppm Zn plus 3750 phytase. ADG was lowest (P < 0.001) in pigs fed 0 ppm
Table 317.
SP1 inclusion 0% 0.5% 1.0% SEM P-valueADG (d 7 to 21), g/d 227b 259a 253a 5.5 0.04ADG (d 21 to 42), g/d 566 582 581 13.1 0.79ADG (overall), g/d 372 389 388 8.0 0.53ADFI (d 7 to 21), g/d 312b 340ab 349a 6.9 0.04ADFI (d 21 to 42), g/d 786 805 809 16.8 0.78ADFI (overall), g/d 515 533 539 10.6 0.53
Table 318. Growth performance of pigs fed ZnO or phytase from d 0 to 21 post-weaning
ZnO, Phytase, ADFI, ADG, FCRppm FTU/kg kg/day kg/day kg/kg100 0 0.260b 0.189d 1.416a
100 3750 0.258b 0.197cd 1.336abc
1250 0 0.254b 0.201cd 1.382abc
1250 1250 0.272ab 0.207bcd 1.392ab
1250 2500 0.267ab 0.214bcd 1.293bc
1250 3750 0.273ab 0.217bc 1.268cd
2500 0 0.287a 0.229ab 1.281bc
2500 3750 0.290a 0.254a 1.150d
SEM 0.010 0.009 0.043P-value 0.0916 0.0004 0.0016a-d Means within columns with different superscripts are different.

141
Zn, 0 ppm Zn plus 3750 phytase, or 1250 ppm Zn compared with pigs fed 2500 ppm Zn or 2500 ppm Zn plus 3750 phy-tase. However, ADG was comparable between pigs fed 1250 ppm Zn plus 1250, 2500 or 3750 FTU/kg phytase and pigs fed 2500 ppm Zn. Pigs fed 0 ppm Zn had the poorest (P < 0.002) FCR compared with pigs fed 1250 ppm Zn plus 2500 or 3750 phytase or pigs fed 2500 ppm Zn with or without phytase. Pigs fed 2500 ppm Zn plus 3750 phytase were more efficient (P < 0.002) than pigs fed all other treatments, except pigs fed 1250 ppm Zn plus 3750 phytase. In conclusion, pig-lets fed 2500 ppm Zn plus 3750 FTU/kg phytase had the best performance. Phytase at 2500 or 3750 FTU/kg improved per-formance in piglets fed 1250 ppm Zn and this was equivalent to piglets fed 2500 ppm Zn without phytase.
Key Words: phytase, piglet, zinc oxide
319 Composite analysis of pharmacological ZnO and superdoses of phytase on piglet fecal scores from d 1 to 10 post-weaning. C. L. Walk1,*, I. J. Wellock2, P. Toplis2, C. L. Bradley1, P. Wilcock1, 1AB Vista Feed Ingredients, Marlborough, United Kingdom, 2Primary Diets, Melmerby, United Kingdom.
Pharmacological zinc oxide (ZnO) may reduce the incidence of scours in newly weaned piglets. However, the level of ZnO required to reduce scours may vary depending on the piglet age at weaning and length of ZnO supplementation. Data from 4 piglet trials were combined and an analysis was conducted to evaluate the influence of pharmacological ZnO dose and superdoses of phytase (1250 to 3750FTU/kg; Quan-tum Blue) on fecal scores from d 1 to 10 post-weaning. The experiments were conducted between 2011 and 2013 in the US or UK according to the dietary and husbandry conditions typical for each location. In each trial, 2 fecal scores were re-corded/pen/day and an average score was calculated from d 1 to 10. Scores were based on a 4 point scale (Wellock et al., 2006) with scores of 1 = firm; 2 = soft, spreads slightly; 3 = very soft, spreads readily; and 4 = watery liquid consistency. Scores are presented in 4 phases: d 1 to 3 as phase 1, d 4 to 6 as phase 2, d 7 to 10 as phase 3 and d 1 to 10 as phase 4. Data were analyzed in JMP v. 10.0 and the model included phase, phytase (none or superdose), dietary ZnO supplementation (0, 1750 or 3500 ppm Zn) and the 2 and 3-way interactions. Significant means were separated using linear and quadratic contrasts. To account for differences in the husbandry and diet from each trial, research site was included in the model as a covariate. There were a total of 128 fecal scores in the com-posite analysis with a minimum score of 1.16, a maximum score of 2.50, and a mean score of 1.53. There was a main effect (P < 0.0001) of phase on fecal scores, with the lowest scores recorded in phase 1 (1.47) and the highest scores re-corded in phase 2 (1.79) compared to phase 3 or 4 (quadratic P < 0.0001). There was a main effect (P < 0.004) of phytase on fecal scores, whereas phytase reduced fecal scores from
1.66 to 1.56. Pigs fed ZnO at 1750 ppm had the highest scores (1.65) compared with pigs fed 3500 ppm Zn (1.56), but these were not different than fecal scores at 0 ppm Zn from ZnO (1.62). In conclusion, fecal scores were highest between d 4 and 6 post-weaning and superdoses of phytase reduced the incidence of scours in piglets.
Key Words: phytase, piglet, scours
320 Digestible phosphorus in canola meal, 00-rapeseed meal, and 00-rapeseed expellers without and with microbial phytase fed to nursery pigs. T. Maison, H. H. Stein*, University of Illinois, Urbana-Champaign.
This experiment was conducted to measure apparent total tract digestibility (ATTD) and standardized total tract digestibility (STTD) of P in canola meal, 00-rapeseed meal, and 00-rape-seed expellers fed to nursery pigs. Two hundred sixteen bar-rows (initial BW: 18.0 ± 1.5 kg) were allotted to a random-ized complete block design with 36 diets and 6 replicate pigs per diet. Five samples of canola meal from solvent-extraction crushing plants in North America, 8 samples of 00-rapeseed meal from solvent-extraction crushing plants in Europe, and 5 samples of 00-rapeseed expellers from mechanical-press crushing plants in Europe were used in the experiment. Eigh-teen diets were prepared by including each source of canola meal, 00-rapeseed meal, and 00-rapeseed expellers in 1 diet. Eighteen additional diets that were similar to the previous 18 diets, with the exception that 1500 units of microbial phytase was included in each diet, were also formulated. The only source of P in the diets was canola meal, 00-rapeseed meal, or 00-rapeseed expellers. Pigs were placed in metabolism cages that allowed for total feces collection. Pigs were fed at 2.5 times their estimated energy requirement for maintenance. In-gredients, diets, and feces were analyzed for P, and the ATTD and STTD of each source of canola meal, 00-rapeseed meal, and 00-rapeseed expellers were calculated. A constant value for endogenous phosphorus loss of 190 mg/kg DMI was used to calculate STTD of P. Results indicated that the ATTD and STTD of P for canola meal were not different from values obtained in 00-rapeseed meal, and the ATTD and STTD of P in 00-rapeseed meal were not different from values for 00-rapeseed expellers. The ATTD and STTD of P increased (P < 0.001) from 44.99 and 48.82% to 64.08 and 67.97% for canola meal, from 46.77 and 50.36% to 63.53 and 67.29% for 00-rapeseed meal, and from 44.83 and 48.60% to 69.28 and 72.99% for 00-rapeseed expellers by using microbial phy-tase in the diets. In conclusion, The ATTD and STTD of P for canola and 00-rapeseed products are not different, and addi-tion of microbial phytase can improve the digestibility of P in canola, 00-rapeseed meal, and 00-rapeseed expellers.
Key Words: canola meal, digestibility, pig, phosphorus, 00-rapeseed meal, 00-rapeseed expellers
142
321 (UGS) Comparison of fermented soybean meal processing methods on nursery pig growth performance. A. B. Clark*, H. L. Frobose, J. M. DeRouchey, M. D. Tokach, S. S. Dritz, R. D. Goodband, J. Woodworth, Kansas State University, Manhattan.
A total of 292 nursery pigs (PIC 327 × 1050; 6.0 ± 1.1 kg BW and 21 d of age) were used in a 31-d experiment compar-ing processing methods of fermented soybean meal (FSBM; Nutraferma, North Sioux City, SD) on growth performance. There were 11 replicate pens/treatment and 6 or 7 pigs/pen. At weaning, pigs were allotted to pens by initial weight to 1 of 4 treatments in a completely randomized design. A 3-phase diet series was used with treatment diets fed during phase 1 (d 0 to 7) and phase 2 (d 7 to 21), with a common diet fed from d 21 to 31. Diets were: 1) negative control (NC; no specialty protein sources), 2) positive control (PC; 4% dried porcine solubles + 1% standard FSBM), 3) FSBM processing method 1 (FSBM1; 5%), and 4) FSBM processing method 2 (FSBM2; 5%). The alternative FSBM processing methods incorporated a proprietary additive post-fermentation at increasing levels (FSBM2 > FSBM1) to further break down anti-nutritional factors. Nutrient analyses of specialty protein sources gener-ally matched for the PC, but in FSBM1 and FSBM2 the CP and AA levels were lower than formulated, with FSBM1 gen-erally 10% lower than FSBM2. From d 0 to 21, pigs fed PC and FSBM2 diets had increased ADG (P < 0.05) while pigs fed PC, FSBM1 and FSBM2 diets had improved G:F (P < 0.05) compared to NC pigs. Also, pigs fed FSBM1 tended (P < 0.06) to have decreased ADG and G:F vs. pigs fed the PC diet. During d 21 to 31, no differences were observed. Overall (d 0 to 31), ADG was higher (P < 0.01) for PC pigs and tended to be higher (P < 0.07) for pigs fed diets containing FSBM2 versus the NC, with pigs fed FSBM1 intermediate. Overall, pigs fed FSBM2 had greater performance than those fed the NC and similar performance to pigs fed the PC, whereas those fed FSBM1 did not. The lower CP and AA content in FSBM1 may have contributed to its diminished growth response.
Key Words: fermented soybean meal, nursery pig, protein sources
322 Evaluation of increasing peptone blend on nursery pig performance. M. A. D. Goncalves*, J. R. Flohr, S. S. Dritz, M. D. Tokach, J. M. DeRouchey, R. D. Goodband, J. C. Woodworth, Kansas State University, Manhattan.
A total of 270 pigs (PIC 327 × 1050, initially 7.1 kg) were used in a 28-d trial to evaluate the effects of increasing levels of a peptone blend on nursery pig performance. The peptone blend is derived from pharmaceutical extraction of chondroitin sul-fate from bovine cartilage and then drying on a soybean hull carrier. Each treatment had 8 replicate pens and 6 or 7 pigs per pen. Dietary treatments were: (1) a diet with 1% blood meal and 2% select menhaden fish meal (positive control), (2) a diet with no added specialty protein source (negative control), (3) a diet containing 4% peptone, (4) a diet containing 8% pep-tone, or (5) a diet containing 12% peptone. Experimental diets were formulated to contain 1.30% SID Lys, and a minimum Val:Lys ratio of 68% without any adjustment for dietary ener-gy content and fed for 14 d. Then a common Phase 2 diet was fed for an additional 14 d to determine carry over effects on growth performance. From d 0 to 14, pigs fed increasing pep-tone blend had increased (linear, P < 0.001) ADFI but poorer (linear, P < 0.001) G:F. From d 14 to 28, when pigs were fed a common diet, pigs previously fed increasing peptone blend had increased (linear, P = 0.03) ADFI and poorer (linear, P = 0.001) G:F. Overall (d 0 to 28), pigs fed diets with increas-ing peptone blend for the first 14 d had increased (linear, P < 0.001) ADFI and poorer G:F (linear, P < 0.001) with no dif-ferences in ADG (P = 0.87). Pigs fed the positive control diet had increased (P = 0.01) overall ADFI compared with pigs fed negative control diet. Up to 4% of the peptone blend can be used in nursery diets from 7 to 11 kg without negatively impacting growth performance.
Key Words: growth performance, nursery pig, peptone blend
Table 321.
NC PC FBSM1 FBSM2 SEM P < D 0 to 21
ADG, g 225a 259by 237abx 249b 8.31 0.03ADFI, g 342 353 339 342 9.45 0.75G:F 0.666a 0.737by 0.703bx 0.728b 0.018 < 0.01
D 0 to 31ADG, g 307ax 339b 322ab 328aby 8.02 0.05ADFI, g 476 507 493 488 11.75 0.32G:F 0.646 0.668 0.654 0.673 0.008 0.10
a,b P < 0.05, x,y P < 0.10
Table 322.
ItemPositive control
Negative control
4% peptone
8% peptone
12% peptone SEM
d 0 to 14ADG, g 283 265 264 258 281 12.5ADFI, ga 399 371 386 429 463 13.5G:Fa 0.708 0.716 0.683 0.601 0.608 0.02
d 0 to 28ADG, g 416 401 396 386 402 8.8ADFI, ga,b 651 608 624 651 685 13.3G:Fa 0.640 0.659 0.636 0.593 0.588 0.01
BW, kgd 0 7.1 7.1 7.1 7.1 7.1 0.06d 14 11.1 10.9 10.8 10.8 11.2 0.21d 28 18.8 18.4 18.2 18.0 18.5 0.27
a Linear increasing peptone (P < 0.05).b Positive vs. Negative control (P < 0.05).

143
323 Effects of Bacillus spp. direct-fed microbial supplementation on the nutrient digestibility by weanling pigs. A. Owusu-Asiedu1, N. W. Jaworski2,*, A. A. Awati1, H. H. Stein2, 1DuPont Industrial Biosciences—Danisco Animal Nutrition, Marlborough, Wiltshire, United Kingdom, 2University of Illinois, Urbana-Champaign.
An experiment was conducted to determine the effect of phy-tase and a Bacillus spp. direct-fed microbial (DFM) supplemen-tation on the nutrient digestibility in weanling pigs. A total of 20 nursery barrows (initial BW: 10.4 ± 1.0 kg) were randomly allotted by BW to 1 of 2 dietary treatments using a random-ized complete block design with 2 diets and 10 replicate pigs per diet. The experimental diets were based on corn, soybean meal, and distillers dried grains with solubles; diet 1 (CON) and diet 2 contained CON plus 500 g/MT Bacillus spp. (CON + DFM). All diets contained 500 FTU/kg of Buttiauxella spp. phytase expressed in Trichoderma reesei. Pigs were fed ad li-bitum and water was available at all times. Pigs were housed in metabolic cages that allowed for total, but separate, collection of feces and urine from each pig during a 5 d balance trial fol-lowing the marker-to-marker approach. Individual pig weights were recorded at the start and end of the experiment. Also, daily allotments of feed were recorded. Values for the apparent total tract digestibility (ATTD) of GE, crude fiber, and NDF were calculated. Data were analyzed using the MIXED procedure of SAS. The model included diet as the fixed effect and block as the random effect. Results indicated that the CON + DFM diet had a greater (P < 0.05) amount of DE (3615 kcal/kg) compared with the CON diet (3518 kcal/kg). The increased DE in the CON + DFM diet resulted in a 9.2% improvement (P < 0.05) in the ATTD of NDF by pigs compared with pigs fed the CON diet. In conclusion, nursery pigs fed diets containing Bacillus spp. had a greater ATTD of NDF compared with pigs fed CON and this resulted in a 2.8% improvement in DE, which may enable in-creased utilization of less expensive fibrous feed ingredients in nursery pig diet formulation.
Key Words: digestibility, direct-fed microbials, pig
324 Effect of supplementation of Bacillus spp. strains with high enzymatic activities on energy efficiency and growth performance in grow-finish pigs fed corn-soybean meal based diet. A. Owusu-Asiedu1,*, A. Awati1, Y. D. Jang2, M. D. Lindemann2, 1DuPont Industrial Biosciences- Danisco Animal Nutrition, Marlborough, Wiltshire, United Kingdom, 2University of Kentucky, Lexington, KY.
The effect of 3 Bacillus spp. strains specifically selected based on their high enzyme producing ability on energy efficiency and growth performance was evaluated in grow-finish pigs fed corn-soybean meal based diets. Fifty-six pigs [(Yorkshire × Landrace) × Duroc] with initial BW 28.50 ± 1.50 kg were used
in the 12 wk study period. Pigs were blocked by BW and sex and randomly assigned to two dietary treatments with 4 pigs/pen and 7 replicate pens/treatment. The diets were formulated to meet the nutritional requirements of the pigs and contained corn, SBM, corn DDGS (15–20%) and wheat middlings (1–7%). The ME and SID Lys in the basal starter, grower and finisher diets were 3241.0, 3234.0 and 3249.0 kcal/kg, and 0.91, 0.75 and 0.61%, respectively. The Bacillus product was added at 0 (Con-trol) or 500 g/MT of feed in the tested diet (BAC, 3 × 10⁸ CFU per gram). All diets contained 500 FTU/kg of Buttiauxella spp. phytase expressed in Trichoderma reesei. Pigs were allowed to consume the assigned experimental diet for the entire study peri-od. Pigs and feed were weighed, and ADG, ADFI and G:F were determined at the start and completion of each study phase. Data were analyzed using the Proc mixed procedure in SAS. Overall, ADG was not affected by BAC supplementation (1.04 vs. 1.03 kg/d; P > 0.05). However, compared to Control pigs, pigs fed the BAC diet consumed less feed (P < 0.05; 2.92 vs. 2.73 kg/d). Compared with Control, BAC pigs had improved (P < 0.05) G:F ratio during Phase 2, 3, and the overall period; the overall G:F ratios were 0.355 and 0.377 for Control and BAC pigs, re-spectively. Bacillus spp. supplementation improved (P < 0.05) energy efficiency during phase 2, 3, and overall study period by 5.2, 8.3 and 6.0%, respectively. In conclusion, supplementation of a combination of the 3 Bacillus strains with high enzymatic activities allowed grow-finish pigs to efficiently utilize energy in feed containing cereal by-products and subsequently improve feed efficiency.
Key Words: pigs, Bacillus, energy efficiency
325 Bioefficacy of high enzyme producing Bacillus spp. strains in nursery and grow-finish pigs fed corn-soybean based diets containing high co-products. A. Owusu-Asiedu1, D. Petri2, S. Baidoo3, G. Jones4, M. D. Lindemann5,*, E. van Heugten 6, 1DuPont Industrial Biosciences—Danisco Animal Nutrition, Marlborough, Wiltshire, United Kingdom, 2BioControl Development—DuPont Nutrition & Health, Waukesha, WI, 3Southern Research and Outreach Center, University of Minnesota, Waseca, MN, 4Danisco USA Inc, Cedar Rapids, IA, 5University of Kentucky, Lexington, KY, 6North Carolina State University, Raleigh.
The potential of Bacillus spp. direct-fed microbial (DFM) in maintaining the intestinal ecosystem and improving animal
Table 324. Bacillus supplementation improves pig performance
Parameter Control BAC SEM P valueOverall ADFI, kg/d 2.92 2.73 0.050 0.02Overall ADG, kg/d 1.036 1.027 0.016 0.73Overall gain to feed 0.355 0.377 0.004 < 0.01Feed cost per kg gain, $/kg gain 0.810 0.766 0.006 < 0.01Income over feed cost, $ 110.90 114.80 1.138 0.06Average feed cost, $/MT 288.60 290.10 – –Energy efficiency (Mcal/kg gain) 9.14 8.59 0.070 < 0.01
144
health and performance is well recognized. However, with the increased usage of cereal by-products (CBP), including corn distillers-dried grains with solubles, little or no informa-tion is available on the specific bioefficacy of DFM in nursery and grow-finish pigs fed diets containing high levels of CBP. The current studies evaluated the bioefficacy of Bacillus spp. specifically selected for high enzyme producing capability on the performance and lean accretion in nursery and grow-finish pigs fed corn-soybean meal-based diets (CSBM) containing 40–50% CBP. Ten independent (4 nursery and 6 grow-finish) with 10–30 and 4–10 pigs/pen in the nursery and grow-finish pigs trials, respectively were conducted. Pigs in each trial were blocked by initial BW and sex, and randomly assigned to pens within blocks. Pens were randomly assigned to the two dietary treatments with a total of 48 and 66 pens/treat-ment in the nursery and grow-finish trials, respectively. The nursery and the grow-finish trials lasted for an average of 6 and 12 wk, respectively. The diets were: Control (CSBM with 40–50% CBP; CON), and CON plus Bacillus spp. DFM, con-taining viable spores (3 × 10⁸ CFU per g, added at 0.5 kg/MT of feed). The diets were formulated to be isocaloric and iso-nitrogenous, and met nutritional requirements for nursery and grow-finish pigs. Feed and water were offered ad libitum. Pigs and feed were weighed at the start and completion of each feeding phase, and ADG, ADFI and G:F ratio were calculated. In two of the grow-finish trials, back fat depth and loin eye area (LEA) were measured at the end of the experimental pe-riod using real-time ultrasound and fat free lean (FFL) was calculated. Data were checked for normality and pooled to-gether for Meta-analysis. In the nursery and grow-finish stud-ies, dietary treatment had no effect (P > 0.05) on final BW, ADFI and ADG. However, G:F ratio improved (P < 0.05) in pigs fed DFM compared with CON in the nursery (0.662 vs. 0.646; SEM = 0.004) and in the grow-finisher (0.360 vs. 0.352; SEM = 0.003). Compared with CON, grow-finish pigs fed the DFM diet had improved (P < 0.05) LEA (41.0 vs. 43.6 cm2; SEM = 0.58), FFL (32.5 vs. 33.5 kg; SEM = 0.33) and daily lean gain (0.348 vs. 0.359 kg/d). In conclusion, Bacillus spp. strains specifically selected with high enzymatic activi-ties allowed pigs to more efficiently utilize CSBM containing 40–50% CBP and improve lean accretion in finisher pigs.
Key Words: Bacillus, pigs, meta-analysis
326 Peroxide value (PV) and thiobarbituric acid reactive substances (TBARS) as indicators of dietary lipid peroxidation, reduced growth performance, and metabolic oxidation status when feeding peroxidized lipids to pigs and broilers. A. R. Hanson*, P. E. Urriola, G. C. Shurson, University of Minnesota, Saint Paul.
To evaluate the impacts of dietary peroxidized lipids on the growth and metabolic oxidation status of nonruminants, data were summarized from studies that measured growth perfor-mance of pigs (n = 16 comparisons) and broilers (n = 26 com-
parisons) fed diets containing peroxidized lipids. Only studies evaluating supplemental lipid sources when feeding isocaloric diets within each comparison were included. Dietary TBARS and PV were obtained from each study, along with response variables including ADG, ADFI, G:F, and serum or plasma concentrations of vitamin E and TBARS. Data were evaluated using UNIVARIATE and CORR procedures of SAS. Overall responses for swine and broilers fed diets with peroxidized lipids showed that ADG was 88.8 ± 12.5% (range = 49.8 to 104.6%), ADFI was 92.5 ± 9.0% (range = 67.8 to 109.8%), and G:F was 95.7 ± 7.2% (range = 70.4 to 106.3%) relative to animals fed diets with unperoxidized lipids. The magnitude of reduction from feeding diets with peroxidized lipids relative to diets with unperoxidized lipids for ADG (11.4 vs. 11.1%) and ADFI (8.8 vs. 6.6%) were similar for swine and poultry, re-spectively. This finding suggests that the growth performance of both species is reduced to a similar extent when feeding peroxidized lipids. For swine, ADG was negatively correlated with dietary TBARS content (r = - 0.63, P = 0.05), but not PV. Conversely, dietary PV was negatively correlated with ADG in broilers (r = - 0.78, P < 0.01), but dietary TBARS concentrations were not reported in any of the 26 broiler stud-ies. The difference in magnitude of change for ADG (11.2%) compared to ADFI (7.5%) suggests that factors in addition to caloric intake contribute to reduced ADG when feeding per-oxidized lipids. For swine and broilers fed peroxidized lipids, serum content of vitamin E was 53.7 ± 26.3% (range = 15.2 to 105.8%, n = 18) and TBARS was 119.7 ± 23.3% (range = 97.0 to 174.8%, n = 12) relative to animals fed unperoxidized lipids, indicating that inclusion of peroxidized lipids in diets contributes to changes in metabolic oxidation status. His-torically, PV has been used to assess lipid peroxidation, but TBARS may be a better measure for predicting the effects of lipid peroxidation on growth in swine. Future research is nec-essary to develop an accurate model for predicting reductions in growth performance and metabolic oxidation status when feeding diets containing peroxidized lipids.
Key Words: broiler, swine, lipid peroxidation
327 Comparison of lipid peroxidation measures for corn oil subjected to different heating times and temperatures. A. R. Hanson1,*, L. Wang1, C. Chen1, B. J. Kerr2, G. C. Shurson1, 1University of Minnesota, Saint Paul, 2USDA-ARS, Ames, IA.
Lipid peroxidation results in the production and degradation of numerous compounds, but assays commonly used to evalu-ate the extent of peroxidation measure a small proportion of these compounds. Therefore, a study was conducted to com-pare several indicators of peroxidation when heating refined corn oil at 185°C for 12 h (RO) or 95°C for 72 h (SO) with air flow of 12 L/min sampled hourly or at 8 h intervals, respec-tively. Samples were assayed for PUFA, FFA, peroxide value (PV), anisidine value (AnV), thiobarbituric acid reactive sub-
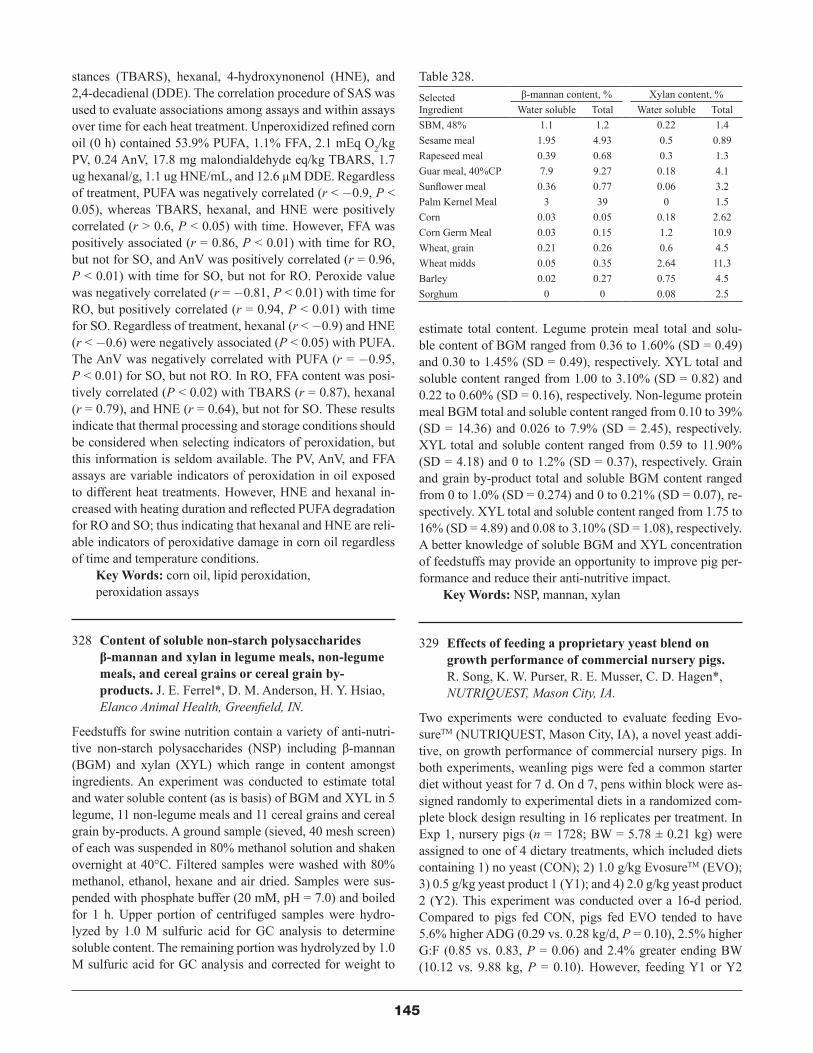
145
stances (TBARS), hexanal, 4-hydroxynonenol (HNE), and 2,4-decadienal (DDE). The correlation procedure of SAS was used to evaluate associations among assays and within assays over time for each heat treatment. Unperoxidized refined corn oil (0 h) contained 53.9% PUFA, 1.1% FFA, 2.1 mEq O2/kg PV, 0.24 AnV, 17.8 mg malondialdehyde eq/kg TBARS, 1.7 ug hexanal/g, 1.1 ug HNE/mL, and 12.6 µM DDE. Regardless of treatment, PUFA was negatively correlated (r < -0.9, P < 0.05), whereas TBARS, hexanal, and HNE were positively correlated (r > 0.6, P < 0.05) with time. However, FFA was positively associated (r = 0.86, P < 0.01) with time for RO, but not for SO, and AnV was positively correlated (r = 0.96, P < 0.01) with time for SO, but not for RO. Peroxide value was negatively correlated (r = -0.81, P < 0.01) with time for RO, but positively correlated (r = 0.94, P < 0.01) with time for SO. Regardless of treatment, hexanal (r < -0.9) and HNE (r < -0.6) were negatively associated (P < 0.05) with PUFA. The AnV was negatively correlated with PUFA (r = -0.95, P < 0.01) for SO, but not RO. In RO, FFA content was posi-tively correlated (P < 0.02) with TBARS (r = 0.87), hexanal (r = 0.79), and HNE (r = 0.64), but not for SO. These results indicate that thermal processing and storage conditions should be considered when selecting indicators of peroxidation, but this information is seldom available. The PV, AnV, and FFA assays are variable indicators of peroxidation in oil exposed to different heat treatments. However, HNE and hexanal in-creased with heating duration and reflected PUFA degradation for RO and SO; thus indicating that hexanal and HNE are reli-able indicators of peroxidative damage in corn oil regardless of time and temperature conditions.
Key Words: corn oil, lipid peroxidation, peroxidation assays
328 Content of soluble non-starch polysaccharides β-mannan and xylan in legume meals, non-legume meals, and cereal grains or cereal grain by-products. J. E. Ferrel*, D. M. Anderson, H. Y. Hsiao, Elanco Animal Health, Greenfield, IN.
Feedstuffs for swine nutrition contain a variety of anti-nutri-tive non-starch polysaccharides (NSP) including β-mannan (BGM) and xylan (XYL) which range in content amongst ingredients. An experiment was conducted to estimate total and water soluble content (as is basis) of BGM and XYL in 5 legume, 11 non-legume meals and 11 cereal grains and cereal grain by-products. A ground sample (sieved, 40 mesh screen) of each was suspended in 80% methanol solution and shaken overnight at 40°C. Filtered samples were washed with 80% methanol, ethanol, hexane and air dried. Samples were sus-pended with phosphate buffer (20 mM, pH = 7.0) and boiled for 1 h. Upper portion of centrifuged samples were hydro-lyzed by 1.0 M sulfuric acid for GC analysis to determine soluble content. The remaining portion was hydrolyzed by 1.0 M sulfuric acid for GC analysis and corrected for weight to
estimate total content. Legume protein meal total and solu-ble content of BGM ranged from 0.36 to 1.60% (SD = 0.49) and 0.30 to 1.45% (SD = 0.49), respectively. XYL total and soluble content ranged from 1.00 to 3.10% (SD = 0.82) and 0.22 to 0.60% (SD = 0.16), respectively. Non-legume protein meal BGM total and soluble content ranged from 0.10 to 39% (SD = 14.36) and 0.026 to 7.9% (SD = 2.45), respectively. XYL total and soluble content ranged from 0.59 to 11.90% (SD = 4.18) and 0 to 1.2% (SD = 0.37), respectively. Grain and grain by-product total and soluble BGM content ranged from 0 to 1.0% (SD = 0.274) and 0 to 0.21% (SD = 0.07), re-spectively. XYL total and soluble content ranged from 1.75 to 16% (SD = 4.89) and 0.08 to 3.10% (SD = 1.08), respectively. A better knowledge of soluble BGM and XYL concentration of feedstuffs may provide an opportunity to improve pig per-formance and reduce their anti-nutritive impact.
Key Words: NSP, mannan, xylan
329 Effects of feeding a proprietary yeast blend on growth performance of commercial nursery pigs. R. Song, K. W. Purser, R. E. Musser, C. D. Hagen*, NUTRIQUEST, Mason City, IA.
Two experiments were conducted to evaluate feeding Evo-sureTM (NUTRIQUEST, Mason City, IA), a novel yeast addi-tive, on growth performance of commercial nursery pigs. In both experiments, weanling pigs were fed a common starter diet without yeast for 7 d. On d 7, pens within block were as-signed randomly to experimental diets in a randomized com-plete block design resulting in 16 replicates per treatment. In Exp 1, nursery pigs (n = 1728; BW = 5.78 ± 0.21 kg) were assigned to one of 4 dietary treatments, which included diets containing 1) no yeast (CON); 2) 1.0 g/kg EvosureTM (EVO); 3) 0.5 g/kg yeast product 1 (Y1); and 4) 2.0 g/kg yeast product 2 (Y2). This experiment was conducted over a 16-d period. Compared to pigs fed CON, pigs fed EVO tended to have 5.6% higher ADG (0.29 vs. 0.28 kg/d, P = 0.10), 2.5% higher G:F (0.85 vs. 0.83, P = 0.06) and 2.4% greater ending BW (10.12 vs. 9.88 kg, P = 0.10). However, feeding Y1 or Y2
Table 328.Selected Ingredient
β-mannan content, % Xylan content, %Water soluble Total Water soluble Total
SBM, 48% 1.1 1.2 0.22 1.4Sesame meal 1.95 4.93 0.5 0.89Rapeseed meal 0.39 0.68 0.3 1.3Guar meal, 40%CP 7.9 9.27 0.18 4.1Sunflower meal 0.36 0.77 0.06 3.2Palm Kernel Meal 3 39 0 1.5Corn 0.03 0.05 0.18 2.62Corn Germ Meal 0.03 0.15 1.2 10.9Wheat, grain 0.21 0.26 0.6 4.5Wheat midds 0.05 0.35 2.64 11.3Barley 0.02 0.27 0.75 4.5Sorghum 0 0 0.08 2.5

146
diets did not affect pig growth performance. In Exp 2, nurs-ery pigs (n = 1296; BW = 5.48 ± 0.40 kg) were assigned to one of 3 dietary treatments including diets containing no yeast (CON), 1.0 g/kg EvosureTM (EVO), or 0.4 g/kg yeast product 3 (Y3). This experiment was conducted over a 42-d period with three diet phases. In Phase 1, feeding EVO resulted in 7.7% greater ADG (0.26 vs. 0.24 kg/d, P = 0.05) and 5.7% greater G:F (0.88 vs. 0.83, P = 0.03) compared with feeding CON. In Phase 2, pigs fed EVO showed 5.2% greater ADG relative to those fed CON (0.42 vs. 0.40, P = 0.02) and Y3 (0.42 vs. 0.40, P = 0.02). The BW at the end of Phase 2 was greater in pigs fed EVO than those fed CON (10.31 vs. 10.06 kg, P = 0.03) and Y3 (10.31 vs. 10.11 kg, P = 0.05). Pig ADG was not affected by dietary treatments in Phase 3, but feeding EVO resulted in lower ADFI (P < 0.05) and higher G:F (P < 0.03) compared with feeding CON and Y3. Feeding Y3 did not affect pig growth performance in this experiment. Results from these two experiments suggest that feeding EvosureTM to nursery pigs improves their growth performance relative to negative control and three other yeast products.
Key Words: growth performance, nursery pigs, yeast
330 A novel procedure for predicting energy digestibility in feedstuffs fed to pigs. S. A. Lee*, C. S. Park, B. G. Kim, Konkuk University, Seoul, South Korea.
A general 3-step in vitro system using conical flasks has been widely employed to simulate the digestion and absorption procedure of pigs. Much time and effort is needed in this con-ventional procedure. Using a DaisyII incubator, in vitro digest-ibility of nutrients in a great number of samples may be mea-sured relatively easily and efficiently. The objective of this study was to develop a novel in vitro system using the DaisyII incubator for estimating energy digestibility of feedstuffs for pigs. The in vivo energy digestibility values of 11 feed ingre-dients including almond meal, barley, 2 different sources of corn gluten feed, corn gluten meal, lupin hulls, lupin kernel, rice bran, soybean meal, wheat, and wheat bran and 12 diets containing the aforementioned ingredients were determined in a previous experiment employing a Latin square design with 12 animals and 12 periods. The ingredient and diet samples were incubated under the condition of enzymes (pepsin, pan-creatin, and a multi-enzyme complex: Viscozyme) with the conventional 3-step (2, 4, and 18 h of incubation respectively)
in vitro system. Additionally, the DaisyII incubator was tested as an in vitro digestion system with 3 replicates of each sam-ple. Equations for predicting in vivo energy digestibility were generated using in vitro dry matter disappearance (IVDMD) as an independent variable. To determine optimum incuba-tion time for each digestion step, multiple digestion periods were tested and nonlinear regression models with incubation time as an independent variable were employed. The IVDMD based on the conventional in vitro procedure (IVDMDFlask) provided fairly reasonable estimates of the energy digestibil-ity: DE:GE = 0.01 + (0.0093 × IVDMDFlask, %) with P < 0.001 and r2 = 0.96. However, the IVDMD using the DaisyII incuba-tor system (IVDMDDaisy) with 2, 4, and 18 h of stepwise incu-bation resulted in less accurate estimates for in vivo energy digestibility (r2 = 0.54). A modified in vitro procedure using DaisyII incubator with 2, 14, and 18 h for the step 1, 2, and 3, respectively, resulted in fairly reasonable estimates of in vivo energy digestibility: DE:GE = 0.02 + (0.0093 × IVDMDDaisy, %) with r2 = 0.88, P < 0.001. In conclusion, IVDMDDaisy can be used for prediction of the energy digestibility of a large number of feedstuffs and may replace IVDMDFlask.
Key Words: DaisyII incubator, in vitro dry matter disappearance, swine
NONRUMINANT NUTRITION: NUTRITIONAL TECHNOLOGIES
AND FEEDING STRATEGIES
331 The effects of withdrawing high-fiber ingredients before market on growth and carcass characteristics in commercial finishing pigs. K. F. Coble*, J. M. DeRouchey, S. S. Dritz, M. D. Tokach, R. D. Goodband, Kansas State University, Manhattan.
It is well recognized that feeding high-fiber diets have nega-tive effects on carcass yield and these effects can be mitigated by withdrawing the high fiber diet before market. However, the optimal time period for withdrawing high-fiber ingredi-ents before marketing has not been determined. A total of 1089 pigs (initially 44.5 kg) were used in a 96-d study. The two diet types fed were a corn-soybean meal control diet with low NDF (9.3%) and a high-fiber diet with high NDF
Table 331.
Item ControlHigh-fiber withdrawal before market, d
Probability, P < 1
Control vs. 0 withdrawal
Duration24 19 14 9 0 Linear Quad
ADG, kg 0.92 0.89 0.88 0.88 0.87 0.88 0.01 0.28 0.79ADFI, kg 2.64 2.60 2.59 2.61 2.60 2.62 0.68 0.53 0.66G:F 0.348 0.340 0.340 0.339 0.336 0.335 0.01 0.07 0.79HCW, kg 99.1 95.8 96.6 96.2 95.5 94.8 0.01 0.05 0.08Yield, % 74.85 74.10 74.62 74.54 74.43 73.93 0.19 0.73 0.271 SEM was 0.010, 0.035, 0.003, 0.909, and 0.496 for ADG, ADFI, G:F, HCW, and yield, respectively.

147
(19%) that contained 30% dried distillers grains with solubles (DDGS) and 19% wheat middlings. Four withdraw strategies were evaluated by feeding the high-fiber diet until 24, 19, 14, or 9 d before harvest, at which time pigs were switched to the control diet and comparing them to the corn soybean meal or high fiber diet fed for the entire 96 d period. Diets were not balanced for energy. Pens of pigs were randomly allotted to 1 of 6 dietary feeding strategies with 25 to 27 pigs per pen and 7 pens per treatment. Overall (d 0 to 96), pigs fed the high-fiber diet through the entire study had decreased (P < 0.01) ADG and G:F compared with those fed the control diet. For pigs ini-tially fed the high-fiber diet and then switched to the control, G/F tended (linear; P < 0.07) to improve as withdrawal period increased from 0 to 24 d. Pigs fed the high-fiber diet through-out had decreased (P < 0.01) HCW than those fed the con-trol diet. Percentage yield using the farm live weight was not significantly influenced by high-fiber diet withdrawal period; however, HCW increased linearly (P < 0.05) as withdrawal period increased. In summary, feeding pigs diets high in fi-ber decreased ADG, G:F, and HCW; however, switching pigs from a high to low fiber diet before market improved HCW.
Key Words: finishing pig, fiber withdrawal, performance
332 Effect of precision feeding strategy on growth performance and nitrogen excretion of growing-finishing pigs. I. Andretta1, C. Pomar2*, J. Rivest3, J. Pomar4, P. A. Lovatto1, J. Radünz Neto1, 1Universidade Federal de Santa Maria, Santa Maria, Brazil, 2Agriculture and Agri-Food Canada, Sherbrooke, QC, Canada, 3Centre de Développement du Porc du Québec, Quebec, QC, Canada, 4Universitat de Lleida, Lleida, Spain.
The objective of this study was to assess the impact of mov-ing from conventional to precision feeding systems on ani-mal performance and nitrogen excretion in growing-finishing pig operations. Sixty randomly selected pigs (initial BW: 41.2 ± 3.9 kg) were used in an 84 d performance trial with pigs fed according to 1) a 3-phases feeding program (3P), providing within each phase a fixed proportion of premixes A (high-nutrient density) and B (low-nutrient density) calculat-ed at the beginning of each phase to satisfy the LYS require-ments of the 80th percentile pig of this group; 2) a multiphase group feeding program (MPG), in which pigs received the same blend of premixes A and B calculated at the beginning of each day to satisfy the LYS requirement of the 80th per-centile pig of this group; and 3) a precision feeding program (MPI), in which pigs were fed individually with daily tailored diets. Feed intake was recorded daily and BW weekly and these data used in a factorial method to estimate the daily nutrient requirements of each pig of the trial. Lean and fat body composition were assessed at the beginning of the trial and every 28 d by dual-energy X-ray absorptiometry (DXA).
Neither ADFI (3.05, 3.07, and 3.05 kg/d), ADG (1.11, 1.11, and 1.10 kg/d), G:F (0.38, 0.37, and 0.37), average daily pro-tein gain (161, 155, and 154 g/d), nor final BW (134, 135, and 136 kg) were affected (P > 0.05) in pigs fed according to the 3P, MPG, and MPI feeding programs, respectively. On aver-age, 3P pigs ingested 23.8 g/d of standardized ileal digestible (SID) LYS and excreted 48.1 g/d of nitrogen. Compared to 3P pigs, MPG and MPI pigs reduced (P < 0.05) SID LYS intake by 17% and 27% and nitrogen excretion (P < 0.05) by 12% and 22%, respectively. Precision feeding is an effective approach for reducing LYS intake and nitrogen excretion in growing-finishing pig operations.
Key Words: nutrition, nutrient requirements, precision feeding.
333 Characterizing the feed intake pattern of immunologically castrated male pigs following administration of the second anti-GnRF injection. A. J. Elsbernd1,*, C. F. M. de Lange2, J. F. Patience1, 1Iowa State University, Ames, 2Department of Animal and Poultry Science, University of Guelph, Guelph, ON, Canada.
The commercial introduction of an anti-GnRF product (Im-provest, Zoetis Inc., Florham Park, NJ) has prompted in-creased interest in developing optimum feeding programs for immunologically castrated male pigs (IC). One characteristic of IC is a rapid increase in feed intake following administration of the second immunization injection. Understanding the na-ture of the change in feed intake is central to the development of optimum feeding programs for IC. The objective of this ex-periment was to compare the feed intake of IC versus physical castrated male pigs (PC) and characterize the dynamic changes in feed intake of IC following the second injection. One hun-dred fifty pigs (PIC 359×C29) of each of the two genders were housed in pens of 5 pigs providing 1.0 m2 per pig on partially slatted floors. Feed and water were available ad libitum. Per pen feed intake was recorded for 2-d intervals starting on the day of the second injection and continued for 14 d. Weekly feed intake was recorded for the following 2 wk. Initial body weight for the IC and PC pigs was 97.2 ± 1.8 kg and 101.2 ± 1.2 kg, respectively. During the week immediately before the second injection, feed intake of IC averaged 2.91 kg/d com-pared to 3.52 kg/d for PC (P < 0.05). There was little change in IC feed intake for d 1–2 (2.83 kg/d) and d 3–4 (2.89 kg/d), or in PC feed intake (3.36 and 3.50 kg/d) for the same periods, such that IC feed intake remained at 83–84% of PC (P < 0.05). However, IC daily feed intake increased rapidly commencing at d 5–6 (86% of PC). This increase continued, such that IC intake was similar to that of PC intake during d 9–10 (3.36 vs. 3.46 kg/d; P > 0.05) and d 11–12 (3.66 vs. 3.52 kg/d; P > 0.05), but exceeded that of PC starting on d 13–14 (3.55 vs. 3.31 kg/d; P < 0.05). Interestingly, average daily feed intake of IC relative to that of PC continued to increase during week

148
3 (3.74 vs. 3.39; P < 0.05) and week 4 (3.86 vs. 3.37 kg/d; P < 0.05) following injection. In conclusion, daily feed intake of IC remained constant for the first 4 d following the second in-jection but then increased relative to PC and continued to do so for the remainder of the 4 wk recording period. By 2 wk post injection, the intake of IC exceeded that of PC.
Key Words: pigs, feed intake, immunological castration
334 Impact of Ractopamine on whole-body and carcass growth and efficiency in pigs reared under moderate heat stress. C. E. Zier-Rush1, M. McGrath1, R. Palan1, A. Vaske2, K. D. Haydon2,*, R. D. Boyd1, 1The Hanor Company, Inc., Franklin, KY, 2Elanco Animal Health, Greenfield, IN.
Paylean® (PLN, Ractopamine) is one of the most important dietary tools available to counteract the growth depressing ef-fect of heat stress in pigs. This study was conducted to provide quantitative data for financial evaluation of PLN in growing pigs reared under moderate heat stress. A total of 2170 PIC terminal castrate and female pigs (91.5 ± 0.5 kg) were used in a growth assay to approx. 123 kg ( ± .6 kg). Pigs were placed in a commer-cial research facility (May/June), blocked by gender, stratified by weight and allocated (22 pigs/pen, with 0.74 m2/pig) to diets either devoid of PLN (CON) or with 5 ppm PLN for the first 21 d followed by 8.8 ppm of PLN for the last 18 d on feed (50 pens/treatment). Environmental controls were manipulated to estab-lish upper and lower temperature limits of 30.1°C and 25.6°C, respectively. Acclimatization began 10 d before initiation by el-evating temperature 0.56°C/d from an initial set point of 21°C. Temperature tended to be at or near maximum 16–18 h/d. Diets were composed of corn, soybean meal, corn ddgs (18.0%) and cwg fat (2.5%). SID lysine content of CON and PLN diets was 0.76 and 1.01% respectively; days on test averaged 39.3 d for CON and PLN pigs (range of 27–44 d). Average feed intake was greater for CON pigs (2.644, 2.595 kg/d; P = 0.062), but whole-body (WB) ADG and G:F ratio were greater (P < 0.001) for the PLN group (0.871 kg/d, 0.336 kg/kg) as compared to CON pigs (0.789, 0.298). Final WB weight (124.9 vs. 121.6 kg, P < 0.001) and carcass dressing %, based on farm WB weight, was improved by PLN (75.0 vs. 73.8%, P < 0.001). This resulted in a carcass gain of 4.0 kg/pig (26.3 vs. 22.3 kg, P < 0.001), on a time constant basis. Carcass ADG and G:F ratio was computed as the difference between estimated initial carcass weight (0.74×WB weight) and plant carcass weight. PLN improved (P < 0.001) ADG and G:F ratio respectively (0.669 kg/d, 0.268 kg/kg), com-pared to the CON group (0.568, 0.215). PLN also improved (P < 0.001) FOM lean (53.1 vs. 51.7%), which was the result of improvements in both FOM fat and FOM loin depth (-2.1, +3.4 mm), thereby suggesting improved saleable meat. Thus, PLN improved carcass growth (4 kg/pig), under conditions of moder-
ate heat stress, to an extent that is unparalleled by any reported nutritional technology.
Key Words: heat stress, growth, ractopamine
335 Effect of feed form (mash vs. pellets) and ractopamine on pork fat quality. N. Matthews1,*, L. Greiner2, C. R. Neill1, S. Jungst1, B. Fields1, R. C. Johnson3, A. Sosnicki1, 1Genus PIC, Hendersonville, TN, 2Carthage Innovative Swine Solutions, Carthage, IL, 3Farmland Foods, Denison, IA.
A trial was conducted in a commercial production system to compare fat quality of PIC337× C29 pigs fed equivalent diets in the form of either mash or pellets. Seven days before the first marketing, pigs were allocated to either control or ractopamine (5 ppm; RAC) diets. Thus, the treatments were a 2× 2 facto-rial arrangement. Experimental units were pen for growth data and pig for fat quality data. A total of 1200 pigs were placed in a wean-finish barn and sorted by sex and randomly allotted to treatments (46 pens; 11 or 12 pens per treatment). A standard diet meeting nutrient requirements for pigs from 5.4 to 122 kg live weight was used. Pigs were marketed to a commercial pack-ing facility where belly fat (n = 534; 130 to 137 per treatment) and clear plate backfat (BF; n = 1025; 246 to 264 per treatment) samples were collected and analyzed using near-infrared spec-troscopy. No feed form× RAC interactions were observed (P > 0.05). Pelleting (4.9%) and RAC (5.4%) improved GF (P < 0.0001), but ADG (P > 0.18) was only numerically higher. Pigs fed pelleted diets had higher belly fat (P < 0.0001) C18:2 (14.9 vs. 16.5), C18:3 (0.62 vs. 0.72), and IV levels (69.2 vs. 71.6), but lower (P < 0.005) C16:0 (23.3 vs. 22.7), C16:1 (2.91 vs. 2.80), C18:0 (9.1 vs. 8.9) and C18:1 (45.3 vs. 44.3) levels. Pigs fed pelleted diets had higher BF (P < 0.0001) C18:2 (15.1 vs. 17.1), C18:3 (0.75 vs. 0.87), and IV levels (69.1 vs. 72.3), but lower (P < 0.0001) C16:0 (23.5 vs. 22.7), C16:1 (2.21 vs. 2.11), C18:0 (9.8 vs. 9.5) and C18:1 (43.8 vs. 42.9) levels. Pigs fed RAC had higher belly fat (P < 0.01) C18:2 (15.3 vs. 16.1), C18:3 (0.66 vs. 0.69), and IV levels (69.8 vs. 71.0), but lower (P < 0.01) C16:0 (23.1 vs. 22.8), C18:0 (9.1 vs. 8.9) and C18:1 (45.0 vs. 44.7) levels. Pigs fed RAC diets had higher BF fat (P < 0.0001) C18:2 (15.6 vs. 16.6), C18:3 (0.78 vs. 0.84), and IV levels (69.9 vs. 71.5), but lower (P < 0.005) C16:0 (23.3 vs. 22.9), C16:1 (2.18 vs. 2.14), C18:0 (9.8 vs. 9.6) and C18:1 (43.6 vs. 43.1) levels. These data indicate that while pelleting and RAC both have positive effects on growth, they could have negative effects on fat quality.
Key Words: pigs, pelleting, ractopamine, fat quality
336 (GS-PHD) Influence of dietary fiber concentrations on the basal endogenous loss of phosphorus in growing pigs. A. R. Son*, B. G. Kim, Konkuk University, Seoul, South Korea.
An experiment was conducted to determine basal endogenous

149
losses (BEL) of phosphorus (P) in growing pigs fed P-free di-ets with various cellulose concentrations. Twelve barrows with an initial mean BW of 49.6 kg (SD = 3.2) were individually housed in metabolism crates that were equipped with a feeder and a nipple drinker. Pigs were allotted to 4 experimental di-ets according to a crossover design. Experimental diets, based mainly on corn starch, sucrose, and gelatin, were formulated to contain 0, 4, 8, or 12% of cellulose. Each period consisted of a 5-d adaptation and a 5-d collection period. The marker-to-marker method was used for fecal collection. The feed intake and P intake were linearly and quadratically increased (P < 0.05) with increasing cellulose concentration in the diet. There were linear and quadratic increases (P < 0.05) in the feces out-put and feces output per feed intake with increasing cellulose concentration in the diet. However, the P content in the feces was decreased (P < 0.001) with increasing dietary cellulose concentration. The apparent total tract digestibility of DM and ash were linearly and quadratically decreased (P < 0.05) with increasing cellulose concentration in the diet. However, the BEL of P as mg per kg of DMI (ranged from 157 to 207 mg/kg of DMI) and total P output were not affected by the dietary cellulose concentrations. In conclusion, the dietary cellulose affects the digestibility of DM and ash, but the cellulose up to 12% does not affect the endogenous loss of P.
Key Words: cellulose, metabolic fecal phosphorus, swine
NONRUMINANT NUTRITION: GROW-FINISH NUTRITION AND MANAGEMENT
337 Influence of a superdose of phytase on finishing pig performance and carcass characteristics. J. R. Flohr*, R. D. Goodband, M. D. Tokach, K. B. Langbein, S. S. Dritz, J. M. DeRouchey, J. Woodworth, Kansas State University, Manhattan.
A total of 1188 finishing pigs (PIC 337 × 1050; initially 36.4 kg) were used in a 92-d experiment to determine the influence of providing phytase above that needed to meet the P require-ment for growth and carcass characteristics. At initiation of the study pens were randomly allotted to treatments based on initial BW. There were 27 pigs per pen and 11 replications
per treatment. The 4 dietary treatments were formed by in-creasing phytase (Optiphos 2000, Enzyvia LLC) to provide 250, 500, 1000, and 2000 phytase units (FTU)/kg. Diets were corn-soybean meal–based and contained 15% bakery meal and decreasing levels of dried distillers grains with solubles in each phase. Diets were fed in 4 phases from approximately 36 to 59, 59 to 82, 82 to 109, and 109 to 131 kg BW and all phases contained the same phytase concentrations. The first 250 FTU/kg of phytase was considered to provide 0.10% P release in meeting the dietary available P levels of 0.29, 0.28, 0.24, and 0.23% and STTD P levels of 0.32, 0.31, 0.27, and 0.27% in phase 1, 2, 3, and 4, respectively, with further addi-tions exceeding the phosphorus requirement. All other nutri-ents were provided at or above requirement of the pigs as de-fined by NRC (2012). All data were analyzed as a completely randomized design with pen as the experimental unit. Overall (d 0 to 92) increasing dietary phytase did not influence (P > 0.05) ADG but reduced (cubic, P < 0.01) ADFI, resulting in increased G:F (cubic, P < 0.01). The cubic response occurred because ADFI was reduced and G:F increased with increased phytase inclusion from 250 to 500 FTU/kg with no response from 1000 to 2000 FTU/kg. Phytase addition to the diet did not influence (P > 0.05) carcass measurements. These results suggest that providing phytase up to 500 FTU/kg has the po-tential to improve feed efficiency.
Key Words: Finishing pigs, phosphorus, phytase
338 Influence of copper sulfate and tribasic copper chloride on feed intake preference in finishing pigs. K. F. Coble1,*, J. M. DeRouchey1, M. D. Tokach1, J. Woodworth1, R. D. Goodband1, S. S. Dritz1, J. L. Usry2 and K. Card1, 1Kansas State University, Manhattan, 2Micronutrients, Social Circle, GA.
When supplemented at 125 to 250 ppm, Cu has consis-tently been demonstrated to increase ADG, mainly through increased feed intake. A total of 150 pigs (initially 86.6 kg) were used in a 15-d study to determine if pigs have a pref-erence to consume diets containing added Cu from either copper sulfate (CuSO4) or tribasic copper chloride (TBCC, IntelliBond C; Micronutrients, Indianapolis, IN). Pigs were placed in pens by sex (5 pigs/pen), with each sex accounting for 15 pens. On d 0, pens of pigs were individually weighed and pens were randomly allotted to 1 of 3 dietary preference
Table 337.
ItemAdded phytase (FTU)/kg
SEM Linear Quadratic Cubic250 500 1000 2000d 0 to 92
ADG, kg 1.04 1.03 1.04 1.02 0.008 0.25 0.27 0.54ADFI, kg 2.64 2.53 2.61 2.57 0.028 0.49 0.72 0.01G:F 0.393 0.409 0.400 0.398 0.004 0.88 0.20 0.01
BW, kgd 0 36.4 36.3 36.4 36.3 0.54 0.94 1.00 0.94d 92 130.9 130.1 130.9 129.5 1.05 0.42 0.68 0.52
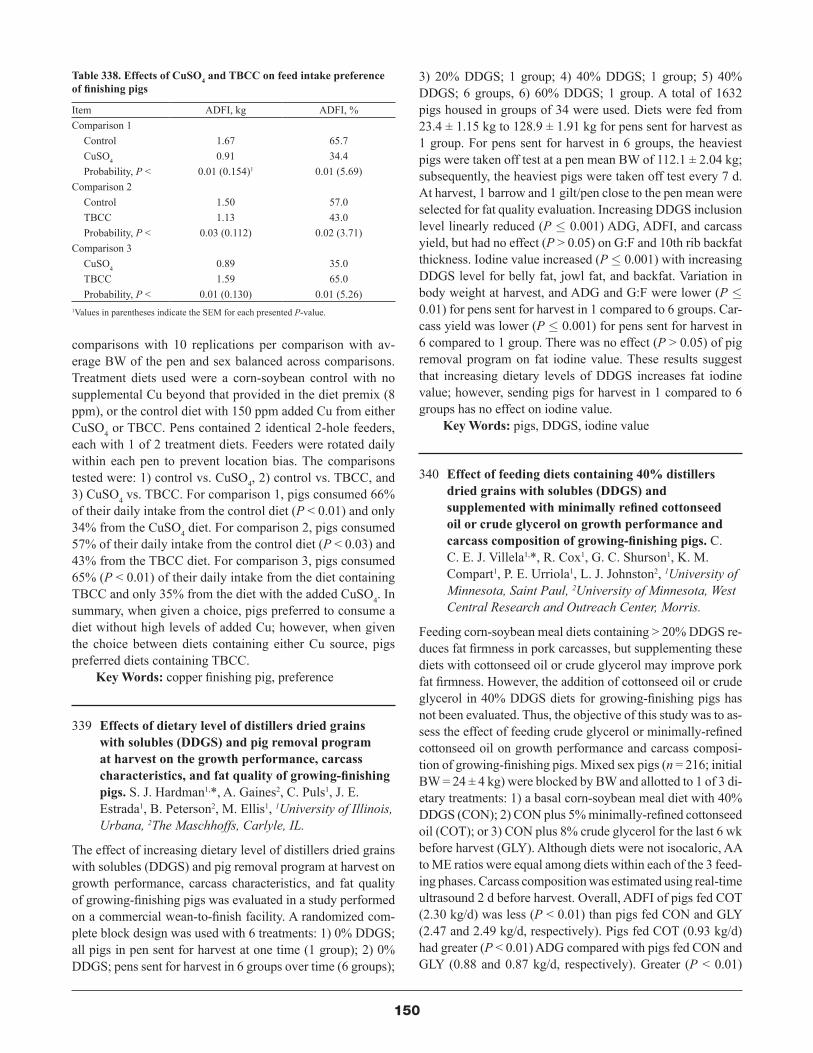
150
comparisons with 10 replications per comparison with av-erage BW of the pen and sex balanced across comparisons. Treatment diets used were a corn-soybean control with no supplemental Cu beyond that provided in the diet premix (8 ppm), or the control diet with 150 ppm added Cu from either CuSO4 or TBCC. Pens contained 2 identical 2-hole feeders, each with 1 of 2 treatment diets. Feeders were rotated daily within each pen to prevent location bias. The comparisons tested were: 1) control vs. CuSO4, 2) control vs. TBCC, and 3) CuSO4 vs. TBCC. For comparison 1, pigs consumed 66% of their daily intake from the control diet (P < 0.01) and only 34% from the CuSO4 diet. For comparison 2, pigs consumed 57% of their daily intake from the control diet (P < 0.03) and 43% from the TBCC diet. For comparison 3, pigs consumed 65% (P < 0.01) of their daily intake from the diet containing TBCC and only 35% from the diet with the added CuSO4. In summary, when given a choice, pigs preferred to consume a diet without high levels of added Cu; however, when given the choice between diets containing either Cu source, pigs preferred diets containing TBCC.
Key Words: copper finishing pig, preference
339 Effects of dietary level of distillers dried grains with solubles (DDGS) and pig removal program at harvest on the growth performance, carcass characteristics, and fat quality of growing-finishing pigs. S. J. Hardman1,*, A. Gaines2, C. Puls1, J. E. Estrada1, B. Peterson2, M. Ellis1, 1University of Illinois, Urbana, 2The Maschhoffs, Carlyle, IL.
The effect of increasing dietary level of distillers dried grains with solubles (DDGS) and pig removal program at harvest on growth performance, carcass characteristics, and fat quality of growing-finishing pigs was evaluated in a study performed on a commercial wean-to-finish facility. A randomized com-plete block design was used with 6 treatments: 1) 0% DDGS; all pigs in pen sent for harvest at one time (1 group); 2) 0% DDGS; pens sent for harvest in 6 groups over time (6 groups);
3) 20% DDGS; 1 group; 4) 40% DDGS; 1 group; 5) 40% DDGS; 6 groups, 6) 60% DDGS; 1 group. A total of 1632 pigs housed in groups of 34 were used. Diets were fed from 23.4 ± 1.15 kg to 128.9 ± 1.91 kg for pens sent for harvest as 1 group. For pens sent for harvest in 6 groups, the heaviest pigs were taken off test at a pen mean BW of 112.1 ± 2.04 kg; subsequently, the heaviest pigs were taken off test every 7 d. At harvest, 1 barrow and 1 gilt/pen close to the pen mean were selected for fat quality evaluation. Increasing DDGS inclusion level linearly reduced (P £ 0.001) ADG, ADFI, and carcass yield, but had no effect (P > 0.05) on G:F and 10th rib backfat thickness. Iodine value increased (P £ 0.001) with increasing DDGS level for belly fat, jowl fat, and backfat. Variation in body weight at harvest, and ADG and G:F were lower (P £ 0.01) for pens sent for harvest in 1 compared to 6 groups. Car-cass yield was lower (P £ 0.001) for pens sent for harvest in 6 compared to 1 group. There was no effect (P ˃ 0.05) of pig removal program on fat iodine value. These results suggest that increasing dietary levels of DDGS increases fat iodine value; however, sending pigs for harvest in 1 compared to 6 groups has no effect on iodine value.
Key Words: pigs, DDGS, iodine value
340 Effect of feeding diets containing 40% distillers dried grains with solubles (DDGS) and supplemented with minimally refined cottonseed oil or crude glycerol on growth performance and carcass composition of growing-finishing pigs. C. C. E. J. Villela1,*, R. Cox1, G. C. Shurson1, K. M. Compart1, P. E. Urriola1, L. J. Johnston2, 1University of Minnesota, Saint Paul, 2University of Minnesota, West Central Research and Outreach Center, Morris.
Feeding corn-soybean meal diets containing > 20% DDGS re-duces fat firmness in pork carcasses, but supplementing these diets with cottonseed oil or crude glycerol may improve pork fat firmness. However, the addition of cottonseed oil or crude glycerol in 40% DDGS diets for growing-finishing pigs has not been evaluated. Thus, the objective of this study was to as-sess the effect of feeding crude glycerol or minimally-refined cottonseed oil on growth performance and carcass composi-tion of growing-finishing pigs. Mixed sex pigs (n = 216; initial BW = 24 ± 4 kg) were blocked by BW and allotted to 1 of 3 di-etary treatments: 1) a basal corn-soybean meal diet with 40% DDGS (CON); 2) CON plus 5% minimally-refined cottonseed oil (COT); or 3) CON plus 8% crude glycerol for the last 6 wk before harvest (GLY). Although diets were not isocaloric, AA to ME ratios were equal among diets within each of the 3 feed-ing phases. Carcass composition was estimated using real-time ultrasound 2 d before harvest. Overall, ADFI of pigs fed COT (2.30 kg/d) was less (P < 0.01) than pigs fed CON and GLY (2.47 and 2.49 kg/d, respectively). Pigs fed COT (0.93 kg/d) had greater (P < 0.01) ADG compared with pigs fed CON and GLY (0.88 and 0.87 kg/d, respectively). Greater (P < 0.01)
Table 338. Effects of CuSO4 and TBCC on feed intake preference of finishing pigs
Item ADFI, kg ADFI, %Comparison 1
Control 1.67 65.7CuSO4 0.91 34.4Probability, P < 0.01 (0.154)1 0.01 (5.69)
Comparison 2Control 1.50 57.0TBCC 1.13 43.0Probability, P < 0.03 (0.112) 0.02 (3.71)
Comparison 3CuSO4 0.89 35.0TBCC 1.59 65.0Probability, P < 0.01 (0.130) 0.01 (5.26)
1Values in parentheses indicate the SEM for each presented P-value.

151
G:F was observed for pigs fed COT (0.41) than pigs fed CON and GLY diets (0.36 and 0.35, respectively). Final BW of pigs fed COT (124.3 kg) was greater (P < 0.01) than pigs fed CON (118.9 kg) and GLY (118.6 kg). Consequently, pigs fed COT had greater (P < 0.01) HCW (94.9 kg) compared with CON and GLY fed pigs (89.9 and 89.2 kg, respectively). No dif-ferences were observed for dressing percentage (75.7, 76.3, and 75.3%), fat-free lean percentage (50.5, 49.7, and 50.0%), backfat depth (2.11, 2.26, and 2.22 cm) and LM area (42.9, 44.2, and 42.5 cm2) for CON, COT and GLY, respectively. In conclusion, pigs fed COT had improved growth performance, which was likely due to greater energy density of diets, but carcass composition was not affected by dietary treatments.
Key Words: cottonseed oil, glycerol, growing- finishing pigs
341 (GS-MS) Effect of adding minimally refined cottonseed oil or crude glycerol to diets containing 40% distillers dried grains with solubles (DDGS) on carcass fat firmness of growing-finishing pigs. C. C. E. J. Villela1,*, R. Cox1, G. C. Shurson1, K. M. Compart1, P. E. Urriola1, L. J. Johnston2, 1University of Minnesota, Saint Paul, 2University of Minnesota, West Central Research and Outreach Center, Morris.
High inclusion ( > 20%) of DDGS in diets for growing-finish-ing pigs causes soft fat in pork carcasses. Cottonseed products or crude glycerol may improve fat firmness. Mixed sex pigs (n = 216, average BW = 24 ± 9 kg) were blocked by BW and allotted to 1 of 3 dietary treatments. Experimental diets in a 3-phase feeding program consisted of basal corn-soybean meal-40% DDGS (CON), CON plus 5% minimally refined cottonseed oil (COT), and CON plus 8% crude glycerol for 6 wk before harvest (GLY). Gilts (16/treatment; 48 total) were harvested (BW = 115 ± 8 kg) and bellies were collected for evaluation. Bellies were suspended perpendicularly on a smoke stick and belly flop angle and flex were determined. Belly fat samples were collected and used to determine thio-barbituric acid reactive substances (TBARS) content on d 0 and 7 post-mortem. Subjective fat firmness was determined for cores of belly, jowl, and backfat. Bellies were processed into bacon, and selected bacon slices were evaluated for shat-ter, shrink, and cooking loss. Because belly thickness tended to differ among treatments, it was used as a covariate for anal-ysis of belly flop angle data. Dietary treatment had no effect on belly flop angle or belly flex measurements. Bacon shrink-age, cooking loss and subjective firmness of backfat were not different than CON for COT or GLY. On d 7 post-mortem, TBARS concentration was greater for pigs fed COT (1.44 ng/mg fat ± 0.06) than for GLY (1.04 ng/mg fat ± 0.06; P = 0.01), but similar to CON (1.25 ng/mg fat ± 0.06). In conclusion, feeding 40% DDGS supplemented with either COT or GLY did not improve belly fat firmness.
Key Words: carcass fat, cottonseed oil, crude glycerol
342 Prebiotic effects on growth performance and immune health in nursery pigs. G. A. Mastromano*, Y. S. Li, H. Tran, J. W. Bundy, P. S. Miller, T. E. Burkey, University of Nebraska, Lincoln.
Prebiotics are fermentable feed ingredients that allow changes in the composition and (or) activity of the gut microbiota that confer beneficial effects on host health. Chicory has high inulin and oli-gofructose content and is a prototype prebiotic for monogastrics. The objective of this experiment was to investigate the effects of dietary prebiotics in nursery pigs by evaluating growth perfor-mance and immune biomarkers. Sixty-four weaned pigs (age 30 to 32 d; BW 8 ± 0.1 kg) of mixed gender were housed (4 pigs/pen) in an environmentally-controlled nursery with ad libitum access to feed and water over a 35-d study. Pigs were randomly assigned to 1 of 4 treatments: control (53% corn, 32% SBM, 7% fishmeal, 8% others), control + 2.5% Grobiotic-S (GS), control + 0.05% chicory (CL), or control + 0.5% chicory (CH). Feeders and pigs were weighed weekly. On d 21, blood samples were obtained from 3 pigs/treatment for collection of peripheral blood mononuclear cells (PBMC). Isolated PBMC were cultured and subsequently challenged with Lipopolysaccharide (LPS; 20 ng/mL). Cell culture supernatants were collected for quantification of cytokines (IL-8 and IL-10). Dietary treatment had no effect on BW. Overall (d 0 to 35), pigs fed GS (0.58 kg) had greater (P < 0.05) ADG compared to control (0.52 kg), CL (0.54 kg), and CH (0.54 kg) pigs. In addition, ADFI was greater (P < 0.05) for pigs fed CL (0.78 kg), CH (0.78 kg), and GS (0.82 kg) compared to control, and ADFI for GS-fed pigs was greater (P < 0.05) than either CL or CH. No differences in G:F were detected among treatments. Secondary LPS challenge increased (P < 0.05) IL-8 secretion from PBMC isolated from CL (23,732 pg/mL) pigs compared to control (10,061 pg/mL) and CH (12,411 pg/mL) pigs. Secretion of IL-10 from PBMC isolated from CL (63 pg/mL) pigs was greater (P < 0.05) compared to control (28 pg/mL) pigs and tended (P < 0.1) to be greater compared to CH (34 pg/mL) pigs. Results indicate that inclusion of prebiotics in nursery pig diets has positive effects on growth performance and may have immunomodulatory effects (in vitro) on cells isolated from prebiotic-fed pigs.
Key Words: biomarker, pig, prebiotic
Table 341. Effect of feeding 40% DDGS diets containing minimally refined cottonseed oil or crude glycerol on carcass fat firmness
Item CON COT GLY SEM P-valueBelly thickness, cm 2.75x 3.18y 3.01xy 0.13 0.07Belly flop angle, degrees 6.21 8.57 6.06 0.95 0.16Lateral belly flex, cm 8.57 9.45 9.12 0.48 0.37Vertical belly flex, cm 35.40 35.23 35.16 0.52 0.93S ubjective backfat
firmness13.25ab 2.64a 3.38b 0.19 0.04
Bacon cook shrink, % 13.48xy 11.01x 14.89y 1.22 0.06Bacon cook loss, % 37.83xy 36.09x 39.72y 1.45 0.07a,b Means within a row lacking common superscripts differ (P < 0.05). x,y Means within a row lacking common superscripts differ (P < 0.10). 1 Scores: 1 = soft; 5 = firm.
152
343 (GS-MS) Selenium-enriched probiotics improves antioxidant status and immune function of piglets raised in a high-temperature environment. F. Gan1, N. Regmi2,*, X. Chen1, C. Lv1, F. Ren1, G. Ye1, C. Pan1, J. Shi1, X. Shi1, H. Zhou1, S. F. Liao2, K. Huang1, 1Nanjing Agricultural University, Nanjing, Jiangsu, China, 2Mississippi State University, Mississippi State.
Heat stress is a detrimental factor negatively affecting animal health and performance. The objective of this study was to in-vestigate the effects of selenium-enriched probiotics (SeP) on antioxidant status and immune function of piglets raised in a high-temperature environment (25~40°C). Forty-eight cross-bred weanling piglets (BW 7.9 ± 0.5 kg), randomly assigned to 4 dietary treatments (n = 12), were fed ad libitum a basal diet (Con, 0.16 mg Se/kg-diet), or a basal diet supplemented with probiotics (P, 0.16 mg Se/kg-diet), sodium selenite (SS, 0.46 mg Se/kg-diet) or SeP (0.46 mg Se/kg-diet). Three piglets were randomly selected from each of the 4 groups for blood collection on Days 0, 14, 28, and 42 and spleen sample col-lection on Day 42 post-feeding. The results of blood sample analyses showed that on Days 14, 28, and 42: (1) Although no difference was found between the P and Con groups in glutathione peroxidase activities, the SS group was higher (P < 0.05) than the P group and the SeP group was higher (P < 0.05) than the SS group. (2) Although no difference was found between the SS and P groups, both groups were higher (P < 0.05) than the Con group in erythrocyte glutathione contents, and serum malondialdehyde and IL-2 contents. the SeP group was further higher (P < 0.05) than the SS or P group. (3) Al-though there was no difference between the SS and P groups and between the SeP and SS groups in serum superoxide dis-mutase activities, the SeP group was higher (P < 0.05) than the P group and the P group was higher (P < 0.05) than the Con group. Furthermore, the analyses of the blood and spleen samples of Day 42 showed that for T lymphocyte prolifera-tion (T cell receptor induced), although no difference was found between the SS and P groups, both groups were higher (P < 0.05) than the Con group, and the SeP group was higher (P < 0.05) than the SS or P group. Taken together, this study showed that the newly-developed SeP product has additive ef-fects of P and Se, and is more effective than the P or SS used alone in improving antioxidant status and immune function of young piglets, suggesting that this product can serve as a new or better feed additive for pigs raised in high-temperature environments. This project was supported in part by the Na-tional Natural Science Foundation of China and Mississippi Agricultural and Forestry Experiment Station.
Key Words: selenium-enriched probiotics, antioxidant status, immune function, pig
344 Liquid feeding of ethanol industry co-products on growth performance of wean to finish pigs. S. Baidoo*, J. Jendza, X. Yang, L. Anil, Southern Research and Outreach Center, University of Minnesota, Waseca, MN.
The objective of this study was to determine the effects of liquid feeding distillers dried grains with solubles (DDGS), wet distillers grains with solubles (WDGS), wet distillers grains (WDG), wet distillers soluble (WDS), and freeze-dried distillers solubles (DDS) on the performance of wean-finish pigs. A total of 480 pigs with initial BW 11.3 ± 1.5 kg were blocked by BW and gender and randomly allocated to 1 of 6 dietary treatments: 1) corn-soybean meal (Control), 2) 30% DDGS (DDGS), 3) 30% DDS in the first 2 wk (phase 1) and 30% DDGS for the remaining phases (DDS), 4) 20% WDS (WDS), 5) 30% WDG (WDG), 6) 30% WDGS (25.5% WDG + 4.5% WDS, WDGS). Conventional dry feeding was applied for treatments 1, 2, and 3, whereas pigs from treatments 4, 5, and 6 were fed using a liquid feeding system. Each treatment had 4 pens of barrows and 4 pens of gilts with 10 pigs per pen. Pigs on liquid feeding had better feed efficiency, lower ADFI, and higher water intake (P < 0.05) when compared with those on dry feeding. However, no difference (P > 0.05) was ob-served for ADG between the liquid feeding and dry feeding for all phases except that dry feeding resulted in higher ADG (P < 0.05) during d 42 to 70 in comparison with liquid feed-ing. During d 14 to 42, the WDS group had lower ADG com-pared with the WDG group (P < 0.05). During d 42 to 70, the corn-soybean diet had greater ADG than the WDS and WDG treatments, and WDS decreased ADG in comparison with the two dry feeding groups DDGS and DDS (P < 0.05). For the overall period and other feeding phases, ADG did not differ among the 6 dietary treatment groups (P > 0.05). No differences in ADFI, feed efficiency, and water intake were found among the 3 groups within the same feeding type for all phases (P > 0.05). Our results suggest that liquid feeding of ethanol industry co-products to wean to finish pigs does not compromise growth performance.
Key Words: liquid feeding, corn ethanol co-products, pigs
345 Evaluation of pineapple byproduct in finishing pigs feeding. U. D. S. Ruiz1,*, T. S. Vasconcelos1, M. C. Thomaz2, V. V. Almeida2, F. R. Castelini2, D. J. Rodrigues2, R. K. Ono1, G. F. Ramos1, J. A. Oliveira1, 1Univ. Estadual Paulista—UNESP, Dracena, Brazil, 2Univ. Estadual Paulista—UNESP, Jaboticabal, Brazil.
This study evaluated pineapple byproduct in finishing swine diets. In Exp. 1 the apparent total tract digestibility (ATTD) of DM, OM, CP and phosphorus (P) of pineapple byproduct, in-cluded in increasing levels in pigs diets, were compared by the difference method. Twenty eight barrows (84.93 ± 1.6 kg of BW) were fed a basal diet or diets formulated by replacing 10,
153
20 or 30% of the basal diet with the test feedstuff. In Exp. 2, 32 barrows were allotted to 1 of 4 diets with increasing levels (0, 9, 18, and 27%) of pineapple byproduct, with the same CP, AA and available P contents. ADG, ADFI and feed conversion ratio (FCR) were evaluated from 77.85 ± 2.53 kg to 101.25 ± 4.18 kg of BW (phase 1) and from 77.85 ± 2.53 kg to 126.71 ± 8.03 kg of BW (phase 2). In both trials pigs were housed individually, with free access to feed and water. All diets were corn-soybean meal based. In Exp. 1 and in phase 1 of Exp.2 the basal diets provided 3230 kcal/kg of ME, 155.1 g/kg of CP and 8.29 g/kg of digestible lysine. In phase 2 of Exp. 2 the basal diet provided 3230 kcal/kg of ME, 139.2 g/kg of CP and 7.48 g/kg of digestible lysine. A complete randomized block design was adopted, each animal was considered an experimental unit and results were submitted to ANOVA and regression analisys. The DM, OM and CP ATTD values of the pineapple byproduct were not affected (P > 0.05) by the feedstuff levels of 10, 20, and 30%, which were: 84.69, 83.81 and 86.01%; 88.33, 85.73 and 86.92%; 77.04, 70.65 and 82.01%, respectively. Phospho-rus digestibility was linearly decreased (P < 0.05), from 59.26 to 32.61%, by the increasing levels of the pineapple byproduct. There were linear decreases (P < 0.01) in ADG (13.1% and 21.4% in phases 1 and 2, respectively) and in ADFI (26.3% and 15.1% in phases 1 and 2, respectively) of the pigs as a result of the increasing levels of the feedstuff. In phase 1, pigs fed diet with 9% of pineapple byproduct presented the smallest (P < 0.05) FCR (2.49) and the highest (P < 0.05) FCR (3.04) was observed in the animals fed diet without the feedstuff. The pineapple byproduct presented high DM, OM and CP ATTD values for pigs, but high levels of the feedstuff in the diets de-crease the animals performance.
Key Words: performance, digestibility, feed restriction
NONRUMINANT NUTRITION: NUTRITION AND MANAGEMENT OF SOWS
346 The perinatal transfer of vitamins and trace elements from sows to piglets. J. J. Matte*, I. Audet, C. L. Girard, Agriculture & Agri-Food Canada, Sherbrooke, QC, Canada.
Nursing piglets are entirely dependent for their micronutrient provision on the transfer (in utero, colostrum and milk) from the dam and this lasts for approximately half the life cycle (con-ception to slaughter) of a pig. As an adequate maternal transfer of these micronutrients is critical, especially for high prolific sows, a simple approach was set up to assess the maternal peri-natal transfer of vitamins and trace elements. Prenatal trans-fer was estimated as limited, passive, or active using a ratio (RU) between pre-farrowing serum concentrations of a given micronutrient in dams and corresponding pre-colostral values in piglets. Efficiency of the postnatal transfer was estimated,
as for RU, from another ratio (RC) between serum concentra-tions of pre- and post-colostral micronutrients in piglets. Data from literature (11 studies) were used for vitamins A, D, E, C, B12, and folates whereas the others were generated from a trial where blood sera from 20 sows and their litter was collected during the perinatal period. t tests were used to determine if RU or RC values differ from 1. Prenatal transfer was active and in favor of piglets (RU < 1, P < 0.01) for Zn and vitamins B6 and biotin (sow trial) as well as for vitamins C and B12 (literature data). This transfer was limited (RU > 1, P < 0.01) for vitamin B2, Fe, Cu, and Se (sow trial) and for vitamins A, E, D, and folates (literature data) whereas it was passive for vitamin B3 (RU = 1, P > 0.37). After birth, the early postnatal transfer through colostrum was active for most micronutrients but vitamins B6 and biotin (RC < 1, P < 0.01). Globally, the perinatal transfer (combination of RU and RC) was favourable to the neonatal piglets for most micronutrients except for vita-mins A and D as well as iron, copper and selenium. For these vitamins and trace elements, it appears that the placenta acts as a barrier for prenatal transfer which is not thereafter compen-sated by the colostrum provision to neonatal piglets. Then, the post-colostral concentrations of these micronutrients in piglets remain below the levels of their dam before parturition. Milk being a poor source of micronutrients, piglets are at risk to suf-fer, shortly after birth and thereafter during lactation, from nu-tritional deficits other than Fe, well known for decades. New targeted neonatal strategies of micronutrient supplementation are possibly required nowadays for suckling piglets.
Key Words: micronutrients, sows, piglets
347 Effects of the combination of 50 ppm L-carnitine and 200 ppb chromium from chromium picolinate on sow reproductive performance, progeny growth performance and carcass quality. T. C. Tsai1, H. J. Kim1,*, J. R. Bergstrom2, J. J. Chewning3, J. K. Apple1, C. V. Maxwell1, 1University of Arkansas, Fayetteville, 2DSM Nutritional Products, North America, Marshall, MO, 3Swine Research Services, Inc., Springdale, AR.
Sows and gilts (n = 254, PIC 29) from three consecutive breeding groups were blocked by parity and initial BW, and randomly assigned to one of two dietary treatment regimens: Control or Control with 50 ppm L-carnitine and 200 ppb chro-mium (CARNICHROME). Sows were rebred after weaning, and remained on the same dietary treatment. Feed was pro-vided during gestation based on a consistent daily feeding of approximately 2.2 kg/d (3.3 kcal ME/kg, 0.65% SID lysine) with adjustments made depending on body condition. Feed (3.3 kcal ME/kg, 1.07% SID lysine) was provided to meet each sow’s appetite during lactation. Progeny (n = 288) (Exp. 2) from the subsequent farrowing of group 2 was sorted by dam’s treatment, blocked by initial BW (6.49 ± 0.34 kg) and sex, allotted within block to 1 of 4 gender-balanced pens, and assigned randomly to 1 of 2 dietary treatment regimens, the

154
Control or CARNICHROME in diets (3.4 kcal ME/kg) with SID lysine content of 1.47%, 1.43%, and 1.29% in phase 1, 2, and 3, respectively. At completion of the nursery study, the 9 heaviest blocks were transferred to finishing barn to con-tinue the same treatments during the growing (1.05 to 0.88% SID lysine and 3.3 kcal ME/kg) and finishing phases (0.75 to 0.65% SID lysine and 3.4 kcal ME/kg). Sows fed CAR-NICHROME tended to have 8% less (P = 0.07) backfat at d 110 of gestation, 33 and 29% reduction (P < 0.06) in backfat change during gestation and at the end of lactation, 10% in-crease (P = 0.03) in ADFI during the third week of lactation, and 11% fewer (P = 0.04) pigs weaned with BW < 3.6 kg. During the nursery phase, ADG and ADFI were reduced (P < 0.05) in progeny from sows fed CARNICHROME (P < 0.05), but were similar in growing/finishing period and for the over-all post-weaning period. G:F was similar (P > 0.32) among the treatments post-weaning. Carcass of progeny from CARNI-CHROME-fed sows had a 1% greater percent lean (P = 0.02), and a 6% reduction (P = 0.06) in 10th rib fat depth, but carcass quality did not differ (P > 0.10) among treatments. Results suggested that CARNICHROME reduced changes in 10th rib backfat of sows, improved lactation intake, and subsequently improved carcass composition of progeny; however, supple-mental CARNICHROME to progeny did not elicit additional improvements in growth performance and carcass quality.
Key Words: L-carnitine and chromium picolinate, reproductive performance
348 Effects of rapeseed meal supplementation in gestation diets on reproductive performance and thyroid hormones in sows. H. B. Choi*, S. S. Jin, S. W. Jung, Y. Y. Kim, Seoul National University, Seoul, South Korea.
The utilization of rapeseed meal (RSM) has been limited as an ingredient for swine diet because it contains anti-nutritional factors such as glucosinolates (GSLs) and erucic acid. How-ever, RSM has a competitive price and there is limited research to determine supplementation level. Therefore the aim of this study was to evaluate the effect of RSM levels in sow diet on reproductive performance, thyroid hormones of sows and per-formance of their progeny. A total of 55 mixed-parity (average = 3.82) sows (F1, Yorkshire× Landrace) with an initial body weight (BW) of 193 ± 1.22 kg were used in this trial and sows were allotted to 1 of 5 treatments based on BW and backfat thickness with 11 replicates in a completely randomized de-sign. The experimental treatments were divided by dietary supplementation level of RSM (0%, 3%, 6%, 9% or 12%) in gestation diets, and sows were provided one diet without RSM during lactation. The content of GSLs in RSM was 16.6 µmol∙g-1 (DM basis). Body weight, backfat thickness at 110 d of pregnancy and weaning to estrus interval after weaning were not affected by dietary RSM levels. Sows fed diets containing RSM had decreased litter and piglet weight at birth (P < 0.05), but litter size, total born alive and weight gain of progeny were
not affected by RSM supplementation. In addition, no differ-ence was observed in average daily feed intake of sows among dietary treatments. Serum triiodothyronine (T3) concentration of sows at 110 d of pregnancy was affected by supplementation level of RSM, resulting in quadratic RSM level response (P < 0.05). Serum thyroxine (T4) concentration was clearly higher (P < 0.01), when sows were fed diets contained 12% RSM at 110 d of pregnancy. However, concentrations of serum T3 and T4 in lactating sows and their piglets were not affected by RSM supplementation. In summary, sows fed diets containing RSM had decreased litter weight at birth and increased serum concentrations of T3 and T4 before farrowing, but there were no detrimental effects on the growth performance of nursing pigs and BW, backfat thickness, and litter size of sows when up to 12% RSM was fed.
Key Words: rapeseed meal; reproductive performance; sow; triiodothyronine; thyroxine
349 Relationship between backfat thickness of sows at d 109 of gestation and performance of sows and suckling pigs. J. Kim1, 2,*, S. Baidoo1, X. Yang1, 1Southern Research and Outreach Center, University of Minnesota, Waseca, MN, 2Department of Animal Resource Science, Kangwon National University, Chuncheon, South Korea.
The present study investigated retrospectively the impact of sow backfat (BF) thickness at d 109 of gestation in differ-ent parities on reproductive performance of sows and perfor-mance of suckling piglets. A total of 11,536 sows were di-vided into ten groups on the basis of BF thickness ( £ 10, 11 to 12, 13 to 14, 15 to 16, 17 to 18, 19 to 20, 21 to 22, 23 to 24, 25 to 26, and ³ 27mm) at 109 d of gestation for each parity (parity 1, 2, 3, 4, 5, 6, 7, and ³ 8). The data were collected between 2000 and 2012. All the sows were fed as per NRC (1998) requirement for gestation and lactation. BF thickness was measured on both sides at about 5 cm from the midline at the last rib using a type A ultrasound probe and averaged. Our results showed that, for each parity, sow BW at d 109 of gestation, farrowing and weaning, or sows BF thickness at weaning were linearly and positively (P < 0.01) associated with BF thickness of sows at d 109 of gestation. However, increase in BF thickness of sows at d 109 of gestation led to a linear decrease (P < 0.01) in sow daily feed intake and a linear increase (P < 0.01) in maternal BF thickness loss and BW loss during the lactation period for each parity. The litter size showed a quadratic (P < 0.01) pattern, increasing gradu-ally and then reducing as d 109 gestation BF increases, for all parity at weaning and parity 4, 5, and ³ 8 at birth. Similarly, for all parity, the litter weight at birth (except for parity 2 and 7) and at weaning, and litter gain during lactation changed quadratically (P < 0.05) with increase of d 109 gestation back fat. Nevertheless, individual piglet weight at birth and wean-ing and daily gain were generally not significantly (P > 0.05)

155
associated with BF at d 109 of gestation except that piglet bodyweight at birth in parity 5 and at weaning in parity 3, 4, and 6 demonstrated a quadratic pattern (P < 0.05) similar to the change of litter size. It seemed that best litter performance was obtained in sows having 19 to 22 mm BF thickness at 109 d of gestation. In conclusion, nutritional management of sows to maintain BF thickness during gestation would be beneficial in performance of sows and suckling piglets.
Key Words: backfat thickness, reproductive performance, sow, suckling piglets
350 (GS-PHD) Interactive effects of different energy intake during periods of gestation and housing system on sow performance. P. Ren*, R. Railton, J. Jendza, S. Baidoo, Southern Research and Outreach Center, University of Minnesota, Waseca.
The current study investigated effects of different energy intake during gestation and housing system on sow perfor-mance. A total of 207 sows (n = 35 for parity 1; n = 35 for parity 2; n = 32 for parity 3; n = 105 for parity > 3) were al-lotted to 1 of 4 dietary treatments using randomized complete block design blocking by initial body weight (BW), parity and backfat. Sows were housed either in individual stalls (n = 101) or group pens (n = 106) with electronic sow feeders during gestation. The experiment started from the first insemination (d 0 of gestation) throughout gestation and lactation period. All sows were fed the same corn-soybean meal basal diet with the amount of maintenance energy intake (106 × BW0.75) throughout the gestation period except 4 periods of 7 d dietary treatments imposed on d 28, d 56, d 84 and d 98 of gestation. During these 4 periods, sows were fed 1 of 4 different energy intakes: 1) 0.5 × maintenance level (0.5 M); 2) 1.0 × mainte-nance level (1.0 M); 3) 1.5 × maintenance level (1.5 M); 4) 2.0 × maintenance level (2.0 M). Sows fed 1.5 M and 2.0 M diets had significantly (P < 0.01) higher BW and backfat at d 109 of gestation, and post-farrowing backfat at d 0 of lacta-tion compared with sows fed 0.5 M and 1.0 M diets. Post-farrowing BW of sows fed 2.0 M diets was significantly (P = 0.01) greater than sows fed 1.0 M diets. Additionally, BW loss from d 109 of gestation to the end of lactation (d 18) was significantly (P < 0.002) greater in sows fed 1.5 M (-25.37 kg) and 2.0 M (-23.47 kg) diets compared with sows fed 0.5 M (-11.72 kg) diets. However, there was no significant dif-ference between sows fed 0.5 M and 1.0 M (-15.57 kg) di-ets. Gestation dietary treatments did not affect reproductive performance of sows. Sows housed in individual stalls lost more BW (P = 0.0066, -22.37 vs. -15.69 kg) from d 109 of gestation to the end of lactation (d 18) compared with sows housed in group pens. In conclusion, introduction of different energy intake in short periods during gestation did not affect reproductive performance of sows, but higher energy intake during gestation can lead to more lactation BW loss. Group pen systems for gestating sows may have beneficial effect
compared with individual stall systems in terms of reducing lactation BW loss.
Key Words: energy intake, housing system, sow performance
NONRUMINANT NUTRITION: WEANED PIG NUTRITON AND MANAGEMENT
351 Influence of increasing pharmacological ZnO dose to 3500 ppm and superdoses of phytase on piglet growth performance and fecal scores from d 0 to 21 post-weaning. C. L. Walk1, I. J. Wellock2,*, P. Toplis2, J. J. Chewning3, P. Wilcock1, 1AB Vista Feed Ingredients, Marlborough, United Kingdom, 2Primary Diets, Melmerby, United Kingdom, 3Swine Research Services, Inc., Springdale, AR.
Pharmacological zinc oxide (ZnO) reduces fecal scours in pig-lets. However, the level of ZnO supplemented can vary between 2000 and 4000 ppm depending on country, piglet age and veteri-nary restrictions. One main experiment was conducted to evalu-ate pharmacological levels of ZnO in the presence or absence of superdoses of phytase (Quantum Blue). This abstract is 1 of 2 and will focus on ZnO levels typically fed in the non-European markets (up to 3500 ppm). Piglets (n = 640) were weaned at ap-proximately 18 to 21 d of age (5.2 ± 1.02 kg) and allocated at 10 pigs/pen and 8 replicate pens/treatment. Piglets were fed one of 8 diets formulated to be adequate (NRC, 1998) in all nutrients including available phosphorus (0.55%) and calcium (0.89%). Zinc supplemented in the diets, above pre-mix levels (100 ppm), was from ZnO (72% Zn). The 8 diets were as follows: 1750 ppm Zn plus 0, 1250, 2500 or 3750 FTU/kg phytase or 3500 ppm Zn plus 0, 1250, 2500 or 3750 FTU/kg phytase. Fecal scores were obtained from d 1 to 10 on a scale from 1 to 4 with 1 = firm and 4 = watery. Statistical analyses were performed using JMP. The model included diet, replicate pen and block and signifi-cant means were separated using t tests. ADFI was lowest (P < 0.05) in pigs fed 1750 or 3500 ppm Zn plus 0 or 1250 FTU/kg phytase compared with pigs fed 3500 ppm Zn plus 3750 FTU/kg phytase. Phytase supplementation at 2500 or 3750 FTU/kg tended to increase (P < 0.07) ADG, especially in pigs fed 3500 ppm Zn compared with pigs fed 1750 ppm Zn without phytase. Feed conversion ratio was not influenced by diet from d 0 to 21. Fecal scores were generally low and ranged from 1 (firm) to 2.5 (soft, spreads slightly) from d 1 to 10. However, fecal scores were the highest (P < 0.001) in pigs fed 1750 ppm Zn without phytase compared with pigs fed 1750 ppm Zn plus 1250 or 3750 FTU/kg phytase or 3500 ppm Zn plus 1250, 2500 or 3750 FTU/kg phytase. In conclusion, phytase supplementation improved ADG and reduced fecal scores in piglets fed 1750 or 3500 ppm Zn from ZnO.
Key Words: phytase, piglets, zinc oxide

156
352 Effects of hydrolyzed vegetable protein or hydrolyzed vegetable and meat protein blend on nursery pig performance. M. A. D. Goncalves*, J. M. DeRouchey, S. S. Dritz, M. D. Tokach, R. D. Goodband, J. C. Woodworth, Kansas State University, Manhattan.
A total of 280 pigs (PIC 327 × 1050, initially 7.6 kg) were used in a 28-d trial to evaluate the effects of hydrolyzed vegetable protein or a blend of hydrolyzed vegetable and meat protein for nursery pigs. Three days after weaning, pigs were allotted to 1 of 4 dietary treatments in a completely randomized de-sign, balancing for initial BW and gender. There were 10 pens per treatment with 7 pigs per pen. The 4 treatment diets were: (1) no added specialty protein source (negative control); (2) 6% select menhaden fish meal; (3) 5% hydrolyzed vegetable protein (Hydr SF 52, International Ingredient Corporation, St. Louis, MO), or (4) 6.5% hydrolyzed vegetable and meat pro-tein blend (HDSF Protein; International Ingredient Corpora-tion). Treatment diets were fed from d 0 to 17 and a common Phase 2 diet was fed from d 17 to 28. From d 0 to 17, pigs fed the negative control diet had improved (P < 0.05) G:F com-pared with pigs fed diets with Hydr SF 52 or HDSF Protein. No differences ( > P > 0.55) in ADG and ADFI were detected among treatments. From d 17 to 28 (common period), no dif-ference ( > P > 0.27) was observed in growth performance between pigs previously fed any of the treatment diets. Overall (d 0 to 28), no differences ( > P > 0.36) were observed in ADG, ADFI, or G:F. Although pigs fed the hydrolyzed vegetable and meat protein sources had similar performance to pigs fed fish meal, definitive conclusions regarding efficacy of the specialty protein sources tested cannot be made because performance was also similar to pigs fed the negative control diet.
Key Words: hydrolyzed vegetable protein, nursery pig, protein sources
353 The effects of a combination of a xylanase and multi enzyme non-starch polysaccharide product on growth performance of 12 to 22 kg nursery pigs. E. D. Fruge1,*, E. Hansen1, S. Hansen1, D. M. Compart2, J. R. Bergstrom3, 1Hubbard Feeds, Inc., Mankato, MN, 2Compart’s Boar Store, Nicollet, MN, 3DSM Nutritional Products, North America, Marshall, MO.
Two experiments (EXP) were conducted to determine the ef-ficacy of a combination of xylanase and multi enzyme non-starch polysaccharide product [Ronozyme®WX (RWX) and VP (RVP), respectively, DSM Nutritional Products] to quan-tify the ME uplift potential. In EXP 1, pigs (N = 969, 11.67 kg) were allotted to 3 dietary treatments (TRT) with 12 replicates and 27 or 28 pigs per pen in a randomized complete block design (RCBD). The EXP 1 TRT were; 1) Control (C), 3450 kcal/kg ME; 2) Negative Control (NC), 3329 kcal/kg ME; 3) NC + 227 g/ton RVP + 150 g/ton RWX. In EXP 2, pigs (N = 889, 13.33 kg) were allotted to 2 dietary TRT with 16 repli-cates and 27 or 28 pigs per pen in a RCBD. The EXP 2 TRT were; 1) C, 3450 kcal/kg ME; 2) C with 3382 kcal/kg ME + 227 g/ton RVP + 150 g/ton RWX. All diets were mash Corn-SBM- 20% DDGS based. Data were analyzed using GLM procedure in SAS. In EXP 1, there were no effects of TRT on ADG. Pigs fed TRT 2 and 3 had increased ADFI compared with pigs fed TRT 1. Pigs fed TRT 1 had the greatest G:F, TRT 2 poorest, with TRT 3 intermediary. Basis the caloric ef-ficiency of the TRT 1 (5630 kcal/kg gain), TRT 2 and 3 were calculated to contain 3270 and 3354 kcal/kg ME, respectively. The caloric uplift of TRT 3 vs. 2 was calculated to be 83 kcal/kg ME. In EXP 2, pigs fed TRT 2 had similar ADG, ADFI, and G:F compared with pigs fed TRT 1. Basis the caloric ef-ficiency of TRT 1 (5611 kcal/kg gain), TRT 2 was calculated to contain 3501 kcal/kg ME which suggests a release of 120 kcal/kg ME. The combination of RWX and RVP was calcu-lated to release 83 to 120 kcal/kg ME.
Key Words: enzyme, growth, pig
Table 352.
ItemNegative control
Fish meal
Hydr SF 52
HDSF Protein SEM
d 0 to 17ADG, g 255 243 244 245 10.7ADFI, g 353 351 364 365 23.6G:F 0.715a 0.686ab 0.667b 0.667b 0.02
d 0 to 28ADG, g 367 362 361 351 6.8ADFI, g 585 588 589 582 10.0G:F 0.629 0.615 0.614 0.603 0.01
BW, kgd 0 7.6 7.6 7.6 7.6 0.09d 17 11.9 11.8 11.7 11.7 0.28d 28 17.9 17.9 17.7 17.4 0.22
a,b Within rows, means with different superscript differ (P < 0.05).
Table 353.
Initial BW, kg ADG, g ADFI, g G:F
Final BW, kg
EXP 1, 20.5 dTRT 1 11.65 378 616b 0.61a 19.41TRT 2 11.69 388 688a 0.58b 19.66TRT 3 11.66 393 660a 0.60ab 19.72SEM 0.12 7.76 11.95 0.008 0.228P = 0.97 0.38 0.01 0.03 0.61
EXP 2, 21 dTRT 1 13.40 574 933 0.61 25.45TRT 2 13.26 580 929 0.62 25.44SEM 0.12 7.65 10.30 0.004 0.160P = 0.42 0.57 0.80 0.15 0.57
1,a,b,c Within a column, means without common superscript differ (P < 0.05).
157
354 Effect of protease on growth performance, intestinal morphology, and inflammatory response of nursery pigs fed corn-soybean meal based diets. J. Guo1,*, P. Biggs2, S. W. Kim1, 1North Carolina State University, Raleigh, 2BioResource International, Inc., Durham, NC.
A keratinase-based additive, Versazyme (VZ, BioResource In-ternational, Inc. Durham, NC), was used as an exogenous source of protease. The experiment was to evaluate the effect of VZ on growth performance, intestinal morphology, and inflamma-tory response of nursery pigs fed diets with a higher inclusion of SBM. One hundred and twenty pigs (7.3 ± 0.1 kg) weaned on d 21 were allotted to 4 experimental treatments based on a 2× 2 factorial arrangement with 2 levels of TID Lys (1.22% and 1.01%) and with or without VZ (0.00 and 0.05%). Diets with 2 levels of TID Lys were achieved by altering the amount of SBM included (24 vs. 30%) during a 2-wk study. Body weight and feed intake were measured weekly. Six pigs from each treat-ment were selected for blood and tissue sample collection. Ileal digesta were collected to measure viscosity. Dietary 1.22% TID Lys increased (P < 0.05) ADG (267 vs. 215 g/d) and G:F (0.68 vs. 0.58) during the entire 2-wk period compared with pigs fed 1.01% TID Lys. There were interactions (P < 0.05) of TID Lys and VZ for ADFI and ADG during entire 2 wk period indicating that VZ improved ADFI (411 vs. 375 g/d) and ADG (282 vs. 252 g/d) of pigs fed 1.22% TID Lys (30% SBM) diet whereas not for pigs fed 1.01% TID Lys (24% SBM) diet. Viscosity of ileal digesta was not different among treatments. Tumor necro-sis factor α (TNF-α) concentration of duodenum and jejunum were not different among treatments. However, VZ tended to decrease (P = 0.055) TNF-α concentration in serum. In addition, an interaction (P < 0.05) between VZ and TID Lys in serum mal-onedialdehyde (MDA) indicated that supplementation of VZ reduced serum MDA concentration at 1.22% TID Lys. Micro-scopic examination of both duodenum and jejunum also showed an interaction (P < 0.05) between 2 treatment factors, reflecting that supplementation of VZ increased villus height:crypt depth ratio at 1.22% TID Lys. Results suggested that VZ had posi-tive effects on growth performance, systemic lipid peroxidation, inflammatory responses and intestinal development of nursery pigs when dietary TID Lys level was 1.22% (30% SBM).
Key Words: keratinase, nursery pigs, soybean meal, TID Lys
355 Effects of fine grinding corn or dried distillers grains with solubles (DDGS) and diet form on growth performance and caloric efficiency of eleven 22-kg nursery pigs. J. A. De Jong*, J. M. DeRouchey, M. D. Tokach, R. D. Goodband, S. S. Dritz, Kansas State University, Manhattan.
Little is known about the effects of fine-grinding other ingre-dients in combination with grinding the corn or the effect that
form (meal vs. pellet) of these diets may have on nursery pig performance. Thus, a total of 687 pigs (PIC 1050 barrows; ini-tially 11.6 kg BW and 37 d of age) were used in a 21-d study to determine the effects of fine grinding corn and/or DDGS and diet form (meal vs. pellet) on growth performance and caloric efficiency of nursery pigs. Pigs were allotted to 1 of 10 dietary treatments (14 pens/treatment and 5 pigs/pen) using 2 groups of nursery pigs. The 10 diets included 4 corn-soybean meal-based diets consisting of: (1) corn ground to ~638 µ in meal form; (2) treatment 1 in pellet form; (3) corn ground to ~325 µ, in meal form, and (4) treatment 3 in pellet form. The remaining 6 diets contained 30% DDGS. Diets 5 through 10 consisted of: (5) corn and DDGS ground to ~638 and 580 µ, in meal form; (6) diet 5 in pellet form; (7) corn and DDGS ground to ~638 and 391 µ, in meal form; (8) diet 7 in pellet form; (9) corn and DDGS ground to ~325 and 391 µ, in meal form, and (10) diet 9 in pellet form. Diets were formulated to 1.28% SID Lys and were not adjusted for energy as DDGS was added. Overall, a corn particle size × diet form interaction was observed (P < 0.01) as a result of increased ADFI when corn was finely ground and fed in pellet form but decreased intake when corn was finely ground and fed in meal form. Pelleting diets decreased (P < 0.001) ADG (594 vs. 560 g), ADFI (872 vs. 864 g), and final BW (23.8 vs. 23.2 kg) but im-proved (P < 0.001) G:F (0.63 vs. 0.65) and caloric efficiency on both an ME and NE basis. Fine-grinding corn decreased (P < 0.04) ADG (588 vs. 572 g) as a result of numerically de-creased ADFI (P > 0.16). Feeding 30% DDGS also decreased (P < 0.01) ADG (591 vs. 568 g), ADFI (897 vs. 898 g), and NE caloric efficiency and tended to decrease (P < 0.07) final BW (23.7 vs. 23.3 kg). In conclusion, pelleting nursery di-ets and fine-grinding ingredients reduced ADG as a result of decreased ADFI, which resulted in improved feed efficiency.
Key Words: DDGS, nursery pig, feed processing, pelleting
356 Effects of feeding increasing levels of a proprietary yeast blend on growth performance of commercial nursery pigs. R. Song*, K. W. Purser, R. E. Musser, C. D. Hagen, NUTRIQUEST, Mason City, IA.
Two experiments were conducted to evaluate feeding increas-ing levels of EvosureTM (NUTRIQUEST, Mason City, IA), a yeast additive for swine, on growth performance of commer-cial nursery pigs. In both experiments, weanling pigs were housed in pens and fed a common starter diet for 7 d. On d 7, pens within block were assigned randomly to experimental diets in a randomized complete block design. Data were ana-lyzed using the MIXED procedure of SAS. In Exp 1, nursery pigs (n = 1188; BW = 5.49 ± 0.31 kg) were allotted to one of 4 dietary treatments containing 0 (CON), 0.22 (EVO1), 0.44 (EVO2) or 0.66 (EVO3) g/kg EvosureTM with 11 replicates per treatment. This experiment was conducted over a 14-d period. Ending BW, ADG and G:F increased linearly (P < 0.05) with
158
increasing levels of EvosureTM. Compared to pigs fed CON, pigs fed EVO3 showed 4.2% greater ending BW (9.44 vs. 9.06 kg, P = 0.01), 10.0% higher ADG (0.30 vs. 0.27 kg/d, P = 0.01) and 9.6% higher G:F (0.86 vs. 0.78, P = 0.05). However, ADFI was not affected (P > 0.24) in this experiment. In Exp 2, nursery pigs (n = 1296; BW = 5.03 ± 0.37 kg) were allotted to one of 4 dietary treatments containing 0 (CON), 0.33 (EVO1), 0.66 (EVO2) or 0.99 (EVO3) g/kg EvosureTM with 12 repli-cates per treatment. Pigs were fed the experimental diets for 21 d and switched to a common nursery diet for 24 d. Similar to Exp 1, feeding increasing levels of EvosureTM for 21 d lin-early increased (P < 0.05) pig BW, ADG and G:F, but did not affect ADFI (P > 0.59). Specifically, feeding EVO3 resulted in 3.7% greater BW (11.0 vs. 10.6 kg, P = 0.04), 7.3% higher ADG (0.30 vs. 0.28 kg/d, P = 0.02), and 5.1% higher G:F (0.80 vs. 0.76, P = 0.02) relative to feeding CON. During the 24 d period when pigs were fed a common diet, BW, ADG and G:F were also increased linearly (P < 0.05) with increasing lev-els of EvosureTM in previous diets. Pigs fed EVO3 were 3.3% heavier than those fed CON (22.7 vs. 22.0 kg, P = 0.05) at the end of this experiment. Results from these two experiments suggest that dietary supplementation of increasing levels of EvosureTM linearly improved pig growth performance, and these linear effects could be extended to a later nursery phase.
Key Words: growth performance, nursery pigs, yeast
357 The effect of increasing dietary betaine concentration on starter pig performance. P. Wilcock*, C. L. Walk, C. L. Bradley, T. Santos, AB Vista Feed Ingredients, Marlborough, United Kingdom.
Betaine (Vistabet) can act in the piglet by a number of bio-chemical pathways potentially sparing methionine and choline or act as an osmo-protectant which may be important in stress-ful or challenged situations such as weaning. An experiment was designed to investigate the impact of increasing dietary levels of betaine on performance of newly weaned piglets. Piglets (n = 360), weaned at approximately 18 to 21 d of age and weighed at 5.8 ± 0.16 kg were allocated at 10 pigs per pen (5 boar and 5 gilts) with 9 replicates per treatment. All pigs were fed a 2 phase program; phase 1 from weaning to d 7 and phase 2 from d 7 to d 21. Diets were formulated to meet all the nutrient requirements of the pig (NRC, 2012) and betaine was added at 4 treatment levels: 0 (T1), 0.75 (T2), 1.5 (T3) and 2.25 mg/kg (T4) in each phase at the expense of corn. From d 0 to d 21, there was a significant linear improvement in ADG (P = 0.009) and FCR (P = 0.001) with increasing betaine dose, but no significant effect on ADFI. The ADG and FCR from 0–21 d for T1, T2, T3 and T4 was 284, 295, 309, and 314 g/d, respectively, while FCR was 1.11, 1.07. 1.04, 1.02, re-spectively. In conclusion the addition of betaine to piglet diets from weaning to 21 d post-weaning improved ADG and FCR.
Key Words: betaine, piglet
358 Effects of reducing the particle size of corn on growth performance of weanling pigs. O. J. Rojas*, H. H. Stein, University of Illinois, Urbana-Champaign.
Results of a previous experiment indicated that reduction of corn particle size from 865 to 339 µm linearly increased the concentration of ME in corn. Two experiments were conduct-ed to test the hypothesis that addition of lipids can be reduced if corn particle size is reduced without affecting growth per-formance of weanling pigs. In both experiments, pigs were fed a common diet for 14 d post-weaning. Pigs were randomly allotted to 4 different diets in a randomized complete block design. There were 4 pigs per pen and 8 replicate pens per treatment. The same batch of soybean meal and fish meal were used in all diets for both experiments, but the corn used was ground to different particle sizes (i.e., 339, 485, 677, or 865 µm). In Exp. 1, 128 weaned pigs (initial BW: 9.95 ± 1.95 kg) were used. In addition to corn, SBM, and fish meal, soy-bean oil was added to diets in increasing amounts to compen-sate for reduced ME in corn with increased particle size. Diets were formulated to contain 3413 kcal ME per kg. In Exp. 2, 128 weaned pigs (initial BW: 9.41 ± 1.54 kg) were used. All diets had the same ingredient composition and no attempt was made to compensate for the reduced ME in diets containing corn ground to a greater particle size. The only difference among diets was the particle size of corn. The G:F for Exp. 1 was 0.65, 0.63, 0.63, and 0.62 and for Exp. 2 was 0.69, 0.70, 0.66, and 0.65 for pigs fed diets containing corn ground to a mean particle size of 339, 485, 677, and 865 µm, respectively. In Exp. 1 and Exp. 2, the final BW, ADG, and ADFI were not different among dietary treatments (linear, P > 0.05). Howev-er, the G:F decreased (linear, P < 0.05) as particle size of corn increased in both experiments, which indicated that the ME of the diets with the greater particle size of corn was reduced compared with the ME of diets with smaller particle sizes of corn. The increased addition of oil to diets with corn ground to the greater particle sizes in Exp. 1 was not effective in com-pensating for the reduced particle size. In conclusion, wean-ling pigs utilize more energy from corn ground to a smaller particle size than if corn is ground to a greater particle size.
Key Words: corn, particle size, pigs
359 Effect of dietary inclusion of a β-mannanase enzyme on growth performance of nursery pigs. C. L. Puls1,*, L. E. Ochoa1, M. Ellis1, J. E. Swan2, J. D. Muegge2, P. D. Matzat3, 1University of Illinois, Urbana, 2Blue River Research Service, Carthage, IN, 3Elanco Animal Health, Greenfield, IN.
The study evaluated the effect of dietary inclusion of a β-mannanase enzyme (Hemicell-HT®, Elanco Animal Health, Greenfield, IN) on growth performance of nursery pigs. The study was performed over a 42-d period from 6.4 ± 0.22 to 25.4 ± 1.66 kg BW as a RCBD with 2 enzyme inclusion lev-

159
els (0 and 48 kU/kg of complete feed). A total of 210 barrows and gilts from 2 farrowing groups were housed in single-gen-der pens of 5. Replicates consisted of 2 single-gender pens with 21 replicates per inclusion level. Diets were formulated to meet or exceed NRC (2012) recommendations for nutri-ent requirements and included 2.5% soybean hulls and 0.5% guar gum meal. Three dietary phases were fed over the 42-d period: Phase 1 = Start to d 14, Phase 2 = d 14 to d 28, and Phase 3 = d 28 to the end of the study. Pigs were weighed at the start and end of the study and at the change of dietary phase; all feed additions to the feeders were recorded. The statistical model accounted for the effect of enzyme level, far-rowing group, and replicate. For the overall 42 d study period, including the enzyme increased (P £ 0.05) growth rate (428 vs. 473 g/d for 0 and 48 kU/kg, respectively; SEM = 7.1), feed intake (681 vs. 720 g/d, respectively; SEM = 10.6), and G:F (0.630 vs. 0.658, respectively; SEM = 0.0082) compared to the control (0 kU/kg). Feeding the enzyme had no effect (P > 0.05) on growth performance in the first 14 d, but increased (P £ 0.05) ADG (558 vs. 589 g/d, respectively; SEM = 11.0; and 578 vs. 672 g/d, respectively; SEM = 10.9) and ADFI (700 vs. 739 g/d, respectively; SEM = 13.9; and 994 vs. 1077 g/d, respectively; SEM = 21.2) from d 14 to 28 and 28 to 42, respectively, and increased (P £ 0.05) G:F (0.582 and 0.626, respectively; SEM = 0.0083) from d 28 to 42 compared to the control (0 kU/kg). The results of this study suggest that including Hemicell-HT®in corn-soybean meal diets with rela-tively high concentrations of β-mannans increased the growth performance of nursery pigs.
Key Words: β-mannanase, Hemicell-HT®, pigs
360 Influence of protein sources on nursery pig performance. K. Moran1,*, E. van Heugten1, D. Funderburke2, C. Funderburke2, 1North Carolina State University, Raleigh, 2Cape Fear Consulting, LLC, Warsaw, NC.
The objective of this study was to determine the impact of various protein sources on the performance of nursery pigs. A total of 462 nursery pigs (BW was 6.76 ± 0.30 kg) were placed into 2 nursery rooms of 12 pens each (17 to 20 pigs/pen) under commercial conditions. Dietary treatments consisted of: fish meal (FM; special select menhaden); blended protein product (BP; avian, porcine, marine and vegetable protein by-prod-ucts; NutriPak, H.J.Baker & Bro., Inc); poultry meal (PM; pet-food grade) and soybean meal supplemented with high levels of synthetic amino acids (SBM + AA). Pigs were fed a 3-phase feeding program, with each period being 12 to 14 d in duration. Inclusion of FM, BP, and PM were 7.5, 7.5 and 10% for phase 1 and 3.75, 3.75 and 4.25% for phase 2, respec-tively. During phase 3, pigs were fed a common diet consist-ing primarily of corn, wheat and SBM. Diets contained 3.43 Mcal/kg ME and 1.40, 1.35 and 1.25% SID lysine for phase 1, 2, and 3, respectively. Feed consumption during phase 1
was reduced (P < 0.05) for pigs fed PM compared to all other treatments (302, 313, 282, and 305 g/d; for FM, BP, PM and SBM + AA, respectively). During phase 3, ADFI was lower (P < 0.05) for pigs fed PM compared to other treatments, but not compared to pigs fed FM. Overall, ADFI was lower for pigs fed PM compared to BP, but it was not different from the other treatments (600, 618, 581, and 602 g/d; for FM, BP, PM and SBM + AA, respectively). Poultry meal reduced (P < 0.05) ADG during phase 1, 3 and overall (243, 248, 213, 254 g/d; 626, 634, 598, 636 g/d and 442, 449, 411, 446 g/d for FM, BP, PM and SBM + AA, respectively). Consequently, pigs fed PM were lighter (P < 0.05) than pigs fed other diets (24.15, 24.32, 23.19 and 24.29kg; for FM, BP, PM and SBM + AA, respectively). For the overall period, gain:feed was reduced (P < 0.05) for pigs fed PM compared to other diets but was not different from BP (0.739, 0.727, 0.706 and 0.735; for FM, BP, PM and SBM + AA, respectively). Results suggest that the use of PM in nursery diets resulted in inferior performance compared to FM, BP and SBM + AA. Although the SBM + AA diet is not typically used in weanling pigs due to potential pig weight and age variations, it performed equal to the FM and BP in this study.
Key Words: nursery pigs, protein sources, performance.
ODOR AND NUTRITION MANAGEMENT
361 (GS-PHD) Effect of Micro-Aid® supplementation on nitrogen losses from cattle manure. A. K. Watson1,*, G. E. Erickson1, T. J. Klopfenstein1, M. J. Rincker2, 1University of Nebraska, Lincoln, 2DPI GLOBAL, Berea, KY.
A 2 × 2 factorial experiment was designed to study the ef-fects of Micro-Aid inclusion in cattle diets on OM and N losses from manure over time. Sixty aluminum pans (33 × 23 × 5 cm) were used to simulate feedlot pen surface, with 15 replications per treatment. Complete manure (urine and feces) was collected from 6 ruminally fistulated steers for 5 d. All cattle were fed a common diet with 3 of the steers ru-minally dosed with 1 g Micro-Aid/steer daily for 10 d before the start of and throughout manure collection. On d 1, soil and manure were weighed into each pan to equal 60% soil and 40% manure, on a DM basis. Manure and soil were com-pletely mixed together to simulate the hoof action of cattle; the mixture was approximately 4 cm deep within each pan. Representative samples of manure and soil were analyzed for OM and N to calculate losses over time. Pans were kept in a temperature controlled room (20°C) for either 30 or 60 d at which time material from the pans was ground through a 1-mm screen, subsampled, and analyzed for OM and N. Soil was essentially devoid of N ( < 0.001%), thus all N in the pans originated from the manure (2.7% N on a DM basis) re-

160
gardless of treatment. Soil OM was 2% and both Micro-Aid (MA) and control (CON) manure averaged 84% OM. Losses of OM, measured as both g lost and % lost, were greater for CON than MA at both 30 d and 60 d (P < 0.01). Losses of OM were greater at 60 d than 30 d for both treatments (P < 0.01), with 68% of losses occurring by d 30 for both treat-ments. Nitrogen losses for CON pans were 24.5 and 48.1% for d 30 and 60 respectively (P < 0.01). Nitrogen losses for MA pans were 32.4 and 33.7% for d 30 and 60 respectively (P = 0.84). At d 30 N losses were similar for CON and MA pans (P = 0.23), but CON pans had 30% greater N losses at d 60 (P = 0.03). Of total N losses at d 60, MA pans lost 97% by d 30 while CON pans lost 50% by d 30. Micro-Aid proved effective at minimizing OM and N losses from cattle manure during storage, which should translate into reduced ammonia volatilization and greater fertilizer value for crop production.
Key Words: manure, nitrogen, organic matter
PHYSIOLOGY
362 (GS-PHD) Effect of selenium-enriched probiotics on selenoprotein gene expression of piglets raised in a high-temperature environment. F. Gan1, T. Wang2,*, X. Chen1, C. Lv1, F. Ren1, G. Ye1, C. Pan1, J. Shi1, X. Shi1, H. Zhou1, S. F. Liao2, K. Huang1, 1Nanjing Agricultural University, Nanjing, Jiangsu, China, 2Mississippi State University, Mississippi State.
Heat stress is considered a detrimental factor that negatively affects animal health and production performance. We have reported that dietary supplementation of selenium-enriched probiotics (SeP) has additive effects of probiotics and sele-nium in improving antioxidant status and immune function of piglets raised in a high-temperature environment (25~40°C). It is known that the biological effects of selenium are exerted through selenoproteins. The objective of this study was to further investigate the SeP effect on the gene expression of three selenoproteins, glutathione peroxidase 1 (GPx1), GPx4 and thioredoxin reductase 1 (TR1), which play important roles in animal antioxidant status and immune responses. Forty-eight crossbred weanling piglets (BW 7.9 ± 0.5 kg) were randomly assigned to 4 dietary treatments (12 piglets/treatment) and fed ad libitum for 42 d a basal diet (Con, 0.16 mg Se/kg-diet), or a basal diet supplemented with probiotics (P, 0.16 mg Se/kg-diet), sodium selenite (SS, 0.46 mg Se/kg-diet) or Se(0.46 mg Se/kg-diet). At the end of the trial, three piglets were randomly selected from each group (n = 3) for liver, kidney and spleen tissue collection and total RNA ex-traction. Real-time quantitative RT-PCR analysis of the RNA samples showed that: (1) For GPx1 and TR1 mRNA levels, although no increases were found in either liver, kidney, or spleen for the P group relative to the Con group, significant
increases (P < 0.05) were detected in the SS group. The SeP group showed further increases (P < 0.05) when compared to the SS group in either one of the three tissues. (2) For GPx4 mRNA level, no significant differences were found among the four treatment groups in either liver, kidney or spleen tis-sue. These results suggest that the beneficial effects of SeP in improving piglets’ antioxidant status and immune func-tion may be exerted through GPx1 and TR1 proteins, but not GPx4 protein. These results also suggest that the organic form of Se (in SeP) is better than inorganic form of Se (in SS) in terms of improving piglets’ antioxidant status and immune function. This project was supported in part by the National Natural Science Foundation of China and Mississippi Agri-cultural and Forestry Experiment Station.
Key Words: selenium-enriched probiotics, selenoprotein, gene expression, pig
363 (GS-PHD) Response of swine divergently selected for feed efficiency to a glucose tolerance test. J. D. Colpoys1,*, D. M. van Sambeek1, L. L. Anderson1, J. C. M. Dekkers1, A. K. Johnson1, F. R. Dunshea2, N. K. Gabler1, 1Iowa State University, Ames, 2The University of Melbourne, Parkville, Australia.
Pigs divergently selected for residual feed intake (RFI) differ in allele frequencies for SNPs near genes that regulate insulin release and function. As insulin is important for energy con-trol and animal growth, insulin sensitivity and glucose clear-ance may help define feed efficiency differences in growing swine. Therefore, our objective was to evaluate insulin sensi-tivity and glucose clearance via an intravenous glucose toler-ance test (IVGTT) in pigs divergently selected for RFI. Six high- (defined as less feed efficient) and six low-RFI (defined as more feed efficient) gilts (68 ± 5.3 kg) from the eighth gen-eration of the ISU Yorkshire RFI selection project were fitted with non-surgical jugular catheters. Three days later, follow-ing an overnight fast, all gilts were subjected to IVGTT (0.25 g glucose/kg BW). Serial blood samples were collected at -60, -30, -15, -1, 2, 5, 10, 15, 20, 30, 45, and 60 min relative to the IVGTT. Plasma glucose and insulin concentrations and the glucose to insulin ratio (G:I) were determined; baseline, peak, and area under the curve (AUC) from baseline to 60 min post-IVGTT data were calculated and analyzed using the Mixed procedure of SAS. The average baseline (-60 to -1 min) glucose and insulin concentrations and G:I did not differ between line (P ³ 0.32). As expected, both lines responded to the IVGTT by increasing plasma glucose and insulin over time (P < 0.01). Plasma glucose and insulin concentrations peaked 2 and 10 min post-IVGTT, respectively. Lines did not differ in peak glucose concentration or G:I (P ³ 0.32); how-ever, low-RFI gilts had a larger peak insulin concentration compared to high-RFI gilts (614 vs. 437 pmol/L, P = 0.03). Similarly, glucose and G:I AUC did not differ between lines; however, low-RFI gilts had a 19% larger AUC compared to

161
high-RFI gilts (P < 0.01). Plasma glucose concentrations took longer to return to baseline post-IVGTT in low-RFI gilts than in high-RFI gilts (30 vs. 20 min, P ³ 0.16); however, regard-less of line, plasma insulin concentrations returned to baseline 30 min post-IVGTT (P ³ 0.55). In conclusion, divergent se-lection for RFI has resulted in altered post-IVGTT induced insulin responses in gilts. Plasma glucose concentrations took longer to return to baseline in the low-RFI gilts, with more insulin following the IVGTT compared to the high-RFI gilts, suggesting some level of insulin resistance in the more feed efficient line. Therefore, glucose sensitivity may be related to RFI and feed efficiency in swine.
Key Words: swine; feed efficiency; glucose tolerance test
364 Changes in the cattle cervical transcriptome between estrus and metestrus. D. Gonzalez-Peña Fundora*, K. Caetano-Anollés1, P. Cardoso2, M. B. Wheeler3, S. L. Rodriguez Zas, University of Illinois, Urbana-Champaign.
The cow’s reproductive tract undergoes changes during the periestrous period that enable sperm access through the cervix to the lumen of the uterus while minimizing pathogen coloni-zation and infection. The objective of this study was to identify the genes that are differentially expressed between the estrus (n = 4) and metestrus (48 h postestrus, n = 5) periods in the cer-vical tissue of synchronized beef heifers. RNA-Seq was used to measure transcript abundance with the Illumina Genome Analyzer II platform. Single-end reads were mapped to the Bos taurus reference genome (Baylor Btau_4.6.1/bos Tau7). In total, 14,420 transcripts from 13,823 genes were tested and 1161 transcripts from 1154 genes were found to be dif-ferentially expressed (False Discovery Rate adjusted P-value < 0.05). Among these, TAP tracheal antimicrobial peptide (TAP) and GABRP γ-aminobutyric acid (GABA) A receptor, pi were overexpressed while PADI1 peptidyl arginine deiminase, type I and TH tyrosine hydroxylase were under-expressed in met-estrus relative to estrus. TAP produced by mucosal epithelial cells of cattle has been associated with defense against bacte-rial pathogens. In turn, GABA has been associated with uterus contractility. Functional analysis of the differentially expressed genes using DAVID identified seven category clusters (en-richment score > 3 equivalent to average category P-value < 0.001). These categories included sterol, cholesterol, and lipid biosynthetic, inflammatory response, tissue development and cell differentiation. These functional categories suggest that changes during the estrus cycle are associated with changes in molecular pathways that in turn may affect the morphology, function and antimicrobial capability of the cervix.
Key Words: RNA-seq, cervix, cow
365 Orchestration of circadian peripheral non-esterified fatty acids rhythms in dairy cows: feeding timing and diet effects. A. Nikkhah*, University of Zanjan, Zanjan, Iran.
The objective was to establish effects of feeding time (0900 vs. 2100 h) of higher (HC, forage to concentrate ratio = 38.5: 61.5) and lower (LC, forage to concentrate ratio = 50.6: 49.4) concentrate diets on periprandial and circadian rhythms and daily averages of peripheral non-esterified fatty acids (NEFA) as a marker of dairy cow energy metabolism. A total of 8 tie stall-housed early-mid lactation Holstein cows including 4 multiparous and 4 primiparous cows were uti-lized in a 4 × 4 Latin square design study with a 2 × 2 facto-rial arrangement of feeding time and diet type. The study had four 21-d periods, each with 14-d of adaptation. Peripheral blood was sampled every 2-h for two non-consecutive 24-h periods via jugular catheters. The repeated measures were analyzed as Mixed Models with fixed effects of diet, feed-ing time, parity, hour, and interactions; and random effects of period, sampling day (period), cow (parity), diet × feeding time × parity × cow (parity), and diet × feeding time × par-ity × day (period). Feeding at 2100 h vs. 0900 h increased DMI within 3-h post-feeding in all cows from 26% to 37% of total daily DMI, and improved milk energy yield without affecting daily DMI. Peripheral blood NEFA in primiparous cows exhibited significant periprandial rhythms (P < 0.01) with preprandial rises and postprandial declines. In multipa-rous cows, however, blood NEFA exhibited rather constant circadian levels with no apparent periprandial changes. Pri-miparous cows had higher average daily blood NEFA than multiparous cows (0.14 vs. 0.10 mmol/L; P < 0.01). Diet and its interaction with feeding time and parity did not affect cir-cadian rhythms and daily averages of blood NEFA (P > 0.05). Evening instead of morning feeding increased eating rate and DMI shortly post-feeding in all cows and, likely thereby, al-tered periprandial rhythms of a major peripheral energy and fat metabolism marker. Feeding time is suggested as a main regulator of peripheral energy-yielding substrate availability in lactating cows, depending on parity.
Key Words: diet, feeding time, non-esterified fatty acid
366 Circadian rhythms of peripheral β-hydroxybutyrate in morning and evening fed lactating cows. A. Nikkhah*, University of Zanjan, Zanjan, Iran.
Feeding time–driven rhythms in animal and human physiol-ogy requires mechanistic exploration. The objective was to establish effects of feeding time of diets with different forage to concentrate ratios on periprandial rhythms and daily aver-ages of peripheral β-hydroxybutyrate (BHBA). A total of 8 early-mid lactation tie stall–housed Holstein cows including 4 multiparous and 4 primiparous cows were utilized in a 4 × 4 Latin square design study with a 2 × 2 factorial arrangement

162
of feeding time and diet type. A higher concentrate (HC, for-age to concentrate ratio = 38.5: 61.5) or a lower concentrate (LC, forage to concentrate ratio = 50.6: 49.4) total mixed ra-tion (TMR) was presented at either 2100 h or 0900 h. The study had four 21-d periods, with 14-d of adaptation. Periph-eral blood was sampled every 2-h for two non-consecutive 24-h periods via jugular catheters. The repeated blood mea-sures were equally-spaced and analyzed as Mixed Models with fixed effects of diet, feeding time, parity, hour, and in-teractions; and random effects of period, sampling day (peri-od), cow (parity), diet × feeding time × parity × cow (parity), and diet × feeding time × parity × day (period). Data were log-transformed for normal residuals distribution and vari-ance homogeneity. Feeding at 2100 h vs. 0900 h increased feed intake within 3-h post-feeding from 26% to 37% of total daily intake, and improved milk energy yield without affect-ing total daily dry matter intake. Peripheral blood BHBA in all cows exhibited significant periprandial rhythms that were mediated by time of feeding (P < 0.01). Peripheral BHBA was higher at 2-h and 4-h post-feeding in cows fed at 2100 h vs. 0900 h. The HC vs. LC decreased daily means of blood BHBA. Data substantiate that evening instead of morning feeding increased eating rate shortly post-feeding and, likely thereby, altered periprandial rhythms of a major peripheral energy and fat metabolism indicator. Feeding time, therefore, can entrain peripheral energy-yielding substrate availability and use in lactating cows.
Key Words: β-hydroxybutyrate, circadian rhythm, feeding time
367 Prepartum somatotropin injections affects gene expression in granulosa cells of the first postpartum dominant follicle in late pregnant Holstein heifers. D. A. Velasco Acosta1, 2, *, A. Schneider2, C. Bespalhok Jacometo2, P. Cardoso1, M. Nunes Corrêa2, 1University of Illinois, Urbana-Champaign, 2Federal University of Pelotas, Pelotas, Rio Grande do Sul, Brazil.
The aim of this study was to determine the effect of prepar-tum somatotropin injection on granulosa cells’ gene expres-sion from the first postpartum dominant follicle of dairy heif-ers. Eighteen late pregnant Holstein heifers were used from a commercial dairy herd in southern Brazil. Heifers were managed under the same conditions and nutritional regimen (pasture-based system). Heifers were randomly assigned to two treatments: somatotropin (ST; n = 8), that received two doses of somatotropin (500 mg/dose) at -28 and -14 d rela-tive to calving; and Control (CN; n = 10); that did not re-ceive somatotropin application. Follicular development was monitored via ultrasound every 3 d starting at 8 DIM until the day in which the first dominant follicle reached a diameter of 16 mm (mean diameter at ovulation of the first postpartum follicle). Follicular fluid from each cow was aspirated and granulosa cells were retrieved immediately by centrifugation,
frozen in liquid nitrogen and stored at -80°C until RNA ex-traction. Gene expression of LHr, STAR, 3β-HSD, P450scc, P450c17 and CYP19A1 was measured by real-time PCR. To-tal RNA was extracted using Trizol (Invitrogen®) according to the manufacturer’s instructions. Integrity of the extracted RNA was assessed by electrophoresis on a 1.5% agarose gel, and only RNA with intact 18S and 28S bands was used. Total RNA was treated with DNase and primed with oligo (dT)20 to synthesize single strand cDNA. The PCR amplifications and fluorescence detection, using the cDNA obtained in the previ-ous step, were performed in duplicate in an Eco Ilumina Real Time PCR, using the SYBR Green detection chemistry, as recommended by the manufacturer. Statistical analyses were performed using GraphPad Prism 5. Average granulosa cells’ LHr mRNA expression was 8.06-fold higher (P < 0.05) in ST than CN. Heifers in ST showed a tendency (P = 0.06) for gran-ulosa cells’ STAR mRNA expression being 7.52-fold higher than heifers in CN. Nonetheless, 3β-HSD, P450scc, P450c17 and CYP19A1 mRNA expression did not change between treatments (P > 0.05). In conclusion, prepartum injection of somatotropin in dairy heifers increased mRNA expression of LH receptor on granulosa cells of the first postpartum domi-nant follicle, potentially increasing the chance of ovulation in this class of follicles.
Key Words: dairy heifers, follicle, somatotropin
368 Hepatic peroxisome proliferator activated receptor α (PPARα) is increased during mid to late gestation in beef cows. C. G. Hart1,*, L. J. Grossner1, L. E. Camacho2, K. C. Swanson2, K. A. Vonnahme2, C. O. Lemley1, 1Mississippi State University, Mississippi State, 2North Dakota State University, Fargo.
Previous studies have shown that hepatic steroid inactivating enzymes, such as cytochrome P450 3A and uridine diphos-phate-glucuronosyltransferase, partially regulate peripheral concentrations of estradiol-17β and progesterone during preg-nancy. Several transcription factors have been implicated in regulating hepatic steroid inactivating enzymes in rodents and humans; however, few studies have examined these pathways in cattle. Therefore, our objective was to examine the effect of early- to mid-gestation maternal dietary restriction followed by realimentation on the hepatic transcription factor PPARα. On d 30 of pregnancy, cows were assigned to dietary regi-mens: control (C; 100% NRC; n = 18) and restricted (R; 60% NRC; n = 34). On d 85 cows were slaughtered (C, n = 6 and R, n = 6), remained on control (CC; n = 12) and restricted (RR; n = 12), or were realimented to control (RC; n = 11). On d 140 cows were slaughtered (CC, n = 6; RR, n = 6; RC, n = 5), remained on control (CCC, n = 6; RCC, n = 5), or were reali-mented to control (RRC, n = 6). On d 254 all remaining cows were slaughtered. At slaughter maternal liver samples were frozen for later determination of PPARα via enzyme-linked immunosorbent assay and cytochrome P450 1A (CYP1A) ac-
163
tivities via a luminogenic substrate. Aldo-keto reductase 1C (AKR1C) activity was measured using the specific substrate 1-acenapthenol. Gestational day effects were tested among C, CC, and CCC cows, while dietary treatment effects were test-ed within a given slaughter day. Data were analyzed using the mixed procedure of SAS. Activity of PPARα was increased (P < 0.001) at d 140 and 254 of gestation vs. d 85. Activity of PPARα did not differ across dietary regimens at any given gestational day (P > 0.1). Activity of CYP1A did not differ across gestational day (P > 0.1) or across dietary regimens at any given gestational day (P > 0.1). Activity of AKR1C did not differ across gestational day (P > 0.2) or across dietary regimens at any given gestational day (P > 0.1). Interesting-ly, hepatic PPARα activity increased as gestation proceeded; however, maternal nutrient restriction did not affect hepatic PPARα. Therefore, PPARα induction during pregnancy may regulate hepatic energy metabolism during an important pe-riod of fetal growth and development irrespective of maternal nutrient restriction. Funded in part by USDA grant number 2009–65203–05812.
Key Words: liver, pregnancy, steroid
369 Maternal metabolizable protein restriction during late gestation leads to greater gravid uterine uptake of total serum nitrites in sheep. L. A. Lekatz1,*, M. L. Van Emon2, L. E. Camacho3, C. S. Schauer2, K. R. Maddock Carlin4, K. A. Vonnahme3, 1Department of Agriculture, Illinois State University, Normal, IL, 2Hettinger Research Extension Center, North Dakota State University, Hettinger, ND, 3North Dakota State University, Fargo, 4Department of Animal Sciences, North Dakota State University, Fargo.
We have previously reported that maternal metabolizable pro-tein restriction during late gestation increases uterine blood flow per fetal weight. To examine the effects of metabolizable pro-tein (MP) restriction during late gestation on total serum nitrite concentration in the uterine and umbilical vessels and transpla-cental exchange of total serum nitrites, 11 pregnant ewes were assigned to one of three isocaloric diets that were formulated to provide 60% of MP (MP60), 80% of MP (MP80), or 100% of MP (MP100) requirements from Day 100 to 130 of gestation. On Day 130 of gestation, uterine and umbilical blood flows were measured by Doppler ultrasonography. Serum samples from the maternal saphenous artery, gravid uterine vein, umbilical artery, and umbilical vein were obtained and analyzed for total nitrite concentration. Total serum nitrites in the maternal artery and gravid uterine vein were less (P £ 0.05) in MP60 ewes com-pared with MP100 ewes (maternal artery: 5.65 vs. 14.5 ± 2.33 µM; uterine vein: 4.65 vs. 16.1 ± 2.28 µM), with MP 80 ewes being intermediate (maternal artery: 10.7 ± 2.33 µM; uterine vein: 10.3 ± 2.28 µM). Total uterine flux of serum nitrites was similar in the MP60 and MP80 ewes (863 and 204 ± 348 µM/ml/min) and indicated there was uterine uptake of total serum
nitrites, but this differed (P = 0.03) from the MP100 ewes, where flux calculations indicated uterine release of total serum nitrites (-704 ± 348 µM/ml/min). Total serum nitrite concentration in both the umbilical artery and umbilical vein were similar (P ³ 0.08) among treatments (umbilical artery: 44.7, 47.9, and 90.9 ± 14.3 µM for MP60, MP80, and MP100 ewes, respectively; um-bilical vein: 49.1, 54.2, and 97.7 ± 15.9 µM for MP60, MP80, and MP100 ewes, respectively). Fetal flux of total serum nitrites was similar (P = 0.35) among treatments (1619, 2960, and 3409 ± 1078 µM/ml/min for MP60, MP80, and MP100 ewes, respec-tively). Similarly, uteroplacental flux of total serum nitrites was similar (P = 0.09) among treatments (-756, -2757, and -3740 ± 1033 µM/ml/min for MP60, MP80, and MP100 ewes, respec-tively). In conclusion, the observed increase in uterine blood flow per fetal weight in the MP60 ewes may be due to increases in nitric oxide uptake.
Key Words: ewes, metabolizable protein, nitrites
370 (UGS) Effects of PMSG dosage on reproductive efficiency of artificially inseminated, farm-raised white-tailed (Odocoileus virginianus) deer. W. M. Haslag1,*, B. C. Shanks1, J. D. Caldwell1, D. R. Hill2, N. L. Forsythe2, 1Department of Agriculture and Environmental Sciences, Lincoln University, Jefferson City, MO, 2Oak Creek Whitetail Ranch, Bland, MO.
The deer breeding industry is a vital and growing segment of the rural economy. Advancements in reproductive technologies, in-cluding estrus synchronization and artificial insemination tech-niques, continue to benefit deer farmers. Deer synchronization procedures for artificial insemination commonly make use of CIDRs and PMSG, and some protocols suggest that more pro-lific does should receive lower doses of PMSG than single-fawn producing does. Therefore, the objective of this study was to determine the effects of PMSG dosage amount on reproductive efficiency of artificially inseminated farm-raised white-tailed deer. Mixed-age, farm-raised white-tailed does (n = 65) were as-signed to treatments consisting of: 1) 2.0 mL of 5000 I.U. PMSG for does having one fawn the previous y (n = 43) or 2) 1.5 mL of 5000 I.U. PMSG for does having two or more fawns the previ-ous y (n = 22). On October 24, 2012 estrus was synchronized by intravaginal insertion of a CIDRTM 330 (Pfizer Animal Health, New York, NY, USA) containing 0.35 g progesterone for 14 d. At the time of CIDR removal, does were injected intramuscu-larly with the appropriate level of PMSG. Approximately 56–58 h later, each doe was artificially inseminated via laparoscopy. Conception rates, number of fawns born per doe, frequency of multiple births, and birth weights did not differ (P ³ 0.38) across treatments. Male and female fawns had similar (P ³ 0.74) birth weights across treatments. Therefore, reproductive efficiencies of does previously producing single fawns that were injected with 2.0 mL of PMSG were equivalent to more prolific does that were given 1.5 mL injections of PMSG.
Key Words: deer, reproduction
164
371 Effects of maintenance energy requirements of gestating beef cows on calf performance. B. H. Boehmer*, K. J. McLean, T. A. Pye, R. P. Wettemann, Oklahoma Agricultural Experiment Station, Stillwater, OK.
Spring-calving Angus cows (n = 123) were used to evalu-ate the effects of maintenance energy requirements (MR) of cows on calf performance and pregnancy rate of cows. In 5 replications, gestating cows (BW: 552 ± 3 kg, BCS: 4.6 ± 0.1, 7.0 ± 0.1 yr of age, 7 to 8 mo. of gestation) were individu-ally fed a complete diet for 30 d (based on Model 1, NRC 2000). Body weights were obtained twice weekly and daily feed intake was adjusted every 2 wk until constant BW was achieved (regression analysis). Mean MR of cows was 86.6 ± 0.9 kcal*kg BW -0.75*d-1. Maintenance energy requirements were used to classify cows as low (L; < 0.5 SD less than year-ly mean), moderate (M; ± 0.5 SD of yearly mean) or high (H; > 0.5 SD more than yearly mean). Body weights of calves, after exposure of cows to maintenance diets, were obtained at birth and weaning (WW). Pregnancy of cows was deter-mined by ultrasonography at 31 ± 1 d after AI. Birth weight and 205 d WW were analyzed with PROC MIXED (SAS Inst. Inc.) with year as a covariate. Pregnancy rate was ana-lyzed with Chi-square (PROC FREQ; SAS Inst. Inc.). Birth weights of calves did not differ among MR classification (P = 0.75). Weaning weights of calves did not differ between H (P = 0.32; 225.5 ± 4.4 kg), M (234.2 ± 3.6 kg), and L (230.2 ± 3.8 kg) cows. Steer calves had greater WW (P = 0.004; 236.5 ± 2.9 kg) compared with heifer calves (223.3 ± 3.5 kg). Preg-nancy rate to first service AI did not differ (P = 0.95) between H (71%), M (71%), and L (74%) cows and pregnancy rates were similar across years (P = 0.29). These results indicate that MR of gestating cows does not influence reproduction or preweaning calf performance. Identification of cows that require less energy input while maintaining performance may improve production efficiency of cows.
Key Words: beef cattle, maintenance, calf performance
372 Effects of maternal nutrient restriction followed by realimentation during early and mid gestation on maternal jugular serum, umbilical cord serum, and amniotic fluid metabolite concentrations in beef cows. L. E. Camacho1,*, C. O. Lemley2, J. Haring1, K. C. Swanson1, K. A. Vonnahme1, 1North Dakota State University, Fargo, 2Mississippi State University, Mississippi State.
We have previously reported that maternal nutrient restriction from d 30 to 85 of gestation tended to increase fetal weight compared to fetuses from control fed cows; however, umbili-cal blood flow was similar between treatments. In addition, when cows were nutrient restricted for a longer duration and after realimentation we did not observe differences in fetal
weight. Therefore, our objective was to examine the effect of early to mid-gestation maternal dietary restriction followed by realimentation on jugular serum, umbilical cord serum, and amniotic fluid metabolites. On d 30 of pregnancy, multiparous cows (initial BW = 620.5 ± 11.3 kg, BCS = 5.1 ± 0.1) were assigned to 1 of 3 dietary treatments: control (C; 100% NRC; n = 18) and restricted (R; 60% NRC; n = 30). On d 85, cows were slaughtered (C, n = 6; R, n = 6), remained on control (CC; n = 12) and restricted (RR; n = 12), or were realimented to control (RC; n = 11). On d 140, cows were slaughtered (CC, n = 6; RR, n = 6; RC, n = 5), remained on control (CCC, n = 6; RCC, n = 5), or were realimented to control (RRC, n = 6). On d 254, all remaining cows were slaughtered. Blood samples from maternal jugular vein, umbilical cord, and amniotic fluid were collected and metabolites concentrations were analyzed. At d 85, maternal serum cholesterol and lactate were elevated (P £ 0.03) in R cows vs. C cows. Maternal serum triglycer-ides, glucose, and blood urea nitrogen (BUN) were similar (P ³ 0.28) between treatments. Umbilical cord serum lactate was greater (P = 0.05) and fructose and BUN tended to be greater (P £ 0.07) in R vs. C fetuses. Umbilical cord cho-lesterol, triglycerides, and glucose were similar (P ³ 0.12) between treatments. At d 140, maternal lactate concentrations tended to be decreased in RR cows vs. CC and RC; however, all other maternal and umbilical cord metabolites at d 140 and 254 of gestation were similar (P ³ 0.13) among treatments. Metabolites in amniotic fluid at d 85, 140, and 254 of gesta-tion were similar (P ³ 0.11) among treatment groups. The greater fetal weight previously observed in nutrient restricted cows might be due in part to the increased metabolites in fetal and maternal systems during early gestation.
Key Words: cows, metabolites, nutrient restriction
RUMINANT NUTRITION
373 Timing of feeding orchestrates periprandial rhythms of circulating glucose in dairy cows. A. Nikkhah*, University of Zanjan, Zanjan, Iran.
The objective was to determine effects of feed presentation time and diet on periprandial rhythms of peripheral blood glu-cose (BG). Four multiparous (83 d in milk) and four primipa-rous (81 d in milk) Holstein cows in a 4 × 4 Latin square design study were fed either a higher concentrate (HC, forage to con-centrate ratio = 38.5: 61.5) or a lower concentrate (LC, forage to concentrate ratio = 50.6: 49.4) total mixed ration (TMR) at either 2100 h or 0900 h in tie stalls. The study had four 21-d pe-riods, each with 14-d of adaptation. Jugular blood was sampled every 2-h for two 24-h periods during sampling weeks. Data were analyzed as repeated measures mixed models. Feeding at 2100 h vs. 0900 h increased eating rate and feed intake within 3-h of feeding from 26% to 37% of total daily intake. BG ex-
165
hibited significant periprandial rhythms that were altered by feeding time (P < 0.01). BG showed a marked decline at 2-h vs. 0-h post feeding in evening-fed cows (67 vs. 74 mg/dL, P < 0.05) but not in morning-fed cows (73 vs. 75 mg/dL, P > 0.10). Feeding HC vs. LC diet increased BG (80 vs. 77 mg/dL, P < 0.05). Time of feeding did not affect daily averages of BG (78.2 mg/dL). Results demonstrate time of feeding as a major determinant of peripandial and circadian rhythms of BG in once-daily fed lactating dairy cows. The multi-purpose utilization of livestock as suitable models for studying diabe-tes in humans and periparturient disorders in high-producing ruminants is elucidated. Feeding and eating behavior orches-tration of circadian glucose-insulin regulation in dairy cows in different physiological states is delineated. Adopting dif-ferential feeding/eating times to manipulate postprandial feed intake patterns, rumen fermentation and acidity rhythms, and peripheral substrate partitioning for more optimal nutrient ef-ficiency and environmental quality is also addressed. Time of feed presentation can consequently affect splanchnic and pe-ripheral energy metabolism and efficiency in lactating cows.
Key Words: timing of feeding, glucose, rhythm
374 Peripheral lactate circadian rhythmicity in dairy cows fed in evening vs. morning. A. Nikkhah*, University of Zanjan, Zanjan, Iran.
The objective was to establish circadian and postprandial rhythms of peripheral lactate in lactating cows fed once daily in evening vs. morning following 28-d adaptation periods. In midlactation, four multiparous and four primiparous lactating Holstein cows in tie stalls were used in a crossover design study with two 6-wk periods, each with 4 wk of adaptation. A total mixed ration (TMR) with 49.8% dry matter-based concentrate was presented at either 0900 h or 2100 h. Jugu-lar blood was sampled every 2-h for two 24-h periods during week 5. The statistical mixed model used for blood lactate analysis included fixed effects of feeding time, parity, hour (of blood sampling), feeding time × parity, hour × parity, and feeding time × hour × parity. The effects of cow within parity, period, and feeding time × period × cow (parity) were con-sidered random. To account for between-hour, within-cow correlations of the repeated measures and thus to minimize Type 1 statistical error risk, the best fitted covariance struc-ture was adopted and modeled. The proportion of daily TMR intake consumed within 3-h post feeding was 55% in cows fed at 2100 h, but 46% in cows fed at 0900 h (P < 0.05). Peripheral lactate exhibited significant circadian rhythms (P < 0.01). Postprandial responses in peripheral lactate were al-tered by feeding time (P < 0.01). The evening feeding, and not the morning feeding, increased plasma lactate at 4-h and 16-h post-feeding relative to baseline P < 0.01). Feeding time did not affect daily averages of plasma lactate. Results establish that time of feeding orchestrates circadian and postprandial rhythms of feed intake and peripheral blood lactate. Time of
eating, therefore, can modulate splanchnic and peripheral lac-tate assimilation and energy dynamics in lactating dairy cows.
Key Words: peripheral lactate, feeding time, circadian rhythm
375 (UGS) Effects of corn silage diets on intestinal morphology in dairy calves. T. J. Pogreba*, S. I. Kehoe, University of Wisconsin, River Falls.
A calf’s diet in the first few weeks of life is critical for gastro-intestinal tract development. Current feed prices are causing producers to experiment with less expensive alternatives. The gastrointestinal tract of ruminants takes weeks to develop af-ter birth. Evaluating intestinal morphology is an indicator of how well the animal is absorbing nutrients. The objective of the study was to determine the post-weaning effects of calf starter and corn silage fed to pre-weaned dairy calves on intes-tinal morphology. A total of 45 calves (n = 15/trmt) were fed a diet of whole milk with 100% calf starter (STA), milk replacer with 60% calf starter and 40% corn silage (SS), or 100% corn silage (SIL). Nine calves were sacrificed after 8 wk of age. Jejunal samples were collected to compare between the three treatment groups. Samples were preserved in formalin and later phosphate buffered saline until further analysis. Slices of tissue were made into nine slides per calf, and stained with methylene blue. Pictures were taken with a compound light microscope and measured using the ImageJ computer pro-gram (NIH, Bethesda, MD). Measurements were recorded in-cluding villi length, crypt depth, and villi width. Least squares means of villi lengths were 97.65, 89.57, and 105.61 µm for treatments STA, SS, and SIL, respectively (P = 0.12). Least squares means of crypt depths were 46.10, 38.69, and 48.58 µm for treatments STA, SS, and SIL, respectively (P = 0.03) and villi diameters were 14.51, 17.17, and 15.38 µm for treat-ments STA, SS, and SIL, respectively (P = 0.69). Results from the study indicated that the calves fed SS had significantly smaller crypt depths compared with the other treatments. This may indicate better intestinal development in calves fed either 100% calf starter or corn silage. More research is needed.
Key Words: corn silage, calves, ruminant
376 Seasonal variation in vitamin d status of beef cattle reared in the midwest and fed to nrc recommendations. E. Casas1,*, T. A. Reinhardt1, J. D. Lippolis1, L. A. Kuehn2, 1USDA, ARS, National Animal Disease Center, Ames, IA, 2USDA-ARS, Clay Center, NE.
The objective was to measure seasonal variation in concen-tration of circulating 25-hydroxyvitamin D (25OHD) in beef cattle reared in the Midwest and fed to NRC recommenda-tions. The concentration of 25OHD reflects adequacy of vi-tamin D intake and indicates vitamin D status. Vitamin D is an important modulator of calcium homeostasis and adequate vitamin D has many positive effects on the immune system.
166
Concentration of 25OHD was measured in crossbred animals from the USMARC Germplasm Evaluation Project. Sixty five steers and 31 heifers were used in the study. Animals were born in March and April of 2012. Plasma samples were col-lected on June 1 (JUN), September 11 (SEP), and October 1 (OCT), of 2012, and in March 1 (MAR), of 2013. Significant differences (P < 0.0001) were observed throughout the year for 25OHD. The concentration of 25OHD in JUN was 26.1 ± 1.7 ng/mL, which was an intermediate value of 25OHD, and statistically significant than the other measurements (P < 0.0001). The SEP and OCT concentrations of 25OHD were similar (P > 0.05) between them, and the highest of the study (50.8 ± 1.7 ng/mL and 53.0 ± 1.7 ng/mL, respectively). The lowest concentration of 25OHD was observed in MAR (16.6 ± 1.7 ng/mL), which was statistically different (P < 0.0001) from all other concentrations. The 25OHD concentrations closely followed seasonal UV exposure for animals housed outdoors in the Midwest. Sex was not a significant source of variation. The concentration of 25OHD representing optimal vitamin D status in cattle for calcium homeostasis has been established at greater than 20 ng/mL, and greater than 30 ng/mL for optimal function of the immune system. Results from the present study indicate that calves soon after birth (JUN) and during winter (MAR), are deficient in 25OHD concentra-tion, therefore, in vitamin D status. In the absence of sufficient UV exposure from sunshine, the dietary vitamin D require-ments for beef cattle need to be reevaluated.
Key Words: cattle, Seasonal variation, vitamin D
377 Conjugated linoleic acid in lamb meat as influenced by quebracho tannin and/or sunflower oil. S. N. Al-Dobaib*, M. A. Shehab-El-Deen, H. M. Kamel, Qassim University, Buraidah, Saudi Arabia.
Enhancing meat quality is challenging researchers to use different nutritional strategies to manipulate fatty acids (FAs) profiles of meat. The main factor affecting meat FAs is FAs profile of the diet. Vegetable oils have been reported to enhance the unsaturated FAs profile of the diet. Howev-er, unsaturated FAs content of meat would be affected due to microbial bio-hydrogenation of dietary unsaturated FAs in the rumen. Quebracho tannins could reduce the activity of ruminal microorganisms and consequently could reduce ruminal bio-hydrogentaion in sheep. Therefore, the current study aimed to investigate the effects of different levels of sunflower oil (F) and/or quebracho tannins (T) on FAs profile and meat quality in lambs. In a 3 × 3 factorial experiment, 72 lambs were divided into 9 treatments; the levels of T or F were 0, 2, and 4% of dry matter. The FAs methyl esters were separated on a Shimadzu 2010A gas chromatograph; capil-lary column (SP2380). Polyunsaturated FAs of extracted fat from LM were significantly increased by increasing T levels in the diet (P < 0.001). The ratio of unsaturated to saturated FAs were significantly increased by increasing F or T levels
in the diet (P < 0.01) (Table 1). Concentration of conjugated linoleic acid (CLA) was significantly increased by increasing T levels in the diet (P < 0.001), and tended to be decreased by increasing F levels (P = 0.08). The interaction between T and F was significant for CLA (P < 0.01) (Table 1). In con-clusion, diet supplemented with sunflower oil or quebracho tannins could improve unsaturated to saturated FA ratio in meat. Sunflower oil-added diets supplemented with quebra-cho tannins enhance CLA content of lamb meat. The current research was funded by King Abdulaziz City for Science and Technology—Saudi Arabia (No.ARP-28–61).
Key Words: lamb meat; conjugated linoleic acid; quebracho tannin
378 (GS-MS) Effects of maternal nutrient restriction and rumen-protected arginine supplementation of ewes on carotid artery hemodynamics during gestation and lamb birth weights. J. L. Peine1,*, K. R. Wellnitz1, G. Q. Jia1, A. M. Meyer 2, L. P. Reynolds1, J. S. Caton1, 1North Dakota State University, Fargo, 2Division of Animal Sciences, University of Missouri, Columbia.
The objective of this study was to use changes in carotid arte-rial blood flow as indices for changes in systemic blood flow during gestation based on plane of nutrition, arginine supple-mentation, and day of gestation. Our hypothesis was that ma-ternal nutrient restriction would increase pulsatility index (PI) and resistance index (RI) in gestating ewes, and reduce lamb birth weights. We also hypothesized that rumen-protected ar-ginine supplementation would recover PI, RI, and lamb birth weights. To test this hypothesis, multiparous, Rambouillet ewes (n = 32; 67.7 ± 6.2 kg initial BW) were allocated to 3 treatments in a completely randomized design at 54 ± 3.9 d of gestation. Dietary treatments were allocated as a com-plete pelleted diet with either 100% of requirements (control, CON), 60% of control (restricted, RES), or RES plus a rumen-protected arginine supplement dosed at 180 mg/kg BW once daily and delivered in a 50 g fine ground corn carrier (RES-
Table 377. Least square means of unsaturated/saturated fatty acids ratio (USFA/SFA) and conjugated linoleic acid (CLA) content of intramuscular fat in LM (g/100 g FAME) as affected by different levels of either sunflower oil and/or quebracho tannin (F or T; 0, 2 or 4% dry matter) in lambs.
Treatment USFA/SFA CLA cis-9 trans-11F0-T0 0.88 0.27F0-T2 1.01 0.57F0-T4 1.09 0.73F2-T0 1.08 0.37F2-T2 1.09 0.37F2-T4 1.18 0.50F4-T0 0.98 0.53F4-T2 1.09 0.43F4-T4 1.14 0.55
P-Values F 0.001 0.08T 0.001 0.001
F×T 0.4 0.01FAME: fatty acids methyl ester

167
ARG). Ewes were penned individually in a temperature- and light-controlled facility. At parturition, lambs were removed from the ewes, weighed, and reared independently. We used Doppler ultrasonography to examine carotid blood flow in ewes from each treatment at d 50, 90, and 130 of pregnancy. The measurements acquired at d 50 were designated our base-line measurements, as this was before any arginine supple-mentation. Data were analyzed using the mixed procedure of SAS including repeated measures. No day of pregnancy × treatment interactions were observed (P ³ 0.17). Pulsatility index was increased in RES and RES-ARG ewes (P £ 0.03), suggesting that restricted ewes experienced greater vascular resistance and lower tissue perfusion of blood compared to CON. We did not observe any treatment or day of gestation differences in RI (P ³ 0.38). In ewes from all treatments, PI was increased at d 90 and 130 as compared with d 50 (P £ 0.001). Peak systolic velocity and end diastolic velocity were greater at d 130 than at d 50 and 90 (P £ 0.04). Birth weight was greater in lambs from CON ewes than lambs from RES ewes (P = 0.04), with lambs from RES-ARG ewes intermedi-ate in weight (5.23, 4.45, and 4.60 ± 0.257 kg, respectively). These results support our hypothesis that maternal nutrient re-striction increases PI and decreases lamb birth weight, where-as rumen-protected arginine supplementation did not recover PI or RI and only partially recovered lamb birth weights.
Key Words: arginine, carotid blood flow, ewes
379 Impact of diet and arginine supplementation on pancreatic mass and digestive enzyme activity in non-pregnant ewes. F. E. Doscher*, C. Bass, A. Grazul-Bilska, S. Kaminski, D. A. Redmer, J. Kirsch, K. C. Swanson, North Dakota State University, Fargo.
Objectives were to determine the possible effects of feed in-take and arginine infusion on pancreatic mass, and α-amylase and trypsin activities in ewes (2 to 4 yr of age; initial BW = 61.8 ± 0.5 kg). Initially, 82 ewes were randomly allocated to one of three feeding groups; control (C; n = 24; 2.14 Mcal/kg), overfed (O; n = 27; 2 × C), or underfed (U; n = 31; 0.6 × C). Estrus was synchronized using a controlled internal drug release (CIDR) device for 14 d. At CIDR withdrawal, ewes from each dietary group were assigned to one of two treatments; Arg (L-Arg HCl, 155 µmol/kgBW) or saline (~10 mL). Treatments were administered 3 times daily for 21–26 d via jugular catheter beginning on Day 0 of the first estrous cycle until the time of tissue collection. Ewes were euthanized during the early (d 5) or mid (d 10)-luteal phase of the second estrous cycle. Each pancreas was immediately removed, weighed, and stored at -80°C until further analy-sis. Data were analyzed as a completely randomized design with a factorial arrangement of treatments (diet, arginine, and diet × arginine). Stage of estrus was initially included in the model but was removed as no differences (P > 0.10) were observed for any of the variables. During nutrition and
Arg-treatment, C maintained BW and body condition score (BCS), O gained 4.1 ± 1.3 kg, and U lost 15.5 ± 0.6 kg; for O, BCS increased by 1.1 ± 0.1 but for U decreased by 0.5 ± 0.1. BW was greatest (P < 0.001) in O, less in C and least in U, and pancreas weights were greater (P = 0.02) in O than U. Concentration of α-Amylase activity (U/g and U/g pro-tein) was greater (P £ 0.04) in O than U α-Amylase activity expressed as kU/pancreas was greater (P £ 0.002) in O than C or U. Trypsin activity (U/g, U/kg BW, and U/g protein) was greatest (P £ 0.05) in U. Arginine treatment did not influence pancreatic mass or α-amylase and trypsin activity. These data demonstrate that increasing feed intake increas-es α-amylase activity but decreasing feed intake increases trypsin activity in the pancreas. Thus, plane of nutrition but not arginine supplementation affects pancreatic mass and exocrine function in non-pregnant ewes which could affect digestive function and feed efficiency. Supported by USDA-AFRI grant 2011–67016–30174 to ATGB and DAR, Hatch Projects ND01748 to DAR and ND01712 to ATGB.
Key Words: sheep, arginine, pancreas
380 Influence of feed restriction and feeding time to growing calves on growth performance and feeding behavior. L. Prezotto*, T. C. Gilbery, A. Islas, M. L. Bauer, K. C. Swanson, North Dakota State University, Fargo.
We hypothesized that limit-feeding and changing feeding pat-terns to consume feed in the nighttime would increase G:F and alter feeding behavior in growing steers and heifers in the winter. The objectives of this research were to determine the effect of limit feeding and feeding time (daytime, nighttime, or 1/2 daytime + 1/2 nighttime) on growth performance and feeding behavior of growing calves fed a corn-silage and hay-based growing diet. Sixty-six steers (322 kg of BW) and thirty heifers (245 kg of BW) of Angus, Simmental, and Shorthorn breeding were assigned randomly to one of four dietary treat-ments: 1) ad libitum feed consumption, 2) limit-fed to 80% of the ad libitum group on a BW basis (limit-fed) in the daytime, 3) limit-fed in the nighttime, and 4) limit-fed 1/2 in the day-time and 1/2 in the nighttime (daytime/nighttime). Animals were fed a corn-silage and hay-based diet from November through February (84 d). Cattle were fed using the Insentec System, which allows for restricting the amount of feed con-sumption and the time with which feed is consumed. Body weights were taken on two consecutive d at the beginning and end of the experiment and every 28 d throughout the experi-ment. Daytime and nighttime groups consumed the meal dur-ing the allowed period (P < 0.001), and the daytime/night-time group consumed the meal during both periods (P > 0.55) validating our model for feeding time. Final BW was greater (P = 0.009) in the ad libitum group when compared to the three limit-fed groups. Moreover, ADG, DMI, DMI relative to BW, time at feeder, meal size, and meal duration were also

168
greater (P < 0.001) in the ad libitum group when compared to the other three treatment groups. There was a tendency (P = 0.09) for higher ADG in animals fed at nighttime when com-pared to the daytime group. The nighttime group spent more time at the feeder (P = 0.04) than the daytime group. The ad libitum group had greater DMI in the daytime when compared to other groups (P < 0.001). Our results suggest that limit-feeding decreased ADG and allowing access to feed at differ-ent times of the d did not influence growth performance and altered some feeding behavior traits in growing calves fed a corn-silage and hay-based diet.
Key Words: backgrounding cattle, limit-feeding, time of feed consumption
381 (UGS) Performance by Katahdin ewes supplemented with different levels of raw whole soybeans while grazing stockpiled tall fescue—1 yr summary. K. A. Vandeloecht*, J. D. Caldwell, B. C. Shanks, A. L. Bax, Department of Agriculture and Environmental Sciences, Lincoln University, Jefferson City, MO.
The phenomenon of flushing in sheep has been well docu-mented and various supplements have been utilized to in-crease pre-breeding nutrition. One option, when available and economically priced, may be raw whole soybeans (RWSB). However, there is minimal research examining the use of RWSB in sheep diets. The objective of this study was to deter-mine the effectiveness of RWSB supplementation during the flushing period on performance by Katahdin ewes while graz-ing stockpiled tall fescue [Lolium arundinaceum (Schreb.) Darbysh]. Sixty-four Katahdin ewes (63 ± 1.4 kg initial BW; 3 ± 0.05 initial BCS) were allocated randomly by age, BW, and BCS to 1 of 8 groups. Groups were then assigned randomly to 1 of 3 RWSB treatments based on percent of BW (as-fed): 1) 0% (control; 2 replications), 2) 0.25% (3 replications), or 3) 0.50% (3 replications). Ewes had access to stockpiled tall fescue and were offered treatment diets for 14 d before breed-ing. At breeding, rams that had passed a BSE were placed in each replication for 44 d. At breeding, end breeding, and fi-nal weights and BCS did not differ (P ³ 0.22) across treat-ments. Ewe ADG, total gain, BCS change during the breeding season, total BCS change, pregnancy rates, and lamb counts did not differ (P ³ 0.20) across treatments. Therefore, supple-menting ewes that are grazing stockpiled tall fescue at 0.25 or 0.50% of body weight (as-fed) with raw whole soybeans may not improve gains and reproductive performance.
Key Words: Breeding, Sheep, Soybeans
382 Effects of reduced fat distillers grains with solubles and condensed distillers solubles on beef steer performance and carcass characteristics. P. M. Walker1,*, R. L. Atkinson2, B. R. Wiegand3, L. A.
Forster4, M. Faulkner1, J. L. Veracini1, 1Illinois State University, Normal, IL, 2Southern Illinois University, Carbondale, IL, 3University of Missouri, Columbia, 4ADM, Decatur, IL.
In this trial, 60 yearling Angus-Simmental cross steers (464 ± 1.32 kg) were stratified by BW to 10 pens with 6 steers/pen to evaluate the feedlot performance and subsequent meat quality characteristics of steers fed reduced fat, modified wet corn dis-tillers grains with solubles (DGS) (average crude fat = 7.3%) or corn condensed distillers solubles (CDS) (average crude fat = 5.7%). Steers were fed one of four whole shelled corn (SC) based diets for 106 d containing 15% ground mature switch-grass hay (DM basis) and 73.26% SC (T1; N = 2), 20.0% CDS and 62.70% SC (T2; N = 3), 40.0% CDS and 42.29% SC (T3; N = 3) or 40.0% DGS and 42.55% SC (T4; N = 2). At har-vest, LM samples from 2 steers in each pen were analyzed. Diets T3 and T4 contained more (P = 0.0001) CP than T1 and T2 diets. The T3 diet contained significantly lower DM, NDF and ADF, and higher (P = 0.0001) ether extract values than diets T1, T2 and T4. Steers fed T3 had lower (P = 0.002) DMI, and similar ADG to steers fed T1, T2 and T4. Steers fed T3 had higher (P = 0.02) G:F than steers fed T4, comparing 0.20 to 0.16, respectively. No differences (P > 0.05) in car-cass characteristics between treatments were observed. Mean quality grade and yield grade were average choice and 3.3, respectively. Lower (P = 0.02) Warner-Bratzler Shear Force of rib steaks were found for T4 compared to T3. Minolta color value for lightness was higher (P = 0.05) at d 7 of aging for T3 compared to T4. Fatty acid analysis showed no significant differences in SFA, PUFA, MUFA or PUFA:SFA among treat-ments. Finishing steer diets containing 40% CDS can be fed with similar feedlot performance and carcass quality as diets containing 0 or 20% CDS, or 40% DGS.
Key Words: finishing steers, condensed distillers solubles, reduced fat corn distillers grains
383 (UGS) Effects of dietary glycerin on rumen metabolism of beef cattle fed 50% dried distillers grains with solubles. C. J. Long*, T. L. Felix, University of Illinois, Urbana-Champaign.
Glycerin improves ADG, efficiency, and marbling scores in beef cattle when fed as a supplemental energy source; how-ever, less is known about its ruminal effects. We hypothesized increasing glycerin in the diet would increase ruminal pH, ruminal propionate concentration (Pr), and in situ fiber disap-pearance; but decrease ruminal hydrogen sulfide gas concen-trations (H2S) in cattle fed dried distillers grains with solubles (DDGS)-based diets. Objectives of this study were to deter-mine effects of 0, 8, and 16% dietary glycerin inclusion on ru-minal metabolism of beef steers fed 50% DDGS (DM basis). Six cannulated steers (initial BW = 656 ± 71 kg) were used in a replicated 3 × 3 Latin square design. Steers were allotted to 1 of 3 dietary treatments: (1) 0% glycerin, (2) 8% glycerin,

169
or (3) 16% glycerin (DM basis). The remainder of the diets consisted of 50% DDGS, 20% silage, 10% supplement, and corn (DM basis). Glycerin replaced corn, on a DM basis, in the diet. Steers were fed once daily for ad-libitum intake and given 14d dietary adaptation at the start of each new feeding period. Then, rumen fluid samples were collected for pH, H2S, and VFA on d 15 of each period. On d 16, a 24h in situ incuba-tion was conducted. Steers fed increasing glycerin inclusions in the diet tended (linear; P = 0.06) to decrease DMI. There was no effect (P ³ 0.38) of glycerin inclusion on 24 h in situ DM or NDF disappearance. Although there was a time by glycerin inclusion interaction (P < 0.01) for ruminal pH, mean ruminal pH did not differ (P = 0.88) as steers were fed increas-ing glycerin (6.06, 6.08, and 6.11, respectively). There was a time by glycerin inclusion interaction (P = 0.05) for acetate concentration (Ac). At 0 h post feeding there was no effect on Ac; however, at 3 and 6 h post-feeding, Ac was reduced with increasing glycerin inclusion. Mean Pr was increased (linear; P = 0.01) with increasing dietary glycerin inclusion. Due to reduced Ac and increased Pr, mean Ac to Pr ratio decreased (linear, P < 0.01) with increasing glycerin. As glycerin inclu-sion increased, mean H2S decreased (linear; P = 0.05). Mean ruminal H2S at 0, 8, and 16% glycerin inclusion were 658.06, 515.83, and 477.22 mg H2S per L, respectively. Contrary to our hypothesis, fiber digestion was not increased in steers fed increasing glycerin; however, ruminal Pr was increased.
Key Words: beef cattle, distillers grains, glycerin
384 Effects of diet on intake and methane emissions of beef steers. B. E. Lehman*, A. R. Green, T. L. Felix, B. C. Ramirez, L. F. Rodríguez, D. W. Shike, University of Illinois, Urbana-Champaign.
Objectives of this study were to determine the effects of diet type on feed intake and methane emissions of beef steers. Fis-tulated steers (n = 12; BW = 725 ± 120 kg) were used in a crossover design with 2 dietary treatments: high forage (HF; 85% chopped grass hay, 10% alfalfa haylage, 5% supple-ment), or high grain (HG; 60% dry cracked corn, 20% corn silage, 10% dry distillers grains with solubles, and 10% sup-plement). Intake was evaluated for 18d via GrowSafe. Steers were then fed for 24hr in environmentally controlled, hood-type chambers during which CH4 concentrations were mea-sured. While steers were in CH4 collection chambers, rumen gas was also collected via cannula puncture at 0, 3, and 9hr post feeding and analyzed for CH4 concentration. Steers fed HG had greater (P ˂ 0.01) DMI than steers fed HF. When steers were fed in gas collection chambers, DMI decreased (P ˂ 0.01) compared to when fed in GrowSafe, regardless of diet; however, DMI during CH4 collection was correlated to DMI during the GrowSafe period (r = 0.73; P ˂ 0.01). Daily CH4 production and g CH4 per kg BW did not differ (P ³ 0.11). However, g CH4 per kg DMI was greater (trend; P = 0.09) for steers fed HF than steers fed HG. Furthermore, diet
did not impact ruminal CH4 concentrations (P = 0.81). Daily CH4 production was correlated to ruminal CH4 concentration at 0hr (r = 0.54; P ˂ 0.01), tended to be correlated at 3hr (r = 0.38; P = 0.07), but was not correlated at 9hr (r = 0.33; P = 0.12). Methane production per kg BW was correlated to ru-men CH4 concentration at 0hr (r = 0.52; P = 0.01), tended to be correlated at 3hr (r = 0.41; P = 0.06), but, again, was not correlated at 9hr (r = 0.33; P = 0.12). Steers fed HG diets had greater DMI compared to those fed HF, supporting previous research. Although diet did not impact daily CH4 production, g CH4 per kg steer BW, or ruminal CH4 concentrations, g CH4 per kg DMI was greater for steers fed forage-based diets than for steers fed grain-based diets.
Key Words: beef cattle, intake, methane
385 (UGS) Effects of pyrethroid and pyrethrin insecticides on beef bull reproductive parameters. S. C. Jimenez Poveda*, J. L. Stewart, C. F. Shipley, V. L. Jarrell, E. J. Navis, F. A. Ireland, T. L. Felix, D. W. Shike, University of Illinois, Urbana-Champaign.
The objective of this research was to determine the effects of pyrethroid, β-cyfluthrin, and pyrethrin premise and fog sprays used in combination with pyrethroid, cyfluthrin and β-cyfluthrin, pour-ons and fly tags on bull reproductive pa-rameters. Concern has risen in the beef industry that pyre-throids and pyrethrins, common insecticides, may impact bull fertility. Studies with rodents indicated insecticides were asso-ciated with sperm abnormalities and disruption of hormones. Recent experiments with beef bulls demonstrated no effects on sperm motility or morphology when Cylence pour-on and Cylence Ultra fly tags were applied at labeled doses. Angus × Simmental crossbred bulls (n = 23; average initial BW = 796 ± 160 kg) were blocked by source and randomly assigned to 2 treatments: (1) pour-on and fly tags (CONT), or (2) pour-on, fly tags, premise spray and fog spray (EXP). The CONT group was treated with Cylence pour-on (active ingredient cyfluthrin; 1%) and 2 Cylence Ultra fly tags (active ingredi-ents β-cyfluthrin; 8% and piperonyl butoxide; 20%). The EXP group was treated with Cylence pour-on, 2 Cylence Ultra fly tags, Tempo premise spray (active ingredients β-cyfluthrin, cyano and methyl 3; 11.8%) and LD-44Z fog spray (pyre-thrins; 0.5% and piperonyl butoxide; 4%). Scrotal circumfer-ences were measured initially and at the end of the 10 wk ex-perimental period. Semen was collected weekly via electroe-jaculation. Whole blood, as a source of serum, was collected from the tail vein weekly to determine peripheral blood tes-tosterone concentrations. Semen was analyzed for progressive and overall motility using computer-assisted semen analysis. There were no differences (P ³ 0.22) in initial or final scrotal circumferences. There was a treatment × wk interaction (P < 0.01) for overall motility, progressive motility, and serum testosterone concentration. At wk 2, CONT bulls had greater (P = 0.05) overall sperm motility and tended to have greater
170
(P = 0.07) progressive motility than EXP bulls; however, at wk 7, EXP bulls tended to have greater (P = 0.09) progres-sive motility than CONT bulls. At wk 3, EXP bulls tended to have greater (P = 0.10) testosterone concentration than CONT bulls; however, at wk 1 and 9, CONT bulls had greater (P £ 0.05) concentrations of testosterone than EXP bulls. Using pyrethrin and pyrethroid premise and fog sprays in combina-tion with fly-tags and pour-ons had variable effects over a 10 wk period on sperm motility and testosterone concentrations.
Key Words: bull, pyrethroid, reproduction
386 Effect of diet on microbial community composition, and methane emission in growing beef cattle. A. L. Knoell*, C. L. Anderson, A. C. Pesta, G. E. Erickson, T. J. Klopfenstein, S. C. Fernando, University of Nebraska, Lincoln.
Methane levels in the atmosphere have tripled since preindus-trial times. Among the major sources of methane production, ruminants account for a considerable fraction of the anthro-pogenic methane produced. At the heart of anaerobic meth-ane production in ruminants is a microbial food chain. The microscale processes of this microbial food chain are greatly influenced by diet. However, the interactions between diet, microbial community composition, and methane emission are poorly understood. Thus, to better understand these interac-tions, we have evaluated methane emission and microbial community composition on a common diet and under differ-ent dietary conditions (high and low quality forage, with and without monensin supplementation, and different levels of modified distillers grain plus solubles (MDGS) supplemen-tation) in growing cattle. Methane and CO2 measurements were made during feeding using an individual feeding fa-cility; 120 individual bunks equipped with the Calan® gate system and an automated gas collection system. Gases were analyzed using a mobile GC unit. CO2 was used as an internal standard and the methane/CO2 ratio was used to determine dietary effects on methane emission. Samples were collected for microbial community analysis via stomach tubing, and the microbial community structure was analyzed using the Ion Torrent personal genome machine (PGM) by sequenc-ing the 16S rRNA gene. Microbial community structure and methane levels were similar in animals on the common diet and changed when different diets were fed. Diet quality (high vs. low quality forage) and level of MDGS supplementa-tion (20% vs. 40%) significantly influenced (P < 0.05) the methane/CO2ratio and the microbial community composition, where high quality forage produced higher levels of methane. However, the level of methane emitted did not change by lev-el of supplementation. These data suggest dietary intervention can be used to change microbial community structure, which in turn can affect methane emission levels. Identifying the members of the rumen microbial community from high and low methane emitting cattle and diets would help identify mi-
crobial community members that influence methane produc-tion in cattle, which may lead to dietary and other intervention strategies to change these microbial populations in the rumen.
Key Words: microbial community, methane
387 The effects of Cellulo-Gest supplement on forage digestibility and feedlot performance for growing steer calves. V. L. Anderson1,*, C. L. Engel2, R. A. Dvorak3, 1North Dakota State University, Carrington, 2Carrington Research Extension Center, North Dakota State University, Carrington, 3Old Mill-Troy, Inc., Overland Park, KS.
An 84d growing trial evaluated the performance and feed efficiency of weaned crossbred beef steers (n = 172; BW = 278 ± 2.3 kg) consuming growing diets with or without the commercially available natural feed supplement Cellulo-Gest (CGS; Old Mill Troy, North Troy, VT). CGS is comprised of calcium carbonate, fermentation extracts of Aspergillus ory-zae and Aspergillus niger, dextrose, lactose, cobalt carbonate, mineral oil, and natural flavorings. A common diet (13% CP and 1.15 Mcal/kg NEg) was formulated with 23% dry-rolled corn, 13% dry-rolled barley, 21% corn distillers grains, 12% chopped switchgrass hay, 28% corn silage and 2.5% vitamin-mineral-ionophore supplement and was supplemented with 4 g/hd/d of CGS or not supplemented(CON). Steers were con-signed by 40 different ranchers in North Dakota, vaccinated and implanted with Ralgro before delivery to the feedlot. Steers were blocked by weight (n = 4) and allotted to identi-cal pens (n = 16) with dietary treatments (n = 2) randomly assigned to pen within block. Data were analyzed using the mixed procedures of SAS for a randomized complete block with replication within block. Dry matter intake was similar between treatments (P = 0.73; 10.7 and 10.6 ± 0.19 kg/hd/d for CGS and CON respectively). However, ADG tended to improve (P = 0.09) for CGS fed steers at 1.83 vs. 1.75 kg/hd/d; respectively for CGS and CON treatments. Feeding CGS did not affect final BW (P = 0.41). CGS tended (P = 0.12) to improve feed efficiency (5.17 vs. 5.40 kg feed/kg gain for CGS and CON treatments, respectively. The cost to feed CGS at the recommended rate of 4 g/hd/d is $0.04 with a net return in this study of $0.17 per hd daily based on improved gain. These data indicate feeding CGS to calves consuming high forage growing diets may enhance rate of gain and im-prove efficiency in the feedlot. An in vitro laboratory test was conducted with rumen fluid from fistulated steers fed CON or CGS to evaluate effects on digestibility of nine high fiber feeds and forages. DM disappearance at 24 h was greater (P < 0.01) for CGS vs. CON (63.4 vs. 59.85% ± 0.58%) with the greatest percentage improvement for CGS over CON in corn stover (18.26%), mixed grass hay (12.35%) and wheat straw (12.27%). CGS appears to be useful when lower quality for-ages and crop residues are fed.
Key Words: beef, digestibility, forage, supplement
171
388 (UGS) Determination of forage quality and in situ digestibility of miscanthus over time. N. F. Reitz*, E. J. Sacks, T. L. Felix, University of Illinois, Urbana-Champaign.
Miscanthus, a C4, perennial grass, may be a potential bioenergy source due to plant yield and hardiness. Excellent yields during early growing stages means miscanthus may also be an alterna-tive forage for ruminants. We hypothesized that early cuttings of miscanthus would be more digestible in ruminants, and have re-duced NDF and ADF concentrations and greater CP concentra-tions than samples taken later in the growing season. Therefore, objectives of this study were to evaluate forage characteristics and in situ digestibility of 3 miscanthus varieties: (1) Miscanthus sacchariflorus (Blumel), (2) Miscanthus xgiganteus (Illinois), and (3) Miscanthus sinensis (Emerald Shadow; Emerald), over time. Samples were taken at 2 wk intervals over 8 wk. Sam-ples were harvested from randomly selected, non-border plants from 4 different plots per variety per time point, to minimize field effects. Samples were analyzed for DM, NDF, ADF, and N. Digestibility was determined by in situ DM disappearance (DMD) and NDF disappearance (NDFD). Field replications of each variety, composited by time, were placed in ruminally fis-tulated steers (n = 2). After 48h incubation, in situ bags were dried at 55°C for 3d, weighed, then composited for 105°C DM and NDF analysis. Data were analyzed via the MIXED proce-dures of SAS (SAS Inst. Inc., Cary, NC). There was an inter-action (P £ 0.03) of variety and week sampled for ADF and NDF concentrations. Over time, ADF and NDF concentration of Emerald increased at a slower rate than either Blumel or Il-linois. There was no variety by week interaction (P = 0.38) for CP concentrations; however, CP decreased (P < 0.01) over time in all varieties. Mean CP concentrations were greatest (P < 0.01) in Emerald and not different in Illinois and Blumel (8.72, 7.89, and 7.96%, respectively). There was an interaction (P < 0.01) of variety and week for DMD. While all varieties decreased from wk 2 through 6, Emerald DMD continued to decrease from 6 to 8 wk but Illinois and Blumel increased. There was a variety by week interaction (P = 0.05) for NDFD. Illinois and Blumel NDFD decreased at a faster rate than Emerald for the first 6 wk. Increasing NDF and ADF concentrations, coupled with decreas-ing CP and in situ disappearance suggest that forage quality of miscanthus decreases over time, reducing its desirability as an alternative forage for cattle.
Key Words: cattle, forage quality, miscanthus
389 The effects of two dietary protein levels and pen bedding in a summer growing and finishing feedlot trial on steer performance, carcass traits, and pen surface temperatures. C. L. Engel1*, V. L. Anderson2, 1Carrington Research Extension Center, North Dakota State University, Carrington, 2North Dakota State University, Carrington.
A summer grow-finishing feedlot trial evaluated effects of di-etary crude protein level and bedding pens, on animal perfor-mance, feed efficiency, carcass traits and pen surface temper-atures. One hundred thirty-six Angus, fall born (n = 66) and yearling steers (n = 70) were blocked by BW and allotted to 1 of 16 pens. Fall calves were fed a growing phase diet (GPD) for 56 d before transitioning to the finishing phase diet (FPD). Yearling steers were marketed after 110 d and fall steers after 96 d on FPD. Protein treatments were similar in energy (1.10 and 1.21 Mcals/kg NEg; GPD and FPD, respectively) and ei-ther 12.2 (Con) or 16.0% CP (HP). Bedding treatments were corn-stover (BD) or no bedding (NB). Treatments were ar-ranged in a 2× 2 factorial with pen as experimental unit. Both protein and bedding treatments had 4 pens/treatment for GPD and 8 pens/treatment for FPD. Air and pen surface tempera-tures were recorded three times daily (morning, noon, and evening) for 3, 28 d periods. The GPD protein treatments had similar (P ³ 0.17) ADG (1.89 ± 0.05 kg), DMI (10.8 ± 0.44 kg*hd-1*d-1), and G:F (0.15 ± 0.003). Bedding treatments had similar (P = 0.41) DMI. The BD treatment had lower (P ³ 0.05) ADG and G:F compared to NB (1.80 vs. 1.98 kg/d and 0.14 vs. 0.16; ADG and G:F, respectively). In FPD, nei-ther bedding pens nor protein level had any effect (P ³ 0.22) on ADG (2.03 ± 0.05 kg/d), DMI (12.9 ± 0.33 kg), G:F (0.16 ± 0.01) or final BW (647.2 ± 20.28 kg). Carcass traits were similar (P ³ 0.18) among protein and bedding treatments, except marbling score. The BD and CON treatments tended (P ³ 0.10) to have higher marbling scores than NB and HP treatments (510.8 and 513.5 vs. 484.6 and 482.0 ± 23.3, re-spectively). Average air and pen surface temperature numeri-cally increased from morning to evening and decreased (P < 0.01) from period 1 to 3, across all readings. The morn-ing surface temperature was similar (P = 0.41) between the NB and BD (19.8 and 20.5°C, respectively). The temperature spread between BD and NB was greater at noon and evening, with NB having higher readings (P < 0.01; 2.3 and 1.7°C, respectively). Overall, HP did not significantly impact animal performance. Bedding pens lowered G:F and ADG in GPD.
Key Words: protein, bedding, feedlot
390 Protection of cottonseed meal protein from rumen degradation using dextrin to create Maillard-type reactions. N. F. Johnson*, M. Kerley, University of Missouri, Columbia.
Various methods of heat processing are used to reduce rumi-nal protein degradation. Reduction in protein degradability occurs because of Maillard-type reactions between reducing carbohydrates and amino groups. We hypothesized that ad-dition of dextrin followed by heat treatment would decrease cottonseed meal (CSM) ruminal protein degradation rate. Treatments were control CSM (C), CSM plus dextrin with-out heat (D), and CSM plus dextrin heated at 140°C for 120 min (DH). Dextrin was included at 3 times the molar con-

172
centration of reactive amino groups. Batch culture in vitro experiments were conducted to compare degradation rates. Treatments (n = 3/treatment/time period) were weighed into tubes, inoculated with a 1:4 mixture of strained rumen fluid and McDougall’s buffer, and closed with stoppers fitted with one-way valves. After inoculation, half of the tubes were im-mediately frozen while the remaining were fermented for 48 h in a shaking water bath at 39°C. Tubes were thawed, centri-fuged to remove supernatant and bacteria, and dried at 55°C. Dry matter and CP disappearance and AA profile of the resi-dues were analyzed at 0 and 48 h. pH was measured at 0, 4, 8, 12, 24, and 48 h of fermentation, at which times supernatant subsamples were taken for ammonia analysis. Ammonia pro-duction was used as a measure of CP degradation and > 88% of feed N was recovered in NH3 by 48 h. Data were analyzed as a completely randomized design using the GLM proce-dure of SAS and Fisher’s LSD for means comparison. Rank transformations were used to normalize pH data. Quadratic equations best fit the rates of NH3 degradation, and linear and quadratic coefficients were calculated and compared among treatments. Crude protein disappearance was greater (P £ 0.05) at 0 h in C than D and DH treatments, but treatments did not differ at 48 h. pH was not different (P > 0.05) among treatments at any time point. Linear slope of NH3 production was greatest for C, and different among all treatments (P £ 0.001). The quadratic coefficient was similar between C and D and both were greater than DH (P £ 0.001). There were no differences in AA profiles among treatments at 0 or 48 h, although concentrations of individual AA changed due to fermentation. We concluded that addition of dextrin to CSM slowed ruminal CP degradation but did not selectively pro-tect AA.
Key Words: CP degradation; Maillard reaction; rumen fermentation
391 Effect of pelleting on digestibility of encapsulated nutrients embedded in a fat matrix. K. J. Herrick1,*, D. A. Sapienza2, F. R. Valdez1, K. E. Griswold1, 1Kemin Industries, Inc., Des Moines, IA, 2Sapienza Analytica, LLC, Slater, IA.
Pelleting of livestock feed is routinely performed because it may offer advantages related to animal health and per-formance. However, the additional handling as well as the temperature and pressure related to pelleting may alter the properties of additives within the pellets, which could lead to reduced animal performance. To determine the effects of pel-leting on digestibility of nutrients embedded in a fat matrix, a concentrate feed was mixed with the following: 1) DL-Me-thionine (MetiPEARL; Kemin Industries Inc., Des Moines, IA); 2) Lysine HCl (LysiPEARL; Kemin Industries, Inc.); or 3) Choline Cl (CholiPEARL; Kemin Industries, Inc.). In ad-dition, a complete feed was mixed with a source of butyric acid (ButiPEARL; Kemin Industries, Inc.). Each embedded
product was mixed at 1.0% of the as fed weight of either the concentrate or complete feed and these treatments were re-ferred to as fortified. Half of the mixture was used as the meal form of each treatment, while the remaining was pelleted. Pelleting was done under commercial conditions. A modified three-step in vitro digestion technique (Sapienza Analytica, LLC; Slater, IA) was used to estimate the 16 h ruminal and intestinal digestive properties. Digestibility estimates were determined for dry matter, crude protein, and the respective nutrient of interest of each treatment. Data were analyzed using the Fit Model of JMP with digestibility estimates in-cluded as Role Variables. Contrasts were used to compare the effects of pelleting and nutrient fortification. The addition of the embedded nutrients increased (P < 0.001) rumen digest-ibility of each of the respective nutrients for both the meal and pelleted forms. Pelleting did not affect (P > 0.01) ruminal digestibility of lysine (35.84 vs. 33.33%), choline (81.48 vs. 81.52%), or butyric acid (45.00 vs. 44.58%) for the fortified meal and pellet forms, respectively. However, ruminal me-thionine digestibility was greater (P < 0.001) for the fortified meal (51.01%) compared with the fortified pellet (27.32%). Additionally, intestinal methionine digestibility was lesser (P < 0.01) for the fortified meal (61.55%) compared with the fortified pellet (72.56%). Intestinal digestibility estimates for the fortified lysine treatments (76.27 vs. 74.01%) tended (P = 0.07) to be greater for the meal compared with the pellet. These results demonstrate that the embedded nutrients evalu-ated in this study can be added to a feed and then pelleted and still have similar or better digestibility characteristics than when fed in a meal form.
Key Words: pelleting, embedded, amino acids
392 Use of treated corn residues in growing diets. S. J. Peterson*, B. L. Nuttelman, D. B. Burken, J. C. MacDonald, G. E. Erickson, University of Nebraska, Lincoln.
A growing study was utilized to evaluate the effects of pellet-ing or grinding corn residue and alkaline treatment versus none. This growing research was completed at the Agricultural Re-search and Development Center (ARDC) near Mead, NE. The trial consisted of 480 backgrounded crossbred steers (BW = 312 ± 8 kg) grown for 80 d. Steers were sorted into four weight blocks, stratified by BW within block, and assigned randomly to pens. Pens were assigned randomly to one of four treatments, with seven pens per treatment and 16 or 24 steers per pen bal-anced by block. Pen served as the experimental unit. Treatments were arranged in a 2 × 2 factorial with corn residue process-ing (grinding vs. pelleting) and chemical treatment (none vs. alkaline) as the factors. Pellets were processed and provided by Iowa Agricultural Bio Fiber out of Harlan, Iowa. All diets con-tained 60% corn residue, 36% distillers grains, and 4% supple-ment (DM basis). Both treated and untreated corn residues were ground (7.62-cm screen) and chemically treated at ARDC. All
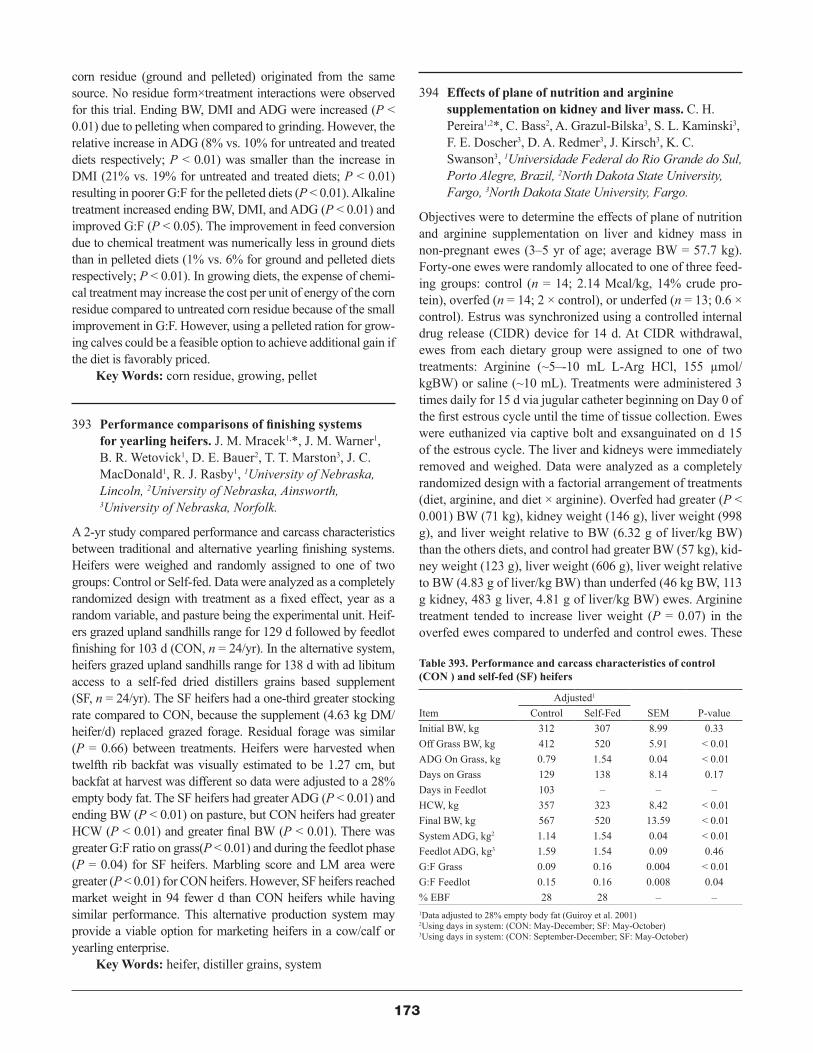
173
corn residue (ground and pelleted) originated from the same source. No residue form×treatment interactions were observed for this trial. Ending BW, DMI and ADG were increased (P < 0.01) due to pelleting when compared to grinding. However, the relative increase in ADG (8% vs. 10% for untreated and treated diets respectively; P < 0.01) was smaller than the increase in DMI (21% vs. 19% for untreated and treated diets; P < 0.01) resulting in poorer G:F for the pelleted diets (P < 0.01). Alkaline treatment increased ending BW, DMI, and ADG (P < 0.01) and improved G:F (P < 0.05). The improvement in feed conversion due to chemical treatment was numerically less in ground diets than in pelleted diets (1% vs. 6% for ground and pelleted diets respectively; P < 0.01). In growing diets, the expense of chemi-cal treatment may increase the cost per unit of energy of the corn residue compared to untreated corn residue because of the small improvement in G:F. However, using a pelleted ration for grow-ing calves could be a feasible option to achieve additional gain if the diet is favorably priced.
Key Words: corn residue, growing, pellet
393 Performance comparisons of finishing systems for yearling heifers. J. M. Mracek1,*, J. M. Warner1, B. R. Wetovick1, D. E. Bauer2, T. T. Marston3, J. C. MacDonald1, R. J. Rasby1, 1University of Nebraska, Lincoln, 2University of Nebraska, Ainsworth, 3University of Nebraska, Norfolk.
A 2-yr study compared performance and carcass characteristics between traditional and alternative yearling finishing systems. Heifers were weighed and randomly assigned to one of two groups: Control or Self-fed. Data were analyzed as a completely randomized design with treatment as a fixed effect, year as a random variable, and pasture being the experimental unit. Heif-ers grazed upland sandhills range for 129 d followed by feedlot finishing for 103 d (CON, n = 24/yr). In the alternative system, heifers grazed upland sandhills range for 138 d with ad libitum access to a self-fed dried distillers grains based supplement (SF, n = 24/yr). The SF heifers had a one-third greater stocking rate compared to CON, because the supplement (4.63 kg DM/heifer/d) replaced grazed forage. Residual forage was similar (P = 0.66) between treatments. Heifers were harvested when twelfth rib backfat was visually estimated to be 1.27 cm, but backfat at harvest was different so data were adjusted to a 28% empty body fat. The SF heifers had greater ADG (P < 0.01) and ending BW (P < 0.01) on pasture, but CON heifers had greater HCW (P < 0.01) and greater final BW (P < 0.01). There was greater G:F ratio on grass(P < 0.01) and during the feedlot phase (P = 0.04) for SF heifers. Marbling score and LM area were greater (P < 0.01) for CON heifers. However, SF heifers reached market weight in 94 fewer d than CON heifers while having similar performance. This alternative production system may provide a viable option for marketing heifers in a cow/calf or yearling enterprise.
Key Words: heifer, distiller grains, system
394 Effects of plane of nutrition and arginine supplementation on kidney and liver mass. C. H. Pereira1,2*, C. Bass2, A. Grazul-Bilska3, S. L. Kaminski3, F. E. Doscher3, D. A. Redmer3, J. Kirsch3, K. C. Swanson3, 1Universidade Federal do Rio Grande do Sul, Porto Alegre, Brazil, 2North Dakota State University, Fargo, 3North Dakota State University, Fargo.
Objectives were to determine the effects of plane of nutrition and arginine supplementation on liver and kidney mass in non-pregnant ewes (3–5 yr of age; average BW = 57.7 kg). Forty-one ewes were randomly allocated to one of three feed-ing groups: control (n = 14; 2.14 Mcal/kg, 14% crude pro-tein), overfed (n = 14; 2 × control), or underfed (n = 13; 0.6 × control). Estrus was synchronized using a controlled internal drug release (CIDR) device for 14 d. At CIDR withdrawal, ewes from each dietary group were assigned to one of two treatments: Arginine (~5–-10 mL L-Arg HCl, 155 µmol/kgBW) or saline (~10 mL). Treatments were administered 3 times daily for 15 d via jugular catheter beginning on Day 0 of the first estrous cycle until the time of tissue collection. Ewes were euthanized via captive bolt and exsanguinated on d 15 of the estrous cycle. The liver and kidneys were immediately removed and weighed. Data were analyzed as a completely randomized design with a factorial arrangement of treatments (diet, arginine, and diet × arginine). Overfed had greater (P < 0.001) BW (71 kg), kidney weight (146 g), liver weight (998 g), and liver weight relative to BW (6.32 g of liver/kg BW) than the others diets, and control had greater BW (57 kg), kid-ney weight (123 g), liver weight (606 g), liver weight relative to BW (4.83 g of liver/kg BW) than underfed (46 kg BW, 113 g kidney, 483 g liver, 4.81 g of liver/kg BW) ewes. Arginine treatment tended to increase liver weight (P = 0.07) in the overfed ewes compared to underfed and control ewes. These
Table 393. Performance and carcass characteristics of control (CON ) and self-fed (SF) heifers
ItemAdjusted1
SEM P-valueControl Self-FedInitial BW, kg 312 307 8.99 0.33Off Grass BW, kg 412 520 5.91 < 0.01ADG On Grass, kg 0.79 1.54 0.04 < 0.01Days on Grass 129 138 8.14 0.17Days in Feedlot 103 – – –HCW, kg 357 323 8.42 < 0.01Final BW, kg 567 520 13.59 < 0.01System ADG, kg2 1.14 1.54 0.04 < 0.01Feedlot ADG, kg3 1.59 1.54 0.09 0.46G:F Grass 0.09 0.16 0.004 < 0.01G:F Feedlot 0.15 0.16 0.008 0.04% EBF 28 28 – –1Data adjusted to 28% empty body fat (Guiroy et al. 2001)2Using days in system: (CON: May-December; SF: May-October)3Using days in system: (CON: September-December; SF: May-October)

174
data indicate that plane of nutrition influences liver and kid-ney mass, and arginine supplementation may influence liver mass regardless of dietary group. Supported by USDA-AFRI grant 2011–67016–30174 to ATGB and DAR, Hatch Projects ND01748 to DAR and ND01712 to ATGB.
Key Words: arginine, liver, kidney
395 Effect of StoverCal, corn silage, and corn stover in diets containing 60% distillers grains on performance and carcass characteristics of feedlot steers. J. P. Schoonmaker*, M. C. Claeys, R. P. Lemenager, Purdue University, West Lafayette, IN.
The acidic nature of dried distillers grains with solubles (DDGS) is a key determinant in depressing DM digestibility in ruminants and consequently plays a primary role in decreased DMI and ADG when DDGS concentrations exceed 30% of the diet DM. The ability of alkali treatments, including calcium hydroxide (Ca(OH)2) to increase rumen pH and enhance fiber digestibility of low quality roughages has been recognized for decades. Addi-tional dietary forage also raises ruminal pH because of increased salivary buffering and may increase fiber digestibility and per-formance. Thus, 2 experiments were conducted to determine the effectiveness of StoverCal (Ca(OH)2) and/or roughage on per-formance and carcass characteristics of steers fed 60% DDGS. Statistical analyses for both studies were conducted using the MIXED procedures of SAS. In experiment 1, 48 steers (353.5 ± 7.55 kg) were allotted to individual pens and fed 1 of 3 diets (DM basis) containing 60% DDGS, 20% corn silage, and 4% vi-tamin/mineral supplement with: 1) 14.5% corn and 1.5% lime-stone, 2) 14% corn and 2% StoverCal, and 3) 14.5% additional corn silage and 1.5% limestone. Steers fed StoverCal consumed the least (P = 0.03) and steers fed added corn silage consumed the most and had the lowest gain:feed (P = 0.02). Dressing per-cent was increased for steers fed StoverCal (P = 0.01). Gain and other carcass characteristics were not affected by treatment (P ³ 0.48). In experiment 2, 112 steers (375.3 ± 19.25 kg) were allotted to group pens (4 pens/treatment; 7 steers/pen) in a 2 × 2 factorial and fed 1 of 4 diets (DM basis) containing 60% DDGS, 17% corn silage, and 4% vitamin/mineral supplement with: 1) 17.5% corn silage and 1.5% limestone, 2) 17% corn silage and 2% StoverCal, 3) 17.25% corn stover and 1.5% limestone, and 4) 17% corn stover and 2% StoverCal. Added stover decreased ADG compared to added corn silage (P = 0.04). StoverCal in-creased ADG when steers were fed stover, but not when steers were fed additional corn silage (P = 0.05; interaction). Forage source or StoverCal did not impact DMI, gain:feed, or carcass characteristics (P ³ 0.10). In conclusion, added forage does not improve performance of cattle fed 60% DDGS. StoverCal may decrease intake and maintain performance when added to 60% DDGS, 34% corn silage diets and increases ADG when added to 60% DDGS diets where corn stover replaces a portion of the corn silage.
Key Words: cattle, calcium hydroxide, roughage
396 Effect of zinc and copper source on finishing steer feedlot performance and incidence of footrot. F. H. Hilscher1,*, G. E. Erickson1, S. B. Laudert2, D. J. Jordon3, B. D. Dicke3, R. J. Cooper3, T. L. Scott3, 1University of Nebraska, Lincoln, 2Micronutrients, Indianapolis, IN, 3Cattlemen’s Nutrition Services, LLC, Lincoln.
A commercial feedlot study compared a combination of inor-ganic and organic copper and zinc trace minerals (CON) to basic copper chloride and zinc hydroxychloride trace minerals (BCHZ) on performance and carcass characteristics as well as the incidence of footrot in feedlot cattle. Crossbred yearling steers (n = 1471, initial BW 273 ± 10 kg) were allocated to pens by sorting every 5 steers into 1 of 2 pens before process-ing within cattle origin. Pens were blocked by cattle origin and were assigned randomly to 1 of 2 treatments (8 pens/treatment). Treatments consisted of adding 19 (finishing) or 25 (growing) mg/kg of copper and 108 (finishing) or 136 (growing) mg/kg of zinc. However, CON consisted of copper sulfate, and a 65% zinc sulfate and 35% zinc methionine complex, whereas BCHZ consisted of basic copper chloride and zinc hydroxychloride trace minerals. Total dietary zinc ranged from 94–146 mg/kg based on analysis. Total dietary copper ranged from 15–29 mg/kg. Upon initiation of the trial, all steers were implanted with Revalor IS. Cattle were fed a growing ration for the first 75 d of the trial and then transitioned to the finishing ration. Cattle were re-implanted with Revalor IS after the growing period and implanted again with Revalor 200 on d 154. Mean d on feed was 216. All steers were fed Zilmax at 8.3 mg/kg of DM for 20 d at the end of the feeding period followed by a 3-d with-drawal period before harvest. Live performance was calculated from pen BW shrunk 4%. Data were analyzed using the Glim-mix procedure of SAS. There was a 4 kg significant difference in initial BW, thus initial BW was used as a covariate in the model. There were no differences in DMI, ADG, final BW, and G:F (P ³ 0.14). Hot carcass weight, dressing percentage and marbling score were also unaffected (P ³ 0.17) by source of trace mineral supplementation. There was no difference (P ³ 0.28) in total morbidity or footrot treatments in terms of total number of pulls or re-treated animals when comparing CON to BCHZ. Cattle that received basic copper chloride and zinc hydroxychloride trace mineral supplement performed similar to cattle that received a conventional trace mineral program.
Key Words: cattle, feedlot performance, trace mineral
397 Effect of supplementing gestating and lactating beef cows with supranutritional concentrations of vitamin D on feedlot performance and carcass characteristics of the progeny. J. P. Schoonmaker1,*, M. A. Engstrom2, R. P. Lemenager1, 1Purdue University, West Lafayette, IN, 2DSM, Eden Prairie, MN.
The last 100 d of gestation (Nov-Mar) in spring-calving cows

175
coincides with the lowest sunlight and lowest potential to syn-thesize vitamin D (VD), potentially causing VD deficiency. Low maternal VD has a significant influence on offspring growth potential, as the VD status of neonatal calves is pri-marily dependent on the VD status of the dam. Furthermore, VD status of progeny could ultimately impact carcass qual-ity. Thus, we hypothesized that supranutritional VD provided to cows would improve growth and carcass characteristics of male progeny. Crossbred cows were allotted by BW, BCS, and breed to 4 treatments to determine the effect of supranu-tritional VD during gestation and/or lactation on feedlot per-formance of male progeny. At 173 d in gestation, cows were allotted to treatments and fed a molasses block that provided 6300 (LD) or 100,000 (HD) IU VD daily. At the mid-point of the calving season, cows were placed on lactation treatments (LD or HD). Treatments were arranged as a 2 × 2 factorial: LD in gestation, followed by LD (LDLD) or HD (LDHD) in lactation, or HD in gestation followed by LD (HDLD) or HD (HDHD) in lactation. Treatments concluded at 79 d postpar-tum and cattle were commingled and managed as one group until feedlot entry, which occurred at 236 d of age. Steers (n = 65, BW = 312 ± 19.5 kg) were allotted to feedlot pens (4 or 5 steers/pen) based on maternal diet and were fed a common diet containing 300 IU of VD/kg until slaughter. Statistical analy-ses were conducted using the MIXED procedures of SAS. BW did not differ among treatments, however, progeny from cows fed HD during lactation tended (P = 0.10) to gain faster and had greater gain:feed (P = 0.04) the first 78 d than prog-eny from cows fed LD during lactation. ADG and gain:feed from d 79 to slaughter and from feedlot entry to slaughter did not differ (P ³ 0.22) and DMI did not differ (P ³ 0.15) among treatments. Progeny from cows fed HD during gestation pro-duced carcasses with less backfat (P = 0.04) that tended (P = 0.08) to have lower yield grades compared with progeny from cows fed LD during gestation. No other carcass trait differed among treatments (P ³ 0.12). In conclusion, adding supranu-tritional VD to gestating and lactating cow diets may alter the pattern and composition of growth of the progeny.
Key Words: beef, vitamin D, developmental programming
398 Influence of forage source on growth performance and feeding behavior in finishing steers. Z. E. Carlson*, T. C. Gilbery, A. Islas, M. L. Bauer, K. C. Swanson, North Dakota State University, Fargo.
Sixty-four steers (394 ± 3.6 kg BW) were utilized to determine the effect of forage source in finishing diets on growth perfor-mance and feeding behavior. Steers were allotted by BW to 3 pens (n = 21 or 22 steers/pen). Within each pen, steers were assigned randomly to 1 of 4 dietary treatments (n = 5 or 6 steers per treatment within pen; n = 16 per treatment) contain-ing different forage sources: 1) alfalfa hay; 2) corn silage; 3) wheat straw; 4) corn stover. Alfalfa hay was provided at 10%
of the diet DM and the other forage sources were offered to provide the same percentage of NDF from forage. Intake and feeding behavior traits were calculated from data generated by the Insentec feeding system. A visit was defined as each time the Insentec system detected a steer at a feeder. Meal was defined as a distinct eating period, which may include short breaks, but which are separated by intervals of no longer than 7 min. Cattle were fed until approximately 650 kg BW and were marketed in two groups at 117 (n = 44) and 155 (n = 20) d. Data were analyzed as a completely randomized block (slaughter group) design. Final BW, ADG, DMI, and G:F did not differ (P ³ 0.12) between treatments. Number of visits and meals per d did not differ (P ³ 0.37) between treatments. Eating time per visit was greatest (P = 0.02) for steers fed wheat straw, least for steers fed alfalfa hay or corn silage, with steers fed corn stover intermediate. Eating time per meal was greatest (P = 0.05) for steers fed wheat straw or corn stover, least for steers fed corn silage, with steers fed alfalfa hay in-termediate. Eating rate (DMI/min) tended to be greatest (P = 0.07) for steers fed alfalfa hay, least for steers fed wheat straw, with steers fed corn silage or corn stover intermediate. These data indicate that growth performance did not differ when different forage sources were fed at a similar NDF inclusion level in high-concentrate finishing diets. However, steers fed wheat straw or corn stover spent more time eating per meal to consume a similar amount of DM. Alternative forage sources may be used to achieve similar growth performance in finish-ing diets if fed at similar NDF inclusion levels, although it may impact feeding behavior.
Key Words: finishing cattle, forage source, growth performance, feeding behavior
399 Pre- and post-weaning performance and health of calves fed texturized calf starters with different additives during the nursery phase. H. Chester-Jones1,*, B. Ziegler2, D. Schimek2, D. Ziegler1, 1University of Minnesota Southern Research and Outreach Center, Waseca, MN, 2Hubbard Feeds Inc., Mankato, MN.
One-hundred-thirty-one (2–4 d old) individually fed Holstein heifer calves (39.3 ± 0.66 kg) were randomly assigned to 1 of 5 treatments to evaluate pre- (d 1–42) and post-weaning (d 43–56) calf performance and health when fed 18% CP (as-fed) texturized calf starters (CS) with different additives. All calves were fed a non-medicated 20% fat:20% protein milk replacer at 0.284 kg in 1.99 L water (12.5% solids) 2× daily for the first 35 d and 1× daily from d 36 to weaning at 42 d. During the first 14 d of the study, neomycin (1600 g/ton) and oxytetracycline (1600 g/ton) were mixed with the milk replacer to provide 22 mg/kg BW daily to each calf to control diarrhea during this period. Calf starters were fed free choice from d 1 and calves had access to fresh water. The additives in the CS included: 1), none (N); 2), decoquinate (DQ) at

176
49.9mg/kg; 3), monensin (M) at 44 mg/kg; 4), lasalocid (L) at 96.8 mg/kg; and 5), bambermycin (B) at 44 mg/kg. Data were analyzed using PROC Mixed procedures of SAS and repeated measures. There were no CS gain affects during d 1 to 14 when CS intake was low. Calves fed B had the highest ADG (P < 0.05), d 15 to 28. From d 29 to 42 calves fed CS with B, L, and DQ had higher ADG (P < 0.05) than those fed M but similar to N calves. Overall pre-weaning daily gains were similar across CS treatments (P > 0.05). Pre-weaning CS intakes were higher for calves fed B vs. those fed N and M. This reflected ADG differences in the interim weigh peri-ods. Daily gains post-weaning and overall were the lowest for calves fed M (P < 0.05). Calves fed B had higher ADG (P < 0.05) for d 1 to 56 vs. N calves. Total d 1 to 56 DMI was the lowest (P < 0.05) for calves fed M. Gain/feed was not affected by CS fed. Average daily gains for the 56 d study were 0.75, 0.78, 0.69, 0.76 and 0.81 kg for calves fed N, DQ, M, L, and B, respectively. There were no health differences across treat-ments (P > 0.05). Under the conditions of this study, calves fed M had the lowest overall performance. Calves fed DQ, L and B performed similarly.
Key Words: calf performance, calf starters, additives
400 (UGS) The effects of fenceline weaning with or without the presence of companion goats on performance and behavior measurements of fall-born calves. E. G. Groose1,*, J. D. Caldwell1, B. C. Shanks1, C. A. Clifford-Rathert1, E. A. Backes2, C. L. Boeckmann1, C. A. DeOrnellis1, 1Department of Agriculture and Environmental Sciences, Lincoln University, Jefferson City, MO, 2University of Arkansas, Fayetteville.
Traditionally, weaning beef calves is initiated by abrupt sepa-ration of a calf from its dam and is associated with behav-ioral distress and reductions in weight gain. Recently, several alternative weaning methods have been proposed and advo-cated including anecdotal reports that placing a companion animal with calves at weaning may improve the weaning pro-cess. Therefore, the objective of our study was to examine if the presence of companion goats affects performance and behavior of fenceline weaned fall-born calves. Over 2 con-secutive years, commercial fall-born Angus calves (n = 40; 220 ± 4.4 kg) were stratified by body weight, sex, and age and allocated randomly to 1 of 8 groups. Groups were then assigned randomly to treatments consisting of 1) fenceline weaning without goats (WOG; 4 replications) or 2) fenceline weaning with goats (WG; 4 replications). Each year 4 ma-ture Boer does were placed into each WG replication at time of weaning. Calves from both treatment groups had constant fenceline contact with their respective dams for the entirety of the study. Calf 14-d post-weaning weight, ADG, and calf gain (14 d) did not differ (P ³ 0.92) across treatments. Percentage of calves vocalizing, walking rapidly, running, standing, and
lying down did not differ (P ³ 0.63) across treatments. How-ever, a time effect (P < 0.01) was observed for vocalizing, with calves vocalizing more at 12 and 24 h compared with 48 and 72 h post-weaning. Therefore, based on these data, the presence of companion goats did not improve performance or behavior of fall-born fenceline weaned calves. Neverthe-less, the possible benefits associated with alternative weaning methods warrants further research.
Key Words: Calves, Goats, Weaning
401 Innovative probiotic and prebiotic combination for early-lactation multiparous cows improves production and starch digestibility. W. L. Braman*, J. E. Kurtz, Chr. Hansen Animal Health and Nutrition, Milwaukee, WI.
The effect of bacterial and yeast probiotic and prebiotic ef-fects on lactating dairy cows is receiving increased interest and recognition. The objective of this trial was to compare supplementation of a combination bacterial and yeast pro-biotic and prebiotic (Probios® Complete, Chr. Hansen, Inc., Milwaukee, WI USA) with a control diet measuring the lac-tation performance, starch digestibility, body condition score (BCS) and fecal score (FS) of Holstein cows. The study was conducted on a 1300 cow dairy. Twenty test cows per pen av-eraging 64 d in milk participated in a 93 d study. Cows were housed in pens of 190 cows each and group was fed a corn and corn silage based diet containing approximately 48% forage, 16.2% crude protein, 1.8 Mcal NEl/kg. 19% ADF, and 32% starch plus sugars (all DM basis). Data collected from the 40 test cows included: individual milk yield, and milk compo-sition. BCS, FS, and data collection periods started on d 30 (P1), 59 (P2), and 93 (P3) of the study. Fecal grab samples were taken at 7 h interval during 3 consecutive days from 20 cows per treatment at initiation and once every 30 d. Feed and orts samples were taken on the same days. Individual data is reported for 39 cows and results were analyzed using analysis of variance with treatment sum of squares partitioned into or-thogonal comparisons. Relative to control, the probiotic treat-ment reduced (P < 0.05) fecal ADF, NDF and starch, while increasing (P < 0.05) fecal protein and fat. The calculated total tract apparent starch digestibility improved (P < 0.05). There were no significant differences in milk production parameters in test cows. Comparing pen data relative to control feeding the probiotic treatment significantly (P < 0.05) increased daily energy corrected milk, (41.0 vs. 42.8 kg/day). Average BCS and FS were not affected by treatment (P > 0.10). Feeding Probios® Complete improved significantly calculated total tract starch digestibility and daily energy corrected milk of early lactation multiparous Holstein cows.
Key Words: direct fed microbials, bacteria, probiotics, prebiotics, starch digestibility

177
402 (GS-MS) Effects of postruminal amino acid supply on growth performance and feed cost of beef steers. M. M. Masiero*, M. S. Kerley, W. J. Sexten, University of Missouri, Columbia.
Seventy-two steers (initial BW 243 ± 4.55 kg) were used to evaluate supplying excessive AA flow during growth phase on performance, feed cost per gain, blood metabolites and subse-quent carcass characteristics of beef cattle. Steers were random-ly assigned to three alfalfa haylage-based diets (30% diet DM) with increasing ruminally undegraded AA; A diet was formu-lated to meet the requirement (BAL) and two diets formulated to exceed (EX1 or EX2) 100% of the most limiting AA during 83d growing phase. Steers were fed a corn-based diet during 83d finishing phase and slaughtered when gain cost exceeded gain value. Initial and final BW did not differ among treatments (P > 0.8), however BW at the end of growing phase tended to decrease (P = 0.09) as postruminal AA supply increased (BAL 398; EX1 391; EX2 385 kg ± 4.05). Calves fed EX1 tended greater ADG (BAL 1.43; EX1 1.76; EX2 1.62 kg ± 0.13; < P < 0.1) during the first 21 d on feed, however this compensatory growth, was not maintained by the end of 83d growing phase (BAL 1.82; EX1 1.74; EX2 1.69 kg ± 0.05; P = 0.14). ADG during finishing phase and overall, feed intake during grow-ing and finishing phase, and feed:gain during growing phase and overall did not differ among treatments (P > 0.6), however, EX1 tended greater feed:gain than BAL and EX2 during finish-ing phase (BAL 7.59; EX1 7.95; EX2 7.24 ± 0.25 P = 0.14). Feed cost per unit of gain ($/Kg of gain) increased (P < 0.001) as postruminal AA was included in the diets (BAL 1.89; EX1 2.07; EX2 2.25 ± 0.05). Quality grade, marbling, HCW, ribeye area, 12th-rib fat thickness, dressing percent, KPH and yield grade, did not differ among treatments (P > 0.6). Blood glucose did not differ (P = 0.99), whereas EX2 had greater blood urea nitrogen compare to BAL and EX1 (BAL 17.29; EX1 16.5; EX2 20.45 ± 0.48; P < 0.001). Our laboratory has demonstrated diets formulated to meet absorbable AA requirement, but have not determined the effect of exceeding absorbable AA require-ment during growth phase on overall performance. AA supply exceeding requirement during growth phase may impact finish-ing phase efficiency. Calves consuming diets with postruminal AA supplied above requirements may respond with greater compensatory growth as occurred in this study, however im-proved growth was not sustained over the feeding period and feed cost per gain were increased.
Key Words: beef, RUP
403 Serum amino acid concentrations in high and low efficiency finishing steers. Z. T. L. Gray1,*, H. C. Cunningham1, K. W. Christensen1, S. I. Paisley1, W. J. Means1, A. M. Meyer2, 1Department of Animal Science, University of Wyoming, Laramie, WY, 2Division of Animal Sciences, University of Missouri, Columbia.
We hypothesized that circulating AA concentrations differ between finishing cattle that vary in efficiency of feed utiliza-tion. The objective of this study was to investigate serum AA concentrations in steers classified as high and low efficiency based on residual feed intake (RFI). Hereford-Angus cross-bred steers (n = 75, 412 ± 3.8 kg initial BW) from a single contemporary group (birth through slaughter) were used in this study. Steers were fed a finishing diet (13.2% CP, 1.8 Mcal NEm/kg, 1.19 Mcal NEg/kg; DM basis) for 80 d using the GrowSafe system to monitor intake. Residual feed intake was calculated as the difference between actual feed intake and expected feed intake of each individual, where expected in-take was determined by regressing ADG and metabolic mid-weight on actual intake. At the end of the feeding period, the 20% most efficient (low RFI, n = 8) and 20% least efficient (high RFI, n = 8) steers with 12th rib fat thickness ³ 1.02 cm were selected for slaughter 6 or 8 d after the end of the feed intake test. During exsanguination at slaughter, blood was col-lected for serum AA analysis. Data were analyzed with PROC MIXED in SAS 9.2 using RFI class (high vs. low efficiency) as a fixed effect. Serum relative histidine concentration (% of total AA) tended to be greater (P = 0.08) in high efficiency than low efficiency steers, whereas all other relative AA were unaffected (P ³ 0.23) by RFI class. The serum concentrations of 19 individual common AA (cysteine was not analyzed), to-tal essential AA, and total AA in addition to ornithine, citrul-line, taurine, hydroxproline, 3-methylhistidine, 1-methylhisti-dine, carnosine, β-alanine, α-amino-N-butyric acid, and cys-tathione were unaffected (P ³ 0.13) by RFI class. All relative essential AA (% of total essential AA) were also unaffected (P ³ 0.16) by RFI class. Data suggest that histidine metabolism may differ in high and low efficiency cattle, resulting in al-tered circulating relative histidine concentrations.
Key Words: amino acids, metabolites, residual feed intake
TEACHING
404 Educational outcomes of an online course: Pharmaceutical Use in Cattle. E. Blythe*, West Texas A&M University, Canyon, TX.
Objective: To assess the effectiveness of a distance-based, on-line course entitled “Pharmaceutical Use in Cattle” by mea-suring the cognitive knowledge of agricultural science stu-dents (n = 27) as felt in their confidence level to explain; legal and regulatory issues that affect responsible pharmaceutical use and food safety principles, basic pharmacokinetics, veteri-nary drug informatics and classes of pharmaceuticals used in the therapeutic treatment of disease states in cattle. The course goal is to provide any interested animal science, dairy sci-ence, meat science, agricultural education, and pre-veterinary

178
medicine student an opportunity to obtain knowledge and skills that can positively impact educational, veterinary and economic outcomes by applying drug knowledge resources to beef and dairy cattle operations. Methods: Quantitative and qualitative methods were utilized to assess the effectiveness of the curriculum. A one group, pre-post, quasi-experimental design was used to evaluate the confidence level and applica-tion skills of the students. A theme analysis was conducted on qualitative data collected on completion of the course. Results: Cognitive post-course scores improved significantly over the pre-course scores on all 11 survey questions. The analysis for each question indicated an increase in the cognitive measure as a result of completing the course curriculum. The reflective commentary on how students will utilize concepts learned in the course was positive. Students reported that increased knowledge in all topic areas would enhance their ability to implement patient safety and food safety principles, serve as the basis for educating others under their supervision, and ul-timately benefit the end consumer and industry. Additionally students reported increased awareness of the depth of drug control regulations, the desire to demystify drug use in cattle, desire to strengthen their working relationship with their at-tending veterinarian, and improve overall herd health, quality, and performance. Students also reported applying what they learned to their personal cattle, to the job market, competi-tive internships, and graduate thesis work. The large majority of students reported a near complete lack of self-awareness on the many facets of pharmaceutical use in cattle before this class. Conclusion: This online course can be used to increase the confidence level of the students’ cognitive knowledge and skills after completion of the curriculum. The online offering of this course is an effective method to educate any interested agricultural science students in the United States on topics specific to pharmaceutical use in cattle.
Key Words: cattle, pharmaceutical, education
405 (GS-MS) Utilization of a modified Delphi method to perform a needs assessment and curriculum revision of a senior-level beef systems management course. E. L. Lundy*, D. D. Loy, P. J. Gunn, Iowa State University, Ames.
Recent, new instructorship of the senior-level beef systems management course at Iowa State University presented the opportunity to conduct a thorough evaluation and potential revision of the course curriculum. The objective of this study was to conduct a critical evaluation of the course and utilize the results to update course objectives and student outcomes. To accomplish this, a select group of industry stakeholders was invited to aid in an assessment of course objectives and student preparation for various careers in the beef industry. Fifteen stakeholders (10 males and 5 females) including cow/calf producers, feedlot operators, and industry professionals, were used in the process. The stakeholders encompassed a
broad range of experience ranging from 2 to more than 60 yr, including both recent graduates and industry thought lead-ers. A series of surveys patterned after the Delphi process was designed to rank the importance of various aspects of the beef industry that students need to understand before entering the industry. This resulted in development of a list of desired stu-dent outcomes created by stakeholders. During the first round, stakeholders individually listed what outcomes and objectives they believed should be considered paramount to the course. Results from round 1 were compiled and subsequently ranked on an individual basis in order of importance by all stakehold-ers during round 2. The third and final round involved a group discussion on rankings from round 2 and development of final ranking of objectives and outcomes. For each ranked outcome category, a composite mean, median, and standard deviation were calculated. Rankings were then used to assess and re-design the course structure and curriculum. Among the top ranked categories (composite mean) were understanding of basic economics/risk management (35.13), ability to calculate total cost of production (35.94), and marketing of the cattle (40.65). Some of the lowest ranked categories (composite mean) included understanding the beef carcass grading sys-tems (62.05), how to use existing beef-based software pro-grams (62.38), and EPDs and breeding systems (63.31). As lowerranked categories are covered in prerequisite courses, this data reinforced the need to build on course prerequisites and not focus on topics taught in prior courses. Utilizing this modified Delphi method with carefully selected stakehold-ers proved to be an effect protocol that allowed instructors to critically evaluate and update course objectives and student outcomes that are relevant to the needs of the industry.
Key Words: beef, Delphi method, teaching
406 Temporal changes in undergraduate students’ self-reported perceptions of motivation of learning, grade anxiety, and instructor effectiveness in animal science courses. J. D. Allen*, G. A. Becker, Northwest Missouri StateUniversity, Maryville.
A weekly, voluntary Likert-type survey was administered to 1 introductory and 5 upper-level undergraduate animal science courses at 2 universities to gain an understanding of students’ perceptions regarding their motivation to learn (Q1), their grade anxiety (Q2), and the instructor’s teaching effective-ness (Q3). A single instructor was responsible for teaching all 6 courses. Each week, excluding the first and final week of courses, students rated their perceptions for each parameter on a scale of 1 (low) to 10 (high). Survey results were analyzed for changes across course and by week as well as correlations among the 3 responses. Linear regression for Q1 was observed using Q2 and Q3 responses (P < 0.01) but was not predictive (r2 = 0.20). Likewise, cubic regression for Q3 was observed using Q2 responses (P < 0.01) and was also not accurately predictive (r2 = 0.10). Rate of weekly responses steadily de-

179
clined to below 60% of initial participants (P < 0.01) with an average weekly response rate of 73% of initial participants. Although grade anxiety did not change over time (5.5 ± 0.27; P > 0.10), perception of learning capacity (range: 6.1 to 7.3 ± 0.21) and teacher effectiveness changed (range: 7.1 to 7.9 ± 0.18; P < 0.01). Within just the introductory course, which is required by the regional university for all agriculture majors, overall learning capacity remained consistent across time and student major (6.6 ± 0.38; P > 0.10; however, grade anxiety and perception of teacher effectiveness were different (P < 0.01) across student major.
Key Words: learning capacity, student perception, teacher effectiveness, teaching
407 Development and implementation of a lean hog futures trading game to enhance student engagement and learning. B. D. Whitaker*, G. W. Arburn, University of Findlay, Findlay, OH.
Undergraduate animal science students often have little knowledge or understanding of commodity markets and of-ten struggle with the concepts and use of futures markets. To introduce swine production and management students to these concepts and principles, a futures trading game was developed and modified to be implemented during a class session. This game replaced a traditional lecture and allowed students to in-teract, strategize, negotiate and observe how a market works. This pedagogy helped meet specific course goals, including, 1) identify, describe and explain key concepts in today’s in-dustry; 2) demonstrate comprehension by solving issues and scenarios associated with the industry, and 3) analyze dif-
ferent management and marketing principles currently used in the industry. The game was designed to allow students to be producers or industry consumers looking to buy, sell, or hold contracts over four rounds of play. Each round included spot pricing, futures trading, and price expectation and veri-fication. Students (n = 23) were evaluated through pre- and post-game assessments to determine if the activity increased their understanding of swine markets, based on a scale where 1 = disagree and 10 = agree. Criteria for increasing knowledge was a positive change in individual assessment score, success-fully applying knowledge was defined as 90% of the students receiving a grade of > 80% on the marketing section of the exam, and a successful educational experience was defined as the students rating the experience > 7. All students significant-ly increased (P < 0.05) their knowledge of hog markets, based on their before (3.87) and after (6.91) self-assessment scores. Students’ application of knowledge was significantly greater (P < 0.05) when participating in the futures game (92.55 ± 4.86%) compared to those that did not (84.16 ± 3.50%). Stu-dents enjoyed the method of learning (9.00) and believed it increased their comprehension of the material (8.83). Students believe that the course objectives were met (8.09) and that the lean hog futures trading game was an appropriate learning strategy to use in a swine production course (8.13) because it provided opportunities for practical experiences (8.39), which are continuously requested by students (9.83). Despite these positive results, students rated the industry and market realism of the game only average (5.09) and modifications to the game will continue to be made as the game continues to be used in classes to cultivate students’ interest in swine production.
Key Words: trading game, swine production, hands-on learning

180
A U T H O R I N D E X
Please note: numbers following author’s name indicate abstract numbers.
A Acosta Camargo, J. A., 176 Adeola, L., 300 Aguilera, A., 286 Ajuwon, K. M., 300 Al-Dobaib, S. N., 377 Al-Owaimer, A. N., 296 Aldrich, G., 243 Alexander, L. S., 84, 165 Alkhuriji, M., 307 Allee, G. L., 54 Allen, B. L., 204 Allen, E. C., 121, 290, 291 Allen, H. K., 195 Allen, J. D., 237, 406 Allen, M. S., 214 Almeida, V. V., 345 Andersen, M. A., 222 Anderson, A. J., 178 Anderson, C., 135, 216, 386 Anderson, D. M., 154, 328 Anderson, J. L., 43 Anderson, L. L., 363Anderson, V. L., 268, 305, 387, 389 Andrade, C., 87 Andretta, I., 332 Anil, L., 344 Apple, J. K., 126, 347 Araiza, B. A., 313 Arburn, G. W., 407 Arce, N., 313 Arent, S., 148 Arentson, R. A., 54, 160 Arkfeld, E. K., 311 Asmus, M. D., 122 Atkinson, R. L., 382 Audet, I., 346 Augspurger, N. R., 34 Austin, K. J., 65 Awati, A., 324 Awati, A. A., 127, 323 Azain, M. J., 86
B Backes, E. A., 229, 400Baes, C., 23 Baez, G. M., 226
Baggerman, J. O., 98 Baidoo, S., 89, 161, 171, 177, 316, 325,
344, 349, 350 Baldwin, L. G., 73 Ball, R. O., 38 Balolong Jr., E., 256 Bandrick, M., 195 Banerjee, D., 6 Bapst, B., 23 Baranko, L. L., 304, 307 Barletta, R. V., 226 Barnes, K. M., 48, 242 Barnes, S. Y., 28 Bartimus, H. L., 228 Basinger, K. L., 270 Bass, B. E., 195 Bass, C., 379, 394 Bates, J. L., 73 Bates, R. O., 26 Bauer, D. E., 393 Bauer, M. L., 380, 398 Baumgard, L. H., 95, 102, 104, 105, 124 Bax, A. L., 229, 381 Beak, H., 248, 249 Beaulieu, A. D., 71 Beaulieu, D., 72 Becker, G. A., 406 Beckman, W., 312 Bee, G., 111 Beever, J. E., 310 Begum, M., 260 Beitz, D. C., 138 Beltranena, E., 90, 179, 181 Bennett, B. P., 239, 240, 257, 258 Bento, H., 134 Berg, E. P., 302, 303, 304, 307 Berger, J. E., 311 Bergstrom, J. R., 126, 130, 131, 137, 189,
234, 347, 353 Bernal, G., 286 Bernal Rubio, Y. L., 26, 301 Bernier, J. F., 190, 315 Berres, M. E., 197 Bespalhok Jacometo, C., 367 Beyer, R. S., 243 Biggs, P., 354 Billing, M. F., 56, 75, 287 Bingham, A. C., 243
Bishop, D. K., 203 Biswas, S. K., 6 Bittner, C. J., 208, 211, 222 Black, D. N., 278, 279 Blythe, E., 404 Boddicker, N., 24 Boeckmann, C. L., 400 Boehmer, B. H., 371 Bohrer, B. M., 76 Bokelman, G. E., 158 Boler, D. D., 76 Booher, C., 285 Borges, J. B. S., 100 Borowicz, P. P., 307 Bott, R. C., 47 Boyd, R. D., 63, 84, 128, 136, 144, 146,
165, 176, 334 Bradford, B., 53, 96, 194 Bradley, C. L., 141, 319, 357 Braman, W. L., 401 Branine, M. E., 98, 99 Bremer, M. L., 209, 211, 212 Brockus, K. E., 78, 244 Brooks, K., 283 Brown, P. K., 143 Brumm, M. C., 54 Bryan, M., 10, 59 Bump, K. D., 45 Bundy, J. W., 27, 28, 135, 162, 174, 342 Burken, D. B., 206, 208, 209, 211, 392 Burkey, T. E., 82, 135, 162, 164, 174,
196, 342 Burnett, D. D., 298, 299 Busby, W. D., 96Butters-Johnson, A. K., 264, 265 Buysse, S. G., 203
C Caetano-Anollés, K., 271, 364 Cai, L., 167 Caldwell, J. D., 228, 229, 270, 370, 381,
400Calhoun, C., 172, 308 Calkins, C. R., 112 Callahan, Z. D., 69, 115, 116, 232 Camacho, L. E., 77, 198, 368, 369, 372 Camargo, F. C., 47 Cammack, K. M., 65, 217
181
Cann, I. K. O., 205 Cantet, R. J. C., 26 Capozzalo, M. M., 91 Card, K., 338 Cardoso, L. L., 100 Cardoso, P., 215, 364, 367 Carlson, Z. E., 398 Carr, S. N., 54, 266 Carr, T. P., 112 Carvalho, P. D., 226 Casas, E., 376 Casey, T., 195 Castelini, F. R., 345 Caton, J. S., 378 Cervantes, M., 313 Chamberlin, D., 81, 88, 178 Chapel, N., 80 Chase, C. C., 200 Chen, C., 89, 327 Chen, X., 166 Chen, X., 343, 362 Chester-Jones, H., 399 Chewning, J. J., 54, 126, 159, 318, 347,
351 Cho, J. H., 169, 170, 248, 251 Choi, H. B., 348 Choi, Y. M., 113 Chorfi, Y., 163 Christensen, K. W., 403 Ciobanu, D. C., 27, 28, 29, 162 Claeys, M. C., 395 Clark, A. B., 321Clark, C. A., 281 Clark, D. L., 309, 310 Clements, A. R., 245 Clifford-Rathert, C. A., 400 Cloutier, L., 315 Coble, K. F., 86, 123, 185, 331, 338 Coetzee, J. F., 73, 96 Coffey, K. P., 228 Coffey, M. T., 57, 85, 87 Cohick, W. S., 107 Colpoys, J. D., 259, 363 Combs, D. K., 51 Compart, D. M., 353 Compart, K. M., 340, 341 Conant, G. C., 217 Connor, J., 146 Cook, E. B., 32 Coomer, J. C., 143 Cooper, R. J., 396 Cordero, G., 141 Correa, S., 286 Corrent, E., 35
Corrigan, M., 8 Cox, R., 172, 308, 340, 341 Crosswhite, J. D., 303 Crowder, S. A., 160 Cruzen, S. M., 108 Cunningham, H. C., 65, 403 Cupp, A. S., 200 Cushman, R. A., 200 Cutshaw Jr., R. L., 290, 291
D Dahlen, C. R., 199, 278, 279 Daigle, C. L., 6 Dalmau, A., 11, 58 Dalsgaard, S., 148 Daniels, K. M., 67, 230, 231 Davis, D. L., 93, 235 Davis, E. H., 28 Davis, M. E., 113 De Jong, J. A., 133, 355 de Lange, C. F. M., 88, 91, 117, 129, 333 De Vries, J. L., 81 Decker, J. E., 21 DeDecker, A. E., 56, 57, 75, 85, 287 Dedrickson, B. J., 281 Dee, S., 285 Deen, J., 13 Dekkers, J. C. M., 24, 25, 164, 276, 277,
311, 363 Dennis, T. S., 267 DeOrnellis, C. A., 400 DeRouchey, J. M., 36, 86, 93, 120, 123,
130, 131, 133, 137, 157, 158, 175, 184, 185, 234, 235, 298, 299, 321, 322, 331, 337, 338, 352, 355
Deschêne, K., 163 DeVries, T., 2 Dicke, B. D., 396 Diefenbacher, N., 239, 240, 257, 258 Dilger, A. C., 76, 294, 309, 310 Dilger, R. N., 62, 84, 165 Dolazza, R. M., 293 Dolezal, M., 23 Doscher, F. E., 302, 379, 394 Drackley, J. K., 42 Dreadin, T., 285 Dritz, S. S., 36, 86, 93, 120, 123, 130,
131, 133, 137, 175, 184, 185, 235, 298, 299, 321, 322, 331, 337, 338, 352, 355
Drouillard, J. S., 236 Duckworth, M. J., 66 Dudash, E. M., 67, 230, 231
Dunkelberger, J., 94 Dunshea, F. R., 363 Durfey, C. L., 233 Dvorak, R. A., 387
E Earleywine, T., 41 Edenburn, B. M., 76 Edmonds, M. S., 189 Edwards, L. L., 201 Eggert, J. M., 121, 290, 291 Ellersieck, M. R., 204 Ellis, M., 266, 272, 288, 289, 292, 306,
615, 339, 359 Elsbernd, A. J., 117, 333 Engel, C. L., 268, 305, 387, 389 Engle, T. B., 28Engelken, T., 96 Engstrom, M. A., 397 Erickson, G. E., 101, 112, 206, 207, 208,
209, 210, 211, 212, 216, 218, 219, 220, 222, 223, 224, 361, 386, 392, 396
Ernst, C. W., 26, 274, 301 Escobar, J., 140, 186 Escobar, K., 286 Estrada, J. E., 288, 306, 339
F Fahrenholz, A. C., 12, 55, 157 Faucitano, L., 11, 58 Faulkner, D. B., 213 Faulkner, M., 382 Felix, T. L., 66, 76, 205, 269, 383, 384,
385, 388 Fennewald, D., 19 Ferket, P., 314 Fernando, R. L., 15, 23 Fernando, S. C., 135, 216, 220, 386 Ferreira, M., 153, 183 Ferrel, J. E., 122, 152, 153, 154, 160, 328 Ferring, C. L., 31 Fields, B., 285, 335 Finck, J. L., 8 First, E., 178 FitzSimmons, M., 82, 164 Fleming, B. O., 244 Flohr, J. R., 130, 322, 337 Fluharty, F. L., 97, 280 Flury, C., 23 Foerder, K. M., 143 Forster, L. A., 382 Forsythe, N. L., 370 Frank, J. W., 195
182
Frantz, E. L., 234 Freetly, H. C., 74 Fritz-Waters, E., 23 Frobose, H. L., 93, 234, 235, 321 Fruge, E. D., 353 Funderburke, C., 360 Funderburke, D., 360
G Gabler, N. K., 60, 82, 95, 124, 138, 164,
259, 276, 277, 311, 363 Gaines, A. M., 306, 312 Gaines, A., 339 Galeota, J. A., 28 Gan, F., 343, 362 Garbossa, C. A. P., 121, 290, 291 García, H., 313 Garrick, D. J., 14, 15, 16, 17, 23 Genther, O. N., 99 Gesing, L. M., 288, 289 Gibson, A. R., 67, 230, 231 Gilbery, T. C., 380, 398 Gillis, D., 72 Girard, C. L., 346 Glewen, K., 224 Gloaguen, M., 35 Glunk, E., 46, 49 Goehring, B., 86 Gómez, J., 286 Goncalves, M. A. D., 36, 157, 175, 322,
352 Gonda, M. G., 18 González, F. A. L., 100 Gonzalez, J. M., 184, 298, 299 Gonzalez-Peña Fundora, D., 202, 271,
273, 364 Gonzalez-Vega, J. C., 83, 151 Gonzalo, E., 190 Goodband, R. D., 36, 86, 93, 120, 123,
130, 131, 133, 137, 175, 184, 185, 234, 235, 298, 299, 321 (NR), 322, 331, 337, 338, 352, 355
Gourley, G. G., 82, 164 Gourley, K. M., 93, 235 Gray, K. A., 30, 32 Gray, Z. T. L., 65, 403 Grazul-Bilska, A., 379, 394 Gredler, B., 23 Green, A. R., 3, 269, 384 Greiner, L., 146, 335 Grev, A. M., 79 Griswold, K. E., 391 Grohmann, N., 272
Groose, E. G., 400 Grossner, L. J., 78, 368 Grubbs, J. K., 109 Gualdrón Duarte, J. L., 26 Guay, F., 163 Gunder, D. L., 241 Gunn, P. J., 281, 405 Guo, J., 57, 64, 85, 354 Gutierrez, N. A., 173 Gänzle, M. G., 166
H Hadrich, J. C., 278, 279 Hagen, C. D., 329, 356 Hahn, J. D., 39 Hall, D. D., 146 Hall, R. J., 143 Hamman, E. R., 311 Hankins, C. C., 160 Hanlin, J. K., 229 Hansen, C. F., 91 Hansen, D., 171, 177 Hansen, E., 353 Hansen, S., 353 Hansen, S. L., 99 Hanson, A. R., 89, 326, 327 Hanson, D., 285 Hardie, L. C., 276 Harding, J. L., 210, 223 Hardman, S. J., 306 Hardman, S. J., 339 Haring, J., 372 Harrell, R. J., 146 Harris, E. K., 92, 172, 308 Harris, M. E., 218 Harris, S. P., 28 Hart, C. G., 78, 244, 368 Hasenauer, T. L., 219 Haslag, W. M., 370 Hastad, C. W., 123, 133 Hathaway, M., 46, 49 Hausman, G. J., 103 Haydon, K. D., 122, 184, 298, 299, 334 Hayr, M. K., 17 He, Y., 13 Henderson-Dean, B., 238Hentges, D., 288 Hergenreder, J. E., 98 Herrick, K. J., 391 Herrick, R., 294 Hess, A., 24 Hilbrands, A. M., 70, 284 Hill, D. R., 370
Hill, G. M., 184 Hilscher, F. H., 396 Hinson, R., 145 Hoblitzell, E. H., 242 Hodgen, J. M., 8 Hoffman, R. M., 48 Hogan, E. K., 309 Holland, B. P., 8 Hollander, J. M., 48 Holloway, C. L., 142 Holzgraefe, D. P., 149, 180 Hooda, S., 129 Hosford, A. D., 98 Hossain, M. M., 169, 170 Hosseindoust, A., 261 Hostetler, C., 245 Houser, T. A., 86, 298, 299 Hsiao, H. Y., 328 Hsu, W., 96Htoo, J. K., 91, 313 Huang, K., 343, 362 Huang, Z., 182 Hubbell, III, D. S., 228 Huber, L. A., 81, 88 Huff-Lonergan, E., 311 Huiatt, T. W., 265 Hurburgh, C. R., 156 Hussein, E. S. O. S., 296 Hutcheson, J. P., 8
I Iakiviak, M., 205 Ilse, B., 268 Ireland, F. A., 269, 385 Islas, A., 380, 398
J James, B. W., 317 Jang, H. C., 249, 250 Jang, Y. J., 254 Jang, Y. D., 324 Jarrell, V. L., 385 Jaworski, N. W., 127, 323 Jendza, J., 177, 344, 350 Jenkins, K. H., 101, 212, 218, 222, 283 Jia, G. Q., 378 Jimenez, S. C., 269 Jimenez Poveda, S. C., 385 Jin, S. S., 348 Jobman, E. E., 28 Johnson, A. K., 259, 363 Johnson, B. J., 98 Johnson, D., 17
183
Johnson, J. S., 95, 105, 124 Johnson, N. F., 390 Johnson, R. K., 27, 28 Johnson, R. C., 69, 311, 335 Johnson, T. P., 28 Johnston, L. J., 70, 89, 92, 172, 262, 263,
284, 308, 340, 341 Johnston, M. E., 203 Jolly, M. L., 210, 216, 223 Jones, A. M., 37 Jones, C. K., 110, 157, 158, 234, 243 Jones, D. F., 143 Jones, G., 325 Jones, M., 207, 224 Jordan, K. E., 175 Jordon, D. J., 396 Jung, D., 246, 250, 252 Jung, S. W., 348 Jungst, S., 285, 335
K Kachman, S. D., 27, 28, 29 Kalbfleisch, T. S., 20 Kalivoda, J. R., 158 Kamel, H. M., 377 Kaminski, S. L., 379, 394 Kaps, M., 19 Karcher, E. L., 178 Karriker, L. A., 73, 82, 96 Karrow, N. A., 129 Keating, A. F., 106, 259Keele, J., 18 Kehoe, S. I., 375 Kellner, T. A., 119 Kelly, D. T., 37 Kelsay, T., 275 Kemp, R. A., 25 Kephart, R. K., 265 Kerkaert, B., 285 Kerley, M., 221, 390, 402 Kern, R. J., 74 Kerr, B. J., 89, 125, 138, 173, 174, 327 Kessie, T. N., 145 Keuter, E. M., 27 Khatib, H., 226 Kiarie, E., 134 Kim, B. G., 330, 336 Kim, H. J., 126, 347 Kim, I. H., 167, 168, 169, 170, 246, 247,
248, 249, 250, 251, 252, 253, 254, 255, 256, 260, 261
Kim, J. C., 91, 132, 168, 191 Kim, J., 316, 349
Kim, S., 247, 252 Kim, S. W., 57, 64, 85, 87, 147, 150, 187,
314, 354 Kim, W. K., 188 Kim, Y. Y., 348 Kim, Y. H. B., 295 King, A., 26 Kipper, M., 297 Kirsch, J., 379, 394 Klein, S. I., 199 Klopfenstein, T. J., 101, 207, 208, 210,
211, 216, 219, 224, 283, 361, 386 Knauer, M., 10, 12, 30, 31, 32, 55, 59 Knoell, A. L., 386 Knox, R. V., 202, 273 Knudsen, K. E. B., 148 Koltes, J. E., 15, 23, 110 Kononoff, P. J., 52 Krehbiel, C. R., 228 Kreuzer, M., 111 Krogh, U., 88 Kuehn, L. A., 18, 376 Kurtz, J. E., 401
L Lakritz, J., 96Lamb, G. C., 199 Lamberson, W. R., 19, 33, 217 Lammers, P. J., 68 Landero, J. L., 179, 181 Langbein, K. B., 130, 337 Langdon II, J. M., 12 Lapointe, J., 163 Lardy, G. P., 278, 279 Larimore, E., 200 Larson, J. E., 78 Laudert, S. B., 396 Lawyer, A., 47 Lay Jr., D. C., 1 Le, A. M. H., 179 Le Floc’h, N., 35 Ledergerber, K., 239, 240, 257, 258 Lee, B. R., 261 Lee, J. P., 255 Lee, J., 15, 16 Lee, K., 113 Lee, S. A., 330 Lehman, B. E., 384 Lei, Y., 247, 251, 254 Lekatz, L. A., 369 Lemenager, R. P., 395, 397 Lemley, C. O., 77, 78, 198, 244, 368, 372 Lents, C. A., 27, 200
Lessard, M., 163 Létourneau Montminy, M. P., 190, 315 Lewis, L. L., 157 Li, H. L., 246, 253 Li, J., 253 Li, M., 125 Li, Y. S., 162, 174, 342 Li, Y., 13, 262, 263 Liao, S. F., 343, 362 Lindemann, M. D., 275, 324, 325 Lindholm-Perry, A. K., 74 Linn, J. G., 40 Lippolis, J. D., 376 Litherland, N. B., 40 Little, C. R., 145 Liu, Y., 139 Lock, A. L., 214 Loerch, S. C., 76, 97, 280 Lonergan, S. M., 311 Long, C. J., 383 Long, N. M., 213 Looft, T., 195 Loor, J. J., 193, 227 Lopes, F., 51 Lorenzen, C. L., 293 Loula, T. J., 61 Lovatto, P. A., 332 Loy, D. D., 405 Lu, H., 300 Lubbers, J. M., 178 Lubitz, J., 81 Luchini, D., 226 Lucot, K. L., 27, 29 Lucy, M. C., 9, 95, 124 Ludden, P. A., 74 Luebbe, M. K., 101, 212, 218, 222 Lundy, E. L., 405 Lunney, J. K., 24, 274 Lv, C., 343, 362 Lynch, B. L., 9 Lærke, H. N., 148
M Ma, Y., 140, 186 MacDonald, J. C., 112, 206, 207, 209,
210, 211, 219, 223, 224, 392, 393 Maclennan, G., 295 Maddock, R. J., 305 Maddock-Carlin, K. R., 305, 369 Maison, T., 320 Malheiros, R. D., 314 Manu, H., 161, 171 Marcoux, M., 297

184
Mariscal, G., 286 Marley, K., 18 Marsteller, T. A., 122 Marston, T. T., 393 Martinec, N., 178 Martinson, K. L., 46, 49, 79, 241 Masiero, M. M., 402 Mason, B., 56, 75, 287 Mastromano, G. A., 162, 174, 342 Matte, J. J., 346 Matthews, J. N., 285 Matthews, N., 335 Matzat, P. D., 359 Mauch, E. D., 277 Maxwell, C. L., 228 Maxwell, C. V., 37, 114, 126, 347 McCarthy, F. D., 238McCulley, M., 144 McCutcheon, J. S., 97, 280 McGlone, J. J., 265 McGrath, M., 334 McKeith, F. K., 312 McKnite, A. M., 28 McLean, K. J., 371 McMillan, E. G., 54 McNeel, A. K., 200 Means, W. J., 403 Mellencamp, M. A., 92, 172, 312 Mendoza, O. F., 306 Mendoza, S. M., 128 Mercadante, V. R. G., 199 Meried, W. G., 171 Meried, W., 161 Meyer, A. M., 65, 378, 403 Meyer, T. A., 160 Meyers, A. L., 178 Miles, J. R., 74, 192, 200 Miller, K. A., 236 Miller, L., 280 Miller, P. S., 27, 135, 162, 174, 196, 342 Miller, R. W., 292, 294 Millman, S. T., 259, 264 Minion, L., 285 Minton, N. O., 221 Moehn, S., 38 Moeser, A. J., 201 Mohammadi Gheisar, M., 255 Monegue, H. J., 275 Monegue, J. S., 275 Montgomery, R. A., 6 Morales, A., 313 Moran, K., 360 Mordhorst, B., 77Morrison, S. Y., 42
Morton, L. W., 280 Moseley, W. M., 292, 294 Mosiman, A. M., 267 Moural, T. W., 28 Mracek, J. M., 393 Muegge, J. D., 359 Mullan, B., 91, 191 Musser, R. E., 329, 356
N Narcy, A., 190 Navis, E. J., 269, 385Neill, C. R., 285, 335 Nelson, D. A., 201 Nelssen, J. L., 93, 120, 184, 235, 298,
299 Nemechek, J. E., 123, 131, 137 Nennich, T. D., 267 Nerem, J., 285 Newman, M. A., 156 Nichols, C. E., 48 Nichols, W. T., 8 Nielsen, M. K., 174 Nikkhah, A., 7, 365, 366, 373, 374 Nitikanchana, S., 120 Nonneman, D., 26 Nunes Corrêa, M., 367 Nuttelman, B. L., 206, 208, 211, 392 Nyachoti, C. M., 188 Nyachoti, M., 134
O O’Diam, K. M., 67, 230, 231 Ochoa, L. E., 359 Ochoa, L. E., 289 Odetallah, N., 140 Odle, J., 144, 164 Oglesby, B. C., 178 Oliveira, J. A., 345 Oliver, W. T., 114 Olson, K. C., 305 Ono, R. K., 345 Orr, M., 80 Owens, F. N., 50 Owusu-Asiedu, A., 127, 323, 324, 325
P Pacheco, W. J., 55 Pairis-Garcia, M. D., 264 Paisley, S. I., 65, 403 Palan, R., 334 Palmer, M., 46 Pan, C., 343, 362
Panazzolo, D. M., 100 Pangeni, D. P., 161, 171, 316 Pardo, C. E., 111 Park, C. S., 330 Park, I., 64, 187, 314 Park, J. W., 260 Parker, R. S., 197 Parr, C. K., 139 Parsons, C. M., 139 Passos, A. A., 87, 147, 150 Patience, J. F., 82, 95, 110, 117, 119, 124,
142, 156, 173, 176, 276, 277, 311, 333 Patino, H. O., 100 Paulk, C. B., 184, 298, 299 Pegg, E. K., 68 Peine, J. L., 378 Peñagaricano, F., 226 Pereira, C. H., 100, 302, 394 Perez, D., 197 Perez, V. G., 149, 180 Perry, G. A., 200 Perry, K. R., 301 Pertzborn, K. M., 73 Pesta, A. C., 220, 386 Peterson, B. A., 288, 306, 312 Peterson, B., 272, 289, 339 Peterson, S. J., 206, 392 Petri, D., 325 Pettigrew, J., 84, 165, 202, 273 Phelps, K. J., 298, 299 Phillips, C. E., 12, 55, 87 Piantoni, P., 214 Pilcher, C. M., 110 Pineda, A., 215 Plastow, G. S., 25, 28 Pluske, J., 91, 132, 168, 191 Pogreba, T. J., 375 Pokharel, B. B., 188 Pomar, C., 190, 297, 315, 332 Pomar, J., 315, 332 Prezotto, L., 302, 380 Prusa, K. J., 119 Puls, C. L., 266, 312, 359 Puls, C., 292, 339 Purser, K. W., 329, 356 Putz, A. M., 30 Pye, T. A., 371
Q Qiu, J. K., 28
R Radcliffe, J. S., 37, 152, 153
185
Radke, T. R., 149, 180 Radünz Neto, J., 332 Railton, R., 350 Rambo, Z. J., 183 Ramirez, B. C., 384 Ramos, G. F., 345 Raney, N. E., 274, 301 Rasby, R. J., 101, 283, 393 Ray, T. M., 237 Redmer, D. A., 77, 379, 394 Reecy, J. M., 23 Regmi, N., 343 Reinhardt, T. A., 376 Reis, T., 286 Reitz, N. F., 388 Remus, J., 146 Ren, F., 343, 362 Ren, P., 161, 171, 350 Resink, J. W., 91 Reynolds, L. P., 378 Rhoades, J. N., 9 Rhoads, R. P., 95, 104, 105, 124 Richards, M. P., 197 Richert, B. T., 37, 121, 122, 152, 153,
183, 290, 291 Richmond, N., 129 Righi, M. M., 264 Rilington, V. D., 301 Rincker, M. J., 361 Ritter, M. J., 266 Rivest, J., 332 Roberts, K., 33 Rocha, L. M., 11, 58 Rochell, S. J., 84, 165 Rodrigues, D. J., 345 Rodríguez, L. F., 384 Rodriguez Zas, S. L., 202, 271, 273, 364 Rogers, A., 178 Rohrer, G. A., 26, 27 Rojas, O. J., 118, 358 Roman Garcia, Y., 67, 230, 231 Rosentrater, K. A., 284 Rosero Tapia, D. S., 144 Ross, C. W., 243 Ross, J. W., 95, 124 Rothschild, M. F., 25, 27, 28 Rowland, R. R. R., 24, 276 Rozeboom, D. W., 178 Rozeboom, G. N., 72 Rubio, S., 286 Ruiz, U. D. S., 345
S Saatchi, M., 14, 15, 16, 17 Sacks, E. J., 388 Safranski, T. J., 9, 95, 115, 116, 124, 204,
232 Sahar, M. W., 267 Salfer, I. J., 182 Samuel, R. S., 317 Santos, T., 357 Sanz Fernandez, M. V., 95, 102, 105, 124 Sapienza, D. A., 391 Sapkota, A., 265 Saucier, L., 11, 58 Savard, C., 163 Schauer, C. S., 305, 369 Schimek, D., 399 Schinckel, A. P., 121, 153, 290, 291 Schmidt, K., 233 Schmitz-Hsu, F., 23 Schnabel, R. D., 21 Schneider, A., 367 Schneider, C. J., 206 Schook, M. R., 278, 279 Schoonmaker, J. P., 66, 395, 397 Schott II, H. C., 81 Schroeder, A. L., 292, 294, 312 Schroeder, A. R., 66, 205 Schroyen, M., 110 Schwab, C. G., 225 Schwartz, K., 82, 164 Schweer, W. P., 82 Scott, T. L., 396 Seate, J. L., 56, 75, 287 See, M. T., 32 Semler, M., 285 Ser_o, N. V. L., 164, 276 Severin, A. J., 110 Sexten, W. J., 221, 402Shackelford, S. D., 26 Shane, M. C., 115, 116, 232 Shanks, B. C., 228, 229, 270, 370, 381,
400 Shaver, R. D., 226 Sheaffer, C. C., 49, 79 Shehab-El-Deen, M. A., 377 Shen, Y., 314 Shi, J., 343, 362 Shi, X., 343, 362 Shike, D. W., 66, 213, 269, 384, 385 Shilling, C., 239, 240, 257, 258 Shipley, C. F., 269, 385, 312Shircliff, K. E., 69 Shirley, R., 136
Sholar, J. F., 259Shreck, A. L., 210, 223 Shurson, G. C., 13, 70, 89, 92, 125, 172,
182, 284, 308, 326, 327, 340, 341Siegford, J. M., 6, 259 Sifri, M., 197 Signer-Hasler, H., 23 Simmins, H., 134 Smith, S., 136 Snelling, W. M., 74 Snyder, W. I., 160 Soltwedel, K. T., 149 Son, A. R., 336 Song, R., 329, 356 Sorensen, J. L., 281 Sorensen, K. L., 305 Sosnicki, A., 285, 335 Sotak, K. M., 155 Souza, A. H., 226 Spangler, D. A., 143 Spangler, M. L., 27, 29 Sparks, C., 164 Sparks, J. C., 82 Spooner, H. S., 48, 242 Stalder, K. J., 117, 265 Stanton, A. L., 4, 44 Stanton, T. B., 195 Stark, C. R., 12, 55, 157, 158 Steibel, J. P., 26, 274 Steichen, P. L., 199 Stein, H. H., 83, 118, 127, 139, 151, 155,
320, 323, 358 Stern, M. D., 182 Stewart, J. L., 269, 385 Stewart, T. S., 153, 300 Steyn, W., 121, 290, 291 Stock, M. L., 73, 96 Streeter, M. N., 8 Stricker, C., 23 Stuart, A., 295 Su, H., 15 Sudbeck, K. M., 112 Suh, Y., 113 Suliman, G. M., 296 Sun, Y., 57, 64, 85 Swan, J. E., 359 Swanson, J. C., 6 Swanson, K. C., 100, 198, 302, 368, 372,
379, 380, 394, 398 Swanson, M. E., 203
T Tan, F. P., 71
186
Tarouco, J. U., 100 Tart, J. K., 27 Taxis, T. M., 217 Taylor, J. F., 21 Thallman, R. M., 20 Thekkoot, D. M., 25 Thomas, C. L., 270Thomaz, M. C., 345 Thompson, P., 6 Thorson, J. F., 27 Timmons, R. A., 317 Tokach, M. D., 36, 86, 93, 120, 123, 130,
131, 133, 137, 158, 175, 184, 185, 235, 298, 299, 321, 322, 331, 337, 338, 352, 355
Toledo, M. Z., 226 Tonsor, G. T., 5 Toplis, P., 318, 319, 351 Torrison, J. L., 183 Touchette, K. J., 36, 136 Tower, J. E., 267 Townsley, R. M., 67, 230, 231 Tran, H., 135, 162, 174, 342 Trenhaile, M. D., 27 Trottier, K. M., 178 Trottier, N. L., 81, 88, 178 Trout, W. E., 266 Tsai, T. C., 126, 347 Tucker, J. D., 228 Tuggle, C. K., 110
U Upadhaya, S. D., 167, 168, 256 Urriola, P. E., 70, 89, 125, 182, 326, 340,
341 Usry, J. L., 185, 338
V Valdez, F. R., 391 Vallet, J. L., 200 Van Alstine, W. G., 84, 165 Van Bibber-Krueger, C. L., 236 Van Emon, M. L., 369 Van Engen, N., 96, 282 van Heugten, E., 12, 55, 128, 144, 325,
360van Leeuwen, J., 138 van Milgen, J., 35 van Sambeek, D. M., 138, 363 Vandeloecht, K. A., 381 Vanderson, C. V., 178 Vanimisetti, H. B., 292, 294 Vann, R., 96
Vargas, D. M. Z., 100 Varnold, K., 112 Vasconcelos, T. S., 345 Vaske, A., 334 Vaugh, M., 23 Vaughn, M. A., 298, 299 Vazquez-Anon, M., 140, 186 Veal, M., 87 Velarde, A., 11, 58 Velasco Acosta, D. A., 367 Velez-Irizarry, D., 274 VenJohn, E., 236 Veracini, J. L., 382 Vergara-Lopes-Serao, N., 173 Villela, C. C. E. J., 340, 341 Voilque, G., 57, 85 Vonnahme, K. A., 77, 198, 304, 368, 369,
372
W Waddell, J., 183 Wagner, S., 80 Waibel, S. M., 238 Walk, C. L., 83, 141, 151, 159, 318, 319,
351, 357 Walker, P. M., 382 Walsh, M. C., 134 Wang, C., 96Wang, H., 22 Wang, L., 327 Wang, L., 262, 263 Wang, T., 362 Ward, M. G., 300 Ward, S. H., 78 Warner, J. M., 101, 283, 393 Watson, A. K., 207, 209, 220, 224, 361 Weaber, R. L., 19 Webel, S. K., 203 Weber, T. E., 164 Weeden, T. L., 160 Wellnitz, K. R., 302, 303, 304, 307, 378 Wellock, I. J., 318, 319, 351 Wells, J. E., 114 Wetovick, B. R., 393 Wettemann, R. P., 371 Wheeler, M. B., 271, 364 Wheeler, T. L., 26 Whitaker, B. D., 233, 239, 240, 257, 258,
407 White, B. J., 120 Wiegand, B. R., 69, 115, 116, 232, 382 Wilbers, L. S., 270 Wilcock, P., 141, 159, 318, 319, 351, 357
Wileman, B., 18 Willis, C., 47 Wilmoth, T. A., 69, 115, 116, 232 Wilson, J., 241 Wilson, M. E., 183 Wilson, T. B., 213 Wiltbank, M. C., 226 Wolter, B. F., 272 Wood, J. R., 27, 200 Wood-Follis, S. L., 292, 294 Woodruff, S. N., 178 Woodward, A. D., 166 Woodward, M. A., 301 Woodworth, J., 36, 130, 175, 321, 322,
337, 338, 352 Wright, E. C., 200 Wu, F., 70 Wulf, L. W., 96Wuliji, T., 229
Y Yang, X., 161, 171, 177, 316, 344, 349 Yates, D. A., 8 Ye, G., 343, 362 Ylioja, C., 178 Yoder, A. D., 243 Yohe, T. T., 67, 230, 231 Young, J. M., 277, 311 Yuan, K., 194
Z Zambito, J. L., 48, 242 Zanton, G. I., 186 Zerby, H. N., 97, 280 Zhang, J., 113 Zhao, J., 186 Zhou, B., 290, 291 Zhou, H., 343, 362Zhou, X., 90 Ziegler, B., 399 Ziegler, D., 399 Zier-Rush, C. E., 63, 136, 334 Zijlstra, R. T., 90, 166, 173, 179, 181
187
K E Y W O R D I N D E X
Please note: numbers following a key word indicate abstract numbers.
AAccuracy, 14Acidifiers, 137Adaptation, 218Additive(s), 218, 399Adipogenesis, 113ADIPOQ, 309Adipose, 309β-Adrenergic receptor, 98Aflatoxin, 64Air classification, 90Algae, 317Allergy, 153AM weaning, 228Amino acid intake, 88Amino acids, 35, 36, 38, 65, 152, 225,
226, 391, 403Analgesia pain, 264Animal behavior, 6Animal protein, 247Animal welfare, 5, 6, 8Antibiotics, 114Antioxidant, 89, 244Antioxidant status, 343Apparent digestibility, 83, 151Arginine, 378, 379, 394L-arginine, 111Artificial insemination, 288Aspirin, 191Assembly, 21Automatic calf feeding equipment, 41AVPR1A, 27
BBacillus, 324, 325Bacillus subtilis, 138Bacitracin, 201Backfat, 291Backfat thickness, 349Backgrounding cattle, 380Bacteria, 401Bedding, 389Beef, 112, 221, 268, 281, 293, 387,
397, 402, 405Beef cattle, 15, 66, 198, 205, 222, 371,
383, 384Beef cow, 213, 283
Beef industry, 278, 279Behavior, 2, 11, 80, 237, 240, 257, 258,
269, 289Benzoic acid, 131, 137Bermudagrass, 87Beta-agonist, 8Betafin, 146Betaine, 128, 357Bioconversion natural complex, 252Bioconversion technology, 251Bioinformatics, 193Biomarker, 342Biomedical, 303, 304, 307Blood, 260Boar exposure, 93Body composition, 303Body condition, 59Boer, 270Bone mineral content, 188Bone mineral density, 188Breed, 296Breeding, 381Broiler, 326Broiler chicken, 314Bull(s), 269, 385Byproducts, 53
CCalcium, 71Calcium hydroxide, 395Calcium oxide, 66, 205, 206Calcium supplements, 83, 151Calf, 268Calf performance, 371, 399Calf starters, 399Calpain calpastatin growth, 108Calsporin, 161Calves, 40, 42, 228, 375, 400Camel, 296Canola meal, 90, 139, 320Canonical discriminant analysis, 164Carbohydrase, 243Carcass, 294Carcass fat, 341Carcass quality, 115Carcass traits, 161Career preparation, 45L-carnitine and chromium picolinate, 347
Carotid blood flow, 378Castration, 73Cation-anion balance, 187Cattle, 8, 19, 99, 208, 223, 376, 388, 395,
396, 404Cell cycle inhibitors, 113Cellulose, 336Centrifugation, 210Cervix, 364Challenges, 278Cholesterol, 304Choline supplementation, 215Chromium, 76Circadian rhythm, 366, 374Citric acid, 68Collection method, 174Condensed distillers solubles, 382Conjugated linoleic acid, 377Copper, 185, 186Copper finishing pig, 338Corn, 118, 156, 236, 358Corn co-products, 173Corn ethanol co-products, 344Corn ethanol co-products ratio, 177Corn germ meal, 176Corn oil, 175, 327Corn processing, 212Corn residue, 207, 209, 224, 392Corn silage, 208, 52, 375Cottonseed oil, 340, 341Cow(s), 268, 364, 372Cow-calf pairs, 101CP degradation, 390Cross fostering, 56, 75, 287Crude glycerol, 341Cryptosporidium, 238Cutting yield, 310
D2D-DIGE, 109Dairy, 17, 51Dairy calf, 41, 67, 230, 231, 237Dairy heifer(s), 43, 267, 367Dairy production, 52DaisyII incubator, 330DDGS, 55, 69, 92, 133, 149, 176, 284,
308, 339, 355De-oiled byproducts, 210

188
Deep intrauterine, 202, 273Deer, 370Delphi method, 405Deoxynivalenol, 163Depletion-repletion, 190Development, 103Developmental programming, 397DGAT1, 17Diarrhea, 132, 166Diet, 365Diet complexity, 131Dietary energy, 72Dietary fat, 43Dietary fiber, 173Digestibility, 90, 142, 152, 156, 173, 174,
210, 246, 247, 247, 320, 323, 345, 387Digestion, 53Direct fed microbial, 67, 127, 230, 231,
323, 401Disease, 196Distillers, 206Distillers dried grains with solubles,
70, 125Distillers grains, 66, 112, 205, 208,
209, 383, 393Distillers grains plus solubles, 211, 212Docosahexaenoic acid, 317Dried distillers grains with solubles, 172Drought, 156, 234, 243Drylot, 268Duration of lactation, 85DXA, 297
EE.coli, 91Eating time, 7Economics, 5, 283Education, 45, 404Electroejaculation, 269Embedded, 391Endometrium, 200, 271Energy, 125, 152, 155, 173, 180, 311Energy efficiency, 324Energy intake, 350Energy supplementation, 100Enterotoxigenic Escherichia coli, 166Environmental enrichment, 240Enzyme, 87, 149, 223, 353, 148, 234Epigenetics, 95, 124Equine, 45, 241Escherichia coli O157:H7, 18Essential oil, 222Estrus, 275
Evening primrose extract, 249Ewes, 369, 378Extruded rice, 247Extruded-pressed Brassica juncea canola
meal, 179
FFarm, 11Fat, 145, 306Fat quality, 69, 119, 335Fatty acid metabolite, 300Fatty acids, 144Fecal microbiota, 170Feed bin, 284Feed consumption rate, 13Feed efficiency, 60, 65, 221, 277, 363Feed efficiency RNA-Seq, 74Feed intake, 290, 333Feed processing, 133, 355Feed restriction, 345Feed utilization, 101Feeder space, 13Feeding behavior, 236, 398Feeding level, 272Feeding time, 365, 366, 374Feedlot, 220, 281, 305, 389Feedlot cattle, 211Feedlot performance, 222, 396Fenceline, 229Fenceline weaning, 228Fermentation, 286Fermented aged garlic, 169Fermented soybean meal, 246, 321Fetal programming, 213Fiber, 51, 53, 132, 180, 223Fiber withdrawal, 331Field pea, 181Finishing, 206Finishing cattle, 398Finishing pig, 86, 167, 185, 254, 331,
168, 184, 337Finishing steers, 382Fish oil, 129Flowability, 284Flunixin meglumine, 264Follicle, 200, 367Forage, 79, 219, 387Forage level, 305Forage quality, 52, 224, 388Forage sorghum, 87Forage source, 398Frozen semen, 202, 273Future, 279
GGain, 276α-Galactosidase, 68GAPDH, 309Gelatinization, 157Gender/castration, 295Gene expression, 113, 362Genetic correlation, 19, 30Genetic lines, 153Genetic Selection, 24Genetics, 28, 32Genome, 21Genome-wide association, 26Genomic breeding values, 14, 16Genomic prediction, 17, 29Genomic selection, 14Genomics, 44, 227Genotype by environment interaction, 19Gestation, 71, 77Giardia, 238Gilt(s), 31, 275, 303, 304, 307Glucose, 373Glucose tolerance test, 363Glutathione, 233Glycerin, 383Glycerol, 340Goats, 400Grass-based beef lamb, 280Grazing, 49, 79, 207, 267Ground beef, 302Group-housing, 71, 263Grow-finish pig, 121Growing, 392Growing cattle, 220Growing pig, 253, 315Growing-finishing pigs, 340Growth, 12, 42, 63, 92, 104, 136, 172,
230, 272, 334, 353Growth feed intake, 285Growth functions, 290Growth performance, 100, 116, 120, 139,
140, 161, 167, 169, 171, 175, 181, 186, 187, 249, 250, 251, 252, 253, 292, 300, 322, 329, 356, 398
Gut development, 314Gut health, 201
H4H Horse Program, 47Habituation, 275Handling, 266Hands-on learning, 407
189
Haplotype diversity, 15Health, 4, 44, 162Health parameters, 237Heat stress, 9, 12, 95, 105, 115, 116, 124,
128, 195, 232, 334Heifer(s), 199, 393Hemicell®, 154Hemicell-HT®, 359Hemicell HT®1.5x, 152, 160Heritability, 18Hidden Markov model, 22High fiber ingredients, 182History, 34Horse, 46, 79, 81, 242Housing, 142Housing system, 350Human interaction, 237Human-approach, 259Hydrolyzed vegetable protein, 352β-Hydroxybutyrate, 366
IIdeal protein, 34, 35IGF-1, 107, 299IGF2 G3072A, 310Immune function, 343Immune response, 163Immune stress, 63Immunochromatography, 238Immunological castration, 117, 312, 333Immunology, 62Improvest, 92, 172, 308, 312In utero, 9In vitro dry matter digestibility, 182In vitro dry matter disappearance, 330Inflammation, 96, 166, 194, 282Injuries, 262Insulin, 102, 103, 104, 106, 107Insulin growth factor 2, 310Insulin receptor, 307Intake, 49, 219, 384Intake pattern, 7Intermittent suckling, 235Intestinal morphology, 81Intestine, 163Iodine value, 69, 119, 339Isoleucine, 313Italian ryegrass, 255, 256IV, 306
KKeratinase, 354Kidney, 394
Kiko, 270
LLactating sows, 88, 239Lactation, 73, 144, 145, 146, 316Lactational estrus, 93Lactulose, 170Lamb(s), 80, 229, 293, 295Lamb meat, 377Lambs grazing alfalfa, 97Lameness, 264Laminitis, 241Laying hen, 6Lean accretion, 127Lean quality, 308Learning capacity, 406Lesion, 10Limit-feeding, 380Linkage disequilibrium, 15Linoleic acid, 119Lipid peroxidation, 326, 327Liquid feeding, 171, 177, 344Litter size, 30, 57, 85Liver, 302, 368, 394Livestock, 1Loin eye area, 232Longevity, 27Low-coverage NGS data, 20LPS, 102Lysine, 117, 122Lysine requirements, 291Lysozyme, 114
MMaillard reaction, 390Maintenance, 371Maize, 50Mammary glands, 57, 107Management, 4, 44, 260, 261Mannan, 328Mannanase, 122, 153β-Mannanase, 160, 359Manure, 361Market-weight pig, 265Maturity, 50ME prediction, 70Meat, 296Meat quality, 11, 254Melatonin, 78, 244Meloxicam, 96, 282Meta-analysis, 26, 325Metabolic fecal phosphorus, 336
Metabolism, 62, 103, 192, 194, 197Metabolites, 372, 403Metabolizable protein, 369Metabolomics, 193Metagenome, 216Metagenomics, 217Methane, 220, 384, 386DL-methionine, 314L-methionine, 314Methodology, 142Microbial community, 386Microbial enumeration, 161Microbiota, 135Micronutrients, 346Milk fat, 214Milk fatty acids, 215Milk production, 107Milk replacer, 40Mineral water, 250Miscanthus, 388Mitochondria, 48Mixing, 289Monensin, 218, 219Monogastrics, 182mTOR, 107Multiple enzyme products, 126Multiplexing, 217Muscle, 48Muzzle, 49Myofiber hyperplasia, 111Myogenesis, 301
NNarasin, 54Natural Betaine, 146NDF, 50, 150NDF digestibility, 51Neonatal, 192Net energy, 120, 121, 136, 176Next generation sequencing, 23NIR, 306Nitrites, 369Nitrogen, 361Nitrogen retention, 37, 88, 176Non-esterified fatty acid, 365NSP, 328Nursery digestibility co-products, 178Nursery pig, 68, 89, 130, 133, 158, 175,
187, 234, 235, 321, 322, 329, 352, 354, 355, 356, 360
Nursing intensity, 85Nutrient digestibility, 148Nutrient metabolism, 196

190
Nutrient partitioning, 102, 105Nutrient requirements, 332Nutrient restriction, 372Nutrition, 2, 227, 332
OO2 consumption, 302Obesity, 48, 242Oil removal, 209, 212, 211Online teaching, 46Oocyte, 106Oocyte penetration, 233Opportunities, 278Organic matter, 361Ossabaw pigs, 300Ovary, 106OvuGel®, 203, 204Ovulation, 204Oxidant status, 242Oxidation, 295
PPancreas, 379Parasite, 281Parasite resistance, 270Particle size, 55, 118, 123, 158, 358Passive agitator, 284Pasture, 268PCV2, 162PCVAD, 28Pellet(s), 12, 123, 392Pellet quality, 55Pelleting, 157, 158, 335, 355, 391Peptone blend, 322Performance, 179, 240, 331, 345, 360Peripheral lactate, 374Peroxidation assays, 327Peroxidized corn oil, 89PG-600, 204Phaffia rhodozyma, 254Pharmaceutical, 404Phase feeding, 316Phosphorus, 130, 188, 190, 320, 337Physiology, 193, 196Phytase, 130, 141, 147, 159, 318, 319,
337, 351Pig(s), 9, 34, 35, 36, 38, 54, 57, 60, 62,
64, 70, 84, 87, 90, 91, 110, 111, 117, 118, 120, 123, 126, 127, 128, 131, 134, 135, 137, 138, 139, 140, 147, 149, 150, 152, 153, 155, 156, 161, 162, 165, 171, 173, 174, 176, 177, 180, 186, 188, 189, 190, 195, 259,
266, 272, 274, 285, 288, 289, 301, 312, 313, 320, 323, 324, 325, 333, 335, 339, 342, 343, 344, 353, 358, 359, 362
Pig growth, 290, 291Piglet(s), 141, 159, 258, 286, 318, 319,
346, 351, 357Piglet mortality, 30Pituitary pars intermedia dysfunction, 81Placentome, 77Plant components, 224PM weaning, 228Policy, 5Poly unsaturated fatty acid, 168Polyspermic penetration, 233Porcine adipose tissue, 103Porcine reproductive and respiratory
syndrome, 164Pork, 58, 69, 293Pork Industry Scholarship, 245Pork quality, 26, 115, 311Post-weaning growth, 110Post-weaning performance, 189Postmortem degradation, 309Poultry, 197PPARg, 309Pre-wean mortality, 56, 75, 287Prebiotic, 342, 401Precision feeding, 315, 332Prediction, 274Prediction equations, 125Preference, 338Pregnancy, 38, 78, 198, 244, 368Prilled fat, 214Probiotic, 143, 253, 401Production practices, 279Production stress, 201Production system, 101Progesterone, 199Protease, 140, 147Protected polyunsaturated fatty acids, 100Protein, 213, 389Protein profile, 109Protein quality, 129Protein sources, 321, 352, 360Protein synthesis, 107, 183Proteome, 200PRRS, 24, 60, 84, 143, 165, 274PRRS transmission, 56, 75, 287PRRSv, 82Puberty, 29, 31Pyrethroid, 385
QqPCR, 301Quebracho tannin, 377
RRactopamine, 76, 115, 116, 121, 122,
183, 232, 266, 292, 294, 334, 335Ractopamine HCl, 99, 184, 298, 29900-Rapeseed expellers, 320Rapeseed meal, 34800-Rapeseed meal, 320Real-time lysine requirements, 315Redox status, 314Reduced fat corn distillers grains, 382Regrinding, 55Reliability, 3Repeatability, 297Replication, 217Reproducibility, 297Reproduction, 10, 31, 32, 59, 203, 370,
385Reproductive performance, 255, 256,
347, 348, 349Research method, 293Residual feed intake, 109, 259, 311, 403Residual gain, 164Reused CIDR, 199RFI, 277Rhizopus microsporus, 138Rhythm, 373RN, 300RNA, 309RNA-seq, 22, 271, 364RNAseq, 110Roughage, 395Rumen development, 67Rumen fermentation, 52, 390Rumen metabolism, 205Ruminal kinetics, 53Ruminant, 375RUP, 402
SSarcomere, 293Saturated fatty acids, 214SCD, 309SCFA, 286Scours, 319Seasonal variation, 376Selenium-enriched probiotics, 343, 362Selenoprotein, 362Semen dose volume, 288
191
Sensor, 3Sequencing, 21Shade, 267Sheep, 379, 381Shelf life, 112, 298Sickness behavior, 4Simulation, 202, 273Single or multiple breed, 16Skeletal muscle, 104Slow-growing pigs, 13Small intestine, 65SNP, 22, 310Social rank, 263Social ranking, 262Socializing, 239, 257, 258Somatotropin, 367Sorghum, 236, 243Sow(s), 10, 32, 59, 85, 144, 145, 146,
203, 255, 256, 260, 261, 262, 263, 264, 316, 346, 348, 349
Sow lactation GWAS, 25Sow performance, 350Soya, 63Soybean meal, 55, 84, 136, 155, 165, 354Soybean(s), 153, 381Split weaning, 93, 235Spray-dried porcine plasma, 135Sprinkling, 265SSC4, 24Standardized digestibility, 83, 151Starch, 157Starch digestibility, 401Starter, 42Starter pigs, 129Stayability, 19Steers, 282, 305Steroid, 368Stocker cattle, 207Stocking density, 72Stress, 239, 282Student perception, 406Suckling history, 57Suckling piglets, 349Sulfur amino acid, 91
Supplement, 387Survival, 192Sweet sorghum, 87Swine, 27, 28, 29, 37, 72, 114, 119, 142,
154, 160, 271, 277, 292, 294, 309, 317, 326, 330, 336, 363
Swine diseases, 61Swine genetics, 33Swine leukocyte antigen, 94Swine production, 407System, 283, 393
TT cells, 231Teacher effectiveness, 406Teaching, 405, 406Teat order, 57Technology, 3Temperature, 232Thyroxine, 348TID Lys, 354Time of feed consumption, 380Timing of feeding, 373Tissue accretion, 60, 82, 95, 124Tocopherol, 197Trace mineral, 396Trading game, 407Traditional weaning, 228Transcriptomics, 193Transition dairy cow, 194Transition period, 227Transport losses, 265Transportation, 96, 282Triiodothyronine, 348Tryptophan, 36
UUndernourishment, 80Unintended consequences, 5US Maine-Anjou beef cattle, 16Uterine blood flow, 78, 198
VVaccine response, 18Valine, 313Vascularity, 77Viral-bacterial interaction, 216Viremia, 276Virginiamycin, 54Virome, 216Viscosity, 148, 150Vitamin C, 189Vitamin D, 376, 397Vitamin E, 168, 191
WWash time, 185Weaned pig, 179, 181Weaner, 91Weaner pigs, 191Weaning, 132, 229, 400Weaning pig, 170Weanling pig, 169, 246, 247, 249, 250,
251, 252, 257Weeds, 241Welfare, 1, 2, 58, 73, 261Wellbeing, 1Wheat, 134Wheat middling, 126, 133, 176Withdrawal, 86WUR, 276
XXylan, 328Xylanase, 134, 147, 150
YYeast, 329, 356Yeast cell wall, 64Yeast rare earth, 167Yield, 86
ZZilpaterol hydrochloride, 98Zinc, 76, 98, 99, 183, 184, 298, 299Zinc oxide, 141, 318, 351Zymannase®, 152, 154

F O R M O R E T H A N
Diamond V is recognized as an innovative, scientifically motivated supplier of nutritional fermentation products, with an emphasis on our customers’ needs and success. Our dedication toward research, technology and quality has earned us a global reputation of trust and reliability within the animal nutrition and health industry.
EXPERTS The Trusted
In Nutrition & Health.EXPERTS
The Trusted
Get the facts, benefits and proof that Diamond V delivers at www.diamondv.com