CUORE: A Cryogenic Underground Observatory for Rare Events
158
CUORE: A CRYOGENIC UNDERGROUND OBSERVATORY FOR RARE EVENTS 28th June 2005 Dipartimento di Fisica dell’Università di Milano-Bicocca e Sezione di Milano dell’INFN,Milano I-20126, Italy Dipartimento di Ingegneria Strutturale del Politecnico di Milano, Milano I-20133, Italy Department of Physics and Astronomy, University of South Carolina, Columbia, South Carolina 29208 USA Laboratori Nazionali del Gran Sasso, I-67010, Assergi (L’Aquila), Italy Dipartimento di Fisica dell’Università di Firenze e Sezione di Firenze dell’INFN, Firenze I-50125, Italy Lawrence Berkeley National Laboratory, Berkeley, California 94720, USA Lawrence Livermore National Laboratory, Livermore, California, 94551, USA Laboratorio de Fisica Nuclear y Altas Energias, Universidad de Zaragoza, 50009 Zaragoza, Spain Kamerling Onnes Laboratory, Leiden University, 2300 RAQ, Leiden, The Netherlands Dipartimento di Scienze Chimiche, Fisiche e Matematiche dell’Università dell’Insubria e Sezione di Milano dell’INFN, Como I-22100, Italy Dipartimento di Fisica dell’Università di Genova e Sezione di Genova dell’INFN, Genova I-16146, Italy University of California, Berkeley, California 94720 USA Laboratori Nazionali di Legnaro, I-35020 Legnaro (Padova), Italy Dipartimento di Fisica dell’Università di Roma e Sezione di Roma 1 dell’INFN, Roma I-16146, Italy ( The CUORE Collaboration ) Professor Ettore Fiorini, Università di Milano Bicocca, Spokesman. 1
-
Upload
independent -
Category
Documents
-
view
0 -
download
0
Transcript of CUORE: A Cryogenic Underground Observatory for Rare Events

CUORE: A CRYOGENIC UNDERGROUNDOBSERVATORY FOR RARE EVENTS
28th June 2005
Dipartimento di Fisica dell’Università di Milano-Bicoccae Sezione di Milano dell’INFN,Milano I-20126, Italy
Dipartimento di Ingegneria Strutturale del Politecnico di Milano,Milano I-20133, Italy
Department of Physics and Astronomy, University of South Carolina,Columbia, South Carolina 29208 USA
Laboratori Nazionali del Gran Sasso,I-67010, Assergi (L’Aquila), Italy
Dipartimento di Fisica dell’Università di Firenzee Sezione di Firenze dell’INFN, Firenze I-50125, Italy
Lawrence Berkeley National Laboratory,Berkeley, California 94720, USA
Lawrence Livermore National Laboratory,Livermore, California, 94551, USA
Laboratorio de Fisica Nuclear y Altas Energias,Universidad de Zaragoza, 50009 Zaragoza, Spain
Kamerling Onnes Laboratory, Leiden University,2300 RAQ, Leiden, The Netherlands
Dipartimento di Scienze Chimiche, Fisiche e Matematiche dell’Università dell’Insubriae Sezione di Milano dell’INFN, Como I-22100, Italy
Dipartimento di Fisica dell’Università di Genovae Sezione di Genova dell’INFN, Genova I-16146, Italy
University of California, Berkeley, California 94720 USA
Laboratori Nazionali di Legnaro,I-35020 Legnaro (Padova), Italy
Dipartimento di Fisica dell’Università di Romae Sezione di Roma 1 dell’INFN, Roma I-16146, Italy
( The CUORE Collaboration )
Professor Ettore Fiorini, Università di Milano Bicocca, Spokesman.
1

2
SCIENTIFIC PERSONAL MEMBERS OF THE CUORE COLLABORATION
R. Ardito1,2, C. Arnaboldi1, D. R. Artusa3, F. T. Avignone III3, M. Balata4, I. Bandac3, M. Barucci5,J.W. Beeman6, F. Bellini14, C. Brofferio1, C. Bucci4, S. Capelli1, F. Capozzi1, L. Carbone1, S. Cebrian7,C. Cosmelli14, O. Cremonesi1, R. J. Creswick3, I. Dafinei14, A. de Waard8, M. Diemoz14, M. Dolinski6,11,H. A. Farach3, F. Ferroni14, E. Fiorini1, G. Frossati8, C. Gargiulo14, E. Guardincerri10, A. Giuliani9,P. Gorla7, T.D. Gutierrez6, E. E. Haller6,11, I. G. Irastorza7, E. Longo14, G. Maier2, R. Maruyama6,11,S. Morganti14, S. Nisi4, E. B. Norman13, A. Nucciotti1, E. Olivieri5, P. Ottonello10, M. Pallavicini10,V. Palmieri12, E. Pasca5, M. Pavan1, M. Pedretti9, G. Pessina1, S. Pirro1, E. Previtali1, B. Quiter6,11,L. Risegari5, C. Rosenfeld3, S. Sangiorgio9, M. Sisti1, A. R. Smith6, S. Toffanin12, L. Torres1, G. Ventura5,N. Xu6, and L. Zanotti1
1. Dipartimento di Fisica dell’Università di Milano-Bicocca e Sezione di Milano dell’INFN, MilanoI-20126, Italy
2. Dipartimento di Ingegneria Strutturale del Politecnico di Milano, Milano I-20133, Italy
3. Dept.of Physics and Astronomy, University of South Carolina, Columbia, South Carolina, USA29208
4. Laboratori Nazionali del Gran Sasso, I-67010, Assergi (L’Aquila), Italy
5. Dipartimento di Fisica dell’Università di Firenze e Sezione di Firenze dell’INFN, Firenze I-50125,Italy
6. Lawrence Berkeley National Laboratory, Berkeley, California, 94720, USA
7. Laboratorio de Fisica Nuclear y Altas Energias, Universidàd de Zaragoza, 50009 Zaragoza, Spain
8. Kamerling Onnes Laboratory, Leiden University, 2300 RAQ, Leiden, The Netherlands
9. Dipartimento di Fisica e Matematica dell’Università dell’Insubria e Sezione di Milano dell’INFN,Como I-22100, Italy
10. Dipartimento di Fisica dell’Università di Genova e Sezione di Genova dell’INFN, Genova I-16146,Italy
11. University of California, Berkeley, California 94720, USA
12. Laboratori Nazionali di Legnaro, I-35020 Legnaro ( Padova ), Italy
13. Lawrence Livermore National Laboratory, Livermore, California, 94550, USA
14. Dipartimento di Fisica dell’Università di Roma e Sezione di Roma 1 dell’INFN, Roma I-16146,Italy

CONTENTS 1
Contents
1 Executive summary 8
2 CUORE Science Motivation 92.1 Theoretical Motivation of Neutrinoless Double-Beta Decay Experiments. . . . . . . . . 92.2 Neutrino Mixing Matrix . . . . . . . . . . . . . . . . . . . . . . . . . . . . . . . . . . 102.3 Neutrinoless Double-Beta Decay. . . . . . . . . . . . . . . . . . . . . . . . . . . . . . 102.4 Experimental Prospects. . . . . . . . . . . . . . . . . . . . . . . . . . . . . . . . . . . 13
3 Status of Neutrinoless Double-Beta Decay Experiments 153.1 Main strategies for Double Beta Decay searches. . . . . . . . . . . . . . . . . . . . . . 163.2 Overview of main experiments and synopsis of results. . . . . . . . . . . . . . . . . . . 183.3 Thermal detector approach to double beta decay. . . . . . . . . . . . . . . . . . . . . . 203.4 Next generation experiments. . . . . . . . . . . . . . . . . . . . . . . . . . . . . . . . 21
4 CUORE experimental prospects 234.1 Double beta decay prospects. . . . . . . . . . . . . . . . . . . . . . . . . . . . . . . . 254.2 Other physics with CUORE. . . . . . . . . . . . . . . . . . . . . . . . . . . . . . . . . 25
4.2.1 WIMP detection . . . . . . . . . . . . . . . . . . . . . . . . . . . . . . . . . . 264.2.2 Solar axion detection. . . . . . . . . . . . . . . . . . . . . . . . . . . . . . . . 294.2.3 Searches for other rare processes. . . . . . . . . . . . . . . . . . . . . . . . . . 32
5 Principles of operation of TeO2 bolometers 345.1 Basic principles of thermal particle detectors. . . . . . . . . . . . . . . . . . . . . . . . 345.2 Semiconductor thermistors. . . . . . . . . . . . . . . . . . . . . . . . . . . . . . . . . 355.3 Detector operation. . . . . . . . . . . . . . . . . . . . . . . . . . . . . . . . . . . . . 365.4 Bolometer applications. . . . . . . . . . . . . . . . . . . . . . . . . . . . . . . . . . . 375.5 Detector model. . . . . . . . . . . . . . . . . . . . . . . . . . . . . . . . . . . . . . . 38
6 Previous results of MiDBD and CUORICINO 436.1 LNGS cryogenic setups. . . . . . . . . . . . . . . . . . . . . . . . . . . . . . . . . . . 436.2 MiDBD experiment. . . . . . . . . . . . . . . . . . . . . . . . . . . . . . . . . . . . . 446.3 CUORICINO experiment. . . . . . . . . . . . . . . . . . . . . . . . . . . . . . . . . . 52
6.3.1 CUORICINO background measurements. . . . . . . . . . . . . . . . . . . . . 536.3.2 CUORICINO background analysis. . . . . . . . . . . . . . . . . . . . . . . . . 536.3.3 Analysis of the CUORICINO background above 3 MeV. . . . . . . . . . . . . 606.3.4 Preliminary measurements of the Copper surface contaminations. . . . . . . . . 646.3.5 CUORICINO vs. CUORE. . . . . . . . . . . . . . . . . . . . . . . . . . . . . 64
7 CUORE project 667.1 Single CUORE detector. . . . . . . . . . . . . . . . . . . . . . . . . . . . . . . . . . . 677.2 The NTD thermistors. . . . . . . . . . . . . . . . . . . . . . . . . . . . . . . . . . . . 697.3 Modular structure of the CUORE detector. . . . . . . . . . . . . . . . . . . . . . . . . 747.4 Location. . . . . . . . . . . . . . . . . . . . . . . . . . . . . . . . . . . . . . . . . . . 76
8 Cryogenic system 798.1 Development of a Pulse-Tube-assisted cryostat. . . . . . . . . . . . . . . . . . . . . . 798.2 Shielding requirements. . . . . . . . . . . . . . . . . . . . . . . . . . . . . . . . . . . 82

CONTENTS 2
9 Required laboratory 839.1 Cooling water requirements. . . . . . . . . . . . . . . . . . . . . . . . . . . . . . . . . 839.2 Power requirements. . . . . . . . . . . . . . . . . . . . . . . . . . . . . . . . . . . . . 859.3 Safety . . . . . . . . . . . . . . . . . . . . . . . . . . . . . . . . . . . . . . . . . . . .859.4 Space requirement. . . . . . . . . . . . . . . . . . . . . . . . . . . . . . . . . . . . . 85
10 Electronics 8610.1 General Description. . . . . . . . . . . . . . . . . . . . . . . . . . . . . . . . . . . . . 8610.2 Thermistor biasing and detector wiring. . . . . . . . . . . . . . . . . . . . . . . . . . . 8610.3 Preamplifier and Cold buffer stage. . . . . . . . . . . . . . . . . . . . . . . . . . . . . 8810.4 Programmable gain amplifier. . . . . . . . . . . . . . . . . . . . . . . . . . . . . . . . 8910.5 Antialiasing filter and analog trigger. . . . . . . . . . . . . . . . . . . . . . . . . . . . 8910.6 Calibrating Pulse Generator System. . . . . . . . . . . . . . . . . . . . . . . . . . . . 9010.7 Voltage Supply system. . . . . . . . . . . . . . . . . . . . . . . . . . . . . . . . . . . 9010.8 Digital control. . . . . . . . . . . . . . . . . . . . . . . . . . . . . . . . . . . . . . . . 9110.9 EMI Shielding. . . . . . . . . . . . . . . . . . . . . . . . . . . . . . . . . . . . . . . . 9110.10Noise considerations. . . . . . . . . . . . . . . . . . . . . . . . . . . . . . . . . . . . 91
11 Data acquisition system (DAQ) 9211.1 Requirements. . . . . . . . . . . . . . . . . . . . . . . . . . . . . . . . . . . . . . . . 9211.2 General architecture. . . . . . . . . . . . . . . . . . . . . . . . . . . . . . . . . . . . . 9211.3 Readout board. . . . . . . . . . . . . . . . . . . . . . . . . . . . . . . . . . . . . . . . 9411.4 Computing system and DAQ layout. . . . . . . . . . . . . . . . . . . . . . . . . . . . 9511.5 Slow control. . . . . . . . . . . . . . . . . . . . . . . . . . . . . . . . . . . . . . . . . 96
12 Construction procedures 9712.1 Material Selection. . . . . . . . . . . . . . . . . . . . . . . . . . . . . . . . . . . . . . 97
12.1.1 Materials for crystal growth. . . . . . . . . . . . . . . . . . . . . . . . . . . . 9712.1.2 Materials for the detector structure. . . . . . . . . . . . . . . . . . . . . . . . . 9812.1.3 Shielding materials. . . . . . . . . . . . . . . . . . . . . . . . . . . . . . . . . 9912.1.4 Other components of the experimental setup. . . . . . . . . . . . . . . . . . . . 99
12.2 Construction environment. . . . . . . . . . . . . . . . . . . . . . . . . . . . . . . . . . 9912.3 Low background technology transfer to the crystal growth company. . . . . . . . . . . 10112.4 CUORE assembly procedure. . . . . . . . . . . . . . . . . . . . . . . . . . . . . . . .10112.5 Work breakdown and construction schedule for the CUORE detector. . . . . . . . . . . 10312.6 General time schedule of the CUORE project. . . . . . . . . . . . . . . . . . . . . . . 104
13 Off-line analysis 10613.1 First-level analysis. . . . . . . . . . . . . . . . . . . . . . . . . . . . . . . . . . . . .10613.2 Second-level analysis. . . . . . . . . . . . . . . . . . . . . . . . . . . . . . . . . . . .108
14 Simulation and predicted performances 10914.1 Background simulations. . . . . . . . . . . . . . . . . . . . . . . . . . . . . . . . . .10914.2 Bulk contaminations. . . . . . . . . . . . . . . . . . . . . . . . . . . . . . . . . . . .11114.3 Surface contaminations. . . . . . . . . . . . . . . . . . . . . . . . . . . . . . . . . . .11114.4 Cosmogenic contribution. . . . . . . . . . . . . . . . . . . . . . . . . . . . . . . . . .11814.5 Underground neutron,µ andγ interactions. . . . . . . . . . . . . . . . . . . . . . . . . 11914.6 Two neutrinos double beta decay background. . . . . . . . . . . . . . . . . . . . . . . 121

CONTENTS 3
15 Innovations in the CUORE structure 12215.1 Innovation in the single module. . . . . . . . . . . . . . . . . . . . . . . . . . . . . . .122
15.1.1 Optimization of the thermistor sensitivity. . . . . . . . . . . . . . . . . . . . . 12215.1.2 Innovative thermal couplings in detector construction. . . . . . . . . . . . . . . 12215.1.3 Modification of the basic crystal size. . . . . . . . . . . . . . . . . . . . . . . . 123
15.2 Possible insertion in CUORE of crystals containing compounds of other nuclear candi-dates forββ(0ν) . . . . . . . . . . . . . . . . . . . . . . . . . . . . . . . . . . . . . .123
15.3 Development of surface sensitive TeO2 elements . . . . . . . . . . . . . . . . . . . . . 12515.4 Development of scintillating TeO2 bolometers. . . . . . . . . . . . . . . . . . . . . . . 128
16 Cleaning of CUORE structure: crystals, frames and ancillaries 13016.1 Surface cleaning techniques. . . . . . . . . . . . . . . . . . . . . . . . . . . . . . . .13016.2 Conclusions. . . . . . . . . . . . . . . . . . . . . . . . . . . . . . . . . . . . . . . . .141
17 Enrichment option 143
18 Structure of the collaboration 144
19 Cost statement 145
20 Conclusions 147

LIST OF FIGURES 4
List of Figures
1 Normal and inverted mass hierarchies schemes. Quasi-degenerate hierarchy correspondsto the casem1 >> δmAT >> δmS . . . . . . . . . . . . . . . . . . . . . . . . . . . . 11
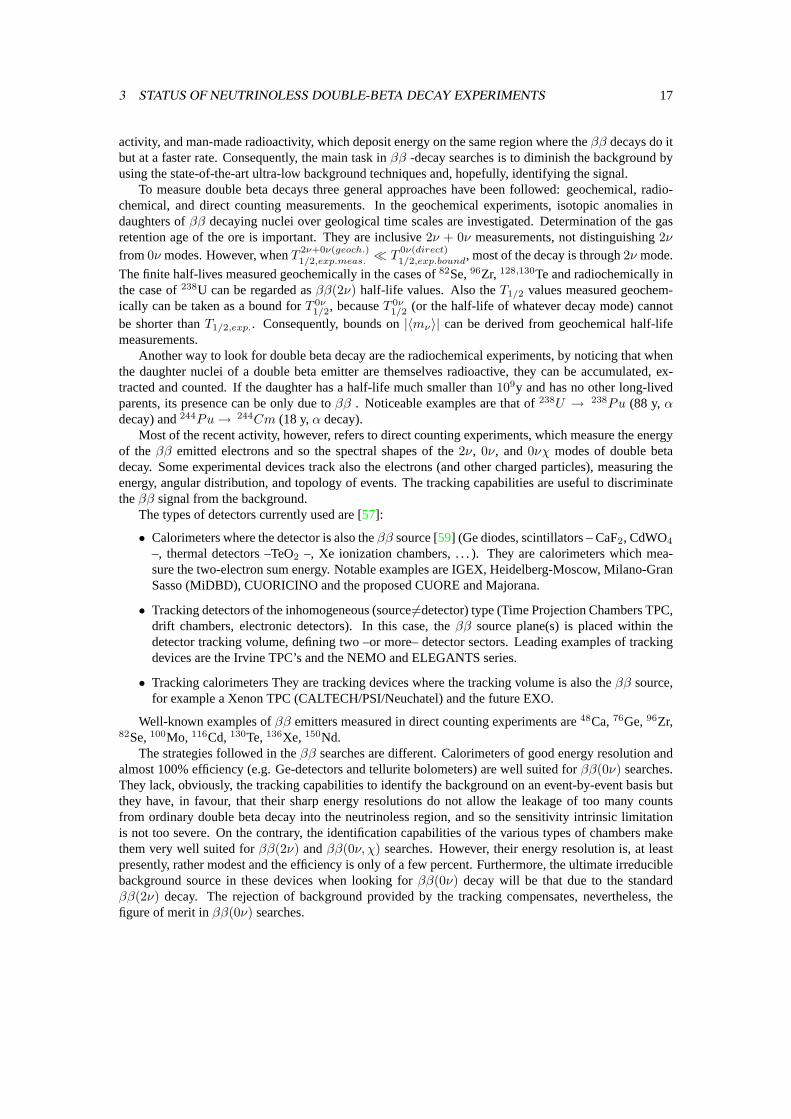
2 Exclusion projected for 1 year of CUORE assuming a threshold of 10 keV, a low energyresolution of 1 keV, and low energy background levels of 0.05 and 0.01 c/keV/kg/dayrespectively. The dashed line corresponds to the MiDBD result.. . . . . . . . . . . . . 28
3 The solid lines represent the sensitivity plot in the (m,σ) plane for CUORE, assuming athreshold of 10 keV, two years of exposure (1500 kg year) and flat backgrounds of 0.05and 0.01 c/keV/kg/day. It has been calculated for〈δ2〉 = 5.6 (see the text). The sensitivitycurve has been also calculated for a possible threshold of 5 keV with a background of 0.01c/keV/kg/day (dashed line).. . . . . . . . . . . . . . . . . . . . . . . . . . . . . . . . . 29
4 Best bound attainable with CUORE (straight line labelled "CUORE") compared withothers limits. . . . . . . . . . . . . . . . . . . . . . . . . . . . . . . . . . . . . . . . . 31
5 Simplified model of a thermal detector (a) and schematic read-out of a resistive ther-mometer (b). . . . . . . . . . . . . . . . . . . . . . . . . . . . . . . . . . . . . . . . . 35
6 Typical load curve for a thermistor at T= 8 mK) (a) and resistance-power curves for athermistor at different base temperatures (b).. . . . . . . . . . . . . . . . . . . . . . . . 37
7 left panel: evaluation of theoptimum pointof a bolometer;right panel: evaluation ofoperation point which maximizes the signal/noise ratio.. . . . . . . . . . . . . . . . . . 38
8 Network representing the detector model.. . . . . . . . . . . . . . . . . . . . . . . . . 399 Detector Merit Curve: simulation (solid curve) and experimental points for the 20 detec-
tor array.. . . . . . . . . . . . . . . . . . . . . . . . . . . . . . . . . . . . . . . . . . . 4010 Real pulses (full line) and simulated pulses (line+points).. . . . . . . . . . . . . . . . . 4111 Scheme of the MiDBD detectors.. . . . . . . . . . . . . . . . . . . . . . . . . . . . . . 4312 An U+Th calibration, sum spectrum of the 20 detectors. . . . . . . . . . . . . . . . . . 4413 Distribution of the single MiDBD detector energy resolutions (FWHM) on the208Tl 2615
keV line. . . . . . . . . . . . . . . . . . . . . . . . . . . . . . . . . . . . . . . . . . . . 4514 Background spectrum: the alpha particle region. . . . . . . . . . . . . . . . . . . . . . 4515 Scatter plot of coincident events between all possible MiDBD detector pairs.. . . . . . . 4716 MiDBD-I (continuous line) and MiDBD-II (dashed line)background spectra after antico-
incidence cut. . . . . . . . . . . . . . . . . . . . . . . . . . . . . . . . . . . . . . . . . 4817 Scheme of a surfaceα decay. . . . . . . . . . . . . . . . . . . . . . . . . . . . . . . . . 5018 Total spectrum (in anticoincidence) in the region of neutrinoless DBD obtained with the
twenty crystal array. The solid curves represent the best fit (lowest curve) and the 68 %and 90 % C.L. excluded signals.. . . . . . . . . . . . . . . . . . . . . . . . . . . . . . 51
19 The CUORICINO detector: scheme of the tower and internal roman lead shields (left),the 13 planes tower (centre), the 4 crystal module (top right) and the 9 crystal module(bottom right).. . . . . . . . . . . . . . . . . . . . . . . . . . . . . . . . . . . . . . . . 54
20 Summed calibration spectrum (232Th source just outside the crysotat) from all the oper-ating 5×5×5 cm3 and 3×3×6 cm3 crystals. . . . . . . . . . . . . . . . . . . . . . . . . 55
21 Distribution of the single CUORICINO detector energy responses normalized to 1 kg ofTeO2. . . . . . . . . . . . . . . . . . . . . . . . . . . . . . . . . . . . . . . . . . . . .55
22 Distribution of the single CUORICINO detector energy resolutions (FWHM) at the208Tl2615 keV line.. . . . . . . . . . . . . . . . . . . . . . . . . . . . . . . . . . . . . . . . 56
23 Summed background spectra from the operating 5×5×5 cm3 and (natural abundance)3×3×6 cm3 crystals. . . . . . . . . . . . . . . . . . . . . . . . . . . . . . . . . . . . . 56
24 Comparison between the background of the 5×5×5 cm3 crystals and that of the natural3×3×6 cm3 crystals in the gamma region.. . . . . . . . . . . . . . . . . . . . . . . . . 57

LIST OF FIGURES 5
25 Comparison between the background of the 5×5×5 cm3 crystals and that of the natural3×3×6 cm3 crystals in the alfa region.. . . . . . . . . . . . . . . . . . . . . . . . . . . 57
26 Comparison between the background spectra of CUORICINO crystals and the back-ground measured in MiDBD-II experiment.. . . . . . . . . . . . . . . . . . . . . . . . 58
27 Summed background spectrum (5.29 kg×y) from all the operating crystals in the regionof neutrinoless double beta decay of130Te (Q-value=2528.8 keV).. . . . . . . . . . . . 59
28 Comparison between spectra obtained with different linearization methods. The ap-pearence of clear alpha structures with thepower lawmetod is evident.. . . . . . . . . . 61
29 Comparison between Monte Carlo and CUORICINO anticoincidence (top) and coinci-dence (bottom) spectra in the case of the TeO2 crystal surface contaminations (λ ∼1 µm)specified in the figure.. . . . . . . . . . . . . . . . . . . . . . . . . . . . . . . . . . . . 62
30 Comparison between Monte Carlo and CUORICINO anticoincidence (top) and coinci-dence (bottom) spectra when a Th surface contamination of the detector copper holder(green line) is added (pink line) to the crystal conatminations considered in fig.29. . . . 63
31 The CUORE detector (left), one of the 19 towers (right).. . . . . . . . . . . . . . . . . 6632 Effects of the system thermal instabilities on the worsening of the detector energy reso-
lution (above). Comparison between calibration spectra before (black curve:∆EFWHM2615
= 30 keV) and after (red curve:∆EFWHM2615 = 6 keV) the stabilization procedure.. . . . 68
33 Graph depicting the solution for thermal and epithermal flux for a set of three monitors,each with different ratios of thermal and epithermal cross-sections.. . . . . . . . . . . . 71
34 Resistivity of various batches of NTD Germanium as a function of 1/√
T . . . . . . . . . 7235 Thermistor performance as a function of the calculated net acceptor concentration. The
first six points (from the left) involved only one irradiation (and show a relatively largespread in deviations from the line) while the last three points are following the secondirradiation and have a very small spread from the line.. . . . . . . . . . . . . . . . . . . 73
36 A four detector module.. . . . . . . . . . . . . . . . . . . . . . . . . . . . . . . . . . . 7437 Improvement in the Detector Merit Curve by increasing the thermistor size: 3×3×1 mm3
thermistors (stars) vs. 3×1.5×0.4 mm3 (diamonds).. . . . . . . . . . . . . . . . . . . . 7538 Noise Power Spectra without damping suspension (1), with damping suspension only (2)
and with dumping suspension + cold electronics (3).. . . . . . . . . . . . . . . . . . . 7539 Fifteen thermistor load curves for the 20 crystal array.. . . . . . . . . . . . . . . . . . . 7640 Final location of CUORE in hall A of the underground Laboratori Nazionali del Gran Sasso.7841 CUORE cryostat and shielding.. . . . . . . . . . . . . . . . . . . . . . . . . . . . . . . 8042 Temperature instability as observed in a typical MiDBD measurement.. . . . . . . . . . 8143 Scheme of the CUORE setup installation.. . . . . . . . . . . . . . . . . . . . . . . . . 8444 Schematic diagram of the front-end electronic circuit operated at room temperature (WFE).8745 Schematic diagram of the front-end having the first stage, the differential bufferQ1, Q2,
at cold.. . . . . . . . . . . . . . . . . . . . . . . . . . . . . . . . . . . . . . . . . . . .8846 Block diagram of the proposed DAQ system. The digitizing boards are housed in 5 VME
crates, each controlled and read by a dedicated Linux PC that uses a VME-PCI interfaceto access the VME bus. All computers are connected via a network (normal 100 Mbitethernet or fast optical link if required) to a set of consoles that provide graphical userinterface and event display. A custom designed software runs on all computers.. . . . . 93
47 Base design of the digitizing board. In this "minimal" version the board simply has thefunction to convert the input signal into a stream of words that are transferred to the DAQcomputers via VME bus.. . . . . . . . . . . . . . . . . . . . . . . . . . . . . . . . . . 95
48 Optional enhanced design of the digitizing board. In this version the board is equippedwith a DSP that can perform additional computing functions like event selection or digitalfiltering. . . . . . . . . . . . . . . . . . . . . . . . . . . . . . . . . . . . . . . . . . . . 96

LIST OF FIGURES 6
49 Gantt diagram illustrating the CUORE detector fabrication schedule.. . . . . . . . . . . 10350 Gantt diagram illustrating the CUORE project time schedule.. . . . . . . . . . . . . . . 10551 Details of the CUORE single modules accounted for in the Monte Carlo simulations. . 11052 Simulated spectra for bulk contaminations of the TeO2 crystals, the Copper structure, the
Roman Lead shield and the outer Lead shield. Each spectrum is obtained by summingthe simulated anticoincidence spectra of all the CUORE detectors.. . . . . . . . . . . . 112
53 Double beta decay region of the simulated spectra for bulk contaminations of the TeO2 crys-tals, the Copper structure, the Roman Lead shield and the outer Lead shield. Each spec-trum is obtained by summing the simulated anticoincidence spectra of all the CUOREdetectors. . . . . . . . . . . . . . . . . . . . . . . . . . . . . . . . . . . . . . . . . . .113
54 Dark matter region of the simulated spectra for contaminations of the TeO2 crystals, theCopper structure, the Roman Lead shield and the outer Lead shield. Each spectrum isobtained by summing the simulated spectra of all the CUORE detectors after the antico-incidence cut. . . . . . . . . . . . . . . . . . . . . . . . . . . . . . . . . . . . . . . . .114
55 ββ(0ν) region of the simulated spectra for the surface contaminations of the TeO2 crys-tals and of the Copper structure. Each spectrum is obtained by summing the simulatedspectra of all the CUORE detectors aftre the anticoincidence cut.. . . . . . . . . . . . . 116
56 Dark matter region of the simulated spectra for the surface contaminations of TeO2 crys-tals and of the Copper structure. Each spectrum is obtained by summing the simulatedanticoincidence spectra of all the CUORE detectors.. . . . . . . . . . . . . . . . . . . . 117
57 Simulated spectrum for the assumed60Co bulk contaminations of TeO2 crystals. Thespectrum is obtained by summing the simulated anticoincidence spectra of all the CUOREdetectors. . . . . . . . . . . . . . . . . . . . . . . . . . . . . . . . . . . . . . . . . . .120
58 Scatter plot of the pulse amplitudes from TeO2 thermistor versus the pulse amplitudesfrom shield thermistor. . . . . . . . . . . . . . . . . . . . . . . . . . . . . . . . . . . .125
59 Scatter plot of the pulse amplitudes from TeO2 thermistor versus the pulse amplitudesfrom shield thermistor obtained with a 12 g TeO2 surface sensitive detector.. . . . . . . 127
60 Rise time distribution of the pulses from the Ge layer thermistor of a 12 g TeO2 surfacesensitive detector.. . . . . . . . . . . . . . . . . . . . . . . . . . . . . . . . . . . . . .128
61 Zoom of the micro-roughness of a metal surface immersed in an electrolytic bath. . . . 13262 Typical I-V characteristic for electropolishing. . . . . . . . . . . . . . . . . . . . . . . 13363 I-V characteristic curve for a standard electropolishing process (circles). The differential
conductivity curve dI/dV (continuous line) and the ratio I/V (shaded line) are displayedversus voltage. We interpret the first minimum in differential conductance as due to edgeeffects and to the not uniform distance between electrodes. . . . . . . . . . . . . . . . 134

LIST OF TABLES 7
List of Tables
1 Best-fit values and 3σ intervals for the three-flavour neutrino oscillation parameters fromglobal data including solar (SK and SNO), atmospheric (SK and MACRO), reactor (Kam-LAND and CHOOZ) and accelerator (K2K) experiments [22] (δm2
ij = m2i −m2
j ). . . . 92 Present constraints on|〈mν〉| . The maximal values of|〈mν〉| (in units of10−3 eV) for
the normal (NH) and inverted (IH) hierarchy cases, and the minimal values of|〈mν〉| (inunits of10−3 eV) for the IH and QD (quasi-degenerate) cases, for the 90% C.L. allowedvalues ofδmS , θS andδmAT . . . . . . . . . . . . . . . . . . . . . . . . . . . . . . . . 12
3 ββ(0ν) nuclear factors of merit FN for 130Te and76Ge according to different evalua-tion methods (QRPA: Quasi Random Phase Approximation, SM: Shell Model and OEM:Operator Expansion Method) and authors. The foreseenββ(0ν) half-lifetime for 130Te(|〈mν〉| =1 eV) is also reported. . . . . . . . . . . . . . . . . . . . . . . . . . . . . . . 13
4 Predicted theoretical half-livesT 2ν1/2 in some representative nuclear models.. . . . . . . 16
5 Limits on Neutrinoless Decay Modes. . . . . . . . . . . . . . . . . . . . . . . . . . . . 216 Current best constraints (upper limits) on|〈mν〉| . . . . . . . . . . . . . . . . . . . . . . 217 Expected limits on the photon-axion coupling for 2 years of exposure of CUORE assum-
ing the quoted values for the experimental parameters. . . . . . . . . . . . . . . . . . . 318 Possible nucleon decays leading to unstable nuclei characterized by the emission of
gamma rays.. . . . . . . . . . . . . . . . . . . . . . . . . . . . . . . . . . . . . . . . . 339 FWHM resolutions (keV) in a calibration spectrum and in the 84000 hours× crystal
background spectrum.. . . . . . . . . . . . . . . . . . . . . . . . . . . . . . . . . . . . 4610 Background reduction factors measured between the two runs of MiDBD.. . . . . . . . 4811 Estimate of the weight of the different sources responsible for the background measured
in the MiDBD-I run. . . . . . . . . . . . . . . . . . . . . . . . . . . . . . . . . . . . . 5112 Half lifetime limits (90 % C.L.) on lepton violating and conserving channels deduced
from the MiDBD data analysis. E0 is the energy analyzed to obtain T1/2, while a.c.indicates that the anticoincidence spectrum was used.. . . . . . . . . . . . . . . . . . . 52
13 Counting rates per unit mass in MiDBD-II and in CUORICINO.. . . . . . . . . . . . . 5814 Estimate of the relative contributions of the different sources responsible for the back-
ground measured in CUORICINO.. . . . . . . . . . . . . . . . . . . . . . . . . . . . . 6015 Radioactive contamination measurements for CUORICINO materials. All values are in
mBq/kg. Al2O3-1 is the original lapping powder used at SICCAS while Al2O3-2 is acertified 0.7µm Sumitomo powder. . . . . . . . . . . . . . . . . . . . . . . . . . . . . 98
16 Bulk contamination levels (in picograms per gram) used in the simulation for TeO2 ,copper and lead.. . . . . . . . . . . . . . . . . . . . . . . . . . . . . . . . . . . . . . .109
17 Available 90% C.L. upper limits for bulk contaminations of TeO2, copper and lead (levelsin picograms per gram if not differently indicated).. . . . . . . . . . . . . . . . . . . . 111
18 Computed background (after the anti-coincidence cut) in theββ(0ν) energy region forbulk contaminations in the different elements for cylindrical structure in units of 10−6
c/keV/kg/y. . . . . . . . . . . . . . . . . . . . . . . . . . . . . . . . . . . . . . . . . .11819 Estimated upper contribution to the CUOREββ(0ν) region from surface contaminations
obtained by using the surface contamination levels evaluated for CUORICINO and as-suming an exponential density profile withλ=1µm for TeO2 crystals (238U ) andλ=5µmfor Copper (238U and232Th ). . . . . . . . . . . . . . . . . . . . . . . . . . . . . . . .118
20 Most favorableββ(0ν) candidate nuclei.. . . . . . . . . . . . . . . . . . . . . . . . . .12421 Breakdown of the total CUORE cost estimates (kEuro). . . . . . . . . . . . . . . . . . 145

1 EXECUTIVE SUMMARY 8
1 Executive summary
Recently, neutrino oscillation experiments have unequivocally demonstrated that neutrinos have massand that the neutrino mass eigenstates mix. These experiments have yielded valuable information on themixing angles and on the mass differences of the three eigenstates. They cannot, however, determinethe scale of the neutrino mass, which is fixed by the lightest neutrino mass eigenvalue. This can onlybe directly determined by beta decay end point spectral shape measurements, or in the case of Majorananeutrinos, by the observation and measurement of the neutrinoless double-beta decay half-life. The os-cillation experiments yield values for the mixing angles and mass differences accurate enough to allowthe prediction of a range of values of the effective mass of the Majorana electron neutrino. The CUOREexperiment is designed with a sensitivity capable of probing all but a small portion of this range.
CUORE is a proposed array of 988, 750 g, TeO2 bolometers operating at 8 to 10 milli-degrees Kelvin,hanging on the bottom of the mixing chamber of a dilution refrigerator. Natural tellurium has a 33.87%abundance of130Te , which is an even-even nucleus that can only decay by double-beta decay. This largenatural abundance eliminates the requirement for the very expensive isotopic enrichment required in allof the other proposed next generation experiments. The signal of neutrinoless double beta decay wouldbe a sharp peak at 2528.8 keV in the bolometric energy spectrum. The proposed array is a cylindricalgeometry of 19 towers of 52 detectors each. Each tower consists of thirteen, four-detector modules. Onesuch tower has been successfully constructed and is being operated in the Gran Sasso Laboratory as a testexperiment, and also as an independent, first-step next generation double-beta decay experiment calledCUORICINO.
Thus far the stability, the energy resolution, as well as the background counting rates, imply thatthe expanded array, CUORE, will be a very competitive next generation experiment. In fact, operatingCUORICINO for 3 years with the present background level will yield a half-life sensitivity for neutrino-less double-beta decay of 6.1×1024 years, corresponding to an effective mass of the electron neutrino ofthe order of 0.3 eV. This will be superior to the present upper bound on the effective electron-neutrinomass set by the76Ge experiments. The early CUORICINO data have already shown us what and wherethe sources of background are and how to reduce them. We conclude that the required reduction in thebackground is possible. This would allow the full CUORE array to achieve a 5-year sensitivity of theorder of 30 meV to the effective neutrino mass. Another order of magnitude reduction will present a realchallenge, but is possible. In that case, a 5-year sensitivity in the effective mass would be around 15 meV.In the least optimistic case above, and in the case of inverted hierarchy of the neutrino mass spectrum, anull experiment would strongly disfavour the Majorana character of neutrinos, whereas a definite obser-vation would confirm that neutrinos are Majorana particles. Only double-beta experiments can achievethis goal. The technology is now proven, and with adequate funding, there are no show-stoppers. It isproposed to build the CUORE experiment in the Laboratori Nazionali del Gran Sasso (LNGS) in As-sergi, Italy, the present site of CUORICINO. CUORE is by far the most cost effective next generationdouble-beta decay experiment proposed.

2 CUORE SCIENCE MOTIVATION 9
2 CUORE Science Motivation
The neutrino mass range of interest favoured by the results of neutrino oscillation experiments is nowwithin the grasp of well-designedββ(0ν) decay experiments. A well established technique has beendeveloped by the MIBETA and CUORICINO experiments that made dramatic improvements in cryogenicspectroscopy. The realization that the technology is available to achieve such a fundamental physics goalprovides the basic motivation for the CUORE experiment.
To convey the importance of neutrino mass and of the CUORE experiment, we present a theoreticalmotivation and a brief recapitulation of past double-beta decay experiments, drawing heavily on our owncompleted work. We present our new technological capabilities to show how the CUORE Collaborationis positioned to make rapid strides toward neutrino mass discovery, as well as measuring the Majoranamass scale. The CUORE apparatus also has application in searches for Cold Dark Matter and Solar Ax-ions and more in general for rare nuclear events.
Parameter Best fit 3σδm2
21 [10−5eV 2] 6.9 5.4–9.5δm2
32 [10−3eV 2] 2.6 1.4–3.7sin2 θ1 0.52 0.31–0.72sin2 θ2 0.006 ≤ 0.054sin2 θ3 0.30 0.23–0.39
Table 1: Best-fit values and 3σ intervals for the three-flavour neutrino oscillation parameters from globaldata including solar (SK and SNO), atmospheric (SK and MACRO), reactor (KamLAND and CHOOZ)and accelerator (K2K) experiments [22] (δm2
ij = m2i −m2
j ).
2.1 Theoretical Motivation of Neutrinoless Double-Beta Decay Experiments
Neutrinoless double-beta decay is by now an old subject [1, 2, 3, 4, 5, 6, 7]. What is new is the factthat positive observation of neutrino oscillations in atmospheric [9, 10, 11, 12], solar [13, 14, 15, 16, 17],reactor [18, 19] and accelerator [20] neutrinos gives new motivation for more sensitive searches. In fact,recently published constraints on the mixing angles of the neutrino-mixing matrix [21, 22, 23, 24, 25]make a strong case that if neutrinos are Majorana particles, there are many scenarios in which nextgeneration double-beta decay experiments should be able to observe the phenomenon and measure theeffective Majorana mass of the electron neutrino,|〈mν〉| , which would provide a measure of the neutrinomass scalem. One fact is clear: neutrino oscillation experiments can only provide data on the massdifferences of the neutrino mass-eigenstates. The absolute scale can only be obtained from direct massmeasurements,3H end point measurements for example [26], or in the case of Majorana neutrinos, moresensitively by neutrinoless double-beta decay. The time for large, next generationββ -decay experimentshas arrived, for if the mass scale is below∼ 0.35eV, ββ -decay may be the only hope for measuring it.

2 CUORE SCIENCE MOTIVATION 10
2.2 Neutrino Mixing Matrix
Using the Chau and Keung parametrization of the Pontecorvo-Maki-Nakagawa-Sakata (PMNS) neutrinomixing matrix [27]: νe
νµ
ντ
= UV
ν1
ν2
ν3
=
c3c2 s3c2 s2e−iδ
−s3c1 − c3s1s2eiδ c3c1 − s3s1s2e
iδ s1c2
s3s1 − c3c1s2eiδ −c3s1 − s3c1s2e
iδ c1c2
×
×
1 0 00 eiφ2/2 00 0 ei(φ3/2+δ)
ν1
ν2
ν3
(1)
whereci ≡ cos θi, si ≡ sin θi, V is a diagonal matrix containing Majorana CP phases that do not appearin neutrino oscillations. While this looks very complicated and populated with many unknowns, neutrinooscillation data [17, 15, 11, 12, 18, 19, 20] have constrained all three of the angles and squared neutrinomass differences as shown in Table1.
Considering the values found in Table1, we find it is possible to make the approximation thatθ2 ≡ 0and assume maximal mixing for the atmospheric neutrino oscillation data, orθ1
∼= 45. Accordingly,
U ∼=
c3 s3 0−s3c1 c3c1 s1
s3s1 −c3s1 c1
∼=
√
32
12 0
− 12√
2
√3
2√
21√2
12√
2−
√3
2√
21√2
(2)
wherec3 =√
32 , s3 = 1
2 andc1 = s1 = 1√2
were used in the second matrix.
2.3 Neutrinoless Double-Beta Decay
The decay rate for the process involving the exchange of a Majorana neutrino can be expressed as follows:
[T 0ν
1/2
]−1
=|〈mν〉|2
m2e
FN . (3)
where
FN ≡ G0ν |M0ν |2 (4)
with G0ν being the two-body phase-space factor including coupling constants andM0ν theββ(0ν) nu-clear matrix element. The quantity|〈mν〉| is the effective Majorana electron neutrino mass given by:
|〈mν〉| ≡ ||ULe1|2m1 + |UL
e2|2m2eiφ2 + |UL
e3|2m3eiφ3 |, (5)
whereeiφ2 and eiφ3 are the Majorana CP phases (±1 for CP conservation) andm1,2,3 are the masseigenvalues. The measured values ofδm2
21 (δm2S solar) andδm2
32 (δm2AT atmospheric) given in table1
motivate the pattern of masses in two possible hierarchy schemes shown in Figure1.In the case of inverted hierarchy the correct expression for|〈mν〉| can be obtained by interchanging
the first and third columns of UV, i.e. by interchanging the roles of m1 and m3.In general, prior to the approximationθ2 = 0 = s2, in the normal hierarchy case we have:
|〈mν〉|NH = |c23c
22m1 + s2
3c22e
iφ2m2 + s22e
iφ3m3|. (6)

2 CUORE SCIENCE MOTIVATION 11
mS2δ
mAT2δ
mS2δ
mAT2δ
m1
m2
m3
m1
m3
m2
Figure 1: Normal and inverted mass hierarchies schemes. Quasi-degenerate hierarchy corresponds to thecasem1 >> δmAT >> δmS .
while in the inverted hierarchy we have:
|〈mν〉|IH = |s22e
iφ3m1 + s23c
22e
iφ2m2 + c23c
22m3|. (7)
With the values and errors (3σ) from Table1, these becomes
|〈mν〉|NH = |(0.69+0.04−0.11)m1 + (0.30+0.07
−0.08)eiφ2m2 + (< 0.054)eiφ3m3|. (8)
|〈mν〉|IH = |(< 0.054)eiφ3m1 + (0.30+0.07−0.08)e
iφ2m2 + (0.69+0.04−0.11)m3|. (9)
From the relations in Figure1, we can writem2 =√
δm2S + m2
1 andm3 =√
δm2AT + δm2
S + m21
in the case of normal hierarchy andm2 =√
δm2AT + m2
1 andm3 =√
δm2S + δm2
AT + m21 in the case
of inverted hierarchy. Equations (6) and (7) can be therefore expressed in terms of mixing angles,δm2S ,
δm2AT , and CP phases as follows [28, 21]:
|〈mν〉|NH =∣∣∣∣c2
2c23m1 + c2
2s23e
iφ2
√δm2
S + m21 + s2
2eiφ3
√δm2
AT + δm2S + m2
1
∣∣∣∣ (10)
|〈mν〉|IH = |s22e
iφ3m1 + s23c
22e
iφ2
√δm2
AT + m21 + c2
3c22
√δm2
S + δm2AT + m2
1|. (11)
With the approximationθ2 ≡ 0 and the further approximation ofδm2S << δm2
AT , equations (10) and(11) are rewritten as follows:
|〈mν〉| = m1
∣∣∣∣∣c23 + s2
3eiφ2
√1 +
δm2s
m21
∣∣∣∣∣ (12)
|〈mν〉|IH =√
δm2AT + m2
1|s23e
iφ2 + c23|. (13)
Actual values of|〈mν〉| for different hierarchies have been recently evaluated by many authors on thebase of the latest results of neutrino oscillation experiments. The results of the analysis of Pascoli et al.are summarized for reference in table2 [21].

2 CUORE SCIENCE MOTIVATION 12
sin2 θ |〈mν〉|maxNH |〈mν〉|min
IH |〈mν〉|maxIH |〈mν〉|min
QD
0.0 3.7 8.7 50.6 47.90.02 4.6 8.6 49.6 42.80.04 5.3 9.9 48.6 45.4
Table 2: Present constraints on|〈mν〉| . The maximal values of|〈mν〉| (in units of 10−3 eV) for thenormal (NH) and inverted (IH) hierarchy cases, and the minimal values of|〈mν〉| (in units of10−3 eV)for the IH and QD (quasi-degenerate) cases, for the 90% C.L. allowed values ofδmS , θS andδmAT .

2 CUORE SCIENCE MOTIVATION 13
Authors/Ref. Method T1/2(130Te ) FN (130Te ) FN (76Ge)(1023 y) (10−13 y−1) (10−13 y−1)
QRPA Staudt et al., 1992 [29] pairing (Paris) 0.77-0.88 29-34 5.9-10pairing (Bonn) 0.9-1.1 24-29 4.5-8.9
QRPA Staudt et al., 1990 [53] 5 5.22 1.12Pantis et al., 1996 [30] no p-n pairing 8.64 3.0 0.73
p-n pairing 21.1 1.24 0.14Vogel et al., 1986 [31] 6.6 3.96 0.19Tomoda et al., 1987 [32] 5.2 5.0 1.2Civitarese et al., 2003[33] 5.2 5.0 0.7Barbero et al., 1999 [34] 3.36 7.77 0.84Simkovic et al, 1997 [35] Full RQRPA 4.66 5.6 0.27Simkovic, 1999 [36] pn-RQRPA 14.5 1.79 0.62Suhonen et al., 1992 [37] 8.34 3.13 0.72Muto et al., 1989 [38] 4.89 5.34 1.1Stoica et al., 2001 [39] large basis 10.7 2.44 0.65
short basis 9.83 2.66 0.9Faessler et al., 1998 [40] 9.4 2.78 0.83Engel et al., 1989 [41] generalized
seniority 2.4 10.9 1.14Aunola et al., 1998 [42] WS 4.56 5.72 0.9
AWS 5.16 5.06 1.33Rodin et al., 2003 [43] QRPA 34.6 0.75 0.45
RQRPA 37.9 0.69 0.36SM Haxton et al., 1984 [44] weak coupling 1.6 16.3 1.54
Caurier et al., 1996 [45] large basis 58 0.45 0.15OEM Hirsh et al., 1995 [46] 7.3 3.6 0.95
Table 3:ββ(0ν) nuclear factors of merit FN for 130Te and76Ge according to different evaluation methods(QRPA: Quasi Random Phase Approximation, SM: Shell Model and OEM: Operator Expansion Method)and authors. The foreseenββ(0ν) half-lifetime for 130Te (|〈mν〉| =1 eV) is also reported.
2.4 Experimental Prospects
It is interesting to compare the values given in Table2 with the projected sensitivity of the CUOREexperiment for130Teββ(0ν) . The projected 5 years sensitivity, discussed in detail later in this proposal,is 2.1×1026 y. Using eq.3 and4 we can obtain the corresponding sensitivity on|〈mν〉| . A list of valuesof FN calculated in the framework of different nuclear models are summarized in table3.
Using the average value of these values, we find that the CUORE experiment predicts a sensitivity of∼30 meV. This value probes a significant portion of the range of values ofm1 given in the table2. Wenote that some of the proposed experiments already consider a possible extension to even larger masses.This is for instance the case for the full ten tons proposal of GENIUS. The cost of this experiment wouldamount to two billion dollars and would require a very long delay for the enrichment of such a largemass of76Ge. A similar extension to ten tons of CUORE would cost at least an order of magnitude less,and would avoid the long delay required by enrichment. The option for an "enriched CUORE" will beconsidered later.
Sinceδm2S << δm2
AT andθ2 is small (Tab.1 and Fig.1), equations (12) and (13) can be used to

2 CUORE SCIENCE MOTIVATION 14
constrain the sum of the masses of all the neutrino eigenstates (Σ ≡ Σjmj) [28]
2|〈mν〉|+√|〈mν〉|2 ± δm2
AT ≤ Σ ≤2|〈mν〉|+
√|〈mν〉|2 ± δm2
AT cos2(2θ3)| cos(2θ3)|
(14)
where the plus is for normal hierarchy and the minus for inverted hierarchy. Equation (14) can be simpli-fied significantly for values of|〈mν〉| achievable in next generation experiments.
Whenδm2AT << Σ2 eq. (14) transforms into
|〈mν〉| ≤Σ3≤ 2|〈mν〉| (15)
which, using the sensitivity projection given above, gives 90 meV≤ Σ ≤ 180 meV. CUORE will there-fore improve the WMAP result (Σ ≤ 700 meV [47]) further constraining the Majorana neutrinos contri-bution to the Cosmic Microwave Background fluctuations.
In a similar manner, CUORE would be very complementary to the proposed KATRIN3H neutrinomass experiment. KATRIN has a projected sensitivity of 200meV[26], therefore should it observe apositive effect, and CUORE place a bound|〈mν〉| « mKATRIN , it would be clear evidence that neutrinosare Dirac particles.
In conclusion, according to most theoretical analyses of of present neutrino experiment results, next-generation DBD experiments with mass sensitivities of the order of 10 meV may find the Majorananeutrino with a non-zero effective electron neutrino mass, if the neutrino is self-conjugate and the neutrinomass spectrum is of the quasi-degenerate type or it has inverted hierarchy. Majorana massive neutrinosare common predictions in most theoretical models, and the value of a few10−2 eV predicted for itseffective mass, if reached experimentally will test its Majorana nature. DBD experiments with evenbetter sensitivities (of the order of meV) will be essential to fix the absolute neutrino mass scale andpossibly to provide information on CP violation. It is therefore evident that next generation neutrinolessdouble-beta decay experiments are the next important step necessary for a more complete understandingof the physics of neutrinos. In this proposal we describe the CUORE experiment, show how it couldreach the required sensitivity, and give details of the work breakdown, cost estimate, and main projectmilestones.

3 STATUS OF NEUTRINOLESS DOUBLE-BETA DECAY EXPERIMENTS 15
3 Status of Neutrinoless Double-Beta Decay Experiments
In the Standard Model, neutrinos and their antiparticles, antineutrinos, are different particles, but noexperimental proof has been provided so far. Nuclear double beta decay addresses both the question ofthe neutrino nature (Dirac or Majorana) and of its possible Majorana mass. The standard nuclear DoubleBeta Decay is a process where a nucleus (A,Z) transforms into its isobar (A,Z± 2) with the emission oftwo electrons (or positrons) and their corresponding neutrinos (νe or νe), say: (A,Z)→(A,Z+2)+2e−+2νe.The most direct way to determine if neutrinos are Majorana particles is to explore, in potential nucleardouble beta emitters (A,Z), if they decay without emitting neutrinos (A,Z)→ (A,Z+2) + 2e−, violatingthe lepton number conservation. For this non-standardββ(0ν) process to happen, the emitted neutrino inthe first neutron decay must be equal to its antineutrino and match the helicity of the neutrino absorbedby the second neutron.
Phenomenologically that implies the presence of a mass term or a right-handed coupling. Well-known arguments of Kayser, Petcov, Rosen and Schechter and Valle [48] show that in the context of anygauge theory, whatever mechanism be responsible for the neutrinoless decay, a Majorana neutrino massis required. In fact [49], the observation of aββ(0ν) decay implies a lower bound for the neutrino mass,i.e. at least one neutrino eigenstate has a non-zero mass.
Another form of neutrinoless decay, (A, Z)→ (A, Z+2) + 2e− + χ may reveal also the existenceof the Majoron (χ), the Goldstone boson emerging from the spontaneous symmetry breaking of B–L(Baryon minus Lepton number), of most relevance in the generation of Majorana neutrino masses and offar-reaching implications in Astrophysics and Cosmology.
Double Beta Decay (DBD) is a classical research topic, which current neutrino physics results haveput on the front-line as an unique probe to explore and elucidate, in the foreseeable future, importantopen questions left unanswered by the oscillation experiments, namely the determination of the absoluteneutrino mass scale.
The DBD are extremely rare processes. In the two neutrino decay mode their half-lives range fromT1/2 ∼ 1018 y to 1025 y. On the other hand, the non-standard neutrinoless decay has not yet beenfound. The experimental investigation of these phenomena requires a large amount of DBD emitter, inlow-background detectors with the capability for selecting reliably the signal from the background. Inthe case of the neutrinoless decay searches, the detectors should have a sharp energy resolution, or goodtracking of particles, or other discriminating mechanisms. There are several natural and enriched isotopesthat have been used in experiments with tens of kilograms. Some of them could be produced in amountslarge enough to be good candidates for next generation experiments. The choice of the emitters should bemade also according to its two-neutrino half-life (which could limit the ultimate sensitivity of the neutri-noless decay), according also to its nuclear factor-of-merit and according to the experimental sensitivitythat the detector can achieve in the case that the emitter is, at the same time, the detector, as is the caseof CUORE. As explained at length later on, the CUORE experiment has chosen as itsββ emitter naturaltellurium oxide, as the natural isotopic abundance of130Te is about 34%. Finally the extremely low back-ground required for high sensitivity double beta decay searches requires the development of techniquesfor identifying, reducing and suppressing the background of all types and origins in the detectors and theirenvironments . All these conditions set the strategies to search for the neutrinoless double beta decay.
The expected signal rate depends on the nuclear matrix element, but the dispersion of results of thecurrent calculations (tab.3) makes uncertain the interpretation of the experimental output.
Improvements in the precision of the theoretical evaluations of the matrix elements are essential.Experimental studies of nuclear structures relevant to DBD will help calculations of the matrix elements.The exploration of the conventional two-neutrino double beta decay of several potential double betaemitters and its comparison with theory must serve to help in determining the most suitable nuclearmodel. These improvements will hopefully provide accurate nuclear matrix elements for the neutrinolessDBD which are crucial for extracting the effective Majorana mass parameter. Table4 gives a summary of

3 STATUS OF NEUTRINOLESS DOUBLE-BETA DECAY EXPERIMENTS 16
Model SM QRPA 1+D OEM MCMReference [50] [51] [45, 52] [31] [53] [54] [46] [55]48Ca(1019y) 2.9 7.2 3.776Ge(1021y) 0.42 1.16 2.2 1.3 3.0 0.28 1.982Se(1020y) 0.26 0.84 0.5 1.2 1.1 2.0 0.88 1.196Zr(1019y) 0.85 1.1 .14-.96100Mo(1019y) 0.6 0.11 1.05 3.4 0.72116Cd(1019y) 6.3 0.52 0.76128Te(1024y) 0.09 0.25 55 2.6 1.4130Te(1021y) 0.017 0.051 2.0 0.22 1.8 2.4 0.1136Xe(1021y) 2.0 0.85 4.6150Nd(1019y) 0.74
Table 4: Predicted theoretical half-livesT 2ν1/2 in some representative nuclear models.
theoretical predictions forββ(2ν) half-lives of several emitters in some representative nuclear models.Due to the extraordinary importance of the neutrinoless double beta decay in extracting information
on the neutrino mass scale, the nuclear matrix element issue has become of paramount importance boththrough direct calculation and through information obtained from nuclear reactions (of type (p,n), forinstance), or through "virtual"β− andβ+ processes which may give informations on the two branchesconnecting the relevant nuclear states in the double beta transition through the intermediate states.
In the case of the two-neutrino double beta decay, the half-lives are customarily expressed as[T 2ν1/2 (0+ →
0+)−1 = G2ν | M2νGT |2, whereG2ν is an integrated kinematical factor [56] and M2ν
GT the nuclearββ Gamow Teller matrix element. Analogously, the neutrinoless decay half-life (as far as the mass termcontribution is concerned) is expressed by means of equations (3) and (4) through the nuclear factor-of-merit FN , the nuclear matrix-elementM0ν , the effective neutrino mass parameter|〈mν〉| and theintegrated kinematic factorG0ν [56].
Concerning the neutrino mass question, the discovery of aββ(0ν) decay will show that at least oneof the Majorana neutrino eigenstates has a mass equal or larger than|〈mν〉| = me/(FNT 0ν
1/2)1/2 eV,
whereT 0ν1/2 is the neutrinoless half life. On the contrary, when only a lower limit of the half-life is
obtained, one gets only an upper bound on|〈mν〉| , but not an upper bound on the masses of any neutrino.In fact, |〈mν〉| can be much smaller than the actual neutrino masses. The|〈mν〉| bounds depend onthe nuclear model used to compute theββ(0ν) matrix element. Theββ(2ν) decay half-lives measuredtill now constitute bench-tests to verify the reliability of the nuclear matrix element calculations which,obviously, are of paramount importance to derive the Majorana neutrino mass upper limit. As statedabove the wide range of the nuclear matrix elements calculations for a given emitter is the main source ofuncertainty in the derivation of the neutrino mass bound.
3.1 Main strategies for Double Beta Decay searches
The experimental signatures of the nuclear double beta decays are in principle very clear: in the case ofthe neutrinoless decay, one should expect a peak (at the Qββ value) in the two-electron summed energyspectrum, whereas two continuous spectra (each one of well-defined shape) will feature the two-neutrinoand the Majoron-neutrinoless decay modes (the first having a maximum at about one third of the Q value,and the latter shifted towards higher energies). In spite of such characteristic imprints, the rarity of theprocesses under consideration make their identification very difficult. Such remotely probable signalshave to be disentangled from a background due to natural radioactive decay chains, cosmogenic-induced
3 STATUS OF NEUTRINOLESS DOUBLE-BETA DECAY EXPERIMENTS 17
activity, and man-made radioactivity, which deposit energy on the same region where theββ decays do itbut at a faster rate. Consequently, the main task inββ -decay searches is to diminish the background byusing the state-of-the-art ultra-low background techniques and, hopefully, identifying the signal.
To measure double beta decays three general approaches have been followed: geochemical, radio-chemical, and direct counting measurements. In the geochemical experiments, isotopic anomalies indaughters ofββ decaying nuclei over geological time scales are investigated. Determination of the gasretention age of the ore is important. They are inclusive2ν + 0ν measurements, not distinguishing2ν
from 0ν modes. However, whenT 2ν+0ν(geoch.)1/2,exp.meas. T
0ν(direct)1/2,exp.bound, most of the decay is through2ν mode.
The finite half-lives measured geochemically in the cases of82Se,96Zr, 128,130Te and radiochemically inthe case of238U can be regarded asββ(2ν) half-life values. Also theT1/2 values measured geochem-ically can be taken as a bound forT 0ν
1/2, becauseT 0ν1/2 (or the half-life of whatever decay mode) cannot
be shorter thanT1/2,exp.. Consequently, bounds on|〈mν〉| can be derived from geochemical half-lifemeasurements.
Another way to look for double beta decay are the radiochemical experiments, by noticing that whenthe daughter nuclei of a double beta emitter are themselves radioactive, they can be accumulated, ex-tracted and counted. If the daughter has a half-life much smaller than109y and has no other long-livedparents, its presence can be only due toββ . Noticeable examples are that of238U → 238Pu (88 y, αdecay) and244Pu → 244Cm (18 y,α decay).
Most of the recent activity, however, refers to direct counting experiments, which measure the energyof the ββ emitted electrons and so the spectral shapes of the2ν, 0ν, and0νχ modes of double betadecay. Some experimental devices track also the electrons (and other charged particles), measuring theenergy, angular distribution, and topology of events. The tracking capabilities are useful to discriminatetheββ signal from the background.
The types of detectors currently used are [57]:
• Calorimeters where the detector is also theββ source [59] (Ge diodes, scintillators – CaF2, CdWO4
–, thermal detectors –TeO2 –, Xe ionization chambers, . . . ). They are calorimeters which mea-sure the two-electron sum energy. Notable examples are IGEX, Heidelberg-Moscow, Milano-GranSasso (MiDBD), CUORICINO and the proposed CUORE and Majorana.
• Tracking detectors of the inhomogeneous (source6=detector) type (Time Projection Chambers TPC,drift chambers, electronic detectors). In this case, theββ source plane(s) is placed within thedetector tracking volume, defining two –or more– detector sectors. Leading examples of trackingdevices are the Irvine TPC’s and the NEMO and ELEGANTS series.
• Tracking calorimeters They are tracking devices where the tracking volume is also theββ source,for example a Xenon TPC (CALTECH/PSI/Neuchatel) and the future EXO.
Well-known examples ofββ emitters measured in direct counting experiments are48Ca,76Ge,96Zr,82Se,100Mo, 116Cd,130Te,136Xe, 150Nd.
The strategies followed in theββ searches are different. Calorimeters of good energy resolution andalmost 100% efficiency (e.g. Ge-detectors and tellurite bolometers) are well suited forββ(0ν) searches.They lack, obviously, the tracking capabilities to identify the background on an event-by-event basis butthey have, in favour, that their sharp energy resolutions do not allow the leakage of too many countsfrom ordinary double beta decay into the neutrinoless region, and so the sensitivity intrinsic limitationis not too severe. On the contrary, the identification capabilities of the various types of chambers makethem very well suited forββ(2ν) andββ(0ν, χ) searches. However, their energy resolution is, at leastpresently, rather modest and the efficiency is only of a few percent. Furthermore, the ultimate irreduciblebackground source in these devices when looking forββ(0ν) decay will be that due to the standardββ(2ν) decay. The rejection of background provided by the tracking compensates, nevertheless, thefigure of merit inββ(0ν) searches.

3 STATUS OF NEUTRINOLESS DOUBLE-BETA DECAY EXPERIMENTS 18
Modular calorimeters can have reasonable amounts ofββ emitters (Heidelberg/Moscow, IGEX, MiDBDand CUORICINO experiments) or large quantities (like CUORE, Majorana and GENIUS). Tracking de-tectors, instead, cannot accommodate large amounts ofββ emitters in the source plate. Recent versionsof tracking devices have 10 kg and more (NEMO3). On the other hand, TPC devices are planning toreach one ton and more of Xenon (EXO).
The general strategy followed to perform a neutrinoless double beta decay experiment is simply dic-tated by the expression of the half-life
T 0ν1/2 ' ln2× N · t
S(16)
where N is the number ofββ emitter nuclei and S the number of recorded counts during time t (orthe upper limit of double beta counts consistent with the observed background). In the case of takingfor S the background fluctuation (when that might be possible) one has the so-called detector factor-of-merit orneutrinoless sensitivity(1σ) which for homogeneous (source=detector) devices - for which thebackground rate scales with the detector mass - reads
FD = 4.17× 1026(f/A)(Mt/BΓ)1/2εΓ years (17)
where B is the background rate (c/(keV kg y)), M the mass ofββ emitter (kg),εΓ the detector efficiencyin the energy intervalΓ around Qββ (Γ = FWHM) and t the running time measurement in years (f isthe isotopic abundance and A the mass number). A slightly different behaviour is expected when thebackground rate is very low ("zero background" orBΓMt << 1 hypothesis)
FD ∼ fMtεΓ/A years (18)
The other guideline of the experimental strategy is to choose, according to equation (3), aββ emitterof large nuclear factor of meritFN = G0ν | M0ν |2, where the kinematical factor qualifies the goodnessof theQββ value andM0ν the likeliness of the transition. Notice that the upper limit on|〈mν〉| is givenby |〈mν〉| ≤ me/(FDFN )1/2, or in terms of its experimental and theoretical components
|〈mν〉| ≤ 2.5× 10⁻⁸ × (A/f)1/2 × (BΓ/Mt)1/4 × ε−1/2Γ ×G
−1/20ν × | M0ν |−1 eV (19)
3.2 Overview of main experiments and synopsis of results
It is out of the scope of this Proposal to fully review the experimental status of the field. We refer the readerto various recent or completed reviews, also including comparison with theory [1, 2, 3, 4, 5, 6, 7, 8, 57, 58].We will sketch in the following a briefing of the main techniques and results and summarize the currentexperimental situation in Tables5 and 6. We will obviously devote more attention to the bolometricexperiments with TeO2, MiDBD and CUORICINO as the antecedents of CUORE.
The Germanium case, as prototype of the calorimetric approach where theββ source is at the sametime detector medium, has a special meaning for this Proposal. The search for the nuclear double betadecay of the isotope76Ge started as earlier as in 1967 by the Milano group [60, 61] which is now leadingthe CUORE Collaboration. Other groups both from USA (USSB-LBL-UCB, Caltech, PNL-USC) andEurope (Zaragoza, PSI-Neuchatel, H/M) continued this search with germanium detectors. The masteringof the techniques in the fabrication of Ge detectors and the continuous reduction of radioactive back-ground achieved steadily since the first prototypes (PNL-USC and USSB-LBL) made the Ge detectorsa reference in the field of double beta decay and other rare event physics phenomena. The effectiveneutrino mass bound obtained from the neutrinoless half life limits achieved with Ge detectors has beensteadily improving along the last decades and now, the current most stringent bounds are led by the re-sults obtained with Germanium experiments (IGEX, H/M). As they are now classical reference resultsfor neutrinos mass bounds, we will describe them even briefly.

3 STATUS OF NEUTRINOLESS DOUBLE-BETA DECAY EXPERIMENTS 19
Two recent experiments have looked for the double beta decay of76Ge. They both employ severalkilograms of enriched76Ge (86%) in sets of detectors: the IGEX Collaboration experiment [62] (a setof three detectors of total mass 6.0 kg) in the Canfranc Underground Laboratory (Spain) and the Heidel-berg/Moscow Collaboration experiment [63] (a set of five detectors amounting to 11 kg) in Gran Sassoand 2.1 kg in the Baksan Neutrino Observatory (Russia). Both experiments were designed to get the high-est possible sensitivity for neutrinoless double beta decay of76Ge: a large amount of the76Ge isotope,in detectors of good energy resolution and very low radioactive background. Very efficient shieldings,both active and passive, were used in the two experiments. As a result, in the case of IGEX the back-ground recorded in the energy region between 2.0 and 2.5 MeV is about 0.2 c/keV kg y prior to PulseShape Discrimination and most of the background in the relevant Qββ region of 2039 keV is accountedfor by cosmogenic activated nuclei (68Ge and60Co). Background reduction through Pulse Shape Dis-crimination successfully eliminates multisite events, characteristic of non-ββ events, leading to less than∼ 0.07c/keV.kg.y. IGEX data corresponding to 8.87 kg y in76Ge provided (using the statistical esti-mator recommended by the Particle Data Group) a half-life lower bound ofT 0ν
1/2 ≥ 1.57 × 1025y at90% C.L. for the complete data set with PSD [64, 65, 66]. Accordingly, the limit on the neutrino massparameter is 0.33–1.31 eV. The uncertainties originate from the spread in the calculated nuclear struc-ture parameters. Data from one of the IGEX detectors, RG–3 –which went underground in Canfrancseveral years ago– corresponding to 291 days, were used to set a value for the2ν-decay mode half-lifeby simply subtracting the MC-simulated background. The best fit to the stripped data corresponds to ahalf-life T 2ν
1/2 = (1.45± 0.20)× 1021 y. The Heidelberg/Moscow experiment operates five p-type HPGe
detectors of enriched76Ge (86%) with a total active mass of 10.96 kg, corresponding to 125.5 mol of76Ge. The recorded background spectrum of the detectors of the H/M experiment corresponding to anexposure of 47.4 kg.y substracted by the MonteCarlo simulation of the background, provides a half-lifefor theββ(2ν) -decay at 68% C.L.T 2ν
1/2 = 1.55 ± 0.01(stat)+0.19−0.15(syst) × 1021y in agreement with
the IGEX result. To derive the neutrinoless decay half-life limit from the H/M experiment, the raw data ofall five detectors as well as data with pulse shape analysis are considered. No indication for a peak at theQ-valueββ(0ν) -decay is seen in none of the two data sets (the first 200 d of measurement of each detectorwere suppressed, because of possible interference with the cosmogenic56Co). Data prior to PSD showa background around the Q-value of (0.19 ± 0.1) c/keV.kg.y similar to that of IGEX. Both backgroundfigures, in IGEX and H/M, together with nthe recent results of CUORICINO to be reported later are thelowest ever obtained without using discrimination mechanisms. The set of H/M data analyzed with PSDcorresponds to 35.5 kg.y of exposure and its background in the energy region between 2000 and 2080keV is (0.06± 0.01)counts/(keV.kg.y). Following the method proposed by PDG, the limit on the half-lifeis [67] T 0ν
1/2 ≥ 1.9 × 1025 y at 90% C.L. No evidence for neutrinoless DBD has been reported so far
[2, 8, 1, 58] with the exception of the claimed discovery of the decay of76Ge reported by a subset of theHeidelberg-Moscow collaboration [68]. This claim has been contested by various authors [72, 73] andalso by other members of the same Heidelberg-Moscow Collaboration [74]. A new analysis in favour ofthe previous claim has however been published recently [159, 75]. After a new statistical analysis of thesame set of data, some of the authors of the H/M collaboration conclude [68, 69, 70, 71] that there existsevidence of a neutrinoless double beta peak. This result has been very widely contested [23, 72, 73, 74].
Another technique, this time of the detector-different-from-source type, employs Time ProjectionChambers. An example of a TPC, successfully operated along many years, was the Time ProjectionChamber of the UC Irvine group which played an historical role in the discovery of the conventionaldouble beta decay. It was a rectangular box filled with helium and located underground at 290 m.w.e.(Hoover Dam). A centralββ source plane divides the volume into two halves, whereas a magnetic fieldis placed perpendicular to the source plane. Electrons emitted from the source follow helical trajectoriesfrom where the momentum and the angles of theβ-particles are determined. Theββ signal is recognizedas two electrons emitted from a common point in the source, with no other associated activity, duringsome time before and after the event. Theββ source is thin enough (few mg/cm2) to allowα-particles to

3 STATUS OF NEUTRINOLESS DOUBLE-BETA DECAY EXPERIMENTS 20
escape and be detected for tagging the background. The UCI TPC series of experiments, finished morethan five years ago, had the merit of having obtained the first direct observation of the double beta decay(82Se). They also successfully measured the two-neutrino double beta decay of100Mo, 150Nd and48Ca.
The NEMO series of detectors are [76, 77, 78] electron tracking devices (with open Geiger cells) filledwith helium gas. An external calorimeter (plastic scintillator) covers the tracking volume and measurestheβ energies and time of flight. Theββ source is placed in a central vertical plane and is divided in twohalves, one enriched and another of natural abundance (of about 150 grams each), to monitor and subtractthe background. To identify aββ signal, one should have a 2e-track with a common vertex (cosα < 0.6)in the source plus two fired plastic scintillators (E deposition>200 keV each). The two-electron eventsare selected by time of flight analysis (in the energy range ofββ ). For instance, NEMO 2 has beenoperating for several years at the Modane Underground Laboratory (Frejus Tunnel) at 4800 m.w.e andhas measured theββ(2ν) decays of100Mo, 116Cd, 82Se and96Zr. A new, bigger detector of the NEMOseries, NEMO 3, has recently started its data taking with sources of up to 10 kg of100Mo and otheremitters [79].
The ELEGANTS V detector of the University of Osaka (placed successively in Kamioka and Oto)is an electron tracking detector which consists of two drift chambers forβ-trajectories, sixteen modulesof plastic scintillators forβ energies and timing measurement, and twenty modules of NaI for X- andγ-rays identification. Theββ signals should appear as two tracks in the drift chamber with the vertex inthe source plus two signals from two plastic scintillator segments. Both enriched and natural sources (ofabout 100 grams) are employed in the detector for background monitoring and subtraction. This detectorhas measured theββ(2ν) decay of116Cd, 100Mo, and several other emitters [80]. A new variant ofELEGANTS is searching for the double beta decay of48Ca.
The Caltech/PSI/Neuchatel Collaboration [81, 82] has investigated the double beta decay of136Xe inthe Gotthard Tunnel (3000 m.w.e.) by using a time projection chamber where the Xenon, enriched upto 62.5% in136Xe, with a total mass of m=3.3 kg, was both the source and the detector medium, i.e. acalorimeter plus a tracking device. It had a cylindrical drift volume of 180 fiducial litres at a pressure of 5atm. Theββ signal appears as a continuous trajectory with distinctive end features: a large angle multiplescattering and increase charge deposition (charge “blobs”) at both ends. As usual, theββ topology givespowerful background rejection, leading to a figure ofB ∼ 10−1 − 10−2 c/keV kg y (at 2480 keV).
Other results worth mentioning are those of the ITEP and Florence-Kiev groups. The ITEP groupmeasured [83] the double beta decay of150Nd (40 g) with a TPC of∼ 300 litres filled with CH4 atatmospheric pressure, in a 700 gauss magnetic field. On the other hand, the group of INR at Kiev [84] isinvestigating the double beta decay of116Cd with cadmium tungstate (116CdWO4) scintillator crystals.
To conclude this synopsis, Table5 summarizes the neutrinoless half-life limits derived in the variousexperiments. From such neutrinoless half-life limits, one can derive Majorana neutrino mass boundsaccording to the nuclear model chosen. Table6 shows the range of bounds derived from the most sensitiveexperiments.
3.3 Thermal detector approach to double beta decay
A series of bolometer experiments has been carried out by the Milan group since 1989 in the Gran SassoLaboratory, searching for the double beta decay of130Te (sec.6). The working principle of these thermaldetectors is explained in section5 of this Proposal. This saga of experiments, their development andachievements, are the origin of the present CUORE proposal. The increase in temperature produced bythe energy released in the crystal due to a nuclear event (i.e.ββ ), is measured by means of a sensorin thermal contact with the absorber. The Milano group has been using Tellurium oxide crystals asabsorbers, and glued NTD Ge thermistors as sensors. Natural Tellurium contains 34% of130Te. Afterusing successively TeO2 crystals of 73 g and 334 g, as well as a set of four of these large crystals, atower-like array of 20 crystals of 340 g in a copper frame at∼ 10 mK was installed and operated: that

3 STATUS OF NEUTRINOLESS DOUBLE-BETA DECAY EXPERIMENTS 21
Emitter Experiment T 0ν1/2 > C.L.%
48Ca HEP Beijing 1.8× 10²² y 6876Ge MPIH/KIAE 1.9× 1025 y 90
IGEX 1.6× 1025 y 9082Se UCI 2.7× 10²² y 68
NEMO 3 4.7× 10²² y 9096Zr NEMO 2 1.3× 10²¹ y 90100Mo LBL/MHC/UNM 2.2× 10²² y 68
UCI 2.6× 10²¹ y 90Osaka 5.5× 10²² y 90NEMO 3 6× 10²² y 90
116Cd Kiev 1.7× 10²³ y 90Osaka 2.9× 10²¹ y 90NEMO 3 1.6× 10²² y 90
130Te Milano 2.1× 10²³ y 90CUORICINO 5.5× 10²³ y 90
136Xe Caltech/UN/PSI 4.4× 10²³ y 90136Xe Rome 1.2× 1024 y 90150Nd UCI 1.2× 10²¹ y 90
NEMO 3 1.4× 10²¹ y 90
Table 5: Limits on Neutrinoless Decay Modes
Experiment |〈mν〉| < (eV)IGEX enrich.76Ge (0.33 ∼ 1.35) (6.0kg)H/M enrich.76Ge (0.35 ∼ 1.05) (11kg)MiDBD nat. 130Te (0.62 ∼ 3.1) (6.8kg)CUORICINO nat.130Te (0.38 ∼ 2.2) (40.7kg)
Table 6: Current best constraints (upper limits) on|〈mν〉| .
was the so-called MiDBD experiment which successfully got the second best neutrino mass bound (afterthe Ge results). An enlarged version of MiDBD, called CUORICINO (meaning small CUORE) is nowtaking data in Gran Sasso (see6.2and6.3) and the limits on the effective neutrino mass obtained in twomonths only are already the best except from those of the Ge experiments (Table6).
3.4 Next generation experiments
The requirements for a next-generation experiment can easily be deduced by reference to equations (16)and (17). To improve the sensitivity of|〈mν〉| by a factor of 100, the quantityNt/S must be increasedby a factor of104. The quantityN can easily be increased by a factor of∼ 102 over present experiments,so thatt/S must also be improved by that amount. Since practical counting times can only be increasedby a factor 2-4, the background should be reduced by a factor 25-50 below the present levels. These areapproximately the target parameters of the next-generation neutrinoless double-beta decay experiments.
The CAMEO proposal involves placing isotopically enriched parent isotopes at the center of BOREX-INO. One example given involves 65 kg of116CdWO4 scintillation crystals. The collaboration predicts a

3 STATUS OF NEUTRINOLESS DOUBLE-BETA DECAY EXPERIMENTS 22
sensitivity of|〈mν〉| ∼60 meV, and with 1000 kg the prediction is|〈mν〉| ∼20 meV [85].As already stated in sec.2, CUORE (sec.7) is a proposed cryogenic experiment with 19 towers of
52 detectors, each one being a 750 g TeO2 bolometer. It will be the only future detector not requiringisotopic enrichment. This means that it would utilize natural abundance Te, containing 33.8%130Te. Adetailed description of CUORE, its performances, sensitivity and physics prospects is given in the presentProposal. A pilot experiment CUORICINO comprising one CUORE tower, is now taking data at LNGS(section6.3). With equivalent background, CUORE would be as sensitive as 400-950 kg of Ge enrichedto 86%76Ge, depending on the nuclear matrix elements used to derive|〈mν〉| . It will be performed in theLaboratori Nazionali del Gran Sasso(LNGS). It has been already approved by the Scientific Committeeof this laboratory and its location in Hall A of the same Laboratory has been established.
EXO is a large proposed TPC, either high-pressure gas or liquid, of enriched136Xe. This noveltechnique involves schemes for locating, isolating, and identifying the daughter136Ba+ ion by laserresonance ionization spectroscopy. EXO is planned as a zero-background experiment and it is expectedto be one of the relevant experiments of the future. Its plans include the use of 1 to 10 tons of Xenon. Aprogram of research and development is underway at the Stanford Linear Accelerator (SLAC) [86].
GENIUS is a proposal to use between 1.0 and 10 tons of "naked" germanium detectors, isotopicallyenriched to 86% in76Ge, directly submerged in a large tank of liquid nitrogen functioning both as acooling medium and a clean shield. Extensive studies were made based on certain assumptions, mea-surements, and Monte Carlo simulations. In Ref. [87, 88], the authors claim a sensitivity range of 1-10meV for |〈mν〉| , using103-104 kg of enriched Ge. A research and development program is underway inthe Gran Sasso Laboratory to develop the techniques for cooling and operating "naked" Ge detectors inliquid nitrogen for extended periods [89, 90].
The Majorana Project is a proposed significant expansion of the IGEX experiment, utilizing newlydeveloped segmented detectors along with pulse-shape discrimination techniques. It proposes 500 fiducialkg of Ge isotopically enriched to 86% in76Ge in the form of 200-250 detectors. Each detector will besegmented into electrically independent volumes, each of which will be instrumented with the new PSDsystem.
The MOON experiment is a proposed major extension of the ELEGANTS experiment. It will utilizebetween 1 and 3 tons of Mo foils, isotopically enriched to 85% in100Mo, inserted between plastic scin-tillators. It will have coincidence and tracking capabilities to search forββ(0ν) decay as well as solarneutrinos. This novel technique for detecting solar neutrinos depends on the special properties of thenuclear decay schemes of100Mo and its daughters, allowing both event and background identification[91].
This list of proposals should produce several experiments with sensitivities sufficient to actually ob-serveββ(0ν) decay or obtain stringent upper bounds on|〈mν〉| reaching the sensitivity range impliedby recent neutrino oscillation results. The attainability of such a goal strongly depends on the true capa-bility of these projects to reach the required background levels in theββ(0ν) region. An experimentalconfirmation of the (often optimistic) background predictions of the various projects (even if extrapolatedfrom the results of lower scale successful experiments) is therefore worthwhile and the construction ofpreliminary test setups is absolutely needed.
Frequently appearing publications on the subject almost always refer to the importance of conductingnext-generation neutrinoless double-beta decay experiments. A complete understanding of the neutrinomass matrix depends on three types of data: neutrino oscillations, tritium beta-decay measurements, andneutrinoless double-beta decay. Each is analogous to one leg of a three-legged stool, and each is necessaryfor the complete picture. The case for a significant investment in next-generation experiments of all threetypes is compelling.

4 CUORE EXPERIMENTAL PROSPECTS 23
4 CUORE experimental prospects
As discussed in the previous sections, a number of recent theoretical interpretations of atmospheric, solarand accelerator neutrino experiments imply that the effective Majorana mass of the electron neutrino,|〈mν〉| , expressed in Eq.5, could be in the range 0.01eV to the present bounds.
Considering this range, could a next generationββ(0ν) - decay experiment detect it? If so, whattechnique would be the best for a possible discovery experiment? We will address these questions inan effort to demonstrate that CUORE, an array of 988, 750 g TeO2 bolometers, is one of the best ap-proaches presently available. It can be launched without isotopic enrichment nor extensive Research andDevelopment (R & D) , and it can achieve next generation sensitivity.
The CUORE project originates as a natural extension of the succesfull MiDBD and CUORICINO130Te experiments, described before, where for the first time large arrays of bolometers were used tosearch forββ(0ν) - decay. The good results obtained so far prove that thebolometrictechnique althoughnovel is competitive and alternative to the traditionalcalorimetricGe technique. The pertinent details ofthe detectors of the CUORE array and its operation at temperature of∼ 10 mK, as well as the backgroundissues, electronics, DAQ and data-analysis are discussed in other parts of this proposal. In the followingwe will discuss the Physics potential of CUORE regarding Double Beta Decay, Dark Matter, Solar Axionssearches, and other rare processes.
Rare event hysics is playing a significant role in Particle Astrophysics and Cosmology. Examples ofsuch rare phenomena could be the detection of non-baryonic particle dark matter (axions or WIMPs),supposedly filling a substantial part of the galactic halos, nucleon decay or neutrinoless double betadecay. These rare signals, if detected, would be important evidence of new physics beyond the StandardModel of Particle Physics, and would have far-reaching consequences in Cosmology. The experimentalachievements accomplished during the last decade in the field of ultra-low background detectors have ledto sensitivities capable of searching for such rare events. Dark matter detection experiments have largelybenefited from the techniques developed for double beta decay searches. We expect a similar symbiosisalso in the case of CUORE and CUORICINO for which Dark Matter detection will be therefore anotherimportant scientific objective.
Due to the low rates of the proposed processes, the essential requirement of these experiments is toachieve an extremely low radioactive background and large mass. Accordingly the use of radiopure de-tector components and shieldings, the instrumentation of mechanisms of background identification, theoperation in an ultra-low background environment, in summary, the use of the state-of-the-art of lowbackground techniques is mandatory. In some of these phenomena, as in the case of the interaction of aparticle dark matter with ordinary matter, a very small amount of energy is deposited, and the sensitivityneeded to detect events within such a range of energies, relies on how low the energy threshold of detec-tion is. In addition, to increase the chances of observing such rare events, a large amount of detector massis in general needed, and so most of the experiments devoted to this type of searches are planned to havelarge detector mass, while keeping the other experimental parameters (background, energy thresholds andresolutions) optimized. On the other hand, the recent development of cryogenic particle detection [92]has led to the extended use of thermal detectors [93, 94] to take advantage of the low energy threshold andgood energy resolution required for the theoretically expected thermal signals. This detection technologyhas also the advantage of enlarging the choice of materials which can be used, either as DM targets orββ decay emitters. After a long period of R&D to master the techniques used in cryogenic particle de-tectors, low temperature devices of various types are now applied to the detection of double beta decayor particle dark matter [95]. A major example of this development were the MiDBD (Milano DoubleBeta Decay) experiment (sec.6.2), which successfully operated a 20 TeO2 crystal array of thermal de-tectors of a total mass of 6.8 kg and CUORICINO discussed below. With the objective of going to largerdetector masses and of improving the sensitivity achieved in the smaller arrays, the CUORE (CryogenicUnderground Observatory for Rare Events) project [96, 97] was born some years ago as a substantial

4 CUORE EXPERIMENTAL PROSPECTS 24
extension of MiDBD. The objective of CUORE is to construct an array of 988 bolometric detectors withcubic crystal absorbers of tellurite of 5 cm side and of about 750 g of mass each. The crystals will bearranged in a cubic compact structure and the experiment will be installed in the Gran Sasso UndergroundLaboratory (LNGS).
The material to be employed first is TeO2, because the main goal of CUORE is to investigate thedouble beta decay of130Te, although other absorbers could also be used to selectively study several typesof rare event phenomenology as it will be discussed later. Apart from the MiDBD experiment, alreadycompleted, a smaller and intermediate stage of CUORE, CUORICINO is presently taking data at LNGS.It consists of 44 cubic crystals slighly larger with respect to those foreseen for CUORE (790 g) and 18smaller crystals (330 g) for a total mass of∼40.7 kg. CUORICINO is, by far, the largest cryogenicdetector on the stage. Its early results are excellent (see section6.3) and represent the most eloquentdemonstration of the CUORE feasibility.
In the following, the Physics Potential of the CUORE experiment with respect to its double beta decaydiscovery potential and its detection capability of WIMP and axions is presented. For this purpose, wewill rely on the CUORE background expected sensitivity described in other sections of this proposal (6.3and14) and tested with the results already obtained in CUORICINO.
In CUORICINO a background improved by a factor 1.5 with respect to the one measured in MiDBD-II has been observed in theββ(0ν) region. The analysis of the low energy region, relevant for darkmatter search, has not been completed but we expect a similar improvement there also. For what con-cerns CUORE on the other hand, MiDBD and CUORICINO have shed light on how the backgroundcontamination dominating the two regions of interest is mostly the intrinsic background due to bulk andsurface contaminations of the constructing materials. With the presently achieved quality of low con-tamination materials and considering the worst possible condition for bulk contaminations (i.e. all thecontamination equal to the present 90%/,C.L. measured upper limits) we proved that the correspond-ing contribution to the CUORE background will be∼0.004 counts/(keV kg y) at theββ(0ν) transitionenergy and∼0.025 counts/(keV kg d) near threshold (section14). Even at these conservative valuestherefore, bulk contaminations will not represent a problem for CUORE sensitivity. A larger backgroundcontribution is however expected when extrapolating to CUORE the surface contributions measured inCUORICINO. A dedicated R&D aiming at reducing the radioactive surface contaminations of the detec-tor structure (mainly copper) is therefore required. A reduction by an order of magnitude of the surfacecontributions seems attainable in a reasonable time (less than 2 years) by simply improving the surfacecleaning procedures used for CUORICINO (e.g. by using cleaner solutions). This would be enough toreduce theββ(0ν) background contributions to the level of few counts/keV/ton/y. Further improvementsare still possible (e.g. active surface bolometers) and are considered by the CUORE collaboration as partof a second R&D phase aiming at an even better sensitivity both forββ(0ν) and dark matter searches(sec.15). In particular, the goal of this CUORE technical R&D will be the reduction of background tothe level of∼0.001 counts/(keV kg y) at theββ(0ν) transition energy and to∼0.01 counts/(keV kg d) atthreshold. The potential of the experiment in this background configuration will also be discussed.
Regarding the expected threshold and resolution, energy thresholds of∼5 keV and energy resolutionslower than 1 keV at the 46 keV line of210Pb were obtained in some test measurements carried out atLNGS ("Hall C" setup) for the early CUORE R&D program [98, 99]. We will assume therefore con-servative values of 10 keV for the energy threshold and of 1 keV for the energy resolutions at threshold,as observed in MiDBD and CUORICINO. As far as the energy resolutions obtained in the double betadecay region, values of 3 keV at 2615 keV were achieved in some of the above mentioned test measure-ments. On the other hand, a 9 keV average value has been measured in the CUORICINO calibrationspectra. A possible energy resolution interval of 5-10 keV (taking into account possible improvements inthe foreseen CUORE R&D, sec.15) will be therefore assumed for CUORE.
Taking into account these expectations, we discuss in the following the prospects of CUORE fordouble beta decay searches, for WIMP detection, for solar axion exploration and for searches on rare

4 CUORE EXPERIMENTAL PROSPECTS 25
nuclear events.
4.1 Double beta decay prospects
The main scientific objective of the CUORE detector is the search for the neutrinoless double-beta decayof the130Te isotope contained in the (natural) TeO2 crystals.
In fact, cryogenic thermal detectors provide several double-beta nuclei to be explored in "active"source/detector calorimeters as it will be discussed later. Some of them have been tested and others arealready in running detectors, like48Ca in CaF2, 130Te in TeO2, and116Cd in CdWO4. As far as theTellurium Oxide is concerned, the130Te isotope is a good candidate for double beta decay searches:its isotopic content in natural Tellurium is 33.87%, and itsββ Q-value (Qββ = 2528.8 ± 1.3 keV) isreasonably above the main radioimpurity lines when looking for a neutrinoless signal. Moreover, this Q-value happens to be between the peak and the Compton edge of the 2615 keV line of208Tl, which leavesa clean window to look for the signal. Finally, it has a fairly good neutrinoless nuclear factor-of-meritFN (sec.2.3). It is in fact apparent (tab.3) that, no matter which nuclear model is used to compute theneutrinoless double-beta decay matrix elements, the nuclear factors of merit of130Te are a factor 5–10more favorable than those of76Ge (the emitter where the best neutrinoless double beta decay half-lifelimits have been achieved so far). This translates into a factor 2 to 3 better as far as the|〈mν〉| (Majorananeutrino mass parameter) bounds are concerned.
The detector factor-of-merit F0νD (eq. (17)), or detection sensitivity, introduced earlier by Fiorini,
provides an approximate estimate of the neutrinoless half-life limit (1σ) achievable with a given detector.In the case of a 5×5×5 cm3 TeO2 bolometers (for which theββ(0ν) detector efficiency is 0.86) we have
F0νD ∼7.59×10²³
√MtBΓ , with M the crystal mass in kg and B the background in counts per keV per year
and per kg of detector mass.To demonstrate the full CUORE physics potential, let us evaluate FD according to our conserva-
tive projection for the CUORE array (750 kg of TeO2 ). As described above, a background of B=0.01c/keV/kg/y would be achievable with a slight improvement of the current available material selection andcleaning techniques (sections12.1, 16 and14) and exploting the possibility to build a dedicated cryostatwith low activity materials and effective shields (sec.8). Assuming finally an energy resolutionΓ(2.5MeV)=5 keV, we would get F0ν
D of 9.4×1025√
t years (6.5×1025√
t years forΓ=10 keV), which in tyears of statistics would provide|〈mν〉| bounds in the range 0.036–0.2 t−1/4 eV (according to QRPAmodels FN predictions, tab.3). However, the R&D to be carried out in CUORE, if successful, would pro-vide a value of B∼0.001 c/keV/kg/y, i.e. a detection sensitivity of FD∼2.96×1026
√t years (2.1×1026
√t
years forΓ=10 keV), or|〈mν〉| bounds in the range∼0.02–0.11 t−1/4 eV. TeO2 crystals made with130Teenriched material have been already operated in MiDBD and CUORICINO, making an enriched CUOREa feasible option (sec.17). Assuming a 95% enrichment in130Te and a background level of b=0.001c/keV/kg/y, the sensitivity would become FD∼8.32×1026
√t years. For an exposure of 5 years, the cor-
responding|〈mν〉| bounds would range from 8 meV to 45 meV depending on the nuclear matrix elementcalculations.
4.2 Other physics with CUORE
Even if double beta decay, particularly in its neutrinoless channel, is the main scientific aim of CUORE,other interesting searches can be tackled with this massive detector. For instance, as stressed above,dark matter detection experiments have largely benefitted in the past from the techniques developed fordouble beta decay searches and we have valid motivations to expect such a symbiosis also in the case ofCUORE and CUORICINO. A number of other searches for rare processes (rare nuclearα andβ decays,electron and nucleon stability, etc.) could however take advantage of the large mass and low backgroundof CUORE. We will discuss in the following, the potential of CUORE for such searches.

4 CUORE EXPERIMENTAL PROSPECTS 26
4.2.1 WIMP detection
Recent cosmological observations [100] provide compelling evidence for the existence of an importantcomponent of non-baryonic cold dark matter in the Universe. Among the candidates to compose this mat-ter, Weakly Interacting Massive Particles (WIMPs) and axions are the front runners. The lightest stableparticles of supersymmetric theories, like the neutralino [101], constitute a particular class of WIMPs.
Under the hypothesis that WIMPS are the main component of the dark matter, these particles shouldfill the galactic halos and explain the flat rotation curves which are observed in spiral galaxies. Thedetection of such particles could be attempted both by means of direct and indirect methods. The directdetection of WIMPs relies on the measurement of their elastic scattering off the target nuclei of a suitabledetector[95]. The non relativistic and heavy (GeV – TeV) WIMPs could hit a detector nucleus producinga nuclear recoil of a few keV. Because of the small WIMP-matter interaction cross sections the rateis extremely low. In the case of SUSY WIMPs, most of the cross section predictions [102, 103, 104](derived using MSSM as the basic frame implemented with different unification hypothesis) encompassa range of values several orders of magnitude (the so-called scatter plots) providing rates rangingfrom 1c/kg/day down to 10−5 c/kg/day according to the particular SUSY model.
It is well known that the predicted signal for the WIMP elastic scattering has an exponentially de-caying energy dependence, hardly distinguishable from the background recorded in the detector. Thesimple comparison of the theoretical WIMP spectrum with the one experimentally obtained, provides anexclusion curve (at a given confidence level), as dark matter component of the halo, of those WIMPs withmasses (m) and cross sections on nucleons (σ) which yield spectra above the measured experimentalrate. To claim a positive identification of the WIMP, however, a distinctive signature is needed. The onlyidentification signals of the WIMP explored up to now are provided by the features of the Earth’s motionwith respect to the dark matter halo. In particular, the annual modulation [105] is originated by the com-bination of the motion of the solar system in the galactic rest frame and the rotation of the Earth aroundthe Sun. Due to this effect, the incoming WIMP velocities in the detector rest frame change continuouslyduring the year, having a maximum in summer and a minimum in winter in the northern hemisphere.Therefore the total WIMP rate changes in time with an oscillating frequency which corresponds to anannual period and a maximum around the beginning of June.
The relative annual variation of the signal is small (a few percent) so in order to detect it one needslarge detector masses to increase statistics and several periods of exposure to minimize systematics. Sev-eral experiments have already searched for this effect [106, 107, 108] and since 1997 the DAMA grouphas reported a positive signal [109] which has been appearing throughout four yearly periods. Recently,the DAMA experiment has extended up to seven yearly periods the annual modulation effect, whichstands now at 6.3σ level [110]. The present situation is no doubt exciting. On one hand that resulthas triggered an intense activity in the field; on the other, the experimental sensitivities of various typesof underground detectors are entering the supersymmetric parameter space [103] and in particular sev-eral of them [111, 112, 113, 114] are excluding, to a larger or lesser degree (within standard frameworkmodels), the region of mass and cross-section where the reported WIMP is supposed to exist. This isparticularly true after the recent results of the CDMS experiment [115] whose disagreement with DAMAis statistically more significant. It is then compulsory to explore this effect with other nuclear targets, andthat will be one of the purposes of CUORE. We will discuss in the following the capabilities of CUOREto exclude or detect WIMPs using the total time-integrated experimental rate and comparing it with thepredicted nuclear recoil rate. To look for the annual modulation signal in CUORE, which in principlehas enough mass to be sensitive to it, one needs to know its stability performance. The analysis of theCUORE potential for annual modulation searches will be performed -following statistical consideration-(see Ref. [116]), with the proviso that systematic uncertainties are under control. Data on the stability ofCUORICINO will be crucial to assess such hypotheses.
To calculate the theoretical WIMP rate, standard hypothesis and astrophysical parameters are as-
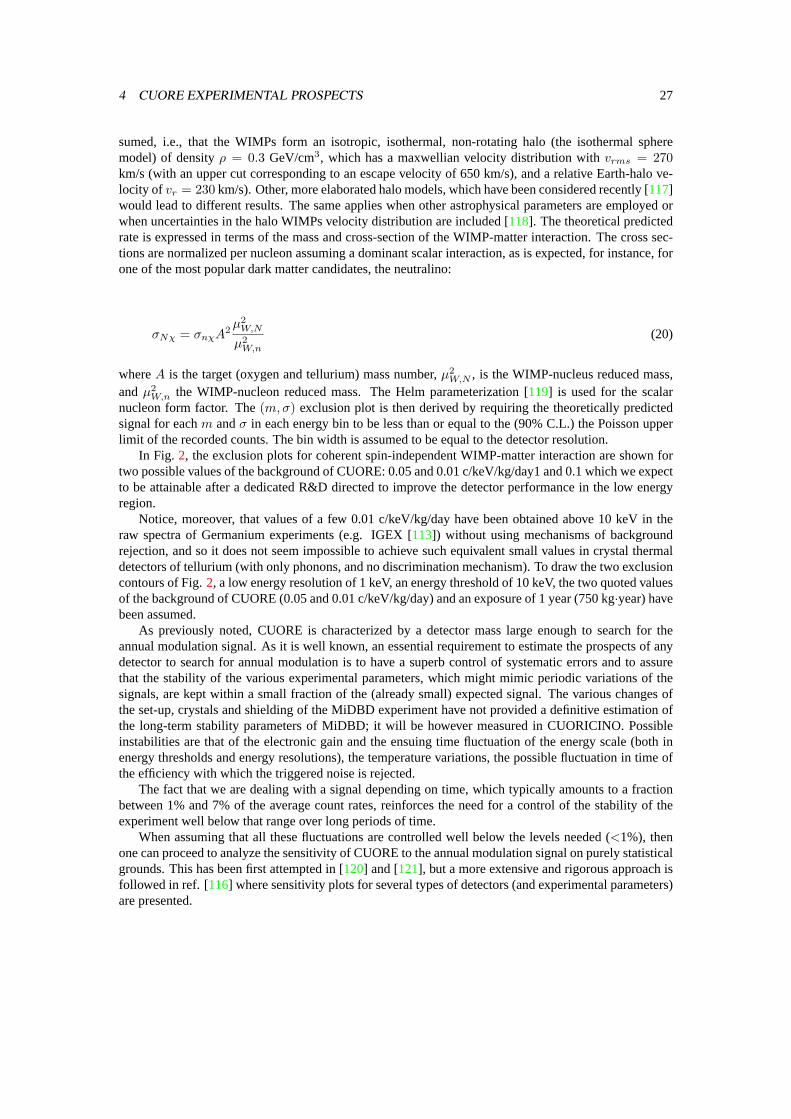
4 CUORE EXPERIMENTAL PROSPECTS 27
sumed, i.e., that the WIMPs form an isotropic, isothermal, non-rotating halo (the isothermal spheremodel) of densityρ = 0.3 GeV/cm3, which has a maxwellian velocity distribution withvrms = 270km/s (with an upper cut corresponding to an escape velocity of 650 km/s), and a relative Earth-halo ve-locity of vr = 230 km/s). Other, more elaborated halo models, which have been considered recently [117]would lead to different results. The same applies when other astrophysical parameters are employed orwhen uncertainties in the halo WIMPs velocity distribution are included [118]. The theoretical predictedrate is expressed in terms of the mass and cross-section of the WIMP-matter interaction. The cross sec-tions are normalized per nucleon assuming a dominant scalar interaction, as is expected, for instance, forone of the most popular dark matter candidates, the neutralino:
σNχ = σnχA2µ2
W,N
µ2W,n
(20)
whereA is the target (oxygen and tellurium) mass number,µ2W,N , is the WIMP-nucleus reduced mass,
andµ2W,n the WIMP-nucleon reduced mass. The Helm parameterization [119] is used for the scalar
nucleon form factor. The(m,σ) exclusion plot is then derived by requiring the theoretically predictedsignal for eachm andσ in each energy bin to be less than or equal to the (90% C.L.) the Poisson upperlimit of the recorded counts. The bin width is assumed to be equal to the detector resolution.
In Fig. 2, the exclusion plots for coherent spin-independent WIMP-matter interaction are shown fortwo possible values of the background of CUORE: 0.05 and 0.01 c/keV/kg/day1 and 0.1 which we expectto be attainable after a dedicated R&D directed to improve the detector performance in the low energyregion.
Notice, moreover, that values of a few 0.01 c/keV/kg/day have been obtained above 10 keV in theraw spectra of Germanium experiments (e.g. IGEX [113]) without using mechanisms of backgroundrejection, and so it does not seem impossible to achieve such equivalent small values in crystal thermaldetectors of tellurium (with only phonons, and no discrimination mechanism). To draw the two exclusioncontours of Fig.2, a low energy resolution of 1 keV, an energy threshold of 10 keV, the two quoted valuesof the background of CUORE (0.05 and 0.01 c/keV/kg/day) and an exposure of 1 year (750 kg·year) havebeen assumed.
As previously noted, CUORE is characterized by a detector mass large enough to search for theannual modulation signal. As it is well known, an essential requirement to estimate the prospects of anydetector to search for annual modulation is to have a superb control of systematic errors and to assurethat the stability of the various experimental parameters, which might mimic periodic variations of thesignals, are kept within a small fraction of the (already small) expected signal. The various changes ofthe set-up, crystals and shielding of the MiDBD experiment have not provided a definitive estimation ofthe long-term stability parameters of MiDBD; it will be however measured in CUORICINO. Possibleinstabilities are that of the electronic gain and the ensuing time fluctuation of the energy scale (both inenergy thresholds and energy resolutions), the temperature variations, the possible fluctuation in time ofthe efficiency with which the triggered noise is rejected.
The fact that we are dealing with a signal depending on time, which typically amounts to a fractionbetween 1% and 7% of the average count rates, reinforces the need for a control of the stability of theexperiment well below that range over long periods of time.
When assuming that all these fluctuations are controlled well below the levels needed (<1%), thenone can proceed to analyze the sensitivity of CUORE to the annual modulation signal on purely statisticalgrounds. This has been first attempted in [120] and [121], but a more extensive and rigorous approach isfollowed in ref. [116] where sensitivity plots for several types of detectors (and experimental parameters)are presented.

4 CUORE EXPERIMENTAL PROSPECTS 28
WM (GeV)
σ(n
)(n
barn
s)
1 5 10 50 100 500 1000 10 - 12
10 - 10
10 - 8
10 - 6
10 - 4
Figure 2: Exclusion projected for 1 year of CUORE assuming a threshold of 10 keV, a low energyresolution of 1 keV, and low energy background levels of 0.05 and 0.01 c/keV/kg/day respectively. Thedashed line corresponds to the MiDBD result.
Following the guidelines of that reference, the sensitivity of a given experimental device to the annualmodulation signal can be precisely quantified by means of theδ parameter, defined from the likelihoodfunction or, equivalently, from theχ2 function of the cosine projections of the data (for further details seeref. [116]):
δ2 = y(σ = 0)− ymin ' χ2(σ = 0)− χ2min. (21)
This parameter measures the statistical significance of the modulation signal detected in an experi-mental set of data. However, for a given (m,σ) and a given experiment, the expected value〈δ2〉 can beestimated using the expression derived in ref. [116]:
〈δ2〉 =12
∑k
Sm,k(σ,mW )2∆Ek
bk + S0,kMTα + 2 (22)
whereSm,k andS0,k are the modulated and non-modulated parts of the WIMP signal in thekth energybin of ∆Ek width, bk is the background in that energy bin andMTα the effective exposure, beingα acoefficient accounting for the temporal distribution of the exposure time around modulation maxima andminima (α = 1/n
∑ni=1 cos2 ω(ti − t0) for n temporal bins).
Using this equation we have estimated the region that could be within reach for CUORE with theabove mentioned assumptions on the background levels. We have fixed a value of 5.6 for〈δ2〉 thatcorresponds to 50% probability of obtaining a positive result at 90% C.L. In figure3 curves are shownobtained for a threshold of 10 keV, two years of exposure and two assumed flat backgrounds of 0.05 and
4 CUORE EXPERIMENTAL PROSPECTS 29
WM (GeV)
σ(n
)(n
barn
s)
1 5 10 50 100 500 1000 10 - 11
10 - 10
10 - 9
10 - 8
10 - 7
10 - 6
Figure 3: The solid lines represent the sensitivity plot in the (m,σ) plane for CUORE, assuming a thresh-old of 10 keV, two years of exposure (1500 kg year) and flat backgrounds of 0.05 and 0.01 c/keV/kg/day.It has been calculated for〈δ2〉 = 5.6 (see the text). The sensitivity curve has been also calculated for apossible threshold of 5 keV with a background of 0.01 c/keV/kg/day (dashed line).
0.01 c/keV/kg/day (solid lines). The possibility of a lower threshold of 5 keV with a background of 0.01c/keV/kg/day is also shown (dashed line).
In conclusion, CUORE will be able to explore (and/or exclude) WIMPs lying in large regions of theirparameter space.
The capability of CUORE to investigate the DAMA region through the exclusion plot (time integratedmethod) relies on getting a background of 0.1 c/keV/kg/day from 10 keV onwards, independently of moreelaborated time modulation methods which require an exhaustive control of the stability of the experi-ment. However, CUORE could also attempt to look for annual modulation of WIMP signals providedthat the stability of the experiment is sufficient.
We would like to note in addition that the nuclei of Tellurium are totally different from those ofGermanium and close in atomic number to Iodine. The ground state of 93% of the Te nuclei is 0+.Comparison among the results from these nuclei seems therefore very interesting.
4.2.2 Solar axion detection
Axions are light pseudoscalar particles which arise in theories in which the Peccei-Quinn U(1) symmetryhas been introduced to solve the strong CP problem [122]. They could have been produced in early stagesof the Universe being attractive candidates for the cold dark matter (and in some particular scenarios forthe hot dark matter) responsible to 1/3 of the ingredients of a flat universe. Dark matter axions can existin the mass window10−2(3) eV < ma ≤ 10−6 eV, but hadronic axions could exist with masses aroundthe eV.
Axions could also be copiously produced in the core of the stars by means of the Primakoff conversion

4 CUORE EXPERIMENTAL PROSPECTS 30
of the plasma photons. In particular, a nearby and powerful source of stellar axions would be the Sun.The solar axion flux can be easily estimated [123, 124] within the standard solar model, resulting in anaxion flux of an average energy of about 4 keV that can produce detectable X-rays when converted in anelectromagnetic field. We would like to stress that, although we focus on the axion because its specialtheoretical motivations, all this scenario is also valid for any generic pseudoscalar (or scalar) particlecoupled to photons [125]. Needless to say that the discovery of any type of pseudoscalar or scalar particlewould be extremely interesting in Particle Physics. We will keep our discussion, however, restricted tothe case of solar axions.
Single crystal detectors provide a simple mechanism for solar axion detection [124, 126]. Axions canpass in the proximity of the atomic nuclei of the crystal where the intense electric field can trigger theirconversion into photons. The detection rate is enhanced if axions from the Sun coherently convert intophotons when their incident angle with a given crystalline plane fulfills the Bragg condition. This inducesa correlation of the signal with the position of the Sun which can be searched for in the data and allowsfor background subtraction.
The potentiality of Primakoff conversion in crystals relies in the fact that it can explore a range ofaxion masses (ma & 0.1 keV) not accessible to other direct searches. Moreover it is a relatively simpletechnique that can be directly applied to detectors searching for WIMPs.
Primakoff conversion using a crystal lattice has already been employed in two germanium experi-ments: SOLAX [127] and COSME-II [128] with the ensuing limits for axion-photon couplinggaγγ .2.7× 10−9 GeV−1 andgaγγ . 2.8× 10⁻⁹ GeV−1 respectively. Also the DAMA collaboration has ana-lyzed 53437 kg-day of data of their NaI set up [129], in a search for solar axions, following the techniquesdeveloped in ref. [130], where a calculation of the perspectives of various crystals detectors (includingNaI) for solar axion searches has been made. The DAMA resultgaγγ . 1.7 × 10⁻⁹ GeV−1 improvesslightly the limits obtained with other crystal detectors [127, 128] and agrees with the result predicted inref. [130]. These "crystal helioscopes" constraints are stronger than that of the Tokyo axion helioscope[131] for ma & 0.26 eV and do not rely on astrophysical considerations (i.e. on Red Giants or HB starsdynamics [132]). The orientation of the crystal was not known so that the data were analyzed taking theangle corresponding to the most conservative limit.
It has been noted that the model that yields the solar axion fluxes used to calculate the expected signalsis not compatible with the constraints coming from helioseismology ifgaγγ & 10−9 GeV−1 [133]. Thiswould imply a possible inconsistency for solar axion limits above that value, and sets a minimal goal forthe sensitivity of future experiments.
The use of CUORE to search for solar axions via Bragg scattering should have some advantageswith respect to germanium detectors, because of the higher Z, larger mass and known orientation of thecrystals. Since the cross-section for Primakoff conversion depends on the square of the atomic number,TeO2 will be a better candidate than Germanium. Needless to say that a low energy threshold is mandatorybecause the expected signal lies in the energy region 2 keV. E . 10 keV and is peaked atE ' 4 keV.As for dark matter searches, this will of course require specific R&D directed to a better performance inthe low energy region.
A detailed analysis has been performed [130] for a TeO2 crystal (which has a tetragonal structure[134]) assuming different values for the experimental parameters. As it is shown in Ref. [130], the boundon axion-photon coupling which a given experiment can achieve can be estimated through the expression:
gaγγ < glimaγγ ' k
(b
c/keV/kg/daykgM
yearsT
)1/8
× 10−9GeV−1 (23)
wherek depends on the crystal structure and material, as well as on the experimental threshold and res-olution. For the case of TeO2 and a threshold of 5 keV,k has been calculated to bek = 2.9 assuming

4 CUORE EXPERIMENTAL PROSPECTS 31
Figure 4: Best bound attainable with CUORE (straight line labelled "CUORE") compared with otherslimits.
an energy resolution of 1 keV. The computation of this expression for some assumed values of the ex-perimental parameters is shown in table7 for CUORE. Flat backgrounds and 2 years of exposure areassumed.
It is worth noticing the faible dependence of the ultimate achievable axion-photon coupling bound onthe experimental parameters, background and exposure MT: the 1/8 power dependence ofgaγγ on suchparameters softens their impact in the final result. The best limit shown in table7 is in fact only one orderof magnitude better than the present limits of SOLAX and COSME-II. Thegaγγ bound that CUOREcould provide is depicted comparatively to other limits in figure4.
Mass Resolution Threshold Background glimaγγ (2 years)
(kg) (keV) (keV) (c/kg/keV/day) (GeV−1)750 1 5 0.01 6.5×10⁻¹⁰
750 1 5 0.05 8.0×10⁻¹⁰
Table 7: Expected limits on the photon-axion coupling for 2 years of exposure of CUORE assuming thequoted values for the experimental parameters
The limit which can be expected from CUORE is better than the helioseismological bound mentionedbefore (see Figure4 and Table7). Notice that in both cases an energy threshold ofEthr ∼ 5 keV (andresolution of∼1 keV) has been assumed. As was described at length in Ref. [130], the crucial parametersfor estimating the perspectives on solar axion detectors with crystals rely on the energy threshold and res-olution (appearing ink), and the level of background achieved (although the influence of this parameter isdamped by a factor 1/8). In particular, a threshold of 5-8 keV would loose most of the axion signal. Other

4 CUORE EXPERIMENTAL PROSPECTS 32
crystal detectors with, say, Ge or NaI (GENIUS, MAJORANA, GEDEON, DAMA, LIBRA, ANAIS, . . . )could surpass CUORE as axion detectors because the energy thresholds of these projects are supposed tobe significantly lower. Also the background is expected to be better.
Nevertheless, it should be stressed that the bounds ongaγγ obtained with this technique in the variousproposed crystal detector arrays stagnate at a few×10−10 GeV−1, not too far from the goal expectedfor CUORE, as has been demonstrated in [130]. There are no realistic chances to challenge the limitinferred from HB stars counting in globular clusters [132] and a discovery of the axion by CUORE wouldpresumably imply either a systematic effect in the stellar-count observations in globular clusters or asubstantial change in the theoretical models that describe the late-stage evolution of low-metallicity stars.To obtain lower values ofgaγγ one should go to the magnet helioscopes like that of Tokyo [131] and thatof CERN (CAST experiment [135] currently taking data).
In particular, until recently the best experimental bound ofgaγγ published came from the Tokyohelioscope:gaγγ ≤ 6 × 10⁻¹⁰ GeV−1 for ma . 0.03 eV andgaγγ ≤ 6.8 − 10.9 × 10⁻¹⁰ GeV−1 forma ∼ 0.05−0.27 eV. The sensitivity of CAST is supposed to provide a boundgaγγ ≤ 5×10⁻¹¹ GeV−1
or even lower. A recent run of CAST has improved the Tokyo limit with a boundgaγγ ≤ 3 × 10⁻¹⁰ forma ≤ 0.05 eV.
4.2.3 Searches for other rare processes
Searches for rare atomic or nuclear events have provided and are going to provide a very rich harvestof important results, some of them probably beyond our imagination. We believe that the technique ofmassive thermal detectors is particularly suitable to search for many of them, but we present here only afew examples just to stimulate our theoretical friends to suggest others.
Electron stability Searches on this decay [136], can represent an important by-product for CUORE.An inclusive experiment on this process can be carried out by detecting the disappearance of an atomicelectron followed by the consequent decay (or series of decays) of the outer-shell electrons to fill thevacancy left by this disappearance. These searches, which have relevance also in connection with chargeconservation and Pauli principle validity, can be carried out by looking for sharp lines correspondingto decays in the atomic tellurium structure. The exclusive charge violating decay of an electron in aneutrino and a photon can be revealed by the presence of peak at 255 keV, spread however by the Dopplerbroadening of the atomic electron motion. Even if not fully exploiting the excellent energy resolution ofCUORE, this decay can be efficiently searched, due to the large mass and low background expected forthis detector.
Nucleon stability CUORE cannot obviously compete with the various experiments specifically de-signed to investigate specific channels of this decay [137]. It can however provide competitive resultson the inclusive decays of a proton or neutron through the search for delayed coincidences between thenucleon decay signature (e.g. high energy releases by nucleon decay products or promptγ’s from nuclearre-arrangement processes) and possible unstable produced nuclei. Possible nucleon decays leading to theproduction of unstable nuclei emitting gamma rays are listed in Table8 . Delayed gamma rays emitted inthese secondary decays could be detected in nearby crystals. If the half-lifetime of the unstable producednuclei would be reasonably short an effective coincidence selection could be applied.Unusual decay modes (e.g.n → 3ν) have been recently suggested as possible dominant modes [138].The CUORE unique capabilities for the detection of prompt low energyγ–rays following such "invisi-ble" decay channels could provide competitive sensitivities for the search of these decay modes whichmay have been missed by previous dedicated experiments. In particular, results from CUORE can becomplementary to those recently obtained by the SNO collaboration.

4 CUORE EXPERIMENTAL PROSPECTS 33
Table 8: Possible nucleon decays leading to unstable nuclei characterized by the emission of gamma rays.
Nucleus Abundance % Decay Product Lifetime Gamma Rays (keV)120Te 0.096 p 119Sn 38.1 h 24
n 119Te 16 h 644.119mTe 4.69 d 154, 1213, 271
122Te 2.6 n 121Te 16.8 d 573, 508121mTe 154 d 1102, 37
123Te 0.908 p 122Sb 2.72 d 564122mSb 4.191 m 61, 76
124Te 4.816 n 123mTe 119.7 d 159125Te 7.14 p 124Sb 60.2 d 603, 1691, 773
124mSb 20.2 m 603, 946, 498126Te 18.95 n 125mTe 58 d 36128Te 31.69 p 127Sb 3.84 d 686, 474, 784
n 127Te 9.4 h 418, 380127mTe 109 d 58
130Te 33.8 p 129Sb 4.4 h 813, 915, 545129mSb 17.7 m 760, 658, 434
n 129Te 1.16 h 460, 28129mTe 33.6 d 696
Rare beta processes113Cd An experiment carried out with a large CdWO4 crystal [139] has determined the transition en-
ergy and lifetime of this nucleus and measured for the first time the shape of the beta spectrum.The study of this transition was also repeated later by exploiting the scintillating properties ofCdWO4 [140]. These results, can be further improved if a large CdWO4 would be inserted into theCUORE detector.
123Te Evidence for the existence of the second forbidden electron capture of this nucleus has beenreported by various authors. An experiment recently carried out by the Milano group [141] hasshown that these evidences could be simply mimicked by other background effects and that thisdecay has actually never been found. The reported values of the half-lifetime for this decay havetherefore to be still considered only as lower limits. The discovery of this decay in CUORE wouldhave relevant implications in nuclear structure theory [142].
Rare alpha decays209Bi A search for the possible decay of this naturally occurring isotope of Bismuth, commonly regarded
as the heavier stable nucleus, was proposed in our previous letter of intent. Recently, however abolometric experiment [143] has detected theα–decay of this nucleus with a lifetime of(1.9 ±0.2) × 1019 years. Better measurements and a better study of this decay could be carried out inCUORE.
180W This nucleus can energeticallyα–decay into176Hf. Indication of this rare decay was obtainedwith conventional detectors [144] but unambiguously detected for the first time thanks to the si-multaneous measurement of phonon and light signals with the CRESST cryogenic detectors [145](T1/2 = (1.8± 0.2)×1018 y, Q = (2516.4± 1.1 (stat.)± 1.2 (sys.)) keV ). This and other rarenuclear alpha decays could be investigated with great accuracy in CUORE.

5 PRINCIPLES OF OPERATION OF TEO2 BOLOMETERS 34
5 Principles of operation of TeO2 bolometers
In a very naive approach a thermal detector is a sensitive calorimeter which measures the energy depositedby a single interacting particle through the corresponding temperature rise.
This is accomplished by using suitable materials (dielectric crystals, superconductors below the phasetransition, etc.) and by running the detector at very low temperatures (usually below 100 mK) in a suitablecryostat (e.g. dilution refrigerators). According to the Debye law, in fact, the heat capacity of a singledielectric and diamagnetic crystal at low temperature is proportional to the ratio (T/ΘD)3 (ΘD is theDebye temperature) so that, providing that the temperature is extremely low, a small energy release in thecrystal results in a measurable temperature rise.
This temperature change can be measured by means of a proper thermal sensor.A low temperature detector (LTD or “bolometer”) consists therefore of three main components (Fig.5
(a)).
Particle absorber : it is the sensitive mass of the device where the particles deposit their energy. Theabsorber material can be chosen quite freely, the only requirements being, in fact, a low heat ca-pacity and the capability to stand the cooling in vacuum. The absorber can therefore be easilyrealised with materials containing any kind of unstable isotopes and many interesting searches aretherefore possible (e.g. beta decay spectroscopy, neutrinoless double beta decay and dark matter).The absorber mass can range from few micrograms to almost one kilogram.
Temperature sensor : it represents a crucial element of the thermal detector needed to measure thetemperature rise induced by the particle interaction. Among the variety of thermometers so fardeveloped, doped semiconductor thermistors are preferred because of their ease of use and thereproducibility with which they can be produced in large quantities.
Thermal link : it mainly depends on the way the massive crystal is held to the structure (heat sink). Itinfluences the time response of the device.
Absorber masses usually characterize LTD’s applications and can range from few hundred micro-grams (X-ray spectroscopy or neutrino mass direct measurements) to several hectograms (Dark Matter orDBD searches).
5.1 Basic principles of thermal particle detectors
The basic idea behind the thermal detector is very simple [146]. Let us assume that the detector has a heatcapacity C (absorber) in thermal connection with a heat sink (kept at temperatureT0) through a thermalconductance G (fig.5(a)).
Let T (t) be the temperature of the absorber as a function of time and let us assume that∆T ≡|T (t) − T0| T0 for all times t, so thatC andG can be treated as constants. Then an instantaneousdeposition of an energy∆E in the absorber gives rise to a temperature pulse whose time development isdescribed by:
∆T (t) =∆E
Cexp
(− t
τ
)with τ =
C
G(24)
As Tmax is given by∆E/C, one immediately sees that, in order to have a significant percentageincrease of the temperature (for an energy release in the keV-MeV range) it is necessary to have a verysmall heat capacity. As already stated above, this can be achieved only operating at very low temperatures.

5 PRINCIPLES OF OPERATION OF TEO2 BOLOMETERS 35
To To
T ~ E / C∆∆ ∆ECG/2
Phonon sensor (thermometer)
Thermal phonons
Heat sink
Absorber support(small thermal link)
Electrical wires
Athermal phononsImpinging particle
RLoadRB VTot
Amplifier
(a) (b)
Figure 5: Simplified model of a thermal detector (a) and schematic read-out of a resistive thermometer(b)
Very small specific heats can be attained by exploiting the strong decrease of the specific heat withtemperature. The specific heat of a dielectric and diamagnetic crystal is in fact due only to lattice contri-butions [93], with a temperature dependance following the Debye law
C(T ) = β
(T
ΘD
)3
T < ΘD (25)
whereβ = 1994 J K−1mol−1 andΘD is the Debye temperature of the crystal.In a very simplified model [147] in which all primary phonons undergo the thermalization process,
an evaluation of the energy resolution can be obtained. In this case in fact the energy resolution of thedetector is only limited by the thermodynamic fluctuations in the number of thermal phonons exchangedwith the heat sink, which produces random fluctuations in the energy content of the absorber. Since themean energy of thermal phonons is∼kT (k is the Boltzman constant), the average total number of thermalphonons N is proportional to C(T)/k and, assuming a Poisson statistics, this imply a contribution to theenergy resolution given by
N =C(T )
k, ∆N =
√N =⇒ σE = ∆N · kT =
√c(T )
kkT = ξ
√kC(T )T 2 (26)
whereξ is a dimensionless factor (generally of the order of unity) whose actual value depends on the de-tails of the temperature sensor, of the thermal link and of the temperature dependance ofC(T ). It shouldbe stressed that, according to eq.26, σE is independentof E, with impressive “theoretical” expectationseven in the case of a massive crystal: a TeO2 crystal with a mass of 1 kg operating at 10 mK couldenergy depositions of the order of few MeV with a resolution of about 20 eV. It should be also stressed,however, that this “thermodynamic limit” doesn’t take into account other sources of energy fluctuations(e.g. metastable electron-hole states or long-lived non thermal phonons) which participate to the energydeposition process and whose contributions to the energy resolution worsening should be therefore min-imized. One should in addition take into account fluctuations in the gain due to temperature instabilitieswhich could normally worsen the resolution.
5.2 Semiconductor thermistors
Thermistors are heavily doped high resistance semiconductors, with an impurity concentration slightlybelow the metal-insulator transition [148]. Good thermistors require a higly homogeneous doping con-

5 PRINCIPLES OF OPERATION OF TEO2 BOLOMETERS 36
centration (see sec7.3) which is achieved, in the case of NTD (Neutron Transmutation Doped) thermis-tors, by means of thermal neutron irradiation throughout the entire volume [149] (sec.7.2). The electricalconductivity of these heavily doped semiconductors strongly depends on the temperature according tothehoppingandvariable range hopping(VRH) mechanisms [150]. In general the resistivity varies withtemperature as
ρ = ρ0e(T0
T )γ
(27)
whereρ0, T0 andγ depends on the doping concentration. In the case of VRH, the value ofγ is 1/2.Thermistors are usually parameterized by their sensitivityA, defined as
A(T ) =∣∣∣∣d lnR
d lnT
∣∣∣∣ = γ
(T0
T
)γ
with R(T ) = ρ(T )l
s= R0 exp
(T0
T
)γ
(28)
wherel ands are the distance between the contacts and the cross section of the thermistor, respectively.The value of the sensitivity is usually in the range 2÷10.
NTD germanium thermistors developed and built at LBNL have been used in all the large mass LTD’sdeveloped by the Milano group. They are made by exposing a ultrapure germanium single crystal to anuclear reactor neutron flux. They are characterized by an excellent reproducibility even if they are inpart made by hand. The values of R0, T0 andγ must be experimentally measured for each thermistor(characterization process). This measurement is performed by coupling the thermistors to a low temper-ature heat sink using a high conductivity epoxy. The temperatureTB (base temperature) of the heat sinkis then varied (15÷ 50 mK) while a steady currentI (bias current) flows trough the thermistors and avoltageV = IR appears across them. This produces a power dissipation which raises the temperatureand acts back on the resistance, until an equilibrium is reached. This phenomenon makes theV − Irelation deviate from linearity. This characteristic behaviour of bolometers is often referred to as “elec-trothermal feedback”. The static resistance is simply the ratio V/I while the dynamic resistance (the onlyone actually involved in the preamplifier matching requirements) is the tangent at theV − I curve. Byfurther increasing the bias current the dynamic resistance crosses the so calledinversion point(whereit vanishes) and becomes then negative. For semiconductor thermistors, a typicalV − I curve, usuallyreferred to asload curve, is represented in Fig.6 (a). By a combined fit to a set of load curves at differentbase temperatures, all the thermistor parameters are evaluated (see Fig.6 (b))
5.3 Detector operation
As mentioned in section5.1, in first approximation, the thermal pulse produced by an energy release inthe absorber is characterized by a very fast rise time and an exponential decay time determined by thephysical characteristics of the individual detector. Such a thermal pulse is then converted into an electricalone by means of the thermistor bias circuit and detector optimization is equivalent to determining the bestconfiguration for a maximum pulse amplitude. Considering the basic circuit shown in Fig.5(b), it’sstraightforward to obtain the relation between the maximum potential drop across the thermistor (Vb),the thermistor parameters and the deposited energy:
∆Vb =RLoadRB
(RLoad + RB)2VTotA
∆Tb
Tb≈ E
CTbA√
P√
RB , (29)
where E is the deposited energy, A is the sensitivity given above in equation (28), Tb and∆Tb are theoperating temperature and the temperature increase of the bolometer, C is the heat capacity of the absorberand P is the electrical power dissipated on the thermistor by the Joule effect. This expression vanishesboth in the limitP → 0 andP → ∞. When the thermistor is operated as a detector sensor, a steadycurrentI flows through it and, in a steady condition, its electrical and thermal parameters are described

5 PRINCIPLES OF OPERATION OF TEO2 BOLOMETERS 37
I[p
A]
BV [mV] 10 410−2 210 10 6
ΩL
n R
[
]
2 4 6 10
0.8
0.4
1.2
1.6
2
2.4
2.8
3.2
8
(a)
6
1012
4
1
Power [pW]
(b)
8
Start of electrothermalfeedback
"Inversion"
Tem
perature
Linear region
Figure 6: Typical load curve for a thermistor at T= 8 mK) (a) and resistance-power curves for a thermistorat different base temperatures (b).
by a point on the detectorV − I curve. This point is usually namedworking point, or optimum pointwhen corresponding to the maximum detector response (maximum amplitude of the voltage pulse). Theoptimum pointof each detector must be determined experimentally. This is accomplished by means of afixed resistance (heater) directly glued onto the crystal through which it is possible to dissipate a knownjoule power into the crystal in a manner perfectly equivalent to a particle energy deposit. Theoptimumpoint correponds to the bias voltage for which the amplitude of theheaterpulses is maximum. A typicalbolometer response as a function of detector bias is shown in Fig.7.
In fact, the actualoptimum pointis chosen by investigating the signal/noise ratio. Since the electronicsources of noise decrease with the resistance of the bolometer the bestworking pointcorresponds to abias voltage slightly higher than the one corresponding to theoptimum point(see Fig.7). The use of theheateralso plays a fundamental role in the stabilization of the bolometer response which changes withthe temperature of the heat sink [151].
5.4 Bolometer applications
Since much information on the initial particle interaction is washed out by the thermalization process (po-sition, momentum and interaction type), true cryogenic detectors are sensitive only to the total depositedenergy which, however, can be measured very accurately (sec.5.1). In fact, the intrinsic energy resolutionof such devices can be as low as a few eV. Main advantages of thermal detectors with respect to conven-tional ones are however represented by their sensitivity to low or non-ionizing events (Dark Matter (DM)searches) and material choice flexibility. Time response is sometimes poor (large mass bolometer pulserise/decay times are of the order of few tens/hundreds msec or more) but, due to the very low countingrates, this is not a limitation at all for DBD (or DM) searches. It should be stressed that the flexibility inthe choice of materials, besides allowing an experimental investigation on any DBD active isotope, meansalso the possibility of selecting materials characterized by a large natural isotopic abundance (a crucialparameter showing a linear dependence in the DBD lifetime sensitivity). Besides prohibitive costs, infact, isotopic enrichment is not always easily attainable and the possibility to choose the DBD candidateelement characterized by the highest natural isotopic abundance represents a big advantage. Becauseof the calorimetric approach, the thermal detectors detection efficiency is generally of the order of unity.Concerning energy resolution, up to now the actual detectors are still far from reaching the limits imposedby the thermodynamic fluctuations of the system internal energy (eq.26). Actual values are in the 1-10

5 PRINCIPLES OF OPERATION OF TEO2 BOLOMETERS 38
I[p
A]
2 4 6 10
0.8
0.4
1.2
1.6
2
2.4
2.8
3.2
8
V [mV]b
Load curve
Signal [A.U.]
Optimum point
ΩResistance [ ]
O.F. Noise (FWHM)
RMS Noise
Signal [a.u.]
Noi
se
[keV
] pointOptimum
Figure 7:left panel:evaluation of theoptimum pointof a bolometer;right panel: evaluation of operationpoint which maximizes the signal/noise ratio.
keV range (FWHM) and seem to scale little with the detector mass (similar values were obtained in detec-tors whose masses scaled from few grams to few hectograms) while showing a quasi-linear dependenceon the energy. Energy resolution is therefore still limited by other contributions (e.g. electronic and mi-crophonic noise, vibrations of the system, etc.) and a good detector design (thermistor choice, mountingsystem, etc.), a low noise read-out electronics and an effective data acquisition and data analysis systemsare of crucial importance for a well performing detector. So far, most of the R & D has been devotedto optimizing the detector performance. Although energy resolution doesn’t seem to scale with detectormass, there is a limit to the single detector mass (imposed not only by the increase of the heat capacity butalso by the technical feasibility of large perfect crystals). In the case of the TeO2 , such a limit has beenset so far to about one kilogram but larger masses could be possible in the near future (section15). Theonly possibility for a detector mass in the ton range is therefore a large array of LTD’s and the main issueis therefore reproducibility. This item has been faced and solved few years ago by the Milano group withthe realization of a TeO2 20 bolometer array (340 g each) and, more recently, by the successful operationof CUORICINO (section6.3).
5.5 Detector model
A rough approximation of the NTD thermistor voltage pulse amplitude∆Vb produced by an energydeposition E into the TeO2 absorber can be obtained by assumingRLoad >> RB in eq. (29):
∆Vb = Vb ·A · ∆Tb
Tb= Vb ·A · E
C Tb(30)
Using the heat capacity discussed earlier, a oneMeV energy deposition into the TeO2 absorber results in∆Tb = 7× 10⁻⁵K. Using equation (30), this results in∆Vb ∼ 600 µV , assuming typical electrical andthermal paramaters at the detector operating point. However, the observed pulses are lower by a factor2to 3, therefore a more quantitative model is needed.
A semi-quantitative Thermal Model (TM) has been developed which describes the detector in termsof three thermal nodes with finite heat capacities: the TeO2 crystal absorber,Ge thermistor lattice, andGe thermistor electrons. For simplification, the lattice component of heat capacity is assumed to benegligible. The network describing the detector is shown in Fig.8. The two heat capacities, and fourthermal conductances and the parasitic power from the vibrations and power dissipated in the thermistor

5 PRINCIPLES OF OPERATION OF TEO2 BOLOMETERS 39
Figure 8: Network representing the detector model.
electrons, are the model parameters. A typical energy deposition of 1MeV in the crystal is used and it isassumed that it is instantaneously thermalized.
A computer code was developed in Milan to determine the static behaviour. The required input dataare: the heat sink temperature, the temperature behaviour of the thermal conductances shown in Fig.8(partially determined withad hocmeasurements), the parasitic power in the crystal, and a set of valuesof electrical Joule power dissipated in the thermistor electrons. The code determines a complete solutionto the static problem, for each power level, and yields the temperature of the three thermal nodes, theresistance of the thermistor, and the current through it for each voltage-current (or power resistance)point of a load curve. When the static operation point is determined, the time evolution of the pulse iscomputed. The main aim of the TM is to have a reliable prediction of the detector figure of merit on thebasis of the known thermal parameters. To address this question it is necessary to solve the non trivialproblem of how to compare the performance of two detectors. A more sensitive thermistor would yieldlarger amplitude pulses, but they are also more sensitive to spurious noise, for example microphonics,crosstalk, and slow heat pulses from vibrations that excite the 1-5Hz portion of the noise spectrum. A

5 PRINCIPLES OF OPERATION OF TEO2 BOLOMETERS 40
Figure 9: Detector Merit Curve: simulation (solid curve) and experimental points for the 20 detectorarray.
lower heat sink temperature yields larger pulses at the price of higher resistance and more spurious noise.Recent experience shows that the best way to define a detector figure of merit is by fixing the heat
sink temperature between7 mK and11 mK and by measuring a load curve. Using particle or heaterpulses, the operation point on the load curve, corresponding to the highest signal is determined. Foreach heat sink temperature, one determines a pair of points, the thermistor resistance,R, and the signalamplitude,V , usually expressed in microvolts perMeV , corresponding to the maximum pulse amplitudefor a given heat sink temperature. One obtains a characteristic curve for that detector by plotting voltagevs resistance, which to a good approximation is a straight line on a log-log plot. This is called the DetectorMerit Curve (DMC). Experience shows that a detector has constant signal-to-noise ratio along a DMC.No large differences in performance are noted for heat sink temperatures of8 mK or 12 mK, becausethe signal level and the spurious noise offset one another. It is better to avoid the extremities of the DMCthat lead to higher spurious noise or low signals.
The best way to compare two different detectors is by using their DMCs. If the DMC of detector Alies systematically above that of detector B, the performance of detector A is superior. It provides thehighest signals for a fixed thermistor resistance value. The main value of the TM is to predict the DMCgiven the temperature behaviour of the thermal parameters discussed above.
As a test of the model, a typical detector of the MiDBD 20-element array was simulated. Thesehave different masses and geometries than the CUORE crystals. A DMC was then constructed usingthe model for this detector. It was then compared to the real DMC measured for the 20-detector array.A significant spread among the experimental points, for all 20-detectors was found. There were tworeasons for this; intrinsic detector differences and the presence of points not corresponding exactly tothe maximum signal. Nevertheless the simulated DMC lies inside of the experimental points and has thecorrect slope (see Fig.9). The detector simulations are not distinguishable from a typical detector of thearray.
The TM must correctly predict not only pulse amplitude, but also time constants. At a typical oper-ating resistance (∼ 100 MΩ) the predicted rise time (10%-90%) and decay time, are respectively 40ms

5 PRINCIPLES OF OPERATION OF TEO2 BOLOMETERS 41
Figure 10: Real pulses (full line) and simulated pulses (line+points).
and 430ms, and lie inside the distribution of these parameters for the 20-detector array. In Fig.10, thesimulated pulse is compared with real pulses collected with four detectors, randomly chosen among the20 elements. It is evident that the pulse-shape of the simulated detector is very similar to that of a typicaldetector of the array. From this it was concluded that the TM is capable of explaining semi-quantitativeperformance of the 20 - element array.
The TM can be used in parallel with specific low temperature experimental tests, to define the op-timum properties of the CUORE element, and the results thus obtained imply the following optimumparameters for the CUORE elements:
1. TeO2 absorber dimensions:50× 50× 50 mm, with a mass of 750g;
2. NTD Thermistor # 31,T0 = 3.0 K, R0 = 1.5 Ω, dimensions3×3×1 mm, with a contact distanceof 3 mm, and with a resistance of50 MΩ atT = 10 mK;
3. absorber-thermistor coupling made with 9 epoxy spots, 0.5 to 0.8mm in diameter, and 50µmhigh;
4. gold connecting wires 50µm in diameter, and 15mm in length;
5. crystals mounted on PTFE blocks with a total PTFE-to-crystal contact area equal to about a fewsquaremm.
In spite of the reasonable agreement obtained between the TM predictions and the performance ofthe 340 g TeO2 detectors, the comprehension of the detector operation principles is far to be complete.The proponents would like to stress in fact that this agreement was obtained with theaveragedetectorbehaviour, while the TM seems to fail when one attempts to fully simulate an individual device. Inparticular, one observes a general trend according to which the simulated pulse amplitudes are smallerthan the experimental ones. Inconsistency appears also in the pulse shape. This is true in particular forthe CUORICINO 790 g detectors, as described below.

5 PRINCIPLES OF OPERATION OF TEO2 BOLOMETERS 42
In the CUORICINO case, the proponents have used an improved version of the code implementingthe thermal model, capable not only of simulating but also of fitting to experimental data of the load curveof individual detectors. After fitting, the agreement between the simulated and the real curve is excellent.Of course the fit procedure changes the initial values of the thermal conductances, as measured in thespecific experiments mentioned above. However, this modification is not drastic and can be justifiedwith the inevitably not complete reproducibility of delicate manual operations like thermistor gluingand crystal insertion in the Teflon blocks. This proves that thestatic part of the model describes thedetector satisfactorily. Problems show up when dealing with thedynamicbehaviour. The simulated pulse,reconstructed using the thermal parameters extracted from the static behaviour of a specific detectorand, in addition, the lattice heat capacity and the electron heat capacity (taken as a free parameter), istoo small, typically a fraction 3 to 5, with respect to the experimental pulses collected for that specificdetector. The decay time is also in disagreement, being typically 3 to 5 times too fast. Note that thisdisagreement cannot be naively solved by postulating a crystal heat capacity lower than expected: in fact,this can solve the discrepancy between the pulse amplitudes, but at the price of making the disagreementbetween decay times even more severe. In addition, while it would not be surprising to find higher thanexpected specific heats for the TeO2 crystals at low temperatures, it is really difficult to justify lowervalues. The impression is that a model based on heat flows, which assumes thermal distribution of theinvolved excitations (phonons in the absorber, electrons in the thermistor), is not totally adequate for thedescription of the detector performance. Some attempts to modify the model by introducing athermalphonons directly absorbed in the thermistor seem to improve our ability to describe the pulse shape andamplitude. However, work is in progress and for the moment no conclusive statement can be made aboutthe mechanism of pulse formation.

6 PREVIOUS RESULTS OF MIDBD AND CUORICINO 43
6 Previous results of MiDBD and CUORICINO
The MiDBD experiment, carried out in Hall A of LNGS by the Milano group, was only the last of aseries of experiments on neutrinoless DBD of130Te, based on the bolometric technique. In fact, theimprovements in the detector performance obtained over the course of years of measurements with detec-tors of constantly increasing mass, led to a large mass, low background experiment whose results finallydemonstrated the competitiveness of the low temperature calorimeters. The idea of CUORE proceeds justfrom the successful results of MiDBD which can be therefore considered as a first step towards CUORE.The possibility to use the available MiDBD cryogenic system to test a single module of CUORE, thuschecking the feasibility of this second generation experiment, finally lead to CUORICINO. Approved andfunded in 2001, CUORICINO is actually the most sensitive experiment on neutrinoless DBD of130Te,and is presently running in Hall A of LNGS, in the same cryostat used for MiDBD.
6.1 LNGS cryogenic setups
Two cryogenic setups were installed in the eighties at LNGS by the Milano group. The first, used in thepast for the MiDBD experiment (Hall A) is now hosting the CUORICINO detector. The second (HallC) has been dedicated to the research and development activities for CUORICINO and CUORE. Bothcryogenic setups consist of dilution refrigerators having powers of 1000µW and 200µW at 100 mKrespectively. They are both equipped with a dedicated Helium liquefier, providing a substantial recoveryof the Helium and preventing Helium contamination of the tunnel atmosphere, and are housed insideFaraday cages to suppress electromagnetic interference. A much larger experimental volume is availablein the Hall A cryogenic setup.
600 mK shield
Roman Lead
Mixing Chamber
OldNew
Four detectors module New four detector module
damped steel spring
35 cm "passing trough"cold finger
Figure 11: Scheme of the MiDBD detectors.
All the materials used for construction of MiDBD and CUORICINO were analysed to determinetheir radioactive contamination levels. These measurements were carried out by means of two largeGe detectors installed in the Gran Sasso underground Low Radioactivity Laboratory. The level of theradon contamination in the air of the Laboratory is continuously monitored. Both dilution refrigeratorsare equipped with heavy shields against environmental radioactivity. In particular, the Hall A dilutionrefrigerator is shielded with two layers of lead of 10 cm minimum thickness each. The outer layer is

6 PREVIOUS RESULTS OF MIDBD AND CUORICINO 44
0.2
0.3
500 1000 1500 2000 2500
Fig. 1
Energy [keV]
Cou
nts
/ (ke
V h
)
0.1
0
Figure 12: An U+Th calibration, sum spectrum of the 20 detectors
of commercial low radioactivity lead, while the internal one is made with special lead with a210Pbcontamination of 16± 4 Bq/kg. The external lead shields are surrounded by an air-tight box flushed withfresh nitrogen from a dedicated evaporator to avoid radon contamination of the gas close to the cryostat.
In order to shield the detectors against the unavoidable radioactive contamination of some fundamen-tal components of the dilution refrigerator thick layers of Roman lead are placed inside the cryostat justaround the detectors. A borated polyethylene neutron shield (10 cm) was added in 2001 to the hall Acryostat.
6.2 MiDBD experiment
The main goal of MiDBD was the study of neutrinoless and two neutrino double beta decay of130Teto 130Xe using the thermal method. In addition, its results on the detector performance, and on thebackground, were demonstrated to be particularly useful for the CUORE and CUORICINO development.
MiDBD consisted of an array of 20 crystals of TeO2 of 3×3×6 cm3 each (340 g), for a total mass of6.8 kg. It was operated in the Hall A dilution refrigerator until December 2001. Sixteen MiDBD crystalswere made of natural TeO2. Of the remaining four, two were isotopically enriched at 82.3 % in128Te andother two at 75.0 % in130Te. Mass spectrometer measurements determined that, due to the crystallizationprocess, these enrichment factors were lower than the original ones (94.7 % and 92.8 %, respectively).The array, held in a copper tower-like frame mounted inside the inner vacuum chamber (IVC) of thedilution refrigerator, was maintained at a constant temperature of about 10 mK.
A Neutron Transmutation Doped (NTD) thermistor and a Si doped resistor were glued on the sur-face of each crystal. The former was used to read-out the thermal signal while the latter acted as aheater to generate a reference heat pulse in the crystal in order to monitor continuously the gain of each

6 PREVIOUS RESULTS OF MIDBD AND CUORICINO 45
Figure 13: Distribution of the single MiDBD detector energy resolutions (FWHM) on the208Tl 2615keV line.
Figure 14: Background spectrum: the alpha particle region

6 PREVIOUS RESULTS OF MIDBD AND CUORICINO 46
bolometer[151]. The electronic readout was accomplished with a room temperature low noise differen-tial voltage-sensitive preamplifier, followed by an amplifier and an antialiasing Bessel filter. The MiDBDdetector was shielded with an internal layer of Roman lead of 1 cm minimum thickness (Fig.11). Inorder to shield the detectors against the unavoidable radioactive contamination due to some fundamentalcomponents of the dilution refrigerator a layer of 10 cm Roman lead was placed above the tower of thearray inside the cryostat. A similar layer, also inside the cryostat, was placed below the tower. The signif-icant effort was carried out to check both the knowledge of the background sources and the performanceof the new detector mounting system proposed for CUORICINO and CUORE. This led to a second run(MiDBD-II) in 2001 in which the detector structure was heavily modified (Fig.11). The MiDBD towerwas completely rebuilt with a structure very similar to the one designed for CUORE/CUORICINO inwhich all the surfaces of the TeO2 crystals and of the mounting structure were subject to a dedicatedetching process aiming to reduce radioactive contaminants. On this occasion, due to the more compactstructure of the tower, an enlargement of the internal Roman lead shields was also realized. An externalneutron shield (10 cm of borated polyethylene) was added in June 2001. MiDBD data collection was di-vided in runs of about 15-20 days. At the beginning and at the end of each run the detector was calibratedwith an exposure, lasting about 3 days, to a mixed U and Th source placed at the two opposite side of the20 crystal tower, just in contact with the external cryostat thermal shields.
The excellent reproducibility of the MiDBD detectors is shown in Fig.12 where the total calibrationspectrum obtained by summing the spectra of the 20 detectors is presented. The overall energy resolutionin the total calibration spectrum and in the total background spectrum are reported in Table9.The singledetector energy resolution distributions at the208Tl 2615 keVγ-line are shown in Fig.13.
The two MiDBD runs totalled∼31,508 (MiDBD-I) and∼5,690 (MiDBD-II) kg×hours of effectiverunning time, respectively. Sum spectra were obtained both with no anticoincidence cut and by operatingeach detector in anticoincidence with all the others (“anticoincidence cut”). In all these spectra the mainlines due to the natural activity of the232Th and238U chains, of40K and the lines at 1173 and at 1332keV due to cosmogenic60Co were observed.
The sum spectra of the two runs obtained after applying theanticoincidence cutare shown in Fig.16.A clear reduction in both continuum andγ/α peaks intensities is observed. This proves the effectivenessof the changes applied in MiDBD-II and provide information on the localization of the main backgroundsources (see Table10).
A background analysis, supported by the Monte Carlo simulation of the detector, allows us to dis-entangle the different sources responsible of the MiDBD background in the two runs and to understandwhich of the changes applied in MiDBD-II are responsible of the observed reductions. The conclusionsthus obtained are the following:
• theγ peaks above∼500 keV of the U and Th chains and the two60Coγ peaks at 1.173 and 1.332
Table 9: FWHM resolutions (keV) in a calibration spectrum and in the 84000 hours× crystal backgroundspectrum.
CalibrationEγ [keV] 583 911 1764 2615
FWHM [keV] 3.6 4.3 5.9 8.1
BackgroundEγ [keV] 583 911 1460 2615
FWHM [keV] 4.2 5.1 6.7 9.3

6 PREVIOUS RESULTS OF MIDBD AND CUORICINO 47
Figure 15: Scatter plot of coincident events between all possible MiDBD detector pairs.

6 PREVIOUS RESULTS OF MIDBD AND CUORICINO 48
Energy [keV]2000 4000 6000 8000 10000
[Cou
nts/
keV
/kg/
y]
1
10
102 MiDBD I
MiDBD II
Figure 16: MiDBD-I (continuous line) and MiDBD-II (dashed line)background spectra after anticoinci-dence cut.
Reduction factors - peaksU and Thγ’s 60Co 40K U and Thα’s
≥ 2 ∼ 2 ∼ 6 ∼ 2
Reduction factors - continuum[1 - 2] MeV [2 - 3] MeV DBD region [3 - 4] MeV∼ 1.3 ∼ 1.6 1.5± 0.3 ∼ 2.4
Table 10: Background reduction factors measured between the two runs of MiDBD.
MeV are mainly due to sources outside the detector, these peaks are substantially reduced by theincreased shield of Roman lead;
• the 40K γ peak is probably due to multiple sources, its reduction being due both to the surfacetreatements and to the increased shield of Roman lead;
• theα peaks of the238U and232Th chains, clearly visible in the background spectrum above 4 MeV,are mainly due to surface contamination of the crystals, their reduction has to be accounted for bythe surface treatment of the crystals;
• 238U and232Th γ peaks below∼ 500 keV are attributed to a surface contamination of the coppermounting structure;
• low intensitiesγ lines of rather short living isotopes are explained by the cosmogenic activation ofboth copper and tellurium.

6 PREVIOUS RESULTS OF MIDBD AND CUORICINO 49
According to our Monte Carlo simulation of the MiDBD detectors, the foregoing sources can com-pletely account for the observed background (peaks and continuum) measured in the two runs.
A semi-quantitative analysis was carried out considering only MiDBD-I data for which the availablestatistics were more significant. In particular, the sources responsible of the background measured in theββ(0ν) region were identified as follows:
1. 232Th contaminations external to the detector structure (only theγ emission from this chain cancontribute to the background, mainly throught the 2615 keV line of208Tl)
2. 238U and232Th surface contaminations of the crystals (α, β andγ emissions from these chainscontribute to the background)
3. 238U and 232Th surface contamination of the copper mounting structure (α, β andγ emissionsfrom these chains contribute to the background)
The first source is identified from the clear 2615 keV208Tl line seen in the spectra of both MiDBDruns. Its localization is based on the analysis of the relative intensities of theγ lines (of different energies)belonging to the232Th chain. Environmentalγ flux in the underground laboratory (measured with a Gedetector just close to our experimental set-up) and the measured contamination of the external lead shieldslead us to rule out these two possible sources for the208Tl line. The contamination seems therefore tobe in the cryostat, and it could reasonably be the sum of the contamination of the various thermal shieldsthat surround our detector. In order to extrapolate the contribution of this source to the background in theββ(0ν) region, we analyzed the calibration spectra obtained with an external232Th source located justoutside the cryostat. The shape of the calibration spectrum is in fact in good agreement with the shape ofthe simulated spectra for radioactive232Th contaminations distributed over the cryostat thermal shields.The observed ratio between the area of208Tl line at 2615 keV and the integral in theββ(0ν) region is14± 2. When compared with the 2615 keV rate observed in the background spectrum (129 counts/kg/y),this translates into a contribution of 0.11 counts/keV/kg/y which is∼20% of the totalββ(0ν) backgroundrate.
The second source can be easily recognized on the basis of theα peaks visible in the background spec-tra. Its location on the surface is deduced from the low energy tails of the peaks and by the coincidencescatter plots. These features exclude in fact the possibility of a bulk origin. Indeed the peak energiescorrespond to the transition energies of the decays implying that both theα particle and the nuclear recoilcontribute to the signal. The decay can only be “contained” in the crystal and the contamination produc-ing the peaks is localized at a sufficient depth of the crystal surface. The low energy tail can be explainedin terms of the fraction of the decays occurring very near to the surface, where part of theα or of the recoilenergy is lost outside the crystal. Since the “lost” energy can be however observed by a second detectorfaced to the one in which the decay occurred (fig.17), a straight line with a negative slope equal to -1 isexpected when plotting coincident events in different faced detectors as is shown in Fig.15. This kind ofanalysis not only yields a further proof thatα peaks are due to a surface contaminations of the crystals, butalso proves that this contamination produces a continuum background extending far below theα decaytransition energy. In particular this source can partially - but not completely - account for the rather flatcontinuous background measured between 3 and 4 MeV, a region where no known relevantγ norα linesfrom natural and cosmogenic radioactivity are present. By the analysis of the coincident events fromαparticles we obtained a rate RD=0.13 counts/keV/kg/y, in the 3–4 Mev interval, for the events with multi-plicity 2 (i.e. events in which 2 crystals are simultaneously hit). The only possible origin for these events,is radioactive decay produced in the fraction of crystal surface facing other crystals (SActive). On theother hand, when the decay occurs in the fraction of crystal surface (SInert) which faces inert materials(e.g. copper), this contributes to the background remaining in the anticoincidence spectrum. By simplyconsidering the geometric evaluation of the ratio SInert/SActive (average Monte Carlo evaluation) we canobtain from RD the expected contribution to the anticoincidence spectrum in the 3–4 MeV region: 0.16±

6 PREVIOUS RESULTS OF MIDBD AND CUORICINO 50
Crystal
Cu frame
Figure 17: Scheme of a surfaceα decay.
0.05 counts/keV/kg/y. In order to extrapolate this rate back to theββ(0ν) region we need to know theshape of the background spectrum. In particular, various estimates of the ratio Rs
3−4/Rsββ (where Rs are
the counting rates in the energy regions of interest after the anticoincidence cut) were obtained on the ba-sis of Monte Carlo simulations of crystal surface contaminations of different depths and density profiles.Unfortunately the ratio depends critically on these parameters and the average Monte Carlo evaluation ofthe ratio has therefore a large error. The extrapolated contribution to theββ(0ν) region background is0.37± 0.1 counts/keV/kg/y corresponding to∼43± 10% of the measured rate.
Concerning the third source, the prove of its relevance is less direct and is mainly based on the obser-vation that the continuous background measured between 3 and 4 MeV cannot be completely explainedby the surface contamination of the crystals.
Other possible sources for this background were taken into account and excluded as relevant forMiDBD: neutrons (ruled out by comparing the background rates measured with and without the neutronshield), muon induced neutrons (ruled out by simulation of the production rate of neutrons in the ex-perimental set up), contamination of other components close to the detectors (such as the Teflon spacersplaced between the copper frame and the crystals, the NTD thermistors, the Si heaters, for which themeasured contamination is too low to account for the observed background). Finally, some tests donewith dedicated detectors in the hall C set-up proved that the etching of the copper structure in a cleanenvironment yields a reduction of the background in the 3-4 MeV region. This fact, and the agreement ofMonte Carlo simulation with the measured spectra, indicate that238U or 232Th surface contamination ofthe copper should be the missing background source.
As in the case of the second background source mentioned above, the contributions of the third sourceto the background rate can be obtained by extrapolating the rate in the 3–4 MeV to theββ(0ν) region.The 3–4 MeV region rate (after the anticoincidence cut) can be evaluated by subtracting the crystal sur-face contribution from the total one: 0.33± 0.1 counts/keV/kg/y. Once again the extrapolation to theββ(0ν) region is model dependent (even if, according to our Monte Carlo evaluations, less so in this case)and the extrapolated contribution theββ(0ν) region background is 0.2± 0.1 counts/keV/kg/y (∼23±

6 PREVIOUS RESULTS OF MIDBD AND CUORICINO 51
Figure 18: Total spectrum (in anticoincidence) in the region of neutrinoless DBD obtained with the twentycrystal array. The solid curves represent the best fit (lowest curve) and the 68 % and 90 % C.L. excludedsignals.
11%). The results of this analysis are summarized in table11
Table 11: Estimate of the weight of the different sources responsible for the background measured in theMiDBD-I run.
Source 208Tl ββ(0ν) region 3-4 MeV regionTeO2
238U and232Th surface contamination - 43± 13% 33± 10%Cu 238U and232Th surface contamination ∼10% 23± 11% 67± 20%232Th contamination of cryostat Cu shields∼90% 20± 5% -
The sum of the spectra obtained in anticoincidence in the two runs in the region above 2000 keV isshown in Fig.18. It corresponds to∼3.56 kg×year of TeO2 and to∼0.98 kg×year of130Te . The clearpeaks corresponding to the lines at 2104 keV (single escape of the 2615 keV208Tl line), at 2204 keV(214Bi) and at 2615 keV (208Tl ), confirm the reproducibility of the array during both runs.
No peak appeared in the region ofββ(0ν) of 130Te, where the rates were, respectively, of 0.59±0.06 and 0.33± 0.11 counts/keV/kg/y, when operated in anticoincidence. Also, no peak appeared atthe energies corresponding to neutrinoless DBD of130Te to excited levels of130Xe, nor at the energy of867 keV corresponding toββ(0ν) of 128Te. Fit parameters and 90 % C.L. limits for the various decayprocesses (Tab.12) were evaluated with a maximum likelihood procedure[152]. Similar results werehowever obtained following the approach proposed by G.J. Feldman and R.D. Cousins [154].

6 PREVIOUS RESULTS OF MIDBD AND CUORICINO 52
Table 12: Half lifetime limits (90 % C.L.) on lepton violating and conserving channels deduced from theMiDBD data analysis. E0 is the energy analyzed to obtain T1/2, while a.c. indicates that the anticoinci-dence spectrum was used.
Isotope Transition Cuts E0 Efficiency T1/2
(keV) (%) (years)130Te 0ν : 0+ → 0+ a.c. 2528.8 84.5 > 2.1× 10²³
130Te 0ν : 0+∗ → 0+ none 1992.8 7.9 > 3.1× 10²²
130Te 0ν : 0+∗ → 2+ none 1992.8 37.5 > 1.4× 10²³
130Te 2ν : 0+ → 0+ a.c. (6.1± 1.4+2.9−3.5)× 1020
130Te 1χ : 0+ → 0+ a.c. > 2.2× 10²¹
130Te 2χ : 0+ → 0+ a.c. > 0.9× 10²¹
128Te 0ν : 0+ → 0+ a.c. 867.2 97.9 > 1.1× 10²³
6.3 CUORICINO experiment
CUORICINO (Fig.19) is a tower made by 13 planes containing 62 crystals of TeO2 . 44 of them arecubes of 5 cm side while the dimension of the others is 3×3×6 cm3 . All crystals are made with naturaltellurite, apart two 3×3×6 cm3 crystals which are enriched in128Te and two others enriched in130Tewith isotopic abundance of 82.3 % and 75 %, respectively. The total mass of CUORICINO is 40.7 kg,the largest by more than an order of magnitude with respect to any cryogenic detector. More details onthe preparation of the crystals and on the mechanical structure of the array is reported elsewhere [153]. Inorder to shield against the radioactive contaminants from the materials of the refrigerator, a 10 cm layerof Roman lead with210Pb activity of <4 mBq/kg [151] is inserted inside the cryostat immediately abovethe CUORICINO tower. A 1.2 cm lateral layer of the same lead is framed around the array to reduce theactivity of the thermal shields. The cryostat is externally shielded by two layers of Lead of 10 cm minimalthickness each. While the outer is made by common Lead, the inner one has a210Pb activity of 16±4 Bq/kg. An additional layer of 2 cm of electrolytic Copper is provided by the cryostat thermal shields.The background due to environmental neutrons is reduced by a layer of Borated Polyethylene of 10 cmminimum thickness. The refrigerator operates inside a Plexiglass anti-radon box flushed with clean N2
and inside a Faraday cage to reduce electromagnetic interferences. Thermal pulses are recorded by meansof Neutron Transmutation Doped (NTD) Ge thermistors thermally coupled to each crystal. Calibrationand stabilization of each bolometer is performed by means of a resistor attached to each absorber andacting as an heater. The front-end electronics for all the 3×3×6 cm3 and for 20 of the 5×5×5 cm3
detectors are located at room temperature. In the so called cold electronics, applied to the remaining24 detectors, the preamplifier is located in a box at∼100 Kelvin near the detector to reduce the noisedue to microphonics, which would be very dangerous when searching for WIMPS. More details on theread-out electronics and DAQ are reported in [153]. CUORICINO is operated at a temperature of∼8mK with a spread of∼one mK. A routine energy calibration is performed before and after each subsetof runs, which lasts about two weeks, by exposing the array to two thoriated tungsten wires insertedin immediate contact with the refrigerator. All runs where the average difference between the initial andfinal calibration is larger than the experimental error in the evaluation of the peak position were discarded.During the first cool down 12 of the 5×5×5 cm3 and one of the 3×3×6 cm3 crystals were lost, due todisconnection of a few of the thermalizers which allow the transmission of the electric signals from thedetectors to room temperature [153]. Since the active mass was of∼30 kg and the energy resolutionexcellent, we decided to continue running for a few months before warming up the array and attack theproblem, which has been now fully solved. The data presented here refers to this first run and to the new
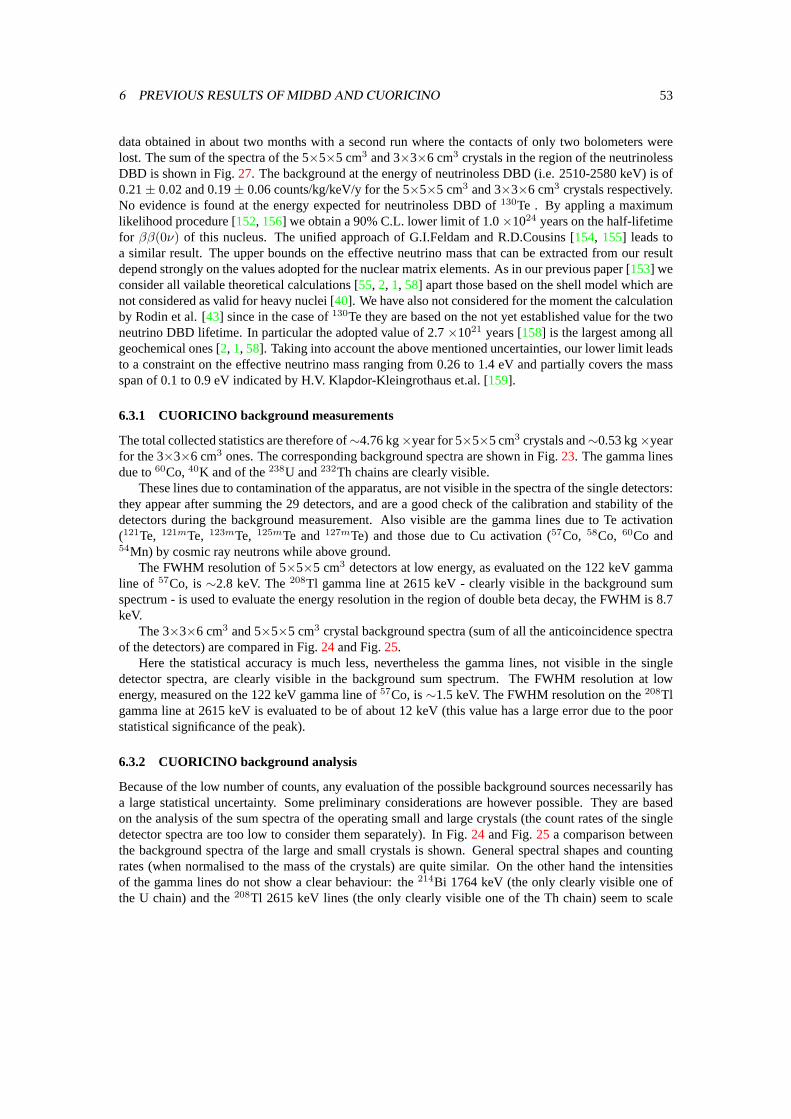
6 PREVIOUS RESULTS OF MIDBD AND CUORICINO 53
data obtained in about two months with a second run where the contacts of only two bolometers werelost. The sum of the spectra of the 5×5×5 cm3 and 3×3×6 cm3 crystals in the region of the neutrinolessDBD is shown in Fig.27. The background at the energy of neutrinoless DBD (i.e. 2510-2580 keV) is of0.21± 0.02 and 0.19± 0.06 counts/kg/keV/y for the 5×5×5 cm3 and 3×3×6 cm3 crystals respectively.No evidence is found at the energy expected for neutrinoless DBD of130Te . By appling a maximumlikelihood procedure [152, 156] we obtain a 90% C.L. lower limit of 1.0×1024 years on the half-lifetimefor ββ(0ν) of this nucleus. The unified approach of G.I.Feldam and R.D.Cousins [154, 155] leads toa similar result. The upper bounds on the effective neutrino mass that can be extracted from our resultdepend strongly on the values adopted for the nuclear matrix elements. As in our previous paper [153] weconsider all vailable theoretical calculations [55, 2, 1, 58] apart those based on the shell model which arenot considered as valid for heavy nuclei [40]. We have also not considered for the moment the calculationby Rodin et al. [43] since in the case of130Te they are based on the not yet established value for the twoneutrino DBD lifetime. In particular the adopted value of 2.7×10²¹ years [158] is the largest among allgeochemical ones [2, 1, 58]. Taking into account the above mentioned uncertainties, our lower limit leadsto a constraint on the effective neutrino mass ranging from 0.26 to 1.4 eV and partially covers the massspan of 0.1 to 0.9 eV indicated by H.V. Klapdor-Kleingrothaus et.al. [159].
6.3.1 CUORICINO background measurements
The total collected statistics are therefore of∼4.76 kg×year for 5×5×5 cm3 crystals and∼0.53 kg×yearfor the 3×3×6 cm3 ones. The corresponding background spectra are shown in Fig.23. The gamma linesdue to60Co,40K and of the238U and232Th chains are clearly visible.
These lines due to contamination of the apparatus, are not visible in the spectra of the single detectors:they appear after summing the 29 detectors, and are a good check of the calibration and stability of thedetectors during the background measurement. Also visible are the gamma lines due to Te activation(121Te, 121mTe, 123mTe, 125mTe and127mTe) and those due to Cu activation (57Co, 58Co, 60Co and54Mn) by cosmic ray neutrons while above ground.
The FWHM resolution of 5×5×5 cm3 detectors at low energy, as evaluated on the 122 keV gammaline of 57Co, is∼2.8 keV. The208Tl gamma line at 2615 keV - clearly visible in the background sumspectrum - is used to evaluate the energy resolution in the region of double beta decay, the FWHM is 8.7keV.
The 3×3×6 cm3 and 5×5×5 cm3 crystal background spectra (sum of all the anticoincidence spectraof the detectors) are compared in Fig.24and Fig.25.
Here the statistical accuracy is much less, nevertheless the gamma lines, not visible in the singledetector spectra, are clearly visible in the background sum spectrum. The FWHM resolution at lowenergy, measured on the 122 keV gamma line of57Co, is∼1.5 keV. The FWHM resolution on the208Tlgamma line at 2615 keV is evaluated to be of about 12 keV (this value has a large error due to the poorstatistical significance of the peak).
6.3.2 CUORICINO background analysis
Because of the low number of counts, any evaluation of the possible background sources necessarily hasa large statistical uncertainty. Some preliminary considerations are however possible. They are basedon the analysis of the sum spectra of the operating small and large crystals (the count rates of the singledetector spectra are too low to consider them separately). In Fig.24 and Fig.25 a comparison betweenthe background spectra of the large and small crystals is shown. General spectral shapes and countingrates (when normalised to the mass of the crystals) are quite similar. On the other hand the intensitiesof the gamma lines do not show a clear behaviour: the214Bi 1764 keV (the only clearly visible one ofthe U chain) and the208Tl 2615 keV lines (the only clearly visible one of the Th chain) seem to scale

6 PREVIOUS RESULTS OF MIDBD AND CUORICINO 54
Figure 19: The CUORICINO detector: scheme of the tower and internal roman lead shields (left), the 13planes tower (centre), the 4 crystal module (top right) and the 9 crystal module (bottom right).

6 PREVIOUS RESULTS OF MIDBD AND CUORICINO 55
Figure 20: Summed calibration spectrum (232Th source just outside the crysotat) from all the operating5×5×5 cm3 and 3×3×6 cm3 crystals.
0
1
2
3
4
5
6
7
8
9
10
11
12
13
14
15
16
Column S
Column T
100 200 300 400 500 µV/MeV
num
ber o
f det
ecto
rs
3x3x6 cm3 crystals5x5x5 cm3 crystals
Figure 21: Distribution of the single CUORICINO detector energy responses normalized to 1 kg of TeO2.

6 PREVIOUS RESULTS OF MIDBD AND CUORICINO 56
0
1
2
3
4
5
6
7
8
9
10
11
12
13
14
15
16
Column S
Column T
4 7 10 13 16 19 FWHM [keV]
num
ber o
f det
ecto
rs
3x3x6 cm3 crystals
5x5x5 cm3 crystals
Figure 22: Distribution of the single CUORICINO detector energy resolutions (FWHM) at the208Tl 2615keV line.
Figure 23: Summed background spectra from the operating 5×5×5 cm3 and (natural abundance) 3×3×6cm3 crystals.

6 PREVIOUS RESULTS OF MIDBD AND CUORICINO 57
Figure 24: Comparison between the background of the 5×5×5 cm3 crystals and that of the natural3×3×6 cm3 crystals in the gamma region.
Figure 25: Comparison between the background of the 5×5×5 cm3 crystals and that of the natural3×3×6 cm3 crystals in the alfa region.

6 PREVIOUS RESULTS OF MIDBD AND CUORICINO 58
Figure 26: Comparison between the background spectra of CUORICINO crystals and the backgroundmeasured in MiDBD-II experiment.
counts/keV/kg/year 1-2 MeV 2-3 MeV 3-4 MeV 4-5 MeVMiDBD-II 3.21±0.08 0.61±0.04 0.29±0.02 1.88±0.06
3×3×6 natural 3.29±0.11 0.38±0.04 0.24±0.03 0.78±0.055×5×5 3.25±0.09 0.41±0.03 0.17±0.02 0.55±0.03
Table 13: Counting rates per unit mass in MiDBD-II and in CUORICINO.
with the efficiency of the detectors (according to the results of a Monte Carlo analysis, the ratio of thedetection efficiency of 5×5×5 cm3 and 3×3×6 cm3 crystals is∼3). The40K line at 1460 keV has thesame intensity per unit mass on the two kind of detectors. The60Co lines at 1173 and 1332 keV, on thecontrary show a higher intensity per unit mass in small crystals. Moreover they undergo a larger reductionby the anticoincidence cuts with respect to otherγ–lines.
In Fig.26a comparison between the background spectra of CUORICINO crystals and the backgroundmeasured in MiDBD-II (20 crystal array second run) is shown.
In Table 13 the counting rates in different energy regions are reported. It is clearly evident thatan improvement was obtained in the 2-3 MeV region (a reduction of∼30% in the counting rates perunit mass either of the small and of the large crystals) despite the reduced internal lead shield usedin CUORICINO (∼1.2 cm thickness of roman lead) with respect to MiDBD-II (∼3 cm thickness ofroman lead). An even better reduction was obtained in the 3-4 MeV region where background is mainlydominated by surface contamination contributions.
With higher statistical accuracy it will be possible to analyze the reasons for this variation of thecounting rates and also for the differences between small and large crystals. To do that, it is indeednecessary to disentangle the different sources of background by considering the counting rates in smallerregions as that between the two gamma peaks at 2448 and 2615 keV (238U and232Th chains respectively)

6 PREVIOUS RESULTS OF MIDBD AND CUORICINO 59
Tl
208
214Bi
Energy (keV
)
Counts
Figure 27: Summed background spectrum (5.29 kg×y) from all the operating crystals in the region ofneutrinoless double beta decay of130Te (Q-value=2528.8 keV).

6 PREVIOUS RESULTS OF MIDBD AND CUORICINO 60
- where we should have contributions by both degradedα’s from surface contaminations and208Tl γ’sfrom bulk contaminations - and the region just above the208Tl 2615 keV line where background sourcesshould be limited to surface contaminations. Moreover, it should be stressed that the effect of discon-nected detectors in reducing the efficiency of the anticoincidence cut (a fundamental tool to study andlocalize background sources) is not negligible.
Table 14: Estimate of the relative contributions of the different sources responsible for the backgroundmeasured in CUORICINO.
Source 208Tl ββ(0ν) region 3-4 MeV regionTeO2
238U and232Th surface contamination - 10± 5% 20± 10%Cu 238U and232Th surface contamination ∼15% 50± 20% 80± 10%232Th contamination of cryostat Cu shields∼85% 30± 10% -
By using the same background model resulting from the MiDBD analysis, and taking into accountthat we changed both the detector structure and the internal set-up of the cryostat (the roman lead shieldand the cryostat copper radiation shields) we evaluated its consistency for CUORICINO. Because of thepoor statistical significance of the data so far collected, the analysis has to be considered as preliminary(it was in particular limited to the 5×5×5 cm3 detectors for which the statistical accuracy is better) evenif its results already tend to identify the most important sources of the CUORICINO background besidesgiving a first quantitative guess of their relevance. The percentage result of the measured background inthe DBD region, is summarized in table14. It should be noticed that CUORICINO data seem to indicatea shallower depth for the crystal surface contaminations relative to MiDBD. A better determination of theactual depth and density profile of this contamination will be available when a fully operating CUORI-CINO and a better statistical accuracy will allow a more significant analysis of the multiple events.
6.3.3 Analysis of the CUORICINO background above 3 MeV
The following analysis tries to identify the background sources responsible of the CUORICINO countingrate in the region above 3 MeV. The analisys is based on both the coincidence (not used in the previousanalyses) and the anticoincidence spectra collected with 5×5×5 cm3 detectors during the first run ofCUORICINO and calibrated with a new, more reliable, techinque in the alpha region. The single spectrahave been calibrated and linearized in energy with a new technique that yields quite better results inthe alpha region: both the gamma lines of the232Th source measurements and the alpha line of210Poclearly visible in the background spectra are used, assuming a power law dependence for the relashionshipbetween pulse amplitude and particle energy. The anticoincidence sum spectrum of 5×5×5 cm3 detectorscalibrated in this way is compared in Fig.28 with the analogous spectrum used in the previous analysisand calibrated only with gama lines (assuming here a polynomial relashionship between pulse amplitudeand particle energy and extrapolating this calibration in the alpha region).
As already mentioned in previous discussions, alpha and beta particles produced by environmentalradioactivity can give important contributions to background above 3 MeV. Because of their low rangethese particles can only be located either in the crystals or on the surfaces of the materials directly facingthe crystals: the copper holder or, less likely, small components placed near the crystals or on the crystalsurface such as the NTD thermistor, the Si heater, their gold wires, the glue and other smaller parts. MonteCarlo simulations of the coincidence and anticoincidence sum spectra of 5×5×5 cm3 detectors producedby radioactive contaminations of the above mentioned elements have been obtained using our GEANT4based code. These spectra have been compared with the measured spectra in order to identify the actualcontaminations responsible of the measured background.

6 PREVIOUS RESULTS OF MIDBD AND CUORICINO 61
Figure 28: Comparison between spectra obtained with different linearization methods. The appearenceof clear alpha structures with thepower lawmetod is evident.
As a first step, bulk and surface contaminations of the crystals have been considered. Both thesecontaminations give rise to peaks (centered at the transition energy of the decay) in the anticoincidencespectrum, but in the case of bulk contaminations these peaks are gaussian and symmetric while in the caseof surface contaminations the peaks show a low energy tail. On the contrary, the only possible sourcescontributing to the coincidence spectrum are the surface contaminations of the crystals. The general shapeand the structures appearing in both background spectra strongly depend on the depth and density profileassumed for the contamination (an exponentially decreasing function characterized by adepthλ: ρ(x)= Ae−λx yielded the best results). The results of the comparison between Monte Carlo simulations andmeasured spectra allow to prove that the alpha peaks of the anticoincidence spectrum of Cuoricino aredue to a surface (and not bulk)232Th and238U contamination of the crystals with the only exception ofthe210Po line which has to be attributed to a bulk contamination of the crystals. The shape of the peaksin the anticoincidence spectrum and the shape of the coincidence spectrum is fully accounted for when asurface contaminationdepthof the order of 1µm or less is assumed. As shown in Fig.29 the identifiedcrystal contaminations yield a satisfactory explanation of the coincidence spectrum. Some contribution tothe continuous part of the anticoincidence spectrum seems however still missing. In order to explain thiscontinuum, a further source, not contributing to the coincidence spectrum, has to be considered. Such asource can be a232Th or238U contamination on the copper surface, as shown in Fig.30. Thedepthof thecontamination should be of the order of∼5 µm (a deeper contamination would produce too high gammapeaks while a thinner contamination would give rise to structure in the anticoincidence spectrum) with atotal activity in the first 1.5µm of the order of 10−9 g/g either in238U or 232Th or both.

6 PREVIOUS RESULTS OF MIDBD AND CUORICINO 62
Counts/keV/kg/y Counts/keV/kg/y
Figure 29: Comparison between Monte Carlo and CUORICINO anticoincidence (top) and coincidence(bottom) spectra in the case of the TeO2 crystal surface contaminations (λ∼1 µm) specified in the figure.

6 PREVIOUS RESULTS OF MIDBD AND CUORICINO 63
Counts/keV/kg/y Counts/keV/kg/y
Figure 30: Comparison between Monte Carlo and CUORICINO anticoincidence (top) and coincidence(bottom) spectra when a Th surface contamination of the detector copper holder (green line) is added(pink line) to the crystal conatminations considered in fig.29.

6 PREVIOUS RESULTS OF MIDBD AND CUORICINO 64
This analysis shows the importance of continuing the CUORICINO background measurement in orderto improve the statistical accuracy of the above described results. These results, on the other hand,show that with a substantial reduction of the copper and TeO2 crystal surface contamination levels thesensitivity goal for CUORE (i.e. a background counting rate of the order of 0.01 counts/keV/kg/y orbetter) can be reached.
6.3.4 Preliminary measurements of the Copper surface contaminations
According to the suggestions of the LNGS Scientific Committee we have investigated various possibilitiesto identify and measure the surface contamination of the detector Copper holders which is expected torepresent the main contribution to the CUORE background level in the neutrinoless double beta decayregion. We would like to remind that the bulk contamination of Uranium and Thorium in copper hasbeen found to be less than a part per trillion, while the analysis of the MIBETA and CUORICINO dataindicates a surface contamination by two to three orders of magnitude larger. Degradedα andβ particlesfrom this source have been found to represent a substantial contribution of the background in the regionof neutrinoless double beta decay. Two main measurement procedures were considered:
• dissolution of different superficial layers of Copper in ultra pure acid and analysys of the resultingsolution with Inductive Coupled Plasma Mass Spectroscopy (ICPMS)
• laser ablation of a number of distributed spots on the Copper surface followed by ICPMS analysisof the dissolved material. We did that in Canada, but the sensitivity seem still low ( 10-8 g/g)
Other approaches like Total Reflection X-Ray Fluorescence (TRXRF) and Secondary Ion Mass Spec-troscopy (SIMS) are also going to be considered, even if they allow to investigate only the very superficiallayer of the Copper samples.
The most powerful method was found by us to be a High Resolution (HR) ICPMS with which pre-liminary results were obtained in collaboration by the Gran Sasso Laboratory (M.Balata and S.Nisi) andthe Mass Spectroscopy group of the European Center of Ispra (P.Tricherini). The procedure has been thefollowing: samples of Copper were attacked with ultrapure nitric acid with different attacking times inorder to extract the material from different thickness. The corresponding solutions were then analyzedin ISPRA with a HR-ICPMS device characterized by a sensitivity up to 10-15 g/g of U and Th in thesolution. The sensitivity in g/g of the dissolved Copper was lower by about three orders of magnitudedue to the small copper concentration in the solution. The preliminary results of a measurement carriedout on a sample of the same Copper used for the CUORICINO detector holders is shown in Fig. 2. Itcan be seen that the average concentration of Uranium and Thorium strongly decreases when consideringcopper layers of 1.48 and 7.5 micron respectively (only a limited number of dissolved layers of differentthickness could be analyzed in the preliminary measurement). This trend of surface contamination as afunction of depth is in excellent agreement with that evaluated from our CUORICINO background model(comparison between Monte Carlo simulations and actual background spectra).
6.3.5 CUORICINO vs. CUORE
While being a self-consistent experiment, CUORICINO finds its place in the CUORE project as a testfacility intended to verify the technical feasibility of CUORE. Indeed the good results obtained as far asthe detector performances are concerned prove that the realization of CUORE could be more straight-forward than expected. There is still someR&D that is required to improve detector reproducibility inorder to reduce the spread in the main parameters that characterise detector performances (as the pulseheight, the energy resolution and the detector signal rise and decay times). Nevertheless the good resultsobtained in CUORICINO prove that the increase in the number of bolometers and in the total mass ofthe array do not substantially affect the quality of the experiment: the MiDBD experiment with 3 times

6 PREVIOUS RESULTS OF MIDBD AND CUORICINO 65
fewer detectors, and a mass 6 times lower than CUORICINO, had a similar energy resolution in the back-ground sum spectrum. For what concerns background evaluation, as stated above CUORICINO is anexcellent tool to predict the expected background for CUORE, when the different geometrical structureof the two setups is taken into account. Indeed CUORE will have a tightly packed structure where theoperation of the detectors in anticoincidence will allow a strong reduction of background. Moreover thelead shield designed for CUORE will be optimized in order to practically cancel the background com-ing from outside. Such an optimization was not possible in CUORICINO which had to be housed in analready existing cryostat characterized by a limited space. Indeed to mount CUORICINO in the samecryostat that was used for MiDBD, the internal Roman lead shield thickness was necessarily reduced thusincreasing the background due toγ rays from the refrigerator materials. This will obviously be not aproblem for CUORE. The CUORICINO background results, although preliminary, are very promising.They demonstrate both the effectiveness of the procedures applied during its preparation and our knowl-edge of its main background contributions. The detailed study of CUORICINO background (i.e. withbetter statistical accuracy) will give more insight into background sources.

7 CUORE PROJECT 66
7 CUORE project
The CUORE detector will consist of an array of 988 TeO2 bolometers arranged in a cylindrical configura-tion of 19 towers of 52 crystals each (Fig.31). The principle of operation of these bolometers is now wellunderstood (sec.5) and since TeO2 is a dielectric and diamagnetic material, according to the Debye Law(25), the heat capacity of a single crystal at sufficiently low temperature can be so low that also a smallenergy release in the crystal can result in a measurable temperature rise. This temperature change can berecorded with thermal sensors and in particular using Neutron Transmutation Doped (NTD) germaniumthermistors. These devices were developed and produced at the Lawrence Berkeley National Laboratory(LBNL) and UC Berkeley Department of Material Science [160]. They have been made uniquely uniformin their response and sensitivity by neutron exposure control with neutron absorbing foils accompanyingthe germanium in the reactor [161].
The TeO2 crystals are produced by the Shanghai Institute for Ceramics (SICCAS), China and theywill be the source of 750 g TeO2 crystals for CUORE [162].
Figure 31: The CUORE detector (left), one of the 19 towers (right).
A single CUORE detector consists of a 5×5×5 cm3 single crystal of TeO2 that acts both as a detectorand source. The detectors will be supported in a copper frame in the 19 tower configuration shownin Fig. 31. The frame, and dilution refrigerator mixing chamber to which it is thermally connected,forms the heat sink, while the PTFE (Polytetrafluoroethylene or TEFLON) stand-offs provide the thermalimpedance which delays the re-cooling of the bolometers. The bolometers operate at∼ 10 mK.
As described above (sec.6.3), the excellent performance of the 5×5×5 cm3 crystals to be used inCUORE has been already proved by CUORICINO [162, 163] which corresponds to a tower of lengthand number of floors slightly larger than in CUORE. We adopted this solution to make use of the full

7 CUORE PROJECT 67
experimental volume available in the dilution refrigerator previously used for the MiDBD experiment.The CUORE detector then will be the final version of a three step development comprising: MiDBD,
CUORICINO, and finally CUORE. This, plus the fact that CUORE requires no isotopic enrichment,(the isotopic abundance of130Te is 33.8%) puts CUORE ahead of other options of truly next generationββ(0ν) experiments. The technology, though novel, is developed and to a large degree proven (sec.5 and6).
7.1 Single CUORE detector
A single CUORE detector is a 5×5×5 cm3 single crystal of TeO2 grown with ultrapure TeO2 powdersand polished on the surfaces. Crystals of TeO2 have a tetragonal structure, and are grown along the (001)axis. The two axes normal to this axis are crystallographically equivalent, a fact relevant to their use inthe search for solar axions discussed previously (sec:4.2.2). The surface hardness is not the same for allsides, which complicates the crystal polishing. We have shown that repeated thermal cycling does notdamage the crystals, as in the cases of crystals of other tellurium compounds, or those of tellurium metal.The Debye temperature of the TeO2 crystals was specially measured for the CUORE project as 232 K[164]. This differs from the previous value of 272 K in the literature [165]. The specific heat of theTeO2 crystals was found to follow the Debye law down to 60 mK; the heat capacity of the 750 g crystalsis 2.3×10⁻⁹ J/K extrapolated down to 10 mK.
The NTD thermistors are attached by epoxy to the crystal and are operated in the Variable RangeHopping (VRH) conduction regime with a Coulomb gap [166, 167, 168]. One of the most significantparameters characterizing the thermal response is the sensitivity A, already introduced in section5 anddefined in equation (28). For our NTD thermistors this parameter ranges between 7 and 10. The resistancebehaviour follows the relation:
R = R0 exp(T0/T )γ ; γ = 1/2. (31)
(see the analogous behavior for the resistivity in equation (27)).The VRH regime occurs in Ge when it is ”doped” close to the Metal to Insulator Transition, which is
∼ 6×10¹⁶ atoms / cm3. This is achieved by thermal neutron radiation in a nuclear reactor (see section7.2).The sensitivity parameter A, depends on the neutron irradiation dose. Therefore, each thermistor must becharacterized at operating temperatures, as described in Sec.5.2and, for Si thermistors, in Ref.[169].
It is very important to optimize the neutron irradiation exposure and to make the exposures as uniformas possible. It is not possible to evaluate the thermistor material directly from the reactor because of thelong half life of 71Ge (11.43 days). A delay of several months is required to see if the Ge needs moreexposure. To circumvent this difficulty, the Ge material is accompanied by foils of metal with long-lived(n, γ) radioactive product nuclides. Accordingly, the neutron exposure of the Ge can be determined ac-curately, and uniformity of exposure is achieved. This technique was developed recently by the LawrenceBerkeley National Laboratory group of the CUORE Collaboration [161]. Following the neutron exposureand radioactive decay period, the NTD germanium is first heat treated to repair the crystal structure thencut into 3×3×1 mm3 strips. The thermistors are glued to the TeO2 crystal by 9 spots of Araldit rapid,Ciba Geigy (now Novartis) epoxy, of 0.4 to 0.7 mm deposited on the crystal surface by an array of pins.The height of each spot is 50µm. This procedure was found to be reasonably reliable and reproduciblein the MiDBD experiment [170]. The heat conductance of the epoxy spots was measured in Milan andthe phenomenological relation was found to be∼2.6×10⁻⁴ (T[K]) 3 watts per degree kelvin per spot.The stabilization of the response of bolometers is crucial because of the unavoidable small variations inthe temperature of the heat bath that change the detector gain (and consequently deteriorates the energyresolution; fig.32).
This problem is successfully addressed by means of a Joule heater glued on to each crystal. The heateris used to inject a uniform energy in the crystal and the thermal gain is monitored and corrected off-line

7 CUORE PROJECT 68
Figure 32: Effects of the system thermal instabilities on the worsening of the detector energy resolution(above). Comparison between calibration spectra before (black curve:∆EFWHM
2615 = 30 keV) and after(red curve:∆EFWHM
2615 = 6 keV) the stabilization procedure.

7 CUORE PROJECT 69
(see Sec.13). The heaters are Si chips with a heavily doped meander structure with a constant resistancebetween 50 to 100 kΩ. They are manufactured by the ITC - IRST company in Trento, Italy. Electricalconnections are made with two 50µm diameter gold wires, ball bonded to metalized surfaces on thethermistor. The gold wires are crimped into a copper tube, which is inserted into a larger one formingthe electrical connection, and avoiding low temperature solder which contains210Pb and traces of otherradioisotopes. The larger copper tube,∼14 mm long and 2 mm in diameter, is glued to the copper framethat supports the crystals. This tube is thermally connected to the frame but electrically insulated. Themounting of the TeO2 crystals is crucial to detector performance, and must fulfill a number of sometimescontradictory criteria:
1. the crystals must be rigidly secured to the frame to prevent power dissipation by friction caused byunavoidable vibrations, that can prevent the crystal from reaching the required temperature and canproduce low frequency noise;
2. the thermal conductance to the heat sink (copper frame) must be low enough to delay the re-coolingof the crystal, following a heat pulse, such that the pulse decay time (re-cooling time) is muchlonger than the rise time;
3. however, the heat conductance must be high enough to guarantee efficient cooling;
4. the frame must compensate for the differences in thermal expansion coefficients of the variousmaterials used;
5. and finally, only materials selected for low radioactivity can be used.
For CUORE, only two materials will be used, copper and PTFE; they can both be obtained with very lowlevels of radioactivity. Copper has a thermal conductivity and specific heat high enough to be an idealheat bath, and has excellent mechanical properties; it machines well, and has excellent tensil, tortionaland compressional strengths.
PTFE is used between the copper frame and the crystals. It has low heat conductance and low heatleak [171]. It compensates for the differences between coefficients of thermal expansion of copper and ofTeO2 . The heat conductance between the crystal and heat sink was measured in a similar configuration,but with a contact area larger by a factor of 2 [172].
The measurements of the temperature dependence of specific heats and thermal conductivities iscrucially important for developing a model that explains detector performance and that can be used toimprove thedetector design (sec.5).
7.2 The NTD thermistors
The key to the success of CUORE is the production of large numbers of nearly identical neutron-transmutation-doped (NTD) Ge thermistors. These are made by neutron transmutation doping of ultra-pure Ge in a nuclear reactor to obtain the proper characteristics of resistance and A, the variation ofresistance with temperature. Melt-doped Ge crystals cannot achieve the necessary uniformity due to avariety of dopant segregation effects. The only technique available for producing such uniform doping isNTD. In typical applications, the neutron absorption probability for a 3 mm thick wafer of Ge is small,on the order of 3 %, leading to a very homogenous, uniform absorption process. The most importantaspect of this process is that70Ge transmutes into Ga, an acceptor, and74Ge transmutes into As, a donor,the primary active dopants in NTD Ge. In this process, one places the Ge in a nuclear reactor where thefollowing reactions take place:
70Ge (21%) + n → 71Ge (σT = 3.43± 0.17b, σR = 1.5b)71Ge → 71Ga (t1/2 = 11.4day) Acceptor (32)

7 CUORE PROJECT 70
74Ge (36%) + n → 75Ge (σT = 0.51± 0.08b, σR = 1.0± 0.2b)75Ge → 75As (t1/2 = 83min) Donor (33)
76Ge (7.4%) + n → 77Ge (σT = 0.16± 0.014b, σR = 2.0± 0.35b)77Ge → 77Se (t1/2 = 38.8hr) DoubleDonor (34)
whereσT andσR refer to the thermal and epithermal neutron capture cross sections, respectively.Since the doping level of the Ge needs to be on the order of1× 1017 atoms/cm3, a very high flux re-
actor, such as that at the University of Missouri or the Massachusetts Institute of Technology, is necessaryto do the doping in a reasonable time. Even more important is the stability of the neutron flux and the en-ergy distribution as measured by the Cd ratio. A large Cd ratio (>200) is desirable. In addition, a minimalfast (>5 MeV) flux is necessary to eliminate contaminants such as3H, 65Zn, and68Ge produced by fastneutrons. These radioactive contaminants degrade the detector operation because of internal radioactivedecay and therefore increased background.
In order to determine both the thermal (ΦT ) and epithermal (ΦR) neutron fluences that the Ge wafersare exposed to during the reactor irradiations, we developed a method using multiple metallic monitorsthat are irradiated with every set of Ge samples. For each monitor foil, the amount of radioactivityproduced depends on the sum (σT ΦT +σRΦR). Each monitor provides one equation in two unknowns, thesolution to which can be depicted as a line on the graph of thermal flux vs. epithermal flux. For multipleelements, multiple lines can be drawn on this same graph, and they will have a common intersection at thesolution of values of thermal and epithermal flux that satisfy all conditions. Essentially, this is a graphicalsolution to several equations in two unknowns. Elements with significantly different ratios ofσT /σR
provide significantly different slopes to the lines and a better determination of the intersection. Fe and Zrare a good combination since they have significantly differentσT /σR and long half-lives.
Once the thermal and epithermal fluences have been determined, the concentration of dopants pro-duced in the germanium can be calculated. The significant quantity involved in thermistor performance isthe net dopant concentration which is equal to the concentration of Ga atoms minus the concentration ofAs atoms minus twice the concentration of Se atoms. Unfortunately, to measure the thermal performanceof the thermistor, one needs to wait for the decay of the activation product71Ge (11.4 day), which requiresapproximately one year. Following this one year of decay, some of the NTD Ge material was made intothermistors and sent to the University of Florence, for testing at low temperatures. Samples were cooledto 30 mK and resistance vs. temperature measurements were made over approximately the 300-30 mKrange. These curves were compared tos similar curves from other batches of NTD Ge as shown in figure34.
For the various batches we ran (NTD-33-38) the data can be combined to show the variation of thetemperature performance vs the calculated net acceptor concentrations. These results are illustrated inFigure35. The three points on the right side of the data set were the results of two irradiations, and themiddle of these three points has properties nearly the same at those of NTD-31, currently being used inCUORICINO.
The problem of producing large numbers of identical thermistors is quite complicated. These ther-mistors, nearly identical to NTD-31, were made with an iterative process whereby the second doping wascalculated following a measurement of the first. This is a very inefficient process for producing largenumbers of thermistors. Fortunately, the same method used to make the thermistors can be used to ana-lyze the results. Neutron capture on71Ga produces72Ga (14 hour half life) and75As activates to76As(26.3 hour half life). Both these isotopes emit gamma rays of high enough energy and intensity to makeprecise measurements of both Ga and As doping levels. Selenium cannot be measured by InstrumentalNeutron Activation Analysis (INAA) because the product nuclide,77Se is stable. Similarly, SecondaryIon Mass Spectroscopy (SIMS) and other mass spectroscopic techniques can be used to determine thedopant concentrations on a much shorter time scale. Two, or even three, irradiations will be required to

7 CUORE PROJECT 71
Figure 33: Graph depicting the solution for thermal and epithermal flux for a set of three monitors, eachwith different ratios of thermal and epithermal cross-sections.

7 CUORE PROJECT 72
Figure 34: Resistivity of various batches of NTD Germanium as a function of 1/√
T .

7 CUORE PROJECT 73
Figure 35: Thermistor performance as a function of the calculated net acceptor concentration. The firstsix points (from the left) involved only one irradiation (and show a relatively large spread in deviationsfrom the line) while the last three points are following the second irradiation and have a very small spreadfrom the line.

7 CUORE PROJECT 74
Figure 36: A four detector module.
produce thermistors with properties close enough to be used in the large array of CUORE. These tech-niques will be further refined in order to allow faster and more uniform production of the thousands ofthermistors required for CUORE.
The plan to make these irradiations more predictable is to use the NTD facility at the MIT reactorwith multiple irradiations on a single large batch of Ge wafers. Each wafer will have its own monitor, andeach will be separately analyzed to determine the appropriate subsequent irradiation to bring them to theright temperature characteristics.
Previous measurements carried out in the Gran Sasso Laboratory [173] have shown that the residualacrtivity of the NTD thermistors becomes fully tolerable in an experiment with thermal detectors alreadya few months after irradiation.
7.3 Modular structure of the CUORE detector
As stated earlier, the CUORE array comprises 988 TeO2 bolometers, grouped in 247 modules of 4bolometers each. These are arranged in 19 towers of 52 crystals each, or a stack 13 modules high.The towers are assembled in a cylindrical structure as shown in Fig.31.
The structure of each four-detector module is shown in Fig.36. The four crystals are held betweentwo copper frames joined by copper columns. PTFE pieces are inserted between the copper and TeO2 ,as a heat impedance and to clamp the crystals. There is a 6 mm gap between crystals with no materialbetween them.
The four detectors are mechanically coupled; some of the PTFE blocks and springs act simultaneouslyon two crystals. Tests of this and a similar structure, but with 3×3×6 cm3 crystals, clearly demonstratethat the CUORE technology is viable. The signal to noise ratio was improved by replacing the 3×1.5×0.4mm3 Ge thermistor by one with dimensions 3×3×1 mm3, which significantly improved the DMC shownin Fig. 37, and by utilizing cold electronics Fig.38. A further noise reduction was finally obtained bysuspending the detector by means of a stainless steel spring.
Reproducibility was tested on the MiDBD array, which had a sufficient number of detectors (20)operating simultaneously. The reproducibility is satisfactory as shown in the load curves in Fig.39.Four-detector modules of 50×50×50 mm3 crystals were also successfully tested, with pulse amplitudesspanning an interval from 50 to 150µV/MeV at∼100 MΩ operation point, in agreement with the thermalmodel. The full width at half maximum FWHM is∼1 keV for low energy gamma peaks, and∼5 to
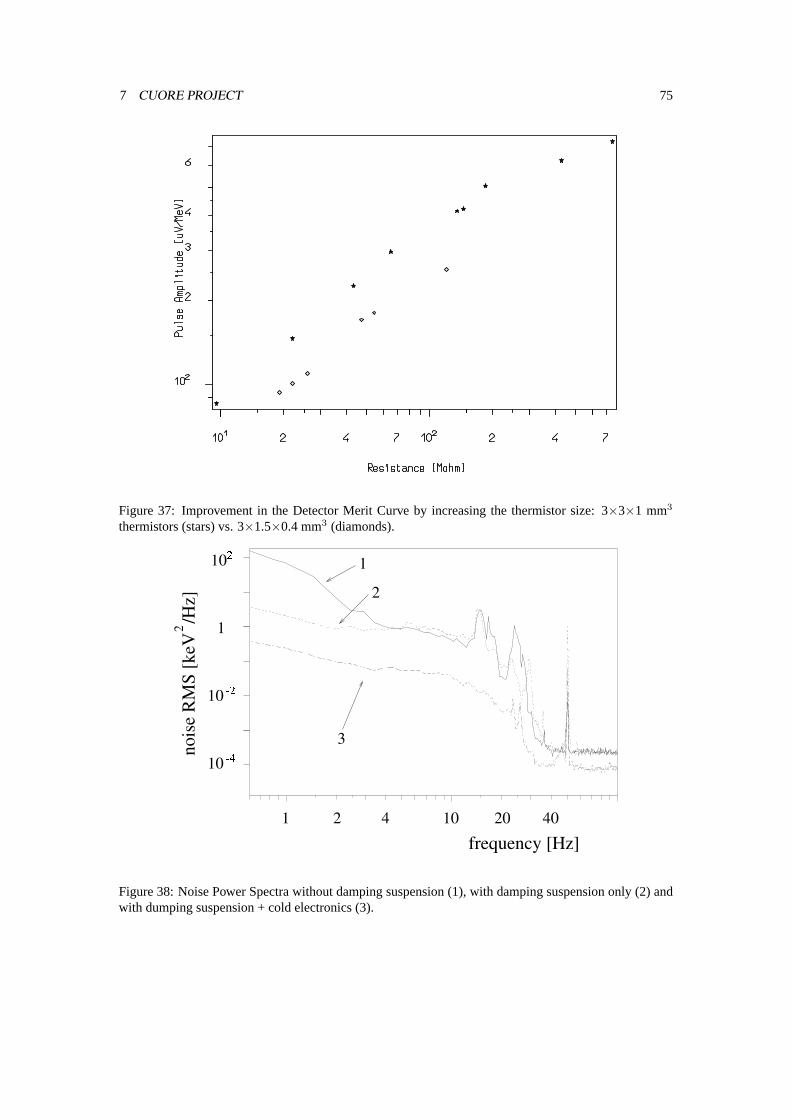
7 CUORE PROJECT 75
Figure 37: Improvement in the Detector Merit Curve by increasing the thermistor size: 3×3×1 mm3
thermistors (stars) vs. 3×1.5×0.4 mm3 (diamonds).
Figure 38: Noise Power Spectra without damping suspension (1), with damping suspension only (2) andwith dumping suspension + cold electronics (3).

7 CUORE PROJECT 76
Figure 39: Fifteen thermistor load curves for the 20 crystal array.
10 keV at 2.6 MeV. A stack of thirteen, 4-detector modules, will be connected by two vertical copperbars. The details of the wiring of the towers is still under development; however, the current plan is for50 µm diameter twisted pairs of nylon coated constantane wire running along the vertical copper bars.On the top of each tower there would be 52 twisted pairs for the thermistors and four for the heaters. Twomore twisted pairs will be required for diagnostic thermometers, one on top and one on the bottom of thetower.
The CUORICINO detector presently taking data at LNGS consists of one of the 52 detector towerswith the exception of the two planes containing the 3×3×6 cm3 crystals discussed earlier. CUORE isan array of 19 towers, each of which will be suspended independently from a large cylindrical copperplate, thermally connected to the mixing chamber of the dilution refrigerator (DR). In this manner, testsof CUORICINO will be tests of the CUORE array. The array will be suspended from the mixing chamberby a vertical spring to decouple the detector from the vibrations of the dilution refrigerator. Tests wereperformed with piezo-electric accelerometers and vibrators to optimize the suspension (see Fig.38). Asa result a pendulum mechanical suspension was designed for the entire CUORE array.
The heavy shielding of CUORE will present non-trivial problems in the energy calibration with ra-dioactive sources. The presently considered option is to use radioactive metal wires encapsulated in PTFEtubes. The tubes would be placed vertically between the towers, and free to slide along a fixed tube to theappropriate calibration point. A vacuum tight sliding seal will allow the part of the tube containing wireto be inserted and extracted from the cryostat.
7.4 Location
CUORE will be located in the underground hall A of Laboratori Nazionali del Gran Sasso (LNGS,L’Aquila - Italy) at a depth of 3400 m.w.e. where the muon flux is reduced to∼3×10⁻⁸ µ/cm−2/s

7 CUORE PROJECT 77
and the neutron flux to∼10−6 n/cm−2/s. After the approval of CUORE by the Gran Sasso ScientificCommittee its final location just near the CRESST installation has been decided as shown in Fig.40

7 CUORE PROJECT 78
Figure 40: Final location of CUORE in hall A of the underground Laboratori Nazionali del Gran Sasso.

8 CRYOGENIC SYSTEM 79
8 Cryogenic system
The CUORE bolometers will operate at temperatures between 7 and 10 mK. This will require an ex-tremely powerful dilution refrigerator (DR). At these temperatures, the cooling power of a DR variesapproximately as T2. Estimates were made of the parasitic power the detector and DR would receivefrom: heat transfer of the residual helium gas in the inner vacuum chamber (IVC), power radiated fromthe 50mK shield facing the detector, and from vibrational energy (microphonic noise). The estimatedvalue is∼1 µ W at 7 mK, using reasonable values for the residual gas pressure and achievable sur-face quality for radiation transfer. The resulting estimate for the radiation contribution was negligible.CUORE will utilize a similar system to that of the Nautilus Collaboration that cools a 2-ton gravitationalantenna. That system experienced a parasitic power of 10µW from unknown sources.
The CUORE detector will be cooled by aHe3/He4 refrigerator with a cooling power of 3 mW at120 mK. Refrigerators with the required characteristics are technically feasible. One example is the DRS-3000 DR model constructed by the Kamerling Onnes Laboratory in Leiden. The unit is shown in Fig.41,inserted in the dewar. One important design feature is the 50 mm diameter clear access to the mixingchamber to allow a rod, suspended from an external structure, to suspend the detector array to minimizevibrations from direct connection to the mixing chamber. The temperature of the rod will be controlledin stages along its length by flexible thermal contacts to avoid vibrations.
The dewar housing the DR will have a jacket of liquid nitrogen (LN) to avoid the need of superin-sulation which is not free of radioactivity. The system is designed with several tubes passing throughthe LN bath, the liquid He bath, and the IVC, to allow refilling with cryogenic liquids, and for sufficientfeed through for electrical connections. Liquefiers will provide constant liquid levels for the two bathsover long periods of operation. The He that evaporates from the main bath and from the 1K-pot will berecovered in a buffer tank and re-liquefied with a helium liquefier with a capacity of several tens of l/day.The gas will be cooled to∼70 K, then to 10 K, by a two stage Gifford-MacMahon cycle. This will befollowed by a Joule-Thompson cycle that liquefies it and injects it back into the main bath. The nitrogenliquefier, on the other hand, will require only a single stage Gifford-MacMahon cycle to cool a cold fingerabove the LN bath. It will condense the evaporated N2 and let it fall back into the bath.
This complex cryogenic system will require a constant monitoring system. It must be capable ofsurveying the operating conditions to allow prompt intervention to correct malfunctions rapidly. In addi-tion, the operating conditions of the entire cryogenic system must be recorded for future correlation withinstabilities in the experimental data (section11.5).
Besides housing the CUORE detector, the dewar will be able to support an effective system of romanlead shields maintained at the low temperature close to the detectors (Fig.41and section8.2).
8.1 Development of a Pulse-Tube-assisted cryostat
The experience collected by the proponents in running CUORICINO, and by the Milano group in runningthe previous 20 detector arrays, shows that a constant (or very slowing varying, of the order of 1 %/day)level of liquid helium in the main bath of the cryostat helps in achieving a steady response of the detectors.Any variation of the main bath level translates into small changes of the mixture flow and therefore of therefrigerator cooling power. These changes are harmful for the stability of the bolometer output and couldspoil the effectiveness of the correction procedure (usually referred as “stabilization”). Detectors needto be operated in a DC-coupling mode because their baseline level reflects the temperature changes andis used for the detector responsestabilization(Fig. 42 and section13). A fundamental point is that thestabilization procedure is effective only if the detector operation point (and therefore the baseline level)is kept inside a narrow environment of the initial value. This cannot be achieved in presence of relativelylarge or fast changes of the liquid helium level.
The basic design described above for CUORE, is based on the successful operation of CUORICINO

8 CRYOGENIC SYSTEM 80
Figure 41: CUORE cryostat and shielding.
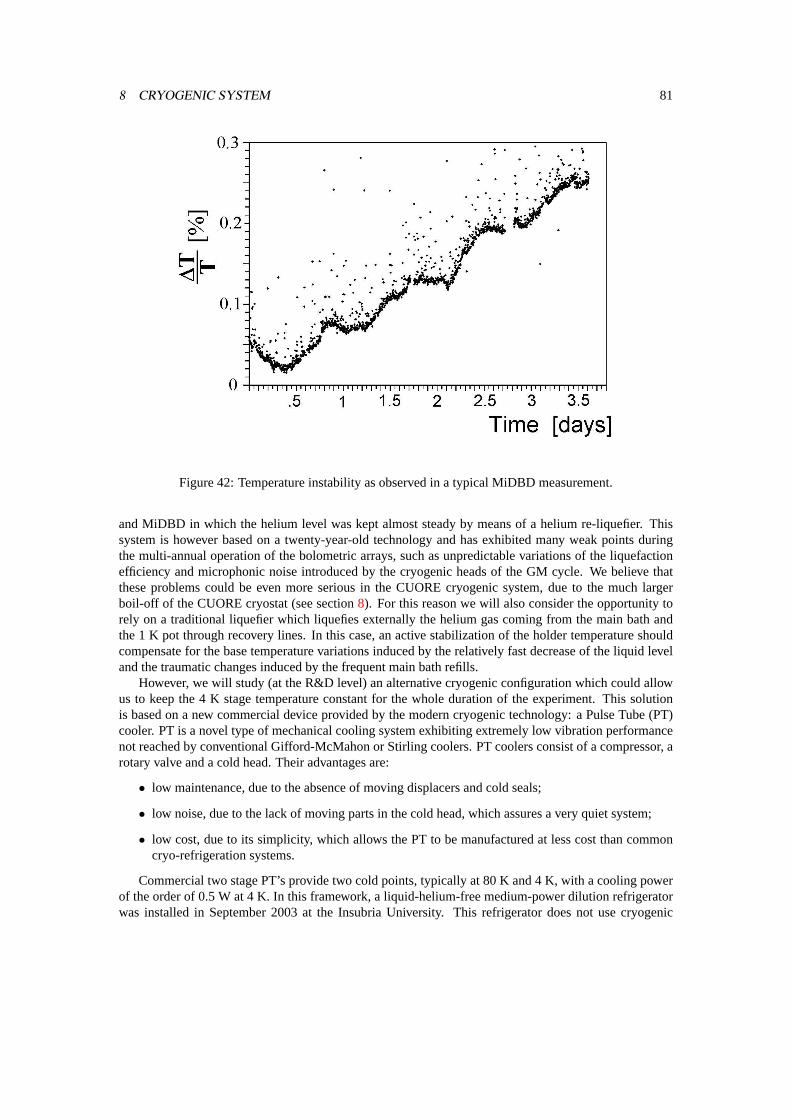
8 CRYOGENIC SYSTEM 81
Figure 42: Temperature instability as observed in a typical MiDBD measurement.
and MiDBD in which the helium level was kept almost steady by means of a helium re-liquefier. Thissystem is however based on a twenty-year-old technology and has exhibited many weak points duringthe multi-annual operation of the bolometric arrays, such as unpredictable variations of the liquefactionefficiency and microphonic noise introduced by the cryogenic heads of the GM cycle. We believe thatthese problems could be even more serious in the CUORE cryogenic system, due to the much largerboil-off of the CUORE cryostat (see section8). For this reason we will also consider the opportunity torely on a traditional liquefier which liquefies externally the helium gas coming from the main bath andthe 1 K pot through recovery lines. In this case, an active stabilization of the holder temperature shouldcompensate for the base temperature variations induced by the relatively fast decrease of the liquid leveland the traumatic changes induced by the frequent main bath refills.
However, we will study (at the R&D level) an alternative cryogenic configuration which could allowus to keep the 4 K stage temperature constant for the whole duration of the experiment. This solutionis based on a new commercial device provided by the modern cryogenic technology: a Pulse Tube (PT)cooler. PT is a novel type of mechanical cooling system exhibiting extremely low vibration performancenot reached by conventional Gifford-McMahon or Stirling coolers. PT coolers consist of a compressor, arotary valve and a cold head. Their advantages are:
• low maintenance, due to the absence of moving displacers and cold seals;
• low noise, due to the lack of moving parts in the cold head, which assures a very quiet system;
• low cost, due to its simplicity, which allows the PT to be manufactured at less cost than commoncryo-refrigeration systems.
Commercial two stage PT’s provide two cold points, typically at 80 K and 4 K, with a cooling powerof the order of 0.5 W at 4 K. In this framework, a liquid-helium-free medium-power dilution refrigeratorwas installed in September 2003 at the Insubria University. This refrigerator does not use cryogenic

8 CRYOGENIC SYSTEM 82
liquids at all: a PT cools the 80 K and the 4 K shields, while the3He-4He mixture is condensed by aJoule-Thompson expansion after thermalization at the 4 K stage. This refrigerator will be a precioustest-bench for this new technique, in terms of reliability and noise level. In the event of convincingperformance of this system, we will design a refrigerator for CUORE endowed with an array of PT’swith the aim to stop or reduce the main bath boil-off or, as an extreme solution, to get rid completely ofcryogenic fluids. This solution would solve much of the stability problem at the root.
8.2 Shielding requirements
Double-beta decay experiments, as well as dark matter searches and searches for rare events in general,require deep underground locations and ultra low radioactive environments. This latter requirement isusually accomplished by placing severe constraints on the selection of the materials used and by therealization of proper shielding surrounding the detectors. In the case that complicated structures like di-lution refrigerators are used, the problem of their shielding and construction using only low radioactivecontamination materials is complex. Moreover, since in MiDBD and CUORICINO a non negligible con-tribution to the background rate in theββ(0ν) region was recognized as originating from environmentalradioactivity, and radioactive contaminations of the cryostat structure (sections6 and14), the design ofeffective shields (specially those directly surrounding the detector) is crucial to reach the sensitivity goalof CUORE.
Part of the bulk lead shielding will be placed inside of the cryostat, and part outside (Fig.41). This willshield the detector from environmental radioactivity and from radioactive contaminations of the dewarstructure, also reducing the total amount of lead required. A4π layer of ultra-low background lead willconstitute 3 cm thick walls of the cubic structure of the array. This layer will be Roman lead whose210Pbactivity was measured to be less than 4 mBq/kg [174]. As for CUORICINO, the dilution refrigerator willbe constructed from materials specially selected for low levels of radioactivity (section14). Nevertheless,these levels might be higher than can be tolerated by the sensitivity requirements. The main goal of theinner lead shield will be therefore of cancelling their dangerous contributions to the CUORE backgroundlevel.
The top of the detector array will be protected by two Pb layers of∼1 m diameter and 10 cm thicknesseach, with a 10 cm diameter central bore to accommodate the copper cold finger that supports the detectorand the narrow neck of two radiation shields of the refrigerator that are at temperatures of 50 mK and600 mK. The layer close to the detector will be made of high quality lead with an activity of 16 Bq/kgof 210Pb. The upper layer will be made of modern lead with an activity of210Pb of 150 Bq/kg. Anotherlayer of lead, 17 cm thick, and with a dimaeter of∼40 cm will be placed directly on the top face ofthe detector. It will be constructed from low activity lead of 16 Bq/kg of210Pb. This configuration isdesigned so that the minimum path to the detector from the IVC and the dilution unit is 20 cm of lead.Finally, outside the dewar, there will be two 10 cm thicknesses of lead, 16 Bq/kg of210Pb for the innerlayer, and 200 Bq/kg for the outer layer. The lead shield will be surrounded with a 10 cm thick box ofborated polyethylene that will also function as an hermetically sealed enclosure to exclude radon. It willbe flushed constantly with dry nitrogen.
The entire dewar, detector, and shield will be enclosed in a Faraday cage to exclude electromagneticdisturbances that also constitute a source of background, albeit at low energies, important to dark matterand solar axion searches. The addition of a muon veto surrounding the entire structure will be alsoconsidered.

9 REQUIRED LABORATORY 83
9 Required laboratory
The entire CUORE setup will be installed underground inside a proper building which will have to guar-antee room for all the setup parts (e.g. cryogenics, electronics, shieldings), for a controlled area to beused during assembling procedures and for all normal monitoring activities.
The hut in which the CUORE experiment will be housed will have therefore to satisfy the followingmain requirements:
• the cryostat and the detector have to be sustained by means of two independent structures, in orderto avoid any possible transmission of mechanical vibrations to the bolometers from the cryogenicfacility.
• the dilution refrigerator has to be kept at a suitable height from the floor to give the possibility ofan easy dismounting of the thermal and radioactivity shields when necessary.
• the area where the cryostat and the front-end electronics are located has to be shielded from elec-tromagnetic interferences by means of a Faraday cage.
• the area where the detector will be assembled must be a clean room in order to avoid radioactivecontamination of the array in the mounting phase.
Following these requirements we made a schematic design of the hut which will be divided in threelevels as shown in Fig.43. At the ground floor a platform of reinforced concrete, with a central aperture ofabout 3 m diameter, will be placed. In this aperture a lifting platform, able to raise at least 50 tons, will berealized with four couples screw-nut, driven by four motors simultaneously controlled. The radioactivityshielding will be placed on the lifting platform; in this way it will be easy to pull down the shieldingswhenever is necessary to open the cryostat. On the ground level, the pumps of the cryostat and thecompressors for the liquefiers (or for the pulse tubes) will also be placed.
The dilution refrigerator will be suspended at about 3.5 m from the ground in order to guarantee aneasy dismounting of the thermal shields (Fig.43). The concrete platform at the ground floor will be thebase for two sets of three pillars each: the first set will go up to the floor of the second level and willsupport a plate to which the cryostat top flange will be anchored; the second set will go up to the ceilingof the second level and will bear the support structure of the detector. An appropriate design for themechanical suspension for the CUORE array is under study. We have however seen that it is relativelyeasy to realize a suitable device since the only unavoidable requirement is the achievement of a lownatural vibration frequency of the system (below 0.5 Hz).
The first level will consist of two separated sections: a clean room (at least class 100), where all theCUORE detector parts will be assembled and stored, and a control room for the cryostat.
The second level will also be separated in two sections. The first one, containing the top of thecryostat, the support structure and the front-end electronics, will be surrounded by a Faraday cage. Thesecond will be used for the data acquisition system.
9.1 Cooling water requirements
Depending on the cryostat design, the thermal power required to cool the pumps and compressors canvary between 40 and 60 kW. The water cooling circuit of the LNGS underground laboratories could inprinciple easily accomplish to our needs but our experience in past years tells us that this circuit hasto reach better reliability and purity of the water. Therefore we will install a water chiller of adequatecooling power that in the future can work as a backup solution to cover possible failures of the laboratorycircuit.

9 REQUIRED LABORATORY 84
Figure 43: Scheme of the CUORE setup installation.

9 REQUIRED LABORATORY 85
9.2 Power requirements
In order to guarantee a continuous operation of the experiment, all the equipment has to be powered byan Uninterrupted Power Supply (UPS) that should have a power in the range 70–100 kVA, dependingon the setup design. Only the water chiller can be powered by a normal power supply, provided thatwater circulation pumps are under UPS and the water circuit has a buffer big enough to resist to powerinterruptions for the same amount of time the UPS does.
9.3 Safety
The CUORE experiment doesn’t use dangerous materials and the only safety requirements concern there-fore the use of cryogenic liquids. Furthermore the amount of liquid nitrogen and liquid helium containedin the cryostat will be of the order of 100 liters and then, also in case of an abrupt evaporation the amountof gas released to air is limited to few hundreds of cubic meters. Of course, in the case of a cryostat usingpulse tubes (instead of cryogenic liquids) this issue would also disappear.
9.4 Space requirement
The space required to allocate CUORE is 10×10 m2 and we consider it sufficient for the installation of thexperiment. Moreover a few square meters outside the hut are required in order to accomodate the waterchiller (it should be placed in a bypass outside the main hall not too far from the hut) and the ventilationsystem of the clean room (close to the hut).

10 ELECTRONICS 86
10 Electronics
Although CUORICINO has many fewer channels with respect CUORE, the design of its electronics hasbeen developed with the aim of fully satisfying the requirements (electrical specification, space occu-pation, cost, etc.) of CUORE. Therefore, the description of the front-end set-up we are proposing forCUORE is very close to the actual front-end of CUORICINO. Very few modifications are needed toupgrade the set-up of CUORICINO to that of CUORE.
10.1 General Description
With the CUORICINO experiment two front-end readouts are being investigated: a configuration con-sisting of 38 channels completely operated at room temperature (“warm electronics”: WFE) and a systemof 24 channels characterized by an additional first differential unity gain buffer stage at low temperature(“cold electronics”: CFE).
The connection between the thermistors and the first stage of the electronics is via a twisted pair of1 m (CFE) and 5 m (WFE) in length. The main reason for these two prototypes is to assess the effectof the microphonic noise of the connecting wires on the detector energy resolution at low energy, inorder to achieve the maximum possible sensitivity at threshold. Since other factors dominate the detectorresolution at higher energies, an equivalent performance is expected there for the two set-ups.
Regardless of the configuration considered, the design of the electronic system must satisfy manyspecifications. Among them, the four major issues can be summarized as follows:
1. It should be characterized by a small noise contribution, in the frequency band of the detector signal(∼one to few tens Hz), generated by the biasing circuitry and the preamplifier.
2. It should accommodate the broad spread of manufacturing characteristics that is typical of thebolometer/thermistor modules. In CUORICINO, for example, the optimum bias current of somemodules is as low as 150 pA, while is as high as 300 pA for others. As a consequence the signalamplitude exhibits a corresponding spread.
3. It should enable in situ measurement of the bolometer DC characteristics.
4. The design should incorporate a high level of remote programmability in order to avoid mechanicalinterventions in the vicinity of the bolometers during the measurements.
In the following subsections we shall give a brief discussion of the circuitries able to address theseissues and presently used for the CUORICINO readout. An extended description of the CUORICINOelectronics can be found in reference [175].
Among some of the important tasks addressed by the readout electronics which are not reported here,a particular attention was given to the setup power supply and the shielding against the electromagneticinterferences. A very precise, multi-output, pulse generator instrument was finally developed to allow acontinuous calibration of the energy conversion gain of the whole array (stabilization).
10.2 Thermistor biasing and detector wiring
In Fig. 44 and Fig.45 are shown the two schematic diagrams of the readout solutions for CUORICINO.As can be easily seen, they differ by the presence of the cold buffer stage in one of them (Q1 and Q2
in Fig. 45). From left to right of both figures we find the detector, its biasing network, the first stage ofamplification (warm/cold) and so on. Any block characterized by a capital P as the first letter of its labelis equipped with at least one remotely programmable functionality. Thermistor biasing is accomplishedby applying a programmable voltage across a series combination of the thermistor and two load resistors.

10 ELECTRONICS 87
PRL
ZBDVA PGA
PGF
TR
OU+
POA
OU-
PTRS
PB+
PB-
PAUX
Fridge
Room T.
PRL
Figure 44: Schematic diagram of the front-end electronic circuit operated at room temperature (WFE).
For the set-up of Fig.44the load resistors,PRL, are also at room temperature. The analysis and min-imization of the contribution to the low frequency (LF) noise from large resistors under bias conditions,is the subject of an independent report [176]. Under computer control, the biasing resistors can assumevalues in the range 11–54 GΩ. This facilitates the measurement of the bolometer’s I-V characteristics atlarge bias. The impedance at the input of the electronics is sufficiently high that parasitic conductance inthe circuit board is an issue that demands great attention. Precautions that we took to suppress parasiticconductance were:
• segregation of the two high impedance detector nodes by a circuit board layer;
• strategic placement of guard traces around the solder junctions of high-impedance componentleads;
• maintenance of a minimum spacing of∼5 mm between high-impedance traces;
• placement of slots at critical locations on the circuit board to avoid conductance through minuteamounts of soldering residue that sometimes escapes the standard cleaning procedures.
Altogether, these solutions yielded excellent results.In the set-up of Fig.45 the pair of load resistors RL is also put close to the buffer location, at low
temperature. The rest of the biasing set-up is unchanged, but the RL value is 54 GΩ and cannot beswitched to 11 GΩ.
The application of the bias voltage to the load resistors is accomplished by the programmable biasattenuator (PB+, PB-), an especially designed Digital to Analog Converter (DAC) characterized by anoptically isolated digital input. It can generate the voltages PB+ and PB- of both Fig.44 and Fig.45,symmetrically with respect to ground (PB-=-PB+). The programmable bias attenuator can also providethe additional feature of inverting the polarity of the bias voltage. This feature is very useful, since byreversing the bias voltage during DC characterization, it is possible to account for the thermoelectriceffect operating in the leads that connect the front-end electronics to the thermistors [177]. To simplifymeasurements and improve accuracy, an additional bus PAUX on Fig.44 and Fig.45 can be connectedto any selected channel to perform the voltage reading with a very precise multimeter, independently ofthe acquisition system. The biasing network is equipped with a heavy low pass filter that reduces to anegligible level whatever noise originates from the power system or from the network itself.

10 ELECTRONICS 88
RL
ZBDVA PGA
PGF
Q1
TR
OU+
POA
Q2 OU-
PTRS
PB+
PB-
PAUX
VD
VE
VE
Fridge
Room T.
RL
Figure 45: Schematic diagram of the front-end having the first stage, the differential bufferQ1, Q2, atcold.
In CUORICINO, the wiring of all the electrical elements at low temperature has been realized bymeans of shielded twisted cables (superconducting coaxial cables with a CuNi and 100µm diameterNbTi twisted pair). Five stages of thermalization cut the thermal conductance of the cables themselves.The five stages are located at 4.2 K, 1.2 K, 120 mK, 50 mK and 5 mK plates and are composed ofsapphire windows (10×20×1 mm3) that are sputtered with gold on the bottom, and have 12 1 mm widetracks (gold-platinum) on the top, where the twisted cables are soldered.
We are studying the possibility of upgrading this set-up with a less expensive solution. First, thesapphire windows are now going to be replaced with flexible Capton windows with thinner and shorterCu tracks. A simple pressure on their center against the cold plate allows an effective thermalization ofthese windows. The next step will be the realization of very thin Cu or CuNi tracks sputtered on a flexibleCapton substrate. This new approach seems to be feasible thanks to the small radioactive backgroundmeasured for Capton.
10.3 Preamplifier and Cold buffer stage
The design of the preamplifier (DVA in Fig.44and Fig.45) satisfies four main requirements:
1. Because the typical source impedance and signal characteristics of a bolometer, the voltage am-plifier is the conventional approach [178]. Its performance is not superior to a charge or currentconfiguration [179], but it allows floating inputs which make biasing naturally compatible with DCcoupling.
2. The long leads (in the WFE option) connecting the preamplifiers with the bolometers have thedrawback of acting as antennas for microphonic noise. We addressed this problem by making thepreamplifier input differential. Compared with a single-sided input the amplifier noise power isdoubled, but the troublesome (common mode) microphonic noise originating in the leads can beeffectively suppressed. Moreover, the differential configuration suppresses interchannel crosstalk.
3. The signal bandwidth of our bolometers extends from 1 Hz to few tens Hz. We then requirethat the preamplifier noise, both series and parallel, be minimized in this frequency interval. TheCUORICINO preamplifier is characterized by a voltage noise floor of 3 nV/
√Hz, that becomes 4
nV/√
Hz at 1 Hz. Its noise current is 4 fA/√
Hz.

10 ELECTRONICS 89
4. Monitoring the baseline of each bolometer, and correlating the baseline shift with the shifts in theoverall system gain, requires a high thermal stability of the preamplifier. A special circuit has beendeveloped that allows the drift to be maintainedbelow 0.2µ V/C.
With the aim of minimizing the microphonic noise due to the length of the leads, we have realized theset-up of Fig.45. It’s main feature is that the first buffer stage of amplification operated at low tempera-ture. The box housing the preamplifiers is in fact anchored to the 4.2 K plate of the dilution refrigerator,next to the detectors. The buffer stage is then warmed in order to reach the optimum temperature for Sil-icon, around 110 K. Each cold stage is a differential buffer (Q1 and Q2) composed of two Silicon JFETsthat work in the source follower configuration [180]. In this way the length of the leads that connectthe detector to this additional buffer stage is reduced to about 1 m, while the remaining wires towardsthe external stage at room temperature are driven by the low output impedance of the differential buffer.The cold buffer stage features a negligible current noise, a floor noise of about 2 nV/
√Hz and a noise
of about 10 nV/√
Hz at 1 Hz. Each cold buffer, together with the load resistors, is located on boardsthat accommodate 6 channels. The boards are fabricated on a substrate made of PTFE 25% reinforcedfiberglass. This solution achieves two goals. First, the small thermal conductance of the PTFE minimizesthe injected thermal power needed to increase the JFET temperature from 4.2 K to the optimum 110 K.Second, the radioactivity level of PTFE is lower by a factor of about two with respect to pure fiberglass. Inaddition, the printed circuit boards have been realized with a thickness of only 0.5 mm thus halving theirmass. The boards are suspended by means of (low thermal conductivity) nylon wires inside thermallyshielded copper boxes which can contain two of them. Although a bit more complex than WFE, the CFEoption has the advantage of offering an effective noise reduction (see Fig.38).
For both configurations, the input offset is the sum of the contributions from the asymmetry of theJFETs and the bias voltage of the NTD thermistor. The JFET asymmetry may contribute up to± 20 mVto the offset. During normal operation, thermistor biasing contributes no more than 20 mV, but for loadcurves acquisition the bias voltage must be adjustable to both polarities and to a magnitude as high as|50mV |. The offset corrector circuit (POA in Fig.44and Fig.45) is designed to compensate input offsetsfrom -80 mV to +80 mV, under the control of the digital section. The POA was implemented with a circuitsolution that minimizes any noise contribution, especially at LF [175]. Once fired by the computer, thePOA adjusts the output offset of the selected readout channel to a default value of 1 V. By request, thisvalue can be changed remotely to an arbitrary level.
An AC (DC) test signal can be injected directly to the DVA inputs in order to test the front-end ofany selected channel and the load resistors of the WFE channels. During this operation, a programmablesystem of relays disconnects the detector (or the cold stage) from the DVA.
10.4 Programmable gain amplifier
The outputs of the preamplifier drive the differential inputs of a programmable gain amplifier, (PGA inFig. 44and Fig.45). The amplifier output to the preamplifier input ratio (voltage gain) can take values inthe range 220–5000 V/V. The differential outputs travel on an analog bus to the filter circuit PGF, whichis followed by analog to digital conversion of the acquisition system.
10.5 Antialiasing filter and analog trigger
In CUORICINO, optimal filtering algorithms are applied to the acquired detector signals (sec.13). Toensure adequate frequency response we have implemented an antialiasing filter (PGF in Fig.44 andFig. 45) at the downstream end of the analog signal processing. This is an active six-pole Bessel low-pass filter, which yields a roll-off of 120dB/decade. In order to adapte the useful bandwidth to eachbolometer module, the cutoff frequency can be adjusted from the computer.

10 ELECTRONICS 90
The input of the trigger circuit (PTRS in Fig.44 and Fig.45) is AC coupled to the output of theantialiasing filter. The core of PTRS is an analog amplifier. The gain of PTRS is adjustable from thecomputer. The AC coupling produces a negative excursion of the trigger circuit input that, if uncompen-sated, would result in a shift of the baseline. A baseline restoring section [181] has been added to PTRS tosuppresses this effect. Pulses from a bolometer may exhibit a trailing undershoot because of the couplingof the inductive part of the bolometer’s dynamic impedance to the parasitic capacitance in shunt with it.After differentiation by the AC coupling, the undershoot of large pulses has the potential to re-trigger. AnRC network [182] within PTRS cancels the effect of the undershoot and thus suppresses re-triggering. Itstime constant has been made adjustable from the computer. The final element in the trigger circuit is atwo-pole Bessel low-pass filter. The cutoff of this filter tracks the cutoff of the antialiasing filter PGF, butis higher in frequency by 4 Hz. A single trigger-Bessel module card accommodates three channels.
10.6 Calibrating Pulse Generator System
Very long measurements need an accurate energy calibration. A radioactive source cannot be left orput (on request) close to our detectors, because of its unavoidable contributions to the dead time andbackground level. Our solution is based on the use of both a radioactive source positioned close tothe array (typically once a month, just outside the cryostat) and an always-present very stable electricalcalibrating system (heater), which inject signals at a faster rate. The radioactive source fixes the energyscale of the detector while the heater effectively corrects gain variations (sec.13).
The electrical calibrating system is composed of a small heater resistor glued on each crystal. Acrossany heater resistor a small voltage pulse is developed which dissipates a small power, that generates asignal very similar to that of an impinging particle.
The accuracy of our calibrating system depends on the stability of the heater resistor, whose charac-teristics are described in [151], and to the electrical pulse generator. To this aim we have developed andare using a very stable pulse generator having the following features:
1. It is modular and provides 4 independent outputs for each card used.
2. Each output generates square pulses that can be completely programmable in amplitude and width,and can span a range corresponding to pulse amplitudes equivalent to a few tens of keV up to morethan 20 MeV.
3. Each pulse occurrence can be driven by an external input (e.g. DAQ), in order to allow for acomplete tagging.
4. The stability of the pulses is within 2 ppm in any parameter.
A complete detailed description of this device is given in [183].
10.7 Voltage Supply system
The voltage supply system is composed of two main stages. The first stage fulfils a pre-adjustment of±13 V by means of several 75 W switching regulators. Special filtering sections are used to suppress anyhigh frequency spike. The second stage outputs provide the desired voltages in the ranges -12–+12 V forthe output stage of the front-end and in the range -10–+10 V for the cold stages and the preamplifiers.The± 10 V output is used also as the reference for the offset correcting circuits. For this reason a verystable (a few ppm/oC drift) and low noise (1.3µ Vpp in the 0.1 Hz to 10 Hz frequency range, at a ratedcurrent of 1.5 A circuit) was designed and built [184]. A single second stage voltage supply supports 24complete channels.

10 ELECTRONICS 91
10.8 Digital control
A digital control system (DCS) enables a computer assisted regulation of the most significant analogfront-end parameters: the thermistor bias current, the input offset correction, the gain, the bandwidth, theapplication of test signals to the inputs, the calibrating pulse injection to the detectors, etc. During dataacquisition the DCS is generally idle. In this state even the DCS clock shuts down, thus eliminating thepossibility that DCS activity will contribute to noise on the analog outputs.
To minimize elecromagnetic interferences (EMI) and ground loops, the communication between theDAQ (sec.11) and the DCS is made with an asynchronous, serial, bi-directional optical fiber link bus.
10.9 EMI Shielding
We foresee, as is partially done now in CUORICINO, surrounding the entire cryostat and the front-endelectronics with a Faraday cage able to shield also low frequency magnetic fields. For this purposethe internal walls of the cage will be covered with a sheet of 0.1–0.2 mm thickness of SKUDOTECH,a very high permeability metal [185]. A sound absorbing material will also cover the internal walls.The EMI shield will be split in two sections. A first Faraday cage will surround the cryostat and itslead/polyethylene shields. The very front-end, fed by the detector connections (output signals and inputbias), will be organized in 12 towers (each composed of 6 standard 19 inch-racks) and connected to thesecond stage located in a smaller Faraday cage sharing one of its walls with the main Faraday cage. Thesmall Faraday cage will house the antialiasing filter, the trigger circuit and the acquisition system opticallyconnected via TCP/IP to the outside world. The choice for a set-up split in two separate rooms allows adistribution of the power dissipation over a large space and an effective reduction of the digital circuitsEMI.
10.10 Noise considerations
The above described analog WFE produces a noise of the order of 50 nV (FWHM) referred to its input,over the 10 Hz bandwidth of the signal. The 54 GΩ load resistors produce 80 nV in the same bandwidth sothat the combined noise is∼100 nV (FWHM). On the other hand, for the CFE option, due to the presenceof the cold buffer stage, the series power noise is increased by a factor of about two, while parallel noiseis decreased by a factor of at least three, mainly due to the use of the cold load resistors. In this way theoverall noise contribution becomes about 90 nV (FWHM). In both cases the noise is considerably belowthe 1.0µV (FWHM) level observed for one of our best performing bolometers. We believe therefore thatthe analog front end is more than adequate for the CUORE needs.
The two front-end solutions have the same level of noise, but the presence of the cold buffer stage,which reduces the high impedance path, should further improve the common mode noise due to thevibration of the leads. Unfortunately, there is another source of microphonics which is not a commonmode: the mechanical friction between the detector and its mounting. If this source would result ina noise level much greater than that of the connecting leads, the use of a cold buffer stage would beunnecessary. This would allow a reduction of the connecting leads by a factor of two and would avoidthermal power injection inside the dilution refrigerator. It should be noticed that the reduction of theparasitic capacitance obtained by shortening the high impedance path is not a concern in the case of ourvery slow signals.

11 DATA ACQUISITION SYSTEM (DAQ) 92
11 Data acquisition system (DAQ)
In this section we describe the architecture of the readout and DAQ system for CUORE. In particular wereport the main requirements that are driving the system design and describe the general architecture ofthe system oulining a few open options. We also give the block diagram of the main readout board andfinally describe the main DAQ system and its software layout.
11.1 Requirements
As described in the previous sections, the signals coming from each crystal are amplified and shaped bya preamplifier that generates pulses well described by the following typical parameters:
• Voltage signals with maximum peak amplitudes as high as 10 V; the signals can be either differ-ential or unipolar; due to the large energy range, the peak amplitude can also be as low as fewmV.
• Rise times of the order of 30 ms, falling times up to an order of magnitude slower.
• Total duration up to several seconds.
The DAQ system must be designed to sample and read out the signals of about 1000 channels1 of thistype with virtually zero dead time, independent readout among channels, self-triggering capability, and,last but not least, optimized cost.
In order not to spoil the energy resolution over the whole range (from 5 keV up to 15 MeV), real 16 bitsampling is required. In addition, the pulse must be sampled for 5 s, in order to get a good measurementof the tail and of the background level. A typical sampling rate of 1 kHz seems adequate, but it is highlyrecommended to allow for a programmable sampling speed around this value. With the aforementionedvalues, the typical event size for one channel is 5000x2 = 10 kbytes.
It is also very important to measure the background level (baseline), both before and after the endof the pulse, therefore it is required to have a suitable internal circular memory and a logic capable ofrecovering the pre-trigger signal conditions.
The choice for real 16 bit sampling poses severe requirements on the noise level acceptable at thechannel input. Assuming a maximum range of 10 V, the noise level must be below 150µV r.m.s.
Being that CUORE is designed to search for very rare events likeββ decays or dark matter inducednuclear recoils, the requirements for the DAQ system for data throughtput are not severe at all. Themaximum foreseen data rate is given by the calibration procedure, that might produce at most few eventsper minute per channel. As described in section11.4, this rate does not pose any special requirement onthe DAQ system, even assuming a complete sampling of the channels without zero suppression.
11.2 General architecture
The CUORE DAQ system must be able to digitize, acquire, analyze online, store and display the pulsesgenerated by 1000 TeO2 bolometers.
Each channel must be completely independent from the others and the readout must introduce zerodead time.
In order to minimize the cost and allow for a maximum flexibility in the on-line analysis and trigger-ing, the system proposed here is mostly based on the large and cheap computing resources that are now

11 DATA ACQUISITION SYSTEM (DAQ) 93
VME CRATE 1 VME CRATE 3 VME CRATE 4 VME CRATE 5VME CRATE 2
Network Switch
System consoles
PC 1 PC 2 PC 3 PC 4 PC 5
VME−PCI interface
Figure 46: Block diagram of the proposed DAQ system. The digitizing boards are housed in 5 VMEcrates, each controlled and read by a dedicated Linux PC that uses a VME-PCI interface to access theVME bus. All computers are connected via a network (normal 100 Mbit ethernet or fast optical link ifrequired) to a set of consoles that provide graphical user interface and event display. A custom designedsoftware runs on all computers.

11 DATA ACQUISITION SYSTEM (DAQ) 94
commercially available, reducing the complexity, and therefore the cost, of the readout boards as muchas possible.
The general structure of the system is shown in Fig.46. It is composed of a set of personal computers,a network infrastructure, a PCI based VME interface and 5 or more VME crates with custom designeddigitizing boards.
We propose to design and build a simple digitizing VME board with full 16 bit dynamic range (possi-bly 24), large internal circular buffers, optional self-triggering capability with a programmable thresholdand digitizing speed programmable in the range from 0.01 KHz up to 10 KHz.
Each board can probably handle 12 channels, to allow reading 240 channels per VME crate (5 VMEcrates2 would then be required with 1000 channels).
In this structure the digital boards are just pure digitizers, that continuously convert the input analoguesignal into a stream of digital words; when a trigger occurs, either generated by the remote front endelectronics or internally generated by the discriminator, the words stored in the internal buffers are copiedto another memory that can be accessed by the main DAQ software via VME bus. The structure of theboard guarantees that the channels remain independent and fulfils the zero dead-time requirement.
Each board issues an interrupt signal on the VME bus whenever a trigger occurs; in this way the mainsoftware may work either in interrupt or in polling mode.
The large and cheap computing power available nowadays yields a large flexibility in the possibleon-line filtering and processing of the data. Full on-line analysis is possible with this structure, allowinga fast and efficient monitoring of the experimental conditions.
The next two sections give a somewhat more detailed description of the digital board and of thecomputing and software architecture.
11.3 Readout board
We are considering two possible block diagrams for the digitizing board. The first is the one sketched inthe previous section and shown in Fig.47.
In this design, the digitizing board is very simple and most of the job is left to the software that runson the DAQ computers; in fact, the board is a pure free-running digitizer, with the minimum amount oflogic needed to recover the data from a few hundred ms before the trigger until several seconds afterthe trigger. The trigger can be either external, i.e. generated by the front end electronics and sent to theboard via a NIM or TTL signal, or can be internally generated with a simple discriminator. To achievethe required resolution (real 16 bits), we will probably put two 12 bit ADCs in parallel, with a preciseamplifier in front of the least significant ADC. In this way 24 bits will in fact be available. The amplifiergain will be chosen to leave a large overlap between the two ADCs, allowing a precise intercalibration.
When a trigger occurs, the FPGA logic will transfer the data (a programmable time window aroundthe trigger signal) to a Dual Port Ram that can be accessed via VME bus. A VME interrupt will be alsogenerated when this transfer is completed, allowing the DAQ computer to start read-out. It will be possibleto use this board either in interrupt mode or in polling mode. Block transfer D32 will be supported too,allowing very fast transfer. The Dual Port Ram will be large enough to keep several minutes of data atnormal trigger rate during calibration.
We are also considering a second approach, a little more complex from the point of view of hardwaredesign, that includes a DSP in the digitizing board (see Fig.48). With this solution, the DSP could beused to perform a first level data filtering and implement “smart” trigger conditions in order to reduce the
1As an option, it has been proposed to add a second sensor to each crystal. This would of course double the number of channels,but would have a negligible impact on the architecture proposed here, except of course an almost linear increase of the total cost ofthe system.
2Should the two sensor options be adopted, the number of required crates would be 10; additionally, we might succeed indesigning a 16 channel digitizing board that would reduce the number of VME crates to 4 or 8. The general structure of the systemwould not be changed at all.

11 DATA ACQUISITION SYSTEM (DAQ) 95
FILTERAMP &
A
1CD
A
2CD
MEMORY
MEMORY
FPGA
FPGA
COUNTER
DAC
DUAL PORT RAM
VME
A
D
INPUT
CLKPROG.
Figure 47: Base design of the digitizing board. In this "minimal" version the board simply has the functionto convert the input signal into a stream of words that are transferred to the DAQ computers via VMEbus.
data rate. In our opinion, with the data rate foreseen for CUORE, it will be possible to perform all thishigher level functions using the computing power of the DAQ system, allowing for more flexibility andreducing the cost of the system. Therefore we prefer the scheme shown in Fig.47 as our baseline designand leave the second design as an option.
11.4 Computing system and DAQ layout
The system shown in Fig.46, with the baseline option for the digitizing board shown in Fig.47, requiresa significant amount of computing power because most of the functions are delegated to the software.
As a baseline design, we propose that each VME crate will house 20 boards, each of them capable ofdigitizing 12 channels. Therefore we need 5 VME crates to read 1000 channels. Each VME crate will beconnected to a PC via a PCI-VME interface. These 5 PCs will be connected via network to another set ofPCs that will perform event building, online analysis, graphical display, system control and monitor.
The network infrastructure will be rather simple, with a single switch star-connected to all PCs. Nor-mal 100 Mbit ethernet is probably more than enough for CUORE but it would be easy to implement thisstructure using 1 Gbit optical link without any architectural modifications. We think, therefore, that thisvery standard network structure is adequate.
We propose to use Linux based PCs for all computers and to use root as a software environment.The software running on each computer will be custom designed while the consoles and the graphicalinterfaces will be root based. A possible WEB interface to the system is foreseen, though network securityproblem will probably limit its use.

11 DATA ACQUISITION SYSTEM (DAQ) 96
DC1 A
AD
DR
ESS
AM
P &
FILT
ER
ADC2
CL
KC
OU
NT
ER
ME
MO
RY
ME
MO
RY
WR
ITE
WR
ITE
DA
C
DISC
R
FPGA
DSP
STA
RT
STO
P
DA
TA
DPR
AM
ON
E FO
R 8 C
HA
NN
EL
S
MA
NY
CH
AN
NE
LS
ON
E FO
R
TR
ESH
AD
DR
ESS
AD
DR
ESS
Figure 48: Optional enhanced design of the digitizing board. In this version the board is equipped with aDSP that can perform additional computing functions like event selection or digital filtering.
11.5 Slow control
During a measurement, all the parameters of the apparatus must be monitored and registered. This isparticularly required in long running time experiments where the acquired data can be “contaminated”with problems related to experimental system conditions. In particular in the case of cryogenic detectorsmany inconveniences can arise from the cryogenic apparatus. The experience gained with MiDBD andCUORICINO detectors showed us the fundamental role played by the temperature instabilities and bythe vibrations induced by the malfunctioning of the cryostat and liquefier. In order to correlate thesefrequently unavoidable problems it is very important to continuously check the main parameters of thecryogenic system (e.g. pressures, mixture flows, cryogenic liquid levels and others). The cryogenicapparatus must be equipped with transducers able to transpose these data in a voltage value to be acquiredby the DAQ during the experiment. Thisenvironmental dataacquisition system can be implementeddirectly in the DAQ or be designed independently and correlated off-line with the experimental data bymeans of a time synchronization between the two systems. The choice of the best approach can definitelybe taken later on; the control system and DAQ designs have in fact little intereference and can evolveindependently. At the moment we are not planning an active automatic control of the apparatus. Thiscould be designed later, when a better definition of the cryogenic and detector apparatuses will exist. Onthe other hand, we would like to implement a human remote control(e.g. WEB interface) in order tomaintain the apparatus in the best measurement condition without the necessity of the constant presenceof a shifter inside the underground laboratory.

12 CONSTRUCTION PROCEDURES 97
12 Construction procedures
The only possibility for the CUORE collaboration to satisfy the sensitivity requirements will be to usesevere procedures for the construction of the experimental setup. According to the experience gained inCUORICINO, this will imply rigorous material selection and construction procedures.
12.1 Material Selection
One of the most critical points of the CUORE experiment will be the selection of all the materials usedin the construction of the detector. Since the selection criteria must result in the minimum possiblecontribution to the background level, it is obvious that this will be accomplished only if the startingquality of the materials will be sufficiently good from the point of view of radio-purity. We can dividethe materials needed for CUORE in three main categories: i) materials for crystal growth; ii) materialsfor the detector structure and iii) materials for the shielding structures. Material selection is importantalso for other parts of the experimental setup (e.g. the cryostat) but in principle these parts can be heavilyshielded so the required limits on their radioactive contaminations are less stringent (section8.2).
12.1.1 Materials for crystal growth
TeO2 is a molecule composed of only two atomic species: Te and O. In practice if we want to producea good stoichiometric material, the oxidation of the Te metal must be realized in few well defined steps.In each step the selection of the compound used will be very critical. The first material to be chosenis obviously Te. The analyzed metallic Te for the CUORICINO production showed limits below thesensitivity of the HPGe detectors installed in LNGS (apart from the well known contamination in210Pb). TeO2 powders were also measured at the LNGS low activity underground laboratory. Contaminationvalues are reported in table15. The presence of210Po can be ascribed either to a genuine210Po contam-ination or to210Pb . Since Pb contaminants should be limited in the CUORE experiment, we will try toinvestigate this point in detail. Two acids are usually used for metallic Te oxidation: Nitric and Hydro-cloric. The ratio used in this preparation is: 1 kg of Te, 1.3 kg of HCl and 2.5 kg of HNO3[186]. So weneed to check with the same accuracy the radio-purity of the acids and of the Te metal. For CUORICINOwe have measured the two acids involved in the crystal production using ICPMS with quite good results:HCl showed a contamination of 1.3 ppt of238U and <1 ppt of232Th, while HNO3 showed 13.1 ppt of238U and 112.3 ppt of232Th. One of the main problems in CUORE will be the systematic control ofthese values during all the crystal production operations. There is another very critical point at this stage:a large quantity of water (few liters per kg) is used to “clean” the TeO2 powder just after their productionand before the growth procedure. This operation can be of course very dangerous because of the possiblepresence of radioactive contaminations in the water that can be transferred to the powder. The impact ofthese contaminations could explain the higher contamination observed in the TeO2 powders with respectto the starting Te metal. The growing procedure usually reduces the contamination levels of the finalcrystal with respect to the bare material. However it is usually difficult to quantify the actual reductionin the produced crystals. On the other hand, an increase of the number of growing cycles - althoughundoubtely useful - would be very expensive. The last critical point in the preparation of the crystalswill be the surface treatment made in order to assure a good contact between crystals and semiconduc-tor chips (thermistors and silicon resistances). The data obtained with MiDBD showed that a relevantcontribution to the background in the double beta decay region could be identified with the presence ofsurface contaminations on the crystals. In the production of the early 3×3×6 cm3 TeO2 crystals, thisconsideration was strongly supported by the measurement of the lapping powders used by the factory.In CUORICINO we carried out the final lapping procedures using a specially selected Al2O3 powder.This showed a radioactive contamination few orders of magnitude lower with respect to the previous ones

12 CONSTRUCTION PROCEDURES 98
Table 15: Radioactive contamination measurements for CUORICINO materials. All values are inmBq/kg. Al2O3-1 is the original lapping powder used at SICCAS while Al2O3-2 is a certified 0.7µmSumitomo powder.
238U 226Ra 214Bi 232Th 228Ac 208Tl 40KAu wires <0.99 <1.58 <.34 <0.33 <.29 <.37 1.3±0.2Al2O3-1 12.1±1.8 24.8±3.7 8.2±1.2 4.85±0.7 6.4±0.9 3.2±0.5 10.2±1.5Al2O3-2 <60.1 21.9±3.3 <1.8 <2.4 <2.1 <2.0 <16Cu screws <18.4 <11.0 <7.3 <13.6 <14.0 <14.0 18.3TeO2 11.5±1.7 30.5±4.6 1.7±0.2 3.4±0.5 2.4±0.36 1.7±0.2 6.6±0.9tin 42.3±6.1 45.1±6.2 39.0±5.8 18.4±2.7 18.4±2.7 18.4±2.7 <65
(tab.15). However, because of the large spread in the grains dimension of this polishing powder, onlyroughly smooth surfaces could be obtained. Alternative approaches are in principle possible (e.g. surfaceacid attack, ion beam sputtering, etc.); the careful test of these methodologies and the development ofpowerful dignostic techniques will be considered in the early CUORE R&D phase (see section16).
12.1.2 Materials for the detector structure
The experience gained in MiDBD and CUORICINO indicates that all the structure of the CUORE de-tector should be mainly made of Cu. Only minor components will be built with different materials. Inthe case of Cu, we have indications that very low limits for the bulk contaminations of the U and Thchains can be reached in specially selected productions. We have measured a number of samples forCUORICINO and found that the Oxygen Free High-Conductivity Cu is definitely better than the stan-dard electrolytic Cu. Moreover some specific productions, made by our colleagues in Germany [187],have shown very low limits in radioactive contaminations, at levels sufficient for CUORE sensitivity re-quirements (see section14). We must plan and control the production of Cu for CUORE directly with thefoundry in order to check the contamination of the material immediately. Moreover the Cu must be storedunderground immediately after production to avoid cosmic ray activation. This poses severe conditionson the physical size of the produced Cu in order to minimize the time needed by the mechanical factoriesfor the production of the final pieces of CUORE.
Another important material in the detector structure is PTFE. The spacers holding the detector in theright position are made with this material and therefore the radioactive contaminations of PTFE can bevery dangerous for the background level of the detector. For organic materials there are two differentproblems: first it is necessary to have very low levels of intrinsic radioactivity, second it is crucial tocontrol the exposure of these materials to air radioactive pollution (typically Radon). In general the ra-dioactivity of organic compounds like PTFE, Nylon etc can be very low, as demonstrated by the Borexinocollaboration [188]. Concerning the diffusion of Radon it is necessary to maintain the selected materi-als in a very clean environment and, to minimize the possible radioactive contamination present in thevolume next to the surface, the external part must be mechanically removed before the realization of thespacers.
The other materials involved in the detector construction are characterized by very small masses.Also in this case however, a good radiopurity level is required in order to avoid any possible dangerouscontribution to the background level. In that sense, the selection of the epoxy glue (connection betweenchips and crystals), of the gold bonding wires (electrical connections), of the electrical pins, etc. must becarefully controlled. The indications obtained from our previous tests, show very good levels for epoxieswhile are non conclusive for gold wires and pins. All these components will be measured again to improve

12 CONSTRUCTION PROCEDURES 99
their contamination limits; alternative approaches (e.g. neutron activation) will also be considered.The last critical part of the detector assembly is represented by the wires used for the electrical con-
nection between the detector and first thermalization stage on the inner lead shield (they are not shielded).It is very difficult, at the moment, to define their actual contribution to the background level since we stilllack a defined design of the final electrical connection. As a matter of fact we will choose the best amonga number of different wire types (constantan, superconductor, etc) and will then design the wiring systemusing only previously selected radio-clean materials.
It should be stressed that all the materials must match two different requirements: they must be char-acterized by low radioactive background and, at the same time, ensure a good performance in a cryogenicenvironment. Of course, is not obvious that to satisfy these very different conditions unavoidable diffi-culties might not arise in correctly defining the material for the specific application.
12.1.3 Shielding materials
The radioactive shields will be made of lead. To minimize the contribution from the lead itself, weneed to build different concentric shields made with lead characterized by different contents of210Pb. It should be stressed that the presence of this nuclide can contribute to the background spectra withthe bremssthrahlug photons produced by the beta decays of the210Bi. The internal lead shield, to beplaced as close as possible to the detector at cryogenic temperatures, will consist of ancient roman leadthat contains a level of210Pb lower than 4 mBq/kg [189]( section8.2). The intermediate lead shield canbe realized with commercial lead with a210Pb contamination of the order of few Bq/kg. The externalpart will be constructed with standard commercial lead that normally has contaminations of the orderof few tens of Bq/kg in210Pb . All the above requirements were already satisfied by the lead used inCUORICINO.
12.1.4 Other components of the experimental setup
There are some parts of the cryogenic environment that need careful design, not only from the point ofview of the cryostat performance, but also for their possible contributions to the radioactive background.In particular, although the upper part of the cryostat will be shielded with respect to the detector volumewith a heavy layer of lead, its most massive components should be constructed with materials character-ized by an acceptable level of impurities. We can indicate a rough limit for these materials and reduce at aminimum their required amount. Of course, the requirements connected to producing a well performingcryogenic apparatus must also be taken into account. Some possible materials that satisfy both require-ments have already been found during the last few years for CUORICINO. This job will continue in thefuture with the systematic selection task needed for the specific application to CUORE.
12.2 Construction environment
The TeO2 crystals will be fabricated at the Institute for Ceramics in Shanghai (SICCAS), China, fromlow-radioactivity ore. Our prior experience with similar crystals fabricated for MiDBD and CUORICINOindicates that the final stages of lapping and polishing must be done in a clean, radioactivity-free environ-ment, recognizing that these detectors are the most-sensitive detectors available for traces of radioactivematerials. Two possible options can be envisaged for the choice and set-up of this environment: a) aconservative option, which follows strictly the CUORICINO experience; b) an innovative option, whichforesees a substantial use of out-sourcing, therefore requiring the development of new environments orthe modification of existing environments presently not suitable for the delicate operations involved inthe CUORE assembly. The main points of the two options are outlined below.

12 CONSTRUCTION PROCEDURES 100
(a) In the conservative option, the crystals will be grown in China, cut in a cubical shape and lappedusing alumina powder down to a grain size of about 15µm. The control of the residual activity inthe lapping pads and in the alumina will be performed (see subsection12.1). The lapped crystalswill be delivered by ship in order to limit exposure to the high-energy hadronic component of thecosmic rays and stored underground. The final most delicate polishing operation will be accom-plished directly in the Gran Sasso laboratory, possibly underground or at least keeping each crystaloutside the underground laboratory just for the time required for polishing. A special environmenthas to be developed for this purpose, consisting of a clean room where several polishers can beinstalled in order to proceed in parallel with many crystals. A radon-free atmosphere consistingof synthetic air should be realized in the clean room. Presently, in the hall C of the undergroundGran Sasso laboratory, there exists a facility which with some modifications, could have the re-quired features: it is the combination of clean rooms developed for the BOREXINO experiment.If available at the time of the CUORE construction, this would be an ideal environment for thepolishing procedure. Otherwise, a similar structure must be built. After polishing, each crystalwill be stored underground in a radon-free container. Once the polishing operation is completed,in the same clean room where it was realized, the thermistors will be attached to the TeO2 crystals.Finally, the crystals will be inserted in their copper frames and the thermistor wires connected tothe read-out pads. Each 4-detector module will be stored independently in a radon-free containerand moved to the cryostat area. The final assembly of the modules will be realized directly in thelower level of the cryostat room, that will have clean room features. As far as the whole detectorwill be completed, it will be connected to the dilution unit of the refrigerator and will be ready forthe final wire connections.
(b) In the innovative option, a large fraction of the detector assembly work will be performed in China,from where the crystals will be shipped in the form of completed 4-detector modules in specialradon-free containers. A clean room environment (class 1000 or better, with radon-abatement)must be set up either at SICCAS or at some other facility under the supervision of LBNL scientists.These same scientists will develop procedures to be used for the production of the crystals. Thefinal polishing operation will be performed by skilled Chinese personnel, but oversight, either in theform of an employee on site or remote access, must be maintained. Finally, these crystals should beinstrumented and packaged into elementary modules, i.e. groups of 4 crystals, frames, thermistors,and heaters before leaving the clean area. Even this operation will be performed by supervisedChinese manpower, after an appropriate training period. Once all the elementary modules havebeen completed, they will be shipped to the underground Gran Sasso laboratory as quickly aspossible to reduce cosmic ray activation. The final assembling will be performed in Gran Sasso asin option (a).
An intermediate solution between the two options is possible. The Chinese part of the work in option(b) could be terminated at the final polishing phase, while the delicate operation of thermistor attachingand 4-module realization would be realized in the Gran Sasso laboratory. In this way, no polishing set-upis required in Europe, but the detector assembly operations will be entirely accomplished underground inthe Gran Sasso laboratory, where skillful physicists and technicians can more easily check the mountingprocedure.
An important point to be considered for the choice between the two options is the total exposure tocosmic rays of the crystals from their growth to their final storage underground. Of course, this expo-sure will be much shorter in case of option (a). An estimate of the production rate of radio-nuclidesgenerated by nuclear reactions induced by high-energy hadrons in the crystals has been already doneusing the COSMO program (see section14). Cosmogenic60Co in TeO2 crystals could be a limitingcontribution for CUORE so that exposure to cosmic rays must be limited as possible. Monte Carlo sim-ulations have shown that a total exposure period of 4 months to cosmic rays would give a contribution to

12 CONSTRUCTION PROCEDURES 101
theββ(0ν) CUORE background below the sensitivity requirement (see section14). Moreover, a recentexperimental determination of the60Co production cross section by protons on Te (0.63±0.15 mb for1.85 GeV p [190]) results in a strong disagreement with COSMO (which yields a much larger one) sothat the allowed exposure period could be much longer. An independent activation measurement carriedout by exposing a 51.1 g TeO2 crystal to a beam of∼1013 24 GeV protons has found a cross section of1.6 mb instead than 2 mb as predicted by COSMO. Since however the effect of cosmic rays is expected tobe dominant in the region of 1-2 GeV a new activation measurement with protons of 1.4 GeV is plannedat the ISOLDE facility of CERN. A similar measurement is planned at Berkeley. Their reults will help inthe final decision about the option to be chosen.
12.3 Low background technology transfer to the crystal growth company
In either case, many critical operations in terms of radioactivity control must be accomplished in China,while more will be required in the case of option (b). Therefore, it is mandatory that low backgroundconcepts will be transferred to SICCAS in order to get satisfactory results as for crystal radiopurity.
– The operations which precede crystallization involve the use of chemical products. In particular,metallic tellurium must be transformed into TeO2 powder: there are indications that U and Thimpurities are added in this phase, that must be carefully checked, both in terms of procedure andof used reagents. In particular, radiopure reagents must be selected by the CUORE collaboration(see section12.1) and provided to the Chinese company.
– There are indications that the Pt crucible used for crystal growth contaminates the crystal withthe isotope190Pt, which is responsible for an alpha line at 3.25 MeV, very dangerous if degradedin energy. Therefore, new crucibles (possibly in Ir) should be developed in collaboration withSICCAS.
– The materials to be used for lapping and polishing (see section12.1), such as pads and powders,must be carefully checked and provided to SICCAS. This operation is even more critical in case ofoption (b) of section12.2. Some experience has been gathered during CUORICINO construction,where special pads and powders down to 0.5µm grain size were selected (see section12.1). Thisselection must be continued until a complete and satisfactory identification of the polishing mate-rials is accomplished. The materials will be delivered to China and used under the supervision ofmembers of the CUORE collaboration.
– In the event that option (b) of section12.2is selected, the copper frames, the thermistors, the heatersand all the tools necessary for the elementary module assembly must be shipped to China in specialcontainers protecting them from exposure to radon and other contaminating agents. The Chinesepersonnel involved in the module assembly will be trained to fabricate and store the modules in theproper conditions in terms of radiopurity.
12.4 CUORE assembly procedure
We list below the main steps which precede and constitute the CUORE assembly procedure, indicating thetypical time necessary to accomplish each step, evaluated on the basis of the CUORICINO experience anddiscussions with SICCAS technicians. Under the general assumption that the total assembly procedureneeds to last no longer than 12 months, these indications will be used in the subsequent section to estimatethe manpower needed, the amount of work that needs to be done “in parallel” and to satisfy the CUOREconstruction schedule.

12 CONSTRUCTION PROCEDURES 102
– Crystal production. Performed entirely in China. Estimated production rate: about 60 crys-tals/month. Total production time: 18 months. In this phase the crystals are produced with lappedsurfaces, down to a∼15µm roughness.
– Crystal polishing. Performed in China or in the Gran Sasso laboratory. The experience gatheredwith polishing crystals in Como for the CUORICINO experiment shows that 3 persons can polish16 crystals/week with two polishers. In order to reach a higher rate of the order of 50 crystals/week,as required in order to remain on schedule with the complete assembly, 3 groups will have to workin parallel.
– Thermistor preparation. Performed in Berkeley (thermistor development and production) and inComo / Florence (bonding and characterization). The thermistors will be all ready for bonding andcharacterization 3 years after the start-up of the CUORE project. The bonding rate is about 20 ther-mistors/day. Two persons working in parallel with two bonding machines (already available) willbond 200 thermistors/week. Total bonding time: 5 weeks. The characterization will be performedin parallel on samples bonded in the first week and should not require additional time.
– Heater preparation. Performed in Trento and in Milano. Eighteen months will be necessary toproduce 2000 heaters, assuming a reasonable 50% yield. The bonding time will be 10 weeks at thesame conditions mentioned in the previous point. The characterization, that cannot be by sample,will have a rate of 50 heaters/week. Therefore, about 1 year is needed for heater selection. Theirproduction and characterization can take place during crystals growth, because no R&D is requiredfor them.
– Heater and thermistor gluing. Performed in China or in the Gran Sasso laboratory. The CUORI-CINO experience shows that 2 persons can glue thermistors and heaters with a rate of 15 crys-tals/week, using the special tools developed for this aim.
– Frame preparation. Performed in the Gran Sasso laboratory. Once the frames and the other copperelements for the typical 4-element module are machined and cleaned (see sections7.1 and12), apreparation work preceding the module mounting must be performed, consisting in assembling theTeflon supports, the read-out pads and in wiring locally the frame. It is reasonable to assume that 2persons can prepare 20 frames (= 1 tower)/week.
– Crystal insertion in the frames. Performed in China or in the Gran Sasso laboratory. The CUORI-CINO experience shows that 2 persons can insert crystals in 2 planes/day.
– Connection of the gold wires. Performed in China or in the Gran Sasso laboratory. The CUORI-CINO experience shows that 1 person can wires in 1 plane/day.
– Assembly of the towers. Performed in the Gran Sasso laboratory. The CUORICINO experienceshows that 2 persons working together can form a tower of 10 elementary modules in about oneweek.
– Assembly of the cube. Performed in the Gran Sasso laboratory. A reasonable assumption is that2 persons can assemble the 19 towers into the CUORE cylinder in about 1 month, provided thatspecial tools for towers manipulation and movement have been realized previously. Of course, theywill need to work without anyone else around the cryostat, and this must be taken into account.
– Cryostat wiring. Performed in a laboratory to be defined and in the Gran Sasso laboratory. Inthe case of CUORICINO, the preparation of a complete set of wires for the tower was made by 2persons and took around 1 month. This operation can be made almost completely on the bench,before the construction of the CUORE cube, by several groups in parallel, so as to prepare all the

12 CONSTRUCTION PROCEDURES 103
Months 1 2 3 4 5 6 7 8 9 10 11 12
Crystals Polishing
Thermistors Bonding
Thermistors Characterization
Frames Preparation
Chips glueing
Single Module construction
Single Module wiring
Single Tower assembling
Total Cube assembling
Wiring on the bench
Wiring on the cryostat
Contact tests
Total persons at a time 16 23 21 21 29 35 22 18 14 10 2 2 2
2 persons
2 p.
4 persons (2 groups in paral.)
4 persons in parallel
4 persons (2 groups in parallel)
8 persons (4 groups in parallel)
4 persons (2 groups in parallel) 2 persons 2 cryostats2 persons 2 bonding tables
2 p. 2 bond. tables
9 persons 6 polishing machines
2 persons
8 persons (4 groups in parallel)
2 persons
1 person
Figure 49: Gantt diagram illustrating the CUORE detector fabrication schedule.
wires in 6 months. An additional time of about 1 week/tower is required to lay the wires in thecryostat. This operation should be made by 2 persons working together. Unfortunately, this workcannot be done in parallel, since no more than 2 people can work on the cryostat simultaneously.Therefore, another 6 months should be considered for laying all the wires in the cryostat.
– Final wire connection and check of the contacts. Performed in the Gran Sasso laboratory. Providedthat the wires in the cryostat have been installed and that a clever method has been developed forconnecting low thermal conductivity thin wires (i.e. special low radioactivity connectors), this jobshould be perfomed in about 1 month by 2 persons working simultaneously on the cryostat. Ofcourse, this job is the only one that cannot be done in parallel with any of the other operations.
The proponents would like to stress that in the previous points no improvement in terms of sim-plification of the procedures was considered with respect to the CUORICINO experience. There areseveral innovations (larger crystals and consequent reduction of the total channels, simplified methodsfor thermistor-absorber coupling, simplified methods for wiring, etc.) which could speed up the assemblyprocedure. Some of these innovations are discussed in section15.
On the other hand, if the method for the abatement of the surface radioactivity presented in section16should be adopted, the assembly procedure will present an increased complexity and might imply somedelay.
12.5 Work breakdown and construction schedule for the CUORE detector
On the basis of the previous section, it is possible to attempt a work breakdown and a constructionschedule for the construction of the CUORE detector. The various items described in section12.4can bereported synoptically in a Gantt diagram (see fig.49), taking care of the two following points:
1) The assembly of the CUORE cube must be completed in about one year. Considering that twoyears are necessary for the growth and preparation of the crystals, this means that CUORE will becooled down for the first time three years after the growth of the first crystal. It is not feasible tospan over three years the 4-detector module fabrication, along with crystal growth, since this wouldconflict with the time necessary to produce and clean the copper elements and with the Researchand Development program.
2) In order to concentrate the detector assembly in one year, and taking into account the requirementsin terms of time and personnel for the realization of the various items, some of the tasks reported

12 CONSTRUCTION PROCEDURES 104
above need to be accomplished by more personnel working in parallel. For example, the operationof chip gluing will be performed by three groups of two people each, since only in this way it willbe possible to accomplish this task in about three months.
Once again, we stress that this construction schedule refers to the CUORE baseline. Innovations (con-sider for example Nd-based crystals or surface sensitive detectors) would inevitably modify the schedulein a way which is difficult to predict now, and might imply some delay. However, the reported analysisshows that the construction of the CUORE detector in its conventional form is feasible in one year, but atthe price of an extensive use of manpower. Notice that in some phases of the assembly, 35 people mustwork simultaneously and full time on the detector preparation. Given the size of the CUORE collabora-tion and the limited availability of technical staff, it is hardly conceivable to realize this formidable taskwithout a substantial use of external resources.
12.6 General time schedule of the CUORE project
As synoptically reported in the Gantt diagram of Figure50 the general time schedule of the CUOREproject requires approximately 5 years after approval. This summarizes the time sequence and durationof all the various tasks described in the previous sections. It should be stressed that the deadlines of manytasks are mandatory since often other jobs depend on them. However, most of the activities foreseen forthe first 18-24 months can run in parallel without much interference. Therefore, most of the required R&Dactivities could proceed during this period without resulting in sizeable delays on the project schedule.This is particularly true (as specified by the dashed filled area in fig.50) for the improvement in thesurface (mainly copper) cleaning procedures.

12 CONSTRUCTION PROCEDURES 105
2005
2006
2007
2008
2009
Cry
sta
lsU
S
Mate
rial Sele
ctio
n
Pro
cedure
sett
ling
Gro
wth
and p
repara
tion
Th
erm
isto
rsU
S
R&
D a
nd G
e irr
adia
tion
Deca
y p
eri
od
Pro
duct
ion
Dete
cto
r str
uctu
reIN
FN
Desi
gn
Mate
rial Sele
ctio
n
Pro
duct
ion
Cle
anin
g
Cry
osta
t &
cry
og
en
ics
INFN
Desi
gn a
nd m
ate
rial se
lect
ion
Const
ruct
ion
Inst
alla
tion a
nd t
est
Sh
ield
ing
sIN
FN
Desi
gn a
nd m
ate
rial se
lect
ion
Const
ruct
ion
Un
derg
rou
nd
Lab
ora
tory
INFN
Desi
gn
Inst
alla
tion
Ele
ctr
on
ics
US
Desi
gn a
nd t
est
Pro
duct
ion
Inst
alla
tion
Data
Acq
uis
itio
nIN
FN
R&
D a
nd p
roto
typin
g
Final desi
gn
DA
Q S
W d
evelo
pm
ent
Pro
duct
ion
Inst
alla
tion
CU
OR
E a
ssem
bly
INFN
/US
Sta
rt d
ate
: 1
st
Jan
uary
20
05
Figure 50: Gantt diagram illustrating the CUORE project time schedule.

13 OFF-LINE ANALYSIS 106
13 Off-line analysis
The main goal of the off-line analysis is the extraction of the relevant physics informations from thelarge amount of raw data recorded by the DAQ system. This task includes both the raw detector pulseanalysis (e.g. amplitude evaluation, noise rejection, gain instability and linearity correction) aiming atproducing reliable n-ple’s (a proper number of parameters fully describing each bolometric pulse) andenergy spectra, and the following multi-dimensional analysis aiming at obtaining the sought physicsresults (e.g.ββ(0ν) or DM interactions). The identification of the single background sources is also animportant goal of the second-level analysis.
13.1 First-level analysis
As described in a previous section, when the output voltage of one detector exceeds the trigger threshold,the acquisition system records a number of converted signal samples. The acquired time window (∼fewsec) must fully contain the pulse development in order to allow an accurate description of its waveform.The existence of a pre-trigger interval just prior to the production of the pulse (“baseline”) guarantees thata small fraction of the number of acquired samples can be used to measure the DC level of the detector(which can be directly correlated to the detector temperature).
The fact that for each trigger an entire waveform is sampled and recorded implies that off-line analysisof a large body of data will require a significant effort. Nevertheless, this effort will be justified becauseof the useful information that can be extracted from the signal waveform. The following are importantgoals for the (first-level orpulse) analysis (FLA):
1. maximization of the signal to noise ratio for the best estimate of the pulse amplitude. This isaccomplished by means of the optimum filter (OF) technique [191];
2. correction of the effects of system instabilities that change the response function of the detectors(gain “stabilization”);
3. rejection of the spurious triggered pulses by means of pulse shape analysis;
4. identification and rejection of radioactive background pulses by means of coincidence analysis.
The OF technique is frequently used with bolometers to evaluate the amplitude of a signal superim-posed on stochastic noise. This algorithm has proven to provide the best estimate of the pulse amplitudeunder general conditions. Relative to a simplemaximum–minimumalgorithm, this technique allows theevaluation of the signal amplitude with much higher efficiency resulting in an effective improvement ofthe detector energy resolution. The following information is needed to implement the OF technique: thedetector response function (i.e. the shape of the signal in a zero noise condition) and the noise powerspectrum. Once these are known, the OF transfer function is easily obtained and used as a digital filterfor the acquired pulses. The role of the OF transfer function is to weight the frequency components ofthe signal in order to suppress those frequencies that are highly influenced by noise. The amplitude of thepulse is then evaluated using optimally filtered pulses. Effective pulse-shape parameters can be deducedfrom the comparison of the filtered pulses with the filtered response function (e.g. rms difference afterproper time synchronization).
In processing the data off-line, the following parameters are evaluated and recorded to disk for eachdigitized pulse (n-ple):
1. thechannel numberi.e., the number of ADC channel that exceeded the trigger threshold;
2. theabsolute timeat which the pulse occurred with a precision of 0.1 msec;

13 OFF-LINE ANALYSIS 107
3. theOF amplitudei.e. the amplitude of the optimally filtered signals
4. thebaseline, obtained by averaging a proper number of points from the pre-trigger interval. Sincethe detectors are DC coupled, it provides a direct measurement of the detector temperature at thecreation of the signal;
5. the signalriseand signaldecay times;
6. thepulse shape parameters, obtained by comparing the acquired pulse with the expected responsefunction of the bolometer after OF or adaptive filters. A further powerful technique is based on theuse of artificial neural networks (ANN);
7. the pile-up fraction. Pile-up is usually efficiently rejected by pulse-shape analysis even if thistechnique can’t identify the rejected pile-up events. In order to improve the pile-up rejection andquantitatively evaluate its rate (e.g. for short-time coincidence analysis), the Wiener-filter algorithmis implemented [192].
The next PLA step is the gain instability correction. The OF amplitudes are corrected to reduce orcancel the effects of system instabilities responsible for the variation of the ratio between the energy Edeposited into a given crystal and the amplitude∆ V of the corresponding electrical pulse. Accordingto equation (29) of our very naive detector model there are three instabilities that can modify the ratio∆ V/E (where V=Vb*G is the output voltage given by the product of the bolometer voltage Vb and theelectronics gain G): i) a variation in the electronic gain G, ii) a variation in the bias VTot and finally iii) avariation in the temperature Tb of the crystal. The electronic system is designed to guarantee a stabilityof G and VTot within 0.1% . It is however, much more difficult to maintain stability within 0.1% of thedetector temperature on long time scales. At a temperature of 10 mK this would require maintaining thetemperature of 1000 crystals to an accuracy of 10µ K for a period of several days.
To overcome this problem, and as already mentioned in previous sections, a silicon resistor glued toeach crystal is used as a heater to produce a reference pulse in the detector. It is connected to a highprecision programmable pulser that produces a fast voltage pulse every few minutes dissipating the sameamount of energy (Eref ) into the crystal each time. These voltage pulses mimic pulses produced in thecrystal by particle interactions and are used to measure the value of the ratio∆ V/E. Any variation ofthe amplitude of the reference pulse is due to variations of the∆V/E ratio. The OF amplitude of thereference pulse is therefore used to measure, every few minutes, the actual value of∆ V/E while thebaseline of the reference pulse provides the contemporary measurement of the value of T. A fit is thenused to obtain the values of∆ V/E as a function of temperature. Therefore, in this step of the off-lineanalysis, the OF amplitude of each pulse is corrected according to the given value of∆ V/E(T[t]) for thedetector temperature at which the pulse has been generated. The effectiveness of this technique has beenproven in the MiDBD experiment, where a typical temperature fluctuation over a day ranged from a fewtenths to∼100µK . After correction, these fluctuations were reduced to less than 1µ K [151] (Fig. 32).
Pulse shape analysis is very useful in rejecting spurious signals produced by microphonics and elec-tronic noise. A confidence level is determined for each pulse shape parameter and for the rise and decaytime of each pulse. Signals falling within these intervals are defined as “true” (or physical) pulses, whilesignals having one or more of their parameters outside of the relevant interval are rejected as noise. Theuse of more than one pulse shape parameter results in better reliability of the rejection technique.
The linearization of the detector response is critically important for energy calibration. The final stepin data processing is the conversion of the OF amplitudes into energy values. The naive bolometer modelpreviously used assumes linearity; several parameters depend however on the crystal temperature, render-ing the corresponding equation non-linear. Accordingly, the relation between∆ V and E will be obtainedperiodically by the use of radioactive calibration sources. The ratio∆V/E will be measured for severalgamma lines, and the data will be fit to the model previously described, but taking into consideration the

13 OFF-LINE ANALYSIS 108
fact that the bolometer resistance and the crystal heat capacity are temperature dependent. This will pro-vide the calibration function of E as a function of∆V, that will then be used to convert the OF amplitudesinto energy values.
Finally, the close packed array of the crystals will allow the rejection of events that left energy inmore than one single crystal. This will be particularly useful in rejecting a very high energy gamma raysthat enter from outside of the array. The small angle Compton scattering in a single crystal can mimic adouble beta decay event, a dark matter scattering, or a solar axion. The probability that this photon wouldescape the rest of the array without a second interaction is small. In addition, background events fromradioactivity within the structure of the array will also have a significant probability of depositing energyin more than one crystal. This will also be true for high and intermediate energy neutrons. In the finalstage of off-line analysis these coincidence events can be identified from the data which will contain thedetector number, signal time, pulse energy, and pile-up parameter.
13.2 Second-level analysis
Since the main goal of CUORE is the search forββ(0ν) of 130Te , the same will also hold for thesecond-level analysis (SLA). In CUORICINO, most of the tools of this analysis are powered by theexperience gained by the Milano group during the previous experiments onββ(0ν) of various nuclides.Since many institutions participating in CUORE have a similar experience, we are planning to merge thevarious analysis techniques of the different groups to apply them to double beta decay processes in orderto obtain a single powerful standard analysis procedure. Nevertheless, it will be essential to be able toguarantee a safe cross-check of the results, so that independent analyses from the various groups will beencouraged.
Detection efficiencies for the various transitions will be evaluated by means Monte Carlo simulationsspecifically designed for the CUORE detector. An updated collection of the most recent calculations fornuclear matrix elements will be kept and updated (according to the various nuclear models). That willbe essential to derive reliable results for the effective neutrino mass parameter, the right handed currentparameters, or the majoron coupling parameter.
Physics analysis for Dark Matter and axion searches in CUORE will be completely designed andrealized in the framework of CUORICINO. In order to improve the noise rejection near threshold anArtificial Neural Network (ANN) approach will be improved (the possibility of an ANN trigger is underinvestigation). The effectiveness and reliability of the rejection techniques based on the selection of multi-dimensional confidence intervals (strongly depending on the suitability of the chosen parameters) will betested in CUORICINO and methods to calibrate the rejection efficiency will be defined. Time stability ofthreshold parameters will be a major issue.

14 SIMULATION AND PREDICTED PERFORMANCES 109
14 Simulation and predicted performances
The goal of CUORE is to achieve a background rate in the range 0.001 to 0.01 counts/(keV·kg·y) at theββ(0ν) transition energy of130Te (2528.8 keV). A low counting rate near threshold (that will be of theorder of∼5–10 keV) is also foreseen and will allow CUORE to produce results for Dark Matter andAxions searches. In Sec.14.1 we present a very conservative evaluation of the background attainablewith CUORE; this is mainly based on the state of the art of detector design and of radioactive contamina-tions. This rather pessimistic approach in background evaluation is the only one that presently guaranteesa reliable prediction. However CUORE construction will require about five years (sec.12.6); there willtherefore be time enough for R& D dedicated to background reduction as is foreseen in most next gener-ations experiments.
14.1 Background simulations
Radioactive contamination of individual construction materials, as well as the laboratory environment,were measured and the impact on detector performance determined by Monte Carlo computations. Thecode is based on the GEANT-4 package; it models the shields, the cryostat, the detector structure and thedetector array. Even smallest details of the detector apparatus (copper frames, screws, signal wires, NTDthermistors, etc.; Fig.51) and of the cryogenic setup were taken into account.
Table 16: Bulk contamination levels (in picograms per gram) used in the simulation for TeO2 , copperand lead.
Contaminant 232Th 238U 40K 210Pb 60CoTeO2 0.5 0.1 1 10µBq/kg 0.2µBq/kg
copper 4 2 1 0 10µBq/kgRoman lead 2 1 1 4 mBq/kg 0
16 Bq/kg lead 2 1 1 16 Bq/kg 0
It includes the propagation of photons, electrons, alpha particles and heavy ions (nuclear recoils fromalpha emission) as well as neutrons and muons. For radioactive chains or radioactive isotopes alpha, betaand gamma/X rays emissions are considered according to their branching ratios. The time structure of thedecay chains is taken into account and the transport of nuclear recoils from alpha emissions is included.
The considered background sources are:
1. bulk and surface contamination of the construction materials from the238U , 232Th chains and40Kand210Pb isotopes;
2. bulk contamination of construction materials due to cosmogenic activation;
3. neutron and muon flux in the Gran Sasso Laboratory;
4. gamma ray flux from natural radioactivity in the Gran Sasso Laboratory;
5. background from theββ(2ν) decay.
In the next sections these background sources and their contribution to CUORE background are dis-cussed. It will be shown that, in a very conservative approach where the CUORE-tower mechanicalstructure is assumed identical to the structure used in CUORICINO, considering the worst possible con-dition for bulk contaminations (i.e. all the contamination equal to the present 90% C.L. measured upper

14 SIMULATION AND PREDICTED PERFORMANCES 110
Figure 51: Details of the CUORE single modules accounted for in the Monte Carlo simulations

14 SIMULATION AND PREDICTED PERFORMANCES 111
limits (Table16)) and assuming for surface contamination a reduction of about a factor ten with respectto CUORICINO, the CUORE background will be∼0.007 counts/(keV·kg·y) at theββ(0ν) transition and∼0.05 counts/(keV·kg·d) near threshold.
14.2 Bulk contaminations
The main contribution to background from bulk contaminants comes from the cryostat structure (cryostatradiation shields), the heavy structures close to the detectors (the copper mounting structure of the array,the Roman lead box and the two lead disks on the top of the array) and from the detectors themselves(the TeO2 crystals). The radioactivity levels used in the computations for these materials are given inTable16. These levels are nearly equal to the best upper limits obtained for the radioactive content ofthese same materials as shown in Table17.
All the values reported in this table are 90% upper limits. Indeed in all cases no evidence of thepresence of radioactive contaminants was obtained for the material examined. The contamination levelsof TeO2 reported in Table17 were obtained from the data collected in the first run of CUORICINOwith the 5×5×5 cm3 crystals. Copper [195] and lead [196] contaminations were determined through lowactivity Ge spectrometry. These data represent the best evaluation reported in literature for the radioactivecontamination of TeO2, copper and lead. From a comparison between Table17 and Table16 it is clearthat the contamination levels assumed for the CUORE simulation are perfectely compatible with thepresently available upper limits. The only exception is that of60Co in TeO2 crystals, whose presence asa cosmogenic contamination of the crystals will be discussed later (sec.14.4).
Concerning small (mass) components of the CUORE detector, which we have not considered so far inthe simulation (e.g. NTD Ge thermistors, Si heaters, glue layers, pins, wires and soldering material,etc.),a very careful selection according to their contamination is planned for the future. In some case wealready have upper limits on their contamination that make their contribution to the CUORE backgroundnegligible; in other cases further measurements will be required.
The results of the Monte Carlo simulations (see Fig.52) using the contamination levels discussed hereare given in Table18 for theββ(0ν) decay . The assumed threshold is 10 keV and only values obtainedafter requiring an anti-coincidence between detectors are indicated. These values have to be considered asupper limits on the possible contribution of bulk contaminations to the CUORE background; they provethat with the already available materials, background levels lower than∼4×10⁻³ counts/keV/kg/y in theββ(0ν) decay region (see Fig .53) and∼3×10⁻² counts/keV/kg/d in the low energy (10-50 keV) region(see Fig.54) are assured.
14.3 Surface contaminations
Surface contaminations contribute to the background only when they are localized on the crystals or onthe copper mounting structure directly facing them. As learned in MiDBD and CUORICINO (sec.6), the
Table 17: Available 90% C.L. upper limits for bulk contaminations of TeO2, copper and lead (levels inpicograms per gram if not differently indicated).
Contaminant method 232Th 238U 40K 210Pb 60CoTeO2 bolometric 0.7 0.1 1. 100µBq/kg 1µBq/kg
Copper [195] Ge diodes 5.6 2 0.3 - 10µBq/kgRoman lead Ge diodes 50 30 2 4 mBq/kg -
Low act. lead [196] Ge diodes 3.4 2.7 1.7± 0.3 23.4± 2.4 Bq/kg 18± 1 µBq/kg

14 SIMULATION AND PREDICTED PERFORMANCES 112
Figure 52: Simulated spectra for bulk contaminations of the TeO2 crystals, the Copper structure, theRoman Lead shield and the outer Lead shield. Each spectrum is obtained by summing the simulatedanticoincidence spectra of all the CUORE detectors.

14 SIMULATION AND PREDICTED PERFORMANCES 113
Figure 53: Double beta decay region of the simulated spectra for bulk contaminations of the TeO2 crys-tals, the Copper structure, the Roman Lead shield and the outer Lead shield. Each spectrum is obtainedby summing the simulated anticoincidence spectra of all the CUORE detectors.

14 SIMULATION AND PREDICTED PERFORMANCES 114
Figure 54: Dark matter region of the simulated spectra for contaminations of the TeO2 crystals, the Cop-per structure, the Roman Lead shield and the outer Lead shield. Each spectrum is obtained by summingthe simulated spectra of all the CUORE detectors after the anticoincidence cut.

14 SIMULATION AND PREDICTED PERFORMANCES 115
presence of even a very low level of radioactive impurities on the surfaces of the detectors can producea non negligible contribution to theββ(0ν) background level. Unfortunately this kind of contamination,that is important mainly for detectors without a surface dead layer (as is the case of bolometers), is poorlystudied. Lacking any data coming from direct measurements of the typical impurity levels present onTeO2 and copper surfaces, we rely on the results obtained in MiDBD and CUORICINO.
These indicate that both a surface contamination of the crystals and of the copper surface of the mount-ing structure is present. In the case of TeO2 , we know that the contamination is mainly238U and that itspresence is strictly connected to the kind of surface treatment undergone by the crystals. In the CUORI-CINO 5×5×5 cm3 crystals this contamination produces a background counting rate in theββ(0ν) regionof about (4± 3)×10−2 counts/keV/kg/y (table14). Concerning the copper surface contamination, we stillmiss a clear indication of its origin and identity (i.e. we are not yet able to distinguih between contribu-tions generated by different sources), but we have an evaluation of theββ(0ν) background counting thatcan be ascribed to them (whatever they are,238U or 232Th): ∼0.1± 0.05 counts/keV/kg/y.
According to a Monte Carlo simulation of the CUORE detector, based on the CUORICINO contam-ination levels, we obtained a background counting rate in theββ(0ν) region (after the anticoincidencecut) of about 1.6×10⁻² counts/keV/kg/y and 5.8×10⁻² counts/keV/kg/y for the TeO2 crystals and thecopper structure respectively19. The goal of CUORE is to reduce the surface contribution by a fac-tor at least 20 with respect to this evaluation, obtaining a background coming from surfaces of about3×10−3 counts/keV/kg/y. Improvements of a factor of∼1.5–2 are expected simply by possible reduc-tions of the copper mounting structure dimensions (the Monte Carlo simulation we used so far refers to anidentical mechanical structure for the CUORE and CUORICINO single detector modules). A reductionby a factor of at least ten of the copper (TeO2 ) surface contamination is therefore the first milestone ofCUORE.
The expected shape of the background produced by surface contaminations in CUORE (after a re-duction by a factor 20 of both the crystal and copper surface contaminations but assuming the samemechanical structure of CUORICINO) is given in Figures55 and56. The corresponding backgroundcontributions in the two regions of interest are summarized in Table19.
As discussed in Sec.12.1, the MiDBD crystal surfaces were contaminated, probably during the pol-ishing procedure, due to the use of highly contaminated powders. Polishing powders with a much lowerradioactive content are however commercially available [197] and have already been used for CUORI-CINO (tab.15) obtaining a clear improvement in the surface contamination. Complete over all control ofthe surface treatments undergone by the crystals after growth, and the use of radiopure substances shouldguarantee an even better result than that obtained in CUORICINO.
A similar situation holds for copper. In MiDBD and in CUORICINO the copper surfaces were treatedwith an etching procedure [198] optimized in order to reduce impurities on surfaces before the sputteringprocess.
This procedure significantly improved the surface quality of copper and reduced its surface contam-ination. However it was not optimized from the point of view of background. The use of low contam-inated liquids (water and inorganic acids are available with238U and232Th contamination levels lowerthan 0.1 pg/g) in a low background environment will allow a sizeable improvement of the surface con-tamination of copper.
This (i.e. similar to CUORICINO but with much more care to prevent radioactive contamination) andother improved cleaning procedures (sec.16) are under study and will represent a consistent part of theCUORE R&D activities during the first two years after approval. Fast diagnostic methods to measure thesurface contamination levels of Copper and determine the effectiveness of the adopted surface cleaningprocedures are also under investigation. Preliminary results indicate that high resolution ICPMS couldsatisfy our requirements [199]. Sensitivities achievable with this technique for238U and232Th are in therange of 10−(3−2) ppt of solution under investigation. Since the maximum solution concentration can be2×10−3, the expected sensitivity on the solute contamination (Copper) would be in the range 1–10 ppt

14 SIMULATION AND PREDICTED PERFORMANCES 116
Figure 55:ββ(0ν) region of the simulated spectra for the surface contaminations of the TeO2 crystals andof the Copper structure. Each spectrum is obtained by summing the simulated spectra of all the CUOREdetectors aftre the anticoincidence cut.
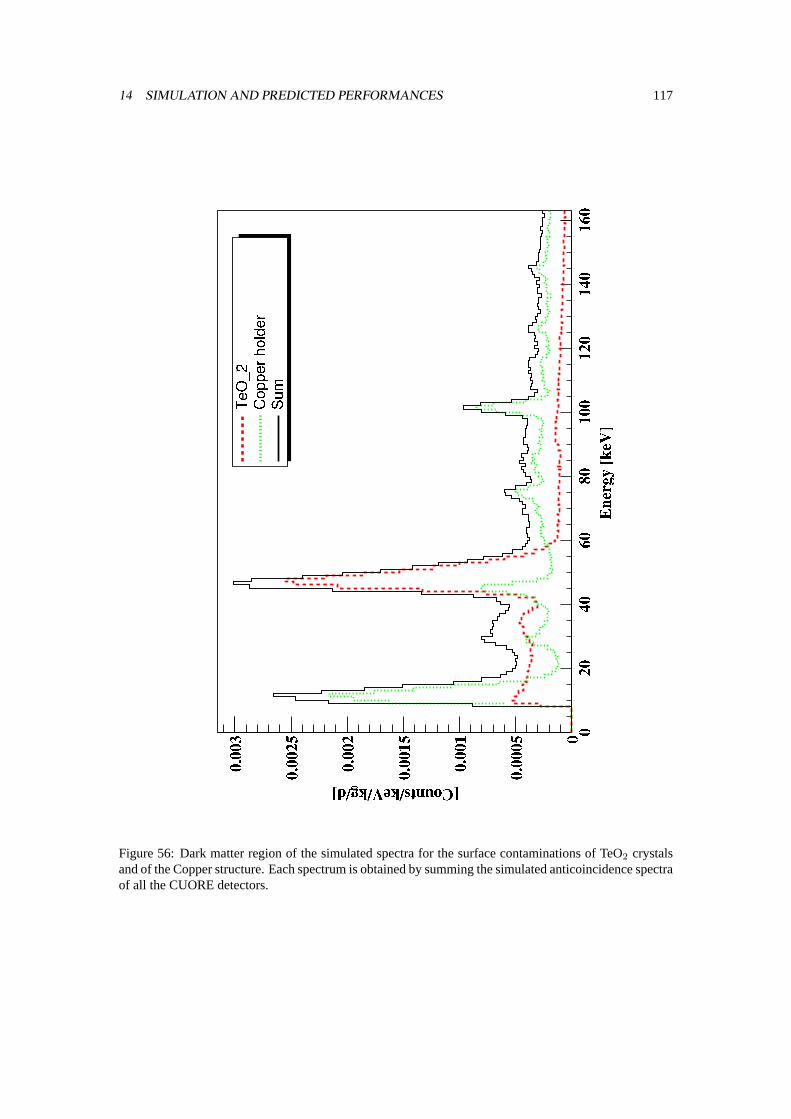
14 SIMULATION AND PREDICTED PERFORMANCES 117
Figure 56: Dark matter region of the simulated spectra for the surface contaminations of TeO2 crystalsand of the Copper structure. Each spectrum is obtained by summing the simulated anticoincidence spectraof all the CUORE detectors.

14 SIMULATION AND PREDICTED PERFORMANCES 118
Cylindrical structure
Simulated 232Th 238U 60Co SumTeO2 212±23.6 14.5±5.11 120±1.95 346±24.2
Cu Box 393±46.3 84.8±28.3 - 477.8±54.3Cu Bars 29.7±4.08 27.1±5.12 - 56.8±6.5
Cu Frames 163±21.5 233±33.7 - 397±39.9Cu 50mK Shield 31.9±2.21 - - 31.9±2.2Roman Pb Shield 604±24.4 - - 604±24.4
Sum 1430±61.5 360±44.6 1200±19.5 1914±76.0
Table 18: Computed background (after the anti-coincidence cut) in theββ(0ν) energy region for bulkcontaminations in the different elements for cylindrical structure in units of 10−6 c/keV/kg/y.
Element Contamination Contribution to theββ(0ν) regionBq/cm2 c/keV/kg/y
TeO2 1.9E-08± 9.8E-09 1.6E-02± 8.4E-03Copper (Thorium) 4.9E-08± 1.9E-08 4.1E-02± 2.6E-03Copper (Uranium) 3.4E-08± 1.3E-08 2.7E-02± 8.6E-03
Total 8.4E-02± 1.2E-02
Table 19: Estimated upper contribution to the CUOREββ(0ν) region from surface contaminations ob-tained by using the surface contamination levels evaluated for CUORICINO and assuming an exponentialdensity profile withλ=1 µm for TeO2 crystals (238U ) andλ=5 µm for Copper (238U and232Th ).
of 238U and 232Th, i.e. enough for our requirements. From the above discussion in fact, the surfacecontamination measured in CUORICINO (assuming a 1µm copper layer) is of the order of∼1–10 ppbof 238U and232Th. Of course radio-purities comparable with the instrumental sensitivity are requiredfor liquids (mainly acids and water) to be used in the solution preparation (i.e. copper surface removal).Liquids satisfying this requirement are however already commonly available.
14.4 Cosmogenic contribution
Cosmogenic activation is produced by cosmic rays when the crystals are above ground during fabricationand shipping of the crystals from the factory to the underground laboratory. To determine the activationwe used COSMO, a code based on computed cross sections, to estimate the type and amount of radionu-clei produced by cosmic rays on TeO2 [200]. The radionuclei produced by the activation of tellurium aremostly tellurium isotopes (A=121,123,125,127) as well as124Sb,125Sb,60Co and tritium, these last threebeing of more concern because of their long half-life (125Sb: beta decay of 2.7 years, end-point energyof 767 keV,60Co: beta decay of 5.27 years end-point energy 2823 keV and3H: beta decay of 12.3 years,end-point energy of 18 keV).
We have studied, toghether with SICCAS who produces the crystals, and on the basis of our presentknowledge of the cosmic rays production rates, a possible time schedule for the crystal growth and ship-ping to Gran Sasso that can guarantee the required low level of60Co (see Fig .57). In the case of CUORE,the control on crystal production will be severe. A single 750 g crystal can be grown in about two months,while to grow the 988 CUORE detectors will require 18 months. Once grown the crystals will be shippedto Italy and stored underground, therefore their total exposition to cosmic rays could be limited to about

14 SIMULATION AND PREDICTED PERFORMANCES 119
4 months. The total induced activities remaining after 2 years underground have been estimated [200]and the consequent contribution to the detector counting rate was deduced by a MC simulation. Theradionuclei that contribute to background throught theirβ− decay are:
• the long living 60Co isotope in theββ(0ν) region, whose activity evaluated with the COSMOprogram is∼0.2 µBq/kg; a minor contribution is due to the isotopes110mAg and 124Sb whoseactivity is 4 times lower and fast decreasing with time;
• in the dark matter regions the long lived nuclei of3H and125Sb with an activity of∼7 µBq/kg forthe former and of∼15µBq/kg for the latter.
The influence of60Co in CUORE background was already considered in the evaluation of the contribu-tions due to bulk contaminations of the crystals, while the contribution of3H and125Sb to the dark matterregion is completely negligible if compared to the intrinsic background from all other sources.
As already mentioned in section12.2, a recent experimental determination of the60Co produc-tion cross section on Te by 1.85 GeV protons has been obtained at LNBL [190]. The measured value(0.63±0.15 mb) is in strong disagreement with the value used by the COSMO program. A similar dis-agreement, even if at a lower extent, has been found on the basis of an activation measurement carriedout at CERN at an energy of 24 GeV, which is however less important for cosmic ray activation. Thedisagreement between the COSMO evaluations and the experimental cross sections has been consideredrecently [193] following the newer calculations of Silberberg and Tsao [194]. A new program (YIELDX)leading to a satisfactory agreement with experimental data was released. Using the new calculations, thecontribution to CUOREββ(0ν) background by cosmogenic60Co is lower by about an order of magnitude(tab.18) with respect to the COSMO calculations. The allowed exposure period for TeO2 crystals couldbe consequently much longer. Further measurements of the60Co production cross section are thereforeof crucial importance and we plan to have, in the near future, other direct measurements by irradiatingTellurium samples with proton beams of suitable energies.
14.5 Underground neutron,µ and γ interactions
As mentioned earlier, neither contributions from underground cosmic muons nor neutrons have been takeninto account in detail in the estimation of the background. However, the following simplified argumentswill serve to have an approximate idea of their contribution. The depth of the LNGS (3500 m.w.e) reducesthe muon flux down to∼2×10⁻⁸ cm−2s−1, but a further effective reduction could be obtained with theuse of an efficient (99.9%) active veto for muons traversing the CUORE setup in order to tag possibleevents associated with them. The muon-induced contribution to the background is therefore expected tobe negligible.
On the other hand, the heavy shieldings surrounding the CUORE detector will substantially reducethe event rate due to environmental radiation of various origin (neutrons and photons), environmental ra-dioactivity (natural decay chains U/Th,210Pb,40K, . . . ), as well as muon interactions in the surroundingsrock or in the shielding itself.
Neutrons may constitute a worrisome background for the dark matter experiment because for appro-priate neutron energies (few MeV) they can produce nuclear recoils (.100 keV) in the detector targetnuclei which would mimic WIMP interactions. Simple kinematics implies that in the case of tellurium,neutrons of 1(5) MeV could elastically scatter off tellurium nuclei producing recoils of energies up to 31(154) keV. In general, one considers neutrons of two origins: from radioactivity in the surroundings ormuon-induced. Depending on the overburden of the underground site (i.e., depending on the muon flux),muon-induced neutrons are produced, at lesser or greater rate, both inside and outside the shielding. Theyare moderated (according to their energies) by the polyethylene/lead shield (when produced outside) ortagged by the muon veto coincidence (when produced within the passive shielding).

14 SIMULATION AND PREDICTED PERFORMANCES 120
Figure 57: Simulated spectrum for the assumed60Co bulk contaminations of TeO2 crystals. The spectrumis obtained by summing the simulated anticoincidence spectra of all the CUORE detectors.

14 SIMULATION AND PREDICTED PERFORMANCES 121
In the case of external neutrons (from the rocks, from fission processes or from (n,α) reactions, aswell as neutrons originated by muons in the walls of the underground site), the environmental neutron fluxhas been measured in LNGS. The result is of∼1×10⁻⁶ cm−2s−1 for the thermal component,∼2×10⁻⁶
cm−2s−1 for the epithermal and∼2×10⁻⁷ cm−2s−1 for energies over 2.5 MeV. They are fairly wellmoderated by the polyethylene and eventually absorbed or captured.
We have carried out a Monte Carlo simulation of the propagation of neutrons through the 10 cm thickborated polyethylene shield of CUORE. The result is that the neutron induced event rate on the entireenergy range (from threhsold to 10 MeV) is much lower than the contribution due the bulk contamina-tion of crystals. Neutrons produced by muon interaction inside the shielding materials are very scarceand they can be efficiently tagged by the muon veto. We have estimated that for the LNGS muon flux(2.5×10⁻⁸ µ/(cm2 s)), muons would produce in the CUORE shielding of polyethylene (10 cm) and lead(20 cm)), about∼0.04 neutrons/day in the polyethylene shield and∼25 neutrons/day in the lead shell. So,independent of the mechanism used to reject or tag the events associated to neutrons, their rather smallnumber is expected to play a secondary role in the total background compared with other main sourcesof background.
A preliminary evaluation of the influence of the environmentalγ background in Gran Sasso resultedin a negligible contribution for theββ(0ν) region and a contribution similar to that of bulk contaminationsfor the dark matter region.
A more complete and detailed study of the background rates from external sources for CUORE isunderway and will be used for the optimization of shieldings and muon veto.
14.6 Two neutrinos double beta decay background
Using the present upper limits for the130Te ββ(2ν) half-life, the unavoidable background producedby theββ(2ν) decay in the dark matter region is lower than 10−4 counts/(keV·kg·y) and is completelynegligible in theββ(0ν) region. This is true because of the relatively good energy resolution of theTeO2 bolometers.
15 INNOVATIONS IN THE CUORE STRUCTURE 122
15 Innovations in the CUORE structure
The CUORE structure described up to now is based on the results obtained in CUORICINO and on theexperience gathered with the test-runs performed in the hall C cryostat on the 5×5×5 cm3 crystals. Wehave been very conservative in the design of every CUORE element. However, we foresee the requirementfor a significant activity of Research and Development during the next few years, in parallel (but withlower priority) with the realization of the CUORE baseline structure outlined so far. In fact, there areindications that several aspects of the CUORE detectors can be improved substantially with respect to thepresent performance (for instance, single element reproducibility) and some of themneedto be improveddramatically (mostly, the background level due to surface contamination that could spoil CUORE, and alarge part of its scientific value, if not controlled adequately).
In this section, we outline the R&D work planned for CUORE and discuss the possible upgradingof the present structure. We would like to stress that all this R&D activity can be carried out in Hall Cwithout any interruption of the presently running CUORICINO experiment.
15.1 Innovation in the single module
15.1.1 Optimization of the thermistor sensitivity
As described in section7.1, our current NTD thermistors (belonging to series # 31) have a T0 valueof about 3.0 K. This parameter has never been optimized and was obtained only in the attempt to geta tolerable resistance value between 10 and 15 mK (not higher than a few hundreds of MΩ). In thetwo versions of the MiDBD arrays, and in the CUORICINO experiment, we had however to heat therefrigerator base temperature up in order to achieve these resistance values. The naturally achieved basetemperature would have lead to too high resistances, of the order of few GΩ. There are two reasons whylower T0 (and therefore lower resistivities at equal temperatures) would probably imply better detectorperformance, in spite of the lower thermistor sensitivity:
• it would be possible to operate detectors either at lower temperatures (therefore with higher signals)or at the same temperature as now, but with lower resistances (therefore with lower noise);
• it is well known that lower T0 thermistors have better electron-phonon coupling (see for instance[201]), favoring therefore a more efficient heat transmission to the thermistor electrons with conse-quent higher pulse amplitudes.
An R&D program, lasting about one year, will therefore define the optimum T0 for CUORE thermistors.Several thermistor species with T0’s ranging from 2 through 3 K will be produced by the Berkeley groupand test detectors will be produced in order to select the best doping level in time for the production ofthe final thermistor batch.
15.1.2 Innovative thermal couplings in detector construction
A set of glues will be selected to improve the coupling between NTD Ge thermistors and energy absorbingcrystals. Methods will be studied to deposit controlled amounts of glue in a reproducible way, in the formof spots and/or a uniform layer. Measurement of the low temperature thermal coupling provided by thevarious glues will be performed, in order to define the most conductive coupling. Of course, all thesecryogenic tests must be accompanied by a careful analysis of glue radioactivity, so as not to introducedangerous radio-impurities. Special NTD Ge thermistors with “pedestals” and “legs” will be developedin order to reduce the surface touching the crystals. This reduction will allow the use of a glue layer at theinterface in spite of the large difference in thermal contraction coefficients between glues and crystallinesolids.

15 INNOVATIONS IN THE CUORE STRUCTURE 123
In addition, the proponents intend to perform tests in a thin film laboratory on eutectic coupling be-tween NTD Ge thermistors and energy absorbing crystal. The most promising couplings will be realizedin small scale prototype detectors and compared with the standard 9-araldyte-spot coupling, mentionedin section5.5.
Innovative methods to hold and couple the absorbing crystals to the thermal bath will be studied, suchas special TEFLON supports, nylon threads, simple gluing etc., with and without additional calibratedthermal links. Prototype small scale detectors will be studied.
Finally, the proponents will perform tests of real-size CUORE modules in LNGS hall C dilutionrefrigerator with the innovative couplings determined in the prototype small scale detectors. If new cou-plings, and a related procedures for their series realization, will be defined within three years since thestart of the CUORE project, they will be introduced in the final CUORE structure.
15.1.3 Modification of the basic crystal size
There is clear experimental evidence that a crystal mass increased by about a factor two should not spoilbasic detector performance. At present, the energy resolution at 2.6 MeV is higher by a significant factor(typically a factor∼5) than that expected from the detector noise. Therefore, an increase of the detectormass by a factor two should affect the intrinsic detector resolution because of the consequent reduction ofthe signal amplitude, but should influence only marginally the energy resolution in the Double Beta Decayregion. Of course, this argument does not apply to the search for Dark Matter and Solar Axions, wherethreshold, and therefore signal-to-noise ratio at low energies, is the crucial parameter. However, in a moreDouble-Beta-Decay-oriented version of the CUORE project, an increase of the crystal size (with equaltotal mass) could bring some advantages, mainly of practical and economical nature (fewer electronicchannels, shorter and easier assembly operations). The proponents have in mind in particular elementarymodules based on 6×6×6 cm3 crystals, whose mass is larger by a factor 1.73 than present crystals’ one.A possible configuration consists of 16 towers arranged in a 4×4 matrix. Each tower will be a stack of9 modules. As in the present configuration, each elementary module will consist of 4 crystals held incommon frames. The total mass would be very similar to the baseline CUORE structure (namely, 756 kg,assuming the same density that provides 750 kg for the present structure), and an almost cubic shapefor the array would be preserved. Another approach consists of giving up the 4-detector arrangementof the single module (which might not be testable in the present refrigerators because of its size) andto move to stacks of single crystals. Even in this case, the favored arrangement is a 8×8×9 (height)three-dimensional crystal matrix. In both solutions, the total number of channels would be 576 instead of1000.
Negotiations for the order and purchase of 6×6×6 TeO2 crystals are in progress. Two such largercrystals have been already ordered and should be tested in Gran Sasso in early 2004.
A final decision on the crystal size should be taken not later than 18 months after CUORE start: thisshould leave sufficient time for the series production of the crystals. That implies a hard R&D work on6×6×6 TeO2 crystals in the first year.
15.2 Possible insertion in CUORE of crystals containing compounds of other nu-clear candidates forββ(0ν)
As pointed out before many compounds containingββ(0ν) candidate nuclei could be inserted in form ofsingle or multiple crystals in the structure of CUORE. Some of these compounds which look as particu-larly favourable from the thermal and nuclear point of view are listed in Table20.
All these compounds have been tested as absorbers of thermal detectors. These tests were successful,but some difficulty was found for NdF3 and NdGaO3, due to the paramagnetic properties of Neodimium.A particularly good candidate would be a crystal of48CaF2. In fact a “scintillating bolometer” where

15 INNOVATIONS IN THE CUORE STRUCTURE 124
Table 20: Most favorableββ(0ν) candidate nuclei.
Compound Isotopic abundance (%) Transition energy (keV)48CaF2 0.0187 427276Ge 7.44 2038.7100MoPbO4 9.63 3034116CdWO4 7.49 2804130TeO2 34 2529150NdF3 4.64 3368
light and heat were simultaneously detected was already operated [202]. Operation of these detectorsin coincidence mode between heat and light pulses would be very effective in the suppression of theββ(0ν) region background due to degraded alpha particles. Unfortunately the very low isotopic abun-dance of48Ca makes this experiment fiscally impossible, unless new processes for enrichment of thisisotope be discovered. Other scintillating bolometers like those with CdWO4 or MoPbO4 can obviouslybe envisaged. We would like to specify here that also TeO2 crystals have been found to emit light [203].Their yield is however very low (about 50 eV per MeV) which make them inefficient for the operation ofa scintillating bolometer. This approach would be in any case much less effective than the active shieldwith Ge or Si bolometers, which will be considered later. This shield would in fact suppress not only thesurface activity due to alpha particles, but also the surface activity due to beta decays.
A dedicated R%D work is foreseen for the Neodimium case, since150Nd is probably the best can-didate to search forββ(0ν) decay [1], thanks to the high transition probability due both to favorablenuclear matrix elements and to the high transition energy (3.37 MeV). Unfortunately,150Nd natural iso-topic abundance is low (5.6 %) and no dielectric diamagnetic compound of Nd is known to exist. Thefirst problem can probably be solved thanks to innovative techniques of isotopic enrichment, such as ICR(Ion Cyclotron Resonance) method [204], while the second one poses a challenge for the bolometrictechnique. The main difficulty, as already mentioned, is due to the magnetic properties of Nd: all the Ndcompounds compatible with growing large crystals present a magnetic ordering implying inevitably highspecific heat at low temperatures. However, the chance to realize a working Nd-based bolometer relieson our ignorance. The thermal models which attempt to explain how a large-mass, phonon-mediatedbolometer works are not completely convincing. In particular, there are indications that a non-thermalcomponent of the signal, due to “high” energy phonons, may be important (see section5, last paragraph).In this case, the specific heat could be a scarcely relevant parameter: the right question would be ratherhow long a non-thermal phonon lives in a crystal with a magnetic ordering and which chance it has totransmit its energy to the NTD thermistor. We have decided to follow a strictly experimental approachand to plan bolometric tests on commercially available crystals containing Nd. We have performed testson existing NdF3 (a paramagnetic material with huge Shotckey peaks at about 70 mK) and NdGaO3
(which presents a more promising antiferromagnetic ordering below∼1 K) crystals in the hall C dilu-tion refrigerator. In particular tests carried out with two cubic crystals of NdGaO3 of 1.3 and 3 cm sidehave not allowed to reach, after weeks of cooling, temperature lower than∼40 mK even if with differenttime profiles. These temperatures would not be sufficient to produce bolometers with acceptable energyresolution.
In about two years from the start of the CUORE project a final answer on the feasibility of a Nd-basedbolometer must be given. In the event of a positive response, a part of the CUORE array (probably notmore than∼10 % in terms of mass) could consist of Nd-based crystals. The Nd section of the array couldbe even more sensitive to Majorana neutrino mass than the Te section, in spite of the lower mass. In thiscase, CUORE would be a formidable two-fold experiment, capable to cross check within itself a positive

15 INNOVATIONS IN THE CUORE STRUCTURE 125
2
2
energy deposition in TeO
TeO thermistor pulse amplitude [mV]
0
1
2
3
4
5
6
7
0 0.2 0.4 0.6 0.8 1 1.2 1.4 1.6 1.8
T base = 7.5 mK
5 MeV
0.2 MeV
1 MeV
2.5 MeV
10 MeV
Ge
ther
mis
tor p
ulse
am
plitu
de [m
V]
energy deposition in Ge
Figure 58: Scatter plot of the pulse amplitudes from TeO2 thermistor versus the pulse amplitudes fromshield thermistor.
result in the search forββ(0ν) decay.
15.3 Development of surface sensitive TeO2 elements
Perhaps, the most important objective of the CUORE R&D program consists of developing methodsto control and to reduce at a negligible level the radioactive background coming from surface events.This background is presently observed in the large mass bolometers of the CUORICINO experiment andwas observed in the previous 20 detector arrays. Monte Carlo simulations (see section14.3) show thatthe dominant background contribution in theββ(0ν) region of interest (around 2.5 MeV) is originatedby passive elements which surround the detectors (in particular, the copper supports for the crystals,which work also as a 5 mK thermal bath for the detectors). This background is to be ascribed to surfacecontaminations in Th and U, which emit energy-degraded alpha particles able to deposit their energy atthe detector surfaces, populating the 2000-4000 keV spectral region. The presently designed CUOREconfiguration would not allow a substantial improvement of this background (expected to be of the orderof 0.1 counts/(keV kg y)) unless sizeable improvements in the reduction of the surface contributionswould be obtained.
The objective of a specific R&D program has to be therefore the realization of elements whose surfacebackground is reduced down to 0.001–0.001 counts/(keV kg y) in order to satisfy the CUORE sensitivityrequirement. This result can be achieved in three ways:
• to improve dramatically the quality of the surface treatment of copper (this option is not discussedhere, see section16, and should be pursued in parallel with the two following ones;
• to realize single CUORICINO and CUORE elements with a radically innovative structure, in whichthe copper surface facing the detectors is reduced by a factor at least 100-1000;

15 INNOVATIONS IN THE CUORE STRUCTURE 126
• to realize bolometers able to distinguish an event originated at the surface from one originated inthe bulk.
As far as the second item is concerned, the R&D program consists of identifying materials whichcan replace copper in forming the main part of the detector holder (best candidates are plastics, such asTEFLON, nylon or acrylic materials, achievable with very high radiopurity). Detector holders based onthese new materials have to be developed, first for reduced-scale detectors, and secondly, after selectionof the most promising solutions, for modules with the final size foreseen for the CUORE experiment.
As far as the third item is concerned, the basic idea consists in the realization of active shields in theform of thin, large-area, ultrapure, Ge or Si bolometers, by which the TeO2 crystals will be surrounded soas to get rid of possible events originating in the germanium (which could release part of their energy inthe main detector) with the anti-coincidence technique. A powerful method would be to thermally couplethese active shields to the main TeO2 detector. The Ge or Si auxiliary bolometers would be attached atthe main crystal providing almost complete coverage without a dedicated holder. In this way, a compositebolometer will be realized with multiple read-out, capable to distinguish the origin of the event (activeshields or TeO2 crystal) by means of the comparison among pulses coming from the different elements.A degraded alpha coming from outside would release its energy in the shield, originating a thermalpulse that, seen by the shield thermistor, would be much higher than a pulse corresponding to the sameenergy released directly in the main TeO2 crystal. In fig. 58 it is possible to appreciate the efficiencyof the separation method. A scatter plot is shown, where the amplitude of the pulses collected with theTeO2 thermistor is plotted against the amplitude of the corresponding pulses collected with the shieldthermistor. Two clearly separated curves identify the events generated in the shield with respect to theevents generated in the main crystal. The pulses have been simulated using a multi-stage thermal model ofthe composite bolometer. In order to reduce the readout channels, the six thermistors of the shields couldbe connected in series or in parallel. In this way, the total number of channels would double. We believethat this is a tolerable complication. The size of the auxiliary bolometers would be 50×50×0.3 mm3 or60×60×0.3 mm3: therefore, the main crystal plus the shields would form a cube with a side only 0.6 mmlarger than the main crystal alone, preserving the general CUORE structure and rendering the assemblingprocedure substantially unchanged. This proposed solution has the potential to control the problem ofthe surface radioactivity relying on a technological improvement of the detector rather than on a bettercleanness of the employed materials.
In order to test the exposed principles, several small scale prototype detectors were realized. In all ofthem the main absorber consisted of a TeO2 single crystal, with masses ranging from 12 g (2×2×0.5 cm3)to 48 g (2×2×2 cm3). A Ge or Si single crystal with a 1.5×1.5 cm2 surface and 500µm thickness wasglued at a 2×2 cm2 face by means of four epoxy spots (1 mm diameter and 50µm thick). NeutronTransmutation Doped (NTD) Ge thermistors were glued at the main absorbers and at the auxiliary Ge orSi bolometers with six epoxy spots (0.5 mm diameter and 50 mm thickness). The NTD chip size was3×1.5×1 mm3 in all cases. The resistance-temperature behavior of the chips is parameterized as usualby the formulaR(T ) = R0e
(T0/T )1/2. The values of R0 and T0 were respectively 2.65 Ohm and 7.8
K. The coupling of the main absorber to the heat bath was realized by means PTFE blocks, as in theCUORICINO modules. The Ge or Si active layers were exposed toα particles. The source was obtainedby a shallow implant of224Ra nuclides onto a piece of copper tape, facing the Ge or Si layer.224Ra isan a emitter with a half life of 3.66 d in equilibrium with itsα andβ emitting daughters. The mainαlines are at 5.68, 6.29, 6.78 and 8.78 MeV. Two weak lines sum up at about 6.06 MeV. The detectors werecooled down in a low power dilution refrigerator located in the Cryogenic Laboratory of the InsubriaUniversity (Como, Italy). The detector thermistors were DC biased through a voltage supply and a 20GOhm room-temperature load resistance. Typical operation temperatures were T∼25 mK, correspondingto a thermistor resistance R∼100 MOhm. The voltage across the thermistor was typically∼25 mV. Wereport here about the results obtained with a 12 g detector with a Ge active layer. Similar results were

15 INNOVATIONS IN THE CUORE STRUCTURE 127
0 500Pulse amplitude (Ge) [mV]
0
0 100 200 300 400
Puls
e am
plitu
de (G
e th
erm
isto
r) [m
V]
0
200
400
600
800
1000
Cou
nts
[A.U
.]
eventsSurface
Bulkevents
Pulse amplitude (TeO thermistor) [mV]
1000
2
MeV5.68
6.78 MeV8.78 MeV
6.29 MeV
Figure 59: Scatter plot of the pulse amplitudes from TeO2 thermistor versus the pulse amplitudes fromshield thermistor obtained with a 12 g TeO2 surface sensitive detector.

15 INNOVATIONS IN THE CUORE STRUCTURE 128
4 6 1080
100
200
300C
ount
s
100 20000
Bulkevents
Surfaceevents
300
400
Pulse amplitude (Ge) [mV]
12
Pulse amplitude (TeO )2[mV]
800
Risetime (Ge thermistor) [ms]
(a)(b)
Figure 60: Rise time distribution of the pulses from the Ge layer thermistor of a 12 g TeO2 surfacesensitive detector.
obtained with the other devices (no remarkable difference was observed between Ge and Si shields). Theenergy absorber was a TeO2 crystal with a rectangular shape (2×2×0.5 cm3 dimension). The fast pulsescoming from the active Ge layer had a rise time of∼6.5 ms and a decay time of∼40 ms, while the pulsescoming from the main absorber were remarkably slower (rise time∼9.7 ms, decay time∼70 ms). Thescatter plot obtained is shown in fig.59. The two bands, corresponding to surface and bulk events, are wellseparated and the 4 mainα lines of the source are clearly appreciable. A powerful separation between thetwo event types can be achieved also by rise time selection. In fig.60(a) the rise time distribution is shownfor pulses from the layer thermistor. The fast surface events are cleanly separated by the slow bulk events.A selection of the “fast” events identifies clearly the surface event band, as shown in fig.60(b). The risetime analysis shows that the scatter plot is redundant to select surface events. It might be convenient thento get rid also of the main absorber thermistor, reducing the read-out channel to one as in the conventionalcase. On the other hand, a detailed analysis will be performed to check if pulse shape discrimination canallow to identify surface events using signals only from the main absorber thermistor. In this case, the Geor Si layers would operate as signal-shape modifiers and would not require additional thermistors, leadingto a substantial simplification of the device. This experiment demonstrates dramatically the power of thetechnique we have developed to identify a superficial impact point in low temperature calorimeters.
15.4 Development of scintillating TeO2 bolometers
Measuring at the same time the light and heat produced in the detector is an attempt already exploited inthe quest for the background reduction [205, 206]. In the DBD, the electrons of the decay will produce atthe same time phonons and light signals (in the region of MeV), while the alpha particles from residualradioactive decays are expected to release a negligible signal in light. In the case of WIMP interactions,the signal is produced by nuclear recoil, then without scintillation, contrary to the main background, given
15 INNOVATIONS IN THE CUORE STRUCTURE 129
by beta and gamma radioactive decays. In the latter case however, the expected signals are in the regionof 10 KeV. Light signals in bolometric detectors can be detected by a second bolometer, thermally decou-pled form the main crystal. An R&D program is developed in the framework of the CUORE collaborationto produce such a hybrid detector based on TeO2. A scintillation signal in a TeO2 bolometer operatedat 20 mK was previously reported [207] and has been confirmed by our preliminary measurements. Themeasured light yield reported was quite low (0.67% that of BGO) but sufficient to distinguish alpha par-ticles and gammas at energies in the MeV range. The scintillation in pure TeO2 crystals may be due toexciton luminescence or to the presence of a defect, for example V-O (oxygen vacancy with one trappedelectron). Anyway, whatever the nature of this scintillation could be, it is clear that a larger light yieldwill be welcome for an improved discrimination power on particles. This can be done only by dopingthe TeO2 crystal with an activator. The crystal growth of doped TeO2 crystals is not easy [208]. This iswhy the choice of the activator ion to enter in the TeO2 lattice (substitutional position is preferred) has tobe carefully studied keeping in mind two main criteria: luminescence properties of the free ion and hostlattice possibility to accept the dopant. In our case, a supplementary constraint is imposed by the factthat the dopant for obvious reasons, has to have stable isotopes only. On the other hand, it is to be notedthat in this application practically no restriction is to be imposed on the emission spectrum and/or on thedecay time. With respect to the host lattice possibility to accept the dopant, several parameters have tobe taken into consideration: ionic radius, oxidation number, coordination number, type of outer atomicshell, electronegativity and chemical hardness of the ion. A first campaign of crystal growth has alreadystarted in collaboration with the Research Institute for Solid State Physics and Optics of the HungarianAcademy of Sciences using four different dopant activators. We expect to get preliminary results at theend of 2004, in order to select the most promising dopant for further attempts.
According to option (a) of section12.2, the R&D program about reduction of surface radioactivitymust be completed at most within two years from the start of CUORE, in order to have time to transferthe new detector concepts to the CUORE mass production.

16 CLEANING OF CUORE STRUCTURE: CRYSTALS, FRAMES AND ANCILLARIES 130
16 Cleaning of CUORE structure: crystals, frames and ancillaries
A peculiar property of thermal detectors is that they are active over the entire volume and thereforestrongly subject to radioactive surface contaminations. This contribution dominates the CUORICINOββ(0ν) background (sec.6.3) and could be a dominant contribution also in CUORE (sec.14) The ma-terial surface cleaning problem is therefore crucial for CUORE success. Notable improvements in thebackground reduction were in fact obtained by applying standard surface cleaning techniques to the de-tector elements (e.g. TeO2 crystal lapping) and to the detector mounting structure (copper box and frames,teflon stand-ups, contact pins, etc.). In a sense, MiDBD and CUORICINO represent a successfull R&Dfor CUORE material surface cleaning. In order to reach a background level lower than 0.01 c/(keV kg y)however, further improvements are required. In particular,all possible surface cleaning techniques mustbe considered in order to choose the most appropriate. Moreover, since cleaning techniques are deeplyselective, effective contamination analysis methods must also be considered/developed. A series of up-to-date cleaning methods are summarized in the following. Each of them shows positive and negativefeatures that must be considered and compared in order to reach a final decision before the CUOREdetector mounting starts. As discussed in sections6.3 and14, a factor of ten reduction in the coppersurface contaminations would be enough to reach the 0.01 counts/(kev·kg·y) ββ(0ν) region backgroundlevel in CUORE. The R&D program about surface cleaning (which must include also the developmentof powerful diagnostic methods) must be completed at most within two years from the start of CUORE(sec.12.6).
16.1 Surface cleaning techniques
A surface contaminant is defined as any material deposited on a substrate that interferes with any processinvolving the surface layer up to a certain depth or that affects surface properties or surface stability inan undesirable way. Surface contaminants can cover the whole surface (e.g. oxide layers or adsorbedhydrocarbon layers), can be limited to restricted areas (e.g. particles or fingerprints) or can be dispersedinto an epidermal layer for a certain depth (e.g. inclusions of foreign material or diffused impurities).Recontamination (for example by adsorbed vapors from the atmosphere) means contamination pickedup after the cleaning process in the external processing environment and before any further processingbegins.
The variability of the contamination is what mainly affects cleaning reproducibility. Therefore, tofail the control contamination means not to control cleaning, and it will be expected that this will bethe main problem for the cleaning operation of the whole CUORE structure. Cleaning is the reductionof surface contamination to an acceptable level in order to have no significant amounts of undesirablematerial. But what are the CUORE requirements to get an adequately clean surface? In the absence ofa clear answer to this question, the strategy suggested by the proponents is to transfer to CUORE theknow-how developed at INFN Legnaro National Laboratory (LNL) in the topic of surface treatmentsfor Superconducting Cavities either made of bulk Niobium or Niobium Sputtered Copper. In additionto that, Padua University and the LNL of INFN are currently holding a Master in “Surface Treatmentsto innovative mechanical technologies for the Industry”. This experience involves both industries andthe material science section of Padua University, and represents the best humus for facing and solving“CUORE problems”.
Our goal is twofold: we would like to clean the CUORE copper structure and to process all theTeO2 Crystals. In the following, we will list all the possible cleaning processes that could be significantfor our purpose. Then, on the basis of the exposed advantages and disadvantages, we will select amongthem the best processes for cleaning the CUORE structure. In this way we will propose two differentsurface treatments, the former for the copper structure, the latter for the TeO2 crystals.
The scope of reviewing all the possible treatments advisable for CUORE is however not only limited

16 CLEANING OF CUORE STRUCTURE: CRYSTALS, FRAMES AND ANCILLARIES 131
to the selection of the best cleaning steps. It is also a warning in getting deep in any issue where cleaningis concerned, in order to have the highest possible control of contamination.
Not knowing if the surface is contaminated, indeed, does not mean that the surface is clean. Sim-ple operations, normally considered of little importance can be detrimental. For instance, it would beabsolutely normal to degrease pieces, before cleaning, by means of Alkaline cleaners. However it isabsolutely mandatory to know that alkaline cleaners generally contain dissolved silicates, carbonates, bo-rates, citrates and even molybdate. Residuals of these particles can remain attached in micro-valleys of amicrorough surface.
Abrasive cleaningThe removal of gross contamination by abrasive cleaning includes the use of:
• Abrasive surfaces: sandpaper, emery paper, steel wool, scotch-brite, scouring pads, etc.
• Abrasive powders in a paste or fluid carrier: SiC, Al2O3, diamond, precipitated calcium carbonate(CaCO3), talc, kaolin, wheat starch. Cerium Oxide (widely used in glass lenses industrial clean-ing was avoided for CUORICINO/CUORE TeO2 crystals because of its high level of radioactiveimpurities).
• Impacting particles entrained in a high velocity gas or liquid stream: vapor honing, glass beadblasting, liquid honing, grit blasting, sand blasting.
• Abrasives combined with an etchant to provide chemical-mechanical abrasion and polishing.
Abrasive particles can be used wet or dry and with various particle sizes. Particles can be acceleratedin a high velocity water stream or in a gas stream by using a pressurized siphon system. In addition toremoving gross contamination, the following results can be obtained:
• Abrasive embedding into the surface even up to hundreds of microns
• Roughening of the surface
• Introduction of microcracks into the surface of brittle materials
• Production of unacceptable distortion of metallic surface due to the compressive stresses introducedby a king of “shot peening”
Blasting done with plastic media is less damaging than with harder grits; however it can leave organiccontamination on the surface). There is however a clean alternative to all that: the cleanest mechan-ical polishing isice micro-dropletsblasting in a high pressure nitrogen stream. This system has beenconceived for the cleaning of superconducting cavities, but it is only in the prototype stage and any appli-cation to CUORE should start ab initio.
Chemical etchingChemical etching removes surface material along with strongly adherent contaminants. Advisable
procedures before chemical etching are:
• Alkaline pre-cleaning, in order to get uniform wetting and etching
• Pickling, i.e. the removal of the large amounts of oxides formed during fabrication process.
• Bright dip, which is nothing else than a Mild Pickling

16 CLEANING OF CUORE STRUCTURE: CRYSTALS, FRAMES AND ANCILLARIES 132
Figure 61: Zoom of the micro-roughness of a metal surface immersed in an electrolytic bath
It must be kept into account that acid cleaning of metals can have the detrimental effect of introducinghydrogen into the surface. If hydrogen embrittlement is a concern, the part should be high-temperaturevacuum baked after etching. Sometimes chemical etching does not remove some constituents from asurface and leaves a smut that must be removed by further etching. Whenever other elements in additionto Copper frames should be treated, a chemical etching using Etchant Vapor instead of a Liquid Phasecould be also considered.
Electrochemical polishingIn an electrolysis cell, the surface of an electrical conductor can be removed by making it the anode of
an electrolytic cell and “de-plating” the material. This iselectro-etchingor electrocleaningor electrodis-solution. The higher the current density, the more roughened the surface (fig.61). Oxygen is released atthe anode: it will react oxidizing contaminants on the surface at low anodic potentials.
Electropolishing is a much smoother process, where the working current density is carefully chosen.In case of Cu electropolished in a H3PO4 solution, in a first approximation, the leveling action is due tothe protection of the smooth areas by a deposited phosphate material, and to the erosion of the exposedpeaks.
Electropolishing leaves a phosphate film on the surface, which can be removed either by leavingpieces in the solution without any applied voltage or by an HCl rinse.
A typical I-V characteristic for the electropolishing of Copper in Ortophosphoric acid solution inthe case of planar and parallel face electrodes and with negligible edge effects is shown in fig.62. Thefollowing behaviour is observed at the voltages corresponding to different sections of the curve:
• Over section Va and Vb the current increases as a linear function of the voltage. Material dissolutionhappens with a too low rate. The process is accompanied by the evolution of Oxygen bubbles that

16 CLEANING OF CUORE STRUCTURE: CRYSTALS, FRAMES AND ANCILLARIES 133
Figure 62: Typical I-V characteristic for electropolishing
promote local pittingof the surface of the piece by sticking to the anode.
• Polishing effect is observed between Vb and Vc; the grain structure is brought into relief, as long asthe process takes place. However roughness levelling and brilliant surface are obtained at voltagesclose to Vc. Here at the end of the plateau there is the minimum of the evolution of Oxygen bubbles.Even a minimum amount of bubbles can represent a limitation to the roughness smoothing action.Migrating toward the top they produce undesired vertical traces depending on the solution agitation.
• At a higher potential, the gas evolution becomes stronger and the surface erosion is accompaniedby pitting. A better surface quality is obtainable at voltages well above Vc, since Oxygen bubbleshave not enough time to stick to the surface.
In the framework of more than 18 years experience in the field of superconducting cavities, the LNLof INFN have well-established experience in Copper electropolishing. At LNL, indeed, a method forcontrolling the electropolishing process has been developed. We try to minimize parasitic problems (suchas gas evolution) by searching the best working point of the I-V characteristic and by following it duringthe whole process. The method consists in a computer assisted monitoring of the I-V characteristic.The process is driven by voltage. An automatic program displays the numeric derivative of I versus V.The working point is chosen as the minimum of such a derivative, i.e. the minimum of bath differentialconductance that corresponds to the point of maximum resistance of the viscous layer.
In figure63, we display the differential conductance compared to the ratio I-V and together with the I-V characteristic. Some literature approximates the minimum of dI/dV with the minimum of I/V. Alreadyfrom the figure below, it is visible that the two minima differ quite substantially in voltage. In any case

16 CLEANING OF CUORE STRUCTURE: CRYSTALS, FRAMES AND ANCILLARIES 134
Figure 63: I-V characteristic curve for a standard electropolishing process (circles). The differentialconductivity curve dI/dV (continuous line) and the ratio I/V (shaded line) are displayed versus voltage.We interpret the first minimum in differential conductance as due to edge effects and to the not uniformdistance between electrodes
that of an electrolytic cell is a non-linear circuit, hence the solution conductivity is a differential quantitywhile, the ratio I/V has no any physical sense in such a case.
Our method allows the determination automatically of the best working point, when electropolishing.Its great advantage is that, by computer controlling, the operator does not need to know what is the metalbeing cleaned, and what acid is being used.
Electroless electrolytic cleaningThis method exploits the difference in electromotive potentials to remove material from one surface
and deposit it on another. Such displacement-type electrolytic eleaning processes are commonly knownfor Silver. When immersing Silver in an undiluted solution of pure household ammonia contained in anAl or Mg tray, the Silver surface is cleaned as the Al or Mg is oxidized.
DeburringDeburring is the removal of the rough edges produced in cutting or shearing. Deburring is performed
by: abrasion, chemical etching, laser vaporization and “flash deburring” (which uses a thermal pulse froman exploding gas-Oxygen mixture to heat and vaporize the thin metal protrusions).

16 CLEANING OF CUORE STRUCTURE: CRYSTALS, FRAMES AND ANCILLARIES 135
Solvent cleaningSolvents dissolve the contaminant taking it into solution. It is possible to use: i) Polar solvents, such as
water and water-alcohol mixtures, used to dissolve ionic salts which are polar contaminates; ii) Non-polarsolvents, such as chlorinated hydrocarbon solvents, used to remove non-polar contaminates such as oil.A mixture of solvents can dissolve both polar and non-polar contaminates. A solvent’s effectiveness isdetermined by the solubility parameter for specific contaminants (i.e. the saturation maximum amount ofa specific contaminant dissolvable in a specific amount of the solvent). Of course the solubility parameterwill be temperature dependent.
Solvent cleaning leaves a surface layer of residue which must be removed. This removal can involve:i) water rinsing; ii) an elevated temperature; iii) other solvents that displace the surface layer. For example,both for cristals and copper frames; a solvent wipe-clean cleaning sequence might be Trichloroethylene-Acetone-Methanol-Isopropanol. Good polar solvents for a variety of polar contaminants (such as ionicsalts) are Water and Water-Alcohol mixtures (typically in a ratio of 1:1). The addition of alcohol lowerswater surface energy allowing it to penetrate into “hideouts” to remove hidden contamination.
Water and water-alcohol mixtures are not good solvents for non-polar contaminants such as oils.
Chlorinated and chlorofluorocarbon solventsChlorinated hydrocarbon solvents, such as Trichloroethylene, are preferred to hydrocarbon solvents for
their lower flammability, but there is concern with their toxicity and carcinogenic properties. Chlorofluo-rocarbons are not carcinogenic and can be used in large quantities. They are, however, less effective thanchlorinates solvents in dissolving contaminants.
1,1,1-trichloroethane (TCA-CHCCl3, or methyl chloroform) is a common chlorinated solvent widelyused in vapor degreasers. TCA has high Permissive Exposure Level (PEL), is classed as non-volatile, haslow toxicity, but it has a high Ozone Depleting Potential (ODP) rating. Hence, in order to meet regulationstandards, Vapors must be contained in enclosed vapor systems.
A possible alternative to TCA is Methyl-ene chloride (MEC-CH2Cl2). It has a rather low PEL, butit has a boiling point of 39.8C. This makes it more difficult to handle but it has the advantage of beingapplicable for vapor degreasing temperature-sensitive materials. It must be kept in mind that MEC is avery aggressive solvent; it can damage plastics and rubbers.
Perchloroethylene (PCE or PERC - Cl2C:CCl2) is particularly suitable for being applied to Copperframes after machining. It has a high boiling point (121.1C), is useful for dissolving heavy greases, andit can contain a large amount of water without degrading its solvency power.
Solvents can be mixed to give synergistic cleaning actions: a typical blend used for metal vapordegreasing is the Azeotrope mixture of Freon TF with methylene chloride or with ethanol. When usingsolvents however great attention must be payed to the performed operation. Some solvents can react withthe surface being cleaned. For example, Chlorinated solvents can react with water to form HCl which canreact with many metals, particularly Al, Mg, Be, Zn , but also Cu and Te to form inorganic salts.
Liquid CO 2 as a solventLiquid CO2 has low surface tension and low viscosity. LCO2 at 20C, which is below the Supercritical
Point, is a well-known good solvent for cleaning metals
Supercritical fluidsIf a gas, such as CO2, is compressed to its “critical pressure”, it liquefies to become a “critical fluid”.
If it is also heated above its “critical temperature”, it becomes a supercritical fluid. Critical fluids andsupercritical fluids are good solvents for many medium-molecular-weight, non-polar or slightly polarorganics. Solubility parameter for which CO2 can vary from 0 in the gas phase to 10 under high pressuresupercritical conditions (SCF-C02- critical point 31C, 74 bar pressure). Values of 6-8 are typical.

16 CLEANING OF CUORE STRUCTURE: CRYSTALS, FRAMES AND ANCILLARIES 136
Supercritical C02 fluid has the following advantages:
• it is stable
• has low toxicity
• minimal cost
• is a solvent for many organic materials
Semi-aqueous cleanersSemi-aqueous clenears refer to solutions of natural or synthetic organic solvents, used in conjunction
with water in some part of cleaning cycle. Water immiscible semi-aqueous cleaners include: terpenes;high-molecular-weight esters; petroleum hydrocarbons; glycol esters. Terpenes are natural hydrocarbonssuch as: the d-limonene; the alpha- and beta-pinenes, derived from citrus and pine oils. They may be aseffective as the CFCs in many instances, but have a greater tendency to leave residues and suffer from thefact that they are slow drying.
Water miscible semi-aqueous cleaners are low-molecular- weight alcohols; ketones; esters; and or-ganic amines. Acetone (CH3COCH3) removes heavy oils quite effectively but tends to leave a residue,that should be removed by a methanol rinse.
Saponifiers, soaps, and detergentsAlkaline saponifiers (generally silicate and phosphate-based) convert organic fats to water soluble
soaps. Alkaline cleaners are generally used hot. Mild alkaline cleaners (pH of 8-10) often have dis-solved silicates, carbonates, borates, and citrates and should be used to clean alkaline-sensitive materials,such as Al and Mg. Strong alkaline cleaners, caustics, (pH = 12) may have water, sodium silicate, sodiummolybdate and sodium fluoroborate.
Sodium silicate developes electrostatic forces that displace the contaminants while depositing a glassyfilm that prevents recontamination. The glassy material is generally removed in the DI water rinse. Afterusing alkaline cleaners, the surface should be followed by an acid dip prior to the water rinse to removealkali salts since alkali salts adhere strongly to surfaces and are difficult to remove by “water rinsing”.Clean oxide surfaces, in particular TeO2 monocrystals strongly adsorb hydrocarbons, and detergents orsolvents normally do not completely remove the hydrocarbons; alkaline or oxidative cleaners must beused to remove the remaining hydrocarbons.
Detergent cleaning is a comparatively mild cleaning technique. In detergent cleaning, the detergentsurrounds contaminants, emulsifying them into suspension, without actually dissolving the material. Thisemulsifying action is assisted by wetting agents and surfactants which loosen the contaminants from thesurface. The most common detergents are soaps which are the water-soluble reaction product of a fattyacid ester and an alkali (usually sodium hydroxide). In solutions, pH adjusters are used to aid in thecleaning action. Generally it is found that basic solutions clean better than acidic solutions if chemicaletching is not involved. The pH of the cleaning solution is often adjusted to be basic, using ammonia orammonium hydroxide.
Chelating agents (sequestering agents) keep into solution the normally in-soluble phosphates. Glasscleaning solutions use chelating agents such as ethylene diamine tetraacetic acid (EDTA) and citric acidwith salts containing hydroxyl and amine substitutes.
Ultrasonic cleaningLow frequency ultrasonic cleaning relies on the jetting action of collapsing cavitation bubbles in contact
with a surface to provide a high pressure jet of fluid against the surface. Ultrasonic cleaning is often agood way to remove loosely adhering particles after a grinding or abrasive procedure and can be used with

16 CLEANING OF CUORE STRUCTURE: CRYSTALS, FRAMES AND ANCILLARIES 137
solvents to remove adsorbed contaminants. Ultrasonic jetting is good for removal of large particles butless efficient as the particle size decreases into the submicron range. The cavitation bubbles are formed bythe tension portion of an ultrasonic wave in a fluid media and grow with time. The size that can be attaineddepends inversely on the frequency and the surface tension of the fluid. High frequencies (>60 kHz) givesmaller bubbles and a higher bubble density. The ultrasonic wave is produced by magnetostrictive orelectrostrictive transducers which can be attached to the fluid-containing tank walls or immersed in thefluid in the form of a probe that can concentrate the ultrasonic energy into a small area. Typically thetransducers operate at 18-120 kHz, at an energy density of about 100 watts/gal of fluid. The ultrasoniccleaner size can be from 5 gallons for a small cleaner, up to very large systems using many transducers.The size of cavitation bubbles in the fluid depends on the vapor pressure, surface energy, and temperatureof the fluid. For example, pure water at 60C and 40 kHz has a maximum cavitation bubble size of about100 microns if a surfactant is present, the bubble size is smaller due to the lowered surface energy. Thejet pressure from the collapsing bubble can be as high as 300 psi. The cavitation jetting is more energeticfor cooler media and when there are no gases in the bubble to hinder its collapse.
Ultrasonic cleaning must be used with care on TeO2 crystals, since the jetting action can produce highpressures that cause erosion and introduce fractures in the surface.
Megasonic cleaningHigh frequency (>400 kHz) ultrasonic cleaning does not cause cavitation. Instead, the action consists
of a train of wave fronts that sweep across a smooth surface producing disruption of the viscous boundarylayers on the substrate surface by viscous drag. The resulting pressure is less than 50 psi and does nothurt fragile surfaces. High frequency transducers can be focused to restrict the area of impact and allowlateral fluid flow from the area of concentration.
Megasonic cleaning utilizes high frequency (850-900 kHz) transducers to produce non-cavitatingpressure waves. The megasonic agitation system is applicable to smooth surfaces, particularly for re-moving particles, but does not work well on configured surfaces where the surface is shadowed from thepressure wave.
Wipe-cleanIn some cases the surface can not be immersed in a fluid and must be cleaned by wiping. Wiping with a
fluid should be done with a moist lint-free cloth or sponge which has no extractables when in contact withthe wiping-fluid. The wiping motion should be a rolling motion such that contamination that is picked-updoes not come into contact with the surface as wiping proceeds.
Strippable coatingsParticles can be removed from surfaces by covering the surface with a liquid polymer, allowing it to
solidify, then mechanically stripping (peeling) the polymer from the surface. This technique is used bythe optics industry to remove particles from mirror surfaces and protect surfaces from abrasion duringassembly, and in silicon technology to remove particulates from silicon wafers. There are many types of“strip coats,” each coating leaves different residues on stripping and have differing corrosion compatibilitywith surfaces. Hydrocarbon residues left by strippable coatings can be removed by oxidation techniques.A strippable coating is not necessarily organic, but it can be also a sputtered getter film, for examplea Niobium, Hafnium or Titanium film sputtered onto copper for Oxygen purification. The film is thenremoved by chemical etching.
RinsingAfter any wet cleaning process the surface should be thoroughly rinsed in pure or ultrapure liquid,
usually water, before allowing to dry. This avoids leaving residues on the surface. A common rinsing

16 CLEANING OF CUORE STRUCTURE: CRYSTALS, FRAMES AND ANCILLARIES 138
technique is to use successive rinses (cascading rinsing) in pure or ultrapure water until the rinse waterretains a high resistivity (e.g., >12 megohm). A problem can be the “dragout” of one fluid with thepart which then contaminates the subsequent fluid tank. For the beginning rinse, a sheeting agent can beadded that lowers the surface tension of the water and aids in flowing the rinse water off the surface. Afterrinsing, the surface should be dried as quickly as possible since the residual water film on the surface willcause particles to stick to the surface and on drying the particles will adhere very tenaciously.
Drying and outgassingDisplacement drying uses anhydrous fluids, such as isopropanol, anhydrous ethyl alcohol denatured
with acetone or methanol, or a commercial drying agent. One of the best drying techniques is a “vapordry” where the cold surface is immersed in the vapor above a heated anhydrous alcohol sump. The coldsurface condenses the alcohol vapor which flows off into the sump taking water and particulates with it.When the surface becomes hot, condensation ceases and the hot surface, when withdrawn dries rapidly.Surfaces can be blown dry using a low velocity dry gas stream. When blowing, a nozzle with a 0.2 micronor smaller particulate filter should be used in the nozzle. In addition, when drying insulator surfaces, thegas should be ionized to prevent charge build-up on the surface. The gas can be ionized with an electronic(corona), or a laser ionizer. But be aware that Electronic ionizers can arc and produce particulates. A highvelocity jet of gas can be shaped to blow-off a moving surface. The jet should impact the on-coming wetsurface at about a 30 angle. Hot gas drying or evaporative drying, uses the recirculation of hot dry,filtered air over the surface to promote evaporation. This drying technique has the problem of “waterspotting” if the fluid is not ultrapure.
Volatile materials from the bulk of the material are removed by outgassing. Obviously TeO2 monocrys-tals will not outgas appreciably, while Outgassing is especially important for Copper. Since diffusion isrequired, the time to outgas a material may be very lengthy if the diffusion rate is slow and/or the diffu-sion distance is long. Generally metals primarily outgas hydrogen, particularly that taken up during acidcleaning or electropolishing.
After drying, the cleaned parts should be stored and transported in a manner that does not undulyrecontaminate the parts.
Reactive cleaningReactive cleaning uses liquids, gases, vapors, or plasmas to react with the contaminant to form a
volatile or soluble reaction product. Reactive cleaning liquids are often oxidizing solutions. Many acid-based systems can be used as oxidants. Nitric acid can also be used as the oxidizing agent. Nitric acidwith hydrofluoric acid is used to oxidize/etch surfaces. Hydrogen peroxide (H2O2) is a good oxidizingsolution for cleaning glass.[64] Often boiling 30 unstabilized H202 is used. Hydrogen peroxide is oftenstabilized, which reduces the release of free oxygen. Unstabilized H2O2 must be stored in a refrigerator toslow decomposition. Hydrogen peroxide is sometimes used with ammonium “hydroxide”, to increase thecomplexing of surface contaminants. However the decomposition rate of the H2O2 is greatly increasedby combination with ammonium hydroxide.
Oxidative cleaning can be performed using chlorine-containing chemicals. For example, a waterslurry of sodium dichloroisocyanurate (i.e. swimming pool chlorine) which has 63% available chlorine,can be used to scrub an oxide surface to remove hydrocarbon contamination. This combines mechanicalscrubbing with oxidation and improves the cleaning action.
Anodic oxidation in an electrolysis cell can be used to clean surfaces. The contaminated layer can beremoved by anodically oxidizing the surface in an electrolytic cell. The oxide layer must be subsequentlyremoved.
Gaseous oxidation cleaning can be used on surfaces where surface oxidation is not a problem. Ox-idation is usually accomplished using oxygen, chlorine, fluorine, ozone, or Nitric oxide which createsvolatile reaction products such as CO and CO2. Reactive gas cleaning may use a reaction with a gas

16 CLEANING OF CUORE STRUCTURE: CRYSTALS, FRAMES AND ANCILLARIES 139
at high temperature to form a volatile material. High temperature air fire is an excellent way to cleansurfaces that are not degraded by high temperature.
Ozone cleaningThe use of oxidation by Ozone created by ultraviolet radiation (UV/Ozone cleaning) at atmospheric
pressure and low temperature has greatly simplified the production, storage and maintenance of hydro-carbon-free surfaces. Historically the UV/0, cleaning process was developed because of the need to cleanvery delicate quartz oscillators. Any attempt to clean the quartz using physical contact caused breakage.The UV/O3, cleaning technique provided a non-contacting way to clean the delicate quartz plates. Theshort wavelength radiation causes bond scission in the hydrocarbon contaminants and generates ozonewhich reacts with carbon to form volatile CO and CO2. Typical exposure times for UV/03 cleaning arefrom a few minutes to remove a few monolayers of hydrocarbon contamination to hours or days or weeksfor storage of cleaned surfaces. The UV/03 cleaning technique has the advantage that it can be used as adry, in-line cleaning technique at atmospheric pressure. The UV/03 cleaning technique is also useful forcleaning holes (vias) in surfaces.
Hydrogen cleaningHigh temperature hydrogen or forming gas (90% N2:10% H2), can be used to remove hydrocarbon
contamination from a surface by hydrogenating the material and making it more volatile. Hydrogenreduction of oxide layers can be used to clean surfaces in a furnace environment. However, Hydrogencleaning can also change the surface chemistry. For example, hydrogen firing of TeO2 could producemetallic Tellurium surface by reducing the Oxyde to metal on the surface.
Reactive plasma cleaning and etchingReactive plasma cleaning uses a reactive species in the plasma to react with the surface to form a
volatile species which leaves the surface at much lower temperatures than those used for reactive gascleaning. The additional requirement on reactive plasma cleaning is that it does not leave a residue.Oxygen or hydrogen are often used for plasma cleaning while fluorine (from SF6, CF4 , CHF3, C2F6
C3F8, or SF6) and chlorine (from HCl, CCl4, or BCl3) are used for plasma etching. The reactive plasmacleaning/etching technique is typically specific and can be used to selectively remove the oxide from thesurface and then have a low etch rate for the substrate material.
Oxygen (or air) plasmas are very effective in removing hydro-carbons and absorbed water vapor fromsurfaces. A typical plasma cleaner has plasma generated by an rf discharge and the surfaces to be cleanedare in a “remote” or “downstream” location and not in the plasma generation region. The surface attainsa potential (sheath potential) that is negative with respect to the plasma, and ions are accelerated fromthe plasma to the surface. For the case of a “cold plasma” which has low energy particles, this sheathpotential will only be a few volts. When the plasma particles are more energetic or the electrons areaccelerated to the surface, the sheath potential can be tens of volts. In addition to being bombarded byions, the surface in contact with the plasma will be bombarded by “activated species”, excited species,thermal species, and high energy photons (UV and, under some conditions, soft X-rays). Ions and excitedspecies will release their energies of ionization or excitation when they impinge on the surface.
Plasma etchers and strippers typically use more aggressive reactant gases such as chlorine or fluorineand are constructed to withstand corrosion and pump the particulates that are often formed in the etchingand stripping process.
When plasma is etching copper, a copper chloride (CuCl2) residue is left on the surface which canbe volatilized by heating to above 200 C. Often mixtures of gases are used for etching and cleaning.Oxygen is often added to the fluorine plasma to promote the formation of atomic fluorine and to oxidizethe surface and thus increase the etch rate. One of the most common gas mixtures used to etch is 96 CF4.

16 CLEANING OF CUORE STRUCTURE: CRYSTALS, FRAMES AND ANCILLARIES 140
Helium is often added to dilute the mixture and to increase the thermal conductivity of the plasma thusreducing the temperature rise of the substrate during etching.
Plasma cleaningPlasmas can be used to clean surfaces in the deposition system in the same manner as they are used to
condition vacuum surfaces. In some PVD deposition systems which are not normally used with a plasma,a “glow bar” or “glow plate” is used as the cathodic or anodic electrode of a DC discharge to createthe plasma. The larger the area of the surface, the better the plasma distribution in the system. Plasmacleaning can be done using an inert gas plasma or can use a plasma containing a reactive gaseous speciesto form a volatile reaction product from the interaction of the gaseous species and the surface species.
“Ion scrubbing” of a surface occurs when a surface, which is in contact with an inert gas plasma,develops a wall sheath and is bombarded by inert gas ions accelerated across this wall sheath. Generallythe ion energy is too low to cause surface damage or physical sputtering, but is effective in the desorptionof adsorbed surface contaminants such as water.
Reactive plasma cleaning/etching can be done in the deposition system in much the same way as wasdescribed in the “external” plasma cleaning. The surface in contact with a plasma containing reactivespecies develops a negative potential with respect to the plasma (self-bias). Ions, along with neutrals and“activated” species, of the reactive species bombard the surface producing volatile reaction product eitherwith contaminants (cleaning) or the substrate material (etching). The most common reactive gas used isoxygen or air.
A major concern in any plasma process is to obtain a uniform plasma over the surface. Some plasma-generation configurations are more amenable to uniformity than are others. The magnetron configurationis one where plasma uniformity is difficult to obtain except in certain applications such as passing thesubstrate through the plasma of a planar magnetron. For CUORE magnetron configurations using movingelectromagnetic fields could be conceived in order to obtain uniform etching without substrate damage.
The reactive etching/cleaning processes produce volatile species which may be deposited in otherparts of the system where there are different plasma conditions. This may have a detrimental effect onthe gas handling/ pumping system and can be a source of particulates in the etching system, that must beperiodically reconditioned.
Sputter cleaningSputter cleaning uses physical sputtering, not chemical reaction, to remove some of the surface layer,
which includes the contaminates. Sputter cleaning is a kind of universal etch since conceptually every-thing can be removed by the sputtering process. However certain types of surface contamination, suchas particles and inclusions of inorganics compounds, are very difficult to remove by sputtering becauseof their shape. This cleaning process can be easily integrated into the deposition process so as to allowno time for recontamination between the cleaning and the deposition process as is done in ion plating.Sputter cleaning however could produce detrimental surface damage on TeO2 crystals, unless very lowpower and low density plasmas are ignited. For TeO2, indeed Helium plasmas are foreseen.
During sputter cleaning, the bombarding gas may become incorporated into the surface and subse-quently released on heating. Sputtering from a plasma environment has the disadvantage that gaseouscontamination in the plasma becomes activated and can react with the surface being cleaned; also sput-tered species can be returned to the surface by scattering (redeposition) and contaminate surface speciescan be recoil-implanted into the surface. Sometimes this makes sputter cleaning difficult. Ion milling,where ion beam sputtering is used to remove surface material, can be done in a vacuum environmentwhere the sputtered species are not redeposited on the substrate surface and gaseous contamination israpidly pumped away.

16 CLEANING OF CUORE STRUCTURE: CRYSTALS, FRAMES AND ANCILLARIES 141
Ion beam cleaningThe use of ion and neutral beams allow the cleaning/etching of a surface in a good vacuum environment.
Energetic ion beams of reactive species can be used to clean/etch surfaces and the process is calledReactive Ion Beam Etching. Beams of uncharged radicals of reactive species (H, Cl, F) can be used toclean surfaces in vacuum. The use of energetic inert gas ion beams to bombard a surface concurrentlywith a molecular beam of the etchant gas (Ion Beam Assisted Etching-IBAE) shows enhanced etchingover either the inert ion bombardment (sputtering) or the molecular beam alone.
16.2 Conclusions
From the analysis of the possibilities listed above, we learn that two different cleaning procedures mustbe conceived for Copper and for Crystals.
For cleaning the Copper structure delivered after fabrication, indeed, we propose the following pro-cedure:
• Mechanical finishing
• Degreasing
• Tumbling or vibratory finishing
• Rinsing
• Bright dipping
• Rinsing
• Electropolishing
• Rinsing
• Ultrasound rinsing
• Chemical etching
• Copper passivation
• Rinsing
• Ultrasound rinsing
• Drying
• Vacuum degassing
• Sputter cleaning
• Storing in controlled atmosphere environment
On the other side for cleaning TeO2 crystals delivered after fabrication, indeed, we propose the fol-lowing procedure:
• Alcohol Rinsing
• Drying
• Helium gas low pressure and low power Sputter cleaning

16 CLEANING OF CUORE STRUCTURE: CRYSTALS, FRAMES AND ANCILLARIES 142
• Ion beam cleaning
• Storing in controlled atmosphere environment
Tests of both procedures will be carried out in the next feature to assess their effectiveness.

17 ENRICHMENT OPTION 143
17 Enrichment option
CUORE is the only proposed next generationββ(0ν) decay experiment that plans the use of non-enrichedmaterial. Indeed, the high isotopic abundance of130Te allows very high sensitivities even using the muchcheaper natural abundant material. This obviously implies that the construction of a larger array would notonly be technically possible but also fiscally acceptable. On the other hand the high natural abundanceof 130Te allows a much simpler and less expensive enrichment procedure than that for other doublebeta decay candidates. Moreover TeO2 crystals made with130Te isotopically enriched material havebeen already tested during the MiDBD experiment with results consistent with those obtained for naturalcrystals, both from the point of view of detector performance and detector background. As discussed insection4.1, a 95% enrichment in130Te of CUORE with a background of 0.001 counts/(keV·kg·y) wouldimply a 5 year sensitivity FD of 1.9×1027 y implying a sensitivity on the Majorana mass parameter inthe range 8-45 meV.
We are presently considering a "partial enrichment" option for CUORE which would leave unalteredthe CUORE structure shown in Fig.31. Four central columns of CUORE would contain 9 inner planesmade by 95% enriched TeO2 crystals with the upper and lower two planes made by natural ones. Wewould have therefore in total 144 enriched and 844 natural crystals, respectively. The sensitivity ofCUORE on the Majorana neutrino mass would be almost doubled if the background of the enrichedcrystal would be the same as that of the natural ones. In addition comparison between the spectra fromthe enriched and natural crystals would be precious to understand the origin of the background especiallyif a peak indicative of neutrinoless double beta decay would be found. Our plan would be to produce inthe USA and test at LNGS three 5×5×5 cm3 crystals enriched in130Te plus three natural ones, withintwo year from the beginning of the project to ensure that the thermal and background properties wouldbe the same as those of CUORICINO. If this would not be the case the option of CUORE entirely madeby natural crystals will be adopted.

18 STRUCTURE OF THE COLLABORATION 144
18 Structure of the collaboration
The CUORE collaboration involves physicists from 14 active groups in Europe and United States, plusabout 50 technicians and a number of undergraduate students. Five Laboratories of international relevanceparticipate to it: the Lawrence Berkeley National Laboratory, the Lawrence Livermore National Labo-ratory, the Laboratori Nazionali del Gran Sasso, the Laboratori Nazionali di Legnaro and the KamerlingOmnes Cryogenic Laboratory in Leiden. All the specific services of these Laboratories will participate tothe various technical problems involved by CUORE: cryogenics, chemical, construction, material prop-erties, electronics, low radioactivity measurement etc. In addition a collaboration has been initiated withthe Department of Structural Engineering of the Politecnico of Milan, one of the leaders in Europe, forthe design and construction simulation of the CUORE structure. With respect to the other experiments onthe same subject, a peculiarity of CUORE is the multidisciplinary aspect required by its construction andoperation. For this reason we would like to mention the “historical” background of the various participat-ing group and their familiarity and internationally acknowledged skill in the specific fields of the project.We will also mention how they will collaborate on the various tasks.
1. The Berkeley group, in addition to its well known experience in low energy nuclear physics, has anoutstanding skill in the fabrication and operation of NTD (Neutron Trasmutation Doped) thermis-tors obtained by controlled irradiation in two USA reactors. Since 15 years they have established aclose collaboration with the Milano group in the development of thermal detectors.
2. The Milan, South Carolina and Zaragoza groups have largely contributed in the field of double betadecay experiment since more than 30 years. The South Carolina group is concentrating on the issueof other candidateββ(0ν) bolometer materials.
3. The Leiden group is one of the leaders in the world arena in the construction and operation ofdilution refrigerators and more in general in the field of Cryogenics
4. the Berkeley, Livermore, Milan (with Como) , South Carolina and Zaragoza groups are workingsince tens of years and often in collaborarion in the study and reduction of radioactive background
5. the Legnaro group is a leading team in Europe in the field of surface treatment and cleaning
6. the Florence group has since tens of years a deep knowledge in the material properties at low andvery low temperature, and is presently collaborating with Como and Milano in the characterizationof a various samples of NTD thermistors produced in Berkeley
7. The Genoa group was and is involved since many years in the field of data acquisition
8. The Milan group is the only one in the world performing searches on double beta decay with thecryogenic technique since fifteen years
All these groups are since the last year collaborating to the development and operation of CUORICINO,which is a first step towards the realization of CUORE.

19 COST STATEMENT 145
19 Cost statement
In this section we give an estimate of the costs of the basic CUORE design described in this proposal withpossible sources of these funds.
Table 21: Breakdown of the total CUORE cost estimates (kEuro)
Start date: 2005 2006 2007 2008 2009 Total US INFN1st January 2005Crystals US 50 50 2800 1400 4300 4300Thermistors US 100 500 600 600Detector structure INFN 170 150 150 100 100 670 670Cleaning INFN 50 350 200 50 50 700 700Cryostat & cryogenics INFN 100 1000 100 1200 1200Shieldings INFN 50 50 500 600 600Underground Laboratory INFN 50 300 500 850 850Electronics US 40 40 480 30 590 590Data Acquisition INFN 10 30 155 155 170 520 520CUORE Installation INFN/US 50 50 900 1000 500 500Contingency INFN/US 300 700 700 600 600 2900 1450 1450Total cost 920 2670 5635 2855 1850 13930 7440 6490
TeO2 crystalsThe final cost of the 988 5×5×5 cm3 TeO2 crystals, as agreed some time ago with SICCAS if of the
order of 4,300 Euro per crystal (comprehensive of Te metal, chemical reduction to TeO2 , crystal growthand preliminary lapping). This would amount to a total of about 4.3 million Euro.
ShieldsAccording to the current quotation of normal and low activity lead and the basic design described in
section8.2, the total cost would amount to 500,000 Euro. An additional cost of 100,000 Euro would berequired for the external neutron shield.
ElectronicsAs described in section10, the front-end electronics for CUORICINO was designed taking into account
CUORE requirements. Few modifications will be therefore required and the cost of each channel (fromthermistor bias circuit to DAQ input) can be precisely estimated: 590 Euro. This cost would include alsoa 10% excess of spare channels.
Dilution refrigerator and cryogenic equipmentThis section would include the dilution refrigerator system, the CUORE cryostat and the liquid helium
and nitrogen systems. A rough estimate amounts to one million Euro.
Underground laboratoryAs described in section9 the underground building will house (besides the CUORE cryogenics, shields,
electronics and DAQ) a clean room for detector assembling and a Faraday cage for front-end electronics.

19 COST STATEMENT 146
The total cost of these structures would amount to 850,000 Euro (200,000 for the Faraday cage, 400,000for the clean room, 150,000 for the laboratory and 100,000 for the UPS’s).
Detector structure and machiningThe cost of the detector structure materials will be dominated by the required amount of copper (5 tons)
whose cost can be estimated around 50,000 Euro. PTFE and other materials would cost 10,000 Euro. Themain conribution would come however from detector structure machining whose cost is estimated of theorder of 500,000 Euro.
DAQ systemAt present, only a very rough estimate of the cost of the DAQ system is possible. In order to satisfy
CUORE requirements in fact, a new design is required with respect to CUORICINO (sec.11). A roughestimate of the total cost amounts to 400 Euro/ch. Additional 50,000 Euro will be required for the slowcontrol system.
Surface cleaning facilities and proceduresAs previously discussed (sec.16), surface cleaning for CUORE requires an intensive R&D phase. A
final cost for the whole item will be possible only after we’ll get a final decision. A rough estimateis however possible by extrapolating our CUORICINO experience. In particular, excluding the cost ofcleaning materials (which could be extremely variable in dependence of the purity requirements) we canestimate a total budget of 700,000 Euro, including both R&D (mainly at INFN LNL) during the first 1-2years and facilities/procedures costs (at LNGS).
NTD thermistorsIn order to produce 2000 NTD Ge thermistors for CUORE, we estimate a cost of approximately
600,000 Eu which will be used to pay for the purchase of the Ge material, the reactor irradiations, thedetermination of the doping levels achieved, and the processing of the NTD material into thermistors. Wealso estimate the time required to do this production to be on the order of three years.

20 CONCLUSIONS 147
20 Conclusions
It should be abundantly clear from the foregoing discussion that the most important remaining issue inneutrino physics is the determination of the neutrino mass scale. Neutrino oscillation experiments haveclearly demonstrated that:
1. neutrinos have mass and that their mass eigenstates mix;
2. the mixing matrix elements have values that imply that next generationββ(0ν) decay experimentsshould be able to determine the scale of neutrino mass in the case of Majorana neutrinos.
The main advantage of CUORE is that it will utilize TeO2 crystals of natural isotopic abundance Te evenif an enriched option could also be considered at an affordable cost. CUORE will offer also the uniquepossibility to search forββ(0ν) of isotopes other than Te. On the other hand, the bolometric technique hasyielded energy resolutions approaching those of intrinsic Ge detectors and energy resolution is cruciallyimportant for an actual observation ofββ(0ν) and a measurement of|〈mν〉| . Important results onbackground reduction have already been obtained in CUORICINO which represents also a valid test ofthe CUORE project feasibility . With a little R&D CUORE will reach a 5–year sensitivity of∼30 meVon |〈mν〉|, which could decrease to 15 meV if the full CUORE R&D program will be successful.
We would like to add that CUORE is the only second generation double beta experiment based on apilot perfectly operating prototype setup (CUORICINO) which consists essentially in one of the CUOREtowers, thus ensuring the complete feasibility of its larger "brother".
The present and future results of CUORICINO will obviously be precious to anticipate the perfor-mance of CUORE. Last but not leat, CUORE is the only experiment with an already approved and fixedunderground location.

20 CONCLUSIONS 148
During the preparation of this Proposal to which he validly contributed, Angel Morales passed away.We lost an outstanding physicist, a devoted teacher and a dear friend.

REFERENCES 149
References
[1] S. Elliott and P. Vogel, Ann. Rev. Nucl. Part. Sci.52 (2002) 115.
[2] V. I. Tretyak and Yu. G. Zdesenko, Atomic Data and Nuclear Data Tables,80 (2002) 83.
[3] Yu. G. Zdesenko, Rev. Mod. Phys., 74 (2002) 663.
[4] H. Ejiri, Prog. in Part. and Nucl. Phys. B 48 (2002) 185.
[5] A. Morales and J. Morales, Nucl. Phys. B (Proc. Suppl.)114(2003) 141.
[6] O. Cremonesi, Nucl. Phys. B (Proc. Suppl.)118(2003) 287
[7] A. Giuliani, Talk given at the 8th Int. Workshop on Topics in Astroparticle and Underground Physics(TAUP2003), 5 - 9 September, 2003, Seattle, USA.
[8] A.S. Barabash, Phys.of Atom.Nuclei 27, 438 (2004).
[9] Y. Fukuda et al., the SuperKamiokande Collaboration, Phys. Rev. Lett., 85 (2000) 3999
[10] T. Toshito et al., the SuperKamiokande Collaboration, Proceedings of the “XXXVIth Rencontres deMoriond on Electroweak Interactions and Unified Theories” and arXiv:hep-ex/ 0105023.
[11] Y. Hayato et al., the SuperKamiokande Collaboration, Talk given at the Int. EPS Conference onHigh Energy Physics, July 17 - 23, 2003, Aachen, Germany.
[12] M. Ambrosio et al., the MACRO Collaboration, Phys. Lett. B566(2003) 35.
[13] Q. R. Ahmad et al., the SNO Collaboration, Phys. Rev. Lett.87 (2001) 071301.
[14] Q. R. Ahmad et al., the SNO Collaboration, Phys. Rev. Lett.89 (2002) 011301 and 011302.
[15] S. N. Ahmed et al., the SNO Collaboration, arXiv:nucl-ex/0309004.
[16] S. Fukuda et al., the SuperKamiokande Collaboration, Phys. Lett. B539(2002) 179.
[17] M. B. Smy et al., the SuperKamiokande Collaboration, arXiv:hep-ex/0309011.
[18] K. Eguchi et al., the KamLAND Collaboration, Phys.Rev.Lett. 90 (2003) 021802, and arXiv:hep-ex/0310047.
[19] M. Apollonio et al., the CHOOZ Collaboration, Phys. Lett. B466(1999) 415.
[20] M. H. Ahn et al., the K2K Collaboration, Phys.Rev.Lett. 90 (2003) 041801.
[21] S. Pascoli and S. T. Petcov, Phys. Lett. B544(2002) 239, and Addendum, arXiv:hep-ph/0310003.
[22] M. Maltoni, T. Schwetz, M. A. Tortola and J. W. F. Valle, arXiv:hep-ph/0309130
[23] F. Feruglio, A. Strumia and F. Vissani, Nucl. Phys. B637(2002) 345, and Addendum, Nucl. Phys.B 659(2003) 359.
[24] S. M. Bilenky, S. Pascoli and S. T. Petcov, Phys. Rev. D64 (2001) 053010.
[25] H. V. Klapdor-Kleingrothaus, H. Päs, A. Yu. Smirnov, Phys. Rev.D 63 (2001) 073005.
[26] A. Osipowicz et al., (the KATRIN Collaboration), arXiv:hep-ex/0109033.

REFERENCES 150
[27] Ling-Lie Chau and Wai-Yee Keung, Phys. Rev. Lett.53 (1984) 1802.
[28] V. Barger, S. L. Glashow, D. Marfatia, and K. Whisnant, Phys. Lett. B532(2002) 15.
[29] A. Staudt, Kuo and H. V. Klapdor-Kleingrothaus, Phys. Rev. C46 (1992) 871.
[30] G. Pantis et al., Phys. Rev. C53 (1996) 695.
[31] P. Vogel et al., Phs. Rev. Lett.57 (1986) 3148.
[32] O. Civitarese, A. Faessler, T. Tomoda, Phys. Lett. B194(1987) 11.
[33] O. Civitarese and J. Suhonen, Nucl. Phys. A 729 (2003) 867.
[34] C. Barbero, F. Krmpotic, A. Mariano, and D. Tadic, Nucl. Phys. A650(1999) 485.
[35] F. Simkovic et al., Phys. Lett. B393(1997) 267.
[36] F. Simkovic, Phys. Rev. C60 (1999) 055502.
[37] J. Suhonen, O. Civitarese and A. Faessler, Nucl. Phys. A543(1992) 645.
[38] K. Muto, E. Bender, and H. V. Klapdor-Kleingrothaus, Z. Phys. A334(1989) 187.
[39] S. Stoica and H. V. Klapdor-Kleingrothaus, Phys. Rev. C63 (2001) 064304.
[40] A. Faessler and F. Simkovic, J. Phys. G24 (1998) 2139.
[41] J. Engel, P. Vogel, and M. R. Zirnbauer, Phys. Lett.B 225(1989)5
[42] M. Aunola and J. Suhonen, Nucl. Phys. A643(1998) 207.
[43] V. A. Rodin, A. Faessler, F. Simkovic and P. Vogel, Phys. Rev. C 68 (2003) 044302
[44] W.C. Haxton, G.J. Stephenson, Prog. Part. Nucl. Phys.12 (1984) 409.
[45] E. Caurier et al., Phys. Rev. Lett.77 (1996) 1954.
[46] J. G. Hirsh et al., Nucl. Phys. A589(1995) 445.
[47] D. N. Spergel et al., Astrophys. J. Suppl.148(2003) 175.
[48] J. Schechter and J.W.F. Valle, Phys. Rev. D25 (1982) 2951.
[49] B. Kayser et al., “New and Exotic Phenomena”, Ed. O. Facker, Editions Frontieres 1987, p. 349.
[50] W. C. Haxton et al.,Phys. Rev. D26 (1982) 1805.
[51] W. C. Haxton et al., Nucl. Phys. B (Proc. Suppl.)31 (1993) 82.
[52] E. Caurier et al., Nucl. Phys. A654(1999) 973c.
[53] A. Staudt et al., Europhys. Lett.13 (1990) 31.
[54] J. Abad, A. Morales, R. Núñez-Lagos, A.F. Pacheco, Ann. Fis.80 (1984) 9; J. Phys. C3 Suppl.45(1984) 147.
[55] J. Suhonen and O. Civitarese, Phys. Rep.300(1998) 123.

REFERENCES 151
[56] M. Doi, T. Kotani, E. Takasugi, Progr. Theor. Phys. Suppl.83 (1985) 1.
[57] F. Avignone,Strategy for future double beta decay experiments, invited paper to Neutrino 2004,Paris June 14-19,2004
[58] S.R. Elliott and J. Engel, J.Phys.G:Nucl.Part.Phys. 30,R 183 (2004)
[59] G. F. Dell’Antonio and E. Fiorini, Suppl. Nuovo Cimento 17 (1960) 132.
[60] E. Fiorini et al., Phys. Lett. B25 (1967) 602.
[61] E. Fiorini et al., Lett. Nuovo Cimento3 (1970) 149.
[62] C. E. Aalseth et al., Phys. Rev. C59 (1999) 2108.
[63] M. Gunther et al, Phys. Rev. D55 (1997) 54.
[64] C. E. Aalseth et al., Phys. At. Nucl.63 (2000) 1225 and 1268.
[65] D. Gonzalez et al., Nucl. Phys. B (Proc. suppl.)87 (2000) 278.
[66] C. E. Aalseth et al., Phys. Rev. D65 (2002) 092007.
[67] H. V. Klapdor-Kleingrothaus et al., Eur. Phys. J. A12 (2001) 147.
[68] H. V. Klapdor-Kleingrothaus et al, Mod. Phys. Lett. A16 (2001) 2409.
[69] H. V. Klapdor-Kleingrothaus, A. Dietz and I. V. Krivosheina, Found. of Phys.32 (2002) 1181.
[70] H. V. Klapdor-Kleingrothaus, Nucl. Instr. and Meth. A510(2003) 281.
[71] H. V. Klapdor-Kleingrothaus, Nucl. Instr. and Meth. A511(2003) 335.
[72] C. E. Aalseth et al, Mod. Phys. Lett. A17 (2002) 1475.
[73] Yu. G. Zdesenko, F. A. Danevich and V. I. Tretyak, Phys. Lett. B546(2002) 206.
[74] A. M. Bakalyarov et al., Proc. of NANP2003, Dubna, Russia, 24 June 2003.
[75] H.V. Klapdor-Kleingrothaus, A. Dietz, I. Krivosheina and O. Chkvorets, Phys. Lett. B 586 (2004)198
[76] F. Piquemal, Nucl. Phys. B (Proc. Suppl.)77 (1999) 352.
[77] X. Sarazin et al., the NEMO Collaboration, arXiv:hep-ex/0006031.
[78] D. Lalanne et al., the NEMO Collaboration, Talk given at the XXth Int. Conf. on Neutrino Phys.and Astroph.(NEUTRINO02), Munich, Germany, 25 - 30 May 2002.
[79] V. Vasiliev et al., the NEMO Collaboration, Talk given at the 1st Yamada symposium (NDM03),Nara, Japan, 9-14 June 2003.
[80] H. Ejiri, Nucl. Phys. B (Proc. Suppl.)77 (1999) 346.
[81] J. Vuilleumier et al., Phys. Rev. D48 (1993) 1009.
[82] J. Farine, Proc. Neutrino 96, Helsinki, June 1996. Ed. K. Enqvist et al., World Scientific, p.347.
[83] V. Artemiev et al., Phys. Lett. B345(1995) 564.

REFERENCES 152
[84] P. G. Bizzeti et al., Nucl. Phys. B (Proc. Suppl.)110(2002) 389.
[85] G. Bellini et al., Eur. Phys. J. C19 (2001) 43.
[86] M. Danilov et al., Phys. Lett. B480(2000) 12.
[87] H. V. Klapdor-Kleingrothaus, J. Hellmig and M. Hirsch, J. Phys. G24 (1998) 483.
[88] H. V. Klapdor-Kleingrothaus et al., Int. J. Mod. Phys. A13 (1998) 3953 and arXiv:hep-ph/9910205.
[89] H. V. Klapdor-Kleingrothaus et al., Nucl. Instr. and Meth. A481(2002) 149.
[90] H. V. Klapdor-Kleingrothaus, Nucl. Instr. and Meth. A511(2003) 341.
[91] H. Ejiri et al., Phys. Rev. Lett.85 (2000) 2917.
[92] N.E. Booth, B. Cabrera and E. Fiorini, Ann. Rev. Nucl. Part. Sci. 46 (1996) 471; K. Pretzl, Nucl.Intrum. And Meth. A 454 (2000) 114; E. Fiorini, Nucl. Phys. B Proc. Suppl. 91 (2001) 262; D.Twerenbold, Rep. Prog. Phys. 59 (1996) 349
[93] E. Fiorini and T. Niinikoski, Nucl. Instrum. and Meth. 224 (1984) 83
[94] Proc. of the Ninth International Workshop on Low Temperature Detectors, Ed. by F. Scott Porter,D. McCammon, M. Galeazzi and C.K. Stahle, Madison (Wisconsin) 22-27 July 2001. Amer. Inst. ofPhys. Vol. 605 (2002)
[95] A. Morales, Nucl. Phys. B Proc. Suppl. 87 (2000) 477 [astro-ph/9912554] and Review Talk givenat TAUP 2001, Sept. 2001, LNGS, [astro-ph/0112550], Nucl. Phys. B Proc. Suppl. 110 (2002) 39.
[96] E. Fiorini, Phys. Rept. 307 (1998) 309.
[97] C. Arnaboldi et al., Astroparticle Physics 20 (2003) 91-110
[98] S. Pirro et al., Nucl. Instrum. Meth. A 444 (2000) 71.
[99] A. Giuliani et al., Nucl. Phys. B Proc. Suppl. 110 (2002) 64.
[100] N. A. Bahcall, J. P. Ostriker, S. Perlmutter, P J. Steinhardt, Science 284 (99) 1481.
[101] G. Jungman, M. Kamionkowski and K. Griest, Phys. Rept. 267 (1996) 195 [hep-ph/9506380].
[102] J. Ellis, K. Ferstl and K. A. Olive, Phys. Rev. D 63 (2001) 065016, [hep-ph/0007113].
[103] A. Bottino, F. Donato, N. Fornengo and S. Scopel, Phys. Rev. D 63 (2001) 125003 [hep-ph/0010203].
[104] L.Bergstrom, Rept. Prog. Phys. 63 (2000) 793, [hep-ph/0002126].
[105] A. K. Drukier, K. Freese and D. N. Spergel, Phys. Rev. D 33 (1986) 3495.
[106] M.L. Sarsa et al., Phys. Lett. B386 (1996) 458.
[107] D. Abriola et al., Astrop. Phys. 10 (1999) 133.
[108] P. Belli et al., Nuovo Cim. C19 (1996) 537.
[109] R. Bernabei et al. [DAMA Collaboration], Phys. Lett. B 480 (2000) 23; R. Bernabei et al. [DAMACollaboration], Phys. Lett. B 450 (1999) 448; R. Bernabei et al., Phys. Lett. B 424 (1998) 195.

REFERENCES 153
[110] R. Bernabei et al. [DAMA Collaboration], Riv. N. Cim. 26 n.1 (2003) 1.
[111] R. Abusaidi et al. [CDMS Collaboration], Phys. Rev. Lett. 84 (2000) 5699 [astro-ph/0002471]; D.Abrams et al. [CDMS Collaboration], [astro-ph/0203500].
[112] A. Benoit et al. [EDELWEISS Collaboration], Phys. Lett. B513 (2001) 15 [astro-ph/0106094]. G.Gerbier, talk given at Neutrino 2002, Munich 30 May 2002.
[113] A. Morales et al. [IGEX Collaboration], Phys. Lett. B 489 (2000) 268 [hep-ex/0002053];A. Morales et al. [IGEX Collaboration], Phys. Lett. B 532 (2002) 8 [hep-ex/0110061].
[114] N. J. T. Smith, for the UKDM Collaboration. Talk at the 4th Workshop on the Identification ofDark Matter (IDM2002), York, September 2002.
[115] D.S. Akerib et al., Phys. Rev. Lett. 93 (2004) 211301.
[116] S. Cebrian et al., Astropart. Phys. 14 (2001) 339 [hep-ph/9912394].
[117] F. Donato, N. Fornengo and S. Scopel, Astropart. Phys. 9 (1998) 247 [hep-ph/9803295];M. Kamionkowski and A. Kinkhabwala, Phys. Rev. D 57 (1998) 3256 [hep-ph/9710337]; J. D. Ver-gados, Phys. Rev. Lett. 83 (1999) 3597; J. D. Vergados, Phys. Rev. D62 (2000) 023519 [astro-ph/0001190]; P. Ullio and M. Kamionkowski, JHEP 0103 (2001) 049 [hep-ph/0006183]; A. M. Green,Phys.Rev. D63 (2001) 043005 [astro-ph/0008318]; C. J. Copi, J. Heo and L. M. Krauss, Phys.Lett.B461 (1999) 43; P. Belli et al., [hep-ph/0203242].
[118] M. Brhlik and L. Roszkowski, Phys. Lett. B464 (1999); P. Belli et al., Phys. Rev. D61 (2000)023512 [hep-ph/9903501]; A. Bottino, F. Donato, N. Fornengo and S. Scopel, Phys. Rev. D62 (2000)056006 [hep-ph/0001309].
[119] J. Engel, Phys. Lett. B264 (1991) 114
[120] Y. Ramachers, M. Hirsch and H. V. Klapdor-Kleingrothaus, Eur. Phys. J. A 3 (1998) 93.
[121] F. Hasenbalg, Astropart. Phys. 9 (1998) 339 [astro-ph/9806198].
[122] R.D. Peccei and H.R. Quinn, Phys. Rev. Lett. 38 (1977) 1440.
[123] K. van Bibber, P. M. McIntyre, D. E. Morris and G. G. Raffelt, Phys. Rev. D 39 (1989) 2089.
[124] R.J. Creswick et al., Phys. Lett. B427 (1998) 235 [hep-ph/9708210].
[125] E. Masso and R. Toldra, Phys. Rev. D 52 (1995) 1755 [hep-ph/9503293].
[126] E. A. Paschos and K. Zioutas, Phys. Lett. B323 (1994) 367.
[127] F. T. Avignone et al.,Phys. Rev. Lett. 81 (1998) 5068 [astro-ph/9708008].
[128] I. G. Irastorza et al.,Nucl. Phys. Proc. Suppl. 87 (2000) 102 [astro-ph/9912491]; A. Morales et al.,Astropart. Phys. 16 (2002) 325 [hep-ex/0101037]
[129] R. Bernabei et al., Phys. Lett. B 515 (2001) 6-12
[130] F. T. Avignone III et al., Nucl. Phys. B (Proc. Suppl.) 72 (1999) 176; S. Cebrian et al., Astropart.Phys. 10 (1999) 397 [astro-ph/9811359].
[131] Y. Inoue et al., [astro-ph/0204338].

REFERENCES 154
[132] G. Raffelt, Nucl. Phys. Proc. Suppl. 77 (1999) 459 [hep-ph/9806506]; P. Sikivie, Nucl. Phys. Proc.Suppl. 87 (2000) 41
[133] H. Schlattl, A. Weiss and G. Raffelt, Astropart. Phys. 10 (1999) 353 [hep-ph/9807476].
[134] M. D. Ewbank, P. R. Newman, E. Ehrenfreund and W. A. Harrison, J. Phys. Chem. Solids 44(1983) 1157.
[135] K. Zioutas et al., Nucl. Instrum. Meth. A 425 (1999) 482 [astro-ph/9801176].
[136] H.O. Back et al , Phys.Lett.B 525 (2002) 29 and references therein
[137] V.I. Tretyak and and Yu.g.Zdesenko, Phys.Lett .B 505 (2001) 59
[138] R.N.Mohapatra and A.Perez-Lorenzana, Phys. Rev. D67 (2003)075015
[139] A. Alessandrello et al, Nucl.Phys. B (Proc.Suppl.) 35 (1994)
[140] F.A. Danevich et al., Phys. At. Nucl. 59 (1996) 1.
[141] A.Alessandrello et al, Phys.Rev. C 67 (2003) 014323
[142] O.Civitarese and J. Suhonen, Phys.Rev. C 64 (2001) 064312
[143] P. de Marcillac et al, [Nature 422 (2003) 876
[144] F.A. Danevich et al., Phys. Rev. C 67 (2003) 014310.
[145] C.Cozzini et al., nucl-ex/0408006.
[146] S.H. Moseley, J.C. Mather and D. McCammon, J. Appl. Phys. 56 (1994) 1257
[147] D. McCammon et al., Nucl. Instr. and Meth. 326 (1993) 157; M.E. Misal et al., Phys. Rev. Lett.70 (1993) 3463; J.A. Shields et al., Phys. Rev.B 47(1992) 12510; S. Tamura, Phys. Rev. B 31 (1985)2574;
[148] M. Mott, Can. J. Phys. 34 (1956) 1356
[149] E. Haller, J. Appl. Phys. 77 (1995) 2857
[150] A. Miller and E. Abrahams, Phys. Rev. 120 (1961) 761
[151] A. Alessandrello et al., Nucl. Instr. and Meth. A 412 (1998) 454
[152] S. Baker and P.D. Cousins., Nucl. Instrum. and Meth. 221 (1984) 437
[153] C. Arnaboldi et al., Phys.Lett. B 584 (2004) 260.
[154] G.J. Feldman and R.D. Cousins, Phys. Rev. D57 (1998) 3873
[155] D.E. Groom et al., Eur. Phys. J C ,15 (2000) 1
[156] R.M. Barnett et al. (PDG), Phys. Rev. D54 (1996) 1
[157] C. Arnaboldi et al., to be submitted to Phys. Lett. B
[158] Bernatowicz et al., Phys. Rev. C 47 (2003) 1993H.V.
[159] Klapdor-Kleingrothaus et al., Nucl.Instrum.and Meth. ,522 (2004) 367.

REFERENCES 155
[160] E.E. Haller et al., Proc. Fourth Int. Conf. on Neutron Transmutation Doping of SemiconductorMaterials, Nat. Bureau of Standards, June 1,2 1982, Gaithersburg MD, R. D. Larrabee ed., (PlenumPress 1984) p 21.
[161] E. Norman and R. J. McDonald - Presentation made to the CUORE collaboration, Milan Italy, 11December 2000 (Private communication).
[162] A. Alessandrello et al., Nucl. Phys. Russ. Academy of Sci, arXiv: hep-ex/0201038
[163] A. Alessandrello et al., Nucl. Phys. B (Proc. Suppl) 87, 78 (2000).
[164] M. Barucci et al., J. Low Temp. Phys.,123(2001) 303
[165] G. K. White, S. J. Collocott, and J. G. Collins, J. Phys. of Condensed Matter 2, 7715 (1990).
[166] A. Giuliani and S. Sanguinetti, Mat. Sci. and Eng. R 11, 52 (1993).
[167] N. F. Mott. Phil. Mag. 19, 835 (1969).
[168] B. I. Shklovskii and A. L. Efros, Sov. Phys. - JETP 33, 468 (1971).
[169] A. Alessandrello et al., J. Phys. D: Appl. Phys. 32s, 3099 (1999).
[170] A. Alessandrello et al., Phys. Lett. B 486, 13 (2000); C.Arnaboldi et al., Phys. Lett. B 557 (2003)167.
[171] F. Pobell, "Matter and Methods at Low Temperatures", Springer - Verlag, Berlin, 1992.
[172] A. Alessandrello et al., Proc. 7 Int. Workshop on Low Temperature Detectors (LTD7),Munich,Germany 27 July - 2 August 1997, ed. S. Cooper, Springei Veilag (1997) p 249.
[173] A. Alessandrello et al, Proc.of the Int.Workshop on Therm. Detectors, ed.by N.Booth and G.I.Simon , Ed.Frontiers 1992, p.91
[174] A. Alessandrello et al., Nucl. Insti. and Meth. B 142 (1998) 163.
[175] C.Arnaboldi et al., IEEE Transactioon Nuclear Science 49 (2002) 2440-2447.
[176] C.Arnaboldi et al., IEEE Transactioon Nuclear Science 49 (2002) 1808-1813.
[177] A.Alessandrello et al., Cryogenics 37 (1997) 27-31.
[178] J.C.Mather, Applied Optics 21 (1982) 1125-1129; R.C.Jones, J. Opt. Soc. Am. 43 (1953) 1-14
[179] A. Fascilla and G. Pessina, Nucl. Instrum. Meth. A 469 (2001) 116-126
[180] C.Arnaboldi, S.Pirro and G.Pessina "The cold electronics of CUORICINO", To be submitted toCryogenics.
[181] C.Liguori and G.Pessina, Nucl. Instrum. Meth. A 437 (1999) 557-559
[182] C.Arnaboldi and G.Pessina, "A Very Simple Baseline Restorer for Nuclear Applications", acceptedfor publication on NIMA A.
[183] C.Arnaboldi, G.Pessina and E.Previtali, IEEE Transaction on Nuclear Science 50 (2003) 979-986.
[184] G.Pessina, The Review of Scientific Instruments 70 (1999) 3473-3478.

REFERENCES 156
[185] SKUDOTECH is a Registered trademark by SELITE, Via Aurelio Saffi 29, 20123 Milano, IT.
[186] SICCAS private communication.
[187] G. Heusser private communication.
[188] Borexino collaboration, Nucl. Instr. and Meth. in Phys. Res. A 406 (1998), 411.
[189] A. Alessandrello et al, Nucl. Instr. and Meth. in Phys. Res. B 83 (1993), 539-544.
[190] E. Norman - Presentation made to the CUORE collaboration, Milan Italy, 2 October 2003 (Privatecommunication).
[191] E.Gatti and P.F.Manfredi, Rivista Nuovo Cimento 9 (1986) 1.
[192] W.H. Press, B.P. Flannery, S.A. Teukosky and W.T. Vetterling,Numerical Recipes in C , The Artof Scientific Computing- Cambridge University Press 1991
[193] J.Amare et al., "Cosmogenic activation of materials", Proc. of the LRT04, Canada - December2004.
[194] R.Silberberg and C.H.Tsao, Astrophys. J.501(1998) 911.
[195] G.Heusser, private communication.
[196] M.Laubenstein, private communication.
[197] Admatechs Co. Ltd., Japan.
[198] V.Palmieri et al., "Electropolishing of seamless 1.5 GHZ OFHC copper cavities", Proc. of the7th
workshop on RF Superconductivity, Gif Sur Yvette, France 1995, B. Bonin ed., DIST CEA/SACLAY96 080/1,2, 605; V.Palmieri et al., "Besides the standard Niobium bath chemical polishing", Proceed-ings of the10th workshop on RF Superconductivity, Sept. 6-11 2001, Tsukuba, Japan, (2002) in press
[199] P.Trincherini, private communication.
[200] The evaluation of cosmogenic activation is obtained with a code based on the measured cosmicray flux and on the interaction cross sections contained in: R. Silberberg and R. Tsao, Astrophys. J.Suppl. Ser.220(1973) 315
[201] A. Alessandrello et al., J. Phys. D32 (2000) 3099.
[202] A.Alessandrello et al., Physics Letters B 420 (1998) 109
[203] P. Marcillac, Proc of LTD 10, Intern. Workshop on Low temp.Detectors, Genoa (Italy) July 2003
[204] D.A.Dolgolenko, N. M. Gorshunov, A. I. Karchevsky et al., J. of Techn. Phys. XLI (2000) 573
[205] T. Shutt et al., NIM A (1993) 326
[206] C. Bobin et al , NIM A 386 (1997) 453 - 457
[207] P. de Marcillac, presented at the 10th International Workshop on Low Temperature Detectors,Genoa Italy 7-11 July 2003
[208] T. Lukasiewicz and A. Majchrowski, Journal of Crystal Growth 116 (1992), 364-366