
Crystal structure and characterization of a novel acentric imidazolium analog
10
Crystal structure and characterization of a novel ferroelastic ionic crystal: 1-Aminopyridinium iodide (C 5 H 7 N 2 ) + I M. Owczarek a , R. Jakubas a,⇑ , V. Kinzhybalo b , W. Medycki c , D. Kruk d , A. Pietraszko b , M. Gała ßzka e , P. Zielin ´ ski e,f a Faculty of Chemistry, University of Wrocław, F. Joliot-Curie 14, 50–383 Wrocław, Poland b Institute of Low Temperature and Structural Research, PAS, Okólna 2, 50–422 Wrocław, Poland c Institute of Molecular Physics, PAS, Smoluchowskiego 17, 60–179 Poznan ´, Poland d Faculty of Mathematics and Computer Science, University of Warmia and Mazury Olsztyn, 10-710 Olsztyn, Poland e The H. Niewodniczan ´ski Institute of Nuclear Physics, Polish Academy of Sciences, Radzikowskiego 152, 31-342 Kraków, Poland f Cracow University of Technology, Institute of Physics, Podchora ß _ zych 1, 30-084 Kraków, Poland article info Article history: Received 1 June 2011 In final form 28 March 2012 Available online 5 April 2012 abstract 1-Aminopyridinium iodide (API) undergoes a reversible first-order phase transition (PT) II ? I at 384 K. The single-crystal X-ray diffraction studies have been carried out at 110, 280 and 401 K. The compound crystallizes in the monoclinic space group P2 1 /c (phase II) and exhibits ferroelastic properties. High tem- perature paraelastic phase (I) is described by the trigonal symmetry (space group R 3m) with the 6-site cations disorder. The mechanism of PT is governed by both cationic dynamics and shifts of the I anions. The conductivity that emerges when approaching the PT temperature is believed to be associated with the charge transfer from I anion to the 1-aminopyridinium cation. Ó 2012 Elsevier B.V. All rights reserved. 1. Introduction Pyridine and its derivatives play an important role in heterocy- clic chemistry [1,2]. The coordination chemistry of heterocyclic amines is a fast-growing area of supramolecular chemistry. Pyridine and its substituted derivatives are often involved in hydrogen-bond interactions [3,4]. In the past decades assessment of discrete hydrogen bonding patterns had received great attention [5,6] because of its widespread occurrence in biological systems. In particular, 1-aminopyridinium iodide plays an important role as a reagent for organic synthesis and it is known as a pharmaceutically important agent [7]. Quite recently, it was reported that 1-amino- pyridinium iodide was applied for chemical modifications of anti- biotic oligomycin A [8]. The title compound was found to be usually used in homogeneous transition metal-catalyzed reactions [9]. 1-Aminopyridine has not been recognized yet from the point of view of synthesis of new hybrid organic–inorganic compounds. There are only two known examples of compounds within this class of materials: structurally characterized (C 5 H 7 N 2 )[PbI 3 ] and [N–NH 2 Py][Ni(mnt) 2 ] (where mnt – maleonitriledithiolate) for which the crystal structure and magnetic properties were evalu- ated [10,11]. 1-Aminopyridinium cation ((C 5 H 7 N 2 ) + ; abbrev. AP) was found to be used in the synthesis as a solid ionic complex (C 5 H 7 N 2 ) + I (abbrev. API). The structural and physical properties of this mate- rial have not been available so far. In this Letter, we report the single-crystal X-ray diffraction studies of API at three tempera- tures, 110, 280 and 401 K. Thermal, dielectric, luminescence prop- erties and molecular dynamics of this compound studied by proton magnetic resonance ( 1 H NMR) are presented and discussed. 2. Experimental Commercial powder of 1-aminopyridinium iodide (TCI Europe, 98%) was twice recrystallized from the dimethylformamide (DMF). Transparent small single crystals of API suitable for both X-ray diffraction and dielectric studies were grown from saturated solution of DMF by slow evaporation at room temperature. DSC heating curves were obtained using Perkin Elmer 8500 dif- ferential scanning calorimeter calibrated using n-heptane and indium. Hermetically sealed Al pans with the polycrystalline mate- rial were prepared in a controlled-atmosphere N 2 glovebox. The measurements were performed between 110 and 400 K. The ther- mal hysteresis was estimated from the scans performed at various rates (20, 10 and 5 K/min) extrapolated to the scanning rate of 0 K/ min. Simultaneous thermogravimetric analysis (TGA) and differen- tial thermal analysis (DTA) were performed on Setaram SETSYS 16/18 instrument in the temperature range 300–600 K with a ramp 0009-2614/$ - see front matter Ó 2012 Elsevier B.V. All rights reserved. http://dx.doi.org/10.1016/j.cplett.2012.03.101 ⇑ Corresponding author. Fax: +48 713282348. E-mail addresses: [email protected], [email protected] (R. Jakubas). Chemical Physics Letters 537 (2012) 38–47 Contents lists available at SciVerse ScienceDirect Chemical Physics Letters journal homepage: www.elsevier.com/locate/cplett
Transcript of Crystal structure and characterization of a novel acentric imidazolium analog
Chemical Physics Letters 537 (2012) 38–47
Contents lists available at SciVerse ScienceDirect
Chemical Physics Letters
journal homepage: www.elsevier .com/locate /cplet t
Crystal structure and characterization of a novel ferroelastic ionic crystal:1-Aminopyridinium iodide (C5H7N2)+I�
M. Owczarek a, R. Jakubas a,⇑, V. Kinzhybalo b, W. Medycki c, D. Kruk d, A. Pietraszko b, M. Gała�zka e,P. Zielinski e,f
a Faculty of Chemistry, University of Wrocław, F. Joliot-Curie 14, 50–383 Wrocław, Polandb Institute of Low Temperature and Structural Research, PAS, Okólna 2, 50–422 Wrocław, Polandc Institute of Molecular Physics, PAS, Smoluchowskiego 17, 60–179 Poznan, Polandd Faculty of Mathematics and Computer Science, University of Warmia and Mazury Olsztyn, 10-710 Olsztyn, Polande The H. Niewodniczanski Institute of Nuclear Physics, Polish Academy of Sciences, Radzikowskiego 152, 31-342 Kraków, Polandf Cracow University of Technology, Institute of Physics, Podchora� _zych 1, 30-084 Kraków, Poland
a r t i c l e i n f o a b s t r a c t
Article history:Received 1 June 2011In final form 28 March 2012Available online 5 April 2012
0009-2614/$ - see front matter � 2012 Elsevier B.V. Ahttp://dx.doi.org/10.1016/j.cplett.2012.03.101
⇑ Corresponding author. Fax: +48 713282348.E-mail addresses: [email protected].
1-Aminopyridinium iodide (API) undergoes a reversible first-order phase transition (PT) II ? I at 384 K.The single-crystal X-ray diffraction studies have been carried out at 110, 280 and 401 K. The compoundcrystallizes in the monoclinic space group P21/c (phase II) and exhibits ferroelastic properties. High tem-perature paraelastic phase (I) is described by the trigonal symmetry (space group R�3m) with the 6-sitecations disorder. The mechanism of PT is governed by both cationic dynamics and shifts of the I� anions.The conductivity that emerges when approaching the PT temperature is believed to be associated withthe charge transfer from I� anion to the 1-aminopyridinium cation.
� 2012 Elsevier B.V. All rights reserved.
1. Introduction
Pyridine and its derivatives play an important role in heterocy-clic chemistry [1,2]. The coordination chemistry of heterocyclicamines is a fast-growing area of supramolecular chemistry.Pyridine and its substituted derivatives are often involved inhydrogen-bond interactions [3,4]. In the past decades assessmentof discrete hydrogen bonding patterns had received great attention[5,6] because of its widespread occurrence in biological systems. Inparticular, 1-aminopyridinium iodide plays an important role as areagent for organic synthesis and it is known as a pharmaceuticallyimportant agent [7]. Quite recently, it was reported that 1-amino-pyridinium iodide was applied for chemical modifications of anti-biotic oligomycin A [8]. The title compound was found to beusually used in homogeneous transition metal-catalyzed reactions[9].
1-Aminopyridine has not been recognized yet from the point ofview of synthesis of new hybrid organic–inorganic compounds.There are only two known examples of compounds within thisclass of materials: structurally characterized (C5H7N2)[PbI3] and[N–NH2Py][Ni(mnt)2] (where mnt – maleonitriledithiolate) forwhich the crystal structure and magnetic properties were evalu-ated [10,11].
ll rights reserved.
pl, [email protected] (R. Jakubas).
1-Aminopyridinium cation ((C5H7N2)+; abbrev. AP) was found tobe used in the synthesis as a solid ionic complex (C5H7N2)+I�
(abbrev. API). The structural and physical properties of this mate-rial have not been available so far. In this Letter, we report thesingle-crystal X-ray diffraction studies of API at three tempera-tures, 110, 280 and 401 K. Thermal, dielectric, luminescence prop-erties and molecular dynamics of this compound studied by protonmagnetic resonance (1H NMR) are presented and discussed.
2. Experimental
Commercial powder of 1-aminopyridinium iodide (TCI Europe,98%) was twice recrystallized from the dimethylformamide(DMF). Transparent small single crystals of API suitable for bothX-ray diffraction and dielectric studies were grown from saturatedsolution of DMF by slow evaporation at room temperature.
DSC heating curves were obtained using Perkin Elmer 8500 dif-ferential scanning calorimeter calibrated using n-heptane andindium. Hermetically sealed Al pans with the polycrystalline mate-rial were prepared in a controlled-atmosphere N2 glovebox. Themeasurements were performed between 110 and 400 K. The ther-mal hysteresis was estimated from the scans performed at variousrates (20, 10 and 5 K/min) extrapolated to the scanning rate of 0 K/min.
Simultaneous thermogravimetric analysis (TGA) and differen-tial thermal analysis (DTA) were performed on Setaram SETSYS16/18 instrument in the temperature range 300–600 K with a ramp
M. Owczarek et al. / Chemical Physics Letters 537 (2012) 38–47 39
rate of 2 K/min. The scans were performed in flowing nitrogen(flow rate: 1 dm3/h).
Dilatometric measurements were performed using Perkin ElmerTMA-7 thermomechanical analyzer in the temperature range 290–400 K with the scanning rate of 5 K/min.
The complex electric permittivity e⁄ = e0 � ie00 was measuredbetween 100 and 400 K by Agilent 4284A Precision LCR Meter atfrequencies in the range between 2 kHz and 2 MHz. The dimen-sions of the crystals were of the order of 3 � 2 � 1 mm3. Silvergraphite electrodes were painted onto opposite large faces. Theoverall errors of the real and imaginary parts of the complex elec-tric permittivity were less than 5% and 10%, respectively.
T1 relaxation times (1H NMR) were measured with ELLAB TEL–Atomic PS 15 spectrometer working at the frequency of 25 MHz.The temperature of the sample was automatically stabilized byUNIPAN 650 temperature controller operating on Pt–100 sensor.The spin–lattice relaxation times were determined using satura-tion recovery technique. The powdered sample for 1H NMR studywas degassed and sealed under vacuum in a glass ampoule.
X-ray diffraction data at 110 and 280 K (phase II) were collectedon an automatic X-ray four-circle KUMA KM4CCD diffractometerwith the use of an Oxford Cryosystem cooler. Graphite monochro-mated Mo-Ka radiation with x-scans were used to collect intensi-ties of the reflections. The lattice parameters were calculated fromthe positions of all the reflections. Data collection and reductionwere made using CrysAlis CCD and CrysAlis RED [12]. The crystalstructures were solved by the direct methods (SHELXS program)[13]. The C–bound H atoms were refined using a riding model, withfixed C–H distances equal to 0.95 Å (at 110 K) and 0.93 Å (at 280 K),and Uiso(H) = 1.2Ueq(C). N–H distances at 280 and 110 K were con-strained to 0.90 Å and their thermal parameters were constrainedto Uiso(H) = 1.5Ueq(N).
The high temperature single-crystal studies (phase I) were car-ried out on KUMA KM4CCD diffractometer equipped with a home-made high-temperature attachment [14]. Six runs of 65 imageseach (Dx = 1.5) were recorded at 401 K. The quality of the col-lected dataset suffered considerably because of the continuouscrystal wobbling (the crystal becomes plastic above PT tempera-ture) in the stream of hot air. Data reduction with the wobblingcorrection was carried out for each run separately, the obtaineddatasets were combined together to give the final dataset of satis-factory quality. The AP cations are disordered in the HT phase. Thedisorder was modeled by a six-site equally occupied cationarrangement around the �3 axis going through the cation gravitycenter. Such disorder requires free in-plane rotation of the cation.Since pyridinium ring atoms occupy very close positions duringreorientation, all ring atoms were refined to be by 5/6 C and by1/6 N. The N atom of the amino group was refined with the occu-pation factor of 1/6. The positions of the Cring-bound H atoms wereconstrained to be equal with the amino group N atoms. N–H dis-tances at 401 K were constrained to 0.90 Å and their thermalparameters were constrained to Uiso(H) = 1.5Ueq(N).
Crystallographic data for the structure reported in this Letter(excluding structure factors) have been deposited with the Cam-bridge Crystallographic Data Centre, CCDC Nos. 823751, 823752and 851940. Copies may be obtained free of charge from the Direc-tor, CCDC, 12 UNION Road, Cambridge CB2 1EZ. UK (fax: +44 1223336033; e-mail: [email protected] or http://www.ccdc.cam.ac.uk).
Powder diffraction studies were carried out on PANalyticalX’Pert Pro diffractometer equipped with Anton Paar TCU 1000 NTemperature Control Unit. The sample was powdered and pressedinto a pellet. Powder diffraction patterns were collected in Bragg–Brentano geometry on heating from 303 to 389 K (exact tempera-tures: 303, 319, 336, 348, 360, 366, 372, 378 and 389 K).
The photoluminescence and excitation spectra were measuredon Hamamatsu Quantum Yield Measurement System equippedwith Photonic Multi-Chanel Analyzer PMA-12 and Xe 150 W lamp.
3. Results
3.1. Thermal properties
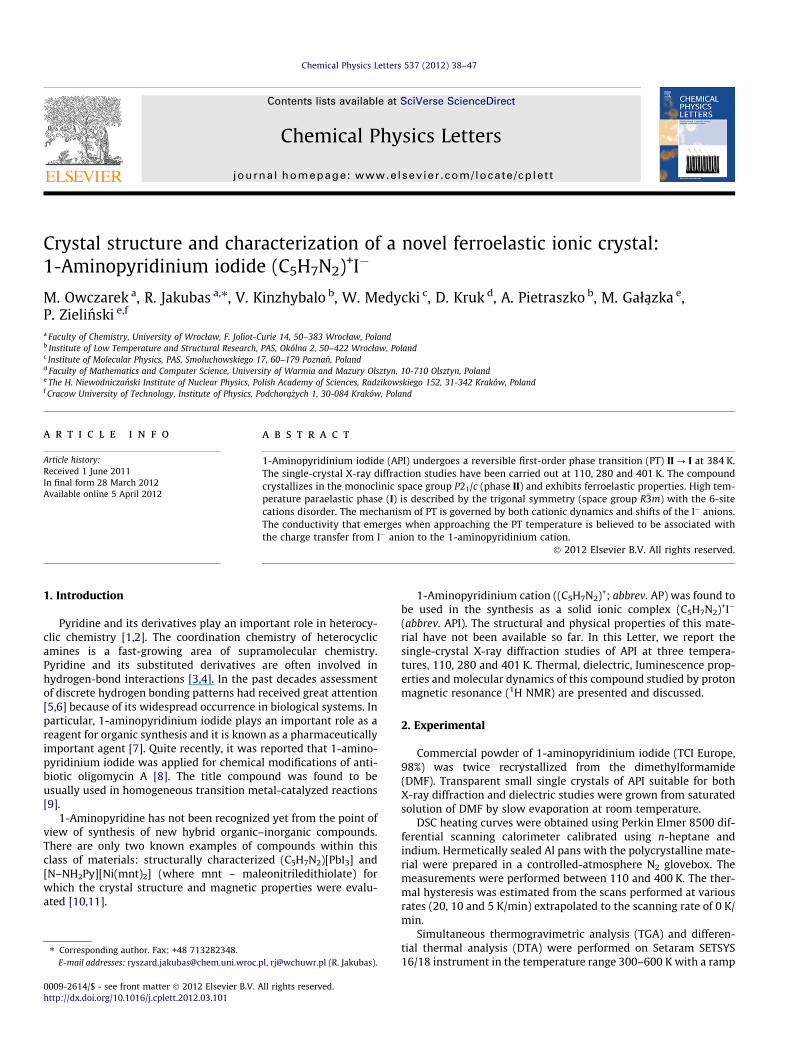
Typical DSC traces of API at the rate of 5 K/min are shown in Fig-ure 1a. A perfectly reversible phase transition (PT) at 384/383 K(heating/cooling) accompanied by significant transition entropy,jDSj = 14 J/mol K, is observed. A relatively small value of the tem-perature hysteresis (DT � 1 K) is encountered in the case of ‘weak’first-order transitions. On the other hand, the significant magni-tude of the transition entropy suggests an order–disorder mecha-nism of the high temperature PT.
Thermal stability of API was studied by means of simultaneousTGA and DTA methods between 300 and 600 K (Figure 1b). Nosteps in the TGA analysis from ambient temperature up to themelting point at about 430 K are observed; the crystal is stable inthis temperature range. The compound starts to decompose justafter melting and this process is completed at ca. 500 K. The firstendothermal peak at ca. 380 K corresponds to the structural PT de-tected in DSC, whereas the higher temperature one is due to themelting of the sample. The entropy of fusion was found to be small,about 22 ± 3 J/mol K. This value seems to fulfill the criterion set byTimmermans for plastic crystals [15].
The linear thermal expansion studies of API (see Figure 1c) werecarried out both on heating and cooling. It should be emphasizedthat these cycles are not well reversible, since after crossing thePT temperature the single crystal strongly distorts and becomesinelastic. Nevertheless, the dilatometric measurements carriedout along all the crystallographic axis confirm discontinuous char-acter of the PT. The estimated values of DV/V at 384 K (on heating)obtained from the measurements of single crystal and polycrystalsamples, prepared in the form of pellets, are comparable andamount about 9 � 10�2. The pressure coefficient dT/dP calculatedaccording to the Clapeyron formula is positive and amounts about72 � 10�2 K/MPa.
3.2. Single crystal studies
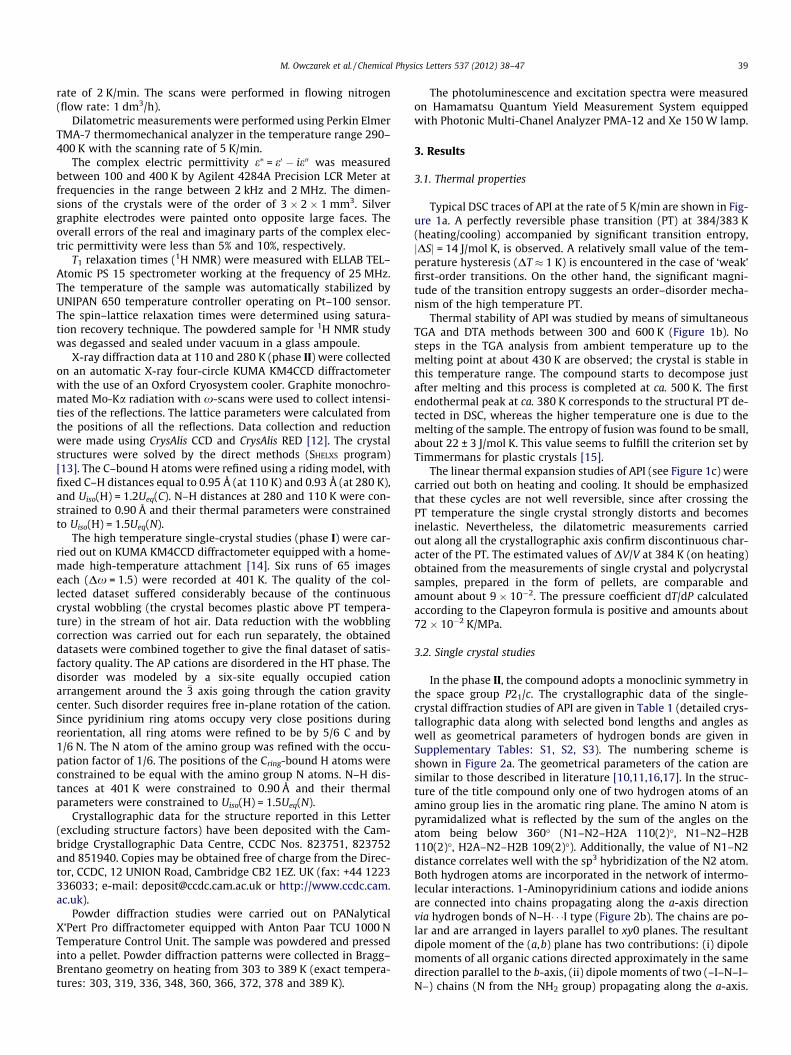
In the phase II, the compound adopts a monoclinic symmetry inthe space group P21/c. The crystallographic data of the single-crystal diffraction studies of API are given in Table 1 (detailed crys-tallographic data along with selected bond lengths and angles aswell as geometrical parameters of hydrogen bonds are given inSupplementary Tables: S1, S2, S3). The numbering scheme isshown in Figure 2a. The geometrical parameters of the cation aresimilar to those described in literature [10,11,16,17]. In the struc-ture of the title compound only one of two hydrogen atoms of anamino group lies in the aromatic ring plane. The amino N atom ispyramidalized what is reflected by the sum of the angles on theatom being below 360� (N1–N2–H2A 110(2)�, N1–N2–H2B110(2)�, H2A–N2–H2B 109(2)�). Additionally, the value of N1–N2distance correlates well with the sp3 hybridization of the N2 atom.Both hydrogen atoms are incorporated in the network of intermo-lecular interactions. 1-Aminopyridinium cations and iodide anionsare connected into chains propagating along the a-axis directionvia hydrogen bonds of N–H� � �I type (Figure 2b). The chains are po-lar and are arranged in layers parallel to xy0 planes. The resultantdipole moment of the (a,b) plane has two contributions: (i) dipolemoments of all organic cations directed approximately in the samedirection parallel to the b-axis, (ii) dipole moments of two (–I–N–I–N–) chains (N from the NH2 group) propagating along the a-axis.
(a)
(b)
(c)H
FII I
300 320 340 360 380 400 420 440
DTA
[a.u
.]
-6
-4
-2
0
300 350 400 450 500 550 600
-100
-80
-60
-40
-20
0
300
0.02
II I
a
b
c
320 340 360 380 400 420
L/L
0
Figure 1. (a) DSC curves for API crystals for heating and cooling runs (5 K/min, m = 7.610 mg). (b) Simultaneous thermogravimetric and differential thermal analyses scan(ramp rate: 2 K/min, sample mass: 10.744 mg). (c) Linear thermal expansion (along a, b, c-axis) obtained on cooling and heating runs with the scanning rate of 5 K/min.
Table 1Crystal data and structure refinement of API at 110, 280 and 401 K.
Empirical formula C5H7N2IFormula weight (g mol�1) 222.03T(K) 110(2) 280(2) 401(2)Space group P21/c P21/c R�3ma (Å) 5.939(2) 6.019(3) a = 5.829(3)b (Å) 17.388(5) 17.328(7)c (Å) 7.030(3) 7.106(4)b (�) 100.90(3) 99.89(3) a = 98.15(3)�V (Å3) 712.9(4) 730.1(6) 191.4(2)Z 4 4 1V/Z 178.2 182.5 191.4Dcalc (g cm�3) 2.069 2.020 1.926l (mm�1) 4.39 4.29 4.09Diffractometer Kuma KM4CCDRadiation type, k (Å) MoKk, 0.71073Measured reflections 4771 12568 1321Independent reflections 1729 3519 160Observed refl. (I > 2r(I)) 1623 2582 83Rint 0.012 0.0195 0.2108Data/restraints/parameters 1729/0/81 3523/2/79 160/2/13
RF2o > 2rðF2
oÞ R1 = 0.0162 R1 = 0.0237 R1 = 0.0484
wR2 = 0.0412 wR2 = 0.0556 wR2 = 0.1103R (all data) R1 = 0.0177 R1 = 0.0371 R1 = 0.0799
wR2 = 0.0419 wR2 = 0.0595 wR2 = 0.1334GooF = S 1.02 1.00 0.98Weighting parameter a/b 0.03/0.19 0.03/0.10 0.0452/0Dqmax/Dqmin (e �3) 0.33/�0.65 0.41/�0.90 0.29/�0.29
w ¼ 1= r2 F20
� �þ ðaPÞ2 þ bP
h iwhere P ¼ ðF2
0 þ 2F2c Þ=3.
40 M. Owczarek et al. / Chemical Physics Letters 537 (2012) 38–47
The resultant dipole moments of adjacent parallel (a,b) layers areoriented in opposite directions as all the components (organic cat-ions and I� anion) within corresponding layers are related to eachother by a symmetry center. Thus, one can distinguish the antipar-
allel arrangement of resultant dipoles moment of the consideredlayers. Three dimensional packing is realized by linking above-mentioned chains by intermolecular interactions of C–H� � �I type.While the C3–H3� � �I1 (�x, 0.5 + y, 0.5 � z) hydrogen bonds connectadjacent chains within the layers, the C2–H2� � �I1 (x � 1, 0.5 � y,0.5 + z) hydrogen bonds bind chains from neighboring layers (Fig-ure 2b).
In all the phases, the crystal packing of the title compoundresembles that of the CsCl structure. The closest environment ofeach 1-aminopyridinium cation can be described as a deformedcube built of eight iodine anions (see Figure 2c). The deformationof the cube is strictly connected with the orientation of the AP cat-ion located inside of the cube. The orientation of the cation in thephase II is stabilized by the hydrogen bonds of N–H� � �I and C–H� � �Itypes.
Single-crystal X-ray diffraction study of API at elevated temper-atures confirmed the presence of the structural phase transition at�384 K. The PT is accompanied with drastic decrease of the qualityof the monocrystal. Nevertheless we were able to collect theamount of data sufficient to start the HT phase structure solutionand refinement. The collected data were best indexed in a rhombo-hedral cell (see Table 1). Structure solution and refinement in theR�3m group led to the most reasonable results. The structural modelincludes disorder of the cations around �3 inversion axis. It requiresa full rotation of the cations within the pyridine plane. Thus, allhydrogen bonds have to be broken in order to release the rotationof the cation in HT phase. The displacement of the I� anions in re-spect to the room temperature phase is required to fit into newsymmetry. During the phase transition from the phase II to I thedistorted cube (Figure 2c) transforms into a rhombohedron. TheI� anions occupy the vertexes of the rhombohedral cell while the1-aminopyridinium cations disordered in six equally-occupiedpositions locate in the center of the cell (Figure 2d and e).
a
b
c
(c)
(d) (e)
I1
C4
C3
C5
C2
C6
N1N2
I1
i
(a) (b)
b
ac
a
b
c
a
b
c
a b
c
a b
c
ab
c
b
ca
ba ca b
c
Figure 2. (a) The numbering scheme of the title compound along with main intermolecular interactions at 280 K (phase II). Thermal ellipsoids are shown at 50 % probabilitylevel. Symmetry code: (i) x � 1, y, z. (b) Packing view of the structure at 280 K, (N/C)–H� � �I type interactions (broken bonds) lead to formation of three dimensional network;the bottom layer is shown in green color. (c) AP cation located in a deformed cube of eight iodine anions at 280 K (phase II) and in the center of rhombohedral cell (phase I;amino group together with pyridinium N atom are equally disordered over six sites). (d) A comparison of the packing in the phase I and II along the �3-axis and (e)perpendicularly to the �3-axis. (For interpretation of the references to color in this figure legend, the reader is referred to the web version of this article.)
M. Owczarek et al. / Chemical Physics Letters 537 (2012) 38–47 41
3.3. Powder diffraction studies
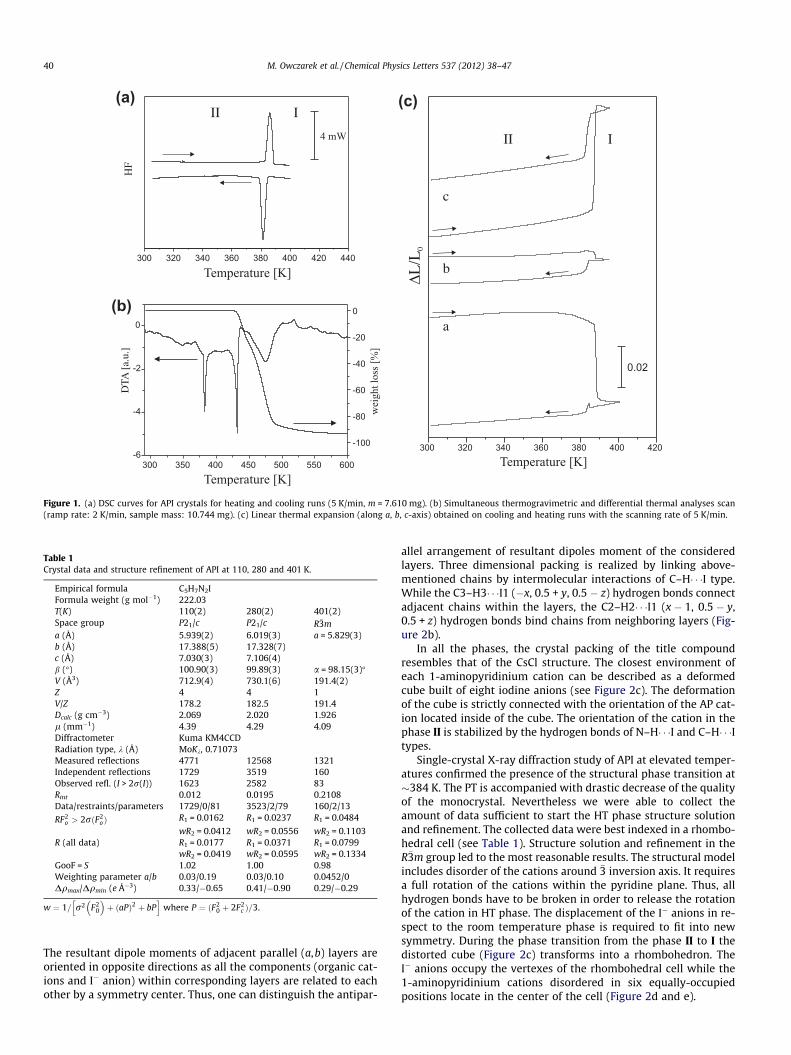
In order to characterize the structural changes of API in thevicinity of PT at 384/383 K (heating/cooling) powder diffractionstudies on heating of the API sample from room temperature upto PT were carried out. The evolution of the powder diffraction pro-files measured from 303 to 378 K is shown in Figure 3a (upperpart). The cell parameters change versus temperature plots, shownin Figure 3b, were built on the basis of the powder profiles taken onheating the sample of API from 303 to 378 K. Interestingly, two ofthe cell parameters, namely b and c, grow monotonously up to thephase transition temperature showing considerable expansion of
0.5% and 1.3% for b and c, respectively, compared to the room tem-perature values. At the same time, the temperature evolution of aand b parameters shows diffused anomaly at 353 K. While the a va-lue is monotonously growing up to 353 K and starts to decreaseabove this temperature, the value of the monoclinic angle de-creases on heating and then over 353 K starts to grow. This is con-sistent with the fact that in the close vicinity of the PT the cellparameters tend to the ones of the prototypic phase. The cells oftwo temperature phases are related by the following matrix:0,0,�1; 2,�2,0; �1,�1,0 (trigonal ? monoclinic). The transforma-tion of cell parameters of the trigonal phase (at 401 K) gives the fol-lowing values: a = 5.829 Å, b = 17.617 Å, c = 7.637 Å, b = 102.50�

300 310 320 330 340 350 360 370 3806.0126.0146.0166.0186.0206.0226.0246.0266.0286.0306.0326.0346.036
17.34
17.36
17.38
17.40
17.42
17.44
300 310 320 330 340 350 360 370 3807.14
7.16
7.18
7.20
7.22
7.24
7.26
99.65
99.70
99.75
99.80
99.85
99.90
99.95
300 310 320 330 340 350 360 370 380735738741744747750
Å ][V 3
o
(a)
(b)
Figure 3. (a) Evolution of powder diffraction profiles of API over the phase II (upper part) and of the high-temperature phase I (lower part). (b) Temperature dependencies oflattice parameters: a, b, c, b and cell volume V (inset).
42 M. Owczarek et al. / Chemical Physics Letters 537 (2012) 38–47
and V = 765.6 Å3. These are the cell parameters of the prototypicphase in the monoclinic setting. It should be emphasized that thevalue of the monoclinic angle in the prototypic phase is not equalto 90� as one could expect. A comparison of these values with thecell parameters of the phase II reflects the deformation whicharises during the I ? II phase transition.
The cell parameters dependence on temperature allows us tofollow the structural changes of API crystal on approaching thePT temperature. The smallest change of the magnitude of the a cellparameter is consistent with the fact that the strongest intermolec-ular interactions in the crystal (N–H� � �I hydrogen bonds) lead toformation of chains along this direction. The interactions of aC–H� � �I type connect the chains in directions of b and c cell param-eters, which grow considerably with temperature. The weakeningand consequent breakdown of C–H� � �I type intermolecular interac-tions can lead to the onset of the cation motion (e.g. the wide-angle
libration). The consequent breaking of N–H� � �I hydrogen bondsleads to a free rotation of the cations within the pyridine plane.The X-ray powder diffraction pattern calculated from the modelobtained by the single-crystal refinement fits the experimentalone measured at 389 K and is shown in Figure 3a (lower part).
3.4. Optical observations
Polarized light microscopy photographs have been taken of anumber of samples in the phase II at 290 K. Most of the domainpatterns show planar domain walls with well defined preferentialorientations. This suggests that one deals here with orientationaldomain states with coherent boundaries [18,19]. The most naturalorigin of the domain structure is the symmetry reduction involvedin the PT at 384 K.

M. Owczarek et al. / Chemical Physics Letters 537 (2012) 38–47 43
3.4.1. Orientational domain states implied by the group-subgrouprelation R�3m ? P21/c
The PT at 384 K of the API crystal involves a fourfold multiplica-tion of the unit cell. One should, thus, expect a system of antiphasedomains usually not distinguishable in the polarized light observa-tions. The correspondence of the basic vectors am, bm, and cm of themonoclinic phase with those ar, br, and cr of the trigonal one re-ferred to the rhombohedral crystallographic system is thefollowing:
am ¼ ar
bm ¼ 2ðbr � crÞcm ¼ br þ cr
ð1Þ
A simultaneous reduction of the macroscopic point symmetryfrom the point group �3m to the one 2/m places this PT into the classof improper ferroelastic. Since the index of the point group 2/m as asubgroup of the one �3m is 3, there are three possible ferroelasticdomains which differ from one another by a spontaneous strain.The matrix of the ‘absolute’ spontaneous strain in the domain S1
corresponding to the basic vectors reported in Eq. (1) with thecrystallographic data obtained at 401 and 280 K reads
ea ¼�0:02395 0 0:05643
0 �0:01656 00:05643 0 �0:0070
264
375 ð2Þ
The orthonormal reference system related to the domain S1 isset so that the axis y is parallel to the crystallographic direction(010) i.e. to the basic vector bm, the axis z is parallel to the crystal-lographic direction (101) i.e. to the lost triple axis, and the axis x isperpendicular to both and forms with them a right-handed system.Subtracting the part of the strain that is identical in all the threedomains one obtains the symmetry breaking strain
e ¼�a 0 c
0 a 00 0 0
264
375 ð3Þ
where a = �0.00369 and c = 0.05643, which has the same form as theone from Ref. [18] (also see International Tables for Crystallography[20]). The spontaneous strains in the remaining domains S2 and S3
can be deduced from that Eq. (3) by a 120� and 240� active rotationsabout the z axis, respectively, as has been done in Ref. [18] (mindhowever the different correspondence of the lattice vectors). Thethree W type domain walls Wij, i,j, = 1, 2, 3 coincide with the mirrorplanes, which transform the corresponding domains mutually intoone another. The orientations of these domain walls are independentof the spontaneous strain. They are given below by the normals tothe walls written in the orthonormal system described
n12 ¼ ðffiffiffi3p
=2;�1=2;0Þn23 ¼ ð0;1;0Þn31 ¼ ð�
ffiffiffi3p
=2;�1=2;0Þð4Þ
The orientations of the W0 type domain walls depend of thecomponents of the spontaneous strain. The wall planes containthe twofold axes which transform the corresponding domainsmutually into one another. The normals n0ij to the planes of thesedomain walls are given below without regarding the misorienta-tions necessary to ensure continuity of the medium.
n012 ¼ ð�a=2;�ffiffiffi3p
a=2; cÞn023 ¼ ða;0; cÞn031 ¼ ð�a=2;
ffiffiffi3p
a=2; cÞð5Þ
To find the normals of the domain walls in the real deformedsystem we have examined the effect of the finite strain onto the
W and W0 domain walls found. For each domain pair (SiSj) we havefound the shear strain transforming the domain Si into Sj and as-sumed that the related deformation leaves the common triple axisinvariant. Thus, e.g., the displacement field transforming the do-main S2 into S3 is:
u23 ¼0 �
ffiffiffi3p
a 0�
ffiffiffi3p
a 0 00 �2
ffiffiffi3p
c 0
264
375
x
y
z
0B@
1CA ð6Þ
The normal m023 to the domain wall W 023 then is found by the
equation:
m0T23 ¼ n0T23
1 �ffiffiffi3p
a 0�
ffiffiffi3p
a 1 00 �2
ffiffiffi3p
c 1
264
375�1
ð7Þ
The resulting normals to the domain walls W0 are:
m012 ¼ �3ac2� a2þ
ffiffi3pð2ffiffi3p
c2þa2ffiffi3pÞ
2 ;�ffiffi3pð6ac2þaÞ
2 �ffiffiffi3p
c2� a2ffiffi3p
2 ;c�3a2ch i
m023 ¼ ½6ac2þa;2ffiffiffi3p
c2þa2ffiffiffi3p
;c�3a2c�
m031 ¼ �3ac2� a2�
ffiffi3pð2ffiffi3p
c2þa2ffiffi3pÞ
2 ;ffiffi3pð6ac2þaÞ
2 �ffiffiffi3p
c2� a2ffiffi3p
2 ;c�3a2ch i
ð8Þ
Analogously the normals to the W domain walls become undersuch a transformation
m12 ¼ffiffi3p
a2ð�1þ3a2Þ �
ffiffi3p
2ð�1þ3a2Þ ;3a
2ð�1þ3a2Þ þ1
2ð�1þ3a2Þ ;0h i
m23 ¼ �ffiffiffiffi3ap
�1þ3a2 ;� 1�1þ3a2 ;0
h im31 ¼
ffiffi3p
a2ð�1þ3a2Þ þ
ffiffi3p
2ð�1þ3a2Þ ;�3a
2ð�1þ3a2Þ þ1
2ð�1þ3a2Þ ;0h i ð9Þ
Now it is possible to calculate the shear angles between eachpair of domains. The angle between mij and nij turns out to amountto 0.367�, which is a negligible value. Therefore the W domainwalls are practically independent of the spontaneous strain. Theshear angle h between two adjacent domains i and j equals the an-gle between the normals m0ij and n0ij. With the crystallographic datain hand one obtains h = 11.0597�. The direct calculus of the sameangle with the assumption of small strain gives h ¼ arctanð2
ffiffiffi3p
ffiffiffiffiffiffiffiffiffiffiffiffiffiffiffia2 þ c2p
Þ ¼ 11:0830� that witnesses to the correctness of the pro-cedures adopted.
In conclusion, the W0 domain walls in the monoclinic phase ofAPI are deviated by an angle of 11.692� from that perpendicularto the crystallographic direction (101) of the monoclinic phase.The shear angle h = 11.0597� across the domain walls W0 is slightlylarger than the monoclinic angle b0 = b � 90� = 9.89� but is defi-nitely smaller than 2b0.
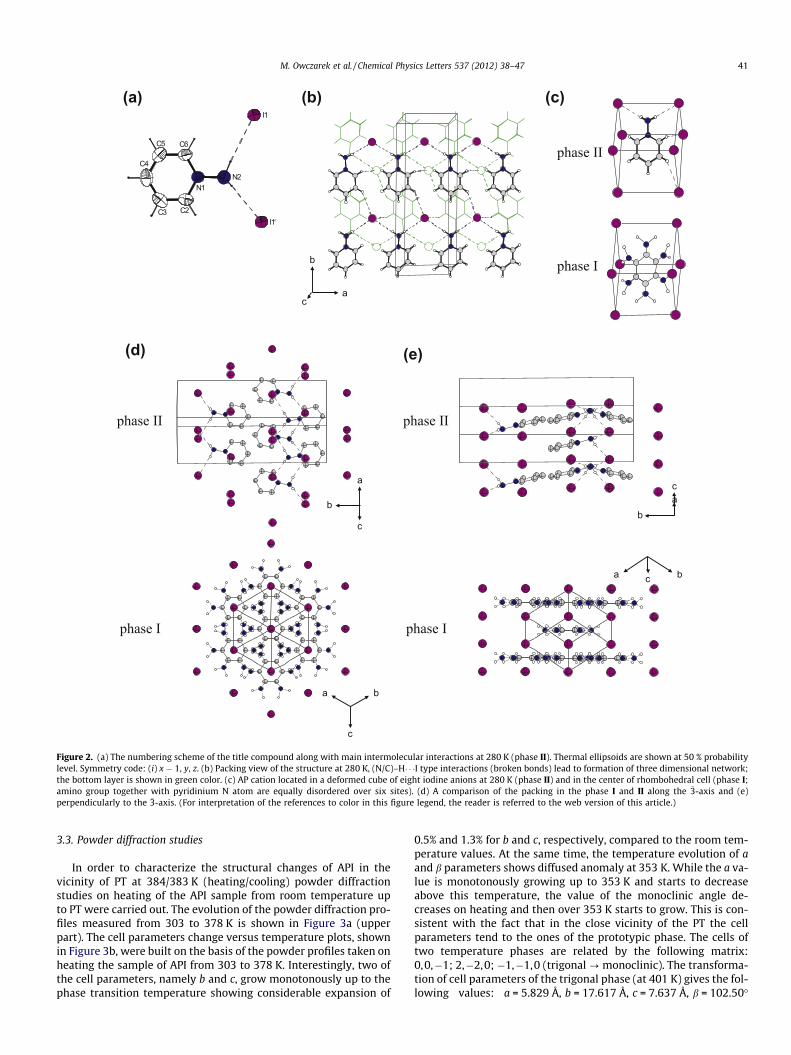
3.4.2. Interpretation of the domain pattern of APIFigure 4 represents one of the numerous examples of parallel
domain walls which arise and move under a uniaxial stress appliedapproximately perpendicular to the wall planes. With the abovesymmetrical analysis in mind one should examine the possibilityof the visible planar domain walls being the W0 boundaries. How-ever this does not seem to be the case because the angles indicatedin Figure 4 are systematically close to the monoclinic anglesb0 = b � 90� = 9.89� and never to the one h/2 = 5.530� i.e. the halfof the total strain across the W0 domain walls. Therefore, oneshould consider another mechanism underlying the visible pat-terns and implying the proximity of the zig-zag angle from Figure4 to the monoclinic angle. This is namely a hypothesis of the visibledomain walls being ferroelastic boundaries in the (a,b) plane of themonoclinic structure which would then be the mirror plane lost ina virtual phase transition from a prototype paraelastic phase. By
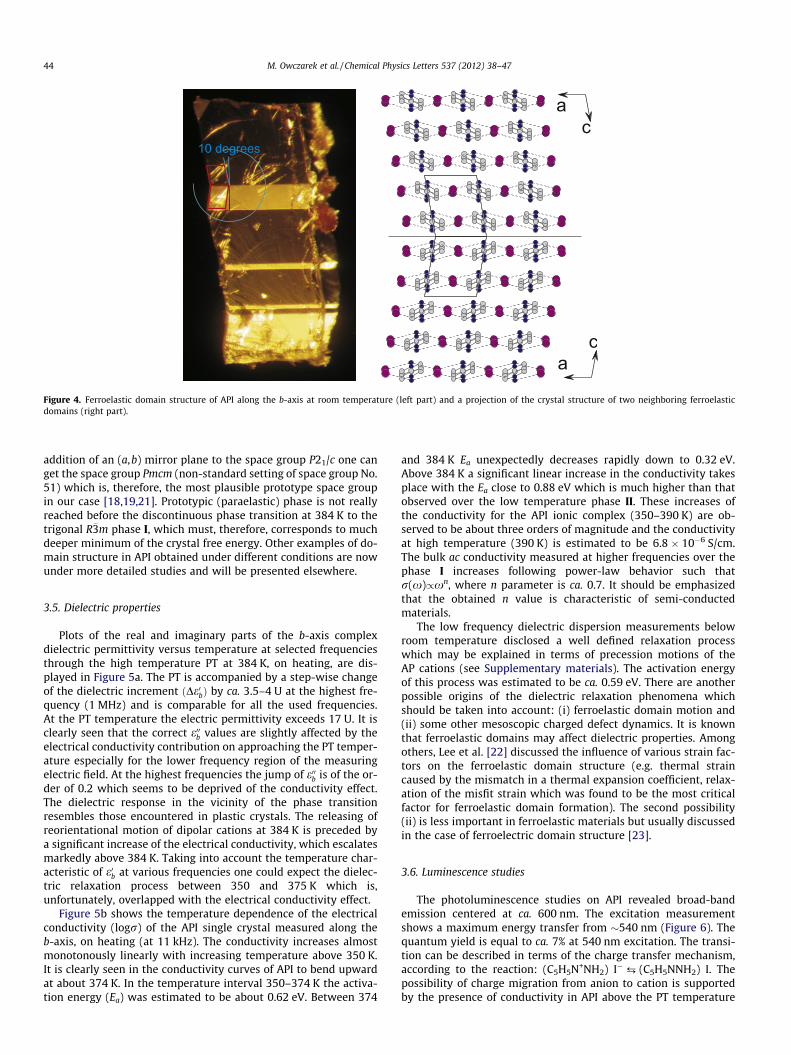
Figure 4. Ferroelastic domain structure of API along the b-axis at room temperature (left part) and a projection of the crystal structure of two neighboring ferroelasticdomains (right part).
44 M. Owczarek et al. / Chemical Physics Letters 537 (2012) 38–47
addition of an (a,b) mirror plane to the space group P21/c one canget the space group Pmcm (non-standard setting of space group No.51) which is, therefore, the most plausible prototype space groupin our case [18,19,21]. Prototypic (paraelastic) phase is not reallyreached before the discontinuous phase transition at 384 K to thetrigonal R�3m phase I, which must, therefore, corresponds to muchdeeper minimum of the crystal free energy. Other examples of do-main structure in API obtained under different conditions are nowunder more detailed studies and will be presented elsewhere.
3.5. Dielectric properties
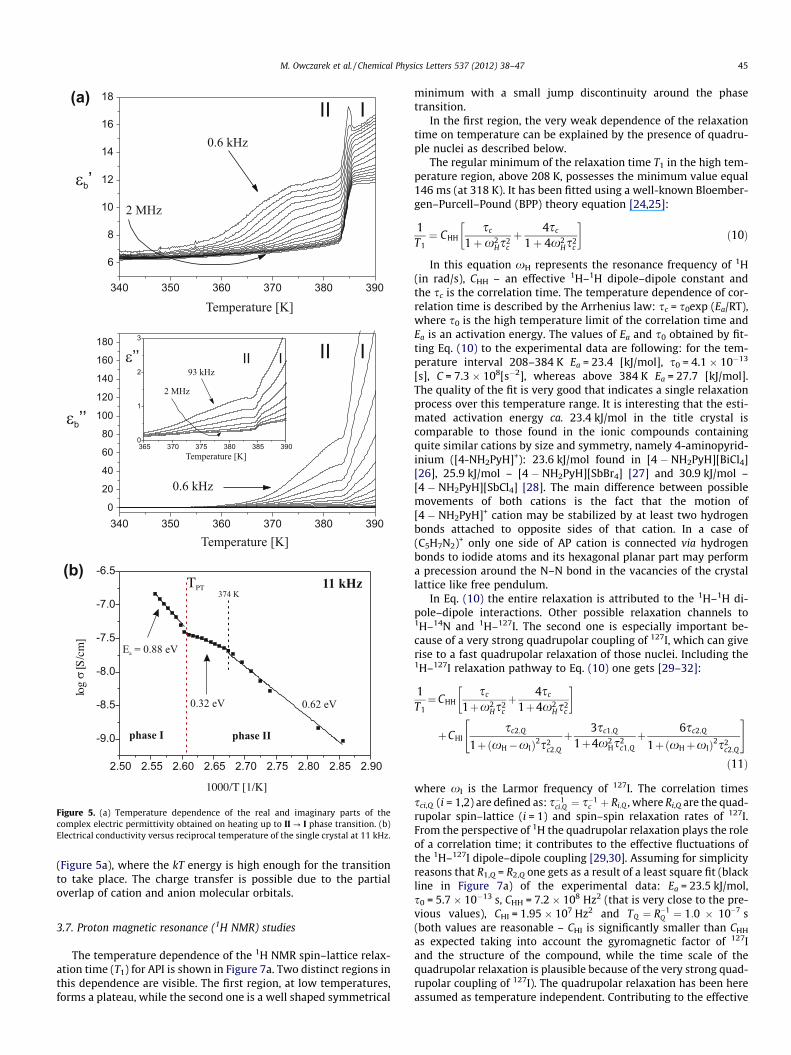
Plots of the real and imaginary parts of the b-axis complexdielectric permittivity versus temperature at selected frequenciesthrough the high temperature PT at 384 K, on heating, are dis-played in Figure 5a. The PT is accompanied by a step-wise changeof the dielectric increment ðDe0bÞ by ca. 3.5–4 U at the highest fre-quency (1 MHz) and is comparable for all the used frequencies.At the PT temperature the electric permittivity exceeds 17 U. It isclearly seen that the correct e00b values are slightly affected by theelectrical conductivity contribution on approaching the PT temper-ature especially for the lower frequency region of the measuringelectric field. At the highest frequencies the jump of e00b is of the or-der of 0.2 which seems to be deprived of the conductivity effect.The dielectric response in the vicinity of the phase transitionresembles those encountered in plastic crystals. The releasing ofreorientational motion of dipolar cations at 384 K is preceded bya significant increase of the electrical conductivity, which escalatesmarkedly above 384 K. Taking into account the temperature char-acteristic of e0b at various frequencies one could expect the dielec-tric relaxation process between 350 and 375 K which is,unfortunately, overlapped with the electrical conductivity effect.
Figure 5b shows the temperature dependence of the electricalconductivity (logr) of the API single crystal measured along theb-axis, on heating (at 11 kHz). The conductivity increases almostmonotonously linearly with increasing temperature above 350 K.It is clearly seen in the conductivity curves of API to bend upwardat about 374 K. In the temperature interval 350–374 K the activa-tion energy (Ea) was estimated to be about 0.62 eV. Between 374
and 384 K Ea unexpectedly decreases rapidly down to 0.32 eV.Above 384 K a significant linear increase in the conductivity takesplace with the Ea close to 0.88 eV which is much higher than thatobserved over the low temperature phase II. These increases ofthe conductivity for the API ionic complex (350–390 K) are ob-served to be about three orders of magnitude and the conductivityat high temperature (390 K) is estimated to be 6.8 � 10�6 S/cm.The bulk ac conductivity measured at higher frequencies over thephase I increases following power-law behavior such thatr(x)/xn, where n parameter is ca. 0.7. It should be emphasizedthat the obtained n value is characteristic of semi-conductedmaterials.
The low frequency dielectric dispersion measurements belowroom temperature disclosed a well defined relaxation processwhich may be explained in terms of precession motions of theAP cations (see Supplementary materials). The activation energyof this process was estimated to be ca. 0.59 eV. There are anotherpossible origins of the dielectric relaxation phenomena whichshould be taken into account: (i) ferroelastic domain motion and(ii) some other mesoscopic charged defect dynamics. It is knownthat ferroelastic domains may affect dielectric properties. Amongothers, Lee et al. [22] discussed the influence of various strain fac-tors on the ferroelastic domain structure (e.g. thermal straincaused by the mismatch in a thermal expansion coefficient, relax-ation of the misfit strain which was found to be the most criticalfactor for ferroelastic domain formation). The second possibility(ii) is less important in ferroelastic materials but usually discussedin the case of ferroelectric domain structure [23].
3.6. Luminescence studies
The photoluminescence studies on API revealed broad-bandemission centered at ca. 600 nm. The excitation measurementshows a maximum energy transfer from �540 nm (Figure 6). Thequantum yield is equal to ca. 7% at 540 nm excitation. The transi-tion can be described in terms of the charge transfer mechanism,according to the reaction: (C5H5N+NH2) I�¡ (C5H5NNH2) I. Thepossibility of charge migration from anion to cation is supportedby the presence of conductivity in API above the PT temperature
(a)
b’
b’’
II
340 350 360 370 380 390
6
8
10
12
14
16
18
340 350 360 370 380 3900
20
40
60
80
100
120
140
160
180
I
II I’’ II I
365 370 375 380 385 3900
1
2
3
(b)
a
TPT
2.50 2.55 2.60 2.65 2.70 2.75 2.80 2.85 2.90
-9.0
-8.5
-8.0
-7.5
-7.0
-6.5
log
[S/c
m]
1000/T [1/K]
Figure 5. (a) Temperature dependence of the real and imaginary parts of thecomplex electric permittivity obtained on heating up to II ? I phase transition. (b)Electrical conductivity versus reciprocal temperature of the single crystal at 11 kHz.
M. Owczarek et al. / Chemical Physics Letters 537 (2012) 38–47 45
(Figure 5a), where the kT energy is high enough for the transitionto take place. The charge transfer is possible due to the partialoverlap of cation and anion molecular orbitals.
3.7. Proton magnetic resonance (1H NMR) studies
The temperature dependence of the 1H NMR spin–lattice relax-ation time (T1) for API is shown in Figure 7a. Two distinct regions inthis dependence are visible. The first region, at low temperatures,forms a plateau, while the second one is a well shaped symmetrical
minimum with a small jump discontinuity around the phasetransition.
In the first region, the very weak dependence of the relaxationtime on temperature can be explained by the presence of quadru-ple nuclei as described below.
The regular minimum of the relaxation time T1 in the high tem-perature region, above 208 K, possesses the minimum value equal146 ms (at 318 K). It has been fitted using a well-known Bloember-gen–Purcell–Pound (BPP) theory equation [24,25]:
1T1¼ CHH
sc
1þx2Hs2
c
þ 4sc
1þ 4x2Hs2
c
� �ð10Þ
In this equation xH represents the resonance frequency of 1H(in rad/s), CHH – an effective 1H–1H dipole–dipole constant andthe sc is the correlation time. The temperature dependence of cor-relation time is described by the Arrhenius law: sc = s0exp (Ea/RT),where s0 is the high temperature limit of the correlation time andEa is an activation energy. The values of Ea and s0 obtained by fit-ting Eq. (10) to the experimental data are following: for the tem-perature interval 208–384 K Ea = 23.4 [kJ/mol], s0 = 4.1 � 10�13
[s], C = 7.3 � 108[s�2], whereas above 384 K Ea = 27.7 [kJ/mol].The quality of the fit is very good that indicates a single relaxationprocess over this temperature range. It is interesting that the esti-mated activation energy ca. 23.4 kJ/mol in the title crystal iscomparable to those found in the ionic compounds containingquite similar cations by size and symmetry, namely 4-aminopyrid-inium ([4-NH2PyH]+): 23.6 kJ/mol found in [4 � NH2PyH][BiCl4][26], 25.9 kJ/mol – [4 � NH2PyH][SbBr4] [27] and 30.9 kJ/mol –[4 � NH2PyH][SbCl4] [28]. The main difference between possiblemovements of both cations is the fact that the motion of[4 � NH2PyH]+ cation may be stabilized by at least two hydrogenbonds attached to opposite sides of that cation. In a case of(C5H7N2)+ only one side of AP cation is connected via hydrogenbonds to iodide atoms and its hexagonal planar part may performa precession around the N–N bond in the vacancies of the crystallattice like free pendulum.
In Eq. (10) the entire relaxation is attributed to the 1H–1H di-pole–dipole interactions. Other possible relaxation channels to1H–14N and 1H–127I. The second one is especially important be-cause of a very strong quadrupolar coupling of 127I, which can giverise to a fast quadrupolar relaxation of those nuclei. Including the1H–127I relaxation pathway to Eq. (10) one gets [29–32]:
1T1¼CHH
sc
1þx2Hs2
c
þ 4sc
1þ4x2Hs2
c
� �
þCHIsc2;Q
1þðxH�xIÞ2s2c2;Q
þ 3sc1;Q
1þ4x2Hs2
c1;Q
þ 6sc2;Q
1þðxHþxIÞ2s2c2;Q
" #
ð11Þ
where xI is the Larmor frequency of 127I. The correlation timessci,Q (i = 1,2) are defined as: s�1
ci;Q ¼ s�1c þ Ri;Q , where Ri,Q are the quad-
rupolar spin–lattice (i = 1) and spin–spin relaxation rates of 127I.From the perspective of 1H the quadrupolar relaxation plays the roleof a correlation time; it contributes to the effective fluctuations ofthe 1H–127I dipole–dipole coupling [29,30]. Assuming for simplicityreasons that R1,Q = R2,Q one gets as a result of a least square fit (blackline in Figure 7a) of the experimental data: Ea = 23.5 kJ/mol,s0 = 5.7 � 10�13 s, CHH = 7.2 � 108 Hz2 (that is very close to the pre-vious values), CHI = 1.95 � 107 Hz2 and TQ ¼ R�1
Q ¼ 1:0 � 10�7 s(both values are reasonable – CHI is significantly smaller than CHH
as expected taking into account the gyromagnetic factor of 127Iand the structure of the compound, while the time scale of thequadrupolar relaxation is plausible because of the very strong quad-rupolar coupling of 127I). The quadrupolar relaxation has been hereassumed as temperature independent. Contributing to the effective
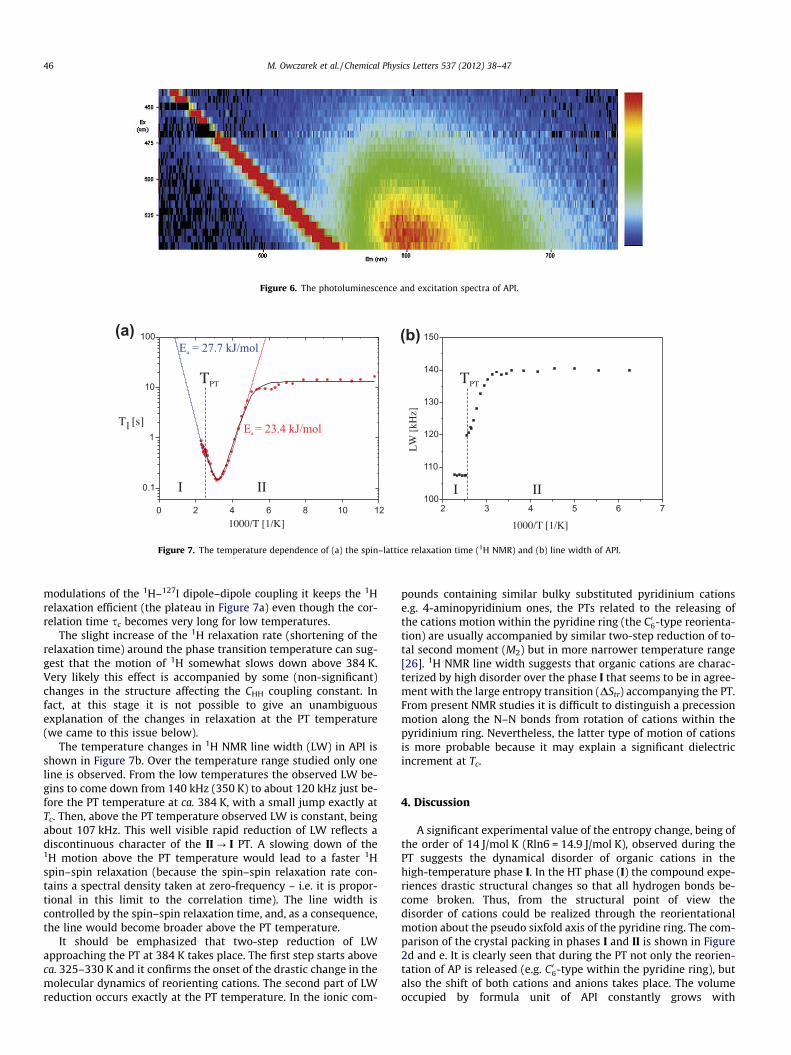
Figure 6. The photoluminescence and excitation spectra of API.
2 3 4 5 6 7100
110
120
130
140
150
1000/T [1/K]
(b)(a)
0 2 4 6 8 10 12
0.1
1
10
100
a
a
1000/T [1/K]
T1[s]
I II I II
LW
[kH
z]
TPTTPT
Figure 7. The temperature dependence of (a) the spin–lattice relaxation time (1H NMR) and (b) line width of API.
46 M. Owczarek et al. / Chemical Physics Letters 537 (2012) 38–47
modulations of the 1H–127I dipole–dipole coupling it keeps the 1Hrelaxation efficient (the plateau in Figure 7a) even though the cor-relation time sc becomes very long for low temperatures.
The slight increase of the 1H relaxation rate (shortening of therelaxation time) around the phase transition temperature can sug-gest that the motion of 1H somewhat slows down above 384 K.Very likely this effect is accompanied by some (non-significant)changes in the structure affecting the CHH coupling constant. Infact, at this stage it is not possible to give an unambiguousexplanation of the changes in relaxation at the PT temperature(we came to this issue below).
The temperature changes in 1H NMR line width (LW) in API isshown in Figure 7b. Over the temperature range studied only oneline is observed. From the low temperatures the observed LW be-gins to come down from 140 kHz (350 K) to about 120 kHz just be-fore the PT temperature at ca. 384 K, with a small jump exactly atTc. Then, above the PT temperature observed LW is constant, beingabout 107 kHz. This well visible rapid reduction of LW reflects adiscontinuous character of the II ? I PT. A slowing down of the1H motion above the PT temperature would lead to a faster 1Hspin–spin relaxation (because the spin–spin relaxation rate con-tains a spectral density taken at zero-frequency – i.e. it is propor-tional in this limit to the correlation time). The line width iscontrolled by the spin–spin relaxation time, and, as a consequence,the line would become broader above the PT temperature.
It should be emphasized that two-step reduction of LWapproaching the PT at 384 K takes place. The first step starts aboveca. 325–330 K and it confirms the onset of the drastic change in themolecular dynamics of reorienting cations. The second part of LWreduction occurs exactly at the PT temperature. In the ionic com-
pounds containing similar bulky substituted pyridinium cationse.g. 4-aminopyridinium ones, the PTs related to the releasing ofthe cations motion within the pyridine ring (the C06-type reorienta-tion) are usually accompanied by similar two-step reduction of to-tal second moment (M2) but in more narrower temperature range[26]. 1H NMR line width suggests that organic cations are charac-terized by high disorder over the phase I that seems to be in agree-ment with the large entropy transition (DStr) accompanying the PT.From present NMR studies it is difficult to distinguish a precessionmotion along the N–N bonds from rotation of cations within thepyridinium ring. Nevertheless, the latter type of motion of cationsis more probable because it may explain a significant dielectricincrement at Tc.
4. Discussion
A significant experimental value of the entropy change, being ofthe order of 14 J/mol K (Rln6 = 14.9 J/mol K), observed during thePT suggests the dynamical disorder of organic cations in thehigh-temperature phase I. In the HT phase (I) the compound expe-riences drastic structural changes so that all hydrogen bonds be-come broken. Thus, from the structural point of view thedisorder of cations could be realized through the reorientationalmotion about the pseudo sixfold axis of the pyridine ring. The com-parison of the crystal packing in phases I and II is shown in Figure2d and e. It is clearly seen that during the PT not only the reorien-tation of AP is released (e.g. C06-type within the pyridine ring), butalso the shift of both cations and anions takes place. The volumeoccupied by formula unit of API constantly grows with

M. Owczarek et al. / Chemical Physics Letters 537 (2012) 38–47 47
temperature, what is consistent with release of AP motion. Thedielectric and NMR studies bring some meaningful informationabout the dynamics of AP cations (dipolar units) in a wide temper-ature region including the structural PT at 384 K. Intriguing dielec-tric feature is an appearance of the electrical conductivity (r)anomaly at 384 K seen as a rapid increase of r through the hightemperature PT. One of the possible explanation of this fact maybe the translational motion of highly polarizable iodide anions.The proton conductivity along the hydrogen bonds is rather ex-cluded as the N–H� � �I bonds are considered as weak ones. The sec-ond possibility is a charge transfer between anion and cation sincesuch an interaction was confirmed at room temperature by theluminescence properties.
A highly polydispersive nature of a low frequency relaxationprocess observed below RT is believed to be related to the librationmotion of cations. Detailed origin of this relaxation at this stage isnot clear. Nevertheless, it is known that in a case of plastic crystalsthe ordered phases are characterized usually by the presence of a‘glass’ phase transition. It was mentioned in the chapter 3.5 thatthis material at high temperatures exhibits some features encoun-tered in plastic crystal. The high temperature PT II ? I at 384 K iswell characterized from the thermodynamic and dielectric pointof view. The entropy transition (DStr = 14 J/mol K) indicates, be-yond all doubts, that the order–disorder contribution to the PTmechanism is dominant. Taking into account the dielectric re-sponse at Tc, the PT should be related with releasing of motionstrongly dipolar groups assigned to the organic cations. The 1HNMR indicates that the libration motion of the AP cations over awide temperature range within the phase II is admitted. The subtleanomaly in T1 versus T�1 curve and a distinct one in LW (linewidth) at 384 K confirm, however, a significant change in the mo-tional state of cations. The C06 type of motion (reorientation withinthe pyridinium ring) is expected to lead to the change in the resul-tant dipole moment of the unit cell which is seen as a step-wise in-crease of the permittivity.
5. Conclusions
1. (C5H7N2)+I� (API) undergoes a reversible discontinuous phasetransition (PT) at 384/383 K (heating/cooling) confirmed bydifferential scanning calorimetry (DSC), dilatometric anddielectric measurements.
2. The single-crystal X-ray diffraction studies have been carriedout at 110, 280 K (phase II) and 401 K (phase I). At roomtemperature (RT) it crystallizes in the monoclinic symmetry(P21/c), whereas in the high temperature phase (I) adoptstrigonal symmetry (R�3m). The crystal structure of API consistsof discrete 1-aminopyridinium cations and iodide anionswhich are connected into chains propagating along the a-axisdirection via hydrogen bonds of N–H� � �I type.
3. The mechanism of the structural PT has two contributions: (i)order–disorder and (ii) displacive. The former contribution isrelated to the reorientational disorder of the 1-aminopyridi-nium cations, the latter one to the mutual shift of the iodideanions and cationic framework.
4. The optical observations under polarizing microscope haveshowed that API is a ferroelastic crystal in the RT phase (II)and paraelastic above 384 K (phase I).
5. The anomaly in the T1 (spin–lattice relaxation time) and 1HNMR line width near 384 K indicate a change in the motionalstate of the cation through the PT. The releasing of two typesof cationic motion is admitted: the precession around the
N–N axis or reorientation about the pseudo sixfold axis ofthe pyridine ring. The plateau of T1 versus temperature curveover the low temperature range is explained in terms of astrong quadrupolar coupling 1H–127I.
6. The luminescence properties assigned to the charge-transfertransition between nitrogen and iodide anions are disclosedin API at room temperature.
Acknowledgements
This work was partially supported by the Polish State Commit-tee for Research (Project Register No.: N N204 147837 and N N202172135). Authors thank to the Reviewers for their excellent sug-gestions and stimulating discussion.
Appendix A. Supplementary data
Supplementary data associated with this article can be found, inthe online version, at http://dx.doi.org/10.1016/j.cplett.2012.03.101.
References
[1] A.F. Pozharski, A.T. Soldatenkov, A.R. Katritzky, Heterocycles in Life andSociety, Wiley, New York, 1997.
[2] A.R. Katritzky, C.W. Rees, E.F.V. Scriven, Comprehensive HeterocyclicChemistry II, Pergamon, Oxford Press, 1996.
[3] G.A. Jeffrey, W. Saenger, Hydrogen Bonding in Biological Structures, Springer,Berlin, 1991.
[4] S. Scheiner, Hydrogen Bonding. A Theoretical Perspective, Oxford UniversityPress, 1997.
[5] T. Steiner, Angew. Chem. 41 (2002) 48.[6] G.R. Desiraju, T. Steiner, The Weak Hydrogen Bond: In Structural Chemistry
and Biology, Oxford University Press, 2001.[7] L. Yahong, S. Yanhui, Aaron L. Odom, J. Am. Chem. Soc. 126 (2004) 1794.[8] L.N. Lysenkova, K.F. Turchin, V.N. Danilenko, A.M. Korolev, M.N.
Preobrazhenskaya, J. Antibiot. 63 (2010) 17.[9] P.A. Evans, E.A. Clizbe, J. Am. Chem. Soc. 131 (25) (2009) 8722.
[10] Y. Shan-Shan, X. Hua, D. Hai-Bao, Acta Cryst. E66 (2010) m1259.[11] D. Hai-Bao, Z. Hong, T. Zheng-Fang, X. Fang, R. Xiao-Ming, Solid State Sci. 11
(2009) 1216.[12] CrysAlis RED, ver. 1.171, Oxford Diffraction Poland, 1995–2003.[13] G.M. Sheldrick, Acta Cryst. A 64 (2008) 112.[14] K. Lukaszewicz, D. Kucharczyk, M. Malinowski, A. Pietraszko, Krist. Tech. 13
(1978) 561.[15] J. Timmermans, Phys. Chem. Solids 18 (1961) 1.[16] C. Yong-Tao, J. Chun-Xiang, Y. Wei, S. Jia-Sen, G. Cheng, Acta Cryst. E64 (2008)
o1506.[17] M. Lämsä, J. Huuskonen, K. Rissanen, J. Pursiainen, Chem. – Eur. J. 4 (1) (1998)
84.[18] J. Sapriel, Phys. Rev. B 12 (1975) 5128.[19] M. Guymont, Phys. Rev. B 18 (1978) 5385.[20] International Tables for Crystallography, vol. D, Domain structures, 2003, p.
480–490 (Chapter 3.4.).[21] M.I. Aroyo et al., Z. Krystallogr. 221 (2006) 15.[22] K. Lee, S. Baik, Annu. Rev. Mater. Res. 36 (2006) 81.[23] S.V. Kalinin et al., Adv. Mater. 22 (2010) 314.[24] A. Abragam, The Principles of Nuclear Magnetism, Clarendon Press, Oxford,
1961.[25] C.P. Slichter, Principles of Magnetic Resonance, Springer-Verlag, Berlin, 1990.[26] B. Kulicka, V. Kinzhybalo, R. Jakubas, Z. Ciunik, J. Baran, W. Medycki, J. Phys.:
Condens. Matter 18 (2006) 5087.[27] M. Hashimoto, H. Terao, H. Fuess, I. Svoboda, H. Ehrenberg, Bull. Chem. Soc.
Jpn. 76 (2003) 749.[28] W. Medycki, K. Hołderna-Natkaniec, J. Swiergiel, R. Jakubas, Solid State NMR
24 (2003) 209.[29] D. Kruk, O. Lips, Solid State Nucl. Magn. Reson. 28 (2005) 180.[30] D. Kruk, W. Medycki, A. Mielczarek, R. Jakubas, C. Uniszkiewicz, Appl. Magn.
Reson. 39 (2010) 233.[31] D. Kruk, F. Fujara, P. Gumann, W. Medycki, Ch. Tacke, Solid State Nucl. Magn.
Reson. 35 (2009) 152.[32] D. Kruk, O. Lips, J. Magn. Reson. 179 (2006) 250.