Cryostratigraphy of late Pleistocene syngenetic permafrost (yedoma) in northern Alaska, Itkillik...
13
Cryostratigraphy of late Pleistocene syngenetic permafrost (yedoma) in northern Alaska, Itkillik River exposure M. Kanevskiy a, ⁎, Y. Shur a , D. Fortier a,b , M.T. Jorgenson a,c , E. Stephani a a Institute of Northern Engineering, University of Alaska Fairbanks, Fairbanks, AK, USA b Département de géographie, Université de Montréal, Montréal, QC, Canada c Alaska Ecoscience, Fairbanks, AK, USA abstract article info Article history: Received 18 June 2010 Available online 17 January 2011 Keywords: Syngenetic permafrost Ground ice Late Pleistocene Yedoma Alaska Extremely ice-rich syngenetic permafrost, or yedoma, developed extensively under the cold climate of the Pleistocene in unglaciated regions of Eurasia and North America. In Alaska, yedoma occurs in the Arctic Foothills, the northern part of the Seward Peninsula, and in interior Alaska. A remarkable 33-m-high exposure along the lower Itkillik River in northern Alaska opened an opportunity to study the unmodified yedoma, including stratigraphy, particle-size distribution, soil carbon contents, morphology and quantity of segregated, wedge, and thermokarst-cave ice. The exposed permafrost sequence comprised seven cryostratigraphic units, which formed over a period from N 48,000 to 5,000 14 C yr BP, including: 1) active layer; 2) intermediate layer of the upper permafrost; 3–4) two yedoma silt units with different thicknesses of syngenetic ice wedges; 5) buried peat layer; 6) buried intermediate layer beneath the peat; and 7) silt layer with short ice wedges. This exposure is comparable to the well known Mus-Khaya and Duvanny Yar yedoma exposures in Russia. Based on our field observations, literature sources, and interpretation of satellite images and aerial photography, we have developed a preliminary map of yedoma distribution in Alaska. © 2010 University of Washington. Published by Elsevier Inc. All rights reserved. Introduction The late Pleistocene environment of Beringia, with its severely cold climate and active eolian sedimentation, was extremely favorable to accumulation of ground ice and formation of syngenetic permafrost, which was formed synchronously with sedimentation in unglaciated areas. As a result, extremely ice-rich permafrost (termed “yedoma”) was formed and remains one of the most prominent features of the periglacial environment in the Arctic. Yedoma is silt-dominated deposits up to 50 m thick with wide and tall ice wedges. After its formation, yedoma was drastically affected by thermokarst and thermal erosion caused by climate changes during the Pleistocene- to-Holocene transition. Understanding the nature and distribution of yedoma is of concern because it is widespread in the arctic and subarctic east Siberia and Alaska, and it provides the foundation for diverse arctic and boreal ecosystems that are vulnerable upon permafrost thawing (Jorgenson and Osterkamp, 2005). Thick yedoma deposits reportedly have substantial soil carbon stores that can contribute to greenhouse gases emissions upon permafrost thawing (Zimov et al., 1997, 2006; Walter et al. 2007). Yet there has been little quantification of the structure and distribution of yedoma in Alaska. In this paper, we address these issues by: (1) reviewing existing information on the nature and distribution of yedoma; (2) describing ground ice characteristics of a unique exposure of yedoma along the Itkillik River in northern Alaska; and (3) developing a preliminary map of yedoma in Alaska. Origin and distribution of Yedoma Terminology, genesis of the deposit, nature of massive ice, and distribution of yedoma have been controversial for decades. The massive ice is so abundant that in some exposures it appears as a continuous horizontal body with isolated soil inclusions. For a long time it had been described as buried glacier ice. One of the Russian names for such permafrost, “ledoviy complex,” reflects the assump- tion of its glacial genesis and should be literarily translated as a “glacial complex.” The translation “ice complex,” which is used in modern scientific literature, emphasizes the high ice content of permafrost and is neutral to hypotheses of the ice genesis. Now in Russian and in international literature the term yedoma is used more often than the term ice complex. Originally, yedoma (Russian eдoмa) means “…a flat hill, a remnant of a terrace, a mound, which rises in several dozen meters above surrounding terrain.” (Murzaev, 1984, page 197). This folk name was introduced into scientific literature by Birkengof (1933) and describes the remnants of terrain with ice-rich permafrost formed in east Siberia in the late Pleistocene. Now the terms yedoma suite, yedoma complex, or just yedoma usually describe Quaternary Research 75 (2011) 584–596 ⁎ Corresponding author. E-mail address: [email protected] (M. Kanevskiy). 0033-5894/$ – see front matter © 2010 University of Washington. Published by Elsevier Inc. All rights reserved. doi:10.1016/j.yqres.2010.12.003 Contents lists available at ScienceDirect Quaternary Research journal homepage: www.elsevier.com/locate/yqres
Transcript of Cryostratigraphy of late Pleistocene syngenetic permafrost (yedoma) in northern Alaska, Itkillik...

Quaternary Research 75 (2011) 584–596
Contents lists available at ScienceDirect
Quaternary Research
j ourna l homepage: www.e lsev ie r.com/ locate /yqres
Cryostratigraphy of late Pleistocene syngenetic permafrost (yedoma) in northernAlaska, Itkillik River exposure
M. Kanevskiy a,⁎, Y. Shur a, D. Fortier a,b, M.T. Jorgenson a,c, E. Stephani a
a Institute of Northern Engineering, University of Alaska Fairbanks, Fairbanks, AK, USAb Département de géographie, Université de Montréal, Montréal, QC, Canadac Alaska Ecoscience, Fairbanks, AK, USA
⁎ Corresponding author.E-mail address: [email protected] (M. Kanevs
0033-5894/$ – see front matter © 2010 University of Wdoi:10.1016/j.yqres.2010.12.003
a b s t r a c t
a r t i c l e i n f oArticle history:Received 18 June 2010Available online 17 January 2011
Keywords:Syngenetic permafrostGround iceLate PleistoceneYedomaAlaska
Extremely ice-rich syngenetic permafrost, or yedoma, developed extensively under the cold climate of thePleistocene in unglaciated regions of Eurasia and North America. In Alaska, yedoma occurs in the ArcticFoothills, the northern part of the Seward Peninsula, and in interior Alaska. A remarkable 33-m-high exposurealong the lower Itkillik River in northern Alaska opened an opportunity to study the unmodified yedoma,including stratigraphy, particle-size distribution, soil carbon contents, morphology and quantity ofsegregated, wedge, and thermokarst-cave ice. The exposed permafrost sequence comprised sevencryostratigraphic units, which formed over a period from N48,000 to 5,000 14C yr BP, including: 1) activelayer; 2) intermediate layer of the upper permafrost; 3–4) two yedoma silt units with different thicknesses ofsyngenetic ice wedges; 5) buried peat layer; 6) buried intermediate layer beneath the peat; and 7) silt layerwith short ice wedges. This exposure is comparable to the well known Mus-Khaya and Duvanny Yar yedomaexposures in Russia. Based on our field observations, literature sources, and interpretation of satellite imagesand aerial photography, we have developed a preliminary map of yedoma distribution in Alaska.
© 2010 University of Washington. Published by Elsevier Inc. All rights reserved.
Introduction
The late Pleistocene environment of Beringia, with its severely coldclimate and active eolian sedimentation, was extremely favorable toaccumulation of ground ice and formation of syngenetic permafrost,which was formed synchronously with sedimentation in unglaciatedareas. As a result, extremely ice-rich permafrost (termed “yedoma”)was formed and remains one of the most prominent features of theperiglacial environment in the Arctic. Yedoma is silt-dominateddeposits up to 50 m thick with wide and tall ice wedges. After itsformation, yedoma was drastically affected by thermokarst andthermal erosion caused by climate changes during the Pleistocene-to-Holocene transition.
Understanding the nature and distribution of yedoma is of concernbecause it is widespread in the arctic and subarctic east Siberia andAlaska, and it provides the foundation for diverse arctic and borealecosystems that are vulnerable upon permafrost thawing (Jorgensonand Osterkamp, 2005). Thick yedoma deposits reportedly havesubstantial soil carbon stores that can contribute to greenhousegases emissions upon permafrost thawing (Zimov et al., 1997, 2006;Walter et al. 2007). Yet there has been little quantification of thestructure and distribution of yedoma in Alaska. In this paper, we
kiy).
ashington. Published by Elsevier In
address these issues by: (1) reviewing existing information on thenature and distribution of yedoma; (2) describing ground icecharacteristics of a unique exposure of yedoma along the ItkillikRiver in northern Alaska; and (3) developing a preliminary map ofyedoma in Alaska.
Origin and distribution of Yedoma
Terminology, genesis of the deposit, nature of massive ice, anddistribution of yedoma have been controversial for decades. Themassive ice is so abundant that in some exposures it appears as acontinuous horizontal body with isolated soil inclusions. For a longtime it had been described as buried glacier ice. One of the Russiannames for such permafrost, “ledoviy complex,” reflects the assump-tion of its glacial genesis and should be literarily translated as a“glacial complex.” The translation “ice complex,” which is used inmodern scientific literature, emphasizes the high ice content ofpermafrost and is neutral to hypotheses of the ice genesis. Now inRussian and in international literature the term yedoma is used moreoften than the term ice complex. Originally, yedoma (Russian eдoмa)means “…a flat hill, a remnant of a terrace, a mound, which rises inseveral dozen meters above surrounding terrain.” (Murzaev, 1984,page 197). This folk name was introduced into scientific literature byBirkengof (1933) and describes the remnants of terrain with ice-richpermafrost formed in east Siberia in the late Pleistocene. Now theterms yedoma suite, yedoma complex, or just yedoma usually describe
c. All rights reserved.

585M. Kanevskiy et al. / Quaternary Research 75 (2011) 584–596
the late Pleistocene syngenetic permafrost, and the term yedoma isused in the permafrost literature mostly as a stratigraphic term forextremely ice-rich silty deposits of late Pleistocene age rather thangeomorphic term (Tomirdiaro, 1980; Kaplina, 1981; Zhestkova et al.,1982, 1986; Zimov et al., 2006;Walter et al., 2007; Schirrmeister et al.,2008, in press; Froese et al., 2009; French and Shur, 2010).
Popov (1953) proposed an alluvial genesis of yedoma and mostRussian investigators have agreed with him. Other hypotheses foryedoma genesis include colluvial (Gravis, 1969), nival (Kunitskiy,1989; Schirrmeister et al., 2008, in press) and eolian (Péwé, 1975;Tomirdiaro, 1980; Hopkins, 1982; Carter, 1988; Höfle and Ping, 1996;Begét, 2001). Zhestkova et al. (1982, 1986) proposed a polygeneticorigin of yedoma that considers yedoma as a climatic phenomenonand applied the idea of “equifinality,” which suggests that similarresults may be achieved by various processes and under differentinitial conditions. They conclude that the leading factors of yedomaformation are cold climate and continuous long-term sedimentation.They also emphasized that yedoma is a gigantic polypedon and thatsoil-forming processes (from a pedological point of view) played animportant role in yedoma formation. Sher (1997) and Sher et al.(2005) support this explanation of the yedoma genesis.
Yedoma is a surficial deposit, ranging generally from 10 to 30 m inthickness, but in some areas it reaches 50 m and sometimes more(Ivanov, 1984; Romanovskii, 1993). Ice wedges typically penetratethe entire sequence of yedoma. The true width of ice wedges variesfrom 2–3 to 5–6 m (an apparent width of ice wedges can be muchmore, depending on the direction of their axes towards the plane ofexposures). Soils of yedoma between ice wedges typically containover 70% silt although sandy yedoma deposits also occur. Poorlydecomposed rootlets present throughout yedoma and thin organic-rich soil horizons are not rare. High ice content, tall ice wedges, and aspecific set of cryostructures are the main diagnostic features ofyedoma deposits.
Formation of yedoma took place in the extremely cold, dry, grassyenvironment called “tundra-steppe” or “mammoth steppe” (Yurtsev,1981; Kaplina, 1981; Guthrie, 1990; Sher, 1997). Such terrain occupiedvast areas of Eurasia and North America in the late Pleistocene. Yedomadoes not haveadirect analog in permafrost formedduring theHolocene.The most similar to yedoma, syngenetic permafrost of contemporaryfloodplains of arctic rivers, is only 3 to 5 m thick (Shur and Jorgenson,1998; Fortier and Allard, 2004; Fortier et al. 2006).
Yedoma is widespread in Siberia (Fig. 1), where the total area of itsoccurrence is about 1 million km2 (Romanovskii, 1993; Zimov et al.,2006; Walter et al., 2007). In Russia, yedoma has been extensivelystudied since the 1950s (Popov, 1953, 1967; Katasonov, 1954, 1969,
Figure 1. Schematic yedoma occurrence in Russia. Key yedoma sites mentioned in thetext: 1—Cape Mamontov Klyk, 2—Mamontovy Khayata, 3—Kular, 4—Mus-Khaya, 5—Oyogosskiy Yar, 6—Bol'shoy Lyakhovskiy Island, 7—Vorontsovskiy Yar, 8—ChukochiyCape, 9—Duvanniy Yar, 10—Ledoviy Obryv, 11—Rogozhniy Cape, 12—Mamontova Gora.(modified from Romanovskii, 1993; Konishchev, 2009).
1978; Vtyurin, 1975; Romanovskii, 1993 and many others), andhundreds of papers on yedoma cryogenic structure and properties areavailable in Russian. Well known yedoma sequences in Siberia such asOyogosskiy Yar, Bolshoy Lyakhovskiy Island, Duvanny Yar, Mamon-tova Gora, Vorontsovskiy Yar, Chukochiy Cape, Kular, Mus-Khaya,Mamontov Klyk, Mamontovy Khayata, Ledoviy Obryv, and RogozhniyCape (Fig. 1) were described by Katasonov (1954), Romanovskii(1958), Gravis (1969), Katasonov and Ivanov (1973), Arkhangelov etal. (1979), Kaplina (1981), Tomirdiaro and Chernen'kiy (1987),Gasanov (1981), Shur (1988a), Kanevskiy (1991, 2004), Vasil'chuk(1992), Kotov (2002), Slagoda (2004).
During the last decade, a Russian-German research team hasperformedmultidisciplinary studies of yedoma sequences in northernYakutia (Meyer et al., 2002; Romanovskii et al., 2004; Grosse et al.,2007; Schirrmeister et al., 2008, in press). Alaska is the second largestregion of contemporary yedoma occurrence in the world, butpublications on the nature, distribution, cryogenic structure andproperties of yedoma in Alaska are limited (Williams and Yeend,1979; Lawson, 1983; Carter, 1988; Hamilton et al., 1988; Hopkins andKidd, 1988; Shur et al., 2004; Bray et al., 2006; Kanevskiy et al.,2008a). In Canada, yedoma sites were identified in the Klondike areaby Fraser and Burn (1997), Kotler and Burn (2000), and Froese et al.(2009).
Itkillik exposure
Jim Helmericks, a long-time resident of the Colville Delta, told usabout the exposure in 2006. We studied this exposure in 2006 and2007. The site (69°34′ N, 150°52′W) is located at the boundary of theArctic Coastal Plain and the Arctic Foothills (Fig. 2). The exposure wasformed by active river erosion of a large remnant of originally gentlyundulating yedoma terrain. The surface of the central part of the hill isflat and its elevation is about 33 m above the Itkillik River water level(measured in August 2007). The total length of exposed face exceeded400 m. The bluff revealed an undisturbed thick section of latePleistocene syngenetic permafrost (Fig. 2B). Yedoma exposures ofsimilar size and quality are rare and their names are famous in thepermafrost literature.
This exposure was not the first one described in this area. Carter(1988) studied two smaller exposures (sites 2 and 3 in Carter's paper).The exposure we studied, as well as Carter's sites 2 and 3, belonged tothe same large remnant of continuous flat yedoma plain (Fig. 2C).Carter described site 2 as an actively eroding amphitheater with theexposed face about 15 m high. He interpreted the permafrost assyngenetic, and suggested that it may be common for the area oflower foothills, which he called a silt belt of northern Alaska.
Methods
To assess soil and permafrost characteristics, we described fivesites on the exposed bluff and continuous cores from 13 boreholes(Fig. 3). We drilled boreholes from 2.5 to 4.2 m deepwith SIPRE corers(7.5 cm and 5 cm in diameter) at various elevations at accessible partsof the exposure. A GPS and a level were used to survey the positions ofboreholes and exposures, and their elevations above the Itkillik Riverwater level. The exposure was documented by hundreds of photo-graphs and numerous sketches.
Cryostructures (patterns formed by ice inclusions in the frozen soil)were described using a classification adapted from several Russian andNorth American classifications (Gasanov, 1963; Katasonov, 1969;Zhestkova, 1982; Murton and French, 1994; Shur and Jorgenson,1998; Melnikov and Spesivtsev, 2000; French and Shur, 2010). In ouryedoma studies in Russia and Alaska, we found that lenticularcryostructure with thin and dense ice lenses and several other similarcryostructures are themost reliable diagnostic features of yedoma soils(Kanevskiy, 1991, 2003; Shur et al., 2004). Figure 4 shows varieties of

Figure 2. (A) Location of our study site along the Itkillik River. (B) Central part of the Itkillik River exposure (32.7 m high above the river), August 2007. Two people stand above thebluff for scale. (C) Location of the Itkillik River exposures, studied by Carter (1988) and by the authors of this paper in 2006–2007.
586 M. Kanevskiy et al. / Quaternary Research 75 (2011) 584–596
these cryostructures, which we term micro-cryostructures. Micro-cryostructures contain thin (less than 1 mm)densely spaced ice lenses.
Numerous soil samples were analyzed to determine particle-sizedistribution, ice and carbon contents, and radiocarbon dates. The grainsize distribution was determined on eight samples using sieve andhydrometer analyses (ASTM D422, 1998). Ice content of thesediments was determined on 96 samples by oven-drying (90 °C,72 h). Gravimetric water content was measured for bulk samplestaken from the bluff. Both gravimetric and volumetric water contentswere calculated for borehole cores. The area occupied by wedge ice inthe exposure was estimated with the ImageJ software, version 1.37von black and white composite drawings based on photographs.
Twenty soil samples were analyzed for Total C and N on dried soilsusing a Leco CHN furnace (Spark, 1996, pp. 967–977) and for TotalCalcium Carbonate (Burt, 2004, method 6E1c) by the Soil TestingLaboratory at the Colorado State University. Organic carbon (OC) wascalculated as the difference between Total C and the C fraction in Total
Carbonate. Radiocarbon dating was performed on 11 samples of peatand twigs by National Ocean Sciences AMS Facility, Woods HoleOceanographic Institution.
A preliminary map of yedoma distribution in Alaska was developedby interpretation of Landsat and Quickbird satellite imagery and aerialphotography, in combination with knowledge gained from our fieldstudies and from literature.
Results and discussion
Cryostratigraphy of Itkillik exposure
The Itkillik exposure was subdivided into seven cryostratigraphicunits (Fig. 3C): (1) active layer and transient layerwith thickness from0.5 to 1.0 m; (2) contemporary intermediate layer from 0.5–1.0 to1.5 m depth; (3) yedoma silt with “thin” ice wedges from 1.5 to 13–14 m depth; (4) yedoma silt with “thick” ice wedges from 13–14 to

Figure 3. (A) Geomorphic map of the Itkillik River exposure. (B) Location of boreholes (2B–11B, 13B–15B) and sites of sampling of exposed permafrost (1E, 12E, 17E, 18E).(C) Cryostratigraphic units of the Itkillik yedoma (ice wedges width not to scale) and radiocarbon age of deposits, 14C yr BP.
587M. Kanevskiy et al. / Quaternary Research 75 (2011) 584–596
27–28 m depth; 5) buried peat layer from 27–28 to 29–31 m depth; 6)buried intermediate layer from 29–31 to 30–32 m depth; and 7) siltwith small buried ice wedges from 30–31 to 32.7 m depth. The threelast units were not continuous throughout the entire length of theexposure. Arrows in Figure 3A show locations of buried peat in theexposure. All these units are described below and the cryogenicstructure of soils and their water contents are summarized in Figure 5.
Figure 4. Micro-cryostructures typical of syngenetic permafrost (ice is black).
Unit 1—active and transient layersThe thaw depth measured on August 13, 2007 at the main
yedoma surface varied from 35 to 86 cm with an average depth of62 cm. The thickness of organic material (moss and peat) in theactive layer varied from 4 to 43 cm. Mineral soil of the active layerwas brown-gray silt with fine sand. The active layer was underlainby a transition zone consisting of transient and intermediate layers(Shur, 1988a,b). The contact between the active and the transientlayers had a reticulate cryostructure with prominent vertical iceveins (Figs. 5 and 6A). The gravimetric water content of soil in thetransient layer varied from 35% to 55%. The transient layer isthe uppermost part of permafrost that occasionally joins the activelayer (Yanovsky, 1933; Shur, 1975, 1988a,b). The thickness of thetransient layer varies widely depending on climate and soil, but inmost of cases does not exceed 30% of the active-layer thickness(Shur et al., 2005).
Unit 2—intermediate layerThe intermediate layer is formed by a gradual decrease of the active-
layer thickness after termination of sedimentation (Shur, 1988a,b). Thislayer is extremely ice-rich and usually is 0.5 to 1.5 m thick. Thinningof the active layer can be caused by succession of vegetation, peataccumulation, changes of surface conditions, and other various localfactors (Shur, 1988a,b; Lewkowicz, 1994; Mackay, 1997).

Figure 5. (A) Cryogenic structure and water content. Combined data from separate cores and exposures (locations are shown in Figs. 3A, B): 2B—0-1.5 m; 9B—1.5–4.7 m; 10B—5.1–7.55 m; 11B—10.25–11.44 m; 12E—13.5–15.9 m; 1E—13.5–17.2 m; 13B—20.9–23.5 m; 14B—25.95–28.23 m; 15B—29.5–31.5 m. (B) Gravimetric water content of Itkillik yedoma,combining data from separate cores (labeled B according to Figs. 3A, B) and exposures (labeled E).
588 M. Kanevskiy et al. / Quaternary Research 75 (2011) 584–596
The intermediate layer was described in seven boreholes (2B–8Bin Fig. 3). The maximum thickness of the intermediate layer(measured above ice wedges of Unit 3) was 108 cm (borehole #2B)and averaged 50 cm. The soil of the intermediate layer was mostlyyellow-gray organic silt with some clay and very fine sand, andoccasional inclusions of peat. The layer was dominated by ataxitic(suspended) cryostructure (Fig. 6B). A size of soil inclusions in the icematrix varied from 0.3×0.8 cm to 1.0×3.0 cm with spacing from 0.2to 2.0 cm. Gravimetric water content of soil in the intermediate layervaried from 54% to 223% and averaged 148%. Relatively small activeice wedges were observed in the intermediate layer. Radiocarbon ageof Unit 2 ranged from 5,300 to 8,600 14C yr BP (Table 1, Fig. 3C).
Unit 3—yedoma silt with thin ice wedgesAt ~1.5–2.5 m depth (borehole 9B), sediments with ataxitic
(suspended) cryostructure were similar to those of the intermediatelayer (Fig. 5A). Gravimetric water content varied from 78% to 142%and averaged 109%. From 2.5 m, ataxitic cryostructure graded intomicro-braided cryostructure (Fig. 6E), and the water contentdecreased with depth.
In the depth interval 2.8–5.0 m depth (borehole 9B), the soil wasyellow-gray silt with small and rare inclusions of organicmatter in theform of poorly decomposed rootlets and twigs, mostly with latentmicro-lenticular (“latent” in terms of cryostructural descriptionsmeans that ice lenses are hardly visible with naked eye) and micro-

Figure 6. Examples of cryogenic structure of the Itkillik River sequence. (A) Reticulate cryostructure of the transient layer (borehole 2B, depth 0.37–0.52 m). (B) Ataxiticcryostructure of the intermediate layer (borehole 5B, depth 1.10–1.23 m). (C) Micro-porphyritic cryostructure (borehole 9B, depth 3.92–4.05 m). (D) Latent micro-lenticularcryostructure combined with micro-layered (borehole 13B, depth 21.45–21.65 m). (E) Micro-braided cryostructure (borehole 9B, depth 2.50–2.65 m). (F) Cryostructure transitionalfrom micro-braided to micro-ataxitic (site 12E, depth 15.7 m).
589M. Kanevskiy et al. / Quaternary Research 75 (2011) 584–596
porphyritic (Fig. 6C) cryostructures. Isolated vertical ice veins up to0.3 cm thick were observed from 3.5 to 4.6 m. Gravimetric watercontent of soil in this interval varied from 39% to 57%.
At 5.0–7.5 m depth (borehole 10B), the sediment was similar tothe previous interval. The ice content was low; cryostructures variedbetween micro-porphyritic and latent micro-lenticular. Ice lensestypically were b0.2 mm thick and inclined. Gravimetric water contentin this interval varied from 33% to 37%.
At 10.3–11.9 m depth (borehole 11B), the soil was uniform graysilt with a prevailing micro-porphyritic cryostructure. Gravimetricwater content varied from 40% to 51%. At 11.1–11.3 m, an inclined icevein up to 0.8 cm thick was observed.
The ice wedges of this unit werewide at the top (about 3–4 m) andtheir width decreased significantly with depth. At the bottom part ofthe unit (at depths from 6–8 to 13–14 m) it rarely exceeded 1–2 m.The distance between wedges varied from 7 to 10 m.
Radiocarbon age of the Unit 3 ranged from 14,300 to 29,300 14C yrBP (Table 1, Fig. 3C).
Unit 4—yedoma silt with thick ice wedgesThis unit differs from the unit above mainly by wider ice wedges
whose width reached 5–7 m. The water contents of silt were alsogreater than those of the Unit 3. Micro-cryostructures prevailed in this
unit. Radiocarbon age of the Unit 4 ranged from 23,900 to 41,700 14Cyr BP (Table 1).
From 13.5 to 15.6 m depth (site 12E), soil was gray silt with raresmall inclusions of organic matter. The main cryostructure wasmicro-porphyritic. Gravimetric water content varied from 42 to 51%. From15.6 to 15.9 m depth, silt was ice-rich; cryostructures varied frommicro-braided to micro-ataxitic (Fig. 6F). The visible ice contentvaried from 30% to 50%, and gravimetric water content was 94%.
Soil at the sampling site 1Ewas yellowish-gray siltwith inclusions ofrootlets and twigs. At 13.5–15.3 m depth, the soil was ice-rich; itscryostructure varied from micro-braided to micro-lenticular withseveral ice layers (so-called belts in the Russian permafrost literature)0.2–0.8 cm thick and spaced 1.5–10 cm apart. Gravimetric watercontents varied from 68% to 96%. At 15.3–15.7 m depth, the soil hadmicro-lenticular cryostructure and gravimetric water contents from 61to 101%. Cryostructure of soil from 15.7 to 17.2 m was mainly latentmicro-lenticular and gravimetric water contents decreased downwardfrom 61% to 51%. At 16.6–16.8 m depth, several ice “belts” 0.2–1.0 cmthick spaced 1.0–5.0 cm apart were observed.
From 20.9 to 23.2 m depth (borehole 13B), soil was brownish-graysilt with small inclusions of organic matter. From 20.9 to 22.0 m,cryostructure was mostly latent micro-lenticular (Fig. 6D) andgravimetric water content was 50–66%. At 22.0–23.2 m depth, soil

Table 1Age of the Itkillik yedoma with depth, based on radiocarbon (14C) and thermolumi-nescence (TL) analyses.
Depth,m
Type ofanalysis
Age Lab.number
Material Reference
0.7 14C AMS 5,320±35a OS-66781 peat This study1.3 14C AMS 8,610±35a OS-66782 peat This study3.0 14C AMS 14,300±50a OS-66783 twigs This study4.0 14C AMS 16,550±75a OS-66784 twigs This study7.4 TL 12,600±700 Alpha-3292 loess Carter (1988),
Site 311.0 14C AMS 29,300±200a OS-66785 twigs This study15.0 14C AMS 26,300±130a OS-66786 twigs This study15.0 14C 28,610±270a USGS-1151 fine-grained org. Carter (1988),
Site 215.0 14C 32,300±1500a I-11,530 fine-grained org. Carter (1988),
Site 216.0 14C AMS 23,900±110a OS-66780 twigs This study17.2 14C 21,580±310a AA-2361 herbaceous plant Carter (1988),
Site 317.4 TL 21,800±1200 Alpha-3291 loess Carter (1988),
Site 320.0 TL 34,700±2200 Alpha-3290 loess Carter (1988),
Site 323.0 14C AMS 41,700±460a OS-66787 fine-grained org. This study28.0 14C AMS 15,500±65a,b OS-66776 twigs This study30.9 14C AMS N48,000a OS-66777 peat This study31.8 14C AMS N47,500a OS-66778 fine-grained org. This study
a 14C yr BP.b Date probably invalid.
Figure 7. (A) Buried peat and underlying sediments with small ice wedges (Units 5–7),east part of the Itkillik River exposure, depth 27–32.7 m. (B) Buried peat andintermediate layer (Units 5–6), sampling site 16E, depth 29.5–32 m. Note thick ice“belts” above the handle of shovel.
590 M. Kanevskiy et al. / Quaternary Research 75 (2011) 584–596
had micro-braided to micro-lenticular cryostructure and gravimetricwater contents from 79% to 104%. Wavy ice lenses were inclined withthe angle increasing downwards from 20° to 70°. At 23.2 m, theborehole reached the inclined boundary with the ice wedge.
Soil in the interval 26–28.2 m (borehole 14B) was gray silt withsmall and rare inclusions of organic matter (twigs, rootlets). To thedepth 26.7 m, silt had micro-braided and micro-lenticular cryostruc-tures and gravimetric water contents from 55% to 93%. At 26.7–28.2 m, prevailing cryostructure was latent micro-lenticular. Gravi-metric water contents varied from 45% to 53%.
At 29.5–31.3 m (borehole 15B), the soil was gray silt with mostlylatent micro-lenticular cryostructure and gravimetric water contentsvaried between 41% and 49%. From the depth of 30.9 m, inclined icelenses were observed with angles reaching 50–60°. At 31.3 m, theborehole reached the inclined boundary with the ice wedge. Abovethe wedge, the soil included numerous sub-vertical ice veins up to0.2 cm thick.
Generally, the silt of units 3 and 4 was uniform with occasionalindistinct subhorizontal lamination. Bands visible in the exposed faceare related mainly to cryogenic features (e.g., ice belts) rather thansedimentational.
Unit 5—buried peat below yedomaA buried peat layer (Fig. 7) was observed at the base of the bluff in
thewestern and eastern parts of the exposure (Fig. 3A). In thewesternpart of exposure (site 16E), dark-brown peat grading with depth intoice-rich organic silt with medium sand occurred from 28 to 31.5 mdepth (Fig. 7B). The lower part of the bluff was covered by slumpedsediments. Radiocarbon age of the peaty silt (site 16E, 30.9 m) was48,000 14C yr BP (Table 1, Fig. 3C), which may represent a minimumage for the deposit.
In the eastern part of the exposure (Fig. 7A), the buried peat layerwas observed from 27 to 29 m depth. In some parts of the bluff, thepeat formed a single layer up to 2 m thick while in other locations itcontained two layers divided by organic-rich silt. The ice wedges ofUnit 4 intruded through the peat layer and penetrated into theunderlying sediments, below the Itkillik River water level (Fig. 7A).
The boundary between units 5 and 4 represents a major climaticshift from warmer, wetter conditions to a dry and cold period witheolian activity. Peat layers of similar age associated with middleWisconsinan/Karginsky interstadial were described in severalyedoma exposures in Russia (Kaplina, 1981; Tomirdiaro, 1980;Tomirdiaro and Chernen'kiy, 1987; Hopkins, 1982).
Unit 6—buried intermediate layerIn the east part of exposure, a buried ice-rich intermediate layer
was located from 29 to 30 m between the buried peat layer and anunderlying silt layer, which contained small buried ice wedges(Fig. 7A). The layer had ataxitic (suspended) cryostructure withnumerous ice “belts” up to 5–7 cm thick, which is typical of theintermediate layer (Fig. 7B).
The occurrence of buried intermediate layers in association withburied peat is typical of yedoma. In northern Yakutia, such layers cancompose up to 20–30% of entire yedoma sections (Kanevskiy, 1991,2004). They indicate periods of slower sedimentation, changingclimatic or environmental conditions. Very often such layers can beobserved right below the layers of buried peat or organic soils (Gubin,2002; Kanevskiy, 2004) similarly to Unit 6 of the Itkillik exposure.
Unit 7—silt with short ice wedgesThis unit was observed in the eastern part of the exposure at 30–
32.7 m depth. The soil was composed of silt similar to soil of units 3
591M. Kanevskiy et al. / Quaternary Research 75 (2011) 584–596
and 4 and contained a few short ice wedges b0.7 m wide and 2.5–3 mhigh. The thick wedges of Unit 4 penetrated at places through this unitto below the Itkillik River water level. Development of thick icewedges displaced soils of unit 7 upward along the sides of wedges, sothat mineral soil separated ice wedges from the buried peat (Fig. 7A).This discontinuity in the peat beds could also occur due to theaccumulation of peat only in the wet central parts of low-centeredpolygons.
Soil particle size
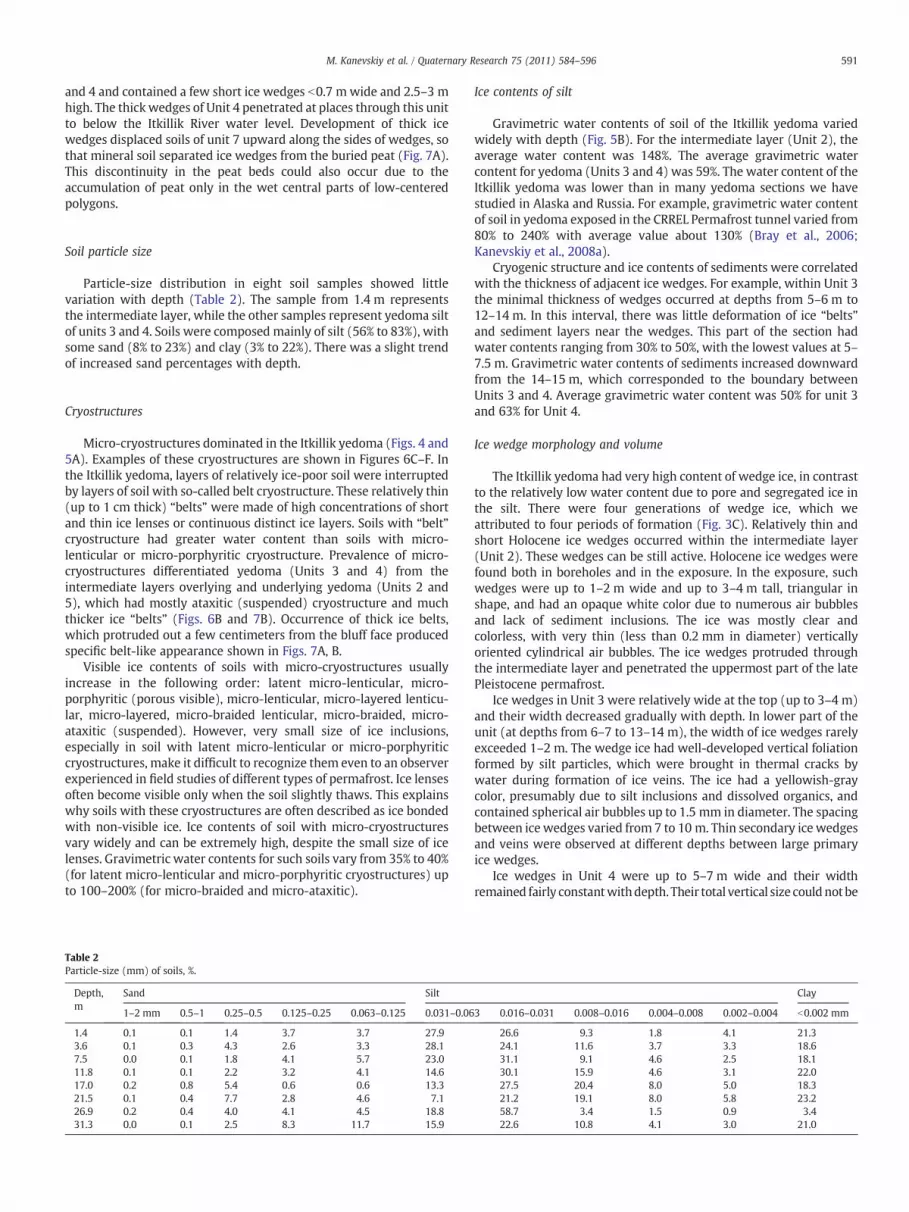
Particle-size distribution in eight soil samples showed littlevariation with depth (Table 2). The sample from 1.4 m representsthe intermediate layer, while the other samples represent yedoma siltof units 3 and 4. Soils were composed mainly of silt (56% to 83%), withsome sand (8% to 23%) and clay (3% to 22%). There was a slight trendof increased sand percentages with depth.
Cryostructures
Micro-cryostructures dominated in the Itkillik yedoma (Figs. 4 and5A). Examples of these cryostructures are shown in Figures 6C–F. Inthe Itkillik yedoma, layers of relatively ice-poor soil were interruptedby layers of soil with so-called belt cryostructure. These relatively thin(up to 1 cm thick) “belts” were made of high concentrations of shortand thin ice lenses or continuous distinct ice layers. Soils with “belt”cryostructure had greater water content than soils with micro-lenticular or micro-porphyritic cryostructure. Prevalence of micro-cryostructures differentiated yedoma (Units 3 and 4) from theintermediate layers overlying and underlying yedoma (Units 2 and5), which had mostly ataxitic (suspended) cryostructure and muchthicker ice “belts” (Figs. 6B and 7B). Occurrence of thick ice belts,which protruded out a few centimeters from the bluff face producedspecific belt-like appearance shown in Figs. 7A, B.
Visible ice contents of soils with micro-cryostructures usuallyincrease in the following order: latent micro-lenticular, micro-porphyritic (porous visible), micro-lenticular, micro-layered lenticu-lar, micro-layered, micro-braided lenticular, micro-braided, micro-ataxitic (suspended). However, very small size of ice inclusions,especially in soil with latent micro-lenticular or micro-porphyriticcryostructures, make it difficult to recognize them even to an observerexperienced in field studies of different types of permafrost. Ice lensesoften become visible only when the soil slightly thaws. This explainswhy soils with these cryostructures are often described as ice bondedwith non-visible ice. Ice contents of soil with micro-cryostructuresvary widely and can be extremely high, despite the small size of icelenses. Gravimetric water contents for such soils vary from 35% to 40%(for latent micro-lenticular and micro-porphyritic cryostructures) upto 100–200% (for micro-braided and micro-ataxitic).
Table 2Particle-size (mm) of soils, %.
Depth,m
Sand Silt
1–2 mm 0.5–1 0.25–0.5 0.125–0.25 0.063–0.125 0.031–0.06
1.4 0.1 0.1 1.4 3.7 3.7 27.93.6 0.1 0.3 4.3 2.6 3.3 28.17.5 0.0 0.1 1.8 4.1 5.7 23.011.8 0.1 0.1 2.2 3.2 4.1 14.617.0 0.2 0.8 5.4 0.6 0.6 13.321.5 0.1 0.4 7.7 2.8 4.6 7.126.9 0.2 0.4 4.0 4.1 4.5 18.831.3 0.0 0.1 2.5 8.3 11.7 15.9
Ice contents of silt
Gravimetric water contents of soil of the Itkillik yedoma variedwidely with depth (Fig. 5B). For the intermediate layer (Unit 2), theaverage water content was 148%. The average gravimetric watercontent for yedoma (Units 3 and 4) was 59%. The water content of theItkillik yedoma was lower than in many yedoma sections we havestudied in Alaska and Russia. For example, gravimetric water contentof soil in yedoma exposed in the CRREL Permafrost tunnel varied from80% to 240% with average value about 130% (Bray et al., 2006;Kanevskiy et al., 2008a).
Cryogenic structure and ice contents of sediments were correlatedwith the thickness of adjacent ice wedges. For example, within Unit 3the minimal thickness of wedges occurred at depths from 5–6 m to12–14 m. In this interval, there was little deformation of ice “belts”and sediment layers near the wedges. This part of the section hadwater contents ranging from 30% to 50%, with the lowest values at 5–7.5 m. Gravimetric water contents of sediments increased downwardfrom the 14–15 m, which corresponded to the boundary betweenUnits 3 and 4. Average gravimetric water content was 50% for unit 3and 63% for Unit 4.
Ice wedge morphology and volume
The Itkillik yedoma had very high content of wedge ice, in contrastto the relatively low water content due to pore and segregated ice inthe silt. There were four generations of wedge ice, which weattributed to four periods of formation (Fig. 3C). Relatively thin andshort Holocene ice wedges occurred within the intermediate layer(Unit 2). These wedges can be still active. Holocene ice wedges werefound both in boreholes and in the exposure. In the exposure, suchwedges were up to 1–2 m wide and up to 3–4 m tall, triangular inshape, and had an opaque white color due to numerous air bubblesand lack of sediment inclusions. The ice was mostly clear andcolorless, with very thin (less than 0.2 mm in diameter) verticallyoriented cylindrical air bubbles. The ice wedges protruded throughthe intermediate layer and penetrated the uppermost part of the latePleistocene permafrost.
Ice wedges in Unit 3 were relatively wide at the top (up to 3–4 m)and their width decreased gradually with depth. In lower part of theunit (at depths from 6–7 to 13–14 m), the width of ice wedges rarelyexceeded 1–2 m. The wedge ice had well-developed vertical foliationformed by silt particles, which were brought in thermal cracks bywater during formation of ice veins. The ice had a yellowish-graycolor, presumably due to silt inclusions and dissolved organics, andcontained spherical air bubbles up to 1.5 mm in diameter. The spacingbetween ice wedges varied from 7 to 10 m. Thin secondary ice wedgesand veins were observed at different depths between large primaryice wedges.
Ice wedges in Unit 4 were up to 5–7 m wide and their widthremained fairly constantwithdepth. Their total vertical size couldnot be
Clay
3 0.016–0.031 0.008–0.016 0.004–0.008 0.002–0.004 b0.002 mm
26.6 9.3 1.8 4.1 21.324.1 11.6 3.7 3.3 18.631.1 9.1 4.6 2.5 18.130.1 15.9 4.6 3.1 22.027.5 20.4 8.0 5.0 18.321.2 19.1 8.0 5.8 23.258.7 3.4 1.5 0.9 3.422.6 10.8 4.1 3.0 21.0
592 M. Kanevskiy et al. / Quaternary Research 75 (2011) 584–596
determined because most of them continued below the Itkillik Riverwater level. Unit 4 also had thin secondary ice wedges between thickprimary ice wedges. Ice wedges in Unit 7, located at the bottom of theexposure beneath the peat layer, were less than 0.7 m inwidth and 2.5–3 m in height. The spacing between ice wedges varied from 3 to 8 m.
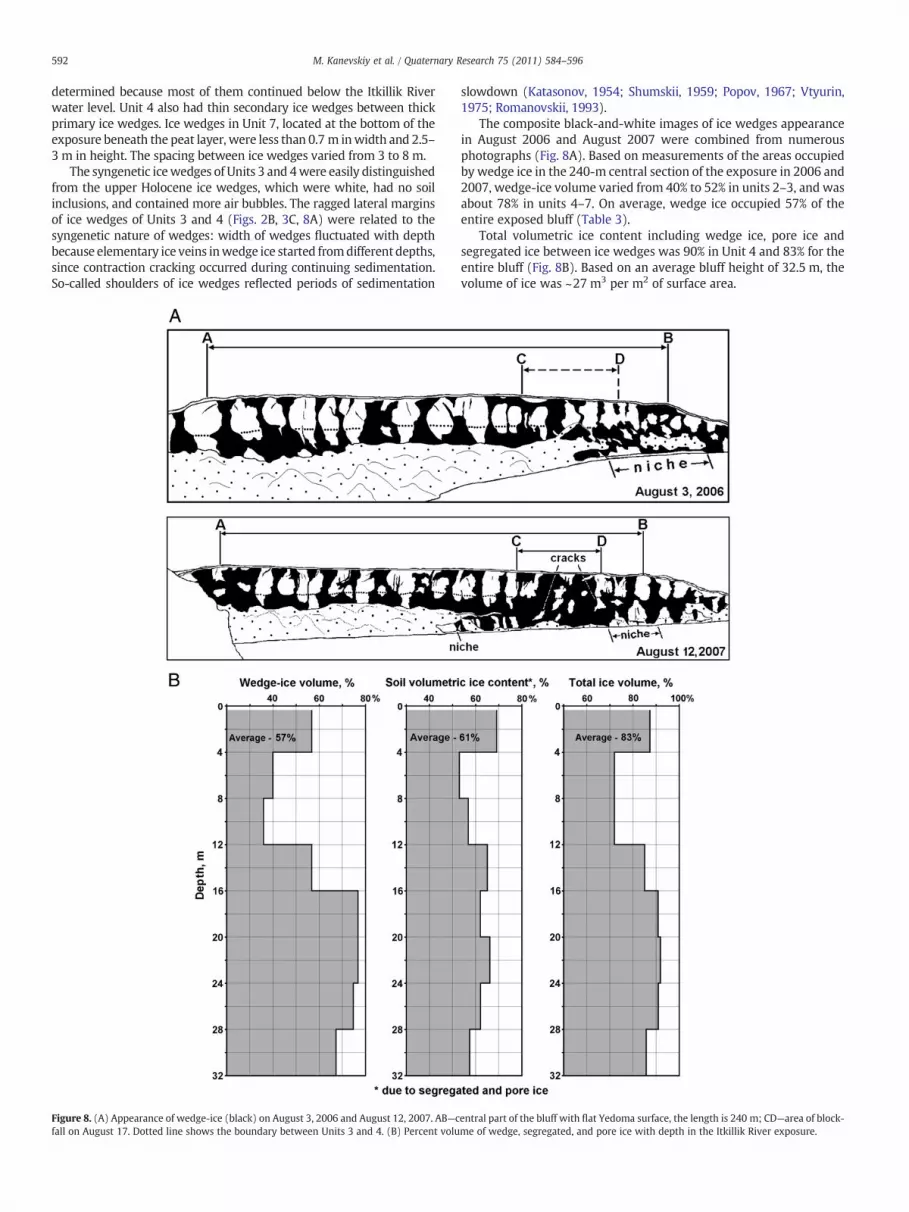
The syngenetic icewedges of Units 3 and 4were easily distinguishedfrom the upper Holocene ice wedges, which were white, had no soilinclusions, and contained more air bubbles. The ragged lateral marginsof ice wedges of Units 3 and 4 (Figs. 2B, 3C, 8A) were related to thesyngenetic nature of wedges: width of wedges fluctuated with depthbecause elementary ice veins inwedge ice started fromdifferent depths,since contraction cracking occurred during continuing sedimentation.So-called shoulders of ice wedges reflected periods of sedimentation
Figure 8. (A) Appearance of wedge-ice (black) on August 3, 2006 and August 12, 2007. AB—cfall on August 17. Dotted line shows the boundary between Units 3 and 4. (B) Percent volu
slowdown (Katasonov, 1954; Shumskii, 1959; Popov, 1967; Vtyurin,1975; Romanovskii, 1993).
The composite black-and-white images of ice wedges appearancein August 2006 and August 2007 were combined from numerousphotographs (Fig. 8A). Based on measurements of the areas occupiedby wedge ice in the 240-m central section of the exposure in 2006 and2007, wedge-ice volume varied from 40% to 52% in units 2–3, and wasabout 78% in units 4–7. On average, wedge ice occupied 57% of theentire exposed bluff (Table 3).
Total volumetric ice content including wedge ice, pore ice andsegregated ice between ice wedges was 90% in Unit 4 and 83% for theentire bluff (Fig. 8B). Based on an average bluff height of 32.5 m, thevolume of ice was ~27 m3 per m2 of surface area.
entral part of the bluff with flat Yedoma surface, the length is 240 m; CD—area of block-me of wedge, segregated, and pore ice with depth in the Itkillik River exposure.
593M. Kanevskiy et al. / Quaternary Research 75 (2011) 584–596
This high volume of ice in the Itkillik yedoma is consistent withestimates by Tomirdiaro and Chernen'kiy (1987) for several yedomasites in Russia. Thawing of this extremely ice-rich material can cause adramatic decrease in elevation of the ground surface. The total thawsettlement of the Itkillik Yedoma can reach 20 m. That is why depthsof thaw-lake basins in yedoma often reach 20–30 m or more(Williams and Yeend, 1979; Ivanov, 1984; Carter, 1988; Hopkinsand Kidd, 1988; Kanevskiy, 2004; Shur et al., 2009; Stephani et al.,2009).
Thermokarst-Cave Ice
The term “thermokarst-cave ice” initially was suggested byShumskii (1959) to describe bodies of massive ice formed by thefreezing of water trapped in underground cavities cut in thepermafrost by running water. In North America, this type of ice wasdescribed as “pool ice” by Mackay (1997). Process of undergroundthermal erosion was observed by French (2007) and Fortier et al.(2007). Studies of yedoma in the CRREL permafrost tunnel revealedthermokarst-cave ice bodies up to 2 m in thickness and 6 m in width,which were underlain by soil with the reticulate-chaotic cryostruc-ture (Shur et al., 2004; Fortier et al., 2008). In exposed part of Itkillikyedoma, we found several bodies of thermokarst-cave ice in themiddle and the lower parts of the bluff. Their width varied from 0.4 mto 3 m and their thickness varied from 0.1 to 1 m. Thermokarst-caveice in the Itkillik yedoma also occurred in combinationwith reticulate-chaotic cryostructure in the underlying silt.
Carbon stocks
Soil carbon in the 31.3-m-deep Itkillik profile comprised mostlyinorganic carbon (IC). IC contents in the active layer were 1.5–1.9%and increased to 2.6–4.6% in samples of frozen silt taken from yedomasoil in between the ice wedges. Mean IC contents in the active layer(1.7%) were about one-half of values in the permafrost (3.7%). Incontrast, organic carbon (OC) contents were 2.8–8.2% in the activelayer and decreased to from 0.01% to 1.7% in the permafrost. Mean OCin the active layer (5.5%) was 12 times greater than that in thepermafrost (0.4%). OC contents of the Itkillik yedoma are relativelylow in comparison with many other yedoma sequences (Zimov et al.,2006; Schirrmeister et al., in press).
When OC contents were summed by layers, carbon stockscalculated from the single profile were 32.5 kg/m2 for the top 1 m,29.4 kg/m2 for the 1–13.5 m increment and 79.9 kg/m2 for the 13.5–31.3 m increment, totaling 141.8 kg/m2 for the entire soil column of31.3 m with the horizontal sequence of 1 m2. When carbon stockswere adjusted for ice-wedge volume (OC assumed to be near zero inwedge ice), the carbon stocks dropped to 32.5, 16.2, and 20.0 kg/m2
for the three increments, respectively, and totaled 68.7 kg/m2 for theentire 31.3 m.
At the Itkillik site, OC made up only 11% of the total carboncontents due to the high carbonate concentrations in the deposit ofwind-blown silt. About 83% of the total volume of the bluff wascomprised of ice. Thus, evaluation of the volume of ice is critical to theaccurate estimation of carbon contents of ice-rich permafrost.
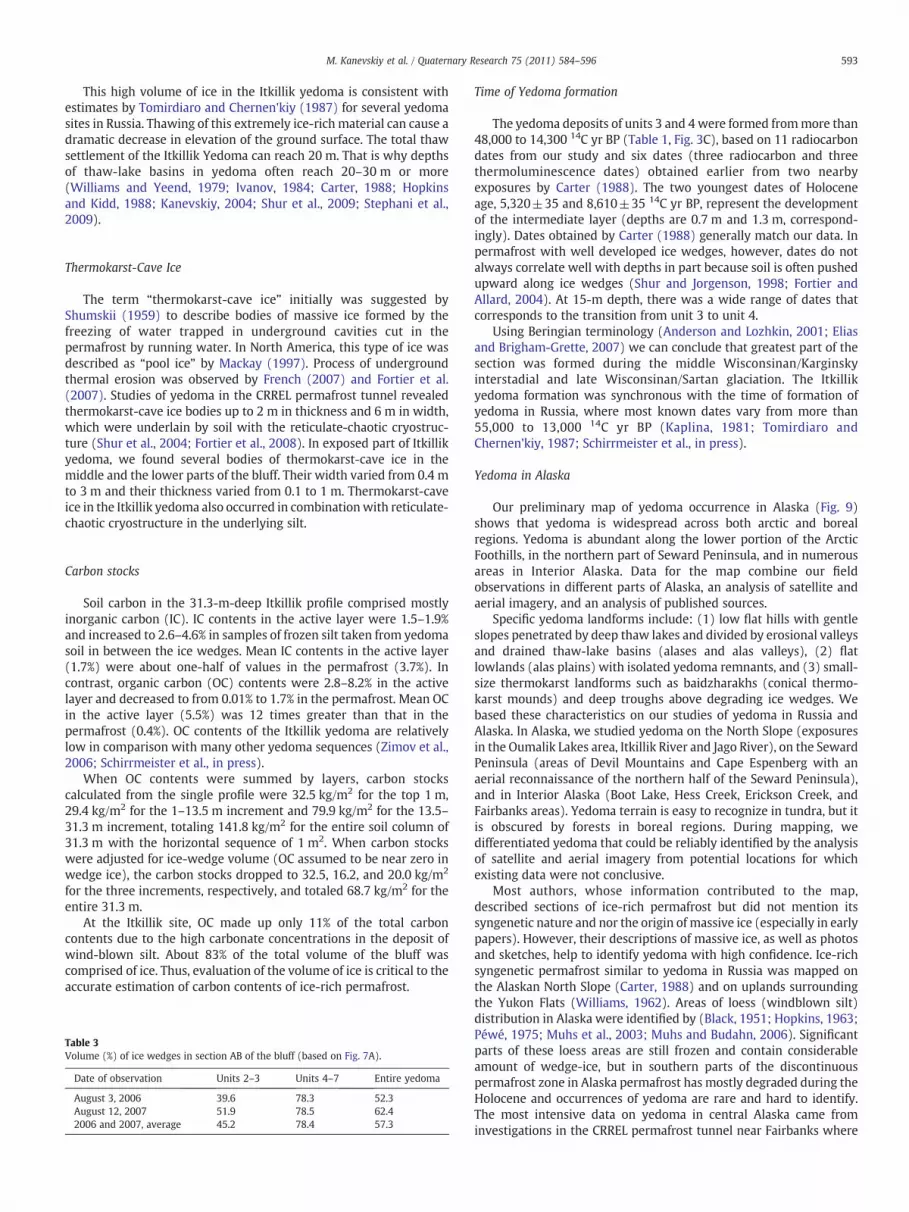
Table 3Volume (%) of ice wedges in section AB of the bluff (based on Fig. 7A).
Date of observation Units 2–3 Units 4–7 Entire yedoma
August 3, 2006 39.6 78.3 52.3August 12, 2007 51.9 78.5 62.42006 and 2007, average 45.2 78.4 57.3
Time of Yedoma formation
The yedoma deposits of units 3 and 4 were formed frommore than48,000 to 14,300 14C yr BP (Table 1, Fig. 3C), based on 11 radiocarbondates from our study and six dates (three radiocarbon and threethermoluminescence dates) obtained earlier from two nearbyexposures by Carter (1988). The two youngest dates of Holoceneage, 5,320±35 and 8,610±35 14C yr BP, represent the developmentof the intermediate layer (depths are 0.7 m and 1.3 m, correspond-ingly). Dates obtained by Carter (1988) generally match our data. Inpermafrost with well developed ice wedges, however, dates do notalways correlate well with depths in part because soil is often pushedupward along ice wedges (Shur and Jorgenson, 1998; Fortier andAllard, 2004). At 15-m depth, there was a wide range of dates thatcorresponds to the transition from unit 3 to unit 4.
Using Beringian terminology (Anderson and Lozhkin, 2001; Eliasand Brigham-Grette, 2007) we can conclude that greatest part of thesection was formed during the middle Wisconsinan/Karginskyinterstadial and late Wisconsinan/Sartan glaciation. The Itkillikyedoma formation was synchronous with the time of formation ofyedoma in Russia, where most known dates vary from more than55,000 to 13,000 14C yr BP (Kaplina, 1981; Tomirdiaro andChernen'kiy, 1987; Schirrmeister et al., in press).
Yedoma in Alaska
Our preliminary map of yedoma occurrence in Alaska (Fig. 9)shows that yedoma is widespread across both arctic and borealregions. Yedoma is abundant along the lower portion of the ArcticFoothills, in the northern part of Seward Peninsula, and in numerousareas in Interior Alaska. Data for the map combine our fieldobservations in different parts of Alaska, an analysis of satellite andaerial imagery, and an analysis of published sources.
Specific yedoma landforms include: (1) low flat hills with gentleslopes penetrated by deep thaw lakes and divided by erosional valleysand drained thaw-lake basins (alases and alas valleys), (2) flatlowlands (alas plains) with isolated yedoma remnants, and (3) small-size thermokarst landforms such as baidzharakhs (conical thermo-karst mounds) and deep troughs above degrading ice wedges. Webased these characteristics on our studies of yedoma in Russia andAlaska. In Alaska, we studied yedoma on the North Slope (exposuresin the Oumalik Lakes area, Itkillik River and Jago River), on the SewardPeninsula (areas of Devil Mountains and Cape Espenberg with anaerial reconnaissance of the northern half of the Seward Peninsula),and in Interior Alaska (Boot Lake, Hess Creek, Erickson Creek, andFairbanks areas). Yedoma terrain is easy to recognize in tundra, but itis obscured by forests in boreal regions. During mapping, wedifferentiated yedoma that could be reliably identified by the analysisof satellite and aerial imagery from potential locations for whichexisting data were not conclusive.
Most authors, whose information contributed to the map,described sections of ice-rich permafrost but did not mention itssyngenetic nature and nor the origin of massive ice (especially in earlypapers). However, their descriptions of massive ice, as well as photosand sketches, help to identify yedoma with high confidence. Ice-richsyngenetic permafrost similar to yedoma in Russia was mapped onthe Alaskan North Slope (Carter, 1988) and on uplands surroundingthe Yukon Flats (Williams, 1962). Areas of loess (windblown silt)distribution in Alaska were identified by (Black, 1951; Hopkins, 1963;Péwé, 1975; Muhs et al., 2003; Muhs and Budahn, 2006). Significantparts of these loess areas are still frozen and contain considerableamount of wedge-ice, but in southern parts of the discontinuouspermafrost zone in Alaska permafrost has mostly degraded during theHolocene and occurrences of yedoma are rare and hard to identify.The most intensive data on yedoma in central Alaska came frominvestigations in the CRREL permafrost tunnel near Fairbanks where
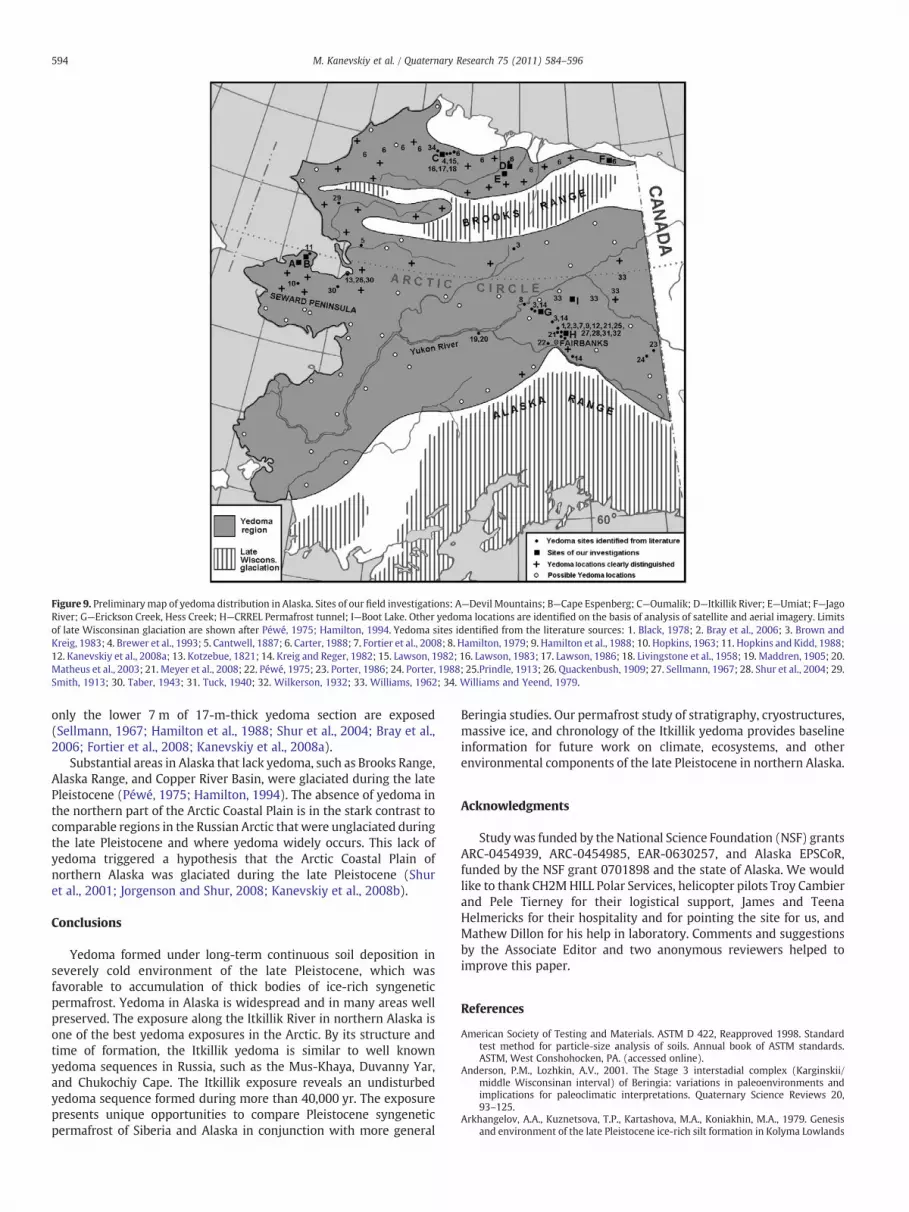
Figure 9. Preliminarymap of yedoma distribution in Alaska. Sites of our field investigations: A—Devil Mountains; B—Cape Espenberg; C—Oumalik; D—Itkillik River; E—Umiat; F—JagoRiver; G—Erickson Creek, Hess Creek; H—CRREL Permafrost tunnel; I—Boot Lake. Other yedoma locations are identified on the basis of analysis of satellite and aerial imagery. Limitsof late Wisconsinan glaciation are shown after Péwé, 1975; Hamilton, 1994. Yedoma sites identified from the literature sources: 1. Black, 1978; 2. Bray et al., 2006; 3. Brown andKreig, 1983; 4. Brewer et al., 1993; 5. Cantwell, 1887; 6. Carter, 1988; 7. Fortier et al., 2008; 8. Hamilton, 1979; 9. Hamilton et al., 1988; 10. Hopkins, 1963; 11. Hopkins and Kidd, 1988;12. Kanevskiy et al., 2008a; 13. Kotzebue, 1821; 14. Kreig and Reger, 1982; 15. Lawson, 1982; 16. Lawson, 1983; 17. Lawson, 1986; 18. Livingstone et al., 1958; 19. Maddren, 1905; 20.Matheus et al., 2003; 21. Meyer et al., 2008; 22. Péwé, 1975; 23. Porter, 1986; 24. Porter, 1988; 25.Prindle, 1913; 26. Quackenbush, 1909; 27. Sellmann, 1967; 28. Shur et al., 2004; 29.Smith, 1913; 30. Taber, 1943; 31. Tuck, 1940; 32. Wilkerson, 1932; 33. Williams, 1962; 34. Williams and Yeend, 1979.
594 M. Kanevskiy et al. / Quaternary Research 75 (2011) 584–596
only the lower 7 m of 17-m-thick yedoma section are exposed(Sellmann, 1967; Hamilton et al., 1988; Shur et al., 2004; Bray et al.,2006; Fortier et al., 2008; Kanevskiy et al., 2008a).
Substantial areas in Alaska that lack yedoma, such as Brooks Range,Alaska Range, and Copper River Basin, were glaciated during the latePleistocene (Péwé, 1975; Hamilton, 1994). The absence of yedoma inthe northern part of the Arctic Coastal Plain is in the stark contrast tocomparable regions in the Russian Arctic that were unglaciated duringthe late Pleistocene and where yedoma widely occurs. This lack ofyedoma triggered a hypothesis that the Arctic Coastal Plain ofnorthern Alaska was glaciated during the late Pleistocene (Shuret al., 2001; Jorgenson and Shur, 2008; Kanevskiy et al., 2008b).
Conclusions
Yedoma formed under long-term continuous soil deposition inseverely cold environment of the late Pleistocene, which wasfavorable to accumulation of thick bodies of ice-rich syngeneticpermafrost. Yedoma in Alaska is widespread and in many areas wellpreserved. The exposure along the Itkillik River in northern Alaska isone of the best yedoma exposures in the Arctic. By its structure andtime of formation, the Itkillik yedoma is similar to well knownyedoma sequences in Russia, such as the Mus-Khaya, Duvanny Yar,and Chukochiy Cape. The Itkillik exposure reveals an undisturbedyedoma sequence formed during more than 40,000 yr. The exposurepresents unique opportunities to compare Pleistocene syngeneticpermafrost of Siberia and Alaska in conjunction with more general
Beringia studies. Our permafrost study of stratigraphy, cryostructures,massive ice, and chronology of the Itkillik yedoma provides baselineinformation for future work on climate, ecosystems, and otherenvironmental components of the late Pleistocene in northern Alaska.
Acknowledgments
Studywas funded by the National Science Foundation (NSF) grantsARC-0454939, ARC-0454985, EAR-0630257, and Alaska EPSCoR,funded by the NSF grant 0701898 and the state of Alaska. We wouldlike to thank CH2MHILL Polar Services, helicopter pilots Troy Cambierand Pele Tierney for their logistical support, James and TeenaHelmericks for their hospitality and for pointing the site for us, andMathew Dillon for his help in laboratory. Comments and suggestionsby the Associate Editor and two anonymous reviewers helped toimprove this paper.
References
American Society of Testing and Materials. ASTM D 422, Reapproved 1998. Standardtest method for particle-size analysis of soils. Annual book of ASTM standards.ASTM, West Conshohocken, PA. (accessed online).
Anderson, P.M., Lozhkin, A.V., 2001. The Stage 3 interstadial complex (Karginskii/middle Wisconsinan interval) of Beringia: variations in paleoenvironments andimplications for paleoclimatic interpretations. Quaternary Science Reviews 20,93–125.
Arkhangelov, A.A., Kuznetsova, T.P., Kartashova, M.A., Koniakhin, M.A., 1979. Genesisand environment of the late Pleistocene ice-rich silt formation in Kolyma Lowlands

595M. Kanevskiy et al. / Quaternary Research 75 (2011) 584–596
(with Chukochy Yar as an example). In: Popov, A.I. (Ed.), Problems of cryolithology,Moscow. Moscow State University, vol. VIII, pp. 110–135 (In Russian).
Begét, J.E., 2001. Continuous Late Quaternary proxy climate records from loess inBeringia. Quaternary Science Reviews 20, 499–507.
Birkengof, A.L., 1933. Observations on forest and permafrost. In: Obruchev, V.A. (Ed.),Proceedings of Commission on Permafrost Studies vol. 3. USSR Academy ofSciences, Leningrad, pp. 41–58 (In Russian).
Black, R.F., 1951. Eolian deposits of Alaska. Arctic 4, 89–111.Black, R.F., 1978. Fabrics of ice wedges in central Alaska. Proceedings of the Third
International Conference on Permafrost, Edmonton, July 10–13, 1978. NationalResearch Council of Canada, Ottawa, pp. 248–253.
Bray, M.T., French, H.M., Shur, Y., 2006. Further cryostratigraphic observations in theCRREL permafrost tunnel, Fox, Alaska. Permafrost and Periglacial Processes 17 (3),233–243.
Brewer, M.C., Carter, L.D., Glenn, R., 1993. Sudden drainage of a thaw lake on the AlaskanArctic Coastal Plain. Proceedings of the Sixth International Conference on Permafrost,July 5–9, Beijing, China. South China University of Technology Press, pp. 48–53.
Brown, J., Kreig, R.A. (Eds.), 1983. Guidebook to permafrost and related features alongthe Elliott and Dalton Highways, Fox to Prudhoe Bay, Alaska. 230 pp.
Burt, R. (Ed.), 2004. Soil Survey Laboratory Methods Manual. Natural ResourceConservation Service, Soil Survey Investigations Report No. 42. 700 pp.
Cantwell, J.C., 1887. A narrative account of the exploration of the Kowak River, Alaska,under the direction of Capt. Michael A. Healy, commanding U.S. Revenue steamerCorwin. In: Healy, M.A. (Ed.), Report of the cruise of the Revenue Marine steamerCorwin in the Arctic Ocean in the year 1885. Government Printing Office,Washington, D.C, pp. 21–52.
Carter, L.D., 1988. Loess and deep thermokarst basins in Arctic Alaska. Proceedings ofthe Fifth International Conference on Permafrost. Tapir publishers, Trondheim,Norway, pp. 706–711.
Elias, S.A., Brigham-Grette, J., 2007. Late Pleistocene events in Beringia. Encyclopedia ofQuaternary Science, pp. 1057–1066.
Fortier, D., Allard, M., 2004. Late Holocene Syngenetic Ice-wedge Polygons Develop-ment, Bylot Island, Canadian Arctic Archipelago. Canadian Journal of Earth Sciences41 (8), 997–1012.
Fortier, D., Allard, M., Pivot, F., 2006. A Late Holocene record of loess deposition in ice-wedge polygons reflecting wind activity and ground moisture conditions, BylotIsland, Eastern Canadian Arctic. The Holocene 16 (5), 635–646.
Fortier, D., Allard, M., Shur, Y., 2007. Observation of rapid drainage system developmentby thermal erosion of ice wedges on Bylot Island, Canadian Arctic Archipelago.Permafrost and Periglacial Processes 18 (3), 229–243.
Fortier, D., Kanevskiy, M., Shur, Y., 2008. Genesis of reticulate-chaotic cryostructure inpermafrost. In: Kane, D.L., Hinkel, K.M. (Eds.), Proceedings of the NinthInternational Conference on Permafrost, June 29 – July 3, 2008, Fairbanks,Alaska: Institute of Northern Engineering, University of Alaska Fairbanks, vol. 1,pp. 451–456.
Fraser, T.A., Burn, C.R., 1997. On the nature and origin of “muck” deposits in theKlondike area, Yukon Territory. Canadian Journal of Earth Sciences 34, 1333–1344.
French, H.M., 2007. The Periglacial Environment, Third Edition. John Wiley and SonsLtd, Chichester, UK. 458 pp.
French, H., Shur, Y., 2010. The principles of cryostratigraphy. Earth-Science Reviews110, 190–206. doi:10.1016/j.earscirev.2010.04.002.
Froese, D.G., Zazula, G.D.,Westgate, J.A., Preece, S.J., Sanborn, P.T., Reyes, A.V., Pearce, N.J.G.,2009. TheKlondikegoldfieldsandPleistoceneenvironmentsof Beringia.GSAToday19(8), 4–10. doi:10.1130/GSATG54A.1.
Gasanov, Sh.Sh., 1963. Morphogenetic classification of cryostructures of frozensediments. Trudy SVKNII, Vol. 3, Magadan (in Russian).
Gasanov, Sh.Sh., 1981. Cryolithological analysis. Nauka, Moscow. 196 pp. (in Russian).Gravis, G.F., 1969. Slope deposits in Yakutia. Nauka, Moscow. 128 pp. (In Russian).Grosse, G., Schirrmeister, L., Siegert, C., Kunitsky, V., Slagoda, E.A., Andreev, A.A.,
Dereviagyn, A.Y., 2007. Geological and geomorphological evolution of a sedimen-tary periglacial landscape in northeast Siberia during the Late Quaternary.Geomorphology 86, 25–51.
Gubin, S.V., 2002. Pedogenesis—a component of mechanism of the late Pleistocene Icecomplex formation. Earth Cryosphere VI (3), 82–91 (In Russian).
Guthrie, R.D., 1990. Frozen Fauna of the Mammoth Steppe: the story of Blue Babe. Univ.Chicago Press, Chicago. 329 pp.
Hamilton, T.D., 1979. Geologic road log, Alyeska haul road, Alaska. June–August 1975:U.S. Geological Survey Open-File Report 79–227. 64 pp.
Hamilton, T.D., 1994. Late Cenozoic glaciation of Alaska. In: Plafker, G., Berg, H.C. (Eds.),The Geology of Alaska. : The Geology of North America, Vol. G-1. Geological Societyof America, Boulder, Colorado, pp. 813–844.
Hamilton, T.D., Craig, J.L., Sellmann, P.V., 1988. The Fox permafrost tunnel: a lateQuaternary geologic record in central Alaska. Geological Society of America Bulletin100, 948–969.
Höfle, C., Ping, C.L., 1996. Properties and soil development of late-Pleistocene paleosolsfrom Seward Peninsula, northwest Alaska. Geoderma 71, 219–243.
Hopkins, D.M., 1963. Geology of the Imuruk Lake area, Seward Peninsula, Alaska. U.S.Geological Survey Bulletin 1141-c 101 pp..
Hopkins, D.M., 1982. Aspects of the paleogeography of Beringia during the latePleistocene. In: Hopkins, Dm., Mathews, J.V., Schweger, C.E., Young, S.B. (Eds.),Paleoecology of Beringia, New York. Academic Press, pp. 3–28.
Hopkins, D.M., Kidd, J.G., 1988. Thaw lake sediments and sedimentary environments.Proceedings of the Fifth International Conference on Permafrost. Tapir publishers,Trondheim, Norway, pp. 790–795.
Ivanov, M.S., 1984. Cryogenic structure of the Quaternary deposits of Lena-Aldanlowland. Nauka, Novosibirsk. 126 pp. (In Russian).
Jorgenson, M.T., Osterkamp, T.E., 2005. Response of boreal ecosystems to varyingmodesof permafrost degradation. Canadian Journal of Forest Research 35, 2100–2111.
Jorgenson, T., Shur, Y., 2008. Glaciation of the Coastal Plain of Northern Alaska. EosTrans. AGU 89 (53) Fall Meet. Suppl., Abstract C11D-0544.
Kanevskiy, M.Z., 1991. The role of quasi-syngenesis in formation of cryogenic structureof Quaternary sediments in Northern Yakutia. In: Melnikov, P.I., Shur, Y.L. (Eds.),The upper horizon of permafrost. Nauka, Moscow, pp. 47–63 (in Russian).
Kanevskiy, M., 2003. Cryogenic structure of mountain slope deposits, northeast Russia.Proceedings of the Eighth International Conference on Permafrost, Zurich,Switzerland, July 21-25, 2003, pp. 513–518. vol. 1.
Kanevskiy, M.Z., 2004. Formation of cryogenic structure of Quaternary sediments ofNorthern Yakutia. Ph.D. thesis. Moscow State University, 179 pp. (in Russian).
Kanevskiy,M., Fortier, D., Shur, Y., Bray,M., Jorgenson, T., 2008a. Detailed cryostratigraphicstudies of syngenetic permafrost in the winze of the CRREL permafrost tunnel, Fox,Alaska. In: Kane, D.L., Hinkel, K.M. (Eds.), Proceedings of the Ninth InternationalConference on Permafrost, June 29–July 3, 2008, Fairbanks, Alaska: Institute ofNorthern Engineering, University of Alaska Fairbanks, vol. 1, pp. 889–894.
Kanevskiy, M., Jorgenson, T., Shur, Y., Dillon, M., 2008b. Buried glacial basal ice along theBeaufort Sea Coast, Northern Alaska. Eos Trans. AGU 89 (53) Fall Meet. Suppl.,Abstract C11D-0531.
Kaplina, T.N., 1981. History of permafrost development in late Cenozoic. In: Dubikov, G.I.,Baulin, V.V. (Eds.), History of development of permafrost in Eurasia. Nauka, Moscow,pp. 153–180 (In Russian).
Katasonov, E.M., 1954. Lithology of frozen Quaternary deposits (cryolithology) of theYana Coastal Plain. PhD Thesis, Obruchev Permafrost Institute (published in 2009,Moscow, PNIIIS), 176 pp. (In Russian)
Katasonov, E.M., 1969. Composition and cryogenic structure of permafrost. NationalResearch Council of Canada, Ottawa, Technical Translation 1358, 25–36.
Katasonov, E.M., 1978. Permafrost-facies analysis as the main method of cryolithology.Proceedings of the Second International Conference on Permafrost, July 13–28, 1973. :USSR Contribution. National Academy of Sciences, Washington, pp. 171–176.
Katasonov, E.M., Ivanov, M.S., 1973. Cryolithology of Central Yakutia. Guidebook, IIInternational Conference on Permafrost, Yakutsk. 38 pp.
Konishchev, V.N., 2009. Climate warming and permafrost. Moscow State University,Geography-Environment-Sustainability 01 (02), 4–19.
Kotler, E., Burn, C.R., 2000. Cryostratigraphy of the Klondike “muck” deposits,westcentral Yukon Territory. Canadian Journal of Earth Sciences 37, 849–861.
Kotov, A.N., 2002. Environment of cryolithogenesis of Ice Complex of Chukotka in thelate Pleistocene. Earth Cryosphere VI (3), 11–14.
Kotzebue, O. von., 1821. A voyage of Discovery into the South Sea and Beering's straits,for the purpose of exploring a north-east passage, undertaken in the years 1815-1818, at the expense of His Highness the Chancellor of the Empire, CountRomanzoff, in the ship Rurick, under the command of the lieutenant in the Russianimperial navy, Otto von Kotzebue. London: Longman, Hurst, Rees, Orme, andBrown, 3 vols.
Kreig, R.A., Reger, R.D., 1982. Air-photo analysis and summary of landform soilproperties along the route of the Trans-Alaska Pipeline System. DGGS, College,Alaska, Geologic report 66. 149 pp.
Kunitskiy, V.V., 1989. Cryolithology of the low Lena River. Permafrost institute,Academy of Sciences of the USSR, Yakutsk. 163 pp. (In Russian).
Lawson, D.E., 1982. Long-termmodifications of perennially frozen sediment and terrainat East Oumalik, northern Alaska. CRREL report 82-36. 33 pp.
Lawson, D.E., 1983. Ground ice in perennially frozen sediments, northern Alaska.Proceedings of the Fourth International Conference on Permafrost. NationalAcademy Press, Washington, DC, pp. 695–700.
Lawson, D.E., 1986. Response of permafrost terrain to disturbance: a synthesis ofobservations from Northern Alaska, U.S.A. Arctic and Alpine Research 18 (1), 1–17.
Lewkowicz, A.G., 1994. Ice-wedge rejuvenation, Fosheim Peninsula, Ellesmere Island,Canada. Permafrost and Periglacial Processes 5, 251–268. doi:10.1002/ppp.3430050405.
Livingstone, D.A., Bryan Jr., K., Leahy, R.G., 1958. Effects of an Arctic environment on theorigin and development of freshwater lakes. Limnology and Oceanography 3,192–214.
Mackay, J.R., 1997. A full-scale experiment (1978–1995) on the growth of permafrostby means of lake drainage, western Arctic coast: a discussion of the method andsome results. Canadian Journal of Earth Sciences 34, 17–33.
Maddren, A.G., 1905. Smithsonian explorations in Alaska in 1904. Smithsonian Misc.Coll. 49, 1–117.
Matheus, P., Begét, J., Mason, O., Gelvin-Reymiller, C., 2003. Late Pliocene to LatePleistocene environments preserved at the Palisades Site, central Yukon River,Alaska. Quaternary Research 60, 33–43.
Melnikov, V.P., Spesivtsev, V.I., 2000. Cryogenic Formations in the Earth's Lithosphere(graphic version). Siberian Publishing Center UIGGM, Siberian Branch of the RASPublishing House, Novosibirsk. 343 pp.
Meyer, H., Dereviagin, A., Siegert, C., Schirrmeister, L., Hubberten, H.-W., 2002.Palaeoclimate reconstruction on Big Lyakhovsky Island, North Siberia—hydrogenand oxygen isotopes in ice wedges. Permafrost and Periglacial Processes 13, 91–106.
Meyer, H., Yoshikawa, K., Schirrmeister, L., Andreev, A., 2008. The Vault Creek Tunnel(Fairbanks Region, Alaska) —a Late Quaternary Palaeoenvironmental PermafrostRecord. In: Kane, D.L., Hinkel, K.M. (Eds.), Proceedings of the Ninth InternationalConference on Permafrost, June 29 – July 3, 2008, Fairbanks, Alaska: Institute ofNorthern Engineering, University of Alaska Fairbanks, vol. 2, pp. 1191–1196.
Muhs, D.R., Budahn, J.R., 2006. Geochemical evidence for the origin of late Quaternaryloess in central Alaska. Canadian Journal of Earth Sciences 43, 323–337.
Muhs, D.R., Ager, T.A., Bettis III, E.A., McGeehin, J., Been, J.M., Begét, J.E., et al., 2003.Stratigraphy and palaeoclimatic significance of Late Quaternary loess–palaeosol

596 M. Kanevskiy et al. / Quaternary Research 75 (2011) 584–596
sequences of the Last Interglacial–Glacial cycle in central Alaska. QuaternaryScience Reviews 22, 1947–1986.
Murton, J.B., French, H.M., 1994. Cryostructures in permafrost, Tuktoyaktuk coastlands,western Arctic Canada. Canadian Journal of Earth Sciences 31, 737–747.
Murzaev, E.M., 1984. Dictionary of folk geographical terms. Mysl, Moscow. 653 pp. (InRussian).
Péwé, T.L., 1975. Quaternary geology of Alaska. U.S. Geological Survey professionalpaper 835. United States Government Printing Office, Washington. 145 pp.
Popov, A.I., 1953. Lithogenesis of alluvial lowlands in the cold climatic conditions.Izvestiya (Transactions) of the USSR Academy of Sciences. Geography 2 (inRussian).
Popov, A.I., 1967. Cryogenic Phenomena in the Earth Crust (Cryolithology). MoscowUniversity Press, Moscow. 304 pp. (in Russian).
Porter, L., 1986. Jack Wade Creek: an in situ Alaskan late Pleistocene vertebrateassemblage. Arctic 39, 297–299.
Porter, L., 1988. Late Pleistocene fauna of Lost Chicken Creek, Alaska. Arctic 41, 303–313.Prindle, L.M., 1913. A geologic reconnaissance of the Fairbanks Quadrangle, Alaska.
USGS Bulletin, 525. Government printing office, Washington. 220 pp.Quackenbush, L.S., 1909. Notes on Alaskan mammoth expeditions. Am. Mus. Nat. Hist.
Bul. 26, 87–130.Romanovskii, N.N., 1958. Paleogeographic conditions of formation of Quaternary
deposits of Bolshoy Lyakhovskiy Island. Moscow State University, Problems ofphysical geography of polar countries 1, 80–88 (in Russian).
Romanovskii, N.N., 1993. Fundamentals of Cryogenesis of Lithosphere. MoscowUniversity Press, Moscow. 336 pp. (in Russian).
Romanovskii, N.N., Hubberten, H.-W., Gavrilov, A.V., Tumskoy, V.E., Kholodov, A.L.,2004. Permafrost of the east Siberian Arctic shelf and coastal lowlands. QuaternaryScience Reviews 23, 1359–1369.
Schirrmeister, L., Meyer, H., Wetterich, S., et al., 2008. The Yedoma Suite of theNortheastern Siberian Shelf region: characteristics and concept of formation. In:Kane, D.L., Hinkel, K.M. (Eds.), Proceedings of the Ninth International Conferenceon Permafrost, June 29–July 3, 2008, Fairbanks, Alaska: Institute of NorthernEngineering, University of Alaska Fairbanks, vol. 2, pp. 1595–1600.
Schirrmeister, L., Kunitsky, V., Grosse, G., Wetterich, S., Meyer, H., Schwamborn, G.,Babiy, O., Derevyagin, A., Siegert, C. in press. Sedimentary characteristics and originof the Late Pleistocene Ice Complex on North-East Siberian Arctic coastal lowlandsand islands—a review. Quaternary International. doi:10.1016/j.quaint.2010.04.004.
Sellmann, P.V., 1967. Geology of the USA CRREL permafrost tunnel, Fairbanks, Alaska.Hanover, New Hampshire, US Army CRREL Technical Report 199. 22 pp.
Sher, A.V., 1997. A brief overview of the late Cenozoic history of the western Beringianlowlands. In: Edwards, M.E., Sher, A.V., Guthrie, R.D. (Eds.), Terrestrial paleoenvir-onmental studies in Beringia. Proceedings of a joint Russian-American Workshop.Fairbanks, Alaska June 1991. Alaska Quaternary Center, pp. 3–7.
Sher, A.V., Kuzmina, S.A., Kuznetsova, T.V., Sulerzhitsky, L.D., 2005. New insights intothe Weichselian environment and climate of the East Siberian Arctic, derived fromfossil insects, plants, and mammals. Quaternary Science Reviews 24, 533–569.
Shumskii, P.A., 1959. Ground (subsurface) ice. Principles of geocryology, Part I, Generalgeocryology: Academy of Sciences of the USSR, Moscow, Chapter IX, pp. 274–327(in Russian) (English translation: C. de Leuchtenberg, 1964, National ResearchCouncil of Canada, Ottawa, Technical Translation 1130, 118 p).
Shur, Y.L., 1975. On the transient layer. Methods of permafrost studies. VSEGINGEO,Moscow, pp. 82–85 (in Russian).
Shur, Y.L., 1988a. Upper horizon of permafrost and thermokarst. Nauka, Novosibirsk.210 pp. (in Russian).
Shur, Y.L., 1988b. The upper horizon of permafrost soils. Proceedings of the FifthInternational Conference on Permafrost. Tapir Publishers, Trondheim: Norway,pp. 867–871. Vol. 1.
Shur, Y., Jorgenson, M.T., 1998. Cryostructure development on the floodplain of ColvilleRiver Delta, Northern Alaska. Permafrost, Proceedings of 7th InternationalConference, Yellowknife, Canada, pp. 993–999.
Shur, Y., Romanovsky, V., Jorgenson, M., 2001. Lack of yedoma as evidence of LatePleistocene glaciation on the Arctic Coastal Plain. Proceedings 52nd Arctic ScienceConference. AAAS, Fairbanks, p. 106.
Shur, Y., French, H.M., Bray, M.T., Anderson, D.A., 2004. Syngenetic permafrost growth:cryostratigraphic observations from the CRREL Tunnel near Fairbanks, Alaska.Permafrost and Periglacial Processes 15 (4), 339–347.
Shur, Y., Hinkel, K.M., Nelson, F.E., 2005. The transient layer: implications forgeocryology and climate-change science. Permafrost and Periglacial Processes 16(1), 5–17.
Shur, Y., Kanevskiy, M.Z., Jorgenson, M.T., Fortier, D., Dillon, M., Stephani, E., Bray, M.,2009. Yedoma and thermokarst in the northern part of Seward Peninsula, Alaska.Eos Trans. AGU 90 (52) Fall Meet. Suppl., Abstract C41A-0443.
Slagoda, E.A., 2004. Cryolithogenic deposits of the coastal plain of Laptev Sea: lithologyand micromorphology (Bykovskiy Peninsula and Muostakh Island). Express,Tyumen. 120 pp. (in Russian).
Smith, P.S., 1913. The Noatak-Kobuk region, Alaska. U.S. Geological Survey Bulletin 536160 pp.
Spark, D.L. (Ed.), 1996. Methods of Soil Analysis: Part 3. Chemical Methods. Soil ScienceSociety of America, Inc, Madison, Wisconsin.
Stephani, E., Dillon, M., Fortier, D., Jorgenson, T., Kanevskiy, M.Z., Shur, Y., 2009.Geomorphological characteristics of Yedoma terrains in the northern part ofSeward Peninsula, Alaska. Eos Trans. AGU 90 (52) Fall Meet. Suppl., Abstract C41A-0435.
Taber, S., 1943. Perennially frozen ground in Alaska: its origin and history. Bulletin ofthe Geological Society of America 54, 1433–1548.
Tomirdiaro, S.V., 1980. Loess-ice formation of Eastern Siberia in the late Pleistocene andHolocene. Nauka, Moscow. 184 pp. (in Russian).
Tomirdiaro, S.V., Chernen'kiy, B.I., 1987. Cryogenic-eolian deposits of east Arctic andSub-Arctic. Nauka, Moscow. 196 pp. (in Russian).
Tuck, R., 1940. Origin of the muck-silt deposits at Fairbanks, Alaska. Bulletin of theGeological Society of America 51, 1295–1310.
Vasil'chuk, Y.K., 1992. Oxigen isotope composition of ground ice (application topaleogeocryological reconstructions). Moscow State University. 2 vols: 420 pp., 264pp. (in Russian).
Vtyurin, B.I., 1975. Ground ice in the USSR. Nauka, Moscow. 215 pp. (in Russian).Walter, K.M., Edwards, M.E., Grosse, G., Zimov, S.A., Chapin III, F.S., 2007. Thermokarst
lakes as a source of atmospheric CH4 during the last deglaciation. Science 318,633–636. doi:10.1126/science.1142924.
Wilkerson, A.S., 1932. Some frozen deposits in the goldfields of interior Alaska.American Museum Novitates 525. 22 pp.
Williams, J.R., 1962. Geologic reconnaissance of the Yukon Flats district, Alaska. U.S.Geological Survey Bulletin 111-H, Washington, DC, pp. 290–311.
Williams, J.R., Yeend, W.E., 1979. Deep thaw lake basins in the inner Arctic Coastal Plain,Alaska. In: Johnson, K.M., Williams, J.R. (Eds.), U.S. Geological Survey in Alaska:accomplishments during 1978: USGS Circular, 804-B, pp. B35–B37.
Yanovsky, V.K., 1933. Expedition to Pechora River to determine the position of thesouthern permafrost boundary. Reports of the Committee for Permafrost Investiga-tions, Vol. 5(2). Akademiia Nauk SSSR, Moscow-Leningrad, pp. 65–149 (in Russian).
Yurtsev, B.A., 1981. Relic steppe complexes of North-East Asia. Nauka, Novosibirsk. 168pp (in Russian).
Zhestkova, T.N., 1982. Formation of cryogenic structure of soils. Nauka, Moscow. 216pp. (in Russian).
Zhestkova, T.N., Shvetsov, P.F., Shur, Y.L., 1982. Yedoma, a climatic formation.XI congressofInternational Union for Quaternary Research, Moscow, 1982: Abstracts, vol. II, p. 389.
Zhestkova, T.N., Shvetsov, P.F., Shur, Y.L., 1986. On genesis of yedoma. In: Ershov, E.D.(Ed.), Geocryology Studies. Moscow State University, Moscow, pp. 108–113.
Zimov, S.A., Voropaev, Y.V., Semiletov, I.P., Davidov, S.P., et al., 1997. North Siberianlakes: a methane source fueled by Pleistocene carbon. Science 277, 800–802.
Zimov, S.A., Schuur, E.A.G., Chapin III, F.S., 2006. Permafrost and the global carbonbudget. Science 312, 1612–1613. doi:10.1126/science.1128908.