Crustal structure under the central High Atlas Mountains (Morocco) from geological and gravity data
18
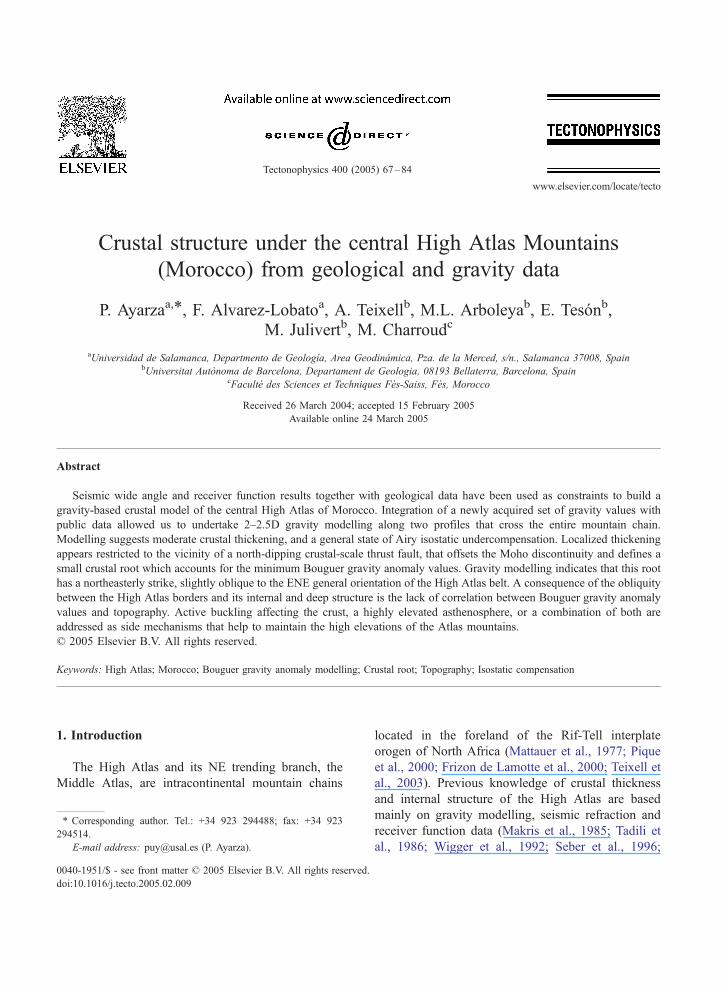
Crustal structure under the central High Atlas Mountains (Morocco) from geological and gravity data P. Ayarza a, T , F. Alvarez-Lobato a , A. Teixell b , M.L. Arboleya b , E. Teso ´n b , M. Julivert b , M. Charroud c a Universidad de Salamanca, Departmento de Geologı ´a, Area Geodina ´mica, Pza. de la Merced, s/n., Salamanca 37008, Spain b Universitat Auto `noma de Barcelona, Departament de Geologia, 08193 Bellaterra, Barcelona, Spain c Faculte ´ des Sciences et Techniques Fe `s-Saiss, Fe `s, Morocco Received 26 March 2004; accepted 15 February 2005 Available online 24 March 2005 Abstract Seismic wide angle and receiver function results together with geological data have been used as constraints to build a gravity-based crustal model of the central High Atlas of Morocco. Integration of a newly acquired set of gravity values with public data allowed us to undertake 2–2.5D gravity modelling along two profiles that cross the entire mountain chain. Modelling suggests moderate crustal thickening, and a general state of Airy isostatic undercompensation. Localized thickening appears restricted to the vicinity of a north-dipping crustal-scale thrust fault, that offsets the Moho discontinuity and defines a small crustal root which accounts for the minimum Bouguer gravity anomaly values. Gravity modelling indicates that this root has a northeasterly strike, slightly oblique to the ENE general orientation of the High Atlas belt. A consequence of the obliquity between the High Atlas borders and its internal and deep structure is the lack of correlation between Bouguer gravity anomaly values and topography. Active buckling affecting the crust, a highly elevated asthenosphere, or a combination of both are addressed as side mechanisms that help to maintain the high elevations of the Atlas mountains. D 2005 Elsevier B.V. All rights reserved. Keywords: High Atlas; Morocco; Bouguer gravity anomaly modelling; Crustal root; Topography; Isostatic compensation 1. Introduction The High Atlas and its NE trending branch, the Middle Atlas, are intracontinental mountain chains located in the foreland of the Rif-Tell interplate orogen of North Africa (Mattauer et al., 1977; Pique et al., 2000; Frizon de Lamotte et al., 2000; Teixell et al., 2003). Previous knowledge of crustal thickness and internal structure of the High Atlas are based mainly on gravity modelling, seismic refraction and receiver function data (Makris et al., 1985; Tadili et al., 1986; Wigger et al., 1992; Seber et al., 1996; 0040-1951/$ - see front matter D 2005 Elsevier B.V. All rights reserved. doi:10.1016/j.tecto.2005.02.009 T Corresponding author. Tel.: +34 923 294488; fax: +34 923 294514. E-mail address: [email protected] (P. Ayarza). Tectonophysics 400 (2005) 67– 84 www.elsevier.com/locate/tecto
Transcript of Crustal structure under the central High Atlas Mountains (Morocco) from geological and gravity data
www.elsevier.com/locate/tecto
Tectonophysics 400
Crustal structure under the central High Atlas Mountains
(Morocco) from geological and gravity data
P. Ayarzaa,T, F. Alvarez-Lobatoa, A. Teixellb, M.L. Arboleyab, E. Tesonb,
M. Julivertb, M. Charroudc
aUniversidad de Salamanca, Departmento de Geologıa, Area Geodinamica, Pza. de la Merced, s/n., Salamanca 37008, SpainbUniversitat Autonoma de Barcelona, Departament de Geologia, 08193 Bellaterra, Barcelona, Spain
cFaculte des Sciences et Techniques Fes-Saiss, Fes, Morocco
Received 26 March 2004; accepted 15 February 2005
Available online 24 March 2005
Abstract
Seismic wide angle and receiver function results together with geological data have been used as constraints to build a
gravity-based crustal model of the central High Atlas of Morocco. Integration of a newly acquired set of gravity values with
public data allowed us to undertake 2–2.5D gravity modelling along two profiles that cross the entire mountain chain.
Modelling suggests moderate crustal thickening, and a general state of Airy isostatic undercompensation. Localized thickening
appears restricted to the vicinity of a north-dipping crustal-scale thrust fault, that offsets the Moho discontinuity and defines a
small crustal root which accounts for the minimum Bouguer gravity anomaly values. Gravity modelling indicates that this root
has a northeasterly strike, slightly oblique to the ENE general orientation of the High Atlas belt. A consequence of the obliquity
between the High Atlas borders and its internal and deep structure is the lack of correlation between Bouguer gravity anomaly
values and topography. Active buckling affecting the crust, a highly elevated asthenosphere, or a combination of both are
addressed as side mechanisms that help to maintain the high elevations of the Atlas mountains.
D 2005 Elsevier B.V. All rights reserved.
Keywords: High Atlas; Morocco; Bouguer gravity anomaly modelling; Crustal root; Topography; Isostatic compensation
1. Introduction
The High Atlas and its NE trending branch, the
Middle Atlas, are intracontinental mountain chains
0040-1951/$ - see front matter D 2005 Elsevier B.V. All rights reserved.
doi:10.1016/j.tecto.2005.02.009
T Corresponding author. Tel.: +34 923 294488; fax: +34 923
294514.
E-mail address: [email protected] (P. Ayarza).
located in the foreland of the Rif-Tell interplate
orogen of North Africa (Mattauer et al., 1977; Pique
et al., 2000; Frizon de Lamotte et al., 2000; Teixell et
al., 2003). Previous knowledge of crustal thickness
and internal structure of the High Atlas are based
mainly on gravity modelling, seismic refraction and
receiver function data (Makris et al., 1985; Tadili et
al., 1986; Wigger et al., 1992; Seber et al., 1996;
(2005) 67–84
P. Ayarza et al. / Tectonophysics 400 (2005) 67–8468
Sandvol et al., 1998; Mickus and Jallouli, 1999; Van
der Meijde et al., 2003). The refraction data sets in
which some interpretations are based have not been
thoroughly presented and often have poor quality. In
addition, the resulting crustal models have not been
integrated with geological data. On the other side,
receiver function data give only 1D velocity informa-
tion that cannot be extrapolated without additional
information. Few existing gravity models show
varying results regarding depth and density of the
different crustal layers. Therefore, the overall crustal
structure and thickness across the High Atlas is partly
unresolved.
In this paper we present two gravity-based crustal
models along two geological transects across the
central High Atlas of Morocco described by Teixell et
al. (2003). These models are constrained by the
available seismic refraction and local receiver func-
tion results, and are integrated with detailed geo-
logical cross-sections. The final crustal sections are in
accordance with the pre-existing geophysical models
regarding crustal thickness, and offer a more complete
view of the crust across the High Atlas. The modelled
crustal structure is compared with other intraconti-
nental mountain belts where earlier rifts have been
tectonically inverted by compression. Finally, we
briefly discuss the mechanisms that support the high
topography of the Atlas mountains.
2. Geological and geophysical overview
The intraplate Atlas mountain belt extends for
more than 2000 km in an E–W direction from
Morocco into Algeria and Tunisia (Fig. 1). It is
composed of faulted and folded Paleozoic, Mesozoic
and Cenozoic rocks with summits that in its western
side reach more than 4000 m. To the north and
northeast, the High Atlas of Morocco is bounded by
the Meseta and the High Plateaux respectively, and to
the south by the Anti-Atlas (Fig. 1), a mountain chain
where topographic elevation is locally in excess of
2000 m, and by the Saharan Platform.
Previous works have shown that the structure of
the High Atlas resulted from the tectonic inversion of
a Mesozoic extensional basin, genetically related to
the opening of the Atlantic and Tethys ocean
(Choubert and Faure-Muret, 1962; Mattauer et al.,
1977; Schaer, 1987; Jacobshagen et al., 1988;
Beauchamp et al., 1999; Laville and Pique, 1992;
Pique et al., 2000). Compression related to conver-
gence between Africa and Europe occurred from
Cenozoic to present times (Laville et al., 1977; Dutour
and Ferrandini, 1985; Gorler et al., 1988; Fraissinet et
al., 1988; Medina and Cherkaoui, 1991; El Harfi et
al., 1996; Morel et al., 1993, 2000, etc.). The average
compression direction was NNW–SSE according to
Mattauer et al. (1977) and Gomez et al. (2000).
Shortening was mainly achieved by thick-skinned
thrusting and folding, affecting the pre-Mesozoic
basement and a Mesozoic–Cenozoic cover. Thin-
skinned thrusting usually played a minor role and
appears related to basement underthrusting (Teixell et
al., 2003). According to the recent work by these
authors, the total shortening due to Cenozoic com-
pression varies between 15% and 24% from west to
east along the central High Atlas.
Rifting-related Triassic and Jurassic igneous rocks
are widespread in the study area (Hailwood and
Mitchell, 1971). In addition, Tertiary and Quaternary
alkaline volcanism (Harmand and Catagrel, 1984) has
been identified in the Middle Atlas, the Meseta, the
High Plateaux, the northern part of the High Atlas,
and in the Anti-Atlas. The tectonic context in which
this volcanism appears is not fully understood yet and
was explained by Harmand and Moukadiri (1986) as
the result of upper mantle deformation which permit-
ted partial melting in a compressive regime.
Seismic refraction studies provided the first esti-
mations of crustal thickness across the High Atlas.
Tadili et al. (1986) modelled refraction/wide angle
data from an experiment carried out in 1975,
concluding that the crustal thickness varies from 25
km along the Atlantic coast of Morocco to 40 km near
Imilchil in the central High Atlas. To the east, these
authors found values of 38 km in the Midelt-Rich
area, descending to 35 km around Errachidia (see Fig.
1 for location). Part of the same data were also
interpreted by Makris et al. (1985) who, in addition,
modelled gravity data using densities (converted from
velocities) of 2820 kg/m3 and 2900 kg/m3 for the
upper and lower crust respectively. These authors
concluded that crustal thickness of the western High
Atlas, the most elevated part of the orogen (south of
Marrakech), ranges from 34 to 38 km, depending on
the assumed thickness of the sedimentary cover.
Fig. 1. (a) Location map of the Atlas mountain chains in the North African foreland. (b) Geological map of the central High Atlas (after Teixell et al., 2003), indicating the area
corresponding to Fig. 2 and the profiles under analysis in Figs. 2–5.
P.Ayarza
etal./Tecto
nophysics
400(2005)67–84
69
P. Ayarza et al. / Tectonophysics 400 (2005) 67–8470
Another seismic refraction experiment was carried out
further to the east in 1986 (Wigger et al., 1992). The
resulting model show that the crust is thickest under-
neath the northern border of the High Atlas near
Midelt, reaching 38–39 km, and thins to the south and
north to 35 km. A coincident magnetotelluric survey
(Schwarz et al., 1992) revealed the existence of a
north-dipping high-conductivity zone in the crust
starting near the surface in the southern border of
the High Atlas (Errachidia). According to these
authors, the conductive zone admitted two alternative
solutions: either it could flatten down at mid crustal
levels or it could plunge continuously northwards to
lower crustal depths.
Additional information about crustal thickness in
the Atlas region has been recently obtained by
receiver function studies. Their results show that the
Mohorovicic discontinuity under Midelt (in the plains
north of the High Atlas; see Fig. 1 for location) is
located at 36 km according to Sandvol et al. (1998) or
at 39 km according to Van der Meijde et al. (2003).
Both results may be compatible if we consider that
Sandvol et al. (1998) found in fact two velocity
jumps, at 36 and 39 km. The shallowest one was
interpreted by them as the crust–mantle boundary,
whereas the deepest one remained uninterpreted. In
general, receiver function results are in good agree-
ment with those of wide angle experiments (see
above).
These geophysical results, combined with estima-
tions of tectonic shortening, suggest that the high
topography of the Atlas cannot be supported by
crustal thickening alone, and therefore the mantle may
play an important role (Teixell et al., 2003; Arboleya
et al., 2004). In fact, low-resolution gravity modelling
carried out by Seber et al. (2001) over North Africa
and the Middle East suggests that the crust underneath
the High Atlas of Morocco is about 5 km thinner than
expected if topography was to be compensated at the
Moho level. On the other hand, Mickus and Jallouli
(1999) suggested that the Saharan and Tunisian Atlas
(Fig. 1a) are partially isostatically compensated, with
regions of overcompensation in Algeria that may be
due to low density material in the upper crust. Finally,
seismic tomography seems to indicate a hot, low
velocity mantle underneath the High Atlas (Seber et
al., 1996). This interpretation is supported by heat
flow data which, although scarce in the High Atlas,
yields values of 54 mW/m2, and much higher in the
Middle Atlas (85 mW/m2; Rimi, 1999).
3. Gravity data
The gravity data used for this study have been
obtained from publicly available worldwide databases
and from local sources, and have been complemented
with new measurements acquired in the High Atlas.
Bouguer gravity data (Figs. 2 and 3) come from the
Moroccan gridded data sets (Hildenbrand et al., 1988).
Topography and free air gravity data (Fig. 2) are taken
from the TOPEX 2-min gravity data set (ftp://
topex.ucsd.edu/pub; Sandwell and Smith, 1997).
Additional gravity measurements have been acquired
during 2002 and 2003 using a Scintrex CG-3 micro-
gravimeter. Gravity sampling, carried out in the eastern
and central parts of the High Atlas of Morocco (Fig. 4),
aimed to improve the short wavelength component of
the gravity anomaly along two NNW–SSE transects,
coincident with geological cross-sections published by
Teixell et al. (2003). These are the Imilchil profile
(from Tinerhir to Khenifra) in the west, and the Midelt-
Errachidia corridor in the east (sections A–AV and
B–BV in Figs. 1, 2 and 4). An absolute gravity base
station located at Ifrane (Middle Atlas), 100 km north
of the High Atlas, was used to build a set of second-
order base stations in the High Atlas. The sampling
spacing of the new data set is around 1 km in the
north–south direction and between 1 and 3 km in the
east–west direction. This gives gravity information of
higher resolution than the pre-existing data sets, where
the spacing between samples was around 5 km in the
plains and much larger in mountain areas (see points in
Fig. 4 for an estimation of the spacing of sampling).
The newly acquired data have been corrected for
topography using the digital 0.5-min topographic
database of Seber et al. (2001), and a reference density
of 2600 kg/m3, which is the average density of the
outcropping rocks. Free air and Bouguer plate correc-
tions have also been applied. Density used for the
Bouguer plate correction was 2670 kg/m3. Finally, the
resulting values have been merged with the pre-
existing Bouguer gravity anomaly data set, showing
a good correlation with it (Fig. 4).
We integrate Bouguer and free air gravity anomaly
maps with topography (Figs. 2 and 3) to make

Fig. 2. (a) Combined topography contour and Bouguer gravity anomaly map of the central High Atlas. Contour interval is 200 m. Bouguer
anomaly values in the colour scale to the right of the figure. Note that minimum Bouguer anomaly values (dark purple) do not always coincide
with the highest elevations. (b) Combined contoured topography and free air anomaly map of the same area. Contour interval is 200 m. Free air
gravity anomaly amplitudes in the scale to the right of the figure.
P. Ayarza et al. / Tectonophysics 400 (2005) 67–84 71
qualitative estimations of the degree of correlation
between gravity and elevation, and accordingly, of the
isostatic state. It is worth mentioning that the free air
gravity anomaly data have a resolution of 2 min,
whereas in the Bouguer gravity anomaly data set the
resolution ranges from 1.8 to 3 min. Resolution of the
TOPEX topographic data set is also 2 min, and
therefore the three data sets may be integrated for a
qualitative interpretation. The newly acquired gravity
data set is used together with the public Bouguer
anomaly map and with a denser topographic database
(Seber et al., 2001) to undertake 2–2.5D forward
Observed Bouguer Gravity Anomaly Observed Bouguer Gravity Anomaly
Theoretical Bouguer Gravity AnomalyTopography
0 20 40 60 80 100 0 20 40 60 80 100
mG
al
-120
-115
-110
-105
-100
-95
-90
-85 2400
2200
2000
1800
1600
1400
1200
1000
(c)-75
-100
-125
-150
-175
-200
-225
-250
-275
Distance (km) Distance (km)
(d)
-180
-160
-140
-120
-100
-80
-60
mG
al
3500
3000
2500
2000
1500
1000
500
(a)
1501005025 75 1250
Distance (km) Distance (km)
(b)
mG
al
met
ers
met
ers
1501005025 75 1250
-50
-100
-150
-200
-250
-300
-350
mG
al
Fig. 3. (a) Elevation and Bouguer gravity anomaly values along profile A–AV (see location in Fig. 2). In this case, the correlation between both
variables is good and long wavelength minimum anomaly values coincide with highest topographies. (b) Difference between the observed and
the theoretical Bouguer anomaly calculated for an isostatically compensated topography (Airy model) along section A–AV. Calculated values
are more negative than the observed ones suggesting undercompensation at a crustal level. (c) Elevation and Bouguer anomaly values for profile
B–BV. Highest topography is in an area of strong anomaly gradient and does not coincide with the minimum Bouguer anomaly values. (d)
Difference between the observed and the theoretical Bouguer anomaly calculated for an isostatically compensated topography (Airy model)
along section B–BV. Observed and calculated values show large differences mostly in the northern half of the section suggesting
undercompensation and an anomalous Moho topography. See discussion in the text.
P. Ayarza et al. / Tectonophysics 400 (2005) 67–8472
gravity modelling across the two transects of the
central High Atlas (Fig. 4).
3.1. Relation between gravity anomalies and
topography
Bouguer gravity anomaly values range from �75
to �160 mgal in the central High Atlas (Fig. 2a).
Minimum values are found close to the southern
border of the central and western parts of the central
High Atlas, and in spite of being located in an area of
high topography, they do not coincide with the highest
summits, which lie further north. In the Midelt region,
the highest topographic elevations do not coincide
with the minimum Bouguer anomaly values either
(Fig. 2a). Therefore, the expected correlation between
topography and Bouguer anomaly is not straightfor-
ward in the High Atlas but shows misfits, suggesting a
lack of local isostatic equilibrium at a crustal level.
Fig. 3a shows that along section A–AV the
correlation between high topography and Bouguer
anomaly minima is reasonable. However, short wave-
length minima reaching almost �180 mgal suggest
the existence of very low-density material at shallow
levels. On the other hand, if we calculate the
theoretical Bouguer anomaly values along section
A–AV for an ideal Airy-type compensated state (Fig.
3b), it becomes evident that the thicker crust required
by such a state would lead to anomalies more negative
than the actual ones.
150000 200000 250000 300000 350000 400000
3450000
3500000
3550000
3650000
3600000
-180 mGal
-170
-160
-150
-140
-130
-120
-110
-100
-90
-80
-70
-60
-50
-40
-30
-20
-10
A'
A
B'
B
Imilchil
Errachidia
Timkit
Midelt
BoumalneTinerhir
4.5º5.5º6.5º 6º7º 5º 4º
31º
32º
33º
31.5º
32.5º
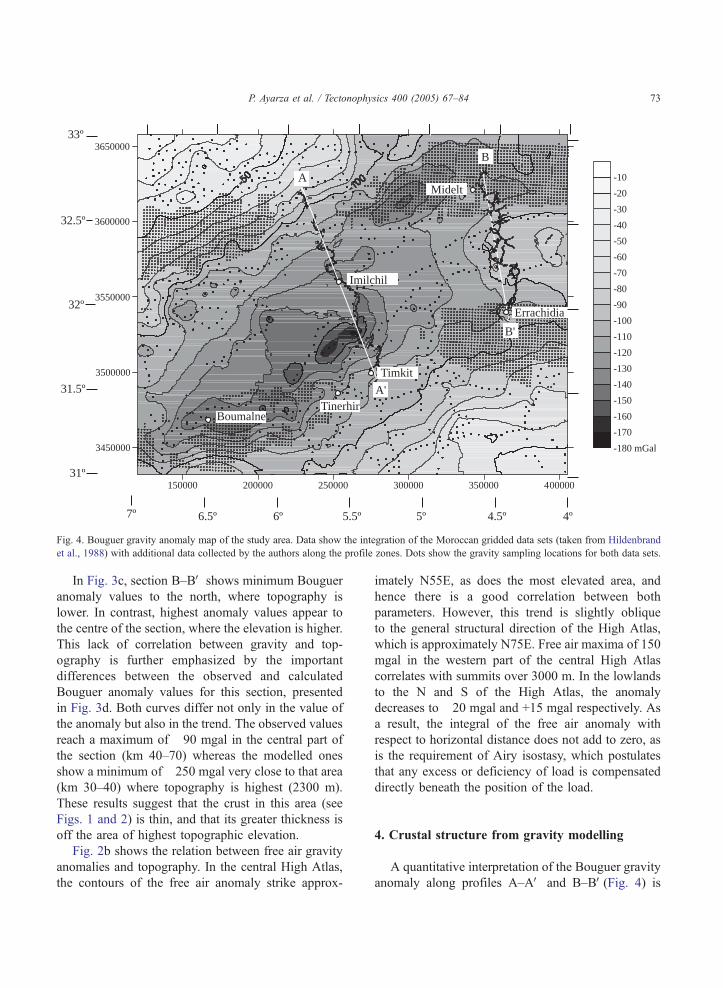
Fig. 4. Bouguer gravity anomaly map of the study area. Data show the integration of the Moroccan gridded data sets (taken from Hildenbrand
et al., 1988) with additional data collected by the authors along the profile zones. Dots show the gravity sampling locations for both data sets.
P. Ayarza et al. / Tectonophysics 400 (2005) 67–84 73
In Fig. 3c, section B–BV shows minimum Bouguer
anomaly values to the north, where topography is
lower. In contrast, highest anomaly values appear to
the centre of the section, where the elevation is higher.
This lack of correlation between gravity and top-
ography is further emphasized by the important
differences between the observed and calculated
Bouguer anomaly values for this section, presented
in Fig. 3d. Both curves differ not only in the value of
the anomaly but also in the trend. The observed values
reach a maximum of �90 mgal in the central part of
the section (km 40–70) whereas the modelled ones
show a minimum of �250 mgal very close to that area
(km 30–40) where topography is highest (2300 m).
These results suggest that the crust in this area (see
Figs. 1 and 2) is thin, and that its greater thickness is
off the area of highest topographic elevation.
Fig. 2b shows the relation between free air gravity
anomalies and topography. In the central High Atlas,
the contours of the free air anomaly strike approx-
imately N55E, as does the most elevated area, and
hence there is a good correlation between both
parameters. However, this trend is slightly oblique
to the general structural direction of the High Atlas,
which is approximately N75E. Free air maxima of 150
mgal in the western part of the central High Atlas
correlates with summits over 3000 m. In the lowlands
to the N and S of the High Atlas, the anomaly
decreases to �20 mgal and +15 mgal respectively. As
a result, the integral of the free air anomaly with
respect to horizontal distance does not add to zero, as
is the requirement of Airy isostasy, which postulates
that any excess or deficiency of load is compensated
directly beneath the position of the load.
4. Crustal structure from gravity modelling
A quantitative interpretation of the Bouguer gravity
anomaly along profiles A–AV and B–BV(Fig. 4) is
P. Ayarza et al. / Tectonophysics 400 (2005) 67–8474
reached through 2D (2.5D for round-shaped out-
cropping igneous bodies) forward modelling using
GM-SYS 4.6 program. The results of modelling are
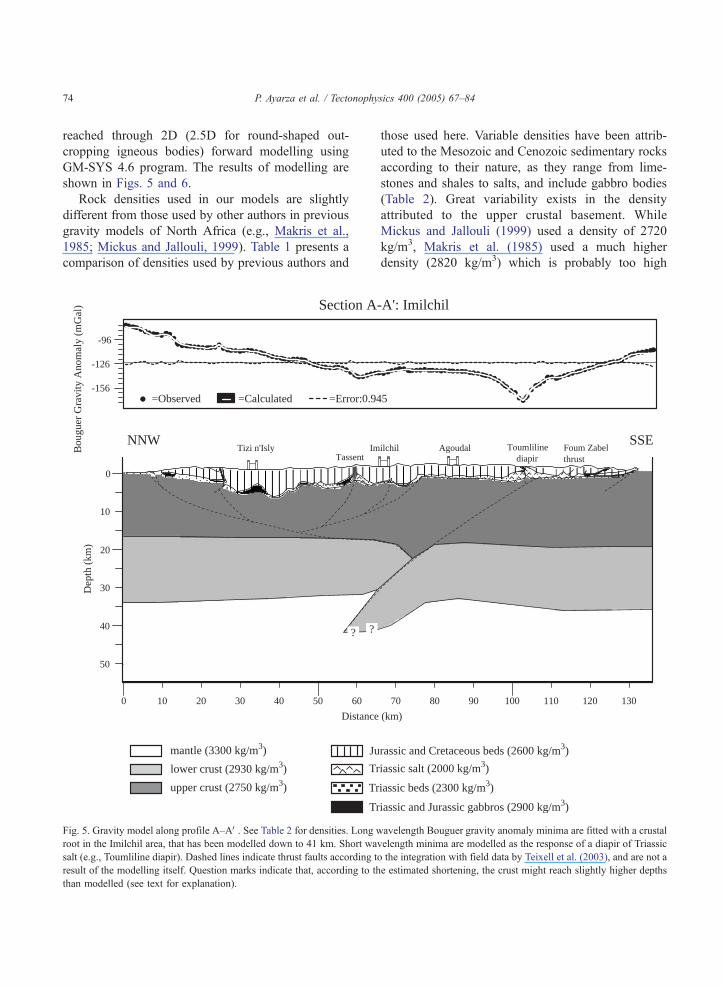
shown in Figs. 5 and 6.
Rock densities used in our models are slightly
different from those used by other authors in previous
gravity models of North Africa (e.g., Makris et al.,
1985; Mickus and Jallouli, 1999). Table 1 presents a
comparison of densities used by previous authors and
Section A
Bou
guer
Gra
vity
Ano
mal
y (m
Gal
)
-156
-126
-96
=Observed =Calculated =Error:0.94
Distance
Dep
th (
km)
ImTizi n'IslyNNW
Tassent
? ?
0 5010 20 30 40 60
40
20
30
10
0
50
mantle (3300 kg/m3)
lower crust (2930 kg/m3)
upper crust (2750 kg/m3)
Ju
Tr
Tr
Tr
Fig. 5. Gravity model along profile A–AV. See Table 2 for densities. Long wroot in the Imilchil area, that has been modelled down to 41 km. Short wa
salt (e.g., Toumliline diapir). Dashed lines indicate thrust faults according t
result of the modelling itself. Question marks indicate that, according to th
than modelled (see text for explanation).
those used here. Variable densities have been attrib-
uted to the Mesozoic and Cenozoic sedimentary rocks
according to their nature, as they range from lime-
stones and shales to salts, and include gabbro bodies
(Table 2). Great variability exists in the density
attributed to the upper crustal basement. While
Mickus and Jallouli (1999) used a density of 2720
kg/m3, Makris et al. (1985) used a much higher
density (2820 kg/m3) which is probably too high
-A': Imilchil
5
(km)
ilchil AgoudalSSE
Toumliline diapir
Foum Zabelthrust
10070 80 90 110 120 130
rassic and Cretaceous beds (2600 kg/m3)
iassic salt (2000 kg/m3)
iassic beds (2300 kg/m3)
iassic and Jurassic gabbros (2900 kg/m3)
avelength Bouguer gravity anomaly minima are fitted with a crustal
velength minima are modelled as the response of a diapir of Triassic
o the integration with field data by Teixell et al. (2003), and are not a
e estimated shortening, the crust might reach slightly higher depths
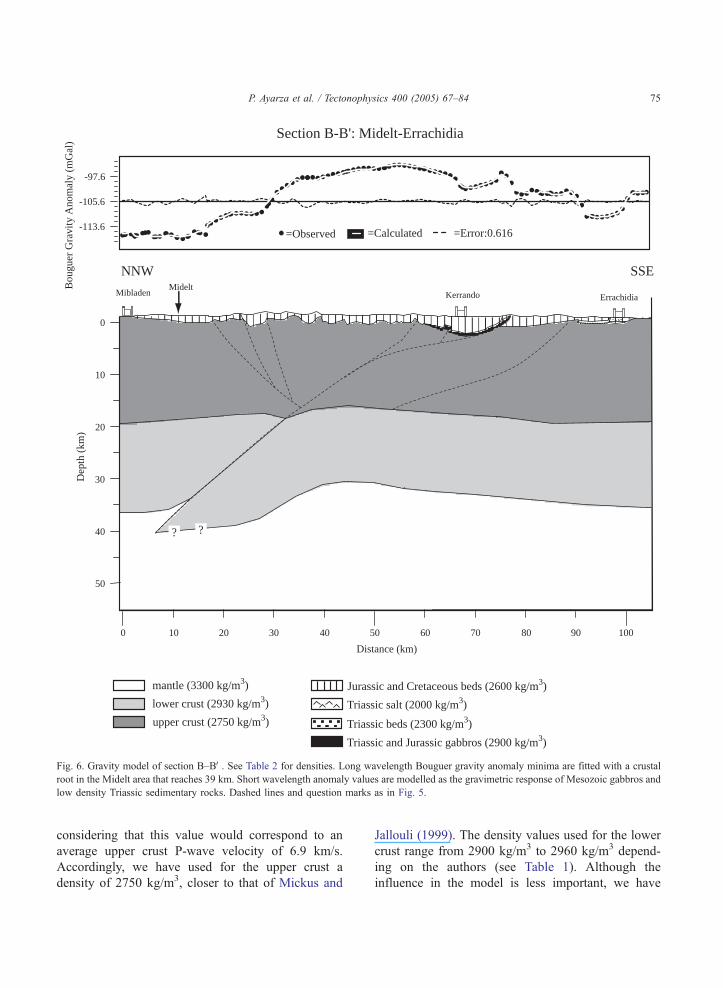
Section B-B': Midelt-Errachidia
-113.6
-105.6
-97.6
Dep
th (
km)
Kerrando ErrachidiaMibladenMidelt
=Calculated =Error:0.616 =Observed
NNW SSE
? ?
Bou
guer
Gra
vity
Ano
mal
y (m
Gal
)
20
30
10
40
0
50
Distance (km)
0 10 20 30 40 50 60 70 80 90 100
mantle (3300 kg/m3)
lower crust (2930 kg/m3)
upper crust (2750 kg/m3)
Jurassic and Cretaceous beds (2600 kg/m3)
Triassic salt (2000 kg/m3)
Triassic beds (2300 kg/m3)
Triassic and Jurassic gabbros (2900 kg/m3)
Fig. 6. Gravity model of section B–BV. See Table 2 for densities. Long wavelength Bouguer gravity anomaly minima are fitted with a crustal
root in the Midelt area that reaches 39 km. Short wavelength anomaly values are modelled as the gravimetric response of Mesozoic gabbros and
low density Triassic sedimentary rocks. Dashed lines and question marks as in Fig. 5.
P. Ayarza et al. / Tectonophysics 400 (2005) 67–84 75
considering that this value would correspond to an
average upper crust P-wave velocity of 6.9 km/s.
Accordingly, we have used for the upper crust a
density of 2750 kg/m3, closer to that of Mickus and
Jallouli (1999). The density values used for the lower
crust range from 2900 kg/m3 to 2960 kg/m3 depend-
ing on the authors (see Table 1). Although the
influence in the model is less important, we have
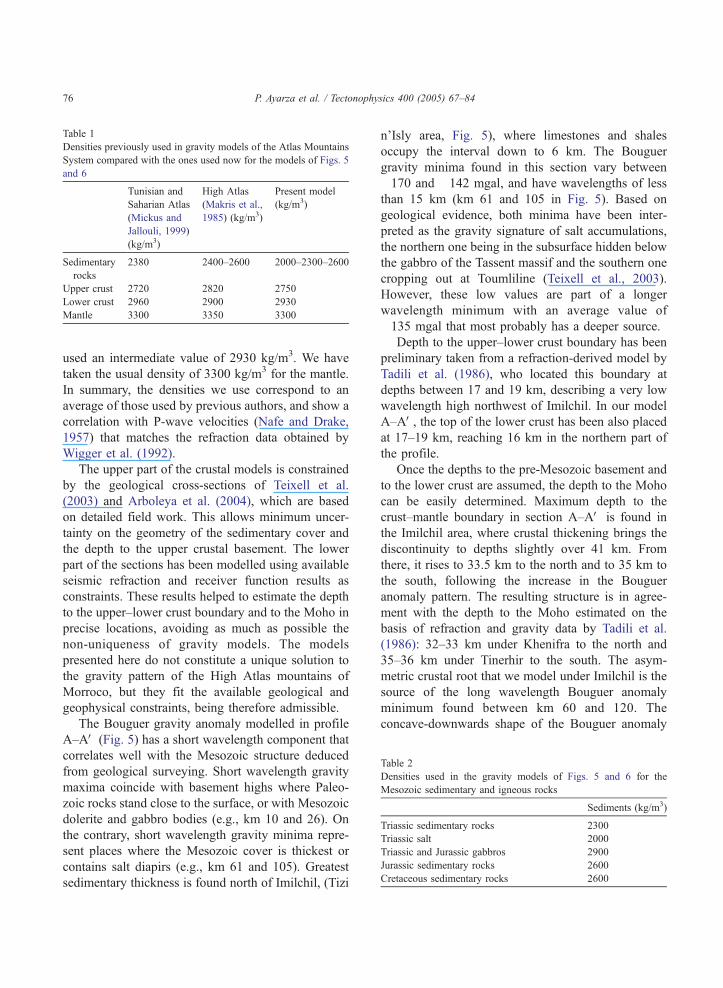
Table 1
Densities previously used in gravity models of the Atlas Mountains
System compared with the ones used now for the models of Figs. 5
and 6
Tunisian and
Saharian Atlas
(Mickus and
Jallouli, 1999)
(kg/m3)
High Atlas
(Makris et al.,
1985) (kg/m3)
Present model
(kg/m3)
Sedimentary
rocks
2380 2400–2600 2000–2300–2600
Upper crust 2720 2820 2750
Lower crust 2960 2900 2930
Mantle 3300 3350 3300
Table 2
Densities used in the gravity models of Figs. 5 and 6 for the
Mesozoic sedimentary and igneous rocks
Sediments (kg/m3)
Triassic sedimentary rocks 2300
Triassic salt 2000
Triassic and Jurassic gabbros 2900
Jurassic sedimentary rocks 2600
Cretaceous sedimentary rocks 2600
P. Ayarza et al. / Tectonophysics 400 (2005) 67–8476
used an intermediate value of 2930 kg/m3. We have
taken the usual density of 3300 kg/m3 for the mantle.
In summary, the densities we use correspond to an
average of those used by previous authors, and show a
correlation with P-wave velocities (Nafe and Drake,
1957) that matches the refraction data obtained by
Wigger et al. (1992).
The upper part of the crustal models is constrained
by the geological cross-sections of Teixell et al.
(2003) and Arboleya et al. (2004), which are based
on detailed field work. This allows minimum uncer-
tainty on the geometry of the sedimentary cover and
the depth to the upper crustal basement. The lower
part of the sections has been modelled using available
seismic refraction and receiver function results as
constraints. These results helped to estimate the depth
to the upper–lower crust boundary and to the Moho in
precise locations, avoiding as much as possible the
non-uniqueness of gravity models. The models
presented here do not constitute a unique solution to
the gravity pattern of the High Atlas mountains of
Morroco, but they fit the available geological and
geophysical constraints, being therefore admissible.
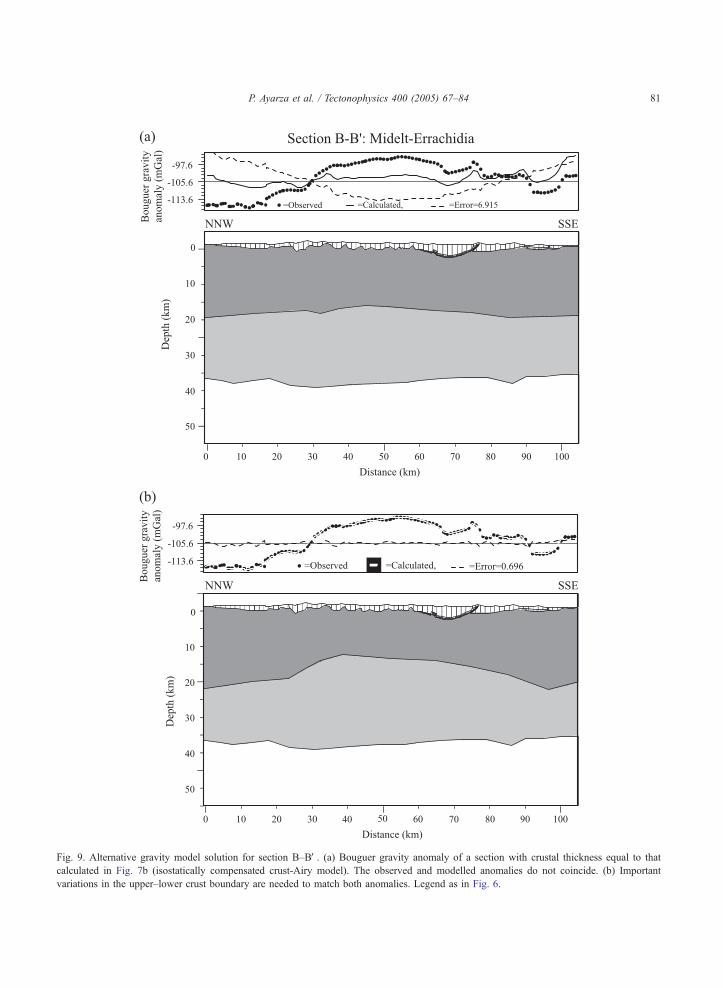
The Bouguer gravity anomaly modelled in profile
A–AV (Fig. 5) has a short wavelength component that
correlates well with the Mesozoic structure deduced
from geological surveying. Short wavelength gravity
maxima coincide with basement highs where Paleo-
zoic rocks stand close to the surface, or with Mesozoic
dolerite and gabbro bodies (e.g., km 10 and 26). On
the contrary, short wavelength gravity minima repre-
sent places where the Mesozoic cover is thickest or
contains salt diapirs (e.g., km 61 and 105). Greatest
sedimentary thickness is found north of Imilchil, (Tizi
n’Isly area, Fig. 5), where limestones and shales
occupy the interval down to 6 km. The Bouguer
gravity minima found in this section vary between
�170 and �142 mgal, and have wavelengths of less
than 15 km (km 61 and 105 in Fig. 5). Based on
geological evidence, both minima have been inter-
preted as the gravity signature of salt accumulations,
the northern one being in the subsurface hidden below
the gabbro of the Tassent massif and the southern one
cropping out at Toumliline (Teixell et al., 2003).
However, these low values are part of a longer
wavelength minimum with an average value of
�135 mgal that most probably has a deeper source.
Depth to the upper–lower crust boundary has been
preliminary taken from a refraction-derived model by
Tadili et al. (1986), who located this boundary at
depths between 17 and 19 km, describing a very low
wavelength high northwest of Imilchil. In our model
A–AV, the top of the lower crust has been also placed
at 17–19 km, reaching 16 km in the northern part of
the profile.
Once the depths to the pre-Mesozoic basement and
to the lower crust are assumed, the depth to the Moho
can be easily determined. Maximum depth to the
crust–mantle boundary in section A–AV is found in
the Imilchil area, where crustal thickening brings the
discontinuity to depths slightly over 41 km. From
there, it rises to 33.5 km to the north and to 35 km to
the south, following the increase in the Bouguer
anomaly pattern. The resulting structure is in agree-
ment with the depth to the Moho estimated on the
basis of refraction and gravity data by Tadili et al.
(1986): 32–33 km under Khenifra to the north and
35–36 km under Tinerhir to the south. The asym-
metric crustal root that we model under Imilchil is the
source of the long wavelength Bouguer anomaly
minimum found between km 60 and 120. The
concave-downwards shape of the Bouguer anomaly

P. Ayarza et al. / Tectonophysics 400 (2005) 67–84 77
profile from km 70 to 110 suggests that the lower
crust to the south of the root may be arched (Fig. 5),
giving the low amplitude relative maximum measured
between km 60 and 100. However, this could also be
an effect of the bounding minimum values originated
by the salt diapirs mentioned above. If the base of the
crust was modelled as a flat boundary at �36 km, to
fit the observed Bouguer gravity anomaly we would
have to introduce important changes in the upper–
lower crust boundary that are not supported by models
deduced from refraction data.
The Bouguer gravity anomaly in section B–
BV(Figs. 2, 4 and 6) shows minimum values of
�117 mgal located in the northernmost part of the
profile, i.e., in the Moulouya plain north of the High
Atlas. From there, entering into the High Atlas, the
anomaly increases to �93 mgal in the central part of
the profile, which surprisingly coincides with the
area of highest topographic elevation. As for section
A–AV, short wavelength anomalies are fitted with
variations in sedimentary thickness and depth to the
basement. Maximum sedimentary thickness close to
4 km is found in the Kerrando syncline (km 68 in
Fig. 6), which corresponds to a succession of
Jurassic shales with minor limestones carried by a
thrust that reactivates an old basin-margin exten-
sional fault (Teixell et al., 2003). Apart from this
case, the basement along this section is located at a
depth close to sea level, implying that the thickness
of sediments is small. Very short wavelength maxima
and minima located in the northern part of the
section may be preliminarily interpreted as an effect
of different degrees of mineralization of the Paleo-
zoic basement, known to be highly productive in the
Mibladen mining district. Other possible sources
such as basic igneous intrusions cannot be ruled
out (Tertiary and Quaternary basalts are known in
the Moulouya plain). In any case, modelling this
irregular and short wavelength pattern appears
arbitrary, and hence, the associated density anomalies
are left unmodelled.
The top of the lower crust is modelled at depths
between 20 km in the northern part of profile B–BVand at 18.5 km in the south, rising to 16 km near the
central part of the section. These values agree in
general with those of Tadili et al. (1986), although the
data set of these authors has low resolution, probably
due to wide station spacing, which leave information
gaps (e.g., between Midelt and Rich, km 10 and 60 in
Fig. 6 where our modelling suggests that the upper–
lower crust boundary shallows by 2 km).
In our model, the crust–mantle boundary defines
an asymmetric crustal root in the Midelt area (Fig. 6),
reaching a maximum depth of around 39 km,
coinciding with the Bouguer anomaly minimum. This
is consistent with the interpretation of receiver
functions by Van der Meijde et al. (2003). From
there, the Moho rises to the north and south to 36 km
in the northern edge of the profile (Mibladen area) and
to 35 km in the southern end (Errachidia area),
following the increase in the gravity anomaly. A local
high in the Moho discontinuity appears around km 45.
It is this high that fits the maximum values of the
Bouguer anomaly in the central part of the section,
and indicates that the lower crust might also be arched
to the south of the root, as deduced for section A–AV.Alternative models with a flat Moho produce similar
results to those for profile A–AV.
5. Discussion
5.1. Deep structure of the High Atlas
Although the surface structure of the High Atlas
has been the subject of many studies (e.g., Laville,
1985; Schaer, 1987; Laville and Pique, 1992; Beau-
champ et al., 1999; Teixell et al., 2003, and references
therein), large uncertainty remains about the structure
of the deeper part of the crust. The models presented
in this work give an image of the crust along two
sections of the High Atlas whose shallow geological
structure has been thoroughly described recently
(Teixell et al., 2003).
Previous crustal models proposed the existence of a
flat, intra-crustal detachment below the High Atlas at
some �20 km, without crustal roots underneath (e.g.,
Jacobshagen et al., 1988; Giese and Jacobshagen,
1992). Beauchamp et al. (1999) also suggested that
Atlas thrusts penetrated only to the middle crust,
leaving the lower crust unfaulted. However, both
Makris et al. (1985) and Wigger et al. (1992) modelled
an asymmetric lower crustal structure beneath the High
Atlas, with gradual thickness increase beneath the
southern boundary of the chain, and a sharper change
beneath the northern boundary. These authors did not
P. Ayarza et al. / Tectonophysics 400 (2005) 67–8478
provide an explanation for this finding, but actually
Giese and Jacobshagen (1992) interpreted it as due to a
small fault offsetting the Moho and dying out rapidly,
without connection with the upper crustal thrust
system. In our view, these features, considered
together with the upper crustal structure and the
gravity modelling results, suggest that thrust faults
may cut the entire crust in a ramp fashion, defining a
localized, small crustal root accounting for the pattern
of the Bouguer gravity anomaly. In Figs. 5 and 6 we
model the crustal root to derive from the displacement
along a major low-angle, north-dipping thrust fault that
effectively offsets the Moho discontinuity. This thrust
fault, whose existence was already suggested by
Arboleya et al. (2004) on the basis of structural data,
is also compatible with one of the solutions for the
north-dipping high conductivity layer modelled by
Schwarz et al. (1992, their Fig. 6a). In this solution, the
conductive layer, that can be interpreted as a zone of
intense deformation with high fluid pressure, reaches
Moho depths beneath the Moulouya plain near Midelt.
The crustal imbrication model presented here is in
agreement with the structure of other inverted
continental rifts that have been imaged by seismic
reflection profiling, e.g., the Central Pyrenees
(Choukroune et al., 1989; Daignieres et al., 1994) or
the Donbas fold belt of Ukraine (Maystrenko et al.,
2003). These profiles showed the existence of crustal-
scale thrust faults that offset the Moho and are
associated to the underthrusting (subduction) of the
lower crust (Munoz, 1992; Teixell, 1998; Maystrenko
et al., 2003). In the case of the High Atlas mountains,
our model might also explain the two receiver-
function velocity jumps at 36 and 39 km (Sandvol
et al., 1998; Van der Meijde et al., 2003), which can
be now interpreted as a Moho duplication.
We model underthrusting (subduction) of the south-
ern (saharan) lower crust under the northern moroccan
crust (Figs. 5 and 6). However, the modelled length of
the imbricated lower crust implies slightly lower
shortening at this level than that deduced for the upper
crust (30 km for a cross-section following A–AV profileand 26 km for B–BV in Teixell et al., 2003). This might
imply that the deeper parts of the root have been
transformed into mineral phases that do not have a
gravimetric and probably seismic signature clearly
different from that of the mantle (i.e., possessing
similar densities and velocities).
The position of the modelled underthrust root shifts
to the north as we go from the western to the eastern
section (i.e., the imbrication of the deep crust does not
follow the High Atlas general direction but is oriented
obliquely, that is NE–SW). This oblique trend is
actually parallel to many internal faults within the
High Atlas, and to the general direction of the Middle
Atlas chain. This is also evident when observing the
direction of the gravity anomalies and some of the
topographic contour lines within the High Atlas,
which also trend NE, obliquely to the general
direction of the chain (Fig. 2). The oblique trend of
the gravity minima cannot be easily explained by
variations in sedimentary thickness. Minimum Bou-
guer gravity anomaly values in the southern border of
the western part of the central High Atlas (Fig. 2)
could be tentatively correlated with the Cenozoic
Ourzazate basin (near Boumalne, Fig. 2). However,
the free air gravity anomaly map does not show a
minimum in that area, suggesting that the anomaly
must have a deep source. The same applies for the
Bouguer anomaly minimum found close to the
Moulouya plain, near Midelt (Fig. 2), that appear in
an area where the basement either crops out or is close
to the surface.
The NE–SW strike characteristic of many of the
internal thrust faults of the High Atlas (see Fig. 1) and
of the Middle Atlas is inherited from normal faults
created during the Mesozoic rifting phase perpendic-
ularly to the extension direction at that time (Mattauer
et al., 1977). However, the general orientation of the
High Atlas trough was rather ENE, suggesting that its
geometry conformed to an oblique rift (El Kochri and
Chorowicz, 1995; Arboleya et al., 2004). Moreover,
our results indicate that during Cenozoic inversion,
the structure of the lower crust was also determined by
the NE trend of the internal faults, rather than by the
general orientation of the rift trough or by the regional
compression direction.
5.2. How is topography supported?
The High Atlas does not show the expected
correlation between topography and gravity (Fig. 3).
Furthermore, where high topographic elevation coin-
cides with minimum Bouguer gravity anomalies, the
latter still seem insufficient to account for the high
altitudes observed (Fig. 3b). Fitting of gravity ano-
P. Ayarza et al. / Tectonophysics 400 (2005) 67–84 79
maly profiles in the central High Atlas was achieved
by modelling the response of varying crustal thick-
ness. The non-uniqueness of the method left several
possibilities open, but in the case of the High Atlas
these have been sorted out taking into account
previous wide angle-refraction seismic data (e.g., the
Bouguer maxima could have alternatively been
modelled with high density material at shallow or
middle crustal levels, which would have resulted in a
thicker crust than in our sections. However, this would
not be supported by seismic data).
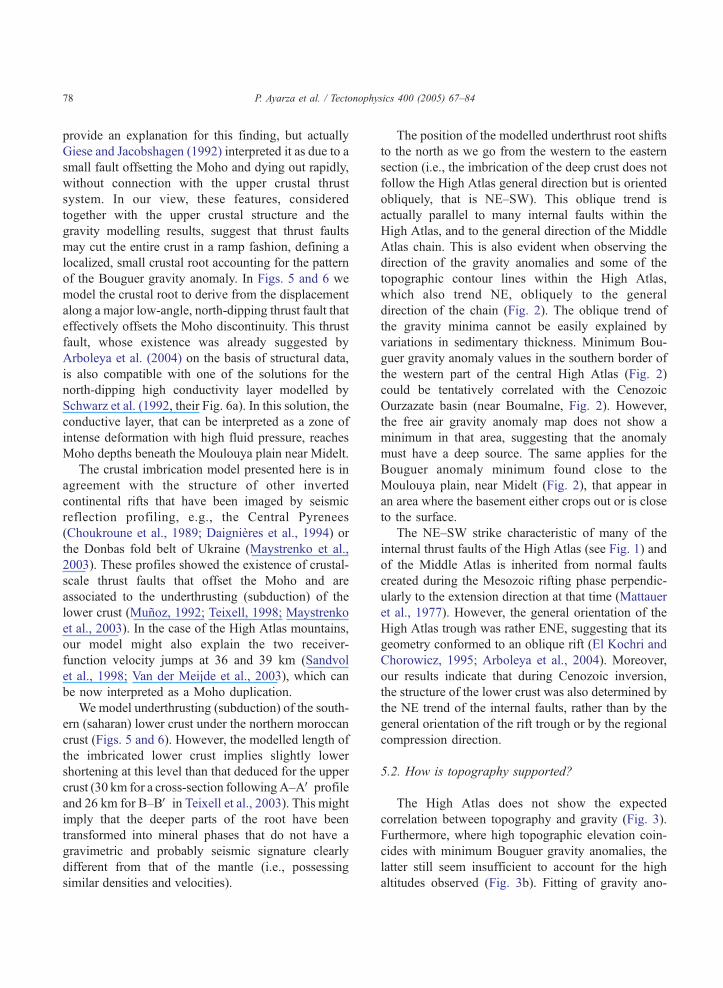
Fig. 7 shows a comparison between the modelled
crustal thickness and that expected for a compensated
crust following Airy local isostasy. Densities used for
this calculation are 2670 kg/m3 for the crust and 3300
kg/m3 for the mantle. In section A–AV (Fig. 7a), the
overall shape of the base of the crust is markedly
different in both cases: differences between modelled
and expected crustal thickness are in excess of 5 km,
and the modelled root does not coincide with the
-20000
-25000
-30000
-35000
-40000
-45000
-20000
-25000
-30000
-35000
-40000
-45000
0
0 50 100
50 100
Distance (km)
Distance (km)
Dep
th (
m)
Dep
th (
m)
(a)
(b)
Fig. 7. Comparison between the Moho depth as deduced from our grav
following the Airy model. (a) Case for section A–AV: the crust as deduced(b) Case for section B–BV: the crust as deduced for the Airy assumptions is
gravity anomaly minimum needs the modelled crust to be thicker.
location of the expected maximum crustal thickness.
Similar conclusions are obtained for section B–BV(Fig. 7b). Neither in this profile, the location of the
modelled crustal root, based on Bouguer gravity
anomaly minima and receiver functions, coincides
with its expected position, beneath the highest
elevations if Airy isostasy would apply. Using higher
mean crustal densities (e.g., 2800 kg/m3) would make
differences even more important.
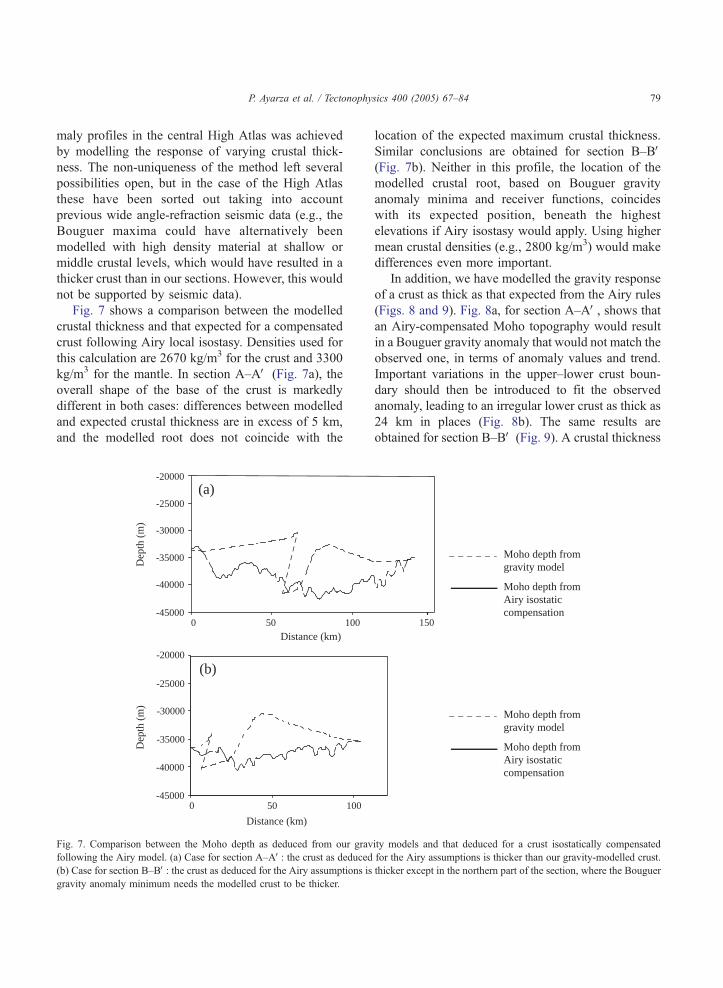
In addition, we have modelled the gravity response
of a crust as thick as that expected from the Airy rules
(Figs. 8 and 9). Fig. 8a, for section A–AV, shows thatan Airy-compensated Moho topography would result
in a Bouguer gravity anomaly that would not match the
observed one, in terms of anomaly values and trend.
Important variations in the upper–lower crust boun-
dary should then be introduced to fit the observed
anomaly, leading to an irregular lower crust as thick as
24 km in places (Fig. 8b). The same results are
obtained for section B–BV (Fig. 9). A crustal thickness
Moho depth from gravity model
Moho depth from Airy isostatic compensation
Moho depth from gravity model
Moho depth from Airy isostaticcompensation
150
ity models and that deduced for a crust isostatically compensated
for the Airy assumptions is thicker than our gravity-modelled crust.
thicker except in the northern part of the section, where the Bouguer
Bou
guer
gra
vity
an
omal
y (m
Gal
)
-144
-104
-64
=Observed, =Calculated, =Error=8.532
Distance (km)
Dep
th (
km)
50
20
30
40
0
10
50
20
30
40
0
10
-156
-126
-96
=Observed, =Calculated, =Error=0.985
Distance (km)
Dep
th (
km)
(a)
(b)
NNW SSE
NNW SSE
Section A-A': Imilchil
0 1005010 20 30 40 60 70 80 90 110 120 130
Bou
guer
gra
vity
an
omal
y (m
Gal
)
0 1005010 20 30 40 60 70 80 90 110 120 130
Fig. 8. Alternative gravity model solution for section A–AV. (a) Bouguer gravity anomaly of a section with crustal thickness equal to that
calculated in Fig. 7a (isostatically compensated crust-Airy model). The observed and modelled anomalies do not coincide. (b) Important
variations in the upper–lower crust boundary are needed to match both anomalies. Legend as in Fig. 5.
P. Ayarza et al. / Tectonophysics 400 (2005) 67–8480
Bo
ug
uer
gra
vit
y
ano
mal
y (
mG
al)
Bo
ug
uer
gra
vit
y
ano
mal
y (
mG
al)
-113.6
-105.6
-97.6
=Observed =Calculated, =Error=6.915
=Observed =Calculated, =Error=0.696
Distance (km)
Dep
th (
km
)
20
30
40
0
10
20
30
40
50
0
10
NNW SSE
NNW SSE
Section B-B': Midelt-Errachidia
-113.6
-105.6
-97.6
Dep
th (
km
)
Distance (km)
(a)
(b)
0 1005010 20 30 40 60 70 80 90
0 1005010 20 30 40 60 70 80 90
50
Fig. 9. Alternative gravity model solution for section B–BV. (a) Bouguer gravity anomaly of a section with crustal thickness equal to that
calculated in Fig. 7b (isostatically compensated crust-Airy model). The observed and modelled anomalies do not coincide. (b) Important
variations in the upper–lower crust boundary are needed to match both anomalies. Legend as in Fig. 6.
P. Ayarza et al. / Tectonophysics 400 (2005) 67–84 81
P. Ayarza et al. / Tectonophysics 400 (2005) 67–8482
like that deduced in Fig. 7b from the Airy calculations
would result in a Bouguer gravity anomaly profile very
different to the observed one (Fig. 9a), and only
important changes in the thickness of the lower crust
would help to fit the curves (Fig. 9b).
We thus conclude that the crustal thickness along
the central High Atlas profiles cannot entirely explain
the observed topography and therefore, that these
mountains are not isostatically compensated. Crustal
thicknesses of 40 and 36 km were deduced respec-
tively for the Saharan and Tunisian Atlas by Mickus
and Jallouli (1999), who consider these values as
indicative of some degree of isostatic compensation.
Comparatively, the central High Atlas of Morocco has
higher topography but similar crustal thickness (see
also models by Makris et al., 1985). It follows that
isostatic compensation has not been reached to the
same degree, and that there must be some additional
mechanism to support the High Atlas elevation that is
unrelated to shortening and crustal thickening (Teixell
et al., 2003; Arboleya et al., 2004).
An explanation for this fact lies on topography
being partly supported by a thin and hot lithosphere.
Strong lines of evidence are the existence of abundant
alkaline volcanism in the Atlasic domain and the low
P-wave velocities detected by Seber et al. (1996)
under the High Atlas. They suggest that the astheno-
sphere may occupy an anomalously high position
helping to support the topography (Seber et al., 1996;
Teixell et al., 2003; Zeyen et al., 2005). On the other
side, the Bouguer gravity anomaly profiles shown in
Figs. 5 and 6 exhibit a concave pattern in the areas
where elevation is highest. This concavity required a
slightly arched lower crust in the models, that might
be the result of buckling during the Cenozoic
compression or, alternatively, an inherited feature
from the Mesozoic crustal thinning.
6. Conclusions
The crustal structure of the High Atlas, as deduced
from integration of gravity modelling and other
existing geophysical and geological data, is charac-
terized by a doubly verging thrust system at upper
crustal levels, which passes into the lower crust to a
major, north dipping thrust fault that we interpret to
offset the Moho discontinuity. An underthrust slab of
saharan, dense lower crust defines a local crustal root
that can be detected to a depth between 38 and 41 km
in the central High Atlas. These results reinforce
models of crustal undercompensation and Moho
involvement in the deformation, defended by some
authors, and have implications for the deep structure
of intracontinental mountain belts. The High Atlas,
together with other small orogens for which there is a
wealth of geophysical data, show that intraplate
orogens seem capable to develop underthrust
(bsubductedQ) crustal roots in spite of not being
considered as destructive plate margins, where roots
are pulled by sinking oceanic slabs.
The crustal root deduced in this work does not
follow the general direction of the High Atlas, but is
oriented NE, parallel to internal, oblique faults reflect-
ing a pre-orogenic, extensional basin configuration. A
straightforward correlation between topography and
Bouguer anomaly is not met in the High Atlas.
Elevations of over 2500 m are supported by a relatively
thin crust that seems insufficient for the observed
mountain load. The existence of a thin crust in the High
Atlas, together with the limited tectonic shortening
reported (b 25%), corroborates that the crust does not
entirely support the Atlas topography. Arching of the
lower crust south of the crustal root suggests that active
buckling may help to maintain the topography, but
recent alkaline volcanism in the vicinity and low P-
wave velocities at upper mantle levels suggests that a
contribution from a thin, hot and less dense lithosphere
is likely.
Acknowledgements
We thank Drs. A. Bellot (MEM, Rabat) and
Mimoun Harnafi (IS, Rabat) for facilitating access to
the gravity base stations of Morocco. Comments by
two anonymous reviewers have contributed to improve
the manuscript. This work has been funded by MCYT
(Spain) projects BTE2000-0159 and BTE2003-00499.
References
Arboleya, M.L., Teixell, A., Charroud, M., Julivert, M., 2004. A
structural transect through the High and Middle Atlas of
Morocco: tectonic implications. J. Afr. Earth Sci. 39, 319–327.

P. Ayarza et al. / Tectonophysics 400 (2005) 67–84 83
Beauchamp, W., Allmendinger, R.W., Barazangui, M., Demnati, A.,
El Alji, M., Dahmani, M., 1999. Inversion tectonics and the
evolution of the High Atlas Mountains, Morocco, based on a
geological-geophysical transect. Tectonics 18, 163–184.
Choubert, G., Faure-Muret, H., 1962. Evolution du domaine
atlasique marocain depuis les temps paleozoRques. In: Soc.
Geol. de France (Ed.), Livre a la Memoire du Professeur Paul
Fallot, Mem. Hors Ser. vol. 1, pp. 447–527.
ECORS Team, 1989. The ECORS deep seismic profile reflection
data and the overall structure of an orogenic belt. Tectonics 8,
23–39.
Daignieres, M., Seguret, M., ECORS Team, 1994. The Arzacq-
Western Pyrenees ECORS Deep Seismic Profile. In: Mascle, A.
(Ed.), Hydrocarbon and Petroleum Geology of France. Eur. Ass.
Petr. Geosci. Spec. Publ. vol. 4, pp. 199–208.
Dutour, A., Ferrandini, J., 1985. Nouvelles observations neo-
tectoniques dans le Haut Atlas de Marrakech et le Haouz
central (Maroc): apports sur l’evolution recente d’un segment du
bati atlasique. Rev. Geol. Dyn. Geogr. Phys. 26, 285–297.
El Harfi, A., Lang, J., Salomon, J., 1996. Le remplissage
continental cenozoRque du bassin d’avant-pays de Ourzazate:
implications sur l’evolution geodynamique du Haut Atlas
central (Maroc). C. R. Acad. Sci., Ser. II 323, 623–630.
El Kochri, A., Chorowicz, J., 1995. Oblique extension in the
Jurassic trough of the central and eastern High Atlas (Morocco).
Can. J. Earth Sci. 33, 84–92.
Fraissinet, C.E., Zouine, M., Morel, J.-L., Poisson, A., Andrieux, J.,
Faure-Muret, A., 1988. Structural evolution of the southern and
northern central High Atlas. In: Jacobshagen, V. (Ed.), The Atlas
System of Morocco. Springer-Verlag, Berlin, pp. 273–291.
Frizon de Lamotte, D., Saint Bezar, B., Bracene, R., 2000. The two
main steps of the Atlas building and geodynamics of the western
Mediterranean. Tectonics 19, 740–761.
Giese, P., Jacobshagen, V., 1992. Inversion tectonics of intra-
continental ranges: high and Middle Atlas, Morocco. Geol.
Rundsch. 81, 249–259.
Gomez, F., Beauchamp, W., Barazangi, M., 2000. Role of Atlas
Mountains (northwest Africa) within the African-Eurasian plate-
boundary zone. Geology 28, 775–778.
Gorler, K., Helmdach, F.-F., Gaemers, P., Heissig, K., Hinsch, W.,
M7dler, K., Schwarzhans, W., Zucht, M., 1988. The uplift of the
Central Atlas as deduced from Neogene continental sediments of
the Ourzazate province, Morocco. In: Jacobshagen, V. (Ed.), The
Atlas System ofMorocco. Springer-Verlag, Berlin, pp. 361–404.
Hailwood, E.A., Mitchell, J.G., 1971. Paleomagnetic and radio-
metric dating results from Jurassic intrusions in South Morocco.
Geophys. J. R. Astron. Soc. 24, 351–364.
Harmand, C., Catagrel, J.M., 1984. Le volcanisme alcalin Tertiaire
et Quaternaire du Moyen Atlas (Maroc): chronologie K/Ar et
cadre geodynamique. J. Afr. Earth Sci. 2, 51–55.
Harmand, C., Moukadiri, A., 1986. Synchronisme entre tectonique
compressive et volcanisme alcalin: exemple de la province
quaternaire du Moyen Atlas (Maroc). Bull. Soc. Geol. Fr. 8 (4),
595–603.
Hildenbrand, T., Kucks, R., Hamouda, M., Bellot, A., 1988.
Bouguer Gravity Map and Related Filtered Anomaly Maps of
Morocco. U.S. Geological Survey, Denver, Colorado.
Jacobshagen, V., Gorler, K., Giese, P., 1988. Geodynamic evolution
of the Atlas System (Morocco) in post-Palaeozoic times. In:
Jacobshagen, V. (Ed.), The Atlas System of Morocco. Springer-
Verlag, Berlin, pp. 481–499.
Laville, E., 1985. Evolution sedimentaire, tectonique et magmatique
du bassin jurassique du Haut Atlas, Maroc: modele en relais
multiples de decrochements. These d’Etat, Montpellier.
Laville, E., Pique, A., 1992. Jurassic penetrative deformation and
Cenozoic uplift in the central High Atlas (Morocco): a tectonic
model, structural and orogenic inversions. Geol. Rundsch. 81,
157–170.
Laville, E., Lesage, J.-L., Seguret, M., 1977. Geometrie, cinematique
(dynamique) de la tectonique atlasique sur le versant sud du Haut
Atlas marocain. Apercu sur les tectoniques hercyniennes et tardi-
hercyniennes. Bull. Soc. Geol. Fr. 7 (19), 527–539.
Makris, J., Demnati, A., Klusmann, J., 1985. Deep seismic soundings
in Morocco and a crust and upper mantle model deduced from
seismic and gravity data. Ann. Geophys. 3, 369–380.
Mattauer, M., Taponnier, P., Proust, F., 1977. Sur les mecanismes de
formation des chaines intracontinentales. L’exemple des chaines
atlasiques du Maroc. Bull. Soc. Geol. Fr. 7 (19), 521–526.
Maystrenko, Y., Stovba, S., Stephenson, R., Bayer, U., Menyoli, E.,
Gajewski, D., Huebscher, C., Rabbel, W., Saintot, A., Staros-
tenko, V., Thybo, H., Tolkunov, A., 2003. Crustal-scale pop-up
structure in cratonic lithosphere: DOBRE deep seismic reflection
study of the Donbas fold belt, Ukraine. Geology 31, 733–736.
Medina, F., Cherkaoui, T., 1991. Focal mechanisms of the Atlas
earthquakes and tectonic implications. Geol. Rundsch. 3,
639–648.
Mickus, K., Jallouli, C., 1999. Crustal structure beneath the Tell and
Atlas Mountains (Algeria and Tunisia) through the analysis of
gravity data. Tectonophysics 314, 373–385.
Morel, J.-L., Zouine, M., Poisson, A., 1993. Relations entre la
subsidence des bassins moulouyens et la creation des reliefs
atlasiques (Maroc): Un exemple d’inversion tectonique depuis le
Neogene. Bull. Soc. Geol. France, 93(1), 164, 79–91.
Morel, J.-L., Zouine, M., Andrieux, J., Faure-Muret, A., 2000.
Deformations neogenes et quaternaires de la bordure nord haut
atlasique (Maroc): role du socle et consequences structurales.
J. Afr. Earth Sci. 30, 119–131.
Munoz, J.A., 1992. Evolution of a continental collision belt:
ECORS-Pyrenees crustal balanced cross-section. In:
McClay, K.R. (Ed.), Thrust Tectonics. Chapman and Hall,
London, pp. 235–246.
Nafe, J.E., Drake, C.L., 1957. Variations with depth in shallow and
deep water marine sediments of porosity, density and the
velocity of compressional and shear waves. Geophysics 22,
523–552.
Pique, A., Charroud, M., Laville, E., ARt Brahim, L., Amrhar, M.,
2000. The Tethys southern margin in Marocco; Mesozoic and
Cenozoic evolution of the Atlas domain. Peri-Tethys Memoir 5:
new data on Peri-Tethyan sedimentary basins. Mem. Mus. Natl.
Hist. Nat. 182, 93–106.
Rimi, A., 1999. Mantle heat flow and geotherms for the main
geologic domains in Morocco. Int. J. Earth Sci. 88, 458–466.
Sandvol, E., Calvert, A., Barazangui, M., 1998. Grid search
modelling of receiver functions: implications for crustal
P. Ayarza et al. / Tectonophysics 400 (2005) 67–8484
structure in the Middle East and North Africa. J. Geophys. Res.
103 (B11), 26899–26917.
Sandwell, D.T., Smith, W.H., 1997. Marine gravity anomaly from
Geosat and ERS1 satellite altimetry. J. Geophys. Res. 102 (B5),
10039–10054.
Schaer, J.P., 1987. Evolution and structure of the High Atlas of
Morocco. In: Schaer, J.P., Rodgers, J. (Eds.), The Anatomy
of Mountain Ranges. Princeton Univ. Press, Princeton, N.J.,
pp. 107–127.
Schwarz, G., Mehi, H.G., Ramdani, H.G., Rath, V., 1992. Electrical
resistivity structure of the eastern Moroccan Atlas System and
its tectonics implications. Geol. Rundsch. 81, 221–235.
Seber, D., Barazangui, M., Aissa Tadili, B., Ramdani, M.,
Ibenbrahim, A., Ben Sari, D., 1996. Three dimensional upper
mantle structure beneath the intraplate Atlas and interplate Rif
mountains of Morocco. J. Geophys. Res. 101 (B2), 3125–3138.
Seber, D., Sandvol, E., Sandvol, C., Brindisi, C., Barazangui, M.,
2001. Crustal model for the Middle East and North Africa
region: implications for the isostatic compensation mechanism.
Geophys. J. Int. 147, 630–638.
Tadili, B., Ramdani, M., Sari, B., Chapochnikov, K., Bellot, A.,
1986. Structure de la croute dans le nord du Maroc. Ann.
Geophys. 4 (1), 99–104.
Teixell, A., 1998. Crustal structure and orogenic material budget in
the west central Pyrenees. Tectonics 17, 395–406.
Teixell, A., Arboleya, M.L., Julivert, M., Charroud, M., 2003.
Tectonic shortening and topography in the central High Atlas
(Morocco). Tectonics 22, doi:10.1029/2002TC001460.
Van der Meijde, M., Van der Lee, S., Giardini, D., 2003. Crustal
structure beneath broad-band seismic stations in the Mediterra-
nean region. Geophys. J. Int. 152, 729–739.
Wigger, P., Asch, G., Giese, P., Heinsohn, W.-D., El Alami, S.O.,
Ramdani, F., 1992. Crustal structure along a traverse across the
Middle and High Atlas mountains derived from seismic
refraction studies. Geol. Rundsch. 81, 237–248.
Zeyen, H., Ayarza, P., Fernandez, M., Rimi, A., 2005. Lithospheric
structure under the western African-European plate boundary: a
transect across the Atlas Mountains and the Gulf of Cadiz.
Tectonics 24, TC2001, doi:10.1029/2004TC001639.