Crustal structure and nature of emplacement of the 85°E Ridge in the Mahanadi offshore based on...
17
Crustal structure and nature of emplacement of the 85°E Ridge in the Mahanadi offshore based on constrained potential field modeling: Implications for intraplate plume emplaced volcanism G. Srinivasa Rao, M. Radhakrishna ⇑ Department of Earth Sciences, Indian Institute of Technology Bombay, Powai, Mumbai 400076, India article info Article history: Received 2 October 2013 Received in revised form 25 January 2014 Accepted 29 January 2014 Available online 5 February 2014 Keywords: Crustal structure Seismic Gravity and magnetic anomalies 85°E Ridge Hotspot volcanism Indian continental margin abstract An integrated interpretation of multi-channel seismic reflection, gravity and magnetic datasets belonging to northern most part of the 85°E Ridge in the Mahanadi offshore is carried out to study the crustal struc- ture and mode of its emplacement. The basement structure map of the ridge reveals that it is 130–150 km wide and is composed of an eastern high which appears as a continuous, broad and smooth topography- and the western high characterized by several steep isolated highs. The seismic velocities reported for the first time over the ridge indicate several sedimentary sequences ranging in velocities between 1.6 and 4.0 km/s above the acoustic basement top. The salient aspects of the sedimentary velocities are; a low velocity layer (2.6–3.2 km/s) within the Cretaceous sequence in the intervening depressions encompass- ing the flank region, and a regionally widespread higher velocity layer (3.5–3.8 km/s) belonging to the Eocene–Oligocene section overlying the ridge. A layer having a velocity of 4.2–4.7 km/s probably made of volcanoclastic rocks is observed immediately below the acoustic basement. The sediment isopach maps presented here for three major horizons are used to compute the 3-D sediment gravity effect to obtain a crustal Bouguer anomaly map of the region. Detailed analysis of the gravity and magnetic anom- aly maps clearly demonstrates the continuity of ridge up to the Mahanadi coast at Chilka Lake. Seismi- cally constrained gravity and magnetic models indicate that the ridge is composed of volcanic material that was emplaced on continental crust in the shelf-slope areas and over the oceanic crust in the deep offshore areas. The modeled crustal structure below the ridge further indicates volcanic emplacement of the ridge on a relatively younger lithosphere. We propose two alternative models for the emplacement of the ridge. Ó 2014 Elsevier Ltd. All rights reserved. 1. Introduction The topography of the northern Indian Ocean is dominated by aseismic ridges and ocean basins which have formed during the breakup of the eastern Gondwanaland and subsequent seafloor spreading. Among these, the Ninetyeast and Chagos-Laccadive ridges are the two most prominent linear N–S trending aseismic ridges and these are believed to be the traces of the Kerguelen and Reunion mantle plumes respectively (Royer et al., 1991). How- ever, regional multi-channel seismic (MCS) reflection data in the northeast Indian Ocean (Curray et al., 1982; Gopala Rao et al., 1997) revealed the presence of another almost N–S trending base- ment feature buried below the thick layer of sediments in the Bay of Bengal (BOB). This feature is named as the 85°E Ridge (after Cur- ray et al. (1982)). The ridge was initially identified as a basement high on three seismic profiles by Curray and Moore (1971), but la- ter, the topographic expression was mapped along many E–W seis- mic profiles (Fig. 1) lying between the Afanasy Nikitin Seamount in the equatorial central Indian Ocean and the East Coast of India (Gopala Rao et al., 1997; Subrahmanyam et al., 1999; Krishna, 2003; Bastia et al., 2010; Michael and Krishna, 2011). Both the 85°E and Ninetyeast ridges (Fig. 1) are buried below 2–6 km of thick sediments of the northern BOB and divide the bay into three major sub-basins between the east coast of India and the And- aman–Nicobar Islands. However, unlike the Ninetyeast ridge, which is associated with a broad positive gravity field, the 85°E Ridge is characterized by a prominent gravity low. This peculiar geophysical character is interpreted to be due to: (a) a two-stage loading process, with an initial emplacement of the ridge on a weak lithosphere (5–15 m.y) leading to excess thickening of the crust, and subsequent loading of sediments on a stronger litho- sphere of 40–80 m.y old (Liu et al., 1982), (b) the result of the den- sity contrast between the metasediments and less dense ridge http://dx.doi.org/10.1016/j.jseaes.2014.01.026 1367-9120/Ó 2014 Elsevier Ltd. All rights reserved. ⇑ Corresponding author. Fax: +91 22 2576 7253. E-mail address: [email protected] (M. Radhakrishna). Journal of Asian Earth Sciences 85 (2014) 80–96 Contents lists available at ScienceDirect Journal of Asian Earth Sciences journal homepage: www.elsevier.com/locate/jseaes
-
Upload
ismdhanbad -
Category
Documents
-
view
0 -
download
0
Transcript of Crustal structure and nature of emplacement of the 85°E Ridge in the Mahanadi offshore based on...

Journal of Asian Earth Sciences 85 (2014) 80–96
Contents lists available at ScienceDirect
Journal of Asian Earth Sciences
journal homepage: www.elsevier .com/locate / jseaes
Crustal structure and nature of emplacement of the 85�E Ridgein the Mahanadi offshore based on constrained potential field modeling:Implications for intraplate plume emplaced volcanism
http://dx.doi.org/10.1016/j.jseaes.2014.01.0261367-9120/� 2014 Elsevier Ltd. All rights reserved.
⇑ Corresponding author. Fax: +91 22 2576 7253.E-mail address: [email protected] (M. Radhakrishna).
G. Srinivasa Rao, M. Radhakrishna ⇑Department of Earth Sciences, Indian Institute of Technology Bombay, Powai, Mumbai 400076, India
a r t i c l e i n f o
Article history:Received 2 October 2013Received in revised form 25 January 2014Accepted 29 January 2014Available online 5 February 2014
Keywords:Crustal structureSeismicGravity and magnetic anomalies85�E RidgeHotspot volcanismIndian continental margin
a b s t r a c t
An integrated interpretation of multi-channel seismic reflection, gravity and magnetic datasets belongingto northern most part of the 85�E Ridge in the Mahanadi offshore is carried out to study the crustal struc-ture and mode of its emplacement. The basement structure map of the ridge reveals that it is 130–150 kmwide and is composed of an eastern high which appears as a continuous, broad and smooth topography-and the western high characterized by several steep isolated highs. The seismic velocities reported for thefirst time over the ridge indicate several sedimentary sequences ranging in velocities between 1.6 and4.0 km/s above the acoustic basement top. The salient aspects of the sedimentary velocities are; a lowvelocity layer (2.6–3.2 km/s) within the Cretaceous sequence in the intervening depressions encompass-ing the flank region, and a regionally widespread higher velocity layer (3.5–3.8 km/s) belonging to theEocene–Oligocene section overlying the ridge. A layer having a velocity of 4.2–4.7 km/s probably madeof volcanoclastic rocks is observed immediately below the acoustic basement. The sediment isopachmaps presented here for three major horizons are used to compute the 3-D sediment gravity effect toobtain a crustal Bouguer anomaly map of the region. Detailed analysis of the gravity and magnetic anom-aly maps clearly demonstrates the continuity of ridge up to the Mahanadi coast at Chilka Lake. Seismi-cally constrained gravity and magnetic models indicate that the ridge is composed of volcanic materialthat was emplaced on continental crust in the shelf-slope areas and over the oceanic crust in the deepoffshore areas. The modeled crustal structure below the ridge further indicates volcanic emplacementof the ridge on a relatively younger lithosphere. We propose two alternative models for the emplacementof the ridge.
� 2014 Elsevier Ltd. All rights reserved.
1. Introduction
The topography of the northern Indian Ocean is dominated byaseismic ridges and ocean basins which have formed during thebreakup of the eastern Gondwanaland and subsequent seafloorspreading. Among these, the Ninetyeast and Chagos-Laccadiveridges are the two most prominent linear N–S trending aseismicridges and these are believed to be the traces of the Kerguelenand Reunion mantle plumes respectively (Royer et al., 1991). How-ever, regional multi-channel seismic (MCS) reflection data in thenortheast Indian Ocean (Curray et al., 1982; Gopala Rao et al.,1997) revealed the presence of another almost N–S trending base-ment feature buried below the thick layer of sediments in the Bayof Bengal (BOB). This feature is named as the 85�E Ridge (after Cur-ray et al. (1982)). The ridge was initially identified as a basement
high on three seismic profiles by Curray and Moore (1971), but la-ter, the topographic expression was mapped along many E–W seis-mic profiles (Fig. 1) lying between the Afanasy Nikitin Seamount inthe equatorial central Indian Ocean and the East Coast of India(Gopala Rao et al., 1997; Subrahmanyam et al., 1999; Krishna,2003; Bastia et al., 2010; Michael and Krishna, 2011). Both the85�E and Ninetyeast ridges (Fig. 1) are buried below 2–6 km ofthick sediments of the northern BOB and divide the bay into threemajor sub-basins between the east coast of India and the And-aman–Nicobar Islands. However, unlike the Ninetyeast ridge,which is associated with a broad positive gravity field, the 85�ERidge is characterized by a prominent gravity low. This peculiargeophysical character is interpreted to be due to: (a) a two-stageloading process, with an initial emplacement of the ridge on aweak lithosphere (5–15 m.y) leading to excess thickening of thecrust, and subsequent loading of sediments on a stronger litho-sphere of 40–80 m.y old (Liu et al., 1982), (b) the result of the den-sity contrast between the metasediments and less dense ridge
80 85 90
-5
0
5
85
E R
idge
Nin
ety
Eas
t R
idge
INDIA
SRI
LANKA
CIB
ANS
Bayof
Bengal
3433
34n.2
34n.1
31
30
30 31
32n.1
32n.2
34
33
32n.1
31
34
33
34
33
32n.2
80 85 90
-5
0
5
-100 -50 0 50GRAVITY
mGal
84 85 86 8715
16
17
18
19
20
-3000 -2000 -1000 0
BATHYMETRY
m
84 85 86 8715
16
17
18
19
-90
-80
-80
-80
-70
-70
-70
-60
-60
-60
-50
-50
-50
-50
-40
-40
-40
-40
-30
-30
-30
-30
-20-2
0
-20
-100
10
20
20
30
30
84 85 86 8715
16
17
18
19
20
-100 -50 0 50GRAVITY
mGal
Rajmahal Traps
Sylhet Traps
BengalBasin
Mah
anad
i
Basin
û
And
aman
Tre
nch
8
76
54
3
2
1
10
15
20
25
10
15
20
25
0 100 200Distance (km)
-10
-8
-6
-4T
WT
(sec
)
85 East Ridge0
Sediment
Seafloor
CC
0 100 200
-10
-8
-6
-4
Seafloor
85 East Ridge0
Sediment
0 100 200-10
-8
-6
-4
0 100 200
-10
-8
-6
-4
-2 Seafloor
85 East Ridge0
Sediment
-2
Seafloor
85 East Ridge0
Sediment
0 100 200
-8
-6
-4 Seafloor
85 East Ridge0
Sediment
7
0 50 100 150 200 250-9
-8
-7
-6
-5
Sediment
Seafloor
85 East Ridge0
6
Sediment
Seafloor
85 East Ridge0
0 100 200-7
-6
-5
5
Sediment
Seafloor
85 East Ridge0
0 100 200
-8
-6
-4
4
0 100 200
-7
-5Sediment
Seafloor
85 East Ridge0
3
0 50 100 150
-7
-6
-5
Sediment
Seafloor
85 East Ridge0
2
0 50 100 150 200
-8
-6
-4
85 East Ridge0Sediment
Seafloor
1
-10
-8
-6
-4
Seafloor
Sediments
85 East Ridge0
80 100 200
-300
0
-2800
-280
0-2800
-2600-2600
-2400
-2200
-220
0
-180
0
-1400-1200-1000-800-600-400-200
0
E
E1
A
B
C
C1
D
D1
B1
A1
H
H1
F F1
G G185
E R
idge
1
CC1
DD
GG
BB1
1
1
DD
BB
GG
1
1
1
°
A
C
B
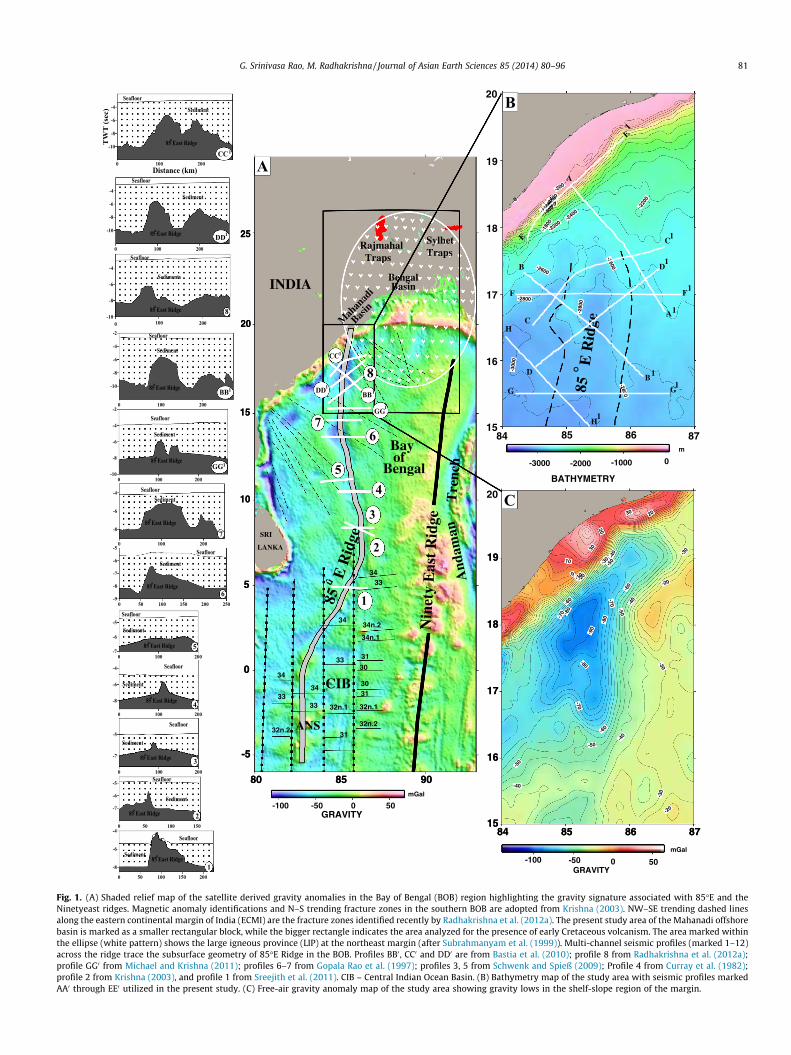
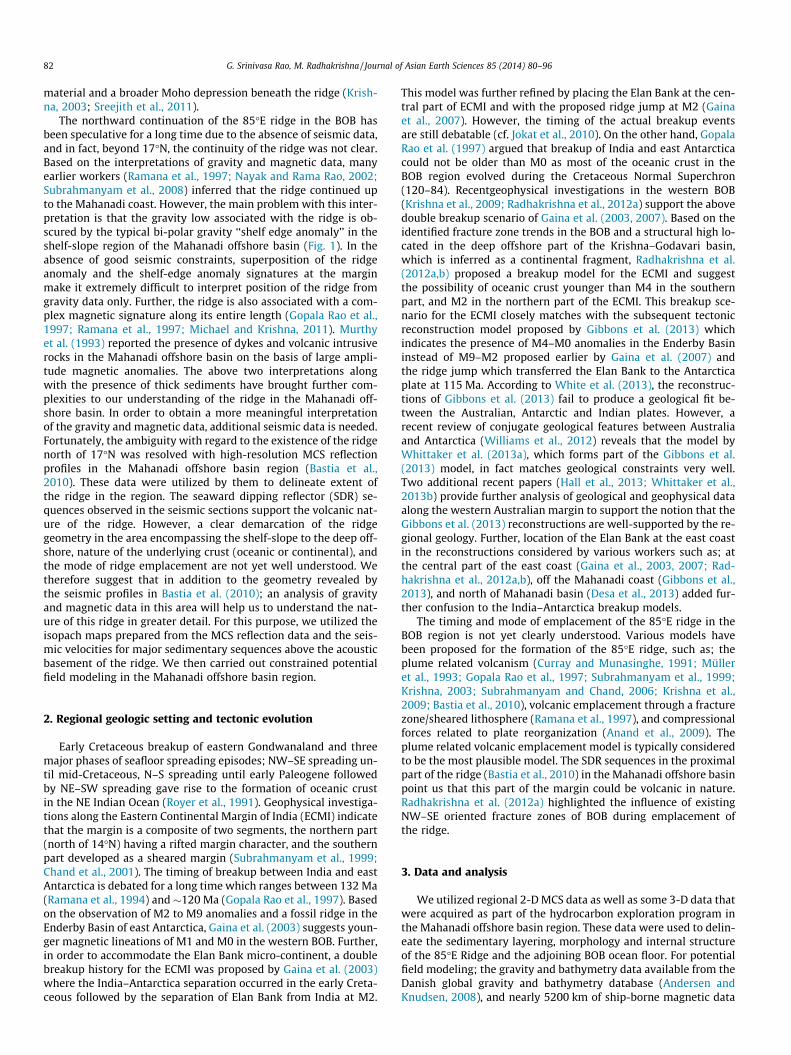
Fig. 1. (A) Shaded relief map of the satellite derived gravity anomalies in the Bay of Bengal (BOB) region highlighting the gravity signature associated with 85�E and theNinetyeast ridges. Magnetic anomaly identifications and N–S trending fracture zones in the southern BOB are adopted from Krishna (2003). NW–SE trending dashed linesalong the eastern continental margin of India (ECMI) are the fracture zones identified recently by Radhakrishna et al. (2012a). The present study area of the Mahanadi offshorebasin is marked as a smaller rectangular block, while the bigger rectangle indicates the area analyzed for the presence of early Cretaceous volcanism. The area marked withinthe ellipse (white pattern) shows the large igneous province (LIP) at the northeast margin (after Subrahmanyam et al. (1999)). Multi-channel seismic profiles (marked 1–12)across the ridge trace the subsurface geometry of 85�E Ridge in the BOB. Profiles BB0 , CC0 and DD0 are from Bastia et al. (2010); profile 8 from Radhakrishna et al. (2012a);profile GG0 from Michael and Krishna (2011); profiles 6–7 from Gopala Rao et al. (1997); profiles 3, 5 from Schwenk and Spieß (2009); Profile 4 from Curray et al. (1982);profile 2 from Krishna (2003), and profile 1 from Sreejith et al. (2011). CIB – Central Indian Ocean Basin. (B) Bathymetry map of the study area with seismic profiles markedAA0 through EE0 utilized in the present study. (C) Free-air gravity anomaly map of the study area showing gravity lows in the shelf-slope region of the margin.
G. Srinivasa Rao, M. Radhakrishna / Journal of Asian Earth Sciences 85 (2014) 80–96 81
82 G. Srinivasa Rao, M. Radhakrishna / Journal of Asian Earth Sciences 85 (2014) 80–96
material and a broader Moho depression beneath the ridge (Krish-na, 2003; Sreejith et al., 2011).
The northward continuation of the 85�E ridge in the BOB hasbeen speculative for a long time due to the absence of seismic data,and in fact, beyond 17�N, the continuity of the ridge was not clear.Based on the interpretations of gravity and magnetic data, manyearlier workers (Ramana et al., 1997; Nayak and Rama Rao, 2002;Subrahmanyam et al., 2008) inferred that the ridge continued upto the Mahanadi coast. However, the main problem with this inter-pretation is that the gravity low associated with the ridge is ob-scured by the typical bi-polar gravity ‘‘shelf edge anomaly’’ in theshelf-slope region of the Mahanadi offshore basin (Fig. 1). In theabsence of good seismic constraints, superposition of the ridgeanomaly and the shelf-edge anomaly signatures at the marginmake it extremely difficult to interpret position of the ridge fromgravity data only. Further, the ridge is also associated with a com-plex magnetic signature along its entire length (Gopala Rao et al.,1997; Ramana et al., 1997; Michael and Krishna, 2011). Murthyet al. (1993) reported the presence of dykes and volcanic intrusiverocks in the Mahanadi offshore basin on the basis of large ampli-tude magnetic anomalies. The above two interpretations alongwith the presence of thick sediments have brought further com-plexities to our understanding of the ridge in the Mahanadi off-shore basin. In order to obtain a more meaningful interpretationof the gravity and magnetic data, additional seismic data is needed.Fortunately, the ambiguity with regard to the existence of the ridgenorth of 17�N was resolved with high-resolution MCS reflectionprofiles in the Mahanadi offshore basin region (Bastia et al.,2010). These data were utilized by them to delineate extent ofthe ridge in the region. The seaward dipping reflector (SDR) se-quences observed in the seismic sections support the volcanic nat-ure of the ridge. However, a clear demarcation of the ridgegeometry in the area encompassing the shelf-slope to the deep off-shore, nature of the underlying crust (oceanic or continental), andthe mode of ridge emplacement are not yet well understood. Wetherefore suggest that in addition to the geometry revealed bythe seismic profiles in Bastia et al. (2010); an analysis of gravityand magnetic data in this area will help us to understand the nat-ure of this ridge in greater detail. For this purpose, we utilized theisopach maps prepared from the MCS reflection data and the seis-mic velocities for major sedimentary sequences above the acousticbasement of the ridge. We then carried out constrained potentialfield modeling in the Mahanadi offshore basin region.
2. Regional geologic setting and tectonic evolution
Early Cretaceous breakup of eastern Gondwanaland and threemajor phases of seafloor spreading episodes; NW–SE spreading un-til mid-Cretaceous, N–S spreading until early Paleogene followedby NE–SW spreading gave rise to the formation of oceanic crustin the NE Indian Ocean (Royer et al., 1991). Geophysical investiga-tions along the Eastern Continental Margin of India (ECMI) indicatethat the margin is a composite of two segments, the northern part(north of 14�N) having a rifted margin character, and the southernpart developed as a sheared margin (Subrahmanyam et al., 1999;Chand et al., 2001). The timing of breakup between India and eastAntarctica is debated for a long time which ranges between 132 Ma(Ramana et al., 1994) and �120 Ma (Gopala Rao et al., 1997). Basedon the observation of M2 to M9 anomalies and a fossil ridge in theEnderby Basin of east Antarctica, Gaina et al. (2003) suggests youn-ger magnetic lineations of M1 and M0 in the western BOB. Further,in order to accommodate the Elan Bank micro-continent, a doublebreakup history for the ECMI was proposed by Gaina et al. (2003)where the India–Antarctica separation occurred in the early Creta-ceous followed by the separation of Elan Bank from India at M2.
This model was further refined by placing the Elan Bank at the cen-tral part of ECMI and with the proposed ridge jump at M2 (Gainaet al., 2007). However, the timing of the actual breakup eventsare still debatable (cf. Jokat et al., 2010). On the other hand, GopalaRao et al. (1997) argued that breakup of India and east Antarcticacould not be older than M0 as most of the oceanic crust in theBOB region evolved during the Cretaceous Normal Superchron(120–84). Recentgeophysical investigations in the western BOB(Krishna et al., 2009; Radhakrishna et al., 2012a) support the abovedouble breakup scenario of Gaina et al. (2003, 2007). Based on theidentified fracture zone trends in the BOB and a structural high lo-cated in the deep offshore part of the Krishna–Godavari basin,which is inferred as a continental fragment, Radhakrishna et al.(2012a,b) proposed a breakup model for the ECMI and suggestthe possibility of oceanic crust younger than M4 in the southernpart, and M2 in the northern part of the ECMI. This breakup sce-nario for the ECMI closely matches with the subsequent tectonicreconstruction model proposed by Gibbons et al. (2013) whichindicates the presence of M4–M0 anomalies in the Enderby Basininstead of M9–M2 proposed earlier by Gaina et al. (2007) andthe ridge jump which transferred the Elan Bank to the Antarcticaplate at 115 Ma. According to White et al. (2013), the reconstruc-tions of Gibbons et al. (2013) fail to produce a geological fit be-tween the Australian, Antarctic and Indian plates. However, arecent review of conjugate geological features between Australiaand Antarctica (Williams et al., 2012) reveals that the model byWhittaker et al. (2013a), which forms part of the Gibbons et al.(2013) model, in fact matches geological constraints very well.Two additional recent papers (Hall et al., 2013; Whittaker et al.,2013b) provide further analysis of geological and geophysical dataalong the western Australian margin to support the notion that theGibbons et al. (2013) reconstructions are well-supported by the re-gional geology. Further, location of the Elan Bank at the east coastin the reconstructions considered by various workers such as; atthe central part of the east coast (Gaina et al., 2003, 2007; Rad-hakrishna et al., 2012a,b), off the Mahanadi coast (Gibbons et al.,2013), and north of Mahanadi basin (Desa et al., 2013) added fur-ther confusion to the India–Antarctica breakup models.
The timing and mode of emplacement of the 85�E ridge in theBOB region is not yet clearly understood. Various models havebeen proposed for the formation of the 85�E ridge, such as; theplume related volcanism (Curray and Munasinghe, 1991; Mülleret al., 1993; Gopala Rao et al., 1997; Subrahmanyam et al., 1999;Krishna, 2003; Subrahmanyam and Chand, 2006; Krishna et al.,2009; Bastia et al., 2010), volcanic emplacement through a fracturezone/sheared lithosphere (Ramana et al., 1997), and compressionalforces related to plate reorganization (Anand et al., 2009). Theplume related volcanic emplacement model is typically consideredto be the most plausible model. The SDR sequences in the proximalpart of the ridge (Bastia et al., 2010) in the Mahanadi offshore basinpoint us that this part of the margin could be volcanic in nature.Radhakrishna et al. (2012a) highlighted the influence of existingNW–SE oriented fracture zones of BOB during emplacement ofthe ridge.
3. Data and analysis
We utilized regional 2-D MCS data as well as some 3-D data thatwere acquired as part of the hydrocarbon exploration program inthe Mahanadi offshore basin region. These data were used to delin-eate the sedimentary layering, morphology and internal structureof the 85�E Ridge and the adjoining BOB ocean floor. For potentialfield modeling; the gravity and bathymetry data available from theDanish global gravity and bathymetry database (Andersen andKnudsen, 2008), and nearly 5200 km of ship-borne magnetic data
G. Srinivasa Rao, M. Radhakrishna / Journal of Asian Earth Sciences 85 (2014) 80–96 83
from the National Institute of Oceanography marine trackline data-base were used. In addition, selected 2-D MCS lines are shown asthey provide information about the morphology and internal struc-ture of the ridge.
3.1. Gravity and bathymetry
High-resolution 10 � 10 satellite derived free-air gravity andbathymetry data available from the Danish global gravity andbathymetry database (Andersen and Knudsen, 2008) was used inthe present study for the purpose of gravity modeling of the ridge.This satellite derived gravity database is useful for regional inves-tigations because free-air gravity anomalies contain informationdown to very short wavelengths (<20 km). The shaded relief mapsof bathymetry and free-air gravity anomalies prepared for thenorthern most part of the 85�E Ridge in the Mahanadi offshore ba-sin region are shown in Fig. 1b and c. Both bathymetry and gravitymaps reveal the shelf-slope morphological features and the associ-ated bi-polar gravity anomaly typical of passive continental mar-gins. Neither the topography of the ridge nor its associatedgravity low is directly discernible from the bathymetry and gravityanomaly maps in the study area. In the subsequent sections, wepresent detailed subsurface seismic information which apart fromrevealing the geometry of ridge can be effectively used to estimatethe sediment gravity effect and crustal Bouguer anomalies over theridge for better understanding.
3.2. Multi-channel seismic reflection imaging
Many regional 2-D MCS lines and some 3-D seismic data in se-lected areas were acquired/procured by the Reliance IndustriesLimited (RIL) as part of the hydrocarbon exploration activity inthe Mahanadi offshore basin (data coverage shown in the inset inFig. 2A). This detailed seismic data is used to prepare time struc-ture maps (isochrons) for various sedimentary layers identifiedon the basis of regionally significant sequence boundaries abovethe acoustic basement top. Also, the data is used to obtain seismicvelocity information pertaining to various sedimentary layers andthe layer belonging to top part of the ridge. In this study, three iso-chron maps were integrated with the modeled velocity structure ofthe ridge to obtain layer thicknesses and depth to the basement.Such information is required for 3-D gravity analyses. A prelimin-ary analysis of seismic data in this region (Bastia et al., 2010) pro-vided the first glimpse of the 85�E Ridge and also gave valuableinformation on the regional sediment dispersal pattern. In thepresent study, we utilized the dataset in greater detail and carriedout constrained gravity and magnetic interpretation. Our emphasishere is mainly to understand the structure, geometry and nature ofthe crust so that probable mode of emplacement of the ridge canbe inferred.
3.2.1. Time structure mapThe time structure map of the basement is prepared based on
the above referred MCS reflection data (Fig. 2A) which revealsthe morphological expression of the ridge. An analysis of thismap by earlier workers indicated that (i) the ridge acted as a sed-iment barrier and influenced the sediment dispersal pattern in thedeepwater Mahanadi offshore basin until the end of Oligocene(Bastia et al., 2010), (ii) morphology of the ridge is partly controlledby the existing fracture zone trends of the BOB (Radhakrishnaet al., 2012a). The map shows that the topography of the ridge isexpressed as two linear structural highs with an isolated sub-basinbetween the two highs. However, further north towards the Maha-nadi shelf, these two highs appear to be merging.
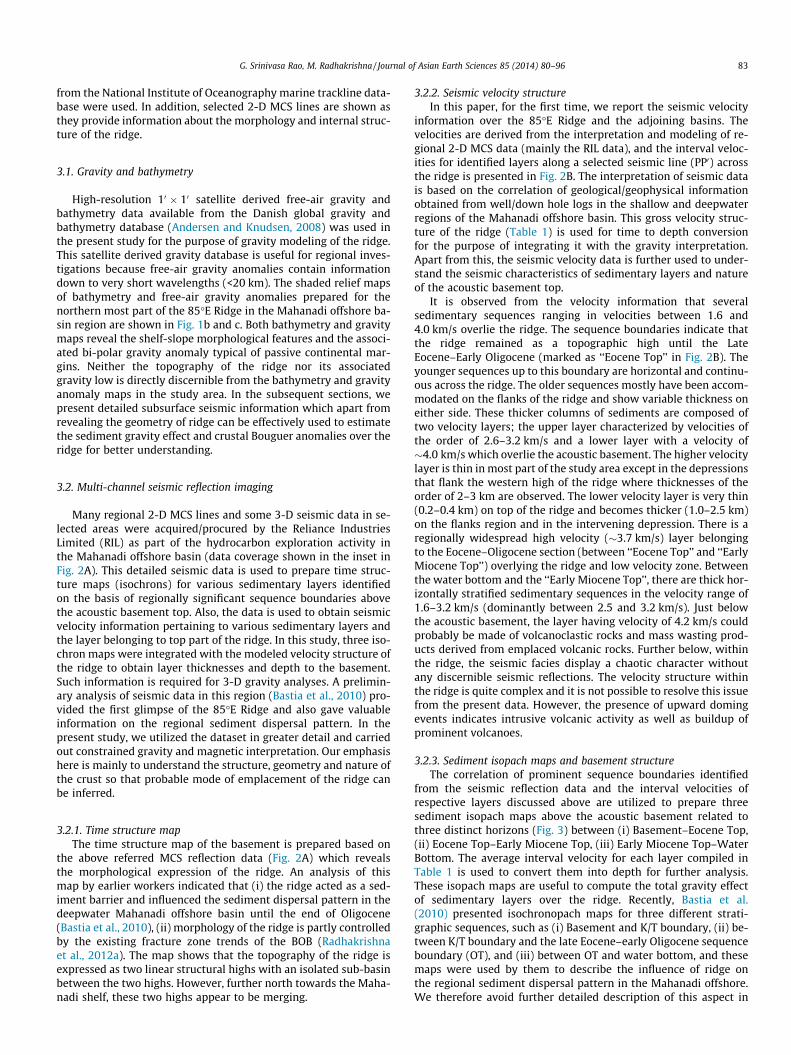
3.2.2. Seismic velocity structureIn this paper, for the first time, we report the seismic velocity
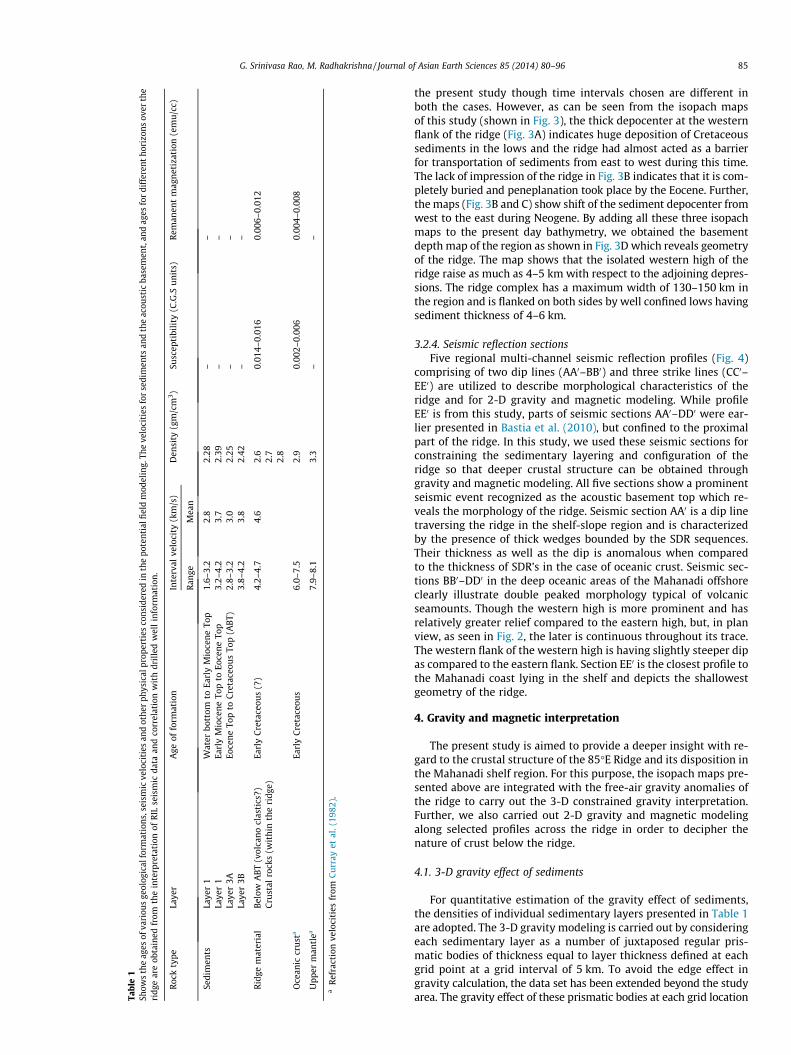
information over the 85�E Ridge and the adjoining basins. Thevelocities are derived from the interpretation and modeling of re-gional 2-D MCS data (mainly the RIL data), and the interval veloc-ities for identified layers along a selected seismic line (PP0) acrossthe ridge is presented in Fig. 2B. The interpretation of seismic datais based on the correlation of geological/geophysical informationobtained from well/down hole logs in the shallow and deepwaterregions of the Mahanadi offshore basin. This gross velocity struc-ture of the ridge (Table 1) is used for time to depth conversionfor the purpose of integrating it with the gravity interpretation.Apart from this, the seismic velocity data is further used to under-stand the seismic characteristics of sedimentary layers and natureof the acoustic basement top.
It is observed from the velocity information that severalsedimentary sequences ranging in velocities between 1.6 and4.0 km/s overlie the ridge. The sequence boundaries indicate thatthe ridge remained as a topographic high until the LateEocene–Early Oligocene (marked as ‘‘Eocene Top’’ in Fig. 2B). Theyounger sequences up to this boundary are horizontal and continu-ous across the ridge. The older sequences mostly have been accom-modated on the flanks of the ridge and show variable thickness oneither side. These thicker columns of sediments are composed oftwo velocity layers; the upper layer characterized by velocities ofthe order of 2.6–3.2 km/s and a lower layer with a velocity of�4.0 km/s which overlie the acoustic basement. The higher velocitylayer is thin in most part of the study area except in the depressionsthat flank the western high of the ridge where thicknesses of theorder of 2–3 km are observed. The lower velocity layer is very thin(0.2–0.4 km) on top of the ridge and becomes thicker (1.0–2.5 km)on the flanks region and in the intervening depression. There is aregionally widespread high velocity (�3.7 km/s) layer belongingto the Eocene–Oligocene section (between ‘‘Eocene Top’’ and ‘‘EarlyMiocene Top’’) overlying the ridge and low velocity zone. Betweenthe water bottom and the ‘‘Early Miocene Top’’, there are thick hor-izontally stratified sedimentary sequences in the velocity range of1.6–3.2 km/s (dominantly between 2.5 and 3.2 km/s). Just belowthe acoustic basement, the layer having velocity of 4.2 km/s couldprobably be made of volcanoclastic rocks and mass wasting prod-ucts derived from emplaced volcanic rocks. Further below, withinthe ridge, the seismic facies display a chaotic character withoutany discernible seismic reflections. The velocity structure withinthe ridge is quite complex and it is not possible to resolve this issuefrom the present data. However, the presence of upward domingevents indicates intrusive volcanic activity as well as buildup ofprominent volcanoes.
3.2.3. Sediment isopach maps and basement structureThe correlation of prominent sequence boundaries identified
from the seismic reflection data and the interval velocities ofrespective layers discussed above are utilized to prepare threesediment isopach maps above the acoustic basement related tothree distinct horizons (Fig. 3) between (i) Basement–Eocene Top,(ii) Eocene Top–Early Miocene Top, (iii) Early Miocene Top–WaterBottom. The average interval velocity for each layer compiled inTable 1 is used to convert them into depth for further analysis.These isopach maps are useful to compute the total gravity effectof sedimentary layers over the ridge. Recently, Bastia et al.(2010) presented isochronopach maps for three different strati-graphic sequences, such as (i) Basement and K/T boundary, (ii) be-tween K/T boundary and the late Eocene–early Oligocene sequenceboundary (OT), and (iii) between OT and water bottom, and thesemaps were used by them to describe the influence of ridge onthe regional sediment dispersal pattern in the Mahanadi offshore.We therefore avoid further detailed description of this aspect in
Fig. 2. (A) Time structure map of the acoustic basement top (ABT) surrounding the 85�E Ridge region in the Mahanadi offshore basin prepared on the basis of a large amount ofindustrial 2D and 3D seismic datasets (shown in inset). The trace of the ridge (white dashed lines) is indicated on the map (after Bastia et al. (2010)). (B) The seismic velocities and theinterpreted seismic horizons (shown in the panel below) along the seismic profile (PP0) across the ridge is used in the present study for further analysis and gravity modeling.
84 G. Srinivasa Rao, M. Radhakrishna / Journal of Asian Earth Sciences 85 (2014) 80–96
Tabl
e1
Show
sth
eag
esof
vari
ous
geol
ogic
alfo
rmat
ions
,sei
smic
velo
citi
esan
dot
her
phys
ical
prop
erti
esco
nsid
ered
inth
epo
tent
ialfi
eld
mod
elin
g.Th
eve
loci
ties
for
sedi
men
tsan
dth
eac
oust
icba
sem
ent,
and
ages
for
diff
eren
thor
izon
sov
erth
eri
dge
are
obta
ined
from
the
inte
rpre
tati
onof
RIL
seis
mic
data
and
corr
elat
ion
wit
hdr
illed
wel
lin
form
atio
n.
Roc
kty
peLa
yer
Age
offo
rmat
ion
Inte
rval
velo
city
(km
/s)
Den
sity
(gm
/cm
3)
Susc
epti
bili
ty(C
.G.S
un
its)
Rem
anen
tm
agn
etiz
atio
n(e
mu
/cc)
Ran
geM
ean
Sedi
men
tsLa
yer
1W
ater
bott
omto
Earl
yM
ioce
ne
Top
1.6–
3.2
2.8
2.28
––
Laye
r1
Earl
yM
ioce
ne
Top
toEo
cen
eTo
p3.
2–4.
23.
72.
39–
–La
yer
3AEo
cen
eTo
pto
Cre
tace
ous
Top
(AB
T)2.
8–3.
23.
02.
25–
–La
yer
3B3.
8–4.
23.
82.
42–
–
Rid
gem
ater
ial
Bel
owA
BT
(vol
cano
clas
tics
?)Ea
rly
Cre
tace
ous
(?)
4.2–
4.7
4.6
2.6
0.01
4–0.
016
0.00
6–0.
012
Cru
stal
rock
s(w
ith
inth
eri
dge)
2.7
2.8
Oce
anic
cru
sta
Earl
yC
reta
ceou
s6.
0–7.
52.
90.
002–
0.00
60.
004–
0.00
8
Upp
erm
antl
ea7.
9–8.
13.
3–
–
aR
efra
ctio
nve
loci
ties
from
Cu
rray
etal
.(19
82).
G. Srinivasa Rao, M. Radhakrishna / Journal of Asian Earth Sciences 85 (2014) 80–96 85
the present study though time intervals chosen are different inboth the cases. However, as can be seen from the isopach mapsof this study (shown in Fig. 3), the thick depocenter at the westernflank of the ridge (Fig. 3A) indicates huge deposition of Cretaceoussediments in the lows and the ridge had almost acted as a barrierfor transportation of sediments from east to west during this time.The lack of impression of the ridge in Fig. 3B indicates that it is com-pletely buried and peneplanation took place by the Eocene. Further,the maps (Fig. 3B and C) show shift of the sediment depocenter fromwest to the east during Neogene. By adding all these three isopachmaps to the present day bathymetry, we obtained the basementdepth map of the region as shown in Fig. 3D which reveals geometryof the ridge. The map shows that the isolated western high of theridge raise as much as 4–5 km with respect to the adjoining depres-sions. The ridge complex has a maximum width of 130–150 km inthe region and is flanked on both sides by well confined lows havingsediment thickness of 4–6 km.
3.2.4. Seismic reflection sectionsFive regional multi-channel seismic reflection profiles (Fig. 4)
comprising of two dip lines (AA0–BB0) and three strike lines (CC0–EE0) are utilized to describe morphological characteristics of theridge and for 2-D gravity and magnetic modeling. While profileEE0 is from this study, parts of seismic sections AA0–DD0 were ear-lier presented in Bastia et al. (2010), but confined to the proximalpart of the ridge. In this study, we used these seismic sections forconstraining the sedimentary layering and configuration of theridge so that deeper crustal structure can be obtained throughgravity and magnetic modeling. All five sections show a prominentseismic event recognized as the acoustic basement top which re-veals the morphology of the ridge. Seismic section AA0 is a dip linetraversing the ridge in the shelf-slope region and is characterizedby the presence of thick wedges bounded by the SDR sequences.Their thickness as well as the dip is anomalous when comparedto the thickness of SDR’s in the case of oceanic crust. Seismic sec-tions BB0–DD0 in the deep oceanic areas of the Mahanadi offshoreclearly illustrate double peaked morphology typical of volcanicseamounts. Though the western high is more prominent and hasrelatively greater relief compared to the eastern high, but, in planview, as seen in Fig. 2, the later is continuous throughout its trace.The western flank of the western high is having slightly steeper dipas compared to the eastern flank. Section EE0 is the closest profile tothe Mahanadi coast lying in the shelf and depicts the shallowestgeometry of the ridge.
4. Gravity and magnetic interpretation
The present study is aimed to provide a deeper insight with re-gard to the crustal structure of the 85�E Ridge and its disposition inthe Mahanadi shelf region. For this purpose, the isopach maps pre-sented above are integrated with the free-air gravity anomalies ofthe ridge to carry out the 3-D constrained gravity interpretation.Further, we also carried out 2-D gravity and magnetic modelingalong selected profiles across the ridge in order to decipher thenature of crust below the ridge.
4.1. 3-D gravity effect of sediments
For quantitative estimation of the gravity effect of sediments,the densities of individual sedimentary layers presented in Table 1are adopted. The 3-D gravity modeling is carried out by consideringeach sedimentary layer as a number of juxtaposed regular pris-matic bodies of thickness equal to layer thickness defined at eachgrid point at a grid interval of 5 km. To avoid the edge effect ingravity calculation, the data set has been extended beyond the studyarea. The gravity effect of these prismatic bodies at each grid location
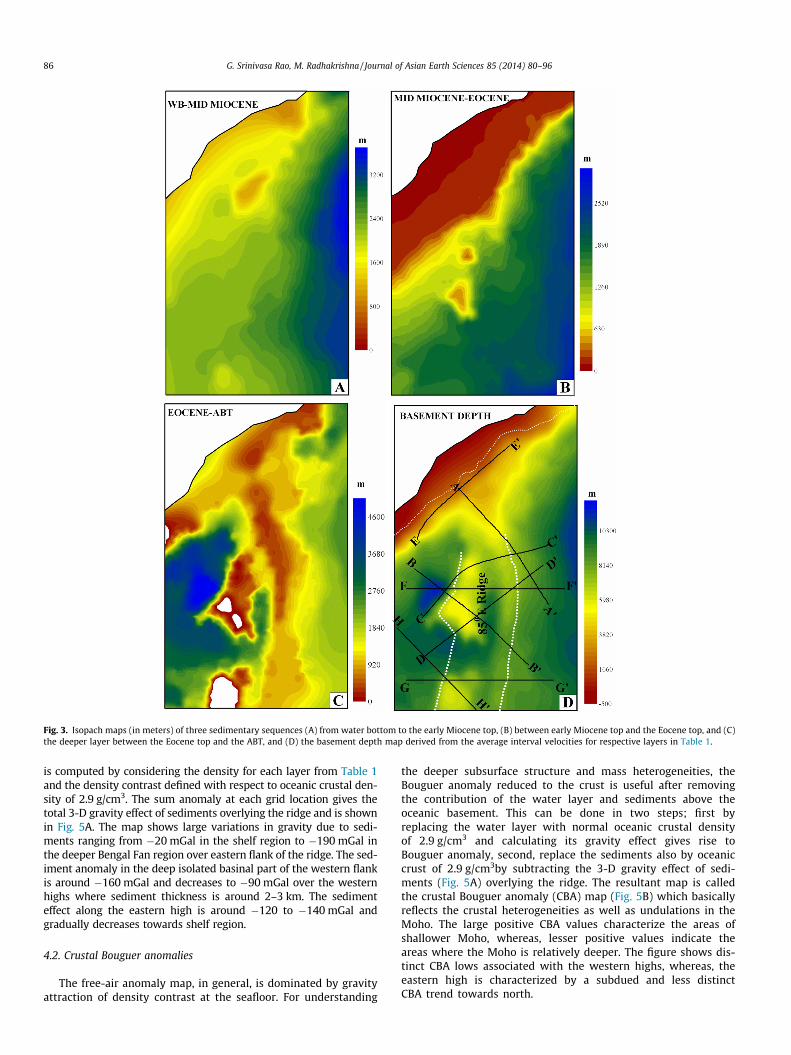
Fig. 3. Isopach maps (in meters) of three sedimentary sequences (A) from water bottom to the early Miocene top, (B) between early Miocene top and the Eocene top, and (C)the deeper layer between the Eocene top and the ABT, and (D) the basement depth map derived from the average interval velocities for respective layers in Table 1.
86 G. Srinivasa Rao, M. Radhakrishna / Journal of Asian Earth Sciences 85 (2014) 80–96
is computed by considering the density for each layer from Table 1and the density contrast defined with respect to oceanic crustal den-sity of 2.9 g/cm3. The sum anomaly at each grid location gives thetotal 3-D gravity effect of sediments overlying the ridge and is shownin Fig. 5A. The map shows large variations in gravity due to sedi-ments ranging from �20 mGal in the shelf region to �190 mGal inthe deeper Bengal Fan region over eastern flank of the ridge. The sed-iment anomaly in the deep isolated basinal part of the western flankis around �160 mGal and decreases to �90 mGal over the westernhighs where sediment thickness is around 2–3 km. The sedimenteffect along the eastern high is around �120 to �140 mGal andgradually decreases towards shelf region.
4.2. Crustal Bouguer anomalies
The free-air anomaly map, in general, is dominated by gravityattraction of density contrast at the seafloor. For understanding
the deeper subsurface structure and mass heterogeneities, theBouguer anomaly reduced to the crust is useful after removingthe contribution of the water layer and sediments above theoceanic basement. This can be done in two steps; first byreplacing the water layer with normal oceanic crustal densityof 2.9 g/cm3 and calculating its gravity effect gives rise toBouguer anomaly, second, replace the sediments also by oceaniccrust of 2.9 g/cm3by subtracting the 3-D gravity effect of sedi-ments (Fig. 5A) overlying the ridge. The resultant map is calledthe crustal Bouguer anomaly (CBA) map (Fig. 5B) which basicallyreflects the crustal heterogeneities as well as undulations in theMoho. The large positive CBA values characterize the areas ofshallower Moho, whereas, lesser positive values indicate theareas where the Moho is relatively deeper. The figure shows dis-tinct CBA lows associated with the western highs, whereas, theeastern high is characterized by a subdued and less distinctCBA trend towards north.

Fig. 4. Five regional seismic profiles AA0 through EE0 (see Fig. 1B for location) utilized for 2-D gravity modeling in the present study. The profiles depict the morphology andinternal structure of the ridge as discussed in the text. ABT – Acoustic Basement Top. Profile EE0 defines the northern most part of the ridge that runs very close to theMahanadi coast along the shelf.
G. Srinivasa Rao, M. Radhakrishna / Journal of Asian Earth Sciences 85 (2014) 80–96 87
4.3. Image enhanced maps and continuity of the ridge in the shelfregion
The trend of the ridge in the shelf region is not clear in Fig. 5Bdespite the removal of the sediment effect. The first vertical deriv-ative is a useful image enhancement tool to reduce the larger dy-namic range in the CBA map as it will enhance the gravity fieldassociated with shallow basement features and suppress the dee-per effects. We prepared first vertical derivative maps of both com-plete Bouguer and CBA maps, just to see how much effect thesediment removal has made on the later one. A comparison ofthe resultant maps (Fig. 6A and B) show that the gravity low asso-ciated with the ridge is clearer in the vertical derivative of the CBAmap as it could successfully separate the strong margin relatedgravity signature and the ridge anomaly. Further, this map clearlydisplays the N–S continuity of gravity low of the ridge up to thecoast and demonstrates the efficiency of gravity modeling whenadditional seismic constraints are brought into the gravity inter-pretation. This aspect is very important and perhaps critical fordelineating the ridge near to the coast. Another interesting ques-tion which needs to be resolved here is about the nature of crustalrocks that are made up of the ridge. For this purpose, we computedthe isostatic residual anomalies in the study area as they areknown to be very useful to understand the crustal heterogeneitiesas well as help to delineate the shallow uncompensated basementfeatures at the margin (Rabinowitz and LaBrecque, 1977; Simpsonet al., 1986). The isostatic residuals are obtained after removing thegravity effect of regional root/anti-root topography (called as re-gional isostatic anomaly) from the complete Bouguer anomaliesby assuming the Airy isostatic compensation in the region. In thisstudy, we removed the isostatic regional anomaly from the CBAvalues instead of the complete Bouguer anomalies. We computedthe first vertical derivative of the resulting isostatic residual mapas shown in Fig. 6C. Note the difference between Fig. 6B and C.While, Fig. 6B could not bring out shallow features very well dueto deeper Moho effect; the shallow features are very well enhanced
in Fig. 6C as well as continuity of the ridge anomaly is much betterrevealed. Further, the sharp isostatic anomaly gradient along theshelf-slope area on either side of the ridge could be inferred asthe Continent-Ocean Boundary (COB). However, in the proximalpart of the ridge, identification of COB becomes difficult as mostof the earlier rift related features might have been obscured bythe volcanic emplacements in this region. Fig. 3D illustrates thatthe shelf-slope area in the proximal part of the ridge is character-ized by the seaward basement feature and from Fig. 6C, we believethat the area may be underlain by the continental crust and there-fore COB must be lying further offshore here. This implies that partof the 85�E Ridge must be underlain by continental crust, animportant aspect to understand the evolution of ridge. We furtheraddress this issue in the section below through gravity and mag-netic modeling.
4.4. Crustal structure derived from gravity and magnetic modeling
The CBA map presented in Fig. 5B reflects the mass anomalieswithin the crust as well as variations in Moho boundary. Due tostrong velocity heterogeneities within the volcanic crustal layersthat comprise the ridge material (Fig. 2), a direct 3-D inversion ofthis map for the delineation of crust-mantle interface is not envis-aged. Therefore, for obtaining crustal configuration below theridge, we carried out 2D forward modeling along seven profiles(AA0–HH0) to obtain the subsurface configuration of ridge as wellas to understand nature of crustal rocks below the ridge. For thispurpose, we have extracted gravity anomalies along the profilesfrom the CBA grid, whereas, the magnetic data required for model-ing is compiled from different sources: AA0 (Cruise report, ORV Sag-arKanya, after Ramana et al.,1993); BB0 and HH0 (Sar et al., 2009);FF0 (Subrahmanyam et al., 2004); GG0 (Michael and Krishna,2011). It is known that the ambiguity in gravity and magneticmodeling can be minimized if we can incorporate additional con-straints on the model parameters as well as its geometry fromother geophysical datasets. In this study, as the profiles have been

Fig. 5. (A) The 3-D gravity effect of sediments overlying the ridge and surrounding region based on the thickness and densities adopted from Fig. 2 and Table 1. (B) CrustalBouguer anomaly map of the region prepared after removing 3-D gravity effect of water and sediment layers overlying the ridge.
88 G. Srinivasa Rao, M. Radhakrishna / Journal of Asian Earth Sciences 85 (2014) 80–96
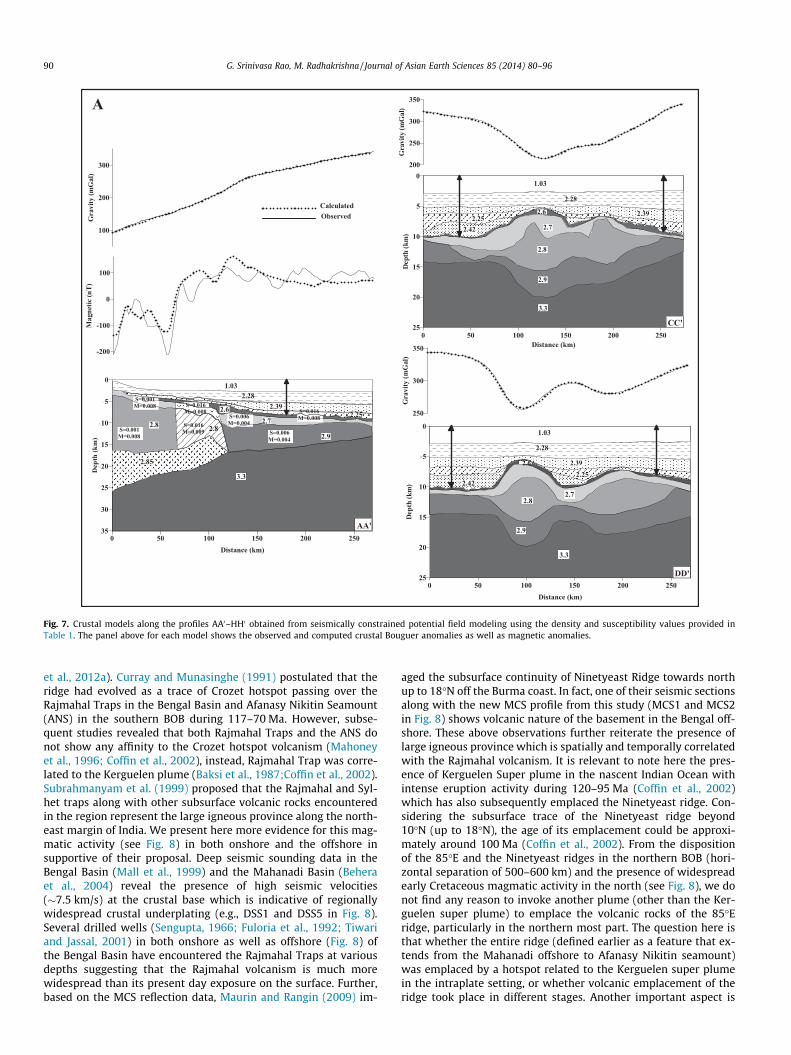
constructed mostly along the MCS lines, the depth converted den-sity layering (derived from seismic velocities shown in Table 1) andgeometry of the ridge are constrained from the seismic data forgravity modeling. However, magnetic modeling requires additionalinformation with regard to the nature and source of emplacementof the ridge. Here, the magnetic model parameters are constrainedbased on the premise that (i) the ridge had formed through volca-nic emplacement as evidenced by the prominent SDR sequences inthe proximal part of the ridge (Bastia et al., 2010), (ii) the source ofthis emplacement is the Kerguelen plume which might havestarted emplacing the ridge in the Mahanadi offshore regionapproximately around 105 Ma onwards when the surroundingoceanic crust is of �120 Ma (Radhakrishna et al., 2012a). Thesetwo inferences are purely conjectural at this stage and are sup-ported by their proposed model for evolution of the ridge. Thismay have given rise to the remanent inclination (62�) and the dec-lination (210�) for the 85�E ridge based on the paleoposition (43�S)of the Kerguelen plume at 105 Ma (Antretter et al., 2002), while forthe surrounding oceanic crust, the values are estimated from thepaleoposition of India during 120–115 Ma. The total intensity ofEarth’s magnetic field is considered as 43,000 nT while the inducedinclination and the declination in this region are 23� and �1.35�respectively. The resultant crustal models of the ridge are shownin Fig. 7A–D. Another aspect, we are interested to look into iswhether the ridge emplacement (in the deep offshore) was onthe pre-existing oceanic crust or over the continental crust? Forthis purpose, we tested both models of the ridge for profiles BB0
and HH0 (Fig. 7B and C). While, the gravity anomalies can be easilyfit through forward modeling by changing the crustal geometry forboth continental as well as oceanic crust due to minor differencesin the density contrasts of the crust-Moho interface for continental(0.45 g/cc) and oceanic (0.40 g/cc), the magnetic anomalies beingsensitive to the magnetization characteristics support the modelin which the ridge is emplaced on the oceanic crust. Deeper crustalseismic data are required to confirm this aspect. The models alongFF0 and GG0 located in the deep offshore also support the emplace-ment of ridge on the oceanic crust. However, for profile AA0 lying in
the Mahanadi shelf region, the crustal model suggests emplacementof the ridge on continental crust. The ridge here is manifested as athick volcanic emplacement on the continental crust landward ofthe COB along this section. Therefore, the models in the present studyreveal that the crust underlying the ridge is continental in the Maha-nadi shelf region and oceanic in the deep offshore regions. Anotherimportant outcome of the models is the strong magnetization con-trast that exists between the ridge material and the surrounding oce-anic crustal rocks which indicates that the ridge had been a productof volcanic emplacement on the existing oceanic crust. The seismicprofiles BB0, CC0 and DD0 (Fig. 4D) show downward concave brightreflector beneath the ridge which indicates sagging of the crust dueto the increase of intrusive volcanic load. The crustal models BB0–HH0 (Fig. 7A–D) shows that the downward depressed Moho belowthe ridge is at a depth of 19–21 km with respect to the surroundingBOB crust where Moho depths are of the order 14–16 km.
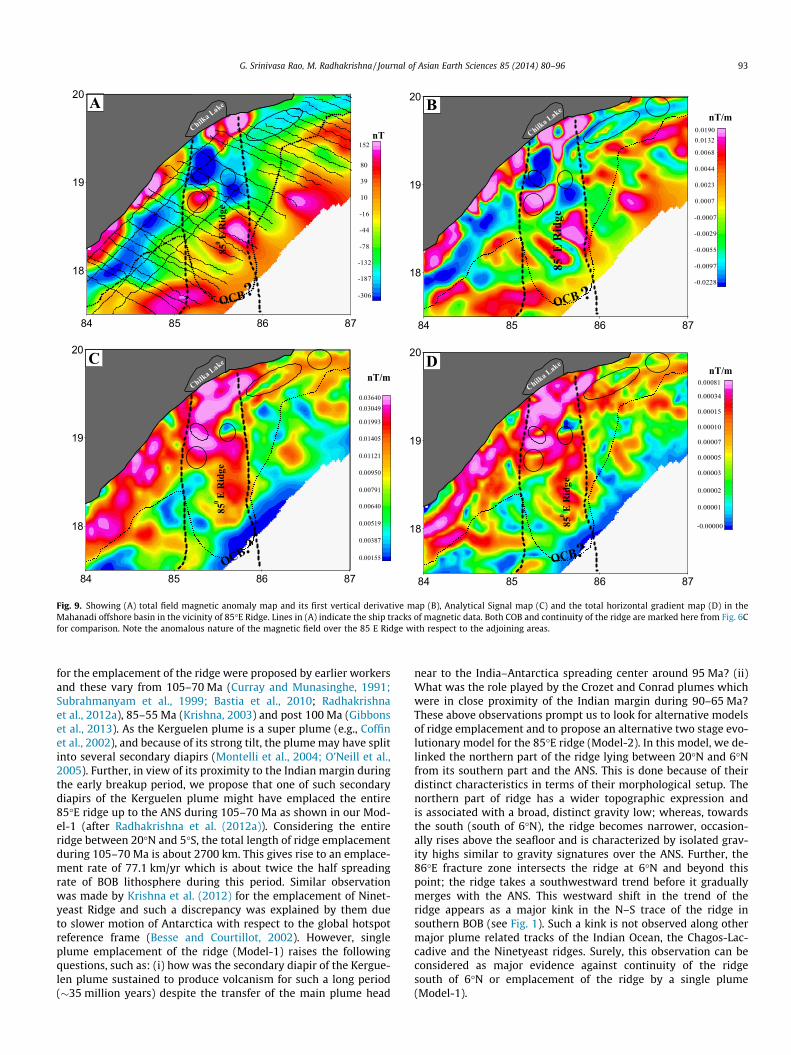
In order to understand the continuation of ridge further north-ward up to the coast, and also to look for any volcanic imprints inthe continental interior, we compiled available geophysical data inthe northeast margin encompassing the Mahanadi and Bengal shelfas well as the corresponding onland basins (Fig. 8). Nearly 5200line km of ship-borne magnetic data along the northeast marginfrom NIO marine trackline database is utilized here. The total mag-netic intensity map prepared from this data, and its first verticalderivative, analytical signal, total horizontal derivative maps areshown in Fig. 9. These maps together reveal that the crustal rocksoffshore Chilka Lake possess anomalous magnetization character-istics and when correlated with Fig. 6C, this region falls in line withthe continuity of 85�E Ridge. Further, the uncompensated base-ment highs shown in Fig. 6C could be related to the emplaced vol-canic rocks in the region.
5. Discussion and implications
The integrated interpretation of geophysical data over the 85�ERidge close to the eastern margin of India in the present studybrings out some important aspects with regard to the ridge, such
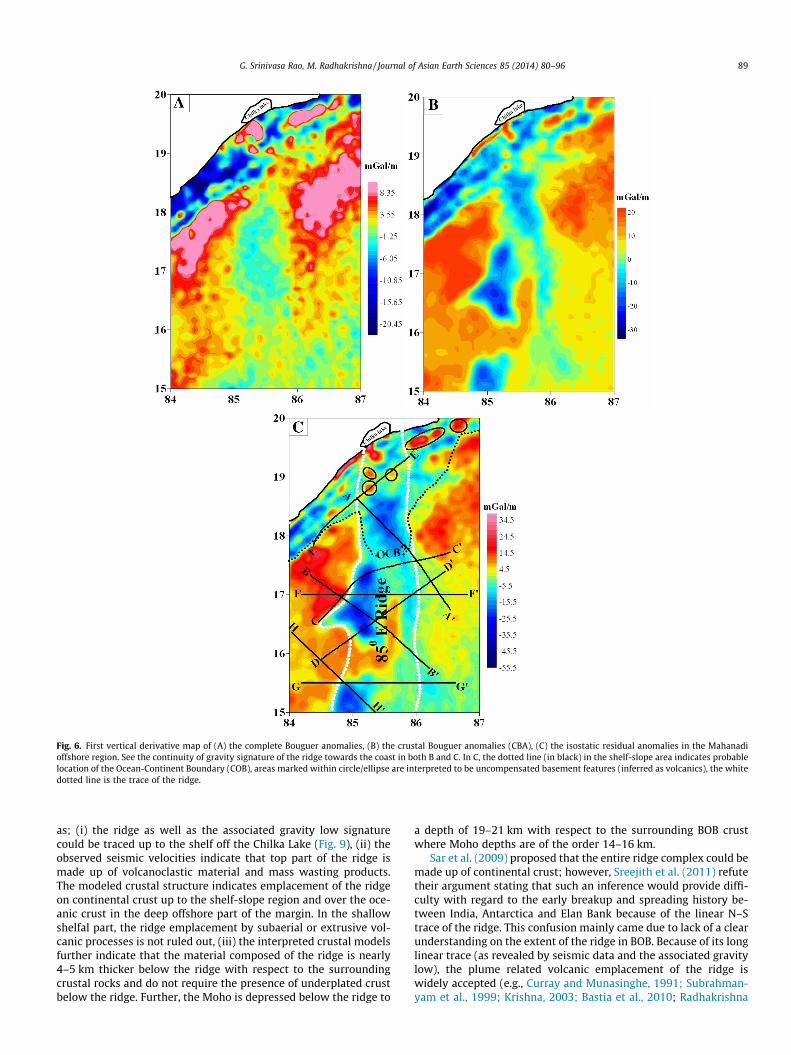
Fig. 6. First vertical derivative map of (A) the complete Bouguer anomalies, (B) the crustal Bouguer anomalies (CBA), (C) the isostatic residual anomalies in the Mahanadioffshore region. See the continuity of gravity signature of the ridge towards the coast in both B and C. In C, the dotted line (in black) in the shelf-slope area indicates probablelocation of the Ocean-Continent Boundary (COB), areas marked within circle/ellipse are interpreted to be uncompensated basement features (inferred as volcanics), the whitedotted line is the trace of the ridge.
G. Srinivasa Rao, M. Radhakrishna / Journal of Asian Earth Sciences 85 (2014) 80–96 89
as; (i) the ridge as well as the associated gravity low signaturecould be traced up to the shelf off the Chilka Lake (Fig. 9), (ii) theobserved seismic velocities indicate that top part of the ridge ismade up of volcanoclastic material and mass wasting products.The modeled crustal structure indicates emplacement of the ridgeon continental crust up to the shelf-slope region and over the oce-anic crust in the deep offshore part of the margin. In the shallowshelfal part, the ridge emplacement by subaerial or extrusive vol-canic processes is not ruled out, (iii) the interpreted crustal modelsfurther indicate that the material composed of the ridge is nearly4–5 km thicker below the ridge with respect to the surroundingcrustal rocks and do not require the presence of underplated crustbelow the ridge. Further, the Moho is depressed below the ridge to
a depth of 19–21 km with respect to the surrounding BOB crustwhere Moho depths are of the order 14–16 km.
Sar et al. (2009) proposed that the entire ridge complex could bemade up of continental crust; however, Sreejith et al. (2011) refutetheir argument stating that such an inference would provide diffi-culty with regard to the early breakup and spreading history be-tween India, Antarctica and Elan Bank because of the linear N–Strace of the ridge. This confusion mainly came due to lack of a clearunderstanding on the extent of the ridge in BOB. Because of its longlinear trace (as revealed by seismic data and the associated gravitylow), the plume related volcanic emplacement of the ridge iswidely accepted (e.g., Curray and Munasinghe, 1991; Subrahman-yam et al., 1999; Krishna, 2003; Bastia et al., 2010; Radhakrishna
200
250
300
350
Gra
vity
(mG
al)
CC'0 50 100 150 200 250
Distance (km)
-25
-20
-15
-10
-5
0
Dep
th(k
m)
2.28
2.392.25
2.42
2.6
2.7
2.8
2.9
3.3
1.03
250
300
350
Gra
vity
(mG
al)
0 50 100 150 200 250Distance (km)
-25
-20
-15
-10
-5
0
Dep
th(k
m)
1.03
2.28
2.39
2.25
2.72.8
3.3
DD'
2.9
2.42
2.6
100
200
300
Gra
vity
(mG
al)
CalculatedObserved
-200
-100
0
100
Mag
netic
(nT)
0 50 100 150 200 250Distance (km)
-35
-30
-25
-20
-15
-10
-5
0
Dep
th(k
m)
AA'
1.03
2.392.6
2.82.9
3.3
2.85
2.7
2.28
2.25 S=0.006M=0.004
S=0.006M=0.004
S=0.016M=0.008
S=0.016M=0.009 S=0.001
M=0.008
S=0.016M=0.008
S=0.001M=0.008
2.8
A
Fig. 7. Crustal models along the profiles AA0–HH0 obtained from seismically constrained potential field modeling using the density and susceptibility values provided inTable 1. The panel above for each model shows the observed and computed crustal Bouguer anomalies as well as magnetic anomalies.
90 G. Srinivasa Rao, M. Radhakrishna / Journal of Asian Earth Sciences 85 (2014) 80–96
et al., 2012a). Curray and Munasinghe (1991) postulated that theridge had evolved as a trace of Crozet hotspot passing over theRajmahal Traps in the Bengal Basin and Afanasy Nikitin Seamount(ANS) in the southern BOB during 117–70 Ma. However, subse-quent studies revealed that both Rajmahal Traps and the ANS donot show any affinity to the Crozet hotspot volcanism (Mahoneyet al., 1996; Coffin et al., 2002), instead, Rajmahal Trap was corre-lated to the Kerguelen plume (Baksi et al., 1987;Coffin et al., 2002).Subrahmanyam et al. (1999) proposed that the Rajmahal and Syl-het traps along with other subsurface volcanic rocks encounteredin the region represent the large igneous province along the north-east margin of India. We present here more evidence for this mag-matic activity (see Fig. 8) in both onshore and the offshore insupportive of their proposal. Deep seismic sounding data in theBengal Basin (Mall et al., 1999) and the Mahanadi Basin (Beheraet al., 2004) reveal the presence of high seismic velocities(�7.5 km/s) at the crustal base which is indicative of regionallywidespread crustal underplating (e.g., DSS1 and DSS5 in Fig. 8).Several drilled wells (Sengupta, 1966; Fuloria et al., 1992; Tiwariand Jassal, 2001) in both onshore as well as offshore (Fig. 8) ofthe Bengal Basin have encountered the Rajmahal Traps at variousdepths suggesting that the Rajmahal volcanism is much morewidespread than its present day exposure on the surface. Further,based on the MCS reflection data, Maurin and Rangin (2009) im-
aged the subsurface continuity of Ninetyeast Ridge towards northup to 18�N off the Burma coast. In fact, one of their seismic sectionsalong with the new MCS profile from this study (MCS1 and MCS2in Fig. 8) shows volcanic nature of the basement in the Bengal off-shore. These above observations further reiterate the presence oflarge igneous province which is spatially and temporally correlatedwith the Rajmahal volcanism. It is relevant to note here the pres-ence of Kerguelen Super plume in the nascent Indian Ocean withintense eruption activity during 120–95 Ma (Coffin et al., 2002)which has also subsequently emplaced the Ninetyeast ridge. Con-sidering the subsurface trace of the Ninetyeast ridge beyond10�N (up to 18�N), the age of its emplacement could be approxi-mately around 100 Ma (Coffin et al., 2002). From the dispositionof the 85�E and the Ninetyeast ridges in the northern BOB (hori-zontal separation of 500–600 km) and the presence of widespreadearly Cretaceous magmatic activity in the north (see Fig. 8), we donot find any reason to invoke another plume (other than the Ker-guelen super plume) to emplace the volcanic rocks of the 85�Eridge, particularly in the northern most part. The question here isthat whether the entire ridge (defined earlier as a feature that ex-tends from the Mahanadi offshore to Afanasy Nikitin seamount)was emplaced by a hotspot related to the Kerguelen super plumein the intraplate setting, or whether volcanic emplacement of theridge took place in different stages. Another important aspect is

CalculatedObserved
250
300
Gra
vity
(mG
al)
-200
-100
0
Mag
netic
(nT)
1.03
0 50 100 150 200 250Distance (km)
-25
-20
-15
-10
-5
0
Dep
th(k
m)
2.6 2.392.25
2.7
2.8
2.9
3.3
2.42
BB'
2.28
3.05
2.95
2.9
2.92.7
2.82.7
1.03
S=0.016M=0.012
S=0.016M=0.008
S=0.016M=0.008
S=0.016M=0.008
S=0.016M=0.012
S=0.016M=0.012
S=0.002M=0.005
S=0.002M=0.005
S=0.016M=0.008 S=0.002
M=0.0052.8
2.9
2.7
250
300
Gra
vity
(mG
al)
-200
-100
0
Mag
netic
(nT)
0 50 100 150 200 250Distance (km)
-30
-25
-20
-15
-10
-5
0
Dep
th(k
m)
2.6 2.392.25
2.7
2.8
3.3
2.42
BB'
2.28
3.05
2.95 2.9
2.82.7
2.9
2.7
S=0.002M=0.005
S=0.002M=0.005
S=0.002M=0.005
S=0.016M=0.008 S=0.016
M=0.012 S=0.016M=0.008
S=0.001
S=0.0012.8
2.7
Model-1(Oceanic Crust) Model-2(Continental Crust)B
-200
-100
0
100
Mag
netic
(nT
)
300
320
340
Gra
v(m
Gal
)
CalculatedObserved
0 50 100 150 200Distance (km)
-15
-12
-9
-6
-3
0
Dep
th(k
m)
2.8
3.3
2.92.8
2.7
2.72.6
2.42
2.39
2.28
1.03
2.9
HH'
S=0.016M=0.008
S=0.016M=0.008
S=0.002M=0.005
S=0.002M=0.005
300
320
340
Gra
vity
(mG
al)
-200
-100
0
100
Mag
netic
(nT
)
0 50 100 150 200Distance (km)
-15
-12
-9
-6
-3
0
Dep
th(k
m)
3.3
2.9
2.82.7 2.7
2.42
2.39
2.28
1.03
HH'
S=0.002M=0.005
S=0.002M=0.005
Model-1(Oceanic Crust) Model-2(Continental Crust)C
S=0.002M=0.005
S=0.016M=0.008
S=0.016M=0.008
S=0.002M=0.005
S=0.016M=0.008 2.6
S=0.016M=0.008
2.8
S=0.001
Fig. 7 (continued)
G. Srinivasa Rao, M. Radhakrishna / Journal of Asian Earth Sciences 85 (2014) 80–96 91
whether there exists any genetic link between the 85�E ridge andthe Afanasy Nikitin seamount at all. To address these ambiguities,we propose here two alternative models (Fig. 10) for the evolutionof the ridge taking into consideration of all available tectonic con-
straints in the BOB region. The need for invoking alternative mod-els has arisen mainly due to lack of clarity on the source of thevolcanic emplacement (Kerguelen, Crozet or Conrad and alterna-tively volcanism along a leaky transform). Further, different times

320
340
Gra
vity
(mG
al)
0
100
200
Mag
netic
(nT
)0 50 100 150 200 250
Distance (km)
-20
-15
-10
-5
0
Dep
th(k
m)
2.8
3.3
2.92.8
2.7 2.7
2.62.42
2.39
2.28
1.03
2.92.92.8
2.7
GG'
S=0.002M=0.004 S=0.014
M=0.008
2.7S=0.002M=0.004
S=0.002M=0.004
S=0.014M=0.008
S=0.016M=0.007
S=0.002M=0.008
S=0.002M=0.008
S=0.002M=0.008
2.8
S=0.016M=0.007
2.9
S=0.016M=0.008
S=0.014M=0.008
S=0.016M=0.007
250
300
350
Gra
vity
(mG
al)
-100
0
100
Mag
netic
(nT
)
0 50 100 150 200 250Distance (km)
-25
-20
-15
-10
-5
0
Dep
th(k
m)
3.3
2.9
2.7
2.62.42
2.392.28
1.03
2.7
2.9
2.42
FF'
2.8
2.9
2.7
S=0.016M=0.006
S=0.016M=0.006
S=0.016M=0.006 S=0.014
M=0.008
S=0.014M=0.008
S=0.014M=0.008
S=0.002M=0.006
S=0.002M=0.006
S=0.002M=0.006
S=0.002M=0.006
S=0.016M=0.008
D
Fig. 7 (continued)
?
84 86 88 90 92
16
18
20
22
24
26 Rajmahal Traps
Sylhet Traps
MC
S1
MCS 2
Nin
ety
Eas
t Rid
ge
85E
Rid
ge0
DSS 1
DSS 2
DSS 3
(118 Ma)
(117 Ma)
DSS5
DSS 4
Area of Crustal Underplating
reported from DSS
Zone of SDR's
(2660)
(3092)(2598)
(2840)
(2312) (2390)
(190)
(329)
(354)
(5107)
(2984)(2191)
(1235)
(1680)
(1866)(2338)
(3488)
0 50 100 150 200-8
-6
-4
-2
0
TW
T(s
ec)
MCS 2 Volcanic Basment
0 50 100 150 200-10
-9
-8
TW
T(s
ec)
SDR'SMCS 1
0 20 40 60 80 100-40
-30
-20
-10
0
Dep
th(K
m)
5.9 6.1
6.5
6.0
7.1
7.5
8.1
(Underplating)
DSS 5
0 20 40 60 80 100 120 140 160 180-60
-40
-20
0
Dep
th(K
m)
5.7 5.9 6.5 3.9 4.6
7.58.2
6.85
6.5 6.6
6.36.4
7.5 (underplating)
DSS 1
Fig. 8. Map showing the compiled geophysical information along the northeast margin in support of widespread early Cretaceous volcanism. The lines (DSS1–DSS5) in theonshore show the location of deep seismic sounding profiles (Mall et al., 1999; Behera et al., 2004) and two profiles (DSS1 and DSS5) depicting the crustal underplating areshown in the right panel. The white circles indicate the location of drilled wells in both onshore and offshore along with the depth (in meters) of Rajmahal Traps encounteredin the respective wells (after Sengupta (1966), Fuloria et al. (1992) and Tiwari and Jassal (2001)). Lines indicate the ship-borne magnetic trackline data in the Mahanadioffshore with the rectangle showing the magnetic anomaly map presented in Fig. 9. The zone of prominent Seaward Dipping Reflectors (SDRs) is from Bastia et al. (2010). Twomulti-channel seismic profiles offshore Bangladesh MCS 1 (present study) and MCS 2 (Maurin and Rangin, 2009) shown in the right panel reveal the volcanic nature of thebasement. Rectangle covering the onshore Bengal and Mahanadi basins indicates the area of gravity anomaly map shown in Fig. 10.
92 G. Srinivasa Rao, M. Radhakrishna / Journal of Asian Earth Sciences 85 (2014) 80–96
-0.0228
-0.0097
-0.0055
-0.0029
-0.0007
0.0007
0.0023
0.0044
0.0068
0.01320.0190
0.00155
0.00387
0.00519
0.00640
0.00791
0.00950
0.01121
0.01405
0.01993
0.030490.03640
-0.00000
0.00001
0.00002
0.00003
0.00005
0.00007
0.00010
0.00015
0.00034
0.00081
-306
-187
-132
-78
-44
-16
10
39
80
152
84 85 86 87
18
19
20
Chilka LakeD
84 85 86 87
18
19
20 B
Chilka Lake
?
85E
Rid
ge0
OCB
?85
ER
idge
0OCB
84 85 86 87
18
19
20
Chilka LakeC
?
85E
Rid
ge0
OCB
84 85 86 87
18
19
20
Chilka LakeA
?
85E
Rid
ge0
OCB
nT
nT/m
nT/mnT/m
Fig. 9. Showing (A) total field magnetic anomaly map and its first vertical derivative map (B), Analytical Signal map (C) and the total horizontal gradient map (D) in theMahanadi offshore basin in the vicinity of 85�E Ridge. Lines in (A) indicate the ship tracks of magnetic data. Both COB and continuity of the ridge are marked here from Fig. 6Cfor comparison. Note the anomalous nature of the magnetic field over the 85 E Ridge with respect to the adjoining areas.
G. Srinivasa Rao, M. Radhakrishna / Journal of Asian Earth Sciences 85 (2014) 80–96 93
for the emplacement of the ridge were proposed by earlier workersand these vary from 105–70 Ma (Curray and Munasinghe, 1991;Subrahmanyam et al., 1999; Bastia et al., 2010; Radhakrishnaet al., 2012a), 85–55 Ma (Krishna, 2003) and post 100 Ma (Gibbonset al., 2013). As the Kerguelen plume is a super plume (e.g., Coffinet al., 2002), and because of its strong tilt, the plume may have splitinto several secondary diapirs (Montelli et al., 2004; O’Neill et al.,2005). Further, in view of its proximity to the Indian margin duringthe early breakup period, we propose that one of such secondarydiapirs of the Kerguelen plume might have emplaced the entire85�E ridge up to the ANS during 105–70 Ma as shown in our Mod-el-1 (after Radhakrishna et al. (2012a)). Considering the entireridge between 20�N and 5�S, the total length of ridge emplacementduring 105–70 Ma is about 2700 km. This gives rise to an emplace-ment rate of 77.1 km/yr which is about twice the half spreadingrate of BOB lithosphere during this period. Similar observationwas made by Krishna et al. (2012) for the emplacement of Ninet-yeast Ridge and such a discrepancy was explained by them dueto slower motion of Antarctica with respect to the global hotspotreference frame (Besse and Courtillot, 2002). However, singleplume emplacement of the ridge (Model-1) raises the followingquestions, such as: (i) how was the secondary diapir of the Kergue-len plume sustained to produce volcanism for such a long period(�35 million years) despite the transfer of the main plume head
near to the India–Antarctica spreading center around 95 Ma? (ii)What was the role played by the Crozet and Conrad plumes whichwere in close proximity of the Indian margin during 90–65 Ma?These above observations prompt us to look for alternative modelsof ridge emplacement and to propose an alternative two stage evo-lutionary model for the 85�E ridge (Model-2). In this model, we de-linked the northern part of the ridge lying between 20�N and 6�Nfrom its southern part and the ANS. This is done because of theirdistinct characteristics in terms of their morphological setup. Thenorthern part of ridge has a wider topographic expression andis associated with a broad, distinct gravity low; whereas, towardsthe south (south of 6�N), the ridge becomes narrower, occasion-ally rises above the seafloor and is characterized by isolated grav-ity highs similar to gravity signatures over the ANS. Further, the86�E fracture zone intersects the ridge at 6�N and beyond thispoint; the ridge takes a southwestward trend before it graduallymerges with the ANS. This westward shift in the trend of theridge appears as a major kink in the N–S trace of the ridge insouthern BOB (see Fig. 1). Such a kink is not observed along othermajor plume related tracks of the Indian Ocean, the Chagos-Lac-cadive and the Ninetyeast ridges. Surely, this observation can beconsidered as major evidence against continuity of the ridgesouth of 6�N or emplacement of the ridge by a single plume(Model-1).

MODEL-1 MODEL-2
E B
Pre M2 (125 Ma)
A
IND
ANT
AUSK BB
M9M4M4
M4M9
M4M9
NW-SE NW-SE
ANT
ER
IND
AUS
K
EB
BB
KP
?
STRT
B
At 115 Ma
Wells reoprted Rajmahal volcanics
At 100 Ma
K
EBBB
KP
RTIND
C ANT
AUS
NNW-SSE
Continental part of85 E Ridge0
Initiation of
Ninetyeast Ridge
ST Wells reoprted Rajmahal volcanics
?
At 90 Ma
K
EBKP
RT
IND
D
Nin
etye
ast R
idge
85E
Ridg
e0
N-SContinental part of
85 E Ridge0
ST
ANS
At 70 Ma
KKP
E
Nin
etye
a st R
idge
85E
Ridg
e0
?
N-SRT
INDContinental part of
85 E Ridge0
ST At 90 Ma
K
EBKP
RT
IND
F
Nin
etye
ast R
idge
85E
Ridg
e0
N-SContinental part of
85 E Ridge0
ST
ANS
At 70 Ma
KKP
G
Nin
etye
a st R
idge
85E
Ridg
e0
N-SRT
INDContinental part of
85 E Ridge0
ST
Fig. 10. Schematic diagram (A to G) showing the proposed models (Model 1 and 2) for the evolution of 85� Ridge in different stages from post Albian (100 Ma) to earlyMaastrichtian (70 Ma). RT-Rajmahal Traps, ANS – Afanasy Nikitin Seamount, ST – Sylhet Traps, K – Kerguelen hotspot, Co – Conrad hotspot, BB – Bunbury Basalts, EB – ElanBank, KP – Kerguelen Plateau, IND – India, ANT – Antarctica, AUS – Australia.
94 G. Srinivasa Rao, M. Radhakrishna / Journal of Asian Earth Sciences 85 (2014) 80–96
Based on the above arguments, we propose an alternative mod-el (Model-2) for the emplacement of the ridge. According to this,the northern part of the ridge had formed due to the source relatedto the Kerguelen plume which has high eruption rate (Coffin et al.,2002) and its activity gradually ceased around 85 Ma because themain plume head has already shifted closer to the India–Antarcticspreading center. This is similar to Model-1. However, for thesouthern part of the ridge, either Crozet or Conrad plumes whichwere in the proximity to the Indian margin around 85 Ma (O’Neillet al., 2003) could be considered as the source of ridge emplace-ment. As the Crozet plume was transferred to the Antarctica plateimmediately after 85 Ma (O’Neill et al., 2003) and the geochemicalresults of lava samples of ANS do not show any affinity to the Cro-zet plume (Mahoney et al., 1996); the Conrad is considered as themost ideal candidate for the emplacement of the southern part ofthe ridge. Further, the Conrad plume shows north–south motionwith respect to the Indian plate during 90–65 Ma (O’Neill et al.,2003). Therefore, we believe that both the southern part of ridgeand the ANS might have been emplaced by a plume source situatednear Conrad rise at present as suggested by Müller et al. (1993). Re-cently, Gibbons et al. (2013) proposed that southern part of the85�E Ridge was emplaced by volcanism through leaky transformof the N–S trending fracture zone during the major plate reorgani-zation. This hypothesis needs further deliberation as fracture zonesare known to be stronger over geological times (Kruse et al., 1996)and could be resistant enough to regional plate reorganization.
Apart from the plume source that formed the ridge, anothercontentious issue of the 85�E Ridge is its mode of emplacement.For this purpose, it is relevant to understand that the seismic veloc-ity imaging of the intraplate oceanic islands, seamounts and aseis-mic ridges that are emplaced by major plume activity in the worldoceans brought out two contrasting types of magmatic emplace-ment processes and led to different crustal configuration such as;
(i) the sub-crustal magmatic underplating indicated by intermedi-ate velocities between lower crust and upper mantle as observed inthe case of Hawaiian and Marqueses islands (Watts et al., 1985; tenBrink and Brocher, 1987; Caress et al., 1995; Charvis et al., 1999),(ii) the intra-crustal intrusion revealed by higher seismic velocitiesin the shallow areas of the crust above Moho in comparison to thesurrounding normal oceanic crust as imaged in the case of GreatMeteor seamount (Wiegel and Grevemeyer, 1999) and the Louis-ville Ridge (Contreras-Reyes et al., 2009). This difference in crustalconfiguration below the intraplate plume related oceanic islands/aseismic ridges is basically attributed by Contreras-Reyes et al.(2009) to the differences in age of the lithosphere over which theplume interference takes place. According to Pollack et al. (1981),while the younger, weaker lithosphere may allow intrusion ofmagma to shallow levels, the older and rigid lithosphere may re-strict intra-crustal melt penetration. The modeled structure(Fig. 7) below the ridge are similar to that observed along otherhotspot related volcanic structures such as; the Great Meteor sea-mount (Wiegel and Grevemeyer, 1999) and the Louisville Ridge(Contreras-Reyes et al., 2009) which are characterized by intra-crustal volcanic intrusive rocks. Therefore, from the present study,it is suggested that the ridge has been emplaced through volcanismon a relatively younger lithosphere.
6. Conclusions
A clear delineation and understanding of geophysical signaturesas well as the underlying subsurface structure related to the north-ern part of the 85�E Ridge is complicated due to the masking effectof continental margin related features of the East Coast of India.Integrated interpretation of geophysical data including seismicreflection, gravity and magnetic anomalies in the Mahanadi off-

G. Srinivasa Rao, M. Radhakrishna / Journal of Asian Earth Sciences 85 (2014) 80–96 95
shore region is carried out here, revealing significant new informa-tion with regard to the subsurface geometry, its continuity as wellas the nature of crustal rocks comprising the ridge. Some salient re-sults obtained in the present investigation are summarized below:
� The interval velocities of sedimentary sequences overlyingthe ABT range between 1.6 and 4.0 km/s having a lowvelocity layer (2.6–3.2 km/s) within the Cretaceoussequence in the depressions flanking the ridge and aregionally widespread high velocity layer (3.5–3.8 km/s)belonging to the Eocene–Oligocene section. Just below theABT, the ridge is characterized by a layer having velocityof 4.2–4.7 km/s and is made up of volcanoclastic rocks.
� The presence of SDR’s, the first vertical derivative maps ofcrustal Bouguer anomalies and the isostatic residuals, andthe magnetic anomaly maps (total field and analytical sig-nal), all together reveals (i) continuity of the ridge up to theMahanadi coast at Chilka Lake, (ii) the isolated volcanic fea-tures as well as volcanic nature of the ABT comprising ofthe ridge material.
� Gravity modeling constrained by the seismic informationindicate that the ridge is made up of intrusive volcanicrocks as well as a depressed Moho giving rise to 4–5 kmof thicker crust below the ridge. The magnetic models fur-ther suggest that the ridge was emplaced on the continen-tal crust in the shelf-slope areas and over the oceanic crustin the deep offshore part of the Indian margin.
� Emplacement of the northern part of the ridge (north of6�N) was initiated from �105 Ma onwards due to a hotspotsource perhaps related to the Kerguelen super plume dur-ing its intense eruption activity which subsequently ceasedat 85 Ma, while the southern part (south of 6�N) might havebeen emplaced by the Conrad plume source.
Acknowledgements
This work was carried out as part of IRCC-IITB funded researchproject (07IR025). The Reliance Industries Ltd. (E&P Division)kindly provided the most valuable industrial seismic data such asthe isochron maps, their modeled seismic velocity informationand few 2-D MCS reflection images belonging to the Mahanadi off-shore basin region. Authors gratefully acknowledge RelianceIndustries Ltd. (E & P Division) for providing this data as well asto permit us to publish this research article. Also, authors wish tothank Rabi Bastia and Satyabrata Nayak for their support and helpduring the initial stages of this work. This work forms part of thePh.D. thesis of the first author. Authors thank R.D. Müller for hiscomments and suggestions. We also thank J.R. Curray and L.T.White for their valuable suggestions on an earlier version of themanuscript.
References
Anand, S.P., Rajaram, M., Majumdar, T.J., Bhattacharyya, R., 2009. Structure andtectonics of 85�E ridge from analysis of geopotential data. Tectonophysics 478,100–110.
Andersen, O., Knudsen, P., 2008. The DNSC08 Global Gravity and Bathymetry.European Geophysical Union Meeting, April 14–18th, Vienna, Austria.
Antretter, M., Steinberger, B., Heider, F., Soffel, H., 2002. Paleolatitudes of theKerguelen hotspot: new paleomagnetic results and dynamic modeling. EarthPlanet. Sci. Lett. 203, 635–650.
Baksi, A.K., Barmann, T.R., Paul, D.K., Farrar, E., 1987. Widespread early Cretaceousflood basalt volcanism in eastern India: geochemical data from ⁄⁄⁄Rajmahal-Bengal-Sylhet Traps. Chem. Geol. 63, 133–141.
Bastia, R., Radhakrishna, M., Das, Suman, Kale, Anand, Cateneanu, Octavian, 2010.Delineation of 85�E ridge and its structure in Mahanadi offshore basin, EasternContinental Margin of India (ECMI) from seismic reflection imaging. Mar. Pet.Geol. 27, 1841–1848.
Behera, L., Sain, K., Reddy, P.R., 2004. Evidence of underplating from seismic andgravity studies in the Mahanadi delta of eastern India and its tectonicsignificance. J. Geophys. Res. 109, B12311. http://dx.doi.org/10.1029/2003JB002764.
Besse, J., Courtillot, V., 2002. Apparent and true polar wander and the geometry ofthe geomagnetic field over the last 200 Myr. J. Geophys. Res. 107 (B11), 2300.http://dx.doi.org/10.1029/2000JB000050.
Caress, D.W., McNutt, M.K., Detrick, R.S., Mutter, J.C., 1995. Seismic imaging of hotspot related crustal underplating beneath the Marquesas Islands. Nature 373,600–603.
Chand, S., Radhakrishna, M., Subrahmanyam, C., 2001. India–East Antarcticamargins: rift shear tectonic setting inferred from gravity and bathymetrydata. Earth Planet. Sci. Lett. 185, 225–236.
Charvis, P., Agus, L., Gallart, J., Hirn, A., Jean-Claude, L., Voogd, B.D., Minshull, T.A.,Hello, Y., Bernard, P., 1999. Spatial distribution of hotspot material added to thelithosphere under La Réunion, from wide-angle data. J. Geophys. Res. 104,2875–2893.
Coffin, M.F., Pringle, M.S., Duncan, R.A., Gladczenko, T.P., Storey, M., Müller, R.D.,Gahagan, L.A., 2002. Kerguelen Hotspot magma output since 130 Ma. J. Petrol.43, 1121–1139.
Contreras-Reyes, E., Grevemeyer, I., Watts, A.B., Planert, L., Flueh, E.R., Peirce, C.,2009. Crustal intrusion beneath the Louisville hotspot track. Earth Planet. Sci.Lett. 289, 323–333.
Curray, J.R., Moore, D.G., 1971. Growth of the Bengal deep sea fan and denudation inthe Himalayas. Geol. Soc. Am. Bull. 82, 563–573.
Curray, J.R., Munasinghe, T., 1991. Origin of the Rajmahal Traps and the 85�E Ridge:preliminary reconstructions of the trace of the Crozet hotspot. Geology 19,1237–1240.
Curray, J.R., Emmel, F.J., Moore, D.G., Raitt, R.W., 1982. Structure, tectonics andgeological history of the northeastern Indian Ocean. In: Nairn, A.E.M., Stehli, F.G.(Eds.), The Ocean Basins and Margins 6, The Indian Ocean. Plenum Press, NewYork, pp. 399–450.
Desa, M., Ramana, M.V., Ramprasad, T., Anuradha, M., Lall, M.V., Kumar, B.J.P., 2013.Geophysical signatures over and around the northern segment of the 85�ERidge, Mahanadi offshore, Eastern Continental Margin of India: tectonicimplications. J. Asian Earth Sci. 73, 460–472.
Fuloria, R.C., Pandey, R.N., Bharali, B.R., Mishra, J.K., 1992. Stratigraphy, structureand tectonics of Mahanadi offshore basin. Recent Geoscientific studies inthe Bay of Bengal and the Andaman Sea. J. Geol. Soc. Ind. Spec. Publ. 29,255–265.
Gaina, C., Mueller, R.D., Brown, B., Ishihara, T., 2003. Microcontinent formationaround Australia. Geol. Soc. Aust. Spec. Publ. 22, 399–410.
Gaina, C., Müller, R.D., Brown, B., Ishihara, T., Ivanov, S., 2007. Breakup andearlyseafloor spreading between India and Antarctica. Geophys. J. Int. 170, 151–169.
Gibbons, A.D., Whittaker, J.M., Müller, R.D., 2013. The breakup of East Gondwana:assimilating constraints from Cretaceous ocean basins around India into a best-fit tectonic model. J. Geophys. Res. 118, 808–822.
Gopala Rao, D., Krishna, K.S., Sar, D., 1997. Crustal evolution and sedimentationhistory of the Bay of Bengal since the Cretaceous. J. Geophys. Res. 102, 17747–17768.
Hall, L.S., Gibbons, A.D., Bernadel, G., Whittaker, J.M., Nicholson, C., Rollet, N.,Muller, R.D., 2013, Architecture of Australia’s Southwest continental marginand implications for Early Cretaceous basin evolution. In: Keep, M., Moss, S.J.(Eds.), The Sedimentary Basins of Western Australia IV: Proceedings of thePetroleum Exploration Society of Australia Symposium, Perth, WA, 2013, pp. 1–20.
Jokat, W., Nogi, Y., Leinweber, V., 2010. New aeromagnetic data from the westernEnderby Basin and consequences for Antarctic-India break-up. Geophys. Res.Lett. 37, L21311. http://dx.doi.org/10.1029/ 2010GL045117.
Krishna, K.S., 2003. Structure and evolution of the Afanasy Nikitin seamount, buriedhills and 85�E ridge in the northeastern Indian Ocean. Earth Planet. Sci. Lett.209, 379–394.
Krishna, K.S., Michael, Laju., Bhattacharyya, R., Majumdar, T.J., 2009. Geoid andgravity anomaly data of conjugate regions of Bay of Bengal and Enderby Basin –new constraints on breakup and early spreading history between India andAntarctica. J. Geophys. Res. 114, B03102. http://dx.doi.org/10.1029/2008JB005808.
Krishna, K.S., Abraham, H., Sager, W.W., Pringle, M.S., Frey, F., Gopala Rao, D.,Levchenko, O.V., 2012. Tectonics of the Ninetyeast Ridge derivedfrom spreading records in adjacent oceanic basins and age constraints of theridge. J. Geophys. Res. 117, B04101. http://dx.doi.org/10.1029/2011JB008805.
Kruse, S.E., McCarthy, M.C., Brudzinski, M.R., Ranieri, M.E., 1996. Evolution andstrength of Pacific fracture zones. J. Geophys. Res. 101 (B6), 13731–13740.
Liu, C.S., Sandwell, D.T., Curray, J.R., 1982. The negative gravity field over the 85�ERidge. J. Geophys. Res. 87, 7673–7686.
Mahoney, J.J., White, W.M., Upton, B.G.J., Neal, C.R., Scrutton, R.A., 1996. Beyond EM-1: Lavas from Afanasy-Nikitin Rise and the Crozet Archipelago, Indian Ocean.Geology 24 (7), 615–618.
Mall, D.M., Rao, V.K., Reddy, P.R., 1999. Deep sub-crustal features in the Bengalbasin: seismic signatures for plume activity. Geophys. Res. Lett. 26, 2545–2548.
Maurin, T., Rangin, C., 2009. Impact of the 90 degrees E ridge at the Indo-Burmesesubduction zone imaged from deep seismic reflection data. Mar. Geol. 266, 143–155.
Michael, L., Krishna, K.S., 2011. Dating of the 85�E Ridge (northeastern IndianOcean) using marine magnetic anomalies. Curr. Sci. 100, 1314–1322.

96 G. Srinivasa Rao, M. Radhakrishna / Journal of Asian Earth Sciences 85 (2014) 80–96
Montelli, R., Nolet, G., Dahlen, F.A., Masters, G., Engdahl, E.R., Hung, S., 2004. Finite-frequency tomography reveals a variety of plumes in the mantle. Science 303,338–343.
Müller, R.D., Royer, J.-Y., Lawver, L.A., 1993. Revised plate motions relative to thehotspots from combined Atlantic and Indian Ocean hotspot tracks. Geology 21,275–278.
Murthy, K.S.R., Rao, T.C.S., Subrahmanyam, A.S., Rao, M.M., Lakshminarayana, S.,1993. Structural lineaments from the magnetic anomaly map of the easterncontinental margin of India (ECMI) and NW Bengal Fan. Mar. Geol. 114, 171–183.
Nayak, G.K., Rama Rao, Ch., 2002. Structural configuration of Mahanadi offshorebasin, India: an aeromagnetic study. Mar. Geophys. Res. 23, 471–479.
O’Neill, C., Mueller, R.D., Steinberger, B., 2003. Geodynamic implications of movingIndian Ocean hotspots. Earth Planet. Sci. Lett. 215 (1–2), 151–168.
O’Neill, C., Mueller, R.D., Steinberger, B., 2005. On the uncertainties in hot spotreconstructions and the significance of moving hot spot reference frames.Geochem. Geophys. Geosyst. 6, Q04003. http://dx.doi.org/10.1029/2004GC000784.
Pollack, H.N., Gass, I.G., Thorpe, R.S., Chapman, D.S., 1981. On the vulnerability oflithospheric plates to mid-plate volcanism: reply to comments by P.R. Vogt. J.Geophys. Res. 86 (B2), 961–966.
Rabinowitz, P.D., Labrecque, J.L., 1977. The isostatic gravity anomaly: key to theevolution of the ocean-continent boundary at passive continental margins.Earth Planet. Sci. Lett. 35, 145–150.
Radhakrishna, M., Rao, G.S., Nayak, Satyabrata., Bastia, R., Twinkle, D., 2012a. EarlyCretaceous fracture zones in the Bay of Bengal and their tectonic implications:constraints from multi-channel seismic reflection and potential field data.Tectonophysics 522, 187–197.
Radhakrishna, M., Twinkle, D., Nayak, S., Bastia, R., Srinivasa Rao, G., 2012b. Crustalstructure and rift architecture across the Krishna–Godavari basin in the centralEastern Continental Margin of India based on analysis of gravity and seismicdata. Mar. Pet. Geol. 37, 129–146.
Ramana, M.V., Subrahmanyam, V., Sarma, K.V.L.N.S., et al., 1993. Report on the 100thOceanographic Cruise of O.R.V Sagarkanya. <http://itg.nio.org/DataCentre.nsf/e451fd1e7755d6ef652575c9001ced37/9657c3893002818865256fc1001d2f00/$FILE/Cruise_Nr_100.pdf> (accessed on 25.04.12).
Ramana, M.V., Nair, R.R., Sarma, K.V.L.N.S., Ramprasad, T., Krishna, K.S.,Subrahmanyam, V., D’Cruz, M., Subrahmanyam, C., Paul, J., Subrahmanyam,A.S., Chandra Sekhar, D.V., 1994. Mesozoic anomalies in the Bay of Bengal. EarthPlanet. Sci. Lett. 121, 469–475.
Ramana, M.V., Subrahmanyam, V., Chaubey, A.K., Ramprasad, T., Sarma, K.V.L.N.S.,Krishna, K.S., Desa, M., Murty, G.P.S., 1997. Structure and origin of the 85�Eridge. J. Geophys. Res. 102, 17995–18012.
Royer, J.-Y., Peirce, J.W., Weissel, J.K., 1991. Tectonic constraints on hotspotformation of the Ninetyeast Ridge. In: Peirce, J., Weissel, J., et al. (Eds.),Proceedings of ODP, Sci. Results, 121: College Station, TX (Ocean DrillingProgram).
Sar, D., Maheshwari, M.K., Rangarajan, S., Bahuguna, C.S., 2009, Eighty five degreeeast ridge and its hydrocarbon potential. Geohorizons, July, 15–23.
Schwenk, T., Spieß, V., 2009. Architecture and stratigraphy of the Bengal Fanasresponse to tectonic and climate revealed from high-resolution seismic data.In: Kneller, B.C., Martinsen, O.J., McCaffrey, B. (Eds.), External Controls on Deep-Water Depositional Systems, vol. 92. SEPM Special Publication, pp. 107–132.
Sengupta, S., 1966. Geological and geophysical studies in western part of Bengalbasin, India. Am. Assoc. Petrol. Geol. Bull. 50, 1001–1017.
Simpson, R.W., Jachens, R.C., Blakely, R.J., 1986. A new isostatic residual gravity mapof the conterminous United States with a discussion on the significance ofisostatic residual anomalies. J. Geophys. Res. 91, 8348–8372.
Sreejith, K.M., Radhakrishna, M., Krishna, K.S., Majumdar, T.J., 2011. Development ofthe negative gravity anomaly of the 85�E Ridge, northeastern Indian Ocean – aprocess oriented modeling approach. J. Earth Syst. Sci. 120, 605–615.
Subrahmanyam, C., Chand, S., 2006. Evolution of the passive continental margins ofIndia – a geophysical appraisal. Gondwana Res. 10, 167–178.
Subrahmanyam, C., Thakur, N.K., Gangadhara Rao, T., Ramana, M.V.,Subrahmanyam, V., 1999. Tectonics of the Bay of Bengal, northeastern IndianOcean: new insights from satellite-derived gravity and shipborne geophysicaldata. Earth Planet. Sci. Lett. 171, 237–251.
Subrahmanyam, M., Vasudeva Rao, N., Prakasa Rao, T.K.S., 2004. Delineation ofbasement and Curie isotherm of Bay of Bengal from spectral analysis ofMagnetic data. J. Ind. Geophys. Union 8, 107–123.
Subrahmanyam, V., Subrahmanyam, A.S., Murty, G.P.S., Murthy, K.S.R., 2008.Morphology and tectonics of Mahanadi Basin, northeastern continentalmargin of India from geophysical studies. Mar. Geol. 253, 63–72.
Ten Brink, U.S., Brocher, T.M., 1987. Multichannel seismic evidence for a subcrustalintrusive complex under Oahu and a model for Hawaiian volcanism. J. Geophys.Res. 92 (B13), 13687–13707.
Tiwari, S., Jassal, G.S., 2001. Origin and evolution of the Garo-Rajmahal Gap. J. Geol.Soc. Ind. 57, 389–403.
Watts, A.B., Ten Brink, U.S., Buhl, P., Brocher, T., 1985. A multichannel seismic studyof lithospheric flexure across the Hawaiian-Emperor seamount chain. Nature315, 105–111.
White, L.T., Gibson, G.M., Lister, G.S., 2013. A reassessment of paleogeographicreconstructions of eastern Gondwana: bringing geology back into the equation.Gondwana Res. 24, 984–998.
Whittaker, J.M., Williams, S.E., Müller, R.D., 2013a. Revised tectonic evolution of theEastern Indian Ocean. Geochem. Geophys. Geosyst. 14 (6), 1891–1909.
Whittaker, J.M., Halpin, J., Williams, S.E., Hall, L.S., Gardner, R., Kobler, M.E., Daczko,N.R., Müller, R.D., 2013b. Tectonic evolution and continental fragmentation ofthe Southern West Australian Margin. In: Keep, M., Moss, S.J. (Eds.), TheSedimentary Basins of Western Australia IV: Proceedings of the PetroleumExploration Society of Australia Symposium, Perth, WA, 2013, pp. 1–16.
Wiegel, W., Grevemeyer, I., 1999. The Great Meteor seamount: seismic structure ofa submerged intraplate volcano. J. Geodyn. 28, 27–40.
Williams, S.E., Whittaker, J.M., Müller, R.D., 2012, Full-fit reconstructions of thesouthern Australian Margin and Antarctica – implications for correlatinggeology between Australia and Antarctica. In: Mares, T. (Ed.), EasternAustralasian Basins Symposium IV. Petroleum Exploration Society ofAustralia, Special Publication, pp. 1–8.