CRP1.1 Characteristics of the site “Aral Sea” SRT2-AS1 - icarda
178
CRP1.1 Characteristics of the site “Aral Sea” SRT2-AS1 Introduction The international research centers of the Consultative Group on International Agricultural Research (CGIAR) have launched the CGIAR Research Programs (CRP). ICARDA as the lead Center jointly with the other partners Centers, research and development organizations in more than 40 countries, regional fora, international development agencies and other relevant international organizations initiated the CGIAR Research Program (CRP1.1) - "Integrated Agricultural Production Systems for the Poor and Vulnerable in Dry Areas". The Program aims to pursue new technology, institutional and policy options for enhancing productivity and managing risks through diversification, sustainable intensification and integrated agro-ecosystem approaches in dry, which ultimately will contribute to the improvement of living standards in the target regions. During the global preparatory meeting in Nairobi, in July 2011, five sites (3 action and 2 satellite sites) have been selected together with national partners for Central Asia and the Caucasus Region. Conducting research and introduction of innovative approaches and technologies will be implemented in two key areas: I. Reducing vulnerability in agro-ecosystems affected by degradation of natural resources. Actions Sites: 1. Aral Sea Region, including the Dashauz province (Turkmenistan), Khorezm province and the Republic of Karakalpakstan (Uzbekistan), Kyzylorda province (Kazakhstan); 2. Rasht Valley (Tajikistan and Kyrgyzstan). II. The intensification of agricultural production in areas with potential for improving food security and improvement of living standards in the short to medium term. Action site: 1. Fergana Valley, which includes Batken, Jalal-Abad and Osh provinces regions (Kyrgyzstan), Sogd province (Tajikistan), Andijan, Namangan and Fergana provinces (Uzbekistan). Satellite sites . Sites that complement Action Sites to sample the diversity of Target Areas, and will also help evaluate and assess innovations developed at the Action Sites for their suitability and user acceptance. 2. Kura-Arax plain in Azerbaijan. 3. Kashkadarya province in Uzbekistan. In addition, 123 descriptors characterizing the climate, topography, soils, water resources, land use, land degradation, demography, agricultural systems, institutional systems and opportunities for agricultural research were identified. To collect the primary data, thirteen focal points from the Action Sites were involved. Data processing and compilation of the data was carried out by the interim Interdisciplinary Research Team (iIRT), coordinated by ICARDA. A preliminary version of the characteristics of the Action Sites had been discussed during the preparatory meeting in Tashkent, May 15-17, 2012.
-
Upload
khangminh22 -
Category
Documents
-
view
1 -
download
0
Transcript of CRP1.1 Characteristics of the site “Aral Sea” SRT2-AS1 - icarda

CRP1.1 Characteristics of the site “Aral Sea” SRT2-AS1
Introduction The international research centers of the Consultative Group on International Agricultural Research (CGIAR) have launched the CGIAR Research Programs (CRP). ICARDA as the lead Center jointly with the other partners Centers, research and development organizations in more than 40 countries, regional fora, international development agencies and other relevant international organizations initiated the CGIAR Research Program (CRP1.1) - "Integrated Agricultural Production Systems for the Poor and Vulnerable in Dry Areas". The Program aims to pursue new technology, institutional and policy options for enhancing productivity and managing risks through diversification, sustainable intensification and integrated agro-ecosystem approaches in dry, which ultimately will contribute to the improvement of living standards in the target regions. During the global preparatory meeting in Nairobi, in July 2011, five sites (3 action and 2 satellite sites) have been selected together with national partners for Central Asia and the Caucasus Region. Conducting research and introduction of innovative approaches and technologies will be implemented in two key areas:
I. Reducing vulnerability in agro-ecosystems affected by degradation of natural resources. Actions Sites: 1. Aral Sea Region, including the Dashauz province (Turkmenistan), Khorezm
province and the Republic of Karakalpakstan (Uzbekistan), Kyzylorda province (Kazakhstan);
2. Rasht Valley (Tajikistan and Kyrgyzstan).
II. The intensification of agricultural production in areas with potential for improving food security and improvement of living standards in the short to medium term. Action site: 1. Fergana Valley, which includes Batken, Jalal-Abad and Osh provinces regions
(Kyrgyzstan), Sogd province (Tajikistan), Andijan, Namangan and Fergana provinces (Uzbekistan).
Satellite sites. Sites that complement Action Sites to sample the diversity of Target Areas, and will also help evaluate and assess innovations developed at the Action Sites for their suitability and user acceptance. 2. Kura-Arax plain in Azerbaijan. 3. Kashkadarya province in Uzbekistan.
In addition, 123 descriptors characterizing the climate, topography, soils, water resources, land use, land degradation, demography, agricultural systems, institutional systems and opportunities for agricultural research were identified. To collect the primary data, thirteen focal points from the Action Sites were involved. Data processing and compilation of the data was carried out by the interim Interdisciplinary Research Team (iIRT), coordinated by ICARDA. A preliminary version of the characteristics of the Action Sites had been discussed during the preparatory meeting in Tashkent, May 15-17, 2012.

These characteristics of sites are not final. It is assumed that interested parties can contribute to the adjustment and the addition of data. This material is collected and synthesized within the CGIAR Research Program (CRP1.1) - Integrated Agricultural Production Systems for the Poor and Vulnerable in Dry Areas", coordinated by the International Center for Agricultural Research in Dry Areas (ICARDA) in the Region of Central Asia and the Caucasus. The data, any inaccuracies or interpretations of the data presented herein are not the responsibility of the CGIAR and ICARDA. The final characteristics of the Site will be posted on the website of the CGIAR Regional Program (www.icarda.cgiar.org/cac). The information contained in the Site Characterization can be freely used for research and other purposes, provided that the source is quoted: CGIAR Regional Program for Central Asia and the Caucasus, c/o ICARDA, Tashkent, Uzbekistan, 2012

CRP1.1 Characteristics of the site “Aral Sea” SRT2-AS1
page 3

CRP1.1 Characteristics of the site “Aral Sea” SRT2-AS1
page 4
CRP1.1 Characteristics of the site “Aral Sea” SRT2-AS1
1. Climate (according to Uzgidromet, Kazhydromet, Тurkmenhydromet) 1.1 Precipitation Precipitation patterns 1.1.1 Range of long-term average annual totals (mm) across the site
Fluctuations in annual amount of precipitations within the entire site: 90-150 mm
1.1.2 Number of rainy seasons (autumn and spring). During the vegetation season: 1. spring 2. autumn
1.1.3 For each rainy season: start and end month(s).
Amount of precipitations for the season: Spring: 40-55 mm Autumn: 15-25 mm 75-85% of the annual amount of precipitations is during the period from October to May. Number of days with precipitations (of 0.1 mm or more): Winter 13-23 Spring 13-16 Summer 3-14 Autumn 6-12
1.1.4 Number of years of daily rainfall records
Meteorological stations: Nukus since 1936.(76), Muynak since 1928. (84), Chimbay since 1927.(85), Takhtakupir since 1986.(26), Urgench since 1881.(130), Khiva since 1928.(84), Tuyamuyun since 1980.(32) The data are stored in the hydro -meteorological data fund of UZGIDROMET (in hard copy). The electronic version of the daily data is available starting from 1971.
Precipitation variability 1.1.5 Inter-annual precipitation variability
The coefficient of variation (CV) of annual precipitation in the region (n=70) 35-37%
1.1.6 Severity and type of drought risk (e.g. delayed onset of the rainy season, lengthy gaps between the
The number of days per year with temperatures above 40 ° C: Maximum 12-17; Average 5,1-7,5.

CRP1.1 Characteristics of the site “Aral Sea” SRT2-AS1
page 5
rains, early end to the rains)) The number of days per year with an atmospheric drought (daytime humidity deficit ≥ 50 hPa ): Maximum 26-55; Average 10-19. Irrigated agriculture zone: basic risk – water shortages in dry years.
1.2 Temperature Temperature means 1.2.1 Range of annual mean temperature (°C) across the site
Average annual temperatures in the site range from 8,4 °C in the north to 14,5°C in the south.
1.2.2 Range of mean max. temperature of the hottest month (°C) across the site
Average maximum temperatures in July from 32°C in the north to 36°C in the south. The absolute maximum in the site-46,3°C.
1.2.3 Range of annual mean min. temperature of the coldest month (°C) across the site
Average minimum of the temperatures in the coldest month in the site from --15°C in the north to -3,5°C in the south. The absolute minimum --39°C
1.2.4 Number of years of daily temperature records
Meteorological stations: Nukus since 1936.(76), Muynak since 1928. (84), Chimbay since 1927.(85), Takhtakupir since 1986.(26), Urgench since 1881.(130), Khiva since 1928.(84), Tuyamuyun since 1980.(32) The data are stored in the hydro -meteorological data fund of UZGIDROMET in hard copy. The electronic version of the daily data are available starting from 1971.
Temperature variations 1.2.5 Intra-annual range of monthly temperature means (C)
Intra-annual variations of average temperature per month from --11 to +27°C in the north, from –1,5 to +29, 5°C in the south. Inter-annual variability of average temperatures per month during the summer 1,0-2,3°C, in winter it can increase 7°C.
1.2.6 Diurnal temperature ranges throughout the year (C)
Fluctuations in average daily temperatures within the year during some years: from --28 to +35°C in the north, from --21 to +37°C in the south. Mean daily amplitude: January 4.5-8,0°C; April 8,4-14,8°C; July 8,6-15,2°C; October 6,0-14,8°C

CRP1.1 Characteristics of the site “Aral Sea” SRT2-AS1
page 6
1.2.7 Frost risk (severity and months of occurrence)
The risk of frost: Dates of extreme air frost Dates of extreme soil frost The earliest Average The latest The earliest Average The latest Risk of spring frost 5.03-22.03 23.03-10.04 22.04-09.05 7.03-29.03 29.03-20.04 26.04-24.05
Risk of autumn frost 10.09-22.09 10.10-25.10 1.11-25.11 3.09-24.09 5.10-22.10 1.11-15.11
Maximum intensity of the frost during spring period is not less than -5◦С. The frequency of frost with intensity of -3,1 - -4◦С does not exceed 10%. The absolute minimum air temperature in April: from –11°C to --2°C. In September from-6,6°C to -2°C The average number of days per year with minimum temperature: below (--10 °C) from 44 days in the north to 15-20 days in the south with maximum 87-90 below (--20°C) from 19 in the north to 1-2 in the south.
1.3 Indices 1.3.1 Range of annual growing degree days, base temperature 5°C (C, heat units) across the site
Total of efficient temperatures 3100-3600 °C along the site
1.3.2 Ranges of mean length (days) of temperature and moisture-limited growing period(s) across the site for predominant agricultural soils
The average duration of the period with an average daily temperature: Number of days Crops Higher than 5°С 230-280 Cereals, alfalfa,
horticultural crops Higher than 10°С 200-250 Cotton, maize Higher than 12°С 180-210 Higher than 15°С 160-190 vegetables, melons
1.3.3 Range of Aridity Index across the site
0,065-0,18
1.4 Climate change projections According to the Second National Statement of Uzbekistan on Climate Change (2008)
Scenario B2

CRP1.1 Characteristics of the site “Aral Sea” SRT2-AS1
page 7
1.4.1 Range of annual mean temperature change (C) across the site for time slices (periods) 2016-2045, 2036-2065, 2066-2095 in comparison to 1961-1990.
2016-2045 (2030) 2046-2065 (2050) 2066-2095 (2080)
1,3°С 2,0°С 3,2°С
1.4.2 Range of relative annual precipitation change (%) across the site for time slices (periods) 2016-2045, 2036-2065, 2066-2095 in comparison to 1961-1990
2016-2045 (2030) 2046-2065 (2050) 2066-2095 (2080)
104% 105% 101%
Scenario A2 1.4.3 Range of annual mean temperature change (C) across the site for time slices (periods) 2016-2045, 2036-2065, 2066-2095 in comparison to 1961-1990.
2016-2045 (2030) 2046-2065 (2050) 2066-2095 (2080)
1,1°С 2,0°С 3,7°С
1.4.4 Range of relative annual precipitation change (%) across the site for time slices (periods) 2016-2045, 2036-2065, 2066-2095 in comparison to 1961-1990.
2016-2045 (2030) 2046-2065 (2050) 2066-2095 (2080)
115% 116% 108%
According to http://seakc.meteoinfo.ru Similar tendencies are expected for Kazakhstan and Turkmenistan
2. Topography 2.1 Landforms (e.g. plains, hills, mountains) across the site (%)
The territory relief in Lower reaches Amudarya as a whole represents plain nature, the slope of area is very insignificant and is directed from the southeast on the northwest. On the arrangement the relief is characterized by a combination of plain spaces and low heights, such as Krantau, Porlitau, Beltau, Kushkanatau, Kiziljar with small high elevations from 53,0 to 200 above sea level. Dashaguz region is located in the north of Turkmenistan in a left-bank part of downstream Amudarya. Northern part - slightly wavy week convex plain which has been cut up by multi-branch irrigational network. Plain formation is genetically related to activity of the ancient water currents following from Amudarya in the Sarykamyshsky hollow. According to a direction of the basic ancient and modern water currents, the surface of

CRP1.1 Characteristics of the site “Aral Sea” SRT2-AS1
page 8
plain of the hollow falls in the west to the Sarykamyshsky hollow (about 0,2 m on 1 km). Absolute elevation of plain close to Amudarya - 80 m, at east slopes of the Sarykamyshsky hollow - 50 m. The occupied space basically represents river quarterly deposits of the alluvial origin, and radical bed of which being tertiary cretaceous and Paleozoic rocks. On the western part there is a plateau Ustyurt, the height of which makes 200,0 - 300,0 m. According to design institute Uzgiprozem, the plain part of territory makes 1,571 thousand km2 (97,3 %), of which hills make 33,9 th. km2 (2,1 %), and mountains make 9,7 thousand km2 (0,6 %, (a southern part). Name Khoresmская
region Republic Karakalpakstan,
Kizilorda region Dashaguz region
Latitude 41°35'05.46"N 42°20'02.98"N 44°51'00.12"N 41°50'05.30"N Longitude 60°40'02.19"E 59°35'20.59"E 65°30'59.64"E 59°57'25.42"E Altitude above the sea level
97 (Urgench city)
76 (Nukus city)
128 (Kizilorda city)
89 (Dashaguz city)
Source: Farming system of Dashaguzskiy region G.Dyujev and other sources, 2.2 Elevation range across the site (m)
Land surface Khoresm region, Republic Karakalpakstan, Kizilorda region Dashaguz region
Plain part 77 - 100 m.
53-110 47-123 50-106
Hills 100-132 m 111-140 124-150 107-156 Mountains 141-300 151-270
2.3 Prevalent slope ranges (%) of different land forms of the site
Land surface Khoresm region Republic Karakalpakstan, % Kizilorda region Dashaguz region
Plain 0.0003-0.0005 (100%)
0,0001 – 0,00025 (97,3 %)
0.0002 – 0,0006 (100%)
0,0002 – 0,0004 (100%)
Hills 0,0003 – 0,01( 2,1 %) Mountains 0,08 – 0,1 (0,6 %)

CRP1.1 Characteristics of the site “Aral Sea” SRT2-AS1
page 9
Source: Institute «Turkmenulumtaslama» and other sources
3. Soils 3.1 Soil types Soil: Soils of the area are characterized as old-irrigated meadow-alluvial, sand-desert, sandy, grey-brown soils
and in some places are covered by saline soils, soils are of takyr type and strongly saline, with a special dark covering, alkali soil. Results of a chemical compound of soil for 2007-2009 have shown following properties of salinity on depth: 0-30 cm - low salinity - of 25 % from a total area; average salinity - 35 %, high salinity - 20 %, very salted - 20 % from a total area. On these areas the soil is very hard for reclamation for agriculture purpose.
3.1.1 Major or agriculturally important soil types and soil associations across the site (classification units, %)
On climatic indicators the territory of downstream of Amudarya is characterized by high dryness, low snow (dry and severe) in the winter. Thanks to nature of a climate and moisture of territories, original soil types and groups were formed here, which are divided on different types of soil (tab. 3.1. and 3.2). Total area of Aral Sea Basin makes approximately - 42,233,9 thousand hectares, out of which irrigated area makes 1,288,1 thousand hectares. (tables 3.1, 3.2, 3,3 и 3.4.). Table 3.1. Soil groups of land fund of Republic Karakalpakstan (1984)
№ Soil Total area, th.ha % Irrigated arable land, th.ha % 1. Grey-brown 6924,7 43 1,6 0,52 2. Takyr 980,0 6,1 24,9 8,10 3. Meadow-takyr and meadow-desert 285,0 1,8 56,1 18,3 4. Meadow-alluvial 1041,4 6,4 211,8 68,9 5. Swamp-meadow 13,6 0,08 12,9 4,2 6. Flood-palin-Meadow, alluvial 594,0 3,68 - 7. Alkiline lands 658,0 4,08 - 8. Desert, sandy 1960,5 12,1 - 9. Water surface 3687,8 22,8 -
Total 16144,9 100 307,3 100
In the territory of the irrigated land there are basically concentrations of Meadow-takyr and Meadow-desert (18,3 %) and Meadow-alluvial (68,9 %) lands During the last years on the one hand in connection with reduction of receipt of Amudarya water, and on the other due to fall of level of subsoil waters in downstream of river Amudarya, considerable changes took place which

CRP1.1 Characteristics of the site “Aral Sea” SRT2-AS1
page 10
characterize transition from meadow to desert soil type, that is aridization of territories. As a result of drying huge territories of deltoid lakes and a sea-bottom, there is a process of formation of unsuitable for use sand-saline soils, that is another prominent feature of the site. Table 3.2. Soil group of land fund of Dashaguzskiy region, (needs to be clarified)
№ Soil Total area, th.ha % Irrigated arable land, th.ha % 1. Sand-desert 401,1 Х 2. Desert-meadow 244,7 Х 3. Desert-takyr 104,3 Х 4. Takyr 84,2 Х 5. Solonchak-meadow 92,3 Х 6. Remaining-meadow 30,1 7. Meadow-takyr 9,6 8. Meadow 25,7 Х 9. Meadow-marsh 40,1 10. Meadow-alluvial 26,1 11. Meadow-flood-plain (swamp) 40,1 12. Sand mobile and poorly fixed 601,7 Total 1700 100 437 100
Х- no data Table 3.3. Land fund of Kizilorda region
№ Name of crops Total area, th.ha % Irrigated arable land, th.ha %
1. Arable land 166 0,66 166 56,6
2. Perennial plantings 2,8 0,01 2,8 1,0 3. Deposit 99,8 0,40 99,8 3,1 4. Haymaking 116,5 0,46 5. Pastures 12538,4 50,36 Including: watering 9193 Household gardens 24,4 0,10 24,4 8,3 In total agricultural land 12947,9 293 100
6. Forestry 5011,2 20,13 - 7. Forest-shrub plantings 88,5 0,36 8. Swamps 12,7 0,05 - 9. Under water 2357,8 9,47 -
10. Other land 4481,5 18,00 - Total 24899,6 100 293 100

CRP1.1 Characteristics of the site “Aral Sea” SRT2-AS1
page 11
Table 3.4. Soil groups of land fund of Khoresm region № Soil Общая площадь,
th. га % Орошаемая пашня, th. га %
1. Gray-brown 5.882 1 2. Takyr 8.475 2 3. Meadow-takyr and meadow-
deserted 8.774 2
4. Meadow-alluvial 333.753 74 5. Swamp-meadow 15.740 4 6. Meadow-inundated, alluvial 2.277 1 7. Saline soils 6.533 1 8. Deserted, sandy and sand 41.993 9 9. Water table 25.699 6
Total 16144,9 449.1 276.6 100
3.2 Soil characterizations for each of the major soil types
The main factors in the soil-forming process (for hydromorphic soils) are sludging due to irrigation, flooding and close (deep) shallow water table.
• Gray-brown soils are characterized by insignificant capacity of loose of loose pit-run fines, a layer 0,5-2,0 m, the low humus content (0,4-0,6 %), high carbon and salinity.
• Takyr soils have high distribution on modern and ancient alluvial deposits. They are basically concentrated on the territory of northern and northeast and northwest part of the region. Crust presence on a surface is characteristic for this type of soil. The humus content fluctuates from 0,4 to 0,8 %.
• Meadow-alluvial soils of a desert zone are developed on alluvial deposits of a river origin. Irrigated meadow soils are the most widespread soils, they make about 2/3 areas of an irrigated arable land. Depending on structure of soils, the humus content fluctuates from 0,5 to 1,8 %.
• Swamp-meadow soils are developed basically on the lower elements of a relief with low level of subsoil water. Usually these soils are characterized by the high content of salts. The humus content fluctuates from 0,8 to 1,5 % with smaller value of phosphorus. For maximum use of these soils, it is necessary to carry out agro-ameliorative actions.
• Meadow-swamp soils in flood-plains of river Amudarya and in a zone of modern delta, periodically flooded at the big floods, with depth 0,5-1,0 m.
• Meadow and swamp-meadow, flood-plain-alluvial soils in a young part of modern delta of the river, occupy extensive inter-current falls. These soils continue the development with receipt of the necessary water and their surface is constantly renewed. The humus content is considerably higher in comparison with other types and this type is the best reserve for irrigation.

CRP1.1 Characteristics of the site “Aral Sea” SRT2-AS1
page 12
• Newly irrigated grey-brown, grey-brown low-power, newly irrigated meadow and a complex of hily sand. (Basically they are extended on ancient remains of a plateau, for example - the Tashsakinsky plateau
• Takyr soils (the area of 300-350 thousand hectares) are extended in the western part of an oasis and make the basic land fund subject to development. Soil salinity is average, chloride-sulphate.
• Sandy deserted soils are formed on grown oases sand and in Zaunguzsky Karakums. In some places they are used for irrigation. Takyrs are extended in southwest part of Dashaguzskiy region. Alkaline lands refer to the lowered sites and to places of outlet of irrigating water.
• Desert-meadow soils. Development of these soils has begun 15-20 years ago, though it was not always conducted systematically, without observance of norms and rules of agricultural practices, that has led to a sharp rising of level of subsoil waters, which at the moment of inspection corresponded to 2-3 meters. Soils on depth of 6-10 cm have turfy horizon, deeper they are crusty, decorated by humus. On the depth of 50 cm there appears rusty - ferriferous coloring.
• Desert takyr. They are formed on proluvial - alluvial loamy-clay deposits on flat and gently wavy surfaces. Subsoil waters are opened on depth of 20-30 meters and do not influence on processes of a water-salt mode of soil thickness. The deserted nature of takyr soils is shown in crust formation (porous, leaf, sometimes reminding a crust of takyr), in absence of considerable moving of carbonates, in low humus and small capacity of absorption.
• Alkali-meadow. These soils develop in the conditions of close strong-mineralized subsoil waters (Ground water level 1-3). The vegetation is also strongly rare and presented by ephimers and a cane. In investigated territory alkaline - meadow lands are presented by light loamy soils, sometimes with pro-layers of heavy loamy mechanical composition.
• Meadow. They are extended on the lowered elements of a relief in hydromorphic conditions with depth of subsoil waters within 1-2 m. The Mineralization of subsoil waters as a result of analyses fluctuates within 4-15 gram/liter. Influence of subsoil waters (rehumidifying) is shown in a view of exposure and oxidations in thickness 80-150 cm. Capillary border is closed with a surface of soils that promotes rising of salts in top of root horizons. Any change of a water mode will lead to change of a salt mode, taking into account features of mechanical structure.
• Meadow - takyr soils occupy the raised sites of area. Morphology of meadow-takyr soils combines lines of meadow and takyr, water-soluble salts containing its considerable quantity. At irrigation of meadow-takyr soil due to rising of subsoil waters they turn in takyr-meadow, where meadow soil formation processes prevail. At long irrigation without a drainage network, they turn to meadow and swampy.
• Meadow soils move with irrigated masses, saline soils, takyr soils and sand. All irrigated meadow soils are salted in various degrees. Due to high content of carbonates, they are most perspective for agriculture. As a result of irrigation, they refer to a class of highly cultured soils of oases at performance of following

CRP1.1 Characteristics of the site “Aral Sea” SRT2-AS1
page 13
conditions: creation of not salted irrigational horizon, increase in soil of humus content, nitrogen and other nutrients for plants, introduction Cotton-Lucerne crop rotations.
• Alkaline lands. Half of irrigated land of Dashoguz region is subject to secondary salinization. Alkaline lands are extended everywhere within irrigated zone. Meadow and swampy Alkaline lands have the least distribution. Their characteristic morphological sign is a land-salt fragile crust and chubby powder type dust sub crustal horizon with a significant amount of salts. In saline soils there is no turf horizon.
• Alkaline lands - the land of ameliorative fund, as without building of a collector-drainage network it is impossible to develop them.
3.2.1 Rooting depth, cm
The depth of the root zone, cm Cotton Wheat Rice Alfalfa Tomato 60-80 40 40 110-180 30
3.2.2. Water holding capacity (defined by measures of field capacity and wilting point)
Water-retaining capacity of soil – ability of the soil to retain a certain amount of water due to the influence of sorption and capillary forces Information about the MFM и SWM in irrigated area depending on mechanical structure Typical soils, located in irrigation zone: # Name of soil MFM* MSW** 1. Meadow-takyr и Meadow-desert 22-23 4-7 2. Meadow-alluvial 20-22 3-6 3. Newly irrigated Meadow-alluvial 19-24 3-5 4. Grey-brown 20-21 4-5 5. Grey brown-meadow 19-21 3-4 6. Swamp-meadow 23-24 5-6 7. Takyr non-saline 22-24 4-5 8. Takyr solonchak soils 21-23 3-4 9. Takyr alkaline-solonchak 22-23 4-5 10. Alluvial-meadow (тугайные) 20-21 3-4 11. Desert-meadow 13,9-21,8 2-3 12. Sand-desert 12,5-20,3 2-3

CRP1.1 Characteristics of the site “Aral Sea” SRT2-AS1
page 14
13. Desert takyr 16,9-25,6 3-4 14. Takyr 16,17-26,8 3-4 15. Alkiline lands meadow 19-21 3-4 16. Meadow 20-22 3-4
* Maximum field moisture ** Moisture of stable wilting
3.2.3 Measure of soil fertility – OC% Transformation of organic matter into humus takes place in the soil with the participation of microorganisms. The remains of various species and other organisms after contact with a soil are decomposed by the microorganisms and used by them as a source of feed and power. Not humus substances include: а) substances of plant or animal origin (carbohydrates, proteins, tannins, lignins, fats, etc.) b) the substance of secondary forms of microbial synthesis (proteins, carbohydrates, fats).). Analysis of data on sampling in experimentation sites and at Aral Sea reveals an extremely low content of humus in the soils. Below given 16 types of soils which are the most widespread within the irrigated lands:
№ Type of soil Humus content 1. Meadow-takyr и Meadow-desert 0,4-0,81% 2. Meadow-alluvial 0,4-1,3% 3. Newly irrigated Meadow-alluvial 0,6-1,1% 4. Grey-brown 0,2-0,4%, 5. Grey-brown-meadow 0,4-0,8% 6. Swamp-meadow 0,6-1,4% 7. Takyr non-saline до 1,5%. 8. Takyr solonchak 2-3%, 9. Takyr alkaline-solonchak 1% 10. Alluvial-meadow (tugay) 1-2% 11. Desert-meadow 0,32-0,45 % 12. Sand-desert 0,28-0,43 % 13. Desert takyr 0,34-0,47 % 14. Takyr 0,36-0,51% 15. Alkiline lands meadow 0,25-0,36 % 16. Meadow 0,37-0,69 %

CRP1.1 Characteristics of the site “Aral Sea” SRT2-AS1
page 15
Carbon forming facts are the stubbles of a vegetative and animal origin, and make the lowest size, the principal cause of which being:
• burning or removal outside the residuals of a vegetative cover (straw, the residuals of a stalk of a cotton, etc.) in the conditions of Republic Karakalpakstan, Khoresmski and Dashaguzskiy regions; mulching of soils is almost not conducted;
• legumes and a lucern are cultivated in extremely limited areas; • low or lack of the stubbles (manure) of animals.
3.2.4 Soil pH Physic-chemical and absorption capacity of soils explains the nature of soil acidity and alkalinity, which play an
important role in agronomic practices. (Acidity of soils is caused by hydrogen ions. Thus рН=7 characterises neutral reaction, рН <7 - acid, рН> 7 alkiline) Usually in the soils pH ranges from 4 to 8. рН < 7 occurs in swamp soils – excess moisture, Alkaline lands рН >8 and higher, Swamp-meadow - рН = 6.
The ratio of crops to the PH Crop Optimum РН Grows in the РН range of
Cotton 7,0-7,5 6-8 Maize 6,0-7,0 - Alfalfa 7,0-8,0 6,8 Wheat 6,0-7,0 5-8 Potato 5,0 4-8 Rice 5,0-6,9 5-7
3.3 Soil problems posing serious management challenges
A complex combination of natural conditions and the existence of salt rocks, management operations, etc. cause widespread reclamation of disadvantaged lands - saline, alkaline, eroded, rocky, marshy, which determines the complex, often dysfunctional, land-reclamation status.

CRP1.1 Characteristics of the site “Aral Sea” SRT2-AS1
page 16
3.3.1 Salinity (severity, soil types and % of area affected)
Within the territory of the irrigated lands (there are all kinds and types of soils, but in the selection of samples for salinity, they are not considered separately) there is a dense network of sampling and there is detailed information on their salinity degree. The results are shown in the below table.
Average magnitude on salinity degree of soil in downstream of Amudarya for the period 1997 – 2010
Years Total irrigated
area Area covered by
monitoring
Salinity degree of soil (layer 0-100 cm)
Non saline. Week saline. Medium saline Strongly saline
th.. ha th.. ha th..ha % th..ha % th..ha % th..ha % 1997 1452,4 1422,8 147,8 10,4 411,4 28,9 644,3 45,3 219,3 15,4 1998 1450,6 1421 139,1 9,8 407,2 28,7 651,2 45,8 223,5 15,7 1999 1445,9 1416,2 164,1 11,6 398,1 28,1 640,2 45,2 213,8 15,1 2000 1449 1419,3 156,6 11,1 390,9 27,5 651,2 45,9 220,6 15,5 2001 1449 1419,4 157 11,1 362,5 25,5 664,9 46,8 235 16,6 2002 1441,9 1412,3 172,9 12,3 322,6 22,8 679,6 48,1 237,2 16,8 2003 1441,8 1412,2 178,4 12,6 331,7 23,5 670,2 47,5 231,9 16,4 2004 1452,8 1423,2 213,3 15,0 352,8 24,8 631,3 44,3 225,8 15,9 2005 1486,8 1457,2 206,2 14,1 349,5 24,0 667,3 45,8 234,2 16,1 2006 1489,8 1460,2 212,3 14,5 337,8 23,1 671,4 46,0 238,7 16,4 2007 1488,6 1459 207,22 14,2 349,55 24,0 664,48 45,5 237,75 16,3 2008 1486,16 1456,56 205,51 14,1 338,44 23,2 673,72 46,3 238,89 16,4 2009 1501,8 1472,2 220,1 15,0 342,9 23,2 669,64 45,5 239,56 16,3 2010 1550 1490,1 224,1 15,0 366,1 24,6 680,74 45,7 219,16 14,7
There is a need to clarify perennial information on salinity in Dashaguzskiy region of R.Turkmenistan, Kizilorda region of R.Kazahstan and Khoresmski region of R.Uzbekistan.
Thus salinity types could be seen as follows:

CRP1.1 Characteristics of the site “Aral Sea” SRT2-AS1
page 17
Salinity degree Type of salinity Non saline soils Sulphate–chloride Week saline Sulphate – chloride Medium saline Chloride – sulphate Strongly saline Chloride – sulphate
According to Institute of Soil Science (2003)in Khoresm region of R.Uzbekistan (on experimental data):
• newly irrigated Grey-brown, Grey-brown poor, newly irrigated meadow and a complex of hilly sand. On a layer 0-30 сm the dense residual makes - 0,23-0,38 %, on layers 50-100сm - 0,1-0,2 %, chlorine: 0,033-0,035 %, sulphate of 0,1-0,19 %. Type of salinity: Chloride-sulphate.
• old irrigated Meadow - alluvial, newly irrigated Meadow - alluvial, newly developed Meadow - alluvial and Swamp - meadow and alluvial soils in a layer 0-30 сm - 0,35-1,4 % (residual area), 50-150 cm - 0,64-1,1 % (residual area), chlorine of 0,07-0,091 %, sulphate of 0,07-0,15 %. Type of salinity: Chloride-sulphate.
• modern newly irrigated Meadow - alluvial, newly developed Meadow-alluvial, meadow and Swamp-meadow soils with a layer 0-30 сm 0,30-0,98 % (residual area), bottom 50-1500 cm - 0,14-1,2 % (residual area), chlorine: 0,025-0,038 %, sulphate: 0,085-0,14 %. Type of salinity: Chloride-sulphate.
The following conclusion, on degree of salinity of soil has been drawn:
- High (from 1.4 to 2.1 % - the dense residual of salts); - Average (from 0,7 to 1,4 % - the dense residual of salts); - Low (from 0,35 to 0,7 % - the dense residual of salts).
3.3.2 Sodicity (severity, soil types and % of area affected)
According to Institute of Soil Science (2003)in Khoresm region of R.Uzbekistan, and based on data of newly developed alluvial soils, alkalinity makes around 2,2-3,8%.
3.3.3 Al-toxicity (severity, soil types and % of area affected)
On all types of soils, 20-23% of total composition is made of silt fractions in ploughed and sub-ploughed horizons (According to Institute of Soil Science of R.Uzbekistan).

CRP1.1 Characteristics of the site “Aral Sea” SRT2-AS1
page 18
3.3.4 Low chemical fertility (organic carbon, CEC, etc.) (description, severity, soil types and % of area affected)
In all soils of Aral Sea, there is a low content of elements such as silicium, aluminum, sulfur, calcium and magnesium. For the normal growth and development of plants, it is essential to have nitrogen, potassium and phosphor in the soil. Selective quantification of these elements in the soils of Aral Sea is shown in the following Table:
№ Type of soil Content Phosphor Potassium Nitrogen
1. Meadow-takyr и Meadow-desert low low average 2. Meadow-alluvial low Too low average 3. Newly irrigated Meadow-alluvial low low average 4. Grey-brown low low average 5. Grey-brown-meadow low low average 6. Swamp-meadow low low average 7. Takyr non-saline low low low 8. Takyr solonchak low low low 9. Takyr alkaline-solonchak Very low low Very low 10. Alluvial-meadow (tugay) low low low 11. Desert-meadow low low low 12. Sand-desert low low low 13. Desert takyr Very low Very low Very low 14. Takyr Very low Very low Very low 15. Alkiline lands meadow low low low 16. Meadow Very low Very low Very low
According to Institute of Soil Science (2003)in Khoresm region of R.Uzbekistan (on experimental data):
• Newly irrigated Grey-brown, Grey-brown poor, newly irrigated meadow and a complex of hilly sand. On a layer of 0,28-0,30 % of 0-30 cm -the general carbon; Percent of the general nitrogen - 0,035-0,039 %; C:N - 7,9-8,2 %; Humic acid - 16,34-20,63 %; Fulvic acid - 36,72-37,06 %.
• Old irrigated Meadow-alluvial, newly irrigated Meadow-alluvial, newly developed Meadow-alluvial and Swamp-meadow and alluvial soils in a layer 0-30 cm. General carbon-0,46-0,55 %. Percent of the general nitrogen - 0,045-0,053 %; C:N - 10,3-10,5 %. Humic acid - 15,45-19,20 %. Fulvic acid - 20,09-23,55 %.
• Modern newly irrigated Meadow-alluvial, newly developed Meadow-alluvial, meadow and Swamp-meadow soils with a layer 0-30 cm. General carbon-0,39-0,50 %. Percent of the general nitrogen - 0,03-0,052 %. C:N - 9,6-13,1 %. Humic acid - 11,20-14,64 %. Fulvic acid – 19,68-20,50 %.

CRP1.1 Characteristics of the site “Aral Sea” SRT2-AS1
page 19
3.3.5 Phosphorus fixation (severity, soil types and % of area affected)
On the given section there is very little information on big territories on all types of soils (such data is absent in general ). Therefore we cite data which have been resulted from a pilot site (FAO) in territory of Meadow-alluvial types of soils (agro-chemical laboratory during last years does not take analyses on phosphorus). Below in the table there is data on 10 points on depth of 40 cm (R. Karakalpakstan). The content of the mobile form of phosphorus on a pilot site of FAO 2006-2008 A.Aybergenov(mg/kg) Depth № of field
1 2 3 4 5 6 7 8 9 10 norm 0 - 10 26 22 28 28 22 30 29 26 25 16 100-200 10 – 20 28 26 30 29 27 38 33 28 23 26 (average) 20 – 30 35 30 33 34 31 36 42 34 41 38 30 – 40 32 34 42 37 40 40 43 38 45 41
According to Institute of Soil Science (2003)in Khoresm region of R.Uzbekistan, on experimental data,
• newly irrigated Grey-brown, Grey-brown, low-power, newly irrigated meadow and a complex of hilly sand. On a layer 0-30 cm. The general phosphorus - 0,09-0,14 % and gross phosphorus - 14-24 mg/kg.
• old irrigated meadow alluvial, newly irrigated meadow alluvial, newly developed meadow alluvial and swampy meadow alluvial soils in a layer 0-3 0 cm. The general phosphorus - 0,09-0,14 % and gross phosphorus - 12-19,4 mg/kg.
• modern newly irrigated meadow alluvial, newly developed meadow alluvial, meadow and swampy meadow soils a layer 0-30 cm. The total phosphorus - 0,10-0,19 % and gross phosphorus - 8,5-14 mg/kg.
Fixation of phosphorus in irrigated land of Dashaguzskiy region
№
Name of crop Level of supply of mobile phosphorus (per 1 kg in mg)
Supply of potash (per 1 kg in mg)
Up to 15 Very low
16-30 low
31-45 average
16-60 high
С 60 high and very high
Up to 150 Very low
151-250 low
251-400 average
From 400 very high

CRP1.1 Characteristics of the site “Aral Sea” SRT2-AS1
page 20
1. Co ton 1:1 1:0,8 1:0,6 1:0,3 - 1:0,5 1:0,3 1:0,2 - 2. Corn 1:1 1:0,7 1:0,6 1:0,3 - 1:0,6 1:0,4 1:0,2 - 3. Rice 1:09 1:0,7 1:0,5 1:0,3 - - - - - 4. Cabbage 1:08 1:0,6 1:0,5 1:0,3 1:0,2 1:0,5 1:0,3 1:0,2 - 5. Tomato 1:1,3 1:1 1:0,7 1:0,5 1:0,3 1:0,5 1:0,3 1:0,1 -
6. Onions and garlic
1:1,3 1:1 1:0,8 1:0,5 1:0,3 1:0,7 1:0,5 1:0,3 -
7. Cucumber 1:1 1:0,7 1:0,5 1:0,3 - 1:0,6 1:0,4 1:0,2 -
8. Vegetable crops
1:0,9 1:0,7 1:0,5 1:0,3 - - - - -
9. Beet 1:1,2 1:1 1:0,7 1:0,5 1:0,3 1:0,7 1:0,5 1:0,3 - 10. Grapes 1:0,9 1:0,7 1:0,6 1:0,4 1:0,2 1:0,6 1:0,4 1:0,2 - 11. Orchard 1:1,2 1:0,5 1:0,4 1:0,2 - 1:0,6 1:0,4 1:0,2 - 12. Grain crops 1:1,2 1:1 1:0,8 1:0,6 1:0,2 1:1 1:0,5 1:0,2 - 13. Potato 1:1,2 1:1 1:0,9 1:0,7 1:0,3 1:1 1:0,8 1:0,5 1:0,3
14. Old lucerne 180 kg/ga
150 112 75 - 65 60 35 -
In dehkan association «Medeniyat» inspections have been made of 650 ha irrigated land. On the basis of research it has been found out, that on the irrigated land there are 52,3 % mobile phosphorus (low) and 44,2 %, which is very low. Exchange potassium 18.5 % - average, 26,1 %- low and 48,5 % -very low. On the basis of the agrochemical analysis of soil, for reception 25 centner/ha of raw cotton it is necessary to apply in soils pure 200 kg of nitrogen, 200 kg phosphorus and 72 kg potassium.
There is no information on fixing phosphorus in Kizilorda region.
3.3.6 Poor profile development (soil types and % of area affected)
Information is not available
3.3.7 Rockiness, stoniness (severity, soil types and % of area affected)
There are no rocky and stony areas in the irrigation zones.
3.3.8 Very compact subsoils (soil types and % of area affected)
According to Institute of Soil Science (2003) in Khoresm region of R.Uzbekistan (on experimental data): • newly irrigated Grey-brown, Grey-brown low-power, newly irrigated meadow and a complex of hilly
sand. On a layer 0-30 см. Volume weight of soil - 1,39-1,48 g/cm3 and 50-100 cm-1,43-1,53/ cm3

CRP1.1 Characteristics of the site “Aral Sea” SRT2-AS1
page 21
Relative density of soil 0-30 cm - 2,75 g/cm3 and on a layer of 50-100 cm - 2,67-2,81/cm3/ Total porosity: 43,9-49 %.
• old irrigated Meadow-alluvial, newly irrigated Meadow-alluvial, newly developed Meadow-alluvial and Swamp-meadow alluvial soils in a layer 0-30 cm. Volume weight of soil - 1,38 1,49 g/cm3 and 50-100 cm-1,35-1,63/ cm3. Relative weight of soil of 0-30 cm - 2,67-2,71 g/vm3 and 50-100 cm - 2,63-2,75/cm3. General porosity: 40,7-50,4 %.
• modern newly irrigated Meadow-alluvial, newly developed Meadow-alluvial, meadow and Swamp-meadow soils in a layer 0-30 cm, volume weight of soil - 1,31-1,49 g/cm3 and 50-100 cm-1,20-1,52/cm3
Relative density of soil of 0-30 cm - 2,64-2,69 g/cm3 and 50-100 cm - 2,64-2,69/cm3. General porosity 38,3-52,7 %. According to project WUFMAS selective measurements with use penetrometer, carried out in 1996-1999 in several farms on meadow and Swamp-meadow and alluvial soils have shown, that in 40 % of cases the indication penetrometer in a layer of 0-70 cm exceeded 1500 кН/m2 that corresponds to the raised density. (35 % for Karakalpakstan). The percent of fields with sub-plough layer has made 30 % (10 % for Karakalpakstanа).
3.3.9 Poor drainage, waterlogging (severity, soil types and % of area affected)
The irrigated land occupied with an agricultural production is basically concentrated on takyr meadow-takyr Meadow-desert, Meadow-alluvial and Meadow-swamp types of soils. In territory of the meadow-swamp land, located on lowered areas there are problems (in irrigated zones), bad working capacity or absence of drainage systems. The areas of these lands are made roughly by 40-50 % from the general arable land of 6,4 th. ha (Republic Karakalpakstan) in a zone of meadow-swamp soils, as a whole drainage systems are in satisfactory conditions. On the given information of Soil Institute (2003) R. Uzbekistan for Khoresm region, the following conclusion can be drawn:
• satisfactory water penetration - (100-200 mm for 10 hours) soils make 19,5 % of the total territory; • unsatisfactory water penetration - (50-100 mm for 10 hours) soils make 17,6 % of the total territory; • very unsatisfactory water penetration - (to 50 mm for 10 hours) soils make 5,2 % of the total territory
According to research (Katz, 1976), in Khoresm region lateral streams of underground water do not exceed 19-26 cm/year, thus, only vertical movements prevail. As a whole drainage density 30-44 m/ha, depth reaches 1,5-2,0 m and the basic collectors of 2,5-3,0 m (Ibrakhimov, etc. 2011). In Dashaguzskiy region there are open drainages, the length of which makes 9120 km (21,7 m/ha). Including length of inter-farm open drainages of 3313 km (7,9 m/ha) and length of on-farm open drainage systems it is equal to 5806 km (13,8 m/ha). Security of the irrigated land in open drainages makes only 54,2 %. All drainage

CRP1.1 Characteristics of the site “Aral Sea” SRT2-AS1
page 22
waters are dumped on the Sarykamyshsky water basin. Length of the Sarykamyshsky water basin is equal to 668 km. In a year on the average it collects 5500 million m3. Operation of open drainage systems does not meet demand. Ниже приведена информация площадь заболоченных земель Dashaguz region Р.Turkmenistan.
Area of water-logged land Dashaguz region, th.ha
Name Г О Д Ы
1986 1990 1995 1999
Area waterlogged 1,6 0,6 19,3 6,1
Также были приведены информация о Characteristics межхозяйственной и внутрихозяйственной оросительной и RLC Dashaguz region R.Turkmenistan.
Characteristics of inter-farm and on-farm network in Dashaguz region
Irrigated area, th.hа
Inter-farm canals On-farm network Specific weight of length in
farm network, running
meters/ha
Total, km
including Total, km
including
Earth bottom
concrete.
Earth bottom concrete canalet
s pipes.
407,3 3185,4 3159,7 25,7 9698,3 9655,9 42,4 0 0 24
Characteristics of collector-drainage network in Dashaguz region
Irrigated area th. hа
Vertical drainage wells The length of collector-drainage network, km
Number, pieces hа/well. including
operating
Main and interfarm. onfarm
Total specific. m / hа Total including.
close specific. m / hа
407,3 0 0 0 3313,5 8,14 5806,15 1049,64 14,26

CRP1.1 Characteristics of the site “Aral Sea” SRT2-AS1
page 23
3.3.10 Excessive drainage (soil types and % of area affected)
There is no over drainage, as they were built in accordance with the project According to Institute of Soil Science (2003)in Khoresm region of R.Uzbekistan, very high-water-permeable - (400 mm. for 10 hours) soils make 13,7 % of the total territory. Highly-permeability - (300-400 mm. for 10 hours) soils make 18,1 % of the total territory. Good water penetration - (200-300 mm. for 10 hours) soils make 15,4 % of the total territory. After construction of lake "Altin-asyr" in Dashaguzskiy region, drainage water will flow to lake better. Level of depth of underground water as a result decreases. The condition of the irrigated land improves. High accumulations of water were formed as a result of the main drainage water diversions of Turkmen lake «Altin-asyr» and draining of drainage systems from areas in different eco-system zones of desert Karakum: Ulshor (26 km2), Rahmonkol (12 km2), Eraji (55 km2), Zennibaba (25 km2), Uzinshor (16 km2), Atabayshor (6 km2), Hangui (25 km2), Airakli (40 km2). On a zone of flow of the main drainage systems of Turkmen lake «Altin-asyr», calculations have been made on a separation of underground waters. By calculations on distance of 1000 m from the main drainage systems on durations of 100 days of filtration, speed of a separation of underground water is equal to 0,024 m/day and after 500 days its speed magnitude will decrease to 0,0052 m/day.
3.3.11 Flooding (severity, soil types and % of area affected) The flooding does not almost occur in the irrigated area of all types of soil; on the contrary, there is a process of
aridization or drainage of soils. Where rice is grown, it is possible to see, that there is a flooding. A rice area under crops is not the considerable.
3.3.12. Other management problems (description, soil types and % of area affected)
In Republic Uzbekistan (Khoresm region and R.Karakalpakstan), due to distribution of land between farms, the quantity of powerful tractors (on balance of farmers) has considerably decreased and many farms have passed to processing (ploughing) by tractors of type Т-28, MTZ, etc. Therefore ploughing of soils is made in the majority of farmers on depth of 0-20 cm that has led to formation compact plough layer below this layer that is the basic constraining factor of growth and development of root system of plants. Also there are facts of untimely and in incomplete volume inter-furrow processing of soils. The capital leveling of irrigated fields is almost not conducted, the crop rotation, harrowing, clearing irrigating and collector-drainage systems, etc. is not observed. Farms are rather young in R. Uzbekistan, as they were created during last 20 years, therefore among farmers which have no operational experience in agriculture and among those who were not engaged in agriculture earlier, there is a requirement for training of the scientifically-proved best practices of conducting agriculture. In view of untimely shortage of equipment and resources, some field works are carried out in deadlines that are reflected in quality of the conducted works. Among problems on agricultural practices it is necessary to pay

CRP1.1 Characteristics of the site “Aral Sea” SRT2-AS1
page 24
attention on water saving activities (such as a laser leveling, leaving the vegetative residuals), system of conducting sustainable agriculture including soil preserving agriculture. Techniques and technologies of irrigation are not observed on irrigated land of Dashaguz region. As a result of it salinity of soils occurs, which in its turn leads to poor harvest of agricultural crops. It is required to introduce water saving techniques and technologies on irrigation of agricultural crops. It is necessary to use everywhere water metering irrigation pipes and siphons.
4. Water resources 4.1 Irrigation water availability The main sources of water in the territory of downstream of Amu-Darya:
• river Amudarya; • river Syrdarya; • underground waters; • returnable collector waters; • lake Sarykamysh etc.; • the small rivers of snow-spring supply Besarik (annual volume of a runoff of 170 million m3), Shelgay,
Asarshik, Teles, Jideli, Akuyuk, Kaynar, Shunkiroy, Sholak, Sassik, Tamdi, etc. These rivers do not reach Syr-Darya , being lost in pebble cones of carrying out at an exit from mountains;
• Turkmendarya; • Gurzhak-Vozeiv; • Gilichbay.
Amudarya, as it has been told above, refers to the basic components of water resources for R. Karakalpakstan, Dashaguzskiy and Khoresmski regions. In hydro-alignment Tuyamuyun water resources during 1997-2010 fluctuated from 12030 to 53607 million m3. Dynamics of an annual runoff during 1997-2010 is resulted below.
The change in volume of annual runoff of river Amudarya for the period 1997-2010 (along Tuyamuyun range,upper irrigated zone of Republic Karakalpakstan, Khoresmski Dashaguzskiy regions).
Years 1997 1998 1999 2000 2001 2002 2003 2004 2005 2006 2007 2008 2009 2010 Runoff volume,mln. m3
26601 58907 35218 20709 17590 32771 41943 33491 50333 32178 26462 19662,1 30217 48174
No data on Kizilorda region.

CRP1.1 Characteristics of the site “Aral Sea” SRT2-AS1
page 25
Apparently from the above-given table one can see that water resources of river Amudarya in downstream are decreasing in the period 2005 for 2008. Only for the last 2-years in the period from 2008 to 2010 the volume of a water runoff is increasing. On Dashoguzsky region in average the farmers get water from irrigation sources approximately about 6000 mln. m3, in shallow years it decreases to 4000 million m3 (this sum is an average index of last 15 years, includes volume on leaching). By 01.01.2001 for 15 sites reserves have been approved, which make 265.4 th.m3/day, forecast reserves in Dashaguz region - 376.4 th.m3/day. Practically all reserves are located near centers of etraps and the region. Averaged data on water demand for the past 20 years:
irrigation 4,0 - 8,0 km3 10,0-24,0%; Internal lakes Up to 0,2 km3 Up to 0,61% Pasture-haymaking lands Up to 0,3 km3 Up to 0,92% drinking water supply 0,16-0,18 km3 0,49-0,55% The industries 0,02-0,025 km3 0,06-0,07% Aral sea Up to 0,20 km3 Up to 61,2% River deltas Up to 4,0 km3 Up to 12,2%
The basic part of water to 95-97 % (in shallow years) is used for irrigation. In high water years the sanitary-ecological outlet is carried out for delta and Aral sea.
4.2 Quality issues (e.g. waste water reuse)
Long-term supervision on change of a mineralization of river water shows their increase within the last 3 decades. If 30-35 years ago the water mineralization in an alignment "Nukus" made 0,7-0,9 g/l on the compact residual, for last year’s their value has reached to 1,6-2,0 g/l. The Principal cause of it is on the one hand this general decrease water content of the rivers, and from other side outlet of a considerable quantity of drainage water in a channel of the river from medium and bottom runoff (to 10 km3 in a year). Data on water salinity of river runoff for the characterized years is given below. Mean monthly data on water salinity in the range Samanbay (R.Karakalpakstan).
Months Years 1960-63 1985 1995 2000 2002 2008 2011
January 0,67 1,07 0,99 1,35 1,76 1,60 1,18 February 0,67 0,92 1,12 1,11 1,51 1,48 1,35 March 0,71 1,07 1,37 1,28 1,47 1,25 1,05 April 0,68 1,01 1,53 1,8 1,10 1,15 1,09 May 0,56 1,07 1,26 1,45 0,82 0,92 1,10

CRP1.1 Characteristics of the site “Aral Sea” SRT2-AS1
page 26
June 0,43 0,95 0,9 0,93 1,10 0,9 0,98 July 0,34 1,13 0,72 0,70 0,72 0,78 0,79
August 0,33 0,64 0,58 0,75 1,28 0,93 0,86 September 0,36 0,50 0,78 0,98 1,02 0,95 1,20
October 0,46 0,42 0,79 0,97 1,25 0,97 1,25 November 0,54 0,50 0,97 1,35 1,6 1,25 1,32 December 0,6 0,62 1,29 1,02 1,45 1,40 1,44 Average 0,53 0,83 1,02 1,14 1,26 1,13 1,13
Quality of surface water in territory Republic Karakalpakstan worsens from year to year. Earlier river water during an annual cycle was referred to hydro carbonate type, the most optimum for the drinking purposes, and for the last years the parity of ions began to vary and now sulphate-chloride type of water prevails even more often, which is harmful to drink. The information on size of a drainage flow and diveriosn of salts, and also diversion of drainage flows in Dashaguz region is resulted below. Diversion of drainage flows makes approximately 47,5 - 52 % from water supply.
Size of a drainage flow and diversion of salts in Dashaguz region
№ Indicators 2000 2005 2010
1. The area, th.hа 411 456 503
2. Water supply, million m3 4813 4036,2 4206,9
3. Drainage flow, million m3 2283,8 1959,8 2188,7
4. % diverted water from drainages 47,5 48,6 52,0
5. diversion of salts, . т 7908,0 7997,7 8841,6
6. %% efficiency from water supply 47 49 52
Diversion of drainage flows in Dashaguz region, mln.m3

CRP1.1 Characteristics of the site “Aral Sea” SRT2-AS1
page 27
№ Indicators 2000 2010 2025 1. Total efficiency 2284 2189 2209 2. Volume of reused collector-drainage water and outlet in
rivers 100 200 350
3. Volume of efficiency outlet to desert depletions 2184 1989 1859
The dynamics of water quality within Republic Karakalpakstan Indicators Standard 2000 2002 2008 2010
dry residues, mg/l 1000 865-1860 692-1413 795-1480 785-1290 chlorides, mg/l 350 194-531 9 -375 145-586 180-626 sulfates, mg/l 500 364-640 170-491 195-497 264-462 total hardness, mg (milliequivalents per liter concentration)
7,0 7-12 5-13 7-14 6-11
Such bad quality of water for the last years leads to increase in disease among inhabitants of this region, especially women and children (disease on 1000 th. person occurs in 4740 to 50460 persons, and infantile death rate on 1000 born live 21-23 persons). From irrigated territories of Republic Karakalpakstan annually returnable-collector waters are formed in 600-2500 million volume m3 (in connection with absence of sewage, their insignificant volume is utilized on local falls). These collector waters have the high content of salts (4000-6000 mg/l) and they are polluted by various pesticides, and other biologically active connections. In connection with insignificant size of capacity of underground waters, with low filtration properties and bad quality, they are practically not used. Khoresm region (Source. Ibragimov, etc. 2011. The mineralization of irrigating water 1 ds/m. the Average mineralization of ground water 1,88 g/l (April), 1,83 g/l (July) and 1,68 g/l (October) (2.35, 2.29 and 2.10 ds/m), each of which has an average level of a deviation 0,98-1.08 gг/l (1 ds/m), and can be classified as moderate on classification of FAO (Rhoades, etc., 1992). Locally, though in small territories, there are high values till 14-15 g/l. In some places it is possible to observe week mineralized ground water 1.3 g/l. This information can be used for water resources management support. On sites with low level of a mineralization, the reuse can be considered as a perspective variant for saving of water. Sites with a high mineralization can help to reveal regions, demanding the further activity on management of water or can promote defining marginal sites. Use of mineralized water on irrigation during the periods of strong accumulation of salts in the top layers of land, in the absence of leaching effect, can be especially harmful. In 2008 potential allocation for a reuse of water from a

CRP1.1 Characteristics of the site “Aral Sea” SRT2-AS1
page 28
collector-drainage network was in volume 275 million m3. The quantity of water for a reuse has been established for the period from 2nd decade of May till September, 2008.
5. Land use/land cover 5.1 Types of agricultural/non-agricultural land
(data need to be clarified) Types of agricultural / non agricultural lands
№ name Khoresm region
Republic Karakalpakstan Kizilorda region Dashaguz region Total
1. Total area 734,3 16144,9 24899,6 1700 43478,8 2. Farmlands 411,2 307,3 293 37 1448,5 3. Arable land 450 166 616 4. Perennial plantings 500,2 2,8 18,5 521,5 5. Pastures 39,8 8937,4 611,4 9588,6
6. Under the rivers and artificial reservoirs, canals
123,3 3687,8 6852 152,5 10815,6
7. Roads 60,5 400 50 510,5 8. Under the buildings
and settlements 658 386 1044
9. Unused lands 160 1543,7 16799,8 430,6 18934,1 Distribution of land resources between agricultural and livestock farms in R..Karakalpakstan, th.. ha.
№
Groups of farms on character of land tenure The total area Farmlands
Out of which arable land and perennial plantings
1. Agricultural 884,4 532,3 293,1
2. Cattle-breeding, based on field feed production
526,6 275,7 22,7
3. Cattle-breeding, based on natural pastures
5251,9 3753,2 8,9

CRP1.1 Characteristics of the site “Aral Sea” SRT2-AS1
page 29
During the last years in connection with reduction of water resources there are considerable changes in distributions of land resources. Basically there are groups of land users (arable land). In Dashaguz region livestock is mainly based on natural rangelands 6114,4 ha. There is no information on other areas.
5.1.1 Extent of rainfed cropland across site (ha, %)
There are no rainfed cultivated lands
5.1.2 Main rainfed crops or varieties grown (ha)
There are no rainfed crops
5.1.3 Extent of irrigated cropland across site (ha, %)
The area if irrigated arable land in Aral Sea Basin (Area of irrigated cultivated land in Aral Sea Basin) years 1997 1998 1999 2000 2001 2002 2003 2004 2005 2006 2007 2008 2009 2010 2011 t .ha 1129 1129 1146,9 1017,8 1030,6 1071,4 1080,2 1084,3 1097,5 1126,8 1134,5 1127,3 1134,6 1129,2 1389
There is no information on Kizilorda regions.
5.1.4 Main irrigated crops or varieties grown (ha)
The main crops cultivated in Aral Sea basin include: cotton, wheat, rice, corn, lucerne and other vegetable-melon crops. Leading crop is the cotton which makes 30-50 % from a total area. Its total area fluctuates from 456,6 to 560 th. ha. in this zone variety of cotton С-4727, Chimbay 3010, Tashkent-6, etc.are cultivated For the last years, in connection with reduction water content of the rivers, the area of rice was reduced from 110,0 th. ha (1980) to 4,0 th. ha. Rice varieties UzROS-59, Uzbek-5, Dubovski-120 and Nukus-2 etc are released for this zone. Wheat cultivation started since 1990, and for the last years its area occupies within 190,4-332,2 th. ha. For the considered period the area of the main cultivated irrigated crops (th. ha) fluctuate:
№ Crops Regions и Republic Total, Aral Sea basin Khoresm Karakalpakstan Kizilorda Dashaguz 1. Cotton 95,1-110,9 74,0-129,8 87,9 - 110,5 197,8-208,8 454,8 - 560 2. Cereals 48,6-72,7 52,8-114,9 8,6 - 51,2 80,4-93,4 190,4 - 332,2 3. Vegetables 10-12,6 4,6-8,7 0,3 - 12,6 5,2-6,3 20,1 - 40,2 4. Melons 3,6-4,9 4,4 – 7,3 1,5 - 4,9 3,8-4,1 13,3 - 21,2

CRP1.1 Characteristics of the site “Aral Sea” SRT2-AS1
page 30
5. Gardens and perennial plantings 9,4-11,4 6,6 - 11,5 4-15 20 - 37,9
6. Maize for grain 1,5-2,5 1,5 - 2,5 7. Maize for silage 4,5-8,7 4,5 - 8,7 8. Barley 20,4-53,6 20,4 - 53,6 9. Other crops 10-41 24,0-39,0 8,2 - 42,4 57,9-87 100,1 - 209,4 10 Rice 4,0 - 110 2,9-29,4 6,9 – 139,4
5.1.5 Extent of pastures across site (ha, %)
Area of pasture lands in Aral sea region years 1997 1998 1999 2000 2001 2002 2003 2004 2005 2006 2007 2008 2009 2010 2011
Th.. ha 11716.2 11716.2 14717 14260.1
No data for Kyzylorda region
5.1.6 Extent of rangelands across site (ha, %)
Area of lands suitable for the pastures in Karakalpakstan years 1997 1998 1999 2000 2001 2002 2003 2004 2005 2006 2007 2008 2009 2010 2011 Th..ha 8600 8650 8659
No data for other regions
5.1.7 Extent of other major land use/land cover types across site (description, ha, %)
Other major types of land use Aral Sea basin
№ Types of land use Regions
Khoresm Karakalpakstan Kizilorda Dashauz 1. Perennial plantations 12083 8559 18,5 2. Household plots 34277 42,8 3. Forestry
Only available information has been given
5.2 Land use trends 5.2.1 Increase/decrease in irrigated cropland due to availability/decline of groundwater resources (severity,
Increase/decrease in irrigated cropland due to availability/decline of groundwater resources (this is not peculiar for the conditions of Republic Karakalpakstan). In the conditions of Republic Karakalpakstan introduction in an agricultural production is carried out on a half- hydromorphic soil formation mode at level of subsoil waters of 1,5-1,6 m from a land surface. However, for the last years in connection with low water, the areas of the irrigated land were reduced and level of ground water (2000-2001) has decreased to 4,0-5,0 m, and also has

CRP1.1 Characteristics of the site “Aral Sea” SRT2-AS1
page 31
% of area affected) passed to more auto-morphic a mode. Transformation of the areas of agricultural crops in agriculture of Republic Turkmenistan for 1990-2007.
№ Crops 1990 2007 г Transformation of the areas of agricultural
crops th..ha % th..ha % Increase (+) Decrease (-)
1. Total area under crops 1230,7 100 1588,1 100 357,4 2. Cotton 623,4 50,7 642,7 40,5 19,3 3. Grain and leguminous 187,3 15,2 865,7 54,5 678,4 Including: wheat 60 4,9 832,9 52,4 772,9 Rice 16 1,3 22,1 1,4 6,1
4. Vegetables 34 2,8 21,8 1,4 -12,2 5. Melons 39,6 3,2 8,9 0,6 -30,7 6. Potato 4,3 0,3 11,1 0,7 6,8 7. Sugar beet 0 0,0 15,9 1,0 15,9 8. Other 4 0,3 0,5 0,0 -3,5 9. Forage crops 337,7 27,4 21,5 1,4 -316,2 Total
720,4 -362,6 1. Besides: Gardens 25,5 15,5 -10 2. Vineyards 26,7 22 -4,7
5.2.2 Changes of land use/land cover types (description, % of area affected
After the independence of Uzbekistan, country faced the problem of providing the population with grain products, and therefore the area under wheat was increased and by present time the area of this type of land users for R. Karakalpakstan makes 65-70 th. ha. (see Section 5.1.4 where it is resulted the areas of cultivation grain crops in limits 52,8-114,9 th..ha).
5.2.3 Other significant changes in land use (description, % of area affected)
As a whole on Republic Karakalpakstan in connection with reduction of receipt of a river drain (water supply now has been reduced on the average to 25-30 %, and in shallow years by 50-60 %) there were following changes in land tenure:
• The areas of pasture-hay-makinging lands were sharply reduced (especially in an irrigation zone) to 50-65 % in comparison with 1965-1970;
• The areas of crops of rice were reduced in 25 times R.Karakalpakstan.

CRP1.1 Characteristics of the site “Aral Sea” SRT2-AS1
page 32
6. Land degradation 6.1 Type and current severity of particular types of land degradation 6.1.1 Salinization (severity, % of area affected)
Major factors of formation of the salt affected soils in Aral Sea basin include: • evaporation of surface and ground waters which more than in 10 times exceeds quantity of rainfall; • the readily soluble salts flowing with surface and ground waters from regions of formation of a surface drain; • hydraulic pressure of ground water, which creates a continuous ascending current of ground waters from depressions to a
surface; • close occurrence of mineralized ground waters (strong saline soils and Alkiline lands); • vegetation (more often halophytes), raising concentration of soil solutions; • security of district CDS or natural drainage; • content of salts in irrigation water and other.
6.1.2 Water erosion (description, severity, % of area affected)
There is also water soil erosion in irrigated foothill plains . Additional research is required.
6.1.3 Wind erosion (severity, % of area affected)
Khoresm region is located in a zone of average wind activity. Winds of a northeast direction are observed in most cases in an annual cycle. Within 6 days of dusty storms (10 - calm) are noticed on the average for a year. Average speed of a wind of 3,5 km/s. Months with active wind activity - December-June. Speed of a wind during this period reaches 3,6-4,5 km/s (Kuziev R 2001. Evolution of soils of Khoresm). Wind erosion of soils in territories Dashaguzskiy regions occurs not only on eroded soil, but also in soils, where the soil moves, and where floods and ravines are formed. For the decision of water and wind erosion in the region, it is required: -The-improved system of knowledge of development of a situation concerning land degradation; -Provide economic or other stimulus for realization of measures on management of process of erosion or on maintenance of crop rotations of sowing crops on slopes with the revealed erosion; -Introduce progressive methods of irrigation on the slope land; -Provide changes at cultivation of grain crops from annual to technical long-term crops or forests in the weakest territories; -Restore the land broken by the industry, mining and other branches; -Introduce new methods and technologies of processing of the land. Below resulted deficiencies, which are the reasons of the above described problems: -Absence of sufficient means to promote monitoring at regional and national level to the budgetary purposes and planning; -Lack of the consent concerning appropriate stimulus; -Lack of experience in the regions on modern methods of an irrigation and outreach to broad masses of farmers; -Fault in maintenance of farmers with irrigating water and other necessary resources in some cases;

CRP1.1 Characteristics of the site “Aral Sea” SRT2-AS1
page 33
-Weak control of execution of laws to provide responsibility of oil and gas enterprises for committing damage; -Weak advocacy and realization of methods and measures on the careful relation to water and the land; -The-weak control on use of water, the land and inefficiency penal sanctions.
6.1.4 Loss of soil organic matter (severity, % of area affected, ha)
According to materials of State Design Institute (GosNIIP), the statistical processing of results of the humus content in irrigated soils on the various periods of researches has shown, that in 1950-1959 in a layer of 0-30 and 30-50 cm the quantity humus made within 1,13-0,998 0,77-0,684 % accordingly, depending on conditions of its formation. Thus the greatest indicators were in meadow-oazis soils in the riverbed deposits of old Amudarya, then - irrigated meadow soils of the same deposits and the least - irrigated meadow soils of modern deposits of Amudarya. These indicators in 1970-1980 on the same soils generated on the same deposits and have made accordingly 1 and 0,84-0,566 %, i.e. have considerably decreased, and in 1996-2000 made: 0,984-0,8 and 0,773-0,545 %. There is a decrease tendency (R.Kuziev 2001. Evolution of soils of Khoresm). The analysis of available data of pilot sites shows, that from year to year on the irrigated land there are facts of decrease in organic substance (humus) on the irrigated land, the principal cause of which being:
• insufficient or full absence of application of organic fertilizers; • reduction of the area of crops of a lucerne and other legume crops, practically absence of the scientifically-proved
crop rotation, i.e. a monoculture; • way of soil' mulching with the residuals of plants and other materials is not practiced.
Annual application rate of mineral fertilizers per 1 kg/ha
Annual application
rate of manure
tn/ha
Total rate of mineral fertilizer in tons
Total rate of manure
in tons Nitrogen
Phosphorus Potassium
Nitrogen Phosphorus
Potassium
Cotton 25 c/ha 216 173 62 15 2,160 1,730 0,650 150
Wheat 35c/ha 120 120 60 10 1,560 1,560 0,780 130
6.1.5 Loss of soil structural stability (severity, % of area affected, ha)
It is necessary to notice the fact, that during the last period, the works directed on improvement of fertility of a soil cover on the irrigated land have considerably weakened by the farmers, namely including:
• untimely ploughing of soils; • compaction of the top layer, destruction of structure of soils;

CRP1.1 Characteristics of the site “Aral Sea” SRT2-AS1
page 34
• decrease in application of organic fertilizers. Loss of structural stability of soil during the last period in Dashoguz region decreases, as farmers substantially apply manure, adhere to requirements of agro-technical practices. Nevertheless, while the advanced systems of an irrigation are poorly applied. Therefore more norms of irrigation are being used. Farmers have been given the land on a long-term basis on a rent bases, therefore they do not aspire to avoid losses, and try to improve condition of structure of soil
6.1.6 Loss of agrobiodiversity (description, severity, % of area affected,ha)
The area of Tugay forests makes less than 1 % of Khoresm. Comparing results of 1990 and 2003 it is possible to see, that about 40 % of the area of forests have been transformed into "other forest land” (forests have become thinner and strongly degraded), as a result rates of degradation of forests make 3,1 %. Nevertheless, these areas can be recycled by natural way or by rehabilitation. If to unite forests and other lands of forests, 17 % of their total area will be transformed into arable lands during this period that corresponds to annual percentage of deforestation of 1,3 %. Because of a heavy use of these farmlands, these territories cannot be restored in tugay forests. Thus, 1.3 % should be considered as a conservative estimation of deforestation. Туhay forests are the important place for habitant and for maintenance of a high bio-diversity. Characteristic types include Populus euphratica, Populus pruinosa and Elaeagnus oxycarpa with mixed types, such as Tamarix spp and Phragmites spp. Forests support some bio-species of the limited birds, such as steppe owl Otus brucei, white fly forestpecker Dendrocopos leucopterus and the Turkestani titmouse, Parus bokharensis plus globally threatened types, including pale pigeon Columba eversmanni (VU), flying and wintering Big Aquila clanga (VU) and сolonial breeding waterfowl, such as night heron Nycticorax Nycticorax. Some mammals otter Lutra Lutra (NT), cane cat Felis Chaus Oxiana and regional subspecies of a red deer (a Bukhara deer) Cervus elaphus bactricanus. Forests are rich also invertebrate, including regionally localized types, such as Glaucopsyche charybdis and Laothe philerema. Annually Amudarya is used by birds, and forests give a valuable place of a stop and wintering for many types of birds. Because of degradation of tugay forests an inhabitancy is under the threat now: three globally threatened types (two birds and one mammal), together with water-marsh lands, providing an inhabitancy to 11 migrating types of birds and one type of mammal. (Tupiza, 2010, the dissertation) Usually, development of the microorganisms promoting mobilization of nutrients amplifies at creation favorable condition in soil. Many authors prove, that for activisation of microbiological processes, the leading role is played by loosening (with a layer turn). Development of number of micro flora, such, as bacteria, actinomycete, mildew of mushrooms and others in soil has a direct relation to the content of manure and manure + limestone. Regular application of organic substances (manure) considerably raises total of microorganisms in soil. Application of organic fertilizers with minerals provides high biological activity of soils. Also other fauna, for example, cordlike (Flagellate), rhizopod(Chiropody) and infusorians (Ciliate), and also earthworms, vertebrate animals are also of great importance at fertility improvement through creation of air in soil. Soils of an Aral Sea basin are the poorest because of above-stated agro-biodiversity and reasons of which include:
• application of high doses of defoliants in soil (1980-2010) as a result of which many species of microorganisms and animals were lost;

CRP1.1 Characteristics of the site “Aral Sea” SRT2-AS1
page 35
• mechanical consolidation of the top layer of land; • the lowest humus content in soil.
Causes of loss and decrease of agro-bio-diversity are: -Losses of micro-organisms in the soil occurs because of application of high doses defoliants in soil; -Impact of soil salt on plants. There are no new technologies of decrease in impact of salts on plants. - Negative impact of an environment; - Change of volume weight of soil to 1,60-1.72g/cm3. Source: Scientific and technical report of the Tashoguz experimental station 2010 г
6.1.7 Other types of land degradation that are significant (description, severity, % of area affected)
As a result of decrease in water-security, the most part of the irrigated land of R. Karakalpakstan, especially under rice crops remained as not sown. Within 15-20 years these lands have not been used in an agricultural production and became uncultivated. On these lands in the beginning (1990-1995) at close level of subsoil waters a process of secondary salinity took place, and the soil lost the fertility and has passed to saline types. For their repeated introduction in an agricultural rotation, great volumes of capital investments will be required. One more factor which will lead to gradual degradation of soils is a monoculture, which takes place within last 20-30 years. For the last years in farms achievements of scientific and technical progress and the best practices designed on reception of high crops of agricultural crops do not take root. Low level of farming practices at above stated and other factors leads to regular decrease of soil' fertility. In Republic Turkmenistan: 1 % of the land is subject to water erosion, vegetation degradations (not used or widely used land) - 74,9 %, deflations (wind erosion) - 2 %, other processes (technological, desertification, flooding of pastures) - 2 %, salinity of the irrigated land - 11 % and other types degradation - 9,6 %.
6.2 Degradation trends 6.2.1 Reclamation of salinized lands (% of area treated)
In R. Karakalpakstan ameliorative conditions are characterized as follows: • the high quality lands have increased from 1985 to 2010 on 89,73 th. ha (84 %); • the lands of satisfactory quality have decreased from 1985 to 2010 on 45,43 th. ha or 13 %; • the lands of unsatisfactory quality have increased from 1985 for 2010 on 15,9 th..ha or 18 %.
The distribution of irrigated lands by their reclamation status in the Republic Karakalpakstan for the period of 1985-2010.

CRP1.1 Characteristics of the site “Aral Sea” SRT2-AS1
page 36
Yrs Total area of irrigated
agricultural lands, th. ha
Characteristics of reclamation of irrigated land Good Satisfactory Unsatisfactory Including, th. ha
th. ha % th.ha % th. ha % On allowable
depth On salinity On both
reasons
1985 455,10 16,77 4 349,44 77 88,890 20 25,00 9,89 54,00 1990 495,30 18,00 4 367,30 74 110,00 22 39,90 6,40 63,70 1991 494,75 15,50 3 370,25 75 108,90 22 45,90 8,10 54,90 1992 496,50 19,70 4 361,80 73 115,00 23 53,80 7,80 53,40 1993 498,80 27,90 6 357,90 72 113,00 23 47,40 7,80 57,80 1994 499,10 29,00 6 357,00 72 113,00 23 65,20 5,80 42,00 1995 500,90 29,00 6 358,90 72 113,00 23 50,60 7,50 54,90 1996 498,10 28,22 6 349,88 70 120,00 24 54,00 8,00 58,00 1997 500,90 28,30 6 362,60 72 110,00 22 47,10 8,00 54,90 1998 500,00 20,00 4 328,30 66 151,70 30 75,40 34,70 41,60 1999 500,80 37,30 7 343,50 69 120,00 24 69,30 7,00 43,70 2000 500,10 41,20 8 355,50 71 103,40 21 27,50 47,60 28,30 2001 500,20 48,70 10 351,50 70 100,00 20 8,000 61,10 30,90 2002 500,20 66,60 10 332,80 67 100,80 20 28,30 60,70 11,80 2007 504,00 85,02 17 308,54 61 110,44 22 43,99 15,25 51,20 2008 504,53 102,33 20 294,52 58 107,68 21 38,94 19,68 49,06 2009 515,05 107,62 21 302,03 59 105,40 20 38,15 36,48 30,78 2010 515,29 106,50 21 304,01 59 104,79 20 45,86 25,69 33,24
6.2.2 Increase in soil erosion (description, % of area affected)
Soil erosion increase in Aral Sea Basin was not almost observed. Every year reduction of soil erosion шт Dashaguz region ща R.Turkmekenistan is observed, as necessary investments are allocated for development of water sector. Improvement the condition of water systems has positively affected conditions of the irrigated land for soil erosions, salinity and waterlogging. On given materials of Dashaguz region, investments (see more in resulted below Table) have been allocated for improvement of fertility of soil .
Investments into development of water sector, million dollars. Years Dashaguz region
2001-2005 168
2006-2010 542 2011-2015 44 2016-2020 80

CRP1.1 Characteristics of the site “Aral Sea” SRT2-AS1
page 37
2021-2025 122
6.2.3 Lowering of groundwater tables (% of area affected, range of change of groundwater levels (m))
Mineralization of ground water in Khoresm region is divided on following categories (according to Soil Institute (2003)). Fresh water is 0-1 g/l, very little salted 1-3 g/l, low-salted 3-5 g/l, medium-salted 5-10 g/l, strong-salted 10-25 g/l. In Khoresm 6,4 % of territory is occupied by fresh subsoil water, 36,1 % of territory is occupied by too low-salted, 29,9 % of territory is occupied by lower-salted, 17,3 % of territory is occupied by medium-salted, 10,3 % of territory by strong-salted soil water. For 17 years (1990-2006), level of ground water (GWL) in Khoresm has shown similar intra-annual tendencies. GWL usually sharply increases from 2 m (± 0) from a surface in December-January to 1,1-1,4 m (± 0) in March as a result of pre-season leaching . After short falling in April-May (1,2-1,5 ± 0 m, the period without an irrigation, except a winter wheat), GWL on all regions rise owing to an irrigation (0,9-1,4 ± 0 m in July). In October, GWL falls gradually to about 1,4-2,0 m (+ -.47-0.66) and further by December. Observable values in the summer show, that close ground waters prevail in majority of Khoresm region during the vegetative period. Territory of Republic Karakalpakstan, Dashaguz and Kizilorda regions is characterized with close level of ground water and accordingly high salinity of soils. Character of change of level of ground water depends from some factors, including:
• water security of year; • presence of a drainage and its working capacity; • an operational experience of irrigators; • conditions of irrigating systems, etc.
As a rule, in days of the normal and high supply, level of ground water is close to a surface of the land and fluctuates: • not vegetative period - 0,2-1,5 m; • during the vegetative period - 1,5-2,2 m.
In shallow years in connection with decrease in size of specific water consumption, level of ground water is sharply reduced (not depending on drainage ) and at places decreases to 4-5 m (2000-2001). During the last years in connection with performance of a government program of land reclamation in Republic Uzbekistan (2008-2012) huge volumes of civil work (reconstruction, repair-regenerative works) have been carried out, that has in turn led to overall decrease in level of ground water, that led to drying the top layer of soils and accordingly to supply of additional volume of irrigation water. On picture 6.1. There are data on fall of level of ground water on Republic Karakalpakstan.

CRP1.1 Characteristics of the site “Aral Sea” SRT2-AS1
page 38
6.2.4 Other significant degradation trends (description, % of area affected)
GWL at Aral Sea basin, including in Khoresm region was comparatively deeper in 1990 rising gradually in consequent years, excluding slight fall in dry 2000 and 2001 years. Standard deviations make 0.47-0.58 m.
Socio-economic descriptors
Колебание уровня грунт овых вод по Республике Каракалпакст ан
180
200
220
240
260
280
300
320
340
360
1997 1998 1999 2000 2001 2002 2003 2004 2005 2006 2007 2008 2009 2010 2011годы
см

CRP1.1 Characteristics of the site “Aral Sea” SRT2-AS1
page 39
7. Demography 7.1 Population 7.1.1 Total population of site, thousand
Total population of site Years 1997 1998 1999 2000 2001 2002 2003 2004 2005 2006 2007 2008 2009 2010 2011 thousand
3737,2 3815,1 3904,1 3992,8 4075,4 4154,2 4230,2 4304,9 4375,0 4498,0 4534,6 4581,3 4624,2 5095,7 5238,2
There are no data on population in Kizilorda region.
7.1.2 Percentage of rural population of site, %
Percentage of rural population of site, % Years 1997 1998 1999 2000 2001 2002 2003 2004 2005 2006 2007 2008 2009 2010 2011
% 64,7 65,2 66,1 66,4 65,9 65,4 65,4 65,5 65,6 65,9 65,2 65,3 60,9 61,2 55,3 There are no data on population in Kizilorda region.
7.1.3 Age distribution of rural population.
Age distribution of rural population
Age (under 5 yrs)
Age (from 5 to 7 yrs)
Age (from 7 to 16 yrs)
Age (from 16 to 45 yrs)
Age (from 45 to 60 yrs)
Age (from 60 yrs and
higher) 225420 74735 336775 954544 222575 90827
Age indicators are for 01.01.2011 No data for Kizilorda and Dashaguzskiy regions.
7.2 Poverty
Poverty headcount ratio at $1.25 a day (PPP) (% of population)
1990 1995 2000 2005 2010 Turkmenistan 14 64 25 .. .. Kazakhstan 0 5 14 0 0 Uzbekistan .. .. .. .. ..
Headcount index: This is the share of the population whose income or consumption is below the poverty line, that is, the share of the population that cannot afford to buy a basic basket of goods. Source: World Bank http://ddp-ext.worldbank.org/ext/ddpreports/ViewSharedReport?&CF=1&REPORT_ID=1336&REQUEST_TYPE=VIEWADVANCED&HF=N

CRP1.1 Characteristics of the site “Aral Sea” SRT2-AS1
page 40
Poverty gap at $1.25 a day (PPP) (%)
1990 1995 2000 2005 2010 Turkmenistan-Turkmenistan 2 26 7 .. .. Kazakhstan-Казахстан 0 1 4 0 0 Uzbekistan-Узбекистан .. .. .. .. ..
Source: World bank http://ddp-ext.worldbank.org/ext/ddpreports/ViewSharedReport?&CF=1&REPORT_ID=1336&REQUEST_TYPE=VIEWADVANCED&HF=N Poverty gap: This provides information regarding how far off households are from the poverty line. This measure captures the mean aggregate income or consumption shortfall relative to the poverty line across the whole population. It is obtained by adding up all the shortfalls of the poor (considering the non-poor has having a shortfall of zero) and dividing the total by the population. Put differently, it gives the total resources needed to bring all the poor to the level of the poverty line (divided by the number of individuals in the population). This measure can also be used for non-monetary indicators, provided that the measure of the distance is meaningful. The poverty gap in education could be the ‘number of years of education missing to reach the defined threshold’ Conditions of a life of the population in Turkmenistan improve every year. Gas, the electric power and food salt is given to the population free of charge.
7.2.1 Poverty amongst rural population (description, %)
Population with low income prevail in the rural areas. In Turkmenistan rural people have an own household plots with size 0,8-0,16 hundred square metres of land. Besides, there are arid lands from 3 to 10 ha.
7.3 Nutrition and health
Morbidity of population, number of patients per 1000 men Regions 1980 1985 1990 1995 2000 2003 2006 2007 2008 2009 2010 Khoresm 453 492 535 632 577 573 654 871,3 887,6 903,9 798

CRP1.1 Characteristics of the site “Aral Sea” SRT2-AS1
page 41
Р.Karakalpakstan Нет инфор 380 475 462 505 Нет инф. 435 683,5 697,8 653,2 676,2 Dashaguzская 49 47 43 40 32 33 368 Нет инф. Нет инф. Нет инф. Нет инф.
Tottal 502 919 1053 1134 1114 606 1457 1554,8 1585,4 1557,1 1474,2
Source: Health in Uzbekistan, statistics data book. Tashkent, pages 2012,233
7.3.1 Nutrition and health status of rural population
Sharp deterioration of ecological conditions in Aral Sea basin, connected with drying of Aral Sea, decrease in volume of a river drain and deterioration of its quality finally has led to universal deterioration of health of the population, living in this zone. The structure and dynamics of separate forms of diseases on Republic Karakalpakstan is subject only to growth: congenital anomalies in 2000 in comparison with 1990 have increased in 6-8 times, ischemic disease of heart - 8,7 times, hypertensive diseasees in 8 times, a stomach ulcer in 5 times, a stomach cancer in 2,2 times, cholelithiasisin 17 times. Main indicators of the health of population in R.Karakalpakstan
№ Indicator 2001 2002 2003 2007 2008 2009 2010 1. Morbidity per 100,0 th.people 47486 44553 50460 43011,6 43464,6 40223,4 40819,7 2. Disabled people per 100 people 4 3,3 3,9 2,3 2,2 1,9 1,9 3. The birth rate per 1000 people, % 24,0 21,9 21,8 23 24,1 24,7 22,7 4. Mortality rate per 100 people, % 6,0 5,8 5,9 5,3 5,4 5,0 5,0 5. Infant mortality rate per 1000 live births 21,0 22,5 23,1 14,1 13,9 13,9 11,8 6. Maternal mortality per 100 thousand newly born 38 41,5 42,7
Source: Health care of Uzbekistanа, Statistic publication. Tashkent 2012, page 233 The increase in disease is observed among the population in countryside. The selective inspection was carried out in territory of farm «Uykala» of Ellikkalinsky area of Republic Karakalpakstan. Frequency of disease among population of Rural Clinic (hereinafter SVP) «Uykala» Ellikkalinsky area of Republic Karakalpakstan (the general. K-in the population) is given below
№ The Names of Diseases 2006 2007 1. Some infectious and parasitic Diseases 31 34 2. Newly revealed patients with malignant tumours 8 5 3. Diseases of endocrineous system and a metabolism 63 65 Diabetes 6 7 Goitre 57 58

CRP1.1 Characteristics of the site “Aral Sea” SRT2-AS1
page 42
4. Anemias 604 674 5. Nervous Diseases 70 70 6. Eye Diseases 12 12 7. Chronic otitises 13 13 8. Diseases cardiovascular system systems 135 139 9. Diseases of respiratory system 106 105 10. Diseases of bodies of digestion 240 241
Chronic gastritis 130 130 Chronic hepatitis 38 38 Chronic cholecystitis 31 38 Stomach ulcer and duodenum. 32 32
11. Diseases of bodies urinary tracts systems 70 70 12. Diseases of a skin 2 1 13. Congenital anomalies 2 2
7.3.2 % of children below 5 years of age at risk of malnutrition
There are no data
7.4 Employment 7.4.1 Gender-related aspects of work in rural households
Gender aspects years 2005 2006 2007 2008 2009 2010 2011 men 13967,6 14320,8 14587,4 14965,4 14442,2 13863,3 13851,1
% 35,2 32,8 32,6 33,0 33,4 29,0 29,8
No data for Kizilorda region. For Republic Karakalpakstan % of women in the managerial positions out of total
1997 1998 1999 2000 2001 2002 2003 2004 2005 2006 2007 2008 2009 2010 2011 Men 11718 11988 12177 12464 11833 11144 11022
% 28,7 29,9 29,9 31,1 31,6 29,1 29,6

CRP1.1 Characteristics of the site “Aral Sea” SRT2-AS1
page 43
7.4.2 Types and importance of non-agricultural employment, %
Non-agricultural employment in %
Years 1997 1998 1999 2000 2001 2002 2003 2004 2005 2006 2007 2008 2009 2010 2011 % 53,5 54,9 51,8 53,8 53,9 54,0 55,8 55,5 55,9 55,9 55,1 48,8 50,5 50,1 49,6
No data for Kizilorda region.
8. Agricultural systems 8.1 Classification 8.1.1 General classification
Information on R.Karakalpakstan, by types of farms.
№
All types of households including
Irrigated land, plain
Total, ha Most cultivated crops (crops, type of cattle)
Cereals cotton Potato Vegetabls melons Forage crops Other cropss
1. All types of farms, including 262964 100159 100971 5946 6756 5912 35417 7803 2. Farm businesses 227084 85786 100266 3141 2822 2836 28915 3318 3. Dehkan farms 31187 15408 0 2720 3795 3000 5291 973 4. Agricultural enterprises 4693 1965 705 85 139 76 1211 512 Total 262964
No data for other regions
8.2 Descriptors related to cropping component 8.2.1 Average farm holding size (ha)
Average farm holding size (ha) Republic,
region 1997 1998 1999 2000 2001 2002 2003 2004 2005 2006 2007 2008 2009 2010 2011
Uzbekistan 16,4 17,2 19,2 23,9 23,7 22,5 27,1 31,8 34,7 37,8 36,1 38,2 63,3 90,6 107,7
Average size of farm in Dashaguz region 3-10 ha No data for Kizilorda region.
8.2.2 Type(s) of rotation
There is no scientifically based rotation (by the years) in almost all of the farmer households in the irrigated area.

CRP1.1 Characteristics of the site “Aral Sea” SRT2-AS1
page 44
In cotton growing area, the crop rotation is carried out at the discretion of individual farms. In 70-80% of cotton fields , the crop rotation is not implemented, i.e. there is a monoculture practice. In some cases, wheat and other crops alternate cotton in the rotation (this is not permissible). At the same time according to the government calendar, there is no area under alfalfa, which was previously used as the alternate crop in rotation. But some farmers apply the following scheme of crop rotation: Cotton-Wheat, Cotton 1-3 years, followed by 1-2 years of a winter wheat and other crops, such as mung-bean, soya, corn, sunflower and vegetables. For soils/regions with low land quality (<= 40) in Khoresm the lucerne crop rotaion (Medicago Sativa L) is recommended within 3 years, then 2 years of a cotton, and annual rotation of a winter wheat with mungbean (summer), with the subsequent cultivation of a soya (Glycine max (L.) Merr.) and a cotton, among proposals on sustainable manufacture of a cotton (Khalikov 2010). Thus, two basic strategic crops-cotton and winter wheat (Bobojonov 2009; Djanibekov 2008) cover the most part of the area of the irrigated land in Khoresm. On the basis of remote and field classification of crops in Khoresm in 2009 Konrad and others (2006) have found out that 32 % and 27 % of a total area is occupied by Cotton and Wheat accordingly. On the areas, not occupied by cotton, and after a winter wheat, farmers grow corn, sorghum, potato, water-melons, melons, pumpkins, vegetables (Bobojonov and others, 2012). Besides, grapes, fruit-trees and other plantings of trees are met in some parts of the region (Conrad and coauthors, 2006). At present, the recommended crop rotations of a soya or mungbean are not met in official statistics of Khoresm. Latest results have shown, that cultivation of a cotton without a crop rotation within six years and more does not reflect a reality any more - the crop rotation occurs, at least on 3/4 areas. While only on 16 % of arable lands in Khoresm, Cotton-Wheat is grown more than five years, on 20 % of cultivated land in Khoresm, Cotton continues to be grown as a monoculture for sequence of six years, and even more. Besides, more than half of arable lands, at least once during the period between 2000 and 2009 were used for cotton cultivation in sequence for more than three years. Crop rotation in Dashaguz region: cotton-wheat-lucerne cotton-wheat three years, then lucerne. No data on Kizilorda region.
8.2.3 Cropping intensity
The intensity of the harvest depends on the type of crops. Below in the table there is information on timeline and the intensity of the harvest.
Type of crop months
IV V VI VII VIII IX X XI XII Duration of harvest, days
cotton - - - - - + + - - 40-60 wheat - - + + - - - - - 25-35

CRP1.1 Characteristics of the site “Aral Sea” SRT2-AS1
page 45
rice - - - - - + + - - 40-60 alfalfa - + - + - + - + - 35-40
vegetables - + + + + + + - - 30-150 melons - - - + + + + - - 40-80
8.2.4 Source(s) of water supply for crop production
The main sources of irrigation are water of river Amudarya and irrigation canals. Water intake from sourceа is carried out on large irrigation to systems as Suenli, Kiziketen, Pahtaarna, Pitnjak-Arna, Tashsaka, Shavat. Delivery of water to farmers is carried out on dense systems, channels. Collector waters is practically not used, (0,1-0,2 million m3 in a year) in view of high mineralizations. For the technical and economic reasons, underground water is not used for irrigation. An atmospheric precipitation practically has no role in irrigation (100 mm a year).
8.2.5 Implements/machinery used, degree of mechanization
In all farmer households of R.Karakalpakstan and Khoresm region for the work of general purposes the most rational is to use the crawler tractors, traction-class Т-4А.
• To perform the cotton seeding work, the tractors MTZ-80x, TTZ 8010 and TTZ 8011 with the capacity of 80 horsepower are used.
• The plows TL-3-35, PD-3-35 are used for fall tillage. • Pre-sowing mineral fertilizers are applied by the chisel device 4KU-4. • To conduct the land leveling on the fields, the long-baseline levelers-P-2, 8 are used.
650 combine harvesters, 1300 ploughing tractors and 2500 tractors-cultivators, and also seeders, levelers and other technics and the equipment have been bought for the last four years in Republic Turkmenistan. On November, 26 of the last head of Turkmenistan state took the decision on acquisition of 270 more combine harvesters of three leading world brands, which are planned for using in different regions of the country. In Turkmenistan there are more than 2 thousand combine harvesters, 2,5th. Ploughing tractors and more than 3 th. Tractors-cultivators. Available technology, tools / equipment in the Khoresm region.(regional statistics), pieces
Years 1997 1998 1999 2000 2001 2002 2003 2004 2005 2006
Total tractors 10835 10028 9537 8964 8857 7518 6789 5933 5461 3419
Cultivators 2982 2888 2581 2429 2185 1994 1742 1425 1206 824 Seed planters 1483 1705 1588 1601 1535 1511 1455 1392 1507 1062 Combines 844 827 772 721 698 626 550 453 341 224
Information on types of farms in Khoresm region

CRP1.1 Characteristics of the site “Aral Sea” SRT2-AS1
page 46
№ Name
Dated for 1.01.2006 Dated for 1.01.2007 Dated for 1.07.2007 Growth or reduction in omparison with 1.01.2006
Tota
l
including
Tota
l
including
Tota
l
including
Tota
l
including в %
Trac
tors
Com
bine
s and
co
tton
harv
estin
g m
achi
nes
Trac
tors
Com
bine
s and
co
tton
harv
estin
g m
achi
nes
Trac
tors
Com
bine
s and
co
tton
harv
estin
g m
achi
nes
Trac
tors
Com
bine
s and
co
tton
harv
estin
g m
achi
nes
1 MTP (Machine-Tractor Parks) 338 248 90 302 227 75 312 241 71 -26 -7 -19 -8%
2 Alternative MTP 4771 4589 182 3800 3673 127 3680 3558 122 -1091 -1031 -60 -
23%
3 Farm businesses 1896 1824 72 2752 2649 103 3094 2973 121 1198 1149 49 63%
4 Other (legal and
physical entities)
6987 6732 255 8099 7761 338 8355 7986 369 1368 1254 114 20%
Total 13992 13393 599 1495
3 1431
0 643 15441 14758 683 1449 1365 84 10
% Source: D.Niyazmetov,Masters theses
8.2.6 Degree of commercialization
Sold products (thou.t). Crops 1997 1998 1999 2000 2001 2002 2003 2004 2005 2006 2007 2008 2009 2010
cotton 269,5 373,498 479,455 324,407 257,511 172,165 164,061 306,654 303,85 294,512 18,775 0,237 258,02 wheat 28 73,508 100,534 110,752 61,006 77,533 91,207 70,263 83,104 102,849 112 70,7 potatoes 28 33,6 56,3 61,6 18,3 30,8 22,5 26,3 26,5 33,5 33,4
Rice 81,142 64,92 2,427 0,363 31,346 20,655
Republic of Karakalpakstan
Types of crops years 1997 1998 1999 2000 2001 2002 2003 2004 2005 2006 2007 2008 2009 2010 2011
Cotton Gross harvest 269,5 156,6 189,4 125,4 111,6 72,6 88 184,1 212,6 193,7 185 165,8 182 188 195,4 Sale 269,5 156,6 189,4 125,4 111,6 72,6 88 184,1 212,6 193,7 185 165,8 182 188 195,4 % 100 100 100 100 100 100 100 100 100 100 100 100 100 100 100

CRP1.1 Characteristics of the site “Aral Sea” SRT2-AS1
page 47
Cereals Gross harvest 49,2 56,4 74,7 89,2 42,7 56,6 137,4 155,1 162,6 215,6 243,1 182,1 183,8 201,3 172,4 Sale 24,5 33,4 49,1 50,5 19 20,5 65,7 57,7 65 78,4 78,9 53,1 82,9 86,3 80,2 % 49,8 59,2 65,7 56,6 44,5 36,2 47,8 37,2 40,0 36,4 32,5 29,2 45,1 42,9 46,5
Wheat Gross harvest 49,1 56,3 74,6 89,2 42,7 56,5 137,3 154,9 162,1 215,2 216,6 181,8 183,5 201 172,1 Sale 24,5 33,4 48,1 50,5 19 28,5 65,7 57,4 65 78,4 78,8 52,1 82,9 86,8 80,2 % 49,9 59,3 64,5 56,6 44,5 50,4 47,9 37,1 40,1 36,4 36,4 28,7 45,2 43,2 46,6
Rice Gross harvest 116,3 137,2 171,0 14,2 1,1 36,0 114 43,9 25,7 55,5 42,0 15 33,7 79,5 5,6 Sale 0 0 0 0 0 0 0 0 0 0 0 0 0 0 0 % 0 0 0 0 0 0 0 0 0 0 0 0 0 0 0
Potato Gross harvest 11,7 8,7 8,5 88 6,8 6,8 8,3 13,8 13,2 15,5 17 21,6 25,1 29,2 32,9 Sale 0 0 0 0 0 0 0 0 0 0 0 0 0 0 0 % 0 0 0 0 0 0 0 0 0 0 0 0 0 0 0
All agricultural products in Dashaguz region, including cotton, rice, sugarbeet are grown on the bases of state order. No information on Kizilorda region.
8.2.7 Spatial organization of cropping in relation to environmental differences (mountains, foothills, plain, etc.)
Height <100 Under the sea level
Height 100-500
Height 500-900 Height 900-1300 Height 1300-1700
Height <1700-2000
Height 2000-2400
Height 2400<
All crops are cultivated
8.3 Descriptors related to animal component
Livestock is an important part of Republic Karakalpakstan agriculture, contributing to the insuring of the population with food and industries by the raw materials. Depending on the natural-climatic conditions of the region, livestock can be divided into intensive (industrial), extensive (grazing), and domestic. Dairy cattle breeding, poultry farming is concentrated in the suburban area of irrigation.
• Pasture livestock is concentrated in the area with the low natural resource potential and domestic livestock -on private lands.

CRP1.1 Characteristics of the site “Aral Sea” SRT2-AS1
page 48
• Sheep breeding - the most common type of livestock activity. The main breeds of sheep are “karakulskaya”.On the average on the maintenance of one sheep in one year it is required 400 c.u and it covers annual requirement to 80-85 % at the expense of pastoral forages, the rest animal receives in the form of concentrates, rough and other types of forages during the winter period. One of the original and also export-demanded skin is karakul (astrakhan) skins of sur color.
• Goat breeding. This type of activity is practiced everywhere, they breed basically local coarse-haired goats in private
farmsteads. The basic production of goat breeding is meat. From a goat they receive on the average 11-15 kg meat in one year and about 0,5 liter of milk a day. For the last 5-10 years there was a sharp increase in a livestock of goats that is probably explained by their unpretentiousness and high reproducibility.
• Camel breeding. Basically they breed one and two-humped camels for manufacture of milk, meat and a wool. Here
basically local people breed Turkumensky Аrvana (one-hump camel). This refers also to Sakarchaginsky and Erbentsky meat and dairy types, the weight of which makes 610-720 kg with a milking of 440-350-4400 litre, with fat content of 3,5 %
• Horse breeding. Local people breed horses of local population and use them as transport means and for sports competition.
Their livestock is much less than sheep and goats and large cattle.
• Cattle breeding. Republic Karakalpakstan is presented by local low productive zebu cattle and partially with its hybrids with red-steppe and black-motley breed. They are characterized with low dairy efficiency (1100-1300 gram on a head in a year) with the fat content in milk of 3,8-4,0 % with average live weight of cows 260-3020 kg and adult bulls of 380-460 kg. All cattle in territory belong to local population and in a year 100 cows usually give 71-75 calves.
Breeding cattle in all farms has meat and dairy orientation and very low productivity (2-4 liters of milk per day).
8.3.1 Main animal species or races kept (thousand).
Breeds and types of livestock in Khoresm region and in R.Karakalpakstan, thousand.
Breeds 1997 1998 1999 2000 2001 2002 2003 2004 2005 2006 2007 2008 2009 2010 2011 Cattle 822,2 835,9 831,3 830,8 829,5 838,6 893,2 961,3 1022,5 1056,9 1207,3 1290,6 1334,9 1391,5 1454,4 Goats and sheep
634,8 639,1 638,6 646,3 654,9 666,0 708,0 773,9 831,5 880,9 926,8 970,5 1001,4 1074,5 1119,7
soliped 21,8 22,3 21,4 21 20,3 20 19,7 20,1 20,5 20,7 21 21,6 22,6 23,2 23,4
poultry 1852,6 1991,2 2003,3 1912,6 1906,6 1974,5 2161 2392,9 2543,6 2818,9 2889,5 3076,8 3834,2 4277,3 4617,3
Other 38,8 39,0 39,4 39,2 39,6 38,6 39,4 39,1 39,8 39,7 39,1 39,5 40,3 46,6 47,9 Camel 5,1 4,7 4,7 4,5 4,6 4,6 4,6 4,8 4,9 4,9 5,1 5,3 5,3 5,4 5,4

CRP1.1 Characteristics of the site “Aral Sea” SRT2-AS1
page 49
There is no separate information on Dashaguz region, but it is available on Republic Turkmenistan (see below)
The basic development indicators of agro-industrial complex of Turkmenistan for the period 2011-2015
Indicators Unit. 2010 2011-2015 (Mean annual)
Total volume the agriculture foodstuffs Mln. Mln. 2968,0 3459,0
Total volume of the foodstuffs of the industrial goods
Mln. ман. 2090,7 2457,5
Manufacture of the main types of the foodstuffs: th. tons. 31,4 34,9
Meat (live weight) th. tons. 37,9 40,8 Milk th. tons. 4,4 5,0 Wool (physical weight) tonsна 2945 3130 Fish and fish products th. tons. 13,7 14,0 Meat th. tons. 91,3 96,8 Vegetable oil th. tons. 11 15 Sugar th. tons. 551,2 565 Flour th. tons. 318,2 347,5 Fibre of raw Cotton th.
heads 54,1 57,6
Cattle th. heads 1,1 1,3
Horses th. heads - -
House poultry th. heads 15,5 16,7
Camels th. heads 1979,3 2296,2
Gotas and sheep Mln. штук 12 12
Saplings Mln. ман. 2390,2 1486,3
Volume large capital investments чел. 68289 76855 Number of workers $ Mln. 488,3 549,6 External trading management $ Mln. 237,6 248,1 Export-Total $ Mln.
250,7 301,5
No data for Kizilorda region.

CRP1.1 Characteristics of the site “Aral Sea” SRT2-AS1
page 50
8.3.2 Feed systems There are two types of animal industries: large-scale (LS) farms and containing cattle in house conditions. Both use four power supply systems:
1. Pastures for grazing of cattle. 2. Grazing on vegetation near to channels, lakes, the rivers, forests and fields. 3. Grazing on stubble (basically in the autumn and in the winter). Some lay lands also are used for grazing. 4. Cattle feeding in house conditions by collected forages (basically during the winter period).
All territory of Karakalpak Kizilkum for vegetative groupings is divided into a number of areas. In mountain areas - Sultan-Uizdaha vegetation is very poor, both on number of types, and by quantity of species and is presented basically by types of grey-fill bushes. Leading plants of this area are a wormforest, kurchatka, ephedra, kuziniya, as an impurity in a cover participate turf of bluegrass bulbous, epher cover makes a basis of fodder stocks for karakul sheep breeding of sandy deserts. Buhansky uplands - the basic vegetative groupings are wormforest and wormforest-bush thickets: a wormforest, fluffy glasswort keyruk, annual ephemers, desert dormouse, teresken and others. In these areas the crop of vegetative weight does not exceed 1,0 - 2,5 centner/ha. Areas of the salted hollows are richer glasswort, as biyurgun, sarsazan and a dwarfish saxaul. The most part of the area of Karakalpak Kizilkum is made of sandy areas, where wormforest thickets, black and sandy saxaul, a reed, jantak (bur), a wormforest (white), straw (wheat), ephemers, cereal on village are considerably widespread cereal on village etc.
Fodder value of some plants Kizilkumа № Plant' names Feed unit, kg Digestible prtotein Calcium, gram Phosphorus,
gram Carotin, gram
1. Reed 0,26 30 2,5 1,2 10 2. Selets 0,43 36 4,2 2,5 10 3. Jantak (bur) 0,18 19 4,4 0,7 40 4. Wormforest (white) 0,19 25 3,3 0,9 20 5. Straw (Wheat) 0,22 10 4,4 0,7 5 6. Ephemer 0,17 14 2,9 0,9 12 7. Lucerne (hay) (Alfa-alfa) 0,49 116 17,7 2,2 45
In a northwest part of Karakalpak' Kizilkum, around the old-alluvial deposits occupying huge falls, the basic background of vegetation of pastures is formed by biyurgun. It is added by annual glasswort and ephemers, and also a wormforest and a black

CRP1.1 Characteristics of the site “Aral Sea” SRT2-AS1
page 51
saxaul. Kizilkums, territories of Kara-Kalpak occupying the most part, differ by a considerable variety of a biological structure and geo-morphological conditions.
8.3.3 Prevalent livestock diseases and mortality
Principal causes of death of the adult cattle were cold stress (two thirds of cases of an animal death occurs during winter time), connected with calving and accidents in large-scale cattle-breeding farms. Calves in large-scale cattle-breeding farms were lost from overcooling and a diarrhea. In some cases in both systems it has been noted that symptoms similar to foot and mouth disease also cause death. Some farms containing cattle in house conditions have specified a sting of insects as the reason of symptoms. Herds of karakul sheep, camels and cattle are grazed on pastures and use collector water which causes various diseases. Close to wetlands in spring-and-summer time the gadfly (gadfly) appears which is source of parasitic diseases as an itch. According to shepherds from disease of itch suffers basically cattle and horses, and approximately 10-15 % of animals from the general livestock, which leads to decrease in efficiency and in some cases there is a murrain of animals. Diseases among animals for the last 2006-2008 on separate selective farms are resulted below. Information on diseases occurred among livestock animals in the past 2006/08 in selected farms of the Republic of Karakalpakstan.
Farms Diseases, % Types of animals
Karakul sheep Cattle Camels 2006 2007 2008 2006 2007 г 2008 2006 2007 2008
Mulk
Brucellosis - - - 27,2 - - - - Foot and mouth
disease - - - - - - - -
Pasteurellosis 2,7 20,1 5,7 - - - - - echinococcosis 9,1 6,3 5,1 - - - - -
Тeylerioz - - - 36,3 21,4 - - - Mad cow disease - - - - - - - -
mange - - - 12,4 15,4 8,6 8,7 9,4 - Tuberculoses - - - - - - - - -
Buhanmerey
Brucellosis - - - 4,5 4,0 - - - - Foot and mouth
disease - - - - - - - - -
Fasciolez 4,9 5,4 3,4 - - - - - - echinococcosis - - - - - - - - -
Тeylerioz - - - 28,5 17,9 6,8 - - - Mad cow - - - - - - - - -

CRP1.1 Characteristics of the site “Aral Sea” SRT2-AS1
page 52
disease mange - - - 8,5 9,4 9,9 11,3 13,4 14,7
Tuberculoses - - - - - - - - -
Kizilkum
Brucellosis - - - 6,5 4,1 - - - - Foot and mouth
disea - - - - - - - - -
Fasciolez 6,5 8,1 7,3 - - - - - - echinococcosis 3,8 6,3 4,4 - - - - - -
Тeylerioz - - 7,5 8,3 5,3 - - - Mad cow disease - - - - - - - -
mange - - 7,8 9,2 11,3 5,6 6,6 6,8 Tuberculoses - - 2,1 2,1 2,9 - - -
8.3.4 Main animal products
1. Cattle: meat, milk, skin. 2. Goats and sheep (G&Sh): meat, milk, wool, skin. 3. Camel: meat, milk, wool, skin. 4. Horse: meat, milk, skin.
Main animal products in Khoresmski regions Products
1997 1998 1999 2000 2001 2002 2003 2004 2005 2006 2007 2008 2009 2010 2011
Meat (beef), live weight, tons 74876 83964 89069
Milk, tons 55800 52478 27947 27160 24296 19581 12386 9894 8015 7419 495353 567080 595776 Eggs, th.pieces 106200 33085 20624 25290 23425 68438 22511 27763 32134 34716 160614 176050 210083
No information for other regions.
8.3.5 Degree of integration with crop component
Now efficiency of pastures makes 1,5-3,5 centner/ha, security by forages makes 50-55 %. Thus desert fodder plants have low eating (15-30 %), digestion (50-55 %) nutritional value (0,3-0,5 feed unit and 30-35 protein in 1kg of a forage). Therefore farmers are interested in feeding of animals on the basis of cultural plants, exceeding feed unit in 10-20 times in comparison with pastoral types of plant. Especially in private farms feeding of animals is carried out by means of sowing cultural plants as: corn, a lucerne, jugara, pumpkin and other types. Most likely the basic livestock of animals in the future will be oriented on cultivation of agricultural

CRP1.1 Characteristics of the site “Aral Sea” SRT2-AS1
page 53
crops. Below in the table there are areas of forage crops of Republic Karakalpakstan. Table. Sown area under fodder crops in Republic Karakalpakstan, (2011). Indicators Shirkats Farm businesses Dehkan farms Total Area,ha 2196 6485 1745 10426
No information for other regions.
8.3.6 Spatial organization in relation to environmental differences (mountains, foothills, plain, etc.)
The basic area of territory is made of plains with a high elevation of 100,0 m. above sea level and only total 8 % occupy heights from 100 to 500 m above sea level. (Except plateau Ustyurt). High elevations from 100 to 500 m are completely deprived of vegetation and are not suitable for animal husbandry (except plateau Ustyurt) In table 8.4 there are types of animals grazing in various conditions.
Type of livestock Above sea level ∠ 100,0 m. from 100 to 500 m. above sea level Sheep breeding + + Goat breeding + + Camel breeding + + Horse breeding + + Cattle breeding + -
8.3.7 Prevalent crop pests, diseases and parasitic flowering plants (parasitic weeds)
Pests downstream of Amudarya: Apple seedworm-Cydiapomonella, <http://www.pherotrap.ru/yablonnaya-plodozhorka> Pea seedworm-Laspeyresianigricana, <http://www.pherotrap.ru/gorokhovaya-plodozhorka> Racemose leaf-roller moth-Lobesiabotrana, <http://www.pherotrap.ru/grozdevaya-listovertka> Cabbage cutworm-Mamestrabrassicae, Exclamatory cutworm-Agrotisexclamationis, Turkestan beetroot moth - Loxostege nudalis Hb., spider mite - Tetranychus turkestani Ug. et Nik, The flour tick - Acarus siro L., Storage pest - Sitophilus granarius L., Tobacco thrips - Thrips tabaci Lind., Wheate thrips - Haplothrips tritici Kurd., Gumming - Xantomonas malvaceanum Dowson., Green apple louse aphis pomi deg, Cereal plant louses - Metopolophium dirhodum Walk.,
Diseases: Root rot - Rhizoctonia solani Kuehn, Black root decay-Thielaviopsis basicola Ferraris f., Ordinary root decay - Helmintliosporium sativum, Macrosporioses - Macrosporium macrosporum Morsy, <http://agra.com.ua/field/242.htm> Root rot - hymatotrichum omnivorum Duggar. <http://agra.com.ua/field/253.htm> Pink rot-Trichothecium roseum Link, <http://agra.com.ua/field/245.htm> Grey rot - Botrytis cinerea Fr. <http://agra.com.ua/field/246.htm> Fuzarios-Fusarium Link, Dark-brown spot - Bipolaris sorokiniana Shoemaker, Mildew - Erysiphe graminis DC. Spread of cotton diseases
1. leaf mottle - Verticillium dahliae Kleb, 2. fusarium -Fusarium oxysporum Schl. f. vasinfectum Bilai, 3. blackarm – Xanthomonas campestris hv. Malvaceaerum

CRP1.1 Characteristics of the site “Aral Sea” SRT2-AS1
page 54
East striped billbug - Chromonotus confkiens Fahrs Leech - Lema melonopus Li Sunnpest - Eurygaster in tegrictps Put Wheaten plant louse - Schizaphis graminum Rond. Cereal plant louse - sitobion avenae F. Field bug - Lygus pratensis Li. Cicadas – Cicadinea. Cotton pests 1. melon aphid – Aphis gossypii C, lov 2. alfalfa aphid - Aphis eraccivora Koch. 3. tobacco thrips – Throps tabaci Lind. 4. greenhouse whitefly – Trinlenrodes Varorariorrum westne 5. cotton whitefly - Bemisia tabaci 6. turnip moth – Agrotis segetum Den 7. cotton moth – Aclithis armigera 8. glasshouse spider mite – Tetranychres urtunal Koch. Some weeds met in cotton and wheat plantings. 1. barnyard grass, millet - Echinochof cus-galli (Z) Beauv 2. field bindweed – Convolvulus arbensis 3. goosefoot family – Chenopodiacae 4. common reed – Phragmites communis Trin Parasite plants 1. field dodder – cuscuta appoximata Robingt 2. . broomrape - orobanche
Spread wheat diseases 1. loose smut – Ustilago tritici (Pers) Jens 2. head smut – Tillettia tritici (Bjerk) 3. yellow rust – Pussinia striiformis West 4. brown rust - Pussinia triticina Erikss
5. powdery mildew – erysiphe graminis DC f. Tritici Marchal Weeds:
1. Shirisa - Amaranthus retroflexus L., 2. Saltbush-Chenopodium album L., 3. Nightshadeblack - Solanum nigrum L., 4. Purslane garden - Portulaca oberacea L., 5. Trailing hollyhock - Hibiscus trionum L., 6. Foxtail grey - Setaria glauca P. В,
7. Chicken millet dew - Echinochloa crusgalli L.
8.4 Market access and characteristics 8.4.1 Distance to closest local market (km, hours of travel) [in SRT2 regions often > 2 hours, in SRT3 regions often < 2 hours]
In each area there is one central market in Aral Sea basin. Some areas have 3-5 markets, however, some of these markets work in certain days of week. As a whole, the markets are scattered all over the region. Access to the nearest markets from settlements is in limits of 2-60 km and more. Only 15 % of settlements are located in more than 8 km from the nearest market. Thus, based on distances to the nearest market, 100 % of settlements can reach the market within 3 hours of driving. Also it is possible to consider the market of regional level, as the majority of the population delivers agricultural production basically on the market located in the centre of an area. Separate farmers (who have transport, a motor vehicle or a tractor) deliver production in the regional centers in Nukus, Urgench, Dashauz and Kizilorda. As here they are more expensive (10-20 % and more) than in the market of the regional centre. There are cases of a daily delivery of agricultural production to the centre of farms.

CRP1.1 Characteristics of the site “Aral Sea” SRT2-AS1
page 55
Thus the distance from a place of location of farmers to the small market, located in the centre of farm fluctuates from 2 to 100 km and time for is accordingly spent for reaching them, as it has been told above from 35 minutes to 3 hours (depending on a type of transport basically on bullock cart). As it was said above, whoever has own motor vehicle, those farmers deliver production in the regional centre (basically in radius of 100 km) and this distance depending on a site fluctuates from 20 to 100 km and time in a way accordingly from 1 till 4 hours.
8.4.2 Sizes of rural markets
The sizes of the rural markets depend on the sizes and efficiency of subsidiary and household farms. In territory of southern areas (Turtkulsky, Berunijsky, Ellikkalinsky, and Amudarya areas), where the population is basically dense and receive higher crop from subsidiary and household farms, the sizes of the rural markets fluctuate from 0,5-to 1,5 ha. In territory of northern areas of R. Karakalpakstan the size of this indicator is lower even more and makes 0,2 - 0,5 ha, it is necessary to notice, that in a countryside not in all farms there are markets, and they deliver their products to the area or regional central markets.
8.4.3 Competitiveness and access to local, national, regional, global markets
In the agricultural sector of the Republic of Uzbekistan, the government sets the orders for production of cotton, and has access to the world market through stock market (farmers do not have direct access to the world market). For other crops like wheat, rice and other vegetables, farmers have access to local and national markets (in this matter there are no specific difficulties) and they have comparative advantages in quality and environmental friendly products. It should be also noted, that farmers deliver and sell in the regional markets basically grapes, dry fruits, tomatoes (non mature).
8.5 Access to land, water and other inputs
According to the Constitution of the Republic of Uzbekistan and other legislations, the government shall regulate all land, water and other resources. For this, there are a number of government regulations (on the international and national levels), where the political, legal and economic aspects of the use of land and water and other resources, including the rights of citizens on access to land, water and other resources are defined.
8.5.1 Access to land All land resources included in the unified state land fund, which, in accordance with the principal intended purposes are subdivided into the following categories: - agricultural land, provided to the farmers and other land users for agricultural purposes; - settlement lands (small households, municipal and other species); - land for industry, transport, nature reserves and other non-agricultural purposes; - The land of the state forest fund; - The land of state water fund; - The land of state reserve. The government establishes the basic rules of Land Management. Under the current land legislation of the Republic of Uzbekistan, the categories of land and land access shall be defined in accordance with their main intended purposes. Most part of the land fund

CRP1.1 Characteristics of the site “Aral Sea” SRT2-AS1
page 56
is used for agricultural purposes. Brief information on the organization of farms. The farm in R. Uzbekistan is organized through a written application on a competitive basis in local authority (khokim) with instructions of a place and the area of a field, employees of the private farms, the planned specialization of farm, a rent and business plan condition. The land is given to a farm on the basis of long-term rent of the land area in the contract (till 50 years). The rights of farmers in renting of the land area is limited, and the land can't be transferred, advantage to owners while sale, mortgage and exchange of land is forbidden. The rented area farms of animal industries is directly connected with quantity of a livestock in the ratio 0,33 ha on an equivalent cattle, and should not be less than 30 heads of cattle equivalent, that will correspond to 10 ha of land. Except grazing of animals, cattle-breeding farms can grow commercial crops (Djanibekov, etc. 2012). Dehkan farms receive the land for lifelong inherited possession, the maximum size is 0,12 ha for habitation both for a domestic garden, and additional 0,12 ha of a distant field is used only for cultivation of agricultural crops (Djanibekov, etc. 2012). Agricultural co-operatives receive the land for constant possession for the purpose of its use for agricultural production (Djanibekov 2008).
8.5.2 Access to water According to the law, each citizen has a right of access to safe water on both international and national levels. Access to the water resources can be carried out in the following ways: • for drinking purposes (water supply and sanitation); • for agricultural production; • for the industry; • to protect the environment. The main legislation on water use and water access exposed in the Constitution of the Republic of Uzbekistan (1992), the Law of the Republic of Uzbekistan “On the limited water use in the Republic of Uzbekistan” (1993), the Law “ On Water” and other legislative acts.
8.5.3 Access to other inputs (seed, fertilizer, etc.)
According to the agreement between farmers and suppliers, and by the request of farmers, the necessary inputs as fuel, seed, fertilizer, tractors (who do not have) are provided according to the established prices. According to the regulatory planning costs estimated for each farm at the end of the year (depending on the size and type of crops) the relevant services are being provided to farmers. Farmers make agreements (preliminary, advance) with the relevant organizations, for example with oil supply centers.

CRP1.1 Characteristics of the site “Aral Sea” SRT2-AS1
page 57
8.6 System problems 8.6.1 Lack of market access
For all crops except cotton, there is an access to domestic markets. Exit to the world level is determined by the regulations of Republic Uzbekistan in the established order. Also backwardness of a market infrastructure (access/absence to the information, roads, to storehouses) and difficult customs rules limit access to the international markets.
8.6.2 Land fragmentation
The land allocation among farms in Uzbekistan is carried out on tender requirements of the existing legal documents. In the beginning, when the farms were developed on the basis of shirkat and farm businesses, the allocation of land between the farmers was carried out on conventional criteria (by the initiative of farmers and availability of land resources) and the area ranged from 1,3 hectares to 100 ha. This allocation of land has led to such undesirable consequences: - Reduction in crop yield due to a lack of mechanisms (tractors) and equipment; - Difficulties in operational services, financial accounting, cost; - In small farms (less than 3-4 ha) a monoculture had been admitted, and it decreased the productivity of the land (no crop rotation). Considering this, during past years (from 2008) the State Program on strengthening land resources by changing small farms on larger (minimum 20 ha, maximum - 200 ha) was adopted. The land allocation among farmers by using this principle has given positive results. Guarantee of possession of land in Republic Uzbekistan. As the unique owner, State of Uzbekistan can withdraw the land from farmers if conditions are estimated that this measure is required. Recent consolidation of the land has increased vulnerability of the leasing rights and has directed incorrect signals for investments into innovations for agriculture. The rights of the land user. The State of Uzbekistan forbids changes in land tenure from one type of manufacture of field crops to gardening or pastures. It limits activity of other types of farms, including cattle-breeding farms, which now avail insufficient areas of land for manufacture of forages. The same refers to the expansion of plantings and introduction systems of agro-forest-amelioration. Crop diversification: the policy of manufacture of cotton and wheat leads to absence of crop diversification. About half of agricultural land is allocated under cultivation of cotton and 25 % for winter wheat cultivation. Access to the land, consolidation of the land has led to an access inequality to the land. About half (50 %) of all farms in Khoresm in 2010 had the size less than 10 ha, occupied about 5 % of the areas of all farmland, were mainly specialised on gardening and vegetable growing. Farms grown cotton and wheat had on the average above 50 ha, and their number made 37 % of all farms and occupied 87 % of all agricultural land in 2010.

CRP1.1 Characteristics of the site “Aral Sea” SRT2-AS1
page 58
Household plots, with the average area of 0.18 ha arable lands of dehkan farms does not allow self-sufficiency of wheat. Dehkan farms get a considerable share of wheat for house consumption and forages for cattle feeding. (Djanibekov 2008, Djanibekov. 2010, Djanibekov 2012).
8.6.3 Decline in animal feed from rangelands
Pastures can be divided on two types: irrigated pastures (located on the irrigated lands (internal) and periodically flooded beyond the irrigated area by flood river flows, non-irrigated pastures, which are irrigated by the precipitations, located in the territory of Uztyurt, Kizilkumа and Karakum. People, living next to the irrigated pastures, constantly graze their livestock on the village pastures without any system. In addition, the development of land on the large area, eventually affects its productivity, both on the quantitative and qualitative manners. This is also due to the sharp increase of local population. If in 1960-1970 the big development of animal industries has taken root in a zone of periodic flooding of Republic Karakalpakstan (Kungradsky, Chimbajsky, Karauzjaksky and Tahtakupyrsky areas), in territory of northern areas here the extensive areas were occupied by a reed (Phragnutes communis) and a broom (Calamagrostisdubia B де) as a water-loving plant. In connection with absence of water in these zones, their place have been replaced by shrubs as the camel prickle (Karelinia) and other types. The areas of the humidified pastures were reduced at 20-25 time, in comparison with 1965-1970. On the territory of non-irrigated pastures (Kizilkum, Karakum, Ustyurt) the day-and-night grazing of animals (sheep) causes a sharp dynamics of yield of forage mass. Crop of green mass in these regions doesn’t exceed 0,8-1,0 c/hа. The following plants are generally growing on these pastures: tamarisk (Tamarix leptostachys Bunge), Siberian salt tree (Halimadendron), haloxylon (Haloxylon Bunge), and other dwarf ephemeral plants, such as Circassian Richter salt grass (Saisola Ricateri Kar), alkali jovnik (Anabasissalsa) Siberian salt tree (Halitadendron) and other families of feed plants. Grazing – sheep and goat breeding, camel and horse breeding based on a full or partial grazing on the pastures, and its negative impact effect on soil, vegetation creates conditions for desertification of the territory and sharp decline in biological diversity.
8.6.4 Soil fertility decline
Despite the huge efforts to improve the productivity of crops, land productivity remains at low level. The main reasons for this are the following factors: • defiance of scientific-based cropping systems; • absence of crop rotation and the widespread introduction of monocultures; • poor quality agricultural activities (plowing, leveling), which is accomplishing not in full capacity • an extremely low level of humus in the soil. • a sharp reduction of the area under Lucerne;

CRP1.1 Characteristics of the site “Aral Sea” SRT2-AS1
page 59
• the emergence of a dense moist plow stifle on the upper horizon below the layer of 20-25 cm, which leads to delay in development of the root system (the density of soils in some cases reaches 1,45-1,6); • NPK nutrients washed from the soil as a result of high rates of leaching irrigations; • high salts content in soil, which are concentrated in the top layer and thus only for cotton, yield losses are 5-10%. • insufficient application of organic fertilizers and mulching. • low farming culture and occurrence of weeds; • insufficient amount of NPK and violation of their relations, which lead to the reduction in land productivity and quality of products. According to the data of agro-chemical services on the average on Republic security nitric fertilizer makes 75-80 %, of potash 50-60 % and phosphorus 35-40 %.
Set of these factors specifies, that productivity of cotton as a whole on Republic Karakalpakstan remains at level 1,4 t/ha, wheat 1,5 t/ha. Principal cause of such low return of the land is (on cotton) productivity:
• in limits from 0,5-to 1,5 t/ha it is a problem of salinity of soils; • in limits from 1,5 to-2,2 t/ha the reason is untimely performance of all actions and shortage in soil of the content of
nitrogen and phosphorus; • in limits from 2,2 t/ha and above- the low content in soil humus and potassium.
Besides quality of soil in Uzbekistan is estimated by land quality (hereinafter bonitet). Soils bonitet is a relative estimation from 0 to 100, data specify in quality of soils and natural fertility (GKZGK 2009). Bonitet represents set of several parameters, beginning from field characteristics (morphology etc.), results of laboratory analyses for various properties of soil (fertility, chemistry etc.). As cotton is the basic agricultural crop in irrigated agriculture of Uzbekistan, it is used as basic crop in an estimation of a bonitet. In 2008 agricultural land resources made about 233 000 ha, which includes arable lands, trees, marginal land and pastures and their average bonitet made 53.
Comparative data of soils bonitet from 1990 to 2006 shows, that no changes could be seen on the average bonitet of soils 54 (Yusupov and others, 2010). However, there are radical changes in the areas of soils, classified as high and high quality with 5,3 and 78,6 th. ha in 1990 to 0,1 and 61,1 th. ha in 2006, accordingly. For the same period, the area of soils of average quality has increased from 78 to 117 th. ha.
Comparison of data from 1950 on 1959 of 0-30 and 30-50 cm layers of soil, since 1970 to 1990 shows the general tendency of decrease in organic substance. Meadow oasis soils located on ancient channels of the rivers and nearby-river deposits had the highest content of organic substance, then it was followed by irrigated meadow soils. The lowest content of organic substance was revealed on meadow soils, formed on recent deposits Amudarya.

CRP1.1 Characteristics of the site “Aral Sea” SRT2-AS1
page 60
8.6.5 Other system problems
The transition from command-centralized management in agricultural production to the free collective and private property during a short time has created big problems, which have already been resolved by the government, but still rising issues need to be solved. The main issues are:
• shortage of water resources, which in the conditions of Republic Karakalpakstan, located in downstream of river Amudarya becomes one of the main factors, preventing further development of an agricultural production;
• poor water control; • for the present not readiness to adapt by farmers new system of market economy; • rather low security of farms by agricultural machinery, fuel and lubricants and fertilizers; • as a result of continuing decrease in the world prices on agricultural products and accordingly low incomes of
agricultural producers (farmers) and the limited possibilities on transition to more profitable models, there is such low return of the irrigated hectare (this question is partially solved in the majority of farms);
• low level of introduction of scientific and technical, progressive technologies in the agriculture, directed on increase of returns from the irrigated hectare.
Availability of water, security, access to credits, 2005-2006 (Information on Khoresm regions) Spheres Barriers to growth
Procurement • Absence of a freedom in choosing among cotton varieties. • Seeds of a cotton are not always of appropriate quality. • Absence of additional sources for acquisition of materials. • Commodity exchange is not popular among farmers. • Bad work of the organizations on rendering of services, such as WUA, MTP. • Delay and insufficient delivery of materials. • The high prices for materials, such as an electricity (for irrigational pumps) or fuel.
Financial • Absence of circulating assets (financial resources). • Unique type of payment for raw cotton is bank remittance, there is no cash on maintenance of families. • Delay in payments. • There is no access of farmers on their settlement accounts. • A lot of contingencies, obligatory donations on charity etc..
Processing of products • Absence of preliminary processing (for preliminary drying of a raw cotton) and equipment for storage in the field.
• Unfair estimation of quality of a raw cotton in ginneries and factories and, hence, decrease in profit of farmers.
• Fixed state-set prices of a raw cotton • Time restrictions during harvesting.
Market • Absence of the supplying organizations that leads to an insufficient competition and the high prices for materials. Cotton growing • Absence of trade channels (as an exception ginneries).

CRP1.1 Characteristics of the site “Aral Sea” SRT2-AS1
page 61
Legislation • Bulky procedures of the taxation demanding much time and efforts of farmers. • Weak legislative knowledge of farmers. • Contradictions between various statutory acts and decrees, an ambiguity, an opaque basis for agricultural
activity.
8.7 System dynamics 8.7.1 Stability, stagnation or evolution towards other more/less productive/profitable/environmentally sustainable systems
Many indicators define stability and development of the agricultural sector of Republic Karakalpakstan, for example, the value of agricultural products (crop production, cotton, wheat, and others), gross yield, crop yield, and livestock). № Indicators 1990 1995 2000 2001 2002 2003 2004 2005 2006 2007 2008 2009 2010 2011
1 Agricultural production (at current prices, billion sums) 36,8 47,3 72,1 119 126,3 198,6 248,3 301,7 324,7 378,7 482,4 581
2 Crop production 16,1 19,4 30,8 68 75,9 114,2 138,4 164,8 153,2 188 256,8 284,6 3 Livestock 20,7 27,9 41,3 51 50,4 84,4 109,9 136,9 171,5 190,7 225,6 296,4 4 Yield Cotton 22,8 19,8 13,1 14,1 11,1 12,2 19,5 20,6 19,1 19,2 17,4 18,4 18,6 20,6 Wheat 10 15,2 23 18,3 30,9 22,5 26,4 27,5 33,6 37,8 28,1 33,6 29,5 26,5
As it can be seen from the tables, in Republic Karakalpakstan the dynamics of development of the basic sectors of agriculture is stably growing in recent years. Cost of production of agriculture of plant growing during 2000 for 2011 has increased from 36,8 on 581,0 billion soums. Also there is a total growth of cost of agriculture on plant growing and on animal industries. In Khoresm there were 79,000 ha forests and other forest land in 1990, but only 60,000 ha. in 2005. Khoresm forestry service has estimated approximately 39 000 ha forests in 2005 in comparison with 47 000 ha in 1990. The area of forests makes about 7 % Khoresm that is above, than on the average 5 %. Only 0,03 ha of forests are due on each inhabitant in Khoresm (Tupitsa 2010). There are no data on Kizilorda and Dashaguzskiy regions.
8.7.2 Most common type of agricultural enterprises (e.g. individual/private, cooperatives, state farms)
Most common type of agricultural enterprises in Khoresm region and R. Karakalpakstan Name Unit. 1997 1998 1999 2000 2001 2002 2003 2004 2005 2006 2007 2008 2009 2010 2011
Farm
ers
Number 2664 2413 3136 5791 7311 9351 12393 15445 22773 27186 28580 27652 16014 10169 8104
Ср.пл. 18,1 18,1 20,9 24,5 23,4 22,1 26,3 29,6 29,0 29,6 28,5 29,9 52,0 80,8 98,8
For 48210,2 43570,4 65510,8 141758,2 171048 206916,4 326525,5 456697,7 659293,6 804675 813600 827300 833152 821583 800574
Deh
kans
Number 335360 348810 363116 369377 376604 385366 397667 398078 410102 420534 436396 436605 445269 482580 483401

CRP1.1 Characteristics of the site “Aral Sea” SRT2-AS1
page 62
Ср.пл. 0,18 0,18 0,18 0,18 0,18 0,18 0,18 0,18 0,18 0,18 0,22 0,22 0,22 0,20 0,20
For 61502 63905 66478,8 67932,4 69261,2 70583,6 73269,4 73259 75494,2 77411,2 96079 96099 96339 97085 97101
Agr
ic
ente
rpris
es
Number 220 213 216 195 185 237 228 157 98 105 27 25 25 25 25
No data for Kizilorda and Dashaguzskiy regions.
8.7.3 Presence of producer associations (e.g. farmers’ groups, water use associations, marketing associations, cooperatives)
Information on associations of producers in R.Karakalpakstan № Farms 1997 1998 1999 2000 2001 2002 2003 2004 2005 2006 2007 2008 2009 2010 2011 1. Farm businesses 386 948 1220 2350 3015 3582 4016 4636 5250 6539 7832 9587 4680 4021 3354 2. WUA 2 3 16 41 73 116 131 133 128 128 129 128
Information on Khoresm region
№ Agricultural organizations, providing services Number, pieces 1. Alternative MTP 119
2. Networks for sale of mineral fertilizers 72
3. Networks for fuel sale 105 4. Minibanks 119 5. Association of Water Consumers 115 6. Networks on sale of breeding cattle and veterinary services 128 7. Networks on purchase of agricultural production 8. Networks on maintenance with the information and consultations
9. "Uzagrosugurta" the State joint-stock insurance company 12 10. Commodity exchange 6
Total for the region 676
Scheme of interaction between Farms and Organization of Agro-service in Republic Uzbekistan (D.Niyazmetovaa, 2007)

CRP1.1 Characteristics of the site “Aral Sea” SRT2-AS1
page 63
№ Agro-service organizations Farms
Association of Farms
MTP Networks for sale of
mineral fertilizers
Networks on sale fuel and
lubricants
Networks on
sale of breeding cattle
and veterin
ary service
s
Association of Water
consumers
Commercial banks
(branches and
minibanks)
Commodity
exchange
"Uzagrosugurta" the State joint-stock insurance company
1 2 3 4 5 6 7 8 9 10 11 12
1. Farms X
Payment of annual
membership dues
Payment of the
mechanized services
Payment of mineral
fertilizers
Payment for fuel and
lubricants
Payment for
breeding cattle
and veterin
ary service
s
Payment for
water and
annual member
ship dues to WUA
Payment for bank
services and interest for
credits, microcredits
Purchase of the goods
Insurance payments
2.
Association of Farms
Rendering of legal and
consulting
services
x
Payment for bank
services and interest for
credits
3.
MTP Rendering of the
mechanised
services
x
Payment for fuel and
lubricants
Payment for bank services and interest for credits
Purchase of the goods Insurance
payments
4.
Networks for sale of mineral fertilizers, “KhoresmKishlokHujalikHimyo”
Sale of mineral fertilize
rs x
Payment for fuel and
lubricants
Payment for bank services and interest for credits
Purchase of the goods

CRP1.1 Characteristics of the site “Aral Sea” SRT2-AS1
page 64
5.
Networks on sale fuel and lubricants “Urgenchneftebasa”
Payment for fuel and
lubricants
Payment for fuel
and lubricants
X
Payment for bank services and interest for credits
6.
Networks on sale of breeding cattle and veterinary services
Sale of breeding cattle
and veterin
ary service
s
x
Payment for bank services and interest for credits
7.
Association of Water consumers
Maintenance with water
X
Payment for bank
services and interest for
credits
8.
Commercial banks (branches and minibanks)
Granting of
credits and
rendering of bank
services
Granting of credits and rendering of bank services
Granting of credits and rendering of bank services
Granting of credits and rendering of bank services
Granting of
credits and
rendering of bank
services
rendering of bank
services
Granting of
credits and
rendering of bank
services г
x
rendering of bank
services
Granting of credits and
rendering of bank services
9.
Commodity exchange
Sale of the
goods (fuel,
mineral fertilizer, etc.)
Sale of the goods (fuel,
mineral fertilizer,
etc.)
x
10.
"Uzagrosugurta" the State joint-stock insurance company
Insurance of crops and
other service
s of
Leasing, Insurance of crops and other services
x

CRP1.1 Characteristics of the site “Aral Sea” SRT2-AS1
page 65
insurance
9. Governance, institutions, policies 9.1 Institutional support
To achieve the goal of economic efficiency, institutional measures in the management and use of land, water and other resources shall avail the following characteristics:
• maintenance of stability of manufactures, that is protection against legal, physical aspects of uncertainty, and also against uncertainty in the rights of possession of the land and water. Users will carry out long-term, favourable investments of land-water resources only under condition of sufficient stability of their rights to water;
• instructions for use of resources should be easy for understanding. Thus, institutional positions for distribution and using resources should provide system of investment with the rights, it is necessary, that these rights were well defined, applicable in practice, provide its transfer and show to users all social costs of their actions. Such properties allow creating the market of the rights which can react to demand change.
Institutional support is carried out by creation of an organizational basis (the form and function, improvement a management in agrarian sector). All these positions are reflected by following legislative documents as Constitution of Republic Uzbekistan (1992), the decree of President Republic Uzbekistan «About the major directions of deepening of reforms in agriculture» and other documents. Stimulus and institutional structure: 1. Economic interest of the farmer in rational use of land-water resources. 2. Incentive - for rational use and saving of water resources. 3. Introduction system of penalties - for thriftless use of water etc.
9.1.1 Extension services and NGOs
Ministry of Agriculture and Water Resources of the Republic Karakalpakstan and its divisions have no official division or department on experience distribution. However, each department, depending on the needs within the year, organizes 2-3 seminars and workshops on all aspects of the agricultural sector, with involvement of all stakeholders. Also with the assistance of foreign experts and NGO, projects on an agricultural production are carried out. In Republic Uzbekistan at national, regional and areal levels activities on training of farmers and education, transfer of knowledge and technologies are carried out by establishments, having the mandate, such as local departments of Ministry of Agriculture and

CRP1.1 Characteristics of the site “Aral Sea” SRT2-AS1
page 66
Water Resources, Associations of farms, also universities, which also have the mandate on dissemination of knowledge among the population, including farmers. Total, at least 14 types of agricultural organizations, rendering services (AgSO) in different degree have been involved in transfer of knowledge to agricultural population, but their influence has sporadic nature (Nazarov, 2008). AgSOs transfer knowledge in three ways: real transfer of knowledge (28 % AgSOs), implicit transfer of knowledge (28 %), and a pure transfer of assets or the service organizations (56 %) (Bekchanov, etc., 2009). Elements of transfer/introduction of agricultural knowledge can be tracked in mass-media and educational activity of NGO concerning protection of the environment and increase of ecological culture of the population as a whole.
9.1.2 Access to improved/adapted varieties/breeds
Many new promising (in local conditions) varieties were developed within the system of agriculture in Republic Karakalpakstan. By the request of farmers', the department on seed production supplies the released varieties of cotton, wheat and other crops of the 2nd and 3rd reproduction (in recent years the quality of varieties, especially of cotton decreased). Many animals are transferred now to private farmers. Farmers buy improved breeds through a state sector from other states (the limited quantity) or renew through the local markets in unlimited quantity. The organized system of breeding of highly productive cows for maintenance of farms and households, does not exist yet on a regular basis in Khoresm and Republic Karakalpakstan, but exists in other regions of Uzbekistan.
9.1.3 Access to animal health services
Department of animal industries of regional administrations of Agriculture and Water Resources are now the basic control bodies of cattle-breeding production. The regional Veterinary administration is also subordinate to this department which organizes training courses for cattle-breeding farmers, or sends them in other establishments for training. Each village has the private veterinary centre, accountable in veterinary administration. The private veterinary centers bear responsibility for diseases of cattle and mortality. Some inoculations among which on foot and mouth disease are obligatory and free, though veterinary surgeons receive a payment for their services. The veterinary centers render private paid services, for example: first aid, artificial insemination and consultations. In each region (even in separate farms) there are points of veterinary service and under applications of the farmers in need they carry out the veterinary aid. Access is unlimited.
9.2 Policies 9.2.1 Pricing/subsidies for inputs (land, water, fertilizer etc.)
The government of Uzbekistan sets the prices for key resources (land use, fertilizers, machinery, etc.) taking into account the level of global and national market. Some farms, which do not have the funds, are provided by the government subsidies, covered by farmers after the harvest. Earlier it was possible to buy without VAT, but not any more. After gaining of independence, in R. Uzbekistan the agricultural sector remains subsidized by state directly and indirectly (World

CRP1.1 Characteristics of the site “Aral Sea” SRT2-AS1
page 67
Bank 2005). Direct grants include expenses on the maintenance of irrigational and drainage networks, free water for irrigation, but farmers pay for services, write-off of debts for shirkats (till 2005), and also maintenance of an agricultural production, such as fertilizers and fuel under the low prices without VAT. Besides, indirect grants consist of soft loans under low interest rates and the low price of cotton oil for agricultural manufacturers. Last tendencies show, however, that along with privatization and re-structuring rural farms, various grants are gradually excluded. For example: Since 2006, farmers have been compelled to pay higher prices (with the VAT) on the basic materials of an agricultural production substantially, because of partial liberalization of the markets. The majority of farmers do not have enough cash money resources and other assets that raise demand for credits for cultivation of agricultural production. The state finances manufacture of a cotton and wheat under bank soft loans with the low interest rate (3 % annually, since 2005, Abdullaev, etc. 2007, Rudenko, 2008). Now grants are mainly applied in farms, engaged in cotton and wheat manufacture. For cotton and wheat cultivation, farmers can get fertilizers and diesel fuel under the prices, which are below market prices. The land tax is subsidized (on the average 25 dollars for hectare). The payment for water use includes only membership dues of association of water users (WUA) (10 US dollars for hectare). Inter-farm irrigating and drainage channels are supported at the expense of the state budget. On-farm irrigating and drainage channels are supported at the expense of collection of membership dues of WUA. Farmers fulfilling quota on cotton can get by-products of processing of cotton, such as cotton oil, сcotton cake for reduced prices.
The planned agrarian policy in Dashoguzsky region provides:
• Maintenance of stably high rates of growth of an agricultural production; • More effective development of branches at the expense of development of breeding and seed-growing, increase
productivity of agricultural crops and efficiency of cattle; • Perfection structure of agriculture of the country, its approach to the consumer' market, introduction the scientifically-
proved crop rotations for sustainable increase of land fertility; • Deepening the degree and quality of processing of agricultural raw materials; • Advancing development of the branches, production of which will promote export potential escalating; • Radical renovation of material base; • Perfection of specialisation and territorial placing of an agricultural production
Mid-annual growth rates of gross output of agriculture in 2000-2005 will make 14,3 %, in 2005-2010. – 10,1%.
9.2.2 Pricing/subsidies for produce
Government of R.Uzbekistan sets the prices for agricultural production with the consideration of changes of the internal market. Pricing policy for each crop or other types of production is based on the contracts and agreements between farmers and government organizations.

CRP1.1 Characteristics of the site “Aral Sea” SRT2-AS1
page 68
The state defines procurement prices on cotton and wheat anew each agricultural season (Spechler coathors, 2004), and presumably (state) increases by 50-55 % a year (Ismailov 2003), this intention, however, not always reachable (Rudenko and Lamers, 2006). For cotton and wheat, the state procurement prices differ between the fixed price, which is paid for volumes of the state obligations and fluctuates depending on a variety of cotton and quality of wheat, on a contractual price (20 % the extra charge) on the remained volume of a cotton and wheat, which is above the state obligations. Additional possibilities exist for marketing of wheat, and farmers can use a difference in the price, and manufacturers of cotton, are compelled to run business with the exclusive government bodies and have limited possibilities in alternative marketing.
9.2.3 Policies related to access to land and water resources
The relevant regulatory documents were developed to obtain an access to land, which are reflected in the «Law on Land and Land Use», which was secured by legal legislations of Republic Uzbekistan. In order to get access to water resources, it shall be required to have the following regulating documents: - Plan for water-use based on the irrigation modulus of district; -Approved documents of local administrative bodies on the size of irrigated areas in the context of crops; - Application of water user in WUA, according to the plan of water use; - An agreement between the water users and suppliers of water; - Book for recording of water received, by the applications and contracts; - An act of reconciliation of the water received.
9.2.4 Farmers’ autonomy to choose crops and crop areas,ha
The state order for crops production in R.Karakalpakstan Years 1997 1998 1999 2000 2001 2002 2003 2004 2005 2006 2007 2008 2009 2010 2011
cotton 1979* 100**
1686 100
1666 100
19337 100
14418 100
24435 100
41816 100
64694 100
82866 100
99748 100
105191 100
102124 100
99321 100
100263 100
93959 100
wheat 850 50
844 50
1138 50
2813 50
2642 50
2884 50
18847 50
22605 50
30532 50
36712 50
47746 50
50919 50
27154 50
54485 50
53348 50
potatoes 9 0
5 0
4 0
8 0
9 0
20 0
32 0
185 0
149 0
352 0
432 0
596 0
1017 0
3147 0
1790 0
fruit 179 0
263 0
278 0
304 0
348 0
623 0
740 0
1013 0
1337 0
2359 0
2503 0
2442 0
2478 0
2308 0
2360 0
vegetable 312 0
551 0
419 0
321 0
385 0
586 0
1144 0
972 0
1085 0
3256 0
3309 0
4957 0
4181 0
2822 0
3011 0
melons 703 0
1345 0
1674 0
1435 0
1385 0
1929 0
2740 0
2907 0
2241 0
3029 0
2834 0
3468 0
3844 0
2836 0
3658 0
rice 5327 0
3504 0
8767 0
15328 0
513 0
3904 0
24484 0
17204 0
10828 0
20400 0
14980 0
8402 0
11083 0
* - cropped area ** - % state order

CRP1.1 Characteristics of the site “Aral Sea” SRT2-AS1
page 69
10. Opportunities for agricultural research 10.1 Opportunities for research on land tenure policy, soil and water management, de-rocking, agro-biodiversity conservation, water harvesting for range shrub plantations, drought-resistant varieties, others
In the territory of Aral Sea basin there are following research institutes: 1. Karakalpak branch of Academy of Sciences of Republic Uzbekistan; 2. Karakalpak Research Institute for Farming; 3. Scientific Research Institute for Rice; 4. Karakalpak branch of Research Institute for Livestock; 5. Karakalpak branch of SANIIRI (Central Asian Irrigation Research Institute); 6. Khoresm branch UzNIIKH (Cotton Research Institute); 7. Khoresm branch of SANIIRI (Central Asian Irrigation Research Institute; 8. Khoresm branch of Farming Institute, etc. Within 40-50 years, these scientific divisions were engaged in creation of scientific bases for introduction of an agricultural production in Republic Karakalpakstan. Huge volumes of research works are conducted on сcotton growing, animal industries, cultivation of soils, fertilizers, irrigation of agricultural crops, plant' protection, pests and number of others. Theoretical and practical scientific bases are now created in the basic directions, the most part of which is introduced in manufacture. However, in connection with creation of farms, interest to scientific works has considerably weakened, that finally leads to decrease in efficiency of the land and accordingly to productivity of agricultural crops. Now there is a need in realization of reforms in the structure of research institutes and the centers, and also in the policy of scientific approach in an agrarian sector.
The information contained in the Site Characterization can be freely used for research and other purposes, provided that the source is quoted: CGIAR Regional Program for Central Asia and the Caucasus, c/o ICARDA, Tashkent, Uzbekistan, 2012

CRP1.1 Characteristics of the "FerganaValley" site SRT3-AS1 Introduction The international research centers of the Consultative Group on International Agricultural Research (CGIAR) have launched the CGIAR Research Programs (CRP). ICARDA as the lead Center jointly with the other partners Centers, research and development organizations in more than 40 countries, regional fora, international development agencies and other relevant international organizations initiated the CGIAR Research Program (CRP1.1) - "Integrated Agricultural Production Systems for the Poor and Vulnerable in Dry Areas". The Program aims to pursue new technology, institutional and policy options for enhancing productivity and managing risks through diversification, sustainable intensification and integrated agro-ecosystem approaches in dry, which ultimately will contribute to the improvement of living standards in the target regions. During the global preparatory meeting in Nairobi, in July 2011, five sites (3 action and 2 satellite sites) have been selected together with national partners for Central Asia and the Caucasus Region. Conducting research and introduction of innovative approaches and technologies will be implemented in two key areas:
I. Reducing vulnerability in agro-ecosystems affected by degradation of natural resources. Actions Sites: 1. Aral Sea Region, including the Dashauz province (Turkmenistan), Khorezm province
and the Republic of Karakalpakstan (Uzbekistan), Kyzylorda province (Kazakhstan); 2. Rasht Valley (Tajikistan and Kyrgyzstan).
II. The intensification of agricultural production in areas with potential for improving food security and improvement of living standards in the short to medium term. Action site: 1. Fergana Valley, which includes Batken, Jalal-Abad and Osh provinces regions
(Kyrgyzstan), Sogd province (Tajikistan), Andijan, Namangan and Fergana provinces (Uzbekistan).
Satellite sites. Sites that complement Action Sites to sample the diversity of Target Areas, and will also help evaluate and assess innovations developed at the Action Sites for their suitability and user acceptance. 2. Kura-Arax plain in Azerbaijan. 3. Kashkadarya province in Uzbekistan.
In addition, 123 descriptors characterizing the climate, topography, soils, water resources, land use, land degradation, demography, agricultural systems, institutional systems and opportunities for agricultural research were identified. To collect the primary data, thirteen focal points from the Action Sites were involved. Data processing and compilation of the data was carried out by the interim Interdisciplinary Research Team (iIRT), coordinated by ICARDA.

A preliminary version of the characteristics of the Action Sites had been discussed during the preparatory meeting in Tashkent, May 15-17, 2012. These characteristics of sites are not final. It is assumed that interested parties can contribute to the adjustment and the addition of data. This material is collected and synthesized within the CGIAR Research Program (CRP1.1) - Integrated Agricultural Production Systems for the Poor and Vulnerable in Dry Areas", coordinated by the International Center for Agricultural Research in Dry Areas (ICARDA) in the Region of Central Asia and the Caucasus. The data, any inaccuracies or interpretations of the data presented herein are not the responsibility of the CGIAR and ICARDA. The final characteristics of the Site will be posted on the website of the CGIAR Regional Program (www.icarda.cgiar.org/cac). The information contained in the Site Characterization can be freely used for research and other purposes, provided that the source is quoted: CGIAR Regional Program for Central Asia and the Caucasus, c/o ICARDA, Tashkent, Uzbekistan, 2012

CRP1.1 Characterization of the "FerganaValley" site SRT3-AS1
page 3

CRP1.1 Characterization of the "FerganaValley" site SRT3-AS1
page 4
CRP1.1 Characteristics of the "FerganaValley" site SRT3-AS1
1. Climate 1.1 Precipitation Precipitation patterns 1.1.1. Range of long-term average annual totals (mm) across the site
Fluctuations in annual amount of precipitations within the entire site: The flat part: 150-250 mm The mountains, foothills -up to 300-600 mm
1.1.2 Number of rainy seasons During the vegetation season: 1. spring 2. autumn
1.1.3 For each rainy season: start and end month(s)
Amount of precipitations for the season: Spring: plains - 60-70 mm, foothills - 100-150 mm Autumn: plains - 35-45, foothills - 65-75 80-90% of the annual amount of precipitations is during the period from October to May. Number of days with precipitations (of 0.1 mm or more): Winter 19-23 Spring 17-19 Summer 5-8 Autumn 10-12
1.1.4 Number of years of daily rainfall records
Meteorological stations: Andijan – from 1900 (112), Fergana - from 1910. (102), Kokand -from 1925 (87), Namangan – from 1891 (121). The data are stored in the hydro -meteorological data fund of UZGIDROMET(in hard copy). The electronic version of the daily data is available starting from 1971.

CRP1.1 Characterization of the "FerganaValley" site SRT3-AS1
page 5
Precipitation variability 1.1.5 Inter-annual precipitation variability (CV %)
The coefficient of variation (CV) of annual precipitation in the region (n = 50) 24-35%
1.1.6 Severity and type of drought risk (e.g. delayed onset of the rainy season, lengthy gaps between the rains, early end to the rains)
The number of days per year with temperatures above 40 ° C: Maximum: 5-7; Average: 1-2. The number of days per year with an atmospheric drought (daytime humidity deficit ≥ 50 hPa): Maximum: 17-19; Average 4-6. The major risks for the agriculture are water shortages in dry years and mudflows.
1.2 Temperature Temperatures means 1.2.1 Range of annual mean temperature (°C) across the site
Average annual temperatures range from 7-11°C (foothills of the eastern part of the valley) and up to 14-15°C (plains).
1.2.2 Range of mean max. temperature of the hottest month (°C) across the site
Average maximum temperatures in July: from 34-35 ° C (plains) and up to 25-30 °C (foothills). The absolute maximum 43,9 ° C.
1.2.3 Range of annual mean min. temperature of the coldest month (°C) across the site
Average minimum of the temperatures in January: -3 .. - 2 ° C (flat part), -9 ... -4 ° C (foothills) The absolute minimum - 28,7 ° C (plains)
1.2.4 Number of years of daily temperature records
Meteorological stations: Andijan – from 1900 (112), Fergana- from 1910 (102), Kokand - from 1925 (87), Namangan- from 1891 (121) . The data are stored in the hydro -meteorological data fund of UZGIDROMET in hard copy. The electronic

CRP1.1 Characterization of the "FerganaValley" site SRT3-AS1
page 6
version of the daily data are available starting from 1971
Temperature variations 1.2.5 Intra-annual range of monthly temperature means (K)
Intra-annual variations of average temperature per month: From - 0.2 to +28 °C (plains), from - 4 to +25 °C (foothills). Inter-annual variability of average temperatures per month during the summer: 1,0-1,5 ° C, winter: 2-3,5°C
1.2.6 Diurnal temperature ranges throughout the year (K)
Fluctuations in average daily temperatures within the year during some years: from -5.5 to +31 ° C (plains), from -15 to +26,5 °C (foothills).
1.2.7 Frost risk (severity and months of occurrence)
The risk of frost: Dates of extreme air frost Dates of extreme soil frost
The earliest Average The latest The
earliest Average The latest
Risk of spring frost
5.02-12.02 6.03-12.03 6.04-25.05 29.02-
13.03 25.03-1.04 24.04-29.04
Risk of autumn frost
15.09-19.10
3.11-17.11 2.12-15.12 26.09-
4.10 22.10-1.11 13.11-4.12
Within the flat area of the site, the maximum intensity of the frost during the spring is: at least -5 °C. The frequency of frost with intensity of -3.1 - 4 °C does not exceed 8%. The absolute minimum air temperature in April: from - 4,8 ° C to -2,3 ° C. In September: from -4,0 °C to -1,0 °C. The average number of days per year with minimum temperature below (- 10 °C) 4 -11 days with a maximum -26-37 days.
1.3 Indices 1.3.1 Range of annual growing The sum of the effective temperatures:3500-3850 °C

CRP1.1 Characterization of the "FerganaValley" site SRT3-AS1
page 7
degree days, base temperature 5°C (K, heat units) across the site 1.3.2 Ranges of mean length (days) of temperature and moisture-limited growing period(s) across the site for predominant agricultural soils
The average duration of the period with an average daily temperature within the plain area of the site: Number of days Crops Higher then 5°С 260-270 Cereals, alfalfa,
horticultural crops Higher then 10°С 220-230 Cotton, maize Higher then 12°С 204-207 Higher then 15°С 175-190 vegetables, melons
1.3.3 Range of Aridity Index across the site
0,19-0,21
1.4 Climate change projections According to the Second National Statement of Uzbekistan on Climate Change (2008)
Scenario B2 1.4.1 Range of annual mean temperature change (K) across the site for time slices 2016-2045, 2036-2065, 2066-2080 in comparison to 1961-1990
2016-2045(2030) 2036-2065 (2050) 2066-2095 (2080)
1,6°С 2,3°С 3,4°С
1.4.2 Range of relative annual precipitation change (%) across the site for time slices 2016-2045, 2036-2065, 2066-2080 in comparison to 1961-1990
2016-2045(2030) 2036-2065 (2050) 2066-2095 (2080)
104% 108% 111%
Scenario A2 1.4.3 Range of annual mean temperature change (K) across the site for time slices 2016-2045, 2036-2065, 2066-2080 in comparison to 1961-1990
2016-2045 (2030) 2036-2065 (2050) 2066-2095 (2080)
1,2°С 2,3°С 4,2°С
1.4.4 Range of relative annual precipitation change (%) across
2016-2045 (2030) 2036-2065 (2050) 2066-2095 (2080)

CRP1.1 Characterization of the "FerganaValley" site SRT3-AS1
page 8
the site for time slices 2016-2045, 2036-2065, 2066-2080 in comparison to 1961-1990
115% 118% 114%
2. Topography 2.1 Landforms (e.g. plains, hills, mountains) across the site (%)
FerganaValley consists of the following regions: Andijan, Fergana and Namangan regions of Uzbekistan, Sogd region of Tajikistan, Osh, Jalalabad and Batken regions of Kyrgyzstan Altitude above the sea level
altitude above the sea level (m)
Territory of Uzbekistan,
%
Territory of Tajikistan,
%
Territory of Kyrgyzstan,
%
Average value, %
< 1,000 100 30 5,8 45,3 1000 - 2000 25 22,6 15,9 2000 - 3000 35 30,6 21,9 3000 - 4000 10 34,0 14,7
> 4000 7,0 2,3
Andijan Fergana Namangan Sogd Osh Jalalabad Batken Latitude 40°47'00.
89"N 40°23'17.39"
N 41°00'04.25"
N 40°17'02.66"
N 40°31'51.
05"N 40°55'37.
36"N 39°57'07.
71"N
Longitude 72°20'02.35"E
71°47'06.19"E
71°40'05.53"E
69°37'57.64"E
72°48'02. 38"E
72°59'08. 35"E
69°50'55. 97"E
Altitude above the sea level
487 (Andijan
city)
579 (Fergana
city)
444 (Namangan
city)
396 (Khudjant
city)
1123 (Osh city)
811 (Jalalabad
city)
931 (Batken
city)
2.2 Elevation range across the site
Landscape Territories in Uzbekistan, m
Territories in Tajikistan, m
Territories in Kyrgyzstan, m
Plain 300-500 300-500 390 -500

CRP1.1 Characterization of the "FerganaValley" site SRT3-AS1
page 9
Pied-mount, Mountains 501-1000 501-4000 501-4500 and higher
2.3 Prevalent slope ranges (%) of different land forms of the site
Provinces in FerganaValley Andijan Fergana Namangan Sogd Osh Djalalabad Batken
Plain 0,0001 – 0,00025 (80,6 %)
0,00010 – 0,00040 (100 %)
0,0001-0,00025 (90 %)
0,004-0,07 (100 %)
0,0002-0,01
(40 %)
0,00025-0,01
(40%)
(500-900 m-55% arable
lands)
0,00025-0,01
(50%)
(400-1500 m -100%)
Hills 0,0003 – 0,01 (19,4%)
0,00025-0,01
(10%)
более 0,01 (60
%)
более 0,01 (60 %)
более 0,01 (50 %)
3. Soils 3.1 Types of soils In the system of latitude soil-climatic zones, the flat part of the FerganaValley, is a desert area with the
gray-brown, sandy desert and takyr soils. In a system of vertical zones (eastern zone) in the eastern part Republic of Uzbekistan, there are gray soils in the foothills and low mountains, brown and brownish black soils of the mountain-forests in medium-mountain zone and light-brown soils of grassland and steppe in highlands. According to the scheme of the provincial division, the FerganaValley is included in the Central Asian soil and climatic province, which is characterized by continental climate (dry) and specific subtropical soils differ from soils of the more northern regions of Eurasia. For the automorphic (zonal) soils of the latitudinal zone and altitudinal soil zones there is a specific number of hydromorphic (wet) soils. There is also a range of transition soils, combining the features of automorphic and hydromorphic soils. Irrigated soils - a number of specific soil types determined by the zoning of the soil and the degree of changes in soil resulting from the irrigated agriculture.

CRP1.1 Characterization of the "FerganaValley" site SRT3-AS1
page 10
Most of the heterogeneity of the genesis of the parent rocks, the complexity of their lithology, different hydrogeological conditions, combined with an arid continental climate and vegetation, led to the formation of variety of soils. Plots of land - part of the land surface having a certain natural historical features and allowing its use for specific purposes. As part of the land resources allocated for agricultural use (arable land, hayfields, pastures, fallow lands under permanent crops), there are lands occupied by households, under planted forests, reclamation constructions, water infrastructures, roads, buildings and other activities. Soil rating The main factor in the qualitative assessment of land is its fertility, which is defined by a score of soil quality (soil rating). Soil rating is a comparative evaluation of soil quality, and its productive capacity, with an average level of intensity of farming and agricultural machinery. Soil rating is based on the properties of the soil, both natural and acquired in the process of domestication, which is closely related to the crop yields. Soil rating is based on the methodological guidelines for the appraisal of irrigated soils, with consideration of the crops that are being cultivated. For the irrigated farming, the soil rating is conducted concerning cotton farming. Soil rating points are defined by taking into account the specific requirements of cotton production, and are suitable for the rating of irrigated soils too (with other cultivated crops). During the grading, the basic features of soil and environmental conditions are considering: soil type or subtype, the duration of irrigation, cultivation, and supply of thermal resources, texture, parent rocks, soil drainage, salinity, stoniness and gypsum content. Assessment is based on a closed 100-points scale. Highest score -100 points are given to the best soils, which have the highest productivity. This scale is adopted for the current level of agricultural production (0.4 t/ha for each point). In assessing the soil types, characterized by various combinations of the basic features, which reduce soil fertility, the appropriate reduction factors for salinity, texture, drainage, gypsum content, etc. are used. Considering the natural fertility of soils and potential productivity of irrigated lands by their productivity

CRP1.1 Characterization of the "FerganaValley" site SRT3-AS1
page 11
and suitability for use in agriculture, ten classes of irrigated lands, which are involved in five agricultural cadastral zones (groups), were defined. The results of adjusting of soil maps and soil rating indicates a worsening of the quality of land, the ongoing processes of soil salinization, increase of groundwater levels, development of water and wind erosion, digression and desertification in recent years. Turan light serozem soils, as well as a small part of the meadow serozem soils. The dark and ordinary serozem soils, light brown. Light brown and dark serozem soils, light brown, dark brown, light brown, and the typical dark brown. Turan light serozem soils and typical light brown and dark serozem soils, light brown, dark brown, light, typical-, and dark brown.
3.1.1 Major or agriculturally important soil types and soil associations across the site (classification units, %)
The soils ofthe FerganaValleyhavedistinctivevarietiesand groups thatdivided on serozemsoils,brown,meadow,swamp, sand, etc. (Table3.1). The soil types ofthe land fund
№ Soil
in % of total area
Arable land, in % of total
area 1. Averageloamy 37,2 43,8 2. Clayey and heavy loamy 22,9 21,0 3. Light loamy 17,8 24,8 4. Sandy loamand sandy 8,4 10,3
5. Stonygravel, crushed stone on the surface ofsoil
10,8 0,1
6. Water table 2,9 Total 100 100
In theareaof irrigated landsin theValley thereare mainly mediumloamy soil(43.8%), clay and loamy soil(21.0%), loamy(24.8%), sandy loamyand sandy soils(10.3%), stony gravel, crushed stone on thesurface of thesoil(0.1%).
3.2 Soil characteristics for each of Soil characteristicsfor eachof the majorsoil types

CRP1.1 Characterization of the "FerganaValley" site SRT3-AS1
page 12
the major soil types The main factorsin thesoil-forming processare sludging due to irrigation,floodingand close(deep) shallow water table.
• Typicalserozem soils are characterized by mediumand light-loamy soils, partially skeletal, with a 0.5-1 munderlain bygravel, humus (1.1-1.8%) and average carbonate content
.
• Light serozemsoils are characterized by the old irrigated soils, with the agro-irrigation horizon with 0.5-1 m, medium- and heavy loamy composition. Sometimes the soil underlain by gravel ( 1-2 m). Newly irrigated light serozem soils are medium loamy. At adyr places (0.3-0.5 m) they underlain by conglomerates, debris or tertiary clays. The content of humus in the plow layer of old irrigated soils is 0.8-1.2%, in the newly irrigated - 0.5-0.8%. Content of nitrogen in the soils is 0.05-0.10%. Soil is quite highly enriched with gross phosphorus and potassium (0.25-0.30% and 0,50-1,30%, respectively). The calcareous content of soils is high - between 8 and 10% of CO 2 carbonates, and gypsum -bearing is low (0.1-0.6% SO4). On the territory of Kyrgyzstan, light serozem soils lay within the altitude of 600-650 m and 700-800 m. Formation of light serozem soils is being in a strong lack of moisture and at relatively high average annual air temperatures (12-13C) under semi-arid ephemeral vegetation conditions. Parent rocks are stony-pebbly deposits, covered on top with a thin coat of fine earth. The texture of light gray soils is predominantly dusty light or medium loamy. The humus content is 1-1.5%, the ratio of carbon to nitrogen - 7, the reaction of the soil solution - alkaline: pH = 7.5 - 8.3. Light serozem
soils are poorly supplied with nitrogen and phosphorus, so there is a need for application of organic and mineral fertilizers.
• Meadow- serozemsoils have heavy andmedium loamy texture,sometimes underlain bygravel within two meters. There is relativelyhigh contentof humusin the plow layer(0.7-1.4%). In thesubsurfacehorizon and inlowerprofile,the amount of humusis reducedto 1.0and 0.4% respectively. The nitrogen contentranges from0.05 to0.14%.The ratio ofcarbon to nitrogen isnarrow(5-6), which indicatesthesaturationof thehumus bynitrogen.Number ofgross phosphorusin soilsranged from0.07 to0.12%, potassium -0.75 to1.56%. The calcareous content of soilsis high -7-10%CO2carbonates.Gypsum-bearingsoilsin the profileis low (0.1-0.7% SO4), which sometimesrisesin the lower horizons upto5-6% ofSO4. Soils arepredominantlynon-saline, only sometimes there are some evidences
of week salinity in the down-adyr depressions.
• Serozem- meadow soils occur mainly on foothill rolling plains and detrital cones of rivers. They are formed because of transformation of serozem soils with raising groundwater level to 2-3 m. The soil

CRP1.1 Characterization of the "FerganaValley" site SRT3-AS1
page 13
texture is hard- and medium loamy, below the agro-irrigation horizon with layers of light loamy and sandy loamy soils. At a depth of 1-2 m (sometimes closer), the soil underlain by gravel. Approximately, at the same depth there are some hydromorphic signs - the rusty and bluish spots gleying. There is less humus in serozem meadow irrigated soils than in meadow serozem soils. Its’ quantity in the plow horizon is 0.5-1.1%, with nitrogen - 0,04-0,09%. There are 0,13-0,27% of gross phosphorus and 0,88-1,70% of potassium. Carbonates are uniformly distributed along the soil profile (from 6 to 8% CO2). There is practically no gypsum in irrigated soils (0.07-0.10% SO4). Serozem
meadow irrigated soils are mainly non-saline, only in cones there are slightly saline soils with a maximum of salinity in the lower horizons (up to 0.5-1% of dry residue).
• Typical turanserozem soils(ordinary)are common inthe areas of lowmountains and piedmountfoothills within thealtitudes of700-1300 m. They are formed within the semi-desertclimatewith an average annualrainfall of 300-400mm andaverage annualair temperature of +11-12 C.The texture ofthe typicalserozem soils is dustymedium loamy, rarely - light. Soils have calcareous content onthe surface, the distribution of carbonatesin the soil profileuneven; their maximum content is observed often at a depth of40-60 cm.The reactionof the soil solutionis alkaline,pH =7-8,1. The humus contentin the typicalserozem soils isin the range of1.8-2.5%, sometimes riches 3%.The ratio ofcarbon to nitrogen is 7-9.Soils arepoorlyrichwith nitrogen andphosphorus, which
necessitatesthe useof organic and mineralfertilizers.Typicalserozem soils- the mainirrigatedland fund offarmers.
• Dark turan serozem soils are formed within the altitudes of 1200-1500 m above sea level, under the couch grass-forb steppes with ephemeroid development cycle. Dark gray soils are dusty loam and characterized by significant accumulation of humus (2.1-4.6%) having the ratio of carbon to nitrogen equal to 7-9. The nitrogen content is 0.39 - 0.41% in the upper horizon. In the distribution of carbonates the following pattern is observed: a small amount of CO2 (2 -4%) in the upper level and the maximum (10 -11%) - in a carbonate-illuvial horizon at a depth of 60 - 100 cm. Dark serozem soils have alkaline soil environment throughout the profile (pH = 6.8 - 7.5). Soils are poorly rich with the basic elements of plant nutrition, so it is necessary to apply organic and mineral fertilizers. Dark serozem soils used in rain-fed agriculture for cereal crops and perennial grasses.
• Light-brown soils- occurat the latitude range of1300-2000m abovesea level.The mainsoil-forming
rocksarecalcareousproluvialand diluvialloams,underlain bypebblerocks at varying depths.The soil texturevaries fromlight to heavy loamy. Light-brown soils are characterized bya lowhumus

CRP1.1 Characterization of the "FerganaValley" site SRT3-AS1
page 14
content(1.0 -2.0%), the CO2 contentof carbonates is5-10%, the reaction of the soilenvironmentis alkaline (pH = 8.2-8.8). There are 0.10-0.25% ofnitrogen, 0.20-0.30% of phosphorus and2.0-2.5% of potassiumin the upper horizonof these soils.They aremore evenly distributedin the soil profile, especially in a depth of0.5 m,ratioof carbonto nitrogen isnarrow, from 4-5 to6-8.The composition ofhumus inlightbrown soilscharacterized by a predominanceofhumic acids overfulvic acids. The ratio ofhumic and fulvic acids,on average,equals to0.4-0.8.
The absorption capacityof thesesoilsis lowand variesfrom 10 to 16mg/eqper 100g of soil.
• Meadow soils -are more widespreadthan otherirrigatedsoils. Their texture is heavy andmedium loamy. On a depth of0,5 m to 1-2 m,soilunderlain bygravelin some places, sometimes by arzyk at the depth. The content of humusin the plow layerof irrigated meadow soils issomewhat higher, ranging from 0.9to 1.9%. The content of nitrogenin the soil is0,05-0,and 12%. The ratio ofcarbon to nitrogen iswide(11-12), indicating a weakenrichmentof humus bynitrogen.Calcareous content of soils issomewhatinflated(7-8%CO2).In down-adyrdepressions andat the peripheries ofthe alluvial fans there someslightly salinesoils
.
• Marsh-meadow soilsconfined todepressionson the periphery ofthe detrital conesof riversand theI-IIterraces above the flood plain. The water table isat a depth of0.5-1m. The texture ofthese soils isheavy andmedium loamy and the profile ismainly layered. Soilson river terraces sometimes are underlain bygravel in the depth of 0.5-1 m. Stronggleying ofsoilsbegins with asubsoil (below the plowable)horizon.The humus contentin the irrigated marsh-meadowsoils is0.5-1.9%. Close shallowwaters andstrongevaporation of moisture fromthe soil surfacecontribute tosoil salinity. There are weakly andnon-salinesoils on river terracesand weakly and moderately saline soilson the peripheryof detrital conesof rivers.
Source: Soil of Kyrgyz SSR. Academy of Sciences of Kyrgyz SSR , Publishing house «Ilim» Frunze 1974, page230.
3.2.1 Rooting depth The depth of the root zone, cm
Cotton Wheat Rice Alfalfa Tomato
65-80 40-45 40-80 15-20, up to100 (3rd yr) 30-75
3.2.2 Water holding capacity (defined by measures of field
Water-retaining capacity of soil – ability of the soil to retain a certain amount of water due to the influence of sorption and capillary forces

CRP1.1 Characterization of the "FerganaValley" site SRT3-AS1
page 15
capacity and wilting point) Information about the MFM и SWM in irrigated area depending on mechanical structure and the type of soil: Maximum field moisture-retention (MFM) capacity and steady wilting moisture (SWM)
№ Type of soil MFM * SWM ** 1. Average loamy 19-25 2-5 2. Clay and heavy loamy 22-24 2-4 3. Light loamy 17-21 1-3 4. Sabulous and sandy 16-19 1-2
5. Stony soil, pebbles,gravel chippings at the surface of the soil
14-18 1
Maximum field moisture-retention (MFM) capacity and steady wilting moisture (SWM) By the type of soil: № Type of soil MFM * SWM ** 1. dark sierozem 18-22 4-5 2. typical sierozem 20-22 4-6 3. light sierozem 17-20 3-5 4. sierozemic -meadow 14-26 5-6 5. gray-brown sierozem 16-18 4-5 6. meadow 20-21 3-5 7. marshy - meadow 23-24 5-6
8. gray-brown granitic and rubbly sierozem
16-18 3-4
9. granitic 12-16 2,5-3,5 * maximum field moisture-retention ** steady wilting moisture
3.2.3 Measure of soil fertility - organic carbon%
In nature, the transformation of organic matter into humus is carried out in the soil with the participation of microorganisms, animals, oxygen, air and water. The remains of various species and other organisms after contact with a soil are decomposed by the microorganisms and used by them as a power source. In the process of decomposition, these residues become more mobile and simple compounds. One part is completely mineralized by microorganisms, and the other part is used for the synthesis of the secondary proteins, fats, carbohydrates, and other elements by the heterotrophic microorganisms. The humus and not humus substances are formed in the process of decomposition.

CRP1.1 Characterization of the "FerganaValley" site SRT3-AS1
page 16
Not humus substances: a) substances of plant or animal origin (carbohydrates, proteins, tannins, lignins, fats, etc.) b) the substance of secondary forms of microbial synthesis (proteins, carbohydrates, fats). Analysis of long-term data on sampling in experimentation sites and at regional level reveals an extremely low content of humus in the soils of the FerganaValley. 5 kinds and 9 types of soils are the most widespread within the irrigated lands: Humus content by mechanical content of soil
№ Type of soil Humus content 1. Clay and heavy loamy 0,75-1,3% 2. Average loamy 1,0-1,9% 3. Light loamy 0,7-1,4% 4. Sabulous and sandy 0,5-1,2%
5. Stony soil, pebbles,gravel chippings at the surface of the soil
0,5-0,9%
Humus content by the type of soil
№ Type of soil Humus content 1. dark sierozem 0,6 - 2,0 % 2. typical sierozem 0,8 - 1,5 % 3. light sierozem 0,6 - 1,3 % 4. sierozemic -meadow 0,7 - 1,9 % 5. gray-brown 0,4 0,7 % 6. meadow 0,8 - 2,4 % 7. marshy - meadow 0,7 - 1,8 % 8. gray-brown granitic and rubbly sierozem No data 9. granitic No data
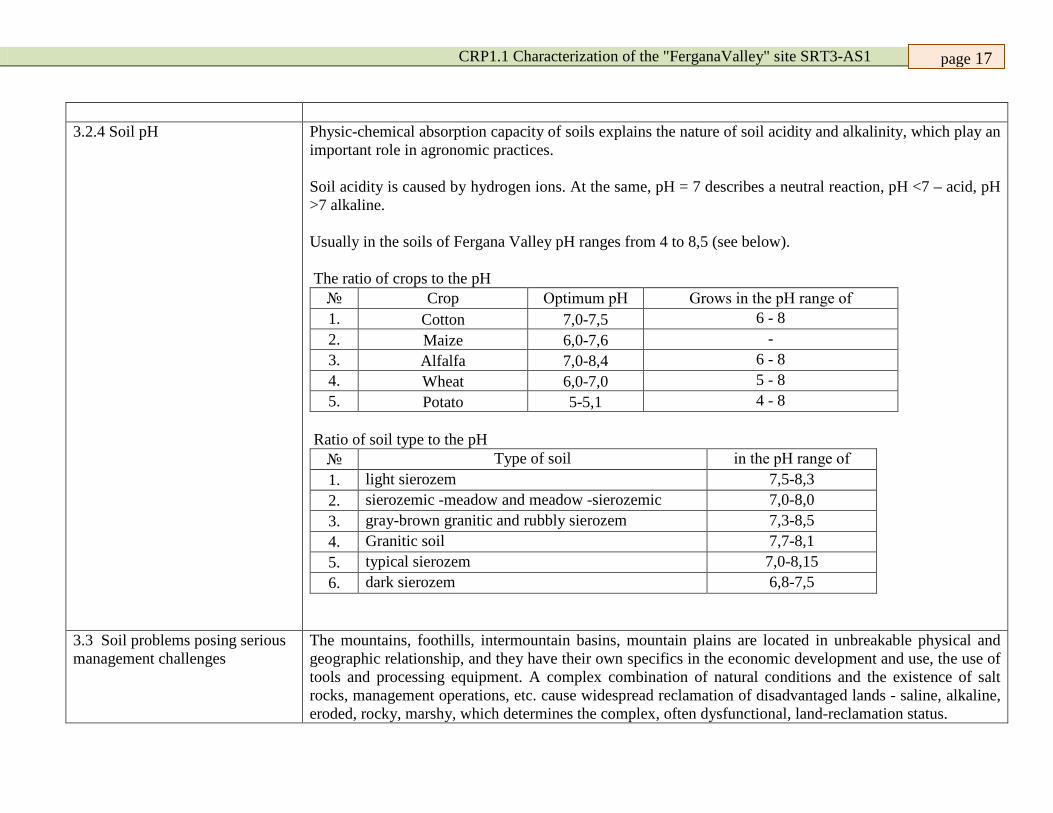
CRP1.1 Characterization of the "FerganaValley" site SRT3-AS1
page 17
3.2.4 Soil pH Physic-chemical absorption capacity of soils explains the nature of soil acidity and alkalinity, which play an
important role in agronomic practices. Soil acidity is caused by hydrogen ions. At the same, pH = 7 describes a neutral reaction, pH <7 – acid, pH >7 alkaline. Usually in the soils of Fergana Valley pH ranges from 4 to 8,5 (see below). The ratio of crops to the pH
№ Crop Optimum pН Grows in the pН range of 1. Cotton 7,0-7,5 6 - 8 2. Maize 6,0-7,6 - 3. Alfalfa 7,0-8,4 6 - 8 4. Wheat 6,0-7,0 5 - 8 5. Potato 5-5,1 4 - 8
Ratio of soil type to the pH
№ Type of soil in the pН range of 1. light sierozem 7,5-8,3 2. sierozemic -meadow and meadow -sierozemic 7,0-8,0 3. gray-brown granitic and rubbly sierozem 7,3-8,5 4. Granitic soil 7,7-8,1 5. typical sierozem 7,0-8,15 6. dark sierozem 6,8-7,5
3.3 Soil problems posing serious management challenges
The mountains, foothills, intermountain basins, mountain plains are located in unbreakable physical and geographic relationship, and they have their own specifics in the economic development and use, the use of tools and processing equipment. A complex combination of natural conditions and the existence of salt rocks, management operations, etc. cause widespread reclamation of disadvantaged lands - saline, alkaline, eroded, rocky, marshy, which determines the complex, often dysfunctional, land-reclamation status.

CRP1.1 Characterization of the "FerganaValley" site SRT3-AS1
page 18
3.3.1 Salinity (severity, soil types and % of area affected)
Within the territory of the irrigated lands (there are all kinds and types of soils, but in the selection of samples for salinity, they are not considered separately) there is a dense network of sampling. There is detailed information on their salinity degree. The results are shown in Table 3.1. Table 3.1.Averaged value of the degree of soil salinity in the FerganaValley for the period of 1997 - 2011.
Yrs
The total irrigated
area th, ha
Area under the observati
on th, ha
Degree of soil salinity (0-100 cm layer)
Not saline Low salinity
Average salinity High salinity
th, ha % th, ha
% th, ha % th, ha
%
1997 988,099 863,246 564,839 57,1 291,013 29,5 97,369 9,9 34,878 3,5
1998 984,381 858,854 584,346 59,4 191,588 19,5 88,069 8,9 120,378 12,2
1999 979,523 857,479 564,894 57,7 237,56 24,3 117,986 12,0 59,083 6,0
2000 982,51 860,396 588,198 59,9 222,508 22,6 122,627 12,5 49,177 5,0
2001 979,216 856,071 590,856 60,3 245,844 25,1 102,493 10,5 40,023 4,1
2002 975,274 852,129 591,673 60,7 241,345 24,7 104,084 10,7 38,172 3,9
2003 977,453 853,439 600,041 61,4 259,068 26,5 74,678 7,6 43,666 4,5
2004 975,157 853,283 601,162 61,6 238,18 24,4 99,391 10,2 36,424 3,7
2005 980,878 862,076 599,563 61,1 244,694 24,9 99,768 10,2 36,853 3,8
2006 985,364 850,753 605,721 61,5 261,74 26,6 81,057 8,2 36,846 3,7
2007 984,618 859,624 612,323 62,2 256,322 26,0 84,321 8,6 31,652 3,2
2008 984,09 861,364 614,818 62,5 253,19 25,7 81,531 8,3 34,551 3,5
2009 985,026 861,131 620,168 63,0 242,716 24,6 85,402 8,7 36,74 3,7
2010 984,106 858,678 612,155 62,2 258,289 26,2 81,002 8,2 32,66 3,3
2011 984,13 856,907 616,949 62,7 254,998 25,9 80,132 8,1 32,051 3,3
Source of information - Hydro geological reclamation expedition in regions Information is not available for Sogd, Osh, Batkent and Jalalabad regions.

CRP1.1 Characterization of the "FerganaValley" site SRT3-AS1
page 19
3.3.2 Sodicity (severity, soil types and % of area affected)
Information from Republic Kyrgyzstan, th. ha
№ Region Saline Alkaline Waterlogg d Granitic Wind erosion Water erosion
1. Batken 17,8 6,2 1,3 29,6 30,2 36,6 2. Jalalabad 7,8 2,3 0,8 56,5 92 103,3 3. Osh 10,9 6,5 8,8 68,2 89,3 91,8
Source of information: The report of the National consultant “Research of the socio-economic factors promoting desertification of land in Kyrgyzstan, and the formulation of necessary reciprocal strategy”, Bishkek 2000. page 103.
3.3.3 Al-toxicity (severity, soil types and % of area affected)
This is no such type of soil in the region
3.3.4 Low chemical fertility (organic carbon, CEC, etc.) (description, severity, soil types and % of area affected)
Compounds of chemical elements in soils consist of oxygen, silicium, aluminum, nitrogen, phosphor, sulfur, potassium, calcium and magnesium. In all soils of FerganaValley, there is a low content of elements such as silicium, aluminum, sulfur, calcium and magnesium. For the normal growth and development of plants, it is essential to have nitrogen, potassium and phosphor in the soil (see down). Selective quantification of these elements in the soils of FerganaValley showed in the following Table:
№ Type of soil Content Phosphor Kalium Nitrogen
1. Average loamy low low average 2. Sabulous and sandy low low average 3. Light loamy low low average 4. Sabulous and sandy low low low 5. Stony soil, pebbles,gravel low low low

CRP1.1 Characterization of the "FerganaValley" site SRT3-AS1
page 20
chippings at the surface of the soil
3.3.5 Phosphorus fixation (severity, soil types and % of area affected)
Information is not available
3.3.6 Poor profile development (soil types and % of area affected)
Information is not available
3.3.7 Rockiness, stoniness (severity, soil types and % of area affected)
There are no rocky and stony areas in the irrigation zones.
3.3.8 Very compact subsoils (soil types and % of area affected)
Requires a collegial discussion of descriptor values
3.3.9 Poor drainage, waterlogging (severity, soil types and % of area affected)
Information is not available
3.3.10 Excessive drainage (soil types and % of area affected)
There is no over drainage, as they were built in accordance with the project
3.3.11 Flooding (severity, soil types and % of area affected)
The flooding almost does not occur in the irrigated area of all types of soil ,as well as the ground water table (GWL) is lower than 3 m Therefore, flooding and water logging is not observed. Source: Annual report Hydro geological expedition (HGE)
3.3.12 Other management problems (description, soil types and % of area affected)
Despite the significant reduction in consumption of chemicals in agricultural production (for the last 10-15 years, the volume of pesticides and chemical fertilizers decreased by 3-4 times), the problem of soil pollution by the toxic substances of residues do not lose its vitality. Research in this area and monitoring of the status of soil pollution are being accomplished be three agencies: the State Committee on Geology and Mineral Resources, UZGLAVGIDROMET (Gydromet Department of Uzbekistan )and the State Committee for Nature Protection. The State Committee on Geology and Mineral Resources published the Geological Atlas of the ecological maps of Uzbekistan.

CRP1.1 Characterization of the "FerganaValley" site SRT3-AS1
page 21
UZGLAVGIDROMET conducts the annual observations (monitoring) of soil contamination in the main agricultural areas of the Republic (by the residues of the organochlorine pesticides, organophosphoric pesticides, herbicides and defoliants). State Scientific Research Institute of Soil Science and Agricultural Chemistry published the Atlas of the soil surface of the Republic of Uzbekistan (2010). On the territory of the Fergana Valley, there are some types of erosion: water and irrigation, devastating mudslides, wind erosion and direct harmful effect of wind on plants. These processes occur due to peculiarities of soil and climatic and relief conditions of the areas. Among the all types of soil erosion within the site, the most widespread is wind erosion. Mudslides are causing great damage to the economy of the FerganaValley. Protecting land from wind and water erosion is one of the most pressing issues for further development of agricultural production, protection and improvement of land use. Factors adversely affecting the productivity of land, their causes and consequences.
Problems Causes Consequences The absence of science-based agricultural zoning
Raw materials focus on the production of raw cotton
Extensive development of agriculture, poor land management
salinization Insecurity and poor exploitation of drainage system
The deterioration of soil fertility, increased consumption of irrigation water, tools, fertilizer and labor
Rocky lands The reclamation of rocky land Low fertility, increased consumption of irrigation water, and labor cost
Gypsum content Reclamation of lands with gypsum content
Low soil fertility, water logging, salinity, karst phenomena
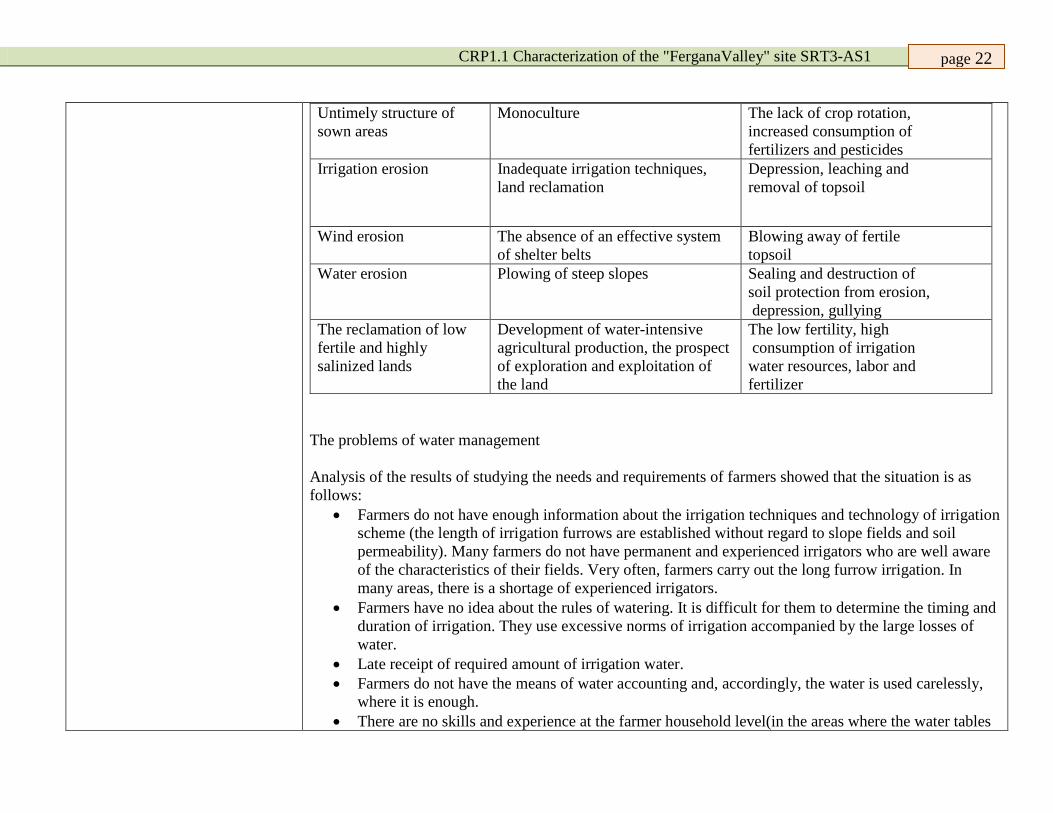
CRP1.1 Characterization of the "FerganaValley" site SRT3-AS1
page 22
Untimely structure of sown areas
Monoculture The lack of crop rotation, increased consumption of fertilizers and pesticides
Irrigation erosion Inadequate irrigation techniques, land reclamation
Depression, leaching and removal of topsoil
Wind erosion The absence of an effective system of shelter belts
Blowing away of fertile topsoil
Water erosion Plowing of steep slopes Sealing and destruction of soil protection from erosion, depression, gullying
The reclamation of low fertile and highly salinized lands
Development of water-intensive agricultural production, the prospect of exploration and exploitation of the land
The low fertility, high consumption of irrigation water resources, labor and fertilizer
The problems of water management Analysis of the results of studying the needs and requirements of farmers showed that the situation is as follows:
• Farmers do not have enough information about the irrigation techniques and technology of irrigation scheme (the length of irrigation furrows are established without regard to slope fields and soil permeability). Many farmers do not have permanent and experienced irrigators who are well aware of the characteristics of their fields. Very often, farmers carry out the long furrow irrigation. In many areas, there is a shortage of experienced irrigators.
• Farmers have no idea about the rules of watering. It is difficult for them to determine the timing and duration of irrigation. They use excessive norms of irrigation accompanied by the large losses of water.
• Late receipt of required amount of irrigation water. • Farmers do not have the means of water accounting and, accordingly, the water is used carelessly,
where it is enough. • There are no skills and experience at the farmer household level(in the areas where the water tables

CRP1.1 Characterization of the "FerganaValley" site SRT3-AS1
page 23
rise). All these facts lead to deterioration of land reclamation, reduction of soil fertility and decrease of crop yields.
4. Water resources
4.1 Irrigation water availability
The main sources of water in the Fergana Valley are: • River Karadarya - mixed filling; • Naryn river - mixed filling; • Maylisay and Tentaksay - snow filling; • Syrdarya River. The largest mountain rivers are Padshaata, Kasansay, Gavasay, Karaungir, Kurgart, Akburasay, Aravansay, Isfairamsai, Shahimardonsay, Sokh, Isfara, Hodzhabakyrgan and other rivers. Irrigation draft consist of the system of springs, water-collecting header and drainage systems, wells for the irrigation and vertical drainage. River flows of Karadarya, Naryn and Akburasay are regulated (Andijan reservoir, Toktogul reservoir, Papan reservoir (last two are located in the territory of Kyrgyzstan)), the river flows of Aravansay, Maylisay and Tentaksay - not regulated. The change in volume of annual runoff of major water sources of the Fergana Valley for the period of 1997
to 2011, million m3
Sources, region
Yrs
1997 1998 1999 2000 2001 2002 2003 2004 2005 2006 2007 2008 2009 2010 2011

CRP1.1 Characterization of the "FerganaValley" site SRT3-AS1
page 24
Karadarya 1806 1853 2467 558 1651 1990 1984 1874 1961 134 1415 1354 1697 2249 1569
Naryn 840,6 649 826,0 886,0 849,2 766,0 656,0 660,0 758,3 769 750 627 604,4 1264 772
Akburasay 55,0 60,8 75,7 62,7 45,7 49,4 49,4 77,5 61,0 49,3 48,3 35,7 34,0 40,2 34,1
Aravansay 4,7 5,4 4, 19,4 8,2 3,5 8,0 25,7 20,2 142 8,5 8,4 9,48 9,2 7,1
Maylisay 61,0 39,0 81,0 40,0 7,8 12,0 9,0 20,0 31,4 22,2 31,5 14,6 16,4 34,7 17,0
Naryn - Syrdarya 2176,1 2276,7 2268,6 2141,9 2450,2 2659,5 2667,1 2676,7 2558,8 2182,6 1982,8 1681,1 1735,6 2199,2 2086,4
Big Fergana Canal
1259,14 1391,9 1441,5 1265,55 1443,1 1659 1633,4 1684,4 1652,6 1365,8 1293 1128,7 1163,3 1464,4 1396,4
Big Andijan Canal
625,88 663,2 555,2 618,35 726 713,1 788,2 731,7 667,8 587,8 515,5 437,1 429,3 576,5 533,5
Syrdarya pump/st. 291,05 221,6 271,9 257,98 281,1 287,4 245,5 260,6 238,4 226,3 174,4 115,3 143 158,4 156,4
Karadarya (SFC) 682,21 469,1 661,7 605,68 648,6 649 692,2 697,5 675 634,5 593,7 483,7 601,3 788 761,1
Melkisay 1306,9 1255,5 1215,6 1116,3 1060,4 967,8 1089 1246,2 1177,5 1104,7 1026,4 805,5 805,1 1084,8 1049
Collector-Drainage System
200,72 1154 224,4 293,5 330,1 270,8 171,3 153,6 71,6 65,4 105,5 173,04 144,6 166,3 151,5
Vertical drainage 95,7 126,2 90,2 182 118,7 126,4 76,6
Batken 663 709 920 635 635 605 621 610 620 602 630 651,98
Jalalabad 1255 1390 711 625 700 577 644 655 886
Osh 2576 1269 1522 1402 1320 1489 1365 1174,3
Sogd 3198 3889,8

CRP1.1 Characterization of the "FerganaValley" site SRT3-AS1
page 25
Averaged data on water demand for the past 15 years:
irrigation 7133,2 - 11217,5 mln m3 94,0 – 96%; drinking water supply 225 –354,0 mln m 3 3,2 - 4,5% production 17,8 - 37,5 mln m 3 0,007-0,076%
95-97% of water (in low water year) is used for irrigation. Source: Annual report of Narin-Kara-darya and Sokh-Syrdarya River Basin Authority
4.2 Quality issues (e.g., waste re-use)
In the Fergana Valley, the quality of irrigation water meets the requirements. Salinity of water in the rivers and small streams is low. In the flood period, and heavy rains (April, May), the silt content in rivers and small streams increases, it is noticeable especially in the foothill areas (Kurgantepa, Djalakuduk, Hadjaabad, Bulakbashi). Moreover, in the rest of the year in the initial part of the source water is almost clean. Downstream silt content increases due to wastewater and channel deformations. At the south part of the Andijan region (Booz, Ulugnar, Balykchy), collected drainage water is used. Its salinity is low and it meets the requirements for irrigation. The details on the silt content in the water of the Karadarya River:
The average silt content in the Teshiktash stream of the Karadarya river (by months)
Months Yrs 1960-63 1985 1995 2000 2005 2010 2011
January 0.21 0.14 0.22 0.23 0.21 0.15 0.05 February 0.47 0.19 0.38 0.45 0.06 0.29 0.05 March 0.47 0.76 0.49 0.40 0.14 0.37 6.14 April 0.40 2.10 0.56 0.37 0.11 4.68 5.18 May 0.42 6.70 0.89 0.35 1.60 7.99 7.54 June 0.24 22.0 0.70 0.32 4.50 21.36 8.70 July 0.27 9.70 0.65 0.79 1.10 26.04 12.25
August 0.32 1.20 0.54 0.72 0.29 17.9 9.46 September 0.14 0.28 0.34 0.45 0.56 12.92 2.92
October 0.98 0.20 0.02 037 6.49 0.25 November 0.72 0.62 0.53

CRP1.1 Characterization of the "FerganaValley" site SRT3-AS1
page 26
December 0.90 0.15 0.05 Average 0.20 3.80 0.41
Fractional composition of suspended water sediment of the Karadarya river
№ Phase of regime
Characteristics of
sediment content
Particle content (% by weight) with the diameter, mm
>1,0 1-0,5 and >0,5
0,5-0,2 and >0,2
0,2-0,1
0,1-0,05
0,05-0,01 and
<0,05
0,01-0,005 and
<0,01
0,005-
0,001 and
<0,005
<0,001
1. Underwater Big 2,9 23 23,3 33 1,2 16,6
Average 2,4 2,9 4,3 33,8 15,4 31,8 9,4 Small 0,2 0,2 0,7 0,5 13,6 84,9
2. Dry spell Big 2,8 14,9 20,7 12,5 49,1
Average 2,9 2,6 1,8 37,7 21,5 26,1 7,4 Small 0,1 0,7 1,9 1,7 15,5 80,1
Water salinity is low and water quality is good. The chemical content of water is provided in the following tables. The dynamics of water quality within the Andijan region.
№ Indicators Standard 2000 2002 2008 2010 1. dry residues, mg/l 1000 410-1210 532-1331 200-990 885-1450 2. chlorides, mg/l 350 6,9-12,5 7,9-19,5 1,4-5,8 8,0-62,6 3. sulfates, mg/l 500 40-125 70-191 75-197 84-262 4. total hardness, mg
(milliequivale ts per liter concentration)
7,0 2-5,41 3-3,5 2-3 3,5-7,0

CRP1.1 Characterization of the "FerganaValley" site SRT3-AS1
page 27
The dynamics of water quality within the Namangan region.
№ Indicators Standard 2001 2005 2008 2011 1. dry residues, mg/l 000 350-1010 421-1114 150-790 755-1130 2. chlorides, mg/l 350 6,5 12,9 6,9-12,5 1,7-5,1 6,2-16,2 3. sulfates, mg/l 500 40-125 70-151 75-137 74-222 4. total hardness, mg
(milliequivalent per liter concentration)
7 2-5,41 3-3,1 1,8-3,2 3,7-7,6
Many areas in Sogd region are irrigated with collector water, as the Chkalovsky massive-2200 hectares, and partially Kanibadam - 1022, Asht - 2500 hectares. About 500 hectares are in other areas.
5. Land use / land cover
According to «АP» of the press-secretary of the lower chamber of parliament of Tajikistan, it has been underlined, that now a share of each inhabitant of Tajikistan makes about 0,08 hectares of the irrigated land, and the given indicator is the lowest among the countries of the Central Asia. Along with it, in Tajikistan the requirement for agricultural production for the last 11 years has increased in 2,5 times. Also it has been underlined, that the ameliorative condition of over 40 thousand hectares of the irrigated land in R.Tadzhikistan is in a poor condition and for their return in agriculture rotation it is necessary to accept effective measures (the Source: from October 31, 2009 «On measures on improvement of an ameliorative condition of the irrigated land of republic for 2010-2014»).
5.1 Kinds of agricultural / non agricultural land
№ Title Regions Andijan Fergana Namangan Batken Jalalabad Osh Sogd
1. The total area 430,3 676 744 123,4 3365,3 2919,3 600 2. armlands 273,5 318,453 882,4 1211,1 822,2 including: Arable land 203,7 249,148 224 72,4 168,1 187,7 237,4

CRP1.1 Characterization of the "FerganaValley" site SRT3-AS1
page 28
Perennial plantings 28,9 45,822 17,4 9,5 10,5 Pastures 21,3 23,483 600,5 1674,7 1480,4 3. Under the rivers
and artificial reservoirs, canals
39 51,333
4. Roads 10,9 25,249 5. Under the buildings
and settlements 21,1 30,1 3278 5325 1218
6. Unused lands 105,4 186,692 1387,2 2154,2 2117,1
5.1.1 Extent of rainfed cropland across site (ha, %)
The area of rainfed lands in Sogd region of the Republic of Tajikistan, ha Yrs 1997 1998 1999 2000 2001 2002 2003 2004 2005 2006 2007 2008 2009 2010 2011 ha 82314 79830 85165 81408 79827 81848 65660 68214 64585 64573 64603 64460 64372 61924 61905
5.1.2 Main rainfed crops or varieties grown (ha)
Reinfed crops in Sogd region (data for 2011)
Wheat Potato Horticultural
crops
Melon crops Other crops
22910 349 324 75 47348
5.1.3 Extent of irrigated cropland across site (ha, %)
Yrs 1997 1998 1999 2000 2001 2002 2003 2004 2005 2006 2007 2008 2009 2010 2011 thou ha 3198,72 3173,462 3728,33 3830,83 3810,57 3810,57 3815,09 3802,662 3798,22 3799,772 3802,48 3808,604 3809,88 3593,86 3793,04
8

CRP1.1 Characterization of the "FerganaValley" site SRT3-AS1
page 29
5.1.4 Main irrigated crops or varieties grown (ha)
The main crops in the Fergana Valley are cotton, wheat, vegetables, melons, orchards and vineyards, perennial plants, and other crops. The leading crop is cotton. The area under cotton covers 35-40% of the total area in the Andijan region. The total area of it ranges from 99.6 to 110.0 thousand hectares. Varieties C-6524, An-35, An -36, An- 37, Namangan-77, Sulton, etc. are also cultivated on this area. The wheat production was started from 1990, and in recent years, the area under wheat - 60-82 thousand hectares. During this period, within the Fergana Valley , the main areas under the irrigated crops (hectares) varied within the following ranges:
Crops Regions
№ Andijan Fergana Namangan Batken Jalalabad Osh Sogd 1. Cotton 99,6 110 103,6 127,33 81,1-108 0,1-0,9 9,8-30,9 7-12 50-58 2. Cereals 60 82 92 133,3 80-92,9 34,1-40,1 6,4-48,3 6,6-74,5 80-108,1 3. Vegetables 4,5 15,3 11,5 16,9 9-13,1 2,-2,3 6,2-9,1 5,8-6,5 8-11,4 4. Melons 4,1 5,8 0,99 3,0 0,98-2,3 0,2-0,3 0,9-3,5 1,4-1,8 4-5,3
5. Gardens and perennial plantings
20,1 25,8 40 99,4 60-83,2 0,3-8 8,3-14 6,2-14,9 8-16,8
6. Crops for farm gardening
25,4 38,6 38,7 62,9 40-50 1,8-2,2 6,9-7,6 8,2-10,2 6-25,2
7. Other crops 6,2 56,3 5,5 7,7 0,08-4,4 0,3-4,8 14-20 15,4-47,28 0,4-15
5.1.5 Extent of pastures across site (ha, %)
Yrs 1997 1998 1999 2000 2001 2002 2003 2004 2005 2006 2007 2008 2009 2010 2011 thou.
ha 22,4612 22,4618 26,5338 26,1814 26,2863 26,4740 25,5066 25,6054
1 25,5138 25,3337 25,5133 5,33279 5,32260 25,7077 24,9564
6

CRP1.1 Characterization of the "FerganaValley" site SRT3-AS1
page 30
5.1.6 Extent of rangelands across site (ha, %)
Information on Sogd region Yrs 1997 1998 1999 2000 2001 2002 2003 2004 2005 2006 2007 2008 2 0
9 2010 2011
thou. ha 22,236 22,178 22,069 21,817 21,361 20,447 20,092 19,602 19,187 18,394 17,873 17,454 17,067 16,596 16,301
No information others oblasts.
5.1.7 Extent of other major land use/land cover types across site (description, ha, %)
Other types of land use in the Fergana Valley (2011).
№ Types of land use Regions
Andijan Fergana Batken Jalalabad Osh Sogd Totally 1. perennial plantations 202 42,1 1740 950 1450 6209,1 2. gardens and vineyards 20505 4843 187 943 265 26743 3. farm gardening 47537 62314 14805 31421 37714 193791 4. forestry 14 216807 294387 99781 610989 5. neglected fields 9619 9619 6. hayfields 1062 1062
5.2 Land use trends 5.2.1 Increase/decrease in irrigated cropland due to availability/decline of groundwater resources (severity, % of area affected)
Reduction of irrigated arable area in Andijan, Fergana and Namangan region occurred due to the construction of various buildings (houses, gas stations, etc.) The area of irrigated lands in the Andijan region in 1990 was 282 thousand hectares, and in 2011 it was 273 5 thousand hectares, the reduction of the area is 3.01%, in the Namangan region - 10%, Fergana region - 4.5%, in Sogd - 1.31%. Arable land of the Republic of Kyrgyzstan, for the last few years decreased to 103,377.7 hectares. (transform. land). Lands were allocated for buildings (a transition from one category to another).
5.2.2 Changes of land use/land cover types (description, % of area affected)
After the independence of Uzbekistan, country faced the problem of providing the population with grain products, and therefore the area under wheat increased, and today, this area reached 80.2 hectares. In 1990 it was 7.8 hectares Due to the development of farmer households, there are some changes such as the reduction of area under

CRP1.1 Characterization of the "FerganaValley" site SRT3-AS1
page 31
alfalfa. During the recent years, within the Kyrgyz Republic, the pasture and forest areas, used by other users, were returned (the lease by other republics), this territory increased on+ 8693.1 ha. The reasons of change of types of land tenure on Sogdijsky area are the following: 1) Planting of new gardens and vineyards - 12094 hectares. 2) Allocation for personal plots and population household farms - 35116 hectares.
5.2.3 Other significant changes in land use (description, % of area affected)
In part of the Fergana Valley, occupied by the Republic of Uzbekistan, following changes in land use took place due to reduced runoff (water supply is now reduced by 15-20% and 30-40% during dry years): • Farmers generally sow cotton and grain (Gov’t order). • In recent years, much attention is paid to the food security, therefore from year to year (2010-2012) the area under fruits and vegetables increasing. • the area under rice was drastically reduced. The actual planting of rice depends on the water runoff of the year, so these figures vary widely. For example, in 2008, sowing of rice was canceled at all, and in 2010 was the opposite. In recent years, 100.7 hectares ( within the Kyrgyz Republic) were given for the construction of public buildings.
6. Land degradation
6.1 Type and current severity of particular types of land degradation 6.1.1 Salinization (severity, % of area affected)
In Fergana valley salt affected soil is observed mainly as 13,2 %(1997), 11,4 % out of total irrigated area (see sector 3.3.1).
6.1.2 Water erosion (description, severity, % of area affected)
Information on irrigated soils, the erosion in the Fergana Valley (Average data on Fergana, Namangan, Andijan and Sogd regions): not eroded 82,1

CRP1.1 Characterization of the "FerganaValley" site SRT3-AS1
page 32
low eroded 7,0 average eroded 8,4 very eroded 2,5
No information from Kyrgyzstan Great damage to the national economy of the republic is caused by mudslides. Protection of land from wind and water erosions is one of the most pressing issues for further development of agricultural production, protection and improvement of land use. The Institute "Uzdaverloyiha" together with the research and project organizations of the republic developed a "scheme of erosion control measures in the Republic of Uzbekistan", which defines the series of measures on erosion control, and their scale and sequence of operations. To protect lands of the region from the erosion it is necessary to plant defensive forest strips; plant terraces on eroded hillsides; consolidate and afforest sands, along a large trunk canals, rivers, reservoirs and around the ravines. It is necessary to create a stand, to build additional mudslides’ water reservoirs, to take measures on enhancement of rivers’ coasts, build tracts to combat mudslides, protective levees and upland ditches; reconstruct the irrigation networks; build various hydro-technical erosion control constructions; and organize a planning of irrigation maps. The annually complex of agro-technical and economic-organizational activities should be carried out by the efforts of farmer households and other agricultural enterprises. Effective organization of irrigation is vital, especially in the adyr lands, where erosion of the fertile surface of soil occurs due to the surplus of water in the furrows and poor organization of irrigation, including the abandonment of fields during the irrigation. The most important organizational and economic activities include: • strict compliance of norms on rational use and protection of lands against the all types of soil erosion by the all households; • maintenance of crop rotations with varying degrees of saturation of perennial and annual grasses; • compliance of the norms on grazing; • rational use of water resources; • prohibition of grazing; • maintenance of pasture rotations
6.1.3 Wind erosion By the nature of wind activity in the Valley there are three areas:

CRP1.1 Characterization of the "FerganaValley" site SRT3-AS1
page 33
(severity, % of are affected)
• Area with weak wind (wind speed -up to 6 m / s) • Area with average wind (wind speed - 6-12 m / s) • Area with strong wind (wind speed - over 12 m / s). Wind erosion and the harmful effect of wind on plants appear on small area of the valley. The information is given for the Sogd region
Degree Yrs 1997 1998 1999 2000 2001 2002 2003 2004 2005 2006 2007 2008 2009 2010 2011
High 1764 1815 1898 1967 1888 2067 17941 1664 1785 1954 1873 1782 1666 1778 1807
Average 13552 14307 14112 15178 14783 14448 13868 14166 14328 14229 13798 14115 13822 14229 14155
Low 30890 30211 29916 28856 29165 30557 31012 30298 30016 29787 30266 30318 29755 29889 30188
6.1.4 Loss of soil organic matter (severity, % of area affected)
The information is given for the Sogd region
Degree Yrs 1997 1998 1999 2000 2001 2002 2003 2004 2005 2006 2007 2008 2009 2010 2011
High 6127 6654 6812 6998 7227 7288 7314 7657 7112 7449 7882 7963 8094 8213 8556 Average 2218 2361 2587 2742 2897 2969 3074 3196 3261 4356 3647 3864 4117 4422 4522
Low 558 669 701 754 883 962 1076 1142 1251 1306 1386 1462 1573 1689 1767
Degree: high (from 3 to 5 %); average (from 1 to 2 %); low (up to 1 %).
6.1.5 Loss of soil structural stability (severity, % of area affected)
The information is given for the Sogd region
Degree Yrs 1997 1998 1999 2000 2001 2002 2003 2004 2005 2006 2007 2008 2009 200 2011
High 7361 7452 7561 8288 8827 9314 9627 9941 10214 10367 11124 11454 11892 12147 12442 Average 3122 3247 3861 4124 4447 4764 4992 5127 5691 5989 6213 6667 6813 6991 7102
Low 856 969 1172 1483 1747 1924 2123 2467 2703 2863 2945 3167 3281 3359 3487
Degree: high (from 5 to 7 %); average (from 2 to 4 %); low (up to 2 %).

CRP1.1 Characterization of the "FerganaValley" site SRT3-AS1
page 34
The loss of structural stability of soil (data from the experimental sites). It should be noted that in recent years, there is significant decline in farmers’ work on improvement of the fertility of soils in the irrigated areas, specifically: • untimely tillage of the soil; • consolidation of the top layer of soil, fracture of soil structure; • reduction in use of organic fertilizers/
6.1.6 Loss of agrobiodiversity (description, severity, % of area affected)
The information is given for the Sogd region, ha
Degree
1997 1998 1999 2000 2001 2002 2003 2004 2005 2006 2007 2008 2009 2010 20
high average
low
1714 454 163
1792 558 192
1814 602 232
1883 667 329
1961 751 473
2024 794 529
2098 844 588
2153 879 647
2203 894 681
2284 927 932
2318 989 979
2414 1021 998
2526 1093 1022
2616 1124 1054
26 11 10
Degree: high (from 1 to 1, 5 %); average (up to 1 %); low (from 0, 5 to 1 %).
6.1.7 Other types of land degradation that are significant (description, severity, % of area affected)
Because of decrease in water availability, the most part of the irrigated lands especially under rice has remained uncultivated. Within 15-20 years, these lands were not used in agricultural production and were out of rotation These lands, in the beginning (1990-1995), were effected by the process of secondary salinization at the shallow groundwater levels, and soil lost its fertility and became salineland. To return those lands for agricultural purposes, a large amount of capital investment is required. Other factors of a gradual degradation of the soil are monoculture practices, which lasting during the last 20-30 years. In recent years, the achievements of scientific and technological progress and innovative experiments designed to obtain high crop yield are not being implemented at the farmer households. The low level of farming, in the context of mentioned and other factors, leads to a systematic decrease of soil fertility. In addition: • in the light sierozem soils of Sogd region, the desertification has reached 0.2% (5035 ha); • in the sierozem -meadow soils and meadow- sierozem soils, the logging reached 0.08% (164 ha);

CRP1.1 Characterization of the "FerganaValley" site SRT3-AS1
page 35
• gray-brown stony and sierozem rubbly soils overgrown by shrubs and herbaceous forests on 0.1% (211 ha); • stony soils are effected by irrigation erosion on 0.9% (1553 ha). The data were obtained from the experiments (2011)
6.2 Degradation trends
6.2.1 Reclamation of salinized lands (% of area treated)
There are no data on land reclamation in Sogd region. According the reclamation data, the situation is characterized as follows: • The lands of good quality have increased on 5.36 thousand.ha over the period of 1997 – 2010 (5,6 %); • The lands of satisfactory quality have decreased on 17.3 thousand.hectares from 1997 to 2010 (1,8 %). • The lands of unsatisfactory quality have decreased on 3.0 thousand.ha from 1997 to 2010 (3,1 %). The distribution of irrigated lands by their reclamation status in the Fergana Valley for the period of 1997-2011
(Fergana, Namangan, Andijan, Jalalabad, Osh and Batken region) Yrs Total area of
irrigated agricultural lands, th. ha
Characteristics of reclamation of irrigated land Good Satisfactory Unsatisfactory Including, th. ha
th. ha % тыс. га % th. ha % Invalid depth of
groundwater level
Invalid depth and soil salinity
1997 965,96 477,94 49,5 399,01 41,3 89,01 9,2 47,06 40,64 1998 962,73 478,55 49,7 386,65 40,2 97,53 10,1 49,26 47,04 1999 958,85 482,4 50,3 372,99 38,9 103,46 10,8 5 ,85 51,32 2000 1236,72 681,72 55,1 437,43 35,4 117,57 9,5 50,8 53,72 2001 1237,45 729,99 59,0 402,79 32,6 104,67 8,5 48,41 46,07 2002 1237,64 697,33 56,3 428,79 34,6 111,52 9,0 51,1 50,25

CRP1.1 Characterization of the "FerganaValley" site SRT3-AS1
page 36
2003 1238,07 700,13 56,6 430,14 34,7 107,8 8,7 50,8 196,86 2004 1237,85 694,93 56,1 431,72 34,9 111,2 9,0 53,5 194,89 2005 1238,55 688,73 55,6 439,02 35,4 110,8 8,9 51,4 195,69 2006 1242,41 708,11 57,0 426,7 34,3 107,6 8,7 50,5 194,87 2007 1245,7 728,28 58,5 416,05 33,4 101,37 8,1 56,34 37,04 2008 1245,36 729,94 58,6 425,58 34,2 89,84 7,2 47,92 33,9 2009 1247,82 728,71 58,4 431,96 34,6 87,15 7,0 40,02 39,14 2010 1251,83 732,37 58,5 434,97 34,7 84,49 6,7 38,02 38,84 2011 1251,97 739,27 59,0 429,47 34,3 83,23 6,6 35,66 40,15
Ниже были даны информации мелиорация земель Sogd region.
Годы 1997 1998 1999 2000 2001 2002 2003 2004 2005 2006 2007 2008 2009 2010 2011 % 1,66 1,90 1,83 1,97 2,12 2,31 2,21 2,67 2,52 2,39 2,57 2,36 2,42 2,46 2,54
6.2.2 Increase in soil erosion (description, % of area affected)
Strong uneven territories of Sogdijsky area and weak stability of soils, frequent rainfalls of high intensity, rare grassy vegetation in aggregate with misuse of land strengthens erosive soil processes, but there are no concrete information.
6.2.3 Lowering of the groundwater tables (% of area affected, range of change in the groundwater levels (m))
The flat area of the Fergana Valley is characterized by a shallow groundwater level and salinity of soil, respectively. The nature of changes in groundwater level is dependent on two factors: - Water availability during the year; - The presence of drainage, and its performance. As a rule, during the years with the normal and high availability of water, the groundwater level is close to the surface and ranges: - during the non-growing season - 1.5-3.5 m; - during the growing season - 1,1-2,8 m In dry years, due to the decrease in water utilization, the groundwater level is declining dramatically (not depending on the availability of drainage) and sometimes drops to 4 or more 5 m In recent years, due to the implementation of the State program on land reclamation of the Republic of

CRP1.1 Characterization of the "FerganaValley" site SRT3-AS1
page 37
Uzbekistan (2008 - 2012.), the significant construction work (reconstruction, maintenance and repair work) was done, which led to a widespread decline in groundwater, which in turn, led to the desiccation of the upper surface of soil and thus use of an additional amount of irrigation water. Groundwater level in Fergana Valley (2011) – depth
2,2 % of territory 0-1 m 8,4 % of territory 1-1,5 m 25 % of territory 1,5-2 m 17,8 % of territory 2-3 m 28,5 % of territory 3-5 m 18,1 % of territory >5 m
6.2.4 Other significant degradation trends (description, % of area affected)
No data
Socio-economical descriptors 7. Demography 7.1 Population 7.1.1 Total population of site
Total population in Fergana Valley Yrs 1997 1998 1999 2000 2001 2002 2003 2004 2005 2006 2007 2008 2009 2010 2011
thou. people 6374,2 6478,7 8984,9 10827,7 10983,3 11141,3 11389,7 11552 11729,2 11893,2 12075,2 12268,2 12501,1 12708,6 12957,4
7.1.2 Percentage of rural population of site
Yrs 1997 1998 1999 2000 2001 2002 2003 2004 2005 2006 2007 2008 2009 2010 2011 % 71,4 71,8 72,0 74,4 74,2 74,5 74,3 74,4 74,4 75,0 75,1 75,2 63,2 63,3 50,2
7.1.3 The age distribution of the rural population
Age
(under 5 yrs)
Age (from 5 to 7 yrs )
Age (from 7 to 16 yrs)
Age (from 16 to 45
yrs)
Age (from 45 to 60
yrs)
Age (from 60 yrs and
higher)

CRP1.1 Characterization of the "FerganaValley" site SRT3-AS1
page 38
415374,4 709744,5 1144443,6 2533555,5
1349726,2
351770,6
Data on 01.01.2011
7.2. Poverty Poverty headcount ratio at $1.25 a day (PPP) (% of population)
1990 1995 2000 2005 2010 Tajikistan .. .. 49 21 7 Kirgiz 0 19 34 23 6 Uzbekistan .. .. .. .. ..
Headcount index: This is the share of the population whose income or consumption is below the poverty line, that is, the share of the population that cannot afford to buy a basic basket of goods. Source: World Bank http://ddp-ext.worldbank.org/ext/ddpreports/ViewSharedReport?&CF=1&REPORT_ID=1336&REQUEST_TYPE=VIEWADVANCED&HF=N
Poverty gap at $1.25 a day (PPP) (%) 1990 1995 2000 2005 2010
Tajikistan .. .. 15 5 1 Kirgiz 0 9 9 6 1 Uzbekistan .. .. .. .. ..
Source: World bank http://ddp-ext.worldbank.org/ext/ddpreports/ViewSharedReport?&CF=1&REPORT_ID=1336&REQUEST_TYPE=VIEWADVANCED&HF=N Poverty gap: This provides information regarding how far off households are from the poverty line. This measure captures the mean aggregate income or consumption shortfall relative to the poverty line across the whole

CRP1.1 Characterization of the "FerganaValley" site SRT3-AS1
page 39
population. It is obtained by adding up all the shortfalls of the poor (considering the non-poor has having a shortfall of zero) and dividing the total by the population. Put differently, it gives the total resources needed to bring all the poor to the level of the poverty line (divided by the number of individuals in the population). This measure can also be used for non-monetary indicators, provided that the measure of the distance is meaningful. The poverty gap in education could be the ‘number of years of education missing to reach the defined threshold’ According to data on Inspection of a standard of living in Tajikistan (2007) Experts of Children's Fund of the United Nations Organization (UNICEF) Poverty line at parity of Purchasing Power (PPP) of 2.15 US Dollars, poverty level in Tajikistan makes 40.9 % Absolute poverty line of The population, living in poverty (poverty line) 53.5% Poverty among children (0-14 years) 57.6% Poverty among adults (15 years and more) 51.3% The population living in an extreme poverty (line of an extreme poverty)
17.1%
Extreme poverty among children (at the age of 0-14 years) 19.2% Extreme poverty among adults (at the age of 15 years and more)
15.9%
Poverty status in Sogd region Poor - 68.8% Non-poor 31.2%
7.2.1 Poverty among the rural population (description, %)
Poverty percent in countryside is higher on 40 %. In Tajikistan - high, but decreasing level of poverty (89 % in 1999, 64 % in 2004 and 53 % in 2007), mainly because of economic growth and remittances (the Analysis... 2010: 9), poverty is more widespread in rural areas and areas where the cotton is grown.
7.3 Health and

CRP1.1 Characterization of the "FerganaValley" site SRT3-AS1
page 40
nutrition Nutrition of the population of the Kyrgyz republic (2010)
№ Basic products
Milled and hulled produ
cts
Wheat Potato
Vegetables and
melons
Fruits and
berries
Meat Milk Eggs, mln. units.
Vegetable fat
Sugar, baker
y produ
cts
1. Storage at the beginning of the year, thou. t
1143,1 432,6 755,3 268,4 22,8 4,6 25,1 15,5 17,9 94,5
2. Produced in the country, thou. t 1510,9 746,2 1334,9 947 185,4 185 1273,5 369,3 18,3 10,9
3. Imported, thou. t 531,1 451 0,7 8,5 80,4 50,9 36 22,7 25,1 65,7 4. Used, thou. t 2040,2 1151,5 1410,2 934,6 283,2 236,3 1275,3 386,1 35,2 115,5
5. Storage at the end of the year, thou. t
1144,9 478,3 680,7 289,3 5,4 4,2 59,3 21,4 26,1 55,6
Source: Information bulletin of KR on food security, National Statistic Committee of KR, Bishkek 2009, page 62. Consumption of iodine salt in Sogd region Non-iodine salt 6.4% Less than 15 ppm iodine 28.8% More than 15 ppm iodine 64.9%
7.3.1 Nutrition and health status of rural population
Food consumption per capita, inв 2007
Groups of products for years consumption per
capita per day, grams
Grain, total 518 Wheat 481 Potato 98 Sugar 22

CRP1.1 Characterization of the "FerganaValley" site SRT3-AS1
page 41
Vegetable oil 33 Vegetables 472 Fruit 155 Meat 71 Eggs 12 Milk 396
Data: FAOSTAT Total indicator of available calories per capita a day in Uzbekistan in 1992, 2003 and 2007 (calories per capita a day)
Groups of products 1992. 2003. 2007. The grain 1627 1415 1464 Potato 49 55 65 Sugar 125 43 78 Nuts 5 11 8 Seed oil 7 11 9 Vegetable oil 292 268 289 Vegetables 94 82 112 Fruit 44 44 78 Meat 150 139 160 Animal fat 33 18 21 Eggs 17 13 16 Milk 243 229 238 The fish 3 1 1
In total 2689 2329 2539 Data FAOSTAT Risks of decrease in level of food safety in Uzbekistan (i) high density, growth of a population and (ii) decrease in volumes of manufacture owing to degradation of ameliorative condition of land, deteriorations of irrigation and drainage systems, (iii) insufficiently developed market, transport, communication and industrial infrastructure. Main indicators of the health of population The basic indicators of health of the population (the general factors of birth rate, death rate and a population natural increase (on 1000 population)
№ Indicators
Andijan Fergana Namangan
2007 2008 2009 2010 2011 2007 2008 2009 2010 2011 2007 2008 2009 2010 2011

CRP1.1 Characterization of the "FerganaValley" site SRT3-AS1
page 42
1. Birth rate on 1000 people 22,6 25 24,5 22,6 21,2 23,6 22,4 22,6 22,1 22 5 24 24,4 22,9 21,5 21,8
2. Death rate on 1000 people 5,1 5,1 4,8 4,9 5,3 5,1 5,2 5,0 5,0 5,0 4,6 4,6 4,3 4,5 4,7
3. Natural growth 17,5 19,9 19,7 17,7 15,9 18,5 17,2 17,6 17,1 17,5 19,4 19,8 18,6 17 17,1
According to the data of the Republic of Kyrgyzstan (2010 ), the infant mortality rate in rural area (children under 1 year per 1,000 live births): Batken region: - 27,0 Jalalabad region: - 20,7 Osh region: - 20,8 Infant mortality rate in rural area (children under 1 year per 1,000 live births): Batken region: - 39,1 Jalalabad region: - 26,4 Osh region: - 29,4 Source: Stat. Department, 2011 (Statistic Department 2011. Republics Kyrgyzstan and Tashkent 2012 (Health care in Uzbekistan)
7.3.2 % of children below 5 years of age at risk of malnutrition
According to the data of Statistical Committee of the Republic of Kyrgyzstan, caloric value of food consumed by children of 1-17 years is 20 126 kcal, which is on 96 kcal more than the daily requires norm (1920 kcal). Consumption of other important elements, such as fats and proteins were below the daily-required norm on 16 and 13 g, respectively. Children of 1- 3 years old lose the necessary nutrients from the daily norm. Among children of 1-11 years, 6.9% were identified as malnourished. The number of malnourished preschool children (1-6 years) is 7.4%. The highest share of underweight children is among the children under one year (18.0)
7.4 Employment 7.4.1 Gender-related aspects of work in rural area
№ Gender aspects of work in rural area Andijan Fergana Namangan Batken Jalalabad Osh
1. Number of females 1326500 1609400 1176500 21715 517762 561550
2. % from total population 46,7 42,1 35,7 49,2 50 49,7
Number of unemployed females 11200 16600 19200

CRP1.1 Characterization of the "FerganaValley" site SRT3-AS1
page 43
1. Percentage of women share in the total number of senior positions
19 19,8 20,5
2. Percentage of women share in the total number of qualified positions
42 40,1 40
3. Percentage of women share in the total number of unqualified positions
5,8 3,3 3,8
4. Percentage of unemployed women share 33,2 36,8 35,7
Share of economically active population on Sogd region persons from 14-64 years- 44.9 % Share of economically active man's population on Sogd region among persons from 14-64 years - 63.9 % Share of economically active female population on Sogd region among persons from 14-64 years-28.5%
7.4.2 Types and importance of non-agricultural employment, %
Non-agricultural employment Regions 2000 2001 2002 2003 2004 2005 2006 2007 2008 2009 2010 2011 Fergana 29,1 28,9 28,8 28,6 28,4 28,2 28,1 28 27,8 58,8 58,6 58,6 Batken 50,8 Jalalabad 50 Osh 50,3
No information others oblast
8. Agricultural systems
8.1 Classification Structural changes in irrigated lands
Yr
Association of Water Users (AWU) or farmers (kolkhoz) Farmer households Other types
Homestead lands
Amount Area including:
WUA Area Amount Area Amount Area Amount Area Units ha Units ha Units га Units га Units га
2000 781 864978 7129 72364 12883 14793 358395 99194 2001 765 859018 7966 84939,4 26334 16075 437951 102927 2002 745 850245 16 38594 10504 140374,8 43949 17211 492598 106234 2003 650 791083 16 38594 13465 211945,6 76375 18742 545589 111339

CRP1.1 Characterization of the "FerganaValley" site SRT3-AS1
page 44
2004 606 740932 26 69578 16357 285450,4 98307 20990 738825 132305 2005 451 585591 79 189227 22589 388867 485292 71093 745843 133366 2006 341 419365 131 277184 44037 647864,5 509754 69492 752116 136248 2007 236 361407 162 350339 54782 784743 510581 65359 758986 139633 2008 230 361460 164 350339 42560 790591 518037 65113 849283 142148 2009 216 361101 162 351939 33807 788747 518189 64501 880389 143154 2010 174 361978 119 351939 25044 785746 515084 59242 891912 139498
No information on the Republic of Kyrgyzstan (Osh, Jalalabad and Batken regions) and Sogd region, Tajikistan.
8.1.1 General classifications
Types of households Irrigated lands , the plains
Totally ha
Preferable cultivated (crops, type of cattle)
Cereals cotton Potato Vegetables melons Forage crops
Horticultural crops
All types of households including 750556 289119 294531 23563 42585 5104 70705 24949 Farmer households 649087 266898 292067 11598 22514 2464 38587 14959 Dekhans households хозяйства 9494 14789 0 8347 19556 2496 11991 2315 Agricultural enterprises 44965 2688 10208 3598 515 144 20137 7675
No information on the Republic of Kyrgyzstan (Osh, Jalalabad and Batken regions) and Sogd region, Tajikistan.
8.2 Descriptors related to cropping component 8.2.1 Average farm holding size (ha)
Republic, region 2000 2001 2002 2003 2004 2005 2006 2007 2008 2009 2010 2011
Uzbekistan 6,9 7,0 6,9 14,3 15,0 16,1 15,4 16,2 16,1 26,8 40,1 42,3 Kyrgyzstan 0,9 2,0
According to data on Survey of living standards in Tajikistan (2007) by UNICEF experts average size of households in Sogd region makes 0.011hа (2007)
8.2.2 Type (s) of crop rotation
There is no scientifically based rotation (by the years) in almost all of the farmer households in the irrigated area.

CRP1.1 Characterization of the "FerganaValley" site SRT3-AS1
page 45
In cotton growing area, the crop rotation is carried out at the discretion of individual farms. In the 70-80%, the crop rotation is not implemented in cotton growing, i.e. there is a monoculture practice. In some cases, wheat and other crops alternate cotton in the rotation. At the same time according to the government calendar, there is no area under alfalfa, which was previously used as the alternate crop in rotation. The proper and scientifically proved crop rotations were not applied for the last years in economy of Sogd region, and the areas under long-term grasses were sharply reduced; in farms until 2008 on the area of 70 % from land, the farmers grew cotton. After 2008, when the future's company has been cancelled, they had conducted diversification of an agricultural production that has served decrease in the areas under cotton. The released areas depending on region are used under vegetable and grain crops. New gardens and vineyards are cultivated on the unproductive lands. For the last 3 years, the area of new gardens and vineyards has increased on 13 thousand hectares. For the given period farms, themselves develop structure of areas under crops with the account of natural-climatic conditions and closeness to the market. The good tendency is visible that the farms for the last years have increased use of organic fertilizers, which favorably influencing efficiency and fertility of soil..
8.2.3 Crop intensity
The intensity of the harvest depends on the type of crops.
Timeline and the intensity of the harvest.
Type of crop Months IV V VI VII VIII IX X I XII Duration of harvest, days
cotton - - - - - + + + + 40-70 wheat - - + + - - - - - 25-35 rice - - - - - + + - - 40-60
alfalfa - + - + - + - + - 35-40 vegetables - + + + + + + - - 20-180
melons - - - + + + + 30-90 tobacco - - - - + + + + - 45-80 oil crops - - - - - + + + - 30-60 potato - - + - - + + + - 20-60

CRP1.1 Characterization of the "FerganaValley" site SRT3-AS1
page 46
8.2.4 Source (s) of water for the crop production
The main resources of irrigation in Fergana Valley are: river Syr Darya, Isfara, Isfayram, Kayindy, Kodjo-Bakirgan, Sokh, Shahimardan, Gauyan, Karaungur-Say, Kasan-Say, Kanish-Kaya, Kurgat, Pashsa-Ata, Sumsar-Say, Changent-Say, Chachkan, Shaydan- Say, Kara-Darya, Arvan-Say, Akbuura, Abshir-Say, Gulcha, Karakuldja, Kizil Suu, Yassy, Kyrgyz-Ata rivers. The river Karadarya -mixed fed steam, the Ak-Bura and Aravansay- glacier-fed stream, the Maylisay- snow-fed river, water draw-off is made of a spring system, collector-drainage chain and from wells for irrigation and vertical drainage. Bring in of water to farmers is carried out by thick system, channels. The average annual use of collect water is 30-60 million m3.
8.2.5 Implements / Machinery used, the degree of mechanization
In all farmer households for the work of general purposes, the most rational is to use the crawler tractors, traction-class T-4A. To perform the cotton seeding work, the tractors MTZ-80x, TTZ 8010 and TTZ 8011 with the capacity of 80 horsepower are used. The plows TL-3-35, PD-3-35 are used for fall tillage. Pre-sowing mineral fertilizers are applied by the chisel device 4KU-4. To conduct the land leveling on the fields, the long-baseline levelers-P-2, 8 are used. Available technology, tools / equipment in the Republic of Kyrgyzstan, pieces
№ Technology/ tools Batken Jalalabad Osh 1. tractors 1 411 3 724 4 404 2. tra tor plows 394 887 865 3. cultivators 75 536 472 4. seed planters 50 372 414 5. combines 97 317 411 6. grain harvesters - 19 3 7. forage harvesters - - 2
According to the data of department of mechanization of Sogdijsky Regional Agro-Industrial Complex, data is available for May-1 about a condition of agricultural machinery. It is necessary to notice, that for the last 15 years renovation of machine-tractor park was carried out not completely, the basic part of technics to 60 % are in the

CRP1.1 Characterization of the "FerganaValley" site SRT3-AS1
page 47
worn condition, but after the organisation of Department AGROLEASING, some farms get the new technics but in insufficient quantity in view of absence of financial assets. Therefore, the farmers use all old technics which demands expensive repair and thus leading to not qualitative work on soil processing.
8.2.6 The degree of commercialization, % of sold products
Sold products (thou.t). № Crops 2000 2001 2002 2003 2004 2005 2006 2007 2008 2009 2010 2011
1. cotton 1064,517 1120,28 1070,24 806,209 987,691 1070,8 938,006 986,57 906,53 928,36 989,92 978,07
2. wheat 1308,299 1389,1 166,81 1774,47 1697,03 1067,9 1727,48
3 1796 1782,1 1252,3 2251,7 1793,1
3. potatoes 310,829 316,213 342,727 404,241 431,357 444,84 479,045 592,92 670,97 712,01 911,94 615,86
4. horticultural crops 345,272 344,771 352,511 301,913 340,181 361,22 423,964 420,61 475,71 508,23 654,37 333,95
5. vegetable 768,57 796,292 812,434 864,552 907,817 940,21 1095,273 1226,7 1330,5 1442 1789,8 952,05
6. melons 46,235 46,338 51,416 60,15 59,41 67,811 86,168 109,17 136,2 157,6 288,16 93,904
7. other crops 84,955 133,906 159,591 155,409 156,341 162,92 179,442 194,41 227,42 282,54 277,97 287,56
No information on the Republic of Kyrgyzstan(from 2000 to 2009).
8.2.7 Saptial organization of cropping in relation to environmental differences
Height <100 Under the sea level
Height 100-500
Height 500-900
Height 900-1300
Height 1300-1700
Height <1700-2000
Height 2000-2400
Height 2400<
All crops In the mountains of Fergana Valley, the following crops are grown: Natural feeds, almonds, walnuts, wild rose. On the foothills: Wheat, barley, alfalfa, sainfoin, horticultures, large fruits and potato. On the plains: Wheat, cotton, tobacco, maize, potato, onion, carrot, beans, vegetables, melons, fruit and berry crops, alfalfa, greenhouse crops, etc.

CRP1.1 Characterization of the "FerganaValley" site SRT3-AS1
page 48
8.3 Descriptors, related to animal component
Livestock is an important part of the Fergana Valley’s agriculture, contributing to the insuring of the population with food and industries by the raw materials. Depending on the natural-climatic conditions of the region, livestock can be divided into intensive (industrial), extensive (grazing), and domestic. Dairy cattle breeding, poultry farming is concentrated in the suburban area of irrigation. Pasture livestock is concentrated in the area with the low natural resource potential and domestic livestock -on private lands. Depending on the natural-climatic conditions of the region it can be divided into intensive (industrial), extensive (grazing), and domestic livestock. Dairy cattle breeding, poultry farming is concentrated in the suburban irrigated area. Sheep breeding - the most common type of livestock activity. The main breeds of sheep are “kyrgyzskaya” with fine wool, merinos, “gissarskaya” and other local breeds. Pasture forages cover 60 - 89% of the total forage needs of livestock, the other gets in the form of concentrates, and other coarse fodder during the winter. Meat, wool consumed locally, woolfell are exported Goat breeding. Goat breeding is popular in the middle mountain regions, mainly local breeds. The population consumes meat and milk; fur fiber is exported. Last years, people consume more goats’ meat, since it is more easily digested and not increase blood pressure. Cattle breeding. Almost every rural family has at least one cow. From late May until the autumn, cattle is grazing on remote pastures, as in the valley area the land is cultivated. Meat and milk sold in the markets. Breeds are mostly local. Horse breeding. Horses forage indoors only during the wintertime, the rest of the time they are forage outdoors on the spring-summer and autumn pastures. They are used for meat production, koumiss (milk), to participate in the national games as ulak tartysh, kiz kuumay, alaman bayga, jorge salysh for money. In addition, horses are used for plowing and field treatment, where is no any opportunity to use technology. Breeds are local (Orlov, Don, Don, blooded mingy). Yak breeding They are mostly grazed on the high mountain pastures, and used for meat and sometimes for milk.

CRP1.1 Characterization of the "FerganaValley" site SRT3-AS1
page 49
Pigs. Pigs are ranched in small quantities, by people living in suburban areas (in home conditions) for the meat
8.3.1 Main animal species or races kept (thou. heads)
The main breeds of livestock Breeds
and types of
livestock
1997 1998 1999 2000 2001 2002 2003 2004 2005 2006 2007 2008 2009 2010 2011
Cattle 641,944 665,773 693,617 721,69 760,619 769,551 852,951 859,09 908,708 1918,182 2021,734 2213,377 2325,912 2494,584 2023,453
small cattle 1217,946 1224,229 1257,539 1249,423 1300,29 1326,986 1435,123 1502,56 1572,245 2635,154 2745,98 3037,739 3208,684 3364,104 4114,108
soliped 3,15 3,26 3,24 3,45 3,6 3,9 4,45 5,47 5,58 17,02 17,55 18,27 18,78 18,8 155,131
poultry 1107,354 1200,958 1324,848 1507,53 1684,861 1854,359 2111,079 2392,468 2876,764 5329,369 5787,656 6988,37 7876,062 9481,281 8261,242
Other 0,61 0,63 0,44 0,73 0,9 0,67 0,73 1,49 1,59 7 5,79 5,05 4,9 5,7 0,994
rabbits 3,277
bee community, units
74,37
There is no information on Batken, Jalalabad and Osh regions (from 1997 to 2010)
8.3.2 Feed systems In the Fergana Valley, especially in the Andijan region, the livestock is popular at the farm level due to the limited pasturelands. There are irrigated lands for the production of forage crops within the farmer households. Feeding systems consist of: forage, hay, alfalfa, sainfoin, silage, pressed forage, corn, and oats. According to the data of department of Livestock of Sogdijsky Regional Agro-Industrial Complex, after 2002 basically cattle and goats and sheep have been left on the balance of large-scale farms, who were allocated land areas in conformity to existing specifications, but for cultivation of thoroughbred breeds, 24 various farms were left on balance of public sector, and also 6 large specialized poultry-farming factories carry out the activity in the region. Large pastures are available in insufficient quantity; therefore, farms themselves are engaged in manufacture and preparation of forage.

CRP1.1 Characterization of the "FerganaValley" site SRT3-AS1
page 50
8.3.3 Prevalent livestock diseases and mortality
Livestock is developing mainly in the farm, where special care and veterinary control of animal diseases organized. Common diseases:
• Cattle: rabies, aphthous fever, cholera, anthrax, emkar, braxy, leptospirosis. • Small cattle: rabies, aphthous fever, pox, cholera, anthrax, brucellosis, salmonellosis, enterotoxemia,
bradsot. • Horses: covering disease, anthrax. • Poultry: Newcastle disease (cholera), pullorosis.
Information on diseases occurred among livestock animals in the past 2010/11 years within 3 areas of the Republic of Kyrgyzstan.
Region Diseases, % animals
Cattle Small cattle Horses Poultry: 1995 2000 2011 1995 2000 2011 1995 2000 2011 1995 2000 2011
Batken
rabies + + aphthous fever pasteurellosis + Siberian plague emkar braxy leptospirosis pox brucellosis + + salmonellosis Newcastle disease (cholera) pullorosis + covering disease +
Jalalabad
rabies + + aphthous fever + pasteurellosis Siberian plague emkar braxy leptospirosis + pox

CRP1.1 Characterization of the "FerganaValley" site SRT3-AS1
page 51
brucellosis + salmonellosis Newcastle disease (cholera) + pullorosis covering disease +
Osh
rabies + + aphthous fever pasteurellosis Siberian plague + emkar braxy leptospirosis pox + brucellosis + + salmonellosis Newcastle disease (cholera) pullorosis covering disease +
According to the data of veterinary service of Sogd region, there is an annual mortality among home livestock; for the period from 1997 to 2011 mortality as a whole made in cattle-2213, sheep and goats -99176, poultry -783514. There is a tendency of reducing morbidity and mortality among the cattle for the last 5 years.
8.3.4 Main livestock products
Meat, milk, sour cream, butter, cream, yogurt, chalap, cheese, kurut, koumiss, wool, woolfell, fur fiber, eggs, silk cocoon, honey.
Products
Measuring unit 2000 2001 2002 2003 2004 2005 2006 2007 2008 2009 2010 2
Meet th. t 55,324 55,945 56,728 61,811 66,498 70,475 73,166 76,455 81,015 86,139 279,668 1
milk th. t 334,633 338,937 344,699 369,015 392,926 419,798 428,903 446,51 477,973 506,479 1900,83 10
Eggs mln. units. 96,714 97,584 101,585 134,636 138,491 144,586 156,665 176,7 182,674 200,414 226,879 3

CRP1.1 Characterization of the "FerganaValley" site SRT3-AS1
page 52
wool dt. 16583 16789 16840 15657 15790 15826 15921 16883 17389 17551 18469 Source: Agriculture, Kyrgyzstan, Bishkek, 2011 and Stat. Management, Uzbekistan
8.3.5 Degree of integration with crop component
Farmers are interested in the crops- based feeding. Especially in the private farmer households, feeding is based on such crops as wheat, oats, and maize for silage and for grain, alfalfa, sainfoin, straw brick, sorghum and other crops. Probably, in the future, the main livestock will be based on the agricultural crops Sown area under fodder crops
Indicators Farmers households
Small farmer households (dekhans)
Totally
Area, ha 33956 6363 40319 According to the data of department of Livestock of Sogdijsky Regional Agro-Industrial Complex, at the expense of production of feed crops and cereals, as well as after harvesting of repeated crops, annually 6,8 feed unit are produced per cattle, аnd also feed is bought from outside
8.3.6 Spatial organization in relation to environmental differences
Type of livestock asle < 100,0 m. Baltic sea from 100 to 500 m. Baltic sea Sheep breeding + + cattle breeding + +
8.3.7 Prevalent crop pests, diseases and parasitic flowering plants (parasitic weeds).
Some weeds on cotton and wheat fields. 1. barnyard grass, millet - Echinochof cus-galli (Z) Beauv 2. field bindweed - Convolvulus arbensis 3. goosefoot family - Chenopodiacae 4. common reed - Phragmites communis Trin Parasitic plants
Pests of wheat • turnip moth - Agrotis segetum Den Et Schiff • cereal leaf beetle - Lema melonopus Li • sunn pest - Eurygaster in tegrictps Put • wheat aphid - Schizaphis graminum Rond. • greenbug - sitobion avenae F. • tarnished plant bug - Lygus pratensis Li. • cicada - Cicadinea.

CRP1.1 Characterization of the "FerganaValley" site SRT3-AS1
page 53
1. field dodder - cuscuta appoximata Robingt 2. broomrape - orobanche 3. pests of cotton 4. melon aphid - Aphis gossypii C, lov 5. alfalfa aphid-Aphis eraccivora Koch. 6. tobacco thrips - Throps tabaci Lind. 7. greenhouse whitefly - Trinlenrodes Varorariorrum westne 8. cotton whitefly-Bemisia tabaci 9. turnip moth - Agrotis segetum Den 10. cotton moth - Aclithis armigera 11. glasshouse spider mite - Tetranychres urtunal Koch.
Common diseases of cotton 1. leaf mottle - Verticillum dahliae 2. fusarium - Fusarium oxysporum. F vasinfectum 3. angular leaf spot - Xanthomonas campestris hv. Malvaceaerum Common diseases of wheat 1. loose smut - Ustilago tritici (Pers) Jens 2. head smut - Tillettia tritici (Bjerk) 3. yellow rust - Pussinia striiformis West 4. brown rust - Pussinia triticina Erikss 5. powdery mildew - erysiphe graminis DC f. Tritici Marchal
8.4 Market access and characteristics 8.4.1 Distance to closest local market (km, hours of travel time)
The most people sell their agricultural products at the local market mainly located in the center of the district. Individual farmers (who have a vehicle or tractor) transport their products to the regional centers of the Fergana Valley, as there prices are higher (on 10-15%) compared to the district market. There is a case of daily supply of agricultural products in the center of the farms. The distance from farmers to small market, located in the center of the farms, varies from 2 to 20 km, and time to reach it ranges from 35 minutes to 1 hours (depending on the type of transport (mostly on araba cart)). Distance from district center to the farmer households varies from 5 to 25 km, depending on the type of transport travel time may vary from 10 minutes to 60 minutes. Those who have own cars, deliver their products to the regional center (mostly within 10-60 km). Distance, depending on the location, varies from 10 to 70 km and travel time takes from 30 minutes to 2 hour. Information on Sogd region: depending on areas and the location: the local markets, where farmers basically hand over their production in the first turn- to Isfarinsky-110 km, Khojend, Kanibadam-75 km, B.Gafurovskij-10 km, J.

CRP1.1 Characterization of the "FerganaValley" site SRT3-AS1
page 54
Rasulovsky - 15 km, Spitamenski-35 km, Mastchinsky - 65 km. The central market is in Sogd region and in the city of Khojend. Wholesale buyers buying production in the local markets realize them in the central market, or after storage resale it to wholesale buyers. Also, there are markets depending on type of production, for example the basic market on onions sale is in Istarashan and Spitamen, on sale of fresh fruit - in Asht, on sale of dried fruits - in Isfara.
8.4.2 Sizes of rural markets
Sizes of rural markets depend on the size and productivity of smallholding and subsidiary personal plots. Within the territory with dense population, farmers get a higher yield on their plots, and the size of rural markets ranges from 0.5 to 1.5 hectares, and more. On the territory of the northern regions, the magnitude of this figure is even lower, 0.2 - 0.5 hectares. It should be noted, that in rural areas, not all farms have their own markets, and they deliver products to the district or regional central markets. The size of markets: 1. Up to 100 m2 2. From 100 to 500 m2 3. from 500 to 1000 m2 4. from 1,000 m2 to 10,000 m2 5. More than 1 hectare, depending on population density.
8.4.3 Competitiveness and access to local, national, regional and global markets
In the agricultural sector of the Republic of Uzbekistan, the government sets the orders for production of cotton, and has access to the world market through stock market (farmers do not have direct access to the world market). For other crops like wheat, rice and other vegetables, farmers have access to local and national markets (in this matter there are no specific difficulties) and they have comparative advantages in quality and environmental friendly products. In the other republics such as Kyrgyzstan and Tajikistan, there are no any government orders; all growing crops can be sold at the regional and world markets. Cotton, fur fiber, partially dried apricots exported to the world markets. Tobacco, meat, vegetables, rice, dried fruits, fruit, honey are for sale on the regional markets Tobacco, cotton, meat, milk, cream, butter, sour cream, yogurt, chalap, cheese, kurut, koumiss, wool, woolfell, eggs, etc. are for sale on the national and local markets.

CRP1.1 Characterization of the "FerganaValley" site SRT3-AS1
page 55
8.5 Access to land, water and other inputs
According to the Constitution of the Republic of Uzbekistan and other legislations, the government must regulate all land, water and other resources. For this, there are a number of government regulations (on the international and national levels), where the political, legal and economic aspects of the use of land and water and other resources, including the rights of citizens on access to land, water and other resources are defined.
8.5.1 Access to land All land resources included in the unified state land fund, which, in accordance with the principal intended purposes are subdivided into the following categories: - agricultural land, provided to the farmers and other land users for agricultural purposes; - settlement lands (small households, municipal and other species); - land for industry, transport, nature reserves and other non-agricultural purposes; - The land of the state forest fund; - The land of state water fund; - The land of state reserve. The government establishes the basic rules of Land Management. Under the current land legislation of the Republic of Uzbekistan, the categories of land and land access shall be defined in accordance with their main intended purposes. Most part of the land fund is used for agricultural purposes. According to the Law of the Kyrgyz Republic, 75% of the total arable land area was allocated among each residents of the republic. All citizens have the land share from 0.03 to 5 ha, and they have the right to sell, lease, and donate it. In conformity with acts of Republic Tajikistan and to the Law on farm-dehkan farms, accepted in 2009, all citizens have access to land tenure for cultivation of agricultural crops and for the use of their needs. Process consists that the citizen writes applications to Local governments, where the decision is made and is transferred in Land committee of area, after registration in Land committee of republic, the farmer receives the certificate on land use when due hereunder. Also, he\she is obliged to promptly submit reports to corresponding bodies about the activity.
8.5.2 Access to water
According to the law, each citizen has a right of access to safe water on both international and national levels. Access to the water resources can be carried out in the following ways: • for drinking purposes (water supply and sanitation); • for agricultural production;

CRP1.1 Characterization of the "FerganaValley" site SRT3-AS1
page 56
• for the industry; • to protect the environment. The main legislation on water use and water access exposed in the Constitution of the Republic of Uzbekistan (1992), the Law of the Republic of Uzbekistan “On the limited water use in the Republic of Uzbekistan” (1993), the Law “ On Water” and other legislative acts. The problem of water supply is quite acute. It is multifaceted and complex. Approximately 90% of water resources in Uzbekistan are formed outside of the country. The water distribution become complicated and the water supply is being reduced each year, which is leading to the yield losses due to the following reasons: establishment of independent states, which have government borders; the reorganization of agricultural enterprises and the increasing of number of water users in the form of farmer households and farms, small agricultural enterprises; population growth; obsolescence of hydro-technical structures, irrigation and collector and drainage networks, pumping stations. The problem of optimal water supply more often occurs with water sources that are not regulated, especially in the Fergana Valley, where the excess of water in cross-border small rivers during the flood period and the deficit during the growing season take place. In the midst of the growing season, the pumping water stations are activated to recharge the shallow water sources. In addition, outdated pumping stations and hydro-technical structures are characterized not only by the complexity, but also by their expensiveness. The budget funds allocated for their use and repair is clearly not enough, and besides, they are decreasing every year. At present, within the all soil-climatic regions, the limiting factor of increasing the productivity of cotton is an increasing shortage of irrigation water during the most critical period - watering during the growing season. Therefore, it is necessary to achieve a stable and sustainable harvest of cotton by the use of science-based modes of irrigation and irrigation technology, and increasing water productivity. Considering the fact that 60% of the population in the Republic of Uzbekistan engaged in agricultural production and about 90% of food products produced on irrigated agricultural lands, the solution of the water management problem is seen in increasing of water and land productivity. The Fergana Valley, in particular the Andijan, is the most populous region in the Republic, where the agricultural production is higher in comparison with the other regions of the country.

CRP1.1 Characterization of the "FerganaValley" site SRT3-AS1
page 57
Reclamation of new lands has almost ended during the Soviet period, but the population and the need for agricultural products still growing rapidly. Therefore, it is vital to use the water resources rationally, increase the productivity of agricultural crops and water / land productivity. In addition, in recent years, the intensity of the various cataclysms in the climate-ecological aspects has increased dramatically. The most shallow and most high-water years, which previously were repeated only once in the century, now occurs during last three years. For example, in 2008, there was lack of water, in 2010 was opposite. Water professionals had to manage the water resources in the extreme situations; moreover, the several mistakes in agricultural production took place because of the low inexperience of farmers and changed climatic conditions. Land users in the Kyrgyz Republic have access to water resources. For the distribution of irrigation water among the water users in the country, there are 477 water user associations (WUAs) managing about 80% of the total irrigated area. Water is free for an irrigation in Republic Tajikistan, but there are payments for water supply, as water is supplied through pump stations; for 1 m3 water in conformity of the Decree of antimonopoly committee from April 1, 2011 the farmer should pay 1,5 dirham and + VAT, in total for cubic meter of water it is necessary to pay 1, 77 dirhams.
8.5.3 Access to other inputs (seed, fertilizer, etc.)
According to the agreement between farmers and suppliers, and by the request of farmers, the necessary resources as fuel, seed, fertilizer, tractors (who do not have) according to the established prices are being provided. According to the regulatory planning costs estimated for each farm at the end of the year (depending on the size and type of crops) the relevant services are being provided to farmers. Farmers make agreements (preliminary, advance) with the relevant organizations, for example with petroleum tank farms. Seed producing farms in Kyrgyzstan provide farmers with seeds of cotton, wheat, maize, tobacco, rice, vegetables, fruits and berry crops. The seeds of good varieties of tomatoes, peppers, melons, vegetables, etc. are imported from the other countries. Fertilizers are not produced in the Kyrgyz Republic and mostly are imported from Uzbekistan and Russia. Plant protection products are imported. Motor fuels are mainly imported from Russia and Kazakhstan.

CRP1.1 Characterization of the "FerganaValley" site SRT3-AS1
page 58
Seeds of agricultural crops in Sogd region are bought at seed-growing and private persons, but mainly farmers themselves are engaged in seed growing. 9 specialized seed-growing farms function In Sogd region on cotton, grain, potato growing. The regional management conducts all process of seeds control. Also, in the region functions Regional vegetable seed department, which is engaged in delivery and realization of seeds from abroad. There are representations of international companies.
8.6 System problems 8.6.1 Lack of market access
For all crops except cotton, there is an access to domestic markets. Exit to the world level is determined by the government regulations. Almost in all districts and big villages in Kyrgyzstan there are markets, where the villagers can buy or sell food, agricultural products, livestock animals, building materials, household equipment, exchange currency ( as the markets neighboring with Uzbekistan and Tajikistan). In remote villages, there are no markets.
8.6.2 Land fragmentation
The land allocation among farmer households in Uzbekistan was based on tender requirements of the existing legal documents. In the beginning, when the farms were developed on the basis of farmer households (shirkat), the allocation of land between the farmers was carried out on conventional criteria (by the initiative of farmers and availability of land resources). That area ranged from 3 hectares (gardening) to 100 ha, or more (cotton and cereals). This allocation of land has led to such undesirable consequences: - Reduction in crop yield due to a lack of mechanisms (tractors) and equipment; - Difficulties in operational services, financial accounting, cost; - In small farms (less than 3-4 ha) to a monoculture had been admitted, and it decreased the productivity of the land (no rotation). Considering this, during past years (from 2008) the State Program on strengthening land resources by changing small farms on larger (minimum 20 ha, maximum - 200 ha) was adopted. The land allocation among farmers by using this principle has given positive results. All land areas were divided into equity and rural residents received their own land. Currently, in the Republic of Kyrgyzstan, the size of the biggest and the smallest land equity is: 0.05 ha -1, 5 ha, respectively. On the basis of the application and the decision of the regional Government of Sogd region, the land is equally

CRP1.1 Characterization of the "FerganaValley" site SRT3-AS1
page 59
distributed among farmers and their share is defined, that is the land belonging directly to the farmer; the size of the land share depending on areas varies within 0,6-1,5 hectares on one farmer.
8.6.3 Decline in animal feed from rangelands
Due to global warming and decrease of rainfall in the highland pastures, the forage grasses quickly dry up. Due to the over grazing, pastures are degraded. The winter of 2011 - 2012 continued longer and in remote regions of the Fergana Valley, farmers’ forage reserves were finished until the end of winter, which brought to the loss in livestock. The percentage of feed decrease on pastures is 10-15%. Pastures can be divided on two types: irrigated pastures (located on the irrigated lands (internal) and periodically flooded beyond the irrigated area by flood river flows, non-irrigated pastures, which are irrigated by the precipitations. People, living next to the irrigated pastures, constantly graze their livestock on the village pastures without any system. In addition, the development of land on the large area, eventually affects its productivity, both on the quantitative and qualitative manners. This is also due to the sharp increase of local population. On the territory of non-irrigated pastures, the day-and-night grazing of animals (sheep) causes a sharp dynamics of yield of forage mass. The following plants are generally growing on these pastures: tamarisk (Tamarix leptostachys Bunge), Siberian salt tree (Halimadendron), haloxylon (Haloxylon Bunge), and other dwarf ephemeral plants, such as Circassian Richter salt grass (Saisola Ricateri Kar), жовник солончаковый (Anabasissalsa) and other host plants Grazing – sheep and goat breeding, based on a full or partial grazing on the pastures, and its negative impact effect on soil, vegetation, and creates conditions for desertification of the territory and sharp decline in biological diversity. Reduction of forages and pastures in Sogd region as a whole depends on suitably climatic conditions and rational use of existing pastures. In addition, Saxaul crops are annually produced, including also other types in 30-45 hectares by Pasturable ameliorative station in Sogd region.
8.6.4 Soil fertility decline
Despite the huge efforts to improve the productivity of crops, land productivity remains at low level. The main reasons for this are the following factors:

CRP1.1 Characterization of the "FerganaValley" site SRT3-AS1
page 60
• defiance of scientific-based cropping systems; • Absence of crop rotation and the widespread introduction of monocultures; • poor quality agricultural activities (plowing, leveling), which is accomplishing not in full capacity; • an extremely low level of humus in the soil; • a sharp reduction of the area under Lucerne; • the emergence of a dense moist plow stifle on the upper horizon below the layer of 20-25 cm, which leads to delay in development of the root system (the density of soils in some cases reaches 1,45-1,6); • NPK nutrients washed from the soil as a result of high rates of leaching irrigations; • high salts content in soil, which are concentrated in the top layer and thus only for cotton, yield losses are 5-10%; • lack of organic fertilizers and mulching; • occurrence of weeds; • insufficient amount of NPK and violation of their relations, which lead to the reduction in land productivity and quality of products. Soil fertility decreases with each passing year. Organic fertilizers are applied, but not in a required amount. Phosphorus, potassium almost not applied. Mostly the nitrogen is applied, but the price on it rising every year. These factors too much influence on soil fertility. It is necessary to notice, in Sogd region of R.Tajikistan till 2008, when futures' company has been strongly developed, there was a tendency of the maximum application of mineral fertilizers and pesticides, and there was a tendency of annual increase in the areas under a cotton; the accepted crop rotation was not practically applied, and reduction of natural fertility of soil started taking place, organic fertilizers were used in not a significant amount. However, for the last 3 years, the tendency of increase in application of organic is observed, as it occurs much cheaper, and more comprehensible. In addition, principal causes of decrease fertility of soil are not correct agricultural practices, not timely processing of soil, not rational use of irrigating water, weak introductions of energy saving technologies. In addition, low (only 5 %) use of phosphoric and potash fertilizers, as in the region there is no manufacture of mineral fertilizers.
8.6.5 Other system problems
The transition from command-centralized management in agricultural production to the free collective and private property during a short time has created big problems, which have already been resolved by the government, but still rising issues need to be solved. The main issues are: • lack of crop rotation and the widespread introduction of monoculture (which crop rotation is necessary); • poor quality agricultural activities, which are implemented inappropriately (plowing, leveling);

CRP1.1 Characterization of the "FerganaValley" site SRT3-AS1
page 61
• an extremely low level of humus in the soil; • lack of applying organic fertilizers and mulching; • low level of farming and the weeds; • lack of water resources; • poor water control; • farmers are not ready to adopt to the new market economy system; • the relatively low supply of agricultural machinery, fuel and fertilizer; • limited opportunities to shift to more cost-effective model due to low returns per irrigated hectare (as the result of the continuing decline of world prices for agricultural products and, accordingly, low-income of agricultural producers (farmers) ( this issue is partially solved in most households)); • low level of implementation of scientific, technical, advanced technologies in agriculture; • shortage of competent experts in Sogd region; • deterioration of machinery; • deterioration of pump stations; • absence of water measuring devices; • a lack of financial assets; • weak introduction of technology for dry and over-humidified period. Also: There is a lack of techniques for cultivation. Approximately, there are 2.5 units of tractors for 100 hectares of land (One (1)-tractor tills 40 hectares of land per the season).
8.7 System dynamics 8.7.1 Stability, stagnation or revolution towards other more / less productive / profitable / environmentally sustainable systems
Many indicators define stability and development of the agricultural sector, for example, the value of agricultural products (crop production, cotton, wheat, and others), gross yield, crop yield, and livestock). Stability and development of the agricultural sector in Andijan region
№ Indicators 2000 2001 2002 2003 2004 2005 2006 2007 2008 2009 2010
1.1
Agricultural production (at current prices, billion sums)
31,95 66,85 91,1 137,9 185,24 313,03 467,17 544,33 510,92 545,31 644,2
1.2 Crop production 142,33 175,49 189,26 206,69 212,86 292,55 539,02 627,69 859,8 1162,8
5
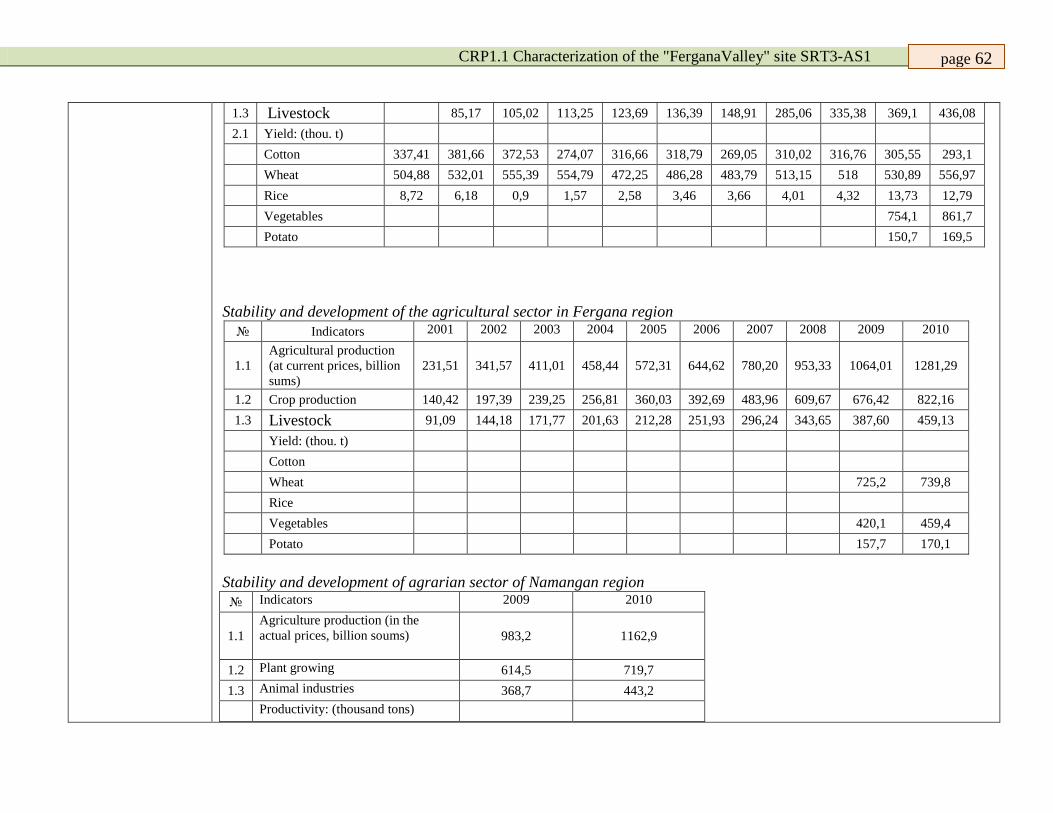
CRP1.1 Characterization of the "FerganaValley" site SRT3-AS1
page 62
1.3 Livestock 85,17 105,02 113,25 123,69 136,39 148,91 285,06 335,38 369,1 436,08 2.1 Yield: (thou. t) Cotton 337,41 381,66 372,53 274,07 316,66 318,79 269,05 310,02 316,76 305,55 293,1 Wheat 504,88 532,01 555,39 554,79 472,25 486,28 483,79 513,15 518 530,89 556,97 Rice 8,72 6,18 0,9 1,57 2,58 3,46 3,66 4,01 4,32 13,73 12,79 Vegetables 754,1 861,7 Potato 150,7 169,5
Stability and development of the agricultural sector in Fergana region
№ Indicators 2001 2002 2003 2004 2005 2006 2007 2008 2009 2010
1.1 Agricultural production (at current prices, billion sums)
231,51 341,57 411,01 458,44 572,31 644,62 780,20 953,33 1064,01 1281,29
1.2 Crop production 140,42 197,39 239,25 256,81 360,03 392,69 483,96 609,67 676,42 822,16 1.3 Livestock 91,09 144,18 171,77 201,63 212,28 251,93 296,24 343,65 387,60 459,13
Yield: (thou. t) Cotton Wheat 725,2 739,8 Rice Vegetables 420,1 459,4 Potato 157,7 170,1
Stability and development of agrarian sector of Namangan region
№ Indicators 2009 2010
1.1 Agriculture production (in the actual prices, billion soums) 983,2 1162,9
1.2 Plant growing 614,5 719,7 1.3 Animal industries 368,7 443,2
Productivity: (thousand tons)

CRP1.1 Characterization of the "FerganaValley" site SRT3-AS1
page 63
Cotton Wheat 434,8 441,0 Vegetables 394,4 439,4 Potato 135,4 152,8
Source: Statistics of the regions of Uzbekistan, Таshkent 2011. Stability and development of the agricultural sector in Kyrgyzstan
№ Indicators 1990 2000 2005 2006 2007 2008 2009 2010
1.1 Agricultural production (at current prices, billion sums) 72103,1 89736,5 112017,
1 111073,5 115023,2
1.2 Crop production 40739,4 50436,4 63137,5 59547,9 59620,4 1.3 Livestock 30359,3 37721,8 47156,5 49236,9 52874,9 2.1 Yield: (thou. t)
Cotton 17,7 26 26,1 25,6 27,4 29,1 29,1 27,9 Wheat 26,2 23,4 23,6 20,7 20 19,4 26,3 21,7 Rice 11,1 26,3 28 28,4 27,6 28,4 30,7 30,5
As can be seen from the tables, in Andijan and Fergana regions, the dynamic of the basic sectors of agriculture is mostly stable growing in recent years. In addition, there is a general increase in crop production and livestock. In the Kyrgyz Republic, livestock sector is stable growing during the past years, but in the crop production (from 2006 to 2008) the increase was changed by later decline due to the decrease in cotton yield and increased cost of fuel, fertilizer, seeds, etc. In Republic Tajikistan in Sogd region there is an annual increase of the indicator: in average in plant industry sector by 8,3-10,3, livestock sector by 4,6-7,9 %. Source: Annual publishing of GDP and collection of works devoted to 20-anniversary of independence of Republic Tajikistan in Sogd region, 2011.
8.7.2 Most common type of agricultural enterprises (e.g. individual / private,
Information on Fergana valley (except for Sogd region). Types of household
Measuring unit
2000 2001 2002 2003 2004 2005 2006 2007 2008 2009 2010

CRP1.1 Characterization of the "FerganaValley" site SRT3-AS1
page 64
cooperatives and state owned farm (sovkhoz))
farmer
Amount 4360 4554 4776 6593 8375 10321 25736 54057 55553 32300 20947 20522 ha 34700 36200 37500 87700 127200 168000 397200 873200 486100 492997 505597 858739
Average, ha
6,9 7,0 6,9 14,3 15,0 16,1 15,4 16,2 16,1 26,8 40,1 42,3
dekhkan
Amount 12654 26118
481666 531583 565180 569899 570060 1461922 906291 910987 911113 1486529
ha 1395 2879 54422 59977 63717 64251 64268 172178 101417 99505 99123 168133
Average, l, ha
0,11 0,11 0,11 0,11 0,11 0,11 0,11 0,12 0,12 0,11 0,11 0,11
shirkat Amount 122358 198364 249523 298652 337985 338123 338236 5 5 5 5 5 state Amount 285 269 242 253 226 state ha 1956685 collective ha 209466 peasant ha 182775 186369 184454 184536 186494 smallholding
ha 835
private Ha 80346 horticultural business
ha 265
Information on Sogd region. Name of farms Ед.изм. 2003 2004 2005 2006 2007 2008 2009 2010 2011 Dehkan farm Кол-во 2491 3534 4049 5025 5651 6282 7487 8439 15262 Collective and state farms
Кол-во 64 50 28 20 11 0 0 0 0
Cooperatives Кол-во 112 110 80 90 68 85 45 221 395 Tendency of reduction COOP until 2010 and tendency of increasing for 3 years are in unification of farmers. Source: Sogd Regional statistics.
8.7.3 Presence of producer associations (e.g.
The presence of associations of producers in Fergana Valley

CRP1.1 Characterization of the "FerganaValley" site SRT3-AS1
page 65
farmers' groups, water use associations, marketing associations, cooperatives)
Producers 2000 2001 2002 2003 2004 2005 2006 2007 2008 2009 2010 2011
Farmer households 7129 7966 10504
13465
16357
22589
44156
53926
42560
33807
25044
17331
Water users associations 1 40 57 83 169 324 522 525 683 564 536
Agricultural cooperatives 22 22
The quantity of associations, as Association of Agrobusiness of Tajikistan (1), Associations of Water users (187), the Union of Business Association of Sogd (1), Production co-operatives, consumer co-operative societies, 187 farmer groups on manufacture of an organic cotton in "Biokishovarz" the enterprise for processing and realisation of dried fruits has increased for the last 3 years in Sogd region (9).
9. Governance, Institutions, Policies 9.1 Institutional Support
To achieve the goal of economic efficiency, improve institutional measures in the management and use of land, water and other resources, the following measures were developed for farmers in Uzbekistan:
• trainings on farmer’ rights, learning the basics of agronomy and farming for the users of land and water resources for the effective use and ensure the stability of agricultural production; • provide access to electronic information on water conservation through the publication of information brochures, posters and other printed materials in a language understandable for the users; • increase the capacity of land and water resource users through the trainings on agricultural production management; • monitoring the effectiveness of use of water and land resources, practical application of scientific and practical recommendations.
In Kyrgyzstan, the following organizations are providing the services on the implementation and dissemination of best practices: the Ministry of Agriculture and Land Reclamation, Department of Water Resources, Department of pastures management, Departments for support of WUAs, Department on agricultural development, regional and district

CRP1.1 Characterization of the "FerganaValley" site SRT3-AS1
page 66
akimiats, rural districts, research institutions. NGOs and PF: Rural counseling services, learning centers, consultations and innovations, “Tes” Center, “Bioservis”, “Mehr Shavkat”, “Tayan”, “Agroline”, “Bilek”, “Agrobazar”, Association of Agricultural Services, DCCA, Association of fruit and vegetable farmer households, etc.
9.1.1 Extension services and NGOs
Within the Ministry of Agriculture and Water Resources of the Republic of Uzbekistan and its departments, there is no any official division or department providing extension services. However, each department, depending on the needs within the year, organizes several seminars and workshops on all aspects of the agricultural sector, with involvement of all stakeholders. The results of experiments of the various projects, implemented with financial support of donors, are being disseminated in the region. For example, within the project on "Improving water productivity at plot level" financed by SDC, the Information Center was developed with the involvement of SANIIRI. Based on the activity of Information Centre, the several stakeholders’ training - seminars, site visits of scientists and experts, the experimental sites for the introduction and learning effective methods of water conservation are being organized. Adjusted recommendations, booklets and brochures to share the experiences in agricultural production are being published based on the systematic monitor. Kyrgyz Research Institute of Agriculture, Irrigation Research Institute, Research Institute of Veterinary, Research Institute of pastures and forages, Research Institutes of the National Academy of Sciences are working on the development of improved locally adapted varieties, animal breeds and technologies. The Central administrative board of agriculture of the region is engaged in development of Agrarian policy in Sogd region, which has in its structure 14 regional managements and 26 subordinated organizations in all directions connected with agriculture. Also all international organizations are engaged in distribution of high technologies, rural population makes including local NGO, as a great mass of population, therefore tendency of increase of work for rural population annually increases. There also exist advisory services of a private sector or services, organized after the termination of the international projects, which successfully carry out the activity in the region in distributions of technologies and knowledge among farmers. For the last 5 years private or individual advisory activity is practiced from leading experts and scientists of a various direction..
9.1.2 Access to improved / adapted varieties / breeds
Many new promising (in local conditions) varieties were developed within the system of agriculture. By the request of farmers', the department on seed production supplies the released varieties of cotton, wheat and other crops of the 2nd and 3rd reproduction (in recent years the quality of varieties, especially of cotton decreased).

CRP1.1 Characterization of the "FerganaValley" site SRT3-AS1
page 67
In Sogd region there are seed-growing farms, and also in the region there is an institute of farming, which successfully works in developing agricultural practices, introduction and breeding of cotton and other agricultural crops. Saplings are produced in 6 large nurseries and even distributed in southern regions of Republic Tajikistan. Seeds of vegetable crops are basically are bought in seed-growing farms; hybrids are bought from private businessmen, manufacture of hybrids in the region is not caried out. Cultivation of melons of Dutch varieties is practised for the last 2 years.
9.1.3 Access to animal health services
In each region Republic of Uzbekistan (even in some households), there are small departments for providing the veterinary services. Access is unlimited. In many rural districts of the Republic of Kyrgyzstan, there are veterinarians. But there are some problems on the places: 1. Not in all rural districts, neighborhoods, villages there are primarily veterinary centers; 2. There are no legal ownership documents for animals; 3. There is no primary records of animals (owner has the record books); 4. Rules on transportation, sale, animal management, drugs storage, etc. are not performed appropriately; 5. In the markets, processing plants, and outside marketplaces, the veterinary service is not up to par; 6. The rights, duties and responsibilities of private veterinarians are not defined. It is necessary to notice, that veterinary service are available to all subjects in all categories of public and a private sector
and the association of veterinary surgeons functions in Sogd region, where 1000 veterinary doctors have been registered. Medicines are basically bought from other countries.
.
9.2 Policies 9.2.1 Pricing / subsidies for input (land, water, fertilizer, etc.)
The government Republic of Uzbekistan sets the prices for key resources (land use, fertilizers, machinery, etc.) with the taking into account the level of global and national market. Some farms, which do not have the funds, are provided by the government subsidies, covered by farmers after the harvest. The credits are provided by the government for the production of the government ordered crops (such as cotton and wheat) including the fuel to use machinery; fertilizers, etc. Price formation in R.Tajikistan and R.Kyrgyzstan is established according to acting legislative covenants. Fuel and lubricants and seeds are provided in critical situations from state reserve

CRP1.1 Characterization of the "FerganaValley" site SRT3-AS1
page 68
9.2.2 Pricing / subsidies for produce
Government sets the prices for agricultural production with the consideration of changes of the internal market. Pricing policy for each crop or other types of production is based on the contracts and agreements between farmers and government organizations.
9.2.3 Policies related to land and water resources
To obtain a stable and secure access to water, the relevant regulatory documents were developed in accordance with the laws of the Republic of Uzbekistan and implemented in the selected farmer households: - Plan for water-use based on the irrigation modulus of district; - Approved documents of local administrative bodies on the size of irrigated areas in the context of crops; - Application of water user in WUA, according to the plan of water use; - An agreement between the water users and suppliers of water; - Book for recording of water received, by the applications and contracts; -Journal of monitoring - An act of reconciliation of the water received.
9.2.4 Farmers’ autonomy to choose crops and crop areas, ha
The state order for crops production in Uzbekistan
1997 1998 1999 2000 2001 2002 2003 2004 2005 2006 2007 2008 2009 2010 2011 cotton 1979 1686 1666 19350 14431,9 24449 41830 64709 82885 99774 105269 102230 99420,9 100363 94059
wheat 850 844 1138 2823 2652,33 2894,7 18858 22616 30546 36731,3 47806 51004 27242,5 54565,2 53428
potatoes 9 5 4 8,55 9,6 20,55 32,53 185,56 149,71 353,03 435,1 600,18 1021,85 3152,69 14,69
fruit 179 263 278 307,1 351,37 626,41 743,54 1016,6 1341,4 2365,24 2521 2468,26 2504,78 2336,69 2388,7
vegetable 312 551 419 322,4 386,67 587,51 1145,6 973,7 1087,2 3259,41 3318,6 4969,48 4193,99 2836,75 3025,8
melons 703 1345 1674 1435 1385,07 1929,1 2740,1 2907,1 2241,1 3029,18 2834,5 3468,9 3844,77 2837,2 3659,2
rice 5327 3504 8767 15328 513 3904 24484 17204 10828 20400 14980 8402 11084,9 3 3
In the Republics of Kyrgyz and Tajikistan, the crop to grow is selected by the choice of farmers and land users. There is no any government restriction on the planting of a particular crop.

CRP1.1 Characterization of the "FerganaValley" site SRT3-AS1
page 69
In Uzbekistan, cotton and wheat are grown according by the government order. Farmers autonomy in choice of crops and cropping areas in Sogd region
The name of crops 1997 1998 1999 2000 2001 2002 2003 2004 2005 2006 2007 2008 2009 2010 2011
Cotton 30 30 30 30 30 30 30 30 30 30 30 30 60 85 85
Vegetables 90 90 90 90 90 90 90 90 90 90 90 90 90 90 90
Grain crops
70 70 70 70 75 75 75 90 90 90 90 90 90 90 90
Grapes 80
Potato 50
Melons 75
Fruit 80
Fodder crops
20
Нет информации по Ферганской region, Р.Каракалпакстан и Р.Кыргызстан.
10. Opportunities for Agricultural Research 10.1 Opportunities for research on land tenure policy, soil and water management, de-rocking, agro-biodiversity conservation, water harvesting for range shrub plantations, drought-resistant varieties, and others
On the territory of the Fergana Valley, there are several research institutes, such as branch of Asaka Cotton Research Institute in Uzbekistan (UzCRI), Research Institute for grain production and Andijan Agricultural Institute, Branch of SANIIRI in Fergana and other RIs, which have separate educational and experimental sites (households). Branch of UzCRI is mainly engaged in cotton production, where scientists are working with hot and drought-resistant varieties. The last varieties developed by the Institute are An-35, An -36, An-37, etc. Branch of UzCRI (Kuva district) is mainly engaged in cotton production, where the scientists are working with the drought-resistant and early maturing varieties. There is a plot-site of SANIIRI (SANIIRI - Central Asian Research Institute for Irrigation) in Fergana region There are all possibilities in the Sogd region for carrying out of agricultural practices, as many international projects

CRP1.1 Characterization of the "FerganaValley" site SRT3-AS1
page 70
practice different management methods in managing water-land resources. For the beginning of research, there is soil-meliorative station, institutes of agriculture, gardening animal industries and others. Таких как: In the Tajikistan have Regional Administration on Melioration and Water Resources, “IAC” Ltd Irrigation and Agricultural Consulting, "Zarzamin"Ltd consulting services, "Tajigiprovodkhoz» and Advisory Training and Information Center. In the Kyrgystan have Institute for Irrigation Kyrgyz Scientific and Research Institute of Irrigation, Rural Advisory Services, CECI Centre Canadien d’Etude et de Coopération Internationale, WUA Support Unit.
Republic Institute of grain production is engaged in seed production of varieties, various researches and production of recommendations for farmers. There are several opportunities to conduct research in the following areas: 1. Development of irrigation regime for various crops. 2. The introduction of water saving irrigation technology in the lowland and foothill areas (mulching, improved furrow irrigation technology, contour-furrow irrigation, etc.). 3. Drip irrigation for the gardens on the slopes and vegetables in greenhouses. 4. Technology of rainfall, storm runoff and melt water (in mountain areas) harvest. 5. Enhancing the role of Water User Association (WUA) in the fair water distribution and development of WUA. 6. Determination of productivity of irrigation water for different crops. 7. Integrated water resources management - improving the relationship between the district offices of Water Resources, WUA, rural districts and water users. 8. Integrated management of agricultural production - improving the relationship between crop production, arable farming, animal husbandry, forestry and pasture. 9. The introduction of innovations of Institute of Agriculture, irrigation, veterinary, pastures and forages. 10. Drought resistant and early- maturing varieties of wheat, rice, maize and other crops. 11. Development of new breeds of cattle for meat and dairy products production. 12. Development of new breeds of small ruminants for meat production. 13. Goat breeding (meat and fur fiber production).

Characteristics of the site «Rasht Valley» SRT2-AS2 Introduction The international research centers of the Consultative Group on International Agricultural Research (CGIAR) have launched the CGIAR Research Programs (CRP). ICARDA as the lead Center jointly with the other partners Centers, research and development organizations in more than 40 countries, regional fora, international development agencies and other relevant international organizations initiated the CGIAR Research Program (CRP1.1) - "Integrated Agricultural Production Systems for the Poor and Vulnerable in Dry Areas". The Program aims to pursue new technology, institutional and policy options for enhancing productivity and managing risks through diversification, sustainable intensification and integrated agro-ecosystem approaches in dry, which ultimately will contribute to the improvement of living standards in the target regions. During the global preparatory meeting in Nairobi, in July 2011, five sites (3 action and 2 satellite sites) have been selected together with national partners for Central Asia and the Caucasus Region. Conducting research and introduction of innovative approaches and technologies will be implemented in two key areas:
I. Reducing vulnerability in agro-ecosystems affected by degradation of natural resources. Actions Sites: 1. Aral Sea Region, including the Dashauz province (Turkmenistan), Khorezm province
and the Republic of Karakalpakstan (Uzbekistan), Kyzylorda province (Kazakhstan); 2. Rasht Valley (Tajikistan and Kyrgyzstan).
II. The intensification of agricultural production in areas with potential for improving food security and improvement of living standards in the short to medium term. Action site: 1. Fergana Valley, which includes Batken, Jalal-Abad and Osh provinces regions
(Kyrgyzstan), Sogd province (Tajikistan), Andijan, Namangan and Fergana provinces (Uzbekistan).
Satellite sites. Sites that complement Action Sites to sample the diversity of Target Areas, and will also help evaluate and assess innovations developed at the Action Sites for their suitability and user acceptance. 2. Kura-Arax plain in Azerbaijan. 3. Kashkadarya province in Uzbekistan.
In addition, 123 descriptors characterizing the climate, topography, soils, water resources, land use, land degradation, demography, agricultural systems, institutional systems and opportunities for agricultural research were identified. To collect the primary data, thirteen focal points from the Action Sites were involved. Data processing and compilation of the data was carried out by the interim Interdisciplinary Research Team (iIRT), coordinated by ICARDA.

A preliminary version of the characteristics of the Action Sites had been discussed during the preparatory meeting in Tashkent, May 15-17, 2012. These characteristics of sites are not final. It is assumed that interested parties can contribute to the adjustment and the addition of data. This material is collected and synthesized within the CGIAR Research Program (CRP1.1) - Integrated Agricultural Production Systems for the Poor and Vulnerable in Dry Areas", coordinated by the International Center for Agricultural Research in Dry Areas (ICARDA) in the Region of Central Asia and the Caucasus. The data, any inaccuracies or interpretations of the data presented herein are not the responsibility of the CGIAR and ICARDA. The final characteristics of the Site will be posted on the website of the CGIAR Regional Program (www.icarda.cgiar.org/cac). The information contained in the Site Characterization can be freely used for research and other purposes, provided that the source is quoted: CGIAR Regional Program for Central Asia and the Caucasus, c/o ICARDA, Tashkent, Uzbekistan, 2012
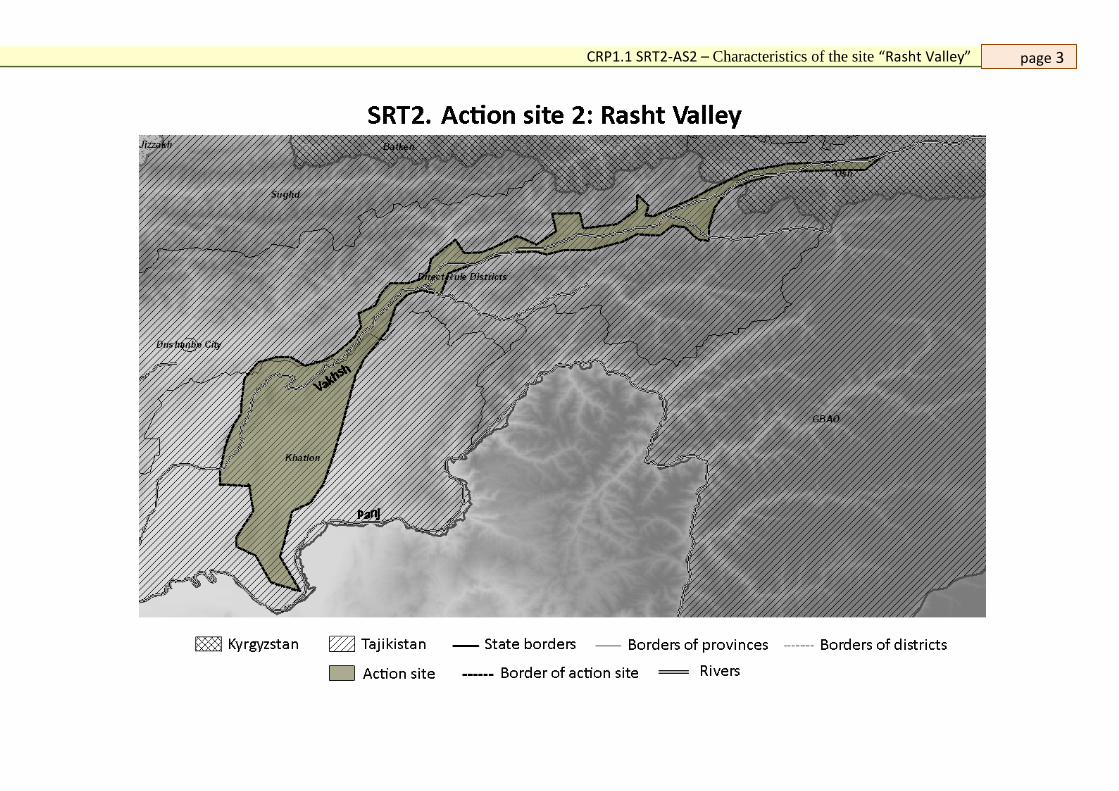
CRP1.1 SRT2-AS2 – Characteristics of the site “Rasht Valley”
page 3

CRP1.1 SRT2-AS2 – Characteristics of the site “Rasht Valley”
page 4
Characteristics of the site «Rasht Valley» SRT2-AS2 Country: Tajikistan, name of the site: Rasht valley Name of the information compiler: Kh.M.Akhmadov. 1. Climate 1.1 Precipitation Precipitation patterns 1.1.1 Range of long-term average annual totals (mm) across the site
Fluctuations in annual amount of precipitations within the entire site: from 416 to 915 mm. Mean annual fluctuations on the site: from 230 to 700 mm in Lyahsh from 600 to 1500 mm in Tavildar.
1.1.2 Number of rainy seasons (winter and spring).
75-85% of the annual amount of precipitations is during the period from December to May
1.1.3 For each rainy season: start and end month(s).
Number of days with precipitations (of 0.1 mm or more):
In winter the rains begin in December and come to an end in February, in spring, accordingly-March-May, in summer and in the autumn the rains are seldom and short-term.
Winter 21-52 Spring 28-53 Summer 7-20 Autumn 9-19
1.1.4 Number of years of daily rainfall records
Not less than 15 years
Precipitation variability 1.1.5 Inter-annual precipitation variability
The coefficient of variation (CV) of annual precipitation in the region: 20-24%
1.1.6 Severity and type of drought risk (e.g. delayed onset
All agricultural crops are irrigated and consequently the delay or the termination of rains influences their development in a little degree. The main reason of a delay of the beginning of field works is clearing fields from

CRP1.1 SRT2-AS2 – Characteristics of the site “Rasht Valley”
page 5
of the rainy season, lengthy gaps between the rains, early end to the rains)
snow. Later thawing of snow can negatively influence the beginning of field works. Mass planting of potato and cultivation of gardens begin since May 15.
1.2 Temperature Temperature means 1.2.1 Range of annual mean temperature (°C) across the site
Average annual temperatures in the site range from 5,7 to 11,7 °C
1.2.2 Range of mean max. temperature of the hottest month (°C) across the site
Average maximum temperatures in July from 21,8-25,7-°C The absolute maximum in the site is 37- 40,0°C .
1.2.3 Range of annual mean min. temperature of the coldest month (°C) across the site
Average minimum of the temperatures in January from –5,1°C to –12,5°C The absolute minimum in the site: от –27°C to –34 °C
1.2.4 Number of years of daily temperature records
Not less than 15 years
Temperature variations 1.2.5 Intra-annual range of monthly temperature means (C)
Intra-annual variations of average temperature per month from –10 to +25°C
1.2.6 Diurnal temperature ranges throughout the year (C)
Average from –26,5 to +40,0°C
1.2.7 Frost risk (severity and months of occurrence)
The risk of frost: from October to May
1.3 Indices 1.3.1 Range of annual growing degree days, base temperature 5°C (C, heat units) across the site
Total of efficient temperatures- from 3286 to 3778°C
1.3.2 Ranges of mean length (days) of temperature and
Duration of vegetation period (number of days) on site:

CRP1.1 SRT2-AS2 – Characteristics of the site “Rasht Valley”
page 6
moisture-limited growing period(s) across the site for predominant agricultural soils
potato 120-140 wheat 120-200 orchards 160-180
Depending on sowing term: Winter grain - 180-200 days as crops are made in September, and harvesting in the end of June
1.3.3 Range of Aridity Index across the site
0,35-0,65
1.4 Climate change projections Source: http://seakc.meteoinfo.ru Scenario A1b 1.4.1 Range of annual mean temperature change (C) across the site for time slices (periods) 2011-2030, 2041-2060, 2080-2099 in comparison to 1980-1999
2011-2030 2041-2060 2080-2099 0,8-1,6°С 2,2-3,2°С 3,3-5,1°С
1.4.2 Range of relative annual precipitation change (%) across the site for time slices (periods) 2011-2030 г.г., 2041-2060, 2080-2099 in comparison to 1980-1999
% out of basic rate 2011-2030 2041-2060 2080-2099
Winter 109,5 Spring 99,4 Summer 94,3 Autumn 102,3
109,4 95,9 87,9 96,5
116,2 94,5 80,1 99,7
Scenario A2 1.4.3 Range of annual mean temperature change (C) across the site for time slices (periods) 2011-2030, 2041-2060, 2080-2099 in comparison to 1980-1999
2011-203 2041-2060 2080-2099 0,8-1,6°С 1,9-2,9°С 4.0-5,8°С
1.4.4 Range of relative annual precipitation change (%) across the site for time slices (periods)
Data is not available

CRP1.1 SRT2-AS2 – Characteristics of the site “Rasht Valley”
page 7
2080-2099 in comparison to 1980-1999 2. Topography 2.1 Landforms (e.g. plains, hills, mountains) across the site (%)
The relief of the chosen site is characteristic for high-mountainous areas. 100 % of territory refers to mountain area. Crests of ridges have typical Alpine nature with abrupt sharp peaks in height of 5500 meters. Valley of the rivers Surhoba, Obihingou and Vakhsh form narrow deep gorges. Rasht valley is located between 380 40` and 33089` longitude, 69055` and 71045` longitude. The total area of territory makes 1682,9 th. hectares
Source: Tajikistan (nature and natural resources),Donish, Dushanbe, 1982
2.2 Elevation range across the site (m)
1200-6785 m. above sea level in Baltiysk sea. Source: Atlas of Tajik SSR, Dushanbe-Moscow, 1968
2.3 Prevalent slope ranges (%) of different land forms of the site
The areas with a slope to 0,3640 (in per million) are made 5 %, from 0,3659 to 0.5774 - 20 % and more than 0.5797 - 75%.
Plains are presented in the form of river above the flood plain terraces
3. Soils 3.1 Soil types 3.1.1 Major or agriculturally important soil types and soil associations across the site (classification units, %)
Type 1. Mountain brown typical soils are extended in a medium and top part of a belt of brown soils and occupy heights from 1600 to 2600 m above sea-level. They refer basically to medium mountain areas, and for the diversified elements of a mountain relief. The climate is more humid, than in a zone of brown carbonate soils, a dry season is shortened, and humid becomes longer (till 7-8 months). Annual quantity of deposits - to 700-950 mm, and in some areas of Hissar mountains - to 1400mm. In the most humid areas of this belt (Gissarsky, Karateginsky, Darvazsky ridges) mesophilous wide-leaf forests and shrubbery vegetation are extended - a walnut, a maple, an apple-tree, pearl-bush. The grassy vegetation in the given belt is developed better and differs by the variety of types, than the belt of underlying brown carbonate soils. Their total area makes about 70 % of territory of the region.
Type 2. High-mountainous meadow-steppe soils are extended in the high-mountainous belt laying above a belt of mountain brown soils on slopes Gissarsky, Turkestani, Karateginsky, Zaalajsky, Darvazsky, Vahshsky and other ridges of Central Tajikistan at height of 2800-3200 m above sea-level and are the most productive pastures and good haying lands. Their total area makes about 15 % of territory of the region.
Type 3. High-mountainous steppe soils occur on Zeravshansky, Turkestani, Darvazsky, Vanchsky, Zaalajsky

CRP1.1 SRT2-AS2 – Characteristics of the site “Rasht Valley”
page 8
ridges and on Peter I ridge, above a subalpine belt with high-mountainous meadow-steppe soils. On Zeravshansky and Turkestan ridges, they fall in to a subalpine belt. Sites with high-mountainous steppe soils in the Alpine zone of semi-humid area of high mountains Tajikistan are a low - and medium productive outrun pastures. Their total area makes about 12 % of territory of the region.
Type 4. High-mountainous meadow soils in mountains occur in a complex with zonal soil formations. On slopes of high-mountainous ridges Darvaza, Karategin and Gissar meadow soils are available on absolute Height 2700 4500 m in the conditions of constant or repeatedly humidifying time, as a result of thawing snows and glaciers, and also on the sites, located in intermountain valleys and hollows, under the influence of soil and river waters. High-mountainous meadow soils occupy the insignificant space (nearby 30 th. hectares), but are the most productive and have high economic value as pastoral lands, and in some places are used as haymaking. Their total area makes about 3 % of territory of the region.
Soil groups of land fund of Rasht valley
№ Soil Total area, th.ha % Irrigated arable land, th.ha %
1. Mountain brown (typical) 1024.6 60.9 26.2 00 2. High-mountain meadow-desert 278.4 16.5 3. High-mountain desert 332.5 19.8 4. High-mountain meadow soil 47.4 2.8 Total 1682,9 100 26.2 100
Sources: Kuteminsky V.Y, Leonteva R. S. Soils of Tajikistan, Irfon, Dushanbe 1966;
Tajikistan (the nature and natural resources), Donish, Dushanbe, 1982; Ahmadov KH.M. Soil' erosion in Tajikistan and division into districts on methods of its combating in the region.
Dushanbe,2010.
3.2 Soil characterizations for each of the major soil types 3.2.1 Rooting depth, cm potato orchards Lucerne wheat Source:
Kuteminsky V.Y, Leonteva R. S. Soils of Tajikistan, Irfon, Dushanbe 1966. Tajikistan (the nature and natural resources), Donish, Dushanbe, 1982
Up to 0,50 Up to 2,0 Up to 1,0 Up to 0,40
3.2.2 Water holding capacity Type 1 Type 2 Note:

CRP1.1 SRT2-AS2 – Characteristics of the site “Rasht Valley”
page 9
(defined by measures of field capacity and wilting point)
8,2-15,4% The soils of the region have not been properly studied, and there are not many soil data
3.2.3 Measure of soil fertility – OC%
Type 1 Type 2 Type 3 Type 4 From 2-3 washed and 5-
12.2 in non-washed Up to 15, in lower horizons
2-3 4,8-6,8 from 5.8 to 8.5%, in lower horizons 1,9-2,0
3.2.4 Soil pH Soil acidity –from weak acidic to weak alkaline reaction, pH = 5.41 -8.48
№ Soil Grows at interval РН 1. Mountain brown (typical) 6.66-8.48 2. High-mountain meadow-desert 6.00-7.40 3. High-mountain desert 6.00-6.60 4. High-mountain meadow soil 5.41-6.10
Sources: Kuteminsky V.Y, Leonteva R. S. Soils of Tajikistan, Irfon, Dushanbe 1966; Tajikistan (the nature and natural resources), Donish, Dushanbe, 1982;
Ahmadov KH.M. Soil' erosion in Tajikistan and division into districts on methods of its combating in the region. Dushanbe,2010.
The ratio of crops to the рН
№ Crop Optimum РН Grows in the РН range of 1. Potato 5,0 6.60-8.50 2. Alfalfa 7,0-8,0 6.00-8.50 3. Wheat 6,0-7,0 6.60-8.50
3.3 Soil problems posing serious management challenges 3.3.1 Salinity (severity, soil types and % of area affected)
Considered soils are not salted

CRP1.1 SRT2-AS2 – Characteristics of the site “Rasht Valley”
page 10
3.3.2 Sodicity (severity, soil types and % of area affected)
In viewed soils there is no sodicity
3.3.3 Al-toxicity (severity, soil types and % of area affected)
All soils in Tajikistan with regard to al-toxicity are not toxic.
3.3.4 Low chemical fertility (organic carbon, CEC, etc.) (description, severity, soil types and % of area affected)
Mountain soils are subject to various degree of erosion, in this regard all chemical indicators depend on degree of erosion. They distinguish three degrees of soil erosion: poor - medium - and strongly eroded soils.
3.3.5 Phosphorus fixation (severity, soil types and % of area affected)
Region' soils are poorly studied also many soil data are absent
3.3.6 Poor profile development (soil types and % of area affected)
Type 1 Type 2 Type 3 Type 4 The soil profile is well
developed From depth of 50-90 сm
large fragments of original rock
Profile of these soils (50-70 cm) is shortened
From depth of 30 cm marlaceous of original rock
3.3.7 Rockiness, stoniness (severity, soil types and % of area affected)
Type 1 Type 2 Type 3 Type 4
Non rocky high (from 20 to 90); from 19.8 to 88% in humus and 61-90 deeper 50 сm high (from 28 to 87);
3.3.8 Very compact subsoils (soil types and % of area affected)
These soils possess good structure and porosity.

CRP1.1 SRT2-AS2 – Characteristics of the site “Rasht Valley”
page 11
3.3.9 Poor drainage, waterlogging (severity, soil types and % of area affected)
These soils possess good water penetration
3.3.10 Excessive drainage (soil types and % of area affected)
No excessive drainage
3.3.11 Flooding (severity, soil types and % of area affected)
These soils are not flooded as are located on high altitude
3.3.12. Other management problems (description, soil types and % of area affected)
The main problem of the given region is shortage of soil-cultivating equipment
4. Water resources 4.1 Irrigation water availability
The given region is well provided by water. The river Surhob, which originates in Kyrgyzstan, where it is called Kizilsu, after a confluence of river Muxu receives his name. River Suhab has a lot of inflows which originate from glaciers and are distinguished by rough character and an abundance of thresholds. The river Vakhsh is formed after merge of river Obihingou and river Surhob,. Change of an annual river flow for the period of 1961-1990 for the Republic Tajikistan is shown on mapping material (see map). Source: Tajikistan (nature and natural resources), Donish, Dushanbe, 1982

CRP1.1 SRT2-AS2 – Characteristics of the site “Rasht Valley”
page 12
Information on change of an annual river flow for many years from different sources in Rasht valley for the period 1997-2011 Источник Годы 1997 1198 1999 2000 2001 2002 2003 2004 2005 2006 2007 2008 2009 2010 2011 р. Сурхоб – гп. Тавильдара
Обём стока в млн. м3
12350 12050 11850 12300 5900 11800 11850 12100 11850 12200 12250 11700 12350 11700 12370
р. Обихингоу – гп. Тавильдара 5775 5970 6100 5700 12200 6050 6100 6025 6140 5900 5750 6150 6150 6100 6285
р. Вахш –гп. Дарбанд 18125 18020 17950 18000 18100 17850 17950 18125 17990 18100 18000 17950 18500 17800 18655
Источник: Гидрометеослужба РТ, Душанбе, 2012
4.2 Quality issues (e.g. waste water reuse)
The module of a drain of the suspended deposits here makes 10-20 g/s for 1 km2. Quarterly deposits are widely developed here and at the expense of erosion the washout module increases. It is an agricultural zone. There are no large enterprises here and consequently a problem of secondary use of sewage or other problems, related to water quality are absent.
5. Land use/land cover 5.1 Types of agricultural/non-agricultural land 1. Total area of land fund territory – 1682.9 th.ha. 2. Agricultural lands -586.1 th.. hа, out of which occupied: Arable land - 13,5 th.. ha. Perennial plantings – 3.1 th.. hа. Pastures - 516.2 th.. hа. Hay making – 2.2 th.. hа. 3. Under the rivers - 21.4 th.. hа. 4. Roads - 2.8 th.. hа. 5. Under the buildings – 3.2 th.. hа. Explanation: the Information on the land of agricultural purpose is resulted without account of household plots, additional farms, forests, swamps, bushes and other land. Source: Land fund of RT, Dushanbe, 2012 5.1.1 Extent of rainfed cropland across site (ha, %)
1997 1998 1999 2000 2001 2002 2003 2004 2005 2006 2007 2008 2009 2010 2011 Source of data: RT Regions, Agency on statistics at President of RT
5.7 0.3
5.6 0.3
5.7 0.3
5.7 0.3
5.7 0.3
5.4 0.3
5.5 0.3
5.8 0.3
5.6 0.3
5.7 0.3
5.3 0.3
5.4 0.3
5.2 0.3
5.2 0.3
5.2 0.3
5.1.1 Extent of wheat Source

CRP1.1 SRT2-AS2 – Characteristics of the site “Rasht Valley”
page 13
rainfed cropland across site (ha, %)
4936 Regions of Republic Tajikistan, Agency on statistics at President of Republic Tajikistan
5.1.3 Extent of irrigated cropland across site (ha, %)
1997 1998 1999 2000 2001 2002 2003 2004 2005 2006 2007 2008 2009 2010 2011 Source of data: Land Fund RT,
Dushanbe, 2012 21.2 1.3
21.2 1.3
21.2 1.3
21.2 1.3
21.2 1.3
21.2 1.3
21.2 1.3
22 1.3
24.2 1.4
24.6 1.5
25.7 1.5
25.8 1.5
26 1.5
26 1.5
26 1.5
5.1.4 Main irrigated crops or varieties grown (ha)
Potato Orchard crops Cereals and legumes Vegetables Oil seed crops 7574 3287 12147 1416 382
Source: Final report on agricultural crops, ASPRT, Dushanbe, 2012
5.1.5 Extent of pastures across site (ha, %)
1997 1998 1999 2000 2001 2002 2003 2004 2005 2006 2007 2008 2009 2010 2011 Source of data: Land Fund RT,
Dushanbe, 2012 496.8 29.5%
493.2 29,3
495.8 29,4
495.8 29,4
496.5 29.5
495.9 29,54
496.0 29,5
504.2 30,0
506.4 30,31
506.4 30,1
561.7 33,4
561.7 33,4
561.5 33,4
552.3 32,8
516.2 30,7
5.1.5 Extent of pastures across site (ha, %)
1997 1998 1999 2000 2001 2002 2003 2004 2005 2006 2007 2008 2009 2010 2011 Source of data: Land Fund RT,
Dushanbe, 2012 1048.4
62.3 1048.4
62.3 1048.4
62.3 1048.4
62.3 1048.4
62.3 1048.2
62.3 1049.3
62.4 1042.1
61.9 1042.1
61.9 1042.1
61.9 994.5 59.1
994.5 59.1
994.5 59.1
994.5 59.1
994.5 59.1
5.1.7 Extent of other major land use/land cover types across site (description, ha, %)
1. Perennial plantings: Horticulture is widely developed in a valley. Its general area makes 2,8 th. hectares (02 %). 2. Household plots: The second for the importance of cultivation of agricultural crops - household plots. Their total area makes about 14154 hectares (1%). Source: Land Fund of Republic Tajikistan. 2012
5.2 Land use trends 5.2.1 Increase/decrease in irrigated cropland due to availability/decline of groundwater resources (severity, % of area affected)
Ground water in this zone is below 3 meters

CRP1.1 SRT2-AS2 – Characteristics of the site “Rasht Valley”
page 14
5.2 Land use trends Potato and other fruits are traditionally grown in Rasht valley. Other type of farming is not strongly developed. Over the last years this type of farming remains as permanent. Source of information: Scientifically based farming system of Tajikistan, Dushanbe, 2010)
5.2.1 Increase/decrease in irrigated cropland due to availability/decline of groundwater resources (severity, % of area affected)
Significant changes didn’t take place over the last 10 years
6. Land degradation 6.1 Type and current severity of particular types of land degradation 6.1.1 Salinization (severity, % of area affected)
Soil of this zone is not saline
6.1.2 Water erosion (description, severity, % of area affected)
1997 1998 1999 2000 2001 2002 2003 2004 2005 2006 2007 2008 2009 2010 2011 Source: Ahmadov Kh.M. Erosion of soils in Tajikistan and division into districts on methods of its combating, Dushanbe, 2010
High 83
85 85 85 87 87 87 87 89 89 89 91 91 91 91
Within low mountain zones poorly-eroded sites are located on a surface of cones of outlet and river terraces. Medium mountain zone is in a average and strong degree subject to water erosion that is promoted by loss of a considerable volume of deposits, a steepness of slopes and other natural factors. This zone is strongly dismembered by erosion-denudation relief forms. On a greater part of a high-mountainous zone, there exit weak-washed dense radical rocks, and there are colluvial, prolluvial deposits, soils are also strongly subject to erosion. The percentage of poor-eroded soil

CRP1.1 SRT2-AS2 – Characteristics of the site “Rasht Valley”
page 15
fluctuates from 6 to 22 %, medium-eroded-24-31 % and strong-eroded - 33-63 %. On the average, erosion in a valley makes 91 %.
Source: Ahmadov Kh.M. Erosion of soils in Tajikistan and division into districts on methods of its combating, Dushanbe, 2010
6.1.3 Wind erosion (severity, % of area affected)
There is no wind erosion in Rasht valley
6.1.4 Loss of soil organic matter (severity, % of area affected, ha)
1997 1998 1999 2000 2001 2002 2003 2004 2005 2006 2007 2008 2009 2010 2011 Source: Ahmadov Kh.M. Erosion of soils in Tajikistan and division into districts on methods of its combating, Dushanbe, 2010
Ср. 20-30
Ср. 20-30
Ср. 20-30
Ср. 20-30
Ср. 20-30
Ср. 20-30
Ср. 20-30
Ср. 20-30
Ср. 20-30
Ср. 20-30
Ср. 20-30
Ср. 20-30
Ср. 20-30
Ср. 20-30
Ср. 20-30
6.1.5 Loss of soil structural stability (severity, % of area affected, ha)
All considered not washed soils possess good structure. Structural stability of a soil depends on degree of soil erosion. Strongly eroded soils, when soil forming rocks move on a surface are characterized by low structure. In this connection loss of structural stability is closely connected with erosion and in percentage parity similar data are absent.
Source Kuteminsky CV.Y, Leonteva R. S. Soils of Tajikistan, Irfon, Dushanbe 1966.
6.1.6 Loss of agrobiodiversity (description, severity, % of area affected,ha)
Data on agro-biodiversity losses are absent. However on our data (measurements were carried out on reference sites) in connection with loading reduction, there is a biodiversity restoration in pastures. Loss of agro-biodiversity does not occur, as the local population aspires to keep and increase various types of trees.
6.1.7 Other types of land degradation that are significant (description, severity, % of area affected)
Type 1 Type 2 Type 3 Type 4 Type 5 Type 6 Type 7 Type 8 High up to 73% In this zone most water erosion has a wide circulation, including linear, ravine, undulated. However in a high-mountainous zone, there is pastoral erosion (Type 1). Summer pastures are located 2000 m above level of Baltic sea. Conducted research shows, that 73 % of their total area is subject to strong or very strong erosion. Some strongly eroded sites as a result of intensive grazing of cattle and destruction of grassy vegetation are cut strongly by erosive forms and, finally are transformed into wastelands. Medium eroded land on summer pastures make 16 % from a total area, and weak-eroded - 1 %. Strong washout of soil on strong - and medium-eroded summer pastures is connected by that in a high-mountainous zone during the summer period there are rainfalls, which lead to intensive washout of not protected surface of soil.

CRP1.1 SRT2-AS2 – Characteristics of the site “Rasht Valley”
page 16
Source: Ahmadov Kh.M. Erosion of soils in Tajikistan and division into districts on methods of its combating, Dushanbe, 2010
6.2 Degradation trends 6.2.1 Reclamation of salinized lands (% of area treated)
Amelioration of land is not carried out due to the lack of salt affected land in the valley.
6.2.2 Increase in soil erosion (description, % of area affected)
The description: Increase of eroded soils is fixed on the basis of space photos and reference sites. The average percent area of increase of eroded soils makes 2 % and basically it occurs in medium mountain and high-mountainous zones. As a whole for 15 years the area of eroded land has increased by 8 %, thus there is a reduction of category of weekly wash out and increase medium washed, strong and the very strongly washed off soils. The area of eroded soil on Rasht valley has increased (from all area of territory) from 83 % in 1997 to 91 % - 2011. (Item 6.1.2.). Monitoring of soil erosion is carried out on reference sites periodically - once in 3-4 years. Researches show, that for the specified period, there is an increase at 2 %. The main reason is the irrational use of the land and intensive grazing of cattle. Source: Ahmadov Kh.M. Erosion of soils in Tajikistan and division into districts on methods of its combating, Dushanbe, 2010
6.2.3 Lowering of groundwater tables (% of area affected, range of change of groundwater levels (m))
Ground water level is deeper (below 3 meters), thus changes are not fixed.
6.2.4 Other significant degradation trends (description, % of area affected)
There are no other significant degradation tendencies.
Socio-economic descriptors 7. Demography 7.1 Population

CRP1.1 SRT2-AS2 – Characteristics of the site “Rasht Valley”
page 17
7.1.1 Total population of site, thousand
1997 1998 1999 2000 2001 2002 2003 2004 2005 2006 2007 2008 2009 2010 2011 Source Regions of RT, Dushanbe, 2011
215.6 218.9 224.6 229.5 234.7 240.4 245,2 255.0 260.0 265.7 273.0 279.4 285.0 282.5 286.9
7.1.2 Percentage of rural population of site, % 7.1.2 Percentage of rural population of site, %
1997 1998 1999 2000 2001 2002 2003 2004 2005 2006 2007 2008 2009 2010 2011 Source Regions of RT, Dushanbe, 2011
97 97 97 97 97 97 97 97 97 97 97 97 97 97 97
In Dzhigatalsky, Tavildarinsky and Todzhikobodsky areas the agricultural population makes 100 %, in Nurabadsky and Rashtsky areas accordingly - 98,1 и 88.0%
Source Regions of RT, Dushanbe, 2011. 7.1.3 Age distribution of rural population.
Age (up to 4 years)
Age (5-7
years)
Age (8-16 years)
Age (from 17
to 45 years)
Age (from 46
to 60 years)
Age (from 61
and higher)
Note: Age distribution is given according classification of Statistic Agency at the President RT.
39.4 19.5 59.7 118,4 28.7 12.6 Source: Census of population and residential fund of Republic Tajikistan for 2010//Population of Republic Tajikistan by gender, age and marital status, volume- II, Dushanbe, 2012
7.2 Poverty. Poverty prevails in a countryside where the share of the needy population makes 40-80 %. Besides, across the valley, people, covered by a drought on number had the greatest share among low income population. In Tajikistan - high, but decreasing level of poverty (89 % in 1999, 64 % in 2004 and 53 % in 2007), mainly because of economic growth and remittances (the Analysis... 2010: 9), poverty is more widespread in rural areas and areas where the cotton is grown.
Data of report prepared within implementation of the EU project of «Technical Assistance to the Program of Support for formation of a policy in the sphere of social protection - a component of the Labor related Politics». The information on labor market of Tajikistan, and also reports were used from:
«The analytical report on carrying out of inspection of a labor in Tajikistan (July-August, 2004)»;
«Inspection of living standards in Tajikistan, 2007», «The Migration Review in Tajikistan. August 2009», «Employment in informal sector of economy in Tajikistan. Dushanbe 2005» 7.2.1 Poverty amongst rural population (description, %)
1997 1998 1999 2000 2001 2002 2003 2004 2005 2006 2007 2008 2009 2010 2011 % 80 80 78 75 72 70 69 66 64 62 59 57 54 52 48
There is a single rate of national currency to $US in the market and National Bank
7.3 Nutrition and health. Population growth - one of the principal causes of reduction source of subsistence in CA countries. The annual increase in population in Tajikistan makes approximately 2 %. (Source: The Regional Environmental Centre for Central Asia (CAREC). The Central Asia: the Progress Review in realization

CRP1.1 SRT2-AS2 – Characteristics of the site “Rasht Valley”
page 18
of agenda for 21 century, page 56). According to UNICEF research (NMSS - NISM, 2009), 12.5 % of weighed children are exhausted and 29.1 % suffer a growth inhibition. The percent of women with weight below an average (deficiency of weight of a body) has increased from 7.7 % (SMBP, conducted in April, 2011) to 11,8 % - the pre-obesity percent (to adiposity) has decreased from 19.5 % to 13.9 %. The obesity index (an adiposity indicator) remained without changes: 7.1 %. These results are similar to results of NRF (National Research on a Food) 2006. Weight is lower among women, probably, as a result of absence of a variety of a food, fast changes in a way of life, and indirectly results of the high prices for a foodstuff, which is defined by a choice at purchase of a foodstuff. 7.3.1 Nutrition and health status of rural population
1997 1998 1999 2000 2001 2002 2003 2004 2005 2006 2007 2008 2009 2010 2011 Source: statistical yearbook, Dushanbe, 2010-2011
low low low low low low medium medium medium medium medium medium medium medium medium
Rate of growth of the population during 1997 - 2011 varies from 101.5 to 104.3 %, at the maximum value 117.9 (Tavildara, 2007) and minimum-91,2 (Jirgatal, 2010). The birth rate during 1997-2011 makes from 20.6 (Tojikobod, 2004) to 41.8 (Tavildara, 2008) The death factor (died on 1000 persons of the population) varies from 2.7 (Tavildara, 2005) to 4.8 (Rasht, 2007) Natural increase of the population from 354 (Tavildara, 2004) to 2740 (Rasht, 2010) people Population natural increase (on 1000 persons of the population) from 16.1 (Tojikobod, 2004) to 38,7 (Tavildara, 2008)
7.3.2 % of children below 5 years of age at risk of malnutrition
No such information
7.4 Employment 7.4.1 Gender-related aspects of work in rural households. 1- From an aggregate number of managerial posts, how many percent is occupied by women 2. From an aggregate number of the qualified posts, how many percent is occupied by women; 3. From an aggregate number of not qualified posts, how many percent is occupied by women;
1997 1998 1999 2000 2001 2002 2003 2004 2005 2006 2007 2008 2009 201 0 2011 Source statistical yearbook, Dushanbe, 2010-2011
1 3 3 3 3 3 3 5 5 5 5 7 7 7 8 8
2 5 5 5 5 5 5 5 7 7 7 7 8 10 10 10
3 30 30 30 30 30 30 30 30 30 30 35 35 35 32 32
4 70 70 70 67 67 63 63 62 58 57 56 54 50 50 50

CRP1.1 SRT2-AS2 – Characteristics of the site “Rasht Valley”
page 19
4. From an aggregate number of the unemployed, how many percent of women
7.4.2 Types and importance of non-agricultural employment, %.
1997 1998 1999 2000 2001 2002 2003 2004 2005 2006 2007 2008 2009 2010 2011 1 20 20 20 20 20 20 20 20 20 20 20 20 20 20 20
2 5 5 5 5 5 5 5 5 5 5 5 5 5 5 5
1. Considered region is an agrarian and consequently the basic part of the population is occupied in agricultural sector. We have included workers in a category of not agricultural sector like local government, educations, culture, public health services, students, the technical personnel, etc., and their number remains almost invariable. 2. Some small processing and sewing enterprises which play an insignificant role in the region development operate here. The basic income is made by remittances of labor emigrants which makes more than 50 % of all income of local population.
8. Agricultural systems 8.1 Classification 8.1.1 General classification
# years State farms Collective farms Dehkan (farmer) farms Household plots
No Area, th.. hа. Number Area, th.. га. Number Area, th.. га. Number Area, th.. га. 1. 2000 47 235.6 20 71.7 1037 99.6 6.5 2. 2001 44 232.9 18 53.8 1095 98.9 6.5 3. 2002 26 163.4 6 23.9 1072 132.0 6.5 4. 2003 33 147.5 5 19.7 1168 215.7 6.6 5. 2004 25 105.5 3 6.8 1384 268.6 7.7 6. 2005 22 97.8 4.2 1613 291.7 10.2 7. 2006 12 60.9 1865 292.7 10.3 8. 2007 12 59.4 1955 281.1 12.9 9. 2008 12 59.2 1988 275.9 12.9 10. 2009 10 48.3 2268 282.3 14.4 11. 2010 8 40.8 2674 278.8 14.1 12. 2011 8 40.1 3013 275.0 14.2
п/н years State farms Collective farms Dehkan (farmer) farms Household plots

CRP1.1 SRT2-AS2 – Characteristics of the site “Rasht Valley”
page 20
Number Area, th., hа
Medium Area, hа Number Area, th.,
hа Medium Area, hа Number Area, th.,
hа Medium Area, hа Number Area, th.,
hа
1. 2000 47 235,6 5012,8 20 71,7 3585,0 1037 99,6 96,0 6,5
2. 2001 44 232,9 5293,2 18 53,8 2988,9 1095 98,9 90,3 6,5
3. 2002 26 163,4 6284,6 6 23,9 3983,3 1072 132 123,1 6,5
4. 2003 33 147,5 4469,7 5 19,7 3940,0 1168 215,7 184,7 6,6
5. 2004 25 105,5 4220,0 3 6,8 2266,7 1384 268,6 194,1 7,7
6. 2005 22 97,8 4445,5 4,2 1613 291,7 180,8 10,2
7. 2006 12 60,9 5075,0 1865 292,7 156,9 10,3
8. 2007 12 59,4 4950,0 1955 281,1 143,8 12,9
9. 2008 12 59,2 4933,3 1988 275,9 138,8 12,9
10. 2009 10 48,3 4830,0 2268 282,3 124,5 14,4
11. 2010 8 40,8 5100,0 2674 278,8 104,3 14,1
12. 2011 8 40,1 5012,5 3013 275 91,3 14,2
Name of crops Agricultural enterprise Population Farm business Cereal and legumes (ha) 554 2854 8739 Potato (hа) 397 3595 3582 Oil seed crops (hа) 19 102 261 vegetables (hа) 20 1165 231 Feed crops 499 1508 3085 Orchards 353 2150 5463
8.2 Descriptors related to cropping component 8.2.1 Average farm holding size (ha)
1997 1998 1999 2000 2001 2002 2003 2004 2005 2006 2007 2008 2009 2010 2011 Source of data: Goscomzem (State Land
Committee) 1.9 2.0 2.0 2.0 2.5 2.5 3.0 3.0 3.0 3.0 3.0 3.0 3.0 3.0 3.0

CRP1.1 SRT2-AS2 – Characteristics of the site “Rasht Valley”
page 21
8.2.2 Type(s) of rotation Applied crop rotations in Rasht valley: the Potato-lucerne (esparcet) potato-grain -potato. The following crop rotation is applied: 3-4 years farmers grow potato, after they sow a lucerne usually for three years, if esparcet, then for 2 years, after again potato, sometimes in a crop rotation grain crops etc. are used for one year Source data: scientifically proved system of conducting agriculture in Tajikistan, Dushanbe, 2010
8.2.3 Cropping intensity Yield of cereals and legumes makes around -15-28 c/hа; Vegetables- 79-191 c/ha; Potato-195-250 c/hа; Fruits - 8-81 c/hа. Source of data: Regions of Republic Tajikistan, Statistics Committee, 2010
Term and Intensiveness of harvest of crops depends on Type of crop. Intensiveness of harvest of crops
Type of crop
Months Duration of harvesting, days IV V VI VII VIII IX X XI XII
Cereals and legumes + + Within 10 days
Potato + + 15-20 days depending on the elevation of place
Orchards (fruits) + + + 15-20 days depending on variety and type of fruit crops
Lucerne/Esparcet + + + + 4 hay crops, and the fifth hay crop (in November) are used for grazing a cattle
Vegetables + + + + 40-90 days depending on Type of vegetable crops
Oil seed crops + + 7-10 days depending on elevation above sea level
Maturing of crops in Rasht zone depending on district elevation occurs stage by stage. Harvesting of some crops begins in August and proceeds within two months. Harvesting of fruit is also closely related to elevation of district and varieties of crops and proceeds to the beginning of November; crops are stored till March-April and provide during the winter period Dushanbinsky and the CIS markets.
8.2.4 Source(s) of water supply for crop production
Sources of water supply for production of agricultural crops are the rivers Surhob and Obihingou, and also their small inflows.

CRP1.1 SRT2-AS2 – Characteristics of the site “Rasht Valley”
page 22
Source of in data: (Scientifically proved system of conducting agriculture Tajikistan, Dushanbe, 2010).
8.2.5 Implements/machinery used, degree of mechanization
Small dehkan farms have mini-equipments. Except that farms have potato harvesting, loosening, soil-cultivating and other equipment. Source of data: Scientifically proved system of conducting agriculture in Tajikistan, Dushanbe, 2010.
8.2.6 Degree of commercialization Potato (1) Fruit (2) Other, honey, herbs and others (3)
1997 1998 1999 2000 2001 2002 2003 2004 2005 2006 2007 2008 2009 2010 2011 Source: Regions Tajikistan, Dushanbe, 2011
1 60 60 60 60 60 60 60 65 65 65 65 65 70 70 70
2 35 35 35 35 35 35 35 30 30 30 30 30 25 25 25
3 5 5 5 5 5 5 5 5 5 5 5 5 5 5 5
8.2.7 Spatial organization of cropping in relation to environmental differences (mountains, foothills, plain, etc.)
Height 900-1300
Height 1300-1700
Height <1700-2000
Height 2000-2400
Height 2400<
Source: Scientifically based system of agriculture of Tajikistan, Dushanbe, 2010
Potato, vegetables, fruit-trees, lucerne and grain crops
8.3 Descriptors related to animal component 8.3.1 Main animal species or races kept (thousand). Cattle (1) Goats and sheep (2) Poultry (3)
1997 1998 1999 2000 2001 2002 2003 2004 2005 2006 2007 2008 2009 2010 2011 Source: Scientifically based system of agriculture of Tajikistan, Dushanbe, 2010
1 48.4 51.3 55.9 59.4 65.4 72.8 78.4 84.2 92.6 96.0 103.8
114.7
122.6
132.5
143.7
2 160,8
162,7
165,3
167,4
170,4
174,8
180,4
183.4
266.4
274.5
297.1
356.6
251.1
370.1
397.9
3 94,5 104,5
114,7
121,6
126,9
134,7
145,1
157.6
159.8
182.2
197.7
223.7
230.0
239.1
251.6
8.3.2 Feed systems Type cattle feedings in various zones of republic is defined by specificity of feed production. Therefore while working out of diets for cattle in Tajikistan, the farmers have allocated in the basic two zones differing on natural-economic conditions. The first zone - irrigation agriculture, where the basic branch is cotton production. This branch includes cotton growing farms, suburban farms (vegerable-growing) where the cattle of a dairy and dairy-meat

CRP1.1 SRT2-AS2 – Characteristics of the site “Rasht Valley”
page 23
direction is developed. Here the basis of feeding of cattle is made by the forages , produced in the irrigation land in a cotton complex - a lucerne, corn, cereals-bean rotation, a beet and a waste of the cotton industry (a peel and cotton cake).
In foothill and mountain zones the basis of feeding of cattle in an annual period is made by pastures, in the winter - hay of natural haymaking, straw and juicy forages (a silo, a beet).
In valley zones diets should provide requirement of animals taking into account their all-year round the stabling. Usually duration of winter feeding averages 155 days, annual - 210 days.
In foothill and mountain zones duration of the pastoral period makes 155 days, stable - 210 days. In structure of a diet of milk cows relative density of the concentrated forages should make 20-25 %, and at highly productive cows with a yield of milk
of 3500-4000 kg - 30-35 %. At feeding enough good bean hay, a high-quality silo, root crops and green forages, counting on 1 kg of milk ,the following expense of concentrates is recommended: 150-180 gram at a daily yield of milk of 10 kg, 180-200 g - at a yield of milk from 10 to 15 kg, 200-250 g - at a yield of milk from 15 to 20 kg, 250-300 g - over 20 kg of milk.
It is important to increase feeding level of cows, especially in first third of lactation for the account higher feeding by root crops and the grain forages rich with carbohydrates. It allows to compensate the deficiency which has developed in an organism of energy for this period. In dry stable period a feeding level as the factor promoting the best growth of foetus and increase milkiness of cows, also should be increased by 20-25 %.
The diet of dry stable cows should provide restoration of expenses during the previous period of a lactation, creation in an organism reserves for maintenance of high level of efficiency in the beginning of lactation , and also normal development of a foetus. It is necessary to consider as the most expedient structure of a diet 30-40 % of hay, 35-40 % of juicy forages and 20-25 % of concentrates.
On 100 kg of live weight it is necessary to provide on 2 and 2,5-3 kg of good-quality hay and root crops, the high quality silo is fed to 10-15 kg a day.
The organization of milking of cows is the important technological element in milk production. It is expedient to start with about 10-15 days after calving, gradually increasing level of a dry matter to 3,5 kg counting on 100 kg of live weight or 1,2-1,3 k.unit on 1 kg of milk with advance additional feeding on 2 k.unit on a milk increase. The basic forages (hay, heylage, the silo, straw) during this period make to 70 % of nutritious diet. The concentrated forages are included in a diet depending on efficiency with gradual increase in their volume. With achievement of high level of milking, the raised norm of feeding should be kept within not less than 5 months.
Feature of feeding dry stable cows is differentiation of norms on the periods. In the first decade after start they establish norm of nutrients within 80 % from average, in the second decade a feeding level is increased up to 100 %, in the third and fourth-to 120 %. Last 10-15 days to calving at the lowered appetite of animals it is necessary to stimulate the raised requirement for nutrients with introduction in a diet of high-quality concentrates and hay.
Recommended approximate diet for incalver dry stable cows and heifers: 3-5 kg of hay, 1,5-2 kg of straw, 8-10 kg haylage, 10-12 kg of a silo, 2-3 kg of mixed fodder, 80-100 г fodder phosphate in the winter, a green lucerne of 35-40 kg and mixed fodders of 2-3 kg - year.
By research experiments it is established, that the feeding of cattle by homogeneous feed premix provides increase of eating to 95 % and more, that is more on 15-20 % in comparison with separate than their feeding. At feeding large horned livestock a mix of hay, straw, haylage, a silo and root crops, dairy efficiency of cows, intensity of growth of young growth and a return of forages production is on 8-10 % higher, than at their use separately. It is explained first of all that for maintenance of optimum synthesis of fabrics of a body and milk secretion, the animal organism should receive all necessary substances simultaneously and in certain parity. At feeding of forages in high-grade feed mix there is a considerable conservation of energy in an organism of an animal at the expense of reduction of energy by chewing, a cud and work of a gastroenteric path in comparison with a usual multi-component diet
The basis of feeding of sheep and goats is based on maximum use of pastoral forages. Relative density of concentrates is low and makes 10-15 % from the general cost of forages. The most difficult and responsible period in sheep and goat breeding is wintering. At this time it is necessary to organize uninterrupted feeding of animals by the high-quality rough, juicy and concentrated forages and to provide completely

CRP1.1 SRT2-AS2 – Characteristics of the site “Rasht Valley”
page 24
requirement of an organism for nutrients - a protein, macro-and microcells (Са, Р, S, Cl), vitamins. It is well-known, that in the conditions of republic, sheep and a goat receive now to 90 % of forages from pastures, and practically they are
not fed by the concentrated forages. Till 1997 the livestock of sheep and goats of state farms Rashtsky, Nurabadsky, Jirgitalski, Fajzabadsky areas and state farm "Sagirdahst" of
Darvazsky area GBAO were on non distant pasture-stall maintenance in mountains in the basic territory of land tenure of farms. In the future development of considerable areas of winter pastures under irrigation arable lands compels to transfer sheep breeding in a number of mountain areas on the semistall maintenance. For this purpose it is necessary to construct premises for sheep, cattle passage roads and bridges to inaccessible now suitable pastures in natural boundaries «Dubursa», «Garif», "Dashti-Hirson" in Rashtsky area, in downstream of river Obihingou in Nurabadsky, natural boundary «Tupchak» Dzhirgitalsky and on a river left bank Hingou in Darvazsky areas with a view of their inclusion in pasture rotation.
Data Source: Scientifically based system of agriculture of Tajikistan.- Dushanbe, 2010
8.3.3 Prevalent livestock diseases and mortality
In Rasht valley there are such diseases: sheep bratzot, helminthiasis diseases of animals, sometimes brucellosis and foot and mouth disease of cattle, and lately there outbreaks of pleuropneumonia in goats. Data Source: Rules of a capture and transfer of a pathological material for laboratory research, Dushanbe, 2008:
8.3.4 Main animal products
The basic livestock products: Milk, meat, fur and skin. Data Source: Statistic Committee The basic products’ production on 2010: meat - 7.6 th. tons, milk - 27 th. tons and a wool 0.2 th. tons. Source: Regions of Republic Tajikistan (Statistical data), Dushanbe, 2011
8.3.5 Degree of integration with crop component
Degree of integration of development of animal industries and plant growing is very high. Gardening, potato growing and planting of forage crops is well combined. From forage crops most widespread are lucernes, esparcet and cereals. Lately the farmers sow corn. Data Source: Scientifically based system of agriculture of TAJIKISTAN. - Dushanbe, 2010
8.3.6 Spatial organization in relation to environmental differences (mountains, foothills, plain, etc.)
Height 900-1300 Height 1300-1700 Height <1700-2000 Height 2000-2400 Height 2400< Data Source: Scientifically based system of agriculture of Tajikistan.- Dushanbe, 2010
Cattle (1), Sheep and goats(2), Poultry (3)

CRP1.1 SRT2-AS2 – Characteristics of the site “Rasht Valley”
page 25
8.3.7 Prevalent crop pests, diseases and parasitic flowering plants (parasitic weeds)
Pests Diseases Weeds Codling moth (Laspeyresia Pomonellal L.) Turkistan browntail (Porthesia cargalia Mogre.) Apple-leaf moth (Heponomeuta malinellus Zell.) Ccommon hawthorn moth (Hyponemeuta padellus L.) Olive (parlatoria) scale (Parlatoria Oleae Colvee.). Black pine-leaf scale (Quadraspidiotus porniciosus comst.). Apricot eurytomid wasps (Eurytoma Samsonowi Was.) Lesser bud moth (Recurvaria nanellia Hb.) Aarachnoid tick(Schirotetranichus pruni Oud), Aphid (Eriosoma lanigerum Haus.). Apple and leaf louse (Ahis pomi Degeer Dusaphis mali Ferr.). Colorado potato beetle (Leptinotarsa decemlineata Say.).
Diseases of fruit crops Scab of apple and peach (Venturia inaegualis Wint. и V. pirina Aderh.). Ttree wart (Sphaeropsis malorum Peck.). Fruit rot (Monilia fructigena Pers.) - Apple mildew (Podosphaera Leucotricha Salm.) Stone-fruit Clasterosporium (Clasterosporium carpophilum (lev.) Aderch). Peach leaf-curl mosaic 85 Plum pockets (Exoascus pruni Sadaeb – Taphrina). Phytophthora (Phytophthora infestans) Dry leaf blight (Macrosporium solani Ell. et Mart.).
Family of blue grass (Poaceae Barnhart) or cereals (Gramineae Juss.) Family blue grass (Poaceae Barnhart) or cereals (Gramineae Juss.) Family buck-wheat (Polygonacea Juss.) The goosefoot family (Chenopodiaceae Vent.) The madder family (Rubiaceae Juss.) Family of violaе (Violaceae Batsch) Family of Amarantus (Amaranthaceae Juss.) Family of cabbage (Brassicaceae Burnett) или Cruciferae (Cruciferae Juss.) Family Malvaceae (Malvaceae Juss.) Family Solanaceae (Solanaceae Juss.). Family Asteraceae (Asteraceae Dumort) или Compositae (Compositae Gisee) Family Broomrape (Orobanchaceae) Family strangleweed (Cuscutaceae) Family bindweed (Convolvulaceae Juss.) Family buckwheat (Poligonaceae Juss.) Family day nettle (Lamiaceae Linal.), или Labiate (Labiatae Juss.). Family Asteraceae (Asteraceae Dumort) или Family of Compositae (Compositae Gisee)
Data Source: Scientifically based system of agriculture of Tajikistan.- Dushanbe, 2010
8.4 Market access and characteristics 8.4.1 Distance to closest local market (km, hours of travel) [in SRT2 regions often > 2 hours, in SRT3 regions often < 2 hours]
1997 1998 1999 2000 2001 2002 2003 2004 2005 2006 2007 2008 2009 2010 2011 Source: Statistic report of RT, Dushanbe, 2011
1 30 30 30 35 35 35 35 35 35 35 30 20 20 20 20
2 70 70 70 65 65 65 65 65 65 65 70 80 80 80 80
The majority of farms realize their production in the big cities which are located at a distance more than 100 km, especially after construction of new road (from border of Kirghizia to a city Dushanbe).

CRP1.1 SRT2-AS2 – Characteristics of the site “Rasht Valley”
page 26
8.4.2 Sizes of rural markets
From 100 to 500 m2 The sizes of the rural markets basically make from 100 to 500 m2 and they are basically located within large settlements.
8.4.3 Sizes of rural markets
national regional world Note: Degree,available, limited, not available
available limited limited
Part of agricultural production (potato) is exported to Kyrgyzstan. Fruits (apples and peaches) are exported to Russia. Other products are sold within the country.
8.5 Access to land, water and other inputs 8.5.1 Access to land Almost 90 % of land in the project area belongs to dehkan farms. The Dehkan (farmer) farm is the independent
managing subject who is carrying out the activity without formation of the legal person, and based on personal work of one person or members of one family and other persons in common making agricultural production, which is based on the land area and other property belonging to members of dehkan farm. Spouses, children adopted, parents and other persons occupied in work in the general farm can be members of dehkan farm. The persons working in dehkan farms on hire are not part of dehkan farm and their labor relations with dehkan farm, are regulated by legislation of Republic Tajikistan on labor.
The Dehkan farms independently defines structure and a way of production, taking into account the interests and can be engaged in any type of the activity, not forbidden by legislation of Republic Tajikistan. Intervention in economic activities of dehkan farm from the state bodies and officials is not allowed, except for the bases, provided by the legislation.
Each capable citizen of Republic Tajikistan has the right to creation dehkan farm. The Dehkan farm can have the following forms: dehkan farm based on individual business;
dehkan farm, the enterprise activity of which is carried out in the form of family business and based on joint property;
dehkan farm created in the form of simple association on the basis of the general share of property and based on the contract on joint activity.
Dehkan farm and its members have the right:
independently to manage the land;
to hand over the land area or its part in rent in case of time invalidity, an appeal in ranks of the army on an active

CRP1.1 SRT2-AS2 – Characteristics of the site “Rasht Valley”
page 27
service, studies and in other cases, defined by legislation of Republic Tajikistan;
in case of withdrawal of the land area by the state, to receive full indemnification of costs for increase of land fertility and for the losses, including the missed income;
to be the proprietor of made production and incomes out of its realization, to demand the share;
voluntarily to refuse land tenure;
to leave structure of dehkan farm according to the share without the consent of other members of dehkan farm;
to use when due hereunder mineral deposits (sand, rubble, clay, stones, sources of waters) and other useful properties of the land area of dehkan farm;
to get, rent or to temporarily use property of the organizations and individual persons;
to conclude contracts for realization of enterprise activity;
to have other rights, provided by the legislation of Republic Tajikistan.
Hunting, fishery, collecting of fruits, including nut-fruits, medicinal grasses, shrub fruits, other natural production, or other activity on given land area of dehkan farm are possible only with the consent of the head of dehkan farm, or on the basis of the agreement of the parties.
If on the land area there are the constructions, multi-visible plantings or other objects, which cannot be moved on other site, dehkan farm compensates to the former land user other costs, unless the parties agree about the other order. Then the given facilities will be transferred to dehkan farm.
Dehkan farms and its members having the land share, are obliged to:
effectively use the land according to a special-purpose designation, raise its fertility, carry out a complex of actions for protection of the land, wood, water and not allowed for deterioration of an ecological condition as a result of the economic activities;
in due time to bring a rent and other types of tax for land tenure;
promote an effective utilization of land, increase productivity of agricultural crops, in due time to represent to local authorities of the area (city) the information, demanded by the law about own activity and land use;
indemnify a loss when due hereunder for decrease in land fertility, admitted because of the land user;

CRP1.1 SRT2-AS2 – Characteristics of the site “Rasht Valley”
page 28
observe treaty obligations and credit-settlement discipline;
-not to break the right of other land users.
8.5.2 Access to water Maintenance of rational use, protection and reproduction of natural resources is one of the primary goals of economic-social development of Republic Tajikistan (RT) in the coming XXI- century, important part of which being working out of measures on regulation of the water resources directed on strengthening of their positive role and the greatest possible liquidation of destructive actions. The decision of such questions will provide in RT protection of soils and vegetation from degradation, will improve the condition of the irrigated land and its drainage network, and will remove threat of washout and formation of floods.
Water influence on a land surface begins, when the first drops of a rain or a portion of thawed and irrigation water fall on it. All water streams formed on a surface of the land, as it is accepted are divided on slope, time and constant. They are also subdivided on agents of distant (river) and close carrying over (all the others) of erosion products.
Now, in connection with a basic change of land and water use and occurrence of private enterprises, it will be necessary to comprehend in a new fashion rich material of erosion experts of RT for the successful decision of system «protection - use - reproduction of water-land resources». Thus it is necessary to give special attention to erosive processes in an irrigated zone, since 90 % of population in RT is concentrated here and this zone undergoes ever growing old anthropogenous loading. About 90 % of the foodstuffs and agricultural raw materials are produced here. The big damage to the irrigated land is made by outlets from irrigated fields in a drainage network, which is estimated in 30-35 % from an irrigation norm. Thus drains become salt affected, their depth decreases, and the width extends, especially in some places there are running in soil -grounds. This demands more frequent very voluminous clearing works. Lack of capital investments because of economic situation in RT on the maintenance of a drainage network in working order started to affect deterioration of an ameliorative condition of the land: rising of level of ground water, increase in evaporation from their surface and, as consequence, secondary salinity and decrease in fertility of soil.
8.5.3 Access to other inputs (seed, fertilizer, etc.)
The basic sources for getting seed, mineral fertilizers and equipment –local and national markets.
8.6 System problems 8.6.1 Lack of market access
The considered region has access to the national and regional markets. Availability of the markets is a determinative for economic development and employment. Besides, availability of the market influences economic structure. It can so happen, that market conditions will go in a direction of undesirable shift from production of the final goods to sectors with the low added value that can be observed in economy of Tajikistan.

CRP1.1 SRT2-AS2 – Characteristics of the site “Rasht Valley”
page 29
The location increases a role of the local market, while the consumption level in the local market is low. It is possible, that efforts for expansion of the markets are not sufficient. On materials of the report, prepared within implementation of the EU project «Technical assistance Program of Support of formation of a policy in sphere of social protection - a component of the Labor Policy». The information was used related to labor market of Tajikistan, and also reports: «The analytical report on carrying out of inspection of a labor in Tajikistan (July-August, 2004)»; «Inspection of a standard of living in Tajikistan, 2007», «the migration Review in Tajikistan. August 2009», «Employment in informal sector of economy in Tajikistan. Dushanbe 2005»
8.6.2 Land fragmentation
In 2004 Governmental order of RT had approved «The Concept of Land use in Republic Tajikistan», which accurately reflects the further management and rational use of land resources. In the republic land reform in agriculture is almost finished now, where dehkan (farmer) farm will be organized on the basis of state farms. Now 99 % of them are reorganized. There remains 1 % - seed-growing and breeding farms which, according to the Governmental order are not subject for re-organization. 6 thousand 705 dehkan (farmers) farms have been organized in Rasht valley till date.
8.6.3 Decline in animal feed from rangelands
Natural pastures and haymaking in Tajikistan occupy more than 432,2 th. hectares, and they are the major source of high-grade and various forages for animal industries (Land fund of Tajikistan, 2011). The stock of forages on pastures according to experts makes more than 907,2 th. tons of dry weight per annum. The pastoral animal industries is favorably economical - it gives the cheapest production, the cost price of which is much below than the cost of production, received at the stall maintenance of cattle during the winter period.
The modern condition of pastures of the Republic is characterized by progressing decrease in their fodder efficiency under the influence of anthropogenous factors. Productivity of pastures strongly fluctuates within the years and productive animals are seldom provided to constant quantity of forages. For maintenance of a stable livestock of cattle in the greatest fodder stresses, it is required to provide additional feed to animals. In this connection, strategy of use of pastures and the cattle maintenance should be diversified in the regions of Republic.
Under the influence of unlimited grazing of cattle, anti-erosion quality of a grassy cover considerably falls, the herbage is broken, some plants are destroyed, slowing down growth of others and soil is rather easily exposed to destructive processes. Development of processes of washout and soil washout affects not only quantity indicators of a condition of pastoral plants, but also leads to reorganization phytocenoses. In connection with unequal adaptation of plants to adverse soil conditions in the places subject to erosion, there is a change of one type by others. All pastoral lands are strongly subject to soil erosion. Some strong eroded sites as a result of intensive grazing of cattle and destruction of grassy vegetation are strongly subject to erosive forms and finally they are transformed into badlands. Soil washout here reaches 4,7 th. m3/hectares/year (Ahmadov, 2011).
At extensive grazing, the eaten grasses almost completely loose generation, shoot and morphologic structure

CRP1.1 SRT2-AS2 – Characteristics of the site “Rasht Valley”
page 30
changes, plants become stocky, elevated system of sprouts partially get rosette form, leaves decrease in 2-3 times, height of a herbage is reduced several times (on low grass-meadow pastures about 40-50 cm to 3-5 cm), the elevated weight of plants is basically concentrated in the lowermost land layers. Valuable fodder grasses drop out of herbage first of all: meadow grass Bukhara and bulbous, Zeravshansky meadow foxtail, a cock's-foot grass, meadow oat grass, Gissar and the Asian onions. Conducted by us on basic types of pastures and haylages numerous field experiences have shown, that at extensive use of pastures, there is a decrease in fertility of soils that leads to deterioration of quantitative structure of herbage on pastures. There is a sharp decrease in productivity.
Long and excessive grazing has transformed pastoral sites into failure (non-convenient). 75-90 % of weight of a herbage make not eatable grasses, thus productivity of fodder weight has decreased at 5-10 times.
8.6.4 Soil fertility decline The main reason of intensive development of degradation of soils in a zone of rain-fed agriculture - development of abrupt slopes, bottom and slopes of negative forms of a relief, the water modular areas of the small rivers, ignoring anti-erosion actions and others. The powerful drain is formed in spring during floods on the opened slope and in a bottom of negative forms of a relief, which washes off the top fertile layer of land and numerous gullies and small ravines, gradation of which leads to formation of the large-goffered forms of a relief.
Under rain-fed agriculture, slopes by steepness to 25 ° are widely used since recently. It is established, that slopes of 10-25 ° - strongly washed, and washout of soils reaches 920 m3/hectares; 5-10 ° are subject to various degree of washing (from weak to very strong) and to 5 ° - week washed (Ahmadov, 2011).
In mountain territory of Republic, they widely used rain-fed terracing under perennial crops. However wrong construction of these terraces leads to intensive development of erosive processes.
Display of erosive processes in a rain-fed zone of agriculture in a great extent depends on culture of land cultivation. In many farms of southern, southeast and southwest parts of Tajikistan, cultivation of land is carried out along a slope. Fall of even insignificant quantity of deposits here leads to intensive development of erosive processes and formation of numerous linear forms. At regular processing, these lands turn to the goffered sites and numerous hollow type falls are formed on their surface. In due course on these lands owing to strong goffered nature it will be impossible to cultivate agricultural crops and the land will grow with weeds, turning in waste, reminding badlands.
On the irrigated land as a result of irrigation the process of wash off and washout is taking place, which are called as the irrigational erosion, causing a huge damage to a national economy.
Major factors of activity of the person, influencing in occurrence and development of irrigational erosion in the course of development and use of the land are:
technology of land development with subsidence of ground; leveling of fields; placing of crops; development of crop rotations; ways and techniques of irrigation; efficiency of irrigating system and its links;
factor of land use; presence of a condition of a water catchment and outlet network; the control on carrying out of irrigation;

CRP1.1 SRT2-AS2 – Characteristics of the site “Rasht Valley”
page 31
qualification and professional skills of attendants.
In the mountain territory lately massive are intensively developing with considerable slopes of a surface (7-15 and more degrees) where superficial gullies are formed at the first irrigation, and on borders of fields - small ravines. Sometimes as a result of irrigational erosion, capacity of a soil cover decreases to 80 cm, thus capacity of a soil cover in an irrigated zone reaches 2.5 m. Display of ravine and linear erosion in a zone of irrigated agriculture is in many respects defined by the depth of basis of erosion: not regulated discharge of irrigating water from fields on the pipes, having deep cut of basis of erosion, leads to intensive formation and growth of ravines. Irrigation of agricultural crops in a greater part of Republic is carried out by surface irrigation method and only on the insignificant area - sprinkler irrigation. Other ways of irrigation are applied on pilot or industrial - pilot sites in small areas. Despite advantages of surface irrigation, it does not meet the increased requirements of rural farming: water delivery is imperfect, distribution across the field is non-uniform, expenses of irrigating water and size of superficial discharge exceed norm. All that in the presence of slopes of a surface and subsidence of ground leads to irrigational erosion.
8.6.5 Other system problems
Other available problems in a system: − Weak explanatory work among members of farms about various categories of land, located in farm; − Irrational use of water for an irrigation; − Shortage of the irrigated land; − Poor quality of a seed material; − Necessity of carrying out of seminars and trainings on the land tenure rights; − Shortage of the literature; − Insufficient knowledge of local population on fundamental laws on land tenure; − Surpluses of the pastoral land (to conclude the contract with others farms about their use); − Absence of a commodity market and the low prices on agricultural production; − Low knowledge of local population of rational use of slope land; − Low knowledge on legislatively statutory acts; − Error of the previous administration of farm on the conclusion of use of the land in rent; − Almost there is no information on land reform; − Absence of corresponding techniques; − Shortage of potable water;

CRP1.1 SRT2-AS2 – Characteristics of the site “Rasht Valley”
page 32
− Reduction of the pastoral areas at the expense of increase in arable lands around settlements; − Question of allocation of pastoral land between kishlaks (villages) for grazing of private cattle; − Indemnification of losses to dehkan farms for carrying out various building and communal works; − Low knowledge of local population on traditional methods of managing agriculture; − Deterioration of agricultural machinery and absence of renovation of tractor-machine park; − Shortages of mineral fertilizers, pesticides, etc.; − Absence of independence at planning and the account of agricultural crops; − Shortages of progressive technology and cultivation methods of agricultural crops in irrigated territories.
8.7 System dynamics 8.7.1 Stability, stagnation or evolution towards other more/less productive/profitable/environmentally sustainable systems
1997 1998 1999 2000 2001 2002 2003 2004 2005 2006 2007 2008 2009 2010 2011 Slow development Stable development
Till 2006 development of agricultural farms of the region was in slow rates. The accepted number of decisions of Government Republic Tajikistan in last five years has given a push to development of a Rasht valley. During the period from 2007 for 2011 in a valley there is some stable development, especially in the field of potato growing and gardening.
8.7.2 Most common type of agricultural enterprises (e.g. individual/private, cooperatives, state farms)
1997 1998 1999 2000 2001 2002 2003 2004 2005 2006 2007 2008 2009 2010 2011
1 (dehkan individual)
Number th..
1.4 1.6 1.7 2.0 2.4 2.6 2.8 3.0 3.1 3.4 3.5 3.7 3.8 4.0 4.1
% 0.7 0.7 0.7 0.7 0.7 0.8 0.8 0.8 0.8 0.8 0.8 0,9 0,9 0,9 0,9
hа 2.8 2.8 2.8 2.8 2.8 2.8 2.8 2.8 2.8 2.8 2.8 2.8 2.8 2.8 2.8
2 (household)
Number, th..
37 37 37 38 38 40 40 41 41 42 43 43 44 45 46
% 0.4 0.5 0.5 0.5 0.3 0.3 0.3 0.4 0.6 0.6 0.8 0.8 0.8 0.8 0.8
hа 0.2 0.2 0.2 0.2 0.2 0.2 0.2 0.2 0.2 0.2 0.2 0.2 0.2 0.2 0.2
8.7.3 Presence of producer associations (e.g. farmers’ groups, water use associations, marketing associations, cooperatives)
There are associations of farms and water users In the valley. № Name 2000 2001 2002 2003 2004 2005 2006 2007 2008 2009 2010 2011 1 Farm businesses
(dehkan) farm 5 5 5 5 5 5 5 5 5 5 5 5
2 WUA 5 5 5 5 5 5 5 5 5 5 5 5 Note: One association of farms and water users is organized in each area of a valley. Associations of farms include all farmers of the

CRP1.1 SRT2-AS2 – Characteristics of the site “Rasht Valley”
page 33
region. The total number of farms in the region (in five areas) makes quantities of farms of 3013 (data on a condition to 01/01/2012) Source: Land fund RT, Dushanbe, RT, 2012
9. Governance, institutions, policies 9.1 Institutional support 9.1.1 Extension services and NGOs
There are pilot sites of the Tadjik academy of agricultural sciences in Rasht valley which, together with local government and experts of the ministry of agriculture, the ministry of water resources, committee on land management and a geodesy both other ministries and departments, NGO and МО hold seminars on dissemination of experience and managing rural farms.
9.1.2 Access to improved/adapted varieties/breeds
wheat potato fruits vegetable Note reference Access is available
Access is available
Access is available
Access is available
Access is available, limited, non available
MAWR RT
Tajik Academy of Sciences has released for agriculture new, perspective varieties of crops. By applications of farmers (dehkans) seeds departments render support at procurement of released new varieties agricultural varieties, or they buy these seeds in the markets on market prices).
9.1.3 Access to animal health services Cattle Goats and
sheep Poultry
Access is available,
limited, non available
Reference MAWR RT
In many rural areas of the valley there are veterinary doctors to render services to animals. Access is available
Access is available
Access is available
9.2 Policies 9.2.1 Pricing/subsidies for inputs (land, water, fertilizer etc.)
Land. According to the land code of Republic Tajikistan, the land is a sole state property, and the state guarantees its effective use in interests of the people.
Land use in Republic Tajikistan is paid. The payment for the land is raised annually in the form of the land tax, and terms of rent payment have been established (in edition of Law RT from 28.02.2004г.N23). Rates, an order of the taxation and a rent for the land, the land tax and its rate are defined by Tax code of Republic Tajikistan (in edition of Law RT from 12.05.01 N 15). The Rent of agricultural land is defined depending on quality and a site of
reference Land code of Republic Tajikistan and the Order of the State agency on an antimonopoly policy and business support at President RT

CRP1.1 SRT2-AS2 – Characteristics of the site “Rasht Valley”
page 34
the land area, taking into account a cadastral estimation (in edition of Law RT from 12.05.01 N 15). Rates of payments for use of other types of land are defined taking into account their site, nature of use, ecological and social and economic features.
Water. According to the Constitution of Republic Tajikistan, water is a sole property of the state and the state guarantees its effective utilization and protection in interests of the people.
Using water facilities for needs of rural farm is carried out in the general, and the special water use order. Watering, irrigation, drying and collector-drainage systems and systems of agricultural water supply, and also separate water economic constructions and the devices belonging to physical and legal bodies can be applied at special water use.
According to the order of the State agency on an antimonopoly policy and business support at Government of Republic Tajikistan for № 45 from April 1, 2011, the payment for delivery 1 meter3 of water makes 1,5 dirhams.
9.2.2 Pricing/subsidies for produce
The price acts as one of levers of distribution of incomes and raising efficiency of an agricultural production. The price, as it is well- known shows term of money of cost of the goods and at a stage of an exit of production from production is formed on the basis of action of the law of cost. However, action of the law of cost in farming, first of all in agriculture, has certain features.
Major of them consists that public cost and consequently also the price of agricultural production is defined not by average conditions of production, as it takes place in the industry, but production conditions on rather worst in fertility lands and location of a commodity market near land sites. The price for production, produced in the worst conditions, should provide a covering of production costs, rent payment (there where it is) and reception of average profit.
The second feature of pricing in agriculture consists in necessity of maintenance of a principle of equivalence for an exchange between the industry and agrarian sector.
The third feature of pricing on agricultural production consists of the fact that direct or indirect differentiation of the prices is provided for natural-climatic zones. At reference of this or that area to corresponding zone, characters of soils and climatic conditions are considered, which influence productivity of agricultural crops, the cost price and production fund-consumption, profitability level and so forth.
In other words, pricing on agricultural production cannot exclusively develop
reference Data analyses of Agency on statistics of RT and State Investment Committee

CRP1.1 SRT2-AS2 – Characteristics of the site “Rasht Valley”
page 35
according to market economy laws. Pricing on production of rural farm is the economic phenomenon of key value as
stability of reproduction in many respects depends on it in the central link of agriculture and thus including a satisfaction of requirements of the population in the basic foodstuff, a standard of living on village as well. The problem of formation of effective system of pricing within the limits of all national farm and its separate branches has always been important in our country. During the long period of time in a counterbalance to objective economic laws the pricing issue was carried out in centralized and planned order. Procurement and retail prices for agricultural products were established compulsorily and contradicted interests of productions. Along with it they did not answer a problem of the effective expanded agrarian reproduction and a parity of the prices on agricultural and an industrial output. Such mechanism of pricing has negatively affected profitability of all rural farms and its consequences are notable till date. The prices and absence of the effective mechanism of their formation are one of the principal causes of unprofitability of many agricultural enterprises. Thereupon the solution of a problem of optimization the system of pricing on production of rural farms in frameworks both separate region, and all country as a whole becomes especially vital. In the cost structure for production, considerable specific weight is occupied by tangible costs of an industrial origin, especially in branches of plant growing. In animal industries branches, the growth of these costs is also observed. From here it is doubtless, that the decisive influence on level of the cost price of production of rural farm is rendered both by a price level on the industry of production, given in agriculture, raw materials, and means of production.
Specific all wages, fertilizer, fuel and lubricants and other expenses are considerable in general in plant growing: accordingly 28,1, 14,7, 19,7 and 20,5 %. But in animal industries costs for forages make about 57 %. Other costs make 12 %. Though specific all wages in the cost price are considerable, however from the point of view of real requirements, they are very scanty: i.e. the absolute size makes from 7 to 12 US dollars, that we cannot stimulate workers with this level on growth of production of agricultural production.
Subsidies. The agriculture is subsidized in the form of financing of Government programs for
development of this or that under-sector from the state budget. There were 16 such programs in 2011, from which 14 are financed. In 2011 volume of financing of these

CRP1.1 SRT2-AS2 – Characteristics of the site “Rasht Valley”
page 36
programs has made 20,0 million somoni, from which 13,5 million somoni have been allocated in the first half of the year. From 2005 to 2011 growth of the allocated means in types of state support has grown from 2,9 million somoni to - 20,0 million and for this period has made 93,6 million somoni. 32,3 million of them makes means directed on support of the seed-growing, 19,0 million - on agricultural machinery acquisition, 17,8 mln. - on pest control of gardens and vineyards, 12,3 - on anti-epizootic works.
9.2.3 Policies related to access to land and water resources
The Parliament and the Government of the country developed and approved many acts and regulations on land management:
− Land Code, 1996 and additions and changes 2003; − Code «On administrative offences», 2000; − Water Code, 2001; − Civil Code, 1999; − Forestry Code, 1993; − Tax Code, 1998; − Law «About wildlife management», 1993; − Law «About land reform», 1992; − Law «On reserves», 1994; − Law «On protection and use of vegetation and fauna preservation», 1994; − Law «On land estimation» - 2001; − Law «On land management» - 2001. − Law of Republic Tajikistan «On dehkan (farmer) farms» accepted in 1992. Changes
have been made to the given law and additions, and the new wording has been accepted in 2002;
− Law of Republic Tajikistan «On an economic estimation» accepted in 2001; − Decree of President Republic Tajikistan «On reorganization of agricultural
enterprises» № 522 from June 25th, 1996; − Decree of President Republic Tajikistan «On realization of the right of land use»
№1021 from June 22nd, 1998. − Resolution of Republic Tajikistan «On measures of performance the Decree of
President Republic Tajikistan « On realization of the right of land use» № 244 from 1998, and others.
reference Laws of RT

CRP1.1 SRT2-AS2 – Characteristics of the site “Rasht Valley”
page 37
9.2.4 Farmers’ autonomy to choose crops and crop areas,ha
The state does not establish areas under crops. Dehkan (farmers) farms cultivate those crops which they choose. In the law about dehkan (farmer) farms it has been stipulated: the dehkan farm independently defines the structure and a way of production taking into account the interests and can be engaged in any type of the activity, not forbidden by legislation of Republic Tajikistan. Intervention in economic activities of dehkan farm from the state bodies and officials is not allowed, except for the bases provided by the legislation. (The law about farmer (dehkan farm), 2002.)
10. Opportunities for agricultural research 10.1 Opportunities for research on land tenure policy, soil and water management, de-rocking, agro-biodiversity conservation, water harvesting for range shrub plantations, drought-resistant varieties, others
The basic problems on the way to introduction of scientific achievements in production include: debts of the most agricultural enterprises for budget of Republic due to lack of financial means for introduction of new scientific developments, the small-scale managing of a great bulk of agricultural productions, absence of advertising and propagation of new developments, low level agricultural knowledge of the majority of workers of sector, etc.
For elimination of the specified problems, it is necessary to organize preferential crediting of priority directions of development of branch, to create centers of consulting services in the villages, to improve legislative base of scientific maintenance of branch, to continue reorganization agricultural enterprises in a direction of the optimum sizes of their functioning.
Breeding and seed-growing and also consulting services are the basic sphere, where agricultural research can qualitatively improve a life of agricultural population, taking into account vertically-zone allotment of the land of an agricultural purpose.
Old type thinking is the basic barrier on a way of development, which prevents elimination of poverty in countryside. Till date the rural worker thinks that the state should provide him/her with all necessary resources of production. The strong consulting push of market thinking is necessary for elimination of this way of thinking (change of way of thinking of farmers (dehkans).
Priority directions of research in a Rasht valley
1. Working out technologies for reception of high crops and breeding new varieties of grain, leguminous, oil seed and forage crops with high potential of efficiency.
2. Breeding of new varieties of grain, leguminous crops with the high maintenance of gluten and the protein.
3. Carrying out breeding works with leguminous crops on creation of varieties resistant to
reference Отчет по УУЗР, Dushanbe, 2010

CRP1.1 SRT2-AS2 – Characteristics of the site “Rasht Valley”
page 38
ascochyta-leaf spot. 4. Improvement technology of adaptable process of agricultural crops to climate change.
5. Collection, studying and preservation of genetic resources of plants for the foodstuffs and agriculture.
6. Sustainable use of genetic resources of plants for the foodstuffs and development agriculture for the purpose of decrease in level of poverty in countryside.
7. Expansion and improvement of genetic base of agricultural crops, increase their stability and efficiency.
8. Improvement technology of stability of genetic resources, their adaptable possibilities to unforeseen changes of environmental conditions.
9. Collection and studying of rare and disappearing local varieties of grain, leguminous crops and their wild relatives.
10. Carrying out of breeding-genetic research and creation of varieties - donors of grain and leguminous crops as sources of an initial material.
11. Working out water-saving and other technologies for increase of soils' fertility. 12. Improvement anti-erosion technologies and improvement condition of soil' fertility. 13. Improve an ameliorative condition of land, ground water.
14. Studying ecology and soil' fertility. 15. Development of resource-saving technologies for livestock production in the
conditions of new forms of managing with decrease in level of poverty of the population. 16. Preservation of genetic resources of types and breeds of animals, increase their
efficiency on the basis of breeding and biotechnology methods.
17. Improvement of technology of beekeeping, comparative studying breeding of bees, reception early queens.
18. Development effective technologies of restoration of the pastoral land and improvement assortment and efficiency of feed crops. There is a Lyahsh base station of the institute of horticulture and vegetable growing of Tajik Academy of Agricultural Sciences in the territory of Rasht valley, which, together with Institutes of farming, animal industries and the National-republican centre of genetic resources carries out priority researches in the above-stated thematic directions. There are limited financial assets for performance of large-scale scientific research works.

CRP1.1 SRT2-AS2 – Characteristics of the site “Rasht Valley”
page 39