Cross-Lingual English Spanish Tonal Accent Labeling Using Decision Trees and Neural Networks
11
-
Upload
independent -
Category
Documents
-
view
1 -
download
0
Transcript of Cross-Lingual English Spanish Tonal Accent Labeling Using Decision Trees and Neural Networks


ESMA Boston Corpus (English)(Spanish) f1a f2b f3a m1b m2b m3b
Input Feature μ σ μ σ μ σ μ σ μ σ μ σ μ σ
f0 range 48.2 26.3 39.6 39.7 56.0 43.3 42.2 42.9 26.7 30.6 24.7 30.7 28.0 27.3f0 maxavg diff 22.8 16.1 19.1 21.2 25.1 21.7 18.7 21.0 14.5 19.5 12.2 16.8 13.2 13.5f0 minavg diff 25.4 14.6 20.4 21.8 30.9 26.4 23.5 25.8 12.3 13.8 12.4 16.0 14.7 15.4f0 avgutt diff -0.8 18.4 -19.0 57.5 -5.5 42.5 -21.6 62.8 -13.4 40.5 -28.0 60.2 -15.6 45.7e range 18.6 8.5 13.9 6.8 16.7 6.4 13.7 6.3 12.9 6.5 12.4 6.9 11.5 5.2e maxavg diff 10.0 5.4 7.7 4.4 9.2 4.1 7.7 4.0 7.7 4.2 7.8 4.8 6.9 3.6e minavg diff 8.6 4.1 6.2 3.1 7.6 3.4 6.0 3.1 5.2 3.0 4.7 2.8 4.6 2.2duration -0.9 9.3 2.5 9.8 4.2 10.6 1.4 12.0 1.0 9.9 -0.5 12.0 1.2 9.5
Table 2. Statistics of the features for the different corpora and subcorpora. Units:f0 range, f0 maxavg diff, f0 minavg diff and f0 avgutt diff in Hz; e range,e maxavg diffand e minavg diff RMSE/100, and duration is normalized*10.
range (e range), difference between maximum and average within word energy(e maxavg range), difference between average and minimum within word energy(e minavg range); duration: maximum normalized vowel nucleus duration fromall the vowels of the word (normalization is done for each vowel type) (duration).
The syntactic lexical POS Tagging information has shown to be useful inthe improvement of the classification results (see [15, 1]). There is no obviouscorrespondence between POS tags used in each corpus: BURNC corpus uses thePenn Treebank tag set (labeled using the BBN tagger [9]) and ESMA uses theEAGLES tag set for Spanish (labeled using the Freeling tagger). We decidedto use the classical classification that considers the different words of the utter-ance to have the role of function word versus content word. This classificationis broadly used for modeling Spanish intonation in Text to Speech contexts [4].The Penn Treebank tags have been collapsed so that the Function Words were:EX (existential there), RP (particle), CC (coordinating conjunction), DT (de-terminer), IN (preposition, conjunction subordinating), WDT (Wh-determiner,TO (to preposition) and CD (cardinal number). The rest of the types of wordsare considered as Content Words. The words of the ESMA corpus are a prioriclassified in terms of function vs. content word as the corpus is segmented intostress groups (an stress group is formed by one content word plus the precedingfunction words).
Regarding to context, we focus on local effects (at the level of word and/orsyllable) as the context can be highly dependent on the language and the mod-eling of its correspondence is beyond the scope of this paper.
2.2 The classifiers
The Weka machine learning toolkit [8] was used to build C4.5 decision trees(J48 in Weka). Different values for the confidence threshold for pruning havebeen tested, although the best results are obtained with the default value (0.25).The minimum number of instances per leaf is also set to the default value (2).
A Multilayer Perceptron (MLP) with a non-linear sigmoid unit is trained foreach classification problem, using the Error Backpropagation learning algorithm.

ESMA-UPC BURNC BURNC.f1a BURNC.f2b BURNC.f3a BURNC.m1b BURNC.m2b BURNC.m3b
ESMA-UPC 86.6/81.0 72.7/76.5 75.6/76.0 74.7/76.1 76.5/77.9 82.7/76.0 73.6/75.5 75.9/74.7BURNC 81.4/60.3 80.5/80.4 – – – – – –BURNC.f1a 71.1/72.1 – 83.2/80.3 79.8/78.3 76.9/74.6 78.7/77.4 80.6/80.4 78.0/76.7BURNC.f2b 81.5/65.5 – 81.5/80.0 84.6/82.9 78.6/74.3 79.0/72.6 81.6/74.5 79.4/75.1BURNC.f3a 80.9/78.6 – 80.7/79.5 79.0/79.8 82.2/80.3 80.3/77.8 82.4/81.6 79.1/77.3BURNC.m1b 76.6/75.9 – 77.6/77.0 78.0/76.8 76.7/75.6 84.7/80.8 74.7/76.9 77.8/75.0BURNC.m2b 74.4/63.0 – 80.5/79.5 77.8/75.1 78.3/73.5 79.1/74.4 83.0/82.3 78.1/75.8BURNC.m3b 69.3/75.5 – 81.5/80.8 78.4/78.9 78.1/77.2 79.9/78.6 79.9/81.0 81.0/76.6
Table 3. Classification rates (in percentages) using words in terms of the presence ofaccent. The training corpus in the rows; the testing one in the columns. In the cells(xx/yy), where xx is the classification rate obtained with the C4.5 classifier, yy withthe MLP classifier.
Several network configurations were tested, achieving the best results with thefollowing: i) single hidden layer with 12 neurons, following the Gori results [7],more hidden units than inputs were used to achieve separation surfaces betweenclosed classes, ii) 100 training epochs, iii) two neurons in the output layer, onefor each class to be classified, then the test input vector is assigned to the classcorresponding to the largest output.
Due to the different scale of the features among the training corpora, wetested different normalization techniques: the Z-Norm, Min-Max, divide by max-imum and euclidean norm 1. The normalization has been processed by corpusand by speakers using the Z-Norm technique. In [6] the negative impact of im-balanced data on final result is shown. Therefore, re-sampling methods wereapplied: minority class example repetition [14] for the MLP classifier and Syn-thetic Minority Oversampling TEchnique (SMOTE) method [3] for the C4.5classifier.
3 Results
Table 2 reports on the mean values and standard deviations of the acoustic inputfeatures of the different corpora and sub-corpora analyzed in this work. For F0related variables, the differences between male and female speakers are clearlyobserved (μ values of f0 range go from 24.7Hz to 28.0Hz for male speakers,but they go from 42.2Hz to 56.0Hz for female speakers). F0 values seem to bemore stable in the ESMA corpus (σ values goes from 14.6Hz to 26.3Hz) thanin the BURNC subcorpora (σ from 13.5Hz to 62.8Hz). In the case of variablesrelated to energy, there are also significant differences among the corpora. TheBURNC seems to be more stable with σ going from 2.2 to 6.9 RMSE/100, versusthe variability observed in the ESMA corpus, going from 4.1 to 8.5 RMSE/100.The duration variable shows significant differences among the diverse corpora.
Table 3 shows the classification rates that are achieved when the differentcorpora interchange its training and testing role. In the conventional scenarios(same corpus for training and testing; diagonal of Table 3). The results go from80.5 to 86.6%, which are the expected ones according to the state of the art: [12]reports state of the art up-to-date results from 75.0% to 87.7% using the Boston

ESMA-UPC BURNC.f2b BURNC.m3bFeature IG Feature IG Feature IG
f0 minavg diff 0.18888 f0 minavg diff 0.232 f0 minavg diff 0.245f0 range 0.18246 f0 range 0.214 f0 range 0.232pos 0.17347 pos 0.199 f0 maxavg diff 0.206f0 avgutt diff 0.15215 duration 0.177 e range 0.169f0 maxavg diff 0.10891 f0 maxavg diff 0.156 e maxavg diff 0.165e range 0.09695 e range 0.152 pos 0.164e minavg diff 0.08156 e maxavg diff 0.13 e minavg diff 0.15e maxavg diff 0.07681 f0 avgutt diff 0.12 duration 0.139duration 0.0063 e minavg diff 0.105 f0 avgutt diff 0.117
Table 4. Info Gain (IG), computed with the WEKA software, of the features whenthey are used to classify the accents in the different corpora.
Radio Corpus with words as the basic reference unit. In the cross-lingual andcross-speaker scenarios (cells out of the diagonal in the Table 3), the classificationrates decrease and they are highly dependent on the sub-corpora used. The bestand worst results are 82.7% and 69.3% in the cross-lingual scenario and 82.4%and 74.7% in the cross-speaker scenario. All these percentages refer to the useof decision trees that seem to be more effective than neural networks.
Table 4 compares the Information Gain of the different features, providing ameasure of the potential loss of entropy which would be generated if the splittingof the training set was carried out in terms of the present feature [16]. The taggingof the Spanish corpus seems to rely mainly on F0 features, as the four mostrelevant features are related with F0 (except the pos feature) and the differencewith respect to the energy and duration features is important. The tagging ofthe English corpus also seems to rely mainly on F0 features (f0 minavg diff
and f0 range share the top ranking position in both corpora). Nevertheless,energy and duration seem to be more relevant for the English transcribers thanfor the Spanish ones. This behaviour seems to be dependent on the speakers:m3b gives more importance to energy than f3a. The speakers f3a and m3b
have been selected as they seem to be, respectively, the best and the worst forpredicting the Spanish accents with the C4.5 decision tree as Table 3 reports.The feature pos appears as one of the most informative features in all the cases(in the BURNC.m3b corpus the feature is down in the ranking but it has a highIG value).
4 Discussion
In spite that the input features are relative magnitudes, significant differences ap-pear between the diverse corpora (see Table 2), affecting both μ and σ. These dif-ferences were expected, independently of the cross-lingual effect, as the differentrecording conditions have a clear impact on the values of the input magnitudes.Thus, for example, the ESMA F0 values have been collected with a laringographdevice and BURNC F0 values with a pitch tracking algorithm leading to lessstable values.
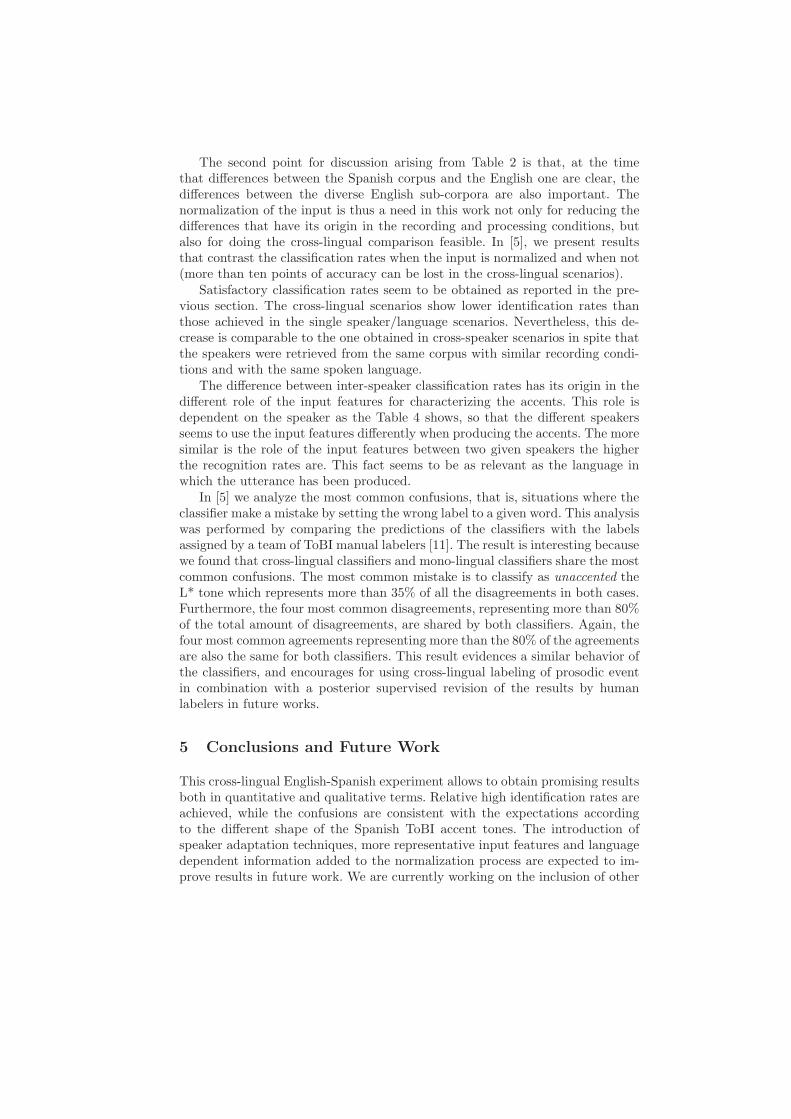
The second point for discussion arising from Table 2 is that, at the timethat differences between the Spanish corpus and the English one are clear, thedifferences between the diverse English sub-corpora are also important. Thenormalization of the input is thus a need in this work not only for reducing thedifferences that have its origin in the recording and processing conditions, butalso for doing the cross-lingual comparison feasible. In [5], we present resultsthat contrast the classification rates when the input is normalized and when not(more than ten points of accuracy can be lost in the cross-lingual scenarios).
Satisfactory classification rates seem to be obtained as reported in the pre-vious section. The cross-lingual scenarios show lower identification rates thanthose achieved in the single speaker/language scenarios. Nevertheless, this de-crease is comparable to the one obtained in cross-speaker scenarios in spite thatthe speakers were retrieved from the same corpus with similar recording condi-tions and with the same spoken language.
The difference between inter-speaker classification rates has its origin in thedifferent role of the input features for characterizing the accents. This role isdependent on the speaker as the Table 4 shows, so that the different speakersseems to use the input features differently when producing the accents. The moresimilar is the role of the input features between two given speakers the higherthe recognition rates are. This fact seems to be as relevant as the language inwhich the utterance has been produced.
In [5] we analyze the most common confusions, that is, situations where theclassifier make a mistake by setting the wrong label to a given word. This analysiswas performed by comparing the predictions of the classifiers with the labelsassigned by a team of ToBI manual labelers [11]. The result is interesting becausewe found that cross-lingual classifiers and mono-lingual classifiers share the mostcommon confusions. The most common mistake is to classify as unaccented theL* tone which represents more than 35% of all the disagreements in both cases.Furthermore, the four most common disagreements, representing more than 80%of the total amount of disagreements, are shared by both classifiers. Again, thefour most common agreements representing more than the 80% of the agreementsare also the same for both classifiers. This result evidences a similar behavior ofthe classifiers, and encourages for using cross-lingual labeling of prosodic eventin combination with a posterior supervised revision of the results by humanlabelers in future works.
5 Conclusions and Future Work
This cross-lingual English-Spanish experiment allows to obtain promising resultsboth in quantitative and qualitative terms. Relative high identification rates areachieved, while the confusions are consistent with the expectations accordingto the different shape of the Spanish ToBI accent tones. The introduction ofspeaker adaptation techniques, more representative input features and languagedependent information added to the normalization process are expected to im-prove results in future work. We are currently working on the inclusion of other

more expressive input features, such as Bezier interpolation parameters and theTilt and Fujisaki parameters to improve results [6]. Furthermore, the inclusionof expert fusion techniques is also being explored to improve the classificationresults, as predictions of the two classifiers can be complementary in some cases.
References
1. Ananthakrishnan, S., Narayanan, S.: Automatic Prosodic Event Detection UsingAcoustic, Lexical, and Syntactic Evidence. Audio, Speech, and Language Process-ing, IEEE Transactions on 16(1), 216–228 (January 2008)
2. Bonafonte, A., Moreno, A.: Documentation of the upc-esma spanish database.Tech. rep., TALP Research Center, Universitat Politecnica de Catalunya,Barcelona, Spain (2008)
3. Chawla, N.V., Bowyer, K.W., Hall, L.O., Kegelmeyer, W.P.: Smote: Syntheticminority over-sampling technique. Journal of Artificial Intelligence Research 16,321–357 (2002)
4. Escudero, D., Cardeoso, V.: Applying data mining techniques to corpus basedprosodic modeling speech. Speech Communication 49, 213–229 (2007)
5. Escudero, D., Gonzalez, C., Vivaracho, C., Cardenoso, V., Aguilar, L.: Analysisof inconsistencies in automatic tonal ToBI labeling. In: Proceedings of TSD 2011(Internatinal Conference on Text, Speech and Dialogue) (in press) (2011)
6. Gonzalez, C., Vivaracho, C., Escudero, D., Cardenoso, V.: On the Automatic ToBIAccent Type Identification from Data. In: Interspeech 2010 (2010)
7. Gori, M.: Are multilayer perceptrons adequate for pattern recognition and verifica-tion? IEEE Trans. on Pattern Analysis and Machine Intelligence 20(11), 1121–1132(November 1998)
8. Hall, M., Frank, E., Holmes, G., Pfahringer, B., Reutemann, P., Witten, I.H.: TheWEKA Data Mining Software: An Update. SIGKDD Explorations 11(1), 10–18(2009)
9. Meteer, M., Schwartz, R.M., Weischedel, R.M.: Post: Using probabilities in lan-guage processing. In: IJCAI. pp. 960–965 (1991)
10. Ostendorf, M., Price, P., Shattuck, S.: The boston university radio news corpus.Tech. rep., Boston University (1995)
11. Prieto, P., Rosedano, P.: Transcription of Intonation of the Spanish Language.LINCOM Studies in Phonetics 06 (2010)
12. Rangarajan Sridhar, V., Bangalore, S., Narayanan, S.: Exploiting Acoustic andSyntactic Features for Automatic Prosody Labeling in a Maximum Entropy Frame-work. IEEE Transactions on Audio, Speech, and Language Processing 16(4), 797–811 (May 2008)
13. Syrdal, A.K., Hirshberg, J., McGory, J., Beckman, M.: Automatic ToBI predictionand alignment to speed manual labeling of prosody. Speech Communication (33),135–151 (2001)
14. Vivaracho-Pascual, Simon-Hurtado, A.: Improving ann performance for imbal-anced data sets by means of the ntil technique. In: IEEE International Joint Con-ference on Neural Networks (18-23 July 2010)
15. Wightman, C., Ostendorf, M.: Automatic labeling of prosodic patterns. IEEETransactions on Speech and Audio Processing 2(4), 469–481 (October 1994)
16. Witten, I.H., Frank, E.: Data Mining: Practical Machine Learning Tools and Tech-niques with Java Implementations. Morgan Kaufmann (1999)