Foreign accent conversion in computer assisted ... - CiteSeerX
Upload
khangminh22Category
view
0download
0
This is a repository copy of Resilience of English vowel perception across regional accent variation.
White Rose Research Online URL for this paper:https://eprints.whiterose.ac.uk/130098/
Version: Accepted Version
Article:
Shaw, Jason A, Best, Catherine, Docherty, Gerry et al. (4 more authors) (2018) Resilience of English vowel perception across regional accent variation. Laboratory Phonology. ISSN 1868-6354 (In Press)
[email protected]://eprints.whiterose.ac.uk/
Reuse
Items deposited in White Rose Research Online are protected by copyright, with all rights reserved unless indicated otherwise. They may be downloaded and/or printed for private study, or other acts as permitted by national copyright laws. The publisher or other rights holders may allow further reproduction and re-use of the full text version. This is indicated by the licence information on the White Rose Research Online record for the item.
Takedown
If you consider content in White Rose Research Online to be in breach of UK law, please notify us by emailing [email protected] including the URL of the record and the reason for the withdrawal request.

1
Resilience of English vowel perception across regional accent variation
Jason A. Shaw1,2, Catherine T. Best1
1The MARCS Institute for Brain, Behaviour and Development, Western Sydney University, Penrith
NSW 2751, Australia
2Dept. of Linguistics, Yale University, New Haven CT 06510, USA
[email protected], [email protected]
Gerard Docherty3
3Arts, Education and Law, Griffith University, Brisbane QLD 4111, Australia
Bronwen G. Evans4
4Dept of Speech, Hearing and Phonetic Sciences, University College London, London WC1E 6BT,
UK
Paul Foulkes5
5Language & Linguistic Science, University of York, Heslington, York, YO10 5DD, UK
Jennifer Hay6

2
6New Zealand Institute of Language, Brain and Behaviour, University of Canterbury, Private Bag
4800, Christchurch 8140, New Zealand
Karen E. Mulak1,7
7Department of Hearing and Speech Sciences, University of Maryland, College Park, MD 20740,
United States
Running title: Perception of native vowel variation

3
Abstract
In two categorization experiments using phonotactically legal nonce words, we tested
Australian English listeners’ perception of all vowels in their own accent as well as in four less
familiar regional varieties of English which differ in how their vowel realizations diverge from
Australian English: London, Yorkshire, Newcastle (UK), and New Zealand. Results of Experiment 1
indicated that amongst the vowel differences described in sociophonetic studies and attested in our
stimulus materials, only a small subset caused greater perceptual difficulty for Australian listeners
than for the corresponding Australian English vowels. We discuss this perceptual tolerance for vowel
variation in terms of how perceptual assimilation of phonetic details into abstract vowel categories
may contribute to recognizing words across variable pronunciations. Experiment 2 determined
whether short-term multi-talker exposure would facilitate accent adaptation, particularly for those
vowels that proved more difficult to categorize in Experiment 1. For each accent separately,
participants listened to a pre-test passage in the nonce word accent but told by novel talkers before
completing the same task as in Experiment 1. In contrast to previous studies showing rapid
adaptation to talker-specific variation, our listeners' subsequent vowel assimilations were largely
unaffected by exposure to other talkers' accent-specific variation. (197 words)
Keywords: vowel perception, sociophonetic variation, English accents, perceptual
learning, Perceptual Assimilation Model

4
1 Introduction
1.1 Phonological limits on phonetic variation
In natural spoken interaction, listeners extract both linguistic properties, i.e., lexical identity
and phonological structure, as well as indexical information about talkers from the speech signal.
Talkers range from the routinely familiar to those who are just being encountered for the first time.
Listeners will have varying degrees of familiarity with a talker’s accent, i.e., speech characteristics
shared within a particular community. In the extreme case of an unfamiliar talker whose accent is
being heard for the first time, listeners may require time to ‘tune in’ to the talkers particular speech
patterns in order to rapidly and accurately identify the intended spoken words. This process is
supported by a phonological system abstracted over a lifetime of experience with phonetic variation
within and across talkers (Best, 2015; Johnson, 1997; Pierrehumbert, 2003).
There is little controversy about the long-standing view that the lexical stock of a language is
predominantly constructed from a finite and abstract system of phonological contrasts (e.g.,
Bloomfield, 1926; Browman & Goldstein, 1989; Chomsky & Halle, 1968; Goldinger, 2007;
Pierrehumbert, 2016). However, work in recent years has highlighted the plasticity of phonological
categories. A given speaker’s productions can change over time in concert with changes in the
ambient speech environment (Tamminga, MacKenzie, & Embick, 2017) including exposure to
languages (Flege, Schirru, & MacKay, 2003; Fowler, Sramko, Ostry, Rowland, & Hallé, 2008; Sancier
& Fowler, 1997), dialects (Nycz, 2013), roommates (Pardo, Gibbons, Suppes, & Krauss, 2012;
Sonderegger, Bane, & Graff, 2017), television (Stuart-Smith, Pryce, Timmins, & Gunter, 2013) or
broader societal change (Harrington, Palethorpe, & Watson, 2000). On shorter timescales, shifts in
production can be observed within a single conversation in response to the interlocutor (Kim,
Horton, & Bradlow, 2011; Pardo, 2006) or within a single experimental session through shadowing

5
(Nielsen, 2011) or even subtler manipulations (Shaw, 2013). In perception, listeners can rapidly
adapt their phonetic expectations for phonological categories to the speech patterns of particular
talkers (e.g., Norris, McQueen, & Cutler, 2003; Cutler et al., 2010), including talkers with accents
other than that of the listener (Bradlow & Bent, 2008; Maye et al., 2008; Sumner, 2011). They also
perceptually compensate for contextual constraints on speech articulation, such as viewing the
speaker holding a pencil between their teeth (e.g., Kraljic & Samuels, 2006).
Understanding the interplay between the phonological system by which the lexicon is
structured, on the one hand, and the extensive talker, accent and token variability that is associated
with the realization of particular phonological categories, on the other, presents a fundamental
theoretical challenge. Addressing that challenge is central to a broader understanding of the
phonological systems of human languages, how they are learned, and how they change over time.
Specifically, a crucial yet still unanswered (indeed, virtually unexamined) question is: For a given
phonological category, what limits of tolerance prevail before listeners’ fine-tuned abilities to deal
with natural phonetic variation start to derail - i.e., before they begin to attribute the phonetic form
they have just heard to a different phonological category in their own regional accent than the
category intended by the speaker?
The concept of perceptual assimilation may be useful in identifying these limits. Perceptual
assimilation was originally proposed to account for cross-language speech perception findings
(Perceptual Assimilation Model [PAM]: e.g., Best, 1995; Best & Tyler, 2007), where it refers to
listeners' strong tendencies to perceive non-native phones as exemplars of the well-entrenched
phonological contrasts of their native language. Perceptual assimilation refers to the specific role
that phonological categories play in shaping speech perception. In the L2 (or non-native speech)
context, perceptual assimilation accounts for difficulties in discriminating many non-native
contrasts, as well as for non-native contrasts that pose little to no discrimination difficulties (e.g.,
6
Best et al., 1988; 2001; Best & Hallé, 2010). Here, we posit that perceptual assimilation of natural
phonetic variation operates within the native language, where it allows listeners to accommodate
novel phonetic variants they encounter to the system of phonological categories they have
abstracted from their prior experience. The mechanism of perceiving speech in terms of
phonological categories (see also, Holt & Lotto, 2010), while it can cause specific difficulties for L2,
may support flexible perception in the native language in crucial ways. Listeners are reasonably
well able to recognize the great majority of words of a novel talker who speaks a previously
unencountered and phonetically disparate regional accent of the same language. This ability may
depend on perceptual assimilation, i.e., that listeners tolerate a wide range of talker variability in
the expression of phonological categories. The benefits of perceptual assimilation in this regard
should be clearest when listeners are able to detect systematic relationships among the categories
of the full phonological system, rather than being presented with only a few phonemes or contrasts.
Perceptual flexibility, in other words, could facilitate recognition of the more stable networks of
phonological contrast that are, and must be, maintained across the entire system (Chodroff &
Wilson, to appear).
Regional variation in English vowels provides a paramount example of higher level constancy,
or phonological systematicity, in the face of phonetic variation. In a wide-ranging survey of regional
accent variation in English, Wells (1982) introduced the Lexical Set framework to express the
phonological coherence of the lexicon across varieties of English as spoken around the world. There
are large swathes of the lexicon that share the “same” phonological vowel category even as the
particular phonetic qualities of the vowel may vary substantially not only from talker to talker, but
also geographically from region to region. We refer to the latter type of variation as regional accents.
Because of this state of affairs, the KIT vowel, for example, refers to how the vowel in all words using
the same stressed vowel as <kit> is phonetically realized within each particular accent. There are,

7
of course, cases of vowel mergers and splits that have taken place historically in some but not other
regional accents of English, i.e., phonological differences. But these processes are the exceptions
(captured in Wells’ framework with either separate lexical sets, e.g., BATH for words that pattern
variably across accents with either TRAP or PALM, or lexical-indexical differences, e.g., <tomato>
as [təˈmɛɪɾoʊ] in American English, in which the bolded vowel belongs to the FACE lexical set, versus
[təˈmɐːɾoʊ] in Australian English, in which the vowel belongs to the PALM set). Overwhelmingly,
the network of phonological contrasts supported by the English lexicon is preserved across regional
accents despite substantial phonetic variation across accents in vowel quality realization for a given
lexical set.
Our aim in the present study was to exploit the natural variation in vowel quality found across
the vowel systems of five regional accents of English in order to assess the stability of the perceptual
system in the face of variation. Specifically, we asked whether the differences across English accents
described in the sociophonetics literature have consequences for the perception of vowels in terms
of phonological categories. We began by assessing how vowels in various accents are perceptually
assimilated, as indexed by vowel categorization and goodness-of-fit ratings (i.e., a listener
judgement of how well a particular token fits into their vowel category), across the entire vowel
inventory, 20 vowels per accent (Experiment 1). We then assessed how pre-test exposure to a
meaningful story told in a given accent may influence perception of vowels in that accent
(Experiment 2). Our experiments provided listeners with exposure from multiple talkers of either
their own English accent or one of the unfamiliar (or, at least, less familiar) regional accents, which
we have carefully selected to exhibit a range of relevant vowel variation.
As our goal was to delineate system-wide behavior, our experimental paradigm falls between
two experimental research traditions (see Cristia et al. 2012 for an overview of many of the relevant
studies). One tradition targets specific speech segments or individual phonemic contrasts, and

8
assesses phonetic adaptation at the level of sub-lexical units (e.g., Evans & Iverson, 2004, 2007;
Kraljic & Samuels, 2005; Maye et al., 2008; Norris, McQueen & Cutler, 2003; Sumner, 2011). These
experiments typically introduce synthesized variation to some relevant acoustic aspect of the target
item, providing a focused test of the perceptual effects of just the manipulated aspect of only the
targeted segment(s). Another tradition uses naturally produced connected, meaningful speech and
assesses how exposure impacts overall comprehension, using dependent measures such as reaction
time or transcription accuracy, without a detailed analysis of the phonetic or phonological
characteristics of the speech for which perception is impacted by accent exposure (e.g., Bradlow &
Bent, 2008; Clark & Garrett, 2004; Floccia et al., 2006, 2009). Experiments in these two traditions
have not been designed to pinpoint system-wide adjustments to phonological expectations in
response to natural phonetic variation. Our approach adopts key aspects of each research tradition
and adds several crucial comparisons. We provide pre-test exposure to either the listeners’ familiar
(native) accent or an unfamiliar accent, in the form of an engaging story (cf. Maye et al., 2008).
However, unlike previous phonetic adaptation research, our materials are not synthetically
manipulated. Instead, we make use of naturally produced variation present in multiple speakers of
regional accents of English. To assess how exposure affects each vowel in the system, unlike prior
research into exposure effects on comprehension of connected speech, i.e., involving real words, our
experiment following pre-test accent exposure probed perception of the entire vowel inventory in
spoken nonce words.
In two experiments, we investigated the effect of accent variation and of pre-test accent
exposure on categorizations of English vowels as spoken in five accents (described in greater detail
below): Australian English (the listeners’ native regional accent) and the four less familiar accents
spoken in London (UK), New Zealand, Yorkshire (UK), and Newcastle (UK). In Experiment 1, we
examined Australian listeners’ perceptual assimilation of vowels in nonce words produced in the

9
five accents, as indexed by categorization and goodness ratings of the vowels after they had first
attended to the pre-test exposure story told by Australian speakers. Experiment 2 assessed whether,
and if so how, categorizations and goodness ratings of those same nonce word vowels spoken in
each of the non-Australian accents are influenced by pre-test exposure to the story, but this time
told by other speakers of that same unfamiliar accent.
1.2 Hypotheses
1.2.1 Experiment 1: Perceptual assimilation of vowels across accents
There are two broad possibilities regarding how listeners may handle the phonetic variation
stemming from talkers of different regional accents across the vowel system of their native language.
Both are grounded in the premise that perceptual attunement creates a system of distinct native-
accent vowel categories to which the phonetic realizations of the vowels in another regional accent
will be assimilated according to perceived similarities and differences. At issue is whether the vowel
differences described in the sociophonetics literature correspond also to perceived differences in
phonological category (or goodness of fit to a category) or whether listeners are able to recover the
intended phonological category despite the phonetic variation.
The PAM framework provides a convenient vocabulary for expressing phonetic/phonological
differences in terms of perception, i.e., how a listener with one type of phonological system
perceives a speaker with a different phonological system (Best, 1995; Best & Tyler, 2007). As
applied to cross-accent speech perception, the relevant assimilation types are as follows: an “other-
accent” vowel can be perceived either as equivalent to the native-accent realization of the same
lexical set vowel (Nativelike assimilation: NL); or as a Category-Goodness (CG) difference from the
native-accented vowel for the same lexical set; or as a Category-Shift (CS) that is perceived as a

10
better example of a different lexical set vowel in the native accent; or as UnCategorized (UC), i.e.,
not perceived as a clear member of any single lexical set vowel in the native accent (Best et al.,
2013; Ying et al., 2013; Best et al., 2015a, 2015b). In comparing the other-accent vowels in our
study to the vowels of the Australian listeners, we make systematic use of this ontology, mapping
sociophonetic descriptions of the accents of interest to these types of perceptional assimilation.
These constitute predictions of the sociophonetic descriptions as expressed in the PAM vocabulary
of assimilation types.
The first broad hypothesis is that the sociophonetic descriptions (reviewed in 1.3 below)
mapped to the perceptual assimilation types above will predict perceptual behavior. On this
hypothesis, listener categorization will be sensitive to the variation documented for these accents.
An alternative hypothesis follows from the tendency for vowels to be weakly categorized in L2
(Bundgaard-Nielsen, Best & Tyler, 2011; Tyler, Best, Faber & Levitt, 2014; Faris, Best & Tyler, 2016)
as well as in the native language (Pisoni, 1975; Repp, 1984). Compared with consonants, categorical
boundaries are not as sharp for vowels. In spoken word recognition, English listeners tolerate more
variation in vowels than in consonants as demonstrated, for example, by the word reconstruction
paradigm, in which English listeners presented with a non-word such as eltimate are more likely to
make a word by changing the vowel eltimate ultimate than by changing a consonant eltimate
estimate (Van Ooijen, 1996). Perception across the vowel system may be flexible to all but extreme
degrees of natural vowel variation, within or between accents. On this hypothesis, listeners will not
be sensitive to the full range of accent differences documented in the sociophonetic literature,
because they will tolerate the variation. Perceptual flexibility could lead to overall accommodation
of most realization differences to the native vowels of the corresponding lexical sets.

11
1.2.2 Experiment 2: Accent exposure effects
Given the unique design of experiment 2, our investigation of accent exposure effects is
somewhat exploratory. Accordingly, we identify several hypotheses for how pre-test accent
exposure might influence patterns of vowel assimilation. The first is the null hypothesis that
naturalistic short-term exposure of the type we have designed for our experiments will not impact
perceptual assimilation of vowels at the sub-lexical level that is involved in our nonce word vowel
tasks. This prediction arises from the following considerations: on the linguistic side, vowel
categories are abstract, they are learned from years of lexical experience, and they participate in
deep networks of phonological knowledge about the lexicon. Moreover, vowels also carry indexical
information about the talker as well as prosodic information. Listeners may not be able to generalize
from naturalistic running speech from multiple talkers to new talkers producing vowels in isolated
nonce words.
Alternatively, a second possibility is raised by a wide range of experimental studies
demonstrating rapid perceptual adaptation to various types of phonetic variation, including both
talker-specific variations and variants generated by phonological rules (e.g., Dahan et al., 2008;
Skoruppa & Peperkamp, 2011). Thus, the second hypothesis is that learners will adjust categories
incrementally in response to the accent variation in a pre-test exposure phase that presents a
meaningful connected speech story told by several speakers of a given accent, thereby developing
situation-specific phonological categories that reduce prediction error in mapping subsequent
speech to those categories (e.g., Kleinschmidt & Jaeger, 2015). It is important to note, however,
that nearly all studies of rapid phonetic adaptation have focused on the listeners' native accent
rather than unfamiliar regional accents (but see Adank, Evans, Stuart-Smith & Scott, 2009; Floccia
et al., 2006), on talker-specific rather than cross-talker adaptation (cf. Kraljic & Samuel, 2006), and

12
on consonants rather than on vowels (cf. Maye, Aslin & Tanenhaus, 2008). Thus, it is a largely open
question whether such rapid adaptation can occur for vowels, across talkers, and for natural (not
synthesized) variation found in non-native regional accents.
A third possibility is that pre-test exposure to an unfamiliar accent will destabilize the vowel
system, leading to less reliable categorization. This hypothesis follows from a posited process of
“category-widening” as a response to unexpected variation (see, e.g., Maye et al., 2008 and
Kleinschmidt & Jaeger, 2015 for discussion). From the standpoint of the listener, the unfamiliar
phonetic variants of accents they have less frequently or rarely encountered (as compared to their
own regional accent) are likely to introduce uncertainty about phonological categories, a response
to which may be to widen the range of tolerated phonetic variation, which would in turn decrease
the stability of categorical distinctions across the system. Maye et al. (2008) argue that the
adaptation-effects observed in their task, which involved exposure to one synthetic “talker”
producing words with categorical vowel substitutions, were not due to category-widening, but this
remains a theoretical possibility for more naturalistic speech environments of the type used in our
materials.
1.3 Selecting the accents for use in the study
One of the unique aspects of our design, in contrast to the previous research from which we
motivated our predictions, is that we sought to evaluate ‘accent-level’ perceptual assimilation of
vowels and perceptual adaptation to the pre-test exposure story passage, as opposed to talker-
specific assimilation and adaptation patterns. To this end, we tested listeners’ vowel categorizations
for each of five accents following pre-test exposure to a passage in the listener’s native accent
(Experiment 1: perceptual assimilation) versus following exposure to multiple talkers of the
unfamiliar accent (Experiment 2: exposure effects), none of whom were the same talkers heard in

13
the test phase (vowels categorization task) of the experiment.
The baseline of comparison, i.e., our listeners' native regional accent, is Australian English
(Aus). The principal patterns of phonological realization associated with this variety are well-
established (Cox 2006; Cox & Palethorpe 2007), and in recent years subject to increasingly fine-
grained analyses (Billington, 2011; Cox & Palethorpe, 2012; Cox et al, 2014). Aus, as well the other
regional accents included in this study, are non-rhotic — /ɹ/ occurs only in syllable onsets. Non-
rhotic accents tend to have more vowels than rhotic accents because the sequence of a vowel
followed by a post-vocalic /ɹ/ in a rhotic variety often corresponds to a distinct vowel category in
a non-rhotic variety. Selecting all non-rhotic varieties simplifies the mappings between accents in
that a vowel in one accent can always be mapped to a vowel in the corresponding lexical item in
another accent (cf., mapping vowels in one accent to /Vɹ/ sequences in another accent). To represent
Aus for the present study, we recruited participants from the south-western suburbs of metropolitan
Sydney. Four further non-rhotic regional accents were then selected, each displaying a different
array of vowel realization disparities from Aus, and thus enabling the formulation of distinctive
hypotheses about the responses of Aus listeners to phonetic properties of vowels that differ
phonetically, or in a few cases systemically, from their own accent: Christchurch in New Zealand,
and southeast London, Yorkshire, and Newcastle in the UK. These regional varieties have all been
extensively analyzed in recent years (New Zealand: Hay et al, 2008; London: Fox, 2015; Tollfree,
1999, Pzredlacka, 2001, Kerswill et al, 2008, Ryfa, 2013; Yorkshire: Haddican et al, 2013;
Newcastle: Watt & Milroy, 1999, Watt & Allen, 2003). Henceforth we refer to these four varieties
respectively as NZ, Lon, Yrk, and Ncl.
We used existing descriptions to define a set of phonological-to-phonetic mappings between
Aus and each comparator accent, organized in relation to Wells’ (1982) lexical sets. For each lexical
14
set in each pairwise accent comparison with Aus, we first identified whether the comparison to the
reference accent (Aus) yielded what Wells describes as a systemic difference, i.e. where the two
varieties differ phonologically with respect to the number of contrasts in the system (for example,
two varieties that differ by virtue of one variety contrasting NEAR and SQUARE vowels and the other
not doing so). We also considered what Wells terms realizational differences, i.e. differences between
accents based on the phonetic variants used across a lexical set. How these characterizations of
production influence cross-accent perception in terms of phonological categories is largely
unknown. To make concrete the predictions of our first hypothesis, we expressed the differences of
the Wellsian taxonomy in terms of the vocabulary of perceptual assimilations in PAM, as introduced
in the hypothesis section above. We considered realizational differences to be CG (Category
Goodness) differences when listener and talker accents for a given lexical set vowel are small and
unlikely to lead the listener to hear a different vowel from the target lexical set than the other-
accent talker intended (e.g., Aus listeners may be more likely to hear the retracted variants of TRAP
in the Ncl accent as perceptibly non-Aus exemplars of TRAP rather than as representing a different
lexical set, such as PALM). In contrast, a CS difference is one where the listener may be led to hear
the variant in the talker’s variety as belonging to a different lexical set from that which the talker
intended (e.g. the raised variant of DRESS found in NZ is likely to be misheard by Aus listeners as
KIT). We reiterate that our a priori characterization of accent differences in terms of perceptual
assimilation types, e.g, CG, CS, etc., is based on published descriptions of the accents and also
verified by our own recordings (see below). Whether or not perceptual assimilation of accent
differences cuts along the same lines as the sociophonetics descriptions (H1) or tolerates a broader
range of variation (H2) remains an empirical question, addressed by our first experiment.
As the basis for expressing accent differences as types of perceptual assimilation, as well as
drawing on recent descriptive accounts of the accents, we also made reference to the vowel
15
productions in real lexical items of the speakers who we recruited for the experiments. As part of
the experimental protocol, each of the four speakers (two male, two female) who produced the
nonce words for the vowel categorization task in each of our target accents produced 3-5 repetitions
of isolated words (the keywords used in the categorization task, described below) for each of the 20
lexical sets which we were interested in analyzing in this study.1 The keywords were: <bead, bid,
bed, bad, bard, bud, rude, hood, bored, pod, paired, beard, bird, toured, paid, code, hide, boyd,
proud>, respectively, for the lexical sets FLEECE, KIT, DRESS, TRAP, PALM (same vowel as START in all
five accents), STRUT, GOOSE, FOOT, THOUGHT (same vowel as NORTH in these accents), LOT, NEAR,
SQUARE, NURSE, CURE, FACE, GOAT, PRICE, CHOICE and MOUTH. From these keyword recordings, we
extracted Lobanov-normalized (Lobanov, 1971) frequencies of F1 and F2 and re-projected the values
in Hz, to normalize for speaker (Adank, Smits, & Van Hout, 2004). Plotting these values by accent
and vowel enabled us to add a visual dimension to our comparative evaluations of the accent pairs.
Figure 1 shows plots of these words, divided into monophthongs (upper panels) and diphthongs
(lower panels). For monophthongs, the ellipses show the 95% confidence intervals (CIs) across
speakers of Lobanov-normalized F1/F2, measured at the vowel midpoints; for diphthongs, the
arrows show the Lobanov-normalized F1/F2 values at 20% and 80% of vowel duration. The
separation into monophthongs and diphthongs is based on classical designation. Note that which
vowels are actually realized as diphthongs differs between Aus, Lon and NZ as a set, versus Ncl and
Yrk as another set. Also note that each accent shows dense regions with numerous overlapping
vowels, and sparser regions with much less overlap. These formant patterns are largely consistent
with published descriptions on each accent (see citations above). We now summarize the findings
of our pairwise accent comparisons, which will refer both to lexical sets, expressed in small caps,
1 This paper does not address vowels in pre-/l/ contexts, which give rise to a range of contrast neutralizations in all five
of our target accents.

16
e.g., DRESS, and the recordings of the keywords displayed Figure 1. In our discussion, we designate
keywords with “<>”, e.g., <bed>. We have ordered the discussion from the most to the least
similar vowel systems of the other accents relative to Aus.
Figure 1. Aus, Lon, NZ, Yrk and Ncl nonce speakers’ keyword vowels (3-5 tokens per keyword per speaker x 2 males
and 2 females per accent) for the nominal (classically-defined) monophthongs (top panel) versus diphthongs (lower
panel) of English. Ellipses for monophthongs represent 95% confidence intervals around the Lobanov (1971) normalized
values of F1/F2 at 50% of vowel duration; colored arrows for diphthongs represent change in formants from 20% of
vowel duration to 80%.
1.3.1 Aus-Lon
For historical reasons (Moore, 2008), it is perhaps unsurprising that Lon is the accent in our
sample that is most phonetically and phonologically similar to the Aus reference accent; it served
as a main contributor to the settling of anglophone Australia. There are no differences that can be
characterized as systemic, i.e., phonological differences between the two vowel systems. A review

17
of the literature on this accent relative to descriptions of Aus suggests a case for CS differences for
the Lon MOUTH and GOAT lexical sets to be respectively categorized as the TRAP and MOUTH vowels
by Aus listeners (Wells, 1982; Tollfree, 1999; Kerswill et al., 2008; Fox, 2015). However, the
acoustic measurements of the Lon stimulus talkers’ productions of the keywords selected to
represent these two lexical sets, <proud> and <code> respectively, suggest these vowels were
realized in such a way as to result instead in, at most, a modest CG difference from Aus.
However, the FOOT vowel for our Lon talkers (<hood>) is notably fronted relative to Aus,
which is consistent with reports of FOOT fronting in London (Tollfree, 1999) but not Aus talkers
(e.g., Cox & Palethorpe, 2007). Thus, Lon FOOT <hood> overlaps in F1/F2 space with Aus NURSE
<bird>. It was therefore possible that Aus listeners would show CS perception of Lon FOOT vowel
as NURSE, although duration differences may push against this outcome, in which case Lon FOOT
might instead be perceived by Aus listeners as neighboring short vowels, e.g., BED, STRUT. The
remaining Lon vowels are likely to either reflect modest CG differences from Aus (KIT, BATH, PRICE,
SQUARE, NEAR, PALM/START, THOUGHT/NORTH in the keywords <bid, past, hide, paired, beard, bard,
bored> respectively; note that the latter two pairs reflect mergers in non-rhotic accents) or no
difference, i.e., NL assimilations (DRESS, TRAP, LOT, STRUT, GOOSE, FACE, CHOICE in <bed, bad, pod,
bud, rude, paid, boyd>).
1.3.2 Aus-NZ
The realizations of most vowels in NZ are quite similar to those in Aus, but a few differ rather
substantially. The only systemic difference is with the NEAR/SQUARE contrast, which is neutralized
for many NZ speakers, yielding (near-)homophonic pairs such as beer/bare and fear/fare. This
situation would be expected to yield CS perception of the vowel in <paired> as NEAR. In addition,
three realizational differences in the anterior half of the vowel space, arising from the chain shift

18
that has taken place in the short front vowels of NZ, are likely to lead to CS assimilations to Aus.
The NZ vowel in TRAP (<bad>) is raised such that it approximates Aus DRESS (<bed>), NZ DRESS
(<bed>) is realized as a high front vowel akin to Aus KIT (<bid>), and NZ KIT (<bid>) is
centralized and lowered relative to Aus, placing it somewhat proximal to Aus NURSE (<bird>)
and/or STRUT (<bud>). There is considerable variability in these realizations across NZ speakers
and phonological contexts, but it is common for listeners who are unfamiliar with NZ accents to
mishear these vowels. Indeed, the NZ KIT vowel has taken on virtual shibboleth status (as in the oft-
cited fush and chups – Bell, 1997). The remaining vowels are likely to yield no difference at all (NL
assimilations to the same Aus vowels), or at most a modest CG difference (e.g., the near-merged
SQUARE and NEAR are both realized as a falling diphthong in NZ but as contrasting long
monophthongs in Aus).
1.3.3 Aus-Yrk
Two differences between Aus and Yrk are systemic. The first is the well-known absence of
historical split between FOOT (<hood>) and STRUT (<bud>) in the accents of the northern half of
England, including Yrk and Ncl. STRUT vowels in these varieties are typically realized with the same
quality as FOOT vowels. The fusion of these categories is clear to see in Figure 1, as is the fact that
the realization of the undifferentiated Yrk FOOT/STRUT category is phonetically very close to the
realization of FOOT in Aus. The second systemic difference relates to the TRAP, BATH, and PALM/START
lexical sets (<bad, past, bard>). BATH is a restricted lexical set that is realized with the same vowel
as TRAP in the north of England, but with the same vowel as PALM/START in southern England
varieties and their historically related varieties in the antipodes, Aus (and NZ) English. In Aus, BATH
is realized with the same low central variant as PALM/START, while TRAP is realized with a short low
front variant that, as pointed out by Cox (2006), has in recent times lowered from [æ] towards [a].

19
Again, these differences can readily be observed in Figure 1. Note that the fused Yrk variant for
TRAP/BATH is located in-between Aus TRAP and Aus BATH/PALM/START, which may also affect how
Aus listeners categorize this Yrk vowel.
The Yrk-Aus accent comparison also yields a number of potential non-systemic CS differences.
Yrk THOUGHT/NORTH (keyword <bored>) can be realized as an unrounded open back variant [ɑ:],
which has the potential to be misheard by Aus listeners as PALM/START. Yrk FACE (<paid>) is
typically realized as a long mid-open monophthongal front vowel ([ɛ:]), which could be misheard
by Aus listeners as the vowel typically encountered for SQUARE (<paired>). Yrk GOAT (<code>)
is typically realized as a long mid-high monophthong varying between [o:] and [ɔ:] or centralized
rounded [ɵː] (Williams & Kerswill, 1999: 143-146), thus rendering it likely to be miscategorized by
Aus listeners as THOUGHT/NORTH or NURSE. The remaining vowels of Yrk are likely to give rise to CG
assimilations to the corresponding Aus vowels or, in the case of CHOICE (<boyd>), to NL
assimilation, as the realization of this lexical set across the two varieties appears to be quite similar.
1.3.4 Aus-Ncl
The Ncl accent's vowel system is the most phonetically distinct from Aus. The Aus-Ncl
comparison yields the same two systemic differences as described above for Aus-Yrk, namely an
absence of the FOOT-STRUT lexical set split, and an alignment of the restricted lexical set BATH with
TRAP. But Ncl diverges further from Yrk in respect of their other differences from Aus. For example,
Ncl GOAT is variably realized as [o:]/[ʊə]. The [o:] variant is likely to be misheard by Aus listeners
as THOUGHT/NORTH, the [ʊə] as a disyllabic vowel found in some CURE words (<toured>; see
below). Ncl PRICE (<hide>) is realized as a rising diphthong, occasionally with a higher, fronted
onset ([ɛɪ], lower F1) than Aus, which may be miscategorized as FACE (<paid>).
Other realizational differences may be heard as a CG variation from the Aus vowel; e.g., Ncl

20
MOUTH is a rising diphthong with a larger F1 trajectory ([ɑʊ]/[eʊ] than Aus MOUTH ([æə]), thus is
likely to sound different but unlikely to be categorically misperceived. The remaining Ncl lexical
set vowels are likely either to be perceived as a CG difference from Aus, or to be heard by Aus
listeners as NL, as their realizations are similar to Aus, e.g., FOOT, CHOICE (<hood, boyd>).
1.3.5 CURE as a special case
The status of CURE (<toured>) across all five accents warrants comment. In all the varieties in
question, this lexical set—which carries a low functional load—either has undergone, or is in the
process of undergoing, change in its realization and in its relationship to other lexical sets. For Lon,
the range of realizational variants spans a diphthongal [ʊə] variant through to a [ɔ:] variant in
which CURE is merged with THOUGHT/NORTH (Ryfa, 2013). The latter forms are more frequent in the
speech of younger speakers. Cox and Palethorpe (2007) note an analogous situation for Aus,
pointing out that a diphthongal variant is produced only infrequently by younger speakers and that
more common variants are a monophthong that has merged with THOUGHT/NORTH ([O:] in Aus) or
a disyllabic realization of [ʉ:ə]. A similar picture is found in Ncl and Yrk where both monophthong
and diphthong variants are in evidence, but younger speakers quite commonly produce diphthongal
and disyllabic variants. In sum, CURE is variable and appears to be in a state of flux within all of the
accents focused on in this study, but the parameters of that variation are somewhat similar across
all locations. It is noteworthy that the limited isolated word material used to derive Figure 1 seems
to have generated primarily monophthongal realizations across all varieties, albeit with slightly
different locations in the F1/F2 space.
1.3.6 Summary
As a result of this comparative analysis, we identified four comparator accents (Lon, NZ, Yrk,
21
Ncl) varying in the type and scale of differences relative to the listener accent (Aus). Of course, in
making these comparisons, it is important to recognize that there is variability in the realization of
any phoneme or lexical set within any accent, across both talkers and tokens, so the comparisons
outlined above are necessarily approximations. Nonetheless, critically for the purposes of this study
they are a sufficient approximation to the typical cross-accent differences to enable us to interpret
our findings.
2 Method
We report on a total of nine different conditions, split across two experiments. All conditions
involve participants listening to the same story told in either their own accent, Aus, or one of the
four unfamiliar (or less familiar) accents, and then completing a vowel categorization and ratings
task with nonce words spoken in one of the five accents. The manipulations across conditions were
the accent of the pre-test exposure story (Aus in Experiment 1; the other accents in Experiment 2)
and the accent of the stimulus materials that were categorized after listening to the story (both
experiments). As a shorthand label for each of the conditions we use one letter from the accent, A
(Aus), L (Lon), Z (NZ), Y (Yrk), N (NcL), and express conditions as combinations of the exposure
story accent and the accent of the nonce words in the test phase. For example, Z-Z refers to the
condition in which listeners heard the story in New Zealand-accented English and then categorized
vowel stimuli also produced in New Zealand-accented English. To assess the influence of regional
accent on perceptual assimilation of vowel categories, the A-A condition (Australian accent for the
story and for the vowel categorization task) served as the baseline for performance in the first
Experiment, in which this condition was compared with A-L, A-Z, A-Y, and A-N to assess the
influence of the differing accents on the perceptual assimilation of vowels. In Experiment 2, the
conditions in which listeners heard the pre-test exposure story and the test items in one of the other

22
accents, L-L, Z-Z, Y-Y, N-N, were used to assess the influence of accent exposure on vowel
categorization. Here, the relevant baseline conditions were A-L, A-Z, A-Y, and A-N from Experiment
1. For example, any change in performance in L-L relative to A-L would indicate an effect of accent
exposure on perceptual assimilation of Lon vowels.
2.1 Participants
144 undergraduates (University of Western Sydney) aged 17.9-30.2 years (M = 21.1;
SD = 2.7) completed a vowel categorization and goodness rating task that used nonce stimuli
produced by multiple talkers of one of five English regional accents. Participants were quasi-
randomly assigned to one of the nine conditions involving combinations of the five accents, i.e.
there were 16 (8M/8F) per condition. All were native monolingual speakers of Aus, with no reported
speech/hearing/language problems and having had minimal long-term regular exposure to other
languages or other regional English accents. All were raised in monolingual Australian English
homes in Greater Western Sydney.
2.2 Stimuli
2.2.1 Pre-test accent exposure passage
Immediately preceding the experimental vowel categorization tasks, participants were asked to
listen to a meaningful passage (~10 minutes) told by multiple speakers of either Aus or of the same
regional accent as the nonce words in the vowel categorization task. For this purpose, we created
an extended version of the children’s story Chicken Little that contained at least ten occurrences, in
stressed syllables of real words, of each vowel used in the nonce items. The complete text of the
story is provided in Appendix B. The exposure passages were created from recordings of two male
23
and two female speakers of each accent (see also 2.2.2 for more information on the speakers) by
selecting three non-adjacent subsections of the passage for each speaker, and concatenating the
subsections in sequence to form the complete story. A 1.5s fade out and fade in was added between
subsections (corresponding to the natural pauses speakers left between subsections). The final
passage was scaled to 65dB.
2.2.2 Nonce words
The phonotactically permissible frame /zVbə/ was used to elicit nonce words for each of the
English vowels in 20 lexical sets: FLEECE, KIT, DRESS, TRAP, PALM, STRUT, GOOSE, FOOT, THOUGHT, LOT,
NEAR, SQUARE, NURSE, CURE, FACE, GOAT, PRICE, CHOICE, MOUTH, and BATH. None of the resulting nonce
items in the /zVbə/ frame formed a real word. The very low phonotactic probability of /zVbə/ also
minimized lexical biases in perception of the nonce target items.
The nonce targets were produced six times each by two female and two male speakers from
each region. None of the speakers were those used for the pre-test exposure passage in the same
accent. Two tokens per nonce word per speaker per accent were selected on the basis that the target
vowel was judged representative of the accent by a phonetically trained researcher experienced
with that accent. Tokens were extracted with a 100 ms buffer of inter-stimulus silence at the
beginning and end of the nonce word. A ramp and damp were imposed on the initial and final 20
ms of each file, respectively, and tokens were normalized to 65 dB.
All speakers recorded for the nonce words and the exposure passage (2.2.1) were recorded in
their native accent region by research assistants familiar with the accent: Lon speakers in London,
Ncl/Yrk speakers in Northern English, NZ speakers in Christchurch and Aus speakers in Sydney. The

24
speakers for the nonce word tokens and the speakers used for the exposure passage were consistent
across all listeners. The age ranges of these speakers (both nonce words and exposure passage
speakers) were: Western Sydney (17.0-26.4 years, M = 21.7, SD = 3.9), southeast London (20.2-
50.6 years; M = 38.0, SD =14.3), Christchurch, New Zealand (18.5-20.6 years, M = 19.6, SD =
1.0), Yorkshire (19.5-31.7 years; M = 24, SD = 5.4), and Newcastle (21.5-45.9 years, M = 31.6,
SD = 11.7).
2.2.3 Keywords
For 19 of the 20 target vowels, a real word was selected to serve as a printed keyword choice
for listeners to use in categorizing the nonce word vowels in the assimilation task. We did not have
a separate keyword for the BATH vowel, as it systematically groups with one of the other vowels for
all accents: in Aus/Lon/NZ, BATH and PALM group together; in Ncl/Yrk, BATH and TRAP group
together. Keywords were presented together on a grid in the form of real /bVd/ words, with
exceptions made if the context did not result in an easily recognizable word (e.g., we used <code>
instead of <bode>, <rude> instead of <booed>). The keywords were: <bead, bid, bed, bad,
bard, bud, rude, hood, bored, pod, paired, beard, bird, toured, paid, code, hide, boyd, proud>,
respectively, for the lexical sets FLEECE, KIT, DRESS, TRAP, PALM (same vowel as START in all five
accents), STRUT, GOOSE, FOOT, THOUGHT (same vowel as NORTH in these accents), LOT, NEAR, SQUARE,
NURSE, CURE, FACE, GOAT, PRICE, CHOICE and MOUTH.
2.3 Procedure
Participants received the pre-test exposure story told in Aus (Experiment 1) or in one of the
four unfamiliar accents (Experiment 2), then heard and judged nonce words in one of the five
accents: Aus (baseline condition in Experiment 1) or Lon, NZ, Yrk, or Ncl (both experiments).

25
Participants were not told which accent(s) they would be listening to, nor in fact did we inform
them that accents were involved in the task. They first completed the pre-test exposure phase in
which they listened to the Chicken Little story, then answered five multiple choice questions about
the story to ensure they had paid attention. Next, they completed the vowel categorization and
goodness rating task in the nonce accent for their condition.
On each trial of the categorization task, participants heard a nonce token. They then saw a grid
on a computer monitor containing the vowel keywords for this 19-alternative forced choice (19AFC)
task. Participants clicked on the keyword whose highlighted vowel they considered to best match
the target vowel in the nonce token they had heard. The layout of keywords on the grid was
randomized across participants, but the order for a given participant remained constant throughout
the task. After selecting a keyword, they were asked to rate the goodness of the fit, i.e., how well
the vowel that they heard matched the vowel in the keyword they had chosen. Participants rated
the goodness of fit on a 7-point Likert scale (7 = excellent, 1 = poor). To familiarize participants
with the task and their randomized grid, prior to the categorization task, they completed training
trials (without feedback) with nonce tokens produced by the speakers of the story, arranged so that
they received one token per grid item. After training, participants completed the categorization test
(160 trials = 20 nonce words x 2 tokens x 4 speakers), presented in random order via e-Prime (v.
2.0.8.22). There were four breaks built into the categorization task. The total task took between 40-
60 minutes, depending on the pace of the individual participant and the time that they chose to rest
during breaks.
2.4 Analysis
PAM provides a framework for interpreting data from categorization and rating tasks, such as
the task employed in this study, in terms of perceptual assimilation types (Best, 1995; Best & Tyler,
26
2007). Different types of perceptual assimilations can be diagnosed from listener behavior by
considering categorization accuracy, goodness ratings and incorrect response patterns. In order to
effectively and efficiently apply this technique, we have formalized how these sources of data are
integrated in diagnosing perceptual behavior. Our analytical expression of the integration of those
contributions aggregates accuracy, goodness ratings, and incorrect response patterns; it is given in
(1). We refer to this measure of listener behavior as Accuracy’.
Accuracy’ is computed as the difference between two weighted conditional probabilities. The
first is 𝑃(c𝑡|s𝑡), the conditional probability of choosing the correct (or target) keyword, c𝑡, given
the stimulus, s𝑡. This term is typically reported as categorization accuracy. The second conditional
probability is (c𝑖|s𝑡), the probability of choosing a particular incorrect keyword, c𝑖 , given the
stimulus, s𝑖. This occurs when the target nonce vowel is perceptually assimilated to a keyword vowel
other than the one intended by the speaker. Since there are 19 keywords in total, the number of
incorrect keywords available for any given trial is 18. The weighted probability (weights are
discussed below) of each incorrect keyword choice is summed to make up the right side of the
difference. This is subtracted from the weighted probability of choosing the correct (or speaker-
intended) keyword vowel. One property of Accuracy’ is that, because it is a difference score, it can
be negative. This is the case whenever the probability of an incorrect keyword selection is greater
than the probability of the correct keyword choice.
In the calculation of Accuracy’, as defined in (1), the conditional probabilities of the target
keyword (the vowel the speaker intended) and the incorrect keywords are expressed relative to the
conditional probability of each keyword selection across the task, yielding the terms 𝑃(𝑐𝑡|𝑠𝑡)𝑃(𝑐𝑡) and
𝑃(𝑐𝑖|𝑠𝑡)𝑃(𝑐𝑖) . Relativized measures are appropriate in this case because they adjust for possible biases in
choosing one keyword over another. With 19 keywords in the experiment, each keyword has an
equal a priori probability of being chosen of 0.052 or 5.2% of the time, i.e., if no other biases

27
contribute to the choice. The average percentage of keyword selection in our experiment was very
close to this (M = 5.3%; SD = 2.0%), but the actual mean percentage choices for individual
keywords ranged from 3.0% (for <bird>) to 10.7% (for <bed>). In accordance with the goals of
this study, we would like to interpret differences in keyword choices in terms of perceptual
assimilation, e.g., to attribute the higher frequency of choosing the <bed> keyword, which
represents the DRESS lexical set, as indicating that nonce word vowels are more often perceptually
assimilated to the DRESS vowel than to the NURSE vowel. We cannot rule out, however, other factors
besides perceptual assimilation that may influence the listeners’ choices of keywords. Properties of
the keywords themselves, such as usage frequency, phonological neighborhood density, semantic
salience, position on the screen, and other yet unknown factors, may also contribute to a listener’s
tendency to choose one keyword more often than another. Dividing the conditional probabilities of
keyword choice, given the stimulus, by keyword probability, i.e., the frequency with which a
keyword was chosen across the experiment by a participant, normalizes the data. We note as well
that at least some of the numerous factors that may influence whether a particular keyword is
chosen more often than another are likely to vary from participant to participant. For example, the
arrangement of the keywords on the screen was a different random configuration for each
participant, possibly affecting individuals’ keyword choice biases. For this reason, we calculated the
experiment-wide probability of a keyword selection by participant.
The last terms to introduce in (1) are the weights, 𝑟𝑡 and 𝑟𝑖. The relative probabilities of accurate
and inaccurate keyword choices are weighted by the participants’ goodness ratings, which were also
collected in the experiment. The term 𝑟𝑡 is the goodness rating when the correct keyword was
chosen. The term 𝑟𝑖 is the goodness rating when the incorrect keyword was chosen. These terms
modulate the accuracy ratings such that correct choices with high goodness ratings increase
Accuracy' while incorrect choices with high goodness ratings decrease Accuracy'. A key assumption

28
in weighting normalized accuracy by goodness ratings is that these two dependent measures tap
into the same mental construct, with ratings providing finer-grained data than accuracy alone.
Although this is assumed in some antecedent literature on cross-language speech perception, the
situation for cross-accent speech perception may be different. Specifically, in the context of cross-
accent perception, ratings may evoke socio-evaluative judgements associated with the accent. In
this case, the possible benefit of ratings tapping into sub-categorical variation may be offset by
influences on ratings that are orthogonal to our main concerns here. For this reason, we also
calculated Accuracy' without ratings, following the equation in (2). We tested for correlations
between weighted (1) and unweighted (2) Accuracy' score within each condition, calculated both
by subject and by vowel. In each case, the correlation was extremely high (Spearman's correlations
within conditions, rho = .95 to .99, tested over all conditions together [by subject] = .97), showing
that the goodness ratings did not much influence the Accuracy' scores. We also noticed some
patterns in the goodness ratings that suggest that they are indeed tapping into something different
from the categorization results. For these reasons, we focus our main presentation of the results
below on unweighted Accuracy', henceforth just Accuracy', and provide a separate analysis of the
goodness ratings in section 3.3. A complete description of the raw results, including accuracy,
goodness ratings and confusion matrices for each accent are provided in the appendix.

29
(1) Weighted Accuracy'
𝐴𝑐𝑐𝑢𝑟𝑎𝑐𝑦′ = 𝑟𝑡 ∗ 𝑃(𝑐𝑡|𝑠𝑡)𝑃(𝑐𝑡) − ∑ 𝑟𝑖18𝑖=1 ∗ 𝑃(𝑐𝑖|𝑠𝑡)𝑃(𝑐𝑖)
(2) Unweighted Accuracy'
𝐴𝑐𝑐𝑢𝑟𝑎𝑐𝑦′ = 𝑃(𝑐𝑡|𝑠𝑡)𝑃(𝑐𝑡) − ∑ 18𝑖=1
𝑃(𝑐𝑖|𝑠𝑡)𝑃(𝑐𝑖)
The results below are organized to address, first, the influence of regional accent on perceptual
assimilation (Experiment 1) and, second, the influence of pre-test exposure accent on assimilations
(Experiment 2). To determine the statistical significance of differences across conditions and across
vowels, we fitted linear mixed effects models to Accuracy’ using the lme4 package (Bates et al.,
2014) in R (version 3.3.1).
For Experiment 1, analyses of the Accuracy' data evaluated the influence of accent on perceptual
assimilation of vowels. We used the native regional accent of the listener group, Aus, as the accent
of pre-test exposure story for all five conditions in this experiment. In the baseline condition the
nonce words in the categorization task that followed the story were also presented in Aus. That
condition served as the basis of comparison for the four other-accent test conditions. We fitted one
model for each comparison of the Aus nonce word condition with another accent nonce word
condition: A-A vs. A-L; A-A vs. A-Z; A-A vs. A-Y; A-A vs. A-N. The fixed factors in the models were
the accent of the nonce stimuli (Aus vs. other), vowel, and the interaction between vowel and accent.
A random intercept for subject was included to capture participant-to-participant variability in task
performance. The fixed factor of accent was treatment-coded, with Aus serving as the reference
level. Thus, negative coefficients for accent indicate lower Accuracy' for the other accent than for

30
Aus. Vowel was coded as a categorical variable with 19 levels.
We used deviation coding (e.g., Menard, 2010; for linguistic analyses see, e.g., Hofmeister,
Jaeger, Arnon, Sag & Slater, 2013; Recasens & Mira, 2015) for the vowel factor, rather than selecting
a reference vowel, because of the difficulty in selecting a single reference level from all vowels
across accents. This approach nonetheless required leaving one vowel out of the deviation coding;
we chose the least-selected keyword vowel <toured> (lexical set CURE). The effect of accent on
Accuracy' for each vowel was therefore compared with an intercept based on the mean Accuracy'
across vowels (minus <toured>). The interaction between vowel and accent was also included as
a factor in all of the models, as we expected that the effect of accent on Accuracy' would not be
uniform across vowels but, rather, driven by the vowels known to differ the most across accents.
For Experiment 2, to evaluate the effect of exposure, we fitted a series of nested models to the
eight relevant conditions (A-L vs. L-L; A-Z vs. Z-Z; A-Y vs. Y-Y; A-N vs. N-N), the most complex of
which included a three-way interaction between vowel (19 levels), accent of the nonce items (L, Z,
Y, N), and exposure accent (story presented in the listeners’ native accent (i.e., Aus), or in the
relevant non-native (non-Aus) accent).
3 Results
3.1 Experiment 1: Perceptual assimilation of vowels across accents
3.1.1 Vowel perception in native Aus
Figure 2 shows Accuracy' by vowel for the Aus baseline (A-A condition). Error bars indicate 95%
confidence intervals. The vowels are ordered from highest Accuracy' on the left side of the figure to

31
lowest Accuracy' on the right. The highest scores were in the 10s for the vowels of keywords <pod>
and <bard>, corresponding to raw accuracies of 80% and 64% correct vowel choices, respectively;
the three highest raw accuracies also included <bed> at 80% correct but its Accuracy' was below
10, reflecting the high overall frequency of choosing that keyword across the experiment. The lowest
Accuracy' score was -9 for <toured>, with the lowest raw accuracy of 21%. Raw accuracy across
vowels and conditions is provided in Appendix C. Confusion matrices are provided in the Appendix
E. Even the highest Accuracy' (and raw accuracies) are not near ceiling levels, underscoring that this
task is challenging for listeners even for native-accented vowels. We observe a positive mean
Accuracy' with error bars that do not overlap zero (see also leftmost column of Table 1), for seven
Aus vowels (those of keywords < pod, bard, boyd, past, bid, bed, code, >). This indicates that, for
these seven vowels, participants chose the correct vowel more often than the sum of all alternatives.
This was not the case for 12 other vowels, which have error bars that overlap zero. These vowels
were just as likely to be categorized as other vowels as they were to be categorized as the target
vowel. At the negative end of the continuum, Accuracy' fell significantly below zero for one Aus
vowel, <toured> (lexical set CURE), indicating it was significantly less likely to be identified as the
CURE vowel than as some other vowel(s). As we discussed in the introduction, for many Australians
this vowel may no longer constitute a separate category (i.e., CURE has undergone or is undergoing
merger with THOUGHT/NORTH).
Table 1 summarizes the fixed effects in the mixed models. We have also included in the two
lefthand columns the vowel coefficients for a mixed model of the A-A condition (excluding the effect
of accent, in this case), so as to quantify the impressive range of Accuracy' found even within the
baseline condition. The columns for London, New Zealand, Yorkshire, and Newcastle show
coefficients for the vowel*accent interaction term in the models described above. We considered t
values > |2.325| (df = 42, p < .025, two-tailed, 97.5% CI) to reflect significant differences in

32
Accuracy' values between a vowel in a given accent and the corresponding Aus vowel (these are
indicated by double asterisk in the table).
Figure 2. Mean Accuracy' scores (error bars = 95% Confidence Intervals) obtained for categorization and
goodness ratings of each vowel in each accent in Experiment 1 (Perceptual assimilation). The dotted gray lines in the
non-Australian accent plots provide the reference levels of Accuracy’ found in the A-A condition, for ease of visual
comparisons across accents.
33
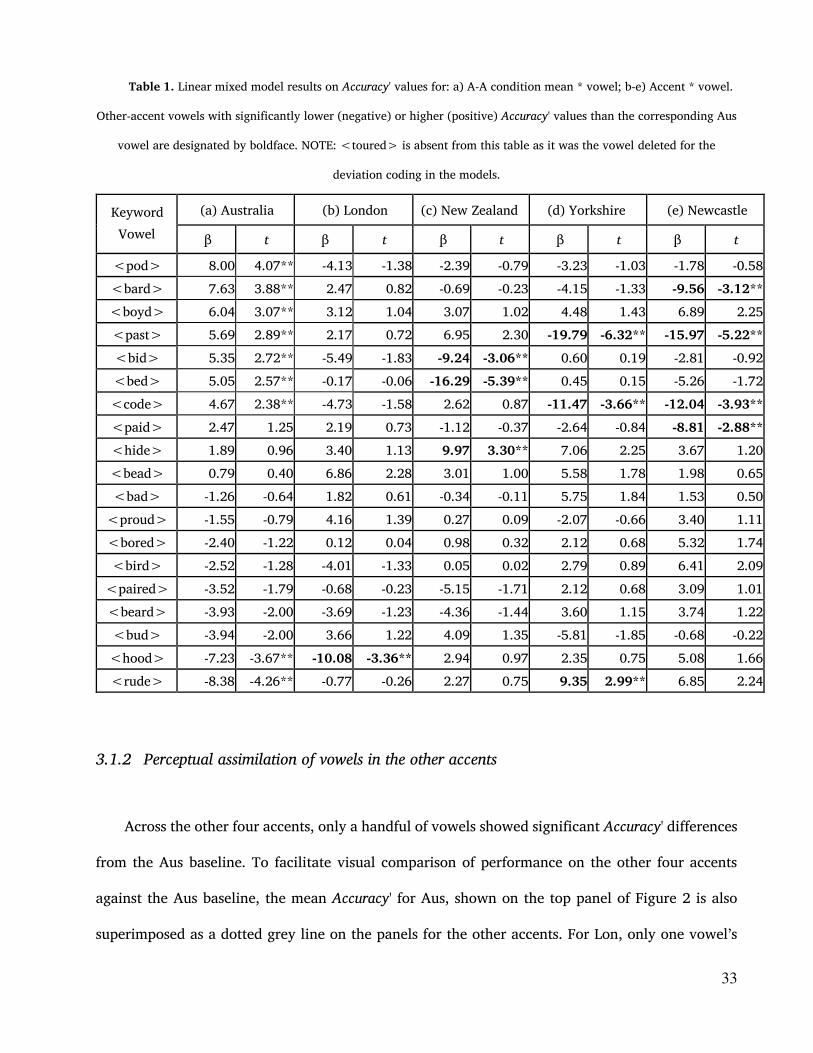
Table 1. Linear mixed model results on Accuracy' values for: a) A-A condition mean * vowel; b-e) Accent * vowel.
Other-accent vowels with significantly lower (negative) or higher (positive) Accuracy' values than the corresponding Aus
vowel are designated by boldface. NOTE: <toured> is absent from this table as it was the vowel deleted for the
deviation coding in the models.
Keyword
Vowel
(a) Australia (b) London (c) New Zealand (d) Yorkshire (e) Newcastle
β t β t β t β t β t
<pod> 8.00 4.07** -4.13 -1.38 -2.39 -0.79 -3.23 -1.03 -1.78 -0.58
<bard> 7.63 3.88** 2.47 0.82 -0.69 -0.23 -4.15 -1.33 -9.56 -3.12**
<boyd> 6.04 3.07** 3.12 1.04 3.07 1.02 4.48 1.43 6.89 2.25
<past> 5.69 2.89** 2.17 0.72 6.95 2.30 -19.79 -6.32** -15.97 -5.22**
<bid> 5.35 2.72** -5.49 -1.83 -9.24 -3.06** 0.60 0.19 -2.81 -0.92
<bed> 5.05 2.57** -0.17 -0.06 -16.29 -5.39** 0.45 0.15 -5.26 -1.72
<code> 4.67 2.38** -4.73 -1.58 2.62 0.87 -11.47 -3.66** -12.04 -3.93**
<paid> 2.47 1.25 2.19 0.73 -1.12 -0.37 -2.64 -0.84 -8.81 -2.88**
<hide> 1.89 0.96 3.40 1.13 9.97 3.30** 7.06 2.25 3.67 1.20
<bead> 0.79 0.40 6.86 2.28 3.01 1.00 5.58 1.78 1.98 0.65
<bad> -1.26 -0.64 1.82 0.61 -0.34 -0.11 5.75 1.84 1.53 0.50
<proud> -1.55 -0.79 4.16 1.39 0.27 0.09 -2.07 -0.66 3.40 1.11
<bored> -2.40 -1.22 0.12 0.04 0.98 0.32 2.12 0.68 5.32 1.74
<bird> -2.52 -1.28 -4.01 -1.33 0.05 0.02 2.79 0.89 6.41 2.09
<paired> -3.52 -1.79 -0.68 -0.23 -5.15 -1.71 2.12 0.68 3.09 1.01
<beard> -3.93 -2.00 -3.69 -1.23 -4.36 -1.44 3.60 1.15 3.74 1.22
<bud> -3.94 -2.00 3.66 1.22 4.09 1.35 -5.81 -1.85 -0.68 -0.22
<hood> -7.23 -3.67** -10.08 -3.36** 2.94 0.97 2.35 0.75 5.08 1.66
<rude> -8.38 -4.26** -0.77 -0.26 2.27 0.75 9.35 2.99** 6.85 2.24
3.1.2 Perceptual assimilation of vowels in the other accents
Across the other four accents, only a handful of vowels showed significant Accuracy' differences
from the Aus baseline. To facilitate visual comparison of performance on the other four accents
against the Aus baseline, the mean Accuracy' for Aus, shown on the top panel of Figure 2 is also
superimposed as a dotted grey line on the panels for the other accents. For Lon, only one vowel’s

34
Accuracy' was significantly different from Aus: the vowel in <hood>, the keyword representing the
FOOT lexical set. For NZ, Australian listeners showed significantly lower Accuracy' on <bid> (KIT)
and <bed> (DRESS). There were also two vowels in Yrk that had significantly lower Accuracy' than
the A-A baseline: <past> (BATH) and <code> (THOUGHT/NORTH). Ncl, as expected, showed the
largest number of significant negative deviations from the Aus baseline. In addition to <past> and
<code>, significant negative effects were also found for <bard> (PALM) and <paid> (FACE).
The vowels that differ significantly from Aus are largely consistent with our earlier summary
of accent differences and with the plots of the keyword vowels produced by our nonce word speakers
for each accent (Figure 1). As summarized in our accent review and confirmed in the nonce talkers'
choice word formant plots (Figure 1), FOOT <hood> is fronted in Lon relative to Aus. Accordingly,
it was often perceived as vowels that are short and non-back in Aus: STRUT <bud> (18%), KIT
<bid> (15%), or DRESS <bed> (14%). The misperception of NZ <bed> (DRESS) as <bid> (46%)
follows from the raised position of NZ DRESS relative to Aus. The low Accuracy' for NZ KIT<bid>,
which is centralized relative to Aus, is largely due to categorizing this vowel as DRESS <bed> (27%),
which is not necessarily a straightforward consequence of the acoustics. It may be a case of hyper-
correction or reflect some familiarity of Aus listeners with NZ vowels. The cases of mis-
categorization of the Northern England vowels also followed predicted trends. Listeners assimilated
Yrk and Ncl GOAT <code> to NORTH/THOUGHT, presumably because of the monophthong quality of
GOAT in Yrk and Ncl. Predictably as well, <past> (BATH) was assimilated to TRAP in both Yrk and
Ncl. The raised position of <bard> (PALM/START) and the high, front monophthongal production
of FACE <paid> in Newcastle is consistent with their categorization, respectively, as
NORTH/THOUGHT <bored> (23%) and DRESS <bed> (29%).
In addition to the largely expected negative effects of accent described above, there were also
a few cases in which, somewhat surprisingly, Australian listeners categorized vowels better in one

35
of the other accents than in Aus. This occurred for NZ vowel of the PRICE lexical set (<hide>), and
Yrk GOOSE <rude>. In the case of the PRICE <hide> vowel, formant measurements at the peak of
the nonce vowel stimuli for each accent (Appendix A) indicate that F1 was notably higher and F2
lower (more open and somewhat more backed), and there was notably less variability, in the NZ
than in the Aus stimuli. It is not clear which of these differences made this vowel easier to categorize
in NZ productions, nor why.2 Moreover, this pattern did not hold for Yrk GOOSE <rude>, where
the Yrk F1 value was instead comparable to the Aus value, while its F2 value was much higher (more
fronted), and its variability on both dimensions was higher rather than lower, relative to Aus.
Moreover, the Lon GOOSE <rude> vowel displayed the same pattern of acoustic differences from
Aus GOOSE <rude> and yet did not yield an Accuracy' difference from Aus. The differences among
these cases may hint that better Accuracy' for a vowel in another accent could rest on its relative
position (and/or variability) within the accent's vowel space.
In sum, the vowels for which significant negative effects of accent were found correspond
closely to differences between accents noted in the descriptive literature. That said, not all such
"known" accent differences degraded Accuracy'. Out of 80 comparisons (20 vowels/accent X 4
accents), only nine (Lon: FOOT; NZ: KIT, DRESS; Yrk: BATH, THOUGHT; Ncl: BATH, GOAT, PALM, FACE)
showed significant negative differences. Thus, to a large degree, the categorization and rating
performance on vowels, as reflected in the Accuracy' scores, is consistent across accents. We return
to this issue in the general discussion revisiting the two broad hypotheses laid out for this
experiment.
2 The dominant error for listeners in both their own accent (Aus) and NZ was the same: <bid> kit and <paid> face in
both cases.

36
3.2 Experiment 2: Accent exposure effects
To evaluate the effect of pre-test exposure accent, we compared vowel categorizations in the
conditions in which listeners heard the exposure story in their native and most familiar accent (Aus)
before completing the nonce vowel categorization task in one of the other (unfamiliar, or less
familiar) accents against the conditions in which they heard the story in the same (unfamiliar)
accent as the nonce stimuli, e.g., a comparison between A-L and L-L conditions. We thus evaluate
whether accent-matched pre-test exposure facilitates performance in the vowel categorization task
when the talkers in the two phases of the experiment are different.
Figure 3 summarizes the exposure effects on vowel Accuracy' scores. For this comparison, the
Aus-other accent conditions (shown in white bars), e.g., A-L, serve as the baseline for the matched
exposure conditions (shown in grey bars), e.g., L-L. For reference, the top panel repeats the Aus
baseline results (A-A condition) and the grey lines indicate those results in each panel.
The main pattern we observe is that the matched exposure conditions (grey bars), e.g., L-L,
closely resemble the unmatched conditions (white bars), e.g., A-L, for each accent. This pattern
indicates that, by and large, pre-test exposure to the story in an unfamiliar accent did not influence
patterns of perceptual assimilation of vowels produced by new talkers of that accent. We evaluated
that observation statistically by fitting a series of three nested linear mixed effects models to the
eight conditions relevant to assessing exposure effects (condition A-A was excluded), which are
represented in the bottom four panels of Figure 3. The baseline model, defined in (i), contained
vowel as the only fixed factor. The second model, the “accent” model in (ii), added the accent of
the test stimuli and the interaction between accent and vowel as predictors. The third model, the
“exposure” model in (iii), added exposure accent as a third factor along with all interactions among
exposure, vowel, and accent, including the three-way interaction. All models contained a random

37
intercept for subjects. Model comparisons, conducted via pairwise ANOVAs, are summarized in (iv)
of Table 2. Adding accent to the model resulted in significant improvement over Baseline (vowel
only). Moreover, the increased model complexity resulting from pairwise interactions between
accent and vowel is justified by the lower AIC (Akaike Information Criterion) in the accent model
than the baseline model. Adding exposure to the model together with interactions between exposure
and the other factors, vowel and accent, increases the complexity of the model substantially, from
82 to 162 degrees of freedom. Yet, despite this substantial increase in degrees of freedom, there is
only a marginal reduction in residual deviance in the exposure model. The differences between the
accent and exposure models is not statistically significant. Moreover, the AIC of the exposure model
is higher than the AIC of the accent model, indicating that the small increase in variance explained
does not justify the additional complexity of the exposure model.

38
Figure 3. Mean Accuracy’ scores (error bars = 95% Confidence Intervals) obtained for each nonce vowel in each
accent in Experiment 2, after story exposure in Aus versus after story exposure in the same unfamiliar accent of the
nonce words task. The dotted gray lines provide the reference levels of Accuracy’ found in the A-A condition (familiar
accent), for ease of visual comparisons across accent exposure conditions.
39
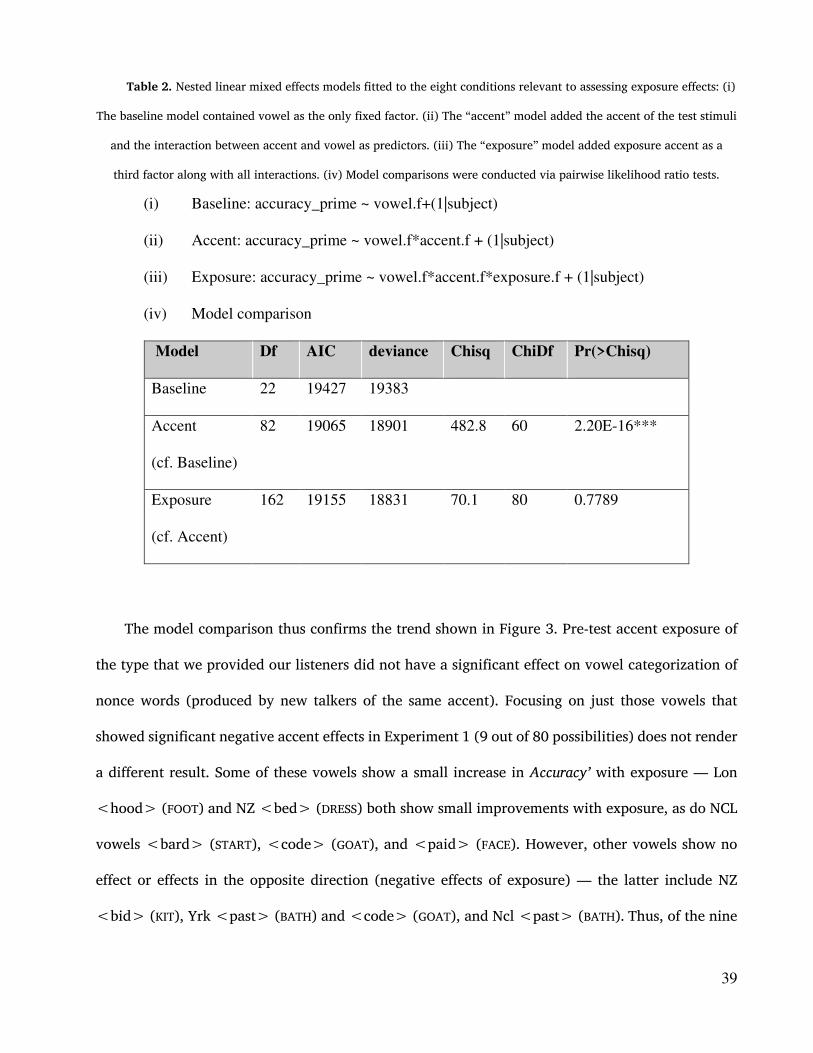
Table 2. Nested linear mixed effects models fitted to the eight conditions relevant to assessing exposure effects: (i)
The baseline model contained vowel as the only fixed factor. (ii) The “accent” model added the accent of the test stimuli
and the interaction between accent and vowel as predictors. (iii) The “exposure” model added exposure accent as a
third factor along with all interactions. (iv) Model comparisons were conducted via pairwise likelihood ratio tests.
(i) Baseline: accuracy_prime ~ vowel.f+(1|subject)
(ii) Accent: accuracy_prime ~ vowel.f*accent.f + (1|subject)
(iii) Exposure: accuracy_prime ~ vowel.f*accent.f*exposure.f + (1|subject)
(iv) Model comparison
Model Df AIC deviance Chisq ChiDf Pr(>Chisq)
Baseline 22 19427 19383
Accent
(cf. Baseline)
82 19065 18901 482.8 60 2.20E-16***
Exposure
(cf. Accent)
162 19155 18831 70.1 80 0.7789
The model comparison thus confirms the trend shown in Figure 3. Pre-test accent exposure of
the type that we provided our listeners did not have a significant effect on vowel categorization of
nonce words (produced by new talkers of the same accent). Focusing on just those vowels that
showed significant negative accent effects in Experiment 1 (9 out of 80 possibilities) does not render
a different result. Some of these vowels show a small increase in Accuracy’ with exposure — Lon
<hood> (FOOT) and NZ <bed> (DRESS) both show small improvements with exposure, as do NCL
vowels <bard> (START), <code> (GOAT), and <paid> (FACE). However, other vowels show no
effect or effects in the opposite direction (negative effects of exposure) — the latter include NZ
<bid> (KIT), Yrk <past> (BATH) and <code> (GOAT), and Ncl <past> (BATH). Thus, of the nine

40
vowels that show significant negative effects of accent, five show small positive effects of exposure
while four show small negative effects of exposure. When we consider exposure effects, the subset
of vowels that showed significant accent effects echoes the broader trend in the data. Some
combinations of vowel and accent show marginal increases and some show marginal decreases. The
overall pattern cannot be distinguished from randomly distributed noise around a null effect of
accent exposure.
From the literature on perceptual learning for speech, we had extrapolated several hypotheses
about possible exposure effects in this task. One of these was that listeners would improve after pre-
test exposure to the target accent because they learn phonetic patterns characteristic of the accent
that generalize to new talkers and to nonce words. Prior perceptual learning studies have shown
generalization across words within talkers (e.g., Norris et al., 2003) and generalization to new
talkers (e.g., Kraljic & Samuel, 2006). Exposure to multiple talkers has also been shown to improve
perceptual learning of a dialect, when the task is to identify that dialect (Clopper & Pisoni, 2004),
and, of course, naturalistic exposure to an accent can lead to changes in vowel categorization
decisions (Evans & Iverson, 2004). However, we are not aware of any positive effects of accent
exposure involving the level of generalization in our task, i.e., across talkers and from words in
context to non-words in vowel categorization. Our results thus suggest a limit on perceptual
learning.
There are many possible reasons for the absence of learning in this paradigm. It is possible that
the vowel categorization task was not sensitive enough — too abstract or too difficult — to pick up
perceptual learning effects. Listeners may have shown more reliable positive exposure effects in a
task that did not focus on the abstract phonological category, such as sentence transcription (Baese-
Berk, Bradlow, & Wright, 2013; Bradlow & Bent, 2008) and sentence verification tasks (Adank,
Evans, Stuart-Smith, & Scott, 2009). It could also be the case that multi-talker exposure does not

41
aid perceptual learning of accent-based vowel differences (cf., Clopper & Pisoni, 2004). In addition,
listeners might have benefitted if they had been provided with explicit labelling of the accent or
instructions that the pre-test exposure accent and the nonce task accent were the same/different.
Additionally, although we screened participants for exposure to the accents in our study via a
questionnaire, we cannot rule out the possibility that listeners may have been “pre-adjusted” to the
accents due to prior exposure of which they were unaware. We also point out that since vowels
carry indexical information about the talker, listeners may have attributed some of the vowel
variation in the pre-test exposure story to the particular talkers, which may also have interfered
with accent-based generalization to the nonce words of new talkers of that accent in the
categorization task.
In the General Discussion, we return to these points and to some trends regarding how Accuracy'
varied for vowels and accents across the experiments. First, however, we consider whether the
goodness ratings for correct/accurate responses alone might reflect some sensitivity to accent
differences that was missed by our Accuracy' index.
3.3 Goodness Ratings
In this section we analyze the goodness ratings, in order to establish whether there is any
residual information in their patterning that cannot be detected by the Accuracy' scores. Figures
showing goodness ratings by vowel and condition are reported in Appendix D.
We fit a linear mixed effects regression model to the raw ratings of accurate responses. Random
effects were participant (listener) and talker, and we tested a three-way interaction among accent,
exposure, and stimulus word. ANOVA comparison with a model containing all two-way interactions

42
reveals the three-way interaction to be highly significant (p<.0001)3. The model interaction is
shown in Figure 4. Separate models fit to each accent show significant interactions between
exposure and accent for York, London and NZ, and significant main effects of exposure for NZ (a
negative effect) and London (a positive effect).
Figure 4. Significant interaction among stimulus word, condition and accent in the analysis of raw goodness
ratings for correct (accurate) vowel categorizations alone. The labels of x-axis correspond to the words provided to
listeners as response categories for the nonce word stimuli.
The effect for the NZ accent is particularly salient, and differs clearly from the other three
accents: pre-test story exposure to NZ speakers leads Australian listeners to rate all NZ nonce vowels
(except the special case CURE vowel) as 'less good' than the same NZ nonce vowels following
exposure to the story told by Aus speakers. If the goodness ratings were providing a channel of
3 In order to check that the use of a linear model for a non-continuous dependent variable wasn't overly influencing the pattern of results in some way, we also checked this with a logistic model, creating two 'goodness' categories by dividing the data at the mean. A logistic model of this binary factor also returns a significant accent x exposure x stimulus word interaction. We choose to report linear models as this allows us to avoid collapsing across response categories.

43
information about the perceptual mapping, then it is hard to understand why goodness ratings of
correct responses would drop to the NZ voices after a period of exposure to the accent. Our
interpretation of this result is that it does not tell us directly about the goodness of the mapping,
but rather, reflects an attitudinal response to the NZ accent. Aus listeners are likely to encounter NZ
speakers in the Sydney environment more often than they would typically encounter speakers of
the UK accents. Therefore, when they heard the NZ accent in the exposure period, this provided
sufficient information to identify the speakers as New Zealanders. We speculate that they then go
on to infer that the voices in the perceptual categorization task are also New Zealanders. Past work
has shown that Australian and New Zealand listeners readily recognize each other’s accents
(Weatheral, Gallois, & Pittam, 1998). Moreover, Aus listeners perceive the way that New Zealanders
pronounce vowels to be 'less good' than Aus vowel pronunciations, so this identification of the
speakers as New Zealanders leads to a wholesale drop in vowel ratings. Australians’ greater degree
of experience with New Zealand English compared to the other accents in the study goes along with
some stereotypes and negative attitudinal responses. Australian material in the media and on the
internet indicates an awareness of New Zealanders' vowel pronunciations, e.g., "where 'Jungle Bills'
is what you sing at Christmas time." Although the results are somewhat controversial, there are
studies suggesting that Australians do not hold the NZ accent in high regard (Bayard 2001),
including an open response survey that reveals a pattern of "reciprocated negativity" between New
Zealanders' and Australians' responses to each other's accents (Garret et al. 2005: 223).
If this drop is not about perceptual adaptation but rather about attitude and experience, as we
propose, we can make two further predictions. First, we might expect to see a wholesale drop in the
non-accurate responses, too. And second, the effect might be mediated by the individual
respondent's own reported experience with New Zealand English.
To test the first prediction, we tested for an interaction between stimulus word and exposure

44
within inaccurate responses to each accent. No interactions or main effects of exposure were found
for the London or Newcastle accent. For York, there was a significant interaction between stimulus
word and exposure, but no main effect of exposure. For NZ, there was both a significant interaction
and a significant main effect (p<.02). That is, for the NZ accent, but not for the other accents, there
is a significant overall drop in goodness, even for the incorrect answers.
To test the second prediction, we entered information about participants' previous experience
into our models. Our background questionnaires asked each listener to self-report any exposure they
had to the target accents. This was designed to screen out participants with high levels of exposure,
for example from family members or other cohabitants. However, the analyzed participants also
contained some variation in their answers to this question. We went through the open responses
and created a binary code, separating those reporting no exposure, or very little (e.g. a one-week
holiday, or occasional interaction with customers), from those who reported greater exposure (e.g.
regular interactions with friends or more distant relatives). There were too few participants with
exposure to York or Newcastle accents, making analysis of this factor impractical for those accents,
and the exposure pattern was imbalanced for the London accent (with relatively few having no
exposure in the AL condition). However, the distribution for the NZ accent made analysis of this
variable practical [17 low experience (10 in Z-Z), and 15 high experience (6 in Z-Z)].

45
Figure 5. Interaction plot showing significant interaction among stimulus, experiment condition, and previous
experience in the raw goodness ratings for correct (accurate) vowel categorizations, for listeners responding to the NZ
accent following the pre-test story in Aus versus in NZ. The labels of x-axis correspond to the words provided to listeners
as response categories for the nonce word stimuli.
A logistic mixed effects model of the NZ goodness ratings to accurate responses revealed a
significant three-way interaction between stimulus word, experimental condition and previous
experience, as shown in Figure 5. When the exposure accent is Australian English, participants with
greater previous experience to NZ English hear the vowels as better examples of their category than
participants with less experience do. Both groups drop their goodness ratings following the NZ
exposure passage, and the distribution of this drop across words differs somewhat for the two
groups. Thus, it seems as though goodness ratings are tapping into something different from the
categorization results, which limits their usefulness for sharpening our conclusions about perceptual
assimilation.
46
4 General Discussion
To address our core question of how listeners handle variation in vowel realizations within
their native language, we investigated the categorization and ratings of vowels in five different
regional accents, including the listener’s native accent. We selected regional accents of English in
which vowel realizations differ to various degrees from those of our listener group’s Australian
accent. We assessed whether the differences between accents that have been described in the
literature have consequences for the perception of vowels in terms of phonological categories and
whether short-term multi-talker exposure to the non-Aus accents yields improvement over baseline
performance.
We considered two broad hypotheses as to how accent variation could impact the perception
of vowels in terms of phonological categories, both of which stem from considerations of how
perceptual assimilation might operate in the native language. In cross-language speech perception,
a situation in which listener and speaker phonological systems differ, perceptual assimilation can
hinder accurate perception of speech contrasts. Along these same lines, our first hypothesis was that
regional accent variation, particularly systemic differences across languages, would lead to
miscategorization, as the phonetic differences would be perceptually assimilated to different lexical
sets than those intended by the speaker, i.e. CS differences. To evaluate this, we cast descriptions of
accents as assimilation types. An alternative hypothesis is that perceptual assimilation exists
primarily to support successful spoken language processing in the native language. More
specifically, the segmental components of an utterance that deviate from their phonetic realizations
in the listener's native accent may still resonate in perception with the language's phonological
categories. To put it another way, phonological categories — or perceivers of them — may tolerate
a good range of natural variation. On this hypothesis, a listener will perceive a vowel category

47
despite substantial variation in its precise phonetic signature. This ability to “hear through”
variation to recover the phonological category may be fundamental to maintaining perceptual
flexibility in the native language. This includes tolerating variability in phonetic form so as to
perceive stable phonological categories across variations in talkers and accents. On this scenario,
perceptual behavior in our task may not cut along the same lines as the descriptions of accent
differences that served as the basis for establishing perceptual assimilation types.
To summarize the main results, we found, firstly, that performance on the task was well below
ceiling overall, even when listening to the native accent. Second, some vowels were categorized
better than others. This was true even for vowels presented in the listeners’ native accent. Moreover,
the pattern of Accuracy' across vowels was largely consistent for the different accents, even as the
physical signal representing those categories varied. That is, only a rather small set of vowels per
accent scored significantly lower Accuracy' values than the corresponding Aus vowel. Third, pre-
test exposure to the accents of the stimuli did not lead to significant improvement in accurate vowel
categorization. Fourth, analyses of accent-exposure effects on the goodness ratings alone, on the
other hand, suggest they may reflect perceivers' attitudinal biases toward particular, more-familiar
accents. In the remainder of this section, we discuss each of these results in turn.
4.1 Baseline performance on the vowel categorization task
The vowel categorization task was hard for listeners. Accuracy’ was well below ceiling for all
vowels and accents. Thus, listeners did not approach perfect consistency in choosing the correct
vowel from the grid for any of the vowels, even when presented in the native accent of the listeners.
Part of this low accuracy is likely due to the less categorical nature of vowel perception as opposed
to consonants (e.g., Pisoni, 1975; Repp, 1984). Indeed, we have observed sharper categorization
boundaries in this type of task for consonants (Shaw et al., 2014). In general, it is known from other
48
tasks, such as word reconstruction, that English listeners tolerate more variation in vowels than in
consonants (Van Ooijen, 1996). Despite this, we find it unlikely that a native listener would fail to
recognize, e.g., minimal pair words differentiated by vowels in their native language. The
experimental task that we employed here, however, is much more difficult than minimal-pair word
recognition, in that it provided the listener with only the bottom-up signal (lacking any lexical or
phonotactic referent), and offered 19 possible responses (all of the monophthong and diphthong
vowel categories in Australian English). For starters, there are very few phonotactic environments
in English in which all vowels are attested, so the practical task of selecting amongst 19 vowels in
a constant phonological frame, such as the one that we posed to the participants, rarely occurs “in
the wild”. Moreover, vowel identity is typically cued by the lexical items that contain the vowels.
We designed our task to eliminate all lexical as well as phonotactic information (by placing the
vowels in the phonotactically licit but rare carrier frame, /zVbə/), leaving the listener with only the
phonetic signal to go on. The listeners’ job was made even more difficult by the task itself in that it
requires an abstract meta-linguistic judgement about phonological categories, and goodness of fit
to those categories. Moreover, the materials in the nonce categorization task drew from four
different speakers of the target accent randomly presented (c.f., a blocked design), and provided no
phonetic context to adjust to the speaker beyond the /zVbə/ frame in which the target vowels were
embedded. Under these circumstances, it is not surprising that vowel categorization is below ceiling.
We interpret the low baseline performance in Aus (the A-A condition) as an indirect indication that
other factors, including lexical item, phonotactic probabilities, and talker information likely
contribute substantially to the ease with which we normally recognize contrastive vowels in words
and larger meaningful utterances. Certainly the indeterminacy associated with the nearly pure
bottom-up categorization our task required leaves plenty of room for other factors to yield higher
accuracy in recognizing vowels in spoken words.
49
4.2 Effects of accent variation
Although we did indeed find some cases in which phonetic variation in vowels, as described in
the literature and verified in our own recordings, influenced listener perception, the results show
that vowel perception is largely consistent across accents. Phonetic differences across the accents
for a number of vowels, including some that are stereotypical of particular accents, failed to result
in significant miscategorizations above and beyond the miscategorization of those vowels in the
native accent. For example, despite the overlap between FOOT and STRUT in Yrk, Australian listeners
did no worse in categorizing and rating Yrk STRUT than they did on their own Aus STRUT vowel.
From the standpoint of our first hypothesis, that accent differences map to perceptual differences,
this is surprising. Rather, this result favors the alternative—that vowels with different realizations
across accents are nevertheless assimilated to the same phonological category. Listeners appear to
assimilate substantial variation, even variation on the magnitude that has been described as
systemic differences across accents. Flexibility in the linguistic interpretation of the signal may,
complementarily, also leave room for perception of indexical information, e.g., properties of the
talker that are also available in the signal (Best, 2015). That is, non-commitment (or minimal
commitment) to the linguistic identity of the signal, in the presence of variation and the absence of
lexical information, may facilitate parsing phonetic variation in terms of talker-specific
characteristics (see also Shaw, 2016). Alongside phonological categories, listeners may also be
abstracting social categories of the talkers from phonetic variants (as argued in Szakay et al., 2016),
a process which may exact an encoding cost (Clopper et al., 2016) but which, conversely, may
provide benefits when the relevant characteristics of the talkers are known.
After correcting for biases in overall likelihood of selection of specific keywords and
incorporating ratings (both incorporated into our Accuracy’ calculation), we found that the pattern

50
in Accuracy’ across vowels was fairly consistent across accents. This may indicate differences in
perceptual assimilation strength across phonological categories, in this case among the vowels of
English. Perceptual asymmetries are not unusual in the vowel perception literature (Polka & Bohn,
2003, 2011; Schwartz et al., 2005), a fact that is expected if vowel categories have different
perceptual strengths. There are also converging results from the phonology literature, where there
is a growing awareness that phonological categories are more graded in both production and
perception than have been typically assumed (Hall, 2009; Smolensky et al., 2014; Warner et al.,
2004). Factors affecting the strength of perceptual assimilation (i.e., tolerance of variance) may
include the predictability of the vowel in context (Shaw and Kawahara, 2017), functional load (e.g.,
Hockett, 1967), phonological neighborhood density (Solomon & Munson, 2004), or phonetic
salience (Carlson et al., 1979; Rosner & Pickering, 1994; Escudero & Vasiliev, 2011), factors that
we plan to pursue in future studies.
Amongst the backdrop of a general consistency in the patterning of Accuracy’ by vowel across
accents, there were a small number of significant negative vowel*accent interactions. These are
cases in which changing the accent leads to significantly lower Accuracy’ for a vowel. A total of nine
such cases (out of a possible 80) were revealed in our data. These include a subset of the differences
that we foregrounded in our review of the accents, but many of the other differences documented
in the literature and present in our materials failed to result in significantly lowered Accuracy’. For
example, the centralized <bid> (KIT) vowel and the raised <bed> (DRESS) vowel in NZ both led
to lower Accuracy’, but the NZ NEAR-SQUARE merger (<beard>~<paired>) and raising of TRAP
(<bad>) did not. Similarly, for both Yrk and Ncl, Accuracy’ was lower for BATH (<past>) and
GOAT (<code>), as expected from our review of these accents in the introduction. Yet the lack of
contrast between FOOT~STRUT in these two accents did not cause a significant decrease in Aus
listeners’ Accuracy’ for either vowel in either accent. In these cases, Aus listeners showed perceptual

51
flexibility, that is, tolerance of the variation. In particular, it is intriguing to note that both of the
two systemic differences among the vowel systems of our selected accents (lack of FOOT-STRUT split
in Yrk and Ncl; NEAR~SQUARE merger in NZ) failed to result in significant accent differences in
Accuracy’. Familiarity with an accent might be at play here and is known to affect perception
(Sumner & Samuel, 2009). Although we screened our participants for relevant exposure, it may be
that these more stereotypical accent differences are known within our listener population despite
lack of direct reported exposure, a hypothesis that could potentially be tested by drawing on
methods from the folk linguistics literature (e.g., Niedzielski & Preston, 2000). However, we note
that all of the vowels involved in the systemic differences we have described here showed fairly low
Accuracy’ even in the baseline A-A condition. They are among the 10 Australian vowels that overlap
with 0 Accuracy’, i.e., that within the context of this task naturally tolerate mutual variation, even
by listeners of accents in which they are not merged. This is probably for reasons that are related
to our discussion of perceptual strength, including properties of the lexicon that are likely to be
shared to a large degree even across our geographically dispersed accents. The perceptual
assimilation results may be suggestive— either independently or in tandem with other lexical factors
— of which vowels are more/less likely to be susceptible to change over time. At the least, we
speculate that toleration of phonetic variation, which varies from vowel to vowel, may contribute
to the perceptual landscape that gives rise to accent differences diachronically.
Returning to our PAM-inspired characterization of assimilation patterns as either CS (category
shifting) or CG (category goodness) differences, as laid out in the introduction, none of the CG
accent differences we had foregrounded had a significant effect on Accuracy’. Recall that the CG
differences are those that sociophonetic descriptions recognize as different phonetic realizations
across accents. These realizations contain information about the regional accent of the talkers but
the phonetic variation does not significantly influence categorization of the vowels. When it comes

52
to mapping a variable phonetic form to a phonological category there is unity in the face of regional
variation. The significant negative effects in our data were all CS differences and, as we have already
indicated, not even all of the CS differences showed significant deviations in Accuracy'. Overall,
perceptual flexibility seems to subsume much of the variation that has been discussed as
distinguishing regional accents of English. From the standpoint of our two hypotheses on how
perceptual assimilation relates to cross-accent differences, we interpret this result as greater support
the second hypothesis— as it predicts that a fair range of variation in relevant phonetic dimensions
should be assimilated to the same phonological category in perception.
4.3 Resilience to exposure
In light of the observed accent effects, we now turn to the topic of exposure, and how relatively
brief but immediate pre-test exposure to a less familiar accent impacted perceptual assimilation.
Our exposure manipulation involved a meaningful story told round-robin by four speakers. Multiple
talker exposure of this degree has been shown to support learning in the L2 perception literature
for some contrasts (Bradlow, Pisoni, Akahane-Yamada, & Tohkura, 1997; Lively, Logan, & Pisoni,
1993; Wang, Spence, Jongman, & Sereno, 1999) and in some studies of foreign accent adaptation
(Baese-Berk et al., 2013; Bradlow & Bent, 2008; Sumner, 2011). However, given the small number
of vowels for which accent actually had a significant effect, the opportunities to make perceptual
gains from exposure at the level of the accent were also relatively small. In numerical terms, the
effect of exposure showed the greatest positive benefit for Newcastle, which makes sense given that
this accent was the most phonetically distinct from the listeners’ accent, based both on our review
of the sociophonetic literature and on listener performance in Experiment 1. There may be no deeper
reason for this except that the larger effect of accent leaves greater potential for improvement. Still,
the effect of exposure was not significant overall, nor was the interaction between exposure and

53
accent or the three-way interaction among accent*exposure*vowel. In short, exposure had little
effect on Accuracy’ for categorization and rating of nonce vowels in any of the other accents in this
experiment. There may be several reasons for the lack of improvement in vowel categorization
following exposure.
We reiterate that the talkers who produced the nonce word items in the perceptual
categorization experiment were different from the talkers who produced the exposure passage in all
conditions. Some of the classic effects of perceptual learning for speech are now known to be talker-
specific. For example, rapid adaptation of fricative categories following exposure to an ambiguous
segment as reported in (Norris, McQueen, & Cutler, 2003) and in (Kraljic & Samuel, 2005) does not
generalize to new speakers (Eisner & McQueen, 2005), although variation in stop consonants can
(Kraljic & Samuel, 2006). Moreover, there is evidence that multiple talkers can be tracked over the
course of the experiment (Kraljic & Samuel, 2007), further suggesting that adaptation may be talker-
specific. Paradigms that provide more naturalistic exposure (as opposed to specific manipulation of
a single contrast) have not reliably shown short-term adaptation (Floccia et al., 2009). Benefitting
from exposure in our paradigm requires adapting to naturalistic speech at the level of the accent as
opposed to adapting only to specific talkers. From the standpoint of the Ideal Adapter (Kleinschmidt
& Jaeger, 2015), accent-based adaptation takes the form of generalization to new talkers and is
predicted to occur as a function of similarity between talkers. An additional complication for
listeners (and for the Ideal Adapter) is that, the exposure story and the categorization task stimuli
were different not only in the specific talkers that produced them but also in style. The exposure
passage involved running speech and a meaningful story; the nonce words were produced in
isolation. There may have been accent level adaptation that simply did not generalize to the nonce
words. Additionally, since nonce words provide no further information to “reinforce” perceptual
adjustments stemming from exposure, listeners may quickly rebound to baseline expectations for

54
vowels in the nonce context. That is, the choice words representing lexical sets on the screen may
have triggered long-term representations of the corresponding vowels as opposed to talker- or
accent- specific adjustments.
Relative to studies that have documented rapid adaptation to talkers and/or accents, our study
is unique in several critical ways. Instead of isolating a few phonetic dimensions and using artificial
manipulation of the speech signal, our study featured natural variation found across talkers and
accents of English and throughout its vowel system. The phonetic properties of our materials varied
and co-varied on numerous dimensions, as they do in naturalistic speech contexts. We gave our
listeners the opportunity to rapidly adapt, but only at the level of the accent, not at the level of the
talker. In all conditions, the talkers in the test phase of our experiment were different from the
talkers of the exposure story. Benefiting from the accent exposure in the story in the vowel
categorization experiment would require abstracting phonetic properties of a given accent from the
exposure story. The results of this experiment produced no evidence for such adaptation effects, and
indeed, experimental evidence for accent-level adaptation to phonological categories, independent
of the words that contain them, on such a short time scale is indeed slim—we have found no such
cases in the literature. Listeners may naturally attribute phonetic variation, such as that represented
in our materials, to properties of the specific speakers and only adapt to the accent at longer
timescales than are feasible to observe in a laboratory experiment (cf. Evans & Iverson, 2007). More
broadly, we surmise that non-commitment to the bottom-up phonological categorization of the
acoustic-phonetic signal in terms of particular vowels should actually benefit lexical recognition
when the message presents real words (recovery of the message) and, moreover, may support
listeners’ ability to attribute phonetic variation to indexical properties of the talker rather than to
linguistic properties of the utterance.

55
4.4 Sensitivity of vowel goodness ratings to attitudes about accents
As reported above, analyses of the goodness ratings alone, unlike the analyses of Accuracy',
revealed a significant effect of accent exposure on judgments about the quality of vowels,
specifically for the New Zealand accent and to a smaller opposing degree for the London vowels.
These two accents are more familiar to the Australian listeners than are the York and Newcastle
(UK) accents, for which exposure yielded no clear effects on goodness ratings. Thus, it appears that
the goodness ratings tap into different perceptual processes than do vowel categorization judgments.
Given the significant negative effect of exposure on vowel goodness ratings for the New Zealand
accent coupled with independent evidence that Australians tend to hold negative attitudes toward
this accent, in contrast with the positive exposure effect on goodness judgments about vowels in the
London accent, which is not generally held in the same low regard, we speculate that vowel
goodness ratings may be more sensitive to prior experience with and/or attitudes about particular
accents than is vowel categorization accuracy. Further research could help delineate the nature of
this experiential and/or attitudinal effect on vowel quality judgments.
5 Conclusion
To assess the contribution of perceptual assimilation to cross-accent vowel categorization, we
conducted a series of vowel categorization experiments across several English accents. The two
experiments compared how Australian listeners categorize vowels in their native accent with vowels
from four other, less familiar regional accents of English, selected for how they differ with respect
to Australian English: London, Yorkshire, and Newcastle (UK), and New Zealand. In Experiment 1,
listeners categorized the vowels without any previous exposure within the context of the task to the
unfamiliar test accents. In Experiment 2, we provided separate groups of Australian listeners with

56
pre-test exposure to each of these accents before test. Results of Experiment 1 confirmed that some
accent differences lead to increased difficulty in categorizing a modest number of vowels. However,
many of the cross-accent vowel differences reported in the literature on English accents and attested
in our stimulus materials failed to increase perceptual confusion by Australian listeners. This is in
part because Australian listeners showed variable performance on even their native vowel
inventory, such that some vowels were categorized more reliably than others. Differences across
accents tended not to cause greater confusion than within-speaker variation in the native (familiar)
accent. We interpret these findings as an indication that the process of perceptual assimilation
functions within the listener's native language to support perceptual flexibility. That is, tolerance of
phonetic differences allows listeners to perceive vowel variation across accents in terms of the same
phonological category. In Experiment 2, we observed that patterns of cross-accent vowel
categorization, including those cases of misperception across accents, remained stable even after
short-term immediate pre-test exposure to a meaningful multi-talker story in the target accent. In
contrast to previous studies showing rapid adaptation to talker and accent variation, our results
suggest that adaptation to accents (as opposed to talkers) at the level of phonological categories (as
opposed to words) through more naturalistic exposure probably takes place at longer timescales
than a single laboratory session permits.
References
Adank, P., Evans, B. G., Stuart-Smith, J., & Scott, S. K. (2009). Comprehension of familiar and unfamiliar
native accents under adverse listening conditions. Journal of Experimental Psychology: Human Perception
and Performance, 35(2), 520.
Adank, P., Smits, R., & Van Hout, R. (2004). A comparison of vowel normalization procedures for language
variation research. The Journal of the acoustical society of America, 116(5), 3099-3107.

57
Bates, D., Maechler, M., Bolker, B., & Walker, S. (2014). lme4: Linear mixed-effects models using Eigen and
S4. R Package Version, 1(7).
Baese-Berk, M. M., Bradlow, A. R., & Wright, B. A. (2013). Accent-independent adaptation to foreign
accented speech. The Journal of the acoustical society of America, 133(3), EL174-EL180.
Best, C. (1995). A direct realist view of cross-language speech perception. In W. Strange (Ed.), Speech
Perception and Linguistics Experience: Issues in Cross-Language Research (pp. 171-204). York, Timonium,
MD.
Best, C. T. (2015). Devil or angel in the details? In J. Romero & M. Riera (Eds.), The Phonetics–Phonology
Interface: Representations and methodologies (pp. 3-32). Amsterdam: John Benjamins.
Best, C. T. & Hallé, P. A. (2010). Perception of initial obstruent voicing is influenced by gestural organization. Journal
of Phonetics, 38, 110-127.
Best, C. T., McRoberts, G. W., & Goodell, E. (2001). American listeners' perception of nonnative consonant contrasts
varying in perceptual assimilation to English phonology. Journal of the Acoustical Society of America, 1097, 775-
794.
Best, C. T., McRoberts, G. W., & Sithole, N. M. (1988). Examination of perceptual reorganization for nonnative
speech contrasts: Zulu click discrimination by English-speaking adults and infants. Journal of Experimental
Psychology: Human Perception and Performance, 14, 45-60.
Best, C. T., Shaw, J. A., & Clancy, E. (2013). Recognizing words across regional accents: the role of
perceptual assimilation in lexical competition. INTERSPEECH 2013, 2128-2132.
Best, C. T., Shaw, J., Mulak, K., Docherty, G., Evans, B., Foulkes, P. Hay, J., Al-Tamimi, J., Mair, K., &
Wood, S. (2015). From Newcastle MOUTH to Aussie ears: Australians’ perceptual assimilation and
adaptation for Newcastle UK vowels. INTERSPEECH 2015, 1932-1936.
Best, C. T., Shaw, J., Mulak, K., Docherty, G., Evans, B., Foulkes, P. Hay, J., Al-Tamimi, J., Mair, K., &
Wood, S. (2015). Perceiving and adapting to regional accent differences among vowel subsystems. In
The Scottish Consortium for ICPhS 2015 (Ed.), Proceedings of the 18th International Congress of Phonetic
Sciences. Glasgow, UK: University of Glasgow. ISBN 978-0-85261-941-4. Paper number 0964.1-5
retrieved from http://www.icphs2015.info/pdfs/Papers/ICPHS0964.pdf

58
Best, C., & Tyler, M. (2007). Nonnative and second-language speech perception: Commonalities and
complementarities. In M. Munro & O.-S. Bohn (Eds.), Second language speech learning: The role of language
experience in speech perception and production (pp. 13-34). Amsterdam: Johns Benjamins.
Billington, R. (2011). Location, location, location! Regional characteristics and national patterns of change
in the vowels of Melbourne adolescents. Australian Journal of Linguistics, 31(3), 275-303.
Bloomfield, L. (1926). A set of postulates for the science of language. Language, 2(3), 153-164.
Bradlow, A. R., & Bent, T. (2008). Perceptual adaptation to non-native speech. Cognition, 106(2), 707-729.
Bradlow, A. R., Pisoni, D. B., Akahane-Yamada, R., & Tohkura, Y. i. (1997). Training Japanese listeners to
identify English /r/ and /l/: IV. Some effects of perceptual learning on speech production. The Journal of
the acoustical society of America, 101(4), 2299-2310.
Browman, C. P., & Goldstein, L. (1989). Articulatory gestures as phonological units. Phonology, 6(02), 201-
251.
Bundgaard-Nielsen, R. L., Best, C. T., & Tyler, M. D. (2011). Vocabulary size is associated with second-
language vowel perception performance in adult learners. Studies in Second Language Acquisition, 33(03),
433-461.
Carlson, R., Granstöm, B., & Klatt, D. (1979). Vowel perception: The relative perceptual salience of selected
spectral and waveform manipulations. The Journal of the acoustical society of America, 65(S1), S6-S6.
Chodroff, E., & Wilson, C. (2017). Structure in talker-specific phonetic realization: Covariation of stop
consonant VOT in American English. Journal of Phonetics, 61, 30-47.
Chodroff, E., & Wilson, C. (2018). Between-category and within-category dependencies among cues for
place and voice. Linguistic Vanguard, 4(S2).
Chomsky, N., & Halle, M. (1968). The Sound Pattern of English. New York: Harper & Row.
Clarke, C. M., & Garrett, M. F. (2004). Rapid adaptation to foreign-accented English. The Journal of the
acoustical society of America, 116(6), 3647-3658.
Clopper, C. G., Tamati, T. N., & Pierrehumbert, J. B. (2016). Variation in the strength of lexical encoding
across dialects. Journal of Phonetics, 58, 87-103.

59
Clopper, C. G., & Pisoni, D. B. (2004). Effects of talker variability on perceptual learning of dialects.
Language and Speech, 47(3), 207-238.
Cox, F. (2006). The acoustic characteristics of/hVd/vowels in the speech of some Australian teenagers.
Australian Journal of Linguistics, 26(2), 147-179.
Cox, F., & Palethorpe, S. (2007). Australian English. Journal of the International Phonetic Association, 37(3),
341-350.
Cox, F., & Palethorpe, S. (2012). Standard Australian English: The sociostylistic broadness continuum. In R.
Hickey (Ed.) Standards of English: Codified varieties around the world, pp. 294-317. Cambridge UK:
Cambridge University Press.
Cox, F., Palethorpe, S., & Bentink, S. (2014). Phonetic archaeology and 50 years of change to Australian
English /iː/. Australian Journal of Linguistics, 34(1), 50-75.
Cristia, A., Seidl, A., Vaughn, C., Schmale, R., Bradlow, A., & Floccia, C. (2012). Linguistic processing of
accented speech across the lifespan. Frontiers in psychology, 3, 479.
Cutler, A., Eisner, F., McQueen, J. M., & Norris, D. (2010). How abstract phonemic categories are necessary
for coping with speaker-related variation. Laboratory Phonology, 10, 91-111.
Dahan, D., Drucker, S. J., & Scarborough, R. A. (2008). Talker adaptation in speech perception: Adjusting
the signal or the representations? Cognition, 108(3), 710-718.
Eisner, F., & McQueen, J. M. (2005). The specificity of perceptual learning in speech processing. Attention,
Perception, & Psychophysics, 67(2), 224-238.
Escudero, P., & Vasiliev, P. (2011). Cross-language acoustic similarity predicts perceptual assimilation of
Canadian English and Canadian French vowels. The Journal of the acoustical society of America,
130(5), EL277-EL283.
Evans, B. G., & Iverson, P. (2004). Vowel normalization for accent: An investigation of best exemplar
locations in northern and southern British English sentences. The Journal of the Acoustical Society of
America, 115(1), 352-361.
Evans, B. G., & Iverson, P. (2007). Plasticity in vowel perception and production: A study of accent change
in young adults. The Journal of the Acoustical Society of America, 121(6), 3814-3826.

60
Faris, M. M., Best, C. T., & Tyler, M. D. (2016). An examination of the different ways that non-native phones
may be perceptually assimilated as uncategorized. The Journal of the Acoustical Society of America,
139(1), EL1-EL5.
Flege, J. E., Schirru, C., & MacKay, I. R. (2003). Interaction between the native and second language
phonetic subsystems. Speech Communication, 40(4), 467-491.
Floccia, C., Goslin, J., Girard, F., & Konopczynski, G. (2006). Does a regional accent perturb speech
processing? Journal of Experimental Psychology: Human Perception and Performance, 32(5), 1276.
Floccia, C., Butler, J., Goslin, J., & Ellis, L. (2009). Regional and foreign accent processing in English: Can
listeners adapt? Journal of Psycholinguistic Research, 38(4), 379-412.
Fowler, C. A., Sramko, V., Ostry, D. J., Rowland, S. A., & Hallé, P. (2008). Cross language phonetic
influences on the speech of French–English bilinguals. Journal of Phonetics, 36(4), 649-663.
Fox, S. (2015). The New Cockney: New Ethnicities and Adolescent Speech in the Traditional East End of
London. Basingstoke, UK: Palgrave Macmillan.
Garrett, P., Williams, A., & Evans, B. (2005). Attitudinal data from New Zealand, Australia, the USA and UK
about each other’s Englishes: Recent changes or consequences of methodologies?. Multilingua, 24(3),
211-235.
Goldinger, S. D. (2007). A complementary-systems approach to abstract and episodic speech perception.
Proceedings of the 16th International Congress of Phonetic Sciences. Saarbrücken: Saarland University. ISBN
978-0-85261-941-4. Paper number 1781.1-6 retrieved from http://www.icphs2007.de
Haddican, B., Foulkes, P., Hughes, V., & Richards, H. (2013). Interaction of social and linguistic constraints
on two vowel changes in northern England. Language Variation and Change, 25(3), 371-403.
Hall, K. C. (2009). A probabilistic model of phonological relationships from contrast to allophony. Unpublished
PhD dissertation, The Ohio State University.
Harrington, J., Palethorpe, S., & Watson, C. I. (2000). Does the Queen speak the Queen's English? Nature,
408(6815), 927-928.
Hay, J., Maclagan, M., & Gordon, E. (2008). New Zealand English. Edinburgh: Edinburgh University Press.

61
Hay, J. B., Pierrehumbert, J. B., Walker, A. J., & LaShell, P. (2015). Tracking word frequency effects through
130 years of sound change. Cognition, 139, 83-91.
Hockett, C. F. (1967). The quantification of functional load. Word, 23(1-3), 300-320.
Hofmeister, P., Jaeger, T. F., Arnon, I., Sag, I. A., & Snider, N. (2013). The source ambiguity problem:
Distinguishing the effects of grammar and processing on acceptability judgments. Language and Cognitive
Processes, 28(1-2), 48-87.
Holt, L. L., & Lotto, A. J. (2010). Speech perception as categorization. Attention, Perception, & Psychophysics,
72(5), 1218-1227.
Kerswill, P., Torgersen, E. N., & Fox, S. (2008). Reversing “drift”: Innovation and diffusion in the London
diphthong system. Language Variation and Change, 20(3), 451-491.
Johnson, K. (1997). Speech perception without speaker normalization: an exemplar model. In K. Johnson &
J. W. Mullennix (Eds.), Talker variability in speech processing (pp. 145-165): San Diego: Academic Press.
Kim, M., Horton, W. S., & Bradlow, A. R. (2011). Phonetic convergence in spontaneous conversations as a
function of interlocutor language distance. Laboratory Phonology, 2(1), 125-156.
Kleinschmidt, D. F., & Jaeger, T. F. (2015). Robust speech perception: recognize the familiar, generalize to
the similar, and adapt to the novel. Psychological Review, 122(2), 148.
Kraljic, T., & Samuel, A. G. (2005). Perceptual learning for speech: Is there a return to normal? Cognitive
Psychology, 51(2), 141-178.
Kraljic, T., & Samuel, A. G. (2006). Generalization in perceptual learning for speech. Psychonomic Bulletin &
Review, 13(2), 262-268.
Kraljic, T., & Samuel, A. G. (2007). Perceptual adjustments to multiple speakers. Journal of Memory and
Language, 56(1), 1-15.
Lively, S. E., Logan, J. S., & Pisoni, D. B. (1993). Training Japanese listeners to identify English /r/ and /l/.
II: The role of phonetic environment and talker variability in learning new perceptual categories. The
Journal of the acoustical society of America, 94(3), 1242-1255.
Maye, J., Aslin, R. N., & Tanenhaus, M. K. (2008). The weckud wetch of the wast: Lexical adaptation to a
novel accent. Cognitive Science, 32(3), 543-562.

62
Moore, B. (2008). Speaking our language: the story of Australian English. Oxford: Oxford University Press
Menard, S. (2010). Logistic regression: From introductory to advanced concepts and applications. Los
Angeles: Sage Publications.
Munson, B., & Solomon, N. P. (2004). The effect of phonological neighborhood density on vowel
articulation. Journal of Speech, Language, and Hearing Research, 47(5), 1048-1058.
Niedzielski, N. A., & Preston, D. R. (2000). Folk linguistics (Vol. 122). Walter de Gruyter.
Nielsen, K. (2011). Specificity and abstractness of VOT imitation. Journal of Phonetics, 39(2), 132-142.
Norris, D., McQueen, J. M., & Cutler, A. (2003). Perceptual learning in speech. Cognitive Psychology, 47(2),
204-238.
Nycz, J. (2013). New contrast acquisition: methodological issues and theoretical implications. English
Language & Linguistics, 17(2), 325-357.
Pardo, J. S. (2006). On phonetic convergence during conversational interaction. The Journal of the acoustical
society of America, 119(4), 2382-2393.
Pardo, J. S., Gibbons, R., Suppes, A., & Krauss, R. M. (2012). Phonetic convergence in college roommates.
Journal of Phonetics, 40(1), 190-197.
Pierrehumbert, J. (2003). Phonetic diversity, statistical learning, and acquisition of phonology. Language and
Speech, 46, 115-154.
Pierrehumbert, J. (2006). The next toolkit. Journal of Phonetics, 34(6), 516-530.
Pierrehumbert, J. B. (2016). Phonological representation: Beyond abstract versus episodic. Annual Review of
Linguistics, 2, 33-52.
Pisoni, D. B. (1975). Auditory short-term memory and vowel perception. Memory & Cognition, 3(1), 7-18.
Polka, L., & Bohn, O.-S. (2003). Asymmetries in vowel perception. Speech Communication, 41(1), 221-231.
Polka, L., & Bohn, O.-S. (2011). Natural Referent Vowel (NRV) framework: An emerging view of early
phonetic development. Journal of Phonetics, 39(4), 467-478.
Przedlacka, J. (2001). Estuary English and RP: Some recent findings. Studia Anglica Posnaniensia, 36, 35-50.
Recasens, D., & Mira, M. (2015). Place and manner assimilation in Catalan consonant clusters. Journal of the
International Phonetic Association, 45(02), 115-147.

63
Repp, B. H. (1984). Categorical perception: Issues, methods, findings. Speech and language: Advances in basic
research and practice, 10, 243-335.
Rosner, B. S., & Pickering, J. B. (1994). Vowel perception and production. Oxford: Oxford University Press.
Ryfa, J. (2013). Englishes of London and the Southeast of England. In T. Hopkins & J. McKenny (Ed.) World
Englishes: Volume I: The British Isles, pp. 31-94. London: Bloomsbury.
Sancier, M. L., & Fowler, C. A. (1997). Gestural drift in a bilingual speaker of Brazilian Portuguese and
English. Journal of Phonetics, 25(4), 421-436.
Schwartz, J.-L., Abry, C., Boë, L.-J., Ménard, L., & Vallée, N. (2005). Asymmetries in vowel perception, in
the context of the Dispersion–Focalisation Theory. Speech Communication, 45(4), 425-434.
Shaw, J. A. (2013). The phonetics of hyper-active feet: Effects of stress priming on speech planning and
production. Laboratory Phonology, 4(1), 159-190.
Shaw, J. A. (2016). Dynamic listening: temporal expectations guide perception of phonetic detail. Poster
presented at LabPhon 15, Cornell, July 13-16.
Shaw, J.A. and S. Kawahara. 2017. Effects of Surprisal and Entropy on vowel duration in Japanese. Language
and Speech. 1-35.
Shaw, J.A., C.T. Best, K. Mulak, G. Docherty, B. Evans, P. Foulkes, and J. Hay. 2014. Effects of short-term
exposure to unfamiliar regional accents: Australians’ categorization of London and York English
consonants. Proceedings of the 14th Australasian International Conference on Speech Science and
Technology, University of Canterbury, New Zealand, 72-75.
Skoruppa, K., & Peperkamp, S. (2011). Adaptation to Novel Accents: Feature-Based Learning of Context-
Sensitive Phonological Regularities. Cognitive Science, 35(2), 348-366.
Smolensky, P., Goldrick, M., & Mathis, D. (2014). Optimization and quantization in gradient symbol
systems: a framework for integrating the continuous and the discrete in cognition. Cognitive Science,
38(6), 1102-1138.
Sonderegger, M., Bane, M., & Graff, P. (2017). The medium-term dynamics of accents on reality television.
Language, 93(3), 598-640.
64
Stuart-Smith, J., Pryce, G., Timmins, C., & Gunter, B. (2013). Television can also be a factor in language
change: Evidence from an urban dialect. Language, 89(3), 501-536.
Sumner, M. (2011). The role of variation in the perception of accented speech. Cognition, 119(1), 131-136.
Sumner, M., & Samuel, A. G. (2009). The effect of experience on the perception and representation of
dialect variants. Journal of Memory and Language, 60(4), 487-501.
Szakay, A., Babel, M., & King, J. (2016). Social categories are shared across bilinguals׳ lexicons. Journal of
Phonetics, 59, 92-109.
Tamminga, M., MacKenzie, L., & Embick, D. (2017). The dynamics of variation in individuals. Linguistic
Variation, 16(2), 300-336.
Tollfree, L. (1999). South East London English: Discrete versus continuous modelling of consonantal
reduction. In P. Foulkes & G. Docherty (Eds.) Urban Voices, pp. 163-184. London: Arnold.
Tyler, M. D., Best, C. T., Faber, A., & Levitt, A. G. (2014). Perceptual assimilation and discrimination of non-
native vowel contrasts. Phonetica, 71(1), 4-21.
Van Ooijen, B. (1996). Vowel mutability and lexical selection in English: Evidence from a word
reconstruction task. Memory & Cognition, 24(5), 573-583.
Wang, Y., Spence, M. M., Jongman, A., & Sereno, J. A. (1999). Training American listeners to perceive
Mandarin tones. The Journal of the acoustical society of America, 106(6), 3649-3658.
Warner, N., Jongman, A., Sereno, J., & Kemps, R. (2004). Incomplete neutralization and other sub-phonemic
durational differences in production and perception: Evidence from Dutch. Journal of phonetics, 32(2),
251-276.
Watt, D., & Allen, W. (2003). Tyneside English. Journal of the International Phonetic Association, 33(02), 267-
271.
Weatheral, A., Gallois, C., & Pittam, J. (1998). Australasians identifying Australasian accents. Te Reo, 153-
162.
Wells, J. C. (1982). Accents of English (3 vols.). Cambridge: Cambridge University Press.
Werker, J. F., & Tees, R. C. (1984). Phonemic and phonetic factors in adult cross-language speech
perception. The Journal of the Acoustical Society of America, 75(6), 1866-1878.

65
Williams, A., & Kerswill, P. (1999). Dialect levelling: change and continuity in Milton Keynes, Reading and
Hull. Urban voices: Accent studies in the British Isles, 141-62.
Ying, J., Shaw, J. A., & Best, C. T. (2013). L2 English learners' recognition of words spoken in familiar
versus unfamiliar English accents. INTERSPEECH 2013, Lyon, 2208-2212.
Acknowledgements
We would like to thank participants in this study and several research assistants who
contributed to the collection of the data reported here—in New Zealand: Ksenia Gnevsheva, Mike
Peek, Alia Hope-Wilson, Nathan Taylor, and Vicky Watson; in Northern England: Jalal Al-Tamimi,
Sophie Wood, Vince Hughes, Amanda Cardoso, Hannah How, Justin Lo, Ella Jeffries and James
Tompkinson; in London: Anita Wagner, Katharine Mair, Gisela Tomé Lourido; in Sydney, Sarah
Wright, Sara Fenwick, and Mark Lathouwers. The exposure passage was written by Meg Mundell.
We thank audiences at the 18th International Congress of Phonetic Sciences in Glasgow, the 15th
Interspeech conference in Dresden, the workshop on Sociophonetic Variability in the English Varieties
of Australia in Brisbane, and the workshop of the Role of Predictability in Shaping Human Language
Sound Patterns in Sydney, where aspects of this research were presented. The project was supported
by Australian Research Council grant DP120104596.
Copyright © 2022 FDOKUMEN