Cross-continental comparisons of butterfly assemblages in tropical rainforests: implications for...
11
Cross-continental comparisons of butterfly assemblages in tropical rainforests: implications for biological monitoring YVES BASSET, 1 ROD EASTWOOD, 2 LEGI SAM, 3 DAVID J. LOHMAN, 2,4 VOJTECH NOVOTNY, 5 TIM TREUER, 2 SCOTT E. MILLER, 6 GEORGE D. WEIBLEN, 7 NAOMI E. PIERCE, 2 SARAYUDH BUNYAVEJCHEWIN, 8 WATANA SAKCHOOWONG, 8 PITOON KONGNOO 9 and MIGUEL A. OSORIO-ARENAS 1 1 Smithsonian Tropical Research Institute, Panama City, Panama, 2 Museum of Com- parative Zoology, Harvard University, Cambridge, MA, USA, 3 The New Guinea Binatang Research Center, Madang, Papua New Guinea, 4 Department of Biology, The City College of New York, The City University of New York, NY, USA, 5 Biol- ogy Center of the Czech Academy of Sciences and School of Biological Sciences, University of South Bohemia, Ceske Budejo- vice, Czech Republic, 6 National Museum of Natural History, Smithsonian Institution, Washington, DC, USA, 7 Bell Museum of Natural History, University of Minnesota, Saint Paul, MN, USA, 8 Thai National Parks Wildlife and Plant Conservation Department, Bangkok, Thailand and 9 Center for Tropical Forest Science, Khao Chong Botanical Garden, Trang, Thailand Abstract. 1. Standardised transect counts of butterflies in old-growth rainforests in different biogeographical regions are lacking. Such data are needed to mitigate the influence of methodological and environmental factors within and between sites and, ultimately, to discriminate between long-term trends and short-term stochastic changes in abundance and community composition. 2. We compared butterfly assemblages using standardised Pollard Walks in the understory of closed-canopy lowland tropical rainforests across three biogeographi- cal regions: Barro Colorado Island (BCI), Panama; Khao Chong (KHC), Thailand; and Wanang (WAN), Papua New Guinea. 3. The length and duration of transects, their spatial autocorrelation, and number of surveys per year represented important methodological factors that strongly influ- enced estimates of butterfly abundance. Of these, the effect of spatial autocorrelation was most difficult to mitigate across study sites. 4. Butterfly abundance and faunal composition were best explained by air temper- ature, elevation, rainfall, wind velocity, and human disturbance at BCI and KHC. In the absence of weather data at WAN, duration of transects and number of forest gaps accounted for most of the explained variance, which was rather low in all cases (<33%). 5. Adequate monitoring of the abundance of common butterflies was achieved at the 50 ha BCI plot, with three observers walking each of 10 transects of 500 m for 30 min each, during each of four surveys per year. These data may be standardised fur- ther after removing outliers of temperature and rainfall. Practical procedures are sug- gested to implement global monitoring of rainforest butterflies with Pollard Walks. Key words. Barro Colorado Island, biological monitoring, Center for Tropical Forest Science, Lepidoptera, Panama, Papua New Guinea, Pollard Walks, Thai- land, tropical rainforest. Correspondence: Yves Basset, Smithsonian Tropical Research Institute, Apartado 0843-03092, Balboa, Ancon, Panama City, Panama. E-mail: [email protected] Insect Conservation and Diversity (2012) doi: 10.1111/j.1752-4598.2012.00205.x Ó 2012 The Authors Insect Conservation and Diversity Ó 2012 The Royal Entomological Society 1
-
Upload
independent -
Category
Documents
-
view
3 -
download
0
Transcript of Cross-continental comparisons of butterfly assemblages in tropical rainforests: implications for...

Cross-continental comparisons of butterflyassemblages in tropical rainforests: implications forbiological monitoring
YVES BASSET,1 ROD EASTWOOD,2 LEGI SAM,3 DAVID J. LOHMAN,2,4
VOJTECH NOVOTNY,5 TIM TREUER,2 SCOTT E. MILLER,6 GEORGE D.WEIBLEN,7 NAOMI E. PIERCE,2 SARAYUDH BUNYAVEJCHEWIN,8
WATANA SAKCHOOWONG,8 PITOON KONGNOO9 and MIGUELA. OSORIO-ARENAS1 1Smithsonian Tropical Research Institute, Panama City, Panama, 2Museum of Com-
parative Zoology, Harvard University, Cambridge, MA, USA, 3The New Guinea Binatang Research Center, Madang, PapuaNew Guinea, 4Department of Biology, The City College of New York, The City University of New York, NY, USA, 5Biol-ogy Center of the Czech Academy of Sciences and School of Biological Sciences, University of South Bohemia, Ceske Budejo-
vice, Czech Republic, 6National Museum of Natural History, Smithsonian Institution, Washington, DC, USA, 7Bell Museumof Natural History, University of Minnesota, Saint Paul, MN, USA, 8Thai National Parks Wildlife and Plant ConservationDepartment, Bangkok, Thailand and 9Center for Tropical Forest Science, Khao Chong Botanical Garden, Trang, Thailand
Abstract. 1. Standardised transect counts of butterflies in old-growth rainforests indifferent biogeographical regions are lacking. Such data are needed to mitigate theinfluence of methodological and environmental factors within and between sites and,ultimately, to discriminate between long-term trends and short-term stochasticchanges in abundance and community composition.2. We compared butterfly assemblages using standardised Pollard Walks in the
understory of closed-canopy lowland tropical rainforests across three biogeographi-cal regions: Barro Colorado Island (BCI), Panama; Khao Chong (KHC), Thailand;and Wanang (WAN), Papua New Guinea.3. The length and duration of transects, their spatial autocorrelation, and number
of surveys per year represented important methodological factors that strongly influ-enced estimates of butterfly abundance. Of these, the effect of spatial autocorrelationwas most difficult to mitigate across study sites.4. Butterfly abundance and faunal composition were best explained by air temper-
ature, elevation, rainfall, wind velocity, and human disturbance at BCI and KHC. Inthe absence of weather data at WAN, duration of transects and number of forestgaps accounted for most of the explained variance, which was rather low in all cases(<33%).5. Adequate monitoring of the abundance of common butterflies was achieved at
the 50 ha BCI plot, with three observers walking each of 10 transects of 500 m for30 min each, during each of four surveys per year. These datamay be standardised fur-ther after removing outliers of temperature and rainfall. Practical procedures are sug-gested to implement global monitoring of rainforest butterflies with PollardWalks.
Key words. Barro Colorado Island, biological monitoring, Center for TropicalForest Science, Lepidoptera, Panama, Papua New Guinea, Pollard Walks, Thai-land, tropical rainforest.
Correspondence: Yves Basset, Smithsonian Tropical Research Institute, Apartado 0843-03092, Balboa, Ancon, Panama City, Panama.
E-mail: [email protected]
Insect Conservation and Diversity (2012) doi: 10.1111/j.1752-4598.2012.00205.x
� 2012 The AuthorsInsect Conservation and Diversity � 2012 The Royal Entomological Society 1

Introduction
Habitat degradation is currently the biggest threat to tropicalinsects; however, the effects of climate changemay soon bemorepervasive (Bale et al., 2002; Deutsch et al., 2008; Chen et al.,
2009). Disentangling the short-term effects of local environmen-tal factors and seasonal variation from the long-term effects ofclimate change on tropical communities can be challenging
because of the diversity and complexity of these communities.Biological monitoring seeks to repeat sampling over time toidentify population patterns (e.g. Yoccoz et al., 2001; Conrad
et al., 2007). Monitoring goals may be diverse, including detect-ing population trends of threatened, endangered, keystone, orcommon species. Monitoring abundant resident (common) spe-cies may be crucial for detecting the early decline of habitats
(Hawking & New, 2002). In this study, we focus on monitoringthe abundance of common species locally (see further discussionon this issue inAppendix S1).
Investigating insects in long-term study plots may capitaliseon existing floristic, phenological, and climatic data, thus simpli-fying efforts to study tropical insects and their interactions with
plants (Godfray et al., 1999). The network of permanent forestdynamics plots monitored by the Center for Tropical Forest Sci-ence (CTFS; Losos&Leigh, 2004) provides ample opportunitiesfor long-term monitoring of insect populations. In 2008, CTFS
proposed to develop a monitoring programme, whose aims areto detect long-term changes in the abundance and compositionof focal assemblages of arthropods, driven primarily by climatic
cycles and changes, as opposed to short-term stochastic changes.This challenge is ideally met by comparing responses of variousarthropod taxa at different rainforest sites, allowing stronger
inferences regarding arthropod responses to long-term changes(i.e. a ‘global’ monitoring programme, Appendix S1). Annualindices consisting of various metrics are calculated for each focal
assemblage. In this article, we consider principally the localabundance of all species censused together, as well as the localabundance and composition of common species (see AppendixS1 andTable S1).
Butterflies are frequently used as indicators of environmentaldisturbance (Thomas, 1991; Kremen, 1992; Ghazoul, 2002), andoffer a number of logistical advantages over other potential indi-
cator taxa. In particular, unlike most insect groups, many (butnot all) butterfly species can often be identified in the field usingfield guides. Butterflies and their larvae play important roles in
ecosystem functioning, including nutrient cycling and pollina-tion (Janzen, 1987; Schowalter, 2006). This implies that tropicalbutterflies should be studied not just as potential biological indi-cators, but as targets of conservation in their own right (Boneb-
rake et al., 2010). Unlike temperate areas, there are currently nobutterfly distribution atlases and few long-term monitoringschemes for butterflies (Grøtan et al., 2012) or any other insects
in the tropics. Butterflies represent one of the focal taxa targetedby the CTFSmonitoring programme.There are severalmethods available tomonitor rainforest but-
terflies, eachwith their own drawbacks (Appendix S2). In partic-ular, passive traps baited with rotting fruits attract adultbutterflies of certain species that imbibe fermenting fruit juice
(DeVries & Walla, 2001). ‘Pollard Walks’, in which butterflies
are counted along timed transects, were pioneered in Englandover 35 years ago (Pollard, 1977; Thomas, 1983). Today, butter-
flymonitoring with PollardWalks includes about 2000 transectsscattered throughout Europe (van Swaay et al., 2008). Suchschemes have yielded convincing data on butterfly population
changes in the face of global climate change (Warren et al.,2001). Observation counts obtained with PollardWalks are pos-itively correlated with the abundances of individual species as
estimated bymark-recapture studies (Pollard, 1979; but seeHar-ker & Shreeve, 2008), and are therefore deemed to be a faithfulmeasure of abundance. However, as butterfly activity depends
on air temperature, solar radiation, wind speed, and time of day(Douwes, 1976; Ribeiro & Freitas, 2010), these parametersshould be measured during sampling and considered in subse-quent statistical treatment (Kery & Plattner, 2007). Pollard
Walks have been performed in tropical rainforests often withtwo goals in mind: (i) assessing local butterfly species richnesswhile expending a minimum of effort, often censusing rather
open habitats as butterfly diversity tends to be higher in thesehabitats (e.g. Sparrow et al., 1994; Walpole & Sheldon, 1999;Hill et al., 2001; Caldas & Robbins, 2003); and (ii) comparing
butterfly species richness in old-growth and disturbed forests orplantations (e.g. Hill et al., 1995; Spitzer et al., 1997; Wood &Gillman, 1998; Ghazoul, 2002; Horner-Devine et al., 2003; Cle-ary & Genner, 2004). An expert panel recommended the use of
Pollard Walks for monitoring butterflies within a subset ofCTFS permanent plots.Examining factors that may strongly influence variation in
the abundance or species richness of butterfly assemblages inold-growth forests may be crucial to discuss changes as theyoccur in disturbed forests. In tropical forests, the high species
diversity and reduced visibility in the understory impede identifi-cation of butterflies ‘on the wing’. For this reason, tropicalstudies often do not include the taxonomically challenging
but exceptionally diverse families Hesperiidae and Lycaeni-dae (Sparrow et al., 1994; Spitzer et al., 1997; Ghazoul, 2002).Long-term studies with relatively high sampling effort directedat the same sites can alleviate this taxonomic challenge by focus-
ing taxonomic expertise on problem groups while amassing asuitable reference collection. To the best of our knowledge, nostudy has yet attempted to compare entire understory butterfly
assemblages from closed-canopy tropical rainforests in differentbiogeographical regions using standardised sampling.Differences in butterfly abundance and ⁄or species richness
observed at different study sites in tropical rainforests may resultfrom a variety of causes, which may be categorised as regionalor local factors. Regional phenomena that varied notablyamong the study sites in this study included biogeography,
recent landscape history, floristics and plant diversity, annualrainfall, and severity of the dry season (Basset et al., 2011). Inthe present study, we focus on local factors, which apply at the
level of transects within a site, and examine whether it may bepossible to standardise them to reduce background noise in thedata. Such factors are multiple, but we may categorise them in
considering two main variables: (i) the abundance of a commonbutterfly species within a transect (Fig. 1) and (ii) the annualabundance of a common butterfly species within a study site
(and its associated precision; Fig. S1). Themain factors influenc-
2 Yves Basset et al.
� 2012 The AuthorsInsect Conservation and Diversity � 2012 The Royal Entomological Society, Insect Conservation and Diversity
ing the first variable can be categorised as methodological (fac-
tors F1–F5; often dependent on time and funding available),mostly spatial (F6–F14), mostly temporal (F15–F20), and moredependent on species traits (F21). All of these factors influence
annual butterfly abundance, in addition to methodological fac-tors dependent on the choice of transects and locations (F22–F24) and of surveys (F25, F26; Fig. S1). The same set of factormay influence the composition of common butterfly species
within transects or sample units, and during the course of theyear.Our far-reaching goals (Appendix S1) are to develop adequate
monitoring protocols for butterflies and other arthropods at sev-eral rainforest sites. To this end, the influence of methodologicaland environmental factors needs to be appreciated and, as far as
possible, standardised or mitigated. However, despite the will-ingness of investigators to develop similar butterfly monitoringprotocols at different rainforest sites, small environmental and
methodological differences among sites are unavoidable andmay complicate the interpretation of monitoring data. Forexample, there may be variation in rainfall patterns among sites,or differences in site size may result in unequal lengths and ⁄ornumbers of transects. This study seeks to evaluate the potentialeffect of these factors, and recommend strategies to minimisepotential complications in the interpretation of monitoring data.
Although we acknowledge the influence of species traits (F21)and spatial factors dependent from species behaviour and life-history (F11, F13, F14), these factors were not investigated in
this contribution. Their standardisation may be difficult or
impossible within or across rainforest sites.The specific aim of this contribution is to develop optimised
protocol guidelines based on PollardWalks for monitoring but-
terflies in the understory of tropical rainforests on a global scale.Our recommendations are supported by data collected at threeCTFS permanent tropical rainforest plots in different biogeo-graphical regions (Neotropical, Oriental and Australian). First,
we evaluate how methodological and local environmental fac-tors affect the collection of butterfly data in Pollard Walks andthen test whether assemblages at the three study sites respond
similarly to these factors. Second, we use our results to illustrateand justify methodological decisions whenever possible. Hence,our three independent study sites are used to explore the ade-
quacy of protocols and their performance for different local fau-nas. Detailed descriptions of butterfly assemblages at the threesites and their differences in abundance and diversity are dis-
cussed elsewhere (Basset et al., 2011).
Methods
Study sites
Neotropical: Barro Colorado Island (BCI) is a 1500 ha islandcreated by the opening of the Panama Canal in 1914. The 50 haCTFS plot is located in the centre of the island, which is a
Observed abundance of a common specieswithin a transect
Methodological factors
Delineationof transect
F2 $
Lengthof transect
F3 $ **
Durationof transect
F4 $ **
Equipment
F1 $
Identity ofobserver
F5 *
Species traitsAdult life span, apparency, size,flight behaviour (incl. height) andtimes, dispersal abilities, etc. F21
ElevationF6 # **
DisturbanceF8 # **
Number/areaforest gaps
F10 # *
Spatial factors
Host-planttaxon F14
HabitatF7 # *
Nectar & alternateN sources F13
Canopyopenness
F9 # *
Microhabitats andflying routes F11
Solarradiation
F12
Temporal factors
Cloudcover
F 18 # *
TemperatureF 15 # ** Humidity
F17 # *
WindF20 # **
RainfallF16 # **
Time of day
F19 $ **
Time & funding available
Fig. 1. Summary of main factors (boxes, F1–F21) influencing the observed abundance of an adult butterfly species within a transect in
the understory of our three rainforest sites. To simplify, relationships between factors are not indicated. Key to symbols for factors:
$ = easy to standardise; # = possible to standardise after removing outliers; *, ** = the effect of this factor was tested in this contribu-
tion with at least one data set (* = weak, ** = strong, see results). Factors without symbols were not tested.
Monitoring rainforest butterflies 3
� 2012 The AuthorsInsect Conservation and Diversity � 2012 The Royal Entomological Society, Insect Conservation and Diversity

biological reserve. A detailed description of the setting and ofthe CTFS plot may be found in Windsor (1990) and Condit
(1998). Oriental: the 24 ha CTFS plot at Khao Chong (KHC) islocated in protected forest of the Khao Chong Research andConservation Promotion Station, which is part of theKhao Ban
Thad Wildlife Sanctuary in Southern Thailand. Australian: thethird site is the newly established 50 ha CTFS plot locatedwithin the 10 000 haWanangConservationArea in PapuaNew
Guinea (WAN). Vegetation at each site can be classified as semi-deciduous lowlandmoist forest, lowland seasonal evergreen for-est, and mixed evergreen hill forest at BCI, KHC, and WAN
respectively. At all CTFS plots, each tree with a diameter atbreast height (DBH) of 1 cm or greater has been counted,mapped, and identified to species (Center for Tropical ForestScience, 2010). Rainfall data were available from the Smithso-
nian Tropical Research Institute for BCI and from the KhaoChong Botanic Garden for KHC. No daily rainfall data wereavailable for WAN. The three study sites have similar latitude
and elevation, butWAN has higher rainfall, BCI has a drier dryperiod, and KHC has a steep slope. Tree diversity is higher atKHCandWAN than at BCI (Table 1).
Butterfly transects and identification
For sake of clarity, we hereafter use the following terms,defined as follows: study sites = the three study areas withinand near the permanent plots of BCI, KHC, and WAN; loca-
tions= spatial locations within study sites where butterfly tran-sects were performed; transects = butterfly transects (‘walks’)replicated at each location; surveys = butterfly transects repli-
cated at each location and during a particular time period (seebelow for further details). Hence, the smallest sampling unit wasone transect, which, depending on analyses, might have been
pooled over surveys or locations (see below). At each site, weused PollardWalks to calculate indices of butterfly species abun-dance along a linear transect that was repeatedly sampled over agiven time interval (Pollard, 1977). Protocols were derived from
pilot studies at each study site, but their suitability for long-termmonitoring is addressed in the discussion. To reduce trampling,
we used concatenated transect location (‘locations’) on estab-lished trails at BCI and KHC (i.e. narrow understory paths not
associated with a canopy opening). At BCI, we designated 10locations of 500 m, at KHC 6 locations of 350 m, and at WAN5 locations of 300 m (the minimum distance between locations
was 200 m; factors F3 and F23 in Figs 1 and S1). To accountfor the steeper slope at KHC, half of the locations were locatedon level terrain (hereafter ‘flatland’; 120–160 m) and half on a
ridge (255–465 m; F6 and F7). During each transect, one obser-ver walked at slow and constant pace along a location in about30 min (F4) while recording butterflies within 5 m of either side
of the trail and to a height of 5–7 m (F2). Butterflies were eitheridentified ‘on the wing’ as accurately as possible (to species,genus or family); netted, identified (at BCI with a home-madefield guide; at KHC from memory; at WAN with the pocket
guide of Parsons, 1991) and released; or collected for processingand identification in the laboratory. AtWAN, field observationsof butterfly flight habits and microhabitat preferences made by
experienced observers improved the ability to identify specimensin the field. Prior to the start of each transect, the observerrecorded air temperature (F15), relative humidity (F17), wind
velocity (F20), percentage cloudiness (F18), and time of day(F19; at WAN, only the last three variables were recorded;details in Appendix S2). We use ‘butterflies censused’ to meanbutterflies both collected and observed within a particular sam-
pling unit.At all sites, we avoided walks on days with inclement weather
(high rainfall or wind, low temperature). Locations were usually
walked between 9:00 and 15:00 hours (F19), on different days.Surveys were performed with a weighted frequency of dry ⁄wetperiods (F25, F26, see Appendix S2). At BCI, each 500 m loca-
tionwaswalked three times during each of four annual quarterlysurveys from June 2008 to March 2010. At KHC, each 350 mlocation was walked four times during each of four annual
quarterly surveys, from August 2008 to November 2009 (F22).There was turnover of observers at both sites, but most tran-sects were surveyed by six observers at BCI and three observersat KHC, with randomisation of observers and starting points
of transect locations (F5). At WAN, each 300-m location waswalked twice by the same observer during each annual monthly
Table 1. Salient characteristics of study sites.
Variable Barro Colorado Island Khao Chong Wanang
Coordinates 9.15�N, 79.85�W 7.54�N, 99.80�E 5.24�S, 145.08�EElevation (m) 120–160 120–330 90–180
Annual average rainfall (mm) 2631 2665 3440
Annual average daily maximum air temperature (�C) 28.5 30.9 30.6
Average length of the dry season (days) 136 120 141
Average monthly rainfall during dry season (mm) 64 82 88
Number of tree recorded in CTFS plot with dbh ‡1cm 208 387 121 500 81 971*
Stems per ha in CTFS plot 4168 5062 4554*
Number of tree species ⁄ genera ⁄ families recorded in CTFS plot 298 ⁄ 181 ⁄ 59 593 ⁄ 285 ⁄ 82 553 ⁄ 273 ⁄ 83*Mean � SE canopy openness (%)� 3.99 � 0.194a 6.06 � 0.445b 2.02 � 0.205c
Sources: Condit (1998); Windsor (1990); Center for Tropical Forest Science (2010).
*Data for the first 18 ha of the 50 ha plot.
�anova, F2,76 = 20.17, P < 0.0001, significant groups designated by different letters (Tukey tests, P < 0.05), see Appendix S2.
4 Yves Basset et al.
� 2012 The AuthorsInsect Conservation and Diversity � 2012 The Royal Entomological Society, Insect Conservation and Diversity

survey from March 2008 to February 2009 (F5, F22). Butter-flies were identified using local collections and a variety of
sources (Appendix S2).
Statistical analyses
Relative variation may be used as a simple estimator of the
precision of the sampling protocol. It is calculated as the percent-age of standard error (SE) relative to themean. This approach isroutinely used in economic entomology, where precision is con-sidered as satisfying when £20% (e.g. Kogan & Herzog, 1983).
A smaller relative variation indicates greater precision. Annualindices of butterfly abundance and their precision were calcu-lated as the mean and SE of pooled abundance per location
within a study site (details in Appendix S1). For these calcula-tions, the independence of data points was crucial. Spatial auto-correlation (F24) can be interpreted as redundant information
on data, because of the contagious effect among adjacent sam-ples. Ignoring spatial autocorrelation leads to overly optimisticstandard errors, inflated degrees of freedom, biased parameter
estimates in correlation or regression analyses, and incorrectinference in statistical analyses (Dormann, 2007; details inAppendix S1). We accounted for potential spatial autocorrela-tion among sampling units (i.e. transects, transects pooled over
surveys or locations) either by correcting the degrees of freedomin statistical tests or by including geographical distance in ourmultivariate analyses. Details of methods and results are given
in Appendices S2 and S3. Spatial autocorrelation was not sig-nificant at BCI. Transects pooled over locations were not spa-tially autocorrelated at WAN and only weakly so at KHC, so
we chose this sampling unit to report faunal composition andtrends in butterfly abundance at all study sites (Table S6 in
Appendix S3).As transects were longer at BCI and walked significantly fas-
ter than at KHC or WAN (Table 2), we standardised butterfly
abundance per 500 m of transect and 30 min duration.We usedEstimateS 8.2 software to calculate Morisita-Horn similarityindices between locations, Mao Tau species accumulation
curves, Coleman rarefaction indices, Chao1 richness estimates,Alpha log series diversity indices and Shannon evenness indices,each with 100 randomisations (Colwell, 2009). To evaluate the
effects of methodological factors F3, F23, F22, F25 and F26, weplotted them against the precision in butterfly abundanceand ⁄or the cumulative number of common species censused (allcalculations and results detailed inAppendices S2 and S3).
We modelled the log abundance of butterflies observed intransects with a lagged-predictormodel of spatial autoregression(Anselin, 1988) using the software SAM (Rangel et al., 2010).
The following predictor variables were used in ourmodels: dura-tion of transect; time of day; wind velocity; percentage cloudi-ness; elevation of middle point of transect location; mean
canopy openness of location; number of gaps in location; sumofgap area in location; human disturbance (categorical variableaccounting for how often people were encountered during tran-sects; Table S2); air temperature; relative humidity; amount of
rainfall on the day and during the 30 preceding days when thetransect was performed (F4, F6, F8–10, F15–20). No rainfalldata were available for WAN and thus WAN models only
included the first nine of the above variables.We used canonical partitioning to interpret spatial variance in
community composition among transects (Borcard et al., 2004).
Table 2. Observations in Pollard Walks at the three study sites. Mean are reported � SE, unless otherwise indicated. For anovas,
different letters denote significant different means (Tukey tests, P < 0.05).
Variable BCI KHC WAN
Butterfly individuals observed 1792 1797 3331
No. species observed 128 131 134
Sampling effort: person-hours, km walked 118, 115 70, 81 56, 36
Percentage of individuals identified to family ⁄ genus ⁄species (%)
98.7 ⁄ 67.1 ⁄ 53.8 94.6 ⁄ 37.8 ⁄ 19.4 100 ⁄ 100 ⁄ 100
Percentage of species identified to species (%) 80.4 90.1 100
Percentage of species observed to local known butterfly fauna* 42.6 32.3 68.9
Average Morisita-Horn similarity between pairwise locations� 0.859 � 0.007a 0.275 � 0.046c 0.767 � 0.034b
Average duration of one transect (min) 32.39 � 0.0002 27.28 � 0.0003 28.20 � 0.0003
Average walking speed (m min)1)� 15.88 � 0.24a 13.66 � 0.25b 11.02 � 0.22c
Average corrected no. butterflies per transect of 500 m
and 30 min§
7.40 � 0.282c 12.31 � 0.729b 49.22 � 2.29a
Coleman rarefaction for 350 individuals (no. of
species � SD)
77.8 � 4.74 130.3 � 1.87 70.5 � 4.18
Species richness estimate: Chao1 (�SD) 171.7 � 15.44 186.7 � 18.05 146.1 � 6.79
Alpha log series index (�SD)– 39.36 � 2.14b 75.13 � 6.22a 27.99 � 1.15b
Shannon index (�SD)** 3.51 � 0.02b 4.49 � 0.05a 3.66 � 0.09b
Dominance: Berger-Parker index 0.220 0.069 0.171
Percentage of species observed as singletons (%) 37.0 44.0 16.3
*Sources: see Appendix S2.
anovas: �F2,12 = 203.0, P < 0.0001; �F2,324 = 81.2, P < 0.0001; §F2,324 = 430.8, P < 0.0001; –F2,12 = 74.5, P < 0.0001;
**F2,12 = 18.8, P < 0.0004.
a, b, c are the results of Tukey tests, indicating significantly different means.
Monitoring rainforest butterflies 5
� 2012 The AuthorsInsect Conservation and Diversity � 2012 The Royal Entomological Society, Insect Conservation and Diversity

This method uses geographic coordinates as explanatory vari-ables in constrained ordinations, such as canonical correspon-
dence analysis (CCA). Environmental variables used in theordinations included all predictor variables from our spatial au-toregression models (see above), plus two other categorical val-
ues: habitat (flatland or ridge, only included for KHC, F7) andthe identity of the observer (only for BCI andKHC; see Appen-dix S2; F5). These analyses were performed with the software
CANOCO (ter Braak & Smilauer, 1998) separately for the threestudy sites, for either common species or for all species observed.Common species were defined as the top 15% in a rank-ordered
list of species (most to least abundant) at each study site, withthe additional proviso that ‘common species’ had to have beencollected at each location within a given site (i.e. the total num-ber of individuals observed was also ‡10 at BCI, ‡6 atKHC and
‡5 atWAN). Our interpretation gives more weight to the resultsobtained with common species as our monitoring programme isdirected towards them (Appendix S1).
Results
Overall comparisons between study sites
Weobserved 1792, 1797, and 3331 individual butterflies repre-
senting 128, 131, and 134 species during 7 surveys and 230 tran-sects, 10 surveys, and 230 transects, and 12 surveys and 120transects at BCI, KHC, andWAN respectively. Abundance and
species richness data of families and subfamilies, as well as fullspecies lists, are discussed elsewhere (Basset et al., 2011). Thepercentage of individuals identified to species was significantly
lower at KHC (19%) than at BCI (54%) and WAN (100%;v2 = 3627.9, P < 0.0001). At WAN, all individuals observedcould be identified to species in the field. Most of the observa-
tions at KHC that were not positively identified included unas-signed Lycaenidae (N = 440) or Nymphalidae (N = 202), andgenus level identifications identical to genera of common species(Appendix S4). Common species included 18, 15, and 20 species,
representing 78.8%, 34.4%, and 73.3% of individuals identifiedat BCI,KHC, andWANrespectively (Appendix S4).When cor-
rected for length and duration of transect, butterfly abundancewas about seven times higher at WAN than at BCI, and fourtimes higher at WAN than at KHC (Table 2). The average
diversity (Alpha log series), evenness (Shannon index), Chao1estimate, and the Coleman rarefaction all suggested that the spe-cies pool was richer at KHC than at BCI or WAN (Table 2;
Basset et al., 2011).While we summarise below ourmain results,the relative importance of each factor affecting butterfly assem-blages is detailed inAppendix S3.
Methodological factors affecting butterfly assemblages
Transect length had a trivial but important effect of accumu-lating observations with distance, similar to that of the durationof transect, which influenced significantly butterfly abundance
at KHC andWAN (see below). Additionally, a plot of transectlength against precision in butterfly abundance suggested thattransect length was adequate at BCI or WAN, but would need
to be increased at KHC (Fig. S2). The identity of observer influ-enced weakly but significantly the composition of butterflyassemblages (see below). Transect replication might have beeneasily standardised to three replicates, preferably performed by
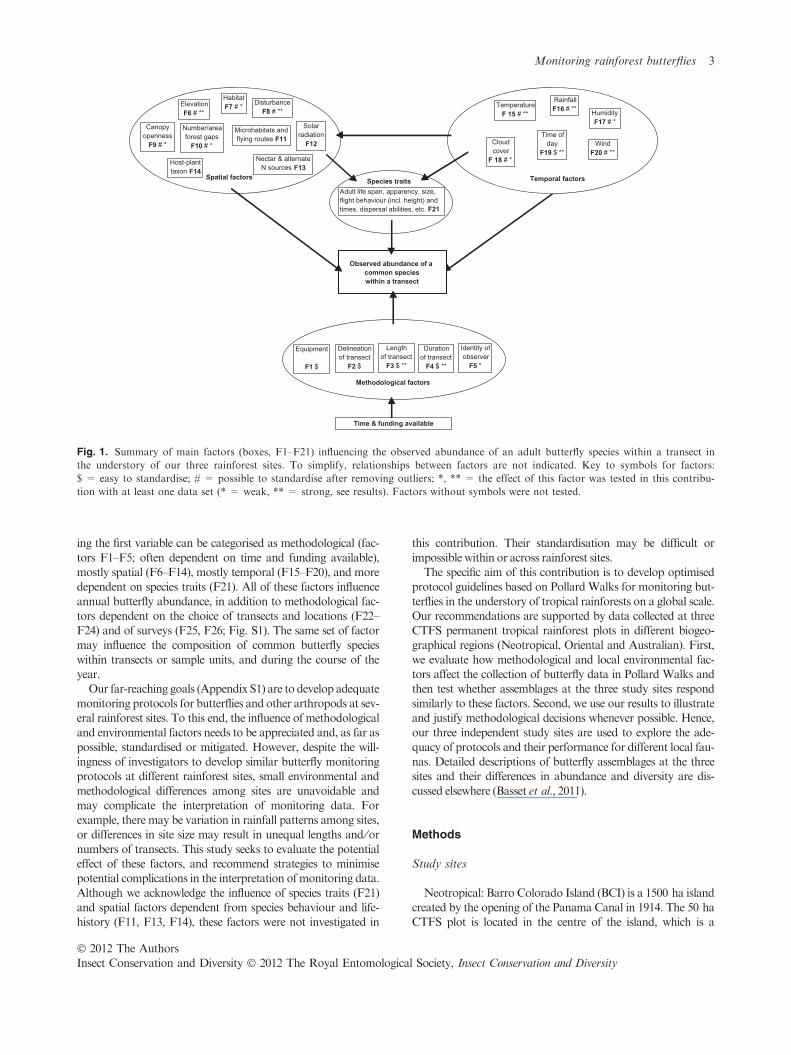
different observers (Fig. S3). The number of locations mighthave been standardised across study sites by considering theminimum number of locations to census common butterfly spe-
cies with good precision in abundance (BCI: > 7, KHC: > 6,WAN: 5; Fig. 2). As already explained inMethods, spatial auto-correlation was severe at KHC, intermediate at WAN, and low
at BCI (Table S6). The timing of surveys within a year appearednot to be so critical, as long as censuses were performed duringboth the driest and wettest periods of the year (Fig. S4). Amini-
mum of four surveys performed per year were adequate atWAN, but six or twelve surveys per year may improve precisionin butterfly abundance, providing that time and funding areavailable (Fig. S5).
2
4
6
8
10
12
14
16
18
20
0 1 2 3 4 5 6 7 8 9 10Number of locations
Prec
isio
n (%
) &cu
mul
ativ
e nu
mbe
r of c
omm
on s
peci
es
BCI
BCI
KHCKHC
WAN
WAN
Fig. 2. Plot of the number of locations at
the three study sites (BCI: circles and
straight lines; KHC: triangles and broken
lines; and WAN: squares and dotted lines)
against precision in abundance for all but-
terflies censused during one year (open
markers) and cumulative mean (and SD)
randomised number of common species
(filled markers). Note that smaller preci-
sion is better and that at least three loca-
tions are needed to calculate a mean of
annual butterfly abundance and associated
precision.
6 Yves Basset et al.
� 2012 The AuthorsInsect Conservation and Diversity � 2012 The Royal Entomological Society, Insect Conservation and Diversity

Environmental factors affecting butterfly abundance
At BCI, 24% of the variance in log butterfly abundance intransects could be explained by a combination of air tempera-ture, elevation, human disturbance, and wind velocity after
accounting for spatial autocorrelation (Table S3). At KHC, ourbest model explained 20% of the variance and included airtemperature, duration of transect, time of day, and total rainfall
for the 30 preceding days as significant variables (Table S3).At KHC, neither butterfly abundance nor species richnessdiffered significantly between flatland and ridge locations
(t-tests, t=0.05,P=0.96 and t=0.47,P=0.67 respectively).In the absence of temperature and rainfall data at WAN, ourbestmodel only explained 8%of variance and included durationof transect as the only significant variable (Table S3). However,
atWAN,mean abundance of butterflies per transect was signifi-cantly lower in the dry season than in the wet season (t= )5.82,P < 0.001), whereas it did not differ significantly at BCI and
KHC (t = 1.81, P = 0.074 and t = )1.06, P = 0.29 respec-tively). At BCI, air temperatures also tended to be lower duringthe dry season than during the wet season, but not significantly
so (t = )0.848, P = 0.37). Thus, trends for higher abundanceof butterflies during the relatively cool dry season at BCIexplained the negative coefficient of temperature in ourmodel ofbutterfly abundance for BCI (Table S3). Butterfly abundance
did not differ significantly with regard to time of day at BCI(hours tested: 9 AM, 10 AM, 11 AM and noon;Kruskal–Wallis test,W = 4.78, P = 0.189), whereas it did at KHC, where abun-
dance peaked at 11 AM and was lowest at 3 PM (hours tested: 10AM, 11 AM, noon, 1 PM, 2 PM and 3 PM; W = 20.09, P = 0.001),and at WAN, where abundance peaked at noon and was low-
est at 9 AM (hours tested: 9 AM, 10 AM, 11 AM, noon, 1 PM, 2 PM;W =15.44,P = 0.031).
Environmental factors affecting the composition ofbutterfly assemblages
Variance in the composition of common butterfly specieswas poorly explained by our weather and data collectionvariables. Overall, 18%, 33%, and 20% of variance was
explained at BCI, KHC, and WAN, respectively, accountingfor spatially and non-spatially structured environmental vari-ance, as well as spatially structured variance not explained by
environmental variables (Table S4). Of the small fraction ofvariance explained by the environmental variables included inthe CCAs, the canonical axes were best explained by wind,total rainfall during the 30 preceding days, time of day, and
the identity of the observer at BCI; by elevation, day rainfall,gap area, and high human disturbance at KHC; and by thenumber of gaps, duration of transects, gap area, and eleva-
tion at WAN (Fig. 3; Table S4). For the common speciesdataset, the fraction of variance that was purely spatial orspatially related to environmental variables was highest at
WAN and lowest at BCI (Table S4). At all study sites, but-terfly faunal composition was significantly influenced by sea-son (wet or dry), but the variance explained was relatively
low (CCA with only a seasonal categorical variable; BCI:
F4,199 = 4.93, P = 0.005, 2.4% of total variance explained;KHC: F4,199 = 5.55, P = 0.005, 6.1% of total variance
explained; WAN: F4,199 = 8.32, P = 0.005, 6.5% of totalvariance explained). The fraction of variance in the faunalcomposition of all butterfly species that was explained was
lower (9%, 16%, and 11% for BCI, KHC, and WAN respec-tively). Significant variables included two observer effects, rela-tive humidity, and percentage cloudiness at BCI; elevation,
total rainfall during the 30 preceding days, canopy openness,and time of day at KHC; and canopy openness, gap area,percentage cloudiness, and elevation at WAN (Table S5).
Discussion
Limitations of pollard walks in tropical rainforests
Pollard Walks, like other methods for monitoring butterflypopulations, have advantages and limitations. The main advan-tages are ease of implementation, the ability to survey both non-
fruit and fruit feeding species (the former representing>80%ofall common species in our transects, Appendix S4), and valuablesampling of multiple habitats by walking relatively long dis-
tances. In contrast to PollardWalks performed in open temper-ate habitats, monitoring butterfly populations in tropicalrainforests with PollardWalks is challenging. In tropical rainfor-
ests, butterfly populations are rather low, visibility is reduced,species pools are large, and cryptic species often common.Hence, a smaller proportion of species are likely to be identifiedin the field. We list in Appendix S5 procedures that may help
increase the rate of species identification. More specifically, atleast four potential drawbacksmay limit the applicability of Pol-lardWalks in tropical rainforests.
1 It represents a measure of butterfly activity, not abun-
dance. Although activity and abundance are reason-ably well correlated at higher latitudes (e.g. Thomas,1983), this could represent a considerable bias in tropi-cal environments with high temperature and rapidly
changing cloud cover. Our regressions modelling but-terfly abundance at BCI and KHC suggest that whilecloud cover and relative humidity may explain little
variance, air temperature and, at BCI, wind velocity,may indeed be important in this regard (see also Ribe-iro & Freitas, 2010). Thus, with global air temperature
rising rapidly (Parmesan & Yohe, 2003), any rise inbutterfly abundance as recorded by Pollard Walks attropical sites would need to be substantiated by inde-pendent measurements, such as mark-recapture studies
or distance sampling (Yoccoz et al., 2001) for some ofthe most common species.
2 Thomas (1983) suggested that transect counts may be
affected by the openness of habitats and visibility ofbutterflies. Alternatively, forest gaps may provide dis-tinct microhabitats frequented by edge and canopy
species. While this is an important consideration forcomparisons between forested and open sites, thiseffect appeared to be low in our study, because all
Monitoring rainforest butterflies 7
� 2012 The AuthorsInsect Conservation and Diversity � 2012 The Royal Entomological Society, Insect Conservation and Diversity

three sites were in tall closed wet tropical rainforestswith overall canopy openness <6%. None of our
models of butterfly abundance was significantly influ-
enced by canopy openness or forest gaps. Still, forestgaps explained a small fraction of the variance in but-
terfly composition at KHC and WAN.
(a)
(c)
(e)(f)
(d)
(b)
Fig. 3. Multivariate analyses for common butterfly species in transects at BCI (a, b), KHC (c, d), and WAN (e, f). Biplot of species (small
filled circles) and transects (large open circles) in the first two axes of the Detrended Correspondence Analysis (a, c, e). Triplot of species
(some identified by codes), transects, and environmental variables (only major ones identified) in the first two axes of the Canonical Corre-
spondence Analysis (b, d, f). See methods for description of variables and Appendix S4 for species codes.
8 Yves Basset et al.
� 2012 The AuthorsInsect Conservation and Diversity � 2012 The Royal Entomological Society, Insect Conservation and Diversity

3 Understory transects may miss a significant proportionof canopy disturbance-specialists (DeVries & Walla,
2001), but as our protocols aimed at recording changesin the abundance or composition of common under-story species, this was not a problem.
4 Transect counts may be affected by butterfly apparencyand flight behaviour (Walpole & Sheldon, 1999) and,thus, relative counts of dull versus apparent species, or
smaller species, may be biased. Such bias does notaffect the ability to assess change for a single speciesover time, but may influence inter-species comparisons
(Dennis et al., 2006). Consequently, some butterfliesmay not be locally amenable to identification in thefield with similar levels of accuracy. Butterflies weremore difficult to identify at KHC, partly because of a
large species pool and many similar, dull coloured spe-cies (Basset et al., 2011). At WAN, additional fieldobservations of butterfly flight habits and micro-habitat
preferences greatly improved the ability to identify spe-cies in the field. We cannot discount an observer effect(e.g. Sparrow et al., 1994); however, this effect was
weak in multivariate analyses of common species cens-used in our transects. This observation is crucial forbutterfly monitoring programmes using Pollard Walksand targeting common species in tropical rainforests.
All our assistants had been trained before the start ofthis project, so we were not comparing seasoned observ-ers with novice observers. However, cultural or educa-
tional differences among observers may also affect theirability to identify species and may influence their pro-pensity or reluctance to assign names to observed but-
terflies. Some cultures have more indigenous names foranimals (including insects) than others, because theseanimals are important for survival as food, medicine,
etc. Hence, those people are more likely to be able torecognise subtle differences and assign names to species(Diamond, 1989). In some cultures where there is uncer-tainty, there may be a tendency to err on the side of
caution, that is not assigning a name. Whereas trainingexperience may be standardised across observers andstudy sites, cultural component is more difficult to fac-
tor out. All observers should undergo a minimum levelof training in the field by an experienced entomologistto reduce the variance among observers, and use locally
adapted identification guides. In addition to improvedtraining, the observer effect may be reduced by ran-domisation of observers and starting points of transectlocations, as was done at all our sites.
At KHC andWAN, our transect data were significantly spa-
tially autocorrelated, whereas this was not the case at BCI. Theproportion of explained variance in faunal composition that wasspatially structured was also higher at KHC and WAN than at
BCI. Spatial autocorrelation at KHC probably resulted fromthe smaller study area, fewer, and shorter transect locations, andclumped locations along an elevation gradient. Our specific rec-ommendations for reducing spatial autocorrelation and a
straightforward interpretation of transect counts in tropical rain-
forests would be ideally to implement transect locations ‡500 mover a large (‡50 ha) and topographically homogeneous study
area. Overall, the BCI protocol appeared superior over KHC orWAN protocols (results of analyses for factors F3–F5 and F22–F26) and generated adequate precision in abundance for com-
mon butterfly species (Table S1). The BCI protocol (threeobservers walking each of 10 locations of 500 m for 30 mineach, during each of four surveys per year) may thus be recom-
mended as a starting point for monitoring the abundance ofcommon butterfly species in the understory of tropical rainfor-ests. This protocolmay further be refined in areas of high butter-
fly abundance, such as atWAN.
Environmental factors affecting butterfly assemblages in
tropical rainforests
Butterfly abundance was considerably higher at WAN than
at other study sites. Our corrected estimates of ca. 50 butterfliesper 500 m of transect (strip of 10 · 500 m = 0.5 ha) at WANare commensurate with independent mark-recapture studies of
common speciesDanis danis andTaenaris spp. near theWanangarea, which estimate 92 butterflies per 0.5 ha (P. Vlasanek un-publ. data). We cannot yet offer convincing explanations for thehigh butterfly abundance atWAN (Basset et al., 2011). The var-
iance explained by our best models to explain abundance andfaunal composition of common species was low at all study sites(<33%). The large proportion of unexplained variance may
originate from many factors, including the presence of hostplants, mud puddles, fruits, floral ⁄extrafloral nectar, other nitro-gen sources, dispersal abilities, particular flying routes (‘under-
story openness’), etc. This emphasises the difficulty of predictingthe composition of species-rich assemblages including represen-tatives with varied life histories. This was confirmed by the low
variance of models that included all species observed—even atWANwhere sample size was higher than at other sites. This con-trasts with the often large differences in faunal composition oftropical butterflies observed within gradients of anthropogenic
disturbance (e.g. Hill et al., 1995; Spitzer et al., 1997).The environmental variables that explained at least some of
the variance in our abundance and faunistic models at BCI and
KHC were air temperature, elevation, rainfall, wind velocity(only at BCI), and human disturbance. In the absence of temper-ature and rainfall data, WAN models explained little. Air tem-
perature and solar radiation greatly influence butterfly activity,whereaswind speed and time of day are less important (Douwes,1976). Elevation may interact in aligning flying routes of butter-flies into streams andwatersheds (Young, 1972).Wind and rain-
fall account for seasonal effects, which were relatively low at allstudy sites. Human disturbance may perturb resting spotsand ⁄or induce trampling of host plants (Comita et al., 2009).
The influence of time of day, which may explain segregation infeeding activities of some rainforest species (Young, 1972), wasnot well marked, as reported in other studies (Leps & Spitzer,
1990). In Europe, Pollard Walks are performed only on dayswhen temperature, rainfall, and wind are within accepted ranges(van Swaay et al., 2008). Our data suggest that optimum
monitoring of common butterflies in closed canopy tropical
Monitoring rainforest butterflies 9
� 2012 The AuthorsInsect Conservation and Diversity � 2012 The Royal Entomological Society, Insect Conservation and Diversity
rainforests may be achieved by removing outliers of elevation,rainfall, and human disturbance within study sites, and that air
temperature should be imperatively recorded for a sound inter-pretation of the data. Further standardisation may be necessaryfor comparing sites at rather different latitudes and elevations.
Conclusions
PollardWalks are a convenient and expedient method for evalu-ating assemblages of common butterflies in old-growth forests,and we have shown that the method can be successfully
extended to the evaluation of such assemblages across differentbiogeographical regions as long as the main methodological fac-tors can be standardised. Methods for reducing observer bias
are suggested aswell as practical procedures to implement globalmonitoring of tropical rainforest butterflies with Pollard Walks(Appendix S5). We hope to use our data as a baseline for identi-
fying habitat-specific species and their potential vulnerability toanthropogenic disturbance (Ghazoul, 2002) and for assessingthe effects of global climatic changes on tropical insect commu-
nities (Bale et al., 2002). Although warming in the tropics maybe relatively small in magnitude, it is likely to have deleteriousconsequences for tropical insects, as they are relatively sensitiveto temperature change and are currently living very close to their
optimal temperature (Deutsch et al., 2008). Although our datado not constitute evidence of the effect of global climate changeon tropical butterflies, they show that (i) tropical butterflies are
sensitive to temperature and as such are good candidates for aglobal monitoring scheme; and (ii) common butterfly speciesmay be censused with adequate precision in tropical rainforests,
provided that monitoring protocols consider the recommenda-tions presented here.
Acknowledgements
Work at BCI and KHC was funded by the CTFS, the Arnold
ArboretumofHarvardUniversity, and grants from theHarvardUniversity Center for the Environment to N.E.P. and fromCTFS to D.J.L. Research at WAN was funded by the Darwin
Initiative for the Survival of Species, USNational Science Foun-dation grant DEB0816749, Czech National Science Foundationgrants 206 ⁄09 ⁄0115 and P505 ⁄10 ⁄0673, CzechMinistry of Edu-
cation ME09082 and LC06073 grants, and International Foun-dation For Science grant D ⁄4986-1. S. Kiratiprayoon and S.Davies helped us to implement our protocols atKHC.Y.Gonz-alez, I. Rivas, C. DeLeon, F. Perez, R. Bobadilla (BCI), T.
Tongrod, M. Reinkaw (KHC), and F. Kimbeng (WAN)recorded butterflies in transects. J. Tennent assisted with speciesidentifications atWAN.Comments byO.Lewis and three anon-
ymous reviewers greatly improved the text.
Supporting information
Additional Supporting Information may be found in the online
version of this article under the DOI reference: doi: 10.1111/j.1752-4598.2012.00205.x:
Appendix S1. Monitoring arthropods at CTFS permanentplots.
Appendix S2. Supplementarymethods.Appendix S3. Supplementary results.Appendix S4.List of common butterfly species.
Appendix S5. Suggested procedures for monitoring butterfliesinside tall closed tropical rainforests.Please note: Neither the Editors nor Wiley-Blackwell are
responsible for the content or functionality of any supportingmaterials supplied by the authors. Any queries (other thanmiss-ing material) should be directed to the corresponding author for
the article.
References
Anselin, L. (1988) Spatial Econometrics: Methods and Models.
Kluwer Academic Publishers, Boston, Massachusetts.
Bale, J.S., Masters, G.J., Hodkinson, I.D., Awmack, C., Bezemer,
T.M., Brown, V.K., Butterfield, J., Buse, A., Coulson, J.C.,
Farrar, J., Good, J.E.G., Harrington, R., Hartley, S., Jones,
T.H., Lindroth, R.L., Press, M.C., Symrnioudis, I., Watt, A.D.
& Whittaker, J.B. (2002) Herbivory in global climate change
research: direct effects of rising temperature on insect herbi-
vores. Global Change Biology, 8, 1–16.
Basset, Y., Eastwood, R., Sam, L., Lohman, D.J., Novotny, V.,
Treuer, T., Miller, S.E., Weiblen, G.D., Pierce, N.E., Bunyavej-
chewin, S., Sakchoowong, W., Kongnoo, P. & Osorio-Arenas,
M.A. (2011) Comparison of rainforest butterfly assemblages
across three biogeographical regions using standardized
protocols. The Journal of Research on the Lepidoptera, 44, 17–28.
Bonebrake, T.C., Ponisio, L.C., Boggs, C.L. & Ehrlich, P.R. (2010)
More than just indicators: a review of tropical butterfly ecology
and conservation. Biological Conservation, 143, 1831–1841.
Borcard, D., Legendre, P., Avois-Jacquet, C. & Tuomisto, H.
(2004) Dissecting the spatial structure of ecological data at
multiple scales. Ecology, 85, 1826–1832.
ter Braak, C.J.F. & Smilauer, P. (1998) CANOCO Reference
Manual and User’s Guide to Canoco for Windows: Software for
Canonical Community Ordination (Version 4). Microcomputer
Power, Ithaca, New York.
Caldas, A. & Robbins, R.K. (2003) Modified Pollard transects
for assessing tropical butterfly abundance and diversity. Biolog-
ical Conservation, 110, 211–219.
Center for Tropical Forest Science (2010) Smithsonian Institution
Global Earth Observatories. <http://www.sigeo.si.edu/> 26th
June 2010.
Chen, I.-C., Shiu, H.-J., Benedick, S., Holloway, J.D., Chey,
V.K., Barlow, H.S., Hill, J.K. & Thomas, C.D. (2009) Eleva-
tion increases in moth assemblages over 42 years on a tropical
mountain. Proceedings of the National Academy of Sciences
USA, 106, 1479–1483.
Cleary, D.F.R. & Genner, M.J. (2004) Changes in rain forest but-
terfly diversity following major ENSO-induced fires in Borneo.
Global Ecology and Biogeography, 13, 129–140.
Colwell, R.K. (2009) EstimateS: Statistical Estimation of Species
Richness and Shared Species from Samples. Version 8.2. User’s
Guide and application. University of Connecticut, Storrs, Con-
necticut. <http://purl.oclc.org/estimates> 21st March 2012.
Comita, L.S., Goldsmith, G.R. & Hubbell, S.P. (2009) Intensive
research activity alters short-term seedling dynamics in a tropi-
cal forest. Ecological Research, 24, 225–230.
10 Yves Basset et al.
� 2012 The AuthorsInsect Conservation and Diversity � 2012 The Royal Entomological Society, Insect Conservation and Diversity

Condit, R. (1998) Tropical Forest Census Plots. Springer-Verlag
and R. G. Landes Company, Berlin, Germany and George-
town, Texas.
Conrad, K.F., Fox, R. & Woiwod, I.P. (2007) Monitoring biodi-
versity: measuring long-term changes in insect abundance.
Insect conservation biology (ed. by A.J.A. Stewart, T.R. New
and O.T. Lewis), pp. 203–225. CABI Publishing, Wallingford,
UK.
Dennis, R.L.H., Shreeve, T.G., Isaac, N.J.B., Roy, D.B., Hardy,
P.B., Fox, R. & Aher, J. (2006) The effect of visual apparency
on bias in butterfly recording and monitoring. Biological Con-
servation, 128, 486–492.
Deutsch, C.A., Tewksbury, J.J., Huey, R.B., Sheldon, K.S., Gha-
lambor, C.K., Haak, D.C. & Martin, P.R. (2008) Impacts of
climate warming on terrestrial ectotherms across latitude. Pro-
ceedings of the National Academy of Sciences, 105, 6668–6672.
DeVries, P.J. & Walla, T.R. (2001) Species diversity and commu-
nity structure in neotropical fruit-feeding butterflies. Biological
Journal of the Linnean Society, 74, 1–15.
Diamond, J.M. (1989) This-fellow frog, name belong-him
Dawko. Natural History, 98, 16, 18–20, 23.
Dormann, C.F. (2007) Effects of incorporating spatial autocorre-
lation into the analysis of species distribution data. Global
Ecology and Biogeography, 16, 129–138.
Douwes, P. (1976) Activity in Heodes virgaureae (Lep., Lycaeni-
dae) in relation to air temperature, solar radiation, and time of
day. Oecologia, 22, 287–298.
Ghazoul, J. (2002) Impact of logging on the richness and diver-
sity of forest butterflies in a tropical dry forest in Thailand.
Biodiversity and Conservation, 11, 521–541.
Godfray, H.C., Lewis, O.T. & Memmott, J. (1999) Studying
insect diversity in the tropics. Philosopohical Transactions of the
Royal Society, Biological Sciences, 354, 1811–1824.
Grøtan, V., Lande, R., Engen, S., Saether, B.-E. & DeVries, P.J.
(2012) Seasonal cycles of species diversity and similarity in a
tropical butterfly community. Journal of Animal Ecology. DOI:
10.1111/j.1365-2656.2011.01950.x
Harker, R.J. & Shreeve, T.G. (2008) How accurate are single site
transect data for monitoring butterfly trends? Spatial and
temporal issues identified in monitoring Lasiommata megera.
Journal of Insect Conservation, 12, 125–133.
Hawking, J.H. & New, T.R. (2002) Interpreting dragonfly
diversity to aid in conservation assessment: lessons from the
Odonata assemblage at Middle Creek, north-eastern Victoria,
Australia. Journal of Insect Conservation, 6, 171–178.
Hill, J.K., Hamer, K.C., Lace, L.A. & Banham, W.M.T. (1995)
Effects of selective logging on tropical forest butterflies on
Buru, Indonesia. Journal of Applied Ecology, 32, 754–760.
Hill, J.K., Hamer, K.C., Tangah, J. & Dawood, M. (2001) Ecology
of tropical butterflies in rainforest gaps. Oecologia, 128, 294–302.
Horner-Devine, M.C., Daily, G.C., Ehrlich, P.R. & Boggs, C.L.
(2003) Countryside biogeography of tropical butterflies. Conser-
vation Biology, 17, 168–177.
Janzen, D.H. (1987) Insect diversity of a Costa Rican dry forest;
why keep it, and how? Biological Journal of the Linnean Soci-
ety, 30, 343–356.
Kery, M. & Plattner, M. (2007) Species richness estimation and
determinants of species detectability in butterfly monitoring
programmes. Ecological Entomology, 32, 53–61.
Kogan, M. & Herzog, D.C. (1983) Sampling Methods in Soybean
Entomology. Springer-Verlag, New York.
Kremen, C. (1992) Assembling the indicator properties of species
assemblages for natural areas monitoring. Ecological Applica-
tions, 2, 203–217.
Leps, J. & Spitzer, K. (1990) Ecological determinants of butterfly
communities (Lepidoptera, Papilionoidea) in the Tam Dao Moun-
tains, Vietnam. Acta Entomologica Bohemoslovaca, 87, 182–194.
Losos, E.C. & Leigh, E.G. Jr., eds. (2004) Tropical Forest Diver-
sity and Dynamism: Findings from a Large Scale Plot Network.
University of Chicago Press, Chicago, Illinois.
Parmesan, C. & Yohe, G. (2003) A globally coherent fingerprint of
climate change impacts across natural systems. Nature, 421, 37–42.
Parsons, M. (1991) Butterflies of the Bulolo-Wau valley. Bishop
Museum Press, Honolulu, Hawaii.
Pollard, E. (1977) A method for assessing changes in the abun-
dance of butterflies. Biological Conservation, 12, 115–153.
Pollard, E. (1979) A national scheme for monitoring the abun-
dance of butterflies: the first three years. Proceedings of the
Entomological Natural History Society, 12, 77–90.
Rangel, T.F., Diniz-Filho, J.A.F. & Bini, L.M. (2010) SAM: A
comprehensive application for Spatial Analysis in Macroecology.
Ecography, 33, 1–5.
Ribeiro, D.B. & Freitas, A.V.L. (2010) Differences in thermal
responses in a fragmented landscape: temperature affects the
sampling of diurnal, but not nocturnal fruit-feeding Lepidop-
tera. The Journal of Research on the Lepidoptera, 42, 1–4.
Schowalter, T.D. (2006) Insect Ecology, an Ecosystem Approach,
2nd edn. Academic Press, San Diego, California.
Sparrow, H.R., Sisk, T.D., Ehrlich, P.R. & Murphy, D.D. (1994)
Techniques and guidelines for monitoring Neotropical butter-
flies. Conservation Biology, 8, 800–809.
Spitzer, K., Jaros, J., Havelka, J. & Leps, J. (1997) Effect of
small-scale disturbance on butterfly communities of an Indochi-
nese montane rainforest. Biological Conservation, 80, 9–15.
van Swaay, C.A.M., Nowicki, P., Settele, J. & van Strien, A.J.
(2008) Butterfly monitoring in Europe: methods, applications
and perspectives. Biodiversity and Conservation, 17, 3455–3469.
Thomas, J.A. (1983) A quick method for estimating butterfly
numbers during surveys. Biological Conservation, 27, 195–211.
Thomas, C.D. (1991) Habitat use and geographic ranges of but-
terflies from the wet lowlands of Costa Rica. Biological Conser-
vation, 55, 269–281.
Walpole, M.J. & Sheldon, I.R. (1999) Sampling butterflies in
tropical rainforest: an evaluation of a transect walk method.
Biological Conservation, 87, 85–91.
Warren, M.S., Hill, J.K., Thomas, J.A., Asher, J., Fox, R., Huntley,
B., Roy, D.B., Telfer, M.G., Jeffcoate, S., Harding, P., Jeffcoate,
G., Willis, S.G., Greatorex-Davis, J.N., Moss, D. & Thomas,
C.D. (2001) Rapid responses of British butterflies to opposing
forces of climate and habitat change.Nature, 414, 65–69.
Windsor, D.M. (1990) Climate and Moisture Variability in a
Tropical Forest: Long-term Records from Barro Colorado
Island, Panama. Smithsonian Institution Press, Washington,
District of Columbia.
Wood, B. & Gillman, M.P. (1998) The effects of disturbance on
forest butterflies using two methods of sampling in Trinidad.
Biodiversity and Conservation, 7, 597–616.
Yoccoz, N.G., Nichols, J.D. & Boulinier, T. (2001) Monitoring
of biological diversity in space and time. Trends in Ecology and
Evolution, 16, 446–453.
Young, A.M. (1972) Community ecology of some tropical rain for-
est butterflies. The American Midland Naturalist, 87, 146–157.
Monitoring rainforest butterflies 11
� 2012 The AuthorsInsect Conservation and Diversity � 2012 The Royal Entomological Society, Insect Conservation and Diversity