croatian nursing journal
144
-
Upload
khangminh22 -
Category
Documents
-
view
0 -
download
0
Transcript of croatian nursing journal


University of Applied Health Sciences Croatian Nursing Council
CROATIAN NURSING JOURNALissn 2584-5659
udc 614.253.5
year of publication 2020.
volume 4
issue 1.
number of pages 1-138
doi 10.24141/2/4/1
place of publication Zagreb
published by University of Applied Health Sciences
circulation The journal is published twice a year
published by UNIVERSITY OF APPLIED HEALTH SCIENCES Mlinarska cesta 38, 10 000 Zagreb, Croatia www.zvu.hr
for the publisher Krešimir Rotim
english translation and proofreading Martina Klanjčić Nikola Novaković
graphic layout studiog6h8
Copyright © 2020. University of Applied Health Sciences

Original scientific papers
JASMINKA FRANJO, SLAĐANA REŽIĆ, BORIS TOT Patient Satisfaction with the Work of Nurses in Primary Health Care . . . . . . . . . . . . . . . . . . . . . . . . . . . . . . . . . . . . 5-19
MIA MILOJEVIĆ, IVAN BRUMINI, IVANA CRNKOVIĆ Differences in Perception of Stress of Physiotherapists Employed in Various Departments . . . . . . . . . . . . . . . . . 21-31
SUZANA VIDOVIĆ VONDRA, SANJA NARIĆ, ANA PAVELIĆ TREMAC, JOSIPA KURTOVIĆ Attitudes of Health Professionals and Primary School Staff towards the Separation of Children from Families and Foster Care . . . . . . . . . . . . . . . . . . . . . . . . . . . . . . . . . . . . . . . . . . . . . . . . . . . . . . . . . . . . . . . . . . . . . . . . . . . . . . 33-45
BOŽICA ZUBEC, JELENA LUČAN The Patients’ Opinion of the Health Visitor Efficiency . . . . . . . . . . . . . . . . . . . . . . . . . . . . . . . . . . . . . . . . . . . . . . . . . . . . . . 47-58
LJILJANA VUKOVIĆ Assessment of Nurses’ Workload in Intensive Care Unit by Use of Scoring Systems . . . . . . . . . . . . . . . . . . . . . . . . . 59-71
SANJA LEDINSKI FIČKO, MATIJA MLINAR, ANA MARIJA HOŠNJAK, MARTINA SMREKAR, BILJANA KURTOVIĆ, JANKO BABIĆ Nursing Student’s Knowledge about Understanding and Prevention of Needle Stick Injury . . . . . . . . . . . . . . . . . 73-80
JOSIPA DOVRANIĆ, MATIJA BAGARIĆ, MARIJA KARAČA, VLADIMIR TRKULJA, DANIJEL MATEK Standard Multimodal Postoperative Analgesia Might Not Be Equally Effective When Comparing Anterior and Posterior Spondylodesis . . . . . . . . . . . . . . . . . . . . . . . . . . . . . . . . . . . . . . . . . . . . . . . . . . . . . . . . . . . . . . . . . . . . . . . . . . . . . . . 81-89
Professional papers
INES DOBRINIĆ, SLAĐANA REŽIĆ ICU Nurses’ Perception of Visits to Patients . . . . . . . . . . . . . . . . . . . . . . . . . . . . . . . . . . . . . . . . . . . . . . . . . . . . . . . . . . . . . . . . 91-101
DENIS TOMA, YULIA CHUSOVA, MARA ŽUPANIĆ A Comparison of Temporal Life Satisfaction of Nursing Students in the Republic of Croatia and the Republic of Bulgaria . . . . . . . . . . . . . . . . . . . . . . . . . . . . . . . . . . . . . . . . . . . . . . . . . . . . . . . . . . . . . . . . . . . . . . . . . . . . . . . 103-111
Reviews
JELENA KITANOVIĆ Household Preparedness for Natural Disasters: A Review of Literature . . . . . . . . . . . . . . . . . . . . . . . . . . . . . . . . . . . . . 113-125
ANA VIDOVIĆ ROGULJIĆ, IRENA ZAKARIJA-GRKOVIĆ Infant and Young Child Feeding in Croatian Nursing Programs: A Cross-Sectional Analysis . . . . . . . . . . . . . . . . . . 127-133
Author Guidelines . . . . . . . . . . . . . . . . . . . . . . . . . . . . . . . . . . . . . . . . . . . . . . . . . . . . . . . . . . . . . . . . . . . . . . . . . . . . . . . . . . . . . . . . . . 135
ISSN: 2584-5659 www.cnj.hr
CROATIAN NURSING JOURNAL Contents
VOLUME: 4; NUMBER: 1; ZAGREB, JUNE 2020


1 Jasminka Franjo2 Slađana Režić3 Boris Tot
¹ Health Centre of the Ministry of the Interior of the Republic of Croatia, Zagreb, Croatia
² Department for Health Care Quality Assurance and Improvement, UHC Zagreb, Croatia
3 Ministry of the Interior of the Republic of Croatia, Zagreb, Croatia
Article received: 04.11.2019.
Article accepted: 14.01.2020.
DOI: 10.24141/2/4/1/1
Author for correspondence: Jasminka Franjo Health Centre of the Ministry of the Interior of the Republic of Croatia Šarengradska 3, Zagreb, Croatia E-mail: [email protected]
Keywords: nurses in primary health care, patient satisfaction, questionnaires for the measurement of patient satisfaction
Abstract
Introduction. Patient satisfaction with provided health care is an important indicator of health care quality. Research on patient satisfaction has been very frequent in recent years.
Aim. A prospective, cross-sectional study was con-ducted at the Health Centre of the Ministry of the Interior of the Republic of Croatia between April and June 2019. The aim of this study was to examine the satisfaction of patients with the work of nurses in primary health care.
Methods. A standardized Nursing Practitioner Satis-faction Survey questionnaire, for which we received the author’s approval, was used. The study involved 200 patients from the Health Centre of the Ministry of the Interior of the Republic of Croatia. Patients who came to the Health Centre’s outpatient clinics requiring only the services of nurses were included in the study. Out of 200 patients surveyed, 185 ques-tionnaires were filled out correctly, while 15 were filled out incorrectly.
Results. Patients from the Health Centre of the Min-istry of the Interior of the Republic of Croatia are satisfied with the work of nurses in primary health care. There is no statistically significant difference in the satisfaction with the work of nurses in primary health care according to gender, education, marital or working status. There is a statistically significant difference in patient satisfaction with the work of nurses according to the respondents’ age, where re-
Patient Satisfaction with the Work of Nurses in Primary Health Care
Croat Nurs J. 2020; 4(1): 5-19

6 Franjo J. et al. Patient Satisfaction with the Work of Nurses in Primary Health Care. Croat Nurs J. 2017; 3(1): 5-19
For hospitals, the Ordinance on Accreditation Stand-ards specifies the systematic planning and imple-mentation of processes for the measurement, moni-toring and analysis of specific areas, and one of the areas is patient experience and satisfaction (3).
Patient satisfaction is increasingly used as an indica-tor of quality in the health care system, although it is a patient’s subjective experience. The involvement of patients in the improvement of health care is desir-able, and according to the World Health Organization, socially, economically and technically important (4). Many studies have shown that patients rate nurses based on their kindness, friendliness, ability to solve an immediate problem, as well as their medical skills (5). Patient satisfaction is defined as the difference between a patient’s expectations and their experi-ences as the user of nursing services. A nurse who wants to provide quality service and satisfy their patients must first understand their patients’ needs and anticipate their expectations (5).
Monitoring health care satisfaction is common prac-tice in many countries. There is no golden standard for the measurement of patient satisfaction. Initially, the EUROPEP instrument was developed to compare the general health care work in Europe as a whole that would provide educational feedback to family physicians and patients (6). Research is being con-ducted to improve health care, which includes:
• reducing waiting times for medical examinations
• data protection and confidentiality
• providing fast services in cases of emergency (6)
• improvements in service quality and care pro-vided
• providing preventive care
• patient decision-making in the treatment and delivery of health care (7)
• health system reforms focused on strengthening primary care and streamlining hospital care (8).
Aim
The aim of this study is to examine the satisfaction of patients with the work of nurses in primary health care.
spondents in the age group between 26 and 40 years are less satisfied (Kruskal-Wallis test, Me=3.8). There is a statistically significant difference in the satisfac-tion of patients with the work of nurses in primary health care according to the respondents’ annual in-come, where satisfaction is more pronounced among respondents with an annual income between 26.000 to 35.000 HRK and in the range between 36.000 to 45.000 HRK (Kruskal-Wallis test, p<0.01).
Conclusion. The patients who took part in the study are satisfied with the work of nurses in primary health care. There are significant differences in terms of age and annual income.
Introduction
Public health care in the Republic of Croatia is imple-mented on the basis of the principles of comprehen-siveness, continuity, accessibility and a holistic ap-proach in primary health care, as well as a specialized approach in specialist care and hospital health care (1).
It is the responsibility of the health care institution to monitor how well patients’ rights are respected. Also, every health care institution is required to con-duct regular surveys of patient experience and satis-faction (2). Patient satisfaction with provided health care is an important indicator of health care quality. Research on patient satisfaction has been very fre-quent in recent years. The problem is the interpreta-tion of results, which can be complex and depends on the research instruments.
According to article 7 (“Patients’ Rights and Experi-ences, Staff Satisfaction”) of the Ordinance on Health Care Quality Standards and the Methods of their Im-plementation, adopted by the Ministry of Health and Social Welfare on 29 June 2011, a health care provid-er must ensure that every patient can exercise their rights when receiving health care services and must also implement all necessary measures to protect these rights in accordance with applicable regula-tions. This includes assessing how well the patients’ rights are respected by regularly surveying their ex-periences and satisfaction once a year and analysing the results (2).

Franjo J. et al. Patient Satisfaction with the Work of Nurses in Primary Health Care. Croat Nurs J. 2017; 3(1): 5-19 7
naire contained patient satisfaction rating scales. The scale consisted of 26 items; 18 items pertained to patient satisfaction, 4 items pertained to commu-nication and 4 items pertained to availability. Every item was marked between 1 and 5 on the Likert scale, with 1 meaning complete disagreement and 5 meaning complete agreement.
StatisticsCategory data is displayed in absolute and relative frequencies. Numerical data is described by median and interquartile ranges. The normality of the indi-vidual domain distributions and the overall scale was examined by the Kolmogorov-Smirnov test, and the results showed a statistically significant deviation from the normal distribution (p<0.01). Therefore, differences between the examined variables for the two independent groups were examined by the Mann-Whitney U test, and by the Kruskal-Wallis test between three and more independent groups. The SPSS for Windows 15.0 computer software package was used for statistical processing and analysis.
Results
Respondents’ basic characteristicsThe study was conducted on 185 respondents, among which 126 (68.1%) were male and 59 fe-male (31.9%). Most respondents belonged to the age group of between 41 and 60 (N=85; 45.9%) and most had secondary education (N=137; 74.1%). Re-garding their marital status, most respondents were married (N=107; 57.8%). A majority of respondents were employed full-time (N=136; 73.5%) and most had an annual income of above 60.000 HRK (N=113; 61.1%). Most respondents answered that they were not sick, 116 (62.7%) (Table 1).
Respondents’ perception of their health statusMost of the respondents in the sample had no inju-ries at the time of the survey (N=156; 84.3%). The most common health issues for which respondents
The specific aims of the study are to determine whether there are differences in patient satisfac-tion with the work of nurses in primary health care according to the demographic characteristics of pa-tients (age, gender, education, marital status), em-ployment and annual income.
Methods
Participants
The study involved 200 patients from the Health Cen-tre of the Ministry of the Interior of the Republic of Croatia. Out of the 200 surveyed patients, 185 ques-tionnaires were included in the analysis because 15 questionnaires were not filled in correctly. Of the total number of respondents, 126 (68.1%) were male and 59 were female (31.9%). Most respondents belonged to the age group between 41 and 60 (N=85; 45.9%). Patients of over 18 years of age who came to the Health Centre’s outpatient clinics requiring only nurs-ing services were included in the study. Patients were asked by the clinic nurse whether they would like to participate in the survey, after which they signed a consent form. A room was provided for them to fill in the questionnaire. The average questionnaire fill-in time was 5 minutes. The study was conducted at the Health Centre of the Ministry of the Interior of the Re-public of Croatia between 1 April and 30 June 2019.
Instrument
As the research instrument, we used the standard-ized questionnaire “Nurse Practitioner Satisfaction Survey” (NPSS), which examines the satisfaction of patients with the service provided by nurses, for which we received the author’s approval (14). The first part of the questionnaire included demographic information such as gender, age, education, marital status, employment and annual income, as well as patient health information such as the assessment of disease and injury for which medications were being taken and the number of prescription medica-tions, number of annual visits to the nurse and type of health insurance. The second part of the question-

8 Franjo J. et al. Patient Satisfaction with the Work of Nurses in Primary Health Care. Croat Nurs J. 2017; 3(1): 5-19
ents take two prescription drugs (N=166; 89.7%) and most are holders of health insurance (N=179; 96.8%). In the previous year, most respondents vis-ited a nurse up to 5 times (N=152; 82.2%) (Table 2).
were receiving medication are blood pressure-relat-ed issues (N=35; 18.9%), followed by issues related to other diseases (N=26; 14.1%), high cholesterol level (N=13; 7.0%), heart disease (N=10; 5.4%) and depression/anxiety (N=9; 4.9%). Most respond-
Table 1. Respondents’ basic characteristics (N=185)
Respondents’ characteristics Number ofrespondents
% ofrespondents
GenderMale 126 68.1
Female 59 31.9
Age (in years)
18-25 33 17.8
26-40 47 25.4
41-60 85 45.9
Over 60 20 10.8
Level of education
Primary 3 1.6
Secondary 137 74.1
Tertiary (Bachelor) 18 9.7
Tertiary (Master) 27 14.6
Marital status
Single 37 20.0
Married 107 57.8
Divorced 14 7.6
Widowed 7 3.8
Life partnership 8 4.3
Other 12 6.5
Employment status
Unemployed 26 14.1
Employed full-time 136 73.5
Employed part-time 1 0.5
Temporarily employed 5 2.7
Retired 13 7.0
Self-employed 3 1.6
Other 1 0.5
Annual income (in HRK)
less than 15.000 37 20.0
15.000-25.000 1 0.5
26.000-35.000 10 5.4
36,000-45,000 5 2.7
46.000-55.000 19 10.3
More than 60.000 113 61.1
How sick are they on this day
very sick 6 3.2
moderately sick 24 13.0
slightly sick 39 21.1
not sick 116 62.7

Franjo J. et al. Patient Satisfaction with the Work of Nurses in Primary Health Care. Croat Nurs J. 2017; 3(1): 5-19 9
Kolmogorov-Smirnov test. According to the obtained results, the tested distributions deviate statistically significantly from the normal distribution, so it is jus-tified to use non-parametric statistical procedures in further processing.
Patient satisfaction domainData presented in table 4 shows that the majority of respondents answered all statements by agreeing or fully agreeing with them. Since the statements have a positive orientation, this supports the conclusion that the respondents are generally satisfied with nurses’ work and service.
Satisfaction with the work of nurses in primary health care
The satisfaction assessment scale for the assess-ment of patient satisfaction with nurses in primary health care includes three domains: patient satisfac-tion (18 items), communication (4 items) and acces-sibility (4 items). As shown in table 3 on the tested sample, the internal consistency coefficient for the patient satisfaction domain is Cronbach α=0.950, for the communication domain it is Cronbach α=0.932, and for the accessibility domain it is Cronbach α=0.810. The obtained results show a high internal reliability of the instrument, both on the individual domains and on the whole scale (Cronbach α=0.966). Testing the normality of distributions across do-mains and on the overall scale was done using the
Table 2. Respondents’ perception of their health status (N=185)
Respondents’ characteristics Number of respondents
% of respondents
How injured they are on this day
very injured 2 1.1
mildly injured 10 5.4
slightly injured 17 9.2
uninjured 156 84.3
Health issues for which the respondents were receiving
medication
High blood pressure 35 18.9
Diabetes 6 3.2
Depression/anxiety 9 4.9
Heart disease 10 5.4
High cholesterol 13 7.0
Asthma, trouble breathing 5 2.7
Cancer 0 0.0
Thyroid problems 5 2.7
Other diseases 26 14.1
Number of prescription drugs
0-2 166 89.7
3-5 13 7.1
6-8 6 3.2
Number of annual visits to the nurse in the preceding year
1-5 times 152 82.2
6-10 times 16 8.6
11-15 times 9 4.9
16 or more times 8 4.3
Type of health insurance
Insured 179 96.8
No health insurance 4 2.2
Foreign health insurance 2 1.1

10 Franjo J. et al. Patient Satisfaction with the Work of Nurses in Primary Health Care. Croat Nurs J. 2017; 3(1): 5-19
Table 3. Internal reliability and testing the normality of distributions Domain Number of items Number of respondents Cronbach α K-S z p
Patient satisfaction 18 185 0.950 1.676 0.001
Accessibility 4 185 0.810 2.327 0.001
Communication 4 185 0.932 3.036 0.001
Scale overall 26 185 0.966 1.689 0.007
Table 4. Agreement with statements in the patient satisfaction domain
Patient satisfactionNumber (%) of respondents Median
(interquartile range)1 2 3 4 5 Total
I was satisfied with my visit to the nurse.2
(1.1)6
(3.2)15
(8.1)65
(35.1)97
(52.4)185
(100)5 (4-5)
I will probably recommend this nurse to others.4
(2.2)8
(4.3)20
(10.8)61
(33.0)92
(49.7)185
(100)4 (4-5)
In the future, I will probably schedule another appointment with the nurse.
5 (2.7)
8 (4.3)
22 (11.9)
55 (29.7)
95 (51.4)
185 (100)
5 (4-5)
The nurse did not rush when working with me.9
(4.9)17
(9.2)22
(11.9)69
(37.3)68
(36.8)185
(100)4 (3-5)
I would prefer to see the nurse rather than the doctor.
13 (7.0)
31 (16.8)
46 (24.9)
45 (24.3)
50 (27.0)
185 (100)
4 (3-5)
The nurse is a skilled health practitioner.2
(1.1)11
(5.9)22
(11.9)61
(33.0)89
(48.1)185
(100)4 (4-5)
The nurse discusses treatment methods other than drugs to solve my issue.
13 (7.0)
24 (13.0)
40 (21.6)
70 (37.8)
38 (20.5)
185 (100)
4 (3-4)
I am satisfied with the way the nurse treats me.6
(3.2)6
(3.2)15
(8.1)58
(31.4)100
(54.1)185
(100)5 (4-5)
I was satisfied with the amount of time that the nurse spent with me.
3 (1.6)
7 (3.8)
18 (9.7)
68 (36.8)
89 (48.1)
185 (100)
4 (4-5)
The nurse is caring.2
(1.1)5
(2.7)19
(10.3)58
(31.4)101
(54.6)185
(100)5 (4-5)
The nurse is knowledgeable about my health issues.
9 (4.9)
19 (10.3)
62 (33.5)
95 (51.4)
185 (100)
5 (4-5)
I trust the nurse.3
(1.6)5
(2.7)12
(6.5)60
(32.4)105
(56.8)185
(100)5 (4-5)
The nurse knows when to consult the doctor.3
(1.6)15
(8.1)67
(36.2)100
(54.1)185
(100)5 (4-5)
The nurse listened to what I had to say.6
(3.2)23
(12.4)61
(33.0)95
(51.4)185
(100)5 (4-5)
The nurse is interested in my health issues.3
(1.6)7
(3.8)28
(15.1)64
(34.6)83
(44.9)185
(100)4 (4-5)
The nurse respects me.2
(1.1)5
(2.7)20
(10.8)60
(32.4)98
(53.0)185
(100)5 (4-5)
I understand what the nurse explained to me.4
(2.2)16
(8.6)67
(36.2)98
(53.0)185
(100)5 (4-5)
The nurse explained things to me in an understandable way.
2 (1.1)
5 (2.7)
19 (10.3)
61 (33.0)
98 (53.0)
185 (100)
5 (4-5)
Key: 1 = I fully disagree, 2 = I do not agree 3 = I am not sure, 4 = I agree, 5 = I fully agree

Franjo J. et al. Patient Satisfaction with the Work of Nurses in Primary Health Care. Croat Nurs J. 2017; 3(1): 5-19 11
Differences in the individual domains and the overall scale according to respondent characteristics
Differences in patient satisfaction with regard to the respondents’ ageThe Kruskal-Wallis test was used to examine the ex-istence of differences between the domains of pa-tient satisfaction with the work of nurses in primary health care and the overall scale with respect to the patients’ age. According to the results shown in table 7, patients are satisfied with nurses’ work (the me-dian of the overall scale according to the age groups is in the interval between 4.2 and 4.5). A statistically significant difference between age groups was ob-served only for the accessibility domain (p<0.05), with slightly less satisfied respondents in the age group of patients of between 26 and 40 years of age (median 3.8 and interquartile range 3.0 to 4.5) rela-tive to other groups.
Accessibility domain
The data presented in table 5 shows that most re-spondents positively assess the accessibility and availability of the nurse, and the most common answers are agreement and full agreement with the content of the statement. However, it should be noted that a larger number of respondents ex-pressed hesitancy (“not sure”) in agreeing with the statements concerning the possibility of arranging a suitable appointment with the nurse (N=38; 20.5%) and that arranging an appointment with the nurse is easier than with a doctor (N=43; 23.2%).
The Communication domain
According to the data in table 6, the respondents are positively oriented and mostly satisfied with the manner and possibility of communicating with the nurse, and they answered mostly with “I fully agree” and “I agree”.
Table 5. Agreement with statements in the accessibility domain
AccessibilityNumber (%) of respondents Median
(interquartile range)1 2 3 4 5 Total
I was able to arrange an appropriate appointment with the nurse.
10 (5.4)
15 (8.1)
38 (20.5)
64 (34.6)
58 (31.4)
185 (100)
4 (3-5)
When I need health care, I can easily arrange an appointment with the nurse.
12 (6.5)
18 (9.7)
22 (11.9)
57 (30.8)
76 (41.1)
185 (100)
4 (3-5)
The Health Centre of the Ministry of the Interior is accessible.
3 (1.6)
14 (7.6)
18 (9.7)
64 (34.6)
86 (46.5)
185 (100)
4 (4-5)
It is easier to arrange an appointment with the nurse than with the doctor.
7 (3.8)
16 (8.6)
43 (23.2)
60 (32.4)
59 (31.9)
185 (100)
4 (3-5)
Key: 1=I fully disagree, 2=I do not agree, 3=I am not sure, 4=I agree, 5=I fully agree
Table 6. Agreement with statements in the communication domain
CommunicationNumber (%) of respondents Median
(interquartile range)1 2 3 4 5 Total
It is easy for me to talk to the nurse about my health issues.
1 (0.5)
5 (2.7)
22 (11.9)
64 (34.6)
93 (50.3)
185 (100)
5 (4-5)
I understood everything the nurse taught me.1
(0.5)5
(2.7)25
(13.5)66
(35.7)88
(47.6)185
(100)4 (4-5)
I felt comfortable asking the nurse questions.1
(0.5)5
(2.7)23
(12.4)60
(32.4)96
(51.9)185
(100)5 (4-5)
I left the nurse’s office with all of the answers that I needed.
1 (0.5)
6 (3.2)
20 (10.8)
61 (33.0)
97 (52.4)
185 (100)
5 (4-5)
Key: 1=I fully disagree, 2=I do not agree, 3=I am not sure, 4=I agree, 5=I fully agree

12 Franjo J. et al. Patient Satisfaction with the Work of Nurses in Primary Health Care. Croat Nurs J. 2017; 3(1): 5-19
statistically significant difference in the satisfaction of patients with the nurses’ work with regard to the respondents’ level of education.
Differences in patient satisfaction with regard to the respondents’ marital statusAccording to the results of the Kruskal-Wallis test shown in table 10, no significant differences were found on the examined domains or on the overall scale with regard to the respondents’ marital status (p>0.05). The respondents are satisfied with the nurses’ work; with regard to the resulting medians and the average rank, the respondents who are di-vorced or widowed are more satisfied with the nurs-es’ work than other groups, which is confirmed by the greater number of responses indicating full agree-ment with the content of the statements offered.
Differences in patient satisfaction with regard to the respondents’ genderThe Mann-Whitney test was used to examine the existence of differences between the domains of pa-tient satisfaction with the work of nurses in primary health care and the overall scale with respect to the patients’ gender. According to the results shown in table 8, patients are satisfied with nurses’ work (the median of the overall scale for both groups is 4.3). No statistically significant differences were found between the examined groups by gender in the indi-vidual domains and the overall scale (p>0.05).
Differences in patient satisfaction with regard to the respondents’ level of educationAccording to the results of the Kruskal-Wallis test shown in table 9, no significant differences were found in the examined domains or on the overall scale with regard to the respondents’ level of educa-tion (p>0.05). The respondents are satisfied with the nurses’ work. Given the values obtained, there is no
Table 7. The medians of the domains and the overall scale, as well as the testing of differences in patient satisfaction with regard to the patients’ AGE (N=185)
Domain Age (in years) N Median
(interquartile range) Mrank χ2 df p
Patient satisfaction
18-25 33 4.3 (3.6-4.8) 88.29
6.551 3 0.08826-40 47 4.2 (3.4-4.7) 77.98
41-60 85 4.4 (3.9-4.8) 100.33
> 60 20 4.5 (3.9-4.8) 104.93
Accessibility
18-25 33 4.0 (3.3-4.8) 93.82
9.606 3 0.022*26-40 47 3.8 (3.0-4.5) 74.59
41-60 85 4.0 (3.6-4.6) 97.82
> 60 20 4.1 (4.0-5.0) 114.43
Communication
18-25 33 4.3 (3.8-5.0) 89.38
3.980 3 0.26426-40 47 4.0 (3.8-5.0) 82.33
41-60 85 4.5 (4.0-5.0) 97.40
> 60 20 4.8 (4.0-5.0) 105.35
Scale overall
18-25 33 4.2 (3.7-4.8) 89.61
6.427 3 0.09326-40 47 4.1 (3.3-4.7) 77.86
41-60 85 4.4 (3.9-4.8) 99.50
> 60 20 4.5 (3.9-4.7) 106.55
*p<0.05

Franjo J. et al. Patient Satisfaction with the Work of Nurses in Primary Health Care. Croat Nurs J. 2017; 3(1): 5-19 13
Table 8. The medians of the domains and the overall scale, as well as the testing of differences in patient satisfaction with regard to the patients’ GENDER (N=185)
Domain Gender N Median (interquartile range) Mrank z p
Patient satisfactionMale 126 4.4 (3.8-4.8) 93.44
-0.164 0.870Female 59 4.4 (3.8-4.8) 92.06
AccessibilityMale 126 4.0 (3.3-4.5) 89.09
-1.462 0.144Female 59 4.0 (3.8-4.8) 101.35
CommunicationMale 126 4.5 (4.0-5.0) 92.16
-0.324 0.746Female 59 4.5 (4.0-5.0) 94.79
Scale overallMale 126 4.3 (3.8-4.7) 92.23
-0.286 0.775Female 59 4.3 (3.8-4.8) 94.64
Table 9. The medians of the domains and the overall scale, as well as the testing of differences in patient satisfaction with regard to the patients’ LEVEL OF EDUCATION (N=185)
Domain Level of education N Median
(interquartile range) Mrank χ2 df p
Patient satisfaction
Primary 3 3.8 (3.4-4.6) 60.67
5.027 3 0.170
Secondary 137 4.3 (3.8-4.8) 90.64
Tertiary (Bachelor)
18 4.2 (3.8-4.7) 87.58
Tertiary (Master)
27 4.6 (4.1-4-8) 112.20
Accessibility
Primary 3 4.0 (3.0-4.5) 82.33
4.821 3 0.185
Secondary 137 4.0 (3.3-4.5) 88.88
Tertiary (Bachelor)
18 4.3 (3.6-4.5) 96.19
Tertiary (Master)
27 4.5 (4.0-4.8) 112.96
Communication
Primary 3 4.0 (3.0-5-0) 73.67
3.943 3 0.268
Secondary 137 4.3 (4.0-5.0) 90.50
Tertiary (Bachelor)
18 4.1 (3.9-5.0) 89.22
Tertiary (Master)
27 5.0 (4.0-5.0) 110.37
Scale overall
Primary 3 3.8 (3.3-4.7) 66.17
5.155 3 0.161
Secondary 137 4.3 (3.8-4.7) 90.06
Tertiary (Bachelor)
18 4.2 (3.8-4.7) 89.33
Tertiary (Master)
27 4.6 (4.0-4.8) 113.35

14 Franjo J. et al. Patient Satisfaction with the Work of Nurses in Primary Health Care. Croat Nurs J. 2017; 3(1): 5-19
Differences in patient satisfaction with regard to the respondents’ annual incomeAccording to the results of the Kruskal-Wallis test shown in table 11, significant differences were found in the examined domains, as well as on the overall scale with regard to the respondents’ annual income (p>0.01). Taking into account the resulting medians and average ranks, satisfaction is more often present in respondents with an annual income in the range between 26.000 to 35.000 HRK and the range be-tween 36.000 to 45.000 HRK, which is confirmed by a greater number of answers indicating full agree-ment with the content of the statements offered.
Differences in patient satisfaction with regard to the respondents’ employment statusAccording to the results of the Kruskal-Wallis test shown in table 11, no statistically significant differ-ences were found in the examined domains or on the overall scale with regard to the respondents’ employ-ment status (p>0.05). The respondents are satisfied with the nurses’ work; with regard to the resulting medians and the average rank, the respondents who are temporarily employed or are retired are more sat-isfied than other groups, which was confirmed by the greater number of responses indicating full agree-ment with the content of the statements offered.
Table 10. The medians of the domains and the overall scale, as well as the testing of differences in patient satisfaction with regard to the patients’ MARITAL STATUS (N=185)
Domain Marital status NMedian
(interquartile range)
Mrank χ2 df p
Patient satisfaction
Single 37 4.2 (3.6-4.7) 85.53
4.713 5 0.452
Married 107 4.4 (3.8-4.8) 94.05
Divorced 14 4.7 (4.1-4.9) 118.32
Widowed 7 4.4 (3.6-4.7) 96.07
Life partnership 8 4.4 (2.9-4.8) 81.38
Other 12 4.2 (3.5-4.6) 83.08
Accessibility
Single 37 4.0 (3.1-4.5) 86.16
7.089 5 0.214
Married 107 4.0 (3.5-4.5) 90.79
Divorced 14 4.4 (4.0-5.0) 122.36
Widowed 7 4.5 (3.8-5.0) 119.14
Life partnership 8 4.0 (3.0-4.9) 93.00
Other 12 3.6 (3.1-4.8) 84.29
Communication
Single 37 4.0 (3.9-5.0) 86.65
4.028 5 0.545
Married 107 4.5 (4.0-5.0) 94.23
Divorced 14 4.9 (4.0-5.0) 111.96
Widowed 7 4.8 (3.8-5.0) 100.29
Life partnership 8 4.1 (3.1-4.8) 72.56
Other 12 4.3 (3.6-5.0) 88.88
Scale overall
Single 37 4.2 (3.6-4.7) 85.77
5.125 5 0.401
Married 107 4.3 (3.9-4.8) 93.18
Divorced 14 4.7 (4.1-4.9) 120.32
Widowed 7 4.6 (3.6-4.7) 101.14
Life partnership 8 4.3 (2.9-4.8) 83.44
Other 12 4.2 (3.5-4.7) 83.42

Franjo J. et al. Patient Satisfaction with the Work of Nurses in Primary Health Care. Croat Nurs J. 2017; 3(1): 5-19 15
(35.1%) agree with the statement “I was satisfied with my visit to the nurse”.
Research conducted worldwide on patient satisfac-tion with the work of nurses shows that patients are generally satisfied with the care provided by nurses. A study conducted in Ireland using the EUROPEP form with questions related to politeness, careful listening, explaining procedures and assistance pro-
Discussion
Patient satisfaction is not just a legitimate demand, but also an important and desirable outcome of every treatment (22,23). In this study conducted on patients, it can be concluded that patients are satis-fied with the work of the nurse in primary care. 97 respondents (52.4%) fully agree and 65 respondents
Table 11. The medians of the domains and the overall scale, as well as the testing of differences in patient satisfaction with regard to the patients’ EMPLOYMENT STATUS (N=185)
Domain Employment status NMedian
(interquartile range)
Mrank χ2 df p
Patient satisfaction
Unemployed 26 4.0 (3.0-4.6) 70.12
8.956 6 0.176
Employed full-time 136 4.4 (3.8-4.8) 96.20
Employed part-time 1 4.0 (4.0-4.0) 66.00
Temporarily employed 5 4.6 (4.0-4.7) 100.70
Retired 13 4.6 (4.3-4.8) 111.88
Self-employed 3 3.9 (3.4-4.9) 83.50
Other 1 3.4 (3.4-3.4) 24.50
Accessibility
Unemployed 26 3.8 (2.8-4.5) 74.75
8.560 6 0.200
Employed full-time 136 4.0 (3.5-4.5) 94.16
Employed part-time 1 4.0 (4.0-4.0) 86.50
Temporarily employed 5 4.8 (3.5-4.9) 118.20
Retired 13 4.3 (4.0-4.8) 116.73
Self-employed 3 4.0 (2.3-4.5) 77.17
Other 1 3.0 (3.0-3.0) 29.50
Communication
Unemployed 26 4.0 (3.2-5.0) 72.69
12.168 6 0.058
Employed full-time 136 4.5 (4.0-5.0) 94.24
Employed part-time 1 4.0 (4.0-4.0) 59.00
Temporarily employed 5 5.0 (3.9-5.0) 111.20
Retired 13 5.0 (4.3-5.0) 123.38
Self-employed 3 4.0 (4.0-5.0) 88.67
Other 1 3.0 (3.0-3.0) 14.00
Scale overall
Unemployed 26 3.8 (3.0-4.7) 70.75
9.223 6 0.161
Employed full-time 136 4.3 (3.8-4.8) 95.75
Employed part-time 1 4.0 (4.0-4.0) 67.00
Temporarily employed 5 4.6 (4.0-4.7) 103.10
Retired 13 4.6 (4.3-4.7) 114.81
Self-employed 3 4.0 (3.3-4.8) 81.50
Other 1 3.3 (3.3-3.3) 24.00

16 Franjo J. et al. Patient Satisfaction with the Work of Nurses in Primary Health Care. Croat Nurs J. 2017; 3(1): 5-19
Netherlands, Germany, Portugal and Ireland) exam-ined medical-technical care, the doctor-patient rela-tion, information sharing, availability, accessibility and the organization of the service. Aspects of gen-eral health care were rated highest, while waiting for a consultation, assistance with emotional problems caused by health issues and concerns about treat-ment costs (9) were rated lower.
Studies done in Canada and New Zealand used the Thrasher and Purc-Stephenson instrument for the measurement of satisfaction and acceptance of health care provided by the nurse. Patients were
vided by a nurse indicates that patients are satisfied with the work of nurses (9). In our study, the patients rated the actions of nurses regarding listening to pa-tients and explaining procedures positively. This is indicated by the answers to the statements: 156 (84.4%) respondents fully agree or agree with the statement “the nurse listened to what I had to say”, whereas 159 (86%) respondents fully agree or agree with the statement “the nurse explained things to me in an understandable way”.
Several studies from eight European countries (Nor-way, Sweden, Denmark, the United Kingdom, the
Table 12. The medians of the domains and the overall scale, as well as the testing of differences in patient satisfaction with regard to the patients’ ANNUAL INCOME (N=185)
Domain Annual income NMedian
(interquartile range)
Mrank χ2 df p
Patient satisfaction
< than 15.000 37 3.9 (3.2-4.6) 70.18
14.989 5 0.006**
15.000-25.000 1 3.8 (3.8-3.8) 47.00
26.000-35.000 10 4.6 (4.3-4.8) 117.10
36.000-45.000 5 4.7 (4.1-4.9) 120.80
46.000-55.000 19 3.9 (3.1-4.7) 75.79
> than 60.000 113 4.4 (3.9-4.8) 100.41
Accessibility
< than 15.000 37 3.8 (2.6-4.3) 69.78
21.291 5 0.010**
15.000-25.000 1 3.3 (3.3-3.3) 40.00
26.000-35.000 10 4.8 (4.3-5.0) 143.05
36.000-45.000 5 4.5 (3.1-5.0) 115.10
46.000-55.000 19 3.8 (3.0-4.5) 74.95
> than 60.000 113 4.0 (3.8-4.5) 98.70
Communication
< than 15.000 37 4.0 (3.3-5.0) 74.74
15.025 5 0.001**
15.000-25.000 1 4.0 (4.0-4.0) 59.00
26.000-35.000 10 5.0 (4.0-5.0) 121.30
36.000-45.000 5 5.0 (4.1-5.0) 117.70
46.000-55.000 19 4.0 (3.0-5.0) 69.89
> than 60.000 113 4.5 (4.0-5.0) 99.57
Scale overall
< than 15.000 37 3.8 (3.0-4.7) 69.95
16.460 5 0.010**
15.000-25.000 1 3.8 (3.8-3.8) 44.00
26.000-35.000 10 4.6 (4.3-4.9) 123.90
36.000-45.000 5 4.7 (4.0-4.6) 119.00
46.000-55.000 19 4.0 (3.2-4.6) 74.71
> than 60.000 113 4.4 (4.0-4.8) 100.71
**p≤0.01

Franjo J. et al. Patient Satisfaction with the Work of Nurses in Primary Health Care. Croat Nurs J. 2017; 3(1): 5-19 17
It is also possible to set up appointments via e-mail and SMS.
A significant difference between the domains of satisfaction with the work of nurses according to gender was determined to a slightly lesser extent in respondents in the age group of between 26 and 40 years of age. Also, the values obtained show there is no statistically significant difference in the patients’ satisfaction with the nurses’ work with regard to the respondents’ level of education. Using the same re-search instrument, Novaković obtained results show-ing that respondents with tertiary (Master) degrees are more satisfied with nurses’ services, but at the same time respondents with primary education were also satisfied with the services of the nurse (4). Ac-cording to the obtained results, a statistically sig-nificant difference between the respondents’ satis-faction with the work of nurses according to annual income is more pronounced in respondents with an annual income of between 26.000 and 35.000 HRK and in the range between 36.000 and 45.000 HRK. Novaković did not obtain these income differences in her study (4).
Agosta states that studies measuring patient satis-faction give positive results because of the impact of nurses’ communication (14). Nurses have a major role in communicating with patients, not only because they are the first to meet and register the patient, but also because the patients themselves have a closer relationship with the nurse than with the doc-tor. It is easier for patients to talk about their issues with nurses, because they assume that nurses know and understand them better. Successful communica-tion promotes a faster and more accurate diagnosis, greater patient satisfaction and better adherence to health recommendations and instructions (15).
Conclusion
The results of this study show that the patients who use the Health Centre of the Ministry of the Interi-or of the Republic of Croatia are satisfied with the work of nurses in primary health care. There is no significant difference in patient satisfaction with the work of nurses in primary care with respect to the
generally satisfied with the provided care and par-ticipation in the treatment (10).
A 1995 USA study on patient satisfaction with the care of nurses, utilizing the Di Tomasso-Willard ques-tionnaire, showed that 97% of the patients were sat-isfied with the nurses’ services (11).
Comparisons between nurses and other health care providers in America found no significant difference between the patient’s baseline characteristics and health status (12).
In Croatia, several studies have been conducted to determine patients’ satisfaction levels with the work of primary health care providers. A study conducted in 100 general/ family practitioners’ offices in the area of Istria, Primorje-Gorski Kotar, Međimurje, Osi-jek-Baranja and Vukovar-Srijem counties found that most patients were satisfied with the services they received at the family physician’s office (4).
A study has been conducted in the Rovinj, Poreč, Umag, Labin, Opatija, Čakovec, Đakovo and Vinkovci areas on the quality of service. There were problems in conducting the survey, because out of 10.000 dis-tributed questionnaires, a large number of the ques-tionnaires was not filled in. In some offices, surveys were not conducted even though the offices had agreed to participate in the survey. Despite imple-mentation problems, researchers were satisfied with the results because they pointed out problems that we are often not even aware of, and which most pa-tients will not openly tell us about (13).
In Croatia, surveys conducted at family physicians’ of-fices provide information on the opinions of patients, where the majority of them is satisfied with the service they receive, while in some settings, dissat-isfaction does not exceed 50% of respondents (13). In most offices, waiting times are too long, the main reasons being too many patients, non-implementa-tion of a patient appointment system, a large num-ber of repeated examinations caused by lengthy pro-cessing and lengthy administrative procedures (13).
More than 60% of respondents at the Ministry of the Interior’s Health Centre responded to the statements about the possibility of setting up an appointment by fully agreeing and agreeing; while 119 (64.3 %) respondents fully agree of agree with the possibility of setting up an appointment with the nurse. The pa-tient appointment system is possible by telephone at a time specified for setting up patient appointments.

18 Franjo J. et al. Patient Satisfaction with the Work of Nurses in Primary Health Care. Croat Nurs J. 2017; 3(1): 5-19
References
1. Zakon o zdravstvenoj zaštiti. Narodne novine 100/2018. Croatian.
2. Pravilnik o standardima kvalitete zdravstvene zaštite i načinu njihove primjene. Narodne novine 79/2011. Croatian.
3. Pravilnik o akreditacijskim standardima za bolničke zdravstvene ustanove. Narodne novine 31/2011. Cro-atian.
4. Novaković J. Zadovoljstvo pacijenata radom medicin-skih sestara/tehničara u primarnoj zdravstvenoj zašti-ti [diplomski rad]. Osijek: Medicinski fakultet Osijek; 2017. Croatian.
5. Gašpert M. Zadovoljstvo bolesnika pruženom zdrav-stvenom skrbi u dnevnim bolnicama [diplomski rad]. Osijek: Medicinski fakultet Osijek; 2017. Croatian.
6. Dimova R, Stoyanova R, Keskinova D. The EURO-PEP questionnaire for patient´s evaluation of gene-ral practice care: Bulgarian experience. Croat Med J. 2017;58(1):63-74.
7. Gavran L, Jašarević E, Hasanica N. Patient satisfaction with primary care: are there differences between the approaches in family and general medicine? Med Glas (Zenica). 2013;10(2):379-84.
8. Spasojevic N, Hrabac B, Huseinagic S. Patient’s Sa-tisfaction with Health Care: a Questionnaire Stu-dy of Different Aspects of Care. Mater Sociomed. 2015;27(4):220-4.
9. Grol R, Wensing M. Patients Evaluate General/Family Practice: The EUROPEP Instrument. Nijmegen: Center for Quality of Care Research; 2000.
10. Gagan MJ, Maybee P. Patient satisfaction with Nurse Practitioner care in primary care settings. Aust J Adv Nurs. 2011;28:12-9.
11. Larrabee JH, Ferri JA, Hartig MT. Patient Satisfaction with Nurse Practitioner Care in Primary Care. J Nurs Care Qual.1997;11(5):9-14.
12. Hooker RS, Cipher DJ, Sekscenski E. Patient Satisfac-tion with Physician Assistant, Nurse Practitioner, and Physician Care: a national Survey of Medicare Benefi-ciaries. JCOM. 2005;12:2.
13. Mazzi B, Krčmar N, Gržalja N, Ferlin D, Ivančić A, Gr-gurev Z, i sur. Mišljenje pacijenata o našem radu ele-ment u procjeni kvalitete. HČJZ. 2007;3(10):1-14. Croatian.
14. Agosta LJ. Psychometric Evaluation of the Nurse Practitioner Satisfaction Survey (NPSS). J Nurs Meas. 2009;17(2):114-33.
15. Havelka M. Zdravstvena psihologija. Jastrebarsko: Na-klada Slap; 1998.
patients’ gender, marital status, working status and level of education.
There is a significant difference in patient satisfac-tion with the work of nurses in primary care with re-spect to the patients’ age. The respondents in the age group of between 26 and 40 years of age are slightly less satisfied.
There is a significant difference in patient satisfac-tion with the work of nurses in primary care with respect to the patients’ annual income. Satisfaction is more pronounced among respondents with an an-nual income of between 26.000 and 35.000 HRK and in the range between 36.000 and 45.000 HRK.
The data obtained through this study of patient sat-isfaction is not representative enough to serve as a decision-making base on a large scale, but is informa-tive and adequate for the creation of an organiza-tional system that puts the patient at the centre of attention. Measuring patient satisfaction should be-come one of the usual methods of our work, point-ing out the necessary changes and showing patients that we care about their opinions.

Franjo J. et al. Patient Satisfaction with the Work of Nurses in Primary Health Care. Croat Nurs J. 2017; 3(1): 5-19 19
zadovoljniji su ispitanici u dobnoj skupini od 26 do 40 godina (Kruskal-Wallisov test, Me = 3,8). Postoji stati-stički značajna razlika u zadovoljstvu pacijenata radom medicinskih sestara/tehničara u primarnoj zdravstve-noj zaštiti prema visini godišnjih prihoda ispitanika, gdje je zadovoljstvo u većoj mjeri prisutno kod ispita-nika s godišnjim prihodima u rasponu od 26.000,00 kn do 35.000,00 kn i rasponu od 36.000,00 kn do 45.000,00 kn (Kruskal-Wallisov test, p < 0,01).
Zaključak. Pacijenti u ovom istraživanju zadovoljni su radom medicinskih sestara/tehničara u primarnoj zdravstvenoj zaštiti. Postoje značajne razlike s obzi-rom na dob i visinu godišnjih prihoda.
Ključne riječi: zadovoljstvo pacijenta, medicinska sestra / medicinski tehničar u primarnoj zdravstvenoj zaštiti, upitni-ci za mjerenje zadovoljstva pacijenata
Sažetak
Uvod. Zadovoljstvo pacijenata pruženom zdravstve-nom njegom jedan je od važnih indikatora kvalitete zdravstvene skrbi i zadnjih se godina učestalo provo-de istraživanja na temu zadovoljstva pacijenata.
Cilj. Provedeno je prospektivno presječno istraživa-nje u Domu zdravlja Ministarstva unutarnjih poslova Republike Hrvatske u periodu od travnja do lipnja 2019. godine. Cilj istraživanja bio je ispitati zadovolj-stvo pacijenata radom medicinskih sestara/tehničara u primarnoj zdravstvenoj zašiti.
Metode. Primijenjen je standardizirani upitnik Nur-sing Practitioner Satisfaction Survey, za koji smo do-bili odobrenje autorice. U istraživanju je sudjelovalo 200 pacijenata Doma zdravlja Ministarstva unutar-njih poslova Republike Hrvatske. U istraživanje su bili uključeni pacijenti koji su došli u ambulante Doma zdravlja i trebali usluge samo medicinskih sestara/tehničara. Od 200 anketiranih pacijenata 185 anketa ispravno je ispunjenih, dok je 15 anketa bilo neisprav-no ispunjeno.
Rezultati. Pacijenti Doma zdravlja Ministarstva unu-tarnjih poslova Republike Hrvatske zadovoljni su ra-dom medicinskih sestara/tehničara u primarnoj zdrav-stvenoj zaštiti. Ne postoji statistički značajna razlika u zadovoljstvu radom medicinskih sestara/tehničara u primarnoj zdravstvenoj zaštiti prema spolu, struč-noj spremi, bračnom te radnom statusu. Statistički je značajna razlika u zadovoljstvu pacijenata radom me-dicinskih sestara/tehničara prema dobi ispitanika, ne-
ZADOVOLJSTVO PACIJENATA RADOM MEDICINSKE SESTRE / MEDICINSKOG TEHNIČARA U PRIMARNOJ ZDRAVSTVENOJ ZAŠTITI


1 Mia Milojević1 Ivan Brumini1 Ivana Crnković
1 University of Applied Health Sciences, Zagreb, Croatia
Article received: 11.11.2019.
Article accepted: 28.01.2020.
DOI: 10.24141/2/4/1/2
Author for correspondence: Mia Milojević University of Applied Health Sciences Zagreb Mlinarska 38, Zagreb, Croatia E-mail: [email protected]
Keywords: perceived stress, physiotherapists, clinical environment
Abstract
Stress in the workplace represents a specific type of stress, stemming from the work environment. Stress-ful situations at work can trigger negative emotions that are linked with anxiety, tension, depression, fa-
tigue and lack of working motivation. The aim of this research is to investigate differences in the percep-tion of stress of physiotherapists employed in various departments. The research was conducted using an online questionnaire aimed at 123 physiotherapists in the Republic of Croatia. The results have showed that respondents perceived their workplace as mod-erately stressful. Considering the difference in the experience and perception of stress with regard to the department where physiotherapists work, the results have showed that there is a statistically sig-nificant difference in the level of perceived stress among the respondents with regard to the depart-ment in which they are employed. It was found that respondents employed in orthopaedics perceived stress to a lesser extent than those individuals em-ployed in health centres and in the department of physical medicine and rehabilitation. The differences in the perception of stress among the respondents who are employed in other departments have shown no statistically significant difference. It was shown that the respondents of 20–25 years of age were found to exhibit statistically significantly lower lev-els of perceived stress compared to subjects of 26–36 years of age. There is no noted statistically sig-nificant difference in the perception of stress among other age groups. It was determined that participants with a lower net monthly salary exhibit statistically significant greater lever of perceived stress in com-parison to participants with a net monthly salary that is greater than the average. The results of the study have shown that there are no statistically significant differences in the level of perceived stress among re-spondents in terms of gender, length of service, level of education or marital status.
Differences in Perception of Stress of Physiotherapists Employed in Various Departments
Croat Nurs J. 2020; 4(1): 21-31

22 Milojević M. et al. Differences in Perception of Stress of Physiotherapists Employed in Various Departments. Croat Nurs J. 2020; 4(1): 21-31
There is numerous research that investigates the in-tensity of stress in medical workers, but there is fewer research about the said phenomenon in physiothera-pists specifically. Croatian databases also lack research on the presence of this syndrome in physiotherapists. Authors Nathiya et al. (2017) have conducted an ob-servational research about professional stress in phys-iotherapists. The aim of the research was to find stress factors in the workplace in 65 physiotherapists. The participants were distributed in two groups according to their employment in a public or private hospital. The author’s conclusion was that physiotherapists work-ing in public hospitals were under less stress when in comparison to those working in private hospitals due to factors related to communication and interpersonal relationships, as well as physical labour that is required of physiotherapists while performing physiotherapeu-tic procedures (3). Aim of the research (Mandy, Rouse, 1997) conducted with 31 younger participants was to investigate the level of burnout at the work place. The results have shown a moderate level of burnout. Fac-tors that are most strongly connected with burnout at the workplace have included the quality/quantity of work, responsibility/authority, job satisfaction, work role and labour organization. Authors have concluded that recognizing burnout at the start of one’s career can limit negative impacts of the said syndrome (4). A research conducted in Saudi Arabia investigated the level of burn-out amongst physiotherapists and the correlation between work and organisational factors. Participants have shown a moderate level or burnout that is reflected with median results obtained using three Maslach Burnout Inventory subscales. Majority of the participants demonstrated moderate to high levels of burnout. The said results are in accordance with our research (5).
Aim
The main aim of this research is to examine differ-ences in the perception of stress of physiotherapists employed in different departments. The goal of the research is also to investigate the correlation between intensity of stress with respect to the socio-demo-graphic characteristics of the respondents. Considering the set goals, the following problems were formulated:
Introduction
Stress is an almost common experience and unavoid-able concept in the modern life and work of each indi-vidual. The concept of stress has been the subject of numerous scientific research, not only in the field of health care, but also in the social and human sciences, and even in the fields of economy, politics and busi-ness. Each area defines stress in its own way, so in the contemporary literature there are numerous defi-nitions of stress. In the literature reviews numerous studies examining the intensity of stress in healthcare professionals are found, but there is little research available on such phenomenon among the physiother-apists. In accordance to the author Ajduković, work or occupational stress indicates a discrepancy between the demands of the workplace and the environment with respect to our capabilities, desires and expecta-tions to meet these requirements. Among the more stressful professions are those focused on working with people. The author states that the assisting pro-fessions are, first and foremost, health professionals most stressed by the susceptible group precisely be-cause they are in direct communication with people who need someone else’s help, and this communica-tion, among other things, involves engaging in the emotional states of others. Meeting and experiencing human pain, suffering and trauma is a major burden on the mental lives of healthcare professionals (1). Ajduković divides the sources of occupational stress and the burnout syndrome into two groups: external and internal. External sources can be further catego-rized as those related to the working conditions, those stemmed from the organization of work, conditions arising from relationships with other people within the organization, and the kind of help that is offered. Under stressors that depend on the individual (individ-ual’s internal sources), the same author includes per-sons who have unrealistic job expectations and fail to adjust to reality (1). Due to there being no precise definition of the clinical environment, we have modi-fied the understanding of the said term in accordance with Brajša (1994). As a clinical environment, we have included the building, equipment, budget, monthly sal-ary, organization and labour distribution, documenta-tion and mutual relationships and stances of employ-ees, unwritten rules, mutual behaviours and mood in the work place (2).
Milojević M. et al. Differences in Perception of Stress of Physiotherapists Employed in Various Departments. Croat Nurs J. 2020; 4(1): 21-31 23
Table 1. Distribution of respondents by type of ward
Ward type N %
Private practice 14 11.38
Health centre/Infirmary 16 13.0
Home physical therapy 13 10.56
Physical medicine and rehabilitation 26 21.13
Internal medicine (cardiology/neurology) 23 18.68
Orthopedics 20 16.26
The unemployed and students 11 8.94
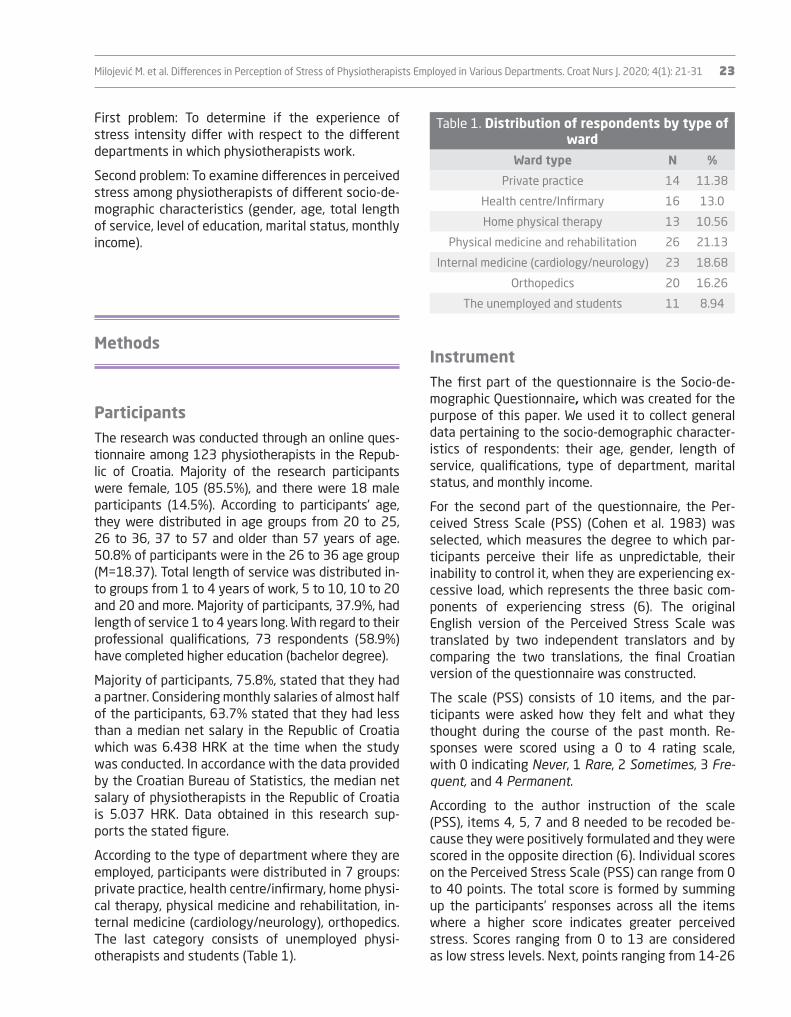
InstrumentThe first part of the questionnaire is the Socio-de-mographic Questionnaire, which was created for the purpose of this paper. We used it to collect general data pertaining to the socio-demographic character-istics of respondents: their age, gender, length of service, qualifications, type of department, marital status, and monthly income.
For the second part of the questionnaire, the Per-ceived Stress Scale (PSS) (Cohen et al. 1983) was selected, which measures the degree to which par-ticipants perceive their life as unpredictable, their inability to control it, when they are experiencing ex-cessive load, which represents the three basic com-ponents of experiencing stress (6). The original English version of the Perceived Stress Scale was translated by two independent translators and by comparing the two translations, the final Croatian version of the questionnaire was constructed.
The scale (PSS) consists of 10 items, and the par-ticipants were asked how they felt and what they thought during the course of the past month. Re-sponses were scored using a 0 to 4 rating scale, with 0 indicating Never, 1 Rare, 2 Sometimes, 3 Fre-quent, and 4 Permanent.
According to the author instruction of the scale (PSS), items 4, 5, 7 and 8 needed to be recoded be-cause they were positively formulated and they were scored in the opposite direction (6). Individual scores on the Perceived Stress Scale (PSS) can range from 0 to 40 points. The total score is formed by summing up the participants’ responses across all the items where a higher score indicates greater perceived stress. Scores ranging from 0 to 13 are considered as low stress levels. Next, points ranging from 14-26
First problem: To determine if the experience of stress intensity differ with respect to the different departments in which physiotherapists work.
Second problem: To examine differences in perceived stress among physiotherapists of different socio-de-mographic characteristics (gender, age, total length of service, level of education, marital status, monthly income).
Methods
ParticipantsThe research was conducted through an online ques-tionnaire among 123 physiotherapists in the Repub-lic of Croatia. Majority of the research participants were female, 105 (85.5%), and there were 18 male participants (14.5%). According to participants’ age, they were distributed in age groups from 20 to 25, 26 to 36, 37 to 57 and older than 57 years of age. 50.8% of participants were in the 26 to 36 age group (M=18.37). Total length of service was distributed in-to groups from 1 to 4 years of work, 5 to 10, 10 to 20 and 20 and more. Majority of participants, 37.9%, had length of service 1 to 4 years long. With regard to their professional qualifications, 73 respondents (58.9%) have completed higher education (bachelor degree).
Majority of participants, 75.8%, stated that they had a partner. Considering monthly salaries of almost half of the participants, 63.7% stated that they had less than a median net salary in the Republic of Croatia which was 6.438 HRK at the time when the study was conducted. In accordance with the data provided by the Croatian Bureau of Statistics, the median net salary of physiotherapists in the Republic of Croatia is 5.037 HRK. Data obtained in this research sup-ports the stated figure.
According to the type of department where they are employed, participants were distributed in 7 groups: private practice, health centre/infirmary, home physi-cal therapy, physical medicine and rehabilitation, in-ternal medicine (cardiology/neurology), orthopedics. The last category consists of unemployed physi-otherapists and students (Table 1).

24 Milojević M. et al. Differences in Perception of Stress of Physiotherapists Employed in Various Departments. Croat Nurs J. 2020; 4(1): 21-31
employment, age, number of years (length) of ser-vice and qualifications was determined using one-way variance analysis (one-way ANOVA test), and as post-hoc test the Tukey’s test was used.
The analysis of the difference in the overall percep-tion of stress among the respondents irrespective of the department where they are employed, and based on gender (M/F), marital status (single/with a part-ner) and monthly earnings (lower/higher than the net average monthly salary) has been determined using the t-test for independent samples.
Results
Table 2 shows 10 statements of the PSS question-naire with the frequency of responses by means of individual claims/questions. For each individual statement, there is a number of participants that chose the statement, percentage of the total num-ber, and mean value with an associated standard de-viation (Mean±SD).
According to the Perceived Stress Scale author’s instructions, the results are obtained by adding re-sponses to 10 statements using one variable that signifies total perceived stress (N/40). In this re-search, the total score was 24 out of total 40 points which suggests that the participants view their work place are moderately stressful (6).
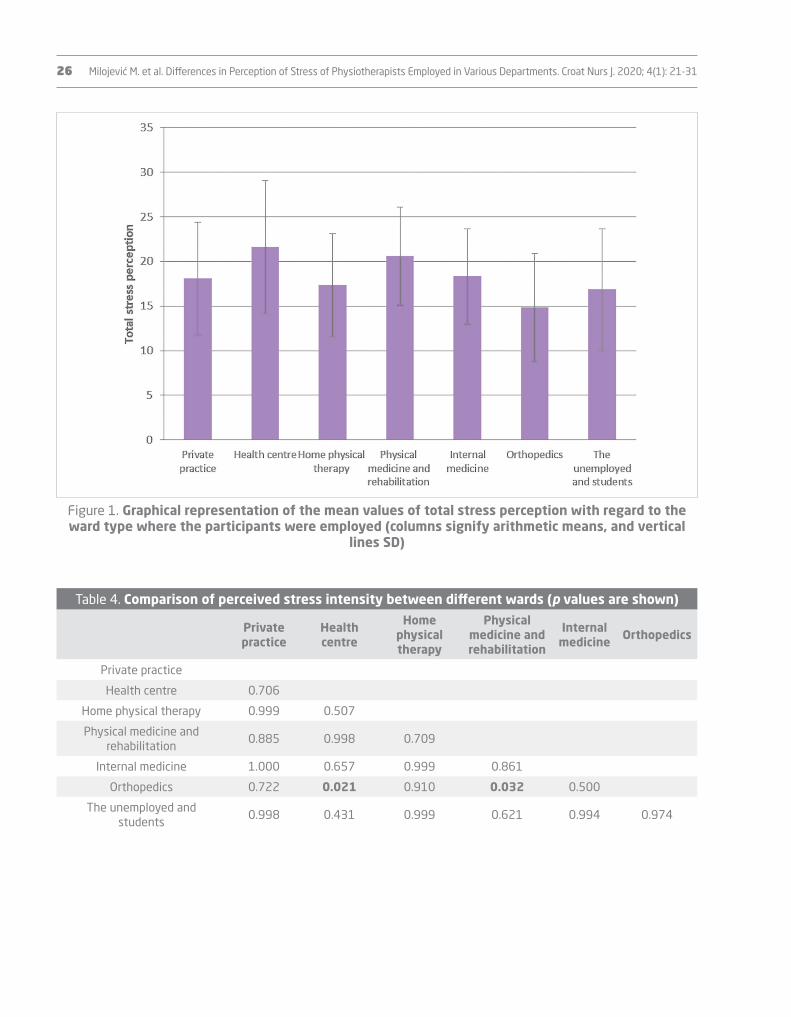
A one-way analysis of variance (one-way ANOVA) was performed and it was determined that there is a statistically significant difference in stress percep-tion in regard to the work place type (F=2.603, df=6, p=0.021). Results of post-hoc analysis (Tukey’s test) are shown in Table 4.
The employees employed at a health centre as well as those employed at the physical medicine and rehabil-itation wards show significantly higher intensity of perceived stress compared to the employees at the orthopedics (health centre vs. orthopedics p=0.021; physical vs. orthopedics p=0.032). The difference in the perception of stress among the respondents em-ployed in other wards shows no statistically signifi-cant difference.
are considered to reflect moderate levels of stress, and the results that range from 27-40 points are con-sidered as high levels of stress (6).
When choosing a measuring instrument, we had in mind maintaining enough time required to complete the questionnaire so that respondents did not lose motivation to complete it and to hold their attention until the completion of the questionnaire. In addi-tion, that the same had been previously described in the literature, validated, and that it had met all other metric characteristics.
There is a shorter and longer version of this ques-tionnaire. Methodological validity, along with valid metric characteristics is the reason for including the short version of the Perceived Stress Scale into this research (7).
ProcedureThe research was conducted during April 2019 through an online questionnaire among physiotherapists on the territory of the Republic of Croatia. The criteria for choosing participants was that they were licenced physiotherapists that were at the time of conducting this research employed in one of the wards. For the choice of the participant sample, we have chosen the social network web page “Facebook Croatian Physi-otherapists” that satisfies the said criteria.
For conducting the research using an online ques-tionnaire, an approval from the Croatian Physiothera-pists’ administrator was granted. The questionnaire was anonymous. All respondents voluntarily agreed to participate in the survey. The first part of the questionnaire contains a notice for the research par-ticipant outlining the topic of the paper, and briefly stating the purpose and aim of this research. At the beginning of each questionnaire there was an in-struction on how to complete the questionnaire. Fol-lowing the notification for the study participants, the participants completed the Socio-demographic Ques-tionnaire, followed by the Perceived Stress Scale (6). The time required to complete the entire question-naire ranged between 5 and 10 minutes.
StatisticsStatistical data processing was performed using the statistical program IBM SPSS Statistics 23.0. The analysis of the difference in the overall perception of stress among respondents by their department of

Milojević M. et al. Differences in Perception of Stress of Physiotherapists Employed in Various Departments. Croat Nurs J. 2020; 4(1): 21-31 25
tistically significant lower level of perceived stress (p=0.044) in comparison to participants aged 26-36. It was determined that participants with a lower net monthly salary exhibit statistically significant greater lever of perceived stress (p=0.011) in com-parison to participants with a net monthly salary that is greater than the average.
Results of total stress perception analysis in regard to age, sex, years of service, level of education, mari-tal status and monthly salary are shown in Table 5.
A statistically significant difference was determined in the level of perceived stress in regard to age (p=0.048). Participants aged 20-25 showed a sta-
Table 2. Mean values of stress perception are determined for each individual statement
Statement*0 1 2 3 4
MEAN±SDN (%)
1How often were you feeling upset due to something
unexpected happening?0
(0)26
(21.1)45
(36.6)37
(30.1)15
(12.1)2.33±0.95
2How often have you felt like you had no control over
important things in your life?14
(11.4)35
(28.5)39
(31.7)30
(24.4)5
(4.1)1.81±1.06
3 How often have you felt nervous and stressed?5
(4.1)17
(13.8)32
(26)50
(40.7)19
(15.4)2.50±1.04
4How often have you felt certain in your abilities to
cope with personal problems?25
(20.3)54
(43.9)27
(22)16
(13)1
(0.8)1.30±0.97
5How often have you felt like things were developing
the way you want them to?8
(6.5)51
(41.5)41
(33.3)18
(14.6)5
(4.1)1.66±0.92
6How often have you felt like you cannot cope with
your responsibilities?14
(11.4)32
(26)41
(33.3)27
(22)9
(7.3)1.86±1.09
7How often were you able to control uncomfortable
situations in your life?12
(9.8)43
(35)46
(37.4)16
(13)6
(4.9)1.68±0.99
8How often have you felt like you were in control of
your work situation?21
(17.1)62
(50.4)25
(20.3)10
(8.1)5
(4.1)1.27±0.93
9How often were you angry due to things out of your
control?6
(4.9)31
(25.2)31
(25.2)42
(34.1)13
(10.6)2.20±1.09
10How often have you felt like difficulties were
accumulating more than you could bear?14
(11.4)41
(33.3)33
(26.8)27
(22)8
(6.5)1.79±1.11
Note: *Each of said questions starts with the following statement: “In the last month”.
Table 3. Distribution of mean value of total stress perception determined in regard to the type of ward where the participants were employed
N Mean SD Minimum Maximum
Private practice 14 18.07 6.306 8 27
Health centre 16 21.56 7.465 7 36
Home physical therapy 13 17.31 5.808 9 27
Physical medicine and rehabilitation 26 20.54 5.523 10 31
Neurology 23 18.3 5.372 9 26
Orthopedics 20 14.8 6.084 3 29
The unemployed 11 16.82 6.853 8 28
TOTAL 123 18.37 6.344 3 36
26 Milojević M. et al. Differences in Perception of Stress of Physiotherapists Employed in Various Departments. Croat Nurs J. 2020; 4(1): 21-31
Figure 1. Graphical representation of the mean values of total stress perception with regard to the ward type where the participants were employed (columns signify arithmetic means, and vertical
lines SD)
Table 4. Comparison of perceived stress intensity between different wards (p values are shown)
Private practice
Health centre
Home physical therapy
Physical medicine and rehabilitation
Internal medicine Orthopedics
Private practice
Health centre 0.706
Home physical therapy 0.999 0.507
Physical medicine and rehabilitation
0.885 0.998 0.709
Internal medicine 1.000 0.657 0.999 0.861
Orthopedics 0.722 0.021 0.910 0.032 0.500
The unemployed and students
0.998 0.431 0.999 0.621 0.994 0.974

Milojević M. et al. Differences in Perception of Stress of Physiotherapists Employed in Various Departments. Croat Nurs J. 2020; 4(1): 21-31 27
Discussion
This research sought to determine whether physi-otherapists employed in different departments dif-fer in perceived stress. It also sought to determine if there is a difference in the overall experience of stress with respect to socio-demographic character-istics (gender, age, total length of service, level of education, marital status and monthly income).
By summing up the answers to the 10 claims it was found that physiotherapists in this study perceived the overall experience of stress as moderate. One can say that such a finding is consistent with other research in the world. For example, in a study by Cam-po, Weiser and Koenig, that was conducted in 2009 in the United States, the goal was to determine the impact of job demands on physiotherapists’ stress and to compare it with other occupations. The sam-ple consisted of 1500 randomly selected members of the American Association for Physical Therapy (APTA). Data were collected through the two validat-ed questionnaires in the interval of one year. Physi-otherapists’ views on their work environment were positive. The level of stress and the job requirements were estimated as moderate (8).
In geographically and culturally diverse environ-ments, research has shown approximately the same results. A search of the literature shows that many studies have addressed the impact of stress on the work of healthcare professionals and their burnout in the workplace. Various authors have emphasized the importance of testing for the burnout syndrome in particular jobs. The conclusion for all of the research that was reported in this paper is that more studies need to be conducted to describe the characteristics of the work environment in this population. Also, the initiatives should be developed and studied in spe-cific institutions that improve the psychosocial work environment for physiotherapists.
In Croatian databases, there is a lack of research aimed at the level of workplace stress in physiotherapists. Majority of research of this type has been conducted on doctors and nurses, while other professions are listed as “other medical staff” (9, 10). Research con-ducted using validated questionnaire are very few in the Republic of Croatia. There is a validated question-naire aimed at medical workers that specifically inves-
Table 5. Results of total stress perception analysis in regard to age, sex, years of
service, level of education, marital status and monthly salary
N Mean SD Statistics
Age group
20 - 25 21 15.62 6.13
26 - 36 63 19.78 6.63 F=2.71
37 - 57 35 17.68 5.51 p=0.048*
Older than 57 4 16.50 5.20
Sex
M 18 17.28 7.48 p=0.433
F 105 18.55 6.15
Years of service
1 - 4 47 18.32 6.38
5-10 24 20.17 7.57 F=0.98
10-20 25 18.00 6.52 p=0.403
More than 20 27 17.18 4.71
Level of education
Secondary school 7 23.00 2.38 F=2.26
Higher education 73 18.40 6.50 p=0.108
University degree 43 17.56 6.28
Marital status
Single 29 19.79 5.85 p=0.167
With a partner 94 17.92 6.45
Monthly salary
Lower than a median net salary
in the Republic of Croatia
79 19.44 6.39 p=0.011**
Higher than a median net salary in the Republic of
Croatia
44 16.43 5.84
Other results show that there is no statistically significant difference between the level of per-ceived stress amongst participants in regard to sex (p=0.403), level of education (p=0.108) and marital status (p=0.167).

28 Milojević M. et al. Differences in Perception of Stress of Physiotherapists Employed in Various Departments. Croat Nurs J. 2020; 4(1): 21-31
of physical medicine and rehabilitation are more stressed than those who work in the orthopaedics department (14).
The results that have been obtained among respond-ent physiotherapists employed in orthopaedics are somewhat unexpected. Although this is a ward that often keeps severely ill patients, patients of differ-ent ages and with a high proportion of the elderly individuals, and patients undergoing post-operative treatment after complex surgery, the research has shown that physiotherapists are under lower inten-sity of stress. On the other hand, in orthopaedics, physiotherapists have a lower dynamics of daily flow of patients, and consequently they have more time for individual access to the patient. A well-organized team approach and proportionally less individual workload is the result of the team collaboration. Physiotherapists do not make their own decisions but exchange experiences at team meetings. This may just be an explanation for the fact that the phys-iotherapists are less stressed.
In line with the socio-demographic characteristics, a statistically significant difference was found with re-spect to age. Respondents aged 20–25 years showed significantly lower levels of perceived stress when compared to the subjects of 26–36 years of age. In the research students and the unemployed have also participated, and they are predominantly in the “good” age group of 20 to 25 years of age, and there is a possibility that the mentioned group would sig-nificantly change the result. Furthermore, the popu-lation of 67-year-old group of individuals contributed only to 3.3% in the survey, which also significantly changes the result.
It was determined that participants with a lower net monthly salary exhibit statistically significant great-er lever of perceived stress in comparison to partici-pants with a net monthly salary that is greater than the average.
In this study it was found that there was no statisti-cally significant difference in the level of perceived stress among respondents with respect to gender, length of service, level of education or marital status.
In the sample, there is a disproportion between the number of bachelors (73) and graduates/individuals having a master’s degree - a total of 43 individuals. The above represented data poses a limitation of this research given that the respondents do not fully rep-resent the sample.
tigates stress at the workplace. Milošević (2010) is the author of the said questionnaire that is unsuitable for online research due to its extensiveness. Hence, we have decided to use the Perceived Stress Scale measuring instrument (PSS) (11). Research conducted by Knežević on how and how much stress in the work-place affects working capabilities of medical workers in the Republic of Croatia was conducted in 2010 with over 1856 medical workers that were employed in 5 different Zagreb hospitals on 19 different specialist wards and it shows that two thirds of medical workers identify their workplace as a source of stress. Sex and age are significantly negatively correlated with the indications of working capabilities of medical workers (12). In the research by Kraljević (2017) that was con-ducted in Croatia most common sources of stress in physiotherapists, level of working capabilities and the relationship between stress, working capabilities and socio-demographic characteristics were examined.
Results have demonstrated that physiotherapists evaluate potential sources of stress as slightly or moderately stressful. The author concludes that there is no statistically significant level of stress in physiotherapists in regard to their socio-demograph-ic characteristics. On the stress intensity scale, most commonly recognized are those linked to work or-ganization and financial restrictions. The said results are partially compliant with our research in which the level of stress at the workplace amongst physiother-apists was moderate. The author’s scale of stress in-tensity corresponds with our conceptual definition of medical environment (13).
With regard to the difference in perceptions of stress between departments, this study has established that respondents employed in orthopaedics per-ceived stress to be significantly less significant than those employed in health centres and in the physical medicine and rehabilitation departments.
The health centre is an institution that implements primary health care measures in the local communi-ty. As a facility for a primary health protection level, the health centres addresses 80-85% of the com-munity health issues. It is a filter of inputs to higher levels of the health system (secondary and tertiary health care levels), which are more inaccessible be-cause they are fewer and therefore more expensive due to the use of expensive technologies. With this in mind it makes it possible to explain the results of this study, which show that physiotherapists work-ing in the health centres and in the departments

Milojević M. et al. Differences in Perception of Stress of Physiotherapists Employed in Various Departments. Croat Nurs J. 2020; 4(1): 21-31 29
The advantage of this research is certainly that it is evidence-based and as such may serve as a starting point for some future scientific procedures.
Conclusion
Despite the relatively limited scientific evidence of physiotherapists’ exposure to workplace stress, avail-able research does indicate to a particular degree of self-perception of stress in the workplace. The re-sults of the researches that were carried out in the world and the results obtained by the authors in the Republic of Croatia partly coincide with the results we have obtained in this paper.
With regard to the socio-demographic characteristics, a statistically significant difference was found with respect to age, with significantly lower levels of per-ceived stress that were exhibited by people from 20 to 25 years of age. It was determined that partici-pants with a lower net monthly salary exhibit statis-tically significant greater lever of perceived stress in comparison to participants with a net monthly salary that is greater than the average.
The results of this study show that there is no statis-tically significant difference in the level of perceived stress among the respondents in terms of gender, length of service, level of education or marital sta-tus. With regard to the difference in the perception of stress between the departments, it was found that the respondents employed in orthopaedics perceived stress to a much lesser extent when compared to the respondents employed in health centres and physical medicine and rehabilitation departments. The differ-ence in the perception of stress among the respond-ents employed in other departments shows no sta-tistically significant difference.
When using the Perceived Stress Scale (PSS) at the level of total perceived stress, the results have shown that the subjects are exposed to moderate stress.
The findings obtained with this research can serve as a basis for future research at a higher scientific level, and as a basis for developing a strategy for reducing stress and thus preventing negative consequences in the workplace.
One of the disadvantages of this research is related to the method of data collection. The use of self-rating scales is a potential drawback of this research. Since they are coupled with a tendency to give socially desirable and favourable answers, the honesty and objectivity of such responses is questioned. This de-ficiency could be solved by using other measuring in-struments (such as peer evaluations) to provide more accurate answers.
The application of the online questionnaire has its advantages and disadvantages. This method of re-search application was used because it was a con-venient way to reach more participants who needed to meet certain conditions. There was no possibility to control the conditions under which the question-naires were filled in, which means that the identity of the participants, their age and gender cannot be verified. Also, there is no possibility of verifying the comprehension of the instructions, and we cannot monitor the participants’ behaviour when completing the questionnaire and making sure that they partici-pate in a serious manner. An important limitation of online research is the limited representativeness of a sample of Internet users for the entire population of physical therapists. Participants were not cho-sen by random selection but by voluntary participa-tion. Therefore, the data obtained in this research should be interpreted carefully and cannot actually be generalized. In future research, it would certainly be interesting to confirm the results on a different specific sample (for example, the older population).
Another major drawback of this research is the use of the Perceived Stress Scale (PSS). This instrument is designed to test general non-specific stress and is one of the most commonly used instruments in psy-chological testing. It is possible that with the imple-mentation of some other measuring instrument that specifically addresses the stress caused by workplace situations we could get different results. Therefore, the recommendation for future research is to apply or develop a more specific measurement scale.
Given the obtained results, research on a more rep-resentative sample of physiotherapists should be conducted, with respect to their age, gender, length of service, qualifications, etc. It would also be inter-esting to investigate possible regional differences in perceived stress among physiotherapists in the Republic of Croatia. Future research could focus on exploring guidelines for stress prevention or on other variables other than stress.

30 Milojević M. et al. Differences in Perception of Stress of Physiotherapists Employed in Various Departments. Croat Nurs J. 2020; 4(1): 21-31
8. Campo MA, Weiser S, Koenig KL. Job strain in physical therapists. Phys Ther. 2009;89(9):946–56.
9. Buljubašić A. Sindrom sagorijevanja među zdravstve-nim djelatnicima [diplomski rad]. Split: Sveučilište u Splitu; 2015. Croatian.
10. Strapajević D. Procjena utjecaja rada u integriranoj bol-ničkoj hitnoj službi na zdravlje i radnu sposobnost dje-latnika. Sestrinski glasnik. 2015;20(3):231-9. Croatian.
11. Milošević M. Izrada mjernog instrumenta stresa na radnom mjestu bolničkih zdravstvenih djelatnika i pro-cjena njegove uporabne vrijednosti [doktorska diser-tacija]. Zagreb: Sveučilište u Zagrebu; 2010. Croatian.
12. Knežević B. Stres na radu i radna sposobnost zdrav-stvenih djelatnika u bolnicama [doktorska disertacija]. Zagreb: Sveučilište u Zagrebu; 2010. Croatian.
13. Kraljević A. Stres i radna sposobnost kod fizioterape-uta [diplomski rad]. Zagreb: Zdravstveno veleučilište; 2017. Croatian.
14. Knežević B, Golubić R, Belošević LJ, Milošević M, Mustaj-begović J. Očuvanje radne sposobnosti bolničkih zdrav-stvenih djelatnika. Acta Med Croatica. 2010;64(5):391-4. Croatian.
References
1. Ajduković D. Izvori profesionalnog stresa i sagorijevanja pomagača. U: Ajduković D, Ajduković M, urednici. Pomoć i samopomoć u skrbi za mentalno zdravlje pomagača. Zagreb: Društvo za psihološku pomoć; 1996. Croatian.
2. Brajša P. Pedagoška komunikologija. Zagreb: Školska knjiga; 1994. Croatian.
3. Nathiya N, Sasikumar K, Jagannath M, Thangaraj M, Adalarasu K. An observational study on occupational stress among physiotherapists. Biomed Pharmacol J. 2017;10(2):889-94.
4. Mandy A, Rouse S. Burnout and work stress in junior physiotherapists. Br J Ther Rehabil. 1997;4:597–603.
5. Al-Imam DM, Al-Sobayel HI. The Prevalence and Severity of Burnout among Physiotherapists in an Arabian Setting and the Influence of Organizational Factors: An Observa-tional Study. J Phys Ther Sci. 2014;26(8):1193–8.
6. Cohen S, Kamarck T, Mermelstein, R. A global measure of perceived stress. J Health Soc Behav. 1983;24(4):385-96.
7. Chiu YH, Lu FJ, Lin JH, Nien CL, Hsu YW, Liu HY. Psycho-metric properties of the Perceived Stress Scale (PSS): measurement invariance between athletes and non-athletes and construct validity. Peer J. 2016;4:e2790.

Milojević M. et al. Differences in Perception of Stress of Physiotherapists Employed in Various Departments. Croat Nurs J. 2020; 4(1): 21-31 31
da ne postoji statistički značajna razlika u razini per-cipiranog stresa među ispitanicima s obzirom na spol, godine radnog staža, stručnu spremu ili bračni status.
Ključne riječi: percipirani stres, fizioterapeuti, kliničko okruženje
Sažetak
Stres na radnom mjestu specifična je vrsta stresa, čiji je izvor u radnom okolišu. Stresne situacije na poslu mogu izazvati negativne emocije koje se povezuju s anksioznošću, napetošću i nedostatkom motivaci-je za rad. Cilj je ovog rada ispitati razlike u percepciji stresa fizioterapeuta zaposlenih na različitim odjeli-ma. Istraživanje je provedeno putem online upitnika među 123 fizioterapeuta na području Republike Hr-vatske. Rezultati su pokazali da ispitanici doživlja-vaju svoje radno mjesto umjereno stresnim. Što se tiče razlike u doživljaju i percepciji stresa s obzirom na odjel na kojem fizioterapeuti rade, rezultati po-kazuju da postoji statistički značajna razlika u razini percipiranog stresa među ispitanicima s obzirom na odjel na kojem su zaposleni. Utvrđeno je da ispitanici zaposleni na ortopediji u statistički značajno manjoj mjeri percipiraju stres u odnosu na ispitanike koji su zaposleni u domovima zdravlja te na odjelu fizikalne medicine i rehabilitacije. Razlika u percepciji stresa među ispitanicima zaposlenima na ostalim odjelima ne pokazuje statistički značajnu razliku. Utvrđeno je da ispitanici u dobi od 20 do 25 godina pokazuju statistički značajno manju razinu percipiranog stresa u odnosu na ispitanike u dobi od 26 do 36 godina. Između ostalih dobnih skupina ne postoji statistički značajna razlika u percepciji stresa. Utvrđeno je i da ispitanici s neto mjesečnom plaćom manjom od pro-sječne pokazuju statistički značajno veću razinu per-cipiranog stresa u odnosu na ispitanike s neto plaćom većom od prosječne. Rezultati istraživanja prikazuju
RAZLIKE U PERCEPCIJI STRESA FIZIOTERAPEUTA ZAPOSLENIH NA RAZLIČITIM ODJELIMA


1 Suzana Vidović Vondra1 Sanja Narić1 Ana Pavelić Tremac1 Josipa Kurtović
1 Neuropsychiatric Hospital „dr. Ivan Barbot”, Popovača, Croatia
Article received: 23.10.2019.
Article accepted: 03.02.2020.
DOI: 10.24141/2/4/1/3
Author for correspondence: Suzana Vidović Vondra Neuropsychiatric Hospital „dr. Ivan Barbot” Vinogradska 55, Popovača, Croatia E-mail: [email protected]
Keywords: attitudes, foster care, separation of children, mental healthcare professionals, school professionals
Abstract
In Croatia, the process of deinstitutionalization of childcare is underway, and it should increase the placement of children in non-institutional forms of care such as foster care. The aim of the study was to examine attitudes towards foster care and child separation among school and adult mental health professionals.
The sample consisted of 159 respondents (employ-ees of elementary schools in Kutina, Popovača and Velika Ludina and employees of the Neuropsychiatric Hospital “Dr. Ivan Barbot” in Popovača). The survey covered all relevant sociodemographic variables, and the Scale of Attitudes Towards Separation of Chil-dren from Family and the Attitudes Towards Foster Care Scale were used to examine attitudes [Ka-menov, Sladovic Franz & Ajdukovic, 2005].
In the sample examined, attitudes to foster care and separation are slightly positive, indicating that there is plenty of room for activities aimed at empowering these views. If further attitudes are to be strength-ened, therefore the population of potential future foster parents is also expected to expand.
It is important to highlight the role of healthcare professionals involved in the mental health care of foster children and to consider their role in modifying general attitudes towards foster care for children and their role in building an optimal foster care system.
Attitudes of Health Professionals and Primary School Staff towards the Separation of Children from Families and Foster Care
Croat Nurs J. 2020; 4(1): 33-45

34 Vidović Vondra S. et al. Attitudes of Health Professionals and Primary School Staff... Croat Nurs J. 2020; 4(1): 33-45
in relation to families and children at risk of separa-tion. The Foster Care Act, which came into force on January 1, 2019, professionalizes foster care and in-troduces special foster care for children in need of special treatment (9). The new law thus brings about positive changes in relation to the foster care regu-lation, which does not, however, guarantee social changes in attitudes towards foster care. Attitudes, in turn, are an important psychological component that drives our behavior and choices.
In Croatia, but also more broadly, there is not much research on attitudes of experts, as well as of the public, towards child separation and foster care. The conducted research in our area shows a slightly posi-tive attitude towards both issues (10,11). Experts who participate directly in decision-making process-es regarding separation and foster care show a bit more positive attitude towards separation than peo-ple in the general population, and somewhat more negative towards foster care (10). A positive attitude towards separation of children from families at risk is not necessarily linked to a positive attitude towards foster care as the best solution for these children, and obviously there is still a lot of investment to be done in raising the quality of foster care so it can be recognized as the best choice for childcare (10).
Investigating public attitudes about separation and foster care is also important in terms of planning and implementing activities to recruit future foster carers.
Background
Examining the attitudes of the general population about foster care is certainly one of the necessary initial steps to plan and implement these activities.
According to Pennington (12), attitude is one of the basic concepts for understanding social life, and one of the basic concepts of social psychology in general. By modern definition, an attitude can be defined as an acquired, relatively permanent and stable organi-zation of positive or negative emotions, values and reactions to an object (12).
No other psychic trait influences events in human society, nor is as influenced by society itself, as atti-
Introduction
Currently in Europe there is a process of deinstitu-tionalization of childcare underway, which means restructuring of institutional care, developing, and strengthening alternative care. It is encouraged by research that growing up in institutions is the least beneficial solution for a child and a serious threat to society as it reduces its resources (1). Children who are growing up in foster families have better men-tal health indicators, better social support, and lower levels of perceived daily stress compared to children living in residential care (2,3,4). In terms of develop-ing and strengthening alternative forms of childcare, a lot is being invested in development of foster care, reduction of the number of children placed in insti-tutions, reduction of the size of institutions and de-veloping family foster homes (the development of professional foster families as solutions for children who need special treatment). Furthermore, various types of foster care are developed – short-term, long-term, in crisis, foster care before adoption, foster care for mother and baby, foster care for families etc. (1). There is strong evidence that children in kinship fos-ter care have fewer behavioral problems (3,4,5) and fewer mental health problems (3,6) than children in non-kinship foster care.
Children age 6 or older in kinship care are less likely to have behavioral problems than peers in non-kin-ship foster care (4,5) infants in kinship care are also less likely to have developmental delays (7).
In Croatia, in 2014, the ratio of institutional care to non-institutional care (foster care and family-type homes) was 39.6% versus 60.4%, while the aim for the year 2016 was to reach 20% to 80% (8). With re-gard to the ratio of children placed in institutions and foster homes, the situation in Croatia is less favora-ble than in Western European countries (1). Childcare homes in Croatia are too large and the number of chil-dren should be reduced, especially for children under 7 years of age. Most foster parents are over 50 years of age, and foster care is not evenly developed in dif-ferent areas of Croatia. Therefore, activities to pro-mote foster care need to be undertaken, especially to mobilize younger citizens and those living in parts of Croatia where foster care is less represented (8). It is necessary to raise the level of preventive measures

Vidović Vondra S. et al. Attitudes of Health Professionals and Primary School Staff... Croat Nurs J. 2020; 4(1): 33-45 35
In Croatia, but also more broadly, a small number of surveys have been conducted on the attitudes of ex-perts, as well as of the public towards child separa-tion and foster care. The conducted research in our area shows a slightly positive attitude towards both issues (10,11). Experts who participate directly in decision-making processes regarding foster care and foster care show a more positive attitude towards separation than individuals in the general popula-tion, and somewhat more negative towards foster care (10), indicating that these are two independent cognitive assessments. A positive attitude towards the separation of children from families at risk is not necessarily linked to a positive attitude towards fos-ter care as the best solution for these children, and obviously there is still a lot of investment to be done in raising the quality of foster care to be recognized as the best choice for separating children (10).
Research into attitudes of general public towards sep-aration and foster care is also important in terms of planning and implementing activities to recruit future foster parents. Bearing in mind that attitudes influ-ence behavior, the implementation of activities aimed at changing attitudes should also have an effect on in-creasing the number of potential future foster parents. In Croatia, foster carers, as already stated, are mostly women over 50 years of age, of lower and secondary education, women, rural residents (16). In this sense, ac-tivities should be carried out in order to attract potential foster carers of younger age, higher education, and also urban residents. Examining the attitudes of the general population about foster care is certainly one of the nec-essary initial steps to plan and implement these activi-ties. Bearing in mind that attitudes influence behavior, the implementation of activities aimed at changing attitudes should also have an effect on increasing the number of potential future foster parents.
People employed in educational work with children are often among the first to detect children whose rights and health are endangered within the family, and often are initiators or participants in the process that ultimately leads to decisions about the need for separation of children. In their workplace, they often come into direct contact with children separated from their families or foster children, and their attitudes towards foster care and separation may certainly af-fect their professional relationship with children and foster parents.
Healthcare professionals, as well as nurses, meet with members of different groups to whom they
tudes are. For that reason attitudes are an important part of a person’s personality. Attitudes are acquired, shaped and changed in the process of social develop-ment of an individual, and are formed based on dif-ferent types of learning (gaining experience). They affect human memory, perception, thinking, and ac-tions, they can foster love or hate, provoke social conflict, or resolve conflicts (13).
According to the three-component model, attitude is the product of cognitive, emotional and behavioral processes and has cognitive, emotional and behav-ioral reactions to an object. This model of attitude structure is also called the ABC model (affect, behav-ior, cognition) (14).
Knowledge, in addition to perceptions of the object, contains an evaluation and includes a positive or negative validation, evaluation and judgment on the characteristics of the object. The emotional compo-nent contains the emotional attitude towards the ob-ject of the attitude, that is, the experience that the object is pleasant and attractive or unpleasant and repulsive. If the object of the attitude is perceived as pleasant and attractive, a positive emotional re-lationship will form. On the other hand, if the object is perceived as unpleasant and repulsive, the emo-tional relationship will be negative. Emotional satura-tion gives the attitude special strength and stability (15). The behavioral component is manifested in the willingness to act towards the object of the attitude. Attitudes can be positive or negative, so a positive attitude is manifested in the desire to support, assist and protect the object of the attitude, while negative attitude in that the object is avoided, disabled or at-tacked. If the person has more information about the object and more contacts with the object then the attitude is more favorable.
Attitudes thus affect attention and presentation, per-ception and judgment, and elaboration and memory. The relationship between attitude and behavior is as strong as attitude and behavior correspond in their specificity or association, and in which these simple aspects, functions and components of attitude are salient at the time that attitude and behavior are measured. Personality variables also influence the relationship between attitude and behavior. As such, attitudes can be examined, and based on the results, obtained conclusions and predictions can be made about the epidemiological status and the trend of changes in relation to the phenomenon with which we associate attitudes.

36 Vidović Vondra S. et al. Attitudes of Health Professionals and Primary School Staff... Croat Nurs J. 2020; 4(1): 33-45
(51.6%), and 44% of the respondents are directly in-volved with children within current workplace. Almost a third of respondents are parents, and 84.9% of respond-ents consider their earnings to be average. The average length of service is 18 years (M=18.48; SD=11.561).
A sample of respondents employed in education field was made up of elementary school staff (classroom teachers, subject teachers, professional assistants) in Kutina, Popovača and Velika Ludina, with 39.6% of respondents (N=63). A sub-sample of the healthcare employees were staff in the Neuropsychiatric Hospi-tal „Dr. Ivan Barbot” in Popovača (nurses , first-year nurses, masters/ nurses, social workers, psycholo-gists, social pedagogues, doctors, carers, occupation-al therapists, professional referents), 58.5% (N=93) .
The Scale of Attitudes Towards Separation of Children from Family and the Attitudes Towards Foster Care Scale were used in which the respondents expressed their attitude on a 5-point Likert scale on each state-ment, with number 1 indicating complete disagree-ment and number 5 indicating complete agreement.
The Scale of Attitudes Towards Separation of Children from Family (5) consists of 20 statements (7 positive and 13 negative). Formation of the total result, which is achieved by summing the answers on individual statements, is preceded by the transformation of the answers on negative statements. The possible range of results is from 20 - extremely negative attitude to 100 - extremely positive attitude, and the mean value is 60 - neutral attitude towards separating chil-dren from their family. In addition to the total result, it is possible to calculate the result on factors that are integral to the total attitude towards the separa-tion. The Scale of Attitudes Towards Separation of Children from Family thus measures four subscales: Benefit of separation, Cruelty of separation, Unprom-ising prospect of a separated child, and Inviolability of the rights of a biological family. The scale reliabil-ity test obtained a high coefficient of internal con-sistency (α=0.85) and one overall result can be ob-tained indicating the intensity of attitudes towards the separation of children from the family.
The Attitudes Towards Foster Care Scale (5) consists of 22 statements (11 positive and 11 negative). Forma-tion of the total result, which is achieved by summing the answers on individual statements, is preceded by the transformation of the answers on negative state-ments. The possible range of results is from 22 - ex-tremely negative attitude to 110 - extremely positive
have certain opinions and attitudes and behave in a certain way. Pediatric nurses are also more likely to encounter foster children and it is important to be aware of the attitudes and potential prejudices they may have towards children, as well as their foster parents. Foster children may also have some specific difficulties and concerns, that they may have during their hospital stay or examination. It is important to know how to respond in such situations, to be empa-thetic, to support both children and foster parents. Similarly, health professionals working in educational institutions can help educate peers (kindergartens, schools) who, due to ignorance, may have prejudices or behave inappropriately towards such children.
A special group of health professionals are those in-volved in mental health care of children and adoles-cents. A nurse in the mental healthcare system, with her attitude and empathetic capacity, can greatly help build a positive attitude towards all relevant car-egivers of vulnerable groups, which is extremely im-portant in the process of destigmatization of children with mental disorders. Also, by promoting mental health, a nurse participates in the primary and sec-ondary prevention of further development and com-plication of psychiatric disorders in foster children.
Aim
This study examined whether there is a difference in attitudes toward foster care and separation of children from their families, between professionals working with children within the educational sys-tem and professionals working in the adult mental healthcare system.
Methods
The sample consisted of 159 respondents, mostly fe-male (80.5%). The average age was 41 years (M=41.13, SD=10.750). Most of them live in a smaller city (66.7%) and are married. Dominant education level is high

Vidović Vondra S. et al. Attitudes of Health Professionals and Primary School Staff... Croat Nurs J. 2020; 4(1): 33-45 37
not think that separated children will not know how to start and care for their families, and do not per-ceive separated children as a burden to society while separation is considered a good measure of protec-tion of the abused and neglected child.
The means on particular factors of the Scale of At-titudes Towards Separation of Children from Family indicate that the respondents have the most posi-tive attitude on Unpromising prospect of a separated child subscale, which means that on average they do not think that separated children are doomed to a non-perspective future (Graph 1).
The mean of the total recoded results of the respond-ents on the Attitudes Towards Foster Care Scale is 76.01. When considering the possible range of the total score from 22 (extremely negative attitude) to 110 (extremely positive attitude) while a neutral at-titude towards foster care represents a value of 66, we can state that these respondents have a slightly positive overall attitude towards foster care.
Table 2 shows that, on average, respondents have a neutral attitude towards experiencing foster parents as people who only care for financial benefits, the lack of expertise in foster families, and the warmer attitude of foster parents towards children compared to profession-als. Respondents express the most positive attitudes towards factor 20 which means that they most agree with experiencing foster parents as greedy people.
Based on the means of the respondents’ results on particular factors of the Attitudes Towards Foster Care Scale, it can be concluded that the respondents have a neutral attitude on the first three subscales, while the average attitude is negative on the Lack of expertise compared to institutions subscale. Re-spondents consider, on average, that foster carers lack expertise in relation to institutions.
Statistically significant differences were obtained in the overall attitude towards child separation as well as in the individual components of attitude to-wards separation between respondents employed in education and health field. Respondents employed in education have a more positive overall attitude (t=2.241; p=0.027) towards the separation of chil-dren compared to respondents employed in health care. Education field employees experience sepa-ration as more beneficial (t=3.486; p= 0.001) and find it less cruel (t=2.507; p=0.013) than those em-ployed in health care. Persons employed in education and health care did not differ in the attitudes on the
attitude, and the mean is 66 – neutral attitude towards foster care. In addition to the total score, it is possible to calculate the score on factors that are integral to the overall attitude towards foster care, and measures four subscales: Negative aspects of foster care - Child exploitation, Foster care as a reflection of love for chil-dren, Advantages of foster care compared to institu-tion, and Lack of expertise compared to institutions. The scale reliability test yielded a high internal consist-ency coefficient (α=0.91) and one overall result indicat-ing the intensity of foster care attitudes was obtained. An electronic version of the questionnaire used in the survey was distributed to primary school staff. A part of the staff of the Neuropsychiatric Hospital „Dr. Ivan Barbot “completed the paper version of the question-naire, while the second part was passed the electronic version of the questionnaire. The questioning was completely anonymous. Participants completing the paper-pen version of the questionnaire completed the questionnaire in groups. The data was collected between the beginning of June and the end of August 2018.
Results
The mean of the recoded total scores of the respond-ents on the Scale of Attitudes Towards Separation of Children from Family is 70.01. When considering the possible range of the total score from 20 (extremely negative attitude) to 100 (extremely positive atti-tude) while a neutral attitude towards child separation is a value of 60, we can state that the respondents have a slightly positive overall attitude towards child separation from the family. Table 1 shows the average values at the level of the whole sample for attitudes towards the separation of children from the family.
Table 1 shows that the respondents the least agree with the position covered by factor number 6, with the statement that the only valid reason for sepa-rating children is the threat to their lives. They have an unspecified or neutral attitude towards the expe-riencing professionals who separate children from families as determined and courageous persons. In this study, respondents expressed the highest agree-ment with factors 4, 9, and 20. Most respondents do
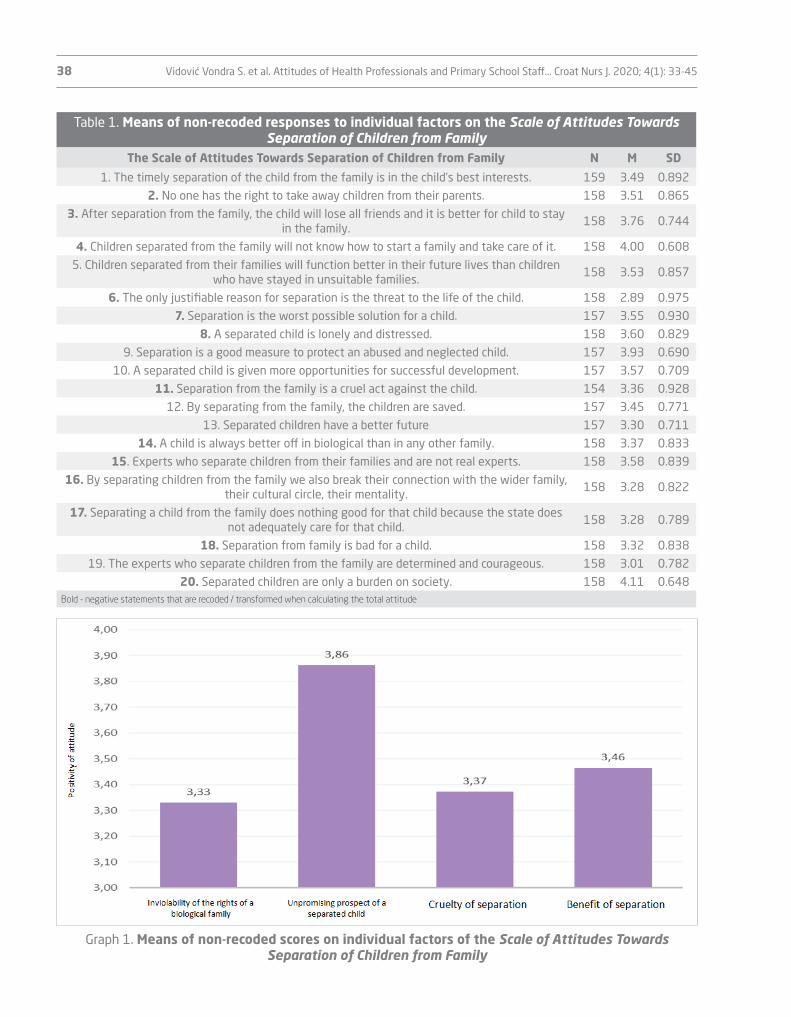
38 Vidović Vondra S. et al. Attitudes of Health Professionals and Primary School Staff... Croat Nurs J. 2020; 4(1): 33-45
Table 1. Means of non-recoded responses to individual factors on the Scale of Attitudes Towards Separation of Children from Family
The Scale of Attitudes Towards Separation of Children from Family N M SD
1. The timely separation of the child from the family is in the child’s best interests. 159 3.49 0.892
2. No one has the right to take away children from their parents. 158 3.51 0.865
3. After separation from the family, the child will lose all friends and it is better for child to stay in the family.
158 3.76 0.744
4. Children separated from the family will not know how to start a family and take care of it. 158 4.00 0.608
5. Children separated from their families will function better in their future lives than children who have stayed in unsuitable families.
158 3.53 0.857
6. The only justifiable reason for separation is the threat to the life of the child. 158 2.89 0.975
7. Separation is the worst possible solution for a child. 157 3.55 0.930
8. A separated child is lonely and distressed. 158 3.60 0.829
9. Separation is a good measure to protect an abused and neglected child. 157 3.93 0.690
10. A separated child is given more opportunities for successful development. 157 3.57 0.709
11. Separation from the family is a cruel act against the child. 154 3.36 0.928
12. By separating from the family, the children are saved. 157 3.45 0.771
13. Separated children have a better future 157 3.30 0.711
14. A child is always better off in biological than in any other family. 158 3.37 0.833
15. Experts who separate children from their families and are not real experts. 158 3.58 0.839
16. By separating children from the family we also break their connection with the wider family, their cultural circle, their mentality.
158 3.28 0.822
17. Separating a child from the family does nothing good for that child because the state does not adequately care for that child.
158 3.28 0.789
18. Separation from family is bad for a child. 158 3.32 0.838
19. The experts who separate children from the family are determined and courageous. 158 3.01 0.782
20. Separated children are only a burden on society. 158 4.11 0.648Bold - negative statements that are recoded / transformed when calculating the total attitude
Graph 1. Means of non-recoded scores on individual factors of the Scale of Attitudes Towards Separation of Children from Family

Vidović Vondra S. et al. Attitudes of Health Professionals and Primary School Staff... Croat Nurs J. 2020; 4(1): 33-45 39
p=0.000) than respondents employed in health care. Educational employees experience a lower presence of Negative aspects of foster care - child exploitation in foster care (t=3.748; p=0.000), experience Foster care as a reflection of love for children to a greater degree (t=5.707; p= 0.000), and consider more positive the Advantages of foster care over an institution (t=5.780; p=0.000) in comparison with respondents employed in health care. Employees in education and health care have a similar (t=1.775; p=0.078) negative attitude on Lack of expertise compared to institutions subscale.
Inviolability of the rights of a biological family sub-scale (t=-0.741; p=0.460) and the Unpromising pros-pect of a separated child subscale (t=1.441; p=0.152).
Statistically significant differences were found in the overall attitude towards foster care as well as in the individual components of attitudes towards foster care between the respondents employed in educa-tion and health.
Respondents employed in education have more posi-tive overall attitude towards foster care (t=5.336;
Table 2. Means of non-recoded responses to individual factors of the Attitudes Towards Foster Care Scale
The Attitudes Towards Foster Care Scale N M SD
1. In a foster family, children receive more love than in institutions. 159 3.43 0.853
2. A foster family is the best solution for caring for a child separated from the family 159 3.42 0.88
3. The foster family provides a safer and better quality environment for the child separated from the primary family.
159 3.49 0.841
4. Foster care is the most natural form of care for a child without parents. 157 3.52 0.924
5. Foster carers are less concerned about protégés than the institution. 159 3.63 0.642
6. Foster parents take children into their families because they love them and want to help them.
159 3.45 0.691
7. Foster parents do not look at earnings and are certainly not on financial gain. 158 3.09 0.812
8. Foster parents are warmer with their child than professionals. 159 3.09 0.774
9. Institutions do better and more professional work with children than foster families.
158 3.18 0.703
10. Foster carers use children as free labor. 159 3.63 0.680
11. Foster families provide high quality care, love and attention. 159 3.25 0.682
12. Foster care is a way by which a person shows love for another living being. 157 3.46 0.721
13. Foster parents most often want to reap some benefits. 159 3.42 0.705
14. Children’s rights are violated in foster families. 158 3.52 0.655
15. In foster families, children are often abused. 159 3.55 0.690
16. Foster parents neglect the development of foster children because they are not their own.
159 3.64 0.629
17. Foster families lack expert knowledge. 158 3.02 0.794
18. Foster parents want to provide children with a family where they will grow up safely.
159 3.65 0.676
19. The foster family cannot provide quality facilities as an institution. 159 3.51 0.692
20. Foster parents are greedy people. 159 3.79 0.637
21. Foster families pay more attention to the child than institutions. 158 3.38 0.710
22. Foster parents live at the expense of a foster child 159 3.61 0.665Bold - negative statements that are recoded / transformed when calculating the total attitude
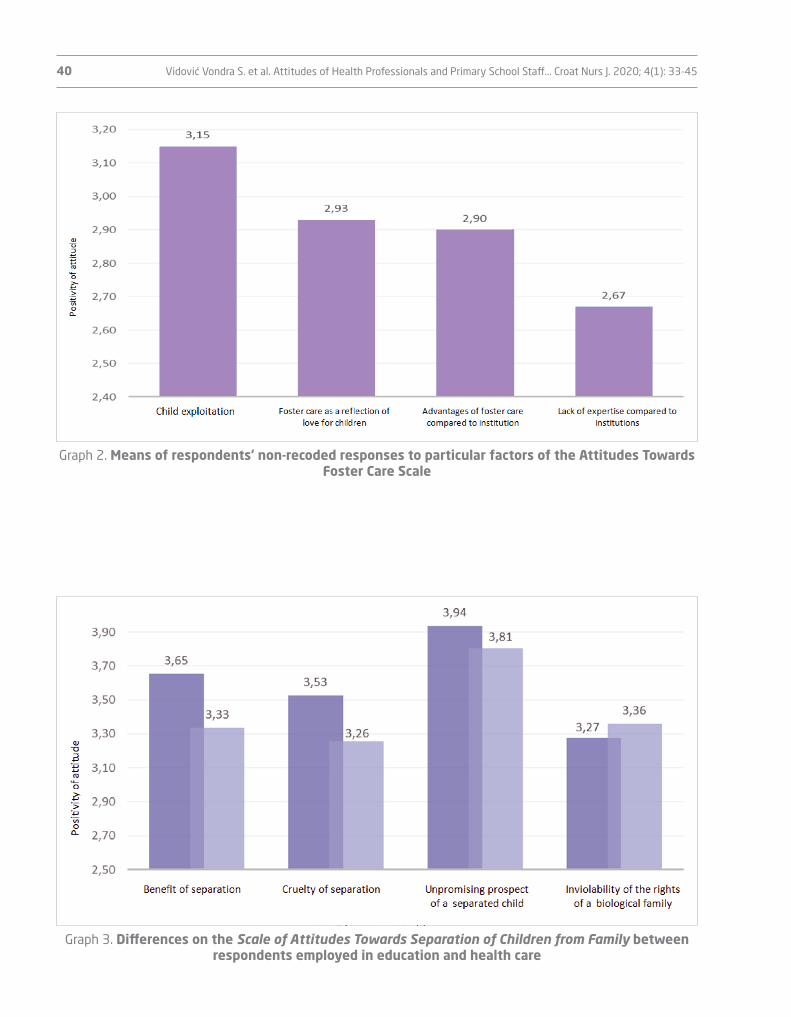
40 Vidović Vondra S. et al. Attitudes of Health Professionals and Primary School Staff... Croat Nurs J. 2020; 4(1): 33-45
Graph 2. Means of respondents’ non-recoded responses to particular factors of the Attitudes Towards Foster Care Scale
Graph 3. Differences on the Scale of Attitudes Towards Separation of Children from Family between respondents employed in education and health care

Vidović Vondra S. et al. Attitudes of Health Professionals and Primary School Staff... Croat Nurs J. 2020; 4(1): 33-45 41
menov, Franz Sladović and Ajduković on a sample of social system experts and general population (10). This sample could be considered, for comparison, as a sample from the general population, since they are people who do not participate directly in the foster care process or in the process of separating children from the family. On average, the respondents have the most positive attitude towards the future of separated children and do not think that separated children are doomed to an unpromising future. On average, they believe that foster parents lack exper-tise compared to institutions. Furthermore, similar results were obtained in the study of attitudes of so-cial services professionals towards foster care, which show that as many as 73.2% of experts agree with the claim that foster families lack expert knowledge (11). Research on foster parents’ attitudes and self-assessment about their own education has yielded different results. Thus, Ajduković et al. (11) find in their study of 79 foster parents, that just under two-thirds of respondents felt they had sufficient knowl-edge of their job. Žižak (16) cites a study of The Puls Agency on the state of foster care in Croatia, which shows that 38% of respondents are satisfied with the education they receive as a way of preparing for the foster care, while 33% believe that with the
Discussion
Respondents in this study showed a slightly positive overall attitude towards foster care and separation of children from the family. They exhibit slightly less variability (dispersal of individual responses) in their attitudes towards separation compared to attitudes towards foster care. In other words, their attitudes are more stable, that is, respondents have similar at-titudes. When it comes to the individual components of attitudes towards foster care, respondents differ the least in attitudes towards Advantages of foster care over an institution subscale. On the other hand, they differ most in attitudes towards the benefits of foster care compared to institutions. When it comes to individual components of attitudes towards sepa-ration, the greatest agreement is expressed in atti-tudes towards the Unpromising prospect of a sepa-rated child and the Benefits of separation, and least in attitudes towards the Inviolability of the rights of the biological family.
Similar results in terms of a slightly positive attitude towards both tested objects were obtained by Ka-
Graph 4. Differences on the Attitudes Towards Foster Care Scale between respondents employed in education and health care

42 Vidović Vondra S. et al. Attitudes of Health Professionals and Primary School Staff... Croat Nurs J. 2020; 4(1): 33-45
inviolability of the rights of a biological family and the unpromising prospect of a separated child.
Kamenov et al. (10) found differences in attitudes between social service professionals and the gen-eral population. Experts had a more negative at-titude towards foster care and a more positive at-titude towards child separation. To a lesser extent, they viewed foster care as a reflection of love, and they perceived significantly more that foster par-ents lacked expertise in comparison to institutions. The authors explained the more positive attitude of experts towards separation by the theory of cogni-tive dissonance according to which experts and de-cision makers about separation have to adapt their attitudes to their behavior. In this study, people em-ployed in education have a more positive attitude towards both foster care and separation from those employed in the adult mental health field. Education employees, unlike adults in the adult mental health sector, are in intense contact with a large number of children. They are likely to be more aware of a threat to the child rights and of various other circumstances that otherwise lead to the separation of children. They may also be more educated on child rights is-sues and more likely to witness the consequences of inadequate parental care on children’s functioning. Due to all the above, it is expected that, given the more realistic extent of harm when it comes to viola-tions of the rights and health of children, education field employees will also have a more positive atti-tude towards the need to separate vulnerable chil-dren from their families.
Compared to other European countries, it is difficult to position the findings as there is no similar survey of attitudes towards foster care. With regard to foster care, research in other European Union countries fo-cuses on the impact of foster care (and various forms of care for children) on children and the outcomes of their experience growing up outside their primary family. Family or related foster care is a child protec-tion measure that has been advocated throughout European countries over the last decade (18). Re-search shows that this form of foster care meets the developmental needs of children and young people at risk better (19). Consequently, after defining at-titudes towards foster care and separation of chil-dren, further research and campaigns should be con-ducted in Croatia to promote precisely those forms of childcare that have proven to offer more positive outcomes.
education they neither gained, nor lost anything. The Sirius Center in Croatia was the leader of the project “Competence Development for Carers and Educators of Children in Foster Care in the Context of Transi-tion from Institutional to Community Based Care”, which ran from 2014 to 2016. Within the project an analysis of needs for additional training of assistant educators, caregivers and foster parents was made. Particular focus was put on transversal skills which include: working with children with behavioral and learning disabilities, coping with stress and over-load, working with children to develop a positive outlook, motivating children for school, skills in the field of communication, establishing and maintain-ing relationships, social skills, values and attitudes, and successfully coping with change and stress (17). This analysis has put forward proposals for improv-ing existing models of foster care, according to which foster parents in Croatia should receive more fre-quent training, workshops and thematic lectures by experts, the system should provide more accessible practical psychological counseling when problems in foster care arise, organize meetings and facilitate the exchange of experience, provide psychological assis-tance, arrange for more training in the field of devel-opmental difficulties of children and child behavior, ensure the availability of support and supervision groups and the possibility for foster parents to be-come involved. Looking at these recommendations, it seems that there is still much room for improvement in foster care education in Croatia, in which nurses involved in the child mental healthcare system cer-tainly play their role as described in the introduction.
Respondents employed in education have a more positive overall attitude towards foster care; they experience there is less presence of child exploita-tion in foster care, they see foster care as a reflection of love to a greater degree, and find that foster care has more advantages than institutions, compared to healthcare professionals working in adult mental health care. Respondents employed in education and those in health field have the same view at the lack of foster parents’ expertise compared to institutions.
The respondents employed in education have a more positive overall attitude towards the separation of children than the respondents employed in health care. Education employees experience more ben-efits in separation and find it less cruel than those employed in health care. Respondents employed in education and those in health field look equally at

Vidović Vondra S. et al. Attitudes of Health Professionals and Primary School Staff... Croat Nurs J. 2020; 4(1): 33-45 43
References
1. Ajduković M. Pristupi zbrinjavanju djece bez odgova-rajuće roditeljske skrbi u Europi. Revija za socijalnu politiku. 2004;11(3-4):299-320. Croatian.
2. Ajduković M, Sladović Franz B. Samoprocjena po-našanja mladih u dječjim domovima i udomitelj-skim obiteljima u Hrvatskoj. Društvena istraživanja. 2004;13(6):1031-54. Croatian.
3. Winokur M, Holtan A, Batchelder KE. Kinship care for the safety, permanency, and well-being of children removed from the home for maltreatment. Cochrane Database Syst Rev. 2014;(1):CD006546.
4. Perry KJ, Price JM. Concurrent child history and con-textual predictors of children’s internalizing and externalizing behavior problems in foster care. Child Youth Serv Rev. 2018;84:125–36.
5. Wu Q, White KR, Coleman KL. Effects of kinship care on behavioral problems by child age: A propensity sco-re analysis. Child Youth Serv Rev. 2015;57:1-8.
6. Stein RE, Hurlburt MS, Heneghan AM, Zhang J, Rolls-Reutz J, Landsverk J, et al. Health status and type of out-of-home placement: informal kinship care in an in-vestigated sample. Acad Pediatr. 2014;14(6):559–64.
7. Stacks AM, Partridge T. Infants placed in foster care prior to their first birthday: Differences in kin and non-kin placements. Infant Ment Health J. 2011;32(5):489–508.
8. Bartuloci M. Smještaj djece izvan obitelji u Republici Hrvatskoj i Smjernice za alternativnu skrb UNICEF-a. Pravnik. 2014;47(95):53-72. Croatian.
9. Glas Istre. Novi zakon o udomiteljstvu omogućit će značajan financijski iskorak za udomitelje. 2018. Available from: https://www.glasistre.hr/hrvatska/novi-zakon-o-udomiteljstvu-omogucit-ce-znacajan-financijski-iskorak-za-udomitelje-570790 Accessed: 10.10.2018. Croatian.
10. Kamenov Ž, Sladović Franz B, Ajduković M. Razvoj ska-la za ispitivanje stavova prema izdvajanju djece iz obi-telji i udomiteljstvu. Hrvatska revija za rehabilitacijska istraživanja. 2006;42(1):55-76. Croatian.
11. Ajduković M, Sladović Franz B, Kamenov Ž. Stavo-vi stručnjaka socijalne skrbi prema izdvajanju djece iz obitelji i udomiteljstvu. Ljetopis socijalnog rada. 2005;12(1):39-66. Croatian.
12. Pennington D. Osnove socijalne psihologije. Jastrebar-sko: Naklada Slap; 1996. Croatian.
13. Petz B. Psihologijski rječnik. Jastrebarsko: Naklada Slap; 2005. Croatian.
14. Rathus SA. Temelji psihologije. Jastrebarsko: Naklada Slap; 2000. Croatian.
15. Hewstone M, Strobe W. Socijalna psihologija. Jastre-barsko: Naklada Slap; 2001. Croatian.
Conclusion
The sample of respondents, consisting of education field staff and staff employed in the adult mental health care, showed slightly positive attitudes to-wards foster care and separation of children from the family. Respondents have the most positive attitude towards the future of separated children and do not think that separated children are doomed to a futile future. They adopt fairly uniform attitudes towards foster carers’ expertise and are of the opinion that foster parents lack expertise compared to institutions.
People who are in professional contact with children have a more positive attitude towards foster care and separation of children from families than those who are not. These results are expected since people in professional contact with children have an insight into more realistic proportions of harm when it comes to vi-olations of children’s rights and health, and are there-fore more likely to be aware of the need and benefit of separating children at risk from their families.
Finally, from the obtained results and their analysis in the context of similar Croatian and foreign studies, there are certain similarities, but also some interest-ing differences. The results, in any case, can initiate a debate on foster care in the current social context. This topic is significant because education and health employees are professionals with most often contact with children, parents, foster parents, foster children, schools and social care centers. In practice, there is a need to examine attitudes towards foster care and separation of children from the family. Therefore, this topic is essential to raise public awareness and de-rive positive attitudes towards foster care in order to spread the idea and practice of foster care as it has been shown to be the optimal form of care for children without parental care. Promoting positive attitudes towards foster care in a narrower and broader social context helps both foster parents and children find the best outcome in already challenging circumstances.

44 Vidović Vondra S. et al. Attitudes of Health Professionals and Primary School Staff... Croat Nurs J. 2020; 4(1): 33-45
18. Negrão M, Moreira M., Veríssimo L, Veiga, E. Public knowledge and perceptions on family foster care: Contributes to it’s development. Análise Psicológica. 2019;37(1):81–92. Portugese.
19. del Valle JF, González-García C. Intervencije za obite-lji djece u sustavu alternativne skrbi u Španjolskoj. U: Knjiga sažetaka i radova Završne konferencije projek-ta FamResPlan. Zagreb: Edukacijsko–rehabilitacijski fakultet Sveučilišta u Zagrebu; 2019.
16. Žižak A. Udomiteljstvo djece u Hrvatskoj, analiza sta-nja i prijedlog smjernica. Zagreb: Unicef Ured za Hrvat-sku; 2010. Croatian.
17. Centar Sirius. Analiza potreba za dodatnim osposo-bljavanjem pomoćnih odgajatelja, odgajatelja i udomi-telja. Available from: https://centar-sirius.hr/1880-2/ Accessed: 13.10.2018. Croatian.
Vidović Vondra S. et al. Attitudes of Health Professionals and Primary School Staff... Croat Nurs J. 2020; 4(1): 33-45 45
Ključne riječi: stavovi, udomiteljstvo, izdvajanje djece, struč-njaci za mentalno zdravlje, školski stručnjaci
Sažetak
U Hrvatskoj je u tijeku proces deinstitucionalizacije skrbi za djecu u sklopu kojeg treba povećati smještaj djece u izvaninstitucijske oblike skrbi poput udomi-teljstva. Cilj istraživanja bio je ispitati stavove prema udomiteljstvu i izdvajanju djece među školskim dje-latnicima i djelatnicima sektora mentalnog zdravlja odraslih, kao i razlike u stavovima između dvije sku-pine stručnjaka.
Uzorak je sačinjavalo ukupno 159 ispitanika (djelatni-ci osnovnih škola u Kutini, Popovači i Velikoj Ludini te djelatnici Neuropsihijatrijske bolnice „Dr. Ivan Barbot” u Popovači). Istraživanjem su obuhvaćene sve rele-vantne sociodemografske varijable, a za ispitivanje stavova primijenjena je Skala stavova prema izdva-janju djece iz obitelji te Skala stavova prema udomi-teljstvu (Kamenov, Sladović Franz i Ajduković, 2005).
U ispitanom uzorku stavovi o udomiteljstvu i izdva-janju blago su pozitivni, što govori da ima prostora za provođenje aktivnosti usmjerenih na osnaživanje ovih stavova. Ako bi se radilo na dodatnom osnaživa-nju stavova, za očekivati je i širenje populacije poten-cijalnih budućih udomitelja.
Važno je istaknuti ulogu zdravstvenih djelatnika koji su uključeni u skrb za mentalno zdravlje udomljene djece te razmotriti njihovu ulogu u modificiranju op-ćih stavova prema udomljavanju djece, kao i njihovu ulogu u izgradnji optimalnog sustava udomljavanja.
STAVOVI ZDRAVSTVENIH DJELATNIKA I DJELATNIKA OSNOVNIH ŠKOLA PREMA IZDVAJANJU DJECE IZ OBITELJI I UDOMITELJSTVU


1 Božica Zubec2 Jelena Lučan
¹ Health Center Sisak, Sisak, Croatia2 Viktorovac High School, Sisak, Croatia
Article received: 28.08.2019.
Article accepted: 11.02.2020.
DOI: 10.24141/2/4/1/4
Author for correspondence: Jelena Lučan Viktorovac High School Aleja narodnih heroja 1, Sisak E-mail: [email protected]
Keywords: health visiting service, users’ contentment
Abstract
Aim. To test the users’ contentment with the health visiting service, to see if the users are getting enough information about their health condition, to see if the users feel they are being frequently visited by the health visitor and to check whether something needs to be changed in the health visiting service work.
Methods. The research was carried out as a term study. 128 users of the health visiting service of Health Centre Sisak participated in a 25-question survey. The answers were defined by the Likert scale.
Results. 82 respondents (65%) believe that the ser-vice is exceptionally organised and 95 of them (75%) are getting all the necessary information about their health condition. 89 respondents (71%) are visited by the service once a month. Some of the sugges-tions on how to improve the service are the follow-ing: more frequent visits, introduction of the after-noon shift for the employed respondents and larger number of health visitors which would prolong their stay at the respondent’s home.
Conclusion. The users of the health visitor service have positive attitude towards the service and they feel they are getting enough information about their health condition.
The Patients’ Opinion of the Health Visitor Efficiency
Croat Nurs J. 2020; 4(1): 47-58

48 Zubec B. et al. The Patients’ Opinion of the Health Visitor Efficiency. Croat Nurs J. 2020; 4(1): 47-58
ly by nurses with a high school diploma and a work permit from the Croatian Chamber of Nurses em-ployed at Home Health Care Institutions or who are self-employed. Nursing services are provided by the nurse at the request, in agreement with and under the supervision of a selected physician, and under the supervision of the home care nurse (10). Patients today strive to be active participants in their health care - from planning to realization, and they want their family to be involved in this process, they want to be members of the team providing health care, to participate in the work of the team (11).
Aim
To examine the attitudes of home care users; to in-vestigate whether the users receive sufficient infor-mation from the home care nurse about their health status; whether they think that the home care nurse frequently visits them; to examine the opinions of the users about what they would change in the home care activity. In addition, the researchers sought to examine whether there are differences in attitudes with regard to rural and urban areas, gender, age and education level of users.
Hypotheses
Hypothesis 1. Beneficiaries have a positive attitude towards the health care service.
Hypothesis 2. Beneficiaries receive sufficient infor-mation from the home care nurse about their health status.
Introduction
The home care health service became an independ-ent activity after the Homeland War, when it was separated from the general/family medicine teams, but due to its focus on curative activities, preven-tive work is abandoned, which should be the base of the home care activity (1). The field of activity of the home care nurse includes the development of a health care plan, implementation, evaluation of the procedures performed, preventive work in co-operation with general practice/family physicians, gynecologists, pediatricians, employees of health centers, as well as those in lease, social institu-tions, schools, home health care institutions, users themselves and their families, all based on their own observations and estimates (2). Home care nursing services are fully covered by the Croatian Health In-surance Fund, and all insured persons are entitled to free use when necessary (3). The home care nurse educational and health care activity takes place in the family and the community within the primary health care and includes the entire population (4). The name of the home care nurse (patronage) has its source in the Latin word patronus, which means care-taker, patroness, advocate, defender (5). The home care nurse’s activity is focused on home visits to the user. During home visits, the nurse collects anam-nestic data, performs physical assessment, observes, provides advice and guidance. The home care nurse also participates in the implementation of national early cancer screening program, and plays an impor-tant role in raising the response, motivating and edu-cating individuals to participate in the programs (6). When a patient leaves the hospital and completes hospital treatment, the head nurse sends a home care nurse in charge of the area of residence in which the patient is living and a hospital discharge letter describing the need for continuing care in the home (7). The basic measures in home health care are: the protection of pregnant women, postpartum women and newborns, infants and young children, the pro-tection of the chronically ill children and adults, the elderly, and protection of persons with disabilities (8,9). The home care nurse is required to explain, to the home care user, the care and the procedures the home care nurse will perform. Home health care is a primary health care activity carried out independent-

Zubec B. et al. The Patients’ Opinion of the Health Visitor Efficiency. Croat Nurs J. 2020; 4(1): 47-58 49
Statistical Software version 18.11.3 (MedCalc Soft-ware bvba, Ostend, Belgium; https://www.medcalc.org; 2019) was used for statistical analysis.
Results
The study was conducted on 128 subjects, of which 29 (22.7%) were men and 99 (77.3%) were women. The average (median) age of the respondents is 69 years, with interquartile ranges from 55 to 77 years, ranging from a minimum of 23 to a maximum of 89 years. The majority of the respondents, 61 (47.7%), are aged 61 to 80. There are 65 (50.8%) respondents from rural areas, and, according to level of education, 58 (45.3%) have high school education. 27 (21.1%) respondents are employed. In addition to the home care nurse 33 (25.8%) respondents are also visited by a home care professional. The majority of the re-spondents, 120 (93.8%), have contact with a home care nurse at their home/apartment. The median number of home care nurse visits is 12 months (in-terquartile range from 4 to 36 months) ranging from one month to 168 months (Table 1).
82 (65%) of the respondents agree that the organi-zation of the home care service is excellent, and 47 (40%) are not sure if there is an accessible book of complaints and praise. 95 (75%) of the respondents state that they receive most of the necessary in-formation about their health status from the home care nurse. The nurse visits most of the respondents, 89 (71%), once a month, while 5 (4%) disagree or strongly disagree with the statement that with infor-mation on their health status, the home care nurse provides information on the exercise of their rights.
For 93 (73%) respondents, the home care nurse will inform their physician of their health problems. 22 (18%) of the respondents agree or fully agree with the statement that some of their home care nurses’ advice contradicts the advice of other health profes-sionals (e.g. general practice physician). 101 (82%) of the respondents fully agree that the visit of the home care nurse is beneficial. 86 (68%) of the respondents fully agree with the statement that from the nurse they receive a lot of new information regarding their health status, and 26 (21%) of the respondents
Methods
The survey was conducted on a total of 128 users of the Sisak Health Care Center’s Home Care Service in the period from May 1 – May 31, 2019. Prior to conducting the research, the permission of the Ethics Committee of the Sisak Health Center and the writ-ten consent of each respondent were obtained. All beneficiaries use home health care services - in their own apartment/home or visit the home care in infir-mary. Users in different areas covered by the Sisak Health Center, rural and urban areas, were surveyed. The survey was conducted using a questionnaire. The questions in the survey were designed by Božica Zubec. The first part of the questionnaire covers gen-eral data on the characteristics of the respondents, gender, age, place of residence, level of education, employment, visits of the home care nurse and/or home care professional, and the provision of home care services. The second part of the questionnaire examines the attitudes of home health care users. In twenty-five questions, users choose the figure that best reflects their views using a Likert scale (1=strongly disagree, 2=disagree, 3=can’t decide, 4= agree, 5=fully agree). The third part of the ques-tionnaire examines how the user would report a specific problem related to nursing care, where the user chooses one of the offered answers. The fourth part of the questionnaire is filled in by the users by writing in a descriptive way if they wish to change something in the functioning of the home care ser-vice, which they believe would improve the work of the home care nurse.
Statistics
Categorical data are represented using absolute and relative frequencies. The normality of the distribution of numerical variables was tested by the Shapiro-Wilk test. Numerical data are described by the median and interquartile ranges due to distributions that do not follow the normal distribution. Differences between normally distributed numerical variables between two independent groups were tested by Mann Whit-ney’s U test and between three independent groups by the Kruskal Wallis test. The significance level was set to Alpha=0.05. The statistical program MedCalc

50 Zubec B. et al. The Patients’ Opinion of the Health Visitor Efficiency. Croat Nurs J. 2020; 4(1): 47-58
ment that they understand the task and role of the home care nurse in the healthcare system, 81 (64%) that they adhere to the instructions received from the home care nurse, and 99 (79%) of the respond-ents completely understand why the home care nurse visits them. So far, 108 (85%) respondents have not had problems with the home care nurse, and 48 (39%) have stated that the home care nurse always announces his/her visit (by telephone or pre-announced day of the month).
If they want to contact their home care nurse, 92 (72%) respondents know how (they have home care services’s contact phone number), while 7 (5%) disa-gree or strongly disagree with this statement. To the majority of the respondents, 107 (84%), home care nurse gives instructions in a completely under-standable way, and if asked to visit someone in poor health in the neighborhood, he/she will always do so, as stated by 77 (64%) respondents (Table 3) .
Respondents had to rate, using grades from 1 to 5, which traits of the home care nurse are important to them - the most important are kindness and proper appearance, expertise, and slightly less important are treatment counseling and lifestyle counseling.
Only 70 (54.6%) of the respondents answered if the home care nurse explained to them what individual care means, what procedures it involves and how long it takes, and of these, 40 (57%) fully agree with that statement, while 10 (14%) disagree or do not fully agree. Only 3 (3%) of the respondents answered that they agree or fully agree not to be visited by the home care nurse (Table 4).
There are no significant differences in the attitude of the nurses’ work by gender, except that men are more likely to state that the home care nurse al-ways announces his/her visit (by telephone or pre-announced day of the month), compared to women.
Respondents living in the city significantly less agree with the statement that there is an accessi-ble book of complaints and praise, that they receive a lot of new information from the home care nurse about their health status and their rights compared to those living in rural areas. Respondents living in the city agree more significantly with the statement that they understand why the home care nurse vis-its them, that they have not had any problems with the home care nurse so far, they can always contact her, and state that the home care nurse gives them instructions in a completely understandable way.
state that the visits should be more frequent, while 36 (30%) do not agree or strongly disagree with this claim (Table 2).
Table 1. Basic characteristics of the respondents
Number (%) of
respondents
Gender
Men 29 (22.7)
Women 99 (77.3)
Age groups
up to 40 18 (14.1)
41 – 60 18 (14.1)
61 – 80 61 (47.7)
81 and more 13 (10.2)
Unanswered 18 (14.1)
Place of residence
Village 65 (50.8)
Town 60 (46.9)
Unanswered 3 (2.3)
Level of education
Elementary school 51 (39.8)
High school education 58 (45.3)
Baccalaureus 12 (9.4)
University education/Masters 4 (3.1)
Unanswered 3 (2.3)
Employment
Yes 27 (21.1)
No 95 (74.2)
Unanswered 6 (4.7)
In addition to home care nurse I am visited by home care professional
Yes 33 (25.8)
No 95 (74.2)
Contact with home care nurse is exercised
In my home/apartment 120 (93.8)
In infirmary 8 (6.3)
Total 103 (100)
An equal number of respondents answered that visits of the home care nurse should last longer. 80 (63%) of the respondents fully agree with the state-

Zubec B. et al. The Patients’ Opinion of the Health Visitor Efficiency. Croat Nurs J. 2020; 4(1): 47-58 51
Table 2. User attitudes towards home care service (1/3)Number (%) of respondents
Strongly disagree Disagree Can´t
decide Agree Fully agree Total
The organization of the home care service is excellent.
0 1 (1) 6 (5) 38 (30) 82 (65) 127 (100)
There is an accessible book of complaints and praise.
24 (21) 9 (8) 47 (40) 19 (16) 18 (15) 117 (100)
I get most of the necessary information about my health status from the home care nurse.
0 0 4 (3) 28 (22) 95 (75) 127 (100)
The home care nurse visits me at least once a month.
2 (2) 3 (2) 8 (6) 24 (19) 89 (71) 126 (100)
I receive most of the information from the home care nurse in relation to the exercise of my rights
(patient rights).0 2 (2) 5 (4) 30 (24) 90 (71) 127 (100)
The home care nurse will inform my physician of my health issues.
1 (1) 1 (1) 9 (7) 22 (18) 91 (73) 124 (100)
Some of my home care nurse’s advice is contradictory to the advice of other healthcare
providers (e.g. general practice physicians )59 (48) 26 (21) 17 (14) 7 (6) 15 (12) 124 (100)
I find the visit of the home care nurse helpful. 0 1 (1) 2 (2) 19 (15) 101 (82) 123 (100)
I get a lot of new health related information from the home care nurse.
0 0 6 (5) 34 (27) 86 (68) 126 (100)
I find that visits from home care nurse should be more frequent.
13 (11) 23 (19) 40 (33) 21 (17) 26 (21) 123 (100)
Table 3. User attitudes towards home care service (2/3)Number (%) of respondents
Strongly disagree Disagree Can´t
decide Agree Fully agree Total
I think visits of the home care nurse should last longer.
20 (21) 20 (21) 25 (27) 9 (10) 20 (21) 94 (100)
I understand the task and role of the home care nurse in the healthcare system.
0 3 (2) 7 (6) 36 (29) 80 (63) 126 (100)
I adhere to the instructions received from the home care nurse.
1 (1) 2 (2) 15 (12) 28 (22) 81 (64) 127 (100)
I disagree with most of my home care nurse's advice.
77 (62) 23 (19) 7 (6) 8 (6) 9 (7) 124 (100)
I understand why the home care nurse visits me. 0 0 1 (1) 26 (21) 99 (79) 126 (100)
So far, I have not had problems with the home care nurse that visits me.
1 (1) 1 (1) 0 17 (13) 108 (85) 127 (100)
Home care nurse always announces his/her visit (by telephone or pre-announced day of the month)
11 (9) 10 (8) 22 (18) 32 (26) 48 (39) 123 (100)
If I want to contact my home care nurse I know how (I have home care services's contact phone number)
4 (3) 3 (2) 5 (4) 23 (18) 92 (72) 127 (100)
Home care nurse gives instructions in a completely understandable way.
0 0 3 (2) 17 (13) 107 (84) 127 (100)
If I ask my home care nurse to visit someone in poor health in the neighborhood, he/she will do it
1 (1) 2 (2) 17 (14) 24 (20) 77 (64) 121 (100)

52 Zubec B. et al. The Patients’ Opinion of the Health Visitor Efficiency. Croat Nurs J. 2020; 4(1): 47-58
nurse should be more frequent, and that they should last longer. Respondents aged 81 and over signifi-cantly more disagree with most of their home care nurse’s advice.
Respondents 61 to 80 years of age significantly less agree with the statement that they understand why they are being visited by a home care nurse and that they have not had any problems with them so far, and that if they wish to contact their home care nurse they have significantly less know how than younger or older respondents. Regarding the traits that the home care nurse should have, respondents aged 61-80 find significantly less important treat-ment counseling (Table 6).
Respondents with higher education agree signifi-cantly less with the statement that the home care nurse informs family physicians about their health problems. Respondents who have only completed elementary school significantly less agree that a visit of the home care nurse is beneficial and sig-nificantly less understand why the home care nurse visits them. There are significantly fewer problems with the home care nurse by respondents with high school or higher education than those who have only completed elementary school, and they also state
Respondents living in rural areas agree more signifi-cantly with the statement that they receive most of the necessary information about their health status from the home care nurse than respondents living in the city.
Regarding the traits that a home care nurse should have, respondents living in rural areas gave a sig-nificantly higher rating to expertise, treatment and lifestyle counseling, compared to respondents living in the city.
Respondents living in the city more significantly state that the home care nurse explained to them what individual care means, what procedures it in-volves, and how long it takes compared to respond-ents from rural areas (Table 5).
Respondents aged 61 to 80 significantly least agree with the statement that from the home care nurse they receive most of the necessary information about their health status, as well as with the state-ment that from the home care nurse they receive a lot of new information regarding their health status, compared to younger or older respondents. Respond-ents up to 60 years of age significantly least agree with the statement that visits by the home care
Table 4. Importance of particular traits of home care nurse, knowledge of practices by home care nurse, and willingness to be visited by him/her more frequently
Number (%) of respondents
Traits of my home care nurse which are important to care
user (grades from 1 to 5)1 2 3 4 5 Total
Expertise 0 0 0 11 (9) 116 (91) 127 (100)
Kindness 0 0 0 7 (6) 120 (94) 127 (100)
Proper appearance 0 0 0 7 (6) 120 (94) 127 (100)
Treatment counseling 0 0 2 (2) 16 (13) 109 (86) 127 (100)
Lifestyle counseling 0 0 5 (4) 24 (20) 94 (76) 123 (100)
For home care users
Strongly disagree
DisagreeCant`t decide
Agree Fully agree Total
My home care nurse explained to me what individual care means, what procedures it
involves and how long it takes.
9 (13) 1 (1) 8 (11) 12 (17) 40 (57) 70 (100)
I don´t want to be visited by the home care nurse.
93 (86) 7 (6) 5 (5) 1 (1) 2 (2) 108 (100)

Zubec B. et al. The Patients’ Opinion of the Health Visitor Efficiency. Croat Nurs J. 2020; 4(1): 47-58 53
Table 5. Assessment of attitudes about the work of the home care service in relation to the place of residence
Median (interquartile range) p*
City Rural areas Total
There is an accessible book of complaints and praise. 2 (1 - 3) 3 (3 - 4) 3 (2 - 4) <0.001
I receive most of the necessary information about my health status from the home care nurse..
5 (5 - 5) 4 (4 - 5) 5 (4 - 5) 0.02
I get most of the information from the home care nurse in relation to the exercise of my rights (patient rights).
5 (5 - 5) 4 (4 - 5) 5 (4 - 5) 0.003
I receive a lot of new health related information from the home care nurse.
5 (5 - 5) 4 (4 - 5) 5 (4 - 5) 0.03
I understand why the home care nurse visits me. 5 (5 - 5) 4 (4 - 5) 5 (5 - 5) 0.04
So far, I have not had any problems with the visiting home care nurse.
5 (5 - 5) 4 (4 - 5) 5 (5 - 5) <0.001
If I want to contact my home care nurse I know how (I have the contact phone number of the home care service)
5 (5 - 5) 4 (4 - 5) 5 (4 - 5) 0.04
The home care nurse gives me directions in a completely understandable way.
5 (5 - 5) 4 (4 - 5) 5 (5 - 5) 0.002
Traits: Expertise 4 (4 - 5) 5 (5 - 5) 5 (5 - 5) 0.03
Treatment counseling 4 (4 - 5) 5 (5 - 5) 5 (5 - 5) 0.002
Lifestyle counseling 4 (4 - 5) 5 (4 - 5) 5 (5 - 5) 0.02
My home care nurse explained to me what certain care means. which procedures it involves and how long it takes
5 (4 - 5) 4 (3 - 5) 5 (3 - 5) 0.005
*Mann Whitney U test
Table 6. Assessment of attitudes about the work of the home care service by age
Median (interquartile range) regarding age p*
Up to 60 61 - 80 81 and more
I receive most of the necessary information about my health status from the home care nurse.
5 (5 - 5) 4 (4 - 5) 5 (5 - 5) 0.008
I receive a lot of new health related information from the home care nurse.
5 (5 - 5) 4 (4 - 5) 5 (4.5 - 5) 0.01
I think that visits by home care nurse should be more frequent. 2 (2 - 3) 3 (3 - 5) 3.5 (3 - 4.8) 0.007
I think that visits by home care nurse should take longer. 2 (1 - 3) 3 (2 - 5) 3 (1.5 - 5) 0.04
I disagree with most of my home care nurse’s advice. 1 (1 - 1) 1 (1 - 2) 2 (1 - 3) 0.04
I understand why the home care nurse visits me. 5 (5 - 5) 4 (4 - 5) 5 (5 - 5) 0.01
So far, I have not had any problems with the visiting home care nurse.
5 (5 - 5) 4 (4 - 5) 5 (5 - 5) 0.01
If I want to contact my home care nurse I know how (I have the contact phone number of the home care service)
5 (5 - 5) 4 (4 - 5) 5 (4.5 - 5) 0.02
Treatment counseling 5 (5 - 5) 4 (4 - 5) 5 (5 - 5) 0.004
*Kruskal Wallis test

54 Zubec B. et al. The Patients’ Opinion of the Health Visitor Efficiency. Croat Nurs J. 2020; 4(1): 47-58
the health center, 4 (3.4%) would report to the other nurse (in infirmary, home care), while 47 (40.6%) would not report them to anyone (Graph 1).
The respondents were able to indicate what they wanted to change in the functioning of the home care service, which they believed would improve the work of the home care nurse. The most common sug-gestions are more frequent visits, then the introduc-tion of an afternoon shift for employed respondents, and that the number of home care nurses should be increased so that each home care nurse could stay longer with the respondents.
that the home care nurse gives them instructions in a completely understandable way unlike respondents who have only completed elementary school.
Considering the traits that the home care nurse must have, treatment counseling and lifestyle counseling are significantly less important for the respondents who have only completed elementary school (Table 8).
With respect to the employment status, in most statements there are no significant differences be-tween the respondents who are employed and those who are not, except for three statements. It is sig-nificantly less important for employed respondents for visits by the home care nurse to last longer, while treatment and lifestyle counseling are significantly less important for those who do not work.
If there were problems with the home care nurse, 52 (44.1%) of the respondents would report it to their family physician, 14 (11.9%) to the head nurse of
Table 7. Assessment of attitudes about the work of the home care service in relation to the level of education
Median (interquartile range) by educational level p*
Elementary School
High school education
Bacc./ masters degree
The home care nurse will inform my general practice physician of my health issues.
5 (4 - 5) 5 (5 - 5) 4 (3 - 5) 0.01
I consider visits by the home care nurse useful. 4 (4 - 5) 5 (5 - 5) 5 (5 - 5) 0.03
I understand why the home care nurse visits me. 4 (4 - 5) 5 (5 - 5) 5 (4 - 5) 0.02
So far. I have not had any problems with the home care nurse. 4 (4 - 5) 5 (5 - 5) 5 (5 - 5) 0.001
The home care nurse gives me instructions in a completely understandable way.
4 (4 - 5) 5 (5 - 5) 5 (5 - 5) 0.001
Treatment counseling 4 (4 - 5) 5 (5 - 5) 5 (5 - 5) 0.01
Lifestyle counseling 4 (4 - 5) 5 (5 - 5) 5 (5 - 5) 0.001
*Kruskal Wallis test
Table 8. Assessment of attitudes about the work of the home care service in relation to work status
Median (interquartile range) by employment p*
Working Not working Total
I think that visits of the home care nurse should take longer. 2 (1 - 3) 3 (2 - 5) 3 (2 - 4) 0.007
Treatment counseling 5 (5 - 5) 4 (4 - 5) 5 (5 - 5) 0.01
Lifestyle counseling 5 (5 - 5) 4 (4 - 5) 5 (5 - 5) 0.03
*Mann Whitney U test

Zubec B. et al. The Patients’ Opinion of the Health Visitor Efficiency. Croat Nurs J. 2020; 4(1): 47-58 55
care provided by the home care nurse includes, what the patient rights are, and the like. Only 70 (54.6%) of the respondents answered whether the home care nurse explained to them what individual care meant. Respondents living in the city more significantly state that the home care nurse explained to them what individual care means, what procedures it involves, and how long it takes compared to rural respond-ents. Respondents living in the city significantly less agree with the statement that there is an accessible book of complaints and praise, that they receive a lot of new information from the home care nurse about their health status and their rights compared to ru-ral respondents. Similar results are shown in Ilakovac research, in which respondents from the city are less satisfied with the work of health workers (13). Re-spondents from the city significantly more agree with the statements that they understand why the home care nurse visits them, that they have not had prob-lems with the home care nurse so far, that they can always contact him/her, and state that the home care nurse gives them instructions in a completely under-standable way. Respondents living in rural areas agree much more with the statement that they receive most
Discussion
Home health care covers the care of people through-out their lifespan. Customer satisfaction is important for improving home health care itself. The majority of users in the survey, 120 (93.8%), have contact with a home care nurse at their home or apartment. There-fore, it can be concluded that these are mostly elderly and chronic patients who have difficulty moving and cannot get in touch with the home care nurse in the infirmary. According to the statistics of the Croatian Institute of Public Health, the largest number of visits (761.308) are to chronic patients, with the purpose of giving instructions and demonstrating certain self-control procedures and preventing complications of the underlying chronic illness, and conducting thera-peutic procedures in barely mobile and immobile per-sons, in agreement with a selected physician (12). A quarter of the users, or 33 (25.8%) of the respondents, are also visited by a home care professional. These are users the home care nurse needs to educate on what individual care means, how long it takes, and what
Graph 1. Distribution of respondents according to whom they would report the home care nurse if there were problems

56 Zubec B. et al. The Patients’ Opinion of the Health Visitor Efficiency. Croat Nurs J. 2020; 4(1): 47-58
81 years and over disagree significantly with most of their home care nurse’s advice. This is an interesting piece of information that can be related to the fact that younger respondents also use other sources of informa-tion (they use the Internet), that is, they do not receive all the necessary information about their health status only from the home care nurse. The confirmation of this is a study by Walkerai et al. where younger respondents were more satisfied with health care as opposed to the older ones (14). Older respondents also have a problem with cognitive deficits so this can explain the fact that the information they received from the home care nurse is not clear enough. In the Novakovic survey from 2017, similar results were obtained, patients often stated that they had received too little information about their ill-ness, that the information was incomprehensible and unclear, that their problems were not taken seriously, that the vocabulary used was incomprehensible (15). A study conducted in Karlovac found that older people rated nurses’ attitudes and care lower (16).
Respondents who completed only elementary school significantly less agree that a visit of the home care nurse is beneficial and significantly less understand why the home care nurse visits them. Similar research results from Ilakovac showed that respondents with un/completed elementary school were significantly more dissatisfied with the rapport and care of the home care nurses (13). The cause can be interpreted in that the home care nurses do not convey certain information in a sufficiently understandable way, given the literacy level of the respondents. In the Novaković survey from 2017, which examines pa-tient satisfaction with the work of nurses in primary health care, there is a significantly lower agreement with the statements in the area of patient satisfac-tion with the amount of information they receive from a nurse in a group of school respondents, while a higher rating with regard to satisfaction is given by respondents with completed elementary education and respondents with a university degree (15).
Respondents find kindness, proper appearance and ex-pertise as the most important, and as slightly less impor-tant - the treatment counseling and lifestyle counseling. Similar results are obtained by Novakovic, where the user does not describe the nurse’s expertise and expe-rience as important, but rather observes decency, confi-dence, careful listening to the patient, which can dispel fear and anxiety, gain patient confidence and facilitate good collaboration (15). Solayappan, Jayakrishan, and Velmani, in 2011, have come up with the factors that
of the necessary information about their health status from the home care nurse than respondents living in the city. Considering the characteristics that a home care nurse should have, the rural respondents gave a higher rating to expertise and treatment counseling. These results illustrate the educational role of the home care nurse in rural areas.
The majority, or 82 (65%) of the users surveyed, agree that the organization of the home care service is excellent. However, there remains a number of us-ers who believe that better home care service should be worked on. Better organization would certainly be aided by the pre-announcement of the visit by phone or the prior agreement with the user on the exact date the next visit is planned, which is confirmed by the fact that only 48 (39%) of the respondents state that the nurse always announces their visit. Men more significantly state that the home care nurse al-ways announces his/her visit, compared to women. Respondents up to 60 years of age significantly least agree with the statement that home care nurse visits should be more frequent and last longer. It is signifi-cantly less important for employed respondents that visits of the home care nurse take longer, which can be explained by the fact that users do not have time for long visits and talks with the home care nurse.
95 (75%) of the respondents state that they receive most of the necessary information about their health status from the home care nurse. The home care nurse visits most of the respondents 89 (71%) once a month, although patients who are also cared for by home care professional should be visited by home care nurse at least twice a month. 80 (63%) of the respondents completely agree with the statement that they under-stand the task and role of the home care nurse in the healthcare system, 81 (64%) that they adhere to the instructions received from the home care nurse, and 99 (79%) of the respondents fully understand why they are visited by the home care nurse. 101 (82%) of the respondents fully agree that the visit of the home care nurse is beneficial. 86 (68%) of the respondents com-pletely agree with the statement that from the home care nurse they receive a lot of new information related to their health status. The respondents aged 61 to 80 years, compared to younger or older respondents, sig-nificantly least agree with the statement that the home care nurse provides most of the necessary information about their health status, as well as with the statement that the home care nurse provides a lot of new infor-mation regarding their health status. Respondents aged

Zubec B. et al. The Patients’ Opinion of the Health Visitor Efficiency. Croat Nurs J. 2020; 4(1): 47-58 57
References
1. Hrvatsko društvo obiteljskih doktora. Patronažna služ-ba i obiteljski liječnik. 2011. Available from: http://www.hdod.net/rad_drustva/Patronazna_i_doktor.pdf Accessed: 15.05.2019. Croatian.
2. Plan i program mjera zdravstvene zaštite iz obveznog zdravstvenog osiguranja. NN 126/2006;2279.
3. Županić M. Organizacija, obrazovanje i kompetencije patronažnih medicinskih sestara. Hrvatski časopis za javno zdravstvo. 2013;9(33):5-15.
4. Mojsović Z. Zdravstvena njega u zajednici. Zagreb: Vi-soka zdravstvena škola; 2005. Croatian.
5. Županić M. Strategije razvoja sestrinstva u zajednici. U: Zbornik radova Konferencije Zdravstvenog veleu-čilišta „Perspektive individualnog i profesionalnog ra-zvoja u sestrinstvu“. Opatija: Zdravstveno veleučilište; 2008. Croatian.
6. Nakić D. Patronažne sestre u provedbi nacionalnih programa ranog otkrivanja raka. Zagreb: Hrvatski za-vod za javno zdravstvo; 2015. Croatian.
7. Hanžek K. Otpusno pismo zdravstvene njege kao oblik suradnje bolničkih i patronažnih sestara [diplomski rad]. Zagreb: Sveučilište u Zagrebu, Medicinski fakul-tet Zagreb; 2015. Croatian.
8. Pravila i opći uvjeti ugovaranja PZZ. Zagreb: Hrvatski zavod za zdravstveno osiguranje; 2006. Croatian.
9. Narodne novine. Pravilnik o uvjetima i načinu ost-varivanja prava iz osnovnog zdravstvenog osiguranja za provođenje zdravstvene njege u kući NN 76/02. Zagreb: Narodne novine d.d. 2002. Croatian.
10. Narodne novine. Zakon o sestrinstvu NN 121/03. Za-greb: Narodne novine d.d. 2003. Croatian.
11. Carr-Hill R. The measurement of patient satisfaction. J Public Health Med. 1992;14(3):236-49.
12. Hrvatski zavod za javno zdravstvo. Hrvatski zdrav-stveno-statistički ljetopis za 2014. godinu. Zagreb: Hrvatski zavod za javno zdravstvo; 2014. Croatian.
13. Ilakovac I. Zadovoljstvo korisnika zdravstvenom za-štitom u Lječilištu Bizovačke toplice [diplomski rad]. Osijek: Sveučilište Josipa Jurja Strossmayera u Osijeku, Medicinski fakultet Osijek; 2017. Croatian.
14. Walker MS, Ristvedt SL, Haughey BH. Patient care in multidisciplinary clinics: does attention to psychoso-cial needs predict patient satisfaction. Scand J Prim Health Care. 2007;25(4):226-31.
15. Novaković J. Zadovoljstvo pacijenata radom medicinskih sestara/tehničara u primarnoj zdravstvenoj zaštiti [di-plomski rad]. Osijek: Sveučilište Josipa Jurja Strossmaye-ra u Osijeku, Medicinski fakultet Osijek; 2017. Croatian.
16. Cvitanović H, Jančić E, Knežević E, Kuljanac I. Zadovolj-stvo bolesnika kvalitetom zdravstvene zaštite u der-matološkoj poliklinici Karlovac. Medicina Fluminesis. 2011;47(1):82-90. Croatian.
17. Gutić D. Upravljanje zadovoljstvom i odnosima s paci-jentima. Osijek: Grafika; 2015. Croatian.
18. Ali-Abri, Al-Balushi A. Patient satisfaction Survey as Tool Towards Quality Improvement. Oman Med J. 2014;29(1):3-7.
make up the biggest gap between the expected and perceived quality of patient health services, such as: proper employee appearance, lack of interest in problem solving, service communication, fulfilling the promise of a healthcare professional, insufficient knowledge to an-swer patient’s query (17). Researchers have also found that the kindness and respect of healthcare profession-als most influences user satisfaction, with communica-tion and explanation being the second most important form of satisfaction (18). This is an interesting piece of information for nurses that could enhance the work of the home care service and customer satisfaction. The most common suggestions of what would improve home care service are more frequent visits, then the introduc-tion of an afternoon shift for employed respondents, and that the number of home care nurses should be in-creased, allowing each home care nurse to stay longer with the respondent. If there were problems with the home care nurse, 52 (44.1%) respondents would report them to their family physician.
Conclusion
Based on the conducted research and the results ob-tained, the following conclusions can be drawn:
• more than half of the respondents were sat-isfied with the organization of the home care service;
• almost all respondents receive most of the necessary information about their health sta-tus from the home care service;
• the majority of the respondents believe that the home care nurse visits them often enough;
• the most common suggestions for improving home care service are more frequent visits, then introducing an afternoon shift for employed re-spondents, and that the number of home care nurses should be increased, allowing each home care nurse to stay longer with the respondent.
Hypothesis 1 is confirmed - home care service beneficiar-ies have a positive attitude towards home care service.
Hypothesis 2 is confirmed - beneficiaries receive suf-ficient information from the home care nurse about their health status.

58 Zubec B. et al. The Patients’ Opinion of the Health Visitor Efficiency. Croat Nurs J. 2020; 4(1): 47-58
Sažetak
Cilj. Ispitati zadovoljstvo korisnika patronažne služ-be, ispitati dobivaju li korisnici dovoljno informacija od patronažne sestre o svojem zdravstvenom stanju, smatraju li da ih patronažna sestra učestalo posjeću-je te što bi promijenili u radu patronažne službe.
Metode. Istraživanje je provedeno kao presječna stu-dija. Ukupno je sudjelovalo 128 korisnika patronažne službe Doma zdravlja Sisak s pomoću anketnog upit-nika koji se sastoji od 25 pitanja. Odgovori se defini-raju primjenom Likertove skale procjena.
Rezultati. Da je organiziranost patronažne službe iz-vrsna slaže se 82 (65 %) ispitanika, a da od patronaž-ne sestre dobije većinu potrebnih informacija o svo-jem zdravstvenom stanju navodi 95 (75 %) ispitanika. Patronažna sestra većinu ispitanika posjećuje, njih 89 (71 %) jednom mjesečno. Najčešći su prijedlozi za poboljšanje funkcioniranja patronažne službe češći posjeti, zatim uvođenje poslijepodnevne smjene za ispitanike koji su u radnom odnosu te da bi se tre-bao povećati broj patronažnih sestara, čime bi svaka patronažna sestra mogla dulje ostati kod ispitanika.
Zaključak. Korisnici patronažne službe imaju po-zitive stavove prema patronažnoj službi i dobivaju dovoljno informacija od patronažne sestre o svojem zdravstvenom stanju
Ključne riječi: patronažna skrb, zadovoljstvo korisnika, pa-tronažna sestra
MIŠLJENJA KORISNIKA USLUGA O NAČINU RADA PATRONAŽNE SLUŽBE
1 Ljiljana Vuković
¹ Clinical Department of Anesthesiology, Resuscitation and Intensive Care Medicine, University Hospital Dubrava, Zagreb, Croatia
Article received: 10.12.2019.
Article accepted: 11.02.2020.
DOI: 10.24141/2/4/1/5
Author for correspondence: Ljiljana Vuković Department of Anesthesiology, Resuscitation and Intensive Care Medicine, University Hospital Dubrava, Avenija Gojka Šuška 6, Zagreb, Croatia E mail: [email protected]
Keywords: workload, nursing, intensive care unit
Abstract
Aim. To assess the level of correlation between two scoring systems: patient categorization according to the Croatian Nursing Council consensus and Nine Equivalents of Nursing Manpower Use Score (NEMS) and their ability to determine if the number of nurses working in the intensive care unit (ICU) is optimal to provide adequate nursing care, and to assess the level of correlation between the severity of patients’ illness and the level of nurses’ satisfaction with provided care.
Methods. Research was performed in surgical ICU of the Clinical Department of Anesthesiology, Re-
suscitation and Intensive Care Medicine, University Hospital Dubrava, in the period between January 8th and April 14th, 2014. 256 patients aged 18-92 years were included in the study. Patient categorization and NEMS were calculated each day during the first 7 days of the ICU stay. NEMS was calculated using a pre-made table of variables and categorization was calculated using an electronic form included in nurs-ing electronic patient files. Satisfaction of provided care was expressed using the Likert scale (1-5).
Results. Study results have shown a moderate but sig-nificant level of correlation between the categorization and NEMS scores. Mean NEMS score during the first 7 days in the ICU was 26.93 ± 4.64 and the highest meas-ured values were at day 4 (30.34±8.1) after which they started decreasing. Mean cumulative NEMS throughout the whole ICU stay was 269.3. According to the fact that according to NEMS scoring system one nurse can provide maximum of 45 points for 24 hours, the results have shown that a 10 bed ICU needs at least 5.98 (6) nurses to provide adequate level of care. Average cat-egorization score was 57.83±4.29 and the highest re-corded score was at day 7 (59.7±4.44). According to the categorization scoring system time needed to provide care for one 4th category patient throughout 24 hours is 10 or more hours. Since the description of the 4th cat-egory doesn’t specify what is the upper limit of time needed to provide care for each patient, 14 hours was used to determine a minimum number of nurses, and according to the categorization score 5.83 (6) nurses are needed in the ICU. Nurses’ satisfaction with pro-vided care has shown a significant negative correlation with NEMS score and categorization score.
Conclusion. Both scoring systems can be used to assess nursing workload in a surgical ICU. However, NEMS is simpler and quicker to use, more applicable, useful and should be routinely used in place of catego-rization to assess nursing workload in surgical ICUs.
Assessment of Nurses’ Workload in Intensive Care Unit by Use of Scoring Systems
Croat Nurs J. 2020; 4(1): 59-71
60 Vuković Lj. Assessment of Nurses’ Workload in Intensive Care Unit by Use of Scoring Systems. Croat Nurs J. 2020; 4(1): 59-71
Measurement of healthcare costs, as well as measur-ing the use of human resources in healthcare system is a challenging task, especially as it is both difficult and expensive to measure resource use in healthcare systems and clinical outcomes. These require devel-opment of special assessment tools that are practi-cal, unique, reproducible and detailed enough to al-low comparison between various institutions, patient groups and individual patients (3).
Optimal number of nurses is a key prerequisite for quality of care in ICUs, however this issue is not as simple as it seems. The incidence of burnout and lack of work satisfaction are inversely proportional to the ratio of numbers of patients and nurses responsible for their care (11). On the other hand, more work-ing places considerably increase costs, with limited financial resources being one important obstacle in employing more nurses at those workplaces. As a direct result of this mismatch, adjusted therapeutic indexes have been developed in order to optimally count, assess and distribute nurses in ICUs (12).
The number of nurses in the ICU is of extreme impor-tance and therefore the assessment of workload is currently the most reliable indicator for establishing optimal numbers of staff. As in recent period there has been a trend towards admitting elderly patients with more comorbidities into ICUs, in combination with newer treatment methods this has resulted in increase in nurses’ workload (13).
Background
Scoring systems in ICUScoring systems in use for critically ill patients are nowadays widely used in ICUs because they can pre-dict the outcome, evaluate the severity of the dis-ease and organ dysfunction level, as well as assess the use of human resources. They can be divided into two groups: those specific for organ systems or dis-eases (such as Glasgow Coma Scale) and those gen-erally for all patients in ICUs (14).
The purpose of scoring systems is to objectively, accurately and reliably measure the severity of the
Introduction
Intensive care medicine (ICM) is a multidisciplinary and multiprofessional area in medicine, providing the highest level of medical management and it in-cludes monitoring, caring, treating and ensuring life support measures for severely ill or seriously injured patients. In the management of critically ill patients, Intensive Care Unit (ICU) is the most expensive part of the healthcare system. Work in the ICU requires knowledge, continuous medical education, skills and experience of all healthcare workers involved, es-pecially nurses. Daily introduction of new technolo-gies, methods, medicines, procedures and treatment strategies continue to make the working scope of a nurse ever more complex, bearing in mind that pro-viding the best care for patients and their families is a nurse’s responsibility.
High costs of ICM, quality of care and patient safety require assessment of nurses’ workload in order to determine adequate conditions that are relevant, both for planning of care and for managing human re-sources (1). Assessment of nurses’ workload already began in the 1970s as a result of a need for deter-mining the severity of illness, cost analysis and effi-ciency in the ICU. In the following decades there was a need for specific tools to measure the workload, which resulted in development of scoring systems focusing on nurses’ activities (2). Scoring systems are becoming more important tools for ICU workload assessment and comparison of effect of outcomes of different ICUs in quality assessment projects (3). It has already been shown that the optimal number of nurses is a key prerequisite for good quality of care in ICUs (4).
Different international associations have stressed the importance of optimal staffing numbers in order to increase patient safety, reduce the number of com-plications and costs (5, 6). Newer evidence shows that reduced numbers of nurses in the staff decrease the quality of care, which results in increased risk of nosocomial infections (7), occurrence of decubitus (8), postoperative complications, extension of hospi-tal stay duration and mortality increase (9). Increased nurses’ workload also has an effect on occurrence of burnout syndrome and more frequent requests for transfer or change of job (10).

Vuković Lj. Assessment of Nurses’ Workload in Intensive Care Unit by Use of Scoring Systems. Croat Nurs J. 2020; 4(1): 59-71 61
through separate scoring of individual factors and calculation of mean values, which then represents the patient’s category. Critical factors are indicators that represent activities which most affect the time spent on providing nursing care.
Categorization in Croatia is performed according to a consensus document issued by Croatian Nursing Council (CNC) which was published in 2006 (16). Pa-tients can be assigned into 4 categories according to the level of help needed to satisfy basic human needs and according to diagnostic and therapeutic procedures performed on each patient. Those factors directly determine the level of care nurse provides, as well as the number and complexity of interventions (16). Through a separate legally binding document categorization has become an obligatory procedure since 2011. To further elaborate on this procedure, it is important to know that following variables are used to determine critical factors: independency evaluation, physical activity, risk of fall, state of con-sciousness, risk for decubitus formation, vital signs, communication, specific procedures in care, diagnos-tic procedures, therapeutic procedures and education (16). Using a point system, patient’s condition is as-sessed daily by the nurse according to those factors and depending on the level of needs, the end result is that patient is assigned a category on a scale of 1-4. Whereas in category 1 the patient is independent in performing daily activities of life, in category 4 the patient is completely dependent in performing daily activities of life. According to the result of a pilot sur-vey conducted in 2005 in 7 institutions in Croatia, CNC made the following recommendation concerning time required per patient in each category during 24 hours: category 1 – self-care: 1-2 hours; category 2 – minimal care: 3-5 hours; category 3 – intermediary care: 6-9 hours; category 4 – intensive care: 10 hours and more (16).
Patient categorization allows quick insight into pa-tients’ needs for care in a ward, changes in condition during the day and from day to day, it facilitates or-ganisation of care and planning of needs for nurses in wards.
Nine Equivalents of Nursing Manpower Use Score (NEMS)There has also been a development of different scoring systems to determine the required levels of provided intensive care and those systems can
disease; as such, they are very useful for clinical de-cision making, evaluation of course and outcome of a disease, quality of care and assessment of health-care personnel workload (12). In the last 20 years, the development of scoring systems in ICUs is mostly warranted by every increasing complexity of possi-bilities for intensive treatment, as well as increasing treatment costs; all of this results in the need for as-sessment of patients’ condition to be as objective as possible.
Ideal scoring system should have following charac-teristics: simplicity and possibility to record needed variables routinely, good calibration, high level of specificity, applicability to all populations and in all countries, capability of predicting functional state and quality of life after discharge from the ICU. At this moment, no scoring system fulfils all of those criteria (15).
At this point, it is also important to note that dif-ferent scoring systems have different purposes and measure different variables, they should be seen as complementing each other, instead of compet-ing against each other. It is well possible that their combined use could provide more accurate indicators of disease severity and prognosis. All these scoring systems should adapt to time, as does the type of patients being admitted to ICUs (as a result of avail-ability of new diagnostic, treatment and prognostic techniques) (14).
Patient categorizationCategorization is a system of assigning categories to patients with regard to certain characteristics, de-pending on the amount of care the patient needs. The need for such a process was first recognized at the beginning of the 20th century, and it was significantly enhanced during the 1950s and 1960s with introduc-tion of the “progressive care” concept. Initially, catego-rization was developed with the intention to show in an easy to understand manner systemic workload and to make it possible for staff needs to be calculated; as time progressed, staffing policy and analysis of costs, efficiency and productivity were added.
This process provides quick insight into the level of the severity of patients’ conditions, showing at the same time required levels of care and number of nurses required to provide adequate care. Two ap-proaches are possible: either through description of individual factors characteristic for each category or

62 Vuković Lj. Assessment of Nurses’ Workload in Intensive Care Unit by Use of Scoring Systems. Croat Nurs J. 2020; 4(1): 59-71
Aim
To assess the level of correlation between two scor-ing systems: patient categorization according to Croa-tian Nursing Council consensus and Nine Equivalents of Nursing Manpower Use Score (NEMS) and their ability to determine if the number of nurses working in the intensive care unit (ICU) is optimal to provide adequate nursing care, and to assess the level of cor-relation between the severity of patients’ illness and the level of nurses’ satisfaction with provided care.
Methods
This prospective study was performed at the ICU of the Department of Anaesthesiology, Resuscitation and Intensive Medicine at University Hospital Dubrava during the period between January 8th and April 14th 2014. The ICU has 10 beds where all the surgical pa-tients are treated, except for those requiring cardiac or vascular surgery. Researchers recorded patients’ demographic and clinical variables, and categoriza-tion (cumulative score which defines 4 categories of patient’s independence and ability to perform daily tasks defined by the Croatian Nursing Council con-sensus (16)) and NEMS scoring were performed every day, from the first until the seventh day of hospital stay in the ICU for every patient at 10 AM. Both scores were calculated by nurses which provided care for each evaluated patient at the time of measurement. Data from the preceding 24 hours were also recorded from medical documentation and included into the da-tabase. NEMS scoring was performed with the use of the appropriate table and instructions provided (17), and categorization scoring was entered electronically into nurses’ documentation of patients.
Likert scale was used to record nurses’ satisfaction at the time of patient discharge from the ICU with the level of care they provided using marks 1 (com-pletely dissatisfied), 2 (dissatisfied), 3 (neither satis-fied nor dissatisfied), 4 (satisfied) and 5 (completely satisfied).
provide useful additional information on the sever-ity and prognosis of a disease, the needed number of nurses and their workload (17). One of the most widely known is NEMS (Nine Equivalents of Nursing Manpower Use Score) which has been derived from TISS and TISS-28 scoring systems (18). NEMS is rec-ognized globally because of its simplicity and the fact that it doesn’t require a lot of time for use (3).
Until a few years ago, most often used indirect scoring systems in ICUs were Therapeutic Interven-tion Scoring System (TISS) and Nine Equivalents of Nursing Manpower Use Score (NEMS). TISS was used since 1974, and is based on classification of patients according to the severity of the disease. It was further modified on several occasions, resulting in the appearance of TISS-28 in 1996, focusing on 28 therapeutic activities and level of use of nurses’ time needed to execute those activities. This system was criticised for its assumption that the number and type of interventions depend on the severity of the disease and the amount of work with the patient; fur-thermore, the complexity of the scoring system was quite time-consuming. This resulted in a simplified version of TISS-28 in 1997, where only 9 variables are used, and the system was named NEMS. NEMS’s greatest advantage is that it’s easier to perform, and its greatest disadvantage is the reduced sensitivity for small changes in the clinical status of the patient, which do affect the care the nurse provides (19,20).
NEMS scoring system is widely used today for its simplicity and speed of scoring as it uses 9 general categories of activities of nurses and factors that are patient-related, which have influence on nurses’ workload during administering care (13). Nurses’ activities which NEMS measures are: basic monitor-ing, intravenous therapy, mechanical ventilation, additional breathing support, use of one vasoactive medication, use of multiple vasoactive medications, dialysis, specific ICU interventions and specific in-terventions outside of ICU (some interventions are mutually exclusive). Patients can be assigned 0-56 points, and one nurse can process a maximum of 45-50 points during 24 hours (2,13,17).

Vuković Lj. Assessment of Nurses’ Workload in Intensive Care Unit by Use of Scoring Systems. Croat Nurs J. 2020; 4(1): 59-71 63
Table 1. Descriptive statistics of participants (N=265)
N %
SexMale 172 64.9
Female 93 35.1
Diagnosis (groups)
Abdominal surgery 134 50.6
Neurosurgery 64 24.2
Thoracic surgery 23 8.7
Maxillofacial surgery 16 6.0
Trauma/Orthopaedics 2 0.8
Polytrauma 5 1.9
Urology 20 7.5
Plastic surgery 1 0.4
Emergency admission
No 175 66.0
Yes 90 34.0
OutcomeAlive 242 91.3
Dead 23 8.7
Table 2 shows descriptive statistics of selected quantitative variables from this study. Mean age of participants was 62.82±13.38 years, while the me-dian of length of stay in the ICU in days was 1 day (interquartile range from 1 to 2 days).
Mean NEMS score during the first 7 days of hospitali-zation was 26.93±4.64 and was highest during the 4th day (30.34±8.10), after which it started to decline (Figure 1). NEMS score are in the range from 0-56.
Mean categorization score value was 57.83±4.29, and the highest categorization score value was dur-ing the 7th day (59.70±4.44) (Figure 2). Categoriza-tion scores are in the range from 16 to 64.
Nurses’ satisfaction with quality of provided care was satisfactory and graded with the mean grade of 4.28±0.50 (which means they were very satisfied with the work done). There weren’t any grades 1 or 2 recorded.
Mean patient NEMS score was 26.93±4.64, and max-imum number of patients during 24 hours was 10, meaning that cumulative NEMS score of the whole ICU was 269.3.
It has already been shown that one nurse can pro-cess up to 45 points during 24 hours (2,13,17). Con-sidering this on the overall ICU organization, one comes to a conclusion that at least 5.98 (6) nurses are required in order to provide adequate care to pa-
In order to conduct this study, the approval from the Ethical Committee of University Hospital Dubrava was requested and received.
ParticipantsThere were in total 265 patients enrolled into this study, between 18 and 92 years of age. Patients younger than 18 and those that spent less than 24 hours in the ICU were considered to be ineligible for participation. Participants were grouped according to their diagnoses (operations) into 8 groups: abdomi-nal surgery, neurosurgery, thoracic surgery, maxil-lofacial surgery, trauma/orthopaedics, polytrauma, urology and plastic surgery. During the period when this study was conducted there were a total of 24 nurses employed at the ICU, 4 have finished under-graduate education (17%) and 20 nurses have fin-ished nursing school (83%). ICU nurses work in shifts of 12 hours, and in every shift there were 4-5 nurses.
StatisticsData is presented in tables and graphs. Analysis in-cluded descriptive statistics with absolute frequen-cies and corresponding prevalences. Additionally, a total number of points was calculated for both scor-ing systems and analysis of variance was used to analyse mean scoring system values in relation to patients’ diagnoses/wards. Furthermore, Pearson’s correlation coefficients were calculated for NEMS scoring system, categorization scoring system and nurses’ opinions about the provided care. All p values of 0.05 or less were considered to be significant. Sta-tistical analysis was performed using data analysis software system STATISTICA, version 10.0 (StatSoft, Inc. (2011), www.statsoft.com).
Results
Descriptive statistics of participants are presented in Table 1. Almost two thirds of the patients were male, and more than 50% of the patients were from the Abdominal Surgery Ward. 90 (34.0%) patients were admitted through the Emergency Ward, and in the observed period 23 (8.7%) died.

64 Vuković Lj. Assessment of Nurses’ Workload in Intensive Care Unit by Use of Scoring Systems. Croat Nurs J. 2020; 4(1): 59-71
Mean values of scoring systems in relation to diagno-sis are presented in Table 3.
One-way variance analysis (ANOVA) showed no sig-nificant differences between diagnoses (all p values were larger than 0.05) as shown in Table 4. These results show that nursing workload in surgical inten-sive care units is not related to the type of surgery itself, but mostly to the ICU procedures which are non-specific.
Table 5 shows Pearson’s correlation coefficients be-tween NEMS, categorization and nurses’ satisfaction with quality of provided care. Correlations between NEMS and categorization are in most cases (except for the 6th and 7th day when there were actually least participants) significant and positive, which suggests that both scoring systems address the same issue.
tients. The number of nurses depends on the time of calculation NEMS scoring system (Figure 1).
Figure 2 shows categorization dynamics by days. Al-though it is similar to dynamics observed with NEMS scoring system, categorization scores are continually increasing from day 2 until day 7. Mean categorization score was 57.83±4.29. Recommended time required for providing adequate care to a single patient in cat-egory 4 during 24 hours is 10 or more hours (16). As in the description of the category 4 there is no upper limit stated on the time needed to provide adequate care for the patient, in order to calculate the required number of nurses we have established that 14 hours are needed, meaning that in order to provide adequate care to patients at least 5.83 (6) nurses are needed at the ICU. This is in line with the calculations performed using the NEMS scoring system.
Table 2. Descriptive statistics of selected quantitative variables
N Mean SD Minimum MaximumPercentiles
25. Median 75.
Age 265 62.82 13.38 18 92 54.50 64 73
Length of ICU stay (days)
265 2.26 2.55 1 15 1 1 2
NEMS 1 265 27.82 4.84 18 50 27 27 27
NEMS 2 98 26.34 8.72 18 50 18 25.50 33
NEMS 3 63 27.40 8.26 18 45 18 27 34
NEMS 4 41 30.34 8.10 18 50 27 27 38
NEMS 5 30 29.57 7.75 18 45 26.50 29.50 34
NEMS 6 23 28.65 7.06 18 40 25 27 34
NEMS 7 20 29.80 8.55 18 50 25.50 27 34
NEMS average of hospitalization days 265 26.93 4.64 18 45 27 27 27
CAT 1 265 58.54 4.50 32 64 56 59 62
CAT 2 98 57.59 4.89 46 64 54 58 62
CAT 3 63 58.37 5.33 44 64 55 60 63
CAT 4 41 59.24 5.49 42 64 58.50 61 63
CAT 5 30 59.37 4.66 48 64 57 61 63
CAT 6 23 59.43 4.58 49 64 57 60 63
CAT 7 20 59.70 4.44 51 64 56 61.50 63.75
Categorization score average of
hospitalization days265 57.83 4.29 44 64 55 58 62
Nurse’s satisfaction with quality of care
provided265 4.28 0.50 3 5 4 4 5

Vuković Lj. Assessment of Nurses’ Workload in Intensive Care Unit by Use of Scoring Systems. Croat Nurs J. 2020; 4(1): 59-71 65
Discussion
Assessment of nurses’ workload is a key element in ensuring their optimal number which is a basic pre-requisite for good quality of care in ICUs. Increased nurses’ workload also has influence on the syndrome
Nurses’ satisfaction with quality of provided care sig-nificantly negatively correlates with mean values of NEMS and categorization (higher level of satisfaction is connected with lower number of points).
Figure 1. Dynamics of NEMS score by days
Figure 2. Categorization of score dynamics by days

66 Vuković Lj. Assessment of Nurses’ Workload in Intensive Care Unit by Use of Scoring Systems. Croat Nurs J. 2020; 4(1): 59-71
Table 3. Mean values of scoring systems in relation to patient diagnosis/ ward
N Mean SD95% CI
Lower Upper
NEMS mean of hospitalization durationNEMS mean of hospitalization duration
Abdominal surgeryAbdominal surgery 134134 26.7026.70 4.804.80 25.8825.88 27.5227.52
NeurosurgeryNeurosurgery 6464 27.9127.91 4.444.44 26.8026.80 29.0229.02
Thoracic surgeryThoracic surgery 2323 27.7327.73 3.113.11 26.3926.39 29.0829.08
Maxillofacial surgeryMaxillofacial surgery 1616 26.8026.80 2.642.64 25.3925.39 28.2128.21
Trauma/OrthopaedicsTrauma/Orthopaedics 22 31.2531.25 18.7418.74 -137.11-137.11 199.61199.61
PolytraumaPolytrauma 55 23.4623.46 3.273.27 19.4019.40 27.5227.52
UrologyUrology 2020 25.0225.02 4.654.65 22.8422.84 27.1927.19
Plastic surgeryPlastic surgery 11 27.0027.00
Categorization mean of hospitalization Categorization mean of hospitalization durationduration
Abdominal surgeryAbdominal surgery 134134 57.8757.87 4.384.38 57.1257.12 58.6258.62
NeurosurgeryNeurosurgery 6464 57.7157.71 4.424.42 56.6056.60 58.8158.81
Thoracic surgeryThoracic surgery 2323 58.4458.44 3.803.80 56.8056.80 60.0960.09
Maxillofacial surgeryMaxillofacial surgery 1616 58.6558.65 3.173.17 56.9656.96 60.3460.34
Trauma/OrthopaedicsTrauma/Orthopaedics 22 57.5057.50 7.787.78 -12.38-12.38 127.38127.38
PolytraumaPolytrauma 55 57.6557.65 3.823.82 52.9052.90 62.4062.40
UrologyUrology 2020 56.4856.48 4.534.53 54.3654.36 58.6058.60
Plastic surgeryPlastic surgery 11 63.0063.00
Nurses’ satisfaction with quality of Nurses’ satisfaction with quality of provided careprovided care
Abdominal surgeryAbdominal surgery 134134 4.274.27 0.500.50 4.194.19 4.364.36
NeurosurgeryNeurosurgery 6464 4.274.27 0.510.51 4.154.15 4.404.40
Thoracic surgeryThoracic surgery 2323 4.254.25 0.490.49 4.044.04 4.474.47
Maxillofacial surgeryMaxillofacial surgery 1616 4.194.19 0.420.42 3.973.97 4.414.41
Trauma/OrthopaedicsTrauma/Orthopaedics 22 4.254.25 1.061.06 -5.28-5.28 13.7813.78
PolytraumaPolytrauma 55 4.084.08 0.110.11 3.943.94 4.224.22
UrologyUrology 2020 4.584.58 0.510.51 4,344,34 4.824.82
Plastic surgeryPlastic surgery 11 4.004.00
Table 4. ANOVA test results in comparison of average values of scoring systems in relation to patient diagnoses/wards
Sum of squares df Mean square
value F p
NEMS mean
Between Groups 254.939 7 36.420 1.725 0.103
Within Groups 5425.681 257 21.112
Total 5680.619 264
CATEGORIZATION mean
Between Groups 84.352 7 12.050 0.650 0.714
Within Groups 4763.155 257 18.534
Total 4847.507 264
Nurses’ satisfaction with quality of provided care
Between Groups 2.222 7 0.317 1.282 0.260
Within Groups 63.643 257 0.248
Total 65.865 264

Vuković Lj. Assessment of Nurses’ Workload in Intensive Care Unit by Use of Scoring Systems. Croat Nurs J. 2020; 4(1): 59-71 67
ties that affect the most time needed to provide care. By use of categorization in Croatia patients are put into one of four categories depending on the level of help needed to satisfy basic human needs, as well as diagnostic and therapeutic procedures on each patient (16); however, it does not evaluate interven-tions which are specific for the ICU. Categorization assesses the state of each patient according to 13 factors and depending on the patient’s needs, the patient is placed in a certain category on the scale of 1 to 4. Each category is scored separately and the total number of points is calculated. After this, three
of burnout at work and more frequent requests for transfer/ change of job (10). For that purpose, in Republic of Croatia categorization scoring system is used in order to estimate the required number of nurses in the entire hospital system, and not just in specific wards such as the ICU. In order to assess nurses’ workload, in this study categorization scoring system was used along with NEMS scoring system, which is recognized globally for its simplicity and the fact that it does not require a lot of time (3).
Categorization scoring system in the assessment uses critical factors – indicators that represent activi-
Table 5. Pearson’s correlation coefficients between NEMS scoring system, categorization and nurses’ satisfaction with quality of provided care
NEMS 1 NEMS 2 NEMS 3 NEMS 4 NEMS 5 NEMS 6 NEMS 7 NEMS mean
Nurses’ satisfaction with quality of provided care
r -0.440** -0.577** -0.506** -0.418** -0.341 -0.281 -0.274 -0.464**
p <0.001 <0.001 <0.001 .007 .065 .195 .242 <0.001
N 265 98 63 41 30 23 20 265
CATEGORIZATION 1
r 0.289** 0.354** 0.305* 0.081 -0.014 0.423* 0.500* 0.279**
p <0.001 <0.001 0.015 0.613 0.941 0.044 0.025 <0.001
N 265 98 63 41 30 23 20 265
CATEGORIZATION 2
r 0.347** 0.660** 0.533** 0.150 0.223 0.259 0.046 0.595**
p <0.001 <0.001 <0.001 0.348 0.237 0.233 0.848 <0.001
N 98 98 63 41 30 23 20 98
CATEGORIZATION 3
r 0.311* 0.632** 0.616** 0.154 0.425* 0.423* 0.578** 0.623**
p 0.013 <0.001 <0.001 0.336 0.019 0.044 0.008 <0.001
N 63 63 63 41 30 23 20 63
CATEGORIZATION 4
r 0.228 0.365* 0.380* 0.431** 0.330 0.237 0.418 0.507**
p 0.152 0.019 0.014 0.005 0.075 0.276 0.067 0.001
N 41 41 41 41 30 23 20 41
CATEGORIZATION 5
r 0.521** 0.362* 0.059 0.436* 0.565** 0.325 0.588** 0.584**
p 0.003 0.050 0.757 0.016 0.001 0.130 0.006 0.001
N 30 30 30 30 30 23 20 30
CATEGORIZATION 6
r 0.161 0.209 -0.086 -0.242 -0.160 0.566** 0.620** 0.254
p 0.462 0.340 0.696 0.266 .466 0.005 0.004 0.242
N 23 23 23 23 23 23 20 23
CATEGORIZATION 7
r 0.337 0.354 0.115 0.002 0.038 0.625** 0.702** 0.487*
p 0.147 0.126 0.630 0.994 0.873 0.003 0.001 0.029
N 20 20 20 20 20 20 20 20
CATEGORIZATION average
r 0.303** 0.614** 0.575** 0.296 0.376* 0.511* 0.658** 0.405**
p <0.001 <0.001 <0.001 0.060 0.041 0.013 0.002 <0.001
N 265 98 63 41 30 23 20 265

68 Vuković Lj. Assessment of Nurses’ Workload in Intensive Care Unit by Use of Scoring Systems. Croat Nurs J. 2020; 4(1): 59-71
tems address the same issue. Nurses’ satisfaction with the level of care provided significantly nega-tively correlates with the means of NEMS scoring systems (higher level of nurses’ satisfaction is con-nected with lower score values). Mean of NEMS score in the first seven days of patients hospitalized in the ICU was 26.93±4.64, whereas it reached its highest value during the 4th day (30.34±8.10) after which it began to decline (Figure 2). This can be explained by the average duration of patient stay in the ICU and the fact that patients that have uneventful ICU stay (i.e. patients who had a scheduled admission) are re-leased by the fourth day, and patients who have had complications during ICU stay (such as occurrence of VAP, anastomosis leakage or surgical wound infec-tion) usually begin deteriorating during days 3 and 4 which requires additional diagnostic and therapeutic procedures which affect nursing workload. Cumula-tive NEMS of the entire department was 269.3 (10 beds) and if taken into account that a single nurse can achieve a maximum of 45 points during the course of 24 hours (2,13,17), then it is clear that, in the ICU at least, 5.98 (6) nurses are require to take adequate care of patients.
Mean categorization score was 57.83±4.29, and the highest value of categorization score was found dur-ing 7th days (59.70±4.44) (Figure 3). Recommended time required for providing care to a patient in cat-egory 4 during 24 hours is 10 or more hours (16). As there is no upper limit of time required for pro-viding care to a patient listed in category 4 descrip-tion, to calculate the necessary number of nurses 14 hours were taken as the required number of hours, meaning that in order to adequately provide care to a patient at least 5.83 (6) nurses are required at the ward. This finding is in line with the finding obtained when using the NEMS scoring system.
Nurses’ satisfaction with the level of care provided significantly negatively correlates with mean NEMS and categorization scores, meaning that the higher NEMS and categorization scores indicate nurses’ dis-satisfaction with the level of care provided. During the course of this study, during one shift in the ICU there were on average 4-5 nurses. The necessary number of nurses was calculated by using the data from both scoring systems and for NEMS this num-ber is 5.98 and for categorization 5.8, meaning that there is a lack of 1-2 nurses in each shift.
As both categorization and NEMS scoring systems can be used for the same purpose, it is important
additional scoring systems are used: to evaluate the state of consciousness (Glasgow Coma Scale), risk of falls (Morse scale) and risk of decubitus formation (Braden scale). In the ICU it is sometimes difficult to objectively assess the patient’s state because most of the patients are either admitted after a major pro-cedure or are sedated and on mechanical ventilation. Another problem in this scoring system’s estimate in the ICU is the fact that the patient’s condition fre-quently changes in the course of 24 hours, so the real question is which assessment to take into ac-count as the relevant one. Use of this scoring system creates a significant burden in terms of the time re-quired for the nurse in the ICU.
Unlike with categorization, NEMS uses therapeutic intervention to assess workload. It assesses nurses’ workload indirectly taking into account activities per-formed during therapeutic interventions, not taking into account independent nurses’ procedures. To-day, a large number of institutions in the world uses NEMS for its simplicity and speed in scoring (13). For example, in Switzerland head nurses are motivated to ensure NEMS scoring is performed and validated (21). There are also numerous studies researching the relation of NEMS to other known scoring sys-tems. One example of this is the study performed by Carmona-Monge and others (2013), which included a significantly higher number of patients and meas-urements; an in other studies, assessment of nurses’ workload was performed by means of NEMS scoring system and NAS (Nursing activities score), a scale that is used to assess activities directly connected to nurses’ profession and in that aspect it was more closely related to direct patient care. In both of these variables there was a high level of correlation not just for direct measurements in each patient, but also for total measurements for patients and for total measurements on the level of the entire ICU. Besides workload, NEMS can also provide useful ad-ditional information on the severity and prognosis of the disease, and is being used in multicentric studies in ICUs, economical purposes (17) and correlates with the severity of the disease (as measured by the em-ployment of SAPS II system) (3).
This study demonstrated moderate level of cor-relation between categorization and NEMS. NEMS and categorization correlations were in most cases (except for days 6 and 7 when the least number of participants was included) significant and positive, pointing towards a conclusion that both scoring sys-
Vuković Lj. Assessment of Nurses’ Workload in Intensive Care Unit by Use of Scoring Systems. Croat Nurs J. 2020; 4(1): 59-71 69
consciousness, risk of fall, and formation of decubi-tus, however it does not evaluate interventions that are specific for the ICU. The use of this scoring sys-tem requires significant use of nurses’ time in the ICU. NEMS scoring system, on the other hand, uses 9 nurse interventions which are specific for ICUs and which have been shown to burden nurses the most, whereas the calculation itself required reasonable amount of time, approximately 1 minute per patient (3). In today’s society there is a need for categoriza-tion of different ICUs and healthcare institutions and their grading in the complete healthcare system; this scoring system can help with that. For this reason, the conducted study shows the need to recognize NEMS scoring system in everyday clinical practice as a simpler, more applicable, faster and more useful scoring system in ICUs.
References
1. Padilha KG, de Sousa RM, Queijo AF, Mendes AM, Reis Miranda D. Nursing Activities Score in the intensive care unit: analysis of the related factors. Intensive Crit Care Nurs. 2008;24(3):197–204.
2. Guccione A, Morena A, Pezzi A, Iapichino G. I cari-chi di lavoro infermieristico. Minerva anestesiol. 2004;70:411-6. Italian.
3. Junger A, Brenck F, Hartmann B, Klasen J, Quinzio L, Benson M, et al. Automatic calculation of the nine equivalents of nursing manpower use score (NEMS) using a patient data management system. Intensive Care Med. 2004;30(7):1487–90.
4. Needleman J, Buerhaus P, Mattke S, Stewart M, Zelevin-sky K. Nurse-staffing levels and the quality of care in hospitals. N Engl J Med. 2002;346(22):1715–22.
5. Aiken LH, Cimiotti JP, Sloane DM, Smith HL, Flynn L, Neff DF. Effects of nurse staffing and nurse educati-on on patient deaths in hospitals with different nurse work environments. Med Care. 2011;49(12):1047–53.
6. Sasichay-Akkadechanunt T, Scalzi CC, Jawad AF. The relationship between nurse staffing and patient out-comes. J Nurs Adm. 2003;33(9):478–85.
7. Hugonnet S, Chevrolet JC, Pittet D. The effect of work-load on infection risk in critically ill patients. Crit Care Med. 2007;35(1):76–81.
8. Lake ET, Cheung RB. Are patient falls and pressure ulcers sensitive to nurse staffing? West J Nurs Res. 2006;28(6):654–77.
to take into account when deciding which scoring systems to use that NEMS scoring system requires less time to perform when compared to categoriza-tion scoring system, mainly due to the fact that it requires fewer components. The time required to perform these scoring systems is an important factor when choosing the most appropriate scoring system as nurses that provided patient care are at the same time responsible for filling out the necessary docu-mentation to perform scoring. It has been shown that the time required to correctly record data can result in unprecisely measured data (13).
Conclusion
This study has shown moderate but significant lev-el of correlation between categorization and NEMS scoring systems. Therefore, each of those scoring systems can be used to assess nurses’ workload in the ICU. Use of both scoring systems has shown that 6 nurses are required in each shift to ensure adequate level of provided care. As both categoriza-tion and NEMS scoring systems can be used for the same purpose it is important to take into account when deciding which scoring system to use the fact that NEMS scoring system can be calculated faster than categorization. In today’s society there is a clear need to categorize different types of ICUs and healthcare institutions, as well as make it possible to grade them in the total healthcare system; in this task the NEMS scoring system can be of great help.
The conclusion of this study is that NEMS scoring system is simpler, more applicable, quicker to use and more useful scoring system which should, instead of categorization scoring system, be used to assess nurs-es’ workload in ICUs. In any case, further research is needed to further validate these results in other ICUs, as well as to determine which scoring system is the best and most useful to assess nurses’ workload.
Relevance to clinical practiceCategorization scoring system for patients is a com-plex scoring system which uses 16 factors with three additional scales for evaluation of patient’s state of

70 Vuković Lj. Assessment of Nurses’ Workload in Intensive Care Unit by Use of Scoring Systems. Croat Nurs J. 2020; 4(1): 59-71
16. Razvrstavanje pacijenata u kategorije ovisno o potrebama za zdravstvenom njegom. Hrvatska ko-mora medicinskih sestara. 2006. Available from: http://www.hkms.hr/data/1321863892_120_ma-la_Kategorizacija-bolesnika%5B1%5D.pdf Accessed: 05.07.2014. Croatian.
17. Rothen HU, Küng V, Ryser DH, Zürcher R, Regli B. Vali-dation of “nine equivalents of nursing manpower use score” on an independent data sample. Intensive Care Med. 1999;25:606–11.
18. Junger A, Hartmann B, Klasen J, Brenck F, Röhrig R, Hempelmann G. Impact of different sampling strate-gies on score results of the Nine Equivalents of Nurs-ing Manpower Use Score (NEMS). Methods Inf Med. 2007;46(4):410–415.
19. Reis Miranda D. The therapeutic intervention scoring system: one single tool for the evaluation of work-load, the work process and management? Intensive Care Med. 1997;23(6):615–17.
20. Reis Miranda D, Moreno R, Iapichino G. Nine equiva-lents of nursing manpower use score (NEMS). Inten-sive Care Med. 1997;23(7):760–65.
21. Perren A, Cerutti B, Merlani P, Perren I, Previsdomini M, Massarotto P, et al. SwissScoring-a nationwide survey of NEMS assessing practices and its accuracy: SwissS-coring-a nationwide survey of NEMS. Acta Anaesthe-siol Scand. 2014;58(4):478–86.
9. Penoyer DA. Nurse staffing and patient outcomes in critical care: a concise review. Crit Care Med. 2010;38(7):1521–28.
10. Van Bogaert P, Clarke S, Willems R, Mondelaers M. Nurse practice environment, workload, burnout, job outcomes, and quality of care in psychiatric hospitals: a structural equation model approach. J Adv Nurs. 2013;69(7):1515–24.
11. Aiken LH, Clarke SP, Sloane DM, Sochalski J, Sil-ber JH. Hospital nurse staffing and patient mortal-ity, nurse burnout, and job dissatisfaction. JAMA. 2002;288(16):1987–93.
12. Perren A, Previsdomini M, Perren I, Merlani P. High ac-curacy of the nine equivalents of nursing manpower use score assessed by critical care nurses. Swiss Med Wkly. 2012;142:w13555.
13. Carmona-Monge FJ, Rollán Rodríguez GM, Quirós Her-ranz C, García Gómez S, Marín-Morales D. Evaluation of the nursing workload through the Nine Equivalents for Nursing Manpower Use Scale and the Nursing Ac-tivities Score: a prospective correlation study. Inten-sive Crit Care Nurs. 2013;29(4):228–33.
14. Vincent JL, Moreno R. Clinical review: Scoring systems in the critically ill. Critical Care. 2010;14(2):207.
15. Bouch DC, Thompson JP. Severity scoring systems in the critically ill. Continuing Education in Anaesthesia, Critical Care & Pain. 2008;8:181–185.

Vuković Lj. Assessment of Nurses’ Workload in Intensive Care Unit by Use of Scoring Systems. Croat Nurs J. 2020; 4(1): 59-71 71
padati. Kumulativni NEMS cjelokupne jedinice inten-zivne medicine iznosio je 269,3. U skladu s činjenicom da prema NEMS-u jedna medicinska sestra tijekom 24 sata može odraditi do najviše 45 bodova, rezultati su pokazali da je u jedinici intenzivne medicine (10 kre-veta) potrebno najmanje 5,98, odnosno šest medicin-skih sestara kako bi odgovarajuće zbrinule bolesnike. Prosječna kategorizacija iznosila je 57,83 ±4,29, a najveća vrijednost kategorizacije je bila tijekom sedmog dana (59,70 ±4,44). Prema kategorizaciji, preporučeno vrijeme potrebno za zbrinjavanje jednog bolesnika u četvrtoj kategoriji tijekom 24 sata iznosi 10 i više sati. Budući da u opisu četvrte kategorije nije navedena gornja granica vremena potrebnog za zbrinjavanje bolesnika, za izračun potrebnog broja medicinskih sestara uzeto je 14 sati, što znači da je za odgovarajuće zbrinjavanje bolesnika prema katego-rizaciji potrebno najmanje 5,83 odnosno šest medi-cinskih sestara na odjelu. To je u skladu s dobivenim podacima iz bodovnog sustava NEMS. Zadovoljstvo medicinske sestre kvalitetom pružene skrbi značajno negativno korelira s prosječnim bodovnim sustavom NEMS i kategorizacijom (veće zadovoljstvo medicin-ske sestre povezano je s nižim zbrojem bodova).
Zaključak. Svaki od navedenih bodovnih sustava može se primijeniti za procjenu sestrinskog radnog opterećenja u jedinici intenzivne medicine. Međutim, NEMS je jednostavniji, primjenjiviji, brži i korisniji bo-dovni sustav i trebalo bi ga, umjesto kategorizacije, primjenjivati za procjenu radnog opterećenja medi-cinskih sestara u jedinicama intenzivne medicine.
Ključne riječi: radno opterećenje, medicinske sestre, jedi-nica intenzivne medicine
Sažetak
Cilj. Odrediti povezanost između dva različita bo-dovna sustava; kategorizacije bolesnika i Nine Equi-valents of Nursing Manpower Use Score (NEMS) i njihovu sposobnost da pokažu je li broj medicinskih sestara u jedinici intenzivne medicine optimalan za pružanje kvalitetne zdravstvene njege. Utvrditi pove-zanost između težine stanja bolesnika i zadovoljstva medicinskih sestara kvalitetom pružene skrbi.
Metode. Istraživanje je provedeno u Kliničkoj bolnici Dubrava na Odjelu intenzivne medicine Klinike za anesteziologiju, reanimatologiju i intenzivnu medic-inu u razdoblju od 8. siječnja do 14. travnja 2014. U istraživanje je bilo uključeno 265 bolesnika u dobi između 18 i 92 godine. Kategorizacija i Nine Equiva-lents of Nursing Manpower Use Score određivali su se svaki dan, od prvog do sedmog dana hospital-izacije u jedinici intenzivne medicine. Također su uvršteni podaci od protekla 24 sata iz medicinske do-kumentacije. Nine Equivalents of Nursing Manpower Use Score računan je uz pomoć predviđene tablice i uputa za izračunavanje, a kategorizacija je unošena u elektroničkom obliku u sestrinsku dokumentaciju bolesnika. Medicinske sestre svoje su zadovoljstvo kvalitetom pružene skrbi ocjenjivale na Likertovoj ljestvici ocjenama od 1 do 5.
Rezultati. U provedenom istraživanju dokazana je visoka povezanost između kategorizacije i NEMS-a. Prosječan NEMS prvih sedam dana hospitalizacije bolesnika u jedinici intenzivne medicine iznosio je 26,93 ±4,64, a najveću vrijednost je imao tijekom četvrtog dana (30,34 ±8,10), nakon čega je počeo
PROCJENA RADNOG OPTEREĆENJA MEDICINSKIH SESTARA U JEDINICI INTENZIVNE MEDICINE PRIMJENOM BODOVNIH SUSTAVA


1 Sanja Ledinski Fičko2 Matija Mlinar1 Ana Marija Hošnjak 1 Martina Smrekar 1 Biljana Kurtović1 Janko Babić
1 University of Applied Health Sciences, Zagreb, Croatia
2 Department of Cardiac Surgery, UHC Zagreb, Croatia
Article received: 26.02.2020.
Article accepted: 30.03.2020.
DOI: 10.24141/2/4/1/6
Author for correspondence: Sanja Ledinski Fičko University of Applied Health Sciences Mlinarska cesta 38, Zagreb, Croatia E-mail: [email protected]
Keywords: needle stick injury (NSI), nursing students, prevention programs
Abstract
Introduction. Needle stick injury (NSI) is an occupa-tional health and safety issue. Nursing students are
prone to NSI due to lack of experience with handling needles and sharps.
Aim. To determine the level of knowledge about the prevention of NSI and examine the level of knowl-edge about the post-exposure procedure and the students’ understanding of NSI.
Methods. The study was conducted in 2017 at the University of Applied Health Sciences in Zagreb. The participants were nursing students from all regions of Croatia. The data was collected using a question-naire containing 17 questions specifically designed for this study. One question had three subquestions and one had five subquestions regarding the knowl-edge of how to react if a needle stick injury occurs. The participants also responded to a questionnaire on their socio-demographic data.
Results. The study included 149 students. The re-sults show that 16 students have experienced NSI. A statistically significant difference was observed among students who have finished a secondary med-ical school in the answers about post-NSI interven-tions and in answers to the question of whether the needle should be recapped. The respondents from medical schools answered correctly. A statistically significant difference was observed among students from non-medical secondary schools in the answers about education on post-exposition procedures and in the answers about necessary action following a needle stick injury. The respondents from non-medi-cal secondary schools had higher scores.
Conclusion. The results of this study can be used to establish appropriate education strategies, increase the awareness of needle stick injuries and minimize the occurrence of these injuries among nursing stu-dents in Croatia.
Nursing Student’s Knowledge about Understanding and Prevention of Needle Stick Injury
Croat Nurs J. 2020; 4(1): 73-80

74 Ledinski F. S. et al. Nursing Student’s Knowledge about Understanding and Prevention of Needle Stick Injury. Croat Nurs J. 2020; 4(1): 73-80
ed a needle stick or sharps injury. Opening the nee-dle cap was the most common causative event (28% of all cases), and a total of 39.5% of NSIs were not reported (5). Talas has reported that 49% of students in her study reported NSI, where 74% of these were injured while on wards. She suggests more intensive education programs directed at students in order to increase their awareness of and compliance with uni-versal safety precautions for NSIs (6). Smith and Leg-gat have stated that such education should incorpo-rate high-risk procedures such as taking the cap off a needle and opening an ampoule (5). Yao et al. have identified insufficient awareness of occupational safety and limited work experience with handling needle stick injuries in nurse students. The authors also state that, when stratified by departments, the highest rate of needle stick injuries was seen in the surgery department (7). Nursing students should be more careful during the disposal of sharps according to Shiao et al. The authors also stated that any public health and infection control strategy should include a universal catch-up HBV vaccination program among students before commencement of internship (8).
Suliman et al. have conducted a cross-sectional study to measure student nurses’ level of knowledge about NSIs. The study reported that most of the students who had suffered NSI did not inform their clinical in-structors (67.1%) or write an incident report (86.3%). The results showed that there was significant differ-ence between students in different years of study. Focusing on NSI in the nursing curriculum and provid-ing more protection and post-exposure intervention for students during their clinical practice is highly rec-ommended (9). There is a need for better education of nursing students and more effective supervision in relation to NSIs and sharps injuries (10). In their lit-erature review, Handiyani et al. identified four main strategies to prevent NSIs, such as education, train-ing, safe needle use and effective communication. Collaboration between hospitals and educational institutions is essential for developing effective NSI prevention programs (11). An educational program (lectures on the risk of unsafe practices and how to avoid them) conducted on the prevention of percu-taneous injuries (PIs) showed a significant decrease of PIs rates among nurses. There was a significant decrease in PIs frequency in both the emergency de-partment (3.4% vs 12.4%) and the intensive care unit (3.4% vs 13.7%) (12). The rate of NSIs among nurs-ing students was relatively high before occupational
Introduction
A needle stick injury (NSI) is any injury caused by a sharp object which does not have to require special care but can lead to infection transmission due to the infected object (needle, ampoule, scalpel). More than 20 pathogens that can transmit infection have been registered, and the most dangerous infections are hepatitis C (HCV), hepatitis B (HBV) and the hu-man immunodeficiency virus (HIV). NSI usually oc-curs when using therapy or diagnostic procedures, and the most common incidents occur with previ-ously used needles. Administering injections, blood sampling, recapping of needles, discarding needles, handling trash and dirty linen (downstream injuries) and missing the target while transferring blood or any kind of fluid from a syringe to a specimen con-tainer (such as a vacuum tube) are the main causes of needle stick injuries (1). The occurrence of NSIs is significantly higher than present estimates sug-gest, which is why the lower frequency of reporting injuries should not be confused with an absence of a problem (2). That is why it is important to empha-size the promotion of “no guilt” culture: do not let the person who has experienced the incident feel guilty.
Nursing is a practical profession, which is why nurs-ing education comprises both classroom teaching and clinical practice (3). Performing an intervention in a safe and proper way in patient care has a major role in the safety of health professionals, including nursing students. In their clinical placement, nursing students are expected to practice, under supervision, all nursing skills performed by registered nurses, including giving injections via various routes and measuring patient blood glucose using the glucom-eter. However, nursing students are less experienced and less skilful in handling needles and sharps (4). Prasuna et al. have found a high rate of needle stick injuries among nursing students, as well as a high rate of under-reported cases. These facts and issues need to be highlighted through regular education on real-life procedures at the entry level and a simplified reporting system, thus providing a more user-friend-ly platform for reporting NSI. It is very important that students report NSI cases according to a well-estab-lished system so they can receive rapid and appro-priate post-exposure prophylaxis (2). In the study of Smith and Leggat, 13.9% of nursing students report-

Ledinski F. S. et al. Nursing Student’s Knowledge about Understanding and Prevention of Needle Stick Injury. Croat Nurs J. 2020; 4(1): 73-80 75
InstrumentA specially designed questionnaire with 17 questions was used in the study. The respondents were offered multiple choices: 1) “yes”, 2) “no” and 1) “yes”, 2) “no” and 3) “not sure”. One question had three subques-tions and one had five subquestions regarding the knowledge of how to react if an NSI occurs. The par-ticipants also responded to a questionnaire on their socio-demographic data, including age, gender, year of study, type of secondary education, whether or not they have had an NSI and their vaccine status for hepatitis B. The questions are divided in two groups. The first group is related to the perception of acquired knowledge and skills, and the second is about the spe-cific issues of post-exposure procedures.
StatisticsSocio-demographic characteristics were analysed as categorical variables and are represented in numbers and relative frequency. Some dimensions contain more than one answer, while others include only one categorical answer. In case of lack of response to some questions, the average of the other answers was used, but only if at least half of the questions are answered (14-16). The statistical difference was determined using the Chi-Square Test. The values of p< 0.05 are evaluated as statistically significant. Sta-tistical analysis is performed by means of the elec-tronic 24.0 SPSS Inc., Chicago, IL, SAD software.
Results
149 of the questionnaires were eligible for analysis. All of the respondents were full-time first-year nurs-ing students, 69 of them (46%), while 80 of them were third-year nursing students (54%). Overall, the data included 134 (93%) women and 15 (7%) men. The largest number of the respondents was in the age range of 21 years. Most of the respondents have finished a “non-medical” secondary school, 95 of them (64%), while 54 (36%) of the respondents finished a “medical” secondary school. Furthermore, after the respondents filled in their sociodemograph-ic data, they had to answer two questions. The first one was whether or not they have had an NSI and
safety training and education programs (OSTEP) in China (on average, 4.65 events/nurse). However, it decreased rapidly to 0.16 events/nurse on average after the OSTEP (13). Education on NSIs should in-clude safe working procedures, as well as why NSIs should be reported, using safe tools for needles, safe waste disposal and using containers for sharp ob-jects, as well as incident procedures - including how and when to seek support. After education, what is learnt needs to be applied in practice.
In Croatia, there is a lack of studies about knowledge of NSI among nursing students. Taking this into ac-count, this study aimed to determine the level of stu-dents’ knowledge about the prevention of NSI and to examine the level of students’ knowledge about post-exposure procedures among nursing students at the University of Applied Health Sciences in 2017.
Methods
ParticipantsThe study was conducted in the second half of 2017. The respondents were full-time nursing students from all regions of Croatia, aged 18 to 28. All partici-pants were fully informed about the aims of the study and provided written informed consent for participa-tion in the study. The total number of respondents is 149. The questionnaire was designed specifically for this study and supplemented by a socio-demo-graphic inquiry, and was personally delivered to all participants. Data collection was carried out at the University of Applied Health Sciences in Zagreb. Fif-teen people who were offered participation chose not to participate. Data collection, preparation, imple-mentation and presentation was in accordance with the legal requirements for the protection of the con-fidentiality of personal information, and approval for the study was obtained from the Ethics Committee of the University of Applied Health Studies (UR-251-1-379-1-17-02).

76 Ledinski F. S. et al. Nursing Student’s Knowledge about Understanding and Prevention of Needle Stick Injury. Croat Nurs J. 2020; 4(1): 73-80
There is a statistically significant difference in the answers about interventions when an NSI occurs de-pending on which secondary school the participants finished. The respondents from medical schools an-swered correctly. There is also a statistically signifi-cant difference in answers to the question of wheth-er to put the cover back on a needle, which is why we can conclude that the participants who finished a medical school have better knowledge.
Table 3. Number of respondents who answered correctly and the Chi-Square Test for the
question about post-exposure interventions
Secondary “medical”
school
Secondary “non-
medical” school
Chi-Square
Test
N N
To whom would you report a
needlestick injury?53 92 0.370
Table 4. Number of respondents who answered correctly and the Chi-Square Test for obtained questions about post-exposure
interventions
Which interventions
need to be implemented after a needle
stick injury:
Number of students
who finished a “medical” secondary school and answered correctly
Secondary “non-
medical” school
Chi-Square
Test
Blood testing- victim
53 94 0.595
Blood testing- patient
43 86 0.054
Post-exposure monitoring
54 93 0.635
Post-exposure education
46 90 0.048
There is no statistical difference in the answers about who they would report the needlestick injury to. Furthermore, there is no statistical difference in the answers about whether it is necessary to take blood for serological testing for patients and injured persons, or in the answers regarding the necessity of monitoring over three months.
the second one was whether or not they have been vaccinated for hepatitis. 16 (11 %) students have had an NSI and one could not remember if they have had any. All students except one reported that they are vaccinated, but 50 (34%) of the students were not sure about their vaccination status.
All of the respondents answered correctly to the question about whether it is necessary to wear pro-tective gloves regardless of which secondary school they have finished.
Table 1. Number of respondents who answered correctly and the Chi-Square Test for the
question about acquired knowledge and skills
Secondary “medical”
school
Secondary “non-
medical” school
Chi-Square
Test
Question N N
After a needle stick injury occurs,
it is necessary to immediately
squeeze out blood under water
40 51 0.011
Table 2. Number of respondents who answered correctly and the Chi-Square Test for obtained
questions about acquired knowledge and skills
Answers to the question: To avoid needle
stick injury, it is necessary to
Secondary “medical”
school
Secondary “non-
medical” school
Chi-Square
Test
wear protective gloves
51 94 0.136
put the cover back on the needle
37 41 0.002
put the needle into a special
container after use
54* 95* -
The “safety-system” reduces
the possibility of a needle stick injury
54* 95* -
It is necessary to restrain a restless
patient or child 52 92 0.598
*all students answered correctly

Ledinski F. S. et al. Nursing Student’s Knowledge about Understanding and Prevention of Needle Stick Injury. Croat Nurs J. 2020; 4(1): 73-80 77
Discussion
This is the first such study conducted at the Universi-ty of Applied Health Sciences to examine the knowl-edge of nursing students of NSI. The healthcare pro-fession has been characterized as a profession that is at high risk of NSI and therefore the transmission of infection. Lack of experience or training, overload and fatigue are the most common causes of NSI (17-19). In a study conducted by Askarian et al., most of the interviewed nurses, 52.5% of them, reported an NSI more than once a year (20). Shiao et al. examined the incidence of NSI in students in Taiwan and report-ed that 61.9% of them experienced an NSI, mostly in hospital rooms (70.1%) (8) during venepuncture or administration of IV therapy (21). Furthermore, an of-ten unreported NSI indicates a lack of knowledge of the reporting system or lack of knowledge of the re-porting process and the importance of recording NSI (21). This is different from our results, which show that students, especially those who have finished a medical school, correctly answered the questions about post-exposure procedure. All of the respond-
There is a statistically significant difference in the answers about conducting education on post-ex-posure interventions. The respondents from a non-medical secondary school had higher scores, i.e. most of them answered correctly.
When all 5 questions about post-exposure interven-tions were obtained and combined into one variable, a total level of knowledge in this aspect was ob-tained and each subject could accumulate a score be-tween 0 to 4. Table 3 gives the average score in that variable with regard to which secondary school the respondents finished, and it can be seen that, on av-erage, more points are obtained by respondents from non-medical schools. Table 4 shows that this differ-ence is statistically significant (t=-2.43, significance 0.016, ie p<0.05).
Table 5. Group statistics for obtained questions about post-exposure interventionsSecondary
school N Mean Std. Deviation Std. Error Mean
post-exposure interventions1 54 3.6296 0.55952 0.07614
2 94 3.8298 0.43101 0.04446
*Medical school (1); Non-medical school (2)
Table 6. Independent samples test for obtained questions about post-exposure interventions
F
Levene’s Test for Equality of Variances
t-test for Equality of Means
Sig. t Df Sig. (2-tailed)
Mean Difference
Std. Error Difference
95% Confidence Interval of the
Difference
Lower Upper
Post-exposure
interventions
Equal variances assumed
16.284 0.000 -2.434 146 0.016 -0.20016 0.08224 -0.36270 -0.03762
Equal variances
not assumed
-2.270 89.37 0.026 -0.20016 0.08817 -0.37534 -0.02498

78 Ledinski F. S. et al. Nursing Student’s Knowledge about Understanding and Prevention of Needle Stick Injury. Croat Nurs J. 2020; 4(1): 73-80
(26). In order to develop further prevention measures and strategies and minimize adverse events, it is im-portant to provide ongoing training in the prevention of NSI, post-exposure procedures, and simulation ex-ercises prior to clinical practice for students.
The students’ knowledge of NSI is satisfactory. They were educated about the possibility of risk, post-ex-posure procedures and prevention. However, it is ob-vious that the students who have finished a medical high school had a higher level of knowledge in these areas. Due to different groups of students, education about NSI should begin from the first year of study.
One suggestion for future research is to conduct a study on a larger sample of participants and on part-time nursing students.
Conclusion
NSI represents an occupational hazard for health care workers. Nursing students are at a high risk of NSI due to a lack of knowledge and clinical experi-ence. In order to ensure their safety and improve their knowledge, it is important to identify strategies for the prevention of NSI. Nursing students in Croa-tia have moderate knowledge about the prevention of NSI and post-exposure procedures. The results of this study show that students who have finished a medical secondary school showed better results when answering questions about interventions for the prevention of needle stick injuries, while stu-dents who have finished a non-medical school show better results when answering questions about post-exposure interventions.
Finally, the results of this study can be used to estab-lish appropriate education strategies, increase the awareness of needle stick injuries and minimize the occurrence of these injuries among nursing students in Croatia.
ents are aware that an NSI can transmit infectious diseases, while students who have finished a medi-cal school achieved, on average, higher results re-garding the procedure during and after NSI. There is a statistically significant difference in the answers to the question of whether to replace the needle cap depending on the type of school, with significantly more correct answers given by the respondents from medical schools, which is contrary to the research of Suliman et al., who claimed that half of the nurses did not know that it was not a standard procedure to replace the protective cap after using a needle (9). In the same study, even fewer respondents (34.8%) knew which procedures needed to be performed af-ter exposure to an NSI, which is also different from our results where students showed a high level of knowledge regarding post-exposure interventions (9). High results related to wearing gloves is corre-lated with the results of our study, where most stu-dents report wearing gloves when handling sharp objects (21), while Vandijki statistically showed that 88.7% of students provided the correct answer to the question of when to use gloves, and 60.2% rec-ognized the importance of wearing protective cloth-ing (21-22). Students are aware of the importance of vaccination, prophylaxis and reprophylaxis, and all re-port being vaccinated, which is similar to other stud-ies where as many as 96% of the students reported being vaccinated against the hepatitis B virus (23). The percentage of needle stick injuries among the respondents is not significantly high, but a higher number of respondents could change the results of the study. Studies conducted on a large number of students indicate a relatively high incidence of NSI during exercise classes (23), with Liu et al. reporting an incidence of 60.8% among students. They proved that the incidence of NSI was significantly higher in the early stage of internships, and higher in the daytime shift than the night shift. Furthermore, the incidence of needle stick injuries was higher during the removal of a needle for the administration of therapy or infusion, accounting for 24.3% of the total incidence (24). The high incidence of NSI (39.76%), mostly during the first year of study, was also re-corded in a study by Prasuna et al. conducted among nursing students, which showed that respondents were unaware of the measures to be taken after exposure (2). Masaaro included 223 students in the final year of study, and the incidence of NSI was 18% (25), which is similar to the results of Stefanati et al., whose study showed that the incidence was 18.82%
Ledinski F. S. et al. Nursing Student’s Knowledge about Understanding and Prevention of Needle Stick Injury. Croat Nurs J. 2020; 4(1): 73-80 79
osmisliti, provesti i opisati znanstveno i stručno istraživanje. Zagreb: M.E.P; 2010. Croatian.
15. Petz B, Kolesarić V, Ivanec D. Petzova statistika. Osnovne statističke metode za nematematičare. Ja-strebarsko: Naklada Slap; 2012. Croatian.
16. Šošić I. Primijenjena statistika. Zagreb: Školska knjiga; 2006. Croatian.
17. Phipps W, Honghong W, Min Y, Burgess J, Pellico L, Wat-kins C, et al. Risk of medical sharps injuries among Chine-se nurses. Am J Infect Control. 2002;30(5):277–82.
18. Rogers B, Goodno L. Evaluation of interventions to prevent needlestick injuries in health care occupati-ons. Am J Prev Med. 2000;18(4 Suppl):90–8.
19. Rubbi I, Cremonini V, Butuc A, Cortini C, Artioli G, Bona-caro A, et al. Incidence and type of health care asso-ciated injuries among nursing students: an experien-ce in northern Italy. Acta Bio Med. 2018;89(7-S):41-9.
20. Ayranci U, Kosgeroglu N. Needlestick and sharps inju-ries among nurses in the healthcare sector in a city of western Turkey. J Hosp Infect. 2004;58(3):216-23.
21. Askarian M, Malekmakan L, Memish ZA, Assadian O. Prevalence of needle stick injuries among dental, nur-sing and midwifery students in Shiraz, Iran. GMS Kran-kenhhyg Interdiszip. 2012;7(1):Doc05.
22. Vandijck DM, Labeau SO, De Somere J, Claes B, Blot SI; Executive Board of the Flemish Society of Critical Care Nurses. Undergraduate nursing students’ knowledge and perception of infection prevention and control. J Hosp Infect. 2008;68(1):92–4.
23. Yang Y, Wu M, Ho C, Chuang H, Chen L, Yang C, et.al. Needlestick/sharps injuries among vocational school nursing students in southern Taiwan. Am J Infect Con-trol. 2004;32(8):431-5 .
24. Liu C, Liu X, Zhu Y, Liu Y. [Influencing factors for need-lestick injuries in student nurses]. Zhonghua Lao Dong Wei Sheng Zhi Ye Bing Za Zhi. Chinese Jour-nal of industrial hygiene and occupational disease. 2015;33(7):528-31. Chinese.
25. Massaro T, Cavone D, Orlando G, Rubino M, Ciciriello M, Musti EM. Infortuni da dispositivi taglienti tra gli studenti di infermieristica: un rischio lavorativo emer-gente [Needlestick and sharps injuries among nursing students: an emerging occupational risk]. G Ital Med Lav Ergon. 2007;29(3 Suppl):631–2. Italian.
26. Stefanati A, Boschetto P, Previato S, Kuhdari P, De Pa-ris P, Nardini M, et al. Indagine sugli infortune tra il per-sonale infermieristico e gli studenti del corso di laurea in infermieristica: analisi epidemiologica descrittiva nel period 2002-2012 in un’Azienda Ospedaliero-Universitaria [A survey on injuries among nurses and nursing students: a descriptive epidemiologic analysis between 2002 and 2012 at a University Hospital]. Med Lav. 2015;106(3):216-29. Italian.
References
1. Norsayani MY, Noor Hassim I. Study on incidence of needle stick injury and factors associated with this problem among medical students. J Occup Health. 2003;45(3):172-8.
2. Prasuna J, Sharma R, Bhatt A, Arazoo, Painuly D, Bu-tola H, et al. Occurrence and knowledge about needle stick injury in nursing students. J Ayub Med Coll Ab-bottabad. 2015;27(2):430-3.
3. Benner P, Sutphen M, Leonard V, Day L. Educating Nurses: A Call for Radical Transformation. 1st ed. San Francisco: Jossey-Bass; 2010.
4. Cheung K, Ho SC, Ching SS, Chang KK. Analysis of needlestick injuries among nursing students in Hong Kong. Accid Anal Prev. 2010;42(6):1744–50.
5. Smith DR, Leggat PA. Needlestick and sharps injuries among nursing students. J Adv Nurs. 2005;51(5):449-55.
6. Talas MS. Occupational exposure to blood and body fluids among Turkish nursing students during clini-cal practice training: frequency of needlestick/sharp injuries and hepatitis B immunisation. J Clin Nurs. 2009;18(10):1394–403.
7. Yao WX, Yang B, Yao C, Bai PS, Qian YR, Huang CH, et al. Needlestick injuries among nursing students in China. Nurse Educ Today. 2010;30(5):435-7.
8. Shiao JS, Mclaws ML, Huang KY, Guo YL. Student nur-ses in Taiwan at high risk for needlestick injuries. Ann Epidemiol. 2002;12(3):197–201.
9. Suliman M, Al Qadire M, Alazzam M, Aloush S, Alsa-raireh A, Alsaraireh FA. Students nurses’ knowledge and prevalence of Needle Stick Injury in Jordan. Nurse Educ Today. 2018;60:23–7.
10. Hambridge K. Needlestick and sharps injuries in the nursing student population. Nurs Stand. 2011;25(27):38–45.
11. Handiyani H, Meily Kurniawidjaja L, Irawaty D, Da-mayanti R. The effective needle stick injury preven-tion strategies for nursing students in the clinical settings: a literature review. Enferm Clin. 2018;28 Suppl 1:167–71.
12. El Beltagy K, El-Saed A, Sallah M, Balkhy HH. Impact of infection control educational activities on rates and frequencies of percutaneous injuries (PIs) at a tertiary care hospital in Saudi Arabia. J Infect Public Health. 2012;5(4):297–303.
13. Yao WX, Wu YL, Yang B, Zhang LY, Yao C, Huang CH, et al. Occupational safety training and education for need-lestick injuries among nursing students in China: inter-vention study. Nurse Educ Today. 2013;33(8):834-7.
14. Tkalac Verčić A, Sinčić Ćorić D, Pološki Vokić N. Priručnik za metodologiju istraživačkog rada - Kako
80 Ledinski F. S. et al. Nursing Student’s Knowledge about Understanding and Prevention of Needle Stick Injury. Croat Nurs J. 2020; 4(1): 73-80
srednju medicinsku školu u odgovorima povezanima s postekspozicijskim mjerama i intervencijama nakon pojave ubodnog incidenta. Studenti koji nisu završili srednju medicinsku školu imali su bolji rezultat.
Zaključak. Rezultati ovog istraživanja mogu se upo-trijebiti za izradu odgovarajućih obrazovnih strategija za povećanje svijesti o ubodnom incidentu te preven-ciju njegove pojave među studentima sestrinstva u Hrvatskoj.
Ključne riječi: ubodni incident, studenti sestrinstva, pre-ventivni programi
Sažetak
Uvod. Ubodni incident predstavlja problem povezan s profesionalnim zdravljem i sigurnošću. Studenti se-strinstva skloni su nastanku ubodnog incidenta zbog nedostatka iskustva pri rukovanju iglama i oštrim predmetima.
Cilj. Odrediti razinu znanja o prevenciji i postekspozi-cijskoj proceduri te poimanju ubodnog incidenta.
Metode. Istraživanje je provedeno tijekom 2017. go-dine na Zdravstvenom veleučilištu u Zagrebu. Sudio-nici su bili studenti studija sestrinstva u dobi od 18 godina i više. Podaci su prikupljeni s pomoću upitnika koji sadrži 17 pitanja, posebno dizajniranog za ovo istraživanje. Prvo pitanje imalo je imalo tri potpitanja, drugo pet potpitanja povezanih sa znanjem kako rea-girati ako se dogodi ubodni incident, a treće trinaest potpitanja povezanih s percepcijom opasnosti ubod-nog incidenta s obzirom na karakteristike pacijenata. Sudionici su također odgovorili na pitanja o sociode-mografskim podacima.
Rezultati. U istraživanju je sudjelovalo 149 studena-ta. Rezultati istraživanja utvrdili su kako je 16 stude-nata doživjelo ubodni incident. Utvrđena je statistički značajna razlika kod studenata koji su završili srednju medicinsku školu u odgovorima povezanima s inter-vencijama u slučaju ubodnog incidenta i u odgovori-ma na pitanje o tome treba li vratiti poklopac na iglu nakon upotrebe. Studenti koji su završili srednju me-dicinsku školu odgovorili su točno. Statistički značaj-na razlika utvrđena je kod studenata koji nisu završili
ZNANJE STUDENATA STUDIJA SESTRINSTVA O PREVENCIJI I POIMANJU UBODNOG INCIDENTA

1 Josipa Dovranić1 Matija Bagarić1 Marija Karača2 Vladimir Trkulja1 Danijel Matek
1 Department of Orthopaedics, University Hospital Center Zagreb, University School of Medicine, Za-greb, Croatia
2 Department of Pharmacology, Zagreb University School of Medicine, Croatia
Article received: 11.02.2020.
Article accepted: 08.04.2020.
DOI: 10.24141/2/4/1/7
Author for correspondence: Josipa Dovranić Salata 6, 10000 Zagreb, Croatia E-mail: [email protected] Danijel Matek Salata 6, 10000 Zagreb, Croatia E-mail: [email protected]
Keywords: scoliosis, spondylodesis, pain management, analgesics
Abstract
Introduction. Surgical treatment of structural ado-lescent scoliosis, either through anterior or posterior spinal fusion, results in severe pain.
Aim. In comparison with the anterior approach, the posterior approach is considered advantageous in that several spine curvatures can be corrected in a single operative act. The aim was to compare the ef-fectiveness of a morphine-based multimodal protocol over the first 48 postoperative hours in anterior and posterior surgeries.
Methods. This retrospective chart review includ-ed consecutive adolescents (10-21 years of age) treated using either the anterior (n=28) or the pos-terior (n=30) approach at a single hospital centre over 3 years (2015-2017). Intravenous morphine (48 mg/24 hours) was administered at hourly inter-vals; pain was assessed using an 11-point (higher score=worse pain) visual analogue scale on 12 oc-casions during the first 24 hours and on 3 occasions during the second 24 hours. Additional analgesia (non-opioid or weak opioid) was delivered on demand and/or according to medical assessment.
Results. With adjustments for age and number of af-fected spinal segments, VAS pain scores were lower in the anterior approach, overall (48 hours) (differ-ence = -18%, 95% CI -30 to -5), and particularly over hours 0-3 (-23%, 95% CI -36 to -7%) and hours 4-6 (-26%, 95% CI -40 to -10%) after the surgery. The rate of additional analgesic administrations was com-parable throughout the observed period (rate ratios around 1.0).
Conclusion. The evaluated intravenous morphine-based multimodal analgesic protocol appeared less effective in surgeries using the posterior approach, suggesting that the two approaches might require different protocols for the same level of analgesia.
Standard Multimodal Postoperative Analgesia Might Not Be Equally Effective When Comparing Anterior and Posterior Spondylodesis
Croat Nurs J. 2020; 4(1): 81-89

82 Dovranić J. et al. Standard Multimodal Postoperative Analgesia Might Not Be Equally Effective... Croat Nurs J. 2020; 4(1): 81-89
eral anaesthesia with intraoperative monitoring, large soft tissue incisions (skin, muscles, ligaments) and bone procedures, and always cause severe pain. Con-sequently, perioperative pain management is of great importance and potent regimens are required. Intra-venous patient-controlled opioid analgesia (PCA) has been generally accepted as a basis for successful pain control in adolescents with idiopathic scoliosis (AIS) and has been compared to various other protocols such as epidural analgesia or intrathecal opioids (11). Different multimodal PCA-based protocols (e.g. with additional ketamine infusion, continuous wound in-filtrations, intravenous lidocaine) (12) have also been evaluated in order to assess the potential of reducing opioid utilization and the adverse effects of opioids. Multimodal PCA (opioid)-based protocols including non-opioid and weak opioid analgesics have been rather commonly employed in this setting. One such protocol has been a standard procedure at our institu-tion and has been employed in AIS patients regardless of whether they are treated using the anterior or the posterior approach. This analysis aimed to assess the relative efficiency of the protocol in the anterior and the posterior approach.
Methods
Design and ethics
This retrospective chart review included consecu-tive adolescents (age ≥10 and ≤21) with verified idiopathic scoliosis treated surgically using ventral derotational spondylodesis (anterior approach) or transpedicular spondylodesis (Neurofrance instru-mentation) (posterior approach) at the Department of orthopaedic surgery of the University Hospital Centre Zagreb over a period of three years (2015-2017). The analysis refers to data routinely collected through a standardized procedure approved by the Institutional Ethics Committee.
Patient management and evaluation
All surgeries were performed by two experienced surgeons, and the choice of the approach was at
Introduction
Structural scoliosis is a three-dimensional spine dis-tortion comprised of frontal (sideways), horizontal (rotation and torsion) and sagittal (kyphosis or lordo-sis) components (1). Etiologically, it is classified as id-iopathic (70-80% of all cases) or secondary, i.e., neu-romuscular, due to congenital disorders of connective tissue (Marfan syndrome) or other causes (rheumatic diseases, trauma, tumours, infections, contractures, metabolic disorders) (2). The main feature of struc-tural scoliosis is the rotational component and the occurrence of the rib hump (1,2). According to the localization and the curvature direction, it is classi-fied as cervical, thoracic, thoracolumbar or lumbar (1,2). Thoracic and lumbar segments are the most commonly affected segments. The primary curvature also produces compensatory secondary curvatures to achieve the balance of the body and the spine (3). Idiopathic scolioses most commonly develop during the growth spurt of puberty and early adolescence, more often in girls than in boys (4).
Treatment procedures vary depending on the type of scoliosis. Initially, conservative methods are used, most commonly physical therapy and applying cor-rective devices, orthoses (5), worn 23, 18, 16 or 12 hours/day depending on the curvature size, the age of the patient and the level of progression. Conserva-tive treatment, however, is frequently not successful and in advanced cases surgical treatment is needed: spinal fusion (spondylodesis) in the corrected position is performed, either using the anterior or the posterior approach (6). Since the introduction by Hibbs in 1911 (7), a variety of surgical methods have been described, but only a few are still in use. In 1983, King et al. (8) proposed a concept of limited fusion for the main thoracic curvatures. Since then, the most commonly used surgical approaches have been the anterior ap-proach (ventral derotational spondylodesis, VDS) and the posterior approach (transpedicular spondylodesis, Neurofrance® instrumentation). For the correction of curvatures, special instrumentation is used in order to correct and block (“stiffen”) the selected segments (9). Studies indicate advantages of the posterior ap-proach in that several curvatures can be corrected in a single operative act, as well as better functional outcomes and shorter hospital stay (10). However, both procedures are extensive, performed with gen-

Dovranić J. et al. Standard Multimodal Postoperative Analgesia Might Not Be Equally Effective... Croat Nurs J. 2020; 4(1): 81-89 83
formed VAS scores obtained at all 15 assessments. The difference between the anterior and the pos-terior approach was estimated (i) overall (the entire 48-hour period); and (ii) based on averaged scores (averages of assessment at 0-3, 4-6, 8-16, 20-24, 32-48 hours). No adjustment for multiple compari-sons was employed, but potential differences in aver-aged scores were considered statistically significant only if the overall difference between the procedures was statistically significant. Differences are ex-pressed as geometric means ratios (GMRs); b) a gen-eralized linear mixed model with a log link and a Pois-son distribution (surgery type, time, surgery*time interaction, adjustment for age and the number of spine segments) was fitted to the number of addi-tional analgesic applications per patient per time in-terval (0-4, >4-8, >8-16, >16-24 and >24-48 hours after surgery). The difference between the anterior and the posterior approach was estimated (i) overall; and (ii) by time-interval. No adjustment for multiple comparisons was employed, but potential differences between the two approaches at individual time in-tervals were considered statistically significant only if the overall difference was statistically significant. Differences are expressed as rate ratios (RR; anterior/posterior approach). Secondary analyses: a) area un-der the VAS score-time curve was determined (trap-ezoidal rule) for the entire observed period (AUC0-48), and also partial AUCs were determined for periods 0-4, 4-8, 8-16, 16-24 and 24-48 hours. A separate general linear model (type of surgery, age and num-ber of affected spine segments) was fitted to each ln-transformed AUC (total and partial). Potential dif-ferences between the anterior and the posterior ap-proach in partial AUCs were considered statistically significant only if the difference in total AUC was significant; b) A generalized linear mixed model with logit link and binary distribution (surgery type, time, surgery*time interaction, age and number of affect-ed spinal segments) was fitted to the proportion of patients requiring at least one additional analgesic administration (at time intervals of 0-4, >4-8, >8-16, >16-24 and >24-48 hours after surgery). The difference between the anterior and the posterior approach was estimated (i) overall; and (ii) by time-interval. No adjustment for multiple comparisons was employed, but potential differences between the two approaches at individual time intervals were considered statistically significant only if the overall difference was statistically significant. Differences are expressed as odds ratios (OR; anterior/posterior
their discretion. Diagnostic procedures and criteria, indication for surgical treatment and the treatment itself were all in line with the national guidelines.
Upon transfer to the intensive care unit (ICU), mor-phine-based analgesia was administered by a nurse upon receiving a patient’s request through the PCA system over 48 post-surgical hours as outlined in Figure 1: a) total daily (24 hours) dose of intravenous morphine was limited to a maximum of 48 mg; b) dur-ing the first 24 hours, all patients received two bolus doses of 4 mg each, one hour apart (starting immedi-ately upon ICU admission), followed by two 2 mg dos-es an hour apart (i.e. a total of 12 mg were delivered over the first 4 hours); c) the remaining 36 mg were delivered in 18 administrations, each one hour apart; d) during the second 24 hours, 2 mg were delivered in hourly intervals; e) pain severity was continuously as-sessed using an 11-point visual analogue scale (VAS), where 0 = no pain and 10 = excruciating pain, at time “0” (upon ICU admission) and then 1, 2, 3, 4, 6, 8, 12, 16, 20, 24, 32, 40 and 48 hours later; f) on the basis of patient demand and clinical assessment (VAS score, previous administrations), additional analgesia was provided via intravenous non-opioid [paracetamol, ketoprofen or metamizole (dipyrone) sodium] or weak opioid analgesics (pethidine, tramadol).
Measures of analgesic efficiency To quantify the level of analgesia, we evaluated: a) VAS pain scores across all assessment time-points over 48 hours, as well as averaged scores across as-sessment points (averages for assessments at 0-3 hours, 4-6, 8-16, 20-24, 32-48 hours after surgery); b) number of administrations of additional analgesics during the observed period and across post-surgical time-intervals (0-4, >4-8, >8-16, >16-24 and >24-48 hours after surgery); c) the proportion of patients receiving at least one dose of an additional analge-sics during the observed period and also across post-surgical time intervals (0-4, >4-8, >8-16, >16-24 and >24-48 hours).
Data analysis and effect measuresWe defined two primary and two secondary analyses for the comparison of the efficiency of the protocol in two surgical settings. Primary analyses: a) a general linear mixed model (surgery type, time, surgery*time interaction, with adjustment for age and the number of spine segments affected) was fitted to ln-trans-
84 Dovranić J. et al. Standard Multimodal Postoperative Analgesia Might Not Be Equally Effective... Croat Nurs J. 2020; 4(1): 81-89
dylodesis, and the changes in Cobb angles resulting from the surgery where somewhat smaller (Table 1). Intrasurgical autotransfusion was used only with the posterior approach, and more patients required packed red cell transfusions (Table 1) indicating more extensive procedures when compared to the anterior approach, although without statistical significance. There were also slight differences in the length of the ICU stay and overall hospitalization (Table 1).
In the primary analysis, with adjustments for age and the number of affected segments, VAS scores for pain over time were consistently lower with the anterior approach than with the posterior approach (Figure 2). Overall, the scores were by around 18% (5% to 30%) lower (Figure 2). They were also lower at assessments taken at 0 to 3 hours (by 23%), 4 to 6 hours (by 26%) and 32 to 48 hours (by 36%) (Figure 2). At the same time (and with the same ad-justments), the number of additional analgesic ap-plications appeared comparable between the groups (Figure 2). Sensitivity analyses (adjustments for Cobb angles instead of the number of affected seg-ments) yielded closely similar estimates (not shown).
In the secondary analysis (Table 2), AUC0-48 for VAS pain scores (the same adjustments as in the primary analy-sis) was by 26% (1% to 45%) lower with the anterior approach than with the posterior approach (GMR=0.74; 95% CI 0.55-0.99) (Table 2). At the same time (and with the same adjustments), the estimated probability of be-ing administered at least one additional dose of analge-sics for the entire 48-hour and across all time-intervals was comparable between the groups (Table 2).
AUCs were analysed by fitting general linear models to ln-transformed values, and the proportions of pa-tients being administered additional analgesics by fitting generalized linear mixed models with logit link and binary distribution. Adjustments were made for time, treatment*time interaction, age and number of affected spine segments.
Discussion/ Conclusion
Operative treatment of adolescent structural scoliosis is an example of a surgical procedure that is demand-ing for both the patient and the whole medical team
approach). For sensitivity analyses, all models were re-fitted so that the adjustment for the number of affected segments was replaced by the severity of scoliosis in the thoracic and the lumbar part (Cobb’s angle) before or after the surgery. We used SAS 9.4 for Windows software (SAS Inc., Cary, NC, USA).
Sample size considerationsNo formal sample size calculations were performed. We expected that the two surgery type groups would differ in size but expected that at least 20 subjects would be included in each group. We considered this to be a sufficiently large sample for (potential) detec-tion of a difference with potential clinical relevance, based on the following reasoning: A. regarding VAS scores, a) the analgesic protocol is employed to keep pain at a sustainable level that could be defined as 2.5 score points (overall average for the observed pe-riod); b) a difference of 20% (or 0.5 score points) for the overall period could be considered practically rel-evant; c) with 15 repeated assessments, no subject attrition, with standard deviation of the difference at each assessment that is equal to the difference (100% relative standard deviation), with autocorrela-tion of 0.5, 20 and 20 subjects in each group would enable >90% probability to detect and overall differ-ence in VAS scores of 20% at two-sided alpha=0.05; B. regarding additional analgesic administration, a) based on experience, we expected that during the 5 time intervals, on average, 1 additional analgesic ad-ministration would be delivered per patient: b) with the same assumptions as for the VAS scores (rela-tive standard deviation of the difference=100%) and with 5 repeated assessments, the sample of 20 and 20 patients would attain >90 probability to detect a 20% overall difference at two-sided alpha=0.05.
Results
Overall, 58 adolescents were included, 28 treated us-ing the anterior approach (only one boy) and 30 (7 boys) treated using the posterior approach (Table 1). Subjects in the former group had generally somewhat less severe scoliosis as judged by the pre-surgical Cobb angles, fewer segments were affected by spon-

Dovranić J. et al. Standard Multimodal Postoperative Analgesia Might Not Be Equally Effective... Croat Nurs J. 2020; 4(1): 81-89 85
oids intravenously, but with a constraint in individual doses as well as their frequency; d) continuous pain assessment at defined intervals. It has been rou-tinely administered to idiopathic scoliosis patients. However, surgeries employing the anterior and the posterior approach differ in that the latter type is typically used in more extensive procedures (13), which was the case in the present analysis. There-fore, it was assumed that, as such, the protocol might not be equally efficient in both procedures. With the limitations inherent to an observational setting and a limited sample size, the present analysis indicates that analgesia achieved in patients treated by the posterior approach was less successful, primarily dur-
responsible. Early post-operative pain management is particularly challenging. Opioid-based (intravenous) patient-controlled analgesia (PCA) is considered a method most likely to yield satisfying results com-pared to alternatives like intrathecal opioid adminis-tration or continuous thoracic epidural analgesia (11).
Different multi-modal protocols based on opioid PCA have been assessed in order to reduce the risk of opioid side-effects (i.e. for the “opioid-sparing” ef-fect). At our institution we use 48-hour multimodal protocol consisted of: a) intravenous opioid PCA with pre-defined bolus doses and their timing; b) pre-de-fined rules (amount, time-intervals) for maintenance doses; c) additional use of weak opioids or non-opi-
Table 1. Patient characteristics. The data are median (range) or count (percent). Differences (∆) are given as “anterior - posterior” approach with 95% confidence intervals (CI)
Anterior Posterior D (95% CI)1 p
N 28 30 --- ---
Age (years) 15 (12-20) 15 (10-18) 0 (-1 to 1) 0.884
Boys 1 (3.6) 7 (23.3) -19.7 (-38.2 to -2.2) 0.029
Pre-surgical Cobb angle, thoracic (degrees) 58.5 (5-97) 61.5 (35-93) -3 (-10 to 2) 0.219
Pre-surgical Cobb angle, lumbar (degrees) 38 (0-70) 42 (0-70) -8 (-20 to 0) 0.072
Number of affected spine segments 7 (5-11) 9 (5-12) -3 (-4 to -2) <0.001
Post-surgical Cobb angle, thoracic (degrees) 15 (0-43) 13 (3-36) 2 (-3 to 6) 0.503
Change in Cobb angle, thoracic (degrees) -41 (-75, 13) -49 (-75, 30) 4 (-2 to 11) 0.170
Post-surgical Cobb angle, lumbar (degrees) 10 (0-33) 8 (0-50) 2 (0 to 10) 0.193
Change in Cobb angle, lumber (degrees) -18 (-60, 10) -33 (-58, 20) 14 (3 to 25) 0.011
Peri-operative blood loss (mL)(x103) 1.24 (0.40-3.00) 1.00 (0.30-3.00) 0.08 (-0.22 to 0.35) 0.602
Intrasurgical autotransfusion (mL) Not used 321 (0-1250) --- ---
Patients receiving packed red cells 2 (7.1) 11 (36.6) -29.5 (-49.0 to -8.7) 0.006
Intensive care unit stay (days) 6 (3-7) 4 (2-5) 1 (1 to 2) <0.001
Hospitalization length (days) 15 (10-19) 15 (11-42) -2 (-4 to 0) 0.0281Median differences by the Mann-Whitney test or proportion (percentage) differences by Fischer’s exact test.
Figure 1. Outline of the intravenous (IV) morphine-based analgesic protocol employed and analgesia-related procedures conducted during the first post-surgical 48 hours (undertaken at the intensive
care unit, ICU). VAS – visual analogue scale

86 Dovranić J. et al. Standard Multimodal Postoperative Analgesia Might Not Be Equally Effective... Croat Nurs J. 2020; 4(1): 81-89
such an assumption. Indirectly, it does not seem to have had practically relevant consequences, at least considering the fact that the ICU stay was somewhat shorter in the group in which the posterior approach was used. In an additional analysis, the number of ICU days was analysed by quantile regression – with adjustments for age, number of segments and surgi-cal approach, and there was no association between partial VAS AUC0-4 and the length of the ICU stay (not shown). In part, this could be due to the fact that,
ing the first 6 hours after surgery – the period of the most intense pain. Based on the VAS pain scores that were evaluated hourly during this period, the differ-ence was estimated as 20-25% weaker analgesia under the same morphine protocol and with a com-parable utilization of additional analgesics (number of administrations, proportion of patients requiring it). We assumed that a 20-25% difference in inten-sity of analgesia could be practically relevant, but the present data do not indicate direct clues to support
Figure 2. Development of Visual analogue scale (VAS) scores for pain over post-surgical time-points of assessment and differences between the anterior and the posterior approach across averaged
time-points (upper panel) and development of number of additional analgesic applications over time intervals and differences between the anterior and the posterior approach (lower panel). Upper
panel. Ln-transformed VAS scores were analysed in a general linear mixed model with treatment, time, treatment*time interaction, and with adjustments for age and the number of affected spine
segments. Values are adjusted geometric mean scores with 95% confidence intervals (95% CI), and differences are expressed as geometric means ratios (GMRs) with 95% CI. Lower panel. The number of applications per patient per time interval was analysed in a generalized linear mixed
model with a log link and Poisson distribution with the same effects as above. Values are adjusted geometric mean numbers of applications with 95% CI and differences are expressed as rate ratios
(RR) with 95% CI. The treatment*time interaction was insignificant in both models.

Dovranić J. et al. Standard Multimodal Postoperative Analgesia Might Not Be Equally Effective... Croat Nurs J. 2020; 4(1): 81-89 87
dicate a lower analgesic efficiency of the protocol in the posterior approach, which for individual patients might make a relevant difference and suggest that an alternative, more “potent” protocol might be more suitable in this setting.
on average, pain intensity throughout the observed 48-hour period was at the level that could be char-acterized as “mild-to-moderate”. The relationship be-tween VAS pain scores and the levels of pain inten-sity (“mild”, “moderate” and “severe”) specifically in children and adolescents undergoing spondylodesis due to structural scoliosis has not been established. However, a recent cross-sectional analysis of 2794 adults and adolescents with musculoskeletal pain undergoing rehabilitation treatment (14) indicated that scores ≤5 (on a 0-10 scale) would correspond to “mild pain”.
The authors also conducted a literature review iden-tifying similar studies: those pertaining to lower back injuries or spinal cord injury indicated cut-offs between “mild” and “moderate” pain at scores in the range between 3-5 (14). Therefore, it is reasonable to assume that both the patients treated using the anterior approach and those treated using the pos-terior approach in the present samples suffered “mild-to-moderate” pain over the period between 0-6 hours after surgery, and mild pain afterwards. Under such circumstances, the observed difference might not be practically relevant. Still, the data strongly in-
Table 2. Summary of secondary outcome analysis: Visual analogue scale scores (VAS) integrated as the area under the curve (AUC), overall and by factions, and odds of at least one administration of additional analgesics overall and by time intervals. Values are adjusted geometric means (AUC) or adjusted probabilities of events. Differences are expressed as geometric means ratios (GMR) or as
odds ratios (OR) with 95% confidence interval (CI).
Anterior Posterior Difference Anterior vs. Posterior
VAS AUC (points*time) GMR (95% (CI) p-value
Overall (0-48 hours) 62.1 84.1 0.74 (0.55-0.99) 0.047
Fraction 0-4 hours 7.95 11.4 0.70 (0.49-1.00) 0.050
Fraction 4-8 hours 4.43 6.33 0.70 (0.46-1.07) 0.098
Fraction 8-16 hours 8.49 8.63 0.98 (0.56-1.73) 0.956
Fraction 16-24 hours 12.2 13.2 0.92 (0.59-1.46) 0.729
Fraction 24-48 hours 25.6 40.6 0.63 (0.35-1.12) 0.116
Probability of at least one application (%) OR (95% CI) p-value
Overall over 48 hours 34.5 36.7 0.90 (0.60-1.37) 0.633
Between 0 and 4 hours 42.8 49.9 0.75 (0.42-1.35) 0.342
Between >4 and 8 hours 20.7 20.3 1.03 (0.47-2.26) 0.947
Between >8 and 16 hours 34.5 29.8 1.24 (0.62-2.49) 0.542
Between >16 and 24 hours 45.6 40.7 1.22 (0.55-2.68) 0.620
Between >24 and 48 hours 32.1 47.4 0.52 (0.26-1.04) 0.063

88 Dovranić J. et al. Standard Multimodal Postoperative Analgesia Might Not Be Equally Effective... Croat Nurs J. 2020; 4(1): 81-89
9. Halm H. Ventral and dorsal correcting and stabilizing methods in idiopathic scoliosis. Long-term outcome. Orthopade. 2000;29(6):543-62.
10. Quack V, Rath B, Schenker H, Schulze A, El Mansy Y, Tingart M, Betsch M. Fusion in adolescent idiopathic scoliosis: Anterior, posterior or combined? One-stage or two-stage? Orthopade. 2015;44(11):879-84.
11. Hudcova J, McNicol E, Quah C, Lau J, Carr DB. Patient controlled opioid analgesia versus conventional opioid analgesia for postoperative pain. Cochrane Database Syst Rev. 2006;(4):CD003348.
12. Pestano CR, Lindley P, Ding L, Danesi H, Jones JB. Meta-Analysis of the Ease of Care from the Nurses’ Perspec-tive Comparing Fentanyl Iontophoretic Transdermal System (ITS) Vs Morphine Intravenous Patient-Con-trolled Analgesia (IV PCA) in Postoperative Pain Ma-nagement. J Perianesth Nurs. 2017;32(4):329-40.
13. Seki H, Ideno S, Ishihara T, Watanabe K, Matsumoto M, Morisaki H. Postoperative pain management in patients undergoing posterior spinal fusion for adolescent idio-pathic scoliosis: a narrative review. Scoliosis Spinal Dis-ord. 2018;13:17.
14. Boonstra Am, Stewart RE, Koke AJA, Oosterwijk RFA, Swaan JL, Schereurs KMG, Preuper HRS. Cut-off points for mild, moderate, and severe pain on the numeric rating scale for pain in patients with chronic muscu-loskeletal pain: variability and influence of sex and catastrophizing. Front Psychol 2016;7:1466.
References
1. Yaman O, Dalbayrak S. Idiopathic scoliosis. Turk Neuro-surg. 2014;24(5):646-57.
2. Fadzan M, Bettany-Saltikov J. Etiological Theories of Adolescent Idiopathic Scoliosis: Past and Present. Open Orthop J. 2017;11:1466-89.
3. Radl R, Maafe M, Ziegler S. Scoliosis: the bent spine. Orthopade. 2011;40(5):449-62.
4. Altaf F, Gibson A, Dannawi Z, Noordeen H. Adolescent idiopathic scoliosis. BMJ. 2013;346:f2508.
5. Kalichman L, Kendelker L, Bezalel T. Bracing and exer-cise-based treatment for idiopathic scoliosis. J Bodyw Mov Ther. 2016;20(1):56-64.
6. Wimmer C, Siam AE, Pfandlsteiner T. Operative tre-atment of scoliosis: Preoperative planning, intraope-rative monitoring, and postoperative management. Orthopade. 2015;44(11):859-68.
7. Hibbs RA. An operation for progressive spinal defor-mities: a preliminary report of three cases from the service of the orthopaedic hospital. 1911. Clin Orthop Relat Res. 2007;460:17-20.
8. King HA, Moe JH, Bradford DS, Winter RB. The selec-tion of fusion levels in thoracic idiopathic scoliosis. J Bone Joint Surg Am. 1983; 65(9):1302-13.

Dovranić J. et al. Standard Multimodal Postoperative Analgesia Might Not Be Equally Effective... Croat Nurs J. 2020; 4(1): 81-89 89
striranih analgetika bila je usporediva tijekom čitavo-ga promatranog perioda (omjer stopa 1,0).
Zaključak. Promatrani intravenski multimodalni pro-tokol baziran na morfiju pokazao se manje uspješnim u pacijenata operiranih stražnjim pristupom, sugeri-rajući da dva promatrana kirurška pristupa zahtijevaju različite protokole za isti stupanj analgezije.
Ključne riječi: skolioza, spondilodeza, kontrola boli, analgetici
Sažetak
Uvod. Kirurško liječenje strukturalnih adolescentnih skolioza prednjim ili stražnjim kirurškim pristupom za posljedicu ima jaku poslijeoperacijsku bol.
Cilj. U usporedbi s prednjim pristupom, smatra se da stražnji pristup ima prednosti u mogućnosti liječenja više skoliotičnih zavoja kralježnice u jednom opera-tivnom aktu. Željeli smo usporediti uspješnost mul-timodalnog protokola za bol temeljenog na morfiju u prvih 48 sati poslijeoperacijskog tijeka kod pacijena-ta operiranih prednjim i stražnjim pristupom.
Metode. Ovaj retrospektivni pregled obuhvatio je uzastopne adolescentne pacijente (u dobi od 10 do 21 godine) liječene prednjim (n = 28) i stražnjim (n = 30) pristupom u jednom bolničkom centru kroz tri godine (2015. – 2017.). Intravenska aplikacija morfija (48 mg / 24 h) provedena je u intervalima od jednog sata, bol je evaluirana primjenom vizualne analogne skale (VAS za bol) u 11 točaka (veći broj = intenzivnija bol) u 12 navrata tijekom prva 24 sata te tri navrata tijekom druga 24 sata. Dodatni analgetici (neopioidni ili slabi opioidni) aplicirani su prema subjektivnim po-trebama pacijenata ili procjeni medicinskog osoblja.
Rezultati. Uz korekcije za dob i broj spinalnih segme-nata zahvaćenih operacijskim liječenjem, VAS za bol bila je niža kod prednjeg pristupa, ukupno (48 sati) (razlika = –18 %, 95 % CI –30 do –5 %) i posebno u periodu od 0 do 3 sata (–23 %, 95 % CI –36 do –7 %) i periodu od 4 do 6 sati (–26%, 95 % CI –40 do -10 %) nakon operacijskog zahvata. Stopa dodatno admini-
STANDARDNA MULTIMODALNA POSLIJEOPERACIJSKA ANALGEZIJA MOŽDA NIJE JEDNAKO USPJEŠNA U USPOREDBI PREDNJE I STRAŽNJE SPONDILODEZE


¹ Ines Dobrinić2 Slađana Režić
¹ Clinic for Lung Diseases Jordanovac, Intensive Care Unit, UHC Zagreb, Croatia
² Department for Health Care Quality Assurance and Improvement, UHC Zagreb, Croatia
Article received: 01.11.2019.
Article accepted: 11.02.2020.
DOI: 10.24141/2/4/1/8
Author for correspondence: Slađana Režić Department for Health Care Quality Assurance and Impro-vement, UHC Zagreb Kišpatićeva 12, Zagreb, Croatia E-mail: [email protected]
Keywords: children’s visits, open ICU concept, visiting policy, visit limitation, visit-related infections
Abstract
Introduction. Visits to patients are part of a posi-tive and effective strategy of helping patients and their families to better adapt to the stress caused by a patient’s admission to an intensive care unit (ICU).
Aim. To determine the ICU nurses’ perception of vis-its to patients.
Methods. The study was conducted at the Univer-sity Hospital Centre Zagreb (UHC). The cross-sectional study included nurses who work in ICUs. An anony-mous, self-designed questionnaire was used and filled in by 44 respondents. The questionnaire consisted of 17 closed-ended questions pertaining to demographic data, questions related to information on visits and questions about the concept of open visits.
Results. Out of the total number of 44 respondents, 25 respondents stated that their ICU has booklets about the manner of visits and visiting hours, and that they hand them out to families, while 19 re-spondents stated that they do not have such book-lets. 61% of the respondents feel they have suf-ficient training to communicate with the patient’s family. 41% of the respondents said that the visits had a positive effect on the patient’s condition and only 2% stated that the visits had no positive effect. 57 % of the respondents think that visits sometimes have a positive effect on the patient’s condition. Of the total number of respondents, 84% feel that visit-ing hours should be limited. Respondents feel that visits sometimes impede them in their work (66%), while 59% of the respondents feel that visits help spread infections. Out of the total number of re-spondents, only 32% of them stated that they were familiar with the open ICU concept.
Conclusion. More than half of the respondents stated that they have a written visiting policy on ICU wards, and that they are trained to communicate with the family members of patients. Most respond-ents feel that visits contribute to the spread of infec-tions and that they would limit children’s visits to the ICU. The respondents’ poor knowledge of the open ICU concept creates one of the barriers to introducing it in their wards.
ICU Nurses’ Perception of Visits to Patients
Croat Nurs J. 2020; 4(1): 91-101

92 Dobrinić I. et al. ICU Nurses’ Perception of Visits to Patients. Croat Nurs J. 2020; 4(1): 91-101
is centred on whether or not visiting hours should be open (unlimited) or closed (limited). It is difficult to define these terms because some ICUs claim to practice open visiting hours, i.e. they allow visitors to visit at any time, but still limit the number of visitors due to limited space (3). A flexible and open visit-ing policy can have a positive effect on the condition of patients and family members and can help them be more satisfied and cope with crises more easily. Some studies indicate that visits should be possible at all times (and that this is necessary), while other studies indicate that it is necessary to preserve the patients’ privacy and the dignity of their visitors (4).
In the last ten years, ICUs around the world have been developing increasingly, but there are still no specific rules or a consensus on visiting policies (5). Visiting rules and policies vary from country to coun-try and depend on culture, hospital and ICU facilities, geographical location, availability of content and technology, staff willingness to accept future chang-es and various routines (5).
Visiting rules are set by the staff in intensive care units, and they have to balance the needs of the family, the need for patients to rest and the nurse’s obligation to provide quality health care. In addition, there are differences among healthcare providers about their comfort levels in communicating with families. For example, those who feel more comfort-able working with families may favour open visits, while those who do not feel comfortable want a stricter visiting policy. To create the best visiting policy, implementing a multidisciplinary strategy can help improve the quality of health care and patient satisfaction through collaboration between teams and, most importantly, involvement of the patient and his or her family in the implementation and plan-ning of a new visiting policy.
Patient priorities for visits vary depending on age, disease-related characteristics, type of ICU, sustaina-ble or unsustainable hemodynamic condition, wheth-er the patient is intubated and differences between the needs of men and women. Although patients prefer the open concept of visits, they sometimes want limited visits, especially when family dynamics are not welcome. In this case, instead of applying a general visit scheme and strategy, certain personal restrictions can be put into place prior to the visitor’s arrival (4).
Introduction
According to the Law on the Protection of Patients’ Rights, the Official Gazette of the Republic of Croatia Narodne Novine, 169/2004, 37/08, Article 2, every patient is guaranteed a general and equal right to quality and continuous health care, appropriate to their state of health, in accordance with generally ac-cepted professional standards and ethical principles, in the best interest of the patient, and respecting their personal views (1). The protection of patients’ rights is implemented according to the principles of humanity and accessibility.
The principle of humanity in the protection of pa-tients’ rights is achieved by ensuring that the patient is respected as a human being, by securing the pa-tient’s right to physical and mental integrity, by pro-tecting the patient’s personality, including respect-ing their privacy and worldview, as well as moral and religious beliefs. The principle of availability in the protection of patients’ rights implies an equal oppor-tunity to protect the rights of all patients (1).
Patients’ rights are:
• the right to co-determination,
• the right to information,
• the right to refuse information,
• the right to accept or reject an individual diag-nostic or therapeutic procedure,
• the right to access medical records,
• the right to confidentiality,
• the right to maintain personal contacts,
• the right to arbitrarily leave the health care facility,
• the right to privacy,
• the right to compensation for damages.
During their hospital stay, patients have the right to receive visitors in accordance with the rules of the medical institution, as well as the right to prohibit visits to a specific person or persons (2).
Visiting policyVisiting policy is a hotly disputed topic among medi-cal professionals with regard to the best way to manage visits to intensive care units. The debate

Dobrinić I. et al. ICU Nurses’ Perception of Visits to Patients. Croat Nurs J. 2020; 4(1): 91-101 93
because of a lack of knowledge and understanding of how to approach the child; there is also a lack of education and resources to support staff to facilitate children’s visits (8).
A child’s visit can provide distraction, hope and a sense of normality and help patients feel safe. Chil-dren can help reduce factors that contribute to the onset of delirium tremens and post-intensive care syndrome. It is important that parents and medical staff prepare the child prior to the visit to the ICU (3). Prepared children do not exhibit negative be-haviour and show fewer signs of emotional change than children who have never visited the ICU before. It is recommended that children’s visits be allowed, provided the children are not the carriers of an infec-tious disease (8).
Understanding a child’s psychological needs is an important element in the development of visiting policies. Allowing children to visit reduces perceived fears and helps develop better understanding; chil-dren are thus not frightened but relieved and joyful when meeting a loved one. The sense of separation and abandonment is reduced, and, depending on the child’s cognitive development, the child can under-stand what is happening. Children’s visits are neces-sary as they facilitate the relationship among family members and help cope with the complications caused by the nature and impact of the critical illness (3).
Limitation of visitsNurses and physicians feel that limiting visiting hours has advantages and disadvantages. The advantages include compliance with the law and prevention of chaos, respect for the patient’s wish not to receive visits, better control of infection transmission, con-sistency and continuity in the work of nurses. The disadvantages of visit limitation include failure to meet the emotional and spiritual needs of the pa-tient and their family, lack of information about the patient’s condition and a high number of visitors in a short time. Restricting visits is associated with tradi-tional beliefs that it is important for patients to rest as much as possible, but this also gives medical staff greater control, preventing crowded patient rooms and avoiding rude or provocative visitors.
Lack of resources, rapid spread of technology and the severity of a patient’s condition are all reasons why nurses may feel threatened or disappointed by the presence of the patient’s family (4).
Benefits for patientsSome nurses believe that visits increase the psy-chological stress for the patient, interfere with the provision of adequate care, mentally exhaust the pa-tient and their family members and contribute to the spread of infections. Studies have proven that the open ICU concept reduces anxiety and depression in patients, reduces the length of stay in the ICU (6) and improves hormone blood levels (5). Several stud-ies have shown that visits provide comfort and sup-port, reduce cardiovascular complications and create a sense of safety and satisfaction (4). Some patients state that they can feel “positive energy” from their visitors, which gives them a stronger will to survive (3) and they are more satisfied because they recog-nize the needs of their family members as well as their own (4). The presence of family members dur-ing procedures also provides them with a sense of protection and safety. They feel that their rights are protected (3). Advantages related to a reduced risk of post-intensive care syndrome (PICS) in patients (PICS-P) and their families (PICS-F) have also been identified (7).
The role of the family in improving the health status of patients is very important. Many studies show that the open concept of visits is recommended in many countries. Medical staff believe that unlimited visit-ing hours improve the mental and physical condition of the patient. This also improves the interaction of patients and their families with the medical staff (4). However, patients prefer shorter visits, a limitation of the number of visitors and privacy during care. In other words, flexible visiting hours are more impor-tant to them than the duration of the visit (5). The right of the patient to have no visits should also be upheld. Some patients do not want visits if they are not sufficiently familiar with the daily routine of the ICU or if they feel unwell. It is important that the pa-tient does not lose the right to confidentiality (3).
Children’s visits to the ICUChildren’s visits to the ICU are often intuitively re-stricted, with the rationale that they might be harmed by what they see or that they would misbehave (8), which in turn would stress and exhaust the patient. These prejudices are neither based on evidence nor on genuine needs of the patient or the children. Med-ical staff is afraid that it will not be able to provide support for the child and the family during their visit

94 Dobrinić I. et al. ICU Nurses’ Perception of Visits to Patients. Croat Nurs J. 2020; 4(1): 91-101
tant role in the efforts to reduce the risk of infection by changing workflow patterns in order to reduce transmission possibilities, emphasizing the impor-tance of compliance with standard precautionary measures, as well as precautionary measures during isolation (9).
Studies conducted with the aim of monitoring the safety and health of patients with limited and un-limited visits show that during unlimited visits, the patient’s environment is significantly more micro-biologically contaminated, which is not surprising. However, sepsis complications in patients were simi-lar with limited and unlimited visits. This contradicts some nurses’ general belief that visitors are the cause of increased infection rates and that they di-rectly infect patients (3).
An observational study on infection prevention was conducted in New York from June to August 2010 at 3 hospitals. The aim of this research was to deter-mine the frequency, type and duration of contacts between various medical professionals, other hos-pital staff and visitors to patients in acute care set-tings through direct observation and a survey among medical professionals (9). Nurses were the most fre-quent visitors (45%), followed by family members (23%), doctors (17%), non-medical staff (7%) and other medical staff (4%). The visits lasted from 1 to 124 minutes (M=3 minutes for each group) (9). 22% of the time, those entering the room did not touch anything in the room, 33% of the time they touched only the patient’s environment, 27% of the time they touched the patient and 18% of the time they were in contact with the patient’s blood/other secretions. Other medical staff (this group includes physiothera-pists, respiratory therapists, radiology technicians and laboratory technicians) visit approximately 2.8 patients per hour, while nurses visit 4.5 patients per hour (9).
The needs of families of patients treated in the ICUFamily members often act as spokespersons and pro-tectors of psychologically or physically compromised patients. Critical conditions often occur unpredict-ably and without warning, and the family may feel vulnerable and helpless at that moment without clear knowledge of what to expect from the medical staff or regarding injuries or the expected outcome of treatment (10). Stress caused by a family mem-
Limitation of visits by adults and children to the ICU is justified if:
• there is a legal reason that has to be docu-mented in the medical records
• a visitor’s behaviour is a risk to the patient, the family, the medical staff and other persons present
• a visitor’s behaviour is obstructing patient care
• the visitor has an infectious disease or is the carrier of an infectious disease that could en-danger the patient’s recovery
• there is an epidemic of an infectious disease in the area that requires visiting hours to be restricted
• an emergency procedure (e.g. resuscitation) is being performed in a shared room, or when intimacy is needed for a private conversation
• visitors visit patients who share a room (visitors can be asked to temporarily leave the room)
• a patient demands that the number of visits be limited.
• there is a need for the protection of patient privacy (8).
Risk of infection transmission during a visit Medical professionals are concerned that visitors could expose vulnerable patients to an increased risk of infection (3). Direct and indirect contact with medical professionals may be an important means of exposure to pathogens causing hospital infections, but little is known about the patterns of contact with staff and visitors in hospitals. Understanding patient contact patterns has important implications, not only for the prevention of infections, but also for other quality and safety measures, such as patient falls (9). It is well known that most infections are transmit-ted by medical professionals who switch between patients without proper hand decontamination. Therefore, evidence indicates that proper washing of hands before the visit should prevent an increase of infections within the ICU (3). Given the importance of frequent interaction of medical staff with the pa-tient in order to ensure safe and quality care, limiting contacts is certainly not in the best interest of the patient or the care team. However, studying contact patterns could potentially improve the understand-ing of ways of transmission, thus playing an impor-

Dobrinić I. et al. ICU Nurses’ Perception of Visits to Patients. Croat Nurs J. 2020; 4(1): 91-101 95
that the most important needs of family members belong to the dimension of “assurance”, but “honesty of information” and “knowing the outcome” are also important. The least important needs are related to the spiritual support of family members (“information on the availability of religious service” and “visit of a priest”). Basic needs and needs for comfort (“good food in the hospital”, “comfortable furniture in the waiting room” and “availability of a telephone near the waiting room”) have proven to be more important than religious needs and religious support (12).
Recognizing the dimensions of different needs of family members is crucial to developing cohesion, effective communication and useful collaboration, aimed at providing the best possible care and sup-port for the patient and their family (11).
Patient diariesDuring their stay in the ICU, patients are exposed to extreme physical and psychological stressors, includ-ing fear, lack of privacy, noise, pain, lack of sleep, de-lirium tremens and the work environment of the ICU. This exposure influences a patient’s recovery and can cause physical and psychological impairments.
Advances in treatment and care increase the number of patients experiencing various problems caused by their stay in the ICU. There are various strategies which help patients, one of them being keeping pa-tient diaries (13).
Patient diaries were presented by Danish nurses in the 1980s as a tool for patient follow-up after dis-charge from the ICU. The involvement of medical pro-fessionals in keeping patient diaries seemed impor-tant for the reduction of anxiety in family members (14). Patient diaries provide an account of events during a patient’s stay in the ICU. By following the design of the timeline, they provide insight into the background of the causes of admission to the ICU and a description of daily activities. In practice, pa-tient diaries are written in different ways, including variations in structural, content and process ele-ments. They are usually written prospectively, and they are referred personally to the individual patient. The diaries are structured: they contain a summary, listing the reason and event leading to a patient’s ad-mission to the ICU, a daily entry about the patient’s condition and closing notes on discharge or transfer from the ICU (13). Patient diaries can be written by family members or by the medical staff (14).
ber’s illness can affect how other family members cope with their condition, and thus may interfere with the support that the patient requires (11). The nurse’s relationship with family members is very important, especially if the relationship between a patient and their family is disrupted because of the patient’s physical condition, such as the patient’s in-ability to speak due to stroke or sedation due to me-chanical ventilation. Changes in the patient’s condi-tion may occur suddenly and may require extensive or complicated treatment procedures. In such cases, physicians and nurses must rely on family members to consent to specific treatment procedures (10). In order to reduce the level of anxiety and psychologi-cal crisis in the patients’ families, their immediate needs need to be identified and met (11).
Nurses were the first among medical staff to show interest in the needs of family members of patients in the ICU (12). In 1979, Molter studied and ranked family needs in a detailed descriptive study. In struc-tured interviews with 40 family members of critically ill patients, he used a list of 45 “needs”, developed from a review of literature and a survey of 23 nursing students (10). A control study conducted by Leske in 1991 developed 45 identified needs into an in-strument known as the “Critical Care Family Needs Inventory” (CCFNI) (10). The results from 55 family members at three separate hospitals supported the validity of the content of the instrument. Leske stud-ied the intrinsic psychometric properties and factor analysis of THE CCFNI tool with 677 family members over a 9-year period (1980-1988) (10). This instru-ment contains 45 items divided into 5 dimensions: information (need for real information about a fam-ily member), proximity (need for contact and staying with a family member), assurance (need for hope for desired outcomes), comfort (need for comfort) and support (includes means, support system or struc-ture) (12). The importance of these five major areas was defined by Leske in the American Association of National Critical-Care Nurses (10). In addition to CCF-NI, there are other tools for the assessment of the needs of the critical care patient’s family and their satisfaction that share similar characteristics. Most of these instruments are based on CCFNI, which is the most widely used instrument worldwide (12).
A study conducted in Chile aimed to identify the most important needs of families whose members were treated in the ICU according to the dimensions identified by Molter and Leske (12). They concluded

96 Dobrinić I. et al. ICU Nurses’ Perception of Visits to Patients. Croat Nurs J. 2020; 4(1): 91-101
in family member satisfaction (16). Not only does the open concept not harm the patients – it creates a support system for them and shapes family environ-ments (4).
The concept of open visits to the ICU provides the pa-tient with family support, improving communication between the patient’s family and the medical staff and improving satisfaction with treatment (5). Re-search-based evidence shows that visiting hours for patients in the ICU must be tailored to the patient’s needs and there should be no time limit on the visit and no limit on the number of people visiting (4).
In Brazil a study was conducted in 2013 about medi-cal staff’s perception regarding the open ICU concept (16). The questionnaire contained 3 questions that gave a negative perception of the open ICU concept: 53.3% of respondents feel that the open ICU concept does not increase family satisfaction with patient care; 59.4% of respondents state that the open ICU concept disrupts the organization of patient care; 72.7% of respondents believe that their work is in-terrupted more often. Although more than 50% of respondents stated that the open ICU concept does not reduce anxiety and stress in family members, most (67.9%) would like to be hospitalized in an ICU having an open visits concept if they had to stay in an ICU (16).
Hospitals wishing to use the open visits concept in their ICU must first monitor visits over several months and ask patients, family members, nurses and physi-cians about their opinion on the open visits concept. (4). In order for the ICU medical staff to embrace the open ICU concept, it is important to emphasize that it is not the same for all hospitals. Also, the open visits concept does not mean that anyone is allowed to en-ter, or that visitors can enter the ICU whenever they want. It is important to emphasize that communica-tion with visitors is a complex process which means that the interests and needs of the patient are con-sidered, medical professionals must have communi-cation skills and visiting family members must be prepared in advance. Changing the terms “open” and “unlimited” to “flexible” and “liberal” could help alle-viate some of the reservations that medical profes-sionals have against the open ICU concept (17).
The aim of patient diaries is to give the patient an accurate and informative collection of events and to facilitate the memorizing of factual data, filling in gaps in memory and minimizing the impact or over-coming imaginary phenomena and hallucinations. It is also recommended to use diaries for family mem-bers to encourage the healing process after witness-ing a traumatic event, or as a basis for discussing a patient’s experience of the illness (7). In families that wrote diaries, extremely low levels of post-traumatic stress symptoms were observed over a 12-month pe-riod after the ICU stay, in both the patient and their family members (9).
In France, interviews were conducted in 2012 and 2013 with 32 families of patients in the ICU to in-vestigate their experience regarding patient diaries written by family members and medical staff (14). Based on the collected data, major areas were identi-fied in which patient diaries improved communication between the patient, family members and medical staff. The diary served as a source of reliable infor-mation about the patient’s health status during the stay in the ICU, benefiting both the patients and their families. Medical information entered by doctors was greatly appreciated by family members because they felt it improved their understanding of the patient’s status (14). The study concluded that patient diaries help improve the relationship between medical staff and the patient’s family. The diaries serve as a vector that brings together the patient, family and medical staff into a single “story” (14).
Open ICU conceptThe open ICU concept can be limited or open. An ICU with a limited visiting concept allows visits only at predetermined hours and limits the number of vis-iting family members. The open ICU concept allows visits over 24 hours, with a limited or unlimited num-ber of visitors. The open visiting concept is common in paediatric ICUs but is still rare in adult ICUs (5).
Due to the complexity of health care in the ICU, ear-lier studies have raised concerns that the open con-cept of visitation may harm the patient by exacerbat-ing psychological stress, interfering with timely and safe health care, impairing patient privacy and in-creasing exposure to infection (15). Further research has shown that the open ICU concept is associated with a reduction in symptoms of depression, anxiety and post-traumatic stress, as well as an improvement

Dobrinić I. et al. ICU Nurses’ Perception of Visits to Patients. Croat Nurs J. 2020; 4(1): 91-101 97
belong to the age group between 35 and 50 years. 12 respondents belong to the age group between 18 and 24 years (27%), while 2 respondents belong to the age group above 50 years (5%).
Average length of service for all respondents is 11 years. Of the total number, 14 respondents have less than 3 years of service (14%), 10 respondents have 3-9 years of service (23%), 10 respondents have 10-20 years of service (23%) and 10 respondents have more than 20 years of service (23%).
The distribution by qualification indicates that most respondents are Bachelors of Nursing (20 respond-ents, 45%), followed by nurses with secondary edu-cation (17 respondents, 39%) and 7 respondents who are Masters of Nursing/graduate nurses (16%). The data is shown in table 1.
Table 1. Respondents’ demographic data
Age Frequency Percentage
18 – 24 years 12 27
25 – 34 years 16 36
35 – 50 years 14 32
50 years or more 2 5
Years of service
Less than 3 years 14 14
3 – 9 years 10 23
10 – 20 years 10 23
20 years or more 10 23
Level of education
Secondary school education
17 39
Bachelor of Nursing 20 45
Master of Nursing 7 16
Total 44 100
25 respondents answered that they had a booklet for visitors at their workplace, while 19 responded that no such booklet existed at their workplace.
When asked which information is provided to patients’ families, a majority of respondents (42) gave the fol-lowing answer: information about the patient’s con-dition, items that can be given to the patient, hours when the physician is available for information and rules for visitors; only 2 respondents answered that they do not provide information about the patient.
Aim
The aim of this paper is to examine the perception of ICU staff regarding visits.
The specific aim is to determine:
• whether ICU staff has a written visiting policy (visiting hours, number of visitors)
• whether staff is educated about communica-tion with visiting family members
• staff perception of children visiting the ICU
• staff perception of infections associated with visitors
• staff perception of the open ICU concept
Methods
The study was conducted in three clinics at the UHC Zagreb: the Clinic for Pulmonary Diseases Jordanovac, the Clinic for Thoracic Surgery Jordanovac and the Clinic for Anaesthesiology and Intensive Medicine.
An anonymous questionnaire was specially designed for use in this study. The questionnaire consisted of 17 closed-ended questions including demographic data, questions about visits and questions about the open ICU concept.
The questionnaire was filled in by 68 nurses; 16 questionnaires were invalid because multiple an-swers were selected. 6 questionnaires were not filled in completely. The total number of question-naires analysed in the study is 44.
Results
Most respondents (16) belong to the age group be-tween 25 and 34 years (36%). 14 respondents (32%)

98 Dobrinić I. et al. ICU Nurses’ Perception of Visits to Patients. Croat Nurs J. 2020; 4(1): 91-101
When asked “Do you think children’s visits should be restricted”, 24 respondents (54%) answered “yes”, 13 respondents answered “no” (30%) and 7 respondents answered “sometimes” (16%). The data is shown in table 5.
Table 5. Do you think children’s visits to the ICU should be restricted?
Frequency Percentage
Yes 24 54
No 13 30
Sometimes 7 16
Total 44 100
When asked “Do visits contribute to the spread of in-fections”, 26 respondents (59%) answered “yes”, 16 respondents (36%) answered “no” and 2 respondents (5%) answered “other” (“only if visitors are not suf-ficiently informed”).
Table 6. Do visits contribute to the spread of infections?
Frequency Percentage
Yes 26 59
No 16 36
Other 2 5
Total 44 100
The following questions refer to the open ICU con-cept. Most nurses answered that they were not fa-miliar with the open ICU concept (30 respondents, 68%), while 14 respondents (32%) said that they were familiar with the concept.
Table 7. Are you familiar with the concept of the open ICU?
Frequency Percentage
Yes 14 32
No 30 68
Total 44 100
Of the total number of respondents, 14 answered the following questions. When asked “Do you think that the open ICU concept could be applied in your workplace?”, 10 respondents (71%) answered “no”, 4 (29%) answered “yes”.
When asked whether they feel they have sufficient training to communicate with families, 27 respond-ents (61%) answered positively, while 17 respond-ents (39%) answered negatively.
Questions about respondents’ perceptions of visits show that most respondents (25 or 57%), think that visits sometimes have a positive effect on the pa-tient’s condition, while 18 respondents (41%) think that visits have a positive effect and 1 respondent says they do not have a positive effect (2%). The data is shown in table 2.
Table 2. Do you feel that visits sometimes have a positive effect on the patient’s
condition?
Frequency Percentage
Yes 18 41
No 1 2
Sometimes 25 57
Total 44 100
When asked “Do you think visiting hours should be limited”, 37 respondents answered “yes” (84%), 4 re-spondents answered “no” (9%) and 3 respondents an-swered “sometimes” (7%). The data is shown in table 3.
Table 3. Do you think visiting hours should be limited?
Frequency Percentage
Yes 37 84
No 4 9
Sometimes 3 7
Total 44 100
The answer to the question “Do visits interfere with your work?” is interesting. 9 respondents (20%) an-swered “yes”, 6 respondents (14%) answered “no” and 29 respondents (66%) answered “sometimes”.
Table 4. Do you feel that visits interfere with your work?
Frequency Percentage
Yes 9 20
No 6 14
Sometimes 29 66
Total 44 100

Dobrinić I. et al. ICU Nurses’ Perception of Visits to Patients. Croat Nurs J. 2020; 4(1): 91-101 99
lieve that they do not have sufficient training to com-municate with family members. Nurses often do not appreciate the visitors’ contribution to the ICU and the benefit it provides for the patient. McAdam et al. state that patients at high risk of dying feel more se-cure and comfortable when their family is with them. They state that the family provides support and en-couragement to the patient, and takes over the role of the patient’s advocate and defender (3).
According to Cappelilini et al., patients believe that family presence gives them emotional support and helps them to better understand the information they receive from medical staff (4). The results of this study show that 41% of respondents feel that visits have a positive effect on the patient’s condi-tion, 57% feel that they sometimes have a positive effect and just 2% of respondents feel that visits have no such effect.
Prior research suggests that limited visiting hours can have a negative effect on the patient and their family. Liu et al. state that in 606 hospitals in the USA, 89,6% of ICUs have a restricted visiting policy. However, in practice, almost the majority of ICUs al-low some exceptions when it comes to visits (15). According to the respondents in this study, visiting hours should be limited (84%), should not be limited (9%) or they should sometimes be limited (7%). The findings show agreement with research results in America, where a restricted visiting policy is imple-mented in most hospitals.
Family presence in the ICU is still a controversial topic. According to Gibson, nurses feel it takes a long time to provide information to families and that this can interfere with patient care (3). He also states that nurses see the time they spend providing in-formation to visitors, answering their questions and answering phone calls as obstacles to patient care. It seems that nurses feel that interaction with visitors makes their job more difficult (3). This study shows different results. Only 20% of respondents state that visitors interfere with their work, while 66% of re-spondents state that this is just sometimes the case. With appropriate education, nurses could understand the benefits of more flexible visiting hours and greater openness of visits.
The main finding of this study is that only 32% (11) of respondents are familiar with the open ICU con-cept. Da Silva Ramos states that there are significant differences in visiting policies, but that the largest
Of the 14 respondents, 9 respondents (64%) felt that an open ICU concept would provide better qual-ity patient care and 5 respondents (36%) felt that it would not provide better quality care.
When asked “Do you think an open ICU concept would provide better patient safety?”, 9 respondents (64%) answered “yes” and 5 respondents (36%) answered “no”.
When asked “What should in your opinion be done to implement the open ICU concept?”, 13 respondents said that it would be necessary to organize train-ing for staff and families and to provide more staff, as well as to invest in infrastructure; 1 respondent thinks that it would be necessary to organize staff training.
Discussion
A total of 44 respondents participated in this study. Out of the total number of respondents, 24 respond-ents state that there are booklets on the manner and time of visits that they hand out to families, while 19 respondents state that they do not have such booklets. A Canadian hospital provides an interest-ing booklet on how and when to visit. In addition to information about visiting hours (which are flex-ible), the booklet also provides information about the ICU, the ICU staff, guidelines on visitor assistance in patient care and useful information about where to park, where to stay (for visitors who do not live in the area) and where to eat (18).
Studies about communication and providing informa-tion about patients are closely related to the needs of the family, as they try to examine how family members perceive and use the informational support they get from medical professionals. In his study, Old-ing examines the time, type, amount and consistency of communication between medical professionals and family members, as well as the way in which this affects family member satisfaction, decision making and quality of care (19).
61% (27) of respondents in our study believe that they have sufficient training to communicate with family members, while 39% (13) of respondents be-

100 Dobrinić I. et al. ICU Nurses’ Perception of Visits to Patients. Croat Nurs J. 2020; 4(1): 91-101
6. American Association of Critical-Care Nurses. Family Visitation in the Adult ICU. Available from: https://www.aacn.org/ Accessed: 16.07.2019.
7. Beesley SJ, Hopkins RO, Francis L, Chapman D, John-son J, Johnson N, et al. Let Them In: Family Presence during Intensive Care Unit Procedures. Ann Am Thorac Soc. 2016;13(7):1155–9.
8. Critical Care Nurse. Family presence: Visitation in the Adult ICU. Available from: http://ccn.aacnjournals.org/ Accessed: 16.07.2019.
9. Cohen B, Hyman S, Rosenberg L, Larson E. Frequency of patient contact with health care personnel and vi-sitors: implications for infection prevention. Jt Comm J Qual Patient Saf. 2012;38(12):560-5.
10. Maxwell KE, Stuenkel D, Saylor C. Needs of family mem-bers of critically ill patients: a comparison of nurse and family perceptions. Heart Lung. 2007;36(5):367–376.
11. Alsharari AF. The needs of family members of patients admitted to the intensive care unit. Patient Prefer Adherence. 2019;13:465-73.
12. Padilla Fortunatti CF. Most important needs of fa-mily members of critical patients in light of the criti-cal care family needs inventory. Invest Educ Enferm. 2014;32(2):306–16.
13. Ullman AJ, Aitken LM, Rattray J, Kenardy J, Le Bro-cque R, MacGillivray S, Hull AM. Diaries for recovery from critical illness. Cochrane Database Syst Rev. 2014(12):CD010468. Available from: https://www.cochranelibrary.com/ Accessed: 16.07.2019.
14. Garrouste-Orgeas M, Périer A, Mouricou P, Gregoire C, Bruel C, Brochon S, et al. Writing in and reading ICU diaries: qualitative study of families’ experience in the ICU. PLoS One. 2014;9(10):e110146. Available from: https://journals.plos.org/plosone/ Accessed: 16.07.2019.
15. Liu V, Read JL, Scruth E, Cheng E. Visitation policies and practices in US ICUs. Crit Care. 2013;17(2):71.
16. da Silva Ramos FJ, Fumis RR, Azevedo LC, Schettino G. Perceptions of an open visitation policy by intensive care unit workers. Ann Intensive Care. 2013;3(1):34.
17. McAdam JL, Puntillo KA. Open visitation policies and practices in US ICUs: can we ever get there? Crit Care. 2013;17(4):171.
18. Toronto Western Hospitals. Available from: https://www.uhn.ca/PatientsFamilies/Visiting_Patients/Pages/visiting_patient.aspx#guidelines Accessed: 16.07.2019.
19. Olding M, McMillan SE, Reeves S, Schmitt MH, Puntillo K, Kitto S. Patient and family involvement in adult critical and intensive care settings: a scoping review. Health Expect. 2016;19(6):1183–1202.
percentage of institutions with an open ICU concept are located in the US region of New England and in Great Britain (5). However, this statistic can also be deceptive, because in most cases “open” merely re-fers to the visiting hours and most ICUs that state having an open ICU concept limit the number and age of visitors (17).
Conclusion
More than half of the respondents stated that they have a written visiting policy on ICU wards, and that they are trained to communicate with family members of patients. Although the positive impact of visits on ICU patients has been proven, most respondents feel that visits contribute to the spread of infections and that limiting children’s visits to the ICU is necessary. The respondents’ poor knowledge of the open ICU concept creates one of the barriers to introducing it in their wards. Additional staff training, infrastructure adjustments and employment of additional staff could facilitate the implementation of the open ICU concept.
References
1. Zakon o zaštiti prava pacijenata. Narodne novine 169/2004, 37/2008. Croatian.
2. Pravilnik o standardima kvalitete zdravstvene zaštite i načinu njihove primjene. Narodne novine 79/11. Croatian.
3. Gibson V, Plowright C, Collins T, Dawson D, Evans S, Gibb P, et al. Position statement on visiting in adult critical care units in the UK. Nurs Crit Care. 2012;17(4):213–8.
4. Khaleghparast S, Joolaee S, Ghanbari B, Maleki M, Peyro-vi H, Bahrani N. A Review of Visiting Policies in Intensi-ve Care Units. Glob J Health Sci. 2015;8(6):267–76.
5. Ramos FJ, Fumis RR, de Azevedo LC, Schettino G. Inten-sive care unit visitation policies in Brazil: a multicenter survey. Rev Bras Ter Intensiva. 2014;26(4):339-46.

Dobrinić I. et al. ICU Nurses’ Perception of Visits to Patients. Croat Nurs J. 2020; 4(1): 91-101 101
cija. Od ukupnog broja ispitanika samo 32 % navodi kako im je poznat koncept otvorenog JIL-a.
Zaključak. Više od pola ispitanika navodi kako imaju pisanu politiku posjeta na odjelima jedinice za inten-zivno liječenje te da su educirani za komunikaciju s članovima obitelji bolesnika. Većina ispitanika smatra kako posjeti pridonose širenju infekcija te bi ograničili posjete djece u JIL-u. Slabo poznavanje ispitanika o konceptu otvorenog JIL-a stvara jednu od barijera za njegovo uvođenje na njihovim odjelima.
Ključne riječi: koncept otvorenog JIL-a, politika posjeta, ograničavanje posjeta, djeca u posjetu, infekcije povezane s posjetima
Sažetak
Uvod. Posjeti bolesnicima dio su pozitivne i učinko-vite strategije koja pomaže bolesnicima i njihovim obiteljima da se bolje prilagode stresu koji nastaje prilikom prijama na odjel intenzivnog liječenja.
Cilj. Cilj je rada utvrditi percepciju medicinskih sestara na odjelima intenzivne skrbi o posjetima bolesnicima.
Metode. Istraživanje je provedeno u KBC-u Zagreb. Presječno istraživanje uključivalo je medicinske se-stre koje rade na odjelima intenzivne skrbi. Primi-jenjena je anonimna anketa kreirana za ovo istra-živanje, koju je ispunilo četrdeset i četiri ispitanika. Anketa se sastojala od 17 pitanja zatvorenog tipa koja su se odnosila na demografske podatke, pitanja povezana s informacijama o posjetima te pitanja o konceptu otvorenih posjeta.
Rezultati. Od ukupnog broja od 44 ispitanika, 25 ispi-tanika navodi da postoje brošure o načinu i vremenu posjeta koje daju obitelji, dok 19 ispitanika navodi kako kod njih ne postoje takve brošure. Dovoljnu edu-kaciju za komunikaciju s obitelji bolesnika navodi da ima 61 % ispitanika. Da posjeti imaju pozitivan učinak na stanje bolesnika odgovorilo je 41 % ispitanika, a samo 2 % ispitanika smatra da posjeti nemaju poziti-van učinak. 57 % ispitanika smatra da posjeti ponekad imaju pozitivan učinak na stanje bolesnika. Od ukup-nog broja ispitanika čak ih 84 % smatra da bi vrijeme posjeta trebalo biti ograničeno. Ispitanici smatraju da posjeti ponekad ometaju njihov rad (66 %), a 59 % ispitanika smatra da posjeti pridonose širenju infek-
PERCEPCIJA MEDICINSKIH SESTARA NA ODJELIMA INTENZIVNE SKRBI O POSJETIMA BOLESNICIMA


¹ Denis Toma² Yulia Chusova¹ Mara Županić
¹ University of Applied Health Sciences, Zagreb, Croatia
² Specialities Medical University of Varna, Varna, Bulgaria
Article received: 07.11.2019.
Article accepted: 17.03.2020.
DOI: 10.24141/2/4/1/9
Author for correspondence: Mara Županić University of Applied Health Sciences Mlinarska cesta 38, Zagreb, Croatia E-mail: [email protected]
Keywords: temporal satisfaction with life, nursing students, place of studying
Abstract
Introduction. Temporal satisfaction with life can be defined as satisfaction of an individual with their past, present and future life. When conducting a clas-sic study of satisfaction with life, the focus is placed on different periods in life in order to avoid a poten-
tial error in measuring satisfaction with life. Closely connected to the concept of satisfaction with life is the concept of happiness, which represents a mo-mentary, passing experience. Although it is pleasant, it can last for a shorter or longer time period. Sat-isfaction with life is a much more complex concept. Many authors define it as a general feeling or opinion about the life of an individual. There are a number of factors from different areas of life that contribute to satisfaction with life. They include work, romantic re-lationships, relations with family and friends, person-al growth and health, among others. The measures of satisfaction with life are generally subjective or they are based on variables that an individual considers especially important in their own life.
Aim. The aim is to question and compare the differ-ences in temporal satisfaction with life among nurs-ing students in Croatia and Bulgaria.
Methods. The study included 100 nursing students, out of which 50 students are studying in the Re-public of Croatia and 50 in the Republic of Bulgaria. The study used a questionnaire as an instrument of research. The questionnaire was The Temporal Sat-isfaction with Life Scale (hereinafter TSWLS), which was devised in 1998 by Pavot and associates.
Results. A statistically significant difference was found in 9 out of 15 statements. Furthermore, a sta-tistically noticeable difference is seen in the average evaluation of overall temporal satisfaction with life between Croatian and Bulgarian nursing students.
Conclusion. The study determined statistically sig-nificant differences in temporal satisfaction with life amongst students of nursing from Croatia and Bulgaria.
A Comparison of Temporal Life Satisfaction of Nursing Students in the Republic of Croatia and the Republic of Bulgaria
Croat Nurs J. 2020; 4(1): 103-111

104 Toma D. et al. A Comparison of Temporal Life Satisfaction of Nursing Students... Croat Nurs J. 2020; 4(1): 103-111
individual lives, ways of confrontation and subjective enjoyment of life. Furthermore, happiness is implied as being part of the latter meaning. It is defined as an overall evaluation of an individual’s life as a whole. By reviewing studies on the topic of happiness, it can be concluded that happiness is most influenced by the environment, especially economic wealth, freedom and close relations. The studies also show a relation between happiness and ways of confrontation that are mostly influenced by physical and mental health.
Gokcen Akyurek, Aysegul Efe & Esra Aki (2019) con-ducted a study entitled Psychometric properties of the Temporal Satisfaction with Life Scale among Turkish people. Its aim was to adapt the Scale of Temporal Satisfaction with Life to the Turkish lan-guage and to explore reliability and validity of the new Turkish version of the scale (4). Considering the central role of satisfaction with life not only for in-dividual but also social wellbeing, a valid evaluation of satisfaction with life has become a main concern and primary challenge for researching quality of life. This makes the cultural adaptation of the scale valu-able in order to provide an assessment of temporal factors in an individual’s satisfaction with life while taking into account the past, present and future. The study was conducted in four phases with 236 partici-pants who were randomly chosen. There were 113 women and 123 men. Taking into account the fact that the scale had a high level of language equiva-lence, other studies were also conducted and ques-tioned reliability and validity. To conclude, the results confirm that TSWLS is a valid and reliable measure of temporal satisfaction with life. The authors claim that researchers can rely on the Turkish version of the scale (5).
Zlopaša and Dremel (2017) conducted a study en-titled Satisfaction with life: a sociological outlook based on the example of Jamaican students. The study was conducted on a non-representative num-ber of students of The University of West Indies, lo-cated in Kingston, the capital of Jamaica. By using the method of a survey, the study involved 73 students. Out of the total number, 44% were women and 56% were men. The minimal age was 18 and the maxi-mum was 36. Alongside the survey method, three semi-structured interviews with female students of The University of West Indies were conducted. This study tried to demonstrate the subjective satisfac-tion with life among students of different courses and years of study. Furthermore, the participants
Introduction
A small number of papers deals with the topic of temporal satisfaction with life, which can be conclud-ed through an overview of the available bibliography. The World Health Organization (WHO) has defined satisfaction with life as the possibility of a person to achieve their goals, expectations, standards and interests in a way that is appropriate to their cultural system and values. Many authors connect the con-cept of temporal satisfaction with life with other con-cepts such as quality of life and happiness. Besides the definition given by WHO, there are a number of other definitions provided by other authors.
The International Wellbeing Group has defined the quality of life as a multidimensional construct that includes the standard of living, health, productivity, the ability to make close contacts, a current feeling of security, a feeling of security for the future and a feeling of belonging in the community (1). In 1984 Ed Diener provided a definition that has been used in interpreting many research papers. He defines satis-faction with life as an overall assessment of feelings and attitudes about an individual’s life in a particu-lar moment. Feelings and attitudes are ranked from negative to positive ones. Furthermore, the theory studies the negative and positive influence of feel-ings and attitudes on satisfaction with life. Although satisfaction with current life circumstances is often evaluated in research studies, Diener and his associ-ates also include the following in satisfaction with life: the desire to change someone’s life; satisfaction with the past; satisfaction with the future; and signif-icant outlooks on someone’s life. Connected terms in bibliography include happiness (which is sometimes regarded as satisfaction with life), quality of life and a subjective or psychological wellbeing, which is a wider concept than that of satisfaction with life (2). Another definition was provided by Ruut Veenhoven. He claims that satisfaction with life is the degree to which a person positively rates the quality of their life as a whole. In other words, how much a person loves the life he or she leads (according to 3). In some of his research, the author deals with the empirical studies of connections between happiness and qual-ity of life. The author claims that the quality of life is envisioned as a broad term that includes three units: the quality of the environment in which the

Toma D. et al. A Comparison of Temporal Life Satisfaction of Nursing Students... Croat Nurs J. 2020; 4(1): 103-111 105
Sinj on an appropriate sample of subjects of different ages. Groups of high school students and university students were questioned in groups, while younger adults who are not students, middle aged people and older people were contacted individually. In the study (Penezić, 2006), the main aim was to attempt to specify the differences between satisfaction with life in different age groups. Assessments of previ-ous satisfaction were the lowest among middle-aged people, while the expected satisfaction with future life was highest in younger adolescents. A newer study aimed to question temporal satisfaction with life in two groups similar in age but with a different place of study (8).
Temporal satisfaction with life can be defined as an individual’s satisfaction with their past, present or future life. In order to reduce a potential error in measuring satisfaction with life, classic research fo-cuses on different periods of life. A measuring instru-ment (TSWLS) is used to distinguish the difference between satisfaction with past, present and future life. Including the temporal perspective helps the participants to focus on a specific time frame or, in
assessed their satisfaction in relation to the stand-ard of living, health, life accomplishments, relations with family and friends, a feeling of belonging to the community and security from financial problems in the future. An analysis of the collected data showed a connection between satisfaction with life, taking into account satisfaction with the standard of living, satisfaction with health, satisfaction with life accom-plishments and satisfaction with their relations with family and friends (6).
Although focusing on youth problems is highly im-portant, in recent time there has been a greater fo-cus on the importance of promoting optimal levels of health in adolescents and pointing towards positive indicators of wellbeing. Among those indicators, sat-isfaction with life is definitely the most important one. The importance of satisfaction with life in ado-lescents has been widely researched. Studies have shown that individual differences in satisfaction with life in adolescents can predict important life outcomes (7).
One of the studies conducted in Croatia took place in 2006. It was conducted in Zadar, Split, Šibenik and
515151636363666666696969696969717171717171747474777777
818181828282
888888909090919191919191
979797999999
104104104112112112
118118118121121121123123123
128128128129129129130130130
191191191263263263
BugarskaHrvatska
RumunjskaLatvija
GrčkaPoljska
MađarskaSlovačkaPortugal
LitvaEstonija
SlovenijaCipar
ŠpanjolskaČeškaItalijaMalta
FrancuskaFinskaBelgija
ŠvedskaNjemačka
AustrijaDanska
NizozemskaIrska
Luksemburg
0 50 100 150 200 250 300
Chart 1. GNP per capita shown in PPS (https://europa.eu/european-union/about-eu/figures/living_hr#quality_of_life)

106 Toma D. et al. A Comparison of Temporal Life Satisfaction of Nursing Students... Croat Nurs J. 2020; 4(1): 103-111
can be predicted to match specific personality traits. It has been noticed that TSWLS can be used in dif-ferent age groups, and other potential uses of the scale are being researched. The scale’s level of reli-ability in this study conducted on a student popula-tion is α=.87. By expanding the study, the scale was also found highly reliable on a population of people in late adulthood (10). TSWLS includes a time frame, and the participants are asked to give grades that re-fer to the past, present and future satisfaction. The first part of the questionnaire consisted of 5 general demographic questions (age, sex, nationality, year of study and the name of university). The second part consisted of 15 claims which had answers in the form of the Likert scale. In this scale, 1 represents the claim “I do not agree at all”, 2: “This mostly does not apply to me”, 3: “This neither applies nor does not apply to me”, 4: “This usually applies to me”, and 5: “This completely applies to me”. The first 5 claims are concerned with the past, claims 6 through 10 with current satisfaction and claims 11 through 15 with future satisfaction. A higher number of total points shows a higher temporal satisfaction with life of the participants. A high grade shows a higher level of satisfaction with life.
Results
The participants of the research were 100 nursing students, out of whom 84% were women and 16% men. The division of sexes in regard to the country in which they are studying is shown in chart 2. The age range of Bulgarian students was from 18 to 43 (M=24, SD=4.9). The age range of Croatian students was from 19 to 26 (M=22, SD=1.5). The age differ-ence between the two groups was statistically sig-nificant (t=2.77; p=0.007).
Table 1 shows the data of the arithmetic mean (M), the standard deviation (SD), the dominant value, the t-value and the p-value. Furthermore, the table shows the results for the claims. Among the five claims that deal with satisfaction with the past, Croa-tian students gave the highest grades for the claim “I am happy with my past” (M=3.74), while the claim “If I were to live my life again, I would not change
other words, on their satisfaction with a specific time frame. The standard of living has a great influence on satisfaction with life.
The standard of living can be compared by measuring the price of certain goods and services with regard to income by using a common fictional currency called the Purchasing Power Standard (PPS). By comparing GNP per capita, shown in PPS, an overview of the standard of living in countries of the European Union is obtained (9).
The Republic of Croatia and the Republic of Bulgaria are ranked 26 and 27 on the European Union’s list of GNP (as shown in chart 1). Although Croatia has a larger GNP according to Eurostat data, Bulgaria is immediately behind. This is the reason why the re-searched data comes from these two countries.
The aim of the study is to examine and compare the difference in temporal satisfaction with life in nurs-ing students from Croatia and Bulgaria.
Methods
The study was conducted in July, August and Sep-tember of 2019. It included 100 nursing students from different institutions from each country and from different years of study. The research was con-ducted by using an on-line questionnaire. The main purpose was to examine temporal satisfaction with life in nursing students in connection with the place where they are studying. The measuring instrument was the Scale of Temporal Satisfaction with Life (hereinafter TSWLS), devised by Pavot in 1998, in a Croatian and a Bulgarian version. It was filled out by 50 nursing students from Croatia and 50 nursing students from Bulgaria. All of the participants were familiar with the aim of the research, and it was ex-plained to them that their participation was volun-tary and anonymous. The average time needed to fill out the questionnaire was 5 minutes.
It has been proven that TSWLS has favourable psy-chometric features such as a high inner consistency and high temporal reliability. The results of the scale are moderately to moderately highly connected to other measures of subjective wellbeing, and they

Toma D. et al. A Comparison of Temporal Life Satisfaction of Nursing Students... Croat Nurs J. 2020; 4(1): 103-111 107
Table 2 shows the arithmetic means (M), standard sample deviations (SD), t-values and P-values of grades for each individual period of life or for the past, present or future lives of nursing students in the Republic of Bulgaria and the Republic of Croatia. Nursing students in Croatia gave, on average, 3.43 points of the Likert scale to the claims concerned with the past. This is 0.29 points less than the Bul-garian students, who gave, on average, 3.72 points to the claims concerned with the past. Croatian stu-dents gave higher points to their current satisfaction with life (M=3.88) than Bulgarian students (M=3.74). On the other hand, Bulgarian nursing students are more optimistic about their future, given the fact that their average grade for those claims (M=3.68) is higher than the average grade given by Croatian nursing students (M=3.51). The total average grade of nursing students from Croatia and Bulgaria re-garding the claims about satisfaction with the past is 3.58, for satisfaction with current life the grade is 3.81 and for the future it is 3.6. By conducting a t-test for large independent samples, it can be con-cluded that it is not a statistically significant differ-ence, although the claims regarding the past showed the most significant difference in points or, in other words, in satisfaction.
The results in table 3 show the overall temporal satisfaction with life for Croatian and Bulgarian stu-dents. The table shows the average grade for each group of students, standard sample deviation, the t-value and the p-value.
anything” received the lowest grade (M=3.22). Out of the claims that deal with the present, the highest grades were given to the claims “I am happy with my present life” and “I currently have all the things that are important to me” (M=4.06). The lowest grades were given to the claim “I would not change any-thing in my present life” (M=3.46). Among the five claims concerned with the future, the Croatian stu-dents gave the highest grades to the claim “I will be happy with my future life” (M=4.1), which points to the suggestion that they will make changes about their current life because the claim “I will not change anything about my life in the future” received the lowest grades (M=2.44). Taking into account their overall satisfaction with future life, Croatian stu-dents are not as optimistic as Bulgarian students. Among the five claims that deal with satisfaction with the past, the Bulgarian students gave the high-est grades to the claim “I am happy with my past” (M=4.2), while the claim “My past was almost ideal to me” received the lowest grades (M=3.46). Among the claims that deal with the present, the highest grades were given to the claim “I am happy with my present life” (M=4.46). The lowest grades were given to the claim “My current life situation is excellent” (M=3.38). The overall situation shows that Bulgarian students are more optimistic than Croatian students. Among the five claims that deal with the future, the high-est grades were given to the claim “I will have all the important things that I want in the future” (M=4.26). The students will also make an effort to change a lot of things because the claim “I will not change any-thing about my life in the future” received the lowest grades (M=2.66). The claims that have a statistically significant difference are specifically indicated (*).
Chart 2. Division of sexes with regard to the place of study

108 Toma D. et al. A Comparison of Temporal Life Satisfaction of Nursing Students... Croat Nurs J. 2020; 4(1): 103-111
Table 1. Temporal satisfaction with life among nursing students in Croatia
Claim
arithmetic mean (M)
standard deviation
(SD)
Dominant value t-value p-value
RH RB RH RB RH RB
If I could live my life again, I would not change anything. 3.22 3.92 1.2 1.12D1=3D2=2
4 3.04 0.003*
I am happy with my past. 3.74 4.2 1.17 0.76 4 4 2.34 0.022*
My past was almost perfect for me. 3.32 3.46 1.06 0.97 4 4 0.7 0.493
My life conditions in the past were excellent. 3.3 3.54 1.11 1.05 3 4 1.1 0.269
In the past, I had important things that I wanted. 3.58 3.5 1.09 1.32 4 4 0.33 0.742
I would not change anything in my present life. 3.46 3.42 1.15 1.4 4 4 0.16 0.876
I am happy with my present life. 4.06 4.46 0.74 0.68 4 5 3.45 0.006*
My present life is almost perfect. 3.62 3.6 0.99 0.99D1=4D2=3
4 0 0.920
My current life conditions are excellent. 3.86 3.38 0.86 1.11 4 4 2.4 0.018*
I currently have all the important things I want. 4.06 3.48 0.84 1.31 4 4 2.64 0.010*
In the future, I will not change anything about my life. 2.44 2.66 1.03 1.24 2 3 0.96 0.337
I will be happy with my future life. 4.1 3.24 0.86 1.2 4 3 4.1 0.0001*
I expect my future to be perfect. 3.64 4.18 1.06 0.92 4 5 2.74 0.008*
In the future, my life conditions will be perfect. 3.54 4.08 0.95 0.92 4 4 2.84 0.005*
In the future, I will have all the important things that I want. 3.86 4.26 0.97 0.96 4 5 2.11 0.041*
Table 2. Results of the scale for temporal satisfaction with life for specific time periods for nursing students in Croatia and Bulgaria
M SDt-value p-value
CRO BUL CRO BUL
Past 3.43 3.72 1.13 1.13 1.28 0.203
Present 3.88 3.74 0.94 1.82 0.48 0.630
Future 3.51 3.68 1.13 1.17 0.74 0.462
Table 3. Overall temporal satisfaction with life
Croatian students t-value p-value
Overall temporal satisfaction with life.
M SD
2.92 0.004*
3.61 0.24
Bulgarian students
M SD
3.71 0.03

Toma D. et al. A Comparison of Temporal Life Satisfaction of Nursing Students... Croat Nurs J. 2020; 4(1): 103-111 109
the same country. The assessments of past satisfac-tion were lowest for middle-aged people, while the expected satisfaction with the future was highest in younger adolescents. In our study we wanted to research temporal satisfaction with life between two groups of people of approximately the same age who study in different countries.
By comparing the results of the previous study (Penezić, 2006) with the results of our study, it can be concluded that a change has occurred in the sat-isfaction with life among groups of younger people. Although in 2006 a group of younger people gave the most points to claims regarding their satisfac-tion with the future, the group of younger people who participated in our study is most satisfied with their life in the present. Most of the students are at the end of their college education, and this fact could contribute to lower points for satisfaction with their future. Because of the fact that they are about to end their formal education and start their careers, which means that they will be forced to accept the work habits in their country, the participants, on average, gave 3.6 points for their satisfaction with future life M=3.52 for participants in Croatia and M=3.68 for participants in Bulgaria.
At the end of 2008, the world financial crisis mani-fested itself in Croatia, firstly by halting economic growth, then by cutting down production and spend-ing and, finally, by lowering the GNP by 5.8%. The financial crisis started in the USA and spread across the world, and is called “the first global financial cri-sis of the 21st century” (11). If we take into account the fact that the average age of Croatian participants was 22, that makes their age at the beginning of the crisis 11 years old. A possible reason for their aver-age grade of 3.43 for past satisfaction could be the financial situation of the country.
In 2007, the Republic of Bulgaria joined the Euro-pean Union. The country also experienced a series of economic problems that are reflected in a high per-centage of the poor population (22%) and unemploy-ment rates of approximately 12% according to data collected in 2013. Although the highest percentage of the population is Bulgarian, the largest minority is Turkish (8.8% in 2015) (12). Bulgarian students gave, on average, 3.72 points to claims regarding sat-isfaction with the past. The reason could be the fact that 34% of the participants does not have Bulgarian citizenship (41% Russian, 41% Turkish, 12% Ukrain-ian and 6% Belarusian). Growing up in an economi-
Discussion
Nursing students in Croatia gave, on average, 3.43 points to claims concerned with the past, while the Bulgarian students gave, on average, 3.72 points to those claims. By doing a t-test for large independ-ent samples, it can be concluded that it is not a sta-tistically significant difference, although the claims regarding the past showed the most significant dif-ference in points or, in other words, in satisfaction. Croatian students gave higher points to current sat-isfaction with life (M=3.88) than did Bulgarian stu-dents (M=3.74). On the other hand, Bulgarian nurs-ing students are more optimistic about their future given the fact that their average grade for those claims (M=3.68) is higher than the average grade given by Croatian nursing students (M=3.51). By do-ing the t-test for large independent samples, a sta-tistically significant difference has been found in 9 to 15 claims.
According to the available bibliography, there are few studies on the topic of temporal satisfaction. One of the studies in Croatia was conducted in 2006 in Zadar, Split, Šibenik and Sinj on an appropriate sam-ple of participants in different age groups. Groups of high school pupils and college students were ques-tioned in groups, while younger adults who do not attend college, middle-aged participants and older participants were contacted individually. The study included several groups of participants. Firstly, there was a group of younger adolescents (high school students) which was made up of 104 participants between the ages of 15 and 17. Secondly, a group of college students and younger adults which con-sisted of 145 participants between the ages of 18 and 29, out of whom most were college students from the Universities in Zadar and Split. This group also included younger adults who had finished their high school education and did not enrol in college but were employed or registered at the Croatian Employ-ment Institute. A group of middle-aged participants consisted of 114 people between the ages of 30 and 49, while the group with older people had 120 par-ticipants aged between 50 and 71 (8).
A study concerned with life satisfaction (Penezić, 2006) attempted to determine the differences in sat-isfaction with life among different age groups from
110 Toma D. et al. A Comparison of Temporal Life Satisfaction of Nursing Students... Croat Nurs J. 2020; 4(1): 103-111
References
1. Cummins RA, Andelman R, Board R, Carman L, Ferriss A, Friedman P, et al. Quality of life definition and ter-minology: a discussion document from the Internati-onal Society for Quality of Life Studies. International Society for Quality of Life Studies. 1998;1-43.
2. Beutell N. Life Satisfaction in Relation to Work and Family. Sloan Work Family Researchers Network. Life satisfaction (in relation to work-family variables). Slo-an Work-Family Encyclopedia. Boston College; 2006.
3. Ackerman CE. Life Satisfaction Theory and 4 Contribu-ting Factors. Positive Psychology. 2018.
4. Veenhoven R. Quality of Life and happiness: not quite the same. In: de Girolamo G, Becchi A, Coppa FS et al, eds. Salute e qualità della vita. Torino: WHO and Cen-tro Scientifico Editore, 2001:67-95.
5. Gokcen A, Aysegul E, Esra A. Psychometric properties of the Temporal Satisfaction with Life Scale among Turk-ish people. Psychiat Clin Psych. 2019;29(2):204-211.
6. Zlopaša K. Zadovoljstvo životom: sociološki pogled na primjeru studenata iz Jamajke [završni rad]. Zagreb: Sve-učilište u Zagrebu, Fakultet hrvatskih studija; 2017. Ava-ilable from: https://urn.nsk.hr/urn:nbn:hr:111:600104. Croatian.
7. Tuce Đ, Fako I. Odrednice zadovoljstva životom kod adolescenata. Psihologijske teme. 2014;23(3):407-33. Croatian.
8. Penezić Z. Zadovoljstvo životom u adolescentnoj i odrasloj dobi. Društvena istraživanja. 2006;15(4-5(84-85)):643-69. Croatian.
9. Europska unija. Živjeti u EU-u; 2017e. Available from: https://europa.eu/europeanunion/about-eu/figures/living_hr#tab-2-4 Accessed: 20.08.2017.
10. Diener E, Emmons RA, Larsen RJ, Griffin S. The Satisfac-tion With Life Scale. J Pers Assess. 1985;49(1):71–75.
11. Benolić M. Svjetska ekonomska kriza: razvoj, utjecaj na Republiku Hrvatsku i subjektivni stavovi studena-ta. Pravnik. 2012;46(92):119-38. Croatian.
12. Hrvatska gospodarska komora. Bugarska – država ra-stućih poslovnih mogućnosti. Hrvatska gospodarska komora. Available from: https://www.hgk.hr/docu-ments/bugarska-drzava-rastucih-poslovnih-moguc-nosti-011220165849665640e14.pdf. Croatian.
cally more stable society (Russia, Turkey, Ukraine and Belarus) whose economy was not as affected by the crisis contributes to a higher average grade for claims regarding satisfaction with the past.
This study has certain methodological restrictions that could influence the results. It is necessary to point out how future studies on the same topic could be improved. The number of participants in this re-search is not indicative of the entire population of nursing students neither in Croatia nor in Bulgaria. The sample consisted of 100 nursing students, 50 from Croatia and 50 from Bulgaria. Future research should increase the number of participants. Fur-thermore, statistical analysis that can be done on this number of participants is restricted, and the re-sults have to be taken with precaution. In this kind of study, the participants sometimes do not answer honestly but in a socially acceptable way. With these guidelines, future research should include other fac-tors that can contribute to temporal satisfaction with life in nursing students, such as the distance between place of study and hometown, various fam-ily factors, marital status, health, the socio-economic situation the individual and their family, etc. Put-ting focus on life satisfaction in younger people is important in order that interventions can be steered towards improving positive indicators of wellbeing. Although this study is flawed, it is the first study in Croatia that dealt with differences in temporal sat-isfaction with life by taking into account where the nursing students live. In this way, it contributed to understanding the very concept of temporal satisfac-tion with life.
Conclusion
A statistically significant difference has been found in the average evaluations of 9 out of 15 claims. Fur-thermore, it can be concluded from the results that there is a statistically significant difference in the average evaluation of temporal satisfaction with life among nursing students from Croatia and Bulgaria. This leads to the conclusion that, in this case, the place of study affects the temporal satisfaction with life among nursing students.

Toma D. et al. A Comparison of Temporal Life Satisfaction of Nursing Students... Croat Nurs J. 2020; 4(1): 103-111 111
Rezultati. Pronađena je statistički značajna razlika u ocjenama devet od 15 tvrdnji. Nadalje, statistički značajna razlika vidljiva je u prosječnoj ocjeni uku-pnoga temporalnog zadovoljstva životom između studenata sestrinstva iz RH i RB.
Zaključak. Istraživanjem su utvrđene statistički zna-čajne razlike u temporalnom zadovoljstvu životom studenata sestrinstva iz Republike Hrvatske i Repu-blike Bugarske.
Ključne riječi: temporalno zadovoljstvo životom, studenti sestrinstva, mjesto studiranja
Sažetak
Uvod. Temporalno zadovoljstvo životom može se de-finirati kao zadovoljstvo pojedinca prošlim, sadašnjim i budućim životom. Kako bi se smanjila potencijalna pogreška mjerenja zadovoljstva životom, u klasično istraživanje zadovoljstva životom stavlja se fokus na različita životna razdoblja. Usko uz pojam zadovolj-stva životom veže se pojam sreće koja predstavlja trenutačno, prolazno iskustvo; iako je ugodno, može se dogoditi da traje duže ili kraće. Zadovoljstvo živo-tom, s druge strane, mnogo je kompleksniji pojam, odnosno brojni autori definiraju ga kao opći osjećaj o životu pojedinca. Postoji mnogo čimbenika koji pri-donose zadovoljstvu životom s brojnih područja, uk-ljučujući posao, romantične veze, odnose s obitelji i prijateljima, osobni razvoj, zdravlje te mnoge druge faktore. Mjere zadovoljstva životom općenito su su-bjektivne ili se temelje na varijablama koje pojedinac smatra osobno važnima u vlastitom životu.
Cilj. Ispitati i usporediti razlike u temporalnom za-dovoljstvu životom studenata sestrinstva Republike Hrvatske i Republike Bugarske.
Metode. U istraživanje je bilo uključeno ukupno 100 studenata sestrinstva, od čega 50 ispitanika studira sestrinstvo u Republici Hrvatskoj, a 50 u Republici Bugarskoj. U istraživanju se kao instrument ispitiva-nja primijenio anketni upitnik Skala temporalnog za-dovoljstva životom (Temporal Satisfaction with Life Scale, dalje u tekstu TSWLS), koju su 1998. godine osmislili Pavot i suradnici.
USPOREDBA TEMPORALNOG ZADOVOLJSTVA ŽIVOTOM STUDENATA SESTRINSTVA REPUBLIKE HRVATSKE I REPUBLIKE BUGARSKE


1,2 Jelena Kitanović
1 Department of Gynecology, Požega General County Hospital, Požega, Croatia
2 PhD student of Social Gerontology at Alma Mater Europaea, Maribor, Slovenia
Article received: 23.10.2019.
Article accepted: 13.01.2020.
DOI: 10.24141/2/4/1/10
Author for correspondence: Jelena Kitanović Department of Gynecology, Požega County General Hospital Osječka 107, Požega, Croatia E-mail: [email protected]
Keywords: hazard, natural disaster, preparedness, older people
Abstract
Numerous literature reviews have been carried out in the area of household preparedness activities for natural disasters. The present study aims to sum-marize the latest findings of natural disaster pre-paredness levels and aims to address the following research questions: What evidence is there for natu-ral disaster preparedness levels? What are the demo-graphic characteristics and potential variables that influence natural disaster preparedness? What has been reported in major bibliographic databases? The first step involved a systematic search to identify relevant studies published between 1995 and 2019 in the following electronic databases EBSCOhost, Scopus, ScienceDirect, and Web of Science. Nineteen studies met the inclusion criteria and were included in the final review. By analysing the available liter-ature, it has been observed that the in the area of preparedness activities for natural disasters most households do not have a rapid development plan for preparation. Although little research has been done on the preparedness of the older population, it will be necessary to analyse which communication methods would be used in case of a natural disaster, as well as look into the benefits of their use for networking and rapid communication of information before and during the natural disaster.
Household Preparedness for Natural Disasters: A Review of Literature
Croat Nurs J. 2020; 4(1): 113-125

114 Kitanović J. Household Preparedness for Natural Disasters: A Review of Literature. Croat Nurs J. 2020; 4(1): 113-125
el disasters occurred, affecting 102 countries. This has resulted in a total of 7.628 deaths, 411 million affected people, and US$ 97 billion of economic dam-ages (9). Compared to 2017, the number of persons aged 60 or above is expected to more than double by 2050 and more than triple by 2100, rising from 962 million in 2017 to 2.1 billion in 2050 and 3.1 billion in 2100 (10). Globally, the number of persons aged 80 or over is projected to increase from 137 million in 2017 to 425 million in 2050, and further to 909 mil-lion in 2100 (10). As the global population of humans increases, the number of deaths by natural disasters is expected to rise (11). As our population demo-graphics change and the number of people with disa-bling conditions increases, it becomes increasingly important to develop appropriate disaster plans (12). One vulnerability can also be understood in terms of functionality related to communication, medical care, independence maintenance, supervision, and transportation (13). There are systematic variations in the social impacts people are likely to experience even controlling for hazard exposure and structural vulnerability (14). Older adults are more vulnerable not because of their age, but because of the nature of their disabilities and how those disabilities limit their capacity to develop and carry out a plan (12). The elderly are more likely to be injured in a disaster because of their frail bodies (15). Without appropri-ate preparation, vulnerable individuals may not be able to evacuate as instructed, reach points of dis-tribution for medical countermeasures, understand written or verbal communications during an emer-gency, or find suitable housing if their residence is destroyed during a disaster (16). The concept of risk can have drastically different connotations for differ-ent groups, depending upon the context in which it is used (17). Risk accumulation, dynamic changes in vulnerabilities, and different phases of crises and dis-aster situations constitute a complex environment for identifying and assessing risks and vulnerabili-ties, risk reduction measures, and adaptation strat-egies (13). Dynamic changes of vulnerability and hazard phenomena also mean that risk is non-static; it changes over time and these changes have to be considered when applying specific assessments, as well as when developing corrective (current risk) or prospective (future risk) interventions (18). Accord-ing to Ranke, preparedness can be defined as organi-zational activities that ensure that the systems, pro-cedures, and resources required to confront a natural disaster are available in order to provide timely assis-
Introduction
According to Fritz disaster is “an event concentrated in time and space, in which a society or one of its subdivisions undergoes physical harm and disrup-tion, such that all or some essential functions of the society or subdivision are impaired” (1). The initiator of disaster research in the context of sociology was Samuel Henry Prince, who in 1920 wrote the first doctoral dissertation on the topic of disaster, which was Canada’s worst catastrophe, the 1917 Halifax explosion. Systematic and extensive social science work on disasters started in the very early 1950s (2). Droughts affect societies more powerfully than ma-ny other natural disasters when the event is coupled with a lack of financial means, emergency manage-ment failure, and a lack of administrative power to enforce existing laws (3). A severe heat wave began in Europe in June 2003 and continued through July until mid-August, raising the summer temperatures by 20 to 30% in comparison with the seasonal av-erage in Celsius degrees over a large portion of the continent, extending from northern Spain to the Czech Republic and from Germany to Italy (4). Most of the victims were over 65 years of age and many of them died from dehydration, hypothermia, or cardio-vascular system failure (5).
In total, the number of weather- and climate-related disasters has more than doubled over the past forty years, accounting for 6.392 events in the 20-year pe-riod between 1996 and 2015, up from 3.017 in the period between 1976 and 1995 (6). Zakour points out that from January 2001 to December 2010 there were 38.400 disasters (6). Of the deaths from dis-asters in this decade, 62.5% occurred in Asia, 23.1% occurred in the Americas, 12.9% occurred in Europe, and 1.3% in Africa (7). Over 700 thousand people have lost their lives, over 1.4 million have been in-jured, and approximately 23 million have been made homeless as a result of disasters (8). According to CRED in Europe, in the period between 2000 and 2017, of 891 natural disasters, 34 were earthquakes (average magnitude 5.7) affecting 13 different coun-tries, mainly Italy and Greece (9). This has resulted in 701 deaths, 257.303 affected people (including 95.189 homeless and 3.103 injured), and almost US$ 29 billion in economic damages. In 2016, EM-DAT preliminary data indicated that 301 country-lev-

Kitanović J. Household Preparedness for Natural Disasters: A Review of Literature. Croat Nurs J. 2020; 4(1): 113-125 115
Methods
The author systematically reviewed the literature using PRISMA (Preferred reporting items for system-atic reviews and meta-analyses) guidelines (23). The first step involved a systematic search to identify rel-evant studies performed in the following electronic databases: articles in English published between 1995 and 2019 in bibliographic databases EBSCO-host, Web of Science, Scopus, and ScienceDirect. The last search was conducted on 25 January 2019. The reviewed articles were obtained by searching using the following keywords: natural disaster, prepared-ness, and hazard. We then used these areas to de-velop a list of keywords and searched for each of these terms in conjunction with the keyword “pre-paredness”.
We limited our search to titles, abstracts, and key-words of the articles to avoid false positive results of full-text search. The whole process of reviewing in-cluded searching for literature, sorting and prioritiz-ing the retrieved literature, and creating a flow chart of the article selection process. The present study was conducted following the recommendations of Liberati et al. and Aveyard (23,24). From a growing list of on-line databases, we selected EBSCOhost, Web of Science, Scopus and ScienceDirect (25,26,27).
Inclusion and Exclusion CriteriaThe search was focused on studies on household preparedness for natural disasters and the pre-disas-ter preparedness of the public, while excluding those studies that fit the exclusion criteria (see Figure 1.).
Characteristics of the included studiesSixteen studies that fulfilled the inclusion criteria were considered for the review (Figure 2). The data extraction phase elaborated the process of sorting the data of selected studies that deal with prepared-ness for natural disasters. Data retrieval for selected studies was performed using Microsoft Excel.
tance to those affected, using existing mechanisms wherever possible (e.g. training, awareness raising, establishment of disaster plans, evacuation plans, purchase and maintenance of necessary supplies, early warning mechanisms, and increasing general knowledge about preparedness) (5). Preparedness activities protect lives and property when threats cannot be controlled or when only partial protec-tion can be achieved (19). It results from a process in which a community examines its susceptibility to the full range of environmental hazards (vulnerabil-ity analysis), identifies available human and material resources for coping with these threats (capability assessment), and defines the organisational struc-tures by which a coordinated response is to be made (plan development) (20). Structured and pre-planned preparedness and a healthy response to a disaster help save lives (21). Most commonly, this cycle is di-vided into four periods of hazard mitigation, disaster preparedness, emergency response, and disaster re-covery (22). Without mechanisms to ensure account-ability and without specific requirements, appropri-ate preparedness is unlikely to be accomplished (16). Older people should be involved in the processes of preparedness planning for disasters. They can play an important role by volunteering because they can have specific skills that are rarely used in disaster preparedness and response assistance.
Aim
The aim of this study was to gain a better under-standing of the existing literature and to provide a synthesis of studies relevant to the topic. This study aims to address the following questions:
RQ 1: What evidence is there of natural disaster pre-paredness?
RQ 2: What are the demographic characteristics and potential variables that influence natural disaster preparedness?
RQ 3: What has been reported in major bibliographic databases?

116 Kitanović J. Household Preparedness for Natural Disasters: A Review of Literature. Croat Nurs J. 2020; 4(1): 113-125
Figure 1. Inclusion and Exclusion Criteria defined for screeningInclusion Criteria Exclusion Criteria
IC1: Studies that explore pre-disaster preparednessEC1: Articles that did not focus on pre-disaster
preparedness
IC2: Peer-reviewed EC2: The study is only published as an abstract
IC3: Full papers EC3: The study is not written in English
IC4: Empirical research EC4: Pre-1995
IC5: All articles published by January 2019 EC5: The paper is repeated
IC6: Explained research methods EC6: Unpublished research
IC7: Clearly described outcomes
Figure 2. PRISMA flow chart of the article selection process. The chart shows the entire search and selection process (23)
Iden
tifi
cati
onSc
reen
ing
Elig
ibili
tyIn
clu
ded
Records screened(n = 3912)
Full-text articles(n = 124)
Full-text articles assessed for quality (n = 63)
Studies included in review(n = 19)
Records excluded(n = 3788)
Full-text excluded with justification (n = 61)
Full-text excluded with justification (n = 44)
Records identified through database
(n = 5359)
Duplicates removed(n = 1447)
Inclusion Exclusion
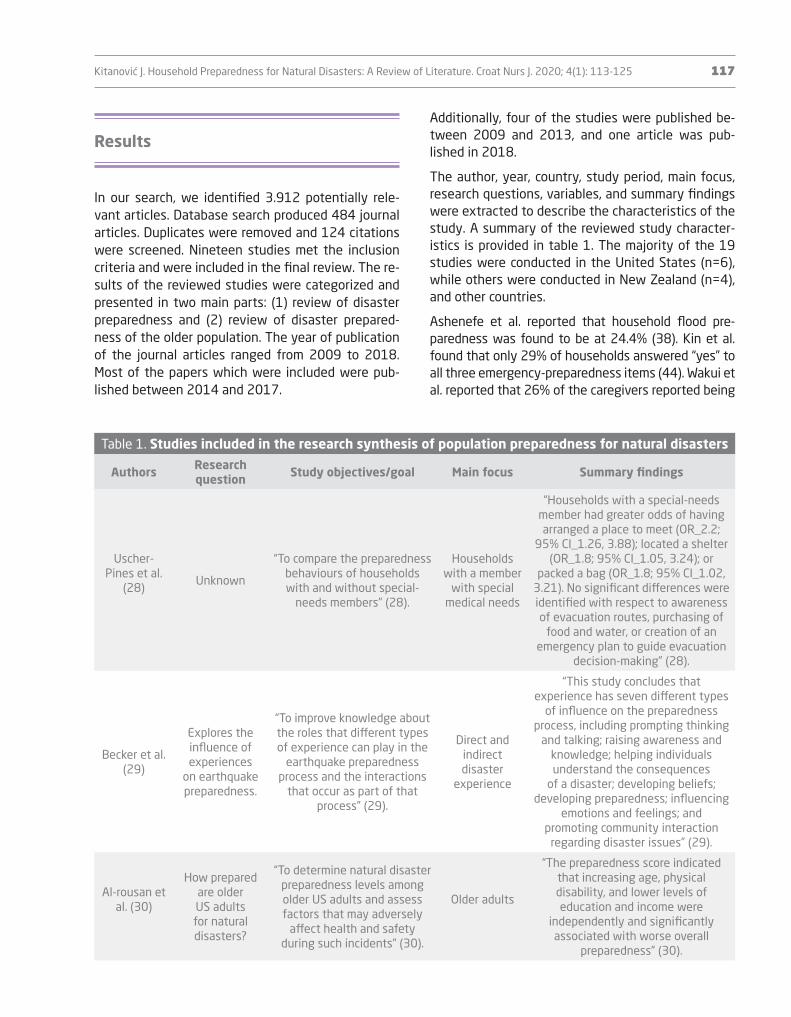
Kitanović J. Household Preparedness for Natural Disasters: A Review of Literature. Croat Nurs J. 2020; 4(1): 113-125 117
Additionally, four of the studies were published be-tween 2009 and 2013, and one article was pub-lished in 2018.
The author, year, country, study period, main focus, research questions, variables, and summary findings were extracted to describe the characteristics of the study. A summary of the reviewed study character-istics is provided in table 1. The majority of the 19 studies were conducted in the United States (n=6), while others were conducted in New Zealand (n=4), and other countries.
Ashenefe et al. reported that household flood pre-paredness was found to be at 24.4% (38). Kin et al. found that only 29% of households answered “yes” to all three emergency-preparedness items (44). Wakui et al. reported that 26% of the caregivers reported being
Results
In our search, we identified 3.912 potentially rele-vant articles. Database search produced 484 journal articles. Duplicates were removed and 124 citations were screened. Nineteen studies met the inclusion criteria and were included in the final review. The re-sults of the reviewed studies were categorized and presented in two main parts: (1) review of disaster preparedness and (2) review of disaster prepared-ness of the older population. The year of publication of the journal articles ranged from 2009 to 2018. Most of the papers which were included were pub-lished between 2014 and 2017.
Table 1. Studies included in the research synthesis of population preparedness for natural disasters
Authors Research question Study objectives/goal Main focus Summary findings
Uscher-Pines et al.
(28)Unknown
“To compare the preparedness behaviours of households with and without special-
needs members” (28).
Households with a member
with special medical needs
“Households with a special-needs member had greater odds of having arranged a place to meet (OR_2.2;
95% CI_1.26, 3.88); located a shelter (OR_1.8; 95% CI_1.05, 3.24); or
packed a bag (OR_1.8; 95% CI_1.02, 3.21). No significant differences were identified with respect to awareness of evacuation routes, purchasing of
food and water, or creation of an emergency plan to guide evacuation
decision-making” (28).
Becker et al. (29)
Explores the influence of experiences
on earthquake preparedness.
“To improve knowledge about the roles that different types of experience can play in the
earthquake preparedness process and the interactions
that occur as part of that process” (29).
Direct and indirect disaster
experience
“This study concludes that experience has seven different types
of influence on the preparedness process, including prompting thinking
and talking; raising awareness and knowledge; helping individuals understand the consequences
of a disaster; developing beliefs; developing preparedness; influencing
emotions and feelings; and promoting community interaction
regarding disaster issues” (29).
Al-rousan et al. (30)
How prepared are older US adults for natural disasters?
“To determine natural disaster preparedness levels among older US adults and assess factors that may adversely
affect health and safety during such incidents” (30).
Older adults
“The preparedness score indicated that increasing age, physical disability, and lower levels of education and income were
independently and significantly associated with worse overall
preparedness” (30).

118 Kitanović J. Household Preparedness for Natural Disasters: A Review of Literature. Croat Nurs J. 2020; 4(1): 113-125
Table 1. Studies included in the research synthesis of population preparedness for natural disasters
Authors Research question Study objectives/goal Main focus Summary findings
Morrison, Oladunjouye
(31)
CEO effectiveness in overseeing
natural disasterpreparedness in
organizations in the
manufacturing sector.
“The perceptions of those in mid-management positions
in terms of the effectiveness of the CEO in overseeing
organizational preparedness in regard to natural disasters
will not vary by region of the country, size of the organization, length of
employment, and education level” (31).
CEO effectiveness in overseeing
natural disaster
preparedness in
organizations
“The perceptions of those in mid-management
positions in terms of the effectiveness of the CEO in overseeing organizational
preparedness in regard to natural disasters will not vary by length of employment, education level, and
size of the organization is rejected” (31).
Gowan et al. (32)
Assessed health-
promoting attributes that build resiliency, conceptualized
as health-protective
attitudes and behaviours.
To determine how QoL and well-being affect household
evacuation preparedness.
Application of QoL scales to pre-event
preparedness
“Spiritual well-being was the only QoL variable that significantly and
uniquely explained variance in preparedness” (32).
Ronoh et al. (33)
UnknownTo contribute to the role of children with disabilities, in
theory, research and practice.
Children with disabilities
“The findings indicate a considerable variation in how children with
disabilities access available resources and perceive, face and cope with
natural hazards” (33).
Okamoto et al. (34)
Unknown
“The study aimed to examine the lessons and learned older
people faced as a result of their displacement, and to assess the impact of the
disaster on their wellbeing and the forms of support available to them. ” (34).
Older adults
“It is revealed that older people relied on their experiences, such as the
tsunami stories they heard or drills in which they participated. It is clear
that this experience also helped other family members” (34).
Sadiq, Graham (35)
What are the determinants
of preparedness
for natural disasters at the organizational
level?
“The goal here is not to review all the risk perception studies at the individual and
household levels, but to show that there is a preponderance
of studies at these levels in comparison to the
organizational level” (35).
Organizational level
preparedness
“This study demonstrated that organization size (facility level) is a
consistent predictor of preparedness at the organizational level” (35).
Mehiriz, Gosselin
(36)
1. How are municipalities prepared for
weather-related
disasters?2. How do
they respond to weather warnings?
“The accountability of local decisionmakers to their citizens motivate
them to develop a disaster management plan that
matches the needs of the population” (36).
Emergency management coordinators
“This study shows that most Quebec municipalities
are sufficiently prepared for weather hazards and undertake measures to protect the population when informed of imminent extreme
weather events” (36).

Kitanović J. Household Preparedness for Natural Disasters: A Review of Literature. Croat Nurs J. 2020; 4(1): 113-125 119
Table 1. Studies included in the research synthesis of population preparedness for natural disasters
Authors Research question Study objectives/goal Main focus Summary findings
Meena et al. (37)
Unknown
“To understand dairy farmers’ perception and preparedness for flood disaster, perceived losses due to disaster, and their adaptation measures”
37).
Farmers’awareness of
floods
“This study concludes that poor communication, weak institutional
support system, and household-based adjustment exacerbate the impacts of flooding in rural communities and that
there needs to be a comprehensive national flood disaster action plan
with special emphasis on agriculture and animal husbandry” (37).
Ashenefe et al. (38)
Unknown
To assess household flood preparedness and associated
factors in the flood-prone community of the district of Dembia, northwest Ethiopia.
Flood preparedness
andassociated
factors
“This study shows that household flood preparedness was found to be
24.4%. Household flood preparedness was significantly associated with the
older age group, attending primary level education, having a higher
monthly income, receiving household level warning messages, having
knowledge on preparedness, prior exposure to a flood, and length of
flood >6 days” (38).
Wakui et al. (39)
Unknown
“To examine the preparedness of family caregivers of older adults with long-term care needs and to identify the
characteristics of older adults and their caregivers that are associated with poor preparedness and greater
concern about disasters” (39).
Older adults with long-term
care
“The majority (75%) of the caregivers had no concrete plans for evacuation
in an emergency, and those caring for persons with dementia were 36% less likely to have any plan. Caregivers with poor health or
limited financial resources or who were responsible for older persons with mobility difficulties reported
higher levels of anxiety about their disaster preparedness” (39).
Kerstholt et al. (40)
How people’s perceptions
of the quality of their social relationships
influence their interpretation
of risk and what they
might do to manage it.
“To examine to what extent these different variables could predict flood preparedness of 629 Dutch citizens resident in the Hague (an area below sea
level)” (40).
People’s beliefs about
the probability of a future
event.
“This study suggests an indirect pathway was mediated by people’s
assessment of the probability of a future event. This supports the
notion that preparatory behaviour is influenced by both a cognitive and an
effective route” (40).
Becker et al. (41)
What influence do individual beliefs have on people’s
interpretation and meaning-
making of earthquake hazards and
preparedness information?
“To identify the diverse hazard- and preparedness-related beliefs people hold and to articulate how these
are influenced by public education to encourage
preparedness” (41).
Individual beliefs
“It is suggested that several salient beliefs found previously to influence
the preparedness process were confirmed by this study, including
beliefs related to earthquakes being an inevitable and imminent threat, self-efficacy, outcome expectancy,
personal responsibility, responsibility for others, and beliefs related to
denial, fatalism, normalization bias, and optimistic bias” (41).

120 Kitanović J. Household Preparedness for Natural Disasters: A Review of Literature. Croat Nurs J. 2020; 4(1): 113-125
Table 1. Studies included in the research synthesis of population preparedness for natural disasters
Authors Research question Study objectives/goal Main focus Summary findings
Hoffmann, Muttarak
(42)Unknown
“To explore the role of education, disaster
experience and a set of potential mediating factors
in explaining a person’s tendency to undertake
preparedness measures” (42).
Educationand disaster experience
Experience of loss and damage caused
by previous disasters increases disaster preparedness.
Kim, Zakour (43)
What is the level of disaster
preparedness among older
adults?
To understand the extent to which older adults are
prepared for disasters and to investigate the factors
associated with their levels of preparedness.
Older adults
“Individuals who have higher levels of social support and more
connections to communityorganizations are more likely to be prepared for disaster-related emergency situations. 29% of
households answered “yes” to all three emergency-preparedness
items” (43).
Kin Lam et al. (44) Unknown
To assess the state of community disaster
preparedness of Hong Kong residents and to identify factors associated with adequate preparedness
behaviours.
Urban disaster preparedness
“Community resilience-building programs should tailor information provision to different age groups
with a focus on the family caregivers of elderly residents. There is a need for promoting first-aid training and
disaster education in the community” (44).
Dominianni et al. (45)
Unknown UnknownPower outage preparedness
“Of all the respondents (n=887), 58% were prepared and 46% expressed concern about health. Respondents with electric-dependent household members (9% of all respondents)
tended to have higher preparedness (70 vs. 56% of respondents without
electric-dependent household members)” (45).
Shapira et al. (46)
Unknown
To evaluate the anticipated behaviour patterns of
residents in a high seismic risk area in Israel in the face
of a strong earthquake.
Anticipated behavioural
response patterns to an
earthquake
“The results demonstrate that residents with low socioeconomic
status are more vulnerable. Several personal and socioeconomic
characteristics are associated with the residents’ expected behaviour. Levels of earthquake preparedness
and dwelling type are significant predictors of choice of the
recommended behavioural strategy” (46).

Kitanović J. Household Preparedness for Natural Disasters: A Review of Literature. Croat Nurs J. 2020; 4(1): 113-125 121
can trigger learning processes that lead to increased preparedness levels (42). Becker et al. found that ex-perience has seven different types of influence on the preparedness process, including prompting thinking and talking; raising awareness and knowledge; helping individuals understand the consequences of a disaster; developing beliefs; developing preparedness; influenc-ing emotions and feelings; and promoting community interaction regarding disaster issues (41). Kerstholt et al. reported that preparatory behaviour is influenced in both cognitive and effective ways (40). The stud-ies included in this review were very heterogeneous in aim and outcome measures. Firstly, some authors suggest that the age of the head of the family, edu-cation, monthly income, a household warning system, knowledge on preparedness and prior exposure were significantly associated with household preparedness (32,38,41,42,44-46). Some studies, such as the one by Mehiriz and Gosselin show that participants are suf-ficiently prepared for weather hazards and undertake measures to protect the population when informed of imminent extreme weather events (36). The character-istics of warning messages are also important in deter-mining people’s protective responses (14). Ashenefe et al. found that there was a strong association between prior exposure and household flood preparedness (38). Respondents who lost power during Superstorm San-dy were not more likely to perceive their households as prepared or actually be prepared (45). Gowan et al. reported that for those with prior disaster experience, however, social network support was anecdotally re-ported as the most helpful resource for coping with di-sasters by a margin of 50% over mental and emotional support combined; only one person identified physical health as the most helpful factor (32). A lack of expe-rience led people to predominantly believe that they were unlikely to be affected by future events, or that they would fare well if a disaster were to occur (29). Ashenefe et al. found that individuals who were aged ≥46 years were nearly three times more likely to have household preparedness when compared with those aged 18–28 years (AOR=2.62; 95% confidence interval [CI]: 1.12, 6.00). Neuhauser et al. found little informa-tion about the readability of emergency preparedness materials for vulnerable populations (47). Efforts to encourage older adults, particularly vulnerable adults, to play an active role in disaster planning may have more success through a strategy that emphasizes not the dangers of failing to prepare but the benefits of being proactive (12).
“somewhat to well prepared” (39). Hoffman and Mut-tarak reported that disaster preparedness is higher in the Philippine sample: 76% reported undertaking di-saster preparedness actions as compared to only 32% in Thailand (42). Individuals who are well-connected with their friends or neighbours can, along with com-munity organizations, build their capacity for effective preparation for disasters (43). Becker et al. found that the more direct an experience was, the more likely people were to relate to the experience, have raised awareness and knowledge, engage in thought and discussion, understand the consequences of disasters, think about their experience in the context of future disasters, form or cement relevant beliefs, have rel-evant emotions and feelings, and have a motivation to prepare (41). Kim and Zakour reported that race and community participation were significantly associated with the dichotomized emergency-preparedness vari-able, suggesting that African Americans were well-prepared and had emergency-disaster plans when compared to older adults of other races or ethnicities (43). Shapira et al. found that higher preparedness was significantly associated with higher education levels, higher income, greater experience with previous emer-gencies, and lower levels of earthquake risk perception (46). Another approach by Al-rousan et al. showed that demographic variables, gender, race/ethnicity, marital status, and living alone were not associated with score levels, but scores were significantly lower (i.e. less prepared) with increasing age and decreasing levels of education and annual income (30). Ashenefe et al. found that the age group of ≥46 years (adjusted odds ratio [AOR]=2.62; 95% CI: 1.12, 6.00), monthly house-hold income >893 Ethiopian Birr (AOR=6.72; 95% CI: 2.2 7, 19.88), primary level education (AOR=22.08; 95% CI: 8.16, 59.74), a household disaster warning system (AOR=5.41; 95% CI: 2.38, 12.32) and knowl-edge of flood prevention (AOR=2.52; 95% CI: 1.43, 5.57) were positively associated with household flood preparedness (38). Dominianni et al. also found that preparedness was lower among Hispanic respondents (45%, p=0.03), those with household income less than US$ 30,000 (45%, p = 0.05), and those who live in multi-family buildings (51%, p=0.02) (45). Gowan et al. showed that the strongest significant contribution to predicting possession of a prepared disaster kit was spiritual well-being (standardized regression coeffi-cient β=0.112; p=0.01) (32). Hoffman and Muttarak found that education positively influences undertaking actions of preparedness (42). Hoffman and Muttarak reported that both education and disaster experience

122 Kitanović J. Household Preparedness for Natural Disasters: A Review of Literature. Croat Nurs J. 2020; 4(1): 113-125
measures. However, there is great potential for de-veloping the understanding of how and why experi-ence contributes to preparedness activities for natu-ral disasters.
Limitations of the review
The limitations were the following: the author in-cluded only published data, which is why there is a possibility of overestimation; inclusion of only peer-reviewed articles; English-language journals, which may have restricted the findings.
Conclusion
By analysing the literature review it has been ob-served that in the area of preparedness activities for natural disasters most of the households do not have a rapid preparation plan for disasters. Although lit-tle research has been done on the preparedness of the older population, it will be necessary to analyse which communication methods would be used in case of a natural disaster, as well as the benefits of their use for networking and the rapid communication of information before and during the natural disaster. On the basis of this analysis, it seems reasonable to conclude that it is necessary to investigate what mo-tivates older people to improve personal prepared-ness for natural disasters.
References
1. Fritz CE. Disaster. In: Merton RK and Nisbet RA, edi-tors. Contemporary Social Problems. New York: Har-court, Brace and World; 1961.
2. Perry RW. What is a disaster? In Rodriguez H, Quaran-telli EL. & Dynes RR, editors. Handbook of disaster re-search. New York: Springer; 2007.
3. UNFCCC. Climate-related risks that are most relevant to African context. – UNFCCCexpert. Addis Ababa: Inter-governmental Panel on Climate; 2012. Available from:
Discussion
The present study aimed to summarize the latest findings on natural disaster preparedness levels. Becker et al., Hoffmann & Muttarak and Tierney et al. generally concluded that an understanding of house-hold preparedness for disasters must be based on an understanding of how the public perceives and acts on risk information. The challenge today is in know-ing how to protect vulnerable older adults from the catastrophic effects of hurricanes, floods, ice storms, heat waves, or wildfires, and the area is yet to be extensively studied (12). Public disaster prepared-ness education campaigns are complex endeavours, regardless of their size or scope (17).
As a secondary objective, this review also collected other variables related to the age of the population, but expected results related to the needs of older adults were not obtained. The studies included in this review focused on the motivational factors for preparedness. There is little evidence of the impact of motivational factors on preparedness.
Implications for practice and policyThere are several implications for preparedness plan-ning for disasters as a result of this review. Firstly, this review can contribute to the identification and evaluation of ways of increasing community support for household preparedness. Secondly, the benefits and impacts of this literature review demonstrate the level of preparation for natural disasters among the older population. Thirdly, the results presented in this study can improve our understanding of the public pre-disaster preparedness behaviour.
Questions for future researchA great deal of progress has been made in the re-search of the relevance of experience and motiva-tion for undertaking preparedness actions. Solutions which are capable of being adapted to the under-standing of how and why experience contributes to preparedness are yet to be developed. Furthermore, one important area of future research is the exami-nation and assessment of significant opportunities for a deeper understanding of motivation that leads to a change in behaviour in order to take preventive
Kitanović J. Household Preparedness for Natural Disasters: A Review of Literature. Croat Nurs J. 2020; 4(1): 113-125 123
22. Zaumseil M, Schwarz S, Von Vacano M, Sullivan GB, Prawitasari-Hadiyono JE. Cultural Psychology of Co-ping with Disasters: The Case of an Earthquake in Ja-va, Indonesia. New York, NY: Springer; 2014.
23. Liberati A, Altman DG, Tetzlaff J, Mulrow C, Gøtzsche PC, Ioannidis JP, et al. The PRISMA statement for repor-ting systematic reviews and meta-analyses of studies that evaluate health care interventions: explanation and elaboration. PLoS Med. 2009;6(7):e1000100.
24. Aveyard H. Doing a Literature Review in Social Care. 3rd ed. Berkshire: Open University Press; 2014.
25. Industries E. I. EBSCO. EBSCO host. Available from: http://search.ebscohost.com/. Accessed: 06.01.2019.
26. Analytics C. Web of knowledge. Web of Science. Avai-lable from: https://www.webofknowledge.com/. Acce-ssed: 06.01.2019.
27. Elsevier. Scopus. ScienceDirect. Available from: https://www.sciencedirect.com/. Accessed: 06.01.2019.
28. Uscher-Pines L, Hausman AJ, Powell S, DeMara P, Hea-ke G, Hagen MG. Disaster preparedness of households with special needs in southeastern Pennsylvania. Am J Prev Med. 2009;37(3):227-230.
29. Becker JS, Paton D, Johnston DM, Ronan KR. Salient beliefs about earthquake hazards and household pre-paredness. Risk Anal. 2013;33(9):1710-27.
30. Al-Rousan TM, Rubenstein LM, Wallace RB. Pre-paredness for natural disasters among older US adults: a nationwide survey. Am J Public Health. 2014;104(3):506-11.
31. Morrison J, Oladunjouye GT. An assessment of CEO oversight of natural disaster preparedness. Interna-tional Journal of Business and Public Administration. 2014;11(2):66-80.
32. Gowan ME, Kirk RC, Sloan JA. Building resiliency: a cross-sectional study examining relationships among health-related quality of life, well-being, and disaster preparedness. Health Qual Life Outcomes. 2014;12:85.
33. Ronoh S, Gaillard JC, Marlowe J. Children with disabili-ties and disaster preparedness: a case study of Chri-stchurch. Kōtuitui: New Zealand Journal of Social Sci-ences Online. 2015;(2):91-102.
34. Okamoto N, Greiner C, Godfred P. Lesson and learned from the older people in case of Great East Japan Ear-thquake and Tsunami of 2011. HumTech. 2015;133-9.
35. Sadiq AA, Graham JD. Exploring the Predictors of Or-ganizational Preparedness for Natural Disasters. Risk Analysis. 2016;36(5):1040-53.
36. Mehiriz K, Gosselin P. Municipalities ‘Preparedness for Weather Hazards and Response to Weather Warnings. PLoS One. 2016:1-17.
37. Meena HR, Meena BS, Sankhala G. Disaster prepared-ness in Himalayan region: Flood disaster victim per-spective. Indian J. Agric. Res. 2016;50(6):594-8.
38. Ashenefe B, Wubshet M, Alemayehu S. Household flo-od preparedness and associated factors in the flood-prone community of Dembia district, Amhara National
https://unfccc.int/resource/docs/napa/eth01.pdf. Acce-ssed: 18.01.2019.
4. United Nations Environment Programme. “Envi-ronment Alert Bulletin. Impacts of summer 2003 heat wave in Europe”. DEWA/ GRID-Europe; 2004.
5. Ranke U. Natural Disaster Risk Management: Geosci-ences and Social Responsibility. Switzerland: Sprin-ger; 2016.
6. CRED. Poverty and death: Disaster mortality 1996–2015. Brussels: Centre for Research on the Epidemio-logy of Disasters; 2016. Available from: https://www.emdat.be/publications. Accessed: 18.01.2019.
7. Zakour MJ, Gillespie, DF. Community Disaster Vulnera-bility: Theory, Research, and Practice. New York: Sprin-ger; 2013.
8. UN. Sendai Framework for Disaster Risk Reduction 2015-2030. Geneva: United Nations; 2015. Available from: https://www.preventionweb.net/files/43291_sendaiframeworkfordrren.pdf. Accessed: 18.01.2019.
9. CRED. The human impact of natural disasters. Brusse-ls: Centre for Research on the Epidemiology of Disa-sters; 2016 b. Available from: https://www.emdat.be/publications. Accessed: 18.01.2019.
10. UN. World Population Prospects: Key Findings and Ad-vance Tables. New York: United Nations Department of Economic and Social Affairs/Population Division. 2017.
11. Abbott P. L. Natural disasters. New York: McGraw-Hill; 2012.
12. Cefalu C. A. Disaster Preparedness. New York: Sprin-ger; 2014.
13. IPCC. Managing the risks of extreme events and di-sasters to advance climate; 2012. Available from: https://www.ipcc.ch/site/assets/uploads/2018/03/SREX_Full_Report-1.pdf. Accessed: 18.01.2019.
14. Lindell MK. Disaster studies. Current Sociology. 2013;61:797–825.
15. McEntire DA. Disaster Response and Recovery: Strate-gies and Tactics for Resilience. Second Edition. Hobo-ken: John Wiley & Sons; 2015.
16. Hoffman R. Preparing for Disaster: Protecting the Most Vulnerable in Emergencies. World Development; 2009.
17. Coppola DP, Maloney EK. Communicating Emergency Preparedness. New York: Auerbach Publications; 2009.
18. Birkmann J, Kienberger S, Alexander D, editors. Asse-ssment of vulnerability to natural hazards: A Europe-an perspective. San Diego: Elsevier; 2014.
19. Perry RW, Lindell MK. Emergency Planning. Hoboken: John Wiley & Sons; 2017.
20. Perry RW, Lindell MK. Preparedness for Emergency Response: Guidelines for the Emergency Planning Process. Disasters.2003;27(4): 336–50.
21. Brebbia CA, Kassab AJ, Divo EA, editors. Second in-ternational conference on disaster management and human health: reducing risk, improving outcomes: Disaster Management and Human Health Risk II. Southampton: WITeLibrary; 2011.
124 Kitanović J. Household Preparedness for Natural Disasters: A Review of Literature. Croat Nurs J. 2020; 4(1): 113-125
2017;43(4):498-509.44. Lam RPK, Leung LP, Balsari S, Hsiao KH, Newnham E,
Patrick K. Urban disaster preparedness of Hong Kong residents: A territory-wide survey. Int J Disaster Risk Reduct. 2017;23:62-9.
45. Dominianni C, Ahmed M, Johnson S, Blum M, Ito Ka-zuhiko LK. Power outage preparedness and concern among vulnerable New York city residents. J Urban Health. 2018;95:716-26.
46. Shapira S, Limor AD, Yaron BD. Anticipated behavioral response patterns to an earthquake: The role of per-sonal and household characteristics, risk perception, previous experience and preparedness. Int J Disaster Risk Reduct.. 2018;21:1-8.
47. Neuhauser L, Ivey SL, Huang D, et al. Availability and readability of emergency preparedness mate-rials for deaf and hard-of-hearing and older adult populations: issues and assessments. PLoS One. 2013;8(2):e55614.
48. Tierney K J, Lindell MK, Perry RW. Facing the unexpec-ted: disaster preparedness and response in the United States. Washington, DC: Henry Press; 2001.
Regional State, northwest Ethiopia. Risk Manag He-althc Policy 2017;10:95-106.
39. Wakui T, Agree EM, Saito T, Kai I. Disaster Prepared-ness Among Older Japanese Adults With Long-Term Care Needs and Their Family Caregivers. Disaster Med Public Health Prep. 2017;11(1):31-8.
40. Kerstholt J, Duijnhoven H, Paton D. Flooding in The Netherlands: How people’s interpretation of per-sonal, social and institutional resources influen-ce flooding preparedness. Int J Disaster Risk Re-duct.2017;24:52-7.
41. Becker JS, Paton D, Johnston DM, Ronan KR, McClure J. The role of prior experience in informing and mo-tivating earthquake preparedness. Int J Disaster Risk Reduct. 2017:179-93.
42. Hoffmann R, Muttarak R. Learn from the past, prepare for the future: Impacts of education and experience on disaster preparedness in the Philippines and Thai-land. World Development. 2017;96:32-51.
43. Kim HJ, Zakour M. Disaster preparedness among ol-der adults: social support, community participati-on, and demographic characteristics. J Soc Serv Res.

Kitanović J. Household Preparedness for Natural Disasters: A Review of Literature. Croat Nurs J. 2020; 4(1): 113-125 125
Sažetak
U području pripreme kućanstava za elementarne nepogode provedeno je mnogo istraživanja. Cilj ove studije bio je pregledati i sažeti najnovija saznanja o razinama pripremljenosti za elementarne nepogo-de. Cilj je ovog istraživanja pronaći odgovore na slje-deća istraživačka pitanja: Koji su dokazi o razinama pripremljenosti za elementarne nepogode? Koje su demografske karakteristike i potencijalne varijable koje utječu na pripremljenost na elementarne nepo-gode? Prvi je korak uključivao sustavno pretraživanje kako bi se identificirale relevantne studije objavlje-ne između 1995. i 2019. u sljedećim elektroničkim bazama podataka: EBSCOhost, Scopus, ScienceDirect i Web of Science. U ovom je istraživanju devetnaest studija ispunilo kriterije uključivanja te je uključeno u završni pregled. Analizom pregleda literature uočeno je da u području pripremljenosti kućanstava za ele-mentarne nepogode većina kućanstava nema plan za pripremu. Iako je proveden malen broj istraživanja o pripremljenosti starije populacije, bit će potrebno analizirati koje će se komunikacijske metode rabiti u slučajevima elementarnih nepogoda te koja će biti korist njihove uporabe za umrežavanje i brzu komuni-kaciju prije i tijekom elementarne nepogode.
Ključne riječi: elementarne nepogode, nesreće, pripre-mljenost, starije osobe
PRIPREMA KUĆANSTAVA ZA ELEMENTARNE NEPOGODE: PREGLED LITERATURE


1 Ana Vidović Roguljić2 Irena Zakarija-Grković
1 Health Center, Split, Croatia2 Department of Family Medicine, Department of
Clinical Skills, University of Split School of Medicine, Split, Croatia
Article received: 12.02.2020.
Article accepted: 25.03.2020.
DOI: 10.24141/2/4/1/11
Author for correspondence: Ana Vidović Roguljić Health Center Split Kavanjinova 2, Split, Croatia E-mail: [email protected]
Keywords: breastfeeding, Croatia, education, infant and young child feeding, nursing curricula, Model Chapter, nurses
Abstract
Introduction. Breastfeeding rates in Croatia are far from WHO recommendations, with only 8% of women exclusively breastfeeding at 6 months. Nurses play a key role in supporting optimal infant feeding; therefore, their undergraduate training should cover this topic.
Aim. The aim of this study was to determine if infant feeding is part of undergraduate nursing programs in Croatia, and to analyse relevant textbooks.
Methods. Between January and March 2019, all pub-licly available nursing undergraduate curricula (N=9) for the 2018/2019 academic year were assessed. Required textbooks were analysed by two indepen-dent assessors using the WHO Infant and Young Child Feeding: Model Chapter for textbooks for medi-cal students and allied health professionals.
Results. Infant feeding was included in all the cur-ricula. The mean number of topics from the Model Chapter covered in the four evaluated textbooks was 30.4%, of which 2.7% were classified as correct and thorough, 21% as correct and brief, and 6.7% as incorrect. Fields most poorly covered were: ‘Policy, health system and community actions’ and ‘Appropri-ate feeding in exceptionally difficult circumstances’.
Discussion. This is one of only a few published stud-ies looking at nursing textbook content related to in-fant feeding. Less than a third of topics, considered mandatory for health professional education, were covered in the required textbooks.
Conclusion. Even though infant feeding was part of all assessed nursing curricula in Croatia, the required textbooks were largely outdated, incomplete and at times incorrect.
Infant and Young Child Feeding in Croatian Nursing Programs: A Cross-Sectional Analysis
Croat Nurs J. 2020; 4(1): 127-133

128 Vidović Roguljić A. et al. Infant and Young Child Feeding in Croatian Nursing Programs... Croat Nurs J. 2017; 3(1): 127-133
wives to develop 36 evaluation items based on pre-2000 international breastfeeding guidelines. The researchers looked at the four most commonly used textbooks in midwifery training in Japan and found that only 40% of the content gave an accurate and sufficient description of breastfeeding (8). A similar study was conducted in Australia, where content re-lated to the first breastfeed in five textbooks com-monly used in midwifery education programs was analysed using criteria developed by the authors. The content analysis scores ranged from 35 to 54 of a total of 105 points (9). Researchers from the United States assessed breastfeeding information in six nursing textbooks published between 1999 and 2006 according to information contained in the American Academy of Paediatrics’ policy statement Breastfeeding and the Use of Human Milk and the WHO Ten Steps to Successful Breastfeeding. Of the 20 topics scored, the mean number of topics present was 17 (range 14-19), of which 11.8 were correct (range 10-15), 5.2 incorrect (range 2-8), and a mean of 3.0 were omitted (range 1-6) (10). The curricula of all public institutions offering an undergraduate nursing degree in Mexico City in 2010, were anal-ysed by researchers who compared curricula with Mexican Official Standards (11) regulating the pro-vision of health care services, including aspects of IYCF. The researchers concluded that the seven pro-grams analysed all contained insufficient and outdat-ed textbooks and inconsistent terms used to denote infant feeding; hence, a thorough update in line with national recommendations was needed (11).
Aim
To the best of our knowledge, only two studies have been published analysing IYCF content in required nursing textbooks, (USA and Mexico) and only one study assessed nursing curricula; therefore, our aim was to analyse IYCF content in both nursing curricula and required textbooks in a European setting, name-ly in Croatia.
Introduction
The World Health Organization (WHO) recommends exclusive breastfeeding (EBF) for the first six months of life, and continued breastfeeding, with comple-mentary foods, until at least 24 months of age (1). Breastfeeding rates in Croatia are far below WHO recommendations, with only 8% of women exclu-sively breastfeeding at 6 months and 22% of wom-en providing any breast milk to their children at 12 months of age (2), despite mothers being entitled to one year of paid maternity leave. There are a range of factors known to influence a mother’s decision to initiate and maintain breastfeeding, including the practical and emotional support from health profes-sionals (3). A Cochrane Review reported that breast-feeding support from health professionals can be effective in extending the duration of breastfeeding (4). To be able to provide appropriate care to women who want to breastfeed, health professionals require training in infant and young child feeding (IYCF). The quality of formal education of health professionals is vital because it represents the core knowledge they are equipped with when caring for mothers. It also shapes their attitudes, which are later difficult to change. Some will go on to advance their knowl-edge but many will rely upon their basic education to guide their practice, referring to textbooks used during their undergraduate education (5). Exposure to breastfeeding, either through formal education, or personal experience, was associated with more posi-tive attitudes towards breastfeeding amongst health professional students (6). Baccalaureate nursing stu-dents in Egypt, who had completed maternal/child nursing didactic and clinical courses, showed a sig-nificant relationship between breastfeeding knowl-edge and attitudes (r=0.236, p=0.011). Cricco-Lizza used a qualitative approach to investigate breast-feeding attitudes, beliefs, and personal experiences of nursing students at the beginning of their formal course work in maternal and child nursing. Findings suggested that nursing students’ positive attitudes towards breastfeeding were crucial for promoting breastfeeding initiation (7).
Only a few researchers have examined the content of textbooks used by midwifery and nursing students in relation to breastfeeding. Of these, researchers in Japan used a 3-round Delphi method among 32 mid-
Vidović Roguljić A. et al. Infant and Young Child Feeding in Croatian Nursing Programs... Croat Nurs J. 2017; 3(1): 127-133 129
EthicsInstitutional Review Board approval was not obtained because this study did not involve human subjects.
Data analysisRequired textbooks related to IYCF were analysed using WHO/UNICEF Infant and Young Child Feeding: Model Chapter for textbooks for medical students and allied health professionals (Model Chapter). The handbook has 112 pages and includes nine sessions with 82 topics related to IYCF (12). Two research-ers (one a general practitioner, breastfeeding course director and International Board Certified Lactation Consultant since 2002, the other a community nurse, who had completed a 90-hour breastfeeding course) independently analysed the literature using a rating structure published by Philipp et al. (e.g., correct and thorough=CT, correct and brief=CB, incorrect=I and omitted=O) (10). When rating the literature, a grade of ˝I˝ was given when the more than 50% informa-tion was present but was incorrect. Both research-ers compared results and solved any discrepancies by examining the information together until reach-ing a unanimous decision. Data were analysed using descriptive statistics, with variables shown as whole numbers and percentages.
Results
IYCF in Croatian nursing programs Of a total of ten nursing programs, nine were ac-cessible: the curriculum for one university’s nursing program was not publicly available. IYCF was covered by all assessed nursing programs. Courses covering these topics were: Pediatrics, Child Healthcare, Ma-ternal and Infant Healthcare, Nursing in the Commu-nity, and The Role of the Nurse in Supporting and Encouraging Breastfeeding. All courses were compul-sory, except for The Role of the Nurse in Support-ing and Encouraging Breastfeeding, which was an elective course offered at one university. All courses were held during the second year of study, apart from Healthcare in the Community, which was held
Methods
DesignA cross-sectional content analysis design was used to determine current curricula and textbook content in Croatian nursing programs during the 2018/2019 academic year. This study design was chosen to ef-ficiently obtain the data necessary to answer the re-search aims.
ParticipantsThe study was conducted between January to March 2019, in the Republic of Croatia, a country with a population of four million. We wanted to include all undergraduate nursing programs in Croatia. Croatian universities offer a total of 10, 3-year nursing under-graduate programs. Upon completion of the nursing program, a one-year internship is undertaken before candidates can apply for the national exam, which ensures basic competency in nursing knowledge. Once nurses have passed the exam and joined the Croatian Nursing Council to obtain their licence, they can choose whether they will work in the hospital setting or in primary care, depending on personal preference and job availability.
In Croatia, community nurses provide primary care to the entire population, including mothers follow-ing discharge from hospital with a minimum of three home visits in the first month, the first being within 72 hours of discharge. During these visits, commu-nity nurses assess maternal physical and mental health, examine the newborn, observe a breastfeed, instruct on infant care, and discuss family support. This service is fully covered by the Croatian Health Insurance Fund. No additional education is required of nurses who work in the community.
Data collection The first author collected the following data via the Internet from all publicly available curricula: Inclusion of IYCF in undergraduate nursing programs; name of course with IYCF component and whether they are re-quired or elective; year of program in which course is offered; course-load coefficient; duration of course; ti-tle of content that covers IYCF; and required textbooks.

130 Vidović Roguljić A. et al. Infant and Young Child Feeding in Croatian Nursing Programs... Croat Nurs J. 2017; 3(1): 127-133
foods are recommended as the best choice for com-plementary feeding” were found (text 1, p. 269) (13). Topics related to maternal care were often incorrect, especially in regard to management of breast en-gorgement, mastitis and sore nipples. Factual errors in textbooks included statements “mastitis is caused by infection…antibiotics are compulsory...causative organisms most frequently respond to amoxicillin...penicillin...” and ˝incision and drainage of breast ab-scesses is necessary˝ (text 1, p. 255- 6) (13).
Discussion
This is the first study to analyse IYCF content in nurs-ing undergraduate programs and required textbooks in Croatia, and only one of a few worldwide. Educa-tion in IYCF was included in all evaluated nursing programs in Croatia. Required textbooks contained less than a third of topics considered mandatory for health professional education, of which only a quar-ter were correctly depicted. Numerous important topics for nursing students were omitted.
Encouragingly, all evaluated nursing programs in Croatia include education on IYCF, demonstrating an awareness among course directors of the impor-tance of nutrition for nursing practice. It also demon-strates that nursing curricula in Croatia are standard-ised. The exact number of hours dedicated to IYCF, though, was unable to be determined, given that this topic was part of other subjects; however, analysing the content of required textbooks provided us with an indirect indication of the scope and weight placed on this topic.
Up to 70% of standard IYCF information was missing from Croatian nursing textbooks. A possible reason for the poor results is the unexpected finding that, according to the 2019 program curricula, the most commonly required textbooks, still being recom-mended, were published between 2003 and 2009. Despite this, we decided to use the Model Chapter as the gold standard to highlight gaps and areas need-ing improvement; hence, the substantially lower results obtained. It should be kept in mind though, that other evidence-based, standard information on IYCF was freely available at the time the assessed
during the third. The most commonly recommended textbooks were: text 1 (n=9) (Pediatrics [Pedijatrija], Mardešić , 2003) (13); text 2 (n=8) (Nursing in the Community: A handbook for nursing studies, part II [Sestrinstvo u zajednici: Priručnik za studij sestrin-stva drugi dio], Mojsović, 2006) (14); text 3 (n=4) (Maternal and infant nursing care [Zdravstvena nje-ga majke i novorođenčeta], Turuk, 2004) (15); text 4 (n=5) Child nursing care [Zdravstvena njega djeteta], Turuk, 2009) (16).
Assessment of required literatureFull assessment of individual textbooks is shown in Table 1. The mean number of topics assessed as cor-rect and thorough, across all four textbooks, was 2.3 out of 82 (2.7%; range, 0-8). The mean number of items scored as correct and briefly presented was 17 (21%; range, 3-26). The mean number of topics pre-sent but scored as incorrect was 5.5 (6.7 %; range, 3-9); whereas, the mean number of topics omitted was 57 (69.5%; range, 39-76). The mean number of topics present, whether correct or incorrect was 25 (30.4%; range, 0-28), of which the mean number cor-rect was 19.5 (23.7%; range 0-28). Summary statis-tics for each textbook are provided in Figure 1. The top ten most commonly covered and omitted topics are shown in Table 2. The only topic covered in all four textbooks was Assessing the child’s growth, but this typically referred to normal weight gain over time, without mentioning the WHO (12) growth charts, and hence was coded as ˝CB˝. The top three most poorly covered sessions/chapters were: (1) Policy, health system and community actions (n=9; 81.8% of topics omitted), (2) Appropriate feeding in exceptionally difficult circumstances (n=6; 66.6% of topics omitted) and (3) The importance of IYCF and recommended practices/Complementary feeding (both chapters with 33.3% of topics omitted).
Most texts correctly described the role of colostrum, how to help a mother position her baby at the breast and causes of infant crying. The most incorrectly de-scribed topics included (1) Recommended IYCF prac-tices, where 66% of texts recommended 4, instead of 6 months of exclusive breastfeeding, and (2) Prin-ciples for complementary feeding where statements as “if the child is thirsty, plain water and fruit juices are the best beverages ” (text 1, p. 243-5) (13), “cit-rus fruit is highly allergenic”, “egg yolks may be given only if hard boiled, while egg whites are to be avoid-ed until the end of the first year” and “industrial baby
Vidović Roguljić A. et al. Infant and Young Child Feeding in Croatian Nursing Programs... Croat Nurs J. 2017; 3(1): 127-133 131
Conclusion
Textbooks used for undergraduate nursing studies in Croatia were outdated, and information related to IYCF was incomplete, inconsistent and often incorrect.
ImplicationsA thorough revision of the literature, conducted at regular intervals, should be standard policy for all undergraduate nursing institutions. This will ensure nursing students receive complete, accurate, up-to-date and evidence-based IYCF information. The WHO Model Chapter can help achieve this goal.
References
1. World Health Organization. Global strategy for infant and young child feeding. Geneva: World Health Orga-nization; 2003.
2. Zakarija-Grković I, Boban M, Janković S, Ćuže A, Burmaz T. Compliance With WHO/UNICEF BFHI Standards in Croatia After Implementation of the BFHI. J Hum Lact. 2018;34(1):106–15.
3. Schmied V, Beake S, Sheehan A, McCourt C, Dykes F. Women’s perceptions and experiences of breastfeeding support: a metasynthesis. Birth. 2011;38(1):49–60.
4. McFadden A, Gavine A, Renfrew MJ, Wade A, Buchanan P, Taylor JL, et al. Support for healthy breastfeeding mothers with healthy term babies. Cochrane Databa-se Syst Rev. 2017;2(2):CD001141.
5. Yang Yang SF, Salamonson Y, Burns E, Schmied V. Bre-astfeeding knowledge and attitudes of health profe-ssional students: a systematic review. Int Breastfeed J. 2018;13:8.
6. Ahmed A, el-Guindy SR. Breastfeeding knowledge and attitudes among Egyptian baccalaureate students. Int Nurs Rev. 2011;58(3):372–8.
7. Cricco-Lizza R. Student nurses’ attitudes and beliefs about breast-feeding. J Prof Nurs. 2006;22(5):314–21.
8. Kaso M, Miyamoto K, Koyama E, Nakayama T. Breast-feeding information in midwifery textbooks in Japan: content analysis with evaluation standards based on Delphi method. J Hum Lact. 2011;27(4):367–77.
9. Cooke M, Cantrill R, Creedy D. The first breastfeed: a content analysis of midwifery textbooks. Breastfeed Rev. 2003;11(3):5–11.
textbooks were published, like ‘Evidence for the Ten Steps to Successful Breastfeeding’ (17) and ‘40-Hour Breastfeeding Counselling Course’ (18) and hence could have been used in preparing materials for nurs-ing students. The content of these sources of infant feeding information overlaps in many respects with the Model Chapter.
Given the role of community nurses in providing IYCF support to mothers after discharge from hospital, it is surprising that there was hardly any mention of Pol-icy, health system and community actions that sup-port IYCF in any of the assessed nursing textbooks, like Training and support of lay and peer counsellors. Another topic omitted in required textbooks was the role and opportunity community nurses have in pro-tecting mothers from unethical marketing of breast milk substitutes by upholding the International Code of Marketing of Breastmilk Substitutes (Code). If nurses are unfamiliar with the Code, of which Croatia is a signatory, then this opportunity will be lost.
In Croatia there are currently over 200 breastfeed-ing support groups, led by community nurses and lay peer supporters (19). The first groups were es-tablished in the mid 1990’s and studies have shown that mothers who attend these groups have higher breastfeeding rates (20). Despite the importance of breastfeeding support groups, none of the nursing textbooks assessed included the topics Fostering breastfeeding support groups and Training and sup-port of community health workers. Behaviour change communication skills should be an integral part of any health professional’s training, and yet this topic was also omitted from all texts. These findings indicate an urgent need to update and improve the quality of nursing textbooks in Croatia.
Limitations of the studyA limitation of this study is that other teaching mate-rials used by teaching staff were not assessed, such as handouts and presentations, which may have con-tained more up-to-date information on IYCF. Given that these informal sources of information are likely to vary between educational institutions, we felt that only standard textbooks should be evaluated. To reduce selection bias all nursing undergraduate programs in Croatia were evaluated.

132 Vidović Roguljić A. et al. Infant and Young Child Feeding in Croatian Nursing Programs... Croat Nurs J. 2017; 3(1): 127-133
15. Turuk V. Zdravstvena njega majke i novorođenčeta. Zagreb: Zdravstveno veleučilište; 2004. Croatian.
16. Turuk V. Zdravstvena njega djeteta. Zagreb: Zdravst-veno veleučilište; 2009. Croatian.
17. World Health Organization. Evidence for the Ten Steps to Successful Breastfeeding. Geneva: World Health Organization; 1998.
18. World Health Organization. 40-Hour Breastfeeding Coun-selling Course. Geneva: World Health Organization; 1993.
19. Hrvatska udruga grupa za potporu dojenja. Popis gru-pa za potporu dojenja. Available from: https://hugpd.hr/o-nama/popis-grupa-za-potporu-dojenja/ Accessed: 20.04.2019. Croatian.
20. Bosnjak AP, Grguric J, Stanojevic M, Sonicki Z. Influ-ence of sociodemographic and psychosocial charac-teristics on breastfeeding duration of mothers at-tending breastfeeding support groups. J Perinat Med. 2009;37(2):185–92.
10. Philipp BL, McMahon MJ, Davies S, Santos T, Jean-Ma-rie S. Breastfeeding information in nursing textbooks needs improvement. J Hum Lact. 2007;23(4):345–9.
11. Salas Valenzuela M, Torre Medina-Mora P, Meza Se-gura C. Alimentación infantil: una reflexión en torno a los programas de estudio de enfermería en la Ciu-dad de México [Infant feeding: a reflection regarding the nursing curricula in Mexico City]. Salud Colect. 2014;10(2):185–99.
12. World Health Organization. Infant and Young Child Feeding: Model Chapter for textbooks for medical stu-dents and allied health professionals. Geneva: World Health Organization; 2009.
13. Mardešić D. Pedijatrija. Zagreb: Školska knjiga; 2003. Croatian.
14. Mojsović Z. Sestrinstvo u zajednici: Priručnik za studij sestrinstva drugi dio. Zagreb: Zdravstveno veleučilište; 2006. Croatian.

Vidović Roguljić A. et al. Infant and Young Child Feeding in Croatian Nursing Programs... Croat Nurs J. 2017; 3(1): 127-133 133
Zaključak. Iako su svi javno dostupni kurikulumi u Hrvatskoj imali zastupljenu temu o prehrani dojen-čadi, ocjenjivani udžbenici uglavnom su zastarjeli, a navedeni sadržaj nepotpun i ponekad pogrešan.
Ključne riječi: dojenje, Hrvatska, obrazovanje, hranjenje dojenčadi i male djece, kurikulum sestrinstva, ogledno po-glavlje SZO-a, medicinske sestre
Sažetak
Uvod. Stope dojenja u Hrvatskoj daleko su od prepo-ruka SZO-a, pri čemu samo 8 % žena isključivo doji djecu u dobi od šest mjeseci. Medicinske sestre igraju ključnu ulogu u pružanju potpore optimalnoj prehrani dojenčadi, stoga bi njihovo preddiplomsko obrazova-nje trebalo obuhvaćati navedenu temu.
Cilj. Ciljevi ove studije bili su utvrditi je li prehrana dojenčadi dio preddiplomskog kurikuluma sestrinstva u Hrvatskoj te analizirati relevantne udžbenike.
Metode. Između siječnja i ožujka 2019. ocjenjivani su javno dostupni preddiplomski kurikulumi studija se-strinstva (N = 9) za akademsku godinu 2018./2019. Relevantne udžbenike analizirala su dva neovisna ocjenjivača koji su se koristili Priručnikom SZO-a o prehrani dojenčadi i male djece za zdravstvene dje-latnike.
Rezultati. Prehrana dojenčadi bila je zastupljena u svim nastavnim kurikulumima. Prosječan broj tema iz Priručnika SZO-a obuhvaćenih u četiri evaluirana udž-benika iznosio je 30,4 %, od čega je 2,7 % ocijenje-no kao prisutno i potpuno navedeno, 21 % prisutno i djelomično navedeno, a 6,7 % kao netočno. Slabo za-stupljene teme bile su: „Politika, zdravstveni sustav i akcije u zajednici” i „Odgovarajuća prehrana u iznimno teškim okolnostima”.
Rasprava. Ovo je jedna od rijetkih studija i prva u Hrvatskoj koja se bavi temom prehrane dojenčadi na preddiplomskim studijima sestrinstva kroz procjenu kurikuluma i sadržaja u relevantnim udžbenicima. Analizom udžbenika ustanovljeno je manje od trećine preporučenog sadržaja na temu prehrane dojenčadi.
PREHRANA DOJENČADI I MALE DJECE NA HRVATSKIM STUDIJIMA SESTRINSTVA: PRESJEČNA STUDIJA

bles, figures and/or other documents in Step 4 (Upload Supplementary Files).
The Croatian Nursing Journal uses the Diamond Open Access model. The articles go through the process of peer review and there are NO author charges. All ar-ticles are freely available at our website to all users immediately upon publication.
AUTHORSHIP
All persons designated as authors should qualify for authorship, and all those who qualify should be listed. Each author should have participated sufficiently in the work to take public responsibility for appropriate portions of the content. All others who contributed to the work who are not authors should be named in the Acknowledgments. All authors should take responsi-bility for the integrity of the whole work, from incep-tion to published article. Each manuscript is checked for plagiarism detection system. By submitting your manuscript to this journal you accept that it will be screened for plagiarism against previous published works.
AIM AND SCOPE
Croatian Nursing Journal is a peer-reviewed nurs-ing journal that publishes original articles that ad-vance and improve nursing science and practice and that serve the purpose of transfer of original and valuable information to journal readers. Croatian Nursing Journal is published biannualy in the English language. Authors are invited to submit original pa-pers in the form of research findings, systematic and methodological review and literature review related to nursing.
SUBMITTING A MANUSCRIPT
All manuscripts must be written in English and in ac-cordance with the ICMJE Recommendations (Recom-mendations by the International Committee of Medi-cal Journal Editors, formerly the Uniform Requirements for Manuscripts), available at: http://www.icmje.org.
The manuscripts must be submitted through an online submission system available at http://www.cnj.hr. The submission system guides you stepwise through the process of entering your details and uploading your files. Manuscripts should be uploaded in Step 2 (Upload Submission) and cover letter, title page, ta-
Author Guidelines

136 Author Guidelines
the authors’ name and precede the institu-tion names
• the name and mailing address of the author responsible for correspondence including his/her e-mail address
• acknowledgments — if any acknowledgment are to be included, they should be briefly stated.
Abstract and Key WordsThe first page should contain the title and the ab-stract (summary) both in English and Croatian, of no more than 200 -250 words each.
The abstract should state the purposes of the study or investigation, basic procedures, main findings, and principal conclusions. It should emphasize new and im-portant aspects of the study or observations. Below the abstract, the authors should provide 3 to 8 key words or short phrases that will assist in cross-index-ing the article and may be published with the abstract. Terms from the Medical Subject Headings (MeSH) list of Index Medicus should be used for key words.
Introduction/Background State the purpose of the article and summarize the rationale for the study or investigation. Give a critical review of relevant literature.
MethodsDescribe the selection and identify all important char-acteristics of the observational or experimental par-ticipants. Specify carefully what the descriptors mean, and explain how the data were collected. Identify the methods, apparatus with the manufacturer’s name and address in parentheses, and procedures in suffi-cient detail to allow other workers to reproduce the re-sults. Provide references to established methods and statistical methods used. Describe new or substantial-ly modified methods, give reasons for using them, and evaluate their limitations. Identify precisely all drugs and chemicals used. Use only generic names of drugs. All measurements should be expressed in SI units.
EthicsPapers dealing with experiments on human subjects should clearly indicate that the procedures followed were in accordance with the ethical standards of the institutional or regional responsible committee on
COVER LETTER
Manuscripts must be accompanied by a cover letter signed by all authors including a statement that the manuscript has not been published or submitted for publishing elsewhere, a statement that the manu-script has been read and approved by all the authors, and a statement about any financial or other conflict of interest. A statement of copyright transfer to the journal must accompany the manuscript.
PREPARATION OF MANUSCRIPT
The manuscript must be prepared using Microsoft Of-fice Word, in a 12-point font, double spacing, in either Times New Roman, Arial or Calibri.
Double spacing should be used throughout, including the title page, abstract, text, acknowledgments, ref-erences, individual tables, and legends. Pages should be numbered consecutively, beginning with the title page. The page number is to be written in the lower right-hand corner of each page. Manuscript must not exceed 20 pages (7500 words) including the abstract, text, references, tables and figures. The text should be accompanied by the title page as a separate page.
The text of the manuscript should be divided into sections: Abstract and Key words, Introduction/Back-ground, Methods, Results, Discussion, Acknowledg-ment, References, Tables, Legends and Figures.
Title pageThe title page should include:
• the title of the article (which should be concise but informative)
• full name of the author(s), with academic degree(s) and institutional affiliation
– If authors belong to several different insti-tutions, superscript digits should be used to relate authors’ names to respective in-stitution. Identical number(s) should follow

Author Guidelines 137
each. Give each column a short heading. Each table should be self-explanatory. Legend or key should be placed in footnotes below the table.
FiguresFigures and illustrations should be professionally drawn and photographed. Make sure that letters, numbers, and symbols should be legible even when reduced in size for publication. Figures should be numbered consecutively according to the order in which they have been first cited in the text.
The preferred formats are JPEG and TIFF, although any format in general use that is not application-spe-cific is acceptable. Make sure that minimum resolu-tion should be 300 DPI.
Graphs, charts, titles and legends in accepted man-uscript will be edited prior to publication. Preferred format for graphs or charts is xls or xlsx.
Abbreviations Use only standard abbreviations. The full term for which an abbreviation stands should precede its first use in the text unless it is a standard unit of measurement.
AcknowledgmentsList all contributors who do not meet the criteria for authorship, such as a person who provided purely technical help, writing assistance, or a department chair who provided only general support. Financial and material support should also be acknowledged.
ReferencesReferences should be numbered consecutively in the order in which they are first mentioned in the text. Identify references in the text, tables, and legends by Arabic numerals in brackets.
References style should follow the NLM standards summarized in the International Committee of Medi-cal Journal Editors (ICMJE) Recommendations for the Conduct, Reporting, Editing and Publication of Schol-arly Work in Medical Journals: Sample References, available at http://www.nlm.nih.gov/bsd/uniform_re-quirements.html
References to papers accepted but not yet published should be designated as “in press” and in case of e-
human experimentation and with the Helsinki Dec-laration and Uniform Requirements for Manuscripts submitted to Biomedical journals. This must be stat-ed at an appropriate point in the article.
StatisticsDescribe statistical methods with enough detail to enable a knowledgeable reader with access to the original data to verify the reported results. Whenev-er possible, quantify findings and present them with appropriate indicators of measurement error or un-certainty. Specify the statistical software package(s) and versions used.
ResultsPresent your results in logical sequence in the text, tables, and illustrations. Do not repeat in the text all the data in the tables or illustrations; emphasize or summarize main findings. Provide exact P-values with three decimal places or as P<0.001.
DiscussionEmphasize the new and important aspects of the study and the conclusions that follow from them. Do not repeat in detail data or other material given in the Introduction or the Results section. Include in the Discussion section the implications of the find-ings and their limitations, including implications for future research, but avoid unqualified statements and conclusions not completely supported by the da-ta. Relate the observations from your study to other relevant studies. State new hypotheses when war-ranted, but clearly label them as such.
Conclusion Emphasize the new and important aspects of the study and the conclusions that follow from them. Do not re-peat in detail data or other material given in the Intro-duction or the Results section. Identify recommenda-tions for practice/research/education or management as appropriate, and consistent with the limitations.
TablesEach table with double spacing should be put on a separate page. Do not submit tables as photographs. Number tables consecutively in the order of their first citation in the text and supply a brief title for

138 Author Guidelines
thors’ suggestions regarding reviewers. Usually four to six months after submission, the authors will re-ceive the reviews. Generally, the instructions, objec-tions and requests made by the reviewers should be closely followed. The authors are invited to revise their manuscript in accordance with the reviewers’ suggestions, and to explain amendments made in ac-cordance with the reviewers’ requests. The articles that receive more than one reviewer’s recommen-dations for “major review” are sent after revision to the same reviewer, who makes final recommenda-tion about the revised article. Based on the review-ers’ suggestions and recommendations, the Editorial Board makes final decision about the acceptance of the submitted article.
Authors will receive a letter confirming acceptance of the paper submitted for publication. Corresponding author will receive page-proof version of the article to make final corrections of possible printing errors.
The Croatian Nursing Journal adheres to the Recom-mendations for the Conduct, Reporting, Editing, and Publication of Scholarly Work in Medical Journals (2016) of the International Committee of Medical Journal Editors and to the Committee on Pub-lication Ethics (COPE) general guidelines for ethical conduct in publishing.
For questions about the editorial process (including the status of manuscript under review) please con-tact the editorial office [email protected].
publication ahead of print, the author should provide DOI. The author should obtain written permission to cite such papers as well as verification that they have been accepted for publication.
List of references should include only those refer-ences that are important to the text. Long list of ref-erences is not desirable because they consume too much space. We kindly ask that authors limit their references to 50 in total. All citations in the text must be listed in the references, and all references should be cited in the text. References should be the most current available on the topic.
EDITORIAL PROCESS
After submission of the manuscript, the author will receive a letter confirming manuscript receipt. All manuscripts received are anonymously sent to two reviewers. Croatian Nursing Journal is committed to promote peer review quality and fairness. The re-viewers are asked to treat the manuscript with confi-dentiality. Authors are welcome to suggest up to five potential reviewers for their manuscript (excluding co-authors or collaborators for the last three years), or to ask for exclusion of reviewer(s) and the reasons for it. The Editorial Board may or may not accept au-


![Hrvatski jezik među Australcima hrvatskog podrijetla [Croatian language maintenance amongst Croatian-Australians]](https://static.fdokumen.com/doc/165x107/6331ed57b6829c19b80bb897/hrvatski-jezik-medu-australcima-hrvatskog-podrijetla-croatian-language-maintenance.jpg)