cro- eport o. 462 Fis eries & a uscrip
20
/K138 cro- ry ar- e Service eport o. 462 Biological Station, St. Andrews, N. B., EOG 2XO Fis eries & a uscrip December 1977 D.J. Wildish, A.J. Wilson and H.M. Akagi
-
Upload
khangminh22 -
Category
Documents
-
view
6 -
download
0
Transcript of cro- eport o. 462 Fis eries & a uscrip

/K138
crory
ar- e Serviceeport o. 462
Biological Station,St. Andrews, N. B., EOG 2XO
Fis eries &a uscrip
December 1977
D.J. Wildish, A.J. Wilson and H.M. Akagi
Fi herie and arine ervice
anu cript Report
Th e report ontain ientifi and t hni' I information that r pre nt animportant ontribution to exi ting no \-I"d... but \\-hi h or om r a on ma) notb appropriate for primar' i ntifi (j.e. Journal) publi ation. Th y differ fromTe hni al R port in t rm of ubje t op and pot ntial Judi n :. anu riptR port d al primaril) "ith national or regional I roblem and di tribution ig n rally r tri t d to in titution or individual 10 ated in pani ular region ofCanada. 0 r tri tion i pia ed on ubj t matt rand th eri ren t th broad
t and poli i of the Fi h rie and ~arine er\ i ,nam Iy, fi h rim nt, t hnolog) and de\ lopment, 0 edn nand aquati environ-
m nt r I \ ant to Canada.1 nu- 'ript R port m' y b it d J
. pp ar abo\ the ab tra t of a h r port.i t1 es and Fi herie Abstracts and \\ ill b
to - i ntifi nd t hni I publi ation .'urn r 1- in thi ri \\- re i . u d a .1anu ript R pon (Biologi al
rie ) of the Biologi al Board of dnddL. dnd ub qu nt to 193 \\- h n th nam ofth Board va hang d by t of Parli ment. a anu ript R port Biolo i al
rie ) of the i h rie R ar h Board of dnad umb r 901-142- \\-ere i u da . dnu ript R port of th Fi h ri R ar h Board of name\\a changed with r port number 1426.
o tail on the a ailabilit' of . anu ript Report in hard opy may beobtained from th i uing e tabli hm nt indi ated on th front o' r.
er ice de peche et de cience de la mer
anu crit
Ce rapport ontiennent de re eignement i ntifiqu et te hniqu quion titu nt une ontribution importante au onnai ance a tu II mai qui pour
une rai on ou pour une autre ne embl nt pa approprie pour la publi ation danun journal ientifique. II e di tinguent de R pport te hnique par la portee duuj t t Ie Ie teur i e~ en effet, il at hent prin ipalement a de prabl'm
d ordre national ou r'gional et la di tribution n t g'neralement limit 'e auorgani me et au p r onne de r' gion parti uliere du anada. II n y a au uner tri tion qu nt au uj t· d fait. la 'ri r n't I va te g mm de interAt t dpolitiqu du r i e de pe he et d la m r notamment ge tion de pc he .te hnique et developpement, cience 0 eanique et en irannement aquatique.au anada.
Le anu rit peu ent ctre on idere omme de publi ation ompl't . Letitr e t p ralt au haut du re um' de haque r pport. qui ra publi' d n la r vuAquatic ciellce and Fi her/es Ab tract t qui figuera dan J'i ndepublication ientifique et te hnique du r i e.
Le num' ro de 1a900 de ette erie ont ete publi' atitre d manu ritbioi gi u ) d r ffi e de biologie du nada. et apre I hangem nt dJ ;:ignation de t or ani m par de ret du Parlem nt. n I . ont . te I ntant que manu rit 'rie biolo iqu ) d r ffi :> de rc her 'he ur Ie pc heri .du anada. Le numero allant de 901 a1 2 ont ete publi tttr d manu ri t dIOffi e d r h r he ur Ie pc herie du an da. Le nom de la 'rie a 'te h ngeapartir du rapport numero 1 26,
La page cou erture porte Ie nom de I etabli ement auteur ou I on peut epro urer Ie rapport OUS ou erture artonnee.
-Cover deSign by Christine Rusk

Fisheries and Marine ServiceManuscript Report 1462
December 1977
SUBLITTORAL MACRO-INFAUNA OF ST. CROIX ESTUARY
by
D. J. Wildish, A. J. Wilson, and H. M. AkagiFisheries and Environmental Sciences
Department of Fisheries and EnvironmentBiological Station
St. Andrews, N.B. EOG 2XO
This is the sixth Manuscript Report in this series fromthe Biological Station, St. Andrews, N.B.

(S) Minister of Supply and Services Canada 1977Cat. no. Fs 97-4/1462 ISSN 0701-7618

iii
ABSTRACT
Wildish, D. J., A. J. Wi son,estuary. Fi . Mar.
1977. Sublittoral macro-infauna of St. Croix14
Taxonomic data for sevenAl.lcjust/Sepi:emiber, 1974 are pr€!seI1ted.
benthic stations n the
Species diversity was in detritus feediof the system, than in estuarine section.primarily suspension feeding.
Densities from 56 to 1,208,479 individuals per m2 ; wet biomasses from 0.9 to 274.4
Key words: St. Croix estuarine benthos, species diversity, density, biomass
RESUME
Wildish, D. J., A. J. Wilson, and H. M. Akagi. 1977. Sublittoral macro-infauna of St. Croixestuary. Fish. Mar. Servo MS Rep. 1462, 14 p.
Les auteurs presentent les donnees taxonomiques qu'ils ont recueillies en sept stationsbenthiques et infralittorales, dans l'estuaire de 1a Sainte-Croix, en aout et en septembre 1974.
La richesse de 1a faune y est considerable: au mains 60 especes ont et6 recensees aux septstations. Les detritivores etaient plus varies dans la zone en forme de fjord, en direction dularge. que dans l'estl.laire. Dans 1a partie de l'estuaire proche de la terre. c'est la faunesuspensivore qui dominait.
La densit' de 1a population a vari' entre 56 et 1 208 479(poids frais>. entre 0,9 et 274,4 g/m2.
smes/m2. et 1a biomasse


RESULTS
and. Canada. natesstations were taken from U.S.
N.O.A.A., chart "Calais to W.The marine end of the ecosystemike, except 35-m maximum
, from the imit to a linefrom Todd' Point to Devi 's Head. The estuary
extends 1 613 mat the centre-channelne from this to the estuarine 1 t and
compares th an estimated distance of 1,887 mfor
MACROFAUNAL SAMPLING
SEDIMENT SAMPLING
Sediment subsamples (200-500 g) were takenfrom two of the grabs in each of the replicateseries at each station. Sorting characteristicsand organic carbon content were determined aspreviously (Akagi and Wildish 1975).
A complete list of the species identifiedduring this work is shown in Table 2.
TAXONOMY
. es were taken with 0.1 m2 Smith-McIntyre grab having a 16-cm effective diggingdepth. Sampling dates were:
August 27, 1974 for stations 20, 17, 16,15, and 14
August 28, 1974 for stations 10, 12September 9, 1974 for stations 7, 5, and 1.
Attempts were made to obtain 10 replicates ateach station. However, at stations 15 and 16adequate samples could not be taken because thebottom was covered with wood chips of sizes >2mm which precluded quantitative sampling. Inaddition, satisfactory quantitative samplescould not be taken at station 7 because thesubstrate was hard.
Individual samples were passed through aseries of sieves (5.0, 2.5, and 1.0 mm2 ) with ajet of sea water and the sieve contents collectedon a black plastic garbage bag. The sampleswere further sorted in the laboratory, involvingremoval of inorganic material, and a preliminarytaxonomic diagnosis made by untrained personnel(rapid sort method). All animals were thenplaced in 5% formalin in sea water and sent tothe Canadian Oceanographic Identification Centre,Ottawa, for taxonomic diagnosis and wet weighing.The data are given in C.O.I.C. Rep. No. 131,Reference 040B. Species (S), numbers of individuals (N), and wet weight biomass inclusive ofshell (6) were determined.
01 Z 3KlJI , I I
MATERIALS AND METHODS
\
\51. Croix Estuary
INTRODUCTION
Designated sampling stations in the St.Croix estuary are shown in Table 1. Time constraints allowed only ten of these stations tobe worked, of which three proved to be unsuitablefor sampling with the Smith-McIntyre grab.
The limits of the system considered are froma line joining Joe's Point and Point asthe seaward limit (Fig. 1) and at the IS 200mabove the International Bridge joining Calais,
The benthic macrofauna and sediment datareported here were obtained as part of aincluding a chemi andcharacteristics St. Croix A~tll~"V
manson and Wildipurpose of thecharacteristics ofdetermine the nature sedimentsand biomass of the constituent macrofauna.thought that such data will be of future value inthe multiple-use resource management of theestuary.
Previous work on the of the St.Croix estuary is reported Craige 6) andKetchum and Keen (1953). exchange ratiosrange from 0.905 to 0.300 and there is a retention time of fresh water in the estuary of 8days. The large freshwater flow from the St..Croix River induces a general counter-clockwisecirculation within Passamaquoddy Bay (Ketchumand Keen 1953). No previous work on sublittoralbenthic ecology is available. A recent investigation of heavy metals in water, biota, andsediment indicates elevated levels in some compartments (Fink et al. 1977) of the St. CroixRiver and estuary.
Fig. 1. Map showing topography and sampling'stations in the St. Croix estuary. Theopen circles indicate stations sampledfor macro-benthos in 1974.

-2-
erat et~tir.n
tidalstmanson and
rnrrln~l~ison of the d sort dataAppendix ) with that of .a.I.C. forsamples (Appendix 2) indicates thatmethod is unsati for ';c"'a~m';,,'
correct number of ,n~,r;,'~
underestimated.are estimatedwhere the isnumber of very smal mussels
Further s is based on the S times Nmatrix of finn,onr!;x 2 or S timesB matrix ofAppendix 3.
ECOLOGICAL ANALYSIS
Dominant (Table 3) may be ~~Y'~nll~A
in two groups corresponding to the estuarine andfjord-like sections of the system. In theestua:in7 secti~n a primaril~ sus~ension-feeding
assoc1at10n domlnated by Myt~Lus 1S present; inthe fjord-like section the macrofauna dominantsare primarily surface deposit feeders or detritus swallowers. Station 10 is an intermediatestation with significant biomasses of suspensionfeeders (e.g. MytiLus and Mya) as well asdetritus swallowers (YoLdia and Nepthys).
A total of 47 identified species (Table 1)were found for the seven stations (70 replicates).In additi on, 13 other taxa i dentifi ed only togenus or higher group, which were certainlymembers of different species, were found. Sixtaxa (see Table 1, Temporary numbers 2, 4, 7,11, 20, and 21), treated in this analysis as newspecies, were doubtful as such. They wereidentified only to genus or higher taxa becauseof damage, etc., yet the list contained one ormore species of the same taxa.
Species diversity calculated as the a valueof Fisher et al. (1943) and twice its standarderror (Table 4) indicates a decl ine in diversityin the estuarine section of the system from .station 12 landwards to station 20. The speciesequilibrium number. S • calculated from the Smaxversus SIN filtering for all replicate samplesat each station also shows this trend. Themaximum Smax value of 55 species is found in thefjord-like section of the St. Croix at station 5.
The density and biomass (Table 5) are lowonly at stations 12 and 20. The very highnumber of individuals at station 14 is mainlycomposed of large numbers of newly settledmussels.
DISCUSSION
The most notable feature of this work isthe obvious evidence of past industrial activityin the form of wood particles from saw mills inthe sediments, the sorting action of the tidalcurrents on these particles, particularly wherethey pass through the "Narrows" near station 15,and the development of a specialized fauna consisting of Gammarus oaeanious and BaZanus sp.which live in association with the wood particles.
Fishery statistics (Perley 1852; Anon.1924; Kendall 1935; and Murchie 1947) indicatethat the St. Croix was, prior to 1825, a productive Atlantic salmon river, although in 1977no migratory run was present. Tentative planshave.been made to reinstate a migratory salmonrun 1n the St. Croix, one requirement for whichis a clean, well oxygenated estuary. Dissolvedoxygen levels in the St. Croix estuary (Kristmanson and Wildish. in preparation) are adequateto allow salmonid migration, but levels arelowest in the most landward few kilometres(stations 17 to 20). The benthic data presentedhere also support the view that environmentalquality in the estuary is poorest just below thetwin towns of St. Stephen and Calais. Obviouslyeffluents entering here would need to be strictlycontrolled to maintain adequate water qualityfor salmon migration.
The benthic data here also providea baseline against whi future man-made changes,both negative and positive, can be assessed.
ACKNOWLEDGMENTS
SEDIMENTS
The proportion of three major size fractionsin dried sediment is shown in Table 6. Themost landward stations (20 to 17) are predominantly hard: rocks grading to sand at station17. At station 16 and 15 large bedS of coarsewood particles (>2 mm) and fibres are present.There is a sorting gradient of wood particlesfrom 15 to 12 with the particle size becoming
We thank Captain and crew of the PANDALUSII for help in sampling and Brenda McCulloughfor typing the manuscript. D. W. McLeese, R.Peterson, B. T. Hargrave and D. Peer criticallyread the manuscript.

REFERENCES
Akagi, H., and D. J. Wildish. 1975. Determination of the sorting characteristics andorganic carbon content of estuarine sediments. Fish. Res. Board Can. MS1370, 15 p.
-3-
Anon. 1924. St. Croix River Ftnational Joint Commission,
Interngton.
Craige, E. H. 1916. Hydrographic investigationsin the St. Croix River and PassamaquoddyBay tn 1914. Cont. Can. Biol. 1914-15, 15:151-161.
Fink, l. K., D. M. Pope, A. B. Harris, and l. L.Schick. 1977. Heavy metal levels insuspended particulates, biota, and sedimentsof the St. Croix, estuary in Maine. landand Water Resources Institute, Univ. ofMaine, Orono 04473.
Fisher, R. A., A. S. Corbett, and C. B. Williams.1943. The relation between the number ofspecies and the number of individuals in arandom sample of an animal population. J.Anim. Ecol. 12: 42-58.
Kendall, W. C. 1935. The Fishes of New England.. Memoirs of the Boston Society of Natural
History, Boston.
Ketchum, B. H., and D. J. Keen. 1953. Theexchanges of fresh and salt waters in theBay of Fundy and in Passamaquoddy Bay. J.Fish. Res. Board Can. 10: 97-124.
Murchie, G. 1947. Saint Croix, the SentinelRiver. Duell, Sloan and Pearce.
Perley, M. H. 1852. Reports of the Sea andRiver Fisheries of New Brunswick. Printerto the Queen.

Table L showing Milne estuarinel calculated for the
DiStation Coordinates
1 45°05.0'N 67"06.0'W 1331 .06 .12 FJORD2 45°05.2'N 67"06.2'W 2163 . 10 • 203 45"06.0'N 67"06.4'W 2996 .14 .284 45°Q6.4'N 67"06.6 W 3827 .18 .365 45°07.0'N 67°07.0'11I 4860 .22 .446 45"07.4'N 67°07.4' \~ 5492 .267 45°07.8'N 67°07.7'W 6241 .298 45°08.3'N 67"08.2'11I 7323 .34 .689 45°G8.7'N 67°08.7'11I 8155 .38 .76
10 45°09.0'N 67°09.3'11I 8903 .42 .8411 45°10.2'N 67°09.0'W 10817 .46 .9212 45"09.9'N 67°1O.3'W 11483 .54 .08 ESTUARY13 45°10.0'N 67°11.7'11I 13148 .62 .2214 45°10.1'N 67°12.9'11I 14811 .69 .3815 45°09.9'N 67°13.8'W 16226 .76 .5216 45°10.3'N 67°14.6'11I 17474 .82 .6417 45°10.9'N 67°15.3'W 19055 .89 .7818 45°11.2'N 67°15.6'W 19638 .92 .8419 45°11.4'N 67°16.1'W 20387 .95 .9020 45°11. 5' N 67°16.6'W 20885 .98 .96
1.00 1.00 FAllS

Table 2.
-5-
list for 7 stations in St. Croix estuary.
018 Lunatia parZida (Broderip &Sowerby, 1829)027 cyZichna aZba (Brown, 1827)031 NuceZZa lapillus (L. 1758)100 NuauZa 1822103 Yoldia sapotiZZa104 MytiZus edulis106 Musau'l.us108 Cr'ene'l.Za f!u-ma,c<UL
111 Astarte112 Astarte a:r'enata subaequi Zatera Sowerby, 1854113 Artica isZandica (Linne, 1767)114 cyclocardia borea'l.is (Conrad, 1831)115 Thyasira flexuosa (Montagu, 1803)116 Cerastoderma pinnuZatum (Conrad, 1831)117 Maooma balthiaa (L., 1758)118 Mya arenaria Linne, 1758120 Lyonsia hyalina Conrad, 1831123 Musculus discors var. Zaevigata Gray, 1824203 Nephtys incisa Malmgren, 1865212 Ophioglyoeragigantea Verrill, 1855215 Nephtys sp.218 Aphrodita Mstata Moore, 1905222 Nereis diversioolor O. F. MUller, 1771223 Nereis sp.*262 Eteone longa (Fabricius, 1780)265 Eteone sp.*269 Goniada macuZata Oersted, 1843274 PraxillelZa praetermissa (Malmgren, 1866)281 Ninoe nigripes Verrill, 1873282 Lumbrineris fragiZis (0. F. Muller, 1776)287 Maldane sarsi Malmgren, 1865347 Pista macuZata (Dalyel1, 1853)351 Pherusa affinis (Leidy, 1855)356 Chone infundibuZiformis (Kroyer, 1856)357 Sternaspis scutata (Renier, 1807)
359 Brada granosa Stimpson, 1854430 Batanu8 crenatus Brugu;ere451 Crangon septemspinosa503 Undo la irrorata504 Gamnarus 1947505 Casao bigelowi508 Leptoaheirus ,514 Gamnarus d,515 Ampelisca macroaepha'l.a l1jeborg 1852581 DiastyZis quacL~spinosa Sars, 1871801 Phascolion stromhi (Montagu, 1804)
Temporary Numbers1 Perip'l.oma sp.2 Ma1danidae3 PraxillelZa sp.4 Ampharetidae5 CO'l.U8 sp.6 Drilonereis sp.7 Owenidae8 Thracia septentrionaZis9 Nemeretea
10 MySi8 sp.11 P01ychaeta12 Chaetode!'rT1a sp.13 Rhodine sp.14 Ampharete sp.15 Oenopota sp.16 Bostrichobranohus pilu'l.aris17 Oenopota biaarinata18 Harmothoe sp.20 Gamnarus sp.21 Po1ynoidae
*In MS No. 1398 these numbers are suppressed. Three-digit numbers in Table 2 can be used to indicatetaxonomic grouping by reference to Tech. Rep. No. 450.
Table 3. Species dominance estimates based on ten samples of 0.1 m2 per station. Numbers refer tospecies as in Table 2.
Station
15
1012141720
N/m 2 > 5
114, 115,103,103 282,281115,103,503,13,1 ,269,282,111,215,114,281114,104,118,103,215,27417,15,027104,504,430,20104,118,117,223223,117
B/m2 > 1.0 9
114.113,282,103,1113.112,114,111.212,103114.118,104,212,103,215
104.018,430118,104,117,114,223

-G-
Table 4. Species diversity data in St. Croix estuary.
Station S/m2 · a ± % S.L
1 28 5 425 33 13.0 14 55
10 24 7.5 12 3312 17 8.0 22 3414 1217 14 2. 12 1920 3 1.0 40
Table 5. Density (N/m 2 ) and wet biomass (g/m 2 ) of macrofaunain the St. Croix estuary based on 10 replicates perstation.
Station Density (N/m2 ) Biomass (g/m2 )
1 207 218.205 137 64.75
10 200 197.7712 56 3.0614 1,208,479 220.4017 682 274.4020 17 0.91
Table 6. Percentage of size fractions in sublittoral sediments from the St. Croix estuary. Numbersin brackets refer to the grab subsampled for sediment analysis.
Station %>2 mm %sand % siltlclay
1(1) 22.5 36.7 40.81(10) 22.5 30.3 47.25(1) 13.6 35.6 50.81{1 ) 20.1 72.3 7.61(10) 15.2 57.3 27.5
lO{1 ) 2.7 10.6 86.710(0) 1.6 17.1 81.312(2) 0.2 6.9 92.912(4) 0.8 9.0 90.214(6) 30.2 25.2 44.614(10) 3.8 8.5 85.715 28.7(wood particles) 61.3 016 Wood particles1611(1) 6.7 56.8 36.511(10) 12.8 70.8 16.420(2) 73.6 16.6 9.820(10) 78.4 15.9 5.7

-7-
Table 7. Sorting characteristics and organic carbon content of St. Croix estuary sediments.
Organic carbon, weight basis%Walkley volatile
Station Mdl!' QD0 Skq(1i Black solids
1(l) 5.80 3.16 -0.46 2.76 7.301(10) 6.20 2.86 -0.58 3.27 6.255(1) 6.75 3.02 -1.12 2.55 6.447(1) 1.95 1.18 -0.11 0.54 2.327(10) 2.75 2.79 +1.33 0.53 5.23
1O( 1) 8.40 1.12 -0.69 3.79 10.3710(10) 7.40 2.01 -0.26 2.03 5.9212(2) 7.60 1.28 -0.25 4.95 14.1512(4) 7.50 1.81 -0.24 2.47 14.0814(6) 6.80 2.52 -0.77 26.52 56.0414(10) 7.40 1. 21 -0.16 2.98 8.2315 (-0.80) Wood particles16 Wood particles1617(1 ) 2.23 3.08 +1.59 3.42 6.9717(10) 1.17 1.06 +0.53 1.03 3.9620~2) 2.00 2.97 +1.39 1.82 8.3820 10) 0.90 2.63 +1.80 2.13 7.47

-8-
Appendix 1. Comparison of rapid sort and COIC identification methods.
Rapid sort COle Rapid sort COleStation S N S N Station S N S \II
7 28 7 22 14 2 1 2 109 48 9 38 5 1,252 ,205
11 91 18 67 5 ,284 5 1,13 13 20 87 6 1,375 7 113 137 20 103 7 2,002 7 1, 96513 164 24 123 9 3.000 10 1,206,92313 179 25 137 9 3,127 10 1,207,16014 206 27 168 10 3,697 10 1,207,77815 246 27 192 11 3,783 10 1,208,18015 261 28 207 11 4,066 12 1,208,479
5 6 12 5 9 17 4 116 6 11811 41 15 30 4 165 6 16812 64 19 44 7 183 12 18412 102 22 63 7 192 12 19313 120 25 79 8 401 12 40815 138 27 89 8 445 13 45215 158 29 99 8 474 14 48316 181 32 116 8 527 14 53716 197 33 133 8 580 14 58616 202 33 137 9 684 14 682
10 7 22 7 20 20 1 1 1 19 39 11 35 4 6 2 5
11 49 12 52 5 9 2 812 65 14 69 5 12 2 1112 85 17 90 5 13 3 1212 99 18 104 5 14 3 1313 178 21 179 5 14 3 1314 188 22 187 5 14 3 1315 201 23 198 5 16 3 1515 203 24 200 5 18 3 17
12 3 8 5 93 11 6 125 16 8 176 22 10 237 30 12 297 34 13 339 41 14 39
10 . 47 16 4410 57 17 5410 60 17 56

-9-Appendix 2. S x N matrix for stations in St. Croix estuary Aug.-Sept. 1974.
Station 1S 2 3 4 5 6 7 8 9 10
018100 1103 5 2 3 1 1 3108 4 2 2 3 3111112113 1114 2 9 6 7 11 4 11 15 9 12115 8 1 4 4 1 6 8 5123 1215 1281 4 1282 4 2 2347 1357505515801
123456 17 18 19 1
10
Station 5
018103 4 2 2 2106 1 1108 1 1111 1 2112 3 2 2113 1114 3115 8 5 1116 2 1 1212215 2218223269 6281 2 1282 2 3287351 1356 2357359 2503 3 6 1508581
124
111213 2 2 3 214 115

-10-
Appendix 2 (cont'
S 2 3 4 5 6 7 8 9 10
Station 10
018103 3 4 3104 39108112114 11 6 12 11 9 7 6 4115 2 1 1118 35203212 1215 2 2 4 2223274 5282357359505508801
24
121316
Station 12
027 2100 1103106118120215 2223274281 2282508801
9 111 1 115 2 2 1 ·417 3 2 2 2 4
Station 14
018 2031 1104 3 1,205,212 31 94 604 949 230 586 396 294118 2223 1265430 3 22 4451 3504 7 7 2 8 2 10 2514 11820 4
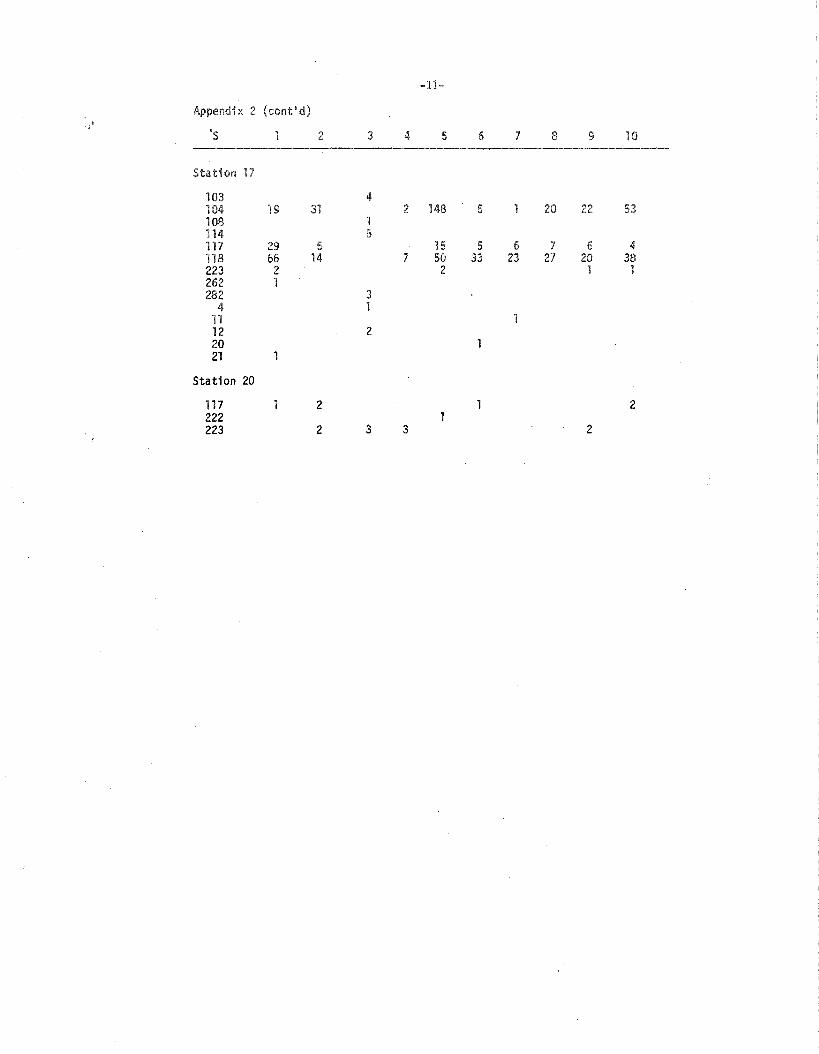
-11-
2
·s 3 4 5 6 7 8 9 10
Station 17
103 4104 19 31 2 148 5 20 2210814
117 29 5 5 6 6 4118 66 14 7 50 33 23 27 20 38223 2 2 1 1262 1282 3
4 11112 22021
Station 20
117 2 2222223 2 3 3 2

-12-
x Biomass Croix
S 4 7
Station
018 0.38100 0.02103 0.85 0,40 0.37 0.04 O. 0.16 0.09 26 0.10108 0.16 0.20 0.14 0.05 0.06 0.14 0.17111 0.19112 0.05113 35.38114 3.18 16.85 12.67 12.38 20.51 7.96 21.07 25.96 22.30 28.84115 0.08 0.01 0.06 0.10 0.02 0.02 0.14 0.07123 0.37215 0.37 0.11281 0.06 0.02 0.06282 0.02 0.48 1.37 1.35 0.14 0.01 0.17347 0357 0.01505 0.03 0.01515 0.02801 0
1 0.05 0.12 0.06 1.092 0.16 0.06 0 0.013 04 0.01 . 05 0.306 0.017 08 0.079 0.02
10 0.03
Station 5
018 0.39103 0.31 0.19 0.10 0.11 0.12 0.19 0.08106 0.21 0.26108 0.10 0.05 0.21111 3.40 2.57 0.15 0.15 0.14 0.08112 8.06 4.60 0.07 0.26 0.04 0.03113 25.24114 2.53 2.57 6.53115 0.08 0.06 0.01116 0.05 0.02 0.02212 1.48215 0.01 0.14 0.15 0.33 0.19218 0.30223 0269 0.14 0.01 0,02 0.05281 0 0 0.01 0

-13-
3
S 2 4 6 7 9 10
4287351 0.03 0.04356 0.02 0.10 O. 0357 0.10359 0.28503 0.01 0.06 0.12 0.02505 0.04 0.06 0.04508 0.05581 0.01
1 0.312 0.03 0.15 0.07 04 0.01 0.01
11 0.0112 0.02 0.0213 0.12 0.01 0 0.18 0.05 0.0614 0.0115 0.11
Station 10
018 0.22103 0.45 0.35 0.67 0.31 0.14 0.50104 8.98108 0.20112 0.13114 22.09 13.39 25.53 25.44 19.75 10.93 15.16 9.93 2.44115 0.02 0.01 0.01118 30.55203 0.48.212 4.06 3.58215 0.67 0.25 0.71 0.15 0.04223 0.29274 0.01 0.05282 0.55357 0.01359 0.12505 0.01508 0.04801 0.01
24 0.01 0.01
12 0.11 0.0213 0.0416 0.05
Station 12
027 0.02 0.03 0.05 0.03100 0.05103 0.02106 0.06 0.20

3
S 2 6 8 0
8120 0.02 0.02 O.215 0.09 0.37 O.223 0.66274 0.05281 0.02 0.01 0.01282 0.05508 0.04801 0.02
9 011 0 0.0415 0.07 0.06 0.04 0.03 0.04 0.15 0.0417 0.09 0.11 0;02 0.03 0.10 0.16 0.02
Station 14
018 0.15 4.39031 0.44104 0.11 3.50 8.17 56.50 16.30 11.79 49.20 28.80 36.30
,:~118 0.21223 0.05265 0.01430 0.10 0 0.16 2.58 0.02 0451 0.16 0.73504 0.11 0.09 0.01 0.01 0.11 0.01 0.11 0.01514 018 0.0320 0 0.04
Station 17
103 0.42104 4.43 9.38 0.21 29.50 1.11 0.06 3.89 6.26 8.74108 0.12114 10.69117 5.79 .36 2.64 0.72 1. 79 0.60 0.73 0.46118 72.20 7.11 1.42 26.40 1 .50 15.70 1 13.90 .50223 0.05 0.42 0.03 1.14262 0.07282 0.58
4 0.0111 012 0.0620 021 0.01
Station 20
117 0.08 0.15 0.04 0.18222 0.22223 0.05 0.05 0.10 0.04