A nnual R eport 2 0 1 0 - Sasken
124
A n n u a l R e p o r t 2 0 1 0 - 2 0 1 1 T h e w i n n e r t a k e s i t a l l : W h e n a l l - r o u n d p e r f o r m a n c e t r u l y m ak e s i t a f i e l d d a y Sasken Annual Report 2010 2011
-
Upload
khangminh22 -
Category
Documents
-
view
2 -
download
0
Transcript of A nnual R eport 2 0 1 0 - Sasken
A n n u a l R e p o r t 2 0 1 0 - 2 0 1 1
The winner takes it all: When all-round performance truly makes it a field
day
Sa
sk
en
An
nu
al
Re
po
rt
20
10
20
11
���"���# �$����%�# &���# �$�����# �"�'# ��'�# ���# �"�#
(���&#�)��$����#*����#��������'#��#�"�#%�&������#�(#+������#��%#�"�#!��%��#
�"��#��#��&����#,$�"#&���#��%��.�#/011#2��&%#�$+#!���#
3'# �$&�������# �"���# !��# ��# �"�# +����# �(# �$�# ���$�&# ��+���4# !�# �����+�# ��#
&����# (���# �# ����# �"��# %�%# ���# *����4# *$�# *����# �����%��# �# ����# �"��# !��#
!��"�$�#%�$*�4#��#���%#��#�"�#�++������4#*$�#���!#"�!#��#�&���"#�#!��#*'#
%������������#$�+���&&�&�%#����!���#��%#��5���#���#���#"$�%��%#+��#�����
��# �"�# *$������# !��&%4# ���!�"# ��%# %�5�&�+����# �(���# %��5�# �����+�����# ��#
*�����#($�$��6���%'#��%#$�"��# ��#��!#�5��$��#�(#*$�������#�&���&'4# �"���#
�������������#�$����%4#�"��#���#!�&&���#��#$�6&����#�"��#!"��"#%���#���#'��&%#
��%#��6&����#�"��#!"��"#��#��+�����5��#2�#���������#�"��#�"��#&�������#��#��#
$���%���#7�$���'�#���+&'#*���$��4#�"�#�����#�$��#�&!�'�#7$���('#�"�#��%4#
����#��#��+����*&�#%�&�5��'#��%#�$������#�����(�������#��#������4#!�#���+&'#
������#����+�#����"��#!�'�#
��4# ������# &������# (���# �"�# �"��+����# ��# �"�# (��&%4# !�# ��&�*����# �"��#
�+����# �"��$�"# �$�# (�5�# ��������4# �+�&'# ���&�%# �4# 34# �4# # ��%# ��# 8"�# 5��$�&#
����$��������# (��# �"��# �"���# �)+&����# ������# �(# +&�'4# �����������# �(# �"�#
2��&%# �$+# !���# �+������# �# 9# �%�+��*�&��'4# 3# 9# 3$�'���'4# �# 9# ��+�*�&��'4#
# 9# �((�����������4# �# 9# ��"���4# �"���# 5��$�&�# ���# ��(&����5�# �(# ������.�# �!�#
��'#��+����#�(#+��(�������#9#�$�#+��+&�4#�*�&��'4#&�������4#+������4#;$�&��'4#
��%#�)��$�����#
�#��7�'#�$�#7�$���'#�"��$�"#�"���#+�����
1
TABLE OF CONTENTS
Board of Directors ...........................................................................................4
Letter to Shareholders .....................................................................................6
Sasken People ..............................................................................................10
Technology and Markets ................................................................................14
Financial Performance - A Seven Year Snapshot............................................25
The Year at a Glance - Consolidated ..............................................................27
Notice ............................................................................................................28
Directors’ Report ...........................................................................................35
Annexure to the Directors’ Report ..................................................................40
Corporate Governance ..................................................................................43
Financial Statements
Auditors’ Report on Abridged Financial Statements .......................................53
Auditors’ Report on Standalone Financial Statements ....................................53
Annexure to the Auditors’ Report ...................................................................54
Abridged Balance Sheet ................................................................................56
Abridged Profit and Loss Account .................................................................57
Cash Flow Statement ....................................................................................58
Notes to Abridged Financial Statements ........................................................60
Balance Sheet Abstract .................................................................................68
Consolidated Auditors’ Report .......................................................................69
Consolidated Balance Sheet ..........................................................................70
Consolidated Profit and Loss Account ...........................................................71
Consolidated Cash Flow Statement ...............................................................72
Schedules Forming Part of the Consolidated Balance Sheet ..........................74
Schedules Forming Part of the Consolidated Profit and Loss Account ...........82
Notes Forming Part of Consolidated Accounts ..............................................85
Statement pursuant to Section 212 of the Companies Act, 1956.................104
Management Discussion and Analysis Report..............................................106
Other Information
Route Map to Sasken Registered Office ......................................................118
Attendance Slip and Proxy Form .................................................................119

SASKEN ANNUAL REPORT 2010-112

3
Adaptability is seen best at the centre of
the batting order, where the all-rounders come in.
With expected agility, unwavering concentration,
and economy of movement, these versatile players
can make or break a game. Whether they bat for a six
or bowl for a wicket, they deliver to the demands of
the game, adapting their talent with adeptness. Their
timely intervention is a game-changer, and must be
so, because the team expects nothing but the best.
SASKEN ANNUAL REPORT 2010-114
Board of Directors
Mr. Rajiv C. Mody Chairman and Managing Director
Dr. Ashok Jhunjhunwala Director
Mr. Bansi S. Mehta Director
Mr. Bharat V. Patel Director
Mr. J. B. Mody Director
Prof. J. Ramachandran Director
Mr. Kiran S. Karnik Director
Mr. Pranabh D. Mody Director
Mr. Sanjay M. Shah Director
Dr. G. Venkatesh Whole Time Director
Mr. Krishna J. Jhaveri Whole Time Director
Ms. Neeta S. Revankar Whole Time Director & Chief Financial Officer
Mr. Bharat P. Mehta Alternate Director to Mr. J. B. Mody
Committees of the Board
Audit Committee
Compensation Committee
Share Transfer and Investor Grievance Committee
Governance and Nomination Committee
Strategy, Business and Marketing Review Committee
Technology, Capabilities and HR Committee
Enterprise Management and Governance Leadership Team
Mr. Rajiv C. Mody Chairman and Chief Executive Officer
Dr. G. Venkatesh CTO, Head World-wide Delivery and Capability
Ms. Neeta S. Revankar CFO and Global Head - HR, IT and Admin.
CFO and Global Head - HR,
IT and Administration
Ms. Neeta S. Revankar
Company Secretary & Compliance Officer
Mr. R. Vittal
Statutory Auditors
S.R. Batliboi & Co.Chartered Accountants
Bankers
Citibank N.A.
Deutsche Bank AG
HDFC
Union Bank of India
Registered and Corporate Office
No.139/25, Ring Road, Domlur,
Bangalore 560 071, INDIA
5
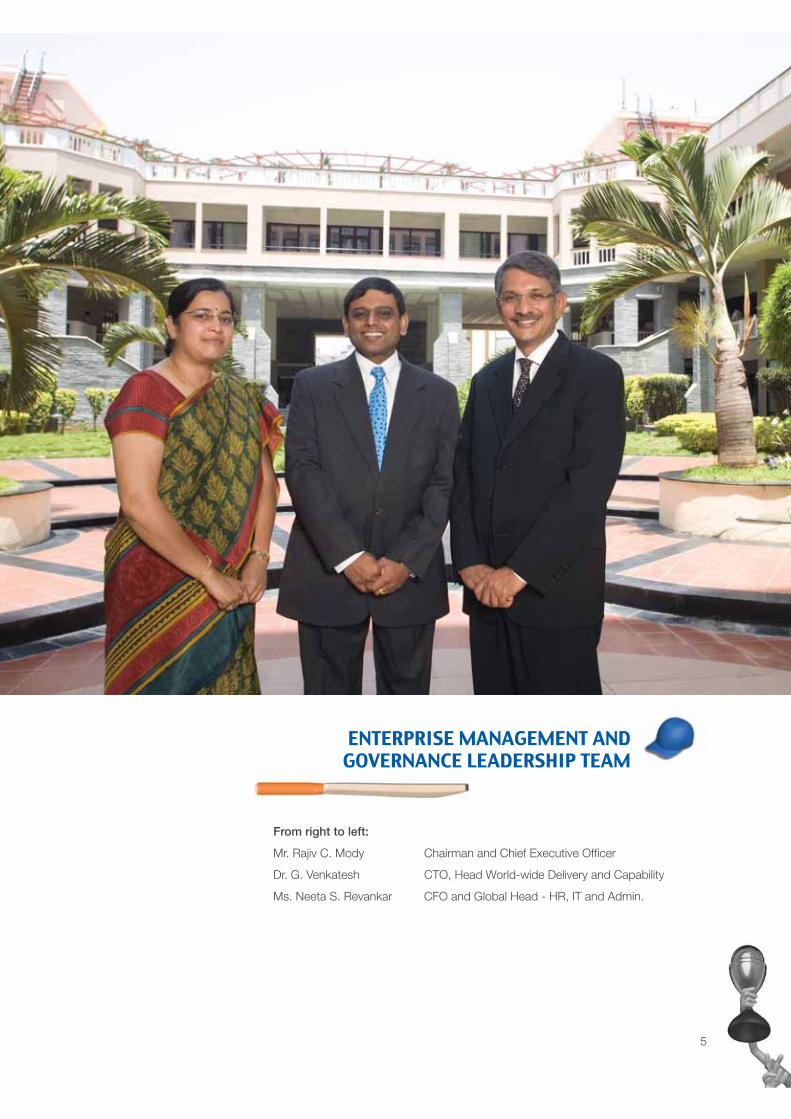
From right to left:
Mr. Rajiv C. Mody Chairman and Chief Executive Officer
Dr. G. Venkatesh CTO, Head World-wide Delivery and Capability
Ms. Neeta S. Revankar CFO and Global Head - HR, IT and Admin.
ENTERPRISE MANAGEMENT AND GOVERNANCE LEADERSHIP TEAM
SASKEN ANNUAL REPORT 2010-116
Dear Shareholder,
I am happy to present to you the performance of the company for FY 2011.
While the economic climate throughout the industry has remained challenging during the year gone by, we have had some successes coupled in the midst of tectonic shifts. This combination of wins and challenges created by the changing landscape in the industry has strengthened our resolve as an organization to tide through this phase. We clearly see a need to return to basics and get back to ABCDE or Adaptability, Buoyancy, Capability, Differentiate while continuing to maintain our unquestionable Ethical standards. It is our conviction that when these values are applied in our day to day functioning, our foundation will be strengthened, as we will emerge stronger to secure growth in the future.
Although we were anticipating a 10% growth over the first half of the year in the second half, we have not been able to meet this entirely. This is primarily because of the continued uncertainty in the business outlook, particularly in the Europe geography. One of our key tier-1 customers announced a significant shift in their platform strategy which impacted our business. In addition, some part of our business addresses rapidly evolving technologies; and business engagements in these areas tend to be short sprints coupled with some uncertainty. Due to increased competitive pressures our customers have scaled down outsourcing in high cost locations more aggressively than what we had anticipated. We are taking active steps to mitigate some of these risks and there are early signs of our business volume increasing in low cost locations.
It gives me immense pleasure however, to inform you that Sasken has started its first engagement in China with a key tier-1 handset vendor; building on this start we will be expanding our geographical reach with customers in this region. The Inmarsat GSPS program commercial service introduction was executed as per plan with the launch being announced in Communiq Asia conference in Singapore.
Smt. Pratibha Devisingh Patil, Hon’ble President of India, on 7th March 2011 launched Sasken’s VyapaarSEWA™ pilot under the ‘Sanchar Shakti’ project scheme of the Department of Telecommunications – Universal Service Obligation Fund (DoT-USOF). VyapaarSEWA™ Sasken’s multi modal platform is one of the four categories of projects aimed at supporting commerce for rural women SHGs under the Sanchar Shakti scheme. The objective of VyapaarSEWA™ is to create strong market linkages for rural women SHGs through Value Added Service applications and contribute to their socio-economic development. The VyapaarSEWA™ platform helps in the reduction of intermediaries by a direct-to-consumer approach and is expected to benefit the producers by directly connecting them to consumers thereby enhancing sustainability of their business.
We have seen some positive upsides in the increased offtake of TDSCDMA in the Chinese market, leading to a significant increase in our product business. It is likely that this market may display some positive momentum in the quarters to come. However, we continue to be cautious about making inferences about this being a long term trend that will continue.
We continue to consolidate and build on our strengths in our key offerings. Some key project wins in the last financial year were integration services for a tier-1 handset vendor, product design and testing services for the TDSCDMA standard, Android MMI integration and stability project for a tier-1 chipset vendor. In addition, we have a significant win to provide integration services in the smart phone space that is based on a platform using the latest symmetric multi processing dual core technology. Our total active customer base is now 127.
While the iPhone helped create a tipping point for mainstream smart phone adoption, Android activations are up significantly as per market research reports. We are well placed to exploit this trend of continued Android adoption which now seems to be targeting all price points, devices and attracting new entrants.
L E T T E R T O S H A R E H O L D E R S
7
Some other key trends that we see in the marketplace that have an impact on our business are the following:
Mobile devices will interwork with servers to create a rich user experience bringing contextual awareness. However these devices will continue to act independently when needed, as mobile devices will not always be connected. In the future, memory and computational power of devices will be leveraged alongside server side capabilities, enabling services to use the most efficient and responsive resource at any given time.
The limited bandwidth of wireless networks is being heavily taxed by the rapid increase of data use. With the increase in uptake of smart phones and wireless 3G modems that are used in conjuction with netbooks, data has far surpassed voice as the leading bandwidth user. We are investing in building capabilities in technologies for effectively delivering and distributing video over wireless channels, and innovative applications involving streaming and sharing of media for both retail and enterprise customers.
Deployment of 4G networks in mature economies seems to be gathering momentum with multiple operators announcing network rollout plans and launch of new devices in several markets. The speed of 4G will make watching live streaming video on mobile a common activity. 4G will provide the ideal foil for rich media applications to take off, presenting us with an opportunity to exploit our rich media capabilities. 4G is also likely to see the introduction of graphics intensive applications which will leverage the compute power of dual core processors that are becoming standard in high end smart phones. Again, we are making investments in 4G technologies like LTE (Long Term Evolution) that would place us in a favourable position here.
Semiconductor vendors are hastening the introduction of multi technology, multi core platforms and struggling to keep pace with the rapid evolution in operating systems and applications that they are expected to support. The proliferation of open source software platforms means that semiconductor vendors and OEMs (Original Equipment Manufacturers) must collaborate stronger than ever before to differentiate themselves in the market place. These provide white spaces for Sasken to step in and fill.
We see our customers are engaged in a process of moving work from high cost locations to low cost locations. What it means for us is that in the short term, we have to deal with a decline in the quantum of work at high cost locations and continue to engage with them through their planning cycle to move business to low cost locations. We continue to see increase in the quantum of RFPs of these companies and this will offset some of the declines that we are currently seeing at high cost locations. In light of this trend, we examined the prospects for our Mexico center. As both the pipeline and future growth prospects were not healthy, we decided to close down operations at our centre in Mexico. This has resulted in a onetime adverse impact on our EBIDTA and PAT margins.
The board had approved a buyback of shares to the extent of `34.5 crores with a maximum price of `260 per share. This is reflective of management’s view that our share is currently undervalued. Our strong cash position gives us the leeway to buyback our shares to the extent approved by the board. We are well on our way to completing the program promised in the buyback.
While attrition was high through the last financial year, focussed efforts are on to retain key talent through innovative measures. Actions have also been intensified to help individuals manage their growth and career aspirations. Across the board we have heightened our employee engagement through increased leadership communication with employees, and a series of targeted initiatives such as employee recognition, performance linked reward systems, managerial training, etc. We expect these initiatives will stem attrition in the next few quarters.
To conclude, we are optimistic of seeing return to growth towards the latter half of the financial year and we continue to make investments in the area of smart phones, LTE and data communications to enable us to benefit from the increased R&D spends which are now becoming visible. Our move to address market adjacencies including consumer electronics, defence, space and the automotive sectors will begin to pay dividends in the coming few quarters. Parallely, we are confident that our resolve to practise our ABCDE will pilot us towards a better future.
Thanking you,
Rajiv C ModyChairman and Managing Director

SASKEN ANNUAL REPORT 2010-118
Buoyancy is a team at its collective best. It is
a spirit that lifts to dominate, irrespective of the past.
When the eleven come together to repeat history on the
field, nothing defines their buoyancy better than their
sheer collaborative genius. So whether it’s a blazing
batting attack or menacing bowling blows or stop-in-
your-tracks fielding, it’s a confident team that knows
what it takes to deliver; and will stop at nothing but a
hundred per cent. It’s no wonder then that they bounce
back in the face of adversity, to bring back the cup!

9
SASKEN ANNUAL REPORT 2010-1110
S A S K E N P E O P L E
As our organization along with the entire industry is on a growth trajectory, the demand for technically competent talent is fierce. With this opportunity comes the challenge to acquire great talent and retain it. Therefore becoming an employer of choice is not only a stated intent, but also a wise business strategy. To enable this, our focus in fiscal 2011 has been on the following themes:
Rewards and Recognition
It is known that timely recognition encourages repeat performance and excellence. Fiscal 2011 saw the spotlight on shaping and executing recognition programs.
The electronic recognition program “virtual marbles” was widely used this year. The swiftest tool for recognition, virtual marbles covered an enormous 63% of our employees. This means about 2 out every 3 employees were formally recognized at least once in a span of 6 months. The impact and visibility was created not just around receiving marbles, but also around giving them. We will continue to make sure every Sasian receives quick recognition for all good work he/ she has done.
Keeping the momentum, awards were introduced for Value Leadership, where employees who live by our IRISE (Integrity, Respect for Individual, Innovation, Customer Centricity and Excellence) values are recognized. Brand Ambassador Awards have been pioneered as well; which will felicitate employees who have been great brand ambassadors of Sasken, both at our premises and onsite. The Execution Champion Awards recognize the champions who really go for their goals with no excuses and deliver to perfection. In the near future, we will be introducing Leadership Awards and New Stars Awards which will aim at managing and retaining high potential talent.
In this industry with high churn, we also took some time to recognize our long serving employees. Separate felicitation sessions were organized for Sasians who have completed 15 years and 10 years with the company. It was heartening to note that over 125 employees were part of the ‘over 10 year’ segment.
Compensation and benefits
We ended fiscal 2010, by articulating our reward philosophy, based upon our business requirements and market best practices. In line with this reward philosophy, in 2011, we carried out a detailed analysis of our job types and built a classification of Job descriptions and job levels. Using this framework we adapted a compensation philosophy that aligns Sasken compensation to the compensation in the market,which consisted of other embedded R&D services organizations operating in India. We also strengthened the variable pay mechanism and brought it closer to market best practice. Compensation revision was driven based upon market parity, affordability, internal parity and performance. With this, we have created the foundation and a common language for compensation decisions in the organization. Though we have been hiring actively, we have been successful in on-boarding newcomers into the organization without creating challenges on internal parity. The fairness and transparency of our compensation design has been appreciated by our employees.
11
Learning and Development
Sasken continues to invest heavily on Learning & Development opportunities under the following categories - Behavioral Training, Technical Capability Building & Project Management Training. These offerings are role-based, so that these investments help each of the employees play their respective roles effectively. For example, our “On Becoming a Leader” intervention prepares our First Time Leaders to play the role of a Project Manager most effectively.
Further, there is a clear focus on ensuring that our Training Engine is agile and quick to respond to changes in relevant technologies and keeps pace with changing market requirements.
In terms of hard numbers during FY 2010-2011, these investments translated to 6000 person days of Behavioral training (roughly 2 person days per employee per year) and 9000 person days of Technical training (roughly 3 person days per employee per year).
Enhanced Employee Communications and Engagement
We revamped our regular channels of communications like CXO Newsletter, Quarterly Business Meets etc. We also piloted unique opportunities for employees to reach out and have conversations with leadership team members.
High performance stems from high engagement. We firmly believe while the organization provides the tools, engagement comes from how effectively a manager is engaging with his / her team. We ran the second edition of our ‘Big Boss’ program, where best people managers were nominated by their direct reportees followed by a selection process, which incorporated a 360 degree feedback. ‘Big Bosses’ are not only rewarded, but their management practices are shared across the organization. This certainly creates a unique, bottom-up recognition of good people management. We have also created a web based manager’s forum for sharing stories and best practices.
Thanks to these initiatives, employee scores are moving in the right direction. Employee engagement is up, levels of attrition are decreasing and the percentage of new joinees through referrals is on the increase.
We will redouble and constantly review our efforts in making sure Sasken soon becomes the Employer of Choice globally, in R&D services.

SASKEN ANNUAL REPORT 2010-1112

13
Capability is perceivable at the top of the line up where the gods of cricket bat.
These batsmen can truly seize a moment and torment the opposition with boundaries
and sixers that swallow up a ball. Their talent bears the distinct flavour of victory and
the promise of a delivery. These master strokesmen stand tall as national inspirations
of capability, practice, and perfection – all ably harnessed to bring in results. Success?
That’s just child’s play then.
SASKEN ANNUAL REPORT 2010-1114
A quiet revolution of some sorts is happening in the telecom industry worldwide. We are heading towards an era of universal connectivity across the world thanks to the proliferation of affordable mobile phone connectivity.Along side this, the rapid adoption of radically new devices such as ‘smart phones’ and tablets is driving up the uptake of innovative applications, which in turn is driving up mobile data usage. The oft quoted “Third Wave” next only to railroads and automobiles depicts the disruption in the communication industry. The bankruptcy of stalwarts such as Nortel and the transformation of the mobile handset ecosystem caused by the entry of Google and Apple into the mobile phone space are changing the world order once dominated by stalwarts such as AT&T.
The exponential increase in the demand for ‘smart phones’ fuelled by the ever-evolving Android eco system has propelled many interesting opportunities for application and content developers. Emergence of iPad and clones provide diversity in portable devices. Apart from the growing mobile Internet usage, video and bandwidth intensive applications in mobile wireless devices drive bandwidth demand today. According to Cisco Visual Networking Index report, Global mobile data traffic in 2010 at 237 petabytes per month was over three times greater than the total global Internet traffic in 2000 and is expected to increase 26 fold during 2010-2015. Of the mobile data traffic, mobile video traffic comprised of about 50 percent. The emergence of cloud computing as a paradigm shift from static resource provisioning to pay-as-you-go model is an interesting development that is likely to address this increasing demand for network bandwidth. While locality and personalization drive differentiation in service offerings, associated security and privacy issues are becoming all the more important. The ubiquitous Internet Protocol (IP) after having made deep inroads in to computers, tablets and mobiles is also making significant inroads in to consumer electronics, automotives and sensors, to name a few. It is predicted that machine IP addresses will soon overtake that of host computers. IP networks are getting ready for sextuple play – including (i) landline / secure voice (ii) wireless / mobile voice (iii) data / Internet (iv) video / TV (v) content / programming control, and (vi) utilities / security / power.
To cope up with the above, telecommunications vendors and service providers around the world have started commercial deployment of a next-generation, truly broadband wireless cellular system, known as the fourth generation (4G) technologies. The 4G system would allow for significantly higher bit rates per user (ranging from 10Mbps-100Mbps), and would support the interoperability of diverse and heterogeneous wireless and mobile networks. This next generation of wireless technologies promises extensive opportunities for wireless services and applications, namely mobile commerce, mobile medicine, mobile education and mobile government.
The above changes provide interesting business opportunities for Sasken. Recognizing the changing landscape of the communication industry, Sasken consciously started looking at R&D services in areas other than its core markets of operation - namely in the adjacencies such as auto, consumer electronics, infotainment, mobile Internet, satellite, government, defense and enterprise mobility. Apart from the wired and wireless services, there is renewed interest in satellite communications for the provisioning of voice and broadband access services. With prior rich project experience in the satellite communication space, Sasken is well positioned to look at more engagements in this area as well.
Another interesting trend that we have been seeing recently is the dis-intermediation of the mobile network operators. Apple, Google and the likes are leveraging the ubiquitous and cost-effective Internet along with unique business models to provide integrated services to customers, bypassing the operator’s networks.
T E C H N O L O G Y A N D M A R K E T S
15
Hence it is a challenge for the operators to retain their traditional stronghold and reduce churn in their subscriber base. Sasken has started looking at possibilities to work with network operators to stitch together end-to-end solutions to fill the gap.
As per the 10th edition of its Global Information Technology Report (2010-2011) released by the World Economic Forum, the rapid uptake of mobile telephones, even in remote locations in countries such as India, has radically increased the potential for information and communication technologies (ICT) to play a constructive role in improving the economic well-being of masses. Realizing that there is an increasing shift from passive consumption to active consumption of Information and Communication Technologies (ICT), Sasken has been an active participant in the development and deployment of mobile Value Added Service platform referred to as VyapaarSEWATM for enabling livelihood activities of rural women Self Help Groups, being piloted under the Sanchar Shakti scheme, an initiative by Department of Telecommunications - Universal Service Obligation Fund (DoT- USOF).
Smart phones and Tablets
The handset market continues to witness growth in ‘smart phones’ at an almost exponential rate. The global ‘smart phone’ shipment of 297 million in 2010 is expected to hit 468 million, a 58 percent increase by 2011.It is expected that by 2012, the ‘smart phone’ shipment is expected to exceed that of PCs and notebooks providing a crucial inflexion point. The ‘smart phone’ OS platform though fragmented has seen Android eroding the market shares of the erstwhile dominant ones. It is predicted that Android’s share in the smart phone market which stands at 23 percent today will reach more than 45 percent by 2016. Though the era of Symbian as the dominating mobile OS is likely to be over, the Nokia-Microsoft alliance is likely to give a fillip to Windows Platform 7 (WP 7) and is likely to provide a differentiated platform for ‘smart phone’ users. Complementarities of components and content developed for the platform breeds “network effects” and hence increases adoption both by users and developers, as evidenced by Android.
Our internal Asset Creation Programmes (ACPs) on Android have been a real success and we have taken a lead towards meeting the growing demand of Android development and porting. As part of the ACPs, Sasken undertakes prototyping of R&D projects. The output from some of these projects have been contributed to the open source community. While ACPs serve as an effective training ground for engineers, it also enables our engineers to innovate and create software assets for Sasken.
Google releases new versions of Android frequently. Handset companies are in a constant race to upgrade to the latest version of Android on their handsets. Every time a handset company releases a new version of Android for their end consumers it creates market goodwill and helps improve shipments of their new devices. Sasken has partnered with key semiconductor companies to enable smooth Android version migrations for the handset companies thereby enabling handset companies to address their market needs. Sasken is currently involved in projects with multiple handset companies for upgrading Android on their devices. Apart from active involvement in Android, we have also re-vectored part of the resource pool to WP7 in tune with the market trends.
Thanks to the disruptive entry of Apple’s iPad, the Consumer Electronic Show held in Las Vegas this year witnessed the unveiling of 85 iPad clones, the highest number of new introductions by any standard. Since its launch in January last year, Apple has sold more than 15 million iPads in 2010. Seeing the success story of iPad, many major PC and laptop manufacturers such as Asus, Dell, HP and Lenovo and mobile device vendors such as Samsung, and RIM, have forayed in to the already crowded Tablet market. While applications ruled the roost in the iPhone disrupted ‘smart phone’ market last year, in this year of tablets, it will be content - whether it be audio, video, e-books or enterprise applications that will distinguish the different players. Since the operating systems used on handsets are now getting extended to the tablet market, Sasken is well positioned to serve customers in this market leveraging on its capabilities and experience in the mobile handset domain.

SASKEN ANNUAL REPORT 2010-1116
Differentiation. Former stalwarts tell us that the magic lies
in determination, dedication, and discipline. That’s the difference the boys
bring in, prepared in spirit and in form. Led with confidence, armed with
deep resolve, and invigourated by practice, the players display a zeal to
perform. Executing what they have learnt, they truly make it a field day,
when they make their mark with their delivery.

17
SASKEN ANNUAL REPORT 2010-1118
Enterprise Mobility
With the widespread adoption of ‘smart phones’ and Tablets, and the deployment of wireless broadband networks such as Long Term Evolution (LTE) and Wi-Max, the enterprise mobility space is likely to see significant traction in the coming years. As mobility of the workforce increases it has become imperative for organizations to integrate the users’ mobile devices with the enterprise networks and systems to improve communication, coordination and collaboration. We are seeing Enterprise Mobile Applications extending beyond the current set of critical applications such as email, and calendaring to other key business functions such as customer relationship management, sales force automation, Enterprise Resource Planning, corporate news feeds, enterprise portals, and unified communications. Soon organizations are likely to treat mobile devices as a critical IT asset and manage the entire corporate lifecycle using mobile enterprise applications. This trend is likely to encompass B2B and B2C functions as well. According to Frost & Sullivan, enterprise mobile applications earned revenue of about $2.84 billion and is expected to reach to $10.17 billion by 2015.
Realizing the potential, Sasken has been engaging with its customers for developing mobile enterprise applications and solutions across various mobile platforms including iPhone iOS, Android, Blackberry RIM and Symbian platforms.
Testing
With the rapid evolution of mobile operating systems and the associated devices, there is a growing need for offering comprehensive testing services including certification to all entities in the eco system, namely, the mobile operators, the handset vendors, and semiconductor manufacturers. With this as a focus area, Sasken has set up a test lab in San Diego, California, USA to provide a one-stop testing solution. In collaboration with Qualcomm, Sasken test lab provides testing, debugging, product validation and certification services that includes handset functionality testing, pre-network vendor inter-operability testing, operator testing, content and portal testing, and field testing. The certification services include 3GPP conformance, Global Certification Forum compliance and Operator specific compliance.
Networks
By 2015, the average mobile network connection speed is likely to increase by 10-fold from the current 215 Kbps to reach more than 2 Mbps. Deployment of Long Term Evolution (LTE) networks capable of theoretical speeds of up 100 Mbps is growing far faster than any previous mobile technologies such as High Speed Packet Access (HSPA). The operators worldwide continue to make massive investment decisions at the same expecting good return on this investment. Apart from the Radio Access Network (RAN) portion, there has been significant investments in backhaul networks and new peering arrangements. According to the Global Mobile Suppliers Association, about 180 operators in 70 countries are now investing in LTE; 17 operators have commercially launched LTE networks in 12 countries and in total, 128 operators have committed to LTE in 52 countries. Even in emerging countries such as India, some of the licensed operators have been exploring the deployment of Time Division (TD)-LTE after the successful auction of 2.3 GHz band for Broadband Wireless Access service. Although the Net Neutrality rulings of the Federal Communications Commission on Net Neutrality released last December hangs in balance due to the rejection by the House of Representatives, the network operators are preparing themselves with methodologies such as Deep Packet Inspection (DPI) to discover traffic characteristics at granular level for optimizing and pricing the network resources.
In tune with the market trends, Sasken has been developing the LTE protocol stack as per the standards and demonstrating its capabilities in LTE development and sustenance to potential customers. Work on DPI and related activities have also started to give us the head start in traffic management and prioritization.

19
Satellite Communications
Apart from the above trends, there is an interesting phenomenon that is unfolding in the satellite communications industry. Satellites with bigger and powerful antennas are being launched in space, thus reducing the transmit power and antenna size requirements on the terminal side. While fixed satellite services continue to drive the broadband revolution in geographically remote areas providing almost same data rates as terrestrial networks, mobile satellite service providers are trying to provide nationwide coverage through a combination of terrestrial and satellite networks. This trend is likely to introduce dual mode handsets with smaller form factor in the market. The operators look for complete solutions from vendors such as Sasken. After proving its capabilities by delivering Inmarsat handheld terminals, Sasken is well placed to leverage its capabilities to address new opportunities in this space. We are also extending our capabilities to provide end-to-end solutions either by leveraging existing capabilities in terrestrial technologies or by partnering with others. Sasken is also targeting to increase its customer base in this segment by working with distribution partners and solution providers and enhancing the offering portfolio to include applications and solutions.
Semiconductors
The increased pervasiveness of electronics, demand for more functionality in electronic products, cross product integration, connectivity and emergence of newer technologies such as 3G and Wi-Max translate into increased demand for semiconductor design and engineering R&D services. The global semiconductor R&D outsourcing market has grown to more than $6 billion and is expected to almost double by 2020. India’s share of this market has also considerably increased from 18 percent in 2005-06 to about 30 percent currently and is expected to reach 40 percent by 2020. Of these outsourced R&D services, embedded software development followed by VLSI design and board design dominate. In addition, with the increasing markets for the electronic products in India, a minor emergent trend is that businesses are looking at domestic R&D services for semiconductor design services companies due to their local market knowledge.
Sasken has been providing high-end embedded solutions in software; post-silicon and pre-silicon validations services; verification and design services in digital and analog modules; and full chip design solutions since 2000 in wired and wireless engineering R&D services space. Going forward, the plan is to focus on continued growth in the Application Specific Integrated Circuit hardware services business, embedded software solutions including application integration in both the wired and wireless domains as well as to focus on expanding into adjacencies in the consumer and automotive space as well.
Sasken has been partnering with semiconductor companies to provide turn-key and end-to-end solutions ranging from chip design to field trials and is considered as a preferred one-stop solution provider. This has prompted many of the customers to make us as the eco system partner in the areas of latest technologies. We see this trend growing in handheld devices, consumer electronics and automotive segments as well.
Auto and Consumer Electronics
The consumer electronics industry that was hit by the recession, partly recovered in 2010. Blu-ray 2.0 players and ‘smart phones’ are getting more popular with consumers looking for multiple functions and high speed internet access. The trend is more towards providing a richer consumer experience that puts focus on multimedia content management. Internet TVs in line with Google TV has emerged due to consumers demands of personalized content. We continue to focus on this segment and build upon the opportunities created by our acquisition of assets of Sasken Inc.
In parallel, we are also focusing on Auto Infotainment. Auto infotainment products have gained popularity in the past years with various automotive OEMs launching models providing access to video content as well as the internet. This has led to a greater focus on rear seat entertainment systems which allow passengers to access media on the go in a safe manner. In this year, we had our first key design win with a major tier-1 infotainment equipment supplier to build and integrate a rear seat entertainment system for the luxury car segment.

SASKEN ANNUAL REPORT 2010-1120

21
Ethics. The finger that guides can often sway a game of cricket in
any direction. The men at the stump and square leg must then uphold
the merit in the game. In a field where actions depict ethics, there’s no
mistaking where the heart lies. But, come what may, the ‘third umpire’
tells it like it is, and like it should be. Because only delivery matters; and
those who play fair, embellished by commitment and toil, clearly make
it to the winning post.
SASKEN ANNUAL REPORT 2010-1122
ConnectM
ConnectM, a Joint Venture between Sasken and IDG Ventures is focused on Energy Management Solutions (EMS) for Commercial Office Buildings and Remote Monitoring Solutions (RMS) for Telecom tower infrastructure providers. The market opportunity in both these verticals is quite large and the driver in the EMS space is the customers’ aspiration and in some cases regulatory compulsions to go green and conserve energy. We see an increased interest level and consequentially adoption by customers in this space of green solutions. Our wireless offering is very unique and makes us the best choice for both existing and new buildings. Because of our wireless capability, our solutions do not require cumbersome in-building cabling and that makes it easier for both ConnectM and the customer to fit these solutions into their existing facilities.
In the telecom tower remote monitoring space, the driver is the need to reduce OPEX and also run the operations in an environment friendly manner. The declining ARPUs (Average revenue per user) of the telecom operators has translated into a pressure on the tower Infrastructure companies to monitor, control and reduce their OPEX through an investment in technology such as RMS. ConnectM is one of the very few companies which can provide a complete turnkey solution to a telecom tower company that spans hardware, software and analytics led managed services. Business analytics is a key differentiator for ConnectM and through our analytics we generate significant value for both the customer and ourselves.
The Telecom Tower RMS business is poised for a steep growth in FY12. ConnectM has completed Proof-Of-Concept and small scale deployments successfully. India alone, currently, has approximately 350,000 telecom towers and this is slated to grow to about 500,000 towers in the next few years. We are currently rolling out RMS for 5000 towers for a leading infrastructure customer and we hope to bag medium to large scale projects from other customers soon.
In the office building EMS space, we have deployed our solutions in approximately 3 Million sq.ft office space. We have also tested and launched our new wireless EMS sensors that can control lighting (including daylight sensing) and Heating Ventilation and Air-Conditioning (HVAC) assets. We hope to consolidate our position in the large and lucrative Air-Handling Unit (AHU) HVAC segment with our EMS solutions in FY12. There is an expected market opportunity for providing EMS for approximately 250 Million sq.ft of office space that is likely to increase up to 400 Million sq. ft over the next 5 years.

23
23 4
5
61
F I N A N C I A L P E R F O R M A N C E

SASKEN ANNUAL REPORT 2010-1124
25
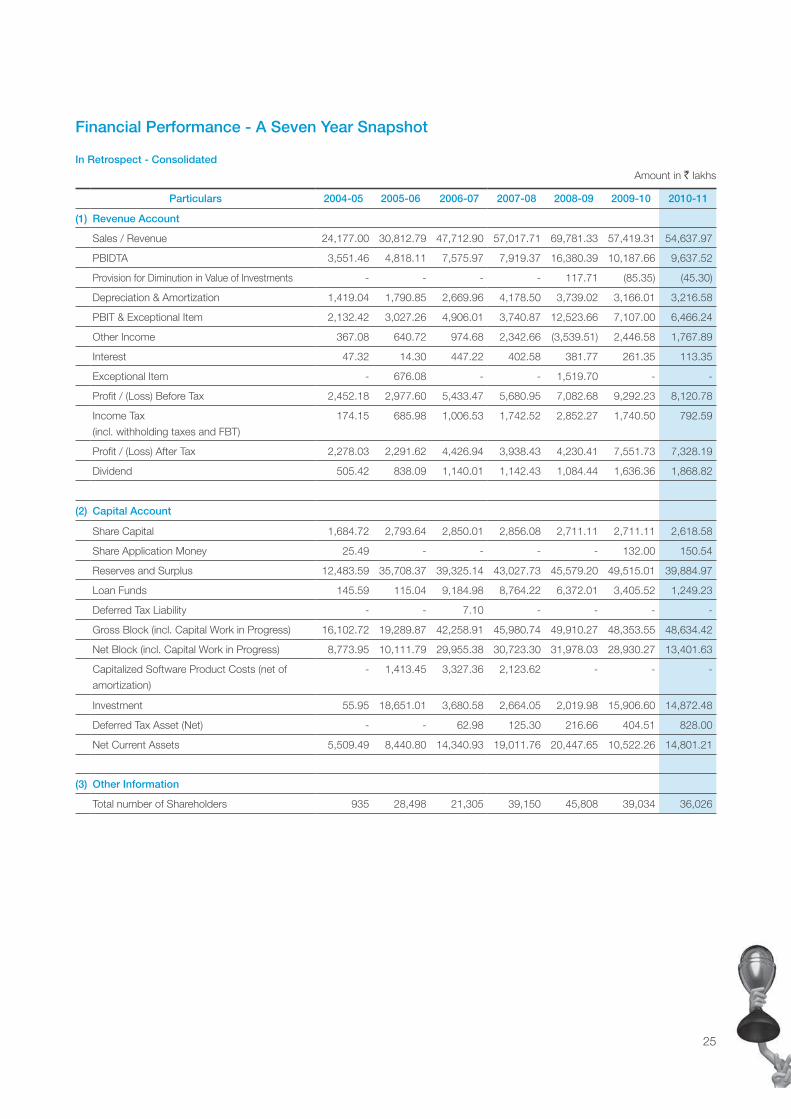
Financial Performance - A Seven Year Snapshot
In Retrospect - Consolidated
Amount in ` lakhs
Particulars 2004-05 2005-06 2006-07 2007-08 2008-09 2009-10 2010-11
(1) Revenue Account
Sales / Revenue 24,177.00 30,812.79 47,712.90 57,017.71 69,781.33 57,419.31 54,637.97
PBIDTA 3,551.46 4,818.11 7,575.97 7,919.37 16,380.39 10,187.66 9,637.52
Provision for Diminution in Value of Investments - - - - 117.71 (85.35) (45.30)
Depreciation & Amortization 1,419.04 1,790.85 2,669.96 4,178.50 3,739.02 3,166.01 3,216.58
PBIT & Exceptional Item 2,132.42 3,027.26 4,906.01 3,740.87 12,523.66 7,107.00 6,466.24
Other Income 367.08 640.72 974.68 2,342.66 (3,539.51) 2,446.58 1,767.89
Interest 47.32 14.30 447.22 402.58 381.77 261.35 113.35
Exceptional Item - 676.08 - - 1,519.70 - -
Profit / (Loss) Before Tax 2,452.18 2,977.60 5,433.47 5,680.95 7,082.68 9,292.23 8,120.78
Income Tax
(incl. withholding taxes and FBT)
174.15 685.98 1,006.53 1,742.52 2,852.27 1,740.50 792.59
Profit / (Loss) After Tax 2,278.03 2,291.62 4,426.94 3,938.43 4,230.41 7,551.73 7,328.19
Dividend 505.42 838.09 1,140.01 1,142.43 1,084.44 1,636.36 1,868.82
(2) Capital Account
Share Capital 1,684.72 2,793.64 2,850.01 2,856.08 2,711.11 2,711.11 2,618.58
Share Application Money 25.49 - - - - 132.00 150.54
Reserves and Surplus 12,483.59 35,708.37 39,325.14 43,027.73 45,579.20 49,515.01 39,884.97
Loan Funds 145.59 115.04 9,184.98 8,764.22 6,372.01 3,405.52 1,249.23
Deferred Tax Liability - - 7.10 - - - -
Gross Block (incl. Capital Work in Progress) 16,102.72 19,289.87 42,258.91 45,980.74 49,910.27 48,353.55 48,634.42
Net Block (incl. Capital Work in Progress) 8,773.95 10,111.79 29,955.38 30,723.30 31,978.03 28,930.27 13,401.63
Capitalized Software Product Costs (net of
amortization)
- 1,413.45 3,327.36 2,123.62 - - -
Investment 55.95 18,651.01 3,680.58 2,664.05 2,019.98 15,906.60 14,872.48
Deferred Tax Asset (Net) - - 62.98 125.30 216.66 404.51 828.00
Net Current Assets 5,509.49 8,440.80 14,340.93 19,011.76 20,447.65 10,522.26 14,801.21
(3) Other Information
Total number of Shareholders 935 28,498 21,305 39,150 45,808 39,034 36,026

SASKEN ANNUAL REPORT 2010-1126
Particulars 2004-05 2005-06 2006-07 2007-08 2008-09 2009-10 2010-11
(4) Ratios
(a) Profitability / Efficiency
Operating Turnover / Total Income (%) 99% 98% 98% 96% 105% 96% 97%
PBIDTA / Total Turnover (%) 15% 16% 16% 13% 25% 17% 17%
PBIT & Exceptional Items / Total Turnover (%) 9% 10% 10% 6% 19% 12% 11%
PBT / Total Turnover (%) 10% 10% 11% 10% 11% 16% 14%
PAT / Total Turnover (%) 9% 7% 9% 7% 6% 13% 13%
Return on Average Net Worth (%)
(PAT / Average Net Worth) (%)
18% 9% 11% 9% 9% 15% 15%
Return on Average Capital Employed (pre-tax)
(PBT+ Interest) / (Average Capital Employed) (%)
19% 11% 13% 14% 16% 19% 17%
Return on Average Capital Employed (post-tax)
(PAT+ Interest) / (Average Capital Employed) (%)
18% 9% 11% 10% 10% 16% 16%
Sales to Average Net Working Capital 5.5 4.4 4.2 3.4 3.5 3.7 4.3
Total Revenues to Average Total Assets 1.9 1.2 1.1 1.1 1.3 1.0 1.1
Fixed Assets Turnover 1.5 1.6 2.4 1.9 2.2 2.0 4.1
(b) Liquidity
Net Working Capital to Total Assets 0.4 0.2 0.3 0.3 0.4 0.2 0.3
Average Collection Period (Days) 82 77 67 78 73 62 65
Current Ratio 2.6 3.2 2.8 2.8 2.5 1.9 2.4
(c) Leverage
Debt - Equity Ratio 0.0 0.0 0.2 0.2 0.1 0.1 0.0
Interest Cover 49.1 161.3 11.0 9.3 32.8 27.2 57.0
Total Assets / Net Worth 1.0 1.0 1.2 1.2 1.1 1.1 1.0
(d) Growth
Growth in Operational Turnover (%) 46% 27% 55% 20% 22% -18% -5%
Growth in PBITDA (%) 29% 36% 57% 5% 107% -38% -5%
Net Profit Growth (%) 24% 1% 93% -11% 7% 79% -3%
Financial Performance - A Seven Year Snapshot (Contd.)
In Retrospect - Consolidated
27
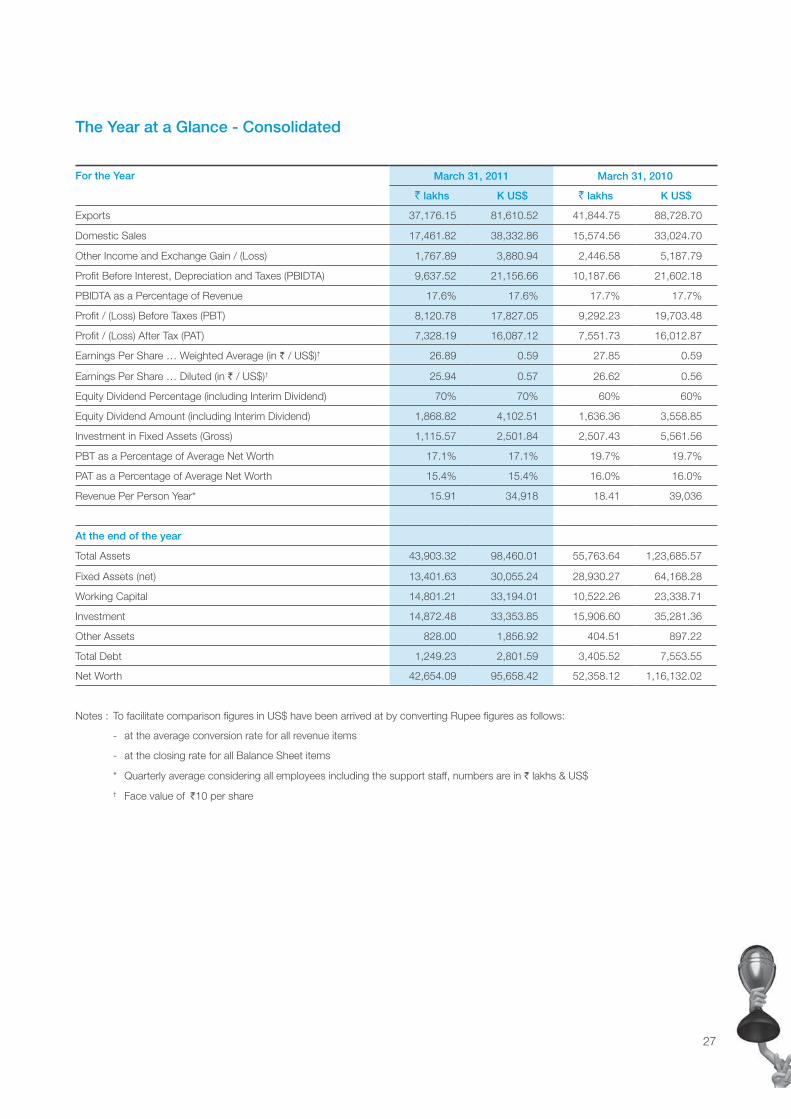
The Year at a Glance - Consolidated
For the Year March 31, 2011 March 31, 2010
` lakhs K US$ ` lakhs K US$
Exports 37,176.15 81,610.52 41,844.75 88,728.70
Domestic Sales 17,461.82 38,332.86 15,574.56 33,024.70
Other Income and Exchange Gain / (Loss) 1,767.89 3,880.94 2,446.58 5,187.79
Profit Before Interest, Depreciation and Taxes (PBIDTA) 9,637.52 21,156.66 10,187.66 21,602.18
PBIDTA as a Percentage of Revenue 17.6% 17.6% 17.7% 17.7%
Profit / (Loss) Before Taxes (PBT) 8,120.78 17,827.05 9,292.23 19,703.48
Profit / (Loss) After Tax (PAT) 7,328.19 16,087.12 7,551.73 16,012.87
Earnings Per Share … Weighted Average (in ` / US$)† 26.89 0.59 27.85 0.59
Earnings Per Share … Diluted (in ` / US$)† 25.94 0.57 26.62 0.56
Equity Dividend Percentage (including Interim Dividend) 70% 70% 60% 60%
Equity Dividend Amount (including Interim Dividend) 1,868.82 4,102.51 1,636.36 3,558.85
Investment in Fixed Assets (Gross) 1,115.57 2,501.84 2,507.43 5,561.56
PBT as a Percentage of Average Net Worth 17.1% 17.1% 19.7% 19.7%
PAT as a Percentage of Average Net Worth 15.4% 15.4% 16.0% 16.0%
Revenue Per Person Year* 15.91 34,918 18.41 39,036
At the end of the year
Total Assets 43,903.32 98,460.01 55,763.64 1,23,685.57
Fixed Assets (net) 13,401.63 30,055.24 28,930.27 64,168.28
Working Capital 14,801.21 33,194.01 10,522.26 23,338.71
Investment 14,872.48 33,353.85 15,906.60 35,281.36
Other Assets 828.00 1,856.92 404.51 897.22
Total Debt 1,249.23 2,801.59 3,405.52 7,553.55
Net Worth 42,654.09 95,658.42 52,358.12 1,16,132.02
Notes : To facilitate comparison figures in US$ have been arrived at by converting Rupee figures as follows:
- at the average conversion rate for all revenue items
- at the closing rate for all Balance Sheet items
* Quarterly average considering all employees including the support staff, numbers are in ` lakhs & US$
† Face value of `10 per share
SASKEN ANNUAL REPORT 2010-1128
Notice
Sasken Communication Technologies LimitedRegistered Office: 139/25, Ring Road, Domlur, Bangalore 560 071.
NOTICE
Notice is hereby given that the Twenty Third Annual General Meeting of the Company will be held on Friday, July 22, 2011 at 4.00 p.m. at the Registered Office of the Company at No.139/25, Ring Road, Domlur, Bangalore 560 071, to transact the following business:
ORDINARY BUSINESS
1. To receive, consider and adopt the Audited Balance Sheet as at March 31, 2011, Profit and Loss Account for the year ended on that date together with the reports of the Directors and the Auditors thereon.
2. To declare a dividend.
3. To appoint a Director in place of Mr. Bansi S. Mehta who retires by rotation and being eligible, offers himself for re-appointment.
4. To appoint a Director in place of Prof. J. Ramachandran who retires by rotation and being eligible, offers himself for re-appointment.
5. To appoint a Director in place of Mr. Bharat V. Patel who retires by rotation and being eligible, offers himself for re-appointment.
6. To appoint Auditors and fix their remuneration.
SPECIAL BUSINESS
7. To consider and if thought fit, to pass with or without modification, the following resolution as a Special Resolution:
RESOLVED that pursuant to the provisions of Sections 198, 269, 309, 310 read with Schedule XIII and other applicable provisions, if any, of the Companies Act, 1956, consent of the Company be and is hereby accorded for the payment of remuneration to Mr. Rajiv C. Mody as Chairman & Managing Director of the Company for the financial year 2011-12 on the following terms:
(a) Fixed Salary of a sum not exceeding `1.00 crore (Rupees One crore only) for the year, as may be determined by the Compensation Committee of the Board of Directors.
(b) Variable Performance Pay of such amount as may be determined by the Compensation Committee for the year.
(c) Other terms such as gratuity, leave, etc. shall be as applicable to other employees of the Company or as may be decided by the Compensation Committee.
(d) The Board of Directors of the Company has the authority to determine the term of office at any time.
RESOLVED FURTHER that in case of absence or inadequacy of profits for the financial year 2011-12, Mr. Rajiv C. Mody be paid such remuneration as may be determined by the Compensation Committee subject to the provisions of Schedule XIII of the Companies Act, 1956.
RESOLVED FURTHER that for the purpose of giving effect to this resolution, the Board of Directors be and is hereby authorized to do all such acts, deeds and things as are incidental thereto or as may be deemed necessary or desirable and to settle any question or difficulty that may arise, in such manner as it may deem fit.
8. To consider and if thought fit, to pass with or without modification, the following resolution as a Special Resolution:
RESOLVED that pursuant to the provisions of Sections 198, 269, 309, 310 read with Schedule XIII and other applicable provisions, if any, of the Companies Act, 1956, consent of the Company be and is hereby accorded for the payment of remuneration to Mr. Krishna J. Jhaveri as Whole Time Director of the Company for the financial year 2011-12 on the following terms:
(a) Fixed Salary of a sum not exceeding US $ 100,000 (US $ One hundred thousand only) for the year and other statutory contributions to be made by the Company as applicable, as may be determined by the Compensation Committee of the Board of Directors.
(b) Variable Performance Pay of such amount as may be determined by the Compensation Committee for the year.
(c) Other terms such as gratuity, leave, etc. shall be as applicable to other employees of the Company or as may be decided by the Compensation Committee.
(d) The Board of Directors of the Company has the authority to determine the term of office at any time.
RESOLVED FURTHER that in case of absence or inadequacy of profits for the financial year 2011-12, Mr. Krishna J. Jhaveri be paid such remuneration as may be determined by the Compensation Committee subject to the provisions of Schedule XIII of the Companies Act, 1956.
RESOLVED FURTHER that for the purpose of giving effect to this resolution, the Board of Directors be and is hereby authorized to do all such acts, deeds and things as are incidental thereto or as may be deemed necessary or desirable and to settle any question or difficulty that may arise, in such manner as it may deem fit.
9. To consider and if thought fit, to pass with or without modification, the following resolution as a Special Resolution:
RESOLVED that pursuant to the provisions of Sections 198, 269, 309, 310 read with Schedule XIII and other applicable provisions, if any, of the Companies Act, 1956, consent of the Company be and is hereby accorded for the payment of remuneration to Dr. G. Venkatesh
29
Notice (Contd.)
as Whole Time Director of the Company for the financial year 2011-12 on the following terms:
(a) Fixed Salary of a sum not exceeding `1.00 crore (Rupees One crore only) for the year, as may be determined by the Compensation Committee of the Board of Directors.
(b) Variable Performance Pay of such amount as may be determined by the Compensation Committee for the year.
(c) Other terms such as gratuity, leave, etc. shall be as applicable to other employees of the Company or as may be decided by the Compensation Committee.
(d) The Board of Directors of the Company has the authority to determine the term of office at any time.
RESOLVED FURTHER that in case of absence or inadequacy of profits for the financial year 2011-12, Dr. G. Venkatesh be paid such remuneration as may be determined by the Compensation Committee subject to the provisions of Schedule XIII of the Companies Act, 1956.
RESOLVED FURTHER that for the purpose of giving effect to this resolution, the Board of Directors be and is hereby authorized to do all such acts, deeds and things as are incidental thereto or as may be deemed necessary or desirable and to settle any question or difficulty that may arise, in such manner as it may deem fit.
10. To consider and if thought fit, to pass with or without modification, the following resolution as a Special Resolution:
RESOLVED that pursuant to the provisions of Sections 198, 269, 309, 310 read with Schedule XIII and other applicable provisions, if any, of the Companies Act, 1956, consent of the Company be and is hereby accorded for the payment of remuneration to Ms. Neeta S. Revankar as Whole Time Director of the Company for the financial year 2011-12 on the following terms:
(a) Fixed Salary of a sum not exceeding `1.00 crore (Rupees One crore only) for the year, as may be determined by the Compensation Committee of the Board of Directors.
(b) Variable Performance Pay of such amount as may be determined by the Compensation Committee for the year.
(c) Other terms such as gratuity, leave, etc. shall be as applicable to other employees of the Company or as may be decided by the Compensation Committee.
(d) The Board of Directors of the Company has the authority to determine the term of office at any time.
RESOLVED FURTHER that in case of absence or inadequacy of profits for the financial year 2011-12, Ms. Neeta S. Revankar be paid such remuneration as may be determined by the Compensation Committee subject to the provisions of Schedule XIII of the Companies Act, 1956.
RESOLVED FURTHER that for the purpose of giving effect to this resolution, the Board of Directors be and is hereby authorized to do all such acts, deeds and things as are incidental thereto or as may be deemed necessary or desirable and to settle any question or difficulty that may arise, in such manner as it may deem fit.
11. To consider and if thought fit, to pass with or without modification, the following resolution as a Special Resolution:
New Employee Stock Option Scheme ESOP 2011
RESOLVED that pursuant to Section 81(1A) and all other applicable provisions of the Companies Act, 1956, Securities and Exchange Board of India (Employee Stock Option Scheme and Employee Stock Purchase Scheme) Guidelines, 1999 (“SEBI Guidelines”), (including any amendment(s), statutory modification(s) or re-enactment(s) thereof) and the relevant provisions of the Memorandum and Articles of Association of the Company and subject to the regulations / guidelines, approvals, consents, permissions and / or sanctions, if any, of the appropriate authorities / institution or bodies as may be necessary, and subject to such conditions and modifications as may be prescribed by any of them while granting such approvals, consents, sanctions and permissions, approval of the members of the Company be and is hereby accorded to the Board of Directors (hereinafter referred to as the Board, which term shall be deemed to include any committee thereof or any Advisory Board appointed for the purpose), to create, offer, issue, allocate and allot 35,00,000 stock options (including restricted stock units or any other similar options by whatever name called) convertible into equity shares or 35,00,000 shares or a combination of stock options and shares of the aggregate nominal face value not exceeding ̀ 3,50,00,000 (Rupees Three crore and fifty lakhs only) to the present and future employees either in full-time or part-time employment of the Company (including its branches in India and abroad) which expression shall include whole time directors, non-executive directors including independent directors, but other than promoter directors of the Company under an Employee Stock Option Plan (hereinafter referred to as “ESOP 2011”) or an Employee Stock Purchase Scheme (hereinafter referred to as “ESPS 2011”) or both or other similar scheme on the terms and conditions as set out in the Explanatory Statement to this item and on such other terms and conditions and in such tranche(s) as may be decided by the Board / Compensation Committee in its absolute discretion.
RESOLVED FURTHER that the Board in its absolute discretion be and is hereby authorized to offer, issue, allocate and allot the above mentioned options and / or shares to a Trust created or to be created for this purpose and appoint such Trustees / Managers as it may determine.
RESOLVED FURTHER that the Company shall conform to the accounting policies specified in the SEBI Guidelines as may be applicable in respect of ESOP 2011 and ESPS 2011.
RESOLVED FURTHER that the number of equity shares of `10 each (or, in case of change in face value of each share, such number of equity shares of the Company altered in the same ratio as ̀ 10 bears to the new face value of the share) to be allotted on exercise of the options under ESOP 2011 or conversions / exchange of any securities convertible into equity shares under this Plan shall not exceed 35,00,000 shares of `10 each (or, in case of change in face value of each share, such number of equity shares of the Company altered in the same ratio as `10 bears to the new face value of the share), and shall be subject to further limits, as the Board may deem fit.

SASKEN ANNUAL REPORT 2010-1130
Notice (Contd.)
RESOLVED FURTHER that the number of options / exercise price shall stand altered for any bonus / rights issue and any increase in number of shares resulting from the increase in outstanding options due to bonus / rights adjustment shall result in an increase in the overall limit of 35,00,000 shares mentioned above.
RESOLVED FURTHER that stock options granted and to be vested in the employees under ESOP 2011 shall be converted into shares by way of allotment of shares on payment of cash, on such terms and conditions and at such price as may be determined by the Board and in accordance with the applicable guidelines and provisions of law and on such other terms and conditions and at such time or times as the Board in its absolute discretion and in the best interests of the Company deem fit.
RESOLVED FURTHER that the number of options granted to any one employee in any one year shall not exceed 1% of the paid up capital of the Company unless previously authorized by a special resolution of the members of the Company and the employees are identified employees and the list of such employees has been placed before the members of the Company and approved. No employee shall, during any financial year of the Company be granted options exceeding the limit fixed by SEBI in this regard from time to time, without a specific special resolution of the members passed at a general meeting or by postal ballot.
RESOLVED FURTHER that the maximum number of options that can be granted to Directors shall be as follows:
Category In any financial year In the aggregate
Per Non-executive / Independent Director 1,00,000 options 0.5% of the issued capital*
All Non-executive / Independent Directors 6,00,000 options 5.0% of the issued capital*
*Issued capital excluding outstanding warrants and conversions.
Options in excess of the above limits can be granted only with prior approval of the members of the Company by a special resolution. No Director shall, during any financial year of the Company be granted options exceeding the limit fixed by SEBI in this regard from time to time, without a specific special resolution of the members passed at a general meeting or by postal ballot.
RESOLVED FURTHER that such shares issued, whether directly, or on exercise of the stock options or arising on conversion of the securities shall rank pari passu with the equity shares of the Company as then issued and in existence including the entitlement as to voting rights, issue of rights shares, bonus shares and other benefits attached to equity shares of the Company.
RESOLVED FURTHER that without prejudice to the generality of the above, but subject to the terms, as approved by the members, the Board / Compensation Committee be and is hereby authorized to implement the ESOP 2011 and ESPS 2011 or other similar scheme, with or without modifications and variations, in one or more tranche(s) in such manner as the Board / Compensation Committee may determine.
RESOLVED FURTHER that the rights attached to shares shall accrue only after the options are exercised / securities are converted into shares and subject to the following terms and conditions:
(a) Each option to be granted to eligible employees shall entitle the employee to apply for and be allotted one equity share of nominal value of `10 each as may be decided by the Company, at a price to be determined by the Board of Directors or the Compensation Committee of the Board as the case may be, and subject to any regulation or guidelines of the Securities and Exchange Board of India (SEBI) in regard to the pricing of the options, as applicable from time to time.
(b) Each option shall vest in the optionee after a minimum of 12 months from the date of grant of the option or at such times as may be determined by the Compensation Committee, from time to time, subject to the minimum vesting period of 12 months.
(c) The option shall be valid and exercisable for such periods as may be determined by the Compensation Committee, from time to time, but will expire not later than 10 years (unless extended) from the date of grant of options or such period as may be decided by the Compensation Committee from time to time. The options will be exercisable by the employees by a written application to the Company to exercise the options in such manner and on such terms and conditions, as decided by the Compensation Committee from time to time.
(d) The subscription price, being exercise price for shares under each option, shall be the price set forth in the notice of grant, which shall not be less than the par value of the equity shares.
(e) The payment for the shares to be allotted upon exercise of an option may consist of cash, cheque or consideration received by the Company under cash-less exercise program implemented by the Company in connection with the Sasken ESOP 2011 / ESPS 2011 or any combination of the foregoing methods of payment.
(f) The options to be granted to eligible employees shall be determined by the Compensation Committee, based on an appraisal process consisting inter alia of the employee’s grade, years of service, present performance, future potential, contribution, conduct and such other factors as may be decided by the Compensation Committee. The options to be granted to Directors will be decided by the Board of Directors of the Company. The number of options / shares offered may be different for different categories of employees.
(g) The maximum number of options / shares that can be granted per employee of the Company will be as per the recommendation made by the Compensation Committee from time to time and other applicable laws in force but in no event shall it be more than 1% of the paid up equity share capital of the Company within one year.
(h) Employees who resign from the services of the Company to become employees of its subsidiary companies and / or vice versa do not forfeit any of the options they hold at the time of such resignation and all the terms and conditions governing the options will continue unaltered.

31
Notice (Contd.)
(i) The Company shall conform to the accounting policies mandated by applicable law or regulations of SEBI or any other relevant regulations as is applicable to the accounting of such options.
(j) In case the Company calculates the employee compensation cost using the intrinsic value of the stock options, the difference between the employee compensation cost so computed and the employee compensation cost that shall have been recognized if it had used the fair value of the options, shall be disclosed in the Directors’ Report and also the impact of this difference on profits and on EPS of the Company shall also be disclosed in the Directors’ Report.
(k) The Compensation Committee shall have the power to make a fair and reasonable adjustment to the number of options and to the exercise price in the case of rights issues, bonus issues and other corporate actions.
(l) Options that lapse either by reason of non-vesting or by reason of non-exercise shall be added back to the pool of options and shall be available for future grants.
(m) The Company may re-price the options which are not exercised whether or not they have been vested, if the ESOP 2011 / ESPS 2011 is rendered unattractive due to fall in the price of the Company’s shares in the market provided that such re-pricing shall not be detrimental to the interest of the employees.
RESOLVED FURTHER that the Board be and is hereby authorized to modify the terms and conditions of ESOP 2011, ESPS 2011 or other similar scheme in order to comply with the guidelines / rules and regulations that may become applicable from time to time.
RESOLVED FURTHER that the consent of the Company be and is hereby accorded for providing any financial assistance to the employees including the directors to acquire, purchase or subscribe to the shares of the Company on exercise of vested stock options or issued under the ESOP 2011 / ESPS 2011.
RESOLVED FURTHER that the Board be and is hereby authorized to take necessary steps for listing of the shares allotted under the ESOP 2011 and / or the ESPS 2011 or other similar scheme on the Stock Exchanges where the securities of the Company are listed as per the provisions of the Listing Agreements with the Stock Exchanges concerned, the guidelines and other applicable laws and regulations.
RESOLVED FURTHER that the Board or any other person authorized in this regard by the Board be and is hereby authorized to settle all questions, difficulties or doubts that may arise in relation to the implementation of the ESOP 2011 and ESPS 2011 or other similar scheme and to the shares (including to amend or modify any terms thereof) issued thereunder, including suspend, withdraw or revise the same (including re-pricing of the options issued earlier) from time to time and to do all such acts, things and deeds whatsoever without being required to seek any further consent or approval of the members or otherwise to the end and intent that the members shall be deemed to have given their approval thereto expressly by the authority of these resolutions.
ESOP 2011 and ESPS 2011 for subsidiary companies / holding Company
RESOLVED FURTHER that the above ESOP 2011 and ESPS 2011 or other similar scheme shall mutatis mutandis apply to full time and part time employees of any of the Company’s subsidiaries or holding Company, whether now or hereafter existing (including its branches in India and abroad) and to part-time / whole time directors, whether now or hereafter of the subsidiaries or holding Company.
12. To consider and if thought fit, to pass with or without modification, the following resolution as a Special Resolution:
Partial Modification of ESOP 2006
RESOLVED that in partial modification of resolution passed on February 25, 2006, approval of members be and is hereby accorded to authorize the Board of Directors (hereinafter referred to as the Board, which term shall be deemed to include any committee thereof or any Advisory Board appointed for the purpose), to make necessary changes in the ESOP Scheme of 2006 in order to enable the Board to add all the options that have lapsed either by reason of non-vesting or by reason of non-exercise to the ESOP pool for future grants.
RESOLVED FURTHER that the Board or any Committee thereof authorized in this regard by the Board be and is hereby authorized to settle all questions, difficulties or doubts that may arise in this regard and to the shares (including to amend or modify any terms thereof) issued herein without being required to seek any further consent or approval of the members or otherwise to the end and intent that the members shall be deemed to have given their approval thereto expressly by the authority of these resolutions.
By order of the Board
R. VittalJune 10, 2011 Company Secretary
Notes:
1. The Explanatory Statement pursuant to Section 173(2) of the Companies Act, 1956 in respect of the Special Business is annexed hereto.
2. A member entitled to attend and vote at the meeting is entitled to appoint a proxy to attend and vote on a poll instead of himself and a proxy need not be a member of the Company. In order to be valid, proxy form must be received at the Registered Office of the Company not less than 48 hours before the commencement of the meeting.
3. Corporate members are requested to send certified copy of the board resolution authorizing their representative(s) to attend and vote at the Annual General Meeting.
4. The Register of Members and Share Transfer Books will remain closed from July 16, 2011 to July 22, 2011 (both days inclusive).
SASKEN ANNUAL REPORT 2010-1132
5. Dividend as may be declared at the Annual General Meeting will be disbursed on or before August 19, 2011 to the shareholders whose names are recorded in the Register of Members on July 15, 2011.
6. National Electronic Clearing Service (NECS) / Mandate / Bank Details:
Per Reserve Bank of India Circular 376-DPSS.(CO).EPPD.No.191-04.01.01-200-10, dated July 29, 2009 the Company will organize payment of dividend through the NECS. In case of shareholders who have not provided to the Company or to their Depository Participant (DP) their account number under Core Banking System (CBS), ECS credit of dividends may not happen. Shareholders are requested to forthwith provide to the Company or to the Share Transfer Agent, Karvy Computershare Pvt. Ltd., their bank account number allotted under CBS along with the name of the Bank, Branch, its 9 digit MICR Code and Account type by quoting their folio number and a photocopy of a cancelled cheque pertaining to the Bank Account. In case of shareholders holding shares in demat form, they are requested to provide the above details to their DP.
7. Copies of the Annual Report will not be distributed at the Annual General Meeting. Members / Proxy Holders are therefore requested to bring to the Annual General Meeting their copy of the Annual Report and the Attendance Slip attached to it duly filled in.
8. Members intending to seek explanation / clarification at the meeting about the information contained in Annual Report are requested to inform the Company Secretary at least a week in advance of their intention to do so, so that relevant information may be made available, if the Chairman permits such information to be furnished.
9. In case of joint holders attending the meeting, only the first named joint holder will be entitled to vote.
10. Members are requested to write to the Company Secretary or to the Share Transfer Agent at the address given below, regarding transfer of shares and for resolving grievances:
The Company SecretarySasken Communication Technologies Limited139/25, Ring Road, Domlur,Bangalore 560 071.Tel: 080 3989 1122 Extn. 4914Fax: 080 3981 3329/2535 1309Email: [email protected]
Karvy Computershare Pvt. Ltd.Plot No.17-24, Vittalrao Nagar, Madhapur, Hyderabad 500 081.Tel: 040 2342 0818/4465 5000Fax: 040 2342 0814/4465 5021Contact Person: Mr. K.S. Reddy, Asst. Gen ManagerEmail: [email protected]
11. (a) Route Map to the venue of the Annual General Meeting (b) Attendance Slip and (c) Proxy Form are given at the end of Annual Report.
ANNEXURE TO NOTICE
Explanatory Statement pursuant to Section 173(2) of the Companies Act, 1956:
The following Explanatory Statement sets out material facts relating to some of the Ordinary Business and all of the Special Business mentioned in the accompanying Notice and should be taken as forming part of the Notice.
Ordinary Business
For Item Nos.3 to 5
Profile of Directors proposed to be re-appointed is given in the attachment to this annexure.
Special Business
For Item Nos.7 to 10
While arriving at the remuneration, the Compensation Committee has considered several factors relating to performance of the Company and that of the Whole Time Directors. The Committee noted the challenges faced by the Company due to some of the large customers being on down turn. Their performance was reviewed on the basis of targets that were set for the year and their contribution towards achieving the same. A new Senior Leadership Team was formed during the year 2010-11 and responsibilities were divided based on the business lines. The Committee considered overall performance of the Whole Time Directors under respective business lines including the prospective growth under these business lines.
Variable Performance Pay to be paid to the Whole Time Directors will be as per the same policy applicable to other employees and / or as determined by the Compensation Committee subject to the limits approved by the Shareholders and Schedule XIII of the Companies Act, 1956.
Mr. Rajiv C. Mody, Mr. Krishna J. Jhaveri, Dr. G. Venkatesh and Ms. Neeta S. Revankar, are concerned or interested in these resolutions to the extent of proposed remuneration to each of them. None of the other Directors of the Company is in any way concerned or interested in these resolutions.
Shareholders’ approval is sought for payment of remuneration to the above said Whole Time Directors, for the financial year 2011-12.
The Board recommends the said resolution for approval of shareholders.
Notice (Contd.)
33
For Item No.11
As at the date of this Notice, only 9,250 options are available for grant under ESOP Plan 2006 and there is need to create additional lot of stock options. It is therefore proposed to create a new Scheme, either by way of an Employee Stock Option Scheme, the ESOP 2011 or an Employee Stock Purchase Scheme, the ESPS 2011 or any similar scheme involving grant or issue of Restricted Stock Units (RSUs) or other similar options by whatever name called with 35,00,000 stock options / shares / units in the aggregate being granted / offered thereunder.
The pricing formula that would be adopted while granting options would be decided by the Compensation Committee of the Board / Board of Directors and the same will be indicated in the Annual Report.
In terms of Clause 6.2 and Clause 17.2 of SEBI guidelines on ESOP and ESPS, your Directors give below the required information:
(a) The total number of shares to be granted / issued under the proposed ESOP 2011 or ESPS 2011 or other similar scheme shall not exceed 35,00,000 equity shares of `10 each.
(b) The persons eligible to receive options / shares are employees and Directors (except Promoter Directors) of the Company, its subsidiaries and holding Company (i) so as to reward extraordinary achievements (ii) to attract critical resources with high potential and (iii) to retain key resources.
(c) Each option shall become vested at such time as set forth in the notice of grant as decided by the Compensation Committee and conveyed in the vesting schedule. Vesting of options will commence after a period of 12 months from the date of grant but will expire not later than 10 years (unless extended) from the date of grant of options or such period as may be decided by the Compensation Committee from time to time. The exercise period will commence from the vesting date and will expire not later than two years from the date of grant of options unless extended by the Board / Compensation Committee. The options will lapse if not exercised within the exercise period (including the extended period, if any). The options will be exercisable by the employees by a written application to the Company to exercise the options in such manner and on such terms and conditions, as decided by the Compensation Committee from time to time.
(d) The subscription price being, exercise price for shares under each option, or shares issued under the ESPS 2011 or other similar scheme shall be the price set forth in the notice of grant, which shall never be less than the par value of the equity shares.
(e) The process for determining the eligibility of the employee to participate in the ESOP 2011, ESPS 2011 or other similar scheme will be specified by the Board / Compensation Committee and will be based on criteria such as employee’s grade, years of service, present performance, future potential, contribution, conduct and such other factors as may be specified. The Board of Directors will decide on grant of options to Directors.
(f) The maximum number of options / shares that can be granted per employee of the Company will be as per the recommendation made by the Compensation Committee from time to time and other applicable laws in force but in no event shall it be more than 1% of the paid up equity share capital of the Company within one year.
(g) The Company shall conform to the accounting policies specified in Securities and Exchange Board of India (Employee Stock Option Scheme and Employee Stock Purchase Scheme) Guidelines, 1999 for all grants / issue of shares as may be applicable.
(h) The Company will adopt Fair Value Method for valuation of the stock options.
(i) In case the Company calculates the employee compensation cost using the intrinsic value of the stock options (i) the difference between the employee compensation cost so computed and the employee compensation cost that shall have been recognized if it had used the fair value of the options, (ii) the impact of this difference on profits and on EPS of the Company shall be disclosed in the Directors’ Report.
The Directors excluding Promoter Directors of the Company may be deemed to be concerned or interested in the resolution to the extent of the stock options or shares they may become entitled to under future grants.
Your Directors recommend the resolution for your approval.
For Item No.12
At the Extraordinary General Meeting held on February 25, 2006, the members approved instituting Employees’ Stock Option Plan (ESOP 2006).
The options that were issued / granted under the said ESOP Plan have a vesting period of one year from the date of grant and generally will vest over a 3 year period in a phased manner. There have been instances where the employees have either resigned even before vesting of options or chose not to exercise their options or surrendered their options. Consequently, such options have gone unutilized. It is proposed to add back such options to the pool of unutilized options so that the same can be utilized for re-issue in future. This proposal is for the benefit of the employees continuing in the employment of the Company.
The Directors excluding Promoter Directors of the Company may be deemed to be concerned or interested in the resolution to the extent of the stock options they may become entitled to under future grants.
Your Directors recommend the resolution for your approval.
By order of the Board
R. VittalJune 10, 2011 Company Secretary
Notice (Contd.)
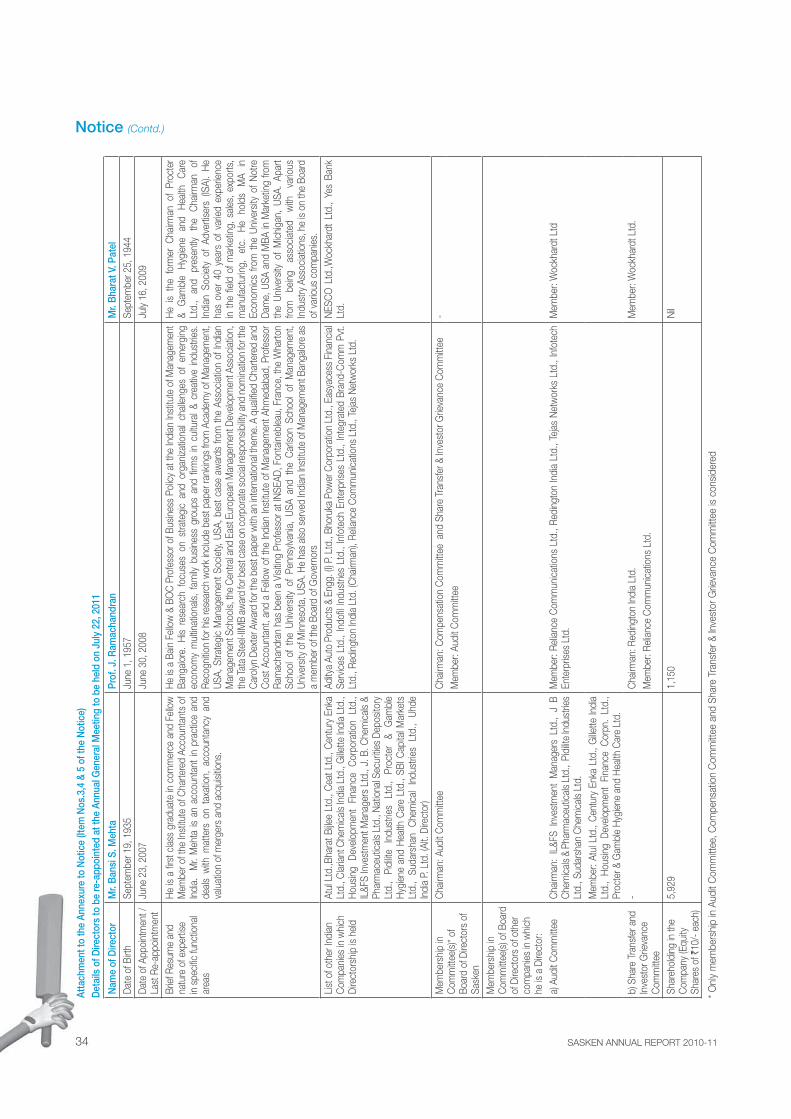
SASKEN ANNUAL REPORT 2010-1134
Atta
chm
ent t
o th
e An
nexu
re to
Not
ice
(Item
Nos
.3,4
& 5
of t
he N
otic
e)
Det
ails
of D
irect
ors
to b
e re
-app
oint
ed a
t the
Ann
ual G
ener
al M
eetin
g to
be
held
on
July
22,
201
1
Nam
e of
Dire
ctor
Mr.
Ban
si S
. Meh
taPr
of. J
. Ram
acha
ndra
nM
r. B
hara
t V. P
atel
Date
of B
irth
Sept
embe
r 19,
193
5Ju
ne 1
, 195
7Se
ptem
ber 2
5, 1
944
Date
of A
ppoi
ntm
ent /
La
st R
e-ap
poin
tmen
tJu
ne 2
3, 2
007
June
30,
200
8Ju
ly 16
, 200
9
Brie
f Res
ume
and
natu
re o
f exp
ertis
e in
spe
cific
func
tiona
l ar
eas
He
is a
first
cla
ss g
radu
ate
in c
omm
erce
and
Fel
low
M
embe
r of t
he In
stitu
te o
f Cha
rtere
d Ac
coun
tant
s of
In
dia.
M
r. M
ehta
is a
n ac
coun
tant
in p
ract
ice
and
deal
s w
ith m
atte
rs o
n ta
xatio
n, a
ccou
ntan
cy a
nd
valu
atio
n of
mer
gers
and
acq
uisit
ions
.
He
is a
Bain
Fel
low
& B
OC
Pro
fess
or o
f Bus
ines
s Po
licy
at th
e In
dian
Inst
itute
of M
anag
emen
t Ba
ngal
ore.
His
rese
arch
foc
uses
on
stra
tegi
c an
d or
gani
zatio
nal
chal
leng
es o
f em
ergi
ng
econ
omy
mul
tinat
iona
ls, f
amily
bus
ines
s gr
oups
and
firm
s in
cul
tura
l & c
reat
ive in
dust
ries.
Re
cogn
ition
for h
is re
sear
ch w
ork
incl
ude
best
pap
er ra
nkin
gs fr
om A
cade
my
of M
anag
emen
t, US
A, S
trate
gic
Man
agem
ent S
ocie
ty, U
SA, b
est c
ase
awar
ds fr
om th
e As
soci
atio
n of
Indi
an
Man
agem
ent S
choo
ls, th
e C
entra
l and
Eas
t Eur
opea
n M
anag
emen
t Dev
elop
men
t Ass
ocia
tion,
th
e Ta
ta S
teel
-IIM
B aw
ard
for b
est c
ase
on c
orpo
rate
soci
al re
spon
sibilit
y and
nom
inat
ion
for t
he
Car
olyn
Dex
ter A
war
d fo
r the
bes
t pap
er w
ith a
n in
tern
atio
nal t
hem
e. A
qua
lified
Cha
rtere
d an
d C
ost A
ccou
ntan
t, an
d a
Fello
w o
f the
Indi
an In
stitu
te o
f Man
agem
ent A
hmed
abad
, Pro
fess
or
Ram
acha
ndra
n ha
s be
en a
Visi
ting
Prof
esso
r at I
NSE
AD, F
onta
ineb
leau
, Fra
nce,
the
Wha
rton
Scho
ol o
f th
e Un
ivers
ity o
f Pe
nnsy
lvani
a, U
SA a
nd t
he C
arlso
n Sc
hool
of
Man
agem
ent,
Unive
rsity
of M
inne
sota
, USA
. He
has
also
ser
ved
Indi
an In
stitu
te o
f Man
agem
ent B
anga
lore
as
a m
embe
r of t
he B
oard
of G
over
nors
He
is th
e fo
rmer
Cha
irman
of
Proc
ter
& G
ambl
e H
ygie
ne
and
Hea
lth
Car
e Lt
d.,
and
pres
ently
th
e C
hairm
an
of
Indi
an S
ocie
ty o
f Ad
verti
sers
(IS
A).
He
has
over
40
year
s of
var
ied
expe
rienc
e in
the
field
of m
arke
ting,
sal
es, e
xpor
ts,
man
ufac
turin
g,
etc.
H
e ho
lds
MA
in
Econ
omic
s fro
m t
he U
nive
rsity
of N
otre
Da
me,
USA
and
MBA
in M
arke
ting
from
th
e Un
ivers
ity o
f M
ichi
gan,
USA
. Ap
art
from
be
ing
asso
ciat
ed
with
va
rious
In
dust
ry A
ssoc
iatio
ns, h
e is
on th
e Bo
ard
of v
ario
us c
ompa
nies
.
Li
st o
f oth
er In
dian
C
ompa
nies
in w
hich
Di
rect
orsh
ip is
hel
d
Atul
Ltd
.,Bha
rat B
ijlee
Ltd.
, Cea
t Ltd
., C
entu
ry E
nka
Ltd.
, Cla
riant
Che
mic
als
Indi
a Lt
d., G
illette
Indi
a Lt
d.,
Hou
sing
Deve
lopm
ent
Fina
nce
Cor
pora
tion
Ltd.
, IL
&FS
Inve
stm
ent M
anag
ers
Ltd.
, J. B
. Che
mic
als
& Ph
arm
aceu
tical
s Lt
d., N
atio
nal S
ecur
ities
Depo
sitor
y Lt
d.,
Pidi
lite
Indu
strie
s Lt
d.,
Proc
ter
& G
ambl
e H
ygie
ne a
nd H
ealth
Car
e Lt
d., S
BI C
apita
l Mar
kets
Lt
d.,
Suda
rsha
n C
hem
ical
Ind
ustri
es L
td.,
Uhde
In
dia
P. L
td. (
Alt.
Dire
ctor
)
Adity
a Au
to P
rodu
cts
& En
gg. (
I) P.
Ltd
., Bh
oruk
a Po
wer
Cor
pora
tion
Ltd.
, Eas
yace
ss F
inan
cial
Se
rvic
es L
td.,
Indo
fil In
dust
ries
Ltd.
, Inf
otec
h En
terp
rises
Ltd
., In
tegr
ated
Bra
nd-C
omm
Pvt
. Lt
d., R
edin
gton
Indi
a Lt
d. (C
hairm
an),
Relia
nce
Com
mun
icat
ions
Ltd
., Te
jas
Net
wor
ks L
td.
NES
CO
Ltd
.,Woc
khar
dt L
td.,
Yes
Bank
Lt
d.
Mem
bers
hip
in
Com
mitt
ee(s
)* of
Bo
ard
of D
irect
ors
of
Sask
en
Cha
irman
: Aud
it C
omm
ittee
C
hairm
an: C
ompe
nsat
ion
Com
mitt
ee a
nd S
hare
Tra
nsfe
r & In
vest
or G
rieva
nce
Com
mitt
ee-
Mem
ber:
Audi
t Com
mitt
ee
Mem
bers
hip
in
Com
mitt
ee(s
) of B
oard
of
Dire
ctor
s of
oth
er
com
pani
es in
whi
ch
he is
a D
irect
or:
a) A
udit
Com
mitt
eeC
hairm
an:
IL&F
S In
vest
men
t M
anag
ers
Ltd.
, J
B C
hem
ical
s &
Phar
mac
eutic
als
Ltd.
, Pi
dilite
Indu
strie
s Lt
d., S
udar
shan
Che
mic
als
Ltd.
Mem
ber:
Relia
nce
Com
mun
icat
ions
Ltd
., Re
ding
ton
Indi
a Lt
d., T
ejas
Net
wor
ks L
td.,
Info
tech
En
terp
rises
Ltd
.M
embe
r: W
ockh
ardt
Ltd
Mem
ber:
Atul
Ltd
., C
entu
ry E
nka
Ltd.
, Gille
tte In
dia
Ltd.
, H
ousin
g De
velo
pmen
t Fi
nanc
e C
orpn
. Lt
d.,
Proc
ter &
Gam
ble
Hyg
iene
and
Hea
lth C
are
Ltd.
b) S
hare
Tra
nsfe
r and
In
vest
or G
rieva
nce
Com
mitt
ee
-C
hairm
an: R
edin
gton
Indi
a Lt
d.M
embe
r: W
ockh
ardt
Ltd
.M
embe
r: Re
lianc
e C
omm
unic
atio
ns L
td.
Shar
ehol
ding
in th
e C
ompa
ny (E
quity
Sh
ares
of `
10/-
eac
h)
5,92
91,
150
Nil
* Onl
y m
embe
rshi
p in
Aud
it C
omm
ittee
, Com
pens
atio
n C
omm
ittee
and
Sha
re T
rans
fer &
Inve
stor
Grie
vanc
e C
omm
ittee
is c
onsi
dere
d
Notice (Contd.)

35
Directors’ Report
Your Directors have pleasure in presenting the report on the business and operations of the Company along with the Abridged Standalone and Unabridged Consolidated Audited Accounts for the financial year ended March 31, 2011.
Result of Operations (Consolidated) - ExtractAmount in ` lakhs
Particulars Year ended March 31, 2011
Year ended March 31, 2010
Revenues 54,637.97 57,419.31
Cost of Revenues 40,183.93 42,919.14
Gross Profit 14,454.04 14,500.17
Non-operating Income (net) 1,767.89 2,446.58
Profit before Income Taxes 8,120.78 9,292.23
Income Taxes Expense, net 792.59 1,740.50
Profit after Tax 7,328.19 7,551.73
Appropriation:
Proposed Equity Dividend 1,178.36 1,084.44
Interim Dividend 690.46 542.22
Dividend Tax 307.49 276.45
(Previous year’s figures have been regrouped wherever necessary to conform to the current year’s presentation)
Your Company’s revenues for the financial year 2010-11 have decreased by 4.84% in rupee terms, from `57,419.31 lakhs in 2009-10 to `54,637.97 lakhs in 2010-11. When compared to the previous year, Software Services, including Network Engineering Services, has gone down by 11.67% contributing 89.7% to the revenues, while the Software Products revenues contributed 10.3%. The net profits decreased from `7,551.73 lakhs in FY 10 to `7,328.19 lakhs during the year, registering a decline of 2.96%. This has translated to an Earnings Per Share of `26.89 in 2010-11 vs. `27.85 in 2009-10.
Business environment
The global mega trends in the embedded space have a strong bearing on the addressable R&D opportunity of your Company. The current addressable opportunity for India in embedded systems across the 8 verticals as assessed by a study carried out by NASSCOM is huge and approximately US$ 50 billion. This is expected to grow at a Compounded Annualized Growth Rate (CAGR) of 12% till 2015 to reach about US$ 90 billion. Telecom and consumer electronics will account for more than half of this available opportunity by 2015. The verticals in which the opportunity is expected to grow the fastest are energy & power, aerospace & defense and healthcare. The growth of the addressable opportunity in telecom, consumer electronics and automotive is expected to be a bit lesser than the overall growth opportunity. These three verticals have borne the brunt of the global recession. During the recovery phase, the expected revenue growth going forward is on the low to moderate side. Telecom, consumer electronics and automotive are also relatively well penetrated by Indian service providers and MNC R&D centers. Hence, the expected growth in offshoring will be moderate.
Growth opportunities for Sasken
Our growth plans will be achieved by focusing on our existing key accounts who are marquee customers with whom we see headroom for growth. We have plans to become one of the top 3 vendors for each of these accounts thereby becoming entrenched as a ‘strategic’ partner of choice.
With a slew of new offerings that leverage our deep domain competencies in all elements of communication value chain we are targeting both large companies and niche players. We are uniquely equipped to service these companies with offerings such as:
�� Full Phone Integration�� IP led offerings in Multimedia�� Offering for the Android market in handsets, tablets and other consumer electronic devices taking advantage of the rapid evolution of the
Android Software Platform.
In addition we are working to define specific offerings for North American Wireless carriers like Network Radio Frequency optimization; Pre-launch Verification for new technologies and hand off’s in mixed mode networks etc., where we have limited traction at present.
We have begun our process of expanding our portfolio of offerings to address new adjacencies like:
�� Satellite communication on the back of our success with INMARSAT�� Automotive electronics using IP acquired by Sasken Inc. and our presence in several leading vendors to Automobile manufacturers for
back seat entertainment�� Consumer Electronics using IP acquired by Sasken Inc. for high end Audio and Video codecs
In all these areas we have commercial engagements and will work towards scaling them in next two to three years.
As noted in the Annual Report of FY 2010, your Company continued to make progress on VyapaarSEWATM which was selected as part of Department of Telecommunication’s - Universal Service Obligation Fund ‘Sanchar Shakti’ Scheme - A pilot initiative in ICT Mobile Value

SASKEN ANNUAL REPORT 2010-1136
Directors’ Report (Contd.)
Added Services for Women’s Self Help Groups in rural India. You will be happy to note that Sanchar Shakti Scheme along with Sasken’s VyapaarSEWATM pilot project was launched on the March 7, 2011 by President of India, H.E. Smt. Pratibha Devisingh Patil.
By successfully executing these plans, Sasken can ‘Consolidate’ its position, leverage its deep domain competencies to ‘Differentiate’ and be able to achieve both ‘Scale and Profitable’ growth in the near term.
Outlook and plans for the business lines we operate:
Sasken business lines cover the entire value chain of the communication market and include adjacent markets where communication is increasingly becoming a critical component such as Automotive and Consumer Electronics, Healthcare, Enterprise etc.
In the device side of our business, we are buoyed by the proliferation of new devices like handsets, tablets, modems and set-top boxes and other device types. The growth of the ‘Smartphone market’ led by Open Source software platforms e.g. Android from Google has provided Sasken with new vistas for growth. Sasken has taken a lead in providing support to Original Equipment Manufacturers (OEMs) and semiconductor vendors by timely investments in building Android related competencies and by its unique ability to understand the needs of the entire eco system involved in building Smartphones and other devices.
In the Automotive and Consumer Electronics adjacencies, Sasken is building on the IP acquired from Ingenient and the existing customer relations we have. Our services will span video connectivity, device drivers, system integration and validation.
In the semiconductor business we are emerging among the top suppliers for some of the largest semiconductor vendors, providing them R&D services. In this market we are leveraging our traditional strength and significant experience in the Semiconductor industry to help global leaders and challengers who seek to accelerate the ‘design to tape out’ cycle.
In this business line we have white space opportunities as the wireless ecosystem infiltrates other industry segments e.g. Healthcare, Energy, Enterprise and Services. We have recently rejuvenated our “Test Lab” set up to support the customers of a Tier 1 North American semiconductor vendor.
In the equipment vendor side of our business we address requirement from Network, Satellite, and Enterprise customers. We are building new capabilities and offerings in the area of Data Communications, Long Term Evolution, Enterprise Applications and Testing.
We have started seeing traction in the enterprise space where we see demand for cloud enabled solutions and the opportunity to bring our handset and network software capabilities which will be key differentiators.
We have ongoing programs in Long Term Evolution and are seeking engagements in “deployment, interoperability testing and system conformance”. In the data communication space the explosive growth of data traffic especially over wireless networks presents us with opportunities in Deep Packet Inspection and technologies to support high quality voice over all IP Networks.
Europe has been a key geography for us and in one of the largest handset OEMs we are seeing new challenges as they have changed their operating system strategy. Despite the shift in their strategy we still see new opportunities in S40, Services and Full Phone integration. Work on their existing platform for smartphones is likely to continue until early next calendar year giving us good time for finding new opportunities. In addition we will address Windows Phone related white spaces in this customer’s ecosystem including HW driver development with Semiconductors and other HW IP suppliers and Apps for operators and enterprises.
On the Hardware side we will leverage our extensive understanding and knowledge of this OEMs ecosystem and capitalize on the delivery centers in European Union and China regions. This geographical spread enables a cost efficient service mix to service opportunities in RF /Antenna design. The combination of our hardware and software knowledge gives us a competitive edge.
Sasken key differentiators:
Some of the unique capabilities of Sasken include its abilities to take a leadership position in:
� Android Software Platform Services� Full Phone (device) Design Services� Intellectual Property (IP) Led Services� Operator Specific Services
We will continue to build on our leadership position in the communications markets and take advantage of imminent convergence trends in these markets. Key wins in Android, fast emerging as an operating system of choice for Smartphones, coupled with our traditional strengths in working with Semiconductor Platforms, deep domain competencies in both Hardware and Software and Ownership of Multimedia IP provide us a good platform to be uniquely positioned in the market to emerge as a market leader with these highly bespoke offerings.
Dividend
Your Company paid an interim dividend of 25% (`2.50 per equity share) in November 2010 and the Board recommends a final dividend of 45% (`4.50 per equity share) thus making the total dividend of 70% (`7.00 per equity share) for the year.
Scheme of Arrangement
Your Company had approached the High Court of Karnataka, Bangalore to create a Business Restructuring Reserve (BRR) to be carved out of Securities Premium Account in terms of a Scheme under Section 391/394 of the Companies Act, 1956 whereby the Business Restructuring Expenses (as covered under the Scheme) will be adjusted against the said Reserve. Pursuant to the Scheme and as approved by the High Court of Karnataka, Bangalore vide its order dated March 31, 2010, a sum of `14,578.08 lakhs, was transferred from the Securities Premium Account and credited to BRR Account during the year ended March 31, 2010.
37
Directors’ Report (Contd.)
Further, during the year ended March 31, 2010, impairment loss on capitalized software amounting to `1,519.70 lakhs, which was charged to Profit and Loss Account in the previous year as exceptional item, being considered as a Restructuring Expense incurred after the Appointed Date, i.e. April 1, 2008, was adjusted against the BRR Account.
During the year ended March 31, 2011, your Company has evaluated its investment in subsidiaries and joint ventures for the purpose of determination of potential diminution in value. Based on such evaluation and considering the underlying factors including downturn in the business of Sasken Finland and the decrease in related activities / businesses, your Company has identified and recognized a provision for diminution in the value of investments / goodwill in Sasken Communication Technologies Oy amounting to `13,058.38 lakhs. The diminution in value of such investments / goodwill being considered as a restructuring expense incurred after the Appointed Date, i.e. April 1, 2008, has been adjusted against the Business Restructuring Reserve Account in accordance with the Scheme.
The impact on the financials had the Scheme not prescribed the aforesaid treatment, is more fully detailed in Item No.5 of the Notes to Abridged Financial Statements.
Consequent to the aforesaid adjustment, the entire amount in BRR has been utilized by the Company during the year ended March 31, 2011.
Buy-back of Shares
In terms of decision of the Board of Directors dated October 21, 2010 and in accordance with the provisions of the Companies Act, 1956 and the Securities and Exchange Board of India (Buy Back of Securities) Regulations, 1998, your Company offered to buy-back its equity shares of face value of `10/- each, up to a maximum amount of `3,454 lakhs at a maximum price of `260/- per share from open market. The Company commenced the buy-back on December 02, 2010. As at March 31, 2011 the Company has bought back 14,32,633 equity shares at an average price of ̀ 158.22 per share, utilizing a sum of ̀ 2,266.70 lakhs (excluding brokerage and other applicable taxes). The amount paid towards buy-back of shares, in excess of the face value, has been appropriated out of Securities Premium Account. In terms of the provisions of Section 77A of the Companies Act, 1956 and SEBI (Buy-Back of Securities) Regulations 1998, as at March 31, 2011 the Company has extinguished 14,32,633 shares. On account of buy-back of shares, the Company has created Capital Redemption Reserve of `143.26 lakhs towards the face value of 14,32,633 shares of `10/- each by way of appropriation against General Reserve.
Employees Stock Option Plan (ESOP)
The Company’s ESOP continues with the philosophy of sharing wealth with its employees and encourages the employees to be partners in the growth of the organization.
ESOP 2000 Scheme
No new grants were made under this scheme during the year under review. There were 22,614 options outstanding with employees as on March 31, 2011.
ESOP 2006 Scheme
New grants made under this scheme during the year are detailed in Annexure 1. The options outstanding with employees including Directors, as on March 31, 2011 were 20,24,175 options. There are 9,250 unissued options as on March 31, 2011.
The details required under SEBI (Employee Stock Option Scheme & Employee Stock Purchase Scheme), Guidelines 1999, as on March 31, 2011 are given in Annexure 1 forming part of this Report.
The options that were issued / granted under the said ESOP Plan have a vesting period of one year from the date of grant and generally will vest over a 3 year period in a phased manner. There have been instances where the employees have either resigned even before vesting of options or chose not to exercise their options or surrendered their options. Consequently, such options have gone unutilized. It is proposed to add back such options to the pool of unutilized options so that the same can be utilized for re-issue in future. The Board of Directors has on June 10, 2011 approved the above proposal and the same forms part of the agenda for the forthcoming Annual General Meeting.
ESOP 2011 Scheme
There is a need to create additional lot of stock options. It is therefore proposed to create a new Scheme ESOP 2011 with 35,00,000 stock options. The Board of Directors has on June 10, 2011 approved the above proposal and the same forms part of the agenda for the forthcoming Annual General Meeting.
Corporate Social Responsibility (CSR)
As a responsible Corporate Citizen, your Company is committed to contributing to the society, environment and community. The focus areas in which we strive to ‘Make a Difference to Everyone’ or ‘MaDE’ and of our endeavor are to serve the community, environment, differently abled citizens, children, underprivileged and academia. Sasken translates this into action by providing financial and non-financial support, as well as extending and encouraging volunteer participation in CSR initiatives.
For over several years your Company has supported Vathsalya Charitable Trust, an NGO, working for the welfare of orphan children. Sasken bears all their medical expenses, on monthly basis subject to a pre-fixed limit. Besides, we also extend our support to other non-governmental voluntary organizations on a case-by-case basis.
On a regular basis, we host Blood Donation Camps and awareness programs on AIDS and Cancer.
‘Prakruti Community’ is another unique program that your Company has been committed to. The community is a group of 20 people, constituted by key stakeholders from the IT, Facilities and Marketing (from a communications perspective) who focus on specific environment centric activities and how we can become more sustainable. Once a quarter, Prakruti holds a review and designs activities, initiatives and other
SASKEN ANNUAL REPORT 2010-1138
effective campaigns. The team is constantly involved in conceiving innovative ways in which the organization can move towards becoming socially more responsible. We also host the ‘Prakruti Mela’, during which we invite environment friendly product vendors to our corporate facility in Bangalore and organize a fair.
Besides, the team organizes a month long ‘Save The Environment’ campaign, where each week of the month is dedicated to one of the following organization wide initiatives: Save water; Save paper; Save food; Save power. On employee safety front, Sasken had organized a weeklong drive to acquaint Sasians with basic life saving skills. First Aid, fire fighting & rescue, and road safety were some of the important subjects covered during this campaign.
Awards Received
As an organization, your Company is always striving to be the best in its category! We at Sasken cherish all our triumphs, be it internal or external, individual victories or those as an entire organization. A few of the significant wins in the year that passed are listed below:
� Gold Award, LACP Spotlight Awards, 2010: Sasken’s Annual Report 2010 won the Gold Award at the League of American Communications Professionals in the Global Communications Category.
� Mr. Rajiv C. Mody: second position as the most ‘value’able CEO in the small companies category, thanks to excellence in performance over the past three years (individually leading the organization to great performance) and also due to a relatively low compensation of `1.47 crore.
� Ms. Neeta S. Revankar: She has been chosen as one of the Top 100 CFOs in India, instituted by the CFO India Magazine.
Patents
The following table gives details about the various patent applications made by your Company, till date
US India Other Countries Acquired
Applied# 51 24 9 -
Granted 30 11 1 1
Granted since last report 4 3 - -
Abandoned 6 4* 3 -
Sold 4 - - -
Pending 15 9 5 -
# Includes divisional patents, which were left out till the last report.
* 3 of the 7 patent applications which were in abandoned state last year have been revived.
Corporate Governance
Your Company is committed to maintaining the highest standards of Corporate Governance. Your Directors adhere to the standards set out by the Securities and Exchange Board of India’s (SEBI) Corporate Governance practices and accordingly have implemented all the major stipulations prescribed. Your Company’s Corporate Governance Compliance Certificate dated April 27, 2011 in line with Clause 49 of the Stock Exchange Listing Agreement is given in Annexure 2 forming part of this Report.
Directors’ Responsibility Statement
As stipulated in Section 217(2AA) of the Companies Act, 1956, your Directors subscribe to the Directors’ Responsibility Statement and confirm that:
�� In the preparation of the annual accounts, the applicable Accounting Standards and in relation to the Scheme of Arrangement, the Order of the High Court of Karnataka have been followed (Refer Note No. 5 of the Abridged Financial Statements / Note No. 4(a) of Notes forming part of the Consolidated Accounts for details).
�� The Directors have selected such accounting policies and applied them consistently and made judgments and estimates that are reasonable and prudent so as to give a true and fair view of the state of affairs of the Company at the end of the financial year and of the profit or loss of the Company for that period.
�� The Directors have taken proper and sufficient care of the maintenance of adequate accounting records in accordance with the provisions of the Act for safeguarding the assets of the Company and for preventing and detecting fraud and other irregularities.
�� The Directors have prepared the annual accounts on a going concern basis.
Subsidiary Companies
As required under Accounting Standard 21, Consolidated Financial Statements incorporate the results of the following subsidiary companies, viz. (a) Sasken Network Engineering Limited (b) Sasken Network Solutions Inc. USA (c) Sasken Communication Technologies Mexico S.A. de C.V. (d) Sasken Communication Technologies (Shanghai) Co. Ltd. (e) Sasken Communication Technologies Oy (f) Sasken Finland Oy (g) Sasken Inc. USA and (h) Sasken Japan KK.
Directors’ Report (Contd.)
39
In terms of the specific approval granted by the Central Government under Section 212(8) of the Companies Act, 1956, and in terms of the general permission granted by the Central Government to all companies vide General Circular No. 3/2011 dated February 21, 2011, the Audited Financial Statements along with the reports of the Board of Directors and the Auditors pertaining to the above subsidiaries have not been attached to this Report. The Financial Statements of the said subsidiaries will be kept for inspection by any investor at the registered office of your Company and that of the subsidiary companies. Investors who want to have a copy of the above may write to the Company Secretary at the registered office.
Directors
Mr. Bansi S. Mehta, Prof. J. Ramachandran and Mr. Bharat V. Patel retire by rotation at the ensuing Annual General Meeting and being eligible offer themselves for re-appointment. Since two of the three members of Governance & Nomination Committee were interested in this matter, the Board of Directors has recommended their re-appointment for consideration of the Shareholders.
Remuneration payable to Executive Directors is detailed in the notice convening the Annual General Meeting for members’ approval.
Conservation of Energy, Technology Absorption and Foreign Exchange Outgo
Annexure 3 forming part of this Report gives information in accordance with the provisions of Section 217(1)(e) of the Companies Act, 1956 read with Companies (Disclosure of Particulars in the Report of Board of Directors), Rules 1988 regarding conservation of energy, technology absorption and foreign exchange earnings and outgo.
ISO 14001:2004
Sasken is compliant with the Environmental Management System Standard - ISO 14001:2004. Sasken is committed to be a responsible member of the communities in which it works. This reaffirms your Company as a responsible corporate citizen.
ISO / IEC 27001:2005
Sasken adheres to the Information Security Management System - ISO / IEC 27001:2005. This is important for assuring our customers of our commitment in protecting their IP as well as sensitizing all employees about confidentiality, integrity and availability of information.
TL 9000 R5.0 (including ISO 9001:2008)
Sasken is compliant with the telecom industry specific Quality Management System Standard - TL 9000 R5.0 which by definition includes the ISO 9001:2008 requirements and in addition telecom domain specific measurement and documentation requirements.
ISO / IEC 17025:2005
Sasken Test Lab is compliant with the Test Lab specific Quality Management System Standard - ISO / IEC 17025:2005. This is important for assuring quality and reliability of test lab reports as required by our customers to meet Global Communication Forum requirements.
Particulars of Employees
We present abridged accounts under Section 219 of the Companies Act, 1956. Pursuant to the Rules and Forms read with Section 219 of the Companies Act, 1956, the particulars of employees, as required under Section 217(2A) of the Companies Act, 1956 read with the Companies (Particulars of Employees) Rules, 1975 have not been provided. However, these particulars are available for inspection at the Registered Office of the Company and upon written request from a shareholder, we will arrange to mail these details. It may be noted that such particulars will not include details of employees of the Company posted and working outside India as per the relevant rules.
Deposits
Your Company has neither accepted nor renewed any deposits during the year. As such, no amount of principal and / or interest is outstanding as on the Balance Sheet date.
Auditors
M/s. S.R. Batliboi & Co., Auditors of the Company retire at the forthcoming Annual General Meeting and have confirmed their eligibility for re-appointment.
Acknowledgement
Your Directors place on record their appreciation of co-operation and support extended by customers, shareholders, vendors, bankers and all governmental and statutory agencies. Your Directors thank the employees for their valuable contribution during the year and look forward to their continued support.
For and on behalf of the Board of Directors
Place : Bangalore Rajiv C. ModyDate : June 10, 2011 Chairman & Managing Director
Directors’ Report (Contd.)
SASKEN ANNUAL REPORT 2010-1140
Annexure to the Directors’ Report
Annexure 1
Disclosures under SEBI (Employee Stock Option Scheme & Employee Stock Purchase Scheme) Guidelines, 1999
Description ESOP 2000 ESOP 2006
1. Number of Options outstanding as on April 1, 2010 28,696 21,25,000
2. Number of Options granted during the year - 6,70,000
3. Number of Options vested (but not exercised) cumulative till March 31, 2011 22,614 7,08,875
4. Number of Options exercised during the year - 5,43,025
5. Number of shares arising as a result of exercise of option - 5,43,025
6. Number of Options lapsed (due to resignation, etc.) during the year ended March 31, 2011 6,082 2,27,800
7. Number of Options outstanding as on March 31, 2011 22,614 20,24,175
8. Money realized by the exercise of Options (in `) - 2,87,41,300
9. Number of Options in force 22,614 20,24,175
10. Variation of terms of Options
ESOP 2000: During the previous year, the exercise period of 25,213 options issued in June 2004 have been extended by 2 years. Consequently, the exercise period for these options now ends on March 31, 2012 / June 30, 2012, all other terms remaining unaltered.
ESOP 2006: Nil
During the financial year 2010-11 no variations were made to the terms of options.
11. Pricing formula for the grant:
Pricing of the Option will be the weighted average of the stock traded price, as on the last day of the quarter previous to the month of grant of Option with a progressive increase for subsequent years or as may be determined by the Compensation Committee from time to time. The first lot of Options will vest after one year from the date of grant of Option and the subsequent lots will vest thereafter. The Option-holder will have 2 years from the date of vesting to exercise the Options. On the expiry of the exercise period, Options that have not been exercised will lapse and cease to be valid. However, the exercise period can be extended for exceptional cases based on approval by the Compensation Committee.
Following is a snapshot of Vesting Schedule applied at different grants:
Options granted during Vesting Schedule Price Range (`)
2004-05 July 2005 - July 2008 160 - 256
2005-06 July 2006 - July 2009 225 - 321
2006-07 July 2007 - July 2009Oct 2007 - Oct 2010Jan 2008 - Jan 2011
234 - 321298 - 394367 - 559
2007-08 Apr 2008 - Apr 2011July 2008 - July 2011Oct 2008 - Oct 2011
475 - 667554 - 746410 - 602
2008-09 Apr 2009 - July 2009 120
2009-10 April 2010 - Oct 2012 52 - 155
2010-11 May 2011 - Oct 2013 190 - 207
12. Details of Options granted to some of the senior managerial personnel during the year under review:
Name No. of Options Vesting Schedule Price Range (`)
Arun Rao 20,000 May 2011 - Jan 2013 188
Ramesh S 20,000 May 2011 - Jan 2013 190
Bharat Shah 50,000 May 2011 - Jan 2013 190
Rajesh A Rao 50,000 Jan 2012 - Oct 2013 207
13. Employee wise details of Options granted to: Employees who were in receipt of grants amounting to 5% or more of total Options granted during the year : Nil
Employees who were granted Options, during any one year, equal to or exceeding 1% of the issued capital (excluding outstanding warrants and conversions) of the Company at the time of grant : Nil
14. Consolidated Diluted Earnings Per Share (EPS) pursuant to issue of shares on exercise of Option calculated in accordance with the Indian Accounting Standard 20 : `25.94 per share

41
Annexure to the Directors’ Report (Contd.)
15. Description of method and significant assumptions used during the year to estimate fair value of Options:
The method applied was the Black - Scholes - Merton formula with the following assumptions:
April 2010 April 2010 April 2010 May 2010 July 2010 July 2010 January 2011
Average risk free interest rate 7.87% 7.87% 8.09% 8.09% 8.09% 8.09% 8.09%
Weighted average expected life of options granted (in years)
2.58 2.58 2.58 2.68 2.63 2.58 2.63
Expected dividend yield 2.73% 2.73% 2.73% 3.21% 3.02% 3.00% 3.33%
Volatility (annualized)* 67.82% 67.82% 67.82% 67.58% 67.02% 66.57% 65.47%
Weighted average market price (`) 219.95 219.95 219.95 186.80 199.00 200.00 180.00
Exercise Price (`) 188.00 190.00 190.00 195.00 200.00 201.00 207.00
Weighted average fair value of the options (`)
101.48 100.84 101.18 75.46 82.05 81.77 65.18
* Based on historical market price of the Company’s shares for the period since listing.
Annexure 2
CORPORATE GOVERNANCE COMPLIANCE CERTIFICATE
ToThe Members,Sasken Communication Technologies Limited,139/25, Domlur Layout, Ring Road, Domlur, Bangalore - 560071.
We have examined all relevant records of Sasken Communication Technologies Limited (the Company) for the purpose of certifying compliance of the conditions of Corporate Governance under Clause 49 of the Listing Agreement with Stock Exchange for the period commencing from April 1, 2010 to March 31, 2011. We have obtained all information and explanation which to the best of our knowledge and belief were necessary for the purposes of the certification.
The compliance of the conditions of Corporate Governance is the responsibility of the Management. Our examination was limited to the procedures and implementation thereof adopted by the Company for ensuring the compliance of conditions of the Corporate Governance as stipulated in the said Clause. This certificate is neither an assurance as to the future viability of the Company nor of the efficacy or effectiveness with which the management has conducted the affairs of the Company.
On the basis of our examination of the records produced, explanations and information furnished, we certify that the Company has complied with:
(a) All the mandatory conditions of the said Clause 49 of the Listing Agreement,
(b) The following non-mandatory requirements of the said Clause 49:�� Constitution of Remuneration Committee (designated as Compensation Committee)�� Implementation of the Whistle Blower Policy�� Audited financial results for half year ended September 30, 2010 were mailed to shareholders.
We further state that this is neither an audit nor an expression of opinion on the financial statement of the Company.
For J. Sundharesan & AssociatesCompany Secretaries
J SUNDHARESAN PartnerPlace : Bangalore Practising Company SecretaryDate : April 27, 2011 FCS 5229, CP No.5164
A) Conservation of Energy - Environmental Management System (EMS)
‘We save for the next generations…Not just money, energy too!!!’
Sasken, with its focus on concentrating highly towards managing the environmental system, has made this its DNA by being environmentally responsible in its workplace. Our employees being important stakeholders have been acting as major ‘Change Agents’ in supporting initiatives such as:
�� 100% compliance to all applicable legislations �� Creating awareness on the consumption of environment’s resources through various campaigns �� Recycling and re-using resources in our Business operations �� Promoting environment friendly products

SASKEN ANNUAL REPORT 2010-1142
Sasken has been committed to achieving high standards of environmental quality and product safety, as well as providing a safe and healthy environment for its employees, contractors and the society.
To create awareness and contribute to conserving the environment, extensive environmental drives were initiated in FY11 that have attracted huge participation from employees. Under the ‘Prakruti Mela’ initiative, we encourage our employees to procure environment friendly products that have helped one to understand the importance of natural resource conservation. With an objective to create ‘Safety’ awareness, Safety Week was observed in the month of March’11 offering knowledge on road, first aid, personnel, fire and workplace safety.
The Company provides employees with the option of using transportation provided by the organization at a subsidized price (50% of the cost is picked up by Sasken). This goes a long way in reducing our carbon footprint. Employees have also chosen to ‘Cycle to work’ for further contribution to the environment.
We have also successfully carried out various waste recycling programmes. A set of guidelines have been put in place by the EMS team to ensure that EMS awareness is driven at the design stage of all hardware and software related projects.
During late 2010, Sasken actively worked on redesigning its ten year old data centre to bring in further reduction in carbon foot print. With the newer compact data centre, Sasken is able to achieve 833Kwh saving per day on its data centre cooling systems and 577Kwh saving per day on the server consumption.
Another highlight has been that of our effort to ‘Save Paper’ by ensuring circulation of electronic Purchase Order copies (E-PO) instead of hard copies. This has brought down the usage of paper tremendously.
At Sasken, our commitment to continuous improvement on environmental performance is integrated into our programs. This is driven by individual commitment of various team members and strong support from the management.
At Sasken our philosophy is
‘Every drop counts, every tree is precious and every watt is valuable. We pledge to take the initiative and make a difference.’
B) Research & Development and Technology Absorption
The Company continued to invest in product R&D during the year in Multimedia, Wireless Broadband and Mobile Value Added Services.
Your Company has been able to leverage the multimedia product portfolio and had a design win with a tier 1 Japanese automotive electronics company, for the delivery of a rear seat entertainment solution. This design win is significant as it realizes your Company’s target to penetrate this segment.
To address the needs of the emerging Android mobile phone market, your company has diversified its expertise into providing solutions on Android Multimedia middleware. It has integrated part of its product portfolio into Android. The Company already has one design win of providing its multimedia components on an Android phone, from a tier 1 Japanese customer.
Multimedia components of the Company continued to be integrated into commercial mobile handsets of a leading Japanese customer.
Your Company was chosen as the leader for the implementation of a work package on Social Mobile Framework (SMF), which is a part of Symbian Foundation open source forum. This package enables easy development of applications interacting with social networking sites on the Internet. This will be part of the releases from Symbian Foundation from April 2011. Due to recent developments, this may not reach a large market. However, the concept could be ported to other platforms.
The IsatPhone Pro phone which was designed by your Company was received with good reviews. This has established your Company as a full phone design house. Your Company expects more business in this area in future years.
Your Company has made judicious investments in the development of an eNodeB (a basestation) for the emerging 4G technology - Long Term Evolution (LTE). The investments have been fruitful and your Company is able to demonstrate an eNodeB which handles live video streaming, voice calls and multiple UE communication.
A full fledged R&D center has been planned by your Company in the IITM Research Park, Chennai. This center will focus on medium term (3 years) R&D in the areas of business relevant to it - Wireless Broadband, Datacom, Hardening of handset software and Accelerated porting of platform software on to hardware platforms. The center will also aim to develop quality seed resources for fueling its growth. The center is expected to be operational in the second quarter of FY12.
As noted in the Annual Report of FY10, your Company continued to make progress on VyapaarSEWATM which was selected as part of Department of Telecommunication’s - Universal Service Obligation Fund ‘Sanchar Shakti’ Scheme - A pilot initiative in ICT Mobile Value Added Services for Women’s Self Help Groups in rural India. You will be happy to note that Sanchar Shakti Scheme along with Sasken’s VyapaarSEWATM pilot project was launched on the March 7, 2011 by President of India, H.E. Smt. Pratibha Devisingh Patil.
Your Company continues to participate in R&D efforts in Broadband Wireless domain through industrial forums, such as CEWiT (Centre of Excellence in Wireless Technology) and IU-ATC (India-UK Advanced Technology Center).
C) Foreign Exchange Earnings and outgo Amount in ` lakhs
Foreign exchange earnings 33,844.92
Foreign exchange outgo (including capital goods purchased, travel expenses (net) and dividend paid in foreign currency)
7,880.25
Annexure to the Directors’ Report (Contd.)
43
Corporate Governance
At Sasken, Senior Management initiates the governance standards and ensures that it is percolated throughout the organization. Your Company firmly believes in the importance of ethics among the employees and strives to develop a work culture that fosters accountability, fairness, integrity and transparency in its dealings, while keeping the whole structure of the Company more responsible towards enhancing the trust of all stakeholders, whether it is majority or minority.
Your Company has a Code of Conduct for its employees and Directors and it is available on its website. Your Company has also in place a Policy on Code of Conduct for Prevention of Insider Trading and an Information Security Policy that ensures proper utilisation of IT resources.
Your Company is in compliance with the requirements of the guidelines on Corporate Governance stipulated under Clause 49 of the Listing Agreement existing as of March 31, 2011 and presents the following Corporate Governance Report for the year 2010-11 based on the said disclosure requirements.
Board of Directors
As on March 31, 2011, the Board of Directors of your Company comprises twelve directors out of which eight are Non-Executive Directors including the Independent Directors and four are Executive Directors. An Alternate Director is also on the Board. The Board has an optimum combination of Executive, Non-Executive and Independent Directors with considerable experience in their respective fields. The Chairman of the Board is an Executive Director and manages the day to day affairs of the Company. Of the entire Board, 50% of the Directors are “Independent”, as defined in Clause 49 of the Listing Agreement.
No Director of the Company is a member in more than 10 committees or acts as Chairman of more than 5 committees across all companies, in which he / she is a director. The names and categories of the Directors on the Board, directorships and shareholding are given below:
Director CategoryShareholding as of
March 31, 2011No. of Directorship held* Committees†
Public Private Chairman MemberMr. Rajiv C. Mody** Executive 11,113 3 1 - -Dr. Ashok Jhunjhunwala Independent 8,470 7 - 1 4Mr. Bansi S. Mehta Independent 5,929 14 1 4 5Mr. Bharat V. Patel Independent - 3 - 1 2Mr. J.B. Mody** Non-Executive 3,68,106 4 3 - 1Prof. J. Ramachandran Independent 1,150 7 2 1 5Mr. Kiran S. Karnik Independent - 1 4 - 1Mr. Pranabh D. Mody** Non-Executive 3,18,506 3 3 - -Mr. Sanjay M. Shah Independent 8,482 - - - -Dr. G. Venkatesh Executive 2,10,707 1 2 - -Mr. Krishna J. Jhaveri** Executive 38,056 - - - -Ms. Neeta S. Revankar Executive 12,242 1 - - -Mr. Bharat P. Mehta# Alt. Director 1,250 3 3 - -
* Does not include directorships in Sasken, foreign companies and companies incorporated under Section 25 of the Companies Act, 1956.** Promoter† Only membership in Audit and Investor Grievance Committees of public limited companies are considered. Does not include membership
in Sasken. # Mr. Bharat P. Mehta is the son-in-law of Mr. J. B. Mody.
The Board normally meets once in a quarter and additionally as and when required. During the year 2010-11, the Board of Sasken met on 4 occasions, i.e. on April 22, 2010, July 31, 2010, October 21, 2010 and January 20, 2011. The maximum gap between the two meetings was not more than 4 months. Quorum was present at all the meetings.
The attendance of the Directors and the sitting fees paid to them for Board / Committee meetings:
Directors No. of Board meetings during 2010-11 Whether attended last AGM held on July 9 , 2010
Sitting fee (In ` lakhs)Held Attended
Mr. Rajiv C. Mody 4 4 Yes -Dr. Ashok Jhunjhunwala 4 4 Yes 1.30Mr. Bansi S. Mehta 4 4 Yes 0.80Mr. Bharat V. Patel 4 3 No 0.50Mr. J.B. Mody 4 - No -Prof. J. Ramachandran 4 4 Yes 1.30Mr. Kiran S. Karnik 4 3 No 0.40Mr. Pranabh D. Mody 4 2 No 0.60Mr. Sanjay M. Shah 4 3 Yes 0.30Dr. G. Venkatesh 4 4 Yes -Mr. Krishna J. Jhaveri 4 3 No -Ms. Neeta S. Revankar 4 4 Yes -Mr. Bharat P. Mehta 4 2 No 0.20

SASKEN ANNUAL REPORT 2010-1144
Corporate Governance (Contd.)
Tenure
Except three of the Promoter Directors, all other Directors of your Company are liable to retire by rotation. One-third of the said Directors are liable to retire every year and if eligible, offer themselves for re-appointment. The Board has the power to determine tenure of all the executive directors.
Profile
The profile of Directors who are being appointed / re-appointed at the Annual General Meeting is given in annexure forming part of the Notice convening the meeting. The profile of all the Directors is available in the website, viz. www.sasken.com.
Remuneration
The Compensation Committee determines the compensation payable to the Executive Directors, within the overall limits approved by the shareholders and in accordance with the provisions of the Companies Act, 1956.
(i) Elements of remuneration package of Executive Directors:
The remuneration of the Executive Directors is broken into two parts viz., Fixed Pay and Variable Performance Pay (VPP). Fixed pay is determined by the Compensation Committee within the limits set by the shareholders. VPP is paid on the basis of performance parameters set for each of the Executive Directors at the beginning of the year, in consultation with the CEO. The Compensation Committee reviews the performance of the Executive Directors. VPP payable to the Executive Directors for the year is determined by the Compensation Committee on the performance of the Directors and also of the Company.
Apart from the remuneration mentioned above, the Executive Directors are not eligible for any other benefits such as commission on net profits etc. Contribution towards provident and superannuation funds is as per the Company’s policy and forms part of the fixed pay. Among the Executive Directors, Mr. Rajiv C. Mody and Mr. Krishna J. Jhaveri being Promoter Directors are not eligible for stock options. Dr. G. Venkatesh and Ms. Neeta S. Revankar are eligible for stock options.
(ii) Elements of remuneration package to Independent / Non-Executive Directors:
The Members have at the Annual General Meeting held on September 19, 2009 approved payment of commission on net profits to the Independent Directors for a period of five years commencing from April 1, 2009 to March 31, 2014 at the rate not exceeding in the aggregate 1% of the net profits of the Company for each financial year as computed under the applicable provisions of the Companies Act, 1956 and such commission be allocated amongst them in such manner as may be decided by the Board of Directors within the limits specified therein.
Towards this end, the Board took into consideration the attendance and contribution made by Independent Directors at Board and certain Committee Meetings as well as the time spent by them on operational matters other than at meetings while arriving at the commission payable to them for the year ended March 31, 2011. No Stock Options were granted to Directors during the year. The following table shows the remuneration paid / payable to the Directors for the year 2010-11:
Amount in ` lakhs
Directors Fixed Remuneration Variable Performance Pay CommissionMr. Rajiv C. Mody 73.13 85.98 -Dr. Ashok Jhunjhunwala - - 8.70Mr. Bansi S. Mehta - - 8.70Mr. Bharat V. Patel - - 7.50Prof. J. Ramachandran - - 8.70Mr. Kiran S. Karnik - - 6.50Mr. Sanjay M. Shah - - 2.00Dr. G. Venkatesh 58.50 20.84 -Mr. Krishna J. Jhaveri 27.49 - -Ms. Neeta S. Revankar 58.50 22.54 -
The proposed remuneration to the Executive Directors for the financial year 2011-12 is given in the notice convening the next Annual General Meeting, forming part of this Annual Report.
M/s. Bansi S. Mehta & Co., Chartered Accountants, were paid a sum of `3,50,000 for the professional advice / services rendered in connection with the Scheme of Arrangement of the Company. Mr. Bansi S. Mehta, a Director of the Company was a Partner of this firm at the relevant time.
Board Committees
In order to have a more focussed attention on the affairs of the Company, the Board has formed various committees. These Committees prepare the groundwork for decision making and report at the subsequent Board Meeting. As of March 31, 2011, your Company has the following committees of the Board of Directors:
(a) Audit Committee(b) Compensation Committee(c) Share Transfer and Investor Grievance Committee(d) Governance and Nomination Committee(e) Strategy, Business and Marketing Review Committee(f ) Technology, Capabilities and HR Committee
45
Corporate Governance (Contd.)
Audit Committee
The Audit Committee was constituted on February 1, 2001. The purpose of this Committee is to ensure the objectivity, credibility and correctness of the Company’s financial reporting and disclosure process, internal controls, risk management policies and processes, tax policies, compliance and legal requirements and associated matters. The Audit Committee comprises four Directors, three of whom are Independent Directors.
Mr. Bansi S. Mehta is the Chairman of the Audit Committee. The other members of the Committee are Prof J. Ramachandran, Dr. Ashok Jhunjhunwala and Mr. Pranabh D. Mody.
The terms of reference are as follows:
1. Regular review of accounts, accounting policies, disclosures, etc.2. Review of the major accounting entries based on exercise of judgment by management and review of significant adjustments arising out
of audit.3. Qualifications in the draft audit report.4. Establishing and reviewing the scope of the independent audit including the observations of the auditors and review of the quarterly,
half-yearly and annual financial statements before submission to the Board.5. Conducting post audit discussions with the independent auditors to ascertain any area of concern.6. Establishing the scope and frequency of internal audit, reviewing the findings of the internal auditors and ensuring the adequacy of internal
control systems.7. To look into reasons for substantial defaults in the payment to depositors, debenture holders, shareholders and creditors.8. To look into the matters pertaining to the Directors’ Responsibility Statement with respect to compliance with Accounting Standards and
accounting policies.9. Compliance with Stock Exchange legal requirements concerning financial statements, to the extent applicable.10. The Committee shall look into any related party transactions i.e. transactions of the Company of material nature, with promoters or
management, their subsidiaries or relatives, etc. that may have potential conflict with the interests of the Company at large.11. To recommend appointment and remuneration of statutory and internal auditors.12. To review the functioning of Whistle Blower mechanism.13. Such other matters as may from time to time be required by any statutory, contractual or other regulatory requirements to be attended to
by the Audit Committee.
The Audit Committee met four times during the year, i.e. on April 22, 2010, July 31, 2010, October 21, 2010 and January 20, 2011. The minutes of the meetings are placed before the Board at the succeeding Board Meeting for information. Quorum was present at all the meetings.
Attendance details at Audit Committee meetings during the year:
Director No. of Meetings
Held Attended
Mr. Bansi S. Mehta 4 4
Prof J. Ramachandran 4 4
Dr. Ashok Jhunjhunwala 4 4
Mr. Pranabh D. Mody 4 2
Mr. Rajiv C. Mody, Chairman & Managing Director, Ms. Neeta S. Revankar, Whole Time Director & CFO and both the Internal as well as Statutory Auditors of the Company are permanent invitees to the Audit Committee meetings.
Mr. R. Vittal, Company Secretary acts as Secretary to the Committee.
Compensation Committee
The Compensation Committee was constituted on February 1, 2001. This Committee’s goal is to ensure that the Company attracts and retains highly qualified employees in accordance with its business plans, that the Company fulfils its ethical and legal responsibilities to its employees, and that management compensation is appropriate.
Prof. J. Ramachandran chairs the Compensation Committee. Dr. Ashok Jhunjhunwala and Mr. Pranabh D. Mody are the members of the Committee.
The terms of reference are as follows:
1. To review performance and determine the remuneration payable to Executive Directors.
2. To determine the number of stock options to be granted under the Company’s Employees Stock Option Scheme and administration of the Stock Option Plan.
3. Establishment and administration of employee compensation and benefit plans.
4. Such other matters as may, from time to time, be required by any statutory, contractual or other regulatory requirements to be attended to by the Compensation Committee.
SASKEN ANNUAL REPORT 2010-1146
The Compensation Committee met three times during the year, i.e. on April 21, 2010, July 30, 2010 and October 21, 2010. The minutes of the meetings are placed before the Board at the succeeding Board Meeting for information. Quorum was present at all the meetings.
Attendance details at Compensation Committee meetings during the year:
Director No. of Meetings
Held Attended
Prof. J. Ramachandran 3 3
Dr. Ashok Jhunjhunwala 3 3
Mr. Pranabh D. Mody 3 2
Share Transfer and Investor Grievance Committee
The Company has a Share Transfer and Investor Grievance Committee at the Board level inter alia to look into various issues relating to Investor Grievances including transfer and transmission of shares, issue of duplicate share certificates, non-receipt of dividend, Annual Report, etc. The Committee meets to approve share transfers, transmissions and issue of duplicate share certificates from time to time. Members of the Committee are Prof. J. Ramachandran (Chairman), Mr. Rajiv C. Mody and Dr. G. Venkatesh.
The Committee met four times during the year i.e. on April 22, 2010, July 30, 2010, October 21, 2010 and January 20, 2011 to deliberate on the aforesaid matters. The minutes of the meetings are placed before the Board at its succeeding meeting for information. Quorum was present at all the meetings.
Attendance details at Investor Grievance Committee meetings during the year:
Director No. of Meetings
Held Attended
Prof. J. Ramachandran 4 4
Mr. Rajiv C. Mody 4 4
Dr. G. Venkatesh 4 4
The shares of the Company are traded on the Stock Exchanges only in dematerialized form and are automatically transferred on delivery in dematerialized form. To expedite transfer of shares in physical segment, authority has been delegated to the Company Secretary to approve such share transfers.
As on March 31, 2011, there were no share transfers pending. Details of number of shares transferred during the year, time taken for effecting transfers and number of complaints received are given in the “Shareholder Information” Section of the Annual Report.
Mr. R. Vittal, Company Secretary acts as the Compliance Officer.
Governance and Nomination Committee
This Committee was constituted on October 21, 2010. The objective of this Committee is among other things, to develop the criteria for, and review annually with the Board, the requisite experience, qualifications, skills and characteristics of existing and new directors, as well as the composition of the Board overall, in accordance with the Corporate Governance Practices. The Committee will determine from time to time, whether those are adequate for the Company’s needs. The Committee shall also evaluate candidates for nomination to the Board, including those recommended by shareholders.
The Committee comprises three Independent Directors with Mr. Kiran S. Karnik as Chairman and other members being Mr. Bansi S. Mehta and Mr. Bharat V. Patel.
Terms of reference are as follows:
1. Assist the Board by identifying individuals qualified to become Board members and to recommend to the Board, the Director nominees for the next Annual General Meeting of the Company or otherwise for filling casual vacancies arising from time to time, having regard inter alia to attendance at Board meetings, participation in Board deliberations etc.
2. Recommend to the Board the Corporate Governance Guidelines as applicable to the Company.
3. Lead the Board in its annual review of the Board’s performance.
4. Recommend to the Board, members and chairpersons for each committee.
5. Support the Board’s endeavour in evaluating the suitability of a director prior to recommending his / her re-appointment by the Shareholders.
6. Guide the Board on corporate governance issues and trends as and when necessary.
7. Serve in an advisory capacity on matters of organizational and governance structure and the conduct of the Board.
Strategy, Business and Marketing Review Committee
This Committee was constituted on October 21, 2010. The main objectives of this Committee are, among other things, to review the Strategic Business Plans, Annual Business Plans of the Company. The Committee comprises three Independent Directors with Prof. J. Ramachandran as Chairman and other members being Dr. Ashok Jhunjhunwala and Mr. Bharat V. Patel.
Corporate Governance (Contd.)
47
Terms of reference are as follows:
1. Assist the Board by analyzing and reviewing with the Senior Leadership Team the Strategic Business Plans, Annual Business Plans.2. Recommend to the Board the adoption of such plans as the Senior Leadership would prepare in consultation with the Committee from
time to time.3. Bring to bear on such plans the best business practices followed by leading companies across the globe relevant to the Company’s
businesses.4. Validate on behalf of the Board proposals for (i) new business venture, (ii) any investment in capital of any entity beyond `5.00 crores,
(iii) any mergers, acquisitions, demergers, (iv) forming new Joint Ventures or wholly owned subsidiary companies and (v) investing in any existing Joint Venture any sum beyond the Board approved limit.
5. Review on an ongoing basis the Capital Budgets and Annual Operating Plans at the end of each half year.6. Be an aid to the Board in reviewing the performance of the Company, its subsidiaries and joint venture companies for the purposes of
Quarterly Business Results. 7. Review with the Senior Management Team on a half yearly basis marketing channels engaged by the Company and advise improvements
thereon. 8. Serve in an advisory capacity on matters of importance on Strategy, Business and Marketing aspects.
The Committee met twice since its formation i.e. on November 15, 2010 and February 26, 2011 to deliberate on the aforesaid matters. The minutes of the meetings are placed before the Board at its succeeding meeting for information. Quorum was present at all the meetings.
Attendance details at Strategy Committee meetings during the year:
Director No. of Meetings
Held Attended
Prof. J. Ramachandran 2 2
Dr. Ashok Jhunjhunwala 2 2
Mr. Bharat V. Patel 2 2
Mr. Kiran S. Karnik (as co-opted member for a particular meeting) 1 1
Technology, Capabilities and HR Committee
This Committee was constituted on October 21, 2010. The Committee shall among other things review new technology and strategy initiatives to spur the growth of the Company. The Committee comprises three Independent Directors with Dr. Ashok Jhunjhunwala as Chairman and other members being Mr. Kiran S. Karnik and Prof J. Ramachandran.
Terms of reference are as follows:
1. Review of new technology being introduced for improving the productivity of employees.2. Strategic initiatives in development of assets and human resources in new technologies.3. Review of the competency map of the organization. This could be with reference to verticals like Android, Symbian, etc.4. Review of the proficiency profile of the organization in the verticals. Discussions on roadmap.5. Training efficiency - Number of people delivered per unit time, cost of delivering a trained resource, capacity of training engine.6. Effectiveness of HR policies for providing work life balance.7. Employee satisfaction indexing and tracking on a periodic basis, say quarterly.8. Review of attrition data and steps being taken to contain the same. Review of effectiveness of the steps being taken.9. Recruitment performance - Number of people hired per unit time, cost of hiring a single resource, capacity to hire.
Management Discussion and Analysis
Management Discussion and Analysis Report is given separately, forming part of this Annual Report and is in accordance with the requirements laid out in Clause 49 of the Listing Agreement with Stock Exchanges.
General Meetings
Details of last three Annual General Meetings of the Company are given below:
Year Venue Date Time
2010 Registered Office of the Company July 9, 2010 4.00 p.m.
2009 Registered Office of the Company September 19, 2009 9.00 a.m.
2008 Registered Office of the Company June 30, 2008 10.00 a.m.
Three Executive Directors (including the Chairman and Managing Director), four Non-Executive / Independent Directors attended the last Annual General Meeting held on July 9, 2010.
At each of the above AGMs, special resolutions were passed approving the remuneration to Executive Directors and commission to the Independent Directors. At the last AGM held on July 9, 2010, special resolutions were also passed for the appointment / re-appointment of Executive Directors.
Corporate Governance (Contd.)

SASKEN ANNUAL REPORT 2010-1148
Other Disclosures
Related Party Transactions:
None of the Non-Executive Directors have any material pecuniary relationship or transactions with the Company. There is no material transaction with any related party, which requires a separate disclosure. Schedule 16 of the Annual Accounts as at March 31, 2011 contains the list of related party relationships and transactions as required by Accounting Standard 18 on Related Party Disclosures issued by the Institute of Chartered Accountants of India.
Details of non-compliance by the company, penalties and strictures imposed on the Company by Stock Exchanges or SEBI or any other statutory authority, on any matter related to capital markets, during the last three years:
The Company has complied with the requirements of the Stock Exchanges and SEBI on matters relating to Capital Markets, as applicable from time to time.
Your Company has a Whistle Blower Policy in place. We confirm that no employee of the Company has been denied access to the Audit Committee in respect of any incident covered by the Whistle Blower Policy.
Means of communication:
Following information is displayed at Company’s website www.sasken.com from time to time:
1. Financial results at the end of each quarter of the year2. Relevant Press Releases3. Company Presentations4. Transcript of tele-conference with Investor Analysts at the end of each quarter5. Shareholding Pattern6. Annual Report
The financial results are published in The Hindu Business Line (a National daily) and in Udayavani (a Kannada daily). The last four quarterly results were published in the above dailies on April 23, 2010, August 1, 2010, October 22, 2010 and on January 21, 2011.
The audited financial results for the half-year ended September 30, 2010 were sent by post to members of the Company.
All material information about the Company is promptly sent through facsimile to the Stock Exchanges where the Company’s shares are listed and released to wire services and the Press for information to the public at large. Besides, the Company disseminates information through Press meets and Analyst meets.
Communication in connection with Buy-back:
Your Company commenced buy-back of shares on December 2, 2010 and as per SEBI (Buy Back of Securities) Regulations, 1998 informed Stock Exchanges and the investors the following information:
�� By filing Daily reports with the Stock Exchanges in respect of the shares bought
�� Publication of notice in Financial Express, all editions, Jansatta, all editions and Udayavani, Bangalore (a) on a fortnightly basis disclosing the number of shares bought and amount utilized and (b) as and when the Company completed an additional 5% of buy-back.
Code of Conduct
All the Members of the Board and Senior Management personnel have affirmed compliance with the Company’s Code of Conduct.
Bangalore Rajiv C. ModyJune 10, 2011 Chairman & Managing Director
Corporate Governance (Contd.)

49
General Shareholder Information
Forthcoming AGM
The next Annual General Meeting of the Company will be held on July 22, 2011 at 4.00 p.m. at the registered office of the Company at 139 / 25, Ring Road, Domlur, Bangalore 560 071.
Tentative Calendar for the financial year April 1, 2011 to March 31, 2012
Quarter ending Likely Board Meeting Schedule
June 30, 2011 Second fortnight of July 2011
September 30, 2011 Second fortnight of October 2011
December 31, 2011 Second fortnight of January 2012
March 31, 2012 Second fortnight of April 2012
Year ending March 31, 2012 Likely Shareholder Meeting Schedule
Annual General Meeting June - July 2012
Book Closure dates for the purpose of dividend
The Register of Members and Share Transfer Books will remain closed from July 16, 2011 to July 22, 2011 (both days inclusive) to determine the entitlement of shareholders to receive the dividend as may be declared for the year ended March 31, 2011.
Payment of Dividend
Dividend on equity shares as recommended by the Directors for the year ended March 31, 2011, when declared at the Annual General Meeting will be paid on or before August 19, 2011:
(a) In respect of shares held in physical form to those members whose names appear on the Company’s Register of Members, after giving effect to all valid share transfers in physical form lodged on or before July 15, 2011 with the Company or the Share Transfer Agent - M/s Karvy Computershare Pvt. Ltd.
(b) In respect of shares held in electronic form, to those “deemed members” whose names appear in the statement of beneficial ownership furnished by National Securities Depository Limited (NSDL) and Central Depository Services (India) Limited (CDSL) as on July 15, 2011.
Listing on Stock Exchange
Your Company’s equity shares are listed on the following stock exchanges:
�� Bombay Stock Exchange Limited (BSE) Scrip Code 532663
�� National Stock Exchange of India Ltd. (NSE) Scrip Code SASKEN
ISIN Number for equity shares INE231F01020
Listing fees for the year 2011-12 have been paid to both the Stock Exchanges.
Stock Market Data
The monthly high and low stock quotations during the financial year 2010-11 and performance in comparison to broad based indices are given below:
Financial Year 2010 – 11
Price @ NSE during each month (In `)
S & P Nifty Index during each month
Price @ BSE during each month (In `)
BSE Sensex during each month
Month High Low High Low High Low High Low
Apr-10 225.65 171.00 5,399.65 5,160.90 225.65 171.00 18,047.86 17,276.80
May-10 220.40 180.00 5,278.70 4,786.45 221.20 180.00 17,536.86 15,960.15
Jun-10 204.90 181.20 5,366.75 4,961.05 205.70 180.00 17,919.62 16,318.39
Jul-10 215.60 192.00 5,477.50 5,225.60 215.80 192.65 18,237.56 17,395.58
Aug-10 215.60 180.15 5,549.80 5,348.90 216.00 180.40 18,475.27 17,819.99
Sep-10 204.35 184.05 6,073.50 5,403.05 203.70 185.50 20,267.98 18,027.12
Oct-10 237.50 183.10 6,284.10 5,937.10 237.00 183.60 20,854.55 19,768.96
Nov-10 197.80 166.00 6,338.50 5,690.35 197.60 167.00 21,108.64 18,954.82
Dec-10 189.00 162.25 6,147.30 5,721.15 189.00 161.15 20,552.03 19,074.57
Jan-11 196.20 151.00 6,181.05 5,416.65 196.60 151.90 20,664.80 18,038.48
Feb-11 166.90 149.10 5,599.25 5,177.70 166.95 151.00 18,690.97 17,295.62
Mar-11 165.50 147.00 5,872.00 5,348.20 165.95 149.50 19,575.16 17,792.17
Corporate Governance (Contd.)

SASKEN ANNUAL REPORT 2010-1150
Investor Correspondence Registrar and Share Transfer Agent
(For share transfers and other communication relating to share
certificates, dividend and change of address)
The Company Secretary
Sasken Communication Technologies Limited,
139 / 25, Ring Road, Domlur,
Bangalore 560 071.
Tel: 080 3989 1122 Extn. 4914
Fax: 080 3981 3329 / 2535 1309
Email: [email protected]
Karvy Computershare Pvt. Ltd.
Plot No.17-24, Vittalrao Nagar,
Madhapur,
Hyderabad 500 081.
Tel: 040 2342 0818 / 4465 5000
Fax: 040 2342 0814 / 4465 5021
Contact Person: Mr. K.S. Reddy, Asst. Gen Manager
Email: [email protected]
Distribution of Shareholding as on March 31, 2011
No. of equity shares held No. of shareholders % of shareholders No. of shares held % of shareholding
1 - 5,000 33,842 93.94 28,45,227 10.87
5,001 - 10,000 1,038 2.88 8,01,052 3.06
10,001 - 20,000 508 1.41 7,52,867 2.88
20,001 - 30,000 195 0.54 4,92,825 1.88
30,001 - 40,000 74 0.20 2,62,293 1.00
40,001 - 50,000 64 0.18 2,97,564 1.14
50,001 - 1,00,000 129 0.36 9,54,439 3.64
1,00,001 and above 176 0.49 1,97,79,526 75.53
Total 36,026 100.00 2,61,85,793 100.00
Corporate Governance (Contd.)
51
Shareholding Pattern as at March 31, 2011
Category No. of shares %
Promoters & Promoter Group 75,94,949 29.00
Mutual Funds 25,66,667 9.80
Foreign Institutional Investors 17,73,744 6.77
Bodies Corporate 26,86,642 10.26
NRIs / Foreign Nationals 12,80,948 4.89
Directors & Relatives (other than Promoter Directors) 2,57,199 0.98
Indian Public & Others 1,00,25,644 38.29
Total 2,61,85,793 100.00
Details of complaints
Description Received Cleared
Non receipt of Dividend / Annual Report 46 46
There are no valid requests pending for share transfers as at March 31, 2011.
Details of Shares held in Suspense Account
Your Company went in for IPO during August 2005 and the shares were allotted to the applicants on August 31, 2005. When the IPO concluded there were 838 cases involving 32,962 shares, which could not be transferred to investors due to reasons such as incomplete / wrong / invalid Demat Account details, etc. With persistent follow up and reminders, we were able to identify and transfer most of the shares. As at March 31, 2011 the number reduced to 27 cases involving 675 shares that remained unclaimed. The unclaimed shares are kept in a separate Suspense Account and will be transferred to the rightful holders as and when they approach the Company. Our efforts to locate the rightful owners will continue. The voting rights on these shares shall remain frozen till the rightful owner of such shares claims the shares.
The current status
Description No. of Holders No. of Shares in Suspense Account
At the beginning of the year 28 700
No. of shareholders that approached for transfer of shares from Suspense Account and to whom shares were transferred during the year
1 25
Status as of March 31, 2011 27 675
Other information useful for Shareholders
During the year, the Company approved 3 requests for transfer of 4,748 shares in physical segment. Share transfer requests are acted upon within 7-10 days from the date of their receipt at the Registered Office / Registrar. In case no response is received within 15 days of lodgement of transfer request, the lodger may write to the Company with full details so that necessary action could be taken to safeguard interests of the concerned against any possible loss / interception during postal transit. As mandated by the Stock Exchanges, the Company has designated [email protected] as the exclusive e-mail ID for redressal of investor complaints. Investors are urged to make use of this facility.
Dematerialization requests duly completed in all respects are normally processed within 7 days from the date of their receipt.
National Electronic Clearing Service / Mandates / Bank Details
Shareholders may note that Bank Account details given by them to their Depository Participants would be used for payment of dividend under National Electronic Clearing Service facility. Shareholders desirous of modifying those instructions may write to the Share Transfer Agent, Karvy Computershare Pvt. Ltd. Hyderabad (for shares held in physical form) or to their respective Depository Participants (for shares held in electronic form), as early as possible and in any case before the date of next Annual General Meeting.
Unclaimed Dividends
Under the provisions of the Companies Act, 1956, any amount that remains unclaimed in the Unpaid Dividend Account of the Company for a period of seven years from the date of transfer to the said account, has to be transferred to the Investor Education and Protection Fund (IEPF) administered by the Central Government. As regards the dividend declared at the Annual General Meeting held on June 11, 2004 remaining unclaimed will be transferred to IEPF within the due date.
After expiry of the said seven years, no claims shall lie against the said Fund or the Company for the amounts of dividend so transferred nor shall any payment be made in respect of such claims. Members who have not encashed the dividend warrants issued on any date after June 2004 may write to the Company and follow the procedure for claiming the amount.
Corporate Governance (Contd.)
SASKEN ANNUAL REPORT 2010-1152
Dematerialization of Shares
Equity Shares of the Company can be traded on the Stock Exchanges only in dematerialized form and at present 93.55% of the shares of the Company are held in demat form. Considering the advantages of scripless trading including enhanced marketability of the shares, shareholders holding shares in physical form are requested to consider dematerializing their shareholding so as to avoid inconvenience in future.
Outstanding Warrants, conversion date and likely impact on equity
3,00,000 convertible warrants were allotted on March 29, 2010 to Mr. Rajiv C. Mody, Chairman & Managing Director and one of the founders of the Company pursuant to a Special Resolution passed by the shareholders under Section 81(1A) of the Companies Act, 1956 read with SEBI (Issue of Capital & Disclosure Requirements) Regulations, 2009. The last date for the conversion is September 28, 2011 (i.e. 18 months from the date of allotment). As and when the warrants are converted, the shareholding of Mr. Mody would increase correspondingly and there would be consequent change in equity.
General
(a) Shareholders holding shares in physical form are requested to notify the Company / Registrar in writing, any change in their address and Bank Account details under the signature of sole / first joint holder. Beneficial owners of shares in demat form are requested to send their instructions regarding change of name, change of address, bank details, nomination, power of attorney, etc. directly to their Depository Participants (DP) as the same are maintained by the DP.
(b) Non-resident shareholders are requested to notify at the earliest:
�� change in their residential status on return to India for permanent settlement;
�� particulars of their NRE Bank Account with a bank in India, if not furnished earlier;
�� Email address, if any, to the Company / Registrar,
(c) In case of loss / misplacement of share certificates, investors should immediately lodge a FIR / Complaint with the police and inform the Company / Registrar along with copy of FIR / acknowledged copy of complaint.
(d) For expeditious transfer of shares, shareholders should fill in complete and correct particulars in the transfer deed. Wherever applicable, registration number of Power of Attorney should also be quoted in the transfer deed at the appropriate place.
(e) Shareholders are requested to maintain record of their specimen signature before lodgement of shares with the Company to obviate possibility of difference in signature at a later date.
(f) Shareholder(s) of the Company who have multiple accounts in identical name(s) or holding more than one Share Certificate in the same name under different Ledger Folio(s) are requested to write to the Company for consolidation of such Folio(s) with the relevant share certificates.
(g) Nomination in respect of shares - Section 109A of the Companies Act, 1956 provides facility for making nominations by shareholders in respect of their holding of shares. Such nomination greatly facilitates transmission of shares from the deceased shareholder to his / her nominee without having to go through the process of obtaining Succession Certificate / Probate of the Will, etc. It would therefore be in the best interests of the shareholders holding shares in physical form registered as a sole holder to make such nominations. Please write to the Company Secretary for a nomination form.
(h) Shareholders holding shares in demat form are advised to contact their DP for making nominations.
(i) Some of the shareholders have not yet exchanged their old share certificates for new share certificates necessitated by the consolidation of capital effected by the Company in July 2004 (i.e. consolidation of two old shares of `5 each into one new share of `10 each). Such holders are advised to send the share certificates immediately. If the share certificates are brought in person for exchange, the new share certificates will be provided on the spot. If the share certificates are sent by post, the new share certificates will be sent under Registered Post within 2 days from the date of receipt of the old share certificates. It is needless to mention that the old share certificate(s) cannot be submitted for dematerialization.
(j) Shareholders are requested to quote their E-mail IDs, Telephone / Fax numbers for prompt reply to their communication.
(k) We solicit suggestions for improving the investor services.
Green Initiative
As part of the Green Initiative, the Ministry of Corporate Affairs (MCA), Government of India, has permitted companies to send official documents to their shareholders electronically.
In accordance with MCA’s Circular No.17 / 2011 dated April 21, 2011, we provide an opportunity to shareholders to register their email address and changes, if any, from time to time, with the Company. When the shareholders’ email address is so registered with us we will be able to send to the shareholders notices and documents through email. If the shareholders wish to register their email address, they may send us an email at [email protected] quoting their DP ID and Client ID. We hope shareholders will appreciate the “Green Initiative” taken by MCA and the Company’s desire to participate in it.
Corporate Governance (Contd.)
53
To
The Members of Sasken Communication Technologies Limited
We have examined the Abridged Balance Sheet of Sasken Communication Technologies Limited as at March 31, 2011 and the Abridged Profit and Loss Account and Cash Flow Statement for the year ended on that date, together with the notes thereon (hereafter collectively referred to as “Abridged Financial Statements”). These Abridged Financial Statements have been prepared by the Company pursuant to Rule 7A of the Companies (Central Government’s) General Rules and Forms, 1956 and Clause 32 of the Listing Agreement and are based on the accounts of the Company for the year ended March 31, 2011 prepared in accordance with Schedule VI to the Companies Act, 1956 and covered by our report dated April 27, 2011 to the members of the Company which report is attached.
For S.R. Batliboi & Co.Firm Registration Number: 301003EChartered Accountants
per Navin AgrawalPartnerMembership No.: 56102
Place : BangaloreDate : April 27, 2011
Auditors’ Report on Abridged Financial Statements
To
The Members of Sasken Communication Technologies Limited
1. We have audited the attached Balance Sheet of Sasken Communication Technologies Limited (“the Company”) as at March 31, 2011, the Profit and Loss Account and the Cash Flow Statement for the year ended on that date annexed thereto. These financial statements are the responsibility of the Company’s management. Our responsibility is to express an opinion on these financial statements based on our audit.
2. We conducted our audit in accordance with auditing standards generally accepted in India. Those Standards require that we plan and perform the audit to obtain reasonable assurance about whether the financial statements are free of material misstatement. An audit includes examining, on a test basis, evidence supporting the amounts and disclosures in the financial statements. An audit also includes assessing the accounting principles used and significant estimates made by management, as well as evaluating the overall financial statement presentation. We believe that our audit provides a reasonable basis for our opinion.
3. Without qualifying our report, attention is drawn to Note no. 4(a) in Schedule 16 of the financial statements regarding write down of the value of investments amounting to `13,058.38 lakhs and adjustment thereof against Business Restructuring Reserve created out of Securities Premium Account in accordance with the Scheme of Arrangement approved by the High Court of Karnataka vide its order dated March 31, 2010, instead of charging off the same to the statement of profit and loss.
4. As required by the Companies (Auditors’ Report) Order, 2003 (as amended), issued by the Central Government of India in terms of sub-section (4A) of Section 227 of the Companies Act, 1956, we enclose in the Annexure a statement on the matters specified in paragraphs 4 and 5 of the said Order.
5. Further to our comments in the Annexure referred to above, we report that:
(a) We have obtained all the information and explanations, which to the best of our knowledge and belief were necessary for the purposes of our audit;
(b) In our opinion, proper books of account as required by law have been kept by the Company so far as appears from our examination of those books;
(c) The Balance Sheet, Profit and Loss Account and Cash Flow Statement dealt with by this report are in agreement with the books of account;
(d) In our opinion the Balance Sheet, Profit and Loss Account and Cash Flow Statement dealt with by this report comply with the accounting standards referred to in sub-section (3C) of Section 211 of the Companies Act, 1956;
(e) On the basis of the written representations received from the directors, as on March 31, 2011, and taken on record by the Board of Directors, we report that none of the directors is disqualified as on March 31, 2011 from being appointed as a director in terms of clause (g) of sub-section (1) of Section 274 of the Companies Act, 1956;
6. In our opinion and to the best of our information and according to the explanations given to us, the said accounts give the information required by the Companies Act, 1956, in the manner so required and, give a true and fair view in conformity with the accounting principles generally accepted in India: (a) in the case of the Balance Sheet, of the state of affairs of the Company as at March 31, 2011;(b) in the case of the Profit and Loss Account, of the profit for the year ended on that date; and (c) in the case of the Cash Flow Statement, of the cash flows for the year ended on that date.
For S.R. Batliboi & Co.Firm registration number: 301003EChartered Accountants
per Navin AgrawalPartnerMembership No.: 56102
Place : BangaloreDate : April 27, 2011
Auditors’ Report on Standalone Financial Statements
SASKEN ANNUAL REPORT 2010-1154
Annexure referred to in paragraph 4 of our report of even date
Re: Sasken Communication Technologies Limited
(i) (a) The Company has maintained proper records showing full particulars, including quantitative details and situation of fixed assets. (b) All fixed assets have not been physically verified by the management during the year but there is a regular programme of verification
which, in our opinion, is reasonable having regard to the size of the Company and the nature of its assets. According to the information and explanations given to us, no material discrepancies were noticed on such verification.
(c) There was no substantial disposal of fixed assets during the year.
(ii) In our opinion and according to the information and explanations given to us, in view of the nature of activities of the Company, the provisions of Clause 4(ii) relating to inventory is not applicable to the Company.
(iii) (a) As informed, the Company has not granted any loans, secured or unsecured to companies, firms or other parties covered in the register maintained under Section 301 of the Companies Act, 1956.
(b) As informed, the Company has not taken any loans, secured or unsecured from companies, firms or other parties covered in the register maintained under Section 301 of the Companies Act, 1956.
(iv) In our opinion and according to the information and explanations given to us, as represented by the management that some items are of a special nature for which alternative quotations cannot be obtained, there is an adequate internal control system commensurate with the size of the Company and the nature of its business, for the purchase of fixed assets and for the sale of software products and services. During the year there was no purchase of inventory. During the course of our audit, no major weakness has been noticed in the internal control system in respect of these areas. During the course of our audit, we have not observed any continuing failure to correct major weakness in internal control system of the Company.
(v) (a) According to the information and explanations given to us, we are of the opinion that the particulars of contracts or arrangements referred to in Section 301 of the Act that need to be entered into the register maintained under Section 301 have been so entered.
b) None of the transactions made in pursuance of such contracts or arrangements exceed the value of Rupees five lakhs in respect of any one such party in the financial year.
(vi) The Company has not accepted any deposits from the public.
(vii) In our opinion, the Company has an internal audit system commensurate with the size and nature of its business.
(viii) To the best of our knowledge and as explained, the Central Government has not prescribed maintenance of cost records under clause (d) of sub-section (1) of Section 209 of the Companies Act, 1956 for the software products and services of the Company.
(ix) (a) According to the records of the Company, the Company is regular in depositing with appropriate authorities undisputed statutory dues including provident fund, investor education and protection fund, employees’ state insurance, income-tax, sales-tax, wealth-tax, service tax, customs duty, excise duty, cess and other material statutory dues applicable to it with the appropriate authorities.Further, since the Central Government has till date not prescribed the amount of cess payable under Section 441 A of the Companies Act, 1956, we are not in a position to comment upon the regularity or otherwise of the Company in depositing the same.
(b) According to the information and explanations given to us, no undisputed amounts payable in respect of provident fund, investor education and protection fund, employees’ state insurance, income-tax, wealth-tax, service tax, sales-tax, customs duty, excise duty, cess and other undisputed statutory dues were outstanding, at the year end, for a period of more than six months from the date they became payable.
(c) According to the records of the Company, the dues outstanding of income-tax, sales-tax, wealth-tax, service tax, customs duty, excise duty and cess on account of any dispute, are as follows:
Name of the Statute Nature of Dues Amount (`) PeriodForum where dispute
is pending
Income Tax Act, 1961 Income taxes 9,22,850 AY 1992-93 Karnataka High Court
Income Tax Act, 1961 Income taxes 60,57,471 AY 1999-00 Karnataka High Court
Income Tax Act, 1961 Income taxes 20,07,902 AY 2000-01 Karnataka High Court
Income Tax Act, 1961 Income taxes 70,56,614 AY 2001-02 Karnataka High Court
Income Tax Act, 1961 Income taxes 1,85,91,921 AY 2002-03 CIT (Appeals)
Income Tax Act, 1961 Income taxes 5,65,515 AY 2003-04 ITAT
Income Tax Act, 1961 Income taxes 34,93,798 AY 2003-04 Karnataka High Court
Income Tax Act, 1961 Income taxes 45,78,380 AY 2004-05 CIT (Appeals)
Income Tax Act, 1961 Income taxes 4,18,48,985 AY 2005-06 CIT (Appeals)
Income Tax Act, 1961 Income taxes 2,53,29,943 AY 2006-07 CIT (Appeals)
Income Tax Act, 1961 Income taxes 5,79,13,076 AY 2008-09 CIT (Appeals)
Income Tax Act, 1961 Income taxes 10,050 AY 2008-09 Pending appeal
Income Tax Act, 1961 Income taxes 24,35,034 AY 2009-10 & AY 2010-11 CIT (Appeals)
KST Act, 1957 KST 45,07,973 FY 2002-03 JCCT (Appeals)
KVAT Act, 2003 KVAT 36,19,006 FY 2003-04 STAT, Karnataka
Annexure to the Auditors’ Report
55
Name of the Statute Nature of Dues Amount (`) PeriodForum where dispute
is pending
CST Act, 1956 CST 2,24,988 FY 2003-04 STAT, Karnataka
KST Act, 1957 KST 1,57,01,106 FY 2004-05 JCCT (Appeals)
KST Act, 1957 KST 1,18,71,588 FY 2004-05 JCCT (Appeals)
KVAT Act, 2003 KVAT 1,77,06,763 FY 2005-06 STAT, Karnataka
CST Act, 1956 CST 84,41,022 FY 2005-06 STAT, Karnataka
KVAT Act, 2003 KVAT 2,06,08,999 FY 2006-07 STAT, Karnataka
CST Act, 1956 CST 1,25,47,166 FY 2006-07 STAT, Karnataka
KVAT Act, 2003 KVAT 3,24,49,018 FY 2007-08 High Court
CST Act, 1956 CST 30,87,244 FY 2007-08 High Court
KVAT Act, 2003 KVAT 5,51,01,166 FY 2008-09 High Court
CST Act, 1956 CST 22,14,793 FY 2008-09 High Court
KVAT Act, 2003 KVAT 4,40,90,543 FY 2009-10 High Court
CST Act, 1956 CST 13,85,838 FY 2009-10 High Court
Canadian Income Tax Laws Income Tax for Branches
4,51,84,311 FY 2000-01 to 2007-08 Canadian Revenue Agency
Canadian Income Tax Laws Income Tax for Branches
1,15,05,759 FY 2000-01 to 2007-08 Ministry of Revenue, Ontario
Total 46,10,58,822
Of the above, `18,78,54,826 has been deposited under protest.
(x) The Company has no accumulated losses at the end of the financial year and it has not incurred cash losses in the current and immediately preceding financial year.
(xi) Based on our audit procedures and as per the information and explanations given by the management, we are of the opinion that the Company has not defaulted in repayment of dues to a financial institution or bank. The Company did not have any outstanding debentures during the year.
(xii) According to the information and explanations given to us and based on the documents and records produced to us, the Company has not granted loans and advances on the basis of security by way of pledge of shares, debentures and other securities.
(xiii) In our opinion, the Company is not a chit fund or a nidhi / mutual benefit fund / society. Therefore, the provisions of clause 4(xiii) of the Companies (Auditor’s Report) Order, 2003 (as amended) are not applicable to the Company.
(xiv) In our opinion, the Company is not dealing in or trading in shares, securities, debentures and other investments. Accordingly, the provisions of clause 4(xiv) of the Companies (Auditor’s Report) Order, 2003 (as amended) are not applicable to the Company.
(xv) According to the information and explanations given to us, the Company has given guarantee for loans taken by others from bank or financial institutions, the terms and conditions whereof, in our opinion, are not prima-facie prejudicial to the interest of the Company.
(xvi) The Company did not have any term loans outstanding during the year.
(xvii) According to the information and explanations given to us and on an overall examination of the Balance Sheet and Cash Flow Statement of the Company, we report that no funds raised on short-term basis have been used for long-term investment.
(xviii) During the year the Company has not made preferential allotment of shares to parties and companies covered in the register maintained under Section 301 of the Act.
(xix) The Company did not have any outstanding debentures during the year.
(xx) The Company has not raised any money through a public issue during the year.
(xxi) Based upon the audit procedures performed for the purpose of reporting the true and fair view of the financial statements and as per the information and explanations given by the management, we report that no fraud on or by the Company has been noticed or reported during the course of our audit.
For S.R. Batliboi & Co.Firm registration number: 301003EChartered Accountants
per Navin AgrawalPartnerMembership No.: 56102
Place : BangaloreDate : April 27, 2011
Annexure to the Auditors’ Report (Contd.)

SASKEN ANNUAL REPORT 2010-1156
Abridged Balance Sheet
Notes to Abridged Financial Statements form an integral part of Abridged Financial Statements.
As per our report on the Abridged Financial Statements of even date.
For S.R. Batliboi & Co. For and on behalf of the Board of Directors of Firm registration number: 301003E Sasken Communication Technologies LimitedChartered Accountants
per Navin Agrawal Rajiv C. Mody G. VenkateshPartner Managing Director Whole Time DirectorMembership No.: 56102
Neeta S. Revankar R. VittalPlace : Bangalore Whole Time Director & Company SecretaryDate : April 27, 2011 Chief Financial Officer
Amount in ` lakhs
As at March 31, 2011
As at March 31, 2010
I. Sources of Funds
(1) Shareholders’ Funds
(a) Equity Share Capital 2,618.58 2,711.11
(b) Share Application Money 150.54 132.00
(c) Employee Stock Options Outstanding (Net of deferred compensation cost) 732.37 393.62
(d) Reserves and Surplus
(i) Capital Redemption Reserve 288.23 144.97
(ii) Business Restructuring Reserve - 13,058.38
(iii) General Reserve 1,983.80 1,230.26
(iv) Hedging Reserve 143.98 -
(v) Surplus in Profit and Loss Account 21,906.70 16,021.53
(vi) Securities Premium Account 12,789.21 14,578.08
Total of (1) 40,613.41 48,269.95
II. Application of Funds
(1) Fixed Assets
(a) Net Block - (Original Cost less Depreciation) 6,006.86 6,770.54
(b) Capital Work-in-Progress 302.82 152.86
(2) Investments (Net of Provisions)
(a) In Subsidiary Companies / Joint Ventures - Unquoted 7,537.91 17,975.07
(b) Others (i) Quoted 13,639.58 14,882.17
(ii) Unquoted - -
(3) Deferred Tax Asset 628.03 -
(4) (i) Current Assets, Loans and Advances
(a) Inventories 95.09 166.55
(b) Sundry Debtors 7,492.63 6,699.25
(c) Cash and Bank Balances 3,338.89 2,398.36
(d) Other Current Assets 1,388.72 1,162.67
(e) Loans and Advances
(i) To Subsidiary Companies 1,661.23 2,662.69
(ii) To Others 6,094.45 4,930.18
Less:
(ii) Current Liabilities and Provisions
(a) Liabilities 4,522.35 6,339.94
(b) Provisions 3,050.45 3,190.45
Net Current Assets (i - ii) 12,498.21 8,489.31
Total of (1) to (4) 40,613.41 48,269.95
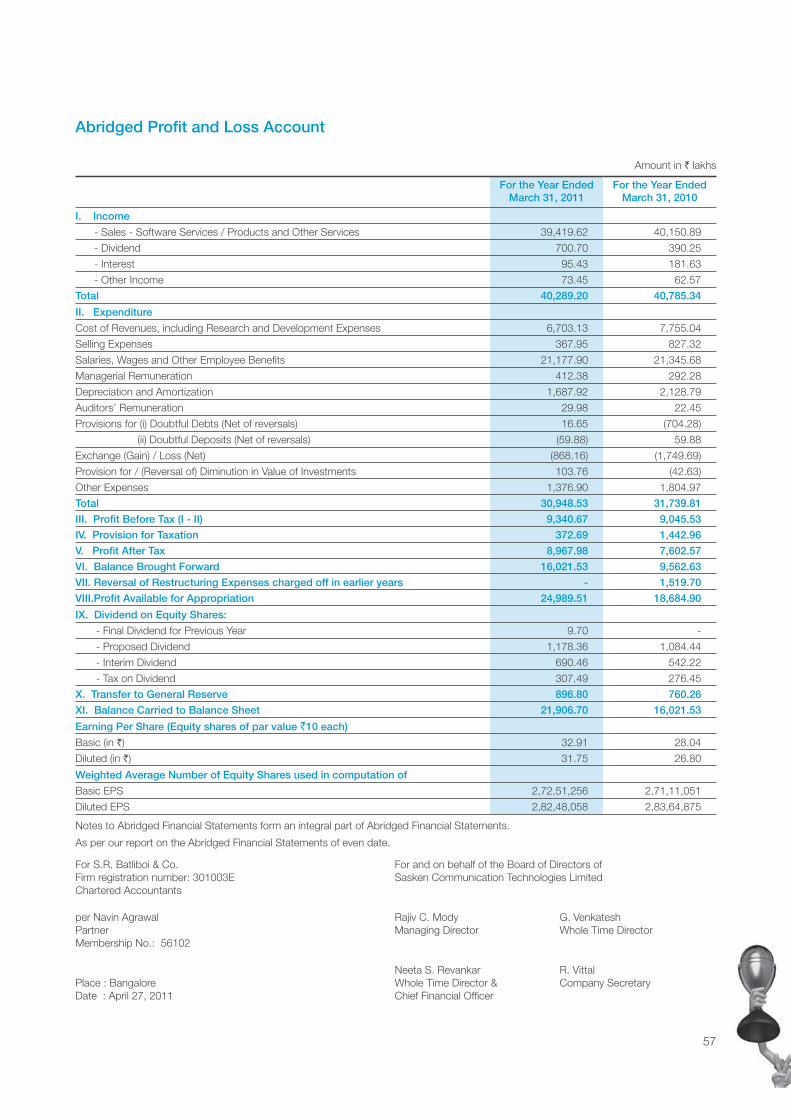
57
Abridged Profit and Loss Account
Amount in ` lakhs
For the Year EndedMarch 31, 2011
For the Year EndedMarch 31, 2010
I. Income
- Sales - Software Services / Products and Other Services 39,419.62 40,150.89
- Dividend 700.70 390.25
- Interest 95.43 181.63
- Other Income 73.45 62.57
Total 40,289.20 40,785.34
II. Expenditure
Cost of Revenues, including Research and Development Expenses 6,703.13 7,755.04
Selling Expenses 367.95 827.32
Salaries, Wages and Other Employee Benefits 21,177.90 21,345.68
Managerial Remuneration 412.38 292.28
Depreciation and Amortization 1,687.92 2,128.79
Auditors’ Remuneration 29.98 22.45
Provisions for (i) Doubtful Debts (Net of reversals) 16.65 (704.28)
(ii) Doubtful Deposits (Net of reversals) (59.88) 59.88
Exchange (Gain) / Loss (Net) (868.16) (1,749.69)
Provision for / (Reversal of) Diminution in Value of Investments 103.76 (42.63)
Other Expenses 1,376.90 1,804.97
Total 30,948.53 31,739.81
III. Profit Before Tax (I - II) 9,340.67 9,045.53
IV. Provision for Taxation 372.69 1,442.96
V. Profit After Tax 8,967.98 7,602.57
VI. Balance Brought Forward 16,021.53 9,562.63
VII. Reversal of Restructuring Expenses charged off in earlier years - 1,519.70
VIII.Profit Available for Appropriation 24,989.51 18,684.90
IX. Dividend on Equity Shares:
- Final Dividend for Previous Year 9.70 -
- Proposed Dividend 1,178.36 1,084.44
- Interim Dividend 690.46 542.22
- Tax on Dividend 307.49 276.45
X. Transfer to General Reserve 896.80 760.26
XI. Balance Carried to Balance Sheet 21,906.70 16,021.53
Earning Per Share (Equity shares of par value `10 each)
Basic (in `) 32.91 28.04
Diluted (in `) 31.75 26.80
Weighted Average Number of Equity Shares used in computation of
Basic EPS 2,72,51,256 2,71,11,051
Diluted EPS 2,82,48,058 2,83,64,875
Notes to Abridged Financial Statements form an integral part of Abridged Financial Statements.
As per our report on the Abridged Financial Statements of even date.
For S.R. Batliboi & Co. For and on behalf of the Board of Directors of Firm registration number: 301003E Sasken Communication Technologies LimitedChartered Accountants
per Navin Agrawal Rajiv C. Mody G. VenkateshPartner Managing Director Whole Time DirectorMembership No.: 56102
Neeta S. Revankar R. VittalPlace : Bangalore Whole Time Director & Company SecretaryDate : April 27, 2011 Chief Financial Officer

SASKEN ANNUAL REPORT 2010-1158
Amount in ` lakhs
For the Year EndedMarch 31, 2011
For the Year EndedMarch 31, 2010
A. Cash Flows from Operating Activities:
Net Profit Before Tax 9,340.67 9,045.53
Adjustments for:
Depreciation 1,687.92 2,094.08
Amortizaton of Technical Knowhow - 34.71
Provision for / (Reversal of) Diminution in value of Investment 103.76 (42.63)
Other Non-Cash (Writeback) / Charges 396.00 69.44
Exchange Gain / (Loss) 340.03 (3,082.49)
Other Income (811.84) (572.81)
Operating Profit Before Working Capital Changes 11,056.54 7,545.83
Adjustments for:
(Increase) / Decrease in Sundry Debtors (777.12) 3,613.12
(Increase) / Decrease in Work in progress 71.46 (166.55)
(Increase) / Decrease in Other Current Assets (230.62) 897.97
(Increase) / Decrease in Loans & Advances (633.34) (201.07)
Increase / (Decrease) in Current Liabilities and Provisions (1,972.93) 1,036.68
Cash generated from Operations 7,513.99 12,725.98
Taxes (Paid) / Received, Net (1,750.98) (1,490.42)
Net Cash from Operations 5,763.01 11,235.56
B. Cash Flows from Investing Activities:
Purchase of Fixed Assets and Intangible Assets (1,163.73) (1,044.03)
Sale of Fixed Assets 13.45 44.64
Dividend Received 57.34 -
Interest Received 53.41 186.70
Sale / (Purchase) of Mutual Funds, net 9,212.79 (12,976.50)
Sale of Investments 2,252.82 -
Purchase of Investments (9,577.40) -
Investment in Subsidiary (2,573.98) (968.13)
Sale of Long term Investments (non trade) 40.76 -
Investment in Joint Ventures including Share Application Money (460.00) (18.63)
Repayment of Loans / (Loans given to Subsidiaries) 375.02 (1,724.50)
Repayment of Advances by Subsidiaries 284.26 1,200.37
Proceeds from Redemption of Debenture Investment in Subsidiary 728.36 -
Investment in Deposits (374.50) -
Redemption of Deposits - 20.55
Net Cash used in Investing Activities (1,131.40) (15,279.53)
Cash Flow Statement
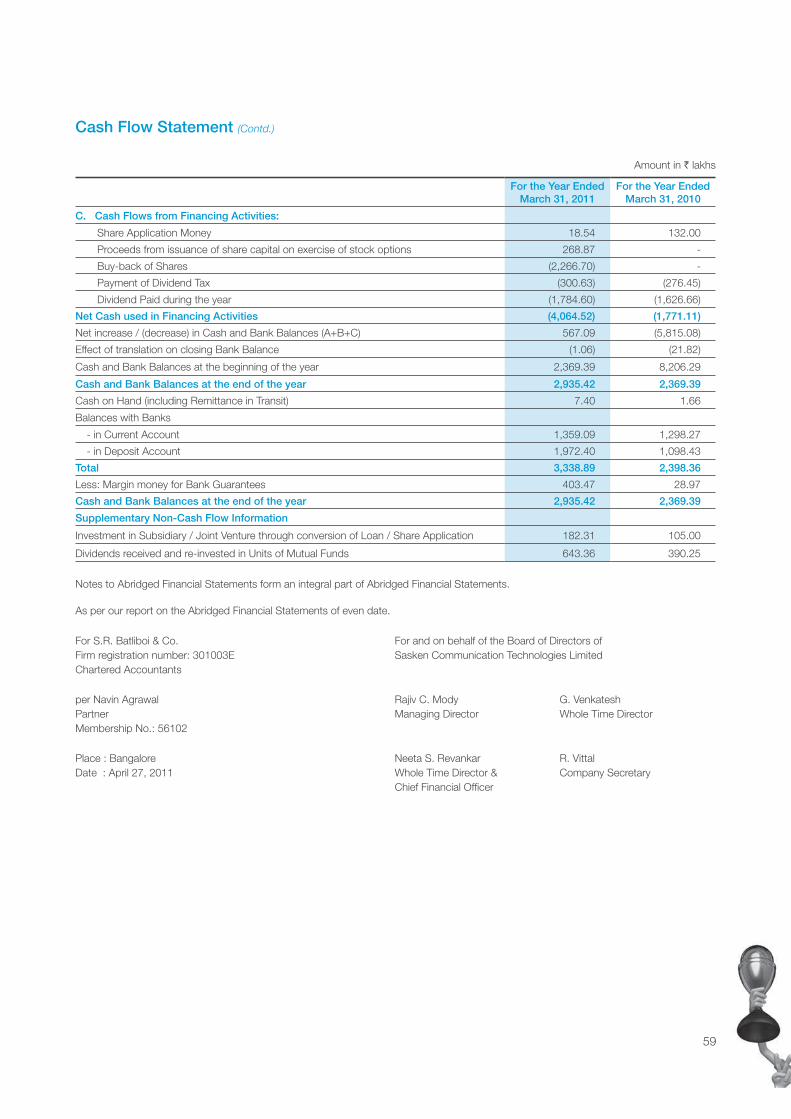
59
Cash Flow Statement (Contd.)
Amount in ` lakhs
For the Year EndedMarch 31, 2011
For the Year EndedMarch 31, 2010
C. Cash Flows from Financing Activities:
Share Application Money 18.54 132.00
Proceeds from issuance of share capital on exercise of stock options 268.87 -
Buy-back of Shares (2,266.70) -
Payment of Dividend Tax (300.63) (276.45)
Dividend Paid during the year (1,784.60) (1,626.66)
Net Cash used in Financing Activities (4,064.52) (1,771.11)
Net increase / (decrease) in Cash and Bank Balances (A+B+C) 567.09 (5,815.08)
Effect of translation on closing Bank Balance (1.06) (21.82)
Cash and Bank Balances at the beginning of the year 2,369.39 8,206.29
Cash and Bank Balances at the end of the year 2,935.42 2,369.39
Cash on Hand (including Remittance in Transit) 7.40 1.66
Balances with Banks
- in Current Account 1,359.09 1,298.27
- in Deposit Account 1,972.40 1,098.43
Total 3,338.89 2,398.36
Less: Margin money for Bank Guarantees 403.47 28.97
Cash and Bank Balances at the end of the year 2,935.42 2,369.39
Supplementary Non-Cash Flow Information
Investment in Subsidiary / Joint Venture through conversion of Loan / Share Application 182.31 105.00
Dividends received and re-invested in Units of Mutual Funds 643.36 390.25
Notes to Abridged Financial Statements form an integral part of Abridged Financial Statements.
As per our report on the Abridged Financial Statements of even date.
For S.R. Batliboi & Co. For and on behalf of the Board of Directors of Firm registration number: 301003E Sasken Communication Technologies LimitedChartered Accountants
per Navin Agrawal Rajiv C. Mody G. VenkateshPartner Managing Director Whole Time DirectorMembership No.: 56102
Place : Bangalore Neeta S. Revankar R. VittalDate : April 27, 2011 Whole Time Director & Company Secretary
Chief Financial Officer

SASKEN ANNUAL REPORT 2010-1160
1. Description of Business
Sasken Communication Technologies Limited (“Sasken” or “the Company”) is a provider of telecommunication software services and solutions to network equipment manufacturers, mobile terminal vendors and semiconductor companies around the world. Sasken delivers end-to-end solutions that enable richer content delivery on next generation networks.
Sasken has its headquarters in Bangalore, India with offices in Pune, Chennai, Hyderabad, Noida, China, Germany, Sweden, United Kingdom (UK), United States of America (USA) and South Korea.
2. Basis for Preparation
The abridged financial statements have been prepared in accordance with the requirements of Rule 7A of the Companies (Central Government’s) General Rules and Forms, 1956 and Clause 32 of the Listing Agreement. These abridged financial statements have been prepared on the basis of the complete set of financial statements for the year ended March 31, 2011. The notes number in the brackets “[ ]” are as they appear in the complete set of financial statements.
The complete set of financial statements have been prepared to comply in all material respects with the notified Accounting Standards by Companies Accounting Standards Rules, 2006 and the relevant provisions of the Companies Act, 1956. The financial statements have been prepared under the historical cost convention on an accrual basis, except in case of assets for which impairment is made and revaluation is carried out. The accounting policies have been consistently applied by the Company and are consistent with those used during the previous year, other than those disclosed.
3. Investments in Subsidiaries and Joint Ventures
(a) As at March 31, 2011, the Company has invested `1,355.44 lakhs (March 31, 2010 `902.44 lakhs) for its 45.77% (March 31, 2010, 49.87%) equity share in ConnectM Technology Solutions Pvt. Ltd.(“ConnectM”). ConnectM has incurred losses since the date of incorporation and the proportionate share of cumulative loss incurred as of March 31, 2011 is `1,243.64 lakhs (March 31, 2010, `798.26 lakhs). The Company believes that ConnectM is currently in the initial stages of business development and these losses are initial start up losses and hence considers the diminution in value of investment as temporary [Note 3 (a) in the Notes to accounts of main financial statements].
(b) As at March 31, 2011, the Company and Tata AutoComp Systems Limited (“TACO”) each hold 50% of the equity in TACO Sasken Automotive Electronics Limited (“TSAE”). The shareholders of TSAE have resolved that the company be wound up voluntarily. Requisite documents have been filed with the Registrar of Companies. Considering the closure of operations of TSAE, the Company has made full provision for diminution in the value of investments in TSAE amounting to `767.84 lakhs as on March 31, 2011 [Note 3 (b) in the Notes to accounts of main financial statements].
(c) As at March 31, 2011, the Company has total investment of ̀ 635.18 lakhs (March 31, 2010 ̀ 542.86 lakhs) in Sasken Communication Technologies (Shanghai) Co. Ltd.(Sasken China), its wholly owned subsidiary. Sasken China has made a loss of `26.93 lakhs for the year ended March 31, 2011 and has accumulated losses of `551.60 lakhs as at March 31, 2011. The Company has provided for diminution of its investment in Sasken China amounting to `282.48 lakhs (March 31, 2010 `144.88 lakhs). Considering that the subsidiary is still in investment phase, the Company is of the view that no additional provision for diminution is required [Note 3 (c) in the Notes to accounts of main financial statements].
4. Capital Commitments and Contingencies
(a) Estimated amount of contracts remaining to be executed on capital account (net of advances) amounted to `316.43 lakhs (As at March 31, 2010 `71.76 lakhs) [Note 4(b) in the Notes to accounts of main financial statements].
(b) Contingent Liabilities
Contingent liabilities towards income taxes and indirect taxes not provided for amount to `2,234.05 lakhs (March 31, 2010 `1,552.70 lakhs) and `2,216.86 lakhs (As at March 31, 2010 `1,188.93 lakhs) respectively.
There are certain claims made against the Company by an investee Company, which are a subject matter of arbitration proceedings. In the view of the management of the Company such claims are frivolous and are not tenable. No provision has been made for such claims pending completion of legal proceedings as the amount of claims are currently not ascertainable [Note 4(c) in the Notes to accounts of main financial statements].
Amount in ` lakhs
As atMarch 31, 2011
As atMarch 31, 2010
Bank Guarantees 274.03 287.35
Corporate Guarantee on behalf of subsidiaries 10,777.68 10,333.98
(c) The Company has operating leases for office premises that are (a) renewable on a periodic basis and are cancellable by giving a notice period ranging from 1 month to 6 months and (b) renewable on a periodic basis and are non-cancellable for specified periods
Notes to Abridged Financial Statements
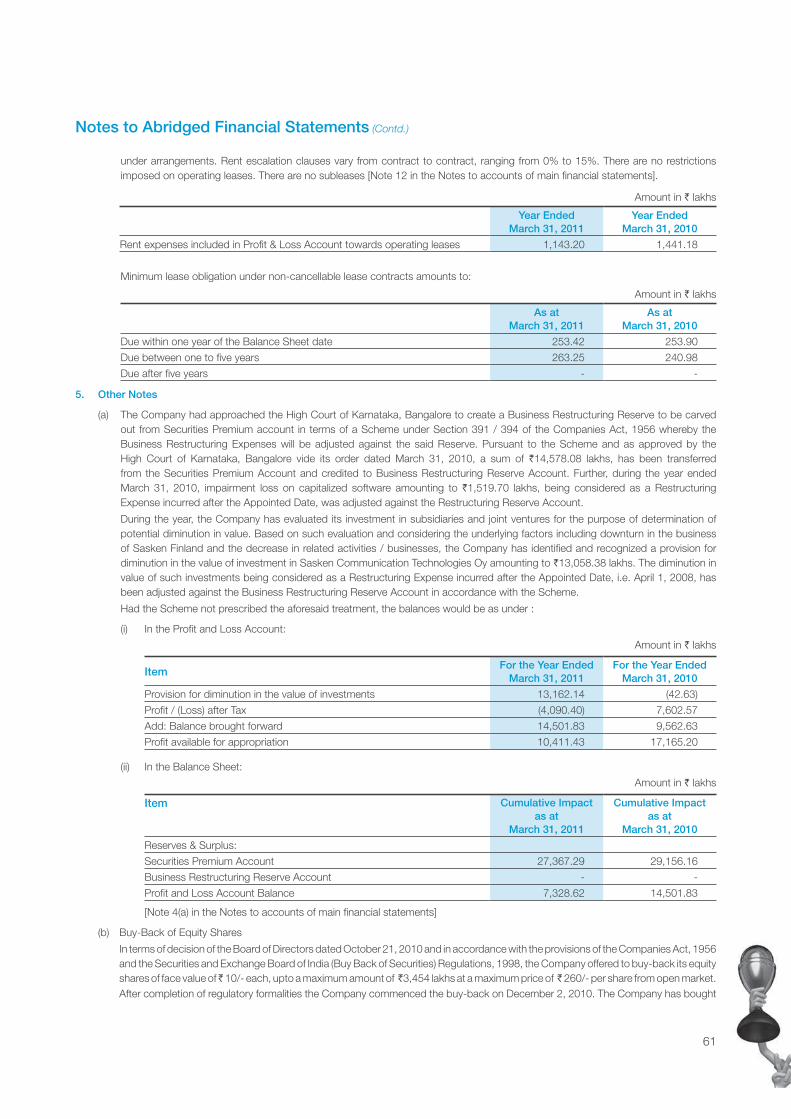
61
under arrangements. Rent escalation clauses vary from contract to contract, ranging from 0% to 15%. There are no restrictions imposed on operating leases. There are no subleases [Note 12 in the Notes to accounts of main financial statements].
Amount in ` lakhs
Year EndedMarch 31, 2011
Year Ended March 31, 2010
Rent expenses included in Profit & Loss Account towards operating leases 1,143.20 1,441.18
Minimum lease obligation under non-cancellable lease contracts amounts to:
Amount in ` lakhs
As atMarch 31, 2011
As at March 31, 2010
Due within one year of the Balance Sheet date 253.42 253.90
Due between one to five years 263.25 240.98
Due after five years - -
5. Other Notes
(a) The Company had approached the High Court of Karnataka, Bangalore to create a Business Restructuring Reserve to be carved out from Securities Premium account in terms of a Scheme under Section 391 / 394 of the Companies Act, 1956 whereby the Business Restructuring Expenses will be adjusted against the said Reserve. Pursuant to the Scheme and as approved by the High Court of Karnataka, Bangalore vide its order dated March 31, 2010, a sum of `14,578.08 lakhs, has been transferred from the Securities Premium Account and credited to Business Restructuring Reserve Account. Further, during the year ended March 31, 2010, impairment loss on capitalized software amounting to `1,519.70 lakhs, being considered as a Restructuring Expense incurred after the Appointed Date, was adjusted against the Restructuring Reserve Account.
During the year, the Company has evaluated its investment in subsidiaries and joint ventures for the purpose of determination of potential diminution in value. Based on such evaluation and considering the underlying factors including downturn in the business of Sasken Finland and the decrease in related activities / businesses, the Company has identified and recognized a provision for diminution in the value of investment in Sasken Communication Technologies Oy amounting to `13,058.38 lakhs. The diminution in value of such investments being considered as a Restructuring Expense incurred after the Appointed Date, i.e. April 1, 2008, has been adjusted against the Business Restructuring Reserve Account in accordance with the Scheme.
Had the Scheme not prescribed the aforesaid treatment, the balances would be as under :
(i) In the Profit and Loss Account:
Amount in ` lakhs
ItemFor the Year Ended
March 31, 2011For the Year Ended
March 31, 2010
Provision for diminution in the value of investments 13,162.14 (42.63)
Profit / (Loss) after Tax (4,090.40) 7,602.57
Add: Balance brought forward 14,501.83 9,562.63
Profit available for appropriation 10,411.43 17,165.20
(ii) In the Balance Sheet:
Amount in ` lakhs
Item Cumulative Impactas at
March 31, 2011
Cumulative Impactas at
March 31, 2010
Reserves & Surplus:
Securities Premium Account 27,367.29 29,156.16
Business Restructuring Reserve Account - -
Profit and Loss Account Balance 7,328.62 14,501.83
[Note 4(a) in the Notes to accounts of main financial statements]
(b) Buy-Back of Equity Shares
In terms of decision of the Board of Directors dated October 21, 2010 and in accordance with the provisions of the Companies Act, 1956 and the Securities and Exchange Board of India (Buy Back of Securities) Regulations, 1998, the Company offered to buy-back its equity shares of face value of ̀ 10/- each, upto a maximum amount of ̀ 3,454 lakhs at a maximum price of ̀ 260/- per share from open market. After completion of regulatory formalities the Company commenced the buy-back on December 2, 2010. The Company has bought
Notes to Abridged Financial Statements (Contd.)
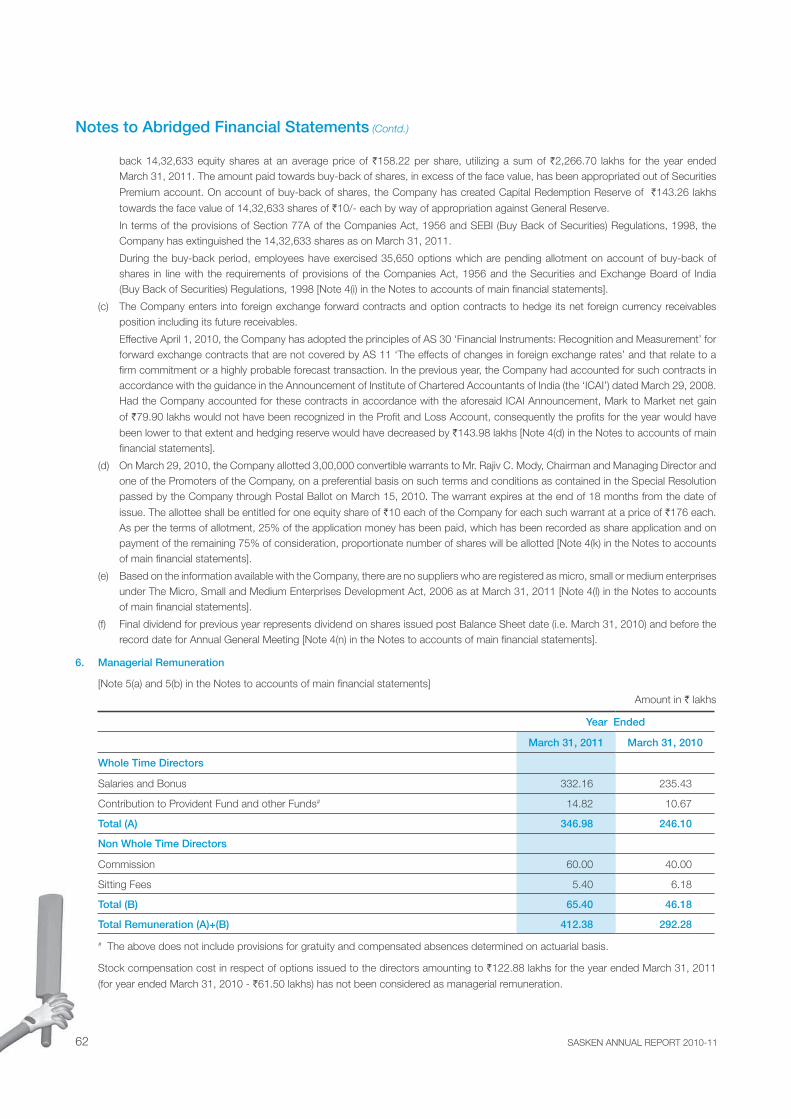
SASKEN ANNUAL REPORT 2010-1162
Notes to Abridged Financial Statements (Contd.)
back 14,32,633 equity shares at an average price of `158.22 per share, utilizing a sum of `2,266.70 lakhs for the year ended March 31, 2011. The amount paid towards buy-back of shares, in excess of the face value, has been appropriated out of Securities
Premium account. On account of buy-back of shares, the Company has created Capital Redemption Reserve of `143.26 lakhs
towards the face value of 14,32,633 shares of `10/- each by way of appropriation against General Reserve.
In terms of the provisions of Section 77A of the Companies Act, 1956 and SEBI (Buy Back of Securities) Regulations, 1998, the Company has extinguished the 14,32,633 shares as on March 31, 2011.
During the buy-back period, employees have exercised 35,650 options which are pending allotment on account of buy-back of shares in line with the requirements of provisions of the Companies Act, 1956 and the Securities and Exchange Board of India (Buy Back of Securities) Regulations, 1998 [Note 4(i) in the Notes to accounts of main financial statements].
(c) The Company enters into foreign exchange forward contracts and option contracts to hedge its net foreign currency receivables position including its future receivables.
Effective April 1, 2010, the Company has adopted the principles of AS 30 ‘Financial Instruments: Recognition and Measurement’ for forward exchange contracts that are not covered by AS 11 ‘The effects of changes in foreign exchange rates’ and that relate to a firm commitment or a highly probable forecast transaction. In the previous year, the Company had accounted for such contracts in accordance with the guidance in the Announcement of Institute of Chartered Accountants of India (the ‘ICAI’) dated March 29, 2008. Had the Company accounted for these contracts in accordance with the aforesaid ICAI Announcement, Mark to Market net gain
of `79.90 lakhs would not have been recognized in the Profit and Loss Account, consequently the profits for the year would have
been lower to that extent and hedging reserve would have decreased by `143.98 lakhs [Note 4(d) in the Notes to accounts of main financial statements].
(d) On March 29, 2010, the Company allotted 3,00,000 convertible warrants to Mr. Rajiv C. Mody, Chairman and Managing Director and one of the Promoters of the Company, on a preferential basis on such terms and conditions as contained in the Special Resolution passed by the Company through Postal Ballot on March 15, 2010. The warrant expires at the end of 18 months from the date of
issue. The allottee shall be entitled for one equity share of `10 each of the Company for each such warrant at a price of `176 each. As per the terms of allotment, 25% of the application money has been paid, which has been recorded as share application and on payment of the remaining 75% of consideration, proportionate number of shares will be allotted [Note 4(k) in the Notes to accounts of main financial statements].
(e) Based on the information available with the Company, there are no suppliers who are registered as micro, small or medium enterprises under The Micro, Small and Medium Enterprises Development Act, 2006 as at March 31, 2011 [Note 4(l) in the Notes to accounts of main financial statements].
(f) Final dividend for previous year represents dividend on shares issued post Balance Sheet date (i.e. March 31, 2010) and before the record date for Annual General Meeting [Note 4(n) in the Notes to accounts of main financial statements].
6. Managerial Remuneration
[Note 5(a) and 5(b) in the Notes to accounts of main financial statements]
Amount in ` lakhs
Year Ended
March 31, 2011 March 31, 2010
Whole Time Directors
Salaries and Bonus 332.16 235.43
Contribution to Provident Fund and other Funds# 14.82 10.67
Total (A) 346.98 246.10
Non Whole Time Directors
Commission 60.00 40.00
Sitting Fees 5.40 6.18
Total (B) 65.40 46.18
Total Remuneration (A)+(B) 412.38 292.28
# The above does not include provisions for gratuity and compensated absences determined on actuarial basis.
Stock compensation cost in respect of options issued to the directors amounting to `122.88 lakhs for the year ended March 31, 2011
(for year ended March 31, 2010 - `61.50 lakhs) has not been considered as managerial remuneration.
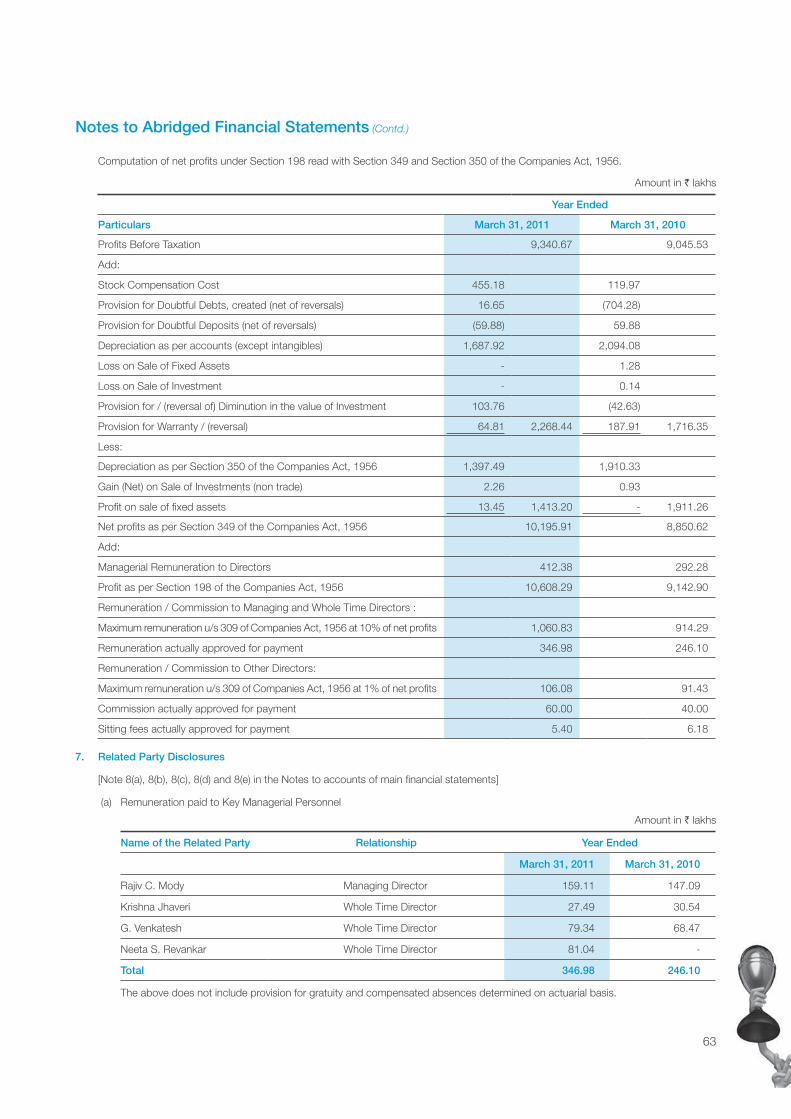
63
Notes to Abridged Financial Statements (Contd.)
Computation of net profits under Section 198 read with Section 349 and Section 350 of the Companies Act, 1956.
Amount in ` lakhs
Year Ended
Particulars March 31, 2011 March 31, 2010
Profits Before Taxation 9,340.67 9,045.53
Add:
Stock Compensation Cost 455.18 119.97
Provision for Doubtful Debts, created (net of reversals) 16.65 (704.28)
Provision for Doubtful Deposits (net of reversals) (59.88) 59.88
Depreciation as per accounts (except intangibles) 1,687.92 2,094.08
Loss on Sale of Fixed Assets - 1.28
Loss on Sale of Investment - 0.14
Provision for / (reversal of) Diminution in the value of Investment 103.76 (42.63)
Provision for Warranty / (reversal) 64.81 2,268.44 187.91 1,716.35
Less:
Depreciation as per Section 350 of the Companies Act, 1956 1,397.49 1,910.33
Gain (Net) on Sale of Investments (non trade) 2.26 0.93
Profit on sale of fixed assets 13.45 1,413.20 - 1,911.26
Net profits as per Section 349 of the Companies Act, 1956 10,195.91 8,850.62
Add:
Managerial Remuneration to Directors 412.38 292.28
Profit as per Section 198 of the Companies Act, 1956 10,608.29 9,142.90
Remuneration / Commission to Managing and Whole Time Directors :
Maximum remuneration u/s 309 of Companies Act, 1956 at 10% of net profits 1,060.83 914.29
Remuneration actually approved for payment 346.98 246.10
Remuneration / Commission to Other Directors:
Maximum remuneration u/s 309 of Companies Act, 1956 at 1% of net profits 106.08 91.43
Commission actually approved for payment 60.00 40.00
Sitting fees actually approved for payment 5.40 6.18
7. Related Party Disclosures
[Note 8(a), 8(b), 8(c), 8(d) and 8(e) in the Notes to accounts of main financial statements]
(a) Remuneration paid to Key Managerial Personnel
Amount in ` lakhs
Name of the Related Party Relationship Year Ended
March 31, 2011 March 31, 2010
Rajiv C. Mody Managing Director 159.11 147.09
Krishna Jhaveri Whole Time Director 27.49 30.54
G. Venkatesh Whole Time Director 79.34 68.47
Neeta S. Revankar Whole Time Director 81.04 -
Total 346.98 246.10
The above does not include provision for gratuity and compensated absences determined on actuarial basis.
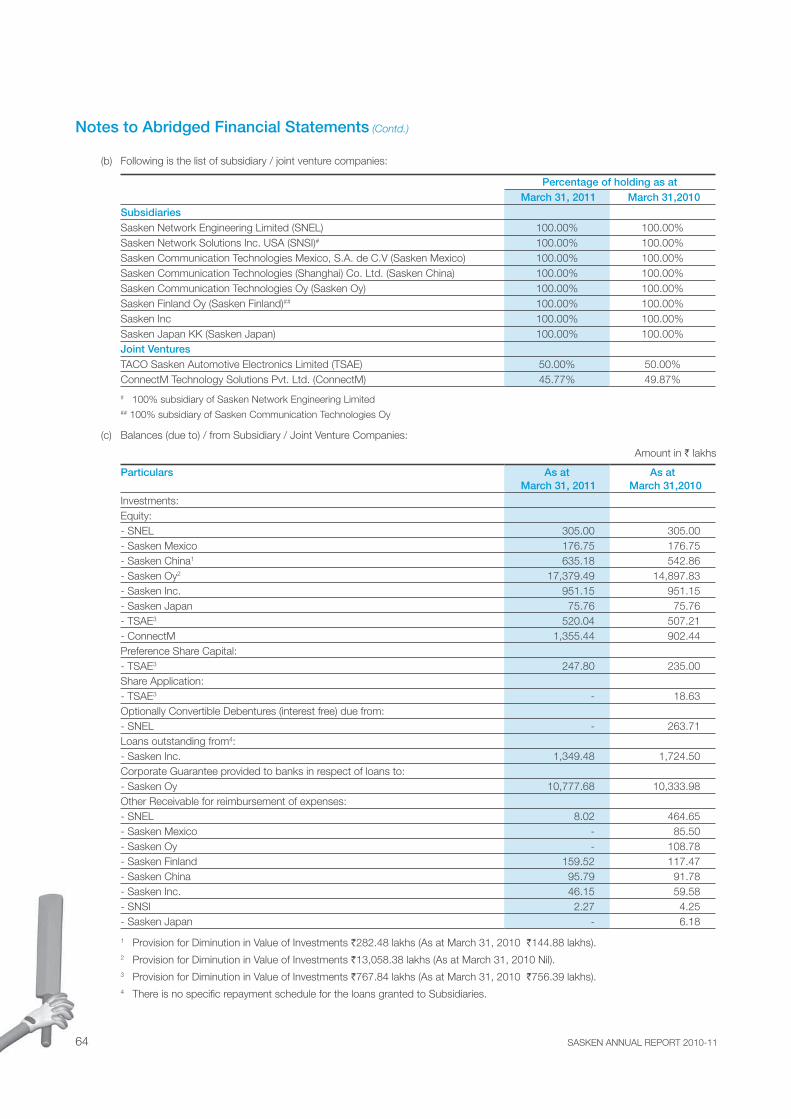
SASKEN ANNUAL REPORT 2010-1164
(b) Following is the list of subsidiary / joint venture companies:
Percentage of holding as at March 31, 2011 March 31,2010
SubsidiariesSasken Network Engineering Limited (SNEL) 100.00% 100.00%Sasken Network Solutions Inc. USA (SNSI)# 100.00% 100.00%Sasken Communication Technologies Mexico, S.A. de C.V (Sasken Mexico) 100.00% 100.00%Sasken Communication Technologies (Shanghai) Co. Ltd. (Sasken China) 100.00% 100.00%Sasken Communication Technologies Oy (Sasken Oy) 100.00% 100.00%Sasken Finland Oy (Sasken Finland)## 100.00% 100.00%Sasken Inc 100.00% 100.00%Sasken Japan KK (Sasken Japan) 100.00% 100.00%Joint VenturesTACO Sasken Automotive Electronics Limited (TSAE) 50.00% 50.00%ConnectM Technology Solutions Pvt. Ltd. (ConnectM) 45.77% 49.87%
# 100% subsidiary of Sasken Network Engineering Limited
## 100% subsidiary of Sasken Communication Technologies Oy
(c) Balances (due to) / from Subsidiary / Joint Venture Companies:
Amount in ` lakhs
Particulars As at March 31, 2011
As at March 31,2010
Investments:Equity:- SNEL 305.00 305.00- Sasken Mexico 176.75 176.75- Sasken China1 635.18 542.86- Sasken Oy2 17,379.49 14,897.83- Sasken Inc. 951.15 951.15- Sasken Japan 75.76 75.76- TSAE3 520.04 507.21- ConnectM 1,355.44 902.44 Preference Share Capital: - TSAE3 247.80 235.00Share Application:- TSAE3 - 18.63Optionally Convertible Debentures (interest free) due from:- SNEL - 263.71Loans outstanding from4:- Sasken Inc. 1,349.48 1,724.50 Corporate Guarantee provided to banks in respect of loans to:- Sasken Oy 10,777.68 10,333.98 Other Receivable for reimbursement of expenses:- SNEL 8.02 464.65- Sasken Mexico - 85.50- Sasken Oy - 108.78- Sasken Finland 159.52 117.47- Sasken China 95.79 91.78- Sasken Inc. 46.15 59.58- SNSI 2.27 4.25- Sasken Japan - 6.18
1 Provision for Diminution in Value of Investments `282.48 lakhs (As at March 31, 2010 `144.88 lakhs). 2 Provision for Diminution in Value of Investments `13,058.38 lakhs (As at March 31, 2010 Nil). 3 Provision for Diminution in Value of Investments `767.84 lakhs (As at March 31, 2010 `756.39 lakhs). 4 There is no specific repayment schedule for the loans granted to Subsidiaries.
Notes to Abridged Financial Statements (Contd.)
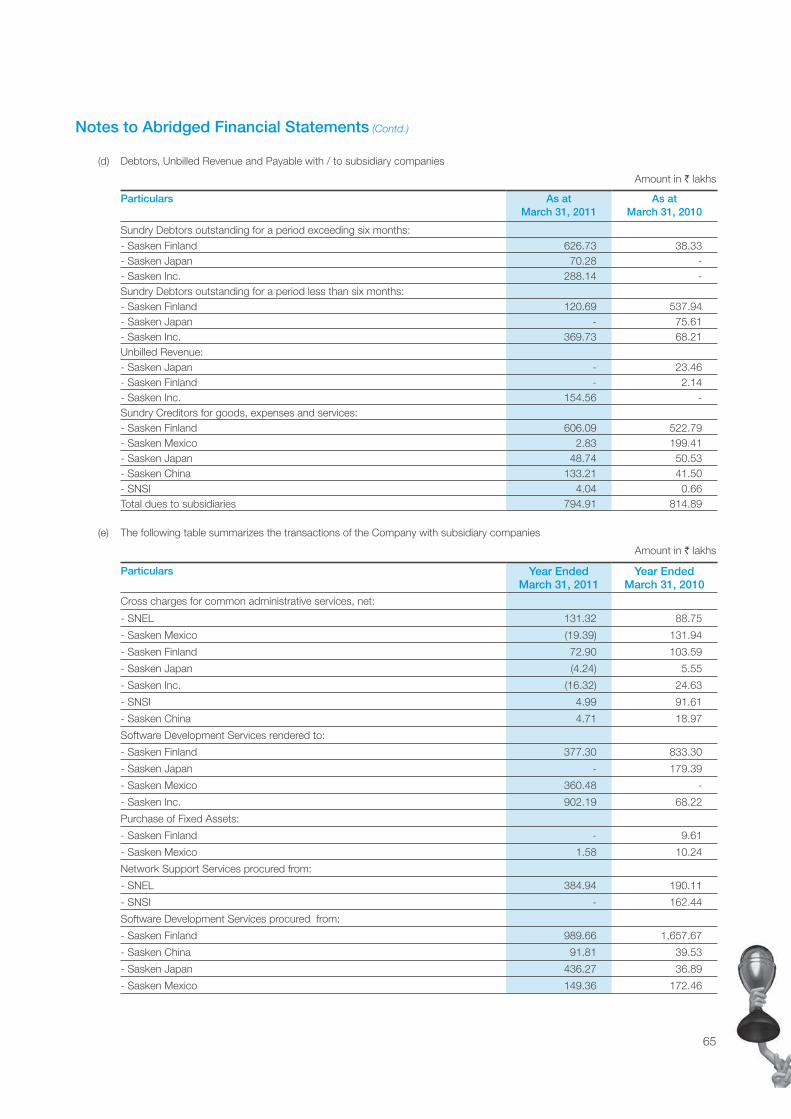
65
(d) Debtors, Unbilled Revenue and Payable with / to subsidiary companies
Amount in ` lakhs
Particulars As atMarch 31, 2011
As atMarch 31, 2010
Sundry Debtors outstanding for a period exceeding six months:- Sasken Finland 626.73 38.33- Sasken Japan 70.28 -- Sasken Inc. 288.14 -Sundry Debtors outstanding for a period less than six months:- Sasken Finland 120.69 537.94- Sasken Japan - 75.61- Sasken Inc. 369.73 68.21Unbilled Revenue:- Sasken Japan - 23.46- Sasken Finland - 2.14- Sasken Inc. 154.56 -Sundry Creditors for goods, expenses and services:- Sasken Finland 606.09 522.79- Sasken Mexico 2.83 199.41- Sasken Japan 48.74 50.53- Sasken China 133.21 41.50- SNSI 4.04 0.66Total dues to subsidiaries 794.91 814.89
(e) The following table summarizes the transactions of the Company with subsidiary companies
Amount in ` lakhs
Particulars Year Ended March 31, 2011
Year Ended March 31, 2010
Cross charges for common administrative services, net:
- SNEL 131.32 88.75
- Sasken Mexico (19.39) 131.94
- Sasken Finland 72.90 103.59
- Sasken Japan (4.24) 5.55
- Sasken Inc. (16.32) 24.63
- SNSI 4.99 91.61
- Sasken China 4.71 18.97
Software Development Services rendered to:
- Sasken Finland 377.30 833.30
- Sasken Japan - 179.39
- Sasken Mexico 360.48 -
- Sasken Inc. 902.19 68.22
Purchase of Fixed Assets:
- Sasken Finland - 9.61
- Sasken Mexico 1.58 10.24
Network Support Services procured from:
- SNEL 384.94 190.11
- SNSI - 162.44
Software Development Services procured from:
- Sasken Finland 989.66 1,657.67
- Sasken China 91.81 39.53
- Sasken Japan 436.27 36.89
- Sasken Mexico 149.36 172.46
Notes to Abridged Financial Statements (Contd.)
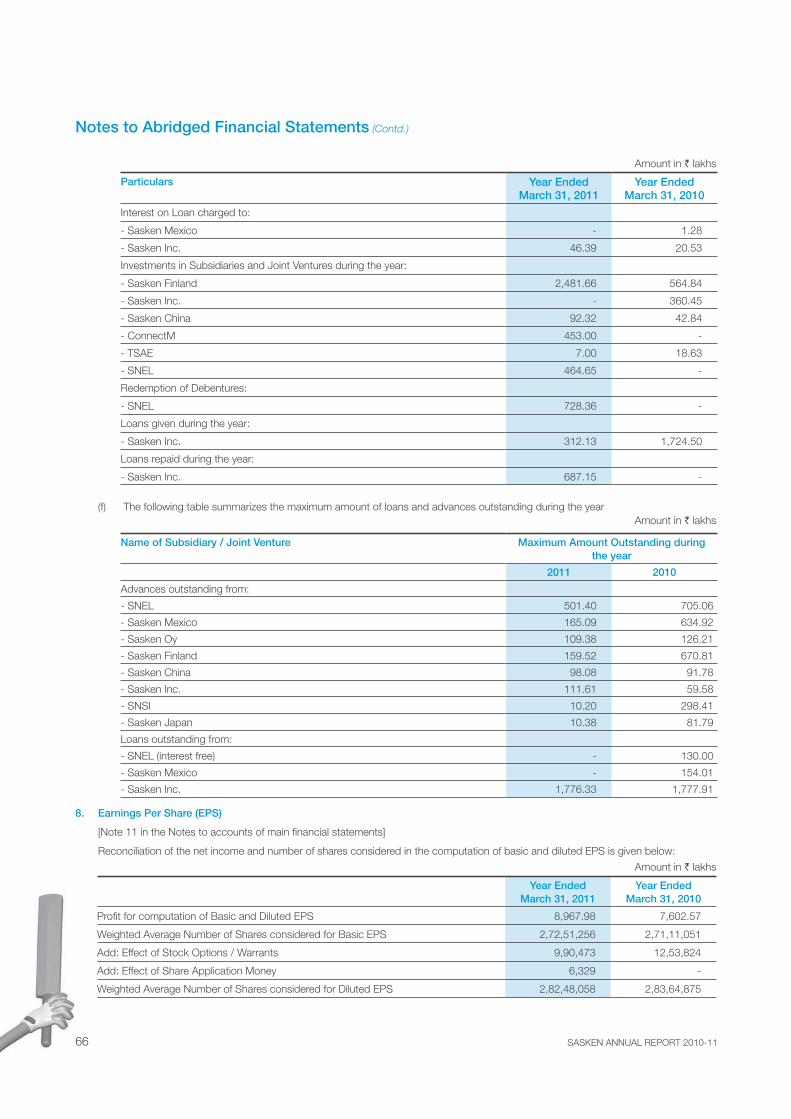
SASKEN ANNUAL REPORT 2010-1166
Particulars Year Ended March 31, 2011
Year Ended March 31, 2010
Interest on Loan charged to:
- Sasken Mexico - 1.28
- Sasken Inc. 46.39 20.53
Investments in Subsidiaries and Joint Ventures during the year:
- Sasken Finland 2,481.66 564.84
- Sasken Inc. - 360.45
- Sasken China 92.32 42.84
- ConnectM 453.00 -
- TSAE 7.00 18.63
- SNEL 464.65 -
Redemption of Debentures:
- SNEL 728.36 -
Loans given during the year:
- Sasken Inc. 312.13 1,724.50
Loans repaid during the year:
- Sasken Inc. 687.15 -
(f) The following table summarizes the maximum amount of loans and advances outstanding during the yearAmount in ` lakhs
Name of Subsidiary / Joint Venture Maximum Amount Outstanding during the year
2011 2010
Advances outstanding from:
- SNEL 501.40 705.06
- Sasken Mexico 165.09 634.92
- Sasken Oy 109.38 126.21
- Sasken Finland 159.52 670.81
- Sasken China 98.08 91.78
- Sasken Inc. 111.61 59.58
- SNSI 10.20 298.41
- Sasken Japan 10.38 81.79
Loans outstanding from:
- SNEL (interest free) - 130.00
- Sasken Mexico - 154.01
- Sasken Inc. 1,776.33 1,777.91
8. Earnings Per Share (EPS)
[Note 11 in the Notes to accounts of main financial statements]
Reconciliation of the net income and number of shares considered in the computation of basic and diluted EPS is given below:
Amount in ` lakhs
Year EndedMarch 31, 2011
Year EndedMarch 31, 2010
Profit for computation of Basic and Diluted EPS 8,967.98 7,602.57
Weighted Average Number of Shares considered for Basic EPS 2,72,51,256 2,71,11,051
Add: Effect of Stock Options / Warrants 9,90,473 12,53,824
Add: Effect of Share Application Money 6,329 -
Weighted Average Number of Shares considered for Diluted EPS 2,82,48,058 2,83,64,875
Notes to Abridged Financial Statements (Contd.)
Amount in ` lakhs
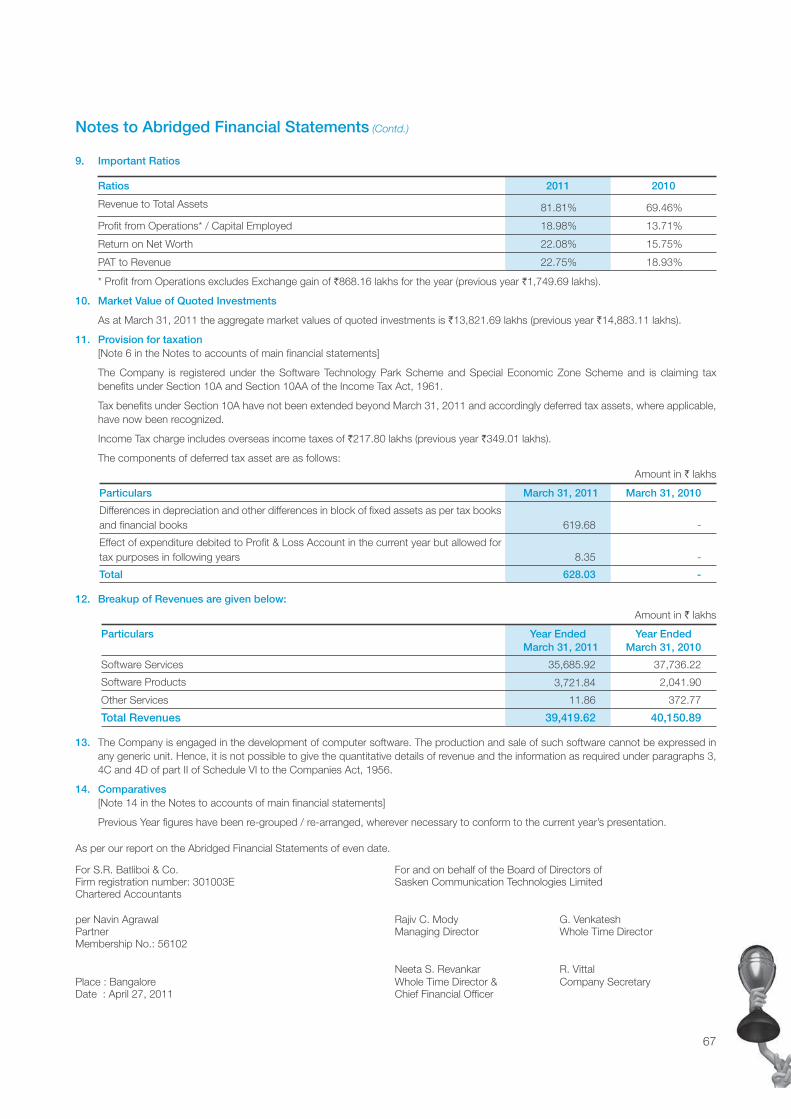
67
9. Important Ratios
Ratios 2011 2010
Revenue to Total Assets 81.81% 69.46%
Profit from Operations* / Capital Employed 18.98% 13.71%
Return on Net Worth 22.08% 15.75%
PAT to Revenue 22.75% 18.93%
* Profit from Operations excludes Exchange gain of `868.16 lakhs for the year (previous year `1,749.69 lakhs).
10. Market Value of Quoted Investments
As at March 31, 2011 the aggregate market values of quoted investments is `13,821.69 lakhs (previous year `14,883.11 lakhs).
11. Provision for taxation [Note 6 in the Notes to accounts of main financial statements]
The Company is registered under the Software Technology Park Scheme and Special Economic Zone Scheme and is claiming tax benefits under Section 10A and Section 10AA of the Income Tax Act, 1961.
Tax benefits under Section 10A have not been extended beyond March 31, 2011 and accordingly deferred tax assets, where applicable, have now been recognized.
Income Tax charge includes overseas income taxes of `217.80 lakhs (previous year `349.01 lakhs).
The components of deferred tax asset are as follows:
Amount in ` lakhs
Particulars March 31, 2011 March 31, 2010
Differences in depreciation and other differences in block of fixed assets as per tax books and financial books 619.68 -
Effect of expenditure debited to Profit & Loss Account in the current year but allowed for tax purposes in following years 8.35 -
Total 628.03 -
12. Breakup of Revenues are given below:
Amount in ` lakhs
Particulars Year Ended March 31, 2011
Year EndedMarch 31, 2010
Software Services 35,685.92 37,736.22
Software Products 3,721.84 2,041.90
Other Services 11.86 372.77
Total Revenues 39,419.62 40,150.89
13. The Company is engaged in the development of computer software. The production and sale of such software cannot be expressed in any generic unit. Hence, it is not possible to give the quantitative details of revenue and the information as required under paragraphs 3, 4C and 4D of part II of Schedule VI to the Companies Act, 1956.
14. Comparatives [Note 14 in the Notes to accounts of main financial statements]
Previous Year figures have been re-grouped / re-arranged, wherever necessary to conform to the current year’s presentation.
Notes to Abridged Financial Statements (Contd.)
As per our report on the Abridged Financial Statements of even date.
For S.R. Batliboi & Co. For and on behalf of the Board of Directors of Firm registration number: 301003E Sasken Communication Technologies LimitedChartered Accountants
per Navin Agrawal Rajiv C. Mody G. VenkateshPartner Managing Director Whole Time DirectorMembership No.: 56102
Neeta S. Revankar R. VittalPlace : Bangalore Whole Time Director & Company SecretaryDate : April 27, 2011 Chief Financial Officer
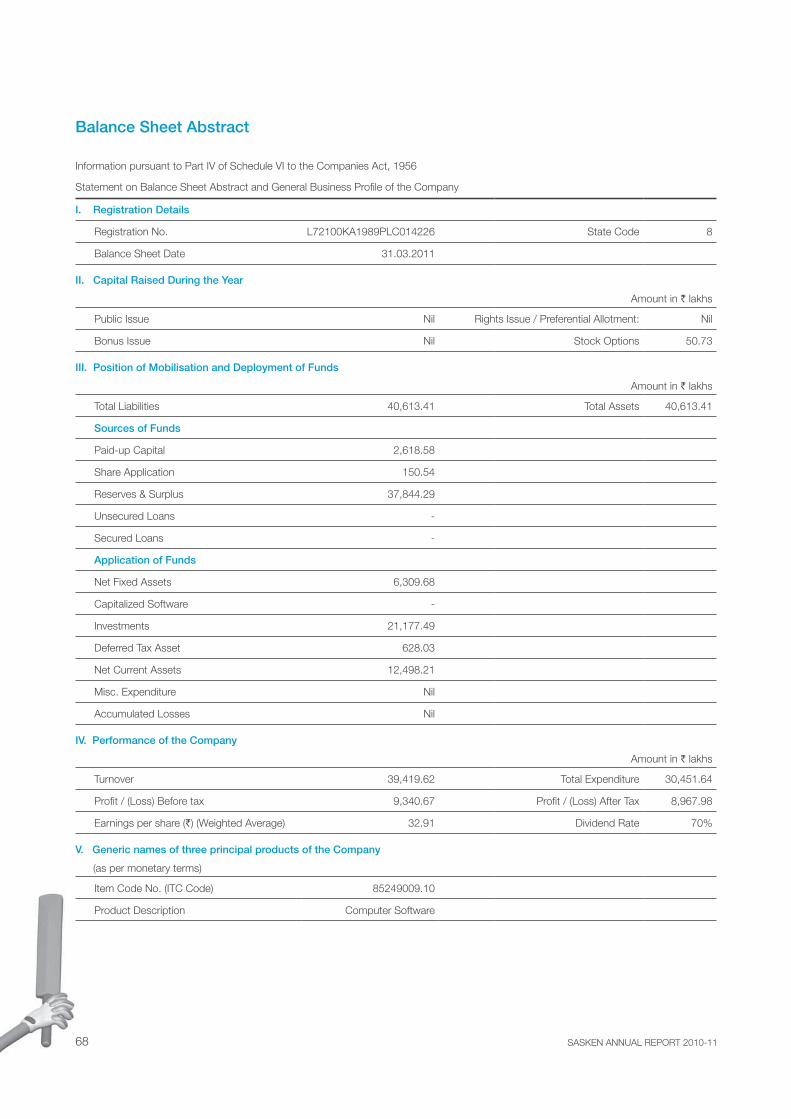
SASKEN ANNUAL REPORT 2010-1168
Information pursuant to Part IV of Schedule VI to the Companies Act, 1956
Statement on Balance Sheet Abstract and General Business Profile of the Company
I. Registration Details
Registration No. L72100KA1989PLC014226 State Code 8
Balance Sheet Date 31.03.2011
II. Capital Raised During the Year
Amount in ` lakhs
Public Issue Nil Rights Issue / Preferential Allotment: Nil
Bonus Issue Nil Stock Options 50.73
III. Position of Mobilisation and Deployment of Funds
Amount in ` lakhs
Total Liabilities 40,613.41 Total Assets 40,613.41
Sources of Funds
Paid-up Capital 2,618.58
Share Application 150.54
Reserves & Surplus 37,844.29
Unsecured Loans -
Secured Loans -
Application of Funds
Net Fixed Assets 6,309.68
Capitalized Software -
Investments 21,177.49
Deferred Tax Asset 628.03
Net Current Assets 12,498.21
Misc. Expenditure Nil
Accumulated Losses Nil
IV. Performance of the Company
Amount in ` lakhs
Turnover 39,419.62 Total Expenditure 30,451.64
Profit / (Loss) Before tax 9,340.67 Profit / (Loss) After Tax 8,967.98
Earnings per share (`) (Weighted Average) 32.91 Dividend Rate 70%
V. Generic names of three principal products of the Company
(as per monetary terms)
Item Code No. (ITC Code) 85249009.10
Product Description Computer Software
Balance Sheet Abstract
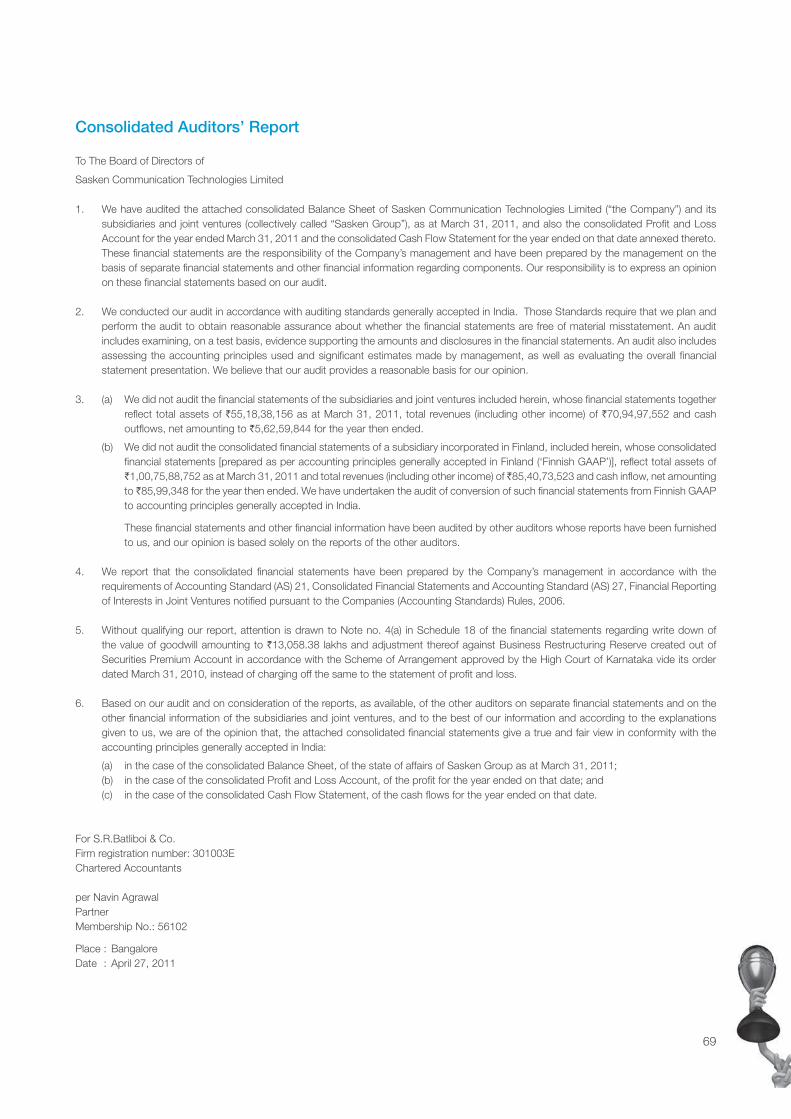
69
To The Board of Directors of
Sasken Communication Technologies Limited
1. We have audited the attached consolidated Balance Sheet of Sasken Communication Technologies Limited (“the Company”) and its subsidiaries and joint ventures (collectively called “Sasken Group”), as at March 31, 2011, and also the consolidated Profit and Loss Account for the year ended March 31, 2011 and the consolidated Cash Flow Statement for the year ended on that date annexed thereto. These financial statements are the responsibility of the Company’s management and have been prepared by the management on the basis of separate financial statements and other financial information regarding components. Our responsibility is to express an opinion on these financial statements based on our audit.
2. We conducted our audit in accordance with auditing standards generally accepted in India. Those Standards require that we plan and perform the audit to obtain reasonable assurance about whether the financial statements are free of material misstatement. An audit includes examining, on a test basis, evidence supporting the amounts and disclosures in the financial statements. An audit also includes assessing the accounting principles used and significant estimates made by management, as well as evaluating the overall financial statement presentation. We believe that our audit provides a reasonable basis for our opinion.
3. (a) We did not audit the financial statements of the subsidiaries and joint ventures included herein, whose financial statements together reflect total assets of `55,18,38,156 as at March 31, 2011, total revenues (including other income) of `70,94,97,552 and cash outflows, net amounting to `5,62,59,844 for the year then ended.
(b) We did not audit the consolidated financial statements of a subsidiary incorporated in Finland, included herein, whose consolidated financial statements [prepared as per accounting principles generally accepted in Finland (‘Finnish GAAP’)], reflect total assets of `1,00,75,88,752 as at March 31, 2011 and total revenues (including other income) of ̀ 85,40,73,523 and cash inflow, net amounting to ̀ 85,99,348 for the year then ended. We have undertaken the audit of conversion of such financial statements from Finnish GAAP to accounting principles generally accepted in India.
These financial statements and other financial information have been audited by other auditors whose reports have been furnished to us, and our opinion is based solely on the reports of the other auditors.
4. We report that the consolidated financial statements have been prepared by the Company’s management in accordance with the requirements of Accounting Standard (AS) 21, Consolidated Financial Statements and Accounting Standard (AS) 27, Financial Reporting of Interests in Joint Ventures notified pursuant to the Companies (Accounting Standards) Rules, 2006.
5. Without qualifying our report, attention is drawn to Note no. 4(a) in Schedule 18 of the financial statements regarding write down of the value of goodwill amounting to `13,058.38 lakhs and adjustment thereof against Business Restructuring Reserve created out of Securities Premium Account in accordance with the Scheme of Arrangement approved by the High Court of Karnataka vide its order dated March 31, 2010, instead of charging off the same to the statement of profit and loss.
6. Based on our audit and on consideration of the reports, as available, of the other auditors on separate financial statements and on the other financial information of the subsidiaries and joint ventures, and to the best of our information and according to the explanations given to us, we are of the opinion that, the attached consolidated financial statements give a true and fair view in conformity with the accounting principles generally accepted in India:
(a) in the case of the consolidated Balance Sheet, of the state of affairs of Sasken Group as at March 31, 2011;(b) in the case of the consolidated Profit and Loss Account, of the profit for the year ended on that date; and(c) in the case of the consolidated Cash Flow Statement, of the cash flows for the year ended on that date.
For S.R.Batliboi & Co.Firm registration number: 301003EChartered Accountants
per Navin AgrawalPartnerMembership No.: 56102
Place : BangaloreDate : April 27, 2011
Consolidated Auditors’ Report
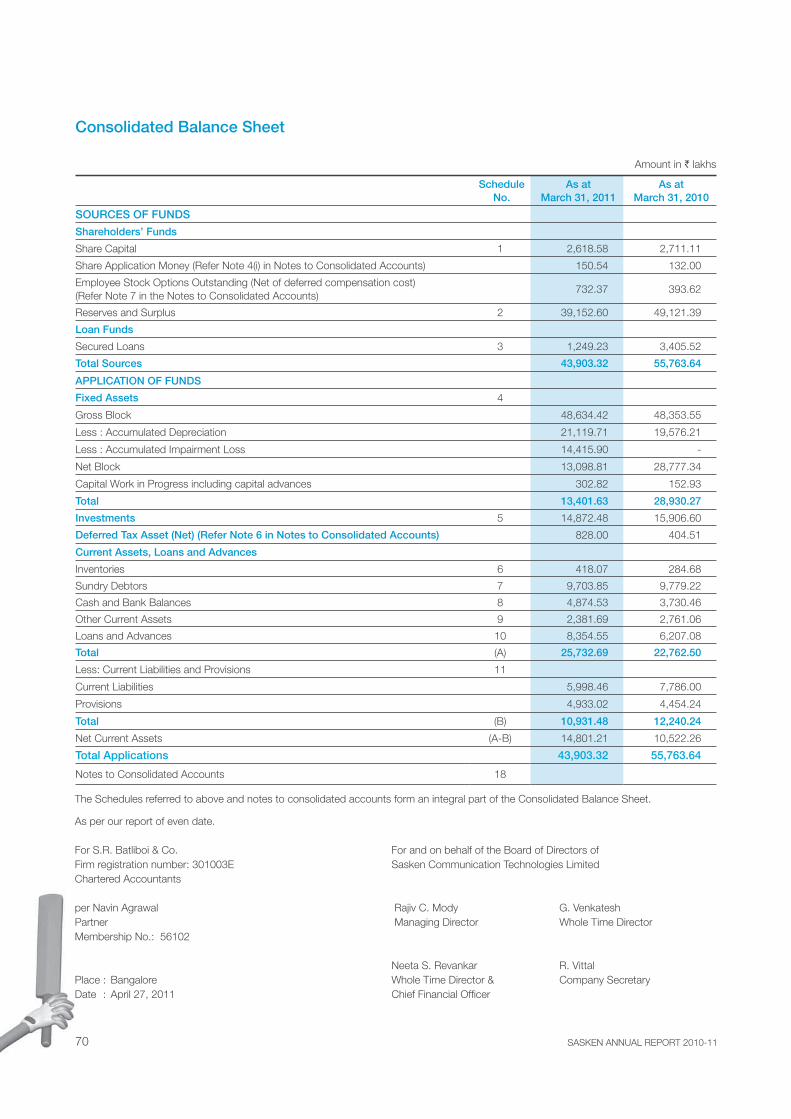
SASKEN ANNUAL REPORT 2010-1170
Amount in ` lakhs
Schedule No.
As at March 31, 2011
As at March 31, 2010
SOURCES OF FUNDS
Shareholders’ Funds
Share Capital 1 2,618.58 2,711.11
Share Application Money (Refer Note 4(i) in Notes to Consolidated Accounts) 150.54 132.00
Employee Stock Options Outstanding (Net of deferred compensation cost) (Refer Note 7 in the Notes to Consolidated Accounts)
732.37 393.62
Reserves and Surplus 2 39,152.60 49,121.39
Loan Funds
Secured Loans 3 1,249.23 3,405.52
Total Sources 43,903.32 55,763.64
APPLICATION OF FUNDS
Fixed Assets 4
Gross Block 48,634.42 48,353.55
Less : Accumulated Depreciation 21,119.71 19,576.21
Less : Accumulated Impairment Loss 14,415.90 -
Net Block 13,098.81 28,777.34
Capital Work in Progress including capital advances 302.82 152.93
Total 13,401.63 28,930.27
Investments 5 14,872.48 15,906.60
Deferred Tax Asset (Net) (Refer Note 6 in Notes to Consolidated Accounts) 828.00 404.51
Current Assets, Loans and Advances
Inventories 6 418.07 284.68
Sundry Debtors 7 9,703.85 9,779.22
Cash and Bank Balances 8 4,874.53 3,730.46
Other Current Assets 9 2,381.69 2,761.06
Loans and Advances 10 8,354.55 6,207.08
Total (A) 25,732.69 22,762.50
Less: Current Liabilities and Provisions 11
Current Liabilities 5,998.46 7,786.00
Provisions 4,933.02 4,454.24
Total (B) 10,931.48 12,240.24
Net Current Assets (A-B) 14,801.21 10,522.26
Total Applications 43,903.32 55,763.64
Notes to Consolidated Accounts 18
Consolidated Balance Sheet
The Schedules referred to above and notes to consolidated accounts form an integral part of the Consolidated Balance Sheet.
As per our report of even date.
For S.R. Batliboi & Co. For and on behalf of the Board of Directors ofFirm registration number: 301003E Sasken Communication Technologies LimitedChartered Accountants
per Navin Agrawal Rajiv C. Mody G. Venkatesh Partner Managing Director Whole Time Director Membership No.: 56102
Neeta S. Revankar R. Vittal Place : Bangalore Whole Time Director & Company SecretaryDate : April 27, 2011 Chief Financial Officer
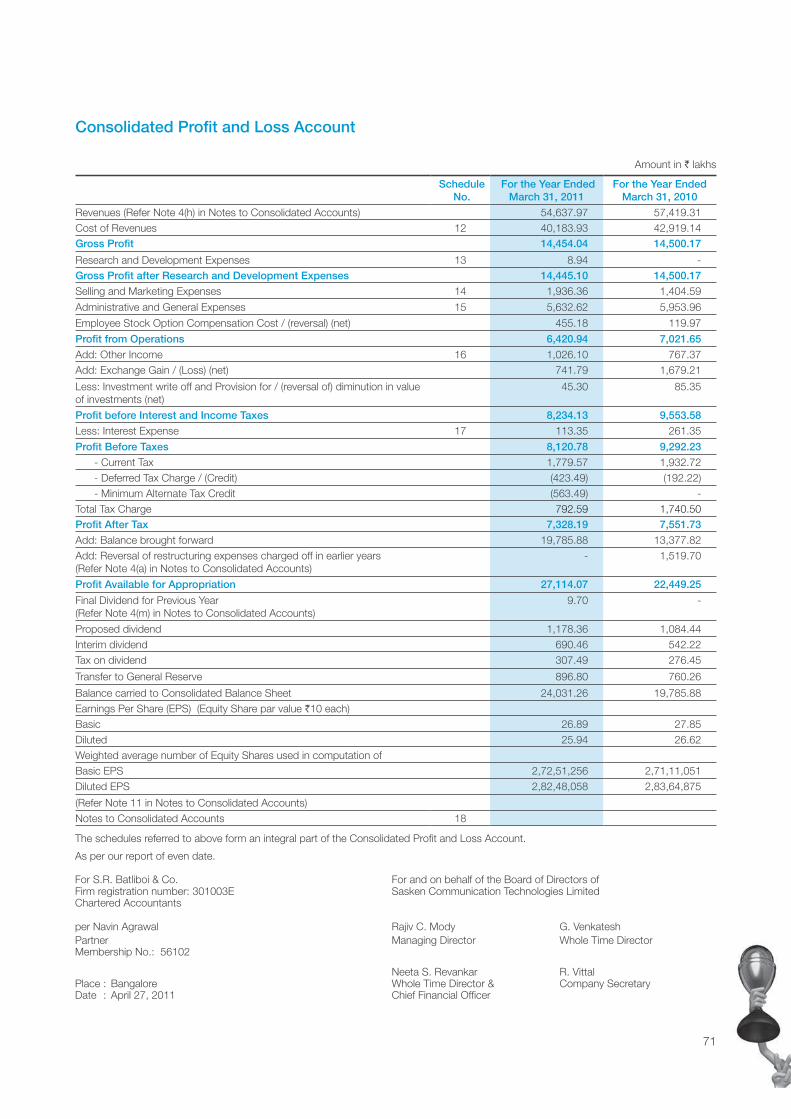
71
Amount in ` lakhs
Schedule No.
For the Year Ended March 31, 2011
For the Year Ended March 31, 2010
Revenues (Refer Note 4(h) in Notes to Consolidated Accounts) 54,637.97 57,419.31 Cost of Revenues 12 40,183.93 42,919.14 Gross Profit 14,454.04 14,500.17
Research and Development Expenses 13 8.94 - Gross Profit after Research and Development Expenses 14,445.10 14,500.17
Selling and Marketing Expenses 14 1,936.36 1,404.59
Administrative and General Expenses 15 5,632.62 5,953.96
Employee Stock Option Compensation Cost / (reversal) (net) 455.18 119.97
Profit from Operations 6,420.94 7,021.65
Add: Other Income 16 1,026.10 767.37 Add: Exchange Gain / (Loss) (net) 741.79 1,679.21
Less: Investment write off and Provision for / (reversal of) diminution in value of investments (net)
45.30 85.35
Profit before Interest and Income Taxes 8,234.13 9,553.58
Less: Interest Expense 17 113.35 261.35
Profit Before Taxes 8,120.78 9,292.23
- Current Tax 1,779.57 1,932.72 - Deferred Tax Charge / (Credit) (423.49) (192.22)- Minimum Alternate Tax Credit (563.49) -
Total Tax Charge 792.59 1,740.50 Profit After Tax 7,328.19 7,551.73
Add: Balance brought forward 19,785.88 13,377.82 Add: Reversal of restructuring expenses charged off in earlier years(Refer Note 4(a) in Notes to Consolidated Accounts)
- 1,519.70
Profit Available for Appropriation 27,114.07 22,449.25
Final Dividend for Previous Year(Refer Note 4(m) in Notes to Consolidated Accounts)
9.70 -
Proposed dividend 1,178.36 1,084.44 Interim dividend 690.46 542.22 Tax on dividend 307.49 276.45
Transfer to General Reserve 896.80 760.26
Balance carried to Consolidated Balance Sheet 24,031.26 19,785.88 Earnings Per Share (EPS) (Equity Share par value `10 each) Basic 26.89 27.85 Diluted 25.94 26.62 Weighted average number of Equity Shares used in computation of Basic EPS 2,72,51,256 2,71,11,051 Diluted EPS 2,82,48,058 2,83,64,875
(Refer Note 11 in Notes to Consolidated Accounts) Notes to Consolidated Accounts 18
Consolidated Profit and Loss Account
The schedules referred to above form an integral part of the Consolidated Profit and Loss Account.
As per our report of even date.
For S.R. Batliboi & Co. For and on behalf of the Board of Directors ofFirm registration number: 301003E Sasken Communication Technologies LimitedChartered Accountants
per Navin Agrawal Rajiv C. Mody G. Venkatesh Partner Managing Director Whole Time Director Membership No.: 56102
Neeta S. Revankar R. Vittal Place : Bangalore Whole Time Director & Company SecretaryDate : April 27, 2011 Chief Financial Officer
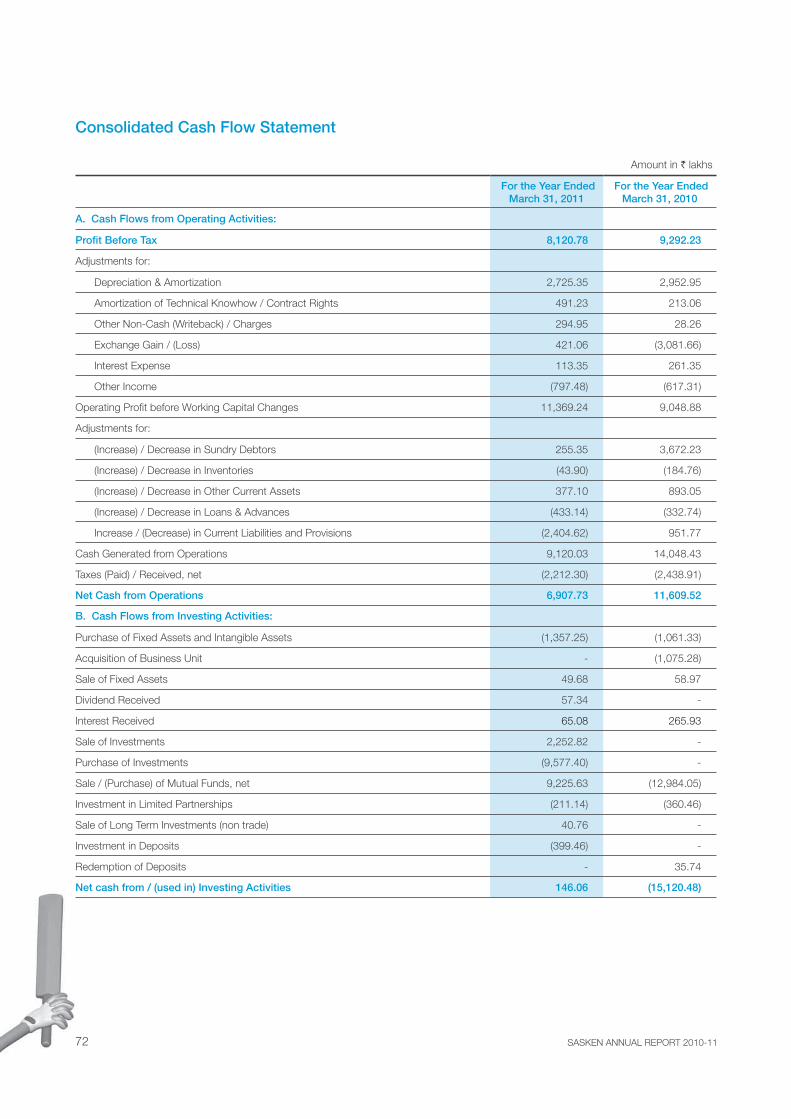
SASKEN ANNUAL REPORT 2010-1172
Amount in ` lakhs
For the Year Ended March 31, 2011
For the Year Ended March 31, 2010
A. Cash Flows from Operating Activities:
Profit Before Tax 8,120.78 9,292.23
Adjustments for:
Depreciation & Amortization 2,725.35 2,952.95
Amortization of Technical Knowhow / Contract Rights 491.23 213.06
Other Non-Cash (Writeback) / Charges 294.95 28.26
Exchange Gain / (Loss) 421.06 (3,081.66)
Interest Expense 113.35 261.35
Other Income (797.48) (617.31)
Operating Profit before Working Capital Changes 11,369.24 9,048.88
Adjustments for:
(Increase) / Decrease in Sundry Debtors 255.35 3,672.23
(Increase) / Decrease in Inventories (43.90) (184.76)
(Increase) / Decrease in Other Current Assets 377.10 893.05
(Increase) / Decrease in Loans & Advances (433.14) (332.74)
Increase / (Decrease) in Current Liabilities and Provisions (2,404.62) 951.77
Cash Generated from Operations 9,120.03 14,048.43
Taxes (Paid) / Received, net (2,212.30) (2,438.91)
Net Cash from Operations 6,907.73 11,609.52
B. Cash Flows from Investing Activities:
Purchase of Fixed Assets and Intangible Assets (1,357.25) (1,061.33)
Acquisition of Business Unit - (1,075.28)
Sale of Fixed Assets 49.68 58.97
Dividend Received 57.34 -
Interest Received 65.08 265.93
Sale of Investments 2,252.82 -
Purchase of Investments (9,577.40) -
Sale / (Purchase) of Mutual Funds, net 9,225.63 (12,984.05)
Investment in Limited Partnerships (211.14) (360.46)
Sale of Long Term Investments (non trade) 40.76 -
Investment in Deposits (399.46) -
Redemption of Deposits - 35.74
Net cash from / (used in) Investing Activities 146.06 (15,120.48)
Consolidated Cash Flow Statement
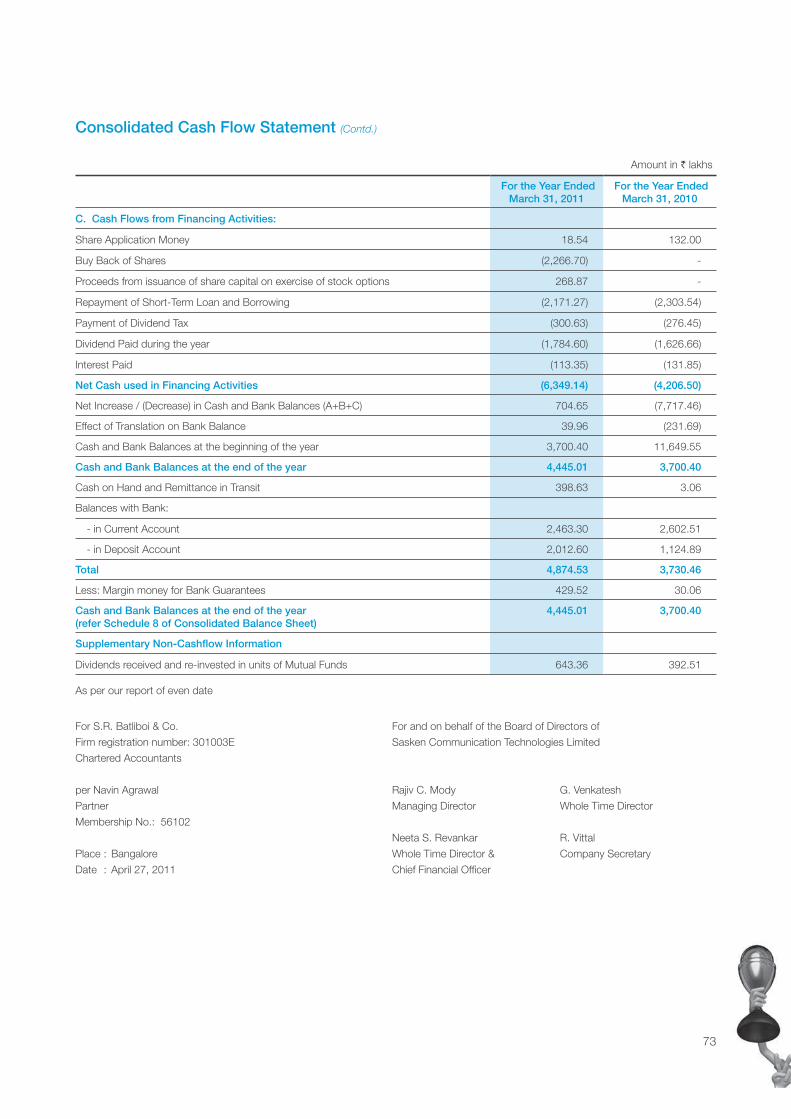
73
Amount in ` lakhs
For the Year Ended March 31, 2011
For the Year Ended March 31, 2010
C. Cash Flows from Financing Activities:
Share Application Money 18.54 132.00
Buy Back of Shares (2,266.70) -
Proceeds from issuance of share capital on exercise of stock options 268.87 -
Repayment of Short-Term Loan and Borrowing (2,171.27) (2,303.54)
Payment of Dividend Tax (300.63) (276.45)
Dividend Paid during the year (1,784.60) (1,626.66)
Interest Paid (113.35) (131.85)
Net Cash used in Financing Activities (6,349.14) (4,206.50)
Net Increase / (Decrease) in Cash and Bank Balances (A+B+C) 704.65 (7,717.46)
Effect of Translation on Bank Balance 39.96 (231.69)
Cash and Bank Balances at the beginning of the year 3,700.40 11,649.55
Cash and Bank Balances at the end of the year 4,445.01 3,700.40
Cash on Hand and Remittance in Transit 398.63 3.06
Balances with Bank:
- in Current Account 2,463.30 2,602.51
- in Deposit Account 2,012.60 1,124.89
Total 4,874.53 3,730.46
Less: Margin money for Bank Guarantees 429.52 30.06
Cash and Bank Balances at the end of the year(refer Schedule 8 of Consolidated Balance Sheet)
4,445.01 3,700.40
Supplementary Non-Cashflow Information
Dividends received and re-invested in units of Mutual Funds 643.36 392.51
As per our report of even date
Consolidated Cash Flow Statement (Contd.)
For S.R. Batliboi & Co. For and on behalf of the Board of Directors of
Firm registration number: 301003E Sasken Communication Technologies Limited
Chartered Accountants
per Navin Agrawal Rajiv C. Mody G. Venkatesh
Partner Managing Director Whole Time Director
Membership No.: 56102
Neeta S. Revankar R. Vittal
Place : Bangalore Whole Time Director & Company Secretary
Date : April 27, 2011 Chief Financial Officer

SASKEN ANNUAL REPORT 2010-1174
Amount in ` lakhs
As at March 31, 2011
As at March 31, 2010
Schedule 1
Share Capital
Authorized Capital
5,00,00,000 Equity Shares of `10 each
(As at March 31, 2010, 5,00,00,000 Equity Shares of `10 each)
5,000.00 5,000.00
Total 5,000.00 5,000.00
Issued, Subscribed and Paid Up Capital
2,76,18,426 Equity Shares of `10 each fully paid up* (As at March 31, 2010, 2,71,11,051 Equity
Shares of `10 each fully paid up) [Refer Note 7 in Notes to Consolidated Accounts]
2,761.84 2,711.11
Less: 14,32,633 Equity Shares of `10 each fully paid up extinguished pursuant to Buy-back Scheme
as at March 31, 2011 (as at March 31, 2010 - Nil) [Refer Note 4(g) in Notes to Consolidated Accounts]
* [Including 56,75,000 Equity Shares of ̀ 10 each alloted as fully paid up Bonus Shares by capitalization
of balance in Profit & Loss Account of `502.83 lakhs and General Reserve of `64.67 lakhs] [As at
March 31, 2010 56,75,000 equity Shares of `10 each]
143.26 -
Total 2,618.58 2,711.11
Schedule 2
Reserves and Surplus
Securities Premium
Opening Balance 14,578.08 29,156.16
Less: Transferred to Business Restructuring Reserve
[Refer Note 4(a) in Notes to Consolidated Accounts]
- 14,578.08
Less: Premium on Equity Shares Bought Back 2,123.44 -
Add: Receipts on exercise of Employee Stock Options 334.57 -
Total 12,789.21 14,578.08
General Reserve
Opening Balance 1,230.26 470.00
Less: Transferred to Capital Redemption Reserve pursuant to Buy-back 143.26 -
Add: Transferred from Profit & Loss Account 896.80 760.26
Total 1,983.80 1,230.26
Capital Redemption Reserve
Opening Balance 144.97 144.97
Add: Transfer from General Reserve 143.26 -
Total 288.23 144.97
Business Restructuring Reserve [Refer Note 4(a) in Notes to Consolidated Accounts]
Opening Balance 13,058.38 -
Add: Transferred from Securities Premium - 14,578.08
Less: Utilized for Restructuring Expense 13,058.38 1,519.70
Total - 13,058.38
Schedules Forming Part of the Consolidated Balance Sheet
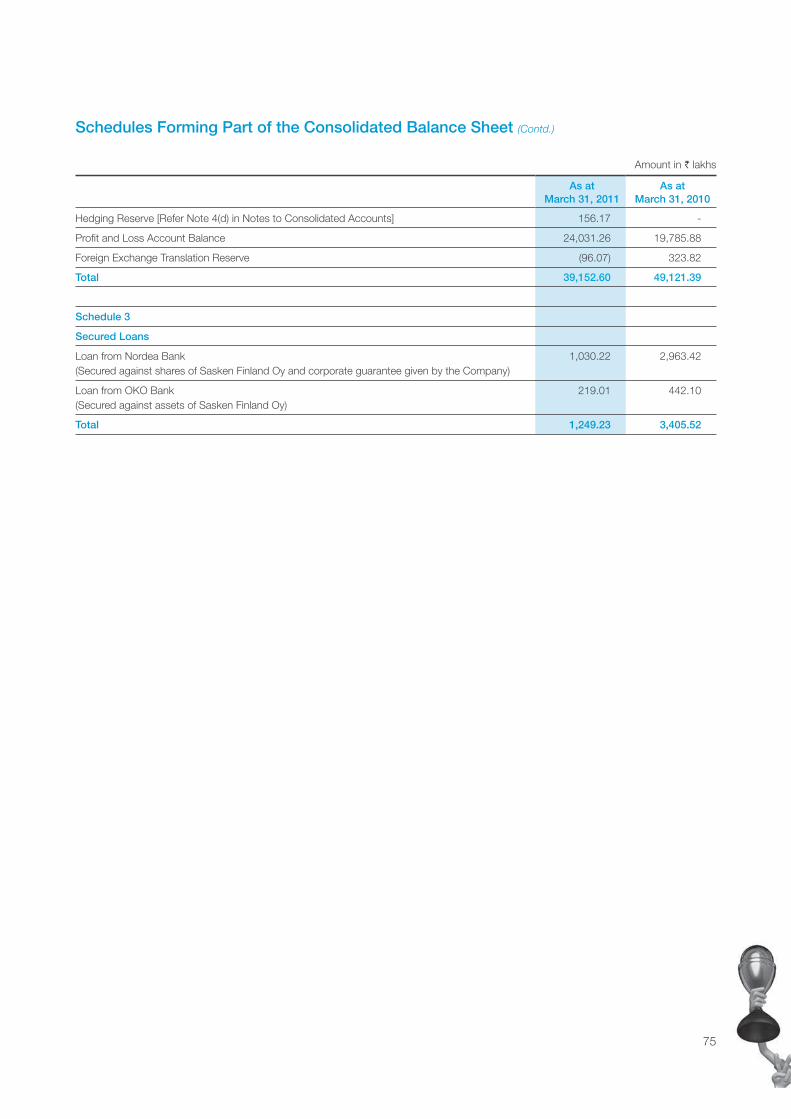
75
Amount in ` lakhs
As at March 31, 2011
As at March 31, 2010
Hedging Reserve [Refer Note 4(d) in Notes to Consolidated Accounts] 156.17 -
Profit and Loss Account Balance 24,031.26 19,785.88
Foreign Exchange Translation Reserve (96.07) 323.82
Total 39,152.60 49,121.39
Schedule 3
Secured Loans
Loan from Nordea Bank (Secured against shares of Sasken Finland Oy and corporate guarantee given by the Company)
1,030.22 2,963.42
Loan from OKO Bank (Secured against assets of Sasken Finland Oy)
219.01 442.10
Total 1,249.23 3,405.52
Schedules Forming Part of the Consolidated Balance Sheet (Contd.)
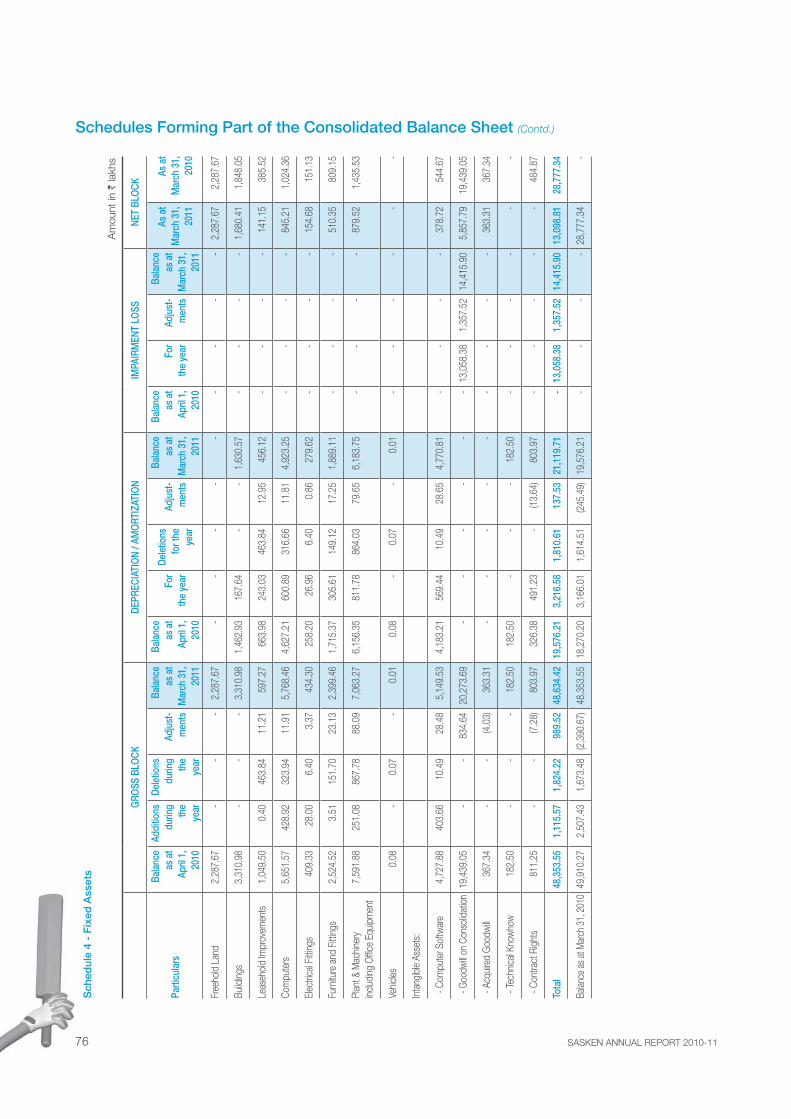
SASKEN ANNUAL REPORT 2010-1176
Schedules Forming Part of the Consolidated Balance Sheet (Contd.)
Sch
edul
e 4
- F
ixed
Ass
ets
Am
ount
in `
lakh
s
GRO
SS B
LOCK
DEPR
ECIA
TIO
N / A
MO
RTIZ
ATIO
NIM
PAIR
MEN
T LO
SSNE
T BL
OCK
Parti
cula
rs
Bala
nce
as a
tAp
ril 1
, 20
10
Addi
tions
durin
g th
eye
ar
Dele
tions
durin
g th
eye
ar
Adju
st-
men
ts
Bala
nce
as a
tM
arch
31,
20
11
Bala
nce
as a
tAp
ril 1
, 20
10
For
the
year
Dele
tions
for t
he
year
Adju
st-
men
ts
Bala
nce
as a
tM
arch
31,
20
11
Bala
nce
as a
tAp
ril 1
, 20
10
For
the
year
Adju
st-
men
ts
Bala
nce
as a
tM
arch
31,
20
11
As a
t M
arch
31,
20
11
As a
t M
arch
31,
20
10
Free
hold
Lan
d2,
287.
67
- -
- 2,
287.
67
- -
- -
- -
- -
- 2,
287.
67
2,28
7.67
Build
ings
3,31
0.98
-
- -
3,31
0.98
1,
462.
93
167.
64
- -
1,6
30.5
7 -
- -
- 1,
680.
41
1,84
8.05
Leas
ehol
d Im
prov
emen
ts1,
049.
50
0.40
46
3.84
11
.21
597.
27
663.
98
243.
03
463.
84
12.
95
456
.12
- -
- -
141.
15
385.
52
Com
pute
rs5,
651.
57
428.
92
323.
94
11.9
1 5,
768.
46
4,62
7.21
60
0.89
31
6.66
11
.81
4,9
23.2
5 -
- -
- 84
5.21
1,
024.
36
Elec
trica
l Fitt
ings
409.
33
28.0
0 6.
40
3.37
43
4.30
25
8.20
26
.96
6.4
0 0.
86
279
.62
- -
- -
154.
68
151.
13
Furn
iture
and
Fitt
ings
2,52
4.52
3.
51
151.
70
23.1
3 2,
399.
46
1,71
5.37
30
5.61
14
9.12
17
.25
1,8
89.1
1 -
- -
- 51
0.35
80
9.15
Plan
t & M
achin
ery
includ
ing O
ffice
Equip
men
t7,
591.
88
251.
08
867.
78
88.0
9 7,
063.
27
6,15
6.35
81
1.78
86
4.03
79
.65
6,1
83.7
5 -
- -
- 87
9.52
1,
435.
53
Vehic
les0.
08
- 0.
07
- 0.
01
0.08
-
0.0
7 -
0.0
1 -
- -
- -
-
Inta
ngib
le As
sets
:
- C
ompu
ter S
oftw
are
4,72
7.88
40
3.66
10
.49
28.4
8 5,
149.
53
4,18
3.21
56
9.44
10
.49
28.6
5 4
,770
.81
- -
- -
378.
72
544.
67
- G
oodw
ill on
Con
solid
ation
19,4
39.0
5 -
- 83
4.64
20
,273
.69
- -
- -
- -
13,0
58.3
8 1,
357.
52
14,4
15.9
0 5,
857.
79
19,4
39.0
5
- A
cquir
ed G
oodw
ill36
7.34
-
- (4
.03)
363.
31
- -
- -
- -
- -
- 36
3.31
36
7.34
- Te
chnic
al Kn
owho
w18
2.50
-
- -
182.
50
182.
50
- -
- 1
82.5
0 -
- -
- -
-
- C
ontra
ct R
ight
s81
1.25
-
- (7
.28)
803.
97
326.
38
491.
23
- (1
3.64
) 8
03.9
7 -
- -
- -
484.
87
Tota
l48
,353
.55
1,11
5.57
1,82
4.22
989.
52
48,6
34.4
219
,576
.21
3,21
6.58
1,81
0.61
137.
53
21,1
19.7
1 -
13,0
58.3
81,
357.
5214
,415
.90
13,0
98.8
128
,777
.34
Balan
ce a
s at M
arch
31,
201
049
,910
.27
2,50
7.43
1,67
3.48
(2,3
90.6
7)48
,353
.55
18,2
70.2
03,
166.
011,
614.
51(2
45.4
9)19
,576
.21
- -
- -
28,7
77.3
4 -

77
Amount in ` lakhs
As at March 31, 2011
As at March 31, 2010
Schedule 5
Investments
A. Long term, Unquoted, Non Trade, at cost
Investment in Omni Capital Fund L.L.P, a Limited Liability Partnership in USA 1,226.23 1,014.42
Fully paid Common Stock of 2Wire Inc, a company incorporated in USA. [As on March 31, 2010 - 14,584 fully paid common stock]
- 83.00
Less: Provision for diminution in value of investment - 83.00
3,92,285 fully paid equity shares of `10/- each of Prime Telesystems Ltd.[As on March 31, 2010 - 3,92,285 fully paid equity shares of `10 each]
240.00 240.00
Less: Provision for diminution in value of investment 240.00 240.00
Fully paid Common shares of Extandon Inc, a company incorporated in USA[As on March 31, 2010 - 2,03,500 fully paid up common shares][Held by third party as collateral]
- 0.23
Less: Provision for diminution in value of investment - 0.23
Investment in JV - TACO Sasken Automotive Electronics Ltd.[also refer Note 3(b) in the Notes to Consolidated Accounts)](i) 52,00,403 equity shares of `10 each, fully paid up(ii) 24,78,000 redeemable preference shares of `10 each, fully paid up
520.04247.80
--
Less: Provision for diminution in value of investment 767.84 -
B. Current - Non Trade, quoted at lower of cost and net realisable value [also refer Note 4(j) in the Notes to Consolidated Accounts]
- Kotak Floater Long Term - Daily Dividend [As at March 31, 2011 - Nil Units]; [Market value - ` Nil] [As at March 31, 2010 - 10,74,359.60 Units of `10.08 each]; [Market value - `108.29 lakhs]
- 108.29
- ICICI Prudential Medium Term Plan Premium Plus Monthly Dividend[As at March 31, 2011 - 55,66,479.94 Units of `10.03 each];[Market Value - `559.05 lakhs] [As at March 31, 2010 - Nil Units]; [Market value - ` Nil]
558.19 -
- DWS Ultra Short-Term Fund - Institutional - Daily Dividend[As at March 31, 2011 - Nil Units]; [Market value - ` Nil] [As at March 31, 2010 - 24,11,846.67 Units of `10.02 each];[Market Value - `241.62 lakhs]
- 241.62
- Kotak Flexi Debt Fund - IP - Daily Dividend[As at March 31, 2011 - Nil Units]; [Market value - ` Nil] [As at March 31, 2010 - 1,51,44,754.59 Units of `10.05 each];[Market Value - `1,521.67 lakhs]
- 1,521.67
- Fortis Money Plus Institutional Plan Daily Dividend [As at March 31, 2011 - Nil Units]; [Market value - ` Nil] [As at March 31, 2010 - 1,64,77,107.23 Units of `10 each];[Market Value - `1,648.22 lakhs]
- 1,648.22
- IDFC Money Manager Fund -TP - Super Institutional Plan C - Daily Dividend [As at March 31, 2011 - Nil Units]; [Market value - ` Nil] [As at March 31, 2010 - 1,05,26,029.52 Units of `10.02 each];[Market Value - `1,054.18 lakhs]
- 1,054.18
- TATA Fixed Maturity Plan Series 26 Scheme C Growth [As at March 31, 2011 - 28,00,000 Units of `10 each]; [Market Value - `290.95 lakhs] [As at March 31, 2010 - Nil Units]; [Market value - ` Nil]
280.00 -
- UTI Treasury Advantage Fund - Institutional Plan (Daily Dividend Option) - Reinvest[As at March 31, 2011 - Nil Units]; [Market value - ` Nil] [As at March 31, 2010 - 71,440.63 Units of `1,000.21 each];[Market Value - `714.56 lakhs]
- 714.56
Schedules Forming Part of the Consolidated Balance Sheet (Contd.)
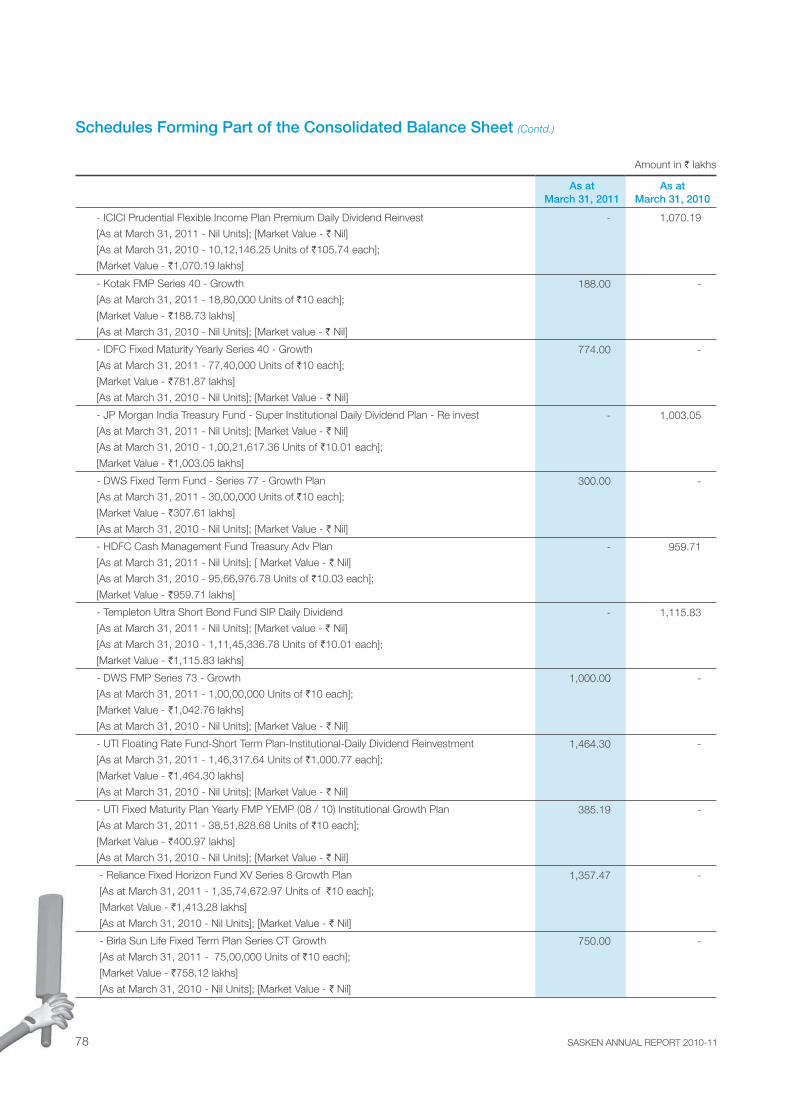
SASKEN ANNUAL REPORT 2010-1178
Amount in ` lakhs
As at March 31, 2011
As at March 31, 2010
- ICICI Prudential Flexible Income Plan Premium Daily Dividend Reinvest
[As at March 31, 2011 - Nil Units]; [Market Value - ` Nil]
[As at March 31, 2010 - 10,12,146.25 Units of `105.74 each];
[Market Value - `1,070.19 lakhs]
- 1,070.19
- Kotak FMP Series 40 - Growth
[As at March 31, 2011 - 18,80,000 Units of `10 each];
[Market Value - `188.73 lakhs]
[As at March 31, 2010 - Nil Units]; [Market value - ` Nil]
188.00 -
- IDFC Fixed Maturity Yearly Series 40 - Growth
[As at March 31, 2011 - 77,40,000 Units of `10 each];
[Market Value - `781.87 lakhs]
[As at March 31, 2010 - Nil Units]; [Market Value - ` Nil]
774.00 -
- JP Morgan India Treasury Fund - Super Institutional Daily Dividend Plan - Re invest
[As at March 31, 2011 - Nil Units]; [Market Value - ` Nil]
[As at March 31, 2010 - 1,00,21,617.36 Units of `10.01 each];
[Market Value - `1,003.05 lakhs]
- 1,003.05
- DWS Fixed Term Fund - Series 77 - Growth Plan
[As at March 31, 2011 - 30,00,000 Units of `10 each];
[Market Value - `307.61 lakhs]
[As at March 31, 2010 - Nil Units]; [Market Value - ` Nil]
300.00 -
- HDFC Cash Management Fund Treasury Adv Plan
[As at March 31, 2011 - Nil Units]; [ Market Value - ` Nil]
[As at March 31, 2010 - 95,66,976.78 Units of `10.03 each];
[Market Value - `959.71 lakhs]
- 959.71
- Templeton Ultra Short Bond Fund SIP Daily Dividend
[As at March 31, 2011 - Nil Units]; [Market value - ` Nil]
[As at March 31, 2010 - 1,11,45,336.78 Units of `10.01 each];
[Market Value - `1,115.83 lakhs]
- 1,115.83
- DWS FMP Series 73 - Growth
[As at March 31, 2011 - 1,00,00,000 Units of `10 each];
[Market Value - `1,042.76 lakhs]
[As at March 31, 2010 - Nil Units]; [Market Value - ` Nil]
1,000.00 -
- UTI Floating Rate Fund-Short Term Plan-Institutional-Daily Dividend Reinvestment
[As at March 31, 2011 - 1,46,317.64 Units of `1,000.77 each];
[Market Value - `1,464.30 lakhs]
[As at March 31, 2010 - Nil Units]; [Market Value - ` Nil]
1,464.30 -
- UTI Fixed Maturity Plan Yearly FMP YEMP (08 / 10) Institutional Growth Plan
[As at March 31, 2011 - 38,51,828.68 Units of `10 each];
[Market Value - `400.97 lakhs]
[As at March 31, 2010 - Nil Units]; [Market Value - ` Nil]
385.19 -
- Reliance Fixed Horizon Fund XV Series 8 Growth Plan
[As at March 31, 2011 - 1,35,74,672.97 Units of `10 each];
[Market Value - `1,413.28 lakhs]
[As at March 31, 2010 - Nil Units]; [Market Value - ` Nil]
1,357.47 -
- Birla Sun Life Fixed Term Plan Series CT Growth
[As at March 31, 2011 - 75,00,000 Units of `10 each];
[Market Value - `758.12 lakhs]
[As at March 31, 2010 - Nil Units]; [Market Value - ` Nil]
750.00 -
Schedules Forming Part of the Consolidated Balance Sheet (Contd.)

79
Amount in ` lakhs
As at March 31, 2011
As at March 31, 2010
- Kotak FMP Series 33 - Growth [As at March 31, 2011 - 24,00,000 Units of `10 each]; [Market Value - `242.96 lakhs] [As at March 31, 2010 - Nil Units]; [Market Value - ` Nil]
240.00 -
- JM Money Manager Fund - Super Plan Daily Dividend [As at March 31, 2011 - 74,88,558.98 Units of `10.01 each]; [Market Value - `749.74 lakhs] [As at March 31, 2010 - Nil Units]; [Market Value - ` Nil]
749.74 -
- Canara Robeco Treasury Advantage Super Inst (DDR) [As at March 31, 2011 - 86,01,488.46 Units of `12.41 each]; [Market Value - `1,067.20 lakhs] [As at March 31, 2010 - Nil Units]; [Market Value - ` Nil]
1,067.20 -
- Birla Sun Life Fixed Term Plan Series CQ Growth [As at March 31, 2011 - 47,60,000 Units of `10 each]; [Market Value - `483.00 lakhs] [As at March 31, 2010 - Nil Units]; [Market Value - ` Nil]
476.00 -
- Kotak FMP Series 29 - Growth [As at March 31, 2011 - 40,00,000 Units of `10 each]; [Market Value - `406.44 lakhs] [As at March 31, 2010 - Nil Units]; [Market Value - ` Nil]
400.00 -
- Birla Sun Life Fixed Term Plan Series CO Growth [As at March 31, 2011 - 25,71,268.57 Units of `10 each]; [Market Value - `261.44 lakhs] [As at March 31, 2010 - Nil Units]; [Market Value - ` Nil]
257.13 -
- HDFC High Interest Fund - Short Term Plan - Dividend [As at March 31, 2011 - Nil Units]; [Market Value - ` Nil] [As at March 31, 2010 - 80,64,745.25 Units of `10.59 each]; [Market Value - `855.12 lakhs]
- 854.18
- Tata Floater Fund Daily Dividend [As at March 31, 2011 - 1,65,80,449.62 Units of `10.04 each]; [Market Value - `1,663.95 lakhs] [As at March 31, 2010 - Nil Units]; [Market Value - ` Nil]
1,663.95 -
- Birla Sunlife Savings Fund - Institutional - Growth [As at March 31, 2011 - 80,586 Units of `18.08 each]; [Market Value - `6.88 lakhs] [As at March 31, 2010 - 1,15,518 Units of `17.34 each]; [Market Value - `10.09 lakhs]
6.67 10.01
- Reliance Money Manager Fund - Short Term - Daily Dividend Plan [As at March 31, 2011 - Nil Units]; [Market Value - ` Nil] [As at March 31, 2010 - 1,33,268.77 Units of `1,001.34 each ]; [Market Value - `1,334.47 lakhs]
- 1,334.47
- Reliance Fixed Horizon Fund XVII Series 1 Growth Plan [As at March 31, 2011 - 40,00,000 Units of `10 each]; [Market Value - `410.04 lakhs] [As at March 31, 2010 - Nil Units]; [Market Value - ` Nil]
400.00 -
- ICICI Prudential Fund Half Yearly Interval Plan 1- Institutional Dividend [As at March 31, 2011 - 51,68,206.57 Units of `10 each]; [Market Value - `517.75 lakhs] [As at March 31, 2010 - Nil Units]; [Market Value - ` Nil]
516.88 -
Schedules Forming Part of the Consolidated Balance Sheet (Contd.)
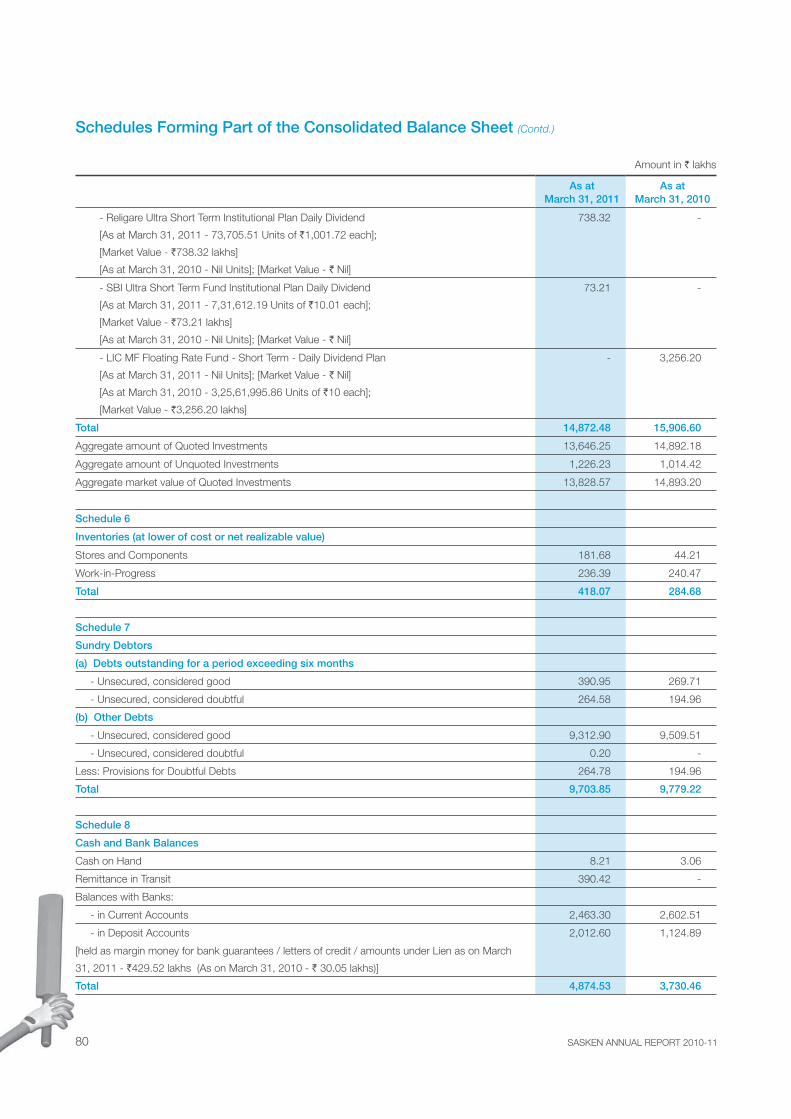
SASKEN ANNUAL REPORT 2010-1180
Amount in ` lakhs
As at March 31, 2011
As at March 31, 2010
- Religare Ultra Short Term Institutional Plan Daily Dividend
[As at March 31, 2011 - 73,705.51 Units of `1,001.72 each];
[Market Value - `738.32 lakhs]
[As at March 31, 2010 - Nil Units]; [Market Value - ` Nil]
738.32 -
- SBI Ultra Short Term Fund Institutional Plan Daily Dividend
[As at March 31, 2011 - 7,31,612.19 Units of `10.01 each];
[Market Value - `73.21 lakhs]
[As at March 31, 2010 - Nil Units]; [Market Value - ` Nil]
73.21 -
- LIC MF Floating Rate Fund - Short Term - Daily Dividend Plan
[As at March 31, 2011 - Nil Units]; [Market Value - ` Nil]
[As at March 31, 2010 - 3,25,61,995.86 Units of `10 each];
[Market Value - `3,256.20 lakhs]
- 3,256.20
Total 14,872.48 15,906.60
Aggregate amount of Quoted Investments 13,646.25 14,892.18
Aggregate amount of Unquoted Investments 1,226.23 1,014.42
Aggregate market value of Quoted Investments 13,828.57 14,893.20
Schedule 6
Inventories (at lower of cost or net realizable value)
Stores and Components 181.68 44.21
Work-in-Progress 236.39 240.47
Total 418.07 284.68
Schedule 7
Sundry Debtors
(a) Debts outstanding for a period exceeding six months
- Unsecured, considered good 390.95 269.71
- Unsecured, considered doubtful 264.58 194.96
(b) Other Debts
- Unsecured, considered good 9,312.90 9,509.51
- Unsecured, considered doubtful 0.20 -
Less: Provisions for Doubtful Debts 264.78 194.96
Total 9,703.85 9,779.22
Schedule 8
Cash and Bank Balances
Cash on Hand 8.21 3.06
Remittance in Transit 390.42 -
Balances with Banks:
- in Current Accounts 2,463.30 2,602.51
- in Deposit Accounts 2,012.60 1,124.89
[held as margin money for bank guarantees / letters of credit / amounts under Lien as on March
31, 2011 - `429.52 lakhs (As on March 31, 2010 - ` 30.05 lakhs)]
Total 4,874.53 3,730.46
Schedules Forming Part of the Consolidated Balance Sheet (Contd.)
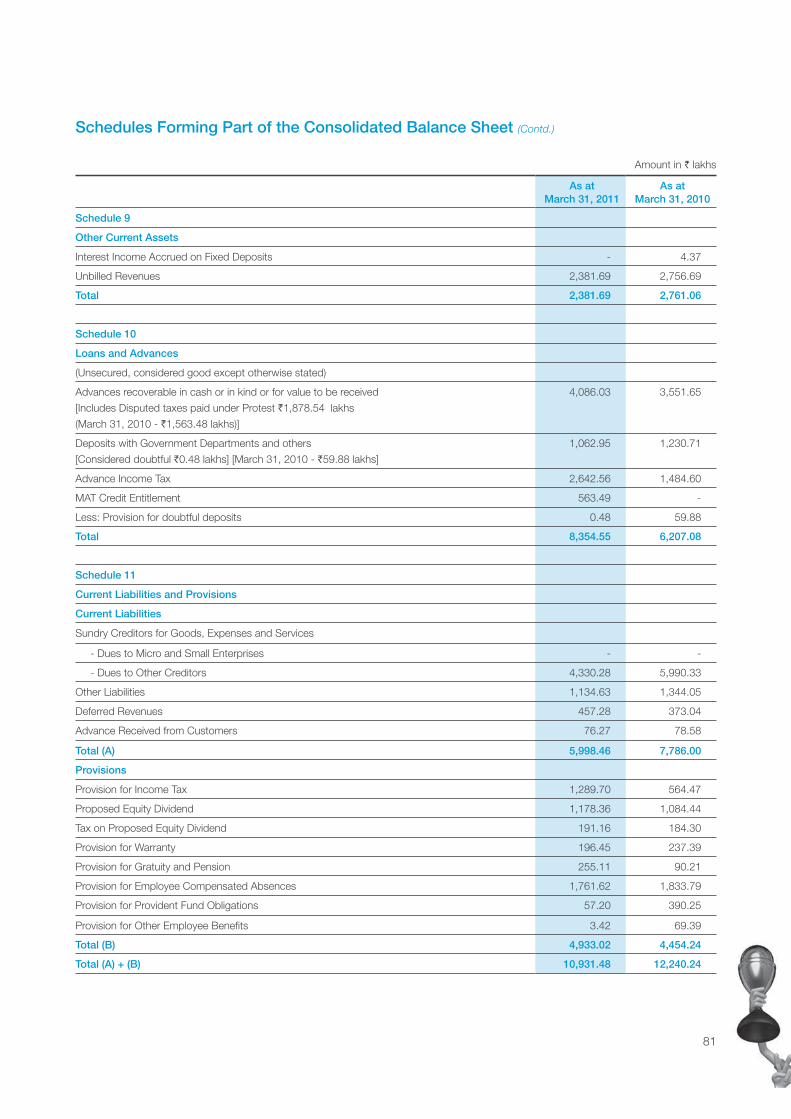
81
Amount in ` lakhs
As at March 31, 2011
As at March 31, 2010
Schedule 9
Other Current Assets
Interest Income Accrued on Fixed Deposits - 4.37
Unbilled Revenues 2,381.69 2,756.69
Total 2,381.69 2,761.06
Schedule 10
Loans and Advances
(Unsecured, considered good except otherwise stated)
Advances recoverable in cash or in kind or for value to be received
[Includes Disputed taxes paid under Protest `1,878.54 lakhs
(March 31, 2010 - `1,563.48 lakhs)]
4,086.03 3,551.65
Deposits with Government Departments and others
[Considered doubtful `0.48 lakhs] [March 31, 2010 - `59.88 lakhs]
1,062.95 1,230.71
Advance Income Tax 2,642.56 1,484.60
MAT Credit Entitlement 563.49 -
Less: Provision for doubtful deposits 0.48 59.88
Total 8,354.55 6,207.08
Schedule 11
Current Liabilities and Provisions
Current Liabilities
Sundry Creditors for Goods, Expenses and Services
- Dues to Micro and Small Enterprises - -
- Dues to Other Creditors 4,330.28 5,990.33
Other Liabilities 1,134.63 1,344.05
Deferred Revenues 457.28 373.04
Advance Received from Customers 76.27 78.58
Total (A) 5,998.46 7,786.00
Provisions
Provision for Income Tax 1,289.70 564.47
Proposed Equity Dividend 1,178.36 1,084.44
Tax on Proposed Equity Dividend 191.16 184.30
Provision for Warranty 196.45 237.39
Provision for Gratuity and Pension 255.11 90.21
Provision for Employee Compensated Absences 1,761.62 1,833.79
Provision for Provident Fund Obligations 57.20 390.25
Provision for Other Employee Benefits 3.42 69.39
Total (B) 4,933.02 4,454.24
Total (A) + (B) 10,931.48 12,240.24
Schedules Forming Part of the Consolidated Balance Sheet (Contd.)

SASKEN ANNUAL REPORT 2010-1182
Amount in ` lakhs
For the Year Ended March 31, 2011
For the Year Ended March 31, 2010
Schedule 12
Cost of Revenues
Salaries & Bonus 26,169.13 28,654.14
Contribution to Provident and Other Funds 2,128.05 2,035.34
Staff Welfare 276.03 290.10
Recruitment and Relocation 283.29 74.17
Rent 2,160.82 2,447.73
Repairs and Maintenance:
- Plant & Machinery 345.73 373.14
- Building 277.11 269.77
- Others 162.51 144.51
Communication Expenses 481.97 693.68
Travel Expenses 1,353.23 1,238.94
Electricity and Water Charges 602.60 633.78
Professional & Consultancy Charges 862.14 882.16
Depreciation 2,480.60 2,773.91
Contract Staff Cost 1,031.98 1,505.10
Software Expenses 121.29 234.10
Training and Conference Expenses 143.31 31.44
Warranty Expenses 78.71 198.90
Miscellaneous Expenses 278.16 177.32
Commission 68.00 106.32
Doubtful Deposits / Advances Written off 22.03 36.00
Provision for Doubtful Deposits / Advances / (Reversals) (59.88) 23.88
Materials and Consumables 361.43 60.58
Provision for Onerous Contract (Refer Note 13 in Notes to Consolidated Accounts) 60.38 2.01
Sub Total 39,688.62 42,887.02
Amortization of Technical Knowhow 491.23 213.06
Add: Opening Balance of Work in Progress 240.47 59.53
Less: Closing Balance of Work in Progress 236.39 240.47
Total 40,183.93 42,919.14
Schedule 13
Research and Development Expenses
[Refer Note 10 in Notes to Consolidated Accounts]
Salaries & Bonus 2.77 -
Contribution to Provident and Other Funds 0.17 -
Professional & Consultancy Charges 6.00 -
Total 8.94 -
Schedules Forming Part of the Consolidated Profit and Loss Account

83
Amount in ` lakhs
For the Year Ended March 31, 2011
For the Year Ended March 31, 2010
Schedule 14
Selling and Marketing Expenses
Salaries & Bonus 1,206.26 926.16
Contribution to Provident and Other Funds 67.40 53.62
Staff Welfare 18.76 10.72
Recruitment and Relocation 25.01 0.59
Rent 27.17 26.89
Repairs and Maintenance:
- Plant & Machinery 2.46 3.17
- Building 6.19 3.85
- Others 0.81 4.94
Communication Expenses 26.56 35.78
Travel Expenses 269.02 194.34
Electricity and Water Charges 5.54 5.33
Professional, Legal & Consultancy Charges 68.70 30.79
Selling Expenses - others 112.63 48.73
Depreciation 23.92 30.75
Training and Conference Expenses 1.64 15.28
Bad Debts (net of recoveries) (4.93) 629.95
Doubtful Debts Provided / (Reversed), net 69.82 (616.30)
Miscellaneous Expenses 9.40 -
Total 1,936.36 1,404.59
Schedule 15
Administrative and General Expenses
Salaries & Bonus 2,891.51 2,589.31
Contribution to Provident and Other Funds 205.21 170.69
Staff Welfare 249.22 165.81
Recruitment and Relocation 108.24 59.17
Rent 256.82 344.58
Rates and Taxes 133.35 210.55
Repairs and Maintenance:
- Plant & Machinery 74.43 112.76
- Building 49.91 77.57
- Others 53.42 47.03
Communication Expenses 139.39 110.10
Travel Expenses 160.14 191.71
Electricity and Water Charges 90.11 69.94
Carried over 4,411.75 4,149.22
Schedules Forming Part of the Consolidated Profit and Loss Account (Contd.)
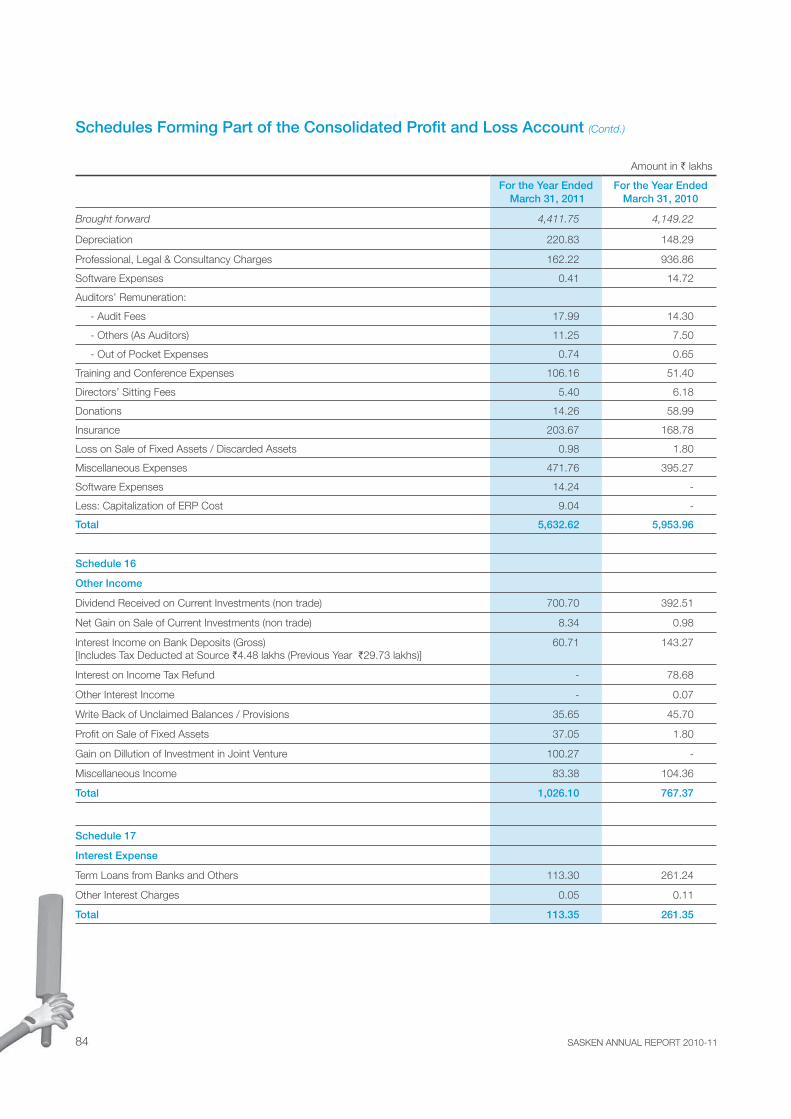
SASKEN ANNUAL REPORT 2010-1184
Amount in ` lakhs
For the Year Ended March 31, 2011
For the Year Ended March 31, 2010
Brought forward 4,411.75 4,149.22
Depreciation 220.83 148.29
Professional, Legal & Consultancy Charges 162.22 936.86
Software Expenses 0.41 14.72
Auditors’ Remuneration:
- Audit Fees 17.99 14.30
- Others (As Auditors) 11.25 7.50
- Out of Pocket Expenses 0.74 0.65
Training and Conference Expenses 106.16 51.40
Directors’ Sitting Fees 5.40 6.18
Donations 14.26 58.99
Insurance 203.67 168.78
Loss on Sale of Fixed Assets / Discarded Assets 0.98 1.80
Miscellaneous Expenses 471.76 395.27
Software Expenses 14.24 -
Less: Capitalization of ERP Cost 9.04 -
Total 5,632.62 5,953.96
Schedule 16
Other Income
Dividend Received on Current Investments (non trade) 700.70 392.51
Net Gain on Sale of Current Investments (non trade) 8.34 0.98
Interest Income on Bank Deposits (Gross) [Includes Tax Deducted at Source `4.48 lakhs (Previous Year `29.73 lakhs)]
60.71 143.27
Interest on Income Tax Refund - 78.68
Other Interest Income - 0.07
Write Back of Unclaimed Balances / Provisions 35.65 45.70
Profit on Sale of Fixed Assets 37.05 1.80
Gain on Dillution of Investment in Joint Venture 100.27 -
Miscellaneous Income 83.38 104.36
Total 1,026.10 767.37
Schedule 17
Interest Expense
Term Loans from Banks and Others 113.30 261.24
Other Interest Charges 0.05 0.11
Total 113.35 261.35
Schedules Forming Part of the Consolidated Profit and Loss Account (Contd.)
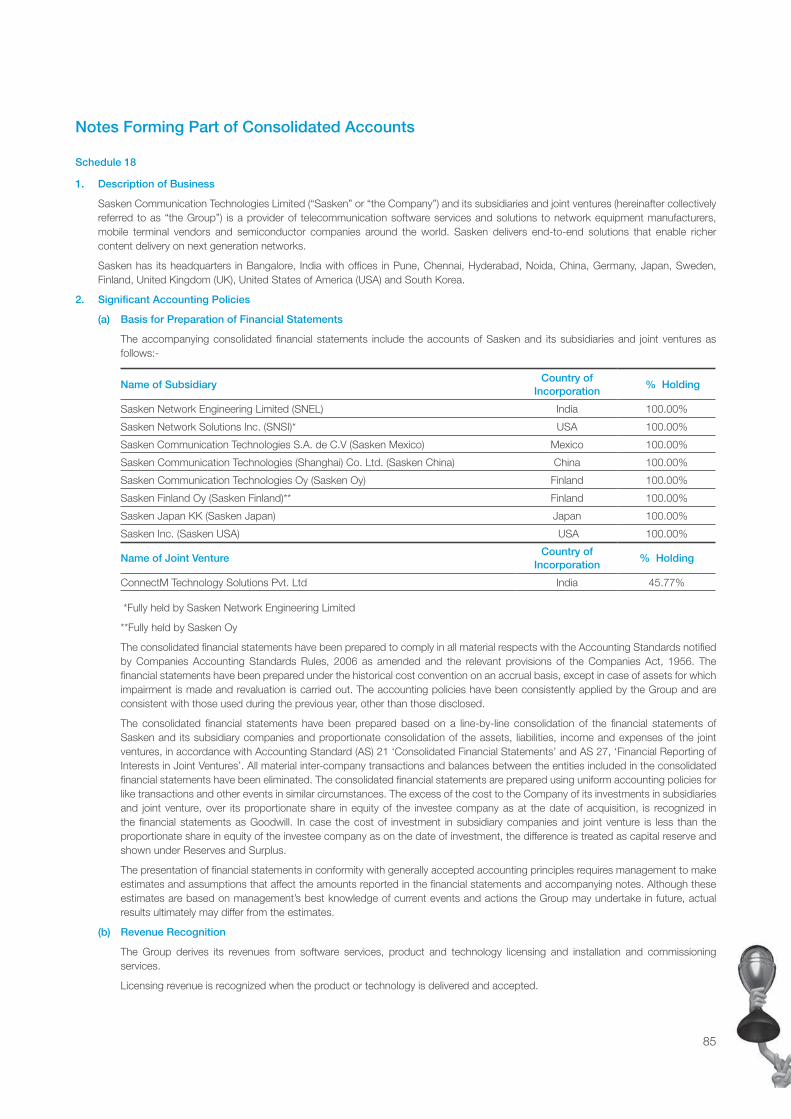
85
Schedule 18
1. Description of Business
Sasken Communication Technologies Limited (“Sasken” or “the Company”) and its subsidiaries and joint ventures (hereinafter collectively referred to as “the Group”) is a provider of telecommunication software services and solutions to network equipment manufacturers, mobile terminal vendors and semiconductor companies around the world. Sasken delivers end-to-end solutions that enable richer content delivery on next generation networks.
Sasken has its headquarters in Bangalore, India with offices in Pune, Chennai, Hyderabad, Noida, China, Germany, Japan, Sweden, Finland, United Kingdom (UK), United States of America (USA) and South Korea.
2. Significant Accounting Policies
(a) Basis for Preparation of Financial Statements
The accompanying consolidated financial statements include the accounts of Sasken and its subsidiaries and joint ventures as follows:-
Name of SubsidiaryCountry of
Incorporation % Holding
Sasken Network Engineering Limited (SNEL) India 100.00%
Sasken Network Solutions Inc. (SNSI)* USA 100.00%
Sasken Communication Technologies S.A. de C.V (Sasken Mexico) Mexico 100.00%
Sasken Communication Technologies (Shanghai) Co. Ltd. (Sasken China) China 100.00%
Sasken Communication Technologies Oy (Sasken Oy) Finland 100.00%
Sasken Finland Oy (Sasken Finland)** Finland 100.00%
Sasken Japan KK (Sasken Japan) Japan 100.00%
Sasken Inc. (Sasken USA) USA 100.00%
Name of Joint VentureCountry of
Incorporation% Holding
ConnectM Technology Solutions Pvt. Ltd India 45.77%
*Fully held by Sasken Network Engineering Limited
**Fully held by Sasken Oy
The consolidated financial statements have been prepared to comply in all material respects with the Accounting Standards notified by Companies Accounting Standards Rules, 2006 as amended and the relevant provisions of the Companies Act, 1956. The financial statements have been prepared under the historical cost convention on an accrual basis, except in case of assets for which impairment is made and revaluation is carried out. The accounting policies have been consistently applied by the Group and are consistent with those used during the previous year, other than those disclosed.
The consolidated financial statements have been prepared based on a line-by-line consolidation of the financial statements of Sasken and its subsidiary companies and proportionate consolidation of the assets, liabilities, income and expenses of the joint ventures, in accordance with Accounting Standard (AS) 21 ‘Consolidated Financial Statements’ and AS 27, ‘Financial Reporting of Interests in Joint Ventures’. All material inter-company transactions and balances between the entities included in the consolidated financial statements have been eliminated. The consolidated financial statements are prepared using uniform accounting policies for like transactions and other events in similar circumstances. The excess of the cost to the Company of its investments in subsidiaries and joint venture, over its proportionate share in equity of the investee company as at the date of acquisition, is recognized in the financial statements as Goodwill. In case the cost of investment in subsidiary companies and joint venture is less than the proportionate share in equity of the investee company as on the date of investment, the difference is treated as capital reserve and shown under Reserves and Surplus.
The presentation of financial statements in conformity with generally accepted accounting principles requires management to make estimates and assumptions that affect the amounts reported in the financial statements and accompanying notes. Although these estimates are based on management’s best knowledge of current events and actions the Group may undertake in future, actual results ultimately may differ from the estimates.
(b) Revenue Recognition
The Group derives its revenues from software services, product and technology licensing and installation and commissioning services.
Licensing revenue is recognized when the product or technology is delivered and accepted.
Notes Forming Part of Consolidated Accounts
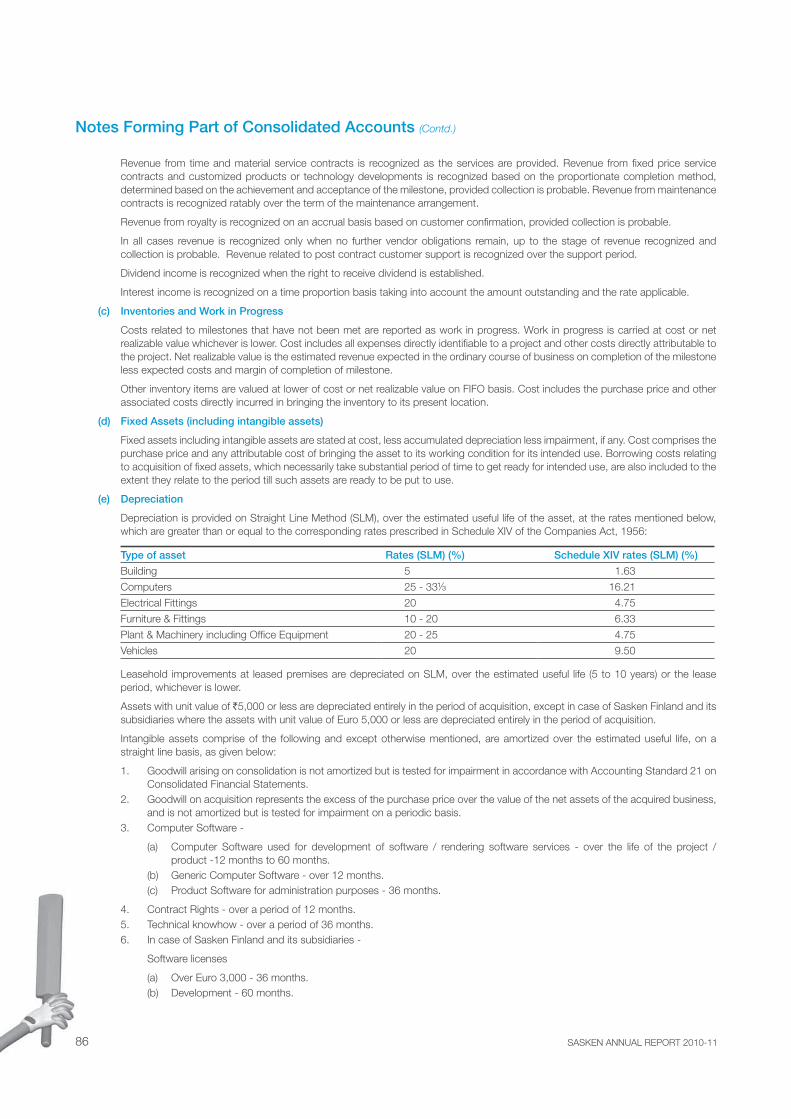
SASKEN ANNUAL REPORT 2010-1186
Revenue from time and material service contracts is recognized as the services are provided. Revenue from fixed price service contracts and customized products or technology developments is recognized based on the proportionate completion method, determined based on the achievement and acceptance of the milestone, provided collection is probable. Revenue from maintenance contracts is recognized ratably over the term of the maintenance arrangement.
Revenue from royalty is recognized on an accrual basis based on customer confirmation, provided collection is probable.
In all cases revenue is recognized only when no further vendor obligations remain, up to the stage of revenue recognized and collection is probable. Revenue related to post contract customer support is recognized over the support period.
Dividend income is recognized when the right to receive dividend is established.
Interest income is recognized on a time proportion basis taking into account the amount outstanding and the rate applicable.
(c) Inventories and Work in Progress
Costs related to milestones that have not been met are reported as work in progress. Work in progress is carried at cost or net realizable value whichever is lower. Cost includes all expenses directly identifiable to a project and other costs directly attributable to the project. Net realizable value is the estimated revenue expected in the ordinary course of business on completion of the milestone less expected costs and margin of completion of milestone.
Other inventory items are valued at lower of cost or net realizable value on FIFO basis. Cost includes the purchase price and other associated costs directly incurred in bringing the inventory to its present location.
(d) Fixed Assets (including intangible assets)
Fixed assets including intangible assets are stated at cost, less accumulated depreciation less impairment, if any. Cost comprises the purchase price and any attributable cost of bringing the asset to its working condition for its intended use. Borrowing costs relating to acquisition of fixed assets, which necessarily take substantial period of time to get ready for intended use, are also included to the extent they relate to the period till such assets are ready to be put to use.
(e) Depreciation
Depreciation is provided on Straight Line Method (SLM), over the estimated useful life of the asset, at the rates mentioned below, which are greater than or equal to the corresponding rates prescribed in Schedule XIV of the Companies Act, 1956:
Type of asset Rates (SLM) (%) Schedule XIV rates (SLM) (%)
Building 5 1.63
Computers 25 - 33 16.21
Electrical Fittings 20 4.75
Furniture & Fittings 10 - 20 6.33
Plant & Machinery including Office Equipment 20 - 25 4.75
Vehicles 20 9.50
Leasehold improvements at leased premises are depreciated on SLM, over the estimated useful life (5 to 10 years) or the lease period, whichever is lower.
Assets with unit value of `5,000 or less are depreciated entirely in the period of acquisition, except in case of Sasken Finland and its subsidiaries where the assets with unit value of Euro 5,000 or less are depreciated entirely in the period of acquisition.
Intangible assets comprise of the following and except otherwise mentioned, are amortized over the estimated useful life, on a straight line basis, as given below:
1. Goodwill arising on consolidation is not amortized but is tested for impairment in accordance with Accounting Standard 21 on Consolidated Financial Statements.
2. Goodwill on acquisition represents the excess of the purchase price over the value of the net assets of the acquired business, and is not amortized but is tested for impairment on a periodic basis.
3. Computer Software -
(a) Computer Software used for development of software / rendering software services - over the life of the project / product -12 months to 60 months.
(b) Generic Computer Software - over 12 months. (c) Product Software for administration purposes - 36 months.
4. Contract Rights - over a period of 12 months. 5. Technical knowhow - over a period of 36 months. 6. In case of Sasken Finland and its subsidiaries -
Software licenses
(a) Over Euro 3,000 - 36 months. (b) Development - 60 months.
Notes Forming Part of Consolidated Accounts (Contd.)
87
(f) Capitalization and Amortization of Software Products
Costs incurred during the research phase are expensed off as period costs. Costs incurred towards development of computer software products meant for sale, lease or otherwise marketed, are capitalized subsequent to establishing the technological feasibility. The costs are expensed as period costs, if the technological feasibility is not established. Capitalization ceases when the product is available for general release to customers. Capitalized software product costs are amortized on a straight line method over the remaining estimated economic life of the product. The unamortized cost of capitalized software products is carried at cost, less accumulated amortization less impairment, if any.
(g) Investments
Investments that are readily realizable and intended to be held for not more than a year are classified as current investments. All other investments are classified as long-term investments. Current investments are carried at lower of cost and net realizable value determined on an individual investment basis. Long-term investments are carried at cost. However, provision for diminution in value is made to recognize a decline other than temporary in the value of the investments.
(h) Foreign Currency Transactions
(i) Initial Recognition - Foreign currency transactions are recorded in the reporting currency, by applying to the foreign currency amount the exchange rate between the reporting currency and the foreign currency approximately at the date of the transaction.
(ii) Conversion - Foreign currency monetary items are reported using the closing rate. Non-monetary items, which are carried in terms of historical cost denominated in a foreign currency, are reported using the exchange rate at the date of the transaction.
(iii) Exchange Differences - Exchange differences arising on the settlement of monetary items or on reporting such monetary items of Company at rates different from those at which they were initially recorded during the year, or reported in previous financial statements, are recognized as income or as expenses in the year in which they arise.
(iv) Translation of Integral and Non-integral foreign operation - The financial statements of an integral foreign operation are translated as if the transactions of the foreign operation have been those of the Group itself.
In translating the financial statements of a non-integral foreign operation for incorporation in financial statements, the assets and liabilities, both monetary and non-monetary, of the non-integral foreign operation are translated at the closing rate; income and expense items of the non-integral foreign operation are translated at exchange rates at the dates of the transactions; and all resulting exchange differences are accumulated in a foreign currency translation reserve until the disposal of the net investment.
On disposal of a non-integral foreign operation, the cumulative amount of the exchange difference which have been deferred and which relate to that operation are recognized as income or expense in the same period in which the gain or loss on disposal is recognized. Where there is a change in the classification of a foreign operation, the translation procedures applicable to the revised classification are applied from the date of the change in the classification.
(i) Employee Benefits
(i) Gratuity
The Group provides for gratuity, a defined benefit plan covering all eligible employees. The plan provides a lump sum payment to eligible employees at retirement or on termination of employment based on the salary of the respective employee and the years of employment with the Company.
The Company contributes to a gratuity fund maintained by an insurance company. The amount of contribution is determined based upon actuarial valuations as at the year end. Such contributions are charged off to the Profit & Loss Account. Provision is made for the shortfall between the actuarial valuation carried out as at the Balance Sheet date, as per Projected Unit Credit Method and the funded balance with the insurance company.
(ii) Provident Fund
Employees other than the employees at foreign branches and foreign subsidiaries are also eligible to receive Provident Fund benefits through a defined benefit plan in which both employee and employer make monthly contributions to the plan. The Company has established a Provident Fund Trust to which contributions towards provident fund are made each month. The Provident Fund Trust guarantees a specified rate of return on such contributions on a periodical basis. The Company will meet the shortfall in the return, if any, which is provided for based on actuarial valuation, carried out as at the Balance Sheet date, as per Projected Unit Credit Method. Contributions towards Provident Fund are charged to the Profit & Loss Account on an accrual basis.
In case of Germany branch, pension contributions are made as per the local laws and regulations. The Company provides for pension benefits, a defined benefit plan, covering all eligible employees. The plan provides for various pension benefits to eligible employees at retirement or on termination of employment based on earnings of the respective employee and the year of employment with the Company. The Company contributes to a reinsured support fund maintained by an external agency. The contributions made by the employer are charged to the Profit and Loss Account on accrual basis. Provision is made for the shortfall between the actuarial valuation carried out as at the Balance Sheet date, as per the projected unit credit method and funded balance.
Notes Forming Part of Consolidated Accounts (Contd.)

SASKEN ANNUAL REPORT 2010-1188
For other overseas branches and subsidiary companies, contributions are made as per the respective country laws and regulations. The same is charged to the Profit and Loss Account on an accrual basis. There are no obligations beyond the respective entity’s contributions.
(iii) Compensated absences Short-term compensated absences are provided based on estimates. Long-term compensated absences are provided for
based on actuarial valuation, done as per projected unit cost method, as at Balance Sheet date.
(iv) Superannuation The Company contributes to a superannuation scheme maintained by an insurance company. Such contributions are charged
to the Profit and Loss Account on an accrual basis. The Company has no other obligations beyond its monthly contributions.
(v) Actuarial gains / losses The actuarial gains / losses on the employee benefits are immediately recognized in the Profit and Loss Account and are not
deferred.
(j) Impairment of Assets
(i) The carrying amounts of assets are reviewed at each Balance Sheet date if there is any indication of impairment based on internal / external factors. An impairment loss is recognized wherever the carrying amount of an asset exceeds its recoverable amount. The recoverable amount is the greater of the asset’s net selling price and value in use based on best estimate. In assessing value in use, the estimated future cash flows are discounted to their present value using a pre-tax discount rate that reflects current market assessments of the time value of money and risks specific to the asset.
(ii) After impairment, depreciation is provided on the revised carrying amount of the assets over its remaining useful life.
(iii) A previously recognized impairment loss is increased or reversed depending on changes in circumstances. However, the carrying value after reversal is not increased beyond the carrying value that would have prevailed by charging usual depreciation if there was no impairment.
(k) Warranty
The Group provides for the estimated costs, based on analysis of past trends and nature of services rendered, which may be incurred under free warranties provided with licensing and service contracts.
(l) Research and Development
Research costs are expensed as incurred. Development expenditure incurred on an individual project is carried forward when its future recoverability can reasonably be regarded as assured. Equipment or facilities that are acquired or constructed for research and development activities, which have alternative future uses are capitalized as tangible assets. Depreciation on such assets, during research phase is charged to expense as research and development costs.
(m) Income Taxes
Tax expense comprises of current and deferred tax. Current income tax is measured at the amount expected to be paid to the tax authorities in accordance with tax laws applicable to the respective jurisdictions. Deferred income taxes reflect the impact of current year timing differences between taxable income and accounting income for the year and reversal of timing differences of earlier years.
Deferred tax is measured based on the tax rates and the tax laws enacted or substantively enacted at the Balance Sheet date. Deferred tax assets and deferred tax liabilities across various countries of operation are not set off against each other as the Group does not have a legal right to do so. Deferred tax assets are recognized only to the extent that there is reasonable certainty that sufficient future taxable income will be available against which such deferred tax assets can be realized. If the Group has carry forward of unabsorbed depreciation and tax losses, all deferred tax assets are recognized only if there is virtual certainty supported by convincing evidence that they can be realized against future taxable profits.
The carrying amount of deferred tax assets are reviewed at each Balance Sheet date. The Group writes-down the carrying amount of a deferred tax asset to the extent that it is no longer reasonably certain or virtually certain, as the case may be, that sufficient future taxable income will be available against which deferred tax asset can be realized. Any such write-down is reversed to the extent that it becomes reasonably certain or virtually certain, as the case may be, that sufficient future taxable income will be available.
Unrecognized deferred tax assets of earlier years are re-assessed and recognized to the extent that it has become reasonably certain or virtually certain, as the case may be that future taxable income will be available against which such deferred tax assets can be realized.
Minimum Alternative tax (MAT) credit is recognized as an asset only when and to the extent there is convincing evidence that the Company will pay normal income tax during the specified period. In the year in which the MAT credit becomes eligible to be recognized as an asset in accordance with the recommendations contained in Guidance Note issued by the Institute of Chartered Accountants of India, the said asset is created by way of a credit to the Profit and Loss Account and shown as MAT Credit Entitlement. The Group reviews the same at each Balance Sheet date and writes down the carrying amount of MAT Credit Entitlement to the extent there is no longer convincing evidence to the effect that the Group will pay normal Income Tax during the specified period.
Notes Forming Part of Consolidated Accounts (Contd.)
89
(n) Stock Compensation Expense
Measurement and disclosure of the employee share-based payment plans is done in accordance with SEBI (Employee Stock Option Scheme and Employee Stock Purchase Scheme) Guidelines, 1999 and the Guidance Note on Accounting for Employee Share-based Payments, issued by the Institute of Chartered Accountants of India. The Group accounts for stock compensation expense based on the fair value of the options granted on the date of grant. Compensation expense is amortized over the vesting period of the option on a straight-line basis. The accounting value of the options outstanding net of the Deferred Compensation Expense is reflected as Employee Stock Options Outstanding.
(o) Earnings Per Share
Basic earnings per share is calculated by dividing the net profit or loss for the year attributable to equity shareholders by the weighted average number of equity shares outstanding during the year. The weighted average number of equity shares outstanding during the year are adjusted for events of bonus issue; bonus element in a rights issue to existing shareholders; share split; and reverse share split (consolidation of shares).
For the purpose of calculating diluted earnings per share, the net profit or loss for the year attributable to equity shareholders and the weighted average number of shares outstanding during the year are adjusted for the effects of all dilutive potential equity shares.
(p) Provisions
A provision is recognized when the enterprise has a present obligation as a result of past event; it is probable that an outflow of resources will be required to settle the obligation, in respect of which a reliable estimate can be made. Provisions are not discounted to its present value and are determined based on best estimate required to settle the obligation at the Balance Sheet date. These are reviewed at each Balance Sheet date and adjusted to reflect the current best estimates.
(q) Segment Policy
Identification of segments: The Group is focused in the telecommunication space. The risks and returns of the Group are predominantly determined by the
nature of the solutions offered to its customers, which may be in the form of products or services. The primary reporting segments are Software Services, Software Products, Network Engineering Services and Automotive, Utilities & Industrial.
The geographical segment information is disclosed based on the location of the customers.
Allocation of common costs: Common allocable costs are allocated to each segment according to the relative contribution of each segment to the total common
costs.
Unallocated items: The Corporate segment includes general corporate income and expense items, which are not allocated to any business segment.
(r) Operating Leases
Leases where the lessor effectively retains substantially all the risks and benefits of ownership of the leased term are classified as operating lease. Operating lease payments are recognized as expense in the Profit and Loss Account on a straight-line basis over the lease term.
(s) Derivatives
Forward exchange contracts not intended for trading or speculation purposes covered by notified AS 11.
The premium or discount arising at the inception of forward exchange contracts is amortized as expense or income over the life of the contract. Exchange differences on such contracts are recognized in the statement of profit and loss in the year in which the exchange rates change. Any profit or loss arising on cancellation or renewal of forward exchange contract is recognized as income or as expense for the year.
Options and Forward exchange contracts not intended for trading or speculation purposes, classified as derivative instruments.
Effective April 1, 2010, the Group has adopted the principles of Accounting Standard (AS) 30 ‘Financial Instruments: Recognition and Measurement’. Accordingly, such derivative instruments, which qualify for hedge accounting are fair valued at Balance Sheet date and the effective portion of the resultant loss / (gain) is debited / credited to the hedging reserve and the ineffective portion is recognized in the Profit and Loss Account.
Changes in the fair value of derivative instruments that do not qualify for hedge accounting are recognized in the Profit and Loss Account as they arise.
Hedge Accounting is discontinued when the hedging instrument expires or is sold, or terminated, or exercised, or no longer qualifies for hedge accounting. Any cumulative gain or loss on the hedging instrument recognized in hedging reserve is transferred to Profit and Loss Account when the forecasted transaction occurs or when a hedged transaction is no longer expected to occur.
(t) Government Subsidy
Grants and subsidies from the government are recognized when there is reasonable assurance that the grant / subsidy will be received and all attaching conditions will be complied with.
When the grant or subsidy relates to an expense item, it is recognized over the periods necessary to match them on a systematic basis to the costs, which it is intended to compensate.
Notes Forming Part of Consolidated Accounts (Contd.)
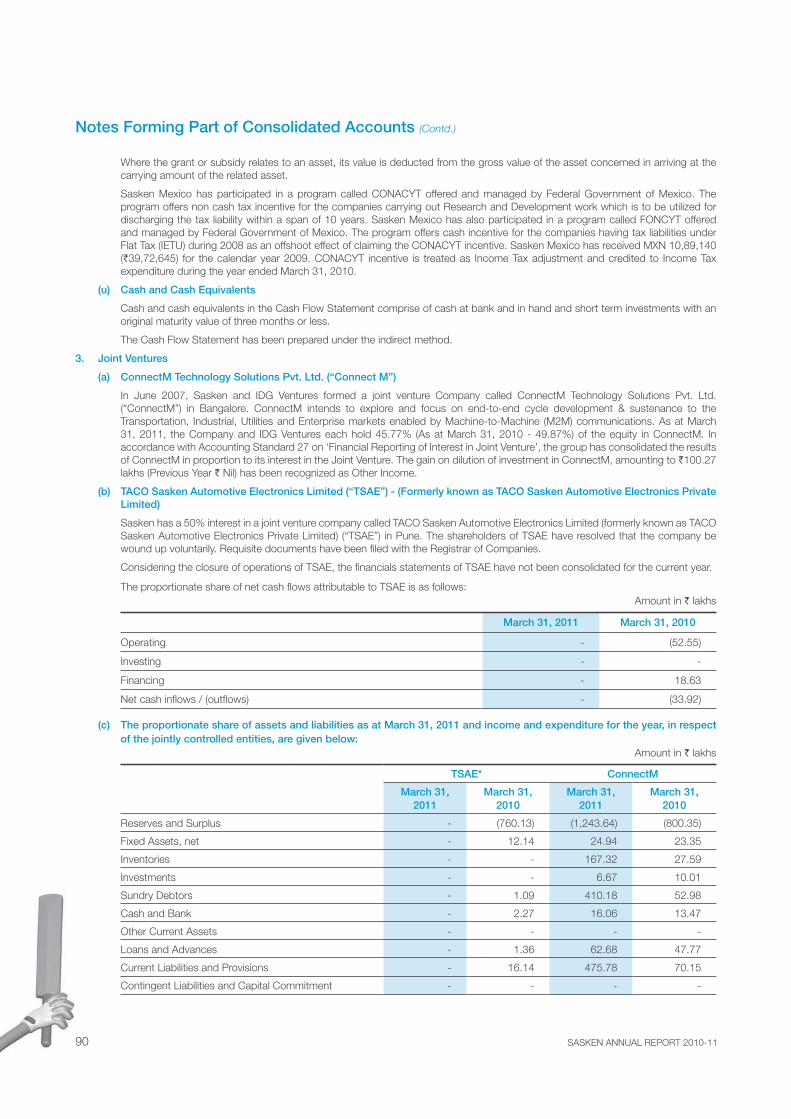
SASKEN ANNUAL REPORT 2010-1190
Where the grant or subsidy relates to an asset, its value is deducted from the gross value of the asset concerned in arriving at the carrying amount of the related asset.
Sasken Mexico has participated in a program called CONACYT offered and managed by Federal Government of Mexico. The program offers non cash tax incentive for the companies carrying out Research and Development work which is to be utilized for discharging the tax liability within a span of 10 years. Sasken Mexico has also participated in a program called FONCYT offered and managed by Federal Government of Mexico. The program offers cash incentive for the companies having tax liabilities under Flat Tax (IETU) during 2008 as an offshoot effect of claiming the CONACYT incentive. Sasken Mexico has received MXN 10,89,140 (`39,72,645) for the calendar year 2009. CONACYT incentive is treated as Income Tax adjustment and credited to Income Tax expenditure during the year ended March 31, 2010.
(u) Cash and Cash Equivalents
Cash and cash equivalents in the Cash Flow Statement comprise of cash at bank and in hand and short term investments with an original maturity value of three months or less.
The Cash Flow Statement has been prepared under the indirect method.
3. Joint Ventures
(a) ConnectM Technology Solutions Pvt. Ltd. (“Connect M”)
In June 2007, Sasken and IDG Ventures formed a joint venture Company called ConnectM Technology Solutions Pvt. Ltd. (“ConnectM”) in Bangalore. ConnectM intends to explore and focus on end-to-end cycle development & sustenance to the Transportation, Industrial, Utilities and Enterprise markets enabled by Machine-to-Machine (M2M) communications. As at March 31, 2011, the Company and IDG Ventures each hold 45.77% (As at March 31, 2010 - 49.87%) of the equity in ConnectM. In accordance with Accounting Standard 27 on ‘Financial Reporting of Interest in Joint Venture’, the group has consolidated the results of ConnectM in proportion to its interest in the Joint Venture. The gain on dilution of investment in ConnectM, amounting to `100.27 lakhs (Previous Year ` Nil) has been recognized as Other Income.
(b) TACO Sasken Automotive Electronics Limited (“TSAE”) - (Formerly known as TACO Sasken Automotive Electronics Private Limited)
Sasken has a 50% interest in a joint venture company called TACO Sasken Automotive Electronics Limited (formerly known as TACO Sasken Automotive Electronics Private Limited) (“TSAE”) in Pune. The shareholders of TSAE have resolved that the company be wound up voluntarily. Requisite documents have been filed with the Registrar of Companies.
Considering the closure of operations of TSAE, the financials statements of TSAE have not been consolidated for the current year.
The proportionate share of net cash flows attributable to TSAE is as follows: Amount in ` lakhs
March 31, 2011 March 31, 2010
Operating - (52.55)
Investing - -
Financing - 18.63
Net cash inflows / (outflows) - (33.92)
(c) The proportionate share of assets and liabilities as at March 31, 2011 and income and expenditure for the year, in respect of the jointly controlled entities, are given below:
Amount in ` lakhs
TSAE* ConnectM
March 31,2011
March 31,2010
March 31,2011
March 31,2010
Reserves and Surplus - (760.13) (1,243.64) (800.35)
Fixed Assets, net - 12.14 24.94 23.35
Inventories - - 167.32 27.59
Investments - - 6.67 10.01
Sundry Debtors - 1.09 410.18 52.98
Cash and Bank - 2.27 16.06 13.47
Other Current Assets - - - -
Loans and Advances - 1.36 62.68 47.77
Current Liabilities and Provisions - 16.14 475.78 70.15
Contingent Liabilities and Capital Commitment - - - -
Notes Forming Part of Consolidated Accounts (Contd.)
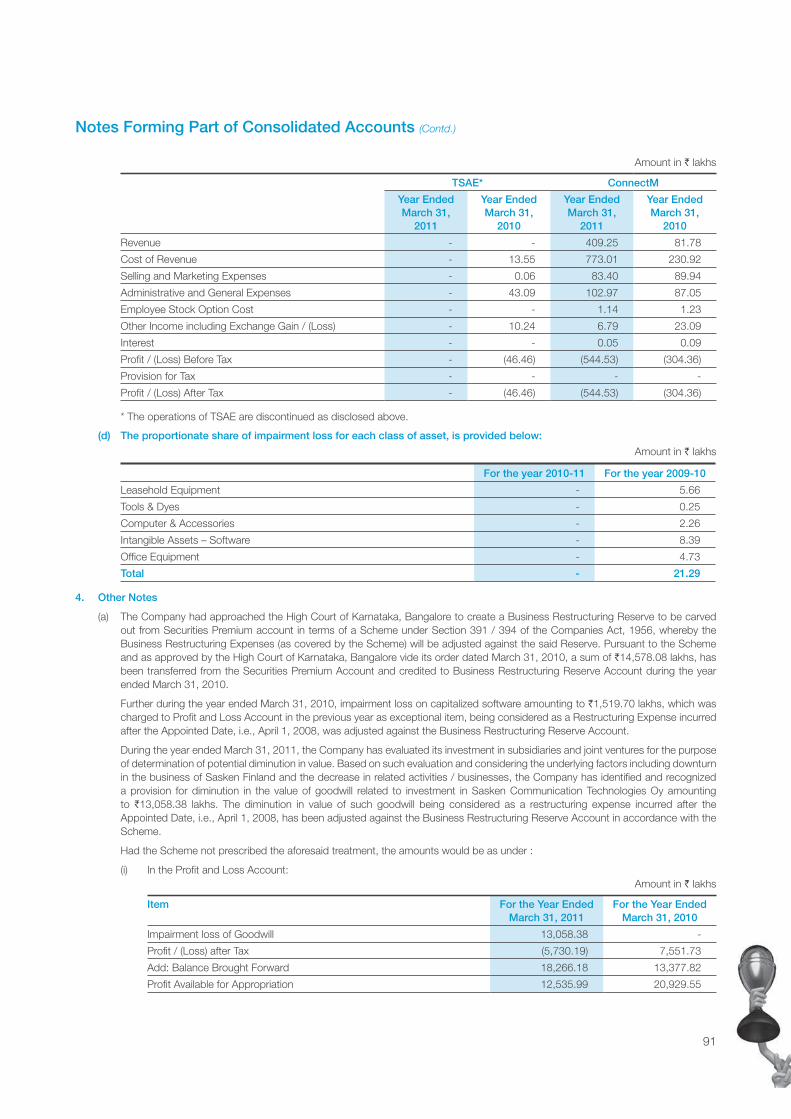
91
Amount in ` lakhs
TSAE* ConnectM
Year EndedMarch 31,
2011
Year EndedMarch 31,
2010
Year EndedMarch 31,
2011
Year EndedMarch 31,
2010
Revenue - - 409.25 81.78
Cost of Revenue - 13.55 773.01 230.92
Selling and Marketing Expenses - 0.06 83.40 89.94
Administrative and General Expenses - 43.09 102.97 87.05
Employee Stock Option Cost - - 1.14 1.23
Other Income including Exchange Gain / (Loss) - 10.24 6.79 23.09
Interest - - 0.05 0.09
Profit / (Loss) Before Tax - (46.46) (544.53) (304.36)
Provision for Tax - - - -
Profit / (Loss) After Tax - (46.46) (544.53) (304.36)
* The operations of TSAE are discontinued as disclosed above.
(d) The proportionate share of impairment loss for each class of asset, is provided below:
Amount in ` lakhs
For the year 2010-11 For the year 2009-10
Leasehold Equipment - 5.66
Tools & Dyes - 0.25
Computer & Accessories - 2.26
Intangible Assets – Software - 8.39
Office Equipment - 4.73
Total - 21.29
4. Other Notes
(a) The Company had approached the High Court of Karnataka, Bangalore to create a Business Restructuring Reserve to be carved out from Securities Premium account in terms of a Scheme under Section 391 / 394 of the Companies Act, 1956, whereby the Business Restructuring Expenses (as covered by the Scheme) will be adjusted against the said Reserve. Pursuant to the Scheme and as approved by the High Court of Karnataka, Bangalore vide its order dated March 31, 2010, a sum of `14,578.08 lakhs, has been transferred from the Securities Premium Account and credited to Business Restructuring Reserve Account during the year ended March 31, 2010.
Further during the year ended March 31, 2010, impairment loss on capitalized software amounting to `1,519.70 lakhs, which was charged to Profit and Loss Account in the previous year as exceptional item, being considered as a Restructuring Expense incurred after the Appointed Date, i.e., April 1, 2008, was adjusted against the Business Restructuring Reserve Account.
During the year ended March 31, 2011, the Company has evaluated its investment in subsidiaries and joint ventures for the purpose of determination of potential diminution in value. Based on such evaluation and considering the underlying factors including downturn in the business of Sasken Finland and the decrease in related activities / businesses, the Company has identified and recognized a provision for diminution in the value of goodwill related to investment in Sasken Communication Technologies Oy amounting to `13,058.38 lakhs. The diminution in value of such goodwill being considered as a restructuring expense incurred after the Appointed Date, i.e., April 1, 2008, has been adjusted against the Business Restructuring Reserve Account in accordance with the Scheme.
Had the Scheme not prescribed the aforesaid treatment, the amounts would be as under :
(i) In the Profit and Loss Account: Amount in ` lakhs
Item For the Year Ended March 31, 2011
For the Year Ended March 31, 2010
Impairment loss of Goodwill 13,058.38 -
Profit / (Loss) after Tax (5,730.19) 7,551.73
Add: Balance Brought Forward 18,266.18 13,377.82
Profit Available for Appropriation 12,535.99 20,929.55
Notes Forming Part of Consolidated Accounts (Contd.)
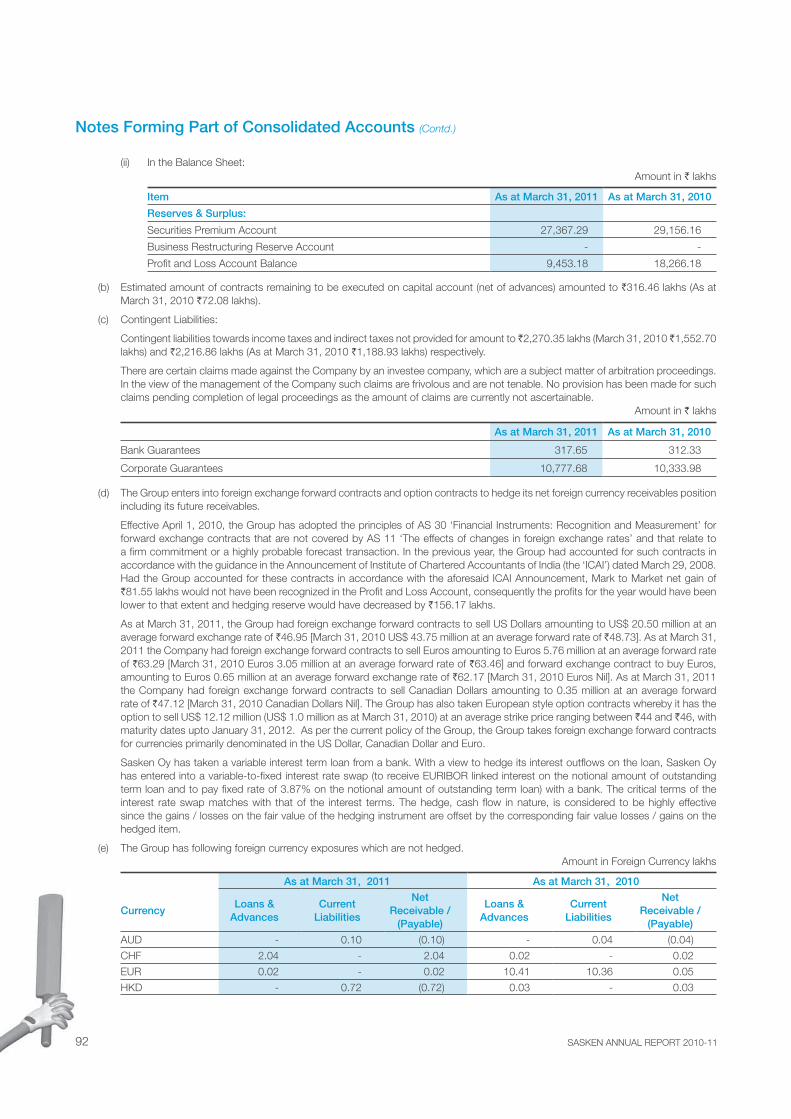
SASKEN ANNUAL REPORT 2010-1192
(ii) In the Balance Sheet:Amount in ` lakhs
Item As at March 31, 2011 As at March 31, 2010
Reserves & Surplus:
Securities Premium Account 27,367.29 29,156.16
Business Restructuring Reserve Account - -
Profit and Loss Account Balance 9,453.18 18,266.18
(b) Estimated amount of contracts remaining to be executed on capital account (net of advances) amounted to `316.46 lakhs (As at March 31, 2010 `72.08 lakhs).
(c) Contingent Liabilities:
Contingent liabilities towards income taxes and indirect taxes not provided for amount to ̀ 2,270.35 lakhs (March 31, 2010 ̀ 1,552.70 lakhs) and `2,216.86 lakhs (As at March 31, 2010 `1,188.93 lakhs) respectively.
There are certain claims made against the Company by an investee company, which are a subject matter of arbitration proceedings. In the view of the management of the Company such claims are frivolous and are not tenable. No provision has been made for such claims pending completion of legal proceedings as the amount of claims are currently not ascertainable.
Amount in ` lakhs
As at March 31, 2011 As at March 31, 2010
Bank Guarantees 317.65 312.33
Corporate Guarantees 10,777.68 10,333.98
(d) The Group enters into foreign exchange forward contracts and option contracts to hedge its net foreign currency receivables position including its future receivables.
Effective April 1, 2010, the Group has adopted the principles of AS 30 ‘Financial Instruments: Recognition and Measurement’ for forward exchange contracts that are not covered by AS 11 ‘The effects of changes in foreign exchange rates’ and that relate to a firm commitment or a highly probable forecast transaction. In the previous year, the Group had accounted for such contracts in accordance with the guidance in the Announcement of Institute of Chartered Accountants of India (the ‘ICAI’) dated March 29, 2008. Had the Group accounted for these contracts in accordance with the aforesaid ICAI Announcement, Mark to Market net gain of `81.55 lakhs would not have been recognized in the Profit and Loss Account, consequently the profits for the year would have been lower to that extent and hedging reserve would have decreased by `156.17 lakhs.
As at March 31, 2011, the Group had foreign exchange forward contracts to sell US Dollars amounting to US$ 20.50 million at an average forward exchange rate of `46.95 [March 31, 2010 US$ 43.75 million at an average forward rate of `48.73]. As at March 31, 2011 the Company had foreign exchange forward contracts to sell Euros amounting to Euros 5.76 million at an average forward rate of `63.29 [March 31, 2010 Euros 3.05 million at an average forward rate of `63.46] and forward exchange contract to buy Euros, amounting to Euros 0.65 million at an average forward exchange rate of `62.17 [March 31, 2010 Euros Nil]. As at March 31, 2011 the Company had foreign exchange forward contracts to sell Canadian Dollars amounting to 0.35 million at an average forward rate of `47.12 [March 31, 2010 Canadian Dollars Nil]. The Group has also taken European style option contracts whereby it has the option to sell US$ 12.12 million (US$ 1.0 million as at March 31, 2010) at an average strike price ranging between `44 and `46, with maturity dates upto January 31, 2012. As per the current policy of the Group, the Group takes foreign exchange forward contracts for currencies primarily denominated in the US Dollar, Canadian Dollar and Euro.
Sasken Oy has taken a variable interest term loan from a bank. With a view to hedge its interest outflows on the loan, Sasken Oy has entered into a variable-to-fixed interest rate swap (to receive EURIBOR linked interest on the notional amount of outstanding term loan and to pay fixed rate of 3.87% on the notional amount of outstanding term loan) with a bank. The critical terms of the interest rate swap matches with that of the interest terms. The hedge, cash flow in nature, is considered to be highly effective since the gains / losses on the fair value of the hedging instrument are offset by the corresponding fair value losses / gains on the hedged item.
(e) The Group has following foreign currency exposures which are not hedged.Amount in Foreign Currency lakhs
As at March 31, 2011 As at March 31, 2010
CurrencyLoans &
AdvancesCurrent
Liabilities
Net Receivable /
(Payable)
Loans & Advances
Current Liabilities
Net Receivable /
(Payable)
AUD - 0.10 (0.10) - 0.04 (0.04)
CHF 2.04 - 2.04 0.02 - 0.02
EUR 0.02 - 0.02 10.41 10.36 0.05
HKD - 0.72 (0.72) 0.03 - 0.03
Notes Forming Part of Consolidated Accounts (Contd.)
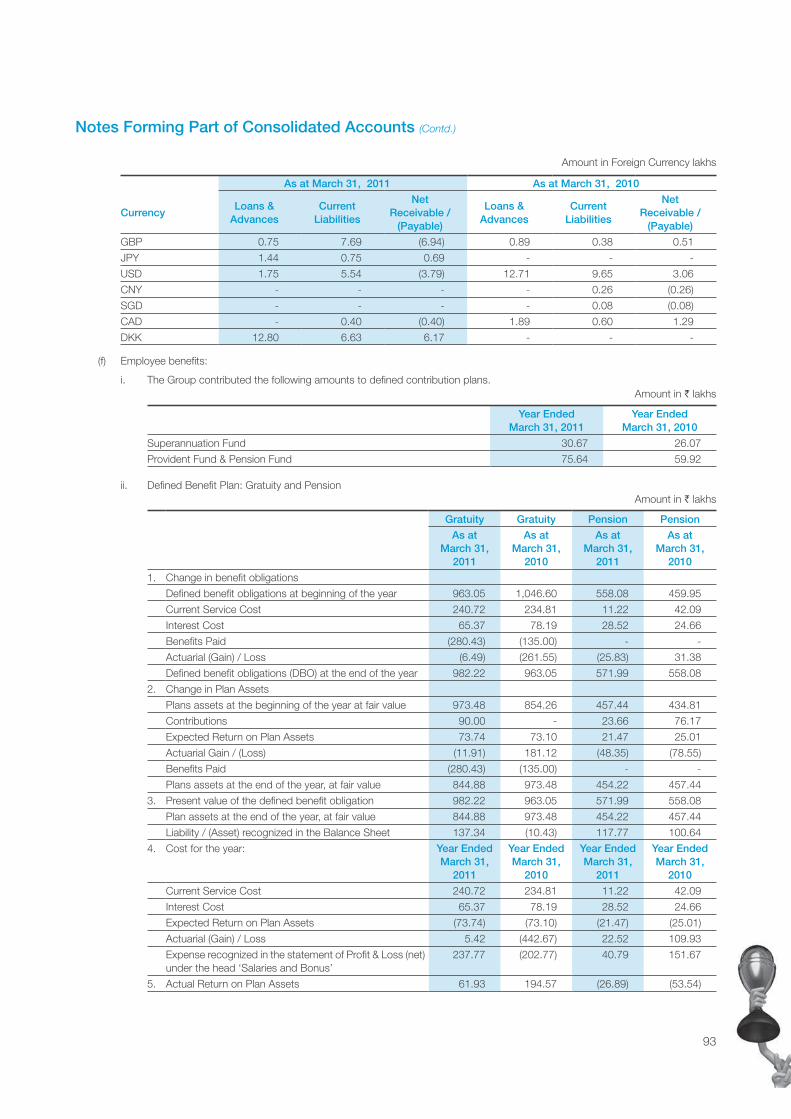
93
As at March 31, 2011 As at March 31, 2010
CurrencyLoans &
AdvancesCurrent
Liabilities
Net Receivable /
(Payable)
Loans & Advances
Current Liabilities
Net Receivable /
(Payable)
GBP 0.75 7.69 (6.94) 0.89 0.38 0.51
JPY 1.44 0.75 0.69 - - -
USD 1.75 5.54 (3.79) 12.71 9.65 3.06
CNY - - - - 0.26 (0.26)
SGD - - - - 0.08 (0.08)
CAD - 0.40 (0.40) 1.89 0.60 1.29
DKK 12.80 6.63 6.17 - - -
(f) Employee benefits:
i. The Group contributed the following amounts to defined contribution plans.Amount in ` lakhs
Year Ended March 31, 2011
Year Ended March 31, 2010
Superannuation Fund 30.67 26.07
Provident Fund & Pension Fund 75.64 59.92
ii. Defined Benefit Plan: Gratuity and PensionAmount in ` lakhs
Gratuity Gratuity Pension Pension
As at March 31,
2011
As at March 31,
2010
As at March 31,
2011
As at March 31,
2010
1. Change in benefit obligations
Defined benefit obligations at beginning of the year 963.05 1,046.60 558.08 459.95
Current Service Cost 240.72 234.81 11.22 42.09
Interest Cost 65.37 78.19 28.52 24.66
Benefits Paid (280.43) (135.00) - -
Actuarial (Gain) / Loss (6.49) (261.55) (25.83) 31.38
Defined benefit obligations (DBO) at the end of the year 982.22 963.05 571.99 558.08
2. Change in Plan Assets
Plans assets at the beginning of the year at fair value 973.48 854.26 457.44 434.81
Contributions 90.00 - 23.66 76.17
Expected Return on Plan Assets 73.74 73.10 21.47 25.01
Actuarial Gain / (Loss) (11.91) 181.12 (48.35) (78.55)
Benefits Paid (280.43) (135.00) - -
Plans assets at the end of the year, at fair value 844.88 973.48 454.22 457.44
3. Present value of the defined benefit obligation 982.22 963.05 571.99 558.08
Plan assets at the end of the year, at fair value 844.88 973.48 454.22 457.44
Liability / (Asset) recognized in the Balance Sheet 137.34 (10.43) 117.77 100.64
4. Cost for the year: Year EndedMarch 31,
2011
Year EndedMarch 31,
2010
Year EndedMarch 31,
2011
Year EndedMarch 31,
2010
Current Service Cost 240.72 234.81 11.22 42.09
Interest Cost 65.37 78.19 28.52 24.66
Expected Return on Plan Assets (73.74) (73.10) (21.47) (25.01)
Actuarial (Gain) / Loss 5.42 (442.67) 22.52 109.93
Expense recognized in the statement of Profit & Loss (net) under the head ‘Salaries and Bonus’
237.77 (202.77) 40.79 151.67
5. Actual Return on Plan Assets 61.93 194.57 (26.89) (53.54)
Notes Forming Part of Consolidated Accounts (Contd.)
Amount in Foreign Currency lakhs
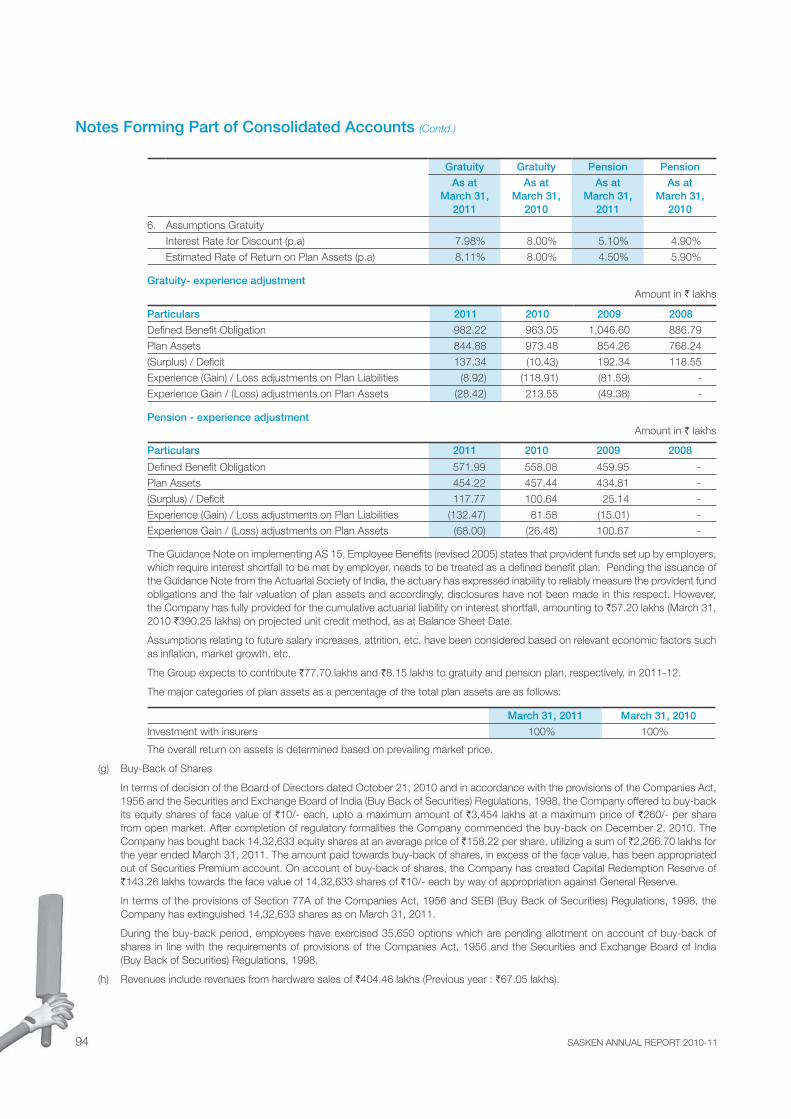
SASKEN ANNUAL REPORT 2010-1194
Gratuity Gratuity Pension Pension
As at March 31,
2011
As at March 31,
2010
As at March 31,
2011
As at March 31,
2010
6. Assumptions Gratuity
Interest Rate for Discount (p.a) 7.98% 8.00% 5.10% 4.90%
Estimated Rate of Return on Plan Assets (p.a) 8.11% 8.00% 4.50% 5.90%
Gratuity- experience adjustmentAmount in ` lakhs
Particulars 2011 2010 2009 2008
Defined Benefit Obligation 982.22 963.05 1,046.60 886.79
Plan Assets 844.88 973.48 854.26 768.24
(Surplus) / Deficit 137.34 (10.43) 192.34 118.55
Experience (Gain) / Loss adjustments on Plan Liabilities (8.92) (118.91) (81.59) -
Experience Gain / (Loss) adjustments on Plan Assets (28.42) 213.55 (49.38) -
Pension - experience adjustmentAmount in ` lakhs
Particulars 2011 2010 2009 2008
Defined Benefit Obligation 571.99 558.08 459.95 -
Plan Assets 454.22 457.44 434.81 -
(Surplus) / Deficit 117.77 100.64 25.14 -
Experience (Gain) / Loss adjustments on Plan Liabilities (132.47) 81.58 (15.01) -
Experience Gain / (Loss) adjustments on Plan Assets (68.00) (26.48) 100.67 -
The Guidance Note on implementing AS 15, Employee Benefits (revised 2005) states that provident funds set up by employers, which require interest shortfall to be met by employer, needs to be treated as a defined benefit plan. Pending the issuance of the Guidance Note from the Actuarial Society of India, the actuary has expressed inability to reliably measure the provident fund obligations and the fair valuation of plan assets and accordingly, disclosures have not been made in this respect. However, the Company has fully provided for the cumulative actuarial liability on interest shortfall, amounting to `57.20 lakhs (March 31, 2010 `390.25 lakhs) on projected unit credit method, as at Balance Sheet Date.
Assumptions relating to future salary increases, attrition, etc. have been considered based on relevant economic factors such as inflation, market growth, etc.
The Group expects to contribute `77.70 lakhs and `8.15 lakhs to gratuity and pension plan, respectively, in 2011-12.
The major categories of plan assets as a percentage of the total plan assets are as follows:
March 31, 2011 March 31, 2010
Investment with insurers 100% 100%
The overall return on assets is determined based on prevailing market price.
(g) Buy-Back of Shares
In terms of decision of the Board of Directors dated October 21, 2010 and in accordance with the provisions of the Companies Act, 1956 and the Securities and Exchange Board of India (Buy Back of Securities) Regulations, 1998, the Company offered to buy-back its equity shares of face value of `10/- each, upto a maximum amount of `3,454 lakhs at a maximum price of `260/- per share from open market. After completion of regulatory formalities the Company commenced the buy-back on December 2, 2010. The Company has bought back 14,32,633 equity shares at an average price of `158.22 per share, utilizing a sum of `2,266.70 lakhs for the year ended March 31, 2011. The amount paid towards buy-back of shares, in excess of the face value, has been appropriated out of Securities Premium account. On account of buy-back of shares, the Company has created Capital Redemption Reserve of `143.26 lakhs towards the face value of 14,32,633 shares of `10/- each by way of appropriation against General Reserve.
In terms of the provisions of Section 77A of the Companies Act, 1956 and SEBI (Buy Back of Securities) Regulations, 1998, the Company has extinguished 14,32,633 shares as on March 31, 2011.
During the buy-back period, employees have exercised 35,650 options which are pending allotment on account of buy-back of shares in line with the requirements of provisions of the Companies Act, 1956 and the Securities and Exchange Board of India (Buy Back of Securities) Regulations, 1998.
(h) Revenues include revenues from hardware sales of `404.46 lakhs (Previous year : `67.05 lakhs).
Notes Forming Part of Consolidated Accounts (Contd.)
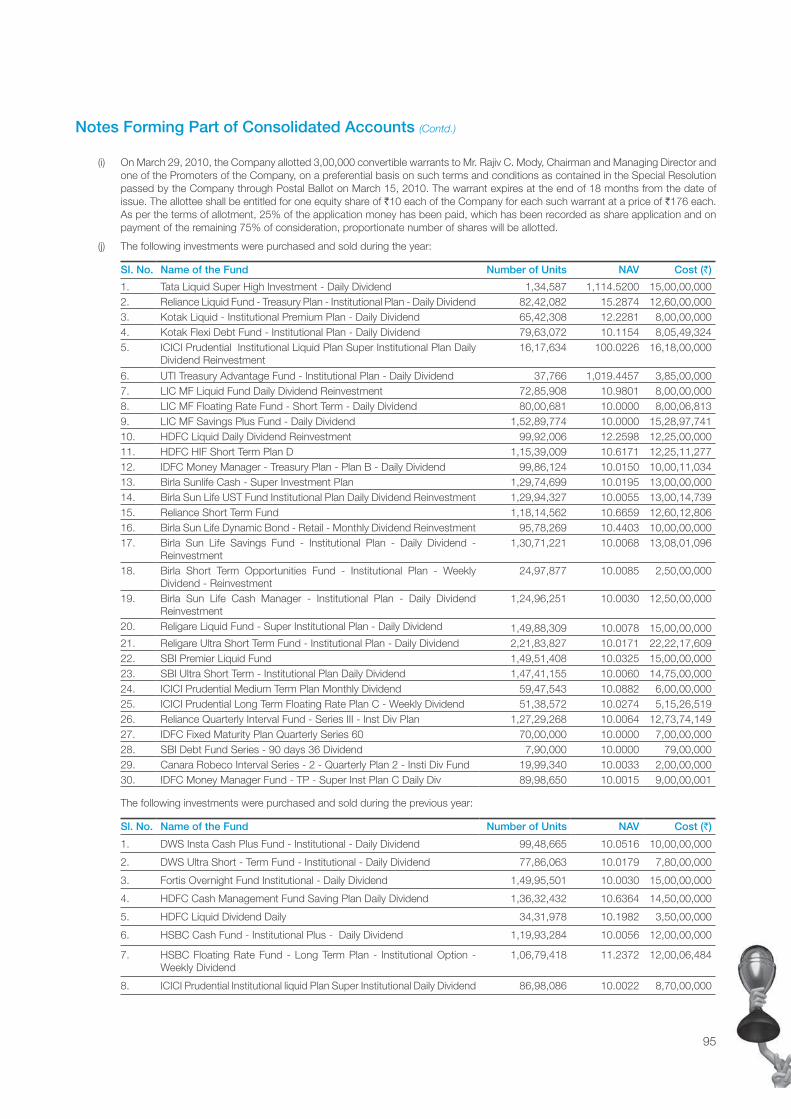
95
Notes Forming Part of Consolidated Accounts (Contd.)
(i) On March 29, 2010, the Company allotted 3,00,000 convertible warrants to Mr. Rajiv C. Mody, Chairman and Managing Director and one of the Promoters of the Company, on a preferential basis on such terms and conditions as contained in the Special Resolution passed by the Company through Postal Ballot on March 15, 2010. The warrant expires at the end of 18 months from the date of issue. The allottee shall be entitled for one equity share of `10 each of the Company for each such warrant at a price of `176 each. As per the terms of allotment, 25% of the application money has been paid, which has been recorded as share application and on payment of the remaining 75% of consideration, proportionate number of shares will be allotted.
(j) The following investments were purchased and sold during the year:
SI. No. Name of the Fund Number of Units NAV Cost (`)
1. Tata Liquid Super High Investment - Daily Dividend 1,34,587 1,114.5200 15,00,00,000 2. Reliance Liquid Fund - Treasury Plan - Institutional Plan - Daily Dividend 82,42,082 15.2874 12,60,00,000 3. Kotak Liquid - Institutional Premium Plan - Daily Dividend 65,42,308 12.2281 8,00,00,000 4. Kotak Flexi Debt Fund - Institutional Plan - Daily Dividend 79,63,072 10.1154 8,05,49,324 5. ICICI Prudential Institutional Liquid Plan Super Institutional Plan Daily
Dividend Reinvestment 16,17,634 100.0226 16,18,00,000
6. UTI Treasury Advantage Fund - Institutional Plan - Daily Dividend 37,766 1,019.4457 3,85,00,000 7. LIC MF Liquid Fund Daily Dividend Reinvestment 72,85,908 10.9801 8,00,00,000 8. LIC MF Floating Rate Fund - Short Term - Daily Dividend 80,00,681 10.0000 8,00,06,813 9. LIC MF Savings Plus Fund - Daily Dividend 1,52,89,774 10.0000 15,28,97,741 10. HDFC Liquid Daily Dividend Reinvestment 99,92,006 12.2598 12,25,00,000 11. HDFC HIF Short Term Plan D 1,15,39,009 10.6171 12,25,11,277 12. IDFC Money Manager - Treasury Plan - Plan B - Daily Dividend 99,86,124 10.0150 10,00,11,034 13. Birla Sunlife Cash - Super Investment Plan 1,29,74,699 10.0195 13,00,00,000 14. Birla Sun Life UST Fund Institutional Plan Daily Dividend Reinvestment 1,29,94,327 10.0055 13,00,14,739 15. Reliance Short Term Fund 1,18,14,562 10.6659 12,60,12,806 16. Birla Sun Life Dynamic Bond - Retail - Monthly Dividend Reinvestment 95,78,269 10.4403 10,00,00,000 17. Birla Sun Life Savings Fund - Institutional Plan - Daily Dividend -
Reinvestment 1,30,71,221 10.0068 13,08,01,096
18. Birla Short Term Opportunities Fund - Institutional Plan - Weekly Dividend - Reinvestment
24,97,877 10.0085 2,50,00,000
19. Birla Sun Life Cash Manager - Institutional Plan - Daily Dividend Reinvestment
1,24,96,251 10.0030 12,50,00,000
20. Religare Liquid Fund - Super Institutional Plan - Daily Dividend 1,49,88,309 10.0078 15,00,00,000 21. Religare Ultra Short Term Fund - Institutional Plan - Daily Dividend 2,21,83,827 10.0171 22,22,17,609 22. SBI Premier Liquid Fund 1,49,51,408 10.0325 15,00,00,000 23. SBI Ultra Short Term - Institutional Plan Daily Dividend 1,47,41,155 10.0060 14,75,00,000 24. ICICI Prudential Medium Term Plan Monthly Dividend 59,47,543 10.0882 6,00,00,000 25. ICICI Prudential Long Term Floating Rate Plan C - Weekly Dividend 51,38,572 10.0274 5,15,26,519 26. Reliance Quarterly Interval Fund - Series III - Inst Div Plan 1,27,29,268 10.0064 12,73,74,149 27. IDFC Fixed Maturity Plan Quarterly Series 60 70,00,000 10.0000 7,00,00,000 28. SBI Debt Fund Series - 90 days 36 Dividend 7,90,000 10.0000 79,00,000 29. Canara Robeco Interval Series - 2 - Quarterly Plan 2 - Insti Div Fund 19,99,340 10.0033 2,00,00,000 30. IDFC Money Manager Fund - TP - Super Inst Plan C Daily Div 89,98,650 10.0015 9,00,00,001
The following investments were purchased and sold during the previous year:
Sl. No. Name of the Fund Number of Units NAV Cost (`)
1. DWS Insta Cash Plus Fund - Institutional - Daily Dividend 99,48,665 10.0516 10,00,00,000
2. DWS Ultra Short - Term Fund - Institutional - Daily Dividend 77,86,063 10.0179 7,80,00,000
3. Fortis Overnight Fund Institutional - Daily Dividend 1,49,95,501 10.0030 15,00,00,000
4. HDFC Cash Management Fund Saving Plan Daily Dividend 1,36,32,432 10.6364 14,50,00,000
5. HDFC Liquid Dividend Daily 34,31,978 10.1982 3,50,00,000
6. HSBC Cash Fund - Institutional Plus - Daily Dividend 1,19,93,284 10.0056 12,00,00,000
7. HSBC Floating Rate Fund - Long Term Plan - Institutional Option - Weekly Dividend
1,06,79,418 11.2372 12,00,06,484
8. ICICI Prudential Institutional liquid Plan Super Institutional Daily Dividend 86,98,086 10.0022 8,70,00,000
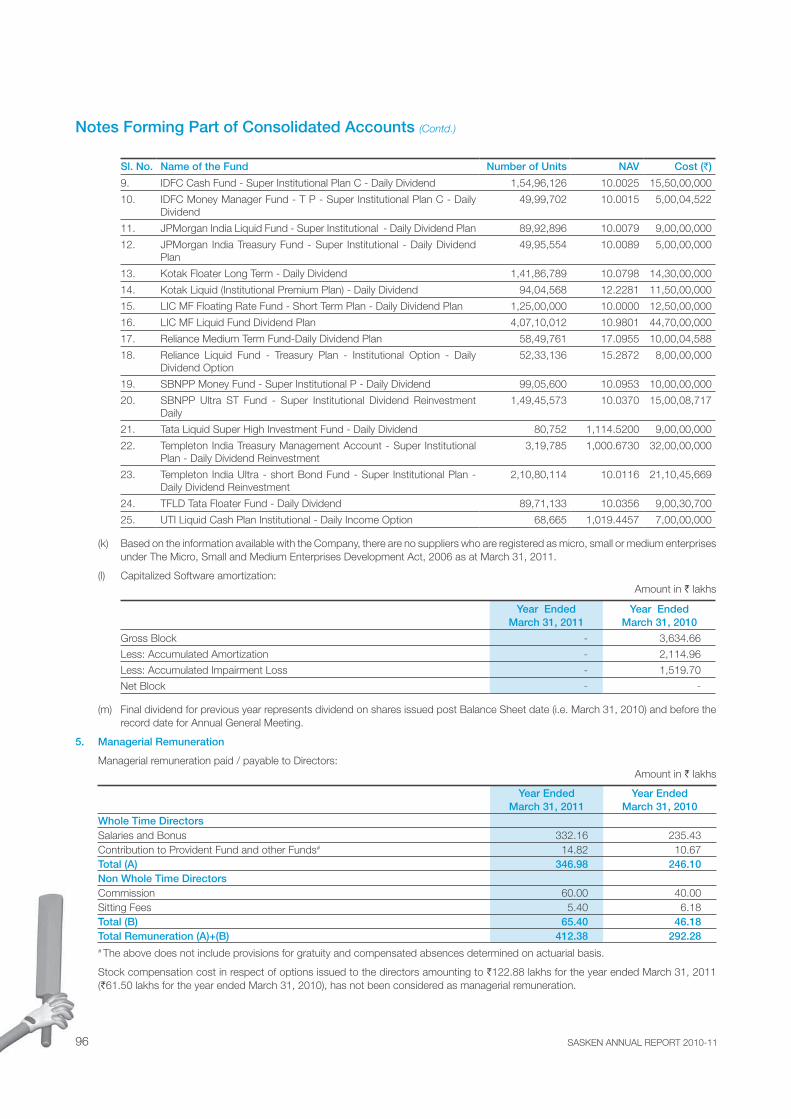
SASKEN ANNUAL REPORT 2010-1196
Notes Forming Part of Consolidated Accounts (Contd.)
Sl. No. Name of the Fund Number of Units NAV Cost (`)
9. IDFC Cash Fund - Super Institutional Plan C - Daily Dividend 1,54,96,126 10.0025 15,50,00,000
10. IDFC Money Manager Fund - T P - Super Institutional Plan C - Daily Dividend
49,99,702 10.0015 5,00,04,522
11. JPMorgan India Liquid Fund - Super Institutional - Daily Dividend Plan 89,92,896 10.0079 9,00,00,000
12. JPMorgan India Treasury Fund - Super Institutional - Daily Dividend Plan
49,95,554 10.0089 5,00,00,000
13. Kotak Floater Long Term - Daily Dividend 1,41,86,789 10.0798 14,30,00,000
14. Kotak Liquid (Institutional Premium Plan) - Daily Dividend 94,04,568 12.2281 11,50,00,000
15. LIC MF Floating Rate Fund - Short Term Plan - Daily Dividend Plan 1,25,00,000 10.0000 12,50,00,000
16. LIC MF Liquid Fund Dividend Plan 4,07,10,012 10.9801 44,70,00,000
17. Reliance Medium Term Fund-Daily Dividend Plan 58,49,761 17.0955 10,00,04,588
18. Reliance Liquid Fund - Treasury Plan - Institutional Option - Daily Dividend Option
52,33,136 15.2872 8,00,00,000
19. SBNPP Money Fund - Super Institutional P - Daily Dividend 99,05,600 10.0953 10,00,00,000
20. SBNPP Ultra ST Fund - Super Institutional Dividend Reinvestment Daily
1,49,45,573 10.0370 15,00,08,717
21. Tata Liquid Super High Investment Fund - Daily Dividend 80,752 1,114.5200 9,00,00,000
22. Templeton India Treasury Management Account - Super Institutional Plan - Daily Dividend Reinvestment
3,19,785 1,000.6730 32,00,00,000
23. Templeton India Ultra - short Bond Fund - Super Institutional Plan - Daily Dividend Reinvestment
2,10,80,114 10.0116 21,10,45,669
24. TFLD Tata Floater Fund - Daily Dividend 89,71,133 10.0356 9,00,30,700
25. UTI Liquid Cash Plan Institutional - Daily Income Option 68,665 1,019.4457 7,00,00,000
(k) Based on the information available with the Company, there are no suppliers who are registered as micro, small or medium enterprises under The Micro, Small and Medium Enterprises Development Act, 2006 as at March 31, 2011.
(l) Capitalized Software amortization:Amount in ` lakhs
Year Ended March 31, 2011
Year Ended March 31, 2010
Gross Block - 3,634.66
Less: Accumulated Amortization - 2,114.96
Less: Accumulated Impairment Loss - 1,519.70
Net Block - -
(m) Final dividend for previous year represents dividend on shares issued post Balance Sheet date (i.e. March 31, 2010) and before the record date for Annual General Meeting.
5. Managerial Remuneration
Managerial remuneration paid / payable to Directors: Amount in ` lakhs
Year Ended March 31, 2011
Year Ended March 31, 2010
Whole Time DirectorsSalaries and Bonus 332.16 235.43Contribution to Provident Fund and other Funds# 14.82 10.67Total (A) 346.98 246.10Non Whole Time DirectorsCommission 60.00 40.00Sitting Fees 5.40 6.18Total (B) 65.40 46.18Total Remuneration (A)+(B) 412.38 292.28
# The above does not include provisions for gratuity and compensated absences determined on actuarial basis.
Stock compensation cost in respect of options issued to the directors amounting to `122.88 lakhs for the year ended March 31, 2011 (`61.50 lakhs for the year ended March 31, 2010), has not been considered as managerial remuneration.
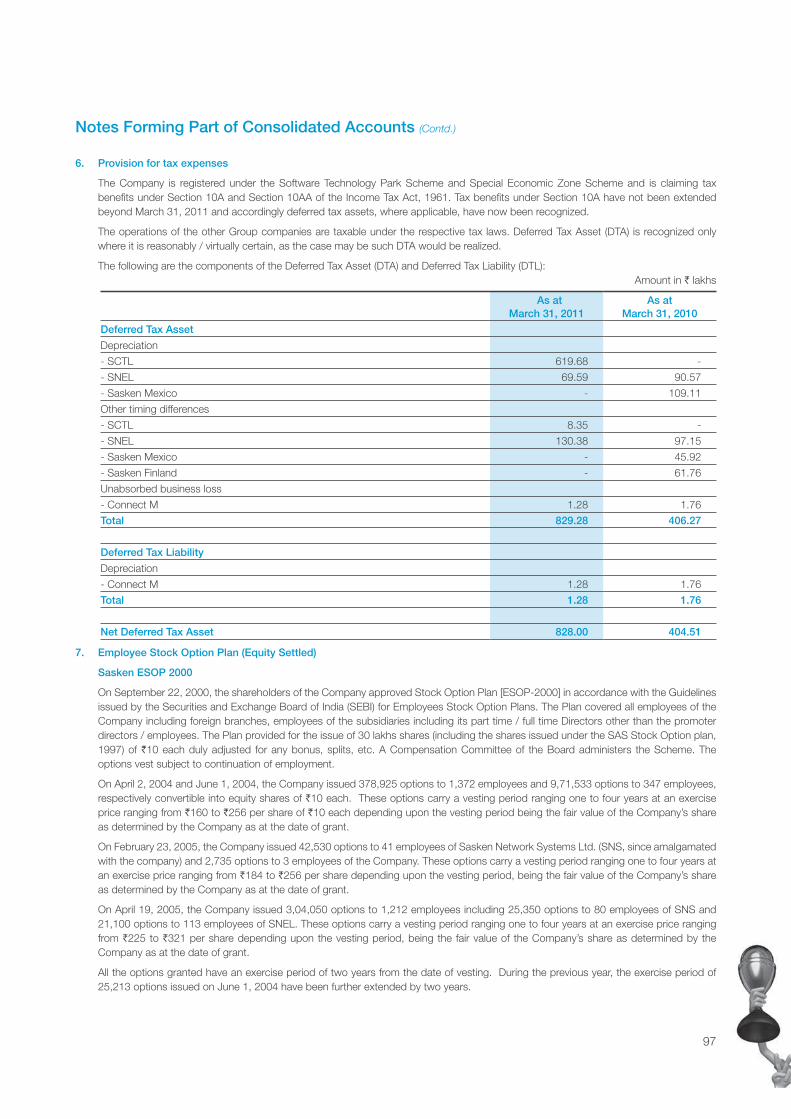
97
Notes Forming Part of Consolidated Accounts (Contd.)
6. Provision for tax expenses
The Company is registered under the Software Technology Park Scheme and Special Economic Zone Scheme and is claiming tax benefits under Section 10A and Section 10AA of the Income Tax Act, 1961. Tax benefits under Section 10A have not been extended beyond March 31, 2011 and accordingly deferred tax assets, where applicable, have now been recognized.
The operations of the other Group companies are taxable under the respective tax laws. Deferred Tax Asset (DTA) is recognized only where it is reasonably / virtually certain, as the case may be such DTA would be realized.
The following are the components of the Deferred Tax Asset (DTA) and Deferred Tax Liability (DTL): Amount in ` lakhs
As atMarch 31, 2011
As atMarch 31, 2010
Deferred Tax Asset
Depreciation
- SCTL 619.68 -
- SNEL 69.59 90.57
- Sasken Mexico - 109.11
Other timing differences
- SCTL 8.35 -
- SNEL 130.38 97.15
- Sasken Mexico - 45.92
- Sasken Finland - 61.76
Unabsorbed business loss
- Connect M 1.28 1.76
Total 829.28 406.27
Deferred Tax Liability
Depreciation
- Connect M 1.28 1.76
Total 1.28 1.76
Net Deferred Tax Asset 828.00 404.51
7. Employee Stock Option Plan (Equity Settled)
Sasken ESOP 2000
On September 22, 2000, the shareholders of the Company approved Stock Option Plan [ESOP-2000] in accordance with the Guidelines issued by the Securities and Exchange Board of India (SEBI) for Employees Stock Option Plans. The Plan covered all employees of the Company including foreign branches, employees of the subsidiaries including its part time / full time Directors other than the promoter directors / employees. The Plan provided for the issue of 30 lakhs shares (including the shares issued under the SAS Stock Option plan, 1997) of `10 each duly adjusted for any bonus, splits, etc. A Compensation Committee of the Board administers the Scheme. The options vest subject to continuation of employment.
On April 2, 2004 and June 1, 2004, the Company issued 378,925 options to 1,372 employees and 9,71,533 options to 347 employees, respectively convertible into equity shares of `10 each. These options carry a vesting period ranging one to four years at an exercise price ranging from `160 to `256 per share of `10 each depending upon the vesting period being the fair value of the Company’s share as determined by the Company as at the date of grant.
On February 23, 2005, the Company issued 42,530 options to 41 employees of Sasken Network Systems Ltd. (SNS, since amalgamated with the company) and 2,735 options to 3 employees of the Company. These options carry a vesting period ranging one to four years at an exercise price ranging from `184 to `256 per share depending upon the vesting period, being the fair value of the Company’s share as determined by the Company as at the date of grant.
On April 19, 2005, the Company issued 3,04,050 options to 1,212 employees including 25,350 options to 80 employees of SNS and 21,100 options to 113 employees of SNEL. These options carry a vesting period ranging one to four years at an exercise price ranging from `225 to `321 per share depending upon the vesting period, being the fair value of the Company’s share as determined by the Company as at the date of grant.
All the options granted have an exercise period of two years from the date of vesting. During the previous year, the exercise period of 25,213 options issued on June 1, 2004 have been further extended by two years.
SASKEN ANNUAL REPORT 2010-1198
Notes Forming Part of Consolidated Accounts (Contd.)
Sasken ESOP 2006
On February 25, 2006, the shareholders of the Company approved Stock Option Plan [ESOP-2006] in accordance with the Guidelines issued by the Securities and Exchange Board of India (SEBI) for Employees Stock Option Plans. The Plan covers all employees of the Company including foreign branches, employees of the subsidiaries and Directors other than the promoter directors / employees. The Plan provides for the issue of 35,75,000 shares of `10 each duly adjusted for any bonus, splits, etc. A Compensation Committee of the Board administers the Scheme. The terms of each issuance would be determined by the Compensation Committee. The Options vest subject to continuation of employment.
On June 17, 2006 and October 18, 2006, the Company issued 1,38,750 options to 5 employees and 4 non-executive directors, and 1,50,000 options to 1 employee, respectively, convertible into equity shares of `10 each. These options carry a vesting period ranging one to four years at an exercise price ranging from `234 to `394 per share of `10 each depending upon the vesting period.
On January 1, 2007, the Company issued 5,000 options to 1 employee, convertible into equity shares of `10 each. These options carry a vesting period ranging one to four years at an exercise price ranging from `367 to `559 per share of `10 each depending upon the vesting period.
On April 1, 2007, the Company issued 2,35,000 options to 5 employees, convertible into equity shares of `10 each. These options carry a vesting period ranging one to four years at an exercise price ranging from `475 to `667 per share of `10 each depending upon the vesting period.
On July 1, 2007, the Company issued 90,000 options to 4 employees, convertible into equity shares of `10 each. These options carry a vesting period ranging one to four years at an exercise price ranging from ̀ 554 to ̀ 746 per share of ̀ 10 each depending upon the vesting period.
On October 1, 2007, the Company issued 10,000 options to 2 employees, convertible into equity shares of `10 each. These options carry a vesting period ranging one to four years at an exercise price ranging from `410 to `602 per share of `10 each depending upon the vesting period.
On April 21, 2008, the Company issued 87,000 options to 4 employees, convertible into equity shares of `10 each. These options carry a vesting period of 1 year at an exercise price of `120 per share of `10 each. The above options granted have an exercise period of 3 months from the date of vesting.
On April 6, 2009 and June 15, 2009, the Company issued 18,60,000 options to 58 employees and 10,000 options to 1 employee, respectively, convertible into equity shares of `10 each. These options carry a vesting period ranging one to three years at an exercise price of `52 per share and `76 per share respectively, of `10 each. The above options granted have an exercise period of two years from the date of vesting.
On July 17, 2009 and September 19, 2009 the Company issued 80,000 options to 4 non executive directors and 80,000 options to 2 employees, respectively, convertible into equity shares of `10 each. These options carry a vesting period ranging one to three years at an exercise price of `52 per share and `108 per share respectively, of `10 each. The above options granted have an exercise period of two years from the date of vesting.
On October 1, 2009, the Company issued 60,000 options to 1 employee, convertible into equity shares of `10 each. These options carry a vesting period ranging one to three years at an exercise price of `155 per share, of `10 each. The above options granted have an exercise period of two years from the date of vesting.
On January 21, 2010, the Company issued 60,000 options to 3 non executive directors at an exercise price of `52 per share and 30,000 options to 1 non executive director at an exercise price of `155 per share, of `10 each. These options carry a vesting period ranging one to three years. The above options granted have an exercise period of two years from the date of vesting.
On April 30, 2010, the Company issued 20,000 options to 1 employee and 70,000 options to 2 employees, respectively, convertible into equity shares of `10 each. These options carry a vesting period ranging one to three years at an exercise price of `188 per share and `190 per share respectively, of `10 each. The above options granted have an exercise period of two years from the date of vesting.
On May 26, 2010, the Company issued 70,000 options to 2 employees convertible into equity shares of `10 each. These options carry a vesting period ranging one to three years at an exercise price of ̀ 195 per share, of ̀ 10 each. The above options granted have an exercise period of two years from the date of vesting.
On July 1, 2010 and July 30, 2010, the Company issued 3,90,000 options to 39 employees and 70,000 options to 7 employees, respectively, convertible into equity shares of `10 each. These options carry a vesting period ranging one to three years at an exercise price of `200 per share and `201 per share respectively, of `10 each. The above options granted have an exercise period of two years from the date of vesting.
On January 01, 2011, the Company issued 50,000 options to 1 employee convertible into equity shares of `10 each. These options carry a vesting period ranging one to three years at an exercise price of `207 per share, of `10 each. The above options granted have an exercise period of two years from the date of vesting.
All the options granted have an exercise period of two years from the date of vesting.
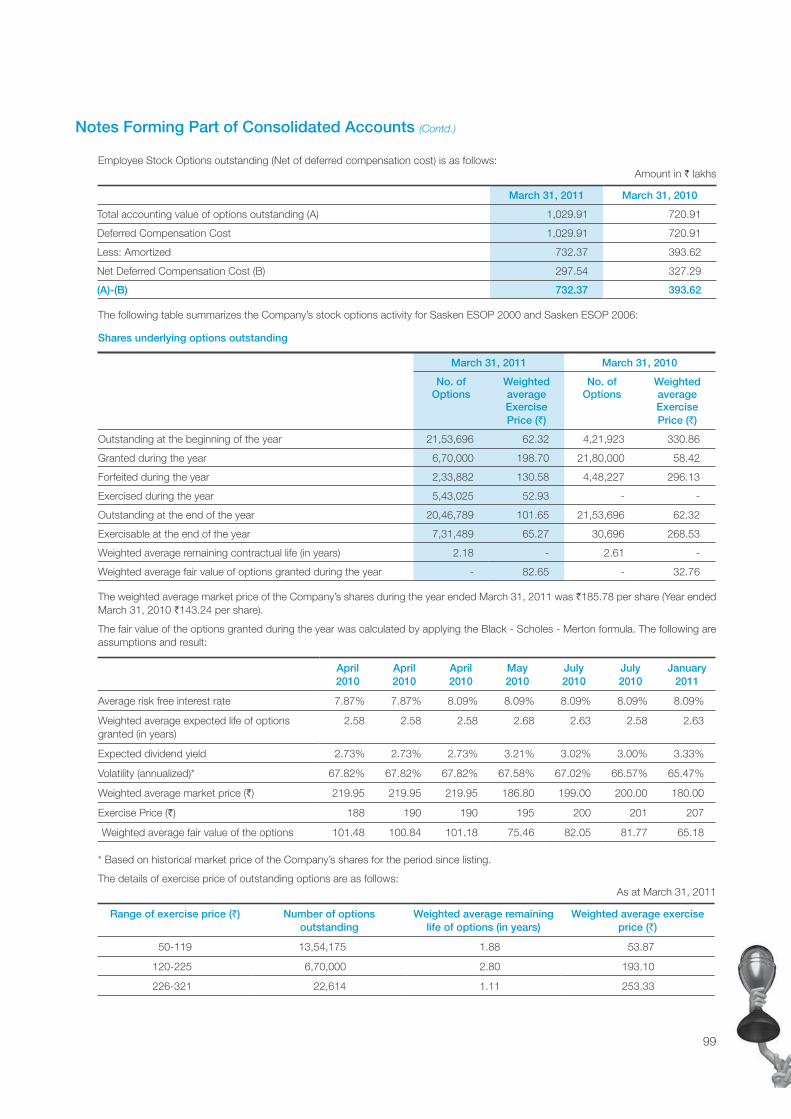
99
Notes Forming Part of Consolidated Accounts (Contd.)
Employee Stock Options outstanding (Net of deferred compensation cost) is as follows: Amount in ` lakhs
March 31, 2011 March 31, 2010
Total accounting value of options outstanding (A) 1,029.91 720.91
Deferred Compensation Cost 1,029.91 720.91
Less: Amortized 732.37 393.62
Net Deferred Compensation Cost (B) 297.54 327.29
(A)-(B) 732.37 393.62
The following table summarizes the Company’s stock options activity for Sasken ESOP 2000 and Sasken ESOP 2006:
Shares underlying options outstanding
March 31, 2011 March 31, 2010
No. of Options
Weighted averageExercisePrice (`)
No. of Options
Weighted averageExercisePrice (`)
Outstanding at the beginning of the year 21,53,696 62.32 4,21,923 330.86
Granted during the year 6,70,000 198.70 21,80,000 58.42
Forfeited during the year 2,33,882 130.58 4,48,227 296.13
Exercised during the year 5,43,025 52.93 - -
Outstanding at the end of the year 20,46,789 101.65 21,53,696 62.32
Exercisable at the end of the year 7,31,489 65.27 30,696 268.53
Weighted average remaining contractual life (in years) 2.18 - 2.61 -
Weighted average fair value of options granted during the year - 82.65 - 32.76
The weighted average market price of the Company’s shares during the year ended March 31, 2011 was `185.78 per share (Year ended March 31, 2010 `143.24 per share).
The fair value of the options granted during the year was calculated by applying the Black - Scholes - Merton formula. The following are assumptions and result:
April 2010
April 2010
April 2010
May 2010
July 2010
July 2010
January 2011
Average risk free interest rate 7.87% 7.87% 8.09% 8.09% 8.09% 8.09% 8.09%
Weighted average expected life of options granted (in years)
2.58 2.58 2.58 2.68 2.63 2.58 2.63
Expected dividend yield 2.73% 2.73% 2.73% 3.21% 3.02% 3.00% 3.33%
Volatility (annualized)* 67.82% 67.82% 67.82% 67.58% 67.02% 66.57% 65.47%
Weighted average market price (`) 219.95 219.95 219.95 186.80 199.00 200.00 180.00
Exercise Price (`) 188 190 190 195 200 201 207
Weighted average fair value of the options 101.48 100.84 101.18 75.46 82.05 81.77 65.18
* Based on historical market price of the Company’s shares for the period since listing.
The details of exercise price of outstanding options are as follows:As at March 31, 2011
Range of exercise price (`) Number of options outstanding
Weighted average remaining life of options (in years)
Weighted average exercise price (`)
50-119 13,54,175 1.88 53.87
120-225 6,70,000 2.80 193.10
226-321 22,614 1.11 253.33

SASKEN ANNUAL REPORT 2010-11100
Notes Forming Part of Consolidated Accounts (Contd.)
As at March 31, 2010
Range of exercise price (`) Number of options outstanding
Weighted average remaining life of options (in years)
Weighted average exercise price (`)
50-119 20,30,000 2.69 54.40
120-225 90,000 3.22 103.33
226-321 28,696 1.92 256.44
322-474 2,000 1.00 442.00
475-746 3,000 3.17 580.67
8. Related Party Disclosures
Remuneration paid to Key Managerial Personnel Amount in ` lakhs
Name of the related party Relationship Year Ended March 31, 2011 Year Ended March 31, 2010
Rajiv C. Mody Managing Director 159.11 147.09
Krishna J. Jhaveri Whole Time Director 27.49 30.54
G. Venkatesh Whole Time Director 79.34 68.47
Neeta S. Revankar Whole Time Director 81.04 -
Total 346.98 246.10
The above does not include provision for gratuity and compensated absences determined on actuarial basis.
9. Segment reporting
The business segmental information is given based on the following segments - Software Services, Software Products, Network Engineering Services and Automotive, Utilities & Industrial. Software Services that are related with Intellectual Property based product offerings are considered part of the Software Products segment. Network Engineering Services segment provides network planning, deployment, commissioning, integration and network operations support to network equipment vendors and operators. Automotive, Utilities & Industrial segment provides services to customers in the area of telematics and infotainment.
a) Business Segment Information
Segment Balance Sheet Amount in ` lakhs
As atMarch 31, 2011
As atMarch 31, 2010
Segment Assets
Software Services 18,221.58 33,157.52
Software Products 1,139.59 1,555.21
Network Engineering Services 2,464.21 2,666.16
Automotive, Utilities & Industrial 672.33 169.12
Unallocated Corporate Assets 32,337.09 30,455.87
Total 54,834.80 68,003.88
Amount in ` lakhs
As atMarch 31, 2011
As atMarch 31, 2010
Segment Liabilities
Software Services 4,117.83 4,824.24
Software Products 378.87 649.94
Network Engineering Services 739.50 801.20
Automotive, Utilities & Industrial 576.34 86.18
Unallocated Corporate Liabilities 6,368.17 9,284.20
Total 12,180.71 15,645.76
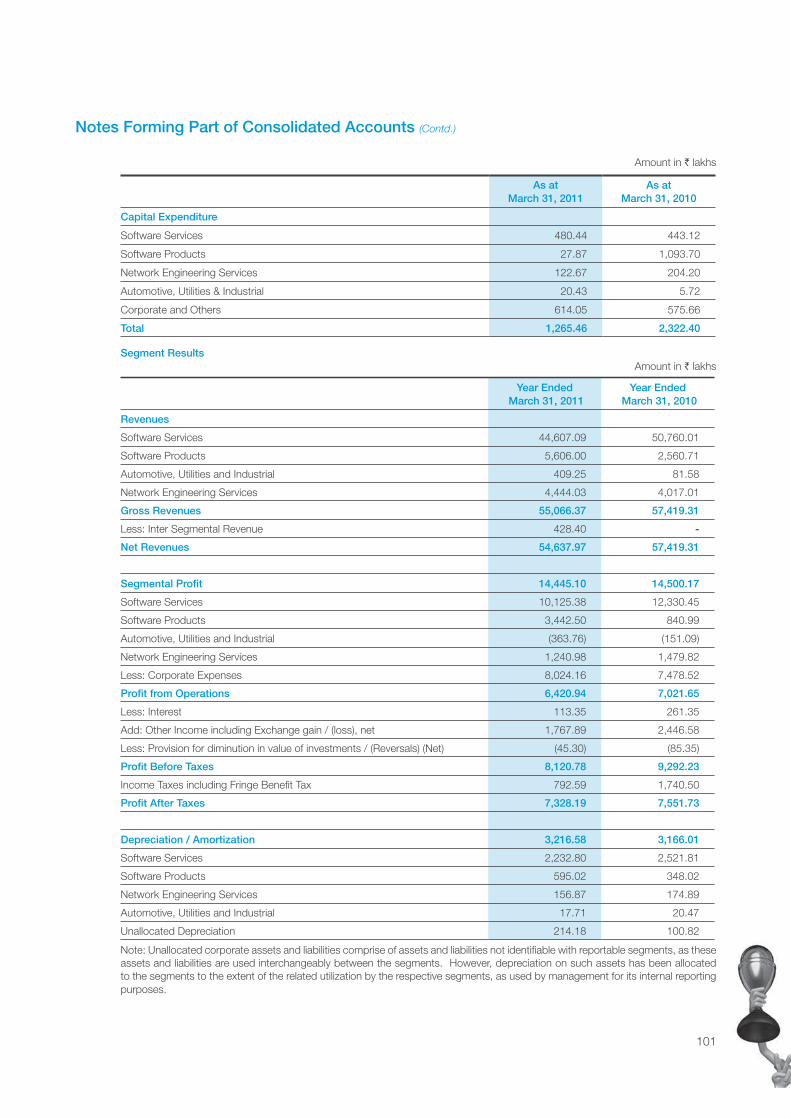
101
Notes Forming Part of Consolidated Accounts (Contd.)
As atMarch 31, 2011
As atMarch 31, 2010
Capital Expenditure
Software Services 480.44 443.12
Software Products 27.87 1,093.70
Network Engineering Services 122.67 204.20
Automotive, Utilities & Industrial 20.43 5.72
Corporate and Others 614.05 575.66
Total 1,265.46 2,322.40
Segment Results Amount in ` lakhs
Year Ended
March 31, 2011Year Ended
March 31, 2010
Revenues
Software Services 44,607.09 50,760.01
Software Products 5,606.00 2,560.71
Automotive, Utilities and Industrial 409.25 81.58
Network Engineering Services 4,444.03 4,017.01
Gross Revenues 55,066.37 57,419.31
Less: Inter Segmental Revenue 428.40 -
Net Revenues 54,637.97 57,419.31
Segmental Profit 14,445.10 14,500.17
Software Services 10,125.38 12,330.45
Software Products 3,442.50 840.99
Automotive, Utilities and Industrial (363.76) (151.09)
Network Engineering Services 1,240.98 1,479.82
Less: Corporate Expenses 8,024.16 7,478.52
Profit from Operations 6,420.94 7,021.65
Less: Interest 113.35 261.35
Add: Other Income including Exchange gain / (loss), net 1,767.89 2,446.58
Less: Provision for diminution in value of investments / (Reversals) (Net) (45.30) (85.35)
Profit Before Taxes 8,120.78 9,292.23
Income Taxes including Fringe Benefit Tax 792.59 1,740.50
Profit After Taxes 7,328.19 7,551.73
Depreciation / Amortization 3,216.58 3,166.01
Software Services 2,232.80 2,521.81
Software Products 595.02 348.02
Network Engineering Services 156.87 174.89
Automotive, Utilities and Industrial 17.71 20.47
Unallocated Depreciation 214.18 100.82
Note: Unallocated corporate assets and liabilities comprise of assets and liabilities not identifiable with reportable segments, as these assets and liabilities are used interchangeably between the segments. However, depreciation on such assets has been allocated to the segments to the extent of the related utilization by the respective segments, as used by management for its internal reporting purposes.
Amount in ` lakhs
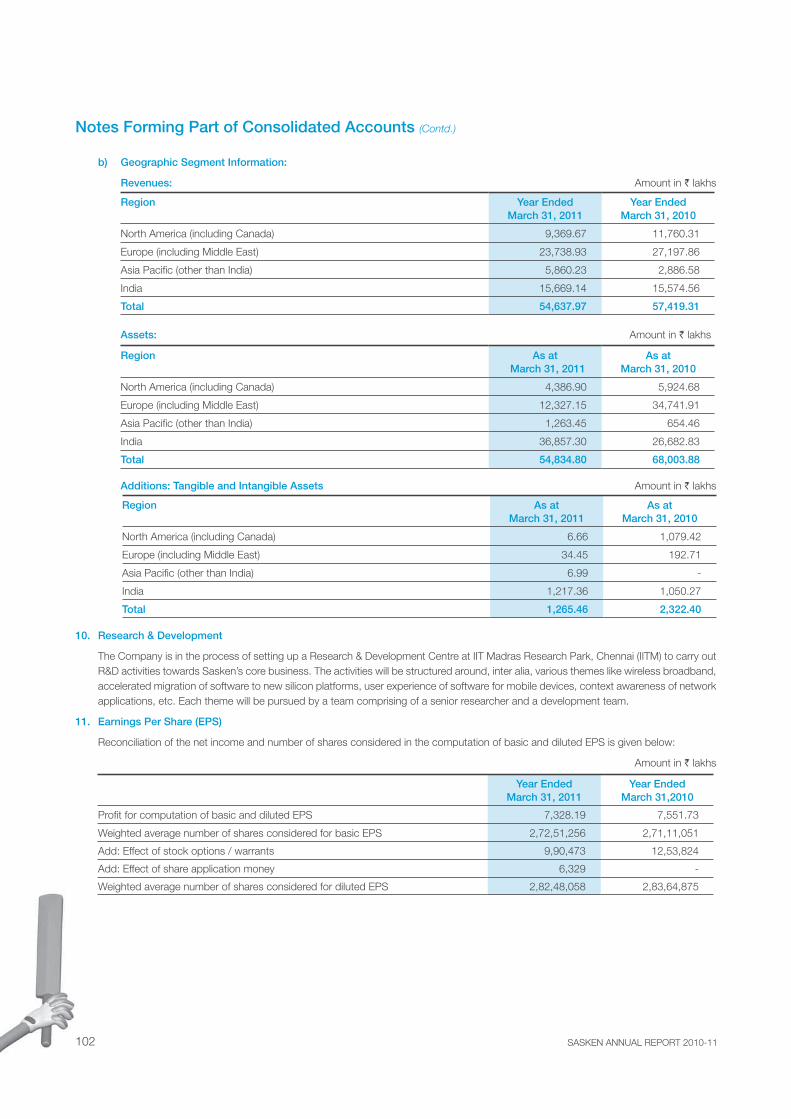
SASKEN ANNUAL REPORT 2010-11102
Notes Forming Part of Consolidated Accounts (Contd.)
b) Geographic Segment Information:
Revenues: Amount in ` lakhs
Region Year EndedMarch 31, 2011
Year EndedMarch 31, 2010
North America (including Canada) 9,369.67 11,760.31
Europe (including Middle East) 23,738.93 27,197.86
Asia Pacific (other than India) 5,860.23 2,886.58
India 15,669.14 15,574.56
Total 54,637.97 57,419.31
Assets: Amount in ` lakhs
Region As at March 31, 2011
As at March 31, 2010
North America (including Canada) 4,386.90 5,924.68
Europe (including Middle East) 12,327.15 34,741.91
Asia Pacific (other than India) 1,263.45 654.46
India 36,857.30 26,682.83
Total 54,834.80 68,003.88
Additions: Tangible and Intangible Assets Amount in ` lakhs
Region As atMarch 31, 2011
As atMarch 31, 2010
North America (including Canada) 6.66 1,079.42
Europe (including Middle East) 34.45 192.71
Asia Pacific (other than India) 6.99 -
India 1,217.36 1,050.27
Total 1,265.46 2,322.40
10. Research & Development
The Company is in the process of setting up a Research & Development Centre at IIT Madras Research Park, Chennai (IITM) to carry out R&D activities towards Sasken’s core business. The activities will be structured around, inter alia, various themes like wireless broadband, accelerated migration of software to new silicon platforms, user experience of software for mobile devices, context awareness of network applications, etc. Each theme will be pursued by a team comprising of a senior researcher and a development team.
11. Earnings Per Share (EPS)
Reconciliation of the net income and number of shares considered in the computation of basic and diluted EPS is given below:
Amount in ` lakhs
Year EndedMarch 31, 2011
Year Ended March 31,2010
Profit for computation of basic and diluted EPS 7,328.19 7,551.73
Weighted average number of shares considered for basic EPS 2,72,51,256 2,71,11,051
Add: Effect of stock options / warrants 9,90,473 12,53,824
Add: Effect of share application money 6,329 -
Weighted average number of shares considered for diluted EPS 2,82,48,058 2,83,64,875
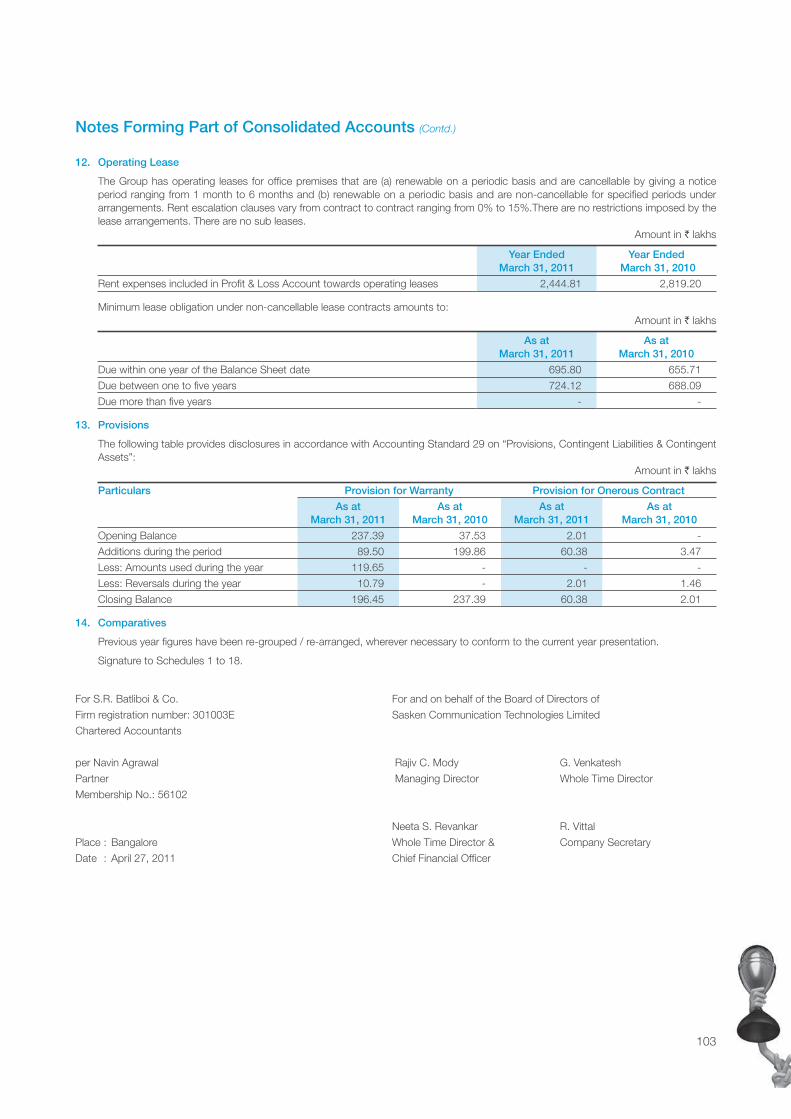
103
Notes Forming Part of Consolidated Accounts (Contd.)
12. Operating Lease
The Group has operating leases for office premises that are (a) renewable on a periodic basis and are cancellable by giving a notice period ranging from 1 month to 6 months and (b) renewable on a periodic basis and are non-cancellable for specified periods under arrangements. Rent escalation clauses vary from contract to contract ranging from 0% to 15%.There are no restrictions imposed by the lease arrangements. There are no sub leases.
Amount in ` lakhs
Year Ended March 31, 2011
Year Ended March 31, 2010
Rent expenses included in Profit & Loss Account towards operating leases 2,444.81 2,819.20
Minimum lease obligation under non-cancellable lease contracts amounts to:Amount in ` lakhs
As atMarch 31, 2011
As atMarch 31, 2010
Due within one year of the Balance Sheet date 695.80 655.71
Due between one to five years 724.12 688.09
Due more than five years - -
13. Provisions
The following table provides disclosures in accordance with Accounting Standard 29 on “Provisions, Contingent Liabilities & Contingent Assets”:
Amount in ` lakhs
Particulars Provision for Warranty Provision for Onerous Contract
As at March 31, 2011
As at March 31, 2010
As at March 31, 2011
As at March 31, 2010
Opening Balance 237.39 37.53 2.01 -
Additions during the period 89.50 199.86 60.38 3.47
Less: Amounts used during the year 119.65 - - -
Less: Reversals during the year 10.79 - 2.01 1.46
Closing Balance 196.45 237.39 60.38 2.01
14. Comparatives
Previous year figures have been re-grouped / re-arranged, wherever necessary to conform to the current year presentation.
Signature to Schedules 1 to 18.
For S.R. Batliboi & Co. For and on behalf of the Board of Directors of
Firm registration number: 301003E Sasken Communication Technologies Limited
Chartered Accountants
per Navin Agrawal Rajiv C. Mody G. Venkatesh
Partner Managing Director Whole Time Director
Membership No.: 56102
Neeta S. Revankar R. Vittal
Place : Bangalore Whole Time Director & Company Secretary
Date : April 27, 2011 Chief Financial Officer
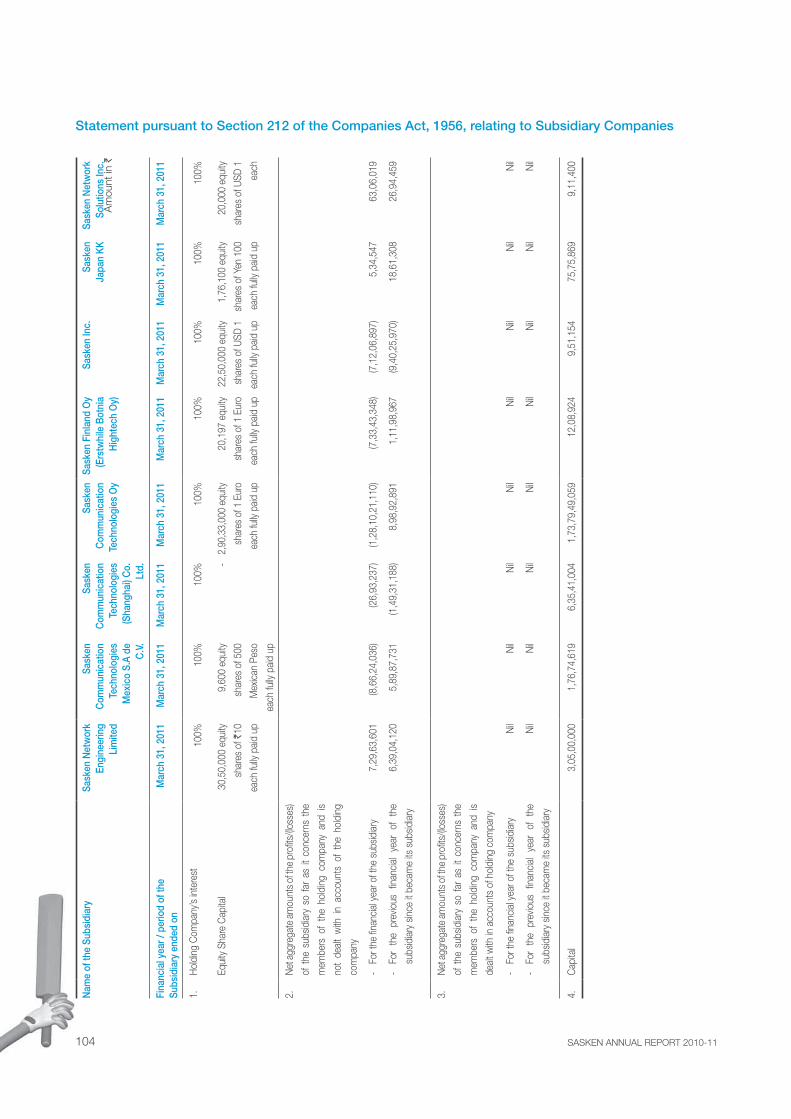
SASKEN ANNUAL REPORT 2010-11104
Statement pursuant to Section 212 of the Companies Act, 1956, relating to Subsidiary Companies
Nam
e of
the
Subs
idia
rySa
sken
Net
wor
k En
gine
erin
g Li
mite
d
Sask
en
Com
mun
icat
ion
Tech
nolo
gies
M
exic
o S.
A de
C
.V.
Sask
en
Com
mun
icat
ion
Tech
nolo
gies
(S
hang
hai)
Co.
Lt
d.
Sask
en
Com
mun
icat
ion
Tech
nolo
gies
Oy
Sask
en F
inla
nd O
y (E
rstw
hile
Bot
nia
Hig
htec
h O
y)
Sask
en In
c.Sa
sken
Ja
pan
KKSa
sken
Net
wor
k So
lutio
ns In
c.
Fina
ncia
l yea
r / p
erio
d of
the
Subs
idia
ry e
nded
on
Mar
ch 3
1, 2
011
Mar
ch 3
1, 2
011
Mar
ch 3
1, 2
011
Mar
ch 3
1, 2
011
Mar
ch 3
1, 2
011
Mar
ch 3
1, 2
011
Mar
ch 3
1, 2
011
Mar
ch 3
1, 2
011
1.H
oldi
ng C
ompa
ny’s
inte
rest
100%
100%
100%
100%
100%
100%
100%
100%
Equi
ty S
hare
Cap
ital
30,
50,0
00 e
quity
shar
es o
f `10
each
fully
pai
d up
9,60
0 eq
uity
shar
es o
f 500
Mex
ican
Pes
o
each
fully
pai
d up
-2,
90,3
3,00
0 eq
uity
shar
es o
f 1 E
uro
each
fully
paid
up
20,1
97 e
quity
shar
es o
f 1 E
uro
each
fully
pai
d up
22,5
0,00
0 eq
uity
shar
es o
f USD
1
each
fully
pai
d up
1,7
6,10
0 eq
uity
shar
es o
f Yen
100
each
fully
pai
d up
20,0
00 e
quity
shar
es o
f USD
1
each
2.N
et a
ggre
gate
am
ount
s of t
he p
rofit
s/(lo
sses
)
of t
he s
ubsid
iary
so
far
as it
con
cern
s th
e
mem
bers
of
the
hold
ing
com
pany
and
is
not
deal
t w
ith i
n ac
coun
ts o
f th
e ho
ldin
g
com
pany
- Fo
r the
fina
ncia
l yea
r of t
he s
ubsid
iary
7,2
9,63
,601
(8
,66,
24,0
36)
(26,
93,2
37)
(1,2
8,10
,21,
110)
(7,3
3,43
,348
) (7
,12,
06,8
97)
5,3
4,54
7 6
3,06
,019
- Fo
r th
e pr
evio
us fi
nanc
ial
year
of
the
subs
idia
ry s
ince
it b
ecam
e its
sub
sidia
ry
6,3
9,04
,120
5
,89,
87,7
31
(1,4
9,31
,188
) 8
,98,
92,8
91
1,1
1,98
,967
(9
,40,
25,9
70)
18,
61,3
08
26,
94,4
59
3.N
et a
ggre
gate
am
ount
s of t
he p
rofit
s/(lo
sses
)
of t
he s
ubsid
iary
so
far
as it
con
cern
s th
e
mem
bers
of
the
hold
ing
com
pany
and
is
deal
t with
in a
ccou
nts
of h
oldi
ng c
ompa
ny
- Fo
r the
fina
ncia
l yea
r of t
he s
ubsid
iary
Nil
Nil
Nil
Nil
Nil
Nil
Nil
Nil
- Fo
r th
e pr
evio
us fi
nanc
ial
year
of
the
subs
idia
ry s
ince
it b
ecam
e its
sub
sidia
ry
Nil
Nil
Nil
Nil
Nil
Nil
Nil
Nil
4.C
apita
l 3
,05,
00,0
00
1,7
6,74
,619
6
,35,
41,0
04
1,73
,79,
49,0
59 1
2,08
,924
9
,51,
154
75,
75,8
69
9,1
1,40
0
Am
ount
in `
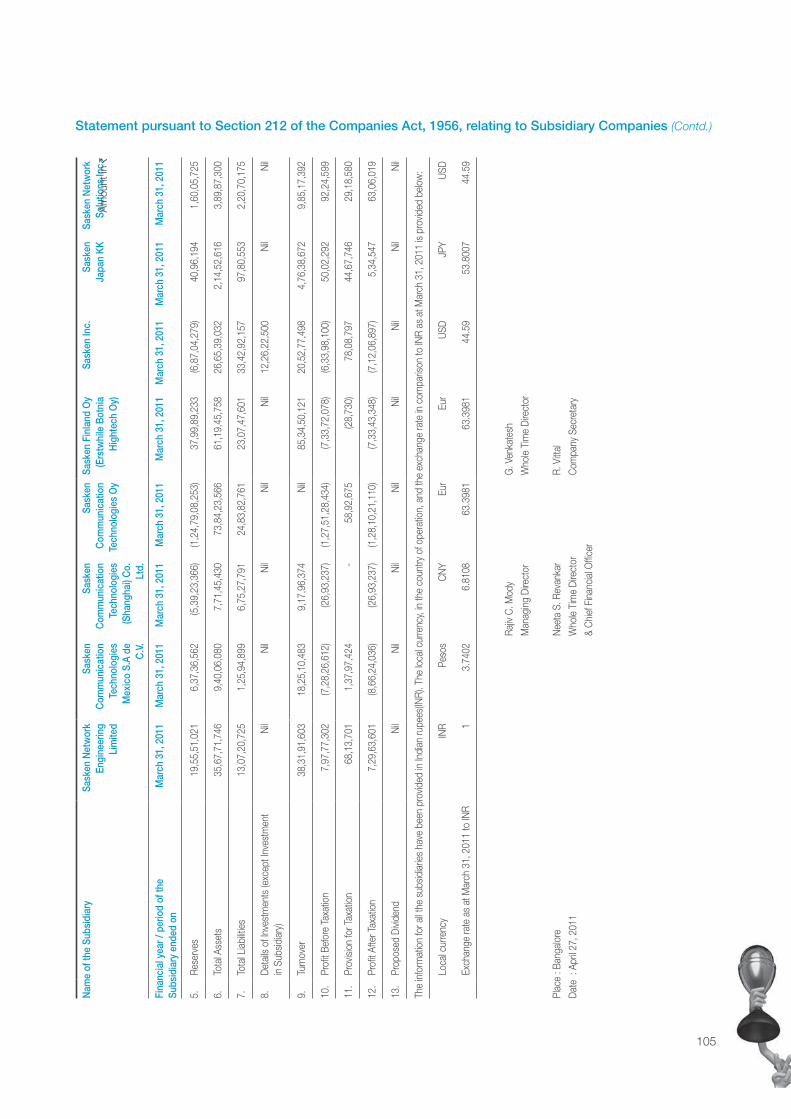
105
Statement pursuant to Section 212 of the Companies Act, 1956, relating to Subsidiary Companies (Contd.)
Nam
e of
the
Subs
idia
rySa
sken
Net
wor
k En
gine
erin
g Li
mite
d
Sask
en
Com
mun
icat
ion
Tech
nolo
gies
M
exic
o S.
A de
C
.V.
Sask
en
Com
mun
icat
ion
Tech
nolo
gies
(S
hang
hai)
Co.
Lt
d.
Sask
en
Com
mun
icat
ion
Tech
nolo
gies
Oy
Sask
en F
inla
nd O
y (E
rstw
hile
Bot
nia
Hig
htec
h O
y)
Sask
en In
c.Sa
sken
Ja
pan
KKSa
sken
Net
wor
k So
lutio
ns In
c.
Fina
ncia
l yea
r / p
erio
d of
the
Subs
idia
ry e
nded
on
Mar
ch 3
1, 2
011
Mar
ch 3
1, 2
011
Mar
ch 3
1, 2
011
Mar
ch 3
1, 2
011
Mar
ch 3
1, 2
011
Mar
ch 3
1, 2
011
Mar
ch 3
1, 2
011
Mar
ch 3
1, 2
011
5.Re
serv
es 1
9,55
,51,
021
6,3
7,36
,562
(5
,39,
23,3
66)
(1,2
4,79
,08,
253)
37,
99,8
9,23
3 (6
,87,
04,2
79)
40,
96,1
94
1,6
0,05
,725
6.To
tal A
sset
s 3
5,67
,71,
746
9,4
0,06
,080
7
,71,
45,4
30
73,
84,2
3,56
6 6
1,19
,45,
758
26,
65,3
9,03
2 2
,14,
52,6
16
3,8
9,87
,300
7.To
tal L
iabi
lities
13,
07,2
0,72
5 1
,25,
94,8
99
6,7
5,27
,791
2
4,83
,82,
761
23,
07,4
7,60
1 3
3,42
,92,
157
97,
80,5
53
2,2
0,70
,175
8.De
tails
of I
nves
tmen
ts (e
xcep
t Inv
estm
ent
in S
ubsid
iary
)N
ilN
ilN
ilN
ilN
il 1
2,26
,22,
500
Nil
Nil
9.Tu
rnov
er 3
8,31
,91,
603
18,
25,1
0,48
3 9
,17,
96,3
74
Nil
85,
34,5
0,12
1 2
0,52
,77,
498
4,7
6,38
,672
9
,85,
17,3
92
10.
Profi
t Bef
ore
Taxa
tion
7,9
7,77
,302
(7
,28,
26,6
12)
(26,
93,2
37)
(1,2
7,51
,28,
434)
(7,3
3,72
,078
) (6
,33,
98,1
00)
50,
02,2
92
92,
24,5
99
11.
Prov
ision
for T
axat
ion
68,
13,7
01
1,3
7,97
,424
-
58,
92,6
75
(28,
730)
78,
08,7
97
44,
67,7
46
29,
18,5
80
12.
Profi
t Afte
r Tax
atio
n 7
,29,
63,6
01
(8,6
6,24
,036
) (2
6,93
,237
) (1
,28,
10,2
1,11
0) (7
,33,
43,3
48)
(7,1
2,06
,897
) 5
,34,
547
63,
06,0
19
13.
Prop
osed
Divi
dend
Nil
Nil
Nil
Nil
Nil
Nil
Nil
Nil
The
info
rmat
ion
for a
ll the
sub
sidia
ries
have
bee
n pr
ovid
ed in
Indi
an ru
pees
(INR)
. The
loca
l cur
renc
y, in
the
coun
try o
f ope
ratio
n, a
nd th
e ex
chan
ge ra
te in
com
paris
on to
INR
as a
t Mar
ch 3
1, 2
011
is pr
ovid
ed b
elow
:
Loca
l cur
renc
yIN
RPe
sos
CN
Y E
ur
Eur
U
SD
JPY
USD
Exch
ange
rate
as
at M
arch
31,
201
1 to
INR
13.
7402
6.81
0863
.398
163
.398
144
.59
53.8
007
44.5
9
Rajiv
C. M
ody
G. V
enka
tesh
Man
agin
g Di
rect
or
Who
le T
ime
Dire
ctor
Plac
e : B
anga
lore
N
eeta
S. R
evan
kar
R. V
ittal
Date
: A
pril 2
7, 2
011
Who
le T
ime
Dire
ctor
Com
pany
Sec
reta
ry
& C
hief
Fin
anci
al O
ffice
r
Am
ount
in `

SASKEN ANNUAL REPORT 2010-11106
IN ADDITION TO HISTORICAL INFORMATION, THIS ANNUAL REPORT CONTAINS CERTAIN FORWARD-LOOKING STATEMENTS. THE FORWARD-LOOKING STATEMENTS CONTAINED HEREIN ARE SUBJECT TO CERTAIN RISKS AND UNCERTAINTIES THAT COULD CAUSE ACTUAL RESULTS TO DIFFER MATERIALLY FROM THOSE REFLECTED IN THE FORWARD-LOOKING STATEMENTS. FACTORS THAT MIGHT CAUSE SUCH A DIFFERENCE INCLUDE, BUT ARE NOT LIMITED TO, THOSE DISCUSSED IN THE MANAGEMENT’S DISCUSSION AND ANALYSIS OF FINANCIAL PERFORMANCE AND ELSEWHERE IN THIS REPORT. READERS ARE CAUTIONED NOT TO PLACE UNDUE RELIANCE ON THESE FORWARD-LOOKING STATEMENTS, WHICH REFLECT MANAGEMENT’S ANALYSIS ONLY AS OF THE DATE HEREOF.
Management’s discussion and analysis of financial performance
The consolidated financial statements have been prepared in compliance with the requirements of the Companies Act, 1956, and Generally Accepted Accounting Principles (GAAP) in India. The management accepts responsibility for the integrity and objectivity of these consolidated financial statements, as well as for various estimates and judgments used in preparing the financial statements. The management’s discussion and analysis is based on the consolidated financial statements.
Company Brief
Sasken is an embedded communications solutions company, that helps businesses across the communications value chain accelerate product development life cycles. Sasken offers a unique combination of research and development consultancy, wireless software products and software services, and works with Network OEMs, Semiconductor Vendors, Terminal Device OEMs and Operators across the world. Global Fortune 500 and Tier 1 companies in these segments are part of Sasken’s customer profile. Established in 1989, Sasken employs 3500+ people, operating from state-of-the-art research and development centers in Bangalore, Pune, Chennai and Hyderabad in India, Kaustinen, Tampere and Oulu in Finland. Sasken is also present in Beijing (China), Kanagawa (Japan), Guildford (UK), Chicago, Dallas & Santa Clara (USA) and Seoul (South Korea).
Sasken has carved a unique position by a thorough understanding of all components of the communications eco-systems spanning semiconductors, mobile devices, network elements and service providers. The value proposition that Sasken brings is that of accelerating the “development cycle” for OEM to speed up their product launch. In addition Sasken can help customers keep pace with rapid changes due to evolution of technology and the resultant fragmentation by helping customers deliver products that are compatible and conform to current releases of both hardware and software.
In addition to being directly involved in the development of a variety of technologies, Sasken is a member of premier technology bodies and forums. Sasken’s quality management systems are certified by ISO 9001:2000, ISO 27001 and TL 9000 standards’ bodies. Sasken’s commitment to environment is highlighted by its ISO 14001 certification.
Outlook
Financial Year 2011 was a challenging year for us and the telecom vertical as key players in the industry reworked their strategies in the wake of the recovery post the 2008 economic downturn.
Business environment
The global mega trends in the embedded space have a strong bearing on the addressable R&D opportunity of Sasken. The current addressable opportunity for India in embedded systems across the 8 verticals as assessed by a study carried out by NASSCOM is huge and approximately US$ 50 billion. This is expected to grow at a compounded annualized growth rate (CAGR) of 12% till 2015 to reach about US$ 90 billion. Telecom and consumer electronics will account for more than half of this available opportunity by 2015. The verticals in which the opportunity is expected to grow the fastest are energy & power, aerospace & defense and healthcare. The growth of the addressable opportunity in telecom, consumer electronics and automotive is expected to be a bit lesser than the overall growth opportunity. These three verticals have borne the brunt of the global recession. During the recovery phase, the expected revenue growth going forward is on the low to moderate side. Telecom, consumer electronics and automotive are also relatively well penetrated by Indian service providers and MNC R&D centers. Hence, the expected growth in offshoring will be moderate.
Growth opportunities for Sasken
Our growth plans will be achieved by focusing on our existing key accounts who are marquee customers with whom we see headroom for growth. We have plans to become one of the top 3 vendors for each of these accounts thereby becoming entrenched as a “strategic” partner of choice.
With a slew of new offerings that leverage our deep domain competencies in all elements of communication value chain we are targeting both large companies and niche players. We are uniquely equipped to service these companies with offerings such as:
�� Full phone integration
�� IP led offerings in Multimedia
�� Offering for the Android market in handsets, tablets and other consumer electronic devices taking advantage of the rapid evolution of the Android Software Platform.
In addition, we are working to define specific offerings for North American Wireless carriers who are engaged in upgrading their wireless networks to support wireless broadband communications.
We have begun the process of expanding our portfolio of offerings to address new adjacencies like:
�� Satellite communication on the back of our success with INMARSAT
�� Automotive and consumer electronics using IP acquired from Ingenient by Sasken Inc. and our relationships with leading companies in this space.
In all these areas we have commercial engagements and will work towards scaling them in next two to three years.
Management Discussion and Analysis Report
107
We have continued to make progress on VyapaarSEWATM which was selected as part of Department of Telecommunications – Universal Service Obligation Fund “Sanchar Shakti” Scheme – a pilot initiative in ICT Mobile Value Added services for Women’s Self Help Groups in rural India. You will be happy to note that Sanchar Shakti Scheme along with Sasken’s VyapaarSEWATM pilot project was launched on the March 7, 2011 by President of India, H.E. Smt. Pratibha Devisingh Patil.
By successfully executing these plans, Sasken can “Consolidate” its position, leverage its deep domain competencies to “Differentiate” and be able to achieve both “Scale and Profitable” growth in the near term.
Outlook and plans for the business lines we operate:
Handsets and Consumer & Automotive Electronics
Our vision for this business line is to “Be the Leader in R&D services for device vendors”. The device space comprises of handsets, tablets, modems and set-top boxes though other device types and form factors will emerge in adjacent spaces such as automotive, consumer electronics, health care etc.
The “Smartphone market”, has been built on the increased adoption of Open source software platform with Android from Google emerging as a leader. An increasing number of Original Equipment Manufacturers (OEMs) have adopted Android and other operating systems and continue to introduce vast number of products that run advanced operating systems. The rapid evolution of hardware, software, networks and applications presents us with growth opportunities. Sasken has taken a lead in providing support to OEMs and semiconductor vendors by timely investments in building Android and related competencies. This combined with our unique ability to understand the needs of the entire eco system involved in building Smartphones and other devices helps us differentiate and take a strong position in market for R&D services. Sasken services help our customers target “Operators or service providers” in the US or “retail markets”, both of whom have specific requirements and challenges.
We have played a pivotal role in delivering R&D services to port various versions of Android on a majority of the chipset platforms in the market today and have helped OEMs launch several different models in the market. These Android based products have been shipped in the North American, European and Asian continents in several countries in these regions. The cumulative volume of these devices exceeds 50 million units. Several leading telecommunication service providers such as Verizon, T-Mobile, SK-Telecom, etc., have carried these Android based devices as their flagship products in all the these markets.
Our successful full phone integration program for INMARSAT (more complex than mobile phones) places us in a unique position to enable OEMs to get more aggressive in pricing, speed up time to market and mitigate risks in the productization phase.
In the Automotive and Consumer Electronics adjacencies, we have leveraged the suite of Ingenient offerings and our Semiconductor partnerships. These offerings include multimedia and connectivity solutions for the automotive infotainment market that take advantage of the increased demands of connectivity in today’s passenger cars. The proliferation of computing and connectivity modules make today’s car vastly different from those made a few years back. The car is seen as a networked entity that provides a host of safety, convenience and entertainment needs to the driver and passengers. We have buoyed by our initial success in this space and are uniquely placed to position ourselves as a system integrator and validation partner of choice. Our IP enabled services will include: Video, connectivity, drivers and system integration support. Our ability to offer a mix of proximity and India based outsourcing gives customers both cost and capability led advantages which helps to make them more competitive.
Semiconductor and North American Operators Accounts
The stated vision of the Semiconductor and North American Operator Accounts Business Line is to “Consolidate our position as a leader in Wireless R&D Technology & Solution knowledge for platform vendors”.
We will endeavor to achieve our vision by emerging among the top suppliers for some of the largest semiconductor vendors, providing them R&D services. We will also target other players who are challengers who seek to outsource their R&D needs and establish themselves in the fastest growing segment in the Semiconductor industry. Leading market analyst put the total worldwide semiconductor revenue close to $ 300 billion and this industry has seen the largest dollar increase in recent times. The growth of the semiconductor industry has largely been on account of robust growth in devices such as smartphones, tablets, e-book readers, automotive infotainment, and wireless communication infrastructure. We have an established presence in all these segments and serve market leaders comprising both semiconductor vendors and OEMs who build products based on silicon plaftorms. We help our customers design, test and integrate communication and connectivity solutions on these platforms.
We will leverage our traditional strength and significant presence in the Semiconductor industry to help customers accelerate the “design to tape out” cycle. Our offerings include:
�� Application Specific Integrated Circuits (ASIC) and Hardware Services spanning: Design, Validation & Testing
�� Software Services: Multimedia, Operating System (Open Source), Application Integration
In this business line, we have white space opportunities as the wireless ecosystem infiltrates other industry segments e.g. Healthcare, Energy, Enterprise and Services. Our partnerships with Semiconductor companies have resulted in early wins in the Consumer Electronics and Automotive adjacencies which we are now scaling.
We are rejuvenating our “Test Lab Services” for Wireless Devices spanning Certification, Debugging, Field and Conformance Testing and expect a good uptick in the testing business.
Management Discussion and Analysis Report (Contd.)
SASKEN ANNUAL REPORT 2010-11108
Networks, Enterprise and Satellite Accounts
In the Networks, Satellite, Enterprise and Government Accounts Business Line, our focus is to serve the following market segments and re-establish ourselves as a strong and dependable R&D services provider for manufacturers of:
�� Network equipment
�� Devices and Network Equipment for Satellite Communication Services Providers
�� Enterprise Mobility and Mobile Embedded Systems
The proliferation of broadband services especially on wireless networks is seen by operators as key to reverse the trend of flat revenue from voice. While voice will continue to be a critical component of revenue, revenue from data application will add and eclipse voice revenues in the next few years. The massive adoption of smartphones has accelerated the deployment of 3G and 4G infrastructure and analyst estimate that this will set the foundation for the new investment in infrastructure that is expected to last through till 2014-15. Estimates range from US $ 250 to 300 billion spend on telecommunication infrastructure for next generation wireless networks in the aforementioned period.
The focus will be on new offerings in Data Communications, Long Term Evolution (LTE), Enterprise Applications and Testing.
We will capitalize on the increasing need for enterprise communication (across industry verticals) powered by cloud - enabled solutions based on our handset and network software capabilities. We have made an initial entry in the retail enterprise space and are offering our services to a leading North American grocery retail chain.
In LTE, we will build offerings to solve some key problems in deployment including: Interoperation, Network congestion, System Conformance and Interoperability testing.
In the Datacom area, our offerings and services will include Packet Transport, Deep Packet Inspection, and enabling superior quality Voice over IP Networks.
Europe Key Accounts
In European Key Accounts Business Line we service some of the largest customers of Sasken.
For one of the largest handset OEMs we are seeing new challenges as they changed their operating system strategy. Despite the shift in their strategy we still see new opportunities in S40, Services and Full Phone integration. In addition, we are gearing up to address Windows Phone related white spaces in this vendors ecosystem.
On the Hardware side, we will leverage our extensive understanding and knowledge gained from having developed over eight hardware systems, which gives us competitive advantage in communication segment. In addition, we will be able to capitalize on the delivery centers in European Union and China regions, which enable a cost efficient service mix.
Our domain strength in RF / antenna knowledge helps us solve Customer’s problems as devices get more complex and use multiple radios. Our capability to execute projects that demand knowledge of both hardware and software is of immense value to customers.
For the Europe based semiconductor accounts, we will provide our comprehensive suite of “Protocol Stack” development and maintenance services & “Connectivity Solutions” to enable them to launch mobiles and tablets that meet the demands of discerning customers. We continue to deepen our offerings relating to Integrated Chip (IC) Design Services offerings for these customers. Capitalizing on the explosive growth of smart phones we will offer these customers full phone reference designs.
Sasken key differentiators
Some of the unique capabilities of Sasken include its abilities to take a leadership position in:
1. Android Software Platform Services
2. Full Phone (device) Design Services
3. Intellectual Property (IP) Led Services
4. Operator Specific Services
We will continue to build on our leadership position in the communications markets and take advantage of imminent convergence trends in these markets. Key wins in Android, fast emerging as an operating system of choice for smartphones, coupled with our traditional strengths in working with Semiconductor Platforms, Deep domain competencies in both Hardware and Software, Ownership of Multimedia IP provides us a good platform to be uniquely positioned in the market to emerge as a market leader with these highly bespoke offerings.
Financial results for the Year Ended March 31, 2011
�� Consolidated revenues for FY 2011 is `54,637.97 lakhs, a decrease of 4.8%, from `57,419.31 lakhs in FY 2010.
�� Software Services revenues, Network Engineering Services revenues, Software Product revenues and Automotive, Utilities and Industrial revenues were `44,607.09 lakhs, `4,444.03 lakhs, `5,606 lakhs and `409.25 lakhs respectively, for FY 2011.
�� The revenue mix amongst Software Services, Network Engineering Services and Software Products changed to 81:8:11 in FY 2011 from 88:7:5 in FY 2010.
�� Cost of Revenues decreased to `40,183.93 lakhs which is 73.5% of revenues in FY 2011 as against `42,919.14 lakhs which is 74.7% of revenues in FY 2010.
Management Discussion and Analysis Report (Contd.)
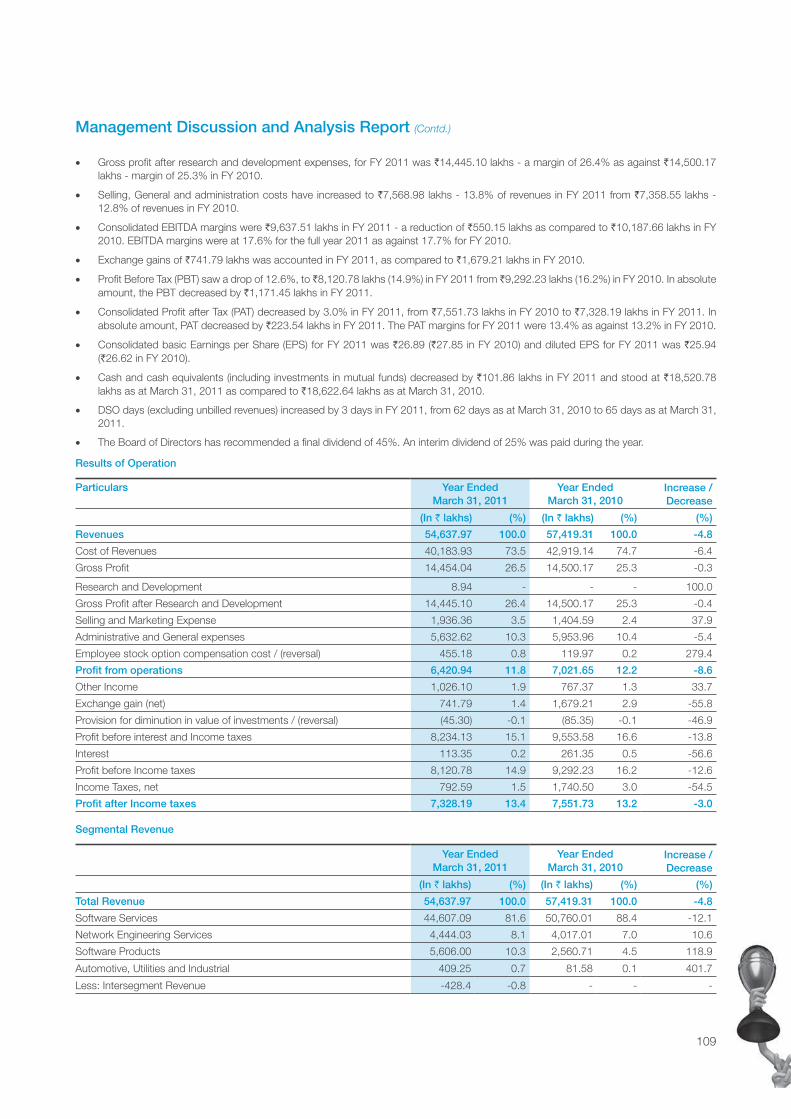
109
�� Gross profit after research and development expenses, for FY 2011 was `14,445.10 lakhs - a margin of 26.4% as against `14,500.17 lakhs - margin of 25.3% in FY 2010.
�� Selling, General and administration costs have increased to `7,568.98 lakhs - 13.8% of revenues in FY 2011 from `7,358.55 lakhs - 12.8% of revenues in FY 2010.
�� Consolidated EBITDA margins were `9,637.51 lakhs in FY 2011 - a reduction of `550.15 lakhs as compared to `10,187.66 lakhs in FY 2010. EBITDA margins were at 17.6% for the full year 2011 as against 17.7% for FY 2010.
�� Exchange gains of `741.79 lakhs was accounted in FY 2011, as compared to `1,679.21 lakhs in FY 2010.
�� Profit Before Tax (PBT) saw a drop of 12.6%, to ̀ 8,120.78 lakhs (14.9%) in FY 2011 from ̀ 9,292.23 lakhs (16.2%) in FY 2010. In absolute amount, the PBT decreased by `1,171.45 lakhs in FY 2011.
�� Consolidated Profit after Tax (PAT) decreased by 3.0% in FY 2011, from `7,551.73 lakhs in FY 2010 to `7,328.19 lakhs in FY 2011. In absolute amount, PAT decreased by `223.54 lakhs in FY 2011. The PAT margins for FY 2011 were 13.4% as against 13.2% in FY 2010.
�� Consolidated basic Earnings per Share (EPS) for FY 2011 was `26.89 (`27.85 in FY 2010) and diluted EPS for FY 2011 was `25.94 (`26.62 in FY 2010).
�� Cash and cash equivalents (including investments in mutual funds) decreased by `101.86 lakhs in FY 2011 and stood at `18,520.78 lakhs as at March 31, 2011 as compared to `18,622.64 lakhs as at March 31, 2010.
�� DSO days (excluding unbilled revenues) increased by 3 days in FY 2011, from 62 days as at March 31, 2010 to 65 days as at March 31, 2011.
�� The Board of Directors has recommended a final dividend of 45%. An interim dividend of 25% was paid during the year.
Results of Operation
Particulars Year EndedMarch 31, 2011
Year EndedMarch 31, 2010
Increase /Decrease
(In ` lakhs) (%) (In ` lakhs) (%) (%)
Revenues 54,637.97 100.0 57,419.31 100.0 -4.8
Cost of Revenues 40,183.93 73.5 42,919.14 74.7 -6.4
Gross Profit 14,454.04 26.5 14,500.17 25.3 -0.3
Research and Development 8.94 - - - 100.0
Gross Profit after Research and Development 14,445.10 26.4 14,500.17 25.3 -0.4
Selling and Marketing Expense 1,936.36 3.5 1,404.59 2.4 37.9
Administrative and General expenses 5,632.62 10.3 5,953.96 10.4 -5.4
Employee stock option compensation cost / (reversal) 455.18 0.8 119.97 0.2 279.4
Profit from operations 6,420.94 11.8 7,021.65 12.2 -8.6
Other Income 1,026.10 1.9 767.37 1.3 33.7
Exchange gain (net) 741.79 1.4 1,679.21 2.9 -55.8
Provision for diminution in value of investments / (reversal) (45.30) -0.1 (85.35) -0.1 -46.9
Profit before interest and Income taxes 8,234.13 15.1 9,553.58 16.6 -13.8
Interest 113.35 0.2 261.35 0.5 -56.6
Profit before Income taxes 8,120.78 14.9 9,292.23 16.2 -12.6
Income Taxes, net 792.59 1.5 1,740.50 3.0 -54.5
Profit after Income taxes 7,328.19 13.4 7,551.73 13.2 -3.0
Segmental Revenue
Year Ended
March 31, 2011Year Ended
March 31, 2010Increase /Decrease
(In ` lakhs) (%) (In ` lakhs) (%) (%)
Total Revenue 54,637.97 100.0 57,419.31 100.0 -4.8
Software Services 44,607.09 81.6 50,760.01 88.4 -12.1
Network Engineering Services 4,444.03 8.1 4,017.01 7.0 10.6
Software Products 5,606.00 10.3 2,560.71 4.5 118.9
Automotive, Utilities and Industrial 409.25 0.7 81.58 0.1 401.7
Less: Intersegment Revenue -428.4 -0.8 - - -
Management Discussion and Analysis Report (Contd.)
SASKEN ANNUAL REPORT 2010-11110
We derive revenues from software services, product and technology licensing, and installation and commissioning services. Revenue from time and material service contracts is recognized as the services are provided. Revenue from fixed price service contracts and customized products or technology developments is recognized based on the proportionate completion method, determined based on the achievement and acceptance of the milestone, provided collection is probable. Revenue from maintenance contracts is recognized ratably over the term of the maintenance arrangement. Licensing revenue is recognized when the product or technology is delivered and accepted. Revenue from royalty is recognized on an accrual basis based on customer confirmation, provided collection is probable.
In all cases revenue is recognized only when no further vendor obligations remain, up to the stage of revenue recognized and collection is probable. Revenue related to post contract customer support is recognized over the support period.
The consolidated revenues in USD terms were at $119.94 million in FY 2011, a decrease of 1.81 million from $121.75 million in FY 2010. The revenue in INR terms has decreased by 4.8% year on year while in US Dollar terms has decreased only by 1.5%. In FY 2011, the rupee appreciated to an average rate of `45.55 in FY 2011 from `47.16 in FY 2010.
In FY 2011, in USD terms, Services revenue (including Network Engineering segment) contributed to 89.0% of the overall revenues, while Product revenues contributed to 10.3% of overall revenues.
Services Revenue
The segmentation of Services revenue (including Network Engineering segment) is as follows :In %
FY 2011 FY 2010Time and Material (including compensation) 80.2 82.5Fixed Price 19.8 17.5Total 100.0 100.0
Services revenue (including Network Engineering segment) derived from services performed in development centers or customer sites in low cost locations are categorized as offshore revenues and revenues from high cost locations are categorized as onsite revenues. The offshore onsite mix of revenues is as follows:
In %
FY 2011 FY 2010Onsite 28.5 28.0Offshore 71.5 72.0Total 100.0 100.0
Though there has been decline in services revenue, year on year, in the last quarter of the financial year we have seen a nominal volume growth of 0.6%.
Products Revenue
The Products Segment revenues have increased for FY 2011 mainly on account of better realization from licensing and royalty revenues. Royalties are from products licensed in earlier years, and is dependent on phone volumes shipped. As newer and newer models of phone are shipped with newer technologies, royalties from old licenses will decline.
Also, the full year consolidation for FY 2011 of a business acquired in US during Q3 of FY 2010 as against one quarter results consolidated for FY 2010 has positively impacted the revenues.
Categorization product revenue is as follows :In %
FY 2011 FY 2010
License fees 32.2 23.1
Royalties 63.2 68.4
Customization 4.6 8.5
Total 100.0 100.0
Segmental EBITDA In ` lakhs
Year EndedMarch 31, 2011
Year EndedMarch 31, 2010
EBITDA Margins 9,637.51 10,187.66
Software Services 6,556.40 8,961.34
Network Engineering services 652.92 993.72
Software Products 2,961.75 595.98 Automotive, Utilities and Industrial (533.57) (363.38)
Management Discussion and Analysis Report (Contd.)
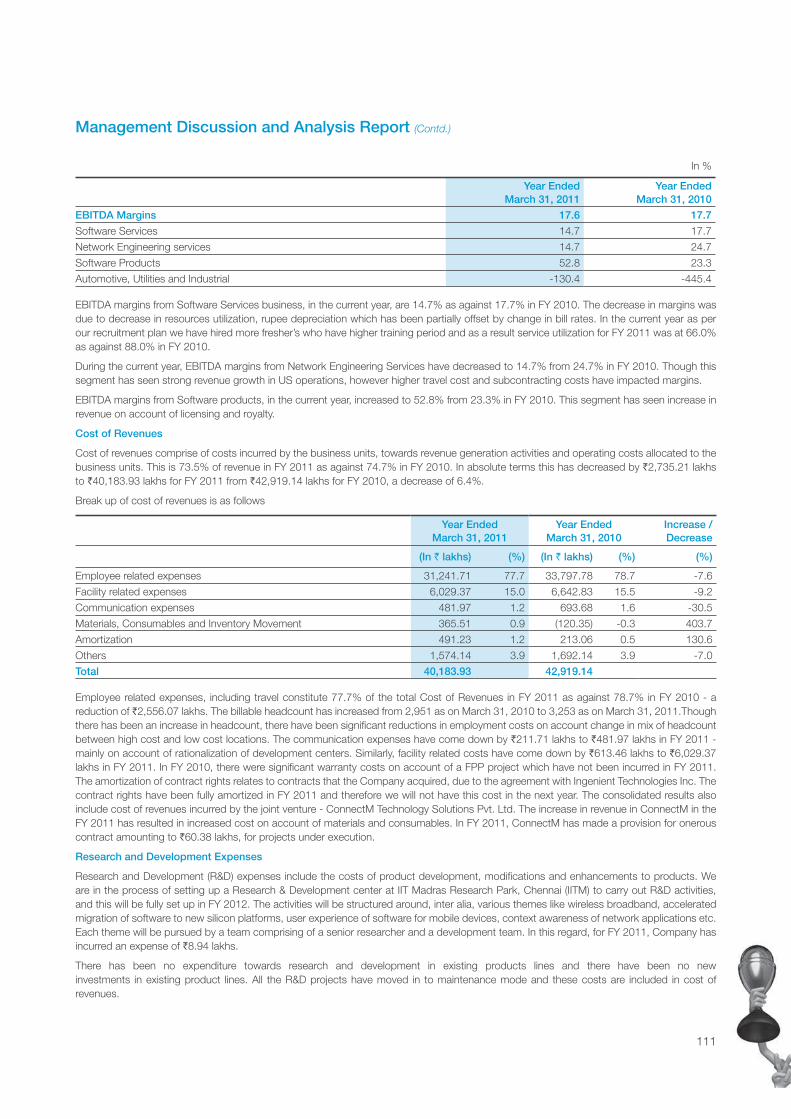
111
In %
Year EndedMarch 31, 2011
Year EndedMarch 31, 2010
EBITDA Margins 17.6 17.7
Software Services 14.7 17.7
Network Engineering services 14.7 24.7
Software Products 52.8 23.3
Automotive, Utilities and Industrial -130.4 -445.4
EBITDA margins from Software Services business, in the current year, are 14.7% as against 17.7% in FY 2010. The decrease in margins was due to decrease in resources utilization, rupee depreciation which has been partially offset by change in bill rates. In the current year as per our recruitment plan we have hired more fresher’s who have higher training period and as a result service utilization for FY 2011 was at 66.0% as against 88.0% in FY 2010.
During the current year, EBITDA margins from Network Engineering Services have decreased to 14.7% from 24.7% in FY 2010. Though this segment has seen strong revenue growth in US operations, however higher travel cost and subcontracting costs have impacted margins.
EBITDA margins from Software products, in the current year, increased to 52.8% from 23.3% in FY 2010. This segment has seen increase in revenue on account of licensing and royalty.
Cost of Revenues
Cost of revenues comprise of costs incurred by the business units, towards revenue generation activities and operating costs allocated to the business units. This is 73.5% of revenue in FY 2011 as against 74.7% in FY 2010. In absolute terms this has decreased by `2,735.21 lakhs to `40,183.93 lakhs for FY 2011 from `42,919.14 lakhs for FY 2010, a decrease of 6.4%.
Break up of cost of revenues is as follows
Year Ended
March 31, 2011Year Ended
March 31, 2010Increase /Decrease
(In ` lakhs) (%) (In ` lakhs) (%) (%)
Employee related expenses 31,241.71 77.7 33,797.78 78.7 -7.6
Facility related expenses 6,029.37 15.0 6,642.83 15.5 -9.2
Communication expenses 481.97 1.2 693.68 1.6 -30.5
Materials, Consumables and Inventory Movement 365.51 0.9 (120.35) -0.3 403.7
Amortization 491.23 1.2 213.06 0.5 130.6
Others 1,574.14 3.9 1,692.14 3.9 -7.0
Total 40,183.93 42,919.14
Employee related expenses, including travel constitute 77.7% of the total Cost of Revenues in FY 2011 as against 78.7% in FY 2010 - a reduction of `2,556.07 lakhs. The billable headcount has increased from 2,951 as on March 31, 2010 to 3,253 as on March 31, 2011.Though there has been an increase in headcount, there have been significant reductions in employment costs on account change in mix of headcount between high cost and low cost locations. The communication expenses have come down by `211.71 lakhs to `481.97 lakhs in FY 2011 - mainly on account of rationalization of development centers. Similarly, facility related costs have come down by `613.46 lakhs to `6,029.37 lakhs in FY 2011. In FY 2010, there were significant warranty costs on account of a FPP project which have not been incurred in FY 2011. The amortization of contract rights relates to contracts that the Company acquired, due to the agreement with Ingenient Technologies Inc. The contract rights have been fully amortized in FY 2011 and therefore we will not have this cost in the next year. The consolidated results also include cost of revenues incurred by the joint venture - ConnectM Technology Solutions Pvt. Ltd. The increase in revenue in ConnectM in the FY 2011 has resulted in increased cost on account of materials and consumables. In FY 2011, ConnectM has made a provision for onerous contract amounting to `60.38 lakhs, for projects under execution.
Research and Development Expenses
Research and Development (R&D) expenses include the costs of product development, modifications and enhancements to products. We are in the process of setting up a Research & Development center at IIT Madras Research Park, Chennai (IITM) to carry out R&D activities, and this will be fully set up in FY 2012. The activities will be structured around, inter alia, various themes like wireless broadband, accelerated migration of software to new silicon platforms, user experience of software for mobile devices, context awareness of network applications etc. Each theme will be pursued by a team comprising of a senior researcher and a development team. In this regard, for FY 2011, Company has incurred an expense of `8.94 lakhs.
There has been no expenditure towards research and development in existing products lines and there have been no new investments in existing product lines. All the R&D projects have moved in to maintenance mode and these costs are included in cost of revenues.
Management Discussion and Analysis Report (Contd.)
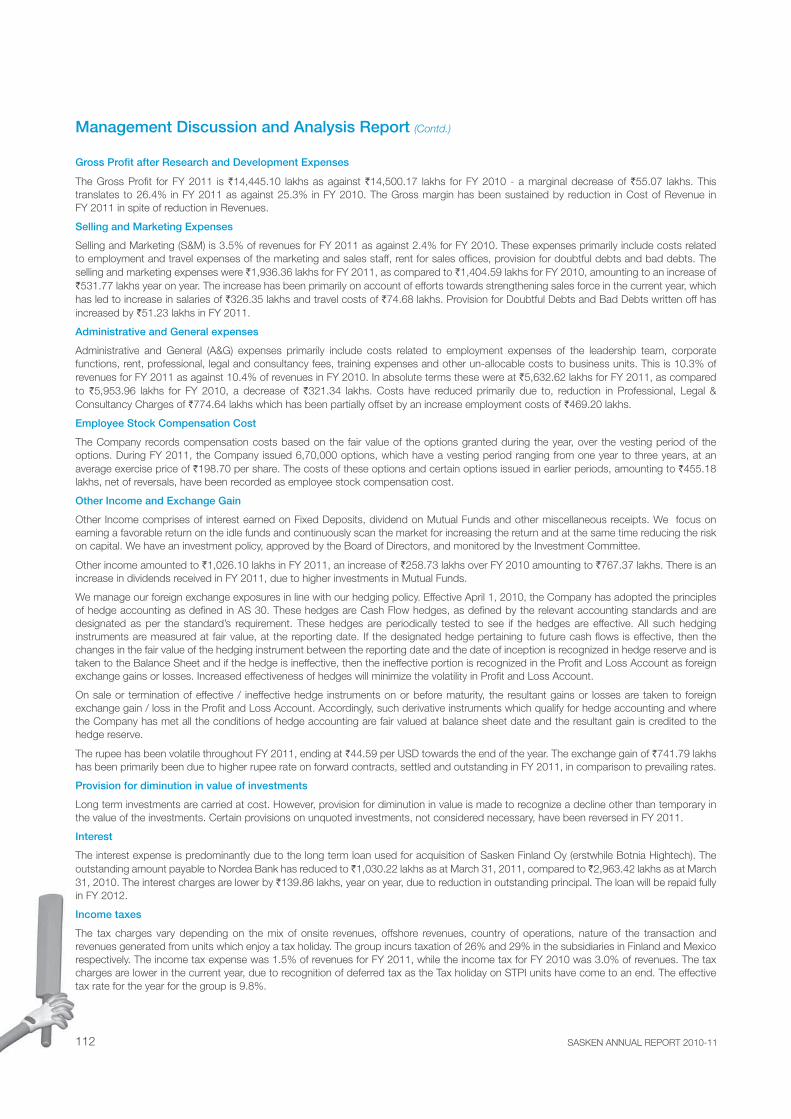
SASKEN ANNUAL REPORT 2010-11112
Gross Profit after Research and Development Expenses
The Gross Profit for FY 2011 is `14,445.10 lakhs as against `14,500.17 lakhs for FY 2010 - a marginal decrease of `55.07 lakhs. This translates to 26.4% in FY 2011 as against 25.3% in FY 2010. The Gross margin has been sustained by reduction in Cost of Revenue in FY 2011 in spite of reduction in Revenues.
Selling and Marketing Expenses
Selling and Marketing (S&M) is 3.5% of revenues for FY 2011 as against 2.4% for FY 2010. These expenses primarily include costs related to employment and travel expenses of the marketing and sales staff, rent for sales offices, provision for doubtful debts and bad debts. The selling and marketing expenses were `1,936.36 lakhs for FY 2011, as compared to `1,404.59 lakhs for FY 2010, amounting to an increase of `531.77 lakhs year on year. The increase has been primarily on account of efforts towards strengthening sales force in the current year, which has led to increase in salaries of `326.35 lakhs and travel costs of `74.68 lakhs. Provision for Doubtful Debts and Bad Debts written off has increased by `51.23 lakhs in FY 2011.
Administrative and General expenses
Administrative and General (A&G) expenses primarily include costs related to employment expenses of the leadership team, corporate functions, rent, professional, legal and consultancy fees, training expenses and other un-allocable costs to business units. This is 10.3% of revenues for FY 2011 as against 10.4% of revenues in FY 2010. In absolute terms these were at `5,632.62 lakhs for FY 2011, as compared to `5,953.96 lakhs for FY 2010, a decrease of `321.34 lakhs. Costs have reduced primarily due to, reduction in Professional, Legal & Consultancy Charges of `774.64 lakhs which has been partially offset by an increase employment costs of `469.20 lakhs.
Employee Stock Compensation Cost
The Company records compensation costs based on the fair value of the options granted during the year, over the vesting period of the options. During FY 2011, the Company issued 6,70,000 options, which have a vesting period ranging from one year to three years, at an average exercise price of `198.70 per share. The costs of these options and certain options issued in earlier periods, amounting to `455.18 lakhs, net of reversals, have been recorded as employee stock compensation cost.
Other Income and Exchange Gain
Other Income comprises of interest earned on Fixed Deposits, dividend on Mutual Funds and other miscellaneous receipts. We focus on earning a favorable return on the idle funds and continuously scan the market for increasing the return and at the same time reducing the risk on capital. We have an investment policy, approved by the Board of Directors, and monitored by the Investment Committee.
Other income amounted to `1,026.10 lakhs in FY 2011, an increase of `258.73 lakhs over FY 2010 amounting to `767.37 lakhs. There is an increase in dividends received in FY 2011, due to higher investments in Mutual Funds.
We manage our foreign exchange exposures in line with our hedging policy. Effective April 1, 2010, the Company has adopted the principles of hedge accounting as defined in AS 30. These hedges are Cash Flow hedges, as defined by the relevant accounting standards and are designated as per the standard’s requirement. These hedges are periodically tested to see if the hedges are effective. All such hedging instruments are measured at fair value, at the reporting date. If the designated hedge pertaining to future cash flows is effective, then the changes in the fair value of the hedging instrument between the reporting date and the date of inception is recognized in hedge reserve and is taken to the Balance Sheet and if the hedge is ineffective, then the ineffective portion is recognized in the Profit and Loss Account as foreign exchange gains or losses. Increased effectiveness of hedges will minimize the volatility in Profit and Loss Account.
On sale or termination of effective / ineffective hedge instruments on or before maturity, the resultant gains or losses are taken to foreign exchange gain / loss in the Profit and Loss Account. Accordingly, such derivative instruments which qualify for hedge accounting and where the Company has met all the conditions of hedge accounting are fair valued at balance sheet date and the resultant gain is credited to the hedge reserve.
The rupee has been volatile throughout FY 2011, ending at `44.59 per USD towards the end of the year. The exchange gain of `741.79 lakhs has been primarily been due to higher rupee rate on forward contracts, settled and outstanding in FY 2011, in comparison to prevailing rates.
Provision for diminution in value of investments
Long term investments are carried at cost. However, provision for diminution in value is made to recognize a decline other than temporary in the value of the investments. Certain provisions on unquoted investments, not considered necessary, have been reversed in FY 2011.
Interest
The interest expense is predominantly due to the long term loan used for acquisition of Sasken Finland Oy (erstwhile Botnia Hightech). The outstanding amount payable to Nordea Bank has reduced to ̀ 1,030.22 lakhs as at March 31, 2011, compared to ̀ 2,963.42 lakhs as at March 31, 2010. The interest charges are lower by `139.86 lakhs, year on year, due to reduction in outstanding principal. The loan will be repaid fully in FY 2012.
Income taxes
The tax charges vary depending on the mix of onsite revenues, offshore revenues, country of operations, nature of the transaction and revenues generated from units which enjoy a tax holiday. The group incurs taxation of 26% and 29% in the subsidiaries in Finland and Mexico respectively. The income tax expense was 1.5% of revenues for FY 2011, while the income tax for FY 2010 was 3.0% of revenues. The tax charges are lower in the current year, due to recognition of deferred tax as the Tax holiday on STPI units have come to an end. The effective tax rate for the year for the group is 9.8%.
Management Discussion and Analysis Report (Contd.)
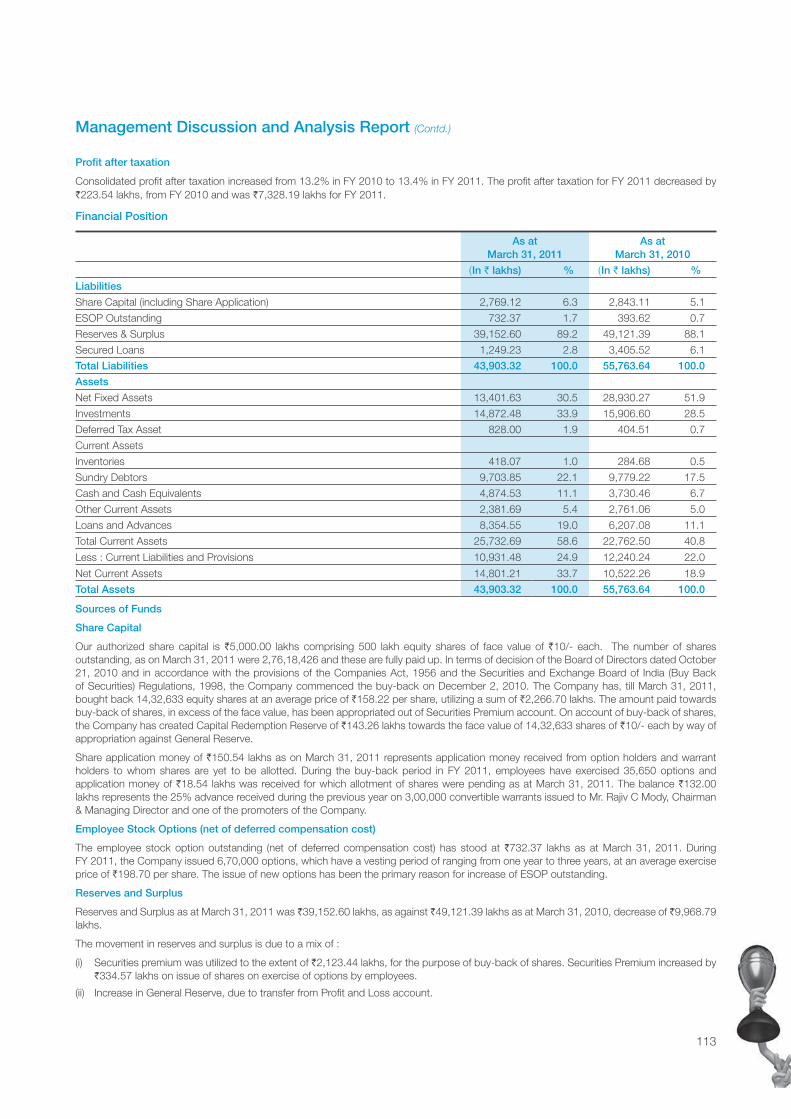
113
Profit after taxation
Consolidated profit after taxation increased from 13.2% in FY 2010 to 13.4% in FY 2011. The profit after taxation for FY 2011 decreased by `223.54 lakhs, from FY 2010 and was `7,328.19 lakhs for FY 2011.
Financial Position
As at March 31, 2011
As atMarch 31, 2010
(In ` lakhs) % (In ` lakhs) %
Liabilities
Share Capital (including Share Application) 2,769.12 6.3 2,843.11 5.1
ESOP Outstanding 732.37 1.7 393.62 0.7
Reserves & Surplus 39,152.60 89.2 49,121.39 88.1
Secured Loans 1,249.23 2.8 3,405.52 6.1
Total Liabilities 43,903.32 100.0 55,763.64 100.0
Assets
Net Fixed Assets 13,401.63 30.5 28,930.27 51.9
Investments 14,872.48 33.9 15,906.60 28.5
Deferred Tax Asset 828.00 1.9 404.51 0.7
Current Assets
Inventories 418.07 1.0 284.68 0.5
Sundry Debtors 9,703.85 22.1 9,779.22 17.5
Cash and Cash Equivalents 4,874.53 11.1 3,730.46 6.7
Other Current Assets 2,381.69 5.4 2,761.06 5.0
Loans and Advances 8,354.55 19.0 6,207.08 11.1
Total Current Assets 25,732.69 58.6 22,762.50 40.8
Less : Current Liabilities and Provisions 10,931.48 24.9 12,240.24 22.0
Net Current Assets 14,801.21 33.7 10,522.26 18.9
Total Assets 43,903.32 100.0 55,763.64 100.0
Sources of Funds
Share Capital
Our authorized share capital is `5,000.00 lakhs comprising 500 lakh equity shares of face value of `10/- each. The number of shares outstanding, as on March 31, 2011 were 2,76,18,426 and these are fully paid up. In terms of decision of the Board of Directors dated October 21, 2010 and in accordance with the provisions of the Companies Act, 1956 and the Securities and Exchange Board of India (Buy Back of Securities) Regulations, 1998, the Company commenced the buy-back on December 2, 2010. The Company has, till March 31, 2011, bought back 14,32,633 equity shares at an average price of `158.22 per share, utilizing a sum of `2,266.70 lakhs. The amount paid towards buy-back of shares, in excess of the face value, has been appropriated out of Securities Premium account. On account of buy-back of shares, the Company has created Capital Redemption Reserve of `143.26 lakhs towards the face value of 14,32,633 shares of `10/- each by way of appropriation against General Reserve.
Share application money of `150.54 lakhs as on March 31, 2011 represents application money received from option holders and warrant holders to whom shares are yet to be allotted. During the buy-back period in FY 2011, employees have exercised 35,650 options and application money of `18.54 lakhs was received for which allotment of shares were pending as at March 31, 2011. The balance `132.00 lakhs represents the 25% advance received during the previous year on 3,00,000 convertible warrants issued to Mr. Rajiv C Mody, Chairman & Managing Director and one of the promoters of the Company.
Employee Stock Options (net of deferred compensation cost)
The employee stock option outstanding (net of deferred compensation cost) has stood at `732.37 lakhs as at March 31, 2011. During FY 2011, the Company issued 6,70,000 options, which have a vesting period of ranging from one year to three years, at an average exercise price of `198.70 per share. The issue of new options has been the primary reason for increase of ESOP outstanding.
Reserves and Surplus
Reserves and Surplus as at March 31, 2011 was ̀ 39,152.60 lakhs, as against `49,121.39 lakhs as at March 31, 2010, decrease of ̀ 9,968.79 lakhs.
The movement in reserves and surplus is due to a mix of :
(i) Securities premium was utilized to the extent of `2,123.44 lakhs, for the purpose of buy-back of shares. Securities Premium increased by `334.57 lakhs on issue of shares on exercise of options by employees.
(ii) Increase in General Reserve, due to transfer from Profit and Loss account.
Management Discussion and Analysis Report (Contd.)
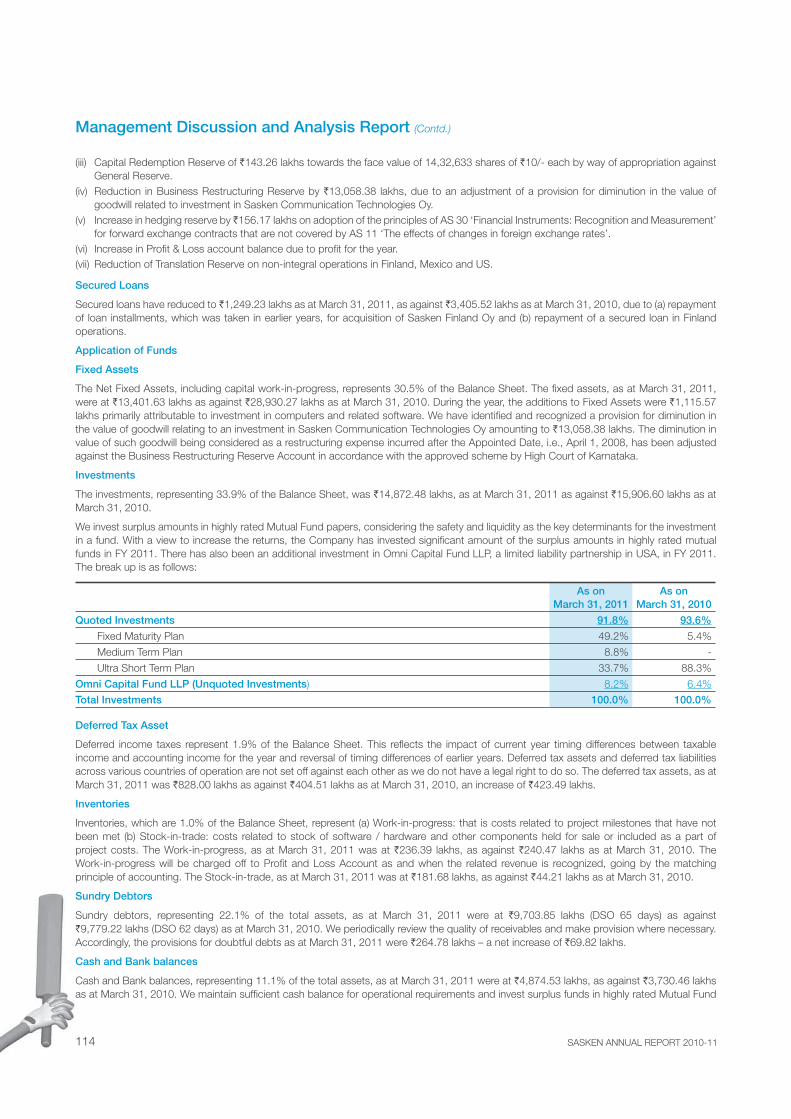
SASKEN ANNUAL REPORT 2010-11114
(iii) Capital Redemption Reserve of `143.26 lakhs towards the face value of 14,32,633 shares of `10/- each by way of appropriation against General Reserve.
(iv) Reduction in Business Restructuring Reserve by `13,058.38 lakhs, due to an adjustment of a provision for diminution in the value of goodwill related to investment in Sasken Communication Technologies Oy.
(v) Increase in hedging reserve by ̀ 156.17 lakhs on adoption of the principles of AS 30 ‘Financial Instruments: Recognition and Measurement’ for forward exchange contracts that are not covered by AS 11 ‘The effects of changes in foreign exchange rates’.
(vi) Increase in Profit & Loss account balance due to profit for the year.(vii) Reduction of Translation Reserve on non-integral operations in Finland, Mexico and US.
Secured Loans
Secured loans have reduced to `1,249.23 lakhs as at March 31, 2011, as against `3,405.52 lakhs as at March 31, 2010, due to (a) repayment of loan installments, which was taken in earlier years, for acquisition of Sasken Finland Oy and (b) repayment of a secured loan in Finland operations.
Application of Funds
Fixed Assets
The Net Fixed Assets, including capital work-in-progress, represents 30.5% of the Balance Sheet. The fixed assets, as at March 31, 2011, were at `13,401.63 lakhs as against `28,930.27 lakhs as at March 31, 2010. During the year, the additions to Fixed Assets were `1,115.57 lakhs primarily attributable to investment in computers and related software. We have identified and recognized a provision for diminution in the value of goodwill relating to an investment in Sasken Communication Technologies Oy amounting to `13,058.38 lakhs. The diminution in value of such goodwill being considered as a restructuring expense incurred after the Appointed Date, i.e., April 1, 2008, has been adjusted against the Business Restructuring Reserve Account in accordance with the approved scheme by High Court of Karnataka.
Investments
The investments, representing 33.9% of the Balance Sheet, was `14,872.48 lakhs, as at March 31, 2011 as against `15,906.60 lakhs as at March 31, 2010.
We invest surplus amounts in highly rated Mutual Fund papers, considering the safety and liquidity as the key determinants for the investment in a fund. With a view to increase the returns, the Company has invested significant amount of the surplus amounts in highly rated mutual funds in FY 2011. There has also been an additional investment in Omni Capital Fund LLP, a limited liability partnership in USA, in FY 2011. The break up is as follows:
As on
March 31, 2011As on
March 31, 2010
Quoted Investments 91.8% 93.6%
Fixed Maturity Plan 49.2% 5.4%
Medium Term Plan 8.8% -
Ultra Short Term Plan 33.7% 88.3%
Omni Capital Fund LLP (Unquoted Investments) 8.2% 6.4%
Total Investments 100.0% 100.0%
Deferred Tax Asset
Deferred income taxes represent 1.9% of the Balance Sheet. This reflects the impact of current year timing differences between taxable income and accounting income for the year and reversal of timing differences of earlier years. Deferred tax assets and deferred tax liabilities across various countries of operation are not set off against each other as we do not have a legal right to do so. The deferred tax assets, as at March 31, 2011 was `828.00 lakhs as against `404.51 lakhs as at March 31, 2010, an increase of `423.49 lakhs.
Inventories
Inventories, which are 1.0% of the Balance Sheet, represent (a) Work-in-progress: that is costs related to project milestones that have not been met (b) Stock-in-trade: costs related to stock of software / hardware and other components held for sale or included as a part of project costs. The Work-in-progress, as at March 31, 2011 was at `236.39 lakhs, as against `240.47 lakhs as at March 31, 2010. The Work-in-progress will be charged off to Profit and Loss Account as and when the related revenue is recognized, going by the matching principle of accounting. The Stock-in-trade, as at March 31, 2011 was at `181.68 lakhs, as against `44.21 lakhs as at March 31, 2010.
Sundry Debtors
Sundry debtors, representing 22.1% of the total assets, as at March 31, 2011 were at `9,703.85 lakhs (DSO 65 days) as against `9,779.22 lakhs (DSO 62 days) as at March 31, 2010. We periodically review the quality of receivables and make provision where necessary. Accordingly, the provisions for doubtful debts as at March 31, 2011 were `264.78 lakhs – a net increase of `69.82 lakhs.
Cash and Bank balances
Cash and Bank balances, representing 11.1% of the total assets, as at March 31, 2011 were at `4,874.53 lakhs, as against `3,730.46 lakhs as at March 31, 2010. We maintain sufficient cash balance for operational requirements and invest surplus funds in highly rated Mutual Fund
Management Discussion and Analysis Report (Contd.)
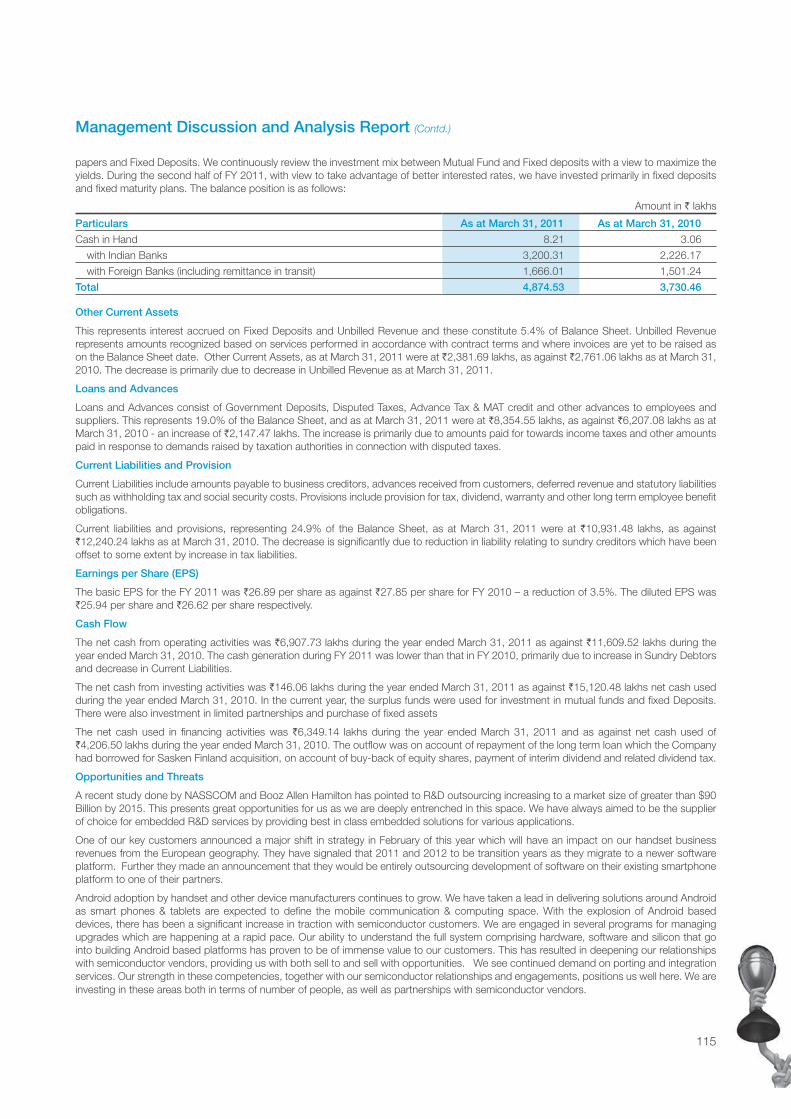
115
papers and Fixed Deposits. We continuously review the investment mix between Mutual Fund and Fixed deposits with a view to maximize the yields. During the second half of FY 2011, with view to take advantage of better interested rates, we have invested primarily in fixed deposits and fixed maturity plans. The balance position is as follows:
Amount in ` lakhs
Particulars As at March 31, 2011 As at March 31, 2010
Cash in Hand 8.21 3.06
with Indian Banks 3,200.31 2,226.17
with Foreign Banks (including remittance in transit) 1,666.01 1,501.24
Total 4,874.53 3,730.46
Other Current Assets
This represents interest accrued on Fixed Deposits and Unbilled Revenue and these constitute 5.4% of Balance Sheet. Unbilled Revenue represents amounts recognized based on services performed in accordance with contract terms and where invoices are yet to be raised as on the Balance Sheet date. Other Current Assets, as at March 31, 2011 were at `2,381.69 lakhs, as against `2,761.06 lakhs as at March 31, 2010. The decrease is primarily due to decrease in Unbilled Revenue as at March 31, 2011.
Loans and Advances
Loans and Advances consist of Government Deposits, Disputed Taxes, Advance Tax & MAT credit and other advances to employees and suppliers. This represents 19.0% of the Balance Sheet, and as at March 31, 2011 were at `8,354.55 lakhs, as against `6,207.08 lakhs as at March 31, 2010 - an increase of `2,147.47 lakhs. The increase is primarily due to amounts paid for towards income taxes and other amounts paid in response to demands raised by taxation authorities in connection with disputed taxes.
Current Liabilities and Provision
Current Liabilities include amounts payable to business creditors, advances received from customers, deferred revenue and statutory liabilities such as withholding tax and social security costs. Provisions include provision for tax, dividend, warranty and other long term employee benefit obligations.
Current liabilities and provisions, representing 24.9% of the Balance Sheet, as at March 31, 2011 were at `10,931.48 lakhs, as against `12,240.24 lakhs as at March 31, 2010. The decrease is significantly due to reduction in liability relating to sundry creditors which have been offset to some extent by increase in tax liabilities.
Earnings per Share (EPS)
The basic EPS for the FY 2011 was `26.89 per share as against `27.85 per share for FY 2010 – a reduction of 3.5%. The diluted EPS was `25.94 per share and `26.62 per share respectively.
Cash Flow
The net cash from operating activities was `6,907.73 lakhs during the year ended March 31, 2011 as against `11,609.52 lakhs during the year ended March 31, 2010. The cash generation during FY 2011 was lower than that in FY 2010, primarily due to increase in Sundry Debtors and decrease in Current Liabilities.
The net cash from investing activities was `146.06 lakhs during the year ended March 31, 2011 as against `15,120.48 lakhs net cash used during the year ended March 31, 2010. In the current year, the surplus funds were used for investment in mutual funds and fixed Deposits. There were also investment in limited partnerships and purchase of fixed assets
The net cash used in financing activities was `6,349.14 lakhs during the year ended March 31, 2011 and as against net cash used of `4,206.50 lakhs during the year ended March 31, 2010. The outflow was on account of repayment of the long term loan which the Company had borrowed for Sasken Finland acquisition, on account of buy-back of equity shares, payment of interim dividend and related dividend tax.
Opportunities and Threats
A recent study done by NASSCOM and Booz Allen Hamilton has pointed to R&D outsourcing increasing to a market size of greater than $90 Billion by 2015. This presents great opportunities for us as we are deeply entrenched in this space. We have always aimed to be the supplier of choice for embedded R&D services by providing best in class embedded solutions for various applications.
One of our key customers announced a major shift in strategy in February of this year which will have an impact on our handset business revenues from the European geography. They have signaled that 2011 and 2012 to be transition years as they migrate to a newer software platform. Further they made an announcement that they would be entirely outsourcing development of software on their existing smartphone platform to one of their partners.
Android adoption by handset and other device manufacturers continues to grow. We have taken a lead in delivering solutions around Android as smart phones & tablets are expected to define the mobile communication & computing space. With the explosion of Android based devices, there has been a significant increase in traction with semiconductor customers. We are engaged in several programs for managing upgrades which are happening at a rapid pace. Our ability to understand the full system comprising hardware, software and silicon that go into building Android based platforms has proven to be of immense value to our customers. This has resulted in deepening our relationships with semiconductor vendors, providing us with both sell to and sell with opportunities. We see continued demand on porting and integration services. Our strength in these competencies, together with our semiconductor relationships and engagements, positions us well here. We are investing in these areas both in terms of number of people, as well as partnerships with semiconductor vendors.
Management Discussion and Analysis Report (Contd.)
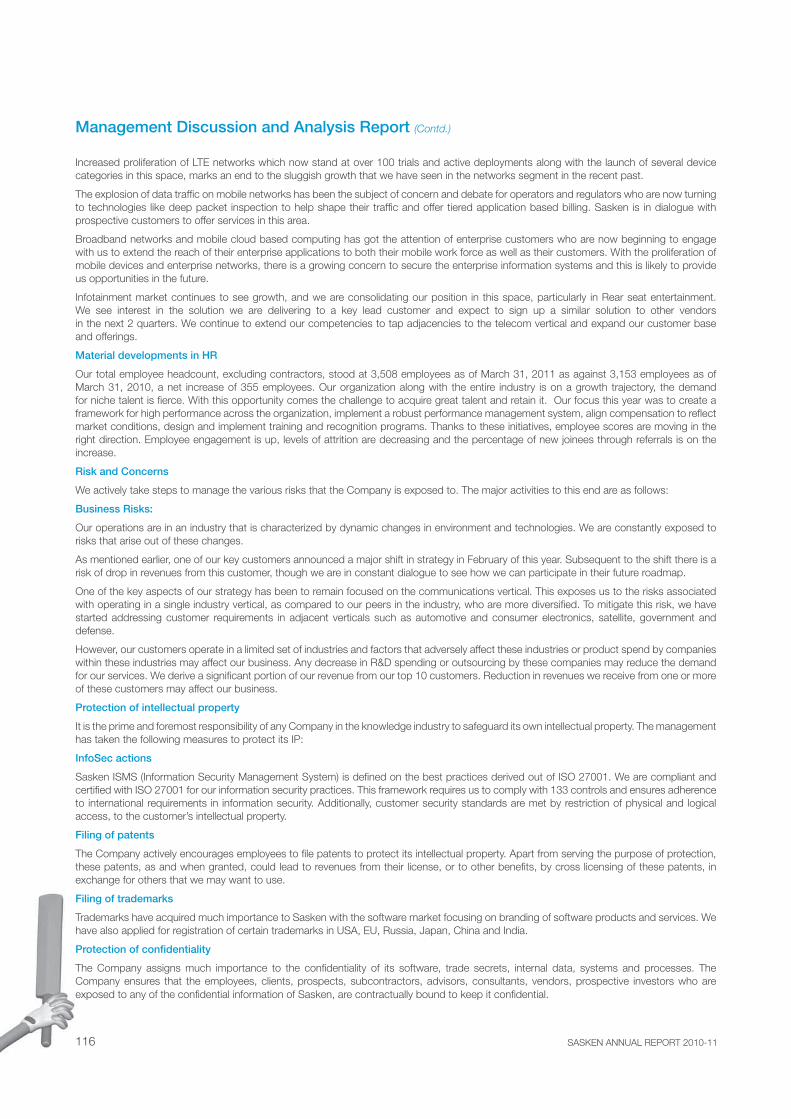
SASKEN ANNUAL REPORT 2010-11116
Increased proliferation of LTE networks which now stand at over 100 trials and active deployments along with the launch of several device categories in this space, marks an end to the sluggish growth that we have seen in the networks segment in the recent past.
The explosion of data traffic on mobile networks has been the subject of concern and debate for operators and regulators who are now turning to technologies like deep packet inspection to help shape their traffic and offer tiered application based billing. Sasken is in dialogue with prospective customers to offer services in this area.
Broadband networks and mobile cloud based computing has got the attention of enterprise customers who are now beginning to engage with us to extend the reach of their enterprise applications to both their mobile work force as well as their customers. With the proliferation of mobile devices and enterprise networks, there is a growing concern to secure the enterprise information systems and this is likely to provide us opportunities in the future.
Infotainment market continues to see growth, and we are consolidating our position in this space, particularly in Rear seat entertainment. We see interest in the solution we are delivering to a key lead customer and expect to sign up a similar solution to other vendors in the next 2 quarters. We continue to extend our competencies to tap adjacencies to the telecom vertical and expand our customer base and offerings.
Material developments in HR
Our total employee headcount, excluding contractors, stood at 3,508 employees as of March 31, 2011 as against 3,153 employees as of March 31, 2010, a net increase of 355 employees. Our organization along with the entire industry is on a growth trajectory, the demand for niche talent is fierce. With this opportunity comes the challenge to acquire great talent and retain it. Our focus this year was to create a framework for high performance across the organization, implement a robust performance management system, align compensation to reflect market conditions, design and implement training and recognition programs. Thanks to these initiatives, employee scores are moving in the right direction. Employee engagement is up, levels of attrition are decreasing and the percentage of new joinees through referrals is on the increase.
Risk and Concerns
We actively take steps to manage the various risks that the Company is exposed to. The major activities to this end are as follows:
Business Risks:
Our operations are in an industry that is characterized by dynamic changes in environment and technologies. We are constantly exposed to risks that arise out of these changes.
As mentioned earlier, one of our key customers announced a major shift in strategy in February of this year. Subsequent to the shift there is a risk of drop in revenues from this customer, though we are in constant dialogue to see how we can participate in their future roadmap.
One of the key aspects of our strategy has been to remain focused on the communications vertical. This exposes us to the risks associated with operating in a single industry vertical, as compared to our peers in the industry, who are more diversified. To mitigate this risk, we have started addressing customer requirements in adjacent verticals such as automotive and consumer electronics, satellite, government and defense.
However, our customers operate in a limited set of industries and factors that adversely affect these industries or product spend by companies within these industries may affect our business. Any decrease in R&D spending or outsourcing by these companies may reduce the demand for our services. We derive a significant portion of our revenue from our top 10 customers. Reduction in revenues we receive from one or more of these customers may affect our business.
Protection of intellectual property
It is the prime and foremost responsibility of any Company in the knowledge industry to safeguard its own intellectual property. The management has taken the following measures to protect its IP:
InfoSec actions
Sasken ISMS (Information Security Management System) is defined on the best practices derived out of ISO 27001. We are compliant and certified with ISO 27001 for our information security practices. This framework requires us to comply with 133 controls and ensures adherence to international requirements in information security. Additionally, customer security standards are met by restriction of physical and logical access, to the customer’s intellectual property.
Filing of patents
The Company actively encourages employees to file patents to protect its intellectual property. Apart from serving the purpose of protection, these patents, as and when granted, could lead to revenues from their license, or to other benefits, by cross licensing of these patents, in exchange for others that we may want to use.
Filing of trademarks
Trademarks have acquired much importance to Sasken with the software market focusing on branding of software products and services. We have also applied for registration of certain trademarks in USA, EU, Russia, Japan, China and India.
Protection of confidentiality
The Company assigns much importance to the confidentiality of its software, trade secrets, internal data, systems and processes. The Company ensures that the employees, clients, prospects, subcontractors, advisors, consultants, vendors, prospective investors who are exposed to any of the confidential information of Sasken, are contractually bound to keep it confidential.
Management Discussion and Analysis Report (Contd.)

117
Contracting process for limitation of liability
Each and every contract entered into by the Company, including both customer and vendor contracts, undergoes a well-settled legal and commercial contract review process. The process ensures that, the clauses, which may be imposed by the customer / vendors that expose the Company to risks are proportionate with the benefits accruing from the contract. The Company is also protected by insurance coverage.
Financial risks:
Foreign exchange fluctuation risk
Most of the Company’s revenues are in US Dollars and Euros, while its expenses are in Indian Rupees. Operating profits are therefore subject to fluctuations in exchange rates. The exchange rate between the Rupee and the US Dollar has changed substantially in the recent year. In FY 2011, the rupee continued to be choppy. The rupee appreciated by 3.4% against USD, from March 31, 2010 till March 31, 2011. The rupee closed at `44.59 to a dollar for FY 2011.
With view to minimize the impact of exchange fluctuations, the Company periodically reviews its foreign exchange exposures and takes appropriate hedges through forward contracts and option contracts, regularly. The policy of the Company is to take hedges for risk mitigation and not for profit maximization. The Company has preset loss limits and unhedged exposures are subject to these loss limits for the purpose of deciding the hedge.
Liquidity Risk
The Board reviews the liquidity position periodically and determines the need for infusion of equity and debt capital into the business. The Company has met its working capital requirements through internal cash accruals during the current year. The Company has fund based and non-fund based lines of credit available, to satisfy any working capital requirements, if required.
Internal Control Systems
The Company continues to comply with the requirements of Enterprise Risk Management (ERM), which is mandated by Clause 49 of the Listing Agreement. Apart from identifying and documenting ‘Entity level’ risks and controls, the exercise involves identifying all significant (a) locations and (b) business processes, followed by (c) documenting each of the process flows (d) creation of risk registers and (e) an assessment of controls by way of testing. The risk register captures all areas of potential financial risks and operational risks and, the associated internal controls that are already in place or have been identified. Annual certification is an important procedure which ends with the CEO and CFO certification. It starts from the ‘control’ owner and then on to the ‘process’ owner and upwards, leading to the CXO’s.
As part of the assessment exercise conducted, certain proposed controls identified in previous periods have been implemented and tested for their effectiveness, and other proposed controls are being implemented. Additionally, certain new controls have been identified for matters of significant importance or relevance, for implementation in the coming periods.
The Company continues to ‘capture and track’, risks and controls. The Company continues to do a regular assessment of the risks and controls for the existing and new process flows. The processes followed by other subsidiary companies would also be brought under the purview of ERM.
Further, as a good corporate governance measure, all matters of significant importance or relevance have been reported to the Audit Committee and the Company’s Statutory Auditors.
Management Discussion and Analysis Report (Contd.)
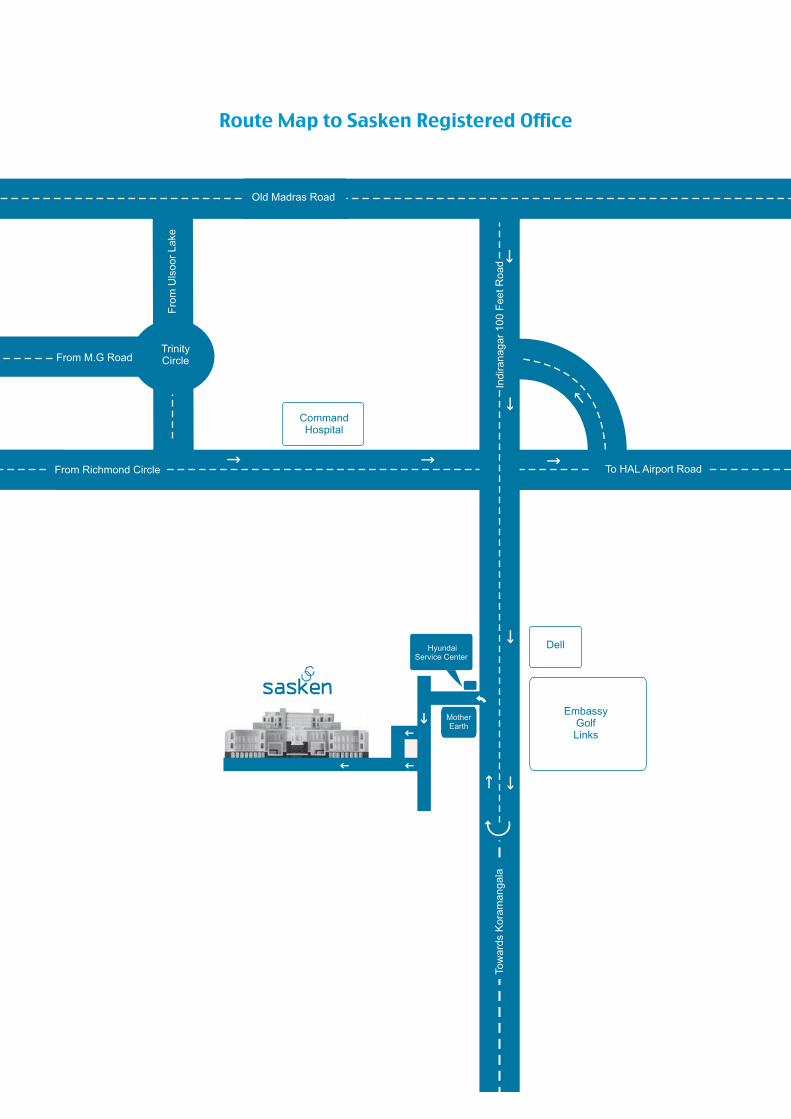
���� ��� ���� � ��� ����
����
���������
����� ���� �� ������
����������
���������� ��
���
��!���"����#�
�� �$�$ ����� ������ ������ � ����
%�� ���� ��
��&������'� ���
(�� ��#�)**������
Route Map to Sasken Registered Office
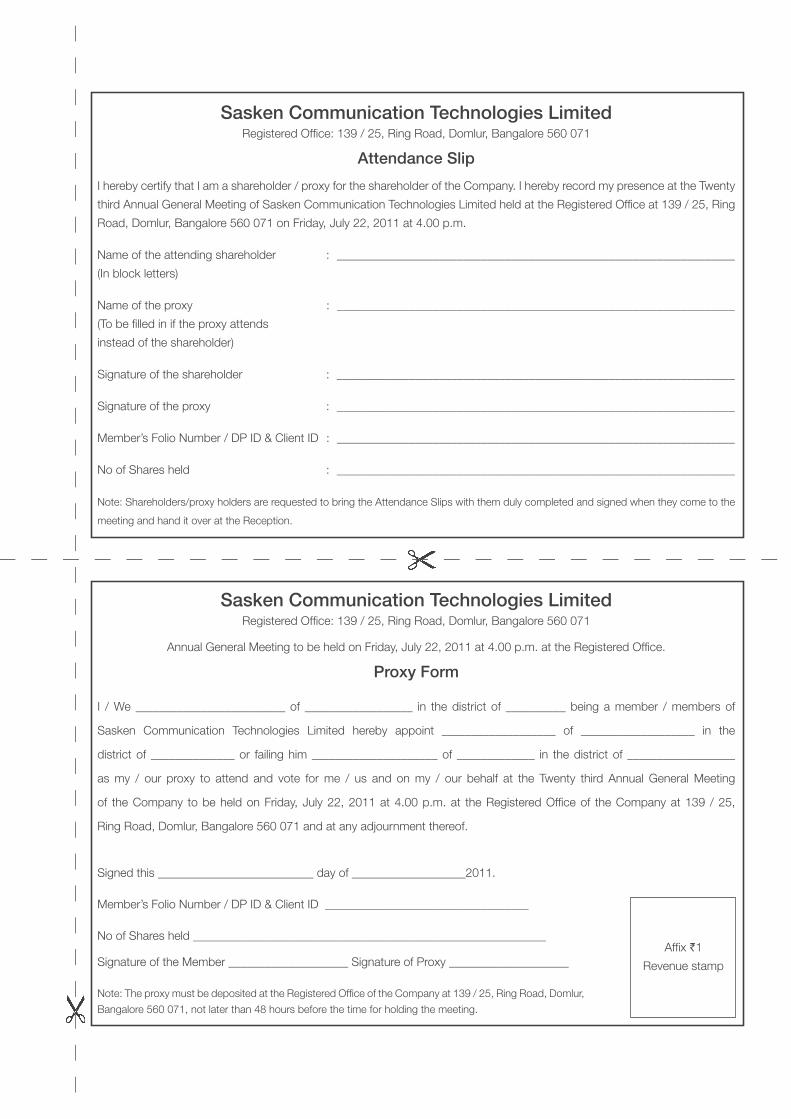
Sasken Communication Technologies LimitedRegistered Office: 139 / 25, Ring Road, Domlur, Bangalore 560 071
Attendance Slip
I hereby certify that I am a shareholder / proxy for the shareholder of the Company. I hereby record my presence at the Twenty
third Annual General Meeting of Sasken Communication Technologies Limited held at the Registered Office at 139 / 25, Ring
Road, Domlur, Bangalore 560 071 on Friday, July 22, 2011 at 4.00 p.m.
Name of the attending shareholder : __________________________________________________________________
(In block letters)
Name of the proxy : __________________________________________________________________
(To be filled in if the proxy attends
instead of the shareholder)
Signature of the shareholder : __________________________________________________________________
Signature of the proxy : __________________________________________________________________
Member’s Folio Number / DP ID & Client ID : __________________________________________________________________
No of Shares held : __________________________________________________________________
Note: Shareholders/proxy holders are requested to bring the Attendance Slips with them duly completed and signed when they come to the
meeting and hand it over at the Reception.
Sasken Communication Technologies LimitedRegistered Office: 139 / 25, Ring Road, Domlur, Bangalore 560 071
Annual General Meeting to be held on Friday, July 22, 2011 at 4.00 p.m. at the Registered Office.
Proxy Form
I / We _________________________ of __________________ in the district of __________ being a member / members of
Sasken Communication Technologies Limited hereby appoint ___________________ of ___________________ in the
district of ______________ or failing him _____________________ of _____________ in the district of __________________
as my / our proxy to attend and vote for me / us and on my / our behalf at the Twenty third Annual General Meeting
of the Company to be held on Friday, July 22, 2011 at 4.00 p.m. at the Registered Office of the Company at 139 / 25,
Ring Road, Domlur, Bangalore 560 071 and at any adjournment thereof.
Signed this __________________________ day of ___________________2011.
Member’s Folio Number / DP ID & Client ID __________________________________
No of Shares held ___________________________________________________________
Signature of the Member ____________________ Signature of Proxy ____________________
Note: The proxy must be deposited at the Registered Office of the Company at 139 / 25, Ring Road, Domlur,
Bangalore 560 071, not later than 48 hours before the time for holding the meeting.
Affix `1
Revenue stamp

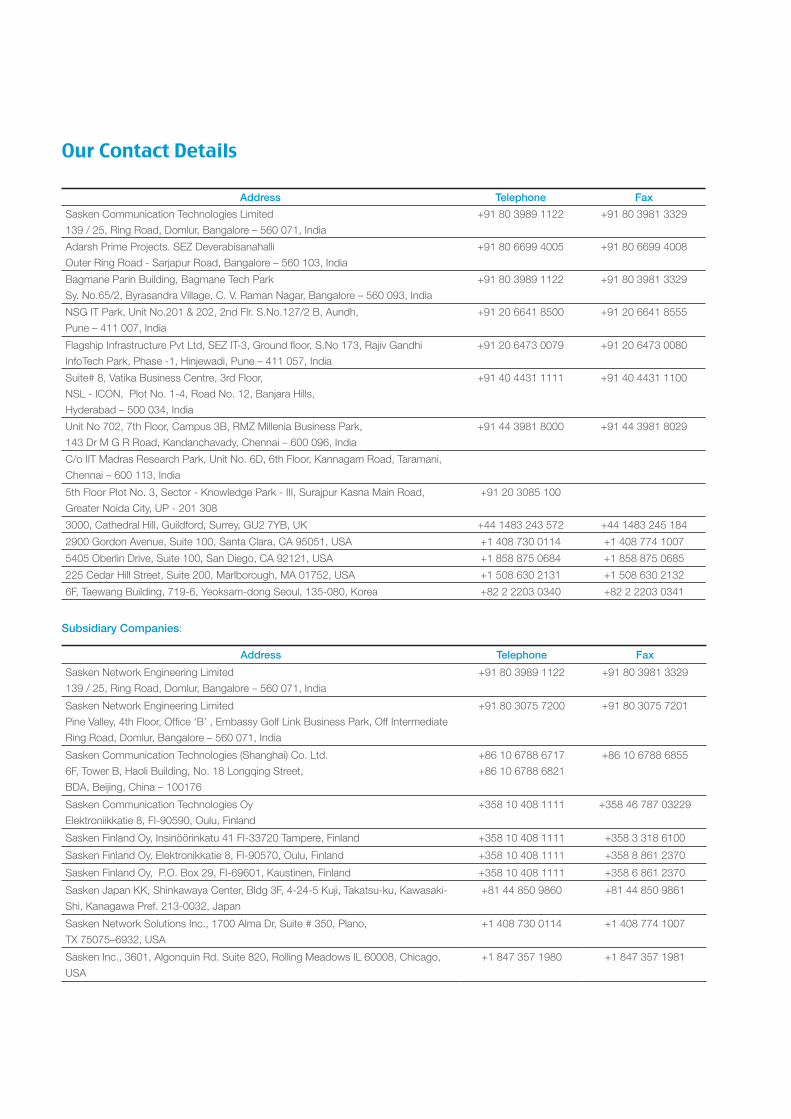
$�#�������#����&�#
Address Telephone Fax
Sasken Communication Technologies Limited
139 / 25, Ring Road, Domlur, Bangalore – 560 071, India
+91 80 3989 1122 +91 80 3981 3329
Adarsh Prime Projects. SEZ Deverabisanahalli
Outer Ring Road - Sarjapur Road, Bangalore – 560 103, India
+91 80 6699 4005 +91 80 6699 4008
Bagmane Parin Building, Bagmane Tech Park
Sy. No.65/2, Byrasandra Village, C. V. Raman Nagar, Bangalore – 560 093, India
+91 80 3989 1122 +91 80 3981 3329
NSG IT Park, Unit No.201 & 202, 2nd Flr. S.No.127/2 B, Aundh,
Pune – 411 007, India
+91 20 6641 8500 +91 20 6641 8555
Flagship Infrastructure Pvt Ltd, SEZ IT-3, Ground floor, S.No 173, Rajiv Gandhi
InfoTech Park, Phase -1, Hinjewadi, Pune – 411 057, India
+91 20 6473 0079 +91 20 6473 0080
Suite# 8, Vatika Business Centre, 3rd Floor,
NSL - ICON, Plot No. 1-4, Road No. 12, Banjara Hills,
Hyderabad – 500 034, India
+91 40 4431 1111 +91 40 4431 1100
Unit No 702, 7th Floor, Campus 3B, RMZ Millenia Business Park,
143 Dr M G R Road, Kandanchavady, Chennai – 600 096, India
+91 44 3981 8000 +91 44 3981 8029
C/o IIT Madras Research Park, Unit No. 6D, 6th Floor, Kannagam Road, Taramani,
Chennai – 600 113, India
5th Floor Plot No. 3, Sector - Knowledge Park - III, Surajpur Kasna Main Road,
Greater Noida City, UP - 201 308
+91 20 3085 100
3000, Cathedral Hill, Guildford, Surrey, GU2 7YB, UK +44 1483 243 572 +44 1483 245 184
2900 Gordon Avenue, Suite 100, Santa Clara, CA 95051, USA +1 408 730 0114 +1 408 774 1007
5405 Oberlin Drive, Suite 100, San Diego, CA 92121, USA +1 858 875 0684 +1 858 875 0685
225 Cedar Hill Street, Suite 200, Marlborough, MA 01752, USA +1 508 630 2131 +1 508 630 2132
6F, Taewang Building, 719-6, Yeoksam-dong Seoul, 135-080, Korea +82 2 2203 0340 +82 2 2203 0341
Subsidiary Companies:
Address Telephone Fax
Sasken Network Engineering Limited
139 / 25, Ring Road, Domlur, Bangalore – 560 071, India
+91 80 3989 1122 +91 80 3981 3329
Sasken Network Engineering Limited
Pine Valley, 4th Floor, Office ‘B’ , Embassy Golf Link Business Park, Off Intermediate
Ring Road, Domlur, Bangalore – 560 071, India
+91 80 3075 7200 +91 80 3075 7201
Sasken Communication Technologies (Shanghai) Co. Ltd.
6F, Tower B, Haoli Building, No. 18 Longqing Street,
BDA, Beijing, China – 100176
+86 10 6788 6717
+86 10 6788 6821
+86 10 6788 6855
Sasken Communication Technologies Oy
Elektroniikkatie 8, FI-90590, Oulu, Finland
+358 10 408 1111 +358 46 787 03229
Sasken Finland Oy, Insinöörinkatu 41 FI-33720 Tampere, Finland +358 10 408 1111 +358 3 318 6100
Sasken Finland Oy, Elektronikkatie 8, FI-90570, Oulu, Finland +358 10 408 1111 +358 8 861 2370
Sasken Finland Oy, P.O. Box 29, FI-69601, Kaustinen, Finland +358 10 408 1111 +358 6 861 2370
Sasken Japan KK, Shinkawaya Center, Bldg 3F, 4-24-5 Kuji, Takatsu-ku, Kawasaki-
Shi, Kanagawa Pref. 213-0032, Japan
+81 44 850 9860 +81 44 850 9861
Sasken Network Solutions Inc., 1700 Alma Dr, Suite # 350, Plano,
TX 75075–6932, USA
+1 408 730 0114 +1 408 774 1007
Sasken Inc., 3601, Algonquin Rd. Suite 820, Rolling Meadows IL 60008, Chicago,
USA
+1 847 357 1980 +1 847 357 1981
� � � � �
� � � � � �
� � � �
� � � �
� � � �
� �
� � �
� � � � � � � � � � � � � � � � � � � �
! ! ! � � � � � � � � � � �
© 2011, Sasken Communication Technologies Ltd. All rights reserved.Products and services mentioned herein are trademarks and service marks of Sasken Communication Technologies Ltd., or the respective companies.
Des
ign
Con
cept
: Chi
nmay
Dho
laki
a >
chi
nmay
99@
gmai
l.com
|
Cop
y: T
ina
| 3
D M
odel
s: P
rash
anth
| B
ackg
roun
ds: V
atsa
l |
Prin
ted
at: M
anip
al P
ress
Ltd
., M
anip
al

![(2Z,N 0 0 0 E)-N 0 0 0 -[(2-Hydroxy-1-naphthyl)- methylidene]furan-2-carbohydrazonic acid](https://static.fdokumen.com/doc/165x107/631360d4b033aaa8b2100e91/2zn-0-0-0-e-n-0-0-0-2-hydroxy-1-naphthyl-methylidenefuran-2-carbohydrazonic.jpg)