R eport & A ccounts - AnnualReports.com
51
09 Report & Accounts Report & Accounts For the year ended 31 March 2009 Trikona Trinity Capital PLC
-
Upload
khangminh22 -
Category
Documents
-
view
0 -
download
0
Transcript of R eport & A ccounts - AnnualReports.com

09R
epor
t&
Acc
ount
sReport & AccountsFor the year ended 31 March 2009Trikona Trinity Capital PLC

Annual Report & Accounts 200901
Chairman’s Statement 2
Investment Portfolio Summary 5
Investment Manager’s Report 6
Development Project Update 10
Equity Holdings 20
Directors’ Report 26
Statement of Directors' Responsibilities 27
Corporate Governance Statement 28
Report of the Independent Auditors 29
Consolidated Income Statement 30
Consolidated Balance Sheet 31
Company Balance Sheet 32
Statements of Changes in Equity 33
Consolidated Cash Flow Statement 34
Notes to the Financial Statements 35
Valuation Letter 48
Company Information Back page
Contents

2Trikona Trinity Capital PLC
Chairman’s StatementMartin AdamsChairman of Trikona Trinity Capital PLC
During the financial year to 31 March 2009, the
Company’s Net Asset Value (“NAV”) declined by
25% from £1.51 to £1.13 per share. The Group
incurred a loss per share of £0.24 (2008: profit of
£0.27) after allowing for a fair value loss on the
revaluation of investments of £163 million. The fall
in NAV was mitigated by the positive effects of an
8% depreciation of UK sterling against the Indian
rupee during the year. As stated in the Company’s
Admission Document, TTC does not hedge currency
risk exposures between UK sterling and the Indian
rupee. The Company’s share price experienced a
substantial drop during the last financial year, and
at its lowest was £0.23 per share representing a
discount to the last previously published NAV of 83%.
At an Extraordinary General Meeting held on 24
March 2009 (“EGM”), shareholders approved the
following new Investment Policy for the Company:
“The Company shall promptly but having due
regard to all applicable legal, governmental and
regulatory constraints and with a view to maximising
shareholder value, dispose of all its assets in an
orderly fashion.
If the Company's Ordinary Shares are trading at
a price below the NAV per Ordinary Share, the
Company shall immediately effect a return of
capital through a cash distribution to Shareholders.
The Company shall continue to seek new investment
opportunities. If the Company's Ordinary Shares are
trading at a price above the NAV per Ordinary Share,
the Board will selectively determine, on a periodic
basis, whether or not to make new investments.”
Implementation of the new Investment Policy has
required, with the assistance of the Manager, a
detailed review of the performance and strategies
with regard to each of the Company’s investments,
with a view to accelerating realisation timetables
without unduly comprising projected returns.
Inevitably, the time frames envisaged for realising
development properties remains longer than those
projected for listed and unlisted equity investments.
The recent buoyant Indian stock market conditions
will, hopefully, permit the acceleration of realisations
of our non-project specific Indian investee companies
and the Manager is currently focused particularly on
supporting these companies through to flotation.
Dear Shareholder,
The difficult conditions experienced in international financial markets in the past 18months caused a sea change in shareholders’ perceptions of the prospects for Indianreal estate, from which the Company was not immune. Shareholders adopted a newinvestment policy for the Company in March 2009, which led to significant changesin the Board to oversee its implementation. In line with the new investment policy,strategies relating to each of the investments held by Trikona Trinity Capital PLC(“TTC”) are currently under reconsideration and a comprehensive review of theCompany’s structure and operations is being undertaken. Although dealing with thesefundamental changes at the Company are challenging, we are making good progress.

Annual Report & Accounts 20093
Returns on the project development assets will be
slower to generate and are crucially dependent on
our partners, licensing, marketing and construction.
New investments and follow-ons by TTC are, in
effect, on hold except where required to protect the
Company’s original investment and/or where legal
obligations exist. New investment opportunities
will, however, be considered as and when the
Company’s share price exceeds NAV.
The Company is not conducting a fire sale of its
assets and remains committed to maximising
shareholder value by selling investments only when
it is appropriate to do so. TTC’s investments in
Pipavav Shipyard Limited and IL&FS Transportation
Networks Limited are progressing towards IPOs in
India and realisation opportunities will arise as
a consequence. On the other hand, as site
development has not commenced on either the
Uppal IT Park – ‘Tech Oasis’ or Luxor Cyber City
projects, realisation prospects are more distant.
Although TTC holds interests in 16 different
companies/projects, the performance and
realisation risk with respect to 8 of the investments
is concentrated on three independent developers:
SKIL, Rustomjee and the Dynamix Balwas group.
The development and performance risk with respect
to 5 investments, comprising 26.8% of the portfolio
at current valuations, rests with Panthera
Developers, a company related to the Manager.
Disposal proceeds from realised investments will
be distributed periodically to shareholders after
taking into consideration on going liabilities. If
investment realisations are implemented as
currently planned, the Board expects that the
Company will be able to return to Shareholders
in the order of £100 million within the 24 month
timescale announced in March 2009.
At 31 March 2009, the Company held £60 million
in cash. Of this amount, £13.2 million was held
as a reserve against investment commitments
and approvals. Since the end of March, the
Company has distributed £12 million through the
repurchase of 21,367,702 shares, equivalent to
9.2% of TTC’s share capital before the buyback
commenced. The Board has authority to purchase
and cancel up to 70% of the Company's ordinary
shares through a general share buy-back or
tender offer(s). The Board will consider the most
appropriate methods of distributing cash taking into
account the views of shareholders.
Remuneration of the Manager aside, the Company’s
operating costs of £2.6 million incurred in the financial
year to 31 March 2009 were equivalent to 1.0% of
period end NAV. Including payments to the Manager
and its related parties, operating costs amounted to
7.5% of NAV. The Audit Committee is undertaking,
with the assistance of the Administrator, a thorough
review of all operating costs with a view to bringing
expenses down to more normal levels.
One of the more significant challenges we face is the
realignment of the Manager’s interests with those of
the Company in the context of the new Investment
Policy. The existing investment management
agreement is long term in nature and incentivises the
Manager to invest and maximise returns over the
longer term. It is not easy to switch investment strategy,
particularly in relation to development properties.
Nevertheless, the Manager has assured the Board
that they will implement the new Investment Policy
even without changes to the management agreement
and incentives. Since the EGM, the Manager has
renegotiated existing investment agreements and
released the Company from £12.9 million of previously
contracted commitments. During our continuing
discussions, TTC will endeavour to clarify and simplify
the multiple service relationships that exist with parties
connected to the Manager and/or its principals.
Valuations of real estate assets in an emerging
economy such as India’s remains a challenge,
particularly as all investments are held through complex
corporate structures and comparables are few and can
be difficult. In valuing TTC’s investments, the Audit
Committee is advised by CB Richard Ellis and Protiviti
Consulting. As required by the Company’s Admission
Document, property valuations have been carried out
in accordance with the Valuation Standards (6th
Edition) of the Royal Institute of Chartered
Surveyors. Although the Company had adopted a new
Investment Policy prior to the end of the financial year,

there has been no material change to the valuation
methodology applied as compared with previous
years’ valuations.
During the last two years, the Company has
developed an important partnership with
SachsenFonds Asset Management GmbH
(“SachsenFonds”), a leading German fund manager.
In 2007 and 2008, SachsenFonds completed the
launch of two India-focused closed end real estate
funds in Germany which acquired significant inter-
ests in TTC’s assets. During the last financial year,
the second SachsenFonds vehicle acquired assets
for £54.3 million from TTC, crystallising a gain of
£16.5 million over cost for the Company. Although the
Company announced that it intended to sell further
assets to a third fund launched by SachsenFonds, the
vehicle failed to complete its capital raising and that
new fund is, to all intents and purposes, dead. TTC
had invested £26 million in companies in India
(shorty after the collapse of Lehman Brothers) in
anticipation of selling a significant portion of some of
those assets to the third SachsenFonds vehicle.
Despite this disappointment, SachsenFonds remains
an important partner for TTC, having invested, in
aggregate, over £86.4 million in TTC assets and the
Company retains certain contingent liabilities
towards SachsenFonds. We intend to engage more
closely with SachsenFonds in the coming months
with a view to maximising potential returns for both
TTC’s and SachsenFonds’ investors.
During the year, several changes were made
to the Board. In October 2008, Andrzej Sobczak
and Pradeep Verma, both of whom worked
with Carrousel Capital Limited, a significant
shareholder in TTC, joined the Board as non-
executive directors. In March 2009, Rak Chugh,
a Managing Director of the Manager, and
Andrzej Sobczak, resigned from the Board. On
the same day, I joined as a Director. Subsequent
to the end of the financial year, in July 2009,
Michael Cassidy, the former chairman, Paul
Orchard-Lisle and Bill Hamilton-Turner all
resigned. Steve Coe joined the board and heads
the Audit Committee. I was asked to assume
the Chairmanship. Of the four current directors,
only Pradeep Verma is remunerated by a
shareholder. As such, the Board is independent
of the shareholders and we are acting in the
interests of the Company and shareholders as
a whole. The Board hopes to appoint one further
independent director with Indian real estate
experience in due course.
Being a Director of TTC has never been for the
faint-hearted and has been a far more demanding
role than many other AIM-listed investment
vehicles. As such, I should like to express the
Board’s gratitude for the services and efforts of
Michael, Paul, Bill, Rak and Andrzej.
Other material changes which occurred with respect
to the operation of TTC during the last financial year
include the appointment of a new Nominated
Adviser, Evolution Securities and new brokers,
Evolution Securities and Arden Partners.
In terms of the outlook for the Company, the
investment environment in India should help facilitate
implementation of the new Investment Policy. The
May 2009 elections in India, which brought about a
decisive victory for the United Progressive Alliance
party led by Manmohan Singh, should provide stable
government with a positive impact on the Indian
economy as further reforms are implemented. The
improved business sentiment and rally in the
Indian stock markets since the election is already
facilitating potential disposal opportunities for TTC.
Nevertheless, much work remains ahead of us. As
progress is made in implementing the Investment
Policy, we hope that investor confidence in TTC will
return and that the stability and positive sentiment
that now exists in India will also prevail among the
shareholders of the Company.
Martin M. Adams
Chairman
4Trikona Trinity Capital PLC
Chairman’s Statement (cont.)

Annual Report & Accounts 20095
Exchange rate is INR 72.86 = £1 at 31 March 2009
EffectiveNav as of Trikona TC31 March Nav as of
Capital 2009 31 MarchProject Investment Commited (£m) 2009 % of total
ID** Investment Name Location Type Date (£m) (100% basis) (adjusted basis*) NAV
DP1 Uppal IT Park Greater Noida, IT/ITES SEZ Oct-06 36.2 39.1 28.7 11.0“Tech Oasis” NCR of Delhi with Residential,
Commercial & IT
DP2 Rustomjee’s Township Thane, Mumbai Residential, Oct-06 10.6 12.4 12.4 4.7(Kapstone) Commercial
& Retail
DP4 Lady Ratan Seasons Worli, Residential Oct-06 13.1 18.2 10.7 4.1(Lokhandwala) Southern Mumbai Space
DP6 Neelkamal Mumbai, Development Dec-06 12.2 11.7 11.7 4.5Marine Drive Pune and Goa company & (DB Hospitality) Hospitality
Platform
DP10 Luxor Cyber City Gurgaon, IT/ITES SEZ Jun-07 38.4 29.8 25.3 9.7NCR of Delhi
DP11 Dynamix Balwas Realty Mumbai Residential & Apr-07 26.4 46.2 46.2 17.7Commercial
DP13 MIG Bandra IV Mumbai Residential May-08 1.6 1.5 1.5 0.6Rustomjee Constructions Space
DP14 Sankalp Township Amreli, Gujarat Township - Oct-08 3.3 2.2 2.2 0.8Residential, Commercial, Retail, Hospitality, Healthcare
DP15 Jodhana Developers Jodhpur, Residential Villas Oct-08 6.1 8.3 8.3 3.2Private Limited Rajasthan and Commercial
DP16 Virar Township Thane Residential, Oct-08 5.7 5.5 5.5 2.1Commercial, Retail
EH7 Fortis Healthcare Pan India Infrastructure Jan-07 13.5 7.4 7.4 2.8Limited
EH8 Pipavav Shipyard Pipavav Port, Infrastructure Jan-07 13.5 29.7 29.7 11.4Limited State of Gujarat
EH9 IL&FS Transportation Pan India Infrastructure Oct-06 5.1 6.0 6.0 2.3Networks Limited (ITNL)
EH12 Phoenix Mills Limited Pan India Retail, Commercial Jun-07 7.4 1.7 1.7 0.7& Hospitality
EH17 Horizon Countrywide Mumbai Infrastructure Oct-08 11.2 5.1 5.1 1.9Logistics Limited
MK Malls Mezzanine debt Mumbai Retail - 12.3 16.5 16.5 6.3
Other - - - - 39.7 42.4 16.2
TOTAL - 281.0 261.3 100
* Adjusted by NAV attributable to minority holders of the Mauritian SPV post realisation ** DP = Development Project; EH = Equity Holding
Investment Portfolio Summary

The year to 31 March 2009 has been a challengingone for Trikona Trinity Capital. The global financial and economic turmoil, and more specifically the extensivecorporate activity faced by the Company during the second half of the year, had a significant impact on itsstrategic direction. These events led to a detailedStrategic Review of the Company, with an ExtraordinaryGeneral Meeting (“EGM”) then held on 24th March2009 to reconsider the Company’s Investment Policy.The Manager continues to work with the Board to helpimplement the new Investment Policy and assist withopportunistic asset realisations.
We have proven our ability to create shareholdervalue by investing in projects at early stages,attracting institutional follow-on investment at highervalues, and creating multiple exit opportunities.During the year, we have worked alongside investeecompanies and partners to build value in a toughglobal environment. Through rigorous project monitoring and reporting, we have ensured thatdevelopment hurdles were sufficiently addressedand overcome.
As the year has progressed, we have regularlyreviewed the product-mix of each of our developmentsin the context of its environment and the surroundingarea. Where prudent, we have initiated detailed discussions with the relevant developer and investeecompanies to suggest ways in which we can changethe product-mix to more effectively utilise cash andensure sales continuity. These discussions havebeen well-received and several of our developmentshave proceeded with these changes.
We have also actively managed the finances of our developments, ensuring that none of our projects ran low on debt despite a high level ofcredit deficiency across the industry. In addition, the Manager has discouraged leveraging the portfolio in response to the hike in interest rates.
Investment Highlights
Since listing, Trikona Trinity Capital has successfullyrealised cash-on-cash returns on six of its 16
projects. Some of the major highlights are as follows:
In Uppal IT Park (DP1), the project received formalapproved as an SEZ by the Government of India andis in the process of being notified by the state government. The master plan for the property hasbeen approved by GNIDA.
In Rustomjee’s Township (DP2), a total saleable areaof 1,178,000 sq. ft (1297 units) has been launched inthe Project, of which 701,275 sq. ft. (790 units) hasbeen pre-sold. This development continues to makeprogress and within the next year KapstoneConstructions Private Ltd. plans to launch another1.1 million sq. ft. of which it anticipates being ableto pre-sell around 550,000 sq. ft.
DB Hospitality (DP6) continues to perform well andmake good progress; civil construction for the Goahotel is complete and the finishing/interior work isdeveloping well. The hotel will be ready for softlaunch in December 2009 and is likely to be commissioned in March 2010. The superstructurefor the Pune hotel and foundation work for theMumbai hotel are progressing and it is anticipatedthat they will be operational by December 2010 andMay 2012 respectively. Since the March year-end,DB Hospitality has diversified into providing in-flightcatering to airlines including Lufthansa Airlines andThai Airlines. The company has also signed anexclusive agreement with Japan’s JAL HotelsCompany Limited, who own 59 luxury hotels worldwide. Under the agreement, DB Hospitality willbe developing DB-Nikko branded properties acrossnine cities in India, whilst investing US$1 billion inhotel projects in India over the next four years. TheCompany also have signed an agreement with HyattPlace and have two hotels under construction; onein Pune and the second in Mundra SEZ. As plannedthe Le Meridien Ahmedabad was inducted in to the DB Hospitality portfolio after following the prescribed process.
The “Kandivili Suburbia” project (one of the eightprojects launched under DB Realty (DP11)), pre-sold227, 098 sq. ft. of affordable residential space within
6Trikona Trinity Capital PLC
Investment Manager’s Report
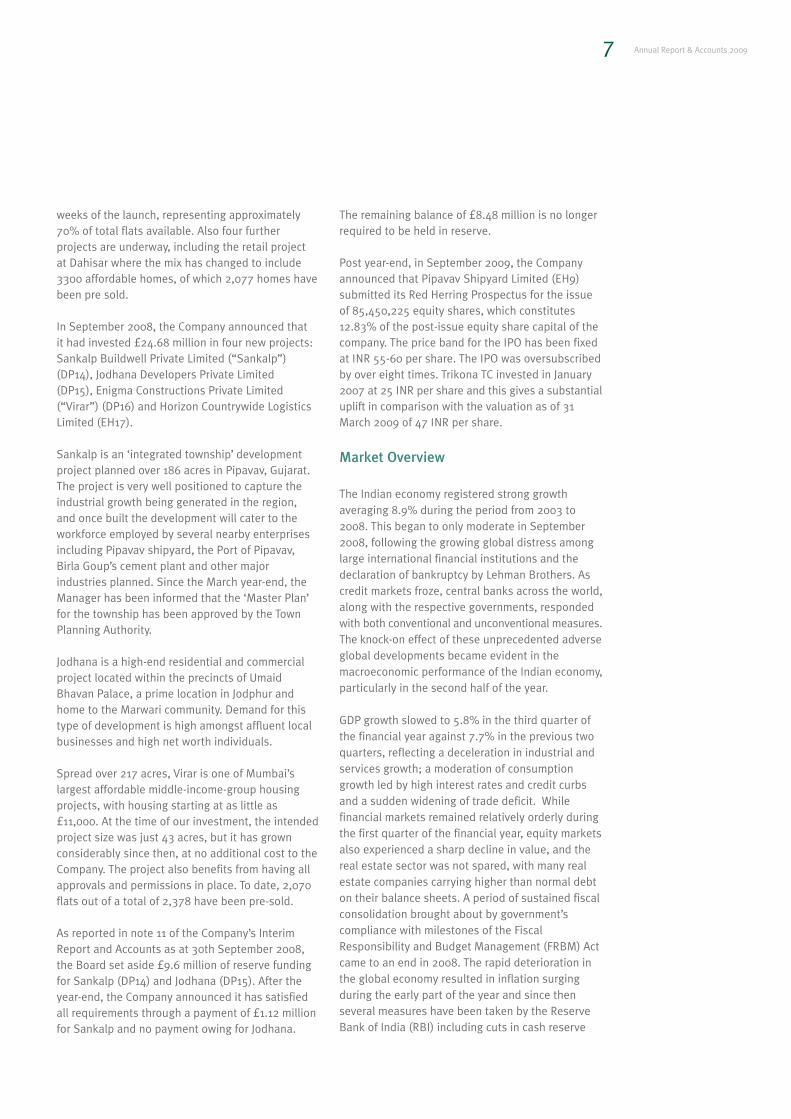
weeks of the launch, representing approximately70% of total flats available. Also four further projects are underway, including the retail project at Dahisar where the mix has changed to include3300 affordable homes, of which 2,077 homes havebeen pre sold.
In September 2008, the Company announced thatit had invested £24.68 million in four new projects:Sankalp Buildwell Private Limited (“Sankalp”)(DP14), Jodhana Developers Private Limited (DP15), Enigma Constructions Private Limited(“Virar”) (DP16) and Horizon Countrywide LogisticsLimited (EH17).
Sankalp is an ‘integrated township’ developmentproject planned over 186 acres in Pipavav, Gujarat.The project is very well positioned to capture theindustrial growth being generated in the region, and once built the development will cater to theworkforce employed by several nearby enterprisesincluding Pipavav shipyard, the Port of Pipavav,Birla Goup’s cement plant and other major industries planned. Since the March year-end, theManager has been informed that the ‘Master Plan’for the township has been approved by the TownPlanning Authority.
Jodhana is a high-end residential and commercialproject located within the precincts of UmaidBhavan Palace, a prime location in Jodphur andhome to the Marwari community. Demand for thistype of development is high amongst affluent localbusinesses and high net worth individuals.
Spread over 217 acres, Virar is one of Mumbai’slargest affordable middle-income-group housingprojects, with housing starting at as little as£11,000. At the time of our investment, the intendedproject size was just 43 acres, but it has grown considerably since then, at no additional cost to theCompany. The project also benefits from having allapprovals and permissions in place. To date, 2,070flats out of a total of 2,378 have been pre-sold.
As reported in note 11 of the Company’s InterimReport and Accounts as at 30th September 2008,the Board set aside £9.6 million of reserve fundingfor Sankalp (DP14) and Jodhana (DP15). After theyear-end, the Company announced it has satisfiedall requirements through a payment of £1.12 millionfor Sankalp and no payment owing for Jodhana.
The remaining balance of £8.48 million is no longerrequired to be held in reserve.
Post year-end, in September 2009, the Companyannounced that Pipavav Shipyard Limited (EH9)submitted its Red Herring Prospectus for the issueof 85,450,225 equity shares, which constitutes12.83% of the post-issue equity share capital of thecompany. The price band for the IPO has been fixedat INR 55-60 per share. The IPO was oversubscribedby over eight times. Trikona TC invested in January2007 at 25 INR per share and this gives a substantialuplift in comparison with the valuation as of 31March 2009 of 47 INR per share.
Market Overview
The Indian economy registered strong growth averaging 8.9% during the period from 2003 to2008. This began to only moderate in September2008, following the growing global distress amonglarge international financial institutions and the declaration of bankruptcy by Lehman Brothers. Ascredit markets froze, central banks across the world,along with the respective governments, respondedwith both conventional and unconventional measures.The knock-on effect of these unprecedented adverseglobal developments became evident in the macroeconomic performance of the Indian economy,particularly in the second half of the year.
GDP growth slowed to 5.8% in the third quarter ofthe financial year against 7.7% in the previous twoquarters, reflecting a deceleration in industrial andservices growth; a moderation of consumptiongrowth led by high interest rates and credit curbsand a sudden widening of trade deficit. While financial markets remained relatively orderly duringthe first quarter of the financial year, equity marketsalso experienced a sharp decline in value, and thereal estate sector was not spared, with many realestate companies carrying higher than normal debton their balance sheets. A period of sustained fiscalconsolidation brought about by government’s compliance with milestones of the FiscalResponsibility and Budget Management (FRBM) Actcame to an end in 2008. The rapid deterioration inthe global economy resulted in inflation surgingduring the early part of the year and since then several measures have been taken by the ReserveBank of India (RBI) including cuts in cash reserve
Annual Report & Accounts 20097

ratio and unwinding/de-sequestering of balancesheld by the Government with the Reserve Bank.Post period end, the government’s efforts haveresulted in head line inflation in negative territoryand estimated longer-term GDP growth returning tolevels of 7-8% with an expected 6.5% GDP growthrate in the full-year of 2010.
Concerns of macroeconomic risk loom over Indiadue to almost certain lower agricultural output andthe resultant inflation in food prices.
The May 2009 election outcome led the way for astable and progressive political regime, unfetteredby the consensus required from smaller regionalparties. The new Government in its budget for theyear 2009 - 2010 continued from the Stimulus policies where focus was on increasing publicspending and signalling across the board tax cuts on individual’s and corporate income to giveimpetus to investment growth and consumption.The spending measures on ‘Infrastructure’ and‘Rural Spend’ focused on ‘Inclusive Growth’.Essentially three broad challenges were addressed:1) Rapid return to high growth rates 2) EnsureInclusive growth 3) Reenergize Government byfocusing on ‘Execution of policies and reforms’. Inline with the announcements a new Direct tax-codehas been introduced.
Post the measures taken by RBI and theGovernment of India, Indian capital markets haveperformed remarkably well and ahead of mostemerging markets with reduced risk and volatility. In the quarter ending June 2009, FII’s were net buyers of US$8.3 billion having previously sold ofUS$15 billion in the full year 2009. In most casesIndian equity markets have outperformed emergingmarkets and other developed countries due to theperception of political stability and higher thanexpected GDP growth. A few developers have soldstakes and raised capital from the equity markets,thereby restructuring their debt and improving cashflows for their projects.
Further, several lead indicators to the IIP (Index ofIndustrial Production), which had started falling,rapidly responding to global cues since June 2008,are now firming into a reversed trend. Soft interestrates and availability of funds have supporteddomestic industrial activity. The IIP, for July 2009,rose 6.8% year-on-year, up from 6.4% a year back.
Real Estate view
The Indian real estate markets saw a sharp correction with a decline in property prices, demandand transaction volumes between September 2008and April 2009. The Indian real estate market whichsaw a 45% CAGR growth over FY2005-2008, experienced a decline of almost 30% on the newbase post the global market fallout in September2008. The softness in demand led to price cuts, areallocation of resources by developers to affordablehousing programs, execution of commercial projects,and postponement of new projects. This was followed by a slew of new and realigned projectdevelopments catering to the affordable housingmarkets. The recent analyses of sales patternsacross India vindicate the change in strategy of thedevelopers. Sales have been brisk and developerswith a good execution record have been able to sell 2 year forward deliveries, as their existinginventories get exhausted. Developers, in order to cash in on the demand for new housing, exitednon-performing large projects, restructured theirportfolio mix, and significantly reduced prices tosuit the ‘buyers’ expectation.
Another significant reason for demand revival wasthe easing of housing loan interest rates, whichdecreased from 13-14% at the end of 2008 to 8-10%in April of 2009. The Government also announced aninterest rate subsidy of one percent for housingloans up to INR 1 million. These lower interest rates, combined with the announced 15-25% pricereduction across the residential, commercial andretail markets, are steadily helping the demandrecovery in the system.
Valuation of Property Portfolio
CB Richard Ellis (CBRE) conducted an independentvaluation of the development properties in whichTrikona Trinity Capital holds full or partial ownershipinterest. Thereafter, the Board of Directors fair valued the assets using valuation procedures andtechniques, which were validated based on certainagreed upon procedures by Protiviti, an independentfirm of advisors.
Additionally unlisted equity securities that amountto £57.3 million have been valued by directors usingvaluation procedures and techniques, which were
8Trikona Trinity Capital PLC
Investment Manager’s Report (cont.)
validated based on certain agreed upon proceduresby Protiviti. Further, listed equity securities thatamount to £9.1 million have been fair-valued usingthe trading data on the Stock Exchange as on 31March 2009.
Based on this assessment, the Directors’ valuationof Trikona Trinity Capital’s total investments, including cash and entity level shareholdings, produced a NAV of £261.3 m of £1.13 per share at 31 March 2009, representing a change of minus25% year-on-year.
In all previous financial statements, the Managerand Board have presented Cost of Equity (COE) as asingle number, which includes a uniform constructionrisk premium of between 1.5% and 2.5% across all projects. In the year to 31 March 2007, this combined figure was 13.29% and for the year to 31 March 2008, this figure was 15.54%.
In this report, the COE is comprised of two numbersa base rate, assumed as 15.77% and a project-by-project risk premium ranging from 2.5% to 10%added to the base rate, and which is based onagreed upon procedures between Protiviti and theCompany. This represents a significant increase in
the COE when compared with prior year accountsand reflects a higher degree of conservatism. On aconstant risk basis, taking the traditional construc-tion risk premium of 1.5% to 2.5%, the NAV pershare would be £1.24 per share as at 31 March2009, compared with £1.13 per share as reported at31 March 2009.
Realisation of Assets
In accordance with the Investment Policy adopted at the Company EGM on 24 March 2009, theManager is committed to maximising shareholdervalue by disposing of existing assets in an orderlyfashion with due regard to all applicable legal, governmental and regulatory restraints.
Outlook
Our role as Manager remains to seek suitable exitopportunities, and source attractive deals throughour partnerships, networks, and broad expertise inIndia. Our team is committed to achieving value forall shareholders and will strive to seek transactionsthat attain a fair asset value in light of the prevailingglobal and local conditions at that time.
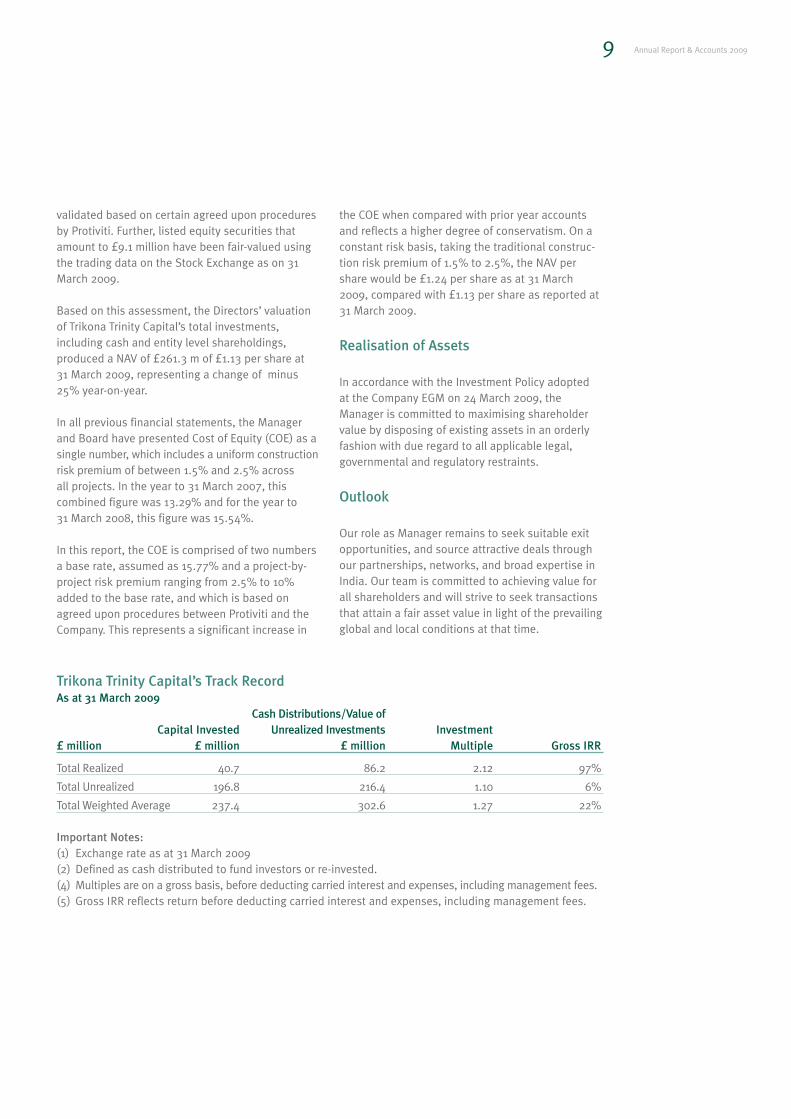
Trikona Trinity Capital’s Track RecordAs at 31 March 2009
Cash Distributions/Value of Capital Invested Unrealized Investments Investment
£ million £ million £ million Multiple Gross IRR
Total Realized 40.7 86.2 2.12 97%
Total Unrealized 196.8 216.4 1.10 6%
Total Weighted Average 237.4 302.6 1.27 22%
Important Notes:(1) Exchange rate as at 31 March 2009(2) Defined as cash distributed to fund investors or re-invested.(4) Multiples are on a gross basis, before deducting carried interest and expenses, including management fees.(5) Gross IRR reflects return before deducting carried interest and expenses, including management fees.
Annual Report & Accounts 20099

10Trikona Trinity Capital PLC
DP1Project Name Uppal IT Park
(Tech Oasis)
Address Tz-7, Information Technology Park,TechZone, Greater Noida, Uttar Pradesh, India
Asset Classes IT/ITES SEZ with Residential, Commercial & IT
Saleable Area 10.16 million sq. ft. on 76 acresPartner Panthera Developers (Promoter)Indian SPV Uppal IT Projects Private
Limited (Company)Mauritian SPV Trinity Capital (One) Limited (TC-1)
Date Nav (£m) IRR% Multiple (x)31 March 09 28.7 36% 1.53Date of investment October 2006
October 2009**Cost of equity 25.77%
(COE base= rate + 10% execution risk)Scheduled exit July 2016Total capital committed £28.9 million18 October 2006 £7.5 million**Total capital invested £36.4 millionCash realized £26.72 million from sale to SFTrikona TC’s ownership in the Mauritian SPV 67%Mauritian SPV’s ownership in DP1 100%** mezzanine investment.
Project SummaryLocated in the National Capital Region (NCR) of Delhi, Greater Noidarepresents one of the fastest growing emerging townships of UttarPradesh. The township is spread over 36,000 hectares, supports apopulation of over 500,000 people and is expected to more thandouble by 2021.
Designated ‘Tech Zone’ by the government of Uttar Pradesh, the plot isdiagonally opposite the recently built Gautam Buddha University, whichis spread over 800 acres and houses a campus hosting residential facilities for 6000 students. The original investment thesis consideredboth independent development and the use of an outside partner byJoint Development Agreement (‘JDA’) partners.
The project has been formally approved as an SEZ by the Governmentof India and is in the process of being notified by the state government.The master plan for the property has been finalized, but may requirereworking. The agreement with the co-developer is in its late stages,with the detailed building drawings/excavation work commencingshortly. With enhanced FSI under the revised guidelines, completion isexpected by July 2016.
Key future milestones• The project value should increase upon the execution of a Joint
Development Agreement (JDA) with an external development partner.
• Phase I involves developing approximately one million sq. ft. of IT/ITeS, residential and hotel space and is expected to completein approximately two years.
Significant developments post March year-end• Environmental clearance for the project has been received from the
authorities.
• Approval has been received from the air force authorities providingclearance for a 190.75 meter high structure. Earlier, the airportauthorities granted the same approval.
• GNIDA approved the master plan for the project.
• The timeline as stipulated in the lease deed from GNIDA, for PhaseI has been extended.
Sale Rate AssumptionBased on CBRE assumptions, the sale rate for Residential is assumed tobe INR 2,450 per sq. ft. while comparable projects in the vicinity arequoting between INR 1,700 to INR 3,300 per sq. ft. Lease rate for IT isassumed to be INR 30 per sq. ft. per month while comparable projectsare quoting INR 28 to INR 35 per sq. ft. per month. Lease rate forCommercial space is assumed to be INR 35 per sq. ft. per month whilecomparable projects are quoting INR 50 to INR 150 per month.
FDI guidelines (project specific)
As state level SEZ notification is under process, the project is governedby guidelines as stipulated under Press Note 2 issued by the DIPP(Department of Industrial Policy and Promotion).
Quoting from Press Note 2 of the 2005 series:
Original investment cannot be repatriated before a period of 3 yearsfrom completion of minimum capitalization (US$10 mn since this is awholly owned subsidiary). However the investor may be permitted toexit earlier with the prior approval of the Government through theFIPB (Foreign Investment Promotion Board).
The guidelines also stipulate that “at least 50% of the project mustbe developed within a period of 5 years from the date of obtainingall statutory clearances. The investor would not be permitted to sell undeveloped plots.”
Realization through stake sale to SachsenFonds
27 Dec 07 17 June 08% of Mauritian SPV sold 8 25
TTC’s remaining % of Mauritian SPV 92 67
Sale Price (£ million)* 6.48 20.24
IRR at sale (%) 161 101
Multiple (x) 2.87 2.86
To whom SF I SF II
*Trikona TC investment of £28.9m, TTC has realized £26.88m through thesale to SF I and SF II.
=COE base rate for the cost of equity in March 2009 is 15.77%. In the past, the Cost of Equitynumber has been presented as a single number and included a uniform risk premiumbetween 1.5% and 2.5% across all projects. In this report the risk premium has been set onproject by project basis as shown above and added to the base rate to arrive at the COE forthe project.
In Sept ’08 a single cost of equity rate of 16.55% was applied across all projects (14.55%base rate and 2% execution risk premium). Historically the final COE rate has been evenlower: March ’07 = 13.29%, Sept ’07 = 12.88%, and March ’08 = 15.54%
Development Project Update

Annual Report & Accounts 200911
DP2Project Name Rustomjee’s TownshipAddress Rustomjee Urbania, Majiwade, Balkum,
Mumbai-Nashik Highway Thane West, Maharashtra
Asset Classes Residential, Commercial, Retail, HospitalitySaleable Area 7.2 million sq. ft. on 127 acresPartner Keystone Realtors Pvt. Ltd. (Promoter)Indian SPV Kapstone Constructions Pvt. Ltd. (Company) Mauritian SPV Trinity Capital (Three) Limited (TC-3)
Date Nav (£m) IRR% Multiple (x)31 March 09 12.35 7% 1.17Date of investment October 2006Cost of equity 21.77%
(COE base rate= + 6% execution risk)Scheduled exit June 2016Total capital committed23 October 2006 £14.4 millionTotal capital invested £10.6 million*Trikona TC’s ownership in the Mauritian SPV 100%Mauritian SPV’s ownership in DP2 16%
*The Indian SPV had an option to call for £3.80 million which has beensurrendered post March year-end.
Project SummarySpanning an area of c. 147 sq. km., Thane houses over one millionpeople and contains over 200 km of roadway. As the fastest growingsatellite city to Mumbai, Thane’s seamless connectivity by road andrail makes it a preferred destination for the middle and upper middleclass population working in Mumbai and Thane.
Rustomjee’s Township is a planned development of an integrated city spread over 127 acres. At the time of investment in October2006, the plan was to construct 7.2 million sq. ft. in a phased mannerover 7 years. In the last 18 months, the developer and Trikona TChave been working closely to deem the project as the approved town centre. If awarded this status, the construction area couldpotentially increase to 9.4 million sq. ft.
Master planning for the overall project is complete and the decisionregarding town centre approval for the project to obtain enhancedFSI is expected. Phase I is sold out and under construction, whilstphase II is currently in the pre-sales stage. Project debt for bothphases has been secured and has been drawn upon as per theschedule agreed with the bank.
Major infrastructure work, such as land levelling, the laying ofapproach roads, and the re-laying of community water pipelines has been completed. The steel yard and mix plant have beeninstalled at the site to ensure uninterrupted supply of materials and it is anticipated that the construction of a flyover to connect two land segments will be completed by the end of this year.Construction of the superstructure for six buildings and foundationwork for another two are in progress.
The project, with enhanced FSI under its township and town centrestatus, is expected to be completed by June 2017.
Key future milestonesThe project value should increase upon receipt of the town centreapproval, at which point it is anticipated that development activity will increase and subject to market conditions, the entire project execution program will be put on fast track.
Sale Rate AssumptionThe sale rate for Residential is INR 3,960 to INR 4,050 per sq. ft. whilecomparable projects in the vicinity are quoting between INR 3,150 toINR 5,500 per sq. ft.
=COE base rate for the cost of equity in March 2009 is 15.77%. In the past, the Cost of Equitynumber has been presented as a single number and included a uniform risk premiumbetween 1.5% and 2.5% across all projects. In this report the risk premium has been set onproject by project basis as shown above and added to the base rate to arrive at the COE forthe project.
In Sept ’08 a single cost of equity rate of 16.55% was applied across all projects (14.55% baserate and 2% execution risk premium). Historically the final COE rate has been even lower:March ’07 = 13.29%, Sept ’07 = 12.88%, and March ’08 = 15.54%.

12Trikona Trinity Capital PLC
DP4Project Name Lady Ratan SeasonsAddress Plot 1 & 2 (of Lower Parel Division),
J.R. Boricha Marg, Mahalaxmi, Mumbai, IndiaAsset Classes ResidentialSaleable Area 1.25 million sq. ft. on 7 acres
(post FSI increase)Partner Lokhandwala Group (Promoter)Indian SPV Lokhandwala Kataria Constructions Pvt.
Ltd. (Company) Mauritian SPV Trinity Capital (Five) Limited (TC-5)
Date Nav (£m) IRR% Multiple (x)31 March 09 10.73 65% 1.56Date of investment October 2006Cost of equity 20.77%
(COE base rate= + 5% execution risk)Scheduled exit July 2013Total capital committed12 October 2006 £12.6 millionTotal capital invested £6.3 millionCash realized £4.76 million to SF I**Trikona TC’s ownership in the Mauritian SPV 59%Mauritian SPV’s ownership in DP4 27%*
**This will increase to 49% after funding of balance tranche.
**Of the committed investment of £12.6m, Trikona TC has realized£4.76m through the sale to SF I.
Project SummaryWorli represents one of the most desirable residential locations inSouth Mumbai. It is home to senior executives, boutique financialservices firms, and the self-employed. This prime development areaenjoys occupancy levels as high as 85% to 90%.
Lady Ratan Seasons is a redevelopment project under a schemedevised by the Slum Rehabilitation Authority. The value for investorsshould be enhanced post the relocation of the slum’s current tenantsaway from the saleable area, but within the overall plot and uponcommencement of the new building, which is expected in December2009 as per the revised understanding with the promoters. The threeyear lock-in also expires by this date and the revised scheduled completion of the project is March 2013.
Consequent to the revised guidelines issued by the authorities, thereis a significant increase in both rehabilitation and saleable areaswhich has led to the rework of designs to accommodate increasedconstruction on the same land area. It is believed that the process willbe completed upon fulfilment of the pending committed investment of£ 6.3 million which should be given to the Company for completion ofthe project. As per the revised terms, the saleable area increased from0.67 million sq. ft. to 0.85 million sq. ft. in view of the changed SlumRehabilitation Authority guidelines, which should considerablyenhance the total value of the project.
Construction of the balance rehab building is expected to start fromOctober-2009 and that of the sale building is expected to start fromJanuary 2010. The project, with enhanced FSI under the revisedguidelines, is expected to complete by June 2013.
Key future milestonesThe project value is anticipated to increase upon full clean up of theslum area.
In a major positive development for the project, the Slum RehabilitationAuthority revoked the Stop Work Notice on July 3, 2009 acting on thedirectives of the Home Department and Government of Maharashtra.
Realization through stake sale to SachsenFonds
27 Dec 07% of Mauritian SPV sold 41TTC’s remaining % of Mauritian SPV 59Sale price (£ million)* 4.76IRR at sale (%) 84Multiple (x) 2.04To whom SF I
*Of the committed investment of £12.6m, TTC has realized £4.76m throughthe sale to SF I.
Sale Rate AssumptionBased on CBRE assumptions, the sale rate for Residential is assumed at INR 14,000 per sq. ft. while comparable projects in the vicinity arequoting between INR 19,000 to INR 29,000 per sq. ft.
=COE base rate for the cost of equity in March 2009 is 15.77%. In the past, the Cost of Equitynumber has been presented as a single number and included a uniform risk premiumbetween 1.5% and 2.5% across all projects. In this report the risk premium has been set onproject by project basis as shown above and added to the base rate to arrive at the COE forthe project.
In Sept ’08 a single cost of equity rate of 16.55% was applied across all projects (14.55% baserate and 2% execution risk premium). Historically the final COE rate has been even lower:March ’07 = 13.29%, Sept ’07 = 12.88%, and March ’08 = 15.54%.

Annual Report & Accounts 200913
DP6Project Name DB Hospitality
(previously Neelkamal Marine Drive)
Address South Mumbai (New Marine Lines), Goa
(Bambolim), Pune (Nagar Road) and Sahar
(near the International Terminal, Mumbai)Asset Classes HospitalitySaleable Area 26.6 acres consolidated across the 4 projectsPartner Dynamix Balwas Group (Promoter)Indian SPV DB Hospitality (Company) Mauritian SPV Trinity Capital (Seven) Limited (TC-7)
Date Nav (£m) IRR% Multiple (x)31 March 09 11.748 -2% 0.96Date of investment 15 December 2006Cost of equity 18.27%-20.77%
(COE base rate=+ 2.5 to 5% execution risk)Scheduled exit May 2012Total capital committed £12.2 million
(15 December 2006 - £5.73m, 31 January 2008 - £6.4m*)
Total capital invested £12.13 million*Trikona TC’s ownership in the Mauritian SPV 100%Mauritian SPV’s ownership in DP6 9.54%*Exchange rate differential at the time of investment
Project SummaryIndia’s growing middle class fuelled by robust economic performanceis proving to be a burgeoning audience for the Indian leisure industry.DB Hospitality currently owns an operational five star hotel, LeMeridien, in Mumbai and land under development for three luxuryhotels over the next two to three years under the Hyatt Brand. Theinvestments are in the cities of Mumbai, Pune and Goa - which offerhigher occupancy rates and higher average room rates.
DB Hospitality offered Trikona TC the opportunity to own a stake in thedevelopment and operation of five star hotels, serviced apartments,leased apartments, a prime resort and a hotel with villas in key business and tourist destinations across India.The decision to investwas driven by the fact that DB Group already had two operationalhotels and proposed to develop further hotels in Mumbai, Pune andGoa; cities that offer relatively higher occupancy and room rates.
Design work on all the hotels is complete. The civil construction forthe Goa hotel is complete and the finishing/interior work is inprogress. The Goa hotel is likely to be soft commissioned in March2010. Pune and Mumbai hotels are planned to be operational byDecember 2010 and May 2012 respectively.
Key future milestonesThe project value should increase upon:
• The planned commissioning of Goa’s largest five-star deluxeresort, the Grand Hyatt
• Substantial progress has been made on finalising the design andpre-construction of the shell of the iconic development which shallbe the tallest structure in India comprising of a five star deluxehotel, serviced apartments and a premium retail mall in southMumbai with an expected completion date of May 2012.
Average Room Rate (ARR) AssumptionBased on CBRE assumptions, the ARR for the Mumbai hotel (under construction) is INR 16,250, Mumbai hotel (operational) is INR 8,750and average Occupancy Rate is 70%, Goa hotel (under construction) isINR 7,000 and Pune hotel (under construction) is INR 9,000.
Subsequent events post March year-endDB Hospitality has diversified into providing in-flight catering servicesto airlines through an entity called ‘Conwood Inflight’. It has anagreement with Lufthansa Airlines and Thai Airlines for its cateringservices. Within India, they currently cater to two Kingfisher Red sectors and propose to increase this to 11 sectors over the next quarter.The Company has also signed a comprehensive exclusive agreementwith Japan’s JAL Hotels Company Limited which has 59 luxury hotelsworldwide, comprising of 829 rooms in Europe, the Middle East, theUS and throughout Japan and the Asia Pacific region.
Under this agreement DB will be developing properties bearing thebrand DB-Nikko in nine cities in India. It is planned that DB Hospitalityinvest a total of USD 1 billion over the next four years for the development of hotel projects in the country. The Nikko hotel openingswill start from 2010.
Under another agreement with Hyatt Place, DB Hospitality have twohotels under construction – one in Pune and the other in the MundraSEZ (the only port based SEZ in India). The Hyatt Place hotels areanticipated to be mid-market city hotels located in and around centresof trade activity and business.
As planned, the operational Le Meridien Ahmadabad was inducted intothe DB Hospitality portfolio.
Total area constructed and sold (under progress)
Grand Hyatt Goa, 171 rooms and 20,000 sq. ft. of retail space
Park Hyatt Mumbai, 510 mts with 95 storeys, 275 Rooms; 50 serviced apartments and 50 long stay residences and 125, 000 sq. ft.of retail space
Grand Hyatt Pune: 324 rooms
Le Meridien, Mumbai (Operating): 171 rooms
=COE base rate for the cost of equity in March 2009 is 15.77%. In the past, the Cost of Equitynumber has been presented as a single number and included a uniform risk premiumbetween 1.5% and 2.5% across all projects. In this report the risk premium has been set onproject by project basis as shown above and added to the base rate to arrive at the COE forthe project.
In Sept ’08 a single cost of equity rate of 16.55% was applied across all projects (14.55% baserate and 2% execution risk premium). Historically the final COE rate has been even lower:March ’07 = 13.29%, Sept ’07 = 12.88%, and March ’08 = 15.54% .

14Trikona Trinity Capital PLC
DP10Project Name Luxor Cyber City Address Village Shikopur, Tehsil Sohna, Gurgaon,
Haryana Asset Classes IT/ITeSSaleable Area 8.18 million sq. ft. on 62.6 acresPartner Uppal & Luxor Group (Promoter)Indian SPV Luxor Cyber City Pvt. Ltd. (Company) Mauritian SPV Trinity Capital (Fourteen) Limited (TC-14)
Date Nav (£m) IRR% Multiple (x)31 March 09 25.33 -6% 0.91Date of investment 12 June 2007Cost of equity 21.27%
(COE base rate= + 5.5% execution risk)Scheduled exit December 2014Total capital committed £38.4 millionTotal capital invested £38.4 millionCash realized £9.42 million to SF IITrikona TC’s ownership in the Mauritian SPV 85%Mauritian SPV’s ownership in DP10 49.38%*
Project SummaryLuxor Cyber City is a planned 63 acre development of an IT/ITeS SEZin Gurgaon, the second largest IT/ITeS destination in India. It is alsoamong the first few Special Economic Zones declared in the NationalCapital Region, enabling it to take advantage of the fact that over8,000 companies may move into an SEZ to retain the tax-free statusthey may lose in the future.
The partners in the project intend to trifurcate the land and carry ontheir own proportionate developments. TC-14 has recently acquired a99.99% stake in Nirmaan Buildwell Pvt. Ltd which should become theco-developer of the SEZ for TC-14’s share of the land, and the TrikonaTC Board has approved the £10.5 million required for completion whichis to be drawn in tranches as per the requirements of the project.
The earlier plan was for the partners to jointly develop the land along-side a reputed co-developer. Despite efforts by Trikona TC, the finaloffer from a leading international developer was not considered to bein the best interest of all parties. Hence, it is planned that Trikona TC’sportion of the land will be developed on a standalone basis.
The master plan for the entire property has been prepared and hasbeen sent to the authorities for approval. The government has decided to lay a new road running though the property which should significantly improve access to our site. It is anticipated thatconstruction activity will start on the approval of the master plan and execution of the trifurcation agreement.
The project is expected to complete by September 2016.
Key future milestonesThe project value should increase upon approval by the SEZ authoritiesof Nirmaan Buildwell Pvt. Ltd. as the co-developer, and post the devel-opment of phase I, which comprises 900,000 sq. ft. out of a total of 3.3million sq. ft. and is due over the next 24 months.
Subsequent events post March year-endCash for completion of £10.5 million, as approved by the Board is yet tobe released.
The Board of LCC has approved the trifurcation process and accordinglyit has been agreed that the TC-14 portion of the property will be developed on a standalone basis by a company nominated by TC-14.
The Master Plan for the entire property has been prepared and submitted to HUDA for approval.
Sale Rate AssumptionBased on CBRE assumptions, the lease rate has been assumed at INR36 per sq. ft. per month while comparable projects in the vicinity arequoting between INR 35 to INR 50 per sq. ft. per month.
FDI guidelines (project specific)
Being a notified SEZ this project is governed by the SEZ Act 2005.
Realization through stake sale to SachsenFonds
17 June 08% of Mauritian SPV sold 15TTC’s remaining % of Mauritian SPV 85Sale Price (£ million)* 9.42IRR at sale (%) 63Multiple (x) 1.64To whom SF II
*Of the committed investment of £38.4m, TTC has realized £9.42m throughthe sale to SF II.
=COE base rate for the cost of equity in March 2009 is 15.77%. In the past, the Cost of Equitynumber has been presented as a single number and included a uniform risk premiumbetween 1.5% and 2.5% across all projects. In this report the risk premium has been set onproject by project basis as shown above and added to the base rate to arrive at the COE forthe project.
In Sept ’08 a single cost of equity rate of 16.55% was applied across all projects (14.55% baserate and 2% execution risk premium). Historically the final COE rate has been even lower:March ’07 = 13.29%, Sept ’07 = 12.88%, and March ’08 = 15.54%.

Annual Report & Accounts 200915
DP11Project Name Dynamix Balwas Realty
(DB Realty)
Address Projects in Mumbai and Pune, MaharashtraAsset Classes Residential, Commercial, Retail and HospitalitySaleable Area 39.93 million sq. ft. Partner Dynamix Balwas Group (Promoter)Indian SPV DB Realty (Company) Mauritian SPV Trinity Capital (Eleven) Limited (TC-11)
Date Nav (£m) IRR% Multiple (x)31 March 09 46.17 36% 1.75Date of investment 23 April 2007Cost of equity 20.77%
(COE base rate= + 5% execution risk)Scheduled exit March 2014Total capital committed £26.4 millionTotal capital invested £26.4 millionTrikona TC’s ownership in the Mauritian SPV 100%Mauritian SPV’s ownership in DP11 5.92%
Project SummaryDynamix Balwas Realty (DB Realty), promoted by Dynamix BalwasGroup, is a US$2 billion conglomerate with a 25 year track record inreal estate development. Designed as a holding company with thespecific purpose of undertaking development rights based or jointventures (JVs)/special purpose vehicles (SPVs) based projects inMumbai, it is now well known for its strong residential portfolio andcapabilities in developing different asset types.
The group’s portfolio of 20 projects is located in prime areas ofMumbai and Pune and will result in 39.93 million sq. ft. of residential,commercial, retail and urban rejuvenation space.
Following successful investments in DB Hospitality and MK Malls, theManager was presented with several interesting projects by theDynamix Balwas Group (DB) and jointly created DB Realty as a holdingcompany of development rights in JVs and SPVs. Based on an investment philosophy of focussing on redevelopment projects, theDB Group operates by clearing tenanted properties where they compensate existing tenants and redevelop the land. The group targets projects in populated areas where land availability is scarce.Strong execution skills complement DB Realty’s business philosophy,and have given the group a competitive advantage as it redefines thelandscape of Mumbai through the development of about 40 millionsq. ft. of land.
Trikona TC’s investment of £26.4 million concluded simultaneouslywith Lehman Brothers’ and IIML’s investment for the same amountand stake holding.DB subsequently added eight more projects in the SPV without any additional equity infusion by investors.
Key future milestonesThe project value should increase upon the completion of the high-endresidential projects in Goregaon and Kandivili and Dahisar which areplanned to be constructed over the next 18 months. Progress on theMahul project, involving development of 8.8 million sq. ft. in one location should also add considerable value.
The IPO registration process for this company is underway. Once priced,the Company should see better valuation and liquidity for this investment.
Subsequent events post March year-endThe project value should increase upon:
• The Dahisar Retail Mall has been repositioned and re-launched asa residential project comprising of 3300 affordable homes of which2077 have been pre-sold.
• The Kandivali project was launched in the last quarter and approximately 70% (393 out of 543) of total flats were sold.
• The developer plans to launch four more projects this year in addition to six projects already under construction out of the total20 projects.
• In addition 3 new projects have been added to the portfolio – twoin Mumbai and one in Pune. This takes the total number of projectsin the portfolio to 23.
• The Board of DB Realty has approved the IPO process to be initiated.
Sale Rate AssumptionThe average realisation to date from the Mahul project has been INR2154 per sq. ft. The average sale rate for Gokuldham is INR 7,483 persq. ft. and for Kandivali Suburbia is INR 5,863 per sq. ft., while for theDahisar project it is INR 2,972 per sq. ft.
State of planning, physical progress and completionTotal area constructed and sold (under progress)
Mahul25 out of 65 buildings have been constructed. This project will ultimately rehabilitate Project Affected People (PAP) in Mumbai. Theproject generates Transferable Development Rights (TDR) in lieu of constructed space handed over to the Government. On completion, this project is anticipated to generate 8.8 million sq. ft. of TDR – of this,3.3 million sq. ft. has already been generated.
Gokuldham480, 365 sq. ft. of high-end residential space pre-sold, out of 1.1 millionsq. ft. planned to be built.
Kandivali Suburbia227, 098 sq. ft. of affordable residential space pre-sold.
Dahisar2077 of 3,300 affordable homes have been pre-sold.
=COE base rate for the cost of equity in March 2009 is 15.77%. In the past, the Cost of Equitynumber has been presented as a single number and included a uniform risk premiumbetween 1.5% and 2.5% across all projects. In this report the risk premium has been set onproject by project basis as shown above and added to the base rate to arrive at the COE forthe project.
In Sept ’08 a single cost of equity rate of 16.55% was applied across all projects (14.55% baserate and 2% execution risk premium). Historically the final COE rate has been even lower:March ’07 = 13.29%, Sept ’07 = 12.88%, and March ’08 = 15.54%.

16Trikona Trinity Capital PLC
DP13Project Name MIG Group IVAddress MIG Group-IV, Gandhi Nagar, Bandra East,
Mumbai - 400051, MumbaiAsset Classes Urban Rejuvenation, ResidentialSaleable Area 267, 370 sq. ft. and rehabilitation
330, 000 sq. ft.Partner Keystone Realtors Pvt. Ltd. (Promoter)Indian SPV Rustomjee Constructions Pvt. Ltd. (Company) Mauritian SPV Trinity Capital (Fifteen) Ltd. (TC-15)
Date Nav (£m) IRR% Multiple (x)31 March 09 1.48 -11% 0.91Date of investment May 2008Cost of equity 21.27%
(COE base rate= + 5.5% execution risk)Scheduled exit September 2009Total capital committed £20.5 millionTotal capital invested £3.79 million*Trikona TC’s ownership in the Mauritian SPV 45%Mauritian SPV’s ownership in DP13 49%
*The investment was intended to be made in 4 tranches as envisaged inthe business plan.
Project SummaryThe site is in close proximity to the Secondary Business District(SBD) of Mumbai known as the Bandra Kurla Complex (BKC), which isfast outgrowing the traditional/preferred Central Business District(CBD) of Nariman Point. As more corporate offices are moving intoBKC, there is an increasing demand for quality residential real estatespace in the adjoining areas.
The MIG colony in Bandra East is divided into six groups – Group I to VI. All the groups are at varying stages of negotiations for redevelopment. The proposed redevelopment project will see a complete renewal of the neighbourhood as the program will involveadding of new community facilities in addition to high-rise housing.The project will encompass 598,133 sq. ft. of which 330,763 sq. ft.will be used for rehabilitating the existing society members and267,370 sq. ft. will be available to the project SPV for sale at themarket value.
It is envisaged that the development will comprise of high-end residential condominiums under the MHADA redevelopment schemein a prime location of Bandra East. Of the total committed investmentof INR 1625 million, an initial investment of INR 300 million wasmade in May 2008, held by Trikona TC and SF (45:55 respectively).
In view of Trikona TC’s new investment policy, a resolution waspassed at the TC-15 level between itself and SF to review the transaction in March 2009. Trikona Capital Group commenced negotiations with the development partner (Keystone Group) in April 2009 to unwind the transaction. The FEMA consultant and legalcounsel are currently working on this.
The process has freed up the committed investment such steps arebeing taken for making an application to FIPB seeking an earlierrepatriation of INR 300 million (£3.89 m) as the invested amount islocked in for 3 years. Upon approval TCM will receive back 45% ofthe invested amount less the cost of winding the transactions out of the disbursed amount subject to RBI/FIPB approvals.
State of planning, physical progress and completionDue to market conditions, the Manager asked the developer to renegotiate terms with the MIG Housing Society. A revised proposalwith the corpus modified down from INR 1,120 million to INR 600 million was presented to the MIG Housing Society and negotiations are underway.
Since there was a request from Trikona TC to generate extra cash, the Manager has initiated the process of unwinding this investmentwith permission from SF and the local developer; a resolution to thiseffect was passed in Mauritius. The IRR would have been in excess of28% if the project was implemented as per the proposed renegotiatedprogram.
=COE base rate for the cost of equity in March 2009 is 15.77%. In the past, the Cost of Equitynumber has been presented as a single number and included a uniform risk premiumbetween 1.5% and 2.5% across all projects. In this report the risk premium has been set onproject by project basis as shown above and added to the base rate to arrive at the COE forthe project.
In Sept ’08 a single cost of equity rate of 16.55% was applied across all projects (14.55% baserate and 2% execution risk premium). Historically the final COE rate has been even lower:March ’07 = 13.29%, Sept ’07 = 12.88%, and March ’08 = 15.54% .

Annual Report & Accounts 200917
DP14Project Name Sankalp Township Address Pipavav, District Amreli, GujaratAsset Classes Township - Residential, Commercial,
Retail, Hospitality and HealthcareSaleable Area 6,622,166 sq. ft. (Residential Plots and Low
Rise Apartments); 877, 600 sq. ft. (Hotel and Retail) and 239, 176 sq. ft. (other Amenities) over 217 acres
Partner Panthera Developers Private Ltd. Indian SPV Sankalp Buildwell Pvt. Ltd. (Company) Mauritian SPV Trinity Capital (Fourteen) Limited (TC-14)
Date Nav (£m) IRR% Multiple (x)31 March 09 2.2 -65% 0.65Date of investment October 2008Cost of equity 21.77%
(COE base rate= + 6% execution risk)Scheduled exit June 2014Total capital committed £3.1 million*Total capital invested £3.1 millionTrikona TC’s ownership in the Mauritian SPV 100%Mauritian SPV’s ownership in DP14 31.6%
*The with an option to invest additional £ 1.4 million
**Voting Rights on the 31.6% and economic benefits on 61.84% post the second amendment agreement. The balance commitment has beencancelled.
Project SummaryThe Sankalp project in Pipavav, Gujarat, is an integrated townshipproject spread over 217 acres, adjacent to one of the fastest growingports and industrial towns in India. The project will cater to thedemand for housing generated by the large blue collar and engineering workforce employed by the already operational port,shipyard and cement plant.
The area around the project site has witnessed tremendous industrial growth, while the local infrastructure and available residential facilities have not been able to keep pace. Sankalp is positioned to capture the local demand for residential and commercial space driven by this industrial development.
Plans for the township offer all the necessary amenities including a school, hospital, hotels and commercial and retail space in onearea. Construction activity in phase I to develop 100 acres shouldcommence in October 2009. Sankalp has signed a MoU to construct252 (0.25 million sq. ft.) flats for shipyard staff as per the specificationsprovided by Pipavav Shipyard Limited. Currently, this workforce commutes to and from work for a minimum duration of one to twohours [each way/per day], whereas the Sankalp Township project islocated only 15 kms from the shipyard and port.
Key future milestonesThe project is expected to be completed in approximately 6 years. Theproject value is anticipated to increase on the delivery of the first 252residential apartments to Pipavav Shipyard Limited, which is expectedwithin the next two years.
Update since March 2009The Master Plan for the township has been approved by the TownPlanning Authority.
State of planning, physical progress and completion• The topographical survey of the project land along with detailed site
and layout analysis has been completed and the EnvironmentalImpact Assessment survey is underway.
• The master plan for the proposed township has been finalized andsubmitted to the Town Planning Authority for approval. This hasnow been approved.
• Detailed building design and cost estimates are being reviewed forthe proposed 252 apartments forming part of phase I of the project.
• The project engineer has been appointed alongside architectural,structural and MEP design consultants. Design of 252 apartmentsoffered to Pipavav Shipyard Limited has been completed.
• In January 2009, the developer and Company entered into aMemorandum of Understanding with the Gujarat Maritime Board(GMB), wherein the Government of Gujarat (GoG) and the GMB willco-operate to establish, develop and implement this project.
• Land development activity is in progress. Tenders for constructionof 252 apartments are being floated. Construction activity isexpected to start from October 2009.
• Completion is anticipated to be in March 2021.
=COE base rate for the cost of equity in March 2009 is 15.77%. In the past, the Cost of Equitynumber has been presented as a single number and included a uniform risk premiumbetween 1.5% and 2.5% across all projects. In this report the risk premium has been set onproject by project basis as shown above and added to the base rate to arrive at the COE forthe project.
In Sept ’08 a single cost of equity rate of 16.55% was applied across all projects (14.55% baserate and 2% execution risk premium). Historically the final COE rate has been even lower:March ’07 = 13.29%, Sept ’07 = 12.88%, and March ’08 = 15.54%

18Trikona Trinity Capital PLC
DP15Project Name Jodhana DevelopersAddress Umaid Bhawan Palace Precincts, District
Jodhpur, RajasthanAsset Classes Residential Villas and Commercial development
including Handicrafts spaceSaleable Area 1,176,120 sq ft (residential villas) and
313,632 sq ft (commercial space)Partner Panthera Developers PrivateIndian SPV Jodhana Developers Pvt. Ltd. (Company) Mauritian SPV Trinity Capital (Seventeen) Limited (TC-17)
Date Nav (£m) IRR% Multiple (x)31 March 09 8.26 112% 1.36Date of investment 1 October 2008Cost of equity 20.77%
(COE base rate= + 5% execution risk)Scheduled exit September 2013Total capital committed £11.9 millionTotal capital invested £5.6 million*Trikona TC’s ownership in the Mauritian SPV 100%Mauritian SPV’s ownership in DP17 48%
*The balance commitment has been cancelled through an amendmentagreement.
Project SummaryThe project comprises the development of 19 acres of commercialarea and 9.7 acres of high-end residential villas located within theprecincts of the Umaid Bhawan Palace.
Umaid Bhawan Palace precincts are in prime locations of Jodhpur,the second largest commercial city of Rajasthan. It hosts India’slargest handicrafts export market and is a gateway to the deserts ofJaisalmer and Barmer and is also an important tourist destination ofIndia. The targeted clientele for the proposed handicrafts, commercialand retail portion of the project are the successful businessmen ofthe city. They are currently operating across the city due to a lack ofany planned development offering quality retail space. For residentialdevelopments, the target market is the rich local and non-residentMarwari diaspora (people originally from Marwar) dispersed acrossIndia and abroad who are keen to have a luxury residence in the capital city of the Marwari Kingdom.
Key future milestonesThe project value should increase upon the commissioning of the handicrafts hub and presales of villas. It is anticipated that work shallcommence shortly.
Subsequent events post March year-endTTC’s liability to fund the portion of SF’s commitment has been extinguished through an amendment agreement signed between theproject company and TTC announced in May 2009.
State of planning, physical progress and completionThe project comprises of residential and commercial developments on two land parcels. The Company has appointed JLLS (Jones Lang La Salle) to carry out the “best use” study to decide on the exact mix of commercial components on the 19 acres. The report was received inthe month of July 2009. Based on the recommendations from JLLS, the planning and design process should start for the commercial segment of 19 acres. The 9.68 acres of residential space is already part of a well laid-out township of Umaid Bhawan Heritage. Designsand specifications for three specimen villas are being finalized. Projectcompletion is expected by January 2014.
=COE base rate for the cost of equity in March 2009 is 15.77%. In the past, the Cost of Equitynumber has been presented as a single number and included a uniform risk premiumbetween 1.5% and 2.5% across all projects. In this report the risk premium has been set onproject by project basis as shown above and added to the base rate to arrive at the COE forthe project.
In Sept ’08 a single cost of equity rate of 16.55% was applied across all projects (14.55% baserate and 2% execution risk premium). Historically the final COE rate has been even lower:March ’07 = 13.29%, Sept ’07 = 12.88%, and March ’08 = 15.54% .

Annual Report & Accounts 200919
DP16Project Name Virar TownshipAddress Survey Nos. 5, Village Dongare (Dongar Pada)
(Village Narangi), Sub-District of Vasai, DistrictThane, India
Asset Classes Residential, Commercial, High Street Retail and Retail Mall
Saleable Area 12.4 million sq. ft.Partner Keystone Realtors Pvt. Ltd. (Promoter)Indian SPV Enigma Constructions Pvt. Ltd. (Company) Mauritian SPV Trinity Capital (Eighteen) Limited (TC-18)
Date Nav (£m) IRR% Multiple (x)31 March 09 5.55 -5% 0.98Date of investment October 2008Cost of equity 21.77%
(COE base rate= + 6% execution risk)Scheduled exit September 2016Total capital committed £10.82 millionTotal capital invested £5.09 million*Trikona TC’s ownership in the Mauritian SPV 100%Mauritian SPV’s ownership in DP13 23.03%*The balance commitment has been cancelled through an amendmentagreement.
Project SummarySpread over 217 acres, this project is one of Mumbai’s largest affordable middle-income group housing projects.
The informal launch has registered pre-sales of almost 30%. Thisnow makes the project a market leader in terms of size in the Virarmicro-market.
At the time of investment, the project had all approvals and permissionsin place. Subsequent to Trikona TC’s investment, there was a beneficialchange in the size of the project (from 43 acres to 217 acres) withoutany additional investment. This project is now structured as a jointventure with the landowner, and construction is proceeding accordingto schedule.
Key future milestonesThe formal launch of 1 million sq. ft. is expected late in 2009.
Subsequent events post March year-endAs part of the re-worked strategy, the land cost has been reworked to INR 338 per sq. ft. from INR 905 per sq. ft. by undertaking the development of the entire 217 acres (43 acres earlier) through a JV withthe land owners (without any additional equity investment from TCM).This has brought down the land cost per sq. ft. saleable area from INR905 to INR 338, (-63%).
The construction cost also has been reduced from INR 1140 per sq. ft. toINR 950 per sq. ft. through value engineering. This has enabled thedeveloper to reduce the sale price across all products. In the twomonths following the change in price, the developer sold an additional1500 flats.
As of August end, a total of 2070 flats out of 2,378 have been sold.Prices have been increased twice since May 2009 approximately 10-12%each time. The average sale price is INR 1800.
State of planning, physical progress and completionMaster planning for the entire site is complete. Detailed designs for allbuildings in the project have been completed and initial approvals in theform of Intimation of Disapproval (IoD) have been obtained. Foundationwork for 15 buildings is in progress. The compound wall for the entiresite has been constructed. Internal roads are being laid. Construction ofan eight acre amusement park is advancing as per the plan. The first setof buildings is expected to be handed over to buyers by July 2010.
The project is expected to complete by March 2025. (previously 2011 –extended due to an increase in land area). Cost for completion per sq.ft. is down due to value engineering, with construction costs down toINR 950 per sq. ft. from INR 1,140 per sq. ft.
Sale Rate AssumptionBased on CBRE assumptions, the sale rate for Residential is INR 1,800to INR 1,900 per sq. ft. while comparable projects in the vicinity arequoting between INR 1,800 to INR 2,491 per sq. ft.
=COE base rate for the cost of equity in March 2009 is 15.77%. In the past, the Cost of Equitynumber has been presented as a single number and included a uniform risk premiumbetween 1.5% and 2.5% across all projects. In this report the risk premium has been set onproject by project basis as shown above and added to the base rate to arrive at the COE forthe project.
In Sept ’08 a single cost of equity rate of 16.55% was applied across all projects (14.55% baserate and 2% execution risk premium). Historically the final COE rate has been even lower:March ’07 = 13.29%, Sept ’07 = 12.88%, and March ’08 = 15.54% .

20Trikona Trinity Capital PLC
EH7Project Name Fortis Healthcare LimitedLocation Pan India Asset Classes Infrastructure Partner Ranbaxy GroupMauritian SPV Trinity Capital (Eight) Limited (TC-8)Type Healthcare facilities, hospitals
Percentage held 3.5%Type PublicExchange Bombay Stock ExchangeTicker [BSE] FORTIS
Date Nav (£m) IRR% Multiple (x)31 March 09 7.4 -25% 0.55Date of investment 15 January 2007Scheduled exit September 2010Total capital committed £13.5 millionTotal capital invested £13.5 millionTrikona TC’s ownership in the Mauritian SPV 100%Mauritian SPV’s ownership in EH7 100%
Project SummaryFortis Healthcare Limited was established in 1996 by the promotersof Ranbaxy Laboratories. Fortis Healthcare has a network of 16 hospitals and 12 satellite centres with 2,500 operational beds and anexisting capacity of 3,000 beds.
Fortis recently acquired 10 marquee hospitals of Wockhardt with a capacity of 1,902 beds, taking Fortis’s total bed capacity to approximately 5000. The hospitals include multi-specialty and super-specialty centres, providing healthcare to patients in cardiaccare, orthopaedics, neurosciences, oncology, renal care, gastroen-terology and mother and child care. Fortis has charted aggressiveplans for setting up around 40 hospitals with approximately 6000beds in India. Currently the company’s two Greenfield projects areunder construction and will add around 600 beds by 2011.
The healthcare services market in India is expected to grow fromRs1,513 billion in 2007 to Rs2,654billion by 2012 (Source: IndiaHealthcare Trends 2008, Technopak Advisors). According to theWorld Health Organisation (WHO), India healthcare spending is verylow. In 2004, it was US$34.9bn, or 5.2% of GDP and governmentspending was a meager 1.2% of the GDP. With the economy growingand incomes rising, healthcare spending is expected to rise to 5.5%of GDP (US$60.9bn) by 2012. Private healthcare spending is likely tocontribute the largest component in 2012, rising to Rs1,560 billionfrom the current level of Rs690 billion.
Over the last 4 years, Fortis Healthcare added 21 hospitals to its bouquet through acquisitions. In Jan 2009, International Hospital Ltd(IHL), its 100 % subsidiary, acquired 28.89% interest in Medical andSurgical Centre (MSCL), a company listed in Mauritius that owns the120- bed Fortis Clinique Darné Hospital in Mauritius for Rs155 million.In Feb 2009, IHL increased its equity interest in Lalitha Healthcare
Private Ltd (LHPL), which owns the Fortis Hospital Seshadripuram in Bangalore, to 67.23% for Rs52 million. The same month, it added FortisModi Hospital Kota, a 100-bed facility to its O&M hospital network takingthe count to five with around 500 operating beds. In August 2009, Fortisacquired 10 key hospitals of Wockhardt hospitals with 1,902 beds.
Key future milestonesFortis plans to double bed capacity by 2012 - The company is looking topenetrate markets in west and south India. It also plans to increase bedcapacity to 6,000 by 2012 from the current capacity of 4,000 beds.
Deal between Fortis and Apollo - The company has taken over the operational and managerial control of the Apollo Modi Hospital in Kotacity (state of Rajasthan) to provide superior healthcare services in theregion.
Separate entity for Escorts Heart Institutes - The company is growing itsflagship cardiac hospital brand ‘Escorts Heart Institutes’ as a separateentity within its newly acquired hospitals.
Subsequent events post March year-endMay 2009, Fortis completed the acquisition of Apollo RM Hospital inBangalore.
June 2009, Fortis took the management control of SL Raheja Hospital in Mumbai. The 200 bed S L Raheja Hospital is one of the affordabledestinations in Mumbai city for cancer and diabetes patients.
June 2009, Fortis reported positive Q1-FY10 top line growth. FortisHealthcare’s revenues increased 33% Y-o-Y to INR 1.85bn. Operatingmargins improved by 500bps to 15.1%.
August 2009, Fortis announced a rights issue at INR 110 per share inAugust’09: Fortis Healthcare announced the terms of an INR 10bn rights issue. The rights issue will result in a dilution of 40%. Since theCompany has not applied for the rights issue post the successful allotment, the company shareholding will reduce from 3.5% to2.5%.The company intends to use the capital for the repayment of part debt payment of INR 1.7bn, redemption of preference capital of INR 2.6bn, 2bn for part funding of its upcoming 350 bed facility atGurgaon and funding of Shalimar Bag facility.
August 2009, Fortis acquired Wockhardt, representing the largestacquisition in Indian Healthcare space. Fortis announced the acquisitionof 10 Wockhardt Hospitals across Mumbai, Kolkata, and Bengaluru with a total bed capacity of 1,902 beds for INR 9.1Bn. The acquisitioncomprises of 8 operational hospitals with a capacity of 1,386 beds (856 operational beds) and 2 hospitals under construction which willadd another 534 beds.
Financials
March Y/E (MN) 2008 2009 Revenue 5071 6307Y/Y Revenue growth -2.4% 24.4%EBITDA margins 4.1% 13.6%EPS (2.45) 0.9 P/E (x) 111xEV/EBITDA 127.2 31.1RoE (5.8) 1,9
Source: Company reports
Equity Holdings

Annual Report & Accounts 200921
EH8Project Name Pipavav ShipyardAddress Pipavav Shipyard, Post Ucchaiya, Via Rajula,
District Amreli, Gujarat Asset Classes Infrastructure (Shipyard) Partner SKIL Group (Promoter)Indian SPV Pipavav Shipyard Limited (Company) Mauritian SPV Trinity Capital (Nine) Limited (TC-9)
Date Nav (£m) IRR% Multiple (x)31 March 09 29.67 44% 2.19Date of investment 23 January 2007Scheduled exit September 2010Total capital committed £13.5 millionTotal capital invested £13.5 millionTrikona TC’s ownership in the Mauritian SPV 100%Mauritian SPV’s ownership in EH8 7.91%
Project SummaryThe International Maritime Organization’s decision to either scrapall single hull structure oil tankers or convert them into double hull
structures by 2010 has revived interest in the shipbuilding sectoracross the globe, reinvigorating a USD250 billion market. This globalrevival has translated into renewed interest in the Indian shipbuildingmarket and has led to an increase in the order book from about INR15 billion in 2002 to over INR 100 billion today.
The Pipavav port started operations in 1996 primarily to cater to therefrigerated cargo market of Veraval but has over the years developedinto a port handling cargo from various nearby and north/west Indialocations. It is the first private sector port in India controlled andoperated by the A. P. Moller Group (Maersk) of Denmark - one of thelargest maritime groups in the world. It has been commercially operational for the last six years and has state of the art handlingequipment, road networks and railroad connectivity, thus offering thenecessary logistical support to the shipyard.
The Pipavav Shipyard is expected to be largest shipyard in India, withthe capacity to build and repair vessels of up to 400,000 DWT. Theshipyard has an all-weather marine enclave and one of the shortestapproach channels, allowing for easy ship movement and faster turnaround time.
The project is spread over 210 acres and is poised to become theworld’s fifth largest shipyard. Upon completion of construction, theshipyard will be capable of ship construction and repairs for a rangeof vessels of different sizes and types, as well as the fabrication andconstruction of products such as offshore platforms, oil and gas rigs,jackets and vessels. The shipyard is being constructed on the principle of concurrent shipbuilding, which means that production of vessels can commence simultaneously as the shipyard is built.
Objective and context SKIL Group has an excellent track record, including but not limited to its implementation of India’s first private port, first PPP project for construction of a connecting railway line to the port and pioneering the largest SEZ outside Mumbai in which RelianceIndustries, India’s largest private sector conglomerate, acquired a controlling stake.
Trikona TC invested at a price of INR 25 per share followed by several PE players such as New York Life and Indus Capital at thesame price. Subsequently, Citadel, SemCorp, Standard CharteredBank’s Asian Infrastructure fund invested at INR 45 per share. Thelast round investors which include Blackstone, Merrill Lynch, Galleon and Deutsche Bank invested at INR 80 per share.
Punj Lloyd, one of India’s largest Engineering & Construction contractors joined the company as co-promoters taking a 25.1%stake in the company bringing strategic value through potentiallylucrative new business opportunities such as oil rigs and FloatingProduction, Storage and Offloading (FPSO) vessels.
The promoters are at an advanced stage of obtaining approval for carrying out high end naval defence projects for the shipyard whichwould insulate the project from cyclical effects of the shipbuildingindustry.
Key future milestones• Project completion date for the shipyard expected around October
2009.
• Delivery of first ship out of the 22 under construction, expectedaround April 2010 with subsequent deliveries at intervals rangingfrom 1 to 3months...The Company expects offshore business of closeto INR 2 billion during the current year 2009-2010 based on 15%success rate on a bidding of about INR 13 billion worth of tenders.
Subsequent events post March year-end• Commercial operations commenced in April 2009 with construction
of four vessels,
• Awarded order for 12 OSV-Offshore Supply Vessels amounting US$111.85 million from ONGC-Oil & Natural Gas Corporation.
• The shipyard has commenced commercial operations since April 2009.
• As planned, the company submitted its Red Herring Prospectus(RHP) with SEBI on September 5, 2009 for issue of 85,450,225Equity Shares. The issue will constitute 12.83% of the post-issueequity share capital of the company.
• The price band for the IPO has been fixed at INR 55/share – INR60/share.
(continues overleaf )

22Trikona Trinity Capital PLC
State of planning, physical progress and completionCritical development risks have already been mitigated as PSL is in advanced stages of implementation and project completion for the shipyard is expected in October 2009. In the first phase of theproject, which is currently under way, one of the existing wet basins (680m x 65m) is being converted into a dry-dock of 661m x65m. This is capable of being used either as one large dry dock capable of accommodating the largest vessels under construction, or as two separate dry docks, each capable of building one Panama x size vessel. This phase is expected to be commissioned by October2009.
The dry dock will be serviced by two Goliath cranes, each having a lifting capacity of 600 tonne, and two level luffing cranes.Dewatering systems capable of meeting the requirements of both docks are being installed. To facilitate afloat fit-out and commissioning of ships, including afloat repairs, a 300 meter long quay, with the capacity for berthing on both sides is being
constructed with adequate draft and serviced by a level luffing crane. The entrance of the dry dock will also have a 100 meter extension track for the Goliath cranes for unloading heavy machineryand equipment weighing up to 1200 tonne directly from ships andheavy lift barges. It is planned that phase I of the Company’s expansion will be augmented with the addition of a shiplift facilitywith land berths which will cater to the construction of small to medium sized ships and heavy lift barges, both merchant anddefence. This facility can also be used for ship repair.Planning isunderway to convert the second dock in to a dry dock.
PSL has executed firm contracts to build twenty two 74,500 DWT Panamax Class bulk carriers with Golden Ocean Group Ltd. Bermuda/Norway, Setaf SAS (Bourbon Groupe, France) and AVGI Maritime, Marshall Islands. PSL’s order book currently standsat USD 885 million. These ships will be delivered between Apr 2010-2012. The first two ships are expected to be delivered bJan-Apr 2010.

Annual Report & Accounts 200923
EH9Project Name ITNLAddress The IL&FS Financial Centre, Plot C22, G Block
Bandra Kurla Complex, Bandra (East), MumbaiAsset Classes InfrastructurePartner IL&FS (Promoter)Indian SPV IL&FS Transportation Networks Ltd (Company) Mauritian SPV Trinity Capital (Two) Limited (TC-2)
Date Nav (£m) IRR% Multiple (x)31 March 09 5.9 7% 1.17Date of investment 5 October 2006Scheduled exit June 2010Total capital committed £5.10 millionTotal capital invested £5.10 millionTrikona TC’s ownership in the Mauritian SPV 100%Mauritian SPV’s ownership in DP2 2.50%
Project SummaryIL&FS Transportation Networks (India) Limited (ITNL) was formed byInfrastructure Leasing and Financial Services Limited (IL&FS) to create a pan-India surface transport business. IL&FS has identified theTransport Sector as an area of focus and represents itself in this sector through ITNL.
ITNL has established itself as a player with significant experience in the development, commissioning and management of road projects and is also developing capabilities in other sub-sectors such as railways, urban transportation systems and logistics.
Trikona TC’s investment in ITNL was carried out with the objective ofparticipating in the development of core infrastructure facilities in India.
Trikona TC’s investment at INR 100 per share was followed byGoldman Sachs at the same price and Standard Chartered AsianInfrastructure Fund (SCAIF) at INR 133 per share.
ITNL, being promoted by IL&FS, has the unique advantage of beingable to enter into ‘Memorandum of Understanding’s’ with variousstate and central government authorities for large road projectsunder the PPP (Public Private Partnership) route, against the conventional bid process. ITNL is a dividend paying company and has paid out two rounds of dividends to Trikona TC between 2006and 2008 totalling INR 12.01 million.
Key future milestonesThe forthcoming IPO of one of ITNL’s subsidiary companies, in additionto its own, will add significant value to Trikona TC’s investment.
Update since May 2009• ITNL executed the Concession Agreement for the Gomti Beawar
project on April 1, 2009 at Delhi. This was probably the last of theprojects which were awarded prior to the announcement of theElection Model code of conduct and the first to be awarded by theMinistry of Road Transport and Highways.
• A consortium comprising ITNL Enso Rail Systems (IERS) and DLF isall set to bag the first privately operated metro line project on a
build-and-operate basis in Haryana. The consortium was the solebidder for the line that would come up in Gurgaon at a cost ofabout INR 10 bn. IERS, together with affiliates, holds 74 percentwhile the remaining 26 percent being held by India’s leading realestate developer DLF.
• ITNL was declared the preferred bidder for Narketpally AddankiMedarametla Road (SH-2 on BOT (toll) basis) of Andhra PradeshRoad Development Corporation (APRDC). Total length of the project is 213 Kms, with an estimated Total Project Cost of INR 16 bn. Concession Period for the Project is 24 years including theConstruction Period of 910 days. ITNL to get a grant amount of INR4.74 bn for viability gap funding.
• ITNL has bid for 13 domestic projects for Road, Railways andAirport developments and 4 international projects involving outlayof over INR 170 bn/USD 3.4 bn.
• As ITNL was on a holding operation mode as the year of turbulentin terms of economic and financial turmoil caused by the crisis inthe international financial sector. Operating revenue of the companyremain stagnant at INR 1.3 bn as per unaudited results for 2008-09; however total revenue including other income shown a declineof 9% over previous year. Consequently, Net profit after taxdeclined to INR 504 m i.e. 35% over previous year. Board of directors have recommended a dividend of 12.5% on equity shares(previous year - 20%) which translates into aggregate dividend ofINR 5.35 m for TCM.
As planned ITNL has initiated the process of filing documentationrequired for an IPO. They are expected to file the Draft Red HerringProspectus (DRHP) with SEBI (Securities Exchange Board of India) by end of September 2009.
State of planning, physical progress and completionAt present, ITNL has a portfolio of 11 strategically located road projectstotalling over 3000 km. Out of the 11 projects, six projects are operational and the remaining five are under implementation. Theoperational projects cover about 1500 km and are generating revenueseither in the form of toll revenues or annuity income from respectivestate governments. ITNL is a dividend paying company.
Road Infrastructure Development Company of Rajasthan (RIDCOR) is a50:50 JV between Government of Rajasthan (GoR) and ITNL. Phase I ofthe project is operational and was conceptualised by the GoR fordevelopment of linking roads to increase connectivity between thenorth and south. It comprises of seven stretches of roads aggregatingto a total length of 1053 km at various strategic locations. Phase II ofthe project is under implementation and comprises of nine stretcheswith a total length of 1340 km. Due to the performance of RIDCOR onroad improvement, the GoR recently awarded three additional roadstretches aggregating to a total length of 153 km as a part of phase II.
The Noida Toll Bridge Company Ltd. (NTBC) project is an eight lane, 7.5km link across the river Yamuna connecting Noida with South Delhi. Itis fully operational, with a registered growth rate of over 150% fromprevious year. Current revenues stand at £9.04 million and has beenbuilt–up as per international standards. NTBC is a listed company.
In order to further its transport initiative, ITNL has acquired an 80%stake for INR 80 million in Nagpur Bus Transport System from VanshInfotech Pvt. Ltd (VIPL). VIPL has been declared as a preferred bidderby Nagpur Municipal Corporation (NMC) for operating its City BusService on a Build Own Operate and Transfer (BOOT) basis for 10 yearsextendable for another five years. The project envisages an acquisitionof about 200 buses for operating in city and payment of royalty of INR3,750-4,000/ USD 75-80 per month per bus to NMC.

24Trikona Trinity Capital PLC
EH12Project Name Phoenix MillsAddress Pan IndiaAsset Classes Retail, Hospitality and CommercialType Retail led mixed development Saleable Area 21.4 million sq. ft.Partner Phoenix Mills LimitedIndian SPV Phoenix Mills Limited Mauritian SPV Trinity Capital (Thirteen) Limited (TC-13)
Date Nav (£m) IRR% Multiple (x)31 March 09 1.72 -56% 0.23Date of investment June 2007Scheduled exit June 2010Total capital committed £7.40 millionTotal capital invested £7.40 millionTrikona TC’s ownership in the Mauritian SPV 100%Mauritian SPV’s ownership in DP12 100%
Project SummaryIndia is one of the ten largest retail markets in the world. With a totalturnover of US$295 billion –its outlay is equivalent to approximately50% of the total private expenditure on consumption and around onethird of the total Indian GDP.
Phoenix Mills Limited is known for its expertise in planning and conceptualising large retail-led, entertainment, commercial and hospitality projects under one project plan and turning them intolandmark destinations.
There are three main business verticals in Phoenix Mills, namely;‘The High Street Phoenix Mills’ mall, 6 Market Cities, and the liquidInvestments and strategic investments in EWDPL, Big Apple andPhoenix Hospitality.
‘The High Street Phoenix Mills Ltd’ (HSP) consists of 1.6 million sq. ft.excluding the Hotel ShangriLa. The HSP area is divided in 5 phaseswith phase I (Skyzone) currently fully operational. Much of the existing income is derived from this phase. Some of the existingAnchor tenants occupying space her are Big Bazaar, Lifestyle andPantaloons. Phase II (Quorum) became fully operational inDecember 2007. Brands here include Marks and Spencers, Lacoste,Pepe etc. Phase III (Palladium) encloses an area of 300,000 sq. ft. ofretail space, and constitutes Grand Galleria, 3 levels of parking, automall, spa, food zone. Once Palladium is fully operational, it will generate c. INR 65 million of revenue per month. Phase IV consists of the Shangri La Hotel, and the Standard Chartered area. The hotelbuildings will be completed by end of 2010 and will be 44 storeys,consisting of 3 levels of podium parking, high end retail shops, grandgalleria, food court and hotel rooms from the 9th to 44th floors. The proposed school will either be operated or maintained byPhoenix or the land will be sold off/leased to a specialized player.
The Six Market Cities are the Kurla mall which will (operational byOctober 2010), the Chennai mall (operational by October 2010-March2011), Bangalore’s Whitefield (complete it by October 2010), Raipurand Kolkatta have been on hold and the Pune/Ramona mall is in ine development.
Market City Phoenix StakeMC Chennai 29.00%MC Pune 51.00%MC Kurla 24.26%MC Bangalore (whitefield) 21.40%MC Bangalore (GKW) 70.00%Bangalore (GWK) Residential 70.00%MC Raipur 33.33%
Key future milestonesCompletion of the various malls expected in October 2010 – March 2011.

Annual Report & Accounts 200925
EH17Project Name Horizon Countrywide Logistics Address 13-14 Khetan Bhavan, 191 Jamshedji Tata Road
Churchgate, Mumbai 400020Asset Classes InfrastructureType Logistics industryPartner SKIL Group (Promoter)Indian SPV Horizon Country Wide Logistics Limited
(Company)Mauritian SPV Trinity Capital (Four) Limited (TC-4)
Date Nav (£m) IRR% Multiple (x)31 March 09 5.09 -85% 0.45Date of investment October 2008Scheduled exit October 2011Total capital committed £11 millionTotal capital invested £11 millionTrikona TC’s ownership in the Mauritian SPV 100%Mauritian SPV’s ownership in EH17 27%
Project SummaryTTC’s investment in HCWLL was carried out with the objective of par-ticipating in the fast growing Indian Logistics industry with a specialfocus on port related logistics through development of ContainerFreight Stations (CFS), Free Trade Warehousing Zones and InlandContainer Depots (ICD).HCWLL, promoted by SKIL Group with whomTTC also has an investment in their shipyard project is poised tobecome one of the prime players in the sector. TTC’s investment atINR 29.11 per share was preceded by an investment by Citadel at INR27.5 per share.
Key future milestonesThe project increases in value upon the commencement of operations inthe Mumbai CFS and FTWZ which is expected 12-18 months from now.
Update since March 2009The company generated revenue of INR 270m from operating activitiesduring first 3 quarters of financial year 2008-09. Company expects toachieve commercial operations at all 8 sites during FY 2010-11.
State of planning, physical progress and completionThe land acquisition of four out of seven sites is complete with each ofthe sites is taking 12-18 months to be developed. Site development isalready in progress in the case of the Navi Mumbai CFS.
The key parks near JNPT, namely the CFS and FTWZ will be the first tobe developed and the other sites will be developed subsequently.

The directors have pleasure in presenting their report and financial statements of the Group for the yearended 31 March 2009.
Principal activity and incorporationThe Company is a closed-end investment company, incorporated on 7 March 2006 in the Isle of Man as apublic limited company. It was admitted to the Alternative Investment Market of the London Stock Exchangeon 21 April 2006.
The Group invests in real estate and real estate related entities in India, primarily in commercial developmentin the office and business space, residential, retail and hospitality sectors deriving returns from development,long-term capital appreciation and income.
The consolidated financial statements comprise the results of the Company and its subsidiaries (togetherreferred to as the “Group”).
Results and dividendsThe Group’s results for the financial year ended 31 March 2009 are set out in the Consolidated IncomeStatement on page 30.
A review of the Group’s activities are set out in the Chairman’s report and Investment Manager’s report onpages 2 and 6 respectively.
The Directors do not recommend the payment of a dividend (2008 : Nill) .
DirectorsThe Directors of the Company during the year and to date of this report, and their remuneration during thefinancial year, were as follows
£’000Michael Cassidy CBE Resigned 14 July 2009 78Rakshitt Chugh Resigned 14 March 2009 -William Hamilton-Turner Resigned 14 July 2009 38Paul Orchard-Lisle CBE Resigned 14 July 2009 45Philip ScalesAndrzej Sobczak Appointed 31 October 2008
Resigned 14 March 2009 11Pradeep Verma Appointed 31 October 2008 11Martin Adams Appointed 14 March 2009 -Stephen Coe Appointed 14 July 2009 -
Directors’ interests in the shares of the Company are detailed in note 13.
Company SecretaryThe secretary of the Company during the year and to the date of this report was Philip Scales.
AuditorsThe auditors, KPMG Audit LLC, being eligible, have expressed their willingness to continue in office in accordance with Section 12(2) of the Isle of Man Companies Act 1982.
On behalf of the Board
Philip ScalesDirector28 September 2009
26Trikona Trinity Capital PLC
Directors’ Report

The Directors are responsible for preparing the Annual Report and the financial statements in accordancewith applicable law and regulations.
Company law requires the Directors to prepare Group and Parent Company financial statements for eachfinancial year, which meet the requirements of Isle of Man company law. In addition, the Directors haveelected to prepare the Group and Parent Company financial statements in accordance with InternationalFinancial Reporting Standards.
The Group and Parent Company financial statements are required by law to give a true and fair view of thestate of affairs of the Group and Parent Company and of the profit or loss of the Group for that period.
In preparing these financial statements, the Directors are required to:
• select suitable accounting policies and then apply them consistently;
• make judgements and estimates that are reasonable and prudent;
• state whether they have been prepared in accordance with International Financial Reporting Standards; and
• prepare the financial statements on the going concern basis unless it is inappropriate to presume thatthe Group and Parent Company will continue in business.
The Directors are responsible for keeping proper accounting records that disclose with reasonable accuracyat any time the financial position of the Parent Company and to enable them to ensure that its financialstatements comply with the Companies Acts 1931 to 2004. They have general responsibility for taking suchsteps as are reasonably open to them to safeguard the assets of the Group and to prevent and detect fraudand other irregularities.
The Directors are responsible for the maintenance and integrity of the corporate and financial informationincluded on the Company's website. Legislation governing the preparation and dissemination of financialstatements may differ from one jurisdiction to another.
Annual Report & Accounts 200927
Statement of Directors’ Responsibilitiesin Respect of the Annual Report and the Financial Statements

28Trikona Trinity Capital PLC
Corporate Governance statement
Although the Company is not obliged by the listing rules to do so, the Board intends, where appropriate fora Company of its size, to comply with the main provisions of the principles of good governance and code ofbest practice set out in the Combined Code (‘the Code’).
Responsibilities of the BoardThe Board of Directors is responsible for the determination of the investment policy of the Company and for its overall supervision via the investment policy and objectives that it has set out. The Board is alsoresponsible for the Company’s day-to-day operations; however, since the Board members are all non-executive,in order to fulfil these obligations, the Board has delegated operations through arrangements with theInvestment Adviser and Administrator.
At each of the regular Board meetings held, the financial performance of the Company and its portfolioassets are reviewed. The Board also receives regular investment performance reports from the InvestmentManager.
Audit CommitteeThe Audit Committee is a sub-committee of the board and makes recommendations to the Board whichretains the right of final decision. The Audit Committee has primary responsibility for reviewing the financialstatements and the accounting policies, principles and practice underlying them, liaising with the externalauditors and reviewing the effectiveness of internal controls. The Audit Committee maintains a risk registerto help it identify, evaluate, monitor and control risks.
The terms of reference of the Audit Committee covers the following:
• The composition of the Committee, quorum and who else attends meetings.
• Appointment and duties of the Chairman.
• Duties in relation to external reporting, including reviews of financial statements, shareholder communications and other announcements.
• Duties in relation to the external auditors, including appointment/ dismissal, approval of fee, discussionof the audit.
• Duties in relation to internal systems, procedures and controls.

Annual Report & Accounts 200929
Report of the Independent AuditorsKPMG Audit LLC, to the members of Trikona Trinity Capital plc
We have audited the Group and Parent Company financial statements (the “financial statements”) of TrikonaTrinity Capital plc for the year ended 31 March 2009 which comprise the Consolidated Income Statement, theConsolidated and Parent Company Balance Sheets, the Consolidated and Parent Company Statements of Changesin Equity and the Consolidated Cash Flow Statement and the related notes. These financial statements have beenprepared under the accounting policies set out therein.
This report is made solely to the Company’s members, as a body, in accordance with section 15 of the CompaniesAct 1982. Our audit work has been undertaken so that we might state to the Company’s members those matters weare required to state to them in an auditor’s report and for no other purpose. To the fullest extent permitted by law,we do not accept or assume responsibility to anyone other than the Company and the Company’s members as abody, for our audit work, for this report, or for the opinions we have formed.
Respective responsibilities of Directors and AuditorsThe Directors’ responsibilities for preparing the Annual Report and the financial statements in accordance withapplicable law and International Financial Reporting Standards are set out in the Statement of Directors’Responsibilities on page 27.
Our responsibility is to audit the financial statements in accordance with relevant legal and regulatory requirementsand International Standards on Auditing (UK and Ireland).
We report to you our opinion as to whether the financial statements give a true and fair view and are properly preparedin accordance with the Companies Acts 1931 to 2004. We also report to you if, in our opinion, the Company has not keptproper accounting records, or if we have not received all the information and explanations we require for our audit.
We read the Directors’ Report and any other information accompanying the financial statements and considerwhether it is consistent with the audited financial statements. We consider the implications for our report if webecome aware of any apparent misstatements or material inconsistencies with the audited financial statements.Our responsibilities do not extend to any other information.
Basis of opinionWe conducted our audit in accordance with International Standards on Auditing (UK and Ireland) issued by theAuditing Practices Board. An audit includes examination, on a test basis, of evidence relevant to the amounts anddisclosures in the financial statements. It also includes an assessment of the significant estimates and judgmentsmade by the Directors in the preparation of the financial statements, and of whether the accounting policies areappropriate to the Group’s and Company's circumstances, consistently applied and adequately disclosed.
We planned and performed our audit so as to obtain all the information and explanations which we considerednecessary in order to provide us with sufficient evidence to give reasonable assurance that the financial statementsare free from material misstatement, whether caused by fraud or other irregularity or error. In forming our opinionwe also evaluated the overall adequacy of the presentation of information in the financial statements.
OpinionIn our opinion the financial statements:
• give a true and fair view, in accordance with International Financial Reporting Standards, of the state of the Groupand Parent Company’s affairs as at 31 March 2009 and of the Group’s loss for the year then ended; and
• have been properly prepared in accordance with the Companies Acts 1931 to 2004.
KPMG Audit LLCChartered AccountantsHeritage Court, 41 Athol StreetDouglas, Isle of Man IM99 1HN
28 September 2009

30Trikona Trinity Capital PLC
Consolidated Income StatementFor the year ended 31 March 2009
2009 2008
Note £’000 £’000
Interest income cash and cash equivalents 4,102 4,967
Dividend received 98 71
Foreign exchange gain/(loss) 86 (41)
10 Fair value movement on investments
17 Reclassification of subsidiary 53,403 -
Other (163,294) 91,406
17 Net realised gains on disposal of subsidiaries 31,795 3,218
Net investment (loss)/income (73,810) 99,621
6 Investment Manager’s management fees (5,491) (5,052)
6 Investment Manager’s performance fees 20,459 (27,663)
5 Other administration fees and expenses (2,602) (3,227)
Total expenses 12,366 (35,942)
(Loss)/profit before tax (61,444) 63,679
7 Taxation - -
(Loss)/profit for the year (61,444) 63,679
Attributable to:
Equity holders of the Company (54,750) 62,497
Minority interest (6,694) 1,182
(Loss)/profit for the year (61,444) 63,679
8 Basic and diluted (loss)/earnings per share (pence) (23.6) 26.9
The notes on pages 35 to 47 form an integral part of the financial statements

Consolidated Balance Sheetat 31 March 2009
Annual Report & Accounts 200931
2009 2008
Note £’000 £’000
Non-current assets
10 Investments as at fair value through profit or loss 234,727 301,858
Total non-current assets 234,727 301,858
Current assets
14 Trade and other receivables 101 558
19 Cash and cash equivalents 60,038 56,617
Inventory - 25,641
Prepayments 142 131
Total current assets 60,281 82,947
Total assets 295,008 384,805
Liabilities
Non-current liabilities
6 Performance fee provision (7,795) (36,308)
Borrowings - (1,250)
Total non-current liabilities (7,795) (37,558)
Current liabilities
15 Trade and other payables (6,006) (4,350)
Total current liabilities (6,006) (4,350)
Total liabilities (13,801) (41,908)
Net assets 281,207 342,897
Represented by:
11 Ordinary shares 2,321 2,321
Distributable reserve 217,362 217,362
Retained reserves 41,758 96,508
Other reserves (167) 212
Total equity attributable to equity holders of the Company 261,274 316,403
21 Minority interest 19,933 26,494
Total equity 281,207 342,897
18 Net Asset Value per share (£) 1.13 1.36
The notes on pages 35 to 47 form an integral part of the financial statements
These financial statements were approved by the Board on 28 September 2009 and signed on their behalf by
Philip Scales Steve CoeDirector Director
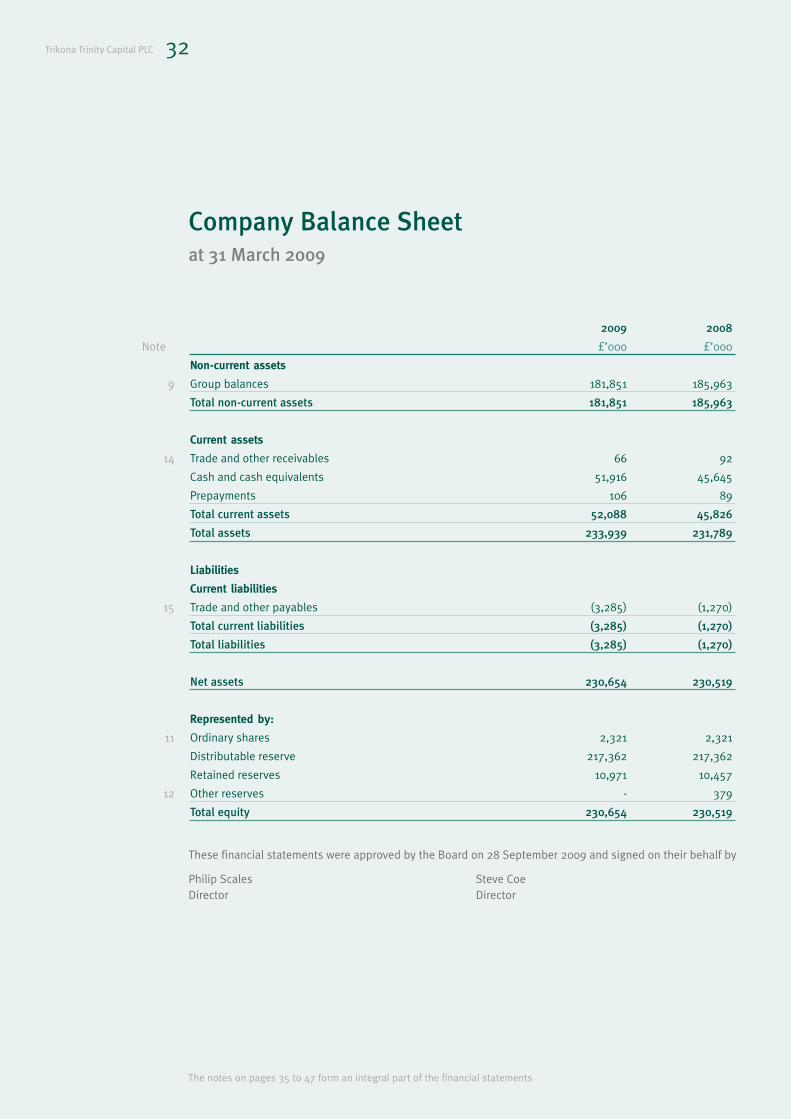
32Trikona Trinity Capital PLC
Company Balance Sheetat 31 March 2009
2009 2008
Note £’000 £’000
Non-current assets
9 Group balances 181,851 185,963
Total non-current assets 181,851 185,963
Current assets
14 Trade and other receivables 66 92
Cash and cash equivalents 51,916 45,645
Prepayments 106 89
Total current assets 52,088 45,826
Total assets 233,939 231,789
Liabilities
Current liabilities
15 Trade and other payables (3,285) (1,270)
Total current liabilities (3,285) (1,270)
Total liabilities (3,285) (1,270)
Net assets 230,654 230,519
Represented by:
11 Ordinary shares 2,321 2,321
Distributable reserve 217,362 217,362
Retained reserves 10,971 10,457
12 Other reserves - 379
Total equity 230,654 230,519
The notes on pages 35 to 47 form an integral part of the financial statements
These financial statements were approved by the Board on 28 September 2009 and signed on their behalf by
Philip Scales Steve CoeDirector Director

Statements of Changes in EquityFor the year ended 31 March 2009
Annual Report & Accounts 200933
TotalShare Distributable Retained Other Shareholders’ Minority Total
Capital Reserves Reserves Reserves Funds Interest Equity
£’000 £’000 £’000 £’000 £’000 £’000 £’000
Group
Balance at 1 April 2007 2,321 217,362 34,011 (1) 253,693 - 253,693
Profit for the year - - 62,497 - 62,497 1,182 63,679
Increase in value of share options - - - 379 379 - 379
Disposal of subsidiaries - - - - 25,082 25,082
Additional investment - - - - - 230 230
Foreign exchange on translation - - - - - - -
of subsidiaries - - - (166) (166) - (166)
Balance at 31 March 2008 2,321 217,362 96,508 212 316,403 26,494 342,897
Balance at 1 April 2008 2,321 217,362 96,508 212 316,403 26,494 342,897
Loss for the year - - (54,750) - (54,750) (6,694) (61,444)
Decrease in value of share options - - - (379) (379) - (379)
Increase in minority interest shareholding - - - - - 16,731 16,731
Disposal of subsidiaries - - - - - (16,824) (16,824)
Additional investment - - - - - 226 226
Balance at 31 March 2009 2,321 217,362 41,758 (167) 261,274 19,933 281,207
Share Distributable Retained Other Shareholders’Capital Reserves Earnings Reserves Funds
£’000 £’000 £’000 £’000 £’000
Company
Balance at 1 April 2007 2,321 217,362 8,409 - 228,092
Profit for the year - - 2,048 - 2,048
Increase in value of share options - - - 379 379
Balance at 31 March 2008 2,321 217,362 10,457 379 230,519
Balance at 1 April 2008 2,321 217,362 10,457 379 230,519
Profit for the year - - 514 - 514
Decrease in value of share options - - - (379) (379)
Balance at 31 March 2009 2,321 217,362 10,971 - 230,654
The notes on pages 35 to 47 form an integral part of the financial statements

34Trikona Trinity Capital PLC
Consolidated Cash Flow Statement For the year ended 31 March 2009
The notes on pages 35 to 47 form an integral part of the financial statements
2009 2008
Note £’000 £’000
16 Net cash used by operating activities (14,449) (15,854)
Cash flows from investing activities
Purchase of investments (39,561) (88,010)
Interest received 4,201 5,031
21 Disposal of subsidiaries 54,754 32,108
Reclassification of subsidiary (1,540) -
Net cash inflow/(outflow) from investing activities 17,854 (50,871)
Cash flows from financing activities
Loan repayments - (461)
Net cash (outflow) from financing activities - (461)
Net increase/(decrease) in cash and cash equivalents 3,405 (67,186)
Cash and cash equivalents at the start of the year 56,617 123,705
Effect of foreign exchange fluctuation on cash held 16 98
Cash and cash equivalents at the end of the year 60,038 56,617

1. General information
The Company and its subsidiaries (together the Group) invest in real estate and real estate related entities in India, primarily in commercialdevelopment in the office and business space, residential, retail and hospitality sectors deriving returns from development, long-term capitalappreciation and income.
The Company is a closed-end investment company incorporated on 7 March 2006 in the Isle of Man as a public limited company. The addressof its registered office is IOMA House, Hope Street, Douglas, Isle of Man.
The Company is listed on the Alternative Investment Market of the London Stock Exchange.
The Group has no employees.
2. Summary of significant accounting policies
The principal accounting policies applied in the preparation of the consolidated financial statements are set out below. These policies have beenconsistently applied to all the entities included in the consolidated financial statements.
2.1 Basis of preparation
The financial statements of the Company are prepared in accordance with International Financial Reporting Standards (“IFRS”), and the Isle ofMan Companies Act 1931 – 2004. The financial statements have been prepared under the historical cost convention as modified by includingnon-controlling investments in portfolio companies at fair value.
The preparation of financial statements in conformity with IFRS requires the use of certain critical accounting estimates. It also requires managementto exercise its judgment in the process of applying the Group’s accounting policies. The areas involving a higher degree of judgment or complexity, orareas where assumptions and estimates are significant to the consolidated financial statements, are disclosed in Note 4.
In accordance with Section 3 of the Isle of Man Companies Act 1982, no separate income statement has been presented for the Company. Theamount of the Company’s profit for the year recognised in the Consolidated Income Statement is £514,000 (2008: £2,048,000).
2.2 Basis of Consolidation
(a) Consolidation
The consolidated financial statements incorporate the financial statements of the Company and entities controlled by the Company (its subsidiariesand subsidiary undertakings). Control is achieved where the Company has the power to govern the financial and operating policies of a portfoliocompany so as to obtain benefits from its activities.
The results of subsidiaries acquired or disposed of during the year are included in the consolidated income statement from the effective date ofacquisition or up to the effective date of disposal, as appropriate.
Where necessary, adjustments are made to the financial statements of subsidiaries to bring the accounting policies used into line with thoseused by the Group. All intra-group transactions, balances, income and expenses are eliminated on consolidation.
(b) Business combinations
The acquisition of subsidiaries is accounted for using the purchase method. The cost of the acquisition is measured at the aggregate of the fairvalues, at the date of exchange, of assets given, liabilities incurred or assumed, and equity instruments issued by the Group in exchange forcontrol of the portfolio company, plus any costs directly attributable to the business combination. The portfolio company’s identifiable assets,liabilities and contingent liabilities that meet the conditions for recognition under IFRS 3 are recognised at their fair value at the acquisitiondate, except for non-current assets (or disposal groups) that are classified as held for resale in accordance with IFRS 5 Non Current AssetsHeld for Sale and Discontinued Operations, which are recognised and measured at fair value less costs to sell.
Goodwill arising on acquisition is recognised as an asset and initially measured at cost, being the excess of the cost of the business combinationover the Group’s interest in the net fair value of the identifiable assets, liabilities and contingent liabilities recognised. If, after reassessment,the Group’s interest in the net fair value of the portfolio company’s identifiable assets, liabilities and contingent liabilities exceeds the cost ofthe business combination, the excess is recognised immediately in profit or loss.
Annual Report & Accounts 200935
Notes to the Financial StatementsFor the year ended 31 March 2009

2.3 Segment reporting
A business segment is a group of assets and operations engaged in providing products or services that are subject to risks and returns that are different from those of other business segments. A geographical segment is engaged in providing products or services within a particular economicenvironment that are subject to risks and returns that are different from those of segments operating in other economic environments.
The Directors are of the opinion that the Group is engaged in a single segment of business being property investment business in one geographicalarea being India.
2.4 Revenue recognition
Revenue includes interest receivable, dividend income and fair value gains and losses.
Interest receivable is accrued on a time basis by reference to the principal outstanding and the effective interest rate applicable.
Fair value gains and losses are recognised in the period of revaluation
Dividend income from investments is recognised when the Company’s right to receive payment has been established, normally the ex-dividend date.
2.5 Expenses
All expenses are accrued for on an accruals basis and are presented as revenue items except for expenses that are incidental to the disposal ofan investment which are deducted from the disposal proceeds.
2.6 Taxation
Income tax expense comprises current and deferred tax. Income tax expense is recognised in profit or loss except to the extent that it relatesto items recognised directly in equity, in which case it is recognised in equity.
(a) Current Income tax
Current tax is the expected tax payable on the taxable income for the year, using tax rates enacted or substantively enacted at the reportingdate, and any adjustment to tax payable in respect of previous years.
(b) Deferred income tax
Deferred tax is recognised using the balance sheet method, providing for temporary differences between the carrying amounts of assets andliabilities for financial reporting purposes and the amounts used for taxation purposes. Deferred tax is not recognised for the following temporary differences: the initial recognition of goodwill, the initial recognition of assets or liabilities in a transaction that is not a businesscombination and that affects neither accounting nor taxable profit, and differences relating to investments in subsidiaries and jointly controlledentities to the extent that they probably will not reverse in the foreseeable future. Deferred tax is measured at the tax rates that are expectedto be applied to the temporary differences when they reverse, based on the laws that have been enacted or substantively enacted by thereporting date.
2.7 Foreign currency transactions
(a) Functional and presentation currency
Items included in the financial statements of each of the Group’s entities are measured using the Currency of the primary economic environmentin which the entity operates (‘the functional Currency’). The consolidated financial statements are presented in Sterling, which is the Company’sfunctional and presentation Currency.
(b) Transactions and balances
Transactions in currencies other than Sterling are translated at the foreign exchange rate ruling at the date of the transaction. Monetary assetsand liabilities denominated in foreign currencies at the balance sheet date are translated into Sterling at the foreign exchange rate ruling atthat date. Foreign exchange differences arising on translation are recognised in the Income Statement. Non-monetary assets and liabilities thatare measured in terms of historical cost in a foreign currency are translated using the exchange rate at the date of transaction. Non-monetaryassets and liabilities denominated in foreign currencies that are stated at fair value are translated into Sterling at foreign exchange rates rulingat the dates the fair value was determined.
(c) Group companies
The results and financial position of all the group entities (none of which has the Currency of a hyperinflationary economy) that have a functional Currency different from the presentation Currency are translated into the presentation Currency as follows:
(i) assets and liabilities for each balance sheet presented are translated at the closing rate at the date of that balance sheet;
36Trikona Trinity Capital PLC
Notes to the Financial Statements (cont)
For the year ended 31 March 2009

(ii) income and expenses for each income statement are translated at average exchange rates (unless this average is not a reasonable approximation of the cumulative effect of the rates prevailing on the transaction dates, in which case income and expenses are translated at the rate on the dates of the transactions); and
(iii) all resulting exchange differences are recognised as a separate component of equity.
2.8 Financial instruments
Financial assets and financial liabilities are recognised when a Group entity becomes a party to the contractual provisions of a financial instrument. Financial assets and financial liabilities are offset if there is a legally enforceable right to set off the recognised amounts and interests and it is intended to settle on a net basis.
2.9 Investments
Investments of the Group where the Group does not have control are designated as at fair value through profit or loss on initial recognition.They are measured at fair value. Unrealised gains and losses arising from revaluation are taken to the income statement.
Investments in entities over which the Group has control are consolidated in accordance with IAS 27.
The fair value of unquoted securities is estimated by the Directors using the most appropriate valuation technique for each investment.
Securities quoted or traded on a recognised stock exchange or other regulated market are valued by reference to the last available bid price.
2.10 Other receivables
Other receivables do not carry any interest and are short-term in nature and are accordingly stated at their nominal value as reduced by appropriate allowances for estimated irrecoverable amounts.
2.11 Financial liabilities and equity
Financial liabilities and equity instruments are classified according to the substance of the contractual arrangement entered into. An equityinstrument is any contract that evidences a residual interest in the assets of the Company after deducting all of its liabilities. Financial liabilitiesand equity instruments are recorded at the proceeds received, net of issue costs.
2.12 Interest-bearing loans and borrowings
Interest-bearing borrowings are recognised initially at fair value less attributable transaction costs. Subsequent to initial recognition, interest-bearing borrowings are stated at amortised cost with any difference between cost and redemption value being recognised in the IncomeStatement over the period of the borrowings on an effective interest basis.
2.13 Other payables
Other payables are not interest bearing and are stated at their nominal value.
2.14 Provisions
A provision is recognised in the balance sheet when the Group has a present legal or constructive obligation as a result of a past event, and it isprobable that an outflow of economic benefits will be required to settle the obligation, and the obligation can be reliably measured. If the effect ismaterial, provisions are determined by discounting the expected future cash flows at a pre-tax rate that reflects current market assessments of thetime value of money and, where appropriate, the risks specific to the liability.
2.15 Share issue costs
The share issue costs of the Company directly attributable to the Placing that would otherwise have been avoided have been taken to theshare premium account
2.16 Dividend distribution
Dividend distribution to the Company’s shareholders is recognised as a liability in the Group’s financial statements in the period in which thedividends are approved.
2.17 Impairment of assets
Assets including goodwill that have an indefinite useful life are not subject to amortisation and are tested annually for impairment. Assets that are subject to amortisation or depreciation are reviewed for impairment whenever events or changes in circumstances indicate that thecarrying amount may not be recoverable. An impairment loss is recognised for the amount by which the asset’s carrying amount exceeds itsrecoverable amount. The recoverable amount is the higher of an asset’s fair value less costs to sell and value in use. For the purposes of assessing impairment, assets are grouped at the lowest levels for which there are separately identifiable cash flows (cash-generating units).
Annual Report & Accounts 200937
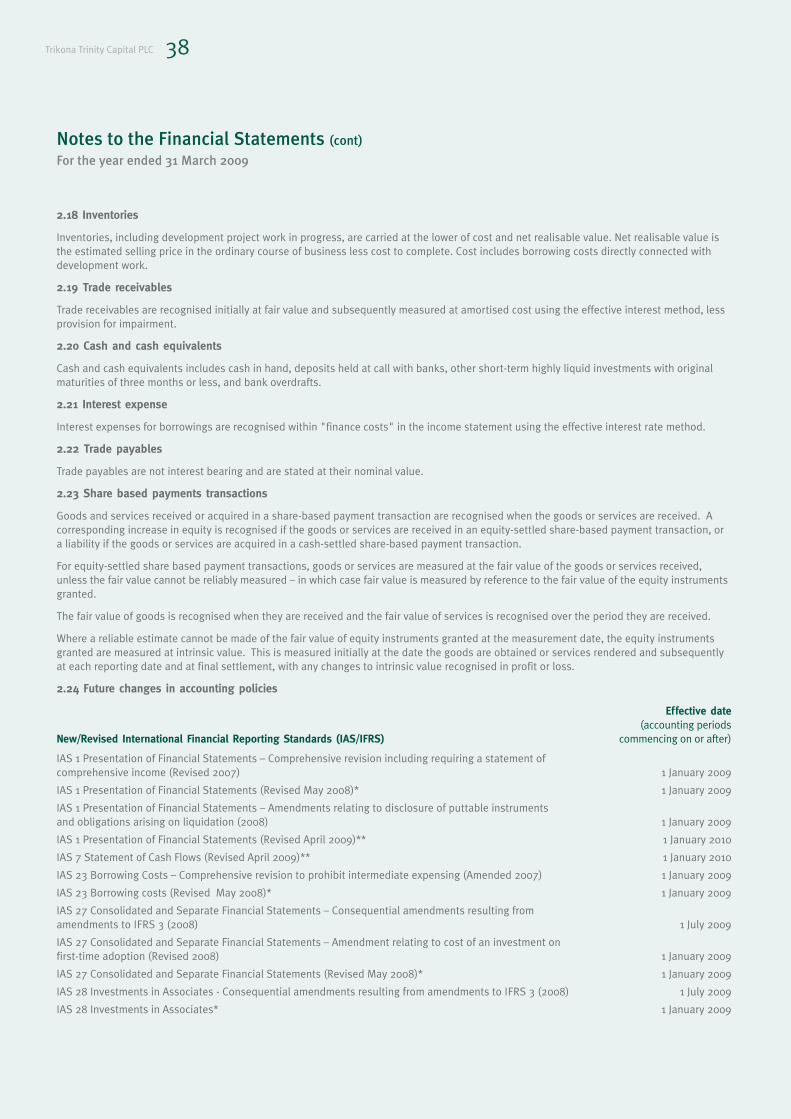
2.18 Inventories
Inventories, including development project work in progress, are carried at the lower of cost and net realisable value. Net realisable value isthe estimated selling price in the ordinary course of business less cost to complete. Cost includes borrowing costs directly connected withdevelopment work.
2.19 Trade receivables
Trade receivables are recognised initially at fair value and subsequently measured at amortised cost using the effective interest method, lessprovision for impairment.
2.20 Cash and cash equivalents
Cash and cash equivalents includes cash in hand, deposits held at call with banks, other short-term highly liquid investments with originalmaturities of three months or less, and bank overdrafts.
2.21 Interest expense
Interest expenses for borrowings are recognised within "finance costs" in the income statement using the effective interest rate method.
2.22 Trade payables
Trade payables are not interest bearing and are stated at their nominal value.
2.23 Share based payments transactions
Goods and services received or acquired in a share-based payment transaction are recognised when the goods or services are received. A corresponding increase in equity is recognised if the goods or services are received in an equity-settled share-based payment transaction, or a liability if the goods or services are acquired in a cash-settled share-based payment transaction.
For equity-settled share based payment transactions, goods or services are measured at the fair value of the goods or services received, unless the fair value cannot be reliably measured – in which case fair value is measured by reference to the fair value of the equity instrumentsgranted.
The fair value of goods is recognised when they are received and the fair value of services is recognised over the period they are received.
Where a reliable estimate cannot be made of the fair value of equity instruments granted at the measurement date, the equity instrumentsgranted are measured at intrinsic value. This is measured initially at the date the goods are obtained or services rendered and subsequentlyat each reporting date and at final settlement, with any changes to intrinsic value recognised in profit or loss.
2.24 Future changes in accounting policies
Effective date(accounting periods
New/Revised International Financial Reporting Standards (IAS/IFRS) commencing on or after)
IAS 1 Presentation of Financial Statements – Comprehensive revision including requiring a statement of comprehensive income (Revised 2007) 1 January 2009
IAS 1 Presentation of Financial Statements (Revised May 2008)* 1 January 2009
IAS 1 Presentation of Financial Statements – Amendments relating to disclosure of puttable instruments and obligations arising on liquidation (2008) 1 January 2009
IAS 1 Presentation of Financial Statements (Revised April 2009)** 1 January 2010
IAS 7 Statement of Cash Flows (Revised April 2009)** 1 January 2010
IAS 23 Borrowing Costs – Comprehensive revision to prohibit intermediate expensing (Amended 2007) 1 January 2009
IAS 23 Borrowing costs (Revised May 2008)* 1 January 2009
IAS 27 Consolidated and Separate Financial Statements – Consequential amendments resulting from amendments to IFRS 3 (2008) 1 July 2009
IAS 27 Consolidated and Separate Financial Statements – Amendment relating to cost of an investment on first-time adoption (Revised 2008) 1 January 2009
IAS 27 Consolidated and Separate Financial Statements (Revised May 2008)* 1 January 2009
IAS 28 Investments in Associates - Consequential amendments resulting from amendments to IFRS 3 (2008) 1 July 2009
IAS 28 Investments in Associates* 1 January 2009
38Trikona Trinity Capital PLC
Notes to the Financial Statements (cont)
For the year ended 31 March 2009
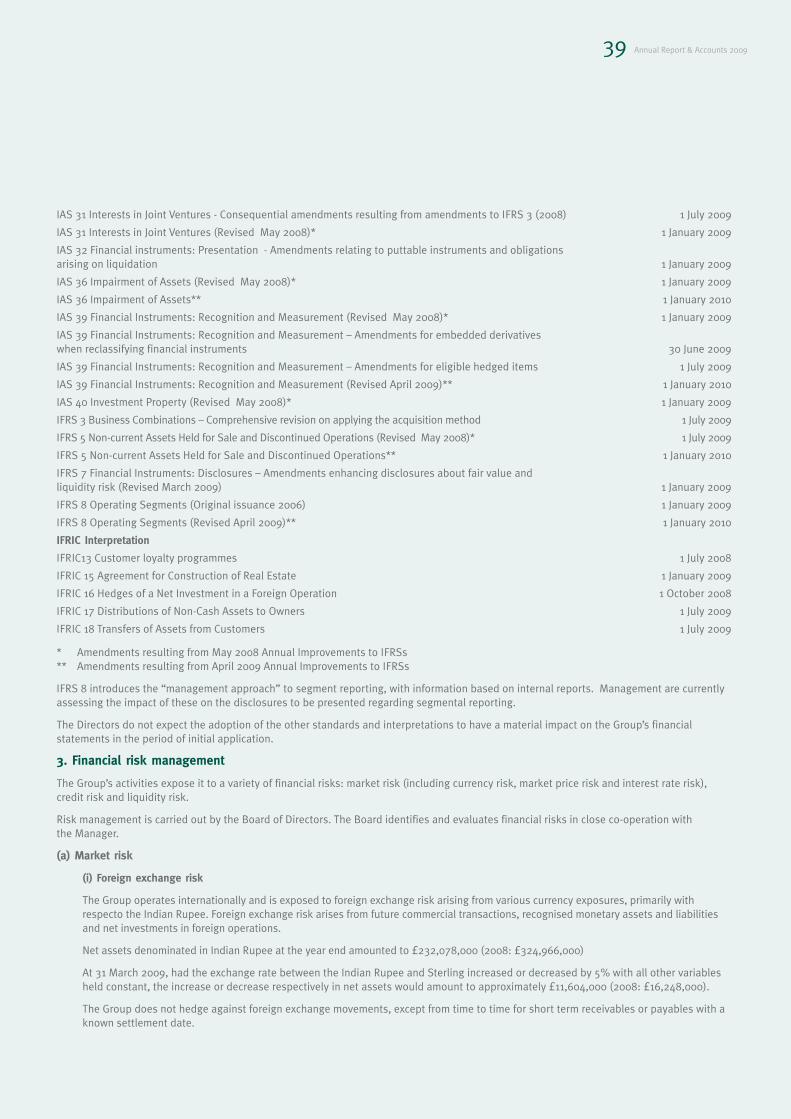
IAS 31 Interests in Joint Ventures - Consequential amendments resulting from amendments to IFRS 3 (2008) 1 July 2009
IAS 31 Interests in Joint Ventures (Revised May 2008)* 1 January 2009
IAS 32 Financial instruments: Presentation - Amendments relating to puttable instruments and obligations arising on liquidation 1 January 2009
IAS 36 Impairment of Assets (Revised May 2008)* 1 January 2009
IAS 36 Impairment of Assets** 1 January 2010
IAS 39 Financial Instruments: Recognition and Measurement (Revised May 2008)* 1 January 2009
IAS 39 Financial Instruments: Recognition and Measurement – Amendments for embedded derivatives when reclassifying financial instruments 30 June 2009
IAS 39 Financial Instruments: Recognition and Measurement – Amendments for eligible hedged items 1 July 2009
IAS 39 Financial Instruments: Recognition and Measurement (Revised April 2009)** 1 January 2010
IAS 40 Investment Property (Revised May 2008)* 1 January 2009
IFRS 3 Business Combinations – Comprehensive revision on applying the acquisition method 1 July 2009
IFRS 5 Non-current Assets Held for Sale and Discontinued Operations (Revised May 2008)* 1 July 2009
IFRS 5 Non-current Assets Held for Sale and Discontinued Operations** 1 January 2010
IFRS 7 Financial Instruments: Disclosures – Amendments enhancing disclosures about fair value and liquidity risk (Revised March 2009) 1 January 2009
IFRS 8 Operating Segments (Original issuance 2006) 1 January 2009
IFRS 8 Operating Segments (Revised April 2009)** 1 January 2010
IFRIC Interpretation
IFRIC13 Customer loyalty programmes 1 July 2008
IFRIC 15 Agreement for Construction of Real Estate 1 January 2009
IFRIC 16 Hedges of a Net Investment in a Foreign Operation 1 October 2008
IFRIC 17 Distributions of Non-Cash Assets to Owners 1 July 2009
IFRIC 18 Transfers of Assets from Customers 1 July 2009
* Amendments resulting from May 2008 Annual Improvements to IFRSs** Amendments resulting from April 2009 Annual Improvements to IFRSs
IFRS 8 introduces the “management approach” to segment reporting, with information based on internal reports. Management are currentlyassessing the impact of these on the disclosures to be presented regarding segmental reporting.
The Directors do not expect the adoption of the other standards and interpretations to have a material impact on the Group’s financial statements in the period of initial application.
3. Financial risk management
The Group’s activities expose it to a variety of financial risks: market risk (including currency risk, market price risk and interest rate risk), credit risk and liquidity risk.
Risk management is carried out by the Board of Directors. The Board identifies and evaluates financial risks in close co-operation with the Manager.
(a) Market risk
(i) Foreign exchange risk
The Group operates internationally and is exposed to foreign exchange risk arising from various currency exposures, primarily with respecto the Indian Rupee. Foreign exchange risk arises from future commercial transactions, recognised monetary assets and liabilities and net investments in foreign operations.
Net assets denominated in Indian Rupee at the year end amounted to £232,078,000 (2008: £324,966,000)
At 31 March 2009, had the exchange rate between the Indian Rupee and Sterling increased or decreased by 5% with all other variablesheld constant, the increase or decrease respectively in net assets would amount to approximately £11,604,000 (2008: £16,248,000).
The Group does not hedge against foreign exchange movements, except from time to time for short term receivables or payables with aknown settlement date.
Annual Report & Accounts 200939

(ii) Market price risk
The Group is exposed to market price risk arising from its investment in unlisted and listed equity investments. All these securities present a risk of capital loss. The Board and Manager are responsible for the selection of investments and monitoring exposure to market risk. All investments are in Indian companies.
If the value of the Group’s investment portfolio had increased by 5%, the Group’s net assets would have increased by £11,736,000 (2008: £15,093,000). A decrease of 5% would have resulted in equal and opposite decrease in net assets.
The Group is exposed to property price risk, property rentals risk and the normal risks of property development through its investment inIndian real estate companies.
(iii) Cash flow and fair value interest rate risk
The Group’s cash and cash equivalents are invested at short term market interest rates.
The table below summarises the Group’s exposure to interest rate risks. It includes the Groups’ financial assets and liabilities at the earlier of contractual re-pricing or maturity date, measured by the carrying values of assets and liabilities.
Less than 3 months Non-interest1 month 1-3 months to 1 year 1-5 years Over 5 years bearing Total
31 March 2009 £’000 £’000 £’000 £’000 £’000 £’000 £’000Financial assetsInvestments - - - 16,511 - 218,216 234,727Trade and other receivables - - - - - 101 101Cash 60,038 - - - - - 60,038Prepayments - - - - - 142 142Total financial assets 60,038 - - 16,511 - 218,459 295,008Financial liabilitiesPerformance fee provision - - - - - 7,795 7,795Trade and other payables - - - - - 6,006 6,006Total financial liabilities - - - - - 13,801 13,801Total interest rate sensitivity gap 60,038 - - 16,511 -
Less than 3 months Non-interest1 month 1-3 months to 1 year 1-5 years Over 5 years bearing Total
31 March 2008 £’000 £’000 £’000 £’000 £’000 £’000 £’000Financial assetsInvestments - - - - - 301,858 301,858Trade and other receivables - - - - - 558 558Cash 56,617 - - - - - 56,617Prepayments - - - - 131 131Total financial assets 56,617 - - - - 302,547 359,164Financial liabilitiesPerformance fee provision - - - - - 36,308 36,308Trade and other payables - - - - - 4,350 4,350Bank loan - 85 256 909 - - 1,250Total financial liabilities - 85 256 909 - 40,658 41,908Total interest rate sensitivity gap 56,617 (85) (256) (909)
(b) Credit risk Credit risk arises on investments, cash balances and debtor balances. The amount of credit risk is equal to the amounts stated in the balance sheet foreach of these assets. Cash balances are limited to high-credit-quality financial institutions. There are no impairment provisions as at 31 March 2009.
(c) Liquidity risk
Prudent liquidity risk management implies maintaining sufficient cash and marketable securities, the availability of funding through an adequateamount of committed credit facilities and the ability to close out market positions. The Company aims to maintain flexibility in funding.
40Trikona Trinity Capital PLC
Notes to the Financial Statements (cont)
For the year ended 31 March 2009

Residual undiscounted contractual maturities of financial liabilities:
Less than 3 months No stated1 month 1-3 months to 1 year 1-5 years Over 5 years maturity
31 March 2009 £’000 £’000 £’000 £’000 £’000 £’000Financial liabilitiesPerformance fee provision - - - - - 7,795Trade and other payables 772 - - - - 5,234Investment commitments - - - - - 10,582
772 - - - - 23,611
Less than 3 months No stated1 month 1-3 months to 1 year 1-5 years Over 5 years maturity
31 March 2008 £’000 £’000 £’000 £’000 £’000 £’000Financial liabilitiesPerformance fee provision - - - - - 36,308Trade and other payables 782 - - - - 3,568Bank loan - 85 256 909 - -
782 85 256 909 - 39,876
4. Critical accounting estimates and assumptions
Estimates and judgements are continually evaluated and are based on historical experience as adjusted for current market conditions andother factors.
The Directors make estimates and assumptions concerning the future. The resulting accounting estimates will, by definition, seldom equal therelated actual results. The estimates and assumptions that have a significant risk of causing a material adjustment to the carrying amounts ofassets and liabilities within the next financial year are outlined below.
(a) Estimate of fair value of unquoted investments
The Group holds full or partial ownership interests in a number of unquoted Indian companies. Some of these companies invest in developmentproperty projects (“the Project Companies”). For the Project Companies, CB Richard Ellis (“CBRE”) conducted an independent valuation of thedevelopment properties owned by each of these companies as at 31 March 2009. Based on CBRE’s valuation of the development properties,the Directors valued the Group’s interest in the equity interests held in each of the Project Companies. The Directors also valued the Group’sownership interests in the non-development property owning unquoted companies. Protiviti, an independent firm of advisors carried out certain agreed upon procedures to validate the computation of the fair value of Groups interest.
For the Project Companies, the Directors’ valuations are based on a discounted cash flow methodology. The methodology is principally basedon company-generated cash flows and observable market data on interest rates and equity returns. The discount rates used for valuing equitysecurities are determined based on historic equity returns for other entities operating in the same industry for which market returns areobservable. Management uses models to adjust the observed equity returns to reflect the actual debt/equity financing structure of the investment. The discount rate applied varies from project to project to take account of the estimated risk and ranges between 18.3% and25.8%. For the non-development property company holdings, a combination of discounted cash flows and price earnings multiples is used.
(b) Estimated performance fee (carried interest) on investments
As described in note 6, a provision has been established for performance fees. This is based on the fair value gains recognised and an estimateof the ultimate IRR of each investment.
5. Other administration fees and expenses 2009 2008
£’000 £’000Audit fees 168 235Professional costs 2,111 1,993Insurance 124 146Directors’ fees 183 138Bank charges 6 7Share based payment expense (note 12) (379) 379Other 389 329
2,602 3,227
Audit fees represent auditor’s remuneration for work undertaken in connection with the statutory audit of the Group.
Annual Report & Accounts 200941

6. Manager fees and performance fees
In consideration of the Manager providing management services, whether itself or through subcontractors, the Company pays fees to theManager in accordance with the Admission Document.
The Manager receives a management fee of 2 per cent. per annum of the amount subscribed on the issue of the Placing Shares plus returnsfrom investment retained by the Group for further investment.
The Manager is also entitled to a carried interest (performance fee) in relation to each investment, subject to meeting minimum returns. Thehurdle is 10 per cent IRR on each relevant investment (“Hurdle”). Following the sale of an investment, if the Hurdle has been met, the Managerwill be entitled to receive a profit share of 20 per cent. of the gain generated by the Group in respect of that investment, provided that if theIRR exceeds 20 per cent., the Manager shall be entitled to 30 per cent. of the gain in respect of that investment. Upon entitlement, 80% of thefee becomes immediately payable, and 20% of the fee is held in escrow. The escrow amount is either paid to the Manager or returned to theCompany at the end of the fund’s life or upon termination of the Portfolio Management Agreement in accordance with a calculation of the total profit share due. A fee of £8,053,000 became payable in the year on disposals, (2008 : £4,485,000) and a provision of £7,795,000 hasbeen made in respect of the relevant fair value investment gains recognised in the financial statements as at 31 March 2009. (31 March 2008:provision of £36,308,000). The Income Statement in the year shows a credit of £28,513,000 due to the reduction in the performance fee provision (2008: a charge of £27,663,000.) The amount held in escrow at 31 March 2009 was £2,584,000, and this is included in the cashamount in the balance sheet.
7. Taxation
There is no liability for income tax in the Isle of Man.
The Group is subject to income tax in Mauritius at the rate of 15% on the chargeable income of Mauritian subsidiaries. They are, however,entitled to a tax credit equivalent to the higher of the foreign tax paid and a deemed credit of 80% of the Mauritian tax on their foreign sourceincome. No provision has been made in the accounts due to the availability of tax losses.
The Group is liable to tax in India on the activities of its Indian subsidiary, however no income tax is due for the period since the Indian subsidiary is engaged in a development project which is still at an early stage and has not yet generated any taxable income.
8. (Loss)/earnings per share
Basic loss per share is calculated by dividing the net loss attributable to equity shareholders of the parent by the weighted average number ofordinary shares outstanding during the year.
2009 2008(Loss)/earnings (thousands) for the purpose of basic (loss)/earnings per share (Loss/profit attributable to equity shareholders of the parent) £(54,750) £62,497
Weighted average number of ordinary shares (thousands) for the purposes of basic earnings per share 232,050 232,050
Basic (loss)/earnings per share (pence) (23.6) p 26.9 p
There is no difference between fully diluted earnings per share and basic earnings per share.
9. Investments in subsidiaries
The subsidiaries of Trikona Trinity Capital PLC are recorded at cost in the accounts of the Company and consolidated in the group financial statements.
Country of Incorporation Proportion of ownership interest Name at 31 March 2009 at 31 March 2008Trinity Capital Mauritius Limited Mauritius 100% 100%Trinity Capital (One) Limited Mauritius 67% 92%Trinity Capital (Two) Limited Mauritius 100% 100%Trinity Capital (Three) Limited Mauritius 100% 100%Trinity Capital (Four) Limited Mauritius 100% 100%Trinity Capital (Five) Limited Mauritius 59% 59%Trinity Capital (Six) Limited Mauritius - 59%Trinity Capital (Seven) Limited Mauritius 100% 100%Trinity Capital (Eight) Limited Mauritius 100% 100%Trinity Capital (Nine) Limited Mauritius 100% 100%Trinity Capital (Ten) Limited Mauritius 12% 60%Trinity Capital (Eleven) Limited Mauritius 100% 100%Trinity Capital (Twelve) Limited Mauritius 100% 100%
42Trikona Trinity Capital PLC
Notes to the Financial Statements (cont)
For the year ended 31 March 2009

Trinity Capital (Thirteen) Limited Mauritius 100% 100%Trinity Capital (Fourteen) Limited Mauritius 85% 100%Trinity Capital (Fifteen) Limited Mauritius 45% 100%Trinity Capital (Sixteen) Limited Mauritius 100% 100%Trinity Capital (Seventeen) Limited Mauritius 100% 100%Trinity Capital (Eighteen) Limited Mauritius 100% 100%Trinity Capital (Nineteen) Limited Mauritius 100% 100%Trinity Capital (Twenty) Limited Mauritius 100% 100%Trinity Capital (Twenty One) Limited Mauritius 100% 100%Trinity Capital (Twenty Two) Limited Mauritius 100% 100%Trinity Capital (Twenty Three) Limited Mauritius 100% 100%Trinity Capital (Twenty Four) Limited Mauritius 100% 100%Uppals I.T. Projects Private Limited India - 92%
Uppals IT is a wholly owned investment of Trikona Trinity Capital (One) Limited and was consolidated in the financial statements up to andincluding the previous financial year. For the current year, Uppals IT has not been consolidated as it no longer meets all the criteria for consolidation as required by IAS 27 following the disposal of a significant shareholding in Trinity Capital (One) Limited.
10. Investments – designated at fair value through profit or loss
Investments are recorded at fair value as follows:
At cost Fair value Adjustment At Fair Value 31 March 2009 £’000 £’000 £’000Development property owning companies (all unlisted equity securities):Uppal IT Project Pvt Ltd. 36,194 2,894 39,088Lokhandwala Kataria Constructions Pvt Ltd. 6,258 5,477 11,735Kapstone Constructions Pvt Ltd. 10,593 1,759 12,352DB Hospitality Pvt Ltd. 12,176 (428) 11,748M K Malls Developers 12,283 4,228 16,511Luxor Cyber City Pvt Ltd. 37,904 (8,108) 29,796DB Realty Pvt Ltd. 26,381 19,789 46,170Rustomjee Constructions Pvt Ltd. (“MIG Bandra”) 1,630 (148) 1,482Sankalp Buildwell Pvt Ltd. 3,330 (1,175) 2,155Jodhana Developers Pvt Ltd. 6,060 2,202 8,262Enigma Constructions Pvt Ltd. (“Virar”) 5,660 (115) 5,545
158,469 26,375 184,844Non-development property company holdingsListed equity securities 20,898 (11,753) 9,145Unlisted equity securities 29,498 11,240 40,738
208,865 25,862 234,727
At cost Fair value Adjustment At Fair Value 31 March 2008 £’000 £’000 £’000Development property owning companies (all unlisted equity securities):Lokhandwala Kataria Constructions Pvt Ltd. 6,258 12,251 18,509Kapstone Construction Pvt Ltd. 10,593 9,010 19,603DB Hospitality Pvt Ltd. 12,176 3,214 15,390Manjeera Retail Holdings 9,605 6,640 16,245M K Malls Developers 24,034 14,851 38,885Luxor Cyber City Pvt Ltd. 37,904 25,896 63,800DB Realty Pvt Ltd. 26,381 34,149 60,530
126,951 106,011 232,962Non-development property company holdingsListed equity securities 20,898 (3,945) 16,953Unlisted equity securities 18,257 33,686 51,943
166,106 135,752 301,858
Annual Report & Accounts 200943

Notes to the Financial Statements (cont)
For the year ended 31 March 2009
44Trikona Trinity Capital PLC
Unlisted equity securities including development property owning companies that amount to £225,582,000 (2008: £284,905,000) have beenfair valued by the Directors as at 31 March 2009. Protiviti, an independent firm of business advisors, carried out certain agreed upon proceduresto validate the computation of fair value. All the fund’s unlisted equity securities comprising development projects are valued using discountedcash flow techniques, with the exception of the investment in Rustomjee Constructions Pvt Ltd. which is valued at the Group’s share of theestimated underlying net asset value. The underlying cash flows for the development projects are based on data generated by CBRE (theCompany’s independent values) in conjunction with the Company’s Investment Advisor, with the exception of DB Realty. DB Realty is valuedon the basis of a mix of discounted cash flows and market comparables. The unlisted equity securities comprising non-development propertyholdings are valued using a mixture of discounted cash flow and price earnings multiples, except for those holdings for which there is a recenttransaction in which case that transaction price is used as the valuation basis.
The investment in MK Malls Developers comprises mezzanine debt stated at a fair value of £16,511,000 and cost of £12,283,000 (31 March2008: £13,479,000 and £12,283,000 respectively).
11. Share capital
Authorised share capital No. of shares £
Ordinary shares of £0.01 each 416,750,000 4,167,500
Deferred shares of £0.01 each 250,000 2,500
417,000,000 4,170,000
No. of Shares Issued Share Capital
and Fully Paid £
Ordinary shares of £ 0.01 each 231,800,200 2,318,002
Deferred shares of £0.01 each 250,000 2,500
232,050,200 2,320,502
The Deferred Shares rank pari passu with the Ordinary Shares save that the Deferred Shares have no right to dividends or voting rights or theright to receive notice of or attend any general meeting. On the return of capital in a winding-up of the Company or otherwise (other than re-purchases or redemptions of shares authorised by special resolution), the Deferred Shares have the right to return of par value paid up thereonin priority to the return of the par value paid up on the Ordinary Shares.
Capital management
The Board’s policy is to maintain a strong capital base so as to maintain investor, creditor and market confidence and to sustain future development of the business. The Board manages the Group’s affairs to achieve shareholder returns through capital growth and income.
The Company had its authority to purchase up to 15% of its own shares on the market renewed at the AGM held on 19 December 2008, so as tohelp manage the discount to net asset value at which the shares may trade. No shares were purchased in the period ended 31 March 2009.
At the EGM held on 24 March 2009, the Company was given authority to purchase up to 70% of its own shares on the market. The Company haspurchased 21,367,702 of its own shares since the balance sheet date for a consideration of £12,037,000.
Group capital comprises share capital and reserves.
Neither the Company nor any of its subsidiaries are subject to externally imposed capital requirements.
12. Share options
Options were granted at the time of the admission to AIM, giving the option holder the right to subscribe for shares at £1.00 per share, exercisable at any time between the first and fifth anniversaries of the admission to AIM, as follows:
Numis 3,787,503 sharesTrikona Advisers 2,525,002 sharesFounder shareholder 1,262,501 shares
The Directors have determined that the fair value of the options granted cannot be reliably measured at the measurement date (the date ofgrant). Therefore, the intrinsic value method has been used to determine the value of the share-based payment transaction.
The intrinsic value at 31 March 2009 is nil (2008: £379,000).

Annual Report & Accounts 200945
13. Directors’ interests
The following former Directors had interests in the shares of the Company at 31 March 2009:
M. J. Cassidy 125,000 Ordinary SharesP. D. Orchard-Lisle 74,192 Ordinary Shares
14. Trade and other receivables
2009 2008 2009 2008Group Group Company Company£’000 £’000 £’000 £’000
Other receivable 101 558 66 92101 558 66 92
15. Trade and other payables
2009 2008 2009 2008Group Group Company Company£’000 £’000 £’000 £’000
Investment commitments on behalf of Minority Interest 2,650 2,654 - -Performance fee payable 2,584 914 2,584 947Other payables 772 782 701 323
6,006 4,350 3,285 1,270
16. Cash used by operations
2009 2008Group Group£’000 £’000
(Loss)/profit for the year (61,444) 63,679Adjustments for:Fair value loss/(gains) on investments 109,891 (91,406)Finance income (4,201) (5,031)Profit on disposal of shares in subsidiaries (31,795) (4,182)Share option expense (379) 379Changes in working capitalIncrease in inventories - (3,430)Increase in receivables (20) (620)(Decrease)/increase in payables (26,501) 24,757Cash used by operations (14,449) (15,854)
17. Disposal of subsidiaries
On 9 May 2008 the Group disposed of the following interest in its subsidiaries for a cash consideration of £54,333,000.
Proportion of subsidiary UnderlyingSubsidiary shares sold investmentTrinity Capital (One) Limited 25% Uppals IT Projects Private LimitedTrinity Capital (Six) Limited 59% Manjeera Retail HoldingsTrinity Capital (Ten) Limited 60%* M K Malls DevelopersTrinity Capital (Fourteen) Limited 15% Luxor Cyber City
* The Group did not dispose of any of the shares in the class to which the economic rights of the underlying mezzanine finance to MK Malls areattached. This is the only economic interest in Trinity Capital (Ten) Limited which the Group retained following the disposal. However, the Groupretained 12% of the voting shares in Trinity Capital (Ten) Limited, but to which no economic rights are attached.

Following this disposal, the Group also has no interest in Trinity Capital (Six) Limited.
The sale crystallised fair value gains of £16,537,000 which had previously been recognised through the profit and loss account and gave rise toadditional gains of £13,709,000 not previously recognised. Selling costs of £1,630,000 have been deducted from the net realised gains in theIncome Statement.
For Uppals IT, the disposal reduced the Group’s effective interest to 67%. A shareholders agreement is also in place for this investment, suchthat this investment has been reclassified from a subsidiary to an investment at fair value through profit or loss. This reclassification gave riseto an immediate fair value gain of £53,403,000, which has been recognised in the income statement. The minority interest share of this gain,being £17,623,000 has also been recognised in the income statement.
18. Net asset valuation (NAV)
The NAV per share is calculated by dividing the net assets attributable to the equity holders of the Company at the end of the period by thenumber of shares in issue.
2009 2008Net assets £261,274,000 £316,403,000Number of shares in issue (note 11) 232,050,000 232,050,000NAV per share £1.13 £1.36
As described in note 17, the fair value gain of the group’s interest in Uppals IT has been recognised for the first time in the current year. If thishad been recognised in the previous financial year, the NAV per share would have been £1.51 instead of £1.36.
19. Cash and cash equivalents
2009 2008 Group Group£’000 £’000
Cash held with banks *16,518 *16,178Money market funds 43,520 40,439
60,038 56,617
* Included in the cash balance is an amount of £2,584,000 (2008: £916,000) held in an escrow account, as described in note 6.
20. Commitments
As at 31 March 2009 the Group had capital commitments of £10,582,000 in respect of capital expenditures contracted for at the balance sheetdate but not yet incurred. This comprised a commitment by Trinity Capital (Three) Limited of £4,117,000 in respect of Kapstone Constructionswhich, since the balance sheet date has been waived by the promoter and a commitment by Trinity Capital (Five) Limited of £6,465,000 inrespect of Lokhandwala Kataria Constructions. Excluded from commitments is an amount of £10,500,000 which the Board approved for investment by Trinity Capital (Fourteen) Limited in Luxor Cybercity, but which is not subject to legal commitment.
21. Contingent Liabilities
The disposal of subsidiaries contracted on 9 May 2008 included provisions whereby the Group would be obliged to make good to the acquirorthe economic loss which would arise upon the non fulfilment of certain conditions in the contractual arrangements with developers. TheDirectors cannot yet state with full certainty that such obligations will not arise, but it is not possible to quantify the level of compensationwhich may become payable.
22. Related party transactions
Related parties and material related party transactions and balances and other transactions with affiliates, including fees, commissions, nocharge transactions, purchases and sales and related amounts receivable or payable must be disclosed.
As defined in International Accounting Standard 24, Related Party Disclosures, parties are considered to be related if one party has the ability to control the other party or exercise significant influence over the other party in making financial and operating decisions. Related party transactions are transfers of resources or obligations between related parties, regardless of whether a price is charged.
Rakshitt Chugh, who was a director of the Company until 14 March 2009, has a beneficial interest in the Manager. Fees charged by the Manager,including performance fees, are described in note 6. The Manager was the beneficial owner of 6,700,000 shares at 31 March 2009.
46Trikona Trinity Capital PLC

Panthera Developers Private Limited (“Panthera”), Enfield Property Management Services Private Limited(“Enfield”), and Broadgate Securities Limited (“Broadgate”) are related parties to the Manager. Panthera is thedeveloper of Uppals IT Projects Private Limited and co-developer of Luxor Cyber City. During the year Pantheraentered into a relationship with Jodhana Developers Pvt. Ltd. as a 1% shareholder and Project Manager, and withSankalp Buildwell as a Developer and Project Manager with 76.14% voting rights but a profit share of 32.9%.Panthera also entered into a Project Advisory relationship with Enigma Constructions Pvt. Ltd. . Enfield is the property manager for some of the development property companies in which the Group is invested. Broadgate provides to the Company capital market advisory services. The aggregate amount of fees paid by the Company to Panthera, Enfield and Broadgate for the services described above for the year ended 31 March 2009 was£3,414,000 (2008: £4,471,000).
Philip Scales is a director of the Company and of the Administrator. The fees of the Administrator for the yearamounted to £95,000 (2008: £50,000).
23. Events after the balance sheet date
The Company purchased 21,367,702 of its own ordinary shares on the open market during the period from the balance sheet date up to 25 June 2009, for a total consideration of £12,037,000.
Annual Report & Accounts 200947

48Trikona Trinity Capital PLC
Valuation Letter
Trikona Trinity Capital PlcIOMA HouseHope StreetDouglasIsle of ManIM1 1AP
Dear Sirs
Valuation and Report as at 31 March 2009 of the India Property Portfolio for Trikona Trinity Capital Plc.
In accordance with our instructions from Trikona Trinity Capital Plc (Trikona Trinity) dated 16 February 2007,CB Richard Ellis (CBRE) have carried out a valuation of 12 properties located in India on behalf of TrikonaTrinity for accounting purposes. The properties valued are:
1. Neelkamal Marine Drive Developers – Royal Le Meridien Hotel, Mumbai. 2. Neelkamal Marine Drive Developers – Hotel & Mixed Use Development, Maharishi Karve Road, Mumbai3. Neelkamal Marine Drive Developers –Hotel Development, Goa4. Neelkamal Marine Drive Developers – Hotel Development, Pune5. Kapstone Constructions – Mixed Use Development, Thane6. Lokhandwala-Kataria Constructions – Apartment Development, Mumbai7. Uppals IT Projects – Mixed Use Development, Noida8. Luxor Cyber City Private Limited – Luxor IT SEZ, Gurgaon, Delhi – Commercial Development9. MIG Bandra (East), Mumbai – Residential Development10. Virar Township, Mumbai (New Property 03/2009)11. Sankalp Township, Gujarat12. Jodhana Residential Villas, Jodhpur, Rajasthan
Eleven of the properties are either development sites or are in the course of development. One property, Le Meriden Hotel in Mumbai, is a completed building and is held for investment.
The valuations were carried out as at the 31 March 2009 and the bases and assumptions on which thevaluations have been carried out are as provided in our Valuation Report dated 31 March 2009.
All the properties were inspected between February 2007 and April 2009.
The valuations have been prepared in accordance with The RICS Valuation Standards (Sixth Edition). Wehave valued the properties individually and no account has been taken of any discount or premium that maybe negotiated in the market if all or part of the portfolio was to be marketed simultaneously, either in lots oras a whole. As instructed, the schedule of capital values contained in the property report provides the 100%value of the properties in their current state and does not account for the ownership % share that TrikonaTrinity has in each project.
The properties have been valued by a valuer who is qualified for the purposes of the valuation in accordancewith the RICS Appraisal and Valuation Standards. The valuations have been carried out by the valuation

Annual Report & Accounts 200949
teams from CBRE in Delhi and Mumbai and the process has been overseen and managed by CBRE inLondon. CBRE have acted as External Valuers.
The property details on which each valuation is based are as set out in our property report and we haverelied on information provided by Trikona Trinity and their representatives in India, including the proposedprojects for the sites, buildable areas and construction costs. Appropriate checks were made by CBRE onvarious assumptions to cross check with standard market practices. We have assumed that all informationprovided is correct and comprehensive.
Where a property exists, we have relied upon the floor areas provided, and for the development projects wehave relied upon the proposed floor areas for the project.
We have not undertaken, nor are we aware of the content of any environmental audit or other environmentalinvestigation or soil survey which may have been carried out on the properties and which may draw attention to any contamination or the possibility of any such contamination. We have not carried out anyinvestigations into the past or present uses of the properties, nor of any neighbouring land, in order toestablish whether there is any potential for contamination and have therefore assumed that none exists.
Our report dated 31 March 2009, and this letter, is for the use only of the party to whom it is addressed forthe specific purpose set out herein and no responsibility is accepted to any third party for the whole or anypart of its contents. Neither the whole nor any part of our report nor any references thereto may be includedin any published document, circular or statement nor published in any way without our prior written approvalof the form and context in which it will appear.
Yours faithfully
GRAHAM HUGHES BSc MRICSExecutive Director - Valuation AdvisoryFor and on behalf of CB Richard Ellis Limited

Company Information
Administrator and RegistrarIOMA Fund and Investment Management Limited
IOMA House
Hope Street
Douglas
Isle of Man
IM1 1AP
AuditorsKPMG Audit LLC
Heritage Court
41 Athol Street
Douglas
Isle of Man
IM99 1HN
ManagerTrikona Advisers Limited
c/o M&C Corporate Services Limited
PO Box 309 LT
Ugland House
South Church Street
George Town
Grand Cayman
Cayman Islands
ValuerCBRE
St Martin’s Court
10 Paternoster Row
London EC4M 7HP
DirectorsMartin Adams (Chairman)
Philip Scales
Pradeep Verma
Stephen Coe
Company SecretaryPhilip Scales
Registered Off iceIOMA House
Hope Street
Douglas
Isle of Man
IM1 1AP
Nominated Adviser (NOMAD)Evolution Securities Limited
100 Wood Street
London
EC2V 7AN
Joint-BrokerArden Partners
Nicholas House
3 Laurence Pountney Hill
London