Building Industrial Clusters in Latin America Paddling Upstream
Upload
khangminh22Category
view
0download
0
sustainability
Article
Critical Issues at the Upstream Level in SustainableSupply Chain Management of Agri-Food Industries:Evidence from Pakistan’s Citrus Industry
Muhammad Asad ur Rehman Naseer 1,*,† , Muhammad Ashfaq 1, Sarfraz Hassan 1,Azhar Abbas 1,* , Amar Razzaq 2 , Mubashir Mehdi 3, Anoma Ariyawardana 4 andMumtaz Anwar 5
1 Institute of Agricultural and Resource Economics, University of Agriculture Faisalabad, Punjab 38040,Pakistan; [email protected] (M.A.); [email protected] (S.H.)
2 College of Economics and Management, Huazhong Agricultural University, No. 1, Shizishan Street,Hongshan District, Wuhan 430070, China; [email protected]
3 Institute of Business Management Sciences, University of Agriculture Faisalabad, Punjab 38040, Pakistan;[email protected]
4 School of Agriculture and Food Sciences, The University of Queensland, Gatton 4343, Australia;[email protected]
5 Department of Economics, University of the Punjab, Lahore 54590, Pakistan; [email protected]* Correspondence: [email protected] (M.A.u.R.N.); [email protected] (A.A.);
Tel.: +92-314-610-7745 (M.A.u.R.N.); +92-302-729-9487 (A.A.)† This research is the outcome of one of the objectives of the first author’s doctoral dissertation.
Received: 2 February 2019; Accepted: 26 February 2019; Published: 3 March 2019�����������������
Abstract: Sustainable supply chain management (SSCM) has recently received increasing attentionfrom researchers and the business community. Due to globalization and changing consumptionpatterns, agri-food industries have undergone a transformation, and the sustainability of agri-foodsupply chains has also received greater attention. However, the issues of SSCM at the upstreamlevel of the supply chain in agri-food industries have not been adequately empirically studied. Thispaper aims to list key issues or constraints in the production and marketing through farmers’ groupdiscussions, supplemented by the literature, and empirically identifies key constraints to SSCMof the citrus industry in Pakistan. The paper used cross-sectional data from 300 farmers involvedin the production and marketing of citrus in Punjab, Pakistan. Farmers were asked to answer ona Likert scale data about potential constraints identified from the literature and farmers’ groupdiscussions. Kendell’s coefficient of concordance and the mean ranking technique was used to rankand to identify the critical constraints in the production and marketing of citrus. In addition, factoranalysis (principal component analysis) was used for the grouping of these constraints. In productionconstraints, factors, such as fertilizer, pesticide, and seed quality, climate change, high productioncost, and agricultural labor performance, are important. These constraints are aligned with some keymarketing factors, such as packaging, grading, and storage facilities. The findings convey messagesfor policymakers to solve these issues and challenges at the upstream level of the SSCM chain in thecitrus and related agri-food industries.
Keywords: agri-food supply chains; critical issues; sustainability; citrus production; marketing;Pakistan
1. Introduction
Agri-food supply chains play a pivotal role in providing farmers with access to markets,which affect the social, economic, and environmental sustainability of rural peasants [1]. Farmers,
Sustainability 2019, 11, 1326; doi:10.3390/su11051326 www.mdpi.com/journal/sustainability

Sustainability 2019, 11, 1326 2 of 19
agribusinesses, governments, and civil society must cooperate to promote inclusive and efficient foodsystems, better integrate small farmers into supply chains and agribusiness, and improve their accessto markets. These models can increase the value added by raw materials, thereby boosting local ruraleconomies, food security, and nutrition, and off-farm employment. Small-scale producers provide over70% of the world’s food needs, and agribusiness is an important source of global employment andincome. Improving the sustainability of the agri-food supply chain can benefit hundreds of millions ofpoor households in developing countries.
In the past few decades, much literature on supply chain management in the manufacturingand service sectors has been produced, but little attention has been paid to the agriculture sector [2].The agriculture sector contributes a major part of human livelihoods and raw materials to otherindustries in developing countries, such as Pakistan. Among agricultural products, food itemshave been least explored in supply chain management [3]. Pakistan relies heavily on agriculture,which accounts for about 19% of the GDP, 43% of the labor force, and about 67% of rural farmers’livelihoods [4]. Although agriculture is the mainstay of rural farmers in Pakistan, rural poverty iswidespread [5].
The main cause of this widespread poverty is the dependence of the country’s agriculture ontraditional agricultural production systems. However, due to the recognition of the importance ofhigh-value agriculture (HVA), such as animal husbandry and horticultural products, farmers arenow shifting from traditional agriculture to agribusiness [6,7]. Therefore, to improve profitability,SSCM of agri-food is now very important. However, Pakistan’s agricultural performance remainssluggish. The main factors contributing to this slow performance include the slow rate of technologicalinnovation, limited adoption of progressive farming techniques, problems with the quality, quantity,and timeliness of inputs, limited investment in construction and infrastructure maintenance, marketingand trade restrictions, pest and livestock diseases, and limited amounts of credit for agriculturalproduction and processing [4].
The growth of HVA, the development of institutions for vertical integration, and other structuralchanges in agricultural supply chains present opportunities and challenges for farmers in developingcountries. The opportunity for small farmers is to increase their income by participating in the modernsupply chains for HVA commodities. The challenge for smallholders is that HVA commodities usuallyhave a high cost of production and there are more risks in production and marketing. To overcomethese types of challenges, there should be strong vertical linkages between farmers and other supplychain actors, but in some cases, farmers cannot meet modern food demands [7]. The background andnature of these challenges must be fully understood throughout the production and marketing processof the agri-food industry to develop and implement appropriate solutions for the improvement ofSSCM. Therefore, this study aims to identify and analyze key production and marketing constraints inthe SSCM of the citrus industry at the upstream level of the chain.
In recent years, production and marketing constraints at the upstream level of agri-food industrieshave received enormous importance as a way of implementing SSCM practices. However, in thedeveloping country of Pakistan, farmers still face several challenges in sustainable supply chainmanagement practices. There is a need to address these constraints to facilitate widespread andsuccessful SSCM practices. Therefore, the basic aim of this study is to investigate the critical productionand marketing constraints of the citrus industry.
Supply chains operating in the Pakistan citrus industry are a typical example. They provides lowvalue to the farmers as well as to the consumers, and the challenges in the SSCM negatively affectthe overall performance of the industry, preventing it from reaching its full potential, particularly themeager share of exports to the total mandarin production [8]. At the same time, the development of thehorticultural industry is in the government’s priority policy area, and public and private stakeholdersare deeply concerned with identifying solutions to resolve emerging challenges for the developmentof the horticultural industry. To overcome these problems, this study provides guidance on how these
Sustainability 2019, 11, 1326 3 of 19
challenges and issues should be addressed in a developing country, much less in a single industry,such as Pakistan’s citrus industry.
Citrus is the leading fruit in terms of production in Pakistan, i.e., 2.36 million tons is producedfrom an area of 206.6 thousand hectares [9]. Pakistan is also the 13th largest producer and 5th largestexporter of citrus in the world [10]. The citrus market in Pakistan is segmented broadly in traditional orinformal and modern or formal sectors. The traditional sector includes direct sales as village retailers,sales to intermediaries, and sales at traditional fruit and vegetable markets that exist in almost everycity in the country. The modern sector includes the sales to the local processors or juice manufacturingfactories, from where it is processed in different juices or exported after waxing and processing byincreasing its shelf life. Most of the small village farmers sell their produce through the traditionalchannel [8,11].
In Pakistan, the fruit-bearing life of citrus orchard trees is 20 to 30 years, which is low comparedwith other citrus producing countries, where its span goes up to 50 years [12]. The basic factor affectingthe citrus supply chain is a lesser use of high-quality citrus production techniques. Farmers do notrealize the orchard as an endeavor; rather, they grow citrus as additional crops in the field. So, theyare not able to fulfill the demand of the citrus crop at the time of need; they create a huge gap incitrus production as they do intercrop different crops in the citrus orchard, which cause unfavorablelosses to the citrus plants and production [12]. Intercropping of valuable crops may increase cropdiversification and increase the sustainability of family farms, as crop diversification improves foodsecurity and household diets, and reduces market and weather risks, not to mention environmentalsustainability [13]. However, this is not the case for Pakistan, as most citrus growers only cultivateforage crops in citrus orchards. Due to the growth of several weeds in the orchard, the cultivation ofdifferent forage crops leads to a reduction in citrus production [14]. In addition, the cultivation andharvesting of forage crops can damage citrus fruits. This effect is more pronounced in the fruitingstage of citrus [15].
The citrus supply chain along with other agri-food commodities has become ineffective, resultingin a decrease in net returns with the passage of time [16]. Multiple factors are responsible for thisineffective supply chain, including variant climatic conditions [17,18]. Inadequate technical support,poor availability of improved varieties, outdated irrigation approaches, an infestation of diseases, andabrupt climatic changes are stressors for the supply chain [19]. Poor planning and quality ignoranceare additional factors affecting supply [20]. Poor quality assurance followed by the adoption oftraditional packaging practices appears inconvenient for higher returns in the international market [6].This miserable condition is costing a loss of millions to the national economy and the livelihoods ofthe growers.
In the true sense, effective SSCM of citrus can harness the best outcomes and attract theinternational market. Quality produce can boost livelihoods and present a significant share inthe national economy [21]. Apart from citrus, all HVA commodities are highly competitive in theinternational market and get high returns. Citrus, in this regard, is special because of the strongcomparative advantage in mandarins [6]. Despite being one of the world’s largest exporters ofmandarins, entry into high-value markets has been tough thus far, possibly due to quality issues.
Despite the considerable amount of literature on the downstream levels of agri-food industriesfor SSCM in Pakistan [7,22–24], no studies have attempted to empirically identify the constraints ofthe upstream level for SSCM of agri-food industries, especially citrus. The upstream level of the citrussupply chain is of prime importance for two reasons. First, it includes farmers who are the main actorsin the SSCM of the citrus industry. Second, the upstream level also severely affects participants at thedownstream level, ultimately affecting citrus exports. Considering the importance of citrus fruit in thenational economy and livelihoods, this study was planned to empirically identify the key constraintson the upstream level in SSCM of the citrus industry in Punjab, Pakistan.
Sustainability 2019, 11, 1326 4 of 19
Theoretical Background
There are several studies that have emphasized the constraints in the citrus supply chainin Pakistan. These constraints cause enormous post-harvest losses in citrus fruits. For example,Johnson [25] estimated that these losses were about 40% in Pakistani citrus fruit. Some studies haveshown that 35% of Pakistan’s total citrus production is lost in the process of supplying fruit from oneplace to another [12]. The percentage of total post-harvest losses is even higher at the farmer level [26].These statistics show that agri-food supply chains, such as citrus, are affected by various factors at theupstream level of the chain.
The main actor at the upstream of the supply chain is the farmer, and the associated factors canbe aggregated into production and marketing constraints. In the past, SSCM only dealt with theefficient production marketing of the raw material to its final destination [27]. However, today, severalother factors are also involved in SSCM, such as climatic factors and quality standards [27–29]. In thefuture, it will become one of the biggest opportunities in the history of economics and commerce [30].As incomes rise, there will be an increase in the demand for environmental standards and people willbecome more concerned regarding environmental standards [31].
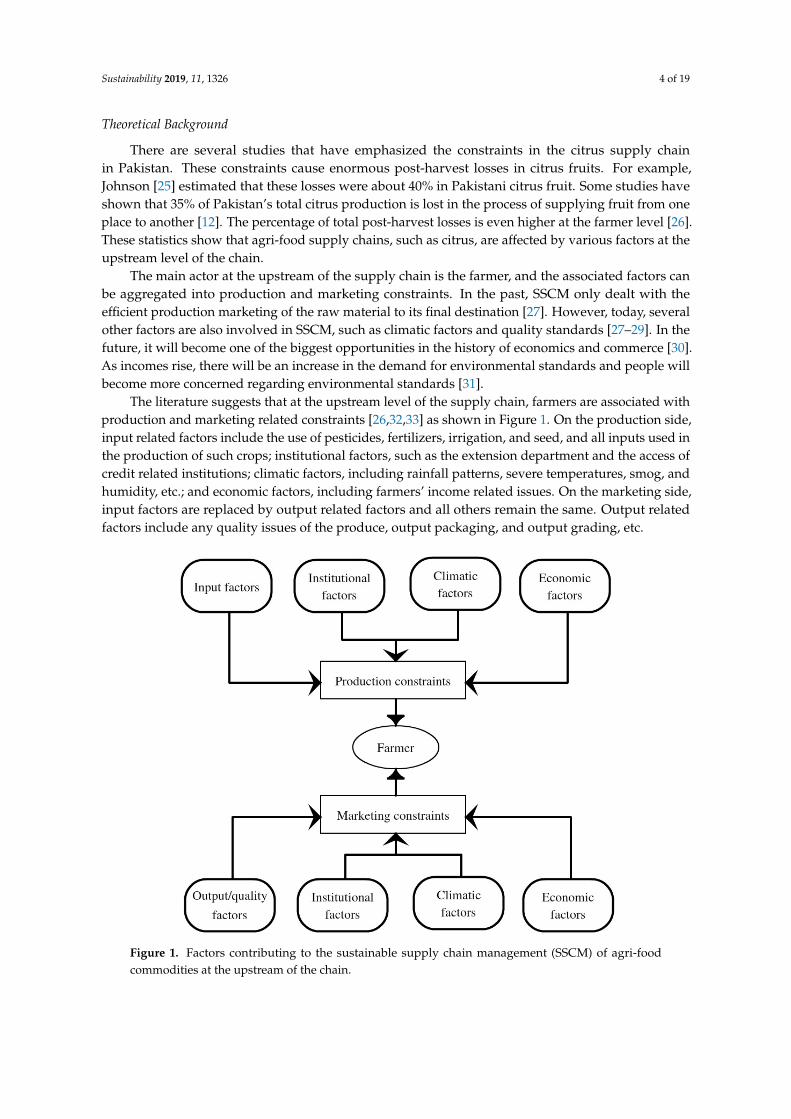
The literature suggests that at the upstream level of the supply chain, farmers are associated withproduction and marketing related constraints [26,32,33] as shown in Figure 1. On the production side,input related factors include the use of pesticides, fertilizers, irrigation, and seed, and all inputs used inthe production of such crops; institutional factors, such as the extension department and the access ofcredit related institutions; climatic factors, including rainfall patterns, severe temperatures, smog, andhumidity, etc.; and economic factors, including farmers’ income related issues. On the marketing side,input factors are replaced by output related factors and all others remain the same. Output relatedfactors include any quality issues of the produce, output packaging, and output grading, etc.
Sustainability 2019, 11, x FOR PEER REVIEW 4 of 19
The main actor at the upstream of the supply chain is the farmer, and the associated factors can be aggregated into production and marketing constraints. In the past, SSCM only dealt with the efficient production marketing of the raw material to its final destination [27]. However, today, several other factors are also involved in SSCM, such as climatic factors and quality standards [27–29]. In the future, it will become one of the biggest opportunities in the history of economics and commerce [30]. As incomes rise, there will be an increase in the demand for environmental standards and people will become more concerned regarding environmental standards [31].
The literature suggests that at the upstream level of the supply chain, farmers are associated with production and marketing related constraints [26,32,33] as shown in Figure 1. On the production side, input related factors include the use of pesticides, fertilizers, irrigation, and seed, and all inputs used in the production of such crops; institutional factors, such as the extension department and the access of credit related institutions; climatic factors, including rainfall patterns, severe temperatures, smog, and humidity, etc.; and economic factors, including farmers’ income related issues. On the marketing side, input factors are replaced by output related factors and all others remain the same. Output related factors include any quality issues of the produce, output packaging, and output grading, etc.
Figure 1. Factors contributing to the sustainable supply chain management (SSCM) of agri-food
commodities at the upstream of the chain.
2. Materials and Methods
2.1. Identification of Constraints
For the listing and identification of potential constraints, five farmers’ group discussions (FGDs) were conducted in the study area. A total of 41 farmers participated in these FGDs, of which 6 to 11 farmers participated in the five sessions. To select farmers for the FGDs, a convenience sampling technique was used. It is a non-probability sampling technique and is considered as being suitable for the selection of FGD participants [34,35]. After the productive sessions of these FGDs, 30 potential constraints were listed/identified for this study, as presented in Tables 1 and 2. After a thorough review of these studies, the 30 constraints that we identified in the FGDs were sub-divided into two
Figure 1. Factors contributing to the sustainable supply chain management (SSCM) of agri-foodcommodities at the upstream of the chain.
Sustainability 2019, 11, 1326 5 of 19
2. Materials and Methods
2.1. Identification of Constraints
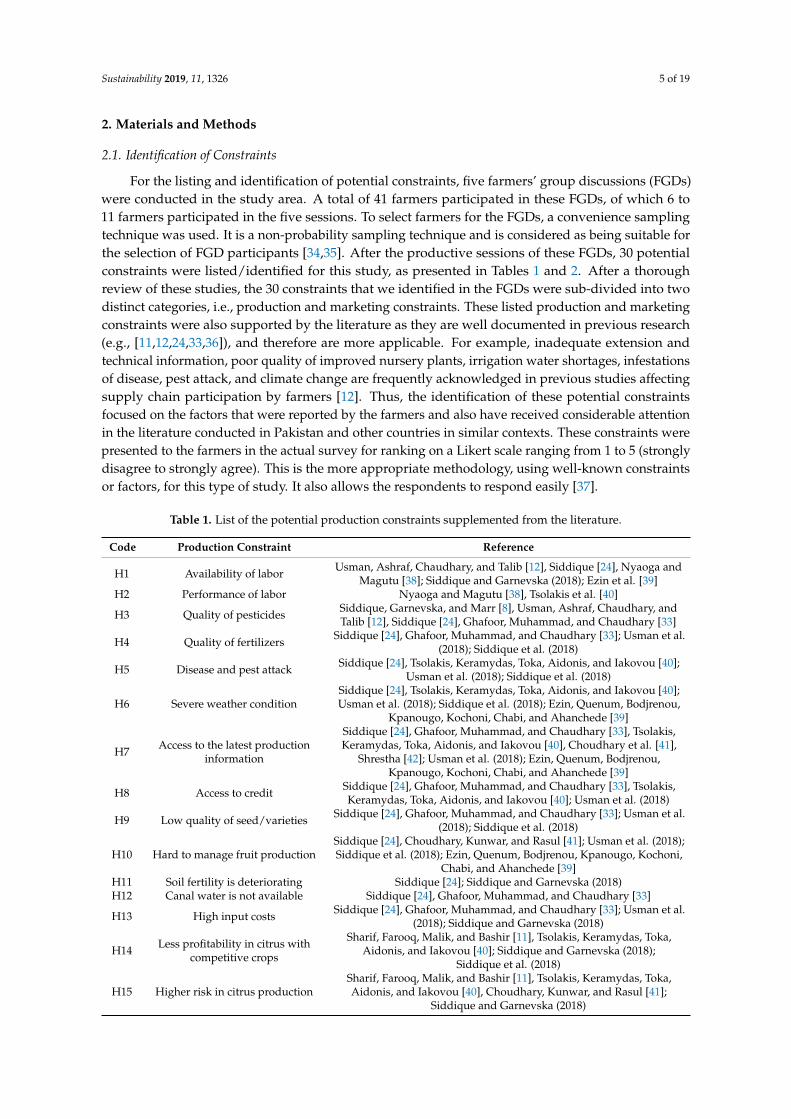
For the listing and identification of potential constraints, five farmers’ group discussions (FGDs)were conducted in the study area. A total of 41 farmers participated in these FGDs, of which 6 to11 farmers participated in the five sessions. To select farmers for the FGDs, a convenience samplingtechnique was used. It is a non-probability sampling technique and is considered as being suitable forthe selection of FGD participants [34,35]. After the productive sessions of these FGDs, 30 potentialconstraints were listed/identified for this study, as presented in Tables 1 and 2. After a thoroughreview of these studies, the 30 constraints that we identified in the FGDs were sub-divided into twodistinct categories, i.e., production and marketing constraints. These listed production and marketingconstraints were also supported by the literature as they are well documented in previous research(e.g., [11,12,24,33,36]), and therefore are more applicable. For example, inadequate extension andtechnical information, poor quality of improved nursery plants, irrigation water shortages, infestationsof disease, pest attack, and climate change are frequently acknowledged in previous studies affectingsupply chain participation by farmers [12]. Thus, the identification of these potential constraintsfocused on the factors that were reported by the farmers and also have received considerable attentionin the literature conducted in Pakistan and other countries in similar contexts. These constraints werepresented to the farmers in the actual survey for ranking on a Likert scale ranging from 1 to 5 (stronglydisagree to strongly agree). This is the more appropriate methodology, using well-known constraintsor factors, for this type of study. It also allows the respondents to respond easily [37].
Table 1. List of the potential production constraints supplemented from the literature.
Code Production Constraint Reference
H1 Availability of labor Usman, Ashraf, Chaudhary, and Talib [12], Siddique [24], Nyaoga andMagutu [38]; Siddique and Garnevska (2018); Ezin et al. [39]
H2 Performance of labor Nyaoga and Magutu [38], Tsolakis et al. [40]
H3 Quality of pesticides Siddique, Garnevska, and Marr [8], Usman, Ashraf, Chaudhary, andTalib [12], Siddique [24], Ghafoor, Muhammad, and Chaudhary [33]
H4 Quality of fertilizers Siddique [24], Ghafoor, Muhammad, and Chaudhary [33]; Usman et al.(2018); Siddique et al. (2018)
H5 Disease and pest attack Siddique [24], Tsolakis, Keramydas, Toka, Aidonis, and Iakovou [40];Usman et al. (2018); Siddique et al. (2018)
H6 Severe weather conditionSiddique [24], Tsolakis, Keramydas, Toka, Aidonis, and Iakovou [40];Usman et al. (2018); Siddique et al. (2018); Ezin, Quenum, Bodjrenou,
Kpanougo, Kochoni, Chabi, and Ahanchede [39]
H7 Access to the latest productioninformation
Siddique [24], Ghafoor, Muhammad, and Chaudhary [33], Tsolakis,Keramydas, Toka, Aidonis, and Iakovou [40], Choudhary et al. [41],
Shrestha [42]; Usman et al. (2018); Ezin, Quenum, Bodjrenou,Kpanougo, Kochoni, Chabi, and Ahanchede [39]
H8 Access to credit Siddique [24], Ghafoor, Muhammad, and Chaudhary [33], Tsolakis,Keramydas, Toka, Aidonis, and Iakovou [40]; Usman et al. (2018)
H9 Low quality of seed/varieties Siddique [24], Ghafoor, Muhammad, and Chaudhary [33]; Usman et al.(2018); Siddique et al. (2018)
H10 Hard to manage fruit productionSiddique [24], Choudhary, Kunwar, and Rasul [41]; Usman et al. (2018);Siddique et al. (2018); Ezin, Quenum, Bodjrenou, Kpanougo, Kochoni,
Chabi, and Ahanchede [39]H11 Soil fertility is deteriorating Siddique [24]; Siddique and Garnevska (2018)H12 Canal water is not available Siddique [24], Ghafoor, Muhammad, and Chaudhary [33]
H13 High input costs Siddique [24], Ghafoor, Muhammad, and Chaudhary [33]; Usman et al.(2018); Siddique and Garnevska (2018)
H14 Less profitability in citrus withcompetitive crops
Sharif, Farooq, Malik, and Bashir [11], Tsolakis, Keramydas, Toka,Aidonis, and Iakovou [40]; Siddique and Garnevska (2018);
Siddique et al. (2018)
H15 Higher risk in citrus productionSharif, Farooq, Malik, and Bashir [11], Tsolakis, Keramydas, Toka,Aidonis, and Iakovou [40], Choudhary, Kunwar, and Rasul [41];
Siddique and Garnevska (2018)

Sustainability 2019, 11, 1326 6 of 19
Table 2. List of potential marketing constraints supplemented from the literature.
Code Marketing Constraint Reference
G1 Perishable nature of the product Sharif, Farooq, Malik, and Bashir [11], Choudhary, Kunwar,and Rasul [41]
G2 Lack of road infrastructureSiddique [24], Tsolakis, Keramydas, Toka, Aidonis, andIakovou [40], Shrestha [42]; Ezin, Quenum, Bodjrenou,
Kpanougo, Kochoni, Chabi, and Ahanchede [39]
G3 Lack of a transportation facility,like a tractor trolley
Sharif, Farooq, Malik, and Bashir [11], Siddique [24],Ghafoor, Muhammad, and Chaudhary [33], Tsolakis,
Keramydas, Toka, Aidonis, and Iakovou [40], Shrestha [42];Usman et al. (2018)
G4 Lack of a packaging facility in thevillage
Siddique and Garnevska [36], Nyaoga and Magutu [38];Usman et al. (2018)
G5 Lack of a packaging facility in theunion council
Nyaoga and Magutu [38]; Siddique and Garnevska (2018);Usman et al. (2018)
G6 Exploitation of the middlemenSharif, Farooq, Malik, and Bashir [11], Siddique [24], Nyaogaand Magutu [38], Tsolakis, Keramydas, Toka, Aidonis and
Iakovou [40]; Usman et al. (2018)
G7 Lack of quality incentives forproper packaging
Tsolakis, Keramydas, Toka, Aidonis, and Iakovou [40],Shrestha [42]; Siddique and Garnevska (2018)
G8 Lack of quality incentives forproper grading by size
Tsolakis, Keramydas, Toka, Aidonis, and Iakovou [40],Shrestha [42]; Siddique and Garnevska (2018)
G9 Lack of quality incentives forproper grading by variety
Tsolakis, Keramydas, Toka, Aidonis, and Iakovou [40],Shrestha [42]; Siddique and Garnevska (2018)
G10 Lack of middlemen competition Siddique [24], Choudhary, Kunwar, and Rasul [41]; Siddiqueand Garnevska (2018)
G11 Lack of market price informationSharif, Farooq, Malik, and Bashir [11], Ghafoor, Muhammad,and Chaudhary [33], Choudhary, Kunwar, and Rasul [41];
Usman et al. (2018)
G12 Rigging in F&V market pricesettlement (boli)
Sharif, Farooq, Malik, and Bashir [11], Shrestha [42];Usman et al. (2018)
G13 Lack of storage facilitiesSharif, Farooq, Malik, and Bashir [11], Siddique [24], Nyaoga
and Magutu [38]; Usman et al. (2018); Ezin, Quenum,Bodjrenou, Kpanougo, Kochoni, Chabi, and Ahanchede [39]
G14 Distance from F&V marketSharif, Farooq, Malik, and Bashir [11], Ghafoor, Muhammad,and Chaudhary [33], Nyaoga and Magutu [38]; Usman et al.
(2018)
G15 No marketing investment Sharif, Farooq, Malik, and Bashir [11], Nyaoga and Magutu[38], Choudhary, Kunwar, and Rasul [41]
2.2. Data Collection and Study Area
Following Razzaq et al. [43], a multistage sampling technique for a better representation of thestudy area was used to select the suitable sample size. In the first stage, the district of Sargodha waspurposely selected due to it being the most significant district in terms of production. In the secondstage, three Tehsils, i.e., Bhalwal, Kotmomin, and Sargodha, were randomly selected. In the thirdstage, 10 villages from each tehsil were randomly chosen, and in the final stage, at least 10 respondentsfrom each village were interviewed through a well-structured questionnaire. Thus, the study used asample size of 300 respondents, including a mix of traditional and modern supply chain participantsrepresenting all farm size categories of small, medium, and large farmers. The sample size used for thestudy is in accordance with the past literature carried out using this type of analysis [7,8,12].
Prior to the data collection, the purpose of the research was described to the respondents, andverbal consent was obtained from all the respondents. Participation in the survey was entirelyvoluntary. We assured participants of the anonymity and confidentiality of their responses. Data werecollected by trained interviewers who were graduate students in agricultural economics.
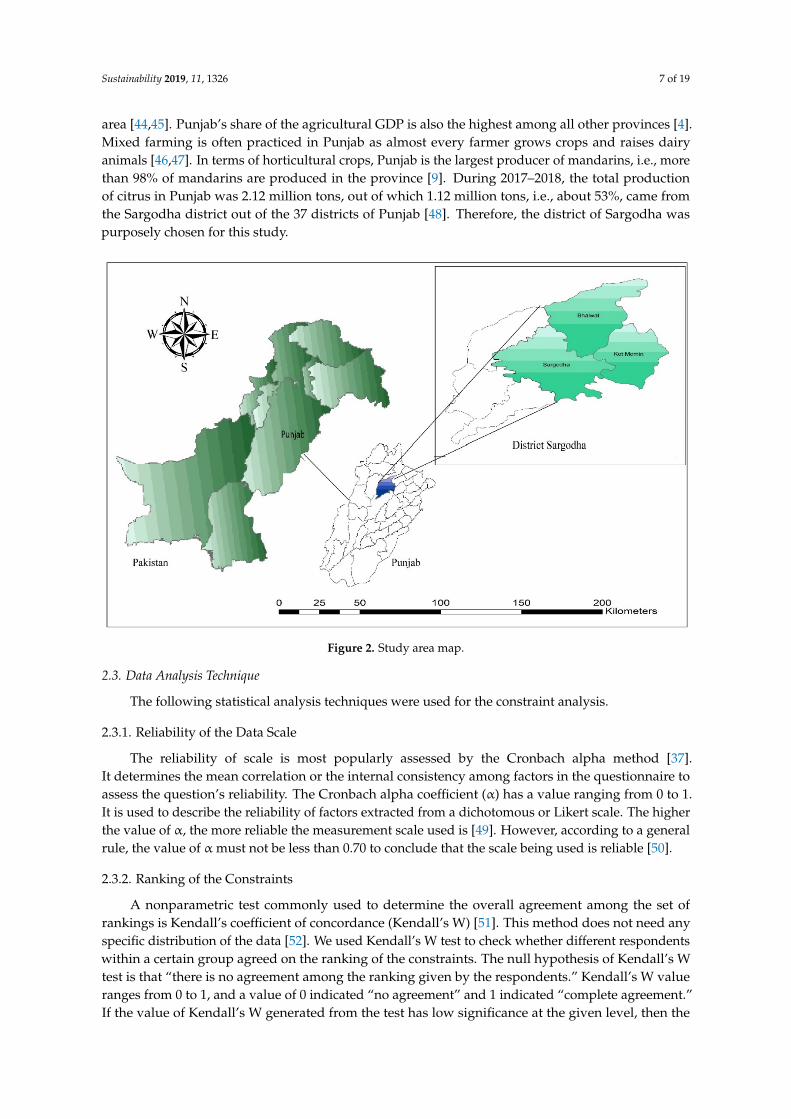
The study was carried out in the Punjab province of Pakistan, as shown in the study area mapin Figure 2. Punjab is the largest province in terms of population and the second largest in terms of
Sustainability 2019, 11, 1326 7 of 19
area [44,45]. Punjab’s share of the agricultural GDP is also the highest among all other provinces [4].Mixed farming is often practiced in Punjab as almost every farmer grows crops and raises dairyanimals [46,47]. In terms of horticultural crops, Punjab is the largest producer of mandarins, i.e., morethan 98% of mandarins are produced in the province [9]. During 2017–2018, the total productionof citrus in Punjab was 2.12 million tons, out of which 1.12 million tons, i.e., about 53%, came fromthe Sargodha district out of the 37 districts of Punjab [48]. Therefore, the district of Sargodha waspurposely chosen for this study.
Sustainability 2019, 11, x FOR PEER REVIEW 7 of 19
study used a sample size of 300 respondents, including a mix of traditional and modern supply chain participants representing all farm size categories of small, medium, and large farmers. The sample size used for the study is in accordance with the past literature carried out using this type of analysis [7,8,12].
Prior to the data collection, the purpose of the research was described to the respondents, and verbal consent was obtained from all the respondents. Participation in the survey was entirely voluntary. We assured participants of the anonymity and confidentiality of their responses. Data were collected by trained interviewers who were graduate students in agricultural economics.
The study was carried out in the Punjab province of Pakistan, as shown in the study area map in Figure 2. Punjab is the largest province in terms of population and the second largest in terms of area [44,45]. Punjab’s share of the agricultural GDP is also the highest among all other provinces [4]. Mixed farming is often practiced in Punjab as almost every farmer grows crops and raises dairy animals [46,47]. In terms of horticultural crops, Punjab is the largest producer of mandarins, i.e., more than 98% of mandarins are produced in the province [9]. During 2017–2018, the total production of citrus in Punjab was 2.12 million tons, out of which 1.12 million tons, i.e., about 53%, came from the Sargodha district out of the 37 districts of Punjab [48]. Therefore, the district of Sargodha was purposely chosen for this study.
Figure 2. Study area map.
2.3. Data Analysis Technique
The following statistical analysis techniques were used for the constraint analysis.
2.3.1. Reliability of the Data Scale
The reliability of scale is most popularly assessed by the Cronbach alpha method [37]. It determines the mean correlation or the internal consistency among factors in the questionnaire to assess the question’s reliability. The Cronbach alpha coefficient (𝛼) has a value ranging from 0 to 1. It is used to describe the reliability of factors extracted from a dichotomous or Likert scale. The higher the value of 𝛼, the more reliable the measurement scale used is [49]. However, according to a general rule, the value of 𝛼 must not be less than 0.70 to conclude that the scale being used is reliable [50].
Figure 2. Study area map.
2.3. Data Analysis Technique
The following statistical analysis techniques were used for the constraint analysis.
2.3.1. Reliability of the Data Scale
The reliability of scale is most popularly assessed by the Cronbach alpha method [37].It determines the mean correlation or the internal consistency among factors in the questionnaire toassess the question’s reliability. The Cronbach alpha coefficient (α) has a value ranging from 0 to 1.It is used to describe the reliability of factors extracted from a dichotomous or Likert scale. The higherthe value of α, the more reliable the measurement scale used is [49]. However, according to a generalrule, the value of α must not be less than 0.70 to conclude that the scale being used is reliable [50].
2.3.2. Ranking of the Constraints
A nonparametric test commonly used to determine the overall agreement among the set ofrankings is Kendall’s coefficient of concordance (Kendall’s W) [51]. This method does not need anyspecific distribution of the data [52]. We used Kendall’s W test to check whether different respondentswithin a certain group agreed on the ranking of the constraints. The null hypothesis of Kendall’s Wtest is that “there is no agreement among the ranking given by the respondents.” Kendall’s W valueranges from 0 to 1, and a value of 0 indicated “no agreement” and 1 indicated “complete agreement.”If the value of Kendall’s W generated from the test has low significance at the given level, then the
Sustainability 2019, 11, 1326 8 of 19
null hypothesis was rejected and it was concluded that some degree of agreement exists among therespondents [51].
2.3.3. Identification of the Key Constraints
A typical quantitative method, i.e., mean score ranking technique (MSRT), was used in this studyto identify and rank the key constraints of the 30 constraints identified in the FDGs. Chan et al. [37]also used the same technique to rank the critical barriers to adopting green building study using afive-point Likert scale. In the MSRT, the highest ranked factor is the most important constraint, and ifthe two constraints have the same mean score, the constraint with the lowest standard deviation isassigned the highest rank. The normalized value of the mean scores was also calculated to identify thekey constraints out of the 30 listed marketing and production constraints faced by the farmers. All theconstraints having a normalized value greater than 0.5 are identified as the key constraints [53] usingthe formula:
Normalized value = (mean − minimum value)/(maximum value − mean) (1)
2.3.4. Grouping of the Constraints
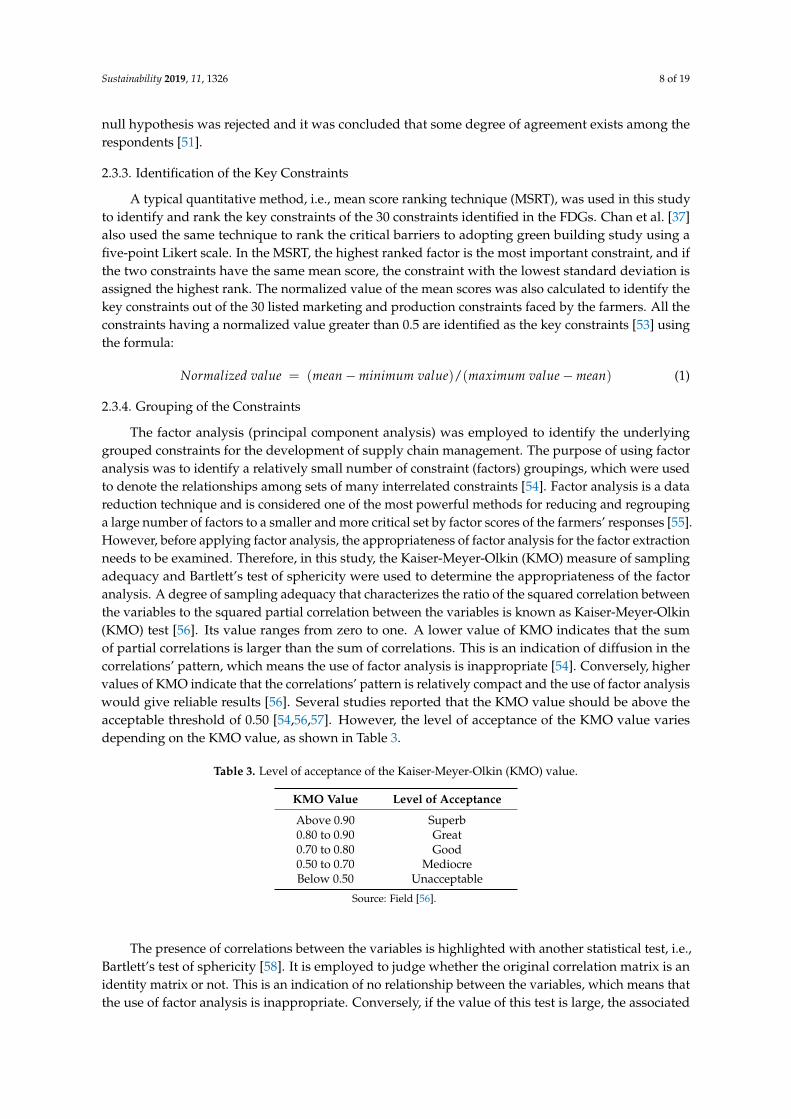
The factor analysis (principal component analysis) was employed to identify the underlyinggrouped constraints for the development of supply chain management. The purpose of using factoranalysis was to identify a relatively small number of constraint (factors) groupings, which were usedto denote the relationships among sets of many interrelated constraints [54]. Factor analysis is a datareduction technique and is considered one of the most powerful methods for reducing and regroupinga large number of factors to a smaller and more critical set by factor scores of the farmers’ responses [55].However, before applying factor analysis, the appropriateness of factor analysis for the factor extractionneeds to be examined. Therefore, in this study, the Kaiser-Meyer-Olkin (KMO) measure of samplingadequacy and Bartlett’s test of sphericity were used to determine the appropriateness of the factoranalysis. A degree of sampling adequacy that characterizes the ratio of the squared correlation betweenthe variables to the squared partial correlation between the variables is known as Kaiser-Meyer-Olkin(KMO) test [56]. Its value ranges from zero to one. A lower value of KMO indicates that the sumof partial correlations is larger than the sum of correlations. This is an indication of diffusion in thecorrelations’ pattern, which means the use of factor analysis is inappropriate [54]. Conversely, highervalues of KMO indicate that the correlations’ pattern is relatively compact and the use of factor analysiswould give reliable results [56]. Several studies reported that the KMO value should be above theacceptable threshold of 0.50 [54,56,57]. However, the level of acceptance of the KMO value variesdepending on the KMO value, as shown in Table 3.
Table 3. Level of acceptance of the Kaiser-Meyer-Olkin (KMO) value.
KMO Value Level of Acceptance
Above 0.90 Superb0.80 to 0.90 Great0.70 to 0.80 Good0.50 to 0.70 MediocreBelow 0.50 Unacceptable
Source: Field [56].
The presence of correlations between the variables is highlighted with another statistical test, i.e.,Bartlett’s test of sphericity [58]. It is employed to judge whether the original correlation matrix is anidentity matrix or not. This is an indication of no relationship between the variables, which means thatthe use of factor analysis is inappropriate. Conversely, if the value of this test is large, the associated
Sustainability 2019, 11, 1326 9 of 19
significance level is small. It means that the population correlation matrix is not an identity matrix andthe use of factor analysis is appropriate [59].
3. Results
Two main approaches were used for the analysis of farmers’ production and marketing ofcitrus constraints, i.e., ranking analysis and the factor analysis (principal component analysis). Thissection presents the constraint analysis results. The section first presents the descriptive results ofthe respondents’ demographic, socioeconomic, and farmer characteristics. It then presents literatureto supplement the selected constraints reported by other researchers, and the results of the rankinganalysis are presented and discussed. Afterwards, this section presents the results of the factor analysis,i.e., principal component analysis.
3.1. Results of the Descriptive Analysis
Different socioeconomic and demographic variables are important in social and economicstudies, where the role of the family and respondent is critical to the research problem under study.The descriptions of important respondent and household variables are presented in Table 4, withthe average age of the respondents being 46.15 years with an average of about 8 years of education.The average family size of the respondents was about 9.76 members with a greater proportion ofchildren than adult males or females. The mean highest educational level in the household was about9.38 years, slightly higher than the respondents’ education.
Table 4. Farmers’ and households’ descriptive statistics.
Characteristic Unit Min. Max. Mean Std. Dev.
Age of the respondent Years 21 70 46.15 11.266Education of the respondent Years 0 18 8.03 3.742
Adult male in the family No. 1 7 3.19 1.361Adult female in the family No. 1 8 2.77 1.315
Children under 15 No. 1 11 3.80 1.870Total family members No. 4 25 9.76 3.505
School going family members No. 0 8 2.83 1.579Highest education in the family Years 0 18 9.38 3.507
Family members employed No. 0 2 0.55 0.714Family labor on the farm No. 1 4 1.44 0.622
Family structureNo.
(percent)Nuclear Joint or extended
160 (53.3) 140 (46.7)
It is also evident from the table that on average every family has 0.55 family members employedin activities other than farming and on average 1.44 farm workers were employed for agriculturalactivities. Survey results also revealed that 53.3% of the households were of a nuclear family structureand 46.7% were of an extended or joint family structure.
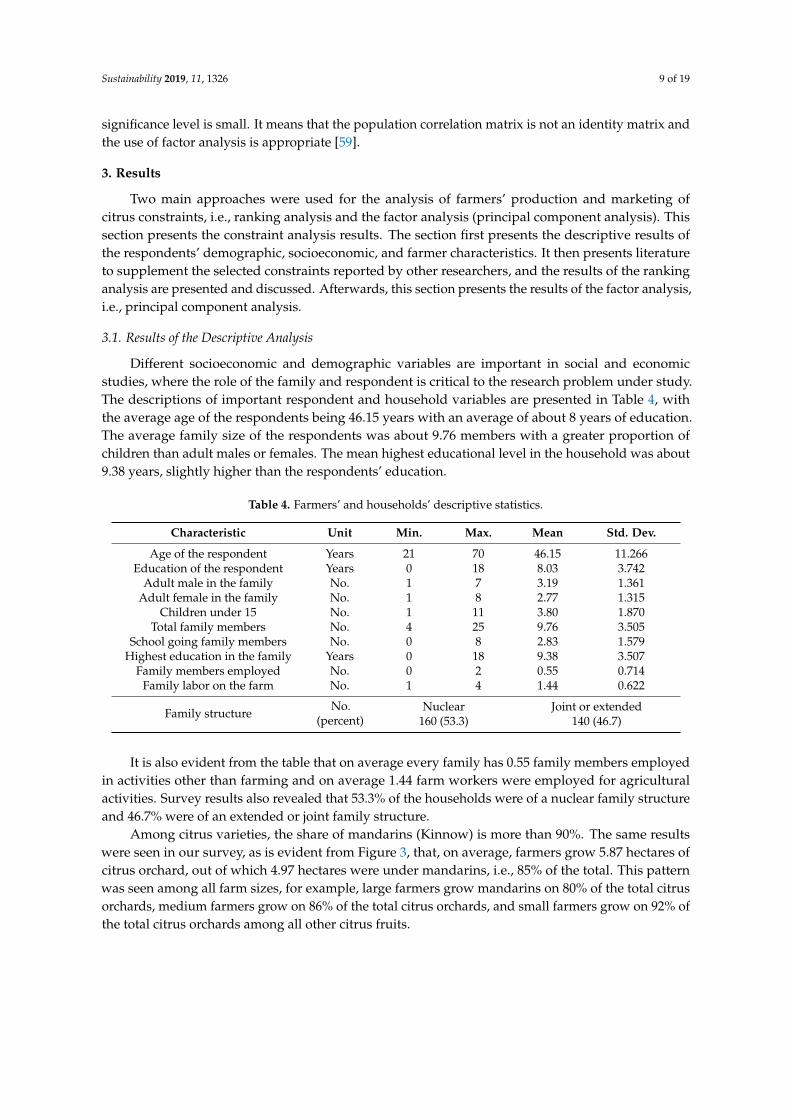
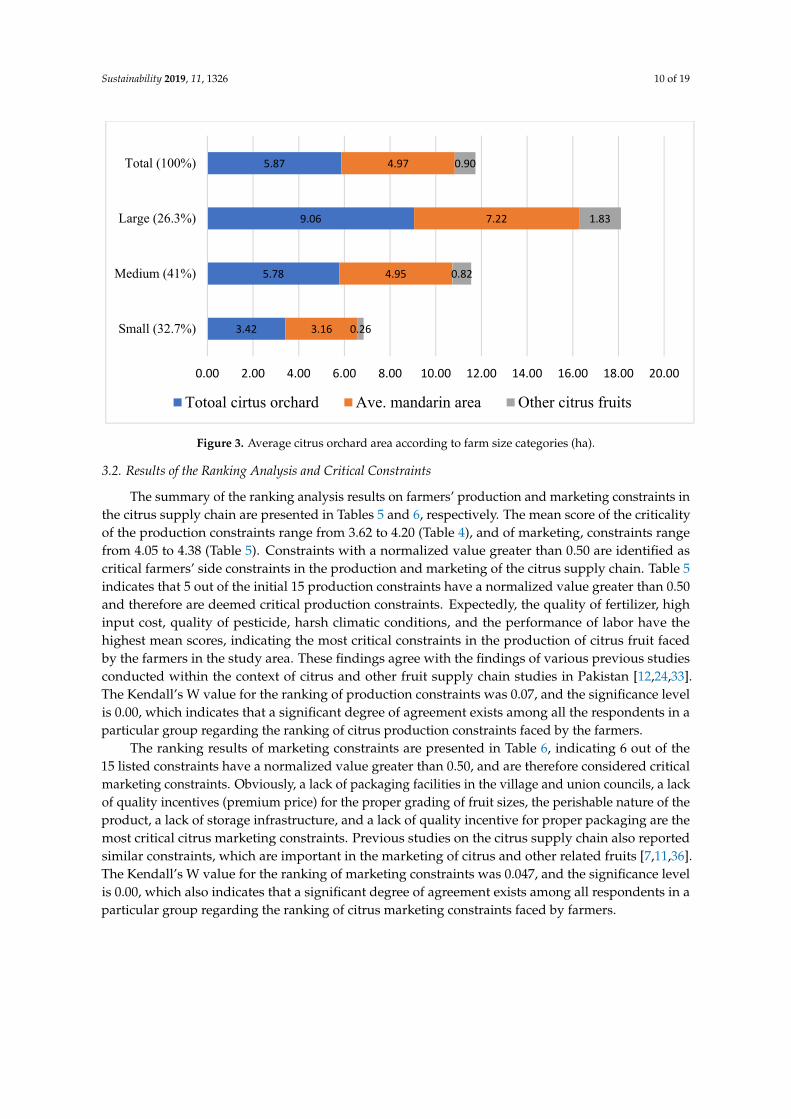
Among citrus varieties, the share of mandarins (Kinnow) is more than 90%. The same resultswere seen in our survey, as is evident from Figure 3, that, on average, farmers grow 5.87 hectares ofcitrus orchard, out of which 4.97 hectares were under mandarins, i.e., 85% of the total. This patternwas seen among all farm sizes, for example, large farmers grow mandarins on 80% of the total citrusorchards, medium farmers grow on 86% of the total citrus orchards, and small farmers grow on 92% ofthe total citrus orchards among all other citrus fruits.
Sustainability 2019, 11, 1326 10 of 19
Sustainability 2019, 11, x FOR PEER REVIEW 10 of 19
Among citrus varieties, the share of mandarins (Kinnow) is more than 90%. The same results were seen in our survey, as is evident from Figure 3, that, on average, farmers grow 5.87 hectares of citrus orchard, out of which 4.97 hectares were under mandarins, i.e., 85% of the total. This pattern was seen among all farm sizes, for example, large farmers grow mandarins on 80% of the total citrus orchards, medium farmers grow on 86% of the total citrus orchards, and small farmers grow on 92% of the total citrus orchards among all other citrus fruits.
Figure 3. Average citrus orchard area according to farm size categories (ha).
3.2. Results of the Ranking Analysis and Critical Constraints
The summary of the ranking analysis results on farmers’ production and marketing constraints in the citrus supply chain are presented in Table 5 and Table 6, respectively. The mean score of the criticality of the production constraints range from 3.62 to 4.20 (Table 4), and of marketing, constraints range from 4.05 to 4.38 (Table 5). Constraints with a normalized value greater than 0.50 are identified as critical farmers’ side constraints in the production and marketing of the citrus supply chain. Table 5 indicates that 5 out of the initial 15 production constraints have a normalized value greater than 0.50 and therefore are deemed critical production constraints. Expectedly, the quality of fertilizer, high input cost, quality of pesticide, harsh climatic conditions, and the performance of labor have the highest mean scores, indicating the most critical constraints in the production of citrus fruit faced by the farmers in the study area. These findings agree with the findings of various previous studies conducted within the context of citrus and other fruit supply chain studies in Pakistan [12,24,33]. The Kendall's W value for the ranking of production constraints was 0.07, and the significance level is 0.00, which indicates that a significant degree of agreement exists among all the respondents in a particular group regarding the ranking of citrus production constraints faced by the farmers.
The ranking results of marketing constraints are presented in Table 6, indicating 6 out of the 15 listed constraints have a normalized value greater than 0.50, and are therefore considered critical marketing constraints. Obviously, a lack of packaging facilities in the village and union councils, a lack of quality incentives (premium price) for the proper grading of fruit sizes, the perishable nature of the product, a lack of storage infrastructure, and a lack of quality incentive for proper packaging are the most critical citrus marketing constraints. Previous studies on the citrus supply chain also reported similar constraints, which are important in the marketing of citrus and other related fruits [7,11,36]. The Kendall's W value for the ranking of marketing constraints was 0.047, and the significance level is 0.00, which also indicates that a significant degree of agreement exists among all respondents in a particular group regarding the ranking of citrus marketing constraints faced by farmers.
3.42
5.78
9.06
5.87
3.16
4.95
7.22
4.97
0.26
0.82
1.83
0.90
0.00 2.00 4.00 6.00 8.00 10.00 12.00 14.00 16.00 18.00 20.00
Small (32.7%)
Medium (41%)
Large (26.3%)
Total (100%)
Totoal cirtus orchard Ave. mandarin area Other citrus fruits
Figure 3. Average citrus orchard area according to farm size categories (ha).
3.2. Results of the Ranking Analysis and Critical Constraints
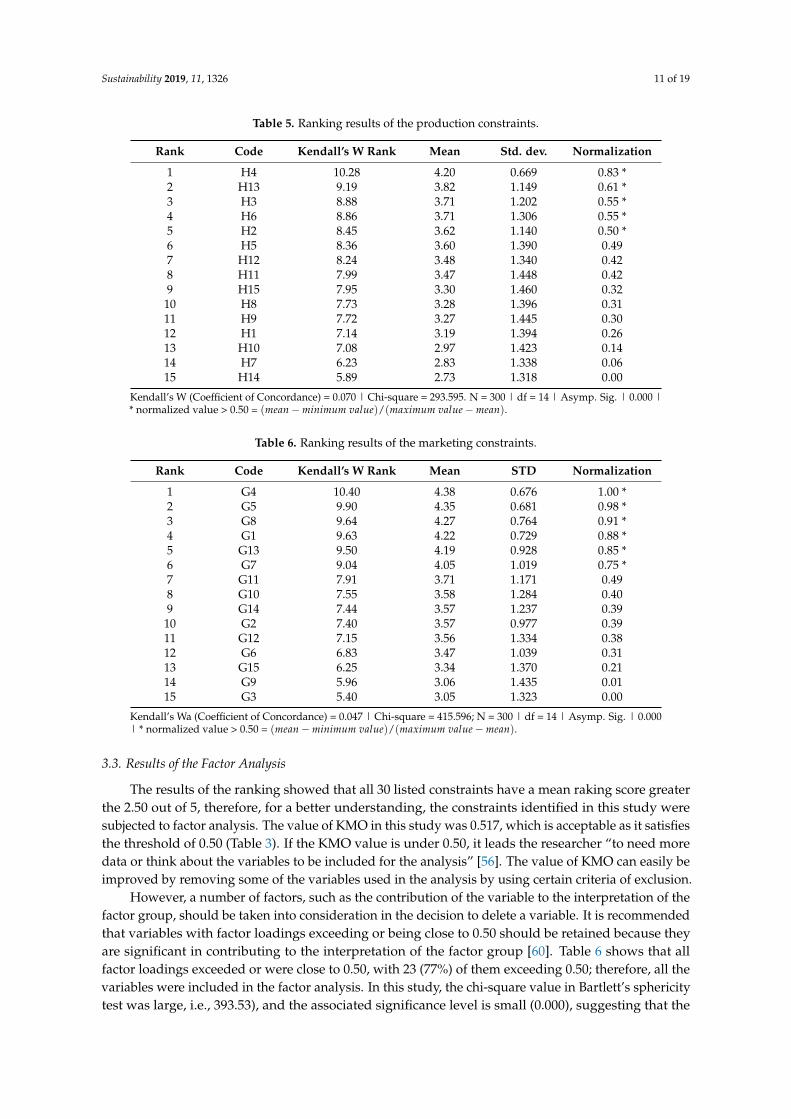
The summary of the ranking analysis results on farmers’ production and marketing constraints inthe citrus supply chain are presented in Tables 5 and 6, respectively. The mean score of the criticalityof the production constraints range from 3.62 to 4.20 (Table 4), and of marketing, constraints rangefrom 4.05 to 4.38 (Table 5). Constraints with a normalized value greater than 0.50 are identified ascritical farmers’ side constraints in the production and marketing of the citrus supply chain. Table 5indicates that 5 out of the initial 15 production constraints have a normalized value greater than 0.50and therefore are deemed critical production constraints. Expectedly, the quality of fertilizer, highinput cost, quality of pesticide, harsh climatic conditions, and the performance of labor have thehighest mean scores, indicating the most critical constraints in the production of citrus fruit facedby the farmers in the study area. These findings agree with the findings of various previous studiesconducted within the context of citrus and other fruit supply chain studies in Pakistan [12,24,33].The Kendall’s W value for the ranking of production constraints was 0.07, and the significance levelis 0.00, which indicates that a significant degree of agreement exists among all the respondents in aparticular group regarding the ranking of citrus production constraints faced by the farmers.
The ranking results of marketing constraints are presented in Table 6, indicating 6 out of the15 listed constraints have a normalized value greater than 0.50, and are therefore considered criticalmarketing constraints. Obviously, a lack of packaging facilities in the village and union councils, a lackof quality incentives (premium price) for the proper grading of fruit sizes, the perishable nature of theproduct, a lack of storage infrastructure, and a lack of quality incentive for proper packaging are themost critical citrus marketing constraints. Previous studies on the citrus supply chain also reportedsimilar constraints, which are important in the marketing of citrus and other related fruits [7,11,36].The Kendall’s W value for the ranking of marketing constraints was 0.047, and the significance levelis 0.00, which also indicates that a significant degree of agreement exists among all respondents in aparticular group regarding the ranking of citrus marketing constraints faced by farmers.
Sustainability 2019, 11, 1326 11 of 19
Table 5. Ranking results of the production constraints.
Rank Code Kendall’s W Rank Mean Std. dev. Normalization
1 H4 10.28 4.20 0.669 0.83 *2 H13 9.19 3.82 1.149 0.61 *3 H3 8.88 3.71 1.202 0.55 *4 H6 8.86 3.71 1.306 0.55 *5 H2 8.45 3.62 1.140 0.50 *6 H5 8.36 3.60 1.390 0.497 H12 8.24 3.48 1.340 0.428 H11 7.99 3.47 1.448 0.429 H15 7.95 3.30 1.460 0.32
10 H8 7.73 3.28 1.396 0.3111 H9 7.72 3.27 1.445 0.3012 H1 7.14 3.19 1.394 0.2613 H10 7.08 2.97 1.423 0.1414 H7 6.23 2.83 1.338 0.0615 H14 5.89 2.73 1.318 0.00
Kendall’s W (Coefficient of Concordance) = 0.070 | Chi-square = 293.595. N = 300 | df = 14 | Asymp. Sig. | 0.000 |* normalized value > 0.50 = (mean − minimum value)/(maximum value − mean).
Table 6. Ranking results of the marketing constraints.
Rank Code Kendall’s W Rank Mean STD Normalization
1 G4 10.40 4.38 0.676 1.00 *2 G5 9.90 4.35 0.681 0.98 *3 G8 9.64 4.27 0.764 0.91 *4 G1 9.63 4.22 0.729 0.88 *5 G13 9.50 4.19 0.928 0.85 *6 G7 9.04 4.05 1.019 0.75 *7 G11 7.91 3.71 1.171 0.498 G10 7.55 3.58 1.284 0.409 G14 7.44 3.57 1.237 0.39
10 G2 7.40 3.57 0.977 0.3911 G12 7.15 3.56 1.334 0.3812 G6 6.83 3.47 1.039 0.3113 G15 6.25 3.34 1.370 0.2114 G9 5.96 3.06 1.435 0.0115 G3 5.40 3.05 1.323 0.00
Kendall’s Wa (Coefficient of Concordance) = 0.047 | Chi-square = 415.596; N = 300 | df = 14 | Asymp. Sig. | 0.000| * normalized value > 0.50 = (mean − minimum value)/(maximum value − mean).
3.3. Results of the Factor Analysis
The results of the ranking showed that all 30 listed constraints have a mean raking score greaterthe 2.50 out of 5, therefore, for a better understanding, the constraints identified in this study weresubjected to factor analysis. The value of KMO in this study was 0.517, which is acceptable as it satisfiesthe threshold of 0.50 (Table 3). If the KMO value is under 0.50, it leads the researcher “to need moredata or think about the variables to be included for the analysis” [56]. The value of KMO can easily beimproved by removing some of the variables used in the analysis by using certain criteria of exclusion.
However, a number of factors, such as the contribution of the variable to the interpretation of thefactor group, should be taken into consideration in the decision to delete a variable. It is recommendedthat variables with factor loadings exceeding or being close to 0.50 should be retained because theyare significant in contributing to the interpretation of the factor group [60]. Table 6 shows that allfactor loadings exceeded or were close to 0.50, with 23 (77%) of them exceeding 0.50; therefore, all thevariables were included in the factor analysis. In this study, the chi-square value in Bartlett’s sphericitytest was large, i.e., 393.53), and the associated significance level is small (0.000), suggesting that the
Sustainability 2019, 11, 1326 12 of 19
population correlation matrix is not an identity matrix. This further reinforces the appropriateness ofusing factor analysis.
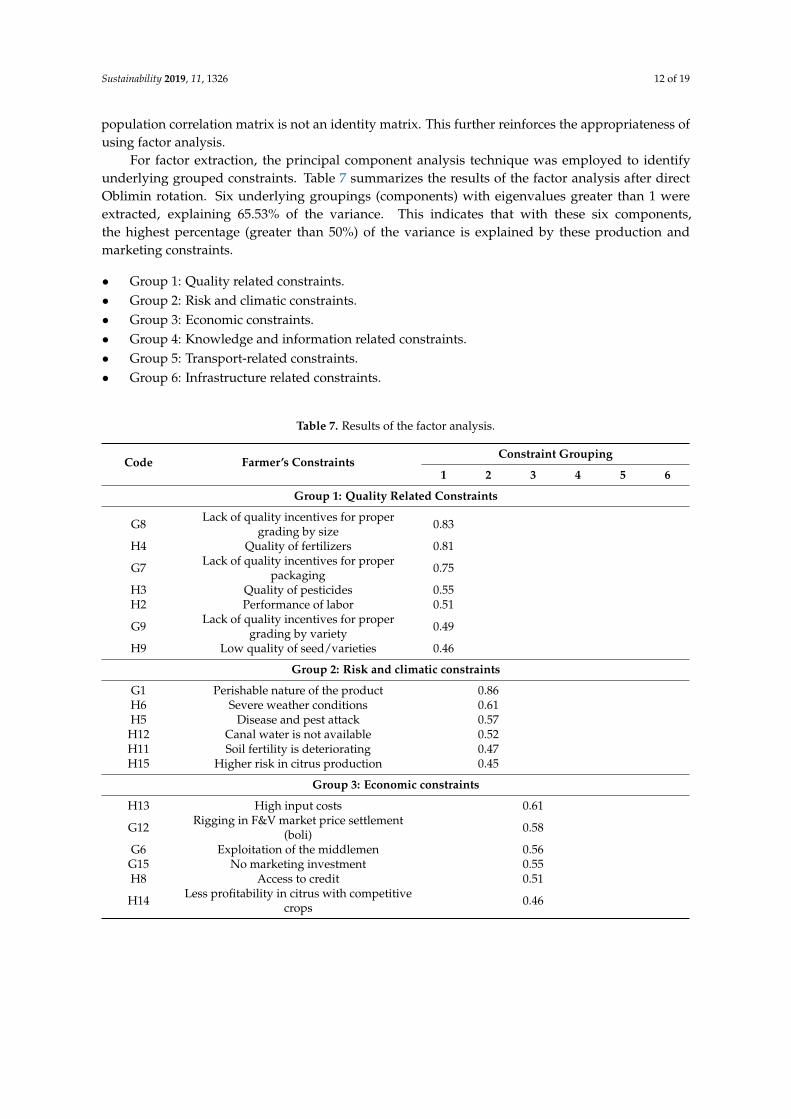
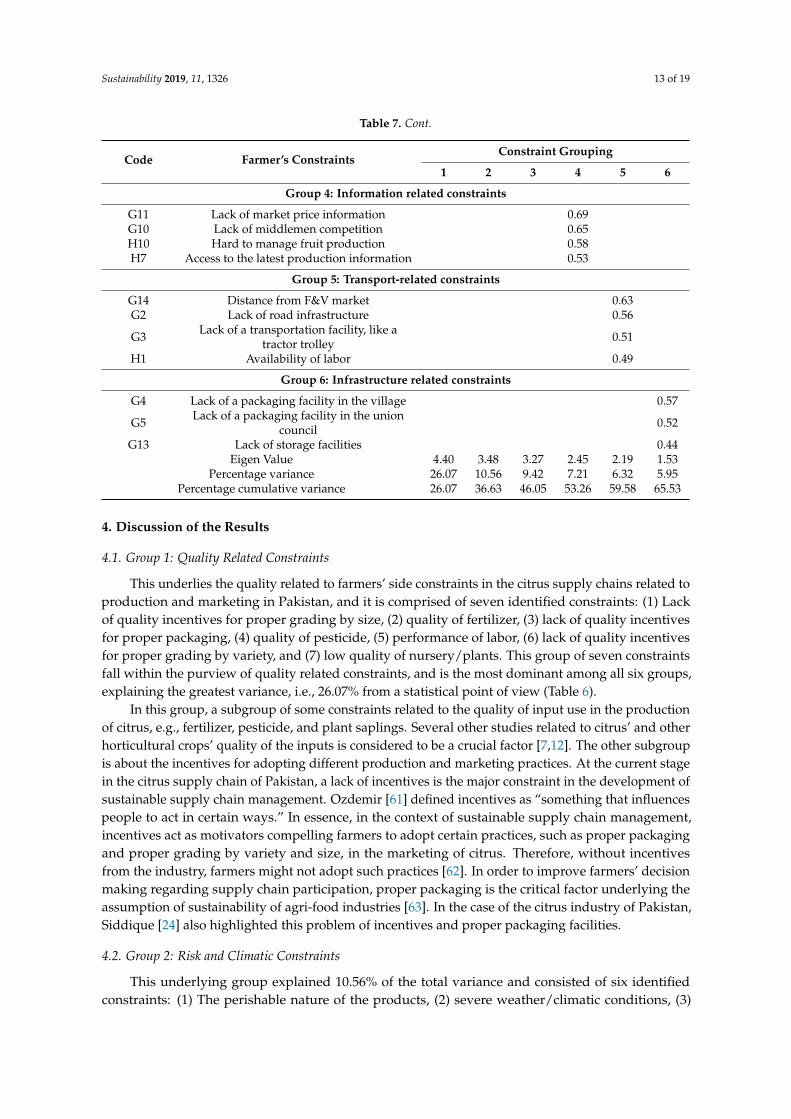
For factor extraction, the principal component analysis technique was employed to identifyunderlying grouped constraints. Table 7 summarizes the results of the factor analysis after directOblimin rotation. Six underlying groupings (components) with eigenvalues greater than 1 wereextracted, explaining 65.53% of the variance. This indicates that with these six components,the highest percentage (greater than 50%) of the variance is explained by these production andmarketing constraints.
• Group 1: Quality related constraints.• Group 2: Risk and climatic constraints.• Group 3: Economic constraints.• Group 4: Knowledge and information related constraints.• Group 5: Transport-related constraints.• Group 6: Infrastructure related constraints.
Table 7. Results of the factor analysis.
Code Farmer’s ConstraintsConstraint Grouping
1 2 3 4 5 6
Group 1: Quality Related Constraints
G8 Lack of quality incentives for propergrading by size 0.83
H4 Quality of fertilizers 0.81
G7 Lack of quality incentives for properpackaging 0.75
H3 Quality of pesticides 0.55H2 Performance of labor 0.51
G9 Lack of quality incentives for propergrading by variety 0.49
H9 Low quality of seed/varieties 0.46
Group 2: Risk and climatic constraints
G1 Perishable nature of the product 0.86H6 Severe weather conditions 0.61H5 Disease and pest attack 0.57
H12 Canal water is not available 0.52H11 Soil fertility is deteriorating 0.47H15 Higher risk in citrus production 0.45
Group 3: Economic constraints
H13 High input costs 0.61
G12 Rigging in F&V market price settlement(boli) 0.58
G6 Exploitation of the middlemen 0.56G15 No marketing investment 0.55H8 Access to credit 0.51
H14 Less profitability in citrus with competitivecrops 0.46
Sustainability 2019, 11, 1326 13 of 19
Table 7. Cont.
Code Farmer’s ConstraintsConstraint Grouping
1 2 3 4 5 6
Group 4: Information related constraints
G11 Lack of market price information 0.69G10 Lack of middlemen competition 0.65H10 Hard to manage fruit production 0.58H7 Access to the latest production information 0.53
Group 5: Transport-related constraints
G14 Distance from F&V market 0.63G2 Lack of road infrastructure 0.56
G3 Lack of a transportation facility, like atractor trolley 0.51
H1 Availability of labor 0.49
Group 6: Infrastructure related constraints
G4 Lack of a packaging facility in the village 0.57
G5 Lack of a packaging facility in the unioncouncil 0.52
G13 Lack of storage facilities 0.44Eigen Value 4.40 3.48 3.27 2.45 2.19 1.53
Percentage variance 26.07 10.56 9.42 7.21 6.32 5.95Percentage cumulative variance 26.07 36.63 46.05 53.26 59.58 65.53
4. Discussion of the Results
4.1. Group 1: Quality Related Constraints
This underlies the quality related to farmers’ side constraints in the citrus supply chains related toproduction and marketing in Pakistan, and it is comprised of seven identified constraints: (1) Lackof quality incentives for proper grading by size, (2) quality of fertilizer, (3) lack of quality incentivesfor proper packaging, (4) quality of pesticide, (5) performance of labor, (6) lack of quality incentivesfor proper grading by variety, and (7) low quality of nursery/plants. This group of seven constraintsfall within the purview of quality related constraints, and is the most dominant among all six groups,explaining the greatest variance, i.e., 26.07% from a statistical point of view (Table 6).
In this group, a subgroup of some constraints related to the quality of input use in the productionof citrus, e.g., fertilizer, pesticide, and plant saplings. Several other studies related to citrus’ and otherhorticultural crops’ quality of the inputs is considered to be a crucial factor [7,12]. The other subgroupis about the incentives for adopting different production and marketing practices. At the current stagein the citrus supply chain of Pakistan, a lack of incentives is the major constraint in the development ofsustainable supply chain management. Ozdemir [61] defined incentives as “something that influencespeople to act in certain ways.” In essence, in the context of sustainable supply chain management,incentives act as motivators compelling farmers to adopt certain practices, such as proper packagingand proper grading by variety and size, in the marketing of citrus. Therefore, without incentivesfrom the industry, farmers might not adopt such practices [62]. In order to improve farmers’ decisionmaking regarding supply chain participation, proper packaging is the critical factor underlying theassumption of sustainability of agri-food industries [63]. In the case of the citrus industry of Pakistan,Siddique [24] also highlighted this problem of incentives and proper packaging facilities.
4.2. Group 2: Risk and Climatic Constraints
This underlying group explained 10.56% of the total variance and consisted of six identifiedconstraints: (1) The perishable nature of the products, (2) severe weather/climatic conditions, (3)
Sustainability 2019, 11, 1326 14 of 19
disease and pest attack, (4) shortage of irrigation water, (5) deterioration of the land, and (6) high risks incitrus production. These six constraints are grouped and named as risk and climate-related constraints.
Risks, particularly related to the supply chain networks of agri-food industries, can be classified ina number of ways [64,65]. However, Hardaker [66] more appropriately classified them into productionand marketing related risks, as used in this study. Leat and Revoredo-Giha [64] also discussed a similartype of production risk that occur because agricultural commodities are affected by uncontrollableevents, such as extreme climatic conditions and outbreaks of pests and diseases. Tummala andSchoenherr [67] conceptualized supply chain risks with an appealing simplicity, namely “an event thatadversely affects supply chain operations resulting in performance measures.”
4.3. Group 3: Economic Constraints
This group consisted of six identified constraints and explained 9.42% of the total variance relatedto the production and marketing of citrus: (1) High cost of inputs; (2) rigging of the setting of themarket price at fruit and vegetable markets, which is called boli in the local language; (3) exploitationby the middlemen; (4) no marketing investment; (5) access to credit; and (6) less profitability in citrusproduction as compared with competitive crops.
Ghafoor et al. [33] reported that high input prices and inadequate agricultural credit were themajor challenges for citrus farmers in Pakistan. Shortages of agricultural credit and expensive inputessential for sustained citrus production lower the potential of citrus production in the district ofSargodha, the same area reported for this study [68]. In addition, Elahi et al. [69] reported that betteraccess to farm advisory services improves agricultural productivity in Punjab. It was also reported byAshraf et al. [70] that the latest technologies are expensive and farmers are relying on manual practices,such as the application of spray, and other mechanization tools in the cultivation of citrus in Sargodha,Punjab. Usman et al. [12] identified poor marketing facilities and the high cost of transportation facedby the citrus farmers. There is generally a big difference in the prices received by the farmers and thatpaid by the consumers due to the high market exploitation of the farmers.
4.4. Group 4: Knowledge and Information Related Constraints
This underlying group consisted of four farmers’ side identified constraints in the citrus supplychain: (1) Lack of market price information, (2) lack of middlemen competition, (3) difficulty inmanaging production, and (4) lack of information related to citrus production. From a statistical point ofview, this group of constraints described 7.21% of the total variance. Several studies in the past literaturefound information, knowledge, and agricultural extension services as the important farmers’ sideconstraints in citrus supply chain studies mostly concerned with production and marketing [12,19,24].
4.5. Group 5: Geographic and Transport Related Constraints
This underlying group described 6.32% of the total variance and consisted of four farmers’side constraints in the citrus supply chain: (1) Distance from fruit and vegetable markets, (2) poorroad infrastructure, (3) lack of a transportation facility, and (4) availability of labor. Usman, Ashraf,Chaudhary, and Talib [12] pointed out that the improvement of road infrastructure, construction ofbridges, and spot maintenance make it easy for growers to reach local markets and other destinationmarkets. There is a need to create better policies to create integrity within remote rural areas (farms)with urban markets through the provision and improvement of road networks [71,72]. In a similarstudy of citrus marketing constraints, Usman, Ashraf, Chaudhary, and Talib [12] found that shortagesand inappropriate transportation facilities have been a major source of quality reduction and citrusfruit losses. Better transportation systems should be provided to growers to reduce transportationcosts and travel times, resulting in better marketing and increased production [73]. The literature [12]also pointed out the labor shortage problem in citrus production, and urged for the development ofthe latest affordable machinery to overcome labor shortage issues.
Sustainability 2019, 11, 1326 15 of 19
4.6. Group 6: Infrastructure Related Constraints
This underlying group consisted of three constraints: (1) Lack of a packaging facility at the village,(2) lack of a packaging facility at the union council, and (3) lack of storage facilities. Statistically, thisgroup described 5.95% of the total variance. It was observed that poor quality assurance followed bythe adoption of traditional packaging practices appears inconvenient for higher profits [19]. In crops,vegetables, and fruits, during packaging, there is an unavoidable amount of losses that occur relatedto low productivity, inefficiency, contamination, and damage of the fresh products [63]. In a previousstudy on citrus constraints [12], it was found that inadequate storage facilities enhanced the shelf life offruits and was the 2nd highest ranked constraint. They also found that along with the lack of storagefacilities, the high cost of storage is also an important issue to be addressed.
5. Concluding Remarks
The implementation of SSCM practices at the upstream level of the chain in agri-food industrieshas received a high level of global attention. However, like many other developing countries, SSCMpractices are still in their infancy and face many constraints in agri-food industries of Pakistan.The citrus industry in Pakistan is a typical example of poor management of SSCM. However, improvingSSCM of the citrus industry can significantly increase export earnings for the country. This can beachieved by effectively addressing the issues and constraints in the entire citrus supply chain. Althoughthere is a large body of literature on the downstream levels for SSCM in agri-food industries, no studieshave attempted to empirically determine the limiting factors for the upstream level. The upstreamlevel of the SSCM includes farmers who are the main participants. Addressing upstream issues canimprove the performance of the entire citrus supply chain. To this end, this study aimed to identify andanalyze the key constraints and issues in the upstream level that affect the production and marketingof the citrus industry in Pakistan. The study was conducted in three locations in the Sargodha districtof Punjab, Pakistan. We conducted five farmer group discussions (FGDs) to identify or list importantconstraints for SSCM of the citrus industry. Farmers reported 30 constraints in the production andmarketing of citrus. These constraints were also validated by an extensive literature survey. Further, weused Kendal’s coefficient of concordance (Kendall’s W- technique) and the mean score normalizationtechnique to identify 11 critical constraints that severely influence production and marketing at theupstream level in the citrus supply chain. On the production side, the quality of fertilizer, high inputcosts, quality of pesticide, harsh climatic conditions, and performance of labor are found to be themost critical constraints faced by the farmers in the study area. Whereas, on the marketing side, a lackof packaging facilities in the village and union councils, lack of quality incentives (premium price) forproper grading of the fruit size, the perishable nature of the product, lack of storage infrastructure,and lack of quality incentives for proper packaging are the most critical citrus marketing constraints.
Furthermore, we used principal component analysis to classify the 30 constraints identifiedin the FGDs into six different groups, namely quality-related constraints, risk and climate-relatedconstraints, economic constraints, knowledge and information-related constraints, geographic andtransport-related constraints, and infrastructure-related constraints. The results of this study not onlyfill the literature gap of SSCM at the upstream level of the chain, but also help to develop policies andtake appropriate measures to address the problems and constraints faced by farmers in the SSCMof Pakistan’s citrus industry. While developing an SSCM policy to improve the citrus industry inPakistan, the government should consider the constraints identified in this study.
Author Contributions: Conceptualization, M.A.u.R.N. & M.M.; Formal analysis, M.A.u.R.N. & A.R.; Investigation,M.A.u.R.N.; Methodology, M.A.u.R.N., S.H., M.A. (Muhammad Ashfaq), & A.A. (Anoma Ariyawardana); Projectadministration, M.A.u.R.N. & M.A. (Muhammad Ashfaq); Resources, M.A. (Muhammad Ashfaq) & A.A. (AzharAbbas); Software, A.R.; Supervision, M.A. (Muhammad Ashfaq), S.H., A.A. (Azhar Abbas) & A.A. (AnomaAriyawardana); Validation, S.H.; Visualization, M.M.; Writing—original draft, M.A.u.R.N. & A.R.; Writing—review& editing, M.A.u.R.N., A.R., M.A. (Muhammad Ashfaq), S.H., M.M., A.A. (Azhar Abbas), M.A. (MuhammadAshfaq), M.A. (Mumtaz Anwar) & A.A. (Anoma Ariyawardana).
Sustainability 2019, 11, 1326 16 of 19
Funding: This research did not receive any specific grant from funding agencies in the public, commercial, ornot-for-profit sectors.
Acknowledgments: The author highly acknowledges the Higher Education Commission (HEC), Pakistan tosponsor his Ph.D. under Indigenous Scholarship Program. Authors also acknowledge the data collection teamand the farmers for their time and effort.
Conflicts of Interest: The author(s) declared no potential conflicts of interest with respect to the research,authorship, and/or publication of this article.
References
1. Naik, G.; Suresh, D.N. Challenges of creating sustainable agri-retail supply chains. IIMB Manag. Rev. 2018.[CrossRef]
2. Ganesh Kumar, C.; Murugaiyan, P.; Madanmohan, G. Agri-Food Supply Chain Management: LiteratureReview. Intell. Inf. Manag. 2017, 9, 68–96. [CrossRef]
3. Samuel, M.V.; Shah, M.; Sahay, B. An Insight into Agri-Food Supply Chains: A Review. Int. J. ValueChain Manag. 2012, 6, 115–143. [CrossRef]
4. GOP. Economic Survey of Pakistan 2017-18; Ministry of Finance, Government of Pakistan: Islamabad, Pakistan,2018.
5. Mukhtar, U.; Zhong, Z.; Tian, B.; Razzaq, A.; Naseer, M.A.u.R.; Hina, T. Does Rural–Urban MigrationImprove Employment Quality and Household Welfare? Evid. Pak. 2018, 10, 4281. [CrossRef]
6. Naseer, M.A.U.R.; Ashfaq, M.; Hassan, S.; Adil, S.A.; Ariyawardana, A. Outlook on the global tradecompetitiveness of Pakistan’s mandarin industry: An application of revealed symmetric comparativeadvantage framework. Outlook Agric. 2018, 48, 1–9. [CrossRef]
7. Badar, H. Value Chain Performance Improvement for Sustainable Mango Industry Development in Pakistan;The University of Queensland: Queensland, Australia, 2015.
8. Siddique, M.I.; Garnevska, E.; Marr, N.E. Factors affecting marketing channel choice decisions of smallholderCitrus growers. J. Agribus. Dev. Emerg. Econ. 2018, 8, 426–453. [CrossRef]
9. Memon, N.A. Citrus Fruit (Kino): Punjab produced 98% of production, Exclusive on Kino. Pak. Food J.2017. Available online: http://foodjournal.pk/2017/Jan-Feb-2017/PDF-Jan-Feb-2017/Dr-Noor-Kino.pdf(accessed on 28 February 2019).
10. FAO. Statistical Bulletin of Crops Food and Agriculture Orgnizations (FAO); FAO: Rome, Italy, 2018.11. Sharif, M.; Farooq, U.; Malik, W.; Bashir, M. Citrus Marketing in Punjab: Constraints and Potential for
Improvement [with Comments]. Pak. Dev. Rev. 2005, 44, 673–694. [CrossRef]12. Usman, M.; Ashraf, I.; Chaudhary, K.M.; Talib, U. Factors impeding citrus supply chain in Central Punjab,
Pakistan. Int. J. Agric. Ext. 2018, 6, 1–5.13. Ouma, G.; Jeruto, P. Sustainable horticultural crop production through intercropping: The case of fruits and
vegetable crops: A review. Agric. Biol. J. N. Am. 2010, 1, 1098–1105. [CrossRef]14. Ahmed, S.; Khan, M.A.; Qasam, M. Effect of intercropping of maize in citrus orchards on citrus leaf miner
infestation and population of its natural enemies. Pak. J. Agric. Sci. 2013, 50, 91–93.15. Bhatnagar, P.; Kaul, M.; Singh, J. Effect of intercropping in kinnow based production system. Indian J.
Arid Horticult. 2007, 2, 15–17.16. Zekri, M. Factors Affecting Citrus Production and Quality. Citrus, D.O., Ed.; Available online: https://crec.ifas.
ufl.edu/extension/trade_journals/2011/2011_dec_factors_citrus.pdf (accessed on 28 February 2019).17. De Fazio, M. Agriculture and Sustainability of the Welfare: The Role of the Short Supply Chain. Agric. Agric.
Sci. Procedia 2016, 8, 461–466. [CrossRef]18. Kazancoglu, Y.; Ozkan-Ozen, Y.D.; Ozbiltekin, M. Minimizing losses in milk supply chain with sustainability:
An example from an emerging economy. Resour. Conserv. Recycl. 2018, 139, 270–279. [CrossRef]19. Iqbal, S.; Kamal, T. Factors Affecting Citrus Productivity in District Dir Lower. J. Econ. Sustain. Dev. 2014, 5,
197–200.20. FAO. FAO Yearbook 2010; Food and Agriculture Organisation of the United Nations: Rome, Italy, 2012.21. Sitek, P.; Wikarek, J.; Nielsen, P. A constraint-driven approach to food supply chain management. Ind. Manag.
Data Syst. 2017, 117, 2115–2138. [CrossRef]
Sustainability 2019, 11, 1326 17 of 19
22. Moazzam, M. Benchmarking Agri-food Supply Chains: A Case of Pakistan and New Zealand Milk System; MasseyUniversity: Palmerston North, New Zealand, 2015.
23. Hussain, S.; Ahmed, W.; Rabnawaz, A.; Sohail Jafar, R.; Akhtar, H.; Guang-Ju, W.; Ullah, S.; JianZhou, Y.Integration and effective supply chain management: A review of agriculture in Pakistan and China. J. Econ.Sustain. Dev. 2015, 6. [CrossRef]
24. Siddique, M.I. Factors Affecting Marketing Channel Choice Decisions in Citrus Supply Chain Massey University;Massey University: Palmerston North, New Zealand, 2015.
25. Johnson, G. Pakistan Citrus Industry Challenges: Opportunities for Australia-Pakistan Collaboration in Research,Development & Extension; ACIAR: Canberra, Australia, 2006.
26. Ahmed, U.I.; Ying, L.; Mushtaq, K.; Bashir, M.K. An econometric estimation of post-harvest losses of kinnowin Pakistan. Int. J. Econ. Commer. Manag. Sci. Lett. 2015, 3, 373–383.
27. Seitz, M.A.; Wells, P.E. Challenging the implementation of corporate sustainability: The case of automotiveengine remanufacturing. Bus. Process Manag. J. 2006, 12, 822–836. [CrossRef]
28. Diabat, A.; Govindan, K. An analysis of the drivers affecting the implementation of green supply chainmanagement. Resour. Conserv. Recycl. 2011, 55, 659–667. [CrossRef]
29. Rao, P.; Holt, D. Do green supply chains lead to competitiveness and economic performance? Int. J. Oper.Prod. Manag. 2005, 25, 898–916. [CrossRef]
30. Hart, S.L. Beyond greening: Strategies for a sustainable world. Harv. Bus. Rev. 1997, 75, 66–77.31. Dowell, G.; Hart, S.; Yeung, B. Do Corporate Global Environmental Standards Create or Destroy Market
Value? Manag. Sci. Lett. 2000, 46, 1059–1074. [CrossRef]32. Badar, H.; Ariyawardana, A.; Collins, R. Capturing Consumer Preferences for Value Chain Improvements in
the Mango Industry of Pakistan. Int. Food Agribus. Manag. Rev. 2015, 18, 131–148.33. Ghafoor, U.; Muhammad, S.; Chaudhary, K. Constraints in availability of inputs and information to citrus
(kinnow) growers of tehsil Toba Tek Singh. Pak. J. Agric. Sci. 2008, 45, 520–522.34. Chamhuri, N.; Batt, P. Exploring the factors influencing consumers‘ choice of retail store when purchasing
fresh meat in Malaysia. Int. Food Agribus. Manag. Rev. 2013, 16, 99–122.35. Malhotra, N.K. Essentials of Marketing Research: A Hands-on Orientation; Pearson Essex: Pearson, UK, 2015.36. Siddique, M.I.; Garnevska, E. Citrus Value Chain (s): A Survey of Pakistan Citrus Industry. In Agriculture
Value Chain; IntechOpen: London, UK, 2018.37. Chan, A.P.C.; Darko, A.; Olanipekun, A.O.; Ameyaw, E.E. Critical barriers to green building technologies
adoption in developing countries: The case of Ghana. J. Clean. Prod. 2018, 172, 1067–1079. [CrossRef]38. Nyaoga, R.; Magutu, P. Constraints management and value chain performance for sustainable development.
Manag. Sci. Lett. 2016, 6, 427–442. [CrossRef]39. Ezin, V.; Quenum, F.; Bodjrenou, R.H.; Kpanougo, C.M.; Kochoni, E.M.; Chabi, B.I.; Ahanchede, A.
Assessment of production and marketing constraints and value chain of sweet potato in the municipalitiesof Dangbo and Bonou. Agric. Food Secur. 2018, 7, 15. [CrossRef]
40. Tsolakis, N.K.; Keramydas, C.A.; Toka, A.K.; Aidonis, D.A.; Iakovou, E.T. Agrifood supply chainmanagement: A comprehensive hierarchical decision-making framework and a critical taxonomy.Biosyst. Eng. 2014, 120, 47–64. [CrossRef]
41. Choudhary, D.; Kunwar, M.S.; Rasul, G. From Farmers to Entrepreneurs—Strengthening Malta orange valuechains through institutional development in Uttarakhand, India. Mt. Res. Dev. 2015, 35, 4–15. [CrossRef]
42. Shrestha, B. A Supply Chain Approach to Study Efficiency and Sustainability in the Nepalese tea Industry; TurkuUniversity of Applied Sciences: Turku, Finland, 2014; Available online: https://www.theseus.fi/handle/10024/85270 (accessed on 1 March 2019).
43. Razzaq, A.; Ping, Q.; Naseer, M.A.u.R.; Abid, M.; Anwar, M.; Javed, I. Can the informal groundwater marketsimprove water use efficiency and equity? Evidence from a semi-arid region of Pakistan. Sci. Total Environ.2019. [CrossRef]
44. Naseer, M.A.u.R.; Ashfaq, M.; Abid, M.; Razzaq, A.; Hassan, S. Current Status and Key Trends in AgriculturalLand Holding and Distribution in Punjab, Pakistan: Implications for Food Security. J. Agric. Stud. 2016, 4, 14.[CrossRef]
45. GOP. Population Census 2017; Pakistan Bureau of Statistics, Government of Pakistan Islamabad; GOP:Washington, DC, USA, 2018.
Sustainability 2019, 11, 1326 18 of 19
46. Ashfaq, M.; Razzaq, A.; Hassan, S.; Haq, S.U. Factors affecting the economic losses due to livestock diseases:A case study of district Faisalabad. Pak. J. Agric. Sci. 2015, 52, 515–520.
47. Ashfaq, M.; Razzaq, A.; Haq, S.U.; Muhammad, G. Economic analysis of dairy animal diseases in Punjab: Acase study of Faisalabad district. J. Anim. Plant Sci. 2015, 25, 1482–1495.
48. GOP. Agriculture Marketing and Information System (AMIS); Government of Punjab, Pakistan: Lahore, Pakistan,2018.
49. Santos, J.R.A. Cronbach’s alpha: A tool for assessing the reliability of scales. J. Exten. 1999, 37, 1–5.50. Tavakol, M.; Dennick, R. Making sense of Cronbach‘s alpha. Int. J. Med. Edu. 2011, 2, 53. [CrossRef]
[PubMed]51. Zhao, X.; Hwang, B.-G.; Low, S.P.; Wu, P. Reducing Hindrances to Enterprise Risk Management
Implementation in Construction Firms. J. Construct. Eng. Manag. 2015, 141, 04014083. [CrossRef]52. Siegel, S. Nonparametric statistics. Am. Stat. 1957, 11, 13–19.53. Lam, P.T.I.; Chan, E.H.W.; Yu, A.T.W.; Cam, W.C.N.; Yu, J.S. Applicability of clean development mechanism
to the Hong Kong building sector. J. Clean. Prod. 2015, 109, 271–283. [CrossRef]54. Norusis, M. SPSS 16.0 Advanced Statistical Procedures Companion; Prentice Hall Press: Upper Saddle River, NJ,
USA, 2008.55. Li, Y.Y.; Chen, P.-H.; Chew, D.A.S.; Teo, C.C.; Ding, R.G. Critical Project Management Factors of AEC Firms for
Delivering Green Building Projects in Singapore. J. Construct.Eng. Manag. 2011, 137, 1153–1163. [CrossRef]56. Field, A. Discovering Statistics Using IBM SPSS Statistics; Sage: Newcastle upon Tyne, UK, 2013.57. Kaiser, H.F. An index of factorial simplicity. Psychometrika 1974, 39, 31–36. [CrossRef]58. Chan, A.P.C.; Lam, P.T.I.; Chan, D.W.M.; Cheung, E.; Ke, Y. Critical Success Factors for PPPs in Infrastructure
Developments: Chinese Perspective. J. Construct. Eng. Manag. 2010, 136, 484–494. [CrossRef]59. Pallant, J. SPSS Survival Manual; McGraw-Hill Education: New York, NY, USA, 2013.60. Matsunaga, M. How to factor-analyze your data right: do’s, don’ts, and how-to’s. Int. J. Psychol. Res. 2010, 3,
97–110. [CrossRef]61. Ozdemir, M.H. An Alternative Incentive System to Improve Productivity at the Turkish Naval Shipyards; Naval
Postgraduate School Monterey: Monterey, CA, USA, 2000; Available online: https://core.ac.uk/download/pdf/36725649.pdf (accessed on 1 March 2019).
62. Darko, A.; Chan, A.P.; Owusu-Manu, D.-G.; Ameyaw, E.E. Drivers for implementing green buildingtechnologies: An international survey of experts. J. Clean. Prod. 2017, 145, 386–394. [CrossRef]
63. Djekic, I.; Sanjuán, N.; Clemente, G.; Jambrak, A.R.; Djukic-Vukovic, A.; Brodnjak, U.V.; Pop, E.;Thomopoulos, R.; Tonda, A. Review on environmental models in the food chain-Current status and futureperspectives. J. Clean. Prod. 2018, 176, 1012–1025. [CrossRef]
64. Leat, P.; Revoredo-Giha, C. Risk and resilience in agri-food supply chains: The case of the ASDA PorkLinksupply chain in Scotland. Supply Chain Manag. Int. J. 2013, 18, 219–231. [CrossRef]
65. Harland, C.; Brenchley, R.; Walker, H. Risk in supply networks. J. Purch. Supply Manag. 2003, 9, 51–62.[CrossRef]
66. Hardaker, J.B. Coping with Risk in Agriculture; CABI: Wallingford, UK, 2004.67. Tummala, R.; Schoenherr, T. Assessing and managing risks using the supply chain risk management process
(SCRMP). Supply Chain Manag. Int. J. 2011, 16, 474–483. [CrossRef]68. Ashraf, S.; Khan, G.A.; Ali, S.; Iftikhar, M.; Mehmood, N. Managing insect pests & diseases of citrus: On
farm analysis from Pakistan. Pak. J. Phytopathol. 2014, 26, 301–307.69. Elahi, E.; Abid, M.; Zhang, L.; ul Haq, S.; Sahito, J.G.M. Agricultural advisory and financial services; farm
level access, outreach and impact in a mixed cropping district of Punjab, Pakistan. Land Use Policy 2018, 71,249–260. [CrossRef]
70. Ashraf, S.; Khan, G.A.; Ali, S.; Iftikhar, M.; Luqman, M.; Hassan, M. Patterns and limitations of micronutrientsapplication for citrus production in sargodha: A challenge for extension education in the Punjab. J. Agric. Res.2015, 53. Available online: https://s3.amazonaws.com/academia.edu.documents/40876030/PATTERNS_AND_LIMITATIONS_OF_MICRONUTRIENTS.pdf?AWSAccessKeyId=AKIAIWOWYYGZ2Y53UL3A&Expires=1551591550&Signature=1tgKUuUcwxsyxMz1UsIOhgcjjcg%3D&response-content-disposition=inline%3B%20filename%3DPATTERNS_AND_LIMITATIONS_OF_MICRONUTRIEN.pdf (accessed on 3February 2019).

Sustainability 2019, 11, 1326 19 of 19
71. Arethun, T.; Bhatta, B.P. Contribution of rural roads to access to-and participation in markets: Theory andresults from northern Ethiopia. J. Transp. Technol. 2012, 2, 165–175. [CrossRef]
72. Markelova, H.; Meinzen-Dick, R.; Hellin, J.; Dohrn, S. Collective action for smallholder market access.Food Policy 2009, 34, 1–7. [CrossRef]
73. IFAD. Rural Poverty Report 2001: The Challenge of Ending Rural Poverty, International Fund for AgriculturalDevelopment; Oxford University Press: Oxford, UK, 2001.
© 2019 by the authors. Licensee MDPI, Basel, Switzerland. This article is an open accessarticle distributed under the terms and conditions of the Creative Commons Attribution(CC BY) license (http://creativecommons.org/licenses/by/4.0/).
Copyright © 2022 FDOKUMEN