Linking supply chain configuration to supply chain performance: A discrete event simulation model
Upload
khangminh22Category
view
0download
0
1
Abstract Number: 015-0501
Managing Supply Chain Risk: A Supply-Side Perspective
Daniel Kern
Friedrich-Alexander-University of Erlangen-Nuremberg, Lange Gasse 20, 90403 Nuremberg, Germany;
e-mail: [email protected]; +49 911 5302-454
Roger Moser
European Business School (EBS), Rheingaustrasse 1, 65375 Oestrich-Winkel, Germany;
e-mail: [email protected]; +91 9902760938
Evi Hartmann
Friedrich-Alexander-University of Erlangen-Nuremberg, Lange Gasse 20, 90403 Nuremberg, Germany;
e-mail: [email protected]; +49 911 5302-444
Marco Moder
Friedrich-Alexander-University of Erlangen-Nuremberg, Lange Gasse 20, 90403 Nuremberg, Germany;
e-mail: [email protected]; +49 911 5302-444
POMS 21st Annual Conference
Vancouver, Canada
May 7 to May 10, 2010

2
Managing Supply Chain Risk: A Supply-Side Perspective
ABSTRACT
Supply chain risk management has gained significant attention in the field of operations
management. In the past, research focused on initiatives that made supply chains leaner, resulting
in efficient but vulnerable operations. In our study, we develop a model for upstream supply
chain risk management. We collected survey data of 162 companies for the empirical analysis. In
a path analytic model we link the risk management activities – risk identification, risk
assessment and risk mitigation – to risk performance. Many studies have stressed the importance
of an iterative risk management process that is constantly adapted to the changing environment.
Therefore, we include the effect of a continuous improvement process on the risk management
activities. The data provides support to all our hypotheses confirming risk management’s
contribution to risk performance. In times of economic crisis, our results provide managers with
an even stronger argument to invest in supply chain risk management initiatives.
Keywords:
supply chain risk management; continuous improvement, structural equations model

3
1. Introduction
The recent past has seen a growing interest in supply chain management topics within the field of
operations management research (Kouvelis, Chambers, & Wang, 2006). Outsourcing, reduction
of inventories and increasing inter-firm cooperation are only a few initiatives that helped to make
supply chains leaner and more efficient. However, Kleindorfer and Saad (2005) argue that
extreme leanness results in a cost-efficient but fragile supply chain. In absence of risk, a lean
process may outperform whereas in a world of uncertainty an efficient but susceptible supply
chain with a high risk exposure might even threaten the other operations of a company. In fact,
the impact of supply chain disruptions on company performance has increased over the past few
years (Hendricks & Singhal, 2005). Single sourcing (Hendricks & Singhal, 2005; Tomlin, 2006),
low inventories (Craighead, Blackhurst, Rungtusanatham, & Handfield, 2007; Hendricks &
Singhal, 2005; Schmitt & Singh, 2009), increased product complexity (Hendricks & Singhal,
2005) and a growing importance of purchasing as a value creation function (Zsidisin, Panelli, &
Upton, 2000) allow only little margin for error and leave supply chains highly vulnerable. At the
same time, global organizations face an increasingly unstable environment in many of their
markets (Manuj & Mentzer, 2008a; Wagner & Bode, 2008). With more sensitive supply chains
on the one hand and higher uncertainty in a global business world on the other hand, disruptions
hit supply chains more often and severe. The negative consequences are immense when risks are
poorly managed or remain undetected (Hendricks & Singhal, 2003).
Thus, managing supply chain risks needs to be a primary objective of any senior executive team
by integrating risk management as part of each and every supply chain (Cohen & Kunreuther,
2007; Ghoshal, 1987; Tomlin, 2006). Hendricks and Singhal (2005) show that past supply chain

4
research heavily focused on cost-efficiency and less on robustness. In a recent survey of Poirier
and Quinn (2004), only one third of the responding firms say that they paid “sufficient attention
to supply chain vulnerability and risk mitigation actions” (Poirier & Quinn, 2004, p. 31). While
the stream of empirical papers in the field of SCM is steadily growing, the few existing empirical
studies heavily rely on secondary data or use more than 10-year old data sets (Cheng & Grimm,
2006; Kouvelis et al., 2006). However, extensive research has been carried out on risk
management in the field of financial markets (Kouvelis et al., 2006). Seshadri and
Subrahmanyam (2005) highlight the potential of applying the concepts of financial risk
management in the field of operations management.
Reviewing the literature and combining previous research shows that a common risk
management process is generally organized into three steps: risk identification, risk assessment,
and risk mitigation (Bode & Wagner, 2009; Kleindorfer & Saad, 2005; Tang 2006). In the past,
authors also stressed the importance of an ongoing risk monitoring and iterative risk
management process that is constantly adapted to the requirements of a changing environment
(Bode & Wagner, 2009; Hendricks & Singhal, 2005; Kleindorfer & Saad, 2005). With no
continuous improvement even successful risk management processes will become weak and
eventually obsolete when environmental conditions change and new risks arise. Thus, we argue,
that in the long run, risk management activities need to go hand-in-hand with a continuous
improvement process.
As to the best of our knowledge, there hardly exist empirical studies on the combined
contribution of risk identification, risk assessment, risk mitigation on supply chain risk
management performance. Hendricks and Singhal (2003, 2005) analyze in their event studies the
stock price effect of more than 500 public disruption announcements made by companies.

5
Wagner and Bode (2006) use a survey-based approach to investigate supply chain vulnerability
including several supply chain characteristics. In our study, we first operationalize the constructs
risk identification, risk assessment, and risk mitigation through an extensive literature review and
link it to risk performance. Furthermore we include the effect of a continuous improvement
process in our model. In a second step we use partial least squares analysis to evaluate the
contribution of these upstream supply chain risk management activities on risk performance.
The remainder of the paper is structured as follows: In section 2 we place our study in the
context of supply chain risk management research. Based on a literature review, we develop and
operationalize our model in section 3. Sampling and data description are then presented in detail
in section 4 together with our measurement and structural model analysis. Section 5 includes the
discussion of the study results and the analysis of our findings. We finally discuss the study
limitations and opportunities for further research in section 6.
2. Upstream Supply Chain Risk Management
Research on supply chain risk management classifies risks into operational risks and disruptions
risks (Tang, 2006) or refers to them as supply-demand coordination risks and disruption risks
(Kleindorfer & Saad, 2005). Operational risks include the everyday management of the supply
chain whereas disruptions risks are associated with unexpected events including natural disasters
(Kouvelis et al., 2006). As a second dimension Tang (2006) suggests structuring the literature on
supply chain risk management according to the mitigation approach. Supply management,
demand management, product management, and information management can all contribute to a
successful mitigation strategy.

6
Recent research stresses the importance of an integrated and holistic approach in supply chain
management because a narrow view on a single focal firm cannot take into consideration the
many interrelations of a global supply chain (Buhman, Kekre, & Singhal, 2005; Steele & Court,
1996; Wagner & Bode, 2006).. Research has come up so far with distinct models and
management tools for various segments of the supply chain. A common classification is the
distinction between upstream and downstream supply chain initiatives. Likewise risks can occur
on the supply side and on the demand side (Kouvelis et al., 2006; Manuj & Mentzer, 2008b;
Wagner & Bode, 2008). Tang’s (2006) classification of risk management approaches within the
supply chain context also distinguishes supply management and demand management. We
follow this argumentation; however, we stress that a holistic view of the supply chain is always
necessary. For example, clear knowledge about the demand side impact is necessary when
assessing supply side risks regarding a potential negative business impact. Our model focuses on
upstream supply chain risk management sometimes also refered to as supply risk management
(Wagner & Bode, 2006; Zsidisin, Ellram, Carter, & Cavinato, 2004).
3. Conceptual Model
Our research model includes five constructs and six relationships among them, as shown in
Figure 1. The constructs are defined in the subsequent chapters and their operationalization is
anchored in the literature. We investigate the effect of risk identification on risk assessment
which again is hypothesized to have positive impact on risk mitigation. Risk mitigation then
directly contributes to risk performance. Additionally, we examine the impact of a continuous
improvement process on the risk identification, risk assessment and risk mitigation activities.

7
-----------------------------------------
Insert Figure 1 about here
-----------------------------------------
3.1 Risk Identification
The critical first step of every risk management process is the identification of risks (Kleindorfer
& Saad, 2005). The identification of risks is triggering the risk management process. Risk
identification aims to discover all relevant risks. This implies that an early judgment is needed to
decide whether a risk is considered to be relevant – and thus will be further assessed – or not.
Therefore, risk identification needs to follow a holistic approach (Buhman et al., 2005),
screening the whole supply chain regularly for weak signals within the supply chain and the
environment. The target of this step is to identify as broadly as possible all potential threats and
all relevant vulnerabilities within the upstream supply chain. We see the scope of risk
identification in analogy of a research process. Basic research at the very beginning needs to be
broad in order to discover various opportunities. In the stage of applied research, however,
efforts need to focus on a deep understanding for a very specific object of research. Risk
identification – like basic research – as the very first step in risk management is targeted to
broadly discover all potential risks. Risk assessment – in analogy to applied research – then aims
to evaluate and understand each relevant risk in detail.
Craighead et al. (2007) argue that disruption severity is influenced by the time it takes for a
company to learn about a risk or to predict a disruption. Companies need to develop the ability to
predict disruptions early, so that risks can be duly assessed and mitigation efforts can take effect.
By carefully scanning these early warning signals, relevant risks are recognized early and
mitigation actions can be initiated in time (Craighead et al., 2007; Hendricks & Singhal, 2003;
Tomlin, 2006; Zsidisin et al., 2004). A totally undirected search for new risks, however, does not
8
use limited resources in the most efficient way. Due to resource constraints it is therefore
necessary to define observation fields and discover potential sources of risks and vulnerabilities.
Due to the complexity of supply chain operations, this requires knowledge about a company’s
most critical components, processes and suppliers in order to focus resources on the most fragile
areas of the supply chain (Hallikas, Virolainen, & Tuominen., 2002; Kleindorfer & Saad, 2005;
Steele & Court, 1996). The operationalization of the risk identification construct including
detailed item description with their respective loadings can be found in the appendix Table A.1.
It is importance to notice that only risks that are identified in the first step can be assessed and
managed in the subsequent process (Berg, Knudsen, & Norrman, 2008). Thus, risk identification
is crucial for the overall risk management process. We expect that excellent activities for
identifying risks lay the foundation for duly assessing the risks in the next step. Thus, we derive
our first hypothesis:
Hypothesis 1: Risk identification activities have a positive impact on risk assessment.
3.2 Risk Assessment
Step two of the risk management process is risk assessment. Almost every definition of risk
assessment in the literature includes an evaluation of likelihood of occurrence and an estimation
of the possible impact in case the risk event unfolds (Hallikas et al., 2002; Harland, Brenchley, &
Walker, 2003; Kleindorfer & Saad, 2005; Manuj & Mentzer, 2008a, 2008b; Ritchie & Brindley,
2007; Schmitt & Singh, 2009; Souza, Goh, & Meng, 2009; Steele & Court, 1996; Yates & Stone,
1992; Zsidisin et al., 2004). Risk assessment processes in the field of supply management are no
exemption here. The main purpose of risk assessment is thus to provide the necessary

9
information about a risk identified in order to effectively avoid it, reduce its likelihood and
impact, accept its occurrence or prepare contingency plans (Baird & Thomas, 1985).
Risk assessment needs to understand the factors leading to the occurrence of a specific risk and
provide information on risk drivers and key vulnerabilities in the upstream supply chain. Special
attention needs to be paid to interrelatedness of risks and trigger events (Harland et al., 2003;
Kleindorfer & Saad, 2005; Manuj & Mentzer, 2008b; Ritchie & Brindley, 2007). The resulting
business impact of a disruption highly depends on the occurrence speed of a specific risk and its
duration (Braunscheidel & Suresh, 2009; Hendricks & Singhal, 2003; Manuj & Mentzer, 2008b;
Schmitt & Singh, 2009). Therefore, the result of risk assessment activities provides a clear
classification of all relevant risks and puts them into a prioritizing order. For the process to be
effective, it needs to be kept simple. Graphical illustration can help to map risks in an appropriate
way to show where, when, and with what likelihood and impact risks might occur (Hallikas et
al., 2002; Harland et al., 2003; Manuj & Mentzer, 2008b; Matook, Lasch, & Tamaschke, 2009;
Norrman & Jansson, 2004; Ritchie & Brindley, 2007; Schmitt & Singh, 2009; Steele & Court,
1996; Souza et al., 2009; Yates & Stone, 1992). Detailed understanding of the specific risk is
necessary to initiate the right mitigation activities. Thus we expect that outstanding risk
assessment activities contribute to a better risk mitigation and therefore we hypothesize:
Hypothesis 2: Risk assessment activities have a positive impact on risk mitigation.
3.3 Risk Mitigation
Risk mitigation makes use of the data collected in the previous step to address potential risks
with the right measures. This includes classic mitigation strategies (before the risk event) as well
10
as contingency plans (after the risk event). For each relevant risk, an appropriate mitigation
strategy needs to be developed and executed. This involves the generation as well as the
assessment of diverse mitigation strategies (Chopra, Reinhardt, & Mohan, 2007; Kleindorfer &
Saad, 2005; Manuj & Mentzer 2008b; Wagner & Bode, 2006). Kleindorfer and Saad (2005)
argue that prevention is better than cure, which requires risk managers to act fast and treat urgent
risks first. Literature states, that early and effective mitigation can only be achieved through
close collaboration with supply chain partners. Risk mitigation needs to be supported from
various functions within the firm. Top management attention is necessary to stress the
importance of this risk management activity and to strictly ensure holistic thinking, decision
making and fast action (Berg et al., 2008; Chen & Paulraj, 2004; Kleindorfer & Saad, 2005;
Zsidisin et al., 2004).
Risk mitigation aims to reduce the probability of risk occurrences and lessen the negative impact
of a risk. These actions can be preventive measures before the risk unfolds as well as
contingency plans in the event a risk already occurred (Tomlin, 2006). Whereas risk
identification and risk assessment indirectly contribute to risk performance by supporting risk
mitigation with the right information at the right time, our risk mitigation construct is directly
linked to risk performance. Therefore, we state our third hypothesis:
Hypothesis 3: Risk mitigation activities have a positive impact on risk performance.
3.4 Continuous Improvement Process
Continuous monitoring and improvement needs to be part of every iterative risk management
process. We argue in line with previous research that risk management activities need to be

11
performed regularly and frequently (Giunipero & Eltantawy, 2004; Kleindorfer & Saad, 2005).
Even after a successful mitigation activity for an occurred risk, continuous monitoring is
necessary to control the risk, analyze the mitigation effectiveness and adjust measures if
necessary at each step of the supply risk management process (Craighead et al., 2007; Giunipero
& Eltantawy, 2004; Matook et al., 2009; Norrman & Jansson, 2004; Rees & Allen, 2008;).
Like every process, supply chain risk management has to adapt to new situations over time and
strive for continuous improvement. The utility of current risk management activities needs to be
assessed regularly and corrections have to be made on an ongoing basis. Clear knowledge about
a firm’s risk management effectiveness can be a strong incentive for employees’ risk awareness
and financial investments (Hendricks & Singhal, 2003; Kleindorfer & Saad, 2005;).
Risk monitoring and continuous improvement help to optimize effectiveness and efficiency of all
previous risk management steps. Ongoing evaluation of a firm’s risk management processes
helps to shed light on potential areas of improvement and acknowledges the contribution of
effective measures of identification. Therefore we expect a positive relationship between
continuous improvement process and risk identification. Thus, we hypothesize:
Hypothesis 4a: A continuous improvement process has a positive impact on risk identification.
By continuously evaluating the effectiveness of risk management activities and adjusting
processes according to best practices and past experience we expect a positive influence of a
continuous improvement process on risk assessment. Thus, we derive our hypothesis:
Hypothesis 4b: A continuous improvement process has a positive impact on risk assessment.

12
A continuous improvement process includes ongoing observation of mitigated risks and
assessment of effectiveness of risk mitigation measures taken. Thus, a company can learn and
develop skills to mitigate risks in the most effective way. Therefore, we hypothesize:
Hypothesis 4c: A continuous improvement process has a positive impact on risk mitigation.
3.5 Risk Performance
Measuring risk performance continues to present a challenge to researchers as well as
practitioners. Berg et al. (2008) conducted a case study about how companies assess the
performance of their supply chain risk management programs. We draw upon those insights
when measuring risk performance and contribute to a further development of the risk
performance construct. Risk management aims to reduce the frequency and impact of supply
risks, therefore performance evaluation should measure such reduction (Berg et al., 2008;
Hendricks & Singhal, 2003; Manuj & Mentzer, 2008b;). To measure a reduction of frequency
and impact we focused on a time horizon of three years, as previously used by Hendricks and
Singhal (2005).
A well managed risk can unfold with only little negative impact on the business. Good risk
performance is indicated by well defined procedures on how to deal with risk. With a systemic
process, clear responsibilities and elaborated contingency plans, companies are able to
accommodate risks according to their daily routines without unplanned firefighting actions (Berg
et al., 2008; Hendricks & Singhal, 2003; Kleindorfer & Saad, 2005; Norrman & Jansson, 2004;
Matook et al., 2009; Steele & Court, 1996; Wagner & Bode, 2008; Zsidisin et al., 2004). This

13
especially requires preparedness and risk awareness of every employee within the firm beyond
the supply management staff (Hallikas et al., 2002; Manuj & Mentzer, 2008b).
4. The empirical study
4.1 Sample and Data Collection
To capture a broad picture of supply chain risk performance, the conceptual model was tested
using information from a wide sample of firms. A mailed survey was the most appropriate
instrument to apply and test our theory. Data collection focused on large and mid-sized
companies in the industrial sector. In according to Simonin (1997) only companies with revenues
above EUR 50 million were selected. Large and mid-sized companies seem most appropriate for
this study because they are more likely to have complex governance systems and standardized
processes in place (Bonaccorsi, Giannangeli, & Rossi, 2006; Simsek, Veiga, Lubatkin, & Dino,
2005). Contacts were obtained from the professional address provider who offered the largest
available research sampling frame of valid addresses within Germany including contact details of
a supply management executive. The measurement items were drawn from relevant literatures.
Respondents indicated their perception for each measurement item on seven-point Likert-type
scales. The face validity of the survey items was assessed by iteratively refining the item
wording and terminology with a panel of 22 experts (individually discussed with eleven senior
managers and eleven academic domain experts). After revising according to their comments the
survey instrument was sent out to 1,146 addresses. Data collection took place during a period of
three months.

14
With a sample of 162 completed questionnaires the effective response rate equals 14.1%. The
mean sales of the resulting sample is €5.1 billion, with a standard deviation of €18.8 billion. The
mean number of employees is around 14,000, with a standard deviation of 45,000. We also
calculated the value added for each company, finding a mean value added of 55% of total sales.
Thus, the sample fulfills the initial requirement of large and mid-sized industrial companies, with
a purchasing function of relevance. We targeted high level managers, since they typically form
more reliable sources of information than less-senior colleagues (Miller & Roth, 1994). The
survey respondents held titles as chief purchasing officer, purchasing officer, supply manager,
supply risk manager. More than 60% of the respondents were (chief) purchasing officers with
purchasing responsibilities within their respective business divisions. Respondents had
substantial work experience within the field of supply management, averaging more than 12
years.
To detect non-response bias, the data was tested for differences between early respondents and
late respondents. Fifty percent of returned questionnaires arrived within ten days after start of the
data collection period. Those eighty-two data sets were considered early respondents, whereas
the remaining eighty respondents are tested as late respondents. A t-test showed no significant
differences between early and late respondents at the 0.05 significance level (Armstrong &
Overton, 1977). Therefore, non-response bias is not a problem in this study.
Although it is common in management research to use key informants as a source, the collected
data is prone to some common method bias. In line with previous studies in this field, we
addressed this potential problem in several ways. We followed the recommendations made by
Podsakoff, Mackenzie, Lee, and Podsakoff (2003) for questionnaire design and data collection.
We designed the survey instrument separating the measurement items in the questionnaire

15
(Drolet & Morrison, 2001; Podsakoff & Organ, 1986) and guaranteed response anonymity.
Furthermore, high ranking informants – like in the current study – are considered to be a more
reliable source (Bagozzi & Phillips, 1982; Phillips, 1981). To further limit the risk of common
method bias, we evaluated for the risk performance constructs the actual number of risk events
with in twelve months and its impact based on the supply chain level rather than solely relying
on respondents’ perception.
4.2 Measures
We operationalized the variables using multi-item reflective measures. Based on our literature
review of section 3, existing measures were used, wherever possible. Newly developed or
adapted constructs and items were rigorously anchored in the literature and discussed in several
focus group workshops to ensure high content validity. For a detailed list of indicators and
constructs with their respective literature sources, the reader is referred to Table A.1-A.5 in the
appendix.
4.3 Analytical Method
We analyzed the measurement model and structural model using partial least squares (PLS),
specifically SmartPLS (Version 2.0 M3 Beta: Ringle, Wende, & Will, 2005), a powerful
multivariate analysis technique. We believed that PLS was the most appropriate analytic
technique for our study for several reasons. This distribution-free method weights indicator
loadings on constructs in context of the theoretical model rather than in isolation (Hulland,
1999). As a variance based method, PLS places minimal demands on measurement scales and
distributional assumptions using least-squares estimation (Chin, 1998a; Fornell & Bookstein,
1982; Wold, 1982). PLS is most appropriate in examining data where the sample size is
16
relatively small (Hulland, 1999; Mitchell & Nault, 2007). Designed to explain variance, PLS is
more suitable for predictive applications and theory building (Chin, 1997). To ensure proper use
of this technique we followed the general procedures described by Chin (1998a) and Hulland
(1999).
4.4 Measurement Model
Construct validity is assessed by its three sub-dimensions: content validity, convergent validity
and discriminant validity. The first, content validity was addressed by rigorously anchoring every
item and every construct in the literature and test its validity within focus group workshops.
We used three measures to assess convergent validity, reliability and internal consistency:
significant path coefficients with values higher than 0.7, composite reliability and average
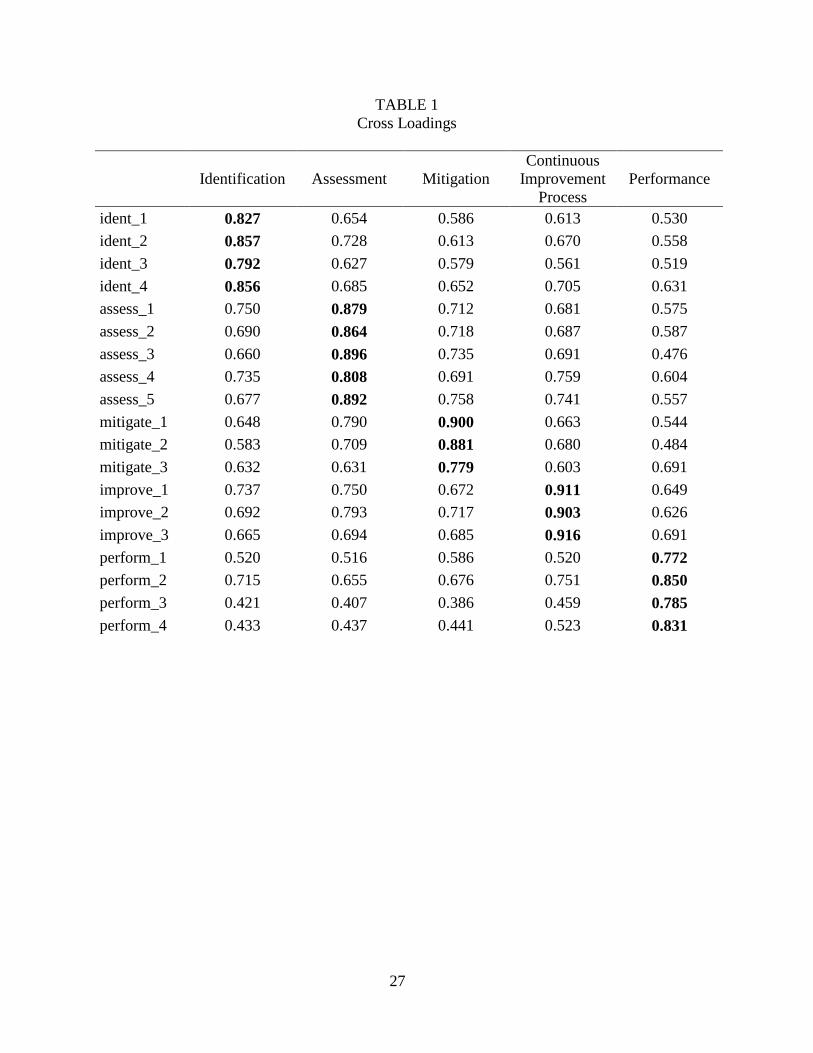
variance extracted (AVE). Table 1 shows the loadings for each measurement item on their
construct. To test their statistical significance we used bootstrapping (Efron &Tibshirani, 1993).
We followed the procedure as in Johnston, McCutcheon, Stuart, and Kerwood (2004), generating
1000 samples of randomly selected cases and then calculated path coefficients and T-statistics
for each sample. The cross-loading results confirm further the validity of the measurement
model.
-----------------------------------------
Insert Table 1 about here
-----------------------------------------
A standardized loading of 0.7 is the commonly applied threshold for item loadings on established
scales (Fornell & Larcker, 1981). All measurement items are highly above the threshold and thus
form a very strong measurement model.

17
-----------------------------------------
Insert Table 2 about here
-----------------------------------------
Composite reliability and average variance extracted for the five latent constructs are shown in
Table 2. Composite reliability measures the inter-item consistency. Unlike cronbach’s alpha,
composite reliability does not assume equally weighted measures and should have a value of at
least 0.7 (Chin, 1998b). The composite reliability of our measure shows values of 0.884 and
above, suggesting that each scale has excellent reliability.
The high values for average variance extracted indicate that the items share far more than half of
the variance of the respective constructs. Each construct easily exceeds the commonly applied
threshold of 0.5 (Chin, 1998b; Fornell & Larcker, 1981).
We assessed discriminant validity in order to address the potential problem of having one
construct overlap the defined area of another construct. One criterion for adequate discriminant
validity is, that each item should load highest on the construct it is intended to measure
(Carmines & Zeller, 1979). Cross loadings are presented in Table 1 with each item loading
highest on its respective construct. Additionally, following the procedures outlines in Fornell and
Larcker (1981), we calculated the squared correlations between the constructs which are
presented in Table 3. Discriminant validity is obtained when all values for squared correlations
are significantly different from 1 (Anderson & Gerbing, 1988). For all our constructs, squared
correlation is much less than 1. Thus this criterion for discriminant validity is satisfied for all our
constructs (Hulland, 1999), indicating that each construct is sufficiently distinct from each other.
A more stringent criterion is formulated by Fornell & Larcker (1981), advising values for
squared correlations to be smaller than the average variance extracted of the respective construct

18
shown in Table 2. All our constructs even satisfy this more stringent criterion with squared
correlations between the constructs being smaller than their respective values for average
variance extracted. Thus, we conclude that all our study constructs show sufficient discriminant
validity.
-----------------------------------------
Insert Table 3 about here
-----------------------------------------
-----------------------------------------
Insert Figure 2 about here
-----------------------------------------
4.5 Structural Model
The results of the structural model are reported in Figure 2. Our model explains 46% of the
variance observed in risk performance. Additionally, 71% of variance observed in risk
mitigation, 75% in risk assessment and 59% in risk identification are explained through our
model. All our above stated hypotheses are supported with path loadings being significant at the
0.001 level.
First, the path coefficient from risk identification to risk assessment is strong, positive and highly
significant (γ1=0.436; p<0.001 level). Thus, organizations that regularly and diligently involve in
identifying supply risks are found to perform equally strong risk assessments. Therefore, our
hypothesis H1 is supported by the model.
Likewise, the path coefficient from risk assessment to risk mitigation is highly positive and also
significant (γ2=0.641; p<0.001 level), Thus it can be stated that firms with due and proper risk

19
assessment tools and activities are most likely to excel in risk mitigation actions, too. Hence we
find support for hypothesis H2.
The standardized path from risk mitigation to risk performance is also statistically significant,
with a positive path coefficient (γ3=0.674; p<0.001 level), giving the notion that organizations
with superior risk mitigation activities perform generally better in managing risks. This lends
support to hypothesis H3.
The path coefficients from the construct of continuous improvement process to the three other
constructs are all highly significant and positive. The positive path coefficient from continuous
improvement process to risk identification (γ4a=0.767; p<0.001 level) implies that companies that
monitor their risk management actions, regularly assess their utility and adjust their risk
management processes accordingly are found to excel also in their risk identification activities.
Hence our hypothesis H4a is supported.
The path coefficient form continuous improvement process to risk assessment is also showing a
positive and significant relationship (γ4b=0.486; p<0.001 level). This implies that a firm’s effort
to regularly assess and adjust its risk management processes has a positive effect on its risk
assessment practices; thus, hypothesis H4b is supported.
It can also be stated that the above mentioned companies are most likely to excel in their risk
mitigation actions as well as is shown by the path coefficient from continuous improvement
process to supply risk mitigation (γ4c=0.234; p<0.001 level); therefore lending support to our
hypothesis H4c.
20
5. Discussion and Implications
Throughout this paper, we addressed the need for professional supply chain risk management
activities along the risk management process – risk identification, risk assessment, and risk
mitigation. We argued that companies with higher competencies in these three process steps of
supply chain risk management show superior performance when it comes to the reduction of the
frequency and impact of supply chain risks. Our findings provide evidence that supply chain risk
activities support the operational and strategic preparedness of organizations towards risk. To the
best of our knowledge, this is the first empirical study on the process dimensions of upstream
supply chain risk management and thus remarkably contributes to theory and practice in several
ways.
Through extensive literature research we significantly elaborate the existing theory. Our detailed
operationalization of constructs notably sheds light on the problem of measuring risk
management efforts. With our scales demonstrating excellent consistency, partial least squared
analysis succeeds to explain between 46% and 75% of the observed variances in our model. The
well selected items provide a sound starting point for further empirical research in this area.
As research on risk identification and risk assessment is scarce (Kouvelis et al., 2006), we put a
special focus on these two constructs and clearly demonstrate their importance within the overall
risk management process. Our results indicate that all constructs are closely linked to their
antecedents, supporting the view of an integrated risk management concept where risk
identification, risk assessment, and risk mitigation can only be successful when closely linked
together. The high variances explained by our model support the notion that accurate risk
assessment is only possible with excellent prior risk identification just as risk mitigation is

21
impossible without prior risk assessment. Activities need to be performed sequentially in order to
yield visible benefits for companies. These empirical results are also consistent with earlier
findings in the case-based literature (Berg et al., 2008; Craighead et al., 2007; Zsidisin et al.,
2000).
Additionally, our results lend support to the application of traditional risk management
constructs in the area of supply chain risk management. Even though the complexity of supply
chains might lead to differing activities from traditional risk management, the basic risk
management process is still suitable. Our study provides significant insights on how risk
management tools and methods derived from previous studies can contribute to risk
performance. Kouvelis et al. (2006) argue, that despite the surge of academic interest in supply
chain risk management, implementation still lacks behind. Well defined measurement methods
and clear evidence can help to translate risk management practices into a business case and
justify investments. Our results provide managers with a strong argument to invest in supply
chain risk management projects (Chen & Paulraj, 2004).
The empirical results do not only support the sequence of risk identification, risk assessment, and
risk mitigation, but also sound a warning note to researchers. Further attention needs to be paid
on the boundaries of the three steps because every company is having slightly different process
definitions for risk identification and risk assessment. Clear definition of scope and boundaries
between the process steps are necessary in order to identify which supply chain risk activities
yield the highest benefits for companies.
The very strong effect of a continuous improvement process on risk identification, risk
assessment, and risk mitigation lends support to the notion that supply chain risk management

22
initiatives need to be living processes, iteratively executed on a regular basis. The link is
strongest from continuous improvement to risk identification which is in line with our
expectations based on the current world economy. The increased speed of changes in the
economic environment – strongly underlined by the current crisis – inevitably results in the need
to continuously adapt internal processes to external changes. The strong effect of continuous
improvement activities on risk identification supports the view of a dynamic environment where
activities need to be readjusted regularly. The impact of continuous improvement on risk
mitigation is still significant, but to a much lower degree. This lends support to the notion, that
risk identification activities need to adapt more frequently to environmental changes and new
risk, whereas risk mitigation strategies are rather constant.
6. Limitations and Future Research Directions
Our study lends credence to the notion that effective risk management processes significantly
contribute to risk performance. In addition, our study further elaborates theory and provides
detailed operationalization of the risk management constructs. In accomplishing these objectives,
however, we made several research design choices that resulted in some limitations to our study.
Even though our sample covers a variety of industrial firms, the data was gathered solely within
Germany which limits the generalizability of the results. Like most studies in the past, we
surveyed high-level supply chain professionals from individual firms, who are capable of reliable
assessments and are generally considered as a reliable source. While mainly relying on the
manufacturer’s perceptions is a potential limitation of our study, it also offers opportunity for
further research. It would be informative to replicate this study within an international setting

23
surveying multiple sources and informants within the individual companies and also across the
supply chain.
Our study clearly shows the strong relationship among the constructs. However, by using a mail
survey methodology, we did not have access to the rich qualitative information that led to the
perceptions indicated by the respondents on the Likert-type scale. An interesting question that
arises from our finding is what specific risks are behind the analyzed data. Qualitative research is
needed to go deeper into the variety of different risks that require distinct mitigation strategies.
Though our model notably shed light into the effect of upstream supply chain risk management
activities to its risk performance, it would be interesting to investigate what other factor
contribute to upstream supply chain risk performance. Further research is needed, possibly using
a longitudinal study approach, to reveal in detail how frequency and impact of risk events change
over time. This would provide even more detailed knowledge about risk management’s effect on
risk performance. Furthermore, future studies should analyze how risk performance impacts
supply performance and how supply performance, in turn, is related to company performance. In
addition, future research that incorporates into the analysis both downstream and upstream risk
management approaches would provide a valuable contribution to the literature by further
developing a holistic model for supply chain risk management.
Given the calamitous events in recent years (such as hurricane Katrina or the Northeastern
electrical power outage), much research remains to be done to further develop supply chain wide
risk management programs that are rigorously linked to performance. Especially during the
economic crisis risks like supplier bankruptcy are expected to increase (Chang, 2003). Thus, the

24
current economic situation emphasizes the importance of robust supply chains and duly executed
risk management.

25
FIGURE 1
Conceptual Model of Upstream Supply Chain Risk Management

26
FIGURE 2
Structural and Measurement Model
27
TABLE 1
Cross Loadings
Identification Assessment Mitigation
Continuous
Improvement
Process
Performance
ident_1 0.827 0.654 0.586 0.613 0.530
ident_2 0.857 0.728 0.613 0.670 0.558
ident_3 0.792 0.627 0.579 0.561 0.519
ident_4 0.856 0.685 0.652 0.705 0.631
assess_1 0.750 0.879 0.712 0.681 0.575
assess_2 0.690 0.864 0.718 0.687 0.587
assess_3 0.660 0.896 0.735 0.691 0.476
assess_4 0.735 0.808 0.691 0.759 0.604
assess_5 0.677 0.892 0.758 0.741 0.557
mitigate_1 0.648 0.790 0.900 0.663 0.544
mitigate_2 0.583 0.709 0.881 0.680 0.484
mitigate_3 0.632 0.631 0.779 0.603 0.691
improve_1 0.737 0.750 0.672 0.911 0.649
improve_2 0.692 0.793 0.717 0.903 0.626
improve_3 0.665 0.694 0.685 0.916 0.691
perform_1 0.520 0.516 0.586 0.520 0.772
perform_2 0.715 0.655 0.676 0.751 0.850
perform_3 0.421 0.407 0.386 0.459 0.785
perform_4 0.433 0.437 0.441 0.523 0.831

28
TABLE 2
Composite Reliability and Average Variance Extracted
Composite Reliability* Average Variance Extracted**
Risk Identification 0.901 0.695
Risk Assessment 0.939 0.754
Risk Mitigation 0.890 0.730
Continuous Improvement Process 0.935 0.828
Risk Performance 0.884 0.657
Notes. Individual item loadings and critical ratios are reported in the appendix.
* Composite reliability is a measure of the internal consistency of the construct indicators.
** Average variance extracted reflects the overall amount of variance in the indicators accounted
for by the latent construct.

29
TABLE 3
Squared Correlation Matrix for Latent Multiple-Item Constructs
Construct Number of
items (1) (2) (3) (4) (5)
(1) Identification 4 1
(2) Assessment 5 0.655 1
(3) Mitigation 3 0.532 0.694 1
(4) Continuous Improvement Process 3 0.589 0.674 0.578 1
(5) Performance 4 0.452 0.416 0.455 0.517 1

30
APPENDIX
The operationalization of the latent constructs is summarized in this appendix. The survey used a
seven-point Likert-type scale asking respondents to indicate to what extent they agree with the
following statements. The scale ranged from “does not apply” (1) to “applies completely” (7).
All constructs were operationalized using multi-dimensional reflective items.
TABLE A.1
Risk Identification
Parcel Item
Standard
loading
Critical
ratio*
ident_1 We are comprehensively informed about basically
possible risks in our supplier network
0.827 26.962
ident_2 We are constantly searching for short-term risks in our
supplier network
0.857 41.999
ident_3 In the course of our risk analysis for all suppliers, we
select relevant observation fields for supply risks
0.792 21.935
ident_4 In the course of our risk analysis for all suppliers, we
define early warning indicators
0.856 36.684

31
TABLE A.2
Risk Assessment
Parcel Item
Standard
loading
Critical
ratio*
assess_1 In the course of our risk analysis for individual suppliers
or supplier groups we look for the possible sources of
supply risks
0.879 44.142
assess_2 In the course of our risk analysis for individual suppliers
or supplier groups we evaluate the probability of supply
risks
0.864 35.805
assess_3 In the course of our risk analysis for individual suppliers
or supplier groups analyze the possible impact of supply
risks
0.896 57.952
assess_4 In the course of our risk analysis for all suppliers, we
classify and prioritize our supply risks
0.808 26.786
assess_5 In the course of our risk analysis for individual suppliers
or supplier groups, we evaluate the urgency of our supply
risks
0.892 43.882
32
TABLE A.3
Risk Mitigation
Parcel Item
Standard
loading
Critical
ratio*
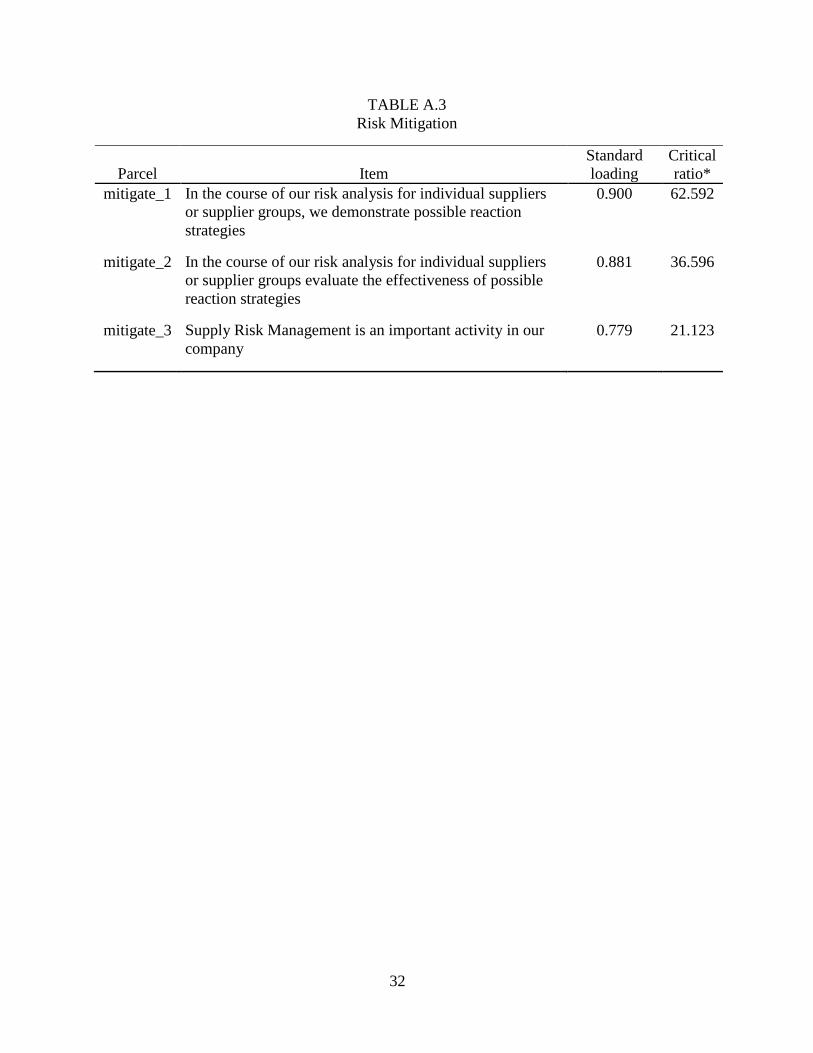
mitigate_1 In the course of our risk analysis for individual suppliers
or supplier groups, we demonstrate possible reaction
strategies
0.900 62.592
mitigate_2 In the course of our risk analysis for individual suppliers
or supplier groups evaluate the effectiveness of possible
reaction strategies
0.881 36.596
mitigate_3 Supply Risk Management is an important activity in our
company
0.779 21.123

33
TABLE A.4
Continuous Improvement Process
Parcel Item
Standard
loading
Critical
ratio*
improve_1 We control our risk management methods in Purchasing
and Supply Management and adapt these to changing
conditions
0.911 62.108
improve_2 We control the progress of measures taken for critical
supply risks
0.903 45.872
improve_3 We control the fundamental effectiveness of our activities
for identifying and analyzing supply risks
0.916 68.216

34
TABLE A.5
Risk Performance
Parcel Item
Standard
loading
Critical
ratio*
perform_1 Our employees are highly sensibilized for the perception
of supply risks
0.772 21.442
perform_2 Our risk management processes in purchasing are very
professionally designed
0.850 34.907
perform_3 We have clearly managed to minimize the frequency of
occurrence of supply risks over the last three years
0.785 15.394
perform_4 We have clearly managed to minimize the impact of
occurrence of supply risks over the last three years
0.831 18.580

35
REFERENCES
Anderson, J. C., & Gerbing, D. W. 1988. Structural equation modeling in practice: A review and
recommended two-step approach. Psychological Bulletin, 103: 411-423.
Armstrong, J. S., & Overton, T. S. 1977. Estimating nonresponse bias in mail surveys. Journal
of Marketing Research, 14: 396-402.
Bagozzi, R. P., & Phillips, L. W. 1982. Representing and testing organizational theories: A
holistic construal. Administrative Science Quarterly, 27: 459-489.
Baird, I. S., & Thomas, H. 1985. Toward a contingency model of strategic risk taking. Academy
of Management Review, 10: 230-243.
Berg, E., Knudsen, D., & Norrman, A. 2008. Assessing performance of supply chain risk
management programmes: A tentative approach. International Journal of Risk Assessment
& Management, 9: 288-310.
Bode, C., & Wagner, S. M. 2009. Risk and security – A logistics service industry perspective. In
S. M. Wagner & C. Bode (Eds.), Managing risk and security. The safeguard of long-term
success for logistics service providers: 1-30. Bern: Haupt.
Bonaccorsi, A., Giannangeli, S., & Rossi, C. 2006. Entry strategies under competing standards:
Hybrid business models in the open source software industry. Management Science, 52:
1085-1098.
Braunscheidel, M. J., & Suresh, N. C. 2009. The organizational antecedents of a firm's supply
chain agility for risk mitigation and response. Journal of Operations Management, 27: 119-
140.
Buhman, C., Kekre, S., & Singhal, J. 2005. Interdisciplinary and interorganizational research:
Establishing the science of enterprise networks. Production & Operations Management, 14:
493-513.
Carmines, E. G., & Zeller, R. A. 2008. Reliability and validity assessment. Newbury Park, CA:
Sage.
Chang, S. J. 2003. Ownership structure, expropriation, and performance of group-affiliated
companies in korea. Academy of Management Journal, 46: 238-253.
Chen, I. J., & Paulraj, A. 2004. Towards a theory of supply chain management: The constructs
and measurements. Journal of Operations Management, 22: 119-150.
Cheng, L. C., & Grimm, C. M. 2006. The application of empirical strategic management
research to supply chain management. Journal of Business Logistics, 27(1): 1-57.

36
Chin, W. W. 1997. Overview of the PLS Method; http://disc-
nt.cba.uh.edu/chin/PLSINTRO.HTM; January 12, 2010.
Chin, W. W. 1998a. The partial least squares approach for structural equation modeling. In G. A.
Marcoulides (Ed.), Modern methods for business research: 295-336. Mahwah NJ: Erlbaum.
Chin, W. W. 1998b. Issues and opinion on structural equation modeling. MIS Quarterly, 22: vii-
xvi.
Chopra, S., Reinhardt, G., & Mohan, U. 2007. The importance of decoupling recurrent and
disruption risks in a supply chain. Naval Research Logistics, 54: 544-555.
Cohen, M. A., & Kunreuther, H. 2007. Operations risk management: Overview of Paul
Kleindorfer's contributions. Production & Operations Management, 16: 525-541.
Craighead, C. W., Blackhurst, J., Rungtusanatham, M. J., & Handfield, R. B. 2007. The severity
of supply chain disruptions: Design characteristics and mitigation capabilities. Decision
Sciences, 38: 131-156.
Drolet, A. L., & Morrison, D. G. 2001. Do we really need multiple-item measures in service
research? Journal of Service Research, 3: 196-204.
Efron, B., & Tibshirani, R. J. 1993. An introduction to the bootstrap. New York: Chapman &
Hall.
Fornell, C., & Bookstein, F. L. 1982. Two structural equation models: LISREL and PLS applied
to consumer exit-voice theory. Journal of Marketing Research, 19: 440-452.
Fornell, C., & Larcker, D. F. 1981. Evaluating structural equation models with unobservable
variables and measurement error. Journal of Marketing Research, 18: 39-50.
Ghoshal, S. 1987. Global strategy: An organizing framework. Strategic Management Journal,
8: 425-440.
Giunipero, L. C., & Eltantawy, R. A. 2004. Securing the upstream supply chain: A risk
management approach. International Journal of Physical Distribution & Logistics
Management, 34: 698-713.
Hallikas, J., Virolainen, V. M., & Tuominen, M. 2002. Risk analysis and assessment in network
environments: A dyadic case study. International Journal of Production Economics, 78:
45-55.
Harland, C., Brenchley, R., & Walker, H. 2003. Risk in supply networks. Journal of Purchasing
& Supply Management, 9: 51-62.
Hendricks, K. B., & Singhal, V. R. 2003. The effect of supply chain glitches on shareholder
wealth. Journal of Operations Management, 21: 501-522.

37
Hendricks, K. B., & Singhal, V. R. 2005. An empirical analysis of the effect of supply chain
disruptions on long-run stock price performance and equity risk of the firm. Production &
Operations Management, 14: 35-52.
Hulland, J. 1999. Use of partial least squares (PLS) in strategic management research: A review
of four recent… Strategic Management Journal, 20: 195-204.
Johnston, D. A., McCutcheon, D. M., Stuart, F. I., & Kerwood, H. 2004. Effects of supplier trust
on performance of cooperative supplier relationships. Journal of Operations Management,
22: 23-38.
Kleindorfer, P. R., & Saad, G. H. 2005. Managing disruption risks in supply chains. Production
& Operations Management, 14: 53-68.
Kouvelis, P., Chambers, C., & Wang, H. 2006. Supply chain management research and
production and operations management: Review, trends, and opportunities. Production &
Operations Management, 15: 449-469.
Manuj, I., & Mentzer, J. T. 2008a. Global supply chain risk management. Journal of Business
Logistics, 29(1): 133-155.
Manuj, I., & Mentzer, J. T. 2008b. Global supply chain risk management strategies.
International Journal of Physical Distribution & Logistics Management, 38: 192-223.
Matook, S., Lasch, R., & Tamaschke, R. 2009. Supplier development with benchmarking as part
of a comprehensive supplier risk management framework. International Journal of
Operations and Production Management, 29: 241-267.
Miller, J. G., & Roth, A. V. 1994. A taxonomy of manufacturing strategies. Management
Science, 40: 285-304.
Mitchell, V. L., & Nault, B. R. 2007. Cooperative planning, uncertainty, and managerial control
in concurrent design. Management Science, 53: 375-389.
Norrman, A., & Jansson, U. 2004. Ericsson's proactive supply chain risk management approach
after a serious sub-supplier accident. International Journal of Physical Distribution &
Logistics Management, 34: 434-456.
Phillips, L. W. 1981. Assessing measurement error in key informant reports: A methodological
note on organizational analysis in marketing. Journal of Marketing Research, 18: 395-415.
Podsakoff, P. M., Mackenzie, S. B., Jeong Yeon Lee, & Podsakoff, N. P. 2003. Common method
biases in behavioral research: A critical review of the literature and recommended remedies.
Journal of Applied Psychology, 88: 879-903.
Podsakoff, P. M., & Organ, D. W. 1986. Self-reports in organizational research: Problems and
prospects. Journal of Management, 12: 531-544.

38
Poirier, C. C., & Quinn, F. J. 2004. How are we doing?: A survey of supply chain progress.
Supply Chain Management Review, 8(8): 24-31.
Rees, J., & Allen, J. 2008. The State of risk assessment practices in information security: An
exploratory investigation. Journal of Organizational Computing & Electronic Commerce,
18: 255-277.
Ringle, C., Wende, S., & Will, A. 2005. SmartPLS 2.0 M3 Beta; http://www.smartpls.de;
January 12, 2010.
Ritchie, B., & Brindley, C. 2007. Supply chain risk management and performance: A guiding
framework for future development. International Journal of Operations and Production
Management, 27: 303-322.
Schmitt, A. J., & Singh, M. 2009. A quantitative analysis of disruption risk in a multi-echelon
supply chain. Massachusetts Institute of Technology. Cambridge, MA, USA.
Seshadri, S., & Subrahmanyam, M. 2005. Introduction to the special issue on "Risk Management
in Operations". Production & Operations Management, 14: 1-4.
Simonin, B. L. 1997. The importance of collaborative know-how: An empirical test of the
learning organization. Academy of Management Journal, 40: 1150-1174.
Simsek, Z., Veiga, J. F., Lubatkin, M. H., & Dino, R. N. 2005. Modeling the multilevel
determinants of top management team behavioral integration. Academy of Management
Journal, 48: 69-84.
Souza, R. de, Goh, M., & Meng, F. 2009. Risk management in supply chains under uncertainty.
In S. M. Wagner & C. Bode (Eds.), Managing risk and security. The safeguard of long-
term success for logistics service providers: 31-58. Bern: Haupt.
Steele, P., & Court, B. H. 1996. Profitable purchasing strategies: A manager's guide for
improving organizational competitiveness through the skills of purchasing. London, New
York: McGraw-Hill.
Tang, C. S. 2006. Perspectives in supply chain risk management. International Journal of
Production Economics, 103: 451-488.
Tomlin, B. 2006. On the value of mitigation and contingency strategies for managing supply
chain disruption risks. Management Science, 52: 639-657.
Wagner, S. M., & Bode, C. 2006. An empirical investigation into supply chain vulnerability.
Journal of Purchasing & Supply Management, 12: 301-312.
Wagner, S. M., & Bode, C. 2008. An empirical examination of supply chain performance along
several dimensions of risk. Journal of Business Logistics, 29(1): 307-325.
39
Wold, H. 1982. Systems under indirect observation using PLS. In C. Fornell (Ed.), A second
generation of multivariate analysis, volume 1: Methods: 325-347. New York: Praeger.
Yates, J. F., & Stone, E. R. 1992. Risk-taking behaviour. Chichester, UK: Wiley.
Zsidisin, G. A. 2003. A grounded definition of supply risk. Journal of Purchasing & Supply
Management, 9: 217-224.
Zsidisin, G. A., Ellram, L. M., Carter, J. R., & Cavinato, J. L. 2004. An analysis of supply risk
assessment techniques. International Journal of Physical Distribution & Logistics
Management, 34: 397-413.
Zsidisin, G. A., Panelli, A., & Upton, R. 2000. Purchasing organization involvement in risk
assessments, contingency plans, and risk management: an exploratory study. Supply Chain
Management: An International Journal, 5: 187-197.
Copyright © 2022 FDOKUMEN