Crisis mitigation through cash assistance to increase local ...
18
Martín Belmonte, Susana; Puig, Jordi; Roca, Mercè; Segura, Marta Article Crisis mitigation through cash assistance to increase local consumption levels: A case study of a bimonetary system in Barcelona, Spain Journal of Risk and Financial Management Provided in Cooperation with: MDPI – Multidisciplinary Digital Publishing Institute, Basel Suggested Citation: Martín Belmonte, Susana; Puig, Jordi; Roca, Mercè; Segura, Marta (2021) : Crisis mitigation through cash assistance to increase local consumption levels: A case study of a bimonetary system in Barcelona, Spain, Journal of Risk and Financial Management, ISSN 1911-8074, MDPI, Basel, Vol. 14, Iss. 9, pp. 1-17, https://doi.org/10.3390/jrfm14090430 This Version is available at: http://hdl.handle.net/10419/258534 Standard-Nutzungsbedingungen: Die Dokumente auf EconStor dürfen zu eigenen wissenschaftlichen Zwecken und zum Privatgebrauch gespeichert und kopiert werden. Sie dürfen die Dokumente nicht für öffentliche oder kommerzielle Zwecke vervielfältigen, öffentlich ausstellen, öffentlich zugänglich machen, vertreiben oder anderweitig nutzen. Sofern die Verfasser die Dokumente unter Open-Content-Lizenzen (insbesondere CC-Lizenzen) zur Verfügung gestellt haben sollten, gelten abweichend von diesen Nutzungsbedingungen die in der dort genannten Lizenz gewährten Nutzungsrechte. Terms of use: Documents in EconStor may be saved and copied for your personal and scholarly purposes. You are not to copy documents for public or commercial purposes, to exhibit the documents publicly, to make them publicly available on the internet, or to distribute or otherwise use the documents in public. If the documents have been made available under an Open Content Licence (especially Creative Commons Licences), you may exercise further usage rights as specified in the indicated licence. https://creativecommons.org/licenses/by/4.0/
-
Upload
khangminh22 -
Category
Documents
-
view
3 -
download
0
Transcript of Crisis mitigation through cash assistance to increase local ...

Martín Belmonte, Susana; Puig, Jordi; Roca, Mercè; Segura, Marta
Article
Crisis mitigation through cash assistance toincrease local consumption levels: A case study of abimonetary system in Barcelona, Spain
Journal of Risk and Financial Management
Provided in Cooperation with:MDPI – Multidisciplinary Digital Publishing Institute, Basel
Suggested Citation: Martín Belmonte, Susana; Puig, Jordi; Roca, Mercè; Segura, Marta (2021) :Crisis mitigation through cash assistance to increase local consumption levels: A case studyof a bimonetary system in Barcelona, Spain, Journal of Risk and Financial Management, ISSN1911-8074, MDPI, Basel, Vol. 14, Iss. 9, pp. 1-17,https://doi.org/10.3390/jrfm14090430
This Version is available at:http://hdl.handle.net/10419/258534
Standard-Nutzungsbedingungen:
Die Dokumente auf EconStor dürfen zu eigenen wissenschaftlichenZwecken und zum Privatgebrauch gespeichert und kopiert werden.
Sie dürfen die Dokumente nicht für öffentliche oder kommerzielleZwecke vervielfältigen, öffentlich ausstellen, öffentlich zugänglichmachen, vertreiben oder anderweitig nutzen.
Sofern die Verfasser die Dokumente unter Open-Content-Lizenzen(insbesondere CC-Lizenzen) zur Verfügung gestellt haben sollten,gelten abweichend von diesen Nutzungsbedingungen die in der dortgenannten Lizenz gewährten Nutzungsrechte.
Terms of use:
Documents in EconStor may be saved and copied for yourpersonal and scholarly purposes.
You are not to copy documents for public or commercialpurposes, to exhibit the documents publicly, to make thempublicly available on the internet, or to distribute or otherwiseuse the documents in public.
If the documents have been made available under an OpenContent Licence (especially Creative Commons Licences), youmay exercise further usage rights as specified in the indicatedlicence.
https://creativecommons.org/licenses/by/4.0/
Journal of
Risk and FinancialManagement
Article
Crisis Mitigation through Cash Assistance to Increase LocalConsumption Levels—A Case Study of a Bimonetary System inBarcelona, Spain
Susana Martín Belmonte 1,* , Jordi Puig 2 , Mercè Roca 2,3 and Marta Segura 2
�����������������
Citation: Martín Belmonte, Susana,
Jordi Puig, Mercè Roca, and Marta
Segura. 2021. Crisis Mitigation
through Cash Assistance to Increase
Local Consumption Levels—A Case
Study of a Bimonetary System in
Barcelona, Spain. Journal of Risk and
Financial Management 14: 430.
https://doi.org/10.3390/
jrfm14090430
Academic Editors: Leander
Bindewald and Georgina M. Gomez
Received: 28 July 2021
Accepted: 2 September 2021
Published: 8 September 2021
Publisher’s Note: MDPI stays neutral
with regard to jurisdictional claims in
published maps and institutional affil-
iations.
Copyright: © 2021 by the authors.
Licensee MDPI, Basel, Switzerland.
This article is an open access article
distributed under the terms and
conditions of the Creative Commons
Attribution (CC BY) license (https://
creativecommons.org/licenses/by/
4.0/).
1 Collaborator with Dimmons Research Group at Internet Interdisciplinary Institute (IN3),Universitat Oberta de Catalunya, Av. Carl Friedrich Gauss, 5, 08860 Barcelona, Spain
2 ESCI-UPF Research in International Studies and Economics (RISE), Passeig Pujades, 1, 08003 Barcelona, Spain;[email protected] (J.P.); [email protected] (M.R.); [email protected] (M.S.)
3 UPF Barcelona School of Management, Carrer de Balmes, 132-134, 08008 Barcelona, Spain* Correspondence: [email protected]; Tel.: +34-619-245-143
Abstract: Subsidies in the form of direct transfers from the government to citizens constitute apowerful mechanism for crisis mitigation and for the alleviation of economic inequalities. However,the connection between direct transfers of cash assistance to selected individual beneficiaries andthe prosperity of their immediate surrounding local economy has not been sufficiently explored.This paper presents a case study which analyzes the effects of allocating cash assistance in the formof a local currency. It shows that, under certain conditions, such a transfer not only provides thebeneficiaries with additional purchasing power to satisfy their needs but also that the monetaryinjection benefits local SMEs by generating additional turnover. Using transactional data from thesystem, some indicators are proposed to analyze the properties of the system, namely, user satisfaction,total and average income generated by local businesses, the local multiplier, the recirculation of thelocal currency, and the velocity of its circulation. Our findings indicate that cash assistance providedin the REC local currency could contribute to local economic development and financial stability bysustaining local commerce, while preserving most of the original positive effects of cash assistance ina legal tender.
Keywords: direct transfers; cash assistance; basic income; local economic development; complementarycurrencies; local currencies; economic multiplier; financial stability; local retail; local consumption
1. Introduction
Complementary currencies are monetary devices that are frequently issued as not-for-profit initiatives with the purpose of fostering social and economic transformation anddevelopment at the local and regional level (Gómez 2019; Gómez and Dini 2016) to protect,stimulate, or reorient economic activities (Blanc 2011).
On the other hand, subsidies in the form of cash transfers have been increasingly usedin the mitigation of economic inequalities and for the development and humanitarian aidinitiatives. Over the last few years, much research has been devoted to cash transfer publicsubsidies and the factors that determine their success in generating wealth and welfare(e.g., Devarajan et al. 2013; Shaefer et al. 2019). However, the number of experiences andstudies devoted to the possibility of transferring subsidies by means of a Complementarycurrency, considering the combined positive impact of both, are limited.
This article analyzes the performance of REC, a pilot local-virtual currency, which ispart of a bimonetary system in Barcelona, Spain. This consists of the REC monetary systemand a euro prepaid bank card, and it is used to pay the so-called Municipal InclusionSubsidy, provided by the Barcelona city council to disfavored citizens of 10 predefinedneighborhoods. Such public policy is aimed at creating a positive economic impact, not
J. Risk Financial Manag. 2021, 14, 430. https://doi.org/10.3390/jrfm14090430 https://www.mdpi.com/journal/jrfm
J. Risk Financial Manag. 2021, 14, 430 2 of 17
only on the subsidized beneficiaries, but also on their surrounding local economy. Thisstrategy seeks to boost the activity of local stores, usually small and medium enterprises,and to increase the effectiveness and impact of public spending.
Our study presents the features of the REC system and analyzes data on the transac-tions in REC performed during the pilot, as well as the results of two surveys carried outwith consumers and businesses participating in the system, to evaluate the effectiveness ofpaying subsidies in a new local currency (instead of the national currency) to foster localdevelopment.
In the next section, we present the background of our study, including research relatedto cash transfer subsidies, the concept of buying local and its multiplier effects, an account ofprevious research on similar experiences with complementary currencies, and a descriptionof the REC system itself. Next, the methodology section presents the indicators and thedata sources analyzed in the paper and the conditions that we aimed to evaluate withthese indicators. These conditions are grounded in previous research reviewed in thebackground section. The results section analyzes a set of six indicators of the performanceof the REC, namely, (1) currency usability, (2) sales in the local currency by the affiliatedbusinesses, (3) affiliated businesses owners’ satisfaction, (4) local multiplier effect of publicspending, (5) recirculation rate, and (6) local currency circulation velocity. In the discussionsection, we evaluate the ability of the REC to regenerate and develop local economic activityon the basis of the results. We do so by contrasting three conditions in the local effectsof alternative spending strategies that we established on the basis of previous research,as presented in the methodology section. The final section presents the conclusions, thelimitations, and further lines of research that should be undertaken to provide furthervalidation and explore factors that may have an impact on the observed results.
2. Background2.1. Cash Transfer Subsidies
Over the last decade, cash transfers have been increasingly used in the mitigation ofeconomic inequalities and in development and humanitarian aid. The World Bank statesthat, in response to the socioeconomic impacts of the COVID-19 pandemic, governmentshave introduced over 1600 social protection measures in almost all of the world’s countriesand territories. Cash assistance has grown by 240% during this time, reaching 1.1 billionpeople (Gentilini et al. 2020). Over the last few years, much research has been devotedto public subsidies in the form of cash transfers and the factors that determine theirsuccess in generating wealth and welfare. For instance, in India, a case was made infavor of a decentralized local management of cash assistance to allow for greater flexibility(Kapur et al. 2008). In Africa, research showed that, by transferring a portion of resource-related government revenues uniformly and universally as direct payments to the population,some countries could increase both private consumption and the provision of public goods,thereby reducing poverty and enhancing social welfare (Devarajan et al. 2013). In the USA,cash assistance has declined in favor of in-kind aid, and this has been associated with areduction in the wellbeing of impoverished families with children (Shaefer et al. 2019).
Cash transfers are used as crisis relief funds as a form of humanitarian aid in theevent of disasters, for poverty alleviation, and for the mitigation of economic and socialinequalities in development projects. Since 2016, humanitarian aid and development havebeen linked as part of the so-called New Way of Working in the UN’s Humanitarian-Development nexus (OCHA 2016). According to the United Nations Office for the Co-ordination of Humanitarian Affairs (OCHA), “the New Way of Working can be describedas working toward achieving collective outcomes that reduce need, risk, and vulnerability, overmultiple years, based on the comparative advantage of a diverse range of actors. This notion of
“collective outcomes” has been placed at the center of the commitment to the New Way of Workingto achieve the Sustainable Development Goals” (OCHA 2016). The “collective outcomes” havethe ultimate goal of fulfilling needs by reducing risks and vulnerability. The capacity ofdifferent actors to contribute to solving each other’s needs stands out as the key concept of
J. Risk Financial Manag. 2021, 14, 430 3 of 17
Comparative Advantage, defined as “the unique, demonstrated capacity and expertise ( . . . ) of oneindividual, group, or institution to meet needs and contribute to risk and vulnerability reduction,over the capacity of another actor” (OCHA 2016).
2.2. The Concept of Buying Local in Local Economic Development
The concept of buying local links cash transfers with the economic development of localcommunities, and it requires that private investment or direct support from governmentbodies be attracted, and that this money is retained in the local economy (Thatcher andSharp 2008). The latter can only be achieved through a shift in the focus of economic activityto meet local needs wherever possible (Hines 2000; Williams 1996; Dobson 1993; Thatcherand Sharp 2008). Buying local or the so-called “import substitution” (Persky et al. 1993) hasplayed an essential role in localizing economic activity and the development of metropolitanareas of the world (Thatcher and Sharp 2008; quoting Persky et al. 1993). The origin of thisconcept can be traced back to Keynes and, more specifically, to Myrdal’s theory of circular andcumulative causation (Myrdal 1957, pp. 13, 26), which states that “the play of forces in the marketnormally tends to increase, rather than decrease the inequalities between regions” because, “in thenormal case, a change does not call forth countervailing changes but, instead, supporting changes,which move the system in the same direction as the first change but much further. Because of suchcircular causation ( . . . ) a social process tends to become cumulative and often gathers speed at anaccelerating rate” (Myrdal 1957, pp. 13–26; Pike et al. 2016, p. 95). Myrdal’s theory was basedon the tendency to disequilibrium and the multiplier effects that are rooted in the Keynesianapproach to economic development (Pike et al. 2016, p. 93). This approach has resulted in theregenerative local development approach (Gómez and Helmsing 2008), as well as the indigenousand place-based approaches to local and regional development (Pike et al. 2016, p. 247).
On these foundations, the local multiplier effect of spending (Sacks 2002) has beenvalidated as a tool to measure the effects of local expenditure (Silovská and Kolaríková2016). For instance, it has been used in the analysis of the impact of public procurement inthe UK, when a hospital in the Cornwall area decided to source its food from local suppliers(Thatcher and Sharp 2008), as well as for the analysis of impact of environmental policies,to measure the effects of shortening the supply chain of subsidized operators in a protectedarea (Brezina et al. 2013, p. 3), and to evaluate the economic impact of the operations of anonline retailer of local food in an English market town (Mitchell and Lemon 2019).
As cash transfers may have a multiplier effect associated with their regenerativeimpact on local economic development, the question becomes whether there are mech-anisms that may help to boost their buying local impact. The promotion of communityand complementary currencies has been proposed to have a significant potential in thisdirection.
2.3. Complementary Currencies
Community and complementary currencies are monetary devices frequently aimed atfostering social and economic transformation and development at the local and regionallevel (Gómez 2019; Gómez and Dini 2016). In the operation of these devices, which areoften managed at a community level, the organizers typically operate in two ways: (1) theyprovide credit limits to each individual and then allow them to buy goods and servicesfrom other participants using credit supported by the community (mutual credit systems),or (2) they encourage individuals to participate, which they can do by exchanging funds inlegal tender for funds in the complementary currency and by buying other participants’goods and services in the complementary currency (local currencies).
Community and complementary currencies are, in many instances, promoted andaimed at encouraging buying local within a given community (Blanc 2018, p. 69; De LaRosa and Stodder 2015; Groppa 2013). Moreover, the digitalization of local currencieshas improved their appeal (Christy et al. 2019) and facilitated the analysis of the paymenttransactions by increasing their traceability (Segura Bonet and Terrats 2019).
J. Risk Financial Manag. 2021, 14, 430 4 of 17
The local multiplier effects of complementary currencies have been found to be higherthan those of legal tender currencies (e.g., Groppa 2013). The fact that complementarycurrencies have not been designed for saving purposes, as they are potentially perceived asweaker in backing than the legal tender (Gómez 2019), implies that the marginal propensityto consume induced via the complementary currencies is close to 100%. This is a factor thatraises the local multiplier effect above that of the legal tender. Several previous experiencesof complementary currencies have shown this. Such is the case, for instance, of PuntoTransactions in El Salvador, whose local performance was exemplified in the theoreticalstudy by Groppa (2013). It is noteworthy that, in that study, the low saving propensityinduced by the complementary currency was not deemed as a weakness, given that thisfeature enhances the purpose that it seeks: to promote a higher frequency of transactionsin the local economy (Blanc 2018, p. 89).
In addition to the local multiplier effect, a way of measuring the capacity of communitycurrencies to generate local expenditure is the velocity of circulation that they generate. Theincome velocity of circulation of money is “the frequency with which money is transferred betweendifferent money holders and, thus, determines how much money is required to service a particular levelof nominal transactions” (Gerdesmeier and Rofia 2002, p. 7). The multiplier effect and velocityof circulation are two measurements of the same phenomenon (Blanc 2018, p. 90). While themultiplier effect measures how many transactions a unit of currency injected in the systemundergoes (with no time limit), the velocity of circulation is the number of transactions thata unit of currency experiences in a given period of time—normally 1 year. The velocity ofcirculation in complementary currencies is very often higher than that of legal tender. Thiswas shown in the study by De La Rosa and Stodder (2015), who analyzed the velocity ofcirculation of different complementary currencies, to define the features of the currencies thatare correlated with higher velocities of circulation. They found that the factors with a higherimpact on the velocity of circulation are (1) the existence of negative interest rates (demurrage),(2) a strong base of business participants with potential to exchange with other participantbusinesses, (3) consumer’s involvement, (4) a medium size of network of participants (not toobig, not too small), and (5) blended loans issued in the legal tender and in the complementarycurrency.
Some complementary currency systems have also been shown to increase macroeco-nomic stability. Two examples stand out. On the one hand, the WIR system in Switzerlandstarted as a community-based mutual credit system but is currently a community-ownedbank. The WIR, has generated a countercyclical effect over a period of more than 85 years,in which the circulation of the currency (volume of transactions and velocity) has increasedin times of crisis (when legal tender was scarcer) and stalled when conventional moneywas stable. This was shown in several studies based on the operational data of the WIRSystem and World Bank’s M2 and GDP data of the Swiss Economy (Stodder 2000, 2009;Stodder and Lietaer 2016). The second example is the case of cash transfers using only localcurrencies at a national level as South Korea’s response to the COVID-19 pandemic. Theyused monetary tools already put in place in 2016, when a vast network of 31 complementarylocal currencies (in paper and digital formats) were launched to channel the payment of abasic income subsidy to young people in large regions. The initiative was released by theKorean government, with the involvement of local, regional, and national governments inthe organization. As a part of the COVID-19 relief program, the equivalent of about 1691million EUR was injected from January to August 2020, using established channels. Oneof the effects of this deployment of local payment tools is that the income of local SMEsobtained by government transfers completely compensated for the reduction in incomefrom sales caused by the pandemic, and consumption levels were sustained throughoutthe last 6 months of 2020, when they sank in other parts of the world. This study is basedon the local currency system data and national statistics of the South Korean Ministry ofSmall and Medium Enterprises (BIRG 2021).
The provision of a cash assistance subsidy had an earlier experience in Brazil, wherea large-scale program (Bolsa Familia) was issued to transfer cash to more than 13 million
J. Risk Financial Manag. 2021, 14, 430 5 of 17
impoverished families. A recent study on the impact of this program on the local labormarket, including its potential detrimental effects in the form of labor disincentive, showedthat the positive multiplier effects of the Bolsa Familia scheme compensated for any down-side effects. This study analyzed differences in the application of the Bolsa Familia programacross the country (difference-in-differences design), based on the program’s official dataand national statistics on formal labor. The results showed that, in the municipalities of thecountry where the total Bolsa Familia cash assistance per capita was higher (13.2% higheron average), formal labor increased by 2%, including recipients and nonrecipients of theBolsa Familia program (Gerard et al. 2021). However, the study of this subsidy did not takeinto account the effect of local and community currencies issued by community develop-ment banks such as Banco Palmas, which are often also Brazilian public bank branches,and which manage both conventional and community currencies (Instituto Banco Palmas| Como Implantar Um Banco Comunitário n.d.). The use of community currency hasincreased local consumption in Brazil (de França Filho et al. 2012); hence, it remains tobe seen if the Bolsa Familia program’s multiplier effects could be connected to the useof complementary currencies in Brazil. It is to be noted that, in 2012, there were about78 community development banks in Brazil (Scalfoni Rigo 2014) issuing their own localcurrency for regional development purposes (Fare et al. 2015); today, there are 121 banksaffiliated with the electronic money platform E-Dinheiro, which offers the digital versionof the wide network of complementary currencies in Brazil (E-dinheiro Brasil n.d.). Thecase study of the Mumbuca E-Dinheiro analyzed the performance of a complementarycurrency adopted by the municipality of Maricá in 2013 and used to deliver basic incomeduring the COVID-19 pandemic. The study showed how this initiative enabled a quickand safe cash distribution aimed at mitigating the effects of the COVID-19 pandemic inBrazil. The analysis was based on E-Dinheiro Platform system data and reported the im-plementation problems of the basic income subsidy delivery, revealed mainly by the press(Gonzalez et al. 2020). Similar and additional advantages were highlighted by JosephStiglitz in the 2021 South Korean Basic Income Conference (Gyeonggi Province Basic In-come Conference) regarding the aforementioned Korean COVID19 relief program in localcurrency where he stated the following: “I think the kind of [basic income] program that youhave [in South Korea] is a particularly well-designed program given the nature of the pandemic( . . . ); if we would have had [in the US] a program based on a voucher (sic) that has to be usedlocally it would have helped more”.1
International humanitarian aid organizations have also started to provide aid incomplementary currencies. Such is the case of the assistance that the Red Cross is providingin Kenya, which is channeled using the Sarafu complementary currency (Dama 2019).
In Spain, some NGOs and municipalities have engaged in a collaboration to chan-nel public subsidies through local currencies. The Ossetana, in the town of San Juan deAznalfarache, Seville, belongs to this category. The currency was launched in 2012 aspaper vouchers with the aim of channeling subsidies for impoverished families in theaftermath of the 2008 crisis; it went digital in 2016 and, to date, remains in circulation. TheGrama, in Santa Coloma de Gramenet, Barcelona, was launched in 2016 by the munici-pality as a digital currency aimed at channeling subsidies addressed to local stores andSME associations to strengthen the local economy. Lastly, the REC in Barcelona city, alsodigital from its start, was launched in 2018 in association with the Barcelona city council(Martín Belmonte 2019). This later experience is the object of our research.
Although the existing precedents indicate that cash transfers provided in a localcurrency can potentially bridge economic support (and humanitarian aid subsidies) withregenerative local development, research on this topic is limited. Moreover, while cashtransfers in local currencies have had important results for macroeconomic stability innon-Western economies, the adaptability of such schemes to Western economies and theirability to have a local multiplier effect require further analysis. Buying local in publicprocurement has increased local multiplier effects; however, the impact of using localcurrencies for public procurement has yet to be tested in terms of the local multiplier effect,
J. Risk Financial Manag. 2021, 14, 430 6 of 17
the velocity of currency circulation, and macroeconomic stability. Lastly, as most localcurrencies are only accepted by SMEs, the advantages of injecting money through a funnelof SMEs is to be explored.
2.4. The REC
This paper analyzes the case of the REC, the Barcelona citizen currency, a local-virtual currency that, for a pilot project of 13 months, between 2018 and 2019, channeled25% of a guaranteed minimum income called Municipal Inclusion Support provided bythe Barcelona City Council Social Services to 600 families. The remaining 75% of thesubsidy was provided to the beneficiaries in EUR (via a prepaid bank card). The subsidywas given to citizens living in 10 neighborhoods of El Besòs, an impoverished area inthe northeast of Barcelona (Spain) which suffers from commercial desertification and aweakened economy. In the period of the intervention, 789,592 REC was put in circulation,generating transactions worth 901,004 REC, of which 643,532 REC was exchanged for EURby the affiliated businesses.
The REC system was implemented as a virtual currency, backed with payment ac-counts in EUR in a Payment Institution regulated under SPD2. The Municipal InclusionSupport beneficiaries were to spend their subsidy in local, independently managed busi-nesses that were invited to be affiliated with the currency, initially at no cost. The participantbusinesses operating in REC were committed by contract to keep a parity between pricesin REC and prices in EUR. These businesses could exchange REC for EUR without anypenalty, although the REC promoters actively encouraged them to spend their REC in thearea. The actual payment was channeled via a mobile app, which allowed the identificationof the recipient with a QR code and the search for goods and services with a geopositionedmarketplace, in which businesses could upload their offers daily.
At the moment of publication of this article, the REC system remains in circulation, butno further cash subsidy additional to the 789,592 REC has been paid in REC yet. Instead,it has been used to provide incentives for local consumption (15% of the exchanges tolocal currency, paid partly by the city council and partly by local businesses). Additionalinformation on the project during the intervention period can be found in the project’sreport (Martín Belmonte 2019).
3. Methodology
Our research was based on the case study of the REC initiative. We grounded ouranalysis in the operational data of the REC system, as well as surveys conducted on theindividual participants and the businesses that took part in the system during the 13 monthtreatment period. From the theoretical propositions that led to the case study (reviewed inthe background section), we focused our attention on key questions and data, from whichwe extracted a set of indicators that allow evaluating to what extent cash assistance paid inREC achieved the objective of linking aid (the so-called Humanitarian-Development Nexus)with local economic development or promotion. We next present the set of indicators underanalysis, the data sources that we used to obtain them, and the conditions evaluated in thediscussion section.
3.1. Indicators
The following indicators were used to analyze the results of the REC as a means ofspending subsidies, in terms of its ability to foster local economic development:
1. Usability of the local currency, based on user satisfaction surveys to cash assistancebeneficiaries. We analyzed whether cash assistance payments in a digital local cur-rency achieve the utility of cash assistance in conventional currency.
2. Amount of cash perceived by the affiliated businesses, computed from the data onthe turnover obtained by these businesses in the local currency.
3. Satisfaction of participant businesses, based on a survey to study whether the increasein their income and the experience with the system are satisfactory.
J. Risk Financial Manag. 2021, 14, 430 7 of 17
4. The local multiplier of the REC payments in local currency, obtained using the dataof the system as the ratio between the global value of transactions operated in RECand the amount of REC introduced in the system. This ratio is compared with theequivalent fiscal multiplier in Spain at the time.2
5. Recirculation of the REC, measuring the percentage of local currency expendituresover local currency income of retailers as a measurement of the extent to whichconsumers are “buying local”.
6. Velocity of circulation of the REC, computed as the sum of transactions of each perioddivided by average money supply of the period and multiplied by 12 to annualizethe monthly values, as compared with the EUR and USD velocity at the time.3
3.2. Data Sources
The data to obtain these indicators were collected using three sources:
• The transaction data of the 25% of the Municipal Inclusion Subsidy (cash assistanceprovided to the beneficiaries) in the REC local currency. The data were obtained fromthe records of the digital management system of the currency.
• Two surveys to the beneficiaries of the subsidy using community currency. The firstsurvey was performed in February 2019, when the currency had been in circulationfor 4 months, and the second survey was carried out almost 1 year after launchingthe currency, in early September 2019. The methodology used was CATI (computer-assisted telephone interviewing), with a standard questionnaire of 13 questions ofdifferent types. The total number of beneficiaries was of 496 in December and 520in July (when the fieldwork was conducted). They were all called up to three timesto participate in the survey, and the total number of interviews was 232 in February(46.77%) and 264 in September (50.64%). The questionnaire of the survey is providedin Supplementary File S1.
• Two surveys of the businesses that participated in the scheme by accepting communitycurrency from their customers and potentially using them for their own payments.These surveys were conducted simultaneously to the beneficiary surveys. The method-ology used was CATI (computer-assisted telephone interviewing) with a standardquestionnaire of 13 questions. The total number of affiliated businesses was of 130 inDecember and 137 in July (when the fieldwork was conducted). All businesses werecontacted up to three times to participate, and a total of 76 responses were obtainedin February (58.46%) and 77 responses were obtained in September (56.20%). Thequestionnaire of the survey is provided in Supplementary File S2.
3.3. Conditions Evaluated in the Discussion of Results
We formulated three conditions for cash assistance in a local currency to drive aregenerative local economic development based on the literature regarding the link betweenaid (the so-called Humanitarian-Development Nexus) and local economic development orpromotion, as analyzed by Gómez and Helmsing (2008) and Thatcher and Sharp (2008),and in line with the priorities stated in the New Way of Working (OCHA 2016).
The following are the conditions evaluated in the discussion section:
Condition 1: cash transfers in the local currency should be carried out in a way that fulfilsthe initial intention of the transfer: to help cover or alleviate the needs of the beneficiary;Condition 2: cash transfers should be an additional monetary injection that is sufficientenough to make a difference to the local economy.Condition 3: the money injected should remain local to a greater extent than under previouscircumstances.
Table 1 presents a summary of the indicators computed and presented in the resultssection, their measurement methodology, and their purpose with respect to the threeconditions evaluated in the discussion section.
J. Risk Financial Manag. 2021, 14, 430 8 of 17
Table 1. Summary of indicators.
Indicator Measurement Purpose
1. Usability of the currencyQualitative indicator based on
the beneficiary satisfactionaccording to the survey.
Assessment of the capacity ofthe currency for buying goods
and services locally(Condition 1).
2. Sales in the local currencyby the affiliated businesses
Quantitative indicator basedon the data on paymenttransactions in the local
currency during the 13 monthperiod of the treatment.
Assessment of the buying localor reinvestment effect, inrelation to local GDP, thelikelihood of businessesdefaulting, and financialstability (Condition 2).
3. Affiliated businessesowners’ satisfaction
Qualitative indicator based onthe surveys on businesses’
satisfaction.
Assessing the quantitativeindicators (Condition 2).
4. Local multiplier effect ofpublic spending
Quantitative indicator of thelocal economic multiplier
based on the system’s data.
Assessment of the multipliereffect of public expenditures,connected with GDP and thefiscal capacity of governments
(Condition 3).
5. Recirculation rate
Quantitative indicator thatcomputes the percentage ofthe income in local currencythat the businesses in turn
spend in local currency(instead of reimbursing it backto EUR) based on the system’s
data.
Recirculation as the cause ofan increase in the localmultiplier and can beconnected to GDP and
financial stability(Condition 3).
6. Velocity of circulationQuantitative indicator basedon the transaction data of the
local currency system.
Relevant for the central bank’ssurveillance of the local
currency, related to the linkbetween the monetary base
and broader monetaryaggregates of financial and
macroeconomic stability(Condition 3).
4. Results4.1. Usability of the Currency
The average income in REC for individual users of the B-MINCOME program was130 REC per month per household. All usability indicators showed an increase betweenthe first and second surveys. The satisfaction indicator for individual users in September2019 was 92% (indicating that beneficiaries were ‘quite’ or ‘very’ satisfied), 10% higherthan when first measured in February 2019. At that time, 89% of consumers found theREC payment app easy to use. Moreover, 99% of users knew where they could spendREC, which was above the 84% initially reported. The user help service dealt with anaverage of 16 queries per month from individual users. Most queries were received in theimplementation phase of the REC. They were mainly attended by telephone or in person,and the help service itself received a 98% approval rating from individual users.
The users indicated that payment in REC had an impact on their consumption habits.In total, 55% indicated so in the last survey, compared with 35% in February. The mainchange that users identified in their consumption was a switch from bigger to smaller localshops and markets, followed by an increase in their purchasing product diversity andquantity. Another impact that consumers identified was their feeling of contributing to theneighborhood’s economy (87.5% of those surveyed), as well as an increased trust among
J. Risk Financial Manag. 2021, 14, 430 9 of 17
consumers toward affiliated businesses (74% in the last survey, compared to 61% in thefirst). Nevertheless, when asked whether the REC had helped them to improve their skillsin the use of new technologies, a majority of consumers answered positively in the firstsurvey (57%), whereas 64% responded negatively in the second survey.
Analyzing the interrelation among responses reveals that the users who consideredthat the currency had a positive impact on the neighborhood were those who were themost generally satisfied with the REC. In particular, only 7% of the participants surveyedanswered that they considered that the REC had a negative or no impact on the localeconomy. Nevertheless, over half of these respondents (53%) reported being satisfied orvery satisfied with the REC. It appears that the use of the currency did not, therefore, helpor reinforce consumers’ perception regarding how the local economy was performing.Moreover, for those for who perceived that the currency generated a positive impact onthe neighborhood, which was the majority (93%), the association with a positive overallsatisfaction rating was highly significant, at over 96% (Pearson correlation coefficient).
The aspects that consumers spontaneously highlighted most frequently as positivetraits of the system were the ease and convenience of paying with the app (68%), the boostit represented with respect to their finances (18%), and the perception of helping to promotetrade in the neighborhood (12%). Negative aspects that were mentioned included the lackof variety among the affiliated businesses (52%), their high prices (52%), and paymentproblems due to slow connections or insufficient coverage (28%), together with otheraspects related with the REC operating system (12%) which could be related to problemsof mobile phone coverage in the districts of operation. This evaluation persisted duringthe period under study despite the fact that municipal markets worked on amelioratingthe situation with the installation of freely available Wi-Fi networks.
4.2. Sales in the Local Currency by the Affiliated Businesses
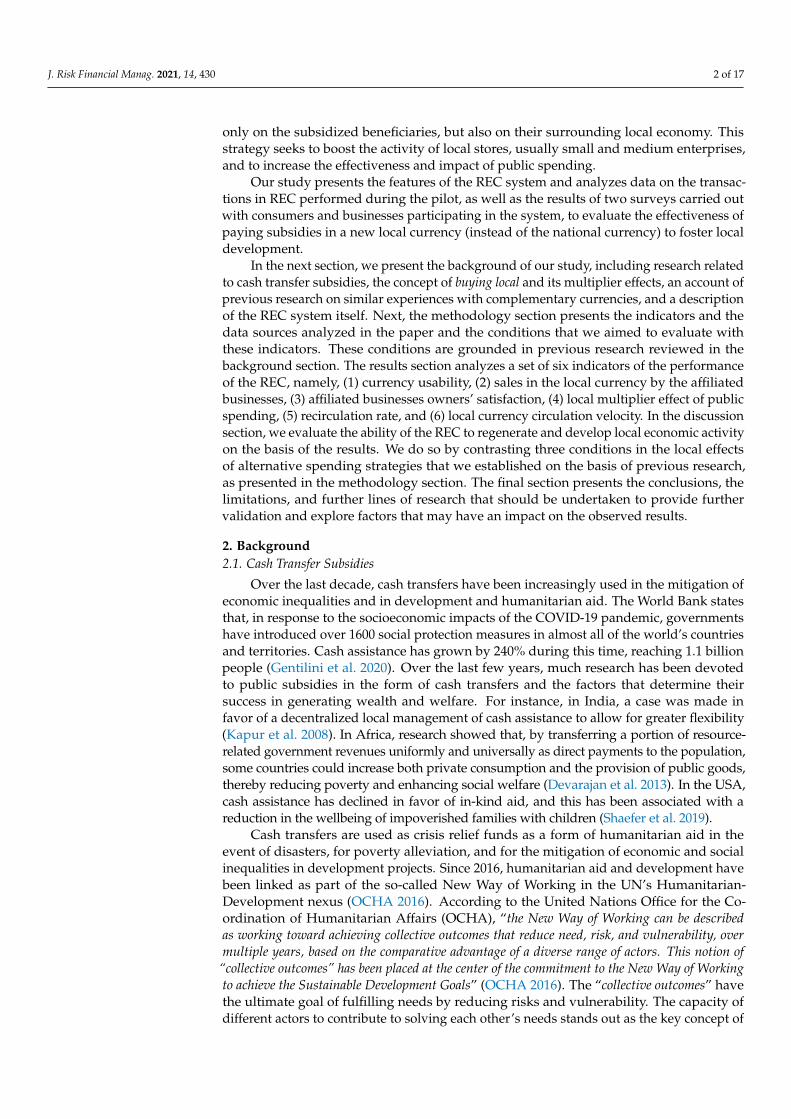
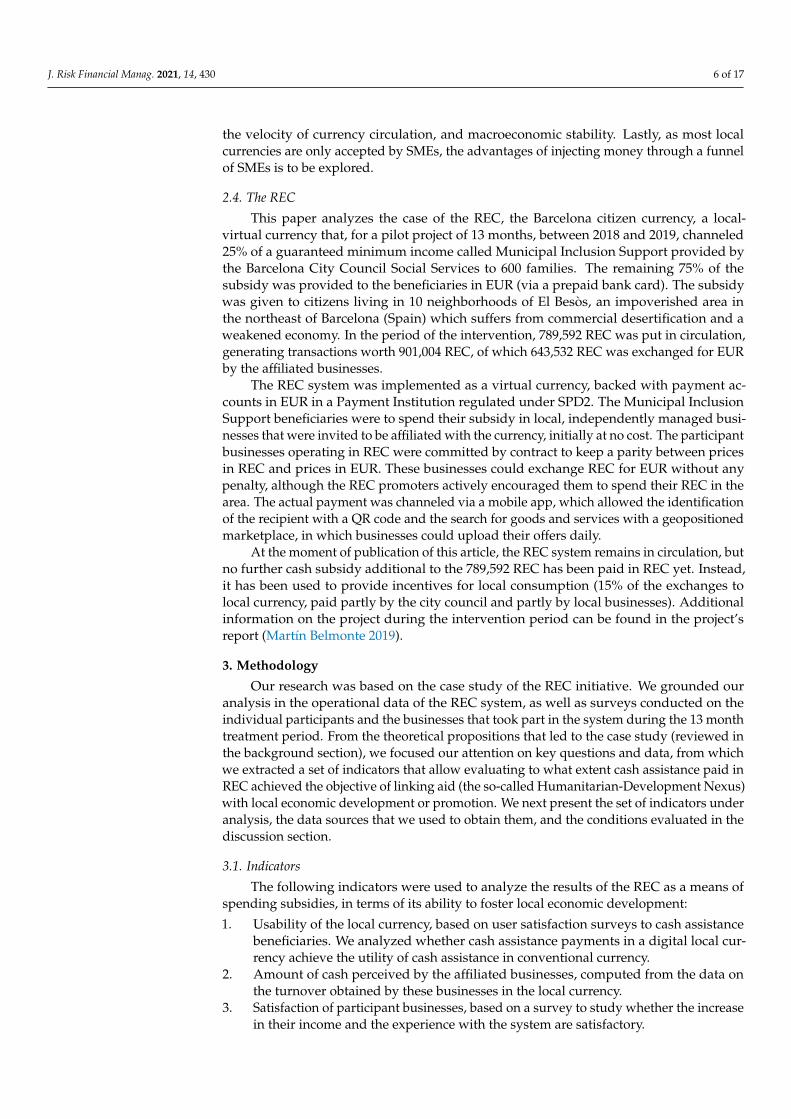
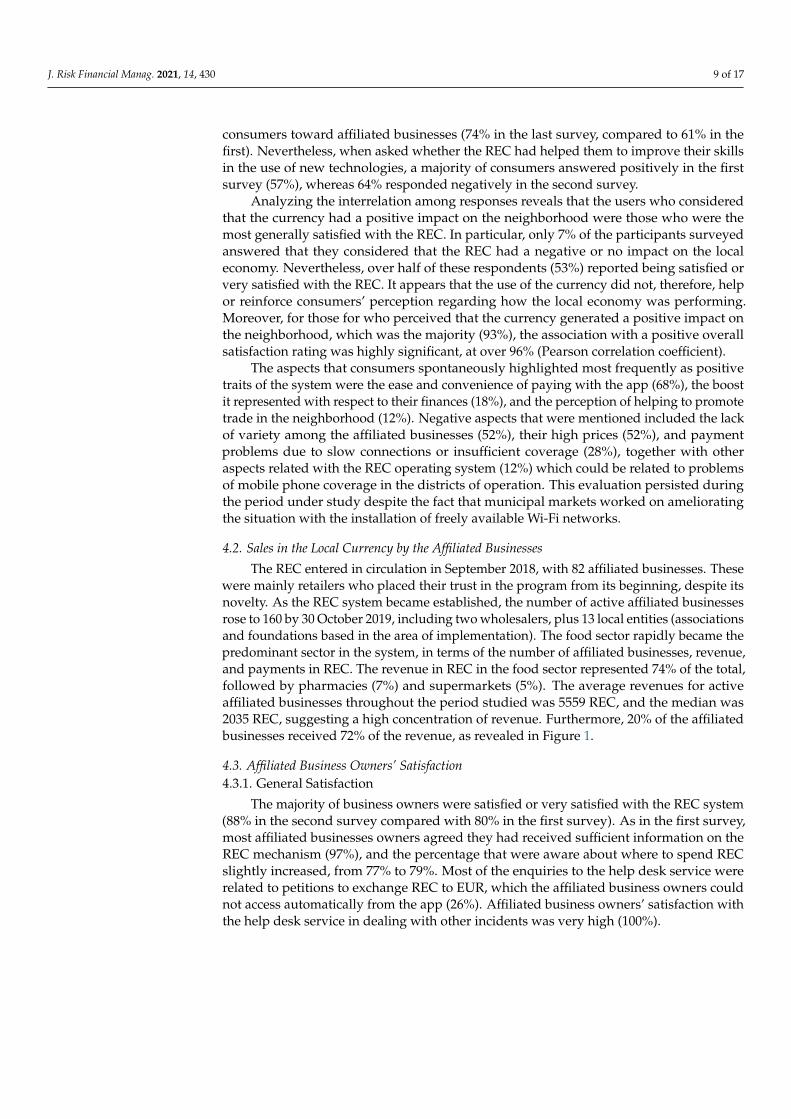
The REC entered in circulation in September 2018, with 82 affiliated businesses. Thesewere mainly retailers who placed their trust in the program from its beginning, despite itsnovelty. As the REC system became established, the number of active affiliated businessesrose to 160 by 30 October 2019, including two wholesalers, plus 13 local entities (associationsand foundations based in the area of implementation). The food sector rapidly became thepredominant sector in the system, in terms of the number of affiliated businesses, revenue,and payments in REC. The revenue in REC in the food sector represented 74% of the total,followed by pharmacies (7%) and supermarkets (5%). The average revenues for activeaffiliated businesses throughout the period studied was 5559 REC, and the median was2035 REC, suggesting a high concentration of revenue. Furthermore, 20% of the affiliatedbusinesses received 72% of the revenue, as revealed in Figure 1.
4.3. Affiliated Business Owners’ Satisfaction4.3.1. General Satisfaction
The majority of business owners were satisfied or very satisfied with the REC system(88% in the second survey compared with 80% in the first survey). As in the first survey,most affiliated businesses owners agreed they had received sufficient information on theREC mechanism (97%), and the percentage that were aware about where to spend RECslightly increased, from 77% to 79%. Most of the enquiries to the help desk service wererelated to petitions to exchange REC to EUR, which the affiliated business owners couldnot access automatically from the app (26%). Affiliated business owners’ satisfaction withthe help desk service in dealing with other incidents was very high (100%).

J. Risk Financial Manag. 2021, 14, 430 10 of 17J. Risk Financial Manag. 2021, 14, x FOR PEER REVIEW 10 of 25
Figure 1. Revenue distribution in REC among businesses in the period.
4.3. Affiliated Business Owners’ Satisfaction 4.3.1. General Satisfaction
The majority of business owners were satisfied or very satisfied with the REC system (88% in the second survey compared with 80% in the first survey). As in the first survey, most affiliated businesses owners agreed they had received sufficient information on the REC mechanism (97%), and the percentage that were aware about where to spend REC slightly increased, from 77% to 79%. Most of the enquiries to the help desk service were related to petitions to exchange REC to EUR, which the affiliated business owners could not access automatically from the app (26%). Affiliated business owners’ satisfaction with the help desk service in dealing with other incidents was very high (100%).
4.3.2. Perception of Increased Sales and Customers A majority of affiliated businesses stated that their sales volumes had increased by
up to 5% in the first survey (64%) and up to 10% in the second survey (66%), and that they had experienced an increase in the number of customers of up to 5% (79%) in the first survey and up to 10% (78%) in the second survey. However, they expressed not having noticed a significant increase in sales in EUR due to the REC system: 72% noticed no increase in the second survey, although this is an improvement with respect to the first survey, when 84% did not notice an increase.
4.3.3. Boosting of Local Businesses In the first survey, businesses expressed that they did not perceive the REC as having
boosted local business (only 46% indicated that it did). In the second survey, however, this changed, and a majority of affiliated businesses expressed that the REC had increased local trade (65%).
4.3.4. Other Perceived Effects of the System Businesses expressed not believing that the REC had helped them to improve their
skills in the use of new technologies (84% responded “little” or “none” to the corresponding question) nor did they express considering that the REC had led them to change any of their consumption habits (87%).
4.3.5. Overall Evaluation When asked to openly quote two positive aspects of the REC system, businesses
highlighted the profits it generated for their businesses (34%), the ease of use and security
Figure 1. Revenue distribution in REC among businesses in the period.
4.3.2. Perception of Increased Sales and Customers
A majority of affiliated businesses stated that their sales volumes had increased by upto 5% in the first survey (64%) and up to 10% in the second survey (66%), and that they hadexperienced an increase in the number of customers of up to 5% (79%) in the first surveyand up to 10% (78%) in the second survey. However, they expressed not having noticed asignificant increase in sales in EUR due to the REC system: 72% noticed no increase in thesecond survey, although this is an improvement with respect to the first survey, when 84%did not notice an increase.
4.3.3. Boosting of Local Businesses
In the first survey, businesses expressed that they did not perceive the REC as havingboosted local business (only 46% indicated that it did). In the second survey, however, thischanged, and a majority of affiliated businesses expressed that the REC had increased localtrade (65%).
4.3.4. Other Perceived Effects of the System
Businesses expressed not believing that the REC had helped them to improve theirskills in the use of new technologies (84% responded “little” or “none” to the correspondingquestion) nor did they express considering that the REC had led them to change any oftheir consumption habits (87%).
4.3.5. Overall Evaluation
When asked to openly quote two positive aspects of the REC system, businesseshighlighted the profits it generated for their businesses (34%), the ease of use and securityof the app and payment channel (30%), the fact that it was a positive initiative (15%),and its ability to help local people (3%). When asked about the negative traits, 38% ofthe businesses expressed that they could not think of any remarkable downsides. Theremaining 62% referred to problems with aspects related to the app and system (44%), thedifficulty in requesting the exchange of REC to EUR by email (22%), and minor aspectsregarding the REC mechanism (19%).
A comparison of the survey data with the transaction data in the system revealed thefollowing:
• The participant businesses who collected the highest amounts in REC had the highestlevels of satisfaction and a stronger perception that the REC was helping the localeconomy.
J. Risk Financial Manag. 2021, 14, 430 11 of 17
• It is noteworthy that affiliated businesses seemingly underestimated their revenue inREC when they responded to the surveys. Cross-analyzing the survey responses withturnover figures in the system, 22 retailers (28.57% of respondents) stated not noticingany increase in turnover due to the REC, despite having cumulatively collected a totalof 33,632.68 REC, which represents an average of 1528.75 REC per shop and 127.39REC per month. The same occurred in the first survey, where 27 businesses (35% ofthe total) cumulatively collected 33,714 REC during the period of circulation, whichrepresents an average of 250 REC per business per month. These businesses, therefore,understated the effects of REC displayed in the data.
4.4. Local Economic Multiplier Effect of Public Spending
Using the transaction data available for the first 13 months of the REC (October 2018to October 2019), the cumulative local economic multiplier of public expenditure wascalculated to be 2.11 by October 2019. Table 2 shows the results obtained for the monthlymultiplier, calculated as the proportion of the global sum of REC transactions over theinjected REC units in that month. The accumulative monthly multiplier was also calculatedas the proportion of the accumulated global sum of REC transactions up to that specificmonth divided by the accumulated injected REC units up to that month. In the process ofcalculating the local multipliers, we could use perfect information about the transactionsmade in REC since all the subsidy payments were formalized through a mobile application(providing full traceability of the local currency in terms of volume of exchanges, involvedagents, and the moment those transactions occurred). As expected, the multiplier effectcaptured by the cumulative monthly multiplier rose month by month.
Table 2. Evolution of multiplier of the public spending in the REC System from October 2018 toOctober 2019.
Month REC Money In TransactionVolume (REC)
MonthlyMultiplier
CumulativeMonthly
Multiplier
September 2018 41,378.52 53.44 1.00 1.00October 2018 51,860.62 26,435.89 1.51 1.28
November 2018 55,041.11 41,720.58 1.76 1.46December 2018 58,545.35 64,413.91 2.10 1.64
January 2019 66,932.70 54,508.45 1.81 1.68February 2019 2591.63 57,156.19 23.05 1.88
March 2019 132,998.93 97,489.65 1.73 1.83April 2019 71,191.97 89,656.79 2.26 1.90May 2019 59,891.81 94,381.36 2.58 1.97June 2019 59,671.50 76,002.98 2.27 2.00July 2019 53,596.12 85,555.32 2.60 2.05
August 2019 47,076.10 56,251.69 2.19 2.06September 2019 47,985.52 72,524.59 2.51 2.09
October 2019 41,446.11 61,416.46 2.48 2.11
The results obtained for the local multiplier must be interpreted as the economicimpact or the multiplicative power that each REC monetary unit initially injected into thesystem (and, therefore, at a microeconomic level) had over the local area in which it wasdeployed. For reference purposes, moving to a macroeconomic level, these results could becompared with the national spending or fiscal multiplier (increase in monetary units of theGDP for each additional spent unit). Martínez and Zubiri (2014) provided estimations ofthe fiscal multiplier for the Spanish economy by following two different methodologies. Inparticular, the average estimated values for the period of 1979–2012 ranged between 1.20and 1.84, calculated over four quarters (1 year) in a stagnant environment.
J. Risk Financial Manag. 2021, 14, 430 12 of 17
4.5. Recirculation Rate
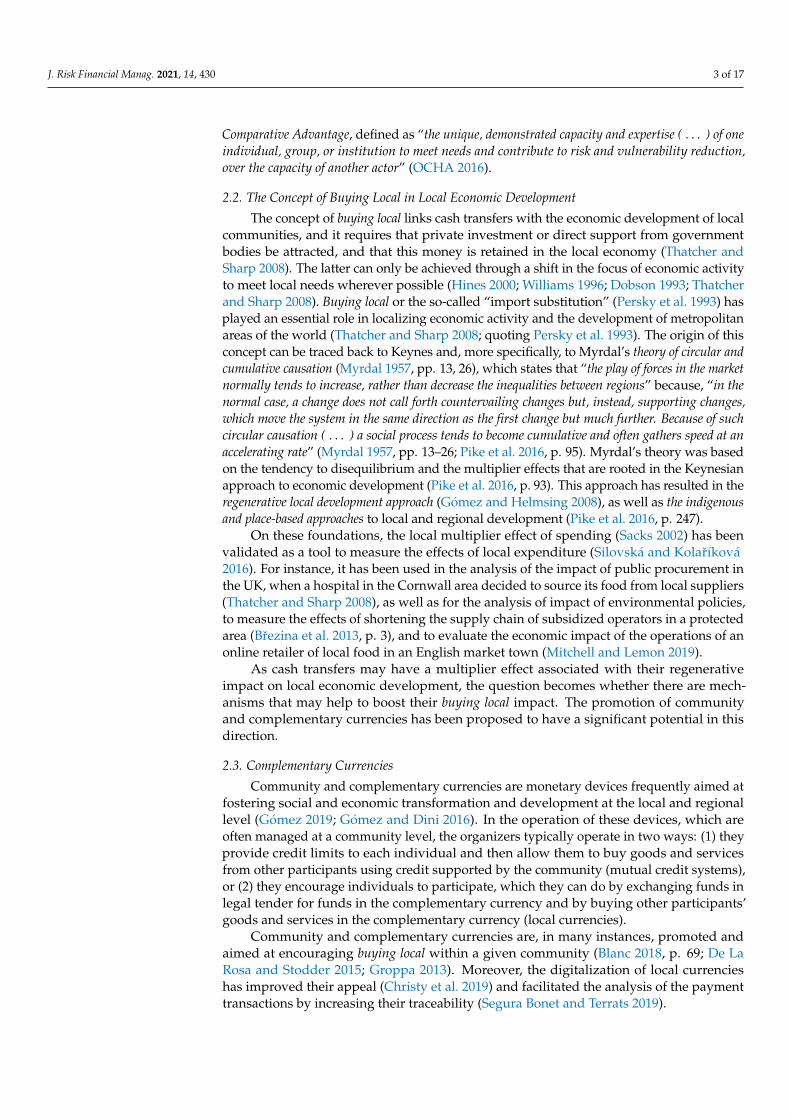
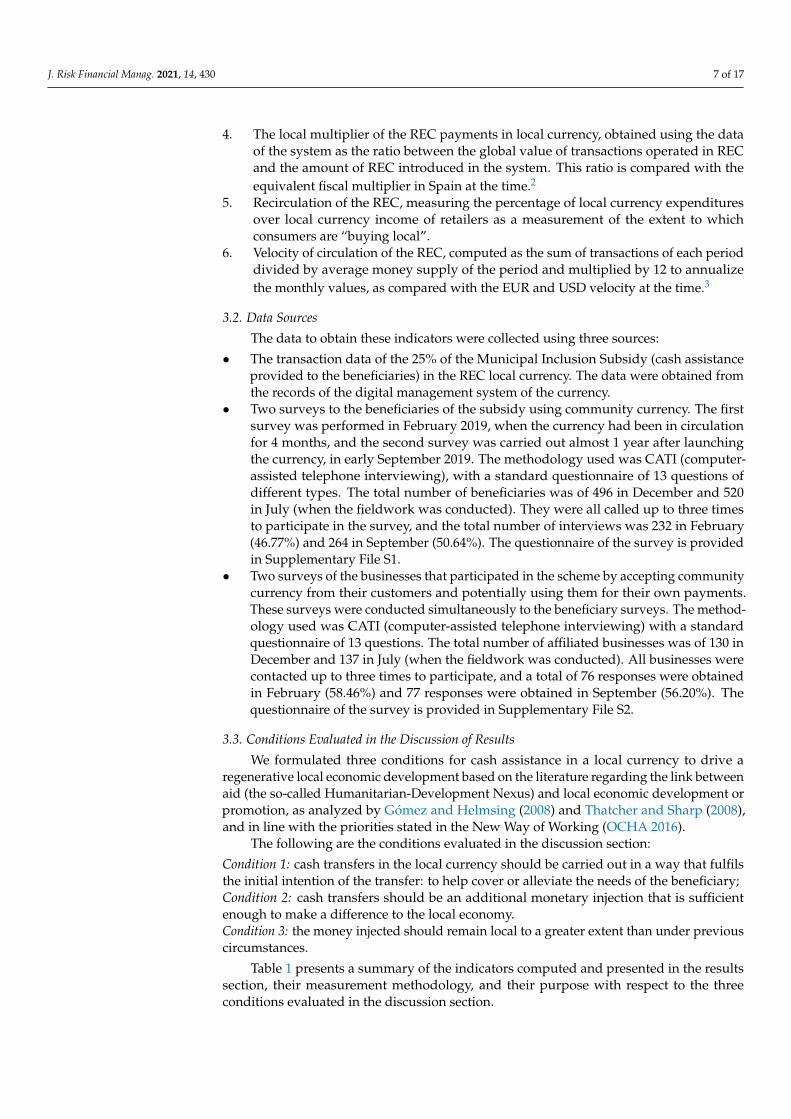
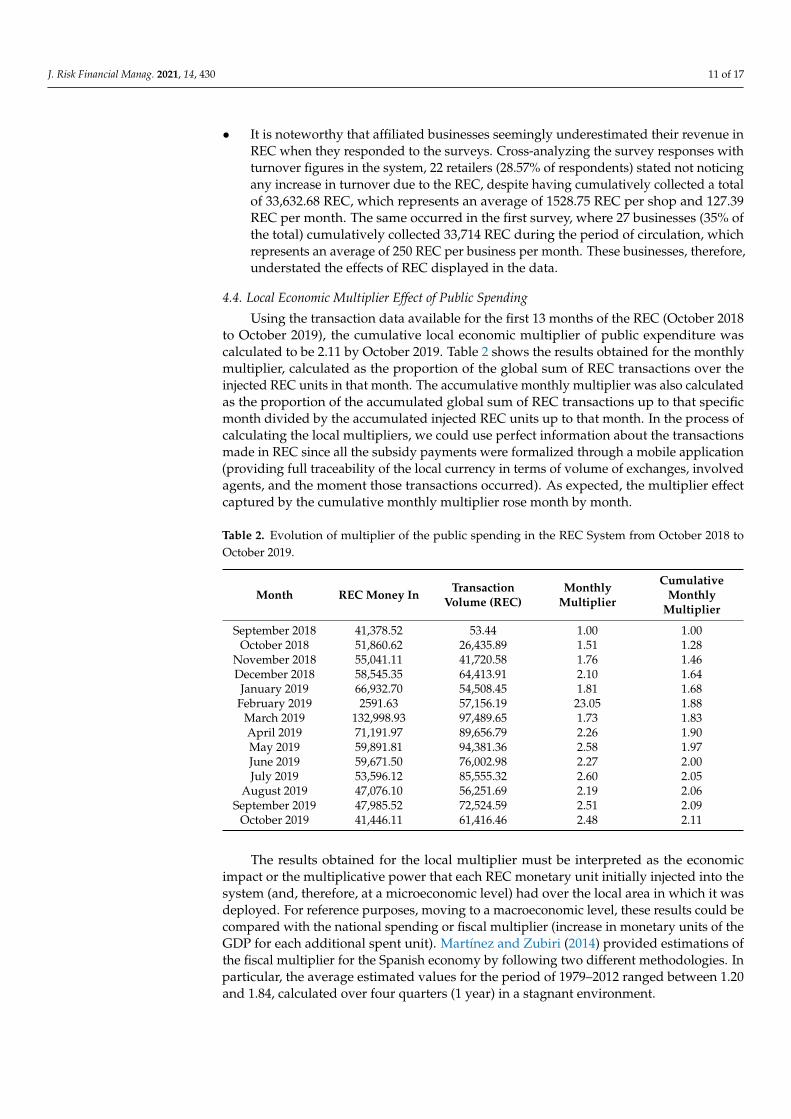
In the initial months of the project, businesses were only recirculating 1.4% of the RECcashed, whereas, at its peak, 33.4% of the REC collected was recirculated. This indicatesthat REC businesses were finding it easier to spend them as the project developed, andmore options for spending them were introduced, including two wholesalers in the foodsector. The recirculation ratio presented in Figure 2 shows spending in REC as a proportionof the revenues collected by retail businesses, clearly showing an upward trend during theperiod.
J. Risk Financial Manag. 2021, 14, x FOR PEER REVIEW 12 of 25
The results obtained for the local multiplier must be interpreted as the economic impact or the multiplicative power that each REC monetary unit initially injected into the system (and, therefore, at a microeconomic level) had over the local area in which it was deployed. For reference purposes, moving to a macroeconomic level, these results could be compared with the national spending or fiscal multiplier (increase in monetary units of the GDP for each additional spent unit). Martínez and Zubiri (2014) provided estimations of the fiscal multiplier for the Spanish economy by following two different methodologies. In particular, the average estimated values for the period of 1979–2012 ranged between 1.20 and 1.84, calculated over four quarters (1 year) in a stagnant environment.
4.5. Recirculation Rate In the initial months of the project, businesses were only recirculating 1.4% of the
REC cashed, whereas, at its peak, 33.4% of the REC collected was recirculated. This indicates that REC businesses were finding it easier to spend them as the project developed, and more options for spending them were introduced, including two wholesalers in the food sector. The recirculation ratio presented in Figure 2 shows spending in REC as a proportion of the revenues collected by retail businesses, clearly showing an upward trend during the period.
Figure 2. Recirculation ratio for REC-affiliated businesses (retailers) from October 2018 to October 2019.
4.6. Velocity of Circulation The REC’s velocity of circulation was calculated as the sum of transactions of each
period divided by the average money supply of the period and multiplied by 12 to annualize the monthly values. An exception was made for the last value, where the velocity of circulation over the last 365 days was calculated as the sum of transaction volumes of this period (6 November 2018 to 6 November 2019) divided by the average money supply of the 365th day. Figure 3 shows the evolution of the velocity of circulation of the REC, which was on average 5.80 during the period of intervention. This value is 5–6 times higher than the M3 income circulation of the EUR, which was 0.9450 in the first quarter of 2018 (TTID 2018b), and also higher than the USD M2 velocity in the same period, which was 1.454 (TTID 2018a).
Figure 2. Recirculation ratio for REC-affiliated businesses (retailers) from October 2018 to October2019.
4.6. Velocity of Circulation
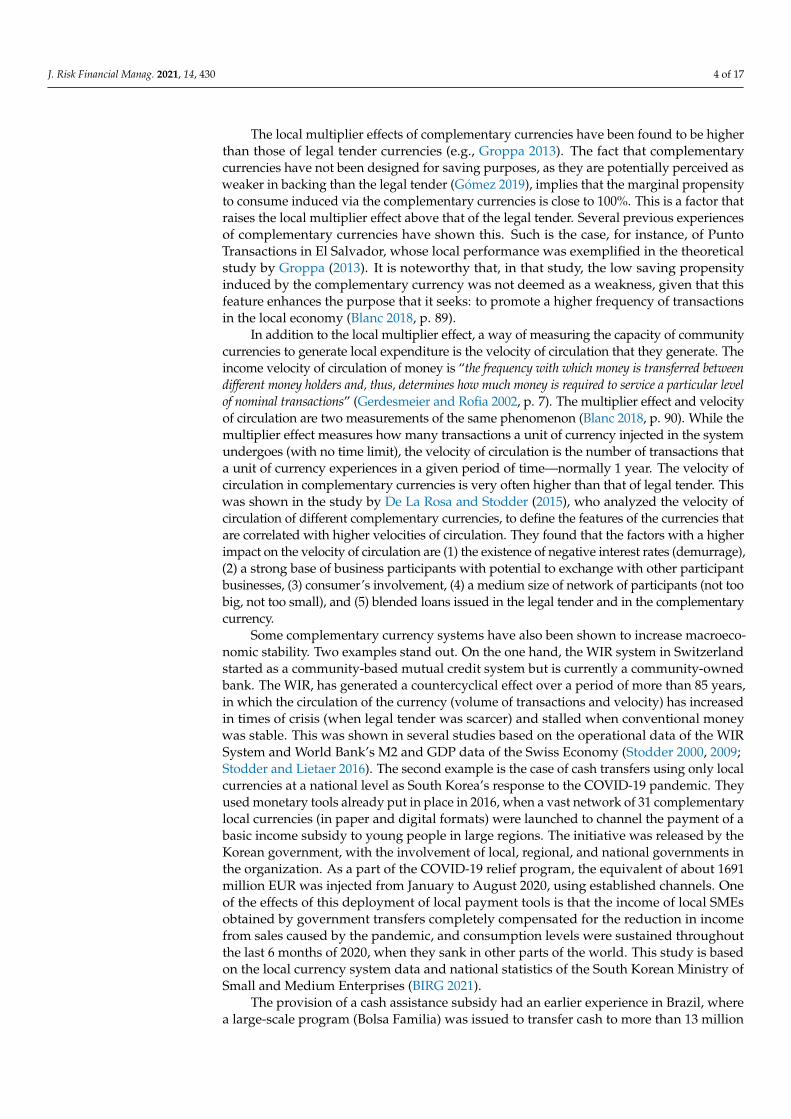
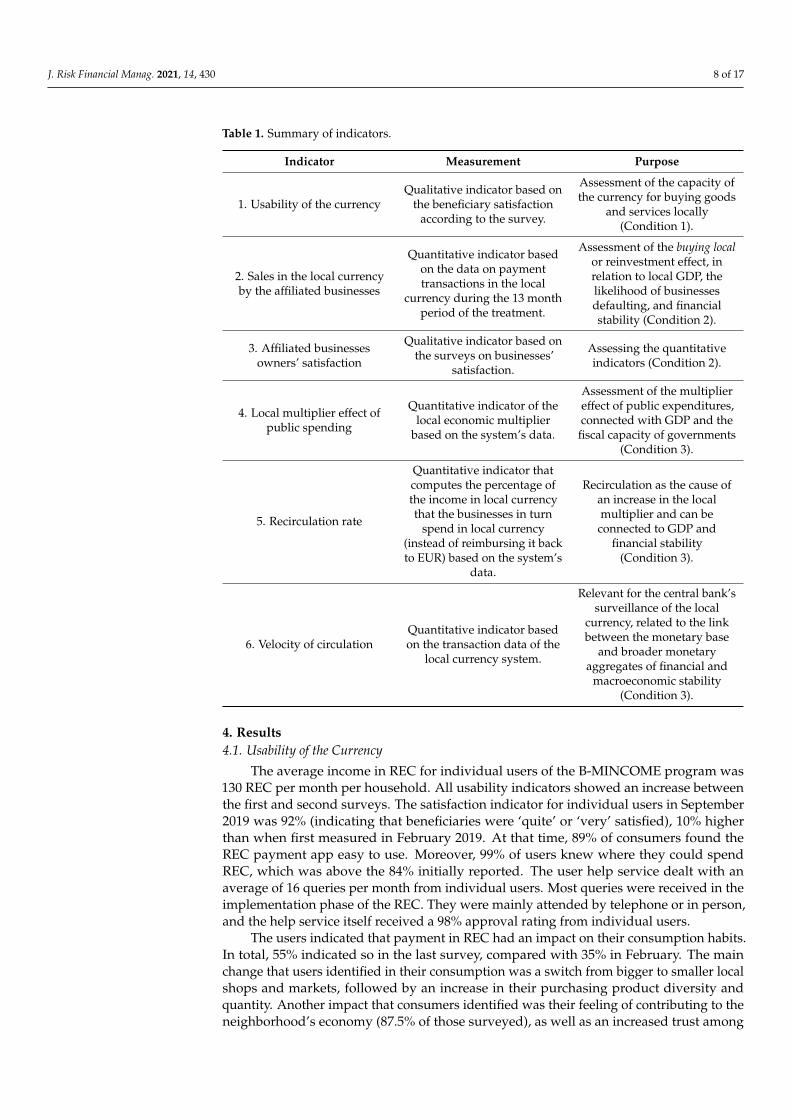
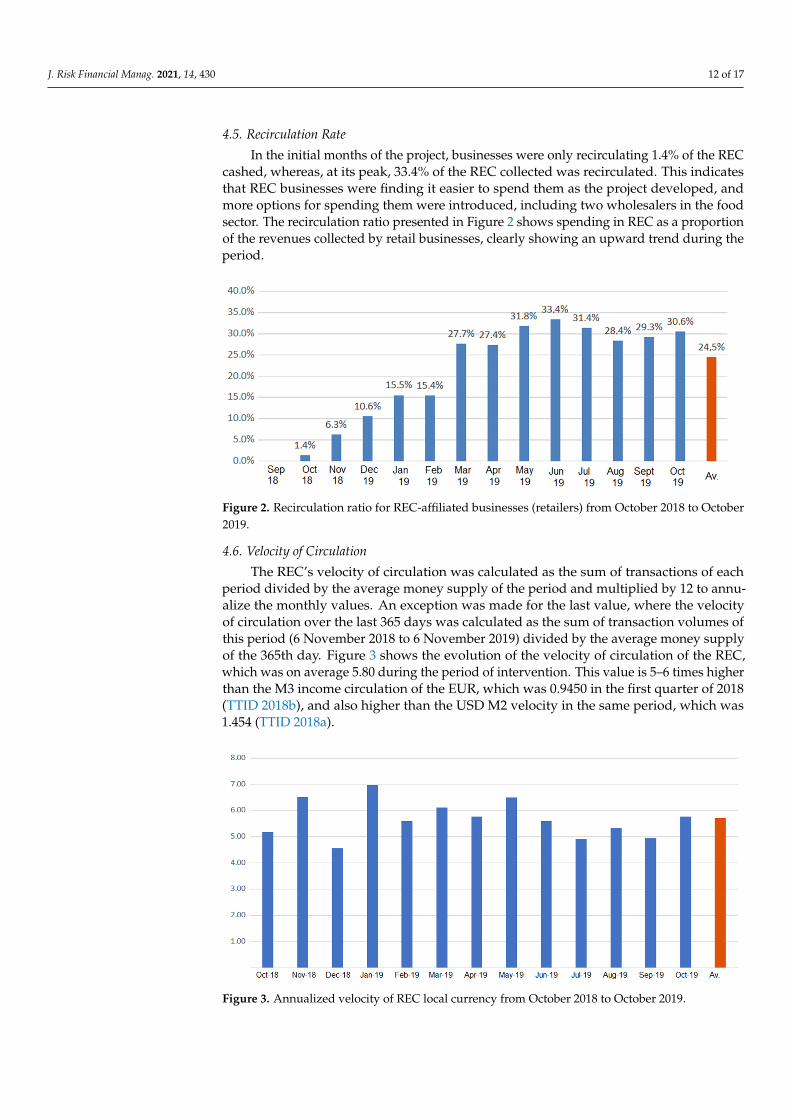
The REC’s velocity of circulation was calculated as the sum of transactions of eachperiod divided by the average money supply of the period and multiplied by 12 to annu-alize the monthly values. An exception was made for the last value, where the velocityof circulation over the last 365 days was calculated as the sum of transaction volumes ofthis period (6 November 2018 to 6 November 2019) divided by the average money supplyof the 365th day. Figure 3 shows the evolution of the velocity of circulation of the REC,which was on average 5.80 during the period of intervention. This value is 5–6 times higherthan the M3 income circulation of the EUR, which was 0.9450 in the first quarter of 2018(TTID 2018b), and also higher than the USD M2 velocity in the same period, which was1.454 (TTID 2018a).
J. Risk Financial Manag. 2021, 14, x FOR PEER REVIEW 13 of 25
Figure 3. Annualized velocity of REC local currency from October 2018 to October 2019.
5. Discussion The REC system was supported with nearly 800,000 in cash assistance to 600
beneficiaries, which was spent in local SMEs. The analysis of the transaction data and the results of the surveys to the Municipal Inclusion Subsidy beneficiaries and affiliated businesses are consistent with those obtained from previous analyses on the effects of complementary currencies. In particular, they show that (1) the multiplier effect of public spending is higher for complementary currencies than conventional currencies (Groppa 2013), (2) public spending in a complementary currency has the potential to increase macroeconomic stability by increasing GDP at a local level in times of crisis (Stodder 2000, 2009; Stodder and Lietaer 2016), and (3) the potential for complementary currencies to produce local economic development (Blanc 2018; Fare et al. 2015; Gómez 2019) is boosted when combined with public expenditure (Gómez and Helmsing 2008).
The indicators obtained corroborate the three conditions evaluated. Data support Condition 1 stating that cash transfers were compliant with the initial intention of the transfer. The cash subsidy in the REC local currency was significantly satisfactory to most beneficiaries and enabled them to buy goods and services to cover basic needs (92% were satisfied or very satisfied). Thus, the main objective of the cash transfer was achieved, including the payment of 25% of the subsidy in a local currency. Since many beneficiaries’ expenditures were only payable in conventional currency (such as utilities and repayments of bank mortgages), it remains an open question whether a 100% payment in local currency or mixed payments in other percentages would have had the same result.
Data also support Condition 2 stating that the cash monetary injections into the local economy should be sufficient to make a difference. According to the system’s data, the average income of businesses in the local currency system (not including the income in EUR) was 5559 REC in the analyzed 13 month period. This caused a positive evaluation of the system by the businesses. One cannot compare with the income that businesses would have had if the system had not been in place, but the positive results of the survey to businesses (of which 88% declared being satisfied or very satisfied) can help assess that a substantial part of it might have been new income, helping the local SMEs improve their economic results. Moreover, since only transactions in REC were analyzed in our study, it is relevant to inquire whether the same result could have been achieved if the Municipal Inclusion Subsidy was 100% paid in EUR. This interpretation is not supported by the results of the survey to shop owners in which they expressed not having noticed a significant increase in sales in EUR due to the REC system; 72% noticed no increase in the second survey, although, in the first survey, 84% noticed no increase. This means that, at least the 600 beneficiaries participating in the REC system were spending mostly REC and
Figure 3. Annualized velocity of REC local currency from October 2018 to October 2019.
J. Risk Financial Manag. 2021, 14, 430 13 of 17
5. Discussion
The REC system was supported with nearly 800,000 in cash assistance to 600 benefi-ciaries, which was spent in local SMEs. The analysis of the transaction data and the resultsof the surveys to the Municipal Inclusion Subsidy beneficiaries and affiliated businessesare consistent with those obtained from previous analyses on the effects of complementarycurrencies. In particular, they show that (1) the multiplier effect of public spending ishigher for complementary currencies than conventional currencies (Groppa 2013), (2) pub-lic spending in a complementary currency has the potential to increase macroeconomicstability by increasing GDP at a local level in times of crisis (Stodder 2000, 2009; Stodderand Lietaer 2016), and (3) the potential for complementary currencies to produce local eco-nomic development (Blanc 2018; Fare et al. 2015; Gómez 2019) is boosted when combinedwith public expenditure (Gómez and Helmsing 2008).
The indicators obtained corroborate the three conditions evaluated. Data supportCondition 1 stating that cash transfers were compliant with the initial intention of thetransfer. The cash subsidy in the REC local currency was significantly satisfactory to mostbeneficiaries and enabled them to buy goods and services to cover basic needs (92% weresatisfied or very satisfied). Thus, the main objective of the cash transfer was achieved,including the payment of 25% of the subsidy in a local currency. Since many beneficiaries’expenditures were only payable in conventional currency (such as utilities and repaymentsof bank mortgages), it remains an open question whether a 100% payment in local currencyor mixed payments in other percentages would have had the same result.
Data also support Condition 2 stating that the cash monetary injections into the localeconomy should be sufficient to make a difference. According to the system’s data, theaverage income of businesses in the local currency system (not including the income inEUR) was 5559 REC in the analyzed 13 month period. This caused a positive evaluationof the system by the businesses. One cannot compare with the income that businesseswould have had if the system had not been in place, but the positive results of the surveyto businesses (of which 88% declared being satisfied or very satisfied) can help assessthat a substantial part of it might have been new income, helping the local SMEs improvetheir economic results. Moreover, since only transactions in REC were analyzed in ourstudy, it is relevant to inquire whether the same result could have been achieved if theMunicipal Inclusion Subsidy was 100% paid in EUR. This interpretation is not supportedby the results of the survey to shop owners in which they expressed not having noticed asignificant increase in sales in EUR due to the REC system; 72% noticed no increase in thesecond survey, although, in the first survey, 84% noticed no increase. This means that, atleast the 600 beneficiaries participating in the REC system were spending mostly REC andnot EUR in local shops, and it is doubtful that Condition 2 could have been achieved if thesubsidy was paid only in EUR.
Lastly, Condition 3 requires that the money injected via a subsidy stays local to agreater extent than before. The three indicators analyzed—the recirculation rate, the localmultiplier, and the velocity of circulation—suggest that this condition was also satisfied.The recirculation rate, which started at 1.4% in the first month and reached 30.6% by theend of the period analyzed, shows that businesses increasingly spent their income in RECin the area of circulation, and that they favored the system by inviting their usual localsuppliers to participate. The accumulated multiplier effect of public spending was strong,as it reached a value of 2.11 by the end of the analyzed period, especially when comparedwith the average fiscal multiplier value in Spain over four quarters (1 year), which wasbetween 1.20 and 1.84. This means that, during the period of analysis, for each EUR ofsubsidy spent in the area, transactions for the equivalent of 1.11 EUR were maintainedwithin the area of circulation. This indicator shows the power of cash assistance paid in alocal currency to increase the aggregated income in the local area and positively impact theGDP. Moreover, from a financial stability standpoint, the steady velocity of circulation ofthe local currency (around 5.8) was much higher than the M3 income circulation velocityof the EUR (0.98 in Q1 2018), which shows the potential of the local currency to increase
J. Risk Financial Manag. 2021, 14, 430 14 of 17
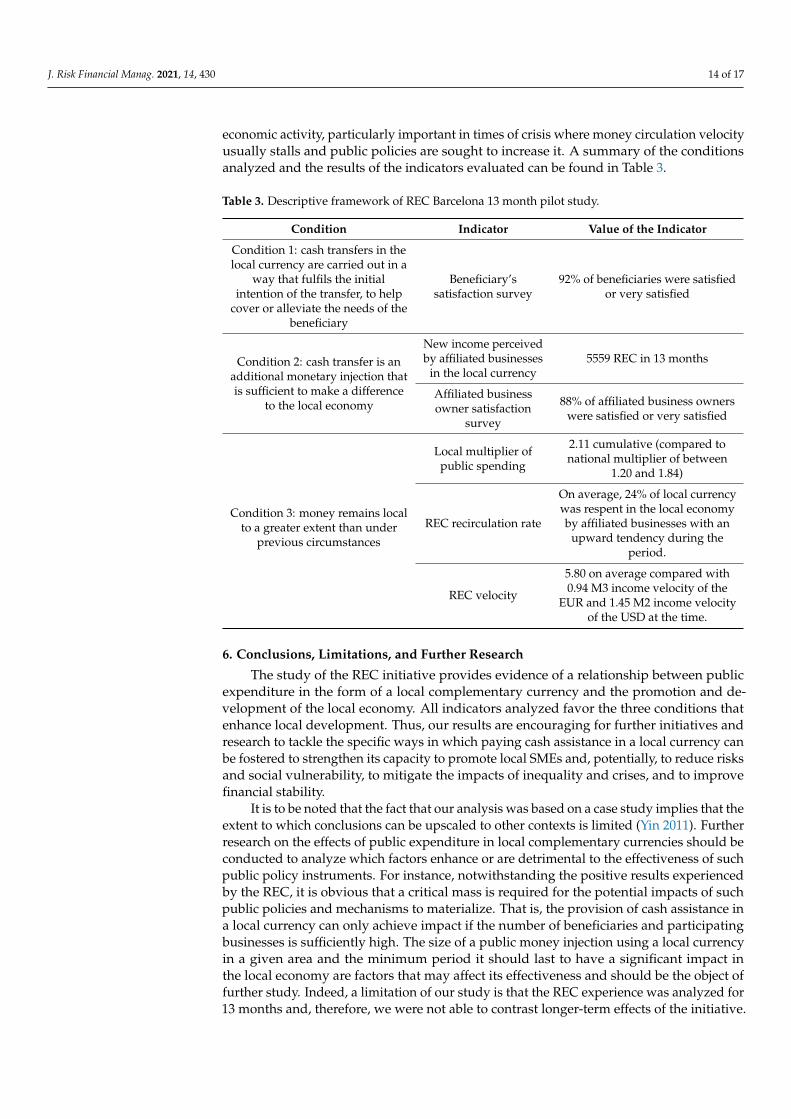
economic activity, particularly important in times of crisis where money circulation velocityusually stalls and public policies are sought to increase it. A summary of the conditionsanalyzed and the results of the indicators evaluated can be found in Table 3.
Table 3. Descriptive framework of REC Barcelona 13 month pilot study.
Condition Indicator Value of the Indicator
Condition 1: cash transfers in thelocal currency are carried out in a
way that fulfils the initialintention of the transfer, to help
cover or alleviate the needs of thebeneficiary
Beneficiary’ssatisfaction survey
92% of beneficiaries were satisfiedor very satisfied
Condition 2: cash transfer is anadditional monetary injection thatis sufficient to make a difference
to the local economy
New income perceivedby affiliated businesses
in the local currency5559 REC in 13 months
Affiliated businessowner satisfaction
survey
88% of affiliated business ownerswere satisfied or very satisfied
Condition 3: money remains localto a greater extent than under
previous circumstances
Local multiplier ofpublic spending
2.11 cumulative (compared tonational multiplier of between
1.20 and 1.84)
REC recirculation rate
On average, 24% of local currencywas respent in the local economyby affiliated businesses with an
upward tendency during theperiod.
REC velocity
5.80 on average compared with0.94 M3 income velocity of the
EUR and 1.45 M2 income velocityof the USD at the time.
6. Conclusions, Limitations, and Further Research
The study of the REC initiative provides evidence of a relationship between publicexpenditure in the form of a local complementary currency and the promotion and de-velopment of the local economy. All indicators analyzed favor the three conditions thatenhance local development. Thus, our results are encouraging for further initiatives andresearch to tackle the specific ways in which paying cash assistance in a local currency canbe fostered to strengthen its capacity to promote local SMEs and, potentially, to reduce risksand social vulnerability, to mitigate the impacts of inequality and crises, and to improvefinancial stability.
It is to be noted that the fact that our analysis was based on a case study implies that theextent to which conclusions can be upscaled to other contexts is limited (Yin 2011). Furtherresearch on the effects of public expenditure in local complementary currencies should beconducted to analyze which factors enhance or are detrimental to the effectiveness of suchpublic policy instruments. For instance, notwithstanding the positive results experiencedby the REC, it is obvious that a critical mass is required for the potential impacts of suchpublic policies and mechanisms to materialize. That is, the provision of cash assistance ina local currency can only achieve impact if the number of beneficiaries and participatingbusinesses is sufficiently high. The size of a public money injection using a local currencyin a given area and the minimum period it should last to have a significant impact inthe local economy are factors that may affect its effectiveness and should be the object offurther study. Indeed, a limitation of our study is that the REC experience was analyzed for13 months and, therefore, we were not able to contrast longer-term effects of the initiative.

J. Risk Financial Manag. 2021, 14, 430 15 of 17
At a methodological level, we based our analysis on several well-established indicatorsof the performance of subsidies and complementary currencies, as well as their effect on thelocal economy. However, it is to be noted that we were not able to compare the indicatorsof the expenditure made in REC with those associated with the expenditure made in EUR(also part of the Municipal Inclusion Subsidy), since the associated data were not similarlytraceable by the system or were not available for analysis. Thus, we had to limit our analysisto a comparison to reference macro-indicators from other studies. For instance, whilevelocity is generally calculated on the macro level as GDP divided by the money supply,the GDP cannot be equated to the sum of all transactions in a given economy. Nevertheless,previous research, such as that of De La Rosa and Stodder (2015), used the same methodto calculate and contrast local currency velocity. Further methodological research shouldaim to develop enhanced measures and procedures that allow contrasting the effectivenessof public policies based on local complementary currencies with a direct comparison ofexpenditure in the conventional currency (where indicators could be obtained for perfectlycomparable scenarios).
In summary, the analysis of our study presents results that are to be evaluated in thespecific context of the REC experience. Moreover, there are methodological enhancementsthat should be tackled in further research. Nonetheless, the results derived from the RECBarcelona case study constitute an important contribution in that they indicate the potentialof new mechanisms for public policy aiming at the promotion of the local economy. Thestudy shows that, under the appropriate circumstances, paying cash assistance in a com-plementary currency can lead to a significant advantage for the beneficiaries, contributingto reduced inequality, risk, and vulnerability, while changing consumption habits to buylocally, as well as promoting local businesses and, thus, boosting the local economy.
Supplementary Materials: The following are available at https://www.mdpi.com/article/10.3390/jrfm14090430/s1.
Author Contributions: Funding acquisition, conceptualization, investigation, and original draftpreparation, S.M.B.; validation, review and editing, methodology, and data curation, M.R., J.P., M.S.and S.M.B. All authors have read and agreed to the published version of the manuscript.
Funding: This research received no external funding although it was written on the basis of data ofthe B-MINCOME project, carried out with the funding of the EUROPEAN COMMISSION (UrbanInnovative Actions Program) and the Barcelona city council, and it was grounded in the final reportof the REC project (Martín Belmonte 2019), which contained the work carried out by the researchteam of the REC project at NOVACT, the ESCI-UPF (Universitat Pompeu Fabra), and the marketresearch consultancy Optimum.
Institutional Review Board Statement: Not applicable. The study does not involve human/animalexperimentation.
Informed Consent Statement: Informed consent was obtained from all subjects involved in thestudy.
Data Availability Statement: The transaction data presented in this study are available on requestfrom the corresponding author. The data are not publicly available due to contractual data protectionliabilities of the REC system management team with the users of the REC system. The surveyquestionnaires are included in Supplementary Files S1 and S2.
Acknowledgments: The publication of this paper was financially supported by Monneta (https://monneta.org/en, accessed on 7 July 2021), a German not-for-profit organization, and the DevelopmentEconomics Research Group at the International Institute of Social Sciences of Erasmus UniversityRotterdam (https://www.iss.nl/en, accessed on 7 July 2021). We would also like to thank SantiagoMarti for his selfless contribution to the B-MINCOME project, Dani Duocastella from NOVACTfor his contribution to the survey design, Ariádne Scalfoni for her useful information on the Brazilcomplementary currency experience, and Kirsten Sutherland Ruibérriz for her insights into cashassistance for humanitarian aid.
J. Risk Financial Manag. 2021, 14, 430 16 of 17
Conflicts of Interest: The leading author of this paper was the promoter of the pilot project thatresulted in the launching of the REC system. Other than that, the authors declare no conflictsof interest. The funders had no role in the design of the study; in the collection, analyses, orinterpretation of data; in the writing of the manuscript, or in the decision to publish the results.
Notes1 (Gyeonggi Province Basic Income International Conference 2021) Joseph Stiglitz keynote speech on the The 3rd Gyeonggi
Province Basic Income International Conference, 5 April 2021 (minute 35.10) Available in: https://www.youtube.com/watch?v=pQO0_KdTEEM&t=641s, accessed on 25 July 2021.
2 In the calculation of the multiplier effect, we do not follow previous studies’ methodology and rather base this on the perfectinformation obtained from the REC system. For instance, Gerard et al. (2021), compare cash assistance payments and formallabour increase data from national statistics which do not apply to our study, rather than transactions. Neither can we use themethodology used by Groppa (2013) since this analyses the credit circuits of a mutual credit system, which is not applicable tothe case of the REC.
3 In the calculation of the velocity, we have followed the same method as De La Rosa and Stodder (2015).
ReferencesBIRG (Basic Income Research Group). 2021. The Effects of Gyeonggi Local Currency on Consumers and Small Businesses in Gyeonggi Province:
Focused on Covid-19 Response. Suwon: The Gyeonggi Research Institute.Blanc, Jérôme. 2011. Classifying “CCs”: Community, complementary and local currencies’ types and generations. International Journal
of Community Currency Research 15: 4–10.Blanc, Jérôme. 2018. Les Monnaies Alternatives. Paris: La Découverte.Brezina, David, Dalibor Šafarík, and Petra Hlavácková. 2013. LM3—Local multiplier in environmental economics. In Public Recreation
and Landscape Protection—With Man Hand in Hand . . . —Conference Proceeding. Brno: Department of Landscape ManagementFFWT Mendel University in Brno, pp. 77–80.
Christy, Xebax, Dante Edme-Sanjurjo, Mathilde Fois-Duclerc, Yannick Lung, Julien Milanesi, Fabienne Pinos, Nicolas Piriou, andTxomin Poveda. 2019. The Impact of Digitization on the Trajectory of a Complementary Local Currency: The Eusko in theNorthern Basque Country. Easy Chair Preprints. Available online: https://easychair.org/publications/preprint/K1MB (accessedon 25 July 2021).
Dama, Caroline. 2019. Red Cross’ Impact Continues Post Cash. Grassroots Economics. Available online: https://www.grassrootseconomics.org/post/red-cross-impact-continues-post-cash (accessed on 7 July 2021).
de França Filho, Genauto Carvalho, Jeová Torres Silva Júnior, and Ariádne Scalfoni Rigo. 2012. Solidarity finance through communitydevelopment banks as a strategy for reshaping local economies: Lessons from Banco Palmas. Revista de Administração 47: 500–15.[CrossRef]
De La Rosa, Josep Lluís, and James Stodder. 2015. On Velocity in several Complementary Currencies. International Journal of CommunityCurrency Research 19: 114–27.
Devarajan, Shantayanan, Marcelo M. Giugale, Helene Ehrhart, Tuan Minh Le, and Huong Nguyen. 2013. The Case for Direct Transfersof Resource Revenues in Africa. Social Science Research Network 333: 2364568. [CrossRef]
Dobson, Ross V.G. 1993. Bringing the Economy Home from the Market. Montreal: Black Rose Books.E-dinheiro Brasil. n.d. Available online: http://edinheirobrasil.org/rede-brasileira-bancos-comunitarios/# (accessed on 20 June 2021).Fare, Marie, Carlos de Freitas, and Camille Meyer. 2015. Territorial development and Community currencies: Symbolic meanings
in Brazilian Community development banks. IJCCR. Available online: https://ijccr.net/2015/02/25/territorial-development/(accessed on 1 March 2021).
Gentilini, Ugo, Mohamed Almenfi, and Pamela Dale. 2020. Social Protection and Jobs Responses to COVID-19: A Real-Time Review ofCountry Measures. World Bank—Working Paper. Available online: https://documents1.worldbank.org/curated/en/467521607723220511/pdf/Social-Protection-and-Jobs-Responses-to-COVID-19-A-Real-Time-Review-of-Country-Measures-December-11-2020.pdf (accessed on 7 July 2021).
Gerard, François, Joana Naritomi, and Joana Silva. 2021. Cash Transfers and Formal Labor Markets—Evidence from Brazil. Availableonline: https://www.dropbox.com/s/kano5q63269623i/CT_GerardNaritomiSilva.pdf?dl=0 (accessed on 10 July 2021).
Gerdesmeier, Claus Brand Dieter, and Barbara Rofia. 2002. Estimating the trend of M3 Income Velocity underlying the RefereceValue for Monetary Growth. ECB Occasional Paper Series N.3. Available online: https://www.ecb.europa.eu/pub/pdf/scpops/ecbocp3.pdf?e93b61ea2210d7d401c1d59a87300482 (accessed on 5 June 2021).
Gómez, Georgina, and Bert Helmsing. 2008. Selective Spatial Closure and Local Economic Development: What Do We Learn from theArgentine Local Currency Systems? World Development 36: 2489–511. [CrossRef]
Gómez, Georgina, and Paolo Dini. 2016. Making sense of a crank case: Monetary diversity in Argentina (1999–2003). Cambridge Journalof Economics 40: 1421–37. [CrossRef]
Gómez, Georgina. 2019. For the Policy Maker: When and How Is Monetary Plurality an Option? In Monetary Plurality in Local, Regionaland Global Economies. Abingdon and New York: Routledge, pp. 275–87. ISBN 978-1-138-28028-1.
J. Risk Financial Manag. 2021, 14, 430 17 of 17
Gonzalez, Lauro, Adrian Kemmer Cernev, Marcelo Henrique de Araujo, and Eduardo H. Diniz. 2020. Moedas complementaresdigitais e políticas públicas durante a crise da COVID-19. Revista de Administração Pública 54: 1146–60. Available online:http://bibliotecadigital.fgv.br/ojs/index.php/rap/article/view/81909 (accessed on 20 July 2021). [CrossRef]
Groppa, Octavio. 2013. Complementary currency and its impact on the economy. International Journal of Community Currency Research17: 45–57.
Gyeonggi Province Basic Income International Conference. 2021. Necessity of Basic Income as Universal Expenditure in COVID-19 Pandemicand Social Transformation. Keynote Speech by Josepth Stiglitz at The 3rd Gyeonggi Province Basic Income International Conferenceon 15-04-2021. Available online: https://www.youtube.com/watch?v=pQO0_KdTEEM&t=641s (accessed on 3 May 2021).
Hines, C. 2000. Localization: A Global Manifesto. London: Earthscan Earth Scan from Routledge.Instituto Banco Palmas | Como Implantar Um Banco Comunitário. n.d. Available online: https://www.institutobancopalmas.org/
como-implantar-um-banco-comunitario/ (accessed on 27 May 2021).Kapur, Devesh, Partha Mukhopadhyay, and Arvind Subramanian. The Case for Direct Cash Transfers to the Poor. Economic and Political
Weekly 43: 37–43.Martín Belmonte, Susana. 2019. REC Citizen Currency—Final Report—B-MINCOME Project. NOVACT. p. 42. Available online:
https://rec.barcelona/wp-content/uploads/2020/02/informe-final_EN_compressed.pdf (accessed on 25 July 2021).Martínez, Jabier, and Ignacio Zubiri. 2014. Los multiplicadores de la política fiscal en España. Papeles de Economía Española 139: 174–98.Mitchell, Andrew, and Mark Lemon. 2019. Using the LM3 method to evaluate economic impacts of an on-line retailer of local food in
an English market town. Local Economy 34: 51–67. [CrossRef]Myrdal, Gunnar. 1957. Economic Theory and Underdeveloped Regions. London: Duckworth.OCHA. 2016. Humanitarian Development Nexus. Available online: https://www.unocha.org/es/themes/humanitarian-development-
nexus (accessed on 15 July 2021).Persky, Joseph, David Ranney, and Wim Wiewel. 1993. Import Substitution and Local Economic Development. Economic Development
Quarterly 7: 18–29. [CrossRef]Pike, Andy, Andrés Rodríguez-Pose, and John Tomaney. 2016. Local and Regional Development, 2nd ed. London: Routledge.Sacks, Justin. 2002. The Money Trail: Measuring Your Impact on the Local Economy Using LM3. London: New Economics Foundation.Scalfoni Rigo, Ariádne. 2014. Moedas Sociais e Bancos Comunitários no Brasil: Aplicações e Implicações, Teóricas e Práticas. Ph.D.
Dissertation, University Federal of Bahia, Salvador, Brazil.Segura Bonet, Marta, and Lluís Muns Terrats. 2019. La importancia de conocer la trazabilidad de las monedas complementarias.
International Journal of Community Currency Research 23: 63–70. [CrossRef]Shaefer, H Luke, Kathryn Edin, Vincent Fusaro, and Pinghui Wu. 2019. The Decline of Cash Assistance and the Well-Being of Poor
Households with Children. Social Forces 98: 1000–25. [CrossRef]Silovská, Hana Cerná, and Jana Kolaríková. 2016. Observation and assessment of local economic development with regard to the
application of the local multiplier. European Planning Studies 24: 1978–94. [CrossRef]Stodder, James. 2000. Reciprocal exchange networks: Implications for macroeconomic stability. Paper presented at 2000 IEEE
Engineering Management Society, EMS—2000 (Cat. No.00CH37139), Albuquerque, NM, USA, August 15; pp. 540–45. [CrossRef]Stodder, James. 2009. Complementary credit networks and macroeconomic stability: Switzerland’s Wirtschaftsring. Journal of Economic
Behavior & Organization 72: 79–95. [CrossRef]Stodder, James, and Bernard Lietaer. 2016. The Macro-Stability of Swiss WIR-Bank Credits: Balance, Velocity, and Leverage. Comparative
Economic Studies 58: 570–605. [CrossRef]Thatcher, Jenny, and Liz Sharp. 2008. Measuring the local economic impact of National Health Service procurement in the UK: An
evaluation of the Cornwall Food Programme and LM3. Local Environment 13: 253–70. [CrossRef]This Time Is Different (TTID). 2018a. The Curious Case of Low U.S. Money Velocity. This Time It Is Different. Available online:
https://thistimeitisdifferent.com/us-money-velocity-may-2018 (accessed on 7 July 2021).This Time Is Different (TTID). 2018b. Euro Area or Eurozone Money Velocity Seems to Be Shockingly Low. This Time It Is Different.
Available online: https://thistimeitisdifferent.com/eurozone-money-velocity-august-2018 (accessed on 7 July 2021).Williams, Colin C. 1996. Local Purchasing Schemes and Rural Development: An Evaluation of Local Exchange and Trading Systems
(LETS). Journal of Rural Studies 12: 231–44. [CrossRef]Yin, Robert K. 2011. Case-Study Research: Design and Methods, 3rd ed. Thousand Oacks: SAGE Publications, Inc.