Crime in Border Regions: The Scandinavian Case of Öresund, 1998–2001
20
Crime in Border Regions: The Scandinavian Case of O ¨ resund, 1998–2001 Va ˆnia Ceccato* and Robert Haining** *Urban Studies Division, Royal Institute of Technology, Stockholm **Department of Geography, University of Cambridge This article compares offense patterns at two points in time in O ¨ resund, a Scandinavian border region that spans Sweden and Denmark. The aim of the analysis is to contribute to a better understanding of the re- lationships between crime and demographic, socioeconomic, and land use covariates in a border area that has been targeted with long-term investments in transport. The changes effected by the construction of the O ¨ re- sund bridge might be expected to have an impact on both the levels and the geographies of different offenses by creating new sites for offending and new, more vulnerable, transient groups. The article focuses on iden- tifying and explaining changes in the geography of crime before and after the bridge was built. Spatial statistical techniques and GIS underpin the methodology employed. The article shows that there have been changes in the levels and the geography of some offenses. Crime in border regions is likely to be of growing interest in Europe as a result of European Union (EU) enlargement and increasing intra-European cross-border movement facilitated by improved communication systems. Key Words: crime trends, border region, spatial statistics and GIS. Introduction R egions in the European Union, during the last decade, have been targets of large transport in- vestments to promote social cohesion, diminish the economic disparities between countries, and improve connections between European capitals (EC 1997; EC 1998). This increase in accessibility makes cities, regions, and countries more vulnerable to crime through new patterns of mobility. The literature on the impact of new transport links on crime patterns at or across internal borders is com- paratively sparse. An exception is the study of the tunnel linking England and France where there is evi- dence of changes in offense patterns (Rikskriminalpoli- sen 1999). In July 2000, the O ¨ resund region saw the completion of a bridge linking Copenhagen and Malmo¨. In this article we present our findings on geographical shifts in offenses between 1998 and 2001. In addition, we seek to explain changes in the geography of crime in Malmo ¨ in terms of demographic, socioeconomic, and land use covariates. The Scandinavian border region of O ¨ resund 1 has been chosen for several reasons (Figure 1). First, in the Nordic context, O ¨ resund is an important growth region that has been moving up the European hierarchy (Matthiessen 2000, 2002). Substantial steps toward the region’s eco- nomic integration were taken through large-scale, long- term infrastructural and business investments. The O ¨ re- sund bridge is the first fixed link between Sweden and Denmark combining a four-lane motorway with a dual- track railway. Second, Baltic and Nordic regions, because of their geographical proximity and well-developed eco- nomic structures (in banking and transport), play an important role as receptors and transit territories for in- ternational organized crime, especially those operating from the east (Ulrich 1994; Galeotti 1995). Third, Sweden and Denmark differ in terms of regu- lations and legislations. There are structural differences in, for instance, income tax, tax on products, social se- curity, and health care, which act as a stimulus to smuggling. Finally, both in Sweden and Denmark, crime data is systematically recorded geographically and tem- porally by the local police authorities at a very detailed level. The structure of this article is as follows. First, the relationship between crime and communication systems in border regions is discussed. Then, a conceptual model for examining the impact of improving cross-border communication on crime patterns is presented, and an analysis of changes between 1998 and 2001 over the whole region is reported. We then discuss changes in the geography of crime in the Swedish city of Malmo ¨ and present the results of modeling the changes in offense patterns there. Directions for future work conclude the article. Annals of the Association of American Geographers, 94(4), 2004, pp. 807–826 r 2004 by Association of American Geographers Initial submission, August 2003; revised submission, January 2004; final acceptance, March 2004 Published by Blackwell Publishing, 350 Main Street, Malden, MA 02148, and 9600 Garsington Road, Oxford OX4 2DQ, U.K.
Transcript of Crime in Border Regions: The Scandinavian Case of Öresund, 1998–2001
Crime in Border Regions: The Scandinavian Case ofOresund, 1998–2001
Vania Ceccato* and Robert Haining**
*Urban Studies Division, Royal Institute of Technology, Stockholm**Department of Geography, University of Cambridge
This article compares offense patterns at two points in time in Oresund, a Scandinavian border region thatspans Sweden and Denmark. The aim of the analysis is to contribute to a better understanding of the re-lationships between crime and demographic, socioeconomic, and land use covariates in a border area that hasbeen targeted with long-term investments in transport. The changes effected by the construction of the Ore-sund bridge might be expected to have an impact on both the levels and the geographies of different offensesby creating new sites for offending and new, more vulnerable, transient groups. The article focuses on iden-tifying and explaining changes in the geography of crime before and after the bridge was built. Spatial statisticaltechniques and GIS underpin the methodology employed. The article shows that there have been changesin the levels and the geography of some offenses. Crime in border regions is likely to be of growing interestin Europe as a result of European Union (EU) enlargement and increasing intra-European cross-bordermovement facilitated by improved communication systems. Key Words: crime trends, border region, spatialstatistics and GIS.
Introduction
Regions in the European Union, during the lastdecade, have been targets of large transport in-vestments to promote social cohesion, diminish
the economic disparities between countries, and improveconnections between European capitals (EC 1997; EC1998). This increase in accessibility makes cities, regions,and countries more vulnerable to crime through newpatterns of mobility.
The literature on the impact of new transport linkson crime patterns at or across internal borders is com-paratively sparse. An exception is the study of thetunnel linking England and France where there is evi-dence of changes in offense patterns (Rikskriminalpoli-sen 1999). In July 2000, the Oresund region saw thecompletion of a bridge linking Copenhagen and Malmo.In this article we present our findings on geographicalshifts in offenses between 1998 and 2001. In addition,we seek to explain changes in the geography of crime inMalmo in terms of demographic, socioeconomic, andland use covariates.
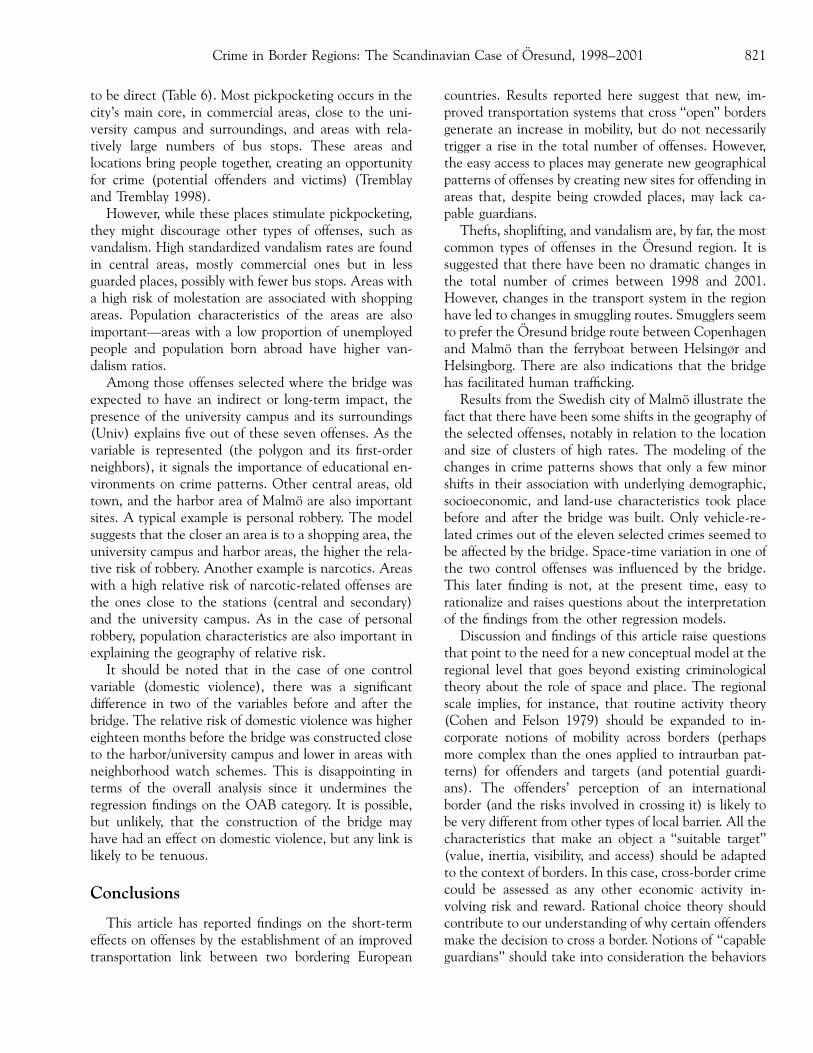
The Scandinavian border region of Oresund1 has beenchosen for several reasons (Figure 1). First, in the Nordiccontext, Oresund is an important growth region that hasbeen moving up the European hierarchy (Matthiessen2000, 2002). Substantial steps toward the region’s eco-nomic integration were taken through large-scale, long-
term infrastructural and business investments. The Ore-sund bridge is the first fixed link between Sweden andDenmark combining a four-lane motorway with a dual-track railway. Second, Baltic and Nordic regions, becauseof their geographical proximity and well-developed eco-nomic structures (in banking and transport), play animportant role as receptors and transit territories for in-ternational organized crime, especially those operatingfrom the east (Ulrich 1994; Galeotti 1995).
Third, Sweden and Denmark differ in terms of regu-lations and legislations. There are structural differencesin, for instance, income tax, tax on products, social se-curity, and health care, which act as a stimulus tosmuggling. Finally, both in Sweden and Denmark, crimedata is systematically recorded geographically and tem-porally by the local police authorities at a very detailedlevel.
The structure of this article is as follows. First, therelationship between crime and communication systemsin border regions is discussed. Then, a conceptual modelfor examining the impact of improving cross-bordercommunication on crime patterns is presented, and ananalysis of changes between 1998 and 2001 over thewhole region is reported. We then discuss changes in thegeography of crime in the Swedish city of Malmo andpresent the results of modeling the changes in offensepatterns there. Directions for future work conclude thearticle.
Annals of the Association of American Geographers, 94(4), 2004, pp. 807–826 r 2004 by Association of American GeographersInitial submission, August 2003; revised submission, January 2004; final acceptance, March 2004
Published by Blackwell Publishing, 350 Main Street, Malden, MA 02148, and 9600 Garsington Road, Oxford OX4 2DQ, U.K.
Literature Overview
The Relationship between Crime andCommunication Systems
Long before the establishment of modern transporta-tion systems, Colquhoun (1800) showed how they shapecrime patterns. He described how thieves preyed onvaluable cargos in the Port of London (see also Tobias1967). Today, public transport links (e.g., railways, roads)and nodes (e.g., stations, airports), together with relatedconsumer services, generate other opportunities for crime.
A new transport terminal may have a direct effect oncrime patterns by creating a new site for offending oraltering patterns of routine activity by motivated of-fenders. According to Brantingham and Brantingham(1981) offenses occur where criminal opportunitiesintersect with areas that are cognitively known to amotivated offender. Public transportation creates imper-sonal spaces that bring together different social groups,attract motivated offenders, and create opportunities forcrime (see, for example, Levine and Wachs 1986; Blockand Davies 1996; Poister 1996; LaVigne 1997; Tremblayand Tremblay 1998; Loukaitou-Sideris 1999).
Transport sites are often crowded but lack ‘‘capableguardians’’—persons who, sometimes just by their pres-ence, discourage crime from taking place (Cohen andFelson 1979). ‘‘Guardians’’ may be formal (e.g., securityguards or CCTV cameras) or informal (e.g., observant andconcerned individuals) (Home Office 2003). Public spaces,like train stations and airports, suffer a double disadvan-tage. They are mostly equipped with impersonal surveil-lance (e.g., CCTV cameras and other forms of surveillance)that may be ineffective (e.g., staff may not have sufficient
training or awareness to be an effective deterrent or maynot be willing to put themselves at risk). Travelers whomight be considered as informal guardians often have nosense of ownership and are unwilling to get involved.Crowding and congestion combined with a physical dete-rioration of the bus or railway station (e.g., poorly lit areas)may further increase the risk of certain types of offenses.
There is also an indirect impact of transport infra-structure on crime patterns. Tourists are often unfamiliarwith the risks they face in an unknown environment andbecome targets. The implementation of a new transportinfrastructure leads to other types of investments in theimmediate area that generate land uses. As Wikstrom(1991) argues, land use determines both the activitiesfound in an area and the composition of the populationat any given time. Shopping areas attract temporarypopulations who are at high risk from so-called tourism-criminality (Rikskriminalpolisen 1999) such as pick-pocketing, shoplifting, thefts of different kinds, and, incertain cases, violence. These new groups are sometimesthe ones that offend and get involved in opportunisticacts of violence and disorder (Dunning 2000; Stott,Hutchison, and Drury 2001).
Crime at a Political Border2
Political borders and the areas close to them are uniqueplaces for criminal activities. A border defines ‘‘the limitsof executive police powers (and) states are reluctant toloosen their grip on these powers since territorial sover-eignty represents an important political and psychologicalthreshold for any European country’’ (Anderson et al.1995, 124). Hajdnijak (2002), for example, points outhow weakened state apparatus and political and socialinstability in the former Yugoslavia create opportunitiesfor crime to the extent that a significant part of thepopulation has been actively involved in criminal schemes(e.g., illicit trade), largely tolerated by the authorities. Theborders represent a form of ‘‘safety valve’’ for pressurescreated by the ever-increasing army of the unemployed.
Table 1 provides a summary of the many factors in thiscontext. Many of the factors relate to the states ratherthan being properties of the border itself. Nevertheless, itis at the border where these factors become important astriggers of crime.
Impact of Improving Cross-Border Communicationson Crime: A Conceptual Framework
We distinguish between three types of offenses inborder regions. First, cross-border crime, such as smug-gling, where the offense involves the transport of goods or
Figure 1. The Oresund region. Source: Adapted from SCB, Orestad:statistik om Oresund, 2003.
Ceccato and Haining808
people illegally over the border. Second, crime that doesnot involve cross-border movement but that is at a higherlevel because of the consequences of cross-border crime.There may be a direct link to cross-border crime (e.g.,money laundering, drugs selling) or the link may be moreindirect (e.g., car theft to facilitate smuggling; burglary topay for drug purchase). Third, crime that is largely un-affected by the border and is not expected to be signifi-cantly higher than elsewhere (e.g., domestic violence).
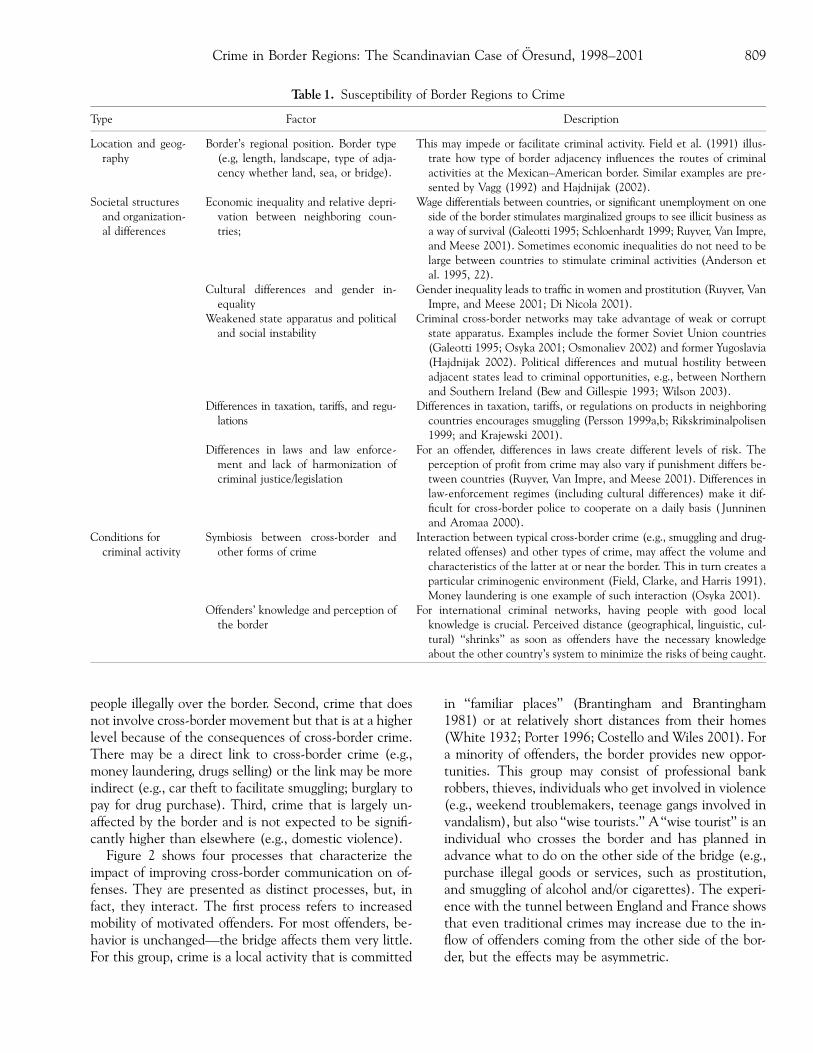
Figure 2 shows four processes that characterize theimpact of improving cross-border communication on of-fenses. They are presented as distinct processes, but, infact, they interact. The first process refers to increasedmobility of motivated offenders. For most offenders, be-havior is unchanged—the bridge affects them very little.For this group, crime is a local activity that is committed
in ‘‘familiar places’’ (Brantingham and Brantingham1981) or at relatively short distances from their homes(White 1932; Porter 1996; Costello and Wiles 2001). Fora minority of offenders, the border provides new oppor-tunities. This group may consist of professional bankrobbers, thieves, individuals who get involved in violence(e.g., weekend troublemakers, teenage gangs involved invandalism), but also ‘‘wise tourists.’’ A ‘‘wise tourist’’ is anindividual who crosses the border and has planned inadvance what to do on the other side of the bridge (e.g.,purchase illegal goods or services, such as prostitution,and smuggling of alcohol and/or cigarettes). The experi-ence with the tunnel between England and France showsthat even traditional crimes may increase due to the in-flow of offenders coming from the other side of the bor-der, but the effects may be asymmetric.
Table 1. Susceptibility of Border Regions to Crime
Type Factor Description
Location and geog-raphy
Border’s regional position. Border type(e.g, length, landscape, type of adja-cency whether land, sea, or bridge).
This may impede or facilitate criminal activity. Field et al. (1991) illus-trate how type of border adjacency influences the routes of criminalactivities at the Mexican–American border. Similar examples are pre-sented by Vagg (1992) and Hajdnijak (2002).
Societal structuresand organization-al differences
Economic inequality and relative depri-vation between neighboring coun-tries;
Wage differentials between countries, or significant unemployment on oneside of the border stimulates marginalized groups to see illicit business asa way of survival (Galeotti 1995; Schloenhardt 1999; Ruyver, Van Impre,and Meese 2001). Sometimes economic inequalities do not need to belarge between countries to stimulate criminal activities (Anderson etal. 1995, 22).
Cultural differences and gender in-equality
Gender inequality leads to traffic in women and prostitution (Ruyver, VanImpre, and Meese 2001; Di Nicola 2001).
Weakened state apparatus and politicaland social instability
Criminal cross-border networks may take advantage of weak or corruptstate apparatus. Examples include the former Soviet Union countries(Galeotti 1995; Osyka 2001; Osmonaliev 2002) and former Yugoslavia(Hajdnijak 2002). Political differences and mutual hostility betweenadjacent states lead to criminal opportunities, e.g., between Northernand Southern Ireland (Bew and Gillespie 1993; Wilson 2003).
Differences in taxation, tariffs, and regu-lations
Differences in taxation, tariffs, or regulations on products in neighboringcountries encourages smuggling (Persson 1999a,b; Rikskriminalpolisen1999; and Krajewski 2001).
Differences in laws and law enforce-ment and lack of harmonization ofcriminal justice/legislation
For an offender, differences in laws create different levels of risk. Theperception of profit from crime may also vary if punishment differs be-tween countries (Ruyver, Van Impre, and Meese 2001). Differences inlaw-enforcement regimes (including cultural differences) make it dif-ficult for cross-border police to cooperate on a daily basis ( Junninenand Aromaa 2000).
Conditions forcriminal activity
Symbiosis between cross-border andother forms of crime
Interaction between typical cross-border crime (e.g., smuggling and drug-related offenses) and other types of crime, may affect the volume andcharacteristics of the latter at or near the border. This in turn creates aparticular criminogenic environment (Field, Clarke, and Harris 1991).Money laundering is one example of such interaction (Osyka 2001).
Offenders’ knowledge and perception ofthe border
For international criminal networks, having people with good localknowledge is crucial. Perceived distance (geographical, linguistic, cul-tural) ‘‘shrinks’’ as soon as offenders have the necessary knowledgeabout the other country’s system to minimize the risks of being caught.
Crime in Border Regions: The Scandinavian Case of Oresund, 1998–2001 809

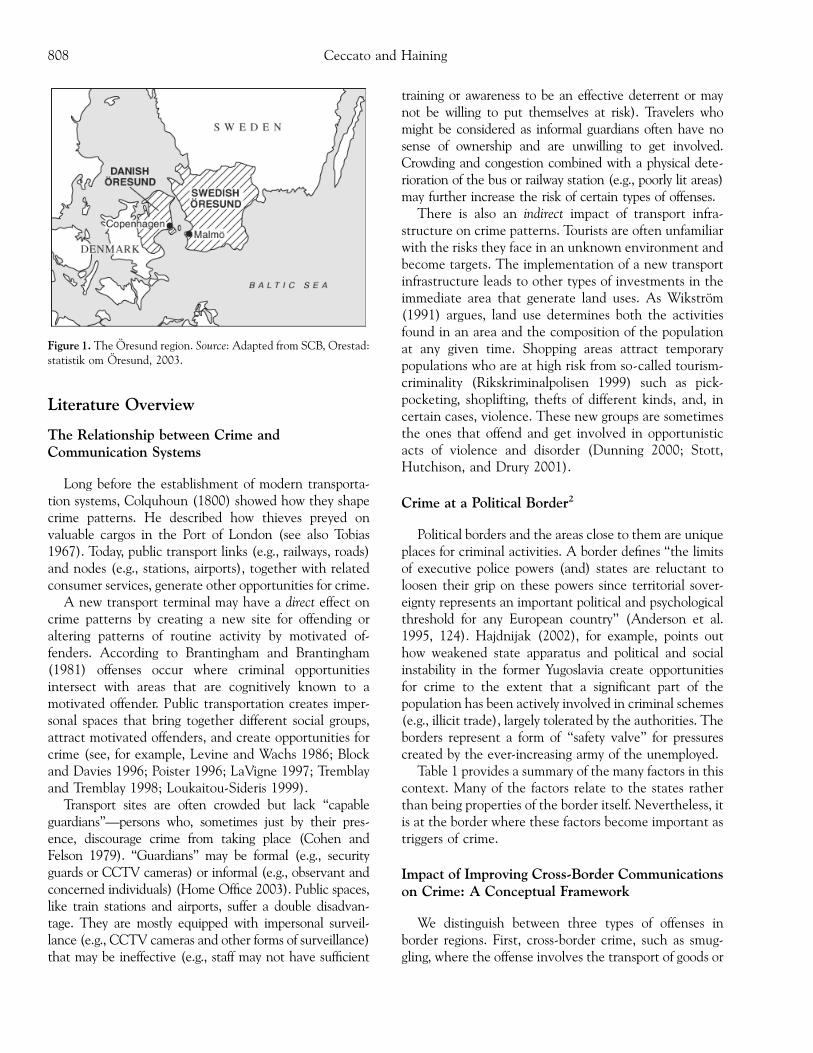
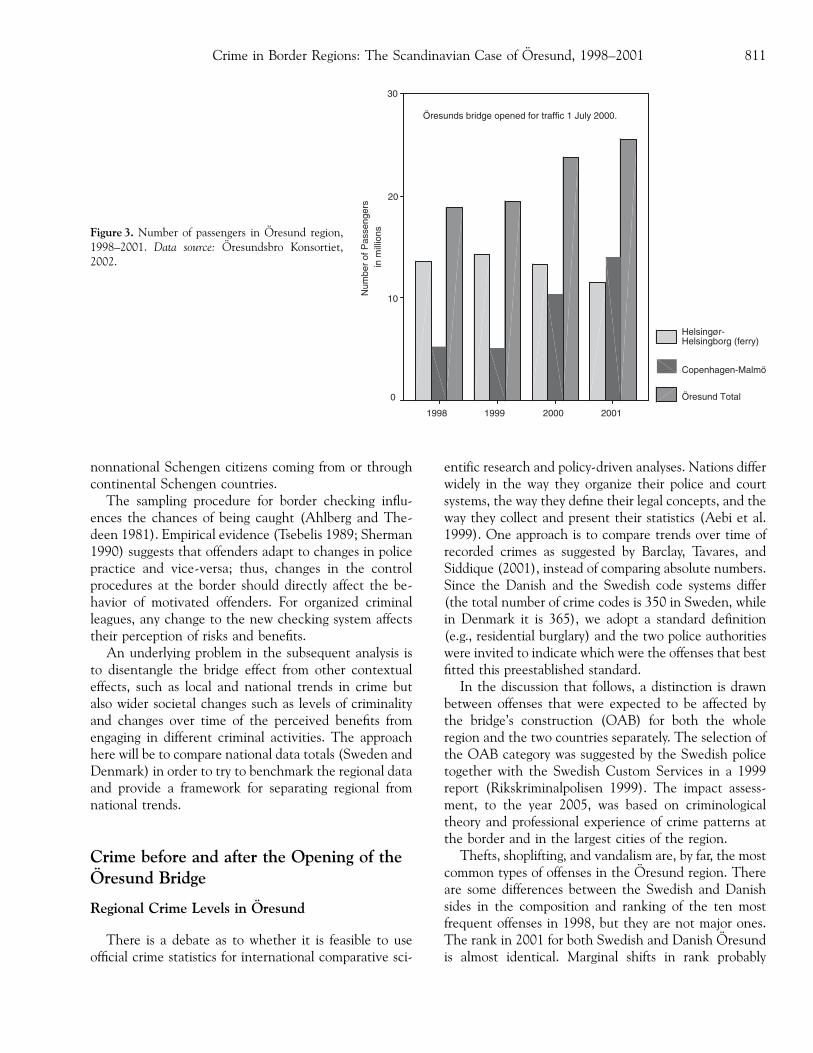
The second process refers to the fact the bridge facili-tates the inflow of transient groups unfamiliar with theenvironment, which leads to an increase in the proportionof victims who are tourists—so-called tourism-criminality(Rikskriminalpolisen 1999). More people does not meanmore guardians (see above). An increase in pickpocketing,theft, and, in certain cases, violence and hooliganism di-rected at visitors are to be expected. Central areas andtheir surroundings, where most tourist attractions are lo-cated, could become hot spots. Figure 3 shows the flow ofpeople in Oresund. The volume between Copenhagen andMalmo has increased 34 percent since 2000 when thebridge opened. Data from Oresundsbro Konsortiet et al.(2002) show that people using the bridge have a veryconcentrated spatial mobility pattern around the Oresundbridge. Swedish travelers traveling either by car or trainover the bridge mainly had the Copenhagen area as theirdestination (42 percent of cars, 70 percent of train pas-sengers). On the Swedish side, as much as 36 percent ofcar trips had Malmo as their destination while, of thoseusing the trains, 72 percent went to Malmo.
The third process refers to changes in land use and,hence, crime patterns in the region. The bridge and thetransport and service-related infrastructure that followcreate new sites and new land uses that generate newopportunities, new patterns of activities, and, hence,new patterns of offenses (Wikstrom 1991). An increasein offenses (e.g., thefts and shoplifting) is expected totake place in central areas and at transport nodes such asrailway stations.
The fourth process deals with the direct impact of thebridge (and new customs routines) on cross-border crime
and, indirectly, on other forms of crime. It is expectedthat the bridge (especially through train services) willdirectly affect smuggling, especially drug users or smalldealers who travel to Denmark with the objective ofacquiring narcotics. The drug trade between Denmarkand Sweden is a consequence of drugs in Denmark beingcheaper, of better quality, and easier to buy than inSweden. In addition, there is a more liberal attitudetoward drugs in Denmark. In Swedish, Myrtraffiken(ants’ traffic) refers to the repeated smuggling of smallquantities of narcotics by train. Some indirect impactmay be noticed on other offenses that are related to drugaddiction, such as residential burglary (Wiles and Cos-tello 1999) and theft from cars. The literature shows thatdrug addicts may get involved in these types of offensesin order to obtain money to buy drugs.
Intervening factors are factors that mediate the effectof the bridge on offenses (see Figure 2). The first of theseis related to the nature of the border or of the countrieswhere the border is located. The importance of thisfactor has already been discussed. The second group offactors includes the type of control processes employedat the border (e.g., the sampling procedure adopted) andpolice practices. Both of these are dependent on politicalagreements (e.g., Schengen agreement, Nordic countriesagreement) and local resourcing and organization (e.g.,staff size, cooperation arrangements with other forces).For instance, the Schengen agreement adopted in March2000 did not change routines at the borders for Nordiccitizens very much because they had access assured byprevious regional agreements. The major difference in-volves the control of the Nordic frontiers in relation to
4
3
2
1
More offenses committed by non-nationals and short-term visitors. Some
spatial redistribution of offending between the two sides of the bridge
More ‘‘ Tourism criminality’,: assault,
pickpocketing
More predatory crimes (e.g., vandalism in public and private places, shoplifting). New geography of where
offenses are committed
More smuggling of narcotics and other illegal goods on this route;
smuggling of otherwise-legal goods, ‘‘ Myrtraffiken’
,
Increase in the routine activity spaces of offenders
Convergence of motivated offenders and victims together with a lack of
capable guardians
More sites where motivated offenders and potential targets interact
Increase in smuggled goods (including humans,
cargo, and drugs) in the border region
Greater mobility of certain motivated offenders
More people unfamiliar with an area; spaces with high
population turnover
Changes in land use. Creation of new sites that are either a
direct (e.g., terminal) or indirect (e.g., shopping precinct) consequence
Easier movement of goods and people
Bridgeconstruction
Offense OutcomeCriminogenic Condition Causal Factor
Regulatory framework
at or close to the border:
e.g., the routine
practices of police and customs officials
Location & geography
Societal structures &
organizational differences
Conditions for criminal activity
Intervening Factors
Figure 2. The impact of improving cross-border communications on crime: a conceptual framework.
Ceccato and Haining810
nonnational Schengen citizens coming from or throughcontinental Schengen countries.
The sampling procedure for border checking influ-ences the chances of being caught (Ahlberg and The-deen 1981). Empirical evidence (Tsebelis 1989; Sherman1990) suggests that offenders adapt to changes in policepractice and vice-versa; thus, changes in the controlprocedures at the border should directly affect the be-havior of motivated offenders. For organized criminalleagues, any change to the new checking system affectstheir perception of risks and benefits.
An underlying problem in the subsequent analysis isto disentangle the bridge effect from other contextualeffects, such as local and national trends in crime butalso wider societal changes such as levels of criminalityand changes over time of the perceived benefits fromengaging in different criminal activities. The approachhere will be to compare national data totals (Sweden andDenmark) in order to try to benchmark the regional dataand provide a framework for separating regional fromnational trends.
Crime before and after the Opening of theOresund Bridge
Regional Crime Levels in Oresund
There is a debate as to whether it is feasible to useofficial crime statistics for international comparative sci-
entific research and policy-driven analyses. Nations differwidely in the way they organize their police and courtsystems, the way they define their legal concepts, and theway they collect and present their statistics (Aebi et al.1999). One approach is to compare trends over time ofrecorded crimes as suggested by Barclay, Tavares, andSiddique (2001), instead of comparing absolute numbers.Since the Danish and the Swedish code systems differ(the total number of crime codes is 350 in Sweden, whilein Denmark it is 365), we adopt a standard definition(e.g., residential burglary) and the two police authoritieswere invited to indicate which were the offenses that bestfitted this preestablished standard.
In the discussion that follows, a distinction is drawnbetween offenses that were expected to be affected bythe bridge’s construction (OAB) for both the wholeregion and the two countries separately. The selection ofthe OAB category was suggested by the Swedish policetogether with the Swedish Custom Services in a 1999report (Rikskriminalpolisen 1999). The impact assess-ment, to the year 2005, was based on criminologicaltheory and professional experience of crime patterns atthe border and in the largest cities of the region.
Thefts, shoplifting, and vandalism are, by far, the mostcommon types of offenses in the Oresund region. Thereare some differences between the Swedish and Danishsides in the composition and ranking of the ten mostfrequent offenses in 1998, but they are not major ones.The rank in 2001 for both Swedish and Danish Oresundis almost identical. Marginal shifts in rank probably
Öresunds bridge opened for traffic 1 July 2000.
2001200019991998
Num
ber
of P
asse
nger
s
30
20
10
0
Helsingør-Helsingborg (ferry)
Copenhagen-Malmö
Öresund Total
in m
illio
nsFigure 3. Number of passengers in Oresund region,1998–2001. Data source: Oresundsbro Konsortiet,2002.
Crime in Border Regions: The Scandinavian Case of Oresund, 1998–2001 811
reflect the opportunistic and, hence, substitutable natureof these common offenses, such as car-related thefts andshoplifting.
However, not all shifts between 1998 and 2001 can beexplained by situational conditions that may increaseone type of offense compared to another. One example isthe significant increase in human smuggling and illegalimmigration, which has become a growing business in-ternationally. According to Schloenhardt (1999), humantrafficking has become a growing business because of therestrictions on legal immigration imposed by industrial-ized countries, the relatively low risks of detection, andthe growing demand for international migration, mostlyin sending countries but also, to some extent, in re-ceiving countries. For both Sweden and Denmark, hu-man smuggling is a new phenomenon. In a Europeanperspective, the so-called Baltic Route has been in-creasingly exploited since the collapse of the SovietEmpire (Di Nicola 2001). In Swedish Oresund, there hasbeen an increase from two cases in 2000 to forty-nine in2002, forty-six cases recorded in Malmo alone. In Den-mark, figures from NCPD (2002) show that women fromthe Baltic States (particularly Latvia) and Asia (partic-ularly Thailand) were brought to Denmark and forcedinto prostitution.
The category of offense that has increased most innumber in Swedish Oresund between 1998 and 2001 isthefts of different types, particularly from cars and of
bicycles. Traffic-related offenses, particularly drivingunder the influence of substances such as alcohol ornarcotics, have also increased. However, such an in-crease may be related, at least partially, to changes in theway the offense is recorded3 or may be linked to theincrease in short weekend trips from Swedish Oresund,mostly Malmo, to Copenhagen.
In the Danish Oresund, figures for 2001 NCPD andpolice (2002) show that, in comparison with previousyears, there was a marked increase in the number ofparticularly dangerous robberies primarily targetingpublic buildings, petrol stations, and valuables in transit,but it is difficult to associate these to the bridge.
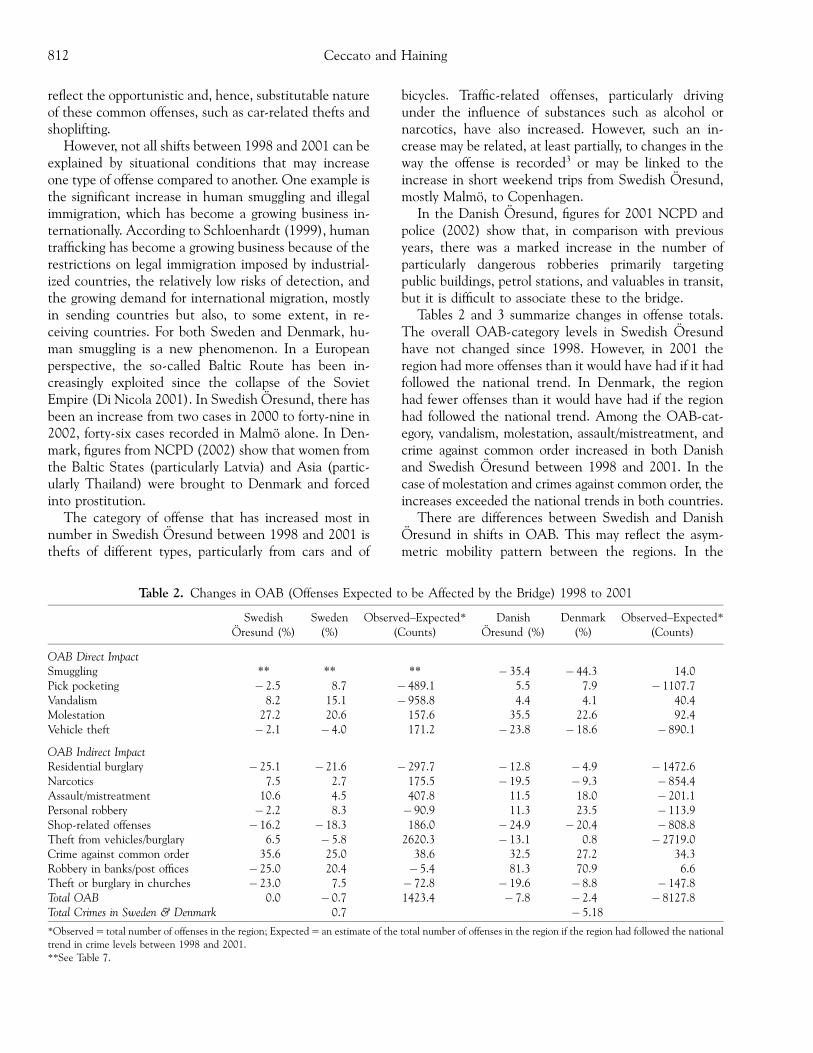
Tables 2 and 3 summarize changes in offense totals.The overall OAB-category levels in Swedish Oresundhave not changed since 1998. However, in 2001 theregion had more offenses than it would have had if it hadfollowed the national trend. In Denmark, the regionhad fewer offenses than it would have had if the regionhad followed the national trend. Among the OAB-cat-egory, vandalism, molestation, assault/mistreatment, andcrime against common order increased in both Danishand Swedish Oresund between 1998 and 2001. In thecase of molestation and crimes against common order, theincreases exceeded the national trends in both countries.
There are differences between Swedish and DanishOresund in shifts in OAB. This may reflect the asym-metric mobility pattern between the regions. In the
Table 2. Changes in OAB (Offenses Expected to be Affected by the Bridge) 1998 to 2001
SwedishOresund (%)
Sweden(%)
Observed–Expected*
(Counts)Danish
Oresund (%)Denmark
(%)Observed–Expected*
(Counts)
OAB Direct ImpactSmuggling ** ** ** � 35.4 � 44.3 14.0Pick pocketing � 2.5 8.7 � 489.1 5.5 7.9 � 1107.7Vandalism 8.2 15.1 � 958.8 4.4 4.1 40.4Molestation 27.2 20.6 157.6 35.5 22.6 92.4Vehicle theft � 2.1 � 4.0 171.2 � 23.8 � 18.6 � 890.1
OAB Indirect ImpactResidential burglary � 25.1 � 21.6 � 297.7 � 12.8 � 4.9 � 1472.6Narcotics 7.5 2.7 175.5 � 19.5 � 9.3 � 854.4Assault/mistreatment 10.6 4.5 407.8 11.5 18.0 � 201.1Personal robbery � 2.2 8.3 � 90.9 11.3 23.5 � 113.9Shop-related offenses � 16.2 � 18.3 186.0 � 24.9 � 20.4 � 808.8Theft from vehicles/burglary 6.5 � 5.8 2620.3 � 13.1 0.8 � 2719.0Crime against common order 35.6 25.0 38.6 32.5 27.2 34.3Robbery in banks/post offices � 25.0 20.4 � 5.4 81.3 70.9 6.6Theft or burglary in churches � 23.0 7.5 � 72.8 � 19.6 � 8.8 � 147.8Total OAB 0.0 � 0.7 1423.4 � 7.8 � 2.4 � 8127.8Total Crimes in Sweden & Denmark 0.7 � 5.18
*Observed5 total number of offenses in the region; Expected5 an estimate of the total number of offenses in the region if the region had followed the national
trend in crime levels between 1998 and 2001.**See Table 7.
Ceccato and Haining812
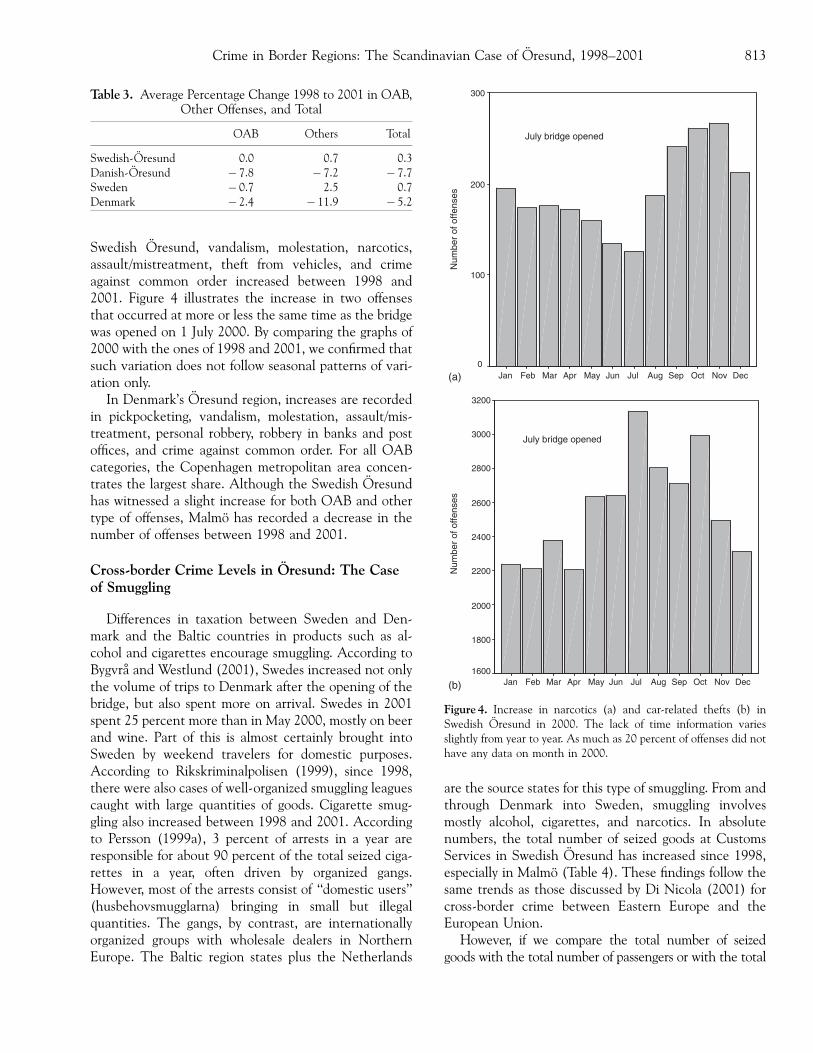
Swedish Oresund, vandalism, molestation, narcotics,assault/mistreatment, theft from vehicles, and crimeagainst common order increased between 1998 and2001. Figure 4 illustrates the increase in two offensesthat occurred at more or less the same time as the bridgewas opened on 1 July 2000. By comparing the graphs of2000 with the ones of 1998 and 2001, we confirmed thatsuch variation does not follow seasonal patterns of vari-ation only.
In Denmark’s Oresund region, increases are recordedin pickpocketing, vandalism, molestation, assault/mis-treatment, personal robbery, robbery in banks and postoffices, and crime against common order. For all OABcategories, the Copenhagen metropolitan area concen-trates the largest share. Although the Swedish Oresundhas witnessed a slight increase for both OAB and othertype of offenses, Malmo has recorded a decrease in thenumber of offenses between 1998 and 2001.
Cross-border Crime Levels in Oresund: The Caseof Smuggling
Differences in taxation between Sweden and Den-mark and the Baltic countries in products such as al-cohol and cigarettes encourage smuggling. According toBygvra and Westlund (2001), Swedes increased not onlythe volume of trips to Denmark after the opening of thebridge, but also spent more on arrival. Swedes in 2001spent 25 percent more than in May 2000, mostly on beerand wine. Part of this is almost certainly brought intoSweden by weekend travelers for domestic purposes.According to Rikskriminalpolisen (1999), since 1998,there were also cases of well-organized smuggling leaguescaught with large quantities of goods. Cigarette smug-gling also increased between 1998 and 2001. Accordingto Persson (1999a), 3 percent of arrests in a year areresponsible for about 90 percent of the total seized ciga-rettes in a year, often driven by organized gangs.However, most of the arrests consist of ‘‘domestic users’’(husbehovsmugglarna) bringing in small but illegalquantities. The gangs, by contrast, are internationallyorganized groups with wholesale dealers in NorthernEurope. The Baltic region states plus the Netherlands
are the source states for this type of smuggling. From andthrough Denmark into Sweden, smuggling involvesmostly alcohol, cigarettes, and narcotics. In absolutenumbers, the total number of seized goods at CustomsServices in Swedish Oresund has increased since 1998,especially in Malmo (Table 4). These findings follow thesame trends as those discussed by Di Nicola (2001) forcross-border crime between Eastern Europe and theEuropean Union.
However, if we compare the total number of seizedgoods with the total number of passengers or with the total
Table 3. Average Percentage Change 1998 to 2001 in OAB,Other Offenses, and Total
OAB Others Total
Swedish-Oresund 0.0 0.7 0.3Danish-Oresund � 7.8 � 7.2 � 7.7Sweden � 0.7 2.5 0.7Denmark � 2.4 � 11.9 � 5.2
(a) DecNovOctSepAugJulJunMayAprMarFebJan
Num
ber
of o
ffens
es
300
200
100
0
(b) DecNovOctSepAugJulJunMayAprMarFebJan
Num
ber
of o
ffens
es
3200
3000
2800
2600
2400
2200
2000
1800
1600
July bridge opened
July bridge opened
Figure 4. Increase in narcotics (a) and car-related thefts (b) inSwedish Oresund in 2000. The lack of time information variesslightly from year to year. As much as 20 percent of offenses did nothave any data on month in 2000.
Crime in Border Regions: The Scandinavian Case of Oresund, 1998–2001 813
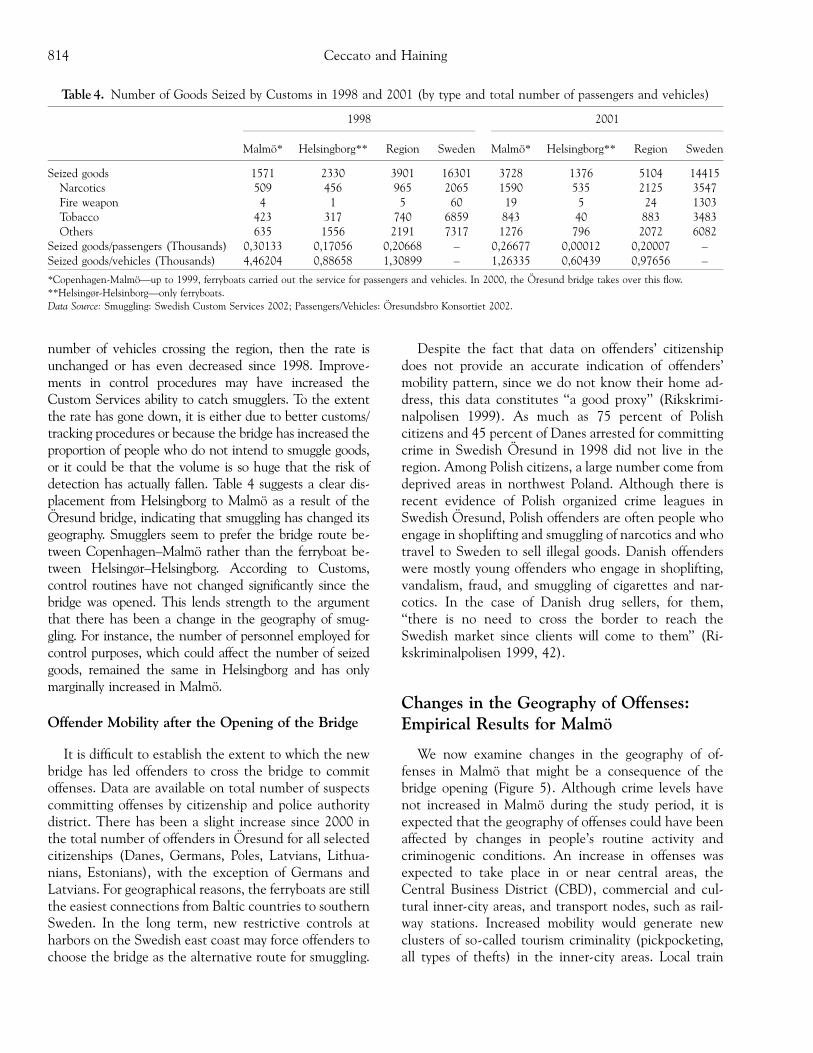
number of vehicles crossing the region, then the rate isunchanged or has even decreased since 1998. Improve-ments in control procedures may have increased theCustom Services ability to catch smugglers. To the extentthe rate has gone down, it is either due to better customs/tracking procedures or because the bridge has increased theproportion of people who do not intend to smuggle goods,or it could be that the volume is so huge that the risk ofdetection has actually fallen. Table 4 suggests a clear dis-placement from Helsingborg to Malmo as a result of theOresund bridge, indicating that smuggling has changed itsgeography. Smugglers seem to prefer the bridge route be-tween Copenhagen–Malmo rather than the ferryboat be-tween Helsing�r–Helsingborg. According to Customs,control routines have not changed significantly since thebridge was opened. This lends strength to the argumentthat there has been a change in the geography of smug-gling. For instance, the number of personnel employed forcontrol purposes, which could affect the number of seizedgoods, remained the same in Helsingborg and has onlymarginally increased in Malmo.
Offender Mobility after the Opening of the Bridge
It is difficult to establish the extent to which the newbridge has led offenders to cross the bridge to commitoffenses. Data are available on total number of suspectscommitting offenses by citizenship and police authoritydistrict. There has been a slight increase since 2000 inthe total number of offenders in Oresund for all selectedcitizenships (Danes, Germans, Poles, Latvians, Lithua-nians, Estonians), with the exception of Germans andLatvians. For geographical reasons, the ferryboats are stillthe easiest connections from Baltic countries to southernSweden. In the long term, new restrictive controls atharbors on the Swedish east coast may force offenders tochoose the bridge as the alternative route for smuggling.
Despite the fact that data on offenders’ citizenshipdoes not provide an accurate indication of offenders’mobility pattern, since we do not know their home ad-dress, this data constitutes ‘‘a good proxy’’ (Rikskrimi-nalpolisen 1999). As much as 75 percent of Polishcitizens and 45 percent of Danes arrested for committingcrime in Swedish Oresund in 1998 did not live in theregion. Among Polish citizens, a large number come fromdeprived areas in northwest Poland. Although there isrecent evidence of Polish organized crime leagues inSwedish Oresund, Polish offenders are often people whoengage in shoplifting and smuggling of narcotics and whotravel to Sweden to sell illegal goods. Danish offenderswere mostly young offenders who engage in shoplifting,vandalism, fraud, and smuggling of cigarettes and nar-cotics. In the case of Danish drug sellers, for them,‘‘there is no need to cross the border to reach theSwedish market since clients will come to them’’ (Ri-kskriminalpolisen 1999, 42).
Changes in the Geography of Offenses:Empirical Results for Malmo
We now examine changes in the geography of of-fenses in Malmo that might be a consequence of thebridge opening (Figure 5). Although crime levels havenot increased in Malmo during the study period, it isexpected that the geography of offenses could have beenaffected by changes in people’s routine activity andcriminogenic conditions. An increase in offenses wasexpected to take place in or near central areas, theCentral Business District (CBD), commercial and cul-tural inner-city areas, and transport nodes, such as rail-way stations. Increased mobility would generate newclusters of so-called tourism criminality (pickpocketing,all types of thefts) in the inner-city areas. Local train
Table 4. Number of Goods Seized by Customs in 1998 and 2001 (by type and total number of passengers and vehicles)
1998 2001
Malmo* Helsingborg** Region Sweden Malmo* Helsingborg** Region Sweden
Seized goods 1571 2330 3901 16301 3728 1376 5104 14415Narcotics 509 456 965 2065 1590 535 2125 3547Fire weapon 4 1 5 60 19 5 24 1303Tobacco 423 317 740 6859 843 40 883 3483Others 635 1556 2191 7317 1276 796 2072 6082
Seized goods/passengers (Thousands) 0,30133 0,17056 0,20668 – 0,26677 0,00012 0,20007 –Seized goods/vehicles (Thousands) 4,46204 0,88658 1,30899 – 1,26335 0,60439 0,97656 –
*Copenhagen-Malmo—up to 1999, ferryboats carried out the service for passengers and vehicles. In 2000, the Oresund bridge takes over this flow.**Helsing�r-Helsinborg—only ferryboats.
Data Source: Smuggling: Swedish Custom Services 2002; Passengers/Vehicles: Oresundsbro Konsortiet 2002.
Ceccato and Haining814
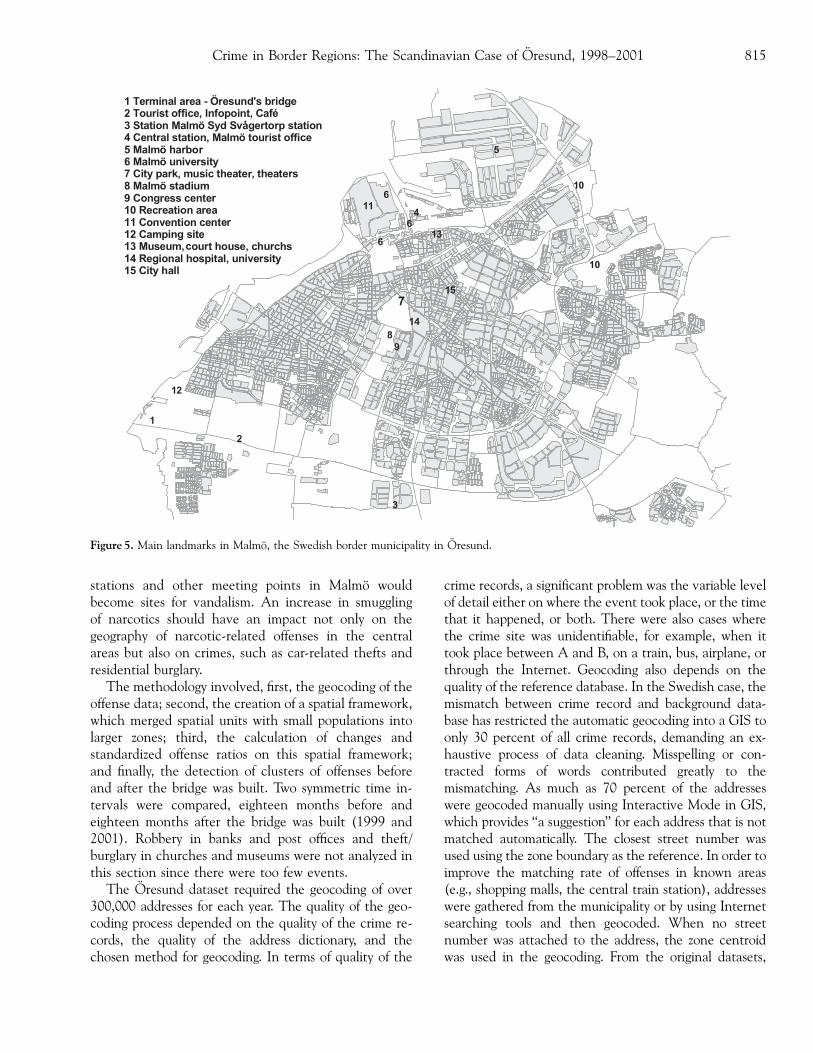
stations and other meeting points in Malmo wouldbecome sites for vandalism. An increase in smugglingof narcotics should have an impact not only on thegeography of narcotic-related offenses in the centralareas but also on crimes, such as car-related thefts andresidential burglary.
The methodology involved, first, the geocoding of theoffense data; second, the creation of a spatial framework,which merged spatial units with small populations intolarger zones; third, the calculation of changes andstandardized offense ratios on this spatial framework;and finally, the detection of clusters of offenses beforeand after the bridge was built. Two symmetric time in-tervals were compared, eighteen months before andeighteen months after the bridge was built (1999 and2001). Robbery in banks and post offices and theft/burglary in churches and museums were not analyzed inthis section since there were too few events.
The Oresund dataset required the geocoding of over300,000 addresses for each year. The quality of the geo-coding process depended on the quality of the crime re-cords, the quality of the address dictionary, and thechosen method for geocoding. In terms of quality of the
crime records, a significant problem was the variable levelof detail either on where the event took place, or the timethat it happened, or both. There were also cases wherethe crime site was unidentifiable, for example, when ittook place between A and B, on a train, bus, airplane, orthrough the Internet. Geocoding also depends on thequality of the reference database. In the Swedish case, themismatch between crime record and background data-base has restricted the automatic geocoding into a GIS toonly 30 percent of all crime records, demanding an ex-haustive process of data cleaning. Misspelling or con-tracted forms of words contributed greatly to themismatching. As much as 70 percent of the addresseswere geocoded manually using Interactive Mode in GIS,which provides ‘‘a suggestion’’ for each address that is notmatched automatically. The closest street number wasused using the zone boundary as the reference. In order toimprove the matching rate of offenses in known areas(e.g., shopping malls, the central train station), addresseswere gathered from the municipality or by using Internetsearching tools and then geocoded. When no streetnumber was attached to the address, the zone centroidwas used in the geocoding. From the original datasets,
Figure 5. Main landmarks in Malmo, the Swedish border municipality in Oresund.
Crime in Border Regions: The Scandinavian Case of Oresund, 1998–2001 815

about 10 percent of the addresses were not geocoded(11.7 percent of the 1998 dataset, 9.8 percent of the 1999dataset, and 10.2 percent of the 2001 dataset).
In order to create robust units for analysis, the initial400 zones in Malmo were aggregated using the zonedesign software ZDES4 (Openshaw, Alvanides, andWhalley 1998). Aggregating small regions or mergingthem into larger ones produces area rates that are morerobust and have smaller standard errors when inter-preted as estimators of the underlying relative risk(Haining 2003). Of the three criteria available in ZDES,population homogeneity was used, combined with ashape-constraint function. The homogeneity criterionensures that the population in the new spatial units is assimilar as possible while the shape-constraint functionproduces polygons that are similar in shape to the orig-inal ones. This is an advantage, but there is a risk thatthe minimum population constraint may be violatedwhen using the shape-constraint function. From a set ofmaps containing 50, 60, 70, 80, and 90 new units ob-tained from ZDES, a map with 70 zones was chosen. Thismap was chosen based on a subjective assessment ofwhat the minimum population ought to be. Only onezone violated the population minimum, so it was man-ually aggregated to a neighboring polygon. The finalnumber of zones was 69 from the original 400. The finalset of zones was created in which the minimum popu-lation size was 998, the maximum was 7,836, the meanwas 3,748, and the standard deviation was 1,617. Thefinal stage of the process involved the creation of a newset of boundaries by removing the boundaries betweenzones in the same region and merging their values usingGIS. Figure 6 illustrates the final set of regions con-taining the 69 new spatial units. Of course, this is onlyone spatial representation of the city of Malmo. Otherspatial frameworks could have been created either at thesame scale or at other scales. All results below are con-ditional on the chosen spatial representation.
Six out of the eleven OAB increased slightly duringthis time period. When aggregated across all elevenOAB, the count remains almost the same between 1999and 2001. Figure 6 illustrates the areas with an increasefor one or more OAB offenses. Car-related thefts (boththeft from vehicles and vehicle thefts) have the highestincrease in areas surrounding Malmo’s Syd Svagertorpstation, possibly as a result of the increase in parked carsin this area. Shop-related thefts had the highest increasein the harbor and central areas, mostly in the northeastwhere a big retailer is located. The increase in residentialburglary was concentrated in the southern part ofMalmo, including Fosie, which is one of the most eth-nically heterogeneous and segregated residential areas
(Bevelander, Carlsson, and Rojas 1997). The geographyof increases is similar for robbery, assault, and narcotics,with the inner city and the parts of Hyllie having thelargest increases. These findings suggest that the in-crease in narcotics, a typical cross-border-related offense,may have affected the dynamics of violent offenses, suchas robbery and assault.
A standardized offense ratio (SOR) for all selectedoffenses was calculated. This includes both those of-fenses where it was hypothesized the bridge might havean effect (OAB) and other offenses. The later were to beused as ‘‘controls.’’ This type of standardization is auseful way of representing data for a set of areas wherethe areas differ in size (absolute values would tend tooveremphasize large areal units) and where it is neces-sary to allow for differences in population characteristicsbetween areas (Haining 2003). The SOR for region i isgiven by:
SORðiÞ ¼ ½OðiÞ=EðiÞ� � 100
O(i) is the observed number of offenses of a given type andE(i) is the expected number of offenses of a given type. Thenumber of offenses per individual at risk was obtained bydividing the total number of offenses in the study area(Malmo) by the total population. The influx of populationinto Malmo as a consequence of the bridge opening doesraise questions about the appropriateness of this chosendenominator but there was no alternative available. Thechoice of the appropriate denominator for particularoffenses is a problem of long standing; for a discussion, see
Figure 6. Areas with an increase in one or more OAB offenses inMalmo eighteen months before and after the bridge.
Ceccato and Haining816

Wikstrom (1991). For each area i, this average rate ismultiplied by the size of the chosen denominator in area i toyield E(i). E(i) can be interpreted as the expected numberof cases of the particular offense in area i under the as-sumption of a random distribution of offenses across thewhole population at risk in the study region (Malmo). Itprovides a baseline from which to analyze the variation inO(i) since the expected value of O(i), under the assump-tion of a Poisson (spatially random) process for the distri-bution of offenses, is the product of E(i) and the quantityr(i). The quantity r(i) is called the area specific effect orrelative risk (see, for example, Haining 2003). SOR(i) is,therefore, an estimator of r(i) expressed as a percentage.
The standard error for SOR(i) under the Poisson as-sumption is given by SE(i)5 [O(i)1/2/E(i)]. A 95 percentconfidence interval is obtained by multiplying SE(i) by1.96 to provide a 95 percent confidence interval for theestimate of r(i). This quantity is added and subtracted toSOR(i). A significant difference between SOR(i) andSOR( j), for example, at the 5 percent significance level,assuming a two-tailed test, would be indicated if their 95percent confidence intervals did not overlap. Preliminarycomparisons of SORs for the 69 spatial units showedthere was no significant change in their geography beforeand after the bridge for any type of offense. Note thatthis does not mean there was no significant change inthe volume of the offenses in each spatial unit.
A cluster-detection technique was applied to inves-tigate local changes in the pattern of SORs. In order todetect changes in the geographical clustering of offenses,Kuldorff’s scan test was used (SaTScan version 2.15;Kuldorff 1997). This technique has a rigorous inferencetheory for identifying statistically significant clusters
(Haining and Cliff 2003). The test here uses the Poissonversion of the scan test since under the null hypothesisof a random distribution of offenses (with no area-spe-cific effects) the number of events in any area is Poissondistributed. This test adjusts for heterogeneity in thebackground population. Because of the nonlongitudinaldata and because we are interested in comparing thesituation before and after the bridge, the spatial scanstatistic was used on the two time periods separately. Fordetails on the scan test see Kulldorf (1997), Hjamlarset al. (1998) and for an overview see Haining and Cliff(2003).
There have been some small shifts in the geography ofthe selected offenses, notably in relation to the locationand size of the hot spots. The geographical pattern ofseven offenses out of eleven has changed, becoming ei-ther larger or smaller than it was eighteen months beforethe bridge (Table 5, Figure 7). However, it is very diffi-cult to argue that these shifts are due to the effects of thebridge. There are two reasons for this conclusion. First,there were shifts not only in the selected OAB offenses,but also in the control offenses. This indicates thatvariation in the geography of offenses may be related tochanges in other intraurban criminogenic conditions(e.g., a rise in unemployment in certain areas, housingturnover). Second, no cluster was found in the imme-diate vicinity of the terminal of the bridge itself or in thesurroundings of the secondary train station (Malmo Sydstation).
Among the offenses that the new bridge was expectedto have had a short-term impact on, only the pick-pocketing cluster is unchanged. This means that anychange in the rate of this offense was not strong enough
Table 5. Most-Likely and Secondary Clusters before and after the Oresund Bridge: Malmo
Type Offenses
18 Months before (1999) 18 Months after (2001)No. Significant* High-
Value Clusters/ No. PolygonsNo. Significant* High-
Value Clusters/ No. Polygons
OAB Pick pocketing 1/5 1/5Vandalism 1/6 1/13
Direct impact Molestation 0 1/5Vehicle theft 1/6 2/6; 5
OAB Residential burglary 0 0Narcotics 1/13 1/5
Direct impact Assault 2/6; 11 1/5Personal robbery 1/6 1/6Shop-related offenses 1/5 1/5Theft from vehicles 1/6 2/6; 5Crime against common order 1/6 1/9
‘‘Control’’ offenses Domestic violence 1/5 1/32Fraud 1/5 1/6
*at the 10% or 5% level of significance.
Note: 2/6; 5 means two clusters, the most likely cluster is composed of 6 polygons and the secondary one is composed of 5 polygons.
Crime in Border Regions: The Scandinavian Case of Oresund, 1998–2001 817
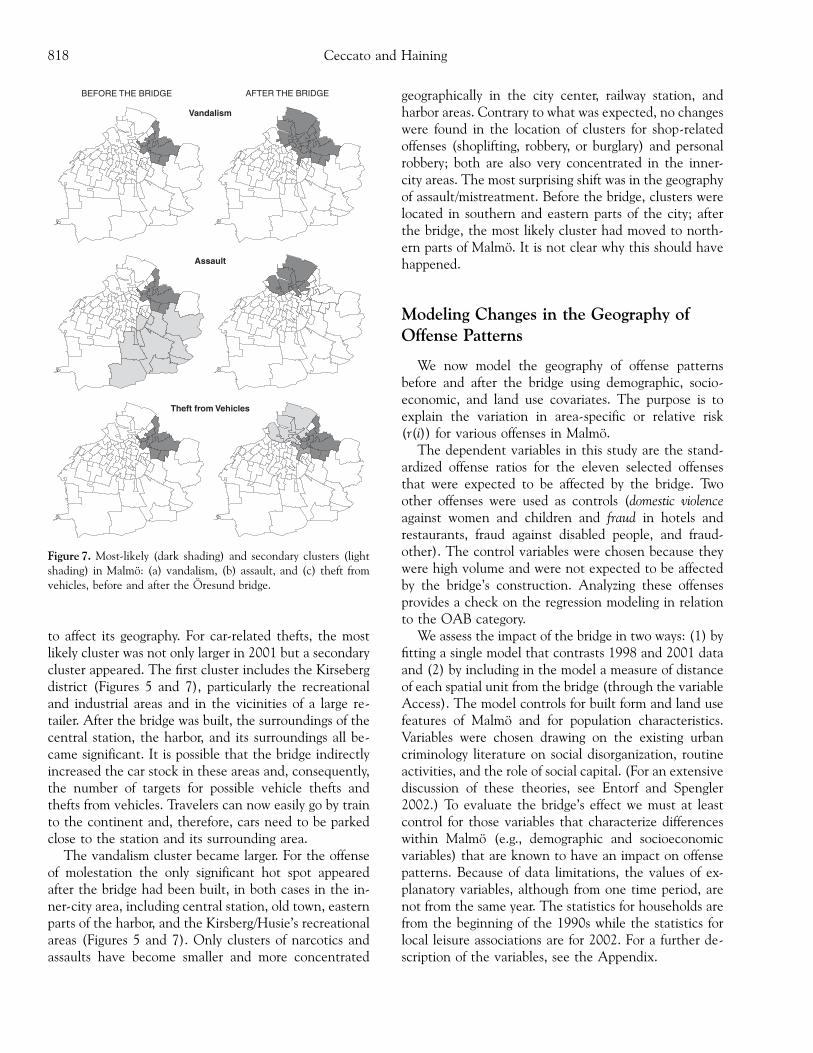
to affect its geography. For car-related thefts, the mostlikely cluster was not only larger in 2001 but a secondarycluster appeared. The first cluster includes the Kirsebergdistrict (Figures 5 and 7), particularly the recreationaland industrial areas and in the vicinities of a large re-tailer. After the bridge was built, the surroundings of thecentral station, the harbor, and its surroundings all be-came significant. It is possible that the bridge indirectlyincreased the car stock in these areas and, consequently,the number of targets for possible vehicle thefts andthefts from vehicles. Travelers can now easily go by trainto the continent and, therefore, cars need to be parkedclose to the station and its surrounding area.
The vandalism cluster became larger. For the offenseof molestation the only significant hot spot appearedafter the bridge had been built, in both cases in the in-ner-city area, including central station, old town, easternparts of the harbor, and the Kirsberg/Husie’s recreationalareas (Figures 5 and 7). Only clusters of narcotics andassaults have become smaller and more concentrated
geographically in the city center, railway station, andharbor areas. Contrary to what was expected, no changeswere found in the location of clusters for shop-relatedoffenses (shoplifting, robbery, or burglary) and personalrobbery; both are also very concentrated in the inner-city areas. The most surprising shift was in the geographyof assault/mistreatment. Before the bridge, clusters werelocated in southern and eastern parts of the city; afterthe bridge, the most likely cluster had moved to north-ern parts of Malmo. It is not clear why this should havehappened.
Modeling Changes in the Geography ofOffense Patterns
We now model the geography of offense patternsbefore and after the bridge using demographic, socio-economic, and land use covariates. The purpose is toexplain the variation in area-specific or relative risk(r(i)) for various offenses in Malmo.
The dependent variables in this study are the stand-ardized offense ratios for the eleven selected offensesthat were expected to be affected by the bridge. Twoother offenses were used as controls (domestic violenceagainst women and children and fraud in hotels andrestaurants, fraud against disabled people, and fraud-other). The control variables were chosen because theywere high volume and were not expected to be affectedby the bridge’s construction. Analyzing these offensesprovides a check on the regression modeling in relationto the OAB category.
We assess the impact of the bridge in two ways: (1) byfitting a single model that contrasts 1998 and 2001 dataand (2) by including in the model a measure of distanceof each spatial unit from the bridge (through the variableAccess). The model controls for built form and land usefeatures of Malmo and for population characteristics.Variables were chosen drawing on the existing urbancriminology literature on social disorganization, routineactivities, and the role of social capital. (For an extensivediscussion of these theories, see Entorf and Spengler2002.) To evaluate the bridge’s effect we must at leastcontrol for those variables that characterize differenceswithin Malmo (e.g., demographic and socioeconomicvariables) that are known to have an impact on offensepatterns. Because of data limitations, the values of ex-planatory variables, although from one time period, arenot from the same year. The statistics for households arefrom the beginning of the 1990s while the statistics forlocal leisure associations are for 2002. For a further de-scription of the variables, see the Appendix.
BEFORE THE BRIDGE
Vandalism
Assault
Theft from Vehicles
AFTER THE BRIDGE
Figure 7. Most-likely (dark shading) and secondary clusters (lightshading) in Malmo: (a) vandalism, (b) assault, and (c) theft fromvehicles, before and after the Oresund bridge.
Ceccato and Haining818
The linear regression model was used in order toexplain the variation in offense ratios. This model isgiven by:
Y ¼ Xbþe
where Y is the vector of standardized offense ratios for1999 and 2001 (eighteen months before and eighteenmonths after the bridge was built) for a particular offense(N5 69 � 2). X is an N � (p11) matrix with p11 ex-planatory or predictor variables, including the constantterm. b is a p11 vector of regression coefficients (b0,
b1,. . .,bp) where b0 is the (intercept) parameter associ-ated with the constant term and e is the N vector ofrandom errors with mean 0 and variance s2I. A dummyvariable D was incorporated into the model. This is toassess the effect of the bridge, both on the intercept termand on each of the regression coefficients, so:
D(i)5 1 if the observation is from 1999, that is beforethe bridge was built (i5 1,. . .,N)
5 0 if the observation is from 2001, that is after thebridge was built (i5 1,. . .,N)
In practice the first 69 values of the dummy vectorconsist of 1s and the second 69 consist of 0s. The fullmodel is given by
Y ¼ b01 þ b0;DDþ b1X1 þ b1;DDTX1 þ :::
þ bPXP þ bp;DDTXP þ e
where DT denotes the transpose of the vector D and 1 isthe N vector of 1s. The intercept coefficient is given byb0 after the bridge and (b01b0;D) before the bridge. Theregression coefficient for the kth covariate is given by bkafter the bridge and (bk1bk;D) before the bridge. We testfor statistically significant differences before and after thebuilding of the bridge by testing the significance of b0;D,b1;D, . . ., bp;D from 0.
The regression analysis was implemented in SpaceStat1.91 (Anselin 1992) since the software has regression-modeling capabilities with a range of diagnostics (in-cluding heteroskedasticity tests) that are appropriate forspatial analysis (see also Ma, Haining, and Wise 1997).In order to test for spatial autocorrelation on the residu-als, a row standardized binary weight matrix (W) wasused that comprised non-zero entries where i and j referto areas that are adjacent and the SOR data refer to thesame time period. The diagonal elements in W are allzero. The full weight matrix can be represented in par-titioned form as follows:
W 00 W
� �1999 2001
For five offenses (vandalism, vehicle theft, residentialburglary, assault, and shop-related offenses) the OLSregression model diagnostics revealed significant spatialautocorrelation in the residuals. Spatial lag and spatialerrors models were fitted in order to address theseproblems (see Haining 2003 for a discussion of when it isappropriate to consider these models). The matrix Wwas used to specify these models, which take the form ofa lag operation on the response variable (spatial lagmodel) and the form of spatial correlation in the errorterm (spatial error model). Table 6 summarizes findingsincluding the significant variables at the 1 percent, 5percent, and 10 percent levels. After extensive analysis,heteroskedasticity remained in the residuals of most ofthe models, and this is an area for further research.6 Nothaving a constant error variance means that the re-gression estimates are not efficient. In the particular caseof Malmo this problem is a consequence of using datafrom spatial units with different sizes of population atrisk. For an extensive discussion of this diagnostic, seeAnselin (1992) and Haining (2003).
Only vehicle-related crimes (vehicle theft and theftfrom vehicles) out of the eleven OAB-category crimeshave regression coefficients that are significantly differentbefore and after the bridge’s construction. Model resultsindicate that the regression coefficient for central and localstations (and their surrounding areas) are significantlydifferent before and after the bridge (DStat and Stat). Wenote that vehicle-related crimes increased after the bridgeopened. An explanation for this might be that the use ofthe bridge as a means to reach the continent (either bytrain or car) results in an increase in traffic flow not only inMalmo in general but, especially, close to transport nodes,such as stations. It may also indicate an increase in thestock of cars parked around the stations and surroundingareas that become vulnerable targets for theft and bur-glary. However, there are other variables that help explainvehicle-related crimes. Vehicle thefts, for instance, areconcentrated in areas with a large share of population agedtwentyfive and younger, high housing mobility, low foreignpopulations, and, surprisingly, with many local leisure as-sociations. In the case of Malmo, local leisure associations,especially those related to sport events, may attract youngmotivated offenders who hang around and blend in withthe local environment. Thus, the presence of local leisureassociations shows little buffering effect on theft-relatedcrimes, which corroborates the findings of Ross and Jang(2000) but goes against results of Rosenfeld, Messner, andBaumer (2001) and Martin (2002) on the impact of localorganizations on crime.
The presence of commercial areas (Shop) explainsthree out of the four OAB where the effect is expected
Crime in Border Regions: The Scandinavian Case of Oresund, 1998–2001 819
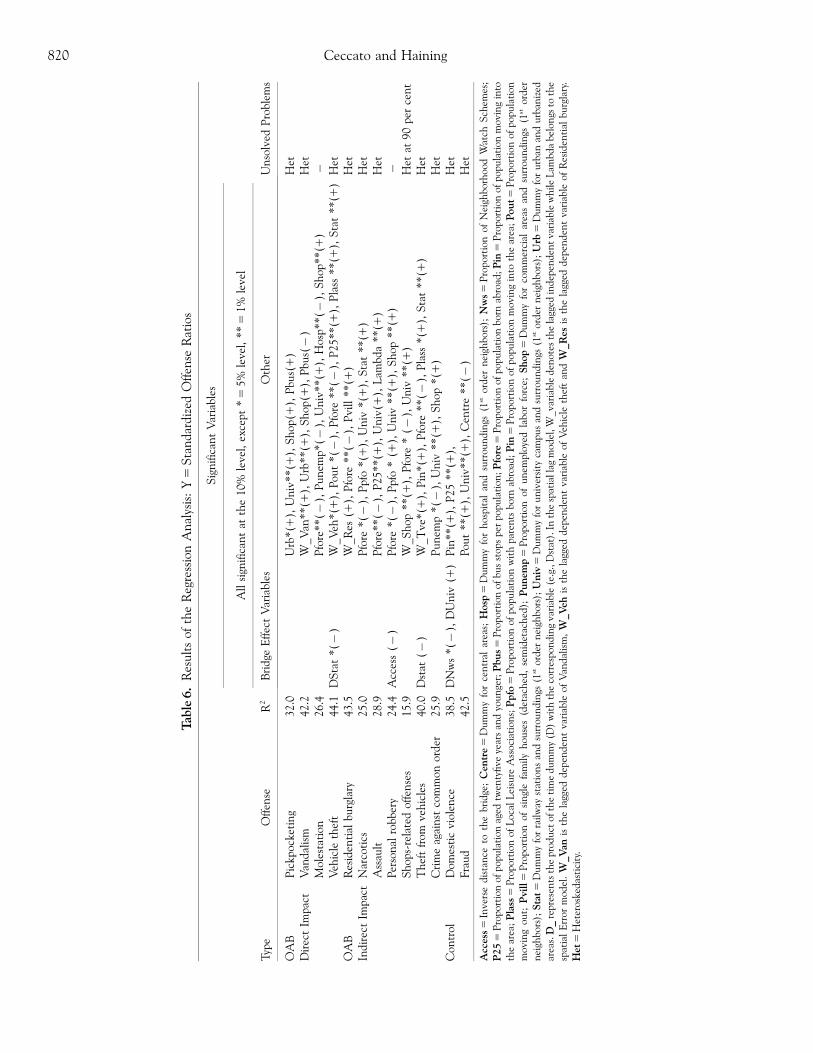
Table6.
Res
ult
sof
the
Reg
ress
ion
An
alys
is:
Y5
Sta
nd
ard
ized
Off
ense
Rat
ios
Sig
nif
ican
tV
aria
bles
Typ
eO
ffen
seR
2
All
sign
ific
ant
atth
e1
0%
leve
l,ex
cept
*5
5%
leve
l,**5
1%
leve
l
Un
solv
edP
robl
ems
Bri
dge
Eff
ect
Var
iabl
esO
ther
OA
BP
ick
pock
etin
g3
2.0
Urb*(1
),U
niv**(1
),S
hop
(1),
Pbu
s(1
)H
etD
irec
tIm
pact
Van
dal
ism
42
.2W
_V
an**(1
),U
rb**(1
),S
hop
(1),
Pbu
s(�
)H
etM
oles
tati
on2
6.4
Pfo
re**(�
),P
un
emp*(�
),U
niv**(1
),H
osp**(�
),S
hop**(1
)�
Veh
icle
thef
t4
4.1
DS
tat*(�
)W
_V
eh*(1
),P
out*(�
),P
fore
**(�
),P
25**(1
),P
lass
**(1
),S
tat**(1
)H
etO
AB
Res
iden
tial
burg
lary
43
.5W
_R
es(1
),P
fore
**(�
),P
vill**(1
)H
etIn
dir
ect
Impa
ctN
arco
tics
25
.0P
fore
*(�
),P
pfo*(1
),U
niv
*(1
),S
tat**(1
)H
etA
ssau
lt2
8.9
Pfo
re**(�
),P
25**(1
),U
niv
(1),
Lam
bda**(1
)H
etPer
son
alro
bber
y2
4.4
Acc
ess
(�
)P
fore
*(�
),P
pfo*
(1),
Un
iv**(1
),S
hop
**(1
)�
Sh
ops-
rela
ted
offe
nse
s1
5.9
W_
Sh
op**(1
),P
fore
*(�
),U
niv
**(1
)H
etat
90
per
cen
tT
hef
tfr
omve
hic
les
40
.0D
stat
(�
)W
_T
ve*(1
),P
in*(1
),P
fore
**
(�
),P
lass
*(1
),S
tat**(1
)H
etC
rim
eag
ain
stco
mm
onor
der
25
.9P
un
emp*(�
),U
niv
**(1
),S
hop
*(1
)H
etC
ontr
olD
omes
tic
viol
ence
38
.5D
Nw
s*(�
),D
Un
iv(1
)P
in**(1
),P
25**(1
),H
etFra
ud
42
.5Pou
t**(1
),U
niv**(1
),C
entr
e**(�
)H
et
Access5
Inve
rse
dis
tan
ceto
the
brid
ge;Cen
tre5
Du
mm
yfo
rce
ntr
alar
eas;
Hosp
5D
um
my
for
hos
pita
lan
dsu
rrou
nd
ings
(1st
ord
ern
eigh
bors
);Nws5
Pro
port
ion
ofN
eigh
borh
ood
Wat
chS
chem
es;
P255
Pro
port
ion
ofpo
pula
tion
aged
twen
tyfi
veye
ars
and
you
nge
r;Pbus5
Pro
port
ion
ofbu
sst
ops
per
popu
lati
on;Pfore5
Pro
port
ion
ofpo
pula
tion
born
abro
ad;Pin5
Pro
port
ion
ofpo
pula
tion
mov
ing
into
the
area
;Plass5
Pro
port
ion
ofL
ocal
Lei
sure
Ass
ocia
tion
s;Ppfo5
Pro
port
ion
ofpo
pula
tion
wit
hpa
ren
tsbo
rnab
road
;Pin5
Pro
port
ion
ofpo
pula
tion
mov
ing
into
the
area
;Pout5
Pro
port
ion
ofpo
pula
tion
mov
ing
out;
Pvill5
Pro
port
ion
ofsi
ngl
efa
mily
hou
ses
(det
ach
ed,
sem
idet
ach
ed);
Punem
p5
Pro
port
ion
ofu
nem
ploy
edla
bor
forc
e;Shop5
Du
mm
yfo
rco
mm
erci
alar
eas
and
surr
oun
din
gs(1
stor
der
nei
ghbo
rs);Stat5
Du
mm
yfo
rra
ilway
stat
ion
san
dsu
rrou
nd
ings
(1st
ord
ern
eigh
bors
);Univ5
Du
mm
yfo
ru
niv
ersi
tyca
mpu
san
dsu
rrou
nd
ings
(1st
ord
ern
eigh
bors
);Urb
5D
um
my
for
urb
anan
du
rban
ized
area
s.D_
repr
esen
tsth
epr
odu
ctof
the
tim
ed
um
my
(D)
wit
hth
eco
rres
pon
din
gva
riab
le(e
.g.,
Dst
at).
Inth
esp
atia
llag
mod
el,W
_va
riab
led
enot
esth
ela
gged
ind
epen
den
tva
riab
lew
hil
eL
ambd
abe
lon
gsto
the
spat
ial
Err
orm
odel
.W
_Van
isth
ela
gged
dep
end
ent
vari
able
ofV
and
alis
m,W
_Veh
isth
ela
gged
dep
end
ent
vari
able
ofV
ehic
leth
eft
andW
_Res
isth
ela
gged
dep
end
ent
vari
able
ofR
esid
enti
albu
rgla
ry.
Het5
Het
eros
ked
asti
city
.
Ceccato and Haining820
to be direct (Table 6). Most pickpocketing occurs in thecity’s main core, in commercial areas, close to the uni-versity campus and surroundings, and areas with rela-tively large numbers of bus stops. These areas andlocations bring people together, creating an opportunityfor crime (potential offenders and victims) (Tremblayand Tremblay 1998).
However, while these places stimulate pickpocketing,they might discourage other types of offenses, such asvandalism. High standardized vandalism rates are foundin central areas, mostly commercial ones but in lessguarded places, possibly with fewer bus stops. Areas witha high risk of molestation are associated with shoppingareas. Population characteristics of the areas are alsoimportant—areas with a low proportion of unemployedpeople and population born abroad have higher van-dalism ratios.
Among those offenses selected where the bridge wasexpected to have an indirect or long-term impact, thepresence of the university campus and its surroundings(Univ) explains five out of these seven offenses. As thevariable is represented (the polygon and its first-orderneighbors), it signals the importance of educational en-vironments on crime patterns. Other central areas, oldtown, and the harbor area of Malmo are also importantsites. A typical example is personal robbery. The modelsuggests that the closer an area is to a shopping area, theuniversity campus and harbor areas, the higher the rela-tive risk of robbery. Another example is narcotics. Areaswith a high relative risk of narcotic-related offenses arethe ones close to the stations (central and secondary)and the university campus. As in the case of personalrobbery, population characteristics are also important inexplaining the geography of relative risk.
It should be noted that in the case of one controlvariable (domestic violence), there was a significantdifference in two of the variables before and after thebridge. The relative risk of domestic violence was highereighteen months before the bridge was constructed closeto the harbor/university campus and lower in areas withneighborhood watch schemes. This is disappointing interms of the overall analysis since it undermines theregression findings on the OAB category. It is possible,but unlikely, that the construction of the bridge mayhave had an effect on domestic violence, but any link islikely to be tenuous.
Conclusions
This article has reported findings on the short-termeffects on offenses by the establishment of an improvedtransportation link between two bordering European
countries. Results reported here suggest that new, im-proved transportation systems that cross ‘‘open’’ bordersgenerate an increase in mobility, but do not necessarilytrigger a rise in the total number of offenses. However,the easy access to places may generate new geographicalpatterns of offenses by creating new sites for offending inareas that, despite being crowded places, may lack ca-pable guardians.
Thefts, shoplifting, and vandalism are, by far, the mostcommon types of offenses in the Oresund region. It issuggested that there have been no dramatic changes inthe total number of crimes between 1998 and 2001.However, changes in the transport system in the regionhave led to changes in smuggling routes. Smugglers seemto prefer the Oresund bridge route between Copenhagenand Malmo than the ferryboat between Helsing�r andHelsingborg. There are also indications that the bridgehas facilitated human trafficking.
Results from the Swedish city of Malmo illustrate thefact that there have been some shifts in the geography ofthe selected offenses, notably in relation to the locationand size of clusters of high rates. The modeling of thechanges in crime patterns shows that only a few minorshifts in their association with underlying demographic,socioeconomic, and land-use characteristics took placebefore and after the bridge was built. Only vehicle-re-lated crimes out of the eleven selected crimes seemed tobe affected by the bridge. Space-time variation in one ofthe two control offenses was influenced by the bridge.This later finding is not, at the present time, easy torationalize and raises questions about the interpretationof the findings from the other regression models.
Discussion and findings of this article raise questionsthat point to the need for a new conceptual model at theregional level that goes beyond existing criminologicaltheory about the role of space and place. The regionalscale implies, for instance, that routine activity theory(Cohen and Felson 1979) should be expanded to in-corporate notions of mobility across borders (perhapsmore complex than the ones applied to intraurban pat-terns) for offenders and targets (and potential guardi-ans). The offenders’ perception of an internationalborder (and the risks involved in crossing it) is likely tobe very different from other types of local barrier. All thecharacteristics that make an object a ‘‘suitable target’’(value, inertia, visibility, and access) should be adaptedto the context of borders. In this case, cross-border crimecould be assessed as any other economic activity in-volving risk and reward. Rational choice theory shouldcontribute to our understanding of why certain offendersmake the decision to cross a border. Notions of ‘‘capableguardians’’ should take into consideration the behaviors
Crime in Border Regions: The Scandinavian Case of Oresund, 1998–2001 821
of people when they are in an unfamiliar environmentand new forms of interaction occur in places that arewell populated, but that have a wide range of impersonalforms of surveillance.
The main challenge in assessing the effect of a newtransport link is to combine individual or group-leveldata on offense, victim, and offender from both sides ofthe border. In this study, only aggregated data on of-fenders by citizenship for Swedish Oresund was availa-ble and was used to illustrate offenders’ mobility. Theindividual data should refer to offenders who cross thebridge to commit crime as well as persons who arevictimized on the other side of the bridge. Linking dataon offense, victims, and offenders is one of the coreissues in modern criminology, and the findings of thisstudy are an example of where the linkage is crucial tounderstanding process. However, much work remains tobe done in solving problems of data access and datacomparability between countries. The fact that crimerecords in most countries are regarded as very sensitiveat the coordinate level makes the process of acquiringthe datasets long, difficult, and costly. Combining crimedata from different countries raises additional chal-lenges.
There is also a need to separate the effect of changestaking place at a border from other structural changestaking place at national and international scales. Theincrease in cases of human trafficking in both Denmark
and Sweden is an example of how processes operating atinternational scales have implications for locally ob-served offense patterns. To take one example, EU en-largement has added new member states to the formerfifteen. The EU’s new frontier now abuts Russia andformer Soviet republics. How these new borders arepoliced will have implications for crime patternsthroughout the EU.
Acknowledgements
This research was undertaken while Vania Ceccatowas a visiting fellow at the Department of Geography atthe University of Cambridge, England. The support ofthe Marie Curie Fellowship Scheme (Grant referenceHPMF-CT-2001-01307) and STINT—The SwedishFoundation for International Cooperation in Researchand Higher Education (Dnr PD2001-1045)—are grate-fully acknowledged by the authors. Thanks also to Dr.Seraphim Alvanides, University of Newcastle, for help indesigning the new spatial units in Z-DES. The authorswould also like to express their thanks to the Co-penhagen Police Authority in Denmark, the Skane Po-lice Authority in Sweden, and the Malmo municipalityand Skane region for providing the dataset used in thisanalysis.
Ceccato and Haining822
Appen
dix:CharacteristicsoftheDataset
Typ
eof
Dat
aD
escr
ipti
onYe
arS
ourc
e
Offenses
Type
SwedishCode
DanishCode
Sm
ugg
lin
g14
00
2,
40
22
,4
00
37
65
01
,7
12
82
19
98
–2
00
1S
kan
ePol
icy
Au
thor
ity
Pic
kpo
cket
ing
84
57
56
07
,7
56
09
,7
56
11
,7
56
13
,7
55
51
Cop
enh
agen
Pol
icy
Au
-th
orit
yV
and
alis
m1
20
1–
3,
12
05
,1
20
77
71
11
–5
,7
71
21
Mol
esta
tion
40
3,
40
7,
40
8,
41
07
42
65
,7
42
66
,7
42
71
Sw
edis
hC
ust
omer
sS
ervi
-ce
sV
ehic
leth
eft2
80
1–
80
67
54
11
,7
54
21
,7
54
41
,7
72
71
–7
7,
77
27
9,
77
31
1R
esid
enti
albu
rgla
ry3
82
5–
82
6,
84
3–
84
4,
85
7,
87
4(9
80
1–
98
02
in2
00
1)
75
21
1–
75
21
3,
75
31
1
Nar
coti
cs5
00
4–
50
06
,5
01
0–
50
12
71
28
1,
84
11
0–
84
11
1,
75
31
2–
75
31
3A
ssau
lt3
51
–3
58
,3
61
–3
68
,3
71
–3
78
,3
81
–3
88
73
21
5–
16
,7
32
41
,7
32
51
,7
32
61
–7
32
62
Per
son
alro
bber
y8
77
–8
79
,8
90
,8
94
–8
95
(20
01
)7
63
19
,7
63
29
Sh
ops-
rela
ted
offe
nse
s8
64
,8
70
,8
18
,8
53
76
31
3,
76
32
3,
75
15
2–
75
15
3,
75
56
0,7
55
62
–3
Th
eft
from
cars
84
07
55
12
–7
55
14
Cri
me
agai
nst
com
mon
ord
er1
60
2–
16
07
70
42
1,
70
42
3R
obbe
ryin
ban
ks
and
post
offi
ces
86
2–
86
3,
86
8–
86
97
63
11
4
Off
ense
sin
plac
esof
tou
rism
58
86
–8
87
75
11
4,
75
18
4D
omes
tic
viol
ence
38
1–
38
4-
Fra
ud
90
3–
90
6-
Dem
ographicand
Socioeconom
icIndicators
Pro
port
ion
sof
Pop
ula
tion
you
nge
rth
anag
e1
8(P
18
,D
P1
8)
20
00
Mal
mo
Mu
nic
ipal
Dat
a-ba
se(S
tati
stic
sS
wed
en)
Pop
ula
tion
old
erth
anag
e6
5(P
25
,D
P2
5)
20
00
Un
empl
oyed
labo
rfo
rce
(Pu
nem
p,D
PU
nem
p)2
00
1
Pop
ula
tion
wit
h(a
tle
ast)
apa
ren
tbo
rnab
road
(Ppf
o,D
ppfo
)2
00
1R
egio
nS
kan
e
Pop
ula
tion
born
abro
ad(P
fore
,D
pfor
e)2
00
1Pop
ula
tion
mov
ing
into
the
area
(Pin
,Dpi
n)
20
00
con
tin
ued
Crime in Border Regions: The Scandinavian Case of Oresund, 1998–2001 823

Typ
eof
Dat
aD
escr
ipti
onYe
arS
ourc
e
Pop
ula
tion
mov
ing
out
the
area
(Pou
t,D
pou
t)2
00
0
Ren
tal
publ
ich
ousi
ng
apar
tmen
ts(P
pho,
Dph
o)1
99
0
Apa
rtm
ents
own
edby
priv
ate
com
pan
ies
(PP
c,D
PP
c)1
99
0
Pri
vate
lyow
ned
sin
gle-
fam
ily
hou
ses
(Pvi
ll,
Dpv
ill)
19
90
Fam
ilie
sav
erag
ed
ispo
sabl
ein
com
e(P
inc,
DP
Inc)
19
99
Hou
seh
old
sre
ceiv
ing
soci
alal
low
ance
(Psa
l,D
PS
al)
19
99
Loc
alle
isu
reas
soci
atio
ns
bypo
p(P
lass
,D
PL
ass)
20
02
Nei
ghbo
rhoo
dW
atch
Sch
emes
bypo
p(P
Nw
s,D
PN
ws)
19
98
LandUseIndicators
Du
mm
yfo
ru
rban
and
urb
aniz
edar
eas
(Urb
,D
urb
)S
kan
eT
raffi
cA
uth
orit
y
Du
mm
yfo
ru
niv
ersi
tyca
mpu
san
dsu
rrou
nd
-in
gs,
1st
ord
ern
eigh
bors
(Un
iv,
Du
niv
)S
wed
ish
Nat
ion
alR
oad
Ass
ocia
tion
Du
mm
yfo
rco
mm
erci
alar
eas
and
surr
oun
d-
ings
,1
stor
der
nei
ghbo
rs(S
hop
,D
shop
)D
um
my
for
cen
tral
/rai
lway
stat
ion
and
sur-
rou
nd
ings
,1
stor
der
nei
ghbo
rs(S
tat,
Dst
at)
Du
mm
yfo
rh
ospi
tal
and
surr
oun
din
gs,
1st
or-
der
nei
ghbo
rs(H
osp,
Dh
osp)
Du
mm
yfo
rC
entr
e(C
entr
e,D
cen
tre)
Du
mm
yfo
rar
eas
ofto
uri
smat
trac
tion
,(T
uri
s,D
turi
s)P
ropo
rtio
nof
bus
stop
sby
popu
lati
on(P
puss
,D
pbu
ss)
Acc
ess
toth
ebr
idge
—In
vers
ed
ista
nce
tobr
idge
(Ace
ss,
Dac
ess)
1For
Sw
eden
,th
ed
ata
isin
com
plet
e;d
ata
onse
ized
good
sfr
omth
eC
ust
omer
sS
ervi
ces
was
use
din
stea
d;
2T
his
excl
ud
esbi
cycl
e,bo
at,
oth
er;
3T
his
incl
ud
esce
llar
,at
tic,
leis
ure
hou
sefo
rS
wed
en;
4T
his
doe
sn
otin
clu
de
post
offi
ces;
5For
Sw
eden
,th
isd
ata
incl
ud
esth
eft
orbu
rgla
ryin
chu
rch
es,
mu
seu
ms,
spor
tar
enas
,ci
nem
as,
hot
els,
wh
ile
for
Den
mar
k,
the
cate
gory
chos
enw
as‘‘B
urg
lary
inge
ner
al,
oth
ers’
’(I
nd
bru
di�v
rig,
ink
l.
Kir
ke/m
use
um
).
Ceccato and Haining824
Notes
1. Our definition of Oresund includes the Copenhagen met-ropolitan area (Hovedstadsregionen), and Scania (Skane) inthe southern part of Sweden. Thus, in this study, we excludethe low-density populated parts of the Danish Oresund, suchas Vastra Sjalland, Lolland and Bornholm.
2. For a general review of studies dealing with borders, see VanHoutum (2000), Leimgruber (1981, 1998, 1999), andBucken-Knapp and Schack (2001).
3. Driving under the influence of substances was recordedseparately from other types of offenses, but lately there hasbeen a common practice to record it in the same database asother offenses. One reason is that driving under the influ-ence of alcohol in combination with narcotics has becomevery common—a fact that confirms the increase of narcoticsin general but that may have inflated the number of casesbecause the offense was possibly recorded in both databases.
4. http://www.geog.leeds.ac.uk/software/zdes/ (last accessed 1July 2004).
5. http://dcp.nci.nih.gov/BB/SaTScan.html (last accessed 1 July2004).
6. One possibility is to model the observed counts as a Poissonor binomial response using the expected counts as the offsetvariable. The evidence here suggests that the analysis willneed to deal with overdispersion.
References
Aebi, M., G. Barclay, J. Jehle, and M. Killias. 1999. Europeansourcebook of crime and criminal justice statistics: Key findings.Strasbourg: Council of Europe.
Ahlberg, J., and T. Thedeen, eds. 1981. En undersokning avseendeekonomisk brottslighet inom tullens ansvarsomradet - ett pilot-projekt. Vol. 2, Ed. D. Magnusson. Stockholm: Utveckling-senheten, BRA.
Anderson, M., M. den Boer, P. Cullen, W. Gilmore, C. Raab, andN. Walker, eds. 1995. Policing the European Union. Oxford,U.K.: Clarendon Press.
Anselin, L. 1992. SpaceStat Tutorial: A workbook for usingSpaceStat in the analysis of spatial data. Morgantown: WestVirginia University.
Barclay, G., C. Tavares, and A. Siddique. 2001. Internationalcomparisons of criminal justice statistics 1999. London: HomeOffice.
Bevelander, P., B. Carlsson, and M. Rojas. 1997. I kruksbarslan-dets storstader: Om invandrare i Stockholm, Goteborg ochMalmo. Kristianstad: SNS.
Bew, P., and G. Gillespie. 1993. Northern Ireland: A chronology ofthe Troubles 1968–1993. Dublin: Gill & Macmillan.
Block, R., and S. Davies. 1996. The environs of rapid transitstations: A focus for street crime or just another risky place?In Crime and place, ed. R. V. Clarke, 236–57. Monsey, NY:Criminal Justice Press.
Brantingham, P. L., and P. J. Brantingham. 1981. Notes onthe geometry of crime. In Environmental criminology, ed.P. J. Brantingham and P. L. Brantingham, 27–54. London:Sage.
Bucken-Knapp, G., and M. Schack, eds. 2001. Borders matter:Transboundary regions in contemporary Europe. Aabenraa:Danish Institute of Border Regions Studies.
Bygvra, S., and H. Westlund. 2001. Oresundsbro - okad inter-aktion? en analys av inkopsresor m.m. fore och efter bronsoppnande. Aabenraa: Danish Institute of Border RegionStudies.
Cohen, L. E., and M. Felson. 1979. Social change and crime ratetrends: A routine activity approach. American SociologicalReview 44:588–608.
Colquhoun, P. 1800. A treatise on the police of the metropolis.London: H. Baldwin and Son.
Costello, A., and P. Wiles. 2001. GIS and the journey to crime:An analysis of patterns in South Yorkshire. In Mapping andanalysing crime data: Lessons from research and practice, ed.A. Hirschfield and K. J. Bowers, 27–60. London: Taylor andFrancis.
Di Nicola, A. 2001. Trafficking in migrants: A European per-spective. In Cross-border crime in a changing Europe, ed. P. C.VanDuyne, V. Ruggiero, M. Scheinost, and W. Valkenburg,63–74. Huntington, NY: Nova.
Dunning, E. 2000. Towards a sociological understanding of foot-ball hooliganism as a world phenomenon. European Journalon Criminal Policy and Research 8 (2): 141–62.
European Commision. 1998. Economic and social cohesion. http://europa.eu.int/comm/employment_social/soc-prot/disable/erdf_in.htm (last accessed 2 July 2004).
European Parliament, Research DG. 1997. Cohesion: The chal-lenge for the future. Theoretical and institutional contributionsto the debate on the reforms of structural policy. REGI 102.http://www.europarl.eu.int/workingpapers/catalog/cat-regi_en.htm (last accessed 2 July 2004).
Field, S., R. V. Clarke, and P. M. Harris. 1991. The Mexicanvehicle market and auto theft in border areas of the UnitedStates. Security Journal 2 (4): 205–11.
Galeotti, M. 1995. Cross-border crime in the former SovietUnion. Boundary and Territory Briefing 1 (5): 1–26.
Haining, R. 2003. Spatial data analysis: Theory and practice.Cambridge, U.K.: Cambridge University Press.
Haining, R., and A. Cliff. 2003. Using Scan statistics to map theincidence of an infectious disease: Measles in the USA 1962–1995. In Geography and health, ed. L. Toubiana, C. Viboud,A. Fhahault, and A. J. Valleron, 177–94. Paris: Inserm.
Hajdnijak, M. 2002. Smuggling in southeast Europe: The Yu-goslav wars and the development of regional criminal net-works in the Balkans. Sofia: CSD–Center for the Study ofDemocracy.
Hjalmars, U., M. Kulldorff, Y. Wahlquist, and B. Lannering.1999. Increased incidence rates but no space-time cluster-ing of childhood malignant brain tumors in Sweden. Cancer85:2077–90.
Home Office. 2003. Routine Activity Theory. http://www.crime-reduction.gov.uk/learningzone/RAT.htm (last accessed 2July 2004).
Junninen, M., and K. Aromaa. 2000. Professional crime acrossthe Finish-Estonian border. Crime, Law and Social Change34:319–47.
Krajewski, K. 2001. Drug trafficking in Poland. In Cross-bordercrime in a changing Europe, ed. P. C. Van Duyne, V. Ruggiero,M. Scheinost, and W. Valkenburg, 75–92. Huntington, NY:Nova.
Kuldorff, M. A. 1997. A spatial scan statistic. Communications inStatistics: Theory and methods 26:1481–96.
LaVigne, N. 1997. Visibility and vigilance: Metro’s situationalapproach to preventing subway crime. Washington, DC:National Institute of Justice.
Crime in Border Regions: The Scandinavian Case of Oresund, 1998–2001 825
Leimgruber, W. 1981. Political boundaries as a factor in regionalintegration, examples from Basle and Ticino. Regio Basil-iensis 2 (192): 192–201.
FFF. 1998. Border trade: The boundary as an incentive andan obstacle to shopping trips. Nordia 22:53–60.
FFF. 1999. Border effects and the cultural landscape: Thechanging impact of boundaries on regional development inSwitzerland. In Nationalising and Denationalising EuropeanBorder Regions, 1800–2000, ed. H. K. A. J. Markusse, 199–221. Amsterdam: Kluwer.
Levine, N., and M. Wachs. 1986. Bus crime in Los Angeles:Measuring the incidence. Transportation Research A 20 (4):273–84.
Loukaitou-Sideris, A. 1999. Hot spots of bus stop crime. Journalof the American Planning Association 65 (4): 395–411.
Ma, J., R. Haining, and S. Wise. 1997. SAGE User’s guide.Sheffield, U.K.: University of Sheffield.
Martin, D. 2002. Spatial patterns in residential burglary: As-sessing the effect of neighbourhood social capital. Journal ofContemporary Criminal Justice 18 (2): 132–46.
Matthiessen, C. W. 2000. Bridging the Oresund: Potential re-gional dynamics integration of Copenhagen (Denmark)and Malmo-Lund (Sweden), a cross border project on theEuropean metropolitan level. Journal of Transport Geography8:171–80.
FFF. 2002. Oresundsomradet–Oresundsregionen: status2001. In Oresundsforbindelse med ett hinder mindre: effekterpa integrationen vid avgiftsfrihet, ed. L. Soderstrom, 61–78.Lund: Justnu.
NCPD and National Commissioner of Danish Police. Status re-port on organised crime in Denmark in 2001. 2002 http://www.politi.dk/PUBL/Organiseret_kriminalitet_2000/Orgk-rim_2001_endeligversion_eng.doc (last accessed 2 July2004).
Openshaw, S., S. Alvanides, and S. Whalley. 1998. Some furtherexperiments with designing output areas for the 2001 UKcensus. Paper read at ESRC/JISC workshops: Planning forthe 2001 census: Determining academic community needsand strategy. School of Geography, Leeds University.
Oresundsbro Konsortiet, Scandlines, DSB, and Skanetraffiken.2002. Trafikundersogelse pa Oresund. Kongens Lyngby: DSB,Scandlines, Skanetrafiken, Oresundsbro Konsortiet.
Osmonaliev, K. 2002. Legal and organizational aspects of thefight against money laundering in Kyrgyztan. In Tacklingcross border crime: Challenges of international developmentco-operation. Speeches and issues Notes. Berlin, http://www.dse.de/ef/crime/osmonaliev.htm (last accessed 2 July2004).
Osyka, I. 2001. Organised economic crime: Problems in theUkraine. In Cross-border crime in a changing Europe, ed. P. C.Van Duyne, V. Ruggiero, M. Scheinost, and W. Valkenburg,115–28. Huntington, NY: Nova.
Persson, L. G. W. 1999a. Cigarett smugglingens struktur, omfattningoch utveckling under senare delen av 1990-talet: fran ax tilllimpa. Stockholm: BRA.
FFF. 1999b. Cigarett smugglingens struktur, omfattning ochutveckling under senare delen av 1990-talet: fran limpa tilllunga. Stockholm: BRA.
Poister, B. 1996. Transit-related crime in suburban areas. Journalof Urban Affairs 18 (1): 63–76.
Porter, M. 1996. Tackling cross border crime. London: Home Of-fice.
Rikskriminalpolisen, RKP-. 1999. Oresundsforbindelsen: ko-nsekvenser for svensk polis och tull. Stockholm: Rikskri-minalpolisen–Kriminalunderrattelsetjansten.
Rosenfeld, R., S. F. Messner, and E. P. Baumer. 2001. Socialcapital and homicide. Social Forces 80 (1): 283–309.
Ross, C. E., and S. J. Jang. 2000. Neighborhood disorder, fear,and mistrust: The buffering role of social ties with neigh-bors. American Journal of Community Psychology 28 (4):401–20.
Ruyver, B., K. Van Impre, and J. Meese. 2001. The need for amultidisciplinary and proactive approach to human traf-ficking: Reflections from two pilots. In Cross-border crime ina changing Europe, edited by P. C. Van Duyne, V. Ruggiero,M. Scheinost, and W. Valkenburg. Huntington, NY: Nova.
Schloenhardt, A. 1999. Organised crime and the business of mi-grant trafficking. Crime, Law and Social Change 32:203–33.
Sherman, L. W. 1990. Police crackdowns: Initial and residualdeterrence. In Crime and justice: An annual review ofresearch, Vol. 12, ed. M. Tonry and N. Morris. Chicago:University of Chicago Press.
Statistiska centralbyran (Statistics Sweden: SCB). 2003. Øre-sunds Databanken 2003 http://www2.dst.dk/Oresund1/ (lastaccessed 2 July 2004).
Stott, C., P. Hutchison, and J. Drury. 2001. Hooligans abroad?Inter-group dynamics, social identity and participation incollective ‘‘disorder’’ at the 1998 World Cup finals. BritishJournal of Social Psychology 40 (3): 359–84.
Tobias, J. J. 1967. Crime and industrial society in the 19th century.New York: Schocken.
Tremblay, C. R., and P. Tremblay. 1998. Social structure, inter-action opportunities and the direction of violent offenses.Journal of Research in Crime and Delinquency 35:295–315.
Tsebelis, G. 1989. The abuse of probability in political analysis:the Robinson Crusoe fallacy. American Political ScienceReview 83:77–91.
Ulrich, C. 1994. The growth of crime in Russia and the Balticregion: RFE/RL Research Report.
Vagg, J. 1992. The borders of crime: The Hong Kong-Chinacross border criminal activity. British Journal of Criminology32 (3): 310–28.
Van Houtum, H. 2000. An overview of European geographicalresearch on borders and border regions. Journal of Border-lands Studies 15:57–83.
White, R. C. 1932. The relations of felonies to environmentalfactors in Indianapolis. Social Forces 10:498–509.
Wikstrom, P. O. 1991. Urban crime, criminals, and victims: TheSwedish experience in an Anglo-American comparative per-spective. Stockholm: Springer-Verlag.
Wiles, P., and A. Costello. 1999. The ‘‘road to nowhere’’: Theevidence for travelling criminals. Sheffield, U.K.: PoliceResearch series.
Wilson, R. 2003. No Frontiers: North-South integration in Ireland2003 http://cain.ulst.ac.uk/dd/report11/report11k.htm. (Ac-cessed 16 June 2003.)
Correspondence: Urban Studies Division, Royal Institute of Technology, Drottning Kristinas vag 3010044 Stockholm, Sweden, e-mail:[email protected] (Ceccato); Department of Geography, University of Cambridge, Downing Place, Cambridge CB2 3EN, U.K., e-mail:[email protected] (Haining).
Ceccato and Haining826