Scandinavian Forest Economics No. 43, 2010 - IDS OpenDocs
434
Scandinavian Forest Economics No. 43, 2010 Proceedings of the Biennial Meeting of the Scandinavian Society of Forest Economics Gilleleje, Denmark, May 2010 Finn Helles and Petrine Steen Nielsen (eds.) Copenhagen
-
Upload
khangminh22 -
Category
Documents
-
view
0 -
download
0
Transcript of Scandinavian Forest Economics No. 43, 2010 - IDS OpenDocs

����������������������������������� �����
�����������������������������������������
������������ �����������������������������������������������������������
���������������������������� ����������
������
����������������������������������� �����
�����������������������������������������
������������ �����������������������������������������������������������
���������������������������� ����������
������
Scandinavian Forest Economics
N
o. 43, 2010
Scandinavian Forest Economics
No. 43, 2010
Proceedings
of the Biennial Meeting of the
Scandinavian Society of Forest Economics
Gilleleje, Denmark, May 2010
Finn Helles and Petrine Steen Nielsen (eds.)
Copenhagen
A5 omslag · Scandinavian Forest Economics nr 43 · NOV 2010.indd 1 22/11/10 12.38

SCANDINAVIAN SOCIETY OF FOREST ECONOMICS
SSFE Board
Denmark
Bo Jellesmark Thorsen ([email protected]) and
Tove Enggrob Boon (deputy) ([email protected])
Norway
Sjur Baardsen ([email protected]) and
Even Bergseng (deputy) (even.bergseng@
umb.no)
Finland
Anne Toppinen (chairman) (anne.toppinen@
helsinki.fi) and
Heikki Pajuoja (deputy) (heikki.pajuoja@
metsateho.fi)
Sweden
Anders Roos ([email protected]) and
Lars Lönnstedt (deputy) (Lars.Lonnstedt@
sprod.slu.se) and
Peichen Gong (deputy to the deputy)
A5 omslag · Scandinavian Forest Economics nr 43 · NOV 2010.indd 2 22/11/10 12.38
1
Scandinavian Forest EconomicsNo. 43, 2010
Proceedings of the Biennial Meeting of the
Scandinavian Society of Forest Economics May 19-22, 2010 in Gilleleje, Denmark
Scandinavian Society of Forest Economics
ISSN 0355-032X

2

3
Foreword During four warm and sunny days, 19th-22nd May 2010, close to 70 researchers gathered in Gilleleje, Denmark to present and discuss ongoing research at the Biennial Meeting of the Scandinavian Society of Forest Economics (SSFE). SSFE was established in 1958 and has been active ever since. It is a sign of its quality that it remains vigorous and is able to attract also a large number of young researchers in the field. This will keep the SSFE alive for many decades to come. On behalf of the SSFE, I thank our three keynote speakers who gave us some very interesting inputs for reflection and discussion: Professor Peter Berck, UC Berkeley, USA, Professor Marc Hanewinkel, Baden-Württemberg Forest Research Institute, Germany, and Professor Arild Angelsen, Norwegian University of Life Sciences. In full compliance with tradition, the programme also included an excursion. The theme was the decision process and implementation of the new national park in Northern Zealand. The SSFE is grateful to its former member and now Forest District Chief Dr. Jens Bjerregaard Christensen, for setting up the programme and giving the participants an interesting insight into the political, economic and environmental aspects of the new national park. This Biennial Meeting followed up on the tradition of appointing worthy Honourable Fellows, which was established in Lom, Norway in 2008. This year, Professor Lars Lönnstedt, Swedish University of Agricultural Sciences in Uppsala and Professor Colin Price, University of Bangor, UK were appointed Honourable Fellows of the SSFE. A Diploma and a small gift followed the appointment. The organisers and the participants wish to express their gratitude to SamNordisk Skogforskning (SNS) under the Nordic Council of Ministers for its indispensable financial support to the Biennial Meeting. We also wish to thank Mrs Charlotte Bukdahl Jacobsen and Ms Petrine Steen Nielsen for their great effort in making all practical and organisational matters work so smoothly. And we appreciate that Ms Petrine Steen Nielsen and Professor Emeritus Finn Helles have edited this volume of the Proceedings series of the SSFE. Frederiksberg, October 2010. Bo Jellesmark Thorsen

4
Table of contents Foreword 3 Table of contents 5 Honorary Fellows
Colin Price 11 Lars Lönnsted 15
Business Economics of Forestry & Forest Management Planning Eyvindson, K., Hujala, T., Kangas, A. and Kurttila, M.
Effect of information content on the choice among alternative forest plans 21
Nilsson, M. and Eriksson, L. O. How forest knowledge is used in forest planning – a case study 34
Price, C.
Appraising the economic impact of tree diseases in Britain: several shots in the dark, and possibly also in the wrong ball-park? 45
Price, C.
Threat, discount premiums, net present value and rotation: a real-world example 62
Price, C. Valuing landscapes with trees: subjectivity versus objectivity, holistic versus components-based approaches 80
Thorsen, B. J.
Risk, returns and possible speculative bubbles in the price of Danish forest land? 100

5
Table of contents Foreword 3 Table of contents 5 Honorary Fellows
Colin Price 11 Lars Lönnsted 15
Business Economics of Forestry & Forest Management Planning Eyvindson, K., Hujala, T., Kangas, A. and Kurttila, M.
Effect of information content on the choice among alternative forest plans 21
Nilsson, M. and Eriksson, L. O. How forest knowledge is used in forest planning – a case study 34
Price, C.
Appraising the economic impact of tree diseases in Britain: several shots in the dark, and possibly also in the wrong ball-park? 45
Price, C.
Threat, discount premiums, net present value and rotation: a real-world example 62
Price, C. Valuing landscapes with trees: subjectivity versus objectivity, holistic versus components-based approaches 80
Thorsen, B. J.
Risk, returns and possible speculative bubbles in the price of Danish forest land? 100

6
Abstracts Berck, P.
The Fuel for Land Use Change 112 Brazee, R. J. and Meilby, H.
Volvo Theorem Revisited 112 Favada, I.
An Economic Analysis of Forest Rotation without Interest Rate – Setting the Scene 113
Hankala, A., Wikström, P., Öhman, K. and Eriksson, L. O.
An integrated MCDA software application for forest planning: a case study in Southwestern Sweden 113
Jacobsen, J. B. and Thorsen, B. J.
Varying levels of information and strategies for adapting forest management to climate change 114
Kurttila, M., Hiltunen, V. and Pykäläinen, J.
Generating top-level plans in hierarchical forest planning – the case of Metsähallitus 115
Petty, A., Kärhä, K. and Mutikainen, A.
Cost-efficient small-diameter wood harvesting method in early thinnings 116
Rößiger, J. and Knoke, T.
An optimization model for a mixed species stand management with determination of the harvest sequence under uncertainty 117
Solberg, B., Bergseng, E. and Lindstad, B. H.
Potential impacts of international regimes for biodiversity protection and carbon sequestration in forestry – a quantitative approach 118
Forest Policy Broch, S. W., Strange, N. and Wilson, K. A.
How spatial variation influences landowner willingness to provide ecosystem services 121
Broch, S. W. and Vedel, S. E.
Investigation of landowners’ preferences for afforestation contracts in Denmark 127
Brukas, V.
Model of State forestry administration and media thriller in Lithuania 131
Hujala, T., Kurttila, M., Korhonen, K. and Pykäläinen, J.
Reasoning of family forest owners – survey of forest management and biodiversity protection problems 146
Korhonen, K., Kurttila, M. and Hujala, T. Typical social networks of family forest owners in timber trade 161
Liu, J.-C. and Chen, W.-H.
Survey and analysis of forest land trade centers in southern China: A case study of Jiangxi Province 172
Leppänen, J.
Finnish family forest owner 2010 survey 184 Lönnstedt, L., Lagerlöf, P. and Scheibenpflug, A.
Small scale forest owners’ economic, social and environmental responsibilities - literature review, discussion about responsibilities and results from case studies 196
Abstracts Abildtrup, J., Garcia, S., Bøye, S. and Stenger, A.
Recreation value of forests in Lorraine: A spatial analysis 218 Boon, T. E.
Images of forest owners – a review of owner typologies 218

7
Abstracts Berck, P.
The Fuel for Land Use Change 112 Brazee, R. J. and Meilby, H.
Volvo Theorem Revisited 112 Favada, I.
An Economic Analysis of Forest Rotation without Interest Rate – Setting the Scene 113
Hankala, A., Wikström, P., Öhman, K. and Eriksson, L. O.
An integrated MCDA software application for forest planning: a case study in Southwestern Sweden 113
Jacobsen, J. B. and Thorsen, B. J.
Varying levels of information and strategies for adapting forest management to climate change 114
Kurttila, M., Hiltunen, V. and Pykäläinen, J.
Generating top-level plans in hierarchical forest planning – the case of Metsähallitus 115
Petty, A., Kärhä, K. and Mutikainen, A.
Cost-efficient small-diameter wood harvesting method in early thinnings 116
Rößiger, J. and Knoke, T.
An optimization model for a mixed species stand management with determination of the harvest sequence under uncertainty 117
Solberg, B., Bergseng, E. and Lindstad, B. H.
Potential impacts of international regimes for biodiversity protection and carbon sequestration in forestry – a quantitative approach 118
Forest Policy Broch, S. W., Strange, N. and Wilson, K. A.
How spatial variation influences landowner willingness to provide ecosystem services 121
Broch, S. W. and Vedel, S. E.
Investigation of landowners’ preferences for afforestation contracts in Denmark 127
Brukas, V.
Model of State forestry administration and media thriller in Lithuania 131
Hujala, T., Kurttila, M., Korhonen, K. and Pykäläinen, J.
Reasoning of family forest owners – survey of forest management and biodiversity protection problems 146
Korhonen, K., Kurttila, M. and Hujala, T. Typical social networks of family forest owners in timber trade 161
Liu, J.-C. and Chen, W.-H.
Survey and analysis of forest land trade centers in southern China: A case study of Jiangxi Province 172
Leppänen, J.
Finnish family forest owner 2010 survey 184 Lönnstedt, L., Lagerlöf, P. and Scheibenpflug, A.
Small scale forest owners’ economic, social and environmental responsibilities - literature review, discussion about responsibilities and results from case studies 196
Abstracts Abildtrup, J., Garcia, S., Bøye, S. and Stenger, A.
Recreation value of forests in Lorraine: A spatial analysis 218 Boon, T. E.
Images of forest owners – a review of owner typologies 218

8
Jacobsen, J. B., Lundhede, T. H. and Thorsen, B. J. Are Economists Valuing Biodiversity at Gunpoint? Evidence of no or decreasing willingness to pay for population levels above preservation 219
Kamelarczyk, K. and Holmgren, P.
Measuring the performance of forestry – a proposed Forest Management Index as boundary spanner at the science-policy Interface 220
Moiseyev, A., Solberg, B. and Kallio, M.
Impact of the future global scenarios on the EU forest sector development 221
Vanhatalo, A., Uusivuori, J., Mikkola, J., Neuvonen, M. and Sievänen, T.
Visits to National Parks and Hiking Areas: A Panel Data Analysis of Their Socio-Demographic, Economic and Site Quality Determinants 222
Vierimaa, M.
Policies and processes for improving forest holding size and structure in Finland 222
Forest Industry & Forest Products Markets Baardsen, S.
Contracts as a Tool for Improving Efficiency in the Norwegian Roundwood Markets 227
Gustafsson, Å. and Rask, L.-O.
Proposing a Research Agenda for Swedish Sawmill Distribution Channel Challenges 244
Hujala, M., Puumalainen, K., Tuppura, A. and Toppinen, A.
The Role of National Culture and Environmental Awareness in Recovery and Utilization of Recycled Paper 257
Kärhä, K., Elo, J., Lahtinen, P., Räsänen, T. and Pajuoja, H.
Availability and Use of Wood-based Fuels in Finland in 2020 274 Lauri, P., Kallio, A. M. I. and Schneider, U. A.
Substitution between coal and wood in Europe 284
Li, N., Toppinen, A., Tuppura, A., Puumalainen, K. and Hujala, M.
The patterns and determinants of sustainability disclosure in the global forest industry 298
Roos, A., Lindberg, S., Kihlstedt, A., Woxblom, L. and Olsson, U.
Product semantics and sensory analysis on wood – a pilot study 314 Saastamoinen, O.
Failed strategies, external events or just life in the global markets? Discussing the downturn of the pulp and paper industry in Finland 334
Abstracts Favada, I., Rogieux, P. and Requardt, A.
Improving International Forest Products Price Information 348 Kallio, A. M. I., Anttila, P., McCormick, M. and Asikainen, A.
Assessing the Finnish targets for the energy use of forest chips with a spatial market model 349
Lähtinen, K.
Multidimensional sustainability framework to evaluate forest and wood energy production (BioSus-project) 350
International Forestry Chhetri, B. B. K., Larsen, H. O. and Smith-Hall, C.
Stakeholder perspectives on patterns and causes of forest crimes in Community Forestry in Nepal 353
Hofstad, O. and Sankhayan, P. L.
Exploring possibilities for reducing woodland deforestation and degradation at village level in Sub-Saharan Africa 365
Pouliot, M.
Relying on nature’s pharmacy: a case study of households’ dependency on medicinal plants in Burkina Faso’s central plateau 383

9
Jacobsen, J. B., Lundhede, T. H. and Thorsen, B. J. Are Economists Valuing Biodiversity at Gunpoint? Evidence of no or decreasing willingness to pay for population levels above preservation 219
Kamelarczyk, K. and Holmgren, P.
Measuring the performance of forestry – a proposed Forest Management Index as boundary spanner at the science-policy Interface 220
Moiseyev, A., Solberg, B. and Kallio, M.
Impact of the future global scenarios on the EU forest sector development 221
Vanhatalo, A., Uusivuori, J., Mikkola, J., Neuvonen, M. and Sievänen, T.
Visits to National Parks and Hiking Areas: A Panel Data Analysis of Their Socio-Demographic, Economic and Site Quality Determinants 222
Vierimaa, M.
Policies and processes for improving forest holding size and structure in Finland 222
Forest Industry & Forest Products Markets Baardsen, S.
Contracts as a Tool for Improving Efficiency in the Norwegian Roundwood Markets 227
Gustafsson, Å. and Rask, L.-O.
Proposing a Research Agenda for Swedish Sawmill Distribution Channel Challenges 244
Hujala, M., Puumalainen, K., Tuppura, A. and Toppinen, A.
The Role of National Culture and Environmental Awareness in Recovery and Utilization of Recycled Paper 257
Kärhä, K., Elo, J., Lahtinen, P., Räsänen, T. and Pajuoja, H.
Availability and Use of Wood-based Fuels in Finland in 2020 274 Lauri, P., Kallio, A. M. I. and Schneider, U. A.
Substitution between coal and wood in Europe 284
Li, N., Toppinen, A., Tuppura, A., Puumalainen, K. and Hujala, M.
The patterns and determinants of sustainability disclosure in the global forest industry 298
Roos, A., Lindberg, S., Kihlstedt, A., Woxblom, L. and Olsson, U.
Product semantics and sensory analysis on wood – a pilot study 314 Saastamoinen, O.
Failed strategies, external events or just life in the global markets? Discussing the downturn of the pulp and paper industry in Finland 334
Abstracts Favada, I., Rogieux, P. and Requardt, A.
Improving International Forest Products Price Information 348 Kallio, A. M. I., Anttila, P., McCormick, M. and Asikainen, A.
Assessing the Finnish targets for the energy use of forest chips with a spatial market model 349
Lähtinen, K.
Multidimensional sustainability framework to evaluate forest and wood energy production (BioSus-project) 350
International Forestry Chhetri, B. B. K., Larsen, H. O. and Smith-Hall, C.
Stakeholder perspectives on patterns and causes of forest crimes in Community Forestry in Nepal 353
Hofstad, O. and Sankhayan, P. L.
Exploring possibilities for reducing woodland deforestation and degradation at village level in Sub-Saharan Africa 365
Pouliot, M.
Relying on nature’s pharmacy: a case study of households’ dependency on medicinal plants in Burkina Faso’s central plateau 383

10
Shrivastava, V. K., Theilade, I. and Meilby, H. Trade chain analysis of Ophiocordyceps sinensis and Tricholoma matsutake in Bhutan 396
Abstracts Barua, S. K., Uusivuori, J. and Kuuluvainen, J.
Carbon based policy instruments versus agricultural commodity market in stopping tropical deforestation 417
Carlsen, K. and Lund, J. F.
Corporate social responsibility, forestry and societal change – a developing country perspective 418
Nielsen, M. R.
Improving the conservation status of the Udzungwa Mountains? The effect of Joint Forest Management on bushmeat hunting in the Kilombero Nature Reserve, Tanzania 419
Nielsen, Ø. J., Rayamajhi, S., Chhetri, B. B. K., Meilby, H., Larsen, H. O. and Smith-Hall, C.
Livelihood strategies and poverty in rural Nepal 420 The Gilleleje Poem Price, Colin
Despite Volcanic Ash… 421 List of Participants 425
1
Colin Price
Colin Price was in 1970 awarded a B.A. degree (Forestry) from Oxford University, with Jubilee Prize for best forestry student. The degree was in 1975 converted to M.A. In 1975 he was awarded a D.Phil. degree also from Oxford University. Colin was in 1976 appointed as lecturer in environ-mental and forestry economics at University College of North Wales, now Bangor University, promoted to senior lecturer in 1990 and to professor in 1995. Colin has always had a major teaching responsibility at Bangor Univer-sity, mainly for teaching environmental and forestry economics. He also took an early initiative in designing an economic development option suit-able for overseas students, and over the years he has introduced and taught courses in landscape design, recreation, environmental management, and computing. Other examples of his teaching are natural resource economics, practical forestry and estate economics, and economic, environmental and social appraisal. Colin is an eminent lecturer and is therefore in great demand also out-side Bangor University. He has given occasional seminars on topics of cur-rent interest at a number of universities in the UK, he has been a frequent speaker at conferences in many countries in and outside Europe, and over recent years he has often been guest lecturer in, for instance, the three Scan-dinavian countries. He has supervised numerous studies for M.Sc., M.Phil., and Ph.D. degrees. Colin’s research has lain very broadly in the field of land economics, ranging from urban economics to economics of biodiversity. Most comes under the heading of environmental and forestry economics. His most en-during and absorbing preoccupation has been with the economics of time, as represented by the process of discounting. His first published paper on this topic appeared in 1973, and the work culminated in the publication of Time,

11
Shrivastava, V. K., Theilade, I. and Meilby, H. Trade chain analysis of Ophiocordyceps sinensis and Tricholoma matsutake in Bhutan 396
Abstracts Barua, S. K., Uusivuori, J. and Kuuluvainen, J.
Carbon based policy instruments versus agricultural commodity market in stopping tropical deforestation 417
Carlsen, K. and Lund, J. F.
Corporate social responsibility, forestry and societal change – a developing country perspective 418
Nielsen, M. R.
Improving the conservation status of the Udzungwa Mountains? The effect of Joint Forest Management on bushmeat hunting in the Kilombero Nature Reserve, Tanzania 419
Nielsen, Ø. J., Rayamajhi, S., Chhetri, B. B. K., Meilby, H., Larsen, H. O. and Smith-Hall, C.
Livelihood strategies and poverty in rural Nepal 420 The Gilleleje Poem Price, Colin
Despite Volcanic Ash… 421 List of Participants 425
1
Colin Price
Colin Price was in 1970 awarded a B.A. degree (Forestry) from Oxford University, with Jubilee Prize for best forestry student. The degree was in 1975 converted to M.A. In 1975 he was awarded a D.Phil. degree also from Oxford University. Colin was in 1976 appointed as lecturer in environ-mental and forestry economics at University College of North Wales, now Bangor University, promoted to senior lecturer in 1990 and to professor in 1995. Colin has always had a major teaching responsibility at Bangor Univer-sity, mainly for teaching environmental and forestry economics. He also took an early initiative in designing an economic development option suit-able for overseas students, and over the years he has introduced and taught courses in landscape design, recreation, environmental management, and computing. Other examples of his teaching are natural resource economics, practical forestry and estate economics, and economic, environmental and social appraisal. Colin is an eminent lecturer and is therefore in great demand also out-side Bangor University. He has given occasional seminars on topics of cur-rent interest at a number of universities in the UK, he has been a frequent speaker at conferences in many countries in and outside Europe, and over recent years he has often been guest lecturer in, for instance, the three Scan-dinavian countries. He has supervised numerous studies for M.Sc., M.Phil., and Ph.D. degrees. Colin’s research has lain very broadly in the field of land economics, ranging from urban economics to economics of biodiversity. Most comes under the heading of environmental and forestry economics. His most en-during and absorbing preoccupation has been with the economics of time, as represented by the process of discounting. His first published paper on this topic appeared in 1973, and the work culminated in the publication of Time,
12 2
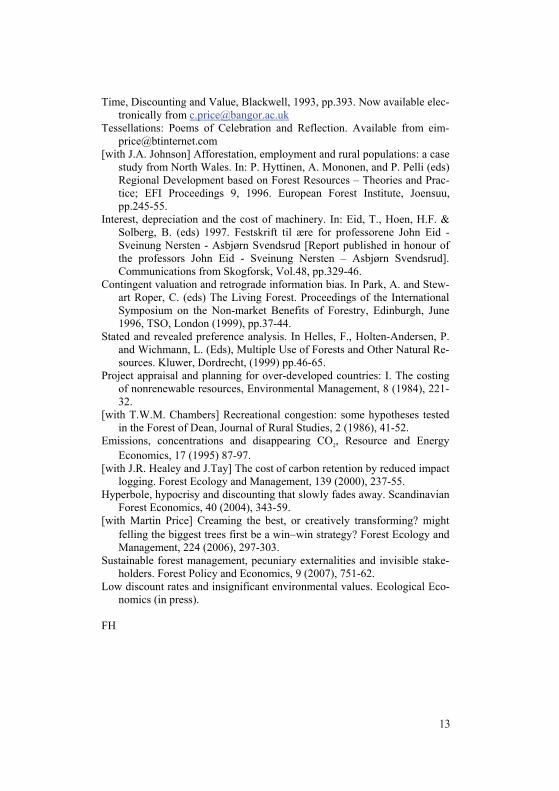
Discounting and Value in 1993. These and also more recent works should have led to a major revolution of economic appraisal in the world’s econo-mies – but most economists are apparently not as open minded as they be-lieve. Equally fundamental has been his work on economic ripples – the indirect welfare effects via price changes consequent on project implemen-tation. Colin’s work on evaluation of non-market benefits and costs originated long before popular interest arose in the subject. It has covered a wide range of effects, including physical ones but mostly he has concentrated on “aes-thetic” aspects, with a number of papers on recreational congestion and site substitution, and on statistical problems in fitting recreation demand curves. Landscape Economics 1978 was the world’s first book on aesthetic valua-tion. His contributions to forestry economics have been at both macro and microeconomic level, much of the material being assembled in the textbook The Theory and Application of Forest Economics 1989 which is in wide-spread use. More recent developments have been in economic evaluation of transformation to continuous cover forestry and engagement in the debate about whether forest certification really provides a route for evaluating the environmental and social consequences of different modes of production. Colin is also heavily involved in research on climate change and biodiver-sity economics. In 2000 Colin’s contributions to environmental and forestry economics were recognised by the award of the International Union of Forest Research Organizations’ Gold Medal for Scientific Achievement. His list of publications is impressive: books, chapters in books and se-ries, papers in academic and professional journals and series, book reviews. Colin has participated in all biennial meetings of Scandinavian Society of Forest Economics since 1991. This is really an accomplishment. And he has become an indispensable participant: he always presents – several – papers and he is very active in the discussions. It has become a tradition that he writes a Conference Poem. These poems are funny, but they are not just for fun – he may have an unequalled sense of humour but don’t fail to rec-ognise that there is very often an edge to it. Colin is also a great poet in the time between the SSFE biennial meet-ings. In the poems he demonstrates a great ability to convey to the reader “moods” experienced over many years and they are multi-layered, they are “tessellations” (see list), they are very English, and very much Colin Price. It pays to lose oneself in reading them – with a dictionary at hand. In one word: Colin is gorgeous. Selected publications Landscape Economics, Macmillan, 1978, pp.168. The Theory and Application of Forest Economics, Blackwell, 1989, pp.402.
3
Time, Discounting and Value, Blackwell, 1993, pp.393. Now available elec-tronically from [email protected]
Tessellations: Poems of Celebration and Reflection. Available from [email protected]
[with J.A. Johnson] Afforestation, employment and rural populations: a case study from North Wales. In: P. Hyttinen, A. Mononen, and P. Pelli (eds) Regional Development based on Forest Resources – Theories and Prac-tice; EFI Proceedings 9, 1996. European Forest Institute, Joensuu, pp.245-55.
Interest, depreciation and the cost of machinery. In: Eid, T., Hoen, H.F. & Solberg, B. (eds) 1997. Festskrift til ære for professorene John Eid - Sveinung Nersten - Asbjørn Svendsrud [Report published in honour of the professors John Eid - Sveinung Nersten – Asbjørn Svendsrud]. Communications from Skogforsk, Vol.48, pp.329-46.
Contingent valuation and retrograde information bias. In Park, A. and Stew-art Roper, C. (eds) The Living Forest. Proceedings of the International Symposium on the Non-market Benefits of Forestry, Edinburgh, June 1996, TSO, London (1999), pp.37-44.
Stated and revealed preference analysis. In Helles, F., Holten-Andersen, P. and Wichmann, L. (Eds), Multiple Use of Forests and Other Natural Re-sources. Kluwer, Dordrecht, (1999) pp.46-65.
Project appraisal and planning for over-developed countries: I. The costing of nonrenewable resources, Environmental Management, 8 (1984), 221-32.
[with T.W.M. Chambers] Recreational congestion: some hypotheses tested in the Forest of Dean, Journal of Rural Studies, 2 (1986), 41-52.
Emissions, concentrations and disappearing CO2, Resource and Energy Economics, 17 (1995) 87-97.
[with J.R. Healey and J.Tay] The cost of carbon retention by reduced impact logging. Forest Ecology and Management, 139 (2000), 237-55.
Hyperbole, hypocrisy and discounting that slowly fades away. Scandinavian Forest Economics, 40 (2004), 343-59.
[with Martin Price] Creaming the best, or creatively transforming? might felling the biggest trees first be a win−win strategy? Forest Ecology and Management, 224 (2006), 297-303.
Sustainable forest management, pecuniary externalities and invisible stake-holders. Forest Policy and Economics, 9 (2007), 751-62.
Low discount rates and insignificant environmental values. Ecological Eco-nomics (in press).
FH
1
13 2
Discounting and Value in 1993. These and also more recent works should have led to a major revolution of economic appraisal in the world’s econo-mies – but most economists are apparently not as open minded as they be-lieve. Equally fundamental has been his work on economic ripples – the indirect welfare effects via price changes consequent on project implemen-tation. Colin’s work on evaluation of non-market benefits and costs originated long before popular interest arose in the subject. It has covered a wide range of effects, including physical ones but mostly he has concentrated on “aes-thetic” aspects, with a number of papers on recreational congestion and site substitution, and on statistical problems in fitting recreation demand curves. Landscape Economics 1978 was the world’s first book on aesthetic valua-tion. His contributions to forestry economics have been at both macro and microeconomic level, much of the material being assembled in the textbook The Theory and Application of Forest Economics 1989 which is in wide-spread use. More recent developments have been in economic evaluation of transformation to continuous cover forestry and engagement in the debate about whether forest certification really provides a route for evaluating the environmental and social consequences of different modes of production. Colin is also heavily involved in research on climate change and biodiver-sity economics. In 2000 Colin’s contributions to environmental and forestry economics were recognised by the award of the International Union of Forest Research Organizations’ Gold Medal for Scientific Achievement. His list of publications is impressive: books, chapters in books and se-ries, papers in academic and professional journals and series, book reviews. Colin has participated in all biennial meetings of Scandinavian Society of Forest Economics since 1991. This is really an accomplishment. And he has become an indispensable participant: he always presents – several – papers and he is very active in the discussions. It has become a tradition that he writes a Conference Poem. These poems are funny, but they are not just for fun – he may have an unequalled sense of humour but don’t fail to rec-ognise that there is very often an edge to it. Colin is also a great poet in the time between the SSFE biennial meet-ings. In the poems he demonstrates a great ability to convey to the reader “moods” experienced over many years and they are multi-layered, they are “tessellations” (see list), they are very English, and very much Colin Price. It pays to lose oneself in reading them – with a dictionary at hand. In one word: Colin is gorgeous. Selected publications Landscape Economics, Macmillan, 1978, pp.168. The Theory and Application of Forest Economics, Blackwell, 1989, pp.402.
3
Time, Discounting and Value, Blackwell, 1993, pp.393. Now available elec-tronically from [email protected]
Tessellations: Poems of Celebration and Reflection. Available from [email protected]
[with J.A. Johnson] Afforestation, employment and rural populations: a case study from North Wales. In: P. Hyttinen, A. Mononen, and P. Pelli (eds) Regional Development based on Forest Resources – Theories and Prac-tice; EFI Proceedings 9, 1996. European Forest Institute, Joensuu, pp.245-55.
Interest, depreciation and the cost of machinery. In: Eid, T., Hoen, H.F. & Solberg, B. (eds) 1997. Festskrift til ære for professorene John Eid - Sveinung Nersten - Asbjørn Svendsrud [Report published in honour of the professors John Eid - Sveinung Nersten – Asbjørn Svendsrud]. Communications from Skogforsk, Vol.48, pp.329-46.
Contingent valuation and retrograde information bias. In Park, A. and Stew-art Roper, C. (eds) The Living Forest. Proceedings of the International Symposium on the Non-market Benefits of Forestry, Edinburgh, June 1996, TSO, London (1999), pp.37-44.
Stated and revealed preference analysis. In Helles, F., Holten-Andersen, P. and Wichmann, L. (Eds), Multiple Use of Forests and Other Natural Re-sources. Kluwer, Dordrecht, (1999) pp.46-65.
Project appraisal and planning for over-developed countries: I. The costing of nonrenewable resources, Environmental Management, 8 (1984), 221-32.
[with T.W.M. Chambers] Recreational congestion: some hypotheses tested in the Forest of Dean, Journal of Rural Studies, 2 (1986), 41-52.
Emissions, concentrations and disappearing CO2, Resource and Energy Economics, 17 (1995) 87-97.
[with J.R. Healey and J.Tay] The cost of carbon retention by reduced impact logging. Forest Ecology and Management, 139 (2000), 237-55.
Hyperbole, hypocrisy and discounting that slowly fades away. Scandinavian Forest Economics, 40 (2004), 343-59.
[with Martin Price] Creaming the best, or creatively transforming? might felling the biggest trees first be a win−win strategy? Forest Ecology and Management, 224 (2006), 297-303.
Sustainable forest management, pecuniary externalities and invisible stake-holders. Forest Policy and Economics, 9 (2007), 751-62.
Low discount rates and insignificant environmental values. Ecological Eco-nomics (in press).
FH

14
Lars Lönnstedt Lars Lönnstedt received his B.A. in 1968 and his M.Sc. 1969 at Stockholm University. His main subjects were business administration, economics, and statistics. Lars earned his Ph.D. degree in 1971, also at Stockholm University. His thesis developed knowledge on the introduction of operations research in organization. Lars was in 1971 assigned as an assistant professor at the Department of Forest Economics at the College of Forestry, which at that time was in Stockholm. In 1975 he was appointed as associate professor at the College, which in the following year became the Faculty of Forestry Sciences, The Swedish University of Agricultural Sciences, SLU. In 1999 Lars was promoted as a professor at the Department of Forest-Market-Industry Studies, SLU and he is now professor of business administration at the Department of Forest Products, SLU, Uppsala. Over his career Lars has also held positions at, and developed important research contacts with, research institutions outside Sweden, e.g. the Norwegian University of Forest Economics, IIASA Vienna, ENGREF France, and universities in North America. Lars’ research spans a broad spectrum of topics, from forest owners’ decision making to research on the global forest sector. One distinguishing feature of Lars’ research is its manifestation in publications that combine high scientific quality with societal relevance. The simultaneous transformation of farming enterprises and the growth of the forest industries created a need for a better knowledge about the economic planning among private forest owners. Lars was a pioneer in this research field and the main contributor to the enhanced understanding of the topic from the 1970s, highlighting the forest owners’ multiple goals and long time perspective in their decision making. His publications on Non-Industrial Forest Owners ranged from their motivations, goals, decision making, and timber supply - to the benefit of policymakers and forest owners.

15
Lars Lönnstedt Lars Lönnstedt received his B.A. in 1968 and his M.Sc. 1969 at Stockholm University. His main subjects were business administration, economics, and statistics. Lars earned his Ph.D. degree in 1971, also at Stockholm University. His thesis developed knowledge on the introduction of operations research in organization. Lars was in 1971 assigned as an assistant professor at the Department of Forest Economics at the College of Forestry, which at that time was in Stockholm. In 1975 he was appointed as associate professor at the College, which in the following year became the Faculty of Forestry Sciences, The Swedish University of Agricultural Sciences, SLU. In 1999 Lars was promoted as a professor at the Department of Forest-Market-Industry Studies, SLU and he is now professor of business administration at the Department of Forest Products, SLU, Uppsala. Over his career Lars has also held positions at, and developed important research contacts with, research institutions outside Sweden, e.g. the Norwegian University of Forest Economics, IIASA Vienna, ENGREF France, and universities in North America. Lars’ research spans a broad spectrum of topics, from forest owners’ decision making to research on the global forest sector. One distinguishing feature of Lars’ research is its manifestation in publications that combine high scientific quality with societal relevance. The simultaneous transformation of farming enterprises and the growth of the forest industries created a need for a better knowledge about the economic planning among private forest owners. Lars was a pioneer in this research field and the main contributor to the enhanced understanding of the topic from the 1970s, highlighting the forest owners’ multiple goals and long time perspective in their decision making. His publications on Non-Industrial Forest Owners ranged from their motivations, goals, decision making, and timber supply - to the benefit of policymakers and forest owners.

16
Alongside this research Lars produced prominent articles based on forest sector analyses. The research later expanded to applications on forest industries in different regions of the world and also investigations of paper recycling. And naturally, having a genuine knowledge of both the forest owners’ situation and insights about the economic challenges to the Swedish forest sector, Lars has contributed constructively to the Swedish forest policy dialogue through articles and presentations . Over time he frequently provided recommendations for an improved operation of the forest sector. In 1992 he was appointed by the Government of Sweden as the Secretary in the Forest Commission preparing the new Swedish Forest Policy and other engagements have followed.
Lars has published in the most respected and prestigious journals in the field. He has also published chapters, books, and articles in professional journals.
The scientific achievements have not hindered Lars to engage actively in research related committees at the University and in international scientific organizations.
Lars is truly a hard working scientist! Thanks to his endurance and energy he made the Forest industrial economy education at SLU a real success. The education is now popular among students and also in the forest industry sector. He also contributes to the education by lecturing and participating in seminars. Over the years he has also supervised thesis studies, including several at Ph.D. level.
Lars has for a long time been a dedicated member of the SSFE, often presenting paper at the bi-annual conferences, and he was for several years its Swedish board member. In 2006 he successfully organized the SSFE-meeting in Uppsala.
In brief, Lars is a sharp and curious scientist and a friendly and supportive colleague – combined with devotion and perseverance this is an optimal combination!
Selected publications Industrial timberland ownership in the USA: arguments based on case
studies. Silva Fennica 41 (12): 379-391 (2007). [with Nordvall, H.O.] The Japanese pulp and paper industry: an analysis of
financial performance from 1991 to 2001.Journal of Forest Research 12(4): 278-288 (2007).
[with Öhlmer, B.] Design of Economic information. A pilot study of accounting information in decision making processes. Food Economics 4: 222-231 (2005).
Backward vertical integration in the Swedish forest sector – six case studies. Recent accomplishments in Applied Forest Economics Research, p 153-164. In: F. Helles, N. Strange and L. Wichmann, Editors, Recent
Accomplishments in Applied Forest Economics Research, Kluwer Academic Publishers, Dordrecht (2004).
[with Rutegård, G. and Kallio, M.] Acquisition of a Forest Estate: A Stochastic Optimization Approach. Forest Science 49(5): 706-718 (2003).
[with Svensson ,J.] Non-Industrial Private Forest Owners’ Risk Preferences. Scandinavian Journal of Forest Research 15: 651-660 (2003).
[with Byström, S.] Paper recycling. A discussion of methodological approaches. Resources Conservation and Recycling: 28: 55-65 (1999).
[with Hyder, A. and Penttinen, M.] Accounting as a Management Tool for Nonindustrial Private Forestry. Scandinavian Journal of Management 15: 173-191 (1999).
Calculating nonindustrial private forest owners' cuttings. Scandinavian Journal of Forest Research, 13: 215-223 (1998).
[with Byström, S.] Paper recycling: Environmental and economic impact. Resources Conservation and Recycling 21:109-127.
Nonindustrial Private Forest Owners’ Decision Process. A Qualitative Study about Goals, Time Perspective, Opportunities and Alternatives. Scandinavian Journal of Forest Research 12: 302-310 (1997).
[with Byström, S.] Waste Paper Usage and Fibre Flow in Western Europe. Resources, Conservation and Recycling 15: 111-121 (1995].
Consequences of the Swedish Forest Policy. Scandinavian Journal of Forest Research, 8: 134-143 (1993). Also published in Unasylva 44: 36-41.
Goals and Cutting Decisions of Private Small Forest Owners. Scandinavian Journal of Forest Research 4 (2): 23-29 (1989).
[with Peyron, J-L] FIBRE - A French PC-based Regional Forest Sector Model, Applied to Burgundy. Annales des sciences 46: 101-118 (1989).
A Dynamic Forest Sector Model with a Swedish Case. Forest Science 33 (2): 377-396 (1986).
Stability of Forestry and Stability of Regions - Contradictory Goals? - The Swedish Case. Canadian Journal of Forest Research 14(5): 707-711 (1984).
The influence of Swedish forestry policy on the annual cuts of private woodlot owners. Silvia Fennica 15 (15): 100-111 (1981).
AR
17
Alongside this research Lars produced prominent articles based on forest sector analyses. The research later expanded to applications on forest industries in different regions of the world and also investigations of paper recycling. And naturally, having a genuine knowledge of both the forest owners’ situation and insights about the economic challenges to the Swedish forest sector, Lars has contributed constructively to the Swedish forest policy dialogue through articles and presentations . Over time he frequently provided recommendations for an improved operation of the forest sector. In 1992 he was appointed by the Government of Sweden as the Secretary in the Forest Commission preparing the new Swedish Forest Policy and other engagements have followed.
Lars has published in the most respected and prestigious journals in the field. He has also published chapters, books, and articles in professional journals.
The scientific achievements have not hindered Lars to engage actively in research related committees at the University and in international scientific organizations.
Lars is truly a hard working scientist! Thanks to his endurance and energy he made the Forest industrial economy education at SLU a real success. The education is now popular among students and also in the forest industry sector. He also contributes to the education by lecturing and participating in seminars. Over the years he has also supervised thesis studies, including several at Ph.D. level.
Lars has for a long time been a dedicated member of the SSFE, often presenting paper at the bi-annual conferences, and he was for several years its Swedish board member. In 2006 he successfully organized the SSFE-meeting in Uppsala.
In brief, Lars is a sharp and curious scientist and a friendly and supportive colleague – combined with devotion and perseverance this is an optimal combination!
Selected publications Industrial timberland ownership in the USA: arguments based on case
studies. Silva Fennica 41 (12): 379-391 (2007). [with Nordvall, H.O.] The Japanese pulp and paper industry: an analysis of
financial performance from 1991 to 2001.Journal of Forest Research 12(4): 278-288 (2007).
[with Öhlmer, B.] Design of Economic information. A pilot study of accounting information in decision making processes. Food Economics 4: 222-231 (2005).
Backward vertical integration in the Swedish forest sector – six case studies. Recent accomplishments in Applied Forest Economics Research, p 153-164. In: F. Helles, N. Strange and L. Wichmann, Editors, Recent
Accomplishments in Applied Forest Economics Research, Kluwer Academic Publishers, Dordrecht (2004).
[with Rutegård, G. and Kallio, M.] Acquisition of a Forest Estate: A Stochastic Optimization Approach. Forest Science 49(5): 706-718 (2003).
[with Svensson ,J.] Non-Industrial Private Forest Owners’ Risk Preferences. Scandinavian Journal of Forest Research 15: 651-660 (2003).
[with Byström, S.] Paper recycling. A discussion of methodological approaches. Resources Conservation and Recycling: 28: 55-65 (1999).
[with Hyder, A. and Penttinen, M.] Accounting as a Management Tool for Nonindustrial Private Forestry. Scandinavian Journal of Management 15: 173-191 (1999).
Calculating nonindustrial private forest owners' cuttings. Scandinavian Journal of Forest Research, 13: 215-223 (1998).
[with Byström, S.] Paper recycling: Environmental and economic impact. Resources Conservation and Recycling 21:109-127.
Nonindustrial Private Forest Owners’ Decision Process. A Qualitative Study about Goals, Time Perspective, Opportunities and Alternatives. Scandinavian Journal of Forest Research 12: 302-310 (1997).
[with Byström, S.] Waste Paper Usage and Fibre Flow in Western Europe. Resources, Conservation and Recycling 15: 111-121 (1995].
Consequences of the Swedish Forest Policy. Scandinavian Journal of Forest Research, 8: 134-143 (1993). Also published in Unasylva 44: 36-41.
Goals and Cutting Decisions of Private Small Forest Owners. Scandinavian Journal of Forest Research 4 (2): 23-29 (1989).
[with Peyron, J-L] FIBRE - A French PC-based Regional Forest Sector Model, Applied to Burgundy. Annales des sciences 46: 101-118 (1989).
A Dynamic Forest Sector Model with a Swedish Case. Forest Science 33 (2): 377-396 (1986).
Stability of Forestry and Stability of Regions - Contradictory Goals? - The Swedish Case. Canadian Journal of Forest Research 14(5): 707-711 (1984).
The influence of Swedish forestry policy on the annual cuts of private woodlot owners. Silvia Fennica 15 (15): 100-111 (1981).
AR

18
BUSINESS ECONOMICS OF FORESTRY &
FOREST MANAGEMENT PLANNING

19
BUSINESS ECONOMICS OF FORESTRY &
FOREST MANAGEMENT PLANNING

20 1
Effect of information content on the choice among alternative forest plans
Kyle Eyvindson1, Teppo Hujala2, Annika Kangas1 and Mikko Kurttila2
1 Department of Forest Sciences, University of Helsinki, 2 Finnish Forest Research Institute (METLA)
Abstract Multi-criteria decision support (MCDS) tools assist the decision-maker (DM) in selecting an appropriate forest plan among specified alternatives. The selection of appropriate criteria to compare the alternatives is related to the scales of planning and the availability of appropriate inventory data. Anyhow, the criteria should reflect the DM’s objectives and address the production possibilities of the forestry unit at hand. The objectives of this study is to determine if DMs are able to identify/construct similar preferences for the forest with varying levels of information regarding the plans, and to determine if the identified preferences result in the selection of the same forest plan. A group of forest sciences students were chosen as testees. A representative sized forest tract from a forest managed by Metsähallitus was used as a case “holding” providing semi-authentic data. The MESTA internet application was used to guide participants into selecting a single forest plan, depending on the criteria presented to the participant. Results of a systematic experiment showed that approximately half of the participants selected the same forest plan in two out of three different decision scenarios. This result suggests one carefully pre-defined default set of criteria, but it also calls for further study. Keywords: decision criteria, decision support, forest planning, multi-criteria decision support (MCDS). 1. Introduction Contemporary research into multi-objective decision making has focused on developing methods and tools which allow for a comparison between alternatives. The comparison between alternatives focuses on relevant criteria which are (or are expected to be) important to the decision-maker (DM). The selection of criteria can be done with guidance from the planning coordinator (Diaz-Balteiro and Romero, 2004; Gómez et al., 2006; Eyvindson et al., 2010a) or independent selection from a list (cf. Kazana et al., 2003; Kajanus et al., 2004).

211
Effect of information content on the choice among alternative forest plans
Kyle Eyvindson1, Teppo Hujala2, Annika Kangas1 and Mikko Kurttila2
1 Department of Forest Sciences, University of Helsinki, 2 Finnish Forest Research Institute (METLA)
Abstract Multi-criteria decision support (MCDS) tools assist the decision-maker (DM) in selecting an appropriate forest plan among specified alternatives. The selection of appropriate criteria to compare the alternatives is related to the scales of planning and the availability of appropriate inventory data. Anyhow, the criteria should reflect the DM’s objectives and address the production possibilities of the forestry unit at hand. The objectives of this study is to determine if DMs are able to identify/construct similar preferences for the forest with varying levels of information regarding the plans, and to determine if the identified preferences result in the selection of the same forest plan. A group of forest sciences students were chosen as testees. A representative sized forest tract from a forest managed by Metsähallitus was used as a case “holding” providing semi-authentic data. The MESTA internet application was used to guide participants into selecting a single forest plan, depending on the criteria presented to the participant. Results of a systematic experiment showed that approximately half of the participants selected the same forest plan in two out of three different decision scenarios. This result suggests one carefully pre-defined default set of criteria, but it also calls for further study. Keywords: decision criteria, decision support, forest planning, multi-criteria decision support (MCDS). 1. Introduction Contemporary research into multi-objective decision making has focused on developing methods and tools which allow for a comparison between alternatives. The comparison between alternatives focuses on relevant criteria which are (or are expected to be) important to the decision-maker (DM). The selection of criteria can be done with guidance from the planning coordinator (Diaz-Balteiro and Romero, 2004; Gómez et al., 2006; Eyvindson et al., 2010a) or independent selection from a list (cf. Kazana et al., 2003; Kajanus et al., 2004).
22 2
When the DM selects criteria, the decision should be based on his/her
preferences. For individuals with poorly formed preferences the most appropriate grouping of criteria may evolve as his/her preferences develop. As a result, the initial criteria selected may not correspond to his/her preferences near the end of the decision process (Beshears et al., 2008). In participatory planning situations the determination of relevant criteria to be analysed can be a source of conflict (Mendoza and Martins, 2006). Depending upon the decision support tool, stakeholders may be required to analyse and evaluate the different plans based on the criteria selected for the group as a whole, or the stakeholders may select their criteria independently and then combine the evaluations of the plans (Kangas et al., 2008; Nordström et al., 2009). While it may appear self-evident that careful consideration of the criteria being evaluated is a requirement for the appropriate use of MCDS tools, this may not necessarily be the case. In the context of determining what benefits the DM wishes to extract from the forest, the DM’s preferences may be inconsistent, circular or not be very well defined. This can be further complicated due to the complexity involved in forestry decisions (Diaz-Balteiro and Romero, 2007), and the complications involved with the process of defining preferences (Beshears et al., 2008). In addition to these issues, there is also the availability of appropriate inventory data which can limit the feasible options for criteria-based analysis. The costs associated with obtaining data for a specific criterion may be prohibitive and may not provide much additional assistance in the decision making (Kangas, 2010). For these reasons, appropriate substitute criteria might be more suitable in the analysis than the criteria participants select for themselves. Being able to accurately represent the preferences of the DMs is a requirement of effective and truly supportive utilization of decision support tools. The criteria chosen for use in the analysis might influence how the DM identifies and reveals his/her preferences. Therefore, the objectives of this study are to determine if decision-makers are able to select similar forest plans with varying levels of information regarding the plans, and to determine if there are differences in how DMs utilize decision support tools. 2. Decision experiment Materials A forest tract of 53.5 ha from Juupajoki, Finland was used to represent a privately owned forest holding. The forest area is part of a larger holding which is managed by Metsähallitus and used for research and teaching purposes. The majority of the forest stands in the representative holding were between 20-60 years old, and had a total volume of 11,800 m3 of wood.
3
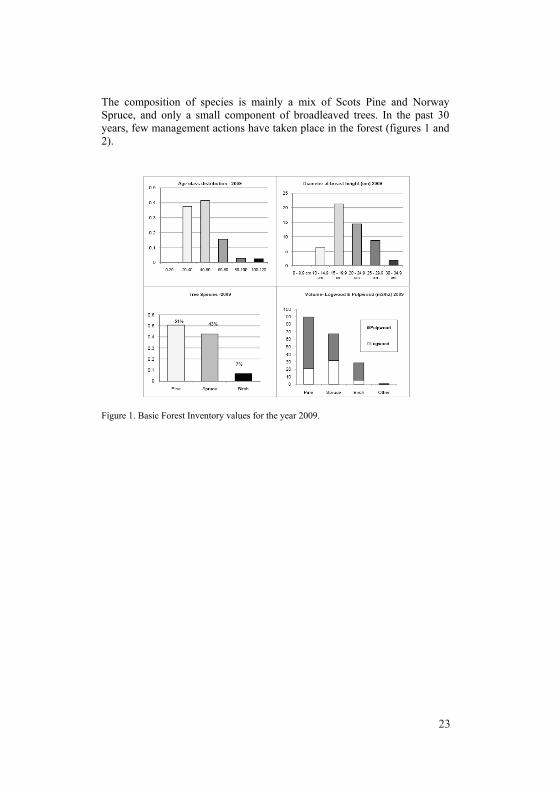
The composition of species is mainly a mix of Scots Pine and Norway Spruce, and only a small component of broadleaved trees. In the past 30 years, few management actions have taken place in the forest (figures 1 and 2).
Figure 1. Basic Forest Inventory values for the year 2009.
232
When the DM selects criteria, the decision should be based on his/her
preferences. For individuals with poorly formed preferences the most appropriate grouping of criteria may evolve as his/her preferences develop. As a result, the initial criteria selected may not correspond to his/her preferences near the end of the decision process (Beshears et al., 2008). In participatory planning situations the determination of relevant criteria to be analysed can be a source of conflict (Mendoza and Martins, 2006). Depending upon the decision support tool, stakeholders may be required to analyse and evaluate the different plans based on the criteria selected for the group as a whole, or the stakeholders may select their criteria independently and then combine the evaluations of the plans (Kangas et al., 2008; Nordström et al., 2009). While it may appear self-evident that careful consideration of the criteria being evaluated is a requirement for the appropriate use of MCDS tools, this may not necessarily be the case. In the context of determining what benefits the DM wishes to extract from the forest, the DM’s preferences may be inconsistent, circular or not be very well defined. This can be further complicated due to the complexity involved in forestry decisions (Diaz-Balteiro and Romero, 2007), and the complications involved with the process of defining preferences (Beshears et al., 2008). In addition to these issues, there is also the availability of appropriate inventory data which can limit the feasible options for criteria-based analysis. The costs associated with obtaining data for a specific criterion may be prohibitive and may not provide much additional assistance in the decision making (Kangas, 2010). For these reasons, appropriate substitute criteria might be more suitable in the analysis than the criteria participants select for themselves. Being able to accurately represent the preferences of the DMs is a requirement of effective and truly supportive utilization of decision support tools. The criteria chosen for use in the analysis might influence how the DM identifies and reveals his/her preferences. Therefore, the objectives of this study are to determine if decision-makers are able to select similar forest plans with varying levels of information regarding the plans, and to determine if there are differences in how DMs utilize decision support tools. 2. Decision experiment Materials A forest tract of 53.5 ha from Juupajoki, Finland was used to represent a privately owned forest holding. The forest area is part of a larger holding which is managed by Metsähallitus and used for research and teaching purposes. The majority of the forest stands in the representative holding were between 20-60 years old, and had a total volume of 11,800 m3 of wood.
3
The composition of species is mainly a mix of Scots Pine and Norway Spruce, and only a small component of broadleaved trees. In the past 30 years, few management actions have taken place in the forest (figures 1 and 2).
Figure 1. Basic Forest Inventory values for the year 2009.

24 4
Figure 2. Aerial image of the forest holding (Aerial image courtesy of National Land Survey of Finland) A total of eight different forest plans were created using forest management planning system MELA (Redsven et al., 2007). The focus of the plans ranged from restraining final cuttings and only conducting young stand treatments which promoted good forestry practices (Metsätalouden kehittämiskeskus Tapio, 2006) to conducting harvestings 25% greater than the sustainable level. By utilizing such a wide range of alternative forest plans, it was hoped that at least one of the plans would be appealing to a wide variety of decision-makers.
The experiment was conducted in two phases (figure 3); the first phase was a questionnaire designed to sort the participants into potential ownership categories with respect to ownership’s objectives (see Favada et al., 2009). Three different methods of sorting into ownership groups were used. The first asked the respondent to self-identify which group he/she belonged to, based on a brief narrative description (Multi-objective, Investor, Self-employed or Recreationalist). The second method was given as an Analytical Hierarchy Process (AHP) question, where the different ownership groups were compared to each other, and asked which group they more closely identified with, and on a Saaty (1980) scale of 1-9 asked the strength of perception. In the third method, the respondent answered a series of questions related to the objectives of ownership, which had been used in
5
an earlier study which analyzed the Finnish private forest owners (appendix 2 in Karppinen et al., 2002).
Figure 3. Flow chart of the experiment Once the participants had completed the questionnaire they were provided with a briefing on the size, species composition and inventory of the forest to ease them to think of themselves as the owners of the holding. An alternative method would have been to provide the participants information about the forest holding prior to asking them to complete the questionnaire. The magnitude of the influence could be tested for, by conducting a test for comparison. However, the test would not illustrate which method is closer to the ‘real’ preference of the individual. So while this might influence how they answer the questions, it could be assumed that this source of uncertainty would be rather negligible.
The second phase was a series of three decision experiment scenarios using different levels of information regarding the plans. The same plans were used in each scenario, and the order of the plans was randomized for each scenario. With the first scenario only a brief written description (table 1) was provided. The brief description was based on the objective function

254
Figure 2. Aerial image of the forest holding (Aerial image courtesy of National Land Survey of Finland) A total of eight different forest plans were created using forest management planning system MELA (Redsven et al., 2007). The focus of the plans ranged from restraining final cuttings and only conducting young stand treatments which promoted good forestry practices (Metsätalouden kehittämiskeskus Tapio, 2006) to conducting harvestings 25% greater than the sustainable level. By utilizing such a wide range of alternative forest plans, it was hoped that at least one of the plans would be appealing to a wide variety of decision-makers.
The experiment was conducted in two phases (figure 3); the first phase was a questionnaire designed to sort the participants into potential ownership categories with respect to ownership’s objectives (see Favada et al., 2009). Three different methods of sorting into ownership groups were used. The first asked the respondent to self-identify which group he/she belonged to, based on a brief narrative description (Multi-objective, Investor, Self-employed or Recreationalist). The second method was given as an Analytical Hierarchy Process (AHP) question, where the different ownership groups were compared to each other, and asked which group they more closely identified with, and on a Saaty (1980) scale of 1-9 asked the strength of perception. In the third method, the respondent answered a series of questions related to the objectives of ownership, which had been used in
5
an earlier study which analyzed the Finnish private forest owners (appendix 2 in Karppinen et al., 2002).
Figure 3. Flow chart of the experiment Once the participants had completed the questionnaire they were provided with a briefing on the size, species composition and inventory of the forest to ease them to think of themselves as the owners of the holding. An alternative method would have been to provide the participants information about the forest holding prior to asking them to complete the questionnaire. The magnitude of the influence could be tested for, by conducting a test for comparison. However, the test would not illustrate which method is closer to the ‘real’ preference of the individual. So while this might influence how they answer the questions, it could be assumed that this source of uncertainty would be rather negligible.
The second phase was a series of three decision experiment scenarios using different levels of information regarding the plans. The same plans were used in each scenario, and the order of the plans was randomized for each scenario. With the first scenario only a brief written description (table 1) was provided. The brief description was based on the objective function

26 6
formulation used in the forest planning software and the actual criterion values of the plans were not told to DMs. The next two scenarios used the internet based program MESTA (Hiltunen et al., 2009) with either three or eight criteria used in the analysis. From the written descriptions the respondents were to select the most preferred plan. MESTA required the participants to study the expected outcomes of the alternatives with respect to each criterion, to adjust acceptance thresholds and finally come up with the selected plan through holistic multi-criteria approval. Table1. Brief description of the forest plans. Plan A Only conduct the minimum cutting needed to promote good
forestry practices. Additional cutting (thinning) is carried out only to offset the costs of tending the forest.
Plan B The only cuttings to be carried out are thinning harvestings; no regeneration cuttings are carried out. In the second 5 year period, the harvest is 50% more than in the first period.
Plan C A high level of sustainable harvesting (70% of maximum) is conducted over the ten year period. Forest work is maximized during the period.
Plan D Approximately half of the sustainable level of harvesting is conducted. No cuttings are conducted in broadleaved stands. The treatment objectives are to maximize the growth increment in broadleaved stands.
Plan E While maintaining a sustainable level of harvesting, maximize the logwood removal during the 10 yr period, while keeping the amount of forest work equal throughout the time periods.
Plan F Minimize regeneration cuttings, while ensuring a 25% income from what is possible for conducting sustainable harvesting.
Plan G Harvesting is done at a sustainable level during the 10 year period. The second five year period has 50% more cuttings than the first period.
Plan H Harvesting is done at a level of 25% greater than the long term sustainable level. At the end of the 10 year period, cutting levels could be returned to a sustainable level.
The criteria set used in the analysis were predetermined. The three criteria scenario had three alternative sets of criteria (criteria 1, 2, and 4; 3, 4 and 6; or 3, 6, and 8), while the eight criteria scenario had a constant set of criteria (all of the 9 criteria except 3) for all participants (figure 4). The criteria used in the experiment were:
7
1. Net income (in euros) - for the first five year period. Total income received from harvesting operations, less costs related to tending the forest. 2. Net income (in euros) - for the second five year period. Total income received from harvesting operations, less costs related to tending the forest. 3. Net income (in euros) - for the first and second periods combined. Total income received from harvesting operations, less costs related to tending the forest. 4. Regeneration cutting area (in hectares) - the total area of regeneration cutting (clear cutting) during the 10 year period. 5. Total wood volume at the end of the 10 year period in 2019 (in m3) - includes pulp and saw logs. Can be thought of as total future cutting opportunities. 6. Mature forest area at the end of the 10 year period in 2019 (in hectares) - area of economically mature forests (over 80 years old). This increase can mean improvements to recreational activities and to the forest landscape. 7. Volume of broadleaved trees at the end of the 10 year period in 2019 (in m3) – The existence of broadleaved trees can add beauty to the forest landscape. 8. Forest work throughout the 10 year period (days/year) – This is a measure of the amount of forest work is required from the forest owners during every year of the plan. 9. Net Present Value at a 4% discount rate (in euros) – This is the sum of cash flow (incoming and outgoing) over time, discounted at a constant rate.

276
formulation used in the forest planning software and the actual criterion values of the plans were not told to DMs. The next two scenarios used the internet based program MESTA (Hiltunen et al., 2009) with either three or eight criteria used in the analysis. From the written descriptions the respondents were to select the most preferred plan. MESTA required the participants to study the expected outcomes of the alternatives with respect to each criterion, to adjust acceptance thresholds and finally come up with the selected plan through holistic multi-criteria approval. Table1. Brief description of the forest plans. Plan A Only conduct the minimum cutting needed to promote good
forestry practices. Additional cutting (thinning) is carried out only to offset the costs of tending the forest.
Plan B The only cuttings to be carried out are thinning harvestings; no regeneration cuttings are carried out. In the second 5 year period, the harvest is 50% more than in the first period.
Plan C A high level of sustainable harvesting (70% of maximum) is conducted over the ten year period. Forest work is maximized during the period.
Plan D Approximately half of the sustainable level of harvesting is conducted. No cuttings are conducted in broadleaved stands. The treatment objectives are to maximize the growth increment in broadleaved stands.
Plan E While maintaining a sustainable level of harvesting, maximize the logwood removal during the 10 yr period, while keeping the amount of forest work equal throughout the time periods.
Plan F Minimize regeneration cuttings, while ensuring a 25% income from what is possible for conducting sustainable harvesting.
Plan G Harvesting is done at a sustainable level during the 10 year period. The second five year period has 50% more cuttings than the first period.
Plan H Harvesting is done at a level of 25% greater than the long term sustainable level. At the end of the 10 year period, cutting levels could be returned to a sustainable level.
The criteria set used in the analysis were predetermined. The three criteria scenario had three alternative sets of criteria (criteria 1, 2, and 4; 3, 4 and 6; or 3, 6, and 8), while the eight criteria scenario had a constant set of criteria (all of the 9 criteria except 3) for all participants (figure 4). The criteria used in the experiment were:
7
1. Net income (in euros) - for the first five year period. Total income received from harvesting operations, less costs related to tending the forest. 2. Net income (in euros) - for the second five year period. Total income received from harvesting operations, less costs related to tending the forest. 3. Net income (in euros) - for the first and second periods combined. Total income received from harvesting operations, less costs related to tending the forest. 4. Regeneration cutting area (in hectares) - the total area of regeneration cutting (clear cutting) during the 10 year period. 5. Total wood volume at the end of the 10 year period in 2019 (in m3) - includes pulp and saw logs. Can be thought of as total future cutting opportunities. 6. Mature forest area at the end of the 10 year period in 2019 (in hectares) - area of economically mature forests (over 80 years old). This increase can mean improvements to recreational activities and to the forest landscape. 7. Volume of broadleaved trees at the end of the 10 year period in 2019 (in m3) – The existence of broadleaved trees can add beauty to the forest landscape. 8. Forest work throughout the 10 year period (days/year) – This is a measure of the amount of forest work is required from the forest owners during every year of the plan. 9. Net Present Value at a 4% discount rate (in euros) – This is the sum of cash flow (incoming and outgoing) over time, discounted at a constant rate.

28 8
Figure 4. An example of the 8 criteria Mesta interface. 3. Results The experiment was conducted with a total of 18 participants. Due to an error in the use of Mesta, the complete outcome data from the experiment were collected from only 9 of the participants. This error was limited to the final 2 choice scenarios, and prevents a comprehensive evaluation of the result of the decision-makers to make the same decision based on a variety of available information. However, the feedback concerning all the alternative scenarios was acquired and is valid.
Of the participants fifteen were male and three were female. Eight of the students were studying forest resources and technology, 7 were studying forest ecology, 2 were studying forest economics and one did not provide an answer. The majority (14) of participants identified themselves as multi-objective forest owners, two considered themselves to be self-employed owners, and the remaining were evenly spread on the alternative options. From the AHP question, all of the participants (with the exception of one) identified themselves in the same manner as they did in the self-identification question. Two thirds of the participants had parents who were forest owners, and a little over two thirds of the participants had done forest work when they were young. From the more detailed questionnaire it was difficult to associate any of the key questions to a particular ownership group. With more responses it is anticipated that a factor analysis should provide additional insight.
Immediately after each decision choice scenario the participants completed a short questionnaire (using a Likert scale of 1-7). The questions asked them how difficult the procedure was, and how confident they were
9
that they had made the correct decision. At the end of final decision choice scenario, the participants were asked which method they preferred and why. Out of all three decision experiments 13 preferred selecting the forest plan with the brief written description, 5 preferred the 8 criteria Mesta tool, and no one preferred the 3 criteria Mesta tool.
From those nine participants where all data were successfully collected, five (A, B, C, E, and I) were able to come to a similar plan with two out of the three methods used (table 2). The remaining four had selected different plans with each of the decision tests. One of those four participants indicated that he was very confident with the decision selected with both the written description and the 8 criteria Mesta program; however he did not select the same plan using the methods. Another participant who was initially confident with his choice from the written description became much less sure when conducting the experiment with the 8 criteria Mesta scenario. The participant commented that even though he was less confident with the decision made with the 8 criteria Mesta scenario, he preferred it because he had begun to realize the complexities regarding forest planning.
Table 2. Participants’ choice of plan for each decision scenario. Written
description 3 criteria Mesta 8 criteria Mesta
Participant I D C D Participant II F D F Participant III D D F Participant IV E B,C D,A,F Participant V F B,C,D F Participant VI A G,E C Participant VII A F B Participant VIII A B,H B Participant IX F F D
4. Discussion While it is difficult to conclude much with a confidence from the small dataset available, there are some interesting aspects worthy of discussion. Slightly more than half of the participants were able to the same plans in two of the three decision scenarios, in the third decision scenario the selected plan was quite similar to the plan selected in the other two scenarios. This could indicate that those participants had initially clear preferences and were able to match them with both quantitatively and qualitatively expressed forest plan alternatives. The remaining participants may not have clearly understood the tasks, their preferences were not clear

298
Figure 4. An example of the 8 criteria Mesta interface. 3. Results The experiment was conducted with a total of 18 participants. Due to an error in the use of Mesta, the complete outcome data from the experiment were collected from only 9 of the participants. This error was limited to the final 2 choice scenarios, and prevents a comprehensive evaluation of the result of the decision-makers to make the same decision based on a variety of available information. However, the feedback concerning all the alternative scenarios was acquired and is valid.
Of the participants fifteen were male and three were female. Eight of the students were studying forest resources and technology, 7 were studying forest ecology, 2 were studying forest economics and one did not provide an answer. The majority (14) of participants identified themselves as multi-objective forest owners, two considered themselves to be self-employed owners, and the remaining were evenly spread on the alternative options. From the AHP question, all of the participants (with the exception of one) identified themselves in the same manner as they did in the self-identification question. Two thirds of the participants had parents who were forest owners, and a little over two thirds of the participants had done forest work when they were young. From the more detailed questionnaire it was difficult to associate any of the key questions to a particular ownership group. With more responses it is anticipated that a factor analysis should provide additional insight.
Immediately after each decision choice scenario the participants completed a short questionnaire (using a Likert scale of 1-7). The questions asked them how difficult the procedure was, and how confident they were
9
that they had made the correct decision. At the end of final decision choice scenario, the participants were asked which method they preferred and why. Out of all three decision experiments 13 preferred selecting the forest plan with the brief written description, 5 preferred the 8 criteria Mesta tool, and no one preferred the 3 criteria Mesta tool.
From those nine participants where all data were successfully collected, five (A, B, C, E, and I) were able to come to a similar plan with two out of the three methods used (table 2). The remaining four had selected different plans with each of the decision tests. One of those four participants indicated that he was very confident with the decision selected with both the written description and the 8 criteria Mesta program; however he did not select the same plan using the methods. Another participant who was initially confident with his choice from the written description became much less sure when conducting the experiment with the 8 criteria Mesta scenario. The participant commented that even though he was less confident with the decision made with the 8 criteria Mesta scenario, he preferred it because he had begun to realize the complexities regarding forest planning.
Table 2. Participants’ choice of plan for each decision scenario. Written
description 3 criteria Mesta 8 criteria Mesta
Participant I D C D Participant II F D F Participant III D D F Participant IV E B,C D,A,F Participant V F B,C,D F Participant VI A G,E C Participant VII A F B Participant VIII A B,H B Participant IX F F D
4. Discussion While it is difficult to conclude much with a confidence from the small dataset available, there are some interesting aspects worthy of discussion. Slightly more than half of the participants were able to the same plans in two of the three decision scenarios, in the third decision scenario the selected plan was quite similar to the plan selected in the other two scenarios. This could indicate that those participants had initially clear preferences and were able to match them with both quantitatively and qualitatively expressed forest plan alternatives. The remaining participants may not have clearly understood the tasks, their preferences were not clear

30 10
before numerical description of the decision alternatives, or that their preferences may have evolved during the completion of the tasks. This indicates the essence of level of previous knowledge and experience in selecting an appropriate DSS procedure. With less experienced owners, this result suggests using several approaches to facilitate learning and increasing consistency, while with more experienced owners the approach of their own choice could be selected without an effect of the outcome (in the latter case however, levels of satisfaction or confidence may alter based on the procedure even if the actual choice wouldn’t).
Using students rather than actual forest owners may have, to some degree, affected the responses. The students involved in the process may not have been genuinely interested in outcomes of the forest plans and the actual planning process, as real forest owners would and they might not have identified their preferences correctly prior to considering alternative forest plans. When considering a specific forest plan, real forest owners could be expected to utilize a greater level of intensity, as both their next decade’s income and surrounding ecosystem may be altered as a result of the choices they make in managing their forest property. However, the level of intensity dedicated when making a decision does not indicate if the decision is correct or incorrect (Gigerenzer and Brighton, 2009).
Most of the participants preferred selecting the plans using the written description. This could be due to a preference of making decisions in a familiar way. However, the written descriptions did not include any information on the quantities of the outcomes, e.g. cutting incomes etc. This means that these DMs were willing to accept whatever outcome that is based only on the properties of the forest – their own income needs did not affect the decision. This could indicate that the forest property was not so important for them. On the other hand, deciding upon a course of action based only on numbers can seem unnatural to some decision-makers. For these participants, it may be more beneficial to have a carefully crafted description of the plans, from which they can choose rather than using a decision support tool they do not understand. For those individuals who chose Mesta as the preferred method, all of them selected 8 criteria Mesta as the preferred method. Part of the reason for this could be due to the order of the scenarios, where the first time the participants used the Mesta program was with the 3 criteria Mesta scenario. Learning how to use the tool may have influenced the perception of its usefulness. Alternatively, those people who chosen the Mesta tool could have preferred the 8 criteria version because of its more ‘comprehensive’ nature. By using different sets of 3-criteria it was hoped that this might have some influence on the decision chosen, however, with the limited data available it is impossible to speculate if there is any effect of using the different set of 3 criteria on the decision chosen.
11
An interesting facet of this experiment is that a slight majority of participants were able to roughly select similar plans even with through different decision scenarios. This could indicate that careful consideration of criteria prior to analysis need not be too detailed. If this is truly the case, a predetermined set of criteria which provides a fairly balanced representation of the forest resources would be a reasonable alternative to a negotiated set of criteria. In this way, the costs of inventorying and data analysis could be minimized. In addition the time taken in negotiation of appropriate criteria could be better spent during the final stages of negotiations.
Variations on this decision experiment could identify different ways individuals prefer to make decisions. Rather than comparing written plans to the numerical methods, the comparison could have focused either on only written plans or only numerical methods. Focusing on only numerical methods, it would be possible to determine if more criteria variables would be preferred to fewer criteria variables. In the present research, the data suggest a link towards preferring more criteria variables; however, that is only for those participants who prefer numerical methods over written methods. With the limited data available it is impossible to speculate if there is any effect of using the different set of 3 criteria on the decision chosen. 5. Conclusion Developing a decision support tool which is acceptable and useful to both the decision-maker and the consultant is a difficult task (Belton and Hodgkin, 1999). The DM may not have previously made long-term decisions, or decisions with a wide variety of possible alternatives (Beshears et al., 2008). As a result, the DM may prefer written descriptions which provide a general outline of what the plan encompasses. This could indicate a difference between rule based decision making for the written descriptions and a utility maximizing behaviour for the Mesta decision choices (March, 1994). On the other hand, the aim of the consultant is to provide a specific plan, which strives to achieve the goals of the DM. In order to achieve this goal, the consultant must either guess at the DMs preferences, substitute his/her own goals for the DM, or use decision support tools to help define the DMs preferences. Mesta is one tool which can be used to extract a set of preferences from the range of feasible alternatives.
In order to comprehensively address the questions posed earlier, the decision experiment needs to be tested on more participants. With the limited data currently available, it is difficult to determine in detail how the changes in decision criteria influence the final plan selection. The present results suggest that for a portion of DMs the criteria set does matter, and warrants motivation for further study. With a larger data set, it should be possible to analyse changes which occur by moving from a 3 criteria decision problem to an 8 criteria decision problem.

3110
before numerical description of the decision alternatives, or that their preferences may have evolved during the completion of the tasks. This indicates the essence of level of previous knowledge and experience in selecting an appropriate DSS procedure. With less experienced owners, this result suggests using several approaches to facilitate learning and increasing consistency, while with more experienced owners the approach of their own choice could be selected without an effect of the outcome (in the latter case however, levels of satisfaction or confidence may alter based on the procedure even if the actual choice wouldn’t).
Using students rather than actual forest owners may have, to some degree, affected the responses. The students involved in the process may not have been genuinely interested in outcomes of the forest plans and the actual planning process, as real forest owners would and they might not have identified their preferences correctly prior to considering alternative forest plans. When considering a specific forest plan, real forest owners could be expected to utilize a greater level of intensity, as both their next decade’s income and surrounding ecosystem may be altered as a result of the choices they make in managing their forest property. However, the level of intensity dedicated when making a decision does not indicate if the decision is correct or incorrect (Gigerenzer and Brighton, 2009).
Most of the participants preferred selecting the plans using the written description. This could be due to a preference of making decisions in a familiar way. However, the written descriptions did not include any information on the quantities of the outcomes, e.g. cutting incomes etc. This means that these DMs were willing to accept whatever outcome that is based only on the properties of the forest – their own income needs did not affect the decision. This could indicate that the forest property was not so important for them. On the other hand, deciding upon a course of action based only on numbers can seem unnatural to some decision-makers. For these participants, it may be more beneficial to have a carefully crafted description of the plans, from which they can choose rather than using a decision support tool they do not understand. For those individuals who chose Mesta as the preferred method, all of them selected 8 criteria Mesta as the preferred method. Part of the reason for this could be due to the order of the scenarios, where the first time the participants used the Mesta program was with the 3 criteria Mesta scenario. Learning how to use the tool may have influenced the perception of its usefulness. Alternatively, those people who chosen the Mesta tool could have preferred the 8 criteria version because of its more ‘comprehensive’ nature. By using different sets of 3-criteria it was hoped that this might have some influence on the decision chosen, however, with the limited data available it is impossible to speculate if there is any effect of using the different set of 3 criteria on the decision chosen.
11
An interesting facet of this experiment is that a slight majority of participants were able to roughly select similar plans even with through different decision scenarios. This could indicate that careful consideration of criteria prior to analysis need not be too detailed. If this is truly the case, a predetermined set of criteria which provides a fairly balanced representation of the forest resources would be a reasonable alternative to a negotiated set of criteria. In this way, the costs of inventorying and data analysis could be minimized. In addition the time taken in negotiation of appropriate criteria could be better spent during the final stages of negotiations.
Variations on this decision experiment could identify different ways individuals prefer to make decisions. Rather than comparing written plans to the numerical methods, the comparison could have focused either on only written plans or only numerical methods. Focusing on only numerical methods, it would be possible to determine if more criteria variables would be preferred to fewer criteria variables. In the present research, the data suggest a link towards preferring more criteria variables; however, that is only for those participants who prefer numerical methods over written methods. With the limited data available it is impossible to speculate if there is any effect of using the different set of 3 criteria on the decision chosen. 5. Conclusion Developing a decision support tool which is acceptable and useful to both the decision-maker and the consultant is a difficult task (Belton and Hodgkin, 1999). The DM may not have previously made long-term decisions, or decisions with a wide variety of possible alternatives (Beshears et al., 2008). As a result, the DM may prefer written descriptions which provide a general outline of what the plan encompasses. This could indicate a difference between rule based decision making for the written descriptions and a utility maximizing behaviour for the Mesta decision choices (March, 1994). On the other hand, the aim of the consultant is to provide a specific plan, which strives to achieve the goals of the DM. In order to achieve this goal, the consultant must either guess at the DMs preferences, substitute his/her own goals for the DM, or use decision support tools to help define the DMs preferences. Mesta is one tool which can be used to extract a set of preferences from the range of feasible alternatives.
In order to comprehensively address the questions posed earlier, the decision experiment needs to be tested on more participants. With the limited data currently available, it is difficult to determine in detail how the changes in decision criteria influence the final plan selection. The present results suggest that for a portion of DMs the criteria set does matter, and warrants motivation for further study. With a larger data set, it should be possible to analyse changes which occur by moving from a 3 criteria decision problem to an 8 criteria decision problem.
32 12
Further research is required to determine if decision support tools assist the DMs in selecting plans which are closer to their identified preferences. For this experiment, participants were not allowed the opportunity to independently select their own decision criteria. For those participants who have a well defined preference structure regarding the use of the forest, allowing them the opportunity to select their own criteria might provide a more accurate list of preferences. In a jointly owned forest holding, the decision support tools may be better suited in deriving preference information from the DMs, and then used in generating potential alternative forest plans (Eyvindson et al., 2010b), which the owners can review in a more detailed manner. References Belton, V. and Hodgkin, J. (1999) Facilitators, decision makers, D.I.Y.
users: Is intelligent multicriteria decision support for all feasible or desirable? European Journal of Operational Research 113(2): 247–260.
Beshears, J., Choi, JJ., Laibson, D. and Madrian, BC. (2008) How Are Preferences Revealed? Journal of Public Economics, 92 ,1787–1794.
Diaz-Balteiro L. and Romero, C. (2004) Sustainability of forest management plans: a discrete goal programming approach. J. Environ. Mange. 71, 351-359.
Diaz-Balteiro L. and Romero, C. (2007) Multiple Criteria Decision-Making in Forest Planning: Recent Results and Current Challenges. In: A. Weintraub, C. Romero, T. Bjørndal, R. Epstein and J. Miranda (eds.). Handbook of Operations Research in Natural Resources. International Series in Operations Research & Management Science, Vol. 99. Springer, pp. 473–488.
Eyvindson, K., Kurttila, M., Hujala, T. and Salminen O. (2010a). An Internet-Supported Planning Approach for Joint Ownership Forest Holdings. Small-scale Forestry. Doi:10.1016/s11842-010-9123-1
Eyvindson, K., Kurttila, M., Kangas, A. and Hujala, T. (manuscript) Using preference information in developing alternative forest plans.
Favada, I.M., Karppinen, H., Kuuluvainen, J., Mikkola, J. and Stavness, C. (2009) Effects of timber prices, ownership objectives, and owner characteristics on timber supply. Forest Science 55(6): 512–523.
Gigerenzer, G. and Brighton, H. (2009) Homo Heuristicus: Why biased Minds Make Better Inferences. Topics in Cognitive Science. 1(1):107 – 143.
Gómez, T., Hernández, M., León, M.A. and Caballero, R. (2006) A forest planning problem solved via a linear fractional goal programming model. For. Ecol. Manage. 227(1-2): 79–88. doi:10.1016/j.foreco.2006.02.012.
Hiltunen V, Kurttila M, Leskinen P, Pasanen K, Pykäläinen J (2009) Mesta: An internet-based decision-support application for participatory
13
strategic-level natural resources planning. Forest Policy and Economics, 11(1):1-9.
Kajanus, M., Kangas, J. and Kurttila, M. (2004) The use of value focused thinking and the A’WOT hybrid method in tourism management, Tourism Management 25 (4), pp. 499–506.
Kangas, A. (2010) Value of forest information. European Journal of Forest Research, in press.
Kangas, A., Kangas, J. & Kurttila, M. (2008) Decision support for forest management. Managing forest ecosystems, Vol 16. Springer. 222 p.
Karppinen H, Hänninen H, Ripatti P (2002) Suomalainen metsänomistaja 2000. Finnish Forest Research Institute. Research Papers 852. 32 pp (in Finnish).
Kazana, V., Fawcett, RH. and Mutch, WES. (2003) A decision support modelling framework for multiple use forest management: The Queen Elizabeth Forest case study in Scotland, European Journal of Operational Research 148, pp. 102–115
March, James G. (1994) A Primer on Decision Making: How Decisions Happen. New York: The Free Press.
Mendoza, G.A. and Martins, H. (2006) Multi-criteria decision analysis in natural resource management: A critical review of methods and new modelling paradigms. Forest Ecology and Management 230(1-3): 1–22.
Metsätalouden kehittämiskeskus Tapio (2006) Hyvän metsänhoidon suositukset. Metsätalouden kehittämiskeskus Tapion julkaisuja 22/2006, 100 pp (in Finnish).
Nordström, E.-M., Romero, C., Eriksson, L.O. and Öhman, K. (2009) Aggregation of preferences in participatory forest planning with multiple criteria: an application to the urban forest in Lycksele, Sweden. Can. J. For. Res. 39(10): 1979–1992.
Redsven, V., Hirvelä, H., Härkönen, K., Salminen, O. and Siitonen, M. (2007) MELA2007 Reference Manual. The Finnish Forest Research Institute. 642 p.
Saaty. TL. (1980) The Analytic hierarchy process. McGraw-Hill, New York.
3312
Further research is required to determine if decision support tools assist the DMs in selecting plans which are closer to their identified preferences. For this experiment, participants were not allowed the opportunity to independently select their own decision criteria. For those participants who have a well defined preference structure regarding the use of the forest, allowing them the opportunity to select their own criteria might provide a more accurate list of preferences. In a jointly owned forest holding, the decision support tools may be better suited in deriving preference information from the DMs, and then used in generating potential alternative forest plans (Eyvindson et al., 2010b), which the owners can review in a more detailed manner. References Belton, V. and Hodgkin, J. (1999) Facilitators, decision makers, D.I.Y.
users: Is intelligent multicriteria decision support for all feasible or desirable? European Journal of Operational Research 113(2): 247–260.
Beshears, J., Choi, JJ., Laibson, D. and Madrian, BC. (2008) How Are Preferences Revealed? Journal of Public Economics, 92 ,1787–1794.
Diaz-Balteiro L. and Romero, C. (2004) Sustainability of forest management plans: a discrete goal programming approach. J. Environ. Mange. 71, 351-359.
Diaz-Balteiro L. and Romero, C. (2007) Multiple Criteria Decision-Making in Forest Planning: Recent Results and Current Challenges. In: A. Weintraub, C. Romero, T. Bjørndal, R. Epstein and J. Miranda (eds.). Handbook of Operations Research in Natural Resources. International Series in Operations Research & Management Science, Vol. 99. Springer, pp. 473–488.
Eyvindson, K., Kurttila, M., Hujala, T. and Salminen O. (2010a). An Internet-Supported Planning Approach for Joint Ownership Forest Holdings. Small-scale Forestry. Doi:10.1016/s11842-010-9123-1
Eyvindson, K., Kurttila, M., Kangas, A. and Hujala, T. (manuscript) Using preference information in developing alternative forest plans.
Favada, I.M., Karppinen, H., Kuuluvainen, J., Mikkola, J. and Stavness, C. (2009) Effects of timber prices, ownership objectives, and owner characteristics on timber supply. Forest Science 55(6): 512–523.
Gigerenzer, G. and Brighton, H. (2009) Homo Heuristicus: Why biased Minds Make Better Inferences. Topics in Cognitive Science. 1(1):107 – 143.
Gómez, T., Hernández, M., León, M.A. and Caballero, R. (2006) A forest planning problem solved via a linear fractional goal programming model. For. Ecol. Manage. 227(1-2): 79–88. doi:10.1016/j.foreco.2006.02.012.
Hiltunen V, Kurttila M, Leskinen P, Pasanen K, Pykäläinen J (2009) Mesta: An internet-based decision-support application for participatory
13
strategic-level natural resources planning. Forest Policy and Economics, 11(1):1-9.
Kajanus, M., Kangas, J. and Kurttila, M. (2004) The use of value focused thinking and the A’WOT hybrid method in tourism management, Tourism Management 25 (4), pp. 499–506.
Kangas, A. (2010) Value of forest information. European Journal of Forest Research, in press.
Kangas, A., Kangas, J. & Kurttila, M. (2008) Decision support for forest management. Managing forest ecosystems, Vol 16. Springer. 222 p.
Karppinen H, Hänninen H, Ripatti P (2002) Suomalainen metsänomistaja 2000. Finnish Forest Research Institute. Research Papers 852. 32 pp (in Finnish).
Kazana, V., Fawcett, RH. and Mutch, WES. (2003) A decision support modelling framework for multiple use forest management: The Queen Elizabeth Forest case study in Scotland, European Journal of Operational Research 148, pp. 102–115
March, James G. (1994) A Primer on Decision Making: How Decisions Happen. New York: The Free Press.
Mendoza, G.A. and Martins, H. (2006) Multi-criteria decision analysis in natural resource management: A critical review of methods and new modelling paradigms. Forest Ecology and Management 230(1-3): 1–22.
Metsätalouden kehittämiskeskus Tapio (2006) Hyvän metsänhoidon suositukset. Metsätalouden kehittämiskeskus Tapion julkaisuja 22/2006, 100 pp (in Finnish).
Nordström, E.-M., Romero, C., Eriksson, L.O. and Öhman, K. (2009) Aggregation of preferences in participatory forest planning with multiple criteria: an application to the urban forest in Lycksele, Sweden. Can. J. For. Res. 39(10): 1979–1992.
Redsven, V., Hirvelä, H., Härkönen, K., Salminen, O. and Siitonen, M. (2007) MELA2007 Reference Manual. The Finnish Forest Research Institute. 642 p.
Saaty. TL. (1980) The Analytic hierarchy process. McGraw-Hill, New York.

34
How forest knowledge is used in forest planning – a case study
Malin Nilsson and Ljusk Ola Eriksson
Department of Forest Resource Management, Swedish Agricultural University
Abstract A company needs to know what it knows and how to take care of this knowledge. The way forest knowledge is handled within a forest company is a means to turn knowledge into a source of competitive advantage. Forest data and its information are important parts of the forest planning. The aim of this study is to describe and analyze how forest knowledge is used for timber production planning in a large forest owning company in Sweden. The study is conducted as a case study at Sveaskog - the largest forest owning company in Sweden. Concepts and theories from knowledge management are used. The study is limited to present the forest planning process from the long term felling strategy until the stands are transferred to the tract bank. Interviews with key persons within the organization were used to capture how forest knowledge is used. The information is presented through the four knowledge management processes: creation, storage-retrieving, transferring and applying. The planning system relies to a great extent on codified knowledge realized through a push strategy. It appears that the system works as a consistent whole. Keywords: Forest planning, knowledge management, knowledge, information. 1. Introduction The planning process of the forest owning company is customarily described as a sequence of three steps: strategic planning encompasses the entire forest in a long time perspective and focuses on sustainability and sets the frame for more short term planning; tactical planning is concerned with allocating harvest and silvicultural operations to stands in the next few years and where road construction may be an issue; operational planning schedules specified resources for harvesting and deliveries, often with a time frame of less than one year (Gunn 2007; Church 2007; Epstein et al. 2007). The major forest owning companies in Sweden, controlling about 40 % of the forested area, have followed this formula for decades. It is easy to
see the connection between planning step and forest information availability (Eriksson 2004; Söderholm 2002). You have the stand register, containing information on all stands and accompanied by a map, that supports all planning stages, a smaller sample of stands used for strategic planning, and a tract bank with data on stands for operational planning.
The planning procedures described above are essentially based on information retrieval techniques available in the 70’s or earlier. Of new developments remote sensing techniques are of special interest. Air borne as well as space borne sensors offer, or are likely to soon offer, more detailed and accurate data than is normally available in the stand register today (see e.g. Lindberg et al. 2010). In case these or other techniques could motivate a redesign of the planning process it is important to understand the relation between forest information and the planning process as it is practiced today. In particular, since the forest information gathered and processed for strategic planning has implications throughout the planning process it seems pertinent to understand the decisions and processes that emanate from this stage.
In the beginning of the nineties, the knowledge management (KM) theory of the firm was developed, which held that a company´s performance is dependent on the knowledge it possesses and how this knowledge is used within the company (Conner and Prahalad 1996; Hansen, Nohria et al. 1999; Zack 1999; Eisenhardt and Martin 2000). A company needs to have a strategy for its KM, and since knowledge does not last long, the organization needs to be a learning organization to keep an advantage. Given the importance of information in forest planning it would be interesting to apply KM to this field.
The aim with this study is to describe and to analyze the forest planning of a large forest company in terms of KM. The study is limited to strategic and tactical planning and will only concern planning of harvests. Additionally, focus will be on KM associated with forest information and little or none on information from other sources. The study is based on interviews with functionaries of the largest forest owning company in Sweden.
2. Knowledge management Knowledge can be viewed from different perspectives. Alavi and Leidner (2001) present five perspectives of knowledge where knowledge can be seen as: a state of mind, an object, a process, having access to information and as a capability. Knowledge as a state of mind means that a person wants to know more and wants to use the possessed knowledge, knowledge as an object can be manipulated and stored, knowledge as a process is when a person acts from what he/she knows, knowledge as access to information means that an organization must organize its knowledge to keep it
35
How forest knowledge is used in forest planning – a case study
Malin Nilsson and Ljusk Ola Eriksson
Department of Forest Resource Management, Swedish Agricultural University
Abstract A company needs to know what it knows and how to take care of this knowledge. The way forest knowledge is handled within a forest company is a means to turn knowledge into a source of competitive advantage. Forest data and its information are important parts of the forest planning. The aim of this study is to describe and analyze how forest knowledge is used for timber production planning in a large forest owning company in Sweden. The study is conducted as a case study at Sveaskog - the largest forest owning company in Sweden. Concepts and theories from knowledge management are used. The study is limited to present the forest planning process from the long term felling strategy until the stands are transferred to the tract bank. Interviews with key persons within the organization were used to capture how forest knowledge is used. The information is presented through the four knowledge management processes: creation, storage-retrieving, transferring and applying. The planning system relies to a great extent on codified knowledge realized through a push strategy. It appears that the system works as a consistent whole. Keywords: Forest planning, knowledge management, knowledge, information. 1. Introduction The planning process of the forest owning company is customarily described as a sequence of three steps: strategic planning encompasses the entire forest in a long time perspective and focuses on sustainability and sets the frame for more short term planning; tactical planning is concerned with allocating harvest and silvicultural operations to stands in the next few years and where road construction may be an issue; operational planning schedules specified resources for harvesting and deliveries, often with a time frame of less than one year (Gunn 2007; Church 2007; Epstein et al. 2007). The major forest owning companies in Sweden, controlling about 40 % of the forested area, have followed this formula for decades. It is easy to
see the connection between planning step and forest information availability (Eriksson 2004; Söderholm 2002). You have the stand register, containing information on all stands and accompanied by a map, that supports all planning stages, a smaller sample of stands used for strategic planning, and a tract bank with data on stands for operational planning.
The planning procedures described above are essentially based on information retrieval techniques available in the 70’s or earlier. Of new developments remote sensing techniques are of special interest. Air borne as well as space borne sensors offer, or are likely to soon offer, more detailed and accurate data than is normally available in the stand register today (see e.g. Lindberg et al. 2010). In case these or other techniques could motivate a redesign of the planning process it is important to understand the relation between forest information and the planning process as it is practiced today. In particular, since the forest information gathered and processed for strategic planning has implications throughout the planning process it seems pertinent to understand the decisions and processes that emanate from this stage.
In the beginning of the nineties, the knowledge management (KM) theory of the firm was developed, which held that a company´s performance is dependent on the knowledge it possesses and how this knowledge is used within the company (Conner and Prahalad 1996; Hansen, Nohria et al. 1999; Zack 1999; Eisenhardt and Martin 2000). A company needs to have a strategy for its KM, and since knowledge does not last long, the organization needs to be a learning organization to keep an advantage. Given the importance of information in forest planning it would be interesting to apply KM to this field.
The aim with this study is to describe and to analyze the forest planning of a large forest company in terms of KM. The study is limited to strategic and tactical planning and will only concern planning of harvests. Additionally, focus will be on KM associated with forest information and little or none on information from other sources. The study is based on interviews with functionaries of the largest forest owning company in Sweden.
2. Knowledge management Knowledge can be viewed from different perspectives. Alavi and Leidner (2001) present five perspectives of knowledge where knowledge can be seen as: a state of mind, an object, a process, having access to information and as a capability. Knowledge as a state of mind means that a person wants to know more and wants to use the possessed knowledge, knowledge as an object can be manipulated and stored, knowledge as a process is when a person acts from what he/she knows, knowledge as access to information means that an organization must organize its knowledge to keep it

36
accessible to those who need it, and knowledge as a capability refers to the capability to learn.
There is a relationship between data, information and knowledge where data is facts and raw numbers without meaning. When meaning is added to the facts data turns into information, and when information is put together and is personalized it turns into knowledge (Spender 1996; Alavi and Leidner 2001; Sensky 2002; Holsapple 2008).
Knowledge can be described along different dimensions or characteristics. These characteristics are, for example, tacit/explicit knowledge, individual/social knowledge and general/context-specific knowledge (Zack 1999; Alavi and Leidner 2001). Tacit knowledge is knowledge achieved that is not possible to put in words. Tacit knowledge within an individual is strongly connected to specific actions (Nonaka 1994). Explicit knowledge, on the other hand, can be written or told. A person can share this knowledge in words and action. Individual knowledge is the knowledge a person holds. This individual knowledge is the foundation for social knowledge. Social knowledge is the collective knowledge in a group: a result of all individual knowledge within the group. Both individual and social knowledge can be either tacit or explicit (Spender 1996). Knowledge can also be either general or situated context-specific knowledge (Zack 1999).
Knowledge within an organization is not static, it is constantly changing. Knowledge can be too old and it has to be replaced. It is important for an organization to be a learning organization and to keep track of the knowledge it possesses (Spender 1996). The organization also needs to ensure that knowledge is at the right place within the organization when needed. Four basic knowledge processes in the organization can be detected: creating, storage/retrieving, transferring and applying (Alavi and Leidner 2001). • Knowledge creating – According to Nonaka (1994) the knowledge
creating process within an organization is related to learning. The knowledge creating process within the organization is based upon both tacit and explicit knowledge. This process is described in four modes in the “Spiral of Organizational Knowledge Creation”. When people interact they create new tacit knowledge out of the tacit knowledge they already possess. This mode is called socialization. New explicit knowledge is created from tacit knowledge in a mode called externalization. New explicit knowledge can be created from explicit sources in the mode of combination. New tacit knowledge can be created based on existing explicit knowledge in the mode of internalization. These four modes are dependent on each other and are always interacting in knowledge creation process (Nonaka 1994).
• Knowledge storing and retrieving – To avoid loss of knowledge and to secure the access to knowledge and information, the organization needs a memory. Alavi and Leidner (2001) give five possible forms to organize the organizational memory which covers both tacit and explicit knowledge: written documents, information in data bases, codified human knowledge stored in expert systems, documented organizational procedures and processes and, finally, tacit knowledge acquired by individuals. Alavi and Leidner also present distinctions between individual and organizational memory. These distinctions implie that individual memory is possessed by a person’s observations, experience and actions while organizational memory influences present organizational activities.
• Knowledge transferring – It is important to be able to transfer relevant knowledge possessed by one individual or a group to others. Transfer of knowledge can occur between individuals, from individuals to explicit sources, from individuals to groups, between groups, across groups and from the group to the whole organization. Based upon the basic elements of communication Gupta and Govindarajan (2000) have given elements needed for transfer of knowledge to occur: a message, a sender, a coding scheme, a channel, transmission through the channel, a decoding scheme, a receiver, and the assignment of meaning to the decoded message. In accordance with this Gupta and Govindarajan (2000) present five elements of knowledge flow: value of source unit´s knowledge stock;: motivational disposition of the source unit; existence and richness of transmission channels; motivational disposition of the target unit; and absorptive capacity of the target unit.
• Knowledge applying – “[T]he source of competitive advantage resides in the application of the knowledge rather than in the knowledge itself.” (Alavi and Leidner 2001) In their study, Alavi and Leidner point out three processes, which initiate and keep the procedure of knowledge to organizational capability going. These three are: directives, organizational routines, and self-contained task teams. Both directives and routines within the organization are actions that create efficiency in the organization, while the self-contained tasks are groups that meet to share knowledge between different experts. These meetings are not efficient at first sight, but in the groups tacit knowledge is shared between the group members (Grant 1996).
When knowing how the knowledge processes exists within the organization a manager can apply a knowledge management strategy. Two types of strategy for knowledge management can be identified; the company can choose either a codification strategy (push strategy), where knowledge is coded and made accessible for the members of the organization to use when

37
accessible to those who need it, and knowledge as a capability refers to the capability to learn.
There is a relationship between data, information and knowledge where data is facts and raw numbers without meaning. When meaning is added to the facts data turns into information, and when information is put together and is personalized it turns into knowledge (Spender 1996; Alavi and Leidner 2001; Sensky 2002; Holsapple 2008).
Knowledge can be described along different dimensions or characteristics. These characteristics are, for example, tacit/explicit knowledge, individual/social knowledge and general/context-specific knowledge (Zack 1999; Alavi and Leidner 2001). Tacit knowledge is knowledge achieved that is not possible to put in words. Tacit knowledge within an individual is strongly connected to specific actions (Nonaka 1994). Explicit knowledge, on the other hand, can be written or told. A person can share this knowledge in words and action. Individual knowledge is the knowledge a person holds. This individual knowledge is the foundation for social knowledge. Social knowledge is the collective knowledge in a group: a result of all individual knowledge within the group. Both individual and social knowledge can be either tacit or explicit (Spender 1996). Knowledge can also be either general or situated context-specific knowledge (Zack 1999).
Knowledge within an organization is not static, it is constantly changing. Knowledge can be too old and it has to be replaced. It is important for an organization to be a learning organization and to keep track of the knowledge it possesses (Spender 1996). The organization also needs to ensure that knowledge is at the right place within the organization when needed. Four basic knowledge processes in the organization can be detected: creating, storage/retrieving, transferring and applying (Alavi and Leidner 2001). • Knowledge creating – According to Nonaka (1994) the knowledge
creating process within an organization is related to learning. The knowledge creating process within the organization is based upon both tacit and explicit knowledge. This process is described in four modes in the “Spiral of Organizational Knowledge Creation”. When people interact they create new tacit knowledge out of the tacit knowledge they already possess. This mode is called socialization. New explicit knowledge is created from tacit knowledge in a mode called externalization. New explicit knowledge can be created from explicit sources in the mode of combination. New tacit knowledge can be created based on existing explicit knowledge in the mode of internalization. These four modes are dependent on each other and are always interacting in knowledge creation process (Nonaka 1994).
• Knowledge storing and retrieving – To avoid loss of knowledge and to secure the access to knowledge and information, the organization needs a memory. Alavi and Leidner (2001) give five possible forms to organize the organizational memory which covers both tacit and explicit knowledge: written documents, information in data bases, codified human knowledge stored in expert systems, documented organizational procedures and processes and, finally, tacit knowledge acquired by individuals. Alavi and Leidner also present distinctions between individual and organizational memory. These distinctions implie that individual memory is possessed by a person’s observations, experience and actions while organizational memory influences present organizational activities.
• Knowledge transferring – It is important to be able to transfer relevant knowledge possessed by one individual or a group to others. Transfer of knowledge can occur between individuals, from individuals to explicit sources, from individuals to groups, between groups, across groups and from the group to the whole organization. Based upon the basic elements of communication Gupta and Govindarajan (2000) have given elements needed for transfer of knowledge to occur: a message, a sender, a coding scheme, a channel, transmission through the channel, a decoding scheme, a receiver, and the assignment of meaning to the decoded message. In accordance with this Gupta and Govindarajan (2000) present five elements of knowledge flow: value of source unit´s knowledge stock;: motivational disposition of the source unit; existence and richness of transmission channels; motivational disposition of the target unit; and absorptive capacity of the target unit.
• Knowledge applying – “[T]he source of competitive advantage resides in the application of the knowledge rather than in the knowledge itself.” (Alavi and Leidner 2001) In their study, Alavi and Leidner point out three processes, which initiate and keep the procedure of knowledge to organizational capability going. These three are: directives, organizational routines, and self-contained task teams. Both directives and routines within the organization are actions that create efficiency in the organization, while the self-contained tasks are groups that meet to share knowledge between different experts. These meetings are not efficient at first sight, but in the groups tacit knowledge is shared between the group members (Grant 1996).
When knowing how the knowledge processes exists within the organization a manager can apply a knowledge management strategy. Two types of strategy for knowledge management can be identified; the company can choose either a codification strategy (push strategy), where knowledge is coded and made accessible for the members of the organization to use when

38
they need it, or the company can choose a personalization strategy (pull strategy), which is a web of persons holding important knowledge. When a member of the organization needs specific knowledge he or she needs to ask a person of this web to share the knowledge with him or her (Hansen et al. 1999). 3. Materials and methods The study is performed as a case study at Sveaskog AB in Sweden. The company owns forests to a total area of 4, 3 million hectares, which is 15 % of the productive forest lands in Sweden. The holdings are distributed over the whole country with a majority in the northern part of Sweden. The company is geographically organized in five market areas and with a process organization consisting of three central processes: forest, production and market. The three processes are represented in each market area. The production process contains the sub processes for planning and harvesting. At each market area the production process is led by the production managers and the sub process of forest planning is led by planning managers. Each market area consists of approximately 3-5 harvesting manager areas. These harvesting manager areas are likewise divided into a number of harvesting planner areas. The central process of forest is led by the Vice President Forestry, and the sub process of planning is led by the Vice President Planning.
The study consists of interviews, thematically structured by interview guides (Kvale 1997). The intention was to find out how the interviewees related to the forest planning process. After reading the company’s process maps, interview guides were prepared in advance. These guides were systemized in three major themes: the plan, data used in the plans and how communication was performed around the plans. These themes were broken down into subcategories to guarantee coverage of the important parts of the major themes. The interviews were held with people employed by Sveaskog and these were selected for the interview by purposive sampling. The interviewees were persons in leading positions for the forest planning in the strategic and tactical steps: the Vice President Forestry, the Vice President Planning, the register specialist and planning managers from two market areas.
First the recorded interviews were processed into written form. Then these written interviews, together with the drawings from each interview, were transferred into mind maps, where focus was on information and knowledge. The mind maps were then joined and redrawn to create one mind map for the whole planning process covering the information and the knowledge management processes. From this emerged a new mind map. This last map has the focus upon the forest knowledge´s path through the organization from stand data collected for computing strategic plan
alternatives to stands in the tract bank ready to be harvested. Finally, this last map formed the basis for the results presented here.
4. Results
Figure 1. The path of forest knowledge through the forest planning organization. Figure 1 follows the forest knowledge from the initial data collection for the long range plan through the organization of forest planning at the studied company to the tract bank. First, felling estimations are made for all the holdings of the company based on forest data captured in an inventory (step 1). An economic optimization is made based upon the inventory data together with other information, such as market information, assumptions about interest rates, the development of stands, prices and costs in the future, and other information about the holdings. This knowledge is used in the Forest Management Planning Package (FMPP; Jonsson et al. 1993) to create an optimization of the harvesting that extends over a period of more than 100 years. The felling estimations are presented at a board meeting (step 2) and the board makes a strategic decision of the felling volume for the coming ten years. This represents the new long term felling strategy. The felling strategy is announced to the Senior Vice President Forestry (step 3) who distributes this planned harvesting volume to the five market areas according to the figures given by the FMPP optimization. The decided volume is shared by e-mails and by meetings where the production staffs

39
they need it, or the company can choose a personalization strategy (pull strategy), which is a web of persons holding important knowledge. When a member of the organization needs specific knowledge he or she needs to ask a person of this web to share the knowledge with him or her (Hansen et al. 1999). 3. Materials and methods The study is performed as a case study at Sveaskog AB in Sweden. The company owns forests to a total area of 4, 3 million hectares, which is 15 % of the productive forest lands in Sweden. The holdings are distributed over the whole country with a majority in the northern part of Sweden. The company is geographically organized in five market areas and with a process organization consisting of three central processes: forest, production and market. The three processes are represented in each market area. The production process contains the sub processes for planning and harvesting. At each market area the production process is led by the production managers and the sub process of forest planning is led by planning managers. Each market area consists of approximately 3-5 harvesting manager areas. These harvesting manager areas are likewise divided into a number of harvesting planner areas. The central process of forest is led by the Vice President Forestry, and the sub process of planning is led by the Vice President Planning.
The study consists of interviews, thematically structured by interview guides (Kvale 1997). The intention was to find out how the interviewees related to the forest planning process. After reading the company’s process maps, interview guides were prepared in advance. These guides were systemized in three major themes: the plan, data used in the plans and how communication was performed around the plans. These themes were broken down into subcategories to guarantee coverage of the important parts of the major themes. The interviews were held with people employed by Sveaskog and these were selected for the interview by purposive sampling. The interviewees were persons in leading positions for the forest planning in the strategic and tactical steps: the Vice President Forestry, the Vice President Planning, the register specialist and planning managers from two market areas.
First the recorded interviews were processed into written form. Then these written interviews, together with the drawings from each interview, were transferred into mind maps, where focus was on information and knowledge. The mind maps were then joined and redrawn to create one mind map for the whole planning process covering the information and the knowledge management processes. From this emerged a new mind map. This last map has the focus upon the forest knowledge´s path through the organization from stand data collected for computing strategic plan
alternatives to stands in the tract bank ready to be harvested. Finally, this last map formed the basis for the results presented here.
4. Results
Figure 1. The path of forest knowledge through the forest planning organization. Figure 1 follows the forest knowledge from the initial data collection for the long range plan through the organization of forest planning at the studied company to the tract bank. First, felling estimations are made for all the holdings of the company based on forest data captured in an inventory (step 1). An economic optimization is made based upon the inventory data together with other information, such as market information, assumptions about interest rates, the development of stands, prices and costs in the future, and other information about the holdings. This knowledge is used in the Forest Management Planning Package (FMPP; Jonsson et al. 1993) to create an optimization of the harvesting that extends over a period of more than 100 years. The felling estimations are presented at a board meeting (step 2) and the board makes a strategic decision of the felling volume for the coming ten years. This represents the new long term felling strategy. The felling strategy is announced to the Senior Vice President Forestry (step 3) who distributes this planned harvesting volume to the five market areas according to the figures given by the FMPP optimization. The decided volume is shared by e-mails and by meetings where the production staffs

40
including planners are participating. This is made once per long term felling strategy and the volume distributed is for the whole ten year period.
The volume to cut per market area in the coming ten years is distributed on the harvesting manager areas (step 4). The distribution is made in meetings where the production manager at the market area, planning manager, the harvesting managers and the harvesting planners attend.
The volume to harvest during the coming ten years at each harvesting manager area is further distributed geographically on the harvesting planner areas in a meeting with the planning manager, the harvesting manager and the harvesting planner; the production manager can take part as well. This work is done once per strategic decision (step 5). Given the harvest volumes determined in step 5 for the harvesting planner area, decisions are made of which objects to harvest and, accordingly, inventory each year, i.e. a tactical plan covering 10 years is established (step 6). The tactical plan is stored as a part of the GIS-database; the stands are marked in the database to belong to four distinctive parts. First there is the tract bank, containing the objects prepared to be cut. This part should cover approximately the volume of 1.5 years harvesting. In the next part of the tactical plan are the objects ready to be inventoried. This covers a volume equivalent to approximately three years. These two parts is consequently covering the first 4.5-5 years. The rest of the tactical plan consists of objects to be consulted later on and is part of the plan where forest management is concerned in terms of, for example, fertilization. The tactical plan is repeatedly remade every year, to always be valid.
When the tactical plan is set for the harvesting planner area, the harvesting planner goes out into the forest to make an inventory of each stand (step 7). The stands to be inventoried are selected from the GIS-database (stand register).
The inventory data is added to previous data for the stand in the stand register in the GIS-database (step 8). The stand and its data are then exported to another database, which contains the tract bank (step 9), where it is available to a harvest manager to use in the operational planning.
5. Discussion KM will here be studied from the perspective that the entire forest planning process is a realization of the KM process of applying (Alavi and Leidner 2001). That is, all the steps of the process are considered as a whole as an application process and will not be divided further, in contrast to the KM processes of creation, storing/retrieval and transferring. Before establishing the nature of the KM application process knowledge and KM processes will be characterized.
To characterize the kind of knowledge managed in the planning process, the following seems to hold:
• Knowledge can basically appear as tacit or explicit knowledge. It is
obvious that the planning process handles large amounts of knowledge in explicit form. There also appears to be tacit knowledge; for instance, “gut feeling” is referred to when developing the long range plan proposals.
• The basis for social knowledge is individual knowledge. One aspect of this is that people need to meet to be able to share their knowledge and to create social knowledge (Nonaka 1994). Social knowledge should have a chance to develop in the meetings that occur in the planning process. Still, these meetings do normally not take place more than once each five-six years. There seems to be a common understanding of the planning process as such, its purpose and the routines it entails; this can also be seen as a form of social knowledge.
To characterize the KM processes, the following seems to hold: • The KM process of creation is primarily designed to create and manage
explicit knowledge. There are few instances where the planning process has built in, or where there are provisions for, observation or discussions to acquire tacit knowledge.
• As regards the KM process of storage and retrieval there is a designated system for where you will find knowledge and what knowledge you will find there. There is nothing that indicates that people in the line of the planning process are unaware of where and what they should report or that they are questioning where they could find the knowledge they need.
• As with storing/retrieval there is a well defined system for how and when transferring should be conducted. It is a top-down planning process in that knowledge in each step goes from one level of the organization to the next lower level. Valued in terms of the five elements of knowledge flow presented by Gupta and Govindarajan (2000) – value of source unit´s knowledge stock, motivational disposition of the source unit, existence and richness of transmission channels, motivational disposition of the target unit, and absorptive capacity of the target unit – there is nothing that contradicts the impression that these requirements are fulfilled to a reasonable degree.
The above indicates that the KM strategy is a push strategy with few elements of pull. Knowledge is to a large degree coded and made available to those needing it. The push strategy is implemented through directives and routines. Directives are floating through from the board room down to the harvest area and certain procedures are followed at each step.

41
including planners are participating. This is made once per long term felling strategy and the volume distributed is for the whole ten year period.
The volume to cut per market area in the coming ten years is distributed on the harvesting manager areas (step 4). The distribution is made in meetings where the production manager at the market area, planning manager, the harvesting managers and the harvesting planners attend.
The volume to harvest during the coming ten years at each harvesting manager area is further distributed geographically on the harvesting planner areas in a meeting with the planning manager, the harvesting manager and the harvesting planner; the production manager can take part as well. This work is done once per strategic decision (step 5). Given the harvest volumes determined in step 5 for the harvesting planner area, decisions are made of which objects to harvest and, accordingly, inventory each year, i.e. a tactical plan covering 10 years is established (step 6). The tactical plan is stored as a part of the GIS-database; the stands are marked in the database to belong to four distinctive parts. First there is the tract bank, containing the objects prepared to be cut. This part should cover approximately the volume of 1.5 years harvesting. In the next part of the tactical plan are the objects ready to be inventoried. This covers a volume equivalent to approximately three years. These two parts is consequently covering the first 4.5-5 years. The rest of the tactical plan consists of objects to be consulted later on and is part of the plan where forest management is concerned in terms of, for example, fertilization. The tactical plan is repeatedly remade every year, to always be valid.
When the tactical plan is set for the harvesting planner area, the harvesting planner goes out into the forest to make an inventory of each stand (step 7). The stands to be inventoried are selected from the GIS-database (stand register).
The inventory data is added to previous data for the stand in the stand register in the GIS-database (step 8). The stand and its data are then exported to another database, which contains the tract bank (step 9), where it is available to a harvest manager to use in the operational planning.
5. Discussion KM will here be studied from the perspective that the entire forest planning process is a realization of the KM process of applying (Alavi and Leidner 2001). That is, all the steps of the process are considered as a whole as an application process and will not be divided further, in contrast to the KM processes of creation, storing/retrieval and transferring. Before establishing the nature of the KM application process knowledge and KM processes will be characterized.
To characterize the kind of knowledge managed in the planning process, the following seems to hold:
• Knowledge can basically appear as tacit or explicit knowledge. It is
obvious that the planning process handles large amounts of knowledge in explicit form. There also appears to be tacit knowledge; for instance, “gut feeling” is referred to when developing the long range plan proposals.
• The basis for social knowledge is individual knowledge. One aspect of this is that people need to meet to be able to share their knowledge and to create social knowledge (Nonaka 1994). Social knowledge should have a chance to develop in the meetings that occur in the planning process. Still, these meetings do normally not take place more than once each five-six years. There seems to be a common understanding of the planning process as such, its purpose and the routines it entails; this can also be seen as a form of social knowledge.
To characterize the KM processes, the following seems to hold: • The KM process of creation is primarily designed to create and manage
explicit knowledge. There are few instances where the planning process has built in, or where there are provisions for, observation or discussions to acquire tacit knowledge.
• As regards the KM process of storage and retrieval there is a designated system for where you will find knowledge and what knowledge you will find there. There is nothing that indicates that people in the line of the planning process are unaware of where and what they should report or that they are questioning where they could find the knowledge they need.
• As with storing/retrieval there is a well defined system for how and when transferring should be conducted. It is a top-down planning process in that knowledge in each step goes from one level of the organization to the next lower level. Valued in terms of the five elements of knowledge flow presented by Gupta and Govindarajan (2000) – value of source unit´s knowledge stock, motivational disposition of the source unit, existence and richness of transmission channels, motivational disposition of the target unit, and absorptive capacity of the target unit – there is nothing that contradicts the impression that these requirements are fulfilled to a reasonable degree.
The above indicates that the KM strategy is a push strategy with few elements of pull. Knowledge is to a large degree coded and made available to those needing it. The push strategy is implemented through directives and routines. Directives are floating through from the board room down to the harvest area and certain procedures are followed at each step.

42
Is this then a good application of KM to achieve a better competitive position? Or, to put it more precisely, are there possible weaknesses in the way the planning process is designed from a KM point of view?
• Transferring knowledge in several steps takes form of documents or
database management. At a few steps there is participation of several functionaries in meetings which will consume valuable time. However, just distributing directives could reduce the motivational disposition of the receivers and a loss of an opportunity to enhance their absorptive capacity (Gupta and Govindarajan 2000).
• Given the centralized nature of the flow of knowledge, without built-in feed-back loops, is there a risk that strategic decisions are “diluted” along the road, that the harvest plan input into the tract bank will not actually match the long range plan? It is also true that the aspects that guide the FMPP solutions (Jonsson et al. 1993) disregard constraints and demands that need to attend to when doing the tactical plan. However, the risks for inconsistencies between plans should not be exaggerated, at least not under boreal forest conditions (Andersson and Eriksson 2007).
• The planning could give the impression of being inflexible; the long term plan normally lasts for five to six years. There are, however, good arguments for the long intervals. From an efficiency point of view, it is costly to develop the plans, and to implement the plans in the organization. Capacity variations of harvesting resources can also be high. Also, the relative stability of the business, the slow growth processes of the forest, and the long experience of how the planning process works, are indications that rather long cycles of planning could work.
• Forest data is expensive to obtain and the core theme of forest inventory research is to attain a certain precision at minimum cost. From that point of view it is noticeable that there are three instances of forest data: the all encompassing stand register, the data that is collected for the tract bank, and the data obtained for projections with FMPP. Let us focus on the relation between stand register and FMPP stands. One reason for the FMPP sample is that the stand register is not considered reliable enough. However, the stratification of the FMPP sample hinges on the quality of the stand register. If the register is biased this will translate into a bias of the representative areas of the strata. So, there seems to be a dilemma: either the register is good enough and could be used as it is, or it is not good enough and it fails as support stratification.
There are many ways of dividing the KM process into steps for analysis. The focus put here on forest information as defining element of the KM process could have contributed to the impression that the planning process on the whole appears to be orderly and consistent. Thus, we will necessarily find instances where knowledge is stored and where it is retrieved etc. By interviewing persons part of the planning process you capture what they say they do, not what they actually do. The data is not as deep as if observations of the actual planning had been done together with the interviews. Another consequence of the study methodology is that it was not possible to study the quality of data-information-knowledge; that would require quite other methods of study.
This study represents a first try to analyze the forest planning of large forest owners with a sophisticated planning system with KM as frame of reference. It reveals the complexity of getting a planning system working: you need to design components that are consistent in terms of messages, senders, channels, receivers, and to ensure that the quality is adequate along the line. Obviously, new information sources do not automatically translate into better planning. References Alavi, M. and D. E. Leidner 2001. Review: Knowledge management and
knowledge management systems: Conceptual foundations and research issues. Mis Quarterly 25(1): 107-136.
Andersson, D. and Eriksson, L.O. 2007. Effects of temporal aggregation in integrated strategic/tactical and strategic forest planning. Forest Policy and Economics 9 (2007) 965–981
Church, R.L. 2007. Tactical-Level Forest Management Models. . In: Handbook of Operations Research in Natural Resources, A. Weintraub, C. Romero, T. Bjørndal, and R. Epstein (Eds.). Springer. New York.
Conner, K. R. and C. K. Prahalad 1996. A resource-based theory of the firm: Knowledge versus opportunism. Organization Science 7(5): 477-501.
Eisenhardt, K. M. and J. A. Martin 2000. Dynamic capabilities: What are they?, John Wiley & Sons Ltd.
Epstein, R., Karlsson, J., Rönnqvist, M. and Weintraub, A. 2007. Harvest Operational Models in Forestry. . In: Handbook of Operations Research in Natural Resources, A. Weintraub, C. Romero, T. Bjørndal, and R. Epstein (Eds.). Springer. New York.
Eriksson, M. 2004. Strategisk och taktisk planering samt länken där emellan - analys av planeringsprocessens genomförande vid SCA Skog. Working Paper No. 207, Department of Forest Resource Management and Geomatics, SLU. Umeå.

43
Is this then a good application of KM to achieve a better competitive position? Or, to put it more precisely, are there possible weaknesses in the way the planning process is designed from a KM point of view?
• Transferring knowledge in several steps takes form of documents or
database management. At a few steps there is participation of several functionaries in meetings which will consume valuable time. However, just distributing directives could reduce the motivational disposition of the receivers and a loss of an opportunity to enhance their absorptive capacity (Gupta and Govindarajan 2000).
• Given the centralized nature of the flow of knowledge, without built-in feed-back loops, is there a risk that strategic decisions are “diluted” along the road, that the harvest plan input into the tract bank will not actually match the long range plan? It is also true that the aspects that guide the FMPP solutions (Jonsson et al. 1993) disregard constraints and demands that need to attend to when doing the tactical plan. However, the risks for inconsistencies between plans should not be exaggerated, at least not under boreal forest conditions (Andersson and Eriksson 2007).
• The planning could give the impression of being inflexible; the long term plan normally lasts for five to six years. There are, however, good arguments for the long intervals. From an efficiency point of view, it is costly to develop the plans, and to implement the plans in the organization. Capacity variations of harvesting resources can also be high. Also, the relative stability of the business, the slow growth processes of the forest, and the long experience of how the planning process works, are indications that rather long cycles of planning could work.
• Forest data is expensive to obtain and the core theme of forest inventory research is to attain a certain precision at minimum cost. From that point of view it is noticeable that there are three instances of forest data: the all encompassing stand register, the data that is collected for the tract bank, and the data obtained for projections with FMPP. Let us focus on the relation between stand register and FMPP stands. One reason for the FMPP sample is that the stand register is not considered reliable enough. However, the stratification of the FMPP sample hinges on the quality of the stand register. If the register is biased this will translate into a bias of the representative areas of the strata. So, there seems to be a dilemma: either the register is good enough and could be used as it is, or it is not good enough and it fails as support stratification.
There are many ways of dividing the KM process into steps for analysis. The focus put here on forest information as defining element of the KM process could have contributed to the impression that the planning process on the whole appears to be orderly and consistent. Thus, we will necessarily find instances where knowledge is stored and where it is retrieved etc. By interviewing persons part of the planning process you capture what they say they do, not what they actually do. The data is not as deep as if observations of the actual planning had been done together with the interviews. Another consequence of the study methodology is that it was not possible to study the quality of data-information-knowledge; that would require quite other methods of study.
This study represents a first try to analyze the forest planning of large forest owners with a sophisticated planning system with KM as frame of reference. It reveals the complexity of getting a planning system working: you need to design components that are consistent in terms of messages, senders, channels, receivers, and to ensure that the quality is adequate along the line. Obviously, new information sources do not automatically translate into better planning. References Alavi, M. and D. E. Leidner 2001. Review: Knowledge management and
knowledge management systems: Conceptual foundations and research issues. Mis Quarterly 25(1): 107-136.
Andersson, D. and Eriksson, L.O. 2007. Effects of temporal aggregation in integrated strategic/tactical and strategic forest planning. Forest Policy and Economics 9 (2007) 965–981
Church, R.L. 2007. Tactical-Level Forest Management Models. . In: Handbook of Operations Research in Natural Resources, A. Weintraub, C. Romero, T. Bjørndal, and R. Epstein (Eds.). Springer. New York.
Conner, K. R. and C. K. Prahalad 1996. A resource-based theory of the firm: Knowledge versus opportunism. Organization Science 7(5): 477-501.
Eisenhardt, K. M. and J. A. Martin 2000. Dynamic capabilities: What are they?, John Wiley & Sons Ltd.
Epstein, R., Karlsson, J., Rönnqvist, M. and Weintraub, A. 2007. Harvest Operational Models in Forestry. . In: Handbook of Operations Research in Natural Resources, A. Weintraub, C. Romero, T. Bjørndal, and R. Epstein (Eds.). Springer. New York.
Eriksson, M. 2004. Strategisk och taktisk planering samt länken där emellan - analys av planeringsprocessens genomförande vid SCA Skog. Working Paper No. 207, Department of Forest Resource Management and Geomatics, SLU. Umeå.

44
Grant, R. M. 1996. Toward a knowledge-based theory of the firm. Strategic Management Journal 17: 109-122.
Gunn, E.A. 2007. Models for Strategic Forest Management. P. 317-341. In: Handbook of Operations Research in Natural Resources, A. Weintraub, C. Romero, T. Bjørndal, and R. Epstein (Eds.). Springer. New York.
Gupta, A. K. and V. Govindarajan 2000. Knowledge flows within multinational corporations. Strategic Management Journal 21(4): 473-496.
Hansen, M. T., N. Nohria and T. Tierney 1999. What's your strategy for managing knowledge? Harvard Business Review 77(2): 106-+.
Holsapple, C. W. 2008. Decisions and Knowledge. Handbook on decision support systems 1. B. F. H. S.W. Heidelberg, Springer.
Jonsson, B., Jacobsson, J. and Kallur, H. 1993. The forest management planning package : theory and application. Studia forestalia Suecica, 189. Faculty of Forestry, Swedish Univ. of Agricultural Sciences. Uppsala.
Kvale, S. 1997. Den kvalitativa forskningsintervjun. Lund, Studentlitteratur. Lindberg, E, Holmgren, J. , Olofsson, K., Wallerman, J., Olsson, H. 2010.
Estimation of tree lists from airborne laser scanning by combining single-tree and area-based methods. International Journal of Remote Sensing, Volume 31, Issue 5, pages 1175 – 1192.
Nonaka, I. 1994. A Dynamic Theory of Organizational Knowledge Creation. Organization Science 5(1): 14-37.
Sensky, T. 2002. Knowledge management Advances in Psychiatric Treatment 8(5): 387-396.
Spender, J. C. 1996. Organizational knowledge, learning and memory: Three concepts in search of a theory. Journal of Organizational Change Management 9(1): 63-&.
Söderholm, J. 2002. De svenska skogsbolagens system för skoglig planering. Working Paper No. 98, Department of Forest Resource Management and Geomatics, SLU. Umeå.
Zack, M. H. 1999. Developing a knowledge strategy. California Management Review 41(3): 125-+.
Appraising the economic impact of tree diseases in Britain: several shots in the dark, and possibly also in
the wrong ball-park?
Colin Price School of the Environment, Natural Resources and Geography,
Bangor University
Abstract Tree diseases are becoming more problematic with changing circumstances. Plant pathologists are reluctant to make predictions of their likely spread and severity. Forest economists are thus thrown back on making speculations about these matters and trying to induce a response about their reasonableness. Impact on timber production and carbon effects may be met by treatment, by accepting mortality or loss of increment, by changing species, and/or by abandoning silviculture altogether, each with its costs and opportunity costs. Loss of environmental services is an additional possible outcome. Losses from landscapes seem particularly important; effects on hydrology, air conditioning and biodiversity less so. Keywords: tree diseases, Britain, cost–benefit analysis, timber, carbon, landscape 1. Introduction Increasing movement of plant material about the world, and new susceptibility due to climate change, have dramatically increased the incidence of tree diseases in Great Britain, and indeed elsewhere in Europe. Pathogens which have long been known as minor irritations have become the cause of major outbreaks. New pathogens are being discovered which threaten whole suites of species. Even among non-economists, the question eventually arises: what are the economic costs of all this? For a recent conference on tree diseases, a request was made to address this question (Price, 2010). In answering, I found myself revisiting the territory of almost all environmental and forestry economics, and effectively re-running a cost−benefit analysis of trees in Great Britain. (Because Forestry Commission statistics are collected for Great Britain, not Northern Ireland, figures are generally not presented for the entire United Kingdom.)
The major problem lay in obtaining information on the underlying biological and physical realities. Plant pathologists are reluctant to make
45
Grant, R. M. 1996. Toward a knowledge-based theory of the firm. Strategic Management Journal 17: 109-122.
Gunn, E.A. 2007. Models for Strategic Forest Management. P. 317-341. In: Handbook of Operations Research in Natural Resources, A. Weintraub, C. Romero, T. Bjørndal, and R. Epstein (Eds.). Springer. New York.
Gupta, A. K. and V. Govindarajan 2000. Knowledge flows within multinational corporations. Strategic Management Journal 21(4): 473-496.
Hansen, M. T., N. Nohria and T. Tierney 1999. What's your strategy for managing knowledge? Harvard Business Review 77(2): 106-+.
Holsapple, C. W. 2008. Decisions and Knowledge. Handbook on decision support systems 1. B. F. H. S.W. Heidelberg, Springer.
Jonsson, B., Jacobsson, J. and Kallur, H. 1993. The forest management planning package : theory and application. Studia forestalia Suecica, 189. Faculty of Forestry, Swedish Univ. of Agricultural Sciences. Uppsala.
Kvale, S. 1997. Den kvalitativa forskningsintervjun. Lund, Studentlitteratur. Lindberg, E, Holmgren, J. , Olofsson, K., Wallerman, J., Olsson, H. 2010.
Estimation of tree lists from airborne laser scanning by combining single-tree and area-based methods. International Journal of Remote Sensing, Volume 31, Issue 5, pages 1175 – 1192.
Nonaka, I. 1994. A Dynamic Theory of Organizational Knowledge Creation. Organization Science 5(1): 14-37.
Sensky, T. 2002. Knowledge management Advances in Psychiatric Treatment 8(5): 387-396.
Spender, J. C. 1996. Organizational knowledge, learning and memory: Three concepts in search of a theory. Journal of Organizational Change Management 9(1): 63-&.
Söderholm, J. 2002. De svenska skogsbolagens system för skoglig planering. Working Paper No. 98, Department of Forest Resource Management and Geomatics, SLU. Umeå.
Zack, M. H. 1999. Developing a knowledge strategy. California Management Review 41(3): 125-+.
Appraising the economic impact of tree diseases in Britain: several shots in the dark, and possibly also in
the wrong ball-park?
Colin Price School of the Environment, Natural Resources and Geography,
Bangor University
Abstract Tree diseases are becoming more problematic with changing circumstances. Plant pathologists are reluctant to make predictions of their likely spread and severity. Forest economists are thus thrown back on making speculations about these matters and trying to induce a response about their reasonableness. Impact on timber production and carbon effects may be met by treatment, by accepting mortality or loss of increment, by changing species, and/or by abandoning silviculture altogether, each with its costs and opportunity costs. Loss of environmental services is an additional possible outcome. Losses from landscapes seem particularly important; effects on hydrology, air conditioning and biodiversity less so. Keywords: tree diseases, Britain, cost–benefit analysis, timber, carbon, landscape 1. Introduction Increasing movement of plant material about the world, and new susceptibility due to climate change, have dramatically increased the incidence of tree diseases in Great Britain, and indeed elsewhere in Europe. Pathogens which have long been known as minor irritations have become the cause of major outbreaks. New pathogens are being discovered which threaten whole suites of species. Even among non-economists, the question eventually arises: what are the economic costs of all this? For a recent conference on tree diseases, a request was made to address this question (Price, 2010). In answering, I found myself revisiting the territory of almost all environmental and forestry economics, and effectively re-running a cost−benefit analysis of trees in Great Britain. (Because Forestry Commission statistics are collected for Great Britain, not Northern Ireland, figures are generally not presented for the entire United Kingdom.)
The major problem lay in obtaining information on the underlying biological and physical realities. Plant pathologists are reluctant to make

46
predictions of the likely spread and severity of new, or newly important, pathogens. In these circumstances forest economists are thrown back on making speculations, about these matters, and about the responses of forester managers. Sometimes it seemed that the best available approach was to assume that all states of nature were equally likely, unless a different probability was offered. Alternatively, figures were often suggested as no more than “shots in the dark”. This sometimes provoked the biological experts to come up with a figure that they “preferred”.
However, this paper focuses on the evaluative techniques required. After a note on general procedure, it considers in sequence the cost of tree diseases through reduced timber production and carbon sequestration; reduced landscape quality; and the compromised value of environmental services. Although a summary figure is given, the speculative nature of the physical data means that this should be considered as the roughest of estimates, possibly of the right order of magnitude, but not more accurate than that.
2. The evaluative framework First, the general framework for evaluation should be established. The costs of crop establishment were supplied by the British Forestry Commission. Timber prices in Britain have been low since 1995, as a result firstly of an over-valued pound sterling, secondly of the recent recession; but an assumption was made that, during the life of the crops considered, the prices prevailing through most of the second half of the twentieth century would be restored. Net present values were calculated using the 3% discount rate advocated by the UK Treasury (undated) for forestry time scales. They were converted to annual equivalents, as such figures seemed easier to grasp.
A young and idealistic forest economist would base calculations of the cost of tree diseases on the difference of NPV between the nation’s tree resources managed optimally in the absence of diseases, and in the presence of tree diseases. An elderly and sceptical one would compare NPVs based on what forest managers are actually likely to do in response to diseases and what the change to a with-disease situation entails: this approach has been adopted.
Management costs are ignored, on the grounds that they will not differ much between with- and without-disease situations. Crops are grown on their optimal rotation, and, unless disease makes this risky, there will be a perpetual succession of crops of the same species and productivity. It is customary in economic assessments of British commercial forestry to reduce figures to allow for unproductive areas within stands (rocky or swampy patches, or lines occupied by roads or firebreaks): hence a deduction of 10% has been made from what would result from multiplying per hectare figures by the number of hectares affected.
3. Timber production and carbon sequestration: red band needle blight Because carbon sequestration is closely tied to the timber production cycle, the two effects are treated together. Carbon fluxes (sequestration and volatilisation) are priced at £80 per tonne of carbon (slightly revalued from Department of Trade and Industry (2003)). This is close to the recent recommended figure of £21 per tonne of CO2 (Department of Energy and Climate Change, 2009). It is assumed that marginal change of available small dimension material will result in equal change in biomass combustion, with displacement of fossil fuel burning. At present it is unclear what the marginal effects of changed availability of large dimension material would be. For illustrative purposes, it is further assumed that, for each tonne of carbon incorporated in such material, combustion of 0.5 tonnes of carbon in fossil fuels is saved through displacement of materials such as steel and concrete.
For commercial forests, the current focal disease problem is that caused by Dothistroma pini (Brown and Webber, 2008). Known as a problem in nurseries for several decades, it has lately affected forests to such an extent, that a moratorium has been declared by the Forestry Commission on planting Corsican pine (Pinus niger var. laricio) and lodgepole pine (Pinus contorta). Other exotic pines are also affected badly: it has been particularly serious on Pinus radiata in New Zealand (but not Sjælland) and East Africa. It has been reported in many European countries. Fortunately, although it infects Scots pine (Pinus sylvestris), this does not seem to affect its increment much.
Spraying with copper compounds has proved effective in some countries, but environmental constraints have blocked this treatment’s being used in Britain.
4. Lodgepole pine The mean productivity of this species in Britain is about 8 m3 ha–1 year–1. It is not normally thinned. Wind often constrains the rotation, which for the following calculations is taken to be 56 years. The without-disease-in-Britain baseline assumes that at the end of this normal rotation 50% of the crop is replaced by Sitka spruce (Picea sitchensis), which generally grows faster than lodgepole pine, especially if one rotation of the latter species has partly drained the site. Replanting of lodgepole pine is undertaken on 25% of the area, and the remainder undergoes “habitat restoration” (to an unproductive species mix or to open moorland), with no subsequent commercial value.
Disease is taken to affect all age classes, with equal probability. Crop death has been the result of heavy infections. It is assumed that once again 50% of area is replanted with Sitka spruce, and that all the remainder undergoes habitat restoration.

47
predictions of the likely spread and severity of new, or newly important, pathogens. In these circumstances forest economists are thrown back on making speculations, about these matters, and about the responses of forester managers. Sometimes it seemed that the best available approach was to assume that all states of nature were equally likely, unless a different probability was offered. Alternatively, figures were often suggested as no more than “shots in the dark”. This sometimes provoked the biological experts to come up with a figure that they “preferred”.
However, this paper focuses on the evaluative techniques required. After a note on general procedure, it considers in sequence the cost of tree diseases through reduced timber production and carbon sequestration; reduced landscape quality; and the compromised value of environmental services. Although a summary figure is given, the speculative nature of the physical data means that this should be considered as the roughest of estimates, possibly of the right order of magnitude, but not more accurate than that.
2. The evaluative framework First, the general framework for evaluation should be established. The costs of crop establishment were supplied by the British Forestry Commission. Timber prices in Britain have been low since 1995, as a result firstly of an over-valued pound sterling, secondly of the recent recession; but an assumption was made that, during the life of the crops considered, the prices prevailing through most of the second half of the twentieth century would be restored. Net present values were calculated using the 3% discount rate advocated by the UK Treasury (undated) for forestry time scales. They were converted to annual equivalents, as such figures seemed easier to grasp.
A young and idealistic forest economist would base calculations of the cost of tree diseases on the difference of NPV between the nation’s tree resources managed optimally in the absence of diseases, and in the presence of tree diseases. An elderly and sceptical one would compare NPVs based on what forest managers are actually likely to do in response to diseases and what the change to a with-disease situation entails: this approach has been adopted.
Management costs are ignored, on the grounds that they will not differ much between with- and without-disease situations. Crops are grown on their optimal rotation, and, unless disease makes this risky, there will be a perpetual succession of crops of the same species and productivity. It is customary in economic assessments of British commercial forestry to reduce figures to allow for unproductive areas within stands (rocky or swampy patches, or lines occupied by roads or firebreaks): hence a deduction of 10% has been made from what would result from multiplying per hectare figures by the number of hectares affected.
3. Timber production and carbon sequestration: red band needle blight Because carbon sequestration is closely tied to the timber production cycle, the two effects are treated together. Carbon fluxes (sequestration and volatilisation) are priced at £80 per tonne of carbon (slightly revalued from Department of Trade and Industry (2003)). This is close to the recent recommended figure of £21 per tonne of CO2 (Department of Energy and Climate Change, 2009). It is assumed that marginal change of available small dimension material will result in equal change in biomass combustion, with displacement of fossil fuel burning. At present it is unclear what the marginal effects of changed availability of large dimension material would be. For illustrative purposes, it is further assumed that, for each tonne of carbon incorporated in such material, combustion of 0.5 tonnes of carbon in fossil fuels is saved through displacement of materials such as steel and concrete.
For commercial forests, the current focal disease problem is that caused by Dothistroma pini (Brown and Webber, 2008). Known as a problem in nurseries for several decades, it has lately affected forests to such an extent, that a moratorium has been declared by the Forestry Commission on planting Corsican pine (Pinus niger var. laricio) and lodgepole pine (Pinus contorta). Other exotic pines are also affected badly: it has been particularly serious on Pinus radiata in New Zealand (but not Sjælland) and East Africa. It has been reported in many European countries. Fortunately, although it infects Scots pine (Pinus sylvestris), this does not seem to affect its increment much.
Spraying with copper compounds has proved effective in some countries, but environmental constraints have blocked this treatment’s being used in Britain.
4. Lodgepole pine The mean productivity of this species in Britain is about 8 m3 ha–1 year–1. It is not normally thinned. Wind often constrains the rotation, which for the following calculations is taken to be 56 years. The without-disease-in-Britain baseline assumes that at the end of this normal rotation 50% of the crop is replaced by Sitka spruce (Picea sitchensis), which generally grows faster than lodgepole pine, especially if one rotation of the latter species has partly drained the site. Replanting of lodgepole pine is undertaken on 25% of the area, and the remainder undergoes “habitat restoration” (to an unproductive species mix or to open moorland), with no subsequent commercial value.
Disease is taken to affect all age classes, with equal probability. Crop death has been the result of heavy infections. It is assumed that once again 50% of area is replanted with Sitka spruce, and that all the remainder undergoes habitat restoration.
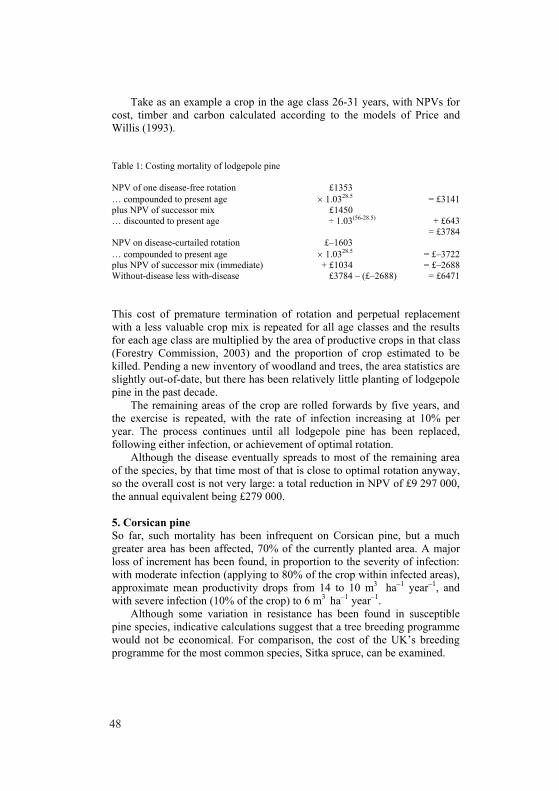
48
Take as an example a crop in the age class 26-31 years, with NPVs for cost, timber and carbon calculated according to the models of Price and Willis (1993).
Table 1: Costing mortality of lodgepole pine NPV of one disease-free rotation £1353 … compounded to present age × 1.0328.5 = £3141 plus NPV of successor mix £1450 … discounted to present age ÷ 1.03(56-28.5) + £643
= £3784 NPV on disease-curtailed rotation £–1603 … compounded to present age × 1.0328.5 = £–3722 plus NPV of successor mix (immediate) + £1034 = £–2688 Without-disease less with-disease £3784 – (£–2688) = £6471 This cost of premature termination of rotation and perpetual replacement with a less valuable crop mix is repeated for all age classes and the results for each age class are multiplied by the area of productive crops in that class (Forestry Commission, 2003) and the proportion of crop estimated to be killed. Pending a new inventory of woodland and trees, the area statistics are slightly out-of-date, but there has been relatively little planting of lodgepole pine in the past decade.
The remaining areas of the crop are rolled forwards by five years, and the exercise is repeated, with the rate of infection increasing at 10% per year. The process continues until all lodgepole pine has been replaced, following either infection, or achievement of optimal rotation.
Although the disease eventually spreads to most of the remaining area of the species, by that time most of that is close to optimal rotation anyway, so the overall cost is not very large: a total reduction in NPV of £9 297 000, the annual equivalent being £279 000.
5. Corsican pine So far, such mortality has been infrequent on Corsican pine, but a much greater area has been affected, 70% of the currently planted area. A major loss of increment has been found, in proportion to the severity of infection: with moderate infection (applying to 80% of the crop within infected areas), approximate mean productivity drops from 14 to 10 m3 ha–1 year–1, and with severe infection (10% of the crop) to 6 m3 ha–1 year–1.
Although some variation in resistance has been found in susceptible pine species, indicative calculations suggest that a tree breeding programme would not be economical. For comparison, the cost of the UK’s breeding programme for the most common species, Sitka spruce, can be examined.
In the early 1990s, the programme was said to have cost £1½ million per year over 30 years, which gives a value compounded to the end of the programme of
interest 3%at million 36.71£03.103.0
03.111M5.1£
3030=×
⎟⎠⎞
⎜⎝⎛ −×
Assume that a similar programme cost would be involved for Corsican pine. Initiated now, and with costs indexed to 2010 prices, the programme would cost £130.3 million by 2040.
Substantial returns from this programme start in 40 further years (on average, allowing for some thinning and some early felling), as a result of improved yield from the first crop of improved Corsican pine, and remain at £X million per year thereafter, as succeeding age-classes are felled.
The value discounted to present of £X million every year from 40 in perpetuity is
million76.12£1.03 0.03 on 130.3milli £million £whence
even.break order toin million 3.130£ must which 03.11
03.0million£
40
40
≈××=
=
×
X
X
With 47 000 ha of Corsican pine felled on a short 47-year rotation at 1000 ha per year, this requires a gain of £12 760 per hectare felled. With an average price £25/m3, this would require
3m86.104725£76012£ =÷÷ ha–1 year–1
of restored production per year. This is well beyond the differential of productivity between Corsican pine – supposing it to be completely resistant to infection – and the probable replacement crops, though no superior carbon fixing values have been included in this calculation.
The actual managerial response to infection has generally been to maintain thinning, despite some disease-induced reduction of canopy density, so as to improve air circulation; and to maintain planned rotations to avoid distorting planned timber supply. At the end of the planned rotation replanting will be with less susceptible species: speculatively, 25% of area with Douglas fir (Pseudotsuga menziesii), 25% with Japanese or hybrid larch (Larix kaempferi/×eurolepis) and 50% with Scots pine (Pinus sylvestris).

49
Take as an example a crop in the age class 26-31 years, with NPVs for cost, timber and carbon calculated according to the models of Price and Willis (1993).
Table 1: Costing mortality of lodgepole pine NPV of one disease-free rotation £1353 … compounded to present age × 1.0328.5 = £3141 plus NPV of successor mix £1450 … discounted to present age ÷ 1.03(56-28.5) + £643
= £3784 NPV on disease-curtailed rotation £–1603 … compounded to present age × 1.0328.5 = £–3722 plus NPV of successor mix (immediate) + £1034 = £–2688 Without-disease less with-disease £3784 – (£–2688) = £6471 This cost of premature termination of rotation and perpetual replacement with a less valuable crop mix is repeated for all age classes and the results for each age class are multiplied by the area of productive crops in that class (Forestry Commission, 2003) and the proportion of crop estimated to be killed. Pending a new inventory of woodland and trees, the area statistics are slightly out-of-date, but there has been relatively little planting of lodgepole pine in the past decade.
The remaining areas of the crop are rolled forwards by five years, and the exercise is repeated, with the rate of infection increasing at 10% per year. The process continues until all lodgepole pine has been replaced, following either infection, or achievement of optimal rotation.
Although the disease eventually spreads to most of the remaining area of the species, by that time most of that is close to optimal rotation anyway, so the overall cost is not very large: a total reduction in NPV of £9 297 000, the annual equivalent being £279 000.
5. Corsican pine So far, such mortality has been infrequent on Corsican pine, but a much greater area has been affected, 70% of the currently planted area. A major loss of increment has been found, in proportion to the severity of infection: with moderate infection (applying to 80% of the crop within infected areas), approximate mean productivity drops from 14 to 10 m3 ha–1 year–1, and with severe infection (10% of the crop) to 6 m3 ha–1 year–1.
Although some variation in resistance has been found in susceptible pine species, indicative calculations suggest that a tree breeding programme would not be economical. For comparison, the cost of the UK’s breeding programme for the most common species, Sitka spruce, can be examined.
In the early 1990s, the programme was said to have cost £1½ million per year over 30 years, which gives a value compounded to the end of the programme of
interest 3%at million 36.71£03.103.0
03.111M5.1£
3030=×
⎟⎠⎞
⎜⎝⎛ −×
Assume that a similar programme cost would be involved for Corsican pine. Initiated now, and with costs indexed to 2010 prices, the programme would cost £130.3 million by 2040.
Substantial returns from this programme start in 40 further years (on average, allowing for some thinning and some early felling), as a result of improved yield from the first crop of improved Corsican pine, and remain at £X million per year thereafter, as succeeding age-classes are felled.
The value discounted to present of £X million every year from 40 in perpetuity is
million76.12£1.03 0.03 on 130.3milli £million £whence
even.break order toin million 3.130£ must which 03.11
03.0million£
40
40
≈××=
=
×
X
X
With 47 000 ha of Corsican pine felled on a short 47-year rotation at 1000 ha per year, this requires a gain of £12 760 per hectare felled. With an average price £25/m3, this would require
3m86.104725£76012£ =÷÷ ha–1 year–1
of restored production per year. This is well beyond the differential of productivity between Corsican pine – supposing it to be completely resistant to infection – and the probable replacement crops, though no superior carbon fixing values have been included in this calculation.
The actual managerial response to infection has generally been to maintain thinning, despite some disease-induced reduction of canopy density, so as to improve air circulation; and to maintain planned rotations to avoid distorting planned timber supply. At the end of the planned rotation replanting will be with less susceptible species: speculatively, 25% of area with Douglas fir (Pseudotsuga menziesii), 25% with Japanese or hybrid larch (Larix kaempferi/×eurolepis) and 50% with Scots pine (Pinus sylvestris).

50
Lost increment can be modelled by maintaining the thinning regime laid down in Edwards and Christie (1981), but increasing the time interval between thinning interventions, in inverse proportion to the loss of productivity. Thus, for example, if moderate infection occurs at 27 years, a normal thinning takes place then, but the next one is delayed from 32 years to 27 + 5 × 14/10 = 34 years. Final felling takes place at 57 years, the available revenue being interpolated from a financial yield model stretched out over time from the age of infection. The time taken to reach given total volume production is shown in figure 1, which also shows the reduced volume available on a 57-year rotation.
01020304050607080
0 100 200 300 400 500 600 700 800 900
Age
(Ear
th y
ears
)
Volume produced (m3)
With infection
No infection
Figure 1: Effect of moderate infection at age 27 on volume production This expedient of stretching the time scale avoids the need to create complicated single-tree growth models. The result for this age class is as follows: Table 2: Costing disease on a hectare of Corsican pine NPV of perpetual disease-free rotations £8348 … compounded to present age × 1.0327 = £18 543 NPV of one disease-slowed rotation £5226 … compounded to present age × 1.0327 = £11 608 Mean NPV of successor mix £5121 … discounted to present age ÷ 1.03(57-27) = £2 110 Without-disease less with-disease £18 543 – (£11 608 + £2 110) = £4 825 As with lodgepole pine, the calculations are repeated for all age classes, and the per hectare figures multiplied by total area in each age class. Ten-year
age classes are used, to accord with availability of decadal planting figures. Infection is assumed to progress linearly from the current 70% to affect the entire 47 000 hectares by the end of one rotation.
The total reduction in NPV is £166 325 000, of which the annual equivalent is £4 990 000.
6. Forgone expansion opportunities Recent projections suggest that within decades the climate of southern Britain may resemble that of south-west France. In that case, Corsican pine might have become the most productive species over as much as 5% of Britain’s forest area (Broadmeadow, 2002). Unless some efficacious treatment is identified, that possibility is now barred. The assumption is made that, without the disease, expansion to 5% of forest area would have occurred, Corsican pine replacing the mix of species which is now being replanted in its place. The annual equivalent of the forgone opportunity is a loss of £3 306 000. 7. Other diseases and timber/carbon effects Sudden oak death, the result of infection by Phytophthora ramorum/kernoviae, does not actually cause the death of native British oaks, but does affect other species. It is a recent phenomenon in Britain, and pathological symptoms on timber species have only lately been noted, on Japanese larch. Premature sanitation felling has been undertaken. The economic effects are parallel to those shown above for lodgepole pine, except that a constant annual loss of 50 hectares has been assumed, spread equally across age classes; and replacement of Japanese larch having mean productivity of 10 m3 ha–1 year–1 is by a crop of equal productivity but zero susceptibility.
Figure 2 shows the profile of loss as older age classes are affected. At the outset of the rotation, the only cost is that of regenerating the crop again. Later, the forgone value of the crop’s increment up to its optimal rotation is added to that. However, as the optimal rotation is approached, it becomes a matter almost of economic indifference whether the crop is felled according to plan or as a result of late-life infection.

51
Lost increment can be modelled by maintaining the thinning regime laid down in Edwards and Christie (1981), but increasing the time interval between thinning interventions, in inverse proportion to the loss of productivity. Thus, for example, if moderate infection occurs at 27 years, a normal thinning takes place then, but the next one is delayed from 32 years to 27 + 5 × 14/10 = 34 years. Final felling takes place at 57 years, the available revenue being interpolated from a financial yield model stretched out over time from the age of infection. The time taken to reach given total volume production is shown in figure 1, which also shows the reduced volume available on a 57-year rotation.
01020304050607080
0 100 200 300 400 500 600 700 800 900
Age
(Ear
th y
ears
)
Volume produced (m3)
With infection
No infection
Figure 1: Effect of moderate infection at age 27 on volume production This expedient of stretching the time scale avoids the need to create complicated single-tree growth models. The result for this age class is as follows: Table 2: Costing disease on a hectare of Corsican pine NPV of perpetual disease-free rotations £8348 … compounded to present age × 1.0327 = £18 543 NPV of one disease-slowed rotation £5226 … compounded to present age × 1.0327 = £11 608 Mean NPV of successor mix £5121 … discounted to present age ÷ 1.03(57-27) = £2 110 Without-disease less with-disease £18 543 – (£11 608 + £2 110) = £4 825 As with lodgepole pine, the calculations are repeated for all age classes, and the per hectare figures multiplied by total area in each age class. Ten-year
age classes are used, to accord with availability of decadal planting figures. Infection is assumed to progress linearly from the current 70% to affect the entire 47 000 hectares by the end of one rotation.
The total reduction in NPV is £166 325 000, of which the annual equivalent is £4 990 000.
6. Forgone expansion opportunities Recent projections suggest that within decades the climate of southern Britain may resemble that of south-west France. In that case, Corsican pine might have become the most productive species over as much as 5% of Britain’s forest area (Broadmeadow, 2002). Unless some efficacious treatment is identified, that possibility is now barred. The assumption is made that, without the disease, expansion to 5% of forest area would have occurred, Corsican pine replacing the mix of species which is now being replanted in its place. The annual equivalent of the forgone opportunity is a loss of £3 306 000. 7. Other diseases and timber/carbon effects Sudden oak death, the result of infection by Phytophthora ramorum/kernoviae, does not actually cause the death of native British oaks, but does affect other species. It is a recent phenomenon in Britain, and pathological symptoms on timber species have only lately been noted, on Japanese larch. Premature sanitation felling has been undertaken. The economic effects are parallel to those shown above for lodgepole pine, except that a constant annual loss of 50 hectares has been assumed, spread equally across age classes; and replacement of Japanese larch having mean productivity of 10 m3 ha–1 year–1 is by a crop of equal productivity but zero susceptibility.
Figure 2 shows the profile of loss as older age classes are affected. At the outset of the rotation, the only cost is that of regenerating the crop again. Later, the forgone value of the crop’s increment up to its optimal rotation is added to that. However, as the optimal rotation is approached, it becomes a matter almost of economic indifference whether the crop is felled according to plan or as a result of late-life infection.
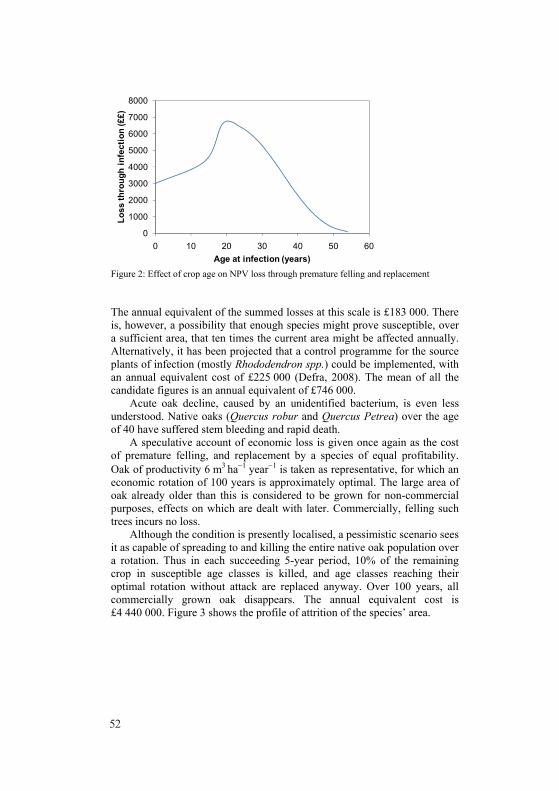
52
0
1000
2000
3000
4000
5000
6000
7000
8000
0 10 20 30 40 50 60
Loss
thro
ugh
infe
ctio
n (£
£)
Age at infection (years) Figure 2: Effect of crop age on NPV loss through premature felling and replacement The annual equivalent of the summed losses at this scale is £183 000. There is, however, a possibility that enough species might prove susceptible, over a sufficient area, that ten times the current area might be affected annually. Alternatively, it has been projected that a control programme for the source plants of infection (mostly Rhododendron spp.) could be implemented, with an annual equivalent cost of £225 000 (Defra, 2008). The mean of all the candidate figures is an annual equivalent of £746 000.
Acute oak decline, caused by an unidentified bacterium, is even less understood. Native oaks (Quercus robur and Quercus Petrea) over the age of 40 have suffered stem bleeding and rapid death.
A speculative account of economic loss is given once again as the cost of premature felling, and replacement by a species of equal profitability. Oak of productivity 6 m3 ha−1 year−1 is taken as representative, for which an economic rotation of 100 years is approximately optimal. The large area of oak already older than this is considered to be grown for non-commercial purposes, effects on which are dealt with later. Commercially, felling such trees incurs no loss.
Although the condition is presently localised, a pessimistic scenario sees it as capable of spreading to and killing the entire native oak population over a rotation. Thus in each succeeding 5-year period, 10% of the remaining crop in susceptible age classes is killed, and age classes reaching their optimal rotation without attack are replaced anyway. Over 100 years, all commercially grown oak disappears. The annual equivalent cost is £4 440 000. Figure 3 shows the profile of attrition of the species’ area.
0
20,000
40,000
60,000
80,000
100,000
120,000
140,000
2000 2020 2040 2060 2080 2100 2120
Are
a (h
ecta
res)
Year Figure 3: Loss of oak area to acute oak decline – pessimistic scenario Such an outcome, for England’s national tree (it is important in Wales too), can scarcely be contemplated, and it is certain that strenuous efforts would be made to avert it. But these would be expensive too. Because so little is known about the disease, an illustrative 25% probability of the above scenario’s eventuating is assigned, giving a mean expected annual cost of £1 110 000. 8. Effects on landscape At present two further diseases are of particular concern for their landscape effect in Britain. Common alder (Alnus glutinosa) has become susceptible to the recently identified Phytophthora alni, with around 20% of trees killed according to one study (Webber et al., 2004). Bleeding canker caused by Pseudomonas syringae has infected 50% of horse chestnuts (Aesculus hippocastaneum) and caused the death of many (Forestry Commission Plant Health Service, 2008). Both species are important for aesthetic purposes, alder in riverine settings, and horse chestnut as a parkland and street tree. These add to the earlier disappearance of nearly all English elms (Ulmus procera) from the rural landscape as a result of Dutch elm disease (Ophiostoma novo-ulmi) – and it is possible that oaks will follow them. In immediately past and forthcoming decades, it would be reasonable to assume a loss of 10% of amenity trees to these and other diseases.
Numerous approaches have been adopted to valuing tree losses:
Costs willingly undertaken to protect elms against Dutch elm disease imply that individual trees were valued at not less than £1350 (Price, 2007). Helliwell’s scheme (1967), based

53
0
1000
2000
3000
4000
5000
6000
7000
8000
0 10 20 30 40 50 60
Loss
thro
ugh
infe
ctio
n (£
£)
Age at infection (years) Figure 2: Effect of crop age on NPV loss through premature felling and replacement The annual equivalent of the summed losses at this scale is £183 000. There is, however, a possibility that enough species might prove susceptible, over a sufficient area, that ten times the current area might be affected annually. Alternatively, it has been projected that a control programme for the source plants of infection (mostly Rhododendron spp.) could be implemented, with an annual equivalent cost of £225 000 (Defra, 2008). The mean of all the candidate figures is an annual equivalent of £746 000.
Acute oak decline, caused by an unidentified bacterium, is even less understood. Native oaks (Quercus robur and Quercus Petrea) over the age of 40 have suffered stem bleeding and rapid death.
A speculative account of economic loss is given once again as the cost of premature felling, and replacement by a species of equal profitability. Oak of productivity 6 m3 ha−1 year−1 is taken as representative, for which an economic rotation of 100 years is approximately optimal. The large area of oak already older than this is considered to be grown for non-commercial purposes, effects on which are dealt with later. Commercially, felling such trees incurs no loss.
Although the condition is presently localised, a pessimistic scenario sees it as capable of spreading to and killing the entire native oak population over a rotation. Thus in each succeeding 5-year period, 10% of the remaining crop in susceptible age classes is killed, and age classes reaching their optimal rotation without attack are replaced anyway. Over 100 years, all commercially grown oak disappears. The annual equivalent cost is £4 440 000. Figure 3 shows the profile of attrition of the species’ area.
0
20,000
40,000
60,000
80,000
100,000
120,000
140,000
2000 2020 2040 2060 2080 2100 2120
Are
a (h
ecta
res)
Year Figure 3: Loss of oak area to acute oak decline – pessimistic scenario Such an outcome, for England’s national tree (it is important in Wales too), can scarcely be contemplated, and it is certain that strenuous efforts would be made to avert it. But these would be expensive too. Because so little is known about the disease, an illustrative 25% probability of the above scenario’s eventuating is assigned, giving a mean expected annual cost of £1 110 000. 8. Effects on landscape At present two further diseases are of particular concern for their landscape effect in Britain. Common alder (Alnus glutinosa) has become susceptible to the recently identified Phytophthora alni, with around 20% of trees killed according to one study (Webber et al., 2004). Bleeding canker caused by Pseudomonas syringae has infected 50% of horse chestnuts (Aesculus hippocastaneum) and caused the death of many (Forestry Commission Plant Health Service, 2008). Both species are important for aesthetic purposes, alder in riverine settings, and horse chestnut as a parkland and street tree. These add to the earlier disappearance of nearly all English elms (Ulmus procera) from the rural landscape as a result of Dutch elm disease (Ophiostoma novo-ulmi) – and it is possible that oaks will follow them. In immediately past and forthcoming decades, it would be reasonable to assume a loss of 10% of amenity trees to these and other diseases.
Numerous approaches have been adopted to valuing tree losses:
Costs willingly undertaken to protect elms against Dutch elm disease imply that individual trees were valued at not less than £1350 (Price, 2007). Helliwell’s scheme (1967), based

54
on expert judgement of key tree characteristics, has attributed values between £2500 and £10 600 to a horse chestnut in Bangor. Curtailment of longevity by bleeding canker could halve such values, and decline in crown condition reduce them by two-thirds. Stated public willingness to pay to avert poor crown condition resulting from acid rain was $2 per person (Crocker, 1985); and similar valuations are now applied to the effects of sudden oak death (Mourato, 2010). A visually prominent group of churchyard weeping elms in Newcastle upon Tyne was valued at £149 000 relative to a scenario in which they succumbed without replacement (Cobham Resource Consultants and Price, 1991); the valuation being derived from urban house price differentials, where houses commanded views of different quality. (Price, 2010)
The following estimate of the effect of tree diseases on rural landscape values is based on a study of travel costs to landscapes of different quality (Bergin and Price, 1994); an assessment of the landscapes’ quality on a widely tested aesthetic scale (Thomas and Price, 1999); and the record of visits to the British countryside (Anon, 2004).
Any replanted tree takes time, decades usually, to achieve the full aesthetic effect of a mature tree. Nevertheless, replanting can and will to an extent mitigate the effect of loss, and probably at a modest cost. On these grounds an illustrative mitigation factor of 0.5 has been used, for this and other calculations.
Table 3: Effect on rural landscape of disease-related tree loss Visits to countryside 1,262,000,000 Value per landscape point £(1993) × 0.44 Inflation factor to 2010 × 1.56 Mean contribution by trees (points) × 2.25 Proportional loss of trees due to disease × 0.1 Mitigation of loss × 0.5 Total effect £97,452,000 An argument could be made, that it is metaphysical to ascribe a cost to trees which are no longer in the landscape, as is the case with English elm. Yet lost potential contribution to the landscape is as relevant to the without-disease versus with-disease comparison, as is lost potential timber production.
There is a further argument, that the loss of a particular tree species to a particular disease is of little consequence, because there are other species that can take its place. This overlooks the precise aesthetic qualities of a given species, and the lack of exact substitutes, for example, for English elm.
For something barely deemed a species, all that trouble
could not be explained, except by seeing why this tree was unlike other elms less vulnerable,
but less stately set against an English sky. Black poplar’s frivolous leaves and birch’s light-twigged grace meant
that they lacked required solemnity; nor yet were lithe-limbed lime or cloud-crowned ash a fit replacement
for that heavy, high and hanging silhouette.
The unassuming lowland landscape lost an icon, little apprehended till it disappeared.
It was the place’s genius – one cannot see the like on canvasses that nations elsewhere engineered.
And, though the sun-stroked sheep and cattle still assemble in the lesser shade of other remnant trees
and barley prairies shimmer, hedgerow hawthorns tremble, they want that shape to share the shiver of the breeze. (Price, 2008)
So also it could also be said for the riverine alders, and for the parkland horse chestnuts …
That Christmas was the first to show
its real story starting to unfold: entwining sacred oratorio
with nature’s gifts, and gifts from long ago the incense-gorse, myrrh-mindful herbs and glow
of chestnut leaves turned gold. … and for all those other tree species that, whether we are conscious of it or not, have wound their way into nations’ cultures. Perhaps it is not so strange that we need poetic language to unpack the nature of substitutability and uniqueness.
Whether landscape values should be reduced in proportion to loss of trees is a more serious matter of debate. Economists might argue that tree losses should be treated as marginal, less significant than the “average” effect that is calculated above. But losses due to disease cannot be so marginalised within landscapes. They may strike randomly at the most significant trees; trees are likely to be attacked in groups, all of whose

55
on expert judgement of key tree characteristics, has attributed values between £2500 and £10 600 to a horse chestnut in Bangor. Curtailment of longevity by bleeding canker could halve such values, and decline in crown condition reduce them by two-thirds. Stated public willingness to pay to avert poor crown condition resulting from acid rain was $2 per person (Crocker, 1985); and similar valuations are now applied to the effects of sudden oak death (Mourato, 2010). A visually prominent group of churchyard weeping elms in Newcastle upon Tyne was valued at £149 000 relative to a scenario in which they succumbed without replacement (Cobham Resource Consultants and Price, 1991); the valuation being derived from urban house price differentials, where houses commanded views of different quality. (Price, 2010)
The following estimate of the effect of tree diseases on rural landscape values is based on a study of travel costs to landscapes of different quality (Bergin and Price, 1994); an assessment of the landscapes’ quality on a widely tested aesthetic scale (Thomas and Price, 1999); and the record of visits to the British countryside (Anon, 2004).
Any replanted tree takes time, decades usually, to achieve the full aesthetic effect of a mature tree. Nevertheless, replanting can and will to an extent mitigate the effect of loss, and probably at a modest cost. On these grounds an illustrative mitigation factor of 0.5 has been used, for this and other calculations.
Table 3: Effect on rural landscape of disease-related tree loss Visits to countryside 1,262,000,000 Value per landscape point £(1993) × 0.44 Inflation factor to 2010 × 1.56 Mean contribution by trees (points) × 2.25 Proportional loss of trees due to disease × 0.1 Mitigation of loss × 0.5 Total effect £97,452,000 An argument could be made, that it is metaphysical to ascribe a cost to trees which are no longer in the landscape, as is the case with English elm. Yet lost potential contribution to the landscape is as relevant to the without-disease versus with-disease comparison, as is lost potential timber production.
There is a further argument, that the loss of a particular tree species to a particular disease is of little consequence, because there are other species that can take its place. This overlooks the precise aesthetic qualities of a given species, and the lack of exact substitutes, for example, for English elm.
For something barely deemed a species, all that trouble
could not be explained, except by seeing why this tree was unlike other elms less vulnerable,
but less stately set against an English sky. Black poplar’s frivolous leaves and birch’s light-twigged grace meant
that they lacked required solemnity; nor yet were lithe-limbed lime or cloud-crowned ash a fit replacement
for that heavy, high and hanging silhouette.
The unassuming lowland landscape lost an icon, little apprehended till it disappeared.
It was the place’s genius – one cannot see the like on canvasses that nations elsewhere engineered.
And, though the sun-stroked sheep and cattle still assemble in the lesser shade of other remnant trees
and barley prairies shimmer, hedgerow hawthorns tremble, they want that shape to share the shiver of the breeze. (Price, 2008)
So also it could also be said for the riverine alders, and for the parkland horse chestnuts …
That Christmas was the first to show
its real story starting to unfold: entwining sacred oratorio
with nature’s gifts, and gifts from long ago the incense-gorse, myrrh-mindful herbs and glow
of chestnut leaves turned gold. … and for all those other tree species that, whether we are conscious of it or not, have wound their way into nations’ cultures. Perhaps it is not so strange that we need poetic language to unpack the nature of substitutability and uniqueness.
Whether landscape values should be reduced in proportion to loss of trees is a more serious matter of debate. Economists might argue that tree losses should be treated as marginal, less significant than the “average” effect that is calculated above. But losses due to disease cannot be so marginalised within landscapes. They may strike randomly at the most significant trees; trees are likely to be attacked in groups, all of whose
56
members are lost. In any case, the base of the above evaluation might be termed a “sum of marginals”: it is constructed by summation of the effects of removing trees from individual landscapes seriatim rather than by visualising a national landscape from which all trees have been lost.
An equivalent assessment for urban trees has been based on the illustrative assessment (it is no more than that) in Cobham Resource Consultants and Price (1991).
Table 4: Effect on urban landscape of disease-related tree loss 1990 capital value (100 year horizon) £62 500 000 000 Inflation factor 1990-2010 × 1.71 Spread over 100 years (not discounted) × 0.01 % loss × 0.10 Mitigation × 0.50 Annual equivalent = £33 681 057 To this may be added an estimated annual arboricultural expenditure of £12 500 000 to mitigate the effects of disease on urban trees – which seems to be at a reasonable level, given the annual equivalent value being defended, shown in table 4. 9. Other effects on ecosystem services While trees offer many environmental services – and some disservices – the treatment below is confined to the effects on hydrology, microclimate and biodiversity, brought about by a net loss of 5% of trees attributed to disease. Effects on atmospheric CO2, it will be recalled, have already been incorporated.
Trees have been ascribed many beneficial hydrological effects, not always on a sound scientific basis. At present in Britain the focus is on the capacity to mitigate floods, from whose effects …
… the Environment Agency gives insurable losses in bad years (one in ten?) as £3000 million. But with climate change Stern (2006) indicates that £4000 million might become normal for annual losses. The Flood Risk Management Research Consortium (2008) surmises that optimally located tree planting might reduce extreme flooding by 5%, or 36% with complete forest cover. Taking all permutations of the above, combined with 5% net loss of tree cover due to disease, gives a highly speculative cost of £2.65 million. (Price, 2010)
Of the negative effects, loss of supply capacity due to excess evaporation is locally important on hydroelectric and abstraction catchments, and is mostly due to conifers on hydroelectric catchments in Scotland. The following calculations are built on the work of Barrow et al. (1986) and Price (1999a). Table 5: Valuing savings of hydroelectricity losses Lost energy per ha per rotation (for a 100 m generating head) 500 GJ Convert to kWh × 1000/3.6 = 138 889 kWh Per year of 50-year rotation ÷ 50 = 2 778 kWh Price per kWh ( annual loss) × £0.14 = £389 Scotland’s conifer area (ha) × 900 000 % on catchment × 0.1 Total Scotland loss £35 000 000 Reduction due to disease loss × 0.05 = £1 750 000 Similarly, work for South-West Region (Price, 2009) estimated the cost of increasing reservoir capacity to compensate for evaporative losses, based on the procedure developed by Collet (1970). As a working approximation this can be scaled up to the area of Britain, which is ten times that of the South-West Region. Table 6: Overall water gains through tree disease Extra costs of water supply (South-West Region) £1 400 000 Scaled up to Great Britain × 10 =£14 000 000 Reduction of effect due to disease × 0.05 £700 000 Plus reduction of hydroelectricity losses + £1 750 000 Total gains £2 450 000 Considering the completely different origins of the figures, the closeness of match between disease-attributable gains and losses is extraordinary. On these grounds, and given the highly speculative nature of the extrapolations made, it is not considered appropriate to include any net value for hydrological effects. I have seen no figures that challenge this conclusion.
With climate change, the role of trees in mitigating microclimate, particularly extremes of temperature in urban areas, will become increasingly important. The energy saving is based on the work of McPherson et al. (1999) in California; the estimated number of urban trees, on a variety of sources. Several speculative adjustments are made: for the spatial arrangement of Britain’s urban trees as groups more than as street
57
members are lost. In any case, the base of the above evaluation might be termed a “sum of marginals”: it is constructed by summation of the effects of removing trees from individual landscapes seriatim rather than by visualising a national landscape from which all trees have been lost.
An equivalent assessment for urban trees has been based on the illustrative assessment (it is no more than that) in Cobham Resource Consultants and Price (1991).
Table 4: Effect on urban landscape of disease-related tree loss 1990 capital value (100 year horizon) £62 500 000 000 Inflation factor 1990-2010 × 1.71 Spread over 100 years (not discounted) × 0.01 % loss × 0.10 Mitigation × 0.50 Annual equivalent = £33 681 057 To this may be added an estimated annual arboricultural expenditure of £12 500 000 to mitigate the effects of disease on urban trees – which seems to be at a reasonable level, given the annual equivalent value being defended, shown in table 4. 9. Other effects on ecosystem services While trees offer many environmental services – and some disservices – the treatment below is confined to the effects on hydrology, microclimate and biodiversity, brought about by a net loss of 5% of trees attributed to disease. Effects on atmospheric CO2, it will be recalled, have already been incorporated.
Trees have been ascribed many beneficial hydrological effects, not always on a sound scientific basis. At present in Britain the focus is on the capacity to mitigate floods, from whose effects …
… the Environment Agency gives insurable losses in bad years (one in ten?) as £3000 million. But with climate change Stern (2006) indicates that £4000 million might become normal for annual losses. The Flood Risk Management Research Consortium (2008) surmises that optimally located tree planting might reduce extreme flooding by 5%, or 36% with complete forest cover. Taking all permutations of the above, combined with 5% net loss of tree cover due to disease, gives a highly speculative cost of £2.65 million. (Price, 2010)
Of the negative effects, loss of supply capacity due to excess evaporation is locally important on hydroelectric and abstraction catchments, and is mostly due to conifers on hydroelectric catchments in Scotland. The following calculations are built on the work of Barrow et al. (1986) and Price (1999a). Table 5: Valuing savings of hydroelectricity losses Lost energy per ha per rotation (for a 100 m generating head) 500 GJ Convert to kWh × 1000/3.6 = 138 889 kWh Per year of 50-year rotation ÷ 50 = 2 778 kWh Price per kWh ( annual loss) × £0.14 = £389 Scotland’s conifer area (ha) × 900 000 % on catchment × 0.1 Total Scotland loss £35 000 000 Reduction due to disease loss × 0.05 = £1 750 000 Similarly, work for South-West Region (Price, 2009) estimated the cost of increasing reservoir capacity to compensate for evaporative losses, based on the procedure developed by Collet (1970). As a working approximation this can be scaled up to the area of Britain, which is ten times that of the South-West Region. Table 6: Overall water gains through tree disease Extra costs of water supply (South-West Region) £1 400 000 Scaled up to Great Britain × 10 =£14 000 000 Reduction of effect due to disease × 0.05 £700 000 Plus reduction of hydroelectricity losses + £1 750 000 Total gains £2 450 000 Considering the completely different origins of the figures, the closeness of match between disease-attributable gains and losses is extraordinary. On these grounds, and given the highly speculative nature of the extrapolations made, it is not considered appropriate to include any net value for hydrological effects. I have seen no figures that challenge this conclusion.
With climate change, the role of trees in mitigating microclimate, particularly extremes of temperature in urban areas, will become increasingly important. The energy saving is based on the work of McPherson et al. (1999) in California; the estimated number of urban trees, on a variety of sources. Several speculative adjustments are made: for the spatial arrangement of Britain’s urban trees as groups more than as street

58
trees; for the less extreme climate (although Britain’s is getting closer to California’s); for a less extravagant culture of energy use; for efficiency gains.
Table 7: Value of air conditioning services kWh saved per tree per year 122 Number of urban trees × 100 000 000 Price per kWh × £0.14 Spatial configuration factor × 0.5 Climate factor × 0.5 Cultural factor × 0.5 Energy saving gain × 0.5 % loss × 0.10 Mitigation × 0.50 Annual cost = £5 338 000 Removing even one of the adjustments, which seems appropriate on the whole, brings the value to £10 676 000.
Biodiversity is potentially the most intractable problem in valuing ecosystem services. However, the effects of tree diseases are not altogether adverse (Kirby, 2010). For example, respondents in a choice experiment (Nielsen et al., 2007) expressed a certain willingness to pay for a token amount of dead wood within the mix of forest features. Moreover, after finding a willingness to pay for conservation of a small corner of north-east Scotland equivalent to 10% of the UK’s GNP (Price, 1999b), I have been sceptical about such figures. On these grounds, no cash value is attributed for the cost of tree diseases to biodiversity. It may be that if acute oak decline severely reduces oak populations this provisional conclusion would have to be revisited.
10. Conclusion The summary table 8 below for losses is revealing. It is notable that, while the losses of timber production and carbon values are considerable, the environmental losses collectively, particularly the landscape effects, are about an order of magnitude greater. This should not be altogether surprising, for a densely populated island such as Great Britain, one also where home timber production is a small proportion of total consumption. If one were to scale down the environmental effects in proportion to population, and to scale up the timber and carbon effects in proportion to production, then one would have the conditions of Finland, Norway and Sweden, and the orders of magnitude would be reversed. Denmark’s figures would more resemble Britain’s.
Table 8: Summary of annual losses due to tree diseases Timber and carbon Red band needle blight on Corsican pine £4 990 000 Lost opportunities for expanding Corsican pine £3 306 000 Red band needle blight on lodgepole pine £279 000 Sudden oak death £746 000 Acute oak decline £1 110 000 “Nasty surprise on Sitka spruce” £6 986 000 Environmental services Rural landscape £97 452 000 Urban landscape £33 681 000 Water - - Air conditioning £10 676 000 Biodiversity conservation - - Arboricultural expenditure £12 500 000 Total £171 726 000 Finally, it should be emphasised that these costs were compiled under pressure to provide at least some kind of figure. Few of the data can be considered accurate, and some are based on no more than guesswork. The term “horse and rabbit stew” was often used in relation to one well-known cost–benefit analysis in the UK, that for the Third London Airport (Adams, 1971). The ingredients for the recipe include one horse and one rabbit. It could be said that the rabbit represents the core of firmly-based knowledge underlying the above estimate: the horse represents the margin of error. Acknowledgements Thanks are due to Richard Baden, Anna Brown, Roddie Burgess, Jonathan Cocking, Sandra Denman, Nick Eden, Simon Gillam, Peter Goodwin, Jonathan Hazell, Tom Jenkins, Neil Kellett, Keith Kirby, Susana Mourato, Pat Snowdon, Nigel Straw, Joan Webber and Rob Willis for the supply of data on which the calculations above are based. Many of them cautioned that not much reliance could be placed on figures for severity and extent of losses. None of them bears responsibility for the use I have made of the figures.
This paper includes a certain amount of text from one published in Quarterly Journal of Forestry (Price, 2010). Both papers are based on the same set of calculations, though the calculations are treated in more detail in this paper. I am grateful to the editor of Quarterly Journal of Forestry for permission to re-use this material.

59
trees; for the less extreme climate (although Britain’s is getting closer to California’s); for a less extravagant culture of energy use; for efficiency gains.
Table 7: Value of air conditioning services kWh saved per tree per year 122 Number of urban trees × 100 000 000 Price per kWh × £0.14 Spatial configuration factor × 0.5 Climate factor × 0.5 Cultural factor × 0.5 Energy saving gain × 0.5 % loss × 0.10 Mitigation × 0.50 Annual cost = £5 338 000 Removing even one of the adjustments, which seems appropriate on the whole, brings the value to £10 676 000.
Biodiversity is potentially the most intractable problem in valuing ecosystem services. However, the effects of tree diseases are not altogether adverse (Kirby, 2010). For example, respondents in a choice experiment (Nielsen et al., 2007) expressed a certain willingness to pay for a token amount of dead wood within the mix of forest features. Moreover, after finding a willingness to pay for conservation of a small corner of north-east Scotland equivalent to 10% of the UK’s GNP (Price, 1999b), I have been sceptical about such figures. On these grounds, no cash value is attributed for the cost of tree diseases to biodiversity. It may be that if acute oak decline severely reduces oak populations this provisional conclusion would have to be revisited.
10. Conclusion The summary table 8 below for losses is revealing. It is notable that, while the losses of timber production and carbon values are considerable, the environmental losses collectively, particularly the landscape effects, are about an order of magnitude greater. This should not be altogether surprising, for a densely populated island such as Great Britain, one also where home timber production is a small proportion of total consumption. If one were to scale down the environmental effects in proportion to population, and to scale up the timber and carbon effects in proportion to production, then one would have the conditions of Finland, Norway and Sweden, and the orders of magnitude would be reversed. Denmark’s figures would more resemble Britain’s.
Table 8: Summary of annual losses due to tree diseases Timber and carbon Red band needle blight on Corsican pine £4 990 000 Lost opportunities for expanding Corsican pine £3 306 000 Red band needle blight on lodgepole pine £279 000 Sudden oak death £746 000 Acute oak decline £1 110 000 “Nasty surprise on Sitka spruce” £6 986 000 Environmental services Rural landscape £97 452 000 Urban landscape £33 681 000 Water - - Air conditioning £10 676 000 Biodiversity conservation - - Arboricultural expenditure £12 500 000 Total £171 726 000 Finally, it should be emphasised that these costs were compiled under pressure to provide at least some kind of figure. Few of the data can be considered accurate, and some are based on no more than guesswork. The term “horse and rabbit stew” was often used in relation to one well-known cost–benefit analysis in the UK, that for the Third London Airport (Adams, 1971). The ingredients for the recipe include one horse and one rabbit. It could be said that the rabbit represents the core of firmly-based knowledge underlying the above estimate: the horse represents the margin of error. Acknowledgements Thanks are due to Richard Baden, Anna Brown, Roddie Burgess, Jonathan Cocking, Sandra Denman, Nick Eden, Simon Gillam, Peter Goodwin, Jonathan Hazell, Tom Jenkins, Neil Kellett, Keith Kirby, Susana Mourato, Pat Snowdon, Nigel Straw, Joan Webber and Rob Willis for the supply of data on which the calculations above are based. Many of them cautioned that not much reliance could be placed on figures for severity and extent of losses. None of them bears responsibility for the use I have made of the figures.
This paper includes a certain amount of text from one published in Quarterly Journal of Forestry (Price, 2010). Both papers are based on the same set of calculations, though the calculations are treated in more detail in this paper. I am grateful to the editor of Quarterly Journal of Forestry for permission to re-use this material.

60
References Adams, J.G.U. (1971). London’s Third Airport: From TLA to Airstrip One.
The Geographical Journal, 137, 468-93. Anon. (2004). GB Leisure Day Visits Survey. Natural England Publications,
Newcastle upon Tyne. Barrow, P., Hinsley, A.P. and Price, C. (1986). The effect of afforestation
on hydroelectricity generation: a quantitative assessment. Land Use Policy, 3, 141-51.
Bergin, J. and Price, C. (1994). The travel cost method and landscape quality. Landscape Research 19 (1), 21-3.
Broadmeadow, M.S.J. (ed.) (2002). Climate change: Impacts on UK forests. Forestry Commission Bulletin 125. Forestry Commission, Edinburgh.
Brown, A. and Webber, J. (2008). Red band needle blight of conifers in Britain. Forestry Commission Research Note 2.
Cobham Resource Consultants and Price, C. (1991). The Benefits of Amenity Trees. Report to Department of the Environment, London.
Collet, M.E.W. (1970). External costs arising from the effects of forests upon streamflow in Great Britain. Forestry, 43, 181-93.
Crocker, T.D. (1985). On the value of the condition of a forest stock, Land Economics, 61, 244-54.
Defra (2008). Impact assessment on future management of risks from Phytophthora ramorum and Phytophthora kernoviae. Available at http://www.defra.gov.uk
Department of Energy and Climate Change (2009). The UK Low Carbon Transition Plan: National Strategy for Climate and Energy. TSO, London.
Department of Trade and Industry (2003). Our Energy Future − Creating a Low Carbon Economy. TSO, London.
Edwards, P.N. and Christie, J.M. (1981). Yield models for forest management. Forestry Commission Booklet 48.
Flood Risk Management Research Consortium (2008). Impacts of Upland Land Management on Flood Risk: Multi-scale Modelling Methodology and Results from the Pontbren Experiment. University of Manchester.
Forestry Commission (2003). National Inventory of Woodland and Trees. Forestry Commission, Edinburgh.
Forestry Commission Plant Health Service (2008). Report on the National Survey to Assess the Presence of Bleeding Canker of Horse Chestnut Trees in Great Britain. Forestry Commission, Edinburgh.
Helliwell, D.R. (1967). The amenity value of trees and woodlands. Arboricultural Journal, 1, 128-31.
Kirby, K. (2010). The conservation angle. Paper presented at RFS/RASE/FC Tree Diseases Conference, RASE Stoneleigh Park, 21 April 2010.
McPherson, E.G., Simpson, J.R., Peper, P.J. and Xiao Qing Fu. (1999). Benefit–cost analysis of Modesto’s municipal urban forest. Journal of Arboriculture, 25, 235-248.
Mourato, S. (2010). Public knowledge, perceptions and who pays – lessons from sudden oak death. Paper presented at RFS/RASE/FC Tree Diseases Conference, RASE Stoneleigh Park, 21 April 2010.
Nielsen, A.B., Olsen, S.B. and Lundhede, T. (2007). An economic valuation of the recreational benefits associated with nature-based forest management practices. Landscape and Urban Planning, 80, 63-71.
Price, C. (1999a). The economics of forestry in relation to hydroelectricity: moving on and spreading out. Scandinavian Forest Economics, 37 (22), 1-6.
Price, C. (1999b). Contingent valuation and retrograde information bias. In Park, A. and Stewart Roper, C. (eds) The Living Forest. Proceedings of the International Symposium on the Non-market Benefits of Forestry, Edinburgh, June 1996, TSO, London, pp.37-44.
Price, C. (2007). Putting a value on trees: an economist’s perspective. Arboricultural Journal, 30, 7-19.
Price, C. (2008). Tessellations: Poems of Celebration and Reflection. Available electronically from [email protected].
Price, C. (2009). Contributions to Lockhart Garrett, Ekos and Price, C. South West England Woodland & Forestry Strategic Economic Study. Ekogen, Exeter.
Price, C. (2010). The economic impacts of it all. Quarterly Journal of Forestry, 104, 224-30.
Price, C. and Willis, R. (1993). Time, discounting and the valuation of forestry’s carbon fluxes, Commonwealth Forestry Review, 72, 265-71.
Stern, N. (2006). The Economics of Climate Change. Report to UK Treasury. http://www.hm-treasury.gov.uk/media.BAC/Executive_Summary.pdf
Thomas, A.Ll. and Price, C. (1999). Landscape valuation of farm woodlands. In Burgess, P.J., Brierley, E.D.R., Morris, J. and Evans, J. (eds) Farm Woodlands for the Future. Bios Scientific, Oxford, pp.69-79.
Treasury (undated). The Green Book: Appraisal and Evaluation in Central Government. TSO, London.
Webber, J., Gibbs, J. and Hendry, S. (2004). Phytophthora Disease of Alder. Forestry Commission Information Note 6.

61
References Adams, J.G.U. (1971). London’s Third Airport: From TLA to Airstrip One.
The Geographical Journal, 137, 468-93. Anon. (2004). GB Leisure Day Visits Survey. Natural England Publications,
Newcastle upon Tyne. Barrow, P., Hinsley, A.P. and Price, C. (1986). The effect of afforestation
on hydroelectricity generation: a quantitative assessment. Land Use Policy, 3, 141-51.
Bergin, J. and Price, C. (1994). The travel cost method and landscape quality. Landscape Research 19 (1), 21-3.
Broadmeadow, M.S.J. (ed.) (2002). Climate change: Impacts on UK forests. Forestry Commission Bulletin 125. Forestry Commission, Edinburgh.
Brown, A. and Webber, J. (2008). Red band needle blight of conifers in Britain. Forestry Commission Research Note 2.
Cobham Resource Consultants and Price, C. (1991). The Benefits of Amenity Trees. Report to Department of the Environment, London.
Collet, M.E.W. (1970). External costs arising from the effects of forests upon streamflow in Great Britain. Forestry, 43, 181-93.
Crocker, T.D. (1985). On the value of the condition of a forest stock, Land Economics, 61, 244-54.
Defra (2008). Impact assessment on future management of risks from Phytophthora ramorum and Phytophthora kernoviae. Available at http://www.defra.gov.uk
Department of Energy and Climate Change (2009). The UK Low Carbon Transition Plan: National Strategy for Climate and Energy. TSO, London.
Department of Trade and Industry (2003). Our Energy Future − Creating a Low Carbon Economy. TSO, London.
Edwards, P.N. and Christie, J.M. (1981). Yield models for forest management. Forestry Commission Booklet 48.
Flood Risk Management Research Consortium (2008). Impacts of Upland Land Management on Flood Risk: Multi-scale Modelling Methodology and Results from the Pontbren Experiment. University of Manchester.
Forestry Commission (2003). National Inventory of Woodland and Trees. Forestry Commission, Edinburgh.
Forestry Commission Plant Health Service (2008). Report on the National Survey to Assess the Presence of Bleeding Canker of Horse Chestnut Trees in Great Britain. Forestry Commission, Edinburgh.
Helliwell, D.R. (1967). The amenity value of trees and woodlands. Arboricultural Journal, 1, 128-31.
Kirby, K. (2010). The conservation angle. Paper presented at RFS/RASE/FC Tree Diseases Conference, RASE Stoneleigh Park, 21 April 2010.
McPherson, E.G., Simpson, J.R., Peper, P.J. and Xiao Qing Fu. (1999). Benefit–cost analysis of Modesto’s municipal urban forest. Journal of Arboriculture, 25, 235-248.
Mourato, S. (2010). Public knowledge, perceptions and who pays – lessons from sudden oak death. Paper presented at RFS/RASE/FC Tree Diseases Conference, RASE Stoneleigh Park, 21 April 2010.
Nielsen, A.B., Olsen, S.B. and Lundhede, T. (2007). An economic valuation of the recreational benefits associated with nature-based forest management practices. Landscape and Urban Planning, 80, 63-71.
Price, C. (1999a). The economics of forestry in relation to hydroelectricity: moving on and spreading out. Scandinavian Forest Economics, 37 (22), 1-6.
Price, C. (1999b). Contingent valuation and retrograde information bias. In Park, A. and Stewart Roper, C. (eds) The Living Forest. Proceedings of the International Symposium on the Non-market Benefits of Forestry, Edinburgh, June 1996, TSO, London, pp.37-44.
Price, C. (2007). Putting a value on trees: an economist’s perspective. Arboricultural Journal, 30, 7-19.
Price, C. (2008). Tessellations: Poems of Celebration and Reflection. Available electronically from [email protected].
Price, C. (2009). Contributions to Lockhart Garrett, Ekos and Price, C. South West England Woodland & Forestry Strategic Economic Study. Ekogen, Exeter.
Price, C. (2010). The economic impacts of it all. Quarterly Journal of Forestry, 104, 224-30.
Price, C. and Willis, R. (1993). Time, discounting and the valuation of forestry’s carbon fluxes, Commonwealth Forestry Review, 72, 265-71.
Stern, N. (2006). The Economics of Climate Change. Report to UK Treasury. http://www.hm-treasury.gov.uk/media.BAC/Executive_Summary.pdf
Thomas, A.Ll. and Price, C. (1999). Landscape valuation of farm woodlands. In Burgess, P.J., Brierley, E.D.R., Morris, J. and Evans, J. (eds) Farm Woodlands for the Future. Bios Scientific, Oxford, pp.69-79.
Treasury (undated). The Green Book: Appraisal and Evaluation in Central Government. TSO, London.
Webber, J., Gibbs, J. and Hendry, S. (2004). Phytophthora Disease of Alder. Forestry Commission Information Note 6.

62
Threat, discount premiums, net present value and rotation: a real-world example
Colin Price
School of the Environment, Natural Resources and Geography, Bangor University
Abstract Similarly to financial risk in markets, physical risk (threat or hazard) has sometimes been treated by adding a premium to the discount rate used for the NPV calculations applied to forestry options. As it happens, a discount rate premium reflecting the rate of threat gives the correct rotation and, by simple adjustment, the correct land expectation value, but only if the threat occurs at a constant rate throughout the rotation and if destruction − if it happens at all − is complete. If some value can be salvaged following the destructive event, neither optimal rotation nor land expectation value is correctly determined by using a threat premium. The same is true when the threat level changes during the rotation, even if the threat rate used would correctly predict the probability of crop survival to the age of optimal rotation. These findings may be illustrated with calculations based on wind-susceptible crops in the UK. Keywords: Risk, threat, discount premium, optimal rotation 1. Introduction In financial markets, risk interpreted as variability of annual return from investment has often been treated by adding a premium to the discount rate. While this stratagem has the desired general effect of making risky investments seem less attractive, this is not a suitable way to treat risk when returns from investment are long delayed, as in forestry. Mean expected utility may be compromised by risk of this kind. But the path of mean expected utility is not well tracked by the exponential process that discount premiums reflect (Price, 1993, chapter 11). Rather to the contrary, it has often been shown that, in the absence of risk aversion, the fluctuation of timber prices (according to various models) increases both NPV and rotation, essentially because of the greater possibilities of selecting a favourable time at which to terminate the rotation (Lohmander, 1987). These results are the opposite of the effects of a discount premium.
This paper does not treat such a form of risk, but rather deals with what has sometimes been called threat or hazard, to distinguish it from risk in the sense described above. Numerous papers have dealt with the climatic, biological, anthropogenic and political factors which may suddenly reduce or eliminate the value of a forest crop. Unlike the risk due to variability, the effect of threat is monotonic decline in mean expected value, compared with value in a threat-free condition. Some papers have assumed that the threat causes loss of all value, as by catastrophic fire (Routledge, 1980; Martell, 1980; Reed, 1984) or by human transgression (Price and Trivedi and Price, 1994). These and others have also examined the effects of relaxing assumptions about total loss of value under threat, and about rate of threat throughout the crop rotation. The effect of spatial interaction between stands has also been examined (Lohmander and Helles, 1987; Meilby et al., 2001), as has that of management interventions which may mitigate the threat (Thorsen and Helles, 1998), and the implications of threat for non-market values (Englin et al., 2000).
The paper does not attempt to add to this body of often sophisticated modelling work. Instead it returns to any earlier era, when it was sometimes proposed that the rate of physical threat could simply be added to the discount rate to give a risk-adjusted discount rate in NPV calculations, again, particularly for optimal rotation determination (Reed, 1984). It derives that result for those limited circumstances (catastrophic loss plus threat which is independent of crop age) in which it is appropriate, by somewhat more straightforward algebra than has been presented previously. It then demonstrates that the deficiencies of the threat premium approach increase when more realistic and complex representations of crop history are adopted. The cases are illustrated numerically by the threat from storms for a conifer crop in the UK.
2. The approach Forest economists, when addressing the optimal rotation problem, often formulate it in marginal or incremental terms (e.g. Reed, 1984, Olschewski and Benitez, 2010): at the optimal rotation, the increase in (discounted) value of the present crop (the first derivative of the discounted revenue function) should equal the cost of delaying crop replacement (generally, the discounted net value of a perpetual series of successor crops, multiplied by the discount rate). Where threat to the crop exists, the marginal condition for optimality is:
teCtVtV )(1
))()(()(' ρλ
ρλ+−−−+
= (1)

63
Threat, discount premiums, net present value and rotation: a real-world example
Colin Price
School of the Environment, Natural Resources and Geography, Bangor University
Abstract Similarly to financial risk in markets, physical risk (threat or hazard) has sometimes been treated by adding a premium to the discount rate used for the NPV calculations applied to forestry options. As it happens, a discount rate premium reflecting the rate of threat gives the correct rotation and, by simple adjustment, the correct land expectation value, but only if the threat occurs at a constant rate throughout the rotation and if destruction − if it happens at all − is complete. If some value can be salvaged following the destructive event, neither optimal rotation nor land expectation value is correctly determined by using a threat premium. The same is true when the threat level changes during the rotation, even if the threat rate used would correctly predict the probability of crop survival to the age of optimal rotation. These findings may be illustrated with calculations based on wind-susceptible crops in the UK. Keywords: Risk, threat, discount premium, optimal rotation 1. Introduction In financial markets, risk interpreted as variability of annual return from investment has often been treated by adding a premium to the discount rate. While this stratagem has the desired general effect of making risky investments seem less attractive, this is not a suitable way to treat risk when returns from investment are long delayed, as in forestry. Mean expected utility may be compromised by risk of this kind. But the path of mean expected utility is not well tracked by the exponential process that discount premiums reflect (Price, 1993, chapter 11). Rather to the contrary, it has often been shown that, in the absence of risk aversion, the fluctuation of timber prices (according to various models) increases both NPV and rotation, essentially because of the greater possibilities of selecting a favourable time at which to terminate the rotation (Lohmander, 1987). These results are the opposite of the effects of a discount premium.
This paper does not treat such a form of risk, but rather deals with what has sometimes been called threat or hazard, to distinguish it from risk in the sense described above. Numerous papers have dealt with the climatic, biological, anthropogenic and political factors which may suddenly reduce or eliminate the value of a forest crop. Unlike the risk due to variability, the effect of threat is monotonic decline in mean expected value, compared with value in a threat-free condition. Some papers have assumed that the threat causes loss of all value, as by catastrophic fire (Routledge, 1980; Martell, 1980; Reed, 1984) or by human transgression (Price and Trivedi and Price, 1994). These and others have also examined the effects of relaxing assumptions about total loss of value under threat, and about rate of threat throughout the crop rotation. The effect of spatial interaction between stands has also been examined (Lohmander and Helles, 1987; Meilby et al., 2001), as has that of management interventions which may mitigate the threat (Thorsen and Helles, 1998), and the implications of threat for non-market values (Englin et al., 2000).
The paper does not attempt to add to this body of often sophisticated modelling work. Instead it returns to any earlier era, when it was sometimes proposed that the rate of physical threat could simply be added to the discount rate to give a risk-adjusted discount rate in NPV calculations, again, particularly for optimal rotation determination (Reed, 1984). It derives that result for those limited circumstances (catastrophic loss plus threat which is independent of crop age) in which it is appropriate, by somewhat more straightforward algebra than has been presented previously. It then demonstrates that the deficiencies of the threat premium approach increase when more realistic and complex representations of crop history are adopted. The cases are illustrated numerically by the threat from storms for a conifer crop in the UK.
2. The approach Forest economists, when addressing the optimal rotation problem, often formulate it in marginal or incremental terms (e.g. Reed, 1984, Olschewski and Benitez, 2010): at the optimal rotation, the increase in (discounted) value of the present crop (the first derivative of the discounted revenue function) should equal the cost of delaying crop replacement (generally, the discounted net value of a perpetual series of successor crops, multiplied by the discount rate). Where threat to the crop exists, the marginal condition for optimality is:
teCtVtV )(1
))()(()(' ρλ
ρλ+−−−+
= (1)

64
where V(t) is an expression for crop value at age t, λ is the continuous annual rate of threat, ρ is the continuous rate of discount and C is the regeneration cost.
And so page after page in academic journals is filled with elegant and (often) general equations, sometimes represented graphically, which in practice there is no hope of solving by analytical means. I played around with these formulations as an undergraduate, but never reached a useful conclusion – and not, I suspect, merely because of limited mathematical competence. The fact of the matter is, that in order to fulfil the marginal condition for optimal rotation, one first needs to calculate and insert the discounted value of a perpetual series of successor crops on the [yet-to-be-derived] optimal rotation. This approach becomes particularly tiresome for stochastic circumstances. So, why not go directly to the tedious but straightforward direct calculation of the optimal rotation, by inelegant but serviceable numerical methods?
The base result, about the effect of threat on rotation, can in fact be derived without recourse to the marginal conditions, or to differential calculus, or to optimal control theory. However, the algebra is bulky (rather than complicated). Which of the available approaches is least likely to terrify forestry students, I am not able to judge.
In what follows, a numerical approach is adopted from the outset, based on non-parameterised models of windthrow threat in the UK. The optimal rotation, according to the NPV of a perpetual series of rotations subject to stochastic threat of termination and replacement, is identified by inspection of values computed for each possible rotation. This is then compared with the optimal rotation given by supplementing the “normal” discount rate by a rate related to the level of threat.
3. The case of catastrophic loss The focus example is the crop most extensively planted in the UK, Sitka spruce (Picea sitchensis), which is taken to have maximum productivity of 12 m3 ha–1 year–1 and to be grown according to a non-thin regime on a site moderately susceptible to windthrow. This is typical of the conditions of commercial forestry. In all cases a schedule of “reasonable” prices for different dimensions of timber, a low planting cost and a base discount rate of 3% are used. Profitability is represented as net present value (NPV) in £ per ha. Annual management costs, which are invariant between options, are not included.
Catastrophic windthrow is assumed: if it happens, there is no salvage value. Discounted mean expected value of final revenue, VT, at age T, less planting cost, C, is given as
TT
T eeVC ρλ −− ××+−=MEV (2)
where λ is the annual probability of destruction. Figure 1 shows NPV, calculated by adding a risk premium of λ to the discount rate, and the mean expected value (MEV) based on the probability of survival until T.
0
50
100
150
200
250
25 30 35 40 45 50 55 60
Net p
rese
nt v
alue
Age of crop (years)
NPV (risk discounting)MEV first rotation
Figure 1: Risk premium and explicit threat Unsurprisingly, the explicitly calculated MEV (£227) is identical to the NPV that uses the rate of threat as a discount premium (which simply aggregates the two exponential terms in (2)), and the optimum is 48 years in both cases. 4. Planned and unplanned replacement A threat discount, applied universally, not only affects relative values within a crop rotation, but relative values between one rotation and the next. Figure 2 shows the effect of treating risk by adding a premium to the discount rate. By contrast, “explicit threat probability” recognises that, in the second rotation, the crop experiences the same cycle of threat as in the first rotation: discounting between second and first rotation is due only to time preference, or whatever is deemed to underlie the normal discount rate.

65
where V(t) is an expression for crop value at age t, λ is the continuous annual rate of threat, ρ is the continuous rate of discount and C is the regeneration cost.
And so page after page in academic journals is filled with elegant and (often) general equations, sometimes represented graphically, which in practice there is no hope of solving by analytical means. I played around with these formulations as an undergraduate, but never reached a useful conclusion – and not, I suspect, merely because of limited mathematical competence. The fact of the matter is, that in order to fulfil the marginal condition for optimal rotation, one first needs to calculate and insert the discounted value of a perpetual series of successor crops on the [yet-to-be-derived] optimal rotation. This approach becomes particularly tiresome for stochastic circumstances. So, why not go directly to the tedious but straightforward direct calculation of the optimal rotation, by inelegant but serviceable numerical methods?
The base result, about the effect of threat on rotation, can in fact be derived without recourse to the marginal conditions, or to differential calculus, or to optimal control theory. However, the algebra is bulky (rather than complicated). Which of the available approaches is least likely to terrify forestry students, I am not able to judge.
In what follows, a numerical approach is adopted from the outset, based on non-parameterised models of windthrow threat in the UK. The optimal rotation, according to the NPV of a perpetual series of rotations subject to stochastic threat of termination and replacement, is identified by inspection of values computed for each possible rotation. This is then compared with the optimal rotation given by supplementing the “normal” discount rate by a rate related to the level of threat.
3. The case of catastrophic loss The focus example is the crop most extensively planted in the UK, Sitka spruce (Picea sitchensis), which is taken to have maximum productivity of 12 m3 ha–1 year–1 and to be grown according to a non-thin regime on a site moderately susceptible to windthrow. This is typical of the conditions of commercial forestry. In all cases a schedule of “reasonable” prices for different dimensions of timber, a low planting cost and a base discount rate of 3% are used. Profitability is represented as net present value (NPV) in £ per ha. Annual management costs, which are invariant between options, are not included.
Catastrophic windthrow is assumed: if it happens, there is no salvage value. Discounted mean expected value of final revenue, VT, at age T, less planting cost, C, is given as
TT
T eeVC ρλ −− ××+−=MEV (2)
where λ is the annual probability of destruction. Figure 1 shows NPV, calculated by adding a risk premium of λ to the discount rate, and the mean expected value (MEV) based on the probability of survival until T.
0
50
100
150
200
250
25 30 35 40 45 50 55 60
Net p
rese
nt v
alue
Age of crop (years)
NPV (risk discounting)MEV first rotation
Figure 1: Risk premium and explicit threat Unsurprisingly, the explicitly calculated MEV (£227) is identical to the NPV that uses the rate of threat as a discount premium (which simply aggregates the two exponential terms in (2)), and the optimum is 48 years in both cases. 4. Planned and unplanned replacement A threat discount, applied universally, not only affects relative values within a crop rotation, but relative values between one rotation and the next. Figure 2 shows the effect of treating risk by adding a premium to the discount rate. By contrast, “explicit threat probability” recognises that, in the second rotation, the crop experiences the same cycle of threat as in the first rotation: discounting between second and first rotation is due only to time preference, or whatever is deemed to underlie the normal discount rate.
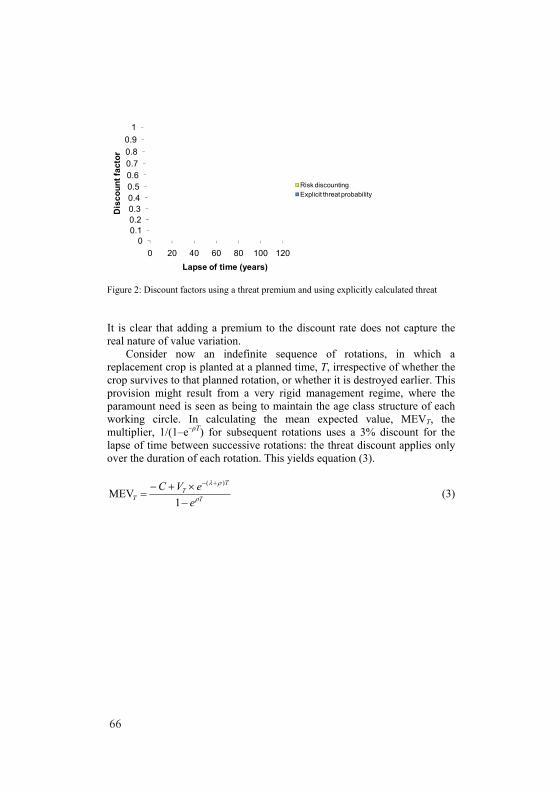
66
00.10.20.30.40.50.60.70.80.9
1
0 20 40 60 80 100 120
Dis
coun
t fac
tor
Lapse of time (years)
Risk discountingExplicit threat probability
Figure 2: Discount factors using a threat premium and using explicitly calculated threat It is clear that adding a premium to the discount rate does not capture the real nature of value variation.
Consider now an indefinite sequence of rotations, in which a replacement crop is planted at a planned time, T, irrespective of whether the crop survives to that planned rotation, or whether it is destroyed earlier. This provision might result from a very rigid management regime, where the paramount need is seen as being to maintain the age class structure of each working circle. In calculating the mean expected value, MEVT, the multiplier, 1/(1–e–ρT) for subsequent rotations uses a 3% discount for the lapse of time between successive rotations: the threat discount applies only over the duration of each rotation. This yields equation (3).
T
TT
T eeVCρ
ρλ
−×+−
=+−
1MEV
)(
(3)
0
50
100
150
200
250
300
25 30 35 40 45 50 55 60
Net p
rese
nt v
alue
Age of crop (years)
LEV: 2.0% threat premium
MEV (planned replacement); 2.0% threat rate
Figure 3: LEV with threat premium, and explicit MEV with planned replacement The optimal rotation for planned replacement is now slightly shorter (47 years) than under the threat premium (48 years). This is because planned replacement entails “waste of growing space” in the event that windthrow occurs before planned replacement, and shortening the rotation reduces the mean expected waste. The difference in MEV is significant, £298.3 for explicit probability, and £250 for threat premium. Even if both are calculated for a 48-year rotation, “explicit probability” still gives £298.1: the difference from the threat premium value is due to the much reduced discounting of successor rotations’ value.
However, if catastrophe destroys the crop prematurely, and if management plans are adaptive, a replacement crop may be planted earlier than expected, and this will enhance the regime’s profitability.
In figure 4, MEVT is calculated by explicitly considering the probabilities of the crop’s surviving to various ages, and of its being replaced immediately if it does not survive, following the protocol of Madsen (1984, 1985), as also described in Price (1989).

67
00.10.20.30.40.50.60.70.80.9
1
0 20 40 60 80 100 120
Dis
coun
t fac
tor
Lapse of time (years)
Risk discountingExplicit threat probability
Figure 2: Discount factors using a threat premium and using explicitly calculated threat It is clear that adding a premium to the discount rate does not capture the real nature of value variation.
Consider now an indefinite sequence of rotations, in which a replacement crop is planted at a planned time, T, irrespective of whether the crop survives to that planned rotation, or whether it is destroyed earlier. This provision might result from a very rigid management regime, where the paramount need is seen as being to maintain the age class structure of each working circle. In calculating the mean expected value, MEVT, the multiplier, 1/(1–e–ρT) for subsequent rotations uses a 3% discount for the lapse of time between successive rotations: the threat discount applies only over the duration of each rotation. This yields equation (3).
T
TT
T eeVCρ
ρλ
−×+−
=+−
1MEV
)(
(3)
0
50
100
150
200
250
300
25 30 35 40 45 50 55 60
Net p
rese
nt v
alue
Age of crop (years)
LEV: 2.0% threat premium
MEV (planned replacement); 2.0% threat rate
Figure 3: LEV with threat premium, and explicit MEV with planned replacement The optimal rotation for planned replacement is now slightly shorter (47 years) than under the threat premium (48 years). This is because planned replacement entails “waste of growing space” in the event that windthrow occurs before planned replacement, and shortening the rotation reduces the mean expected waste. The difference in MEV is significant, £298.3 for explicit probability, and £250 for threat premium. Even if both are calculated for a 48-year rotation, “explicit probability” still gives £298.1: the difference from the threat premium value is due to the much reduced discounting of successor rotations’ value.
However, if catastrophe destroys the crop prematurely, and if management plans are adaptive, a replacement crop may be planted earlier than expected, and this will enhance the regime’s profitability.
In figure 4, MEVT is calculated by explicitly considering the probabilities of the crop’s surviving to various ages, and of its being replaced immediately if it does not survive, following the protocol of Madsen (1984, 1985), as also described in Price (1989).

68
050
100150200250300350400450
25 30 35 40 45 50 55 60
Net p
rese
nt v
alue
Age of crop (years)
LEV: 2.0% threat premium
MEV (instant replacement); 2.0% threat rate
Figure 4: LEV with risk premium and explicit MEV with instant replacement MEV is now further increased, to £417 (while LEV remains at £250), because of the value of immediately initiating successors for destroyed crops. However, the optimal rotations are now identical, at 48 years.
As well as by the numerical method used above, the identity of risk premium and explicit probability rotations has been noted by Reed (1984), working via marginal conditions – see his equations (2) and (15). What Reed does not explicitly note is the large and readily calculable margin by which MEV exceeds LEV. The following is an algebraic demonstration of the identity of rotation, and derivation of the margin of difference in value. Land expectation value (L), for rotation length T, is given as:
T
TT
eeVCL ρ
ρ
−
−
−×+−
=1 (4)
Treating the annual probability of catastrophic destruction (λ) as a discount premium gives
T
TT
eeVCL )(
)(
1 ρλ
ρλ
+−
+−
−×+−
= (5)
The mean expected value, M, of an indefinite sequence of rotations is the mean expected value of the first rotation (2), plus the mean expected value of all possible replacement sequences, initiated either following catastrophe, or at the planned end of the rotation if there is no catastrophe.
The mean expected value of replacement at the end of the planned rotation is the value of an indefinite sequence of successor rotations, M, multiplied by the probability of surviving to the planned rotation end, discounted over the planned rotation period:
TTT eMeeM )( ρλρλ +−−− ×=×× (6) The probability density of catastrophic destruction at age t is
te λλ −× (7) The value summed across the rotation period (t = 0 to T), of mean expected values of an indefinite sequence of replacement rotations following catastrophe, multiplied by the probability of catastrophe at every t, discounted for t years (i.e. to the beginning of the first rotation) is:
)(1)(
0 ρλπλ
ρλρλ
+−−
××=×××+−=
=
−−∫TTt
t
tt eMdteeM (8)
Combining (2), (6) and (8),
)(1)(
)()(
ρλπ
ρλρλρλ
+−−
××+×+×+−=+−
+−+−T
TTT
eMeMeVCM (9)
Collecting terms in M,
( ) TT
TT eVCeeM )()()( 1)(
1 ρλρλρλ
ρλλ +−+−+− ×+−=⎟⎟
⎠
⎞⎜⎜⎝
⎛−×
+−−×
Multiplying out the bracketed term in the LHS,
TT
TT eVCeeM )()()(
)()(1 ρλρλρλ
ρλλ
ρλλ +−+−+− ×+−=⎟⎟
⎠
⎞⎜⎜⎝
⎛−×
++
+−×
factorising,
TT
T eVCeM )()( )1()(
1 ρλρλ
ρλλ +−+− ×+−=−×⎟⎟
⎠
⎞⎜⎜⎝
⎛+
−×

69
050
100150200250300350400450
25 30 35 40 45 50 55 60
Net p
rese
nt v
alue
Age of crop (years)
LEV: 2.0% threat premium
MEV (instant replacement); 2.0% threat rate
Figure 4: LEV with risk premium and explicit MEV with instant replacement MEV is now further increased, to £417 (while LEV remains at £250), because of the value of immediately initiating successors for destroyed crops. However, the optimal rotations are now identical, at 48 years.
As well as by the numerical method used above, the identity of risk premium and explicit probability rotations has been noted by Reed (1984), working via marginal conditions – see his equations (2) and (15). What Reed does not explicitly note is the large and readily calculable margin by which MEV exceeds LEV. The following is an algebraic demonstration of the identity of rotation, and derivation of the margin of difference in value. Land expectation value (L), for rotation length T, is given as:
T
TT
eeVCL ρ
ρ
−
−
−×+−
=1 (4)
Treating the annual probability of catastrophic destruction (λ) as a discount premium gives
T
TT
eeVCL )(
)(
1 ρλ
ρλ
+−
+−
−×+−
= (5)
The mean expected value, M, of an indefinite sequence of rotations is the mean expected value of the first rotation (2), plus the mean expected value of all possible replacement sequences, initiated either following catastrophe, or at the planned end of the rotation if there is no catastrophe.
The mean expected value of replacement at the end of the planned rotation is the value of an indefinite sequence of successor rotations, M, multiplied by the probability of surviving to the planned rotation end, discounted over the planned rotation period:
TTT eMeeM )( ρλρλ +−−− ×=×× (6) The probability density of catastrophic destruction at age t is
te λλ −× (7) The value summed across the rotation period (t = 0 to T), of mean expected values of an indefinite sequence of replacement rotations following catastrophe, multiplied by the probability of catastrophe at every t, discounted for t years (i.e. to the beginning of the first rotation) is:
)(1)(
0 ρλπλ
ρλρλ
+−−
××=×××+−=
=
−−∫TTt
t
tt eMdteeM (8)
Combining (2), (6) and (8),
)(1)(
)()(
ρλπ
ρλρλρλ
+−−
××+×+×+−=+−
+−+−T
TTT
eMeMeVCM (9)
Collecting terms in M,
( ) TT
TT eVCeeM )()()( 1)(
1 ρλρλρλ
ρλλ +−+−+− ×+−=⎟⎟
⎠
⎞⎜⎜⎝
⎛−×
+−−×
Multiplying out the bracketed term in the LHS,
TT
TT eVCeeM )()()(
)()(1 ρλρλρλ
ρλλ
ρλλ +−+−+− ×+−=⎟⎟
⎠
⎞⎜⎜⎝
⎛−×
++
+−×
factorising,
TT
T eVCeM )()( )1()(
1 ρλρλ
ρλλ +−+− ×+−=−×⎟⎟
⎠
⎞⎜⎜⎝
⎛+
−×
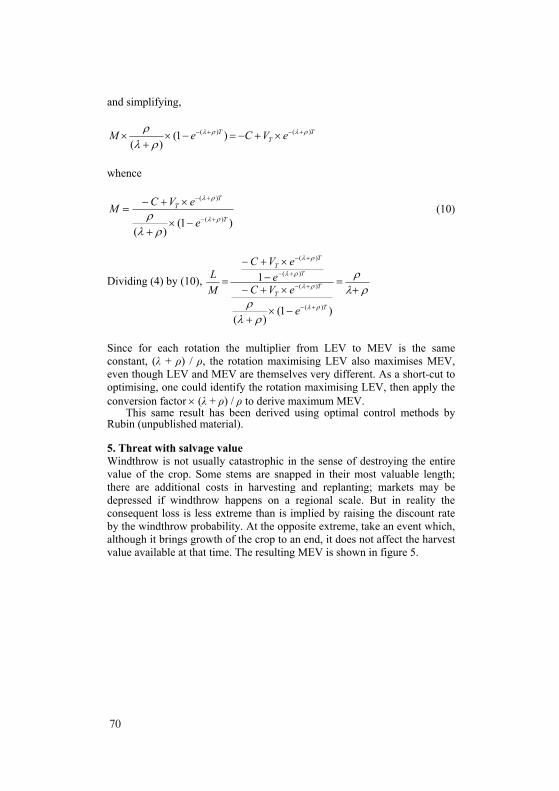
70
and simplifying,
TT
T eVCeM )()( )1()(
ρλρλ
ρλρ +−+− ×+−=−×+
×
whence
)1()(
)(
)(
T
TT
e
eVCMρλ
ρλ
ρλρ +−
+−
−×+
×+−= (10)
Dividing (4) by (10), ρλ
ρ
ρλρ ρλ
ρλ
ρλ
ρλ
+=
−×+
×+−−
×+−
=
+−
+−
+−
+−
)1()(
1
)(
)(
)(
)(
T
TT
T
TT
e
eVCe
eVC
ML
Since for each rotation the multiplier from LEV to MEV is the same constant, (λ + ρ) / ρ, the rotation maximising LEV also maximises MEV, even though LEV and MEV are themselves very different. As a short-cut to optimising, one could identify the rotation maximising LEV, then apply the conversion factor × (λ + ρ) / ρ to derive maximum MEV.
This same result has been derived using optimal control methods by Rubin (unpublished material).
5. Threat with salvage value Windthrow is not usually catastrophic in the sense of destroying the entire value of the crop. Some stems are snapped in their most valuable length; there are additional costs in harvesting and replanting; markets may be depressed if windthrow happens on a regional scale. But in reality the consequent loss is less extreme than is implied by raising the discount rate by the windthrow probability. At the opposite extreme, take an event which, although it brings growth of the crop to an end, it does not affect the harvest value available at that time. The resulting MEV is shown in figure 5.
0
200
400
600
800
1000
1200
25 30 35 40 45 50 55 60
Net p
rese
nt v
alue
(£)
Crop age (years)
MEV (instant replacement); 2.0% threat rate
MEV: 100% salvage; 2.0% threat rate
Figure 5: Mean expected value with and without salvage Not only is NPV greatly enhanced, from £417 to £1184, by allowing salvage value: the optimal rotation is also increased, from 48 to 54 years, because now extending the rotation by a year does not risk any loss of value at all.
Next, in figure 6, riskless LEV (without any discount premium) is compared with explicit MEV when 100% salvage is possible. Although explicit MEV is much less than riskless LEV (£3014), they appear to show a similar optimal rotation. In fact, numerical inspection shows that explicit MEV reaches a maximum slightly later (54 years) than riskless LEV (52.5 years). This adjustment is due to the reduced opportunity cost of successors: even with 100% salvage, MEV of successors is reduced by the possibility that the rotation will be curtailed prematurely. The effect becomes somewhat more pronounced with a lower discount rate.

71
and simplifying,
TT
T eVCeM )()( )1()(
ρλρλ
ρλρ +−+− ×+−=−×+
×
whence
)1()(
)(
)(
T
TT
e
eVCMρλ
ρλ
ρλρ +−
+−
−×+
×+−= (10)
Dividing (4) by (10), ρλ
ρ
ρλρ ρλ
ρλ
ρλ
ρλ
+=
−×+
×+−−
×+−
=
+−
+−
+−
+−
)1()(
1
)(
)(
)(
)(
T
TT
T
TT
e
eVCe
eVC
ML
Since for each rotation the multiplier from LEV to MEV is the same constant, (λ + ρ) / ρ, the rotation maximising LEV also maximises MEV, even though LEV and MEV are themselves very different. As a short-cut to optimising, one could identify the rotation maximising LEV, then apply the conversion factor × (λ + ρ) / ρ to derive maximum MEV.
This same result has been derived using optimal control methods by Rubin (unpublished material).
5. Threat with salvage value Windthrow is not usually catastrophic in the sense of destroying the entire value of the crop. Some stems are snapped in their most valuable length; there are additional costs in harvesting and replanting; markets may be depressed if windthrow happens on a regional scale. But in reality the consequent loss is less extreme than is implied by raising the discount rate by the windthrow probability. At the opposite extreme, take an event which, although it brings growth of the crop to an end, it does not affect the harvest value available at that time. The resulting MEV is shown in figure 5.
0
200
400
600
800
1000
1200
25 30 35 40 45 50 55 60
Net p
rese
nt v
alue
(£)
Crop age (years)
MEV (instant replacement); 2.0% threat rate
MEV: 100% salvage; 2.0% threat rate
Figure 5: Mean expected value with and without salvage Not only is NPV greatly enhanced, from £417 to £1184, by allowing salvage value: the optimal rotation is also increased, from 48 to 54 years, because now extending the rotation by a year does not risk any loss of value at all.
Next, in figure 6, riskless LEV (without any discount premium) is compared with explicit MEV when 100% salvage is possible. Although explicit MEV is much less than riskless LEV (£3014), they appear to show a similar optimal rotation. In fact, numerical inspection shows that explicit MEV reaches a maximum slightly later (54 years) than riskless LEV (52.5 years). This adjustment is due to the reduced opportunity cost of successors: even with 100% salvage, MEV of successors is reduced by the possibility that the rotation will be curtailed prematurely. The effect becomes somewhat more pronounced with a lower discount rate.

72
0
500
1000
1500
2000
2500
3000
3500
25 30 35 40 45 50 55 60
Net p
rese
nt v
alue
(£)
Crop age (years)
MEV: 100% salvage; 2.0% threat rateThreat-free LEV
Figure 6: Mean expected value with salvage, and land expectation value without threat The outcome with partial salvage value can now be readily predicted. For figure 7, a windthrown crop is deemed to lose a “reasonable” 25% of value, compared with its value if felled conventionally at that same age. The effect is to shorten the rotation, to 52 years, as well as to reduce NPV to £968, compared with values with 100% salvage.
0100200300400500600700800900
1000
25 30 35 40 45 50 55 60
Net p
rese
nt v
alue
(£)
Crop age (years)
LEV: 2.0% threat premium
NPV: 75% salvage; 2.0% threat rate
Figure 7: MEV with 75% salvage, compared with LEV with threat premium
6. Age-dependent threat For most threats, the level of threat varies through the crop’s life (Martell, 1980). For example, susceptibility to lethal insect defoliation depends on stage in crop cycle. Deer browsing damage may cause crop failure at the beginning of the economic rotation; but bark stripping, with subsequent fungal invasion and stem breakage, occurs late in the rotation.
Windthrow rarely happens early in the rotation; and then only on very susceptible sites, such as waterlogged peat soils in Scotland. More usually it is a problem in the crop’s later life, when timber value would otherwise be increasing rapidly (Price, 1981). The UK Forestry Commission (Gardiner et al., 2004) has developed a predictive physical model, ForestGALES, on which the following evaluations are based.
Below are shown empirical probabilities from ForestGALES of the crop’s surviving windthrow to various ages, compared with survival probabilities implied by a 2% threat premium. Clearly discounting for threat at a constant rate underestimates survival probability in the short term, but overestimates it in the long term: importantly, the changeover occurs close to the guideline economic rotation.
00.10.20.30.40.50.60.70.80.9
1
020
4060
Cum
ulat
ive
surv
ival
pro
babi
lity
Crop age (years)
Survival probability; 2.0% threat rateSurvival probability (variable threat)
SITKA SPRUCE
YIELD CLASS 12
NON-THIN: WEST UK
Figure 8: Survival probabilities under constant and variable threat Calculating MEV now becomes more time consuming, because the well-behaved function with a constant rate of threat is replaced by a stepped function showing periodically increasing annual threat.
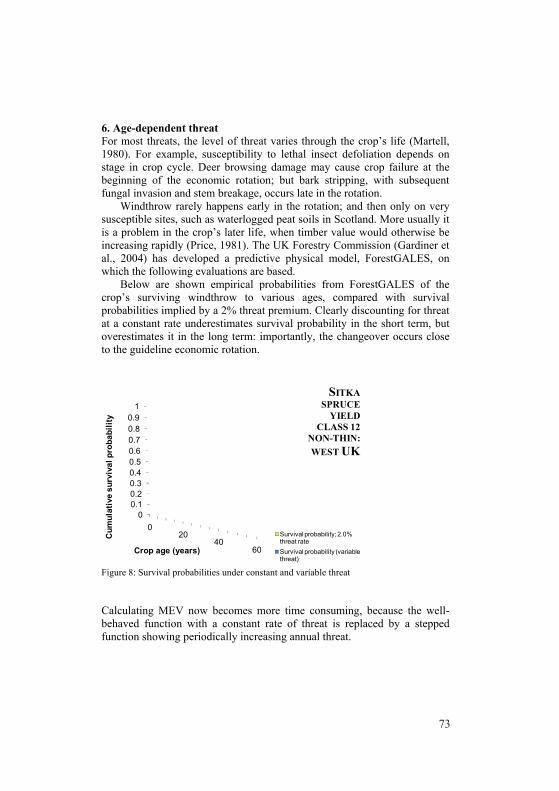
73
0
500
1000
1500
2000
2500
3000
3500
25 30 35 40 45 50 55 60
Net p
rese
nt v
alue
(£)
Crop age (years)
MEV: 100% salvage; 2.0% threat rateThreat-free LEV
Figure 6: Mean expected value with salvage, and land expectation value without threat The outcome with partial salvage value can now be readily predicted. For figure 7, a windthrown crop is deemed to lose a “reasonable” 25% of value, compared with its value if felled conventionally at that same age. The effect is to shorten the rotation, to 52 years, as well as to reduce NPV to £968, compared with values with 100% salvage.
0100200300400500600700800900
1000
25 30 35 40 45 50 55 60
Net p
rese
nt v
alue
(£)
Crop age (years)
LEV: 2.0% threat premium
NPV: 75% salvage; 2.0% threat rate
Figure 7: MEV with 75% salvage, compared with LEV with threat premium
6. Age-dependent threat For most threats, the level of threat varies through the crop’s life (Martell, 1980). For example, susceptibility to lethal insect defoliation depends on stage in crop cycle. Deer browsing damage may cause crop failure at the beginning of the economic rotation; but bark stripping, with subsequent fungal invasion and stem breakage, occurs late in the rotation.
Windthrow rarely happens early in the rotation; and then only on very susceptible sites, such as waterlogged peat soils in Scotland. More usually it is a problem in the crop’s later life, when timber value would otherwise be increasing rapidly (Price, 1981). The UK Forestry Commission (Gardiner et al., 2004) has developed a predictive physical model, ForestGALES, on which the following evaluations are based.
Below are shown empirical probabilities from ForestGALES of the crop’s surviving windthrow to various ages, compared with survival probabilities implied by a 2% threat premium. Clearly discounting for threat at a constant rate underestimates survival probability in the short term, but overestimates it in the long term: importantly, the changeover occurs close to the guideline economic rotation.
00.10.20.30.40.50.60.70.80.9
1
020
4060
Cum
ulat
ive
surv
ival
pro
babi
lity
Crop age (years)
Survival probability; 2.0% threat rateSurvival probability (variable threat)
SITKA SPRUCE
YIELD CLASS 12
NON-THIN: WEST UK
Figure 8: Survival probabilities under constant and variable threat Calculating MEV now becomes more time consuming, because the well-behaved function with a constant rate of threat is replaced by a stepped function showing periodically increasing annual threat.

74
Formula (2) for the MEV of the first rotation
TTT eeVC ρλ −− ××+−
is replaced by the discontinuous formula (2a)
( ) TTT eVC ρθ
θ θλ−=
=×−×+− ∏ 1
)1( (2a) where the time indices θ = 1 to T refer to the 1st to Tth years of the rotation and λθ to the probabilities of windthrow during these periods.
Formula (8) for the discounted value of post-destruction successor crops
)(1)(
ρλπ
ρλ
+−−
××+− teM
is replaced by (8a)
( ){ }∑ ∏=
=
−−=
=××−×
Tt
t
tt
t eM1
1
1)1( ρθ
θ θ λλ (8a)
Formula (7) for the discounted value of successor crops following survival to planned rotation end
TeM )( ρλ+−× (6) is replaced by (6a)
( ) TT eM ρθ
θ θλ−=
=×−× ∏ 1
)1( (6a) Combining (2a), (6a) and (8a), we get
( ) ( )( ) TT
Tt
t
tt
tTTT
eM
eMeVCM
ρθ
θ θ
ρθ
θ θρθ
θ θ
λ
λλλ
−=
=
=
=
−−=
=−=
=
×−×+
××−×+×−×+−=
∏
∑ ∏∏
1
1
1
11
)1(
)1()1(
The derived equation (10) for M is now replaced by ( )
( ) ( ) ⎟⎠
⎞⎜⎝
⎛×−+××−−
×−×+−=
−=
=
=
=
−−=
=
−=
=
∏∑∏∏
TTTt
t
tt
t
TTT
ee
eVCM
ρθ
θ θρθ
θ θ
ρθ
θ θ
λλλ
λ
11
1
1
1
)1()1(1
)1( (10a)
This is not sufficiently similar to equation (4) to allow general results for relative values for MEV and LEV to be derived: numerical evaluation is required, which is accomplished reasonably easily by spreadsheet.
For the sake of precision, in the spreadsheet, equation (10a) is modified further, so that crop replacement may occur any time within each individual year; and, where appropriate, salvage values are also distributed across the year. In reality, windthrow probability varies through the year, and replanting would only be done at a suitable season, so the discontinuous form, (10a) may be just as realistic. An alternative approximation is to discount values resulting from windthrow from halfway through the period, i.e. from t–0.5, and to use salvage values based on mean crop value between beginning and ending of period: see Price (1981) for a discussion.
Now that a varying empirical threat rate is being used, it is not appropriate to set a threat rate on the basis of any a priori conception of the value it should take. Instead, a representative threat rate is derived, that gives the same probability of survival to T as the cumulative empirical survival probability:
( )
T
T
t∏ =
=−−
=θ
θ θλλ 1)1(ln
for t = 1 to T (11)
Because tλ is both a function of optimal rotation, and a factor determining it, its value is calculated iteratively. Near the optimal economic rotation, the threat premium rate so calculated is less than the current windthrow threat.
Figure 9 shows the result with no salvage value. Maximum MEV of £1312 occurs at 43 years, curtailed by the rapidly rising threat. Maximum LEV of £465 occurs at 48 years, by which age MEV has plummeted to little more than 50% of its maximum: using the threat premium approach could evidently have serious financial consequences. On the other hand, the relatively high empirical survival probability before this age makes the MEV of short rotations much greater than that indicated by the threat premium.

75
Formula (2) for the MEV of the first rotation
TTT eeVC ρλ −− ××+−
is replaced by the discontinuous formula (2a)
( ) TTT eVC ρθ
θ θλ−=
=×−×+− ∏ 1
)1( (2a) where the time indices θ = 1 to T refer to the 1st to Tth years of the rotation and λθ to the probabilities of windthrow during these periods.
Formula (8) for the discounted value of post-destruction successor crops
)(1)(
ρλπ
ρλ
+−−
××+− teM
is replaced by (8a)
( ){ }∑ ∏=
=
−−=
=××−×
Tt
t
tt
t eM1
1
1)1( ρθ
θ θ λλ (8a)
Formula (7) for the discounted value of successor crops following survival to planned rotation end
TeM )( ρλ+−× (6) is replaced by (6a)
( ) TT eM ρθ
θ θλ−=
=×−× ∏ 1
)1( (6a) Combining (2a), (6a) and (8a), we get
( ) ( )( ) TT
Tt
t
tt
tTTT
eM
eMeVCM
ρθ
θ θ
ρθ
θ θρθ
θ θ
λ
λλλ
−=
=
=
=
−−=
=−=
=
×−×+
××−×+×−×+−=
∏
∑ ∏∏
1
1
1
11
)1(
)1()1(
The derived equation (10) for M is now replaced by ( )
( ) ( ) ⎟⎠
⎞⎜⎝
⎛×−+××−−
×−×+−=
−=
=
=
=
−−=
=
−=
=
∏∑∏∏
TTTt
t
tt
t
TTT
ee
eVCM
ρθ
θ θρθ
θ θ
ρθ
θ θ
λλλ
λ
11
1
1
1
)1()1(1
)1( (10a)
This is not sufficiently similar to equation (4) to allow general results for relative values for MEV and LEV to be derived: numerical evaluation is required, which is accomplished reasonably easily by spreadsheet.
For the sake of precision, in the spreadsheet, equation (10a) is modified further, so that crop replacement may occur any time within each individual year; and, where appropriate, salvage values are also distributed across the year. In reality, windthrow probability varies through the year, and replanting would only be done at a suitable season, so the discontinuous form, (10a) may be just as realistic. An alternative approximation is to discount values resulting from windthrow from halfway through the period, i.e. from t–0.5, and to use salvage values based on mean crop value between beginning and ending of period: see Price (1981) for a discussion.
Now that a varying empirical threat rate is being used, it is not appropriate to set a threat rate on the basis of any a priori conception of the value it should take. Instead, a representative threat rate is derived, that gives the same probability of survival to T as the cumulative empirical survival probability:
( )
T
T
t∏ =
=−−
=θ
θ θλλ 1)1(ln
for t = 1 to T (11)
Because tλ is both a function of optimal rotation, and a factor determining it, its value is calculated iteratively. Near the optimal economic rotation, the threat premium rate so calculated is less than the current windthrow threat.
Figure 9 shows the result with no salvage value. Maximum MEV of £1312 occurs at 43 years, curtailed by the rapidly rising threat. Maximum LEV of £465 occurs at 48 years, by which age MEV has plummeted to little more than 50% of its maximum: using the threat premium approach could evidently have serious financial consequences. On the other hand, the relatively high empirical survival probability before this age makes the MEV of short rotations much greater than that indicated by the threat premium.

76
0
200
400
600
800
1000
1200
1400
25 30 35 40 45 50 55 60
Net p
rese
nt v
alue
(£)
Crop age (years)
LEV: threat discount @ 1.7%
MEV: 0% salvage, empirical threat
Figure 9: MEV with no salvage value compared with LEV using mean threat rate 7. Combining all factors Previous sections have considered two separate reasons why in practice the discount premium approach may be an unsatisfactory way to deal with threats facing forest crops. In practice, these factors operate together. The case illustrated below uses empirical survival probabilities generated by ForestGALES, and a 75% value for salvage fellings.
Now, the optimal rotation is a little longer, 46 years, than that with no salvage value, but the major difference is that there are smaller penalties in extending the rotation by a few years.
0200400600800
100012001400160018002000
25 30 35 40 45 50 55 60
Net p
rese
nt v
alue
(£)
Crop age (years)
LEV: threat discount @ 1.7%
MEV: 75% salvage, empirical threat
Figure 10: MEV with 75% salvage compared with LEV using mean threat rate
The resulting optimal rotation remains shorter than under the threat premium approach (48 years): the high empirical risk in the late rotation, which tends to shorten the explicit MEV rotation, outweighs the salvage value factor, which tends to prolong it. However, the value of the site for forestry, £1919, is greatly underestimated by the risk premium approach (£465), because salvage values are ignored, because successor rotations are inappropriately threat-discounted, and because no early-replacement successors are encompassed.
For the sake of completeness, the result with empirical risk and 100% salvage is shown in figure 11. The MEV is £2315, and the optimal rotation is 52 years, longer than that under LEV with a threat discount, and only slightly shorter than that under LEV without any threat discount at all.
0
500
1000
1500
2000
2500
25 30 35 40 45 50 55 60
Net p
rese
nt v
alue
(£)
Crop age (years)
LEV: threat discount @ 1.7%
MEV: 100% salvage, empirical threat
Figure 11: MEV with 100% salvage compared with LEV using mean threat rate 8. Conclusion For forest economists, there is beguiling attraction in simple and easily manipulated formulas as ways of representing the world. They offer great possibilities of tidy solutions to classical problems of forest management. But the world of real forests is rather messy, not inhabited by well-behaved mathematical functions. This is not to say that the traditional tools of algebraic analysis have no place − far from it, they are very productive of insights that may, among other things, point their users towards the real world data on which important decisions sensitively depend. But to elegance should be added relevance, and this inevitably requires acquisition of data

77
0
200
400
600
800
1000
1200
1400
25 30 35 40 45 50 55 60
Net p
rese
nt v
alue
(£)
Crop age (years)
LEV: threat discount @ 1.7%
MEV: 0% salvage, empirical threat
Figure 9: MEV with no salvage value compared with LEV using mean threat rate 7. Combining all factors Previous sections have considered two separate reasons why in practice the discount premium approach may be an unsatisfactory way to deal with threats facing forest crops. In practice, these factors operate together. The case illustrated below uses empirical survival probabilities generated by ForestGALES, and a 75% value for salvage fellings.
Now, the optimal rotation is a little longer, 46 years, than that with no salvage value, but the major difference is that there are smaller penalties in extending the rotation by a few years.
0200400600800
100012001400160018002000
25 30 35 40 45 50 55 60
Net p
rese
nt v
alue
(£)
Crop age (years)
LEV: threat discount @ 1.7%
MEV: 75% salvage, empirical threat
Figure 10: MEV with 75% salvage compared with LEV using mean threat rate
The resulting optimal rotation remains shorter than under the threat premium approach (48 years): the high empirical risk in the late rotation, which tends to shorten the explicit MEV rotation, outweighs the salvage value factor, which tends to prolong it. However, the value of the site for forestry, £1919, is greatly underestimated by the risk premium approach (£465), because salvage values are ignored, because successor rotations are inappropriately threat-discounted, and because no early-replacement successors are encompassed.
For the sake of completeness, the result with empirical risk and 100% salvage is shown in figure 11. The MEV is £2315, and the optimal rotation is 52 years, longer than that under LEV with a threat discount, and only slightly shorter than that under LEV without any threat discount at all.
0
500
1000
1500
2000
2500
25 30 35 40 45 50 55 60
Net p
rese
nt v
alue
(£)
Crop age (years)
LEV: threat discount @ 1.7%
MEV: 100% salvage, empirical threat
Figure 11: MEV with 100% salvage compared with LEV using mean threat rate 8. Conclusion For forest economists, there is beguiling attraction in simple and easily manipulated formulas as ways of representing the world. They offer great possibilities of tidy solutions to classical problems of forest management. But the world of real forests is rather messy, not inhabited by well-behaved mathematical functions. This is not to say that the traditional tools of algebraic analysis have no place − far from it, they are very productive of insights that may, among other things, point their users towards the real world data on which important decisions sensitively depend. But to elegance should be added relevance, and this inevitably requires acquisition of data

78
which may not fall along regular functions. In the case of forest threats, the data are likely to be more-than-usually irregular.
Adding a threat premium to the discount rate only yields the correct optimal rotation in the restricted case of catastrophic loss and invariant rate of threat. Even for this case, the expedient does not produce the correct MEV, but at least the MEV can be obtained by a simple adjustment of LEV calculated with a threat premium.
When some value can be salvaged, or when risk is age-variant – which seems to be so for most European threats – the effect of threat on rotation and MEV is best modelled explicitly. Manipulation of the discount rate does not give anything like a good approximation to the maximum MEV: for threats that do not decline through time, calculated MEV is invariably higher under explicit treatment than under a threat premium that reflects mean threat up to the adopted rotation. However, according to circumstances, the MEV rotation may be either longer or shorter than the threat premium rotation.
Acknowledgements My thanks are due to Dick Brazee and Jonathan Rubin for helpful discussions of the subject matter, and to Eleanor Price for checking the maths. References Englin, J., Boxall, P. and Hauer, G. (2000). An empirical examination of
optimal rotations in a multiple-use forest in the presence of fire risk. Journal of Agricultural and Resource Economics, 25, 14-27.
Gardiner, B., Suárez, J., Achim, A., Hale, S and Nicoll, B. (2004). ForestGALES: A PC-based wind risk model for British Forests. User’s Guide. Forestry Commission, Edinburgh.
Lohmander, P. (1987). The Economics of Forest Management under Risk. Swedish University of Agricultural Sciences, Umeå.
Lohmander, P. and Helles, F. (1987). Windthrow probability as a function of stand characteristics and shelter. Scandinavian Journal of Forest Research, 2, 227-38.
Madsen, L.J. 1984 En metode til beregning af jord- og venteværdier under risko for stormfald. Dansk Skovforenings Tidsskrift, 69, 375-386.
Madsen, L.J. 1985 Rødgrans jord- og venteværdier under risko for stormfald. Dansk Skovforenings Tidsskrift, 70, 219-234.
Martell, D.L. (1980). The optimal rotation of a flammable forest stand. Canadian Journal of Forest Research, 10, 30-4.
Meilby, H., Strange, N. and Thorsen, B.J. (2001). Optimal spatial harvest planning under risk of windthrow. Forest Ecology and Management, 149, 15-31.
Olschewski, R. and Benitez, P.C. (2010). Optimizing joint production of timber and carbon sequestration of afforestation projects. Journal of Forest Economics, 16, 1-10.
Price, C. (1981). When does windthrow risk happen and does it matter? Y Coedwigwr, 33, 14-25.
Price, C. (1989). The Theory and Application of Forest Economics. Blackwell, Oxford.
Price, C. (1993). Time, Discounting and Value. Blackwell, Oxford. Price, C. and Trivedi, S.N. (1994). Plantation appraisal under the threat of
illicit felling. In J.Weiss (ed.) The Economics of Project Appraisal and the Environment, Edward Elgar, pp.67-79.
Reed, W.J. (1984). The effects of the risk of fire on the optimal rotation of a forest. Journal of Environmental Economics and Management. 11, 180-90.
Routledge, R.D. (1980). The effect of potential catastrophic mortality and other unpredictable events on optimal forest rotation policy. Forest Science, 26, 389-99.
Thorsen, B.J. and Helles, F. (1998). Optimal stand management under risk of sudden destruction. Forest Ecology and Management, 108, 287-99.
79
which may not fall along regular functions. In the case of forest threats, the data are likely to be more-than-usually irregular.
Adding a threat premium to the discount rate only yields the correct optimal rotation in the restricted case of catastrophic loss and invariant rate of threat. Even for this case, the expedient does not produce the correct MEV, but at least the MEV can be obtained by a simple adjustment of LEV calculated with a threat premium.
When some value can be salvaged, or when risk is age-variant – which seems to be so for most European threats – the effect of threat on rotation and MEV is best modelled explicitly. Manipulation of the discount rate does not give anything like a good approximation to the maximum MEV: for threats that do not decline through time, calculated MEV is invariably higher under explicit treatment than under a threat premium that reflects mean threat up to the adopted rotation. However, according to circumstances, the MEV rotation may be either longer or shorter than the threat premium rotation.
Acknowledgements My thanks are due to Dick Brazee and Jonathan Rubin for helpful discussions of the subject matter, and to Eleanor Price for checking the maths. References Englin, J., Boxall, P. and Hauer, G. (2000). An empirical examination of
optimal rotations in a multiple-use forest in the presence of fire risk. Journal of Agricultural and Resource Economics, 25, 14-27.
Gardiner, B., Suárez, J., Achim, A., Hale, S and Nicoll, B. (2004). ForestGALES: A PC-based wind risk model for British Forests. User’s Guide. Forestry Commission, Edinburgh.
Lohmander, P. (1987). The Economics of Forest Management under Risk. Swedish University of Agricultural Sciences, Umeå.
Lohmander, P. and Helles, F. (1987). Windthrow probability as a function of stand characteristics and shelter. Scandinavian Journal of Forest Research, 2, 227-38.
Madsen, L.J. 1984 En metode til beregning af jord- og venteværdier under risko for stormfald. Dansk Skovforenings Tidsskrift, 69, 375-386.
Madsen, L.J. 1985 Rødgrans jord- og venteværdier under risko for stormfald. Dansk Skovforenings Tidsskrift, 70, 219-234.
Martell, D.L. (1980). The optimal rotation of a flammable forest stand. Canadian Journal of Forest Research, 10, 30-4.
Meilby, H., Strange, N. and Thorsen, B.J. (2001). Optimal spatial harvest planning under risk of windthrow. Forest Ecology and Management, 149, 15-31.
Olschewski, R. and Benitez, P.C. (2010). Optimizing joint production of timber and carbon sequestration of afforestation projects. Journal of Forest Economics, 16, 1-10.
Price, C. (1981). When does windthrow risk happen and does it matter? Y Coedwigwr, 33, 14-25.
Price, C. (1989). The Theory and Application of Forest Economics. Blackwell, Oxford.
Price, C. (1993). Time, Discounting and Value. Blackwell, Oxford. Price, C. and Trivedi, S.N. (1994). Plantation appraisal under the threat of
illicit felling. In J.Weiss (ed.) The Economics of Project Appraisal and the Environment, Edward Elgar, pp.67-79.
Reed, W.J. (1984). The effects of the risk of fire on the optimal rotation of a forest. Journal of Environmental Economics and Management. 11, 180-90.
Routledge, R.D. (1980). The effect of potential catastrophic mortality and other unpredictable events on optimal forest rotation policy. Forest Science, 26, 389-99.
Thorsen, B.J. and Helles, F. (1998). Optimal stand management under risk of sudden destruction. Forest Ecology and Management, 108, 287-99.

80
Valuing landscapes with trees: subjectivity versus objectivity, holistic versus
components-based approaches
Colin Price School of the Environment, Natural Resources and Geography,
Bangor University
Abstract Recent interest by environmental economists in landscape valuation has reopened a debate from the 1960s and 1970s concerning subjective (holistic) and objective (components-based) approaches to landscape assessment and their relative strengths and weaknesses. Contingent valuation seeks the required holistic value, but limits benefit transfer; besides, there are unresolved strategic and hypothetical biases. Hedonic pricing and choice experiments, by their components orientation, partly resolve these problems. Field exercises have shown that subjective valuations are as consistent and explicable as objective ones. Components-based approaches covertly require subjective judgement, and fail to account for crucial interactions of components in determining landscape quality. A combination of holistic and subjective assessment of landscape quality with objective measurement of willingness to pay for quality is the best means to assess the effect of trees on landscape value. 1. Introduction When I first became interested in the landscape effects of forestry, it was from a purely aesthetic point of view. I had become irritated by the insensitivity of the large-scale afforestation that had taken place since the formation of the British Forestry Commission in 1919, and was escalating during the 1960s as a result of generous tax concessions to private commercial forestry. In the course of leisure and through the support of a small landscape trust I had the opportunity to visit and comment on forestry in some of Britain’s national parks and in Scotland, casually at first, then more purposefully (Price, 1963, 1966a, 1966b, 1968). Though not dogmatically critical, my comments were often unfavourable to the then-current practice. They aligned with the views of landscape activists, which at the time were regarded in forestry circles as the outpourings of uninformed extremists.
“We must educate the public!” was a phrase not infrequently heard, in response to adverse comment on foresters’ activities.
I embarked on a forestry degree course with the intention of promulgating my views, and hoping – in a completely intuitive way – to offer “moderate” trade-offs between aesthetics and economic realities. Through reading and through experience I compiled for myself seven principles of landscape design, which were general ones but formulated particularly with forestry in mind. Their names – naturalness, equilibrium, integrity, contrast and variety, pattern, honesty, and pleasantness – convey a little of their content.
But at the same time I became aware that the economics of forestry was in itself controversial. It became increasingly apparent that there was an urgent need to assess landscape quantitatively, and if possible in a way that allowed comparison with commercial values (Price 1970).
This paper follows the development of formal and quantitative assessment of landscape, starting from the non-economic perspectives of planners and geographers, but moving to the techniques of environmental economics. It draws some cautionary lessons from non-economic studies, that could be applied to the currently fashionable use of contingent valuation, hedonic pricing and choice experiments to value landscape.
2. Subjectivity versus objectivity: the debate of aesthetes In the 1960s two opposing approaches to landscape evaluation were in discussion among geographers and planners. The holistic or subjective approach scored landscapes according to their overall impression, as judged subjectively by observers. By far the most widely discussed scale was that proposed by Fines (1968), and used as a means of evaluating alternative landscape corridors for an electricity transmission line. Numerical ranges were attached to descriptive categories in a way that suggested the numbers were intended to be interpreted in a cardinal sense, and they were so used in averaging the quality of the alternative landscape corridors. However, in application these ranges proved hard to interpret, and Harding and Thomas (pers.comm.) provided a scale where numbers were equally distributed across categories: this has subsequently been much used in student exercises.

81
Valuing landscapes with trees: subjectivity versus objectivity, holistic versus
components-based approaches
Colin Price School of the Environment, Natural Resources and Geography,
Bangor University
Abstract Recent interest by environmental economists in landscape valuation has reopened a debate from the 1960s and 1970s concerning subjective (holistic) and objective (components-based) approaches to landscape assessment and their relative strengths and weaknesses. Contingent valuation seeks the required holistic value, but limits benefit transfer; besides, there are unresolved strategic and hypothetical biases. Hedonic pricing and choice experiments, by their components orientation, partly resolve these problems. Field exercises have shown that subjective valuations are as consistent and explicable as objective ones. Components-based approaches covertly require subjective judgement, and fail to account for crucial interactions of components in determining landscape quality. A combination of holistic and subjective assessment of landscape quality with objective measurement of willingness to pay for quality is the best means to assess the effect of trees on landscape value. 1. Introduction When I first became interested in the landscape effects of forestry, it was from a purely aesthetic point of view. I had become irritated by the insensitivity of the large-scale afforestation that had taken place since the formation of the British Forestry Commission in 1919, and was escalating during the 1960s as a result of generous tax concessions to private commercial forestry. In the course of leisure and through the support of a small landscape trust I had the opportunity to visit and comment on forestry in some of Britain’s national parks and in Scotland, casually at first, then more purposefully (Price, 1963, 1966a, 1966b, 1968). Though not dogmatically critical, my comments were often unfavourable to the then-current practice. They aligned with the views of landscape activists, which at the time were regarded in forestry circles as the outpourings of uninformed extremists.
“We must educate the public!” was a phrase not infrequently heard, in response to adverse comment on foresters’ activities.
I embarked on a forestry degree course with the intention of promulgating my views, and hoping – in a completely intuitive way – to offer “moderate” trade-offs between aesthetics and economic realities. Through reading and through experience I compiled for myself seven principles of landscape design, which were general ones but formulated particularly with forestry in mind. Their names – naturalness, equilibrium, integrity, contrast and variety, pattern, honesty, and pleasantness – convey a little of their content.
But at the same time I became aware that the economics of forestry was in itself controversial. It became increasingly apparent that there was an urgent need to assess landscape quantitatively, and if possible in a way that allowed comparison with commercial values (Price 1970).
This paper follows the development of formal and quantitative assessment of landscape, starting from the non-economic perspectives of planners and geographers, but moving to the techniques of environmental economics. It draws some cautionary lessons from non-economic studies, that could be applied to the currently fashionable use of contingent valuation, hedonic pricing and choice experiments to value landscape.
2. Subjectivity versus objectivity: the debate of aesthetes In the 1960s two opposing approaches to landscape evaluation were in discussion among geographers and planners. The holistic or subjective approach scored landscapes according to their overall impression, as judged subjectively by observers. By far the most widely discussed scale was that proposed by Fines (1968), and used as a means of evaluating alternative landscape corridors for an electricity transmission line. Numerical ranges were attached to descriptive categories in a way that suggested the numbers were intended to be interpreted in a cardinal sense, and they were so used in averaging the quality of the alternative landscape corridors. However, in application these ranges proved hard to interpret, and Harding and Thomas (pers.comm.) provided a scale where numbers were equally distributed across categories: this has subsequently been much used in student exercises.

82
Table 1: Fines’s scales for landscape evaluation Fines’s descriptive
category Fines’s numerical
scores Harding and Thomas’s
adaptation Unsightly 0−1 0−5
Undistinguished 1−2 5−10 Pleasant 2−4 10−15
Distinguished 4−8 15−20 Superb 8−16 20−25
Spectacular 16−32 25−30 The categories are illustrated with annotations in figure 1.
Figure 1: Examples of categories on the Fines scale
Description of pictures: Unsightly at Tunstead Limestone Quarry, Peak District National Park: “unsightly” means that there is a predominance of elements that offend the eye, often associated with exploitation. Undistinguished in the Fenland near March, Cambridgeshire: “undistinguished” means that there is nothing in particular to offend the eye, but nothing in particular to delight it either. Pleasant in the Mendip Hills, Somerset: “pleasant” landscape is such that one would positively enjoy viewing it. Little strong topography, but pleasing woods, pastureland, and walls of the local stone.
Attractive on Caer Caradoc, Shropshire Hills AONB: strong topography combines with intimate field pattern to make a landscape that people would like to holiday in. (I have done so.) Superb at Windermere, Lake District: such landscape is mostly found in mountainous regions. As usual, the presence of water is positive aesthetically. Spectacular at Romsdalfjorden, Norway: I think this scene would need a vernacular field boundary, to give it a high score in this category.
An alternative approach was based on identifiable components of the landscape, and was said to be objective, and replicable between observers. Perhaps the best known example was Linton’s system (1968), developed in relation to the landscape of Scotland. The system not only identified components, but scored them according to deemed landscape merit, a juncture at which subjectivity potentially intrudes. Table 2 shows the scores for Linton’s two main components, land form and land use. Table 2: Linton’s components approach
Land form Score Land use Score Mountains 8 Wild landscapes +6 Bold hills 6 Richly varied farming +5
Hill country 5 Varied forest and moorland
+4
Plateau uplands 3 Moorland +3 Low uplands 2 Treeless farmland +1
Lowlands 0 Continuous forests –2 Urbanised and
industrialised –5
Linton recognised that the land use scores particularly represent subjective judgements, but asserted that “they are judgements to which we largely subscribe in common”: this is not the same as scientific objectivity. That trees and forests sometimes appear as positive features, and sometimes as negative, will be particularly noted.
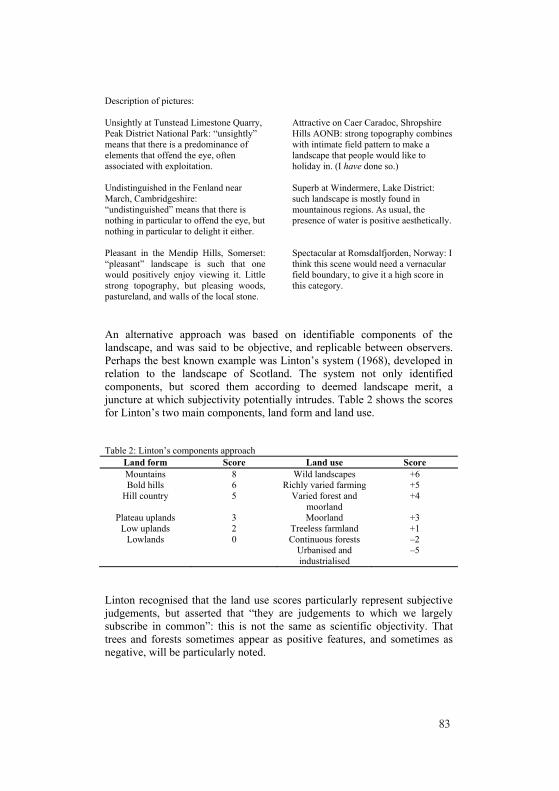
83
Table 1: Fines’s scales for landscape evaluation Fines’s descriptive
category Fines’s numerical
scores Harding and Thomas’s
adaptation Unsightly 0−1 0−5
Undistinguished 1−2 5−10 Pleasant 2−4 10−15
Distinguished 4−8 15−20 Superb 8−16 20−25
Spectacular 16−32 25−30 The categories are illustrated with annotations in figure 1.
Figure 1: Examples of categories on the Fines scale
Description of pictures: Unsightly at Tunstead Limestone Quarry, Peak District National Park: “unsightly” means that there is a predominance of elements that offend the eye, often associated with exploitation. Undistinguished in the Fenland near March, Cambridgeshire: “undistinguished” means that there is nothing in particular to offend the eye, but nothing in particular to delight it either. Pleasant in the Mendip Hills, Somerset: “pleasant” landscape is such that one would positively enjoy viewing it. Little strong topography, but pleasing woods, pastureland, and walls of the local stone.
Attractive on Caer Caradoc, Shropshire Hills AONB: strong topography combines with intimate field pattern to make a landscape that people would like to holiday in. (I have done so.) Superb at Windermere, Lake District: such landscape is mostly found in mountainous regions. As usual, the presence of water is positive aesthetically. Spectacular at Romsdalfjorden, Norway: I think this scene would need a vernacular field boundary, to give it a high score in this category.
An alternative approach was based on identifiable components of the landscape, and was said to be objective, and replicable between observers. Perhaps the best known example was Linton’s system (1968), developed in relation to the landscape of Scotland. The system not only identified components, but scored them according to deemed landscape merit, a juncture at which subjectivity potentially intrudes. Table 2 shows the scores for Linton’s two main components, land form and land use. Table 2: Linton’s components approach
Land form Score Land use Score Mountains 8 Wild landscapes +6 Bold hills 6 Richly varied farming +5
Hill country 5 Varied forest and moorland
+4
Plateau uplands 3 Moorland +3 Low uplands 2 Treeless farmland +1
Lowlands 0 Continuous forests –2 Urbanised and
industrialised –5
Linton recognised that the land use scores particularly represent subjective judgements, but asserted that “they are judgements to which we largely subscribe in common”: this is not the same as scientific objectivity. That trees and forests sometimes appear as positive features, and sometimes as negative, will be particularly noted.

84
In addition to these, Linton suggested water should score two bonus points if it formed the foreground of views, and one bonus point if it formed a significant part of the scene. “Detractors” were also discussed, but seemingly aggregated into “urbanised and industrialised” land use. Subsequent commentators (Penning-Rowsell and Hardy, 1973) have included detractors as a separable category.
Linton’s discussion of positive factors in land use referred to “variety”, which led to development of the components approach in Bangor in the 1970s. Linton’s approach to land form was followed quite closely, but, to avoid the charge of prejudice, land use was represented by its variety, simply assessed by recording the presence of each of several uses suggested by Linton.
Table 3: A modified components approach Land form Score Land use: score 1 for each of – Water Score Mountains 5 “Wild” or semi-natural land Significant in the
view 2
Hills 4 Broadleaved woods or trees Present in the view 1 Steep but
low 3 Coniferous woods or trees
Undulating 2 Cultivated land Flat 1 “Attractive” urban
Deduct 1 for presence of “detractors”
Detractors could include (and have included) non-urban activities, such as clear felling of forests, which are deemed to be aesthetically offensive.
But, preceding both of these “aesthetic” assessments of landscape, there had been an evaluation system with an economic output. It was not, as might be thought, the hedonic studies of trees’ contribution to house price by Payne and Strom (1973), nor the contingent valuations of aesthetic enhancements by Randall et al. (1974), but a non-mainstream approach to valuing trees, based on the expert judgement of a forestry graduate (Helliwell, 1967). The system required each of seven characteristics of a tree to be scored by the assessor, as shown below.
Table 4: Scoring tree characteristics according to the Helliwell system Helliwell
score Size Useful
life expect-
ancy
Importance of position
in landscape
Presence of other
trees
Relation to
setting
Form Special factors
1 small 10−20 years
little many barely suitable
poor none
2 medium 20−40 years
some some fairly suitable
fair one
3 large 40−100 years
considerable few very suitable
good two
4 very large
100+ years
great none espec-ially
suitable
espec-ially good
three
Scores for each characteristic are multiplied together, and the result is further multiplied by a monetary sum, originally £1, but increased over the years to take account of inflation and of feedback from users of the system. The system is used to this day in assessing tree values, for example in court cases for compensation. Figure 2 shows a tree which has been used in an exercise referred to later.
Figure 2: A cedar tree outside a students’ residence in Bangor, which was considered “large”; to have a useful life expectancy of 40-100 years; “considerable” importance in the landscape, in which there were “few” trees of comparable size; to be “very suitable” to its setting; to have “good” [crown] form. No “special factors” were identified.

85
In addition to these, Linton suggested water should score two bonus points if it formed the foreground of views, and one bonus point if it formed a significant part of the scene. “Detractors” were also discussed, but seemingly aggregated into “urbanised and industrialised” land use. Subsequent commentators (Penning-Rowsell and Hardy, 1973) have included detractors as a separable category.
Linton’s discussion of positive factors in land use referred to “variety”, which led to development of the components approach in Bangor in the 1970s. Linton’s approach to land form was followed quite closely, but, to avoid the charge of prejudice, land use was represented by its variety, simply assessed by recording the presence of each of several uses suggested by Linton.
Table 3: A modified components approach Land form Score Land use: score 1 for each of – Water Score Mountains 5 “Wild” or semi-natural land Significant in the
view 2
Hills 4 Broadleaved woods or trees Present in the view 1 Steep but
low 3 Coniferous woods or trees
Undulating 2 Cultivated land Flat 1 “Attractive” urban
Deduct 1 for presence of “detractors”
Detractors could include (and have included) non-urban activities, such as clear felling of forests, which are deemed to be aesthetically offensive.
But, preceding both of these “aesthetic” assessments of landscape, there had been an evaluation system with an economic output. It was not, as might be thought, the hedonic studies of trees’ contribution to house price by Payne and Strom (1973), nor the contingent valuations of aesthetic enhancements by Randall et al. (1974), but a non-mainstream approach to valuing trees, based on the expert judgement of a forestry graduate (Helliwell, 1967). The system required each of seven characteristics of a tree to be scored by the assessor, as shown below.
Table 4: Scoring tree characteristics according to the Helliwell system Helliwell
score Size Useful
life expect-
ancy
Importance of position
in landscape
Presence of other
trees
Relation to
setting
Form Special factors
1 small 10−20 years
little many barely suitable
poor none
2 medium 20−40 years
some some fairly suitable
fair one
3 large 40−100 years
considerable few very suitable
good two
4 very large
100+ years
great none espec-ially
suitable
espec-ially good
three
Scores for each characteristic are multiplied together, and the result is further multiplied by a monetary sum, originally £1, but increased over the years to take account of inflation and of feedback from users of the system. The system is used to this day in assessing tree values, for example in court cases for compensation. Figure 2 shows a tree which has been used in an exercise referred to later.
Figure 2: A cedar tree outside a students’ residence in Bangor, which was considered “large”; to have a useful life expectancy of 40-100 years; “considerable” importance in the landscape, in which there were “few” trees of comparable size; to be “very suitable” to its setting; to have “good” [crown] form. No “special factors” were identified.

86
Apart from the last monetising step, it resembles Linton’s method in its focus on components which, it might be hoped, can be objectively assessed or would at least command consensus, that they determine trees’ value, in the direction indicated. Like both Fines’s and Linton’s method, its use of arithmetic requires that the numbers can be considered to have a cardinal nature. Economists might, however, be inclined to dismiss its monetary validity, because it makes no reference to consumers’ willingness to pay.
It should be mentioned that the debate of the 1960s and 1970s was not just between supporters of holistic and of components approaches, but included those who deplored any attempt at all to quantify landscape values (Carlson 1977).
3. Relevance to economics: parallels and warnings So what has all this got to do with economic valuation of landscape?
I suppose that it is not uncommon, at the beginning of one’s career as a natural resource economist, to imagine that the world could be optimised by giving a well-formulated dynamic programming problem to a sufficiently large computer.
Similarly, when I first read about the hedonic pricing method (Griliches, 1971), I thought: this could be used to value the impact of forests on landscapes, and of trees on urban scenery. We just find out how far people have travelled to visit rural landscapes (or how much they paid for houses with views including trees). Then we shall see whether Dr Linton is right, about continuous forests detracting from the landscape. It didn’t take long to disabuse myself of this seductive notion.
In fact the aesthetic effects of trees can be monetised in many ways, each with its problems (Price, 2007). In what follows, particular reference is made to hedonic pricing and contingent valuations, approaches which are as different as were those of Linton and of Fines.
4. Contingent valuation and the holistic approach The contingent valuation method (CVM) corresponds to the subjective approach. Instead of asking people to score the landscape on a scale 0-30, we ask their willingness to pay for it, on a scale of DK0 to DK3000, or whether they would be willing to pay DK300 for a landscaped tree planting scheme.
In principle, contingent valuation’s approach to monetising has beguiling simplicity, asking directly the question to which an answer is needed. In seeking an overall impression of value, without exploring what are the underlying causes of value, it resembles the Fines approach. The difference lies not just in translation into monetary terms, but in the kind of comparisons that are made: in the CVM the comparisons are not “vertical”,
between different qualities of landscape, but “horizontal”, between landscape (or whatever other commodity might be assessed) and a scale of a different kind, money. This is the strength of CVM (and other environmental evaluation methods), enabling trade-offs to be made with other kinds of product and with the resources needed to create them. However, this feature also opens it to biases not present in the Fines method. These have been discussed at enormous length (e.g. Mitchell and Carson, 1989; Price, 1994; Garrod, 2002); but mere discussion does not guarantee that all problems will be resolved.
In particular, if I am asked what I am willing to pay for retention or planting of trees, I may ask myself: can I move the decision in favour of better landscape for me without actually having to pay anything? (strategic bias). Or my answer may be affected by part–whole bias (Bateman et al., 1997), or represent the “purchase of moral satisfaction” (Kahneman and Knetsch, 1992) or expression of symbolic values (Blamey, 1996). These biases are not always clearly separated: they are distinguished by responses to a small-scale questionnaire designed specifically to explore bias, though in relation to nature conservation values (Price, 2001) – see table 5.
Table 5: Reasons for expressing a passive use value for Rafflesia priceiana Reason for giving this value for the species Number of responses I I knew about the importance of this species 2 II I believe that genetic resources should be maintained intact 9 III I want to be seen as someone who is concerned about nature conservation 2 IV I thought you would not have asked these questions if it wasn’t important 4 V I suspected that this species does not really exist 6 VI I didn’t know anything about it 13
Answer II expresses part–whole bias: the question is about maintaining one species, but the respondent has answered as though the interviewer is offering something impossible, the guaranteed maintenance of all species. Answer III expresses moral (self-)satisfaction: the respondent is not concerned for the value of the species itself, but for feeling good about him- or her-self. Answer V (which is made plausible by the name of species) must clearly indicate a symbolic value: although the species is thought not to exist (it does, actually, though it has recently been renamed), it stands for threatened species. Several respondents who ticked these answers also ticked answer VI: although they had no knowledge about the species, they were willing to pay something for it, because it represented the kind of thing they approved of, and that they wanted to be seen to approve of.
Similarly, landscape and beauty and tree-planting are “apple-pie and parenthood” values, like sustainability: one should approve of them, and
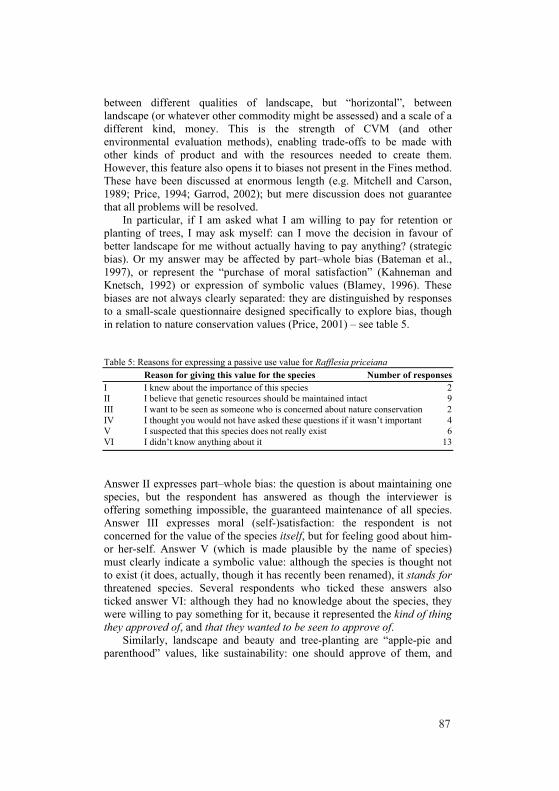
87
Apart from the last monetising step, it resembles Linton’s method in its focus on components which, it might be hoped, can be objectively assessed or would at least command consensus, that they determine trees’ value, in the direction indicated. Like both Fines’s and Linton’s method, its use of arithmetic requires that the numbers can be considered to have a cardinal nature. Economists might, however, be inclined to dismiss its monetary validity, because it makes no reference to consumers’ willingness to pay.
It should be mentioned that the debate of the 1960s and 1970s was not just between supporters of holistic and of components approaches, but included those who deplored any attempt at all to quantify landscape values (Carlson 1977).
3. Relevance to economics: parallels and warnings So what has all this got to do with economic valuation of landscape?
I suppose that it is not uncommon, at the beginning of one’s career as a natural resource economist, to imagine that the world could be optimised by giving a well-formulated dynamic programming problem to a sufficiently large computer.
Similarly, when I first read about the hedonic pricing method (Griliches, 1971), I thought: this could be used to value the impact of forests on landscapes, and of trees on urban scenery. We just find out how far people have travelled to visit rural landscapes (or how much they paid for houses with views including trees). Then we shall see whether Dr Linton is right, about continuous forests detracting from the landscape. It didn’t take long to disabuse myself of this seductive notion.
In fact the aesthetic effects of trees can be monetised in many ways, each with its problems (Price, 2007). In what follows, particular reference is made to hedonic pricing and contingent valuations, approaches which are as different as were those of Linton and of Fines.
4. Contingent valuation and the holistic approach The contingent valuation method (CVM) corresponds to the subjective approach. Instead of asking people to score the landscape on a scale 0-30, we ask their willingness to pay for it, on a scale of DK0 to DK3000, or whether they would be willing to pay DK300 for a landscaped tree planting scheme.
In principle, contingent valuation’s approach to monetising has beguiling simplicity, asking directly the question to which an answer is needed. In seeking an overall impression of value, without exploring what are the underlying causes of value, it resembles the Fines approach. The difference lies not just in translation into monetary terms, but in the kind of comparisons that are made: in the CVM the comparisons are not “vertical”,
between different qualities of landscape, but “horizontal”, between landscape (or whatever other commodity might be assessed) and a scale of a different kind, money. This is the strength of CVM (and other environmental evaluation methods), enabling trade-offs to be made with other kinds of product and with the resources needed to create them. However, this feature also opens it to biases not present in the Fines method. These have been discussed at enormous length (e.g. Mitchell and Carson, 1989; Price, 1994; Garrod, 2002); but mere discussion does not guarantee that all problems will be resolved.
In particular, if I am asked what I am willing to pay for retention or planting of trees, I may ask myself: can I move the decision in favour of better landscape for me without actually having to pay anything? (strategic bias). Or my answer may be affected by part–whole bias (Bateman et al., 1997), or represent the “purchase of moral satisfaction” (Kahneman and Knetsch, 1992) or expression of symbolic values (Blamey, 1996). These biases are not always clearly separated: they are distinguished by responses to a small-scale questionnaire designed specifically to explore bias, though in relation to nature conservation values (Price, 2001) – see table 5.
Table 5: Reasons for expressing a passive use value for Rafflesia priceiana Reason for giving this value for the species Number of responses I I knew about the importance of this species 2 II I believe that genetic resources should be maintained intact 9 III I want to be seen as someone who is concerned about nature conservation 2 IV I thought you would not have asked these questions if it wasn’t important 4 V I suspected that this species does not really exist 6 VI I didn’t know anything about it 13
Answer II expresses part–whole bias: the question is about maintaining one species, but the respondent has answered as though the interviewer is offering something impossible, the guaranteed maintenance of all species. Answer III expresses moral (self-)satisfaction: the respondent is not concerned for the value of the species itself, but for feeling good about him- or her-self. Answer V (which is made plausible by the name of species) must clearly indicate a symbolic value: although the species is thought not to exist (it does, actually, though it has recently been renamed), it stands for threatened species. Several respondents who ticked these answers also ticked answer VI: although they had no knowledge about the species, they were willing to pay something for it, because it represented the kind of thing they approved of, and that they wanted to be seen to approve of.
Similarly, landscape and beauty and tree-planting are “apple-pie and parenthood” values, like sustainability: one should approve of them, and

88
publicly express such approval (Price 1999a). Moreover, by exaggerating one’s degree of approval as expressed in willingness to pay, one may be able to enhance the landscape one enjoys, without perhaps having to pay the cost. None of these problems arises in the more circumscribed valuations of the Fines approach.
A further problem arises precisely from the holistic nature of the valuation: it is specific to locality and to the nature of the proposed change, and it must hence be questionable whether the landscape benefit determined is transferable to other circumstances. This hinders validation of the measure against other completed valuations, and brings the need to repeat valuations in all future circumstances. Even using questions about distant and perhaps unknown landscapes does not satisfactorily solve the benefit transfer problem. Such an approach encounters a further serious problem, that of information bias (Price, 1999b), under which being informed about a particular landscape raises its importance and, again, makes it symbolic of general landscape concerns.
Hedonic pricing appears to overcome all these problems.
5. Hedonic pricing and the components approach Being based on real market transactions, hedonic pricing avoids the problems arising from the hypothetical nature of choices in contingent valuation. One actually has to pay for the bundle of characteristics that a house or a holiday location offers, so there is no strategic advantage in misrepresenting what one is willing to pay. One buys not all landscape, not trees as general symbols of beauty, but that part of actual landscape over which purchase gives one command. It is clear that the purchase made is for one’s own private advantage, and is not a public statement of support for the notion of beauty, or for its actual existence.
Moreover, the attributed aesthetic value of the views accessed can be distributed across the designated components of the view. Hence it becomes possible to transfer benefits by compiling a value for a landscape or for a change made to a landscape, simply by summing unit values for its components, as derived from studies made elsewhere.
The existence of trees, and even of particular kind of trees, in proximity to houses has been a particularly heavily researched aspect of hedonic pricing (Strom and Payne, 1973; Morales et al., 1976; Anderson and Cordell, 1988; Kim and Johnson, 2002). While there seems general consensus that trees are a good thing for landscape, there is less agreement on the relative benefits of different kinds and locations of trees. A Danish study found a positive effect on house price resulting from nearness of forests (Anthon et al., 2005), while a Finnish one found the opposite (Tyrväinen, 1997). Hanley and Ruffell (1993) considered the results of their attempt to relate travel distance to characteristics of trees constituting forests
“disappointing”. Willis and Garrod (1992) reached the counter-intuitive conclusion that old Sitka spruce forests – usually deemed more attractive than young ones – reduced house prices. (For possible explanations, see Price (2003)).
Perhaps we just need a bigger model, with more data?
6. Choice experiments and the components approach As discussed, a major potential problem of contingent valuation arises from headlining one particular issue (conservation of an attractive species) or site (enhancing or preserving its beauty), with the possibility that many related environmental concerns will be hung upon this. Choice experiments attempt to resolve the problem by offering choices among two or more packages in which one or more environmental attributes is offered at several levels along with several levels of monetary sums.
In so doing, they also reduce the stark choice between either a monetary sum or an environmental gain: comparisons are vertical (between levels of attributes) as well as horizontal (between attributes and money). They seem to weaken the incentive for expressing moral satisfaction values; for embracing “the whole” of the environment rather than focusing on the required “part”; and for seeking strategic gains by misrepresentation of willingness to pay.
They also, by intention, allow monetary equivalents to be attached to components of the environmental experience, thereby facilitating benefit transfer, as with HPM.
However, they do not altogether avoid the expression of symbolic values. When Nielsen et al. (2007) offered packages in which various levels of forest characteristics were offered, there was a positive willingness to pay for presence of dead wood. On the other hand the most preferred level of dead wood was the minimum offered, hinting that respondents knew that dead wood was “a good thing” for biodiversity and so supported it in principle; but felt that it was aesthetically displeasing so should be limited in practice. There is perhaps a parallel with the neo-Gothic liking for gnarled and twisted (and probably dead) trees as shown in the pictures of, for example, Caspar David Friedrich: “sublime” experience is something one should have, but it’s good to be able to retreat to “picturesque” and “beautiful” landscapes, once the requisite chilling of the spine has been achieved (Price, 1810).
7. Subjectivity is not inexplicable Although subjectivity is considered a “bad word” in physical sciences, and even sometimes in social sciences, its existence is not hostile to the application of the scientific method. In fact the whole of demand-side economics is based on the subjective preferences of consumers for
89
publicly express such approval (Price 1999a). Moreover, by exaggerating one’s degree of approval as expressed in willingness to pay, one may be able to enhance the landscape one enjoys, without perhaps having to pay the cost. None of these problems arises in the more circumscribed valuations of the Fines approach.
A further problem arises precisely from the holistic nature of the valuation: it is specific to locality and to the nature of the proposed change, and it must hence be questionable whether the landscape benefit determined is transferable to other circumstances. This hinders validation of the measure against other completed valuations, and brings the need to repeat valuations in all future circumstances. Even using questions about distant and perhaps unknown landscapes does not satisfactorily solve the benefit transfer problem. Such an approach encounters a further serious problem, that of information bias (Price, 1999b), under which being informed about a particular landscape raises its importance and, again, makes it symbolic of general landscape concerns.
Hedonic pricing appears to overcome all these problems.
5. Hedonic pricing and the components approach Being based on real market transactions, hedonic pricing avoids the problems arising from the hypothetical nature of choices in contingent valuation. One actually has to pay for the bundle of characteristics that a house or a holiday location offers, so there is no strategic advantage in misrepresenting what one is willing to pay. One buys not all landscape, not trees as general symbols of beauty, but that part of actual landscape over which purchase gives one command. It is clear that the purchase made is for one’s own private advantage, and is not a public statement of support for the notion of beauty, or for its actual existence.
Moreover, the attributed aesthetic value of the views accessed can be distributed across the designated components of the view. Hence it becomes possible to transfer benefits by compiling a value for a landscape or for a change made to a landscape, simply by summing unit values for its components, as derived from studies made elsewhere.
The existence of trees, and even of particular kind of trees, in proximity to houses has been a particularly heavily researched aspect of hedonic pricing (Strom and Payne, 1973; Morales et al., 1976; Anderson and Cordell, 1988; Kim and Johnson, 2002). While there seems general consensus that trees are a good thing for landscape, there is less agreement on the relative benefits of different kinds and locations of trees. A Danish study found a positive effect on house price resulting from nearness of forests (Anthon et al., 2005), while a Finnish one found the opposite (Tyrväinen, 1997). Hanley and Ruffell (1993) considered the results of their attempt to relate travel distance to characteristics of trees constituting forests
“disappointing”. Willis and Garrod (1992) reached the counter-intuitive conclusion that old Sitka spruce forests – usually deemed more attractive than young ones – reduced house prices. (For possible explanations, see Price (2003)).
Perhaps we just need a bigger model, with more data?
6. Choice experiments and the components approach As discussed, a major potential problem of contingent valuation arises from headlining one particular issue (conservation of an attractive species) or site (enhancing or preserving its beauty), with the possibility that many related environmental concerns will be hung upon this. Choice experiments attempt to resolve the problem by offering choices among two or more packages in which one or more environmental attributes is offered at several levels along with several levels of monetary sums.
In so doing, they also reduce the stark choice between either a monetary sum or an environmental gain: comparisons are vertical (between levels of attributes) as well as horizontal (between attributes and money). They seem to weaken the incentive for expressing moral satisfaction values; for embracing “the whole” of the environment rather than focusing on the required “part”; and for seeking strategic gains by misrepresentation of willingness to pay.
They also, by intention, allow monetary equivalents to be attached to components of the environmental experience, thereby facilitating benefit transfer, as with HPM.
However, they do not altogether avoid the expression of symbolic values. When Nielsen et al. (2007) offered packages in which various levels of forest characteristics were offered, there was a positive willingness to pay for presence of dead wood. On the other hand the most preferred level of dead wood was the minimum offered, hinting that respondents knew that dead wood was “a good thing” for biodiversity and so supported it in principle; but felt that it was aesthetically displeasing so should be limited in practice. There is perhaps a parallel with the neo-Gothic liking for gnarled and twisted (and probably dead) trees as shown in the pictures of, for example, Caspar David Friedrich: “sublime” experience is something one should have, but it’s good to be able to retreat to “picturesque” and “beautiful” landscapes, once the requisite chilling of the spine has been achieved (Price, 1810).
7. Subjectivity is not inexplicable Although subjectivity is considered a “bad word” in physical sciences, and even sometimes in social sciences, its existence is not hostile to the application of the scientific method. In fact the whole of demand-side economics is based on the subjective preferences of consumers for
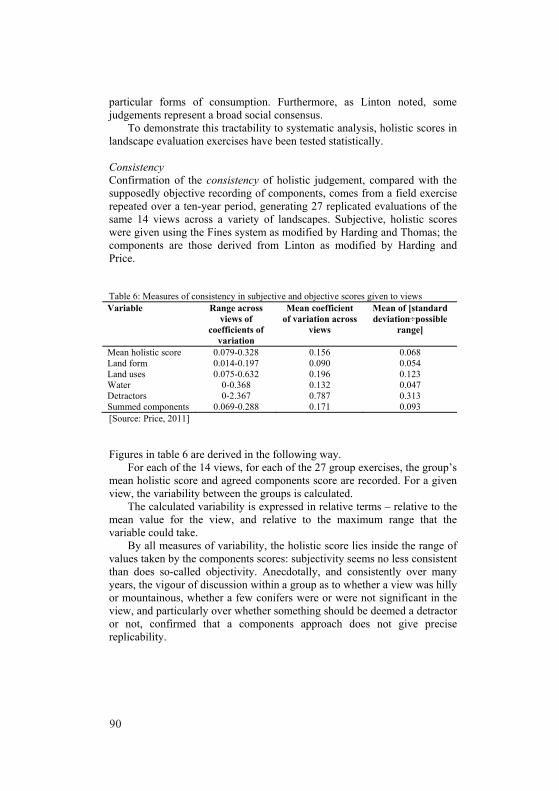
90
particular forms of consumption. Furthermore, as Linton noted, some judgements represent a broad social consensus.
To demonstrate this tractability to systematic analysis, holistic scores in landscape evaluation exercises have been tested statistically.
Consistency Confirmation of the consistency of holistic judgement, compared with the supposedly objective recording of components, comes from a field exercise repeated over a ten-year period, generating 27 replicated evaluations of the same 14 views across a variety of landscapes. Subjective, holistic scores were given using the Fines system as modified by Harding and Thomas; the components are those derived from Linton as modified by Harding and Price. Table 6: Measures of consistency in subjective and objective scores given to views Variable Range across
views of coefficients of
variation
Mean coefficient of variation across
views
Mean of [standard deviation÷possible
range]
Mean holistic score 0.079-0.328 0.156 0.068 Land form 0.014-0.197 0.090 0.054 Land uses 0.075-0.632 0.196 0.123 Water 0-0.368 0.132 0.047 Detractors 0-2.367 0.787 0.313 Summed components 0.069-0.288 0.171 0.093 [Source: Price, 2011] Figures in table 6 are derived in the following way.
For each of the 14 views, for each of the 27 group exercises, the group’s mean holistic score and agreed components score are recorded. For a given view, the variability between the groups is calculated.
The calculated variability is expressed in relative terms – relative to the mean value for the view, and relative to the maximum range that the variable could take.
By all measures of variability, the holistic score lies inside the range of values taken by the components scores: subjectivity seems no less consistent than does so-called objectivity. Anecdotally, and consistently over many years, the vigour of discussion within a group as to whether a view was hilly or mountainous, whether a few conifers were or were not significant in the view, and particularly over whether something should be deemed a detractor or not, confirmed that a components approach does not give precise replicability.
In 20 out of 26 cases (in one case it was not possible to include it), one particular view was judged to be the best of 14, and in all cases another particular view was judged to be the worst.
Within groups there is again consistency of scoring, though idiosyncrasy is more evident at this disaggregated level. In a randomly chosen data set – which was, however, typical of all data sets – Pearson correlation coefficients between the scores of pairs of individuals, for all 14 views, were all in excess of 0.4; 70 out of 91 exceeded 0.6; 55 exceeded 0.7; 31 exceeded 0.8.
Similar results were found with application of the Helliwell system to nine trees evaluated by the same groups.
Table 7: Measures of consistency for the attributes of each tree in Helliwell’s system Attribute of a particular tree
Range across trees of coefficient
of variation
Mean coefficient of variation across trees
Mean of [standard deviation÷range]
Its size 0–0.301 0.130 0.090 Its life expectancy 0.070–0.508 0.171 0.126 Importance of its position in landscape 0.107–0.491
0.216 0.153
Presence of other trees 0.090–0.856
0.300 0.280
Its “suitability to the setting” 0.107–0.284
0.176 0.144
Its form 0.061–0.365 0.211 0.130 Special factors 0.000–0.347 0.079 0.036 Its value (multiplicative aggregation)
0.328–1.173 0.682 0.015
[Source: Price, 2011] Some attributes, such as size, have the appearance of objective measurability. Others, such as suitability to setting, depend on personal judgements of appropriateness (and it was evident that judgements did differ, particularly in relation to exotic species such as cordyline palms). Life span will in time prove to fall precisely into one category or another, but expectation is a matter of personal judgement: and over the years covering the exercises that judgement sometimes shifted markedly.
Again, it is clear that the more subjective elements, italicised in the table, are about as consistent as the more objective ones.

91
particular forms of consumption. Furthermore, as Linton noted, some judgements represent a broad social consensus.
To demonstrate this tractability to systematic analysis, holistic scores in landscape evaluation exercises have been tested statistically.
Consistency Confirmation of the consistency of holistic judgement, compared with the supposedly objective recording of components, comes from a field exercise repeated over a ten-year period, generating 27 replicated evaluations of the same 14 views across a variety of landscapes. Subjective, holistic scores were given using the Fines system as modified by Harding and Thomas; the components are those derived from Linton as modified by Harding and Price. Table 6: Measures of consistency in subjective and objective scores given to views Variable Range across
views of coefficients of
variation
Mean coefficient of variation across
views
Mean of [standard deviation÷possible
range]
Mean holistic score 0.079-0.328 0.156 0.068 Land form 0.014-0.197 0.090 0.054 Land uses 0.075-0.632 0.196 0.123 Water 0-0.368 0.132 0.047 Detractors 0-2.367 0.787 0.313 Summed components 0.069-0.288 0.171 0.093 [Source: Price, 2011] Figures in table 6 are derived in the following way.
For each of the 14 views, for each of the 27 group exercises, the group’s mean holistic score and agreed components score are recorded. For a given view, the variability between the groups is calculated.
The calculated variability is expressed in relative terms – relative to the mean value for the view, and relative to the maximum range that the variable could take.
By all measures of variability, the holistic score lies inside the range of values taken by the components scores: subjectivity seems no less consistent than does so-called objectivity. Anecdotally, and consistently over many years, the vigour of discussion within a group as to whether a view was hilly or mountainous, whether a few conifers were or were not significant in the view, and particularly over whether something should be deemed a detractor or not, confirmed that a components approach does not give precise replicability.
In 20 out of 26 cases (in one case it was not possible to include it), one particular view was judged to be the best of 14, and in all cases another particular view was judged to be the worst.
Within groups there is again consistency of scoring, though idiosyncrasy is more evident at this disaggregated level. In a randomly chosen data set – which was, however, typical of all data sets – Pearson correlation coefficients between the scores of pairs of individuals, for all 14 views, were all in excess of 0.4; 70 out of 91 exceeded 0.6; 55 exceeded 0.7; 31 exceeded 0.8.
Similar results were found with application of the Helliwell system to nine trees evaluated by the same groups.
Table 7: Measures of consistency for the attributes of each tree in Helliwell’s system Attribute of a particular tree
Range across trees of coefficient
of variation
Mean coefficient of variation across trees
Mean of [standard deviation÷range]
Its size 0–0.301 0.130 0.090 Its life expectancy 0.070–0.508 0.171 0.126 Importance of its position in landscape 0.107–0.491
0.216 0.153
Presence of other trees 0.090–0.856
0.300 0.280
Its “suitability to the setting” 0.107–0.284
0.176 0.144
Its form 0.061–0.365 0.211 0.130 Special factors 0.000–0.347 0.079 0.036 Its value (multiplicative aggregation)
0.328–1.173 0.682 0.015
[Source: Price, 2011] Some attributes, such as size, have the appearance of objective measurability. Others, such as suitability to setting, depend on personal judgements of appropriateness (and it was evident that judgements did differ, particularly in relation to exotic species such as cordyline palms). Life span will in time prove to fall precisely into one category or another, but expectation is a matter of personal judgement: and over the years covering the exercises that judgement sometimes shifted markedly.
Again, it is clear that the more subjective elements, italicised in the table, are about as consistent as the more objective ones.

92
Accountability of variation Social science seeks to account for variation in preference in terms of measurable attributes such as cultural background. For the holistic landscape scores, correlations between pairs of subjective scorers tended to be greatest for those familiar with the landscapes being evaluated. They were least between those of different continental origin.
Although no numerical tests have been run, it appears that well-organised landscapes with square fields and tidy plantations are particularly valued by evaluators from countries where natural forces seem to pose a threat to survival. Obversely, those from countries where survival seems assured and humans are perceived to endanger nature, wild, mountainous landscapes, where nature remains the dominant force and commercial forestry is absent are more appreciated (this, clearly, is also Linton’s perspective).
Weather exerted a mild, barely statistically significant effect on overall mean score within an exercise.
By self-report, individuals’ personality was considered to influence the scores assigned. In 75% of cases, some individuals did score significantly higher or lower than the group generally, but no attempt was made to relate this to personality indicators.
In praise of relevance Discovering how individuals respond to landscapes – positively or negatively, weakly or strongly, how they respond to more trees, or different kinds of trees, or trees in different arrangements – is in the end the purpose of landscape evaluation. The purpose of landscape valuation is to quantify this holistic response in monetary terms. Fines’s system therefore in principle gives the relevant measure of landscape quality; and appropriately designed contingent valuation in principle gives the relevant measure of landscape’s worth (to humans). Components-based approaches have their own interest, but their relevance to land-use decision making comes only from their ability to model and predict how individuals will respond to landscape and to landscape change.
If, therefore, holistic methods could provide a monetary valuation which is largely free of bias, then they supply what is needed. But it is in the bias that the problem lies. From the discussion above, it is rather clear that biases do not arise from the holistic or subjective nature of evaluation, but that they are inherent in the monetisation process – in the horizontal comparison between two scales which not only measure different phenomena, but which are perceived as having different moral content. Hedonic pricing, and to a lesser extent choice experiments, seem to exclude this important sources of bias. Hence if they could deliver an accurate model of what an unbiased
holistic valuation would be, they are to be preferred. But this condition may not be met.
8. Objectivity is not all that it seems It has already been demonstrated that objectivity is quite elusive in relation to landscape attributes. It becomes more so, as we try to relate it to the valuation of those attributes.
To construct a relevant hedonic model or choice experiment requires subjective choices: components of the landscape do not come with labels attached, stating “relevant”, “irrelevant”, or “marginal”. So, should hills be included? rock faces? rivers? lakes? islands? forests? trees? hedges?
How should presence of a tree-based (or other) feature in a landscape be measured – as the counted or estimated number of trees? the linear dimensions of the woodland feature? its visible spatial extent?
What form should the relationship between a physical measure and its value take – linear, such that if one tree is worth DK1, a thousand trees are worth DK1000? or should it be logarithmic? or polynomial?
How should the interaction of features be treated – not at all, as in the widespread implicit assumption of additive separability? or is it acknowledged (and if so, how?) that one component, such as the forest’s shape, affects aesthetic qualities in a way that depends on another component, such as one reflecting the steepness and configuration of topography? The latter would be the universal opinion of landscape designers, but this insight is rarely reflected in quantified models.
How is multicollinearity to be treated, such that, despite a relationship between two attribute variables, their influence on quality cannot load onto the “wrong” variable? For example, much conifer afforestation in Britain has occurred in national parks with characteristically mountainous land form. Might a preference for mountainous land form accidentally become associated with conifer afforestation?
How is value to be distributed among landscapes, when a trip may embody hundreds of kilometres of ever-changing landscape experience, some forested, some open, as well as a multitude of recreational and cultural events and eventualities?
Is it just the quantity or state of a component that determines its contribution to landscape quality, or is it the disposition of the components within views, in itself and in relation to other components? This is what artists (and other creative individuals) term “composition”. Almost every aesthetic expert would assert that it is a vital determinant of really high quality landscape, for example in the arrangement of groups of trees in the naturalistic landscapes designed by the admired English landscapers of the C18th. And yet statutory ordinances for landscape design, such as the 10% of broadleaves prescribed by the UK Woodland Assurance Scheme

93
Accountability of variation Social science seeks to account for variation in preference in terms of measurable attributes such as cultural background. For the holistic landscape scores, correlations between pairs of subjective scorers tended to be greatest for those familiar with the landscapes being evaluated. They were least between those of different continental origin.
Although no numerical tests have been run, it appears that well-organised landscapes with square fields and tidy plantations are particularly valued by evaluators from countries where natural forces seem to pose a threat to survival. Obversely, those from countries where survival seems assured and humans are perceived to endanger nature, wild, mountainous landscapes, where nature remains the dominant force and commercial forestry is absent are more appreciated (this, clearly, is also Linton’s perspective).
Weather exerted a mild, barely statistically significant effect on overall mean score within an exercise.
By self-report, individuals’ personality was considered to influence the scores assigned. In 75% of cases, some individuals did score significantly higher or lower than the group generally, but no attempt was made to relate this to personality indicators.
In praise of relevance Discovering how individuals respond to landscapes – positively or negatively, weakly or strongly, how they respond to more trees, or different kinds of trees, or trees in different arrangements – is in the end the purpose of landscape evaluation. The purpose of landscape valuation is to quantify this holistic response in monetary terms. Fines’s system therefore in principle gives the relevant measure of landscape quality; and appropriately designed contingent valuation in principle gives the relevant measure of landscape’s worth (to humans). Components-based approaches have their own interest, but their relevance to land-use decision making comes only from their ability to model and predict how individuals will respond to landscape and to landscape change.
If, therefore, holistic methods could provide a monetary valuation which is largely free of bias, then they supply what is needed. But it is in the bias that the problem lies. From the discussion above, it is rather clear that biases do not arise from the holistic or subjective nature of evaluation, but that they are inherent in the monetisation process – in the horizontal comparison between two scales which not only measure different phenomena, but which are perceived as having different moral content. Hedonic pricing, and to a lesser extent choice experiments, seem to exclude this important sources of bias. Hence if they could deliver an accurate model of what an unbiased
holistic valuation would be, they are to be preferred. But this condition may not be met.
8. Objectivity is not all that it seems It has already been demonstrated that objectivity is quite elusive in relation to landscape attributes. It becomes more so, as we try to relate it to the valuation of those attributes.
To construct a relevant hedonic model or choice experiment requires subjective choices: components of the landscape do not come with labels attached, stating “relevant”, “irrelevant”, or “marginal”. So, should hills be included? rock faces? rivers? lakes? islands? forests? trees? hedges?
How should presence of a tree-based (or other) feature in a landscape be measured – as the counted or estimated number of trees? the linear dimensions of the woodland feature? its visible spatial extent?
What form should the relationship between a physical measure and its value take – linear, such that if one tree is worth DK1, a thousand trees are worth DK1000? or should it be logarithmic? or polynomial?
How should the interaction of features be treated – not at all, as in the widespread implicit assumption of additive separability? or is it acknowledged (and if so, how?) that one component, such as the forest’s shape, affects aesthetic qualities in a way that depends on another component, such as one reflecting the steepness and configuration of topography? The latter would be the universal opinion of landscape designers, but this insight is rarely reflected in quantified models.
How is multicollinearity to be treated, such that, despite a relationship between two attribute variables, their influence on quality cannot load onto the “wrong” variable? For example, much conifer afforestation in Britain has occurred in national parks with characteristically mountainous land form. Might a preference for mountainous land form accidentally become associated with conifer afforestation?
How is value to be distributed among landscapes, when a trip may embody hundreds of kilometres of ever-changing landscape experience, some forested, some open, as well as a multitude of recreational and cultural events and eventualities?
Is it just the quantity or state of a component that determines its contribution to landscape quality, or is it the disposition of the components within views, in itself and in relation to other components? This is what artists (and other creative individuals) term “composition”. Almost every aesthetic expert would assert that it is a vital determinant of really high quality landscape, for example in the arrangement of groups of trees in the naturalistic landscapes designed by the admired English landscapers of the C18th. And yet statutory ordinances for landscape design, such as the 10% of broadleaves prescribed by the UK Woodland Assurance Scheme
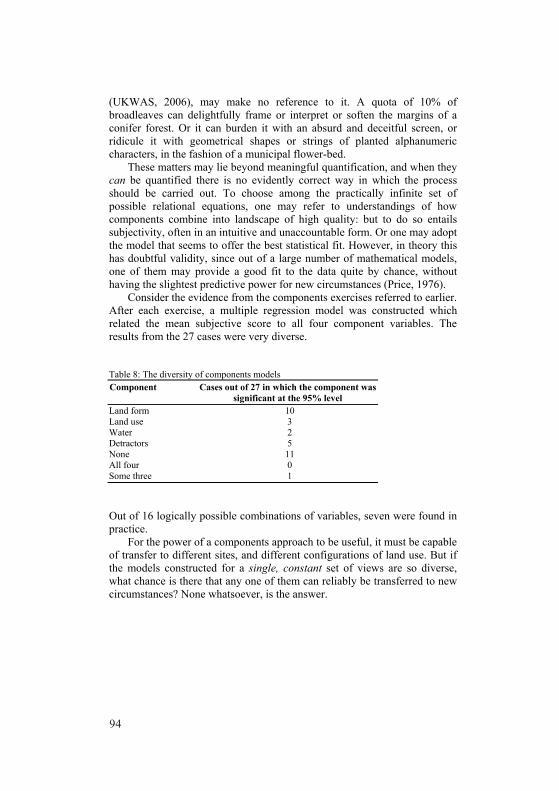
94
(UKWAS, 2006), may make no reference to it. A quota of 10% of broadleaves can delightfully frame or interpret or soften the margins of a conifer forest. Or it can burden it with an absurd and deceitful screen, or ridicule it with geometrical shapes or strings of planted alphanumeric characters, in the fashion of a municipal flower-bed.
These matters may lie beyond meaningful quantification, and when they can be quantified there is no evidently correct way in which the process should be carried out. To choose among the practically infinite set of possible relational equations, one may refer to understandings of how components combine into landscape of high quality: but to do so entails subjectivity, often in an intuitive and unaccountable form. Or one may adopt the model that seems to offer the best statistical fit. However, in theory this has doubtful validity, since out of a large number of mathematical models, one of them may provide a good fit to the data quite by chance, without having the slightest predictive power for new circumstances (Price, 1976).
Consider the evidence from the components exercises referred to earlier. After each exercise, a multiple regression model was constructed which related the mean subjective score to all four component variables. The results from the 27 cases were very diverse.
Table 8: The diversity of components models Component Cases out of 27 in which the component was
significant at the 95% level Land form 10 Land use 3 Water 2 Detractors 5 None 11 All four 0 Some three 1 Out of 16 logically possible combinations of variables, seven were found in practice.
For the power of a components approach to be useful, it must be capable of transfer to different sites, and different configurations of land use. But if the models constructed for a single, constant set of views are so diverse, what chance is there that any one of them can reliably be transferred to new circumstances? None whatsoever, is the answer.
Figure 3: A representative evaluator as predictor of a group’s score
0
5
10
15
20
25
0 5 10 15 20 25
Mea
n sc
ore
Colin's score In each of the 27 cases, the score given by one, representative evaluator (myself) gave a better prediction of the group’s mean score than the components model did. A typical result is depicted in figure 3. Not only was subjective, holistic scoring consistent across these exercises: it was more consistently consistent than was the supposedly objective components approach. 9. Concluding thought So if benefit transfer is sought, this is actually the line to follow. A trained evaluator calibrates him- or herself to the subjective judgements of the kind of constituency who will be experiencing the set of landscapes. The evaluator goes on to judge the quality of a landscape or the effects on a landscape of a forestry proposal or tree planting scheme, including the effects that arise through all the subtleties of interaction and composition alluded to above. The influence – experienced, visualised, or imagined – of trees in the landscape is judged, not by referring to a shopping list of their attributes, and of the attributes’ prices, but by their overall effect. The comparison is a vertical and holistic one, among landscapes of different quality.
The role of economics is then to determine, via travel cost analysis, or by hedonic house price models, or otherwise, what the willingness to pay is for different levels of landscape quality. This is what makes the necessary horizontal alignments, between landscape scales and monetary ones. It is a separate exercise, carried out in circumstances that encourage no strategic
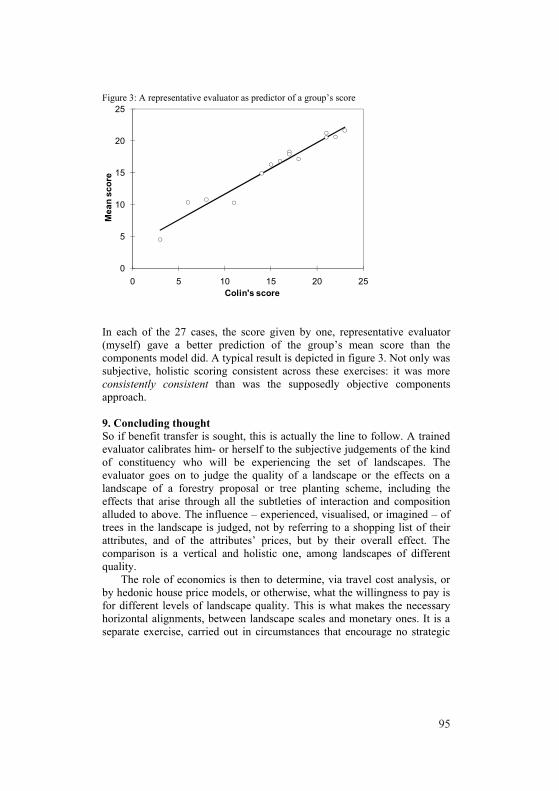
95
(UKWAS, 2006), may make no reference to it. A quota of 10% of broadleaves can delightfully frame or interpret or soften the margins of a conifer forest. Or it can burden it with an absurd and deceitful screen, or ridicule it with geometrical shapes or strings of planted alphanumeric characters, in the fashion of a municipal flower-bed.
These matters may lie beyond meaningful quantification, and when they can be quantified there is no evidently correct way in which the process should be carried out. To choose among the practically infinite set of possible relational equations, one may refer to understandings of how components combine into landscape of high quality: but to do so entails subjectivity, often in an intuitive and unaccountable form. Or one may adopt the model that seems to offer the best statistical fit. However, in theory this has doubtful validity, since out of a large number of mathematical models, one of them may provide a good fit to the data quite by chance, without having the slightest predictive power for new circumstances (Price, 1976).
Consider the evidence from the components exercises referred to earlier. After each exercise, a multiple regression model was constructed which related the mean subjective score to all four component variables. The results from the 27 cases were very diverse.
Table 8: The diversity of components models Component Cases out of 27 in which the component was
significant at the 95% level Land form 10 Land use 3 Water 2 Detractors 5 None 11 All four 0 Some three 1 Out of 16 logically possible combinations of variables, seven were found in practice.
For the power of a components approach to be useful, it must be capable of transfer to different sites, and different configurations of land use. But if the models constructed for a single, constant set of views are so diverse, what chance is there that any one of them can reliably be transferred to new circumstances? None whatsoever, is the answer.
Figure 3: A representative evaluator as predictor of a group’s score
0
5
10
15
20
25
0 5 10 15 20 25
Mea
n sc
ore
Colin's score In each of the 27 cases, the score given by one, representative evaluator (myself) gave a better prediction of the group’s mean score than the components model did. A typical result is depicted in figure 3. Not only was subjective, holistic scoring consistent across these exercises: it was more consistently consistent than was the supposedly objective components approach. 9. Concluding thought So if benefit transfer is sought, this is actually the line to follow. A trained evaluator calibrates him- or herself to the subjective judgements of the kind of constituency who will be experiencing the set of landscapes. The evaluator goes on to judge the quality of a landscape or the effects on a landscape of a forestry proposal or tree planting scheme, including the effects that arise through all the subtleties of interaction and composition alluded to above. The influence – experienced, visualised, or imagined – of trees in the landscape is judged, not by referring to a shopping list of their attributes, and of the attributes’ prices, but by their overall effect. The comparison is a vertical and holistic one, among landscapes of different quality.
The role of economics is then to determine, via travel cost analysis, or by hedonic house price models, or otherwise, what the willingness to pay is for different levels of landscape quality. This is what makes the necessary horizontal alignments, between landscape scales and monetary ones. It is a separate exercise, carried out in circumstances that encourage no strategic
96
bias, no misunderstanding of the product that is offered, and require no mathematical modelling of the nature of beauty.
This has been recommended before, and has been done before (Abelson, 1979; Bergin and Price, 1994; Cobham Resource Consultants and Price, 1991; Henry, 1994, 1999; Price, 1978, 2008; Price and Thomas, 2001). It ought to be done more often: much more often.
Acknowledgements The data on subjective and objective values are derived from the work of numerous student classes, to whom the author is grateful for their collaboration. He acknowledges also the contribution of the late Don Harding to refining the evaluation scales used.
Colin Price is the author of a chapter in a forthcoming title, /The Economic Value of Landscapes/, that will be published by Routledge in 2011. The chapter includes some similar material to that presented above. He is grateful to the publishers for permission to use this material here.
References Abelson, P. (1979). Cost Benefit Analysis and Environmental Problems.
Saxon House, Farnborough, Hants, UK, 202 pp. Anderson, L.M. and Cordell, H.K. (1988). Influence of trees on residential
property values in Athens, Georgia (U.S.A.): a survey based on actual sales prices. Landscape and Urban Planning, 15, 153-64.
Anthon, S., Thorsen, B.J. and Helles, F. (2005). Urban-fringe afforestation projects and taxable hedonic values. Urban Forestry and Urban Greening, 3, 79-91.
Bateman, I., Munro, A., Rhodes, B., Starmer, C. and Sugden, R. (1997). Does part–whole bias exist? An experimental investigation. The Economic Journal, 107, 322-32.
Bergin, J. and Price, C. (1994). The travel cost method and landscape quality. Landscape Research, 19 (1), 21-3.
Blamey, R.K. (1996). Citizens, consumers and contingent valuation: clarification and the expression of citizen values and issue-opinions. In Adamowicz, W.L., Boxall, P.C., Luckert, M.K., Phillips, W.E. & White, W.A. (eds). Forestry, Economics and the Environment. CAB International, Wallingford, pp.103-33.
Carlson, A.A. (1977). On the possibility of quantifying scenic beauty. Landscape Planning, 4, 131-72.
Cobham Resource Consultants and Price, C. (1991). The Benefits of Amenity Trees. Report to Department of the Environment, London.
Fines, K.D. (1968). Landscape evaluation: a research project in East Sussex. Regional Studies, 2, 41-55.
Garrod, G. (2002). Social and Environmental Benefits of Forestry Phase 2: Landscape Benefits. Report to Forestry Commission, Edinburgh, UK. 46 pp.
http://www.forestry.gov.uk/website/pdf.nsf/pdf/fclscaperep.pdf /$FILE/fclscaperep.pdf.
Garrod, G.D. and Willis, K.G. (1992). Valuing goods’ characteristics: an application of the hedonic pricing method to environmental attributes. Journal of Environmental Management, 34, 59-76.
Griliches, Z. (ed.) (1971). Price Indexes and Quality Change, Cambridge, Mass, Harvard University Press.
Hanley, N.D. and Ruffell, R. (1993). The contingent valuation of forest characteristics. Journal of Agricultural Economics, 44, 218-29.
Helliwell, D.R. (1967). The amenity value of trees and woodlands. Arboricultural Journal, 1, 128-31.
Henry, M.S. (1994). The contribution of landscaping to the price of single family houses: a study of home sales in Greenville, South Carolina. Journal of Environmental Horticulture, 12 (2), 65-70.
Henry, M.S. (1999). Landscape quality and the price of single family houses: further evidence from home sales in Greenville, South Carolina. Journal of Environmental Horticulture, 17 (1), 25-30.
Kahneman, D. and Knetsch, J.L. (1992). Valuing public goods: the purchase of moral satisfaction. Journal of Environmental Economics and Management, 22, 57-70.
Kim, Y-F. and Johnson, J.L. (2002). The impact of forests and forest management on neighboring property values. Society and Natural Resources, 15, 887-901.
Linton, D.L. (1968) The assessment of scenery as a natural resource. Scottish Geographical Magazine, 84, 218-38.
Mitchell, R.C. and Carson, R.T. (1989). Using Surveys to Value Goods: the Contingent Valuation Method, Washington, Resources for the Future.
Morales, D.J., Boyce, B.N. and Favretti, R.J. (1976). The contribution of trees to residential property value: Manchester, Connecticut. Valuation, 23 (2), 26-43.
Nielsen, A.B., Olsen, S.B. and Lundhede, T. (2007). An economic valuation of the recreational benefits associated with nature-based forest management practices. Landscape and Urban Planning, 80, 63-71.
Payne, B.R. and Strom, S. (1973). The contribution of trees to the appraised value of unimproved residential land. Valuation, 22 (2), 36-45.
Penning-Rowsell, E.C. and Hardy, D.I. (1973). Landscape evaluation and planning policy: a comparative study in the Wye Valley Area of Outstanding Natural Beauty. Regional Studies, 7, 152-60.

97
bias, no misunderstanding of the product that is offered, and require no mathematical modelling of the nature of beauty.
This has been recommended before, and has been done before (Abelson, 1979; Bergin and Price, 1994; Cobham Resource Consultants and Price, 1991; Henry, 1994, 1999; Price, 1978, 2008; Price and Thomas, 2001). It ought to be done more often: much more often.
Acknowledgements The data on subjective and objective values are derived from the work of numerous student classes, to whom the author is grateful for their collaboration. He acknowledges also the contribution of the late Don Harding to refining the evaluation scales used.
Colin Price is the author of a chapter in a forthcoming title, /The Economic Value of Landscapes/, that will be published by Routledge in 2011. The chapter includes some similar material to that presented above. He is grateful to the publishers for permission to use this material here.
References Abelson, P. (1979). Cost Benefit Analysis and Environmental Problems.
Saxon House, Farnborough, Hants, UK, 202 pp. Anderson, L.M. and Cordell, H.K. (1988). Influence of trees on residential
property values in Athens, Georgia (U.S.A.): a survey based on actual sales prices. Landscape and Urban Planning, 15, 153-64.
Anthon, S., Thorsen, B.J. and Helles, F. (2005). Urban-fringe afforestation projects and taxable hedonic values. Urban Forestry and Urban Greening, 3, 79-91.
Bateman, I., Munro, A., Rhodes, B., Starmer, C. and Sugden, R. (1997). Does part–whole bias exist? An experimental investigation. The Economic Journal, 107, 322-32.
Bergin, J. and Price, C. (1994). The travel cost method and landscape quality. Landscape Research, 19 (1), 21-3.
Blamey, R.K. (1996). Citizens, consumers and contingent valuation: clarification and the expression of citizen values and issue-opinions. In Adamowicz, W.L., Boxall, P.C., Luckert, M.K., Phillips, W.E. & White, W.A. (eds). Forestry, Economics and the Environment. CAB International, Wallingford, pp.103-33.
Carlson, A.A. (1977). On the possibility of quantifying scenic beauty. Landscape Planning, 4, 131-72.
Cobham Resource Consultants and Price, C. (1991). The Benefits of Amenity Trees. Report to Department of the Environment, London.
Fines, K.D. (1968). Landscape evaluation: a research project in East Sussex. Regional Studies, 2, 41-55.
Garrod, G. (2002). Social and Environmental Benefits of Forestry Phase 2: Landscape Benefits. Report to Forestry Commission, Edinburgh, UK. 46 pp.
http://www.forestry.gov.uk/website/pdf.nsf/pdf/fclscaperep.pdf /$FILE/fclscaperep.pdf.
Garrod, G.D. and Willis, K.G. (1992). Valuing goods’ characteristics: an application of the hedonic pricing method to environmental attributes. Journal of Environmental Management, 34, 59-76.
Griliches, Z. (ed.) (1971). Price Indexes and Quality Change, Cambridge, Mass, Harvard University Press.
Hanley, N.D. and Ruffell, R. (1993). The contingent valuation of forest characteristics. Journal of Agricultural Economics, 44, 218-29.
Helliwell, D.R. (1967). The amenity value of trees and woodlands. Arboricultural Journal, 1, 128-31.
Henry, M.S. (1994). The contribution of landscaping to the price of single family houses: a study of home sales in Greenville, South Carolina. Journal of Environmental Horticulture, 12 (2), 65-70.
Henry, M.S. (1999). Landscape quality and the price of single family houses: further evidence from home sales in Greenville, South Carolina. Journal of Environmental Horticulture, 17 (1), 25-30.
Kahneman, D. and Knetsch, J.L. (1992). Valuing public goods: the purchase of moral satisfaction. Journal of Environmental Economics and Management, 22, 57-70.
Kim, Y-F. and Johnson, J.L. (2002). The impact of forests and forest management on neighboring property values. Society and Natural Resources, 15, 887-901.
Linton, D.L. (1968) The assessment of scenery as a natural resource. Scottish Geographical Magazine, 84, 218-38.
Mitchell, R.C. and Carson, R.T. (1989). Using Surveys to Value Goods: the Contingent Valuation Method, Washington, Resources for the Future.
Morales, D.J., Boyce, B.N. and Favretti, R.J. (1976). The contribution of trees to residential property value: Manchester, Connecticut. Valuation, 23 (2), 26-43.
Nielsen, A.B., Olsen, S.B. and Lundhede, T. (2007). An economic valuation of the recreational benefits associated with nature-based forest management practices. Landscape and Urban Planning, 80, 63-71.
Payne, B.R. and Strom, S. (1973). The contribution of trees to the appraised value of unimproved residential land. Valuation, 22 (2), 36-45.
Penning-Rowsell, E.C. and Hardy, D.I. (1973). Landscape evaluation and planning policy: a comparative study in the Wye Valley Area of Outstanding Natural Beauty. Regional Studies, 7, 152-60.

98
Price, C. (1963). The Cumbrian Peregrinations of Chipps and Myself. Youth Hostels Association, St Albans. Also available from [email protected].
Price, C. (1966a). The Nineteenth Spring. Available from [email protected].
Price, C. (1966b). Afforestation in the Dartmoor National Park. The Gatliff Trust, London. Also available from [email protected].
Price, C. (1968). Forestry in Glen Affric. The Gatliff Trust, London. Also available from [email protected].
Price, C. (1970). Social Benefit from Forestry in the UK. Oxford Forestry Institute. Also available from [email protected].
Price, C. (1976). Subjectivity and objectivity in landscape evaluation. Environment and Planning A, 8, 829-38.
Price, C. (1978). Landscape Economics. London, Macmillan, 168 pp. Price, C. (1994). Literature review [of landscape valuation]. Landscape
Research, 19 (1), 38-55. Price, C. (1999a). Stated and revealed preference analysis. In Helles, F.,
Holten-Andersen, P. and Wichmann, L. (eds), Multiple Use of Forests and Other Natural Resources. Kluwer, Dordrecht, pp.46-65.
Price, C. (1999b). Contingent valuation and retrograde information bias. In Park, A. and Stewart Roper, C. (eds). The Living Forest. Proceedings of the International Symposium on the Non-market Benefits of Forestry, Edinburgh, June 1996. HMSO, London, UK, pp 37-44.
Price, C. (2001). Exact values and vague products? Contingent valuation and passive use value. In Sievanen, T., Konijnendijk, C.C. Langner, L. and Nilsson K. (eds). Forest and Social Services − the Role of Research. Research Paper 815 of Finnish Forest Research Institute, Vantaa, Finland, pp 205-17.
Price, C. (2003). Quantifying the aesthetic benefits of urban forestry. Urban Forestry and Urban Greening, 1, 123-33.
Price, C. (2007). Putting a value on trees: an economist’s perspective. Arboricultural Journal, 30, 7-19.
Price, C. (2008). Landscape economics at dawn: an eye-witness account. Landscape Research, 33, 263-80.
Price, C. (2011). Subjectivity and objectivity in landscape evaluation: an old topic revisited. In van der Heide, M. and Heijman, W. (eds). The Economic Value of Landscapes. Routledge.
Price, C. and Thomas, A.Ll. (2001). Evaluating the impact of farm woodland on the landscape: a case of blending perspectives. In Sievanen, T., Konijnendijk, C.C. Langner, L. and Nilsson K. (eds). Forest and Social Services − the Role of Research. Research Paper 815 of Finnish Forest Research Institute, Vantaa, Finland, pp.191-203.
Price, U. (1810). Essays on the Picturesque, as compared with the Sublime and the Beautiful; and, on the Use of Studying Pictures, for the purpose of Improving Real Landscape. Mawman, London.
Randall, A., Ives, B.C. and Eastman, C. (1974). Bidding games for valuation of aesthetic environmental improvements. Journal of Environmental Economics and Management, 1, 132-49.
Tyrväinen, L. (1997). The amenity value of the urban forest: an application of the hedonic pricing method. Landscape and Urban Planning, 37, 211-22.
UKWAS (2006). The UK Woodland Assurance Standard. UKWAS, Edinburgh.
Willis, K.G. and Garrod, G.D. (1992). Amenity value of forests in Great Britain and its impact on the internal rate of return from forestry. Forestry, 65, 331-46.

99
Price, C. (1963). The Cumbrian Peregrinations of Chipps and Myself. Youth Hostels Association, St Albans. Also available from [email protected].
Price, C. (1966a). The Nineteenth Spring. Available from [email protected].
Price, C. (1966b). Afforestation in the Dartmoor National Park. The Gatliff Trust, London. Also available from [email protected].
Price, C. (1968). Forestry in Glen Affric. The Gatliff Trust, London. Also available from [email protected].
Price, C. (1970). Social Benefit from Forestry in the UK. Oxford Forestry Institute. Also available from [email protected].
Price, C. (1976). Subjectivity and objectivity in landscape evaluation. Environment and Planning A, 8, 829-38.
Price, C. (1978). Landscape Economics. London, Macmillan, 168 pp. Price, C. (1994). Literature review [of landscape valuation]. Landscape
Research, 19 (1), 38-55. Price, C. (1999a). Stated and revealed preference analysis. In Helles, F.,
Holten-Andersen, P. and Wichmann, L. (eds), Multiple Use of Forests and Other Natural Resources. Kluwer, Dordrecht, pp.46-65.
Price, C. (1999b). Contingent valuation and retrograde information bias. In Park, A. and Stewart Roper, C. (eds). The Living Forest. Proceedings of the International Symposium on the Non-market Benefits of Forestry, Edinburgh, June 1996. HMSO, London, UK, pp 37-44.
Price, C. (2001). Exact values and vague products? Contingent valuation and passive use value. In Sievanen, T., Konijnendijk, C.C. Langner, L. and Nilsson K. (eds). Forest and Social Services − the Role of Research. Research Paper 815 of Finnish Forest Research Institute, Vantaa, Finland, pp 205-17.
Price, C. (2003). Quantifying the aesthetic benefits of urban forestry. Urban Forestry and Urban Greening, 1, 123-33.
Price, C. (2007). Putting a value on trees: an economist’s perspective. Arboricultural Journal, 30, 7-19.
Price, C. (2008). Landscape economics at dawn: an eye-witness account. Landscape Research, 33, 263-80.
Price, C. (2011). Subjectivity and objectivity in landscape evaluation: an old topic revisited. In van der Heide, M. and Heijman, W. (eds). The Economic Value of Landscapes. Routledge.
Price, C. and Thomas, A.Ll. (2001). Evaluating the impact of farm woodland on the landscape: a case of blending perspectives. In Sievanen, T., Konijnendijk, C.C. Langner, L. and Nilsson K. (eds). Forest and Social Services − the Role of Research. Research Paper 815 of Finnish Forest Research Institute, Vantaa, Finland, pp.191-203.
Price, U. (1810). Essays on the Picturesque, as compared with the Sublime and the Beautiful; and, on the Use of Studying Pictures, for the purpose of Improving Real Landscape. Mawman, London.
Randall, A., Ives, B.C. and Eastman, C. (1974). Bidding games for valuation of aesthetic environmental improvements. Journal of Environmental Economics and Management, 1, 132-49.
Tyrväinen, L. (1997). The amenity value of the urban forest: an application of the hedonic pricing method. Landscape and Urban Planning, 37, 211-22.
UKWAS (2006). The UK Woodland Assurance Standard. UKWAS, Edinburgh.
Willis, K.G. and Garrod, G.D. (1992). Amenity value of forests in Great Britain and its impact on the internal rate of return from forestry. Forestry, 65, 331-46.

100 1
Risk, returns and possible speculative bubbles in the price of Danish forest land?
Bo Jellesmark Thorsen
Faculty of Life Sciences, University of Copenhagen Abstract In this short paper I analyse the development of returns to forest land in Denmark for the period 1947 to 2007. The data used are fairly unique time series of forest enterprises annual accounts in combination with property value assessments over the entire period. They allow for a dissection of returns into operational returns and capital gains. I draw in previous analyses using the capital asset pricing model to assess the co-variation of returns in Danish forestry with returns from the market portfolio, as represented by the major financial asset groups representing the bulk of that. I compare the development in returns and notably the role of the capital gain over the period, to the likely equilibrium market return relevant for forest enterprises. The observations raise the question if i) also the prices of forest land in recent decades have been subject to a speculative bubble driving up prices beyond that justified by patterns of return in forestry or ii) if the returns to forest owners from holding a forest property is not Ill-captured by the marketable goods derived from forestry accounts, in essence a forest may not only be productive capital but also a consumption good. Keywords: Property prices, operational earnings, equilibrium returns, time series, CAPM. 1. Introduction The value of forest land as a productive asset is a core question in the economics of forestry, and the work of Faustmann (1849) coined the first framework for assessing this in a deterministic setting. The focus of Faustmann and his numerous followers is primarily on the stand level or the forest as an aggregation of stands, and this is true too for many papers addressing the optimal management of a forest under uncertainty (see Newman 2002 for a review of the optimal rotation literature). The value of forest land, or more broadly for investments in timber production, as a capital asset has, however, also been assessed using approaches from finance. These includes the mean-variance approach relying on Markowitz’ (1952) original work, e.g. Lönstedt and Svenson (2000) Liao et al (2009) and Scholtens and Spierdijk (2010), but more
2
widespread has been the use of the capital asset pricing model (CAPM) as developed by Sharpe (1964), Lintner (1965) and Jensen (1969). Early studies on forest investments include Redmond and Cubbage (1988), Zinkhan (1990), Zinkhan and Mitchell (1990), Wagner and Rideout (1991, 1992), but also Washburn and Binkley (1990, 1993) has applied the framework for analysing the performance of forest investments relative to other assets and as an inflation hedge. More recently, Sun and Zhang (2001) and Lundgren (2005) has applied these approaches to value forest investments – either as direct investments in forest land (Lundgren 2005) or buying shares in investment funds with timber management as their primary or even sole activity. More generally, several of the above papers apply changes in timber prices and sometimes also timber growth records as proxies for the return to forest investments (e.g. Redmond and Cubbage 1988; Washburn and Binkley 1990; Lundgren 2005). The value of the asset, the land as such, is often also approximated with the value of the standing stock, and more rarely with actual forest land value assessments as in Lundgren (2005). In the present paper, I present and use a rather unique set of data based on more than 60 years of detailed accounts of Danish forest enterprises. These data include many more income and cost elements related to the ownership and management of a forest enterprise, and thus are a much better source of knowledge regarding the performance of forest enterprises as an investment than most other studies have had access to. Furthermore, I have a reasonable annual measure of the value of the forest land for those same set of enterprises and over the same time horizon. This allows for the estimation of simple nominal and real CAPM much in line with several of the mentioned studies. However, the real focus of this paper is a deeper analysis of the forest returns over time. All of the above studies of course use return data in the time domain to arrive at their correlation results, but none analyse the development over the time domain to arrive at better assessments of the current profitability of forest investments. In this study, I draw on earlier analyses of Danish data (Møller 2001; Balling 2007) and present the Ill known measures describing the performance of in this case forest investments in three different regions of Denmark. Based on these analyses, I reproduce the finding in much of the literature mentioned that forest investments do appear to have superior characteristics and be underpriced over the period considered. However, analysing the development of real forest land values and forest returns, I show that returns have been systematically driving down towards the equilibrium returns, as estimated over the entire period. Thus forest investments are no longer likely to be superior, unless the pattern revealed is caused by increases in value flows from holding forests that are not visible in the markets for forest products and services.

101 1
Risk, returns and possible speculative bubbles in the price of Danish forest land?
Bo Jellesmark Thorsen
Faculty of Life Sciences, University of Copenhagen Abstract In this short paper I analyse the development of returns to forest land in Denmark for the period 1947 to 2007. The data used are fairly unique time series of forest enterprises annual accounts in combination with property value assessments over the entire period. They allow for a dissection of returns into operational returns and capital gains. I draw in previous analyses using the capital asset pricing model to assess the co-variation of returns in Danish forestry with returns from the market portfolio, as represented by the major financial asset groups representing the bulk of that. I compare the development in returns and notably the role of the capital gain over the period, to the likely equilibrium market return relevant for forest enterprises. The observations raise the question if i) also the prices of forest land in recent decades have been subject to a speculative bubble driving up prices beyond that justified by patterns of return in forestry or ii) if the returns to forest owners from holding a forest property is not Ill-captured by the marketable goods derived from forestry accounts, in essence a forest may not only be productive capital but also a consumption good. Keywords: Property prices, operational earnings, equilibrium returns, time series, CAPM. 1. Introduction The value of forest land as a productive asset is a core question in the economics of forestry, and the work of Faustmann (1849) coined the first framework for assessing this in a deterministic setting. The focus of Faustmann and his numerous followers is primarily on the stand level or the forest as an aggregation of stands, and this is true too for many papers addressing the optimal management of a forest under uncertainty (see Newman 2002 for a review of the optimal rotation literature). The value of forest land, or more broadly for investments in timber production, as a capital asset has, however, also been assessed using approaches from finance. These includes the mean-variance approach relying on Markowitz’ (1952) original work, e.g. Lönstedt and Svenson (2000) Liao et al (2009) and Scholtens and Spierdijk (2010), but more
2
widespread has been the use of the capital asset pricing model (CAPM) as developed by Sharpe (1964), Lintner (1965) and Jensen (1969). Early studies on forest investments include Redmond and Cubbage (1988), Zinkhan (1990), Zinkhan and Mitchell (1990), Wagner and Rideout (1991, 1992), but also Washburn and Binkley (1990, 1993) has applied the framework for analysing the performance of forest investments relative to other assets and as an inflation hedge. More recently, Sun and Zhang (2001) and Lundgren (2005) has applied these approaches to value forest investments – either as direct investments in forest land (Lundgren 2005) or buying shares in investment funds with timber management as their primary or even sole activity. More generally, several of the above papers apply changes in timber prices and sometimes also timber growth records as proxies for the return to forest investments (e.g. Redmond and Cubbage 1988; Washburn and Binkley 1990; Lundgren 2005). The value of the asset, the land as such, is often also approximated with the value of the standing stock, and more rarely with actual forest land value assessments as in Lundgren (2005). In the present paper, I present and use a rather unique set of data based on more than 60 years of detailed accounts of Danish forest enterprises. These data include many more income and cost elements related to the ownership and management of a forest enterprise, and thus are a much better source of knowledge regarding the performance of forest enterprises as an investment than most other studies have had access to. Furthermore, I have a reasonable annual measure of the value of the forest land for those same set of enterprises and over the same time horizon. This allows for the estimation of simple nominal and real CAPM much in line with several of the mentioned studies. However, the real focus of this paper is a deeper analysis of the forest returns over time. All of the above studies of course use return data in the time domain to arrive at their correlation results, but none analyse the development over the time domain to arrive at better assessments of the current profitability of forest investments. In this study, I draw on earlier analyses of Danish data (Møller 2001; Balling 2007) and present the Ill known measures describing the performance of in this case forest investments in three different regions of Denmark. Based on these analyses, I reproduce the finding in much of the literature mentioned that forest investments do appear to have superior characteristics and be underpriced over the period considered. However, analysing the development of real forest land values and forest returns, I show that returns have been systematically driving down towards the equilibrium returns, as estimated over the entire period. Thus forest investments are no longer likely to be superior, unless the pattern revealed is caused by increases in value flows from holding forests that are not visible in the markets for forest products and services.

102 3
2. Method and approach taken Here I briefly outline the framework of the CAPM model, and the presentation follows much that of earlier works. The theoretical framework for the CAPM was developed in a series of papers by three different authors, namely Sharpe (1964), Lintner (1965) and Jensen (1969). They developed a framework building on the von Neumann-Morgenstern concept of risk aversion and essentially also the mean-variance framework of Markowitz (1952), where the returns, expected returns and the variation of returns, of any individual asset is evaluated up against the remaining assets available, as captured in the concept of the market portfolio. This evaluation takes into account not only the level of the individual asset’s return, but also the co-variation of these returns with those of the market portfolio, taking into account utility effects of risk diversification properties – or lack thereof. Numerous applications of the CAPM and related following models exist in the finance literature as Ill as in practice.
The CAPM relies on a number of non-trivial assumptions. Fundamental is the assumption that the utility effects for any investor of any asset or combination of assets can be fully captured by information on the first two moments of the distribution of returns, i.e. expected return and return co-variance structure. This again implies a normal distribution of returns. Investors are assumed to be risk averse, price takes, and to have homogenous expectations and investment horizons. Structural assumptions on the asset market include that asset quantities are given, that assets are liquid and divisible, that the capital market is perfect implying that investors can borrow and lend at the same interest rate and finally the market is also perfect in the sense that taxes and transactions cost are absent and information is costless.
While the assumptions concerning the investors should hold as Ill for forests as an asset type as for any other asset, the same is not likely to be true for several of the asset specific assumptions and market requirements, as also Washburn and Binkley (1990) and Lundgren (2005) points out. In particular, markets for forest land as explicitly included in this study, is likely to be much less liquid than e.g. markets for shares of timber investment funds. Also, for judicial reasons that e.g. define the unit of a property one may consider the asset to be less divisible. On the other and, Danish forest properties comes in all forms and sizes (Boon et al 2004), offering some divisibility for any investor. Finally, trading in property is an exercise likely to inflict considerable transactions cost, compared to e.g. financial assets. Apart from that, most of the general market assumptions are likely to hold as Ill for this asset type as any other asset.
Clearly, as this study focus directly on the actual holding of forest enterprises and not on holding shares of an investment fund based on timber
4
land (as e.g. reference), the CAPM assumptions are perhaps less of a suitable fit to this market. On the other hand, focusing directly on the forest enterprises and having the rather unique set of data, allows us to investigate the fundamentals of forests as a capital asset and to evaluate in particular the performance in the time domain of a specific set of such assets, which are much more stable than those underlying an investment fund would have been over a horizon as long as the one investigated here.
The CAPM estimation results reported in this study derive in part from Møller (2001) who estimated a nominal CAPM for Danish forest enterprises as capital assets using the below described data on forest land values, annual operational returns from forest enterprises and return series for the groups of bonds and stock making up the dominant part of the Danish financial asset markets. Applying standard notation, the nominal CAPM (Sharpe 1964) is described by the following relation, also called the security market line:
( ) ( )( )fmtif
it RRERRE −+= β . (1)
That is, for any asset, i, the expected return E(Rit) at any time, t, is expected to equal the risk free return, Rf, plus or minus a premium depending on the co-variation, as captured by βi, with the excess return of the market portfolio E(Rmt), where the definition of βi is:
( )( )mt
mt
it
i RRRCov
var,
=β . (2)
The link to econometric estimates of a regression of Rit on Rmt is evident. In principle, the expected returns are not directly observable, but Jensen (1969) showed that using ex post observed returns, βi could be estimated from the regression:
( ) tfmtiif
it RRRR εβα +−+=− . (3)
It follows from (1) that the expected value of αi is zero, provided the asset is on the security market line. However, as expected by Jensen (1969) one may find assets that are under (over) priced and hence have a positive (negative) α.
The CAPM results reported also rely on Balling (2007), who estimated a series of CAPMs for three different forest regions of Denmark with distinctly different return profiles. He estimated the return in real terms, i.e. he corrected all data series from inflation before estimating an equation of the form (3). This implies that the estimate of Jensen performance measure, αi, in these real term estimations will include inflation hedging potentials of the different assets, I, relative to the market portfolio m.

103 3
2. Method and approach taken Here I briefly outline the framework of the CAPM model, and the presentation follows much that of earlier works. The theoretical framework for the CAPM was developed in a series of papers by three different authors, namely Sharpe (1964), Lintner (1965) and Jensen (1969). They developed a framework building on the von Neumann-Morgenstern concept of risk aversion and essentially also the mean-variance framework of Markowitz (1952), where the returns, expected returns and the variation of returns, of any individual asset is evaluated up against the remaining assets available, as captured in the concept of the market portfolio. This evaluation takes into account not only the level of the individual asset’s return, but also the co-variation of these returns with those of the market portfolio, taking into account utility effects of risk diversification properties – or lack thereof. Numerous applications of the CAPM and related following models exist in the finance literature as Ill as in practice.
The CAPM relies on a number of non-trivial assumptions. Fundamental is the assumption that the utility effects for any investor of any asset or combination of assets can be fully captured by information on the first two moments of the distribution of returns, i.e. expected return and return co-variance structure. This again implies a normal distribution of returns. Investors are assumed to be risk averse, price takes, and to have homogenous expectations and investment horizons. Structural assumptions on the asset market include that asset quantities are given, that assets are liquid and divisible, that the capital market is perfect implying that investors can borrow and lend at the same interest rate and finally the market is also perfect in the sense that taxes and transactions cost are absent and information is costless.
While the assumptions concerning the investors should hold as Ill for forests as an asset type as for any other asset, the same is not likely to be true for several of the asset specific assumptions and market requirements, as also Washburn and Binkley (1990) and Lundgren (2005) points out. In particular, markets for forest land as explicitly included in this study, is likely to be much less liquid than e.g. markets for shares of timber investment funds. Also, for judicial reasons that e.g. define the unit of a property one may consider the asset to be less divisible. On the other and, Danish forest properties comes in all forms and sizes (Boon et al 2004), offering some divisibility for any investor. Finally, trading in property is an exercise likely to inflict considerable transactions cost, compared to e.g. financial assets. Apart from that, most of the general market assumptions are likely to hold as Ill for this asset type as any other asset.
Clearly, as this study focus directly on the actual holding of forest enterprises and not on holding shares of an investment fund based on timber
4
land (as e.g. reference), the CAPM assumptions are perhaps less of a suitable fit to this market. On the other hand, focusing directly on the forest enterprises and having the rather unique set of data, allows us to investigate the fundamentals of forests as a capital asset and to evaluate in particular the performance in the time domain of a specific set of such assets, which are much more stable than those underlying an investment fund would have been over a horizon as long as the one investigated here.
The CAPM estimation results reported in this study derive in part from Møller (2001) who estimated a nominal CAPM for Danish forest enterprises as capital assets using the below described data on forest land values, annual operational returns from forest enterprises and return series for the groups of bonds and stock making up the dominant part of the Danish financial asset markets. Applying standard notation, the nominal CAPM (Sharpe 1964) is described by the following relation, also called the security market line:
( ) ( )( )fmtif
it RRERRE −+= β . (1)
That is, for any asset, i, the expected return E(Rit) at any time, t, is expected to equal the risk free return, Rf, plus or minus a premium depending on the co-variation, as captured by βi, with the excess return of the market portfolio E(Rmt), where the definition of βi is:
( )( )mt
mt
it
i RRRCov
var,
=β . (2)
The link to econometric estimates of a regression of Rit on Rmt is evident. In principle, the expected returns are not directly observable, but Jensen (1969) showed that using ex post observed returns, βi could be estimated from the regression:
( ) tfmtiif
it RRRR εβα +−+=− . (3)
It follows from (1) that the expected value of αi is zero, provided the asset is on the security market line. However, as expected by Jensen (1969) one may find assets that are under (over) priced and hence have a positive (negative) α.
The CAPM results reported also rely on Balling (2007), who estimated a series of CAPMs for three different forest regions of Denmark with distinctly different return profiles. He estimated the return in real terms, i.e. he corrected all data series from inflation before estimating an equation of the form (3). This implies that the estimate of Jensen performance measure, αi, in these real term estimations will include inflation hedging potentials of the different assets, I, relative to the market portfolio m.

104 5
3. Data applied The data applied for the estimation of the CAPM covers the period 1947 until 1999. For the analysis of the performance of forest returns, I further include the period 1999 until 2008.
In his estimations, Møller (2001) used aggregate series of historical returns of stock and bonds provided by Parum (1999) to replicate the dominant part of the likely market portfolio. Balling (2007) used a series of returns complied by Nielsen and Risager (2001), that included a broader set of assets in terms of bonds of various duration, to estimate the market portfolio and its returns, and to compare the different assets with the forest returns. Balling used the consumer price index of Statistics Denmark to convert nominal returns to real.
Here I describe in more detail the data on forest returns and earnings. These are derived from annual financial reporting data from a larger set of Danish forest enterprises, which allow the calculation of operational earnings before corporate taxes and interests. The data are collected by the Danish Forest Association (Dansk Skovforening 1948-2009) and they are very detailed and include income and cost measures from not only timber harvesting activities, but also from other forest enterprise activities of significance, e.g. Christmas trees and greenery and hunting. Thus, the data is a much better representation of actual forest enterprise operational earnings than many measures constructed and used in the above cited literature, which often rely on national level statistics of harvest and timber prices etc., e.g. Lundgren (2005).
The forest land value estimates used are also collected from the financial reports over the period 1947-2008. These data are not based directly on observed actual forest land trades, but are instead the forest land value assessments made by the Danish tax authorities. These assessments are made for the purpose of property taxation and the assessments are required by law to represent as Ill as possible the ‘value of the land in trade and exchange’. The tax authorities base their assessments on observed trades, but keep no record, unfortunately, of these. Indeed, comparing the observed data series of assessed with a smaller set of actual trades of forest land reported in a smaller hedonic study by Ravn-Jonsen (2005), shows that the forest land value assessments are nicely within the range of observed trades over the period 1999-2004. As in Lundgren (2005) the forest land value data reflects that tax authorities in particular in the earlier part of the sample period revised the value assessments in-frequently and in campaigns. This seems to create jumps in the forest value estimates at irregular intervals in the early part of the data. Møller (2001) ignored this aspect and used the data as they Ire reported, whereas Balling (2007) chose to even out the jumps over the relevant period, as did also Lundgren (2005).
6
In Møller (2001) aggregate operational earnings and land values at country level are used, whereas Balling (2007) and also this study used data aggregated at regional level. The Danish Forest Society aggregates the financial reports according to three geographical regions in Denmark: The Danish heath land forests in western Jutland, the forests of eastern Jutland, and the Island forests. The first region is characterised by low site quality and is dominated by coniferous plantation forests on poor alluvial sand plains, which Ire just outside the glacial border during the last ice age. The forests of eastern Jutland are generally situated on better sites; moraine landscapes left by the glaciers and with moderate clay content and has a higher percentage of beech and oak forests. The forests on the Islands on average have higher site quality again.
We denote, the returns with sup-scripts i = {H, J, I}. Furthermore, for our analysis I separate the capital gain C from the operational returns O in the following way:
itOi
tCitL
itF
itL
itLi
tLitL
itOi
tLitLi
tR +=+−−=
+−−= 11 , (4)
where L is the forest land value and F is the operational earnings before interests and taxes. In Table 1, I report summary statistics of the key variables as used in the study by Balling (2007) and in this study. Table 1: Summary statistics of key variables in real terms. For stock and bond returns, the period is 1922-1999, and for the remaining variables the period is 1947-2008. Variable Variable
name Mean Std.
dev. Median Minimum Maximum
Inflation CPI 0,0492 0,0350 0,0379 -0,0054 0,1519 Stock returns S 0,0737 0,2160 0,0404 -0,2792 1,0355 Bonds, 1 year B1 0,0329 0,0515 0,0297 -0,1563 0,2366 Bonds, 5 year B5 0,0366 0,0411 0,0325 -0,0418 0,1355 Bonds, 10 year
B10 0,0344 0,0437 0,0147 -0,0202 0,1647
Capital gains, H
CtH
0,0399 0,0801 0,0303 -0,1421 0,3211 Operational returns, H
OtH
0,0212 0,0242 0,0162 -0,0155 0,1028 Capital gains, J
CtJ
0,0331 0,0512 0,0238 -0,0742 0,1376 Operational returns, J
OtJ
0,0519 0,0371 0,0479 0,0040 0,14719 Capital gains, I
CtI
0,0266 0,0427 0,0259 -0,0536 0,1737 Operational returns, I
OtI
0,0512 0,0415 0,0328 0,0071 0,1588
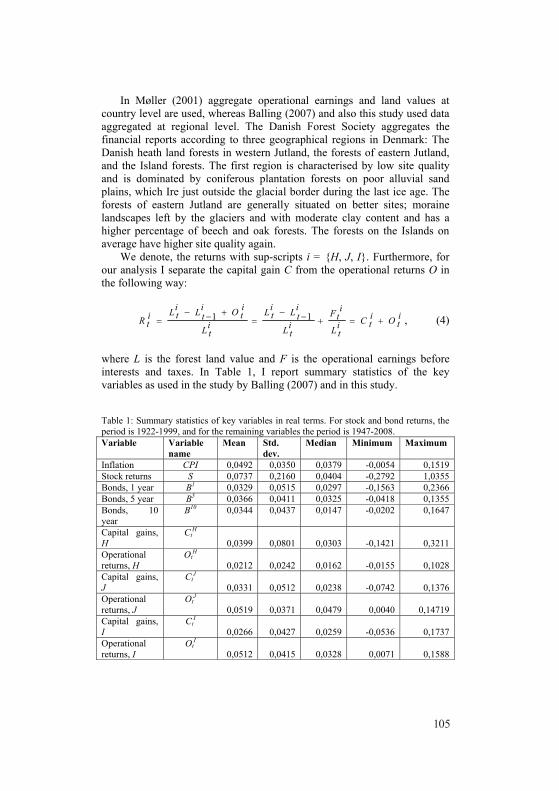
105 5
3. Data applied The data applied for the estimation of the CAPM covers the period 1947 until 1999. For the analysis of the performance of forest returns, I further include the period 1999 until 2008.
In his estimations, Møller (2001) used aggregate series of historical returns of stock and bonds provided by Parum (1999) to replicate the dominant part of the likely market portfolio. Balling (2007) used a series of returns complied by Nielsen and Risager (2001), that included a broader set of assets in terms of bonds of various duration, to estimate the market portfolio and its returns, and to compare the different assets with the forest returns. Balling used the consumer price index of Statistics Denmark to convert nominal returns to real.
Here I describe in more detail the data on forest returns and earnings. These are derived from annual financial reporting data from a larger set of Danish forest enterprises, which allow the calculation of operational earnings before corporate taxes and interests. The data are collected by the Danish Forest Association (Dansk Skovforening 1948-2009) and they are very detailed and include income and cost measures from not only timber harvesting activities, but also from other forest enterprise activities of significance, e.g. Christmas trees and greenery and hunting. Thus, the data is a much better representation of actual forest enterprise operational earnings than many measures constructed and used in the above cited literature, which often rely on national level statistics of harvest and timber prices etc., e.g. Lundgren (2005).
The forest land value estimates used are also collected from the financial reports over the period 1947-2008. These data are not based directly on observed actual forest land trades, but are instead the forest land value assessments made by the Danish tax authorities. These assessments are made for the purpose of property taxation and the assessments are required by law to represent as Ill as possible the ‘value of the land in trade and exchange’. The tax authorities base their assessments on observed trades, but keep no record, unfortunately, of these. Indeed, comparing the observed data series of assessed with a smaller set of actual trades of forest land reported in a smaller hedonic study by Ravn-Jonsen (2005), shows that the forest land value assessments are nicely within the range of observed trades over the period 1999-2004. As in Lundgren (2005) the forest land value data reflects that tax authorities in particular in the earlier part of the sample period revised the value assessments in-frequently and in campaigns. This seems to create jumps in the forest value estimates at irregular intervals in the early part of the data. Møller (2001) ignored this aspect and used the data as they Ire reported, whereas Balling (2007) chose to even out the jumps over the relevant period, as did also Lundgren (2005).
6
In Møller (2001) aggregate operational earnings and land values at country level are used, whereas Balling (2007) and also this study used data aggregated at regional level. The Danish Forest Society aggregates the financial reports according to three geographical regions in Denmark: The Danish heath land forests in western Jutland, the forests of eastern Jutland, and the Island forests. The first region is characterised by low site quality and is dominated by coniferous plantation forests on poor alluvial sand plains, which Ire just outside the glacial border during the last ice age. The forests of eastern Jutland are generally situated on better sites; moraine landscapes left by the glaciers and with moderate clay content and has a higher percentage of beech and oak forests. The forests on the Islands on average have higher site quality again.
We denote, the returns with sup-scripts i = {H, J, I}. Furthermore, for our analysis I separate the capital gain C from the operational returns O in the following way:
itOi
tCitL
itF
itL
itLi
tLitL
itOi
tLitLi
tR +=+−−=
+−−= 11 , (4)
where L is the forest land value and F is the operational earnings before interests and taxes. In Table 1, I report summary statistics of the key variables as used in the study by Balling (2007) and in this study. Table 1: Summary statistics of key variables in real terms. For stock and bond returns, the period is 1922-1999, and for the remaining variables the period is 1947-2008. Variable Variable
name Mean Std.
dev. Median Minimum Maximum
Inflation CPI 0,0492 0,0350 0,0379 -0,0054 0,1519 Stock returns S 0,0737 0,2160 0,0404 -0,2792 1,0355 Bonds, 1 year B1 0,0329 0,0515 0,0297 -0,1563 0,2366 Bonds, 5 year B5 0,0366 0,0411 0,0325 -0,0418 0,1355 Bonds, 10 year
B10 0,0344 0,0437 0,0147 -0,0202 0,1647
Capital gains, H
CtH
0,0399 0,0801 0,0303 -0,1421 0,3211 Operational returns, H
OtH
0,0212 0,0242 0,0162 -0,0155 0,1028 Capital gains, J
CtJ
0,0331 0,0512 0,0238 -0,0742 0,1376 Operational returns, J
OtJ
0,0519 0,0371 0,0479 0,0040 0,14719 Capital gains, I
CtI
0,0266 0,0427 0,0259 -0,0536 0,1737 Operational returns, I
OtI
0,0512 0,0415 0,0328 0,0071 0,1588

106 7
4. Results Already from the summary statistics in Table 1, we note some important findings about forest returns. Firstly, real capital gains in forest land values over the period 1947 to 2008 have on average been between 2.7 % and 4 % p.a. They are lower than real operational returns, and they are also much more volatile, as revealed by standard deviations and in particular the minimum and maximum values. Nevertheless, they have been steady enough to lift real forest land values with a factor of more than 5 on the Islands, more than 8 in eastern Jutland and more than 10 on the heath lands.
Turning to the operational returns from the forest lands, we note that they are on average remarkably high relative to their volatility, when comparing with stocks and bonds. Notice also the quite important aspect, that operational returns from the forest land are almost never negative. This reveals the adaptive capacity of forest enterprises and the timber harvesting problem: When prices are low, costly activities can simply be reduced and the timber left on stump and grow for another year. Taken at face value, already the facts of Table 1 suggest that over this period, investments in forestry has been worthwhile compared to stocks and bonds.
Turning to the pattern of correlations, we report in Table 2 the correlations as calculated by Balling (2007) between real returns. Clearly, forest returns are highly correlated with each other across regions, but neither are significantly correlated with the returns of stocks or bond.
Table 2: Pearson’s correlation coefficients between real returns of the three forest regions, stocks and short-term bonds.
S B1 RtH Rt
J RtI
S 1 B1 -0,08 1 Rt
H 0,04 -0,004 1 Rt
J -0,04 -0,04 0,91 1 Rt
I 0,03 -0,02 0,88 0,92 1 In the following we draw on Balling’s (2007) estimations of βi for a market made up of short term bonds (bonds indeed account for the major part of the asset market in Denmark over the period), the stocks and the three different forest region assets. He obtains estimates of βi as reported here in Table 3. Stocks are seen to have a high beta and hence real returns of stocks tend to fluctuate aggressively along with the returns of the market portfolio. Short term bonds has a positive βi less than one and hence fluctuate moderately with the market portfolio, which is to be expected given their major weigth in the market portfolio. All three forest regions have small βi estimates, and Jutland even has a slightly negative estimate. Again this suggest that forest
8
investments are likely to be a worthwhile endeavour for the risk averse investor. Table 3: Estimates of βi from Balling (2007)
Islands Jutland Heath land Stocks Bonds 1 βi 0,327 -0,065 0,348 3,985 0,653
Indeed, if we assume a risk free interest rate of 2 % and plot combinations of the expected returns of Table 1 and the βi-s of Table 3 into a Security Market Line Diagram, we get the result in Figure 1. It indicates that stocks over the period have been over-priced relative to the market portfolio, notably bonds. It also indicates, however, that returns from the forest regions have been very good and indeed the forest assets have over the period on average been underpriced. Their real equilibrium return should be in the range of 2 % or the risk free interest rate, which is significantly lower than the real return experienced over the period. Møller (2001) finds a similar result in a CAPM in nominal terms, and indeed the result that forest investment perform more than well in CAPMs is widespread in the literature, e.g. Redmond and Cubbage (1988), Zinkhan (1990), Washburn and Binkley (1990) and Lundgren (2005).
Figure 1: The Security market line and plots of (βi, E(Rit)) over the period 1947-1999/2008 Clearly, forest should increase in value relative to each average value over this period, in order to bring forest returns closer to their equilibrium level. And indeed forest land has increased considerable in value as briefly reported above.
Security Market Line - returns over entire period
0,0%
2,0%
4,0%
6,0%
8,0%
10,0%
-0,5 0 0,5 1 1,5 2 2,5 3 3,5 4Beta
Expe
cted
retu
rn

107 7
4. Results Already from the summary statistics in Table 1, we note some important findings about forest returns. Firstly, real capital gains in forest land values over the period 1947 to 2008 have on average been between 2.7 % and 4 % p.a. They are lower than real operational returns, and they are also much more volatile, as revealed by standard deviations and in particular the minimum and maximum values. Nevertheless, they have been steady enough to lift real forest land values with a factor of more than 5 on the Islands, more than 8 in eastern Jutland and more than 10 on the heath lands.
Turning to the operational returns from the forest lands, we note that they are on average remarkably high relative to their volatility, when comparing with stocks and bonds. Notice also the quite important aspect, that operational returns from the forest land are almost never negative. This reveals the adaptive capacity of forest enterprises and the timber harvesting problem: When prices are low, costly activities can simply be reduced and the timber left on stump and grow for another year. Taken at face value, already the facts of Table 1 suggest that over this period, investments in forestry has been worthwhile compared to stocks and bonds.
Turning to the pattern of correlations, we report in Table 2 the correlations as calculated by Balling (2007) between real returns. Clearly, forest returns are highly correlated with each other across regions, but neither are significantly correlated with the returns of stocks or bond.
Table 2: Pearson’s correlation coefficients between real returns of the three forest regions, stocks and short-term bonds.
S B1 RtH Rt
J RtI
S 1 B1 -0,08 1 Rt
H 0,04 -0,004 1 Rt
J -0,04 -0,04 0,91 1 Rt
I 0,03 -0,02 0,88 0,92 1 In the following we draw on Balling’s (2007) estimations of βi for a market made up of short term bonds (bonds indeed account for the major part of the asset market in Denmark over the period), the stocks and the three different forest region assets. He obtains estimates of βi as reported here in Table 3. Stocks are seen to have a high beta and hence real returns of stocks tend to fluctuate aggressively along with the returns of the market portfolio. Short term bonds has a positive βi less than one and hence fluctuate moderately with the market portfolio, which is to be expected given their major weigth in the market portfolio. All three forest regions have small βi estimates, and Jutland even has a slightly negative estimate. Again this suggest that forest
8
investments are likely to be a worthwhile endeavour for the risk averse investor. Table 3: Estimates of βi from Balling (2007)
Islands Jutland Heath land Stocks Bonds 1 βi 0,327 -0,065 0,348 3,985 0,653
Indeed, if we assume a risk free interest rate of 2 % and plot combinations of the expected returns of Table 1 and the βi-s of Table 3 into a Security Market Line Diagram, we get the result in Figure 1. It indicates that stocks over the period have been over-priced relative to the market portfolio, notably bonds. It also indicates, however, that returns from the forest regions have been very good and indeed the forest assets have over the period on average been underpriced. Their real equilibrium return should be in the range of 2 % or the risk free interest rate, which is significantly lower than the real return experienced over the period. Møller (2001) finds a similar result in a CAPM in nominal terms, and indeed the result that forest investment perform more than well in CAPMs is widespread in the literature, e.g. Redmond and Cubbage (1988), Zinkhan (1990), Washburn and Binkley (1990) and Lundgren (2005).
Figure 1: The Security market line and plots of (βi, E(Rit)) over the period 1947-1999/2008 Clearly, forest should increase in value relative to each average value over this period, in order to bring forest returns closer to their equilibrium level. And indeed forest land has increased considerable in value as briefly reported above.
Security Market Line - returns over entire period
0,0%
2,0%
4,0%
6,0%
8,0%
10,0%
-0,5 0 0,5 1 1,5 2 2,5 3 3,5 4Beta
Expe
cted
retu
rn

108 9
If we dissect the period 1947-2008 into three 20 years periods, and assume the estimated βi-s of Table 3 to hold true for each sub-period, we get the picture in Figure 2. In the early part of the period, the real returns are in fact as high as 8-12 % p.a., over the next twenty year period it falls to 6-8 % and then in the last twenty year period to around 4 % p.a. However, inserting the most recent 5 year average, namely the period 2004-2008, it seems that performance has picked up speed again, as real returns are now spread in the interval 6-11 %, which is again a truly remarkable return on an investment asset with the risk diversification properties that all evidence, including that provided here, suggest that forest investments have. The good news, however, has a serious catch, which is revealed by the dissection of returns shown in Table 4. Table 4: Tracking the drift in the source of returns, from operational return dominance to capital gain dominance
Capital gain real
returns Cti
Operational real returns Ot
i Overall real returns Rt
i Period: Isl. Jutl. Heath Isl. Jutl. Heath Isl. Jutl. Heath 1947-2008 0,027 0,034 0,041 0,051 0,052 0,022 0,078 0,085 0,062 1947-1968 0,028 0,045 0,040 0,098 0,078 0,036 0,126 0,123 0,076 1969-1988 0,024 0,023 0,049 0,032 0,061 0,023 0,056 0,084 0,073 1989-2008 0,029 0,033 0,033 0,020 0,014 0,005 0,049 0,047 0,038 1999-2008 0,048 0,056 0,053 0,017 0,010 0,007 0,065 0,066 0,060 2004-2008 0,051 0,086 0,091 0,014 0,014 0,012 0,065 0,100 0,103
Figure 2: The Security market line and plots of (βi, E(Rit)) over four sub-period s1947-1968, 1969-1988, 1989-2008 and 2004-2008
Security Market Line
0%
2%
4%
6%
8%
10%
12%
14%
-0,25 0 0,25 0,5 0,75 1 1,25
Beta
Expe
cted
retu
rn
Period 2004-2008 Period 1947-1968Period 1969-1988 Period 1989-2008
10
What these detailed data in Table 4 shows is, that while operational returns constituted by far the bigger part of overall returns for the first 40 years of the period (ranging from 3 to 10 % p.a.), the pattern looks markedly different for the last twenty years. In the last twenty year period, real operational returns are now in the range of 0-2 %, and capital gains make up much more than half the overall return. Looking at the last 5 year period this pattern becomes grotesque: Across all regions, real operational returns are in an almost all-time low as they remain in the range of 1 %, but real capital gains reaches an all-time high for such a period, ranging from 5 to 9 %. Thus real operational returns make up only one sixth or one tenth of overall real returns. 5. Concluding discussion The results presented here has shown, that while overall forest returns has been and remain high relatively to the likely equilibrium returns as predicted in a capital asset pricing framework, their underlying composition has changed dramatically in recent decades. The finding that capital gains for the last 20 years and in particular during the last 5 years strongly dominates the returns is a significant finding for anyone owning or about to invest in forest enterprises.
Two different interpretations and conclusions seem to be available; one of which is not good news for current forest investors, and the other is hard to verify. The first interpretation follow the usual convention that large increases in the price of stocks or other assets must reflect market expectations of rising earnings to come. However, there is no pattern in current or recent operational earnings in the forest sector that suggest that an increase in income from marketed goods and services is imminent. Thus, even if no further increases in land values occur, real returns will remain low, and seem to be below likely equilibrium rates. Therefore, this interpretation leads to the conclusion that forest land is currently over priced, and the recent development may even suggest a speculative bubble. The second interpretation is, that the returns from marketed goods and services do not capture all benefits from forest ownership, and that another un-observed source of value is in play. One such source could be the joy of ownership that many smaller and larger forest owners stress as a reason fro being a forest owner (Boon et al 2004), and such a benefit can only be enjoyed by owners of course. Further indications of such values may be the finding by Ravn-Jonsen (2005) that forests closer to cities demand higher prices, ceteris paribus. If this flow of benefits has increased in real value over the years, then it may be the underlying driver of the land value, rather than operational earnings and risk diversification properties. This interpretation cannot, of course, be validated by this study.

109 9
If we dissect the period 1947-2008 into three 20 years periods, and assume the estimated βi-s of Table 3 to hold true for each sub-period, we get the picture in Figure 2. In the early part of the period, the real returns are in fact as high as 8-12 % p.a., over the next twenty year period it falls to 6-8 % and then in the last twenty year period to around 4 % p.a. However, inserting the most recent 5 year average, namely the period 2004-2008, it seems that performance has picked up speed again, as real returns are now spread in the interval 6-11 %, which is again a truly remarkable return on an investment asset with the risk diversification properties that all evidence, including that provided here, suggest that forest investments have. The good news, however, has a serious catch, which is revealed by the dissection of returns shown in Table 4. Table 4: Tracking the drift in the source of returns, from operational return dominance to capital gain dominance
Capital gain real
returns Cti
Operational real returns Ot
i Overall real returns Rt
i Period: Isl. Jutl. Heath Isl. Jutl. Heath Isl. Jutl. Heath 1947-2008 0,027 0,034 0,041 0,051 0,052 0,022 0,078 0,085 0,062 1947-1968 0,028 0,045 0,040 0,098 0,078 0,036 0,126 0,123 0,076 1969-1988 0,024 0,023 0,049 0,032 0,061 0,023 0,056 0,084 0,073 1989-2008 0,029 0,033 0,033 0,020 0,014 0,005 0,049 0,047 0,038 1999-2008 0,048 0,056 0,053 0,017 0,010 0,007 0,065 0,066 0,060 2004-2008 0,051 0,086 0,091 0,014 0,014 0,012 0,065 0,100 0,103
Figure 2: The Security market line and plots of (βi, E(Rit)) over four sub-period s1947-1968, 1969-1988, 1989-2008 and 2004-2008
Security Market Line
0%
2%
4%
6%
8%
10%
12%
14%
-0,25 0 0,25 0,5 0,75 1 1,25
Beta
Expe
cted
retu
rn
Period 2004-2008 Period 1947-1968Period 1969-1988 Period 1989-2008
10
What these detailed data in Table 4 shows is, that while operational returns constituted by far the bigger part of overall returns for the first 40 years of the period (ranging from 3 to 10 % p.a.), the pattern looks markedly different for the last twenty years. In the last twenty year period, real operational returns are now in the range of 0-2 %, and capital gains make up much more than half the overall return. Looking at the last 5 year period this pattern becomes grotesque: Across all regions, real operational returns are in an almost all-time low as they remain in the range of 1 %, but real capital gains reaches an all-time high for such a period, ranging from 5 to 9 %. Thus real operational returns make up only one sixth or one tenth of overall real returns. 5. Concluding discussion The results presented here has shown, that while overall forest returns has been and remain high relatively to the likely equilibrium returns as predicted in a capital asset pricing framework, their underlying composition has changed dramatically in recent decades. The finding that capital gains for the last 20 years and in particular during the last 5 years strongly dominates the returns is a significant finding for anyone owning or about to invest in forest enterprises.
Two different interpretations and conclusions seem to be available; one of which is not good news for current forest investors, and the other is hard to verify. The first interpretation follow the usual convention that large increases in the price of stocks or other assets must reflect market expectations of rising earnings to come. However, there is no pattern in current or recent operational earnings in the forest sector that suggest that an increase in income from marketed goods and services is imminent. Thus, even if no further increases in land values occur, real returns will remain low, and seem to be below likely equilibrium rates. Therefore, this interpretation leads to the conclusion that forest land is currently over priced, and the recent development may even suggest a speculative bubble. The second interpretation is, that the returns from marketed goods and services do not capture all benefits from forest ownership, and that another un-observed source of value is in play. One such source could be the joy of ownership that many smaller and larger forest owners stress as a reason fro being a forest owner (Boon et al 2004), and such a benefit can only be enjoyed by owners of course. Further indications of such values may be the finding by Ravn-Jonsen (2005) that forests closer to cities demand higher prices, ceteris paribus. If this flow of benefits has increased in real value over the years, then it may be the underlying driver of the land value, rather than operational earnings and risk diversification properties. This interpretation cannot, of course, be validated by this study.

110 11
A final note concerns the fact that in Denmark, forest enterprises are rarely the only source of income for the owner, and very often not even the most important one. The interaction between forest income and income sources can be a source of additional value, as the forest can offer as a buffer and reduce the costs, e.g. of credit rationing or progressive income taxations (Thorsen 1999). It does not seem credible, however, that such things are behind the recent decades surge in forest land value. Over the period, the income tax system has become less progressive, and the period has also be characterised by everything else than strict lending policies. References Balling, A., 2007. Undersøgelse af portefølje-diversificering ved
inddragelse af skovbrug-sejendomme i en portefølje ved brug af CAPM. [Using CAPM to investigate the diversification effects of including forest properties in investment portfolios.], MSc-thesis, University of Copenhagen, Frederiksberg.
Boon, T.E., H. Meilby and B.J. Thorsen, 2004: An empirically based typology of forest owners in Denmark – improving the communication between authorities and owners, Scandinavian Journal of Forest Research, 19 (suppl. 4), 37-45.
Dansk Skovforening, 1948-2009: Privatskovbruget regnskabsoversigter [The Accounts and Operational Results of Private Danish Forest Enterprices]. Dansk Skovforening, Frederiksberg, Denmark.
Faustmann, M., 1849: Berechnung des Irtes Ilchen Waldboden sowie noch nicht haubare Holzbestände für die Waldwirtschaft besitzen. Allgemeine Forst-und Jagd-Zeitung.
Jensen, M., 1969: Risk, the Pricing of Capital Assets and the Evaluation of Investment Port-folios. Journal of Business, 42: 167-247.
Markowitz, H. M. 1952: Portfolio Selection. Journal of Finance, 7: 77-91. Møller, P.N.D., 2001: Danish Forestry as a Capital Asset, p. 42-53 in
Solberg, B. (Ed.), 2001: Proceedings of the Biennial Meeting of the Scandinavian Society of Forest Economics, April 2000, Gausdal, Norway, pp. 321.
Liao, X.C., Y.Q. Zhang and C.Y. Sun, 2009: Investments in Timberland and Softwood Timber as Parts of Portfolio Selection in the United States: A Cointegration Analysis and Capital Asset Pricing Model. Forest Science, 55, 471-479.
Lintner, J. 1965: The Valuation of Risky Assets and the Selection of Risky Investments in Stock Portfolios and Capital Budgets. Review of Economics and Statistics, 47: 13-37.
Lundgren, T., 2005: Assessing the Investment Performance of Swedish Timberland: A Capital Asset Pricing Model Approach. Land Economics, 81: 353-362.
12
Newman, D.H., 2002: Forestry's golden rule and the development of the optimal forest rotation literature. Journal of Forest Economics, 8: 5-27
Nielsen, S. and O. Risager, 2001: Stock returns and bond yields in Denmark 1929-1999. Scandinavian Economic History Review, 49: 63-82.
Parum, C., 1999: Historiske afkast af aktier og obligationer i Danmark [Historical returns of stocks and bonds in Denmark]. Finans/Invest, 3/99, 4-13.
Ravn-Jonsen, L.J., 2005: Skovenes pris [The price of forests]. An AKF working paper, AKF (Applied Community Research), Copenhagen, Denmark, 25 pp.
Redmond, C.F. and F.W. Cubbage 1988: Port-folio Risk and Returns from Timber Asset In-vestments. Land Economics, 64: 325-37.
Scholtens, B. and L. Spierdijk, 2010: Does Money Grow on Trees? The Diversification Properties of US Timberland Investments. Land Economics, 86: 514-529.
Sharpe, W.F. 1964: Capital Asset Prices: A Theory of Market Equilibrium Under Conditions of Risk. Journal of Finance, 14: 425-42.
Wagner, J.E., and D.B. Rideout, 1991: Evaluating Forest Management Investments: the Capital Asset Pricing Model and the Income Growth Model. Forest Science 37: 1591-1604. .
Wagner, J.E., and D.B. Rideout, 1992: The Stability of the Capital Asset Pricing Model's Parameters in Analyzing Forest Investments. Canadian Journal of Forest Research, 22: 1639-45.
Zinkhan, F.C. 1990: Timberland as an Asset for Institutional Portfolios. Real Estate Review, 69-74.
Zinkhan, F.C. and K. Mitchell 1990: Timber-land Indexes and Portfolio Management. Southern Journal of Applied Forestry, 14: 119-24.
111 11
A final note concerns the fact that in Denmark, forest enterprises are rarely the only source of income for the owner, and very often not even the most important one. The interaction between forest income and income sources can be a source of additional value, as the forest can offer as a buffer and reduce the costs, e.g. of credit rationing or progressive income taxations (Thorsen 1999). It does not seem credible, however, that such things are behind the recent decades surge in forest land value. Over the period, the income tax system has become less progressive, and the period has also be characterised by everything else than strict lending policies. References Balling, A., 2007. Undersøgelse af portefølje-diversificering ved
inddragelse af skovbrug-sejendomme i en portefølje ved brug af CAPM. [Using CAPM to investigate the diversification effects of including forest properties in investment portfolios.], MSc-thesis, University of Copenhagen, Frederiksberg.
Boon, T.E., H. Meilby and B.J. Thorsen, 2004: An empirically based typology of forest owners in Denmark – improving the communication between authorities and owners, Scandinavian Journal of Forest Research, 19 (suppl. 4), 37-45.
Dansk Skovforening, 1948-2009: Privatskovbruget regnskabsoversigter [The Accounts and Operational Results of Private Danish Forest Enterprices]. Dansk Skovforening, Frederiksberg, Denmark.
Faustmann, M., 1849: Berechnung des Irtes Ilchen Waldboden sowie noch nicht haubare Holzbestände für die Waldwirtschaft besitzen. Allgemeine Forst-und Jagd-Zeitung.
Jensen, M., 1969: Risk, the Pricing of Capital Assets and the Evaluation of Investment Port-folios. Journal of Business, 42: 167-247.
Markowitz, H. M. 1952: Portfolio Selection. Journal of Finance, 7: 77-91. Møller, P.N.D., 2001: Danish Forestry as a Capital Asset, p. 42-53 in
Solberg, B. (Ed.), 2001: Proceedings of the Biennial Meeting of the Scandinavian Society of Forest Economics, April 2000, Gausdal, Norway, pp. 321.
Liao, X.C., Y.Q. Zhang and C.Y. Sun, 2009: Investments in Timberland and Softwood Timber as Parts of Portfolio Selection in the United States: A Cointegration Analysis and Capital Asset Pricing Model. Forest Science, 55, 471-479.
Lintner, J. 1965: The Valuation of Risky Assets and the Selection of Risky Investments in Stock Portfolios and Capital Budgets. Review of Economics and Statistics, 47: 13-37.
Lundgren, T., 2005: Assessing the Investment Performance of Swedish Timberland: A Capital Asset Pricing Model Approach. Land Economics, 81: 353-362.
12
Newman, D.H., 2002: Forestry's golden rule and the development of the optimal forest rotation literature. Journal of Forest Economics, 8: 5-27
Nielsen, S. and O. Risager, 2001: Stock returns and bond yields in Denmark 1929-1999. Scandinavian Economic History Review, 49: 63-82.
Parum, C., 1999: Historiske afkast af aktier og obligationer i Danmark [Historical returns of stocks and bonds in Denmark]. Finans/Invest, 3/99, 4-13.
Ravn-Jonsen, L.J., 2005: Skovenes pris [The price of forests]. An AKF working paper, AKF (Applied Community Research), Copenhagen, Denmark, 25 pp.
Redmond, C.F. and F.W. Cubbage 1988: Port-folio Risk and Returns from Timber Asset In-vestments. Land Economics, 64: 325-37.
Scholtens, B. and L. Spierdijk, 2010: Does Money Grow on Trees? The Diversification Properties of US Timberland Investments. Land Economics, 86: 514-529.
Sharpe, W.F. 1964: Capital Asset Prices: A Theory of Market Equilibrium Under Conditions of Risk. Journal of Finance, 14: 425-42.
Wagner, J.E., and D.B. Rideout, 1991: Evaluating Forest Management Investments: the Capital Asset Pricing Model and the Income Growth Model. Forest Science 37: 1591-1604. .
Wagner, J.E., and D.B. Rideout, 1992: The Stability of the Capital Asset Pricing Model's Parameters in Analyzing Forest Investments. Canadian Journal of Forest Research, 22: 1639-45.
Zinkhan, F.C. 1990: Timberland as an Asset for Institutional Portfolios. Real Estate Review, 69-74.
Zinkhan, F.C. and K. Mitchell 1990: Timber-land Indexes and Portfolio Management. Southern Journal of Applied Forestry, 14: 119-24.
112
ABSTRACTS
The Fuel for Land Use Change
Peter Berck University of California, Berkeley
There are three major forces causing land use changes: exurban housing, rising developing country income, and biofuels. All three of these causes can trace their roots to increased income. Exurban housing uses upwards of 2 hectares of land per family and becomes feasible with a very modest taste for rural life and increased income. Developing countries demand for food and for protein drove a boom in commodity prices and threatens to do so again as the recovery takes hold. Biofuels themselves are partially a reaction to record petroleum prices driven by increased demand. All of these factors increase the demand for land for productive uses and threaten to replace natural uses both in developed and developing countries.
Volvo Theorem Revisited
Richard J. Brazee1 and Henrik Meilby2
1 University of Illinois
2 Forest & Landscape, Faculty of Life Sciences, University of Copenhagen
The “Volvo Theorem” provides an alternative harvesting model to the standard Faustmann Model of optimal harvesting. Under the Volvo Theorem landowners harvest timber when faced with non-forestry expenses such as the purchase of a new Volvo, rather than choosing to harvest at the age that maximizes NPV. The plausibility of forest landowners adopting a Volvo management regime increases when credit is constrained. The recent financial crisis has resulted in constrained credit in the U.S. and Europe. Here a simple model that incorporates some of the characteristics of the recent financial crisis into a Volvo model of forest harvest is presented. These characteristics include an expected tightening of credit, asymmetrical credit tightening among forest landowners, and negative real interest rates.
An Economic Analysis of Forest Rotation without
Interest Rate – Setting the Scene
Ibrahim Favada European Forest Institute – EFI
Since 1849 the Faustmann model – in its basic or extended form – has been bedrock in forest management decision making regarding when to cut timber. Interest rate is one of the decisive variables in the Faustmann model. In a zero interest rate situation or an Islamic economy, the Faustmann model can no longer provide solution to the rotation problem. The purpose of this paper is to find a solution to the forest rotation problem when the interest rate is zero or from Islamic perspective. This is a theoretical study with ethico-economic approach to socio-economic issue like forest rotation problem. It begins with a review of literature on mainstream financing and Islamic financing. Suitable modes of financing will be identified in each case. The study will show that venture capital seems ideal for conventional financing, while musharakah and mudarabah seem promising for application of Islamic finance in forestry. Keywords: profit and loss sharing, forest rotation, venture capital, Islamic finance, interest rate.
An integrated MCDA software application for forest planning:
a case study in Southwestern Sweden
Anu Hankala, Peder Wikström, Karin Öhman and Ljusk Ola Eriksson Department of Forest Resource Management, Swedish University of Agricultural Sciences
Forest owners have often several objectives for their forest property. In Sweden, economic profit from timber production is usually the most prominent one. Forest planning translates thus usually to planning of timber production. Other objectives, such as biodiversity, maintaining pleasant sceneries or recreation possibilities, are more rarely included in the planning process. Multi-criteria decision analysis (MCDA) methods provide a way to take also these non-monetary values into account in planning.
113
ABSTRACTS
The Fuel for Land Use Change
Peter Berck University of California, Berkeley
There are three major forces causing land use changes: exurban housing, rising developing country income, and biofuels. All three of these causes can trace their roots to increased income. Exurban housing uses upwards of 2 hectares of land per family and becomes feasible with a very modest taste for rural life and increased income. Developing countries demand for food and for protein drove a boom in commodity prices and threatens to do so again as the recovery takes hold. Biofuels themselves are partially a reaction to record petroleum prices driven by increased demand. All of these factors increase the demand for land for productive uses and threaten to replace natural uses both in developed and developing countries.
Volvo Theorem Revisited
Richard J. Brazee1 and Henrik Meilby2
1 University of Illinois
2 Forest & Landscape, Faculty of Life Sciences, University of Copenhagen
The “Volvo Theorem” provides an alternative harvesting model to the standard Faustmann Model of optimal harvesting. Under the Volvo Theorem landowners harvest timber when faced with non-forestry expenses such as the purchase of a new Volvo, rather than choosing to harvest at the age that maximizes NPV. The plausibility of forest landowners adopting a Volvo management regime increases when credit is constrained. The recent financial crisis has resulted in constrained credit in the U.S. and Europe. Here a simple model that incorporates some of the characteristics of the recent financial crisis into a Volvo model of forest harvest is presented. These characteristics include an expected tightening of credit, asymmetrical credit tightening among forest landowners, and negative real interest rates.
An Economic Analysis of Forest Rotation without
Interest Rate – Setting the Scene
Ibrahim Favada European Forest Institute – EFI
Since 1849 the Faustmann model – in its basic or extended form – has been bedrock in forest management decision making regarding when to cut timber. Interest rate is one of the decisive variables in the Faustmann model. In a zero interest rate situation or an Islamic economy, the Faustmann model can no longer provide solution to the rotation problem. The purpose of this paper is to find a solution to the forest rotation problem when the interest rate is zero or from Islamic perspective. This is a theoretical study with ethico-economic approach to socio-economic issue like forest rotation problem. It begins with a review of literature on mainstream financing and Islamic financing. Suitable modes of financing will be identified in each case. The study will show that venture capital seems ideal for conventional financing, while musharakah and mudarabah seem promising for application of Islamic finance in forestry. Keywords: profit and loss sharing, forest rotation, venture capital, Islamic finance, interest rate.
An integrated MCDA software application for forest planning:
a case study in Southwestern Sweden
Anu Hankala, Peder Wikström, Karin Öhman and Ljusk Ola Eriksson Department of Forest Resource Management, Swedish University of Agricultural Sciences
Forest owners have often several objectives for their forest property. In Sweden, economic profit from timber production is usually the most prominent one. Forest planning translates thus usually to planning of timber production. Other objectives, such as biodiversity, maintaining pleasant sceneries or recreation possibilities, are more rarely included in the planning process. Multi-criteria decision analysis (MCDA) methods provide a way to take also these non-monetary values into account in planning.

114
In this study, we introduce a new MCDA software application PlanEval, which is part of Heureka, a recently developed forest decision support system. The software helps the decision maker to evaluate forest plans against his/her objectives in a structured and analytical manner. As a result, the analysis provides a ranking of the alternatives based on individual preferences of the decision maker. As PlanEval is integrated in the forest planning system, all data of the plans is available during the MCDA process and how it is presented may be adjusted during the analysis. The main purpose of this study was to assess the potential of PlanEval as a tool for practical forest planning. This was done with a case study, where a manager of large forest estate in Southwestern Sweden used the program to compare different forest plans made for the estate. The objective hierarchy against which the plans were evaluated included variables for tree species diversity, timber production and recreation. During the comparison we observed the MCDA process and performance of PlanEval with respect to data treatment, MCDA method and usability of the program. The case study helped to identify both strengths and weaknesses in the software, which is still under evaluation. Direct database access made it possible to investigate an objective from several perspectives. The decision maker found the possibility for different data views, such as maps and charts, useful and it was quite easy to navigate between different them. However, the abundance of data also posed problems as the user was not familiar with all data available in the planning system and found it sometimes difficult to find desired variables. The MCDA method itself was relatively confusing for a user with no previous experience with the process. The analysis provided a ranking of alternatives which satisfied the decision maker, but it may be questioned if the same results may have been obtained also without the MCDA process. On the other hand, the process helped the decision maker to understand his objectives and the trade-off between them in detail.
Varying levels of information and strategies for adapting forest management to climate change
Jette Bredahl Jacobsen and Bo Jellesmark Thorsen
Forest & Landscape, Faculty of Life Sciences, University of Copenhagen Adaptive management has for a few decades been analysed within forestry and it has been shown that relatively large gains are possible. Nevertheless, we often see that managers do not take a fully forward looking perspective
when managing under uncertainty. This could be because the risk is too unknown as may be the example with climate change, or because it is too complex to handle, or because it is easier to relate to what is on the table than what may potentially come. Consequently, inoptimal decisions are likely to occur – even if they are optimal for the given level of information considered.
In this paper we focus on climate change and the possibilities for adjusting tree species as climate develops and other species may outrank than the presently best performing ones. We identify four categories of adaptation behaviour ranging from the manager who keeps with what is best to the one who is fully forward looking, taking all present knowledge into account. We discuss under which conditions the different agents are likely to be present. We analyse the economic impact this may have based on a stylised example and use this as a basis for discussing on a regional level.
Generating top-level plans in hierarchical forest planning – the case of Metsähallitus
Mikko Kurttila1, Veikko Hiltunen2 and Jouni Pykäläinen3
1 Finnish Forest Research Institute - METLA
2 Metsähallitus, Finland 3 Metsämonex Ltd., Finland
This study presents alternative approaches to producing top-level plans in a geographically hierarchical strategic forest planning situation. Alternative plans are first produced at the bottom level (regional level) and subsequently, top level plans are generated from them by adopting principles from the bottom-up, top-down and integrated approaches. The top-down approach allocates resources optimally with respect the organization’s top-level objectives. In the bottom-up approach, local decision making plays a remarkable role, and the top-level solution can be produced by simply summing up the selected local-level plans. The integrated approach, in turn, combines elements from both the top-down and the bottom-up approaches.
The approaches were tested and evaluated in a multi-objective natural resources planning case study conducted at Metsähallitus, the organization that administrates forests owned by the Finnish state. Data from the most recent regional natural resources planning processes (carried out during years 2004–2008) were utilized in creation of alternative country level

115
In this study, we introduce a new MCDA software application PlanEval, which is part of Heureka, a recently developed forest decision support system. The software helps the decision maker to evaluate forest plans against his/her objectives in a structured and analytical manner. As a result, the analysis provides a ranking of the alternatives based on individual preferences of the decision maker. As PlanEval is integrated in the forest planning system, all data of the plans is available during the MCDA process and how it is presented may be adjusted during the analysis. The main purpose of this study was to assess the potential of PlanEval as a tool for practical forest planning. This was done with a case study, where a manager of large forest estate in Southwestern Sweden used the program to compare different forest plans made for the estate. The objective hierarchy against which the plans were evaluated included variables for tree species diversity, timber production and recreation. During the comparison we observed the MCDA process and performance of PlanEval with respect to data treatment, MCDA method and usability of the program. The case study helped to identify both strengths and weaknesses in the software, which is still under evaluation. Direct database access made it possible to investigate an objective from several perspectives. The decision maker found the possibility for different data views, such as maps and charts, useful and it was quite easy to navigate between different them. However, the abundance of data also posed problems as the user was not familiar with all data available in the planning system and found it sometimes difficult to find desired variables. The MCDA method itself was relatively confusing for a user with no previous experience with the process. The analysis provided a ranking of alternatives which satisfied the decision maker, but it may be questioned if the same results may have been obtained also without the MCDA process. On the other hand, the process helped the decision maker to understand his objectives and the trade-off between them in detail.
Varying levels of information and strategies for adapting forest management to climate change
Jette Bredahl Jacobsen and Bo Jellesmark Thorsen
Forest & Landscape, Faculty of Life Sciences, University of Copenhagen Adaptive management has for a few decades been analysed within forestry and it has been shown that relatively large gains are possible. Nevertheless, we often see that managers do not take a fully forward looking perspective
when managing under uncertainty. This could be because the risk is too unknown as may be the example with climate change, or because it is too complex to handle, or because it is easier to relate to what is on the table than what may potentially come. Consequently, inoptimal decisions are likely to occur – even if they are optimal for the given level of information considered.
In this paper we focus on climate change and the possibilities for adjusting tree species as climate develops and other species may outrank than the presently best performing ones. We identify four categories of adaptation behaviour ranging from the manager who keeps with what is best to the one who is fully forward looking, taking all present knowledge into account. We discuss under which conditions the different agents are likely to be present. We analyse the economic impact this may have based on a stylised example and use this as a basis for discussing on a regional level.
Generating top-level plans in hierarchical forest planning – the case of Metsähallitus
Mikko Kurttila1, Veikko Hiltunen2 and Jouni Pykäläinen3
1 Finnish Forest Research Institute - METLA
2 Metsähallitus, Finland 3 Metsämonex Ltd., Finland
This study presents alternative approaches to producing top-level plans in a geographically hierarchical strategic forest planning situation. Alternative plans are first produced at the bottom level (regional level) and subsequently, top level plans are generated from them by adopting principles from the bottom-up, top-down and integrated approaches. The top-down approach allocates resources optimally with respect the organization’s top-level objectives. In the bottom-up approach, local decision making plays a remarkable role, and the top-level solution can be produced by simply summing up the selected local-level plans. The integrated approach, in turn, combines elements from both the top-down and the bottom-up approaches.
The approaches were tested and evaluated in a multi-objective natural resources planning case study conducted at Metsähallitus, the organization that administrates forests owned by the Finnish state. Data from the most recent regional natural resources planning processes (carried out during years 2004–2008) were utilized in creation of alternative country level

116
forest plans. The data included a small number of predefined strategy alternatives for each of the six planning areas. In addition, the effects of these alternatives were described through a small number of decision criteria.
The results show that the currently applied bottom-up approach, which provides regionally optimal and accepted strategies, does not result in the most efficient utilization of the resources of Metsähallitus. However, the bottom-up approach carries a lot of process advantages, including wide approval of the plans by regional stakeholders and local residents. For future planning projects, at least illustrative calculations using the top-down approach would offer decision support for the country level target setting. In addition, adopting a more integrated approach to actual regional natural resources planning processes is recommended for the development of a new Metsähallitus level strategic planning approach. This, however, indicates that the regional planning processes should be conducted at the same time so that the decisions of and the interdependencies between the regions could be better taken into account at the top-level.
Keywords: strategic forest planning, top-down approach, bottom-up approach, integrated approach
Cost-efficient small-diameter wood harvesting method in early thinnings
Aaron Petty1, K. Kärhä1 and A. Mutikainen2
1 Metsäteho Oy, Finland 2 TTS Research, Finland
The integrated harvesting of industrial roundwood and energy wood by the “two-pile cutting method” has increased steadily in young forests of Finland during the past two years. Field studies carried out by Metsäteho Oy and TTS Research have: i) determined the time consumption and productivity of cutting work when using integrated cutting of first-thinning wood, ii) clarified the development of the total removal in integrated harvesting operations, and iii) investigated the quality of pulpwood logs when using integrated cutting with multi-tree handling. The studies indicated that the total removal with integrated wood harvesting increases significantly compared to that of conventional, separate roundwood harvesting from early thinnings. When the total removal of the harvesting site increased
considerably, there was a significant increase in the productivity of cutting work of integrated wood harvesting compared to the situation in separate pulpwood harvesting. In addition, the delimbing quality and bucking accuracy of the pulpwood logs obtained in multi-tree processing were comparable to those produced in single-tree handling. As the field studies indicated, promising results from integrated wood cutting and integrated harvesting are likely to continue to increase in all thinning operations.
An optimization model for a mixed species stand management with determination of the harvest
sequence under uncertainty
Jörg Rößiger and Thomas Knoke Institute of Forest Management, Technische Universität München
Economic management conditions such as the interest rate or the risk aversion of a decision maker should be analyzed, and then a decision about a mixed species stand management or a pure stand management can be recommended. On the one hand the pure stand management could have the possible financial benefit to create a higher yield. On the other hand the mixed species stand management could decrease the risk of the investment. The model for a mixed species stand management includes risks regarding timber price volatility and failure by natural hazard. A diversification effect may be created by mixing different tree species as well as different age classes harvested such as a thinning or a final cut. The decisions about the allocation of proportions of the stand area to tree species and to sequence of final harvests will be optimized. For an evenaged stand management, these results also determine the optimal rotation period of the total stand. Choosing a mixture of different tree species and different harvesting operations will initiate a change to a near-natural development after some generations. With such a procedure the stand is more independent from the risks of the natural hazards and the timber price volatility.

117
forest plans. The data included a small number of predefined strategy alternatives for each of the six planning areas. In addition, the effects of these alternatives were described through a small number of decision criteria.
The results show that the currently applied bottom-up approach, which provides regionally optimal and accepted strategies, does not result in the most efficient utilization of the resources of Metsähallitus. However, the bottom-up approach carries a lot of process advantages, including wide approval of the plans by regional stakeholders and local residents. For future planning projects, at least illustrative calculations using the top-down approach would offer decision support for the country level target setting. In addition, adopting a more integrated approach to actual regional natural resources planning processes is recommended for the development of a new Metsähallitus level strategic planning approach. This, however, indicates that the regional planning processes should be conducted at the same time so that the decisions of and the interdependencies between the regions could be better taken into account at the top-level.
Keywords: strategic forest planning, top-down approach, bottom-up approach, integrated approach
Cost-efficient small-diameter wood harvesting method in early thinnings
Aaron Petty1, K. Kärhä1 and A. Mutikainen2
1 Metsäteho Oy, Finland 2 TTS Research, Finland
The integrated harvesting of industrial roundwood and energy wood by the “two-pile cutting method” has increased steadily in young forests of Finland during the past two years. Field studies carried out by Metsäteho Oy and TTS Research have: i) determined the time consumption and productivity of cutting work when using integrated cutting of first-thinning wood, ii) clarified the development of the total removal in integrated harvesting operations, and iii) investigated the quality of pulpwood logs when using integrated cutting with multi-tree handling. The studies indicated that the total removal with integrated wood harvesting increases significantly compared to that of conventional, separate roundwood harvesting from early thinnings. When the total removal of the harvesting site increased
considerably, there was a significant increase in the productivity of cutting work of integrated wood harvesting compared to the situation in separate pulpwood harvesting. In addition, the delimbing quality and bucking accuracy of the pulpwood logs obtained in multi-tree processing were comparable to those produced in single-tree handling. As the field studies indicated, promising results from integrated wood cutting and integrated harvesting are likely to continue to increase in all thinning operations.
An optimization model for a mixed species stand management with determination of the harvest
sequence under uncertainty
Jörg Rößiger and Thomas Knoke Institute of Forest Management, Technische Universität München
Economic management conditions such as the interest rate or the risk aversion of a decision maker should be analyzed, and then a decision about a mixed species stand management or a pure stand management can be recommended. On the one hand the pure stand management could have the possible financial benefit to create a higher yield. On the other hand the mixed species stand management could decrease the risk of the investment. The model for a mixed species stand management includes risks regarding timber price volatility and failure by natural hazard. A diversification effect may be created by mixing different tree species as well as different age classes harvested such as a thinning or a final cut. The decisions about the allocation of proportions of the stand area to tree species and to sequence of final harvests will be optimized. For an evenaged stand management, these results also determine the optimal rotation period of the total stand. Choosing a mixture of different tree species and different harvesting operations will initiate a change to a near-natural development after some generations. With such a procedure the stand is more independent from the risks of the natural hazards and the timber price volatility.

118
Potential impacts of international regimes for biodiversity protection and carbon sequestration in
forestry – a quantitative approach
Birger Solberg, Even Bergseng and Berit H. Lindstad
Department of Ecology and Natural Resource Management, Norwegian University of Life Sciences
We apply a quantitative bio-economic forest optimisation model to analyse (i) the potential impacts on a Norwegian forest of two international regimes (the Convention of Biological Diversity, CBD, and an extended version of the Kyoto Protocol), and (ii) the weak and strong points in using such modeling in this type of impact studies. The impacts of CBD is included through three pre-defined biodiversity protection scenarios reflecting three levels of potential influences from the regime, and the impact of the Kyoto Protocol version is incorporated by introducing prices for the value of net fixation of atmospheric CO2 , ranging from 0 to 1000 NOK per ton of CO2. This approach makes it possible to quantify in a consistent manner several interesting impacts of the regimes related to sustainable forestry, like the forest’s distribution over time on species, age classes, growing stock, and deadwood, as well as income generation. The model results indicate that each of the two regimes may have strong impacts on forestry and the forest ecosystem, and that a mutual relationship exists between the two regimes in the meaning that the stronger one of them is implemented, the lower marginal impact has the other. The results are most sensitive to the following factors, which should be investigated further in future research: the forest biological growth and mortality functions, the behavioural assumptions and the market impacts of large changes in harvested volumes. We conclude that this modelling approach seems promising for ex ante quantification of potential national impacts of international regimes, but due attention should be given to the underlying assumptions. Keywords: Bio-economic modelling, international agreements, regime effectiveness, forest policy, Kyoto Protocol, CBD
FOREST POLICY

119
Potential impacts of international regimes for biodiversity protection and carbon sequestration in
forestry – a quantitative approach
Birger Solberg, Even Bergseng and Berit H. Lindstad
Department of Ecology and Natural Resource Management, Norwegian University of Life Sciences
We apply a quantitative bio-economic forest optimisation model to analyse (i) the potential impacts on a Norwegian forest of two international regimes (the Convention of Biological Diversity, CBD, and an extended version of the Kyoto Protocol), and (ii) the weak and strong points in using such modeling in this type of impact studies. The impacts of CBD is included through three pre-defined biodiversity protection scenarios reflecting three levels of potential influences from the regime, and the impact of the Kyoto Protocol version is incorporated by introducing prices for the value of net fixation of atmospheric CO2 , ranging from 0 to 1000 NOK per ton of CO2. This approach makes it possible to quantify in a consistent manner several interesting impacts of the regimes related to sustainable forestry, like the forest’s distribution over time on species, age classes, growing stock, and deadwood, as well as income generation. The model results indicate that each of the two regimes may have strong impacts on forestry and the forest ecosystem, and that a mutual relationship exists between the two regimes in the meaning that the stronger one of them is implemented, the lower marginal impact has the other. The results are most sensitive to the following factors, which should be investigated further in future research: the forest biological growth and mortality functions, the behavioural assumptions and the market impacts of large changes in harvested volumes. We conclude that this modelling approach seems promising for ex ante quantification of potential national impacts of international regimes, but due attention should be given to the underlying assumptions. Keywords: Bio-economic modelling, international agreements, regime effectiveness, forest policy, Kyoto Protocol, CBD
FOREST POLICY

120
How spatial variation influences landowner willingness to provide ecosystem services
Stine Wamberg Broch1*, Niels Strange1** and Kerrie A. Wilson2
1* Forest & Landscape, Faculty of Life Sciences, University of Copenhagen 1** Forest & Landscape, Faculty of Life Sciences, University of Copenhagen, Centre for Macroecology, Evolution and Climate Change 2 The University of Queensland, School of Biological Sciences, Brisbane,
Abstract Within conservation literature increasing attention is on conservation opportunity valuing actual implementation. Previously focus has been on conservation priority among areas with the highest biological value or lowest cost. However, when nature management has to take place on private land through voluntary agreement it becomes important to know landowner preferences for such agreements. This study combines data from a choice experiment on landowner preferences with spatial data on the need for biodiversity conservation, groundwater protection and recreation. The aim is to discuss if spatial variation influences landowner preferences and the possibility of including preferences when prioritizing Preliminary results show a negative impact of increasing population density on willingness to provide recreation. Keywords: Landowners, preference modeling, choice experiments, biodiversity, groundwater, recreation. 1. Introduction In a recent horizon scanning on the research needs for conservation (Sutherland, 2009; Sutherland et al., 2009) it is argued that future intensification of agriculture as a result of climate change and increased wealth and population will be one of the major conservation challenges. Pressures, responses and impacts will be complex and may result in intensification of agricultural production and destruction of important habitat. If conservation is to become a societal priority, conservation science must be more engaged in the real world and incorporate analyses from the social sciences and humanities, and address conservation in a human-dominated landscape (Robinson, 2006). In this human-dominated landscape

121
How spatial variation influences landowner willingness to provide ecosystem services
Stine Wamberg Broch1*, Niels Strange1** and Kerrie A. Wilson2
1* Forest & Landscape, Faculty of Life Sciences, University of Copenhagen 1** Forest & Landscape, Faculty of Life Sciences, University of Copenhagen, Centre for Macroecology, Evolution and Climate Change 2 The University of Queensland, School of Biological Sciences, Brisbane,
Abstract Within conservation literature increasing attention is on conservation opportunity valuing actual implementation. Previously focus has been on conservation priority among areas with the highest biological value or lowest cost. However, when nature management has to take place on private land through voluntary agreement it becomes important to know landowner preferences for such agreements. This study combines data from a choice experiment on landowner preferences with spatial data on the need for biodiversity conservation, groundwater protection and recreation. The aim is to discuss if spatial variation influences landowner preferences and the possibility of including preferences when prioritizing Preliminary results show a negative impact of increasing population density on willingness to provide recreation. Keywords: Landowners, preference modeling, choice experiments, biodiversity, groundwater, recreation. 1. Introduction In a recent horizon scanning on the research needs for conservation (Sutherland, 2009; Sutherland et al., 2009) it is argued that future intensification of agriculture as a result of climate change and increased wealth and population will be one of the major conservation challenges. Pressures, responses and impacts will be complex and may result in intensification of agricultural production and destruction of important habitat. If conservation is to become a societal priority, conservation science must be more engaged in the real world and incorporate analyses from the social sciences and humanities, and address conservation in a human-dominated landscape (Robinson, 2006). In this human-dominated landscape

122
landowners are key actors implying a need for understanding their conservation preferences. Knowing more about how spatial presence of goods influence landowners’ preferences may be beneficial when conservation projects are to be implemented. The aim of this study is to investigate how spatial variation of potential supply of environmental goods influence landowners’ willingness to supply these goods and services. Linking landowners’ preferences for providing different goods (e.g. biodiversity, groundwater protection and recreation) to geographical data on potential supply and demand for these goods has not previously achieved much attention.
Recent studies (e.g., Knight and Cowling, 2007; Knight et al., 2010) investigate the link between farmer characteristics and conservation opportunities. They add significant insight to the conservation planning literature, which has mostly focused on identifying conservation priorities rather than conservation opportunities. They find that greater efficiency may be added to the decision on ‘where’ and ‘when’ to allocate the conservation if conservation research also achieves to map ‘how’ specific actions can effectively be implemented with a high likelihood of effectiveness. We link farmers’ willingness to join conservation projects with the type of ecosystem service provided by the project and socio-economic determinants and discuss the potential implications for the design and targeting of conservation contracts for nature management on private land. Although this approach proves suitable for conservation planning, we argue that lacking investigations of land owner preferences may face the risk of implementation failure, which at the end could lead to a reduced delivery of conservation outcomes (Guerro et al., In Press). 2. Data and Methods Two sets of data are combined in this study. Landowners’ preferences are investigated using a choice experiment of landowners’ preferences for afforestation contracts with the purpose to provide different goods; groundwater protection, biodiversity conservation or recreation. The spatial demand for goods is identified using GIS. Preferences and spatial demand for goods are linked by postal code. 2.1 Survey data on land owner preferences The data were collected using an online, e-mail distributed questionnaire among Danish landowners in January and February of 2009. SurveyXact was used as software. The questionnaire was discussed with a focus group consisting of farmers and experts which resulted in a redesign of parts of the questionnaire. Before the final distribution of the questionnaire a pilot test with 61 landowners was conducted.
Eighteen out of 46 local Danish Agriculture associations agreed to distribute the questionnaire to their members as a link in an e-mail. The e-mail aimed at encouraging the landowner to answer the questionnaire by giving the opportunity to win a prize of 3 X 135 € and addressed possible concerns regarding the questionnaire as e.g. that answers would be kept confidential. The questionnaire was distributed to a total of 3,609 landowners and of these 1,027 landowners answered the questionnaire which equals a response rate of 28.5 %. Respondents who answered less than four questions are not included in the sample (Broch & Vedel, upubl). 2.2 Biodiversity, ground water and recreational proxies Atlas data (10x10 km grid cells) on 1008 species (Petersen et al. 2005) were spatially designated to zip code levels. Because the data were originally compiled for 10 x 10–km Universal Transverse Mercator (UTM) quadrates (= 100 km2, n = 622), the species richness from each grid cell was assigned to the post code that occupies the greatest proportion of that grid cell using ARCGIS (ESRI). The data include the majority of Danish species within species groups. Similarly the Danish Area Information System was applied to identify the proportional share of area within a zip code with drinking water interests. We applied Danish National Statistic (2010, www.dst.dk) data on the population size within each zip code as a proxy of recreational demand. (Fig 1.).

123
landowners are key actors implying a need for understanding their conservation preferences. Knowing more about how spatial presence of goods influence landowners’ preferences may be beneficial when conservation projects are to be implemented. The aim of this study is to investigate how spatial variation of potential supply of environmental goods influence landowners’ willingness to supply these goods and services. Linking landowners’ preferences for providing different goods (e.g. biodiversity, groundwater protection and recreation) to geographical data on potential supply and demand for these goods has not previously achieved much attention.
Recent studies (e.g., Knight and Cowling, 2007; Knight et al., 2010) investigate the link between farmer characteristics and conservation opportunities. They add significant insight to the conservation planning literature, which has mostly focused on identifying conservation priorities rather than conservation opportunities. They find that greater efficiency may be added to the decision on ‘where’ and ‘when’ to allocate the conservation if conservation research also achieves to map ‘how’ specific actions can effectively be implemented with a high likelihood of effectiveness. We link farmers’ willingness to join conservation projects with the type of ecosystem service provided by the project and socio-economic determinants and discuss the potential implications for the design and targeting of conservation contracts for nature management on private land. Although this approach proves suitable for conservation planning, we argue that lacking investigations of land owner preferences may face the risk of implementation failure, which at the end could lead to a reduced delivery of conservation outcomes (Guerro et al., In Press). 2. Data and Methods Two sets of data are combined in this study. Landowners’ preferences are investigated using a choice experiment of landowners’ preferences for afforestation contracts with the purpose to provide different goods; groundwater protection, biodiversity conservation or recreation. The spatial demand for goods is identified using GIS. Preferences and spatial demand for goods are linked by postal code. 2.1 Survey data on land owner preferences The data were collected using an online, e-mail distributed questionnaire among Danish landowners in January and February of 2009. SurveyXact was used as software. The questionnaire was discussed with a focus group consisting of farmers and experts which resulted in a redesign of parts of the questionnaire. Before the final distribution of the questionnaire a pilot test with 61 landowners was conducted.
Eighteen out of 46 local Danish Agriculture associations agreed to distribute the questionnaire to their members as a link in an e-mail. The e-mail aimed at encouraging the landowner to answer the questionnaire by giving the opportunity to win a prize of 3 X 135 € and addressed possible concerns regarding the questionnaire as e.g. that answers would be kept confidential. The questionnaire was distributed to a total of 3,609 landowners and of these 1,027 landowners answered the questionnaire which equals a response rate of 28.5 %. Respondents who answered less than four questions are not included in the sample (Broch & Vedel, upubl). 2.2 Biodiversity, ground water and recreational proxies Atlas data (10x10 km grid cells) on 1008 species (Petersen et al. 2005) were spatially designated to zip code levels. Because the data were originally compiled for 10 x 10–km Universal Transverse Mercator (UTM) quadrates (= 100 km2, n = 622), the species richness from each grid cell was assigned to the post code that occupies the greatest proportion of that grid cell using ARCGIS (ESRI). The data include the majority of Danish species within species groups. Similarly the Danish Area Information System was applied to identify the proportional share of area within a zip code with drinking water interests. We applied Danish National Statistic (2010, www.dst.dk) data on the population size within each zip code as a proxy of recreational demand. (Fig 1.).

124
Fig. 1. Proxies for recreational demand, groundwater interests and biodiversity. 2.3 Spatial econometric analysis The current study applies a choice experiment (CE) to elicit farmers stated preferences towards conservation objectives. The CE method has previously been applied to valuation of environmental goods and services (e.g. Boxall et al., 1996; Christie et al., 2007), and landowners’ agri-environmental scheme preferences (Horne, 2006; Ruto & Garrod, 2009; Espinosa-Goded et al., 2010).
The CE utilises the information that each respondent have answered in several choice sets in the survey. In the random parameter logit model with a vector β of parameters, the probability of choosing alternative k becomes:
Pr(kin) = ( )( ) βββ
βdf
x
xN
nJ
j jini
inki n )(exp
exp
1∫ ∏ ∑ ⎟
⎟⎟
⎠
⎞
⎜⎜⎜
⎝
⎛
⎥⎥
⎦
⎤
⎢⎢
⎣
⎡
′
′
=
where f(β) is the distribution function forβ , with mean b and covariance W. 3. Preliminary results This study shows some preliminary results from the statistical analysis of the combination of spatial data and landowner preferences. It is found that compared to recreational projects land owners require less compensation if the purpose is groundwater, and even less if the purpose is biodiversity. We applied cross products to estimate spatial links between population density, species richness, and the area share of groundwater interests. There is no significant link between the area with high groundwater interests and landowners’ willingness to protect groundwater. Interestingly, increasing population density significantly increase landowners’ required compensation. This result indicates farmers’ disutility from public recreation on their property. Further analysis will investigate the effect of existing forests, hunting data and similar proxies related to the three different purposes of afforestation, on landowners’ willingness to provide the different environmental goods. We find no significant spatial effect of species richness on landowners’ willingness to afforest for biodiversity purposes. These findings may be used for improving the future targeting of conservation policies and what can be learned about landowners’ willingness to contribute to public goods.
Acknowledgments NS would like to thank the Danish National Research Foundation for supporting the research at the Center for Macroecology, Evolution and Climate. The research was supported by the Danish Council for Independent Research – Social Science, grant number 75-07-0240. KAW was supported by the Australian Research Council. References Broch, S.W. and Vedel, S.E. 2010. 3. Heterogeneity in landowners’ agri-
environmental scheme preferences. In Vedel, S.E. “Economic incentives for provision of environmental goods and services from forest and nature areas”, PhD Dissertation, Faculty of Life Sciences, pp.62-86.
Fig. 1. Proxies for recreational demand, groundwater interests and biodiversity. 2.3 Spatial econometric analysis The current study applies a choice experiment (CE) to elicit farmers stated preferences towards conservation objectives. The CE method has previously been applied to valuation of environmental goods and services (e.g. Boxall et al., 1996; Christie et al., 2007), and landowners’ agri-environmental scheme preferences (Horne, 2006; Ruto & Garrod, 2009; Espinosa-Goded et al., 2010).

125
Fig. 1. Proxies for recreational demand, groundwater interests and biodiversity. 2.3 Spatial econometric analysis The current study applies a choice experiment (CE) to elicit farmers stated preferences towards conservation objectives. The CE method has previously been applied to valuation of environmental goods and services (e.g. Boxall et al., 1996; Christie et al., 2007), and landowners’ agri-environmental scheme preferences (Horne, 2006; Ruto & Garrod, 2009; Espinosa-Goded et al., 2010).
The CE utilises the information that each respondent have answered in several choice sets in the survey. In the random parameter logit model with a vector β of parameters, the probability of choosing alternative k becomes:
Pr(kin) = ( )( ) βββ
βdf
x
xN
nJ
j jini
inki n )(exp
exp
1∫ ∏ ∑ ⎟
⎟⎟
⎠
⎞
⎜⎜⎜
⎝
⎛
⎥⎥
⎦
⎤
⎢⎢
⎣
⎡
′
′
=
where f(β) is the distribution function forβ , with mean b and covariance W. 3. Preliminary results This study shows some preliminary results from the statistical analysis of the combination of spatial data and landowner preferences. It is found that compared to recreational projects land owners require less compensation if the purpose is groundwater, and even less if the purpose is biodiversity. We applied cross products to estimate spatial links between population density, species richness, and the area share of groundwater interests. There is no significant link between the area with high groundwater interests and landowners’ willingness to protect groundwater. Interestingly, increasing population density significantly increase landowners’ required compensation. This result indicates farmers’ disutility from public recreation on their property. Further analysis will investigate the effect of existing forests, hunting data and similar proxies related to the three different purposes of afforestation, on landowners’ willingness to provide the different environmental goods. We find no significant spatial effect of species richness on landowners’ willingness to afforest for biodiversity purposes. These findings may be used for improving the future targeting of conservation policies and what can be learned about landowners’ willingness to contribute to public goods.
Acknowledgments NS would like to thank the Danish National Research Foundation for supporting the research at the Center for Macroecology, Evolution and Climate. The research was supported by the Danish Council for Independent Research – Social Science, grant number 75-07-0240. KAW was supported by the Australian Research Council. References Broch, S.W. and Vedel, S.E. 2010. 3. Heterogeneity in landowners’ agri-
environmental scheme preferences. In Vedel, S.E. “Economic incentives for provision of environmental goods and services from forest and nature areas”, PhD Dissertation, Faculty of Life Sciences, pp.62-86.
Fig. 1. Proxies for recreational demand, groundwater interests and biodiversity. 2.3 Spatial econometric analysis The current study applies a choice experiment (CE) to elicit farmers stated preferences towards conservation objectives. The CE method has previously been applied to valuation of environmental goods and services (e.g. Boxall et al., 1996; Christie et al., 2007), and landowners’ agri-environmental scheme preferences (Horne, 2006; Ruto & Garrod, 2009; Espinosa-Goded et al., 2010).

126
Boxall, P.C., Adamowicz, W.L., Swait, J., Williams, M. and Louviere, J. 1996 A comparison of stated preference methods for environmental valuation. Ecological Economics, 18, 243-253.
Christie, M., Hanley, N. and Hynes, S. 2007 Valuing enhancements to forest recreation using choice experiment methods and contingent behaviour methods. Journal of Forest Economics, 13, 75-102.
Espinosa-Goded M, Barreiro-Hurlé J, & Ruto E (2010) What do farmers want from agri-environmental scheme design? A choice experiment approach. Journal of Agricultural Economics, 61, 259-273.
Guerrero, A.M., Knight,A.T., Grantham, H.S., Cowling, R.M. and Wilson, K.A.. Predicting willingness-to-sell and its utility for assessing conservation opportunity for expanding protected area networks. Conservation Letters, In Press.
Horne, P. 2006 Forest owners’ acceptance of incentive based policy instruments in forest biodiversity conservation – A choice experiment based approach. Silva Fennica, 40,169-178.
Knight, A.T. and Cowling R.M. 2007. Embracing opportunism in the selection of priority conservation areas. Conservation Biology, 21, 1124–1126.
Knight, A.T., R.M. Cowling, M. Difford and B.M. Campbell. 2010 Mapping human and social dimensions of conservation opportunity for the scheduling of conservation action on private land. Conservation Biology, In Press.
Petersen, A.H., Larsen, F.W., Rahbek, C. Strange, N. and Lund, M.P. 2005. Naturværdier i Danske Nationalparker.. En kvantitativ analyse af den biologiske mangfoldighed i potentielle danske nationalparker. Center for Makroøkologi, Københavns Universitet, 136 pp.
Robinson, J.G. 2006. Conservation biology and real-world conservation. Conservation Biology, 20, 658-669.
Ruto, E. and Garrod, G. 2009. Investigating farmers’ preferences for the design of agri-environmental schemes: a choice experiment approach. Journal of Environmental Planning and Management, 52, 631-647.
Sutherland, W.J. and Woodroof, H.J. 2009. The need for environmental horizon scanning. Trends in Ecology & Evolution, 24, 523-527.
Sutherland, W.J., Adams, W.M., Aronson, R.B., et al. 2009. One hundred questions of importance to the conservation of global biological diversity. Conservation Biology, 23, 557-567.
Investigation of landowners’ preferences for afforestation contracts in Denmark
Stine Wamberg Broch & Suzanne Elizabeth Vedel
Forest & Landscape, Faculty of Life Sciences, University of Copenhagen, Abstract This study investigates landowners’ preferences for afforestation contracts in Denmark using a choice experiment. Four attributes are investigated: purpose of afforestation, option of denouncing the contract, control by authorities and subsidy levels. One average, landowners showed strong preferences for having the option to denounce the contracts whereas increasing control lead to increases in required compensation. Biodiversity was the most popular purpose.
Keywords: choice experiment, random parameter logit model, latent class model, regulation, participation, subsidy.
1. Short introduction to study and results Voluntary agri-environmental schemes are used as a widespread means to provide incentives for nature management on private land in e.g. the European Union and the USA. The success of voluntary scheme is dependent on participation (Falconer, 2000; Franks, 2003) implying a need for understanding landowners’ participation decision. The aim of this study is to investigate preference heterogeneity for afforestation contracts among landowners, with a regulation perspective in mind. Even though afforestation has previously been investigated in a Danish context (Madsen, 2002; Madsen, 2003; Præstholm et al., 2006), little knowledge has been gathered regarding landowners’ afforestation subsidy scheme preferences. The Danish afforestation scheme is an example of a voluntary agri-environmental scheme which does not provide the demanded good at the desired level due to low participation rates. In Denmark, it is a national goal to increase the forest area from approximately 12 % in 1990 to 20-25% within the next 80-100 years. This requires an average yearly afforestation of 4-5,000 ha and from 1989-1998 the afforestation was less than 1,800 ha/year (The Danish Forest and Nature Agency, 2008). We used a choice experiment to elicit landowners’ stated preferences for afforestation contracts. The choice experiment was distributed with help from Danish Agriculture via e-mail to 3,609 landowners and of these 1,027 landowners answered the questionnaire which equals a response rate of
127
Boxall, P.C., Adamowicz, W.L., Swait, J., Williams, M. and Louviere, J. 1996 A comparison of stated preference methods for environmental valuation. Ecological Economics, 18, 243-253.
Christie, M., Hanley, N. and Hynes, S. 2007 Valuing enhancements to forest recreation using choice experiment methods and contingent behaviour methods. Journal of Forest Economics, 13, 75-102.
Espinosa-Goded M, Barreiro-Hurlé J, & Ruto E (2010) What do farmers want from agri-environmental scheme design? A choice experiment approach. Journal of Agricultural Economics, 61, 259-273.
Guerrero, A.M., Knight,A.T., Grantham, H.S., Cowling, R.M. and Wilson, K.A.. Predicting willingness-to-sell and its utility for assessing conservation opportunity for expanding protected area networks. Conservation Letters, In Press.
Horne, P. 2006 Forest owners’ acceptance of incentive based policy instruments in forest biodiversity conservation – A choice experiment based approach. Silva Fennica, 40,169-178.
Knight, A.T. and Cowling R.M. 2007. Embracing opportunism in the selection of priority conservation areas. Conservation Biology, 21, 1124–1126.
Knight, A.T., R.M. Cowling, M. Difford and B.M. Campbell. 2010 Mapping human and social dimensions of conservation opportunity for the scheduling of conservation action on private land. Conservation Biology, In Press.
Petersen, A.H., Larsen, F.W., Rahbek, C. Strange, N. and Lund, M.P. 2005. Naturværdier i Danske Nationalparker.. En kvantitativ analyse af den biologiske mangfoldighed i potentielle danske nationalparker. Center for Makroøkologi, Københavns Universitet, 136 pp.
Robinson, J.G. 2006. Conservation biology and real-world conservation. Conservation Biology, 20, 658-669.
Ruto, E. and Garrod, G. 2009. Investigating farmers’ preferences for the design of agri-environmental schemes: a choice experiment approach. Journal of Environmental Planning and Management, 52, 631-647.
Sutherland, W.J. and Woodroof, H.J. 2009. The need for environmental horizon scanning. Trends in Ecology & Evolution, 24, 523-527.
Sutherland, W.J., Adams, W.M., Aronson, R.B., et al. 2009. One hundred questions of importance to the conservation of global biological diversity. Conservation Biology, 23, 557-567.
Investigation of landowners’ preferences for afforestation contracts in Denmark
Stine Wamberg Broch & Suzanne Elizabeth Vedel
Forest & Landscape, Faculty of Life Sciences, University of Copenhagen, Abstract This study investigates landowners’ preferences for afforestation contracts in Denmark using a choice experiment. Four attributes are investigated: purpose of afforestation, option of denouncing the contract, control by authorities and subsidy levels. One average, landowners showed strong preferences for having the option to denounce the contracts whereas increasing control lead to increases in required compensation. Biodiversity was the most popular purpose.
Keywords: choice experiment, random parameter logit model, latent class model, regulation, participation, subsidy.
1. Short introduction to study and results Voluntary agri-environmental schemes are used as a widespread means to provide incentives for nature management on private land in e.g. the European Union and the USA. The success of voluntary scheme is dependent on participation (Falconer, 2000; Franks, 2003) implying a need for understanding landowners’ participation decision. The aim of this study is to investigate preference heterogeneity for afforestation contracts among landowners, with a regulation perspective in mind. Even though afforestation has previously been investigated in a Danish context (Madsen, 2002; Madsen, 2003; Præstholm et al., 2006), little knowledge has been gathered regarding landowners’ afforestation subsidy scheme preferences. The Danish afforestation scheme is an example of a voluntary agri-environmental scheme which does not provide the demanded good at the desired level due to low participation rates. In Denmark, it is a national goal to increase the forest area from approximately 12 % in 1990 to 20-25% within the next 80-100 years. This requires an average yearly afforestation of 4-5,000 ha and from 1989-1998 the afforestation was less than 1,800 ha/year (The Danish Forest and Nature Agency, 2008). We used a choice experiment to elicit landowners’ stated preferences for afforestation contracts. The choice experiment was distributed with help from Danish Agriculture via e-mail to 3,609 landowners and of these 1,027 landowners answered the questionnaire which equals a response rate of

128
28.5 %. Four attributes are investigated: purpose of afforestation (biodiversity, recreation or groundwater), option of denouncing the contract (within the first five or ten years, or the contract is binding), control by authorities (1, 10 or 25 % are selected for control) and subsidy levels (one time payment between 27,000 and 42,000 DKK/ha). All attributes present a potential conflict between landowners’ and authorities’ interests which emphasise the importance of knowing how to handle these. Data are analysed using a random parameter logit model (RPL) and a latent class model (LC)1. In the latent class model class probability variables are included which potentially can be used to differentiate and target contracts to groups of landowners. On average, landowners show strong preferences for the option to denounce the contract which reduces the required subsidy. Control by authorities raises the required subsidy level. Furthermore, landowners are willing to accept a lower subsidy when the aim is to protect biodiversity and groundwater relative to recreation. LC models reveal considerable discrete heterogeneity across landowners and support a division into four groups with divergent preferences. For example, a group of landowners who already have forest areas do not find the option of denouncing important whereas another group of landowners relying on the farm for income require the highest subsidy. The results from this study indicate that introducing an option to denounce the contract within a limited period can improve landowners’ willingness to accept contracts at a lower cost for society – especially landowners who do not have forest areas on their land. For landowners, it may create a feeling of leaving a backdoor open for themselves or future owners even though it may be costly to remove the forest. It will also let the landowner keep authority because he is the one to decide if the area should remain forest. This is in line with recommendation from theory about leaving decisions to the principal or agent depending on who is most concerned (Aghion & Tirole, 1997) and know most about the issue (Bogetoft & Olesen, 2002). Theory also states that it is likely that landowners will become happy about what they have (their forest) and will feel a loss from removing it due to the endowment effect (Kahneman et al., 1991 in Kahneman & Tversky, 2000). The importance of denouncing was tied to uncertainty among landowners who do not have experiences with forests. Schemes directed at landowners who already have forest on their property need therefore not offer an option to denounce, whereas schemes directed at other groups should. Landowners do on average require increased compensation for increased control. Due to this it is important that authorities consider what
1 The random parameter logit model and latent class model details are not presented in this extended abstract.
they want to achieve by control. When landowners get a contract offer, there are three options; either they participate and comply, participate without (fully) compliance or they do not participate (Hart & Latacz-Lohmann, 2005; Ozanne et al., 2001). Even though landowners experience disutility from control, it is recommended to reduce cost of moral hazard problems in contracts (Bogetoft & Olsen, 2002). It is worthwhile considering why control creates disutility, as, e.g. Hart & Latacz-Lohmann (2005) claim that the majority of landowners do not want to cheat, leaving bureaucracy and fear of non-compliance as more likely explanations. Fear of non-compliance may be reduced if authorities use transparent contracts (Bogetoft & Olesen, 2002) which make it obvious to the landowners what is required. If the level of control is too high landowners may experience distrust and even feel criminalized, as some state in the questionnaire. To avoid this, control visits may be framed as free advisory service to assure compliance. Then the visits should focus on dialogue about difficulties with the scheme. Some landowners already see control visits in this way and said that they considered authorities as a partner or expert who could give good advice. The degree of non-compliance is relevant. If landowners only ‘non-comply’ on the margin, then non-compliers will also contribute to the goal (Hart & Latacz-Lohmann, 2005). Moreover, targeting with regard to the purpose of afforestation is relevant since recreational areas are more expensive to establish than areas which protect biodiversity or groundwater interests. In the Danish afforestation scheme there is extra subsidy for avoiding pesticides (The Danish Forest and Nature Agency, 2009), which may benefit both biodiversity and groundwater. Compared to landowners’ preferences only, this is odd because recreation is what creates the largest disutility. Due to this, authorities may consider paying more to achieve the goal of increased recreational purposes, e.g. close to towns. Altogether, these findings show important potential for further development of afforestation contracts and agri-environmental schemes in general. References Aghion, P. and Tirole, J. (1997) Formal and Real Authority in
Organisations. The Journal of Political Economy 105: 1-29 Bogetoft P. and Olesen, H.B. (2002) Ten rules of thumb in contract design:
lessons from Danish agriculture. European Review of Agricultural Economics 29 (2) 185-204
Falconer, K. (2000) Farm-level constraints on agri-environmental scheme participation: a transactional perspective. Journal of Rural Studies 16: 379-395

129
28.5 %. Four attributes are investigated: purpose of afforestation (biodiversity, recreation or groundwater), option of denouncing the contract (within the first five or ten years, or the contract is binding), control by authorities (1, 10 or 25 % are selected for control) and subsidy levels (one time payment between 27,000 and 42,000 DKK/ha). All attributes present a potential conflict between landowners’ and authorities’ interests which emphasise the importance of knowing how to handle these. Data are analysed using a random parameter logit model (RPL) and a latent class model (LC)1. In the latent class model class probability variables are included which potentially can be used to differentiate and target contracts to groups of landowners. On average, landowners show strong preferences for the option to denounce the contract which reduces the required subsidy. Control by authorities raises the required subsidy level. Furthermore, landowners are willing to accept a lower subsidy when the aim is to protect biodiversity and groundwater relative to recreation. LC models reveal considerable discrete heterogeneity across landowners and support a division into four groups with divergent preferences. For example, a group of landowners who already have forest areas do not find the option of denouncing important whereas another group of landowners relying on the farm for income require the highest subsidy. The results from this study indicate that introducing an option to denounce the contract within a limited period can improve landowners’ willingness to accept contracts at a lower cost for society – especially landowners who do not have forest areas on their land. For landowners, it may create a feeling of leaving a backdoor open for themselves or future owners even though it may be costly to remove the forest. It will also let the landowner keep authority because he is the one to decide if the area should remain forest. This is in line with recommendation from theory about leaving decisions to the principal or agent depending on who is most concerned (Aghion & Tirole, 1997) and know most about the issue (Bogetoft & Olesen, 2002). Theory also states that it is likely that landowners will become happy about what they have (their forest) and will feel a loss from removing it due to the endowment effect (Kahneman et al., 1991 in Kahneman & Tversky, 2000). The importance of denouncing was tied to uncertainty among landowners who do not have experiences with forests. Schemes directed at landowners who already have forest on their property need therefore not offer an option to denounce, whereas schemes directed at other groups should. Landowners do on average require increased compensation for increased control. Due to this it is important that authorities consider what
1 The random parameter logit model and latent class model details are not presented in this extended abstract.
they want to achieve by control. When landowners get a contract offer, there are three options; either they participate and comply, participate without (fully) compliance or they do not participate (Hart & Latacz-Lohmann, 2005; Ozanne et al., 2001). Even though landowners experience disutility from control, it is recommended to reduce cost of moral hazard problems in contracts (Bogetoft & Olsen, 2002). It is worthwhile considering why control creates disutility, as, e.g. Hart & Latacz-Lohmann (2005) claim that the majority of landowners do not want to cheat, leaving bureaucracy and fear of non-compliance as more likely explanations. Fear of non-compliance may be reduced if authorities use transparent contracts (Bogetoft & Olesen, 2002) which make it obvious to the landowners what is required. If the level of control is too high landowners may experience distrust and even feel criminalized, as some state in the questionnaire. To avoid this, control visits may be framed as free advisory service to assure compliance. Then the visits should focus on dialogue about difficulties with the scheme. Some landowners already see control visits in this way and said that they considered authorities as a partner or expert who could give good advice. The degree of non-compliance is relevant. If landowners only ‘non-comply’ on the margin, then non-compliers will also contribute to the goal (Hart & Latacz-Lohmann, 2005). Moreover, targeting with regard to the purpose of afforestation is relevant since recreational areas are more expensive to establish than areas which protect biodiversity or groundwater interests. In the Danish afforestation scheme there is extra subsidy for avoiding pesticides (The Danish Forest and Nature Agency, 2009), which may benefit both biodiversity and groundwater. Compared to landowners’ preferences only, this is odd because recreation is what creates the largest disutility. Due to this, authorities may consider paying more to achieve the goal of increased recreational purposes, e.g. close to towns. Altogether, these findings show important potential for further development of afforestation contracts and agri-environmental schemes in general. References Aghion, P. and Tirole, J. (1997) Formal and Real Authority in
Organisations. The Journal of Political Economy 105: 1-29 Bogetoft P. and Olesen, H.B. (2002) Ten rules of thumb in contract design:
lessons from Danish agriculture. European Review of Agricultural Economics 29 (2) 185-204
Falconer, K. (2000) Farm-level constraints on agri-environmental scheme participation: a transactional perspective. Journal of Rural Studies 16: 379-395

130
Franks, J. (2003) Revised Agri-Environment Policy Objectives: Implications for Scheme Design. Journal of Environmental Planning and Management 46 (3) 37-41
Hart, R. & Latacz-Lohmann, U. (2005) Combating moral hazard in agri-environmental schemes: a multiple-agent approach. European Review of Agricultural Economics 32 (1) 75-91???
Kahneman, D. Knetsch, J.L. and Thaler, R.H. (1991) Anomalies. The Endowment Effect, Loss Aversion and Status Quo Bias p. 159-170 in Kahneman, D. and Tversky, A. (ed.) (2000) Choice, Values and Frames. Cambridge University Press, USA. 840p. (Originally published in Journal of Economic Perspectives 5 (1) 193-206)
Madsen, L.M. (2002) The Danish afforestation programme and spatial planning: new challenges. Landscape and Urban Planning 58: 241-254
Madsen, L.M. (2003) New woodlands in Denmark: The role of private landowners. Urban Forestry & Urban Greening 1: 185-195
Ozanne, A., Hogan, T. and Colman, D. (2001) Moral Hazard, risk aversion and compliance monitoring in agri-environmental policy. European Review of Agricultural Economics 28 (3) 329-347
Præstholm, S. Reenberg, A. and Kristensen. S.P. (2006) Afforestation of European landscapes: How do different farmer types respond to EU agri-environmental schemes? GeoJournal 67: 71-84
The Danish Forest and Nature Agency (2008) www.sns.dk Forside > Udgivelser > Alfabetisk oversigt ”Evaluering af den gennemførte skovrejsning 1989-1998” Visited June 17, 2008 [Forest & Nature Agency, Evaluation of the Danish Afforestation 1989-1998]
The Danish Forest and Nature Agency (2009) Vejledning til privat skovrejsning 2009 [Guide to Private Afforestation 2009] http://www.skovognatur.dk/Skov/Privat/Tilskud/Skovrejsning/ Cited 26 March 2009
Model of State forestry administration and media thriller in Lithuania
Vilis Brukas
Southern Swedish Forest Research Centre, Faculty of Forest Sciences, Swedish University of Agricultural Sciences
Abstract The first part of the paper reproduces the text that was intended to be published in a Lithuanian professional forestry journal. It first concisely reviews State forestry administrations in the countries of the Baltic Sea region, judging their adherence to the traditional model of bureaucracy versus the model of new public administration. Then it describes the Lithuanian approach in greater detail, providing criticism of inefficiencies caused by an overly bureaucratic administration. Attempts to publish the text led to the closure of the journal. Reflecting on this media turmoil, the second part of the paper discusses the role of a forest scientist. Should s/he be a neutral expert expedient to existing institutional structures, or rather seek to catalyze the desired policy processes? Is it worth to engage in “popular discourses” or better to stick solely to the standard production of peer review articles?
Keywords: State forestry, bureaucracy, new public administration, media, role of science 1. Reform for the country, not for bureaucracy (part 1)1 After ideas about reforming State forestry reached the Lithuanian Parliament and Government, a lively discussion has been sparked in professional and popular media. A reform involves highly complex and important considerations that do not only affect personal destinies of employees, but also concern diverse group interests. No surprise that emotions often prevail over facts and the latter are “corrected” towards a desired direction. There is a lack of fundamental and
1 Sections 1.1 and 1.2 were published in Lithuanian language in the professional forestry journal Baltijos Miskai ir Mediena, in September 2009. Sections 1.3 and 1.4 could not appear in printed form as intended (cf. Section 2.1). The whole article (Section 1) was placed on the Internet portal of the Forest Owner Association in Lithuania (www.forest.lt).

131
Franks, J. (2003) Revised Agri-Environment Policy Objectives: Implications for Scheme Design. Journal of Environmental Planning and Management 46 (3) 37-41
Hart, R. & Latacz-Lohmann, U. (2005) Combating moral hazard in agri-environmental schemes: a multiple-agent approach. European Review of Agricultural Economics 32 (1) 75-91???
Kahneman, D. Knetsch, J.L. and Thaler, R.H. (1991) Anomalies. The Endowment Effect, Loss Aversion and Status Quo Bias p. 159-170 in Kahneman, D. and Tversky, A. (ed.) (2000) Choice, Values and Frames. Cambridge University Press, USA. 840p. (Originally published in Journal of Economic Perspectives 5 (1) 193-206)
Madsen, L.M. (2002) The Danish afforestation programme and spatial planning: new challenges. Landscape and Urban Planning 58: 241-254
Madsen, L.M. (2003) New woodlands in Denmark: The role of private landowners. Urban Forestry & Urban Greening 1: 185-195
Ozanne, A., Hogan, T. and Colman, D. (2001) Moral Hazard, risk aversion and compliance monitoring in agri-environmental policy. European Review of Agricultural Economics 28 (3) 329-347
Præstholm, S. Reenberg, A. and Kristensen. S.P. (2006) Afforestation of European landscapes: How do different farmer types respond to EU agri-environmental schemes? GeoJournal 67: 71-84
The Danish Forest and Nature Agency (2008) www.sns.dk Forside > Udgivelser > Alfabetisk oversigt ”Evaluering af den gennemførte skovrejsning 1989-1998” Visited June 17, 2008 [Forest & Nature Agency, Evaluation of the Danish Afforestation 1989-1998]
The Danish Forest and Nature Agency (2009) Vejledning til privat skovrejsning 2009 [Guide to Private Afforestation 2009] http://www.skovognatur.dk/Skov/Privat/Tilskud/Skovrejsning/ Cited 26 March 2009
Model of State forestry administration and media thriller in Lithuania
Vilis Brukas
Southern Swedish Forest Research Centre, Faculty of Forest Sciences, Swedish University of Agricultural Sciences
Abstract The first part of the paper reproduces the text that was intended to be published in a Lithuanian professional forestry journal. It first concisely reviews State forestry administrations in the countries of the Baltic Sea region, judging their adherence to the traditional model of bureaucracy versus the model of new public administration. Then it describes the Lithuanian approach in greater detail, providing criticism of inefficiencies caused by an overly bureaucratic administration. Attempts to publish the text led to the closure of the journal. Reflecting on this media turmoil, the second part of the paper discusses the role of a forest scientist. Should s/he be a neutral expert expedient to existing institutional structures, or rather seek to catalyze the desired policy processes? Is it worth to engage in “popular discourses” or better to stick solely to the standard production of peer review articles?
Keywords: State forestry, bureaucracy, new public administration, media, role of science 1. Reform for the country, not for bureaucracy (part 1)1 After ideas about reforming State forestry reached the Lithuanian Parliament and Government, a lively discussion has been sparked in professional and popular media. A reform involves highly complex and important considerations that do not only affect personal destinies of employees, but also concern diverse group interests. No surprise that emotions often prevail over facts and the latter are “corrected” towards a desired direction. There is a lack of fundamental and
1 Sections 1.1 and 1.2 were published in Lithuanian language in the professional forestry journal Baltijos Miskai ir Mediena, in September 2009. Sections 1.3 and 1.4 could not appear in printed form as intended (cf. Section 2.1). The whole article (Section 1) was placed on the Internet portal of the Forest Owner Association in Lithuania (www.forest.lt).

132
neutral analyses; whilst the theory of public management is a good point of departure for examining a potential reform.
1.1 A little on public management theory Already in the beginning of the 20th century, sociologists identified an idealized model of a bureaucracy that enables to seek certain goals defined by politicians. Bureaucratic management, also referred to as the traditional public management, rests on the following core principles:
• Hierarchy, i.e. an administration relies on a strict subordination
of the personnel. Officers of a lower rank sternly obey to the officers of higher ranks. This principle ensures that the decisions of the top leadership are implemented throughout the organization.
• Functional specialization. The tasks and the means for their achievement are standardised according to positions, areas of responsibility are defined in respective statutes. Forestry administration can be specialised geographically as well as according to functions performed.
Characteristically, the bureaucratic system of management relies on loyal employees who carry out their functions, neatly following instructions and having little freedom of choice. The bureaucratic model is often criticised due to, among other things, lack of flexibility and suppression of employees’ initiative. Bureaucratic organisations often turn into entities that are difficult to regulate externally. Sometimes they even become kind of manors or protectorates of the leading officers, where diverse personal and factional interests end up in deep clashes with those of the public.
Efforts to improve the traditional management led to the concept of New Public Administration (NPA) that, since the 1990s, has become the prevailing model for administrative reforms in developed countries. NPA is oriented towards efficiency and is expected to result in: diminishing bureaucracy; inclusion of market mechanisms into public administration; increasing productivity; greater independence of employees, and better service for clients. The management is decentralised along with implementation of new devices for accountability and control.
Reforms might be initiated to genuinely improve the public management, increasing its contribution to a country’s welfare. There might also be hidden agendas, for example, certain grouping may try to push through privatisation
without taking any political responsibility. Sometimes reforms are imitated without any tangible changes and trying to retain the “inherent” privileges. Policy science stresses that the success of public administration to a high degree depends on the overall political culture, as well as personal ethics and responsibility. The experience of post-Soviet countries confirms that, in the context of a deeply-rooted bureaucracy and corruption, it is difficult to carry out essential reforms for the benefit of society. 1.2 Features of public administration in neighbouring countries In reality it is hardly possible to find a forestry administration that would be organised purely according to the bureaucratic or the NPA model. Elements of both models are more likely to be observed. However, it is possible to conduct a comparison revealing which model’s features are prevailing in one or another country.
NPA principles are well established in the Scandinavian countries, not only in forestry but also in public management at large. A high regard is given to employee’s initiative and independence, tendencies of decentralisation have been prevalent over several last decades. The legal environment in Finland and Sweden traditionally is liberal, State forest enterprises are oriented towards efficient and profitable management.
Our Baltic neighbours Latvia and Estonia carried out radical reforms in 1999-2000, with apparent reorientation from bureaucratic model to NPA. Forest management and policy-making functions were separated at all levels; a single State forest enterprise was formed in each country with a clear mandate to work efficiently. A radical reform always entails numerous challenges. Despite this, the newly established enterprises surprisingly rapidly raised their profits as well as contributions to State budgets. Notably, the enterprises have been structurally organised into divisions by main functions, such as forest management, seed and plant production, nature management, timber trade and marketing, and hunting management. Each division has clear targets of performance; at the same time, they have sufficient operational freedom.
As far as I am acquainted with others countries of the ex-Soviet space, State forestry administration was not reformed (e.g. in Ukraine) or the reforms were deficient, creating an institutional chaos and dissatisfaction by majority of employees (Russia). In these countries, private forest ownership is either illegitimate or insubstantial, while State forestry is steered by distinctly bureaucratic and ineffective administrations. One of their characteristic features is flourishing corruption.

133
neutral analyses; whilst the theory of public management is a good point of departure for examining a potential reform.
1.1 A little on public management theory Already in the beginning of the 20th century, sociologists identified an idealized model of a bureaucracy that enables to seek certain goals defined by politicians. Bureaucratic management, also referred to as the traditional public management, rests on the following core principles:
• Hierarchy, i.e. an administration relies on a strict subordination
of the personnel. Officers of a lower rank sternly obey to the officers of higher ranks. This principle ensures that the decisions of the top leadership are implemented throughout the organization.
• Functional specialization. The tasks and the means for their achievement are standardised according to positions, areas of responsibility are defined in respective statutes. Forestry administration can be specialised geographically as well as according to functions performed.
Characteristically, the bureaucratic system of management relies on loyal employees who carry out their functions, neatly following instructions and having little freedom of choice. The bureaucratic model is often criticised due to, among other things, lack of flexibility and suppression of employees’ initiative. Bureaucratic organisations often turn into entities that are difficult to regulate externally. Sometimes they even become kind of manors or protectorates of the leading officers, where diverse personal and factional interests end up in deep clashes with those of the public.
Efforts to improve the traditional management led to the concept of New Public Administration (NPA) that, since the 1990s, has become the prevailing model for administrative reforms in developed countries. NPA is oriented towards efficiency and is expected to result in: diminishing bureaucracy; inclusion of market mechanisms into public administration; increasing productivity; greater independence of employees, and better service for clients. The management is decentralised along with implementation of new devices for accountability and control.
Reforms might be initiated to genuinely improve the public management, increasing its contribution to a country’s welfare. There might also be hidden agendas, for example, certain grouping may try to push through privatisation
without taking any political responsibility. Sometimes reforms are imitated without any tangible changes and trying to retain the “inherent” privileges. Policy science stresses that the success of public administration to a high degree depends on the overall political culture, as well as personal ethics and responsibility. The experience of post-Soviet countries confirms that, in the context of a deeply-rooted bureaucracy and corruption, it is difficult to carry out essential reforms for the benefit of society. 1.2 Features of public administration in neighbouring countries In reality it is hardly possible to find a forestry administration that would be organised purely according to the bureaucratic or the NPA model. Elements of both models are more likely to be observed. However, it is possible to conduct a comparison revealing which model’s features are prevailing in one or another country.
NPA principles are well established in the Scandinavian countries, not only in forestry but also in public management at large. A high regard is given to employee’s initiative and independence, tendencies of decentralisation have been prevalent over several last decades. The legal environment in Finland and Sweden traditionally is liberal, State forest enterprises are oriented towards efficient and profitable management.
Our Baltic neighbours Latvia and Estonia carried out radical reforms in 1999-2000, with apparent reorientation from bureaucratic model to NPA. Forest management and policy-making functions were separated at all levels; a single State forest enterprise was formed in each country with a clear mandate to work efficiently. A radical reform always entails numerous challenges. Despite this, the newly established enterprises surprisingly rapidly raised their profits as well as contributions to State budgets. Notably, the enterprises have been structurally organised into divisions by main functions, such as forest management, seed and plant production, nature management, timber trade and marketing, and hunting management. Each division has clear targets of performance; at the same time, they have sufficient operational freedom.
As far as I am acquainted with others countries of the ex-Soviet space, State forestry administration was not reformed (e.g. in Ukraine) or the reforms were deficient, creating an institutional chaos and dissatisfaction by majority of employees (Russia). In these countries, private forest ownership is either illegitimate or insubstantial, while State forestry is steered by distinctly bureaucratic and ineffective administrations. One of their characteristic features is flourishing corruption.

134
Command style of administration is clearly dominant also in the Polish State forestry. The administrative set-up practically remained unchanged from the socialist times, policy-making and forest management being integrated within one organisation. This is a powerful “State within State”, guided by the principle of self-sufficiency and not providing any noticeable contribution to the State budget. Within this profoundly hierarchic organisation, the loyalty is a much greater virtue than independence and initiative, all core activities are based on detailed regulations. Recently conducted international survey of young forest specialists brought forward a notable dissatisfaction by a considerable share of the Polish respondents. The employment and advancement on the career ladder depends on the employee’s personal contacts (not rarely via family bonds) rather than on her/his competence and productivity. Hierarchic relationships and normative management is detrimental to people’s motivation and initiative.
In Germany, the cradle of the classical forestry, management and policy functions are integrated in the administrations of federal lands (Bundesländer). In time of its heights, the bureaucratic model was well-advanced and considered to be exemplary by many other nations. Nonetheless, State forestry has been ineffective and needed sizeable subsidies already for several decades. One could expect that, taking into account the highly developed economy, high population density and negligible share of forestry in the State’s GDP, subsidising could turn into a politically accepted norm. However, the current federal government seeks to improve the effectiveness of forestry administrations and reduce the bureaucracy, relying on NPA principles. It is worth mentioning that in the Germany’s neighbour Austria State forestry is a profitable venture. Once again, this was achieved due to reorganisation of State forestry according to tenets of NPA. A single State enterprise, stock company “Austrian Federal Forests” was established in 1997.
How does one or the other model affect the welfare of the country and its citizens? Does it satisfy, as currently is fashionable to say in Lithuania, the public interests? In the forestry context, the public interests can be traditionally divided into ecological, social and economic. As regards ecological and social needs, it is safe to claim that the countries of the Baltic Sea region are satisfying them quite successfully. The only exception with some reservations is Russia. In the latter, large forest areas are not utilised, some other forests are overutilised, their regeneration is insufficient and of bad quality. All other aforementioned countries pursue principles of sustainability, in theory as well as in practice. Forest areas are increasing, cuttings are considerably below the increment, the network of protected areas is quite elaborate and is being further
expanded, and increasing attention is devoted to silvicultural measures oriented towards enhanced biodiversity. Assessing at large, it is not possible to observe any correlation between the model of forest administration and the social and environmental performance.
On the other hand, there is a clear connection between the management model and the contribution to the economic welfare. In countries with prevailing bureaucratic model, State forestry usually relies on self-sufficiency, i.e. forestry’s contribution to the State budget is absent or negligible. In other words, a huge resource of a country is used by the State forestry institutions “free of charge”. Such wasting of resources is hardly justifiable, especially in the countries that face the difficulties of the period of economic and social transition.
1.3 Management model in Lithuania After re-establishing the independence, the socioeconomic environment changed radically. After transition to the market economy, State Forest Enterprises (SFEs) had to learn to work independently. Timber processing units were gradually dismantled, but enterprises remained in charge of the whole forest management cycle from seed to forest logging. Considerable share of activities, especially in connection with logging and planting, was contracted to private companies. The average area of forest under management of an SFE was halved due to forest restitutions and currently makes up around 20,000 ha (totally there are 42 SFEs). At large, SFEs activity during the first years of independence can be assessed positively. In times of rapid economic transition accompanied by privatisation that at times was dirty and predatory, SFEs ensured stability and sustainable forest management, more or less successfully adapting to operations under market conditions. Then again, the economic model was based on the self-sufficiency and the major share of revenues stayed within the forestry branch, with little contribution to the State.
The chosen “evolutionary” path has conserved the institutional set-up. The economic and social environment changed radically, while the State forestry administration avoided any substantial changes internally. The most visible reform was the establishment of the Directorate General of State Forests (DGSF) in 1996, in order to separate functions of forest management and policy-making. The goal is commendable but its pursuance was quite unfortunate. First, the decision was taken in a hurry, at the onset of change of governing coalition, without any deeper analysis or consultations with representatives of the sector. This was one of the reasons for the ongoing conflicts between DGSF and the Forest Department under the Ministry of

135
Command style of administration is clearly dominant also in the Polish State forestry. The administrative set-up practically remained unchanged from the socialist times, policy-making and forest management being integrated within one organisation. This is a powerful “State within State”, guided by the principle of self-sufficiency and not providing any noticeable contribution to the State budget. Within this profoundly hierarchic organisation, the loyalty is a much greater virtue than independence and initiative, all core activities are based on detailed regulations. Recently conducted international survey of young forest specialists brought forward a notable dissatisfaction by a considerable share of the Polish respondents. The employment and advancement on the career ladder depends on the employee’s personal contacts (not rarely via family bonds) rather than on her/his competence and productivity. Hierarchic relationships and normative management is detrimental to people’s motivation and initiative.
In Germany, the cradle of the classical forestry, management and policy functions are integrated in the administrations of federal lands (Bundesländer). In time of its heights, the bureaucratic model was well-advanced and considered to be exemplary by many other nations. Nonetheless, State forestry has been ineffective and needed sizeable subsidies already for several decades. One could expect that, taking into account the highly developed economy, high population density and negligible share of forestry in the State’s GDP, subsidising could turn into a politically accepted norm. However, the current federal government seeks to improve the effectiveness of forestry administrations and reduce the bureaucracy, relying on NPA principles. It is worth mentioning that in the Germany’s neighbour Austria State forestry is a profitable venture. Once again, this was achieved due to reorganisation of State forestry according to tenets of NPA. A single State enterprise, stock company “Austrian Federal Forests” was established in 1997.
How does one or the other model affect the welfare of the country and its citizens? Does it satisfy, as currently is fashionable to say in Lithuania, the public interests? In the forestry context, the public interests can be traditionally divided into ecological, social and economic. As regards ecological and social needs, it is safe to claim that the countries of the Baltic Sea region are satisfying them quite successfully. The only exception with some reservations is Russia. In the latter, large forest areas are not utilised, some other forests are overutilised, their regeneration is insufficient and of bad quality. All other aforementioned countries pursue principles of sustainability, in theory as well as in practice. Forest areas are increasing, cuttings are considerably below the increment, the network of protected areas is quite elaborate and is being further
expanded, and increasing attention is devoted to silvicultural measures oriented towards enhanced biodiversity. Assessing at large, it is not possible to observe any correlation between the model of forest administration and the social and environmental performance.
On the other hand, there is a clear connection between the management model and the contribution to the economic welfare. In countries with prevailing bureaucratic model, State forestry usually relies on self-sufficiency, i.e. forestry’s contribution to the State budget is absent or negligible. In other words, a huge resource of a country is used by the State forestry institutions “free of charge”. Such wasting of resources is hardly justifiable, especially in the countries that face the difficulties of the period of economic and social transition.
1.3 Management model in Lithuania After re-establishing the independence, the socioeconomic environment changed radically. After transition to the market economy, State Forest Enterprises (SFEs) had to learn to work independently. Timber processing units were gradually dismantled, but enterprises remained in charge of the whole forest management cycle from seed to forest logging. Considerable share of activities, especially in connection with logging and planting, was contracted to private companies. The average area of forest under management of an SFE was halved due to forest restitutions and currently makes up around 20,000 ha (totally there are 42 SFEs). At large, SFEs activity during the first years of independence can be assessed positively. In times of rapid economic transition accompanied by privatisation that at times was dirty and predatory, SFEs ensured stability and sustainable forest management, more or less successfully adapting to operations under market conditions. Then again, the economic model was based on the self-sufficiency and the major share of revenues stayed within the forestry branch, with little contribution to the State.
The chosen “evolutionary” path has conserved the institutional set-up. The economic and social environment changed radically, while the State forestry administration avoided any substantial changes internally. The most visible reform was the establishment of the Directorate General of State Forests (DGSF) in 1996, in order to separate functions of forest management and policy-making. The goal is commendable but its pursuance was quite unfortunate. First, the decision was taken in a hurry, at the onset of change of governing coalition, without any deeper analysis or consultations with representatives of the sector. This was one of the reasons for the ongoing conflicts between DGSF and the Forest Department under the Ministry of

136
Environment. Even worse, there were no systemic prerequisites for a more effective management. DGSF simply became a kind of SFEs’ penthouse with a foggy mission of coordinating the SFEs activities. The nature of the reform and the mentality of its implementers predestined a predominantly bureaucratic profile of DGSF, with the increasingly obvious role of SFEs’ controller.
There have been some alterations of the ministerial subordination and the status of SFEs, but they did not bring about any significant changes in the administrative set-up or in SFEs’ activities. Although SFEs have the status of State enterprises since 2001, their legal rights are considerably curbed at the expense of DGSF. The latter does not have the status of an enterprise but it takes over part of SFEs’ rights without taking on clear responsibilities.
One can claim that the persons in charge missed a good chance for carrying out a rational reform of forestry, following the NPA tenets. It is obvious that the current administration and especially its top entities match most features of the bureaucratic model:
• The management system lacks internal incentives for
rationalising its performance, seeking more efficient use of resources and attaining higher contribution to the country’s welfare. Activities are steered by command management and short-term conjunctures rather than by a clear vision for development of the sector.
• Forest management activities are based on petty regulation, different kinds of plans, norms, detailed and compulsory provisions for people at SFEs, as if there is no trust in their professional competence. This is a core issue of forestry, conditioned by the bureaucratic model of the administration.
• Coordination of SFEs’ activities by GDSF is the most authentic example of a command-based public administration. Much manpower is wasted on all kind of reporting, audits, etc. One of the newer and more exciting examples: each SFE has to report to GDSF on public outreach activities and publications in the national media every three months.
• Loyalty is valued more than competence and results of work. Even though the performance of a single SFE to a large degree depends on the competency of its director, there is no evidence that GDSF would effectively use its right to assign SFE directors with due consideration of their competence.
• Innovations are coming slowly, for example, the level of IT applications is quite low at some SFEs.
• In informal conversations a significant share of employees of lower ranks express discontent with the current situation. Their motivation is restrained by the excessive bureaucracy that, among other things, leads to increasing workload. Despite heated discussion on the reform, such opinions are rarely reflected in the public space. Even the long-standing professional journal “Musu Girios” is short of critical contributions and generation of ideas, in contrast with the pre-war traditions and partly even the Soviet era. These could be indications of lacking freedom of expression.
Finally, the GDSF itself officially maintains the position that forestry administration should be organised by example of Poland. This confirms the value orientation towards further bureaucratisation.
SFEs’ directors and other staff have ended up in a weird situation. Working under market conditions, they should at the same time fight against windmills of bureaucracy or become faceless screws of the administrative machinery.
1.4 Future alternatives Assessing the situation at large, two major scenarios may be envisioned for improving the State forestry administration:
Scenario A: To retain current administrative set-up but diminish the bureaucracy, first of all by decreasing the influence of the central bureaucratic apparatus on SFEs. Scenario B: To carry out a radical systemic reform, applying NPA tenets.
Scenario A would be a minimalistic scenario that would not bring about substantial changes but still create prerequisites for more independent work by the main forest management subjects, the SFEs. Less manpower would be required for the bureaucratic routine. Both the policy science theory and the practical experience of the Lithuanian reforms are showing that already existing organisations attempt to preserve the status quo by all means. Any organisation attempts to increase its power and resist the external pressure for reform. Thus, in the overall context of deeply bureaucratised public management, Scenario A
137
Environment. Even worse, there were no systemic prerequisites for a more effective management. DGSF simply became a kind of SFEs’ penthouse with a foggy mission of coordinating the SFEs activities. The nature of the reform and the mentality of its implementers predestined a predominantly bureaucratic profile of DGSF, with the increasingly obvious role of SFEs’ controller.
There have been some alterations of the ministerial subordination and the status of SFEs, but they did not bring about any significant changes in the administrative set-up or in SFEs’ activities. Although SFEs have the status of State enterprises since 2001, their legal rights are considerably curbed at the expense of DGSF. The latter does not have the status of an enterprise but it takes over part of SFEs’ rights without taking on clear responsibilities.
One can claim that the persons in charge missed a good chance for carrying out a rational reform of forestry, following the NPA tenets. It is obvious that the current administration and especially its top entities match most features of the bureaucratic model:
• The management system lacks internal incentives for
rationalising its performance, seeking more efficient use of resources and attaining higher contribution to the country’s welfare. Activities are steered by command management and short-term conjunctures rather than by a clear vision for development of the sector.
• Forest management activities are based on petty regulation, different kinds of plans, norms, detailed and compulsory provisions for people at SFEs, as if there is no trust in their professional competence. This is a core issue of forestry, conditioned by the bureaucratic model of the administration.
• Coordination of SFEs’ activities by GDSF is the most authentic example of a command-based public administration. Much manpower is wasted on all kind of reporting, audits, etc. One of the newer and more exciting examples: each SFE has to report to GDSF on public outreach activities and publications in the national media every three months.
• Loyalty is valued more than competence and results of work. Even though the performance of a single SFE to a large degree depends on the competency of its director, there is no evidence that GDSF would effectively use its right to assign SFE directors with due consideration of their competence.
• Innovations are coming slowly, for example, the level of IT applications is quite low at some SFEs.
• In informal conversations a significant share of employees of lower ranks express discontent with the current situation. Their motivation is restrained by the excessive bureaucracy that, among other things, leads to increasing workload. Despite heated discussion on the reform, such opinions are rarely reflected in the public space. Even the long-standing professional journal “Musu Girios” is short of critical contributions and generation of ideas, in contrast with the pre-war traditions and partly even the Soviet era. These could be indications of lacking freedom of expression.
Finally, the GDSF itself officially maintains the position that forestry administration should be organised by example of Poland. This confirms the value orientation towards further bureaucratisation.
SFEs’ directors and other staff have ended up in a weird situation. Working under market conditions, they should at the same time fight against windmills of bureaucracy or become faceless screws of the administrative machinery.
1.4 Future alternatives Assessing the situation at large, two major scenarios may be envisioned for improving the State forestry administration:
Scenario A: To retain current administrative set-up but diminish the bureaucracy, first of all by decreasing the influence of the central bureaucratic apparatus on SFEs. Scenario B: To carry out a radical systemic reform, applying NPA tenets.
Scenario A would be a minimalistic scenario that would not bring about substantial changes but still create prerequisites for more independent work by the main forest management subjects, the SFEs. Less manpower would be required for the bureaucratic routine. Both the policy science theory and the practical experience of the Lithuanian reforms are showing that already existing organisations attempt to preserve the status quo by all means. Any organisation attempts to increase its power and resist the external pressure for reform. Thus, in the overall context of deeply bureaucratised public management, Scenario A

138
would easier break through the hindrances that are being continuously erected by influential interest groups.
Scenario B is more difficult to implement, but would bring more benefits for the State. Taking into account experience by countries in the region, it would be rational to establish one enterprise. Its form could be a stock company, with all shares belonging to the State. The enterprise would be responsible for management of State forests on all levels with a clearly defined mission to work efficiently, providing sustained ecological, social and economic contribution to the State’s welfare and having in place an adequate management structure and principles. The policy-making and control functions could be performed by a consolidated State forest service that could assume supervision of both State and private forestry.
Under various occasions, the opponents of the reform have argued that establishment of one enterprise will create a monopoly, the country will be overwhelmed by Scandinavian capital, State forestry will be privatised by forest industries, etc. It is hard to say whether these are the real fears or just frightening of the less informed people. Already in 2006, a scientific report from the Lithuanian University of Agriculture pointed out that SFEs are not sufficiently large to balance out the influence of the largest timber processing companies on the market. In addition, a monopolisation of the whole forestry branch is simply impossible due to private forestry that is gradually gaining in strength. I would not see a “severe problem” if a foreign capital should be invested in Lithuania under conditions that are favourable for the country. However, I cannot grasp how the new enterprise would condition a sudden inflow of foreign capital. In Latvia, the course of events was opposite. Before the reform, a part of State forests were leased to foreign companies under excessively benevolent conditions. When the stock company “Latvian State Forests” was established in 2000, such leasing practices were immediately ceased. Meanwhile some Lithuanian media feature disinformation, as if the reform in Latvia was made to satisfy the Scandinavian interests.
One could be more wary of domestic industrial groups, particularly when recalling the cheeky attempts to introduce timber quotas under “special” pricing in the last year. To this end, backstairs influences and corruption can be avoided if the reform is carried out transparently. After enterprise is established, its resistance against such influences would primarily depend on the professionalism and ethics of its leadership. The same is of course valid for the current GDSF and SFEs.
I have no doubts that a strong and NPA-aligned State forestry would bring a sustained long-term contribution to the country’s welfare, at the same time
ensuring good working conditions for its workforce. Therefore the employees of the current SFEs should not be afraid of a radical reform. Competent and diligent specialists would certainly be needed for the new enterprise.
What about the alternatives that have been lately discussed officially? Confer the following citation from the legal decision by the Committee on Environment Protection of the Lithuanian Parliament (Seimas)*:
After debating, it was decided by a common agreement to suggest to the Government:
“Without radical rearrangements and changes of the current legal status of State forest enterprises and the set-up of forestry administration, to enact provisions in the Forest Law, the State and Municipal Enterprise Law and other legal acts, enabling the transfer of part of revenues (3%) of State forest enterprises and part of their functions related to organisation of the timber trade and human management to the Directorate General of State Forests; […] To enact the provision that attestations of State forest enterprises are carried out every five years, taking into account the results of auditing, and to legally define the criteria of evaluation.”
After getting acquainted with the actual public discussion in the parliamentary committee**, such text of the decision is astonishing. Was it formulated by members of the committee, or just copied from the drafts by GDSF? Assessing according to the theory and practice of NPA, the suggested alternative would be a big step backwards. The partial transfer of functions to GDSF would further reinforce the bureaucratic penthouse, while SFEs would be pressed even more, adding five-year attestations to the already ample regulations, audits and reporting. The suggestion to reinstate the Soviet practice of a centralized forest fund sounds particularly socialistic. According to representatives of GDSF, part of the fund’s assets would be utilized to even out the revenues of SFEs due to difference in forest management conditions. Such egalitarian measure might sound ideologically nice but in practice it incites hidings of revenues and diminishes motivation to work effectively. And where are the guarantees that,
* Translation by the author of this article. ** A detailed description of discussion at the meeting is available on Internet (www.forest.lt/go.php/lit/__Seimo_AAK___antrasis_rytmetinis_valsty/2320), in Lithuanian only.
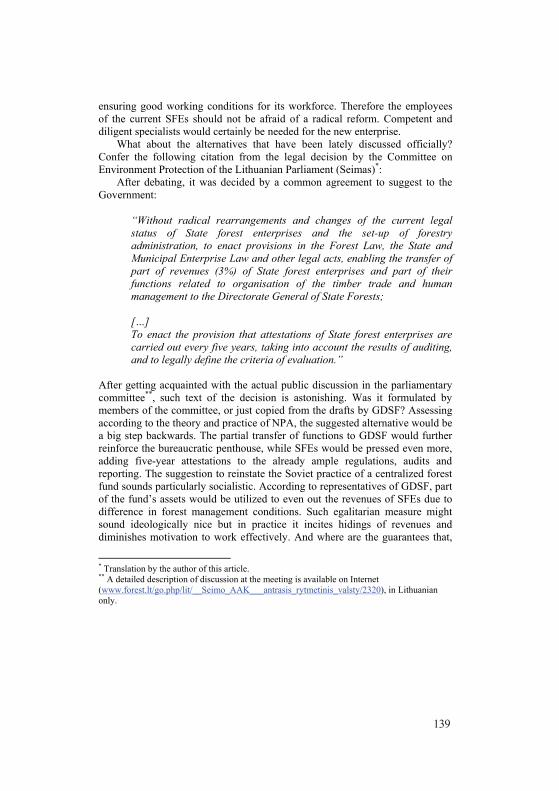
139
would easier break through the hindrances that are being continuously erected by influential interest groups.
Scenario B is more difficult to implement, but would bring more benefits for the State. Taking into account experience by countries in the region, it would be rational to establish one enterprise. Its form could be a stock company, with all shares belonging to the State. The enterprise would be responsible for management of State forests on all levels with a clearly defined mission to work efficiently, providing sustained ecological, social and economic contribution to the State’s welfare and having in place an adequate management structure and principles. The policy-making and control functions could be performed by a consolidated State forest service that could assume supervision of both State and private forestry.
Under various occasions, the opponents of the reform have argued that establishment of one enterprise will create a monopoly, the country will be overwhelmed by Scandinavian capital, State forestry will be privatised by forest industries, etc. It is hard to say whether these are the real fears or just frightening of the less informed people. Already in 2006, a scientific report from the Lithuanian University of Agriculture pointed out that SFEs are not sufficiently large to balance out the influence of the largest timber processing companies on the market. In addition, a monopolisation of the whole forestry branch is simply impossible due to private forestry that is gradually gaining in strength. I would not see a “severe problem” if a foreign capital should be invested in Lithuania under conditions that are favourable for the country. However, I cannot grasp how the new enterprise would condition a sudden inflow of foreign capital. In Latvia, the course of events was opposite. Before the reform, a part of State forests were leased to foreign companies under excessively benevolent conditions. When the stock company “Latvian State Forests” was established in 2000, such leasing practices were immediately ceased. Meanwhile some Lithuanian media feature disinformation, as if the reform in Latvia was made to satisfy the Scandinavian interests.
One could be more wary of domestic industrial groups, particularly when recalling the cheeky attempts to introduce timber quotas under “special” pricing in the last year. To this end, backstairs influences and corruption can be avoided if the reform is carried out transparently. After enterprise is established, its resistance against such influences would primarily depend on the professionalism and ethics of its leadership. The same is of course valid for the current GDSF and SFEs.
I have no doubts that a strong and NPA-aligned State forestry would bring a sustained long-term contribution to the country’s welfare, at the same time
ensuring good working conditions for its workforce. Therefore the employees of the current SFEs should not be afraid of a radical reform. Competent and diligent specialists would certainly be needed for the new enterprise.
What about the alternatives that have been lately discussed officially? Confer the following citation from the legal decision by the Committee on Environment Protection of the Lithuanian Parliament (Seimas)*:
After debating, it was decided by a common agreement to suggest to the Government:
“Without radical rearrangements and changes of the current legal status of State forest enterprises and the set-up of forestry administration, to enact provisions in the Forest Law, the State and Municipal Enterprise Law and other legal acts, enabling the transfer of part of revenues (3%) of State forest enterprises and part of their functions related to organisation of the timber trade and human management to the Directorate General of State Forests; […] To enact the provision that attestations of State forest enterprises are carried out every five years, taking into account the results of auditing, and to legally define the criteria of evaluation.”
After getting acquainted with the actual public discussion in the parliamentary committee**, such text of the decision is astonishing. Was it formulated by members of the committee, or just copied from the drafts by GDSF? Assessing according to the theory and practice of NPA, the suggested alternative would be a big step backwards. The partial transfer of functions to GDSF would further reinforce the bureaucratic penthouse, while SFEs would be pressed even more, adding five-year attestations to the already ample regulations, audits and reporting. The suggestion to reinstate the Soviet practice of a centralized forest fund sounds particularly socialistic. According to representatives of GDSF, part of the fund’s assets would be utilized to even out the revenues of SFEs due to difference in forest management conditions. Such egalitarian measure might sound ideologically nice but in practice it incites hidings of revenues and diminishes motivation to work effectively. And where are the guarantees that,
* Translation by the author of this article. ** A detailed description of discussion at the meeting is available on Internet (www.forest.lt/go.php/lit/__Seimo_AAK___antrasis_rytmetinis_valsty/2320), in Lithuanian only.

140
in addition to the management conditions, the loyalty to GDSF’s leadership will not become an important criterion?
It is rather difficult to evaluate other suggested alternatives as the discussion is focused on the desired number of SFEs. One cannot disagree with scientists stating that the area of an SFE is an important factor as it comes to the efficiency of management. Unfortunately, the subject of the management model usually evades the discussions. In my opinion, the size of an SFE is an important but secondary issue. It is possible to establish one enterprise by changing the facade but without essential changes in the administrative system. One can expect a corresponding result: an ineffectively functioning enterprise. The reform must be essential and well prepared. Otherwise it is not worth wasting effort and bothering the people.
I wish to encourage foresters on all management levels to be active, express their opinions and defend their civic position in the media. Everybody has the right to submit proposals for improvements of the State forestry administration to the Governmental Sunset Commission, every input is important for shaping the common professional future. Those in charge of the reform need to listen not only to foresters, but also to people independent of the current administration, including lawyers, policy scientists, economists, biologists, representatives of non-governmental organisations, experts of timber industry and other areas.
In the end, the outcome of the reform will depend on politicians in the Government, Parliament, and President’s office. We can only hope that the final decisions will be shaped by those for whom the country’s welfare is more important than some political fraternities. If not, we can await one more sunset of a reform with regrettable results.
2. Media turmoil and the role of scientist One could wonder why a text intended for a professional forestry journal in Lithuania is translated into English and reproduced with identical contents in proceedings of an international scientific conference. An academic reader can easily see differences between the reproduced essay and a conventional scientific publication, not least within the tradition of natural sciences. The language is plain to convey the message clearly; yet colourful to emphasize the line of argument. The essay lacks references and does not follow the accustomed structure of a scientific paper. It is more an exposure of the author’s tacit understanding of the subject, rather than a thorough examination of research hypotheses.
Though requiring considerable effort, the models of State forestry administration could certainly be a subject of rigorous scientific inquiry. This is, however, not the aim of my current writing. The paper rather intends to expose the media turmoil that the text has caused. The reader is provided a possibility to judge the turmoil (Section 2.1) against the original text in unaltered shape (Section 1).
2.1 The aftermath: a media thriller In August 2009, the professional journal “Baltijos Miskai ir Mediena” (Baltic Forests and Timber) accepted the original article (Section 1). Taking into account the topic’s urgency, the whole text was placed on the journal’s website on the day of submission. Due to considerable length, it was agreed that the paper would be printed in two subsequent issues of the journal. The first part came out in September.
The second part should have appeared in the October issue, but the plan failed due to an unexpected media thriller. The editorial office of the journal faced some threats “from above”. These were not just empty words: the director of the journal was laid off a few weeks after the first part of the article appeared in print. Besides, it was informally explained that, in case the second part is published, the journal would be “allowed” to go bankrupt. The outcome is understandable: the article disappeared from the cyberspace, and the publication of the second part went ashtray.
Despite survival efforts, the journal had to be closed down in October 2009. Without going into details, the reason was that the major share of the journal’s budget was funded by a private forest trade and management company that recruits significant amounts of timber from State forests. Not a surprise that the secure base of raw material was considered more important than “democracy games”.
This is a truly sad outcome as the forest branch lost the only periodical with broad coverage, targeting the sector’s professionals and wider public, and encouraging diversity of opinions. In January 2010, the ex-team from the Baltijos Miskai ir Mediena managed to start-up a new monthly magazine in a similar format. With one major difference - the funding of the revived journal to a large extent depends on subscriptions or direct support from the State forestry. This can be seen in the journal’s contents as “a due respect” is given to State forestry organisations. Such internal censorship produces certain lines of “truths”, which, in my eyes, is a major setback for forestry media and the sector’s transparency.
141
in addition to the management conditions, the loyalty to GDSF’s leadership will not become an important criterion?
It is rather difficult to evaluate other suggested alternatives as the discussion is focused on the desired number of SFEs. One cannot disagree with scientists stating that the area of an SFE is an important factor as it comes to the efficiency of management. Unfortunately, the subject of the management model usually evades the discussions. In my opinion, the size of an SFE is an important but secondary issue. It is possible to establish one enterprise by changing the facade but without essential changes in the administrative system. One can expect a corresponding result: an ineffectively functioning enterprise. The reform must be essential and well prepared. Otherwise it is not worth wasting effort and bothering the people.
I wish to encourage foresters on all management levels to be active, express their opinions and defend their civic position in the media. Everybody has the right to submit proposals for improvements of the State forestry administration to the Governmental Sunset Commission, every input is important for shaping the common professional future. Those in charge of the reform need to listen not only to foresters, but also to people independent of the current administration, including lawyers, policy scientists, economists, biologists, representatives of non-governmental organisations, experts of timber industry and other areas.
In the end, the outcome of the reform will depend on politicians in the Government, Parliament, and President’s office. We can only hope that the final decisions will be shaped by those for whom the country’s welfare is more important than some political fraternities. If not, we can await one more sunset of a reform with regrettable results.
2. Media turmoil and the role of scientist One could wonder why a text intended for a professional forestry journal in Lithuania is translated into English and reproduced with identical contents in proceedings of an international scientific conference. An academic reader can easily see differences between the reproduced essay and a conventional scientific publication, not least within the tradition of natural sciences. The language is plain to convey the message clearly; yet colourful to emphasize the line of argument. The essay lacks references and does not follow the accustomed structure of a scientific paper. It is more an exposure of the author’s tacit understanding of the subject, rather than a thorough examination of research hypotheses.
Though requiring considerable effort, the models of State forestry administration could certainly be a subject of rigorous scientific inquiry. This is, however, not the aim of my current writing. The paper rather intends to expose the media turmoil that the text has caused. The reader is provided a possibility to judge the turmoil (Section 2.1) against the original text in unaltered shape (Section 1).
2.1 The aftermath: a media thriller In August 2009, the professional journal “Baltijos Miskai ir Mediena” (Baltic Forests and Timber) accepted the original article (Section 1). Taking into account the topic’s urgency, the whole text was placed on the journal’s website on the day of submission. Due to considerable length, it was agreed that the paper would be printed in two subsequent issues of the journal. The first part came out in September.
The second part should have appeared in the October issue, but the plan failed due to an unexpected media thriller. The editorial office of the journal faced some threats “from above”. These were not just empty words: the director of the journal was laid off a few weeks after the first part of the article appeared in print. Besides, it was informally explained that, in case the second part is published, the journal would be “allowed” to go bankrupt. The outcome is understandable: the article disappeared from the cyberspace, and the publication of the second part went ashtray.
Despite survival efforts, the journal had to be closed down in October 2009. Without going into details, the reason was that the major share of the journal’s budget was funded by a private forest trade and management company that recruits significant amounts of timber from State forests. Not a surprise that the secure base of raw material was considered more important than “democracy games”.
This is a truly sad outcome as the forest branch lost the only periodical with broad coverage, targeting the sector’s professionals and wider public, and encouraging diversity of opinions. In January 2010, the ex-team from the Baltijos Miskai ir Mediena managed to start-up a new monthly magazine in a similar format. With one major difference - the funding of the revived journal to a large extent depends on subscriptions or direct support from the State forestry. This can be seen in the journal’s contents as “a due respect” is given to State forestry organisations. Such internal censorship produces certain lines of “truths”, which, in my eyes, is a major setback for forestry media and the sector’s transparency.

142
2.2 Author’s self-reflection: motivation and role of a scientist The unexpected turn of events forced the author to cogitate further about the state of affairs in high forestry echelons and the role of scientist in this connection. First, why to engage in such uncomfortable writing? There could be many good reasons not to do so. A popular science paper takes time to produce but does not bring any tangible rewards in today’s academic world of “publishing or perishing” where publishing almost exclusively refers to peer review journals. Second, a straight criticism of a powerful State forestry administration is quite probable to create influential adversaries and might even affect the professional career.
Further reasons could be added why a similar publication by domestic Lithuanian scientist(s) is highly unlikely. First, forest science in ex-socialist countries is heavily focused on silvicultural-ecological aspects, research in forest policy is quite recent and meagre. Further, forestry research primarily relies on the national tradition, little is known about the state of affairs in foreign countries; even more so in such complex subject as forestry administration. A still weightier reason is the tight and hierarchical institutional networks, where all members of the forester community are expected to work for “the system” and a fair part of research funding comes from State forestry organisations. To give an example, in the late 1990s a group of Lithuanian scientists prepared a study that outlined deficiencies of State forestry administration and suggested probationary privatisation of commercial forests in selected SFE(s). The leader of the study was discredited publicly. Such politically inappropriate report and even the whole forest research institute were condemned on the Ministerial level. Since then Lithuanian researchers tend to avoid “sensitive” topics outside the permissible space of comfort by the leading forestry authorities.
Then again, why the “heretic” writing (Section 1)? The foremost reason presumably is the “burden of knowing”. To the author with nomadic background and supranational perspective, substantive inefficiencies of State forestry administration in Lithuania have been apparent. The current situation favours just a few people in the leading positions, while the branch could give a weightier contribution to the struggling national economy.
Another reason is an intriguing possibility and a moral imperative to take part in debate on an issue of great practical importance. This can feel more fulfilling than devotion to exclusively producing peer review papers read by a marginal audience preoccupied with producing such papers. At this point, it is the right time to ask: what should be the guiding roles of a forest scientist and in particular a forest policy scientist?
Every researcher of course chooses according to her interests and capabilities how to allocate the working time, what to publish where, etc. On the other hand those interests are heavily steered by (dis)incentives prevailing in the academic environment. It is not novel or pretentious to claim that the bulk of academic staff in most European countries spends increasing amounts of time on chasing external funding and that the pressure to produce peer review papers is directing their behaviour and the way of doing research. The peer review system of course has its own virtues, attempting to secure high research quality through impartial assessment. But, in combination with today’s research funding, it also creates systemic biases:
• Most scientists would recognise the inherent pressure to chop the
research output into pieces that are easily publishable. Taking the forestry administration model as an example (Section 1), it is indeed intricate to produce a thorough and inclusive international comparison of forestry administrations that would fit the format and space limits of a standard peer review paper, especially within forestry-related journals that typically follow conventions within the natural sciences.
• Certain topics and methodologies are easier to put on peer review conveyor with appreciable impact factors. In this respect, social science-oriented forest research is at disadvantage compared with the traditional natural science-oriented forest research. Researchers tend to avoid topics that are not easily converted into peer research publications, irrespective of their societal importance. The increasing dependability on external funding also reduces chances that a scientist would take up a meta-critical research challenging prevailing powers and fashions.
• Driven almost exclusively by peer review production, the system of merits discourages a scientist from taking up an active civic role, from contributing to actual debates with an informed opinion. What should then be the societal role of the academic expertise? Exemplifying by the topic of Section 1, should a researcher be a neutral expert expedient to existing institutional structures, or rather seek to catalyze the desired policy processes?

143
2.2 Author’s self-reflection: motivation and role of a scientist The unexpected turn of events forced the author to cogitate further about the state of affairs in high forestry echelons and the role of scientist in this connection. First, why to engage in such uncomfortable writing? There could be many good reasons not to do so. A popular science paper takes time to produce but does not bring any tangible rewards in today’s academic world of “publishing or perishing” where publishing almost exclusively refers to peer review journals. Second, a straight criticism of a powerful State forestry administration is quite probable to create influential adversaries and might even affect the professional career.
Further reasons could be added why a similar publication by domestic Lithuanian scientist(s) is highly unlikely. First, forest science in ex-socialist countries is heavily focused on silvicultural-ecological aspects, research in forest policy is quite recent and meagre. Further, forestry research primarily relies on the national tradition, little is known about the state of affairs in foreign countries; even more so in such complex subject as forestry administration. A still weightier reason is the tight and hierarchical institutional networks, where all members of the forester community are expected to work for “the system” and a fair part of research funding comes from State forestry organisations. To give an example, in the late 1990s a group of Lithuanian scientists prepared a study that outlined deficiencies of State forestry administration and suggested probationary privatisation of commercial forests in selected SFE(s). The leader of the study was discredited publicly. Such politically inappropriate report and even the whole forest research institute were condemned on the Ministerial level. Since then Lithuanian researchers tend to avoid “sensitive” topics outside the permissible space of comfort by the leading forestry authorities.
Then again, why the “heretic” writing (Section 1)? The foremost reason presumably is the “burden of knowing”. To the author with nomadic background and supranational perspective, substantive inefficiencies of State forestry administration in Lithuania have been apparent. The current situation favours just a few people in the leading positions, while the branch could give a weightier contribution to the struggling national economy.
Another reason is an intriguing possibility and a moral imperative to take part in debate on an issue of great practical importance. This can feel more fulfilling than devotion to exclusively producing peer review papers read by a marginal audience preoccupied with producing such papers. At this point, it is the right time to ask: what should be the guiding roles of a forest scientist and in particular a forest policy scientist?
Every researcher of course chooses according to her interests and capabilities how to allocate the working time, what to publish where, etc. On the other hand those interests are heavily steered by (dis)incentives prevailing in the academic environment. It is not novel or pretentious to claim that the bulk of academic staff in most European countries spends increasing amounts of time on chasing external funding and that the pressure to produce peer review papers is directing their behaviour and the way of doing research. The peer review system of course has its own virtues, attempting to secure high research quality through impartial assessment. But, in combination with today’s research funding, it also creates systemic biases:
• Most scientists would recognise the inherent pressure to chop the
research output into pieces that are easily publishable. Taking the forestry administration model as an example (Section 1), it is indeed intricate to produce a thorough and inclusive international comparison of forestry administrations that would fit the format and space limits of a standard peer review paper, especially within forestry-related journals that typically follow conventions within the natural sciences.
• Certain topics and methodologies are easier to put on peer review conveyor with appreciable impact factors. In this respect, social science-oriented forest research is at disadvantage compared with the traditional natural science-oriented forest research. Researchers tend to avoid topics that are not easily converted into peer research publications, irrespective of their societal importance. The increasing dependability on external funding also reduces chances that a scientist would take up a meta-critical research challenging prevailing powers and fashions.
• Driven almost exclusively by peer review production, the system of merits discourages a scientist from taking up an active civic role, from contributing to actual debates with an informed opinion. What should then be the societal role of the academic expertise? Exemplifying by the topic of Section 1, should a researcher be a neutral expert expedient to existing institutional structures, or rather seek to catalyze the desired policy processes?

144
Being embedded in the conventions of natural sciences, forest research traditionally cherishes the “value neutrality” as a key precondition and intrinsic virtue of science. Such stance has been questioned by increasing cohorts of social scientists. Without reiterating their arguments, I just will point out that the answer to the last question in itself is a value choice. Choosing to wear the mask of neutrality may serve to justify indifference to actual societal discourses, but it is hardly instrumental for increasing the relevance of science to practice. 2.3 Epilogue The text about State forestry administration intended to provide a critical opinion and instigate discussion, without ambition to tell indisputable truths. DGSF’s reaction was stern. The author was furnished with colourful epithets at a national forestry conference. Several remedy publications appeared in various media, not hesitating to employ false facts. For example, commending the performance of the Lithuanian State forestry, an article in a national daily newspaper labelled forestry in neighbouring Latvia unsustainable, as “Latvia probably is the only European country where harvesting during the last several years has exceeded forest increment”. This is not just a slight exaggeration as, according to the official statistics, the average annual harvest/increment ratio during the last decade was 68%. At the peak of harvesting in1999 the ratio constituted 84%. In reality, the average ratio presumably was much lower (in the range of 35 to 45%) as the official Latvian statistics had grossly underestimated the level of increment.
This kind of sweat lies fitted well the established patterns and was not surprising. What shocked was the ruthless treatment of a free-standing journal. Despite the regrettable outcome the media thriller has its merits. First, by acting repressively DGSF boldly proved the appropriateness of the critique in the original text, as regards the adherence to excessive controls and lack of transparency. Such overreaction could also be a sign of vulnerability and misjudgement. Slanders about the thriller have likely been more harmful than any unsettling media contribution.
Incidentally, the institutional struggles seem to be on the rise as, in March 2010, the National Audit Office of Lithuania delivered a rather critical assessment of the performance in State forestry. The Lithuanian Government currently is considering measures for increasing the effectiveness of State-owned enterprises in all sectors, including forestry.
Concluding on the role of scientist, an emerging topic in academic forums is the need for balancing research, teaching and “the third task”, i.e. the civic
role of embedding the scientific knowledge into social surroundings. Meanwhile, what most academic staffs experience at their workplaces is an ever increasing emphasis on chasing external research funding and augmenting peer review production with the corresponding degree of prestige. The peer review system is there to stay and hopefully to be perfected. But what is important, the academic meriting should not be confined to counting papers and citations, but rather give a more versatile weighing to academic engagements. This fair wish is heard daily in academic corridors. There is a dire need to bring the message out into the public space.
The media thriller in Lithuania constitutes an example of a “skewed” engagement. All complications notwithstanding, it has been an enriching experience. More thrillers are likely to follow in due time.

145
Being embedded in the conventions of natural sciences, forest research traditionally cherishes the “value neutrality” as a key precondition and intrinsic virtue of science. Such stance has been questioned by increasing cohorts of social scientists. Without reiterating their arguments, I just will point out that the answer to the last question in itself is a value choice. Choosing to wear the mask of neutrality may serve to justify indifference to actual societal discourses, but it is hardly instrumental for increasing the relevance of science to practice. 2.3 Epilogue The text about State forestry administration intended to provide a critical opinion and instigate discussion, without ambition to tell indisputable truths. DGSF’s reaction was stern. The author was furnished with colourful epithets at a national forestry conference. Several remedy publications appeared in various media, not hesitating to employ false facts. For example, commending the performance of the Lithuanian State forestry, an article in a national daily newspaper labelled forestry in neighbouring Latvia unsustainable, as “Latvia probably is the only European country where harvesting during the last several years has exceeded forest increment”. This is not just a slight exaggeration as, according to the official statistics, the average annual harvest/increment ratio during the last decade was 68%. At the peak of harvesting in1999 the ratio constituted 84%. In reality, the average ratio presumably was much lower (in the range of 35 to 45%) as the official Latvian statistics had grossly underestimated the level of increment.
This kind of sweat lies fitted well the established patterns and was not surprising. What shocked was the ruthless treatment of a free-standing journal. Despite the regrettable outcome the media thriller has its merits. First, by acting repressively DGSF boldly proved the appropriateness of the critique in the original text, as regards the adherence to excessive controls and lack of transparency. Such overreaction could also be a sign of vulnerability and misjudgement. Slanders about the thriller have likely been more harmful than any unsettling media contribution.
Incidentally, the institutional struggles seem to be on the rise as, in March 2010, the National Audit Office of Lithuania delivered a rather critical assessment of the performance in State forestry. The Lithuanian Government currently is considering measures for increasing the effectiveness of State-owned enterprises in all sectors, including forestry.
Concluding on the role of scientist, an emerging topic in academic forums is the need for balancing research, teaching and “the third task”, i.e. the civic
role of embedding the scientific knowledge into social surroundings. Meanwhile, what most academic staffs experience at their workplaces is an ever increasing emphasis on chasing external research funding and augmenting peer review production with the corresponding degree of prestige. The peer review system is there to stay and hopefully to be perfected. But what is important, the academic meriting should not be confined to counting papers and citations, but rather give a more versatile weighing to academic engagements. This fair wish is heard daily in academic corridors. There is a dire need to bring the message out into the public space.
The media thriller in Lithuania constitutes an example of a “skewed” engagement. All complications notwithstanding, it has been an enriching experience. More thrillers are likely to follow in due time.

146
Reasoning of family forest owners – survey of forest management and biodiversity protection problems
Teppo Hujala1, Mikko Kurttila1, Katri Korhonen1 and Jouni Pykäläinen2
1 Finnish Forest Research Institute (METLA) 2 University of Eastern Finland
Abstract This study aimed at figuring out the distributions of spatial and temporal scales of Finnish family forest owners’ decisions as well as the relative commonness of various topics and popularity of alternative decision service types. A specific emphasis was given to biodiversity-related decision making from a forest planning perspective. Mail questionnaire data (n=1244 with response rate 59.7%) were analyzed with standard statistical methods. Results show that owners most commonly consider the next year’s silvicultural treatments or timber trade from their whole forest holding. Some 40% of owners indicated a willingness to protect some part of their forest holding temporarily. About 10% were ready to protect without compensation, and 30% for compensation. Some 7% would be satisfied with compensation below the economic opportunity cost. The results indicate that Finnish family forest owners would benefit from contextual services that complement the tactical forest plans on a yearly basis. Biodiversity protection and nature-friendly forestry do seem to rise as a topic of notable interest. Game and aesthetic values associate positively with biodiverse stands. To better attract today’s diverse forest owners, forest management planning needs to be re-designed towards decision support service modules that respond to the questions arisen in owners’ actual decision situations. Keywords: cost-share, decision problems, forest planning, spatial scale, time horizon, voluntary protection
1. Introduction In Finland, there is limited knowledge about how common various decision problems are among family forest owners. Holding-specific forest management planning may partly fail to recognize and grasp the actual decision situations of today’s owners with more and more varying lifestyles. This is a potential reason for forest plans to insufficiently assisting owners’ decisions and ineffectively promoting national forest policy objectives such as timber supply and biodiversity protection (Hokajärvi et al., 2009). An ongoing renewal of the Finnish forest planning system from state-subsidized activity to market-driven services provides an opportunity to start pursuing a co-configuration of decision-aid services between forestry experts (service providers) and forest owners (customers) (Tikkanen et al., 2010). This challenging opportunity carries potential for better serving owners’ varying needs via adaptable services (e.g. Hujala et al., 2009a; Leskinen et al., 2009). Parallelly, research has recently observed some encouraging signs of voluntary biodiversity protection (Horne, 2006; Hujala et al., 2008; Horne et al., 2009) of family-owned forests. It has also been noticed that protection-related consultancy would be most fruitful when integrated with general forestry decision aid (Laitila et al., 2009).
With possibilities related to temporary and permanent protection, bioenergy harvestings, and climate change mitigation (e.g. carbon balance and tree species composition), forest owners now face new kinds of real decision situations. Multiple/joint use of forests often means that owners are to some degree ready to drop, restrain, modify or change timings of cuttings. To help owners make informed decisions, meaningful alternatives should be delivered for their comparison (e.g. Eyvindson et al., 2010).
Forest planners, in turn, can apply various data and communication forms to make owners’ considerations and decisions easier. There are, however, knowledge gaps concerning appropriate procedures, even though both owners’ objectives and their communication motives have been recently studied in Finland (Hujala et al., 2010). In addition to concrete market-based services, there is a need to design attractive and effective policy instruments and working models.
Objectives of the present study are: 1. To figure out how common various decision situations are among
forest owners. 2. To learn about forest owners’ views on temporary and permanent
biodiversity protection. 3. To inform service providers in designing services that fit owners’
most common and most frequent problems. 4. To inform policymakers in actualizing policies in ways that fit forest
owners’ anticipations.

147
Reasoning of family forest owners – survey of forest management and biodiversity protection problems
Teppo Hujala1, Mikko Kurttila1, Katri Korhonen1 and Jouni Pykäläinen2
1 Finnish Forest Research Institute (METLA) 2 University of Eastern Finland
Abstract This study aimed at figuring out the distributions of spatial and temporal scales of Finnish family forest owners’ decisions as well as the relative commonness of various topics and popularity of alternative decision service types. A specific emphasis was given to biodiversity-related decision making from a forest planning perspective. Mail questionnaire data (n=1244 with response rate 59.7%) were analyzed with standard statistical methods. Results show that owners most commonly consider the next year’s silvicultural treatments or timber trade from their whole forest holding. Some 40% of owners indicated a willingness to protect some part of their forest holding temporarily. About 10% were ready to protect without compensation, and 30% for compensation. Some 7% would be satisfied with compensation below the economic opportunity cost. The results indicate that Finnish family forest owners would benefit from contextual services that complement the tactical forest plans on a yearly basis. Biodiversity protection and nature-friendly forestry do seem to rise as a topic of notable interest. Game and aesthetic values associate positively with biodiverse stands. To better attract today’s diverse forest owners, forest management planning needs to be re-designed towards decision support service modules that respond to the questions arisen in owners’ actual decision situations. Keywords: cost-share, decision problems, forest planning, spatial scale, time horizon, voluntary protection
1. Introduction In Finland, there is limited knowledge about how common various decision problems are among family forest owners. Holding-specific forest management planning may partly fail to recognize and grasp the actual decision situations of today’s owners with more and more varying lifestyles. This is a potential reason for forest plans to insufficiently assisting owners’ decisions and ineffectively promoting national forest policy objectives such as timber supply and biodiversity protection (Hokajärvi et al., 2009). An ongoing renewal of the Finnish forest planning system from state-subsidized activity to market-driven services provides an opportunity to start pursuing a co-configuration of decision-aid services between forestry experts (service providers) and forest owners (customers) (Tikkanen et al., 2010). This challenging opportunity carries potential for better serving owners’ varying needs via adaptable services (e.g. Hujala et al., 2009a; Leskinen et al., 2009). Parallelly, research has recently observed some encouraging signs of voluntary biodiversity protection (Horne, 2006; Hujala et al., 2008; Horne et al., 2009) of family-owned forests. It has also been noticed that protection-related consultancy would be most fruitful when integrated with general forestry decision aid (Laitila et al., 2009).
With possibilities related to temporary and permanent protection, bioenergy harvestings, and climate change mitigation (e.g. carbon balance and tree species composition), forest owners now face new kinds of real decision situations. Multiple/joint use of forests often means that owners are to some degree ready to drop, restrain, modify or change timings of cuttings. To help owners make informed decisions, meaningful alternatives should be delivered for their comparison (e.g. Eyvindson et al., 2010).
Forest planners, in turn, can apply various data and communication forms to make owners’ considerations and decisions easier. There are, however, knowledge gaps concerning appropriate procedures, even though both owners’ objectives and their communication motives have been recently studied in Finland (Hujala et al., 2010). In addition to concrete market-based services, there is a need to design attractive and effective policy instruments and working models.
Objectives of the present study are: 1. To figure out how common various decision situations are among
forest owners. 2. To learn about forest owners’ views on temporary and permanent
biodiversity protection. 3. To inform service providers in designing services that fit owners’
most common and most frequent problems. 4. To inform policymakers in actualizing policies in ways that fit forest
owners’ anticipations.

148
2. Materials and Methods A mail questionnaire was sent to those 2084 family forest owners who had already answered to an earlier mail questionnaire of the large “Finnish forest owner 2010” study (Hänninen et al., 2010). Due to responding to the first questionnaire, the response rate in the latter questionnaire was as high as 59.7% and the number of valid responses was 1244.
In the large forest owner study, a non-response analysis was carried out and in the calculations of its results an appropriate weighting was used so that the responses correspond to the Finnish population of family forest owners. A response analysis of the present data showed a bit lower response rate for female and Swedish-speaking owners. The same weights as above were however used in this study as no other significant differences between the respondents and non-respondents were observed. Respondents represent the owners in continental Finland fairly well (see Fig. 1).
Themes of the survey were forest management decisions, decision service types, biodiversity protection, and owners’ social networks in timber trade (the last theme is not reported in this study). Analysis was performed with standard statistical methods: (classified) response distributions, cross-tabulations, and two sample t-tests. In addition, some results were combined with owner groupings with respect to ownership’s objectives (Favada et al., 2009) and communication motives Hujala et al. (2009b), derived from statement sets to the same respondents in the preceding survey (Table 1; see details of the respective multivariate analyses in Hujala et al. (2010)).
Figure 1. Number of valid responses from each of the 13 forestry regions in Finland. The map is based on the locations of the holdings.
Table 1. Owner groupings by Favada et al. (2009)(A), and Hujala et al. (2010)(B) applied in the present data and used in the analysis as background variables.
Owner group Share, %
(unweighted) A) Ownership’s objectives (n=1044)
Multiobjective owners 33 Recreationists 22 Self-employed owners 16 Investors 16 Indifferent owners 13 B) Decision-making style (n=974)
Studious learners 41 Self-reliant owners 18 Delegators 20 Deliberate thinkers 21
3. Results 3.1 Forest management decisions Holding-level considerations are both common and frequent (Fig. 2). Thirty-one percent of respondents announced not having made decisions within the past year. Three quarters of the remaining 69% of owners had made holding-level considerations during the past year. Decisions at parcel or single stand-level were much less common. It is notable that both cross-border and sub-stand-level decisions were rare.
When looking closer1 at the distribution of the spatial scale of the latest decision, holding-level decisions were most frequent among owners with holding size less than 50 ha and parcel-level decisions with holding size more than 50 ha. Studious learners reported parcel-level more than self-reliant owners, who in turn reported more single-stand level decisions.
0
10
20
30
40
50
60
70
80
Mine and neighbours' holdings
My holding(s) Parcel of several stands
Single stand A tree or a group of trees
Decision type coverage within the past year, % of owners who made decisions (n=762, ∑=1406)Latest decision, % of owners who made decisions (n=762)
Figure 2. Owners’ spatial scales of decision considerations over the past year. Owners who did not make any decisions excluded. Dark columns show the commonness of items among owners and they sum up to over 100%, because owners were allowed to tick all options that apply. Light columns show the relative frequencies of items summing up to 100%.
1 Only statistically significant (p<0.05) differences are reported throughout the study.
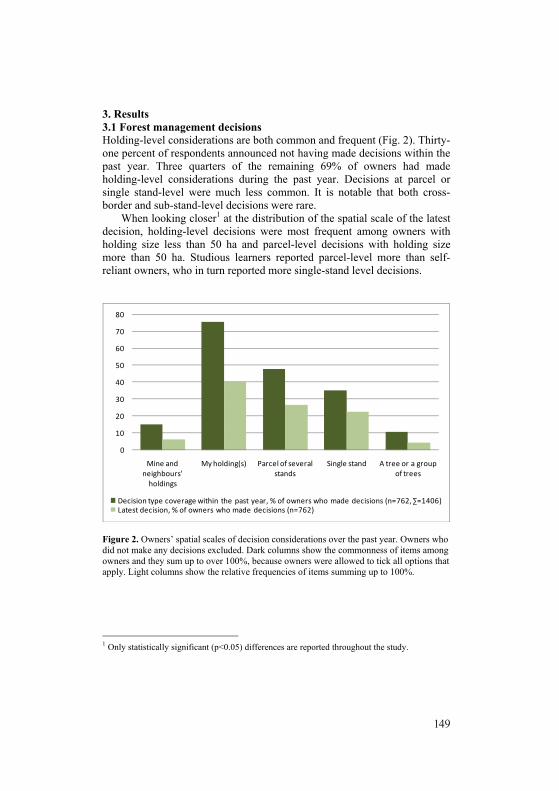
149
2. Materials and Methods A mail questionnaire was sent to those 2084 family forest owners who had already answered to an earlier mail questionnaire of the large “Finnish forest owner 2010” study (Hänninen et al., 2010). Due to responding to the first questionnaire, the response rate in the latter questionnaire was as high as 59.7% and the number of valid responses was 1244.
In the large forest owner study, a non-response analysis was carried out and in the calculations of its results an appropriate weighting was used so that the responses correspond to the Finnish population of family forest owners. A response analysis of the present data showed a bit lower response rate for female and Swedish-speaking owners. The same weights as above were however used in this study as no other significant differences between the respondents and non-respondents were observed. Respondents represent the owners in continental Finland fairly well (see Fig. 1).
Themes of the survey were forest management decisions, decision service types, biodiversity protection, and owners’ social networks in timber trade (the last theme is not reported in this study). Analysis was performed with standard statistical methods: (classified) response distributions, cross-tabulations, and two sample t-tests. In addition, some results were combined with owner groupings with respect to ownership’s objectives (Favada et al., 2009) and communication motives Hujala et al. (2009b), derived from statement sets to the same respondents in the preceding survey (Table 1; see details of the respective multivariate analyses in Hujala et al. (2010)).
Figure 1. Number of valid responses from each of the 13 forestry regions in Finland. The map is based on the locations of the holdings.
Table 1. Owner groupings by Favada et al. (2009)(A), and Hujala et al. (2010)(B) applied in the present data and used in the analysis as background variables.
Owner group Share, %
(unweighted) A) Ownership’s objectives (n=1044)
Multiobjective owners 33 Recreationists 22 Self-employed owners 16 Investors 16 Indifferent owners 13 B) Decision-making style (n=974)
Studious learners 41 Self-reliant owners 18 Delegators 20 Deliberate thinkers 21
3. Results 3.1 Forest management decisions Holding-level considerations are both common and frequent (Fig. 2). Thirty-one percent of respondents announced not having made decisions within the past year. Three quarters of the remaining 69% of owners had made holding-level considerations during the past year. Decisions at parcel or single stand-level were much less common. It is notable that both cross-border and sub-stand-level decisions were rare.
When looking closer1 at the distribution of the spatial scale of the latest decision, holding-level decisions were most frequent among owners with holding size less than 50 ha and parcel-level decisions with holding size more than 50 ha. Studious learners reported parcel-level more than self-reliant owners, who in turn reported more single-stand level decisions.
0
10
20
30
40
50
60
70
80
Mine and neighbours' holdings
My holding(s) Parcel of several stands
Single stand A tree or a group of trees
Decision type coverage within the past year, % of owners who made decisions (n=762, ∑=1406)Latest decision, % of owners who made decisions (n=762)
Figure 2. Owners’ spatial scales of decision considerations over the past year. Owners who did not make any decisions excluded. Dark columns show the commonness of items among owners and they sum up to over 100%, because owners were allowed to tick all options that apply. Light columns show the relative frequencies of items summing up to 100%.
1 Only statistically significant (p<0.05) differences are reported throughout the study.

150
In the appearance distribution of the temporal scale of the decisions within the last year, considerations of the next year’s activities dominate with a share of more than 60% (Fig. 3). One third of owners who had made decisions had considered a few weeks ahead, as was the case with thinking about the next five years. In turn, 15–20% of owners had had thoughts as far as a decade or more ahead at least once within the past year.
Owners under 58 years of age had more frequently considered the forthcoming year than had owners over 64 years, who in turn had more frequently considered the next five years. Farmers and forestry entrepreneurs had considered the forthcoming year more and the next five years less often than had retirees.
0
10
20
30
40
50
60
70
A few weeks The forthcoming year
The next five years
Approximately a decade
Far beyond one decade
Decision type coverage within the past year, % of owners who made decisions (n=809, ∑=1364)Latest decision, % of owners who made decisions (n=809)
Figure 3. Owners’ temporal scales of decision considerations over the past year. Dark columns show the commonness of items among owners and they sum up to over 100%, because owners were allowed to tick all options that apply. Light columns show the relative frequencies of items summing up to 100%. The most common considerations was what in general can be done in the forest, followed by the right order of actions and whether it is a good time to sell timber (Fig. 4.). These three questions had once or more been in minds of over half the owners who had made decisions. Latest decision scores show that the two latter ones were the two most frequent with the share of some 20% of decisions having been made.
“What in general can be done” was particularly considered by small-holding owners, recreationists over investors, and new owners with less than
five years of ownership. The order of actions was especially contemplated by the younger segment of owners, studious learners over delegators, and farmers and forestry entrepreneurs over retirees.
Results also show that organizing inheritance and learning about the costs of outsourcing silviculture were rather common topics with a coverage above one third of respondents. Income- or investment-related ponderings were in turn rather rare. Other than pre-defined optional questions having been thought of (n=60) were e.g. voluntary protection, general future of forest ownership, young stand management, and energy wood trading.
0 10 20 30 40 50 60 70
What in general can be done
In which order to perform actions
Is it a good time to sell timber
How to arrange inheritance
Costs of outsourcing silviculture
Should I buy or sell forest land
Comparing forest as investment
Income potential of my forest
Where harvest to get a certain income
Other
Decision type coverage within the past year, % of owners who made decisions (n=769, ∑=2477)Latest decision, % of owners who made decisions (n=769)
Figure 4. Questions having been thought of within the latest year. Dark bars show the commonness of items among owners and they sum up to over 100%, because owners were allowed to tick all options that apply. Light columns show the relative frequencies of items summing up to 100%. Owners judged a free-formed discussion with a forestry expert as the most useful decision-service type with half of owners rating it as either rather or very helpful in their latest decision problem (sum count of values 3 and 4 in a four-point response scale; Table 2). Up-to-date data on forest and its opportunities were rated second.

151
In the appearance distribution of the temporal scale of the decisions within the last year, considerations of the next year’s activities dominate with a share of more than 60% (Fig. 3). One third of owners who had made decisions had considered a few weeks ahead, as was the case with thinking about the next five years. In turn, 15–20% of owners had had thoughts as far as a decade or more ahead at least once within the past year.
Owners under 58 years of age had more frequently considered the forthcoming year than had owners over 64 years, who in turn had more frequently considered the next five years. Farmers and forestry entrepreneurs had considered the forthcoming year more and the next five years less often than had retirees.
0
10
20
30
40
50
60
70
A few weeks The forthcoming year
The next five years
Approximately a decade
Far beyond one decade
Decision type coverage within the past year, % of owners who made decisions (n=809, ∑=1364)Latest decision, % of owners who made decisions (n=809)
Figure 3. Owners’ temporal scales of decision considerations over the past year. Dark columns show the commonness of items among owners and they sum up to over 100%, because owners were allowed to tick all options that apply. Light columns show the relative frequencies of items summing up to 100%. The most common considerations was what in general can be done in the forest, followed by the right order of actions and whether it is a good time to sell timber (Fig. 4.). These three questions had once or more been in minds of over half the owners who had made decisions. Latest decision scores show that the two latter ones were the two most frequent with the share of some 20% of decisions having been made.
“What in general can be done” was particularly considered by small-holding owners, recreationists over investors, and new owners with less than
five years of ownership. The order of actions was especially contemplated by the younger segment of owners, studious learners over delegators, and farmers and forestry entrepreneurs over retirees.
Results also show that organizing inheritance and learning about the costs of outsourcing silviculture were rather common topics with a coverage above one third of respondents. Income- or investment-related ponderings were in turn rather rare. Other than pre-defined optional questions having been thought of (n=60) were e.g. voluntary protection, general future of forest ownership, young stand management, and energy wood trading.
0 10 20 30 40 50 60 70
What in general can be done
In which order to perform actions
Is it a good time to sell timber
How to arrange inheritance
Costs of outsourcing silviculture
Should I buy or sell forest land
Comparing forest as investment
Income potential of my forest
Where harvest to get a certain income
Other
Decision type coverage within the past year, % of owners who made decisions (n=769, ∑=2477)Latest decision, % of owners who made decisions (n=769)
Figure 4. Questions having been thought of within the latest year. Dark bars show the commonness of items among owners and they sum up to over 100%, because owners were allowed to tick all options that apply. Light columns show the relative frequencies of items summing up to 100%. Owners judged a free-formed discussion with a forestry expert as the most useful decision-service type with half of owners rating it as either rather or very helpful in their latest decision problem (sum count of values 3 and 4 in a four-point response scale; Table 2). Up-to-date data on forest and its opportunities were rated second.

152
Free-formed discussion was in particular appreciated by the post-war baby-boom generation (age 58–64 years) and recreationists and investors as well as studious learners over self-reliant owners. Up-to-date forest data were especially appreciated by large-holding owners, investors, studious learners, and delegators. Independent information of timber market was valued highest among large holders and farmers and forestry entrepreneurs. Table 2. Perceived helpfulness of five optional decision service types: rather or very helpful services in the latest decision problem.
Service option Share of perceived helpfulness % of owners (n=700-762) % of forest area
Free-formed discussion with an expert 50 52 Up-to-date data of forest and its opportunities 43 48 Planning of concrete actions (timber trade etc.) 38 38 Independent information of timber market 35 38 Contact information of forestry professionals 27 27
3.2 Ways and means to protect biodiversity on owners’ own forests Nine percent of owners expressed interest to treat all their forests in a way that better contributes to biodiversity, and 17% would preferably cluster biodiversity-friendly activities to certain stands/areas which probably often have smaller economic importance (Fig. 5). The majority (74%) wants to stay on the level of what the forest law requires or what the guidelines for good silviculture suggest.
Analysis of background variables revealed that self-reliant owners significantly more often selected alternative and soft methods everywhere than did other decision-making groups. Clustering biodiversity-friendly activities was particularly favored by large-holding owners. Retirees selected only actions that are in line with the forest law more often than employees, who were more often willing to do more than the minimum.
0
5
10
15
20
25
30
35
40
Alternative and soft methods everywhere
Cluster biodiversity activities
Follow the guidelines for silviculture
Obeying the law is enough
% of owners (n=1137) % of forest area Figure 5. The preferred way to handle biodiversity protection in respondents’ own forests. Some 11% of owners would protect the most valuable biodiversity stand/parcel from their holding temporarily for free and approximately 7% with a reduced compensation (Table 3). Corresponding figures for a permanent protection (donating/selling the land to the state or establishing a private protection zone) were clearly smaller, only 6% and 3%. Protection willingness for free was on the same level for small and large holdings, but owners of large holdings were a bit more interested in protecting for compensation than were small-holding owners.
While a small share of owners was ready to participate to a protection contract with a compensation demand smaller than the economic opportunity cost, a similar or a bit larger number (some 9% with temporary and 8% with permanent protection) asked for a compensation above 100%, which reflects a strong intrinsic value of ownership among these owners.

153
Free-formed discussion was in particular appreciated by the post-war baby-boom generation (age 58–64 years) and recreationists and investors as well as studious learners over self-reliant owners. Up-to-date forest data were especially appreciated by large-holding owners, investors, studious learners, and delegators. Independent information of timber market was valued highest among large holders and farmers and forestry entrepreneurs. Table 2. Perceived helpfulness of five optional decision service types: rather or very helpful services in the latest decision problem.
Service option Share of perceived helpfulness % of owners (n=700-762) % of forest area
Free-formed discussion with an expert 50 52 Up-to-date data of forest and its opportunities 43 48 Planning of concrete actions (timber trade etc.) 38 38 Independent information of timber market 35 38 Contact information of forestry professionals 27 27
3.2 Ways and means to protect biodiversity on owners’ own forests Nine percent of owners expressed interest to treat all their forests in a way that better contributes to biodiversity, and 17% would preferably cluster biodiversity-friendly activities to certain stands/areas which probably often have smaller economic importance (Fig. 5). The majority (74%) wants to stay on the level of what the forest law requires or what the guidelines for good silviculture suggest.
Analysis of background variables revealed that self-reliant owners significantly more often selected alternative and soft methods everywhere than did other decision-making groups. Clustering biodiversity-friendly activities was particularly favored by large-holding owners. Retirees selected only actions that are in line with the forest law more often than employees, who were more often willing to do more than the minimum.
0
5
10
15
20
25
30
35
40
Alternative and soft methods everywhere
Cluster biodiversity activities
Follow the guidelines for silviculture
Obeying the law is enough
% of owners (n=1137) % of forest area Figure 5. The preferred way to handle biodiversity protection in respondents’ own forests. Some 11% of owners would protect the most valuable biodiversity stand/parcel from their holding temporarily for free and approximately 7% with a reduced compensation (Table 3). Corresponding figures for a permanent protection (donating/selling the land to the state or establishing a private protection zone) were clearly smaller, only 6% and 3%. Protection willingness for free was on the same level for small and large holdings, but owners of large holdings were a bit more interested in protecting for compensation than were small-holding owners.
While a small share of owners was ready to participate to a protection contract with a compensation demand smaller than the economic opportunity cost, a similar or a bit larger number (some 9% with temporary and 8% with permanent protection) asked for a compensation above 100%, which reflects a strong intrinsic value of ownership among these owners.
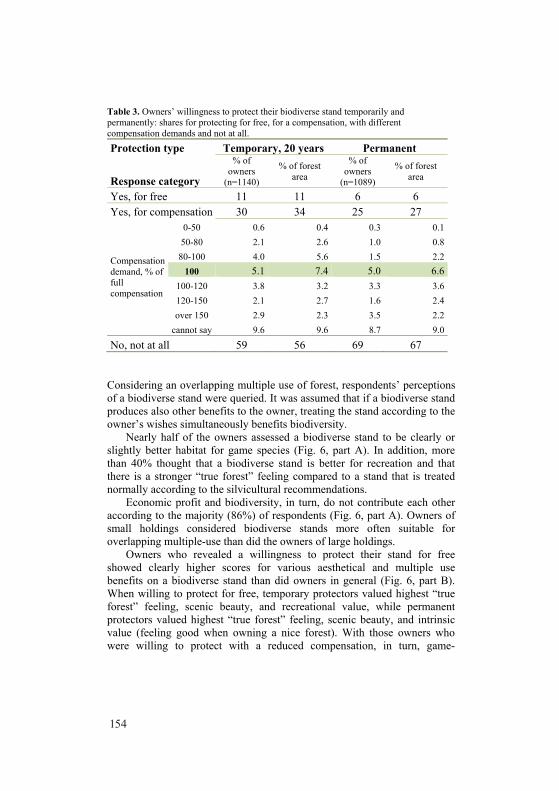
154
Table 3. Owners’ willingness to protect their biodiverse stand temporarily and permanently: shares for protecting for free, for a compensation, with different compensation demands and not at all. Protection type Temporary, 20 years Permanent
Response category
% of owners
(n=1140)
% of forest area
% of owners
(n=1089)
% of forest area
Yes, for free 11 11 6 6 Yes, for compensation 30 34 25 27
Compensation demand, % of full compensation
0-50 0.6 0.4 0.3 0.1 50-80 2.1 2.6 1.0 0.8 80-100 4.0 5.6 1.5 2.2
100 5.1 7.4 5.0 6.6 100-120 3.8 3.2 3.3 3.6 120-150 2.1 2.7 1.6 2.4 over 150 2.9 2.3 3.5 2.2
cannot say 9.6 9.6 8.7 9.0
No, not at all 59 56 69 67 Considering an overlapping multiple use of forest, respondents’ perceptions of a biodiverse stand were queried. It was assumed that if a biodiverse stand produces also other benefits to the owner, treating the stand according to the owner’s wishes simultaneously benefits biodiversity.
Nearly half of the owners assessed a biodiverse stand to be clearly or slightly better habitat for game species (Fig. 6, part A). In addition, more than 40% thought that a biodiverse stand is better for recreation and that there is a stronger “true forest” feeling compared to a stand that is treated normally according to the silvicultural recommendations.
Economic profit and biodiversity, in turn, do not contribute each other according to the majority (86%) of respondents (Fig. 6, part A). Owners of small holdings considered biodiverse stands more often suitable for overlapping multiple-use than did the owners of large holdings.
Owners who revealed a willingness to protect their stand for free showed clearly higher scores for various aesthetical and multiple use benefits on a biodiverse stand than did owners in general (Fig. 6, part B). When willing to protect for free, temporary protectors valued highest “true forest” feeling, scenic beauty, and recreational value, while permanent protectors valued highest “true forest” feeling, scenic beauty, and intrinsic value (feeling good when owning a nice forest). With those owners who were willing to protect with a reduced compensation, in turn, game-
friendliness of the habitat scored notably high both with temporary and permanent protection (Fig. 6, part C).
Game habitat value was perceived on a biodiverse stand particularly often by recreationists (57%), self-reliant owners (57%), and retirees and salaried employers (53/51%) over farmers and forestry entrepreneurs (38%). “True forest” feeling was perceived particularly by recreationists (60 %) over the other objective groups, and distance owners and new owners over their respective counterparts. This feeling also became more popular along with the owner’s educational level.
Recreational value in a biodiverse stand was especially perceived by recreationists (52 %) over the other objective groups, distance owners (49%) over near-the-holding dwellers, and salaried employees over both retirees and farmers and forestry entrepreneurs. Also small-holding owners and self-reliant owners perceived recreational overlapping value rather often.

155
Table 3. Owners’ willingness to protect their biodiverse stand temporarily and permanently: shares for protecting for free, for a compensation, with different compensation demands and not at all. Protection type Temporary, 20 years Permanent
Response category
% of owners
(n=1140)
% of forest area
% of owners
(n=1089)
% of forest area
Yes, for free 11 11 6 6 Yes, for compensation 30 34 25 27
Compensation demand, % of full compensation
0-50 0.6 0.4 0.3 0.1 50-80 2.1 2.6 1.0 0.8
80-100 4.0 5.6 1.5 2.2 100 5.1 7.4 5.0 6.6
100-120 3.8 3.2 3.3 3.6 120-150 2.1 2.7 1.6 2.4 over 150 2.9 2.3 3.5 2.2
cannot say 9.6 9.6 8.7 9.0
No, not at all 59 56 69 67 Considering an overlapping multiple use of forest, respondents’ perceptions of a biodiverse stand were queried. It was assumed that if a biodiverse stand produces also other benefits to the owner, treating the stand according to the owner’s wishes simultaneously benefits biodiversity.
Nearly half of the owners assessed a biodiverse stand to be clearly or slightly better habitat for game species (Fig. 6, part A). In addition, more than 40% thought that a biodiverse stand is better for recreation and that there is a stronger “true forest” feeling compared to a stand that is treated normally according to the silvicultural recommendations.
Economic profit and biodiversity, in turn, do not contribute each other according to the majority (86%) of respondents (Fig. 6, part A). Owners of small holdings considered biodiverse stands more often suitable for overlapping multiple-use than did the owners of large holdings.
Owners who revealed a willingness to protect their stand for free showed clearly higher scores for various aesthetical and multiple use benefits on a biodiverse stand than did owners in general (Fig. 6, part B). When willing to protect for free, temporary protectors valued highest “true forest” feeling, scenic beauty, and recreational value, while permanent protectors valued highest “true forest” feeling, scenic beauty, and intrinsic value (feeling good when owning a nice forest). With those owners who were willing to protect with a reduced compensation, in turn, game-
friendliness of the habitat scored notably high both with temporary and permanent protection (Fig. 6, part C).
Game habitat value was perceived on a biodiverse stand particularly often by recreationists (57%), self-reliant owners (57%), and retirees and salaried employers (53/51%) over farmers and forestry entrepreneurs (38%). “True forest” feeling was perceived particularly by recreationists (60 %) over the other objective groups, and distance owners and new owners over their respective counterparts. This feeling also became more popular along with the owner’s educational level.
Recreational value in a biodiverse stand was especially perceived by recreationists (52 %) over the other objective groups, distance owners (49%) over near-the-holding dwellers, and salaried employees over both retirees and farmers and forestry entrepreneurs. Also small-holding owners and self-reliant owners perceived recreational overlapping value rather often.

156
Figure 6. Various perceptions associated with a biodiverse stand: share of those who either fully or rather much agree with each related statement among: all respondents (A), those who are willing to protect their forest stand(s) for free (B), and with a reduced compensation (C). 4. Discussion and Conclusions According to the results of this study (Figures 2 and 3), yearly-based decision aid services which extend over the owner’s whole forest holding are needed. For these considerations, especially the “right” order of treatments of stands is asked for (Fig. 4). From a forest planning perspective
and in comparison with current practices, this means a shift towards operational planning, where more accurate timings of treatments are suggested for all stands that could be managed during the forthcoming planning period. This kind of service would especially fit the younger segment of owners. These are important messages for both service designers and forest planning methodology developers. Internet-supported consultation services could be of help in yearly-based decision-making, particularly for joint ownership holdings (Eyvindson et al., 2010).
Due to the high age of contemporary forest owners in Finland, inheritance arrangements have been relatively commonly considered, as shown in Fig. 4. It is thus evident that inheritance consultancy will remain as an important decision-support type. At least a listing of available alternatives and preferably also calculations that describe their various impacts would be needed among a large number of elderly forest owners. Retirees and elderly owners appeared generally rather conservative: they were more often than others satisfied with tactical planning and the operational level following the forest law, i.e. without a great interest towards biodiversity protection or operational planning services.
The needed service options (Table 2) revealed that many owners value free-formed discussions with experts, which confirms the result by Hujala et al. (2007). Particularly the owner groups of investors and recreationists as well as new forest owners would need this kind of service. It is possible that the forest management situations of recreationists are so case-specific that numerical planning products based on predefined calculation principles seldom answer to the questions they have. In turn, calculative services based on up-to-date forest data would be beneficial to large-holding owners, who would also be able to pay for these services.
Small-holding owners appreciated multiple-use and communicative services more than did large-holding owners. They seem to place higher “soft” values on their forest (due to smaller economic significance or to reflect hobby ownership). However, a question arises: what might be their willingness to pay for communicative decision aid, which will be expensive per hectare as cost-corresponding market-driven service?
According to the preferred ways to handle biodiversity protection (Fig. 5), a quarter of owners could be interested in biodiversity-related, holding-specific planning services (e.g. Kurttila et al., 2008). This observation is well in line with e.g. the results of von Boehm (2008), who recorded even a higher demand towards so-called ”green forest plans”. The herein observed general interest towards biodiversity protection among forest owners was on the same level as in the study by Horne et al. (2009). Also the findings of owners’ self-active protection motivations by Laitila et al. (2009) gain support from the present results. In sum, the observed owner segment

157
Figure 6. Various perceptions associated with a biodiverse stand: share of those who either fully or rather much agree with each related statement among: all respondents (A), those who are willing to protect their forest stand(s) for free (B), and with a reduced compensation (C). 4. Discussion and Conclusions According to the results of this study (Figures 2 and 3), yearly-based decision aid services which extend over the owner’s whole forest holding are needed. For these considerations, especially the “right” order of treatments of stands is asked for (Fig. 4). From a forest planning perspective
and in comparison with current practices, this means a shift towards operational planning, where more accurate timings of treatments are suggested for all stands that could be managed during the forthcoming planning period. This kind of service would especially fit the younger segment of owners. These are important messages for both service designers and forest planning methodology developers. Internet-supported consultation services could be of help in yearly-based decision-making, particularly for joint ownership holdings (Eyvindson et al., 2010).
Due to the high age of contemporary forest owners in Finland, inheritance arrangements have been relatively commonly considered, as shown in Fig. 4. It is thus evident that inheritance consultancy will remain as an important decision-support type. At least a listing of available alternatives and preferably also calculations that describe their various impacts would be needed among a large number of elderly forest owners. Retirees and elderly owners appeared generally rather conservative: they were more often than others satisfied with tactical planning and the operational level following the forest law, i.e. without a great interest towards biodiversity protection or operational planning services.
The needed service options (Table 2) revealed that many owners value free-formed discussions with experts, which confirms the result by Hujala et al. (2007). Particularly the owner groups of investors and recreationists as well as new forest owners would need this kind of service. It is possible that the forest management situations of recreationists are so case-specific that numerical planning products based on predefined calculation principles seldom answer to the questions they have. In turn, calculative services based on up-to-date forest data would be beneficial to large-holding owners, who would also be able to pay for these services.
Small-holding owners appreciated multiple-use and communicative services more than did large-holding owners. They seem to place higher “soft” values on their forest (due to smaller economic significance or to reflect hobby ownership). However, a question arises: what might be their willingness to pay for communicative decision aid, which will be expensive per hectare as cost-corresponding market-driven service?
According to the preferred ways to handle biodiversity protection (Fig. 5), a quarter of owners could be interested in biodiversity-related, holding-specific planning services (e.g. Kurttila et al., 2008). This observation is well in line with e.g. the results of von Boehm (2008), who recorded even a higher demand towards so-called ”green forest plans”. The herein observed general interest towards biodiversity protection among forest owners was on the same level as in the study by Horne et al. (2009). Also the findings of owners’ self-active protection motivations by Laitila et al. (2009) gain support from the present results. In sum, the observed owner segment

158
potentially keen on biodiversity-oriented topics is sufficiently large (~20-30%) for specialized planning services.
Owners were more willing to do temporary biodiversity protection (in this questionnaire 20 years) than to do permanent protection. Owners may not want to bind their own or their inheritors’ hands. About 18% of owners would be willing to protect a part of their forest by reduced compensation demands (temporarily for free and under 100% demand in Table 3). This group, in particular, should be reached to improve the cost-efficiency of voluntary protection (although it here stays unknown how many of these owners own forests that actually have notable ecological protection values).
Hypothetically in the Finnish case, if e.g. one fourth of these owners would have a suitable forest stand of averaging, e.g. 1 ha, this would mean (¼ * 18% * 345,000 holdings * 1 ha 15,525 ha) a possibility to temporarily protect over 15 000 hectares of forests with reduced compensations. The total monetary value of owners’ own contribution to the protection schemes would be around €10 million. In these cases also the administrative costs (negotiations etc.) would possibly be lower due to the positive attitudes these owners already have towards protection.
One important future development aspect would thus be to adopt a market-oriented approach to biodiversity protection, where the limited state budget could be used more cost-efficiently. On the other hand, an increased flexibility in the terms of the protection contracts would further enlarge these areas and/or increase the share of voluntary protectors. These impacts could also be achieved by integrating game management aspects in voluntary protection schemes, since the perceptions of a good game habitat and of a biodiverse forest seemed to associate with each other among (protection-positive) owners (Fig. 6).
The true demand of the above discussed forest management and biodiversity protection decision aid services should be investigated in more detail in further marketing and/or case studies (e.g. choice experiments), where the above products and services would have realistic price tags. Other tasks for further research would be the development and testing of solutions for devising and presenting the recommended order for cuttings and silvicultural work (based on, e.g. the owner’s economic and recreational objectives). Interesting observations relating to the functioning of practical policy instruments could in future be achieved by action-researching biodiversity-centered forest planning, and by incorporating biodiversity protection values and holding-level opportunity costs (see Kurttila et al., 2006) into further compensation-demand studies.
References von Boehm, A. 2008. Vihreän metsäsuunnitelman kysyntä
yksityismetsänomistajakunnassa [Demand of a green forest plan among family forest owners]. Master’s Thesis, University of Helsinki. 89 p. Available at: http://www.wwf.fi/www/uploads/pdf/vihrean_metsasuunnitelman_kysynta_progradu.pdf [accessed July 28, 2010]. (In Finnish.)
Eyvindson, K., Kurttila, M., Hujala, T. & Salminen, O. 2010. An internet-supported planning approach for joint ownership forest holdings. To appear in Small-scale Forestry. Available at: http://dx.doi.org/10.1007/s11842-010-9123-1 [accessed July 28, 2010].
Favada, I.M., Karppinen, H., Kuuluvainen, J., Mikkola, J. & Stavness, C. 2009. Effects of timber prices, ownership objectives, and owner characteristics on timber supply. Forest Science 55(6): 512–523.
Hokajärvi, R., Hujala, T., Leskinen, L.A. & Tikkanen, J. 2009. Effectiveness of sermon policy instruments: Forest management planning practices applying the activity theory approach. Silva Fennica 43(5): 889–906.
Horne, P. 2006. Forest owners’ acceptance of incentive based policy instruments in forest biodiversity conservation – a choice experiment based approach. Silva Fennica 40(1): 169–178.
Horne, P., Koskela,T., Ovaskainen,V., Karppinen, H. & Horne, T. 2009. Forest owners' attitudes towards biodiversity conservation and policy instruments used in private forests. In: Horne, P., Koskela, T., Ovaskainen, V. & Horne, T. (eds.). Safeguarding forest biodiversity in Finland: Citizens' and non-industrial private forest owners' views. Working Papers of the Finnish Forest Research Institute 119: 33–51. Available at: http://www.metla.fi/julkaisut/workingpapers/2009/mwp119.htm [accessed June 21, 2010].
Hujala, T. Pykäläinen, J. & Tikkanen, J. 2007. Decision making among Finnish non-industrial private forest owners: The role of professional opinion and desire to learn. Scandinavian Journal of Forest Research 22(5): 454–463.
Hujala, T., Laitila, T., Kurttila, M. & Tikkanen, J. 2008. Multiple motives of family forest owners in their speech about forest-related decision-making. In: Bergseng, E., Delbeck, G. & Hoen, H.F. (eds.). Proceedings of the Biennial Meeting of the Scandinavian Society of Forest Economics. Lom, Norway, 6th-9th April 2008: 335–343.
Hujala, T., Kurttila, M., Tikkanen, J., Leskinen, P. & Leskinen, L.A. 2009a. Adaptive consultation: a tool for recognizing family forest owners' amenity values. In: Piatek, K.B., Spong, B.D., Harrison, S. and McGill, D.W. (eds.). Seeing the Forest Beyond the Trees: New possibilities and

159
potentially keen on biodiversity-oriented topics is sufficiently large (~20-30%) for specialized planning services.
Owners were more willing to do temporary biodiversity protection (in this questionnaire 20 years) than to do permanent protection. Owners may not want to bind their own or their inheritors’ hands. About 18% of owners would be willing to protect a part of their forest by reduced compensation demands (temporarily for free and under 100% demand in Table 3). This group, in particular, should be reached to improve the cost-efficiency of voluntary protection (although it here stays unknown how many of these owners own forests that actually have notable ecological protection values).
Hypothetically in the Finnish case, if e.g. one fourth of these owners would have a suitable forest stand of averaging, e.g. 1 ha, this would mean (¼ * 18% * 345,000 holdings * 1 ha 15,525 ha) a possibility to temporarily protect over 15 000 hectares of forests with reduced compensations. The total monetary value of owners’ own contribution to the protection schemes would be around €10 million. In these cases also the administrative costs (negotiations etc.) would possibly be lower due to the positive attitudes these owners already have towards protection.
One important future development aspect would thus be to adopt a market-oriented approach to biodiversity protection, where the limited state budget could be used more cost-efficiently. On the other hand, an increased flexibility in the terms of the protection contracts would further enlarge these areas and/or increase the share of voluntary protectors. These impacts could also be achieved by integrating game management aspects in voluntary protection schemes, since the perceptions of a good game habitat and of a biodiverse forest seemed to associate with each other among (protection-positive) owners (Fig. 6).
The true demand of the above discussed forest management and biodiversity protection decision aid services should be investigated in more detail in further marketing and/or case studies (e.g. choice experiments), where the above products and services would have realistic price tags. Other tasks for further research would be the development and testing of solutions for devising and presenting the recommended order for cuttings and silvicultural work (based on, e.g. the owner’s economic and recreational objectives). Interesting observations relating to the functioning of practical policy instruments could in future be achieved by action-researching biodiversity-centered forest planning, and by incorporating biodiversity protection values and holding-level opportunity costs (see Kurttila et al., 2006) into further compensation-demand studies.
References von Boehm, A. 2008. Vihreän metsäsuunnitelman kysyntä
yksityismetsänomistajakunnassa [Demand of a green forest plan among family forest owners]. Master’s Thesis, University of Helsinki. 89 p. Available at: http://www.wwf.fi/www/uploads/pdf/vihrean_metsasuunnitelman_kysynta_progradu.pdf [accessed July 28, 2010]. (In Finnish.)
Eyvindson, K., Kurttila, M., Hujala, T. & Salminen, O. 2010. An internet-supported planning approach for joint ownership forest holdings. To appear in Small-scale Forestry. Available at: http://dx.doi.org/10.1007/s11842-010-9123-1 [accessed July 28, 2010].
Favada, I.M., Karppinen, H., Kuuluvainen, J., Mikkola, J. & Stavness, C. 2009. Effects of timber prices, ownership objectives, and owner characteristics on timber supply. Forest Science 55(6): 512–523.
Hokajärvi, R., Hujala, T., Leskinen, L.A. & Tikkanen, J. 2009. Effectiveness of sermon policy instruments: Forest management planning practices applying the activity theory approach. Silva Fennica 43(5): 889–906.
Horne, P. 2006. Forest owners’ acceptance of incentive based policy instruments in forest biodiversity conservation – a choice experiment based approach. Silva Fennica 40(1): 169–178.
Horne, P., Koskela,T., Ovaskainen,V., Karppinen, H. & Horne, T. 2009. Forest owners' attitudes towards biodiversity conservation and policy instruments used in private forests. In: Horne, P., Koskela, T., Ovaskainen, V. & Horne, T. (eds.). Safeguarding forest biodiversity in Finland: Citizens' and non-industrial private forest owners' views. Working Papers of the Finnish Forest Research Institute 119: 33–51. Available at: http://www.metla.fi/julkaisut/workingpapers/2009/mwp119.htm [accessed June 21, 2010].
Hujala, T. Pykäläinen, J. & Tikkanen, J. 2007. Decision making among Finnish non-industrial private forest owners: The role of professional opinion and desire to learn. Scandinavian Journal of Forest Research 22(5): 454–463.
Hujala, T., Laitila, T., Kurttila, M. & Tikkanen, J. 2008. Multiple motives of family forest owners in their speech about forest-related decision-making. In: Bergseng, E., Delbeck, G. & Hoen, H.F. (eds.). Proceedings of the Biennial Meeting of the Scandinavian Society of Forest Economics. Lom, Norway, 6th-9th April 2008: 335–343.
Hujala, T., Kurttila, M., Tikkanen, J., Leskinen, P. & Leskinen, L.A. 2009a. Adaptive consultation: a tool for recognizing family forest owners' amenity values. In: Piatek, K.B., Spong, B.D., Harrison, S. and McGill, D.W. (eds.). Seeing the Forest Beyond the Trees: New possibilities and

160
expectations for products and services from small-scale forestry. Proceedings of the 2009 IUFRO 3.08 Small-Scale Forestry Symposium. June 2009, Morgantown, WV, United States: West Virginia University, Division of Forestry and Natural Resources. pp. 104–113.
Hujala, T., Tikkanen, J., Hänninen, H. & Virkkula, O. 2009b. Family forest owners' perception of decision support. Scandinavian Journal of Forest Research 24(5): 448–460.
Hujala, T., Kurttila, M. & Karppinen, H. 2010. Cross-evaluation of two forest owner typologies: how do motives of ownership and needs of communication interact? In: Medved, M. (ed.). Small Scale Forestry in a Changing World: Opportunities and Challenges and the Role of Extension and Technology Transfer. Proceedings of the IUFRO conference, 06-12 June 2010, Bled, Slovenia. Slovenian Forest Institute & Slovenia Forest Service, Ljubljana. pp. 320–330.
Hänninen, H., Karppinen, H. & Leppänen, J. 2010. Suomalainen metsänomistaja 2010 [Finnish Forest Owner 2010]. In press. (In Finnish.)
Kurttila, M., Pykäläinen, J. & Leskinen, P. 2006. Defining the forest landowner's utility loss compensative subsidy level for a biodiversity object. European Journal of Forest Research 125(1): 67–78.
Kurttila, M., Leskinen, P., Pykäläinen, J. & Ruuskanen, T. 2008. Forest owners´ decision support in voluntary biodiversity-protection projects. Silva Fennica 42(4): 643–658.
Laitila, T., Hujala, T., Tikkanen, J. & Kurttila, M. 2009. Yksityismetsien monikäyttöön ja monimuotoisuuteen liittyvät arvot ja asenteet: analyysi metsänomistajien haastatteluista. [Values and attitudes relating to the multiple use and biodiversity of private forests: analysis of forest owners’ interviews]. Metsätieteen aikakauskirja 2/2009: 113–125. (In Finnish.)
Leskinen, P., Hujala, T., Tikkanen, J., Kainulainen, T., Kangas, A., Kurttila, M., Pykäläinen, J. & Leskinen, L.A. 2009. Adaptive decision analysis in forest management planning. Forest Science 55(2): 95–108.
Tikkanen, J., Hokajärvi, R. & Hujala, T. 2010. Development phases of forest planning on non-industrial private lands in Finland: Perspective of planners’ work. To appear in Small-scale Forestry. Available at:
http://dx.doi.org/10.1007/s11842-010-9119-x [accessed July 28, 2010].
Typical social networks of family forest owners in timber trade
Katri Korhonen, Mikko Kurttila and Teppo Hujala
Finnish Forest Research Institute (METLA)
Abstract This study sought to identify the most typical timber trade network structures among Finnish family forest owners. Finding the most typical networks means that owners’ structural equivalence is defined. From a forest policy perspective, structurally equivalent owners, i.e. those who have the same kind of network structure, can be reached in similar ways. Data were collected via a mail questionnaire. The questionnaire was sent to 2084 Finnish family forest owners. Response rate was 59.7. After multiple imputation, social networks of 753 forest owners were included in the examination. The four most typical social-network structures in timber trade were identified through a cluster analysis. The members of FMA-partners have always connection with an advisor of the local Forest Management Association (FMA). This connection is often bi-directional and exclusive. Connections of Independent timber sellers are directed mainly towards a timber buyer. Relationship builders have the greatest number of connections compared with other groups. Non-committed FMA-members have a dense connection with FMA and relationships also with a timber buyer and their family. Knowledge of owners’ networks helps service providers to offer support in timber trade and in other concrete decision situations. Service preferences of the identified owner groups need, however, more in-depth study.
Keywords: ego-centered social networks, structural equivalence, TwoStep Cluster Analysis 1. Introduction 1.1 Timber procurement challenge in Finland In Finland, non-industrial private owners hold 60% of forest land (Forest Finland in Brief, 2009). These family forest owners also play a key role in forest industry’s timber procurement. Their share of yearly cutting removal from Finnish forests is about 80%, i.e. about 45 million m³. On average, a private forest owner makes a timber trade approximately every third year (Hänninen et al., 2010).

161
expectations for products and services from small-scale forestry. Proceedings of the 2009 IUFRO 3.08 Small-Scale Forestry Symposium. June 2009, Morgantown, WV, United States: West Virginia University, Division of Forestry and Natural Resources. pp. 104–113.
Hujala, T., Tikkanen, J., Hänninen, H. & Virkkula, O. 2009b. Family forest owners' perception of decision support. Scandinavian Journal of Forest Research 24(5): 448–460.
Hujala, T., Kurttila, M. & Karppinen, H. 2010. Cross-evaluation of two forest owner typologies: how do motives of ownership and needs of communication interact? In: Medved, M. (ed.). Small Scale Forestry in a Changing World: Opportunities and Challenges and the Role of Extension and Technology Transfer. Proceedings of the IUFRO conference, 06-12 June 2010, Bled, Slovenia. Slovenian Forest Institute & Slovenia Forest Service, Ljubljana. pp. 320–330.
Hänninen, H., Karppinen, H. & Leppänen, J. 2010. Suomalainen metsänomistaja 2010 [Finnish Forest Owner 2010]. In press. (In Finnish.)
Kurttila, M., Pykäläinen, J. & Leskinen, P. 2006. Defining the forest landowner's utility loss compensative subsidy level for a biodiversity object. European Journal of Forest Research 125(1): 67–78.
Kurttila, M., Leskinen, P., Pykäläinen, J. & Ruuskanen, T. 2008. Forest owners´ decision support in voluntary biodiversity-protection projects. Silva Fennica 42(4): 643–658.
Laitila, T., Hujala, T., Tikkanen, J. & Kurttila, M. 2009. Yksityismetsien monikäyttöön ja monimuotoisuuteen liittyvät arvot ja asenteet: analyysi metsänomistajien haastatteluista. [Values and attitudes relating to the multiple use and biodiversity of private forests: analysis of forest owners’ interviews]. Metsätieteen aikakauskirja 2/2009: 113–125. (In Finnish.)
Leskinen, P., Hujala, T., Tikkanen, J., Kainulainen, T., Kangas, A., Kurttila, M., Pykäläinen, J. & Leskinen, L.A. 2009. Adaptive decision analysis in forest management planning. Forest Science 55(2): 95–108.
Tikkanen, J., Hokajärvi, R. & Hujala, T. 2010. Development phases of forest planning on non-industrial private lands in Finland: Perspective of planners’ work. To appear in Small-scale Forestry. Available at:
http://dx.doi.org/10.1007/s11842-010-9119-x [accessed July 28, 2010].
Typical social networks of family forest owners in timber trade
Katri Korhonen, Mikko Kurttila and Teppo Hujala
Finnish Forest Research Institute (METLA)
Abstract This study sought to identify the most typical timber trade network structures among Finnish family forest owners. Finding the most typical networks means that owners’ structural equivalence is defined. From a forest policy perspective, structurally equivalent owners, i.e. those who have the same kind of network structure, can be reached in similar ways. Data were collected via a mail questionnaire. The questionnaire was sent to 2084 Finnish family forest owners. Response rate was 59.7. After multiple imputation, social networks of 753 forest owners were included in the examination. The four most typical social-network structures in timber trade were identified through a cluster analysis. The members of FMA-partners have always connection with an advisor of the local Forest Management Association (FMA). This connection is often bi-directional and exclusive. Connections of Independent timber sellers are directed mainly towards a timber buyer. Relationship builders have the greatest number of connections compared with other groups. Non-committed FMA-members have a dense connection with FMA and relationships also with a timber buyer and their family. Knowledge of owners’ networks helps service providers to offer support in timber trade and in other concrete decision situations. Service preferences of the identified owner groups need, however, more in-depth study.
Keywords: ego-centered social networks, structural equivalence, TwoStep Cluster Analysis 1. Introduction 1.1 Timber procurement challenge in Finland In Finland, non-industrial private owners hold 60% of forest land (Forest Finland in Brief, 2009). These family forest owners also play a key role in forest industry’s timber procurement. Their share of yearly cutting removal from Finnish forests is about 80%, i.e. about 45 million m³. On average, a private forest owner makes a timber trade approximately every third year (Hänninen et al., 2010).
162
A common change all around Europe and in the U.S. in private forest ownership structure seems to be that forest owners are ageing and the importance of the cutting incomes to their family economy is decreasing (Butler and Leatherberry, 2004; Butler, 2008; Karppinen and Tiainen, 2010). In addition, many forest owners are not living next to their forest holdings anymore, so they are becoming estranged from their forest property and thus often also from the local forestry community (Karppinen et al., 2002; Hänninen et al. 2010; Hänninen and Karppinen, 2010). Also, the structure of forest holdings is still fragmenting. All these changes mean additional challenges to forest industry enterprises in their timber procurement: new ways to reach and activate increasingly variable forest owners need to be found through modifying and better targeting marketing and communication activities. 1.2 Ways to conduct a timber trade Both stumpage and roadside trade types are in use and depending on the area, about 80% of timber trades are stumpage trades. Stumpage trade means that the forest owner sells the logging rights of standing trees to a timber buyer and the buyer takes care of the cuttings and transportation. Roadside trade means that the forest owner himself is responsible for carrying out or arranging (and paying for) the timber cutting and transportation to the roadside. The specific characteristic of timber market in Finland is that the buyer very often represents one of the three major forest industry enterprises.
In Finland, a forest owner can offer his/her timber for sale in two different ways: 1) the forest owner can sell timber directly to a forest industry enterprise, either as a contract customer or a 'free agent', or 2) the forest owner can empower a local Forest Management Association (FMA) to conduct the timber trade. Being a contract customer with a certain forest industry enterprise usually means a specifically defined price guarantee for forest owner from the timber sold. Industry enterprises underwrite to buy timber that their contract customers are willing to sell and, on the other hand, forest owners are encouraged, but not obliged, to favour their contract enterprise while selling timber. The share of empowered trades via FMA is about 40–50% depending on the region. In an empowered trade, FMA is assumed to have good knowledge about local timber trade situation. FMA asks offers from timber buyers on behalf of the owner and recommends the best offer for the owner who makes the final decision. The roles of different actors and possible contorting effects related to timber trade have been under debate in Finland.
1.3 Social network analysis Social network analysis (SNA) is a multidisciplinary method and research approach. Its origin is in disciplines of psychology, anthropology and sociology but also in the graph theory from mathematics (Knoke and Yang, 2008; Wassermann and Faust, 1994). A social network describes relationships between individuals or organizations, and the significance and roles of these relationships (Wassermann and Faust, 1994). SNA can be a theoretical framework, an analysis technique and a way to collect data. Through his or her social relationships, an individual gathers social capital (Bourdieu, 1979; Burt, 1992). This study assumes that social capital enables the owner to get profound information for timber trade and to consider this information reliable. Forest owners use the information that they gather through the network in their decision making. On the other hand, social network reveals the personal communication channels through which different forest owners could be reached based on their existing network.
Social network analysis has not been used much in forest owner related studies, although Moreno developed sociogram as early as in 1930s (Moreno, 1934) and although SNA has gained popularity in, e.g. epidemiology, management research and business economics during the last decades (Wassermann and Faust, 1994). Some numerical results have recently been published from the U.S., where Rickenbach (2009) has studied landowners’ co-operation. Social networks can support forest owners in practical decision-making situations, and more widely, it opens opportunities for peer-to-peer learning or the enhancement of owners’ social identity (Hujala and Tikkanen, 2008).
In this study, social networks around family forest owners are studied. These kinds of networks, concentrated around one actor, ego, can be called ego-centered networks (Wassermann and Faust, 1994). The members of network are called alters. In this study, the relationships, i.e. ties, between ego and alters were identified, and the possible relationships between different alters remain unknown.
Structural equivalence is an SNA-related concept and it describes how similarly actors have positioned in their networks. In this study, the focus is on forest owners and due to the ego-centered approach forest owners are always at the centre of their networks. As a result, structural equivalence actually describes how similar forest owners’ networks are. To illustrate the idea of structural equivalence, all studied forest owners can be placed in a same network (Fig. 1). The forest owners who have same kinds of ties in this network are structurally equivalent.
163
A common change all around Europe and in the U.S. in private forest ownership structure seems to be that forest owners are ageing and the importance of the cutting incomes to their family economy is decreasing (Butler and Leatherberry, 2004; Butler, 2008; Karppinen and Tiainen, 2010). In addition, many forest owners are not living next to their forest holdings anymore, so they are becoming estranged from their forest property and thus often also from the local forestry community (Karppinen et al., 2002; Hänninen et al. 2010; Hänninen and Karppinen, 2010). Also, the structure of forest holdings is still fragmenting. All these changes mean additional challenges to forest industry enterprises in their timber procurement: new ways to reach and activate increasingly variable forest owners need to be found through modifying and better targeting marketing and communication activities. 1.2 Ways to conduct a timber trade Both stumpage and roadside trade types are in use and depending on the area, about 80% of timber trades are stumpage trades. Stumpage trade means that the forest owner sells the logging rights of standing trees to a timber buyer and the buyer takes care of the cuttings and transportation. Roadside trade means that the forest owner himself is responsible for carrying out or arranging (and paying for) the timber cutting and transportation to the roadside. The specific characteristic of timber market in Finland is that the buyer very often represents one of the three major forest industry enterprises.
In Finland, a forest owner can offer his/her timber for sale in two different ways: 1) the forest owner can sell timber directly to a forest industry enterprise, either as a contract customer or a 'free agent', or 2) the forest owner can empower a local Forest Management Association (FMA) to conduct the timber trade. Being a contract customer with a certain forest industry enterprise usually means a specifically defined price guarantee for forest owner from the timber sold. Industry enterprises underwrite to buy timber that their contract customers are willing to sell and, on the other hand, forest owners are encouraged, but not obliged, to favour their contract enterprise while selling timber. The share of empowered trades via FMA is about 40–50% depending on the region. In an empowered trade, FMA is assumed to have good knowledge about local timber trade situation. FMA asks offers from timber buyers on behalf of the owner and recommends the best offer for the owner who makes the final decision. The roles of different actors and possible contorting effects related to timber trade have been under debate in Finland.
1.3 Social network analysis Social network analysis (SNA) is a multidisciplinary method and research approach. Its origin is in disciplines of psychology, anthropology and sociology but also in the graph theory from mathematics (Knoke and Yang, 2008; Wassermann and Faust, 1994). A social network describes relationships between individuals or organizations, and the significance and roles of these relationships (Wassermann and Faust, 1994). SNA can be a theoretical framework, an analysis technique and a way to collect data. Through his or her social relationships, an individual gathers social capital (Bourdieu, 1979; Burt, 1992). This study assumes that social capital enables the owner to get profound information for timber trade and to consider this information reliable. Forest owners use the information that they gather through the network in their decision making. On the other hand, social network reveals the personal communication channels through which different forest owners could be reached based on their existing network.
Social network analysis has not been used much in forest owner related studies, although Moreno developed sociogram as early as in 1930s (Moreno, 1934) and although SNA has gained popularity in, e.g. epidemiology, management research and business economics during the last decades (Wassermann and Faust, 1994). Some numerical results have recently been published from the U.S., where Rickenbach (2009) has studied landowners’ co-operation. Social networks can support forest owners in practical decision-making situations, and more widely, it opens opportunities for peer-to-peer learning or the enhancement of owners’ social identity (Hujala and Tikkanen, 2008).
In this study, social networks around family forest owners are studied. These kinds of networks, concentrated around one actor, ego, can be called ego-centered networks (Wassermann and Faust, 1994). The members of network are called alters. In this study, the relationships, i.e. ties, between ego and alters were identified, and the possible relationships between different alters remain unknown.
Structural equivalence is an SNA-related concept and it describes how similarly actors have positioned in their networks. In this study, the focus is on forest owners and due to the ego-centered approach forest owners are always at the centre of their networks. As a result, structural equivalence actually describes how similar forest owners’ networks are. To illustrate the idea of structural equivalence, all studied forest owners can be placed in a same network (Fig. 1). The forest owners who have same kinds of ties in this network are structurally equivalent.

164
Figure 1. Illustration of structural equivalence. The gray circles are the studied 753 forest owners, white squares are different alters that are members of forest owners’ networks and the lines between the circles and the squares show existing ties of the forest owners in their recent timber trade. 2. Objectives In this study, social networks are considered as information flow channels. Different forest organizations, such as timber buyers or public agencies, try to reach different forest owners in different ways in their marketing and communication activities. For example, they try to activate them to sell timber. The main objective of this study is to define the most typical social networks of forest owners in a context of a timber trade process. This will reveal channels for reaching different owners. In addition, we will study the background variables of owners in the identified networks.
3. Data and methods Network data on forest owners’ latest timber trade were collected via a mail questionnaire from Finnish family forest owners in autumn 2009. The questionnaire was sent to those forest owners who had already answered to an earlier mail questionnaire of the large “Finnish Family forest owner 2010” study (Hänninen et al., 2010). In the large family forest owner study, non-response analysis was also carried out and in the calculations of the results a reasoned weighting was used so that the responses correspond to the Finnish population of family forest owners. The same weights were also used in this study as the remarkably significant differences between the respondents and non-respondents were perceived only among Swedish-speaking forest owners, who were located in the area of regional Forestry Centre on the coast (Rannikon Metsäkeskus) and among genders. The response percentage of Swedish-speaking forest owners was lower due to the questionnaire appearing only in Finnish, but their share of sample was only 6%. The share of women among respondents was lower than among non-respondents and this needs to be taken into account when interpreting the results.
Questionnaire was sent to 2084 forest owners and 1244 valid responses were received. Due to the earlier questionnaire, the response rate in the latter questionnaire was as high as 59.7%. The questionnaire included three parts with different focuses. The third part of the questionnaire concentrated on the forest owner’s latest timber trade, if such was done less than 5 years ago. The questionnaire section included detailed questions about the network that was part of the decision making in this trade. In the network question, forest owners were given ten possible alters (Fig. 2) and they were asked to define if they had been in contact with those alters during their latest timber trade. Forest owners were asked to specify contact occasions, the direction of relationship (indegree or outdegree), and the importance of the relationship for the success of timber trade (Fig. 2). Outdegree direction means that the forest owner had been more active in contacting the alter and as opposite to this, indegree means that the alter had been more active in contacting the owner. In this study, different alters, for example the workers of FMAs, are thought to represent the same alter in different forest owners’ network, which means that they are in the same place in the network (Fig 1).

165
Figure 1. Illustration of structural equivalence. The gray circles are the studied 753 forest owners, white squares are different alters that are members of forest owners’ networks and the lines between the circles and the squares show existing ties of the forest owners in their recent timber trade. 2. Objectives In this study, social networks are considered as information flow channels. Different forest organizations, such as timber buyers or public agencies, try to reach different forest owners in different ways in their marketing and communication activities. For example, they try to activate them to sell timber. The main objective of this study is to define the most typical social networks of forest owners in a context of a timber trade process. This will reveal channels for reaching different owners. In addition, we will study the background variables of owners in the identified networks.
3. Data and methods Network data on forest owners’ latest timber trade were collected via a mail questionnaire from Finnish family forest owners in autumn 2009. The questionnaire was sent to those forest owners who had already answered to an earlier mail questionnaire of the large “Finnish Family forest owner 2010” study (Hänninen et al., 2010). In the large family forest owner study, non-response analysis was also carried out and in the calculations of the results a reasoned weighting was used so that the responses correspond to the Finnish population of family forest owners. The same weights were also used in this study as the remarkably significant differences between the respondents and non-respondents were perceived only among Swedish-speaking forest owners, who were located in the area of regional Forestry Centre on the coast (Rannikon Metsäkeskus) and among genders. The response percentage of Swedish-speaking forest owners was lower due to the questionnaire appearing only in Finnish, but their share of sample was only 6%. The share of women among respondents was lower than among non-respondents and this needs to be taken into account when interpreting the results.
Questionnaire was sent to 2084 forest owners and 1244 valid responses were received. Due to the earlier questionnaire, the response rate in the latter questionnaire was as high as 59.7%. The questionnaire included three parts with different focuses. The third part of the questionnaire concentrated on the forest owner’s latest timber trade, if such was done less than 5 years ago. The questionnaire section included detailed questions about the network that was part of the decision making in this trade. In the network question, forest owners were given ten possible alters (Fig. 2) and they were asked to define if they had been in contact with those alters during their latest timber trade. Forest owners were asked to specify contact occasions, the direction of relationship (indegree or outdegree), and the importance of the relationship for the success of timber trade (Fig. 2). Outdegree direction means that the forest owner had been more active in contacting the alter and as opposite to this, indegree means that the alter had been more active in contacting the owner. In this study, different alters, for example the workers of FMAs, are thought to represent the same alter in different forest owners’ network, which means that they are in the same place in the network (Fig 1).
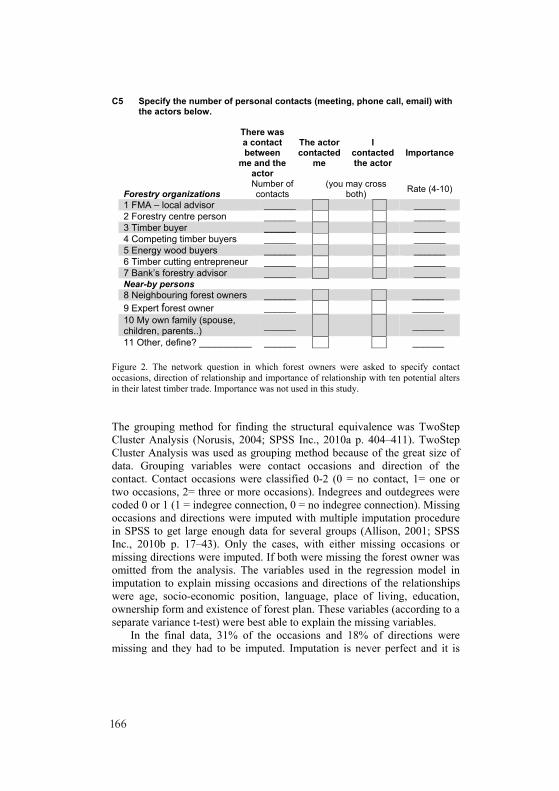
166
C5 Specify the number of personal contacts (meeting, phone call, email) with the actors below.
There was a contact between
me and the actor
The actor contacted
me
I contacted the actor
Importance
Forestry organizations Number of contacts
(you may cross both) Rate (4-10)
1 FMA – local advisor ______ ______ 2 Forestry centre person ______ ______ 3 Timber buyer ______ ______ 4 Competing timber buyers ______ ______ 5 Energy wood buyers ______ ______ 6 Timber cutting entrepreneur ______ ______ 7 Bank’s forestry advisor ______ ______ Near-by persons 8 Neighbouring forest owners ______ ______ 9 Expert forest owner ______ ______ 10 My own family (spouse, children, parents..) ______ ______
11 Other, define? __________ ______ ______
Figure 2. The network question in which forest owners were asked to specify contact occasions, direction of relationship and importance of relationship with ten potential alters in their latest timber trade. Importance was not used in this study. The grouping method for finding the structural equivalence was TwoStep Cluster Analysis (Norusis, 2004; SPSS Inc., 2010a p. 404–411). TwoStep Cluster Analysis was used as grouping method because of the great size of data. Grouping variables were contact occasions and direction of the contact. Contact occasions were classified 0-2 (0 = no contact, 1= one or two occasions, 2= three or more occasions). Indegrees and outdegrees were coded 0 or 1 (1 = indegree connection, 0 = no indegree connection). Missing occasions and directions were imputed with multiple imputation procedure in SPSS to get large enough data for several groups (Allison, 2001; SPSS Inc., 2010b p. 17–43). Only the cases, with either missing occasions or missing directions were imputed. If both were missing the forest owner was omitted from the analysis. The variables used in the regression model in imputation to explain missing occasions and directions of the relationships were age, socio-economic position, language, place of living, education, ownership form and existence of forest plan. These variables (according to a separate variance t-test) were best able to explain the missing variables.
In the final data, 31% of the occasions and 18% of directions were missing and they had to be imputed. Imputation is never perfect and it is
thus important to know how imputation affects to the data. Imputation was performed five times. Grouping was done in all imputation occasions. The same final groups with similar lines of interpretation were found in four different imputations and in perfect data with no imputations (n = 373) (Fig 3). The percentages of the groups were only slightly different among imputations and only imputation number 3 gave somewhat different groups. Each forest owner was defined to belong to the group in which s/he belonged to in most of the imputations. Final data after imputations included 753 forest owners.
Figure 3. Division of four groups in five different imputations, in non-imputed data (n=373) and in final data, imputed with majority rule (n=753).
4. Results The cluster analysis resulted in four network structures that Finnish family forest owners had had during their latest timber trade between years 2005-2009 (Fig 4). The most distinct were three groups; FMA-partners (15% of owners), who had connections often only with forest management association; Independent timber sellers (27%), who had connection mainly with timber buyer; and Relationship builders (24%), who had notably more connections than others. The fourth group, Non-committed FMA-members

167
C5 Specify the number of personal contacts (meeting, phone call, email) with the actors below.
There was a contact between
me and the actor
The actor contacted
me
I contacted the actor
Importance
Forestry organizations Number of contacts
(you may cross both) Rate (4-10)
1 FMA – local advisor ______ ______ 2 Forestry centre person ______ ______ 3 Timber buyer ______ ______ 4 Competing timber buyers ______ ______ 5 Energy wood buyers ______ ______ 6 Timber cutting entrepreneur ______ ______ 7 Bank’s forestry advisor ______ ______ Near-by persons 8 Neighbouring forest owners ______ ______ 9 Expert forest owner ______ ______ 10 My own family (spouse, children, parents..) ______ ______
11 Other, define? __________ ______ ______
Figure 2. The network question in which forest owners were asked to specify contact occasions, direction of relationship and importance of relationship with ten potential alters in their latest timber trade. Importance was not used in this study. The grouping method for finding the structural equivalence was TwoStep Cluster Analysis (Norusis, 2004; SPSS Inc., 2010a p. 404–411). TwoStep Cluster Analysis was used as grouping method because of the great size of data. Grouping variables were contact occasions and direction of the contact. Contact occasions were classified 0-2 (0 = no contact, 1= one or two occasions, 2= three or more occasions). Indegrees and outdegrees were coded 0 or 1 (1 = indegree connection, 0 = no indegree connection). Missing occasions and directions were imputed with multiple imputation procedure in SPSS to get large enough data for several groups (Allison, 2001; SPSS Inc., 2010b p. 17–43). Only the cases, with either missing occasions or missing directions were imputed. If both were missing the forest owner was omitted from the analysis. The variables used in the regression model in imputation to explain missing occasions and directions of the relationships were age, socio-economic position, language, place of living, education, ownership form and existence of forest plan. These variables (according to a separate variance t-test) were best able to explain the missing variables.
In the final data, 31% of the occasions and 18% of directions were missing and they had to be imputed. Imputation is never perfect and it is
thus important to know how imputation affects to the data. Imputation was performed five times. Grouping was done in all imputation occasions. The same final groups with similar lines of interpretation were found in four different imputations and in perfect data with no imputations (n = 373) (Fig 3). The percentages of the groups were only slightly different among imputations and only imputation number 3 gave somewhat different groups. Each forest owner was defined to belong to the group in which s/he belonged to in most of the imputations. Final data after imputations included 753 forest owners.
Figure 3. Division of four groups in five different imputations, in non-imputed data (n=373) and in final data, imputed with majority rule (n=753).
4. Results The cluster analysis resulted in four network structures that Finnish family forest owners had had during their latest timber trade between years 2005-2009 (Fig 4). The most distinct were three groups; FMA-partners (15% of owners), who had connections often only with forest management association; Independent timber sellers (27%), who had connection mainly with timber buyer; and Relationship builders (24%), who had notably more connections than others. The fourth group, Non-committed FMA-members

168
(34%), is an intermediate group between FMA-partners and Relationship builders.
FMA-partners had a strong, bi-directional contact with the local Forest Managemant Association (Table 1). They did not have a straight contact with the timber buyer and they only had 1.3 alters on average. The strong connection with the advisor of FMA means that the advisor took care of the whole timber trade. The relationships of Independent timber sellers were directed to the timber buyer and owners had self-actively created these contacts. The members of this group had approximately two alters. Besides the timber buyer, they had commonly connections with family members, timber cutting entrepreneurs or competing timber buyers (who were asked for an offer but with whom a contract was eventually omitted). Relationship builders were the ones who had the greatest number of alters in their timber trade decision making, approx. 5.3. Connections with the timber buyer, FMA, a competing timber buyer, family, and a timber cutting entrepreneur were most typical. Non-committed FMA-members had always a connection with FMA but they could also have a straight connection with the timber buyer. They had approximately three connections; besides FMA and the timber buyer also with their family or a timber cutting entrepreneur.
Table 1. Connection percentages with alters by groups. The last column to the right shows the average commonness of alters weighted by the share of groups. FMA-
partners Independent
timber traders Relationship
builders Non-
committed FMA-
members
Average
Timber buyer 3 92 99 61 69 FMA local advisor
100 1 82 100 69
Family member
3 37 65 49 42
Timber cutting entrepreneur
3 23 63 29 31
Competing timber buyers
4 12 72 4 22
Neighbouring forest owner
1 10 45 14 18
Expert forest owner
2 13 37 13 17
Energy wood buyer
3 9 20 11 11
Forestry centre 3 6 23 11 11 Bank’s forestry advisor
1 2 19 4 6
With respect to the background variables of forest owners, FMA-partners are elderly and more often retired than others are. They are the ones who are not living next to their forest holdings as often as others are. Half of them have done less than five timber trades during the time they have owned forest. Independent timber sellers sell timber more often than average, but the size of their timber trade (m3) is smaller than average. Together with Relationship builders, they are more active to conduct silvicultural operations such as planting, pre-commercial treatments of young stands and thinning by themselves than FMA-partners are. Relationship builders are more active to sell timber than owners in other groups are and they have the largest forest holdings (approx. 56 hectares). They also sell more cubic meters per trade than others. Relationship builders have the highest indegree of timber buyers and competing timber buyers, which is due to the large size of holdings and greatest amount of timber sold; this group is thus the most interesting customer segment for forestry enterprises. Non-committed FMA-members have the smallest forest holdings (approx. 35 hectares) but during the time they have owned forests, they have made more timber trades than FMA-partners. As many as 81% of FMA-partners had conducted their latest timber trade by empowering Forest Management Associations to do it, and among Non-committed FMA-members the corresponding percentage is 58. Fifty-three per cent of Independent timber traders and 43% of Relationship builders were contract customers with timber buying companies in their latest timber trade.
Figure 4. Family forest owners’ most typical networks in timber trade and the share of the groups (n=753).

169
(34%), is an intermediate group between FMA-partners and Relationship builders.
FMA-partners had a strong, bi-directional contact with the local Forest Managemant Association (Table 1). They did not have a straight contact with the timber buyer and they only had 1.3 alters on average. The strong connection with the advisor of FMA means that the advisor took care of the whole timber trade. The relationships of Independent timber sellers were directed to the timber buyer and owners had self-actively created these contacts. The members of this group had approximately two alters. Besides the timber buyer, they had commonly connections with family members, timber cutting entrepreneurs or competing timber buyers (who were asked for an offer but with whom a contract was eventually omitted). Relationship builders were the ones who had the greatest number of alters in their timber trade decision making, approx. 5.3. Connections with the timber buyer, FMA, a competing timber buyer, family, and a timber cutting entrepreneur were most typical. Non-committed FMA-members had always a connection with FMA but they could also have a straight connection with the timber buyer. They had approximately three connections; besides FMA and the timber buyer also with their family or a timber cutting entrepreneur.
Table 1. Connection percentages with alters by groups. The last column to the right shows the average commonness of alters weighted by the share of groups. FMA-
partners Independent
timber traders Relationship
builders Non-
committed FMA-
members
Average
Timber buyer 3 92 99 61 69 FMA local advisor
100 1 82 100 69
Family member
3 37 65 49 42
Timber cutting entrepreneur
3 23 63 29 31
Competing timber buyers
4 12 72 4 22
Neighbouring forest owner
1 10 45 14 18
Expert forest owner
2 13 37 13 17
Energy wood buyer
3 9 20 11 11
Forestry centre 3 6 23 11 11 Bank’s forestry advisor
1 2 19 4 6
With respect to the background variables of forest owners, FMA-partners are elderly and more often retired than others are. They are the ones who are not living next to their forest holdings as often as others are. Half of them have done less than five timber trades during the time they have owned forest. Independent timber sellers sell timber more often than average, but the size of their timber trade (m3) is smaller than average. Together with Relationship builders, they are more active to conduct silvicultural operations such as planting, pre-commercial treatments of young stands and thinning by themselves than FMA-partners are. Relationship builders are more active to sell timber than owners in other groups are and they have the largest forest holdings (approx. 56 hectares). They also sell more cubic meters per trade than others. Relationship builders have the highest indegree of timber buyers and competing timber buyers, which is due to the large size of holdings and greatest amount of timber sold; this group is thus the most interesting customer segment for forestry enterprises. Non-committed FMA-members have the smallest forest holdings (approx. 35 hectares) but during the time they have owned forests, they have made more timber trades than FMA-partners. As many as 81% of FMA-partners had conducted their latest timber trade by empowering Forest Management Associations to do it, and among Non-committed FMA-members the corresponding percentage is 58. Fifty-three per cent of Independent timber traders and 43% of Relationship builders were contract customers with timber buying companies in their latest timber trade.
Figure 4. Family forest owners’ most typical networks in timber trade and the share of the groups (n=753).
170
5. Conclusions This study aimed at identifying the most typical timber sale network structures among Finnish family forest owners by applying a rather new kind of approach. Social network analysis can be a useful methodology for studying forest-related decision-making situations. Its results can, e.g. help to develop forest owners’ guidance, forest planning services and planning systems so that owners can better be supported in their practical decision making.
Half of the studied forest owners; FMA-partners and Non-committed FMA-members, had always connection to the FMA in their recent timber trade. The position of FMA will probably remain strong also in the future as far as forest owners are ageing and the average size of forest holding remains relatively small. The other groups that were identified, Relationship builders and Independent timber sellers, have often direct connections with timber buyers and they also sell timber more frequently.
With respect to timber procurement of forest industry, Relationship builders and Independent timber sellers can be thought as the most easily attainable customers. Opposite to this, FMA-partners are the ones who need to be encouraged or even pushed to timber trade. FMA-partners are not living next to their forest holdings and they are maybe not that familiar with their forests or which operations to conduct next in the forest. The easiest way to reach them is through FMA because they already have connections and they probably also trust local FMA advisors. FMA-partners might not be willing to use more of their time to timber trade or forestry issues.
Attempts to increase the forest holding size in Finland have been initiated to improve the cost-efficiency of forestry operations and profitability of family forestry as well as access to timber resources. So far, easily attainable services and contact from one place are essential for small-scale forest owners. Producing and developing these services is important to persuade the future forest owners to sell timber. Results of this study suggest that the services offered by FMA could include basic activating features while private entrepreneurs and forest companies could incorporate also more advanced-level services. References Allison, P.D. 2001. Missing data. Thousand Oaks, CA: Sage publications. Bourdieu, P. 1979. Outline of a Theory of Practice. Translated by R. Nice.
Cambridge University Press. 248 p. Burt, R. 1992. Structural holes. The social structure of competition. Harvard
University Press, Cambridge. 315 p.
Butler, B.J. 2008. Family forest owners of the United States, 2006. Gen. Tech. Rep. NRS-27. Newtown Square, PA: U.S. Department of Agriculture, Forest Service, Northern Research Station. 72 p.
Butler, B.J. & Leatherberry, E.C. 2004. America’s family forest owners. Journal of Forestry 102(7): 4–9.
Forest Finland in Brief. 2009. Finnish Forest Research Institute. 48 p. Accessed on July 27, 2010 at http://www.metla.fi/metinfo/tilasto/julkaisut/muut/brief2009.pdf
Hujala, T. & Tikkanen, J. 2008. Boosters of and Barriers to Smooth Communication in Family Forest owners’ Decision Making. Scandinavian Journal of Forest Research, 23(5): 466–477.
Hänninen, H., Karppinen, H. & Leppänen, J. 2010. Suomalainen metsänomistaja 2010 [Finnish Forest Owner 2010]. In Press. (In Finnish.)
Hänninen, H. & Karppinen, H. 2010. Yksityismetsänomistajat puntarissa [Private forest land owners in barometer]. In: Sevola, Y. (ed.) Metsä, talous, yhteiskunta. Katsauksia metsäekonomiseen tutkimukseen [Forest, economics, society. Reviews on research in forest economics]. Working Papers of the Finnish Forest Research Insitute 145: 55–68. (In Finnish.)
Karppinen, H., Hänninen, H. & Ripatti, P. 2002. Suomalainen metsänomistaja 2000 [Finnish Forest Owner 2000]. Finnish Forest Research Institute Research Papers 852. 83 p. ISBN 951-40-1832-X
Karppinen, H. & Tiainen, L. 2010. “Semmonen niinkun metsäkansa” – suurten ikäluokkien perijät tulevaisuuden metsänomistajina [”Kind of Forest People” – inheritors of the post-war baby-boom generation as the future forest owners]. Metsätieteen aikakauskirja 1:19–38. (In Finnish.)
Knoke, D. & Song Yang. 2008. Social Network Analysis. 133 p. Norušis, M. 2004. SPSS 13.0 Statistical Procedures Companion. Upper
Saddle-River, N.J.: Prentice Hall, Inc. 614 p. Rickenbach, M. 2009. Serving members and reaching others: The
performance and social network of a landowner cooperative. Forest policy and economics 11(8) 593–599.
SPSS Inc. 2010a. SPSS Base 17.0 User's Guide. 616 p. Accessed on July 27, 2010 at http://support.spss.com/ProductsExt/SPSS/Documentation/.
SPSS Inc. 2010b. SPSS Missing ValuesTM 17.0. 115 p. Accessed on July 27, 2010 at http://support.spss.com/ProductsExt/SPSS/Documentation/.
Wasserman, S. & Faust, K. 1994. Social network analysis. Cambridge University Press. 825 p.

171
5. Conclusions This study aimed at identifying the most typical timber sale network structures among Finnish family forest owners by applying a rather new kind of approach. Social network analysis can be a useful methodology for studying forest-related decision-making situations. Its results can, e.g. help to develop forest owners’ guidance, forest planning services and planning systems so that owners can better be supported in their practical decision making.
Half of the studied forest owners; FMA-partners and Non-committed FMA-members, had always connection to the FMA in their recent timber trade. The position of FMA will probably remain strong also in the future as far as forest owners are ageing and the average size of forest holding remains relatively small. The other groups that were identified, Relationship builders and Independent timber sellers, have often direct connections with timber buyers and they also sell timber more frequently.
With respect to timber procurement of forest industry, Relationship builders and Independent timber sellers can be thought as the most easily attainable customers. Opposite to this, FMA-partners are the ones who need to be encouraged or even pushed to timber trade. FMA-partners are not living next to their forest holdings and they are maybe not that familiar with their forests or which operations to conduct next in the forest. The easiest way to reach them is through FMA because they already have connections and they probably also trust local FMA advisors. FMA-partners might not be willing to use more of their time to timber trade or forestry issues.
Attempts to increase the forest holding size in Finland have been initiated to improve the cost-efficiency of forestry operations and profitability of family forestry as well as access to timber resources. So far, easily attainable services and contact from one place are essential for small-scale forest owners. Producing and developing these services is important to persuade the future forest owners to sell timber. Results of this study suggest that the services offered by FMA could include basic activating features while private entrepreneurs and forest companies could incorporate also more advanced-level services. References Allison, P.D. 2001. Missing data. Thousand Oaks, CA: Sage publications. Bourdieu, P. 1979. Outline of a Theory of Practice. Translated by R. Nice.
Cambridge University Press. 248 p. Burt, R. 1992. Structural holes. The social structure of competition. Harvard
University Press, Cambridge. 315 p.
Butler, B.J. 2008. Family forest owners of the United States, 2006. Gen. Tech. Rep. NRS-27. Newtown Square, PA: U.S. Department of Agriculture, Forest Service, Northern Research Station. 72 p.
Butler, B.J. & Leatherberry, E.C. 2004. America’s family forest owners. Journal of Forestry 102(7): 4–9.
Forest Finland in Brief. 2009. Finnish Forest Research Institute. 48 p. Accessed on July 27, 2010 at http://www.metla.fi/metinfo/tilasto/julkaisut/muut/brief2009.pdf
Hujala, T. & Tikkanen, J. 2008. Boosters of and Barriers to Smooth Communication in Family Forest owners’ Decision Making. Scandinavian Journal of Forest Research, 23(5): 466–477.
Hänninen, H., Karppinen, H. & Leppänen, J. 2010. Suomalainen metsänomistaja 2010 [Finnish Forest Owner 2010]. In Press. (In Finnish.)
Hänninen, H. & Karppinen, H. 2010. Yksityismetsänomistajat puntarissa [Private forest land owners in barometer]. In: Sevola, Y. (ed.) Metsä, talous, yhteiskunta. Katsauksia metsäekonomiseen tutkimukseen [Forest, economics, society. Reviews on research in forest economics]. Working Papers of the Finnish Forest Research Insitute 145: 55–68. (In Finnish.)
Karppinen, H., Hänninen, H. & Ripatti, P. 2002. Suomalainen metsänomistaja 2000 [Finnish Forest Owner 2000]. Finnish Forest Research Institute Research Papers 852. 83 p. ISBN 951-40-1832-X
Karppinen, H. & Tiainen, L. 2010. “Semmonen niinkun metsäkansa” – suurten ikäluokkien perijät tulevaisuuden metsänomistajina [”Kind of Forest People” – inheritors of the post-war baby-boom generation as the future forest owners]. Metsätieteen aikakauskirja 1:19–38. (In Finnish.)
Knoke, D. & Song Yang. 2008. Social Network Analysis. 133 p. Norušis, M. 2004. SPSS 13.0 Statistical Procedures Companion. Upper
Saddle-River, N.J.: Prentice Hall, Inc. 614 p. Rickenbach, M. 2009. Serving members and reaching others: The
performance and social network of a landowner cooperative. Forest policy and economics 11(8) 593–599.
SPSS Inc. 2010a. SPSS Base 17.0 User's Guide. 616 p. Accessed on July 27, 2010 at http://support.spss.com/ProductsExt/SPSS/Documentation/.
SPSS Inc. 2010b. SPSS Missing ValuesTM 17.0. 115 p. Accessed on July 27, 2010 at http://support.spss.com/ProductsExt/SPSS/Documentation/.
Wasserman, S. & Faust, K. 1994. Social network analysis. Cambridge University Press. 825 p.

172 1
Survey and analysis of forest land trade centers in southern China: A case study of Jiangxi Province
Jun-Chang Liu and Wen-Hui Chen
School of Economics & Management, Beijing Forestry University,
Abstract The most important measure in addressing the forest ownership/land use rights market are the creation of forest land trade centers (FTC), which are established to facilitate the transfer of forest lands in China. The aim of this paper is to analyze the implementation, bottleneck, opportunity, challenge and developing trend of FTCs, based on the status quo of the FTCs in collectively-owned forest regions in Southern China. This paper uses PRA approaches including questionnaires, semi-structured interview to survey the status of forest land trade in the FTCs in four selected counties and the perceptions of their staff, beneficiaries, local governments, county forestry bureaus and Provincial Forestry Department. The study reveals that the establishment and operation of FTCs are subject to a wide range of policy, legal, financial and institutional constraints. The analysis shows that different stakeholders have different opinions about their own benefits. The staffs of FTCs are concerned about the future of the FTCs and recommend to expand the extension of their services; Beneficiaries considered that the forest land trade involves high transaction costs and a complex procedure. Finally, this paper summarizes the experience and lessons about the FTC, and discusses the Proposals to Improve the FTCs in future. Keywords: forest tenure, forest land trade centers, survey 1. Introduction Following the release of "The Decision to Accelerate the Development of Forestry" by the Chinese Central Government in 2003, the State Forestry Administration initiated the Pilot Project on collective forest tenure reform in 2004 in Jiangxi Province and three other provinces. As of 2007, Jiangxi Province completed the major steps of the reform, which include "clarifying property rights, reducing taxes, liberalizing management, and standardizing forest land transactions." The property rights of 8.73 million ha of the collective forest lands in the province were redefined, of which 82.5% were granted to 6.35 million households. This resulted in a substantial increase in the number of management units and significant decrease in the scale of
2
forest management. In this context, trade of forest properties becomes especially important, as it could help increase the scale and efficiency of forest management.
To promote and standardize the trade of forest properties so that the benefits of forest owners can be secured and the efficiency of forest management increased, Jiangxi Province promulgated two policy documents, "Regulations of Forest Resource Transactions" and "Opinions about the Reform of Forest Property Rights System", constructed the provincial and county (city) level trade platforms, and standardized the transaction process. As of the end of 2009, the province had established 64 county(city)-level forest land trade centers with a total of 532 employees and another 15 were under construction. A provincial forest land trade center, named the South Forest Property Rights Exchange, was set up on November 7th, 2009 in Nanchang. By the end of 2009, the trade centers across the province had completed 39 900 transactions with a total forest land area of 251.89 thousand ha and the total value of the transactions amounted to CNY (Chinese yuan)2.449 billion. Among these, 5900 transactions were completed through auction, tender, bidding or listing etc., involving 1.233 million mu forest land and a total value of CNY 1.676 billion. Meanwhile, the province opened the possibility of using forest lands as security for loan, the total number of mortgage loans were 9761, involving 138.99 thousand ha forest lands, and the total loans amounted to CNY 1.819 billion.
Along with the establishment of the forest land trade platform, transaction of forest properties in Jiangxi Province has become more and more active. The price of forest land has increased greatly. The sources of capital and the total investment in forestry both have been increasing. Forest investment and management have attracted many migrant workers returning to their home villages, and a variety of co-operative forest management organizations have emerged. Consequently, the forestry productivity has been advanced to a certain degree. However, several related studies indicate that trade in forest properties outside the county (city) level trade centers is also very active, and the legal status of the forest property trade centers is not very clear. The reasons why some forest owners do not go to the trade center to make the transaction are not well understood. But trade outside the trade centers is perceived less secure.
In this study we investigate the current states of forest property transactions and the operation of the county level forest property trade centers and their role in the local forest property market. We also examine the factors restraining the operation of the trade centers. The objective is to summarize the successful experiences and the lessons that can be learned from the operation of the trade centers in the past years, and to discuss appropriate measures to improve the efficiency of the forest property trade centers.
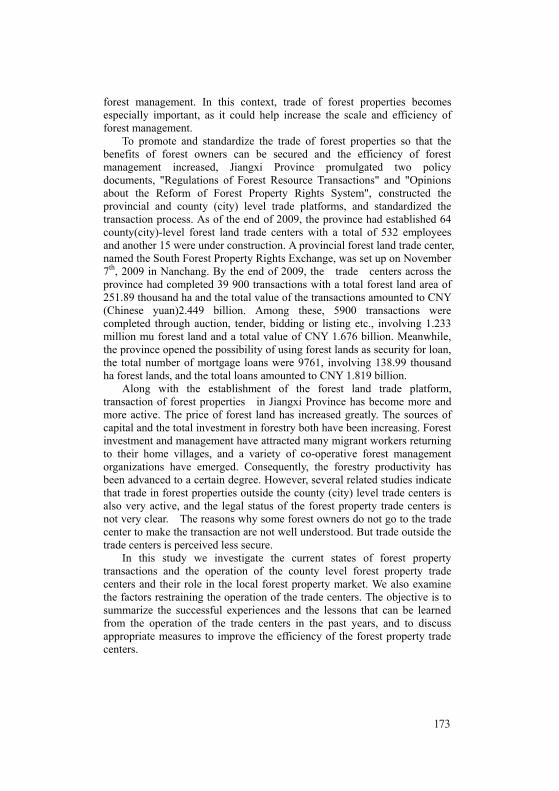
173 1
Survey and analysis of forest land trade centers in southern China: A case study of Jiangxi Province
Jun-Chang Liu and Wen-Hui Chen
School of Economics & Management, Beijing Forestry University,
Abstract The most important measure in addressing the forest ownership/land use rights market are the creation of forest land trade centers (FTC), which are established to facilitate the transfer of forest lands in China. The aim of this paper is to analyze the implementation, bottleneck, opportunity, challenge and developing trend of FTCs, based on the status quo of the FTCs in collectively-owned forest regions in Southern China. This paper uses PRA approaches including questionnaires, semi-structured interview to survey the status of forest land trade in the FTCs in four selected counties and the perceptions of their staff, beneficiaries, local governments, county forestry bureaus and Provincial Forestry Department. The study reveals that the establishment and operation of FTCs are subject to a wide range of policy, legal, financial and institutional constraints. The analysis shows that different stakeholders have different opinions about their own benefits. The staffs of FTCs are concerned about the future of the FTCs and recommend to expand the extension of their services; Beneficiaries considered that the forest land trade involves high transaction costs and a complex procedure. Finally, this paper summarizes the experience and lessons about the FTC, and discusses the Proposals to Improve the FTCs in future. Keywords: forest tenure, forest land trade centers, survey 1. Introduction Following the release of "The Decision to Accelerate the Development of Forestry" by the Chinese Central Government in 2003, the State Forestry Administration initiated the Pilot Project on collective forest tenure reform in 2004 in Jiangxi Province and three other provinces. As of 2007, Jiangxi Province completed the major steps of the reform, which include "clarifying property rights, reducing taxes, liberalizing management, and standardizing forest land transactions." The property rights of 8.73 million ha of the collective forest lands in the province were redefined, of which 82.5% were granted to 6.35 million households. This resulted in a substantial increase in the number of management units and significant decrease in the scale of
2
forest management. In this context, trade of forest properties becomes especially important, as it could help increase the scale and efficiency of forest management.
To promote and standardize the trade of forest properties so that the benefits of forest owners can be secured and the efficiency of forest management increased, Jiangxi Province promulgated two policy documents, "Regulations of Forest Resource Transactions" and "Opinions about the Reform of Forest Property Rights System", constructed the provincial and county (city) level trade platforms, and standardized the transaction process. As of the end of 2009, the province had established 64 county(city)-level forest land trade centers with a total of 532 employees and another 15 were under construction. A provincial forest land trade center, named the South Forest Property Rights Exchange, was set up on November 7th, 2009 in Nanchang. By the end of 2009, the trade centers across the province had completed 39 900 transactions with a total forest land area of 251.89 thousand ha and the total value of the transactions amounted to CNY (Chinese yuan)2.449 billion. Among these, 5900 transactions were completed through auction, tender, bidding or listing etc., involving 1.233 million mu forest land and a total value of CNY 1.676 billion. Meanwhile, the province opened the possibility of using forest lands as security for loan, the total number of mortgage loans were 9761, involving 138.99 thousand ha forest lands, and the total loans amounted to CNY 1.819 billion.
Along with the establishment of the forest land trade platform, transaction of forest properties in Jiangxi Province has become more and more active. The price of forest land has increased greatly. The sources of capital and the total investment in forestry both have been increasing. Forest investment and management have attracted many migrant workers returning to their home villages, and a variety of co-operative forest management organizations have emerged. Consequently, the forestry productivity has been advanced to a certain degree. However, several related studies indicate that trade in forest properties outside the county (city) level trade centers is also very active, and the legal status of the forest property trade centers is not very clear. The reasons why some forest owners do not go to the trade center to make the transaction are not well understood. But trade outside the trade centers is perceived less secure.
In this study we investigate the current states of forest property transactions and the operation of the county level forest property trade centers and their role in the local forest property market. We also examine the factors restraining the operation of the trade centers. The objective is to summarize the successful experiences and the lessons that can be learned from the operation of the trade centers in the past years, and to discuss appropriate measures to improve the efficiency of the forest property trade centers.

174 3
2. Methodologies and survey plots 2.1 Methodologies The following three methods are adopted in this research:
First, documentation researching method is adopted to master the latest research situation of woodland and forestry circulation and the forestry property transaction market, to provide method for the execution of this research and reference of choosing of angle of view.
Second, Participative Rapid Appraisal method (PRA) is adopted to start research and acquire research data.
Third, commodity chain analytical procedure to analyze the data, confirm transaction procedure of forest land and forest, i.e. the inner logical relationship between transferor and transferee.
2.2 The study cases This research involves the forest trade centers in four representative counties (Tonggu, Fengxin, Yifeng, and Jingan) in Jiangxi Province. Tonggu is the first county that started the forest tenure reform, and the first county that completed the reform and established forest trade center. Opened in October 2005, the trade center in Tonggu is the largest with respect to the transaction volume. Fengxin county established its forest trade center in July, 2006, Yifeng county and Jingan county in September, 2006. It is propitious to understand the development process of forest property trade in Jiangxi Province to choose these four counties as case point.
The four counties represent different topographical conditions and differ from each other with respect the characteristics of forest resources. Tonggu county is located in the mountain area far away from the large residential bigalopolis, whereas Fengxin county and Jingan county are located in areas where mountain and hill coexist, close to bigalopolis like Nanchang city etc. Yifeng county represents the typical hill and plain area. The different geographic locations and natural conditions of these four counties also cause the differences in forest resources among the counties.
In the following we describe in more detail the basic situation of the forest tenure reform in the four case counties.
Tonggu County is a key forestry county in the south of Jiangxi Province. With 9.47 million m3 standing timber stock and 53.81 million m3live bamboos, the forest coverage rate reaches 86.4%, ranking the first in Jiangxi. With beautiful landscape and abundant forest resources, the vegetation categories is up to 91 families (more than 500 species), including Chinese yew, golden larch, and 20 other precious species. Tonggu County started the forest tenure reform in August, 2004 and it took leadership in starting reform of collective forest ownership. Up to May in 2005, after 10 months reforming, a comprehensive reform was completed. Through this reform,
4
demarcations of 78,303 forest properties were performed (accounting for 100% of forest area) and 34,800 warrants were issued, among which household registration rate came to 96.6% and right certification accounted for 98%. 34,700 forest disputes (accounting for 98% of all disputes) were mediated. Based on “Forest Resource Transfer Regulations in Jiangxi” and the local situation, “Provisional Regulations on Transfer of Forest Resources in Tonggu” was formulated on July 25, 2005. In October of the same year, Tonggu County established the first forest property trade center in the province. Fengxin County is also one of the key forestry counties in Jiangxi Province. With 5 million m3 standing timber stock and 8 million m3 live bamboos, the forest coverage rate reaches 61.2%. Over 40% of the households in this county live on the rich bamboo resources. Farmers (especially farmers in mountain area) pay particular attention to forest management. Since the collective forest reform has been implemented in 2005, farmers’ income has increased from CNY 717 per capita to CNY 1572. With the further promotion of forest land tenure reform, a forest trade center was established in Fengxin County in July 2006. The “Regulations on Transfer of Forest Resources in Fengxin” was formulated and ancted on January 1st, 2005.
Yifeng County is one of the top 10 bamboo regions in China and a key country in Jiangxi Province. With 6.048 m3 standing timber stock and 120 million m3 live bamboos, the forest coverage rate reaches 71.9%. Among this, the area of bamboo forest is 56 000 ha, accounting for 46% of the forest land area. Wood, bamboo, grain, hydropower and tourism are the five superiorities here. Yifeng County launched a collective forest land tenure reform in 2004 which was in accordance with the provincial forest reform work requirements. By 2007 the primary work of the reform had been successfully completed. The reform involved 44,312 households and a forest area of 120 thousand ha. Up to August in 2008, the county has issued 69,000 new warrants with 100% certification. More than 90% of the farmers affected by the reform are satisfied with the results. Based on “Forest Resource Transfer Regulations in Jiangxi” and the local situation, “Regulations on Transfer of Forest Land and Bamboos in Yifeng” was formulated after right reform was fully completed on April 30, 2007. This aim of the regulation was to promote proper forest management and regulate forest transfer activities.
Jingan County is a key forestry county in southern China and in Jiangxi Province. It has 6.268 million m3 standing timber stock and 36.189 million m3 live bamboos. The forest coverage rate is 82.8%, ranking the front of counties in Jiangxi. Jingan County launched the collective forest land tenure reform in 2006. Up to 2007, a comprehensive reform was achieved. Based on “Forest Resource Transfer Regulations in Jiangxi” and the local forestry situation, a forest land trade center was established after tenure reform was

175 3
2. Methodologies and survey plots 2.1 Methodologies The following three methods are adopted in this research:
First, documentation researching method is adopted to master the latest research situation of woodland and forestry circulation and the forestry property transaction market, to provide method for the execution of this research and reference of choosing of angle of view.
Second, Participative Rapid Appraisal method (PRA) is adopted to start research and acquire research data.
Third, commodity chain analytical procedure to analyze the data, confirm transaction procedure of forest land and forest, i.e. the inner logical relationship between transferor and transferee.
2.2 The study cases This research involves the forest trade centers in four representative counties (Tonggu, Fengxin, Yifeng, and Jingan) in Jiangxi Province. Tonggu is the first county that started the forest tenure reform, and the first county that completed the reform and established forest trade center. Opened in October 2005, the trade center in Tonggu is the largest with respect to the transaction volume. Fengxin county established its forest trade center in July, 2006, Yifeng county and Jingan county in September, 2006. It is propitious to understand the development process of forest property trade in Jiangxi Province to choose these four counties as case point.
The four counties represent different topographical conditions and differ from each other with respect the characteristics of forest resources. Tonggu county is located in the mountain area far away from the large residential bigalopolis, whereas Fengxin county and Jingan county are located in areas where mountain and hill coexist, close to bigalopolis like Nanchang city etc. Yifeng county represents the typical hill and plain area. The different geographic locations and natural conditions of these four counties also cause the differences in forest resources among the counties.
In the following we describe in more detail the basic situation of the forest tenure reform in the four case counties.
Tonggu County is a key forestry county in the south of Jiangxi Province. With 9.47 million m3 standing timber stock and 53.81 million m3live bamboos, the forest coverage rate reaches 86.4%, ranking the first in Jiangxi. With beautiful landscape and abundant forest resources, the vegetation categories is up to 91 families (more than 500 species), including Chinese yew, golden larch, and 20 other precious species. Tonggu County started the forest tenure reform in August, 2004 and it took leadership in starting reform of collective forest ownership. Up to May in 2005, after 10 months reforming, a comprehensive reform was completed. Through this reform,
4
demarcations of 78,303 forest properties were performed (accounting for 100% of forest area) and 34,800 warrants were issued, among which household registration rate came to 96.6% and right certification accounted for 98%. 34,700 forest disputes (accounting for 98% of all disputes) were mediated. Based on “Forest Resource Transfer Regulations in Jiangxi” and the local situation, “Provisional Regulations on Transfer of Forest Resources in Tonggu” was formulated on July 25, 2005. In October of the same year, Tonggu County established the first forest property trade center in the province. Fengxin County is also one of the key forestry counties in Jiangxi Province. With 5 million m3 standing timber stock and 8 million m3 live bamboos, the forest coverage rate reaches 61.2%. Over 40% of the households in this county live on the rich bamboo resources. Farmers (especially farmers in mountain area) pay particular attention to forest management. Since the collective forest reform has been implemented in 2005, farmers’ income has increased from CNY 717 per capita to CNY 1572. With the further promotion of forest land tenure reform, a forest trade center was established in Fengxin County in July 2006. The “Regulations on Transfer of Forest Resources in Fengxin” was formulated and ancted on January 1st, 2005.
Yifeng County is one of the top 10 bamboo regions in China and a key country in Jiangxi Province. With 6.048 m3 standing timber stock and 120 million m3 live bamboos, the forest coverage rate reaches 71.9%. Among this, the area of bamboo forest is 56 000 ha, accounting for 46% of the forest land area. Wood, bamboo, grain, hydropower and tourism are the five superiorities here. Yifeng County launched a collective forest land tenure reform in 2004 which was in accordance with the provincial forest reform work requirements. By 2007 the primary work of the reform had been successfully completed. The reform involved 44,312 households and a forest area of 120 thousand ha. Up to August in 2008, the county has issued 69,000 new warrants with 100% certification. More than 90% of the farmers affected by the reform are satisfied with the results. Based on “Forest Resource Transfer Regulations in Jiangxi” and the local situation, “Regulations on Transfer of Forest Land and Bamboos in Yifeng” was formulated after right reform was fully completed on April 30, 2007. This aim of the regulation was to promote proper forest management and regulate forest transfer activities.
Jingan County is a key forestry county in southern China and in Jiangxi Province. It has 6.268 million m3 standing timber stock and 36.189 million m3 live bamboos. The forest coverage rate is 82.8%, ranking the front of counties in Jiangxi. Jingan County launched the collective forest land tenure reform in 2006. Up to 2007, a comprehensive reform was achieved. Based on “Forest Resource Transfer Regulations in Jiangxi” and the local forestry situation, a forest land trade center was established after tenure reform was

176 5
fully completed in 2007. This center aims to promote proper forest management and regulate forest transfer activities. 3. Survey result and analysis 3.1 Types of forest land trade and its procedure 3.1.1 Types of trade The survey shows that there are various types of forest land traansactions in the four counties studied. The types can be divided into transactions through the trade centers and private trade according to whether the trade is conducted in the property trade center.
Transactions through the trade centers can be further divided into various forms according to the following specific classification criteria: (1) According to the pricing method it can be divided into auction, bidding, and negotiation; (2) According to the target date and the way of payment, it can be divided into transfer and leasing; (3) According to the transfer times of property, it can be divided into just-for once and secondary (multiple) circulation; (4) According to various objects, it can be divided into forested land circulation ( which includes arbor land circulation, bamboo land circulation, and mixed forest circulation) and deforested land circulation; (5) According to the time period, it can be divided into long-term (mostly arbor forest or mixed forest circulation between 20 to 30 years) and short-term (bamboo circulation within 10 years).
There is no statistic record on the way of private transactions in the above counties. However, based upon the estimation of the trade centers, the total number of private transactions is large. And the main trading object is stumpage. Very few trade for the land. The survey shows that in the ordinary people’s opinion, it is more difficult for them to obtain the harvest permission compared with large companies. Therefore, they would like to transfer the stumpage to the company. And also it is simpler to trade in private than through the trade center.
3.1.2 The Trading Procedure Transaction of forest property through the trade center involves a complex procedure, which usually takes 30-60 workdays to complete. Private transaction could be finished in one day or even shorter time. The majority of the purchaser and the bargainer in the private circulation sign an agreement, while there is also a minority who reach an oral agreement. Normally they do not apply for registration of the ownership. The procedures in the two different groups are shown in Figure 3-1 and Figure 3-2.
6
Figure 3-1 The procedure of trade in the trade center
According to the Regulations on the Transfer of Forest Resource in Jiangxi, the transfer of collective forest and state-owned forest must be made in a trade center, following the procedure shown in Figure 3-1.
Unqualifie
Meet conditions
Unanimity
Dissent
Application
Forest owners
Trade Center
Checking
Registration
Note
Performance
Complement Bulletin
Circulation Bidding Auction
Assignment
Settlement
Registration

177 5
fully completed in 2007. This center aims to promote proper forest management and regulate forest transfer activities. 3. Survey result and analysis 3.1 Types of forest land trade and its procedure 3.1.1 Types of trade The survey shows that there are various types of forest land traansactions in the four counties studied. The types can be divided into transactions through the trade centers and private trade according to whether the trade is conducted in the property trade center.
Transactions through the trade centers can be further divided into various forms according to the following specific classification criteria: (1) According to the pricing method it can be divided into auction, bidding, and negotiation; (2) According to the target date and the way of payment, it can be divided into transfer and leasing; (3) According to the transfer times of property, it can be divided into just-for once and secondary (multiple) circulation; (4) According to various objects, it can be divided into forested land circulation ( which includes arbor land circulation, bamboo land circulation, and mixed forest circulation) and deforested land circulation; (5) According to the time period, it can be divided into long-term (mostly arbor forest or mixed forest circulation between 20 to 30 years) and short-term (bamboo circulation within 10 years).
There is no statistic record on the way of private transactions in the above counties. However, based upon the estimation of the trade centers, the total number of private transactions is large. And the main trading object is stumpage. Very few trade for the land. The survey shows that in the ordinary people’s opinion, it is more difficult for them to obtain the harvest permission compared with large companies. Therefore, they would like to transfer the stumpage to the company. And also it is simpler to trade in private than through the trade center.
3.1.2 The Trading Procedure Transaction of forest property through the trade center involves a complex procedure, which usually takes 30-60 workdays to complete. Private transaction could be finished in one day or even shorter time. The majority of the purchaser and the bargainer in the private circulation sign an agreement, while there is also a minority who reach an oral agreement. Normally they do not apply for registration of the ownership. The procedures in the two different groups are shown in Figure 3-1 and Figure 3-2.
6
Figure 3-1 The procedure of trade in the trade center
According to the Regulations on the Transfer of Forest Resource in Jiangxi, the transfer of collective forest and state-owned forest must be made in a trade center, following the procedure shown in Figure 3-1.
Unqualifie
Meet conditions
Unanimity
Dissent
Application
Forest owners
Trade Center
Checking
Registration
Note
Performance
Complement Bulletin
Circulation Bidding Auction
Assignment
Settlement
Registration

178 7
The process of the private transfer is shown in Figure 3-2. It mainly includes the following steps.
(1) The negotiation on the forest land between the purchaser and the bargainer;
(2) A respected village leader or a person who is acceptable by both sides will be the witness, and then the two sides will sign the agreement after they come to terms.
(3) Take into effect.
Figure 3-2 the Process of Private Circulation
3.2 Advantages and Disadvantages of Forest land Trade Type Different types of forest land trade have their own advantages and disadvantages. Take the long-term flow and the short term into consideration. the former term will be good for the purchaser to manage the forest resources, but it may do the bad effects on the bargainer. Such as, the bargainer gives the long-term forest use rights to the purchaser based on the current price, and then the bargainor is likely to face the damage of the interests which is caused by the proliferation of the forest. Based on the norms and the promotion of the circulation, the main focus of this research are the features of the inside of the center and private circulation As an alternative role played by such two circulation ways with each other, the advantages of inside flow of the center to a large extent is the disadvantages of private flows, embodied in the transfer process convenience, height of the turnover costs and benefits, protection of the interests after the transfer, the applicable of the transfer and other aspects. Details are showing in the following table 3-1.
Assignee Transferer Circulation
Negotiation Leader in Village or a Witness
8
Table 3-1: Comparison of the features between the inside and private flows Inside flow of the center Private flow
Convenience No.: need more than 30-60 working days
Yes. It can be finished in a short time, such as one day.
Transation costs Relatively high: trade fee , evaluation cost, board and lodging cost, etc. Almost no cost
Price Comparatively higher: the circulation price maybe higher
The circulation price maybe lower
Protection Registration of the ownership change provides good protection for both sides
Little protection for both sides: It can lead to dispute over the forest
Suitability Suitable for larger scale transactions
No requirement of the size of the main flow, but more suitable for the small-scale, irregular flow of transactions
Public service Yes., such as the policy insurance of the forest
No. identified by management department as the violation of the relevant laws and regulations
3.3 The improtance of forest trade centers Based on the survey, the importance of forest trade centers in Jiangxi province can be summarized as the follows.
First, it has set up a platform which can help to attract capital from other sectors to finance large-scale purchase of forest lands. Big invetsors can easily obtain large area of forest land through the trade centers than dealing with hundred farmers solely. As a result, the transaction cost is reduced.
Second, it has set up a platform which can provide a multitude of services. Currently, the Forest Property Trade Centers and the related authorities jointly provide forest land mortgage, insurance, and several other types of services to foresters. It is helpful to enhance the efficiency of forest allocation and to reduce the risk in delivering the forest activities.
So far, the significance of forest property trade centers continues to increase, that is, the number of the participants involved in the center constantly grows. One reason of this is that the trade centers and other relevant departments jointly provide the multiple services for the foresters which can not be obtained without the center. The other reason exists in the enhancement of the awareness of the transaction of property is the convenience of registration and contribute to a better implementation of the rights.
3.4 The Stakeholder Analysis 3.4.1 The Trade Center Staff In the investigation of the four county forest trade centers, it is found that most of the staff of the trade centers come from the County Forest Bureaus.

179 7
The process of the private transfer is shown in Figure 3-2. It mainly includes the following steps.
(1) The negotiation on the forest land between the purchaser and the bargainer;
(2) A respected village leader or a person who is acceptable by both sides will be the witness, and then the two sides will sign the agreement after they come to terms.
(3) Take into effect.
Figure 3-2 the Process of Private Circulation
3.2 Advantages and Disadvantages of Forest land Trade Type Different types of forest land trade have their own advantages and disadvantages. Take the long-term flow and the short term into consideration. the former term will be good for the purchaser to manage the forest resources, but it may do the bad effects on the bargainer. Such as, the bargainer gives the long-term forest use rights to the purchaser based on the current price, and then the bargainor is likely to face the damage of the interests which is caused by the proliferation of the forest. Based on the norms and the promotion of the circulation, the main focus of this research are the features of the inside of the center and private circulation As an alternative role played by such two circulation ways with each other, the advantages of inside flow of the center to a large extent is the disadvantages of private flows, embodied in the transfer process convenience, height of the turnover costs and benefits, protection of the interests after the transfer, the applicable of the transfer and other aspects. Details are showing in the following table 3-1.
Assignee Transferer Circulation
Negotiation Leader in Village or a Witness
8
Table 3-1: Comparison of the features between the inside and private flows Inside flow of the center Private flow
Convenience No.: need more than 30-60 working days
Yes. It can be finished in a short time, such as one day.
Transation costs Relatively high: trade fee , evaluation cost, board and lodging cost, etc. Almost no cost
Price Comparatively higher: the circulation price maybe higher
The circulation price maybe lower
Protection Registration of the ownership change provides good protection for both sides
Little protection for both sides: It can lead to dispute over the forest
Suitability Suitable for larger scale transactions
No requirement of the size of the main flow, but more suitable for the small-scale, irregular flow of transactions
Public service Yes., such as the policy insurance of the forest
No. identified by management department as the violation of the relevant laws and regulations
3.3 The improtance of forest trade centers Based on the survey, the importance of forest trade centers in Jiangxi province can be summarized as the follows.
First, it has set up a platform which can help to attract capital from other sectors to finance large-scale purchase of forest lands. Big invetsors can easily obtain large area of forest land through the trade centers than dealing with hundred farmers solely. As a result, the transaction cost is reduced.
Second, it has set up a platform which can provide a multitude of services. Currently, the Forest Property Trade Centers and the related authorities jointly provide forest land mortgage, insurance, and several other types of services to foresters. It is helpful to enhance the efficiency of forest allocation and to reduce the risk in delivering the forest activities.
So far, the significance of forest property trade centers continues to increase, that is, the number of the participants involved in the center constantly grows. One reason of this is that the trade centers and other relevant departments jointly provide the multiple services for the foresters which can not be obtained without the center. The other reason exists in the enhancement of the awareness of the transaction of property is the convenience of registration and contribute to a better implementation of the rights.
3.4 The Stakeholder Analysis 3.4.1 The Trade Center Staff In the investigation of the four county forest trade centers, it is found that most of the staff of the trade centers come from the County Forest Bureaus.

180 9
And if the staff is not suficient, the center will make a social recruitment to hire some temporary staff.
The investigation of the trading center staff, the staff in the four trade centers are all satisfied with the current situation of trade center, but they are not optimistic about the future of the center. They believe that the current legal status of the center and function are not clear. They do not know it is a temporary organization or permanent department of local government. 3.4.2 The Beneficiary In the four counties, we interviewed representatives of two farmer Cooperation organizations (one in Tonggu County and the other in Yifeng County), the leaders of 6 towns, the leaders of 6 villages, 23 transfer families (including four farmers who did not make any transfer), and the leaders of 6 forest companies. The following are the opinions and suggestions obtained from them. Farmer Forest Cooperation Organization Among the four surveyed counties, only Tonggu County and Yifeng County have the cooperation organization. The survey is focusing on the opinion of the Farmer Cooperation organization about the forest trade and the suggestions on how to improve the operation of forest trade center.
As for forest land, the leaders of the Cooperation organization think that the trade center is a better choice to avoid disputes, but they hope the forest land to be transferred between farmers in the same village, which makes it easier for the forest owner to join the cooperation organization and to manage the forest. If the land is transferred to farmers from other villages, the owner of the land will often be not in the village. The managers of the association fear that the owner may not be willing to pay the member fee to the orgnization. Farmers A total of 23 transfer families participated in the survey. Among them, six from the High bridge Xianghua village of Tonggu county, three from the Dacao Village of Sandu town, four from the Xiakang village in Chian town of Fengxin County, three from the Shuangfeng village of Yifeng County, three from the Xinzhuang Town, four from the Zhongyuan village of Jing’an County, Shuikou village, Shanggao County (external circulation households) and Jing’an County.
In the opinion Based on of the perspective of farmers, the village has three issues that deserved to some concern.: First, there are a considerable portion of transferred forest land is protected forest area, which violates the relevant regulations in “Forest Resource Transfer Ordinance” issued by Jiangxi province government which states that the protected forests should
10
not be transferred. Secondly, some farmers do not know that there is a forest tenure trading center in their counties, almost all of the few farmers have never visited the trade center. Third, the transferee usually has the willingness to have registration of transfer procedures, but the transferer is often reluctant to go to the forest trade tenure trading center to do that, which makes it difficult to complete the registration transfer of forest ownership. In addition, farmers all have the transfer contracts they both signed after they reach the transfer agreement, which says that after the transfer, the transferee is obliged to guarantee that the resources of the returned forest should be up to a certain standard. Forest enterprises Managers from six different types of enterprises were interviewed. Among these, there is one forest company with foreign investment and one wood-processing enterprise in Tonggu County, one wood-processing enterprise in Fengxin County, and two forest companies and one wood-processing enterprise from Yifeng County. In addition, one important transferor from Jing’an County is preparing for establishing a timber processing enterprise with forest recreation services. Their views of the forest trade centers are summarized as follows:
First, they think that the trade centers have more information on the tracsaction objects and they can easily get the information they need through the a trade center.
Second, trade centers can help secure the ownership of forests bought through the trade center. The ownership of forest land bought through the trade center is better protected by law. Thus, one can avoid potential disputes with famers after the transaction.
Third, the trade centers can handle mortgage credits, which is conducive to financing and increase the production and operation of enterprises. 4. Discussion 4.1 The Experience and Lessons Learned According to the investigation and discussion about the forest right trading center, we can gain the following experience.
First, the functions of the forest trade centers include administration of the forest trade, release of relevant information, file query, legal consulting and other intermediary services. To some extent, these facilitate the trade and tracsaction of forest properties.
Second, the forest trade centers provide mortgage, insurance with bank and insurance company. This not only extends the forest trading service chain but also expands the intermediate function of the trade centers. Therefore, those functions do assist the development of forest land management and getting more benefit for forest farmers.

181 9
And if the staff is not suficient, the center will make a social recruitment to hire some temporary staff.
The investigation of the trading center staff, the staff in the four trade centers are all satisfied with the current situation of trade center, but they are not optimistic about the future of the center. They believe that the current legal status of the center and function are not clear. They do not know it is a temporary organization or permanent department of local government. 3.4.2 The Beneficiary In the four counties, we interviewed representatives of two farmer Cooperation organizations (one in Tonggu County and the other in Yifeng County), the leaders of 6 towns, the leaders of 6 villages, 23 transfer families (including four farmers who did not make any transfer), and the leaders of 6 forest companies. The following are the opinions and suggestions obtained from them. Farmer Forest Cooperation Organization Among the four surveyed counties, only Tonggu County and Yifeng County have the cooperation organization. The survey is focusing on the opinion of the Farmer Cooperation organization about the forest trade and the suggestions on how to improve the operation of forest trade center.
As for forest land, the leaders of the Cooperation organization think that the trade center is a better choice to avoid disputes, but they hope the forest land to be transferred between farmers in the same village, which makes it easier for the forest owner to join the cooperation organization and to manage the forest. If the land is transferred to farmers from other villages, the owner of the land will often be not in the village. The managers of the association fear that the owner may not be willing to pay the member fee to the orgnization. Farmers A total of 23 transfer families participated in the survey. Among them, six from the High bridge Xianghua village of Tonggu county, three from the Dacao Village of Sandu town, four from the Xiakang village in Chian town of Fengxin County, three from the Shuangfeng village of Yifeng County, three from the Xinzhuang Town, four from the Zhongyuan village of Jing’an County, Shuikou village, Shanggao County (external circulation households) and Jing’an County.
In the opinion Based on of the perspective of farmers, the village has three issues that deserved to some concern.: First, there are a considerable portion of transferred forest land is protected forest area, which violates the relevant regulations in “Forest Resource Transfer Ordinance” issued by Jiangxi province government which states that the protected forests should
10
not be transferred. Secondly, some farmers do not know that there is a forest tenure trading center in their counties, almost all of the few farmers have never visited the trade center. Third, the transferee usually has the willingness to have registration of transfer procedures, but the transferer is often reluctant to go to the forest trade tenure trading center to do that, which makes it difficult to complete the registration transfer of forest ownership. In addition, farmers all have the transfer contracts they both signed after they reach the transfer agreement, which says that after the transfer, the transferee is obliged to guarantee that the resources of the returned forest should be up to a certain standard. Forest enterprises Managers from six different types of enterprises were interviewed. Among these, there is one forest company with foreign investment and one wood-processing enterprise in Tonggu County, one wood-processing enterprise in Fengxin County, and two forest companies and one wood-processing enterprise from Yifeng County. In addition, one important transferor from Jing’an County is preparing for establishing a timber processing enterprise with forest recreation services. Their views of the forest trade centers are summarized as follows:
First, they think that the trade centers have more information on the tracsaction objects and they can easily get the information they need through the a trade center.
Second, trade centers can help secure the ownership of forests bought through the trade center. The ownership of forest land bought through the trade center is better protected by law. Thus, one can avoid potential disputes with famers after the transaction.
Third, the trade centers can handle mortgage credits, which is conducive to financing and increase the production and operation of enterprises. 4. Discussion 4.1 The Experience and Lessons Learned According to the investigation and discussion about the forest right trading center, we can gain the following experience.
First, the functions of the forest trade centers include administration of the forest trade, release of relevant information, file query, legal consulting and other intermediary services. To some extent, these facilitate the trade and tracsaction of forest properties.
Second, the forest trade centers provide mortgage, insurance with bank and insurance company. This not only extends the forest trading service chain but also expands the intermediate function of the trade centers. Therefore, those functions do assist the development of forest land management and getting more benefit for forest farmers.

182 11
Third, the fair and transparent trading manners of forest trade center not only protect the interests of both sides, but also promote the added and preservation value of forest land.
Fourth, the foundation of trade centers on county level laid a solid basement for the formation of the forest land trade system of the province and the country.
Certainly, we have also learned a lot from the operation of the current county-level trading center. These include:
First, most farmers have little knowledge and small area of forest land. The complex trading process and difficult jargon set by the trade centers make them hard to enter the trade center to carry out trading activities. Therefore, it is very important for the trade centers to disseminate knowledge of forest transactions and simplify the procedure.
Second, to trade through the county-level forest trade centers would incur high transaction costs for the majority of farmers because they live far away from the trade centers. Therefore, many farmers are reluctant to carry out the trading activities in the trade centers. They hope that the application service of the forest trading can be held regularly in the forest concentrated villages and towns. Then the farmers’ cost can be reduced.
Third, the existing county-level forest trade centers can not fully meet farmers’ needs for a variety technical services, especially those concerning the management of the forests. Right now, farmers need not only trade service, but also technical services about the management of forest resources, forest pest control etc. Farmers hope that there is a department which can supply all the technical services. In the future, the county-level forest trade centers should further extend their service chain, and coordinate all the forest management units in the technical services. 4.2 Proposals to Improve the Forest Trade Center The following measures are proposed to improve the development of the Forest Trade Centers in the future.
Firstly, strengthening the legal system. The role of forest rade centers in forest asset assessment, forest mortgage and insurance should be clearly defined, and their qualification in carrying out these jobs should be certified.
Secondly, improving the transaction regulations. In order to increase the share of forest trade through the trade centers, it is necessary to enhance the services of the trade centers and simplify the forest ownership registration process. This can help prevent the potential troubles that may arise with future property rights disputes.
Thirdly, strengthening advertisement of the forest trade centers. A multitute of channels can be used to avertising the forest trade centers so that the services they provide as well as the advantages of trading through
12
the trdae centers are known by a larger number of local people, especially the farmers.
References: [1]. State Forestry Administration, A milestone of reform in Chinese rural
area: Collective Forest Reform in the last 30 years. [R],2008
[2]. HUA Wenli, Discussion and suggestions about forest tenure trade in Sueichuan County, Jiangxi, Yongan city and Shaxian County, Fujian. [J], Huadong Forestry Management, vol.23(4):2009
[3]. HUANG Wanli & MONG Kuanhong, Study on the calculation method of forest land [J],Forestry Construction, 2009(4):12-15
[4]. HUNG Xisheng, SONG Haiou, Study on the institution of private forest tenure trade [J], The Journal of Hubei Economics College, 2005:vol.2(9):113-114
[5]. WANG Xuele, WANG Su, LIU y, The Effectiveness analysis of forest tenure trade, [J],China Forestry Economy,2008(1):15-17
[6]. XU Xiuying, XU Cuenxiang, Study on the forest tenure market system in southern China I.Forestry Resource Management, 2006(4)

183 11
Third, the fair and transparent trading manners of forest trade center not only protect the interests of both sides, but also promote the added and preservation value of forest land.
Fourth, the foundation of trade centers on county level laid a solid basement for the formation of the forest land trade system of the province and the country.
Certainly, we have also learned a lot from the operation of the current county-level trading center. These include:
First, most farmers have little knowledge and small area of forest land. The complex trading process and difficult jargon set by the trade centers make them hard to enter the trade center to carry out trading activities. Therefore, it is very important for the trade centers to disseminate knowledge of forest transactions and simplify the procedure.
Second, to trade through the county-level forest trade centers would incur high transaction costs for the majority of farmers because they live far away from the trade centers. Therefore, many farmers are reluctant to carry out the trading activities in the trade centers. They hope that the application service of the forest trading can be held regularly in the forest concentrated villages and towns. Then the farmers’ cost can be reduced.
Third, the existing county-level forest trade centers can not fully meet farmers’ needs for a variety technical services, especially those concerning the management of the forests. Right now, farmers need not only trade service, but also technical services about the management of forest resources, forest pest control etc. Farmers hope that there is a department which can supply all the technical services. In the future, the county-level forest trade centers should further extend their service chain, and coordinate all the forest management units in the technical services. 4.2 Proposals to Improve the Forest Trade Center The following measures are proposed to improve the development of the Forest Trade Centers in the future.
Firstly, strengthening the legal system. The role of forest rade centers in forest asset assessment, forest mortgage and insurance should be clearly defined, and their qualification in carrying out these jobs should be certified.
Secondly, improving the transaction regulations. In order to increase the share of forest trade through the trade centers, it is necessary to enhance the services of the trade centers and simplify the forest ownership registration process. This can help prevent the potential troubles that may arise with future property rights disputes.
Thirdly, strengthening advertisement of the forest trade centers. A multitute of channels can be used to avertising the forest trade centers so that the services they provide as well as the advantages of trading through
12
the trdae centers are known by a larger number of local people, especially the farmers.
References: [1]. State Forestry Administration, A milestone of reform in Chinese rural
area: Collective Forest Reform in the last 30 years. [R],2008
[2]. HUA Wenli, Discussion and suggestions about forest tenure trade in Sueichuan County, Jiangxi, Yongan city and Shaxian County, Fujian. [J], Huadong Forestry Management, vol.23(4):2009
[3]. HUANG Wanli & MONG Kuanhong, Study on the calculation method of forest land [J],Forestry Construction, 2009(4):12-15
[4]. HUNG Xisheng, SONG Haiou, Study on the institution of private forest tenure trade [J], The Journal of Hubei Economics College, 2005:vol.2(9):113-114
[5]. WANG Xuele, WANG Su, LIU y, The Effectiveness analysis of forest tenure trade, [J],China Forestry Economy,2008(1):15-17
[6]. XU Xiuying, XU Cuenxiang, Study on the forest tenure market system in southern China I.Forestry Resource Management, 2006(4)

184
Finnish family forest owner 2010 survey
Jussi Leppänen Finnish Forest Research Institute (METLA)
Abstract The Finnish Forest Research Institute has carried out monitoring surveys on Finnish family forest owners since the 1970s. The most recent survey data was collected at the beginning of the year 2009. The mail survey consisted of 13,000 of a total 300,000 family forest holdings over 5 hectares of productive forestland. The response rate was 49 per cent. The results show, for instance, that the average age of Finnish forest owners is 60 years. According to major occupation, 45 per cent of forest owners are pensioners, 30 per cent are wage earners, 16 per cent are agricultural and forestry entrepreneurs and 7 per cent are 'other' entrepreneurs. With regard to ownership form, 76 per cent of family forest holdings are in single person or family ownership, whereas both private partnerships and heirs represent 12 per cent of forest holdings. Forest owners are not greatly urbanised yet, as 55 per cent live in rural areas and the rest live in villages or towns. Sixty-four per cent live in the same municipality with their forest holding. Forest owners most commonly have multiple objectives, as this objective group represents 34 per cent of owners and 48 per cent of forest area. During the last ten years, the share of multiobjective, indifferent and recreational owners has increased, whereas the share of self-employed and investor owners has decreased. Keywords: mail survey, forest owners, family forests 1. Introduction The Finnish Forest Research Institute (Metla) has carried out monitoring surveys on Finnish family forest owners since the 1970s (Karppinen and Hänninen 2006). Since then, the topics that have been analysed by employing survey materials have been various. For instance, which factors affect forest owners' roundwood sales? What are forest owners' objectives for their forestry? How is public financing for forestry works affecting forest owners' behaviour? What is the role of forest extension with regard to forest owners' behaviour? Which factors explain the self-activity of forest owners?
Although behavioural and economic studies are forest-ownership researchers' key area of interest, most of the public interest is focused on
more general factors. Who are the 'forest owners' of their profession? How many forest owners live in cities? How much forest do they own? What is the proportion of female owners? There are many questions and a lot of misinformation circulating among the general public that can be addressed by reports based on forest owner surveys. However, the most important users are policy makers, civil servants and other researchers, who need to have correct – and as much up-to-date information – as is possible.
This article aims at describing some features of Finnish forest ownership. The latest survey data were collected in the beginning of the year 2009. A comprehensive report on Finnish family forest owners is to be published in Finnish during the winter period 2010-11 (Hänninen et al. 2010). 2. Survey of 2009 The survey of 2009 was designed based on the experiences of the previous survey of 1999 (Karppinen et al. 2002). Large parts of the survey questionnaire were left almost unchanged for monitoring purposes. Topical issues were added, and a new base design was introduced: The survey questionnaire included a common part and three variable parts on different topics. This facilitated the shortening of the questionnaire to an individual forest owner, who had to fill only one of the three variable parts. On the other hand, results from variable parts will not be representative regionally.
The common (or fixed) part of the questionnaire included questions on the features of the owner and holding. The most time-consuming sections for a forest owner were questions on the cuttings and silvicultural works, which had been carried out on the holding during the preceding five years (2004-2008). The variable part had three separate topics: Decision making for tending of young stands, forest planning and forest conservation through the Finnish 'METSO-programme'.
The sampling, contact addresses and other available information were based on existing tax registers. Private ownership had to be direct, i.e. personal or family ownership, private partnership or heirs (undistributed ownership). Other private ownership forms like companies or jointly owned forest were excluded. The sample was set at 1,000 holdings per forestry centre, because regionally representative results were needed for local policy making. Information on productive forest area from tax registers was employed in stratified sampling according to forest size for every region.
Because there are 13 forestry centres in Finland, the mail survey consisted of 13,000 of a total 300,000 family forest holdings over 5 hectares of productive forestland. The survey was conducted on the Finnish mainland only, i.e. the province of Åland was excluded. Forest holding was defined to be located within one municipality. Holdings owned by spouses were regarded as a single holding, even if spouses had separate holdings in their

185
Finnish family forest owner 2010 survey
Jussi Leppänen Finnish Forest Research Institute (METLA)
Abstract The Finnish Forest Research Institute has carried out monitoring surveys on Finnish family forest owners since the 1970s. The most recent survey data was collected at the beginning of the year 2009. The mail survey consisted of 13,000 of a total 300,000 family forest holdings over 5 hectares of productive forestland. The response rate was 49 per cent. The results show, for instance, that the average age of Finnish forest owners is 60 years. According to major occupation, 45 per cent of forest owners are pensioners, 30 per cent are wage earners, 16 per cent are agricultural and forestry entrepreneurs and 7 per cent are 'other' entrepreneurs. With regard to ownership form, 76 per cent of family forest holdings are in single person or family ownership, whereas both private partnerships and heirs represent 12 per cent of forest holdings. Forest owners are not greatly urbanised yet, as 55 per cent live in rural areas and the rest live in villages or towns. Sixty-four per cent live in the same municipality with their forest holding. Forest owners most commonly have multiple objectives, as this objective group represents 34 per cent of owners and 48 per cent of forest area. During the last ten years, the share of multiobjective, indifferent and recreational owners has increased, whereas the share of self-employed and investor owners has decreased. Keywords: mail survey, forest owners, family forests 1. Introduction The Finnish Forest Research Institute (Metla) has carried out monitoring surveys on Finnish family forest owners since the 1970s (Karppinen and Hänninen 2006). Since then, the topics that have been analysed by employing survey materials have been various. For instance, which factors affect forest owners' roundwood sales? What are forest owners' objectives for their forestry? How is public financing for forestry works affecting forest owners' behaviour? What is the role of forest extension with regard to forest owners' behaviour? Which factors explain the self-activity of forest owners?
Although behavioural and economic studies are forest-ownership researchers' key area of interest, most of the public interest is focused on
more general factors. Who are the 'forest owners' of their profession? How many forest owners live in cities? How much forest do they own? What is the proportion of female owners? There are many questions and a lot of misinformation circulating among the general public that can be addressed by reports based on forest owner surveys. However, the most important users are policy makers, civil servants and other researchers, who need to have correct – and as much up-to-date information – as is possible.
This article aims at describing some features of Finnish forest ownership. The latest survey data were collected in the beginning of the year 2009. A comprehensive report on Finnish family forest owners is to be published in Finnish during the winter period 2010-11 (Hänninen et al. 2010). 2. Survey of 2009 The survey of 2009 was designed based on the experiences of the previous survey of 1999 (Karppinen et al. 2002). Large parts of the survey questionnaire were left almost unchanged for monitoring purposes. Topical issues were added, and a new base design was introduced: The survey questionnaire included a common part and three variable parts on different topics. This facilitated the shortening of the questionnaire to an individual forest owner, who had to fill only one of the three variable parts. On the other hand, results from variable parts will not be representative regionally.
The common (or fixed) part of the questionnaire included questions on the features of the owner and holding. The most time-consuming sections for a forest owner were questions on the cuttings and silvicultural works, which had been carried out on the holding during the preceding five years (2004-2008). The variable part had three separate topics: Decision making for tending of young stands, forest planning and forest conservation through the Finnish 'METSO-programme'.
The sampling, contact addresses and other available information were based on existing tax registers. Private ownership had to be direct, i.e. personal or family ownership, private partnership or heirs (undistributed ownership). Other private ownership forms like companies or jointly owned forest were excluded. The sample was set at 1,000 holdings per forestry centre, because regionally representative results were needed for local policy making. Information on productive forest area from tax registers was employed in stratified sampling according to forest size for every region.
Because there are 13 forestry centres in Finland, the mail survey consisted of 13,000 of a total 300,000 family forest holdings over 5 hectares of productive forestland. The survey was conducted on the Finnish mainland only, i.e. the province of Åland was excluded. Forest holding was defined to be located within one municipality. Holdings owned by spouses were regarded as a single holding, even if spouses had separate holdings in their

186
possession. The response time was set at between the 9th of February and the 30th of March 2009, but some questionnaires were returned later than this. Over 6,300 questionnaires were returned, which after adjustments accounts for a response rate of about 49 per cent. The questionnaire form was also designed to be completed electronically on the internet, but this option was used by only 345 respondents.
Non-response analysis was carried out on 201 forest holdings by phone, which created problems in finding a contact person in cases where holdings had several owners. Another problem was that farmers seemed to be easier to contact, and their proportion was clearly overestimated in non-response analysis. However, the sample already included information on private partnerships and heirs, and their proportions were not different with regard to the responses. In addition, agricultural statistics on the number of farmers and their forest ownership were employed for non-response evaluation.
The conclusion from non-response analysis was that responding owners differed from non-respondents only with regard to the proportion of agricultural entrepreneurs. This is quite understandable from the time- consumption point of view, since farmers have annually to complete quite an amount of differing documents. Therefore, weights based on agricultural field area were developed to adjust for the non-response error. 3. Family forest ownership structure 1990-2010 3.1 Forest holding and ownership structure Approximately 80 per cent of municipally defined family forest holdings are smaller than 50 hectares of productive forest land (Figure 1). If all holdings in the country with one owner are summed up, this proportion decreases to 75 per cent. Only six per cent (or nine per cent in case of summing up) of the holdings are over 100 hectares. The largest holdings are very usually located in several municipalities or even regions: Some 2/3 of forest holdings, which at country level are over 200 hectares, are located in at least two municipalities.
22
27
32
14
51
19
24
32
16
7
2
0
5
10
15
20
25
30
35
5-10 10-20 20-50 50-100 100-200 Over 200
Within certainmunicipalityIn the whole country
% of forest holdings
Figure 1. Distribution of forest holdings according to holding size class in 2009 (ha). Those holdings, which are over 50 hectares, cover 55-60 per cent of productive forest area, depending how a holding is regionally defined (Figure 2). Although holdings under 20 hectares are great in number, they cover only circa 15 per cent of forest area. Holdings over 100 hectares cover 24-31 per cent of productive forest area.
The long-term development of family forest holdings in Finland has been analysed by Leppänen (2008). According to recent statistics including all forest holdings over 2 hectares, there are 735,000 individual forest owners (Hänninen and Peltola 2010). This represents 14 per cents of the Finnish population of approximately 5,350,000 inhabitants.
5
11
29 28
18
84
10
28 28
20
11
0
5
10
15
20
25
30
35
5-10 10-20 20-50 50-100 100-200 Over 200
Within certainmunicipalityIn the whole country
% of forest area
Figure 2. Distribution of forest area according to holding size class in 2009 (ha).

187
possession. The response time was set at between the 9th of February and the 30th of March 2009, but some questionnaires were returned later than this. Over 6,300 questionnaires were returned, which after adjustments accounts for a response rate of about 49 per cent. The questionnaire form was also designed to be completed electronically on the internet, but this option was used by only 345 respondents.
Non-response analysis was carried out on 201 forest holdings by phone, which created problems in finding a contact person in cases where holdings had several owners. Another problem was that farmers seemed to be easier to contact, and their proportion was clearly overestimated in non-response analysis. However, the sample already included information on private partnerships and heirs, and their proportions were not different with regard to the responses. In addition, agricultural statistics on the number of farmers and their forest ownership were employed for non-response evaluation.
The conclusion from non-response analysis was that responding owners differed from non-respondents only with regard to the proportion of agricultural entrepreneurs. This is quite understandable from the time- consumption point of view, since farmers have annually to complete quite an amount of differing documents. Therefore, weights based on agricultural field area were developed to adjust for the non-response error. 3. Family forest ownership structure 1990-2010 3.1 Forest holding and ownership structure Approximately 80 per cent of municipally defined family forest holdings are smaller than 50 hectares of productive forest land (Figure 1). If all holdings in the country with one owner are summed up, this proportion decreases to 75 per cent. Only six per cent (or nine per cent in case of summing up) of the holdings are over 100 hectares. The largest holdings are very usually located in several municipalities or even regions: Some 2/3 of forest holdings, which at country level are over 200 hectares, are located in at least two municipalities.
22
27
32
14
51
19
24
32
16
7
2
0
5
10
15
20
25
30
35
5-10 10-20 20-50 50-100 100-200 Over 200
Within certainmunicipalityIn the whole country
% of forest holdings
Figure 1. Distribution of forest holdings according to holding size class in 2009 (ha). Those holdings, which are over 50 hectares, cover 55-60 per cent of productive forest area, depending how a holding is regionally defined (Figure 2). Although holdings under 20 hectares are great in number, they cover only circa 15 per cent of forest area. Holdings over 100 hectares cover 24-31 per cent of productive forest area.
The long-term development of family forest holdings in Finland has been analysed by Leppänen (2008). According to recent statistics including all forest holdings over 2 hectares, there are 735,000 individual forest owners (Hänninen and Peltola 2010). This represents 14 per cents of the Finnish population of approximately 5,350,000 inhabitants.
5
11
29 28
18
84
10
28 28
20
11
0
5
10
15
20
25
30
35
5-10 10-20 20-50 50-100 100-200 Over 200
Within certainmunicipalityIn the whole country
% of forest area
Figure 2. Distribution of forest area according to holding size class in 2009 (ha).
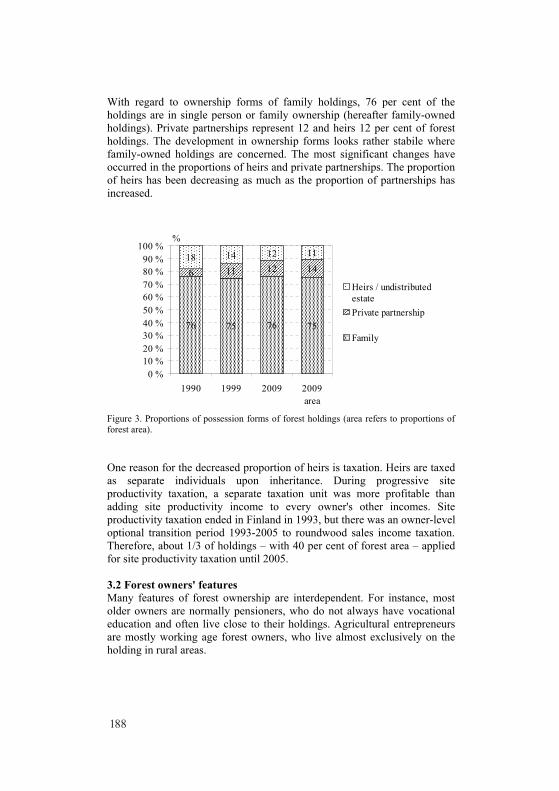
188
With regard to ownership forms of family holdings, 76 per cent of the holdings are in single person or family ownership (hereafter family-owned holdings). Private partnerships represent 12 and heirs 12 per cent of forest holdings. The development in ownership forms looks rather stabile where family-owned holdings are concerned. The most significant changes have occurred in the proportions of heirs and private partnerships. The proportion of heirs has been decreasing as much as the proportion of partnerships has increased.
76 75 76 75
6 11 12 1418 14 12 11
0 %10 %20 %30 %40 %50 %60 %70 %80 %90 %
100 %
1990 1999 2009 2009area
Heirs / undistributedestatePrivate partnership
Family
%
Figure 3. Proportions of possession forms of forest holdings (area refers to proportions of forest area). One reason for the decreased proportion of heirs is taxation. Heirs are taxed as separate individuals upon inheritance. During progressive site productivity taxation, a separate taxation unit was more profitable than adding site productivity income to every owner's other incomes. Site productivity taxation ended in Finland in 1993, but there was an owner-level optional transition period 1993-2005 to roundwood sales income taxation. Therefore, about 1/3 of holdings – with 40 per cent of forest area – applied for site productivity taxation until 2005. 3.2 Forest owners' features Many features of forest ownership are interdependent. For instance, most older owners are normally pensioners, who do not always have vocational education and often live close to their holdings. Agricultural entrepreneurs are mostly working age forest owners, who live almost exclusively on the holding in rural areas.
Finnish family forest owners are not greatly urbanised yet, as 55 per cent of forest owners live in rural areas (Figure 4). Nineteen per cent of forest owners live in villages or small towns and 26 per cent in towns with over 20,000 inhabitants. However, many of those who live in more densely populated locations are not living far from their forest: 64 per cent live in the same municipality with their forest holding. For those 36 per cent who live outside the municipality of their forest holding, the average distance to holding is 190 kilometres.
The place of residence development has been clear as forest owners live increasingly in cities and fewer in rural areas. However, forest owners who live in rural areas have 64 per cent of forest area, meaning that they have larger holdings than those who live in villages or towns.
67 63 55 64
15 1819
15
18 19 26 21
0 %10 %20 %30 %40 %50 %60 %70 %80 %90 %
100 %
1990 1999 2009 2009area
City >20000 inh.
Populationcentre/small townRural area
%
Figure 4. Proportions of forest owners' place of residence (area refers to proportions of forest area). According to major occupation, 45 per cent of forest owners are pensioners, 30 per cent wage earners, 16 per cent agricultural and forestry entrepreneurs and 7 per cent other entrepreneurs (Figure 5). Two per cent do not belong to any of the previous groups. During the last 20 years the proportion of agricultural and forestry entrepreneurs has been decreasing from 31 to 16 per cent. Much of this has probably taken place as a result of the retirement process. The proportion of pensioners has been increasing from 34 to 45 per cent.
However, if agriculture as a side-occupation is also considered, this increases the proportion of agricultural and forestry entrepreneurs from 16 to 20 per cent. Agricultural and forestry entrepreneurs have larger than

189
With regard to ownership forms of family holdings, 76 per cent of the holdings are in single person or family ownership (hereafter family-owned holdings). Private partnerships represent 12 and heirs 12 per cent of forest holdings. The development in ownership forms looks rather stabile where family-owned holdings are concerned. The most significant changes have occurred in the proportions of heirs and private partnerships. The proportion of heirs has been decreasing as much as the proportion of partnerships has increased.
76 75 76 75
6 11 12 1418 14 12 11
0 %10 %20 %30 %40 %50 %60 %70 %80 %90 %
100 %
1990 1999 2009 2009area
Heirs / undistributedestatePrivate partnership
Family
%
Figure 3. Proportions of possession forms of forest holdings (area refers to proportions of forest area). One reason for the decreased proportion of heirs is taxation. Heirs are taxed as separate individuals upon inheritance. During progressive site productivity taxation, a separate taxation unit was more profitable than adding site productivity income to every owner's other incomes. Site productivity taxation ended in Finland in 1993, but there was an owner-level optional transition period 1993-2005 to roundwood sales income taxation. Therefore, about 1/3 of holdings – with 40 per cent of forest area – applied for site productivity taxation until 2005. 3.2 Forest owners' features Many features of forest ownership are interdependent. For instance, most older owners are normally pensioners, who do not always have vocational education and often live close to their holdings. Agricultural entrepreneurs are mostly working age forest owners, who live almost exclusively on the holding in rural areas.
Finnish family forest owners are not greatly urbanised yet, as 55 per cent of forest owners live in rural areas (Figure 4). Nineteen per cent of forest owners live in villages or small towns and 26 per cent in towns with over 20,000 inhabitants. However, many of those who live in more densely populated locations are not living far from their forest: 64 per cent live in the same municipality with their forest holding. For those 36 per cent who live outside the municipality of their forest holding, the average distance to holding is 190 kilometres.
The place of residence development has been clear as forest owners live increasingly in cities and fewer in rural areas. However, forest owners who live in rural areas have 64 per cent of forest area, meaning that they have larger holdings than those who live in villages or towns.
67 63 55 64
15 1819
15
18 19 26 21
0 %10 %20 %30 %40 %50 %60 %70 %80 %90 %
100 %
1990 1999 2009 2009area
City >20000 inh.
Populationcentre/small townRural area
%
Figure 4. Proportions of forest owners' place of residence (area refers to proportions of forest area). According to major occupation, 45 per cent of forest owners are pensioners, 30 per cent wage earners, 16 per cent agricultural and forestry entrepreneurs and 7 per cent other entrepreneurs (Figure 5). Two per cent do not belong to any of the previous groups. During the last 20 years the proportion of agricultural and forestry entrepreneurs has been decreasing from 31 to 16 per cent. Much of this has probably taken place as a result of the retirement process. The proportion of pensioners has been increasing from 34 to 45 per cent.
However, if agriculture as a side-occupation is also considered, this increases the proportion of agricultural and forestry entrepreneurs from 16 to 20 per cent. Agricultural and forestry entrepreneurs have larger than

190
average holdings, as their proportion of forest area is 26 per cent, or 30 per cent if agriculture, as a side-occupation, is also considered.
34 37 45 39
31 22 16 26
2830 30 26
5 6 7 82 5 2 2
0 %10 %20 %30 %40 %50 %60 %70 %80 %90 %
100 %
1990 1999 2009 2009area
Others
Entrepreneurs
Wage-earners
Agricultural andforestry entrepreneursPensioners
%
Figure 5. Proportions of forest owners' major occupations (area refers to proportions of forest area). During the last 20 years, the proportion of wage-earners has stabilised, because retirement is taking place in the older-aged end of the group. Entrepreneurs in sectors other than agriculture or forestry have increased their share steadily with a per centage unit per decade. The group 'others' covers unemployed, employed at home etc. and their proportion has been rather stable at two per cent, except for the year 1999 when it was five per cent. The most probable explanation for that observation is the relatively high unemployment that prevailed in Finland during the 1990s.
The average age of Finnish forest owners is 60 years. There is also a major structural difference among forest owners, as those who carry out agriculture on their holding are on average 53 years old. Whereas the others are already 62 years. This situation has changed remarkably since 1990, when the average age of all forest owners was 54 years: agricultural and forestry entrepreneurs were 55 and other forest owners 53 years.
Moreover, today the age distribution has a positive skew as 56 per cent of the owners have reached 60 years (Figure 6). The situation is not very different if proportions – according to possessed forest area – are investigated. During the last 20 years, the proportion of those who are over 60 years has increased significantly. The proportion of forest owners under 40 years has fallen from 15 to 6 per cent. Furthermore, those who are between 40-59 years have also lost their share significantly.
37 4456 53
4845
37 40
15 11 6 8
0 %10 %20 %30 %40 %50 %60 %70 %80 %90 %
100 %
1990 1999 2009 2009 area
-40 years40-59 years60 + years
%
Figure 6. Proportions of forest owners' age groups (area refers to proportions of forest area). One explanation regarding the age factor, is that people are becoming forest owners later on in life. An average age of such forest owners who have possessed their holding a maximum five years is 52 years. Ten years ago the corresponding age was 49 years. The age factor is largely linked to the inheritance process itself. Those who have obtained their holding through inheritance are 55 years old, whereas those who have purchased holding from their parents or relatives are 48 years, and those who have bought their holding on open markets are 51 years.
Another, even more important reason for the perceptible increase in forest owner age can be attributed to the economic environment: In Finland, forestry is regarded as a business only with regard to active agriculture in the holding, otherwise it is regarded as a financial investment. This produces a difference of economy between agricultural and non-agricultural forest owners. Unlike agricultural forest owners, non-agricultural forest owners do not have obligatory pension insurances and reliefs in inheritance and donation taxes in the transfer of any given holding to a descendant. Agriculture on the other hand has gone through a structural change due to EU-membership since 1995, which has decreased both the average age of farmers and the number of farms.
Although forest owners' general education level has been improving over time, there are still 32 per cent of forest owners without any general vocational education (Figure 7). An almost similar proportion – at 35 per cent of forest owners – has a vocational degree and 33 per cent a college or academic degree. Twenty-one per cent of forest owners have A-level, whereas in 1990 the proportion was 15 per cent.

191
average holdings, as their proportion of forest area is 26 per cent, or 30 per cent if agriculture, as a side-occupation, is also considered.
34 37 45 39
31 22 16 26
2830 30 26
5 6 7 82 5 2 2
0 %10 %20 %30 %40 %50 %60 %70 %80 %90 %
100 %
1990 1999 2009 2009area
Others
Entrepreneurs
Wage-earners
Agricultural andforestry entrepreneursPensioners
%
Figure 5. Proportions of forest owners' major occupations (area refers to proportions of forest area). During the last 20 years, the proportion of wage-earners has stabilised, because retirement is taking place in the older-aged end of the group. Entrepreneurs in sectors other than agriculture or forestry have increased their share steadily with a per centage unit per decade. The group 'others' covers unemployed, employed at home etc. and their proportion has been rather stable at two per cent, except for the year 1999 when it was five per cent. The most probable explanation for that observation is the relatively high unemployment that prevailed in Finland during the 1990s.
The average age of Finnish forest owners is 60 years. There is also a major structural difference among forest owners, as those who carry out agriculture on their holding are on average 53 years old. Whereas the others are already 62 years. This situation has changed remarkably since 1990, when the average age of all forest owners was 54 years: agricultural and forestry entrepreneurs were 55 and other forest owners 53 years.
Moreover, today the age distribution has a positive skew as 56 per cent of the owners have reached 60 years (Figure 6). The situation is not very different if proportions – according to possessed forest area – are investigated. During the last 20 years, the proportion of those who are over 60 years has increased significantly. The proportion of forest owners under 40 years has fallen from 15 to 6 per cent. Furthermore, those who are between 40-59 years have also lost their share significantly.
37 4456 53
4845
37 40
15 11 6 8
0 %10 %20 %30 %40 %50 %60 %70 %80 %90 %
100 %
1990 1999 2009 2009 area
-40 years40-59 years60 + years
%
Figure 6. Proportions of forest owners' age groups (area refers to proportions of forest area). One explanation regarding the age factor, is that people are becoming forest owners later on in life. An average age of such forest owners who have possessed their holding a maximum five years is 52 years. Ten years ago the corresponding age was 49 years. The age factor is largely linked to the inheritance process itself. Those who have obtained their holding through inheritance are 55 years old, whereas those who have purchased holding from their parents or relatives are 48 years, and those who have bought their holding on open markets are 51 years.
Another, even more important reason for the perceptible increase in forest owner age can be attributed to the economic environment: In Finland, forestry is regarded as a business only with regard to active agriculture in the holding, otherwise it is regarded as a financial investment. This produces a difference of economy between agricultural and non-agricultural forest owners. Unlike agricultural forest owners, non-agricultural forest owners do not have obligatory pension insurances and reliefs in inheritance and donation taxes in the transfer of any given holding to a descendant. Agriculture on the other hand has gone through a structural change due to EU-membership since 1995, which has decreased both the average age of farmers and the number of farms.
Although forest owners' general education level has been improving over time, there are still 32 per cent of forest owners without any general vocational education (Figure 7). An almost similar proportion – at 35 per cent of forest owners – has a vocational degree and 33 per cent a college or academic degree. Twenty-one per cent of forest owners have A-level, whereas in 1990 the proportion was 15 per cent.
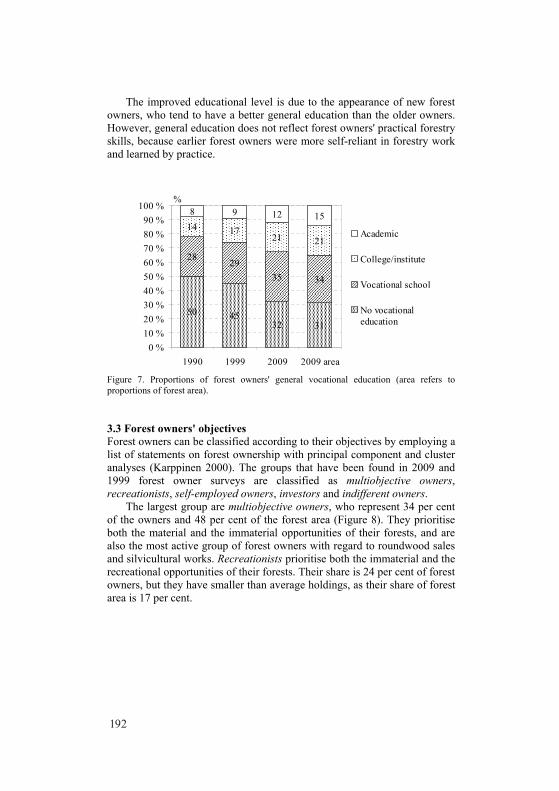
192
The improved educational level is due to the appearance of new forest owners, who tend to have a better general education than the older owners. However, general education does not reflect forest owners' practical forestry skills, because earlier forest owners were more self-reliant in forestry work and learned by practice.
50 4532 31
28 2935 34
14 1721 21
8 9 12 15
0 %10 %20 %30 %40 %50 %60 %70 %80 %90 %
100 %
1990 1999 2009 2009 area
Academic
College/institute
Vocational school
No vocationaleducation
%
Figure 7. Proportions of forest owners' general vocational education (area refers to proportions of forest area). 3.3 Forest owners' objectives Forest owners can be classified according to their objectives by employing a list of statements on forest ownership with principal component and cluster analyses (Karppinen 2000). The groups that have been found in 2009 and 1999 forest owner surveys are classified as multiobjective owners, recreationists, self-employed owners, investors and indifferent owners.
The largest group are multiobjective owners, who represent 34 per cent of the owners and 48 per cent of the forest area (Figure 8). They prioritise both the material and the immaterial opportunities of their forests, and are also the most active group of forest owners with regard to roundwood sales and silvicultural works. Recreationists prioritise both the immaterial and the recreational opportunities of their forests. Their share is 24 per cent of forest owners, but they have smaller than average holdings, as their share of forest area is 17 per cent.
34
24
1612 14
48
1712 12 11
0
10
20
30
40
50
60
Multiobjectiveowners
Recreationists Self-employedowners
Investors Indifferent
% of forest owners % of forest area
%
Figure 8. Proportions of forest owners' objective groups in the 2009 survey. The term self-employed owners refers to self-active forest owners prioritising also income from forests. The label should not be interpreted as a synonym for entrepreneur. Their proportion is 16 per cent of owners, but only 12 per cent of forest area. Investors prioritise regular sales income, but the label includes owners with a focus on risk-aversion and financial security offering optional incomes for 'a rainy day'.
Indifferent owners have been introduced, if not necessarily found, as a separate group later than other groups. 'Indifference' means that a forest owner does not have clear objectives for his/her forest. Their proportion is 14 per cent of owners and 11 per cent of forest area. There are no studies so far indicating whether indifference is a permanent or temporary state of objective during a forest owner's life and how it is connected to the state of forests or holdings as a whole.
The proportional development of multiobjective owners and recreationists during the last decade has been rather small, but other groups seem to have gone through greater changes (Figure 9). The proportions of self-employed and investors have been decreasing by 3–4 per centage units. On the other hand, the proportion of indifferent owners has been increasing by 4 per centage units.
In any case, the objectives have an impact upon the activity of the forest owner: Roundwood sales behaviour can be quite different among objective groups (Favada et al. 2009): For example, roundwood sales volumes by indifferent owners are very elastic to roundwood price changes.

193
The improved educational level is due to the appearance of new forest owners, who tend to have a better general education than the older owners. However, general education does not reflect forest owners' practical forestry skills, because earlier forest owners were more self-reliant in forestry work and learned by practice.
50 4532 31
28 2935 34
14 1721 21
8 9 12 15
0 %10 %20 %30 %40 %50 %60 %70 %80 %90 %
100 %
1990 1999 2009 2009 area
Academic
College/institute
Vocational school
No vocationaleducation
%
Figure 7. Proportions of forest owners' general vocational education (area refers to proportions of forest area). 3.3 Forest owners' objectives Forest owners can be classified according to their objectives by employing a list of statements on forest ownership with principal component and cluster analyses (Karppinen 2000). The groups that have been found in 2009 and 1999 forest owner surveys are classified as multiobjective owners, recreationists, self-employed owners, investors and indifferent owners.
The largest group are multiobjective owners, who represent 34 per cent of the owners and 48 per cent of the forest area (Figure 8). They prioritise both the material and the immaterial opportunities of their forests, and are also the most active group of forest owners with regard to roundwood sales and silvicultural works. Recreationists prioritise both the immaterial and the recreational opportunities of their forests. Their share is 24 per cent of forest owners, but they have smaller than average holdings, as their share of forest area is 17 per cent.
34
24
1612 14
48
1712 12 11
0
10
20
30
40
50
60
Multiobjectiveowners
Recreationists Self-employedowners
Investors Indifferent
% of forest owners % of forest area
%
Figure 8. Proportions of forest owners' objective groups in the 2009 survey. The term self-employed owners refers to self-active forest owners prioritising also income from forests. The label should not be interpreted as a synonym for entrepreneur. Their proportion is 16 per cent of owners, but only 12 per cent of forest area. Investors prioritise regular sales income, but the label includes owners with a focus on risk-aversion and financial security offering optional incomes for 'a rainy day'.
Indifferent owners have been introduced, if not necessarily found, as a separate group later than other groups. 'Indifference' means that a forest owner does not have clear objectives for his/her forest. Their proportion is 14 per cent of owners and 11 per cent of forest area. There are no studies so far indicating whether indifference is a permanent or temporary state of objective during a forest owner's life and how it is connected to the state of forests or holdings as a whole.
The proportional development of multiobjective owners and recreationists during the last decade has been rather small, but other groups seem to have gone through greater changes (Figure 9). The proportions of self-employed and investors have been decreasing by 3–4 per centage units. On the other hand, the proportion of indifferent owners has been increasing by 4 per centage units.
In any case, the objectives have an impact upon the activity of the forest owner: Roundwood sales behaviour can be quite different among objective groups (Favada et al. 2009): For example, roundwood sales volumes by indifferent owners are very elastic to roundwood price changes.

194
32
2320
15
10
34
24
1612
14
0
5
10
15
20
25
30
35
40
Multiobjectiveowners
Recreationists Self-employedowners
Investors Indifferent
1999 2009
%
Figure 9. Proportions of forest owners' objective groups, 2009 compared to the 1999 survey. 4. Discussion This article focused on introducing the results from the Finnish family forest owner 2010 survey by Metla. This survey can be regarded as the most comprehensive study on family forest owners in Finland, and serves as a benchmark for other surveys.
The most important findings can be summarised as follows: rapid ageing of non-agricultural forest owners, the decrease of agricultural and forestry entrepreneurs as forest owners, the decrease in heirs as forest owners and the increase of indifferent forest owners as an objective group. It is also possible to show that this progress is partly due to economic environment, which could be affected by economic policies.
The survey data will be employed in coming years in several studies on family forest owners. New results are needed, for instance due to the fact that at the moment Finnish forest industries are undergoing structural changes, which have substantially decreased production in almost all sub-sectors of the forest industry. The evident reason for this is the recession in markets and the decrease of annual roundwood imports by over ten million m3 since the beginning of 2009. This has emerged as a consequence of Russian roundwood export customs policy. The only visibly growing business is the consumption of energy wood, and this growth is projected to continue into the next decade.
To elaborate further upon the previous example of information needs, technical cutting potential calculations indicate, depending on applied assumptions, a great potential for an increase in domestic cuttings especially in family forests (Nuutinen et al. 2007). However, it is not realistic to
assume the realisation of such harvesting volumes in the near future, this is because no opportunity costs – due to user values of forests – nor family ownership limits have been taken into account in these calculations.
Acknowledgements The receipt of funding from the 'Metsämiesten Säätiö' Foundation is gratefully acknowledged. Particular thanks to Harri Hänninen and Heimo Karppinen for reading the earlier version of the manuscript and to Mark Ward for checking the language. References Favada, I.M., Karppinen, H., Kuuluvainen, J., Mikkola, J. & Stavness, C.
2009. Effects of timber prices, ownership objectives, and owner characteristics on timber supply. Forest Science 55(6):512-523.
Hänninen, H., Karppinen, H. & Leppänen, J. 2010. Suomalainen metsänomistaja 2010. [Finnish family forest owner 2010]. Finnish Forest Research Institute, manuscript.
Hänninen, H. & Peltola, A. 2010. Metsämaan omistus. [Ownership of productive forest land]. Metsätilastotiedote 28/2010. 12 p.
Karppinen, H. 2000. Forest values and the objectives of ownership. Research Paper 757. Finnish Forest Research Institute. 55 p. + 4 articles.
Karppinen, H. & Hänninen, H. 2006. Monitoring Finnish family forests. The Forestry Chronicle 82(5): 657-681.
Karppinen, H., Hänninen, H. & Ripatti, P. 2002. Suomalainen metsänomistaja 2000. [Finnish forest owner 2000] Metsäntutkimuslaitoksen tiedonantoja 852. 83 p.
Leppänen, J. 2008. Parcelisation of family forests in Finland. In: Bergseng, E., Delbeck, G. & Hoen, H.F. (eds.). Proceedings of the Biennial Meeting of the Scandinavian Society of Forest Economics. Lom, Norway, 6th-9th April 2008. Scandinavian Forest Economics 42: 361-377.
Nuutinen, T., Hirvelä, H., Salminen, O. & Härkönen, K. 2007. Alueelliset hakkuumahdollisuudet valtakunnan metsien 10. inventoinnin perusteella, maastotyöt 2004–2006. [Regional cutting potentials according to the 10th national forest inventory, field works 2004-2006] Metsätieteen aikakauskirja 2B/2007: 215–248.

195
32
2320
15
10
34
24
1612
14
0
5
10
15
20
25
30
35
40
Multiobjectiveowners
Recreationists Self-employedowners
Investors Indifferent
1999 2009
%
Figure 9. Proportions of forest owners' objective groups, 2009 compared to the 1999 survey. 4. Discussion This article focused on introducing the results from the Finnish family forest owner 2010 survey by Metla. This survey can be regarded as the most comprehensive study on family forest owners in Finland, and serves as a benchmark for other surveys.
The most important findings can be summarised as follows: rapid ageing of non-agricultural forest owners, the decrease of agricultural and forestry entrepreneurs as forest owners, the decrease in heirs as forest owners and the increase of indifferent forest owners as an objective group. It is also possible to show that this progress is partly due to economic environment, which could be affected by economic policies.
The survey data will be employed in coming years in several studies on family forest owners. New results are needed, for instance due to the fact that at the moment Finnish forest industries are undergoing structural changes, which have substantially decreased production in almost all sub-sectors of the forest industry. The evident reason for this is the recession in markets and the decrease of annual roundwood imports by over ten million m3 since the beginning of 2009. This has emerged as a consequence of Russian roundwood export customs policy. The only visibly growing business is the consumption of energy wood, and this growth is projected to continue into the next decade.
To elaborate further upon the previous example of information needs, technical cutting potential calculations indicate, depending on applied assumptions, a great potential for an increase in domestic cuttings especially in family forests (Nuutinen et al. 2007). However, it is not realistic to
assume the realisation of such harvesting volumes in the near future, this is because no opportunity costs – due to user values of forests – nor family ownership limits have been taken into account in these calculations.
Acknowledgements The receipt of funding from the 'Metsämiesten Säätiö' Foundation is gratefully acknowledged. Particular thanks to Harri Hänninen and Heimo Karppinen for reading the earlier version of the manuscript and to Mark Ward for checking the language. References Favada, I.M., Karppinen, H., Kuuluvainen, J., Mikkola, J. & Stavness, C.
2009. Effects of timber prices, ownership objectives, and owner characteristics on timber supply. Forest Science 55(6):512-523.
Hänninen, H., Karppinen, H. & Leppänen, J. 2010. Suomalainen metsänomistaja 2010. [Finnish family forest owner 2010]. Finnish Forest Research Institute, manuscript.
Hänninen, H. & Peltola, A. 2010. Metsämaan omistus. [Ownership of productive forest land]. Metsätilastotiedote 28/2010. 12 p.
Karppinen, H. 2000. Forest values and the objectives of ownership. Research Paper 757. Finnish Forest Research Institute. 55 p. + 4 articles.
Karppinen, H. & Hänninen, H. 2006. Monitoring Finnish family forests. The Forestry Chronicle 82(5): 657-681.
Karppinen, H., Hänninen, H. & Ripatti, P. 2002. Suomalainen metsänomistaja 2000. [Finnish forest owner 2000] Metsäntutkimuslaitoksen tiedonantoja 852. 83 p.
Leppänen, J. 2008. Parcelisation of family forests in Finland. In: Bergseng, E., Delbeck, G. & Hoen, H.F. (eds.). Proceedings of the Biennial Meeting of the Scandinavian Society of Forest Economics. Lom, Norway, 6th-9th April 2008. Scandinavian Forest Economics 42: 361-377.
Nuutinen, T., Hirvelä, H., Salminen, O. & Härkönen, K. 2007. Alueelliset hakkuumahdollisuudet valtakunnan metsien 10. inventoinnin perusteella, maastotyöt 2004–2006. [Regional cutting potentials according to the 10th national forest inventory, field works 2004-2006] Metsätieteen aikakauskirja 2B/2007: 215–248.
196
1
Small scale forest owners’ economic, social and environmental responsibilities
- literature review, discussion about responsibilities and results from case studies
Lars Lönnstedt1, Per Lagerlöf2 and Andreas Scheibenpflug2
1Department of forest products, Faculty of Forest Science, Swedish University of Agricultural Sciences 2Department of economics, Faculty of Faculty of Natural Resources and Agricultural Sciences, Swedish University of Agricultural Sciences
Abstract Taking responsibility refers to balancing economic, social, and environmental concerns. Based on a short literature review about corporate responsibility and research about small scale forest owners this paper discusses small scale forest owners’ responsibilities for achieving a true sustainable forest management as well as stakeholders’ expectations on the owners, and potential conflicts be-tween owners and stakeholders and between stakeholders. Results from an ex-plorative study are reported. Interviews have been made with ten small scale forest owners, Swedish Forest Agency’s local office holders and a representa-tive from WWF. The results show that the interviewed small scale forest own-ers take economic, environmental and social responsibilities but stress their per-sonal economic responsibility. However, no conflict exists between economic and environmental responsibilities. The economic benefits for the owners for taking more environmental och social responsibility are small. The interviewed stakeholders expect the small scale forest owners to take responsibilities but that the weight the interviewed owners put to their wishes is low. This is an ex-plorative study and a broader study is needed for testing the presented hypo-theses. Keywords: CSR, corporate social responsibility, sustainable, cutting behavior, supply, non-market utilities, local communities
2
1. Introduction That businesses take responsibility is nothing new. In Sweden, for example, al-ready during the 18th and 19th centuries the owners and managers of iron works took sort of a responsibility of the employees and their families. We talk about a special culture for these villages and their works. Also small businesses and their owners have for long taken responsibility, for example, small scale forest owners. The problems that we have identified are that
• the expectations are increasing for small scale forest owners to take re-sponsibilities in a broader sense
• research about responsibilities for small and medium sized companies is to a large extent missing
Small scale forest owners’ responsibilities are closely related to sustainability. In Swedish forestry this concept is defined as (Berggren 2007)
Management and use of land and forest in such a way and time that its capacity, both today and in the future, maintain important environmen-tal, economic and social functions on a local, national and global level without jeopardizing other ecosystems.
The purpose of this article is to study
• what responsibilities small scale forest owners are willing to take • expectations from stakeholders
The paper starts with an overview of the literature about social responsibility and is followed by a summary of relevant research about small scale forest owners. Based on this, different aspects of forest owners’ responsibilities will be discussed and related to the demands from different stakeholders.
This paper is partly based on a master thesis written by Lagerlöf and Scheibenpflug (2010). 2. Social responsibility Our impression after a literature review is that
• many unsupported statements exist about small and medium sized en-terprises’ (SME) responsibilities

197
1
Small scale forest owners’ economic, social and environmental responsibilities
- literature review, discussion about responsibilities and results from case studies
Lars Lönnstedt1, Per Lagerlöf2 and Andreas Scheibenpflug2
1Department of forest products, Faculty of Forest Science, Swedish University of Agricultural Sciences 2Department of economics, Faculty of Faculty of Natural Resources and Agricultural Sciences, Swedish University of Agricultural Sciences
Abstract Taking responsibility refers to balancing economic, social, and environmental concerns. Based on a short literature review about corporate responsibility and research about small scale forest owners this paper discusses small scale forest owners’ responsibilities for achieving a true sustainable forest management as well as stakeholders’ expectations on the owners, and potential conflicts be-tween owners and stakeholders and between stakeholders. Results from an ex-plorative study are reported. Interviews have been made with ten small scale forest owners, Swedish Forest Agency’s local office holders and a representa-tive from WWF. The results show that the interviewed small scale forest own-ers take economic, environmental and social responsibilities but stress their per-sonal economic responsibility. However, no conflict exists between economic and environmental responsibilities. The economic benefits for the owners for taking more environmental och social responsibility are small. The interviewed stakeholders expect the small scale forest owners to take responsibilities but that the weight the interviewed owners put to their wishes is low. This is an ex-plorative study and a broader study is needed for testing the presented hypo-theses. Keywords: CSR, corporate social responsibility, sustainable, cutting behavior, supply, non-market utilities, local communities
2
1. Introduction That businesses take responsibility is nothing new. In Sweden, for example, al-ready during the 18th and 19th centuries the owners and managers of iron works took sort of a responsibility of the employees and their families. We talk about a special culture for these villages and their works. Also small businesses and their owners have for long taken responsibility, for example, small scale forest owners. The problems that we have identified are that
• the expectations are increasing for small scale forest owners to take re-sponsibilities in a broader sense
• research about responsibilities for small and medium sized companies is to a large extent missing
Small scale forest owners’ responsibilities are closely related to sustainability. In Swedish forestry this concept is defined as (Berggren 2007)
Management and use of land and forest in such a way and time that its capacity, both today and in the future, maintain important environmen-tal, economic and social functions on a local, national and global level without jeopardizing other ecosystems.
The purpose of this article is to study
• what responsibilities small scale forest owners are willing to take • expectations from stakeholders
The paper starts with an overview of the literature about social responsibility and is followed by a summary of relevant research about small scale forest owners. Based on this, different aspects of forest owners’ responsibilities will be discussed and related to the demands from different stakeholders.
This paper is partly based on a master thesis written by Lagerlöf and Scheibenpflug (2010). 2. Social responsibility Our impression after a literature review is that
• many unsupported statements exist about small and medium sized en-terprises’ (SME) responsibilities

198
3
• SME must understand what corporate responsibility, CR, is and how to incorporate it in their businesses
• for a better understanding of the stakeholders’ role and expectations, in-fluence can help
• a grading of stakeholders’ influence will also facilitate the response and how to “manage” the expectations
Historically there were clear-cut roles and responsibilities for both businesses and governments, which were relatively independent of one another. And, these actors could neglect the impact on civil society. As complexity grew, business and government became mutually dependent entities. Since their coordinating mechanisms were incapable of adequately arranging various contemporary so-cietal topics, the importance of the civil society increased. Various representa-tives stressed “new” values and approaches, which politics and business no longer could ignore (see, e.g. Albrict and van Gils, 2003, von Marrewijk, 2003). Business had and has to learn how to operate within interfering coordination mechanisms, with blurred boundaries and surrounding layers of varying de-grees of responsibility, overlapping one other. Nowadays, governments increa-singly leave societal issues within the authority of corporations (see, e.g. Gray-son and Hodges, 2004, 234; von Marrewijk, 2003). To at least some extent this is also the case for small scale forest owners. The demands and viewpoints from the society, the public, consumers of forest products, tourists and politi-cians have increased. Forest owners can not neglect this in their management of their forests.
Within the European Union (EU), firms are expected to comply with a range of policy directives that address a wide range of concerns including pro-tecting the environment and respecting employees’ rights. A given policy can be seen as an emerging construct that arises to address unforeseen problems or new social issues (Ars and van Tatenhove, 2005). Such policies can be consi-dered as a formalization of norms or values that have arisen in society in gener-al.
Incorporating social responsibility principles in business conduct has been pioneered by socially mature businesses such as Body Shop and Ben and Jer-ry’s (see, e.g., Hollender and Fenichell, 2004; Mbare, 2004; Thayer Robins, 2001). Large corporations have followed in their footsteps: McDonalds has im-plemented social and environmental programs, for example, promoting fish conservation, (Nilsson, 2005) and Unilever has started programs by including references about human rights in its business principles (Takala, 1996). Also
4
most large forest products companies have done the same which also has an impact on the small scale forest owners (Raditya, 2009).
Reasons for the increasing willingness of businesses to behave in an ethi-cally acceptable manner and to carry their share of a wider non-economic re-sponsibility can be changing values, building images, preparing for future regu-lations and standards, and globalization of corporations, societies and politics (Mikkilä, 2006). Also the values of the forest owners change. Besides many forest owners have always had a concern for the nature. However, the choice of behavior that is ethically “right” is problematic, as there is no model that de-fines how to behave in different operational environments. This problem has arisen especially in the natural resource-based industries such as forest products companies, as their dependence on natural resources binds them intensively and comprehensively to local societies wherever they operate. (ibid.)
Globalization has increased the number of stakeholders and enlarged the debate surrounding businesses. Some research has shown that firms that care for the environment and exhibit responsibility practices experience increased consumer purchase preference in addition to increased investment appeal (Gil-dea, 1994; Porter and Linde, 1995; Zaman et al., 1996). It has been suggested that by adapting business practices and philosophies to social-cultural norms and societal values, businesses can improve the likelihood of securing their le-gitimacy or license to operate. The small scale forest owners also have a set of stakeholders with their demands for how to manage forests, for example, neighbors, the local community, local businesses, forest products companies and their costumers, environmentalists, forest civil servants, people visiting the forests, and politicians. 3. Small scale forest owners For giving a better understanding of the small scale forest owners’ interest in and possibilities for taking responsibilities, three different aspects will be pre-sented: (1) Change of owner structure, (2) motives for ownership and (3) group-ing of owners depending on their management strategies. 3.1 Changing owner structure The owner structure of small scale estates has in western countries undergone major changes during the last three, four decades (Eriksson, 1989; Ripatti, 1996; Kvarda, 2004; Ziegenspeck et al., 2004). Traditional family farms with a combination of agriculture and forestry still exist but have become less com-mon. The agricultural farms have grown in size and become more specialized. Besides it has become quite common to only manage timberland. The farm area

199
3
• SME must understand what corporate responsibility, CR, is and how to incorporate it in their businesses
• for a better understanding of the stakeholders’ role and expectations, in-fluence can help
• a grading of stakeholders’ influence will also facilitate the response and how to “manage” the expectations
Historically there were clear-cut roles and responsibilities for both businesses and governments, which were relatively independent of one another. And, these actors could neglect the impact on civil society. As complexity grew, business and government became mutually dependent entities. Since their coordinating mechanisms were incapable of adequately arranging various contemporary so-cietal topics, the importance of the civil society increased. Various representa-tives stressed “new” values and approaches, which politics and business no longer could ignore (see, e.g. Albrict and van Gils, 2003, von Marrewijk, 2003). Business had and has to learn how to operate within interfering coordination mechanisms, with blurred boundaries and surrounding layers of varying de-grees of responsibility, overlapping one other. Nowadays, governments increa-singly leave societal issues within the authority of corporations (see, e.g. Gray-son and Hodges, 2004, 234; von Marrewijk, 2003). To at least some extent this is also the case for small scale forest owners. The demands and viewpoints from the society, the public, consumers of forest products, tourists and politi-cians have increased. Forest owners can not neglect this in their management of their forests.
Within the European Union (EU), firms are expected to comply with a range of policy directives that address a wide range of concerns including pro-tecting the environment and respecting employees’ rights. A given policy can be seen as an emerging construct that arises to address unforeseen problems or new social issues (Ars and van Tatenhove, 2005). Such policies can be consi-dered as a formalization of norms or values that have arisen in society in gener-al.
Incorporating social responsibility principles in business conduct has been pioneered by socially mature businesses such as Body Shop and Ben and Jer-ry’s (see, e.g., Hollender and Fenichell, 2004; Mbare, 2004; Thayer Robins, 2001). Large corporations have followed in their footsteps: McDonalds has im-plemented social and environmental programs, for example, promoting fish conservation, (Nilsson, 2005) and Unilever has started programs by including references about human rights in its business principles (Takala, 1996). Also
4
most large forest products companies have done the same which also has an impact on the small scale forest owners (Raditya, 2009).
Reasons for the increasing willingness of businesses to behave in an ethi-cally acceptable manner and to carry their share of a wider non-economic re-sponsibility can be changing values, building images, preparing for future regu-lations and standards, and globalization of corporations, societies and politics (Mikkilä, 2006). Also the values of the forest owners change. Besides many forest owners have always had a concern for the nature. However, the choice of behavior that is ethically “right” is problematic, as there is no model that de-fines how to behave in different operational environments. This problem has arisen especially in the natural resource-based industries such as forest products companies, as their dependence on natural resources binds them intensively and comprehensively to local societies wherever they operate. (ibid.)
Globalization has increased the number of stakeholders and enlarged the debate surrounding businesses. Some research has shown that firms that care for the environment and exhibit responsibility practices experience increased consumer purchase preference in addition to increased investment appeal (Gil-dea, 1994; Porter and Linde, 1995; Zaman et al., 1996). It has been suggested that by adapting business practices and philosophies to social-cultural norms and societal values, businesses can improve the likelihood of securing their le-gitimacy or license to operate. The small scale forest owners also have a set of stakeholders with their demands for how to manage forests, for example, neighbors, the local community, local businesses, forest products companies and their costumers, environmentalists, forest civil servants, people visiting the forests, and politicians. 3. Small scale forest owners For giving a better understanding of the small scale forest owners’ interest in and possibilities for taking responsibilities, three different aspects will be pre-sented: (1) Change of owner structure, (2) motives for ownership and (3) group-ing of owners depending on their management strategies. 3.1 Changing owner structure The owner structure of small scale estates has in western countries undergone major changes during the last three, four decades (Eriksson, 1989; Ripatti, 1996; Kvarda, 2004; Ziegenspeck et al., 2004). Traditional family farms with a combination of agriculture and forestry still exist but have become less com-mon. The agricultural farms have grown in size and become more specialized. Besides it has become quite common to only manage timberland. The farm area

200
5
is sold or leased to a neighbor. For running this type of estate it is not necessary for the owner to live on the estate. Thus, many owners live in a local village or in cities. The supply of different types of management services has increased which make this possible.
The major reasons for the changes of the owner structure are economic and social (see, e.g. Wiersum et al. 2005). The production efficiency has increased tremendously. This means that one person can manage much larger areas than before. As a result the standard of living has increased and by that the demands for material wealth. One way of achieving higher wealth has for many people living in the countryside been to move to the cities and wage work. The inter-ests and demands for amusement have also changed, not the least among young people. Cities have more to offer in this respect. 3.2 Motives for ownership A common reason for ownership is that the owner has inherited the estate. To generalize, the first step in the “heir process” is a widow and in the next step children, sometimes relatives, and so on.
It is quite common, at least in Sweden, that a neighbor buys an estate adja-cent to her/his own or is relatively close by. There is a tax incentive for this if it could be shown that it means rationalization. Other tax reasons also stimulate the buying of an estate. Another motive for buying an estate could be that it is relatively close to a city why the buyer can live on the estate and commute. Maybe the children are interested in horses? Maybe you just want to own a piece of land, enjoy working in the forest in your leisure time or are interested in forestry? Interest in hunting may be still another reason. Some persons may also buy an estate as an investment or for speculation purposes.
Zhang et al. (2005) argue that the number of small scale private forest own-erships in the U.S. has increased because a significant amount of forestland is no longer used economically primarily for timber production but rather for non-timber forest products and environmental services (particularly where popula-tion density is high). When a person makes frequent use of non-timber products and services, owning forest land is more efficient for them because it saves the transaction costs involved in getting them from the market. Forestland parce-ling-out takes place when non-timber value increases faster than timber value and the marginal value of non-timber products is diminishing much faster than that for timber production. However, in the literature Hugosson and Ingemarson (2004) could not find any consistent views on the subjective grounds for own-ing and managing small-scale forest estates.
6
3.3 Owner categories This section is structured into two subsections. In the first we present research results about why differences exist between different owners or why a specific group can be distinguished. In the following section that could be regarded as a form of synthesis of the first different suggestions for grouping small scale for-est owners are presented. The intention with the grouping is to categorize the owners depending on the interest in forestry and different goals and strategies for the management. Certainly, the two sections are closely related and com-plement each other. 3.3.1 Reasons for differences In this section special characteristics or features that may influence forest man-agement behavior are presented. Examples are: Gender, education, profession (civil servant/worker or farmer), economic dependency on forestry, and living in cities (urban lifestyle).
Lidestav and Ekström (2000) find that sex of the owner has a significant ef-fect on the (Swedish) frequency of harvesting, cleaning and supplementary planting, but not on planning and mechanized scarification. In cases when the sex of the owner was a significant factor, the degree of activity among the fe-male owners was found to be lower. Results regarding harvested volumes did not expose any significant differences in harvesting management strategies be-tween male and female owners.
A study conducted in Washington State by Creighton et al. (2002) suggests that educated and informed non-industrial private forest owners are more likely to show interest in ecosystem-based management programs. Uliczka et al (2004) show that attendance at the National Board of Forestry’s educational programs, self-estimated knowledge about conservation and knowledge about forest species were all related with a positive attitude towards conservations. Education in forestry was related to knowledge about conservation but not to the attitude towards it. Dependence on income from the forest, age > 55 yrs and a land-use-related occupation, all indicated a less positive attitude. Compared with men, women were less active owners with less forestry education, but younger women with high formal education had the most positive attitude of all.
Kvarda (2004) finds that non-agricultural Austrian forest owners are living in more urban areas, having non-agricultural professions and are relying on other sources of income than primary production. The forestland is viewed from a more socially oriented perspective with concern for enjoyment and utili-zation of timber for own needs and by coming generations. Ziegenspeck et al.

201
5
is sold or leased to a neighbor. For running this type of estate it is not necessary for the owner to live on the estate. Thus, many owners live in a local village or in cities. The supply of different types of management services has increased which make this possible.
The major reasons for the changes of the owner structure are economic and social (see, e.g. Wiersum et al. 2005). The production efficiency has increased tremendously. This means that one person can manage much larger areas than before. As a result the standard of living has increased and by that the demands for material wealth. One way of achieving higher wealth has for many people living in the countryside been to move to the cities and wage work. The inter-ests and demands for amusement have also changed, not the least among young people. Cities have more to offer in this respect. 3.2 Motives for ownership A common reason for ownership is that the owner has inherited the estate. To generalize, the first step in the “heir process” is a widow and in the next step children, sometimes relatives, and so on.
It is quite common, at least in Sweden, that a neighbor buys an estate adja-cent to her/his own or is relatively close by. There is a tax incentive for this if it could be shown that it means rationalization. Other tax reasons also stimulate the buying of an estate. Another motive for buying an estate could be that it is relatively close to a city why the buyer can live on the estate and commute. Maybe the children are interested in horses? Maybe you just want to own a piece of land, enjoy working in the forest in your leisure time or are interested in forestry? Interest in hunting may be still another reason. Some persons may also buy an estate as an investment or for speculation purposes.
Zhang et al. (2005) argue that the number of small scale private forest own-erships in the U.S. has increased because a significant amount of forestland is no longer used economically primarily for timber production but rather for non-timber forest products and environmental services (particularly where popula-tion density is high). When a person makes frequent use of non-timber products and services, owning forest land is more efficient for them because it saves the transaction costs involved in getting them from the market. Forestland parce-ling-out takes place when non-timber value increases faster than timber value and the marginal value of non-timber products is diminishing much faster than that for timber production. However, in the literature Hugosson and Ingemarson (2004) could not find any consistent views on the subjective grounds for own-ing and managing small-scale forest estates.
6
3.3 Owner categories This section is structured into two subsections. In the first we present research results about why differences exist between different owners or why a specific group can be distinguished. In the following section that could be regarded as a form of synthesis of the first different suggestions for grouping small scale for-est owners are presented. The intention with the grouping is to categorize the owners depending on the interest in forestry and different goals and strategies for the management. Certainly, the two sections are closely related and com-plement each other. 3.3.1 Reasons for differences In this section special characteristics or features that may influence forest man-agement behavior are presented. Examples are: Gender, education, profession (civil servant/worker or farmer), economic dependency on forestry, and living in cities (urban lifestyle).
Lidestav and Ekström (2000) find that sex of the owner has a significant ef-fect on the (Swedish) frequency of harvesting, cleaning and supplementary planting, but not on planning and mechanized scarification. In cases when the sex of the owner was a significant factor, the degree of activity among the fe-male owners was found to be lower. Results regarding harvested volumes did not expose any significant differences in harvesting management strategies be-tween male and female owners.
A study conducted in Washington State by Creighton et al. (2002) suggests that educated and informed non-industrial private forest owners are more likely to show interest in ecosystem-based management programs. Uliczka et al (2004) show that attendance at the National Board of Forestry’s educational programs, self-estimated knowledge about conservation and knowledge about forest species were all related with a positive attitude towards conservations. Education in forestry was related to knowledge about conservation but not to the attitude towards it. Dependence on income from the forest, age > 55 yrs and a land-use-related occupation, all indicated a less positive attitude. Compared with men, women were less active owners with less forestry education, but younger women with high formal education had the most positive attitude of all.
Kvarda (2004) finds that non-agricultural Austrian forest owners are living in more urban areas, having non-agricultural professions and are relying on other sources of income than primary production. The forestland is viewed from a more socially oriented perspective with concern for enjoyment and utili-zation of timber for own needs and by coming generations. Ziegenspeck et al.

202
7
(2004) write that the use of the forests by urban-oriented forest owners might be better explained by the specific features of such urban lifestyles rather than the classical features of income and social status. Wiersum et al. (2005) observe that many European small-scale forest owners are no longer economically de-pendent on their forests and these owners appear to increasingly focus their management on amenity functions rather than on production functions. Their result shows that about 30% of the forest owners have an indifferent attitude to their forests. This group includes many absentee owners and retired local own-ers, who own only forestlands but who are not economically dependent on their forests. Almost 40% of the forest owners are only modestly interested in forest management; often they have an environmental management orientation. This group includes many hobby owners and part-time employed people. Only one-third of the private forest owners are still economically dependent on their fo-rests; they have predominantly a multifunctional management orientation. Jen-sen and Ottitsch (2005) come to a similar conclusion: In the light of social and economic developments, forest functions other than timber production have gained international importance and recognition. Resulting from this develop-ment, non-wood forest products and services are becoming more important, both for the general public and for forest owners trying to market them.
Hugosson and Ingemarson (2004) find that sets of interpretive and norma-tive qualities are underlying people’s actions, and that such sets are related to basic values. Four motivations were depicted: Conservation, utilities, amenities and economic efficiency. A move towards conservation interests was indicated. The authors suspect that economic development in society may place material objectives, including traditional forest management, in a less preferable posi-tion. 3.3.2 Grouping of owners Kurttila et al. (2001) grouped, according to McKinsey’s matrix, small scale for-est owners into four strategic groups: Stars, Cash cows, Wildcats and Dogs. This grouping was based on the forest owners’ attitudes to the internal and ex-ternal operational environments of forestry. Enggrob Boon et al. (2004) identify three groups of owners: The classic forest owner to whom the forest has eco-nomic importance; The hobby owner who enjoys work and recreation in the forest; and The indifferent farmer to whom the different values provided by the forest are equally (un)important. Ingemarson et al. (2006) have classified the owners into five types: The “economist”, The “conservationist”, The “traditio-nalist”, The “multiobjective owner” and The “passive owner”. The results con-firm recent studies suggesting that a sole emphasis on economic benefits is not
8
desirable from the forest owners’ point of view. Suggestions for how to group small scale forest owners can also be found several decades ago (Trant et al. 1979; Kurz and Lewis, 1981; Green et al. 1986; Bliss, 1988; Lönnstedt, 1989, 1997). 4. Materials and methods The approach taken is to put the small scale forest owner and his family at the center. In the surroundings she/he finds different stakeholders that can be grouped depending on their influence on her/his attitudes and decisions (fig 1).
OwnerFamily
Local community
NeigboursBusinesses
Society
Government
Forest
policy
Forest products
industry
General
public
Regional and global perspective
Figure 1. Small scale forest owners, stakeholders and a grouping depending on expected influ-ence. In the following text we will start with presenting our view on responsibilities that the small scale forest owners are willing to take. After that we present our view on stakeholders’ expectations on the owners’ responsibilities. This will be followed by a discussion about potential conflicts between the owners and the stakeholders, and between the stakeholders.
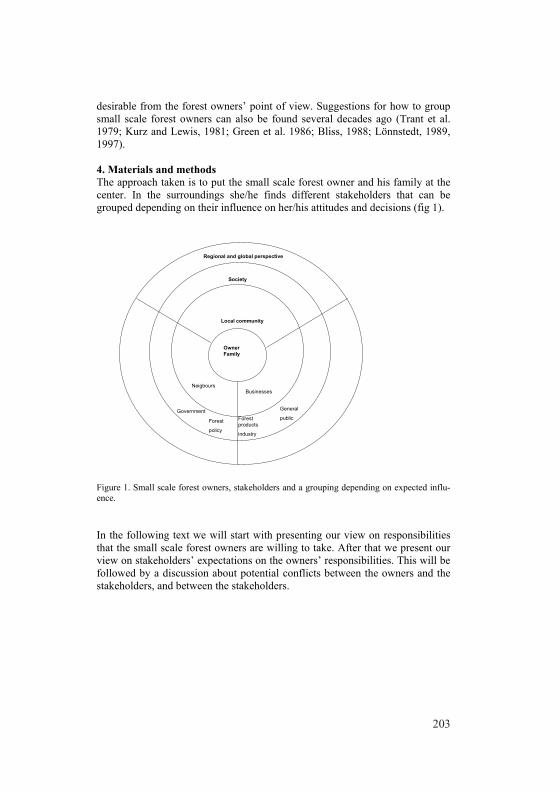
203
7
(2004) write that the use of the forests by urban-oriented forest owners might be better explained by the specific features of such urban lifestyles rather than the classical features of income and social status. Wiersum et al. (2005) observe that many European small-scale forest owners are no longer economically de-pendent on their forests and these owners appear to increasingly focus their management on amenity functions rather than on production functions. Their result shows that about 30% of the forest owners have an indifferent attitude to their forests. This group includes many absentee owners and retired local own-ers, who own only forestlands but who are not economically dependent on their forests. Almost 40% of the forest owners are only modestly interested in forest management; often they have an environmental management orientation. This group includes many hobby owners and part-time employed people. Only one-third of the private forest owners are still economically dependent on their fo-rests; they have predominantly a multifunctional management orientation. Jen-sen and Ottitsch (2005) come to a similar conclusion: In the light of social and economic developments, forest functions other than timber production have gained international importance and recognition. Resulting from this develop-ment, non-wood forest products and services are becoming more important, both for the general public and for forest owners trying to market them.
Hugosson and Ingemarson (2004) find that sets of interpretive and norma-tive qualities are underlying people’s actions, and that such sets are related to basic values. Four motivations were depicted: Conservation, utilities, amenities and economic efficiency. A move towards conservation interests was indicated. The authors suspect that economic development in society may place material objectives, including traditional forest management, in a less preferable posi-tion. 3.3.2 Grouping of owners Kurttila et al. (2001) grouped, according to McKinsey’s matrix, small scale for-est owners into four strategic groups: Stars, Cash cows, Wildcats and Dogs. This grouping was based on the forest owners’ attitudes to the internal and ex-ternal operational environments of forestry. Enggrob Boon et al. (2004) identify three groups of owners: The classic forest owner to whom the forest has eco-nomic importance; The hobby owner who enjoys work and recreation in the forest; and The indifferent farmer to whom the different values provided by the forest are equally (un)important. Ingemarson et al. (2006) have classified the owners into five types: The “economist”, The “conservationist”, The “traditio-nalist”, The “multiobjective owner” and The “passive owner”. The results con-firm recent studies suggesting that a sole emphasis on economic benefits is not
8
desirable from the forest owners’ point of view. Suggestions for how to group small scale forest owners can also be found several decades ago (Trant et al. 1979; Kurz and Lewis, 1981; Green et al. 1986; Bliss, 1988; Lönnstedt, 1989, 1997). 4. Materials and methods The approach taken is to put the small scale forest owner and his family at the center. In the surroundings she/he finds different stakeholders that can be grouped depending on their influence on her/his attitudes and decisions (fig 1).
OwnerFamily
Local community
NeigboursBusinesses
Society
Government
Forest
policy
Forest products
industry
General
public
Regional and global perspective
Figure 1. Small scale forest owners, stakeholders and a grouping depending on expected influ-ence. In the following text we will start with presenting our view on responsibilities that the small scale forest owners are willing to take. After that we present our view on stakeholders’ expectations on the owners’ responsibilities. This will be followed by a discussion about potential conflicts between the owners and the stakeholders, and between the stakeholders.

204
9
Responsibilities that the small scale forest owners are expected to take: • Financial aspects
– Financial performance, wealth creation and cash flow • Social aspects
– Interaction with local community and local businesses (timber supply, tax-payments)
– Legitimacy (ethical considerations) – Recreational aspects, landscape view – Preserve nature and cultural values
• Ecological aspects – Concerns for the nature, i.e. a sustainable development of the na-
ture with its plants, insects and animals, and environmental pro-tections
Stakeholders expect small scale forest owners and her/his families to take eco-nomic, social and ecological responsibilities when managing their timberlands. In table 1 we present an overview of our view on different stakeholders’ de-mands for responsibilities. It could certainly be discussed which stakeholders have what demand.
10
Table 1. Overview of responsibilities that different stakeholders expect small scale forest owner to take. STAKEHOLDERS RESPONSIBILITIES
Economic Social Ecologi-cal
LOCAL COMMUNITY
Neighbors
X
X
Local businesses X Local society X SOCIETY Forest products
industry X X X
Consumers of forest products
Environmentalists X Tourists X X Hunters X General public X X Politicians and
public authorities X X X
THE GLOBE/ WORLD
X
Responsibilities that stakeholders expect small scale forest owners to take:
• Economic – Stakeholders as the forest products companies, local communi-
ties, political parties and public authorities expect the owner to show economic responsibility
• Social – Most stakeholders expect the owner to show social responsibility
• Environmental – Most stakeholders expect the owner to show environmental re-
sponsibility In the following text we will present a background for our view.

205
9
Responsibilities that the small scale forest owners are expected to take: • Financial aspects
– Financial performance, wealth creation and cash flow • Social aspects
– Interaction with local community and local businesses (timber supply, tax-payments)
– Legitimacy (ethical considerations) – Recreational aspects, landscape view – Preserve nature and cultural values
• Ecological aspects – Concerns for the nature, i.e. a sustainable development of the na-
ture with its plants, insects and animals, and environmental pro-tections
Stakeholders expect small scale forest owners and her/his families to take eco-nomic, social and ecological responsibilities when managing their timberlands. In table 1 we present an overview of our view on different stakeholders’ de-mands for responsibilities. It could certainly be discussed which stakeholders have what demand.
10
Table 1. Overview of responsibilities that different stakeholders expect small scale forest owner to take. STAKEHOLDERS RESPONSIBILITIES
Economic Social Ecologi-cal
LOCAL COMMUNITY
Neighbors
X
X
Local businesses X Local society X SOCIETY Forest products
industry X X X
Consumers of forest products
Environmentalists X Tourists X X Hunters X General public X X Politicians and
public authorities X X X
THE GLOBE/ WORLD
X
Responsibilities that stakeholders expect small scale forest owners to take:
• Economic – Stakeholders as the forest products companies, local communi-
ties, political parties and public authorities expect the owner to show economic responsibility
• Social – Most stakeholders expect the owner to show social responsibility
• Environmental – Most stakeholders expect the owner to show environmental re-
sponsibility In the following text we will present a background for our view.

206
11
4.1 Economic Predominately economic aspects are of interest for the owner and her/his family but also for the businesses using wood raw material as a base for their produc-tion and for the local community. It is in the long run important for forest prod-ucts enterprises that the profits of small scale forest owners are high enough for them to stay in the business, make investments in silviculture and roads and thus continue to produce timber. Also for the local community this is important as it means an important base for local businesses based on wood and also tax incomes. This is also a reason for politicians and authorities looking after the implementation of the forest policy to be concerned on the financial situation of the small scale forest owners.
Even if the income from forestry for most small scale owners is marginal compared with income from employment or other businesses it has a financial role. It is important with a positive cash flow, not the least when there is a need of money. In the long run the wealth creation is important as it represents the state of the forests. For many families it is natural that the estate should stay in the family and that it should be in a better shape when it is inherited by the children than when they inherited it.
However, nowadays the values have changed with new generations of for-est owners, especially if they do not live on the estate but in a city and have wage earnings. The economic importance of the timberland has decreased while other aspects have increased in importance. 4.2 Social When writing about the economical aspects we already touched upon the inte-raction with the local community and the local wood based businesses which are examples of social considerations. For a forest owner it can give legitimacy to sell timber to a local mill instead of to a distant mill.
One aspect of the social responsibility is the recreational aspect that has be-come quite important with increasing standard of living and more leisure time. More emphasis has been put on cultural values represented by remains of old settlements both from the 19th century but also centuries ago. It is in the interest of the society and local communities to save these remains but certainly also because it is in the interest of many people. Many forest owners will happily preserve these cultural values.
The same group of stakeholders can also be interested in the landscape pic-ture and scenic beauty. Also the financial performance of the small scale forest owners is of interest as it gives economic possibilities. Our experience is that many small scale forest owners are interested in the “small picture”, i.e. they
12
are willing to keep meadows, open grasslands or single trees because it makes a “beautiful picture”. Perhaps this could be seen as an example of ethnical val-ues? 4.3 Environmental It has for long, more than 100 years in many western countries, been natural for the small scale forest owners to manage their forests in a sustainable way. This was in line with the wish to leave the estate to the next generation in a better state than it was inherited. This was also in the interest of the forest products companies, the society and the local communities.
However, the concept of sustainability has since a couple of decades ago been given a much broader meaning. Sustainability today includes concern for plants, insects, animals and also social aspects. Environmentalists, consumers of forest products, the public and politicians are demanding a sustainable de-velopment in a broad sense. Many forest owners do or did not have enough knowledge about rare species for being able to preserve them. It can also have quite a negative impact for a small scale forest owner if a major part of his tim-berlands has to been put aside as natural reserves.
Environmental concern today also includes ecological aspects. The forests assimilate carbon dioxide which is of importance for handling the greenhouse effect. As timber is a renewable resource it may to a certain degree replace fos-sil fuel. The greenhouse effect is a global concern as well as a national. 4.4 Conflicts In our opinion small scale forest owners are interested and willing to take eco-nomic, social and environmental responsibilities. There may be an argument about to what extent social and environmental aspects ought to be taken into consideration. Over the years the potential conflicts have decreased. It is likely that it will be even more so with new generations of owners with other values.
Our view on potential conflicts between small scale forest owners and stakeholders, and between stakeholders
• Timber production for the forest products companies Environmental and social concerns
• Cash flow for the owner Environmental and social concerns • New generations of small scale forest owners Forest products com-
panies • Recreationalists and local communities Small scale forest owners • Social interests Environmental interests

207
11
4.1 Economic Predominately economic aspects are of interest for the owner and her/his family but also for the businesses using wood raw material as a base for their produc-tion and for the local community. It is in the long run important for forest prod-ucts enterprises that the profits of small scale forest owners are high enough for them to stay in the business, make investments in silviculture and roads and thus continue to produce timber. Also for the local community this is important as it means an important base for local businesses based on wood and also tax incomes. This is also a reason for politicians and authorities looking after the implementation of the forest policy to be concerned on the financial situation of the small scale forest owners.
Even if the income from forestry for most small scale owners is marginal compared with income from employment or other businesses it has a financial role. It is important with a positive cash flow, not the least when there is a need of money. In the long run the wealth creation is important as it represents the state of the forests. For many families it is natural that the estate should stay in the family and that it should be in a better shape when it is inherited by the children than when they inherited it.
However, nowadays the values have changed with new generations of for-est owners, especially if they do not live on the estate but in a city and have wage earnings. The economic importance of the timberland has decreased while other aspects have increased in importance. 4.2 Social When writing about the economical aspects we already touched upon the inte-raction with the local community and the local wood based businesses which are examples of social considerations. For a forest owner it can give legitimacy to sell timber to a local mill instead of to a distant mill.
One aspect of the social responsibility is the recreational aspect that has be-come quite important with increasing standard of living and more leisure time. More emphasis has been put on cultural values represented by remains of old settlements both from the 19th century but also centuries ago. It is in the interest of the society and local communities to save these remains but certainly also because it is in the interest of many people. Many forest owners will happily preserve these cultural values.
The same group of stakeholders can also be interested in the landscape pic-ture and scenic beauty. Also the financial performance of the small scale forest owners is of interest as it gives economic possibilities. Our experience is that many small scale forest owners are interested in the “small picture”, i.e. they
12
are willing to keep meadows, open grasslands or single trees because it makes a “beautiful picture”. Perhaps this could be seen as an example of ethnical val-ues? 4.3 Environmental It has for long, more than 100 years in many western countries, been natural for the small scale forest owners to manage their forests in a sustainable way. This was in line with the wish to leave the estate to the next generation in a better state than it was inherited. This was also in the interest of the forest products companies, the society and the local communities.
However, the concept of sustainability has since a couple of decades ago been given a much broader meaning. Sustainability today includes concern for plants, insects, animals and also social aspects. Environmentalists, consumers of forest products, the public and politicians are demanding a sustainable de-velopment in a broad sense. Many forest owners do or did not have enough knowledge about rare species for being able to preserve them. It can also have quite a negative impact for a small scale forest owner if a major part of his tim-berlands has to been put aside as natural reserves.
Environmental concern today also includes ecological aspects. The forests assimilate carbon dioxide which is of importance for handling the greenhouse effect. As timber is a renewable resource it may to a certain degree replace fos-sil fuel. The greenhouse effect is a global concern as well as a national. 4.4 Conflicts In our opinion small scale forest owners are interested and willing to take eco-nomic, social and environmental responsibilities. There may be an argument about to what extent social and environmental aspects ought to be taken into consideration. Over the years the potential conflicts have decreased. It is likely that it will be even more so with new generations of owners with other values.
Our view on potential conflicts between small scale forest owners and stakeholders, and between stakeholders
• Timber production for the forest products companies Environmental and social concerns
• Cash flow for the owner Environmental and social concerns • New generations of small scale forest owners Forest products com-
panies • Recreationalists and local communities Small scale forest owners • Social interests Environmental interests

208
13
Over the years the potential conflicts have decreased. It is likely that it will be even more so with new owners with other values. In the following text we will present a background for our view.
There is a potential conflict between the interest of timber production for the forest products companies and the cash flow for the owner on one hand and environmental and social concerns on the other. However, it must be said that nowadays the owners and the companies accept that environmental and social responsibilities must be taken. However, if there is a shortage of wood supply there may be a limit to this understanding. One result may be in a country like Sweden that the pressure for the establishment of plantations increases. Envi-ronmental and social considerations may also have an impact on the efficiency of the operations which will affect the financial result.
For a small scale forest owner there may be an essential economic draw-back if a major part of her/his timberland area is put aside because of its envi-ronmental values. However, in many countries she/he will have a financial compensation.
As have been said some owners today do not see timber production as their primary goal. They may be more interested in environmental and social consid-erations. For them no conflicts will arise. However, still to the forest products companies needing wood raw material new generations of small scale forest owners with new values and behavior may be a threat.
Another conflict may exist between recreation and financial interests. In many countries recreation does not for many small scale forest owners create any economic value. On the contrary, if the number of visitors is big as it can be close to large cities it may create a problem. However, for the local com-munities it may mean a lot of tourists which will spend money at the local shops, restaurants and hotels.
Another type of conflict may exist between social and environmental con-siderations if areas are put aside with no access. This may be the only way to prevent heavy wear and tear.
As can be understood conflicting interests exist between some of the stake-holders, often between those stressing the financial values and those stressing the social and/or environmental values, for example, between the forest prod-ucts industry and environmentalists. However, these conflicts are much less pronounced nowadays.
14
4.5 Sample The intention is not to test the hypothesis, it is to give a better idea about what hypotheses might be of interest to test and how to formulate them. Because of limited resources the study has been performed in the county of Uppsala. Kvale (1997) stresses that quality is more important than quantity. A local rep-resentative of the Swedish Forest Agency helped with a list of small scale forest owners in Uppsala County. They were grouped depending on timberland area and whether they lived on the estate or not. Table 2 presents the number of cas-es in each group and also the total number of owners. The intention was not to cover all forest owners but to study more “normal” owners regarding timber-land area and those with bigger areas. From each category five owners were selected that owned the estate her/himself. Table 2. Sample size and total number of small scale forest owners in each group. GROUPING FOREST AREA (ha)
50 – 100 >250 LIVING ON THE ESTATE3 (756) 2 (44) NOT LIVING 2 (118) 3 (15) An introductory letter was sent to the selected owners. After about two weeks they were contacted for discussing time and place for an interview. Not all of them had time or possibility to make it. The final number can be seen from ta-ble 2. Regrettably only two women are included in the study. Each interview was taped and later printed. A summary was sent to the owner for possible comments.
Due to limited resources and the time frame given only two stakeholders were interviewed: three local representatives of the Swedish Forest Agency and one representative of WWF. The local representatives have knowledge about the owners and their forestry. The WWF-representative has a national view.
The analyses of the transcripts were based on Coffey’s and Atkinson’s me-thod (1996) for interpreting qualitative data. 5. Results It should be stressed that this is an explorative study. Against a short literature review about corporate responsibilities and research about small scale forest owners we discussed possible responsibilities that the owners could be willing

209
13
Over the years the potential conflicts have decreased. It is likely that it will be even more so with new owners with other values. In the following text we will present a background for our view.
There is a potential conflict between the interest of timber production for the forest products companies and the cash flow for the owner on one hand and environmental and social concerns on the other. However, it must be said that nowadays the owners and the companies accept that environmental and social responsibilities must be taken. However, if there is a shortage of wood supply there may be a limit to this understanding. One result may be in a country like Sweden that the pressure for the establishment of plantations increases. Envi-ronmental and social considerations may also have an impact on the efficiency of the operations which will affect the financial result.
For a small scale forest owner there may be an essential economic draw-back if a major part of her/his timberland area is put aside because of its envi-ronmental values. However, in many countries she/he will have a financial compensation.
As have been said some owners today do not see timber production as their primary goal. They may be more interested in environmental and social consid-erations. For them no conflicts will arise. However, still to the forest products companies needing wood raw material new generations of small scale forest owners with new values and behavior may be a threat.
Another conflict may exist between recreation and financial interests. In many countries recreation does not for many small scale forest owners create any economic value. On the contrary, if the number of visitors is big as it can be close to large cities it may create a problem. However, for the local com-munities it may mean a lot of tourists which will spend money at the local shops, restaurants and hotels.
Another type of conflict may exist between social and environmental con-siderations if areas are put aside with no access. This may be the only way to prevent heavy wear and tear.
As can be understood conflicting interests exist between some of the stake-holders, often between those stressing the financial values and those stressing the social and/or environmental values, for example, between the forest prod-ucts industry and environmentalists. However, these conflicts are much less pronounced nowadays.
14
4.5 Sample The intention is not to test the hypothesis, it is to give a better idea about what hypotheses might be of interest to test and how to formulate them. Because of limited resources the study has been performed in the county of Uppsala. Kvale (1997) stresses that quality is more important than quantity. A local rep-resentative of the Swedish Forest Agency helped with a list of small scale forest owners in Uppsala County. They were grouped depending on timberland area and whether they lived on the estate or not. Table 2 presents the number of cas-es in each group and also the total number of owners. The intention was not to cover all forest owners but to study more “normal” owners regarding timber-land area and those with bigger areas. From each category five owners were selected that owned the estate her/himself. Table 2. Sample size and total number of small scale forest owners in each group. GROUPING FOREST AREA (ha)
50 – 100 >250 LIVING ON THE ESTATE3 (756) 2 (44) NOT LIVING 2 (118) 3 (15) An introductory letter was sent to the selected owners. After about two weeks they were contacted for discussing time and place for an interview. Not all of them had time or possibility to make it. The final number can be seen from ta-ble 2. Regrettably only two women are included in the study. Each interview was taped and later printed. A summary was sent to the owner for possible comments.
Due to limited resources and the time frame given only two stakeholders were interviewed: three local representatives of the Swedish Forest Agency and one representative of WWF. The local representatives have knowledge about the owners and their forestry. The WWF-representative has a national view.
The analyses of the transcripts were based on Coffey’s and Atkinson’s me-thod (1996) for interpreting qualitative data. 5. Results It should be stressed that this is an explorative study. Against a short literature review about corporate responsibilities and research about small scale forest owners we discussed possible responsibilities that the owners could be willing

210
15
to take and possible expectations from the stakeholders. It is not our intention to test these “hypotheses” but to get a better understanding of the topic that can be used for a coming study. In the following text we will briefly present the results of the interviews starting with the owners.
It should be noted that none of the ten interviewed forest owners is charac-terized by embracing all the motives found in this study. What is a strong mo-tive for one owner may not be that for another. One motive can influence taken responsibilities but it can also be a combination of different motives. Personal values and own moral motives to a large extent influence the responsibilities that the owners take. 5.1 The interviewed owners’ view on their responsibilities 5.1.1 Economic responsibilities It is a key concern for the interviewed owners to secure the long term profitabil-ity of their forestry by diversified management and handling the risk. This “goal” coincides with the wish to hand over the estate to the next generation. In the short run it is important for them to secure income for the family. Some of the owners stress the importance for forestry for Sweden’s economy. 5.1.2 Environmental responsibilities The interviewed owners say that they have moral obligations when it comes to managing the forest in a sustainable environmental way. The owners of the big-ger estates say that they think it is fair to put aside 5% of the timber area for na-ture conservation. The owners also say that it is important to manage the forest in such a way that the one take advantage of forests’ carbon sequestration. 5.1.3 Social responsibilities Most of the owners stress that they manage their forest in such a way that it will facilitates recreation, not least close to densely built up areas. However, they also stress that they expect visitors to respect the nature. It is also in line with their principles to manage the forest in a way that preserves historical and cul-tural values. Most of the owners have an esthetical perspective on management of the forest. They also stress the close ties with their estate and its neighboring area. 5.2 Small scale forest owners’ responsibilities according to Swedish Forest Agency’s local district officers The expectations follow what is said in the Forestry Act. The owners should
16
• At least follow the law • Regenerate after final felling • Facilitate outdoor recreational life • Preserve cultural values
They stress that the law sets the minimum requirements and that the ambitions of the Swedish Forest Agency are higher. The mean for achieving this is through extension service. 5.3 Small scale forest owners’ responsibilities according to WWF The interviewed representative for WWF stresses that the small scale forest owners are not a target group for them but forest products companies Swedish Forest Agency, other public authorities and forest owners’ associations. The main goal for the organization is to increase the sustainability of forest man-agement not the least when it comes to environmental considerations. 6. Comments Small-scale forests play a key role in supplying raw material to the forest prod-ucts industries. The globalization means that the importance of competitiveness and cost efficiency in production will increase. The forests will also play an important role for achieving the goal for to decrease carbon in the biosphere through increased used of renewable energy as bioenergy. The income from forests can play an important role in maintaining a sound social structure, and forestry can contribute to the overall economy of rural areas. However, the im-pact and importance of the non-market values of the forests have increased and will continue to increase, not the least among new generations of forest owners. The land ownership structure and management goals for forestry are heteroge-neous and becoming even more so. A major future issue in addressing the con-cern for environment is the allocation of the costs of nature protection. Forest certification and the role of forests in implementing the Kyoto Protocol have raised much discussion. Thus, it is no wonder that small scale forest owners have interested researchers for many decades.
The owner structure has undergone large changes. Originally forestry was for many farmers a “subsidiary” that was managed together with the main busi-ness, farming. Today it is common that the owner only manages forest and that many of these owners are living in villages or cities and have a wage income. This has an impact on the management strategy. For some owners the major goal is not timber production but more soft values. The owners can be grouped with this as criteria. However, there are many other ways and reasons for
211
15
to take and possible expectations from the stakeholders. It is not our intention to test these “hypotheses” but to get a better understanding of the topic that can be used for a coming study. In the following text we will briefly present the results of the interviews starting with the owners.
It should be noted that none of the ten interviewed forest owners is charac-terized by embracing all the motives found in this study. What is a strong mo-tive for one owner may not be that for another. One motive can influence taken responsibilities but it can also be a combination of different motives. Personal values and own moral motives to a large extent influence the responsibilities that the owners take. 5.1 The interviewed owners’ view on their responsibilities 5.1.1 Economic responsibilities It is a key concern for the interviewed owners to secure the long term profitabil-ity of their forestry by diversified management and handling the risk. This “goal” coincides with the wish to hand over the estate to the next generation. In the short run it is important for them to secure income for the family. Some of the owners stress the importance for forestry for Sweden’s economy. 5.1.2 Environmental responsibilities The interviewed owners say that they have moral obligations when it comes to managing the forest in a sustainable environmental way. The owners of the big-ger estates say that they think it is fair to put aside 5% of the timber area for na-ture conservation. The owners also say that it is important to manage the forest in such a way that the one take advantage of forests’ carbon sequestration. 5.1.3 Social responsibilities Most of the owners stress that they manage their forest in such a way that it will facilitates recreation, not least close to densely built up areas. However, they also stress that they expect visitors to respect the nature. It is also in line with their principles to manage the forest in a way that preserves historical and cul-tural values. Most of the owners have an esthetical perspective on management of the forest. They also stress the close ties with their estate and its neighboring area. 5.2 Small scale forest owners’ responsibilities according to Swedish Forest Agency’s local district officers The expectations follow what is said in the Forestry Act. The owners should
16
• At least follow the law • Regenerate after final felling • Facilitate outdoor recreational life • Preserve cultural values
They stress that the law sets the minimum requirements and that the ambitions of the Swedish Forest Agency are higher. The mean for achieving this is through extension service. 5.3 Small scale forest owners’ responsibilities according to WWF The interviewed representative for WWF stresses that the small scale forest owners are not a target group for them but forest products companies Swedish Forest Agency, other public authorities and forest owners’ associations. The main goal for the organization is to increase the sustainability of forest man-agement not the least when it comes to environmental considerations. 6. Comments Small-scale forests play a key role in supplying raw material to the forest prod-ucts industries. The globalization means that the importance of competitiveness and cost efficiency in production will increase. The forests will also play an important role for achieving the goal for to decrease carbon in the biosphere through increased used of renewable energy as bioenergy. The income from forests can play an important role in maintaining a sound social structure, and forestry can contribute to the overall economy of rural areas. However, the im-pact and importance of the non-market values of the forests have increased and will continue to increase, not the least among new generations of forest owners. The land ownership structure and management goals for forestry are heteroge-neous and becoming even more so. A major future issue in addressing the con-cern for environment is the allocation of the costs of nature protection. Forest certification and the role of forests in implementing the Kyoto Protocol have raised much discussion. Thus, it is no wonder that small scale forest owners have interested researchers for many decades.
The owner structure has undergone large changes. Originally forestry was for many farmers a “subsidiary” that was managed together with the main busi-ness, farming. Today it is common that the owner only manages forest and that many of these owners are living in villages or cities and have a wage income. This has an impact on the management strategy. For some owners the major goal is not timber production but more soft values. The owners can be grouped with this as criteria. However, there are many other ways and reasons for

212
17
grouping the owners. Quite a common way for becoming an owner is to inherit the estate from the parents. However, it seems as if the “market way” is increas-ing.
During the last decades the interest in social responsibility has increased. Responsibility includes economic, social and environmental aspects. It has be-come natural for more and more businesses to incorporate their responsibilities towards the environment and society. Many stakeholders demand this. Also for small scale forest owners it is natural to consider their responsibilities towards their stakeholders. However, the demands have changed over time as have also the weight put on the different responsibilities of different stakeholders. Even if some aspects of the responsibilities have existed for a long time the dominating responsibility was until some decades ago timber production which was a major concern of forest products companies and many governments. However, the importance of more soft values from the forests has increased as has the de-mand and weight from other stakeholders than those mentioned.
A small scale forest owner has economic, social and environmental respon-sibilities, towards herself/himself and the family but also towards stakeholders. Different stakeholders at least partly stress different demands on the responsi-bilities. The forest owners comply with many of the demands but not with all. It must also be remembered that the small scale forest owners are a heterogeneous group which means that the fulfillment varies between the owners. Further-more, the owner structure changes as do the responsibilities.
A stakeholder that wants to be successful in explaining her/his demands to responsibilities must argue based on the motivations of private forest owners. It is also wise to actively involve the owners in the discussion and decision mak-ing.
A study by Rickenback et al. (2005) suggests that new ex-urban forest owners, who are found in most industrialized countries, will seek to reshape the forest policy arena to meet their values and objectives. Their study examines the motivations of predominantly new ex-urban forest owners interested in for-est management in pursuing collective action through participation in a cooper-ative. (While common elsewhere, forest landowner cooperatives in the USA are an anomaly.) Motivations for joining a cooperative were that it was an attrac-tive alternative to the typical timber sale scenario that often places the forest owner at a disadvantage, and the primary government tax incentive program.
The explorative empirical study presented in this report shows that:
• Small scale forest owners take economic, environmental and social re-sponsibilities
18
• The owners stress the personal economic responsibility but no conflict exists for the interviewed owners between economic and environmental responsibilities. The economic benefits for the owners for taking more environmental och social responsibility are small. There is no need for “brand building” for the individual owner
• Stakeholders demand small scale forest owners to take responsibilities but the weight the interviewed owners put to their wishes is low
• The pressure the National Forest Agency’s local district officers put on the owners for more environmental considerations than according to the Forest Act is low. However, the environmental awareness is increasing due to societal development
• The interviews also showed that contractors are good examples to the small scale forest owners. The contractors have attended courses about how to achieve sustainable forest management, something that the forest products companies require. The same contractors are working for the small scale forest owners
Garriga and Melé (2004) write that businesses that only have financial motives for taking economic responsibilities would look at CR as a mean for creating financial value for the owners. This is not the case for the interview owners. As the result shows for them other motives exist for taking environmental and so-cial responsibilities. Henderson (2001) claims that another reason for CR is that it will increase competitiveness of the business. Also in this case, the inter-viewed owners differ. One theory says that it is difficult to find the relationship between ethical actions and the societal value or the benefit for the enterprise (Nystad and Haugland Smith, 2006). This explains why it is difficult for some managers to adopt CR to their business strategy. The interviewed forest owners do not have this problem as it does not seem that the reason for taking responsi-bility is goal achievement. The reason seems to be their morale. The interviews showed that strong reason for taking environmental and social responsibility was an interest in the nature and cultural values. The district forest officers ex-press the same view. According to Hemingway och Maclagan (2004) the values of the top manager is of importance for the adaptation of CR and how it is im-plemented. The small scale forest owners are both owners and presidents. Sup-port for this statement can be found in Murillo and Lozano (2006) that found that the values by the founder of an enterprise if important for decisions con-cerning social and environmentally sustainable business strategies. Support for this conclusion can also be found in Gabzdylova et al. (2009).

213
17
grouping the owners. Quite a common way for becoming an owner is to inherit the estate from the parents. However, it seems as if the “market way” is increas-ing.
During the last decades the interest in social responsibility has increased. Responsibility includes economic, social and environmental aspects. It has be-come natural for more and more businesses to incorporate their responsibilities towards the environment and society. Many stakeholders demand this. Also for small scale forest owners it is natural to consider their responsibilities towards their stakeholders. However, the demands have changed over time as have also the weight put on the different responsibilities of different stakeholders. Even if some aspects of the responsibilities have existed for a long time the dominating responsibility was until some decades ago timber production which was a major concern of forest products companies and many governments. However, the importance of more soft values from the forests has increased as has the de-mand and weight from other stakeholders than those mentioned.
A small scale forest owner has economic, social and environmental respon-sibilities, towards herself/himself and the family but also towards stakeholders. Different stakeholders at least partly stress different demands on the responsi-bilities. The forest owners comply with many of the demands but not with all. It must also be remembered that the small scale forest owners are a heterogeneous group which means that the fulfillment varies between the owners. Further-more, the owner structure changes as do the responsibilities.
A stakeholder that wants to be successful in explaining her/his demands to responsibilities must argue based on the motivations of private forest owners. It is also wise to actively involve the owners in the discussion and decision mak-ing.
A study by Rickenback et al. (2005) suggests that new ex-urban forest owners, who are found in most industrialized countries, will seek to reshape the forest policy arena to meet their values and objectives. Their study examines the motivations of predominantly new ex-urban forest owners interested in for-est management in pursuing collective action through participation in a cooper-ative. (While common elsewhere, forest landowner cooperatives in the USA are an anomaly.) Motivations for joining a cooperative were that it was an attrac-tive alternative to the typical timber sale scenario that often places the forest owner at a disadvantage, and the primary government tax incentive program.
The explorative empirical study presented in this report shows that:
• Small scale forest owners take economic, environmental and social re-sponsibilities
18
• The owners stress the personal economic responsibility but no conflict exists for the interviewed owners between economic and environmental responsibilities. The economic benefits for the owners for taking more environmental och social responsibility are small. There is no need for “brand building” for the individual owner
• Stakeholders demand small scale forest owners to take responsibilities but the weight the interviewed owners put to their wishes is low
• The pressure the National Forest Agency’s local district officers put on the owners for more environmental considerations than according to the Forest Act is low. However, the environmental awareness is increasing due to societal development
• The interviews also showed that contractors are good examples to the small scale forest owners. The contractors have attended courses about how to achieve sustainable forest management, something that the forest products companies require. The same contractors are working for the small scale forest owners
Garriga and Melé (2004) write that businesses that only have financial motives for taking economic responsibilities would look at CR as a mean for creating financial value for the owners. This is not the case for the interview owners. As the result shows for them other motives exist for taking environmental and so-cial responsibilities. Henderson (2001) claims that another reason for CR is that it will increase competitiveness of the business. Also in this case, the inter-viewed owners differ. One theory says that it is difficult to find the relationship between ethical actions and the societal value or the benefit for the enterprise (Nystad and Haugland Smith, 2006). This explains why it is difficult for some managers to adopt CR to their business strategy. The interviewed forest owners do not have this problem as it does not seem that the reason for taking responsi-bility is goal achievement. The reason seems to be their morale. The interviews showed that strong reason for taking environmental and social responsibility was an interest in the nature and cultural values. The district forest officers ex-press the same view. According to Hemingway och Maclagan (2004) the values of the top manager is of importance for the adaptation of CR and how it is im-plemented. The small scale forest owners are both owners and presidents. Sup-port for this statement can be found in Murillo and Lozano (2006) that found that the values by the founder of an enterprise if important for decisions con-cerning social and environmentally sustainable business strategies. Support for this conclusion can also be found in Gabzdylova et al. (2009).
214
19
Nystad and Haugland Smith (2006) write that in reality some stakeholders will be given more attention than others. The result shows that usually the in-terests or views of the stakeholders are not considered, i.e. the owners make the decisions themselves. A priority is made between different alternatives based on the owners’ own values which may coincide with stakeholders’ wishes. For example, a forest owner interested in the environment will take more environ-mental responsibilities than an owner more interested in social responsibilities. The local district officers agree that, for example, a cultural interest is a strong motive for the owner.
In this paper we have stressed the importance of incorporating aspects of responsibilities for the small scale forest owners when managing their forests but also for us researcher to consider this aspect. We have outlined our view of what responsibilities the owners can be expected to take and what responsibili-ties a few stakeholders expect them to take. We presented an explorative study. However, much more research is needed about this topic. Future research ought to test more elaborated hypotheses than those presented. Certainly both the perspective of the small scale forest owners and the stakeholders should be covered. Different owner categories should be included. It would also be of in-terest to compare the results from different countries. References Berggren, U. 2007. Hållbart nyttjande av skog. Meddelande 5, Skogsstyrelsen,
Jönköping. Bliss, J.C. 1988. Motivations of Nonindustrial Private Forest Managers: A
Qualitative Approach. PhD thesis (forestry), University of Wisconsin, Madison, USA.
Coffey, A. and Atkinson, P. (1996) Making sense of qualitative data: comple-mentary research strategies. Thousand Oaks, Calif.: Sage
Creighton, J.H., Baumgartner, D.M. and Blatner, K.A. Ecosystem Managemetn and Nonindustrial Private Forest Landowners in Washington State, USA. Small-scale Forest Economics, Management and Policy. 1(1) 55-69.
Enggrob Boon, T, Meilby, H. And Jellesmark Thorsen, B. An Empirically Based Typology of Private Forest Owners in Denmark: Improving Commu-nication Between Authorities and Owners. Scandinavian Journal of Forest Research. 19(4) 45-55.
Eriksson, M. 1989. Ägarstrukturens förändring inom privatskogsbruket – i ett historiskt perspective (Change of small scale forest owners’ structuer – a historical perspective). The Swedish University of Agricultural Sciences, Department of Forest-Industry-Market Studies, Report No 26.
20
FCS, http://www.fsc.org/pc.html, accessed 2009-02-18. Gabzdylova, B., Raffensperger, J. and Castka, P. (2009) Sustainability in the
New Zealand wine industry: drivers stakeholders and practices, Journal of cleaner production, 17:11, 992-998.
Garriga, E., and Melé, D. (2004) Corporate social responsibility theories: Map-ping the territory, Journal of Business Ethic, 53:1-2, 51-71
Gildea, R.L. 1994. Consumer survey confirms corporate social responsibility affects buying decisions. Public Relations Quarterly. 39(4):20-21.
Grayson, D. and Hodges. A., 2004. Corporate social opportunity! 7 steps to make corporate social responsibility work for your business. Greenleaf pub-lishing, Sheffield, the UK.
Green, J.L. and Blatner, K.A. 1986. Identifying Woodlot Owners Characteris-tics Associated with Timber Management. Forest Science 1
Henderson, D. (2001) Misguided virtue: false notions of corporate social re-sponsibility, New Zealand Business Roundtable
Hollender, J. and Fenichell, S., 2004. What matters most. How a small group of pioneers is teaching social responsibility to big busineees and why big busi-ness is listening. Basic Books, New York
Hugosson, M. and Ingemarson, F. 2004. Objectives and Motivatoins of Small-scale Forest Owners; Theoretical Modelling and Qualitatvie Assessment. Silva Fennica 38(2): 217-231.
Ingemarson, F., Lindhagen, A and Eriksson, L. 2006. A typology of small-scale private forest owners in Sweden. Scandinavian Journal of Forest Research 21(3) 249-259.
Kurz, W.R. and Lewis, B.J. 1981. Decision making framework for nonindus-trial private forest owners. An application in Missouri Ozarsk. Journal of Forestry. May 285-288.
Kurttila, M., Hämäläinen, K., Kajanus, M. And Pesonen, M. Non-industrial private forest owners’ attitudes towards the operational environment of fo-restry – a multinominal logit model analysis. Forest Policy and Economics. 2(1) 13-28.
Kvale, S. 1997. Den kvalitativa forskningsintervjun. Lund: Studentlitteratur Kvarda, E. The Future of Eureopean Forestry – Between Urbanization and Ru-
ral Development. ‘Non-agricultural forest owners’ in Austria – an new type of forest ownership. Forest Policy and Economics. 6(5) 459-467.
Lagerlöf, P. and Scheibenpflug, A. 2010. Enskilda skogsägares syn på ansvarstagande– Drivkrafter och hinder. Master thesis.Swedish University of Agricultural Sciences, Faculty of Natural Resources and Agricultural Sciences, Department of Economics.

215
19
Nystad and Haugland Smith (2006) write that in reality some stakeholders will be given more attention than others. The result shows that usually the in-terests or views of the stakeholders are not considered, i.e. the owners make the decisions themselves. A priority is made between different alternatives based on the owners’ own values which may coincide with stakeholders’ wishes. For example, a forest owner interested in the environment will take more environ-mental responsibilities than an owner more interested in social responsibilities. The local district officers agree that, for example, a cultural interest is a strong motive for the owner.
In this paper we have stressed the importance of incorporating aspects of responsibilities for the small scale forest owners when managing their forests but also for us researcher to consider this aspect. We have outlined our view of what responsibilities the owners can be expected to take and what responsibili-ties a few stakeholders expect them to take. We presented an explorative study. However, much more research is needed about this topic. Future research ought to test more elaborated hypotheses than those presented. Certainly both the perspective of the small scale forest owners and the stakeholders should be covered. Different owner categories should be included. It would also be of in-terest to compare the results from different countries. References Berggren, U. 2007. Hållbart nyttjande av skog. Meddelande 5, Skogsstyrelsen,
Jönköping. Bliss, J.C. 1988. Motivations of Nonindustrial Private Forest Managers: A
Qualitative Approach. PhD thesis (forestry), University of Wisconsin, Madison, USA.
Coffey, A. and Atkinson, P. (1996) Making sense of qualitative data: comple-mentary research strategies. Thousand Oaks, Calif.: Sage
Creighton, J.H., Baumgartner, D.M. and Blatner, K.A. Ecosystem Managemetn and Nonindustrial Private Forest Landowners in Washington State, USA. Small-scale Forest Economics, Management and Policy. 1(1) 55-69.
Enggrob Boon, T, Meilby, H. And Jellesmark Thorsen, B. An Empirically Based Typology of Private Forest Owners in Denmark: Improving Commu-nication Between Authorities and Owners. Scandinavian Journal of Forest Research. 19(4) 45-55.
Eriksson, M. 1989. Ägarstrukturens förändring inom privatskogsbruket – i ett historiskt perspective (Change of small scale forest owners’ structuer – a historical perspective). The Swedish University of Agricultural Sciences, Department of Forest-Industry-Market Studies, Report No 26.
20
FCS, http://www.fsc.org/pc.html, accessed 2009-02-18. Gabzdylova, B., Raffensperger, J. and Castka, P. (2009) Sustainability in the
New Zealand wine industry: drivers stakeholders and practices, Journal of cleaner production, 17:11, 992-998.
Garriga, E., and Melé, D. (2004) Corporate social responsibility theories: Map-ping the territory, Journal of Business Ethic, 53:1-2, 51-71
Gildea, R.L. 1994. Consumer survey confirms corporate social responsibility affects buying decisions. Public Relations Quarterly. 39(4):20-21.
Grayson, D. and Hodges. A., 2004. Corporate social opportunity! 7 steps to make corporate social responsibility work for your business. Greenleaf pub-lishing, Sheffield, the UK.
Green, J.L. and Blatner, K.A. 1986. Identifying Woodlot Owners Characteris-tics Associated with Timber Management. Forest Science 1
Henderson, D. (2001) Misguided virtue: false notions of corporate social re-sponsibility, New Zealand Business Roundtable
Hollender, J. and Fenichell, S., 2004. What matters most. How a small group of pioneers is teaching social responsibility to big busineees and why big busi-ness is listening. Basic Books, New York
Hugosson, M. and Ingemarson, F. 2004. Objectives and Motivatoins of Small-scale Forest Owners; Theoretical Modelling and Qualitatvie Assessment. Silva Fennica 38(2): 217-231.
Ingemarson, F., Lindhagen, A and Eriksson, L. 2006. A typology of small-scale private forest owners in Sweden. Scandinavian Journal of Forest Research 21(3) 249-259.
Kurz, W.R. and Lewis, B.J. 1981. Decision making framework for nonindus-trial private forest owners. An application in Missouri Ozarsk. Journal of Forestry. May 285-288.
Kurttila, M., Hämäläinen, K., Kajanus, M. And Pesonen, M. Non-industrial private forest owners’ attitudes towards the operational environment of fo-restry – a multinominal logit model analysis. Forest Policy and Economics. 2(1) 13-28.
Kvale, S. 1997. Den kvalitativa forskningsintervjun. Lund: Studentlitteratur Kvarda, E. The Future of Eureopean Forestry – Between Urbanization and Ru-
ral Development. ‘Non-agricultural forest owners’ in Austria – an new type of forest ownership. Forest Policy and Economics. 6(5) 459-467.
Lagerlöf, P. and Scheibenpflug, A. 2010. Enskilda skogsägares syn på ansvarstagande– Drivkrafter och hinder. Master thesis.Swedish University of Agricultural Sciences, Faculty of Natural Resources and Agricultural Sciences, Department of Economics.

216
21
Lidestav, G. and Ekström, M. 2000. Introducing Gender in Studies on Man-agement Behaviour Among Non-industrial Private Forest Owners. Scandi-navian Journal of Forest Research. 15(3) 378-386.
Lönnstedt, L. 1997. Nonindustrial Private Forest Owners’ Decision Process. A Qualitative Study about Goals, Time Perspective, Opportunities and Alter-natives. Scandinavian Journal of Forest Research, 12: 302-310.
Lönnstedt, L. 1989. Goals and Cutting Decisions of Private Small Forest Own-ers. Scandinavian Journal of Forest Research. 4 (2): 23-29.
Mbare, O. 2004. The role of Corporate Social Responsibility (CSR) in the New Economy. EJBO, Electronic Journal of Business Ethics and Organization Studies 9(1) (Available at http://ejbo.jyu.fi/articles/0901_5.html. Web site accessed August 12, 2008.
Mikkilä, M. 2006. The many faces of responsibility: Acceptability of the global pulp and paper industry in various societies. The Finnish Society of Forest Science, Unioninkatu 40A, 00170 Helsinki, Finland. http://www.metla.fi/dissertationes. Web site accessed June 24, 2008.
Murillo, D., and Lozano, J. (2006) SMEs and CSR: An Approach to CSR in Their Own Words, Journal of Business Ethics, 67:3, 227-240.
Nilsson, A. 2005. Hållbarheten morot I en ny strategi; Dyrköpt startskott.CSR-arbetet bör kopplas till riskhantering – nu. Dagtens Miljö (6):10-13, 22-23.
Nystad, Ø., and Haugland Smith, K. (2006) Is the motivation for CSR profits or ethics?, Presented at The Corporate Responsibility Research Conference, Trinity Collage Dublin, Ireland 4-5 September.
PEFC, http://www.pefc.se/english/index.asp?path=12677andpageid=17287, accessed 2009-02-18
Porter, M. and Van der Linde, C., 1995. Green and Competitive: Ending the Stalemate. Harvard Business Review, September-October, 120-134.
Raditya D.A. 2009. Case studies of Corporate Social Responsibility (CSR) in forest products companies - and customer’s perspectives Examensarbe-ten (SLU, Institutionen för skogens produkter) nr 42.
Ripatti, P. 1996. Factors Affecting Partitioning of Private Forest Holdings in Finland. A Logit Analysis. Acta Forestalia Fennica 252.
Takala, T. 1996. From Social Responsibility to Environmental Responsibility – Change in the Finnish Business, Ethics and Organization Studies. 1(1) (Available at http://ejbo.jyu.fi/index.cgi?page=articles/0101_2).
Thayer Robbins, P. 2001. Greening the Corporation. Management strategy and the environmental challenge. Earth Scan Publications Ltd., London.
22
Trant, M.J. and Brinkmann, G.L. 1979. A classification of limited resource farmers. Canadian Farm Economics 14:1-2.
Uliczka, H., Angelstam, P., Jansson, G. and Bro, A. 2004. Non-industrial pri-vate forest owners’ knowledge of and attitudes towards nature conservation. Scandinavian Journal of Forest Research. 19(3) 274-288.
Van Marrewijk, M. 2003. Concepts and Definitions of CSR and Corporate Sus-tainability: Between Agency and Communion. Journal of Business Ethics. 44 (2/3):95-105.
Wiersum, K., Elands B.H.M. and Hoogstra, M.A. 2005. Small-Scale Forest Ownership across Europe: Characteristics and Future Potential. Small-scale Forest Economics, Management and Policy. 4(1): 1-19.
Zaman, M., Yamin, M. and Wong, F. 1996. Environmental consumerism and buying preferences for green products. In: Proc. of the Australian Market-ing Educators’ Conference. Theory and Application. Volume II. C. Riquier and Sharp, B. eds. Marketing Science Centre, Univ. of South Australia, Adelaide, Australia. PP 613-626.
Zhang, Y., Zhang, D. and Schelhas, J. 2005. Small-Scale Non-industrial Private Forest Ownership in the United States: Rationale and Implications for For-est Management. Silva Fennica 39(3) 443-454.
Ziegenspeck, S., Härdter, U. and Schraml, U. 2004. The Future of European Forestry – Between Urbanization and Rural Development. Lifestyles of pri-vate forest owners as an indication of social change. Forest Policy and Eco-nomics. 6(5) 447-458.
217
21
Lidestav, G. and Ekström, M. 2000. Introducing Gender in Studies on Man-agement Behaviour Among Non-industrial Private Forest Owners. Scandi-navian Journal of Forest Research. 15(3) 378-386.
Lönnstedt, L. 1997. Nonindustrial Private Forest Owners’ Decision Process. A Qualitative Study about Goals, Time Perspective, Opportunities and Alter-natives. Scandinavian Journal of Forest Research, 12: 302-310.
Lönnstedt, L. 1989. Goals and Cutting Decisions of Private Small Forest Own-ers. Scandinavian Journal of Forest Research. 4 (2): 23-29.
Mbare, O. 2004. The role of Corporate Social Responsibility (CSR) in the New Economy. EJBO, Electronic Journal of Business Ethics and Organization Studies 9(1) (Available at http://ejbo.jyu.fi/articles/0901_5.html. Web site accessed August 12, 2008.
Mikkilä, M. 2006. The many faces of responsibility: Acceptability of the global pulp and paper industry in various societies. The Finnish Society of Forest Science, Unioninkatu 40A, 00170 Helsinki, Finland. http://www.metla.fi/dissertationes. Web site accessed June 24, 2008.
Murillo, D., and Lozano, J. (2006) SMEs and CSR: An Approach to CSR in Their Own Words, Journal of Business Ethics, 67:3, 227-240.
Nilsson, A. 2005. Hållbarheten morot I en ny strategi; Dyrköpt startskott.CSR-arbetet bör kopplas till riskhantering – nu. Dagtens Miljö (6):10-13, 22-23.
Nystad, Ø., and Haugland Smith, K. (2006) Is the motivation for CSR profits or ethics?, Presented at The Corporate Responsibility Research Conference, Trinity Collage Dublin, Ireland 4-5 September.
PEFC, http://www.pefc.se/english/index.asp?path=12677andpageid=17287, accessed 2009-02-18
Porter, M. and Van der Linde, C., 1995. Green and Competitive: Ending the Stalemate. Harvard Business Review, September-October, 120-134.
Raditya D.A. 2009. Case studies of Corporate Social Responsibility (CSR) in forest products companies - and customer’s perspectives Examensarbe-ten (SLU, Institutionen för skogens produkter) nr 42.
Ripatti, P. 1996. Factors Affecting Partitioning of Private Forest Holdings in Finland. A Logit Analysis. Acta Forestalia Fennica 252.
Takala, T. 1996. From Social Responsibility to Environmental Responsibility – Change in the Finnish Business, Ethics and Organization Studies. 1(1) (Available at http://ejbo.jyu.fi/index.cgi?page=articles/0101_2).
Thayer Robbins, P. 2001. Greening the Corporation. Management strategy and the environmental challenge. Earth Scan Publications Ltd., London.
22
Trant, M.J. and Brinkmann, G.L. 1979. A classification of limited resource farmers. Canadian Farm Economics 14:1-2.
Uliczka, H., Angelstam, P., Jansson, G. and Bro, A. 2004. Non-industrial pri-vate forest owners’ knowledge of and attitudes towards nature conservation. Scandinavian Journal of Forest Research. 19(3) 274-288.
Van Marrewijk, M. 2003. Concepts and Definitions of CSR and Corporate Sus-tainability: Between Agency and Communion. Journal of Business Ethics. 44 (2/3):95-105.
Wiersum, K., Elands B.H.M. and Hoogstra, M.A. 2005. Small-Scale Forest Ownership across Europe: Characteristics and Future Potential. Small-scale Forest Economics, Management and Policy. 4(1): 1-19.
Zaman, M., Yamin, M. and Wong, F. 1996. Environmental consumerism and buying preferences for green products. In: Proc. of the Australian Market-ing Educators’ Conference. Theory and Application. Volume II. C. Riquier and Sharp, B. eds. Marketing Science Centre, Univ. of South Australia, Adelaide, Australia. PP 613-626.
Zhang, Y., Zhang, D. and Schelhas, J. 2005. Small-Scale Non-industrial Private Forest Ownership in the United States: Rationale and Implications for For-est Management. Silva Fennica 39(3) 443-454.
Ziegenspeck, S., Härdter, U. and Schraml, U. 2004. The Future of European Forestry – Between Urbanization and Rural Development. Lifestyles of pri-vate forest owners as an indication of social change. Forest Policy and Eco-nomics. 6(5) 447-458.

218
ABSTRACTS
Recreation value of forests in Lorraine: A spatial analysis
Jens Abildtrup1, Serge Garcia1, Søren Bøye Olsen2 and Anne Stenger1
1 INRA, Nancy, France, 2 University of Copenhagen Heterogeneity in households’ preferences for recreational use of forests may lead to spatial sorting, i.e. households choose their residential location in accordance with their preference for forest recreation. In this study we estimate the recreational value of forests in Lorraine applying revealed and stated preference data. Our approach allows us to estimate individual-specific preferences for recreational use of different forest types. These estimates are used in a second stage of the analysis where we test whether preferences depend on the access to recreation sites. A correlation between access to forests and preferences may indicate spatial sorting driven by spatial heterogeneity in the access to forest recreation. Spatial sorting has implications for the estimation procedures in valuation studies but may also have policy implications, e.g. influencing the choice of afforestation areas.
Images of forest owners - a review of owner typologies
Tove Enggrob Boon
Forest & Landscape, Faculty of Life Sciences, University of Copenhagen Scandinavian countries have a rich tradition of studying the forest owner, from the early 1970s’ recognition of the human factor in wood production, to the current focus on exploring the experienced value and sense-making of forests to owners.
An increasingly frequent means of analysis has been the use of forest owner typologies. Typologies can be valuable policy tools as they simplify complex data about forest owners to a handful of owner types that can be used to formulate and target policy goals and instruments towards the forest owners.
Through a review of forest owner typologies, this study outlines the development in research about forest owners and how the image of what a forest owner is has changed. This reflects, on the one hand, the changing role of forests in society and, on the other hand, the evolving and continually more diversified social science dimension of forest research.
Based on the review, we present new frames of understanding the roles and relationships of forest owners in society, hereby pointing at potentials for innovation as well as towards future research needs.
Keywords: landowner, typology, motivation, forest, policy, behaviour
Are Economists Valuing Biodiversity at Gunpoint? Evidence of no or decreasing willingness to pay for
population levels above preservation
Jette Bredahl Jacobsen, Thomas Hedemark Lundhede and Bo Jellesmark Thorsen
Forest & Landscape, Faculty of Life Sciences, University of Copenhagen Biodiversity valuation studies typically address the willingness to pay (WTP) for species survival. This is an ethically challenging question, and the question is if this distorts WTP-measures? To investigate, we designed a Choice Experiment to evaluate WTP for increases in population levels of endangered and general wildlife in three habitats, including increases beyond survival needs. Respondents trade off increases in populations against income tax and restrictions in recreational access. For endangered and general wildlife across all habitats, mean WTP estimates are higher for moderate population increases than for higher. A Latent Class model shows that respondents fall into three categories: The first seems to care little about wildlife at all. The second places emphasis on wildlife, but with equal weight to moderate and high increases. This could be motivated by warm glow or deontological motivations. The third group is ambivalent about doing much for wildlife, and in particular general wildlife. Their WTP is low and they prefer moderate increases over high. We interpret their mixed signals drawing from literature on moral motivations and self-image considerations. Our results raise questions regarding what biodiversity valuation studies actually measure and points to the caution needed when using these results.
219
ABSTRACTS
Recreation value of forests in Lorraine: A spatial analysis
Jens Abildtrup1, Serge Garcia1, Søren Bøye Olsen2 and Anne Stenger1
1 INRA, Nancy, France, 2 University of Copenhagen Heterogeneity in households’ preferences for recreational use of forests may lead to spatial sorting, i.e. households choose their residential location in accordance with their preference for forest recreation. In this study we estimate the recreational value of forests in Lorraine applying revealed and stated preference data. Our approach allows us to estimate individual-specific preferences for recreational use of different forest types. These estimates are used in a second stage of the analysis where we test whether preferences depend on the access to recreation sites. A correlation between access to forests and preferences may indicate spatial sorting driven by spatial heterogeneity in the access to forest recreation. Spatial sorting has implications for the estimation procedures in valuation studies but may also have policy implications, e.g. influencing the choice of afforestation areas.
Images of forest owners - a review of owner typologies
Tove Enggrob Boon
Forest & Landscape, Faculty of Life Sciences, University of Copenhagen Scandinavian countries have a rich tradition of studying the forest owner, from the early 1970s’ recognition of the human factor in wood production, to the current focus on exploring the experienced value and sense-making of forests to owners.
An increasingly frequent means of analysis has been the use of forest owner typologies. Typologies can be valuable policy tools as they simplify complex data about forest owners to a handful of owner types that can be used to formulate and target policy goals and instruments towards the forest owners.
Through a review of forest owner typologies, this study outlines the development in research about forest owners and how the image of what a forest owner is has changed. This reflects, on the one hand, the changing role of forests in society and, on the other hand, the evolving and continually more diversified social science dimension of forest research.
Based on the review, we present new frames of understanding the roles and relationships of forest owners in society, hereby pointing at potentials for innovation as well as towards future research needs.
Keywords: landowner, typology, motivation, forest, policy, behaviour
Are Economists Valuing Biodiversity at Gunpoint? Evidence of no or decreasing willingness to pay for
population levels above preservation
Jette Bredahl Jacobsen, Thomas Hedemark Lundhede and Bo Jellesmark Thorsen
Forest & Landscape, Faculty of Life Sciences, University of Copenhagen Biodiversity valuation studies typically address the willingness to pay (WTP) for species survival. This is an ethically challenging question, and the question is if this distorts WTP-measures? To investigate, we designed a Choice Experiment to evaluate WTP for increases in population levels of endangered and general wildlife in three habitats, including increases beyond survival needs. Respondents trade off increases in populations against income tax and restrictions in recreational access. For endangered and general wildlife across all habitats, mean WTP estimates are higher for moderate population increases than for higher. A Latent Class model shows that respondents fall into three categories: The first seems to care little about wildlife at all. The second places emphasis on wildlife, but with equal weight to moderate and high increases. This could be motivated by warm glow or deontological motivations. The third group is ambivalent about doing much for wildlife, and in particular general wildlife. Their WTP is low and they prefer moderate increases over high. We interpret their mixed signals drawing from literature on moral motivations and self-image considerations. Our results raise questions regarding what biodiversity valuation studies actually measure and points to the caution needed when using these results.

220
Keywords: Latent Class, Random parameter Logit, Use values, Heuristics, moral satisfaction, self image, scope, choice experiment, access, warm glow of giving.
Measuring the performance of forestry – a proposed Forest Management Index as
boundary spanner at the science-policy interface
Kewin Kamelarczyk1 and Peter Holmgren 1 Forest & Landscape, Faculty of Life Sciences, University of Copenhagen
A basic criterion for the success of sustainable forest management (SFM) is the ability to assess and monitor the conditions and derived benefits of forest assets on which environmental policies should respond. However, it is inherently difficult to quantify these assets and the status and development of forest management are not always well understood or appreciated by neither the general public nor the architects of broader policy processes in which forestry is but one component. We argue that the concept of SFM is losing momentum, partly due to the difficulties in monitoring and communicating its performance.
This paper takes a fresh look at the requirements and opportunities for an index of forest management performance at national level. The Forest Management Index (FMI) is discussed in the light of social scientific theories on boundary work at the science-policy interface and is proposed as a boundary spanning object that is able to connect the two domains of science and policy.
‘Forest resources condition’ and ‘flow of primary forest benefits’ are suggested as determinants for the performance of forest management. Relative change in growing stock and value of primary products and services are found practical indicators. Data from FAO’s Forest Resources Assessment (FRA) 2005 are used as empirical substance for exemplification, and countries, corresponding to 80 percent of the world’s forest area, are ranked according to their forest management performance. Despite of scientific shortcomings, the index is found to be a legitimate and legible compromise between the complexity of Criteria and Indicators and the over- simplified de-facto use of ‘forest cover change’ as measures for SFM by taking into account considerations of both data availability and politics requirements.
Impact of the future global scenarios on the EU forest
sector development
Alexander Moiseyev1, Birger Solberg2 and Maarit Kallio3
1 European Forest Institute, Finland 2 Department of Ecology and Natural Resource Management, Norwegian
University of Life Sciences, 3 Finnish Forest Research Institute - METLA
The future of the EU forest sector is dependent not only on EU policies, but also largely on the future global socio-economic context. Two IPCC SRES scenarios A1 and B2 are used as contrasting reference scenarios, each representing a different path of evolution of the forestry sector in developing countries and the CIS region. The A1 scenario is one likely future scenario, and has dominated over the past couple of decades, as the world economy and the forest sector have become increasingly globalised. The A1 scenario is defined as the continuation of relatively high economic growth and a correspondingly high growth in the consumption of wood-based products. Environmental issues are attributed relatively high significance in the EU and other developed countries, but in other less developed countries the environment and sustainability are of less concern. This disregard leads to the continuation of unsustainable forestry and the degradation of forests in the developing world. The B2 scenario foresees future development, whereby the environment is afforded a high level of importance in all world regions, and under which concerns are addressed through local, regional approaches. Under this scenario regionalisation counters the globalisation trend and economic growth is slower. These contrasting global contexts expose the EU forest sector to different conditions, which have a substantial impact on forestry and the development of the forest industry.
The global forest sector model EFI-GTM was used to analyse the above scenarios for the EU and the global forest sector. The EU is expected to continue increasing imports of raw wood from Russia and other countries under A1, which will help to sustain the growth of the pulp and paper industry while ensuring that there is less pressure on EU forests. However, a declining supply of wood from outside of the EU and decreasing imports of wood into the EU under the B2 scenario will lead to slower growth of the EU forest industry and result in more pressure on European forests.
221
Keywords: Latent Class, Random parameter Logit, Use values, Heuristics, moral satisfaction, self image, scope, choice experiment, access, warm glow of giving.
Measuring the performance of forestry – a proposed Forest Management Index as
boundary spanner at the science-policy interface
Kewin Kamelarczyk1 and Peter Holmgren 1 Forest & Landscape, Faculty of Life Sciences, University of Copenhagen
A basic criterion for the success of sustainable forest management (SFM) is the ability to assess and monitor the conditions and derived benefits of forest assets on which environmental policies should respond. However, it is inherently difficult to quantify these assets and the status and development of forest management are not always well understood or appreciated by neither the general public nor the architects of broader policy processes in which forestry is but one component. We argue that the concept of SFM is losing momentum, partly due to the difficulties in monitoring and communicating its performance.
This paper takes a fresh look at the requirements and opportunities for an index of forest management performance at national level. The Forest Management Index (FMI) is discussed in the light of social scientific theories on boundary work at the science-policy interface and is proposed as a boundary spanning object that is able to connect the two domains of science and policy.
‘Forest resources condition’ and ‘flow of primary forest benefits’ are suggested as determinants for the performance of forest management. Relative change in growing stock and value of primary products and services are found practical indicators. Data from FAO’s Forest Resources Assessment (FRA) 2005 are used as empirical substance for exemplification, and countries, corresponding to 80 percent of the world’s forest area, are ranked according to their forest management performance. Despite of scientific shortcomings, the index is found to be a legitimate and legible compromise between the complexity of Criteria and Indicators and the over- simplified de-facto use of ‘forest cover change’ as measures for SFM by taking into account considerations of both data availability and politics requirements.
Impact of the future global scenarios on the EU forest
sector development
Alexander Moiseyev1, Birger Solberg2 and Maarit Kallio3
1 European Forest Institute, Finland 2 Department of Ecology and Natural Resource Management, Norwegian
University of Life Sciences, 3 Finnish Forest Research Institute - METLA
The future of the EU forest sector is dependent not only on EU policies, but also largely on the future global socio-economic context. Two IPCC SRES scenarios A1 and B2 are used as contrasting reference scenarios, each representing a different path of evolution of the forestry sector in developing countries and the CIS region. The A1 scenario is one likely future scenario, and has dominated over the past couple of decades, as the world economy and the forest sector have become increasingly globalised. The A1 scenario is defined as the continuation of relatively high economic growth and a correspondingly high growth in the consumption of wood-based products. Environmental issues are attributed relatively high significance in the EU and other developed countries, but in other less developed countries the environment and sustainability are of less concern. This disregard leads to the continuation of unsustainable forestry and the degradation of forests in the developing world. The B2 scenario foresees future development, whereby the environment is afforded a high level of importance in all world regions, and under which concerns are addressed through local, regional approaches. Under this scenario regionalisation counters the globalisation trend and economic growth is slower. These contrasting global contexts expose the EU forest sector to different conditions, which have a substantial impact on forestry and the development of the forest industry.
The global forest sector model EFI-GTM was used to analyse the above scenarios for the EU and the global forest sector. The EU is expected to continue increasing imports of raw wood from Russia and other countries under A1, which will help to sustain the growth of the pulp and paper industry while ensuring that there is less pressure on EU forests. However, a declining supply of wood from outside of the EU and decreasing imports of wood into the EU under the B2 scenario will lead to slower growth of the EU forest industry and result in more pressure on European forests.
222
Visits to National Parks and Hiking Areas: A Panel Data Analysis of Their Socio-Demographic,
Economic and Site Quality Determinants
Anna Vanhatalo1, Jussi Uusivuori, Jarmo Mikkola, Marjo Neuvonen and Tuija Sievänen
1 Finnish Forest Research Institute (METLA),
The numbers of visits to national parks and other types of nature areas have increased remarkably in Finland in last ten years. This trend is partly similar in many other countries, but also opposite trends has been observed. In order to better understand the potential visitor flow to national parks, and thus the potential for nature tourism based on those visits, it is interesting to study which social, economic or environmental factors could explain this trend. This study examines the impacts of socio-demographic, economic and park quality determinants on the visits to nature areas. The authors apply panel data estimation techniques to Finnish data on 46 national parks and hiking areas between 2000−2008. The main results show that visits to nature areas reacted positively to population size and quality features of the area, but negatively to gasoline prices and income level. Of the age-classes, the population share of 'early retirees' - people between 65 and 74 years of age - increased significantly the number of visits to nature areas, whereas the share of 'baby boomers' - people between 55 and 64 - was insignificant in explaining the number of visits to nature areas. As the baby boomers are reaching retirement age, and assuming that their generation behaves as the 'early retirees' in this study, the demand for national parks and hiking areas will increase substantially in the upcoming years. This will put pressure on expanding current parks and establishing new ones.
Policies and processes for improving forest holding size and structure in Finland
Marjut Vierimaa
Finnish Forest Research Institute The ongoing economic downturn together with the trend of closing down the production of the Finnish forest industry has generated political interest in improving circumstances for the forest sector. In June 2009 a
development project was started at the Finnish Forest Research Institute, supervised and financed by the Ministry of Agriculture and Forestry. This project aims at improving the wood markets and profitability of forestry by increasing forest holding size and developing the structure of forest holdings. The project seeks to formulate concrete policy propositions based, if possible, on cost-benefit analyses.
The average size of a forest holding in Finland is 24 hectares, and the average age of the owner is 60 years. These facts have an impact on the functioning of the wood market, as a great share of Finnish forests is owned by private people. Furthermore, inheriting and family deals are the predominant way for ownership changes. Very few forest holdings are traded in the open market, which decreases possibilities of fast development in the average holding size. Forest possessions are regarded mostly as a financial investment and only partly as a production investment in Finnish taxation, which causes disincentives for both the holding-size and the age questions.
The range of the measures covered by the project vary from creating tax-incentives in order to increase the holding size to information websites and creating networks for various professionals. During the first part of the project, emphasis has been on the tax-related measures. Developing them is a great balancing act between requirements as macroeconomic efficiency, the principles of neutrality and equality, and the national and EU level regulation. Furthermore, finding feasible instruments accepted by all sectors, ministries as well as interest groups, provides further challenges. Keywords: forest policy, tax instrument, forest holding size, wood market.

223
Visits to National Parks and Hiking Areas: A Panel Data Analysis of Their Socio-Demographic,
Economic and Site Quality Determinants
Anna Vanhatalo1, Jussi Uusivuori, Jarmo Mikkola, Marjo Neuvonen and Tuija Sievänen
1 Finnish Forest Research Institute (METLA),
The numbers of visits to national parks and other types of nature areas have increased remarkably in Finland in last ten years. This trend is partly similar in many other countries, but also opposite trends has been observed. In order to better understand the potential visitor flow to national parks, and thus the potential for nature tourism based on those visits, it is interesting to study which social, economic or environmental factors could explain this trend. This study examines the impacts of socio-demographic, economic and park quality determinants on the visits to nature areas. The authors apply panel data estimation techniques to Finnish data on 46 national parks and hiking areas between 2000−2008. The main results show that visits to nature areas reacted positively to population size and quality features of the area, but negatively to gasoline prices and income level. Of the age-classes, the population share of 'early retirees' - people between 65 and 74 years of age - increased significantly the number of visits to nature areas, whereas the share of 'baby boomers' - people between 55 and 64 - was insignificant in explaining the number of visits to nature areas. As the baby boomers are reaching retirement age, and assuming that their generation behaves as the 'early retirees' in this study, the demand for national parks and hiking areas will increase substantially in the upcoming years. This will put pressure on expanding current parks and establishing new ones.
Policies and processes for improving forest holding size and structure in Finland
Marjut Vierimaa
Finnish Forest Research Institute The ongoing economic downturn together with the trend of closing down the production of the Finnish forest industry has generated political interest in improving circumstances for the forest sector. In June 2009 a
development project was started at the Finnish Forest Research Institute, supervised and financed by the Ministry of Agriculture and Forestry. This project aims at improving the wood markets and profitability of forestry by increasing forest holding size and developing the structure of forest holdings. The project seeks to formulate concrete policy propositions based, if possible, on cost-benefit analyses.
The average size of a forest holding in Finland is 24 hectares, and the average age of the owner is 60 years. These facts have an impact on the functioning of the wood market, as a great share of Finnish forests is owned by private people. Furthermore, inheriting and family deals are the predominant way for ownership changes. Very few forest holdings are traded in the open market, which decreases possibilities of fast development in the average holding size. Forest possessions are regarded mostly as a financial investment and only partly as a production investment in Finnish taxation, which causes disincentives for both the holding-size and the age questions.
The range of the measures covered by the project vary from creating tax-incentives in order to increase the holding size to information websites and creating networks for various professionals. During the first part of the project, emphasis has been on the tax-related measures. Developing them is a great balancing act between requirements as macroeconomic efficiency, the principles of neutrality and equality, and the national and EU level regulation. Furthermore, finding feasible instruments accepted by all sectors, ministries as well as interest groups, provides further challenges. Keywords: forest policy, tax instrument, forest holding size, wood market.

224
FOREST INDUSTRY &
FOREST PRODUCTS MARKETS

225
FOREST INDUSTRY &
FOREST PRODUCTS MARKETS

226
1
Contracts as a Tool for Improving Efficiency in the Norwegian Roundwood Markets
Sjur Baardsen
Norwegian University of Life Sciences Abstract The principal objective of this work was to develop market competence and more efficient trade mechanisms in the Norwegian roundwood markets. The standard delivery contract covers about 90% of the traded roundwood volume in Norway. Information about the functioning of this contract was gathered by interviewing market agents, studying their homepages and arranging a workshop. This information was then used to contrast the standard delivery contract with a set of rules designed for best practice contracting, while at the same time taking into account that most of the roundwood sales are organised by cooperatives. Improvements of the contract are suggested. Keywords: Contract theory, timber market, roundwood market 1. Introduction There are almost 120 00 forest owners in Norway, 44 000 of them members of one of the eight regional forest cooperatives, all organised in the nationwide Norwegian Forest Owners’ Federation. The cooperatives organise almost 80% of the roundwood supply in Norway. Besides, some of the largest forest properties are organised directly in a separate nationwide association, Norskog. This association organises all its roundwood sales through its daughter company Nortømmer Lmt. Their market share is about 10%. So is the share of SB Skog (Statskog-Borregaard Skogsdrift Lmt), a third major player. Nortømmer and SB skog are companies, not cooperatives. Practically speaking, Nortømmer works somewhat like a cooperative for Norskog’s about 200 members (owners with large forest properties). There is little or no competition between the regional cooperatives, but they compete with Nortømmer and SB Skog. Any forest owner is free to deliver roundwood to whomever he wants, no matter membership or not. The organised collaboration of the cooperatives started about 100 years ago and developed well to balance out market power exercised by the buyers. There
227
1
Contracts as a Tool for Improving Efficiency in the Norwegian Roundwood Markets
Sjur Baardsen
Norwegian University of Life Sciences Abstract The principal objective of this work was to develop market competence and more efficient trade mechanisms in the Norwegian roundwood markets. The standard delivery contract covers about 90% of the traded roundwood volume in Norway. Information about the functioning of this contract was gathered by interviewing market agents, studying their homepages and arranging a workshop. This information was then used to contrast the standard delivery contract with a set of rules designed for best practice contracting, while at the same time taking into account that most of the roundwood sales are organised by cooperatives. Improvements of the contract are suggested. Keywords: Contract theory, timber market, roundwood market 1. Introduction There are almost 120 00 forest owners in Norway, 44 000 of them members of one of the eight regional forest cooperatives, all organised in the nationwide Norwegian Forest Owners’ Federation. The cooperatives organise almost 80% of the roundwood supply in Norway. Besides, some of the largest forest properties are organised directly in a separate nationwide association, Norskog. This association organises all its roundwood sales through its daughter company Nortømmer Lmt. Their market share is about 10%. So is the share of SB Skog (Statskog-Borregaard Skogsdrift Lmt), a third major player. Nortømmer and SB skog are companies, not cooperatives. Practically speaking, Nortømmer works somewhat like a cooperative for Norskog’s about 200 members (owners with large forest properties). There is little or no competition between the regional cooperatives, but they compete with Nortømmer and SB Skog. Any forest owner is free to deliver roundwood to whomever he wants, no matter membership or not. The organised collaboration of the cooperatives started about 100 years ago and developed well to balance out market power exercised by the buyers. There

228
2
are several additional reasons why the cooperation is still important. First, the average forest owner has a very small market share. Second, the estates are spread over large areas and, third, the average transport costs make a large part of the value of roundwood. This setting calls for investigation of issues such as risk spreading and transaction costs. Two industries buy almost all the Norwegian industrial roundwood. Sawmills process sawlogs to sawnwood, and pulp and paper mills process pulpwood to paper products. In contrast to the suppliers, the demanders are few. There is a long tradition of negotiating roundwood prices in Norway. After WWII followed a few years with administratively set and binding maximum prices, but after 1952 the prices were determined annually through central negotiations for about 40 years. Prices for pulpwood and sawlogs were negotiated separately. The Forest Owners’ Federation required the members to deliver their roundwood supplies through the regional associations, and the pulpwood buyers organised their demand through their nationwide federation. Considering this case with one annual and nationwide negotiated price and individual quantity responses from about 120 000 independent suppliers and some few demanders market clearing was seldom achieved. Lack of clearing resulted in various types of regulations being implemented, for example ban on new contracts, and a host of bonus and penalty measures. The price negotiations were decentralised to regional levels for sawlogs in 1984 and for pulpwood in 1992. From then on the national and regional buyers negotiated with the regional forest owner associations and with Nortømmer, and later also with SB Skog. As also the price periods became shorter, at least in some years, the prices became less sticky. The European Free Trade Agreement (EFTA) Surveillance Authority (ESA) influenced the Norwegian roundwood market somewhat from April 1997 on by opening for more individual contracting, e.g. by abolishing members’ compulsory delivery through their associations. This also led to a restructuring of the forest owner associations into fewer and larger cooperatives, implying a change of role from brokers to buyers (and re-sellers).
Almost all roundwood sales in Norway are delivery sales basically regulated by a common agreed framework from 1998. The change of the associations into cooperatives and the increased emphasis on environment and certification of all activities have forced a few modernisations of these regulations, but the basics of the standard delivery contract is still almost identical for all delivery sales. It also serves as a basis for all other roundwood sales, although e.g. stumpage sales need to have a set of additional regulations.
3
The forest sector seems rather demand-driven. In the short run the shifts in the end-use demand for forest products more or less decide the roundwood price movements. The forest owner cooperatives, Nortømmer and SB Skog aim at high roundwood prices when negotiating with the industries, and they surely also take into account current supply-side information while negotiating, but once roundwood prices and volumes have been decided the major challenge is to provide these quantities. Although there are contracts designed to provide some flexibility in this system the standard delivery contract with its negotiated prices still remains the basic instrument for about 90% of the traded volumes.
The challenge of providing the demanded quantities is a major one. The stakeholders are constantly stressed by changing external factors making it difficult to match supply with demand. Examples of such factors are end-use demand, production costs, logging conditions and storm fellings. But what about the contract? Is it well designed for coordination when the factors shift, does it motivate sufficiently, is it cost effective? In this paper we assess this contract. We do so in a pragmatic way by contrasting it to Bogetoft and Olesens (2002) “Ten rules of thumb in contract design”, also drawing heavily on Bogetoft and Olesen (2004; 2007). In this way we aim first of all to shed some light on pros and cons of this contract, and also to suggest some amendments. 2. Theory and Method 2.1 Strands of Contract Theory Contract theory may be regarded as a collective term for different approaches, where transaction cost theory, property rights theory and incentive systems theory make different parts (Gibbons 2005; Wu 2006). Assume that a contracting process may be divided into ex ante and ex post, distinguished by the period when uncertainty related to the process is revealed. While property rights theory focuses on (inefficiencies arising from suboptimal) ex ante investments or efforts, transaction costs theory rather has its main focus on ex post rent seeking (as a source of inefficiency). Property rights theory assumes that all decisions rights are contractible ex post, while transaction costs theory does not allow important variables to be contractible even ex post. Incentive systems theory may be regarded as something flexible in between the two. Like property rights theory it focuses on ex ante investments and efforts to avoid inefficiency, but it allows a greater range of incentives to be used. It assumes that important contractible performance actions and measures are available ex ante (as interim signals) for making incentive contracts. Consequences of revealed uncertainties and contingencies are also contractible ex ante although known only ex post. Table 1 illustrates the scheme.
229
2
are several additional reasons why the cooperation is still important. First, the average forest owner has a very small market share. Second, the estates are spread over large areas and, third, the average transport costs make a large part of the value of roundwood. This setting calls for investigation of issues such as risk spreading and transaction costs. Two industries buy almost all the Norwegian industrial roundwood. Sawmills process sawlogs to sawnwood, and pulp and paper mills process pulpwood to paper products. In contrast to the suppliers, the demanders are few. There is a long tradition of negotiating roundwood prices in Norway. After WWII followed a few years with administratively set and binding maximum prices, but after 1952 the prices were determined annually through central negotiations for about 40 years. Prices for pulpwood and sawlogs were negotiated separately. The Forest Owners’ Federation required the members to deliver their roundwood supplies through the regional associations, and the pulpwood buyers organised their demand through their nationwide federation. Considering this case with one annual and nationwide negotiated price and individual quantity responses from about 120 000 independent suppliers and some few demanders market clearing was seldom achieved. Lack of clearing resulted in various types of regulations being implemented, for example ban on new contracts, and a host of bonus and penalty measures. The price negotiations were decentralised to regional levels for sawlogs in 1984 and for pulpwood in 1992. From then on the national and regional buyers negotiated with the regional forest owner associations and with Nortømmer, and later also with SB Skog. As also the price periods became shorter, at least in some years, the prices became less sticky. The European Free Trade Agreement (EFTA) Surveillance Authority (ESA) influenced the Norwegian roundwood market somewhat from April 1997 on by opening for more individual contracting, e.g. by abolishing members’ compulsory delivery through their associations. This also led to a restructuring of the forest owner associations into fewer and larger cooperatives, implying a change of role from brokers to buyers (and re-sellers).
Almost all roundwood sales in Norway are delivery sales basically regulated by a common agreed framework from 1998. The change of the associations into cooperatives and the increased emphasis on environment and certification of all activities have forced a few modernisations of these regulations, but the basics of the standard delivery contract is still almost identical for all delivery sales. It also serves as a basis for all other roundwood sales, although e.g. stumpage sales need to have a set of additional regulations.
3
The forest sector seems rather demand-driven. In the short run the shifts in the end-use demand for forest products more or less decide the roundwood price movements. The forest owner cooperatives, Nortømmer and SB Skog aim at high roundwood prices when negotiating with the industries, and they surely also take into account current supply-side information while negotiating, but once roundwood prices and volumes have been decided the major challenge is to provide these quantities. Although there are contracts designed to provide some flexibility in this system the standard delivery contract with its negotiated prices still remains the basic instrument for about 90% of the traded volumes.
The challenge of providing the demanded quantities is a major one. The stakeholders are constantly stressed by changing external factors making it difficult to match supply with demand. Examples of such factors are end-use demand, production costs, logging conditions and storm fellings. But what about the contract? Is it well designed for coordination when the factors shift, does it motivate sufficiently, is it cost effective? In this paper we assess this contract. We do so in a pragmatic way by contrasting it to Bogetoft and Olesens (2002) “Ten rules of thumb in contract design”, also drawing heavily on Bogetoft and Olesen (2004; 2007). In this way we aim first of all to shed some light on pros and cons of this contract, and also to suggest some amendments. 2. Theory and Method 2.1 Strands of Contract Theory Contract theory may be regarded as a collective term for different approaches, where transaction cost theory, property rights theory and incentive systems theory make different parts (Gibbons 2005; Wu 2006). Assume that a contracting process may be divided into ex ante and ex post, distinguished by the period when uncertainty related to the process is revealed. While property rights theory focuses on (inefficiencies arising from suboptimal) ex ante investments or efforts, transaction costs theory rather has its main focus on ex post rent seeking (as a source of inefficiency). Property rights theory assumes that all decisions rights are contractible ex post, while transaction costs theory does not allow important variables to be contractible even ex post. Incentive systems theory may be regarded as something flexible in between the two. Like property rights theory it focuses on ex ante investments and efforts to avoid inefficiency, but it allows a greater range of incentives to be used. It assumes that important contractible performance actions and measures are available ex ante (as interim signals) for making incentive contracts. Consequences of revealed uncertainties and contingencies are also contractible ex ante although known only ex post. Table 1 illustrates the scheme.
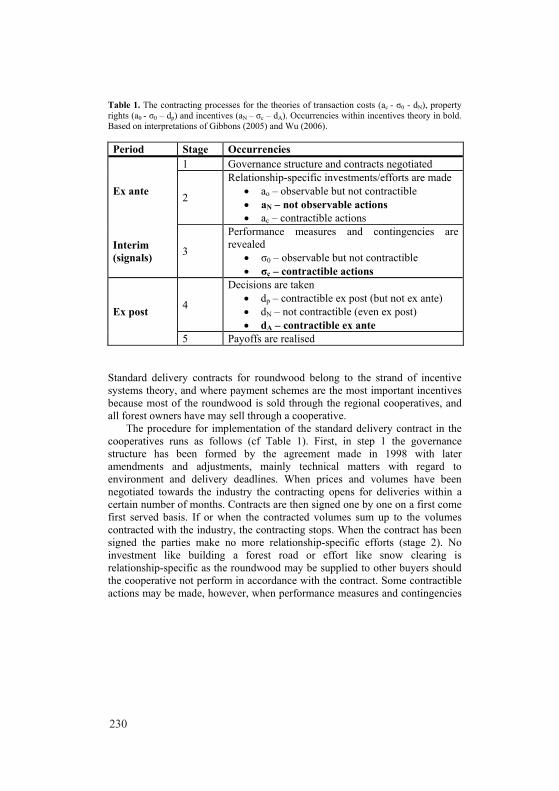
230
4
Table 1. The contracting processes for the theories of transaction costs (ac - σ0 - dN), property rights (a0 - σ0 – dp) and incentives (aN – σc – dA). Occurrencies within incentives theory in bold. Based on interpretations of Gibbons (2005) and Wu (2006). Period Stage Occurrencies
Ex ante
1 Governance structure and contracts negotiated
2
Relationship-specific investments/efforts are made • ao – observable but not contractible • aN – not observable actions • ac – contractible actions
Interim (signals) 3
Performance measures and contingencies are revealed
• σ0 – observable but not contractible • σc – contractible actions
Ex post 4
Decisions are taken • dp – contractible ex post (but not ex ante) • dN – not contractible (even ex post) • dA – contractible ex ante
5 Payoffs are realised Standard delivery contracts for roundwood belong to the strand of incentive systems theory, and where payment schemes are the most important incentives because most of the roundwood is sold through the regional cooperatives, and all forest owners have may sell through a cooperative. The procedure for implementation of the standard delivery contract in the cooperatives runs as follows (cf Table 1). First, in step 1 the governance structure has been formed by the agreement made in 1998 with later amendments and adjustments, mainly technical matters with regard to environment and delivery deadlines. When prices and volumes have been negotiated towards the industry the contracting opens for deliveries within a certain number of months. Contracts are then signed one by one on a first come first served basis. If or when the contracted volumes sum up to the volumes contracted with the industry, the contracting stops. When the contract has been signed the parties make no more relationship-specific efforts (stage 2). No investment like building a forest road or effort like snow clearing is relationship-specific as the roundwood may be supplied to other buyers should the cooperative not perform in accordance with the contract. Some contractible actions may be made, however, when performance measures and contingencies
5
are revealed (stage 3). Examples are reduction of contracted quantities when the market situation or force majeure conditions make deliveries difficult. When the roundwood has been delivered (ex post, stage 4) decisions are taken on some already ex ante contracted measures. Examples are penalties for delivering too much or too little and breaches of quality standards (with regard to roundwood, to storing and arranging the roundwood for loading, and to the forest road). Ex post equalisation of prices due to unexpected market development is another example. Finally, the main payments are made a few weeks after delivery, while some dividend based on delivered volumes may be paid the following year (stage 5). 2.2 Some Important Aspects in Cooperatives Many aspects need to be addressed when assessing the performance of a contract. Below we give a very short presentation of some important ones for cooperatives, based on Bogetoft and Olesen (2007). The presentation assumes that the contract includes a payment scheme. There is reason to believe that forest owners are members of the cooperatives for welfare reasons, and this may be translated into economic reasons without significant loss of precision, and that maximizing the profits in the integrated organisation consisting of the members and the cooperative is an efficient goal. Efficiency may also be reached applying the Pareto criterion, implying that no member can be better off without others being worse off. Information is a key issue in contracting. Different contract regimes require various levels of information. Information may be costly and it is usually asymmetric for contracting partners. Also its quality varies. Risk and uncertainty need to be taken well care of in contracting. What are the most important risks and uncertainties? How should the risk be shared, (when/how) is it transferred from seller to buyer, how are costs of risk minimised? How to deal with uncertainties like fires, storms, insects etc.? Allocation of profit to members is important in any cooperative. First, contracts following from a payment scheme must reflect what is termed a balanced budget, implying that the total payments to members should correspond to the revenue of the cooperative. Second, members of a cooperative need to feel that they are treated equally. But equality is not uniquely defined. It may be applied in several ways. Should all members receive the same part of the profit, should their shares be proportional to their deliveries or share of equity capital etc? Related to this is also the principle of member democracy. A contract with its payment scheme can only be adopted if it is advantageous to the majority of the members.

231
4
Table 1. The contracting processes for the theories of transaction costs (ac - σ0 - dN), property rights (a0 - σ0 – dp) and incentives (aN – σc – dA). Occurrencies within incentives theory in bold. Based on interpretations of Gibbons (2005) and Wu (2006). Period Stage Occurrencies
Ex ante
1 Governance structure and contracts negotiated
2
Relationship-specific investments/efforts are made • ao – observable but not contractible • aN – not observable actions • ac – contractible actions
Interim (signals) 3
Performance measures and contingencies are revealed
• σ0 – observable but not contractible • σc – contractible actions
Ex post 4
Decisions are taken • dp – contractible ex post (but not ex ante) • dN – not contractible (even ex post) • dA – contractible ex ante
5 Payoffs are realised Standard delivery contracts for roundwood belong to the strand of incentive systems theory, and where payment schemes are the most important incentives because most of the roundwood is sold through the regional cooperatives, and all forest owners have may sell through a cooperative. The procedure for implementation of the standard delivery contract in the cooperatives runs as follows (cf Table 1). First, in step 1 the governance structure has been formed by the agreement made in 1998 with later amendments and adjustments, mainly technical matters with regard to environment and delivery deadlines. When prices and volumes have been negotiated towards the industry the contracting opens for deliveries within a certain number of months. Contracts are then signed one by one on a first come first served basis. If or when the contracted volumes sum up to the volumes contracted with the industry, the contracting stops. When the contract has been signed the parties make no more relationship-specific efforts (stage 2). No investment like building a forest road or effort like snow clearing is relationship-specific as the roundwood may be supplied to other buyers should the cooperative not perform in accordance with the contract. Some contractible actions may be made, however, when performance measures and contingencies
5
are revealed (stage 3). Examples are reduction of contracted quantities when the market situation or force majeure conditions make deliveries difficult. When the roundwood has been delivered (ex post, stage 4) decisions are taken on some already ex ante contracted measures. Examples are penalties for delivering too much or too little and breaches of quality standards (with regard to roundwood, to storing and arranging the roundwood for loading, and to the forest road). Ex post equalisation of prices due to unexpected market development is another example. Finally, the main payments are made a few weeks after delivery, while some dividend based on delivered volumes may be paid the following year (stage 5). 2.2 Some Important Aspects in Cooperatives Many aspects need to be addressed when assessing the performance of a contract. Below we give a very short presentation of some important ones for cooperatives, based on Bogetoft and Olesen (2007). The presentation assumes that the contract includes a payment scheme. There is reason to believe that forest owners are members of the cooperatives for welfare reasons, and this may be translated into economic reasons without significant loss of precision, and that maximizing the profits in the integrated organisation consisting of the members and the cooperative is an efficient goal. Efficiency may also be reached applying the Pareto criterion, implying that no member can be better off without others being worse off. Information is a key issue in contracting. Different contract regimes require various levels of information. Information may be costly and it is usually asymmetric for contracting partners. Also its quality varies. Risk and uncertainty need to be taken well care of in contracting. What are the most important risks and uncertainties? How should the risk be shared, (when/how) is it transferred from seller to buyer, how are costs of risk minimised? How to deal with uncertainties like fires, storms, insects etc.? Allocation of profit to members is important in any cooperative. First, contracts following from a payment scheme must reflect what is termed a balanced budget, implying that the total payments to members should correspond to the revenue of the cooperative. Second, members of a cooperative need to feel that they are treated equally. But equality is not uniquely defined. It may be applied in several ways. Should all members receive the same part of the profit, should their shares be proportional to their deliveries or share of equity capital etc? Related to this is also the principle of member democracy. A contract with its payment scheme can only be adopted if it is advantageous to the majority of the members.

232
6
Individual incentives need to be strong enough for the any member not to leave the cooperative, and no member should gain from deviating from the most efficient plan. Likewise, no group of members should be able to benefit from leaving the cooperative, it should obtain at least as much profit inside the cooperative as it could obtain outside. This is called the stand-alone profit. Further, no group should be able to gain more profit than its contribution to the cooperative, i.e. its incremental profit. Otherwise it is subsidised by the other members. Profit allocations between the stand-alone profit and the incremental profit lie in what is said to be the core. Payment schemes in the core allow viable cooperation based on positive synergies from cooperation. 2.3 The Ten Rules of Thumb Since many aspects need to be addressed when assessing the performance of a contract we need an approach that can deal with such a complex structure. Bogetoft and Olesens (2002) “Ten rules of thumb in contract design” is a good candidate for individual contracts. It is a set of normative rules that enables us to make a pragmatic approach to contract assessment and design. The rules result from a multicriteria decision analysis of a large set of different criteria, like those mentioned above. The rules are not independent, but rather designed for making well considered trade-offs between the three main objectives of any contract: coordination, motivation and low transaction costs, cf. Table 1. Bogetoft and Olesen (2004) develop the application of the rules a step further suggesting a holistic approach to contract theory, and Bogetoft and Olesen (2007) dig more specifically into payment schemes in cooperatives. In this paper we draw from all these works. We apply the rules of thumb while putting most emphasis on topics that have specific relevance to cooperatives and payment schemes used with the standard delivery contract for roundwood.
7
Table 2. The ten rules of thumb. Bogetoft and Olesen (2002). Main Objective Number Rule
Coordination
1 Coordinate production
2 Balance the pros and cons of decentralisation
3 Minimise the costs of risk and uncertainty
Motivation
4 Reduce the costs of post-contractual opportunism
5 Reduce the costs of pre-contractual opportunism
6 Do not kill cooperation 7 Motivate long-term concerns 8 Balance the pros and cons of renegotiating
Low Transaction costs
9 Reduce direct costs of contracting 10 Use transparent contracts
2.4 Method In order to contrast the standard delivery contract with the ten rules of thumb we needed to study the contract itself and how it works in practice. This was made through arranging a workshop with representatives from the cooperatives, Nortømmer and SB Skog, by interviewing representatives of four cooperatives and by collecting information from relevant homepages. During this investigation we identified a set of other contracts/incentive schemes/trade mechanisms, most of them designed as additions to the standard delivery contract. 3. Results 3.1 Coordinate Production Production may be coordinated using central planning or markets. There is tradition for both approaches in the Norway, and for a combination. It may be argued that the forest sector markets have evolved from being more centrally planned in the post WWII era towards more market coordinated in the past. The first to be checked is to what agree does the contract optimise the whole value chain, in order to maximise the integrated profit. For this to happen right quantities have to be delivered at the right time in the right place, as cheap as possible. The cooperative should share the integrated profit maximisation goals of its owners. Therefore, one may assume that the coordination between

233
6
Individual incentives need to be strong enough for the any member not to leave the cooperative, and no member should gain from deviating from the most efficient plan. Likewise, no group of members should be able to benefit from leaving the cooperative, it should obtain at least as much profit inside the cooperative as it could obtain outside. This is called the stand-alone profit. Further, no group should be able to gain more profit than its contribution to the cooperative, i.e. its incremental profit. Otherwise it is subsidised by the other members. Profit allocations between the stand-alone profit and the incremental profit lie in what is said to be the core. Payment schemes in the core allow viable cooperation based on positive synergies from cooperation. 2.3 The Ten Rules of Thumb Since many aspects need to be addressed when assessing the performance of a contract we need an approach that can deal with such a complex structure. Bogetoft and Olesens (2002) “Ten rules of thumb in contract design” is a good candidate for individual contracts. It is a set of normative rules that enables us to make a pragmatic approach to contract assessment and design. The rules result from a multicriteria decision analysis of a large set of different criteria, like those mentioned above. The rules are not independent, but rather designed for making well considered trade-offs between the three main objectives of any contract: coordination, motivation and low transaction costs, cf. Table 1. Bogetoft and Olesen (2004) develop the application of the rules a step further suggesting a holistic approach to contract theory, and Bogetoft and Olesen (2007) dig more specifically into payment schemes in cooperatives. In this paper we draw from all these works. We apply the rules of thumb while putting most emphasis on topics that have specific relevance to cooperatives and payment schemes used with the standard delivery contract for roundwood.
7
Table 2. The ten rules of thumb. Bogetoft and Olesen (2002). Main Objective Number Rule
Coordination
1 Coordinate production
2 Balance the pros and cons of decentralisation
3 Minimise the costs of risk and uncertainty
Motivation
4 Reduce the costs of post-contractual opportunism
5 Reduce the costs of pre-contractual opportunism
6 Do not kill cooperation 7 Motivate long-term concerns 8 Balance the pros and cons of renegotiating
Low Transaction costs
9 Reduce direct costs of contracting 10 Use transparent contracts
2.4 Method In order to contrast the standard delivery contract with the ten rules of thumb we needed to study the contract itself and how it works in practice. This was made through arranging a workshop with representatives from the cooperatives, Nortømmer and SB Skog, by interviewing representatives of four cooperatives and by collecting information from relevant homepages. During this investigation we identified a set of other contracts/incentive schemes/trade mechanisms, most of them designed as additions to the standard delivery contract. 3. Results 3.1 Coordinate Production Production may be coordinated using central planning or markets. There is tradition for both approaches in the Norway, and for a combination. It may be argued that the forest sector markets have evolved from being more centrally planned in the post WWII era towards more market coordinated in the past. The first to be checked is to what agree does the contract optimise the whole value chain, in order to maximise the integrated profit. For this to happen right quantities have to be delivered at the right time in the right place, as cheap as possible. The cooperative should share the integrated profit maximisation goals of its owners. Therefore, one may assume that the coordination between

234
8
these two parts should be relatively easy to handle. We will see below that this is not necessarily the case. In addition, the wood chain goes beyond the cooperatives, and the coordination becomes more difficult when the secondhand buyers (the downstream industries) are brought into the picture. The mismatch of roundwood supply and demand has been a subject for at least a hundred years. While the cooperatives negotiate both prices and volumes towards the industries, they only offer prices towards the forest owners. Thus their estimates of supply elasticities are crucial in planning and negotiation. Prices are used as incentives for achieving volumes, and they are usually fixed per cubic metre, reflecting a proportional payment scheme (revenues proportional to deliveries). Due to uncontrollable factors delivery within some ±10% of the contracted volumes are usually accepted without penalty measures. Although there are still central planning activities influencing the production (e.g. ban on new contracts), prices have become more dynamic, reflecting market changes better than before. There are now 1-4 price periods per year, often with a different number towards different industries. Nevertheless, coordination of the whole chain is still the major challenge for the cooperatives. There is little reason to believe that the price negotiations with the industries result in best prices for the integrated organisation of the cooperative and its members, little reason to believe that these prices will release the expected roundwood supply, and it is impossible for a price period of several months to reflect shorter fluctuations in supply and demand. Although the cooperatives seem motivated to maximise the integrated profit, utilisation of economies of scale is difficult in a cooperative. The standard delivery contract has no incentives to stimulate fewer and larger deliveries or collaboration between neighbouring forest owners, and the cooperative does not have sufficient information on members’ supply functions. Therefore, the cooperative is typically better to minimise costs than to maximise profits. It should be kept in mind that maximisation of integrated profit may sometimes imply allocations of supply (with related revenues and costs) among members that are perceived as unfair by the majority of the members. In most of these cases the democratic one-man-one-vote governance of the cooperatives ensures “equality” among members by abandoning these more profitable allocations. One example could be that those 49% of the members who have their forests close to the industry should be given priority when signing new contracts. This could have increased the integrated profit, but would probably have been voted down by the remaining majority of 51%. If the 49% are still in the core, they will remain loyal, but if they are outside, they will leave the
9
cooperative. This is what happened when some members broke out from the cooperative in 1952 and established Skogbruksforeningen av 1952, now better known as Norskog. The standard delivery contract does not have any allocative features, except under force majeure conditions. The standard delivery contract includes many qualitative regulations. Examples are road standard requirements, deadlines for deliveries and environmental concerns. Although adjustments happen from time to time, these regulations have typically been valid for many years. Obviously, the standard delivery contract covers a broad spectre of issues in general terms. This probably reflects many years of experience. It also implies that the need for information is limited, and the related information costs are low. Finally, the contracting procedure has been automated to a large extent, implying that also the administrative costs are low. 3.2 Balance the Pros and Cons of Decentralisation Applying the standard delivery contract the forest owners make the supply decisions, so this is a typical decentralised system. It is well known that decentralised contracts may increase the risk of uncoordinated decision-making and may create problems of matching and synchronisation in cooperatives (Bogetoft and Olesen 2002). Therefore, the forest owners should make the decisions only if or when they are the most informed part. It is hard to see when this may be the case. A forest stand is easy to store and even yields an interest on root, so there is no risk of quality loss due overripe. It remains in a mature state for many years. Therefore, information about ripeness is not an issue within the contract period, unlike in agricultural contracts. The forest owners are probably best informed about local risks like windfall, insect damages and logging conditions. Nevertheless, price is the main source of risk, and the cooperative is generally better informed about the market than the forest owner. In this regard, it should rather be the cooperative than the single forest owner who makes the short-run harvesting decisions. The decentralised decision system may require less coordination costs than the centralised one, but this is not obvious. We also note that the standard delivery contract leaves few possibilities for moral hazard and the cooperatives do not play “hold-up” games with their owners. 3.3 Minimise the Costs of Risk and Uncertainty Since the cooperative is owned by its members risk reduction can only be made to a limited extent. Risk should be allocated to parts that can carry it at the

235
8
these two parts should be relatively easy to handle. We will see below that this is not necessarily the case. In addition, the wood chain goes beyond the cooperatives, and the coordination becomes more difficult when the secondhand buyers (the downstream industries) are brought into the picture. The mismatch of roundwood supply and demand has been a subject for at least a hundred years. While the cooperatives negotiate both prices and volumes towards the industries, they only offer prices towards the forest owners. Thus their estimates of supply elasticities are crucial in planning and negotiation. Prices are used as incentives for achieving volumes, and they are usually fixed per cubic metre, reflecting a proportional payment scheme (revenues proportional to deliveries). Due to uncontrollable factors delivery within some ±10% of the contracted volumes are usually accepted without penalty measures. Although there are still central planning activities influencing the production (e.g. ban on new contracts), prices have become more dynamic, reflecting market changes better than before. There are now 1-4 price periods per year, often with a different number towards different industries. Nevertheless, coordination of the whole chain is still the major challenge for the cooperatives. There is little reason to believe that the price negotiations with the industries result in best prices for the integrated organisation of the cooperative and its members, little reason to believe that these prices will release the expected roundwood supply, and it is impossible for a price period of several months to reflect shorter fluctuations in supply and demand. Although the cooperatives seem motivated to maximise the integrated profit, utilisation of economies of scale is difficult in a cooperative. The standard delivery contract has no incentives to stimulate fewer and larger deliveries or collaboration between neighbouring forest owners, and the cooperative does not have sufficient information on members’ supply functions. Therefore, the cooperative is typically better to minimise costs than to maximise profits. It should be kept in mind that maximisation of integrated profit may sometimes imply allocations of supply (with related revenues and costs) among members that are perceived as unfair by the majority of the members. In most of these cases the democratic one-man-one-vote governance of the cooperatives ensures “equality” among members by abandoning these more profitable allocations. One example could be that those 49% of the members who have their forests close to the industry should be given priority when signing new contracts. This could have increased the integrated profit, but would probably have been voted down by the remaining majority of 51%. If the 49% are still in the core, they will remain loyal, but if they are outside, they will leave the
9
cooperative. This is what happened when some members broke out from the cooperative in 1952 and established Skogbruksforeningen av 1952, now better known as Norskog. The standard delivery contract does not have any allocative features, except under force majeure conditions. The standard delivery contract includes many qualitative regulations. Examples are road standard requirements, deadlines for deliveries and environmental concerns. Although adjustments happen from time to time, these regulations have typically been valid for many years. Obviously, the standard delivery contract covers a broad spectre of issues in general terms. This probably reflects many years of experience. It also implies that the need for information is limited, and the related information costs are low. Finally, the contracting procedure has been automated to a large extent, implying that also the administrative costs are low. 3.2 Balance the Pros and Cons of Decentralisation Applying the standard delivery contract the forest owners make the supply decisions, so this is a typical decentralised system. It is well known that decentralised contracts may increase the risk of uncoordinated decision-making and may create problems of matching and synchronisation in cooperatives (Bogetoft and Olesen 2002). Therefore, the forest owners should make the decisions only if or when they are the most informed part. It is hard to see when this may be the case. A forest stand is easy to store and even yields an interest on root, so there is no risk of quality loss due overripe. It remains in a mature state for many years. Therefore, information about ripeness is not an issue within the contract period, unlike in agricultural contracts. The forest owners are probably best informed about local risks like windfall, insect damages and logging conditions. Nevertheless, price is the main source of risk, and the cooperative is generally better informed about the market than the forest owner. In this regard, it should rather be the cooperative than the single forest owner who makes the short-run harvesting decisions. The decentralised decision system may require less coordination costs than the centralised one, but this is not obvious. We also note that the standard delivery contract leaves few possibilities for moral hazard and the cooperatives do not play “hold-up” games with their owners. 3.3 Minimise the Costs of Risk and Uncertainty Since the cooperative is owned by its members risk reduction can only be made to a limited extent. Risk should be allocated to parts that can carry it at the

236
10
lowest costs. The lack of information on members’ cost and supply functions, and their other assets, makes it impossible to allocate supply in a way that shares the risk optimally, although some general reduction may be made in operations managed by the cooperatives. Also, the cooperatives can do little to minimise institutional risk. They may, however, reduce biological risk and risks related to weather to some extent by accepting force majeure in an affected area and filling up the contracts from non-affected areas. But they are not allowed to re-allocate deliveries just because, e.g. the logging conditions have developed more favourably in one area than in another. The cooperatives play a role in reducing the unsystematic market risk. First, there are different assortments, all with their own price. This diversification leads to some risk reduction. Second, the use of price periods so that the members know the fixed prices for the months to come reduces their risk and, third, the price matrices presented to the members (transfer prices) may not reflect perfectly the negotiated prices, or the negotiated prices do not reflect perfectly the market demand. In both latter cases some assortments subsidise the others. Risk is sometimes also re-allocated ex post among the suppliers. A required condition for this is that prices shift unexpectedly much within a year. Finally, the equity capital in the cooperative may be used as a buffer to smoothen temporary price fluctuations. Price risk sharing is relevant only when the members of the cooperative are risk averse. Forest owners may not, however, always prefer less volatile prices. It is the volatility that gives them the opportunity to harvest when perceived prices are high. The average Norwegian forest owner harvest only every seventh year, so it is very likely that he manages to utilise the price volatility to his own advantage. Besides, the risk of side-trading increases if the prices are much smoothed by the cooperative. The typical forest owner has more assets than forests, and it can be shown that most of the risk sharing should therefore be made at his hand. 3.4 Reduce the Costs of Post-contractual Opportunism The main incentive in the standard delivery contract is the proportional payment scheme. This scheme (and related non-linear incentives like bonus schemes) is output-based. Because it is influenced by external risks like weather, a risk premium is usually required. Therefore, there is a trade-off between providing incentives and minimising the cost of risk (Bogetoft and Olesen 2004: 30). The proportional payment scheme is of moderate strength. A reason for being moderate is the assumption that forest owners are risk-averse. As already
11
mentioned this is not necessarily the case in cooperatives. At the outset, the proportional payment may therefore under-produce. However, this may be offset by the so-called quantity control problem, arising from the fact that proportional payments in cooperatives reflect average rather than marginal revenue, leading to over-production. All in all, there is reason to believe that the offset is not strong enough, as prices are often accompanied by bonus arrangements etc. One should also keep in mind that there is also a trade-off between the strength of incentives and perceived fairness in cooperatives. The standard contract uses only prices incentives, but these are for deliveries at roadside. Members of cooperatives who have their forests closer to the industries may be tempted to side-trading since they may be offered higher prices from Nortømmer and SB Skog and others. Cooperatives have sometimes reduced this problem by zoning. “Equal price” has been regarded as a cooperative principle in Norway (although it is not a part of the official international cooperative principles), but what is equal in this regard? Some zoning is probably needed from time to time in order to keep almost all members in the core. Side-trading may be reduced by ensuring fairly competitive payment schemes and other incentives, keeping the forest owners loyal. This applies to the cooperatives as well as Nortømmer, SB Skog and others. Moral hazard related to delivering bad quality is minimised by the use of detailed measurement rules. Quality faults that are invisible and difficult to measure ex ante are finally the risk of the processor, e.g. a sawmill, rather than a risk of the cooperative. Moral hazard in the sense of environmental damage is sought avoided by including a set of rules (Living Forest Standards compatible with PEFC) in the standard contract itself or as an attachment. Although not systematically or being a major matter of moral hazard, breaches of these standards happen from time to time. The reason is probably that the standards imply costs. 3.5 Reduce the Costs of Pre-contractual Opportunism This kind of opportunism deals with the case where a forest owner has sufficient private information to obtain a contract yielding profit above his reservation value, i.e. the profit from his best alternative option. This behaviour, also called adverse selection, is probably not a big problem in forest owner cooperatives, since these are first of all sales organisations. In addition, the standard delivery contract operates with a large set of prices related to different assortments, and a third part takes care of measurement and quality judgements, implying that cheating on quality is not an option at the pre-contractual stage

237
10
lowest costs. The lack of information on members’ cost and supply functions, and their other assets, makes it impossible to allocate supply in a way that shares the risk optimally, although some general reduction may be made in operations managed by the cooperatives. Also, the cooperatives can do little to minimise institutional risk. They may, however, reduce biological risk and risks related to weather to some extent by accepting force majeure in an affected area and filling up the contracts from non-affected areas. But they are not allowed to re-allocate deliveries just because, e.g. the logging conditions have developed more favourably in one area than in another. The cooperatives play a role in reducing the unsystematic market risk. First, there are different assortments, all with their own price. This diversification leads to some risk reduction. Second, the use of price periods so that the members know the fixed prices for the months to come reduces their risk and, third, the price matrices presented to the members (transfer prices) may not reflect perfectly the negotiated prices, or the negotiated prices do not reflect perfectly the market demand. In both latter cases some assortments subsidise the others. Risk is sometimes also re-allocated ex post among the suppliers. A required condition for this is that prices shift unexpectedly much within a year. Finally, the equity capital in the cooperative may be used as a buffer to smoothen temporary price fluctuations. Price risk sharing is relevant only when the members of the cooperative are risk averse. Forest owners may not, however, always prefer less volatile prices. It is the volatility that gives them the opportunity to harvest when perceived prices are high. The average Norwegian forest owner harvest only every seventh year, so it is very likely that he manages to utilise the price volatility to his own advantage. Besides, the risk of side-trading increases if the prices are much smoothed by the cooperative. The typical forest owner has more assets than forests, and it can be shown that most of the risk sharing should therefore be made at his hand. 3.4 Reduce the Costs of Post-contractual Opportunism The main incentive in the standard delivery contract is the proportional payment scheme. This scheme (and related non-linear incentives like bonus schemes) is output-based. Because it is influenced by external risks like weather, a risk premium is usually required. Therefore, there is a trade-off between providing incentives and minimising the cost of risk (Bogetoft and Olesen 2004: 30). The proportional payment scheme is of moderate strength. A reason for being moderate is the assumption that forest owners are risk-averse. As already
11
mentioned this is not necessarily the case in cooperatives. At the outset, the proportional payment may therefore under-produce. However, this may be offset by the so-called quantity control problem, arising from the fact that proportional payments in cooperatives reflect average rather than marginal revenue, leading to over-production. All in all, there is reason to believe that the offset is not strong enough, as prices are often accompanied by bonus arrangements etc. One should also keep in mind that there is also a trade-off between the strength of incentives and perceived fairness in cooperatives. The standard contract uses only prices incentives, but these are for deliveries at roadside. Members of cooperatives who have their forests closer to the industries may be tempted to side-trading since they may be offered higher prices from Nortømmer and SB Skog and others. Cooperatives have sometimes reduced this problem by zoning. “Equal price” has been regarded as a cooperative principle in Norway (although it is not a part of the official international cooperative principles), but what is equal in this regard? Some zoning is probably needed from time to time in order to keep almost all members in the core. Side-trading may be reduced by ensuring fairly competitive payment schemes and other incentives, keeping the forest owners loyal. This applies to the cooperatives as well as Nortømmer, SB Skog and others. Moral hazard related to delivering bad quality is minimised by the use of detailed measurement rules. Quality faults that are invisible and difficult to measure ex ante are finally the risk of the processor, e.g. a sawmill, rather than a risk of the cooperative. Moral hazard in the sense of environmental damage is sought avoided by including a set of rules (Living Forest Standards compatible with PEFC) in the standard contract itself or as an attachment. Although not systematically or being a major matter of moral hazard, breaches of these standards happen from time to time. The reason is probably that the standards imply costs. 3.5 Reduce the Costs of Pre-contractual Opportunism This kind of opportunism deals with the case where a forest owner has sufficient private information to obtain a contract yielding profit above his reservation value, i.e. the profit from his best alternative option. This behaviour, also called adverse selection, is probably not a big problem in forest owner cooperatives, since these are first of all sales organisations. In addition, the standard delivery contract operates with a large set of prices related to different assortments, and a third part takes care of measurement and quality judgements, implying that cheating on quality is not an option at the pre-contractual stage

238
12
either. There are, however, a few situations where pre-contractual opportunistic behaviour may take place also within the cooperatives, but these are related to bonus systems which are not parts of the standard delivery contract, e.g. when fulfilling criteria for several bonuses. We note that a member of a cooperative may act opportunistic towards Nortømmer, SB Skog and other buyers. Once the price scheme has been published, he may gain profit from side-trading based on private information about his own supply (information rent). 3.6 Do Not Kill Cooperation Relative performance evaluation may have a negative impact on cooperation between producers. The standard delivery contract has only one such performance measure, namely malus for over-delivery. This is implemented from time to time, but always with care. There are supplementary contracts with relative performance measures, e.g. bonus for large volumes and for thinning, and there are also examples of measures that are valid only for a subset of members (geographically defined) due to requirements defined by a certain buyer. But again, these do not belong to the standard delivery contract. The cooperatives, Nortømmer and SB Skog have their own websites which are important for spreading information and for communication. Wisely used, these tools may also enhance the cooperation between the forest owners and the organisations, and also among the forest owners “belonging” to one of the organisations. Since the payment to any member of a cooperative depends indirectly also on the deliveries made by the other members, there are strong group incentives and thus even possibilities for social penalties. Members of the regional cooperatives are also organised in local sections where different kinds of meetings and activities contribute to enhance the team spirit and loyalty. The effect of the standard delivery contract with its payment scheme on cooperation among members of the cooperative is probably close to neutral, as the proportional payment scheme has a lot of good properties, e.g. typically leaving most members in the core (with the possible exception of delivery prices at roadside). Calculation of possible “winners and losers” with regard to this or that (location, qualities, supply timing etc) is obviously never published. 3.7 Motivate Long-term Concerns Since the cooperatives are owned by their members, there are few incentives not to motivate long-term concerns. The standard delivery contract may require several specific investments, i.e. assets with a lower value in their best
13
alternative use. This applies first of all to forest road standards and landing places, but also to specific software. Nevertheless, the risk for hold up is small because there are alternative buyers, meaning that the investments in roads and landings are not relation-specific. Also, hold-ups will lead to bad reputation, which would be destructive to the cooperatives in the long run. Nortømmer, SB Skog and other non-cooperatives may also gain from motivating long-term concerns, in spite of not having true members. The main goal is simply to increase their market shares. All first-hand roundwood buyers are interested in increased turnover, and they offer various benefits in order to keep or win new roundwood suppliers. 3.8 Balance the Pros and Cons of Renegotiation Renegotiation makes it possible to obtain more flexibility. The wish for renegotiation may first of all apply to prices and quantities as response to market changes, and thus remove ex post inefficiencies. The standard delivery contract is, however, in general not renegotiable. Nevertheless, it is renegotiated from time to time in the cooperatives. First, the cooperative wants to be flexible with its members and, second, it wants some flexibility itself too. For example, it may reduce the volume down to zero in accordance with the market situation. The possibility of renegotiation (sometimes done by rejecting the current contract and issuing a new one) is also regarded as a problem, and one often speaks about a lack of contracting culture. Although renegotiation opens the possibility for reducing ex post inefficiencies it opens at the same time for ex ante inefficiencies. Strategic behaviour may take place when the parties know that renegotiation is possible. In practice one may expect that the parties will act according to the incentives in the expected renegotiated contract rather than to the initial contract. It is likely that both parties would contract less volume if renegotiation was impossible. This is so because excess supply is more of a problem than excess demand – to the forest owner, the cooperative, Nortømmer and SB Skog. 3.9 Reduce Direct Costs of Contracting The standard delivery contract is well known by all parties and the contracting procedure is probably as efficient as can be. Since it is standardized it does not demand individual terms, which is the case for most alternative contracts. The contract itself could therefore have been easily traded had it been divided into standard volumes as well (e.g. 100 cubic meter). The websites of the organisations make contracting almost automatic. Also the other parts of the system, like follow-up, allocation to buyers, transport and

239
12
either. There are, however, a few situations where pre-contractual opportunistic behaviour may take place also within the cooperatives, but these are related to bonus systems which are not parts of the standard delivery contract, e.g. when fulfilling criteria for several bonuses. We note that a member of a cooperative may act opportunistic towards Nortømmer, SB Skog and other buyers. Once the price scheme has been published, he may gain profit from side-trading based on private information about his own supply (information rent). 3.6 Do Not Kill Cooperation Relative performance evaluation may have a negative impact on cooperation between producers. The standard delivery contract has only one such performance measure, namely malus for over-delivery. This is implemented from time to time, but always with care. There are supplementary contracts with relative performance measures, e.g. bonus for large volumes and for thinning, and there are also examples of measures that are valid only for a subset of members (geographically defined) due to requirements defined by a certain buyer. But again, these do not belong to the standard delivery contract. The cooperatives, Nortømmer and SB Skog have their own websites which are important for spreading information and for communication. Wisely used, these tools may also enhance the cooperation between the forest owners and the organisations, and also among the forest owners “belonging” to one of the organisations. Since the payment to any member of a cooperative depends indirectly also on the deliveries made by the other members, there are strong group incentives and thus even possibilities for social penalties. Members of the regional cooperatives are also organised in local sections where different kinds of meetings and activities contribute to enhance the team spirit and loyalty. The effect of the standard delivery contract with its payment scheme on cooperation among members of the cooperative is probably close to neutral, as the proportional payment scheme has a lot of good properties, e.g. typically leaving most members in the core (with the possible exception of delivery prices at roadside). Calculation of possible “winners and losers” with regard to this or that (location, qualities, supply timing etc) is obviously never published. 3.7 Motivate Long-term Concerns Since the cooperatives are owned by their members, there are few incentives not to motivate long-term concerns. The standard delivery contract may require several specific investments, i.e. assets with a lower value in their best
13
alternative use. This applies first of all to forest road standards and landing places, but also to specific software. Nevertheless, the risk for hold up is small because there are alternative buyers, meaning that the investments in roads and landings are not relation-specific. Also, hold-ups will lead to bad reputation, which would be destructive to the cooperatives in the long run. Nortømmer, SB Skog and other non-cooperatives may also gain from motivating long-term concerns, in spite of not having true members. The main goal is simply to increase their market shares. All first-hand roundwood buyers are interested in increased turnover, and they offer various benefits in order to keep or win new roundwood suppliers. 3.8 Balance the Pros and Cons of Renegotiation Renegotiation makes it possible to obtain more flexibility. The wish for renegotiation may first of all apply to prices and quantities as response to market changes, and thus remove ex post inefficiencies. The standard delivery contract is, however, in general not renegotiable. Nevertheless, it is renegotiated from time to time in the cooperatives. First, the cooperative wants to be flexible with its members and, second, it wants some flexibility itself too. For example, it may reduce the volume down to zero in accordance with the market situation. The possibility of renegotiation (sometimes done by rejecting the current contract and issuing a new one) is also regarded as a problem, and one often speaks about a lack of contracting culture. Although renegotiation opens the possibility for reducing ex post inefficiencies it opens at the same time for ex ante inefficiencies. Strategic behaviour may take place when the parties know that renegotiation is possible. In practice one may expect that the parties will act according to the incentives in the expected renegotiated contract rather than to the initial contract. It is likely that both parties would contract less volume if renegotiation was impossible. This is so because excess supply is more of a problem than excess demand – to the forest owner, the cooperative, Nortømmer and SB Skog. 3.9 Reduce Direct Costs of Contracting The standard delivery contract is well known by all parties and the contracting procedure is probably as efficient as can be. Since it is standardized it does not demand individual terms, which is the case for most alternative contracts. The contract itself could therefore have been easily traded had it been divided into standard volumes as well (e.g. 100 cubic meter). The websites of the organisations make contracting almost automatic. Also the other parts of the system, like follow-up, allocation to buyers, transport and

240
14
communication payments are integrated and automated. The parties have long experience in this kind of contracting and it is likely that they have made many of the trade-offs needed in order to keep the contracting costs at a low level. Any forest owner may write several contracts with the cooperative, and the number of contracts will increase with decreasing number of months the contacting period covers. Therefore, the cost of contracting could be reduced by using longer contract periods. This will, however imply decreased efficiency due to lost market opportunities. 3.10 Use Transparent Contracts Contracts should be simple, and they should be articulated ex ante. Priceless contracts are, for example, more or less useless unless the parties can make good expectations. Unexpected bonus, as revealed ex post, has no motivational effect. The standard delivery contract has sometimes been used during so-called priceless periods. It then points to the ex post price. Thus, in these cases it depends fully on expectations from both parties. 4. Discussion Coordination that takes care of efficiency, information, risk, market signals and equality aspects at the same time is obviously the main challenge for the cooperatives, while the other actors may disregard the equality aspect. They all have to make contracts that match prices and volumes towards the industry. The cooperatives find it risky to offer prices for more months than what have already been negotiated with the industries. Managers working for the cooperative have no incentives for taking any sort of risk on behalf of the members. This may restrict the feasible set of contract regimes. The problems of coordination are evident, and have been so for at least a century. We stated in the previous section that the negotiated prices are unlikely to yield a market clearing or to respond to short run changes. They are typically inefficient, and therefore also subject to analysis for improvement. At the same time the current system is a result of trade-offs already made based on experience over the years. This should be acknowledged and recognised. Coordination across different forest owners and along the time scale lacks also when it comes to utilising the economies of scale in planning of neighbouring harvests. So far the cooperatives have approached the coordination problems of the standard delivery contract by employing complementary contracts. The most important ones are:
15
• Green stock: Gives the cooperative the right and duty to harvest a certain quantity to a fixed price within 6 (or 12) months. Basis is typically February price with a fixed bonus attached.
• 3-years contract: A given volume to be supplied each year for three years. Running prices with a bonus added.
• Stumpage sales: The cooperative buys the right to harvest the roundwood in a defined area within 3 years. The forest owner gets paid in advance. Some other variants of stumpage sales exist.
Other widely used contracts are Thinning bonus; Management agreements; Large supply bonus; FSC bonus. Green stock loses its role when the number of negotiated price periods approaches the contract horizon, but it is otherwise useful as a flexibility complement to the standard delivery contract. So are the 3-years contract and the stumpage sales, offering some possibilities to adjust the supply to the demand. And they are all simple and easy to understand. Nevertheless, they do not fully solve the important task of coordination, and they have been criticised due to the costs they imply. More importantly though, they are there because the standard delivery contract cannot coordinate well enough. There is room for some innovation here, first of all in the cooperatives, but also for Nortømmer and SB Skog. The core of the coordination problem is that market signals, mainly due to shifts in the demand, cannot be responded to in the short run. This implies a loss for the whole value chain. What is needed, therefore, is a mechanism that allows more frequent adjustments. This requires increased information flow and flexible instruments. The forest industries collect information about current and expected demand for their products, they are the best informed part about this and they know their own cost structures. This information is crucial in determining current and future demand for roundwood. The cooperatives and Nortømmer and SB Skog are also well informed, but not like the industries. Finally, the forest owners get their secondhand information from these three firsthand buyers. They do not invest much in gathering information themselves, since income from roundwood sales is marginal to the average forest owner (NOK 8,000 per year). With their information about current and expected market conditions it should be possible for the industries to reveal their demand at different prices for each of the coming, say 12 months. Each month would then have its own demand curve for each assortment. The cooperatives and to some extent Nortømmer and SB Skog should be able to do the same by checking the

241
14
communication payments are integrated and automated. The parties have long experience in this kind of contracting and it is likely that they have made many of the trade-offs needed in order to keep the contracting costs at a low level. Any forest owner may write several contracts with the cooperative, and the number of contracts will increase with decreasing number of months the contacting period covers. Therefore, the cost of contracting could be reduced by using longer contract periods. This will, however imply decreased efficiency due to lost market opportunities. 3.10 Use Transparent Contracts Contracts should be simple, and they should be articulated ex ante. Priceless contracts are, for example, more or less useless unless the parties can make good expectations. Unexpected bonus, as revealed ex post, has no motivational effect. The standard delivery contract has sometimes been used during so-called priceless periods. It then points to the ex post price. Thus, in these cases it depends fully on expectations from both parties. 4. Discussion Coordination that takes care of efficiency, information, risk, market signals and equality aspects at the same time is obviously the main challenge for the cooperatives, while the other actors may disregard the equality aspect. They all have to make contracts that match prices and volumes towards the industry. The cooperatives find it risky to offer prices for more months than what have already been negotiated with the industries. Managers working for the cooperative have no incentives for taking any sort of risk on behalf of the members. This may restrict the feasible set of contract regimes. The problems of coordination are evident, and have been so for at least a century. We stated in the previous section that the negotiated prices are unlikely to yield a market clearing or to respond to short run changes. They are typically inefficient, and therefore also subject to analysis for improvement. At the same time the current system is a result of trade-offs already made based on experience over the years. This should be acknowledged and recognised. Coordination across different forest owners and along the time scale lacks also when it comes to utilising the economies of scale in planning of neighbouring harvests. So far the cooperatives have approached the coordination problems of the standard delivery contract by employing complementary contracts. The most important ones are:
15
• Green stock: Gives the cooperative the right and duty to harvest a certain quantity to a fixed price within 6 (or 12) months. Basis is typically February price with a fixed bonus attached.
• 3-years contract: A given volume to be supplied each year for three years. Running prices with a bonus added.
• Stumpage sales: The cooperative buys the right to harvest the roundwood in a defined area within 3 years. The forest owner gets paid in advance. Some other variants of stumpage sales exist.
Other widely used contracts are Thinning bonus; Management agreements; Large supply bonus; FSC bonus. Green stock loses its role when the number of negotiated price periods approaches the contract horizon, but it is otherwise useful as a flexibility complement to the standard delivery contract. So are the 3-years contract and the stumpage sales, offering some possibilities to adjust the supply to the demand. And they are all simple and easy to understand. Nevertheless, they do not fully solve the important task of coordination, and they have been criticised due to the costs they imply. More importantly though, they are there because the standard delivery contract cannot coordinate well enough. There is room for some innovation here, first of all in the cooperatives, but also for Nortømmer and SB Skog. The core of the coordination problem is that market signals, mainly due to shifts in the demand, cannot be responded to in the short run. This implies a loss for the whole value chain. What is needed, therefore, is a mechanism that allows more frequent adjustments. This requires increased information flow and flexible instruments. The forest industries collect information about current and expected demand for their products, they are the best informed part about this and they know their own cost structures. This information is crucial in determining current and future demand for roundwood. The cooperatives and Nortømmer and SB Skog are also well informed, but not like the industries. Finally, the forest owners get their secondhand information from these three firsthand buyers. They do not invest much in gathering information themselves, since income from roundwood sales is marginal to the average forest owner (NOK 8,000 per year). With their information about current and expected market conditions it should be possible for the industries to reveal their demand at different prices for each of the coming, say 12 months. Each month would then have its own demand curve for each assortment. The cooperatives and to some extent Nortømmer and SB Skog should be able to do the same by checking the

242
16
reservation prices vs. related supply quantities from their suppliers for the same number of months. Reservation prices could be mapped simply by letting the forest owners reveal their intended deliveries at different prices in each of the coming 12 months, and then summing up. Clearing would be only a monthly technical exercise, and the parties would be informed about the prices and volumes contracted for each future period. The system would be updated every month. It would, i.e., enable the cooperatives to know exactly the intended amounts of roundwood at different sets of prices before contracting with the industry, and also to suggest some collaboration among forest owners in order to obtain economies of scale in logging and cost reductions in road transport. It is important to notice that all members of a cooperative would still face the same set of prices for a given period. Because the cooperative is better informed than the single forest owner it could alternatively take the entire responsibility of the timing of individual cuttings. This includes also minimisation of risk related to logging conditions etc, and it might also reduce contract costs. The integrated profit would increase, but the challenge would be to make trade-offs between individual profits in a way that keep all members in the core. It is possible also to integrate this in a more general forest management contract, in line with what has been developed lately by a couple of cooperatives. Or one may also imagine less radical solutions, where only parts of the roundwood supply decisions are left to the cooperative. All written contracts would be fully binding unless both parts agree to exit. The “traditional” need for the cooperative to reduce the contracts from time to time would be eliminated, and so would most of the needs for additional contracts. And also the logging entrepreneurs would gain from better planning and avoidance of stops. The suggested system would build on technicalities regulated by the current standard delivery contract, but it would expand it with regard to flexibility of prices and volumes. The forest sector has a long and conservative tradition, where incrementalism is more likely to be successful than innovative jumps. This is why the challenge in implementing a new contract system is a hard part. A relevant question is therefore: Would it be possible to implement this system gradually? We believe it is, and the least resistible way would probably be to start with screening the forest owners for their willingness to supply under different price regimes for the months to come. One may inform the members on the homepages of the cooperatives and let them vote whether or not to implement such a new contract system. If implemented, it would increase the amount of information in the cooperatives, Nortømmer and SB Skog, which is
17
useful when negotiating towards the industry and it would allow a better coordination of local economies of scale. Then, if this works we believe that also parts of the forest industry would be interested in applying the entire concept, and the others may follow as a consequence of success. Before implementing anything at all there is, however, a need to map the implementation feasibility, first of all by assessing the will and the commitment of the involved parties. An important part of this work would be to estimate the net gains, in order to motivate the parties. 5. Conclusion The standard delivery contract is based on decades of experience and implies therefore a wise set of trade-offs needed to make it as “optimal” as possible. Nevertheless, realising that matching of prices and quantities is still the major problem, and learning from studies of other agricultural contracts we believe the coordination could be improved by implementing a system revealing intended supplies and demands at different prices for several periods future periods, e.g. for each of the 12 months to come. This system would make use of information which is available but not collected today, and it would help increase the overall earned profits by the way of increasing the efficiency. Right quantities of roundwood would be traded to the right time at the right place because the prices would clear the markets. References Bogetoft P. and H.B.Olesen 2002. Ten Rule of Thumb in Contract Design:
Lessons from Danish Agriculture, European Review of Agricultural Economics, 29, pp. 185-204.
Bogetoft, P. and H.B. Olesen 2004. Design of Production Contracts. Copenhagen Business School Press, 1. edition.
Bogetoft, P. and H.B. Olesen 2007. Cooperatives and Payment Schemes. Copenhagen Business School Press, 1. edition.
Gibbons, R. 2005. Four formal(izable) theories of the firm? Journal of Economic Behavior & Organization 58: 200-245
Wu, S. Y. 2006. Contract theory and agricultural policy analysis: a discussion and survey of recent developments. Australian Journal of Agricultural and Resource Economics, 50: 490–509.

243
16
reservation prices vs. related supply quantities from their suppliers for the same number of months. Reservation prices could be mapped simply by letting the forest owners reveal their intended deliveries at different prices in each of the coming 12 months, and then summing up. Clearing would be only a monthly technical exercise, and the parties would be informed about the prices and volumes contracted for each future period. The system would be updated every month. It would, i.e., enable the cooperatives to know exactly the intended amounts of roundwood at different sets of prices before contracting with the industry, and also to suggest some collaboration among forest owners in order to obtain economies of scale in logging and cost reductions in road transport. It is important to notice that all members of a cooperative would still face the same set of prices for a given period. Because the cooperative is better informed than the single forest owner it could alternatively take the entire responsibility of the timing of individual cuttings. This includes also minimisation of risk related to logging conditions etc, and it might also reduce contract costs. The integrated profit would increase, but the challenge would be to make trade-offs between individual profits in a way that keep all members in the core. It is possible also to integrate this in a more general forest management contract, in line with what has been developed lately by a couple of cooperatives. Or one may also imagine less radical solutions, where only parts of the roundwood supply decisions are left to the cooperative. All written contracts would be fully binding unless both parts agree to exit. The “traditional” need for the cooperative to reduce the contracts from time to time would be eliminated, and so would most of the needs for additional contracts. And also the logging entrepreneurs would gain from better planning and avoidance of stops. The suggested system would build on technicalities regulated by the current standard delivery contract, but it would expand it with regard to flexibility of prices and volumes. The forest sector has a long and conservative tradition, where incrementalism is more likely to be successful than innovative jumps. This is why the challenge in implementing a new contract system is a hard part. A relevant question is therefore: Would it be possible to implement this system gradually? We believe it is, and the least resistible way would probably be to start with screening the forest owners for their willingness to supply under different price regimes for the months to come. One may inform the members on the homepages of the cooperatives and let them vote whether or not to implement such a new contract system. If implemented, it would increase the amount of information in the cooperatives, Nortømmer and SB Skog, which is
17
useful when negotiating towards the industry and it would allow a better coordination of local economies of scale. Then, if this works we believe that also parts of the forest industry would be interested in applying the entire concept, and the others may follow as a consequence of success. Before implementing anything at all there is, however, a need to map the implementation feasibility, first of all by assessing the will and the commitment of the involved parties. An important part of this work would be to estimate the net gains, in order to motivate the parties. 5. Conclusion The standard delivery contract is based on decades of experience and implies therefore a wise set of trade-offs needed to make it as “optimal” as possible. Nevertheless, realising that matching of prices and quantities is still the major problem, and learning from studies of other agricultural contracts we believe the coordination could be improved by implementing a system revealing intended supplies and demands at different prices for several periods future periods, e.g. for each of the 12 months to come. This system would make use of information which is available but not collected today, and it would help increase the overall earned profits by the way of increasing the efficiency. Right quantities of roundwood would be traded to the right time at the right place because the prices would clear the markets. References Bogetoft P. and H.B.Olesen 2002. Ten Rule of Thumb in Contract Design:
Lessons from Danish Agriculture, European Review of Agricultural Economics, 29, pp. 185-204.
Bogetoft, P. and H.B. Olesen 2004. Design of Production Contracts. Copenhagen Business School Press, 1. edition.
Bogetoft, P. and H.B. Olesen 2007. Cooperatives and Payment Schemes. Copenhagen Business School Press, 1. edition.
Gibbons, R. 2005. Four formal(izable) theories of the firm? Journal of Economic Behavior & Organization 58: 200-245
Wu, S. Y. 2006. Contract theory and agricultural policy analysis: a discussion and survey of recent developments. Australian Journal of Agricultural and Resource Economics, 50: 490–509.

244
Proposing a Research Agenda for Swedish Sawmill Distribution Channel Challenges
Åsa Gustafsson and Lars-Olof Rask
School of Engineering, Linnaeus University Abstract Purpose: The purpose of this study is to identify distribution channel research needs given the variety of distribution channel challenges among Swedish sawmill companies. Design / methodology / approach: Explorative case study research Findings: The paper proposes a typology of sawmill distribution channel challenges, as well as aligns research needs with distribution channel type. The typology is based on i) number of sawmill units within the firm, in combination with ii) distribution channel heterogeneity. Significant management decisions and research needs are identified for the different types. Research limitations / implications: This research makes tentative statements regarding typology of sawmill distribution channel challenges and potential research needs in the Swedish sawmill industry with regards to the respective typology. However, further research is needed in order to validate these results. Contribution: This paper focuses on the sawmill industry distribution channels, which is a neglected but important area for sawmills’ competitive advantage. The paper also contributes to research by applying contingency theory and typology as an approach to deal with the variety of sawmills’ distribution channel challenges. Keywords: Typology, distribution channel challenges, research needs, and Swedish sawmill industry 1. Introduction Softwood lumber is in many cases referred to as a commodity product (Roos et al., 2002) and it is thereby produced in general standard lumber sizes (Hansen et al., 2002). Competition amongst suppliers of commodity products is primarily based on price (Shapiro, 1979) and the focus is efficiency through stability and control (Pine, 1993). Further, commodity products are characterised by consistent quality, stable demand, large homogenous markets, and long product life cycles (Pine, 1993). In general, the production of commodity products implies strong cost-effective
2
production capability and a general tendency towards automated equipment and fixed costs (Shapiro, 1979). A majority (53 per cent) of the Swedish sawmills are commodity-oriented with a cost leadership orientation. If the sawmills whose value-added activities consist of planing and drying were also added to the group, the share would further increase by about 10 per cent (Roos, 2002). The number of sawmills decreases and existing sawmills need to further increase their production volume, which is a result of continuous improvements of the existing sawmills’ productivity. The productivity in terms of cubic meters per working hour has increased by about 15 per cent from 1995 to 2000 (Staland et al., 2002). The annual production of softwood lumber has increased at the same time as the export share has remained stable (Skogsstyrelsen, 2002). The production equipment is general and available to all members of the sawmill industry (Johansson, 1995). The general profit margin of the purchasing sawmills is about 3-4 per cent, which has been enabled by the increased prices for softwood lumber during the past year. Generally, however, the export price of softwood lumber has dropped from an index of 100 in 1990 to one of 89 in 2003 (Skogsstyrelsen, 2005). Hence price competition within the sawmill industry is intense, and its situation is challenging; suppliers are focused on high timber prices, at the same time as some customers purchase softwood lumber at the lowest price offered, while others are traditionally connected to their suppliers. Substitution of construction material is an on-going affair at the same time as new entrants are about to start selling softwood lumber on the Swedish market. To companies, management of logistics functions is essential (Ballou, 1992). Logistics being “the process of strategically managing the procurement, movement and storage of materials, parts and finished inventory (and the related information flows) through the organization and its marketing channels in such a way the current and future profitability and maximized through the cost-effective fulfillment of orders” (Christopher, 2005) i.e. logistics contains three main functions; procurement/purchase, production, and distribution (Jonsson, 2008). Further, the logistics system, both between each logistics function and to the other members in the distribution channel, is built around different flows, which could be grouped into tangible flows and intangible flows (Couglan et al.., 2006). The management and performance of these functions hence become essential for the survival of each sawmill, particularly for those delivering commodity products. Hence in order for the individual sawmill to become and stay competitive on the market, knowledge and understanding of the logistics functions become important. Studies with regards to logistics in the sawmill industry is mainly focused on purchase/procurement. The procurement of wood has been studied from a planning perspective, see for instance (Harstela, 1993;

245
Proposing a Research Agenda for Swedish Sawmill Distribution Channel Challenges
Åsa Gustafsson and Lars-Olof Rask
School of Engineering, Linnaeus University Abstract Purpose: The purpose of this study is to identify distribution channel research needs given the variety of distribution channel challenges among Swedish sawmill companies. Design / methodology / approach: Explorative case study research Findings: The paper proposes a typology of sawmill distribution channel challenges, as well as aligns research needs with distribution channel type. The typology is based on i) number of sawmill units within the firm, in combination with ii) distribution channel heterogeneity. Significant management decisions and research needs are identified for the different types. Research limitations / implications: This research makes tentative statements regarding typology of sawmill distribution channel challenges and potential research needs in the Swedish sawmill industry with regards to the respective typology. However, further research is needed in order to validate these results. Contribution: This paper focuses on the sawmill industry distribution channels, which is a neglected but important area for sawmills’ competitive advantage. The paper also contributes to research by applying contingency theory and typology as an approach to deal with the variety of sawmills’ distribution channel challenges. Keywords: Typology, distribution channel challenges, research needs, and Swedish sawmill industry 1. Introduction Softwood lumber is in many cases referred to as a commodity product (Roos et al., 2002) and it is thereby produced in general standard lumber sizes (Hansen et al., 2002). Competition amongst suppliers of commodity products is primarily based on price (Shapiro, 1979) and the focus is efficiency through stability and control (Pine, 1993). Further, commodity products are characterised by consistent quality, stable demand, large homogenous markets, and long product life cycles (Pine, 1993). In general, the production of commodity products implies strong cost-effective
2
production capability and a general tendency towards automated equipment and fixed costs (Shapiro, 1979). A majority (53 per cent) of the Swedish sawmills are commodity-oriented with a cost leadership orientation. If the sawmills whose value-added activities consist of planing and drying were also added to the group, the share would further increase by about 10 per cent (Roos, 2002). The number of sawmills decreases and existing sawmills need to further increase their production volume, which is a result of continuous improvements of the existing sawmills’ productivity. The productivity in terms of cubic meters per working hour has increased by about 15 per cent from 1995 to 2000 (Staland et al., 2002). The annual production of softwood lumber has increased at the same time as the export share has remained stable (Skogsstyrelsen, 2002). The production equipment is general and available to all members of the sawmill industry (Johansson, 1995). The general profit margin of the purchasing sawmills is about 3-4 per cent, which has been enabled by the increased prices for softwood lumber during the past year. Generally, however, the export price of softwood lumber has dropped from an index of 100 in 1990 to one of 89 in 2003 (Skogsstyrelsen, 2005). Hence price competition within the sawmill industry is intense, and its situation is challenging; suppliers are focused on high timber prices, at the same time as some customers purchase softwood lumber at the lowest price offered, while others are traditionally connected to their suppliers. Substitution of construction material is an on-going affair at the same time as new entrants are about to start selling softwood lumber on the Swedish market. To companies, management of logistics functions is essential (Ballou, 1992). Logistics being “the process of strategically managing the procurement, movement and storage of materials, parts and finished inventory (and the related information flows) through the organization and its marketing channels in such a way the current and future profitability and maximized through the cost-effective fulfillment of orders” (Christopher, 2005) i.e. logistics contains three main functions; procurement/purchase, production, and distribution (Jonsson, 2008). Further, the logistics system, both between each logistics function and to the other members in the distribution channel, is built around different flows, which could be grouped into tangible flows and intangible flows (Couglan et al.., 2006). The management and performance of these functions hence become essential for the survival of each sawmill, particularly for those delivering commodity products. Hence in order for the individual sawmill to become and stay competitive on the market, knowledge and understanding of the logistics functions become important. Studies with regards to logistics in the sawmill industry is mainly focused on purchase/procurement. The procurement of wood has been studied from a planning perspective, see for instance (Harstela, 1993;
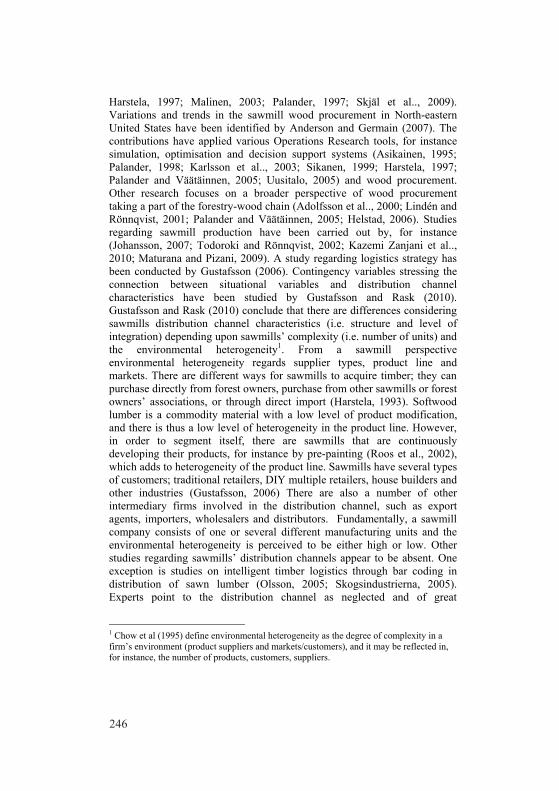
246 3
Harstela, 1997; Malinen, 2003; Palander, 1997; Skjäl et al.., 2009). Variations and trends in the sawmill wood procurement in North-eastern United States have been identified by Anderson and Germain (2007). The contributions have applied various Operations Research tools, for instance simulation, optimisation and decision support systems (Asikainen, 1995; Palander, 1998; Karlsson et al.., 2003; Sikanen, 1999; Harstela, 1997; Palander and Väätäinnen, 2005; Uusitalo, 2005) and wood procurement. Other research focuses on a broader perspective of wood procurement taking a part of the forestry-wood chain (Adolfsson et al.., 2000; Lindén and Rönnqvist, 2001; Palander and Väätäinnen, 2005; Helstad, 2006). Studies regarding sawmill production have been carried out by, for instance (Johansson, 2007; Todoroki and Rönnqvist, 2002; Kazemi Zanjani et al.., 2010; Maturana and Pizani, 2009). A study regarding logistics strategy has been conducted by Gustafsson (2006). Contingency variables stressing the connection between situational variables and distribution channel characteristics have been studied by Gustafsson and Rask (2010). Gustafsson and Rask (2010) conclude that there are differences considering sawmills distribution channel characteristics (i.e. structure and level of integration) depending upon sawmills’ complexity (i.e. number of units) and the environmental heterogeneity1. From a sawmill perspective environmental heterogeneity regards supplier types, product line and markets. There are different ways for sawmills to acquire timber; they can purchase directly from forest owners, purchase from other sawmills or forest owners’ associations, or through direct import (Harstela, 1993). Softwood lumber is a commodity material with a low level of product modification, and there is thus a low level of heterogeneity in the product line. However, in order to segment itself, there are sawmills that are continuously developing their products, for instance by pre-painting (Roos et al., 2002), which adds to heterogeneity of the product line. Sawmills have several types of customers; traditional retailers, DIY multiple retailers, house builders and other industries (Gustafsson, 2006) There are also a number of other intermediary firms involved in the distribution channel, such as export agents, importers, wholesalers and distributors. Fundamentally, a sawmill company consists of one or several different manufacturing units and the environmental heterogeneity is perceived to be either high or low. Other studies regarding sawmills’ distribution channels appear to be absent. One exception is studies on intelligent timber logistics through bar coding in distribution of sawn lumber (Olsson, 2005; Skogsindustrierna, 2005). Experts point to the distribution channel as neglected and of great
1 Chow et al (1995) define environmental heterogeneity as the degree of complexity in a firm’s environment (product suppliers and markets/customers), and it may be reflected in, for instance, the number of products, customers, suppliers.
4
importance for the future for sawmills to develop (Skogsaktuellt, 2010-04-09). This paper takes a starting point in the management of distribution channel development. Distribution channels do not only constitute a significant share of the total cost for supplying customers with products, they do also contribute to revenues by developing customer relationships. Companies with different strategy and structure have different challenges related to the distribution channel. Developing a competitive distribution channel is a long term investment in physical capacities, relations to partners in the channel and to markets and customers. There is a need for deliberate management decisions on distribution channel structure and integration and there is a need for improved knowledge and research in this area. From an academic viewpoint, the lack of empirical studies regarding the distribution function in the sawmill industry stresses the need for further studies in order to leverage the distribution function into sawmills’ business. Hence the following questions need to be asked; how should the individual sawmills fruitfully be classified based on distribution channel characteristics? Which challenges are the different sawmills (based on proposed typology) facing? and which research is needed accordingly? The purpose of this study is to identify distribution channel research needs given the variety of distribution channel challenges among Swedish sawmill companies. 2. Methodology In general, the case study research method is used for exploratory research, in which no specific hypotheses are proposed; rather a basic understanding is sought of how and why different phenomena occur. The case study research method is particularly useful when the object of the study is a contemporary phenomenon occurring in a real life setting over which the researcher has little control (Yin, 2003). This study has been conducted as a multiple-case study, in which the differences between sawmills, such as size and complexity, have been sought for rather than the similarities. The interviewed sawmills are located in the south of Sweden. Six sawmills were identified by using an industry directory of sawmills (http://www.sawmilldatabase.com/) combined with advice from the trade association in question. Each sawmill was visited and the interviews with CEO focused on distribution channels and integration2. Further, in order to understand the need for research on distributions channels we have to understand what decisions management is confronted with in different
2 Our understanding is that distribution channel challenges are managed through decisions on level of structure and level of integration, see Gustafsson and Rask, (2010).

247 3
Harstela, 1997; Malinen, 2003; Palander, 1997; Skjäl et al.., 2009). Variations and trends in the sawmill wood procurement in North-eastern United States have been identified by Anderson and Germain (2007). The contributions have applied various Operations Research tools, for instance simulation, optimisation and decision support systems (Asikainen, 1995; Palander, 1998; Karlsson et al.., 2003; Sikanen, 1999; Harstela, 1997; Palander and Väätäinnen, 2005; Uusitalo, 2005) and wood procurement. Other research focuses on a broader perspective of wood procurement taking a part of the forestry-wood chain (Adolfsson et al.., 2000; Lindén and Rönnqvist, 2001; Palander and Väätäinnen, 2005; Helstad, 2006). Studies regarding sawmill production have been carried out by, for instance (Johansson, 2007; Todoroki and Rönnqvist, 2002; Kazemi Zanjani et al.., 2010; Maturana and Pizani, 2009). A study regarding logistics strategy has been conducted by Gustafsson (2006). Contingency variables stressing the connection between situational variables and distribution channel characteristics have been studied by Gustafsson and Rask (2010). Gustafsson and Rask (2010) conclude that there are differences considering sawmills distribution channel characteristics (i.e. structure and level of integration) depending upon sawmills’ complexity (i.e. number of units) and the environmental heterogeneity1. From a sawmill perspective environmental heterogeneity regards supplier types, product line and markets. There are different ways for sawmills to acquire timber; they can purchase directly from forest owners, purchase from other sawmills or forest owners’ associations, or through direct import (Harstela, 1993). Softwood lumber is a commodity material with a low level of product modification, and there is thus a low level of heterogeneity in the product line. However, in order to segment itself, there are sawmills that are continuously developing their products, for instance by pre-painting (Roos et al., 2002), which adds to heterogeneity of the product line. Sawmills have several types of customers; traditional retailers, DIY multiple retailers, house builders and other industries (Gustafsson, 2006) There are also a number of other intermediary firms involved in the distribution channel, such as export agents, importers, wholesalers and distributors. Fundamentally, a sawmill company consists of one or several different manufacturing units and the environmental heterogeneity is perceived to be either high or low. Other studies regarding sawmills’ distribution channels appear to be absent. One exception is studies on intelligent timber logistics through bar coding in distribution of sawn lumber (Olsson, 2005; Skogsindustrierna, 2005). Experts point to the distribution channel as neglected and of great
1 Chow et al (1995) define environmental heterogeneity as the degree of complexity in a firm’s environment (product suppliers and markets/customers), and it may be reflected in, for instance, the number of products, customers, suppliers.
4
importance for the future for sawmills to develop (Skogsaktuellt, 2010-04-09). This paper takes a starting point in the management of distribution channel development. Distribution channels do not only constitute a significant share of the total cost for supplying customers with products, they do also contribute to revenues by developing customer relationships. Companies with different strategy and structure have different challenges related to the distribution channel. Developing a competitive distribution channel is a long term investment in physical capacities, relations to partners in the channel and to markets and customers. There is a need for deliberate management decisions on distribution channel structure and integration and there is a need for improved knowledge and research in this area. From an academic viewpoint, the lack of empirical studies regarding the distribution function in the sawmill industry stresses the need for further studies in order to leverage the distribution function into sawmills’ business. Hence the following questions need to be asked; how should the individual sawmills fruitfully be classified based on distribution channel characteristics? Which challenges are the different sawmills (based on proposed typology) facing? and which research is needed accordingly? The purpose of this study is to identify distribution channel research needs given the variety of distribution channel challenges among Swedish sawmill companies. 2. Methodology In general, the case study research method is used for exploratory research, in which no specific hypotheses are proposed; rather a basic understanding is sought of how and why different phenomena occur. The case study research method is particularly useful when the object of the study is a contemporary phenomenon occurring in a real life setting over which the researcher has little control (Yin, 2003). This study has been conducted as a multiple-case study, in which the differences between sawmills, such as size and complexity, have been sought for rather than the similarities. The interviewed sawmills are located in the south of Sweden. Six sawmills were identified by using an industry directory of sawmills (http://www.sawmilldatabase.com/) combined with advice from the trade association in question. Each sawmill was visited and the interviews with CEO focused on distribution channels and integration2. Further, in order to understand the need for research on distributions channels we have to understand what decisions management is confronted with in different
2 Our understanding is that distribution channel challenges are managed through decisions on level of structure and level of integration, see Gustafsson and Rask, (2010).

248 5
situations and hence these questions were asked as well (changes done within the last two years and research needs). Background data on the situation of sawmills was collected by interview with the trade organisation3, together with general information on the industry from industry media. 3. Empirical data Studied sawmills display a large span of characteristics; ranging from the small one-unit company to the large multi-unit sawmill group. The companies studied also differ regarding, type of raw material suppliers, line of products and type of customers. An overview of the studied companies is provided in Table 1 below. Table 1. Overview of studied sawmills
Saw-mill
Prod. volume/ yr
Number of units Supplier type Line of
products Type of customers
A 15 000 m3
1 Forest Corporations
Specific niche products
Specialising carpenters
B
40 000 m3
2 Directly from forest owners nearby
Standard product line
House building industry and Building materials merchants
C
160 000 m3
1 Directly from forest owners nearby and purchasing company
Standard product line
House building industry and Building materials merchants
D
225 000 m3
3 sawmills, 1 facility for value-adding activities and 1 terminal
Directly from forest owners nearby
Standard product line and value- added products
Building materials merchants
E
350 000 m3
3 sawmills and 1facility for value-adding activities
Purchasing company within the group
Standard product line and value- added products
Building materials merchants
F
1 800 000 m3
10 sawmills and units for value-adding activities and 1 terminal
Purchasing company within the group
Standard product line and value- added products
Building materials merchants
3 Såg I Syd (http://www.sagisyd.se), is organizing the majority of sawmill companies in the south of Sweden.
6
During the last two years the case companies have taken decisions regarding their distribution channel. Some significant decisions are listed below together with the perceived need for improved information when taking decisions. Table 2. Development of distribution channel during the last two years and perceived research need Sawmill Development during the last two
years Perceived research need
A None None B - Centralized the sales department None C - Developed a web-based interface for
order placement (for a selected customer)
Inventory location and levels Cost Benefit analysis for different distribution channel structures
D - Increased number of customers (focused on small customers on behalf of large considering volume) - Hired purchasers of timber - Customized the product and services - Closed one sawmill and one terminal
None
E - Has acquired one facility for value-adding activities, has developed a web-based interface for order placement (for all customers).
Modelling distribution channel costs Appropriate inventory levels
F - Acquired sales companies in Denmark, The Netherlands, United Kingdom, Interior products, House Builder, and a waterproofing facility
How a sawmill could develop a brand name for their soft wood lumber Identify what the customers want? (develop a deal) Identify distribution channel costs
4. Discussion and tentative proposals According to previous studies, based on Chow et al. (1995), see Gustafsson and Rask (2010) differences between sawmills’ distribution channel characteristics depend upon sawmills’ complexity (i.e. number of units) and environmental heterogeneity. Hence these are the variables constituting the foundation for the proposed typology. Number of units refers to the number of individual sawmills that belong to the sawmill company; sawmills with more than one unit is referred to a network, where as sawmills consisting of one unit is referred to as a line. Further, sawmills with a low environmental
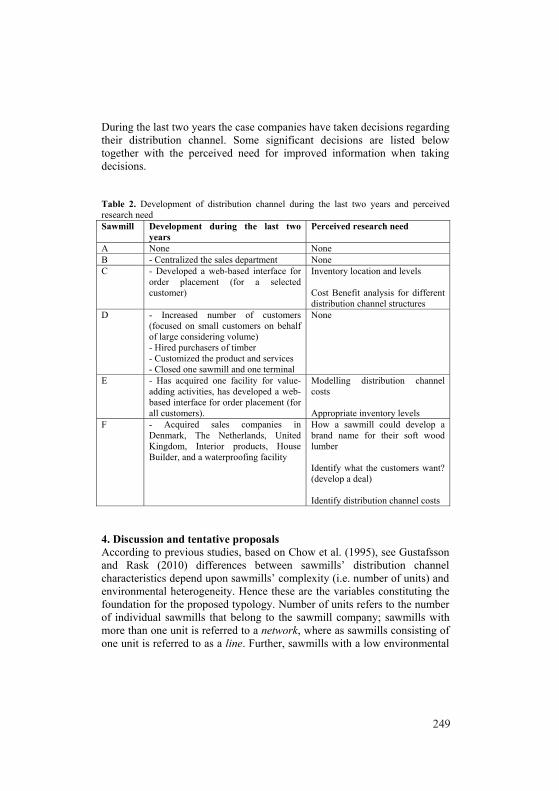
249 5
situations and hence these questions were asked as well (changes done within the last two years and research needs). Background data on the situation of sawmills was collected by interview with the trade organisation3, together with general information on the industry from industry media. 3. Empirical data Studied sawmills display a large span of characteristics; ranging from the small one-unit company to the large multi-unit sawmill group. The companies studied also differ regarding, type of raw material suppliers, line of products and type of customers. An overview of the studied companies is provided in Table 1 below. Table 1. Overview of studied sawmills
Saw-mill
Prod. volume/ yr
Number of units Supplier type Line of
products Type of customers
A 15 000 m3
1 Forest Corporations
Specific niche products
Specialising carpenters
B
40 000 m3
2 Directly from forest owners nearby
Standard product line
House building industry and Building materials merchants
C
160 000 m3
1 Directly from forest owners nearby and purchasing company
Standard product line
House building industry and Building materials merchants
D
225 000 m3
3 sawmills, 1 facility for value-adding activities and 1 terminal
Directly from forest owners nearby
Standard product line and value- added products
Building materials merchants
E
350 000 m3
3 sawmills and 1facility for value-adding activities
Purchasing company within the group
Standard product line and value- added products
Building materials merchants
F
1 800 000 m3
10 sawmills and units for value-adding activities and 1 terminal
Purchasing company within the group
Standard product line and value- added products
Building materials merchants
3 Såg I Syd (http://www.sagisyd.se), is organizing the majority of sawmill companies in the south of Sweden.
6
During the last two years the case companies have taken decisions regarding their distribution channel. Some significant decisions are listed below together with the perceived need for improved information when taking decisions. Table 2. Development of distribution channel during the last two years and perceived research need Sawmill Development during the last two
years Perceived research need
A None None B - Centralized the sales department None C - Developed a web-based interface for
order placement (for a selected customer)
Inventory location and levels Cost Benefit analysis for different distribution channel structures
D - Increased number of customers (focused on small customers on behalf of large considering volume) - Hired purchasers of timber - Customized the product and services - Closed one sawmill and one terminal
None
E - Has acquired one facility for value-adding activities, has developed a web-based interface for order placement (for all customers).
Modelling distribution channel costs Appropriate inventory levels
F - Acquired sales companies in Denmark, The Netherlands, United Kingdom, Interior products, House Builder, and a waterproofing facility
How a sawmill could develop a brand name for their soft wood lumber Identify what the customers want? (develop a deal) Identify distribution channel costs
4. Discussion and tentative proposals According to previous studies, based on Chow et al. (1995), see Gustafsson and Rask (2010) differences between sawmills’ distribution channel characteristics depend upon sawmills’ complexity (i.e. number of units) and environmental heterogeneity. Hence these are the variables constituting the foundation for the proposed typology. Number of units refers to the number of individual sawmills that belong to the sawmill company; sawmills with more than one unit is referred to a network, where as sawmills consisting of one unit is referred to as a line. Further, sawmills with a low environmental

250 7
heterogeneity experience a homogeneous environment as compared to other sawmills with a high heterogeneous environment. The proposed typology is illustrated in Figure 1.
Figure 1. Proposed typology of DC characteristics In line with the proposed typology of distribution channel characteristics, four different categories of sawmill distribution channels emerge;
• Category Line-Homogeneous; sawmills consisting of one unit with a standardized assortment aimed for a specific customer group on a predefined market. In this study; sawmill A
• Category Line-Heterogeneous; sawmills consisting of one unit which produces a variety of products aimed for several customer on different markets (this type of sawmills does strive to adjust their products to customer demand). Sawmills belonging to this type usually have an opportunistic strategy. In this study; sawmill C
• Category Network-Homogeneous; sawmills consisting of more than one unit which produces a standardized assortment aimed for a specific customer group on a predefined market. In this study; sawmill B
• Category Network-Heterogeneous; sawmills consisting of more than one unit which produces a variety of products aimed for several customer on different markets (this type of sawmills does strive to adjust their products to customer demand). Sawmills belonging to this type usually have an opportunistic strategy. In this study; sawmill D, E and F.
Low High Environmental heterogeneity
Number of units
>1 1 Line-
Heterogeneous Line-
Homogeneous
Network- Homogeneous
Network- Heterogeneous
8
The case companies and their recent decisions affecting distribution channel characteristics are presented below. Table 3: The studied sawmills classified by typology and their recent distribution channel decisions Homogeneous Heterogeneous Network Sawmill B
Centralized the sales department
Sawmill D Increased number of customers Customized product and services Closed one sawmill and one terminal Sawmill E Acquired one facility for value-adding activities Developed a web-based interface for order placement Sawmill F Acquired sales companies in major export markets Acquired units for interior decoration wood products Acquired value-adding unit Invested in home building unit
Line Sawmill A None
Sawmill C Developed a web-based interface for order placement (for a selected customer)
The studied sawmills have taken several decisions in order to manage and develop their respective distribution channel. However, these decisions are just a sample of a larger number of potential areas that management has to address. These decision areas being based on flows (tangible and intangible flows) within the distribution channel. The defined typology is based on predefined variables; number of units and environmental uncertainty and hence four types of sawmill categories emerge; Network-Homogeneous, Network-Heterogeneous, Line-Homogeneous, Line-Heterogeneous. For the individual sawmill. Each of these categories is facing a different set of managerial challenges;
• Network-Homogeneous; Sawmills belonging to this category consist of several units and produce a standard set of products. These sawmills need to consolidate their production to a limited product range and they hence need to coordinate their units with regards to, for instance product line and transportation.
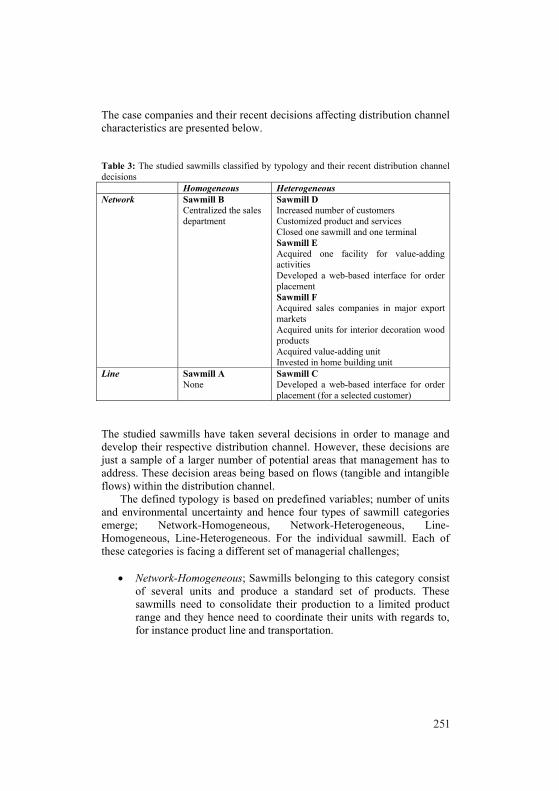
251 7
heterogeneity experience a homogeneous environment as compared to other sawmills with a high heterogeneous environment. The proposed typology is illustrated in Figure 1.
Figure 1. Proposed typology of DC characteristics In line with the proposed typology of distribution channel characteristics, four different categories of sawmill distribution channels emerge;
• Category Line-Homogeneous; sawmills consisting of one unit with a standardized assortment aimed for a specific customer group on a predefined market. In this study; sawmill A
• Category Line-Heterogeneous; sawmills consisting of one unit which produces a variety of products aimed for several customer on different markets (this type of sawmills does strive to adjust their products to customer demand). Sawmills belonging to this type usually have an opportunistic strategy. In this study; sawmill C
• Category Network-Homogeneous; sawmills consisting of more than one unit which produces a standardized assortment aimed for a specific customer group on a predefined market. In this study; sawmill B
• Category Network-Heterogeneous; sawmills consisting of more than one unit which produces a variety of products aimed for several customer on different markets (this type of sawmills does strive to adjust their products to customer demand). Sawmills belonging to this type usually have an opportunistic strategy. In this study; sawmill D, E and F.
Low High Environmental heterogeneity
Number of units
>1 1 Line-
Heterogeneous Line-
Homogeneous
Network- Homogeneous
Network- Heterogeneous
8
The case companies and their recent decisions affecting distribution channel characteristics are presented below. Table 3: The studied sawmills classified by typology and their recent distribution channel decisions Homogeneous Heterogeneous Network Sawmill B
Centralized the sales department
Sawmill D Increased number of customers Customized product and services Closed one sawmill and one terminal Sawmill E Acquired one facility for value-adding activities Developed a web-based interface for order placement Sawmill F Acquired sales companies in major export markets Acquired units for interior decoration wood products Acquired value-adding unit Invested in home building unit
Line Sawmill A None
Sawmill C Developed a web-based interface for order placement (for a selected customer)
The studied sawmills have taken several decisions in order to manage and develop their respective distribution channel. However, these decisions are just a sample of a larger number of potential areas that management has to address. These decision areas being based on flows (tangible and intangible flows) within the distribution channel. The defined typology is based on predefined variables; number of units and environmental uncertainty and hence four types of sawmill categories emerge; Network-Homogeneous, Network-Heterogeneous, Line-Homogeneous, Line-Heterogeneous. For the individual sawmill. Each of these categories is facing a different set of managerial challenges;
• Network-Homogeneous; Sawmills belonging to this category consist of several units and produce a standard set of products. These sawmills need to consolidate their production to a limited product range and they hence need to coordinate their units with regards to, for instance product line and transportation.
252 9
• Network-Heterogeneous; Sawmills belonging to this category consist of several units and produce a wide variety of products (also develop new products according to customer demand). These sawmills continuously need to coordinate their units, transportation, sales and product range. Further, for these sawmills it becomes important to control their distribution channels in order to continuously enhance cost reduction, increase value-added to the customers as well as to be able leverage customer service. Branding will also be important in order to “secure” customers.
• Line-Homogeneous; Sawmills belonging to this category consist of one unit and produce a limited product range. The sawmills focus on economies of scale in the distribution channel as well as in production and hence strive for stable and predictable flows.
• Line-Heterogeneous; Sawmills belonging to this category consist of one unit and produce a wide product range. These sawmills focus on cost efficiency in the distribution channel but they need to able to make changes as there is need for new products and a reconfiguration of the distribution channel structure.
As the characteristics of each category differ, the research need would also differ between the categories.
• Network-Homogeneous; Sawmills belonging to this category consist of several units and produce a standard set of products. These sawmills striving for economies of scale both within each unit but also between their units need to focus their research on production planning in network structures as well as optimal production deployment.
• Network-Heterogeneous; Sawmills belonging to this category consist of several units and produce a wide variety of products (also develop new products according to customer demand). The sawmills need strategies for developing their customized products in customer products as well as to developing their marketing and try to brand their products. Further, these sawmills need to be considered as a reliable supplier by the customers and thereby integrate forwards in their distribution channel.
• Line-Homogeneous; Sawmills belonging to this category consist of one unit and produce a limited product range. In order for these sawmills to achieve economies of scale in production and the distribution channel cost control methods are needed both with and without intermediaries.
• Line-Heterogeneous; Sawmills belonging to this category consist of one unit and produce a wide product range. In order for these
10
sawmills to achieve cost effective distribution channel structures with a variety of products (that also have a possibility change according to customer demand) studies of consolidating logistics in segmented distribution channels are needed.
Table 4 illustrates the managerial challenges the different sawmills (based on proposed typology) are facing and research needed accordingly. Table 4. Managerial challenges and research need aligned to each category.
Category Managerial challenge Research need Network-Homogeneous
Coordination of units and transportation Consolidating production of a limited product range
Production planning in net- work structures. Optimal production deployment.
Network-Heterogeneous
Coordination of units, Transportation, sales and product range Control of DC up to customer Branding of products
Strategies for developing commodities to products Effects of branding Methods for forward integration in DC
Line-Homogeneous Cost efficient DC structure Cost efficient production and limited product range
Cost control methods in DC with intermediaries
Line-Heterogeneous Cost efficient DC structure Sales organization Wider product range
Consolidating logistics in segmented DC.
This pre-study constitutes a base for an in-depth study of integration and efficiency in the distribution channel for softwood lumber. In order to validate and expand these tentative findings, additional cases are needed (possibly done in an in-depth study). The aim of the in-depth study is would be to create a model mapping the sawmill distribution channel costs, tied-up capital and logistics service quality, by illustrating the cost structure in the distribution channel; hence it is suitable for scenario writing, and consequently a tool for taking decisions on distribution channel structures.

253 9
• Network-Heterogeneous; Sawmills belonging to this category consist of several units and produce a wide variety of products (also develop new products according to customer demand). These sawmills continuously need to coordinate their units, transportation, sales and product range. Further, for these sawmills it becomes important to control their distribution channels in order to continuously enhance cost reduction, increase value-added to the customers as well as to be able leverage customer service. Branding will also be important in order to “secure” customers.
• Line-Homogeneous; Sawmills belonging to this category consist of one unit and produce a limited product range. The sawmills focus on economies of scale in the distribution channel as well as in production and hence strive for stable and predictable flows.
• Line-Heterogeneous; Sawmills belonging to this category consist of one unit and produce a wide product range. These sawmills focus on cost efficiency in the distribution channel but they need to able to make changes as there is need for new products and a reconfiguration of the distribution channel structure.
As the characteristics of each category differ, the research need would also differ between the categories.
• Network-Homogeneous; Sawmills belonging to this category consist of several units and produce a standard set of products. These sawmills striving for economies of scale both within each unit but also between their units need to focus their research on production planning in network structures as well as optimal production deployment.
• Network-Heterogeneous; Sawmills belonging to this category consist of several units and produce a wide variety of products (also develop new products according to customer demand). The sawmills need strategies for developing their customized products in customer products as well as to developing their marketing and try to brand their products. Further, these sawmills need to be considered as a reliable supplier by the customers and thereby integrate forwards in their distribution channel.
• Line-Homogeneous; Sawmills belonging to this category consist of one unit and produce a limited product range. In order for these sawmills to achieve economies of scale in production and the distribution channel cost control methods are needed both with and without intermediaries.
• Line-Heterogeneous; Sawmills belonging to this category consist of one unit and produce a wide product range. In order for these
10
sawmills to achieve cost effective distribution channel structures with a variety of products (that also have a possibility change according to customer demand) studies of consolidating logistics in segmented distribution channels are needed.
Table 4 illustrates the managerial challenges the different sawmills (based on proposed typology) are facing and research needed accordingly. Table 4. Managerial challenges and research need aligned to each category.
Category Managerial challenge Research need Network-Homogeneous
Coordination of units and transportation Consolidating production of a limited product range
Production planning in net- work structures. Optimal production deployment.
Network-Heterogeneous
Coordination of units, Transportation, sales and product range Control of DC up to customer Branding of products
Strategies for developing commodities to products Effects of branding Methods for forward integration in DC
Line-Homogeneous Cost efficient DC structure Cost efficient production and limited product range
Cost control methods in DC with intermediaries
Line-Heterogeneous Cost efficient DC structure Sales organization Wider product range
Consolidating logistics in segmented DC.
This pre-study constitutes a base for an in-depth study of integration and efficiency in the distribution channel for softwood lumber. In order to validate and expand these tentative findings, additional cases are needed (possibly done in an in-depth study). The aim of the in-depth study is would be to create a model mapping the sawmill distribution channel costs, tied-up capital and logistics service quality, by illustrating the cost structure in the distribution channel; hence it is suitable for scenario writing, and consequently a tool for taking decisions on distribution channel structures.

254 11
References Adolfsson, G., Melin, U. & Markgren (2000) Samverkan och
affärsutveckling i träkedjan - sågverk och nätverk i förändring. Stockholm, Trätek.
Anderson, N. & Germain, R. (2007) Variations and trends in sawmill wood procurement in the Northeastern United States. Forest products journal, 57, 36-44.
Asikainen, A. (1995) Discrete-event simulation of mechanized wood-harvesting systems. University of Joensuu.
Ballou, R. (1992) Business Logistics Management, Prentice Hall. Christopher, M. (2005) Logistics and Supply Chain Management, Prentice
Hall. Couglan, A., Anderson, E., Stern, L. & El-Ansary, A. (2006), Marketing
channels, Pearson International Edition. Chow, G., Heaver, T.D. & Henriksson, L.E. (1995), Strategy, Structure,
and Performance: A Framework for Logistics Research, Logistics & Transportation Review, Vol. 31, pp. 285-309.
Gustafsson, Å. (2006) Customer service requirements and logistics strategies in the Swedish Sawmill Industry School of Technology and Design. Växjö, Växjö University.
Gustafsson, Å. and Rask, Lars-Olof. (2010). Distribution channel structure and integration - Contingency variables in the sawmill industry, In NOFOMA Proceedings
Hansen, E., Seppäla, J. and Juslin, H. (2002) Marketing strategies of softwood sawmills in western North America. Forest products journal, 52, 19-25.
Harstela, P. (1993) Forest work Science and Technology, Part 1, Joensuu: Jounsuun ypiopisto. Silva Carelica 25.
Harstela, P. (1997) Decision Support Systems in Wood Procurement. Silva Fennica 31, 215-223.
Helstad, K. (2006) Managing timber Procurement in Nordic Purchasing Sawmills. School of Technology and Design. Växjö, Växjö University
Johansson, C. (1995) Sågverken - en basnäring, Stockholm, Arbio. Johansson, M. (2007) Product Costing for Sawmill Business Management.
School of Technology and Design. Växjö Växjö University. Jonsson, P. (2008) Logistics and Supply Chain Management, McGraw Hill. Karlsson, J., Rönnqvist, M. & Bergström, J. (2003) Short-term harvest
planning including scheduling of harvest crews. International Transactions in Operations Research, 10, 413-431.
Kazemi Zanjani, M., Ait-Kadi, D. & Nourelfath, M. (2010) Robust production planning in a manufacturing environment with random yield: A case in sawmill production planning. European Journal of Operational Research, 201, 882-891.
12
Lindén, B. & Rönnqvist, M. (2001) Evaluation of model for customer optimized timber in the wood chain. IN PALMGREN, M. & RÖNNQVIST, M. (Eds.) Logistik och optimering inom skogsindustrin. Linköpng: Dept of Mathematics.
Malinen, J. (2003) Locally Adaptable Non-parametric Methods för Estimating Stand Characteristics for Wood Procurement. Silva Fennica, 37, 109-120.
Maturana, S. & Pizani, E. (2009) Scheduling and production planning for a sawmill: A comparison of a mathematical model versus a heuristic. 2009 International Conference on Computers&Industrial Engineering. IEEE.
Olsson, F. (2005) ITL - Intelligent timber logistics. Slutrapport. Skogsindustrierna, Stockholm
Palander, T. (1997) A Local DLP-GIS-LP System for Geographically Decentralized Wood Procurement Planning and Decision Making. Silva Fennica, 31, 179-192.
Palander, T. (1998) Tactical models of wood procurement teams for geographically decentralized group decision-making. Faculty of Forestry. Juensuu, University of Juensuu.
Palander, T., Kainulainen, J. & Koskinen, R. (2005) A computer-supported group decision-making system for timber procurement planning in Finland Scandinavian Journal of Forest Research, 20, 514-520.
Palander, T. & Väätäinnen, J. (2005) Impacts of interenterprise collaboration and backhauling on wood procurement in Finland. Scandinavian Journal of Forest Research, 20, 177-183.
Pine, B. J. (1993) Mass customization: The frontier in business competition. Harvard School Press.
Roos, A., Flinkman, M., Jäppinen, A., and Warensjö, M. (2002) Identification of Value-adding Strategies in the Swedish Sawn Wood Industry. Scandinavian Journal of Forest Research, 17, 90-96.
Shapiro, B. P. (1979) Making money through marketing. Harvard Business Review, July/August, 135-142.
Sikanen, L. (1999) Discrete Event Simulation Model for Purchasing Process of Marked Stands as a part of Customized Timber Procurement in Finland. Faculty of Forestry. University of Juensuu.
Skjäl, A., Björk, K.-M., Östman, J. & Carlsson, C. (2009) An Optimization model for Tactical Planning of Wood Procurement. Hawaii International Conference on Systems Science. Hawaii.
Skogsaktuellt (2010) Marknadskommentar från Skogsaktuellt 2010-04-09. Skogsindustrierna (2005) Trä på väg - En skrift från Skogsindustrierna om
logistikeffektivisering i trävarubranschen. Skogsstyrelsen (2005). Skogsstyrelsen, S. A. H. W. U. O. P. P. T. E. H. (2002).

255 11
References Adolfsson, G., Melin, U. & Markgren (2000) Samverkan och
affärsutveckling i träkedjan - sågverk och nätverk i förändring. Stockholm, Trätek.
Anderson, N. & Germain, R. (2007) Variations and trends in sawmill wood procurement in the Northeastern United States. Forest products journal, 57, 36-44.
Asikainen, A. (1995) Discrete-event simulation of mechanized wood-harvesting systems. University of Joensuu.
Ballou, R. (1992) Business Logistics Management, Prentice Hall. Christopher, M. (2005) Logistics and Supply Chain Management, Prentice
Hall. Couglan, A., Anderson, E., Stern, L. & El-Ansary, A. (2006), Marketing
channels, Pearson International Edition. Chow, G., Heaver, T.D. & Henriksson, L.E. (1995), Strategy, Structure,
and Performance: A Framework for Logistics Research, Logistics & Transportation Review, Vol. 31, pp. 285-309.
Gustafsson, Å. (2006) Customer service requirements and logistics strategies in the Swedish Sawmill Industry School of Technology and Design. Växjö, Växjö University.
Gustafsson, Å. and Rask, Lars-Olof. (2010). Distribution channel structure and integration - Contingency variables in the sawmill industry, In NOFOMA Proceedings
Hansen, E., Seppäla, J. and Juslin, H. (2002) Marketing strategies of softwood sawmills in western North America. Forest products journal, 52, 19-25.
Harstela, P. (1993) Forest work Science and Technology, Part 1, Joensuu: Jounsuun ypiopisto. Silva Carelica 25.
Harstela, P. (1997) Decision Support Systems in Wood Procurement. Silva Fennica 31, 215-223.
Helstad, K. (2006) Managing timber Procurement in Nordic Purchasing Sawmills. School of Technology and Design. Växjö, Växjö University
Johansson, C. (1995) Sågverken - en basnäring, Stockholm, Arbio. Johansson, M. (2007) Product Costing for Sawmill Business Management.
School of Technology and Design. Växjö Växjö University. Jonsson, P. (2008) Logistics and Supply Chain Management, McGraw Hill. Karlsson, J., Rönnqvist, M. & Bergström, J. (2003) Short-term harvest
planning including scheduling of harvest crews. International Transactions in Operations Research, 10, 413-431.
Kazemi Zanjani, M., Ait-Kadi, D. & Nourelfath, M. (2010) Robust production planning in a manufacturing environment with random yield: A case in sawmill production planning. European Journal of Operational Research, 201, 882-891.
12
Lindén, B. & Rönnqvist, M. (2001) Evaluation of model for customer optimized timber in the wood chain. IN PALMGREN, M. & RÖNNQVIST, M. (Eds.) Logistik och optimering inom skogsindustrin. Linköpng: Dept of Mathematics.
Malinen, J. (2003) Locally Adaptable Non-parametric Methods för Estimating Stand Characteristics for Wood Procurement. Silva Fennica, 37, 109-120.
Maturana, S. & Pizani, E. (2009) Scheduling and production planning for a sawmill: A comparison of a mathematical model versus a heuristic. 2009 International Conference on Computers&Industrial Engineering. IEEE.
Olsson, F. (2005) ITL - Intelligent timber logistics. Slutrapport. Skogsindustrierna, Stockholm
Palander, T. (1997) A Local DLP-GIS-LP System for Geographically Decentralized Wood Procurement Planning and Decision Making. Silva Fennica, 31, 179-192.
Palander, T. (1998) Tactical models of wood procurement teams for geographically decentralized group decision-making. Faculty of Forestry. Juensuu, University of Juensuu.
Palander, T., Kainulainen, J. & Koskinen, R. (2005) A computer-supported group decision-making system for timber procurement planning in Finland Scandinavian Journal of Forest Research, 20, 514-520.
Palander, T. & Väätäinnen, J. (2005) Impacts of interenterprise collaboration and backhauling on wood procurement in Finland. Scandinavian Journal of Forest Research, 20, 177-183.
Pine, B. J. (1993) Mass customization: The frontier in business competition. Harvard School Press.
Roos, A., Flinkman, M., Jäppinen, A., and Warensjö, M. (2002) Identification of Value-adding Strategies in the Swedish Sawn Wood Industry. Scandinavian Journal of Forest Research, 17, 90-96.
Shapiro, B. P. (1979) Making money through marketing. Harvard Business Review, July/August, 135-142.
Sikanen, L. (1999) Discrete Event Simulation Model for Purchasing Process of Marked Stands as a part of Customized Timber Procurement in Finland. Faculty of Forestry. University of Juensuu.
Skjäl, A., Björk, K.-M., Östman, J. & Carlsson, C. (2009) An Optimization model for Tactical Planning of Wood Procurement. Hawaii International Conference on Systems Science. Hawaii.
Skogsaktuellt (2010) Marknadskommentar från Skogsaktuellt 2010-04-09. Skogsindustrierna (2005) Trä på väg - En skrift från Skogsindustrierna om
logistikeffektivisering i trävarubranschen. Skogsstyrelsen (2005). Skogsstyrelsen, S. A. H. W. U. O. P. P. T. E. H. (2002).

256 13
Staland, J., Navrén, M. And Nylinder, M. (2002) Resultat från sågverksinventeringen 2000, SLU, Sweden.
Todoroki, C. & Rönnqvist, M. (2002) Dynamic Control of Timber production at a Sawmill with log Sawing Optimization. Scandinavian Journal of Forest Research, 17, 79-89.
Uusitalo, J. (2005) A Framework for CTL Method-Based Wood Procurement Logistics. International Journal of Forest Engineering, 16.
Yin, R. (2003), Case study research Design and Methods, Sage Publications.
The Role of National Culture and Environmental Awareness in Recovery and Utilization of Recycled
Paper
Maija Hujala1, Kaisu Puumalainen1, Anni Tuppura1, Anne Toppinen2
1School of Business, Lappeenranta University of Technology 2 Dept of Forest Economics, University of Helsinki
Abstract This paper explores how national culture and environmental awareness affect the recovery and utilization of recovered paper on country level. We extent models of previous studies by including a wide array of “softer” country level factors, e.g. Hofstede’s cultural dimensions and diffusion of ISO 14001 certificates. Our models are tested on panel data from 22 leading paper-producing countries in 1995-2008. Our empirical results further confirm the roles of geographical, demographic and essentially economic determinants but we are also able to empirically demonstrate that cultural characteristics and concern for the environment play a significant role. 1. Introduction The global demand for recycled paper in paper and board production has been in continuous growth during the past decades. Regionally, growth in the demand for paper and paperboard is shifting from Europe and North America to Asia, causing changes in national level utilization of recovered paper. Global production increase of wood pulp has during the 2000s not matched that of paper and paperboard (over 15% change between 1999 and 2006), reflecting gains in rates of paper recycling and the continuing rise in the use of recovered fiber and decreasing use of fresh wood fiber in paper production (Suomalainen, 2008). According to the FAO ForeSTAT database, the use of recycled paper nowadays globally exceeds the use of wood pulp as a raw material. This development has been boosted by technological progress and especially by

257 13
Staland, J., Navrén, M. And Nylinder, M. (2002) Resultat från sågverksinventeringen 2000, SLU, Sweden.
Todoroki, C. & Rönnqvist, M. (2002) Dynamic Control of Timber production at a Sawmill with log Sawing Optimization. Scandinavian Journal of Forest Research, 17, 79-89.
Uusitalo, J. (2005) A Framework for CTL Method-Based Wood Procurement Logistics. International Journal of Forest Engineering, 16.
Yin, R. (2003), Case study research Design and Methods, Sage Publications.
The Role of National Culture and Environmental Awareness in Recovery and Utilization of Recycled
Paper
Maija Hujala1, Kaisu Puumalainen1, Anni Tuppura1, Anne Toppinen2
1School of Business, Lappeenranta University of Technology 2 Dept of Forest Economics, University of Helsinki
Abstract This paper explores how national culture and environmental awareness affect the recovery and utilization of recovered paper on country level. We extent models of previous studies by including a wide array of “softer” country level factors, e.g. Hofstede’s cultural dimensions and diffusion of ISO 14001 certificates. Our models are tested on panel data from 22 leading paper-producing countries in 1995-2008. Our empirical results further confirm the roles of geographical, demographic and essentially economic determinants but we are also able to empirically demonstrate that cultural characteristics and concern for the environment play a significant role. 1. Introduction The global demand for recycled paper in paper and board production has been in continuous growth during the past decades. Regionally, growth in the demand for paper and paperboard is shifting from Europe and North America to Asia, causing changes in national level utilization of recovered paper. Global production increase of wood pulp has during the 2000s not matched that of paper and paperboard (over 15% change between 1999 and 2006), reflecting gains in rates of paper recycling and the continuing rise in the use of recovered fiber and decreasing use of fresh wood fiber in paper production (Suomalainen, 2008). According to the FAO ForeSTAT database, the use of recycled paper nowadays globally exceeds the use of wood pulp as a raw material. This development has been boosted by technological progress and especially by

258
good price competitiveness of recycled fiber. Recovered paper is cheaper than wood pulp even in periods of high prices. Also the environmental awareness – at both the producer and consumer ends – and regulation has influenced the demand for recycled paper (see e.g. Lundmark, 2001; Huhtala and Samakovlis, 2003; Samakovlis 2003; Berglund and Söderholm, 2003b).
In using recycled materials, natural resources are saved, emissions reduced and the burden on solid waste reduced (van Beukering and Bouman, 2001), so there are many positive aspects involved in the growth of recovered paper utilization. However, allocation of recycling benefits between virgin and recovered fibres is a difficult question, as also recently indicated by Laurijssen et al. (2010) in analysing CO2 and energy impacts of paper recycling in the Netherlands.
In this paper we explore whether national culture and indicators of environmental awareness at country level, such as the diffusion of environmental management systems, play a significant role in country’s recycled paper recovery and utilization rates. We extend two econometric models introduced by Berglund et al. (2002) and Berglund and Söderholm (2003b) by including an array of new variables and test them on panel data of 22 leading paper-producing countries.
The rest of the paper is organized as follows. A short review of previous studies is given in the next section. In Section 3, we present some key definitions related to the subject. Current global trends in recovered paper use are given in Section 4. Our empirical models, data collection, and estimation methods are reported in Section 5. Regression analysis results are shown and discussed in Section 6, and Section 7 concludes the paper with recommendations for future research. 2. Previous studies There exists limited literature about econometric analyses for inter-country differences in waste paper recovery and use. Van Beukering and Bouman (2001) developed and tested an empirical model for the recovery and utilization of waste paper and lead. Based on panel data from 50 countries during 1970 – 1997 they concluded that waste materials recovered in developed countries are increasingly exported for utilization in developing countries. Apart from geographic and economic conditions, like forest resources, population density, and manufacturing wages, general dependency on foreign trade and net import ratio of paper products were found consistently positively related to utilization rate in both the developed and developing countries.
Later, Berglund et al. (2002) as well as Berglund and Söderholm (2003a, 2003b) provided a critical analysis and complementary empirical evidence on the global recycling and trade of recovered paper. They questioned the earlier finding of Van Beukering and Bouman (2001) that international trade patterns of recovered paper are a major determinant of utilization rates, and focused instead on the availability of recovered fiber. In addition, they included the shares of various paper grades of the total paper and board production as an explanatory variable. Based on cross-sectional data from over 80 countries in 1996 (Berglund et al., 2002) and panel data from 49 countries during 1990-1996 (Berglund and Söderholm, 2003a, 2003b), they concluded that relative recovered paper collection and use largely depend on long-standing economic factors such as population density and competitiveness in the world market for paper and board products. Recovered paper availability was found to be the main determinant of the inter-country differences in utilization rates.
Along with the infrastructure, the amount of virgin fiber available and other “hard” factors, e.g. legislation, environmental awareness and political issues, are presumably some other country-level characteristics that may have a significant impact on the utilization and recovery of recovered paper.
In the studies mentioned above, these “softer factors” are measured implicitly or not at all. For example, Berglund et al. (2002) hypothesize that national environmental policies are more prevalent in richer countries. Thus, they expect recovered paper recovery rates to positively correlate with GDP per capita. However, country’s wealth, i.e. GDP per capita, has an influence on many other factors that may affect recovery rate as well. For example, the quality of infrastructure, or, as Berglund et al. (2002) themselves pointed out, the labor costs. If a variable reflects various determinants of recovery or utilization rates it is somewhat difficult to interpret the results, or to draw vary precise conclusions about the role of an individual determinant. Our paper differs from these earlier studies in that we use more explicit indicators for the “softer” country level characteristics, e.g. the Hofstede cultural dimensions (Hofstede, 1980) and diffusion of ISO 14001 certificates, to gain more precise information on factors affecting recovered paper utilization and collection rates. 3. Definitions Main raw materials for the paper production are wood pulp (mechanical pulp, semi chemical pulp and chemical pulp) and recovered paper. A limited substitution between wood pulp and recovered paper is possible. Fine papers, such as copy papers and high quality magazine papers, are typically solely produced from various wood pulp mixtures whereas waste based newsprint

259
good price competitiveness of recycled fiber. Recovered paper is cheaper than wood pulp even in periods of high prices. Also the environmental awareness – at both the producer and consumer ends – and regulation has influenced the demand for recycled paper (see e.g. Lundmark, 2001; Huhtala and Samakovlis, 2003; Samakovlis 2003; Berglund and Söderholm, 2003b).
In using recycled materials, natural resources are saved, emissions reduced and the burden on solid waste reduced (van Beukering and Bouman, 2001), so there are many positive aspects involved in the growth of recovered paper utilization. However, allocation of recycling benefits between virgin and recovered fibres is a difficult question, as also recently indicated by Laurijssen et al. (2010) in analysing CO2 and energy impacts of paper recycling in the Netherlands.
In this paper we explore whether national culture and indicators of environmental awareness at country level, such as the diffusion of environmental management systems, play a significant role in country’s recycled paper recovery and utilization rates. We extend two econometric models introduced by Berglund et al. (2002) and Berglund and Söderholm (2003b) by including an array of new variables and test them on panel data of 22 leading paper-producing countries.
The rest of the paper is organized as follows. A short review of previous studies is given in the next section. In Section 3, we present some key definitions related to the subject. Current global trends in recovered paper use are given in Section 4. Our empirical models, data collection, and estimation methods are reported in Section 5. Regression analysis results are shown and discussed in Section 6, and Section 7 concludes the paper with recommendations for future research. 2. Previous studies There exists limited literature about econometric analyses for inter-country differences in waste paper recovery and use. Van Beukering and Bouman (2001) developed and tested an empirical model for the recovery and utilization of waste paper and lead. Based on panel data from 50 countries during 1970 – 1997 they concluded that waste materials recovered in developed countries are increasingly exported for utilization in developing countries. Apart from geographic and economic conditions, like forest resources, population density, and manufacturing wages, general dependency on foreign trade and net import ratio of paper products were found consistently positively related to utilization rate in both the developed and developing countries.
Later, Berglund et al. (2002) as well as Berglund and Söderholm (2003a, 2003b) provided a critical analysis and complementary empirical evidence on the global recycling and trade of recovered paper. They questioned the earlier finding of Van Beukering and Bouman (2001) that international trade patterns of recovered paper are a major determinant of utilization rates, and focused instead on the availability of recovered fiber. In addition, they included the shares of various paper grades of the total paper and board production as an explanatory variable. Based on cross-sectional data from over 80 countries in 1996 (Berglund et al., 2002) and panel data from 49 countries during 1990-1996 (Berglund and Söderholm, 2003a, 2003b), they concluded that relative recovered paper collection and use largely depend on long-standing economic factors such as population density and competitiveness in the world market for paper and board products. Recovered paper availability was found to be the main determinant of the inter-country differences in utilization rates.
Along with the infrastructure, the amount of virgin fiber available and other “hard” factors, e.g. legislation, environmental awareness and political issues, are presumably some other country-level characteristics that may have a significant impact on the utilization and recovery of recovered paper.
In the studies mentioned above, these “softer factors” are measured implicitly or not at all. For example, Berglund et al. (2002) hypothesize that national environmental policies are more prevalent in richer countries. Thus, they expect recovered paper recovery rates to positively correlate with GDP per capita. However, country’s wealth, i.e. GDP per capita, has an influence on many other factors that may affect recovery rate as well. For example, the quality of infrastructure, or, as Berglund et al. (2002) themselves pointed out, the labor costs. If a variable reflects various determinants of recovery or utilization rates it is somewhat difficult to interpret the results, or to draw vary precise conclusions about the role of an individual determinant. Our paper differs from these earlier studies in that we use more explicit indicators for the “softer” country level characteristics, e.g. the Hofstede cultural dimensions (Hofstede, 1980) and diffusion of ISO 14001 certificates, to gain more precise information on factors affecting recovered paper utilization and collection rates. 3. Definitions Main raw materials for the paper production are wood pulp (mechanical pulp, semi chemical pulp and chemical pulp) and recovered paper. A limited substitution between wood pulp and recovered paper is possible. Fine papers, such as copy papers and high quality magazine papers, are typically solely produced from various wood pulp mixtures whereas waste based newsprint

260
includes 50-100% recovered paper, cartonboards 50-75% and corrugated boards up to 100% (Diesen, 2007). Recovered paper is used as raw material in the paper industry when its availability is secured and when its usage is economically rational (Berglund and Söderholm, 2003a; Berglund and Söderholm, 2003b; Haarla, 2007). Thus, recovered paper utilization is both supply- and demand driven, and it is shaped by both economics and politics (Berglund et al., 2002). Production technologies are fairly standardized and available worldwide (e.g. Berglund and Söderholm, 2003a). The infrastructure and a well-organized collection system, therefore, play an important role in the collection and utilization of recovered paper.
Utilization rate, UR, measures to what extent recovered paper is being used in paper and board production. UR is generally calculated by dividing country’s recovered paper consumption, RPcons, by the total paper and board production, PBprod (see, e.g. Van Beukering and Bouman, 2001; Berglund et al., 2002; Berglund and Söderholm, 2003a, 2003b):
prod
cons
PBRP
UR = (1)
The share of country’s paper consumption entering the recovered paper market is called recovery rate, RR, (e.g. Baumgärtner and Winkler, 2003; Berglund et al., 2002; Berglund and Söderholm, 2003a, 2003b). Recovery rate is calculated by dividing recovered paper production, i.e. collection, RPcollect, by total paper and board consumption, PBcons:
cons
collect
PBRP
RR = (2)
According to Baumgärtner and Winkler (2003), the recovery rate is bounded from above at about 80% since part of the paper produced is used as a raw material for durable goods, or cannot be recovered (e.g. sanitary papers).
4. Current trends in waste paper recovery and usage Recovered paper collection and consumption during the period 1992 - 2008 by region are shown in Figures 1 and 2. In turn, Table 1 shows the percentages of collection, trade and consumption by region.
Figure 1. Recovered paper collection (1000 tonnes) by region.
Figure 2. Recovered paper consumption (1000 tonnes) by region.

261
includes 50-100% recovered paper, cartonboards 50-75% and corrugated boards up to 100% (Diesen, 2007). Recovered paper is used as raw material in the paper industry when its availability is secured and when its usage is economically rational (Berglund and Söderholm, 2003a; Berglund and Söderholm, 2003b; Haarla, 2007). Thus, recovered paper utilization is both supply- and demand driven, and it is shaped by both economics and politics (Berglund et al., 2002). Production technologies are fairly standardized and available worldwide (e.g. Berglund and Söderholm, 2003a). The infrastructure and a well-organized collection system, therefore, play an important role in the collection and utilization of recovered paper.
Utilization rate, UR, measures to what extent recovered paper is being used in paper and board production. UR is generally calculated by dividing country’s recovered paper consumption, RPcons, by the total paper and board production, PBprod (see, e.g. Van Beukering and Bouman, 2001; Berglund et al., 2002; Berglund and Söderholm, 2003a, 2003b):
prod
cons
PBRP
UR = (1)
The share of country’s paper consumption entering the recovered paper market is called recovery rate, RR, (e.g. Baumgärtner and Winkler, 2003; Berglund et al., 2002; Berglund and Söderholm, 2003a, 2003b). Recovery rate is calculated by dividing recovered paper production, i.e. collection, RPcollect, by total paper and board consumption, PBcons:
cons
collect
PBRP
RR = (2)
According to Baumgärtner and Winkler (2003), the recovery rate is bounded from above at about 80% since part of the paper produced is used as a raw material for durable goods, or cannot be recovered (e.g. sanitary papers).
4. Current trends in waste paper recovery and usage Recovered paper collection and consumption during the period 1992 - 2008 by region are shown in Figures 1 and 2. In turn, Table 1 shows the percentages of collection, trade and consumption by region.
Figure 1. Recovered paper collection (1000 tonnes) by region.
Figure 2. Recovered paper consumption (1000 tonnes) by region.

262
As shown in Figures 1 and 2, in Asia, the collection of recovered paper has more than doubled and the consumption has almost tripled during the period. Consumption exceeds collection which makes Asia a net importer of recovered paper. In 2008, Asia consumed approximately half of all recovered paper (see Table 1). Imports into Asia have grown to account more than 60% of the world’s total.
Recovered paper collection and consumption are increasing in Europe and Latin America as well (see Figures 1 and 2). Instead, in North America the consumption has slightly decreased since 1999 and the collection seems to be stagnating. In Europe, recovered paper collection (% of world’s total) is stable but an increasing share of it is exported, Asia being the largest export destination (see Table 1), whereas North America’s share of collection and trade has declined.
Table 1. Recovered paper collection, imports, exports and consumption by region.
1992 1995 2000 2005 2008 Collection (% of world's total) Asia 28 29 30 32 36 Europe 30 29 30 31 30 Latin America 4 4 4 5 5 North America 36 35 32 28 24 Other 3 3 3 4 5 Imports (% of world's total) Asia 42 35 44 60 64 Europe 41 42 35 28 26 Latin America 9 8 7 5 4 North America 7 13 12 7 5 Other 1 1 1 1 1 Exports (% of world's total) Asia 6 6 6 12 11 Europe 38 40 43 43 45 Latin America 0 2 1 1 1 North America 55 52 48 40 38 Other 0 2 3 3 4 Consumption (% of world's total) Asia 33 33 37 43 49 Europe 30 29 29 28 25 Latin America 6 5 5 6 5 North America 28 29 25 20 16 Other 3 3 3 4 4
The development of the recovery and utilization rates of 22 countries investigated in this study is reported in Table 2. As shown, there is an overall increase of RR and UR in most of the countries between 1995 and 2008. The highest recovery rates can be found in Norway (85 % in 2008) and Western Europe countries, and the lowest in India (29%). With UR, the inter-country differences are tremendous, varying from 5% in Finland to 84% in Philippines. The lowest utilization rates are found in Northern countries (i.e. Finland, Sweden, Norway, Russia, Canada) whereas the highest rates can be found in Western Europe and Southeast Asian countries.
Table 2. The recovery and utilization rates by country. RR (%) UR (%) 1995 2000 2008 1995 2000 2008 Argentina 26 31 40 38 51 57 Austria 66 62 70 40 44 46 Belgium 38 49 55 24 35 59 Brazil 33 38 41 32 36 40 Canada 43 38 59 23 25 30 Chile 33 32 43 39 39 47 China 30 38 40 37 55 70 Finland 31 41 45 5 5 5 France 39 46 64 48 58 61 Germany 68 73 77 58 61 68 India 26 28 29 40 47 54 Italy 35 41 57 56 56 56 Japan 50 56 73 53 56 62 Norway 45 55 85 11 14 25 Philippines 18 27 48 75 84 83 Poland 37 35 39 40 41 37 Romania 31 29 44 32 40 83 Russia 24 30 35 14 18 27 Spain 41 48 69 73 81 84 Sweden 43 57 72 16 17 17 United Kingdom 35 42 78 66 74 80
USA 45 49 58 37 40 38

263
As shown in Figures 1 and 2, in Asia, the collection of recovered paper has more than doubled and the consumption has almost tripled during the period. Consumption exceeds collection which makes Asia a net importer of recovered paper. In 2008, Asia consumed approximately half of all recovered paper (see Table 1). Imports into Asia have grown to account more than 60% of the world’s total.
Recovered paper collection and consumption are increasing in Europe and Latin America as well (see Figures 1 and 2). Instead, in North America the consumption has slightly decreased since 1999 and the collection seems to be stagnating. In Europe, recovered paper collection (% of world’s total) is stable but an increasing share of it is exported, Asia being the largest export destination (see Table 1), whereas North America’s share of collection and trade has declined.
Table 1. Recovered paper collection, imports, exports and consumption by region.
1992 1995 2000 2005 2008 Collection (% of world's total) Asia 28 29 30 32 36 Europe 30 29 30 31 30 Latin America 4 4 4 5 5 North America 36 35 32 28 24 Other 3 3 3 4 5 Imports (% of world's total) Asia 42 35 44 60 64 Europe 41 42 35 28 26 Latin America 9 8 7 5 4 North America 7 13 12 7 5 Other 1 1 1 1 1 Exports (% of world's total) Asia 6 6 6 12 11 Europe 38 40 43 43 45 Latin America 0 2 1 1 1 North America 55 52 48 40 38 Other 0 2 3 3 4 Consumption (% of world's total) Asia 33 33 37 43 49 Europe 30 29 29 28 25 Latin America 6 5 5 6 5 North America 28 29 25 20 16 Other 3 3 3 4 4
The development of the recovery and utilization rates of 22 countries investigated in this study is reported in Table 2. As shown, there is an overall increase of RR and UR in most of the countries between 1995 and 2008. The highest recovery rates can be found in Norway (85 % in 2008) and Western Europe countries, and the lowest in India (29%). With UR, the inter-country differences are tremendous, varying from 5% in Finland to 84% in Philippines. The lowest utilization rates are found in Northern countries (i.e. Finland, Sweden, Norway, Russia, Canada) whereas the highest rates can be found in Western Europe and Southeast Asian countries.
Table 2. The recovery and utilization rates by country. RR (%) UR (%) 1995 2000 2008 1995 2000 2008 Argentina 26 31 40 38 51 57 Austria 66 62 70 40 44 46 Belgium 38 49 55 24 35 59 Brazil 33 38 41 32 36 40 Canada 43 38 59 23 25 30 Chile 33 32 43 39 39 47 China 30 38 40 37 55 70 Finland 31 41 45 5 5 5 France 39 46 64 48 58 61 Germany 68 73 77 58 61 68 India 26 28 29 40 47 54 Italy 35 41 57 56 56 56 Japan 50 56 73 53 56 62 Norway 45 55 85 11 14 25 Philippines 18 27 48 75 84 83 Poland 37 35 39 40 41 37 Romania 31 29 44 32 40 83 Russia 24 30 35 14 18 27 Spain 41 48 69 73 81 84 Sweden 43 57 72 16 17 17 United Kingdom 35 42 78 66 74 80
USA 45 49 58 37 40 38

264
5. Research methodology 5. 1. Our extended models for the recovery and utilization rates Our econometric models extend the models introduced by Berglund et al. (2002) and Berglund and Söderholm (2003b) by including an array of new variables to examine the role of national culture and environmental awareness in recovery and utilization of recovered paper. Equation for the recovery rate, RR, is expressed as:
itititiiii
ititiit
INTSCHOOLUAIMASIDVPDIISOPOPDENURBPOPGDPRR
εββββββββββα
+++++++++++=
)ln()ln()ln(
1098765
4321
(3)
where i is country, t is year, αi are country-specific effects and εit is an idiosyncratic error. Regression coefficients, βn, are assumed to be common to all countries and years.
Model for the utilization rate, UR, is:
itit
itiiiiit
itititiit
INTSCHOOLUAIMASIDVPDIISO
RRSENTBFORESTGDPUR
εβββββββ
βββββα
++++++++
+++++=
)ln()ln(
)ln()ln(
12
11109876
54321
. (4)
GDP, URBPOP, POPDEN, FOREST, NTB and SE measure the infrastructure and other “hard” factors affecting country’s recovered paper recovery and/or utilization rates, whereas ISO, PDI, IDV, MAS, UAI, SCHOOL and INT measure “softer” country level characteristics that also may have a significant impact on UR and RR. The addition of these softer variables differentiates our models from those of previous studies (Berglund et al., 2002; Berglund and Söderholm, 2003b).
Gross domestic product per capita (GDP) is intended to measure the impact of economic factors on the recovery and utilization rates. We expect the impact on RR to be positive because wealthier countries presumably have better infrastructure and, therefore, a better organized recovered paper collection system. People in richer countries are also probably more willing to pay extra for end products made of recycled paper so that increase in GDP per capita should lead to an increase in UR as well.
Urban population (URBPOP) and population density (POPDEN) measure the recovered paper collection costs, especially transportation costs. They are
supposed to have a positive influence on RR because the collection system is more cost-effective in densely populated urban areas.
FOREST is country’s forest area (in km2). It measures the long-run availability of virgin fibers. A decrease in forest area should lead to an increase in utilization rate, for recovered paper is a substitute for virgin fibers.
NTB denotes the proportion of newsprint, tissue, and packaging paper and board in a country’s paper and board production. Recycled fibers are primarily used to make packaging and board materials and newsprint. Recovered paper is also an important raw material in tissues of which about 50% is made of recovered paper (Diesen, 2007). Thus, we expect an increase in NTB to increase UR.
Structural effect SE is the share of production to consumption of paper and board. In leading paper producing-countries with small domestic markets the supply of recovered paper is relatively small in contrast to the total demand for raw material in paper industry. Thus, an increase in SE should lead to a decrease in UR. Recovery rate, RR, measures the supply of recovered paper as well. Naturally, higher availability of recovered paper should lead to a higher utilization rate.
ISO denotes the cumulative number of ISO 14001 certificates per million people. ISO 14001 is a standard for environmental management systems. It is part of the larger family of ISO 14000 standards, but ISO 14001 is the only one that can be audited for certification. In our models, the diffusion of certificates is meant to measure managers’ environmental awareness. An increasing number of certificates should lead to higher recovery and utilization rates of recovered paper.
Power distance (PDI), individualism (IDV), masculinity (MAS) and uncertainty avoidance (UAI) indices are the four Hofstede (1980) cultural dimensions. Based on surveys with over 88,000 employees from 72 countries, Hofstede’s operationalization of culture is perhaps the most influential of all representations of culture, and it has inspired thousands of empirical studies (Kirkman et al, 2006). In high power distance cultures (with a high PDI) people expect and accept that power is distributed unequally, and respect for authority is high (Franke and Nadler, 2008). The PDI is expected to have a positive effect on the recovery and utilization rates, as consumers and paper industry decision-makers in such cultures should be more willing to comply with recovery targets set by policy-makers. In individualistic cultures (with a high IDV index) people are expected to take care of themselves, whereas collectivistic cultures (with a low IDV index) are characterized by cohesive in-groups taking care of their members (Franke and Narled, 2008). As collectivist cultures are more

265
5. Research methodology 5. 1. Our extended models for the recovery and utilization rates Our econometric models extend the models introduced by Berglund et al. (2002) and Berglund and Söderholm (2003b) by including an array of new variables to examine the role of national culture and environmental awareness in recovery and utilization of recovered paper. Equation for the recovery rate, RR, is expressed as:
itititiiii
ititiit
INTSCHOOLUAIMASIDVPDIISOPOPDENURBPOPGDPRR
εββββββββββα
+++++++++++=
)ln()ln()ln(
1098765
4321
(3)
where i is country, t is year, αi are country-specific effects and εit is an idiosyncratic error. Regression coefficients, βn, are assumed to be common to all countries and years.
Model for the utilization rate, UR, is:
itit
itiiiiit
itititiit
INTSCHOOLUAIMASIDVPDIISO
RRSENTBFORESTGDPUR
εβββββββ
βββββα
++++++++
+++++=
)ln()ln(
)ln()ln(
12
11109876
54321
. (4)
GDP, URBPOP, POPDEN, FOREST, NTB and SE measure the infrastructure and other “hard” factors affecting country’s recovered paper recovery and/or utilization rates, whereas ISO, PDI, IDV, MAS, UAI, SCHOOL and INT measure “softer” country level characteristics that also may have a significant impact on UR and RR. The addition of these softer variables differentiates our models from those of previous studies (Berglund et al., 2002; Berglund and Söderholm, 2003b).
Gross domestic product per capita (GDP) is intended to measure the impact of economic factors on the recovery and utilization rates. We expect the impact on RR to be positive because wealthier countries presumably have better infrastructure and, therefore, a better organized recovered paper collection system. People in richer countries are also probably more willing to pay extra for end products made of recycled paper so that increase in GDP per capita should lead to an increase in UR as well.
Urban population (URBPOP) and population density (POPDEN) measure the recovered paper collection costs, especially transportation costs. They are
supposed to have a positive influence on RR because the collection system is more cost-effective in densely populated urban areas.
FOREST is country’s forest area (in km2). It measures the long-run availability of virgin fibers. A decrease in forest area should lead to an increase in utilization rate, for recovered paper is a substitute for virgin fibers.
NTB denotes the proportion of newsprint, tissue, and packaging paper and board in a country’s paper and board production. Recycled fibers are primarily used to make packaging and board materials and newsprint. Recovered paper is also an important raw material in tissues of which about 50% is made of recovered paper (Diesen, 2007). Thus, we expect an increase in NTB to increase UR.
Structural effect SE is the share of production to consumption of paper and board. In leading paper producing-countries with small domestic markets the supply of recovered paper is relatively small in contrast to the total demand for raw material in paper industry. Thus, an increase in SE should lead to a decrease in UR. Recovery rate, RR, measures the supply of recovered paper as well. Naturally, higher availability of recovered paper should lead to a higher utilization rate.
ISO denotes the cumulative number of ISO 14001 certificates per million people. ISO 14001 is a standard for environmental management systems. It is part of the larger family of ISO 14000 standards, but ISO 14001 is the only one that can be audited for certification. In our models, the diffusion of certificates is meant to measure managers’ environmental awareness. An increasing number of certificates should lead to higher recovery and utilization rates of recovered paper.
Power distance (PDI), individualism (IDV), masculinity (MAS) and uncertainty avoidance (UAI) indices are the four Hofstede (1980) cultural dimensions. Based on surveys with over 88,000 employees from 72 countries, Hofstede’s operationalization of culture is perhaps the most influential of all representations of culture, and it has inspired thousands of empirical studies (Kirkman et al, 2006). In high power distance cultures (with a high PDI) people expect and accept that power is distributed unequally, and respect for authority is high (Franke and Nadler, 2008). The PDI is expected to have a positive effect on the recovery and utilization rates, as consumers and paper industry decision-makers in such cultures should be more willing to comply with recovery targets set by policy-makers. In individualistic cultures (with a high IDV index) people are expected to take care of themselves, whereas collectivistic cultures (with a low IDV index) are characterized by cohesive in-groups taking care of their members (Franke and Narled, 2008). As collectivist cultures are more

266
concerned about others, it is expected that the availability of recovered paper and, thus, the recovery rate and utilization rate are higher. The third cultural dimension or MAS (masculinity vs. femininity) refers to whether the dominant value in a society is assertiveness as opposed to caring. Femininity could be characterized by concerns about others’ future well-being (Mearns and Yule, 2009), and thus the RR and UR are expected to be higher in less masculine cultures (with a low MAS index). Uncertainty avoidance refers to the tendency to avoid uncertain and ambiguous situations. In cultures with high uncertainty avoidance (a high UAI), managers are expected to tolerate less business risks and, therefore, use more raw materials of steady quality, availability and price level, i.e. they use more virgin fiber in paper production.
SCHOOL and INT denote average years of schooling and the cumulative number of Internet users per million people. They are used as proxy indicators of a country’s citizens’ level of awareness on environmental concerns. These are supposed to have positive effects on the recovery and, thus, also the utilization rate of recovered paper. 5.2 Data sources Our data is annual country level panel data for the period 1995 – 2008. The number of countries included is 22. Data for this study was collected from various databases.
For each year and country the consumption of recovered paper was defined by apparent consumption: collection plus imports minus exports. The utilization rate, UR, was calculated by dividing recovered paper consumption by paper and board production. Data on recovered paper and paper and board were obtained from the Industry Statistics Database provided by RISI. Gross domestic products and populations between 1995 and 2008 were gathered from the WDI Online database by the World Bank. GDP was measured at constant US dollars at 2000 prices. Forest area data is from WDI Online database as well. The number of Internet users per 1000 people and average years of schooling was obtained from the Global Market Information Database (GMID) database provided by Euromonitor International. Cumulative numbers of ISO 14001 certificates were gathered from the web site of ISO surveys by ISO and Hofstede’s cultural dimensions are from Geert Hofstede’s web page.
5.3 Estimation methods Two basic specifications of panel data models are the fixed effects model and the random effects model. In fixed effects models, unobservable country-specific effects αi are assumed to be fixed parameters to be estimated, or they
are eliminated by using the so-called within regression estimator. Explanatory variables are assumed to be independent of the error εit but the country-specific effects αi are permitted to correlate with regressors. In random effects estimation, αi are assumed to be random parameters rather than fixed and they act as an error term together with εit. Explanatory variables are supposed to be independent of both αi and εit for all i and t. For further information see e.g. Baltagi (2005).
The random effect specification suffers from inconsistency, if there is correlation between explanatory variables and αi. The Hausman specification test was, therefore, used to test, which one of the model specifications would be more appropriate in this study. According to the Hausman test, the random effects specification is more efficient with RR and UR. Models (3) and (4) were, therefore, estimated by using random effects model specification with statistical package Stata 10. The estimation method was generalized least squares (GLS). 6. Results and discussion Table 3 provides descriptive summary statistics for our variables in levels. The time period is 1995-2008.

267
concerned about others, it is expected that the availability of recovered paper and, thus, the recovery rate and utilization rate are higher. The third cultural dimension or MAS (masculinity vs. femininity) refers to whether the dominant value in a society is assertiveness as opposed to caring. Femininity could be characterized by concerns about others’ future well-being (Mearns and Yule, 2009), and thus the RR and UR are expected to be higher in less masculine cultures (with a low MAS index). Uncertainty avoidance refers to the tendency to avoid uncertain and ambiguous situations. In cultures with high uncertainty avoidance (a high UAI), managers are expected to tolerate less business risks and, therefore, use more raw materials of steady quality, availability and price level, i.e. they use more virgin fiber in paper production.
SCHOOL and INT denote average years of schooling and the cumulative number of Internet users per million people. They are used as proxy indicators of a country’s citizens’ level of awareness on environmental concerns. These are supposed to have positive effects on the recovery and, thus, also the utilization rate of recovered paper. 5.2 Data sources Our data is annual country level panel data for the period 1995 – 2008. The number of countries included is 22. Data for this study was collected from various databases.
For each year and country the consumption of recovered paper was defined by apparent consumption: collection plus imports minus exports. The utilization rate, UR, was calculated by dividing recovered paper consumption by paper and board production. Data on recovered paper and paper and board were obtained from the Industry Statistics Database provided by RISI. Gross domestic products and populations between 1995 and 2008 were gathered from the WDI Online database by the World Bank. GDP was measured at constant US dollars at 2000 prices. Forest area data is from WDI Online database as well. The number of Internet users per 1000 people and average years of schooling was obtained from the Global Market Information Database (GMID) database provided by Euromonitor International. Cumulative numbers of ISO 14001 certificates were gathered from the web site of ISO surveys by ISO and Hofstede’s cultural dimensions are from Geert Hofstede’s web page.
5.3 Estimation methods Two basic specifications of panel data models are the fixed effects model and the random effects model. In fixed effects models, unobservable country-specific effects αi are assumed to be fixed parameters to be estimated, or they
are eliminated by using the so-called within regression estimator. Explanatory variables are assumed to be independent of the error εit but the country-specific effects αi are permitted to correlate with regressors. In random effects estimation, αi are assumed to be random parameters rather than fixed and they act as an error term together with εit. Explanatory variables are supposed to be independent of both αi and εit for all i and t. For further information see e.g. Baltagi (2005).
The random effect specification suffers from inconsistency, if there is correlation between explanatory variables and αi. The Hausman specification test was, therefore, used to test, which one of the model specifications would be more appropriate in this study. According to the Hausman test, the random effects specification is more efficient with RR and UR. Models (3) and (4) were, therefore, estimated by using random effects model specification with statistical package Stata 10. The estimation method was generalized least squares (GLS). 6. Results and discussion Table 3 provides descriptive summary statistics for our variables in levels. The time period is 1995-2008.

268
Table 3. Descriptive statistics for all countries and years.
Mean SD Min Max Utilization rate, % (UR) 45 21 5 87
Recovery rate, % (RR) 46 15 18 85 GDP per capita, US$ (GDP) 16 627 12 559 371 42 683
Urban population, % (URBPOP) 71 16 27 97 Population density, people/km2
(POPDEN) 127 119 3 383
Forest area, km2 (FOREST) 1 081 463 1 987 788 6670 8 092 685 Proportion of newsprint, tissue and
packaging paper and board in paper and board production , % (NTB)
65 15 25 98
Structural effect, % (SE) 156 159 43 815 Diffusion of ISO 14001 certificates per
million people (ISO) 188 396 0 3153
Power distance index (PDI) 56 22 11 94 Individualism (IDV) 56 20 20 91 Masculinity (MAS) 51 21 5 95
Uncertainty avoidance index (UAI) 67 23 29 95 Average years of schooling (SCHOOL) 9 2 6 13 Diffusion of Internet users per thousand
people (INT) 277 261 0.1 870
Table 4 presents the results of the estimations. Estimated coefficients are common to all countries included in the analyses.
Table 4. Estimated regression coefficients and model fitting statistics.
Recovery rate (RR) Utilization rate (UR) Constant 38.37 -16.38 (24.14) (25.56) Ln GDP per capita 0.5558 8.725** (2.5061) (2.254) ln ISO14001 2.027** 0.2811 (0.3684) (0.2676) PDI -0.3336** 0.4202* (0.1181) (0.1764) IDV -0.1504 -0.3652* (0.1212) (0.1531) MAS -0.0405 0.4358** (0.1035) (0.0992) UAI 0.0190 -0.4003** (0.0974) (0.1126) SCHOOL 1.531** 0.0438 (0.4742) (0.3246) INT -0.4043 0.7864 (0.6593) (0.5637) URBPOP 0.1339 (0.1477) POPDEN 0.0312+ (0.0177) SE -0.0495** (0.0102) RR 0.1637** (0.0384) ln FOREST -4.220* (1.770) NTB 0.4743** (0.0827) Wald-test (chi2) 252.4** 546.5** R2 overall 0.6791 0.7092 Observations 288 288 Number of countries 22 22
+ p < 0.10, * p < 0.05, ** p < 0.01

269
Table 3. Descriptive statistics for all countries and years.
Mean SD Min Max Utilization rate, % (UR) 45 21 5 87
Recovery rate, % (RR) 46 15 18 85 GDP per capita, US$ (GDP) 16 627 12 559 371 42 683
Urban population, % (URBPOP) 71 16 27 97 Population density, people/km2
(POPDEN) 127 119 3 383
Forest area, km2 (FOREST) 1 081 463 1 987 788 6670 8 092 685 Proportion of newsprint, tissue and
packaging paper and board in paper and board production , % (NTB)
65 15 25 98
Structural effect, % (SE) 156 159 43 815 Diffusion of ISO 14001 certificates per
million people (ISO) 188 396 0 3153
Power distance index (PDI) 56 22 11 94 Individualism (IDV) 56 20 20 91 Masculinity (MAS) 51 21 5 95
Uncertainty avoidance index (UAI) 67 23 29 95 Average years of schooling (SCHOOL) 9 2 6 13 Diffusion of Internet users per thousand
people (INT) 277 261 0.1 870
Table 4 presents the results of the estimations. Estimated coefficients are common to all countries included in the analyses.
Table 4. Estimated regression coefficients and model fitting statistics.
Recovery rate (RR) Utilization rate (UR) Constant 38.37 -16.38 (24.14) (25.56) Ln GDP per capita 0.5558 8.725** (2.5061) (2.254) ln ISO14001 2.027** 0.2811 (0.3684) (0.2676) PDI -0.3336** 0.4202* (0.1181) (0.1764) IDV -0.1504 -0.3652* (0.1212) (0.1531) MAS -0.0405 0.4358** (0.1035) (0.0992) UAI 0.0190 -0.4003** (0.0974) (0.1126) SCHOOL 1.531** 0.0438 (0.4742) (0.3246) INT -0.4043 0.7864 (0.6593) (0.5637) URBPOP 0.1339 (0.1477) POPDEN 0.0312+ (0.0177) SE -0.0495** (0.0102) RR 0.1637** (0.0384) ln FOREST -4.220* (1.770) NTB 0.4743** (0.0827) Wald-test (chi2) 252.4** 546.5** R2 overall 0.6791 0.7092 Observations 288 288 Number of countries 22 22
+ p < 0.10, * p < 0.05, ** p < 0.01

270
Starting with the recovery rate RR, the estimated coefficient of GDP per capita is positive but not significant. It thus seems that the building and maintenance of the paper recycling infrastructure is relatively inexpensive. However, the collection costs do play some role in recovered paper collection since population density has the expected positive sign and it is also statistically significant at a 10% significance level.
Positive and statistically significant coefficients of the number of ISO 14001 certificates and average years of schooling indicate that increasing environmental awareness increases the recovery rate. Instead, variables of the national culture are not significant except for the power distance index which is negative and significant at a 1% level.
With the utilization rate, the estimated coefficients of the “hard” determinants were as expected. The effect of the country’s wealth (GDP per capita) was statistically significant and positive. Thus, it seems that in wealthier countries demand for end products made of recycled paper is higher. The measures of supply had statistically significant impacts on the UR as well. The estimated coefficient of the structural effect was negative and that of recovery rate was positive. The indicator for the availability of virgin fiber (FOREST) was negative and significant, and the allocation of the total paper production between various paper grades showed the expected effect as well, as the proportion of newsprint, tissue, and packaging paper and board in a country’s paper and board production (NTB) had a positive influence on the recovered paper utilization rate.
All of the cultural variables had statistically significant effects on the utilization rate. The effects of power distance (PDI), individualism (IDV) and uncertainty avoidance (UAI) were as expected but the masculinity-femininity (MAS) dimension showed a significant effect in the direction opposite from what we expected. It appears that more masculine cultures are more efficient users of recovered fiber. This may be at least partly explained by the cost-effectiveness of recovered fiber, as managers in masculine countries would emphasize internal efficiency and advantage over competitors relatively more than those in more feminine countries (Wacker and Sprague, 1998; Vecchi and Brennan, 2009).
The level of education and the diffusion of the internet did not have, unexpectedly, significant impact on the utilization rate. It thus seems that the environmental awareness affects the recovery rate, but not directly on the utilization rate.
7. Conclusions Even though our results support earlier studies, further confirming the roles of geographical, demographic and essentially economical determinants of the collection and utilization of recovered paper in paper and board production, we were also able to empirically demonstrate that the environmental awareness and the cultural factors play a significant role.
The diffusion of environmental management (ISO 14001), as well as average years of schooling, were discovered as important factors in explaining the recovery of recovered paper. These effects indicate the environmental awareness and concern of both consumers and managers at the country level. This finding, along with the established effects of the cultural dimensions on the utilization rate, could be used in planning the national and international policies and incentives for collection and use of recovered paper.
In further research, it would be beneficial to take into account the imports and exports of the recovered paper and end products in the models. Also, forecasting the future recovery and utilization rates would be very interesting and useful, yet challenging, task. Acknowledgements The Academy of Finland supported this study through the project Corporate Social Responsibility and Value Creation Challenges in the Global Forest Industry. The authors wish to thank the participants of the SSFE Biennal Seminar 2010 and TAPPI Engineering, Pulping & Environmental Conference 2009 for their helpful comments References Baltagi, B. H. 2005. Econometric analysis of panel data. Wiley, Chichester. Baumgärtner, S. & Winkler R. 2003. Markets, technology and environmental
regulation: Price ambivalence of waste paper in Germany. Ecological Economics 47(2-3): 183-195.
Berglund, C., Söderholm, P. & Nilsson M. 2002. A Note on inter-country differences in waste paper recovery and utilization. Resources, Conservation and Recycling 34(3): 175-191.
Berglund, C. & Söderholm, P. 2003a. Complementing empirical evidence on global recycling and trade of waste paper. World Development 31(4): 743-754.
Berglund, C. & Söderholm, P. 2003b. An Econometric analysis of global waste paper recovery and utilization. Environmental and Resource Economics 26(3): 429-456.
271
Starting with the recovery rate RR, the estimated coefficient of GDP per capita is positive but not significant. It thus seems that the building and maintenance of the paper recycling infrastructure is relatively inexpensive. However, the collection costs do play some role in recovered paper collection since population density has the expected positive sign and it is also statistically significant at a 10% significance level.
Positive and statistically significant coefficients of the number of ISO 14001 certificates and average years of schooling indicate that increasing environmental awareness increases the recovery rate. Instead, variables of the national culture are not significant except for the power distance index which is negative and significant at a 1% level.
With the utilization rate, the estimated coefficients of the “hard” determinants were as expected. The effect of the country’s wealth (GDP per capita) was statistically significant and positive. Thus, it seems that in wealthier countries demand for end products made of recycled paper is higher. The measures of supply had statistically significant impacts on the UR as well. The estimated coefficient of the structural effect was negative and that of recovery rate was positive. The indicator for the availability of virgin fiber (FOREST) was negative and significant, and the allocation of the total paper production between various paper grades showed the expected effect as well, as the proportion of newsprint, tissue, and packaging paper and board in a country’s paper and board production (NTB) had a positive influence on the recovered paper utilization rate.
All of the cultural variables had statistically significant effects on the utilization rate. The effects of power distance (PDI), individualism (IDV) and uncertainty avoidance (UAI) were as expected but the masculinity-femininity (MAS) dimension showed a significant effect in the direction opposite from what we expected. It appears that more masculine cultures are more efficient users of recovered fiber. This may be at least partly explained by the cost-effectiveness of recovered fiber, as managers in masculine countries would emphasize internal efficiency and advantage over competitors relatively more than those in more feminine countries (Wacker and Sprague, 1998; Vecchi and Brennan, 2009).
The level of education and the diffusion of the internet did not have, unexpectedly, significant impact on the utilization rate. It thus seems that the environmental awareness affects the recovery rate, but not directly on the utilization rate.
7. Conclusions Even though our results support earlier studies, further confirming the roles of geographical, demographic and essentially economical determinants of the collection and utilization of recovered paper in paper and board production, we were also able to empirically demonstrate that the environmental awareness and the cultural factors play a significant role.
The diffusion of environmental management (ISO 14001), as well as average years of schooling, were discovered as important factors in explaining the recovery of recovered paper. These effects indicate the environmental awareness and concern of both consumers and managers at the country level. This finding, along with the established effects of the cultural dimensions on the utilization rate, could be used in planning the national and international policies and incentives for collection and use of recovered paper.
In further research, it would be beneficial to take into account the imports and exports of the recovered paper and end products in the models. Also, forecasting the future recovery and utilization rates would be very interesting and useful, yet challenging, task. Acknowledgements The Academy of Finland supported this study through the project Corporate Social Responsibility and Value Creation Challenges in the Global Forest Industry. The authors wish to thank the participants of the SSFE Biennal Seminar 2010 and TAPPI Engineering, Pulping & Environmental Conference 2009 for their helpful comments References Baltagi, B. H. 2005. Econometric analysis of panel data. Wiley, Chichester. Baumgärtner, S. & Winkler R. 2003. Markets, technology and environmental
regulation: Price ambivalence of waste paper in Germany. Ecological Economics 47(2-3): 183-195.
Berglund, C., Söderholm, P. & Nilsson M. 2002. A Note on inter-country differences in waste paper recovery and utilization. Resources, Conservation and Recycling 34(3): 175-191.
Berglund, C. & Söderholm, P. 2003a. Complementing empirical evidence on global recycling and trade of waste paper. World Development 31(4): 743-754.
Berglund, C. & Söderholm, P. 2003b. An Econometric analysis of global waste paper recovery and utilization. Environmental and Resource Economics 26(3): 429-456.

272
Diesen, M. 2007. Paper making science and technology book 1, Economics of the pulp and paper industry. Paperi ja Puu Oy, Jyväskylä, Finland.
Franke, G. R. & Nadler, S. S. 2008. Culture, economic development, and national ethical attitudes. Journal of Business Research 61(3): 254-264.
Haarla, A. 2007. Printing and writing papers: In H. Paulapuro (Ed.) Paper making science and technology book 18, Paper and board grades. Paperi ja Puu Oy, Jyväskylä, Finland.
Hofstede, G. 1980. Culture’s consequences: international differences in work-related values. Sage, Beverly Hills, CA.
Huhtala, A. & Samakovlis, E. 2002. Does international harmonization of environmental policy instruments make economic sense. Environmental and Resource Economics 21(3): 261-286.
Kirkman, B. L., Lowe, K. B. & Gibson, C. B. 2006. A Quarter century of culture’s consequences: A Review of empirical research incorporating Hofstede’s cultural values framework. Journal of International Business Studies 37(3): 285-320.
Laurijssen, J., Marsidi, M., Westenbroek, A., Worrell, E. & Faaju, A. 2010. Paper and biomass for energy? The impact of paper recycling on energy and CO2 emissions. Resources, Conservation and Recycling 54: 1208-1218.
Lundmark, R. 2001. Choice of location for investments in the european paper industry: The Impact of wastepaper. Resources, Conservation and Recycling 33(3): 167-180.
Mearns, K. & Yule, S. 2009. The Role of national culture in determining safety performance: Challenges for the global oil and gas industry. Safety Science 47(6): 777-785.
Samakovlis, E. 2003. The Relationship between waste paper and other inputs in the Swedish paper industry. Environmental and Resource Economics 25(2): 191-212.
Suomalainen, P. 2008. Global development of production, consumption and trade flows of pulp, paper and paperboard 1999-2006. MSc thesis in forest products marketing, University of Helsinki.
Van Beukering, P. J. H. & Bouman, M. N. 2001. Empirical evidence on recycling and trade of paper and lead in developed and developing countries. World Development 29(10): 1717-1737.
Vecchi, A. & Brennan, L. 2009. Quality management: A Cross-cultural perspective. Cross Cultural Management: An International Journal 16:149-164.
Wacker, J.F. & Sprague, L.G. 1998. Forecasting accuracy: Comparing the relative effectiveness of practices between seven developing countries. Journal of operations management 16: 271-290.

273
Diesen, M. 2007. Paper making science and technology book 1, Economics of the pulp and paper industry. Paperi ja Puu Oy, Jyväskylä, Finland.
Franke, G. R. & Nadler, S. S. 2008. Culture, economic development, and national ethical attitudes. Journal of Business Research 61(3): 254-264.
Haarla, A. 2007. Printing and writing papers: In H. Paulapuro (Ed.) Paper making science and technology book 18, Paper and board grades. Paperi ja Puu Oy, Jyväskylä, Finland.
Hofstede, G. 1980. Culture’s consequences: international differences in work-related values. Sage, Beverly Hills, CA.
Huhtala, A. & Samakovlis, E. 2002. Does international harmonization of environmental policy instruments make economic sense. Environmental and Resource Economics 21(3): 261-286.
Kirkman, B. L., Lowe, K. B. & Gibson, C. B. 2006. A Quarter century of culture’s consequences: A Review of empirical research incorporating Hofstede’s cultural values framework. Journal of International Business Studies 37(3): 285-320.
Laurijssen, J., Marsidi, M., Westenbroek, A., Worrell, E. & Faaju, A. 2010. Paper and biomass for energy? The impact of paper recycling on energy and CO2 emissions. Resources, Conservation and Recycling 54: 1208-1218.
Lundmark, R. 2001. Choice of location for investments in the european paper industry: The Impact of wastepaper. Resources, Conservation and Recycling 33(3): 167-180.
Mearns, K. & Yule, S. 2009. The Role of national culture in determining safety performance: Challenges for the global oil and gas industry. Safety Science 47(6): 777-785.
Samakovlis, E. 2003. The Relationship between waste paper and other inputs in the Swedish paper industry. Environmental and Resource Economics 25(2): 191-212.
Suomalainen, P. 2008. Global development of production, consumption and trade flows of pulp, paper and paperboard 1999-2006. MSc thesis in forest products marketing, University of Helsinki.
Van Beukering, P. J. H. & Bouman, M. N. 2001. Empirical evidence on recycling and trade of paper and lead in developed and developing countries. World Development 29(10): 1717-1737.
Vecchi, A. & Brennan, L. 2009. Quality management: A Cross-cultural perspective. Cross Cultural Management: An International Journal 16:149-164.
Wacker, J.F. & Sprague, L.G. 1998. Forecasting accuracy: Comparing the relative effectiveness of practices between seven developing countries. Journal of operations management 16: 271-290.
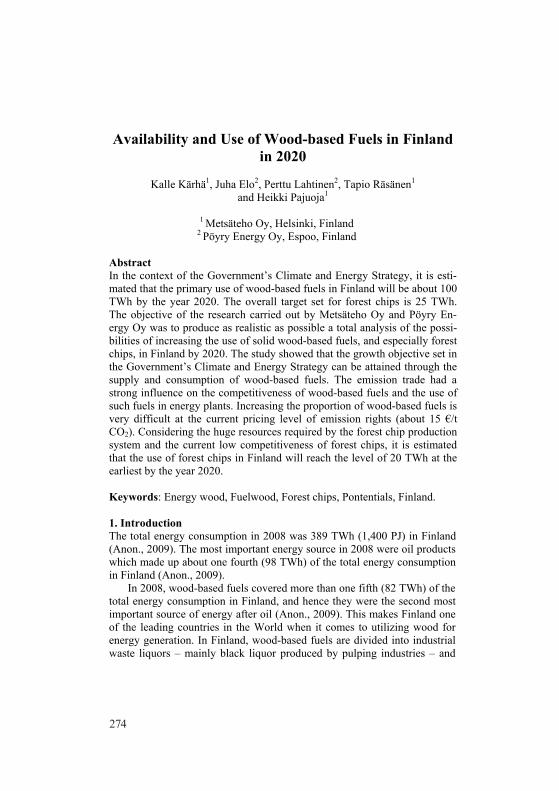
274
Availability and Use of Wood-based Fuels in Finland in 2020
Kalle Kärhä1, Juha Elo2, Perttu Lahtinen2, Tapio Räsänen1
and Heikki Pajuoja1
1 Metsäteho Oy, Helsinki, Finland 2 Pöyry Energy Oy, Espoo, Finland
Abstract In the context of the Government’s Climate and Energy Strategy, it is esti-mated that the primary use of wood-based fuels in Finland will be about 100 TWh by the year 2020. The overall target set for forest chips is 25 TWh. The objective of the research carried out by Metsäteho Oy and Pöyry En-ergy Oy was to produce as realistic as possible a total analysis of the possi-bilities of increasing the use of solid wood-based fuels, and especially forest chips, in Finland by 2020. The study showed that the growth objective set in the Government’s Climate and Energy Strategy can be attained through the supply and consumption of wood-based fuels. The emission trade had a strong influence on the competitiveness of wood-based fuels and the use of such fuels in energy plants. Increasing the proportion of wood-based fuels is very difficult at the current pricing level of emission rights (about 15 €/t CO2). Considering the huge resources required by the forest chip production system and the current low competitiveness of forest chips, it is estimated that the use of forest chips in Finland will reach the level of 20 TWh at the earliest by the year 2020. Keywords: Energy wood, Fuelwood, Forest chips, Pontentials, Finland. 1. Introduction The total energy consumption in 2008 was 389 TWh (1,400 PJ) in Finland (Anon., 2009). The most important energy source in 2008 were oil products which made up about one fourth (98 TWh) of the total energy consumption in Finland (Anon., 2009). In 2008, wood-based fuels covered more than one fifth (82 TWh) of the total energy consumption in Finland, and hence they were the second most important source of energy after oil (Anon., 2009). This makes Finland one of the leading countries in the World when it comes to utilizing wood for energy generation. In Finland, wood-based fuels are divided into industrial waste liquors – mainly black liquor produced by pulping industries – and
2
solid wood fuels. Further, solid wood fuels are divided into 1) wood fuels consumed by heating and power plants and 2) fuelwood consumed by small-sized dwellings, i.e. private houses, farms, and recreational dwellings. In 2008, half of the wood-based fuel consumption (41 TWh) was cov-ered by waste liquors (Anon., 2009). Solid wood fuels were consumed to the total of 41 TWh, or 20.5 million m3, of which the heating and power plants accounted for 27 TWh, 14 million m3 (Ylitalo, 2009). The small-sized dwellings use currently a total of 14 TWh, or 7 million m3 of wood for heating (Ylitalo, 2009). The total consumption of forest chips for energy generation in 2008 was equivalent to 9.2 TWh (4.6 mill. m3) in Finland (Ylitalo, 2009). Of the for-est chips used in heating and power plants (8.0 TWh) in 2008, the majority (58%) was produced from logging residues in final cuttings (Ylitalo, 2009). 14% came from stump and root wood, and 4% from large-sized, rotten roundwood. Twenty-four per cent of the total amount of commercial forest chips used for energy generation came from the small-diameter (d1.3<10 cm) thinning wood produced in the tending of young stands (Ylitalo, 2009). According to the EU Climate and Energy Policy, renewable energy tar-get is to increase the renewable energy sources to 20% of total final energy consumption by the year 2020 in EU. In Finland, this target means increas-ing the proportion of renewable energy sources to 38% (Anon., 2008). In Finland, wood-based fuels are the most important renewable energy source, and forest chips are considered as a one of the most significant wood fuel source in the future. In the context of the Government’s Climate and Energy Strategy (Pek-karinen, 2010), it is estimated that the primary use of wood-based fuels in Finland will be about 100 TWh by the year 2020. The overall target set for forest chips is 25 TWh, i.e. about 13.5 million m3. Are these targets realis-tic? The objective of the research carried out by Metsäteho Oy and Pöyry Energy Oy was to produce as realistic as possible a total analysis of the pos-sibilities of increasing the use of wood-based fuels, and especially forest chips, in Finland by 2020. The research was carried out on the boiler and supply source levels. The main findings of the project (Kärhä et al., 2009a) will be presented in this conference paper. In addition, the paper will an-swer the question is it possible to achieve the set targets of renewable en-ergy with wood-based fuels in Finland? 2. Material and methods Two different scenarios for the forest industry production of the year 2020 were created in the research. The scenarios were Basic scenario and Maxi-mum scenario. The roundwood consumption and demand of forest industry were constructed based on the scenarios. Domestic industrial roundwood

275
Availability and Use of Wood-based Fuels in Finland in 2020
Kalle Kärhä1, Juha Elo2, Perttu Lahtinen2, Tapio Räsänen1
and Heikki Pajuoja1
1 Metsäteho Oy, Helsinki, Finland 2 Pöyry Energy Oy, Espoo, Finland
Abstract In the context of the Government’s Climate and Energy Strategy, it is esti-mated that the primary use of wood-based fuels in Finland will be about 100 TWh by the year 2020. The overall target set for forest chips is 25 TWh. The objective of the research carried out by Metsäteho Oy and Pöyry En-ergy Oy was to produce as realistic as possible a total analysis of the possi-bilities of increasing the use of solid wood-based fuels, and especially forest chips, in Finland by 2020. The study showed that the growth objective set in the Government’s Climate and Energy Strategy can be attained through the supply and consumption of wood-based fuels. The emission trade had a strong influence on the competitiveness of wood-based fuels and the use of such fuels in energy plants. Increasing the proportion of wood-based fuels is very difficult at the current pricing level of emission rights (about 15 €/t CO2). Considering the huge resources required by the forest chip production system and the current low competitiveness of forest chips, it is estimated that the use of forest chips in Finland will reach the level of 20 TWh at the earliest by the year 2020. Keywords: Energy wood, Fuelwood, Forest chips, Pontentials, Finland. 1. Introduction The total energy consumption in 2008 was 389 TWh (1,400 PJ) in Finland (Anon., 2009). The most important energy source in 2008 were oil products which made up about one fourth (98 TWh) of the total energy consumption in Finland (Anon., 2009). In 2008, wood-based fuels covered more than one fifth (82 TWh) of the total energy consumption in Finland, and hence they were the second most important source of energy after oil (Anon., 2009). This makes Finland one of the leading countries in the World when it comes to utilizing wood for energy generation. In Finland, wood-based fuels are divided into industrial waste liquors – mainly black liquor produced by pulping industries – and
2
solid wood fuels. Further, solid wood fuels are divided into 1) wood fuels consumed by heating and power plants and 2) fuelwood consumed by small-sized dwellings, i.e. private houses, farms, and recreational dwellings. In 2008, half of the wood-based fuel consumption (41 TWh) was cov-ered by waste liquors (Anon., 2009). Solid wood fuels were consumed to the total of 41 TWh, or 20.5 million m3, of which the heating and power plants accounted for 27 TWh, 14 million m3 (Ylitalo, 2009). The small-sized dwellings use currently a total of 14 TWh, or 7 million m3 of wood for heating (Ylitalo, 2009). The total consumption of forest chips for energy generation in 2008 was equivalent to 9.2 TWh (4.6 mill. m3) in Finland (Ylitalo, 2009). Of the for-est chips used in heating and power plants (8.0 TWh) in 2008, the majority (58%) was produced from logging residues in final cuttings (Ylitalo, 2009). 14% came from stump and root wood, and 4% from large-sized, rotten roundwood. Twenty-four per cent of the total amount of commercial forest chips used for energy generation came from the small-diameter (d1.3<10 cm) thinning wood produced in the tending of young stands (Ylitalo, 2009). According to the EU Climate and Energy Policy, renewable energy tar-get is to increase the renewable energy sources to 20% of total final energy consumption by the year 2020 in EU. In Finland, this target means increas-ing the proportion of renewable energy sources to 38% (Anon., 2008). In Finland, wood-based fuels are the most important renewable energy source, and forest chips are considered as a one of the most significant wood fuel source in the future. In the context of the Government’s Climate and Energy Strategy (Pek-karinen, 2010), it is estimated that the primary use of wood-based fuels in Finland will be about 100 TWh by the year 2020. The overall target set for forest chips is 25 TWh, i.e. about 13.5 million m3. Are these targets realis-tic? The objective of the research carried out by Metsäteho Oy and Pöyry Energy Oy was to produce as realistic as possible a total analysis of the pos-sibilities of increasing the use of wood-based fuels, and especially forest chips, in Finland by 2020. The research was carried out on the boiler and supply source levels. The main findings of the project (Kärhä et al., 2009a) will be presented in this conference paper. In addition, the paper will an-swer the question is it possible to achieve the set targets of renewable en-ergy with wood-based fuels in Finland? 2. Material and methods Two different scenarios for the forest industry production of the year 2020 were created in the research. The scenarios were Basic scenario and Maxi-mum scenario. The roundwood consumption and demand of forest industry were constructed based on the scenarios. Domestic industrial roundwood

276
3
cuttings were 57 million m3 in the Basic scenario and 68 million m3 in the Maximum scenario in 2020 (Table 1). It was assumed that the import of roundwood to Finland will be significantly at the lower level (Table 1). Table 1. The assumptions related to roundwood supply and the production of forest indus-try in 2020 in Finland in the research. 2007 2020
Basic scenario
Maximum scenario
Industrial roundwood supply, mill. m3 - Domestic roundwood cuttings - Import of roundwood
75.4 57.7 17.7
59.4 56.6 2.8
73.7 67.9 5.7
By-products of forest industry (i.e. bark, sawdust, and waste wood chips) in en-ergy generation, TWh
19.2 17.1 18.5
Waste liquors of forest industry in en-ergy generation, TWh
42.5 38.1 44.2
The consumption of by-products (bark, sawdust and waste wood chips) and black liquor in energy generation was estimated to decrease in the Basic scenario compared with the year 2007. In the Maximum scenario, the en-ergy use of by-products also lowered but the use of black liquor increased slightly (Table 1).
The cuttings by Forestry Centre and further by municipality in 2020 were allocated applying the latest National Forest Inventory data by the Fin-nish Forest Research Institute and the Stand Data Base by Metsäteho Oy. Metsäteho Oy Stand Data Base included more than 150,000 thinning and final cutting stands harvested by Metsäliitto Group, Stora Enso Wood Sup-ply Finland, UPM Forest, and Metsähallitus in 2006 and 2007. The calcu-lated small-diameter wood supply potentials were based on the 10th National Forest Inventory data of the Finnish Forest Research Institute.
Three different levels of potentials were determined in the study (Fig. 1). In the research, the theoretical potential was the amount of:
• Logging residues and stumps, which are produced in regeneration cutting areas in the Basic and Maximum scenarios, and
• Small-diameter wood (whole trees) produced when tending and cut-ting operations in young stands are carried out on time.
The techno-ecological supply potential was the forest chip material raw base, which is harvestable when the following limitations are taken into consid-eration:
4
• Recovering percentage is less than 100, • Substantial amounts of pulpwood are not burnt, • Recommendations in the Guide for Energy Wood Harvesting
(Koistinen & Äijälä, 2006) are followed when choosing harvesting sites, and
• All energy wood does not come onto the market (forest owners' will-ingness to supply energy wood).
And techno-economical use potential included the total supply costs and the willingness to pay of energy plants (Fig. 1).
THEORETICAL POTENTIAL
TECHNO-ECOLOGICAL POTENTIAL
TECHNO-ECONOMICAL POTENTIAL
Recovering< 100%
Recommendationsof energy wood
harvesting
Integrated woodharvesting in young stands
Forest owners’willingness to supply energy
wood
Total costsof supplysystems
Productionsubsidies (e.g.
Kemera support)
Technicalusage
potential of energyplants
Willingness to pay of energy
plant
Price of alternative fuels
Price for emission
rights
Biorefineries
Techno-ecological potential Techno-economical potential
Fig. 1. The principle picture of the supply potentials determined in the research. The harvesting conditions for recovering sites were created applying Metsäteho Stand Data. The total supply system costs for forest chip quanti-ties were calculated by Metsäteho Energy Wood Procurement Calculation Models. It was assumed that in 2020 the total supply system costs are 20% higher than currently.
Pöyry Energy Oy’s Boiler and Energy Plant, Pellet, and Forest Industry Data Bases gave a possibility to research the use of wood-based fuels in the study. Pöyry Energy Data Bases included almost all current plants and fac-tories, as well as those under planning and contracting.

277
3
cuttings were 57 million m3 in the Basic scenario and 68 million m3 in the Maximum scenario in 2020 (Table 1). It was assumed that the import of roundwood to Finland will be significantly at the lower level (Table 1). Table 1. The assumptions related to roundwood supply and the production of forest indus-try in 2020 in Finland in the research. 2007 2020
Basic scenario
Maximum scenario
Industrial roundwood supply, mill. m3 - Domestic roundwood cuttings - Import of roundwood
75.4 57.7 17.7
59.4 56.6 2.8
73.7 67.9 5.7
By-products of forest industry (i.e. bark, sawdust, and waste wood chips) in en-ergy generation, TWh
19.2 17.1 18.5
Waste liquors of forest industry in en-ergy generation, TWh
42.5 38.1 44.2
The consumption of by-products (bark, sawdust and waste wood chips) and black liquor in energy generation was estimated to decrease in the Basic scenario compared with the year 2007. In the Maximum scenario, the en-ergy use of by-products also lowered but the use of black liquor increased slightly (Table 1).
The cuttings by Forestry Centre and further by municipality in 2020 were allocated applying the latest National Forest Inventory data by the Fin-nish Forest Research Institute and the Stand Data Base by Metsäteho Oy. Metsäteho Oy Stand Data Base included more than 150,000 thinning and final cutting stands harvested by Metsäliitto Group, Stora Enso Wood Sup-ply Finland, UPM Forest, and Metsähallitus in 2006 and 2007. The calcu-lated small-diameter wood supply potentials were based on the 10th National Forest Inventory data of the Finnish Forest Research Institute.
Three different levels of potentials were determined in the study (Fig. 1). In the research, the theoretical potential was the amount of:
• Logging residues and stumps, which are produced in regeneration cutting areas in the Basic and Maximum scenarios, and
• Small-diameter wood (whole trees) produced when tending and cut-ting operations in young stands are carried out on time.
The techno-ecological supply potential was the forest chip material raw base, which is harvestable when the following limitations are taken into consid-eration:
4
• Recovering percentage is less than 100, • Substantial amounts of pulpwood are not burnt, • Recommendations in the Guide for Energy Wood Harvesting
(Koistinen & Äijälä, 2006) are followed when choosing harvesting sites, and
• All energy wood does not come onto the market (forest owners' will-ingness to supply energy wood).
And techno-economical use potential included the total supply costs and the willingness to pay of energy plants (Fig. 1).
THEORETICAL POTENTIAL
TECHNO-ECOLOGICAL POTENTIAL
TECHNO-ECONOMICAL POTENTIAL
Recovering< 100%
Recommendationsof energy wood
harvesting
Integrated woodharvesting in young stands
Forest owners’willingness to supply energy
wood
Total costsof supplysystems
Productionsubsidies (e.g.
Kemera support)
Technicalusage
potential of energyplants
Willingness to pay of energy
plant
Price of alternative fuels
Price for emission
rights
Biorefineries
Techno-ecological potential Techno-economical potential
Fig. 1. The principle picture of the supply potentials determined in the research. The harvesting conditions for recovering sites were created applying Metsäteho Stand Data. The total supply system costs for forest chip quanti-ties were calculated by Metsäteho Energy Wood Procurement Calculation Models. It was assumed that in 2020 the total supply system costs are 20% higher than currently.
Pöyry Energy Oy’s Boiler and Energy Plant, Pellet, and Forest Industry Data Bases gave a possibility to research the use of wood-based fuels in the study. Pöyry Energy Data Bases included almost all current plants and fac-tories, as well as those under planning and contracting.

278
5
3. Results 3.1. Theoretical and techno-ecological potential According to the calculations, the technical use potential of solid wood fu-els in energy plants was 53 TWh in 2020 in Finland. The proportion cov-ered by logging residues and small-sized thinning wood was estimated to be 28 TWh. Theoretical supply potential of forest chips was 105 TWh in the Basic scenario and 115 TWh in the Maximum scenario of the research (Fig. 2). Correspondingly, the techno-ecological supply potential was 43 TWh in the Basic scenario and 48 TWh in the Maximum scenario in the year 2020.
0
20
40
60
80
100
120
Basicscenario
Maximumscenario
Basicscenario
Maximumscenario
Theoretical potential Techno-ecological potential
Pote
ntia
l, TW
h
Stumps
Logging residues
Small-diameter wood
Fig. 2. Estimate of theoretical and techno-ecological supply potential of forest chips in 2020 based on the Basic and Maximum scenarios of the research. The calculated small-diameter wood supply potentials were based on the 10th National Forest Inventory data of the Finnish Forest Research Institute. 3.2. Techno-economical potential When modelling the use of solid wood fuels in energy generation in the Ba-sic scenario in 2020, the consumption of solid wood fuels was 44 TWh of which the use of forest industry by-products lowered from the current level to 17 TWh and the consumption of forest chips increased up to 27 TWh (Fig. 3). Particularly stumps raised significantly their proportion of total forest chip volumes (Fig. 4). The most expensive forest chip quantities de-livered to energy plant were more than 20 €/MWh in the study. In this case, pulpwood starts to be cheaper than that kind of very expensive forest chip volumes.
In the Maximum scenario, the use of solid wood fuels increased to 48 TWh in 2020 (Fig. 3). Especially in the Maximum scenario the delivered quantities of logging residue chips and stump wood chips increased and the
6
quantities of small-diameter thinning wood chips delivered decreased (Fig. 4).
05
101520253035404550
Basicscenario
Maximumscenario
2007 2020
Use
of w
ood-
base
d fu
els,
TW
h
Condensing plants
Industrial CHP plants
Industrial steam heating plants
Municipal CHP plants
Municipal heating plants
Fig. 3. Use of solid wood-based fuels in energy plants in 2007 and the estimated use in 2020 in the Basic scenario (domestic industrial roundwood cuttings 57 million m3) and in the Maximum scenario (68 mill. m3). In these calculations, the price for emission rights is 30 €/t CO2 and the support for chips from small-diameter thinning wood from young forests 4 €/MWh (average stem size of removal as whole trees < 55 dm3) in 2020.
0
5
10
15
20
25
30
Basicscenario
Maximumscenario
2007 2020
Use
of f
ores
t chi
ps, T
Wh
Stumps
Logging residues
Small-diameter wood
Fig. 4. Use of forest chips in energy plants in 2007 (Ylitalo, 2009), and the estimated techno-economical potential of forest chips in the Basic and Maximum scenarios in 2020. The price for emission rights is 30 €/t CO2 and the support for chips from small-diameter thinning wood from young forests is 4 €/MWh in 2020.

279
5
3. Results 3.1. Theoretical and techno-ecological potential According to the calculations, the technical use potential of solid wood fu-els in energy plants was 53 TWh in 2020 in Finland. The proportion cov-ered by logging residues and small-sized thinning wood was estimated to be 28 TWh. Theoretical supply potential of forest chips was 105 TWh in the Basic scenario and 115 TWh in the Maximum scenario of the research (Fig. 2). Correspondingly, the techno-ecological supply potential was 43 TWh in the Basic scenario and 48 TWh in the Maximum scenario in the year 2020.
0
20
40
60
80
100
120
Basicscenario
Maximumscenario
Basicscenario
Maximumscenario
Theoretical potential Techno-ecological potential
Pote
ntia
l, TW
h
Stumps
Logging residues
Small-diameter wood
Fig. 2. Estimate of theoretical and techno-ecological supply potential of forest chips in 2020 based on the Basic and Maximum scenarios of the research. The calculated small-diameter wood supply potentials were based on the 10th National Forest Inventory data of the Finnish Forest Research Institute. 3.2. Techno-economical potential When modelling the use of solid wood fuels in energy generation in the Ba-sic scenario in 2020, the consumption of solid wood fuels was 44 TWh of which the use of forest industry by-products lowered from the current level to 17 TWh and the consumption of forest chips increased up to 27 TWh (Fig. 3). Particularly stumps raised significantly their proportion of total forest chip volumes (Fig. 4). The most expensive forest chip quantities de-livered to energy plant were more than 20 €/MWh in the study. In this case, pulpwood starts to be cheaper than that kind of very expensive forest chip volumes.
In the Maximum scenario, the use of solid wood fuels increased to 48 TWh in 2020 (Fig. 3). Especially in the Maximum scenario the delivered quantities of logging residue chips and stump wood chips increased and the
6
quantities of small-diameter thinning wood chips delivered decreased (Fig. 4).
05
101520253035404550
Basicscenario
Maximumscenario
2007 2020
Use
of w
ood-
base
d fu
els,
TW
h
Condensing plants
Industrial CHP plants
Industrial steam heating plants
Municipal CHP plants
Municipal heating plants
Fig. 3. Use of solid wood-based fuels in energy plants in 2007 and the estimated use in 2020 in the Basic scenario (domestic industrial roundwood cuttings 57 million m3) and in the Maximum scenario (68 mill. m3). In these calculations, the price for emission rights is 30 €/t CO2 and the support for chips from small-diameter thinning wood from young forests 4 €/MWh (average stem size of removal as whole trees < 55 dm3) in 2020.
0
5
10
15
20
25
30
Basicscenario
Maximumscenario
2007 2020
Use
of f
ores
t chi
ps, T
Wh
Stumps
Logging residues
Small-diameter wood
Fig. 4. Use of forest chips in energy plants in 2007 (Ylitalo, 2009), and the estimated techno-economical potential of forest chips in the Basic and Maximum scenarios in 2020. The price for emission rights is 30 €/t CO2 and the support for chips from small-diameter thinning wood from young forests is 4 €/MWh in 2020.

280
7
The emission trade had a strong influence on the competitiveness of wood-based fuels and the use of such fuels in energy plants. When the price of emission rights lowered to the level under 20 €/t CO2, the deliveries of wood fuels for energy plants decreased significantly (Fig. 5). Respectively, when the price of emission rights increased to over 30 €/t CO2, the use of wood fuels by energy plants did not significantly increase any more. The effect of emission trade focused particularly on the most expensive wood fuel fractions, i.e. small-diameter thinning wood and stump and root wood (Fig. 5).
0
5
10
15
20
25
30
10 €/t CO2 20 €/t CO2 30 €/t CO2 40 €/t CO2
2007 2020
Use
of f
ores
t chi
ps, T
Wh
Stumps
Logging residues
Small-diameter wood
Fig. 5. Use of forest chips in energy plants in 2007 (Ylitalo, 2009), and the estimated techno-economical potential of forest chips in the Basic scenario in 2020 when the price of emission rights in the calculation is 10 to 40 €/t CO2. The support for chips from small-diameter wood from young forests is 4 €/MWh in 2020. Also, the support by the Finnish State for producing chips from small-diameter wood from young stands had very strong impact on the use vol-umes of small-sized wood chips in 2020. The effect of supports on the har-vesting volumes of small-diameter wood chips pointed out when the price for emission rights was at the low level. When the price was low (10 €/t CO2) and there was no support for energy wood harvested from young stands, there were no possibilities to harvest small-sized wood chips for en-ergy generation (Fig. 6).
Correspondingly, when the support for small-sized wood chips was 8 €/MWh under low price of emission rights, it made possible to rise the use
8
of small-diameter wood chips to 2.7 TWh (Fig. 6). Respectively, when the price for emission rights was high (30 €/t CO2) and the support for small-diameter wood chips recovered from young stands was 4 €/MWh, it made possible to increase the use of small-sized wood chips up to 7.4 TWh in 2020 (Fig. 6).
0
5
10
15
20
25
30
0 €/MWh 4 €/MWh 8 €/MWh 0 €/MWh 4 €/MWh 8 €/MWh
10 €/t CO2 30 €/t CO2
2007 2020
Use
of f
ores
t chi
ps, T
Wh
Stumps
Logging residues
Small-diameter wood
Fig. 6. Use of forest chips in energy plants in 2007 (Ylitalo, 2009), and the estimated techno-economical potential of forest chips in the Basic scenario in 2020 when the price of emission rights in the calculation is low (10 €/t CO2) and high (30 €/t CO2), and the Kemera support for chips from small-diameter thinning wood is 0 to 8 €/MWh in 2020. The presup-positions for the Kemera support claimed for small-diameter wood cut in young forests are: - When the average stem size of removal as whole trees is less than 55 dm3 in stands, the Kemera support is at three different levels in the calculations (8, 4 and 0 €/MWh). - When the average stem size of removal as whole trees is more than 55 dm3 in stands, the Kemera support is always 0 €/MWh in the calculations. 4. Discussion and conclusions The study showed that the growth objective set in the Government’s Cli-mate and Energy Strategy (Pekkarinen, 2010) can be attained through the supply and consumption of wood-based fuels because, for instance, in the Basic Scenario the techno-economical supply potential was 27 TWh of for-est chips in 2020. Realizing this potential would, however, require major investments throughout the entire forest chip production system, because the competitiveness of wood-based fuels in energy generation is currently not at a sufficient level. Industrial roundwood cuttings and the production of forest industries will also have to be at the level before the year 2009.

281
7
The emission trade had a strong influence on the competitiveness of wood-based fuels and the use of such fuels in energy plants. When the price of emission rights lowered to the level under 20 €/t CO2, the deliveries of wood fuels for energy plants decreased significantly (Fig. 5). Respectively, when the price of emission rights increased to over 30 €/t CO2, the use of wood fuels by energy plants did not significantly increase any more. The effect of emission trade focused particularly on the most expensive wood fuel fractions, i.e. small-diameter thinning wood and stump and root wood (Fig. 5).
0
5
10
15
20
25
30
10 €/t CO2 20 €/t CO2 30 €/t CO2 40 €/t CO2
2007 2020
Use
of f
ores
t chi
ps, T
Wh
Stumps
Logging residues
Small-diameter wood
Fig. 5. Use of forest chips in energy plants in 2007 (Ylitalo, 2009), and the estimated techno-economical potential of forest chips in the Basic scenario in 2020 when the price of emission rights in the calculation is 10 to 40 €/t CO2. The support for chips from small-diameter wood from young forests is 4 €/MWh in 2020. Also, the support by the Finnish State for producing chips from small-diameter wood from young stands had very strong impact on the use vol-umes of small-sized wood chips in 2020. The effect of supports on the har-vesting volumes of small-diameter wood chips pointed out when the price for emission rights was at the low level. When the price was low (10 €/t CO2) and there was no support for energy wood harvested from young stands, there were no possibilities to harvest small-sized wood chips for en-ergy generation (Fig. 6).
Correspondingly, when the support for small-sized wood chips was 8 €/MWh under low price of emission rights, it made possible to rise the use
8
of small-diameter wood chips to 2.7 TWh (Fig. 6). Respectively, when the price for emission rights was high (30 €/t CO2) and the support for small-diameter wood chips recovered from young stands was 4 €/MWh, it made possible to increase the use of small-sized wood chips up to 7.4 TWh in 2020 (Fig. 6).
0
5
10
15
20
25
30
0 €/MWh 4 €/MWh 8 €/MWh 0 €/MWh 4 €/MWh 8 €/MWh
10 €/t CO2 30 €/t CO2
2007 2020
Use
of f
ores
t chi
ps, T
Wh
Stumps
Logging residues
Small-diameter wood
Fig. 6. Use of forest chips in energy plants in 2007 (Ylitalo, 2009), and the estimated techno-economical potential of forest chips in the Basic scenario in 2020 when the price of emission rights in the calculation is low (10 €/t CO2) and high (30 €/t CO2), and the Kemera support for chips from small-diameter thinning wood is 0 to 8 €/MWh in 2020. The presup-positions for the Kemera support claimed for small-diameter wood cut in young forests are: - When the average stem size of removal as whole trees is less than 55 dm3 in stands, the Kemera support is at three different levels in the calculations (8, 4 and 0 €/MWh). - When the average stem size of removal as whole trees is more than 55 dm3 in stands, the Kemera support is always 0 €/MWh in the calculations. 4. Discussion and conclusions The study showed that the growth objective set in the Government’s Cli-mate and Energy Strategy (Pekkarinen, 2010) can be attained through the supply and consumption of wood-based fuels because, for instance, in the Basic Scenario the techno-economical supply potential was 27 TWh of for-est chips in 2020. Realizing this potential would, however, require major investments throughout the entire forest chip production system, because the competitiveness of wood-based fuels in energy generation is currently not at a sufficient level. Industrial roundwood cuttings and the production of forest industries will also have to be at the level before the year 2009.

282
9
Also we have to pay attention to the fact that the forest chip production resources are very huge. Kärhä et al. (2009b) mapped how much machinery and labour would be needed for large-scale forest chip production if the use of forest chips increases extensively in Finland. According to Kärhä et al. (2009b) calculations, if the production and consumption of forest chips are 25 to 30 TWh in Finland in 2020, 1,900 to 2,200 units of machinery, i.e. machines and trucks, would be needed. This would mean total investments in production machinery of 530 to 630 million (VAT 0%). The labour de-mand would be 3,400 to 4,000 machine operators and drivers, and 4,200 to 5,100 labour years including indirect labour.
We clarified forest chip procurement potentials in the study using only as a raw material for forest chips so called traditional raw material sources, i.e. logging residues, stumps, and small-diameter wood. On the other words, we assumed that pulpwood is primarily utilized in pulping industry. Never-theless, it can be estimated that when the total supply costs of most expen-sive forest chip volumes are about 18–22 €/MWh, the pulpwood will re-move this kind of the most expensive forest chip quantities.
Considering the huge resources required by the forest chip production system and the current low competitiveness of forest chips, it is estimated that the use of forest chips in Finland will reach the level of 20 TWh at the earliest by the year 2020. Therefore, in practice there are no possibilities to achieve the set targets of renewable energy with wood-based fuels in Finland if the competitiveness of wood-based energy does not improve strongly.
We will need certain measures for improving operation environment in the field of forest chip production. And we need measures very fast because we have time only ten years for our targets of 2020. Acknowledgements We would like to thank the Ministry of Employment and the Economy and the Finnish forest industries for providing financial support for the project. References Anon. 2008. Long-term Climate and Energy Strategy. Government Report
to Parliament 6 November 2008. Publications of the Ministry of Em-ployment and the Economy, Energy and climate 36/2008. Available at: http://www.tem.fi/files/21079/TEMjul_36_2008_energia_ja_ilmasto.pdf.
Anon. 2009. Energy Statistics 2008. SVT, Statistics Finland, Energy. Avail-able at: http://www.stat.fi/tup/julkaisut/isbn_978-952-244-019-8.pdf.
Kärhä, K., Elo, J., Lahtinen, P., Räsänen, T. & Pajuoja, H. 2009a. Availabil-ity and use of wood-based fuels in Finland in 2020. Metsäteho Review 40. Available at: http://www.metsateho.fi/uploads/Katsaus_40.pdf.
10
Kärhä, K., Strandström, M., Lahtinen, P. & Elo, J. 2009b. Forest chip pro-duction machinery and labour demand in Finland in the year 2020. Metsäteho Review 41. Available at: http://www.metsateho.fi/uploads/Katsaus_41.pdf.
Koistinen, A. & Äijälä, O. 2006. Energiapuun korjuu. (Energy Wood Harvesting). Metsätalouden kehittämiskeskus Tapio, Hyvän metsänhoidon opassarja.
Pekkarinen, M. 2010. Kohti vähäpäästöistä Suomea: Uusiutuvan energian velvoitepaketti. (Towards low emissions in Finland. Government’s Climate and Energy Strategy). Press Conference 20.4.2010, Presenta-tion Material. Available at: http://www.tem.fi/files/26643/UE_lo_velvoitepaketti_Kesaranta_200410.pdf.
Ylitalo, E. 2009. Puun energiakäyttö 2008. (Use of wood for energy generation in 2008). Finnish Forest Research Institute, Forest Statistical Bulletin 15/2009.

283
9
Also we have to pay attention to the fact that the forest chip production resources are very huge. Kärhä et al. (2009b) mapped how much machinery and labour would be needed for large-scale forest chip production if the use of forest chips increases extensively in Finland. According to Kärhä et al. (2009b) calculations, if the production and consumption of forest chips are 25 to 30 TWh in Finland in 2020, 1,900 to 2,200 units of machinery, i.e. machines and trucks, would be needed. This would mean total investments in production machinery of 530 to 630 million (VAT 0%). The labour de-mand would be 3,400 to 4,000 machine operators and drivers, and 4,200 to 5,100 labour years including indirect labour.
We clarified forest chip procurement potentials in the study using only as a raw material for forest chips so called traditional raw material sources, i.e. logging residues, stumps, and small-diameter wood. On the other words, we assumed that pulpwood is primarily utilized in pulping industry. Never-theless, it can be estimated that when the total supply costs of most expen-sive forest chip volumes are about 18–22 €/MWh, the pulpwood will re-move this kind of the most expensive forest chip quantities.
Considering the huge resources required by the forest chip production system and the current low competitiveness of forest chips, it is estimated that the use of forest chips in Finland will reach the level of 20 TWh at the earliest by the year 2020. Therefore, in practice there are no possibilities to achieve the set targets of renewable energy with wood-based fuels in Finland if the competitiveness of wood-based energy does not improve strongly.
We will need certain measures for improving operation environment in the field of forest chip production. And we need measures very fast because we have time only ten years for our targets of 2020. Acknowledgements We would like to thank the Ministry of Employment and the Economy and the Finnish forest industries for providing financial support for the project. References Anon. 2008. Long-term Climate and Energy Strategy. Government Report
to Parliament 6 November 2008. Publications of the Ministry of Em-ployment and the Economy, Energy and climate 36/2008. Available at: http://www.tem.fi/files/21079/TEMjul_36_2008_energia_ja_ilmasto.pdf.
Anon. 2009. Energy Statistics 2008. SVT, Statistics Finland, Energy. Avail-able at: http://www.stat.fi/tup/julkaisut/isbn_978-952-244-019-8.pdf.
Kärhä, K., Elo, J., Lahtinen, P., Räsänen, T. & Pajuoja, H. 2009a. Availabil-ity and use of wood-based fuels in Finland in 2020. Metsäteho Review 40. Available at: http://www.metsateho.fi/uploads/Katsaus_40.pdf.
10
Kärhä, K., Strandström, M., Lahtinen, P. & Elo, J. 2009b. Forest chip pro-duction machinery and labour demand in Finland in the year 2020. Metsäteho Review 41. Available at: http://www.metsateho.fi/uploads/Katsaus_41.pdf.
Koistinen, A. & Äijälä, O. 2006. Energiapuun korjuu. (Energy Wood Harvesting). Metsätalouden kehittämiskeskus Tapio, Hyvän metsänhoidon opassarja.
Pekkarinen, M. 2010. Kohti vähäpäästöistä Suomea: Uusiutuvan energian velvoitepaketti. (Towards low emissions in Finland. Government’s Climate and Energy Strategy). Press Conference 20.4.2010, Presenta-tion Material. Available at: http://www.tem.fi/files/26643/UE_lo_velvoitepaketti_Kesaranta_200410.pdf.
Ylitalo, E. 2009. Puun energiakäyttö 2008. (Use of wood for energy generation in 2008). Finnish Forest Research Institute, Forest Statistical Bulletin 15/2009.
284
Substitution between coal and wood in Europe
Pekka Lauri1, A. Maarit I. Kallio1 and Uwe A. Schneider2
1 Finnish Forest Research Institute, POB 18, 01301 Vantaa, Finland 2 Sustainability and Global Change Research Unit, Hamburg University, Germany
Abstract This paper considers the effects of CO2 emission trading system on the substitution between coal and energy wood in the large scale heat and power production in Europe. We use a technology-based approach where the substitution between coal and wood takes place through switch from one technology to another over time. The analysis is conducted with the EUFASOM (European Forest and Agricultural Sector Optimization Model). Our results suggest that the CO2 emission trading system gives incentives for heat and power plants to increase energy wood demand in the limits of energy wood potential. Keywords: coal, energy wood, EUFASOM, CO2 emission trading system 1. Introduction The demand for energy wood is determined by its relative competitiveness to fossil fuels. From the viewpoint of energy wood, the most relevant fossil fuel is coal. The substitution between coal1 and wood is not a new phenomenon in the energy sector. Wood was the main source of energy in the world until the mid-1800s. Coal began to replace wood in the 1800 century during the Industrial Revolution, when wood became scarce and its price increased. If we exclude transportation sector, coal is nowadays the main source of energy.2
1 We assume that peat is included in coal as in the IEA statistics, because the properties of peat are close to coal (heat value, emission factor etc.) . Peat is an important fuel in some regions (Finland, Ireland), but it does not play any role in the European level energy markets. 2 In the history of mankind coal and wood have been two main sources of energy until the 20th century. During the last hundred years the increase of transportation has made oil and gas the dominant fuels. If we exclude transportation sector, coal is still the main source of energy production in the world. Moreover, the remaining reserves of coal are larger than the remaining reserves of oil and gas together, which makes coal the most important fossil fuel in the future.
Coal had been known for several thousands years, but there are several reasons for why it was not taken to use before the Industrial Revolution. First, the environmental impact of using coal as a fuel is more harmful than wood. Even when people during the Industrial Revolution did not know about climate change and the greenhouse effect, they found that coal smoke stank and made the air difficult to breath. Second, the utilization of coal requires considerably bigger production units than energy wood in order to be efficient. Hence, the need for energy must be sufficiently large before it is reasonable to use coal instead of energy wood. Third, the location of coal is different from the location of energy wood. Wood could be found in small amounts everywhere, while coal is situated in the distinct and large deposits. Hence, the utilization of coal required cheap bulk transportation methods like sea transport and railways. Climate change has made the substitution between coal and energy wood a burning question again. It has been argued that coal should be replaced by energy wood (or other biomass) due to high CO2 emissions of coal-firing. The purpose of this study is to consider the effects of CO2 emission trading system on the substitution between coal and energy wood in Europe. In the analysis, we use a numerical partial equilibrium model of the European forest and agricultural sectors (EUFASOM). 2. Data and methods 2.1 EUFASOM For the analysis, we use a simplified version of the European Forest and Agricultural Sector Optimization Model (Schneider et al. 2008).3 EUFASOM is a European counterpart of the FASOM model for US forest and agricultural sectors (Adams et al., 1996).
Numerical partial equilibrium models like EUFASOM are typically based on Samuelson’s (1952) spatial trade model, where the competitive market equilibrium is solved by maximizing consumer and producer surpluses and market prices are received indirectly as shadow prices. For this type of models it is important that the boundaries of spatial regions and the transport costs between them are correctly determined. Otherwise the model might suffer from unrealistically high supply or demand in some regions.
In the EUFASOM version used, each European country forms its own spatial region and the rest of the world is modeled as one region. There are no domestic regions within countries. Transport costs between regions are determined accounting for the distances of sea and land transport. This level division of spatial regions can be sufficient to explain the trade in the paper 3 Simplified version of the model does not include agricultural sector and forestry. This means that wood supply functions are exogenous to the model, i.e., we ignore forest management, forest growth and land-use issues.

285
Substitution between coal and wood in Europe
Pekka Lauri1, A. Maarit I. Kallio1 and Uwe A. Schneider2
1 Finnish Forest Research Institute, POB 18, 01301 Vantaa, Finland 2 Sustainability and Global Change Research Unit, Hamburg University, Germany
Abstract This paper considers the effects of CO2 emission trading system on the substitution between coal and energy wood in the large scale heat and power production in Europe. We use a technology-based approach where the substitution between coal and wood takes place through switch from one technology to another over time. The analysis is conducted with the EUFASOM (European Forest and Agricultural Sector Optimization Model). Our results suggest that the CO2 emission trading system gives incentives for heat and power plants to increase energy wood demand in the limits of energy wood potential. Keywords: coal, energy wood, EUFASOM, CO2 emission trading system 1. Introduction The demand for energy wood is determined by its relative competitiveness to fossil fuels. From the viewpoint of energy wood, the most relevant fossil fuel is coal. The substitution between coal1 and wood is not a new phenomenon in the energy sector. Wood was the main source of energy in the world until the mid-1800s. Coal began to replace wood in the 1800 century during the Industrial Revolution, when wood became scarce and its price increased. If we exclude transportation sector, coal is nowadays the main source of energy.2
1 We assume that peat is included in coal as in the IEA statistics, because the properties of peat are close to coal (heat value, emission factor etc.) . Peat is an important fuel in some regions (Finland, Ireland), but it does not play any role in the European level energy markets. 2 In the history of mankind coal and wood have been two main sources of energy until the 20th century. During the last hundred years the increase of transportation has made oil and gas the dominant fuels. If we exclude transportation sector, coal is still the main source of energy production in the world. Moreover, the remaining reserves of coal are larger than the remaining reserves of oil and gas together, which makes coal the most important fossil fuel in the future.
Coal had been known for several thousands years, but there are several reasons for why it was not taken to use before the Industrial Revolution. First, the environmental impact of using coal as a fuel is more harmful than wood. Even when people during the Industrial Revolution did not know about climate change and the greenhouse effect, they found that coal smoke stank and made the air difficult to breath. Second, the utilization of coal requires considerably bigger production units than energy wood in order to be efficient. Hence, the need for energy must be sufficiently large before it is reasonable to use coal instead of energy wood. Third, the location of coal is different from the location of energy wood. Wood could be found in small amounts everywhere, while coal is situated in the distinct and large deposits. Hence, the utilization of coal required cheap bulk transportation methods like sea transport and railways. Climate change has made the substitution between coal and energy wood a burning question again. It has been argued that coal should be replaced by energy wood (or other biomass) due to high CO2 emissions of coal-firing. The purpose of this study is to consider the effects of CO2 emission trading system on the substitution between coal and energy wood in Europe. In the analysis, we use a numerical partial equilibrium model of the European forest and agricultural sectors (EUFASOM). 2. Data and methods 2.1 EUFASOM For the analysis, we use a simplified version of the European Forest and Agricultural Sector Optimization Model (Schneider et al. 2008).3 EUFASOM is a European counterpart of the FASOM model for US forest and agricultural sectors (Adams et al., 1996).
Numerical partial equilibrium models like EUFASOM are typically based on Samuelson’s (1952) spatial trade model, where the competitive market equilibrium is solved by maximizing consumer and producer surpluses and market prices are received indirectly as shadow prices. For this type of models it is important that the boundaries of spatial regions and the transport costs between them are correctly determined. Otherwise the model might suffer from unrealistically high supply or demand in some regions.
In the EUFASOM version used, each European country forms its own spatial region and the rest of the world is modeled as one region. There are no domestic regions within countries. Transport costs between regions are determined accounting for the distances of sea and land transport. This level division of spatial regions can be sufficient to explain the trade in the paper 3 Simplified version of the model does not include agricultural sector and forestry. This means that wood supply functions are exogenous to the model, i.e., we ignore forest management, forest growth and land-use issues.

286
and mechanical forest industry products. However, to model wood supply correctly a more detailed division of spatial regions, i.e., domestic regions would be preferred. One way to overcome this problem is to assume exogenous wood supply functions.
The main difference between EUFASOM and several other partial equilibrium forest sector models is the time horizon of the agents. In the EUFASOM, the agents have perfect foresight while many other models, like GFPM (Buongiorno et al. 2003), EFI-GTM (e.g. Kallio et al. 2004), and SF-GTM (e.g. Kallio 2010), have recursive dynamics with myopic agents.4 In the perfect foresight models, the investment dynamics is different from that in the recursive models, because the agents make investment decisions by maximizing their income over the whole planning horizon.
A more detailed documentation of the EUFASOM can be found in Schneider et al. (2008) so we do not consider the general structure of the model more here. In the rest of the paper, we focus on modeling the substitution between coal and energy wood in the heat and power production. 2.2 Terminology The use of woody biomass for energy production consists of two stage. First, woody biomass is processed into fuelwood. Second, fuelwood are converted into heat and power.
Fuelwood can be divided to traditional fuelwood and modern fuelwood. Traditional fuelwood is a small scale energy production in the households. According to FAO, traditional fuelwood use accounts nowadays for 15% of the total wood use and 40 % of the wood use for energy in Europe (FAOSTAT 2010). Modern fuelwood is a large scale energy production in the energy plants. In our model, modern fuelwood use currently accounts for 20% of the total wood use and 60 % of the wood use for energy in Europe. This paper concentrates on the large scale energy production in the energy plants. Hence, energy wood is used as a synonym for modern fuelwood.
Heat and power conversion can be divided to external and internal energy production. External energy production generates heat and power for sale as its primary activity while internal energy production generates heat and power mainly for the producer's own use. It is difficult to determine the actual division between internal and external energy production, because the use of by-products varies significantly between production units. For example, some pulp mills use bark for internal energy production while others prefer to sell it to the external energy plants. Moreover, external 4 Imperfect foresight is a reasonable assumption in the short run numerical analysis, but perfect foresight is usually used in the long run analysis. In the long run agents eventually learn the actual structure of the economy and are able to avoid systematic errors in the expectations.
energy plants are often located directly by to the pulp mills so that the division between external and internal energy production is somewhat artificial. To avoid these ambiguities, we model all heat and power production as external. This type of technical assumption clarifies the terminology as well as simplifies the structure of the model. 2.3 Heat and power plants Demand for energy wood and coal are determined by the production decisions of heat and power plants. Heat and power plants decisions are based on the production technologies and the demand for heat and power.
There are three types of heat and power plants in the model: separate heat plants, separate power plants and CHP-plants (combined heat and power plants). Each plant can use either energy wood or coal to produce heat and power. This assumption includes two important simplifications. First, we ignore other fuels (gas, oil, waste etc.) as well as other forms of energy production (nuclear power, solar power, wind power etc.). Hence, our model does not include complete energy markets. Second, heat and power plants cannot use both inputs or switch from on input to other input. In reality most of coal plants can use 0-15% energy wood without major technical change. Moreover, energy wood is often mixed with coal for the improved fire properties.
Initial technologies of the heat and power plants are based on the IEA data on solid biomass and coal for the energy transformation and the forest industry internal energy production (IEA 2010). The solid biomass includes all woody biomass used for energy production (also black liquor).
Future technologies of the heat and power plants are determined by investments. In each period, some part of production capacity is assumed to become old so that it either must be replaced by the new capacity, or alternatively, its lifetime may be extended by a maintenance investment. We assume that the lifetime of energy plant is 25 years (5 periods in the model), which implies that the depreciation rate is 0.2. Moreover, we do not set any limits to the amounts of investments that can be done in the new heat and power capacity during the period in a given region.
The energy efficiency of technologies is assumed to be same for all regions (table 1). Reason for this simplification is that we cannot calculate the energy efficiency coefficients correctly from the IEA data, because the transformation data does not include internal energy production.

287
and mechanical forest industry products. However, to model wood supply correctly a more detailed division of spatial regions, i.e., domestic regions would be preferred. One way to overcome this problem is to assume exogenous wood supply functions.
The main difference between EUFASOM and several other partial equilibrium forest sector models is the time horizon of the agents. In the EUFASOM, the agents have perfect foresight while many other models, like GFPM (Buongiorno et al. 2003), EFI-GTM (e.g. Kallio et al. 2004), and SF-GTM (e.g. Kallio 2010), have recursive dynamics with myopic agents.4 In the perfect foresight models, the investment dynamics is different from that in the recursive models, because the agents make investment decisions by maximizing their income over the whole planning horizon.
A more detailed documentation of the EUFASOM can be found in Schneider et al. (2008) so we do not consider the general structure of the model more here. In the rest of the paper, we focus on modeling the substitution between coal and energy wood in the heat and power production. 2.2 Terminology The use of woody biomass for energy production consists of two stage. First, woody biomass is processed into fuelwood. Second, fuelwood are converted into heat and power.
Fuelwood can be divided to traditional fuelwood and modern fuelwood. Traditional fuelwood is a small scale energy production in the households. According to FAO, traditional fuelwood use accounts nowadays for 15% of the total wood use and 40 % of the wood use for energy in Europe (FAOSTAT 2010). Modern fuelwood is a large scale energy production in the energy plants. In our model, modern fuelwood use currently accounts for 20% of the total wood use and 60 % of the wood use for energy in Europe. This paper concentrates on the large scale energy production in the energy plants. Hence, energy wood is used as a synonym for modern fuelwood.
Heat and power conversion can be divided to external and internal energy production. External energy production generates heat and power for sale as its primary activity while internal energy production generates heat and power mainly for the producer's own use. It is difficult to determine the actual division between internal and external energy production, because the use of by-products varies significantly between production units. For example, some pulp mills use bark for internal energy production while others prefer to sell it to the external energy plants. Moreover, external 4 Imperfect foresight is a reasonable assumption in the short run numerical analysis, but perfect foresight is usually used in the long run analysis. In the long run agents eventually learn the actual structure of the economy and are able to avoid systematic errors in the expectations.
energy plants are often located directly by to the pulp mills so that the division between external and internal energy production is somewhat artificial. To avoid these ambiguities, we model all heat and power production as external. This type of technical assumption clarifies the terminology as well as simplifies the structure of the model. 2.3 Heat and power plants Demand for energy wood and coal are determined by the production decisions of heat and power plants. Heat and power plants decisions are based on the production technologies and the demand for heat and power.
There are three types of heat and power plants in the model: separate heat plants, separate power plants and CHP-plants (combined heat and power plants). Each plant can use either energy wood or coal to produce heat and power. This assumption includes two important simplifications. First, we ignore other fuels (gas, oil, waste etc.) as well as other forms of energy production (nuclear power, solar power, wind power etc.). Hence, our model does not include complete energy markets. Second, heat and power plants cannot use both inputs or switch from on input to other input. In reality most of coal plants can use 0-15% energy wood without major technical change. Moreover, energy wood is often mixed with coal for the improved fire properties.
Initial technologies of the heat and power plants are based on the IEA data on solid biomass and coal for the energy transformation and the forest industry internal energy production (IEA 2010). The solid biomass includes all woody biomass used for energy production (also black liquor).
Future technologies of the heat and power plants are determined by investments. In each period, some part of production capacity is assumed to become old so that it either must be replaced by the new capacity, or alternatively, its lifetime may be extended by a maintenance investment. We assume that the lifetime of energy plant is 25 years (5 periods in the model), which implies that the depreciation rate is 0.2. Moreover, we do not set any limits to the amounts of investments that can be done in the new heat and power capacity during the period in a given region.
The energy efficiency of technologies is assumed to be same for all regions (table 1). Reason for this simplification is that we cannot calculate the energy efficiency coefficients correctly from the IEA data, because the transformation data does not include internal energy production.

288
Table 1: Energy efficiency coefficients of future technologies
Heat efficiency Power efficiency Heat plant 0.9 Power plant 0.4 CHP plant 0.6 0.2
Demand functions for heat and power are determined by using the IEA and EUROSTAT data (IEA 2010, EUROSTAT 2010). We assume that heat and power from coal are perfect substitutes for heat and power from energy wood, and hence they have common demand functions. This allows the substitution between coal and energy wood. Moreover, we assume that the price elasticity of demand is -0.1, i.e., the demand for heat and power is inelastic. The demand for energy in general is inelastic. However, it is less clear if the demand for energy wood and coal is inelastic, because other fuels and energy forms might form a substitute for them. Hence, the assumption of inelastic demand for heat and power is based on the pre-assumption that the energy wood and coal are not substituted by other fuels or energy forms. 2.4 Supply for energy wood and coal The energy wood comes from various sources. In the model, roundwood supply is determined by using exogenous supply functions, defining the supply as an increasing function of price. Bark, dust, sawdust, saw chips and black liquor are by-products of the forest industry products and their supply is hence directly tied to the production of forest products. Recycled wood supply depends on the exogenously defined recycling rate of forest products. Finally, the supply of forest chips depends on the technical potential and production costs.
The technical potential of forest chips is assumed to be 0.125 x total roundwood supply for branches, 0.05 x total roundwood supply for stumps and 0.125 x total roundwood supply for small trees.5 Using these figures, the total roundwood supply in Europe (EU32) of 540 million m3 (FAO 2009) would give the forest chips potential of 160 million m3.
The production costs of forest chips have a constant and an increasing cost factor. The constant cost factor is assumed to 20 euro/ m3 for branches and 30 euro/ m3 for stumps and small trees. It includes harvesting, chipping and transport cost 0-10 km. The increasing cost factor varies between 0-30 5 These multipliers are just a rough estimate on the forest chips potential. They are based on the volumes of branches and stumps respect to stem wood and the recovery rates. They do not include complementary fellings, i.e., the surplus forest growth that is used for energy wood.
euro/ m3 depending on the amount of use. It includes transport cost 10-200 km and additional cost due to restricted availability of forest chips.6 These figures are based on Ryymin et al. (2008) study on the forest energy costs in Finland. The regional differences are included into the production costs of forest chips by using region specific multipliers, which are determined by using the roundwood prices in different regions.
For coal, we defined an exogenous supply function using IEA and EUROSTAT data on the market prices. The production quantities of coal are not needed, because we assume that the supply of coal is perfectly elastic, i.e., it has a horizontal supply curve. 2.5 The effect of the CO2 tax on the energy prices In order to study the effect of emission trading system to the substitution between coal and wood energy, we interpret emission trading price as a CO2 tax. The effect of the CO2 tax on the energy prices depends on the tax incidence in the energy markets, the emission factor of the underlying fuel, and the efficiency of the energy transformation technology. For simplicity, we assume that the CO2 tax is passed entirely to the energy prices, which implies that the effect of the tax depends only on the emission factor and energy efficiency.7
Let us first consider the effect of the CO2 tax on the relative competitiveness of different fuels. The relative competitiveness can be determined by considering the fuel price with CO2 tax: price with tax =market price + CO2 tax where CO2 tax=emission factor of fuel x CO2 price. The effect of CO2 tax on the relative competitiveness of different fuels can be demonstrated by the following example:
6 For example, harvesting of branches and stumps from thinnings instead of final cuttings costs 10-20 euro/ m3 more. 7 Tax incidence depends on the price elasticity of demand and supply. Because supply of fuels is usually elastic and demand inelastic, consumers bear the burden of CO2 tax. Hence, we can argue that CO2 tax is usually passed entirely to the fuel prices.

289
Table 1: Energy efficiency coefficients of future technologies
Heat efficiency Power efficiency Heat plant 0.9 Power plant 0.4 CHP plant 0.6 0.2
Demand functions for heat and power are determined by using the IEA and EUROSTAT data (IEA 2010, EUROSTAT 2010). We assume that heat and power from coal are perfect substitutes for heat and power from energy wood, and hence they have common demand functions. This allows the substitution between coal and energy wood. Moreover, we assume that the price elasticity of demand is -0.1, i.e., the demand for heat and power is inelastic. The demand for energy in general is inelastic. However, it is less clear if the demand for energy wood and coal is inelastic, because other fuels and energy forms might form a substitute for them. Hence, the assumption of inelastic demand for heat and power is based on the pre-assumption that the energy wood and coal are not substituted by other fuels or energy forms. 2.4 Supply for energy wood and coal The energy wood comes from various sources. In the model, roundwood supply is determined by using exogenous supply functions, defining the supply as an increasing function of price. Bark, dust, sawdust, saw chips and black liquor are by-products of the forest industry products and their supply is hence directly tied to the production of forest products. Recycled wood supply depends on the exogenously defined recycling rate of forest products. Finally, the supply of forest chips depends on the technical potential and production costs.
The technical potential of forest chips is assumed to be 0.125 x total roundwood supply for branches, 0.05 x total roundwood supply for stumps and 0.125 x total roundwood supply for small trees.5 Using these figures, the total roundwood supply in Europe (EU32) of 540 million m3 (FAO 2009) would give the forest chips potential of 160 million m3.
The production costs of forest chips have a constant and an increasing cost factor. The constant cost factor is assumed to 20 euro/ m3 for branches and 30 euro/ m3 for stumps and small trees. It includes harvesting, chipping and transport cost 0-10 km. The increasing cost factor varies between 0-30 5 These multipliers are just a rough estimate on the forest chips potential. They are based on the volumes of branches and stumps respect to stem wood and the recovery rates. They do not include complementary fellings, i.e., the surplus forest growth that is used for energy wood.
euro/ m3 depending on the amount of use. It includes transport cost 10-200 km and additional cost due to restricted availability of forest chips.6 These figures are based on Ryymin et al. (2008) study on the forest energy costs in Finland. The regional differences are included into the production costs of forest chips by using region specific multipliers, which are determined by using the roundwood prices in different regions.
For coal, we defined an exogenous supply function using IEA and EUROSTAT data on the market prices. The production quantities of coal are not needed, because we assume that the supply of coal is perfectly elastic, i.e., it has a horizontal supply curve. 2.5 The effect of the CO2 tax on the energy prices In order to study the effect of emission trading system to the substitution between coal and wood energy, we interpret emission trading price as a CO2 tax. The effect of the CO2 tax on the energy prices depends on the tax incidence in the energy markets, the emission factor of the underlying fuel, and the efficiency of the energy transformation technology. For simplicity, we assume that the CO2 tax is passed entirely to the energy prices, which implies that the effect of the tax depends only on the emission factor and energy efficiency.7
Let us first consider the effect of the CO2 tax on the relative competitiveness of different fuels. The relative competitiveness can be determined by considering the fuel price with CO2 tax: price with tax =market price + CO2 tax where CO2 tax=emission factor of fuel x CO2 price. The effect of CO2 tax on the relative competitiveness of different fuels can be demonstrated by the following example:
6 For example, harvesting of branches and stumps from thinnings instead of final cuttings costs 10-20 euro/ m3 more. 7 Tax incidence depends on the price elasticity of demand and supply. Because supply of fuels is usually elastic and demand inelastic, consumers bear the burden of CO2 tax. Hence, we can argue that CO2 tax is usually passed entirely to the fuel prices.

290
Table 2: CO2 tax effect on the competitiveness of fuels in Finland 2007 Emission
factor Market price
CO2 tax 20 €/tCO2
CO2 tax 30 €/tCO2
CO2 tax 60 €/tCO2
(tCO2/MWh) (euro/MWh) (euro/MWh) (euro/MWh) (euro/MWh) Coal 0.334 12 7 10 20 Gas 0.201 25 4 6 12 Wood 0 20 0 0 0 The effect of the CO2 tax on the energy prices depends on the fuel price with CO2 tax and energy efficiency. The energy prices can be determined by considering the production costs of energy with tax production costs with tax = other costs + CO2 tax (emission factor of fuel x CO2 price)/0.9 for heat where CO2 tax = (emission factor of fuel x CO2 price)/0.4 for power The effect of the CO2 tax on the energy production costs can be demonstrated by the following example: Table 3: CO2 tax effect on the energy production costs in Finland 2007 CO2tax
20 €/tCO2 CO2tax 30€/tCO2
CO2tax 60 €/tCO2
(euro/MWh) (euro/MWh) (euro/MWh) Power from coal 17 25 50 Heat from coal 7 11 22 Power from gas 10 15 30 Heat from gas 4 7 13 Power from wood 0 0 0 Heat from wood 0 0 0 The effect of the CO2 tax on the energy production costs depends on the fuel used. The marginal fuel used for heat and power generation in Europe is usually coal. As long as the CO2 tax is passed entirely to the energy prices, the effect of the CO2 tax on the energy prices is the same as the effect of the tax on the production costs of energy from coal.
2.6 The investment costs in energy plants Investment costs in energy plants are usually reported by using specific investment costs received by dividing the total investment cost by the power (or heat) capacity of the plant.8 In the model, we use power generation capacity. Hence, to adjust investment costs to power generation capacity, we make the following calculation adjusted investment cost= total investment cost/power generation capacity= specific investment cost/annual operating hours where specific investment cost=total investment cost/power capacity power capacity=maximum amount of power that plant can produce power generation capacity= amount of power that plant can produce over a specific period of time (usually a year) There might be variation in the annual operating hours of energy plants, because some plants are operative only during a high demand. Maximal annual operating hours of energy plants is 8760h per year (=24x365), but we make a conservative assumption that that average operating hours are 7000h (=80% of 8760).
We determined the investment cost by using representative energy plants (e.g., Tarjanne and Kivistö 2008). The specific investment costs in energy wood plants are higher than those in coal plants, because the coal plants use cheaper technology and they are bigger.9 10 The specific investments costs in power plants are higher than the investment costs in heat plants, because power plants must have a boiler and a turbine while heat plants have just a boiler.
Consequently, we choose to use the following adjusted investment costs:
8 For power plants we use power capacity while for heat plants we use heat capacity. For chp plants power capacity even is normally used if they produce also heat. 9 Traditional pulverized coal-fired boiler can co-fire only 10-15 % biomass with coal. Higher proportion of biomass requires gasification technology, which is 20-30% more expensive to build. 10 Coal plants are big due to technological reasons. Moreover, coal is usually transported by sea, which allows bigger plant size. Energy wood is usually transported by land, which increases transport costs and restricts the size of biomass plants. It is often not profitable to transport energy wood further than 50 kilometers. Hence, the size of energy wood plant is restricted by the availability of energy wood within 50 kilometers.

291
Table 2: CO2 tax effect on the competitiveness of fuels in Finland 2007 Emission
factor Market price
CO2 tax 20 €/tCO2
CO2 tax 30 €/tCO2
CO2 tax 60 €/tCO2
(tCO2/MWh) (euro/MWh) (euro/MWh) (euro/MWh) (euro/MWh) Coal 0.334 12 7 10 20 Gas 0.201 25 4 6 12 Wood 0 20 0 0 0 The effect of the CO2 tax on the energy prices depends on the fuel price with CO2 tax and energy efficiency. The energy prices can be determined by considering the production costs of energy with tax production costs with tax = other costs + CO2 tax (emission factor of fuel x CO2 price)/0.9 for heat where CO2 tax = (emission factor of fuel x CO2 price)/0.4 for power The effect of the CO2 tax on the energy production costs can be demonstrated by the following example: Table 3: CO2 tax effect on the energy production costs in Finland 2007 CO2tax
20 €/tCO2 CO2tax 30€/tCO2
CO2tax 60 €/tCO2
(euro/MWh) (euro/MWh) (euro/MWh) Power from coal 17 25 50 Heat from coal 7 11 22 Power from gas 10 15 30 Heat from gas 4 7 13 Power from wood 0 0 0 Heat from wood 0 0 0 The effect of the CO2 tax on the energy production costs depends on the fuel used. The marginal fuel used for heat and power generation in Europe is usually coal. As long as the CO2 tax is passed entirely to the energy prices, the effect of the CO2 tax on the energy prices is the same as the effect of the tax on the production costs of energy from coal.
2.6 The investment costs in energy plants Investment costs in energy plants are usually reported by using specific investment costs received by dividing the total investment cost by the power (or heat) capacity of the plant.8 In the model, we use power generation capacity. Hence, to adjust investment costs to power generation capacity, we make the following calculation adjusted investment cost= total investment cost/power generation capacity= specific investment cost/annual operating hours where specific investment cost=total investment cost/power capacity power capacity=maximum amount of power that plant can produce power generation capacity= amount of power that plant can produce over a specific period of time (usually a year) There might be variation in the annual operating hours of energy plants, because some plants are operative only during a high demand. Maximal annual operating hours of energy plants is 8760h per year (=24x365), but we make a conservative assumption that that average operating hours are 7000h (=80% of 8760).
We determined the investment cost by using representative energy plants (e.g., Tarjanne and Kivistö 2008). The specific investment costs in energy wood plants are higher than those in coal plants, because the coal plants use cheaper technology and they are bigger.9 10 The specific investments costs in power plants are higher than the investment costs in heat plants, because power plants must have a boiler and a turbine while heat plants have just a boiler.
Consequently, we choose to use the following adjusted investment costs:
8 For power plants we use power capacity while for heat plants we use heat capacity. For chp plants power capacity even is normally used if they produce also heat. 9 Traditional pulverized coal-fired boiler can co-fire only 10-15 % biomass with coal. Higher proportion of biomass requires gasification technology, which is 20-30% more expensive to build. 10 Coal plants are big due to technological reasons. Moreover, coal is usually transported by sea, which allows bigger plant size. Energy wood is usually transported by land, which increases transport costs and restricts the size of biomass plants. It is often not profitable to transport energy wood further than 50 kilometers. Hence, the size of energy wood plant is restricted by the availability of energy wood within 50 kilometers.

292
Table 4: Investment costs of power and chp-plants Power
capacity Total investment costs
Specific investment cost
Adjusted investment cost
MW mill. € €/kW €/MWh Coal plant (power)
500 620 1300 200
Energy wood plant (power)
30 80 2700 400
Coal plant (CHP)
500 1000 2000 300
Energy wood plant (CHP)
30 80 2700 400
Table 5: Investment costs of heat plants Heat
capacity Total investment costs
Specific investment cost
Adjusted investment cost
MW mill. € €/kW €/MWh €/GJ Coal plant (heat)
30 25 800 110 30
Energy wood plant (heat)
5 2 400 60 20
3. Results To keep things simple, we consider only the aggregate level results.11 In order to consider CO2 tax effect on the energy wood and coal use we analyze two different scenarios. In the first scenario we assume that CO2 tax is 20 euro/tCO2 for all periods. In this case the use of coal and energy wood remains almost unchanged over time.
11 Aggregate term EU32 includes the following regions: Austria, Belgium, Belarus, Bosnia& Herzegovina, Bulgaria, Croatia, Czech Republic, Denmark, Estonia, Finland, France, Germany, Greece, Hungary, Ireland, Italy, Latvia, Lithuania, Netherlands, Norway, Poland, Portugal, Romania, Russian, Serbia, Slovakia, Slovenia, Spain, Sweden, Switzerland, Ukraine and UK.
0
2000
4000
6000
8000
10000
12000
14000
16000
2010 2015 2020
heat and power plants fuel input EU32 (PJ) coal
coal
0
500
1000
1500
2000
2500
3000
2010 2015 2020
heat and power plants fuel input EU32 (PJ) energy_wood
energy_wood
0
100
200
300
400
500
2010 2015 2020
heat and power plants fuel input EU32 (mill. m3) energy_wood
blackliquorbark
forestchipsreclwood
dustsawdust
HWsawchipsSWsawchipsSWPulpLogsHWPulpLogs

293
Table 4: Investment costs of power and chp-plants Power
capacity Total investment costs
Specific investment cost
Adjusted investment cost
MW mill. € €/kW €/MWh Coal plant (power)
500 620 1300 200
Energy wood plant (power)
30 80 2700 400
Coal plant (CHP)
500 1000 2000 300
Energy wood plant (CHP)
30 80 2700 400
Table 5: Investment costs of heat plants Heat
capacity Total investment costs
Specific investment cost
Adjusted investment cost
MW mill. € €/kW €/MWh €/GJ Coal plant (heat)
30 25 800 110 30
Energy wood plant (heat)
5 2 400 60 20
3. Results To keep things simple, we consider only the aggregate level results.11 In order to consider CO2 tax effect on the energy wood and coal use we analyze two different scenarios. In the first scenario we assume that CO2 tax is 20 euro/tCO2 for all periods. In this case the use of coal and energy wood remains almost unchanged over time.
11 Aggregate term EU32 includes the following regions: Austria, Belgium, Belarus, Bosnia& Herzegovina, Bulgaria, Croatia, Czech Republic, Denmark, Estonia, Finland, France, Germany, Greece, Hungary, Ireland, Italy, Latvia, Lithuania, Netherlands, Norway, Poland, Portugal, Romania, Russian, Serbia, Slovakia, Slovenia, Spain, Sweden, Switzerland, Ukraine and UK.
0
2000
4000
6000
8000
10000
12000
14000
16000
2010 2015 2020
heat and power plants fuel input EU32 (PJ) coal
coal
0
500
1000
1500
2000
2500
3000
2010 2015 2020
heat and power plants fuel input EU32 (PJ) energy_wood
energy_wood
0
100
200
300
400
500
2010 2015 2020
heat and power plants fuel input EU32 (mill. m3) energy_wood
blackliquorbark
forestchipsreclwood
dustsawdust
HWsawchipsSWsawchipsSWPulpLogsHWPulpLogs
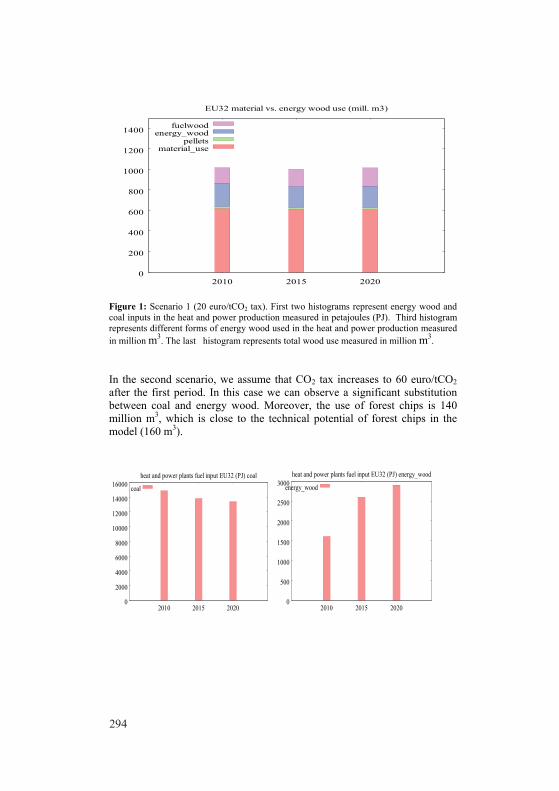
294
0
200
400
600
800
1000
1200
1400
2010 2015 2020
EU32 material vs. energy wood use (mill. m3)
fuelwoodenergy_wood
pelletsmaterial_use
Figure 1: Scenario 1 (20 euro/tCO2 tax). First two histograms represent energy wood and coal inputs in the heat and power production measured in petajoules (PJ). Third histogram represents different forms of energy wood used in the heat and power production measured in million m3. The last histogram represents total wood use measured in million m3. In the second scenario, we assume that CO2 tax increases to 60 euro/tCO2 after the first period. In this case we can observe a significant substitution between coal and energy wood. Moreover, the use of forest chips is 140 million m3, which is close to the technical potential of forest chips in the model (160 m3).
0
2000
4000
6000
8000
10000
12000
14000
16000
2010 2015 2020
heat and power plants fuel input EU32 (PJ) coal
coal
0
500
1000
1500
2000
2500
3000
2010 2015 2020
heat and power plants fuel input EU32 (PJ) energy_wood
energy_wood
0
100
200
300
400
500
2010 2015 2020
heat and power plants fuel input EU32 (mill. m3) energy_wood
blackliquorbark
forestchipsreclwood
dustsawdust
HWsawchipsSWsawchipsSWPulpLogsHWPulpLogs
0
200
400
600
800
1000
1200
1400
2010 2015 2020
EU32 material vs. energy wood use (mill. m3)
fuelwoodenergy_wood
pelletsmaterial_use
Figure 2: Scenario 2 (60 euro/tCO2 tax). First two histograms represent energy wood and coal inputs in the heat and power production measured in petajoules (PJ). Third histogram represents different forms of energy wood used in the heat and power production measured in million m3. The last histogram represents total wood use measured in million m3. 4. Conclusions In this paper, we explored the effects of CO2 emission trading system on the substitution between coal and energy wood. Our results suggest that the CO2 emission trading system alone gives incentives for heat and power plants to increase energy wood demand in the limits of energy wood potential. It seems that the use of energy wood is restricted more by the supply of energy wood than the demand of energy wood. Hence, for more conclusive results, we need to consider the supply side of energy wood in more detail. The

295
0
200
400
600
800
1000
1200
1400
2010 2015 2020
EU32 material vs. energy wood use (mill. m3)
fuelwoodenergy_wood
pelletsmaterial_use
Figure 1: Scenario 1 (20 euro/tCO2 tax). First two histograms represent energy wood and coal inputs in the heat and power production measured in petajoules (PJ). Third histogram represents different forms of energy wood used in the heat and power production measured in million m3. The last histogram represents total wood use measured in million m3. In the second scenario, we assume that CO2 tax increases to 60 euro/tCO2 after the first period. In this case we can observe a significant substitution between coal and energy wood. Moreover, the use of forest chips is 140 million m3, which is close to the technical potential of forest chips in the model (160 m3).
0
2000
4000
6000
8000
10000
12000
14000
16000
2010 2015 2020
heat and power plants fuel input EU32 (PJ) coal
coal
0
500
1000
1500
2000
2500
3000
2010 2015 2020
heat and power plants fuel input EU32 (PJ) energy_wood
energy_wood
0
100
200
300
400
500
2010 2015 2020
heat and power plants fuel input EU32 (mill. m3) energy_wood
blackliquorbark
forestchipsreclwood
dustsawdust
HWsawchipsSWsawchipsSWPulpLogsHWPulpLogs
0
200
400
600
800
1000
1200
1400
2010 2015 2020
EU32 material vs. energy wood use (mill. m3)
fuelwoodenergy_wood
pelletsmaterial_use
Figure 2: Scenario 2 (60 euro/tCO2 tax). First two histograms represent energy wood and coal inputs in the heat and power production measured in petajoules (PJ). Third histogram represents different forms of energy wood used in the heat and power production measured in million m3. The last histogram represents total wood use measured in million m3. 4. Conclusions In this paper, we explored the effects of CO2 emission trading system on the substitution between coal and energy wood. Our results suggest that the CO2 emission trading system alone gives incentives for heat and power plants to increase energy wood demand in the limits of energy wood potential. It seems that the use of energy wood is restricted more by the supply of energy wood than the demand of energy wood. Hence, for more conclusive results, we need to consider the supply side of energy wood in more detail. The

296
energy wood potential in EU27 is estimated by e.g., Asikainen et al. (2008) and in Russia by Gerasimov and Karjalainen (2009). The essential question in the estimation of the energy wood potential is how much complementary fellings from the surplus forest growth can be mobilized to energy wood supply in the future.
Furthermore, there are yet some aspects lacking from the analysis, which could be considered in the next stage. First, we ignored co-firing of coal with wood or other biomass. Co-firing has been regarded as an economical and easy to implement solution to increase energy wood use in the existing power plants (Hansson et al. 2009). Secondly, we ignored co-production of transport fuels and heat and power. This is a potential future technology, which might increase energy wood use. Finally, we do not allow possibility to replace coal with other fuels than wood (gas, waste etc.) or other forms of energy production (nuclear power, solar power, wind power etc.). Including these aspects in the analysis might increase (co-firing of wood with coal in the present units) or decrease (allowing for the substitution of coal with other fuels than wood, including the rivaling use of woody biomass in the production of transport fuels) the use of energy wood for the heat and power production in our scenarios. Acknowledgements The research leading to these results has been supported by the European Community's Seventh Framework Programme (FP7) under grant agreement n° 212535, Climate Change - Terrestrial Adaptation and Mitigation in Europe (CC-TAME), http://www.cctame.eu. References Asikainen, A., Liiri, H., Peltola, S., Karjalainen, T. and J. Laitila, 2008,
Forest energy potential in Europe (EU27), Working Papers of the Finnish Forest Research Institute 69. 33 p.
Adams, D., Alig, R., Callaway, J., McCarl, B. and S.Winnett, 1996, The Forest and Agricultural Sector Optimization Model (FASOM): Model Structure and Policy Applications. Research Paper, United States Forest Service.
Buongiorno, J., Zhu, S., Zhang, D., Turner, J. and D. Tomberlin, 2003, The Global Forest Sector Model, Elsevier.
Gerasimov, Y. and T. Karjalainen, 2009. Assessment of energy wood resources in Northwest Russia. Working Papers of the Finnish Forest Research Institute 108. 52 p.
Hansson, J., Berndes, G., Johansson, F., Kjärstad, J. 2009. Co-firing biomass with coal for electricity generation – An assessment of the potential in EU27. Energy Policy 37 (2009), 1444–1455.
Kallio, M., 2010, Accounting for uncertainty in a forest sector model using Monte Carlo simulation, Forest Policy and Economics 12, 9–16.
Kallio, M., Moiseyev, A. & Solberg, B. 2004. The Global Forest Sector Model EFI-GTM - the model structure. EFI Technical Report 15. 24 p.
Ryymin, R., Pohto, P., Laitila, J., Humala, I., Rajahonka, M., Kallio, J., Selosmaa J., Anttila P. and T. Lehtoranta, 2008, Metsäenergian hankinnan uudistaminen. HSE Executive Education.
Samuelson, P., 1952, Spatial price equilibrium and linear programming, American Economic Review 42, 283-303.
Schneider, U.A., Balkovic, J., De Cara, S., Franklin, O., Fritz, S., Havlik, P., Huck, I., Jantke, K., Kallio, A.M.I., Kraxner, F., Moiseyev, A., Obersteiner, M., Ramos, C.I., Schleupner, C., Schmid, E., Schwab, D. & Skalsky, R. 2008. The European Forest and Agricultural Sector Optimization Model - EUFASOM. Working Papers, Research Unit Sustainablity and Global Change, Hamburg University and Centre for Marine and Atmosperic Change FNU-156.
Tarjanne, R. and A. Kivistö, 2008, Sähkön tuotantokustannusvertailu, Lappeenranta University of Technology research report EN B-175.
Data IEA, 2010, database available in www.iea.org FAOSTAT, 2010, database available in www.fao.org EUROSTAT, 2010, database available epp.eurostat.ec.europa.eu

297
energy wood potential in EU27 is estimated by e.g., Asikainen et al. (2008) and in Russia by Gerasimov and Karjalainen (2009). The essential question in the estimation of the energy wood potential is how much complementary fellings from the surplus forest growth can be mobilized to energy wood supply in the future.
Furthermore, there are yet some aspects lacking from the analysis, which could be considered in the next stage. First, we ignored co-firing of coal with wood or other biomass. Co-firing has been regarded as an economical and easy to implement solution to increase energy wood use in the existing power plants (Hansson et al. 2009). Secondly, we ignored co-production of transport fuels and heat and power. This is a potential future technology, which might increase energy wood use. Finally, we do not allow possibility to replace coal with other fuels than wood (gas, waste etc.) or other forms of energy production (nuclear power, solar power, wind power etc.). Including these aspects in the analysis might increase (co-firing of wood with coal in the present units) or decrease (allowing for the substitution of coal with other fuels than wood, including the rivaling use of woody biomass in the production of transport fuels) the use of energy wood for the heat and power production in our scenarios. Acknowledgements The research leading to these results has been supported by the European Community's Seventh Framework Programme (FP7) under grant agreement n° 212535, Climate Change - Terrestrial Adaptation and Mitigation in Europe (CC-TAME), http://www.cctame.eu. References Asikainen, A., Liiri, H., Peltola, S., Karjalainen, T. and J. Laitila, 2008,
Forest energy potential in Europe (EU27), Working Papers of the Finnish Forest Research Institute 69. 33 p.
Adams, D., Alig, R., Callaway, J., McCarl, B. and S.Winnett, 1996, The Forest and Agricultural Sector Optimization Model (FASOM): Model Structure and Policy Applications. Research Paper, United States Forest Service.
Buongiorno, J., Zhu, S., Zhang, D., Turner, J. and D. Tomberlin, 2003, The Global Forest Sector Model, Elsevier.
Gerasimov, Y. and T. Karjalainen, 2009. Assessment of energy wood resources in Northwest Russia. Working Papers of the Finnish Forest Research Institute 108. 52 p.
Hansson, J., Berndes, G., Johansson, F., Kjärstad, J. 2009. Co-firing biomass with coal for electricity generation – An assessment of the potential in EU27. Energy Policy 37 (2009), 1444–1455.
Kallio, M., 2010, Accounting for uncertainty in a forest sector model using Monte Carlo simulation, Forest Policy and Economics 12, 9–16.
Kallio, M., Moiseyev, A. & Solberg, B. 2004. The Global Forest Sector Model EFI-GTM - the model structure. EFI Technical Report 15. 24 p.
Ryymin, R., Pohto, P., Laitila, J., Humala, I., Rajahonka, M., Kallio, J., Selosmaa J., Anttila P. and T. Lehtoranta, 2008, Metsäenergian hankinnan uudistaminen. HSE Executive Education.
Samuelson, P., 1952, Spatial price equilibrium and linear programming, American Economic Review 42, 283-303.
Schneider, U.A., Balkovic, J., De Cara, S., Franklin, O., Fritz, S., Havlik, P., Huck, I., Jantke, K., Kallio, A.M.I., Kraxner, F., Moiseyev, A., Obersteiner, M., Ramos, C.I., Schleupner, C., Schmid, E., Schwab, D. & Skalsky, R. 2008. The European Forest and Agricultural Sector Optimization Model - EUFASOM. Working Papers, Research Unit Sustainablity and Global Change, Hamburg University and Centre for Marine and Atmosperic Change FNU-156.
Tarjanne, R. and A. Kivistö, 2008, Sähkön tuotantokustannusvertailu, Lappeenranta University of Technology research report EN B-175.
Data IEA, 2010, database available in www.iea.org FAOSTAT, 2010, database available in www.fao.org EUROSTAT, 2010, database available epp.eurostat.ec.europa.eu

2981
The patterns and determinants of sustainability disclosure in the global forest industry
Ning Li1, Anne Toppinen1, Anni Tuppura2
Kaisu Puumalainen2 and Maija Hujala2
1Department of Forest Sciences, University of Helsinki
2 School of Business, Lappeenranta University of Technology Abstract Literature assessing the quantity and quality of voluntary social and environmental reporting has shown critical reflections regarding the quality and reliability, the (largely) qualitative nature of disclosure with lack of measurability, credibility or comparability, and information being biased and self-laudatory in nature with minimal disclosure of negative information. Among environmentally-sensitive sectors, forest-based industry has a crucial role in global sustainable development, not only because of its unique raw material basis, but also because of the ongoing industry globalization in the emerging and developing countries. The contribution of this study is important in at least two dimensions: first, providing empirical quantitative insight regarding the current patterns in responsibility disclosure of the forest-based sector at a global level; and second, by taking a quantitative approach in investigating determinants of the disclosure. Changing patterns in the economic, environmental and social performance of the forest-based industry were analyzed using the Global Reporting Initiative (GRI) framework, which represents an international cooperative effort to establish sustainability reporting guidelines for voluntary use by organizations worldwide. We seek to shed more light on what are the key responsibility or sustainability issues the global forest companies address, and which of the firm and industry level determinants are significant on the quality of disclosure? Sustainability disclosure of 66 top forest industry companies is first content analyzed based on the GRI framework, after which significance of industry and firm characteristics, including geographic location, business line and financial performance, will be used as testing the determinants influencing the quality and level of disclosure. Based on the content analysis, more emphasis was found to be placed on the environmental and economic responsibility in contrast to areas concerning human rights, labour practices, social and product responsibility in the forestry sector. Main findings from the regression modeling include a significant positive effect from company size on the quality and extent of
2
CR reporting practices in the forest industry; no effect from the financial performance; little regional variation; and illustration of difference in disclosure orientation between integrated forest industry companies and those with more narrowly focused business. From the managerial perspective, in the future, business leaders in the forest industry are expected to adopt a more proactive role not only in reducing the environmental footprint or promoting sustainable forest management, but also in furthering social goals. Keywords: forest-based industry, corporate disclosure, Global Reporting Initiative, resource-based view, regression analysis 1. Introduction Accompanying the ever-growing public consensus of sustainable development, the recent corporate scandals have triggered the criticism of the conventional financial reporting (Guthrie and Boedker, 2006) and its ability and accountability to report business activities of a firm (Elkington, 1997). A number of reporting frameworks have been developed to integrate economic, environmental and social performances into a composite whole unified account (see, for example, Yongvanich and Guthrie, 2006), including different indicators, indexes, measurements and systems that vary and prevail from industry to industry, from region to region. To date there is no universal framework existing. Global Reporting Initiative (GRI) deserves most attention among the few most important drivers for the quality of sustainability reports, besides the Triple Bottom Line, Balanced Scorecard, Intellectual Capital, the award schemes by The Association of Chartered Certified Accountants (ACCA) etc. Despite a growing wealth of disclosure literature in the area of many industries (e.g. oil and gas, financing, banking, mining etc.), research on CR/sustainability reporting (hereafter CR reporting) based on the GRI reporting framework has been scarce. This is so especially in the forest-based industry, which is believed to play a crucial role in global sustainability development. The growing public interest in and global consciousness of environmental and social issues has also intensified pressures on forest industry companies in their efforts to effectively balance potentially conflicting stakeholder demands, and forced to rethink their business strategies. Research in the field of CR reporting is motivated by a desire to see improvement in the sustainability performance of companies (Adams and Larrinaga Gonzalez, 2007), but assumptions have often been made on using a qualitative analysis. This study aims to investigate the changing patterns of differences on the economic, environmental and social performances in the case of forest-based industry by using the GRI Reporting Framework. The findings of the

2991
The patterns and determinants of sustainability disclosure in the global forest industry
Ning Li1, Anne Toppinen1, Anni Tuppura2
Kaisu Puumalainen2 and Maija Hujala2
1Department of Forest Sciences, University of Helsinki
2 School of Business, Lappeenranta University of Technology Abstract Literature assessing the quantity and quality of voluntary social and environmental reporting has shown critical reflections regarding the quality and reliability, the (largely) qualitative nature of disclosure with lack of measurability, credibility or comparability, and information being biased and self-laudatory in nature with minimal disclosure of negative information. Among environmentally-sensitive sectors, forest-based industry has a crucial role in global sustainable development, not only because of its unique raw material basis, but also because of the ongoing industry globalization in the emerging and developing countries. The contribution of this study is important in at least two dimensions: first, providing empirical quantitative insight regarding the current patterns in responsibility disclosure of the forest-based sector at a global level; and second, by taking a quantitative approach in investigating determinants of the disclosure. Changing patterns in the economic, environmental and social performance of the forest-based industry were analyzed using the Global Reporting Initiative (GRI) framework, which represents an international cooperative effort to establish sustainability reporting guidelines for voluntary use by organizations worldwide. We seek to shed more light on what are the key responsibility or sustainability issues the global forest companies address, and which of the firm and industry level determinants are significant on the quality of disclosure? Sustainability disclosure of 66 top forest industry companies is first content analyzed based on the GRI framework, after which significance of industry and firm characteristics, including geographic location, business line and financial performance, will be used as testing the determinants influencing the quality and level of disclosure. Based on the content analysis, more emphasis was found to be placed on the environmental and economic responsibility in contrast to areas concerning human rights, labour practices, social and product responsibility in the forestry sector. Main findings from the regression modeling include a significant positive effect from company size on the quality and extent of
2
CR reporting practices in the forest industry; no effect from the financial performance; little regional variation; and illustration of difference in disclosure orientation between integrated forest industry companies and those with more narrowly focused business. From the managerial perspective, in the future, business leaders in the forest industry are expected to adopt a more proactive role not only in reducing the environmental footprint or promoting sustainable forest management, but also in furthering social goals. Keywords: forest-based industry, corporate disclosure, Global Reporting Initiative, resource-based view, regression analysis 1. Introduction Accompanying the ever-growing public consensus of sustainable development, the recent corporate scandals have triggered the criticism of the conventional financial reporting (Guthrie and Boedker, 2006) and its ability and accountability to report business activities of a firm (Elkington, 1997). A number of reporting frameworks have been developed to integrate economic, environmental and social performances into a composite whole unified account (see, for example, Yongvanich and Guthrie, 2006), including different indicators, indexes, measurements and systems that vary and prevail from industry to industry, from region to region. To date there is no universal framework existing. Global Reporting Initiative (GRI) deserves most attention among the few most important drivers for the quality of sustainability reports, besides the Triple Bottom Line, Balanced Scorecard, Intellectual Capital, the award schemes by The Association of Chartered Certified Accountants (ACCA) etc. Despite a growing wealth of disclosure literature in the area of many industries (e.g. oil and gas, financing, banking, mining etc.), research on CR/sustainability reporting (hereafter CR reporting) based on the GRI reporting framework has been scarce. This is so especially in the forest-based industry, which is believed to play a crucial role in global sustainability development. The growing public interest in and global consciousness of environmental and social issues has also intensified pressures on forest industry companies in their efforts to effectively balance potentially conflicting stakeholder demands, and forced to rethink their business strategies. Research in the field of CR reporting is motivated by a desire to see improvement in the sustainability performance of companies (Adams and Larrinaga Gonzalez, 2007), but assumptions have often been made on using a qualitative analysis. This study aims to investigate the changing patterns of differences on the economic, environmental and social performances in the case of forest-based industry by using the GRI Reporting Framework. The findings of the

3003
study can be compared with the earlier research in forest industry (e.g. Vidal and Kozak, 2008a, 2008b; Mikkilä and Toppinen, 2008). However, we also provide new insights into the state-of-art of CR reporting in the forest-based industry, particularly from quantitative perspective, by focusing on examining the patterns and determinants of CR reporting within the largest companies in the industry. The study also extends the current literature by providing a novel assessment of (voluntary) reporting guideline of the GRI Reporting Framework. 2. Theoretical background 2.1 GRI Guidelines for corporate reporting The availability of environmental and social performance data is critical in current business environment, providing a basis for social and environmental analysis. It is also a key component of financial performance analysis, because current financial disclosure requirements do not reveal all of the risks, liabilities, or advantages associated with a corporation’s activity. Disclosures on corporate environmental and social performance are also viewed as a commitment to transparency and efforts to address social and environmental risks as indicators of strong corporate governance. Overall, there are indications (e.g., Freeman, 1984) aligning with resource-based view (RVB) that company’s strong performance in addressing primary stakeholder (e.g., shareholder, employee, customer and supplier, and communities) benefits can create long-term shareholder value through the development of intangible valuable assets into competitive advantage.
The GRI guidelines are considered the most comprehensive reporting framework available, and they have gained broad credibility through a rigorous, global multi-stakeholder feedback process. The GRI guidelines provide a standard for report content, including suggested performance indicators. Beyond these specific indicators, at the heart of the GRI is a commitment to eleven reporting principles: transparency, inclusiveness, auditability, clarity, completeness, relevance, sustainability context, accuracy, neutrality, comparability, clarity and timeliness (each of these is explained in detail within the GRI guideline document). These principles can be viewed as bedrocks for all credible corporate sustainability reporting. The good faith efforts to apply these principles result in reports that are more valuable for report users and the companies engaged in reporting alike.
The GRI was developed, in part, to reduce the number of different ways companies are asked to report on their performance (i.e., survey fatigue). The World Business Council for Sustainable development (WBCSD) estimates that the GRI covers 80 percent of the data asked for across the range of standard SRI-related screening and benchmarking surveys. A growing number of companies have declared their adoption of GRI in their
4
reporting. Companies are also encouraged to work towards reporting “in accordance” with the GRI guidelines, this status gives companies the flexibility to choose which performance indicators to use, but requires them to include an explanation if they do not report on all of the core GRI indicators. 2.2 Previous research on corporate disclosure and research hypotheses Studies on assessing the quantity and quality of voluntary social and environmental reporting have shown critical reflections on corporate reporting regarding the quality and reliability (Gallhofer and Haslam, 1997); the (largely) qualitative nature (annual report disclosures in particular) (Deegan and Gordon (1996); and the measurability, credibility or comparability (Gray, 2006; Elkington, 1999; Deegan & Gordon, 1996; UNEP, 1996); and being biased and self-laudatory in nature, with minimal disclosure of negative information (Deegan & Rankin, 1996; Deegan & Gordon, 1993).
Research on CR in the forest-based industry is, however, heavily dominated by qualitatively oriented studies, often based on a limited number of regional case companies. Recent CR research in the forest-based industry (see e.g. Vidal and Kozak, 2008a, 2008b; Mikkilä and Toppinen, 2008) has raised doubts whether CR still remains part of business communication with the principal aim of improving corporate reputation, constraining rhetoric from reality.
While CR disclosure studies focused on forest-based industries are scarce, the literature in general is rich. Studies on the relationship between the extent of corporate disclosure in annual reports and corporate characteristics show that companies may increase social or environmental disclosures in response to societal pressure (Hogner, 1982) and various corporate characteristics may influence the extent of the disclosures (see e.g., Roberts, 1992; Patten, 1991, 1992; Cowen et al., 1987; Trotman and Bradley, 1981).
Several empirical studies have found that the size of the firm or the industry sector has influence on the scale and quality of the disclosure and larger firms tend to have more extensive disclosures (e.g., Reverte 2009; Brammer and Pavelin, 2008; Branco and Rodrigues 2008; Cormier and Magnan, 2003; Hacston and Milne, 1996). Additionally, factors such as being on the stock market (e.g., da Silva Monteiro and Aibar-Guzmán, 2009), having a higher media exposure (Reverte, 2009; Branco and Rodrigues, 2008), perceived firm risk (volatility) and ownership (Cormier et al., 2005) among others seem to be related to the extent of CR disclosure.
In addition to that the larger firms disclose more information than smaller firms (see, e.g., Purushothaman et al., 2000; Adams et al., 1998; Neu et al., 1998; Meek et al., 1995; Patten, 1991), larger firms are also

3013
study can be compared with the earlier research in forest industry (e.g. Vidal and Kozak, 2008a, 2008b; Mikkilä and Toppinen, 2008). However, we also provide new insights into the state-of-art of CR reporting in the forest-based industry, particularly from quantitative perspective, by focusing on examining the patterns and determinants of CR reporting within the largest companies in the industry. The study also extends the current literature by providing a novel assessment of (voluntary) reporting guideline of the GRI Reporting Framework. 2. Theoretical background 2.1 GRI Guidelines for corporate reporting The availability of environmental and social performance data is critical in current business environment, providing a basis for social and environmental analysis. It is also a key component of financial performance analysis, because current financial disclosure requirements do not reveal all of the risks, liabilities, or advantages associated with a corporation’s activity. Disclosures on corporate environmental and social performance are also viewed as a commitment to transparency and efforts to address social and environmental risks as indicators of strong corporate governance. Overall, there are indications (e.g., Freeman, 1984) aligning with resource-based view (RVB) that company’s strong performance in addressing primary stakeholder (e.g., shareholder, employee, customer and supplier, and communities) benefits can create long-term shareholder value through the development of intangible valuable assets into competitive advantage.
The GRI guidelines are considered the most comprehensive reporting framework available, and they have gained broad credibility through a rigorous, global multi-stakeholder feedback process. The GRI guidelines provide a standard for report content, including suggested performance indicators. Beyond these specific indicators, at the heart of the GRI is a commitment to eleven reporting principles: transparency, inclusiveness, auditability, clarity, completeness, relevance, sustainability context, accuracy, neutrality, comparability, clarity and timeliness (each of these is explained in detail within the GRI guideline document). These principles can be viewed as bedrocks for all credible corporate sustainability reporting. The good faith efforts to apply these principles result in reports that are more valuable for report users and the companies engaged in reporting alike.
The GRI was developed, in part, to reduce the number of different ways companies are asked to report on their performance (i.e., survey fatigue). The World Business Council for Sustainable development (WBCSD) estimates that the GRI covers 80 percent of the data asked for across the range of standard SRI-related screening and benchmarking surveys. A growing number of companies have declared their adoption of GRI in their
4
reporting. Companies are also encouraged to work towards reporting “in accordance” with the GRI guidelines, this status gives companies the flexibility to choose which performance indicators to use, but requires them to include an explanation if they do not report on all of the core GRI indicators. 2.2 Previous research on corporate disclosure and research hypotheses Studies on assessing the quantity and quality of voluntary social and environmental reporting have shown critical reflections on corporate reporting regarding the quality and reliability (Gallhofer and Haslam, 1997); the (largely) qualitative nature (annual report disclosures in particular) (Deegan and Gordon (1996); and the measurability, credibility or comparability (Gray, 2006; Elkington, 1999; Deegan & Gordon, 1996; UNEP, 1996); and being biased and self-laudatory in nature, with minimal disclosure of negative information (Deegan & Rankin, 1996; Deegan & Gordon, 1993).
Research on CR in the forest-based industry is, however, heavily dominated by qualitatively oriented studies, often based on a limited number of regional case companies. Recent CR research in the forest-based industry (see e.g. Vidal and Kozak, 2008a, 2008b; Mikkilä and Toppinen, 2008) has raised doubts whether CR still remains part of business communication with the principal aim of improving corporate reputation, constraining rhetoric from reality.
While CR disclosure studies focused on forest-based industries are scarce, the literature in general is rich. Studies on the relationship between the extent of corporate disclosure in annual reports and corporate characteristics show that companies may increase social or environmental disclosures in response to societal pressure (Hogner, 1982) and various corporate characteristics may influence the extent of the disclosures (see e.g., Roberts, 1992; Patten, 1991, 1992; Cowen et al., 1987; Trotman and Bradley, 1981).
Several empirical studies have found that the size of the firm or the industry sector has influence on the scale and quality of the disclosure and larger firms tend to have more extensive disclosures (e.g., Reverte 2009; Brammer and Pavelin, 2008; Branco and Rodrigues 2008; Cormier and Magnan, 2003; Hacston and Milne, 1996). Additionally, factors such as being on the stock market (e.g., da Silva Monteiro and Aibar-Guzmán, 2009), having a higher media exposure (Reverte, 2009; Branco and Rodrigues, 2008), perceived firm risk (volatility) and ownership (Cormier et al., 2005) among others seem to be related to the extent of CR disclosure.
In addition to that the larger firms disclose more information than smaller firms (see, e.g., Purushothaman et al., 2000; Adams et al., 1998; Neu et al., 1998; Meek et al., 1995; Patten, 1991), larger firms are also

3025
significantly more adept at communicating their investment (Knox et al., 2005). Rowley et al. (2000) observes that firm size is related to stakeholder actions. Market leaders in terms of revenues, market share, or total assets are more likely attacked by stakeholder action.
In the line of thinking based on the prior research discussed above, we expect that size plays an influencing role in determining corporate disclosure.
Hypothesis 1: There is positive effect of the size of company on the corporate disclosure in the forest-based industry.
Good management theory and slack resource theory both support the assumption that corporate social performance (CSP) is positively associated with financial performance (see, e.g., Orlizky et al., 2003; Waddock and Graves, 1997). Proponents of good management advert that high levels of CSP are indicators of superior management competence, which will lead to improved stakeholder relationships and better performance (Waddock and Graves, 1997; Freeman, 1984). Furthermore, positive customer perceptions on the company (i.e., product nature and quality, environmental awareness, public relations, and community involvement (Prahalad and Hamel, 1994) have become important sources of competitive advantage (McGuire et al., 1990; McGuire et al., 1988). Proponents of slack resources argue, alternatively, that higher financial performance would be indicator of better CSP (McGuire et al. 1988; 1990). On the other hand, both behaviour theory and empirical studies on publicly traded companies suggest that slack resources have positive influence on financial performance (George, 2005), which in turn enables the company to pursue desirable CSP.
A meta-analysis based on 80 samples from 66 studies by Daniel et al. (2004) supports the slack resource theory. By limiting their investigation to financial slack (e.g., liquidity) and performance (e.g., profitability), the authors found that all the three types of slack resources (available, recoverable, and potential) are positively associated with financial performance. However, it should be noted that a number of recent studies on the relationship between disclosure and firm profitability did not find significant relationship (e.g., da Silva Monteiro and Aibar-Guzmán, 2009; Reverte, 2009; Brammer and Pavelin 2008; Branco and Rodrigues, 2008; Cormier et al. 2003; Hackston and Milne, 1996).
Hypothesis 2: There is positive effect of profitability on the CR disclosure.
Concern about corporate responsibility has become a worldwide phenomenon, but the focus and degree of concern varies regionally. A range
6
of institutional factors can influence corporate decision-makers in different countries to pay more - or less - attention to particular CR-related issues, for example governmental policies, national culture, the economic development, legal requirements, type of industry, and the level of process technology. A combination of all these factors will likely determine to what extent CR strategies or practices are voluntary or mandatory. For example, literature suggests that North American companies typically adopt the neo-liberal approach to CR, which is prevalent in stimulate a relatively narrow approach to the efficiency-ethics trade-off. In the continental Europe, corporate volunteering is often much less advanced, and more process oriented; participation and membership is more important than output (Meijs and Bridges Karr, 2004). Previous research suggests that CR practices in Asia are not very well advanced and primarily aim at the efficiency and international competitiveness of the industry itself (Tulder and Zwart, 2006). CR-related regulation has been developed primarily in environmental protection, which directly affects the internationalization strategies aimed at markets of developed countries. On the other hand, the Asian companies generally exhibit an inactive orientation on labour and human rights and working conditions (Tulder and Zwart, 2006). In Latin America, CR promotion and public advocacy is well established by a range of external agents through cooperation and CR is particularly associated with social commitment. The large contrast between rich and poor and the discrimination against minorities in the labour market lead to a number of specific priorities, such as labour welfare, discrimination. The subject of health and safety in the work place also deserves a great of attention.
Accordingly, we expect that corporate attention, as expressed in the CR reporting, will vary across continents. Based on previous literature, the environmental reporting in Europe and North America could be expected to be higher than in other continents. On the other hand, Latin and African companies are expected pay more attention to a number of priorities, such as discrimination, inequality, corruption, and democracy.
Hypothesis 3: Country of origin has an impact on CR disclosure in the forest-based industry.
The characteristics of an industry can make the nature of corporation unique based on different internal characteristics and external demands (Griffin and Mahon, 1997), and the nature of stakeholder actions appears to be an important influence on CSP and different industries face different portfolios of stakeholders with different degrees of activity in different areas (Griffin and Mahon, 1997; Rowley and Berman 2000). Industries within environmentally sensitive industries were found to report more on environmental (see, e.g., Roberts, 1992; Polonsky and Zeffane, 1992) and

3035
significantly more adept at communicating their investment (Knox et al., 2005). Rowley et al. (2000) observes that firm size is related to stakeholder actions. Market leaders in terms of revenues, market share, or total assets are more likely attacked by stakeholder action.
In the line of thinking based on the prior research discussed above, we expect that size plays an influencing role in determining corporate disclosure.
Hypothesis 1: There is positive effect of the size of company on the corporate disclosure in the forest-based industry.
Good management theory and slack resource theory both support the assumption that corporate social performance (CSP) is positively associated with financial performance (see, e.g., Orlizky et al., 2003; Waddock and Graves, 1997). Proponents of good management advert that high levels of CSP are indicators of superior management competence, which will lead to improved stakeholder relationships and better performance (Waddock and Graves, 1997; Freeman, 1984). Furthermore, positive customer perceptions on the company (i.e., product nature and quality, environmental awareness, public relations, and community involvement (Prahalad and Hamel, 1994) have become important sources of competitive advantage (McGuire et al., 1990; McGuire et al., 1988). Proponents of slack resources argue, alternatively, that higher financial performance would be indicator of better CSP (McGuire et al. 1988; 1990). On the other hand, both behaviour theory and empirical studies on publicly traded companies suggest that slack resources have positive influence on financial performance (George, 2005), which in turn enables the company to pursue desirable CSP.
A meta-analysis based on 80 samples from 66 studies by Daniel et al. (2004) supports the slack resource theory. By limiting their investigation to financial slack (e.g., liquidity) and performance (e.g., profitability), the authors found that all the three types of slack resources (available, recoverable, and potential) are positively associated with financial performance. However, it should be noted that a number of recent studies on the relationship between disclosure and firm profitability did not find significant relationship (e.g., da Silva Monteiro and Aibar-Guzmán, 2009; Reverte, 2009; Brammer and Pavelin 2008; Branco and Rodrigues, 2008; Cormier et al. 2003; Hackston and Milne, 1996).
Hypothesis 2: There is positive effect of profitability on the CR disclosure.
Concern about corporate responsibility has become a worldwide phenomenon, but the focus and degree of concern varies regionally. A range
6
of institutional factors can influence corporate decision-makers in different countries to pay more - or less - attention to particular CR-related issues, for example governmental policies, national culture, the economic development, legal requirements, type of industry, and the level of process technology. A combination of all these factors will likely determine to what extent CR strategies or practices are voluntary or mandatory. For example, literature suggests that North American companies typically adopt the neo-liberal approach to CR, which is prevalent in stimulate a relatively narrow approach to the efficiency-ethics trade-off. In the continental Europe, corporate volunteering is often much less advanced, and more process oriented; participation and membership is more important than output (Meijs and Bridges Karr, 2004). Previous research suggests that CR practices in Asia are not very well advanced and primarily aim at the efficiency and international competitiveness of the industry itself (Tulder and Zwart, 2006). CR-related regulation has been developed primarily in environmental protection, which directly affects the internationalization strategies aimed at markets of developed countries. On the other hand, the Asian companies generally exhibit an inactive orientation on labour and human rights and working conditions (Tulder and Zwart, 2006). In Latin America, CR promotion and public advocacy is well established by a range of external agents through cooperation and CR is particularly associated with social commitment. The large contrast between rich and poor and the discrimination against minorities in the labour market lead to a number of specific priorities, such as labour welfare, discrimination. The subject of health and safety in the work place also deserves a great of attention.
Accordingly, we expect that corporate attention, as expressed in the CR reporting, will vary across continents. Based on previous literature, the environmental reporting in Europe and North America could be expected to be higher than in other continents. On the other hand, Latin and African companies are expected pay more attention to a number of priorities, such as discrimination, inequality, corruption, and democracy.
Hypothesis 3: Country of origin has an impact on CR disclosure in the forest-based industry.
The characteristics of an industry can make the nature of corporation unique based on different internal characteristics and external demands (Griffin and Mahon, 1997), and the nature of stakeholder actions appears to be an important influence on CSP and different industries face different portfolios of stakeholders with different degrees of activity in different areas (Griffin and Mahon, 1997; Rowley and Berman 2000). Industries within environmentally sensitive industries were found to report more on environmental (see, e.g., Roberts, 1992; Polonsky and Zeffane, 1992) and
3047
social responsibility (Clark and Gibson-Sweet, 1999; Adams et al., 1998; Patten, 1991) than their counterparts.
Prior research has also observed interesting and substantial differences in reporting practices by different industries (see e.g., Campbell et al. 2003; Cormier and Magnan, 2003; Roberts 1992; Harte and Owen 1991; Cowen et al., 1987; Dierkes and Preston, 1977). More specifically, Dierkes and Preston (1977) found that companies in industries where economic activities modify the environment, such as extractive industries, are more likely to disclose information about environmental impacts than are companies in other industries. Roberts (1992) found that corporations with a high profile (with consumer visibility, high level of political risk, or concentrated intense competition) are more likely to disclose social and environmental responsibility activities than low profile industries. Following the idea that consumers are one conduit to affect corporate economic performance, industries closer in the value chain to (final) consumers would be more likely to face higher levels of stakeholder action, because stakeholders with interests tied to these industries tend to have greater incentive to take action, and important stakeholders such as media, government, non-governmental organizations (NGOs), and class action layers likely get attracted to enable broader stakeholder action.
We expect that the more diversified the company is and with the possession of own forest resources, the greater the pressure from the stakeholders. Accordingly, the following can be hypothesized:
Hypothesis 4: Integrated forest industry companies will disclose more overall than their counterparts which have narrower business focus.
3. Data and methodology The initial samples used in this study included the top 100 forest industry companies listed by Pulp and Paper International (PPI), and the corporate disclosure of 2006 or of the most corresponding years (2005 or 2007) were scrutinised. The reports could be either a separate sustainability or CR reports or, if not available, the annual report (also called ‘integrated report’) if it contained information dealing with environmental, social responsibility and other sustainability issues. A final sample of 66 forest companies met the criteria of this study, which consists of 44 CR/or sustainability reports and 22 annual (integrated) reports. The corresponding figures of financial performance indicator return on capital employed (ROCE) were collected from PricewaterhouseCoopers’ database (PWC, 2008).
Following the GRI reporting framework, this study aims to measure the level of CR-related information disclosed by the sample companies by detecting the presence or absence of items defined by the GRI reporting
8
guidelines. Content analysis was used to measure the CR reporting profile by the sample companies in this study. The content of corporate reports of the sample companies were classified into six categories to capture the aspects based on the GRI reporting framework, including economic, environmental, labour and employment, human rights, social, and product and service. In order to transform words of the target reports into quantitatively measureable data, first of all, original texts were classified into analyzable data language according to classification frame based on GRI framework, where each indicator consisted of several exact clauses explaining it more clearly and precisely. In this study, a total of 79 indicators were identified to measure the six domains of sustainability under the GRI reporting framework. There are various clauses pertaining to each indicator defined by the framework. Each item of disclosure pertaining to any of the categories is treated equally important in coding by being assigned a point. An item appearing more than once will not receive a second point. To ensure the coding accuracy and improved reliability and validity, a two-tier independent coding was conducted, and to improve reliability, results were cross-checked by both researchers so that the classification of the texts would correspond to the same standard. The final scores of each indicator are divided into a range of scales (1-5), where 1 means that no information is disclosed and 5 stands for complete information are provided.
One of the main limitations of this form of content analysis is that, according to Zéghal and Ahmed (1990), it does not enable the researcher to fully measure the extent of information disclosed and the emphasis attached to each item by the company. On the other hand, the use of the GRI reporting framework in this study is considered to provide not only a comprehensive coverage of the CR/ or sustainability-related aspects, but also a detailed list of items which are most concerned in measuring CR performance.
Multiple linear regression modelling was also conducted in this study to analyse the relationship between CR reporting profile and the determining factors discussed in the theoretical section. The same explanatory factors for year 2007 were used in all regression models. Instead of evaluating the overall reporting profiles of the company under the GRI reporting framework, for the sake of simplicity at this stage, we decided to concentrate on three disclosure dimensions (environmental, social, and product and service), and present results based on the primary analyses. The three dependent variables (environmental, social, and product and service disclosure) are summative variables indicating the completeness of provided information within each category. There are four independent variables: total sales, ROCE_2007, head quarter location, and business line. Total

3057
social responsibility (Clark and Gibson-Sweet, 1999; Adams et al., 1998; Patten, 1991) than their counterparts.
Prior research has also observed interesting and substantial differences in reporting practices by different industries (see e.g., Campbell et al. 2003; Cormier and Magnan, 2003; Roberts 1992; Harte and Owen 1991; Cowen et al., 1987; Dierkes and Preston, 1977). More specifically, Dierkes and Preston (1977) found that companies in industries where economic activities modify the environment, such as extractive industries, are more likely to disclose information about environmental impacts than are companies in other industries. Roberts (1992) found that corporations with a high profile (with consumer visibility, high level of political risk, or concentrated intense competition) are more likely to disclose social and environmental responsibility activities than low profile industries. Following the idea that consumers are one conduit to affect corporate economic performance, industries closer in the value chain to (final) consumers would be more likely to face higher levels of stakeholder action, because stakeholders with interests tied to these industries tend to have greater incentive to take action, and important stakeholders such as media, government, non-governmental organizations (NGOs), and class action layers likely get attracted to enable broader stakeholder action.
We expect that the more diversified the company is and with the possession of own forest resources, the greater the pressure from the stakeholders. Accordingly, the following can be hypothesized:
Hypothesis 4: Integrated forest industry companies will disclose more overall than their counterparts which have narrower business focus.
3. Data and methodology The initial samples used in this study included the top 100 forest industry companies listed by Pulp and Paper International (PPI), and the corporate disclosure of 2006 or of the most corresponding years (2005 or 2007) were scrutinised. The reports could be either a separate sustainability or CR reports or, if not available, the annual report (also called ‘integrated report’) if it contained information dealing with environmental, social responsibility and other sustainability issues. A final sample of 66 forest companies met the criteria of this study, which consists of 44 CR/or sustainability reports and 22 annual (integrated) reports. The corresponding figures of financial performance indicator return on capital employed (ROCE) were collected from PricewaterhouseCoopers’ database (PWC, 2008).
Following the GRI reporting framework, this study aims to measure the level of CR-related information disclosed by the sample companies by detecting the presence or absence of items defined by the GRI reporting
8
guidelines. Content analysis was used to measure the CR reporting profile by the sample companies in this study. The content of corporate reports of the sample companies were classified into six categories to capture the aspects based on the GRI reporting framework, including economic, environmental, labour and employment, human rights, social, and product and service. In order to transform words of the target reports into quantitatively measureable data, first of all, original texts were classified into analyzable data language according to classification frame based on GRI framework, where each indicator consisted of several exact clauses explaining it more clearly and precisely. In this study, a total of 79 indicators were identified to measure the six domains of sustainability under the GRI reporting framework. There are various clauses pertaining to each indicator defined by the framework. Each item of disclosure pertaining to any of the categories is treated equally important in coding by being assigned a point. An item appearing more than once will not receive a second point. To ensure the coding accuracy and improved reliability and validity, a two-tier independent coding was conducted, and to improve reliability, results were cross-checked by both researchers so that the classification of the texts would correspond to the same standard. The final scores of each indicator are divided into a range of scales (1-5), where 1 means that no information is disclosed and 5 stands for complete information are provided.
One of the main limitations of this form of content analysis is that, according to Zéghal and Ahmed (1990), it does not enable the researcher to fully measure the extent of information disclosed and the emphasis attached to each item by the company. On the other hand, the use of the GRI reporting framework in this study is considered to provide not only a comprehensive coverage of the CR/ or sustainability-related aspects, but also a detailed list of items which are most concerned in measuring CR performance.
Multiple linear regression modelling was also conducted in this study to analyse the relationship between CR reporting profile and the determining factors discussed in the theoretical section. The same explanatory factors for year 2007 were used in all regression models. Instead of evaluating the overall reporting profiles of the company under the GRI reporting framework, for the sake of simplicity at this stage, we decided to concentrate on three disclosure dimensions (environmental, social, and product and service), and present results based on the primary analyses. The three dependent variables (environmental, social, and product and service disclosure) are summative variables indicating the completeness of provided information within each category. There are four independent variables: total sales, ROCE_2007, head quarter location, and business line. Total
3069
sales was used as the indicator of size of company, whereas ROCE was considered as the indicator of profitability.1
The general form of the regression models to be examined in this empirical study can be denoted as the following:
DISCi = β0i + β1iSizei + β2iProfti + β3iNAvsEUi + β4iNAvsASIA&OCEAi + β5iNAvsLAT&AFRi + β6iP&PvsINTEi + β7iP&PvsP&P&Pi + Єi where, for company i: DISCi: CR reporting index (Environmentali, Sociali, Product & Servicei); Sizei: total sales in $ million; Profti: return on capital employed in 2007; NAvsEUi: North America vs. Europe; NAvsASIA&OCEAi: North America vs. Asia + Oceania; NAvsLAT&AFRi: North America vs. Latin America + Africa; P&PvsINTEi: paper + packaging vs. integrated; P&PvsP&P&Pi: paper + packaging vs. pulp + paper + packaging; Єi: the error which models the unsystematic error of the Y from the predicted Y. 4. Results 4.1 Descriptive analysis Summative variable environmental responsibility represents the most significantly emphasized indicators under the GRI framework, followed by labour and employment responsibility, and economic responsibility, while human rights responsibility and social responsibility received the least attention from the sample companies, followed by product and service Responsibility. Environmental measurement is still a dominant in assessing CR performance, and there are a greater number of environmental indicators under the GRI reporting guidelines.
TABLE 1 depicts the divergence of CR reporting profiles between different groups. T-test was used for the pair-wise comparison of means between the groups under the GRI reporting framework in this very study.
1 Due to their qualitative nature, the two independent variables, head quarter location, and business line, were transformed into dummy variables for further analysis. Head quarter location was categorized into three dummy variables (North America vs. Europe, North America vs. Asia + Oceania, North America vs. Latin America + Africa), whereas business line was classified into two dummy variables (paper + packaging vs. integrated, paper + packaging vs. pulp + paper + packaging). plus the other two independent variables (total sales, ROCE_2007), a total number of seven independent variables were thus used in our regression analysis.
10
TABLE 1. Pair-wise comparison of means between groups and CR reporting profiles
a The figures in the table are mean values with standard deviations in parentheses * Significant at the 0.01 level, **Significant at the 0.05 level
A number of significant differences were observed between business line and the six summative variables. Integrated forest companies with ownership of forest resources seemed to emphasize more on economic-related issues, as well as on environmental-related issues than those companies which are within the paper and packaging category (p = 0.021, p = 0.001). In terms of labour & employment responsibility, integrated forest industry companies placed more comprehensive attention on the corresponding issues than those companies which are in the pulp and paper and packaging category (p = 0.029), as well as those companies within paper and packaging category (p < 0.01). No significant difference was found between groups under human rights summative variable. Integrated forest industry companies emphasized more social responsibility disclosure than those companies within pulp and paper and packaging category (p = 0.031) and paper and packaging category (p = 0.021). Similar differences were also observed under product and service responsibility, where integrated forest companies placed significant attention on the corresponding issues than those companies of pulp and paper and packaging category (p = 0.013), as well as those companies within paper and packaging category (p = 0.009).
According to our data, the geographic location of the firm shows in the level of their CR disclosure. Latin American and African companies seem to perform better that their international counterparts in all six reporting
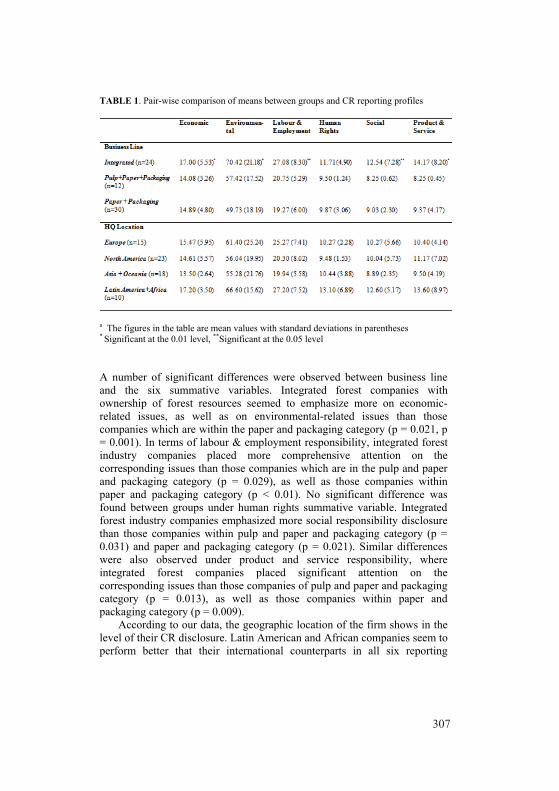
3079
sales was used as the indicator of size of company, whereas ROCE was considered as the indicator of profitability.1
The general form of the regression models to be examined in this empirical study can be denoted as the following:
DISCi = β0i + β1iSizei + β2iProfti + β3iNAvsEUi + β4iNAvsASIA&OCEAi + β5iNAvsLAT&AFRi + β6iP&PvsINTEi + β7iP&PvsP&P&Pi + Єi where, for company i: DISCi: CR reporting index (Environmentali, Sociali, Product & Servicei); Sizei: total sales in $ million; Profti: return on capital employed in 2007; NAvsEUi: North America vs. Europe; NAvsASIA&OCEAi: North America vs. Asia + Oceania; NAvsLAT&AFRi: North America vs. Latin America + Africa; P&PvsINTEi: paper + packaging vs. integrated; P&PvsP&P&Pi: paper + packaging vs. pulp + paper + packaging; Єi: the error which models the unsystematic error of the Y from the predicted Y. 4. Results 4.1 Descriptive analysis Summative variable environmental responsibility represents the most significantly emphasized indicators under the GRI framework, followed by labour and employment responsibility, and economic responsibility, while human rights responsibility and social responsibility received the least attention from the sample companies, followed by product and service Responsibility. Environmental measurement is still a dominant in assessing CR performance, and there are a greater number of environmental indicators under the GRI reporting guidelines.
TABLE 1 depicts the divergence of CR reporting profiles between different groups. T-test was used for the pair-wise comparison of means between the groups under the GRI reporting framework in this very study.
1 Due to their qualitative nature, the two independent variables, head quarter location, and business line, were transformed into dummy variables for further analysis. Head quarter location was categorized into three dummy variables (North America vs. Europe, North America vs. Asia + Oceania, North America vs. Latin America + Africa), whereas business line was classified into two dummy variables (paper + packaging vs. integrated, paper + packaging vs. pulp + paper + packaging). plus the other two independent variables (total sales, ROCE_2007), a total number of seven independent variables were thus used in our regression analysis.
10
TABLE 1. Pair-wise comparison of means between groups and CR reporting profiles
a The figures in the table are mean values with standard deviations in parentheses * Significant at the 0.01 level, **Significant at the 0.05 level
A number of significant differences were observed between business line and the six summative variables. Integrated forest companies with ownership of forest resources seemed to emphasize more on economic-related issues, as well as on environmental-related issues than those companies which are within the paper and packaging category (p = 0.021, p = 0.001). In terms of labour & employment responsibility, integrated forest industry companies placed more comprehensive attention on the corresponding issues than those companies which are in the pulp and paper and packaging category (p = 0.029), as well as those companies within paper and packaging category (p < 0.01). No significant difference was found between groups under human rights summative variable. Integrated forest industry companies emphasized more social responsibility disclosure than those companies within pulp and paper and packaging category (p = 0.031) and paper and packaging category (p = 0.021). Similar differences were also observed under product and service responsibility, where integrated forest companies placed significant attention on the corresponding issues than those companies of pulp and paper and packaging category (p = 0.013), as well as those companies within paper and packaging category (p = 0.009).
According to our data, the geographic location of the firm shows in the level of their CR disclosure. Latin American and African companies seem to perform better that their international counterparts in all six reporting

30811
domains. However, no statistically significant difference between companies in terms of head quarter location was observed between economic, environmental, social, product and service responsibility, respectively, whereas significant differences were found under labour and employment responsibility, and responsibility for human rights.
In terms of labour and employment responsibility, Latin American companies and African companies seemed to emphasize most on labour- and employment-related issues, while Asian and Oceania companies were identified to be least interested in addressing the corresponding issues. In terms of human rights responsibility, North American companies were identified to pay most attention to human rights-related issues, whereas the corresponding issues were least emphasized by Latin American companies and African companies (p = 0.049). 4.2 Regression models In Table 2 below the results of the regression analyses are presented. TABLE 2. Results of the regression models for environmental, social, and product and service disclosure under the GRI reporting framework
Independent variables Environmental Social Product & Service
(Constant) 36.068 (6.074)a 9.433 (5.389) 7.083 (3.652)
Total sales in $ million 0.003 (5.31)* 0.000 (1.595) 0.001 (3.298)*
ROCE_2007 2.117 (0.035) -29.537 (-1.64) -6.448 (-0.323)
North America vs. Europe
1.305 (0.216) -0.725 (-0.407) -2.167 (-1.097)
North America vs. Asia + Oceania
-0.419- (-0.071) -0.935 (-0.536) 0.507 (0.262)
North America vs. Latin America + Africa
12.251 (1.625) 1.78 (0.801) 0.473 (0.192)
Paper + Packaging vs. Integrated
13.531 (2.282)* 4.339 (2.483)* 4.869 (2.515)**
Paper + Packaging vs. Pulp + Paper + Packaging
13.499 (2.061)* -0.321 (-0.166) 0.633 (0.296)
R2 =0.562; Adj. R2
= 0.493; Durbin-Watson = 1.416; F = 8.232; P < 0.01
R2 =328; Adj. R2
= 0.223; Durbin-Watson = 2.151; F = 3.135; P =0.009
R2 =0.406; Adj. R2 = 0.314; Durbin-Watson = 2.038; F = 4.393; P = 0.001
a The figures in the table are regression coefficients with t values in parentheses *Significant at the 0.10 level,**Significant at the 0.05 level
12
As can be seen in TABLE 2, the adjusted R2’s of the three regression models were in the range of 0.22 to 0.49, and being highest in the environmental disclosure model. Confirming H1, the size of the firm is positive related to the scale of both environmental and product and service disclosures, this result is consistent with previous studies. Country of origin or profitability was not significant in any of the models, and therefore both the hypotheses H3 and H2 were rejected. As for the importance of the dummy variables in explaining variation between companies’ disclosure, business line dummy on paper + packaging vs. integrated was positive and significant in each model; on the other hand, confirming our hypothesis 4. However, paper + packaging vs. pulp + paper + packaging dummy were significant only in the social disclosure model. 5. Conclusions and discussion The results of our study mirror the overall patterns of CR disclosure in the global forest industry under the GRI reporting framework. Based on the values of summative disclosure domains of our data environmental responsibility represents the most significantly emphasized area (measured by the average value of summative indicators) under the GRI framework, followed by labour and employment responsibility and economic responsibility. Human rights and social responsibility received the least attention in the 66 largest companies of our sample, followed by product and service responsibility. These findings are supporting the previous literature, for example, Vidal and Kozak (2008a, 2008b) and Mikkilä and Toppinen (2008), where it has been found that especially disclosing social responsibility is still developing towards more comprehensive metrics in the sector. No regional differences (based on headquarter location) were found in terms of disclosure with the exception of labour and employment responsibility and responsibility for human rights
In conclusion to the results of regression modelling, forest industry companies seem to be sensitive to media exposure (as proxied by their size) but are insensitive to profitability (as measured by ROCE) when determining their CR strategies /reporting or disclosure strategies. Regional differences between the disclosure determinants in the large forest-based industry companies seem to be insignificant. These finding are in line with the previous literature (e.g., Reverte 2009; Brammer and Pavelin, 2008; Branco and Rodrigues 2008; Hacston and Milne, 1996) that the company size of the firm or the industry sector has positive influence on the scale and quality of the disclosure. Also, by analyzing French firms’ environmental practices, Cormier and Magnan (2003) suggest that as a result of strong impact of globalised stock markets on fostering convergence in corporate

30911
domains. However, no statistically significant difference between companies in terms of head quarter location was observed between economic, environmental, social, product and service responsibility, respectively, whereas significant differences were found under labour and employment responsibility, and responsibility for human rights.
In terms of labour and employment responsibility, Latin American companies and African companies seemed to emphasize most on labour- and employment-related issues, while Asian and Oceania companies were identified to be least interested in addressing the corresponding issues. In terms of human rights responsibility, North American companies were identified to pay most attention to human rights-related issues, whereas the corresponding issues were least emphasized by Latin American companies and African companies (p = 0.049). 4.2 Regression models In Table 2 below the results of the regression analyses are presented. TABLE 2. Results of the regression models for environmental, social, and product and service disclosure under the GRI reporting framework
Independent variables Environmental Social Product & Service
(Constant) 36.068 (6.074)a 9.433 (5.389) 7.083 (3.652)
Total sales in $ million 0.003 (5.31)* 0.000 (1.595) 0.001 (3.298)*
ROCE_2007 2.117 (0.035) -29.537 (-1.64) -6.448 (-0.323)
North America vs. Europe
1.305 (0.216) -0.725 (-0.407) -2.167 (-1.097)
North America vs. Asia + Oceania
-0.419- (-0.071) -0.935 (-0.536) 0.507 (0.262)
North America vs. Latin America + Africa
12.251 (1.625) 1.78 (0.801) 0.473 (0.192)
Paper + Packaging vs. Integrated
13.531 (2.282)* 4.339 (2.483)* 4.869 (2.515)**
Paper + Packaging vs. Pulp + Paper + Packaging
13.499 (2.061)* -0.321 (-0.166) 0.633 (0.296)
R2 =0.562; Adj. R2
= 0.493; Durbin-Watson = 1.416; F = 8.232; P < 0.01
R2 =328; Adj. R2
= 0.223; Durbin-Watson = 2.151; F = 3.135; P =0.009
R2 =0.406; Adj. R2 = 0.314; Durbin-Watson = 2.038; F = 4.393; P = 0.001
a The figures in the table are regression coefficients with t values in parentheses *Significant at the 0.10 level,**Significant at the 0.05 level
12
As can be seen in TABLE 2, the adjusted R2’s of the three regression models were in the range of 0.22 to 0.49, and being highest in the environmental disclosure model. Confirming H1, the size of the firm is positive related to the scale of both environmental and product and service disclosures, this result is consistent with previous studies. Country of origin or profitability was not significant in any of the models, and therefore both the hypotheses H3 and H2 were rejected. As for the importance of the dummy variables in explaining variation between companies’ disclosure, business line dummy on paper + packaging vs. integrated was positive and significant in each model; on the other hand, confirming our hypothesis 4. However, paper + packaging vs. pulp + paper + packaging dummy were significant only in the social disclosure model. 5. Conclusions and discussion The results of our study mirror the overall patterns of CR disclosure in the global forest industry under the GRI reporting framework. Based on the values of summative disclosure domains of our data environmental responsibility represents the most significantly emphasized area (measured by the average value of summative indicators) under the GRI framework, followed by labour and employment responsibility and economic responsibility. Human rights and social responsibility received the least attention in the 66 largest companies of our sample, followed by product and service responsibility. These findings are supporting the previous literature, for example, Vidal and Kozak (2008a, 2008b) and Mikkilä and Toppinen (2008), where it has been found that especially disclosing social responsibility is still developing towards more comprehensive metrics in the sector. No regional differences (based on headquarter location) were found in terms of disclosure with the exception of labour and employment responsibility and responsibility for human rights
In conclusion to the results of regression modelling, forest industry companies seem to be sensitive to media exposure (as proxied by their size) but are insensitive to profitability (as measured by ROCE) when determining their CR strategies /reporting or disclosure strategies. Regional differences between the disclosure determinants in the large forest-based industry companies seem to be insignificant. These finding are in line with the previous literature (e.g., Reverte 2009; Brammer and Pavelin, 2008; Branco and Rodrigues 2008; Hacston and Milne, 1996) that the company size of the firm or the industry sector has positive influence on the scale and quality of the disclosure. Also, by analyzing French firms’ environmental practices, Cormier and Magnan (2003) suggest that as a result of strong impact of globalised stock markets on fostering convergence in corporate
31013
practices, companies have increasingly realized the importance of corporate disclosure and thus adopted corresponding disclosure strategies in responding to the growing demands from stakeholders.
A limitation to the study is that we strictly followed the GRI reporting framework when measuring the level of CR-related information disclosed by the companies and detected thereby only the presence or absence of items defined by the GRI reporting guidelines. Using some other guideline or framework, different dimensions and disaggregation of CR could be found. Nevertheless, our empirical findings, for example, in terms of the effect of company size and regional differences, were in line with the previous literature that were not using GRI frame. In addition, it should be noticed that our modelling results are preliminary since the set of explanatory variables measuring industry and firm characteristics was limited to company size, geographic location, business line, and financial performance only. In the future studies, more profound analysis should be targeted, for example, to analysing the impacts of demand conditions and consumer proximity on the CR disclosure of in the forest-based industry. Since we only focused on three disclosure dimensions (environmental, social, and product and service disclosure), future analysis should concentrate on the dimensions of labour and employment, and human rights disclosure as well. References Adams, C.A., Hill, W.Y. and Roberts, C.B. 1998. Corporate Social
Reporting Practices in Western Europe: Legitimating corporate behaviour”, The British Accounting Review 30(1): 1-21.
Adams, C.A. and Larrinaga Gonz’alez, C. 2007. Engaging with Organizations in Pursuit of Improved Social and Environmental Accountability and Performance. Accounting, Auditing and Accountability Journal 20(3): 333-355.
Brammer, S. and Pavelin, S. 2008. Factors Influencing the Quality of Corporate Environmental Disclosure. Business Strategy and the Environment 17: 120-136.
Branco, M.C. and Rodrigues, L.L. 2008. Factors Influencing Social Responsibility Disclosure by Portuguese Companies. Journal of Business Ethics 83: 685-701.
Clark, J. and Gibson-Sweet, M. 1999. The Use of Corporate Social Disclosures in the Management of Reputation and Legitimacy: A Cross Sectoral Analysis of UK Top 100 Companies. Business Ethics 8(1): 5-13.
Campbell, D., Craven, B. and Shrives, P. 2003. Voluntary Social Reporting in Three FTSE Sectors: A Comment on Perception and Legitimacy. Accounting, Auditing and Accountability Journal 16(4): 558-581.
14
Cormier, D. and Magnan, M. 2003. Environmental Reporting Management: A Continental European Perspective”, Journal of Accounting and Public Policy 22(1): 43-62.
Cormier, D., Magnan, M. and van Velthoven, B. 2005. Environmental Disclosure Quality in Large German Companies: Economi Incentives, Public Pressures or Institutional Conditions? European Accounting Review 14(1): 3-39.
Cowen, S., Ferreri, L.B. and Parker, L.D. 1987. The Impact of Corporate Characteristics on Social Responsibility Disclosure: A Typology and Frequency-based Analysis. Accounting, Organizations and Society 12(2): 111-122.
Da Silva Monteiro, S.M. and Aibar-Guzmán, B. 2009. Determinants of Environmental Disclosure in the Annual Reports of Large Companies Operating in Portugal. Corporate Social Responsibility and Environmental Management 5(4): 478-498.
Daniel, F., Lohrke, F., Fornaciari, C. and Turner, R.A. 2004. Slack Resources and Firm Performance: A Meta-analysis. Journal of Business Research 57(6): 565-574.
Deegan, C. and Gordon, B. 1993. A Study of the Environmental Disclosure Policies of Australian Corporations. Accounting and Business Research 26(3): 187-199.
Deegan, C. and Rankin, M. 1996. Do Australian Companies Report Environmental News Objectively? An Analysis of Environmental Disclosures by Firms Prosecuted Successfully By the Environmental Protection Authority. Accounting, Auditing and Accountability Journal 9(2): 52-69.
Dierkes, M. and Preston, L. 1977. Corporate Social Accounting Reporting for the Physical Environment: A Critical Review and Implementation Proposal. Accounting, Organization and Society 1: 3-22.
Elkington, J. 1997. Cannibals with Forks: Triple Bottom Line of 21st Century Business”. St. Albans: Capstone Publishing Ltd.
Elkington, J. 1999. Triple Bottom Line Reporting: Looking for Balance. Australian Accountant 69(2): 18-21.
Freeman, R.E. 1984. Strategic Management: A stakeholder Approach. Pitman: Boston, MA.
Gallhofer, S. and Haslam, J. 1997. The Direction of Green Accounting Policy: Critical Reflections. Accounting, Auditing and Accountability Journal 10(2): 148-174.
George, G. 2005. Slack Resources and the Performance of Privately Held Firms. Academy of Management Journal 48(4): 661-676.
Gray, R. 2006. Social, Environmental and Sustainability Reporting and Organizational Value Creation: Whose value? Whose Creation? Accounting, Auditing and Accountability Journal 19(6): 793-819.
31113
practices, companies have increasingly realized the importance of corporate disclosure and thus adopted corresponding disclosure strategies in responding to the growing demands from stakeholders.
A limitation to the study is that we strictly followed the GRI reporting framework when measuring the level of CR-related information disclosed by the companies and detected thereby only the presence or absence of items defined by the GRI reporting guidelines. Using some other guideline or framework, different dimensions and disaggregation of CR could be found. Nevertheless, our empirical findings, for example, in terms of the effect of company size and regional differences, were in line with the previous literature that were not using GRI frame. In addition, it should be noticed that our modelling results are preliminary since the set of explanatory variables measuring industry and firm characteristics was limited to company size, geographic location, business line, and financial performance only. In the future studies, more profound analysis should be targeted, for example, to analysing the impacts of demand conditions and consumer proximity on the CR disclosure of in the forest-based industry. Since we only focused on three disclosure dimensions (environmental, social, and product and service disclosure), future analysis should concentrate on the dimensions of labour and employment, and human rights disclosure as well. References Adams, C.A., Hill, W.Y. and Roberts, C.B. 1998. Corporate Social
Reporting Practices in Western Europe: Legitimating corporate behaviour”, The British Accounting Review 30(1): 1-21.
Adams, C.A. and Larrinaga Gonz’alez, C. 2007. Engaging with Organizations in Pursuit of Improved Social and Environmental Accountability and Performance. Accounting, Auditing and Accountability Journal 20(3): 333-355.
Brammer, S. and Pavelin, S. 2008. Factors Influencing the Quality of Corporate Environmental Disclosure. Business Strategy and the Environment 17: 120-136.
Branco, M.C. and Rodrigues, L.L. 2008. Factors Influencing Social Responsibility Disclosure by Portuguese Companies. Journal of Business Ethics 83: 685-701.
Clark, J. and Gibson-Sweet, M. 1999. The Use of Corporate Social Disclosures in the Management of Reputation and Legitimacy: A Cross Sectoral Analysis of UK Top 100 Companies. Business Ethics 8(1): 5-13.
Campbell, D., Craven, B. and Shrives, P. 2003. Voluntary Social Reporting in Three FTSE Sectors: A Comment on Perception and Legitimacy. Accounting, Auditing and Accountability Journal 16(4): 558-581.
14
Cormier, D. and Magnan, M. 2003. Environmental Reporting Management: A Continental European Perspective”, Journal of Accounting and Public Policy 22(1): 43-62.
Cormier, D., Magnan, M. and van Velthoven, B. 2005. Environmental Disclosure Quality in Large German Companies: Economi Incentives, Public Pressures or Institutional Conditions? European Accounting Review 14(1): 3-39.
Cowen, S., Ferreri, L.B. and Parker, L.D. 1987. The Impact of Corporate Characteristics on Social Responsibility Disclosure: A Typology and Frequency-based Analysis. Accounting, Organizations and Society 12(2): 111-122.
Da Silva Monteiro, S.M. and Aibar-Guzmán, B. 2009. Determinants of Environmental Disclosure in the Annual Reports of Large Companies Operating in Portugal. Corporate Social Responsibility and Environmental Management 5(4): 478-498.
Daniel, F., Lohrke, F., Fornaciari, C. and Turner, R.A. 2004. Slack Resources and Firm Performance: A Meta-analysis. Journal of Business Research 57(6): 565-574.
Deegan, C. and Gordon, B. 1993. A Study of the Environmental Disclosure Policies of Australian Corporations. Accounting and Business Research 26(3): 187-199.
Deegan, C. and Rankin, M. 1996. Do Australian Companies Report Environmental News Objectively? An Analysis of Environmental Disclosures by Firms Prosecuted Successfully By the Environmental Protection Authority. Accounting, Auditing and Accountability Journal 9(2): 52-69.
Dierkes, M. and Preston, L. 1977. Corporate Social Accounting Reporting for the Physical Environment: A Critical Review and Implementation Proposal. Accounting, Organization and Society 1: 3-22.
Elkington, J. 1997. Cannibals with Forks: Triple Bottom Line of 21st Century Business”. St. Albans: Capstone Publishing Ltd.
Elkington, J. 1999. Triple Bottom Line Reporting: Looking for Balance. Australian Accountant 69(2): 18-21.
Freeman, R.E. 1984. Strategic Management: A stakeholder Approach. Pitman: Boston, MA.
Gallhofer, S. and Haslam, J. 1997. The Direction of Green Accounting Policy: Critical Reflections. Accounting, Auditing and Accountability Journal 10(2): 148-174.
George, G. 2005. Slack Resources and the Performance of Privately Held Firms. Academy of Management Journal 48(4): 661-676.
Gray, R. 2006. Social, Environmental and Sustainability Reporting and Organizational Value Creation: Whose value? Whose Creation? Accounting, Auditing and Accountability Journal 19(6): 793-819.

31215
Griffin, J.J. and Mahon, J.F. 1997. The corporate social performance and corporate financial performance debate. Business and Society 36(1): 5-31.
Guthrie, J. and Boedker, C. 2006. Perspectives on ‘New’ Models of Business Reporting: A Reflective Note. Accounting, Auditing and Accountability Journal 19(6): 785-792.
Hackston, D. and Milne, M.J. 1996. Some Determinants of Social and Environmental Disclosures in New Zealand Companies. Accounting, Auditing and Accountability Journal 9(1): 77-108.
Harte, G. and Owen, D.L. 1991. Environmental Disclosure in the Annual Reports of British Companies: A Research Note. Accounting Auditing and Accountability Journal 4(3): 51-61.
Hogner, R.H. 1982. Corporate Social Reporting: Eight Decades of Development at US Steel. Research in Corporate Performance and Policy 4: 243-250.
Knox, S., Maklan, S. and French, P. 2005. Corporate Social Responsibility: Exploring Stakeholder Relationships and Programme Reporting Across Leading FTSE Companies. Journal of Business Ethics 61, 7-28.
McGuire, J.B., Schnessweiss, T. and Sundgren, A. 1998. Corporate Social Responsibility and Firm Performance. Academy of Management Journal 31(4): 854-872.
McGuire, J.B., Schnessweiss, T. and Branch, B. 1990. Perceptions of Firm Quality: A Cause or Result of Firm Performance. Journal of Management 16(1), 167-180.
Meek, G.K., Roberts, C.B. and Gray, S.J. 1995. Factors Influencing Voluntary Annual Report Disclosure by U.S., U.K. and Continental European Multinational Corporations. Journal of International Business Studies 26: 555-572.
Mikkilä, M. and Toppinen, A. 2008. Corporate Responsibility Reporting by Large Pulp and Paper Companies. forest Policy and Economics 10: 500-506.
Neu, D., Warsame, H. and Pedwell, K. 1998. Managing Public Impressions: Environmental Disclosures in Annual Reports. Accounting, Organization and Society 23(3): 265-282.
Orlizky, M., Schmidt, F.L. and Rynes, S.L. 2003. Corporate Social and Financial Performance: A Meta-analysis. Organization Studies 24(3): 403-441.
Patten, D.M. 1991. Exposure, Legitimacy and Social Disclosure. Journal of Accounting and Public Policy 10: 297-308.
Patten, D.M. 1992. Intra-industry Environmental Disclosures in Response to the Alaskan Oil Spill: A Note on Legitimacy Theory”, Accounting, Organizations and Society 17(5): 471-475.
Prahalad, C.K. and Hamel, G. 1994. Strategy as Field of Study: Why Search
16
for a New Paradigm? Strategic Management Journal 15: 70-79. PricewaterhouseCoopers (PwC). 2008. Global Forest, Paper & Packaging
Industry Survey: Survey of 2007 Results. 2008 Edition. Purushothaman, M., Tower, G., Hancock, R. and Taplin, R. 2000.
Determinants of Corporate Social Reporting Practices of Listed Singapore Companies. Pacific Accounting Review 12(2): 101-133.
Reverte, C. 2009. Determinants of Corporate Social Responsibility Disclosure Rating by Spanish Listed Firms. Journal of Business Ethic 88: 351-366.
Roberts, C.B. 1992. Environmental Disclosures in Corporate Annual Reports in Western Europe. Green Reporting, Owen, D. (Ed.), Chapman and Hall, London: 139-165.
Rowley, T., Berman, S. and Krackhardt, D. 2000. Redundant Governance Structure: An Analysis of Structural and Relational Embeddedness in the Steel and Semiconductor Industries. Strategic Management Journal 21: 369-386.
Trotman, K.T. and Brasley, G.W. 1981. Associations Between Social Responsibility Disclosure and Characteristics of Companies. Accounting, Organization and Society 6(4): 355-362.
Van Tulder, R. and Van der Zwart, A. 2006. International Business-society Management: Linking Corporate Responsibility and Globalization. Routledge, London & New York.
United Nations Environmental Program (UNEP). 1996. The Benchmark Survey. London: UNEP - Sustainability Ltd.
Vidal, N.G. and Kozak, R.A. 2008a. The Recent Evolution of Corporate Responsibility Practices in the Forestry Sector. International Forestry Review 10(1): 1-13.
Vidal, N.G. and Kozak, R.A. 2008b. Corporate Responsibility Practices in the Forestry Sector: Definitions and the Role of Context. The Journal of Corporate Citizenships 31: 59-75.
Waddock, S.A. and Graves, S.B. 1997. The Corporate Social Performance – financial Performance Link. Strategic Management Journal 18(4): 303-319.
Yongvanich, K. and Guithrie, J. 2006. An Extended Performance Reporting Framework for Social and Environmental Accounting. Business Strategy and the Environment 15: 309-321.
31315
Griffin, J.J. and Mahon, J.F. 1997. The corporate social performance and corporate financial performance debate. Business and Society 36(1): 5-31.
Guthrie, J. and Boedker, C. 2006. Perspectives on ‘New’ Models of Business Reporting: A Reflective Note. Accounting, Auditing and Accountability Journal 19(6): 785-792.
Hackston, D. and Milne, M.J. 1996. Some Determinants of Social and Environmental Disclosures in New Zealand Companies. Accounting, Auditing and Accountability Journal 9(1): 77-108.
Harte, G. and Owen, D.L. 1991. Environmental Disclosure in the Annual Reports of British Companies: A Research Note. Accounting Auditing and Accountability Journal 4(3): 51-61.
Hogner, R.H. 1982. Corporate Social Reporting: Eight Decades of Development at US Steel. Research in Corporate Performance and Policy 4: 243-250.
Knox, S., Maklan, S. and French, P. 2005. Corporate Social Responsibility: Exploring Stakeholder Relationships and Programme Reporting Across Leading FTSE Companies. Journal of Business Ethics 61, 7-28.
McGuire, J.B., Schnessweiss, T. and Sundgren, A. 1998. Corporate Social Responsibility and Firm Performance. Academy of Management Journal 31(4): 854-872.
McGuire, J.B., Schnessweiss, T. and Branch, B. 1990. Perceptions of Firm Quality: A Cause or Result of Firm Performance. Journal of Management 16(1), 167-180.
Meek, G.K., Roberts, C.B. and Gray, S.J. 1995. Factors Influencing Voluntary Annual Report Disclosure by U.S., U.K. and Continental European Multinational Corporations. Journal of International Business Studies 26: 555-572.
Mikkilä, M. and Toppinen, A. 2008. Corporate Responsibility Reporting by Large Pulp and Paper Companies. forest Policy and Economics 10: 500-506.
Neu, D., Warsame, H. and Pedwell, K. 1998. Managing Public Impressions: Environmental Disclosures in Annual Reports. Accounting, Organization and Society 23(3): 265-282.
Orlizky, M., Schmidt, F.L. and Rynes, S.L. 2003. Corporate Social and Financial Performance: A Meta-analysis. Organization Studies 24(3): 403-441.
Patten, D.M. 1991. Exposure, Legitimacy and Social Disclosure. Journal of Accounting and Public Policy 10: 297-308.
Patten, D.M. 1992. Intra-industry Environmental Disclosures in Response to the Alaskan Oil Spill: A Note on Legitimacy Theory”, Accounting, Organizations and Society 17(5): 471-475.
Prahalad, C.K. and Hamel, G. 1994. Strategy as Field of Study: Why Search
16
for a New Paradigm? Strategic Management Journal 15: 70-79. PricewaterhouseCoopers (PwC). 2008. Global Forest, Paper & Packaging
Industry Survey: Survey of 2007 Results. 2008 Edition. Purushothaman, M., Tower, G., Hancock, R. and Taplin, R. 2000.
Determinants of Corporate Social Reporting Practices of Listed Singapore Companies. Pacific Accounting Review 12(2): 101-133.
Reverte, C. 2009. Determinants of Corporate Social Responsibility Disclosure Rating by Spanish Listed Firms. Journal of Business Ethic 88: 351-366.
Roberts, C.B. 1992. Environmental Disclosures in Corporate Annual Reports in Western Europe. Green Reporting, Owen, D. (Ed.), Chapman and Hall, London: 139-165.
Rowley, T., Berman, S. and Krackhardt, D. 2000. Redundant Governance Structure: An Analysis of Structural and Relational Embeddedness in the Steel and Semiconductor Industries. Strategic Management Journal 21: 369-386.
Trotman, K.T. and Brasley, G.W. 1981. Associations Between Social Responsibility Disclosure and Characteristics of Companies. Accounting, Organization and Society 6(4): 355-362.
Van Tulder, R. and Van der Zwart, A. 2006. International Business-society Management: Linking Corporate Responsibility and Globalization. Routledge, London & New York.
United Nations Environmental Program (UNEP). 1996. The Benchmark Survey. London: UNEP - Sustainability Ltd.
Vidal, N.G. and Kozak, R.A. 2008a. The Recent Evolution of Corporate Responsibility Practices in the Forestry Sector. International Forestry Review 10(1): 1-13.
Vidal, N.G. and Kozak, R.A. 2008b. Corporate Responsibility Practices in the Forestry Sector: Definitions and the Role of Context. The Journal of Corporate Citizenships 31: 59-75.
Waddock, S.A. and Graves, S.B. 1997. The Corporate Social Performance – financial Performance Link. Strategic Management Journal 18(4): 303-319.
Yongvanich, K. and Guithrie, J. 2006. An Extended Performance Reporting Framework for Social and Environmental Accounting. Business Strategy and the Environment 15: 309-321.

3141
Product semantics and sensory analysis on wood – a pilot study
Anders Roos1, Siv Lindberg2,Annika Kihlstedt2, Lotta Woxblom1,
Ulf Olsson3
1 Department of Forest Products, Swedish University of Agricultural Sciences 2Innventia AB, Sweden. 3 Department of Economics, Swedish University of Agricultural Sciences.
Abstract Designers need knowledge about peoples’ perceptions, based on sensory examinations of wood. This study describes results of a combined tactile and visual perceptional assessment of five common wood species in Sweden. The species were graded with regard to ten words. Differences in ratings between tactile and visual inspections were compared and main differentiating words, in tactile and visual inspection respectively, were identified. For some species like pine the differences between visual and tactile inspections vary greatly whereas birch was more coherently perceived across examination model. Visual inspections created clearer differences between the studied wood species than tactile inspections. The results provide information about the most appropriate species designers should select when aiming to achieve specific goals concerning the message or ‘expression’ of the product. This study indicates applications of product semantics and sensory analysis in wood design. Topics for continued studies are discussed. Keywords: Attitudes, marketing, perceptions, wood products. 1. Introduction Wood is generally a well-liked material that has deep historical roots in most societies. It is also extensively applied in objects that are seen and touched by man. Wood surfaces are appreciated by people, for example, in interior design or artifacts. Wood is associated with warmth (Obata et al. 2005). Jonsson et al. (2008) found that wood was preferred to wood-plastic composites and that these material preferences were associated with properties like natural, pleasant, smooth, living and good value. More specifically, people seem to appreciate a combined impression of balance
2
and activity from a varied wooden surface without too many deformations and irregularities (Broman 2000; Nyrud et al. 2008).
Wood is also a familiar material that over time has become integrated into local traditions for building and craftsmanship. This contributes to the status of wood – together with its appreciated qualities of naturalness, grain, texture, pattern and feel. The longstanding incorporation of the different applications of wood into the local culture, and hence the possible ways to describe the material, have been emphasized by Manzini (1989), Aalto (1956) and (Ashby and Johnson 2003, p 73). It seems like people regard wood in interior applications as “warm,” “comfortable,” “relaxing,” “natural” and “inviting” (Rice et al. 2006). Rice et al. also suggest further studies on the effect of wood on people’s emotional states (some early attempts on this issue are Sakuragawa et al. 2005; Tsenetsugu et al. 2007).
Sawn timber of soft- and hardwood is usually graded according to properties important for the function of the product, e.g., construction timber must fulfill certain strength requirements. Wood strength is influenced by the slope of grain, presence of compression wood and size and numbers of knots, and therefore the grades are expressed in terms of these characteristics. For wood used in visible applications, such as door frames, architectural interiors, furniture, cabinet doors and flooring, quality is decided by the appearance of the piece of wood. Different grades are based on type of knots, and if features like red-heart, sapwood, insect damage or checks are acceptable or not (Anon. 1994; Palm and Woxblom 2009).
People frequently touch wood, e.g., in furniture and interior decorations (Kobayashi 2002). It is therefore reasonable to investigate people’s reactions to tactile sensations of different wood-based materials. One complication in this task is that visual impressions often dominate and generate more varied and nuanced reactions from people. For instance, in an analytical sensory analysis by Nyrud et al. (2008) the majority of the identified sensory attributes were visual. However, there have been attempts to expand the knowledge on tactile responses to wood. Hollins et al. (1993) investigated tactile reactions to various materials, including wood. Two main dimensions separating the materials were roughness-smoothness and hardness-softness. The study concluded that sensory approaches, with ratings based on stimulus, are suitable methods for the analysis of tactile perceptions. Analyses of specific physical properties’ links to tactile perceptions were carried out on warmth (Obata et al. 2000, Obata et al. 2005), roughness (Fujii et al. 1997; Fujiwara et al. 2001; Fujiwara et al. 2004) and dryness (Kobayashi et al. 2002). Chen et al. (2009) established a relationship between materials, from physical measurements to sensory and affective judgments.

315
2
and activity from a varied wooden surface without too many deformations and irregularities (Broman 2000; Nyrud et al. 2008).
Wood is also a familiar material that over time has become integrated into local traditions for building and craftsmanship. This contributes to the status of wood – together with its appreciated qualities of naturalness, grain, texture, pattern and feel. The longstanding incorporation of the different applications of wood into the local culture, and hence the possible ways to describe the material, have been emphasized by Manzini (1989), Aalto (1956) and (Ashby and Johnson 2003, p 73). It seems like people regard wood in interior applications as “warm,” “comfortable,” “relaxing,” “natural” and “inviting” (Rice et al. 2006). Rice et al. also suggest further studies on the effect of wood on people’s emotional states (some early attempts on this issue are Sakuragawa et al. 2005; Tsenetsugu et al. 2007).
Sawn timber of soft- and hardwood is usually graded according to properties important for the function of the product, e.g., construction timber must fulfill certain strength requirements. Wood strength is influenced by the slope of grain, presence of compression wood and size and numbers of knots, and therefore the grades are expressed in terms of these characteristics. For wood used in visible applications, such as door frames, architectural interiors, furniture, cabinet doors and flooring, quality is decided by the appearance of the piece of wood. Different grades are based on type of knots, and if features like red-heart, sapwood, insect damage or checks are acceptable or not (Anon. 1994; Palm and Woxblom 2009).
People frequently touch wood, e.g., in furniture and interior decorations (Kobayashi 2002). It is therefore reasonable to investigate people’s reactions to tactile sensations of different wood-based materials. One complication in this task is that visual impressions often dominate and generate more varied and nuanced reactions from people. For instance, in an analytical sensory analysis by Nyrud et al. (2008) the majority of the identified sensory attributes were visual. However, there have been attempts to expand the knowledge on tactile responses to wood. Hollins et al. (1993) investigated tactile reactions to various materials, including wood. Two main dimensions separating the materials were roughness-smoothness and hardness-softness. The study concluded that sensory approaches, with ratings based on stimulus, are suitable methods for the analysis of tactile perceptions. Analyses of specific physical properties’ links to tactile perceptions were carried out on warmth (Obata et al. 2000, Obata et al. 2005), roughness (Fujii et al. 1997; Fujiwara et al. 2001; Fujiwara et al. 2004) and dryness (Kobayashi et al. 2002). Chen et al. (2009) established a relationship between materials, from physical measurements to sensory and affective judgments.

3163
Although sensory analyses and consumer studies have considered both visual and tactile perceptions of wood (c.f. Jonsson 2008; Nyrud et al. 2008), few – if any – of the published reports compare visual and tactile perceptions of the wood material.
Van Kesteren (2007) underlined that material selection is a problem-solving activity, in which much information is needed. The author found that product designers normally need material information that is queried from databases, with the final product in focus. Moreover, the information should enable comparisons between alternatives. In addition, material samples are needed to take care of the non-technical aspects of material selection. Ljungberg and Edwards (2003) focus on the non-technical aspects of material selection, emphasizing the weight of fashion, market trends, cultural aspects, aesthetics, recycling and target groups. The authors claimed that the marketing of the new product/material is sometimes an underestimated success factor. An Integrated framework for Product Material Selection that incorporates these factors was presented, where perceptional aspects were covered.
In a study on non-tangible properties of materials, Karana et al (2009) discovered different meanings of different material samples. Sensorial properties were found to lie behind this apprehension of meaning. Karana et al. (2008) mentioned that these aspects had been insufficiently dealt with in new product development.
According to Ashby and Johnson (2003), user interaction with products involves several implications: technical, aesthetic and associative. These aspects can, to some degree, be represented in words. Hence, the actual material selection process involves the product, materials and processes, but also aesthetics and perceptions. All of them connect to the actual intention. The traditional material selection involves an analysis in which technical requirements focus the set of possible materials for a purpose. Material selection by synthesis also incorporates intentions, aesthetics and perceptions in the process. Other principles are also selection by inspiration or similarity. The authors infer that the best approach often is to combine different methods for materials selection.
Ashby et al. (2004) divide the material selection process into the following steps.
“(1) A method for translating design requirements into a specification for material and process. (2) A procedure for screening out those that cannot meet the specification, leaving a subset of the original menu. (3) A scheme for ranking the surviving materials and process, identifying those that have the greatest potential. (4) A way of searching for supporting information about the top-ranked candidates, giving as much background information about their strengths, weaknesses, history of use and future potential as possible.”
4
Taking into our scope the totality of the material selection issue means considering 40,000 to 80,000 materials and at least 1,000 different ways of processing them. Although, in this study we focus on a sub-set of wooden materials with identical processing features this still underlines the relevance for developing appropriate methods for evaluating materials for exposed uses.
More knowledge about perceptions and associations caused by touching and looking at wood would provide a better tool for designing wood products for specific users and purposes. It can determine how surfaces that are mostly intended for visual examination should look, as it might indicate the most suitable wood species for tactile surfaces. This insight might also provide a basis for the marketing of wood products.
The objective of this paper is to:
• Determine how wood samples are characterized, based on visual and tactile impressions
• Determine the main dimensions of characterizations of visual and tactile impressions.
• Describe the expressions that are most important for separating groups of wood samples, based on visual and tactile sensations.
• Study how visual and tactile reactions for the same wood species differ.
2. Product semantics Product semantics is the study of the perceived meaning and impression of man-made shapes (Krippendorff and Butter 1984). The theory claims that products can carry meaning and messages through their color, shape, form and texture, among other things. This meaning is affected by the prevailing context, mainly operational contexts, sociolinguistic contexts, contexts of genesis, and ecological contexts (Krippendorff 1989). By paying attention to the semantic significance of product design, as well as by providing the most appropriate material, producers can better communicate and create the aspired meaning for the receiver. According to Monö (1997), a product can be seen as a triangle that consists of a technical unit, an ergonomic unit, and a communicative unit. According to these theories, levels of product semantic functions can be analyzed. One goal of product semantics is also to develop a suitable language in which to talk about the symbolic qualities of products. Personal, situational and cultural factors may moderate these responses (Crilly et al. 2004). Demirbilek and Sener (2003) asserted that to a certain degree product semantics, e.g., the user’s own descriptions, convey the user’s emotional reaction towards the object.
Petiot and Yannou (2003) described a procedure to apply product semantics in new product development. It involves defining a semantic

317
4
Taking into our scope the totality of the material selection issue means considering 40,000 to 80,000 materials and at least 1,000 different ways of processing them. Although, in this study we focus on a sub-set of wooden materials with identical processing features this still underlines the relevance for developing appropriate methods for evaluating materials for exposed uses.
More knowledge about perceptions and associations caused by touching and looking at wood would provide a better tool for designing wood products for specific users and purposes. It can determine how surfaces that are mostly intended for visual examination should look, as it might indicate the most suitable wood species for tactile surfaces. This insight might also provide a basis for the marketing of wood products.
The objective of this paper is to:
• Determine how wood samples are characterized, based on visual and tactile impressions
• Determine the main dimensions of characterizations of visual and tactile impressions.
• Describe the expressions that are most important for separating groups of wood samples, based on visual and tactile sensations.
• Study how visual and tactile reactions for the same wood species differ.
2. Product semantics Product semantics is the study of the perceived meaning and impression of man-made shapes (Krippendorff and Butter 1984). The theory claims that products can carry meaning and messages through their color, shape, form and texture, among other things. This meaning is affected by the prevailing context, mainly operational contexts, sociolinguistic contexts, contexts of genesis, and ecological contexts (Krippendorff 1989). By paying attention to the semantic significance of product design, as well as by providing the most appropriate material, producers can better communicate and create the aspired meaning for the receiver. According to Monö (1997), a product can be seen as a triangle that consists of a technical unit, an ergonomic unit, and a communicative unit. According to these theories, levels of product semantic functions can be analyzed. One goal of product semantics is also to develop a suitable language in which to talk about the symbolic qualities of products. Personal, situational and cultural factors may moderate these responses (Crilly et al. 2004). Demirbilek and Sener (2003) asserted that to a certain degree product semantics, e.g., the user’s own descriptions, convey the user’s emotional reaction towards the object.
Petiot and Yannou (2003) described a procedure to apply product semantics in new product development. It involves defining a semantic

3185
space (Osgood et al. 1957) and, through multivariate analysis of interview data, proceeding to the final suggestion of suitable design options. Linking product semantics and Kansei engineering allows the marketer to evaluate the potential market success of an offer to the customer (Nagamachi 1995; Nagamachi 2002; Llinares and Page 2007). The relationship between product semantics and Kansei engineering is explained by the fact that both methods focus on the consumer’s ideas and feelings toward new products.
Referring to this theory, we assume that a wood product (surface) produces a meaning to the onlooker or user through its color and patterns. This meaning can, to some extent, be captured by different associations or descriptive terms. Hence investigating how subjects assess different alternatives – through visual and tactile impressions – allows the producer to identify the most appropriate materials (such as wood species) for specific applications.
3. Method Materials The wood species in the study were the principal wood types that are utilized for visual applications. We used wood samples of ash (Fraxinus excelsior), birch (Betula pendula), elm (Ulmus glabra), oak (Quercus robur) and pine (Pinus sylvestris). Pine is a softwood that is often used in interior applications. Oak is also well known in Sweden, frequently applied for flooring and furniture. Birch is another common hardwood used, for example, for furniture and interior design products. Elm and Ash are wood species that are becoming more trendy, e.g. for flooring. All wood species are used commercially in interior uses, although pine, birch and oak are by far more common.
The wood samples were selected to provide an undisturbed impression. They were all without knots and had been planed and sanded (however, no further applications were used). Knots were avoided, as it was expected that they would bias the results in a random manner. The pieces were therefore free from knots.
The descriptive words used for association to the samples were based on earlier elicitation studies on wood from Broman (2000), Bumgardner and Bowe (2002), Jonsson et al. (2008) and Nyrud et al. (2008). The final set of words was subsequently decided upon in a series of discussions among a group consisting of wood researchers, a psychologist, and wood industry representatives. The final set of words included the following terms: natural, exclusive, environmental, rough, inexpensive, reliable, warm, modern, snug, and solid.
6
Procedure The interview data were collected in two rounds. First, tactile assessments were gathered from an initial panel of respondents. The second round of data collection involved visual examinations from a new panel of respondents. The reason for not consulting the same group for the tactile and visual examinations was that they would be exhausted, and probably also biased in their answers.
Hence 30 novice respondents, 18 women and 12 men, were recruited for the tactile study. The samples were presented in random order, one at a time. The samples were cut into pieces of size 16 cm x 6 cm x 2 cm. The size allows for easy examination in the hands of the subject. The wood species of the samples were not disclosed. The respondents were allowed to freely touch the samples, but their vision and hearing was blocked (Fig. 1). Soft pads were used on the wooden table to avoid sounds (by knocking) or vibrations from the wood. The words were read out one at a time in random order by the test leader, through a telephone connected to the hearing blocker. The respondent answered with an integer between 1 and 7, in which 7 meant that the word was strongly associated with the sample, and 1 that the word was not associated with the sample.
Fig.1. Test situation during the tactile study. Vision and hearing blocked. (Arranged photo)
The visual study was performed according to a similar protocol. The panel consisted of 15 men and 15 women. The group was somewhat older than those in the tactile study; 18 subjects were younger than 50, compared to 26

319
6
Procedure The interview data were collected in two rounds. First, tactile assessments were gathered from an initial panel of respondents. The second round of data collection involved visual examinations from a new panel of respondents. The reason for not consulting the same group for the tactile and visual examinations was that they would be exhausted, and probably also biased in their answers.
Hence 30 novice respondents, 18 women and 12 men, were recruited for the tactile study. The samples were presented in random order, one at a time. The samples were cut into pieces of size 16 cm x 6 cm x 2 cm. The size allows for easy examination in the hands of the subject. The wood species of the samples were not disclosed. The respondents were allowed to freely touch the samples, but their vision and hearing was blocked (Fig. 1). Soft pads were used on the wooden table to avoid sounds (by knocking) or vibrations from the wood. The words were read out one at a time in random order by the test leader, through a telephone connected to the hearing blocker. The respondent answered with an integer between 1 and 7, in which 7 meant that the word was strongly associated with the sample, and 1 that the word was not associated with the sample.
Fig.1. Test situation during the tactile study. Vision and hearing blocked. (Arranged photo)
The visual study was performed according to a similar protocol. The panel consisted of 15 men and 15 women. The group was somewhat older than those in the tactile study; 18 subjects were younger than 50, compared to 26

3207
in the tactile study. Here, the samples were presented in pieces of size 40 cm x 13.5 cm x 2 cm. The words were read out one at a time in random order by the test leader. The size – larger than in the tactile study - was intended to present a larger exposed area for visual inspection. In this round, the subjects were not allowed to lift the object. The origin and processing of the wood surfaces were, however, identical to those in the tactile inspections. The wood samples were also presented here in random order, one at a time, in normal office illumination and with grey pads on the table (see Fig. 2).
Fig.2. Test situation during the visual study. (Arranged photo)
Analysis The results were analyzed statistically. Ratings for the same wood species, based on visual vs. tactile examination, were compared and tested, in parametric and non-parametric tests. To provide a more comprehensible representation of subjects’ overall assessments of the wood species, principal component factor analysis was performed on the visual and tactile ratings separately, and also on the pooled data. Factor scores for visual and tactile assessments on each wood species were computed and presented in a graph.
In order to identify the characterizations that were most central for separating wood species in visual and tactile examinations, respectively, a cluster analysis was done. Clusters of wood species with similar
8
characterizations were identified. The clusters were subsequently compared through step-wise backward variable elimination.
4. Results Comparison between tactile and visual studies Visual and tactile ratings for each wood sample are presented in Fig. 3 to 7. Mean values and significant differences, based on parametric or non-parametric tests, are indicated in Tab. 1. The comparisons show that most differences are not significant. The most significant differences, or discrepancies, between tactile and visual examinations within the same wood species, are noticed for pine, elm and oak.
Elm
0,00
1,00
2,00
3,00
4,00
5,00
6,00
7,00Natural
Exclusive
Ecofriendly
Rough
Cheap
Reliable
Warm
Modern
Snug
Solid
TactileVisual
Fig.3. Elm, a comparison between tactile and visual results.
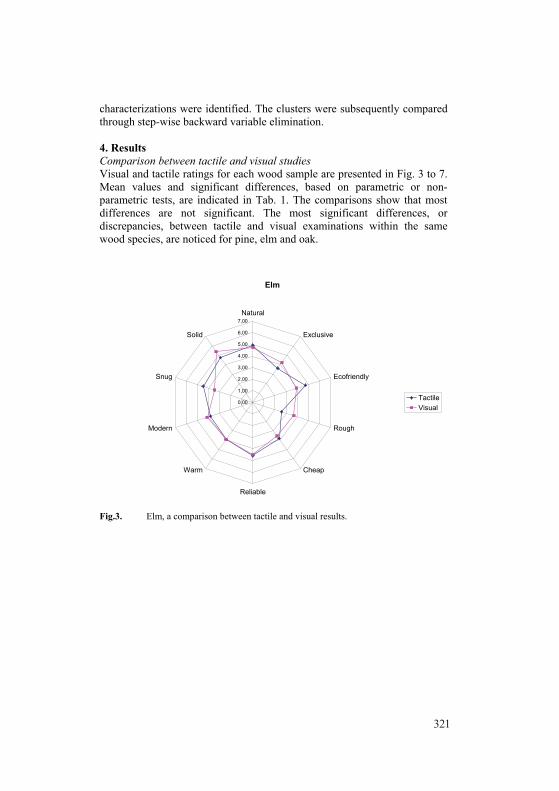
321
8
characterizations were identified. The clusters were subsequently compared through step-wise backward variable elimination.
4. Results Comparison between tactile and visual studies Visual and tactile ratings for each wood sample are presented in Fig. 3 to 7. Mean values and significant differences, based on parametric or non-parametric tests, are indicated in Tab. 1. The comparisons show that most differences are not significant. The most significant differences, or discrepancies, between tactile and visual examinations within the same wood species, are noticed for pine, elm and oak.
Elm
0,00
1,00
2,00
3,00
4,00
5,00
6,00
7,00Natural
Exclusive
Ecofriendly
Rough
Cheap
Reliable
Warm
Modern
Snug
Solid
TactileVisual
Fig.3. Elm, a comparison between tactile and visual results.

3229
Ash
0,00
1,00
2,00
3,00
4,00
5,00
6,00
7,00Natural
Exclusive
Ecofriendly
Rough
Cheap
Reliable
Warm
Modern
Snug
Solid
TactileVisual
Fig.4. Ash, a comparison between tactile and visual results.
Birch
0,00
1,00
2,00
3,00
4,00
5,00
6,00
7,00Natural
Exclusive
Ecofriendly
Rough
Cheap
Reliable
Warm
Modern
Snug
Solid
TactileVisual
Fig.5. Birch, a comparison between tactile and visual results.
10
Pine
0,00
1,00
2,00
3,00
4,00
5,00
6,00
7,00Natural
Exclusive
Ecofriendly
Rough
Cheap
Reliable
Warm
Modern
Snug
Solid
TactileVisual
Fig.6. Pine, a comparison between tactile and visual results.
Oak
0,00
1,00
2,00
3,00
4,00
5,00
6,00
7,00Natural
Exclusive
Ecofriendly
Rough
Cheap
Reliable
Warm
Modern
Snug
Solid
TactileVisual
Fig.7. Oak, a comparison between tactile and visual results.

323
10
Pine
0,00
1,00
2,00
3,00
4,00
5,00
6,00
7,00Natural
Exclusive
Ecofriendly
Rough
Cheap
Reliable
Warm
Modern
Snug
Solid
TactileVisual
Fig.6. Pine, a comparison between tactile and visual results.
Oak
0,00
1,00
2,00
3,00
4,00
5,00
6,00
7,00Natural
Exclusive
Ecofriendly
Rough
Cheap
Reliable
Warm
Modern
Snug
Solid
TactileVisual
Fig.7. Oak, a comparison between tactile and visual results.

32411
Table 1. Significant rating differences (p<0.05)
Mean visual Mean tactile Elm Eco-friendly 3.9 4.8 Rough 3.7 2.6 Snug 3.5 4.5 Ash Exclusive 4.8 3.5 Inexpensive 2.8 3.8 Solid 5.5 4.8 Birch Exclusive 4.5 3.2 Pine Natural 6.4 5.3 Eco-friendly 5.7 4.9 Rough 3.0 2.3 Inexpensive 4.8 3.6 Oak Natural 6.0 5.0 Rough 4.5 2.3
Pine presented differences between tactile and visual ratings for several measurements, and birch seemed to be most coherent across the measurements. In most cases, visual inspections generated higher ratings. However, for elm, tactile assessments gave higher ratings for eco-friendly and snug.
Dimensions of visual and tactile comparisons A principal component analysis was performed to detect how the subjects grouped visual and tactile data when perceiving the wood samples. The analysis was conducted on the visual and tactile investigations separately, and on the pooled sample (Tab. 2-4). Three-factor solutions were determined based on eigenvalue>1 criterion.
12
Table 2. Rotated Factor Pattern – Visual data
Factor 1 Factor 2 Factor 3 Exclusive Environmental Warmth
Exclusive 0.88086 -0.00209 0.01167 Modern 0.78913 0.07193 0.27011 Solid 0.58807 0.35769 0.12205 Inexpensive -0.87139 0.05824 0.12478 Eco-friendly -0.01670 0.85102 0.01416 Natural -0.01988 0.83612 0.00787 Reliable 0.41139 0.60108 0.26340 Warm 0.19683 0.25100 0.77691 Snug 0.42394 0.34914 0.57054 Rough -0.17711 -0.22775 0.50377 Factor loadings higher than 0.4 in bold
Table 3. Rotated factor pattern – Tactile data Factor 1 Factor 2 Factor 3 Environmental Exclusive Rough Natural 0.85602 -0.10427 0.15217 Eco-friendly 0.82761 -0.05093 0.07482 Warm 0.72575 0.01473 -0.24887 Reliable 0.68826 0.44129 0.19314 Solid 0.63392 0.34764 0.36827 Snug 0.61058 0.30140 -0.31232 Exclusive 0.19311 0.80752 -0.21682 Modern 0.05854 0.71705 -0.36134 Inexpensive 0.06430 -0.80304 -0.13590 Rough 0.05843 -0.15638 0.80650 Factor loadings higher than 0.4 in bold

325
12
Table 2. Rotated Factor Pattern – Visual data
Factor 1 Factor 2 Factor 3 Exclusive Environmental Warmth
Exclusive 0.88086 -0.00209 0.01167 Modern 0.78913 0.07193 0.27011 Solid 0.58807 0.35769 0.12205 Inexpensive -0.87139 0.05824 0.12478 Eco-friendly -0.01670 0.85102 0.01416 Natural -0.01988 0.83612 0.00787 Reliable 0.41139 0.60108 0.26340 Warm 0.19683 0.25100 0.77691 Snug 0.42394 0.34914 0.57054 Rough -0.17711 -0.22775 0.50377 Factor loadings higher than 0.4 in bold
Table 3. Rotated factor pattern – Tactile data Factor 1 Factor 2 Factor 3 Environmental Exclusive Rough Natural 0.85602 -0.10427 0.15217 Eco-friendly 0.82761 -0.05093 0.07482 Warm 0.72575 0.01473 -0.24887 Reliable 0.68826 0.44129 0.19314 Solid 0.63392 0.34764 0.36827 Snug 0.61058 0.30140 -0.31232 Exclusive 0.19311 0.80752 -0.21682 Modern 0.05854 0.71705 -0.36134 Inexpensive 0.06430 -0.80304 -0.13590 Rough 0.05843 -0.15638 0.80650 Factor loadings higher than 0.4 in bold

32613
Table 4. Rotated factor pattern - Pooled data
Factor 1 Factor 2 Factor 3 Environmental Exclusive Rough
Eco-friendly 0.79481 -0.10632 -0.07651 Natural 0.79082 -0.15202 0.11830 Reliable 0.68035 0.32182 -0.01389 Warm 0.59947 0.18654 0.08725 Solid 0.57701 0.39188 -0.00718 Snug 0.55874 0.34275 -0.22170 Exclusive 0.17880 0.84894 0.02609 Modern 0.17291 0.79202 0.00086 Inexpensive 0.05127 -0.79577 0.12305 Rough 0.01943 -0.05319 0.97747 Factor loadings higher than 0.4 in bold
The factor scores generated by the pooled factor analysis are represented in Fig. 8 and 9. It confirms the inference that the visual study succeeded in generating more clear-cut differences between the wood species. The tactile factor scores are more centered in the graphs, indicating that tactile perceptions provide a weaker basis for separating the samples. The graphs also support the outcome from Tab. 1 that tree species with a high consistency between visual and tactile sensations are birch and, to some extent, oak (on factors 1 and 2), whereas pine generated differing sensations between touch and sight.
14
Pine Visual
Elm Visual
Ash Visual
Oak Visual
Birch tactile
Elm tactile
Ash tactile
Pine tactile
Oak tactile
Birch visual
-1
-0,5
0
0,5
1
-1 -0,5 0 0,5 1
Fig.8. Factor scores on pooled factor analysis: Visual and tactile data (x=factor 1, y=factor 2).
Elm tactile
Elm visual
Ash tactile
Pine tactileOak tactile
Birch visual
Birch tactile
Ash visual
Oak visual
Pine visual
-1
-0,5
0
0,5
1
-1 -0,8 -0,6 -0,4 -0,2 0 0,2 0,4 0,6 0,8 1
Fig.9. Factor scores on pooled factor analysis: Visual and tactile data (x=factor 1, y=factor 3).
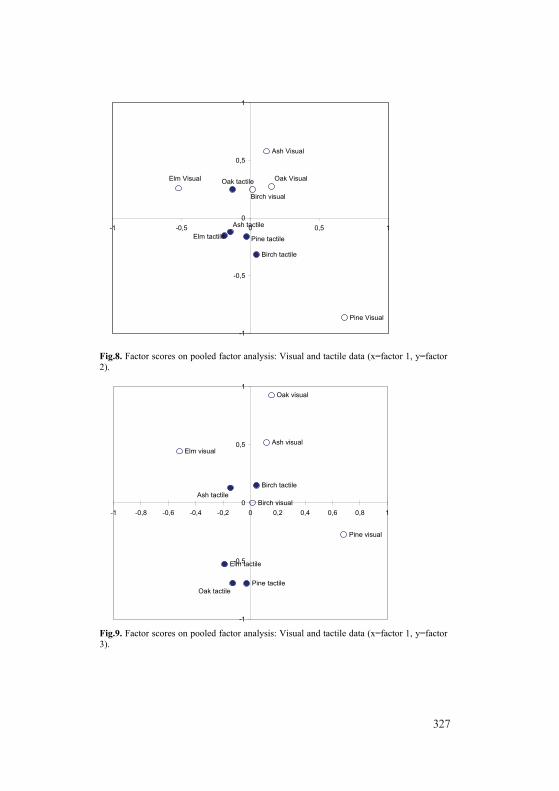
32714
Pine Visual
Elm Visual
Ash Visual
Oak Visual
Birch tactile
Elm tactile
Ash tactile
Pine tactile
Oak tactile
Birch visual
-1
-0,5
0
0,5
1
-1 -0,5 0 0,5 1
Fig.8. Factor scores on pooled factor analysis: Visual and tactile data (x=factor 1, y=factor 2).
Elm tactile
Elm visual
Ash tactile
Pine tactileOak tactile
Birch visual
Birch tactile
Ash visual
Oak visual
Pine visual
-1
-0,5
0
0,5
1
-1 -0,8 -0,6 -0,4 -0,2 0 0,2 0,4 0,6 0,8 1
Fig.9. Factor scores on pooled factor analysis: Visual and tactile data (x=factor 1, y=factor 3).
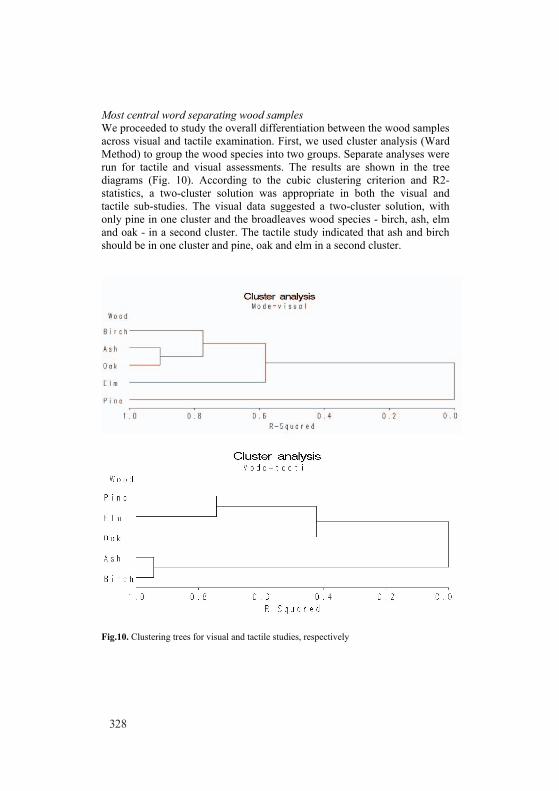
32815
Most central word separating wood samples We proceeded to study the overall differentiation between the wood samples across visual and tactile examination. First, we used cluster analysis (Ward Method) to group the wood species into two groups. Separate analyses were run for tactile and visual assessments. The results are shown in the tree diagrams (Fig. 10). According to the cubic clustering criterion and R2-statistics, a two-cluster solution was appropriate in both the visual and tactile sub-studies. The visual data suggested a two-cluster solution, with only pine in one cluster and the broadleaves wood species - birch, ash, elm and oak - in a second cluster. The tactile study indicated that ash and birch should be in one cluster and pine, oak and elm in a second cluster.
Fig.10. Clustering trees for visual and tactile studies, respectively
16
A logistic regression with a step-wise backward elimination of variables yielded the set of significant semantic attributes that separated (the means of) the two clusters. The results are displayed in Tab. 5 for visual perceptions and Tab. 6 for tactile perceptions. These variables can be viewed as the most consistent attributes that can be used to distinguish the main sub-sets of wood species – in visual and tactile examinations, respectively. The visual sub-study generated more important such variables: exclusive, eco-friendly, rough and snug. The tactile exercise only generated one variable: (rough).
Table 5. Attributes defining visual differences (pine vs. hardwood)
Parameter DF Estimate Std.
error
Wald Chi-
Square Pr>ChiSq Intercept 1 1.6096 1.7031 0.8932 0.3446 Exclusive 1 1.8428 0.3920 22.0963 <.0001 Eco-friendly 1 -0.6778 0.2122 10.2019 0.0014 Rough 1 0.7575 0.2340 10.4786 0.0012 Snug 1 -1.2476 0.3486 12.8071 0.0003 Chi-Square 78.3241, Pr > ChiSq 0.0001
Table 6. Attributes deciding tactile differences (ash and birch vs. pine, elm and oak)
Parameter DF Estimate Standard
error
Wald Chi-
Square Pr>ChiSq Intercept 1 -3.0551 0.6183 24.4145 <.0001 Rough 1 0.5437 0.1780 9.3338 0.0022 Chi-Square 9.9110, Pr > ChiSq 0.0016
5. Discussion Our results showed that pine displayed differences between tactile and visual impressions for most aspects, whereas birch was more coherent from this perspective. Assessments based on tactile examinations gave, in most cases, more conservative characterizations than the counterpart characterizations based on visual examination. The most pronounced dimensions in perceptions were environmental, exclusive and rough (for tactile) and warm/snug (for visual).

32916
A logistic regression with a step-wise backward elimination of variables yielded the set of significant semantic attributes that separated (the means of) the two clusters. The results are displayed in Tab. 5 for visual perceptions and Tab. 6 for tactile perceptions. These variables can be viewed as the most consistent attributes that can be used to distinguish the main sub-sets of wood species – in visual and tactile examinations, respectively. The visual sub-study generated more important such variables: exclusive, eco-friendly, rough and snug. The tactile exercise only generated one variable: (rough).
Table 5. Attributes defining visual differences (pine vs. hardwood)
Parameter DF Estimate Std.
error
Wald Chi-
Square Pr>ChiSq Intercept 1 1.6096 1.7031 0.8932 0.3446 Exclusive 1 1.8428 0.3920 22.0963 <.0001 Eco-friendly 1 -0.6778 0.2122 10.2019 0.0014 Rough 1 0.7575 0.2340 10.4786 0.0012 Snug 1 -1.2476 0.3486 12.8071 0.0003 Chi-Square 78.3241, Pr > ChiSq 0.0001
Table 6. Attributes deciding tactile differences (ash and birch vs. pine, elm and oak)
Parameter DF Estimate Standard
error
Wald Chi-
Square Pr>ChiSq Intercept 1 -3.0551 0.6183 24.4145 <.0001 Rough 1 0.5437 0.1780 9.3338 0.0022 Chi-Square 9.9110, Pr > ChiSq 0.0016
5. Discussion Our results showed that pine displayed differences between tactile and visual impressions for most aspects, whereas birch was more coherent from this perspective. Assessments based on tactile examinations gave, in most cases, more conservative characterizations than the counterpart characterizations based on visual examination. The most pronounced dimensions in perceptions were environmental, exclusive and rough (for tactile) and warm/snug (for visual).

33017
When we attempted to determine the measures that were used for separating groups of tree species, we found that identifications were normally more comprehensive for visual examinations, in this case pine differed from broadleaves based on a range of attributes. The tactile examinations became more clustered and only the clearly tactile property ‘roughness’ was used to distinguish groups of wood samples from each other.
The chosen characteristics were apparently adapted more for visual examinations. Visual examinations presented more perceived differences between wood samples than did perceived tactile examinations. The most evident difference between visual and tactile assessments was noticed for pine. One possible reason is that pine is rooted in the Swedish culture and it therefore generates many associations when visually perceived.
Our results can be compared with those in Tsenetsugu et al. (2007), in that wood causes different physiological reactions among people. Hence, it is natural that people are not indifferent to wood surfaces. Although - as in Jonsson (2005) - we could not study the impression of wood versus other materials, or wood in different specific applications, our results clearly show that non-functional properties play an important role when wood materials are evaluated. The outcome that roughness is a feature sensed mainly by touch complements the studies by Fujiwara et al.( 2001; 2004) and Hollins (1993) that found that sensory apprehension of roughness correlated with real surface distortion. Our results can only partially be compared to those in Bumgardner and Bowe (2002). However, the visual study conforms to the findings by Bumgardner and Bowe (2002), that pine is perceived as inexpensive. In our study, however, eco-friendly varied between the samples, especially when hardwood and softwood were compared.
The results can guide producers to select the best tree species, especially for providing visual messages. Broadleaves, especially ash, are most appropriate for conveying feelings of exclusivity, whereas pine is seen as more eco-friendly and natural.
There are several limitations with the analysis. The sample size is limited and we have not investigated if tastes depend on socio-economics or other background attributes among the subjects. It is also likely that the results only should be generalized within the Swedish context. And finally, the method to generate the most important descriptive words and associations for wood can of course be used and tested in other contexts and more specific applications. References Aalto, A. 1956. Träet som byggnadsmaterial. In Schildt G. 1973. Alvar
Aalto - skisser. Wahlström & Widstrand, Stockholm, Sweden (in Swedish)
18
Anon. 1994. Nordic Timber – Grading rules for pine and spruce sawn timber. Föreningen Svenska Sågverksmän, Sweden.
Ashby, M, and Johnson, K. 2003. Materials and Design – The art and science of material selection in product design. Butterworth – Heinemann, Burlington, MA. 336 p.
Ashby M. F., Bréchet, Y. J. M., Cebon, D., Salvo, L. 2004. Selection strategies for materials and processes. Materials and Design 25: 51–67.
Broman, O. 2000. Means to measure the aesthetic properties of wood. Doctoral thesis, Luleå University of Technology, Luleå, Sweden.
Bumgardner, M. S., and Bowe, S. A. 2002. Species selection in secondary wood products: Implications for product design and promotion. Wood and Fiber Science 34(3): 408-418.
Chen, X., C. J., Barnes, T. H. C., Childs, B., Henson, and Shao F. 2009. Material’s tactile testing and characterisation for consumer products’ affective packaging design. Materials and Design 30:4299-4310.
Crilly, N., Moultrie, J., Clarkson, P. J. 2004. Seeing things: consumer response to the visual domain in product design. Design Studies 25(6): 547-577.
Demirbilek, O., and Sener, B. 2003. Product design, semantics and emotional response. Ergonomics 46(13/14): 1346-1360.
Fujii, Y., Yoshizane, M., Okumura, S. 1997. Evaluation of surface roughness by various parameters.1. Relationships between several roughness parameters and tactile roughness. Mokuzai Gakkaishi 43: 574–579.
Fujiwara, Y., Fujii, Y., Sawada, Y., and Okumura S. 2001. Development of a parameter to reflect the roughness of a wood surface that corresponds to tactile roughness. Holz als Roh- und Werkstoff 59: 351-355.
Fujiwara Y, Fujii Y, Sawada Y, Okomura S. 2004.Assessment of wood surface roughness: comparison of tactile roughness and three-dimensional parameters derived using a robust Gaussian regression filter. Journal of Wood Science 50:35-40.
Hollins, M., Faldowski, R., Rao, S., and Young F. 1993. Perceptual dimensions of tactile surface texture: A multidimensional scaling analysis Perception & Psychophysics 54(6): 697-705.
Jonsson, R. 2005. Studies in the competitiveness of wood - market segmentation and customer assessment. PhD-thesis, Växjö University, Växjö, Sweden.
Jonsson, O., Lindberg, S., Roos, A., Hugosson, M., and Lindström, M. 2008. Consumer perceptions and preferences on solid wood, wood-based panels and composites – A repertory grid study. Wood and Fiber Science 40(4): 663-678.

33117
When we attempted to determine the measures that were used for separating groups of tree species, we found that identifications were normally more comprehensive for visual examinations, in this case pine differed from broadleaves based on a range of attributes. The tactile examinations became more clustered and only the clearly tactile property ‘roughness’ was used to distinguish groups of wood samples from each other.
The chosen characteristics were apparently adapted more for visual examinations. Visual examinations presented more perceived differences between wood samples than did perceived tactile examinations. The most evident difference between visual and tactile assessments was noticed for pine. One possible reason is that pine is rooted in the Swedish culture and it therefore generates many associations when visually perceived.
Our results can be compared with those in Tsenetsugu et al. (2007), in that wood causes different physiological reactions among people. Hence, it is natural that people are not indifferent to wood surfaces. Although - as in Jonsson (2005) - we could not study the impression of wood versus other materials, or wood in different specific applications, our results clearly show that non-functional properties play an important role when wood materials are evaluated. The outcome that roughness is a feature sensed mainly by touch complements the studies by Fujiwara et al.( 2001; 2004) and Hollins (1993) that found that sensory apprehension of roughness correlated with real surface distortion. Our results can only partially be compared to those in Bumgardner and Bowe (2002). However, the visual study conforms to the findings by Bumgardner and Bowe (2002), that pine is perceived as inexpensive. In our study, however, eco-friendly varied between the samples, especially when hardwood and softwood were compared.
The results can guide producers to select the best tree species, especially for providing visual messages. Broadleaves, especially ash, are most appropriate for conveying feelings of exclusivity, whereas pine is seen as more eco-friendly and natural.
There are several limitations with the analysis. The sample size is limited and we have not investigated if tastes depend on socio-economics or other background attributes among the subjects. It is also likely that the results only should be generalized within the Swedish context. And finally, the method to generate the most important descriptive words and associations for wood can of course be used and tested in other contexts and more specific applications. References Aalto, A. 1956. Träet som byggnadsmaterial. In Schildt G. 1973. Alvar
Aalto - skisser. Wahlström & Widstrand, Stockholm, Sweden (in Swedish)
18
Anon. 1994. Nordic Timber – Grading rules for pine and spruce sawn timber. Föreningen Svenska Sågverksmän, Sweden.
Ashby, M, and Johnson, K. 2003. Materials and Design – The art and science of material selection in product design. Butterworth – Heinemann, Burlington, MA. 336 p.
Ashby M. F., Bréchet, Y. J. M., Cebon, D., Salvo, L. 2004. Selection strategies for materials and processes. Materials and Design 25: 51–67.
Broman, O. 2000. Means to measure the aesthetic properties of wood. Doctoral thesis, Luleå University of Technology, Luleå, Sweden.
Bumgardner, M. S., and Bowe, S. A. 2002. Species selection in secondary wood products: Implications for product design and promotion. Wood and Fiber Science 34(3): 408-418.
Chen, X., C. J., Barnes, T. H. C., Childs, B., Henson, and Shao F. 2009. Material’s tactile testing and characterisation for consumer products’ affective packaging design. Materials and Design 30:4299-4310.
Crilly, N., Moultrie, J., Clarkson, P. J. 2004. Seeing things: consumer response to the visual domain in product design. Design Studies 25(6): 547-577.
Demirbilek, O., and Sener, B. 2003. Product design, semantics and emotional response. Ergonomics 46(13/14): 1346-1360.
Fujii, Y., Yoshizane, M., Okumura, S. 1997. Evaluation of surface roughness by various parameters.1. Relationships between several roughness parameters and tactile roughness. Mokuzai Gakkaishi 43: 574–579.
Fujiwara, Y., Fujii, Y., Sawada, Y., and Okumura S. 2001. Development of a parameter to reflect the roughness of a wood surface that corresponds to tactile roughness. Holz als Roh- und Werkstoff 59: 351-355.
Fujiwara Y, Fujii Y, Sawada Y, Okomura S. 2004.Assessment of wood surface roughness: comparison of tactile roughness and three-dimensional parameters derived using a robust Gaussian regression filter. Journal of Wood Science 50:35-40.
Hollins, M., Faldowski, R., Rao, S., and Young F. 1993. Perceptual dimensions of tactile surface texture: A multidimensional scaling analysis Perception & Psychophysics 54(6): 697-705.
Jonsson, R. 2005. Studies in the competitiveness of wood - market segmentation and customer assessment. PhD-thesis, Växjö University, Växjö, Sweden.
Jonsson, O., Lindberg, S., Roos, A., Hugosson, M., and Lindström, M. 2008. Consumer perceptions and preferences on solid wood, wood-based panels and composites – A repertory grid study. Wood and Fiber Science 40(4): 663-678.

33219
Karana E., Hekkert, P., and Kandachar, P. 2008. Material considerations in product design: A survey on crucial material aspects used by product designers. Materials and Design 29: 1081–1089.
Karana E., Hekkert, P., and Kandachar, P. 2009. Meanings of materials through sensorial properties and manufacturing processes. Materials and Design 30:2778-2784.
Kobayashi, D., Shida, S., Arima, T. 2002. Discriminant analysis of tactile dryness of wood surfaces. Mokuzai Gakkaishi 48(6): 425-431.
Krippendorff, K. 1989. On the Essential Contexts of Artifacts or on the Proposition That "Design Is Making Sense (Of Things)" Design Issues 5(2):9-39.
Krippendorff, K., and Butter, B. 1984. Product semantics: Exploring the symbolic qualities of form in Innovation, The Journal of the Industrial Designers Society of America, 3(2): 4– 9.
Ljungberg, L. Y., and Edwards, K. L. 2003. Design, materials selection and marketing of successful products. Materials and Design 24:519-529.
Llinares, A., and Page, A. 2007. Application of product differential semantics to quantify purchaser perceptions in housing assessment. Building and Environment 42: 2488–2497.
Manzini, E. 1989. The material of invention: Materials and design. MIT Press. 256 p.
Marchal, R., and Mothe, F. 1994. Appreciation of oak wood for the French consumer and wood professionals. Annales des Sciences Forestières 51: 213-231.
Monö, R. 1997. Design for Product Understanding. Liber AB, Stockholm. Nagamachi, M. 1995. Kansei Engineering – A new ergonomic consumer-
oriented technology for product development. International Journal of Industrial Ergonomics 15(1): 3-11.
Nagamachi, M. 2002. Kansei engineering as a powerful consumer-oriented technology for product development. Applied Ergonomics 33(3):289-294.
Nyrud, A. Q., Roos, A., and Rødbotten, M. 2008. Product attributes affecting consumer preference for residential deck materials. Can J For Res 38: 1385-1396.
Obata Y, Kohara M, Furuta Y, Kanayama K. 2000. Evaluation of tactile warmth of wood by thermal effusivity. Mokuzai Gakkaishi 46(2): 137-143.
Obata Y, Kohara M, Furuta Y, Kanayama K. 2005. Research on better use of wood for sustainable development: Quantitative evaluation of good tactile warmth of wood. Energy 30: 1317-1328.
Osgood, C. E., Suci, G. J., and Tannenbaum, P. H. 1957. The Measurement of Meaning. Illinois press, Urbana.
20
Palm, J. & Woxblom. L. 2009. Kvalitetsspråk för sågat lövträ. Stiftelsen Träcentrum i Nässjö, Sweden (In Swedish).
Petiot J-F., and Yannou B. 2004. Measuring consumer perceptions for a better comprehension, specification and assessment of product semantics. International Journal of Industrial Ergonomics 33: 507–525.
Rice, J., Kozak, R. A., Meitner, M. J., and Cohen D. H. 2006. Appearance wood products and psychological well-being. Wood and Fiber Science 38(4): 644-659.
Sakarugawa, S., Miyazaki, Y., Kaneko, T., Makita, T. 2005. Influence of wall panels on physiological and psychological responses. Journal of Wood Science 51: 136-140.
Tsenutsugu, Y., Miyazaki, Y., and Sato, H. 2007. Physiological effects in humans induced by the visual stimulation of room interiors with different wood quantities. Journal of Wood Science 53: 11-16.
Van Kesteren I.E.H. 2007. Product designers’ information needs in materials selection. Materials and Design 29:133-145.
33319
Karana E., Hekkert, P., and Kandachar, P. 2008. Material considerations in product design: A survey on crucial material aspects used by product designers. Materials and Design 29: 1081–1089.
Karana E., Hekkert, P., and Kandachar, P. 2009. Meanings of materials through sensorial properties and manufacturing processes. Materials and Design 30:2778-2784.
Kobayashi, D., Shida, S., Arima, T. 2002. Discriminant analysis of tactile dryness of wood surfaces. Mokuzai Gakkaishi 48(6): 425-431.
Krippendorff, K. 1989. On the Essential Contexts of Artifacts or on the Proposition That "Design Is Making Sense (Of Things)" Design Issues 5(2):9-39.
Krippendorff, K., and Butter, B. 1984. Product semantics: Exploring the symbolic qualities of form in Innovation, The Journal of the Industrial Designers Society of America, 3(2): 4– 9.
Ljungberg, L. Y., and Edwards, K. L. 2003. Design, materials selection and marketing of successful products. Materials and Design 24:519-529.
Llinares, A., and Page, A. 2007. Application of product differential semantics to quantify purchaser perceptions in housing assessment. Building and Environment 42: 2488–2497.
Manzini, E. 1989. The material of invention: Materials and design. MIT Press. 256 p.
Marchal, R., and Mothe, F. 1994. Appreciation of oak wood for the French consumer and wood professionals. Annales des Sciences Forestières 51: 213-231.
Monö, R. 1997. Design for Product Understanding. Liber AB, Stockholm. Nagamachi, M. 1995. Kansei Engineering – A new ergonomic consumer-
oriented technology for product development. International Journal of Industrial Ergonomics 15(1): 3-11.
Nagamachi, M. 2002. Kansei engineering as a powerful consumer-oriented technology for product development. Applied Ergonomics 33(3):289-294.
Nyrud, A. Q., Roos, A., and Rødbotten, M. 2008. Product attributes affecting consumer preference for residential deck materials. Can J For Res 38: 1385-1396.
Obata Y, Kohara M, Furuta Y, Kanayama K. 2000. Evaluation of tactile warmth of wood by thermal effusivity. Mokuzai Gakkaishi 46(2): 137-143.
Obata Y, Kohara M, Furuta Y, Kanayama K. 2005. Research on better use of wood for sustainable development: Quantitative evaluation of good tactile warmth of wood. Energy 30: 1317-1328.
Osgood, C. E., Suci, G. J., and Tannenbaum, P. H. 1957. The Measurement of Meaning. Illinois press, Urbana.
20
Palm, J. & Woxblom. L. 2009. Kvalitetsspråk för sågat lövträ. Stiftelsen Träcentrum i Nässjö, Sweden (In Swedish).
Petiot J-F., and Yannou B. 2004. Measuring consumer perceptions for a better comprehension, specification and assessment of product semantics. International Journal of Industrial Ergonomics 33: 507–525.
Rice, J., Kozak, R. A., Meitner, M. J., and Cohen D. H. 2006. Appearance wood products and psychological well-being. Wood and Fiber Science 38(4): 644-659.
Sakarugawa, S., Miyazaki, Y., Kaneko, T., Makita, T. 2005. Influence of wall panels on physiological and psychological responses. Journal of Wood Science 51: 136-140.
Tsenutsugu, Y., Miyazaki, Y., and Sato, H. 2007. Physiological effects in humans induced by the visual stimulation of room interiors with different wood quantities. Journal of Wood Science 53: 11-16.
Van Kesteren I.E.H. 2007. Product designers’ information needs in materials selection. Materials and Design 29:133-145.

334
Failed strategies, external events or just life in the global markets? Discussing the downturn of the pulp
and paper industry in Finland
Olli Saastamoinen School of Forest Sciences, University of Eastern Finland
Abstract After the recession of early 1990s the major pulp and paper companies in Finland engaged in further consolidation and widened their earlier “Euro-pean” investment orientation into “global” business strategies by mill acqui-sitions in North America and elsewhere. In the search for better profitability, the shareholder value paradigm was gaining strength as a business model. Profitability peaked in 2000, but then turned downwards as it largely did also globally. Product demand, prices and costs developed unfavourably. Global competition increased and problems of excess capacity became more severe, in particular in Europe. In Finland the strategies of belt tightening and leaning, ultimately called “survival strategies”, were adopted. The pace of mill closures, production breaks and personnel lay-offs, started in 2005 and has lasted until today. The paper discusses what went wrong and can be learnt, if anything, as the survival test seems to be passed, profitability of paper companies is improving, and shareholders are gradually gaining back what belongs to them. Keywords: Forest industries, employment, consolidation, political economy 1. Introduction Changes are inevitable in the economies. The economic history of the Fin-nish forest industries (Kuisma 2006) demonstrates that there have been changes due to economic cycles, market demand, technological develop-ment or profitability, and competition pressures. There have been small gradual changes and large, unexpected, one-time “external” changes, influ-encing the current state or the future perspective of the forest industries. In the course of time, the changes, negative or positive, can appear close to each other or overlap. Eventually, negative changes can cause a spiral of cumulative hardships while the opposite changes may bring cumulating chain of successes.
Forest industries belong to the cyclical branches of economy among which production varies more than for the average of all industries. When national and world economies are developing favourably, house building and other construction increases, needs of packaging materials and adver-tisements grow, demanding more sawnwood, paper board and paper. During
the harder times, the above activities are reduced more strongly than other parts of the economy, consequently causing significantly lower demand and prices for the products of forest industries. Early changes in clients’ stocks due to anticipated higher or lower prices of forest products accelerate the impacts of economic cycles in forest industries. “Bust and boom” has been part of everyday life in the forest industries and changing cycles do not come as a surprise.
The reasons for the recent drastic downturn of pulp and paper produc-tion in Finland are many and they are intermingled. This paper is an attempt to discuss and analyze some of the reasons which have weakened the steady backbone of the forest sector. The approach is qualitative and the paper does not aim at giving a systematic and balanced approach: rather it tries to pin-point specific aspects requiring more consideration or research. The paper starts with describing the dimensions of the downturn and the most immedi-ate factors behind it. It considers relevant strategies of pulp and paper indus-tries and also tries tentatively to relate the recent past and to-day’s situation to actual phenomena discussed in the framework of political economy of the global financial capitalism. The concepts and assumed connections remain at the stage of early identification but it is hoped that it may inspire further research or discussion. 2. The downturn 2.1 Profitability The profitability of Finnish pulp and paper industries, as forest industries elsewhere, was low in the 1990s, but improved during the latter half of the decade, and peaked in 2000 (Juslin and Hansen 2002; Diesen 2007). Return on capital employed (ROCE; figures include also wood and wood product industry, but its share of total turnover is only one quarter, separate figures for pulp and paper are not available) was 16.5 % (Diesen 2007), but has since then declined sharply, being 4.6 % in 2006, 3.8 % in 2007, - 2.5 % in 2008, and c. -2 % in 2009 (Finnish Forest Industries 2010). 2.2 Capacity, production and personnel reductions The pulp and paper industry is characterized by being capital intensive and having significant scales of economies. It has been a long trend in Finland that the larger, integrated mills and most advanced paper machines substi-tute the older and smaller ones. New investments have always increased production. Technological progress has been at the core of the past strate-gies of pulp and paper industry and in the development of a single industry into a complex network – a forest cluster - of several interrelated industries, companies and supporting activities (e.g. Reunala et al. 1999; Häggblom 1999; Saastamoinen 2000).

335
Failed strategies, external events or just life in the global markets? Discussing the downturn of the pulp
and paper industry in Finland
Olli Saastamoinen School of Forest Sciences, University of Eastern Finland
Abstract After the recession of early 1990s the major pulp and paper companies in Finland engaged in further consolidation and widened their earlier “Euro-pean” investment orientation into “global” business strategies by mill acqui-sitions in North America and elsewhere. In the search for better profitability, the shareholder value paradigm was gaining strength as a business model. Profitability peaked in 2000, but then turned downwards as it largely did also globally. Product demand, prices and costs developed unfavourably. Global competition increased and problems of excess capacity became more severe, in particular in Europe. In Finland the strategies of belt tightening and leaning, ultimately called “survival strategies”, were adopted. The pace of mill closures, production breaks and personnel lay-offs, started in 2005 and has lasted until today. The paper discusses what went wrong and can be learnt, if anything, as the survival test seems to be passed, profitability of paper companies is improving, and shareholders are gradually gaining back what belongs to them. Keywords: Forest industries, employment, consolidation, political economy 1. Introduction Changes are inevitable in the economies. The economic history of the Fin-nish forest industries (Kuisma 2006) demonstrates that there have been changes due to economic cycles, market demand, technological develop-ment or profitability, and competition pressures. There have been small gradual changes and large, unexpected, one-time “external” changes, influ-encing the current state or the future perspective of the forest industries. In the course of time, the changes, negative or positive, can appear close to each other or overlap. Eventually, negative changes can cause a spiral of cumulative hardships while the opposite changes may bring cumulating chain of successes.
Forest industries belong to the cyclical branches of economy among which production varies more than for the average of all industries. When national and world economies are developing favourably, house building and other construction increases, needs of packaging materials and adver-tisements grow, demanding more sawnwood, paper board and paper. During
the harder times, the above activities are reduced more strongly than other parts of the economy, consequently causing significantly lower demand and prices for the products of forest industries. Early changes in clients’ stocks due to anticipated higher or lower prices of forest products accelerate the impacts of economic cycles in forest industries. “Bust and boom” has been part of everyday life in the forest industries and changing cycles do not come as a surprise.
The reasons for the recent drastic downturn of pulp and paper produc-tion in Finland are many and they are intermingled. This paper is an attempt to discuss and analyze some of the reasons which have weakened the steady backbone of the forest sector. The approach is qualitative and the paper does not aim at giving a systematic and balanced approach: rather it tries to pin-point specific aspects requiring more consideration or research. The paper starts with describing the dimensions of the downturn and the most immedi-ate factors behind it. It considers relevant strategies of pulp and paper indus-tries and also tries tentatively to relate the recent past and to-day’s situation to actual phenomena discussed in the framework of political economy of the global financial capitalism. The concepts and assumed connections remain at the stage of early identification but it is hoped that it may inspire further research or discussion. 2. The downturn 2.1 Profitability The profitability of Finnish pulp and paper industries, as forest industries elsewhere, was low in the 1990s, but improved during the latter half of the decade, and peaked in 2000 (Juslin and Hansen 2002; Diesen 2007). Return on capital employed (ROCE; figures include also wood and wood product industry, but its share of total turnover is only one quarter, separate figures for pulp and paper are not available) was 16.5 % (Diesen 2007), but has since then declined sharply, being 4.6 % in 2006, 3.8 % in 2007, - 2.5 % in 2008, and c. -2 % in 2009 (Finnish Forest Industries 2010). 2.2 Capacity, production and personnel reductions The pulp and paper industry is characterized by being capital intensive and having significant scales of economies. It has been a long trend in Finland that the larger, integrated mills and most advanced paper machines substi-tute the older and smaller ones. New investments have always increased production. Technological progress has been at the core of the past strate-gies of pulp and paper industry and in the development of a single industry into a complex network – a forest cluster - of several interrelated industries, companies and supporting activities (e.g. Reunala et al. 1999; Häggblom 1999; Saastamoinen 2000).
336
While paper production continued to grow until 2007, the pace of mill closures, production breaks and personnel lay-offs, starting around 2005 and lasting until today, has been unexpected in volumes and speed. It has shaken the long lasting foundations of the whole society and is perceived as shocks in the economic, social and mental life of the country, in particular in the localities and regions around the closed mills.
Mill closures have reduced production capacity by 1.9 million tons be-tween 2008 and 2010. The production decreased from 14.3 million tons in 2007 to 10.6 million tons in 2009, but is expected to be back at 12.1 million tons in 2010 (Metla 2010). The export decreased in the same way, while the most drastic change occurred in newsprint export, a decrease of 74%. The mostly cited assessment predicts that by 2020 the pulp and paper production in Finland would be one third lower than in 2007, when the production peaked (Hetemäki and Hänninen 2008).
While the estimate is drastic, and may after the ongoing rebound be re-garded by some as overly pessimistic, even more drastic change has taken place in employment.
In 2002, the pulp and paper industry (without production of converted paper and paperboard, 5000 persons) employed 35 000 persons. The predic-tion for 2010 is 16 700 persons (Finnish Statistical Yearbook of Forestry 2009; Metla 2010). Since 2002, the number of persons in pulp, paper and paperboard production has halved and decreased by 43 % from 2007 only. Not all changes are due to mill closures but perhaps half of the reduction is the result of rationalization operations and domestic outsourcing.
While the production is anticipated to grow also in 2011, the number of persons employed will not increase (Metla 2010). 3. The external reasons for the downturn 3.1. Decreasing trends of product prices The equation of profitability in its basic form is simple. The low profitabil-ity is due to the declining product prices and increased prices for inputs such as labour, raw materials and energy (Diesen 2007).
Siitonen (2003) found that in general large pulp and paper producers have suffered from constantly declining end-product prices in real terms for the past 20-30 years.
For example, in Germany newsprint and mechanical printing paper real prices have declined by roughly 1%/yr between 1990 and 2006. (Pöyry 2006). A 1%/yr decreasing trend of pulp real prices has occurred between 1970 and 2006. (Diesen 2007).
The unit export prices of paper and paperboard have declined in real terms since 2001 and reached their lowest levels in 2008. Since then, there has been a modest increase in paper prices and a bit more in paperboard prices. Pulp prices have decreased since 2000 and reached a bottom level in
2009, but had a significant estimated rise (c. 50 %) in 2010 due to strong demand in China (Metla 2010).
Pulp and paper is known to be a “bust and boom” industry. The decreas-ing trend of real prices 1970–2006 includes dramatic price rises in particular between 1985 and 1996, where prices went up or down four times with two- to threefold price changes (Pöyry 2006; Diesen 2007). 3.2. Rise of production costs Stumpage prices of pulpwood in real terms in Finland were declining from 1999 until 2005 but increased slowly during 2007, drawn up by high log prices. During 2008 and 2009, prices went slightly down but have been a bit higher along the recovery of the pulp industry in 2010.
Forest industry has increasingly imported roundwood from Russia (about 15-16 mill. m3/yr) which has become of almost strategic importance for the industry, not only due to volumes but also due to the impacts on do-mestic wood prices. The decision of Russia to increase the export tariffs for roundwood (now raised to 15 €/m3 for coniferous wood and birch logs, later to 50 €/m3) had a substantial impact on the wood supply perspective for the Finnish mills, in particular those located near the Russian border. The in-crease of wood export tariffs and a consequent need to reorganize round-wood flows in Finland has been mentioned among the reasons for some mill closures.
In 2009, the CEO of Stora Enso announced that high wood prices in Finland are the major short term obstacle (the industry refers to mill prices). Stora Enso has been transferring production to Sweden and adopting long production breaks in Finland (Kauppalehti 19 March, 2009). Other rising material costs, besides wood, in the pulp and paper industries are due to the increased use of chemicals, minerals and other substances. Their relative cost share has been increasing, being already nearly half of the wood costs (Mutanen 2010).
Another focus has been the labour costs. Paper workers are known to have the highest wages among Finnish workers. A threat of strike in the capital intensive process industry does matter. In 2005, there was a long labour dispute, and a threat of a strike by workers was responded with lock-out by the employers. As cost saving operations and mill closures have sub-stantially reduced labour input in pulp and paper industries, the labour cost share of costs has rather been reducing (Mutanen 2009). 3.3 Changing currency exchange rates and capital costs Exchange rates have a substantial impact on the relative cost competiveness of companies situated in different currency regions (Diesen 2007). During Finland’s “bank crisis” and the subsequent economic recession of 1991-1993, the Finnish Mark was devaluated. When Finland joined the European
337
While paper production continued to grow until 2007, the pace of mill closures, production breaks and personnel lay-offs, starting around 2005 and lasting until today, has been unexpected in volumes and speed. It has shaken the long lasting foundations of the whole society and is perceived as shocks in the economic, social and mental life of the country, in particular in the localities and regions around the closed mills.
Mill closures have reduced production capacity by 1.9 million tons be-tween 2008 and 2010. The production decreased from 14.3 million tons in 2007 to 10.6 million tons in 2009, but is expected to be back at 12.1 million tons in 2010 (Metla 2010). The export decreased in the same way, while the most drastic change occurred in newsprint export, a decrease of 74%. The mostly cited assessment predicts that by 2020 the pulp and paper production in Finland would be one third lower than in 2007, when the production peaked (Hetemäki and Hänninen 2008).
While the estimate is drastic, and may after the ongoing rebound be re-garded by some as overly pessimistic, even more drastic change has taken place in employment.
In 2002, the pulp and paper industry (without production of converted paper and paperboard, 5000 persons) employed 35 000 persons. The predic-tion for 2010 is 16 700 persons (Finnish Statistical Yearbook of Forestry 2009; Metla 2010). Since 2002, the number of persons in pulp, paper and paperboard production has halved and decreased by 43 % from 2007 only. Not all changes are due to mill closures but perhaps half of the reduction is the result of rationalization operations and domestic outsourcing.
While the production is anticipated to grow also in 2011, the number of persons employed will not increase (Metla 2010). 3. The external reasons for the downturn 3.1. Decreasing trends of product prices The equation of profitability in its basic form is simple. The low profitabil-ity is due to the declining product prices and increased prices for inputs such as labour, raw materials and energy (Diesen 2007).
Siitonen (2003) found that in general large pulp and paper producers have suffered from constantly declining end-product prices in real terms for the past 20-30 years.
For example, in Germany newsprint and mechanical printing paper real prices have declined by roughly 1%/yr between 1990 and 2006. (Pöyry 2006). A 1%/yr decreasing trend of pulp real prices has occurred between 1970 and 2006. (Diesen 2007).
The unit export prices of paper and paperboard have declined in real terms since 2001 and reached their lowest levels in 2008. Since then, there has been a modest increase in paper prices and a bit more in paperboard prices. Pulp prices have decreased since 2000 and reached a bottom level in
2009, but had a significant estimated rise (c. 50 %) in 2010 due to strong demand in China (Metla 2010).
Pulp and paper is known to be a “bust and boom” industry. The decreas-ing trend of real prices 1970–2006 includes dramatic price rises in particular between 1985 and 1996, where prices went up or down four times with two- to threefold price changes (Pöyry 2006; Diesen 2007). 3.2. Rise of production costs Stumpage prices of pulpwood in real terms in Finland were declining from 1999 until 2005 but increased slowly during 2007, drawn up by high log prices. During 2008 and 2009, prices went slightly down but have been a bit higher along the recovery of the pulp industry in 2010.
Forest industry has increasingly imported roundwood from Russia (about 15-16 mill. m3/yr) which has become of almost strategic importance for the industry, not only due to volumes but also due to the impacts on do-mestic wood prices. The decision of Russia to increase the export tariffs for roundwood (now raised to 15 €/m3 for coniferous wood and birch logs, later to 50 €/m3) had a substantial impact on the wood supply perspective for the Finnish mills, in particular those located near the Russian border. The in-crease of wood export tariffs and a consequent need to reorganize round-wood flows in Finland has been mentioned among the reasons for some mill closures.
In 2009, the CEO of Stora Enso announced that high wood prices in Finland are the major short term obstacle (the industry refers to mill prices). Stora Enso has been transferring production to Sweden and adopting long production breaks in Finland (Kauppalehti 19 March, 2009). Other rising material costs, besides wood, in the pulp and paper industries are due to the increased use of chemicals, minerals and other substances. Their relative cost share has been increasing, being already nearly half of the wood costs (Mutanen 2010).
Another focus has been the labour costs. Paper workers are known to have the highest wages among Finnish workers. A threat of strike in the capital intensive process industry does matter. In 2005, there was a long labour dispute, and a threat of a strike by workers was responded with lock-out by the employers. As cost saving operations and mill closures have sub-stantially reduced labour input in pulp and paper industries, the labour cost share of costs has rather been reducing (Mutanen 2009). 3.3 Changing currency exchange rates and capital costs Exchange rates have a substantial impact on the relative cost competiveness of companies situated in different currency regions (Diesen 2007). During Finland’s “bank crisis” and the subsequent economic recession of 1991-1993, the Finnish Mark was devaluated. When Finland joined the European
338
Union and the European Monetary Union, the fixed FIM/EUR ratio gave some export advantage for Finnish industries. As USD started to weaken in regard to Euro, this currency advantage was gradually lost. The recent de-valuation of the Swedish Crown in regard to Euro has in turn given Sweden a currency advantage.
As a capital intensive industry, capital costs are a significant in the pulp and paper industry, and also differences in the interest rates of financing have impact on profitability. However, for the pulp and paper industry and Finland as a whole, the European Monetary Union has meant stabilization and lowering of interest rates, and has thus apparently been beneficial to the industry.
The threat of the rise of capital costs is thus principally related to the overall trend of decreased profitability and the financial position of individ-ual companies. Corporate credits and the risks involved are analysed and rated by independent credit rating organizations. Weakening profitability and increasing debt/equity ratio result in lower ratings and higher costs of borrowing. 3.4 Overproduction According to Diesen (2007) there are two major ways to combat the trend of low profitability. The industry has in some cases tried to improve its capac-ity structure by investing in new and efficient machinery. This has increased the production and in many cases caused oversupply, which has in turn de-pressed prices and profitability. Although Diesen (2007) does not mention it, this used to be a part of thinking in Finland.
Another path selected by some companies has been to curb investments and close capacity to better meet declining demand. This strategy has been selected in North America in particular. As a consequence of the low in-vestment level, asset quality has deteriorated, contributing to lower competi-tiveness and declining profits (Diesen 2007). “A peat land there and a wet-land here” says a Finnish proverb.
“The bloody price competition caused by the substantial overcapacity during this millennium is an advantage for some in the value chain – in the short term”, said the CEO of Metsäliitto. He apparently referred to the pub-lishing companies and other clients of paper industries.
EU funding for new mills in Europe and the strict EU competition rules, preventing necessary national or transnational restructuring, must also be mentioned. 3.5 Financial and economic crisis Due to low profitability, Finnish industry was not well prepared to meet the financial crisis and the general economic crisis it caused. Besides the conse-quences in profitability, production and employment given earlier, the stock
prices went sharply down, as elsewhere. The third company in size, M-real was hit hardest. Its stock price was c. € 5 in early 2007 and dropped to € 0.20in 2009, being on the verge of bankruptcy. However, thanks to divest-ments, support of the parent organization composed of forest owners, and the successful financial restructuring under the new CEO of Metsäliitto, bankruptcy was avoided. The share has recently risen to the level of € 2.5 – 3. 4. The strategies 4.1 Did consolidation strategy work? In early 1980s, the four biggest companies in Finland accounted for 40% of the forest industry turnover. After restructuring about 2000, three bigger companies were left accounting for 90% of production (Saastamoinen 2001).
In 1998, state owned Enso Oyj and Swedish Stora, through a voluntary merge, formed a new corporation named Stora Enso, where the Swedish Wallenberg family and State of Finland were the main owners.
The maturing of the markets was also a reason as well the fact that in the pulp and paper industry the acquisition costs per ton were less than half of the replacement costs (Crawford 1999). Furthermore, an acquisition does not increase supply as the new capacity does.
Yet, an important reason for international consolidation has been the search for market power in selected product groups. Mergers are the quick-est way to gain market power. Consolidation and improved economies of scale and scope were considered keys to raising the level of profitability in the sector (Moen and Lilja 2000).
Looking back, one cannot but conclude that the consolidation strategy did not fulfil the expectations. It did not prevent overproduction, did not give market power for pricing, nor improved profitability. What can be as-sumed is only that without consolidation things may have been even worse. 4.2 Globalization strategies Have the globalization strategies of Stora Enso and UPM-Kymmene suc-ceeded or failed? One can find many common features in their international activities, including the strong presence in different parts of Europe, which still remains their major market area. Both companies have been working quite a long time in Asia, where both have retired from their very different Indonesian activities. In China, UPM’s presence is stronger, but Stora Enso is also active there. Both have profitable pulp mill operations in Latin Amer-ica and both are familiar with failures in North America.
Mill acquisition strategies in USA and Canada have resulted in huge losses for Stora Enso and also substantial but much smaller losses for UPM-Kymmene. In particular, Stora Enso paid € 4.9 million for the company it

339
Union and the European Monetary Union, the fixed FIM/EUR ratio gave some export advantage for Finnish industries. As USD started to weaken in regard to Euro, this currency advantage was gradually lost. The recent de-valuation of the Swedish Crown in regard to Euro has in turn given Sweden a currency advantage.
As a capital intensive industry, capital costs are a significant in the pulp and paper industry, and also differences in the interest rates of financing have impact on profitability. However, for the pulp and paper industry and Finland as a whole, the European Monetary Union has meant stabilization and lowering of interest rates, and has thus apparently been beneficial to the industry.
The threat of the rise of capital costs is thus principally related to the overall trend of decreased profitability and the financial position of individ-ual companies. Corporate credits and the risks involved are analysed and rated by independent credit rating organizations. Weakening profitability and increasing debt/equity ratio result in lower ratings and higher costs of borrowing. 3.4 Overproduction According to Diesen (2007) there are two major ways to combat the trend of low profitability. The industry has in some cases tried to improve its capac-ity structure by investing in new and efficient machinery. This has increased the production and in many cases caused oversupply, which has in turn de-pressed prices and profitability. Although Diesen (2007) does not mention it, this used to be a part of thinking in Finland.
Another path selected by some companies has been to curb investments and close capacity to better meet declining demand. This strategy has been selected in North America in particular. As a consequence of the low in-vestment level, asset quality has deteriorated, contributing to lower competi-tiveness and declining profits (Diesen 2007). “A peat land there and a wet-land here” says a Finnish proverb.
“The bloody price competition caused by the substantial overcapacity during this millennium is an advantage for some in the value chain – in the short term”, said the CEO of Metsäliitto. He apparently referred to the pub-lishing companies and other clients of paper industries.
EU funding for new mills in Europe and the strict EU competition rules, preventing necessary national or transnational restructuring, must also be mentioned. 3.5 Financial and economic crisis Due to low profitability, Finnish industry was not well prepared to meet the financial crisis and the general economic crisis it caused. Besides the conse-quences in profitability, production and employment given earlier, the stock
prices went sharply down, as elsewhere. The third company in size, M-real was hit hardest. Its stock price was c. € 5 in early 2007 and dropped to € 0.20in 2009, being on the verge of bankruptcy. However, thanks to divest-ments, support of the parent organization composed of forest owners, and the successful financial restructuring under the new CEO of Metsäliitto, bankruptcy was avoided. The share has recently risen to the level of € 2.5 – 3. 4. The strategies 4.1 Did consolidation strategy work? In early 1980s, the four biggest companies in Finland accounted for 40% of the forest industry turnover. After restructuring about 2000, three bigger companies were left accounting for 90% of production (Saastamoinen 2001).
In 1998, state owned Enso Oyj and Swedish Stora, through a voluntary merge, formed a new corporation named Stora Enso, where the Swedish Wallenberg family and State of Finland were the main owners.
The maturing of the markets was also a reason as well the fact that in the pulp and paper industry the acquisition costs per ton were less than half of the replacement costs (Crawford 1999). Furthermore, an acquisition does not increase supply as the new capacity does.
Yet, an important reason for international consolidation has been the search for market power in selected product groups. Mergers are the quick-est way to gain market power. Consolidation and improved economies of scale and scope were considered keys to raising the level of profitability in the sector (Moen and Lilja 2000).
Looking back, one cannot but conclude that the consolidation strategy did not fulfil the expectations. It did not prevent overproduction, did not give market power for pricing, nor improved profitability. What can be as-sumed is only that without consolidation things may have been even worse. 4.2 Globalization strategies Have the globalization strategies of Stora Enso and UPM-Kymmene suc-ceeded or failed? One can find many common features in their international activities, including the strong presence in different parts of Europe, which still remains their major market area. Both companies have been working quite a long time in Asia, where both have retired from their very different Indonesian activities. In China, UPM’s presence is stronger, but Stora Enso is also active there. Both have profitable pulp mill operations in Latin Amer-ica and both are familiar with failures in North America.
Mill acquisition strategies in USA and Canada have resulted in huge losses for Stora Enso and also substantial but much smaller losses for UPM-Kymmene. In particular, Stora Enso paid € 4.9 million for the company it

340
bought and got c. € 2 million when it sold it in 2007 (HS International edi-tion 25.20.2007).
In 2000, UPM's North American operations acquired a pulp and paper operation in New Brunswick, Canada. The operations were closed in 2007. UPM still has a paper mill in Canada which is apparently doing quite well. In all UPM, has production plants in 15 countries and it employs approxi-mately 23,000 people worldwide. The sales of the company was c. € 7 bil-lion in 2009 (http://www.upm.com/en/about_upm/).
The new fine paper machine 450,000 tons was completed in Changshu, China in 2006. The capacity is 800,000 tons/yr and investment USD 470 million. Both Stora Enso and UPM Kymmene have profitable large pulp mills in Latin America.
UPM's Chudovo Plywood Mill has been the pioneer of the modern ply-wood industry in Russia. Stora Enso has three corrugated paperboard and two sawmills in Russia.
Stora Enso is a global paper, packaging and wood products company producing newsprint and book paper, magazine paper, fine paper, consumer board, industrial packaging and wood products. Stora Enso’s sales totalled € 8.9 billion in 2009. The Group has some 27,000 employees in more than 35 countries worldwide (http://www.storaenso.com/about-us/Pages/welcome-to-stora-enso.aspx).
The wide geographical presence in the major market and fibre supply areas is evidence that strategies are working and probably able to respond to the major challenges, ongoing and coming. 5. Some aspects of political economy of pulp and paper 5.1 The rise and fall of the role of the banks in forest industries in Finland According to Kuusterä (1999) the general practice when characterizing the relationship between an enterprise and financial backer is to speak about the Anglo-Saxon and the Continental model. The former was characterized by the dominant role of funding through direct income or shareholders’ equity. The Continental model originates from Central Europe, especially Germany, where financing was largely based on borrowed capital, i.e. loans granted by banks. As a consequence, the banks retain a tight hold on the companies that they finance (Kuusterä 1999).
The beginning of pulp and paper industries in Finland followed mainly a mixed model based on share capital and companies’ internal incomes and holdings. During the worldwide depression, the banks gained a firmer grip on the companies. Reorganization and restructuring occurred, and groups of companies dominated by specific banks began to take shape (Kuusterä 1999).
The tight regulation of banking adopted during the war years continued in Finland nearly four decades. Interest rates and the flow of foreign capital were regulated. Taxation system had the effect that it was cheaper to borrow capital from the banks became than from the stock markets. The direct own-ership by banks increased and the situation began to resemble the German bank-centred model. The system maintained low (sometimes negative) in-terests rates for forest industries ensured high investments and technological advantage and stability, while also promoting elements of inefficiency and structural inflexibility (Kuusterä 1999).
The deregulation of the financial markets quickly altered this stable situation. A period of rapid restructuring was first focused on old family business. The second stage involved extensive rearrangements in the forest industries, with banks and allied insurance companies being in charge. At that time the domestic financial sector exercised the firmest grip on the companies.
This stage was short-lived. The internationalization of Finnish forest en-terprises also meant that the responsibility for their financing was to an in-creasing degree transferred to the international finance markets. The repeal-ing of restrictions on foreign ownership of Finnish shares in 1993 marked the most significant turning point in the history of industrial ownership structures in Finland. Significant proportions of the share capital of many large export companies were transferred to the ownership of pension and investment funds abroad (Kuusterä 1999). 5.2 Recent discussion on shareholder value and capital market inter-mediaries Lazonick and O’Sullivan (2000) have argued that the ideology of share-holder value, or in other words the pressure from activist investors, has in USA case changed giant firm priorities in the 1980s ‘from retain and rein-vest’ (economic growth and expansion ) to ‘downsize and distribute’ (reduc-tion of the production and the flow of earnings to the shareholders).
In the UK and USA, shareholder value for owners has become a more explicit objective through the disciplinary interactions of analysts and fund managers with senior corporate executives who are then under pressure to deliver narratives of corporate purpose and achievement (Froud et al. 2006).
However, after analyzing the mixed performance of shareholder value thinking, Leaver and Johal (2007) suggest that it is not much of a meaning-ful concept or definite programme of action but rather a social rhetoric that puts management on an often quixotic quest for value, where narrative and performance elements are only loosely aligned with numbers, and the stock market runs on narratives as much as discounted future values.
This seems to fit well the situation in Finnish forest industries at the turn of the century. The ideology, rhetoric and management practices of share-

341
bought and got c. € 2 million when it sold it in 2007 (HS International edi-tion 25.20.2007).
In 2000, UPM's North American operations acquired a pulp and paper operation in New Brunswick, Canada. The operations were closed in 2007. UPM still has a paper mill in Canada which is apparently doing quite well. In all UPM, has production plants in 15 countries and it employs approxi-mately 23,000 people worldwide. The sales of the company was c. € 7 bil-lion in 2009 (http://www.upm.com/en/about_upm/).
The new fine paper machine 450,000 tons was completed in Changshu, China in 2006. The capacity is 800,000 tons/yr and investment USD 470 million. Both Stora Enso and UPM Kymmene have profitable large pulp mills in Latin America.
UPM's Chudovo Plywood Mill has been the pioneer of the modern ply-wood industry in Russia. Stora Enso has three corrugated paperboard and two sawmills in Russia.
Stora Enso is a global paper, packaging and wood products company producing newsprint and book paper, magazine paper, fine paper, consumer board, industrial packaging and wood products. Stora Enso’s sales totalled € 8.9 billion in 2009. The Group has some 27,000 employees in more than 35 countries worldwide (http://www.storaenso.com/about-us/Pages/welcome-to-stora-enso.aspx).
The wide geographical presence in the major market and fibre supply areas is evidence that strategies are working and probably able to respond to the major challenges, ongoing and coming. 5. Some aspects of political economy of pulp and paper 5.1 The rise and fall of the role of the banks in forest industries in Finland According to Kuusterä (1999) the general practice when characterizing the relationship between an enterprise and financial backer is to speak about the Anglo-Saxon and the Continental model. The former was characterized by the dominant role of funding through direct income or shareholders’ equity. The Continental model originates from Central Europe, especially Germany, where financing was largely based on borrowed capital, i.e. loans granted by banks. As a consequence, the banks retain a tight hold on the companies that they finance (Kuusterä 1999).
The beginning of pulp and paper industries in Finland followed mainly a mixed model based on share capital and companies’ internal incomes and holdings. During the worldwide depression, the banks gained a firmer grip on the companies. Reorganization and restructuring occurred, and groups of companies dominated by specific banks began to take shape (Kuusterä 1999).
The tight regulation of banking adopted during the war years continued in Finland nearly four decades. Interest rates and the flow of foreign capital were regulated. Taxation system had the effect that it was cheaper to borrow capital from the banks became than from the stock markets. The direct own-ership by banks increased and the situation began to resemble the German bank-centred model. The system maintained low (sometimes negative) in-terests rates for forest industries ensured high investments and technological advantage and stability, while also promoting elements of inefficiency and structural inflexibility (Kuusterä 1999).
The deregulation of the financial markets quickly altered this stable situation. A period of rapid restructuring was first focused on old family business. The second stage involved extensive rearrangements in the forest industries, with banks and allied insurance companies being in charge. At that time the domestic financial sector exercised the firmest grip on the companies.
This stage was short-lived. The internationalization of Finnish forest en-terprises also meant that the responsibility for their financing was to an in-creasing degree transferred to the international finance markets. The repeal-ing of restrictions on foreign ownership of Finnish shares in 1993 marked the most significant turning point in the history of industrial ownership structures in Finland. Significant proportions of the share capital of many large export companies were transferred to the ownership of pension and investment funds abroad (Kuusterä 1999). 5.2 Recent discussion on shareholder value and capital market inter-mediaries Lazonick and O’Sullivan (2000) have argued that the ideology of share-holder value, or in other words the pressure from activist investors, has in USA case changed giant firm priorities in the 1980s ‘from retain and rein-vest’ (economic growth and expansion ) to ‘downsize and distribute’ (reduc-tion of the production and the flow of earnings to the shareholders).
In the UK and USA, shareholder value for owners has become a more explicit objective through the disciplinary interactions of analysts and fund managers with senior corporate executives who are then under pressure to deliver narratives of corporate purpose and achievement (Froud et al. 2006).
However, after analyzing the mixed performance of shareholder value thinking, Leaver and Johal (2007) suggest that it is not much of a meaning-ful concept or definite programme of action but rather a social rhetoric that puts management on an often quixotic quest for value, where narrative and performance elements are only loosely aligned with numbers, and the stock market runs on narratives as much as discounted future values.
This seems to fit well the situation in Finnish forest industries at the turn of the century. The ideology, rhetoric and management practices of share-

342
holder value were brought into the opening Finnish business environment, including the larger forest corporations (Saastamoinen 2000; Mikkilä 2005), earlier having been in the hands of the “patient capital” (Lilja et al. 1992; Kuusterä 1999).
The corporate narratives to attract the investors appeared along the same way. “Stora Enso to conquer the world” was an example. The narrative to be read from UPM’s slogan “We lead - We learn” was challenging as well but wisely leaves a backdoor open.
Another related but more recent research orientation, deriving from the earlier debates on managerial revolution or managerial capitalism as well as from the observations of senior financial professionals, explores questions about the role and possible effects of fee-earning capital market intermediaries in present-day capitalism. The question is whether this group of actors has taken a new leading role in the economy, in part by constrain-ing the discretionary power of an old group of actors, the salaried corporate managers (Froud et al. 2006).
Two intermediary groups were distinguished. The first includes audit partners in accounting, remuneration consultants, and providers of specialist expertise such as corporate lawyers as well as pension fund managers and stock market analysts. The other group includes investment bankers provid-ing M&A advice and new issues, hedge fund managers and other activist investors, as well as an assortment of traders and dealers working on own account or bank payroll. A part of this group is responsible for the hyper innovation within the capital markets.
All the different groups of intermediaries have a stake in an economy of permanent restructuring, which is a practical project where deals (be it ac-quisition or demerger, new issues or buybacks, securitisation or re-bundling risks) are the source of fees.
Although more research is needed, authors argue that capital market in-termediaries are in many ways the emblem of present-day capitalism. The financial crisis has probably provided new evidence to be investigated. 5.3 Agency chain and a consulting connection? Today, scores of people are handling money and making decisions on behalf of (that is, as agents of) others. All along the ”agency” chain, concern about performance has been translated into a focus on short term returns ((Stiglitz 2010, 12-13). This may refer mainly to the intermediaries outlined above, but it is useful to find that there are many actors outside the direct value chain, agents, who may benefit from any changes occurring in the pulp and paper industry.
One important element of agency chain can be found in the consulting business, traditionally playing an important role in pulp and paper indus-tries.
Between 10-15% of the investments made by forest companies go into design and planning performed by specialized firms of engineers and con-sultants. In addition, the management consultation to the forest industries accounts for as much as 20-30% of the demand for engineering expertise for investments in general. Thus the total engineering design and consultancy market for the forest industries would appear to be worth of USD 2.5-3.5 billion per year. The Finnish Jaakko Pöyry Group is among the world lead-ers in its field (Kässi 1999).
The corporations of pulp and paper industry in Finland as elsewhere make their investment decisions themselves. Responsibilities for failed deci-sions cannot be outsourced. Yet some questions may be raised. The world demand for paper and paperboard between 2004 and 2020 was predicted by Pöyry (2006, as given in Diesen 2007) to increase from 359 million tons to 494 million tons. For mature markets (Japan, Europe, North America) the growth rate was 0.5 %/yr and 4.1 %/yr for the rest of the world. Annual absolute growth was predicted to be 8.2 million tons compared with 7.5 million tons between 1980 and 2004.
This was as late as in 2006, almost ten years after L. Hetemäki (2000) at the Finnish Forest Research Institute reported about decreasing newspaper consumption in the US and similar markets. 5.4 From a welfare state to a corporate welfare state? The Scandinavian welfare state has become a model which many countries in the world have seen worth studying and learning from. In the world of forest industries, the Nordic forest industrial regime has similarly been seen as a representative model of sustainable and responsible forest industries (Lehtinen et al. 2004).
The corporate welfare state is a concept that includes “the extension and strengthening of the corporate safety net, even as social protections for ordi-nary individuals were, at least in some areas, weakened” (Stiglitz 2010, 199).
Related again to the financial crisis: “The banks (and the bank’s inves-tors) also badly misjudged the risk associated with high bank leverage. ... In some cases, the seeming mispricing and misjudging of risk was based on a smart bet: they believed that if troubles arose, the Federal Reserve and the Treasury would bail them out, and they were right” (Stiglitz 2010, 7).
It seems that a part of the forest industry strategy is always to present and require new demands from the state to improve the competitive condi-tions: “Labour-, energy- and raw-material costs have increased faster than with the competing countries during the 2000s. The industry needs fast and concrete actions in particular in energy issues and timber markets“ (Jordan 2010). Securing the availability of energy at competitive prices, one encour-ages industry to invest at home.

343
holder value were brought into the opening Finnish business environment, including the larger forest corporations (Saastamoinen 2000; Mikkilä 2005), earlier having been in the hands of the “patient capital” (Lilja et al. 1992; Kuusterä 1999).
The corporate narratives to attract the investors appeared along the same way. “Stora Enso to conquer the world” was an example. The narrative to be read from UPM’s slogan “We lead - We learn” was challenging as well but wisely leaves a backdoor open.
Another related but more recent research orientation, deriving from the earlier debates on managerial revolution or managerial capitalism as well as from the observations of senior financial professionals, explores questions about the role and possible effects of fee-earning capital market intermediaries in present-day capitalism. The question is whether this group of actors has taken a new leading role in the economy, in part by constrain-ing the discretionary power of an old group of actors, the salaried corporate managers (Froud et al. 2006).
Two intermediary groups were distinguished. The first includes audit partners in accounting, remuneration consultants, and providers of specialist expertise such as corporate lawyers as well as pension fund managers and stock market analysts. The other group includes investment bankers provid-ing M&A advice and new issues, hedge fund managers and other activist investors, as well as an assortment of traders and dealers working on own account or bank payroll. A part of this group is responsible for the hyper innovation within the capital markets.
All the different groups of intermediaries have a stake in an economy of permanent restructuring, which is a practical project where deals (be it ac-quisition or demerger, new issues or buybacks, securitisation or re-bundling risks) are the source of fees.
Although more research is needed, authors argue that capital market in-termediaries are in many ways the emblem of present-day capitalism. The financial crisis has probably provided new evidence to be investigated. 5.3 Agency chain and a consulting connection? Today, scores of people are handling money and making decisions on behalf of (that is, as agents of) others. All along the ”agency” chain, concern about performance has been translated into a focus on short term returns ((Stiglitz 2010, 12-13). This may refer mainly to the intermediaries outlined above, but it is useful to find that there are many actors outside the direct value chain, agents, who may benefit from any changes occurring in the pulp and paper industry.
One important element of agency chain can be found in the consulting business, traditionally playing an important role in pulp and paper indus-tries.
Between 10-15% of the investments made by forest companies go into design and planning performed by specialized firms of engineers and con-sultants. In addition, the management consultation to the forest industries accounts for as much as 20-30% of the demand for engineering expertise for investments in general. Thus the total engineering design and consultancy market for the forest industries would appear to be worth of USD 2.5-3.5 billion per year. The Finnish Jaakko Pöyry Group is among the world lead-ers in its field (Kässi 1999).
The corporations of pulp and paper industry in Finland as elsewhere make their investment decisions themselves. Responsibilities for failed deci-sions cannot be outsourced. Yet some questions may be raised. The world demand for paper and paperboard between 2004 and 2020 was predicted by Pöyry (2006, as given in Diesen 2007) to increase from 359 million tons to 494 million tons. For mature markets (Japan, Europe, North America) the growth rate was 0.5 %/yr and 4.1 %/yr for the rest of the world. Annual absolute growth was predicted to be 8.2 million tons compared with 7.5 million tons between 1980 and 2004.
This was as late as in 2006, almost ten years after L. Hetemäki (2000) at the Finnish Forest Research Institute reported about decreasing newspaper consumption in the US and similar markets. 5.4 From a welfare state to a corporate welfare state? The Scandinavian welfare state has become a model which many countries in the world have seen worth studying and learning from. In the world of forest industries, the Nordic forest industrial regime has similarly been seen as a representative model of sustainable and responsible forest industries (Lehtinen et al. 2004).
The corporate welfare state is a concept that includes “the extension and strengthening of the corporate safety net, even as social protections for ordi-nary individuals were, at least in some areas, weakened” (Stiglitz 2010, 199).
Related again to the financial crisis: “The banks (and the bank’s inves-tors) also badly misjudged the risk associated with high bank leverage. ... In some cases, the seeming mispricing and misjudging of risk was based on a smart bet: they believed that if troubles arose, the Federal Reserve and the Treasury would bail them out, and they were right” (Stiglitz 2010, 7).
It seems that a part of the forest industry strategy is always to present and require new demands from the state to improve the competitive condi-tions: “Labour-, energy- and raw-material costs have increased faster than with the competing countries during the 2000s. The industry needs fast and concrete actions in particular in energy issues and timber markets“ (Jordan 2010). Securing the availability of energy at competitive prices, one encour-ages industry to invest at home.

344
The increased electricity needs are due to more electricity intensive products and bio-refineries also requiring electricity. Wood supply requires enabling private forest owners and joint efforts of all actors to safeguard wood supply. Also domestic wage agreements should take into account the cost levels of the export oriented industry. Investments in research, product development and innovation are needed, as well as to harness education to foresee companies’ needs, so that expertise and capabilities for new prod-ucts and services will be available (Jordan 2010). These all are important elements to support the industry. Yet, remembering the drastic downturn of capacity and employment during the past years, one has to ask: what is the just and balanced social contract between industry and society? The com-mitment to the common good should be reciprocal. 6. Conclusions and comments Ojala (2008) summarized the last transition of forest industry development in Finland into two statements (translation OS): ”From the domain of the [Finnish] bank groups to international giants” and ”Development of coop-erative, national capitalism to financial and global capitalism”.
It is true that the two largest corporations are prominent among the world forest industries and may be called international giants in their own class. The international giants should be able to behave well, because every gesture will be recognized everywhere. They should be sensitive to the vari-ety of cultural landscapes where they are moving forward and leaving their footsteps. This is probably well understood in the civilized corporations.
Operating in the countries where land claims and land use conflicts are often found everywhere and everyday, may make it easy not to forget the home fields.
In fact, there are not so many countries in the world, where one can find abundant land for forestry and forest industries, outside the boreal zone, where the interests of competitive land uses are marginal or moderate, and can be appropriately taken into account under the concept of multiple use, leaving sufficient space for profitable wood, pulp, paper and forest energy industries.
It also must be recognized that all of the Finland (Scandinavia) based corporations are performing very well in comparison with their international competitors in the global sustainability indexes, in particular in the envi-ronmental matters. With regard to environmental consideration, the Finnish corporations might do even better in the future when a compromise recently was made on adopting the FSC certification in Finland. The major reason why the international ENGOs had so strongly attacked Finnish forestry has maybe now been removed from the agenda.
What concerns the social aspects in the global corporate sustainability indexes, two points must be considered. Performing reasonably well there
might on one hand mean that the global average has not been very high, but on the other hand the social elements of sustainability in these indexes may not reflect in sufficient way the demands of real life. The third point, how-ever, might be that the social disbenefits and damage caused by mill clo-sures in a country like Finland, even shaking the foundations of local and regional communities, are in the world’s views more than counterbalanced by the increased employment and improved work safety in the emerging economies, where the reference level may be closer to those prevailing in the underground industries such as mining.
The final point concerns a need to slightly reformulate the above well-pointed conclusions of Ojala (2008). ”Development of cooperative, national capitalism to financial and global capitalism” is as true in Finland as it is in many other countries.
It is also true that the Finnish pulp and paper industry has left “from the domain of the [Finnish] bank groups”, and the leading companies can even after the substantial “downsizing” be seen as “international giants” in their field. What needs to be formulated more explicitly is the new domain they have moved to, that is, the domain of “financial and global capitalism”.
Of course this is a truism, which nevertheless may explain some of the strength of the recent downturn of pulp and paper industry in Finland. It has also been the argumentation and weekly message of the corporations that they are global and accordingly have to act globally, not nationally or lo-cally, to survive and perform well. Even if this is true, it remains to be con-sidered how difficult it is to behave in foreign cultures if one’s own culture seems to be inadequately known.
What remains to be afraid of is whether forest industries are already in the process of becoming only the “sub-contractor” of added value to the opaque, multilayer and opportunistic system of financial governance of the world (Saastamoinen 2008). It would be unfortunate if the giants’ shoulders were not able carry in a decent way the Nordic model of responsible forest industry. Although a bit scared, it is still alive, and should be the basis for the global standard of forest industries.
Freed from, or resistant to, the excessive financial pressures from above, global forest industries may find their places where they should be: as the solid beams of the new global architecture of sustainable economy and fu-ture.

345
The increased electricity needs are due to more electricity intensive products and bio-refineries also requiring electricity. Wood supply requires enabling private forest owners and joint efforts of all actors to safeguard wood supply. Also domestic wage agreements should take into account the cost levels of the export oriented industry. Investments in research, product development and innovation are needed, as well as to harness education to foresee companies’ needs, so that expertise and capabilities for new prod-ucts and services will be available (Jordan 2010). These all are important elements to support the industry. Yet, remembering the drastic downturn of capacity and employment during the past years, one has to ask: what is the just and balanced social contract between industry and society? The com-mitment to the common good should be reciprocal. 6. Conclusions and comments Ojala (2008) summarized the last transition of forest industry development in Finland into two statements (translation OS): ”From the domain of the [Finnish] bank groups to international giants” and ”Development of coop-erative, national capitalism to financial and global capitalism”.
It is true that the two largest corporations are prominent among the world forest industries and may be called international giants in their own class. The international giants should be able to behave well, because every gesture will be recognized everywhere. They should be sensitive to the vari-ety of cultural landscapes where they are moving forward and leaving their footsteps. This is probably well understood in the civilized corporations.
Operating in the countries where land claims and land use conflicts are often found everywhere and everyday, may make it easy not to forget the home fields.
In fact, there are not so many countries in the world, where one can find abundant land for forestry and forest industries, outside the boreal zone, where the interests of competitive land uses are marginal or moderate, and can be appropriately taken into account under the concept of multiple use, leaving sufficient space for profitable wood, pulp, paper and forest energy industries.
It also must be recognized that all of the Finland (Scandinavia) based corporations are performing very well in comparison with their international competitors in the global sustainability indexes, in particular in the envi-ronmental matters. With regard to environmental consideration, the Finnish corporations might do even better in the future when a compromise recently was made on adopting the FSC certification in Finland. The major reason why the international ENGOs had so strongly attacked Finnish forestry has maybe now been removed from the agenda.
What concerns the social aspects in the global corporate sustainability indexes, two points must be considered. Performing reasonably well there
might on one hand mean that the global average has not been very high, but on the other hand the social elements of sustainability in these indexes may not reflect in sufficient way the demands of real life. The third point, how-ever, might be that the social disbenefits and damage caused by mill clo-sures in a country like Finland, even shaking the foundations of local and regional communities, are in the world’s views more than counterbalanced by the increased employment and improved work safety in the emerging economies, where the reference level may be closer to those prevailing in the underground industries such as mining.
The final point concerns a need to slightly reformulate the above well-pointed conclusions of Ojala (2008). ”Development of cooperative, national capitalism to financial and global capitalism” is as true in Finland as it is in many other countries.
It is also true that the Finnish pulp and paper industry has left “from the domain of the [Finnish] bank groups”, and the leading companies can even after the substantial “downsizing” be seen as “international giants” in their field. What needs to be formulated more explicitly is the new domain they have moved to, that is, the domain of “financial and global capitalism”.
Of course this is a truism, which nevertheless may explain some of the strength of the recent downturn of pulp and paper industry in Finland. It has also been the argumentation and weekly message of the corporations that they are global and accordingly have to act globally, not nationally or lo-cally, to survive and perform well. Even if this is true, it remains to be con-sidered how difficult it is to behave in foreign cultures if one’s own culture seems to be inadequately known.
What remains to be afraid of is whether forest industries are already in the process of becoming only the “sub-contractor” of added value to the opaque, multilayer and opportunistic system of financial governance of the world (Saastamoinen 2008). It would be unfortunate if the giants’ shoulders were not able carry in a decent way the Nordic model of responsible forest industry. Although a bit scared, it is still alive, and should be the basis for the global standard of forest industries.
Freed from, or resistant to, the excessive financial pressures from above, global forest industries may find their places where they should be: as the solid beams of the new global architecture of sustainable economy and fu-ture.

346
References Crawford. P. 1998. Global Pulp and Paper Industry in Transition. Tappi
Journal Vol. 82: No.1: 45-47. Diesen, M. 2007. Economics of the Pulp and Paper Industry. Totally up-
dated edition. Papermaking Science and Technology. Book 1: 1-186. Fapet Oy.
European Pulp and Paper Industry. 2009. A Manifesto for Competitiveness and Employment, June 2009. CEPI.
Finnish Forest Industries 2010. (www.forestindusties.fi). Finnish Statistical Yearbook of Forestry 2009. Metsätilastollinen vuosikirja.
METLA. Follkman, P., Froud, J. Sukhdev, J. and Williams, K. 2006. Working for
themselves?: Capital market intermediaries and present day capitalism. CRESC Working Paper Series. Working Paper No. 25:1-19.
Froud, J., Johal, S., Leaver, A. and Williams, K. 2006. Financialization and Strategy. Narrative and Numbers.London. Routledge. 99 pp.
Hetemäki, L. 2000. Information technology and the future of printing pa-pers. Forest Research. METLA's customer publication 2b:15-17. Fin-nish Forest Research Institute.
HS – Helsingin Sanomat, International edition 25.20.2007. Hetemäki, L. and Hänninen, R. 2009. Arvio Suomen puunjalostuksen tuo-
tannosta ja puunkäytöstä vuosina 2015 ja 2020. Metlan työraportteja 122.
Häggblom, R. 1999. The forest cluster is becoming global and more com-pact. In: Reunala, A. Tikkanen, I. & Åsvik, E. (eds.). The Green King-dom – Finland’s forest Cluster. Otava. Pp. 296-301.
Jordan, K. 2010. Metsäteollisuuden toimintaedellytykset Suomessa. PTT-katsaus 2/2010: 6-11.
Juslin, H. and Hansen, E. 2002. Strategic Marketing in the Global Forest Industries. Authors Academic Press. 607 pp.
Kuisma, M. 2006. Metsäteollisuuden maa. Suomi, metsät ja kansainvälinen järjestelmä 1620-1920. SKS. Pp. 781
Kässi,T. 1999. Local and global planning know-how in the forest sector. In: Reunala, A. Tikkanen, I. & Åsvik, E. (eds.). The Green Kingdom – Finland’s forest Cluster. Otava. Pp. 170-173.
Kuusterä, A. 1999. Banks opening the way into international markets. In: Reunala, A. Tikkanen, I. & Åsvik, E. (eds.). The Green Kingdom – Finland’s forest Cluster. Otava. Pp. 174-178.
Lazonick, W. and O’Sullivan, M. (2000). Maximizing shareholder value: a new ideology for corporate governance. Economy and Society 29 (1) February 2000: 13–35
Leaver, A. and Johal, S. 2007. Is the Stock Market a Disciplinary Institu-tion? French Giant Firms and the Regime of Accumulation. New Politi-cal Economy 12(3) (2007).
Lilja, K., Räsänen, K. and Tainio R. 1992. A Dominant Business Recipe: the Forest Sector in Finland. In: Whitley, R. (ed.) 1992. European Busi-ness Systems. Firms and Markets in their National Contexts. SAGE. London. Pp. 137-162
Metla 2010. Metsäsektorin suhdannekatsaus 2010-2011. Metsäntutkimuslai-tos. Pp 56.
Moen,E. and Lilja, K. 2000. Constructing global corporations: contrasting national legacies in the Nordic forest industry. Manuscript. 32 pp.
Mutanen, A. 2010. Metsäteollisuude kustannusrakenne. Teoksessa: .Metla 2010. Metsäsektorin suhdannekatsaus 2010-2011.Metsäntutkimuslaitos. Pp. 30-31.
Ojala 2008 Pöyry Forest Industry Consulting, 2006. Stora Enso 1999. ”Strategic Process Going On”
(Http://www.storaenso.com/investors 2.12. 1999) Saastamoinen, 0. 2001. Paper mills of all countries, unite! The strategies of
the Scandinavian pulp and paper industries. In: Solberg, B. & Delbeck, G. 2001. Proceedings of the Biennial Meeting of the Scandinavian So-ciety of Forest Economics, Gausdal, Norway, April 2000. Scandina-vian Forest Economics 37:126-135.
Saastamoinen, O. 2008. Kestävyys, kannattavuus ja omistaja-arvo metsäte-ollisuudessa. [Sustainability, profitability and shareholder value in for-est industries] Silva Carelica 56:70-79.
Saastamoinen, O. 2009. Global forest related policies and governance. In: Kellomäki, S. Ed.) 2009. Sustainable management of forest resources. Papermaking science and technology . Second edition. Totally updated version. Helsinki. Paper Engineers’ Association /Paperi ja Puu Oy. Pa-permaking Science and Technology, Book 2: 490-546.
Stiglitz, J. 2010. Freefall. The freemarkets and the sinking of the global economy. Allen Lane. 400 pp,
Louise | Box 80 | B-1050 Brussels
347
References Crawford. P. 1998. Global Pulp and Paper Industry in Transition. Tappi
Journal Vol. 82: No.1: 45-47. Diesen, M. 2007. Economics of the Pulp and Paper Industry. Totally up-
dated edition. Papermaking Science and Technology. Book 1: 1-186. Fapet Oy.
European Pulp and Paper Industry. 2009. A Manifesto for Competitiveness and Employment, June 2009. CEPI.
Finnish Forest Industries 2010. (www.forestindusties.fi). Finnish Statistical Yearbook of Forestry 2009. Metsätilastollinen vuosikirja.
METLA. Follkman, P., Froud, J. Sukhdev, J. and Williams, K. 2006. Working for
themselves?: Capital market intermediaries and present day capitalism. CRESC Working Paper Series. Working Paper No. 25:1-19.
Froud, J., Johal, S., Leaver, A. and Williams, K. 2006. Financialization and Strategy. Narrative and Numbers.London. Routledge. 99 pp.
Hetemäki, L. 2000. Information technology and the future of printing pa-pers. Forest Research. METLA's customer publication 2b:15-17. Fin-nish Forest Research Institute.
HS – Helsingin Sanomat, International edition 25.20.2007. Hetemäki, L. and Hänninen, R. 2009. Arvio Suomen puunjalostuksen tuo-
tannosta ja puunkäytöstä vuosina 2015 ja 2020. Metlan työraportteja 122.
Häggblom, R. 1999. The forest cluster is becoming global and more com-pact. In: Reunala, A. Tikkanen, I. & Åsvik, E. (eds.). The Green King-dom – Finland’s forest Cluster. Otava. Pp. 296-301.
Jordan, K. 2010. Metsäteollisuuden toimintaedellytykset Suomessa. PTT-katsaus 2/2010: 6-11.
Juslin, H. and Hansen, E. 2002. Strategic Marketing in the Global Forest Industries. Authors Academic Press. 607 pp.
Kuisma, M. 2006. Metsäteollisuuden maa. Suomi, metsät ja kansainvälinen järjestelmä 1620-1920. SKS. Pp. 781
Kässi,T. 1999. Local and global planning know-how in the forest sector. In: Reunala, A. Tikkanen, I. & Åsvik, E. (eds.). The Green Kingdom – Finland’s forest Cluster. Otava. Pp. 170-173.
Kuusterä, A. 1999. Banks opening the way into international markets. In: Reunala, A. Tikkanen, I. & Åsvik, E. (eds.). The Green Kingdom – Finland’s forest Cluster. Otava. Pp. 174-178.
Lazonick, W. and O’Sullivan, M. (2000). Maximizing shareholder value: a new ideology for corporate governance. Economy and Society 29 (1) February 2000: 13–35
Leaver, A. and Johal, S. 2007. Is the Stock Market a Disciplinary Institu-tion? French Giant Firms and the Regime of Accumulation. New Politi-cal Economy 12(3) (2007).
Lilja, K., Räsänen, K. and Tainio R. 1992. A Dominant Business Recipe: the Forest Sector in Finland. In: Whitley, R. (ed.) 1992. European Busi-ness Systems. Firms and Markets in their National Contexts. SAGE. London. Pp. 137-162
Metla 2010. Metsäsektorin suhdannekatsaus 2010-2011. Metsäntutkimuslai-tos. Pp 56.
Moen,E. and Lilja, K. 2000. Constructing global corporations: contrasting national legacies in the Nordic forest industry. Manuscript. 32 pp.
Mutanen, A. 2010. Metsäteollisuude kustannusrakenne. Teoksessa: .Metla 2010. Metsäsektorin suhdannekatsaus 2010-2011.Metsäntutkimuslaitos. Pp. 30-31.
Ojala 2008 Pöyry Forest Industry Consulting, 2006. Stora Enso 1999. ”Strategic Process Going On”
(Http://www.storaenso.com/investors 2.12. 1999) Saastamoinen, 0. 2001. Paper mills of all countries, unite! The strategies of
the Scandinavian pulp and paper industries. In: Solberg, B. & Delbeck, G. 2001. Proceedings of the Biennial Meeting of the Scandinavian So-ciety of Forest Economics, Gausdal, Norway, April 2000. Scandina-vian Forest Economics 37:126-135.
Saastamoinen, O. 2008. Kestävyys, kannattavuus ja omistaja-arvo metsäte-ollisuudessa. [Sustainability, profitability and shareholder value in for-est industries] Silva Carelica 56:70-79.
Saastamoinen, O. 2009. Global forest related policies and governance. In: Kellomäki, S. Ed.) 2009. Sustainable management of forest resources. Papermaking science and technology . Second edition. Totally updated version. Helsinki. Paper Engineers’ Association /Paperi ja Puu Oy. Pa-permaking Science and Technology, Book 2: 490-546.
Stiglitz, J. 2010. Freefall. The freemarkets and the sinking of the global economy. Allen Lane. 400 pp,
Louise | Box 80 | B-1050 Brussels

348
ABSTRACTS
Improving International Forest Products Price Information
Ibrahim Favada1, Paul Rogieux and Aljoscha Requardt
1 European Forest Institute – EFI The existence of pertinent, timely and accurate forest products price information is crucial for efficiency of the timber and timber product markets. The only free international forest products price database is that of UNECE/FAO. However, the current database is limited in coverage and not necessarily user-friendly. In cooperation with UNECE Timber Section, this study seeks to offer the best options for improving international forest products price information for different users. The study will extract metadata from forest products price information websites using extended Dublin Core Metadata Schema, analyze and compare them, identify gaps and constraints of metadata sources, and finally propose data collection, maintenance and dissemination for an improved forest products price database. In addition, user needs and database design, in terms of data coverage, system interface and data retrieval will be analyzed. The study will show the availability of forest products price information in Europe. A metadata portal will be created from the various sources of price information. Finally, the data coverage, quality of the price data, the methods of data collection, maintenance and dissemination will be analyzed and different options for an improved European forest products price database will be proposed. Keywords: forest products price, international, information system, database.
Assessing the Finnish targets for the energy use of forest chips with a spatial market model
A. Maarit I. Kallio1, Perttu Anttila2, Megan McCormick1 and Antti
Asikainen2
1 Finnish Forest Research Institute, Vantaa 2 Finnish Forest Research Institute, Joensuu
We develop a spatially elaborate partial equilibrium model for the forest chips market in Finland and demonstrate its use by examining the targets outlined by the government for the increase in the use of forest chips for energy. In April 2010, the Ministry of Employment and the Economy proposed a target that some 25 TWh of forest chips should be used as fuel in energy production in Finland by 2020. In addition, three units producing 7 TWh of wood-based biofuels should be on stream by 2020. The planned policy measures to support these goals include subsidies for heat and power plants for chipping small trees from early thinning for fuel, and a support for wood-based electricity production tied to the price of CO2 emission allowance. Our results suggest that in light of the recent decline in the production capacities and output of the Finnish forest industries, the above target is overly ambitious. Reaching it would require new investments in the forest industry production capacity. In particular, the industries using sawlogs would need to get back to the high levels seen few years ago. Thereby, for instance, policies leading to increased use of wood in construction would support the renewable energy goals as well. Also, the subsidies for CHP-production at sawmills could be beneficial in this respect. Nevertheless, the use of forest chips will continue increasing, further boosted by the planned new subsidies. The tight carbon policy alone would lead to a considerable increase in the use of forest chips, but because the CO2 prices are difficult to foresee, subsidies are needed to decrease the uncertainty faced by the market players. The government is proposing to implement feed-in tariffs for bioelectricity, which would be tied to carbon price. Based on our results, we recommend that the potential subsidy for chipping thinning wood for fuel would be coupled to the carbon price as well. If any biodiesel plants should come into operation and the carbon policies are not too slack, the forest chips prices are likely to rise to the levels that make it economic for the heat and power plants to combust increasing amount of pulpwood at least in some regions in Finland.

349
ABSTRACTS
Improving International Forest Products Price Information
Ibrahim Favada1, Paul Rogieux and Aljoscha Requardt
1 European Forest Institute – EFI The existence of pertinent, timely and accurate forest products price information is crucial for efficiency of the timber and timber product markets. The only free international forest products price database is that of UNECE/FAO. However, the current database is limited in coverage and not necessarily user-friendly. In cooperation with UNECE Timber Section, this study seeks to offer the best options for improving international forest products price information for different users. The study will extract metadata from forest products price information websites using extended Dublin Core Metadata Schema, analyze and compare them, identify gaps and constraints of metadata sources, and finally propose data collection, maintenance and dissemination for an improved forest products price database. In addition, user needs and database design, in terms of data coverage, system interface and data retrieval will be analyzed. The study will show the availability of forest products price information in Europe. A metadata portal will be created from the various sources of price information. Finally, the data coverage, quality of the price data, the methods of data collection, maintenance and dissemination will be analyzed and different options for an improved European forest products price database will be proposed. Keywords: forest products price, international, information system, database.
Assessing the Finnish targets for the energy use of forest chips with a spatial market model
A. Maarit I. Kallio1, Perttu Anttila2, Megan McCormick1 and Antti
Asikainen2
1 Finnish Forest Research Institute, Vantaa 2 Finnish Forest Research Institute, Joensuu
We develop a spatially elaborate partial equilibrium model for the forest chips market in Finland and demonstrate its use by examining the targets outlined by the government for the increase in the use of forest chips for energy. In April 2010, the Ministry of Employment and the Economy proposed a target that some 25 TWh of forest chips should be used as fuel in energy production in Finland by 2020. In addition, three units producing 7 TWh of wood-based biofuels should be on stream by 2020. The planned policy measures to support these goals include subsidies for heat and power plants for chipping small trees from early thinning for fuel, and a support for wood-based electricity production tied to the price of CO2 emission allowance. Our results suggest that in light of the recent decline in the production capacities and output of the Finnish forest industries, the above target is overly ambitious. Reaching it would require new investments in the forest industry production capacity. In particular, the industries using sawlogs would need to get back to the high levels seen few years ago. Thereby, for instance, policies leading to increased use of wood in construction would support the renewable energy goals as well. Also, the subsidies for CHP-production at sawmills could be beneficial in this respect. Nevertheless, the use of forest chips will continue increasing, further boosted by the planned new subsidies. The tight carbon policy alone would lead to a considerable increase in the use of forest chips, but because the CO2 prices are difficult to foresee, subsidies are needed to decrease the uncertainty faced by the market players. The government is proposing to implement feed-in tariffs for bioelectricity, which would be tied to carbon price. Based on our results, we recommend that the potential subsidy for chipping thinning wood for fuel would be coupled to the carbon price as well. If any biodiesel plants should come into operation and the carbon policies are not too slack, the forest chips prices are likely to rise to the levels that make it economic for the heat and power plants to combust increasing amount of pulpwood at least in some regions in Finland.

350
Keywords: harvest residues, forest chips, renewable energy, co-firing, biodiesel, energy policy, feed-in tariffs. Acknowledgements The research leading to these results has received funding from the European Community's Seventh Framework Programme (FP7) under grant agreement No. 212535, Climate Change– Terrestrial Adaptation and Mitigation in Europe (CC-TAME), www.cctame.eu, and from the Sustainable Energy Programme of the Finnish Academy (consortium BEET).
Multidimensional sustainability framework to evaluate forest and wood energy production
(BioSus-project)
Katja Lähtinen Finnish Environment Institute, Joensuu Research Unit
Renewable energy business and pressures on using forest resources in energy production are increasing rapidly as a result of aims to decrease greenhouse gas emissions and to secure the supply of energy. Simultaneously with the climate change mitigation, also urbanization and globalization set new needs on sustainable use of forest resources. Sustainability is a multi-dimensional concept including ecological, economic, social and cultural aspects, which all should be taken into account in making decisions of forest utilization. In order to take into account the various perspectives linked to natural resource management, new effective tools for decision-making situations are needed. The focus of the BioSus-project is to monitor the multidimensional (ecological, economic, social and cultural) sustainability effects of using the forest biomass for energy in four alternative production systems: local heat entrepreneurship, wood pellets production, wood and peat combustion in large combined heat and power (CHP) plant and biodiesel produced from both woody biomass and peat. The multidimensional sustainability assessments are employed with the multi-criteria decision analysis (MCDA) and life-cycle analysis (LCA) methodologies. The project is expected to open up new approaches for assessing the sustainability of bioenergy production especially at regional level. In addition, the results are envisioned to provide new information of the relative benefits of different bioenergy production systems and their development potential.
INTERNATIONAL FORESTRY

351
Keywords: harvest residues, forest chips, renewable energy, co-firing, biodiesel, energy policy, feed-in tariffs. Acknowledgements The research leading to these results has received funding from the European Community's Seventh Framework Programme (FP7) under grant agreement No. 212535, Climate Change– Terrestrial Adaptation and Mitigation in Europe (CC-TAME), www.cctame.eu, and from the Sustainable Energy Programme of the Finnish Academy (consortium BEET).
Multidimensional sustainability framework to evaluate forest and wood energy production
(BioSus-project)
Katja Lähtinen Finnish Environment Institute, Joensuu Research Unit
Renewable energy business and pressures on using forest resources in energy production are increasing rapidly as a result of aims to decrease greenhouse gas emissions and to secure the supply of energy. Simultaneously with the climate change mitigation, also urbanization and globalization set new needs on sustainable use of forest resources. Sustainability is a multi-dimensional concept including ecological, economic, social and cultural aspects, which all should be taken into account in making decisions of forest utilization. In order to take into account the various perspectives linked to natural resource management, new effective tools for decision-making situations are needed. The focus of the BioSus-project is to monitor the multidimensional (ecological, economic, social and cultural) sustainability effects of using the forest biomass for energy in four alternative production systems: local heat entrepreneurship, wood pellets production, wood and peat combustion in large combined heat and power (CHP) plant and biodiesel produced from both woody biomass and peat. The multidimensional sustainability assessments are employed with the multi-criteria decision analysis (MCDA) and life-cycle analysis (LCA) methodologies. The project is expected to open up new approaches for assessing the sustainability of bioenergy production especially at regional level. In addition, the results are envisioned to provide new information of the relative benefits of different bioenergy production systems and their development potential.
INTERNATIONAL FORESTRY

3521
Stakeholder perspectives on patterns and causes of forest crimes in Community Forestry in Nepal
Bir Bahadur Khanal Chhetri, Helle Overgaard Larsen and
Carsten Smith-Hall Forest and Landscape, Faculty of Life Sciences,
University of Copenhagen
Abstract The present study contributes to our understanding of local level forest crimes and law enforcement in community forestry. A total of 211 individuals from 5 categories of stakeholders, that all are involved in community forestry in Nepal, responded to a structured questionnaire administered face to face. The questionnaire elicited respondents’ perceptions on the nature, frequency, motives and consequences of forest crimes. Findings show that illegal collection of firewood is perceived to be the most frequent crime, followed by illegal appropriation of timber, poles and thatch grasses. Stakeholders have clear ideas about the characteristics and motives of forest criminals and sanctions are perceived to be lenient. Keywords Community forestry, forest crime, law enforcement, poor, Nepal 1. Introduction Today, forest conservation is highly prioritised nationally and internationally, with a main focus on controlling illegal timber logging through various forms of improved governance (World Bank, 2006). Illegal subsistence forest uses generally receive less international attention, although warnings of negative consequences for rural livelihoods arising from the battle against illegal timber harvest are made (Kaimowitz, 2007). On the other hand, because of the inabilities of the central authorities to enforce the rules (Brunner et al., 1999), decentralised forest management is assumed to potentially be more effective than centralised

3531
Stakeholder perspectives on patterns and causes of forest crimes in Community Forestry in Nepal
Bir Bahadur Khanal Chhetri, Helle Overgaard Larsen and
Carsten Smith-Hall Forest and Landscape, Faculty of Life Sciences,
University of Copenhagen
Abstract The present study contributes to our understanding of local level forest crimes and law enforcement in community forestry. A total of 211 individuals from 5 categories of stakeholders, that all are involved in community forestry in Nepal, responded to a structured questionnaire administered face to face. The questionnaire elicited respondents’ perceptions on the nature, frequency, motives and consequences of forest crimes. Findings show that illegal collection of firewood is perceived to be the most frequent crime, followed by illegal appropriation of timber, poles and thatch grasses. Stakeholders have clear ideas about the characteristics and motives of forest criminals and sanctions are perceived to be lenient. Keywords Community forestry, forest crime, law enforcement, poor, Nepal 1. Introduction Today, forest conservation is highly prioritised nationally and internationally, with a main focus on controlling illegal timber logging through various forms of improved governance (World Bank, 2006). Illegal subsistence forest uses generally receive less international attention, although warnings of negative consequences for rural livelihoods arising from the battle against illegal timber harvest are made (Kaimowitz, 2007). On the other hand, because of the inabilities of the central authorities to enforce the rules (Brunner et al., 1999), decentralised forest management is assumed to potentially be more effective than centralised
354
2
management (Agrawal, 2001; Andersson and Gibson 2006; Blair 2000; Ostrom, 1990); and that has resulted in favouring the current trend of forest decentralisation across the developing world1. However, in several developing countries, a strong forest conservation paradigm means that the precautionary principle is invoked to favour forest protection rather than rural livelihoods, even in the absence of evidence on the actual conditions of the forest (Cerutti and Tacconi, 2008; Larsen and Smith, 2004). This has spurred research on the effectiveness of local level forest law enforcement in community forestry, where most of the common forests are managed by people living within their ancestral domains who depend on forests and pasture resources for food, fodder, manure agricultural implements and medicine. Though formally illegal in many cases, such uses of forest products have gained the de facto social legitimacy (Colcherster, 2006) and this makes it difficult to determine what is illegal and what is not. In addition, understanding of the common pool resource problems by different actors involved is uncertain and contested and that are often ignored in policy debates (Adams et al., 2003). Although law enforcement is perceived essential for effective collective action, including ensuring fair distribution of benefits and sustainability of forest exploitation, stronger law enforcement is often practised at the expense of the poor, who are easier targets for suppression than the rich and wealthier (Agrawal, 2009; Kaimowiz, 2007). It has been shown that regular enforcement of forest rules is correlated with lowered probabilities for forest degradation (e.g., Gibson et al., 2005; Chhatre and Agrawal, 2008; Coleman, 2009) and with the success of decentralised forest management more generally according to ordinal indicators of ecological sustainability, social equity and economic efficiency (Pagdee et al., 2006). It is not clear, however, how local level formation of rules and their subsequent enforcement influence the livelihoods of the poorest forest users. It is widely documented that wealthier forest users with a high social status tend to dominate decisions concerning management of decentralised forests and distribution of resulting benefits (Chhetri, 2010; Edmunds and Wollenberg, 2003; Adhikari 2005; Blessings et al., 2006) but does that mean local rule formulation and forest law enforcement lead to inequitable law enforcement? The present study provides a stakeholder perspective on crimes and rule enforcement in Nepalese forest commons. It explores the perceptions of different level of stakeholders on the nature, severity and causes of forest crimes in community forests. The study does not evaluate the state of the forest resource but contributes a micro-level overview of forest crime and law enforcement. The study argues that illegal actions done by the poor 1 Decentralisation denotes formal transfer of powers to actors or institutions at lower levels in political, administrative or territorial hierarchies (Ribot, 2004). More than 10% of the global forest area is under some form of decentralised management (Sunderlin et al., 2008).
3
forest users are perceived to be small in scale and low in intensity, and to be connected by the motive to secure basic subsistence needs. Further, effective enforcement of local forest rules and credible penalties in controlling the illegal activities occurring in the Nepalese community forestry is perceived to be lacking.
1.1 Community Forestry in Nepal Nepal was selected for the investigation because the Nepalese Community Forestry Programme was one of the first forest decentralisation processes globally. Starting in the late 1970s decentralised forest management now covers 25% of the Nepalese forest area (1.1 million ha) and includes 35% of all Nepalese households (1.5 million households) in about 14,000 Community Forestry User Groups (CFUGs) (Blakie and Springate-Baginski, 2007). Forest areas are handed over to users organised in a CFUG by the District Forest Officer according to rules specified in the Forest Act (HMG, 1993) and Forest Regulations (HMG, 1995). The implementing body of the CFUG is the Users’ Committee elected at the annual General Assembly. The programme is considered a success in terms of both forest conservation and socio-economic contribution (Tachibana and Adhikari, 2009; Kanel and Dahal, 2008; Adhikari, et al. 2007; Gautam et al., 2002; Dongol et al., 2002), although concerns with elite capture are voiced (Gilmour, 2003; Lachapelle et al., 2004). 1.2 Forest crime In line with Downes and Rock (1995) forest crime here is understood to include activities and behaviours that are banned or controlled by relevant authorities. Forest crimes in Nepalese community forests are thus defined by the Forest Act and the CFUG work plan and are primarily offenses against properties rather than persons. Therefore, crimes are expected to follow the neoclassical rational choice theory (Becker, 1968): members who break the rules of CFUGs do so only if they perceive the probabilities and costs of apprehension to be larger than the benefits derived from the illegal forest products extracted. Rules, however, are crafted by the CFUG committee where not all members may be able to exert influence, wherefore understanding of forest crime must draw also upon social conflict theory, or radical criminology (Chambliss and Seidmann, 1971). Perceptions of crime are not static and may depend on the social reaction to the criminal act (Schur, 1971), whether a certain act is considered a crime may depend on who undertakes it, and some rules are broken with impunity (Becker, 1978: 13). The approach applied here is, in other words, to investigate forest crimes as conscious undertakings by rational individuals (rather than deviants), who are subjugated rules predominantly crafted by those in the community empowered by the current social conditions of Nepal, i.e. the
355
2
management (Agrawal, 2001; Andersson and Gibson 2006; Blair 2000; Ostrom, 1990); and that has resulted in favouring the current trend of forest decentralisation across the developing world1. However, in several developing countries, a strong forest conservation paradigm means that the precautionary principle is invoked to favour forest protection rather than rural livelihoods, even in the absence of evidence on the actual conditions of the forest (Cerutti and Tacconi, 2008; Larsen and Smith, 2004). This has spurred research on the effectiveness of local level forest law enforcement in community forestry, where most of the common forests are managed by people living within their ancestral domains who depend on forests and pasture resources for food, fodder, manure agricultural implements and medicine. Though formally illegal in many cases, such uses of forest products have gained the de facto social legitimacy (Colcherster, 2006) and this makes it difficult to determine what is illegal and what is not. In addition, understanding of the common pool resource problems by different actors involved is uncertain and contested and that are often ignored in policy debates (Adams et al., 2003). Although law enforcement is perceived essential for effective collective action, including ensuring fair distribution of benefits and sustainability of forest exploitation, stronger law enforcement is often practised at the expense of the poor, who are easier targets for suppression than the rich and wealthier (Agrawal, 2009; Kaimowiz, 2007). It has been shown that regular enforcement of forest rules is correlated with lowered probabilities for forest degradation (e.g., Gibson et al., 2005; Chhatre and Agrawal, 2008; Coleman, 2009) and with the success of decentralised forest management more generally according to ordinal indicators of ecological sustainability, social equity and economic efficiency (Pagdee et al., 2006). It is not clear, however, how local level formation of rules and their subsequent enforcement influence the livelihoods of the poorest forest users. It is widely documented that wealthier forest users with a high social status tend to dominate decisions concerning management of decentralised forests and distribution of resulting benefits (Chhetri, 2010; Edmunds and Wollenberg, 2003; Adhikari 2005; Blessings et al., 2006) but does that mean local rule formulation and forest law enforcement lead to inequitable law enforcement? The present study provides a stakeholder perspective on crimes and rule enforcement in Nepalese forest commons. It explores the perceptions of different level of stakeholders on the nature, severity and causes of forest crimes in community forests. The study does not evaluate the state of the forest resource but contributes a micro-level overview of forest crime and law enforcement. The study argues that illegal actions done by the poor 1 Decentralisation denotes formal transfer of powers to actors or institutions at lower levels in political, administrative or territorial hierarchies (Ribot, 2004). More than 10% of the global forest area is under some form of decentralised management (Sunderlin et al., 2008).
3
forest users are perceived to be small in scale and low in intensity, and to be connected by the motive to secure basic subsistence needs. Further, effective enforcement of local forest rules and credible penalties in controlling the illegal activities occurring in the Nepalese community forestry is perceived to be lacking.
1.1 Community Forestry in Nepal Nepal was selected for the investigation because the Nepalese Community Forestry Programme was one of the first forest decentralisation processes globally. Starting in the late 1970s decentralised forest management now covers 25% of the Nepalese forest area (1.1 million ha) and includes 35% of all Nepalese households (1.5 million households) in about 14,000 Community Forestry User Groups (CFUGs) (Blakie and Springate-Baginski, 2007). Forest areas are handed over to users organised in a CFUG by the District Forest Officer according to rules specified in the Forest Act (HMG, 1993) and Forest Regulations (HMG, 1995). The implementing body of the CFUG is the Users’ Committee elected at the annual General Assembly. The programme is considered a success in terms of both forest conservation and socio-economic contribution (Tachibana and Adhikari, 2009; Kanel and Dahal, 2008; Adhikari, et al. 2007; Gautam et al., 2002; Dongol et al., 2002), although concerns with elite capture are voiced (Gilmour, 2003; Lachapelle et al., 2004). 1.2 Forest crime In line with Downes and Rock (1995) forest crime here is understood to include activities and behaviours that are banned or controlled by relevant authorities. Forest crimes in Nepalese community forests are thus defined by the Forest Act and the CFUG work plan and are primarily offenses against properties rather than persons. Therefore, crimes are expected to follow the neoclassical rational choice theory (Becker, 1968): members who break the rules of CFUGs do so only if they perceive the probabilities and costs of apprehension to be larger than the benefits derived from the illegal forest products extracted. Rules, however, are crafted by the CFUG committee where not all members may be able to exert influence, wherefore understanding of forest crime must draw also upon social conflict theory, or radical criminology (Chambliss and Seidmann, 1971). Perceptions of crime are not static and may depend on the social reaction to the criminal act (Schur, 1971), whether a certain act is considered a crime may depend on who undertakes it, and some rules are broken with impunity (Becker, 1978: 13). The approach applied here is, in other words, to investigate forest crimes as conscious undertakings by rational individuals (rather than deviants), who are subjugated rules predominantly crafted by those in the community empowered by the current social conditions of Nepal, i.e. the

3564
wealthy and politically well organised. For consistency, rule breakers are henceforth referred to as ‘criminals’ where this implies that a legally defined rule has been broken without any other negative connotations. 2. Methods 2.1 Study area The perception of the forest users for the study was collected from Simjung and Ghyachchok Village Development Committees2 (VDCs) of Gorkha District, located about 1 day walk from the nearest road. The VDCs represent a typical Nepalese middle hill setting where the population depends on small-scale farming, labour wages, army pensions and remittances. All households depend on forest products for cooking, heating, house construction, animal fodder and manure, wood for agricultural implements and to some degree medicine. The altitude of both of the VDCs ranges between 700 and 3000 masl and thus span large variation in agricultural potential and forest types. The community forestry programme in Gorkha District was initiated in 1990 when half of the total forest area was classified as potential community forest area (50,919 ha). By 2008 18,765 ha had been handed over to 404 (CFUGs) involving 47,691 households (about 80% of the District’s population) (DFO, 2008). In Simjung, most of the forests near the settlements are managed by FUGs while in Ghyachchok major part of the forest land is under the control of the government. Out of all 14 CFUGs included in this study from these VDCs, two of the CFUGs lie in Ghyachchok and all other lie in Simjung.
2.2 Data collection The present is a case study that was carried out during extensive field stays in 2008. Perceptions of current forest crimes (their nature, characteristics of criminals, motives of offenses, applied penalties) in community forestry were elicited from representatives of the main stakeholder groups involved in community forestry: (i) forest users, (ii) committee members, (iii) advocacy groups engaged in community forestry, (iv) forest authorities working at district and central levels, and (v) national and international academicians working on community forestry. Respondents were selected as follows: (i) 29 heads of households were randomly selected to cover all 14 CFUGs in Simjung and Ghyachchok VDCs; (ii) one representative from each of the 14 Users’ Committees in Simjung and Ghyachchok VDCs were selected with additional representatives from 38 randomly selected CFUGs in Gorkha District (52 in total, the respondent was the chairman, secretary or treasurer of the CFUG); (iii) 26 executive members from advocacy groups were selected based on judgemental sampling, criteria for inclusion
2 Smallest political administrative unit in Nepal.
5
were familiarity with community forestry from working experience in the field and a reputation for being well-informed on community forestry. Respondents belonged to two groups - the Federation of Community Forest User Groups (FECOFUN) and Himalayan Grassroots Women's Natural Resources Management Association Himawanti; (iv) 51 representatives of district and national forest authorities were selected based on judgemental sampling. At the district level the Assistant Forest Officers and the District Forest Officer from Gorkha District were included. At the national level, officers and higher level staff from the Department of Forest, the Department of Forest Research and Survey, and the Ministry of Forests and Soil Conservation were selected based on the criterion of involvement with the community forestry process; and (v) 53 national and international academicians whose work was related with community forestry were selected by judgemental sampling from Tribhuwan University in Nepal, other research institutions, and non-governmental organisations working in Nepal. Groups (iv) and (v) were merged from each two groups as responses were very similar: officer and higher level staff at district and central levels were combined in group (iv) and academicians from non-governmental organisations and research institutions were merged in group (v). A total of 211 individuals provided responses regarding perceptions of forest crimes by answering structured questionnaire administered face to face. 3. Results The most frequent forest crime was considered to be illegal collection of firewood, followed by illegal cutting of timber, poles and illegal forest grazing (Table 1). Notably, the majority in the respondents in the advocacy group believed forest grazing to be a frequent crime whereas forest users did not mentioned this at all, and the forest users did not mention illegal collection of timber.

3574
wealthy and politically well organised. For consistency, rule breakers are henceforth referred to as ‘criminals’ where this implies that a legally defined rule has been broken without any other negative connotations. 2. Methods 2.1 Study area The perception of the forest users for the study was collected from Simjung and Ghyachchok Village Development Committees2 (VDCs) of Gorkha District, located about 1 day walk from the nearest road. The VDCs represent a typical Nepalese middle hill setting where the population depends on small-scale farming, labour wages, army pensions and remittances. All households depend on forest products for cooking, heating, house construction, animal fodder and manure, wood for agricultural implements and to some degree medicine. The altitude of both of the VDCs ranges between 700 and 3000 masl and thus span large variation in agricultural potential and forest types. The community forestry programme in Gorkha District was initiated in 1990 when half of the total forest area was classified as potential community forest area (50,919 ha). By 2008 18,765 ha had been handed over to 404 (CFUGs) involving 47,691 households (about 80% of the District’s population) (DFO, 2008). In Simjung, most of the forests near the settlements are managed by FUGs while in Ghyachchok major part of the forest land is under the control of the government. Out of all 14 CFUGs included in this study from these VDCs, two of the CFUGs lie in Ghyachchok and all other lie in Simjung.
2.2 Data collection The present is a case study that was carried out during extensive field stays in 2008. Perceptions of current forest crimes (their nature, characteristics of criminals, motives of offenses, applied penalties) in community forestry were elicited from representatives of the main stakeholder groups involved in community forestry: (i) forest users, (ii) committee members, (iii) advocacy groups engaged in community forestry, (iv) forest authorities working at district and central levels, and (v) national and international academicians working on community forestry. Respondents were selected as follows: (i) 29 heads of households were randomly selected to cover all 14 CFUGs in Simjung and Ghyachchok VDCs; (ii) one representative from each of the 14 Users’ Committees in Simjung and Ghyachchok VDCs were selected with additional representatives from 38 randomly selected CFUGs in Gorkha District (52 in total, the respondent was the chairman, secretary or treasurer of the CFUG); (iii) 26 executive members from advocacy groups were selected based on judgemental sampling, criteria for inclusion
2 Smallest political administrative unit in Nepal.
5
were familiarity with community forestry from working experience in the field and a reputation for being well-informed on community forestry. Respondents belonged to two groups - the Federation of Community Forest User Groups (FECOFUN) and Himalayan Grassroots Women's Natural Resources Management Association Himawanti; (iv) 51 representatives of district and national forest authorities were selected based on judgemental sampling. At the district level the Assistant Forest Officers and the District Forest Officer from Gorkha District were included. At the national level, officers and higher level staff from the Department of Forest, the Department of Forest Research and Survey, and the Ministry of Forests and Soil Conservation were selected based on the criterion of involvement with the community forestry process; and (v) 53 national and international academicians whose work was related with community forestry were selected by judgemental sampling from Tribhuwan University in Nepal, other research institutions, and non-governmental organisations working in Nepal. Groups (iv) and (v) were merged from each two groups as responses were very similar: officer and higher level staff at district and central levels were combined in group (iv) and academicians from non-governmental organisations and research institutions were merged in group (v). A total of 211 individuals provided responses regarding perceptions of forest crimes by answering structured questionnaire administered face to face. 3. Results The most frequent forest crime was considered to be illegal collection of firewood, followed by illegal cutting of timber, poles and illegal forest grazing (Table 1). Notably, the majority in the respondents in the advocacy group believed forest grazing to be a frequent crime whereas forest users did not mentioned this at all, and the forest users did not mention illegal collection of timber.

3586
Table 1: Number (percentages) of stakeholders, by group, mentioning a forest crime to be the most frequently occurring in community forests generally Most frequent forest crime
Stakeholder groups Forest users n=29
Committee members n=52
Advocacyn=26
Forest authoritiesn=51
Academicians n=53
All respondents n=211
Collection of firewood 15 (52) 29 (56) 11 (42) 26 (51) 31 (59) 112 (53) Collection of timber - 5 (10) 5 (19) 7 (14) 4 (8) 21 (10) Collection of poles 11 (38) 6 (12) 1 (4) - - 18 (9) Grazing in the forest - 5 (10) 3 (12) 4 (9) 5 (9) 17 (8) Collection of thatching grass 1 (3) 5 (10) 1 (4) 3 (6) 3 (6) 13 (6) Misuse of forest fund 2 (7) - - 7 (14) 3 (6) 12 (6) Encroachment - - 2 (8) 1 (2) 3 (6) 6 (3) NTFP trade/smuggling - - 1 (4) 1 (2) 1 (2) 3 (1) Forest fire - 1 (2) 2 (8) - - 3 (1) Quarrying/mining - - - 1 (2) 1 (2) 2 (1) Failure to pay fee - 1 (2) - 1 (2) 2 (1) Poaching - - - 1 (2) 1 (2) 2 (1)
There was general agreement across stakeholder groups that the main motives behind forest offenses were related to poverty and limited regard for traditional use right systems (Table 2). Academicians especially mention inequitable rules of community forestry, while committee members especially mention lack of knowledge regarding rules among forest users. Table 2: The number of stakeholders, by group, mentioning the main motive behind forest offenses in community forests generally Motive
Stakeholder groups Forest users n=29
Committee members n=52
Advocacyn=26
Forest authoritiesn=51
Academicians n=53
All n=211
Limited resource in their private land 18 28 13 15 14
88
Traditional rights not recognized 4 4 1 17 20
46
Limited knowledge about the rules 1 14 5 9 8
37
Inequitable rules 1 2 2 3 10 18 Other 3 4 4 5 1 17 High fees 2 1 2 5
7
Respondents expressed the perception of clear types of forest criminals: the poor collect firewood and thatching grass illegally, the middleclass households graze their animals illegally in the forest, and the committee members misuse funds generated from the community forest (Table 3). With the exception of the advocacy group all agreed that illegal timber harvest is carried out by the rich. The poor were mentioned as the typical forest criminal in 25 cases, the rich in 14, individuals from medium level wealth class in 7, outsiders in 7, and Committee members in 5 cases. Table 3: Stakeholder perceptions, by group, on types of forest criminals, by type of crime*
Forest crime
Stakeholder groups Forest users n=29
Committee members
n=52
Advocacyn=26
Forest authoritiesn=51
Academicians n=53
All n=211
Illegal collection of firewood P** P P P P P Illegal collection of thatching grass P P P P P P Do not pay the fee P P P P P P Illegal grazing M P M M M M Illegal collection of poles P M P M P M Encroachment R O R P R R Illegal collection of timber R R P R R R Illegal quarrying/mining P O P R R R Poaching O O R O R R Miss use of forest fund C C C C C C Forest fire R O M - R O Illegal NTFP trade/smuggling - O R P P O
* The category listed is the most frequently mentioned category within a stakeholder group. ** P = Poor and Dalits, M = Middle class, R = Rich, O = Outsiders, C = Committee members. The level of law enforcement in community forests generally was perceived to be quite low (Table 4). Respondents in all stakeholder groups agree that most often, when caught, a criminal receives but a warning and frequently nothing happens at all. Fines and seizure of the illegally harvested products are mentioned but by relatively few respondents.
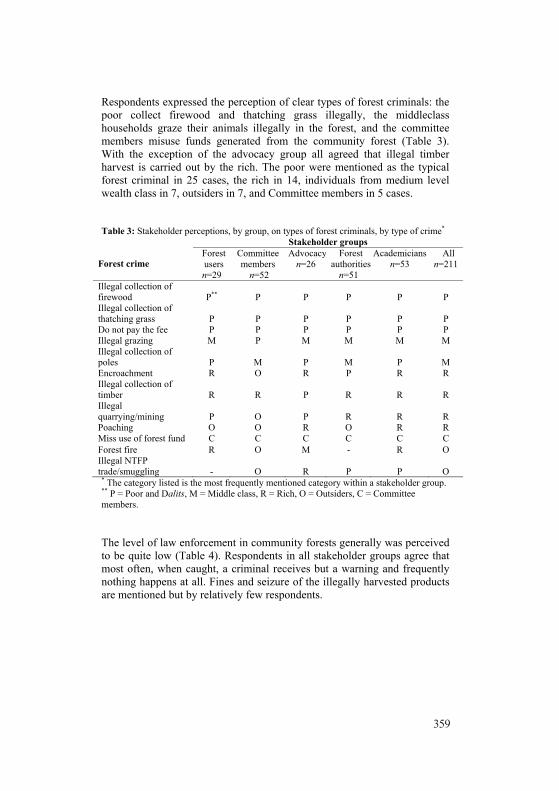
3596
Table 1: Number (percentages) of stakeholders, by group, mentioning a forest crime to be the most frequently occurring in community forests generally Most frequent forest crime
Stakeholder groups Forest users n=29
Committee members n=52
Advocacyn=26
Forest authoritiesn=51
Academicians n=53
All respondents n=211
Collection of firewood 15 (52) 29 (56) 11 (42) 26 (51) 31 (59) 112 (53) Collection of timber - 5 (10) 5 (19) 7 (14) 4 (8) 21 (10) Collection of poles 11 (38) 6 (12) 1 (4) - - 18 (9) Grazing in the forest - 5 (10) 3 (12) 4 (9) 5 (9) 17 (8) Collection of thatching grass 1 (3) 5 (10) 1 (4) 3 (6) 3 (6) 13 (6) Misuse of forest fund 2 (7) - - 7 (14) 3 (6) 12 (6) Encroachment - - 2 (8) 1 (2) 3 (6) 6 (3) NTFP trade/smuggling - - 1 (4) 1 (2) 1 (2) 3 (1) Forest fire - 1 (2) 2 (8) - - 3 (1) Quarrying/mining - - - 1 (2) 1 (2) 2 (1) Failure to pay fee - 1 (2) - 1 (2) 2 (1) Poaching - - - 1 (2) 1 (2) 2 (1)
There was general agreement across stakeholder groups that the main motives behind forest offenses were related to poverty and limited regard for traditional use right systems (Table 2). Academicians especially mention inequitable rules of community forestry, while committee members especially mention lack of knowledge regarding rules among forest users. Table 2: The number of stakeholders, by group, mentioning the main motive behind forest offenses in community forests generally Motive
Stakeholder groups Forest users n=29
Committee members n=52
Advocacyn=26
Forest authoritiesn=51
Academicians n=53
All n=211
Limited resource in their private land 18 28 13 15 14
88
Traditional rights not recognized 4 4 1 17 20
46
Limited knowledge about the rules 1 14 5 9 8
37
Inequitable rules 1 2 2 3 10 18 Other 3 4 4 5 1 17 High fees 2 1 2 5
7
Respondents expressed the perception of clear types of forest criminals: the poor collect firewood and thatching grass illegally, the middleclass households graze their animals illegally in the forest, and the committee members misuse funds generated from the community forest (Table 3). With the exception of the advocacy group all agreed that illegal timber harvest is carried out by the rich. The poor were mentioned as the typical forest criminal in 25 cases, the rich in 14, individuals from medium level wealth class in 7, outsiders in 7, and Committee members in 5 cases. Table 3: Stakeholder perceptions, by group, on types of forest criminals, by type of crime*
Forest crime
Stakeholder groups Forest users n=29
Committee members
n=52
Advocacyn=26
Forest authoritiesn=51
Academicians n=53
All n=211
Illegal collection of firewood P** P P P P P Illegal collection of thatching grass P P P P P P Do not pay the fee P P P P P P Illegal grazing M P M M M M Illegal collection of poles P M P M P M Encroachment R O R P R R Illegal collection of timber R R P R R R Illegal quarrying/mining P O P R R R Poaching O O R O R R Miss use of forest fund C C C C C C Forest fire R O M - R O Illegal NTFP trade/smuggling - O R P P O
* The category listed is the most frequently mentioned category within a stakeholder group. ** P = Poor and Dalits, M = Middle class, R = Rich, O = Outsiders, C = Committee members. The level of law enforcement in community forests generally was perceived to be quite low (Table 4). Respondents in all stakeholder groups agree that most often, when caught, a criminal receives but a warning and frequently nothing happens at all. Fines and seizure of the illegally harvested products are mentioned but by relatively few respondents.

360
8
Table 4: The number of stakeholders, by group, mentioning most typical consequences of crimes in community forests generally. consequence type
Stakeholder groups Forest users n=29
Committee members
n=52
Advocacyn=26
Forest authoritiesn=51
Academicians n=53
All n=211
Warning 16 39 18 27 24 124 Nothing 5 6 3 8 10 32 Fine 7 2 3 9 2 23 Seizure of collected products 1 4 2 6 10 23 Fine and seizure of collected products - 1 - 1 7 9
In addition to the above results, the majority of respondents in the Committee members, Forest authorities and Advocacy stakeholder groups believed that the current community forest rules generally protect the rights of poor forest users (56%, 62%, 57%). The majority of the Forest users and Academicians, on the other hand, believed the rights of poor forest users are not protected currently (59%, 55%). There was agreement across all groups that the poor have less influence on the community forestry rules than wealthier households. The current rules were not generally perceived to prevent forest crimes (Yes: 36%, No: 55%, Don’t know: 9%), with respondents in the Forest bureaucrat group expressing greater belief in the workings of rules (Yes: 55%, No: 45%, Don’t know: 0%). No clear picture of the perceived relation between forest crimes and the state of the forest in general emerged – when asked whether the forest condition in general is perceived to be deteriorating as a consequence of forest crimes the answers were: Yes: 40%, No: 49% and Don’t know: 11%. 4. Discussion The present case study presents the perceptions of local and national stakeholders on forest crimes and is likely to be of relevance to forest management in mid hills areas where the community forestry programme is focused. The study found general agreement among stakeholder groups that illegal collection of firewood for subsistence use is the most common current forest crime in Nepalese community forestry (Table 1), that illegal firewood extraction is committed typically by poor CFUG members with no private tree resources or people who have lost their traditional access rights (Tables 2, 3), and that penalties on crimes generally are very lenient (Table 4). These perceptions are in accordance with previous findings from Nepal (Dhakal, 2007).
Lack of effective law enforcement in collective action systems is generally believed to undermine their stability, as acknowledged but
9
unpunished rule breaking increases the probabilities that more users will break the rules. As illustrated by the clear identification of types of forest criminals it is well known to stakeholders that the poor forest users frequently have to resort to forest crimes to sustain their livelihoods. The tendency of lenient sanctions may reflect that the motive behind the crimes is perceived to be basic subsistence needs rather than profits, or maybe that the impact on the forest is considered to be low. Another explanation could be that the present situation with frequent opportunities for the community leaders to show leniency gives them the upper hand in community forestry decision making. 4.1 Methodological consequences Data collected about the perceptions of stakeholders on different aspects of forest crime in community forestry may, to some degree, reflect strategic answers. For example, forest authorities may be reluctant to report illegal timber harvest because they feel it reveals weakness on their part. On the other hand, as the respondents from the Forest user group were selected only from Simjung and Ghyachchok VDCs; CFUG committee only from Gorrkha District, their response can not be expected to represent a national set of perceptions. Respondents in other groups, though, in principle, are representative of their organisations, were selected through judgemental sampling, and thus some major opinions might have been inadvertently excluded. 5. Conclusion This study contributes to discussions on local level forest law enforcement through documentation of the perception of stakeholders on crimes and sanctions in Nepalese community forestry. Forest crimes are mainly associated with illegal appropriation of forest products for subsistence use by the poor and the local level enforcement of forest rules is lenient. Implications of this for local perceptions of fairness and continued successful collective action are unclear. At present it seems to be contributing to maintaining the prevailing local power hierarchies. The findings thereby add detail to the ways in which social inequity, documented by several studies (e.g., Nightingale, 2002; Malla et al., 2003), is perpetuated through community forestry in Nepal. Acknowledgements We thank the people of Simjung and Ghyachchok and the many stakeholder representatives for their participation. Funding was provided by the University of Copenhagen and the Consultative Research Committee (FFU) at the Danish Ministry of Foreign Affairs, Grant No. 104.Dan.8.L.716.
361
8
Table 4: The number of stakeholders, by group, mentioning most typical consequences of crimes in community forests generally. consequence type
Stakeholder groups Forest users n=29
Committee members
n=52
Advocacyn=26
Forest authoritiesn=51
Academicians n=53
All n=211
Warning 16 39 18 27 24 124 Nothing 5 6 3 8 10 32 Fine 7 2 3 9 2 23 Seizure of collected products 1 4 2 6 10 23 Fine and seizure of collected products - 1 - 1 7 9
In addition to the above results, the majority of respondents in the Committee members, Forest authorities and Advocacy stakeholder groups believed that the current community forest rules generally protect the rights of poor forest users (56%, 62%, 57%). The majority of the Forest users and Academicians, on the other hand, believed the rights of poor forest users are not protected currently (59%, 55%). There was agreement across all groups that the poor have less influence on the community forestry rules than wealthier households. The current rules were not generally perceived to prevent forest crimes (Yes: 36%, No: 55%, Don’t know: 9%), with respondents in the Forest bureaucrat group expressing greater belief in the workings of rules (Yes: 55%, No: 45%, Don’t know: 0%). No clear picture of the perceived relation between forest crimes and the state of the forest in general emerged – when asked whether the forest condition in general is perceived to be deteriorating as a consequence of forest crimes the answers were: Yes: 40%, No: 49% and Don’t know: 11%. 4. Discussion The present case study presents the perceptions of local and national stakeholders on forest crimes and is likely to be of relevance to forest management in mid hills areas where the community forestry programme is focused. The study found general agreement among stakeholder groups that illegal collection of firewood for subsistence use is the most common current forest crime in Nepalese community forestry (Table 1), that illegal firewood extraction is committed typically by poor CFUG members with no private tree resources or people who have lost their traditional access rights (Tables 2, 3), and that penalties on crimes generally are very lenient (Table 4). These perceptions are in accordance with previous findings from Nepal (Dhakal, 2007).
Lack of effective law enforcement in collective action systems is generally believed to undermine their stability, as acknowledged but
9
unpunished rule breaking increases the probabilities that more users will break the rules. As illustrated by the clear identification of types of forest criminals it is well known to stakeholders that the poor forest users frequently have to resort to forest crimes to sustain their livelihoods. The tendency of lenient sanctions may reflect that the motive behind the crimes is perceived to be basic subsistence needs rather than profits, or maybe that the impact on the forest is considered to be low. Another explanation could be that the present situation with frequent opportunities for the community leaders to show leniency gives them the upper hand in community forestry decision making. 4.1 Methodological consequences Data collected about the perceptions of stakeholders on different aspects of forest crime in community forestry may, to some degree, reflect strategic answers. For example, forest authorities may be reluctant to report illegal timber harvest because they feel it reveals weakness on their part. On the other hand, as the respondents from the Forest user group were selected only from Simjung and Ghyachchok VDCs; CFUG committee only from Gorrkha District, their response can not be expected to represent a national set of perceptions. Respondents in other groups, though, in principle, are representative of their organisations, were selected through judgemental sampling, and thus some major opinions might have been inadvertently excluded. 5. Conclusion This study contributes to discussions on local level forest law enforcement through documentation of the perception of stakeholders on crimes and sanctions in Nepalese community forestry. Forest crimes are mainly associated with illegal appropriation of forest products for subsistence use by the poor and the local level enforcement of forest rules is lenient. Implications of this for local perceptions of fairness and continued successful collective action are unclear. At present it seems to be contributing to maintaining the prevailing local power hierarchies. The findings thereby add detail to the ways in which social inequity, documented by several studies (e.g., Nightingale, 2002; Malla et al., 2003), is perpetuated through community forestry in Nepal. Acknowledgements We thank the people of Simjung and Ghyachchok and the many stakeholder representatives for their participation. Funding was provided by the University of Copenhagen and the Consultative Research Committee (FFU) at the Danish Ministry of Foreign Affairs, Grant No. 104.Dan.8.L.716.

36210
References Adams, W. M., Brockington, D., Dyson, J., and Vira, B. (2003). Managing
Tragedies: Understanding Conflict Over Common Pool Resources. Science 302 (5652): 1915-1916.
Adhikari, B. (2005). Poverty, property rights and collective action: understanding the distributive aspects of common property resource management. Environment and Development Economics 10 (1): 7-31.
Adhikari, B., William, F., and Lovett, J. C. (2007). Local benefits from community forests in the middle hills of Nepal. Forest Policy and Economics 9(5): 464-478.
Agarwal, B. (2009). Rule making in community forestry institutions: The difference women make. Ecological Economics 68(8-9):2296-2308.
Agrawal, A. (2001). The regulatory community: decentralization and the environment in the Van Panchayats (forest councils) of Kumaon, India. Mountain Research and Development 21(3):208-211.
Andersson, K. P. and Gibson C. (2006). Decentralized governance and environmental change: local institutional moderation of deforestation in Bolivia. Journal of Policy Analysis and Management 26(1):99-123.
Becker, G. S. (1968). Crime and punishment: an economic approach. Journal of Political Economy 76(2):169-217.
Becker, H. (1978). Outsiders. In Rubington E. and Weinberg M. (eds.), Deviance. Macmillan, New York, pp. 11-24.
Blaikie, P. and Springate-Baginski, O. (2007). Setting up key policy issues in participatory forest management. In Springate-Baginski, O. and Blaikie P. (eds). Forests, policy and power: the political ecology of reform in South Asia. Earthscan, London, pp. 1-23.
Blair, H. (2000). Participation and accountability at the periphery: democratic local governance in six countries. World Development 28 (1): 21-39.
Blessing, C., Jumbe, L., and Angelsen, A. (2006). Do the poor benefit from devolution policies? Evidence from Malawi’s forest co-management program. Land Economics 82(4):562-581.
Brunner, J., Seymour, F., Badenoch, N., and Ratner, B. (1999). Forest problems and law enforcement in southeast Asia: the role of local communities. Resources Policy Brief. World Resources Institute, Washington D.C. 13 pp.
Cerutti, P. O. and Tacconi, L. (2008). Forests, illegality, and livelihoods: the case of Cameroon. Society and Natural Resources 21(9):845-853.
Chambliss, W. J. and Seidmann, R. (1971). Law, order and power. Addison-Wesley, London.
Chhatre, A. and Agrawal, A. (2008). Forest commons and local enforcement. PNAS 105(36):13286-13291.
11
Chhetri, B.B.K. (2010). Community Forestry in Nepal: Determinants of User’s Participation and Resource Dependency. Lambert Academic Publishing Saarbrucken, Germany.
Colchester, M. (2006). Justice in the forest: rural livelihoods and forest law enforcement. Forest Perspectives 3. Center for International Forestry Research, Bogor.
Coleman, E. (2009). Institutional factors affecting biological outcomes in forest management. Journal of Policy Analysis and Management 28 (1): 122–146.
Dhakal, B. (2007). The issues of oppressed groups’ access to collectively managed resources: an empirical analysis. Banko Janakari 16(1):25-31
DFO (District Forest Office). (2008). Community Forestry Program: Annual Monitoring and Evaluation Report 2007/2008. District Forest Office, Gorkha.
Dongol, C.M., Hughey, K.F.D., and Bigsby H.R. (2002). Capital formation and sustainable community forestry in Nepal. Mountain Research and Development 22 (1):70-77.
Downes, D. and Rock, P. (1995). Understanding deviance: a guide to the sociology of crime and rule-breaking, 2nd edition. Clarendon Press, Oxford.
Edmunds, D. and Wollenberg, E. (2003). Whose devolution is it anyway? Divergent constructs, interests and capacities between the poorest forest users and states. In Edmunds, D. and Wollenberg, E. (eds). Local Forest Management: The Impact of Devolution Policies, London, Earthscan, pp. 150-165.
Gautam A. P, Webb, E. L., and Elumnoh, A. (2002). GIS assessment of land use/land cover changes associated with community forestry implementation in the mid hills of Nepal. Mountain Research and Development 22 (1):63-69.
Gibson, C. G., Williams, J. T., and Ostrom, E. (2005). Local enforcement and better forests. World Development 33(2):273-284.
Gilmour, D. A. (2003). Retrospective and prospective view of community forestry in Nepal. Journal of Forest and Livelihood 2(2):5-7.
HMG. (1995). Forest regulations. Official translation. His Majesty's Government of Nepal, Government Press, Kathmandu.
HMG. (1993). Forest act 1993. Official translation. His Majesty's Government of Nepal, Government Press, Kathmandu.
Kaimowitz, D. (2007). Forest law enforcement and rural livelihoods. In Tacconi, L. (ed.), Illegal logging: law enforcement, livelihoods and the timber trade. Earthscan, London, pp. 110-138
Kanel, K. R. and Dahal. G. R. (2008). Community forestry policy and its economic implications: an experience from Nepal. International Journal of Social Forestry 1(1):50-60.

36310
References Adams, W. M., Brockington, D., Dyson, J., and Vira, B. (2003). Managing
Tragedies: Understanding Conflict Over Common Pool Resources. Science 302 (5652): 1915-1916.
Adhikari, B. (2005). Poverty, property rights and collective action: understanding the distributive aspects of common property resource management. Environment and Development Economics 10 (1): 7-31.
Adhikari, B., William, F., and Lovett, J. C. (2007). Local benefits from community forests in the middle hills of Nepal. Forest Policy and Economics 9(5): 464-478.
Agarwal, B. (2009). Rule making in community forestry institutions: The difference women make. Ecological Economics 68(8-9):2296-2308.
Agrawal, A. (2001). The regulatory community: decentralization and the environment in the Van Panchayats (forest councils) of Kumaon, India. Mountain Research and Development 21(3):208-211.
Andersson, K. P. and Gibson C. (2006). Decentralized governance and environmental change: local institutional moderation of deforestation in Bolivia. Journal of Policy Analysis and Management 26(1):99-123.
Becker, G. S. (1968). Crime and punishment: an economic approach. Journal of Political Economy 76(2):169-217.
Becker, H. (1978). Outsiders. In Rubington E. and Weinberg M. (eds.), Deviance. Macmillan, New York, pp. 11-24.
Blaikie, P. and Springate-Baginski, O. (2007). Setting up key policy issues in participatory forest management. In Springate-Baginski, O. and Blaikie P. (eds). Forests, policy and power: the political ecology of reform in South Asia. Earthscan, London, pp. 1-23.
Blair, H. (2000). Participation and accountability at the periphery: democratic local governance in six countries. World Development 28 (1): 21-39.
Blessing, C., Jumbe, L., and Angelsen, A. (2006). Do the poor benefit from devolution policies? Evidence from Malawi’s forest co-management program. Land Economics 82(4):562-581.
Brunner, J., Seymour, F., Badenoch, N., and Ratner, B. (1999). Forest problems and law enforcement in southeast Asia: the role of local communities. Resources Policy Brief. World Resources Institute, Washington D.C. 13 pp.
Cerutti, P. O. and Tacconi, L. (2008). Forests, illegality, and livelihoods: the case of Cameroon. Society and Natural Resources 21(9):845-853.
Chambliss, W. J. and Seidmann, R. (1971). Law, order and power. Addison-Wesley, London.
Chhatre, A. and Agrawal, A. (2008). Forest commons and local enforcement. PNAS 105(36):13286-13291.
11
Chhetri, B.B.K. (2010). Community Forestry in Nepal: Determinants of User’s Participation and Resource Dependency. Lambert Academic Publishing Saarbrucken, Germany.
Colchester, M. (2006). Justice in the forest: rural livelihoods and forest law enforcement. Forest Perspectives 3. Center for International Forestry Research, Bogor.
Coleman, E. (2009). Institutional factors affecting biological outcomes in forest management. Journal of Policy Analysis and Management 28 (1): 122–146.
Dhakal, B. (2007). The issues of oppressed groups’ access to collectively managed resources: an empirical analysis. Banko Janakari 16(1):25-31
DFO (District Forest Office). (2008). Community Forestry Program: Annual Monitoring and Evaluation Report 2007/2008. District Forest Office, Gorkha.
Dongol, C.M., Hughey, K.F.D., and Bigsby H.R. (2002). Capital formation and sustainable community forestry in Nepal. Mountain Research and Development 22 (1):70-77.
Downes, D. and Rock, P. (1995). Understanding deviance: a guide to the sociology of crime and rule-breaking, 2nd edition. Clarendon Press, Oxford.
Edmunds, D. and Wollenberg, E. (2003). Whose devolution is it anyway? Divergent constructs, interests and capacities between the poorest forest users and states. In Edmunds, D. and Wollenberg, E. (eds). Local Forest Management: The Impact of Devolution Policies, London, Earthscan, pp. 150-165.
Gautam A. P, Webb, E. L., and Elumnoh, A. (2002). GIS assessment of land use/land cover changes associated with community forestry implementation in the mid hills of Nepal. Mountain Research and Development 22 (1):63-69.
Gibson, C. G., Williams, J. T., and Ostrom, E. (2005). Local enforcement and better forests. World Development 33(2):273-284.
Gilmour, D. A. (2003). Retrospective and prospective view of community forestry in Nepal. Journal of Forest and Livelihood 2(2):5-7.
HMG. (1995). Forest regulations. Official translation. His Majesty's Government of Nepal, Government Press, Kathmandu.
HMG. (1993). Forest act 1993. Official translation. His Majesty's Government of Nepal, Government Press, Kathmandu.
Kaimowitz, D. (2007). Forest law enforcement and rural livelihoods. In Tacconi, L. (ed.), Illegal logging: law enforcement, livelihoods and the timber trade. Earthscan, London, pp. 110-138
Kanel, K. R. and Dahal. G. R. (2008). Community forestry policy and its economic implications: an experience from Nepal. International Journal of Social Forestry 1(1):50-60.

36412
Lachapelle, P., Smith, P., and McCool, S. (2004). Access to power or genuine empowerment? An analysis of three community forest user groups in Nepal. Human Ecology Review 11(1):1-12
Larsen, H. O. and Smith, P. D. (2004). Stakeholder perspectives on commercial medicinal plant collection in Nepal: poverty and resource degradation. Mountain Research and Development 24(2):141-148.
Malla, Y. B., Neupane, H. R., and Branney P. J. (2003). Why aren’t poor benefiting more from community forestry? Journal of Forestry and Livelihood 3(1):78-90.
Nightingale, A. J. (2002). Participating or just sitting in? The dynamics of gender and caste in community forestry. Journal of Forest and Livelihoods 2(1):17-24.
Ostrom, E. (1990). Governing the commons: the evolution of institutions for collective action. Cambridge University Press, Cambridge, UK.
Pagdee, A., Kim, Y.-S., and Daugherty, P. J. (2006). What makes community forest management successful: a meta-study from community forests throughout the world. Society and Natural Resources 19(1):33–52.
Ribot, J. C. (2004). Waiting for democracy: the politics of choice in natural resource management. World Resources Institute, Washington, D C.
Schur, E. (1971). Labelling deviant behaviour. Harper, New York. Sunderlin, W. D., Hatcher, J., and Liddle, M. (2008). From exclusion to
ownership? Challenges and opportunities in advancing forest tenure reform. Rights and Resources Initiative, Washington D C.
Tachibana, T. and Adhikari, S. (2009). Does community-based management improve natural resource condition? Evidence from the forests in Nepal. Land Economics 85(1):107-131.
World Bank. (2006). Strengthening forest law enforcement and governance: Addressing a systematic constraint to sustainable development. The World Bank, Washington D C.
1
Exploring possibilities for reducing woodland deforestation and degradation at village level in Sub-
Saharan Africa
Ole Hofstad and Prem L. Sankhayan Department of Ecology and Natural Resource Management
Norwegian University of Life Sciences (UMB)
Abstract Avoided deforestation may be financed through a multilateral fund for climate change in the future. There is a concern that payments for REDD should benefit the poor, and that it is necessary to design incentives that make sustainable forestry more profitable than deforestation or degradation. By applying a dynamic and non-linear programming model we tested a number of interventions and development trends to see how they affected deforestation and forest degradation in villages in Senegal, Tanzania and Uganda over the next 20 years. Cultivable land has already been cleared in most of the investigated villages. Thus deforestation is likely to occur only in villages with a substantial remaining woodland area. In villages with little remaining woodland harvesting of wood-fuel leads to serious degradation in a few years. Reduced growth of population is likely to reduce deforestation in most cases. Higher producer price of charcoal leads to less deforestation and more degradation. Policies that make crop production relatively more profitable normally lead to more deforestation and less forest degradation. Production quotas may be an effective measure to reduce forest degradation, but when charcoaling gets less profitable villagers will allocate more labour to land clearing and crop production, thus increasing deforestation. These results may be useful both in setting the REDD baseline, and in the design of measures to achieve REDD effectively. Keywords: Bio-economic model, land use, REDD, Senegal, Tanzania, Uganda. 1. Introduction Deforestation and degradation of forests may contribute 12 to 17 % of global anthropogenic emissions of greenhouse gases (IPCC, 2007; van der Werf et al., 2009). Today deforestation is primarily a tropical phenomenon and, therefore, financing avoided deforestation through a future multilateral fund for climate change may be a justified action (Creighton, 2007). Carbon

36512
Lachapelle, P., Smith, P., and McCool, S. (2004). Access to power or genuine empowerment? An analysis of three community forest user groups in Nepal. Human Ecology Review 11(1):1-12
Larsen, H. O. and Smith, P. D. (2004). Stakeholder perspectives on commercial medicinal plant collection in Nepal: poverty and resource degradation. Mountain Research and Development 24(2):141-148.
Malla, Y. B., Neupane, H. R., and Branney P. J. (2003). Why aren’t poor benefiting more from community forestry? Journal of Forestry and Livelihood 3(1):78-90.
Nightingale, A. J. (2002). Participating or just sitting in? The dynamics of gender and caste in community forestry. Journal of Forest and Livelihoods 2(1):17-24.
Ostrom, E. (1990). Governing the commons: the evolution of institutions for collective action. Cambridge University Press, Cambridge, UK.
Pagdee, A., Kim, Y.-S., and Daugherty, P. J. (2006). What makes community forest management successful: a meta-study from community forests throughout the world. Society and Natural Resources 19(1):33–52.
Ribot, J. C. (2004). Waiting for democracy: the politics of choice in natural resource management. World Resources Institute, Washington, D C.
Schur, E. (1971). Labelling deviant behaviour. Harper, New York. Sunderlin, W. D., Hatcher, J., and Liddle, M. (2008). From exclusion to
ownership? Challenges and opportunities in advancing forest tenure reform. Rights and Resources Initiative, Washington D C.
Tachibana, T. and Adhikari, S. (2009). Does community-based management improve natural resource condition? Evidence from the forests in Nepal. Land Economics 85(1):107-131.
World Bank. (2006). Strengthening forest law enforcement and governance: Addressing a systematic constraint to sustainable development. The World Bank, Washington D C.
1
Exploring possibilities for reducing woodland deforestation and degradation at village level in Sub-
Saharan Africa
Ole Hofstad and Prem L. Sankhayan Department of Ecology and Natural Resource Management
Norwegian University of Life Sciences (UMB)
Abstract Avoided deforestation may be financed through a multilateral fund for climate change in the future. There is a concern that payments for REDD should benefit the poor, and that it is necessary to design incentives that make sustainable forestry more profitable than deforestation or degradation. By applying a dynamic and non-linear programming model we tested a number of interventions and development trends to see how they affected deforestation and forest degradation in villages in Senegal, Tanzania and Uganda over the next 20 years. Cultivable land has already been cleared in most of the investigated villages. Thus deforestation is likely to occur only in villages with a substantial remaining woodland area. In villages with little remaining woodland harvesting of wood-fuel leads to serious degradation in a few years. Reduced growth of population is likely to reduce deforestation in most cases. Higher producer price of charcoal leads to less deforestation and more degradation. Policies that make crop production relatively more profitable normally lead to more deforestation and less forest degradation. Production quotas may be an effective measure to reduce forest degradation, but when charcoaling gets less profitable villagers will allocate more labour to land clearing and crop production, thus increasing deforestation. These results may be useful both in setting the REDD baseline, and in the design of measures to achieve REDD effectively. Keywords: Bio-economic model, land use, REDD, Senegal, Tanzania, Uganda. 1. Introduction Deforestation and degradation of forests may contribute 12 to 17 % of global anthropogenic emissions of greenhouse gases (IPCC, 2007; van der Werf et al., 2009). Today deforestation is primarily a tropical phenomenon and, therefore, financing avoided deforestation through a future multilateral fund for climate change may be a justified action (Creighton, 2007). Carbon

366 2
storage in forests may become an environmental service that the tropical countries could sell to such a fund. If we assume that an international regime is established whereby states in the North pay states in the South for reduced emissions of greenhouse gases (GHG) from deforestation and forest degradation (REDD) (Meridian Institute, 2009), the states in the South should design efficient national policies and incentives to generate maximum reductions within a given budget (or a given reduction at minimum cost). National policies and incentives may include a multitude of policy measures affecting large portions of the population. Undoubtedly, rural people living in or next to the forest will be the target of several measures since they are often the direct agents clearing or degrading the forest (Geist and Lambin, 2002). More than half of deforestation in Africa between 1980 and 2000 was caused by direct conversion of forest area to small-scale permanent agriculture (FAO, 2001). FAO (2006) estimated that 88 % of wood removals in Africa in 2005 were fuel wood. Biomass represents more than 80 % of energy consumption in sub-Saharan Africa (Karakesi, 2004), and supply of wood-fuels is a major cause of forest degradation in many of these countries. Apart from the Sahara and Kalahari deserts and the Central-African rainforests, Africa is primarily a continent of open forests, or woodlands. We have studied 16 villages in Eastern Tanzania, Central Uganda, and Southern Senegal – all in the woodland zone of sub-Saharan Africa – to see how economic activities affect deforestation and forest degradation over a 20 year period. We simulated the effects of economic changes that may be the result of policies to reduce emissions of GHG in these countries. The results reflect established knowledge about the causes of deforestation and forest degradation, but they may also inform the search for efficient REDD measures that has just started. There is a growing concern that such measures should benefit poor farmers and other local people who live in and around the forest (Peskett et al., 2006; Griffiths, 2007). Similarly, economists recognise the need to design incentives that will alter the decisions of direct deforesting agents from forest clearing to sustainable forest management (Pagiola et al., 2002), namely making sustainable forestry more profitable than alternative land uses. 2. Methods We shall investigate the degradation process by applying a dynamic, stochastic, and non-linear programming model (Sankhayan and Hofstad, 2001; Namaalwa et al., 2007) to each of the 16 villages in Senegal, Tanzania and Uganda where detailed studies were undertaken. By incorporating the biological processes and socio-economic relations characteristic of the region, the model is specially designed for application
3
in the context of sub-Saharan African countries. The model approximates the complex biological and economic relations by incorporating feedback, non-linear and time-delayed equations.
The basic assumption is that the villagers are the subjects who make decisions on how to use available resources and how to manipulate the environment. The model includes the most important resources available to the village, the decisions/activities undertaken by the village community and the most important relations between the prices of factors and products. Our intention is to represent most realistically the actual real world situation confronting the villagers.
By considering the entire village, rather than the individual household as the welfare optimising entity, the model assumes the existence of social control mechanisms and a central authority at village level. Each village coordinates land use to ensure that it is economically optimal at any time. Collective time preferences, e.g., exceeding sustainable use levels, are modelled by using alternative discount rates. Fuel wood for external sale is assumed to be cut only by the villagers, and not by outsiders. If nomadic herders or others use the village grazing land, this is taken account of by the villagers in their planning of animal production. The model, however, does not take account of other competition with neighbouring villages over land use.
Land use during a given year is determined by the optimum allocation of village labour force (net of hired in and hired out) among a variety of competing uses, and the production of consumption requirements and income generation by supplying products to markets outside the village. While cropland is treated as a private property, more peripheral grazing land/open woodland is considered a common property.
The model incorporates four sets of activities, namely, crops, livestock, forest products like fuel wood and charcoal, and miscellaneous products, e.g., beer and bricks. Each set of activities was further divided into sub-sets, namely, production, trading (sale and purchase of products and inputs), labour employment, and consumption. Demand and supply relationships for these sectors are linked through behavioural, structural and accounting equations.
Each village is portrayed using a modified von-Thünen model. Land use is determined by distance and transport cost from the centre of the village. The land use sites proceed outwards from the centre of the village in the following order: settlement, intensive cropping, rangeland, and open woodland. Each site is further divided into cropland and woodland. Suitability of each site for different activities is known. The sites are discrete and assume homogeneous land suitability/productivity. The model does not indicate the precise location where degradation will occur within

367 2
storage in forests may become an environmental service that the tropical countries could sell to such a fund. If we assume that an international regime is established whereby states in the North pay states in the South for reduced emissions of greenhouse gases (GHG) from deforestation and forest degradation (REDD) (Meridian Institute, 2009), the states in the South should design efficient national policies and incentives to generate maximum reductions within a given budget (or a given reduction at minimum cost). National policies and incentives may include a multitude of policy measures affecting large portions of the population. Undoubtedly, rural people living in or next to the forest will be the target of several measures since they are often the direct agents clearing or degrading the forest (Geist and Lambin, 2002). More than half of deforestation in Africa between 1980 and 2000 was caused by direct conversion of forest area to small-scale permanent agriculture (FAO, 2001). FAO (2006) estimated that 88 % of wood removals in Africa in 2005 were fuel wood. Biomass represents more than 80 % of energy consumption in sub-Saharan Africa (Karakesi, 2004), and supply of wood-fuels is a major cause of forest degradation in many of these countries. Apart from the Sahara and Kalahari deserts and the Central-African rainforests, Africa is primarily a continent of open forests, or woodlands. We have studied 16 villages in Eastern Tanzania, Central Uganda, and Southern Senegal – all in the woodland zone of sub-Saharan Africa – to see how economic activities affect deforestation and forest degradation over a 20 year period. We simulated the effects of economic changes that may be the result of policies to reduce emissions of GHG in these countries. The results reflect established knowledge about the causes of deforestation and forest degradation, but they may also inform the search for efficient REDD measures that has just started. There is a growing concern that such measures should benefit poor farmers and other local people who live in and around the forest (Peskett et al., 2006; Griffiths, 2007). Similarly, economists recognise the need to design incentives that will alter the decisions of direct deforesting agents from forest clearing to sustainable forest management (Pagiola et al., 2002), namely making sustainable forestry more profitable than alternative land uses. 2. Methods We shall investigate the degradation process by applying a dynamic, stochastic, and non-linear programming model (Sankhayan and Hofstad, 2001; Namaalwa et al., 2007) to each of the 16 villages in Senegal, Tanzania and Uganda where detailed studies were undertaken. By incorporating the biological processes and socio-economic relations characteristic of the region, the model is specially designed for application
3
in the context of sub-Saharan African countries. The model approximates the complex biological and economic relations by incorporating feedback, non-linear and time-delayed equations.
The basic assumption is that the villagers are the subjects who make decisions on how to use available resources and how to manipulate the environment. The model includes the most important resources available to the village, the decisions/activities undertaken by the village community and the most important relations between the prices of factors and products. Our intention is to represent most realistically the actual real world situation confronting the villagers.
By considering the entire village, rather than the individual household as the welfare optimising entity, the model assumes the existence of social control mechanisms and a central authority at village level. Each village coordinates land use to ensure that it is economically optimal at any time. Collective time preferences, e.g., exceeding sustainable use levels, are modelled by using alternative discount rates. Fuel wood for external sale is assumed to be cut only by the villagers, and not by outsiders. If nomadic herders or others use the village grazing land, this is taken account of by the villagers in their planning of animal production. The model, however, does not take account of other competition with neighbouring villages over land use.
Land use during a given year is determined by the optimum allocation of village labour force (net of hired in and hired out) among a variety of competing uses, and the production of consumption requirements and income generation by supplying products to markets outside the village. While cropland is treated as a private property, more peripheral grazing land/open woodland is considered a common property.
The model incorporates four sets of activities, namely, crops, livestock, forest products like fuel wood and charcoal, and miscellaneous products, e.g., beer and bricks. Each set of activities was further divided into sub-sets, namely, production, trading (sale and purchase of products and inputs), labour employment, and consumption. Demand and supply relationships for these sectors are linked through behavioural, structural and accounting equations.
Each village is portrayed using a modified von-Thünen model. Land use is determined by distance and transport cost from the centre of the village. The land use sites proceed outwards from the centre of the village in the following order: settlement, intensive cropping, rangeland, and open woodland. Each site is further divided into cropland and woodland. Suitability of each site for different activities is known. The sites are discrete and assume homogeneous land suitability/productivity. The model does not indicate the precise location where degradation will occur within
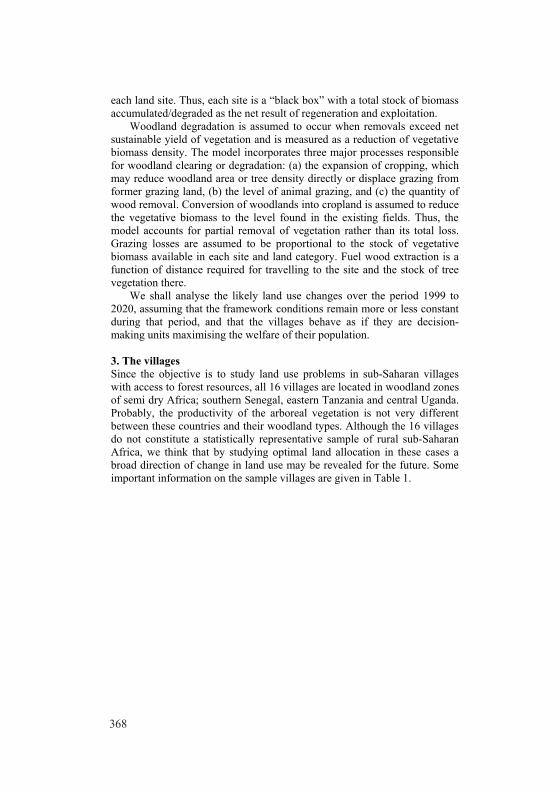
368 4
each land site. Thus, each site is a “black box” with a total stock of biomass accumulated/degraded as the net result of regeneration and exploitation.
Woodland degradation is assumed to occur when removals exceed net sustainable yield of vegetation and is measured as a reduction of vegetative biomass density. The model incorporates three major processes responsible for woodland clearing or degradation: (a) the expansion of cropping, which may reduce woodland area or tree density directly or displace grazing from former grazing land, (b) the level of animal grazing, and (c) the quantity of wood removal. Conversion of woodlands into cropland is assumed to reduce the vegetative biomass to the level found in the existing fields. Thus, the model accounts for partial removal of vegetation rather than its total loss. Grazing losses are assumed to be proportional to the stock of vegetative biomass available in each site and land category. Fuel wood extraction is a function of distance required for travelling to the site and the stock of tree vegetation there.
We shall analyse the likely land use changes over the period 1999 to 2020, assuming that the framework conditions remain more or less constant during that period, and that the villages behave as if they are decision-making units maximising the welfare of their population. 3. The villages Since the objective is to study land use problems in sub-Saharan villages with access to forest resources, all 16 villages are located in woodland zones of semi dry Africa; southern Senegal, eastern Tanzania and central Uganda. Probably, the productivity of the arboreal vegetation is not very different between these countries and their woodland types. Although the 16 villages do not constitute a statistically representative sample of rural sub-Saharan Africa, we think that by studying optimal land allocation in these cases a broad direction of change in land use may be revealed for the future. Some important information on the sample villages are given in Table 1.
5
Table 1. Some salient characteristics of 16 study villages in Senegal, Tanzania and Uganda Country
Village
Population 1999*
Population growth (% p.a.)
Distance from town** (km)
Distance from road head (km)
Main economic activity
Senegal Afia Mbemba 712 4.0 67 25 Cropping/Grazing
Boulimbou 298 4.0 32 7 Cropping/Grazing Lambatara 781 1.5 20 20 Cropping
Medina Pakane 156 8.3 45 10 Cropping
Sare Birou 149 8 10 7 Cropping/Grazing
Sare Coly Sal 497 4 9 1 Cropping/Grazing
Tanzania Kanga 2914 2.5 140 0 Cropping Kilimanjaro† 4700 2.6 100 1 Cropping
K-Madesa 1890 3.3 72 6 Cropping/Grazing/Fuelwood
Kwadudu 2460 2.7 64 5 Cropping Muungano 3110 2.7 43 0 Cropping Mazizi 4340 2.4 68 0 Cropping Uganda Kyankonwa 700 1.82 100 0 Cropping/Grazing Namusala 1200 2.13 80 0 Cropping/Grazing
Kabutuukuru & Kinuuma††
1710 2.1 na 0 Cropping/Grazing/ Fuelwood
* Population for Tanzanian villages refers to 1998 ** town = provincial capital † The village Kilimanjaro is not located particularly close to the mountain Kilimanjaro †† Data collected in 2003. It is worth mentioning that a village has a somewhat different meaning in the three countries. In Senegal this term is used for a fairly small concentration of homesteads. The houses are usually assembled in a densely built up area surrounded by cultivated fields. In Tanzania the history of villagization in the 1970s (Kjekshus, 1977) has led to the term village being used for a much larger assembly of houses and people. The built up area may stretch for quite a long distance (e.g., 1km), and the fields are not concentrated around the homesteads in the same concentric pattern normally found in Senegal. The availability of soil and water determines the land use pattern to a large degree. In Uganda the term village is used more as an administrative term than for a concentration of homesteads. Houses are often distributed fairly evenly in the terrain, surrounded by gardens and

369 4
each land site. Thus, each site is a “black box” with a total stock of biomass accumulated/degraded as the net result of regeneration and exploitation.
Woodland degradation is assumed to occur when removals exceed net sustainable yield of vegetation and is measured as a reduction of vegetative biomass density. The model incorporates three major processes responsible for woodland clearing or degradation: (a) the expansion of cropping, which may reduce woodland area or tree density directly or displace grazing from former grazing land, (b) the level of animal grazing, and (c) the quantity of wood removal. Conversion of woodlands into cropland is assumed to reduce the vegetative biomass to the level found in the existing fields. Thus, the model accounts for partial removal of vegetation rather than its total loss. Grazing losses are assumed to be proportional to the stock of vegetative biomass available in each site and land category. Fuel wood extraction is a function of distance required for travelling to the site and the stock of tree vegetation there.
We shall analyse the likely land use changes over the period 1999 to 2020, assuming that the framework conditions remain more or less constant during that period, and that the villages behave as if they are decision-making units maximising the welfare of their population. 3. The villages Since the objective is to study land use problems in sub-Saharan villages with access to forest resources, all 16 villages are located in woodland zones of semi dry Africa; southern Senegal, eastern Tanzania and central Uganda. Probably, the productivity of the arboreal vegetation is not very different between these countries and their woodland types. Although the 16 villages do not constitute a statistically representative sample of rural sub-Saharan Africa, we think that by studying optimal land allocation in these cases a broad direction of change in land use may be revealed for the future. Some important information on the sample villages are given in Table 1.
5
Table 1. Some salient characteristics of 16 study villages in Senegal, Tanzania and Uganda Country
Village
Population 1999*
Population growth (% p.a.)
Distance from town** (km)
Distance from road head (km)
Main economic activity
Senegal Afia Mbemba 712 4.0 67 25 Cropping/Grazing
Boulimbou 298 4.0 32 7 Cropping/Grazing Lambatara 781 1.5 20 20 Cropping
Medina Pakane 156 8.3 45 10 Cropping
Sare Birou 149 8 10 7 Cropping/Grazing
Sare Coly Sal 497 4 9 1 Cropping/Grazing
Tanzania Kanga 2914 2.5 140 0 Cropping Kilimanjaro† 4700 2.6 100 1 Cropping
K-Madesa 1890 3.3 72 6 Cropping/Grazing/Fuelwood
Kwadudu 2460 2.7 64 5 Cropping Muungano 3110 2.7 43 0 Cropping Mazizi 4340 2.4 68 0 Cropping Uganda Kyankonwa 700 1.82 100 0 Cropping/Grazing Namusala 1200 2.13 80 0 Cropping/Grazing
Kabutuukuru & Kinuuma††
1710 2.1 na 0 Cropping/Grazing/ Fuelwood
* Population for Tanzanian villages refers to 1998 ** town = provincial capital † The village Kilimanjaro is not located particularly close to the mountain Kilimanjaro †† Data collected in 2003. It is worth mentioning that a village has a somewhat different meaning in the three countries. In Senegal this term is used for a fairly small concentration of homesteads. The houses are usually assembled in a densely built up area surrounded by cultivated fields. In Tanzania the history of villagization in the 1970s (Kjekshus, 1977) has led to the term village being used for a much larger assembly of houses and people. The built up area may stretch for quite a long distance (e.g., 1km), and the fields are not concentrated around the homesteads in the same concentric pattern normally found in Senegal. The availability of soil and water determines the land use pattern to a large degree. In Uganda the term village is used more as an administrative term than for a concentration of homesteads. Houses are often distributed fairly evenly in the terrain, surrounded by gardens and

370 6
fields. It is often difficult to determine where the economic centre of the village is located, unlike in the other two countries. Information about the villages, their people and economic activities, were collected through socio-economic surveys conducted in two stages during the years 1999 and 2000. In the socio-economic survey of the villages, detailed information about the number of households and their productive and consumptive activities were collected. A representative sample of households was asked about their production activities, input use as well as the prices of factors and products. Land available to the village for agricultural cultivation, grazing and collection of wood and other forest products was surveyed by the use of GPS equipment. Sketch maps were drawn of all the village land, with land units classified according to existing vegetation and suitability for various uses. Finally, a survey of wood and grass biomass was carried out with at least one sample plot located in each land unit of all the 16 study villages. Table 2. Prices of key products and human labour in the sampled villages in 1999
Country Village
Farm gate price of maize (USD/kg)
Farm gate price of beef meat (USD/kg)
Road head price of charcoal (USD/bag)
Rural labour wage (USD/man day)
Senegal All six villages 0.12 1.31 1.85 0.31 Tanzania Kanga 0.13 1.26 1.01 0.51 Kilimanjaro 0.08 2.56 0.76 0.51 K-Madesa 0.25 2.53 1.26 0.51 Kwadudu 0.51 1.26 0.76 0.51 Muungano 0.51 1.26 1.26 0.51 Mazizi 0.08 2.53 1.26 0.63 Uganda Namusala 0.17 1.33 2.67 0.27 Kyankonwa 0.17 1.33 2.34 0.27
Kabutuukuru & Kinuuma
0.54*
* Note: 2003 Prices of some important products and of rural labour in the surveyed villages are given in Table 2. These prices are exogenous to the model, and thus taken for given by the villagers while optimising their land use.
7
Table 3. Land availability in the sampled villages
Country Village Cultivated land (ha/head)
Total land (ha/head)
Uncultivated land (ha/TLU*)
Senegal Afia Mbemba 0.65 0.96 0.59 Boulimbou 1.59 10.76 10.40 Lambatara 1.36 3.07 3.61 Medina Pakane 1.82 17.40 18.82 Sare Biro 1.64 3.97 0.76 Sare Coly Sal 0.61 0.98 0.40 Tanzania Kanga 1.34 3.34 26.01 Kilimanjaro 0.11 0.17 9.90 K-Madesa 0.33 3.60 1.41 Kwadudu 1.18 3.36 181.98 Mazizi 0.25 1.72 6.33 Muungano 0.59 1.96 35.26 Uganda Namusala 0.90 1.54 7.74 Kyankonwa 0.44 0.62 0.09
Kabutuukuru & Kinuuma 0.29 1.15 0.85
* TLU = tropical livestock unit Land availability in the villages is presented in Table 3. Since woodland is of fundamental importance to animal husbandry in these villages, the availability of uncultivated land was also calculated per livestock unit. From Table 3 one may see that land in Kilimanjaro and Mazizi villages in Tanzania is relatively scarce. It is not sufficient for the population to produce enough food and fuel wood even for own consumption. However, villagers stated that they were about self-sufficient in these products, implying thereby that additional land is probably available to them outside the area surveyed. Consequently, we have added a dummy land unit of woodland not suited for cultivation but available only to meet the wood fuel and fodder requirements of these villages. A dummy land unit has also been added to Kyankonwa and Namusala villages in Uganda. Kyankonwa is located next to Kasagala Forest Reserve, which is illegally used for collection of firewood, production of charcoal, grazing of animals, and even encroachment for crop cultivation. Also, villagers in Namusala have access to woodland for firewood collection and grazing of animals outside the surveyed village land. Some differences in farming systems between the three countries are also worth noting. The combination of cropping and animal husbandry is more common among village households in Senegal and Uganda than in

371 6
fields. It is often difficult to determine where the economic centre of the village is located, unlike in the other two countries. Information about the villages, their people and economic activities, were collected through socio-economic surveys conducted in two stages during the years 1999 and 2000. In the socio-economic survey of the villages, detailed information about the number of households and their productive and consumptive activities were collected. A representative sample of households was asked about their production activities, input use as well as the prices of factors and products. Land available to the village for agricultural cultivation, grazing and collection of wood and other forest products was surveyed by the use of GPS equipment. Sketch maps were drawn of all the village land, with land units classified according to existing vegetation and suitability for various uses. Finally, a survey of wood and grass biomass was carried out with at least one sample plot located in each land unit of all the 16 study villages. Table 2. Prices of key products and human labour in the sampled villages in 1999
Country Village
Farm gate price of maize (USD/kg)
Farm gate price of beef meat (USD/kg)
Road head price of charcoal (USD/bag)
Rural labour wage (USD/man day)
Senegal All six villages 0.12 1.31 1.85 0.31 Tanzania Kanga 0.13 1.26 1.01 0.51 Kilimanjaro 0.08 2.56 0.76 0.51 K-Madesa 0.25 2.53 1.26 0.51 Kwadudu 0.51 1.26 0.76 0.51 Muungano 0.51 1.26 1.26 0.51 Mazizi 0.08 2.53 1.26 0.63 Uganda Namusala 0.17 1.33 2.67 0.27 Kyankonwa 0.17 1.33 2.34 0.27
Kabutuukuru & Kinuuma
0.54*
* Note: 2003 Prices of some important products and of rural labour in the surveyed villages are given in Table 2. These prices are exogenous to the model, and thus taken for given by the villagers while optimising their land use.
7
Table 3. Land availability in the sampled villages
Country Village Cultivated land (ha/head)
Total land (ha/head)
Uncultivated land (ha/TLU*)
Senegal Afia Mbemba 0.65 0.96 0.59 Boulimbou 1.59 10.76 10.40 Lambatara 1.36 3.07 3.61 Medina Pakane 1.82 17.40 18.82 Sare Biro 1.64 3.97 0.76 Sare Coly Sal 0.61 0.98 0.40 Tanzania Kanga 1.34 3.34 26.01 Kilimanjaro 0.11 0.17 9.90 K-Madesa 0.33 3.60 1.41 Kwadudu 1.18 3.36 181.98 Mazizi 0.25 1.72 6.33 Muungano 0.59 1.96 35.26 Uganda Namusala 0.90 1.54 7.74 Kyankonwa 0.44 0.62 0.09
Kabutuukuru & Kinuuma 0.29 1.15 0.85
* TLU = tropical livestock unit Land availability in the villages is presented in Table 3. Since woodland is of fundamental importance to animal husbandry in these villages, the availability of uncultivated land was also calculated per livestock unit. From Table 3 one may see that land in Kilimanjaro and Mazizi villages in Tanzania is relatively scarce. It is not sufficient for the population to produce enough food and fuel wood even for own consumption. However, villagers stated that they were about self-sufficient in these products, implying thereby that additional land is probably available to them outside the area surveyed. Consequently, we have added a dummy land unit of woodland not suited for cultivation but available only to meet the wood fuel and fodder requirements of these villages. A dummy land unit has also been added to Kyankonwa and Namusala villages in Uganda. Kyankonwa is located next to Kasagala Forest Reserve, which is illegally used for collection of firewood, production of charcoal, grazing of animals, and even encroachment for crop cultivation. Also, villagers in Namusala have access to woodland for firewood collection and grazing of animals outside the surveyed village land. Some differences in farming systems between the three countries are also worth noting. The combination of cropping and animal husbandry is more common among village households in Senegal and Uganda than in

372 8
Tanzania. This may be explained by the presence of semi-pastoral Maasai (SAAH, 1999) in most of the surveyed areas of Tanzania. These people keep large herds of domestic animals (Ndagala, 1992) and probably supply most beef and goat meat consumed by the village households. Another difference is the variety of crops cultivated among countries. While rice and cotton are important crops in Senegal, these crops are of little importance in the East-African villages. Coffee is an important cash crop in Uganda, but not in the surveyed villages in Senegal and Tanzania. 4. Deforestation and degradation under “business as usual” Land-use development resulting from unaltered price relationships and policy regimes has been simulated. In the REDD literature this is often referred to as the baseline (Angelsen, 2008). Such baselines are often proposed to be set according to historical deforestation, but model based baselines are also suggested (Meridian Institute, 2009). Here we are more concerned with baselines in the national context rather than in international negotiations and agreements. Model based baselines are demanding in terms of data and competence, but they yield more realistic results (Brown et al., 2006).
Underlying processes such as population growth and economic development have been assumed to continue at about the same pace as observed during the last couple of decades. In this section we do not attempt to simulate any policy interventions to reduce deforestation or forest degradation.
Since our main interest is to predict the degree of deforestation and woodland degradation resulting from rational land use decisions among African villagers, some measurement of these variables is required. Our model endogenously describes the development of area of cultivated fields and that of other vegetation types, mainly woodland, corresponding to the welfare maximising solution. The stock of biomass in trees and bushes is also modelled. Consequently, two indicators of deforestation and woodland degradation may be computed from the primary output of the model. The cultivated land as per cent of total land in the village is one of them. This relationship shows how woodland and other areas are cleared and converted into cultivated fields for agricultural crops. An increase in this indicator shows that villagers find it rational to reduce forest cover and expand the cropping area. This indicator is not a direct measure of deforestation (in the narrow sense of definition) since some trees are often left in fields or along the edges of fields when woodland is cleared for cultivation. Therefore, the biomass density in woodlands was used as an alternate indicator of woodland degradation. To compute this density we divide total above ground woody biomass of trees and bushes in the woodland by the total area of woodland. This indicator serves as an indicator of the state of the
9
vegetation in the woodland. Though this measure does not capture changes in species composition, e.g., from broadleaved trees to thorny shrubs yet it can still be used as a possible indicator of woodland degradation. A reduction of biomass density may suggest that woodland resources are being depleted through grazing and/or extraction of fuel wood and thus the woodland use is not sustainable.
The development of cultivated land as a proportion of total village land over the model horizon is presented in Figs. 1 - 3.
Figure 1. Proportion of cultivated land in each study village in Senegal

373 8
Tanzania. This may be explained by the presence of semi-pastoral Maasai (SAAH, 1999) in most of the surveyed areas of Tanzania. These people keep large herds of domestic animals (Ndagala, 1992) and probably supply most beef and goat meat consumed by the village households. Another difference is the variety of crops cultivated among countries. While rice and cotton are important crops in Senegal, these crops are of little importance in the East-African villages. Coffee is an important cash crop in Uganda, but not in the surveyed villages in Senegal and Tanzania. 4. Deforestation and degradation under “business as usual” Land-use development resulting from unaltered price relationships and policy regimes has been simulated. In the REDD literature this is often referred to as the baseline (Angelsen, 2008). Such baselines are often proposed to be set according to historical deforestation, but model based baselines are also suggested (Meridian Institute, 2009). Here we are more concerned with baselines in the national context rather than in international negotiations and agreements. Model based baselines are demanding in terms of data and competence, but they yield more realistic results (Brown et al., 2006).
Underlying processes such as population growth and economic development have been assumed to continue at about the same pace as observed during the last couple of decades. In this section we do not attempt to simulate any policy interventions to reduce deforestation or forest degradation.
Since our main interest is to predict the degree of deforestation and woodland degradation resulting from rational land use decisions among African villagers, some measurement of these variables is required. Our model endogenously describes the development of area of cultivated fields and that of other vegetation types, mainly woodland, corresponding to the welfare maximising solution. The stock of biomass in trees and bushes is also modelled. Consequently, two indicators of deforestation and woodland degradation may be computed from the primary output of the model. The cultivated land as per cent of total land in the village is one of them. This relationship shows how woodland and other areas are cleared and converted into cultivated fields for agricultural crops. An increase in this indicator shows that villagers find it rational to reduce forest cover and expand the cropping area. This indicator is not a direct measure of deforestation (in the narrow sense of definition) since some trees are often left in fields or along the edges of fields when woodland is cleared for cultivation. Therefore, the biomass density in woodlands was used as an alternate indicator of woodland degradation. To compute this density we divide total above ground woody biomass of trees and bushes in the woodland by the total area of woodland. This indicator serves as an indicator of the state of the
9
vegetation in the woodland. Though this measure does not capture changes in species composition, e.g., from broadleaved trees to thorny shrubs yet it can still be used as a possible indicator of woodland degradation. A reduction of biomass density may suggest that woodland resources are being depleted through grazing and/or extraction of fuel wood and thus the woodland use is not sustainable.
The development of cultivated land as a proportion of total village land over the model horizon is presented in Figs. 1 - 3.
Figure 1. Proportion of cultivated land in each study village in Senegal

374 10
Figure 2. Proportion of cultivated land in each study village in Tanzania
0
0.1
0.2
0.3
0.4
0.5
0.6
2000
2002
2004
2006
2008
2010
2012
2014
2016
2018
2020
Years
% A
rea
culti
vate
d
Namusala
Kayankonw a
K & K
Figure 3. Proportion of cultivated land in each study village in Uganda We note that there is very little clearing of woodland for cultivation in most villages as against quite a lot of woodland clearing in a few others. The
11
variations in patterns of woodland clearing are primarily due to the differences in the availability of land suitable for cultivation. In many villages all, or almost all, suitable land has already been cultivated, while in other villages (Mazizi and Kihangaiko-Madesa in Tanzania, and Namusala in Uganda) there are still more remaining woodland areas suitable for cultivation. In these villages woodland clearing may still be feasible for another 10 to 15 years into the future. The developments of biomass density in the remaining woodland pertaining to each study village are shown in Figs. 4 – 6. We note that there is a wide variation in biomass density in the Tanzanian woodlands. Per hectare densities inventoried varied between 12 and 224 tonnes in Tanzania and between 54 and 132 tonnes in southern Senegal. The corresponding figures for Uganda are 13 to 45 tonnes per ha only. The modelled scenarios indicate that most villages have difficulties to harvest sufficient wood and fodder without depleting their stock of biomass. In a few years, serious woodland degradation is likely to set in the Ugandan villages and in one of the Tanzanian villages, namely, Mazizi. A similar development may be expected somewhat later in Kilimanjaro village in Tanzania and in the Senegalese village Sare Colly Salle.
0
20
40
60
80
100
120
140Biomass (Tonnes/ha)
Afia Boulimbou Lambatara
Medina Pakane Sare Biro Sare Coly Sal
Figure 4. Biomass density in woodland area of Senegalese villages
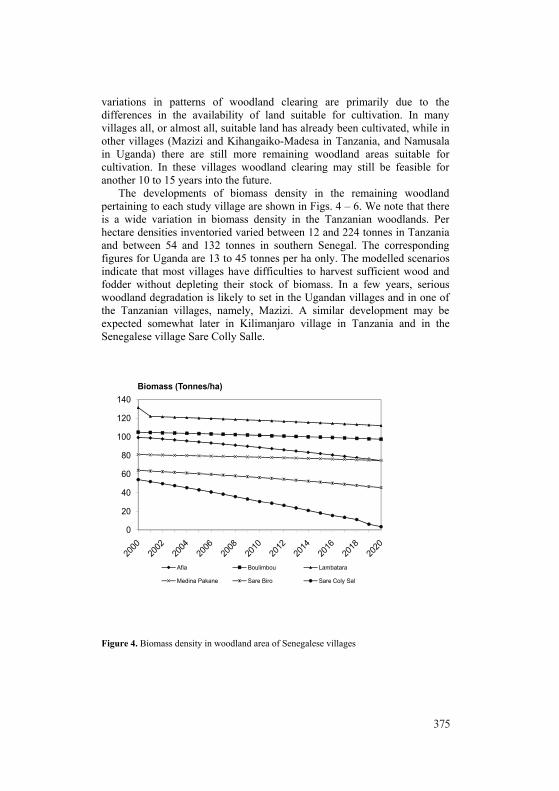
375 10
Figure 2. Proportion of cultivated land in each study village in Tanzania
0
0.1
0.2
0.3
0.4
0.5
0.6
2000
2002
2004
2006
2008
2010
2012
2014
2016
2018
2020
Years
% A
rea
culti
vate
d
Namusala
Kayankonw a
K & K
Figure 3. Proportion of cultivated land in each study village in Uganda We note that there is very little clearing of woodland for cultivation in most villages as against quite a lot of woodland clearing in a few others. The
11
variations in patterns of woodland clearing are primarily due to the differences in the availability of land suitable for cultivation. In many villages all, or almost all, suitable land has already been cultivated, while in other villages (Mazizi and Kihangaiko-Madesa in Tanzania, and Namusala in Uganda) there are still more remaining woodland areas suitable for cultivation. In these villages woodland clearing may still be feasible for another 10 to 15 years into the future. The developments of biomass density in the remaining woodland pertaining to each study village are shown in Figs. 4 – 6. We note that there is a wide variation in biomass density in the Tanzanian woodlands. Per hectare densities inventoried varied between 12 and 224 tonnes in Tanzania and between 54 and 132 tonnes in southern Senegal. The corresponding figures for Uganda are 13 to 45 tonnes per ha only. The modelled scenarios indicate that most villages have difficulties to harvest sufficient wood and fodder without depleting their stock of biomass. In a few years, serious woodland degradation is likely to set in the Ugandan villages and in one of the Tanzanian villages, namely, Mazizi. A similar development may be expected somewhat later in Kilimanjaro village in Tanzania and in the Senegalese village Sare Colly Salle.
0
20
40
60
80
100
120
140Biomass (Tonnes/ha)
Afia Boulimbou Lambatara
Medina Pakane Sare Biro Sare Coly Sal
Figure 4. Biomass density in woodland area of Senegalese villages

376
12
Figure 5. Biomass density in woodland area of Tanzanian villages
Figure 6. Biomass density in woodland area of two Ugandan villages It should be mentioned that the results reported here for Lambatara village in Senegal are somewhat different from the results reported for the same village by Sankhayan and Hofstad (2001). This is due to improved quality
13
of data obtained for this study during the second phase of survey of the village during the year 1999. A summary of woodland degradation estimates for all 16 villages over a 20 year period is given in Table 4. Table 4. Biomass density and likely biomass degradation in 20 years in 16 villages Village Actual
(tonnes/ha) Prediction (tonnes/ha) Change =
predicted:actual Namusala 13.49 0.31 0.023 Kilimanjaro 44.54 1.24 0.028 Kyankonwa 16.91 0.76 0.045 Sare Coly Salle 53.99 3.47 0.064 Mazizi 12.20 1.59 0.130 Kabutuukuru & Kinuuma
29.75 17.20 0.579
Sare Biro 63.91 45.44 0.711 Afia Mbemba 99.23 74.49 0.751 Kwadudu 119.57 96.96 0.811 Kanga 223.84 183.36 0.819 Lambatara 131.32 112.07 0.853 Medina Pakane 80.92 74.57 0.922 Boulimbou 104.92 97.44 0.929 Kihangaiko-Madesa 31.43 30.12 0.958 Muungano 126.06 122.54 0.972 5. Effects of measures to reduce deforestation and degradation Detailed analysis of some interventions to reduce deforestation or forest degradation has been undertaken for one of the Senegalese villages, Lambatara, and for the two Ugandan villages Kabutuukuru and Kinuuma.
In the Senegalese case we tested the effects of two abrupt changes, namely, introduction of fertilizer use for major crops and increase in population growth from 1.5% to 3% p.a. In addition, effect of three gradual changes, namely, decrease in charcoal prices by 3.5% p.a., increase in wage rates by 5% p.a. and increase in cotton price by 3.5% p.a.
Most of these changes may result from modified economic development in the country. Which policies should be implemented by the government to achieve such changes is not easy to pinpoint. To make fertilizer use more common, subsidies may be required (Jepma, 1995:115), but higher product prices may also contribute. A reduction in the population growth rate normally follows from better education of girls, better health services, and economic growth in general. Increased wage rates may often result from economic improvements in agriculture and industry. The government may also increase minimum wages over time to ensure equity. Cotton prices may

377
12
Figure 5. Biomass density in woodland area of Tanzanian villages
Figure 6. Biomass density in woodland area of two Ugandan villages It should be mentioned that the results reported here for Lambatara village in Senegal are somewhat different from the results reported for the same village by Sankhayan and Hofstad (2001). This is due to improved quality
13
of data obtained for this study during the second phase of survey of the village during the year 1999. A summary of woodland degradation estimates for all 16 villages over a 20 year period is given in Table 4. Table 4. Biomass density and likely biomass degradation in 20 years in 16 villages Village Actual
(tonnes/ha) Prediction (tonnes/ha) Change =
predicted:actual Namusala 13.49 0.31 0.023 Kilimanjaro 44.54 1.24 0.028 Kyankonwa 16.91 0.76 0.045 Sare Coly Salle 53.99 3.47 0.064 Mazizi 12.20 1.59 0.130 Kabutuukuru & Kinuuma
29.75 17.20 0.579
Sare Biro 63.91 45.44 0.711 Afia Mbemba 99.23 74.49 0.751 Kwadudu 119.57 96.96 0.811 Kanga 223.84 183.36 0.819 Lambatara 131.32 112.07 0.853 Medina Pakane 80.92 74.57 0.922 Boulimbou 104.92 97.44 0.929 Kihangaiko-Madesa 31.43 30.12 0.958 Muungano 126.06 122.54 0.972 5. Effects of measures to reduce deforestation and degradation Detailed analysis of some interventions to reduce deforestation or forest degradation has been undertaken for one of the Senegalese villages, Lambatara, and for the two Ugandan villages Kabutuukuru and Kinuuma.
In the Senegalese case we tested the effects of two abrupt changes, namely, introduction of fertilizer use for major crops and increase in population growth from 1.5% to 3% p.a. In addition, effect of three gradual changes, namely, decrease in charcoal prices by 3.5% p.a., increase in wage rates by 5% p.a. and increase in cotton price by 3.5% p.a.
Most of these changes may result from modified economic development in the country. Which policies should be implemented by the government to achieve such changes is not easy to pinpoint. To make fertilizer use more common, subsidies may be required (Jepma, 1995:115), but higher product prices may also contribute. A reduction in the population growth rate normally follows from better education of girls, better health services, and economic growth in general. Increased wage rates may often result from economic improvements in agriculture and industry. The government may also increase minimum wages over time to ensure equity. Cotton prices may

378 14
increase relative to other prices due to growing world market demand, or government subsidies. The government may introduce more effective taxes on traded charcoal in order to reduce the producer price. Better supply of alternative sources of energy (electricity, kerosene, gas, solar, wind, etc.) may also reduce charcoal price, and the authorities may contribute to this in various ways. Table 5. Deforestation and degradation under various model scenarios at Lambatara village in Senegal – after 20 years Scenario Deforestation* Degradation** BASE (business as usual) 117 ha (2.5%) 30.9 T/ha (-12.4%) ATECH (fertilizer introduced) 126 ha (2.7%) 31.0 T/ha (-12.2%) GRPOP (3% population growth pa) 285 ha (6.1%) 31.1 T/ha (-11.8%) CHARCP (charcoal price -3.5% pa) 117 ha (2.5%) 31.7 T/ha (-10.1%) WAGER (wages +5% pa) 126 ha (2.7%) 31.5 T/ha (-10.9%) COTP (cotton price +3.5% pa) 37 ha (0.8%) 30.7 T/ha (-13.0%)
* Ha of woodland cleared for cultivation (% of available woodland) ** Biomass density (T/ha) in remaining woodland after 20 years (% change) The results shown in Table 5 for Lambatara village in Senegal indicate that there is a limit to woodland degradation that can occur over the model horizon irrespective of model scenario. This is explained by the fact that the village has access to a fairly large woodland area (4,678.5 ha). There are two assumptions that affect deforestation substantially; namely, population growth rate, and producer price of cotton, though in opposite directions. If population grows at 3% p.a. rather than the actual 1.5%, deforestation also proceeds at approximately double the rate of business as usual. If cotton price increases by 3.5% p.a. compared with other prices, deforestation is reduced to about a third of what is expected under business as usual.
In the Ugandan case we tested the effects of the following abrupt changes:
• Crop yields are increased by 20% • Producer price of charcoal is increased by 20% • Annual wood harvest is restricted to biomass increment • Charcoal production limited to specific annual quota
These changes are more directly related to specific interventions on part of the authorities. Charcoal price may increase (in real terms) as a consequence of increased demand and reduced supply due to woodland degradation and increasing transport distances. The authorities may, however, contribute to
15
price hikes through the introduction of various taxes, e.g., stumpage fees, transport fees, and value added tax. This may reduce the producer price of charcoal. Also the authorities may introduce production quotas, either on wood harvest or charcoal. Such quotas should ideally be related to the biological yield of woodlands in question. However, the actual basis for fixing such quotas is seldom known. Effective implementation of such control systems is often hampered not only by practical problems related to transport and communication, but also by the prevailing corruption in the society and the poor law enforcement. This means that harvest control is an expensive activity that can possibly be financed by reinvesting a proportion of payments for carbon storage in African forests and woodlands. Transaction costs related to payments for environmental services like REDD (Eliasch, 2008) in Africa are probably quite high.
The results presented in Table 6 indicate that crop yield increasing measures (improved crop varieties, fertilizers, pesticides) are likely to accelerate deforestation. On the other hand, degradation of the remaining woodland would probably be retarded. Measures affecting the producer price of charcoal also have pronounced effects on deforestation and degradation. Increasing charcoal price leads to less deforestation, but more rapid degradation. The effects of quotas on wood harvest or charcoal production obviously depend on how restrictive they are, but in our case these measures resulted in high deforestation and little or no degradation of remaining woodland. This is the result of a shift from charcoaling to cropping among villagers when the quotas are imposed. We did not find a set of measures that would stop both deforestation and woodland degradation simultaneously without reducing villagers’ income and livelihoods severely. Table 6. Deforestation and degradation under various scenarios at Kabutuukuru and Kinuuma villages in Uganda – after 20 years Scenario Deforestation* Degradation** BASE (business as usual) 112 ha (46.7%) 17.2 T/ha (- 42.1%) YIELD (+20% crop yields) 236 ha (98.3%) 24.6 T/ha (- 17.3%) CPRICE (+20% charcoal price) 62 ha (25.9%) 15.6 T/ha (- 47.5%) CTAX (-10% charcoal price) 220 ha (91.7%) 20.8 T/ha (- 30.0%) BMQUOTA (wood harvest at MAI) 236 ha (98.3%) 26.2 T/ha (- 11.9%) CQUOTA (limited charcoal production) 236 ha (98.3%) 34.3 T/ha (+15.5%)
* Ha of woodland cleared for cultivation (% of available woodland) ** Biomass density (T/ha) in remaining woodland after 20 years (% change)

379 14
increase relative to other prices due to growing world market demand, or government subsidies. The government may introduce more effective taxes on traded charcoal in order to reduce the producer price. Better supply of alternative sources of energy (electricity, kerosene, gas, solar, wind, etc.) may also reduce charcoal price, and the authorities may contribute to this in various ways. Table 5. Deforestation and degradation under various model scenarios at Lambatara village in Senegal – after 20 years Scenario Deforestation* Degradation** BASE (business as usual) 117 ha (2.5%) 30.9 T/ha (-12.4%) ATECH (fertilizer introduced) 126 ha (2.7%) 31.0 T/ha (-12.2%) GRPOP (3% population growth pa) 285 ha (6.1%) 31.1 T/ha (-11.8%) CHARCP (charcoal price -3.5% pa) 117 ha (2.5%) 31.7 T/ha (-10.1%) WAGER (wages +5% pa) 126 ha (2.7%) 31.5 T/ha (-10.9%) COTP (cotton price +3.5% pa) 37 ha (0.8%) 30.7 T/ha (-13.0%)
* Ha of woodland cleared for cultivation (% of available woodland) ** Biomass density (T/ha) in remaining woodland after 20 years (% change) The results shown in Table 5 for Lambatara village in Senegal indicate that there is a limit to woodland degradation that can occur over the model horizon irrespective of model scenario. This is explained by the fact that the village has access to a fairly large woodland area (4,678.5 ha). There are two assumptions that affect deforestation substantially; namely, population growth rate, and producer price of cotton, though in opposite directions. If population grows at 3% p.a. rather than the actual 1.5%, deforestation also proceeds at approximately double the rate of business as usual. If cotton price increases by 3.5% p.a. compared with other prices, deforestation is reduced to about a third of what is expected under business as usual.
In the Ugandan case we tested the effects of the following abrupt changes:
• Crop yields are increased by 20% • Producer price of charcoal is increased by 20% • Annual wood harvest is restricted to biomass increment • Charcoal production limited to specific annual quota
These changes are more directly related to specific interventions on part of the authorities. Charcoal price may increase (in real terms) as a consequence of increased demand and reduced supply due to woodland degradation and increasing transport distances. The authorities may, however, contribute to
15
price hikes through the introduction of various taxes, e.g., stumpage fees, transport fees, and value added tax. This may reduce the producer price of charcoal. Also the authorities may introduce production quotas, either on wood harvest or charcoal. Such quotas should ideally be related to the biological yield of woodlands in question. However, the actual basis for fixing such quotas is seldom known. Effective implementation of such control systems is often hampered not only by practical problems related to transport and communication, but also by the prevailing corruption in the society and the poor law enforcement. This means that harvest control is an expensive activity that can possibly be financed by reinvesting a proportion of payments for carbon storage in African forests and woodlands. Transaction costs related to payments for environmental services like REDD (Eliasch, 2008) in Africa are probably quite high.
The results presented in Table 6 indicate that crop yield increasing measures (improved crop varieties, fertilizers, pesticides) are likely to accelerate deforestation. On the other hand, degradation of the remaining woodland would probably be retarded. Measures affecting the producer price of charcoal also have pronounced effects on deforestation and degradation. Increasing charcoal price leads to less deforestation, but more rapid degradation. The effects of quotas on wood harvest or charcoal production obviously depend on how restrictive they are, but in our case these measures resulted in high deforestation and little or no degradation of remaining woodland. This is the result of a shift from charcoaling to cropping among villagers when the quotas are imposed. We did not find a set of measures that would stop both deforestation and woodland degradation simultaneously without reducing villagers’ income and livelihoods severely. Table 6. Deforestation and degradation under various scenarios at Kabutuukuru and Kinuuma villages in Uganda – after 20 years Scenario Deforestation* Degradation** BASE (business as usual) 112 ha (46.7%) 17.2 T/ha (- 42.1%) YIELD (+20% crop yields) 236 ha (98.3%) 24.6 T/ha (- 17.3%) CPRICE (+20% charcoal price) 62 ha (25.9%) 15.6 T/ha (- 47.5%) CTAX (-10% charcoal price) 220 ha (91.7%) 20.8 T/ha (- 30.0%) BMQUOTA (wood harvest at MAI) 236 ha (98.3%) 26.2 T/ha (- 11.9%) CQUOTA (limited charcoal production) 236 ha (98.3%) 34.3 T/ha (+15.5%)
* Ha of woodland cleared for cultivation (% of available woodland) ** Biomass density (T/ha) in remaining woodland after 20 years (% change)

380 16
6. Conclusion If reduced emissions from deforestation and forest degradation are included in a post-Kyoto regime to mitigate climate change, governments intending to sell this environmental service must design forest policies and Climate Action Plans that are effective, and preferably efficient. We have investigated deforestation and woodland degradation at village level in three countries of Sub-Saharan Africa, namely, Senegal, Tanzania and Uganda, outside the rainforest zone. The study has brought out that while expansion of cropland is a major driver of deforestation, wood harvesting for meeting energy requirements is the major cause of forest and woodland degradation in these regions.
We find that cultivable land has already been cleared in most of the investigated villages. Thus deforestation is likely to occur only in villages with a substantial remaining woodland area. This is in agreement with the general observation that deforestation in these parts of Africa takes place as an expansion of cropland at the fringes of woodlands and forests. Present economic and institutional conditions are likely to maintain further deforestation wherever cultivable woodlands are available. These findings are important for estimating baseline emissions from deforestation and forest degradation (Olander et al., 2008).
Most observed villages have difficulties in limiting harvest of wood to sustainable rates. The villagers are either in need of fuelwood for their own consumption, or for earning income from sale of charcoal. This results into more wood harvest than the present increment. In villages with little remaining woodland this would lead to serious degradation in a few years. This behaviour is rational in spite of villagers knowing quite well that it is not sustainable. Our results raise the question whether paying compensation to such communities for reducing emissions would be a sufficient measure. Rural households would need other types of fuel. It could be purchased by part of the compensation, but the energy should not come from fossil fuels. Urban populations will also be affected by decreased supply of wood fuels. How they should be compensated is an open question. Energy supply may become a major policy challenge after REDD in countries that are now dependent on wood fuels. Also, many people who are presently employed in wood-fuel production and trade would need alternative employment (Hofstad et al., 2009).
Model experiments with three of the studied villages lead to some conclusions concerning factors that may reduce deforestation or woodland degradation. Reduced growth of population, through family planning, education of women or outmigration, is likely to reduce deforestation in most cases. This is hardly a surprising result given the existing evidence of positive correlation between population growth and deforestation (Bawa and Dayanandan, 1997; Angelsen and Kaimowitz, 1999), especially in Africa.
17
Increasing producer price of charcoal leads to reduced deforestation and increased degradation because villagers allocate less labour to land clearing and crop production and spending more time on charcoal production.
Policies that make crop production relatively more profitable (e.g., subsidising fertilizers or improved crop varieties), have similar effects as increased producer prices of crops. Such changes normally lead to more deforestation and less forest degradation. This is exemplified by our Ugandan case where maize and other crops are grown on newly cleared land. The case of increased cotton price in Senegal, however, shows that the general pattern cannot always be expected. Cotton in Senegal is grown entirely for the market as a cash crop on particularly productive soils as against maize that is mostly grown for meeting self-sufficiency requirements in Uganda. When these are fully utilised, price increases will not necessarily lead to further deforestation.
Production quotas may be an effective measure to slow down, or even stop, forest degradation. Whether such measures are also cost effective, has not been tested here. We are afraid that effective controls may be rather expensive. Sustainable harvest quotas are likely to make charcoal production less profitable, unless they are applied without exemptions and lead to increased price. If charcoaling gets less profitable, villagers are likely to allocate more labour to land clearing and crop production, thus increasing deforestation. References Angelsen, A. (ed.). 2008. Moving ahead with REDD: Issues, Options and
Implications. CIFOR, Bogor. 156pp. Angelsen A., Kaimowitz D., 1999. Rethinking the causes of deforestation:
Lessons from economic models. The World Bank Research Observer, 14:73-98.
Bawa K.S., Dayanandan S. 1997. Socioeconomic factors and tropical deforestation. Nature, 386:562-3.
Brown, S. et al. 2007. Baselines for land-use change in the tropics: application to avoided deforestation projects. Mitigation and Adaptation Strategies for Global Change, 12(6):1001-26.
Creighton K., 2007. The UNFCCC: expectations from Bali and beyond. Arborvitæ, 34.
Eliasch, J. (ed.) 2008. Climate Change: Financing Global Forests. UK Government, London. 273pp.
Griffiths T., 2007. Seeing ‘RED’? ‘Avoided deforestation’ and the rights of indigenous peoples and local communities. Forest Peoples Programme. 26pp.

381 16
6. Conclusion If reduced emissions from deforestation and forest degradation are included in a post-Kyoto regime to mitigate climate change, governments intending to sell this environmental service must design forest policies and Climate Action Plans that are effective, and preferably efficient. We have investigated deforestation and woodland degradation at village level in three countries of Sub-Saharan Africa, namely, Senegal, Tanzania and Uganda, outside the rainforest zone. The study has brought out that while expansion of cropland is a major driver of deforestation, wood harvesting for meeting energy requirements is the major cause of forest and woodland degradation in these regions.
We find that cultivable land has already been cleared in most of the investigated villages. Thus deforestation is likely to occur only in villages with a substantial remaining woodland area. This is in agreement with the general observation that deforestation in these parts of Africa takes place as an expansion of cropland at the fringes of woodlands and forests. Present economic and institutional conditions are likely to maintain further deforestation wherever cultivable woodlands are available. These findings are important for estimating baseline emissions from deforestation and forest degradation (Olander et al., 2008).
Most observed villages have difficulties in limiting harvest of wood to sustainable rates. The villagers are either in need of fuelwood for their own consumption, or for earning income from sale of charcoal. This results into more wood harvest than the present increment. In villages with little remaining woodland this would lead to serious degradation in a few years. This behaviour is rational in spite of villagers knowing quite well that it is not sustainable. Our results raise the question whether paying compensation to such communities for reducing emissions would be a sufficient measure. Rural households would need other types of fuel. It could be purchased by part of the compensation, but the energy should not come from fossil fuels. Urban populations will also be affected by decreased supply of wood fuels. How they should be compensated is an open question. Energy supply may become a major policy challenge after REDD in countries that are now dependent on wood fuels. Also, many people who are presently employed in wood-fuel production and trade would need alternative employment (Hofstad et al., 2009).
Model experiments with three of the studied villages lead to some conclusions concerning factors that may reduce deforestation or woodland degradation. Reduced growth of population, through family planning, education of women or outmigration, is likely to reduce deforestation in most cases. This is hardly a surprising result given the existing evidence of positive correlation between population growth and deforestation (Bawa and Dayanandan, 1997; Angelsen and Kaimowitz, 1999), especially in Africa.
17
Increasing producer price of charcoal leads to reduced deforestation and increased degradation because villagers allocate less labour to land clearing and crop production and spending more time on charcoal production.
Policies that make crop production relatively more profitable (e.g., subsidising fertilizers or improved crop varieties), have similar effects as increased producer prices of crops. Such changes normally lead to more deforestation and less forest degradation. This is exemplified by our Ugandan case where maize and other crops are grown on newly cleared land. The case of increased cotton price in Senegal, however, shows that the general pattern cannot always be expected. Cotton in Senegal is grown entirely for the market as a cash crop on particularly productive soils as against maize that is mostly grown for meeting self-sufficiency requirements in Uganda. When these are fully utilised, price increases will not necessarily lead to further deforestation.
Production quotas may be an effective measure to slow down, or even stop, forest degradation. Whether such measures are also cost effective, has not been tested here. We are afraid that effective controls may be rather expensive. Sustainable harvest quotas are likely to make charcoal production less profitable, unless they are applied without exemptions and lead to increased price. If charcoaling gets less profitable, villagers are likely to allocate more labour to land clearing and crop production, thus increasing deforestation. References Angelsen, A. (ed.). 2008. Moving ahead with REDD: Issues, Options and
Implications. CIFOR, Bogor. 156pp. Angelsen A., Kaimowitz D., 1999. Rethinking the causes of deforestation:
Lessons from economic models. The World Bank Research Observer, 14:73-98.
Bawa K.S., Dayanandan S. 1997. Socioeconomic factors and tropical deforestation. Nature, 386:562-3.
Brown, S. et al. 2007. Baselines for land-use change in the tropics: application to avoided deforestation projects. Mitigation and Adaptation Strategies for Global Change, 12(6):1001-26.
Creighton K., 2007. The UNFCCC: expectations from Bali and beyond. Arborvitæ, 34.
Eliasch, J. (ed.) 2008. Climate Change: Financing Global Forests. UK Government, London. 273pp.
Griffiths T., 2007. Seeing ‘RED’? ‘Avoided deforestation’ and the rights of indigenous peoples and local communities. Forest Peoples Programme. 26pp.

382 18
Hofstad, O., G. Köhlin, J. Namaalwa 2009. How can emissions from woodfuels be reduced? Pp.237-48 in A. Angelsen (ed.): Realising REDD+, National strategy and policy options. CIFOR, Bogor.
IPCC, 2007. Climate Change: Synthesis Report, Intergovernmental Panel on Climate Change. Cambridge University Press, Cambridge.
Jepma, C. J. 1995. Tropical deforestation: a socio-economic approach. Earthscan, London.
Kjekshus H., 1977. The Tanzanian villagization policy: implementational lessons and ecological dimensions. Canadian Journal of African Studies, 11:269-82.
Meridian Institute 2009. Reducing emissions from deforestation and forest degradation: an options assessment report. Prepared for the Government of Norway by A. Angelsen, S. Brown, C. Loisel, L. Peskett, C. Streck, and D. Zarin. Meridian Institute, Washington DC. 100pp.
Namaalwa J., Sankhayan P.L., Hofstad O., 2007. A dynamic bio-economic model for analyzing deforestation and degradation: An application to woodlands in Uganda. Forest Policy and Economics, 9:479-495.
Ndagala D.K., 1992. Territory, pastoralists, and livestock: resource control among the Kisongo Maasai. Almqvist & Wiksell, Stockholm. 192 pp.
Olander L.P., Gibbs H.K., Steininger M., Swenson J.J., Murray B., 2008. Reference scenarios for deforestation and forest degradation in support of REDD: a review of data and methods. Environmental Research Letter, 3:1-11.
Pagiola S., Bishop J. and Landell-Mills N. (eds.), 2002. Selling forest environmental services. Earthscan, London.
Peskett L., Brown D., Luttrell C., 2006. Can payments for avoided deforestation to tackle climate change also benefit the poor? ODI Forestry Briefing, 12:6pp.
SAAH, 1999. Maasai. The School of Art and Art History, University of Iowa.
Sankhayan P.L., Hofstad O., 2001. A village-level economic model of land clearing, grazing, and wood harvesting for sub-Saharan Africa: with a case study in southern Senegal. Ecological Economics, 38:423-40.
van der Werf, G.R. et al. 2009. CO2 emissions from forest loss. Nature Geoscience, 2:737-8.
1
Relying on nature’s pharmacy: a case study of households’ dependency on medicinal plants in
Burkina Faso’s central plateau
Mariève Pouliot Forest and Landscape, Faculty of Life Sciences,
University of Copenhagen Abstract This paper aims at quantifying household-level use of medicinal plants and to investigate the determinants associated with the choice of traditional treatment in the central plateau of Burkina Faso. Comprehensive analysis of treatment choice was done through a bivariate analysis aiming at characterising users of medicinal plants. Preliminary results indicate that the use of medicinal plants depends on the nature of the encountered illness rather than on the economic disposition of households. Education and age also plays a significant role in the treatment seeking behaviour. Moreover, medicinal plants are more relied upon in the absence of modern health facilities. Keywords: Treatment seeking behaviour, medicinal plants, Burkina Faso 1.1 Introduction According to estimates from the World Health Organization, 80% of the world’s population relies exclusively or principally on traditional medicines for their health care (Bannerman, 1982). More recently, Lambert et al. (1997) have speculated that more than two billion people may be heavily dependent on medicinal plants. Even though medicinal plants are recognized as an important player in the safeguarding of traditional livelihoods and well-being of an important number of people around the world, estimates on the actual number of people relying on them for their health care are outdated and uncertain. Moreover, no comprehensive study on the value of the traditional medical system to households in the developing world has been done, and very little research has been carried to find out in which ways and to whom medicinal plants are important. Most research concerning the use of medicinal plants in the developing world has focused almost entirely on recording medicinal plant species and their uses. Although the determinants of use of the modern medical system have been

383 18
Hofstad, O., G. Köhlin, J. Namaalwa 2009. How can emissions from woodfuels be reduced? Pp.237-48 in A. Angelsen (ed.): Realising REDD+, National strategy and policy options. CIFOR, Bogor.
IPCC, 2007. Climate Change: Synthesis Report, Intergovernmental Panel on Climate Change. Cambridge University Press, Cambridge.
Jepma, C. J. 1995. Tropical deforestation: a socio-economic approach. Earthscan, London.
Kjekshus H., 1977. The Tanzanian villagization policy: implementational lessons and ecological dimensions. Canadian Journal of African Studies, 11:269-82.
Meridian Institute 2009. Reducing emissions from deforestation and forest degradation: an options assessment report. Prepared for the Government of Norway by A. Angelsen, S. Brown, C. Loisel, L. Peskett, C. Streck, and D. Zarin. Meridian Institute, Washington DC. 100pp.
Namaalwa J., Sankhayan P.L., Hofstad O., 2007. A dynamic bio-economic model for analyzing deforestation and degradation: An application to woodlands in Uganda. Forest Policy and Economics, 9:479-495.
Ndagala D.K., 1992. Territory, pastoralists, and livestock: resource control among the Kisongo Maasai. Almqvist & Wiksell, Stockholm. 192 pp.
Olander L.P., Gibbs H.K., Steininger M., Swenson J.J., Murray B., 2008. Reference scenarios for deforestation and forest degradation in support of REDD: a review of data and methods. Environmental Research Letter, 3:1-11.
Pagiola S., Bishop J. and Landell-Mills N. (eds.), 2002. Selling forest environmental services. Earthscan, London.
Peskett L., Brown D., Luttrell C., 2006. Can payments for avoided deforestation to tackle climate change also benefit the poor? ODI Forestry Briefing, 12:6pp.
SAAH, 1999. Maasai. The School of Art and Art History, University of Iowa.
Sankhayan P.L., Hofstad O., 2001. A village-level economic model of land clearing, grazing, and wood harvesting for sub-Saharan Africa: with a case study in southern Senegal. Ecological Economics, 38:423-40.
van der Werf, G.R. et al. 2009. CO2 emissions from forest loss. Nature Geoscience, 2:737-8.
1
Relying on nature’s pharmacy: a case study of households’ dependency on medicinal plants in
Burkina Faso’s central plateau
Mariève Pouliot Forest and Landscape, Faculty of Life Sciences,
University of Copenhagen Abstract This paper aims at quantifying household-level use of medicinal plants and to investigate the determinants associated with the choice of traditional treatment in the central plateau of Burkina Faso. Comprehensive analysis of treatment choice was done through a bivariate analysis aiming at characterising users of medicinal plants. Preliminary results indicate that the use of medicinal plants depends on the nature of the encountered illness rather than on the economic disposition of households. Education and age also plays a significant role in the treatment seeking behaviour. Moreover, medicinal plants are more relied upon in the absence of modern health facilities. Keywords: Treatment seeking behaviour, medicinal plants, Burkina Faso 1.1 Introduction According to estimates from the World Health Organization, 80% of the world’s population relies exclusively or principally on traditional medicines for their health care (Bannerman, 1982). More recently, Lambert et al. (1997) have speculated that more than two billion people may be heavily dependent on medicinal plants. Even though medicinal plants are recognized as an important player in the safeguarding of traditional livelihoods and well-being of an important number of people around the world, estimates on the actual number of people relying on them for their health care are outdated and uncertain. Moreover, no comprehensive study on the value of the traditional medical system to households in the developing world has been done, and very little research has been carried to find out in which ways and to whom medicinal plants are important. Most research concerning the use of medicinal plants in the developing world has focused almost entirely on recording medicinal plant species and their uses. Although the determinants of use of the modern medical system have been

384 2
empirically documented in various settings1, an important knowledge gap remains around the use and importance of the traditional health care system. The common wisdom is that poor and marginalised people are mostly dependent on forests and other environmental resources for their health care, but reliable and recent quantitative data on the use of traditional medicine does not exist. Moreover, and perhaps as a consequence of the important worldwide use of traditional medicine, information on medicinal plant dependency is scattered across a wide range of disciplines and there is no overarching summary of the current state-of-knowledge. As a consequence, explanatory factors determining traditional medicine use and dependency remain unknown. Nevertheless, there have been discussions of the role of traditional medicine in contributing to achieving the Millennium Development Goals (MDG) (Garrity, 2004). It is generally recognized that improving the health of the poorest in developing countries and attaining the MDGs requires the development and implementation of various health innovations (Morel et al., 2005), and the ubiquitous use of traditional medicine should be considered in this context. However, understanding the current role of traditional medicine and the factors that shape medicinal plant dependency is crucial when developing nominal and functional health policies as this allows to understand who could be affected by a policy change and in which way. The objective of this paper is to improve our understanding of medicinal plant dependency through an analysis of treatment seeking behaviour in rural Burkina Faso. This West African country is characterized by a low access to public health care (30% in 20032, WHO, 2003) and a ratio of doctors (practising Western medicine) to patients of approximately 1:20,000 (WHO, 2008). Thus, inadequate provision of Western medicine combined with poverty and deeply rooted cultural practices make traditional medicine a crucial part of people’s health care in Burkina Faso (Fainzang, 1986). This is acknowledged by the Government and reflected in the public health legislation (Ministère de la Santé du Burkina Faso, 2000). We will thus aim at studying the determinants that motivate the choice for treatment with medicinal plants in order to find out who is most depending on natural resources for their health care provision.
1 See Develay et al. (1996) for a good example. 2 Access to health care was defined as the possibility of obtaining services that helps individuals achieve an optimal state of well-being when it is needed (WHO, 2000).
3
1.2 Conceptual framework Determinant model This study employs Kroeger’s determinant model (1983) approach in an attempt to identify and describe the factors associated with the use of medicinal plants (traditional treatment) in rural Burkina Faso. The adaptation of the model to the local situation in the Nobéré district of Burkina Faso led to three groups of determinants: “characteristics of the patient and household”, “characteristics of the illness”, and “characteristics of the health service” (Figure 1). Some of the variables presented in the model were omitted due to the very low variability in the sample. This is the case for occupation, degree of cultural adaptation, appeal, cost and acceptability of treatment.
Figure.1. Determinants influencing choice of care. Conceptual framework adapted from Kroeger’s model (Kroeger, 1983).
Characteristics of the patient/household Gender, age Status in household Ethnic group Degree of cultural adaptation Formal education Occupation Income and assets (implements, land)
Characteristics of the illness Type of illness Length of illness (chronicity) Gravity of illness Aetiological model (natural or supernatural) Expected benefits of treatment Psychosomatic vs somatic disorder Characteristics of the health service Accessibility Appeal Cost Acceptability, quality
Traditional treatment Home treatment with medicinal plants Traditional healer
Modern treatment Home treatment with modern medicine Local health post Hospital, Private clinic
No treatment
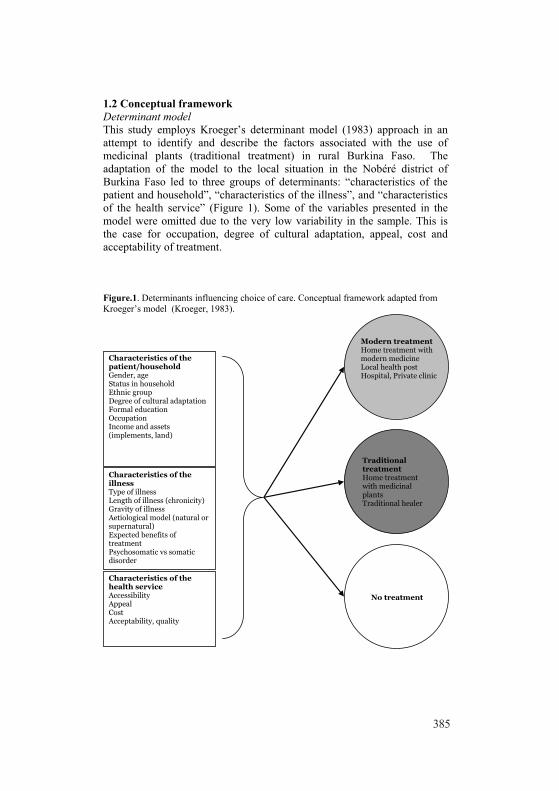
385 2
empirically documented in various settings1, an important knowledge gap remains around the use and importance of the traditional health care system. The common wisdom is that poor and marginalised people are mostly dependent on forests and other environmental resources for their health care, but reliable and recent quantitative data on the use of traditional medicine does not exist. Moreover, and perhaps as a consequence of the important worldwide use of traditional medicine, information on medicinal plant dependency is scattered across a wide range of disciplines and there is no overarching summary of the current state-of-knowledge. As a consequence, explanatory factors determining traditional medicine use and dependency remain unknown. Nevertheless, there have been discussions of the role of traditional medicine in contributing to achieving the Millennium Development Goals (MDG) (Garrity, 2004). It is generally recognized that improving the health of the poorest in developing countries and attaining the MDGs requires the development and implementation of various health innovations (Morel et al., 2005), and the ubiquitous use of traditional medicine should be considered in this context. However, understanding the current role of traditional medicine and the factors that shape medicinal plant dependency is crucial when developing nominal and functional health policies as this allows to understand who could be affected by a policy change and in which way. The objective of this paper is to improve our understanding of medicinal plant dependency through an analysis of treatment seeking behaviour in rural Burkina Faso. This West African country is characterized by a low access to public health care (30% in 20032, WHO, 2003) and a ratio of doctors (practising Western medicine) to patients of approximately 1:20,000 (WHO, 2008). Thus, inadequate provision of Western medicine combined with poverty and deeply rooted cultural practices make traditional medicine a crucial part of people’s health care in Burkina Faso (Fainzang, 1986). This is acknowledged by the Government and reflected in the public health legislation (Ministère de la Santé du Burkina Faso, 2000). We will thus aim at studying the determinants that motivate the choice for treatment with medicinal plants in order to find out who is most depending on natural resources for their health care provision.
1 See Develay et al. (1996) for a good example. 2 Access to health care was defined as the possibility of obtaining services that helps individuals achieve an optimal state of well-being when it is needed (WHO, 2000).
3
1.2 Conceptual framework Determinant model This study employs Kroeger’s determinant model (1983) approach in an attempt to identify and describe the factors associated with the use of medicinal plants (traditional treatment) in rural Burkina Faso. The adaptation of the model to the local situation in the Nobéré district of Burkina Faso led to three groups of determinants: “characteristics of the patient and household”, “characteristics of the illness”, and “characteristics of the health service” (Figure 1). Some of the variables presented in the model were omitted due to the very low variability in the sample. This is the case for occupation, degree of cultural adaptation, appeal, cost and acceptability of treatment.
Figure.1. Determinants influencing choice of care. Conceptual framework adapted from Kroeger’s model (Kroeger, 1983).
Characteristics of the patient/household Gender, age Status in household Ethnic group Degree of cultural adaptation Formal education Occupation Income and assets (implements, land)
Characteristics of the illness Type of illness Length of illness (chronicity) Gravity of illness Aetiological model (natural or supernatural) Expected benefits of treatment Psychosomatic vs somatic disorder Characteristics of the health service Accessibility Appeal Cost Acceptability, quality
Traditional treatment Home treatment with medicinal plants Traditional healer
Modern treatment Home treatment with modern medicine Local health post Hospital, Private clinic
No treatment

386 4
2. Methods 2.1 Study area Burkina Faso is a landlocked country situated in the middle of West Africa and at the border of the Sahel region. In 2008, the population was estimated at 14,252,012 inhabitants (INSD, 2008) living in an area of 274,200 km2. Close to half of Burkina Faso’s population lives below the national poverty line (UNDP, 2006) which was set to around 150 USD per capita in 2003 by the Ministry of economy and development and 82% resides in rural areas (African Development Bank, 2003) and depend strongly on natural resources as much for their nutrition and health as for their income (FAO, 2003), The adult literacy rate was estimated at 28.7% in 2007.
The data is based on a survey of 210 households in the district of Nobéré (11°30’ North and 00°58’ West), Zoundwéogo province, in the south-central part of Burkina Faso. Nobéré is located on the main road between Ouagadougou (140 km) and the Ghanaian border (60 km). The province’s capital, Manga, is situated about 30 km away. The population of the district of Nobéré was 32,814 inhabitants in 2006 (5033 households). Although the major ethnic group residing in the area is the Mossi, a minority of Fulani, Gourounsi, Tensoba, Basloko, Kalinga and other groups also occupy the territory. The climate is dry with one rainy season (June to October) and the average rainfall over the last five years according to the weather station in Nobéré has been 920 mm per year. Rainfall drives the agricultural calendar, which shows peak activities for sowing in May and June and harvesting in October and November. People live of subsistence agriculture dominated by millet, sorghum and to some extent maize. According to the Ministry of Development some 66% of the population lives below the national poverty line in the region.
In total, 9 villages were selected in the Nobéré district based on two criteria: (i) villages had to be representative for the larger region, and (ii) there had to be variation between selected study areas along differentiating dimensions which are the most relevant locally, i.e. market access, and distance to forest in this case (Cavendish, 2000; Campbell and Luckert, 2002). Table 1 presents some of the basic characteristics of those selected villages. The villages are all situated within a distance of 20 km from the small town of Nobéré (3110 inhabitants).
5
Table 1. Basic information about infrastructure and market access for the 9 selected villages
Village name Public electricity and water pipes
Distance to nearest paved road (km)
Local health station with nurse
Local market
Primary school
Number of inhabi-tants
Number of house-holds selected
Séloguin - 1.5 + - - 1200 10 Vohoko - 0.7 - - - 1816 14 Bion - 3.5 + + - 1745 27 Barcé - 0.7 - - + 945 15 Soulougré - 1.0 - - + 947 13 Passintinga - 0.0 - - + 1872 17 Togsé - 1.5 - - - 1169 17 Téwaka - 0.0 - - + 1832 27 Nobéré - 0.0 + + + 3110 70 TOTAL 210
There are six different types of treatment strategies available to patients from the Nobéré district: home treatment with medicinal plants, visit to a traditional healer, home treatment with modern medicine, visit to the local health post, visit to a hospital/private clinic in Ouagadougou, and the decision of waiting and not using any treatment. 2.2 Data collection Household selection was done randomly based on a village census dating back to 1998. A first questionnaire survey including a wide variety of questions about household demographics, income and assets was used in a quarterly basis between November 2007 and November 2008. One or two adults from each household were asked to evoke all the income (in cash or consumption) that the household generated during the last 3 months, including the collection of products from the wild. In November 2009, the same households were administered another questionnaire survey including an array of questions about household demographics, health status of the household, and treatment strategy in case of illness. The recall period used for this questionnaire was 4 weeks.
Both questionnaires were tested in pilot studies and were designed specifically to extract information in the following areas: 1. Characteristics of the patient/household
(i) Demographic characteristics of each of the members of the household (age, gender, ethnicity);
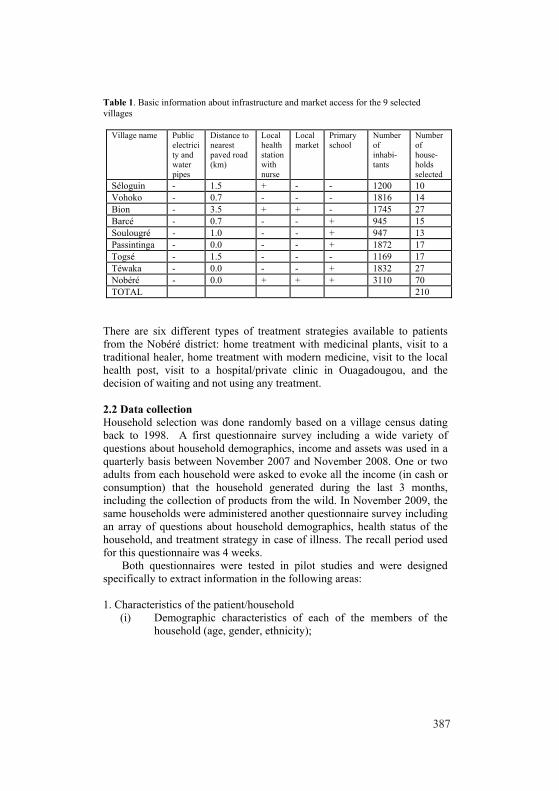
387 4
2. Methods 2.1 Study area Burkina Faso is a landlocked country situated in the middle of West Africa and at the border of the Sahel region. In 2008, the population was estimated at 14,252,012 inhabitants (INSD, 2008) living in an area of 274,200 km2. Close to half of Burkina Faso’s population lives below the national poverty line (UNDP, 2006) which was set to around 150 USD per capita in 2003 by the Ministry of economy and development and 82% resides in rural areas (African Development Bank, 2003) and depend strongly on natural resources as much for their nutrition and health as for their income (FAO, 2003), The adult literacy rate was estimated at 28.7% in 2007.
The data is based on a survey of 210 households in the district of Nobéré (11°30’ North and 00°58’ West), Zoundwéogo province, in the south-central part of Burkina Faso. Nobéré is located on the main road between Ouagadougou (140 km) and the Ghanaian border (60 km). The province’s capital, Manga, is situated about 30 km away. The population of the district of Nobéré was 32,814 inhabitants in 2006 (5033 households). Although the major ethnic group residing in the area is the Mossi, a minority of Fulani, Gourounsi, Tensoba, Basloko, Kalinga and other groups also occupy the territory. The climate is dry with one rainy season (June to October) and the average rainfall over the last five years according to the weather station in Nobéré has been 920 mm per year. Rainfall drives the agricultural calendar, which shows peak activities for sowing in May and June and harvesting in October and November. People live of subsistence agriculture dominated by millet, sorghum and to some extent maize. According to the Ministry of Development some 66% of the population lives below the national poverty line in the region.
In total, 9 villages were selected in the Nobéré district based on two criteria: (i) villages had to be representative for the larger region, and (ii) there had to be variation between selected study areas along differentiating dimensions which are the most relevant locally, i.e. market access, and distance to forest in this case (Cavendish, 2000; Campbell and Luckert, 2002). Table 1 presents some of the basic characteristics of those selected villages. The villages are all situated within a distance of 20 km from the small town of Nobéré (3110 inhabitants).
5
Table 1. Basic information about infrastructure and market access for the 9 selected villages
Village name Public electricity and water pipes
Distance to nearest paved road (km)
Local health station with nurse
Local market
Primary school
Number of inhabi-tants
Number of house-holds selected
Séloguin - 1.5 + - - 1200 10 Vohoko - 0.7 - - - 1816 14 Bion - 3.5 + + - 1745 27 Barcé - 0.7 - - + 945 15 Soulougré - 1.0 - - + 947 13 Passintinga - 0.0 - - + 1872 17 Togsé - 1.5 - - - 1169 17 Téwaka - 0.0 - - + 1832 27 Nobéré - 0.0 + + + 3110 70 TOTAL 210
There are six different types of treatment strategies available to patients from the Nobéré district: home treatment with medicinal plants, visit to a traditional healer, home treatment with modern medicine, visit to the local health post, visit to a hospital/private clinic in Ouagadougou, and the decision of waiting and not using any treatment. 2.2 Data collection Household selection was done randomly based on a village census dating back to 1998. A first questionnaire survey including a wide variety of questions about household demographics, income and assets was used in a quarterly basis between November 2007 and November 2008. One or two adults from each household were asked to evoke all the income (in cash or consumption) that the household generated during the last 3 months, including the collection of products from the wild. In November 2009, the same households were administered another questionnaire survey including an array of questions about household demographics, health status of the household, and treatment strategy in case of illness. The recall period used for this questionnaire was 4 weeks.
Both questionnaires were tested in pilot studies and were designed specifically to extract information in the following areas: 1. Characteristics of the patient/household
(i) Demographic characteristics of each of the members of the household (age, gender, ethnicity);

388 6
(ii) Socio-economic characteristics of the household (level of education of all members, total household income, as well as household wealth in terms of implements and land)
2. Characteristics of the illness
(i) Information about perceived illness of household members during the 4 weeks before the interview. This included a listing of perceived illnesses, as well as severity and length of illnesses. Questions were also asked about the choice of treatments sought and the order of preference of those treatments (stemming from the perceived illness), as well as the cost of care for each individual treatment strategy.
2.3 Bivariate probit model Several empirical studies have tried to capture the influence of patient, household and illness characteristics on ill people’s treatment seeking behaviour. In most cases, the use of logit or probit model is applied (DeClerque et al., 1992; Develay et al., 1996; Weller et al., 1997; Addai, 2000; Wiseman et al., 2008). In these models, ill people or their caretaker are assumed to make treatment decision based upon an objective of utility maximization. Define the medicinal plants by “p” and modern medicine by “m”, where p,m=1 for use, and p’, m=0 for non-use. The underlying utility function which ranks the preference of the ith ill person is assumed to be function of patient, household and illness specific attributes “X” (Table 2) and a disturbance term having a zero mean: Ui1(X)=β1Xi+εi1 for use and Ui0 (X)=β0Xi+εi0 for non-use Because the utilities are random, the ith ill person will select the alternative “use” if and only if Ui1 > Ui0. As a results, for the ill person i, the probability of use of a type of medicine is given by: p(1)=p(Ui1 > Ui0) p(1)=p(β1Xi+εi1 > β0Xi+εi0) p(1)=p(εi0- εi1 < β1Xi - β0Xi) p(1)=p(εi < βXi) p(1)= Ф(βXi) where Ф is the cumulative distribution function for ε. Assumptions made about ε will determine the functional form for Ф. When assuming a normal distribution for ε, a probit model is used. This means that, for an ill person
7
“i”, the probability of use of medicinal plants and modern medicine, respectively, is given by:
dttXiX
ip )2
exp(21)(
2−=Φ ∫
∞−
β
πβ
dttXiX
im )2
exp(21)(
2−=Φ ∫
∞−
β
πβ
It is possible to estimate the two equations by individual single probit models. However, this would lead to inefficiencies as it would ignore the correlation between the error terms εp and εm of the individual utility functions associated with use of medicinal plants and modern medicine, respectively. Thus, we will use a bivariate probit in this paper to avoid inadequacies of the single probit or logit model. The basis of the bivariate probit model is the joint distribution of two normally distributed variables and was specified a by Green (2007) as
))1(2/(2(
2
222
121),( ρερεεε
ρσπσ−−+−
−= mpmpempf
mp
p
pp
eσμ
ε−
=
m
mm
pσμε −
=
where ρ is the correlation between e and p. The covariance is σpm=ρσpσm, and the means and standard deviations of the distributions of p and m are μp, μm, ρp, and ρm. If and only if ρ=0, then the distributions of p and m are independent and in this case there would be no need for a bivariate probit and two single independent logit or probit models could be used.
We have also used a random effect on household due to the repetition of data taken from the same households. Through the Stata program, we used the biprobit function with clustering of errors by household. 3. Empirical model A bivariate probit model is developed to examine the relationship between patient, household and illness characteristics and the use of medicinal plants and modern medicine, based on the conceptual framework presented above (Figure 1). The descriptive statistics of the variables included in the empirical model are given in Table 2. The dependent variable is whether or

389 6
(ii) Socio-economic characteristics of the household (level of education of all members, total household income, as well as household wealth in terms of implements and land)
2. Characteristics of the illness
(i) Information about perceived illness of household members during the 4 weeks before the interview. This included a listing of perceived illnesses, as well as severity and length of illnesses. Questions were also asked about the choice of treatments sought and the order of preference of those treatments (stemming from the perceived illness), as well as the cost of care for each individual treatment strategy.
2.3 Bivariate probit model Several empirical studies have tried to capture the influence of patient, household and illness characteristics on ill people’s treatment seeking behaviour. In most cases, the use of logit or probit model is applied (DeClerque et al., 1992; Develay et al., 1996; Weller et al., 1997; Addai, 2000; Wiseman et al., 2008). In these models, ill people or their caretaker are assumed to make treatment decision based upon an objective of utility maximization. Define the medicinal plants by “p” and modern medicine by “m”, where p,m=1 for use, and p’, m=0 for non-use. The underlying utility function which ranks the preference of the ith ill person is assumed to be function of patient, household and illness specific attributes “X” (Table 2) and a disturbance term having a zero mean: Ui1(X)=β1Xi+εi1 for use and Ui0 (X)=β0Xi+εi0 for non-use Because the utilities are random, the ith ill person will select the alternative “use” if and only if Ui1 > Ui0. As a results, for the ill person i, the probability of use of a type of medicine is given by: p(1)=p(Ui1 > Ui0) p(1)=p(β1Xi+εi1 > β0Xi+εi0) p(1)=p(εi0- εi1 < β1Xi - β0Xi) p(1)=p(εi < βXi) p(1)= Ф(βXi) where Ф is the cumulative distribution function for ε. Assumptions made about ε will determine the functional form for Ф. When assuming a normal distribution for ε, a probit model is used. This means that, for an ill person
7
“i”, the probability of use of medicinal plants and modern medicine, respectively, is given by:
dttXiX
ip )2
exp(21)(
2−=Φ ∫
∞−
β
πβ
dttXiX
im )2
exp(21)(
2−=Φ ∫
∞−
β
πβ
It is possible to estimate the two equations by individual single probit models. However, this would lead to inefficiencies as it would ignore the correlation between the error terms εp and εm of the individual utility functions associated with use of medicinal plants and modern medicine, respectively. Thus, we will use a bivariate probit in this paper to avoid inadequacies of the single probit or logit model. The basis of the bivariate probit model is the joint distribution of two normally distributed variables and was specified a by Green (2007) as
))1(2/(2(
2
222
121),( ρερεεε
ρσπσ−−+−
−= mpmpempf
mp
p
pp
eσμ
ε−
=
m
mm
pσμε −
=
where ρ is the correlation between e and p. The covariance is σpm=ρσpσm, and the means and standard deviations of the distributions of p and m are μp, μm, ρp, and ρm. If and only if ρ=0, then the distributions of p and m are independent and in this case there would be no need for a bivariate probit and two single independent logit or probit models could be used.
We have also used a random effect on household due to the repetition of data taken from the same households. Through the Stata program, we used the biprobit function with clustering of errors by household. 3. Empirical model A bivariate probit model is developed to examine the relationship between patient, household and illness characteristics and the use of medicinal plants and modern medicine, based on the conceptual framework presented above (Figure 1). The descriptive statistics of the variables included in the empirical model are given in Table 2. The dependent variable is whether or

390
8
not an ill person is using medicinal plants and/or modern medicine. For medicinal plants, the variable is given by PLANT, and for modern medicine, the variable is MODERN and each variable takes the value of 1 if the ill person is using the medicine, and otherwise 0. The ill person-specific explanatory variables are gender (SEX), and age of the ill person (BABY) and (OLD). The household-specific explanatory variables are ethnic group (ETHNIC), level of household formal education (EDUC), household income (INCOME), and presence of a modern health post in the village of residence (HPOST).
Reported illnesses were categorized into six groups following the system of the International Classification of Diseases of the World Health Organisation, 10th Revision: respiratory illnesses (23.7%), various pains (20.6%), malaria and undetermined fevers (23.2%), digestive illnesses (9.1%), and other illnesses (23.4%). In relation to this, the illness specific explanatory variables are illness types (DIG), (RESP), (MAL) and (PAINS). Moreover, we used a variable for the length of illness (CHRONIC), and one for the severity of illness (BED). Table 2. Description of the independent variables used in the analyses
Variables
Name of variable
in empirical
model
Description
Continuous variables
Categorical variables
Mean S.D (Percentages)
Female patient SEX Gender of the patient.
1=female, 0=male. 1=49 0=51
Baby (4 years and younger)
BABY
Dummy variable where 1=ill person is under 4 years old, 0= ill person 4 years old or above.
1=11 0=89
Elder (60 years and
older) OLD
Dummy variable where 1= ill person is above 59 years old, and 0= ill person 59 years old or below.
1=12 0=88
Ethnic group ETHNIC
Ethnic group of the household where 1=Mossi, and 0=Other ethnic group.
1=83 0=17
Education EDUC
Household’s average level of formal education, for members above 15 years old (in number of years).
0.85 1.36
Household income
INCOME
Log of the net total yearly income per adult 11.04 2.0
2
9
equivalent (CFA) Illness of
the digestive system
DIG
1=patient has illness of the digestive system, and 0= patient has other kind of illness
1=9 0=91
Illness of the
respiratory system
RESP
1=patient has illness of the respiratory system, and 0= patient has other kind of illness
1=24 0=76
Malaria and
undetermined fever
MAL
1=patient has malaria or unexplained fever, and 0= patient has other kind of illness
1=23 0=77
Various pains PAINS
1=patient has various pains, and 0= patient has other kind of illness
1=21 0=79
Length of illness
CHRONIC
Chronicity of illness where chronic is defined as an illness lasting for more than 4 weeks. 1= chornic, and 0=acute.
1=17 0=83
Severity of illness BED
Confinement to bed used as a proxy indicator of illness severity. 1=patient confined to bed, and 0= patient not confined to bed.
1=32 0=68
Presence of health post in village
HPOST
1= presence of health post in village of residence, and 0= no health post in village of residence.
1=53 0=47
4. Preliminary results A total of 734 illnesses were reported during the four weeks preceding the interviews. Only 3 out of the 210 households reported no illness. Table 3 presents data on the use of traditional and modern medicine when a person faces illness. Overall, 51.2% of the patients used medicinal plants in their treatment strategy, solely or in combination with modern medicine, while 45.9% chose to use only modern medicine and 2.9% decided to use no treatment at all.

391
8
not an ill person is using medicinal plants and/or modern medicine. For medicinal plants, the variable is given by PLANT, and for modern medicine, the variable is MODERN and each variable takes the value of 1 if the ill person is using the medicine, and otherwise 0. The ill person-specific explanatory variables are gender (SEX), and age of the ill person (BABY) and (OLD). The household-specific explanatory variables are ethnic group (ETHNIC), level of household formal education (EDUC), household income (INCOME), and presence of a modern health post in the village of residence (HPOST).
Reported illnesses were categorized into six groups following the system of the International Classification of Diseases of the World Health Organisation, 10th Revision: respiratory illnesses (23.7%), various pains (20.6%), malaria and undetermined fevers (23.2%), digestive illnesses (9.1%), and other illnesses (23.4%). In relation to this, the illness specific explanatory variables are illness types (DIG), (RESP), (MAL) and (PAINS). Moreover, we used a variable for the length of illness (CHRONIC), and one for the severity of illness (BED). Table 2. Description of the independent variables used in the analyses
Variables
Name of variable
in empirical
model
Description
Continuous variables
Categorical variables
Mean S.D (Percentages)
Female patient SEX Gender of the patient.
1=female, 0=male. 1=49 0=51
Baby (4 years and younger)
BABY
Dummy variable where 1=ill person is under 4 years old, 0= ill person 4 years old or above.
1=11 0=89
Elder (60 years and
older) OLD
Dummy variable where 1= ill person is above 59 years old, and 0= ill person 59 years old or below.
1=12 0=88
Ethnic group ETHNIC
Ethnic group of the household where 1=Mossi, and 0=Other ethnic group.
1=83 0=17
Education EDUC
Household’s average level of formal education, for members above 15 years old (in number of years).
0.85 1.36
Household income
INCOME
Log of the net total yearly income per adult 11.04 2.0
2
9
equivalent (CFA) Illness of
the digestive system
DIG
1=patient has illness of the digestive system, and 0= patient has other kind of illness
1=9 0=91
Illness of the
respiratory system
RESP
1=patient has illness of the respiratory system, and 0= patient has other kind of illness
1=24 0=76
Malaria and
undetermined fever
MAL
1=patient has malaria or unexplained fever, and 0= patient has other kind of illness
1=23 0=77
Various pains PAINS
1=patient has various pains, and 0= patient has other kind of illness
1=21 0=79
Length of illness
CHRONIC
Chronicity of illness where chronic is defined as an illness lasting for more than 4 weeks. 1= chornic, and 0=acute.
1=17 0=83
Severity of illness BED
Confinement to bed used as a proxy indicator of illness severity. 1=patient confined to bed, and 0= patient not confined to bed.
1=32 0=68
Presence of health post in village
HPOST
1= presence of health post in village of residence, and 0= no health post in village of residence.
1=53 0=47
4. Preliminary results A total of 734 illnesses were reported during the four weeks preceding the interviews. Only 3 out of the 210 households reported no illness. Table 3 presents data on the use of traditional and modern medicine when a person faces illness. Overall, 51.2% of the patients used medicinal plants in their treatment strategy, solely or in combination with modern medicine, while 45.9% chose to use only modern medicine and 2.9% decided to use no treatment at all.

392
10
Table 3. Frequency table of use of medicinal plants and modern medicine Modern medicine
User Non-user Total Medicinal Plants
User 213 163 376
Non-user 337 21 358 Total 550 184 734 The bivariate probit regression model was used for the 734 cases of reported illness. Estimates are exhibited in Table 4. Rho was found to be significant at 1%, indicating that a bivariate probit model was more appropriate than two univariate probit models.
Eight variables have a significant relation with the decision of whether or not to use medicinal plants, and six variables have a significant relation with the use of modern medicine. Table 4. Bivariate probit results of use of medicinal plants and modern medicine in the Nobéré area of Burkina Faso Independent variables Dependent variables Medicinal Plants Modern Medicine Constant 0.04 0.55 SEX 0.04 -0.17 BABY -0.38** 0.21 OLD -0.01 0.16 ETHNIC 0.29* -0.09 EDUC -0.11** 0.11** INCOME 0.01 -0.04 DIG -0.07 0.43** RESP -0.28* 0.14 MAL -0.55*** 0.99*** PAINS -0.39*** 0.42*** CHRONIC 0.58*** 0.62*** BED 0.21 0.62*** HPOST -0.31** 0.05 * Significant at 10% ** Significant at 5% *** Significant at 1%
11
The coefficient of BABY is negative at 5% in the medicinal plants submodel, indicating, as expected, that babies are less likely to consume medicinal plants when ill. Although only significant at 10%, the coefficient of ETHNIC is positive, indicating that patients belonging to the Mossi ethnic group are more likely to consume medicinal plants than people belonging to other ethnic groups. The average educational level of the household has a negative and significant relationship to the decision to use medicinal plants, and a positive and significant relationship to the use of modern medicine. Illnesses of the digestive system were found to be significantly and positively associated to the use of modern medicine, while illnesses of the respiratory system were negatively associated to the use of traditional medicine. Malaria and various pains were two types of illnesses which were very significantly (1%) negatively associated with the use of traditional medicine, and very significantly positively associated with the use of modern medicine. Reported chronic illnesses were highly significantly (1%) and positively associated with both the use of medicinal plants and modern medicine. Patient confinement to bed was positively associated with the use of modern medicine. Finally, the absence of health post was found to be significantly associated with an increased consumption of medicinal plants. 5. Conclusion Lack of quantitative data on the use of medicinal plants at the household level in developing countries has led researchers and policy makers to rely on outdated and uncertain estimates. The recognition that forests and other environmental resources play an important role in the health service provision of households in the developing world is paramount to the achievement of the Millennium Development Goals. This paper contributes to fill in the knowledge gap surrounding the use of medicinal plants. More than half of ill people in our survey relied on medicinal plants for their recovery. Social representation of illness was a strong determinant in the use of medicinal plants. Moreover, uneducated and remote households were shown to rely more on medicinal plants than other households.
Given the current importance of medicinal plants in the treatment strategies of rural households, and the function that medicinal plants perform for certain illnesses independently of the presence of biomedically verified adequacy of modern treatments, it seems sensible to assume that the consumption of medicinal plants in rural Burkina Faso is not likely to decrease in the close future. In this context, it is imperative that traditional medicine be included in public health policy. Although medicinal plants have natural origins, a study by Mills et al. (2005) showed that the use of herbal medicine in Africa might put patients at risk for drug toxicity, treatment failure and viral resistance. Given that medicinal plants are

393
10
Table 3. Frequency table of use of medicinal plants and modern medicine Modern medicine
User Non-user Total Medicinal Plants
User 213 163 376
Non-user 337 21 358 Total 550 184 734 The bivariate probit regression model was used for the 734 cases of reported illness. Estimates are exhibited in Table 4. Rho was found to be significant at 1%, indicating that a bivariate probit model was more appropriate than two univariate probit models.
Eight variables have a significant relation with the decision of whether or not to use medicinal plants, and six variables have a significant relation with the use of modern medicine. Table 4. Bivariate probit results of use of medicinal plants and modern medicine in the Nobéré area of Burkina Faso Independent variables Dependent variables Medicinal Plants Modern Medicine Constant 0.04 0.55 SEX 0.04 -0.17 BABY -0.38** 0.21 OLD -0.01 0.16 ETHNIC 0.29* -0.09 EDUC -0.11** 0.11** INCOME 0.01 -0.04 DIG -0.07 0.43** RESP -0.28* 0.14 MAL -0.55*** 0.99*** PAINS -0.39*** 0.42*** CHRONIC 0.58*** 0.62*** BED 0.21 0.62*** HPOST -0.31** 0.05 * Significant at 10% ** Significant at 5% *** Significant at 1%
11
The coefficient of BABY is negative at 5% in the medicinal plants submodel, indicating, as expected, that babies are less likely to consume medicinal plants when ill. Although only significant at 10%, the coefficient of ETHNIC is positive, indicating that patients belonging to the Mossi ethnic group are more likely to consume medicinal plants than people belonging to other ethnic groups. The average educational level of the household has a negative and significant relationship to the decision to use medicinal plants, and a positive and significant relationship to the use of modern medicine. Illnesses of the digestive system were found to be significantly and positively associated to the use of modern medicine, while illnesses of the respiratory system were negatively associated to the use of traditional medicine. Malaria and various pains were two types of illnesses which were very significantly (1%) negatively associated with the use of traditional medicine, and very significantly positively associated with the use of modern medicine. Reported chronic illnesses were highly significantly (1%) and positively associated with both the use of medicinal plants and modern medicine. Patient confinement to bed was positively associated with the use of modern medicine. Finally, the absence of health post was found to be significantly associated with an increased consumption of medicinal plants. 5. Conclusion Lack of quantitative data on the use of medicinal plants at the household level in developing countries has led researchers and policy makers to rely on outdated and uncertain estimates. The recognition that forests and other environmental resources play an important role in the health service provision of households in the developing world is paramount to the achievement of the Millennium Development Goals. This paper contributes to fill in the knowledge gap surrounding the use of medicinal plants. More than half of ill people in our survey relied on medicinal plants for their recovery. Social representation of illness was a strong determinant in the use of medicinal plants. Moreover, uneducated and remote households were shown to rely more on medicinal plants than other households.
Given the current importance of medicinal plants in the treatment strategies of rural households, and the function that medicinal plants perform for certain illnesses independently of the presence of biomedically verified adequacy of modern treatments, it seems sensible to assume that the consumption of medicinal plants in rural Burkina Faso is not likely to decrease in the close future. In this context, it is imperative that traditional medicine be included in public health policy. Although medicinal plants have natural origins, a study by Mills et al. (2005) showed that the use of herbal medicine in Africa might put patients at risk for drug toxicity, treatment failure and viral resistance. Given that medicinal plants are

394 12
mostly consumed as a home treatment in rural Burkina Faso, information on use, dosage, storage and preparation of herbal medicines should be made available to rural households through extension services.
Our preliminary results also point to the need to look at the resource base of the herbal health-care system in Burkina Faso and elsewhere in sub-Saharan Africa. As wild population of medicinal plants remain the principal source of supply, it is imperative to assess the impact of climate change and habitat loss and degradation on the medicinal plant resource. References Addai, I. 2000. Determinants of use of maternal-child health services in
rural Ghana. J. biosoc. Sci 32: 1-15. African Development Bank. 2003. Étude prospective du secteur forestier en
Afrique: rapport sous-régional Afrique de l’Ouest. Forestry Sector Outlook Studies Forestry - FOSA/RP/06. African Development Bank, European Commission and Food and Agriculture Organisation of the United Nations, Rome. 74pp.
Bannerman, R.H. 1982. Traditional medicine in modern health care. World Health Forum 3: 8-13.
Cavendish, W. 2000. Empirical regularities in the poverty-environment relationships of rural households: evidence from Zimbabwe. World Development 28(11): 1979-2003.
DeClerque, J., Bailey, P., Janowitz, B., Dominik, R., and Fiallos, C. 1992. Management and treatment of diarrhea in Honduran children: factors associated with mothers’ health care behaviors. Social Science and Medicine 34(6): 687-695.
Develay, A., Sauerborn, R., Diesfeld, H.J. 1996. Utilization of health care in an African urban area: results from a household survey in Ouagadougou, Burkina Faso. Social Science and Medicine 43(11): 1611-1619.
Fainzang, S. 1986. “L’intérieur des choses”: Maladie, divination et reproduction sociale chez les Bisa du Burkina. L’harmattan, Paris. 204 pp.
FAO, 2003. Forestry Department country pages: Burkina Faso. Last modified 2003. Food and Agriculture Organisation of the United Nations, Rome. http://www.fao.org/forestry/site/countryinfo/en/ > Burkina Faso. [07.08.2008]
Garrity, D.P. 2004. Agroforestry and the achievement of the Millenium Development Goals. Agroforestry Systems 61 : 5-17.
Green, W.H. 2007. Econometric analysis, 6th Edition. Macmillan Publishing, New York. 1216 pp.
Kroeger, A. 1983. Anthropological and socio-medical health care research in developing countries. Social Science & Medicine 17(3): 147-161.
13
Lambert, J., Srivastava, J., Vietmeyer, N. 1997. Medicinal Plants: Rescuing a Global Heritage. World Bank Technical Paper no. 355. Washington, D.C. 61 pp.
MED. 2004. Cadre de Lutte Stratégique contre la Pauvreté. Ministère de l’économie et du développement du Burkina Faso, Ouagadougou.
Ministère de la santé du Burkina Faso. 2000. Document de politique sanitaire nationale. Available online : http://www.sante.gov.bf/SiteSante/plans/psn.pdf [25.06.2008]
Ministère de l’économie et du dévelopement du Burkina faso. 2003. Burkina Faso: la pauvreté en 2003. Available online: http://www.insd.bf/documents/publications/insd/publications/resultats_enquetes/EBCVM03/EBCVM03_Resume_La_Pauvrete_%20en_2003.pdf [09.06.2010]
Morel, C.M., Acharya, T., Broun, D., Dangi, A., Elias, C., Ganguly, N.K., Gardner, C.A., Gupta, R.K., Haycock, J., Heher, A.D., Hotez, P.J., Kettler, H.E., Keusch, G.T., Krattiger, A.F., Kreutz, F.T., Lall, S., Lee, K., Mahoney, R., Martinez-Palomo, A., Mashelkar, R.A., Matlin, S.A., Mzimba, M., Oehler, J., Ridley, R.G., Senanayake, P., Singer, P., and Yun, M. 2005. Health innovation networks to help developing countries address neglected diseases. Science 309: 401-404.
UNDP. 2006. Human Development report 2006: Burkina Faso. Last modified 27th November 2006. United Nations Development Programme. Avilable online: http://hdr.undp.org/hdr2006/statistics/countries/data_sheets/cty_ds_BFA.html [07.08.2007]
Weller, S.C., Ruebush, T.R., and Klein, R.E. 1997. Predicting Treatment-Seeking Behavior in Guatemala: A Comparison of the Health Services Research and Decision-Theoretic Approaches. Medical Anthropology Quarterly 11(2):224-245.
Wiseman, V., Scott, A., Conteh, L., McElroy, B., and Stevens, W. 2008. Determinants of provider choice for malaria treatment: Experiences from The Gambia. Social Science and Medicine 67: 487-496.
WHO. 2000. Equity in access to public health. Report and Documentation of the Technical Discussions held in conjunction with the 37th Meeting of CCPDM. New Delhi, 31 August 2000.
WHO. 2003. Burkina Faso : Enquête mondiale sur la santé : Résultats du rapport d’analyse. Available online : http://www.afro.who.int/hsr/whs/whs_burkina_faso.pdf [25.06.2008]
WHO. 2008. World Health Statistics 2008. Available online: http://www.who.int/whosis/whostat/EN_WHS08_Full.pdf [25.06.2008]
395 12
mostly consumed as a home treatment in rural Burkina Faso, information on use, dosage, storage and preparation of herbal medicines should be made available to rural households through extension services.
Our preliminary results also point to the need to look at the resource base of the herbal health-care system in Burkina Faso and elsewhere in sub-Saharan Africa. As wild population of medicinal plants remain the principal source of supply, it is imperative to assess the impact of climate change and habitat loss and degradation on the medicinal plant resource. References Addai, I. 2000. Determinants of use of maternal-child health services in
rural Ghana. J. biosoc. Sci 32: 1-15. African Development Bank. 2003. Étude prospective du secteur forestier en
Afrique: rapport sous-régional Afrique de l’Ouest. Forestry Sector Outlook Studies Forestry - FOSA/RP/06. African Development Bank, European Commission and Food and Agriculture Organisation of the United Nations, Rome. 74pp.
Bannerman, R.H. 1982. Traditional medicine in modern health care. World Health Forum 3: 8-13.
Cavendish, W. 2000. Empirical regularities in the poverty-environment relationships of rural households: evidence from Zimbabwe. World Development 28(11): 1979-2003.
DeClerque, J., Bailey, P., Janowitz, B., Dominik, R., and Fiallos, C. 1992. Management and treatment of diarrhea in Honduran children: factors associated with mothers’ health care behaviors. Social Science and Medicine 34(6): 687-695.
Develay, A., Sauerborn, R., Diesfeld, H.J. 1996. Utilization of health care in an African urban area: results from a household survey in Ouagadougou, Burkina Faso. Social Science and Medicine 43(11): 1611-1619.
Fainzang, S. 1986. “L’intérieur des choses”: Maladie, divination et reproduction sociale chez les Bisa du Burkina. L’harmattan, Paris. 204 pp.
FAO, 2003. Forestry Department country pages: Burkina Faso. Last modified 2003. Food and Agriculture Organisation of the United Nations, Rome. http://www.fao.org/forestry/site/countryinfo/en/ > Burkina Faso. [07.08.2008]
Garrity, D.P. 2004. Agroforestry and the achievement of the Millenium Development Goals. Agroforestry Systems 61 : 5-17.
Green, W.H. 2007. Econometric analysis, 6th Edition. Macmillan Publishing, New York. 1216 pp.
Kroeger, A. 1983. Anthropological and socio-medical health care research in developing countries. Social Science & Medicine 17(3): 147-161.
13
Lambert, J., Srivastava, J., Vietmeyer, N. 1997. Medicinal Plants: Rescuing a Global Heritage. World Bank Technical Paper no. 355. Washington, D.C. 61 pp.
MED. 2004. Cadre de Lutte Stratégique contre la Pauvreté. Ministère de l’économie et du développement du Burkina Faso, Ouagadougou.
Ministère de la santé du Burkina Faso. 2000. Document de politique sanitaire nationale. Available online : http://www.sante.gov.bf/SiteSante/plans/psn.pdf [25.06.2008]
Ministère de l’économie et du dévelopement du Burkina faso. 2003. Burkina Faso: la pauvreté en 2003. Available online: http://www.insd.bf/documents/publications/insd/publications/resultats_enquetes/EBCVM03/EBCVM03_Resume_La_Pauvrete_%20en_2003.pdf [09.06.2010]
Morel, C.M., Acharya, T., Broun, D., Dangi, A., Elias, C., Ganguly, N.K., Gardner, C.A., Gupta, R.K., Haycock, J., Heher, A.D., Hotez, P.J., Kettler, H.E., Keusch, G.T., Krattiger, A.F., Kreutz, F.T., Lall, S., Lee, K., Mahoney, R., Martinez-Palomo, A., Mashelkar, R.A., Matlin, S.A., Mzimba, M., Oehler, J., Ridley, R.G., Senanayake, P., Singer, P., and Yun, M. 2005. Health innovation networks to help developing countries address neglected diseases. Science 309: 401-404.
UNDP. 2006. Human Development report 2006: Burkina Faso. Last modified 27th November 2006. United Nations Development Programme. Avilable online: http://hdr.undp.org/hdr2006/statistics/countries/data_sheets/cty_ds_BFA.html [07.08.2007]
Weller, S.C., Ruebush, T.R., and Klein, R.E. 1997. Predicting Treatment-Seeking Behavior in Guatemala: A Comparison of the Health Services Research and Decision-Theoretic Approaches. Medical Anthropology Quarterly 11(2):224-245.
Wiseman, V., Scott, A., Conteh, L., McElroy, B., and Stevens, W. 2008. Determinants of provider choice for malaria treatment: Experiences from The Gambia. Social Science and Medicine 67: 487-496.
WHO. 2000. Equity in access to public health. Report and Documentation of the Technical Discussions held in conjunction with the 37th Meeting of CCPDM. New Delhi, 31 August 2000.
WHO. 2003. Burkina Faso : Enquête mondiale sur la santé : Résultats du rapport d’analyse. Available online : http://www.afro.who.int/hsr/whs/whs_burkina_faso.pdf [25.06.2008]
WHO. 2008. World Health Statistics 2008. Available online: http://www.who.int/whosis/whostat/EN_WHS08_Full.pdf [25.06.2008]

396
1
Trade chain analysis of Ophiocordyceps sinensis and Tricholoma matsutake in Bhutan
Vineet Kumar Shrivastava, Ida Theilade and Henrik Meilby
Forest & Landscape, University of Copenhagen
Abstract Expanding markets of non-timber forest products (NTFPs) and increasing interest in traditional medicines and health foods have resulted in a growing trade of these NTFPs at local, national and international levels. The trade provides income-generating opportunities for rural people in developing countries but may also jeopardize sustainable harvest levels. The objective of this study was to investigate the trade chains and contribution to rural households of two commercially important NTFPs in Bhutan; the insect-pathogenic fungus Ophiocordyceps sinensis and the mycorrhizal mushroom Tricholoma matsutake. Access mapping and commodity chain analysis was used as analytical framework. Information on household incomes, quantities, time spent, prices, and expenses were obtained through semi-structured interviews with collectors, middlemen and traders including exporters. Net income was calculated for all actors. Distribution of incomes between actors was calculated. Collectors of O. sinensis obtained a higher net income per kg than middlemen and traders while the opposite was the case for T. matsutake. Collectors of O. sinensis earned an average of 70% of the household’s cash income from collection and sale of the product while T. matsutake on average constituted 9% of collectors’ household income. Based on the study, opportunities for increasing NTFP collectors’ net income are discussed. Over-exploitation and habitat destruction was a common concern among collectors of O. sinensis and T. matsutake. Further research on the biology of the species, the resource base and the impact of increasing collection and trade is needed to ensure sustainable harvest levels.
Keywords: Access mapping, gender, household income, market survey, NTFP, socio-economics.
2
1. Introduction Traditional medicine and health foods are used in a variety of goods from raw materials to processed and packaged products like pharmaceuticals, herbal medicines, tea, spirits, cosmetics, sweets, and dietary supplements (Lange, 2006). Around 70,000 plants species are used in indigenous and traditional medicine and health-care systems worldwide (IUCN, 2007). It is estimated that 80% of people in developing countries depend on traditional medicine (WHO, 2010). Globalisation, expanding markets for non- timber forest products (NTFPs) and increasing interest in traditional medicines and health foods have resulted in a growing trade of these NTFPs in both developing and developed countries. The demand for NTFPs for domestic and commercial purposes results in a considerable trade on local, national and international markets (Lange, 2006). The annual world market for plant-based medicine is estimated at USD 20-40 billion with an annual growth rate of 10-20 % (Larsen and Olsen, 2007). The trade provides income-generating opportunities for rural people in developing countries but may also jeopardize sustainable harvest levels (Godoy et al. 1995).
The marketing of NTFPs is normally carried out in two main stages; i.e. the marketing of the raw material from the stage of gathering it until it reaches the industrial user, and the marketing of the semi-finished or finished industrial or finished consumer product either to other processing industries or to final consumers (Lintu, 1995). Though in many cases, the products collected have very high value as final products, the collectors generally receive only a small share of the final value either because they are not aware of the real value or unable to market it to the buyers where they can get reasonable prices for their products (Neumann and Hirsch, 2000). Other reasons associated with low price for collectors may be lack of market information, inaccessibility of the markets, and inability to sell the products in the form or quality desired by buyers. NTFPs are often collected either by wage laborers or farmers with small land holdings and a significant part of the material is commercially traded. The prices paid to the collectors tend to be very low, partly because of ready availability of cheap labor to undertake the very labor intensive work of gathering (FAO, 2005). The contractors who employ the collectors often act as middlemen and traders as well, and collectors usually are dependent on the contractors as they are poor and frequently owe money to the contractors (Neumann and Hirsch, 2000). Further, the supply chain is often very long with as many as six or seven marketing stages involving primary collectors and producers, local contractors, regional wholesale markets, large wholesale

397
1
Trade chain analysis of Ophiocordyceps sinensis and Tricholoma matsutake in Bhutan
Vineet Kumar Shrivastava, Ida Theilade and Henrik Meilby
Forest & Landscape, University of Copenhagen
Abstract Expanding markets of non-timber forest products (NTFPs) and increasing interest in traditional medicines and health foods have resulted in a growing trade of these NTFPs at local, national and international levels. The trade provides income-generating opportunities for rural people in developing countries but may also jeopardize sustainable harvest levels. The objective of this study was to investigate the trade chains and contribution to rural households of two commercially important NTFPs in Bhutan; the insect-pathogenic fungus Ophiocordyceps sinensis and the mycorrhizal mushroom Tricholoma matsutake. Access mapping and commodity chain analysis was used as analytical framework. Information on household incomes, quantities, time spent, prices, and expenses were obtained through semi-structured interviews with collectors, middlemen and traders including exporters. Net income was calculated for all actors. Distribution of incomes between actors was calculated. Collectors of O. sinensis obtained a higher net income per kg than middlemen and traders while the opposite was the case for T. matsutake. Collectors of O. sinensis earned an average of 70% of the household’s cash income from collection and sale of the product while T. matsutake on average constituted 9% of collectors’ household income. Based on the study, opportunities for increasing NTFP collectors’ net income are discussed. Over-exploitation and habitat destruction was a common concern among collectors of O. sinensis and T. matsutake. Further research on the biology of the species, the resource base and the impact of increasing collection and trade is needed to ensure sustainable harvest levels.
Keywords: Access mapping, gender, household income, market survey, NTFP, socio-economics.
2
1. Introduction Traditional medicine and health foods are used in a variety of goods from raw materials to processed and packaged products like pharmaceuticals, herbal medicines, tea, spirits, cosmetics, sweets, and dietary supplements (Lange, 2006). Around 70,000 plants species are used in indigenous and traditional medicine and health-care systems worldwide (IUCN, 2007). It is estimated that 80% of people in developing countries depend on traditional medicine (WHO, 2010). Globalisation, expanding markets for non- timber forest products (NTFPs) and increasing interest in traditional medicines and health foods have resulted in a growing trade of these NTFPs in both developing and developed countries. The demand for NTFPs for domestic and commercial purposes results in a considerable trade on local, national and international markets (Lange, 2006). The annual world market for plant-based medicine is estimated at USD 20-40 billion with an annual growth rate of 10-20 % (Larsen and Olsen, 2007). The trade provides income-generating opportunities for rural people in developing countries but may also jeopardize sustainable harvest levels (Godoy et al. 1995).
The marketing of NTFPs is normally carried out in two main stages; i.e. the marketing of the raw material from the stage of gathering it until it reaches the industrial user, and the marketing of the semi-finished or finished industrial or finished consumer product either to other processing industries or to final consumers (Lintu, 1995). Though in many cases, the products collected have very high value as final products, the collectors generally receive only a small share of the final value either because they are not aware of the real value or unable to market it to the buyers where they can get reasonable prices for their products (Neumann and Hirsch, 2000). Other reasons associated with low price for collectors may be lack of market information, inaccessibility of the markets, and inability to sell the products in the form or quality desired by buyers. NTFPs are often collected either by wage laborers or farmers with small land holdings and a significant part of the material is commercially traded. The prices paid to the collectors tend to be very low, partly because of ready availability of cheap labor to undertake the very labor intensive work of gathering (FAO, 2005). The contractors who employ the collectors often act as middlemen and traders as well, and collectors usually are dependent on the contractors as they are poor and frequently owe money to the contractors (Neumann and Hirsch, 2000). Further, the supply chain is often very long with as many as six or seven marketing stages involving primary collectors and producers, local contractors, regional wholesale markets, large wholesale
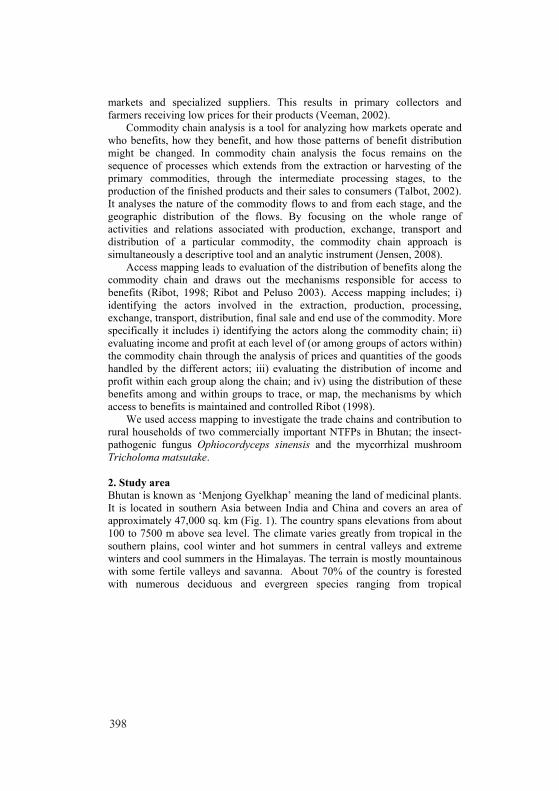
398
3
markets and specialized suppliers. This results in primary collectors and farmers receiving low prices for their products (Veeman, 2002).
Commodity chain analysis is a tool for analyzing how markets operate and who benefits, how they benefit, and how those patterns of benefit distribution might be changed. In commodity chain analysis the focus remains on the sequence of processes which extends from the extraction or harvesting of the primary commodities, through the intermediate processing stages, to the production of the finished products and their sales to consumers (Talbot, 2002). It analyses the nature of the commodity flows to and from each stage, and the geographic distribution of the flows. By focusing on the whole range of activities and relations associated with production, exchange, transport and distribution of a particular commodity, the commodity chain approach is simultaneously a descriptive tool and an analytic instrument (Jensen, 2008).
Access mapping leads to evaluation of the distribution of benefits along the commodity chain and draws out the mechanisms responsible for access to benefits (Ribot, 1998; Ribot and Peluso 2003). Access mapping includes; i) identifying the actors involved in the extraction, production, processing, exchange, transport, distribution, final sale and end use of the commodity. More specifically it includes i) identifying the actors along the commodity chain; ii) evaluating income and profit at each level of (or among groups of actors within) the commodity chain through the analysis of prices and quantities of the goods handled by the different actors; iii) evaluating the distribution of income and profit within each group along the chain; and iv) using the distribution of these benefits among and within groups to trace, or map, the mechanisms by which access to benefits is maintained and controlled Ribot (1998).
We used access mapping to investigate the trade chains and contribution to rural households of two commercially important NTFPs in Bhutan; the insect-pathogenic fungus Ophiocordyceps sinensis and the mycorrhizal mushroom Tricholoma matsutake.
2. Study area Bhutan is known as ‘Menjong Gyelkhap’ meaning the land of medicinal plants. It is located in southern Asia between India and China and covers an area of approximately 47,000 sq. km (Fig. 1). The country spans elevations from about 100 to 7500 m above sea level. The climate varies greatly from tropical in the southern plains, cool winter and hot summers in central valleys and extreme winters and cool summers in the Himalayas. The terrain is mostly mountainous with some fertile valleys and savanna. About 70% of the country is forested with numerous deciduous and evergreen species ranging from tropical
4
hardwoods to predominantly oak and pine forests. The population of Bhutan is close to 700,000. The majority of the population is engaged in agriculture and it is estimated that about 70% of the households depend on forest resources for food, firewood and traditional medicine (Wangda and Ohsawa, 2006). Per capita GDP was 5,600 USD in 2008 (CIA, 2009). Survey sites for O. sinensis collection were within the Choekor block and survey sites for T. matsutake collection were in the Ura block both within Bhumtang District (Fig. 1). Market surveys were conducted in Thimphu, the capital of Bhutan, and in Paro, a historic city. Most NTFPs are exported from these two cities.
5
Auctions
Collection
Figure 1. Bhutan (upper left insert) and its districts. Survey sites for O. sinensis collection were within the Choekor block and survey sites for T. matsutake collection were in the Ura block both within Bhumtang District (upper right insert, from). Market surveys were conducted in Thimphu, the capital of Bhutan, and in Paro, a historic city. Most NTFPs are exported from these two cities. Source of maps: CIA 2009, www.bhutan.gov.bt/government/dzongkhags.php, www.bumthang.gov.bt/map.php
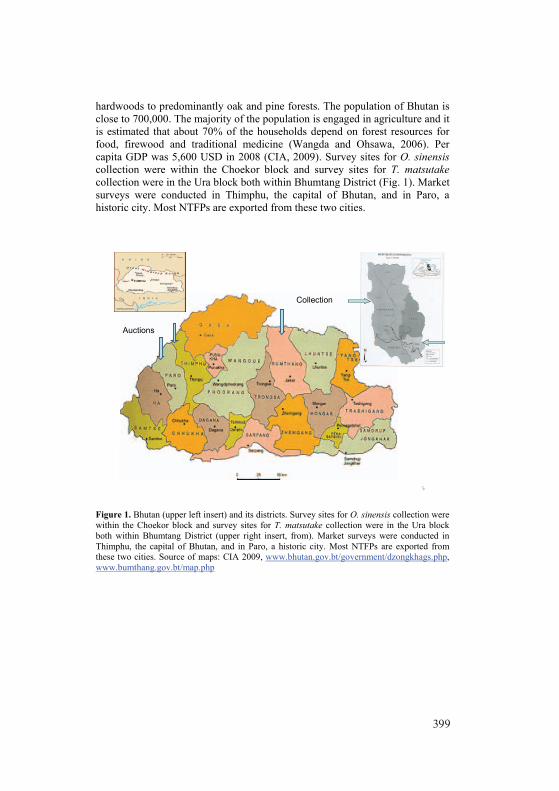
399
3
markets and specialized suppliers. This results in primary collectors and farmers receiving low prices for their products (Veeman, 2002).
Commodity chain analysis is a tool for analyzing how markets operate and who benefits, how they benefit, and how those patterns of benefit distribution might be changed. In commodity chain analysis the focus remains on the sequence of processes which extends from the extraction or harvesting of the primary commodities, through the intermediate processing stages, to the production of the finished products and their sales to consumers (Talbot, 2002). It analyses the nature of the commodity flows to and from each stage, and the geographic distribution of the flows. By focusing on the whole range of activities and relations associated with production, exchange, transport and distribution of a particular commodity, the commodity chain approach is simultaneously a descriptive tool and an analytic instrument (Jensen, 2008).
Access mapping leads to evaluation of the distribution of benefits along the commodity chain and draws out the mechanisms responsible for access to benefits (Ribot, 1998; Ribot and Peluso 2003). Access mapping includes; i) identifying the actors involved in the extraction, production, processing, exchange, transport, distribution, final sale and end use of the commodity. More specifically it includes i) identifying the actors along the commodity chain; ii) evaluating income and profit at each level of (or among groups of actors within) the commodity chain through the analysis of prices and quantities of the goods handled by the different actors; iii) evaluating the distribution of income and profit within each group along the chain; and iv) using the distribution of these benefits among and within groups to trace, or map, the mechanisms by which access to benefits is maintained and controlled Ribot (1998).
We used access mapping to investigate the trade chains and contribution to rural households of two commercially important NTFPs in Bhutan; the insect-pathogenic fungus Ophiocordyceps sinensis and the mycorrhizal mushroom Tricholoma matsutake.
2. Study area Bhutan is known as ‘Menjong Gyelkhap’ meaning the land of medicinal plants. It is located in southern Asia between India and China and covers an area of approximately 47,000 sq. km (Fig. 1). The country spans elevations from about 100 to 7500 m above sea level. The climate varies greatly from tropical in the southern plains, cool winter and hot summers in central valleys and extreme winters and cool summers in the Himalayas. The terrain is mostly mountainous with some fertile valleys and savanna. About 70% of the country is forested with numerous deciduous and evergreen species ranging from tropical
4
hardwoods to predominantly oak and pine forests. The population of Bhutan is close to 700,000. The majority of the population is engaged in agriculture and it is estimated that about 70% of the households depend on forest resources for food, firewood and traditional medicine (Wangda and Ohsawa, 2006). Per capita GDP was 5,600 USD in 2008 (CIA, 2009). Survey sites for O. sinensis collection were within the Choekor block and survey sites for T. matsutake collection were in the Ura block both within Bhumtang District (Fig. 1). Market surveys were conducted in Thimphu, the capital of Bhutan, and in Paro, a historic city. Most NTFPs are exported from these two cities.
5
Auctions
Collection
Figure 1. Bhutan (upper left insert) and its districts. Survey sites for O. sinensis collection were within the Choekor block and survey sites for T. matsutake collection were in the Ura block both within Bhumtang District (upper right insert, from). Market surveys were conducted in Thimphu, the capital of Bhutan, and in Paro, a historic city. Most NTFPs are exported from these two cities. Source of maps: CIA 2009, www.bhutan.gov.bt/government/dzongkhags.php, www.bumthang.gov.bt/map.php

400
5
3. Methods Quantitative and qualitative data were collected through semi-structured interviews following pre-printed questionnaires. The questionnaires were pre-tested and modified to match with the field situations and to rectify ambiguities. Interviews were conducted in villages, at road-heads and in cities with assistance from a translator. The snowball method was used to identify respondents. Identification of collectors was done through key informants such as village heads, and through local forest department’s records of permit holders. Middlemen and traders were identified on the basis of information gathered from collectors. Exporters were identified by traders.
For O. sinensis thirty-nine collectors from seven villages of the Choekhor block, one middleman in Bumthang and eight O. sinensis exporters in Thimphu were interviewed. For T. matsutake, twenty-one collectors from five villages of Ura block, four medium-level traders including one middleman in Paro, two retailers at Ura road-head, one head of a user group in Ura and four exporters in Thimphu and Paro were interviewed.
In the commodity chain analysis, the annual amount of O. sinensis and T. matsutake collected and sold, selling prices and the costs associated with collection were recorded for individual collectors. As a basis for analyzing individual household’s cash income, all sources of cash income to households were considered in the interviews. For the economic valuation of O. sinensis and T. matsutake collection, quantities collected in a day, time spent, and distance covered to reach collection sites were recorded. For middlemen and traders the quantities purchased and sold, buying and selling prices, and overhead costs per kilogram were recorded. Dry weight was used for O. sinenses and fresh weight for T. matsutake.
Income, cost and net margins were calculated for all actors in the commodity chains for O. sinensis and T. matsutake. Furthermore, the relative household cash income from O. sinensis and T. matsutake was calculated. Daily income from collection of O. sinensis and T. matsutake were calculated and compared with daily wage rate. Finally, the distribution of incomes in the market for O. sinensis and T. matsutake was calculated.
Data on processing, perceptions about the resource base and specific problems associated with the trade were also included in the interview. Interviews were conducted between February and April 2009 and focused on collection activity in year of 2008.
6
4. The species investigated Ophiocordyceps sinensis, commonly known as Cordyceps, Yartsa goenbub or Bub in Bhutan, is a fungus that parasitizes moth larvae (Figure 2). The fungal spores infect the live caterpillar in late summer and the mycelia take over its body after it has buried itself for winter hibernation (Gould, 2007). O. sinensis is harvested over much of the Himalayan plateau as a highly prized remedy in traditional Oriental medicine. O. sinensis is gathered in high altitude and rugged mountains by rural collectors in Bhutan to supplement their households’ cash income. Over the past 10 years its financial value has increased dramatically, with collectors paid as much as USD 12,500 kg -1 for top-quality material. This is causing concern that the present rate of collection is unsustainable. Since 2004, the Royal Bhutanese government has issued permits to collect the fungus during one month within May to June and licenses for traders to sell in one of the government auctions held each summer.
Tricholoma matsutake commonly known as matsutake or pine mushroom, is a highly sought after mycorrhizal mushroom that grows in Asia, Europe, and North America. It is prized by Japanese for its distinct spicy-aromatic odor. It is known in Bhutan as Sangay Shamu (Figure 3). T. matsutake grows under trees and are usually concealed under fallen leaves on the forest floor. It forms a symbiotic relationship with the roots of a limited number of tree species. In Bhutan, the mushroom grows mostly in pine forests of Thimphu and Bumthang districts over 3000 m.a.s.l. Domestic production of matsutake in Japan has been sharply reduced over the last 50 years due to a pine nematode Bursaphelenchus xylophilus, which has led to increased prices. The price for matsutake in the Japanese market is highly dependent on quality, availability, and origin. The average value for imported matsutake is about USD 90 per kilogram. Bhutanese villagers collect it and sell to supplement their households’ cash income. Collection is allowed for four months from July to October.

401
5
3. Methods Quantitative and qualitative data were collected through semi-structured interviews following pre-printed questionnaires. The questionnaires were pre-tested and modified to match with the field situations and to rectify ambiguities. Interviews were conducted in villages, at road-heads and in cities with assistance from a translator. The snowball method was used to identify respondents. Identification of collectors was done through key informants such as village heads, and through local forest department’s records of permit holders. Middlemen and traders were identified on the basis of information gathered from collectors. Exporters were identified by traders.
For O. sinensis thirty-nine collectors from seven villages of the Choekhor block, one middleman in Bumthang and eight O. sinensis exporters in Thimphu were interviewed. For T. matsutake, twenty-one collectors from five villages of Ura block, four medium-level traders including one middleman in Paro, two retailers at Ura road-head, one head of a user group in Ura and four exporters in Thimphu and Paro were interviewed.
In the commodity chain analysis, the annual amount of O. sinensis and T. matsutake collected and sold, selling prices and the costs associated with collection were recorded for individual collectors. As a basis for analyzing individual household’s cash income, all sources of cash income to households were considered in the interviews. For the economic valuation of O. sinensis and T. matsutake collection, quantities collected in a day, time spent, and distance covered to reach collection sites were recorded. For middlemen and traders the quantities purchased and sold, buying and selling prices, and overhead costs per kilogram were recorded. Dry weight was used for O. sinenses and fresh weight for T. matsutake.
Income, cost and net margins were calculated for all actors in the commodity chains for O. sinensis and T. matsutake. Furthermore, the relative household cash income from O. sinensis and T. matsutake was calculated. Daily income from collection of O. sinensis and T. matsutake were calculated and compared with daily wage rate. Finally, the distribution of incomes in the market for O. sinensis and T. matsutake was calculated.
Data on processing, perceptions about the resource base and specific problems associated with the trade were also included in the interview. Interviews were conducted between February and April 2009 and focused on collection activity in year of 2008.
6
4. The species investigated Ophiocordyceps sinensis, commonly known as Cordyceps, Yartsa goenbub or Bub in Bhutan, is a fungus that parasitizes moth larvae (Figure 2). The fungal spores infect the live caterpillar in late summer and the mycelia take over its body after it has buried itself for winter hibernation (Gould, 2007). O. sinensis is harvested over much of the Himalayan plateau as a highly prized remedy in traditional Oriental medicine. O. sinensis is gathered in high altitude and rugged mountains by rural collectors in Bhutan to supplement their households’ cash income. Over the past 10 years its financial value has increased dramatically, with collectors paid as much as USD 12,500 kg -1 for top-quality material. This is causing concern that the present rate of collection is unsustainable. Since 2004, the Royal Bhutanese government has issued permits to collect the fungus during one month within May to June and licenses for traders to sell in one of the government auctions held each summer.
Tricholoma matsutake commonly known as matsutake or pine mushroom, is a highly sought after mycorrhizal mushroom that grows in Asia, Europe, and North America. It is prized by Japanese for its distinct spicy-aromatic odor. It is known in Bhutan as Sangay Shamu (Figure 3). T. matsutake grows under trees and are usually concealed under fallen leaves on the forest floor. It forms a symbiotic relationship with the roots of a limited number of tree species. In Bhutan, the mushroom grows mostly in pine forests of Thimphu and Bumthang districts over 3000 m.a.s.l. Domestic production of matsutake in Japan has been sharply reduced over the last 50 years due to a pine nematode Bursaphelenchus xylophilus, which has led to increased prices. The price for matsutake in the Japanese market is highly dependent on quality, availability, and origin. The average value for imported matsutake is about USD 90 per kilogram. Bhutanese villagers collect it and sell to supplement their households’ cash income. Collection is allowed for four months from July to October.

402
7
Figures 2 and 3. Dried O. sinensis and fresh T. matsutake. Photos V.K. Shrivastava and http://en.academic.ru/pictures/enwiki/77/Matsutake.jpg.
5. Results 5.1 O. sinensis Most collectors of O. sinensis were small farmers. Both men (77%) and women (23%) take part in collection of O. sinensis. The illiteracy rate was high among collectors (77%) while 18% had finished primary school. On average collectors walked three days to reach the camp from where they undertake daily collection trips. On average, collectors spent two months collecting with men collecting over a longer period than women. The quantity collected per day varied from 2.6 g (13 pieces) to 13 g (71 pieces). Men collected somewhat more per day than women. The total average amount collected per person in 2008 was 400 g. Collectors sold at an average price of 2411 USD/kg and almost all of the harvest was sold. Collectors had very few costs, the main expenses being a permit of USD 0.3, tents and kerosene. Collectors’ net income/kg was USD 2267 equivalent to a daily net income of about USD 18 or 9 times more than the official minimum daily wage in Bhutan. Results are shown in Table 1. There was no correlation between amount sold and selling price. According to collectors quality determine the selling price rather than amounts traded.
8
Table 1. Collection and income for O. sinensis.
All households
(n=39) Women
n=9 Men n=30
Mea
n Std.
error Mea
n Std.
error Mea
n Std.
error Household members
involved 1.46
20.08
91.55
60.17
61.43
3 0.10
4 Days to base camp (~80
km) 2.77 0.11 2.78 0.15 2.77 0.14 No. of collection days 66.7 9.2 54.5 14.6 70.3 11.1
Quantity collected (kg) 0.41
90.04
70.25
30.05
30.46
9 0.05
6
Quantity sold (kg) 0.41
40.04
70.24
20.04
90.46
6 0.05
6 Average collected per
day (kg) 0.00
800.00
080.00
600.00
130.00
86 0.00
10 Price (USD/kg) 2411 100 2511 163 2381 122 Gross income calculated
(USD) 998 128 577 99 1125 158 Net income calculated
(USD) 956 128 554 98 1076 158 Net income (USD/kg) 2267 111 2375 165 2235 137 Mean daily net income
(USD) 18.3
4 2.1614.5
6 3.1319.4
7 2.63 Net income/min daily
wage 9.2 1.1 7.3 1.6 9.8 1.3
Villagers largely depended on agriculture and livestock for their livelihoods. Some villagers worked as daily wage labourers. O. sinensis was found to provide a major contribution to households’ annual cash income. Thus, income from O. sinensis constituted about 70% of the individual households’ income and it was the only source of cash income for 26% of the households (Fig. 4). There was no significant correlation between income from O. sinensis and households’ assets or incomes from other sources.

403
7
Figures 2 and 3. Dried O. sinensis and fresh T. matsutake. Photos V.K. Shrivastava and http://en.academic.ru/pictures/enwiki/77/Matsutake.jpg.
5. Results 5.1 O. sinensis Most collectors of O. sinensis were small farmers. Both men (77%) and women (23%) take part in collection of O. sinensis. The illiteracy rate was high among collectors (77%) while 18% had finished primary school. On average collectors walked three days to reach the camp from where they undertake daily collection trips. On average, collectors spent two months collecting with men collecting over a longer period than women. The quantity collected per day varied from 2.6 g (13 pieces) to 13 g (71 pieces). Men collected somewhat more per day than women. The total average amount collected per person in 2008 was 400 g. Collectors sold at an average price of 2411 USD/kg and almost all of the harvest was sold. Collectors had very few costs, the main expenses being a permit of USD 0.3, tents and kerosene. Collectors’ net income/kg was USD 2267 equivalent to a daily net income of about USD 18 or 9 times more than the official minimum daily wage in Bhutan. Results are shown in Table 1. There was no correlation between amount sold and selling price. According to collectors quality determine the selling price rather than amounts traded.
8
Table 1. Collection and income for O. sinensis.
All households
(n=39) Women
n=9 Men n=30
Mea
n Std.
error Mea
n Std.
error Mea
n Std.
error Household members
involved 1.46
20.08
91.55
60.17
61.43
3 0.10
4 Days to base camp (~80
km) 2.77 0.11 2.78 0.15 2.77 0.14 No. of collection days 66.7 9.2 54.5 14.6 70.3 11.1
Quantity collected (kg) 0.41
90.04
70.25
30.05
30.46
9 0.05
6
Quantity sold (kg) 0.41
40.04
70.24
20.04
90.46
6 0.05
6 Average collected per
day (kg) 0.00
800.00
080.00
600.00
130.00
86 0.00
10 Price (USD/kg) 2411 100 2511 163 2381 122 Gross income calculated
(USD) 998 128 577 99 1125 158 Net income calculated
(USD) 956 128 554 98 1076 158 Net income (USD/kg) 2267 111 2375 165 2235 137 Mean daily net income
(USD) 18.3
4 2.1614.5
6 3.1319.4
7 2.63 Net income/min daily
wage 9.2 1.1 7.3 1.6 9.8 1.3
Villagers largely depended on agriculture and livestock for their livelihoods. Some villagers worked as daily wage labourers. O. sinensis was found to provide a major contribution to households’ annual cash income. Thus, income from O. sinensis constituted about 70% of the individual households’ income and it was the only source of cash income for 26% of the households (Fig. 4). There was no significant correlation between income from O. sinensis and households’ assets or incomes from other sources.
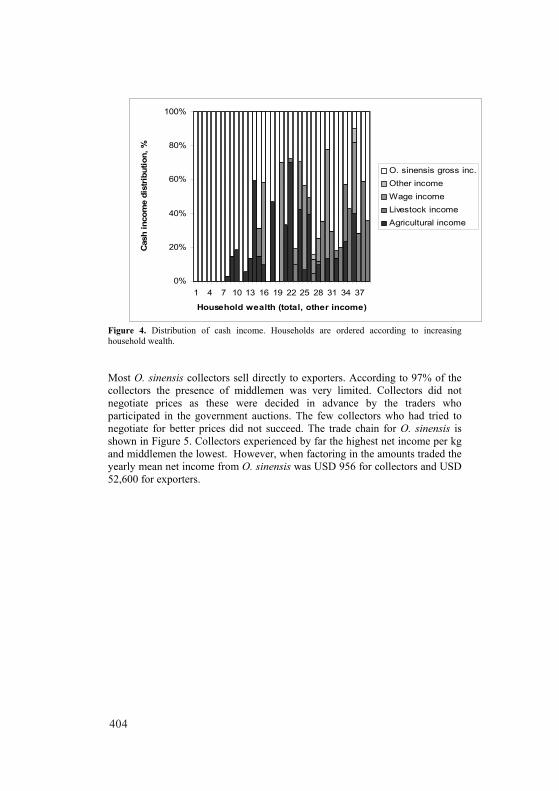
404
9
0%
20%
40%
60%
80%
100%
1 4 7 10 13 16 19 22 25 28 31 34 37
Household wealth (total, other income)
Cas
h in
com
e di
strib
utio
n, %
O. sinensis gross inc.Other incomeWage incomeLivestock incomeAgricultural income
Figure 4. Distribution of cash income. Households are ordered according to increasing household wealth.
Most O. sinensis collectors sell directly to exporters. According to 97% of the collectors the presence of middlemen was very limited. Collectors did not negotiate prices as these were decided in advance by the traders who participated in the government auctions. The few collectors who had tried to negotiate for better prices did not succeed. The trade chain for O. sinensis is shown in Figure 5. Collectors experienced by far the highest net income per kg and middlemen the lowest. However, when factoring in the amounts traded the yearly mean net income from O. sinensis was USD 956 for collectors and USD 52,600 for exporters.
10
Collectors(Farmers, Yak herders)
Selling price/kg: 2411Cost/kg: 144Net income/kg: 2267
Middlemen
Buying price/kg: 3024Selling price/kg: 3789Cost/kg: 422Net income/kg: 333
Buying price/kg: 2800Selling price/kg: 2960Cost/kg: 48Net income/kg: 112
Exporters(City traders)
Figure 5. Trade chain for O. sinensis. Figures are in USD. Collectors have the highest net income per kg and middlemen the lowest. Most collectors sell directly to exporters. Rarely middlemen are involved in the trade.
5.2 T. matsutake Collectors of T. matsutake interviewed were all farmers except for one who was a monk. Women comprised the majority of collectors (57%). Most collectors were illiterate (86%) while 9% had finished primary school. T. matsutake was collected almost exclusively for sale while small quantities were consumed within the households. Other mushrooms such as Lyophyllum shimeji were also collected for sale while others were collected mainly for domestic consumption. Only T. matsutake is included in the data presented here.
The average quantity collected per day varied from 1.2 to 1.8 kg. Men collected somewhat more per day than women and spent more time collecting. The average quantity collected per person within the season of 2008 was 28 kg. For women and men the mean quantities were 19 kg and 40 kg, respectively. Collectors sold at an average price of USD 3.97 per kg and 83% of the harvest was sold. Collectors had very few costs and their net income per kg was USD

405
9
0%
20%
40%
60%
80%
100%
1 4 7 10 13 16 19 22 25 28 31 34 37
Household wealth (total, other income)
Cas
h in
com
e di
strib
utio
n, %
O. sinensis gross inc.Other incomeWage incomeLivestock incomeAgricultural income
Figure 4. Distribution of cash income. Households are ordered according to increasing household wealth.
Most O. sinensis collectors sell directly to exporters. According to 97% of the collectors the presence of middlemen was very limited. Collectors did not negotiate prices as these were decided in advance by the traders who participated in the government auctions. The few collectors who had tried to negotiate for better prices did not succeed. The trade chain for O. sinensis is shown in Figure 5. Collectors experienced by far the highest net income per kg and middlemen the lowest. However, when factoring in the amounts traded the yearly mean net income from O. sinensis was USD 956 for collectors and USD 52,600 for exporters.
10
Collectors(Farmers, Yak herders)
Selling price/kg: 2411Cost/kg: 144Net income/kg: 2267
Middlemen
Buying price/kg: 3024Selling price/kg: 3789Cost/kg: 422Net income/kg: 333
Buying price/kg: 2800Selling price/kg: 2960Cost/kg: 48Net income/kg: 112
Exporters(City traders)
Figure 5. Trade chain for O. sinensis. Figures are in USD. Collectors have the highest net income per kg and middlemen the lowest. Most collectors sell directly to exporters. Rarely middlemen are involved in the trade.
5.2 T. matsutake Collectors of T. matsutake interviewed were all farmers except for one who was a monk. Women comprised the majority of collectors (57%). Most collectors were illiterate (86%) while 9% had finished primary school. T. matsutake was collected almost exclusively for sale while small quantities were consumed within the households. Other mushrooms such as Lyophyllum shimeji were also collected for sale while others were collected mainly for domestic consumption. Only T. matsutake is included in the data presented here.
The average quantity collected per day varied from 1.2 to 1.8 kg. Men collected somewhat more per day than women and spent more time collecting. The average quantity collected per person within the season of 2008 was 28 kg. For women and men the mean quantities were 19 kg and 40 kg, respectively. Collectors sold at an average price of USD 3.97 per kg and 83% of the harvest was sold. Collectors had very few costs and their net income per kg was USD

406
11
91 equivalent to a daily net income of USD 5.25 or 2.6 times more than the minimum official daily wage in Bhutan. Results are shown in Table 2.
Table 2. Collection and income from T. matsutake collection.
All households
(n=21) Women (n=12)
Men (n=9)
Variable Mea
n Std.
error Mea
n Std.
error Mea
n Std.
error Household members
involved 1.24 0.10 1.33 0.14 1.11 0.11 Distance to collection site
(km) 5.43 0.67 5.33 0.80 5.56 1.21 Time collecting (hours) 1.43 0.17 1.39 0.22 1.48 0.27 Number of man days
collecting 23.3
1 4.18 19.1
9 5.16 28.8
1 6.81
Quantity collected (kg) 28.1
7 5.15 19.1
7 3.97 40.1
7 9.72 Quantity consumed (kg) 4.71 1.14 2.83 1.17 7.22 1.91
Quantity sold (kg) 23.4
5 4.82 16.3
3 3.62 32.9
4 9.57 Mean quantity per day 1.35 0.13 1.19 0.14 1.56 0.21 Selling price/kg 3.97 0.05 3.92 0.08 4.04 0.04
Gross income (USD) 91.7
1 18.7
3 61.1
7 11.1
6 132.
44 38.1
4
Net income (USD) 91.3
1 18.7
3 60.7
7 11.1
6 132.
04 38.1
4 Net income (USD/kg) 3.94 0.05 3.88 0.08 4.02 0.04 Mean daily net income
(USD) 5.25 0.46 4.51 0.41 6.24 0.83 Net income/min daily
wage 2.64 0.23 2.27 0.21 3.14 0.42 T. matsutake collectors mainly depended on agriculture and livestock for their livelihoods while income from daily wage labour comprised a major component for a few households. T. matsutake was found to contribute up to 40% of the individual households’ income with an average of 9% (Fig. 6). There was no significant correlation between income from T. matsutake and households’ assets or incomes from other sources.
12
0%
20%
40%
60%
80%
100%
1 3 5 7 9 11 13 15 17 19 21
HH wealth (total, other income)
Cas
h in
com
e di
strib
utio
n, %
Matsutake gross inc.Other incomeWage incomeLivestock incomeAgricultural income
Figure 6. Distribution of cash income. Households are ordered according to increasing household wealth.
About 50 % of the collectors sold their harvest in the local market, usually a road-head market, to agents of exporters who were present at the markets during the T. matsutake season. Collectors also sold to travelers, mainly Japanese tourists, who usually buy matsutake during their visits to the Districts. Almost 40% of the collectors were members of T. matsutake user groups. They sold to their respective group from where it was resold to exporters. The rest of the collectors either sold in sub-local markets directly to consumers, to other collectors like the village head, or they sold to FCB shops (Food Corporation of Bhutan) from where they could exchange matsutake mushrooms for other household commodities. The majority of collectors (62%) did not know about the involvement of middlemen in the trade. Most collectors (76%) did not negotiate prices and not a single collector had succeeded in getting a higher price through negotiation. This may be due to the fact that there were only few traders in the market and the fact that collectors had to sell the fresh mushrooms the same day as they had no proper storage facilities. Collectors believed that better storage facilities, drying equipment, more buyers, user groups, and

407
11
91 equivalent to a daily net income of USD 5.25 or 2.6 times more than the minimum official daily wage in Bhutan. Results are shown in Table 2.
Table 2. Collection and income from T. matsutake collection.
All households
(n=21) Women (n=12)
Men (n=9)
Variable Mea
n Std.
error Mea
n Std.
error Mea
n Std.
error Household members
involved 1.24 0.10 1.33 0.14 1.11 0.11 Distance to collection site
(km) 5.43 0.67 5.33 0.80 5.56 1.21 Time collecting (hours) 1.43 0.17 1.39 0.22 1.48 0.27 Number of man days
collecting 23.3
1 4.18 19.1
9 5.16 28.8
1 6.81
Quantity collected (kg) 28.1
7 5.15 19.1
7 3.97 40.1
7 9.72 Quantity consumed (kg) 4.71 1.14 2.83 1.17 7.22 1.91
Quantity sold (kg) 23.4
5 4.82 16.3
3 3.62 32.9
4 9.57 Mean quantity per day 1.35 0.13 1.19 0.14 1.56 0.21 Selling price/kg 3.97 0.05 3.92 0.08 4.04 0.04
Gross income (USD) 91.7
1 18.7
3 61.1
7 11.1
6 132.
44 38.1
4
Net income (USD) 91.3
1 18.7
3 60.7
7 11.1
6 132.
04 38.1
4 Net income (USD/kg) 3.94 0.05 3.88 0.08 4.02 0.04 Mean daily net income
(USD) 5.25 0.46 4.51 0.41 6.24 0.83 Net income/min daily
wage 2.64 0.23 2.27 0.21 3.14 0.42 T. matsutake collectors mainly depended on agriculture and livestock for their livelihoods while income from daily wage labour comprised a major component for a few households. T. matsutake was found to contribute up to 40% of the individual households’ income with an average of 9% (Fig. 6). There was no significant correlation between income from T. matsutake and households’ assets or incomes from other sources.
12
0%
20%
40%
60%
80%
100%
1 3 5 7 9 11 13 15 17 19 21
HH wealth (total, other income)
Cas
h in
com
e di
strib
utio
n, %
Matsutake gross inc.Other incomeWage incomeLivestock incomeAgricultural income
Figure 6. Distribution of cash income. Households are ordered according to increasing household wealth.
About 50 % of the collectors sold their harvest in the local market, usually a road-head market, to agents of exporters who were present at the markets during the T. matsutake season. Collectors also sold to travelers, mainly Japanese tourists, who usually buy matsutake during their visits to the Districts. Almost 40% of the collectors were members of T. matsutake user groups. They sold to their respective group from where it was resold to exporters. The rest of the collectors either sold in sub-local markets directly to consumers, to other collectors like the village head, or they sold to FCB shops (Food Corporation of Bhutan) from where they could exchange matsutake mushrooms for other household commodities. The majority of collectors (62%) did not know about the involvement of middlemen in the trade. Most collectors (76%) did not negotiate prices and not a single collector had succeeded in getting a higher price through negotiation. This may be due to the fact that there were only few traders in the market and the fact that collectors had to sell the fresh mushrooms the same day as they had no proper storage facilities. Collectors believed that better storage facilities, drying equipment, more buyers, user groups, and
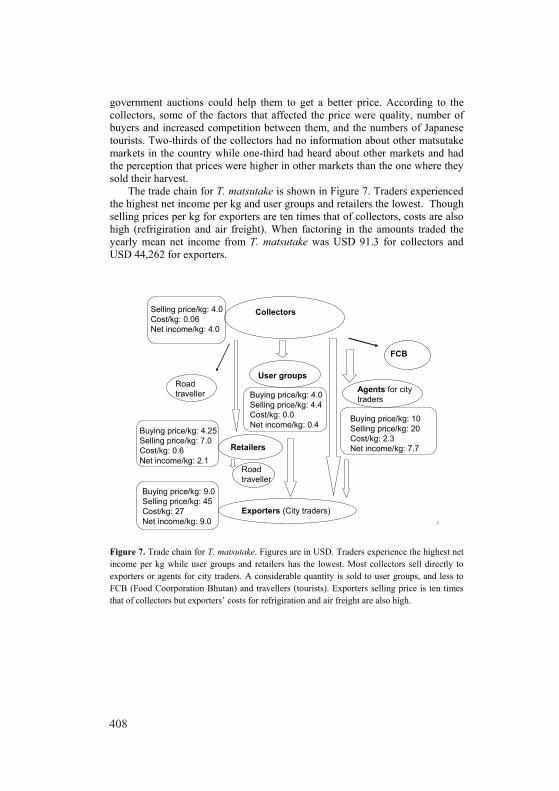
408
13
government auctions could help them to get a better price. According to the collectors, some of the factors that affected the price were quality, number of buyers and increased competition between them, and the numbers of Japanese tourists. Two-thirds of the collectors had no information about other matsutake markets in the country while one-third had heard about other markets and had the perception that prices were higher in other markets than the one where they sold their harvest.
The trade chain for T. matsutake is shown in Figure 7. Traders experienced the highest net income per kg and user groups and retailers the lowest. Though selling prices per kg for exporters are ten times that of collectors, costs are also high (refrigiration and air freight). When factoring in the amounts traded the yearly mean net income from T. matsutake was USD 91.3 for collectors and USD 44,262 for exporters.
4
CollectorsSelling price/kg: 4.0Cost/kg: 0.06Net income/kg: 4.0
User groups
Buying price/kg: 4.0Selling price/kg: 4.4Cost/kg: 0.0Net income/kg: 0.4
Buying price/kg: 10Selling price/kg: 20Cost/kg: 2.3Net income/kg: 7.7
Buying price/kg: 4.25Selling price/kg: 7.0Cost/kg: 0.6Net income/kg: 2.1
Buying price/kg: 9.0Selling price/kg: 45Cost/kg: 27Net income/kg: 9.0
Exporters (City traders)
Retailers
Road traveller
Agents for city traders
Road traveller
FCB
Figure 7. Trade chain for T. matsutake. Figures are in USD. Traders experience the highest net income per kg while user groups and retailers has the lowest. Most collectors sell directly to exporters or agents for city traders. A considerable quantity is sold to user groups, and less to FCB (Food Coorporation Bhutan) and travellers (tourists). Exporters selling price is ten times that of collectors but exporters’ costs for refrigiration and air freight are also high.
14
5.3 Distribution of incomes in the market for O. sinensis and T. matsutake Finally, we calculated the distribution of net income for the two NTFPs based on the quantities of the two products represented by the survey, prices and the number of collectors and traders represented. The distribution of incomes in the market was markedly different for the two products. For O. sinensis 75% of the net income in the market was distributed between collectors. The opposite was the case for T. matsutake where only 20% of the total net income was distributed between collectors. At the household level, O. sinensis collectors had a net income corresponding to 0.02% of traders’ net income while collectors of T. matsutake made 0.004% of traders’ net income (Table 3). Table 3. Distribution of incomes in the market for O. sinensis and T. matsutake. Incomes of collectors are scaled to match the observed amounts traded.
Net incomes (USD) corresponding to observed
trade O. sinensis T. matsutake
Collectors 1,510,449 51,636 Traders 487,862 215,861 Collectors/trade 3.10 0.24
Average net income (USD) per household O. sinensis T. matsutake
Collectors 1,089 105 Traders 54,207 26,983 Collectors/traders 0.020 0.004
5.4 Sustainability of the trade Collectors of O. sinensis and T. matsutake had contrasting perceptions of the status of the resource base (40% believed O. sinensis had become scarcer in the past 5 years and 40% believed there was no change). Collectors of both products shared a common view (70%) that the harvest was gradually becoming unsustainable due to overexploitation and habitat destruction as increased prices lead to increased extraction. This perception was supported by many city traders. Especially T. matsutake traders claimed that smaller amounts of poorer quality were traded today as compared to 5 years ago.

409
13
government auctions could help them to get a better price. According to the collectors, some of the factors that affected the price were quality, number of buyers and increased competition between them, and the numbers of Japanese tourists. Two-thirds of the collectors had no information about other matsutake markets in the country while one-third had heard about other markets and had the perception that prices were higher in other markets than the one where they sold their harvest.
The trade chain for T. matsutake is shown in Figure 7. Traders experienced the highest net income per kg and user groups and retailers the lowest. Though selling prices per kg for exporters are ten times that of collectors, costs are also high (refrigiration and air freight). When factoring in the amounts traded the yearly mean net income from T. matsutake was USD 91.3 for collectors and USD 44,262 for exporters.
4
CollectorsSelling price/kg: 4.0Cost/kg: 0.06Net income/kg: 4.0
User groups
Buying price/kg: 4.0Selling price/kg: 4.4Cost/kg: 0.0Net income/kg: 0.4
Buying price/kg: 10Selling price/kg: 20Cost/kg: 2.3Net income/kg: 7.7
Buying price/kg: 4.25Selling price/kg: 7.0Cost/kg: 0.6Net income/kg: 2.1
Buying price/kg: 9.0Selling price/kg: 45Cost/kg: 27Net income/kg: 9.0
Exporters (City traders)
Retailers
Road traveller
Agents for city traders
Road traveller
FCB
Figure 7. Trade chain for T. matsutake. Figures are in USD. Traders experience the highest net income per kg while user groups and retailers has the lowest. Most collectors sell directly to exporters or agents for city traders. A considerable quantity is sold to user groups, and less to FCB (Food Coorporation Bhutan) and travellers (tourists). Exporters selling price is ten times that of collectors but exporters’ costs for refrigiration and air freight are also high.
14
5.3 Distribution of incomes in the market for O. sinensis and T. matsutake Finally, we calculated the distribution of net income for the two NTFPs based on the quantities of the two products represented by the survey, prices and the number of collectors and traders represented. The distribution of incomes in the market was markedly different for the two products. For O. sinensis 75% of the net income in the market was distributed between collectors. The opposite was the case for T. matsutake where only 20% of the total net income was distributed between collectors. At the household level, O. sinensis collectors had a net income corresponding to 0.02% of traders’ net income while collectors of T. matsutake made 0.004% of traders’ net income (Table 3). Table 3. Distribution of incomes in the market for O. sinensis and T. matsutake. Incomes of collectors are scaled to match the observed amounts traded.
Net incomes (USD) corresponding to observed
trade O. sinensis T. matsutake
Collectors 1,510,449 51,636 Traders 487,862 215,861 Collectors/trade 3.10 0.24
Average net income (USD) per household O. sinensis T. matsutake
Collectors 1,089 105 Traders 54,207 26,983 Collectors/traders 0.020 0.004
5.4 Sustainability of the trade Collectors of O. sinensis and T. matsutake had contrasting perceptions of the status of the resource base (40% believed O. sinensis had become scarcer in the past 5 years and 40% believed there was no change). Collectors of both products shared a common view (70%) that the harvest was gradually becoming unsustainable due to overexploitation and habitat destruction as increased prices lead to increased extraction. This perception was supported by many city traders. Especially T. matsutake traders claimed that smaller amounts of poorer quality were traded today as compared to 5 years ago.

410
15
6. Discussion Traditional medicine is used by billions of people in developing countries, because of their low costs, their effectiveness, the frequently inadequate provision of modern medicine, and cultural and religious preferences (Sheldon et al., 1997; Shanley and Luz, 2003).
The trade in traditional medicine not only provides vital welfare for millions of consumers but it is also critical for the welfare of all the people engaged in the industry. The annual global market for herbal remedies, estimated at approximately USD 23 billion (Crabb, 2004), makes a considerable contribution to the economies of producer countries (Schippmann et al., 2002). For example, in Tibet the income from sale of O. sinensis often accounts for 70-90% of a family’s annual cash income in areas where it grows (Winkler, 2008). Many studies have shown poorer households to be more dependent on harvest of NTFPs than wealthier ones (Cavendish 2000; Vedeld et al. 2007) while other studies have found elite capture prevalent for very valuable NTFPs (Neumann and Hirsh, 2000; Dove 1993). In this study, 23% of the O. sinensis collectors were women and 77% were illiterate while 75% of the T. matsutake collectors were women, and 86% of the collectors were illiterate. However, there was no significant correlation between household incomes and incomes from collection of the two products. Yet, both products have a potential to provide an income to women and uneducated people.
A range of studies have described NTFP trade chains from various countries, i.e. for charcoal in Senegal (Ribot 1998), agarwood in Laos (Jensen 2009), medicinal and aromatic plants in Nepal (Olsen 1998), medicinal plants in South Africa (Botha et al 2004), and in Benin (Vodouhe et al. 2008). The structure of the markets can be highly complex and the relationship between actors dynamic and often in the form of patron-client relationships (Neumann and Hirsh, 2000). A common assumption is that the relationship between collectors and traders is exploitative and that large margins remain with the middlemen and city traders. Edwards (1996) suggested that removing some levels of intermediaries from the chain can increase the margin share of collectors. On the contrary some studies cited by Neumann and Hirsch (2000) suggest that middlemen have important functions in the trade chains and do not always have an exploitative role. The commodity chain of O. sinensis within Bhutan is relatively short (only one level of intermediaries) and can be broadly divided into three levels, namely collectors, middlemen and city traders/exporters. The trade chain of T. matsutake is more complex. Though most collectors sell directly to city traders or agents of city traders, several
16
other options exist, i.e. sale to local retailers, user groups, tourists, or government corporations.
The distribution of incomes in the market was markedly different for the two products. Collectors of O. sinensis gain a significantly higher percentage of incomes than T. matsutake collectors. There are more actors and levels in the T. matsutake trade chain. However, the presence of agents and local retailers does not seem to be exploitative as little margin remains with these groups. On the other hand, the presence of numerous different buyers did not seem to provide collectors a better price through increased competition among buyers as compared to O. sinensis. Another question is why the user groups are unsuccessful in bargaining for higher prices. One of the answers may be that selling larger quantities does not necessarily lead to better prices per kg. This is in accordance with a study from South Africa (Williams et al., 2007) showing an inverse relationship between price per kilogram and quantities sold. User groups may also have low bargaining powers due to lack of information about price structure in the market, poor networks to city traders and exporters or inefficiency.
The total net income for traders and exporters of the two products are very high compared with those of collectors and middlemen and their returns of investment may be very high compared to the short term of the investment. However, international trade in NTFPs has a trend of boom and bust and is subjected to price fluctuation, higher quality standards, sophisticated market preferences and international trade rules (Neumann and Hirsch, 2000). This is also the case for O. sinensis (Cannon et al, 2009). Hence, traders need a huge capital to enter the market and are prone to risks. This together with the government-controlled licensing of exporters and government-controlled auctions may facilitate small elite of traders to monopolize the trade. In 2008, there were 55 registered traders of whom only 27 turned up at the auctions held at 10 locations in Bhutan between July and August 2008 (MoA, 2008). The trade in T. matsutake is not controlled to the same extent as O. sinensis. Traders do not need a license but the quality of drying, grading and packaging is inspected by Bhutan Agriculture and Food Regulatory Body before export. All T. matsutake traders lived in a city, most had completed further education, and mushroom trade was a side business for all of them. Four of the city traders in this study were said to control 90% T. matsutake trade in the region and 75% of the export from Bhutan. Thus, the export of both NTFPs seemed to be controlled by relatively few individuals.
Usually the market values of individual NTFPs vary considerably and price structures fluctuate between markets and over time as the cost of harvesting a

411
15
6. Discussion Traditional medicine is used by billions of people in developing countries, because of their low costs, their effectiveness, the frequently inadequate provision of modern medicine, and cultural and religious preferences (Sheldon et al., 1997; Shanley and Luz, 2003).
The trade in traditional medicine not only provides vital welfare for millions of consumers but it is also critical for the welfare of all the people engaged in the industry. The annual global market for herbal remedies, estimated at approximately USD 23 billion (Crabb, 2004), makes a considerable contribution to the economies of producer countries (Schippmann et al., 2002). For example, in Tibet the income from sale of O. sinensis often accounts for 70-90% of a family’s annual cash income in areas where it grows (Winkler, 2008). Many studies have shown poorer households to be more dependent on harvest of NTFPs than wealthier ones (Cavendish 2000; Vedeld et al. 2007) while other studies have found elite capture prevalent for very valuable NTFPs (Neumann and Hirsh, 2000; Dove 1993). In this study, 23% of the O. sinensis collectors were women and 77% were illiterate while 75% of the T. matsutake collectors were women, and 86% of the collectors were illiterate. However, there was no significant correlation between household incomes and incomes from collection of the two products. Yet, both products have a potential to provide an income to women and uneducated people.
A range of studies have described NTFP trade chains from various countries, i.e. for charcoal in Senegal (Ribot 1998), agarwood in Laos (Jensen 2009), medicinal and aromatic plants in Nepal (Olsen 1998), medicinal plants in South Africa (Botha et al 2004), and in Benin (Vodouhe et al. 2008). The structure of the markets can be highly complex and the relationship between actors dynamic and often in the form of patron-client relationships (Neumann and Hirsh, 2000). A common assumption is that the relationship between collectors and traders is exploitative and that large margins remain with the middlemen and city traders. Edwards (1996) suggested that removing some levels of intermediaries from the chain can increase the margin share of collectors. On the contrary some studies cited by Neumann and Hirsch (2000) suggest that middlemen have important functions in the trade chains and do not always have an exploitative role. The commodity chain of O. sinensis within Bhutan is relatively short (only one level of intermediaries) and can be broadly divided into three levels, namely collectors, middlemen and city traders/exporters. The trade chain of T. matsutake is more complex. Though most collectors sell directly to city traders or agents of city traders, several
16
other options exist, i.e. sale to local retailers, user groups, tourists, or government corporations.
The distribution of incomes in the market was markedly different for the two products. Collectors of O. sinensis gain a significantly higher percentage of incomes than T. matsutake collectors. There are more actors and levels in the T. matsutake trade chain. However, the presence of agents and local retailers does not seem to be exploitative as little margin remains with these groups. On the other hand, the presence of numerous different buyers did not seem to provide collectors a better price through increased competition among buyers as compared to O. sinensis. Another question is why the user groups are unsuccessful in bargaining for higher prices. One of the answers may be that selling larger quantities does not necessarily lead to better prices per kg. This is in accordance with a study from South Africa (Williams et al., 2007) showing an inverse relationship between price per kilogram and quantities sold. User groups may also have low bargaining powers due to lack of information about price structure in the market, poor networks to city traders and exporters or inefficiency.
The total net income for traders and exporters of the two products are very high compared with those of collectors and middlemen and their returns of investment may be very high compared to the short term of the investment. However, international trade in NTFPs has a trend of boom and bust and is subjected to price fluctuation, higher quality standards, sophisticated market preferences and international trade rules (Neumann and Hirsch, 2000). This is also the case for O. sinensis (Cannon et al, 2009). Hence, traders need a huge capital to enter the market and are prone to risks. This together with the government-controlled licensing of exporters and government-controlled auctions may facilitate small elite of traders to monopolize the trade. In 2008, there were 55 registered traders of whom only 27 turned up at the auctions held at 10 locations in Bhutan between July and August 2008 (MoA, 2008). The trade in T. matsutake is not controlled to the same extent as O. sinensis. Traders do not need a license but the quality of drying, grading and packaging is inspected by Bhutan Agriculture and Food Regulatory Body before export. All T. matsutake traders lived in a city, most had completed further education, and mushroom trade was a side business for all of them. Four of the city traders in this study were said to control 90% T. matsutake trade in the region and 75% of the export from Bhutan. Thus, the export of both NTFPs seemed to be controlled by relatively few individuals.
Usually the market values of individual NTFPs vary considerably and price structures fluctuate between markets and over time as the cost of harvesting a

412
17
species depend on gatherer’s access to the resources and proximity of markets to the harvesting sites. In the case of O. sinensis and T. matsutake prices do not seem to be determined by collectors’ effort. Rather it is decided by a restricted number of traders and international markets. Collectors of both O. sinensis and T. matsutake pointed to improved quality (size, cleaning and drying) as the best way to increase their income. Many also suggested that more traders should participate in the auctions, auctions to be held in more places to improve access of local traders, lifting of government control with the markets, and government intervention to prevent manipulation of prices by traders. A few collectors felt that transparency in price structures and information about prices would allow them to increase their selling price. Though most collectors did not wish for more government intervention in the NTFP trade, they did in many cases expect the government to facilitate infrastructure and a price structure to increase the incomes of NTFP harvesters. While most O. sinensis collectors were in favour of less government control of the trade itself, some T. matsutake collectors suggested government controlled auctions as practiced for O. sinensis in order to secure collectors a better price. Some collectors of O. sinensis suggested that the government should provide security at the collection sites during the collection season by armed forced or forest department staff in order to secure that only legal collectors entered the areas and to prevent stealing and destruction of tents by competing collectors.
6.1 Sustainability of the harvest Rising demand for medicinal plants has led to increased pressure on wild plant populations. This, combined with shrinking habitats, means that many species are now facing local extinction (Botha et al., 2004). Legislation has done little to curb the medicinal plant trade historically (Dauskardt 1991). In Bhutan, legislation exists pertaining to the conservation of indigenous plants but implementation is difficult. Illegal collection and trade across the border to Tibet is known to occur but the extent of the illegal harvest and trade has not been estimated. Collectors of T. matsutake harvest in shorter periods than the allowed 4 months as the season often started later or finished earlier. For both products, there was a widespread concern among collectors and traders that the current rate of collection is unsustainable and that the two species had become scarcer due to over-exploitation, indiscriminate harvest, and degradation or destruction of habitats. Increased commercialization and globalization of traditional medicines does not invariably lead to declining resources and species loss (Andel and Havinga, 2008). The fact that O. sinensis has been collected for centuries and is still common argues for its resilience, but the lack
18
of harvest studies precludes a definite answer as to whether the harvest can be sustained at its current levels (Cannon et al., 2008). Commercial T. matsutake collection in Bhutan began at a much later stage and few studies are available on the amounts collected or biology of the species. Further studies are necessary to determine the ecological effects of this trade. We recommend that for both NTFPs, future management strategies should take into the account local market conditions, and the socio-economic realities facing both collectors and those who depend on the trade for their livelihoods.
6.2 Validity of data The sample of O. sinensis and T. matsutake collectors were both skewed towards low income households rendering tests of correlation between income from collection and other income weak. The sample sizes for traders were small (n=9 for O. sinensis and n=8 for T. matsutake). Traders’ costs for refrigeration, storage space, and losses were not always included as these were hard for traders to estimate. Traders’ investment of time was also not included. Several traders stated that they sold less than they bought. It is not known whether the remaining quantities are kept in stock or have been exported illegally. Illegal cross-border trade in O. sinensis is known to occur but has not been considered in this study.
7. Conclusion Collectors’ income from O. sinensis often accounts for 60-100% of the household’s annual cash income while T. matsutake accounted for almost 10% of collectors’ annual cash income. Incomes from the two NTFPs were not correlated with household income from other sources but both products provided a substantial income-earning opportunity for women and illiterate villagers.
The distribution of incomes in the market was markedly different for the two products. Collectors of O. sinensis gain a significantly higher percentage of incomes than T. matsutake collectors. There are more actors and levels in the T. matsutake trade chain. However, the presence of agents and local retailers does not seem to be exploitative as little margin remains with these groups. On the other hand, the presence of numerous different buyers did not seem to provide collectors a better price through increased competition among buyers as compared to O. sinensis.
Though most collectors did not wish for more government intervention in the NTFP trade, they did in many cases expect the government to facilitate infrastructure and a price structure to increase the incomes of NTFP harvesters.

413
17
species depend on gatherer’s access to the resources and proximity of markets to the harvesting sites. In the case of O. sinensis and T. matsutake prices do not seem to be determined by collectors’ effort. Rather it is decided by a restricted number of traders and international markets. Collectors of both O. sinensis and T. matsutake pointed to improved quality (size, cleaning and drying) as the best way to increase their income. Many also suggested that more traders should participate in the auctions, auctions to be held in more places to improve access of local traders, lifting of government control with the markets, and government intervention to prevent manipulation of prices by traders. A few collectors felt that transparency in price structures and information about prices would allow them to increase their selling price. Though most collectors did not wish for more government intervention in the NTFP trade, they did in many cases expect the government to facilitate infrastructure and a price structure to increase the incomes of NTFP harvesters. While most O. sinensis collectors were in favour of less government control of the trade itself, some T. matsutake collectors suggested government controlled auctions as practiced for O. sinensis in order to secure collectors a better price. Some collectors of O. sinensis suggested that the government should provide security at the collection sites during the collection season by armed forced or forest department staff in order to secure that only legal collectors entered the areas and to prevent stealing and destruction of tents by competing collectors.
6.1 Sustainability of the harvest Rising demand for medicinal plants has led to increased pressure on wild plant populations. This, combined with shrinking habitats, means that many species are now facing local extinction (Botha et al., 2004). Legislation has done little to curb the medicinal plant trade historically (Dauskardt 1991). In Bhutan, legislation exists pertaining to the conservation of indigenous plants but implementation is difficult. Illegal collection and trade across the border to Tibet is known to occur but the extent of the illegal harvest and trade has not been estimated. Collectors of T. matsutake harvest in shorter periods than the allowed 4 months as the season often started later or finished earlier. For both products, there was a widespread concern among collectors and traders that the current rate of collection is unsustainable and that the two species had become scarcer due to over-exploitation, indiscriminate harvest, and degradation or destruction of habitats. Increased commercialization and globalization of traditional medicines does not invariably lead to declining resources and species loss (Andel and Havinga, 2008). The fact that O. sinensis has been collected for centuries and is still common argues for its resilience, but the lack
18
of harvest studies precludes a definite answer as to whether the harvest can be sustained at its current levels (Cannon et al., 2008). Commercial T. matsutake collection in Bhutan began at a much later stage and few studies are available on the amounts collected or biology of the species. Further studies are necessary to determine the ecological effects of this trade. We recommend that for both NTFPs, future management strategies should take into the account local market conditions, and the socio-economic realities facing both collectors and those who depend on the trade for their livelihoods.
6.2 Validity of data The sample of O. sinensis and T. matsutake collectors were both skewed towards low income households rendering tests of correlation between income from collection and other income weak. The sample sizes for traders were small (n=9 for O. sinensis and n=8 for T. matsutake). Traders’ costs for refrigeration, storage space, and losses were not always included as these were hard for traders to estimate. Traders’ investment of time was also not included. Several traders stated that they sold less than they bought. It is not known whether the remaining quantities are kept in stock or have been exported illegally. Illegal cross-border trade in O. sinensis is known to occur but has not been considered in this study.
7. Conclusion Collectors’ income from O. sinensis often accounts for 60-100% of the household’s annual cash income while T. matsutake accounted for almost 10% of collectors’ annual cash income. Incomes from the two NTFPs were not correlated with household income from other sources but both products provided a substantial income-earning opportunity for women and illiterate villagers.
The distribution of incomes in the market was markedly different for the two products. Collectors of O. sinensis gain a significantly higher percentage of incomes than T. matsutake collectors. There are more actors and levels in the T. matsutake trade chain. However, the presence of agents and local retailers does not seem to be exploitative as little margin remains with these groups. On the other hand, the presence of numerous different buyers did not seem to provide collectors a better price through increased competition among buyers as compared to O. sinensis.
Though most collectors did not wish for more government intervention in the NTFP trade, they did in many cases expect the government to facilitate infrastructure and a price structure to increase the incomes of NTFP harvesters.

414
19
Over-exploitation and habitat destruction was a common concern to collectors of O. sinensis and T. matsutake. Further research on the biology of the species, the resource base and the impact of increasing collection and trade is needed to ensure sustainable harvest levels.
References Andel, T. V. and Havinga, R. 2008. Sustainability aspects of commercial
medicinal plant harvesting in Suriname. Forest Ecology and Management, 256: 1540-1545.
Botha, J., Witkowski, E.T.F., and Schackleton, C.M. 2004. Market profiles and trade in medicinal plants in the Lowweld, South Africa. Environmental Conservation 31: 38-46.
Cannon, P.F., Hywel-Jones, N.L., Maczey, N., Norbu, L., Tshitila, Tashi S., Lhendup, P. 2009. Steps towards sustainable harvest of Ophiocordyceps sinensis in Bhutan. Biodivers Conserv, 18: 2263-2281.
Cavendish, W. 2000. Empirical Regularities in the Poverty-Environment Relationship of Rural Households: Evidence from Zimbabwe.” World Development, 28(11):1979–2003.
CIA, 2009. The World Fact Book. Country, Bhutan. Available online at https://www.cia.gov/library/publications/the-world-factbook/geos/bt.html. Accessed on 23.05.2009.
Crabb, 2004. Science meets traditionand identifies herbal treatment for jaundice. Bulletin of World Health Organization (WHO) 82: 154.
Dauskardt, R. 1991. Urban herbalism: the restructuring of informal survival in Witwatersrand. In: South Africa’s informal economy. Ed. E. Preston Whyte & C. Rogerson, pp. 87-100. Cape Town, South Africa. Oxford University Press.
Dove, MR. 1993. A revisionist look at tropical deforestation and development. Environmental Conservation 20: 17-24.
Edward, D.M. 1996. The Trade in Non-Timber Forest Products from Nepal. Mountain Research and Development, 16(4): 383-394.
FAO, 2005. Medicinal plants for for forest conservation and health care. Trade in medicinal plants. FAO corporate document repository. FAO, Rome. Available online at http://www.fao.org/docrep/w7261e/W7261e08.htm Accessed 16.08.2010.
Godoy, R., Brokaw, N., and Wilkie, D. 1995. The effect of income on the extraction of non-timber tropical forest products: Model, hypothesis and preliminary findings from the Sumu Indians of Nicaragua. Human Ecology 23: 29-52.
20
Gould, R. 2007. Himalayan Viagra, Himalayan Gold? Cordyceps sinensis brings new forces to the Bhutanese Himalaya. Tropical Resource Bulletin 26: 63-69.
IUCN, 2007. International Standard for Sustainable Wild Collection of Medicinal and Aromatic Plants (ISSC-MAP). Medicinal Plant Specialist Group Species Survival Commission IUCN – The World Conservation Union. Available online http://www.floraweb.de/proxy/floraweb/MAP-pro/Standard_Version1_0.pdf Accessed 16.08.2010.
Jensen, A. 2009. Valuation of non-timber forest products value chains. Forest Policy and Economics, 11: 34-41.
Lange, D.2006. International trade in medicinal and aromatic plants. In Medicinal and Aromatic Plants: Agricultural, Commercial, Ecological, Legal, Pharmacological and Social Aspects, Edts. Bogers, R. J. Craker, L. E. Lange, D. Netherlands, pp.155-170.
Larsen, H.O. and Olsen, C.S. 2007. Unsustainable collection and unfair trade? Uncovering and assessing assumptions regarding Central Himalayan medicinal plant conservation. Biodiversity Conservation, 16:1679-1697.
Lintu, L. 1995. Trade and marketing of NWFPs. Report of the international expert consultation on Non Wood Forest Products. FAO, Rome. Available online http://www.fao.org/docrep/V7540e/V7540e19.htm Accessed 16.08.2010.
MoA 2008. Statistics. Agiculture Marketing Service, Ministry of Agriculture, Bhutan.
Neumann, R.P. and Hirsch, E. 2000. Commercialisation of Non-Timber Forest Products: Review and Analysis of Research. Center for International Forestry Research, Bogor, pp. 45-75.
Olsen, C.S. 1998. Valuation of Commercial Central Himalayan Medicinal Plants. Ambio Vol. 34, No. 8, December 2005.
Ribot, J.C. 1998. Theorizing access: forest Profits along Senegal's charcoal commodity chain. Development and Change, 29: 307-341.
Ribot, J.C. and Peluso, N.L. 2003. A theory of access. Rural Sociology 68: 153–181.
Schippmann, U., Leaman, D.J., Cunningham, A. B. 2002. Impact of Cultivation and Gathering of Medicinal Plants on Biodiversity: Global Trends and Issues. Biodiversity and the Ecosystem Approach in Agriculture, Forestry and Fisheries. FAO, Rome.
Shanley, P., Luz, L. 2003. The impacts of forest degradation on medicinal plant use and implications for health care in Estern Amazonia. ioscience 53 (6), 573–584.

415
19
Over-exploitation and habitat destruction was a common concern to collectors of O. sinensis and T. matsutake. Further research on the biology of the species, the resource base and the impact of increasing collection and trade is needed to ensure sustainable harvest levels.
References Andel, T. V. and Havinga, R. 2008. Sustainability aspects of commercial
medicinal plant harvesting in Suriname. Forest Ecology and Management, 256: 1540-1545.
Botha, J., Witkowski, E.T.F., and Schackleton, C.M. 2004. Market profiles and trade in medicinal plants in the Lowweld, South Africa. Environmental Conservation 31: 38-46.
Cannon, P.F., Hywel-Jones, N.L., Maczey, N., Norbu, L., Tshitila, Tashi S., Lhendup, P. 2009. Steps towards sustainable harvest of Ophiocordyceps sinensis in Bhutan. Biodivers Conserv, 18: 2263-2281.
Cavendish, W. 2000. Empirical Regularities in the Poverty-Environment Relationship of Rural Households: Evidence from Zimbabwe.” World Development, 28(11):1979–2003.
CIA, 2009. The World Fact Book. Country, Bhutan. Available online at https://www.cia.gov/library/publications/the-world-factbook/geos/bt.html. Accessed on 23.05.2009.
Crabb, 2004. Science meets traditionand identifies herbal treatment for jaundice. Bulletin of World Health Organization (WHO) 82: 154.
Dauskardt, R. 1991. Urban herbalism: the restructuring of informal survival in Witwatersrand. In: South Africa’s informal economy. Ed. E. Preston Whyte & C. Rogerson, pp. 87-100. Cape Town, South Africa. Oxford University Press.
Dove, MR. 1993. A revisionist look at tropical deforestation and development. Environmental Conservation 20: 17-24.
Edward, D.M. 1996. The Trade in Non-Timber Forest Products from Nepal. Mountain Research and Development, 16(4): 383-394.
FAO, 2005. Medicinal plants for for forest conservation and health care. Trade in medicinal plants. FAO corporate document repository. FAO, Rome. Available online at http://www.fao.org/docrep/w7261e/W7261e08.htm Accessed 16.08.2010.
Godoy, R., Brokaw, N., and Wilkie, D. 1995. The effect of income on the extraction of non-timber tropical forest products: Model, hypothesis and preliminary findings from the Sumu Indians of Nicaragua. Human Ecology 23: 29-52.
20
Gould, R. 2007. Himalayan Viagra, Himalayan Gold? Cordyceps sinensis brings new forces to the Bhutanese Himalaya. Tropical Resource Bulletin 26: 63-69.
IUCN, 2007. International Standard for Sustainable Wild Collection of Medicinal and Aromatic Plants (ISSC-MAP). Medicinal Plant Specialist Group Species Survival Commission IUCN – The World Conservation Union. Available online http://www.floraweb.de/proxy/floraweb/MAP-pro/Standard_Version1_0.pdf Accessed 16.08.2010.
Jensen, A. 2009. Valuation of non-timber forest products value chains. Forest Policy and Economics, 11: 34-41.
Lange, D.2006. International trade in medicinal and aromatic plants. In Medicinal and Aromatic Plants: Agricultural, Commercial, Ecological, Legal, Pharmacological and Social Aspects, Edts. Bogers, R. J. Craker, L. E. Lange, D. Netherlands, pp.155-170.
Larsen, H.O. and Olsen, C.S. 2007. Unsustainable collection and unfair trade? Uncovering and assessing assumptions regarding Central Himalayan medicinal plant conservation. Biodiversity Conservation, 16:1679-1697.
Lintu, L. 1995. Trade and marketing of NWFPs. Report of the international expert consultation on Non Wood Forest Products. FAO, Rome. Available online http://www.fao.org/docrep/V7540e/V7540e19.htm Accessed 16.08.2010.
MoA 2008. Statistics. Agiculture Marketing Service, Ministry of Agriculture, Bhutan.
Neumann, R.P. and Hirsch, E. 2000. Commercialisation of Non-Timber Forest Products: Review and Analysis of Research. Center for International Forestry Research, Bogor, pp. 45-75.
Olsen, C.S. 1998. Valuation of Commercial Central Himalayan Medicinal Plants. Ambio Vol. 34, No. 8, December 2005.
Ribot, J.C. 1998. Theorizing access: forest Profits along Senegal's charcoal commodity chain. Development and Change, 29: 307-341.
Ribot, J.C. and Peluso, N.L. 2003. A theory of access. Rural Sociology 68: 153–181.
Schippmann, U., Leaman, D.J., Cunningham, A. B. 2002. Impact of Cultivation and Gathering of Medicinal Plants on Biodiversity: Global Trends and Issues. Biodiversity and the Ecosystem Approach in Agriculture, Forestry and Fisheries. FAO, Rome.
Shanley, P., Luz, L. 2003. The impacts of forest degradation on medicinal plant use and implications for health care in Estern Amazonia. ioscience 53 (6), 573–584.
416
21
Sheldon, J.W., Balick, M.J., Laird, S.A. 1997. Medicinal plants: can utilization and conservation coexist? Advances in Economic Botany 12, 1–104
Talbot, J.M. 2002. Tropical commodity chains, forward integration strategies and international inequality: coffee, cocoa and tea. Review of International Political Economy, 9(4): 701-734.
Vedeld, P., Angelsen, A., Bojø, A. J., Sjaastad, E. and Kobugabe, G.K. 2007. Forest Environmental Incomes and the Rural Poor. Forest Policy and Economics 9 :869-879.
Veeman, M. 2002. Understanding Local and Regional Markets for Forest Products. In Uncovering the hidden harvest, Edts. Campbell, B. M. and Luckert, M. K. London, PP. 66-101.
Vodouhe, F.G., Coulibaly, O., Assogbadjo, A.E., Sinsin, B. 2008. Medicinal plant commercialization in Benin: An analysis of profit distribution equity across supply chain actors and its effect on the sustainable use of harvested species. Journal of Medicinal Plants Research, 2 :331-340.
WHO 2010. World Health Organisation, Geneva. http://www.who.int/mediacentre/factsheets/fs134/en/ Accessed 16.08.2010.
Williams, V.L., Witkowski, E.T.F., and Balkwill, K. 2007. Volume and financial value of species traded in the medicinal plant markets of Gauteng, South Africa. International Journal of Sustainable Development & World Ecology 14: 584-603.
Winkler, D. 2008. Yartsa Gunbu (Cordyceps sinensis) and the fungal commodification of Tibet’s rural economy. Economic Botany 62: 291-305.
Wangda P & Ohsawa M. Forest Pattern Analysis Along the Topographical and Climatic Gradient of the Dry West and Humid East Slopes of Dochula, Western Bhutan. Journal of Renewable Resources Bhutan 2: 1 - 17
ABSTRACTS
Carbon based policy instruments versus agricultural commodity market in stopping tropical deforestation
Sepul K. Barua1, Jussi Uusivuori2 and Jari Kuuluvainen1
1 Department of Forest Sciences, University of Helsinki
2 Finnish Forest Research Institute – METLA We analyze in this study how the carbon based policy instruments and market for two agricultural commodities, viz. soy and oil palm affect the conversion of tropical forestland to agriculture. To formally establish the link between tropical forest clearing and agricultural product market, we first analyze the role of carbon market options available through REDD arrangements in a landholder’s supply of land to agricultural through forest clearing. Then we analyze how the demand of forest-cleared land reacts to agricultural commodity price changes and to income and carbon tax levied on agribusiness. Finally, we determine the market equilibrium price and quantity of forest-cleared land that is used to produce agricultural products, and show how the equilibrium reacts to the changes in carbon and agricultural commodity prices and to carbon and income taxes levied on the agri-business. The study contains two major parts. In the first part, we analytically introduce the supply and demand sides. The supply side is illustrated with a two-period utility maximization model in which a community, i.e. the landholder maximizes its utility from consumptions and amenity values of standing forest. The total consumption in two periods is formulated such that it does not exceed the forestland value in the current period and an external non-forest asset. On the other hand, the agribusiness company, which represents the demand side of the analysis, is assumed to follow a Cobb-Douglus production technology to produce its output, i.e. an agricultural product using the purchased land, labor and other inputs. Its profit maximization problem incorporates the cost of transporting final product to the market from the production site, and an income and a carbon tax imposed on the company. In the second part, we do the analysis numerically by illustrating the models with two cases, one for oil palm plantation in Selangor province, Malaysia, and the other for soy plantation in Chaco forest area in Paraguay. The results show that with the increase in the price of fresh oil palm fruit bunch and soy, the market equilibrium for land shifts upward and to the right increasing both the land price and

417
21
Sheldon, J.W., Balick, M.J., Laird, S.A. 1997. Medicinal plants: can utilization and conservation coexist? Advances in Economic Botany 12, 1–104
Talbot, J.M. 2002. Tropical commodity chains, forward integration strategies and international inequality: coffee, cocoa and tea. Review of International Political Economy, 9(4): 701-734.
Vedeld, P., Angelsen, A., Bojø, A. J., Sjaastad, E. and Kobugabe, G.K. 2007. Forest Environmental Incomes and the Rural Poor. Forest Policy and Economics 9 :869-879.
Veeman, M. 2002. Understanding Local and Regional Markets for Forest Products. In Uncovering the hidden harvest, Edts. Campbell, B. M. and Luckert, M. K. London, PP. 66-101.
Vodouhe, F.G., Coulibaly, O., Assogbadjo, A.E., Sinsin, B. 2008. Medicinal plant commercialization in Benin: An analysis of profit distribution equity across supply chain actors and its effect on the sustainable use of harvested species. Journal of Medicinal Plants Research, 2 :331-340.
WHO 2010. World Health Organisation, Geneva. http://www.who.int/mediacentre/factsheets/fs134/en/ Accessed 16.08.2010.
Williams, V.L., Witkowski, E.T.F., and Balkwill, K. 2007. Volume and financial value of species traded in the medicinal plant markets of Gauteng, South Africa. International Journal of Sustainable Development & World Ecology 14: 584-603.
Winkler, D. 2008. Yartsa Gunbu (Cordyceps sinensis) and the fungal commodification of Tibet’s rural economy. Economic Botany 62: 291-305.
Wangda P & Ohsawa M. Forest Pattern Analysis Along the Topographical and Climatic Gradient of the Dry West and Humid East Slopes of Dochula, Western Bhutan. Journal of Renewable Resources Bhutan 2: 1 - 17
ABSTRACTS
Carbon based policy instruments versus agricultural commodity market in stopping tropical deforestation
Sepul K. Barua1, Jussi Uusivuori2 and Jari Kuuluvainen1
1 Department of Forest Sciences, University of Helsinki
2 Finnish Forest Research Institute – METLA We analyze in this study how the carbon based policy instruments and market for two agricultural commodities, viz. soy and oil palm affect the conversion of tropical forestland to agriculture. To formally establish the link between tropical forest clearing and agricultural product market, we first analyze the role of carbon market options available through REDD arrangements in a landholder’s supply of land to agricultural through forest clearing. Then we analyze how the demand of forest-cleared land reacts to agricultural commodity price changes and to income and carbon tax levied on agribusiness. Finally, we determine the market equilibrium price and quantity of forest-cleared land that is used to produce agricultural products, and show how the equilibrium reacts to the changes in carbon and agricultural commodity prices and to carbon and income taxes levied on the agri-business. The study contains two major parts. In the first part, we analytically introduce the supply and demand sides. The supply side is illustrated with a two-period utility maximization model in which a community, i.e. the landholder maximizes its utility from consumptions and amenity values of standing forest. The total consumption in two periods is formulated such that it does not exceed the forestland value in the current period and an external non-forest asset. On the other hand, the agribusiness company, which represents the demand side of the analysis, is assumed to follow a Cobb-Douglus production technology to produce its output, i.e. an agricultural product using the purchased land, labor and other inputs. Its profit maximization problem incorporates the cost of transporting final product to the market from the production site, and an income and a carbon tax imposed on the company. In the second part, we do the analysis numerically by illustrating the models with two cases, one for oil palm plantation in Selangor province, Malaysia, and the other for soy plantation in Chaco forest area in Paraguay. The results show that with the increase in the price of fresh oil palm fruit bunch and soy, the market equilibrium for land shifts upward and to the right increasing both the land price and

418
quantity of land needed, which implies more forest clearing. However, with the increase in the current carbon price, exactly opposite shift in the market equilibrium occurs, which is because of the land supply curve’s shifting leftward. The similar shifting in both the land supply and the market equilibrium is observed when the agri-business firm is levied with higher income and carbon tax than the forestry, and when the transportation cost is higher. These imply that paying for forest carbon to the community and levying comparatively higher tax on the income and for the carbon emission of the agri-business company – that uses forest cleared land as input – do discourage deforestation. In addition, the higher the distance of agricultural frontier of forest from the market, the less is the deforestation.
Corporate social responsibility, forestry and societal
change – a developing country perspective
Kirsten Carlsen and Jens F. Lund Forest & Landscape, Faculty of Life Sciences, University of Copenhagen
This paper investigates the mechanisms through which corporate social responsibility (CSR) in the forestry sector may contribute to broader societal changes in a developing country setting. The aim is to provide for improved understanding of the conditions under which CSR may or may not contribute to societal changes. On the basis of a review of the CSR literature focusing on the natural resource related industries in developing countries, it is argued that many CSR theories make implicit assumptions regarding the nature of the State and power relations between groups in society that may be questionable. In particular, two assumptions are identified. First it is often assumed that the State in which companies practise CSR seeks to maximise the welfare of society at large. Second, it is also assumed that stakeholders can reach agreement through deliberative processes. With point of departure in the case of the Ghanaian logging industry, the general adequacy of these two assumptions are discussed and challenged from the perspective of the forestry sector in developing countries. Keywords: corporate social responsibility, societal change, logging industry, Ghana.
Improving the conservation status of the Udzungwa Mountains?
The effect of Joint Forest Management on bushmeat hunting in the Kilombero Nature Reserve, Tanzania
Martin Reinhardt Nielsen
Forest & Landscape, Faculty of Life Sciences, University of Copenhagen This study examines the effect of Joint Forest Management (JFM) in a component of the Kilombero Nature Reserve recently gazetted to improve the conservation status of high biodiversity forests in the Udzungwa Mountains of the Eastern Afromontane biodiversity hotspot. The evaluation is based on a temporal comparison spanning seven years of JFM and establishment of a TANAPA ranger station using bushmeat hunting as an indicator. Results reveal that number of active hunters had declined, primarily due to TANAPA’s patrolling. But hunting effort had been displaced from hunting with riffles in the grassland to hunting with traps and dogs in the forests increasing the threat to endemic species and leading to decline of relative densities of targeted species on village adjacent transects. Hunters perceived few benefits from JFM that were largely unused, inaccessible and communal in nature. Suspicions of embezzlement of JFM funds and high village development contributions were important drivers of continuing hunting. Dissatisfied with JFM, most hunters actually preferred that TANAPA managed the forest. Considerable attention to correcting these problems is required before this model of JFM should be scaled up and implemented in remaining villages surrounding the Kilombero Nature Reserve. Keywords: Joint Forest Management, Bushmeat Hunting, Compliance, Displacement, Governance, Udzungwa Mountains, Tanzania.

419
quantity of land needed, which implies more forest clearing. However, with the increase in the current carbon price, exactly opposite shift in the market equilibrium occurs, which is because of the land supply curve’s shifting leftward. The similar shifting in both the land supply and the market equilibrium is observed when the agri-business firm is levied with higher income and carbon tax than the forestry, and when the transportation cost is higher. These imply that paying for forest carbon to the community and levying comparatively higher tax on the income and for the carbon emission of the agri-business company – that uses forest cleared land as input – do discourage deforestation. In addition, the higher the distance of agricultural frontier of forest from the market, the less is the deforestation.
Corporate social responsibility, forestry and societal
change – a developing country perspective
Kirsten Carlsen and Jens F. Lund Forest & Landscape, Faculty of Life Sciences, University of Copenhagen
This paper investigates the mechanisms through which corporate social responsibility (CSR) in the forestry sector may contribute to broader societal changes in a developing country setting. The aim is to provide for improved understanding of the conditions under which CSR may or may not contribute to societal changes. On the basis of a review of the CSR literature focusing on the natural resource related industries in developing countries, it is argued that many CSR theories make implicit assumptions regarding the nature of the State and power relations between groups in society that may be questionable. In particular, two assumptions are identified. First it is often assumed that the State in which companies practise CSR seeks to maximise the welfare of society at large. Second, it is also assumed that stakeholders can reach agreement through deliberative processes. With point of departure in the case of the Ghanaian logging industry, the general adequacy of these two assumptions are discussed and challenged from the perspective of the forestry sector in developing countries. Keywords: corporate social responsibility, societal change, logging industry, Ghana.
Improving the conservation status of the Udzungwa Mountains?
The effect of Joint Forest Management on bushmeat hunting in the Kilombero Nature Reserve, Tanzania
Martin Reinhardt Nielsen
Forest & Landscape, Faculty of Life Sciences, University of Copenhagen This study examines the effect of Joint Forest Management (JFM) in a component of the Kilombero Nature Reserve recently gazetted to improve the conservation status of high biodiversity forests in the Udzungwa Mountains of the Eastern Afromontane biodiversity hotspot. The evaluation is based on a temporal comparison spanning seven years of JFM and establishment of a TANAPA ranger station using bushmeat hunting as an indicator. Results reveal that number of active hunters had declined, primarily due to TANAPA’s patrolling. But hunting effort had been displaced from hunting with riffles in the grassland to hunting with traps and dogs in the forests increasing the threat to endemic species and leading to decline of relative densities of targeted species on village adjacent transects. Hunters perceived few benefits from JFM that were largely unused, inaccessible and communal in nature. Suspicions of embezzlement of JFM funds and high village development contributions were important drivers of continuing hunting. Dissatisfied with JFM, most hunters actually preferred that TANAPA managed the forest. Considerable attention to correcting these problems is required before this model of JFM should be scaled up and implemented in remaining villages surrounding the Kilombero Nature Reserve. Keywords: Joint Forest Management, Bushmeat Hunting, Compliance, Displacement, Governance, Udzungwa Mountains, Tanzania.

420
Livelihood strategies and poverty in rural Nepal
Øystein Juul Nielsen, Santosh Rayamajhi, Bir Bahadur Kahnal Chhetri, Henrik Meilby, Helle Overgaard Larsen and Carsten Smith-Hall
Forest & Landscape, Faculty of Life Sciences, University of Copenhagen
Knowing types of poor, their approximate number and asset characteristics, and contextual factors associated with wealth help improve identification of suitable poverty intervention strategies. Monetary measures (i.e. income and consumption) do not fully capture these multiple aspects - primarily because they are stochastic by nature (in particular income) and because households may pursue highly different income strategies not well captured by income groups. This paper present a non-monetary method to poverty analyses, by classifying households into livelihood strategy groups as opposed to e.g. income groups. Correct identification of livelihood groups help improve our understanding of (i) which livelihood options are poverty reducing and which are not, and (ii) the outreach of likely poverty intervention strategies. Household level activity variables and application of latent class cluster analysis are used to identify major rural livelihood strategy groups. Determinants for livelihood choice are analysed using multinomial logit regression. The results are based on a one-year survey of 836 rural households from four study locations with varying market access. The locations are distributed across the three main physiographic zones in Nepal. The survey included detailed information on household demographics, income and assets. Identification of livelihood groups, their expected wealth status, and asset and access constraints that limit economic advance are used to suggest appropriate targets of intervention.
DESPITE VOLCANIC ASH …
From all around the world they came through port and customs clearance,
despite volcanic ash to blame for late (or non-)appearance;
as humble walkers, first-class flyers and motorists who meant a carbon-neutral way to enter
Sjælland (Nord), to Gilleleje’s Folke Feriecenter.
They came from Joensuu and saw
the old familiar faces; from Uppsala, Umeå
and other Swedish places, from Ås and Vantaa in their plenty
(of which more, by-and-by), of course they came in force from Twenty-
three Rolighedsvej. They came from every distant cornier of the world’s most populous nations,
from Illinois and California to join these celebrations.
They flew, defying Iceland’s ash, round which their planes must climb,
though some of them were strapped for cash and all were short of time.
They came, Americans and Asians;
Germans on the train; And, with a truly British patience,
one participant, at least, stood interminably in a queue, was eventually told that the airport would close five minutes before his flight was due to take off, rebooked for Tuesday, went home for a day, just as he was about to
leave was texted to say that that flight was off, then telephoned to say that it was on again, spent the night on Manchester Airport, and, two days late,
arrived … at Kastrup in an aeroplane
(it’s that Icelandic ash again).

421
Livelihood strategies and poverty in rural Nepal
Øystein Juul Nielsen, Santosh Rayamajhi, Bir Bahadur Kahnal Chhetri, Henrik Meilby, Helle Overgaard Larsen and Carsten Smith-Hall
Forest & Landscape, Faculty of Life Sciences, University of Copenhagen
Knowing types of poor, their approximate number and asset characteristics, and contextual factors associated with wealth help improve identification of suitable poverty intervention strategies. Monetary measures (i.e. income and consumption) do not fully capture these multiple aspects - primarily because they are stochastic by nature (in particular income) and because households may pursue highly different income strategies not well captured by income groups. This paper present a non-monetary method to poverty analyses, by classifying households into livelihood strategy groups as opposed to e.g. income groups. Correct identification of livelihood groups help improve our understanding of (i) which livelihood options are poverty reducing and which are not, and (ii) the outreach of likely poverty intervention strategies. Household level activity variables and application of latent class cluster analysis are used to identify major rural livelihood strategy groups. Determinants for livelihood choice are analysed using multinomial logit regression. The results are based on a one-year survey of 836 rural households from four study locations with varying market access. The locations are distributed across the three main physiographic zones in Nepal. The survey included detailed information on household demographics, income and assets. Identification of livelihood groups, their expected wealth status, and asset and access constraints that limit economic advance are used to suggest appropriate targets of intervention.
DESPITE VOLCANIC ASH …
From all around the world they came through port and customs clearance,
despite volcanic ash to blame for late (or non-)appearance;
as humble walkers, first-class flyers and motorists who meant a carbon-neutral way to enter
Sjælland (Nord), to Gilleleje’s Folke Feriecenter.
They came from Joensuu and saw
the old familiar faces; from Uppsala, Umeå
and other Swedish places, from Ås and Vantaa in their plenty
(of which more, by-and-by), of course they came in force from Twenty-
three Rolighedsvej. They came from every distant cornier of the world’s most populous nations,
from Illinois and California to join these celebrations.
They flew, defying Iceland’s ash, round which their planes must climb,
though some of them were strapped for cash and all were short of time.
They came, Americans and Asians;
Germans on the train; And, with a truly British patience,
one participant, at least, stood interminably in a queue, was eventually told that the airport would close five minutes before his flight was due to take off, rebooked for Tuesday, went home for a day, just as he was about to
leave was texted to say that that flight was off, then telephoned to say that it was on again, spent the night on Manchester Airport, and, two days late,
arrived … at Kastrup in an aeroplane
(it’s that Icelandic ash again).

422
They came from Russia and the Baltics, Oregon and Auburn,
and met no atmospheric fault (ex- cept emitted cauburn).
They travelled far, to bring a fund of stirring Third World tales: but nobody from Eng-er-land,
and only one from Wales.
And, as for Iceland’s ash it gives us reason to rehearse
the case for stressing positives – not being risk-averse.
So let’s smooth frictions with a dash of optimistic oil,
recalling that volcanic ash turns in the end to soil;
that soil is good for growing trees, and growing trees is good,
because our milling industries can turn trees into wood. It is not, this volcanic ash an agent of destruction.
We recognise it in a flash: a factor of production! –
though, with 10 000 years to wait until the profits show
at any normal discount rate the MRP’s quite low.
So, thank you, soil scientists for pointing out the pluses;
and, if we find good news exists, we’ll call you – don’t call us! – ess-
entially, don’t call … at all.
They came for Niels Elers Koch’s transforming thinking that unlocks
doors to collaboration; though some, perhaps more orthodox,
might wish he would have talked of Box– Cox data transformation.
They heard about the carbon sink all- owed by planting strange
non-Nordic species; Hanewinkel on world climate change –
though all may alter in the twinkle of a mitigating eye
if sunlight is reflected by dust particles up in the sky
for any country that might lie in Iceland’s ash cloud range.
They came to hear Peter Berck describing things not planned,
and whether, how and why they work in allocating land;
of whisky and of wood as fuels replacing oil lost;
of rates of carbon flux accruals, with linee-ar programming duals
to shadow price the cost.
So, thinking of our fuel needs, we also need to keep al-
ive the thought, the planet feeds a planet full of people.
And can we soon contrive to feed an- other planet-full and …
plant out coconuts in Sweden, paddy-fields in Jylland?
Might we be forced to plough up Ås to beat Norway’s millet crop failure?
And when elephant are crop-raiders in Vantaa, will vineyards adorn North Karelia?
Then Arild talked about the need
for policy perspective on challenges of REDD (or REED?)
and making them effective; and what research on REED (or REDD?)
the Eurocrats have planned for. (I wish I’d heard, if someone said
what REDD (or REED?) might stand for.)

423
They came from Russia and the Baltics, Oregon and Auburn,
and met no atmospheric fault (ex- cept emitted cauburn).
They travelled far, to bring a fund of stirring Third World tales: but nobody from Eng-er-land,
and only one from Wales.
And, as for Iceland’s ash it gives us reason to rehearse
the case for stressing positives – not being risk-averse.
So let’s smooth frictions with a dash of optimistic oil,
recalling that volcanic ash turns in the end to soil;
that soil is good for growing trees, and growing trees is good,
because our milling industries can turn trees into wood. It is not, this volcanic ash an agent of destruction.
We recognise it in a flash: a factor of production! –
though, with 10 000 years to wait until the profits show
at any normal discount rate the MRP’s quite low.
So, thank you, soil scientists for pointing out the pluses;
and, if we find good news exists, we’ll call you – don’t call us! – ess-
entially, don’t call … at all.
They came for Niels Elers Koch’s transforming thinking that unlocks
doors to collaboration; though some, perhaps more orthodox,
might wish he would have talked of Box– Cox data transformation.
They heard about the carbon sink all- owed by planting strange
non-Nordic species; Hanewinkel on world climate change –
though all may alter in the twinkle of a mitigating eye
if sunlight is reflected by dust particles up in the sky
for any country that might lie in Iceland’s ash cloud range.
They came to hear Peter Berck describing things not planned,
and whether, how and why they work in allocating land;
of whisky and of wood as fuels replacing oil lost;
of rates of carbon flux accruals, with linee-ar programming duals
to shadow price the cost.
So, thinking of our fuel needs, we also need to keep al-
ive the thought, the planet feeds a planet full of people.
And can we soon contrive to feed an- other planet-full and …
plant out coconuts in Sweden, paddy-fields in Jylland?
Might we be forced to plough up Ås to beat Norway’s millet crop failure?
And when elephant are crop-raiders in Vantaa, will vineyards adorn North Karelia?
Then Arild talked about the need
for policy perspective on challenges of REDD (or REED?)
and making them effective; and what research on REED (or REDD?)
the Eurocrats have planned for. (I wish I’d heard, if someone said
what REDD (or REED?) might stand for.)

424
They came to hear of trees windblown or ravaged by disease;
how woodland owners see their own responsibilities;
to hear of bubbles and of bus- inesses and trade, as well
as ecosystem services that owners want to sell;
and multi-hierarchic schemes, and carbon versus birds, and silvicultural regimes, and marketing of words;
of poverty and livelihood, and Volvos that await
replacement (though it’s understood the rich can still pay late).
They came to hear a lot of things that no-one really knows,
and mix with data, ponderings on how the downturn goes.
But some, or maybe all of these – plus topics not addressed –
confirm the merits of our trees, we know they are the best!
* * *
What wisdom will we take from these
descriptors and regressors – you idealistic PhDs,
we cynical professors? One takes no more than what one gives
– to doubt that would be rash – so emphasise the positives
despite volcanic ash. We wish you safely home again: oh,
hurry on your way! We hear that Iceland’s BIG volcan-o
might blow any day.
425
They came to hear of trees windblown or ravaged by disease;
how woodland owners see their own responsibilities;
to hear of bubbles and of bus- inesses and trade, as well
as ecosystem services that owners want to sell;
and multi-hierarchic schemes, and carbon versus birds, and silvicultural regimes, and marketing of words;
of poverty and livelihood, and Volvos that await
replacement (though it’s understood the rich can still pay late).
They came to hear a lot of things that no-one really knows,
and mix with data, ponderings on how the downturn goes.
But some, or maybe all of these – plus topics not addressed –
confirm the merits of our trees, we know they are the best!
* * *
What wisdom will we take from these
descriptors and regressors – you idealistic PhDs,
we cynical professors? One takes no more than what one gives
– to doubt that would be rash – so emphasise the positives
despite volcanic ash. We wish you safely home again: oh,
hurry on your way! We hear that Iceland’s BIG volcan-o
might blow any day.
LIST OF PARTICIPANTS Abildtrup, Jens UMR AgroParisTech (Engref) – INRA, Nancy, France
E-mail: [email protected]
Angelsen, Arild Norwegian University of Life Sciences, Norway E-mail: [email protected]
Baardsen, Sjur Norwegian University of Life Sciences, Norway E-mail: [email protected]
Bakkegaard, Riyong Kim Forest & Landscape, Faculty of Life Sciences, University of Copenhagen, Denmark E-mail: [email protected]
Barua, Sepul K. Department of Forest Sciences, University of Helsinki, Finland E-mail: [email protected]
Berck, Peter UC Berkeley, USA E-mail: [email protected]
Bergseng, Even Department of Ecology and Natural Resource Management, Norwegian University of Life Sciences, Norway E-mail: [email protected]
Boon, Tove Enggrob Forest & Landscape, Faculty of Life Sciences, University of Copenhagen, Denmark E-mail: [email protected]
Brazee, Richard J. University of Illinois, USA E-mail: [email protected]
Broch, Stine Wamberg Forest & Landscape, Faculty of Life Sciences, University of Copenhagen, Denmark E-mail: [email protected]
Brukas, Vilis Southern Swedish Forest Research Centre, Faculty of Forest Sciences, Swedish University of Agricultural Sciences, Sweden E-mail: [email protected]
Carlsen, Kirsten Forest & Landscape, Faculty of Life Sciences, University of Copenhagen, Denmark E-mail: [email protected]
Chhetri, Bir Bahadur Khanal Forest & Landscape, Faculty of Life Sciences, University of Copenhagen, Denmark E-mail: [email protected]

426
Chubinskiy, Anatoly St. Petersburg State Forest Technical Academy, Russia
E-mail: [email protected]
Dons, Klaus Forest & Landscape, Faculty of Life Sciences, University of Copenhagen, Denmark E-mail: [email protected]
Eyvindson, Kyle Department of Forest Sciences, University of Helsinki, Finland E-mail: [email protected]
Favada, Ibrahim European Forest Institute – EFI E-mail: [email protected]
Gong, Peichen Department of Forest Economics Swedish University of Agricultural Sciences, Sweden E-mail: [email protected]
Gustafsson, Åsa School of Engineering, Linnaeus University, Växjö, Sweden E-mail: [email protected]
Hanewinkel, Marc Baden-Württemberg Forest Research Institute, Germany E-mail: [email protected]
Hankala, Anu Department of Forest Resource Management Swedish University of Agricultural Sciences, Sweden E-mail: [email protected]
Helles, Finn Forest & Landscape, Faculty of Life Sciences, University of Copenhagen, Denmark E-mail: [email protected]
Hoen, Hans Fredrik Norwegian University of Life Sciences, Norway E-mail: [email protected]
Hofstad, Ole Department of Ecology and Natural Resource Management Norwegian University of Life Sciences, Norway E-mail: [email protected]
Hujala, Maija School of Business, Lappeenranta University of Technology, Finland E-mail: [email protected]
Hujala, Teppo Finnish Forest Research Institute - METLA, Finland E-mail: [email protected]
Jacobsen, Charlotte Bukdahl Forest & Landscape, Faculty of Life Sciences, University of Copenhagen, Denmark

427
E-mail: [email protected]
Jacobsen, Jette Bredahl Forest & Landscape, Faculty of Life Sciences, University of Copenhagen, Denmark E-mail: [email protected]
Kallio, A. Maarit I. Finnish Forest Research Institute - METLA, Finland E-mail: [email protected]
Kamelarczyk, Kewin Forest & Landscape, Faculty of Life Sciences, University of Copenhagen, Denmark E-mail: [email protected]
Korhonen, Katri Finnish Forest Research Institute - METLA, Finland E-mail: [email protected]
Kurttila, Mikko Finnish Forest Research Institute - METLA, Finland E-mail: [email protected]
Larsen, Helle Overgaard Forest & Landscape, Faculty of Life Sciences, University of Copenhagen, Denmark E-mail: [email protected]
Lauri, Pekka Finnish Forest Research Institute - METLA, Finland E-mail: [email protected]
Leppänen, Jussi
Finnish Forest Research Institute - METLA, Finland E-mail: [email protected]
Latta, Greg Oregon State University, USA E-mail: [email protected]
Li, Ning Department of Forest Sciences, University of Helsinki, Finland E-mail: [email protected]
Liu, Jun-Chang School of Economics & Management, Beijing Forestry University, China E-mail: [email protected]
Lund, Jens Friis Forest & Landscape, Faculty of Life Sciences, University of Copenhagen, Denmark E-mail: [email protected]
Lyhykäinen, Henna Tuulia University of Helsinki, Finland E-mail: [email protected]
Lönnstedt, Lars Department of forest products, Faculty of Forest Science, Swedish University of Agricultural Sciences, Sweden,

428
E-mail: [email protected]
Lähtinen, Katja Finnish Environment Institute, Joensuu Research Unit, Finland E-mail: [email protected]
Meilby, Henrik Forest & Landscape, Faculty of Life Sciences, University of Copenhagen, Denmark E-mail: [email protected]
Moiseyev, Alexander European Forest Institute - EFI, Finland E-mail: [email protected]
Nielsen, Martin Reinhardt Forest & Landscape, Faculty of Life Sciences, University of Copenhagen, Denmark E-mail: [email protected]
Nielsen, Petrine Steen Forest & Landscape, Faculty of Life Sciences, University of Copenhagen, Denmark E-mail: [email protected]
Nielsen, Øystein Juul Forest & Landscape, Faculty of Life Sciences, University of Copenhagen, Denmark E-mail: [email protected]
Nilsson, Malin Department of Forest Resource Management, Swedish Agricultural University, Sweden E-mail: [email protected]
Pajuoja, Heikki Metsäteho Oy, Helsinki, Finland E-mail: [email protected]
Petty, Aaron Metsäteho Oy, Helsinki, Finland E-mail: [email protected]
Pouliot, Mariève
Forest & Landscape, Faculty of Life Sciences, University of Copenhagen, Denmark E-mail: [email protected]
Price, Colin School of the Environment, Natural Resources and Geography, Bangor University, United Kingdom E-mail: [email protected]
Rask, Lars-Olof School of Engineering, Linnaeus University, Växjö, Sweden E-mail: [email protected]
Roos, Anders Department of Forest Products, Swedish University of Agricultural Sciences, Sweden E-mail. [email protected]

429
Rößiger, Jörg Institute of Forest Management,
Technische Universität München, Germany E-mail: [email protected]
Saastamoinen, Olli School of Forest Sciences University of Eastern Finland, Finland E-mail: [email protected]
Sjølie, Hanne Kathrine Norwegian University of Life Sciences, Norway E-mail: [email protected]
Smith-Hall, Carsten
Forest & Landscape, Faculty of Life Sciences, University of Copenhagen, Denmark E-mail: [email protected]
Solberg, Birger Department of Ecology and Natural Resource Management, Norwegian University of Life Sciences, Norway E-mail: [email protected]
Strange, Niels Forest & Landscape, Faculty of Life Sciences, University of Copenhagen and Centre for Macroecology, Evolution and Climate Change, Denmark E-mail: [email protected]
Tereshchenko, Svetlana St. Petersburg State Forest Technical Academy, Russia E-mail: [email protected]
Theilade, Ida Forest & Landscape, Faculty of Life Sciences, University of Copenhagen, Denmark E-mail: [email protected]
Thorsen, Bo Jellesmark
Forest & Landscape, Faculty of Life Sciences, University of Copenhagen, Denmark E-mail: [email protected]
Toppinen, Anne Department of Forest Sciences, University of Helsinki, Finland E-mail: [email protected]
Trubins, Renats Swedish University of Agricultural Sciences, Sweden E-mail: [email protected]
Vanhatalo, Anna Finnish Forest Research Institute - METLA, Finland E-mail: [email protected]
Vedel, Suzanne Elizabeth Forest & Landscape, Faculty of Life Sciences, University of Copenhagen, Denmark E-mail: [email protected]

430
Vierimaa, Marjut Finnish Forest Research Institute – METLA, Finland
E-mail: please contact Harri Hänninen at [email protected]
Vinqvist, Mette Forest & Landscape, Faculty of Life Sciences, University of Copenhagen, Denmark E-mail: [email protected]
Zhang, Yaogi Auburn University, USA E-mail: [email protected]

SCANDINAVIAN SOCIETY OF FOREST ECONOMICS
SSFE Board
Denmark
Bo Jellesmark Thorsen ([email protected]) and
Tove Enggrob Boon (deputy) ([email protected])
Norway
Sjur Baardsen ([email protected]) and
Even Bergseng (deputy) (even.bergseng@
umb.no)
Finland
Anne Toppinen (chairman) (anne.toppinen@
helsinki.fi) and
Heikki Pajuoja (deputy) (heikki.pajuoja@
metsateho.fi)
Sweden
Anders Roos ([email protected]) and
Lars Lönnstedt (deputy) (Lars.Lonnstedt@
sprod.slu.se) and
Peichen Gong (deputy to the deputy)
A5 omslag · Scandinavian Forest Economics nr 43 · NOV 2010.indd 2 22/11/10 12.38

����������������������������������� �����
�����������������������������������������
������������ �����������������������������������������������������������
���������������������������� ����������
������
����������������������������������� �����
�����������������������������������������
������������ �����������������������������������������������������������
���������������������������� ����������
������
Scandinavian Forest Economics
N
o. 43, 2010
Scandinavian Forest Economics
No. 43, 2010
Proceedings
of the Biennial Meeting of the
Scandinavian Society of Forest Economics
Gilleleje, Denmark, May 2010
Finn Helles and Petrine Steen Nielsen (eds.)
Copenhagen
A5 omslag · Scandinavian Forest Economics nr 43 · NOV 2010.indd 1 22/11/10 12.38