BIDS WORKING PAPER - IDS OpenDocs
296
ft ft a*i amft? m ra BIDS WORKING PAPER fWSTl it/TE OFj 1 -1JUN1988' flfp&toFMEST STUDIES tlJftARY Working Paper No. A GREEN REVOLUTION IN BANGLADESH : ITS NATURE AND IMPACT ON INCOME DISTRIBUTION Mahabub Hossain* October 1987 w m m l?Wf, BANGLADESH INSTITUTE OF DEVELOPMENT STUDIES DHAKA. BANGLADESH
-
Upload
khangminh22 -
Category
Documents
-
view
2 -
download
0
Transcript of BIDS WORKING PAPER - IDS OpenDocs

f t f t a * i a m f t ? m r a
BIDS WORKING PAPER
fWSTl it/TE OFj
1 -1JUN1988' flfp&toFMEST STUDIES
tlJftARY
Working Paper No. A
GREEN REVOLUTION IN BANGLADESH :
ITS N AT UR E AND IMPACT ON INCOME D I S T R I B U T I O N
Mahabub Hossain*
October 1987
w m m
l?Wf,
BANGLADESH INSTITUTE OF DEVELOPMENT STUDIES DHAKA. BANGLADESH

p S Inform ation R esource Unit U niversity o f Sussex ralm er, Brighf6n BN I 9RE. UK
Working Paper No. 4
GREEN REVOLUTION IN BANGLADESH :
ITS N ATURE AND IMPACT ON INCOME D I S T R I B U T I O N
Mahabub Hossain*
October 1987
F'rice: Tk. 100.00
The author is a Senior Research Fellow at The BangladeshInstitute of Development Studies (BIDS), GPO Box 3854, Dhaka,Bangladesh.
The study was carried out by The Bangladesh Institute ofDevelopment Studies in collaboration with The International FoodPolicy Research Institute.
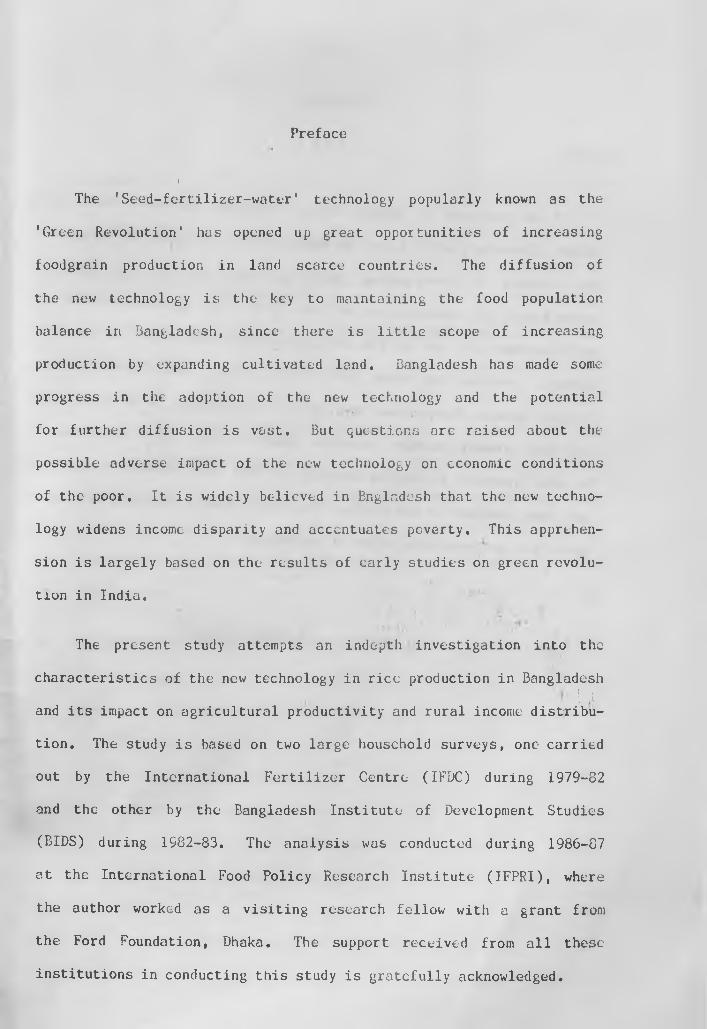
Preface
The 'Seed-fertilizer-water* technology popularly known as the
'Green Revolution' has opened up great opportunities of increasing
foodgrain production in land scarce countries. The diffusion of
the new technology is the key to maintaining the food population
balance in Bangladesh, since there is little scope of increasing
production by expanding cultivated land. Bangladesh has made some
progress in the adoption of the new technology and the potential: • • * •' * n *
for further diffusion is vast. But questions are raised about the
possible adverse impact of the new technology on economic conditions
of the poor. It is widely believed in Bnglndesh that the new techno
logy widens income disparity and accentuates poverty. This apprehen
sion is largely based on the results of early studies on green revolu
tion in India.
The present study attempts an indepth investigation into the
characteristics of the new technology in rice production in Bangladesh
U -and its impact on agricultural productivity and rural income distribu
tion. The study is based on two large household surveys, one carried
out by the International Fertilizer Centre (IFDC) during 1979-82
and the other by the Bangladesh Institute of Development Studies
(BIDS) during 1982-83. The analysis was conducted during 1986-87
at the International Food Policy Research Institute (IFPRI), where
the author worked as a visiting research fellow with a grant from
the Ford Foundation, Dhaka. The support received from all these
institutions in conducting this study is gratefully acknowledged.
I

( ii )
I am indebted to Rehman SoMian (Director General, BIDS) John
Mellor (Director, IFPRI) and Raisuddin Ahmed for their encouragement
and counsel at every stage of this research. I also wish to
acknowledge the contribution of M.A. Quasem and Raisuddin Ahmed who
collaborated with me in the design and implementation of the BIDS
Survey. Joachim Von Braun, R.W. Herdt, J.C, Flinn, Pranab Bardhan,
Keijiro Otsuka Steve Jones and Noel P. Magor read an earlier draft
: 5 Iand the present version benefits greatly from their comments. I
am also grateful to Andrew Bernard for his able research assistance
and deep interest in the study. The author alone, however, is respon
sible for any remaining error or inadequacy.
Mahabub Hossain

( iii )
CONTENTS
Pa^e No.1. SUMMARY 1
2. INTRODUCTION 7
3. TECHNOLOGICAL PROGRESS AND GROWTH OF CROPPRODUCTION - A MACRO PICTURE 22
Resource Base and the Need for Technological Progress 22
Diffusion of the Modern Technology 27
The Mew Seeds 27
Development of Irrigation Facilities 30
Fertilizer Consumption 35
Complementarity of the Modern Technology Package 38
Impact on Growth 43
Level and Fluctuation of Food Prices 47
Conclusions 51
4. Tift MAXt$£ OF ALTERNATIVE RICfr^ECHNOLOGIES 58
Introduction 58
Level and Fluctuation of Crop Yield 60
Use of Inputs 65
Family and Hired Labor 65
Animal and Mechanical Power 69
Chemical Fertilizer and Manure 73
Irrigation and Pesticides 76
Seeds ‘ 78
Unit Costs and Profitability of Cultivation 79
Conclusions 93

( iv )
5. PRODUCTIVITY AND EFFICIENCY OF RESOURCE USE 97
Intensity of Land Use and Cropping Patterns 97
Productivity cf Land and Labor 102
Relative Economic Efficiency 111
Conclusions 122
6. FARM SIZE, TENANCY AND ADOPTION OF MODERN TECHNOLOGY 126
The Issues 127
Pattern of Adoption 131
Farm Size and Adoption of MV: 131
Tenancy and Adoption of MV: 133
Irrigation and Adoption of MV: 136
Adoption of Fertilizer: 141
Adoption Behavior: An Econometric Analysis 143
Size, Land Productivity and Prices 154
Conclusions 158
7. LABOR MARKET AND EMPLOYMENT EFFECTS OF THEMODERN TECHNOLOGY 163
Participation in Economic Activities - v - w
Extent and Composition of Employment - 169
Labor Market ! 177
General Conditions 177
The Impact of Technology * 179
Operation of the Labor Market - A Multi-Variate Analysis 183
Determinants of .Labor Supply 183
Page Mo.

( V )
Determinants of Demand for Agricultural Labor 192
The Impact of Technology on the Wage Rate 195
Conclusions 196
8. LINKAGE EFFECTS OF AGRICULTURAL GROWTH 201
Introduction 201
Expansion of Market: An Analysis of Consumption Patterns 203
Methodology 203
Discussion of Results 205
Reinvestment of Surplus 210
Impact on the Land Market 215
Conclusions 219
9. EFFECT ON INCOME DISTRIBUTION AND POVERTY 222
The Level and Structure of Income 223
Impact Effect of Technology: A Regression Estimate 230
Distribution of Income 235
Alleviation of Poverty 240
Conclusions 244
10. POLICY IMPLICATIONS 248
Strengthening Agricultural Research and Extension 249
Public Investment for Irrigation 251
Provision of Credit 2^4
REFERENCES 267
Page No.
( V i )
Table 1
Table 2
Table 3.1
Table 3.2
Table 3,3
Table 3.4
Table 3.5
Table 3.6
Table 3.7
Table 3.8
Table 3,9
Table 4,1
Table 4.2
Table 4.3
Table 4.4
X able 4.5
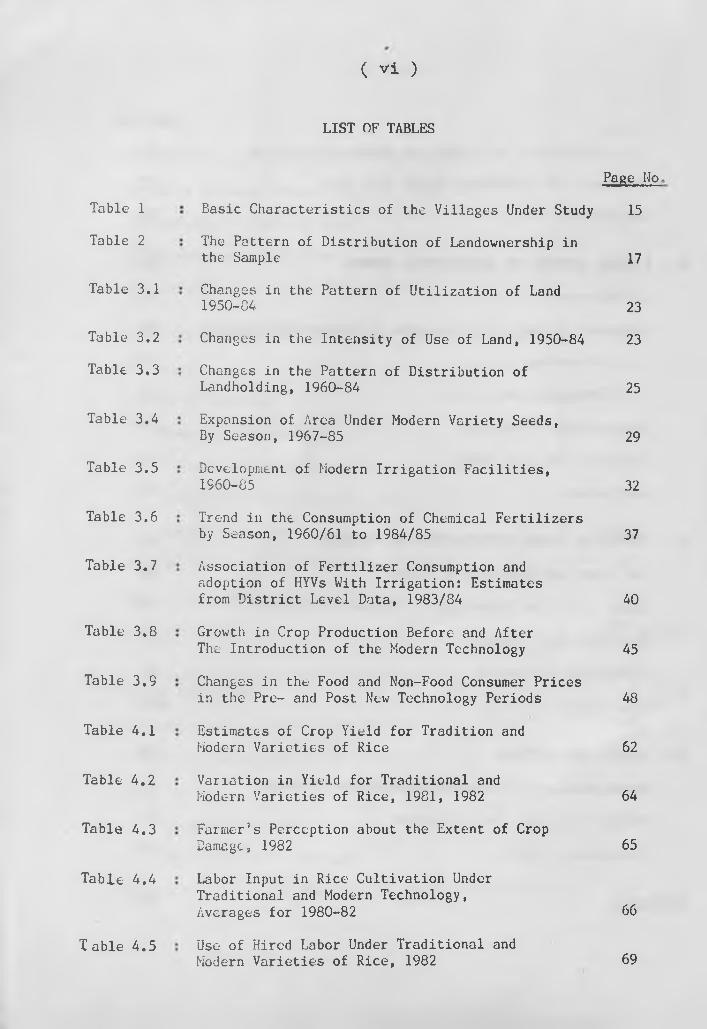
LIST OF TABLES
Page Ho
Basic Characteristics of the Villages Under Study 15
The Pattern of Distribution of Landownership inthe Sample 17
Changes in the Pattern of Utilization of Land1950-84 23
Changes in the Intensity of Use of Land, 1950-84 23
Changes in the Pattern of Distribution of Landholding, 1960-84 25
Expansion of Area Under Modern Variety Seeds,By Season, 1967-85 29
Development of Modern Irrigation Facilities,1960-85 32
Trend in the Consumption of Chemical Fertilizers by Season, 1960/61 to 1984/85 37
Association of Fertilizer Consumption andadoption of HYVs With Irrigation: Estimatesfrom District Level Data, 1983/84 40
Growth in Crop Production Before and AfterThe Introduction of the Modern Technology 45
Changes in the Food and Non-Food Consumer Pricesin the Pre- and Post New Technology Periods 48
Estimates of Crop Yield for Tradition andModern Varieties of Rice 62
Variation in Yield for Traditional andModern Varieties of Rice, 1981, 1982 64
Farmer’s Perception about the Extent of CropDamage, 1982 65
Labor Input in Rice Cultivation Under Traditional and Modern Technology,Averages for 1980-82 66
Use of Hired Labor Under Traditional andModern Varieties of Rice, 1982 69

Table 4.7
Table 4.8
Table 4.9
Table 4.1(
Table 4.1:
Table 4.1:
Table 4.1:
Table 5.1
Table 5.2
Table 5.3
Table 5.4
Table 5.5
Table 5.6
Table 4.6
(vii)
Use of Animal and Mechanical Power Under Traditional and Modern Technology:Averages for 1980-82 70
Use of Chemical Fertilizers and Manure Under Traditional and Modern Technology, Averages,1980-82 75
Use of Irrigation and Pesticides Under Traditional and Modern Varieties of Rice, Averages for 1980-82 76
The Cost on Account of Seeds for Traditionaland Modern Varieties of Rice, 1982 79
Cost of Production and Profits Under Traditionaland Modern Varieties, at 1984-85 National LevelPrices 84
The Effect of Changes in Prices on Costs of Production and Profits, 1975/76 to 1984/85 88
Costs and Profitability at Farm Specific Prices,Production and Input Use, 1982 91
Profits and Family Income at Farm Specific Prices for Different Size and Tenurial Groups 92
Pattern and Intensity of Use of Irrigatedand Unirrigated Land, 1981 98
Pattern and Intensity of Land Use in Technologically Developed and Under-developed Villages, 1981 99
Estimates of Cobb-Douglas Production Functionsfor Different Varieties of Rice, 1982 107
Estimates of Average and Marginal Products ofLand and Labor, Crop Level, 1982 108
Selected Characteristics of Profitable and Loss flaking Sample Farms 115
Tests of Hypothesis of Relative and AbsolutePrice Efficiency and Constant Returns to Scale 116
Page Mo.
Table 5.7 : Joint Estimates of Profit Functions andInput Demand Equations, 1982 118

( v i i i )
Table 5.8
T a b ic 6 .1
Table 6.2
Table 6.3
Table 6.4
Table 6.5
Table 6.6
Table 6.7
Table 6.8
Table 6.9
Table 6.1C
Table 6.1]
Table 6.12
Table 7.1
Table 7.2
Table 7.3
: Indirect Estimates oi the Elasticity andMarginal Productivity of Inputs
: Adoption of Modern Varieties of Rice byFarm Size and Tenancy, 1982
: Incidence of Tenancy by Season and Technology,1982
: Adoption of Modern Varieties on Owned and RentedLand for Mixed-Tenant Farmers: EY Season, 1982
: Adoption of Modern Varieties by Level of Landand Access of Land to Irrigation Facilities, 1981
: Adoption of Modern Varieties in Irrigated andUnirrigated Villages by Farm Size, 1982
: Adoption of Modern Varieties by Type ofIrrigation and the Age of Experience, 1982
: Use of Chemical Fertilizers by Farm Sizeand Tenancy, 1982
: Factors Influencing the Decision to AdoptMVs, Profit Estimate
: Determinants of Adoption of Modern Varietiesof Rice, 1982
: Incidence of Irrigation and Tenancy forDifferent Groups of Farmers
: Farm Size and Productivity of Land ByTechnology, 1982
: Prices of Major Agricultural Inputs ByFarm Size and Tenancy
: Labor Force Participation in Developed andUnderdeveloped Areas by Landholding, 1982
: Occupation of Family Members Aged 10 to 25,By Landownership and Sex
: Duration of Employment in TechnologicallyDeveloped and Underdeveloped Areas by Landownership Groups
Page Ho
121
132
134
135
138
139
140
142
145
149
154
156
157
166
169
172
( ix )
Table 7.5
Tabalc 7.6
Table 7.7
Table 7.8
Table 7.9
Table 7.10
Table 7.11
Table 7.12
Table 7.13
Table 8.1
Table 8.2
Table 8.3
Table 8.4
Table 8.5
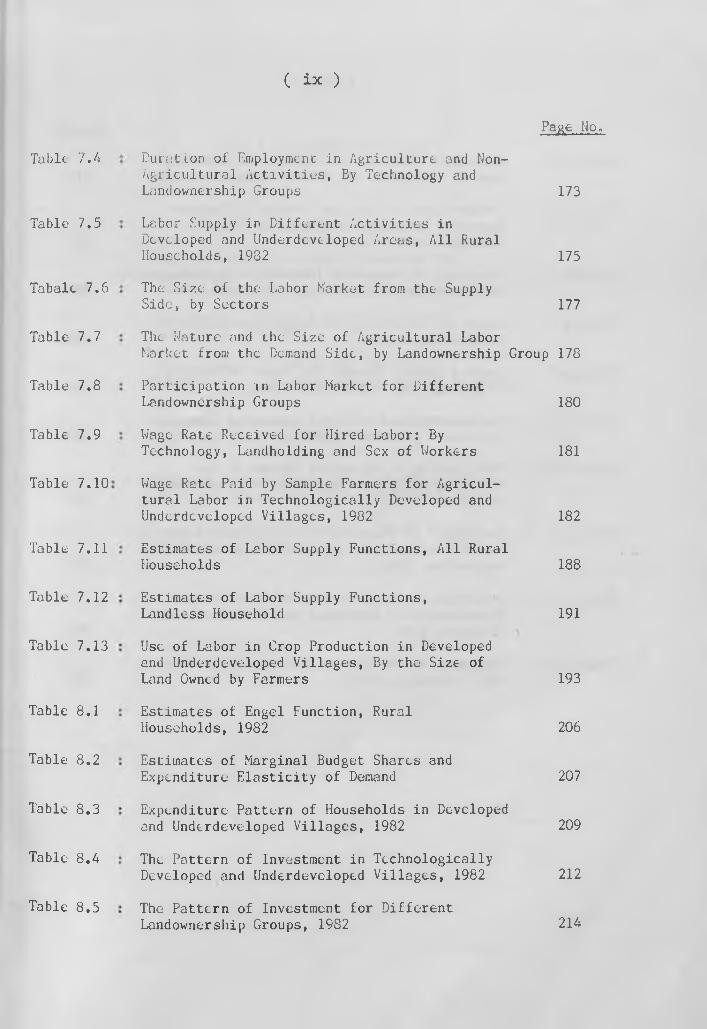
Tabic 7.4 Duration of Employment in Agriculture and Hon- Agricultural Activities, By Technology and Landownership Groups 173
Labor Supply in Different Activities in Developed and Underdeveloped Areas, All Rural Households, 1982 175
The Size of the Labor Market from the SupplySide, by Sectors 177
The Nature and the Size of Agricultural LaborMarket from the Demand Side, by Landownership Group 178
Participation in Labor Market for Different Landownership Groups 180
Wage Rate Received for Hired Labor: ByTechnology, Landholding and Sex of Workers 181
Wage Rate Paid by Sample Farmers for Agricultural Labor in Technologically Developed and Underdeveloped Villages, 1982 182
Estimates of Labor Supply Functions, All Rural Households 188
Estimates of Labor Supply Functions,Landless Household 191
Use of Labor in Crop Production in Developedand Underdeveloped Villages, By the Size ofLand Owned by Farmers 193
Estimates of Engel Function, RuralHouseholds, 1982 206
Estimates of Marginal Budget Shares andExpenditure Elasticity of Demand 207
Expenditure Pattern of Households in Developedand Underdeveloped Villages, 1982 209
The Pattern of Investment in Technologically Developed and Underdeveloped Villages, 1982 212
The Pattern of Investment for Different Landownership Groups, 1982 214
Page Non

( X )
Table 8.6
Tabic 8.7
Tabic 9.1
Table 9.2
Table 9.3
Table 9,4
Tabic 9.5
Table 9.6
Table 9.7
Table 9.8
Sources of Acquisition of Land in Technologically Developed and Underdeveloped Villages 216
Transactions in the Land Market in Technologically Developed and Underdevolopud Villages, 1982 218
Structure of Household Incomes in Technologically Developed and Underdeveloped Villages, 1982 224
Impact of Technology on Income for Different Landholding Groups 226
Incomes Earned Through the Labor Market: By Technology and Landholding Groups 229
The Determinants of Rural Household Incomes:Regression Estimates, 1982 233
Distribution of Household Income in the Technologically Developed and Underdeveloped villages 236
The Degree of Inequality in the Distribution of Income and Landholding, Gini Ratios for Sample Households, 1982 239
Estimates of the Incidence of Poverty in Technologically Developed and Underdeveloped Villages, 1982 243
Incidence of Poverty by Landownership Groupand Technology, 1982 243
Page Ho,

*( xi )
Tabic 1
Table 2
Table 3
Table 4
Table 5
Table 6
LIST OF SUPPLEMENTARY TABLES
Page Mo,
Long-Term Change in Land Allocation toMajor Crops, 1950-85 258
Estimates of Growth Equations for CropProduction, 1950-85 259
Village Level Variation in the Use ofFertilizers in Traditional and Modern Varieties 260
Estimates of Translog Production Functions for Different Rice Varieties, 1982 261
Marginal Budget Shares and Expenditure Elasticity of Demand for Different Commodities 262
Changes in the Structure of Income forthe Landless Group., 265

1. SUMMARY
A major constraint to increasing food production in bangladesh
is the stagnant supply of land. There is little scope for expanding
cultivable land beyond the current level of 9.0 million hectares with
which the country feeds more than 100 million persons. The cultivated
land area remained unchanged since the independence in 1971, although
the population increased by about 50 per cent since then. The growth
of cereal production since the early seventies has barely managed
to keep the level of food imports at 10 per cent of the domestic
demand. This was achieved with a respectable progress in the diffusion
of the new agricultural technology, the modern seed varieties of rice
and wheat and the use of chemical fertilizers.
Technological progress is the key to maintaining the food-popula-
tion balance in the country - and the scope of further diffusion of
the new technology is vast. Only about a third of the rice and wheat
area has been covered ,with modern variety seeds, and the consumption
of chemical fertilizers has reached to the level of 45 nutrient kg
per hectare of land. But, following the results of the early studies
on 'green revolution' in India, there is a widespread apprehension
in the country that the diffusion of the new technology would contri
bute to worsening income inequality and deepening absolute poverty.
There have been few systematic and representative studies on
Bangladesh examining the effect of technological change at the farm
and economy levels. In 1979-82 a survey was carried out covering
2400 sample farms in 117 villages throughout the country; in 1981-82 a

- 2 -
second large survey was completed covering 16 villages. This study
analyzed these two sets of survey data to assess the productivity
and equity impact of the modern rice technology.
The yield of paddy is estimated at 3.3 tons per hectare for
modern varieties compared to 1.6 tons for local varieties. Farmers
used 199 days of labor per hectare in the cultivation of modern varie
ties compared to 137 days for local varieties. The new varieties
absorbed about Tk 5500 (at 1984/85 prices) per hectare in cash costs
compared to about Tk 2000 for local varieties, but the estimated
profit was about Tk 5700 per ha for the former compared to Tk 2600
for the latter. In Bangladesh, where land is so scarce, and the
size of landholding so small, high profit per hectare is important.
But costs per ton of output is a more conclusive measure of profit
ability. The cost per ton of paddy output was Tk 3700 for local
varieties and Tk 3000 for the new varieties, clearly demonstrating
that the value of increased output exceeded the increased costs of
growing the modern varieties. The net return to family labor was
Tk 87 per day for modern varieties and 75 for local varieties, com
pared to the agricultural wage rate of Tk 24 per day.
The small farmers and tenants adopted the new technology as
readily as the medium and large ones. Farmers operating less than
one ha of land allocated 52 per cent of their rice land to modern
varieties, compared to 45 per cent for those with 1 to 2 ha and 42
per cent for those with over two hectares of land. The yield per
hectare was also higher on smaller farms. But profits and family

- 3 -
income was lower on smaller farms, because they paid about 25 per
cent higher water charges, and about 10 per cent higher wage rates
than the large ones. The profits were substantially less on rented
land for the obvious reason that the tenant has to pay 50 per cent
of the gross produce as rent, and bear all costs of inputs. But the
profits per ha on tenant farms were higher for the modern varieties
compared to the local varieties. The diffusion of the new technology
thus increases incomes for all groups of farmers, but also increases
the inequality in the distribution of agricultural incomes among farm
households.
To get an overall indication of the effect of new technology
on income distribution, the survey villages were divided into two
equal groups according to the degree to which the new technology was
used. In the advanced villages 54 per cent of the land was irrigated
and farmers allocated 61 per cent of the land to modern rice varieties
compared to eight and five per cent, respectively for backward villa
ges. The difference in fertilizer use was eight times between the
two groups of villages. In advanced villages total household income
was 29 per cent higher, and per capita income 22 per cent higher,
compared to the backward villages. The comparison of the pattern
of income distribution for all rural households (including the land
less) however, shows a neutral effect of the new technology. The Gini
concentration ratio of household income was the same (0.39) in the
two groups of villages, the concentration ratio measured along the
per capita income scale was however slightly higher in the advanced
villages (0.36) than in the backward ones (0.34). The comparison

- 4 -
of the income for the two groups ot villages in the per capita income
scale shows that the relative position of the bottom 40 per cent of
the households remained unchanged while the top 10 per cent
gained relatively at the expense of the middle 40 per cent. The pro
portion of population living below the poverty line was 32 per cent
in the advanced villages compared to 47 per cent in the backward
villages.
The positive effect of the new technology on alleviation of/1.. '.1
poverty was the result of substantial increases in income of the func
tionally landless households (with less than 0.2 ha of land, who are
the bottom one-third of the households in the landholding scale)
through higher employment and wages. The annual income for this group
of households was1 about Tk 14,300 in the advanced villages compared
to Tk 9,700 in the backward villages, the per cent difference was
almost as much as the large landowners (with over two ha of land).
The farmers used 45 per cent additional labor in growing modern varie
ties, and irrigation, by increasing cropping intensity about one-third, also
increased the demand for labor. But as income increases, higher income
households substitute leisure for labor and supply less labor in the
market. The increased labor demand is met by more employment for
the functionally landless in the advanced villages and from lower
income households from backward villages. Total employment was four
per cent higher in the advanced villages; for the functionally landless
group it was 26 per cent higher. The new technology also puts a signi
ficant upward pressure on the wage rate, which is another factor behind
the increases in incomes of the poor. The wage rate for agricultural

- 5 -
in backward ones.
The growth of income from the new technology expands the market
for non-farm goods and services. In the backward villages households' !>. '• 1 I ;
spent about 60 per cent of the marginal budget on crop and forestry
sector output, which are land based, in the advanced villages the
share was 47 per cent. The marginal budget share of rural services,
which are mostly labor based, and in which the poor arc more involved,
was about 18 per cent in advanced villages compared to 7.5 per cent
in backward villages. The expenditure pattern thus appears to be
another mechanism through which some benefits of the new technology
trickles down to lower income groups.
The increased incomes, however, do not promote capital accumula
tion in agriculture or in non-farm activities. The rate of directly
productive investment is estimated at 7.3 per cent of total expenditure
in the advanced villages compared to 11.7 per cent in the backward
villages. The high income group spends proportionately more for
improvement of housing and for transfers, such as purchases of land.
Households in advanced villages acquired about 32 per cent of the
land through the market compared to 25 per cent for backward villages.
The impact of the new technology on the land market may be a potential
source of further concentration of landholding and greater inequality
in the distribution of agricultural incomes.
Thus, there is a case for siphoning off some of the surplus accu
mulated through technological diffusion, from the upper income groups.
This may be achieved through higher agricultural taxation and the
labor was about 25 per cent higher in the advanced villages - than
- 6 -
cost recovery of public investment in agriculture. It may be advisable
to withdraw subsidies on irrigation which mostly benefit the large
and medium landowners. A reallocation of public investment from major
irrigation projects to small scale projects with pumps and tubewells,
to the extent it is technically feasible, may also save resources,
because the cost recovery from large scale projects has been proved
to be extremely difficult. The government will need additional
resources from domestic sources for irrigation investment, and
strengthening agricultural research, extension and credit institutions
- for promoting further diffusion of the new technology. The present
low levels of cereal prices in international markets and political
pressure from cereal-surplus developed countries suggest that it may
be increasingly difficult for the government to mobilize foreign aid
for this purpose.

- 7 -
2. INTRODUCTION
There are few countries in the Third World where technological
progress is of higher importance in maintaining the food -population
balance than in Bangladesh. The country now supports a population
of about 104 million persons with a density of about 700 persons per
square kilometer. The growth rate of population which has started
declining only recently is still about 2.3 per cent per annum. Since
per capita income is extremely low, nearly two-thirds of the income4*:;. >1 't * •!
is spent on food. The income elasticity of demand for food (mostly
rice) is variously estimated at 0.53 to 0.73.— Thus, if the country
has to achieve a modest growth of per capita income of about two per
cent per annum, which has been the experience since it gained indepen
dence from Pakistan in 1971, food production has to grow at over 3,4
per cent to avoid further increase in cereal imports, which currently
run at about 10 per cent of domestic demand.
But agriculture does not have resources to meet that challenge.
Practically all cultivable land is in use and the pressure of increas
ing population has reduced the average size of farm holding from 3.53
acres in 1960 to 2.25 acres in 1983/84,— The increase in the inten
sity of land use through raising additional crops during a year (crop
ping intensity) which has been the major source of growth of crop
production till the late sixties, has slowed down considerably in
recent years. Nearly 85 per cent of the cropped land is devoted to
the production of cereals, indicating little scope of diversion of
land from non-food to food crops. Since Bangladesh was densely
populated decades earlier (density of 200 persons per km2 in 1901),

th. possibility of increasing production through additional use of
Libor in individual crop varieties Might also have bee exhausted
by farmers long ago.
'tV • ... V. • 1Thus, rapid technological progress is the key to maintaining
• » y r, ;
the food population balance in the country. This was recognized by’ 1 i . 1 *. ••• **. • « r '
the government 4 in the early sixties. At that time farmers rarely
used modern agricultural inputs such as chemical fertilizers and irri
gation. Fertilizer application was limited to tea gardens and govern
ment experimental farms and irrigation wa;S practiced on about seven
per cent of the land , using labor intensive, indigenous methods. The
major constraint to the application of modern agricultural inputs' i • . .. •,was the flooding of land during the rainy season and the lack of irri-
O 'gation facilities during the dry season. Recognizing that farmers
would not come forward to make lumpy investments on modern irrigation. ’ • c
• I
equipment because of the small farm size and the scattered and frag
mented nature of holdings, the government set up the Water Development
Board (BWDB), with the responsibility of developing the water resources
of the country through multipurpose flood control, drainage, and-Irri
gation projects. At the same time the Agricultural Development Corpo-* * i : ' ‘
ration (BADC) was established for procurement and distribution of. r\ ' : ' ( fr* -i • ,
modern irrigation equipment, chemical fertilizers, and improved seeds
among farmers at highly subsidized prices.'-■iv -n . P ' 0
. • V • • J..: ‘ • *Thanks to the efforts of these institutions, Bangladesh experi
enced some progress in the use of the modern agricultural inputs over
the last quarter century. The modern varieties (MV) of rice seeds
developed in international research stations were made available to

- 9 -
farmers for dry season crops (boro) in 1968 and wet season crops (aman)
in 1970, but their diffusion really picked up after the mid seventies
(Chapter 2). By 1984/85 the area irrigated by modern methods increased
to about one-fifth of the cultivated land. Irrigation, along with
flood control and improved drainage, facilitated the spread of modern
input responsive MVs, which now cover about one-fourth of the cropped
land and about one-third of sown area under cereal crops. The expan
sion of irrigation and the shift of cropped land from traditional
to MVs have been the major factor behind rapid growth in the level
of fertilizer consumption which has risen from insignificance in the
early sixties to about 18 kg of nutrients per acre of cropped land
by 1984/85, despite the gradual withdrawal of subsidy on this input
3/since the mid seventies.— The above figures also indicate that the
potential for further increase in production through diffusion of
the modern technology is still vast. It largely depends on the capa
city of the government to accelerate investment on irrigation, flood
control, and drainage, which determines the expansion of the other
two elements of the modern technology, MV seeds and chemical fertilizers
(Chapter 6).
In Bangladesh, however, the modern technology is widely believed
to be contributing to worsening income inequality and deepening abso-
l 4/rute poverty.— This view is prevalent among the development thinkers
and policy makers in the country as well as among the donor community
which finances most of the investment on water resource development.
The growth in crop production in the post-independence period (1971—
85) has been faster than during the previous two decades (1950-71),—

- 10 -
but studies based on household expenditure surveys show that absolute
poverty afflicts two-thirds to four-fifths of the rural population
6/and that it worsened alarmingly during the seventies.— Other indirect
evidences of the deteriorating economic conditions of the rural poor
in the seventies are downward trends in the real wages of agricultural
laborers and in the intake of energy and protein. The results of
the national nutrition surveys show that the per capita daily energy
intake has declined by about nine per cent between 1962-64 to 1975-
76 period and another seven per cent by 1981-02.—
In view of the above observations, concerns are expressed about
the role of the modern technology in improving the condition of the
poor. The hypothesis is that the impact of production growth from
application of the modern technology is felt much more on the increase
in land and labor productivity, which is appropriated mainly by the
higher income groups, than on the generation of new employment or
on the increase in wage rate from which the poor may gain. The impres
sion is obtained by early studies on green revolution in India which
argued that although the new agricultural technology is scale neutral,
the small farmers cannot participate in its diffusion as much as the
large ones because (i) the new crop varieties require a large amount
of investment on purchased inputs which the poor cannot affort (ii)
small farmers have little access to financial institutions from which. -V ' ' ■" ‘V ' ' ' '■ •: '
working capital can be borrowed on reasonable terms. Also, by making
agricultural enterprises more profitable for larger farmers, the new
technology forces tenants off the land as tenancy evictions follow ,
and the new inflated surplus of the rich is used to buy out the margi
nal and small landholders, forcing them to landless. The net result,

- 11 -
it is argued, is a rapid increase in the inequality of income and
asset distribution and a worsening of rural poverty.-i ■
A contrasting view which is only recently being appreciated is
that the new technology may benefit the poor in the long run by (i)
reducing the cost of production and thereby lowering the prices of
food and (ii) generating more employment in non-farm sectors by keeping
9/real wages low and stimulating demand for non-farm goods and services.—
Since most of the income of the poor originate from labor and their
marginal propensity to consume food is very high, these indirect
effects of the technological progress are considered to be highly
favourable. According to this view, if poverty increases, it is
because of late and slow technological progress such that its favour
able effects cannot outweigh the unfavorable effects of high popula
tion growth;— and delays in adopting new technology will result
in even more accentuation of poverty.
The above hypotheses regarding the nature and impact of the new
agricultural technology have not yet been rigorously tested for Bangla
desh. A large number of village studies have been undertaken to look
into the impact of farm size and tenancy on productivity and they
provide information on adoption of MVs and use of fertilizer for diffe
rent groups of farms.— But the studies are not based on any rigorous
and systematic treatment of sufficiently large and disaggregated data,
and so the results are speculative and conjeetual in nature, and also
the results do not show any consistent pattern. The few rigorous
attempts that have been made are based on data collected from onv_
or two villages and for the period of the early seventies when the

- 12 -
technology had not progressed very far. And, the impact of the techno
logy on employment and its indirect effects on non-farm activity and
on income distribution among rural households is poorly documented.
Obviously an indepth investigation into the characteristics of the
new technology and its impact on productivity and income distribution
is overdue. This is the objective of this study.
Two large household surveys have been conducted in recent years
which provide disaggregated information that from the basis of this
study. The first survey was conducted by the International Fertilizer
Development Centre in collaboration with the Bangladesh Agricultural
Research Council for studying the distributional consequences of ferti
lizer use. This is the most comprehensive farm survey conducted so
far in the country. The survey work started with the 1979 monsoon
season crops and continued for 10 consecutive seasons up to the 1982
aman season crops. A multistage random sampling method was used in
the survey which ultimately covered 2400 sample farms and about 10,000
sample plots in 117 villages from 20 Upazilas scattered throughout
16 to 21 Bangladesh (old) districts. The survey collected detailed
input-output data for all crops disaggregated by the type of technology
used and the information was collected at the plot level. We do not
have access to the plot or farm level data but detailed disaggregated
information was presented at the crop and technology level in the
12/published reports of the survey,— which has been used here for analy
zing the nature of the modern varieties of rice vis-a-vis the tradi
tional ones (Chapter 4).

The second survey was conducted by the International Food Policy
Research Institute in collaboration with the Bangladesh Institute
of Development Studies for evaluation of the development impact of
the infrastructure created under the food for work program in the
13/country.-^— The survey was conducted in 16 selected villages scattered
through the four administrative divisions in the country and represent
the principal ecological zones. A census of all households in the
selected villages were carried out to serve as the sample frame for
the study. The households were classified into eight groups based
on the size of the landholding (four groups) and the occupation of
the head of the household (agriculture and non-agriculture). A propor
tionate random sample was then drawn from each stratum so as to have
40 households in each village. The total sample size thus consists
of 640 households and about 5200 plots operated by them. A few sample
households could not be included in the analysis due to missing obser
vations and doubtful information. The authors was involved in the
design and implementation of the survey.
The field work was conducted during September 1981 to January
1983 administering five sets of structural questionnaire collecting
information on the pattern of land use at the level of the plot for
1981 calendar year, cost and returns for various crops grown during
1982 at the farm level, and employment, income, investment, and con
sumption at the household level for 1982, The disaggregated household
and plot level data have been analyzed here to investigate the impact
of the modern technology on productivity, employment, and incomes
(Chapters 5 to 9).
- 13 -

The villages studied represent a wide range of levels of develop
ment of the modern rice technology (Table 1). In five villages, less
than five per cent of the cropped area was covered by the modern varie
ties of rice, while in four others more than 70 per cent of the area
has been covered. The variation is mainly the result of the access
of the villages to irrigation facilities, which have been developed
mainly by the government during the last two decades and mostly through
foreign assistance. In four of the villages, irrigation facilities
were almost non-existent, two of them located in the coastal district
of Khulna, where salinity of the water makes irrigation development
difficult. In three other districts, some of the area is irrigated
by indigenous methods (swing baskets and dhones). At the other end,
in five villages more than 50 per cent of the cultivated land had
irrigation facilities, three of them located in Comilla, where irriga
tion facilities were developed early (in the sixties) by the Comilla
cooperative movement. The consumption of chemical fertilizer ranges
from almost insignificant in the villages in Khulna to nearly 130
kg of materials per cropped acre in the villages in Comilla, and the
level of consumption is highly related to the proportion of area under
the modern varieties of rice.
One of the methods used in this paper to assess the impact of
the technology is to compare the mean values of the variables in the
technological developed and underdeveloped villages. Since in Bangla
desh only about one-fifth of the area had irrigation facilities at
the time of the survey, we used that figure for classifying the villa
ges into two groups. This also divides the sample into two equal

BASIC CHARACTERISTICS OF THE VILLAGES UNDER STUDY
- 15 -
TABLE 1
Name of the
villageDistrict
Average
size of
land
owned
(acres)
Average
house
hold
size
Per cent
of land
irrigated
Area under
modern
variety
(per cent of
cropped land)
Fertilizer
Consumption
(kilograms
of materials
per acre of
cropped land)
Per cet
of cro(
area
under
tenanq
Developed Area: 2.26 6.52 53.8 61.4 62.2 16.0
Chasapara Comilla * 2.1 A 6. BO 66.9 99.5 126.4 16.4
Illashpur Comilla 1.67 6.78 56.3 73.2 133.6 21.1
Khunta Comilla 1.80 6.23 83.3 83.2 130.4 15.0
Harishpur Jessore 3.72 6.6B 52.9 01.0 94.3 27.1
Rawtora Pabna o.aa 6.B9 58.0 46.9 65.1 2.5
Rajarampur Dhaka 2.61 5.40 32.9 33.9 .. 22.2 17.1
Charkhamar Dhaka 2.50 6.40 42.4 25.7 30.3 4,7
Bandabeel Kushtia 2.65 6.79 36.3 24.7 32.4 13.5
Underdeveloped Areasr f . .
2.26 6.35 8.0 5.2 10.8 15.9
Govindapur Dhaka 2.36 5.43 20.4 13.0 14.1 7.8
Sayedpur Dhaka 2.03 6.30 8.8 3.2 6.9 12.0
Patgari Pabna 1.77 6.68 12.6 10.4 13.1 5.0
Roakuli Kushtia 3.41 6.63 3.B 4.0 18.1 3.6
Gobrapara Jessore 3.62 7.53 3.9 nil 7.9 19.5
Khejurdanga Khulna 1.61 5.62 13.6 17.2 30.1 14.0
Birhat Khulna 1.64 6.25 nil nil 1.0- 36.2
Taliamara Khulna 1.45 5.05 nil nil 1.3 45.7

- 16 -
size groups, with eight villages and 317 households in each group.
In the developed villages nearly three-fifths of the cropped land
was sown with the modern varieties of rice compared to only five per
cent in the underdeveloped villages. The former group used 82 kgs
of fertilizer materials per acre of cropped land compared to 11 kgs
for the latter group (Table 1).
The pattern of distribution of land for the sample households
is shown in Table 2. About 30 per cent of the households own up to
0.5 acres, which is considered in Bangladesh as functionally landless.
This category is estimated by the recent Agricultural Census of Bangla
desh (1983-84) at 46 per cent (it includes urban households). At
the other end, about 10 per cent of the households own more than five
acres, and may be considered as large farmers in the Bangladesh stan
dard, Their proportion for the country as a whole is estimated at
8,5 per cent. The average size of landownership for the sample is
2.26 acres, compared to 2.00 acres for Bangladesh. Thus the degree
of landlessness is lower and the amount of land owned is higher for
the sample than in Bangladesh, The pattern of land distribution is,
however, very similar in the technological developed and underdeveloped
villages. The two groups have the same average size of landownership,
and the same proportion of landless households. The proportion of
large farmers and their share of total land is, however, slightly
higher in the developed villages. The proportion of area cultivated
by tenants varies widely across villages, but the average for the
two groups of villages are similar (Table 1).

- 17 -
THE PATTERN OF DISTRIBUTION OF LANDOWNERSHIP IN THE SAMPLE
TABLE 2
Landownership group (acres)
Number of samples
Percent of households
Percent of land owned
Percent of population
Average size o. land Owned (acres
Developed Area 317 100.0 100.0 100.0 2.26
Up to 0.5 97 30.6 2.0 25.6 0.17
0.51 - 2.0 103 32.5 16.6 29.6 1.16
2.01 - 5.0 80 25.2 36.1 28.6 3.24
5,01 - 7.5 20 6.3 16.7 8.2 5.9
7.51 and above 17 5.4 28.6 8.0 12.07
Underdeveloped Area 317 100.0 100.0 100.0 2.26
Up to 0.5 94 29.7 2.0 23.1 0.15
0.51 - 2.0 111 35.0 17.4 33.8 1.13
2.01 - 5.0 31 25.6 38.1 29.1 3.37
5.01 - 7.5 17 5.4 14.8 6.6 6.24
7.51 and above 14 4.4 27.7 7.4 14.17
Total Sample 634 100.0 100.0 100.0 2.26
Up to 0.5 191 30.1 , 2.0 24.4 0.15
0.51 - 2.0 214 i. 33.8 : 17.0 i 31.7 1.14
2.01 - 5.0 161 25.4 37.1 28.8 3.31
5.01 - 7.5 i37 5.8 15.7 . 7.4 6.10
7.51 and above r 31 4.9 28.1 7.8 13.02

- 18 -
As a background to the detailed micro-level analysis which follows,
Chapter 3 given an overview of the technological progress in Bangladesh,
; . * ’ f'v ‘ *
and its impact cn agricultural growth and on trend in relative prices,
using national level data for the 1950-85 period. The characteristics
of the modern varieties of rice vis-a-vis the traditional ones, in
terms of the use of various inputs and the implications on the cost
of production and profits, are described in Chapter 4, using detailed
input-output information provided by the IFDC survey. The impact
of the technology on the productivity of land and labor and the effi
ciency of resource use is analyzed in Chapter 5 through estimation
of production functions and profit functions. Chapter 6 studies the
impact of farm size and tenure on the adoption of the new technology
in order to assess the consequences of the technological progressi . »r .
on the distribution of income among various groups of farmers. About
a third of the rural households in Bangladesh are landless and a half
own less than 0.5 acres, these households depend on the labor market
for employment and income. In order to complete the assessment of
equity implications of the technological diffusion, Chapter 7 traces
the employment effects by analyzing the supply of and the demand for
labor for different groups of households in the technologically advan
ced and backward villages. The chapter also estimates labor supply
functions with disaggregated household level information and estimates
the effect of technological change on the agricultural wage rate.
The issue of the indirect effects of the new technology on generation\ *
of employment and income, for the poor through expansion of the market

for non-farm goods and services is taken up in Chapter 8. The chapter
also analyzes the investment behavior of different landholding groups,
and the impact of the growth of income on the land market. The effect
of the technology on the level and distribution of income and on alle
viation of rural poverty is summarized in Chapter 9. The implications
of the major findings of the study for policies to promote rural deve
lopment are discussed in Chapter 10.

- 20 -
1. For various estimates of the income and expenditure elasticityof the demand for food for Bangladesh see, W. Mahmud, "Foodgrain Demand Elasticities of Rural Households in Bangladesh: An Analysis of Pooled Bata’', The Bangladesh Development Studies, 7, (No.l, 1979); Bangladesh Bureau of Statistics, Report of the Bangladesh household Expenditure Survey, 3981-82, Dhaka, (March 1986):34-39; R. Ahmed, Agricultural Price Policies under Complex Socioeconomic and Natural Constraints*', Research Report No. 27 (Washington DC, IFPRI, 1981): 52-56.'
2. Bangladesh Bureau of Statistics, (Report of the 1983-84 Censusof Agriculture and Livestock, Dhaka, Ministry of Planning, 1986).
3. For details of the development in the field of fertilizer consumption, see International Food Policy Research Institute and Bangladesh Institute of Development Studies, Fvertilizer Pricing Policy and Poodgrain Production Strategy in Bangladesh, Technical Annex, (Washington DC, 1985).
4. See, for example, Mosharraf Hossain, A. Rashid, and S. Jahan,Rural Poverty in Bangladesh: A Report to the Like Minded Group,(Dhaka University, 1986); van Schendel, W,, Peasant Mobility: The Odds of Peasant Life in Bangladesh, Assen, (The Netherlands, 1981).
5. Mahabub Hossan, '’Agricultural Development in Bangladesh: A Historical Perspective'1, The Bangladesh Development Studies, 12 (December 1984): 29-57,
6. Azizur R, Khan, "Poverty and Inequality in Rural Bangladesh1'. In ILO (ed) Poverty and Landlessness in Rural Asia, ILO, (Geneva, 1977); Q.K. Ahmad and Mahabub Hossain'', An Evaluation of Selected Policies and Programs for Alleviation of Rural Poverty in Bangladesh". In R. Islam (ed) Strategies for Alleviating Poverty in Rural Asia, ILO (ARTEP, Bangkok, 1985).
7. N. Hasan and K. Ahmad, "Studies on Food and Nutrient Intake byRural Population of Bangladesh", Ecology of Food and Nutrition, 15 (No. 12, 1984); 143-158. .........
8. For a detailed articulation of this view, see Keith Griffin, The Political Economy of Agrarian Change: An Essay on the Green Revolution, Harvard University Press, (Cambridge, Massachusetts, 1964) and Andrew Pears, Seeds of Plenty, Seeds of Want: Social and Economic Implications of the Green Revolution" Clarendon Press (Oxford, 1980), For a detailed empirical study reporting the early results of the new agricultural technology in India, see B. Farmer (ed) Green Revolution, Macmillan, London, 1977.
Chapter 2 Notes

- 21 -
9. For this view, see John W. MeJlor, ‘'Determinants of Rural Poverty: The Dynamics of Production, Technology, and Price", in J.W. Mellor and G,ivi. Dcsai (ed) Agricultural Change and Rural Poverty, The Johns Hopkins University Press (Baltimore and London, 1985); and "Food Price Policy and Income Distribution in Low-incomc Countries”, Economic Development and Cultural Change, 27 (October 1976): 1—26„
10. This is supported by M.L. Dantwala, "Technology, Growth, and Equity in Agriculture", in J.W, Mellor and G.M. Desai (ed) op. cit, 110-123.
11. A survey of the results of these studies can be obtained from R.W. Herdt and L, Garcia, "Adoption of Modern Rice Technology: The Impact of Size and Tenure in Bangladesh" (mimeo), International Rice Research Institute, (Manila, 1982).
12. International Fertilizer Development Centre, Agricultural Production, Fertilizer Use, and Equity Consideration: Results and Analysis of Farm Survey Data, 1979-80 and 1982-84, (Alabama, 1982, 1984).
13. Bangladesh Institute of Development Studies and International Food Policy Research Institute, Development Impact of the Food for Work Program in Bangladesh, A report submitted to the World Food Program, Rome, (Washington DC, 1985).

- 22 -
3. TECHNOLOGICAL PROGRESS AND GROWTH OF CROP PRODUCTION -A MACRO PICTURE
Resource Base and the Need for Technological Progresss
The continuous high growth of population has made Bangladesh
an extreme land scarce country and land can no longer be counted as
an important source of growth of agricultural production. The total
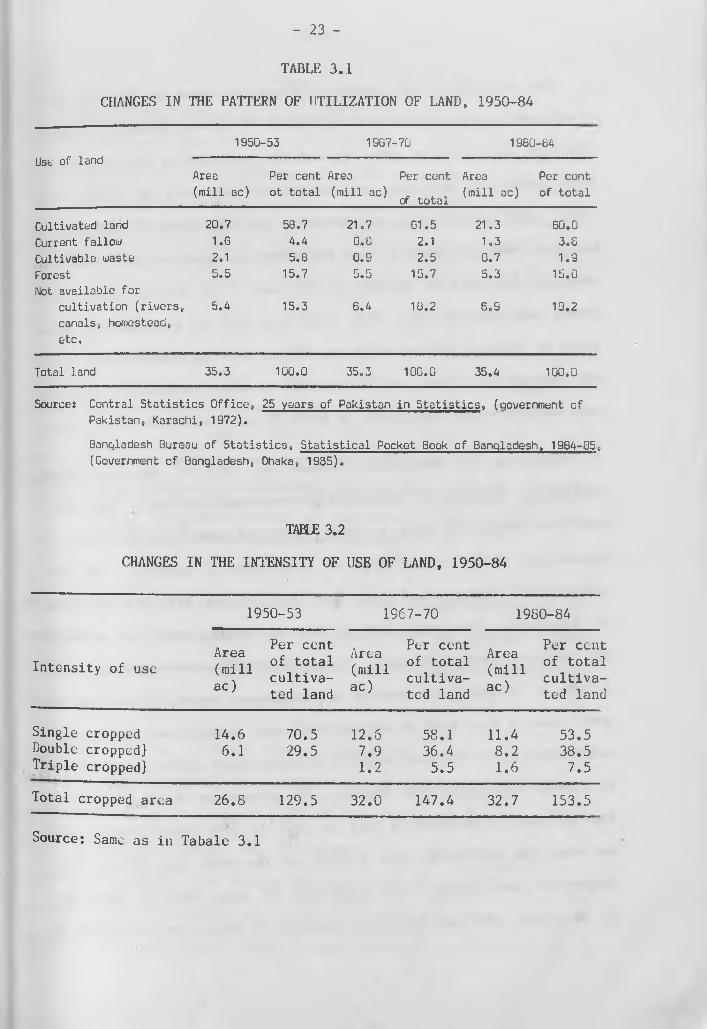
area of the country amounts to 35 million acres of which about 60
per cent is cultivated and most of the remaining land is under forests,
rivers, and homestead (Table 3.1). There has been very little increase
in cultivated land since the early fifties (see Figure 1), and by
the end of the sixties, a type of equilibrium has been reached in
the land use pattern, which has changed very little since. At present,
the waste land which can be reclaimed for cultivation is only 1,9
per cent of the total land.
The effective supply of land could, however, be raised through
growing additional crops on the same land during the year. This was
indeed one of the means by which production was increased from this
limited resource base. In the yearly fifties, only one-fourth of
of the total land was cropped more than once during the year. The
intensity of cropping increased very rapidly in the sixties from about
130 per cent in 1960/61 to 148 per cent by 1969/70. The cropping
intensity continued to increase in the post-independence period but
the rate of increase has slowed down. (see Figure 1 and Table 3.2).
further increase would depend on the expansion of irrigation facilities
which allow the growing of additional crops on seasonally fallow land
during the dry winter season (boro).
- 23 -
TABLE 3.1
CHANGES IN THE PATTERN OF UTILIZATION OF LAND, 1950-84
Use of land
1950-53 1967-■70 1980--84
Area
(mill ac)
Per cent Area
ot total (mill ac)
Per cent Area
. , (mill ac) of total v '
Per cent
of total
Cultivated land
Current fallow
Cultivable waste
Forest
Not available for
cultivation (rivers
canals, homestead,
etc.
20.7
1.6
2,1
5.5
, 5.4
58.7
4.4
5.6
15.7
15.3
21.7
0.0
0.9
5.5
6.4
61.5
2.1
2.5
15.7
18.2
21.3
1.3
0.7
5.3
6.9
60.0
3.6
1.9
15.0
19.2
Total land 35.3 100.0 35.3 100.0 35.4 100.0
5ources Central Statistics Office, 25 years of Pakistan in Statistics, (government of
Pakistan, Karachi, 1972).
Bangladesh Bureau of Statistics, Statistical Pocket Book of Bangladesh , 1964-85,
(Government of Bangladesh, Dhaka, 1935).
TABLE 3.2
CHANGES IN THE INTENSITY OF USE OF LAND, 1950-84
1950-53 1967-70 1980-84
Intensity of useArea(millac)
Per cent of total cultivated land
Area(millac)
Per cent of total cultivated land
Area(millac)
Per cent of total cultivated land
Single cropped Double cropped] Triple cropped]
14.66.1
70.529.5
12.6
7.91.2
58.136.45.5
11.48.21.6
53.538.5 7.5
Total cropped area 26.8 129.5 32.0 147.4 32.7 153.5
Source: Same as in Tabale 3.1

- 24 -
The majority of the people continue to depend on land for their
livelihood because of limited expansion of non-agricultural sectors,
inhibited partly by the small size of internal markets for non-agricul-
tural goods and services, perpetuated by low-levels of income. The
value added generated by manufacturing is only about 10 per cent of
the gross domestic product, and the share of construction, trade and
transport services is another 20 per cent. The 1983/84 Labor Force
Survey has recorded that only eight per cent of the civilian labor
force is employed in manufacturing, 17 per cent in construction, trade
and transport services, and 12 per cent in other services.— Agricul
ture still provides employment to about 60 per cent of the labor force.
Owing to the population pressure and lack of non-agricultural
employment, the land is cultivated in very small holdings. Also hold
ings are fragmented into a large number of scattered plots due to
application of the islamic laws of inheritance of property. The 1977
agricultural census found that two-fifths of the farm had more than
10 fragments. The small farm defined as holding under 2.5 acres is
the dominant production unit. With the traditional technology, such
a farm is incapable of proucing a subsistence income, so most of the
small farmers also work as agricultural wage laborers and engage them
selves in various non-farm activities during slack agricultural seasons
to augment the income from farming. The proportion of the small farms
has increased from about a half in 1960 to over two-thirds by 1984
and they now cultivate about a third of the total land (Table 3.3).
During the same period, the proportion of large farm declined from
10 to 5 per cent and the area operated by them from two-fifths to

- 25 -
TABLE 3.3
CHANGES IN THE PATTERN OF DISTRIBUTION OF LANDHOLDING, 1960-84
Size of farm (acres)
Percent of holding
Percent of area operated
Average size of farm
1960 v1983 1960 1983 1960 1983
Under 1.0 24.3 40.4 3.2 7.8 0.47 0.44
1.0 - 2.5 27.3 29.9 13.0 21.2 1.68 1.60
2.5 - 5.0 26.3 18.0 26.4 27.5 3.55 3.45
5.0 - 7.5 11.4 6.8 19.3 17.6 6.00 5.91
7.5 - over 10.7 4.9 38.1 25.9 12.60 11.85
All Farms 100.0 100.0 100.0 100.0 3.54 2.26
Source: 1960 Census of Agriculture, Vol II, East Pakistan, Agricultural Census Organization, Government of Pakistan, Karachi, 1962. Bangladesh Bureau of Statistics, Report of the 1983- 84 Census of Agriculture and Livestock, Dhaka, 1986.
to one-fourth of the total land. The above characteristics of the
landholding imply that there are few farmers who can generate enough
surplus for reinvestment in agriculture, particularly in indivisible
assets such as irrigation equipment.
• • J
While land is extremely scarce, Bangladesh is known to have an
abundant water resource, the planned use of which for agricultural
production was almost non-existent even by the early sixties. Three
major rivers, the Ganges, the Brahmaputra, and the Meghna and their
numerous tributaries flow through Bangladesh and discharge huge volumes
of water. Heavy rainfall and geological structure produce excellent
supplies of ground water, which in most regions are available up to

- 26 -
a depth of about 12 meters and at less than six meters in large parts
of the country and hence can be developed with relatively low cost.
The recently completed National Water Plan estimates that nearly sixty
per cent of the land can be irrigated by development of surface water
through water conservation measures and withdrawing of streamflows
2/from rivers.“• The ground water resource potential is estimated,
on the basis of 75 per cent usable recharge, at 17,140 Kim3 which can
irrigate about 9.4 million acres or about 45 per cent of the culti
vated land, Currently only about a fifth of the total land is irriga
ted. Obviously, there is a vast potential for further development
of water resources in the country.
The new varieties of rice and wheat, developed by the internatio
nal agricultural research stations and introduced to the farmers in
Bangladesh in the late 1960s, opened up the possibility of increasing
the supply of food on the limited land through development of water
resources. The new varieties produce a substantially higher amount
per unit of land compared to the traditional varieties, but they need
careful water management and application of chemical fertilizer in
large amounts, without which they fare no better compared to the tradi
tional varieties. Thus, production could be increased from the shift
of land from traditional to the modern varieties which are popularly
known as the ’secd-fertilizer” technology, provided the land has access
to flood control, drainage, and irrigation facilities. At the some
time, the expansion of irrigation facilities would increase the effcc-• , : .Mo
tive supply of land during the dry winter season when a large propor
tion of land is kept fallow due to inadequate moisture in the soil.

- 27 -
The diffusion of new technology supported by the development of water
resources is thus the key to maintaining the food population balance
in the country.
Diffusion of the Modern Technology
The New Seeds
Rice seed improvement management experiments have been conducted
at the Dhaka Research Station since 1911, But a set of modern
varieties were imported in the late 1960s to support the accelerated
3/food production program sponsored by the Ford Foundation.— During
the 1970s, large quantity of modern variety seeds were imported from
IRRI in the Philippines and from India.
In 1970 the Bangladesh Rice Research Institute (BRRI) was set
up to develop varieties better suited to local growing conditions.
By 1983, BRRI introduced 16 short duration modern varieties. The
newer varieties have yield rates similar to the earlier ones but are
superior with respect to disease resistance and grain quality. Ric^
is grown in three distinct seasons, aus (early monsoon; April to
August), aman (monsoon; August to December), and boro (dry season;
January to May). The new varieties have been introduced in all three
seasons. In addition, a number of improved wheat varieties have been
imported from CIMMYT and India and multiplied in the seed multiplica
tion faims of the Bangladesh Agricultural Development Corporation
(BADC) for distribution among farmers. The most popular wheat variety
ls .Sonalikaf bred in India using materials from CIMMYT and its predece
ssors based on "Mexican" material.-7

-28 -
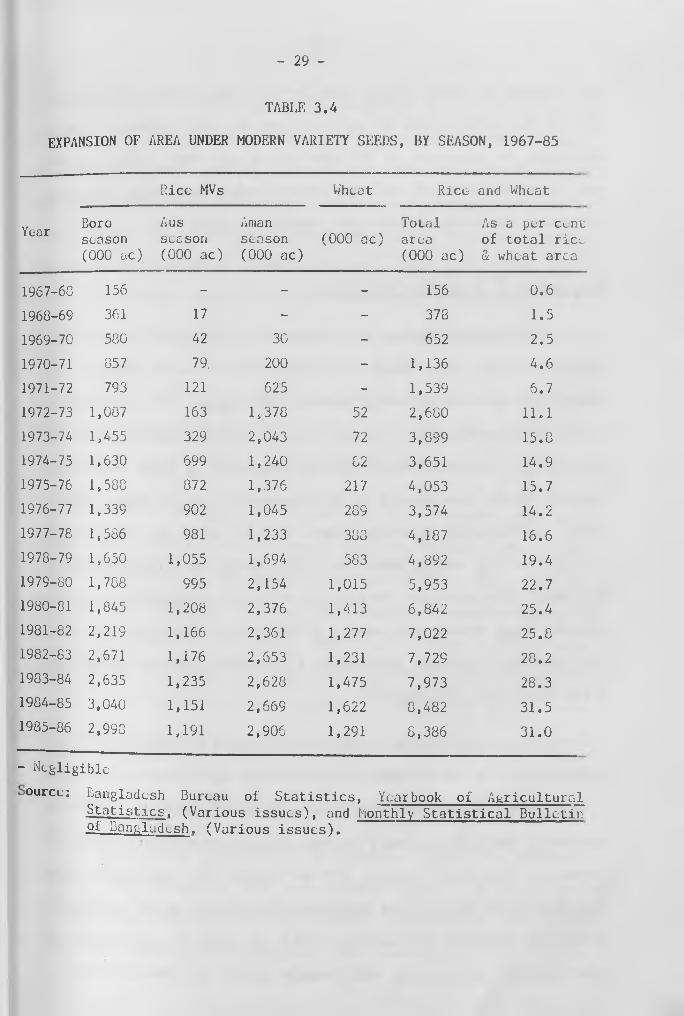
The official statistics on the expansion of area under the modern
seed varieties of rice and wheat are reported in Table 3.4. The figures
show that the us^ of the new seeds was negligible up to the end of
thu sixties„ but picked up rapidly within the 1970-74 period which
was followed by a period a stagnation during 1974-78 period. Thu
expansion, however, resumed during 1973/79 and continued through
1984/85 at a rate of about 600,000 thousand acres per year, which
doubled the area covered by the new seeds within a period of sev^n
years. The apparent stagnation in the MV area in the mid-seventies
may, however, be statistical rather than real. The Ministry of Agri
culture set up "Task Forces'* in 1974 and 1975 to evaluate the progress
of MV aman and wheat programs and the field investigation by the tax
force revealed substantial over-reporting of HYV aman acreage and
a minor under-reporting of MV wheat a c r e a g e . R e c o g n i z i n g that the
early information on MV expansion was over reported, the Bangladesh
Bureau of Statistics made substantial downward adjustments in the
area under aman and boro MVs for 1974/75 to 1 9 1 6 / 1 1 In view of
this adjustment in official series, one could argue that the diffusion
of the new seed varieties has proceeded steadily since their introduc
tion in the late sixties.
By 1985 nearly one-third of the cereal area had been covered
by the new seeds. Nearly two-thirds of the MV area are cropped during
the overalpping boro and aus seasons when the crops are grown with
irrigation. Now about 97 per cent of the area under wheat has been
covered by MVs, which has expanded largely at the expense of minor
dry season crops such as oilseeds and pulses. The MV wheat area how
ever comprises only 15 per cent of the MV cereal area. For rice,
- 29 -
TABLE 3.4
EXPANSION OF AREA UNDER MODERN VARIETY SEEDS, BY SEASON, 1967-85
Year
Rice MVs Wheat Rice and Wheat
Boro season (000 ac)
Aussea son (000 ac)
Aman season (000 ac)
(000 ac)Total area (000 ac)
As a per cent of total rice <3 wheat area
1967-68 156 - - - 156 0.6
1968-69 361 17 - - 378 1.5
1969-70 580 42 30 - 652 2.5
1970-71 857 79, 200 - 1,136 4.6
1971-72 793 121 625 - 1,539 6.7
1972-73 1,087 163 1,370 52 2,680 11.1
1973-74 1,455 329 2,043 72 3,899 15.8
1974-75 1,630 699 1,240 82 3,651 14.9
1975-76 1,588 872 1,376 217 4,053 15.7
1976-77 1,339 902 1,045 289 3,574 14.2
1977-78 1,586 981 1,233 388 4,107 16.6
1978-79 1,650 1,055 1,694 583 4,892 19.4
1979-80 1,788 995 2,154 1,015 5,953 22.7
1980-81 1,845 1,208 2,376 1,413 6,842 25.4
1981-82 2,219 1,166 2,361 1,277 7,022 25.0
1982-83 2,671 1,176 2,653 1,231 7,729 20.2
1983-84 2,635 1,235 2,628 1,475 7,973 28.3
1984-85 3,040 1,151 2,669 1,622 0,482 31.5
1985-86 2,998 1,191 2,906 1,291 8,386 31.0
- Negligible
ource: Bangladesh Bureau of Statistics, Yearbook of Agricultural-Statistics, (Various issues), and Monthly Statistical Bulletin of Bangladesh, (Various issues).

- 30 -
the coverage is about 78 per cent for the boro season, 16 per cent
for the aus season, and 20 per cent for the aman season. A major
constraint to expansion of MV area during the aman season is that
more than two-thirds of the area remains under deep water throughout
the season and is not suitable for growing the dwarf MVs.
Development of Irrigation Facilities
Before modern irrigation was introduced in Bangladesh, cultivators
used to irrigate boro paddy by lifting surface water through such
traditional devices as swing boskets and dhoncs. It is estimated
by the 1960 agricultural census that in 1959/60, nearly seven per
cent of the cultivated land received irrigation by these traditional
methods, mostly concentrated in the depressed basins of Sylhet, Mymen-
singh, and Rajshahi districts, where surface water was available at
a height of 1-2 meters below the field during the driest months of
the year. The subsequent development of modern irrigation has partly
replaced these traditional sources of irrigation, the area under which
has reportedly declined from about 1.5 million acres in 1970/71 to
0.9 million acres by 1984/85.—7
The initiative for the development of modern irrigation facilities
had been taken by the government since farmers were unwilling or unable
to make large lumpsum investments on irrigation equipment. The major
constraint has been the small average- size of farms and the scattered
fragmented holdings. During 1976-84 period the government spent
Tk 7720 million per year for development activities in the agriculture
sector, of which Tk 3200 million (42%) was spent for irrigation and
flood control. The projects were financed mainly with foreign aid.

- 31 -
The earliest approach of the government to expand irrigation
facilities was through construction of large scale multi-purpose irri
gation, flood control, and drainage projects implemented by the Bangla
desh Water Development Board. A number of major projects were imple
mented during the sixties and seventies, which have been largely
successful in protecting coastal and river bult areas from saline
water intrusion and floods, but they played only a minor role in the.
irrigation development of the country; the area irrigated by such
projects constitute only about one-tenth of the total area irrigated
in the country. The provision of irrigation through the water deve
lopment board projects has been costly since both the capital and
current cost are borne almost entirely by the government.—
Most of the irrigation development in Bangladesh has taken place
through use of small scale equipment such as low lift pumps (LLP),
deep tubewclls (DTW), and shallow tubewells (STW). Up to the mid
seventies, the expansion followed upon subsidized rental of one to
two cusec capacity low lift pumps to farmers’ cooperatives
(Table 3.5). The number of pumps under operation rose quickly from
about 3,000 in 1965/66 to about 35,000 by 1973/74, but the expansion
since then has been slow. From 1978/79, the government has started
selling pumps to individual farmers and cooperatives. The subsidy
still remains at about 30 per cent of the procurement cost.—
The promotion of ground water development started late, beginning
in 1967/68 and moved at a slow pace through 1977/78. Initially, deep
tubewells were rented to bonafide farmers’ cooperatives which formed
water users groups with contiguous plots amounting to at least 50

- 32 -
TABLE 3.5
DEVELOPMENT OF MODERN IRRIGATION FACILITIES, 1960-85
Year
Units of Irrigation Equipment under Operation (000)
Area Irrigated by modern method s/a
Total area irrigated
Lowliftpumps
Deeptubewells
Shallowtubewells
000 ac
As a per cent of cultivated land
000 ac
As a per cent of cultivated land
1960/61 1,4 62 0.3 1,433 7 . 0 ^1965/66 3.4 - - 200 0.9 n.a. n.a.1969/70 17.9 1.0 - 830 3.8 2,613 12.01973/74 35.3 1.5 1.0 1,501 7.2 3,201 15.31974/75 35.5 2.7 2.4 1,564 7.5 3,562 17.01975/76 36.4 3.0 4.0 1,606 7.6 3,458 16.51976/77 20.2 4.5 5.4 1,341 6.6 3,004 14.71977/78 36.7 7.5 12.3 1,951 9.4 3,223 15.81970/79 35.9 9.3 17.0 2,295 11.0 3,903 18.91979/80 37.4 9.8 22.4 2,638 12.6 4,226 20.31980/81 36.1 10.1 38.4 3,033 14.3 4,520 21.41981/82 30.2 11.5 66.5 3,626 17.1 5,076 23.91982/03 42.2 13.8 104.1 4,036 19.0 5,345 25.11983/84 43.7 15.5 109.7 , 4,313 20.2 5,432 25.41984/05 49.8 16.7 137.0^ 4,579 21.5 5,483 25.7
Figures for shallow tubewell is includes those fielded by the Bangladesh Krishi Bank as estimated in the BADC report on Sale of Shallow Tubewclls in the North-west and South-eastern districts of Bangladesh (mimeo, Dhaka , BDC, 1984), The area irrigated as reported in this table exceeds the figure provided by the Bangladesh bureau of Statistics because of this discrepancy, as the later did not include the area irrigated by these shallow tubewells.
b/ For 1959/60, as estimated by the 1960 Pakistan Census of Agriculture
c j This figure is low compared to a World Bank estimate - which shows that in 1986 there were more than 170,000 shallow tubewells in the country.
Source: BADC, Annual Report (Various Issues) and Ministry of Finance, Bangladesh Economic Survey, Various Issues.

- 33 -
acre in area. The group would bear the operation cost and pay a pump
rental to BADC which was highly subsidized. Beginning in 1978/79,
the government started selling DTWs to groups and private individuals
at a subsidy of about 70 to 80 per cent. The number of DTWs increased
from 800 in 1970/71 to about 4,500 by 1976/77 and then more rapidly
to about 16,700 by 1984/85.
The spurt of expansion of irrigation, however, began with the
promotion of small capacity (less than 0.5 cusec) shallow tubewells
since the mid seventies. From the very beginning, these were sold
to farmers almost at cost price, but most of the purchases were finan
ced by loans from the Bangladesh Krishi (agricultural development)
Bank, a large proportion of which were not repaid. The sales of
shallow tubewells increased rapidly during the 1979-83 period but
slackened since then.*^^ The tubewells now account for over a half
of the total irrigated area in the country.
The official statistics on area irrigated by different methods
is known to be of dubious quality. The figures provided by different
agencies in charge of development of irrigation are not consistent
with the figures published by the Bangladesh bureau of Statistics
which probably underestimates the area irrigated by shallow tubewells
sold through the private sector by the Bangladesh Krishi Bank* It
is also reported in a number of field surveys that some of the equip
ments sold to farmers may be used for non-agricultural pur poses. ' ~
The margin of error, however, may not be very large, as the 1983-84
agricultural census estimates the irrigated area at 1.62 million ac,

- 34 -
against the official estimate of the area irrigated by modern methods
at 1.75 million ac for that year.
The time series on irrigated land, compiled from the figures
released by the BADC, BWDB, and the Ministry of Finance are represented. I •
in Table 3.5. It will be noted that modern irrigation was almost
negligible even by the end of the sixties and its development has
been fast up since 1977/78. Still, only about one-fourth of the culti
vated area is irrigated and about one-fifth is irrigated by modern
methods. The potential for further development of irrigation is thus
considerable.
Economic analysis of various modes of water conducted by the
National Water Plan on the basis of (a) the observed cropping pattern
and input-output coefficients, and (b) shadow prices of inputs and
output gives a rate of return on investment of 35 per cent for minor
12/irrigation equipment.— The incentive for farmers to invest in small
scale irrigation equipment has also been examined by the National
Water Plan using a cashflow analysis, at the existing terms of loans
from the financial institutions. It shows that individual farmers
have enough incentives to invest on shallow tubewells and low-lift
pumps but for deep tubewells private investment is not financially
feasible at existing terms, but investment through cooperatives provide
ample financial incentives. In spite of the high profitability, the
government achieved only 25 per cent of the planned targets for irriga-. w- '*
tion expansion during the First Five Year Plan (1973-78), and 71 per
cent during the Second Five Year Plan (1980-84). The major constraints
to expansion of irrigation seems to be (a) poor financial capacity

- 35 -
owing to low level of income of the farmers, low tax-GNP ratio and
the inability of the government to recoup the investment cost from
the beneficiary, (b) low implementation capacity of public institutions
which often leads to time and cost overruns in project implementation,r;;- . . . •!'•!, , i(c) differential pricing of water by the BADC and BWBB and also for
different equipments by BADC, which may dampen private initiatives
for investment, (d) high unit costs of account of variable inputs
due to low capacity utilization of equipment, (e) lack of proper zoning
of areas suitable for different equipments which may result in improper*'• V*. J
siting leading to low capacity utilisation and (f) organizational
problems in forming cooperatives of water users.
Fertilizer Consumption
Although chemical fertilizers were introduced in the country
in the 1950s, their application was mostly limited to tea gardens
and government experimental farms until the early sixties. With the
objective of popularizing this new input to farmers, the BADC, a
parastatal organization established for procurement and distribution
of modern agricultural inputs to farmers, started selling fertilizers
to farmers at highly subsidized prices. It is estimated that in 1968/
69, the average rate of subsidy was about 58 per cent for urea and
phosphate, and 67 per cent for potash.-^^ With rapidly increasing
sales, the subsidy rates began to put a heavy burden on the government
budget in the early seventies. This, together with an increase in
the procurement cost of fertilizers, led the government to reduce
subsidies. By 1983/84 the budgetary subsidy was reduced to about. X
2 Sper cent of the cost, and the economic subsidy valued at border

prices was about 23 per cent in that year.—* At present, there is
little subsidy on fertilizer. Over the 1972-84 period fertilizer
prices increased by 20 per cent per annum, compared to a 10 per cent
increase in the prices of crop output. Another policy change intro
duced' since 1978 in handing over of distribution of fertilizers at
the local level from BADC to private traders. Under the new system,
traders can buy fertilizer from BADC sales centres at the government
fixed prices and sell it to farmers at a market determined price.
The BADC still keeps control over procurement of fertilizers and dis
tribution to primary sales points and, for that purpose, it plans
supply to maintain adequate stocks.
The trend in the consumption of fertilizers can be reviewed in
Table 3.6. In 1960/61 the consumption was almost negligible at less
than one kg of nutrient per acre of sown area. By the end of the
sixties, the consumption increased to over 4 kg per acre, and it
tripled within the next decade to about 13 kg by 1979/80. After a
brief period of stagnation during the 1979-83 period, the consumption
picked up again over the 1983-85 period. The sales in 1984/85 reached
1.26 million tons of fertilizers valued at about 5.3 per cent of the
value added in crop production. Over the 1970-85 period, the trend
rate of growth of consumption was about 10 per cent per annum.
Time series data on fertilizers application on crops is not avail
able for.Bangladesh. Trend in use in different seasons could, however,
be constructed from BADC sales figures which are available by months.
Fertilizer is applied on the main aman paddy crop during July to
October period when no other fertilizer using crops are widely
- 36 -

- 37 -
TABLE 3.6
TREND IN THE CONSUMPTION OF CHEMICAL FERTILIZERS BY SEASON,1960/61 TO 1904/85
Year
Total Fertilizer Sales (000 tons of materials)
Sales per (Kg of
unit of cropped land nutrients per acre)
Aman Boro Aus Total Total Boro season
1960/61 20 13 16 49 0.9 2.6
1965/66 45 28 35 108 1.7 5.3
1970/71 109 130 70 309 4.6 15.2
1973/74 109 200 81 386 5.9 22.1
1975/76 139 234 92 465 7.0 24.1
1976/77 154 227 140 521 8.0 24.9
1977/76 207 325 195 727 10.9 33.0
1978/79 256 358 140 754 11.1 35.7
1979/80 252 424 179 855 12,5 37.6
1980/81 265 42.9 195 889 12.8 35.2
1981/82 291 392 160 843 12.1 30.9
1982/83 245 507 216 968 13.7 38.0
1983/84 267 629 233 1129 16.1 47.3
1904/85
1985/86
364 669 228 1260 18.1 44.8
Source: Compiled from BADC Annual Reports, and The Monthly StatisticalBulletin of Bangladesh, (Various issues)

cultivated. November to March is the fertilizer application season
for various rabi crops such as potato, wheat, mustard, sugarcane,
and also boro paddy, which is grown under irrigated conditions. Aus
paddy and jute are treated with fertilizer from April to June. The
constructed time scries on season-specific consumption of fertilizer,
reported in Table 3.0, shows that the major focus of the growth of
fertilizer consumption has been on the boro and rabi crops cultivated
during the winter season. The major portion of the area under MVs
are also cultivated during this season. These crops now account for
about one-fourth of the sown area, but in 1984/85 sales during the
season accounted for over a half of the total fertilizer sales in
the country. The rate of application of fertilizer in the boro
season crops at present is about 3.5 times higher than that for all
crops taken together (Table 3.8). It is estimated elsewhere^-^ that the
share of MV crops in total fertilizer consumption has increased from
about 25 per cent in 1969/70 to over 61 per cent in 1983/84. Of the
total increase in consumption over the 1977-84 period, 81 per cent
was associated with the increased use on MVs and 51 per cent with
increased use on irrigated land. Thus, MV seeds and irrigation have
played an increasingly important role in the growth of fertilizer
consumption in Bangladesh.
1 •• I
Complementarity of the Modern Technology Package^^
The time series data reviewed above show a high degree of comple
mentarity between irrigation, fertilizer use and the diffusion of
MV seed (Figures 2 and 3). But irrigation could be the leading
- 38 -

input in the sense that adoption of id Vs and application of fertilizers
follows development of irrigation facilities. The followings '
analysis based on regional level cross-scction data for 1983/84,
the latest normal year for which data are available, shows the nature
of complementarity and the leading role of irrigation.
A large variation in the diffusion of the new technology is
found among the regions in the country. By 1984/85 the proportion
of land irrigated by modern methods has increased to over one-third
in the districts of Bogra, Kushtia, and Chittagong, while it was
still less than 15 per cent in the costal districts of Patuakhali,
Barisal, Khulna, and Noakhali. Similarly the proportion of cereal
area cultivated with TV seeds varied between 75 per cent in Chittagong
to less than 20 per cent in Patuakhali, Barisal, Khulna, and Sylhet.
Fertilizer consumption per acre of cultivated land varies from over
150 kgs of materials in the districts of Chittagong, Bogra and Kushtia
to less than 50 kg in the districts of Patuakhali, Barisal, Khulna,
Fnridpur and Sylhet.
The relationship between the intensity of fertilizer consumption
and the per cent of the net shown area irrigated is shown by regression
equations in Table 3.7 estimated by the OLS method on the district
level cross-section data. In order to reduce specification errors,
which differ across districts, r as
annual rainfall, the level of land, and the average size of farm
have been used as additional explanatory variables. The farm size
variable was found to be statistically insignificant in all esti
mating equations and hence it was dropped. Since both too much and
too little rainfall can effect fertilizer use, the absolute deviation
- 39 - ■ '
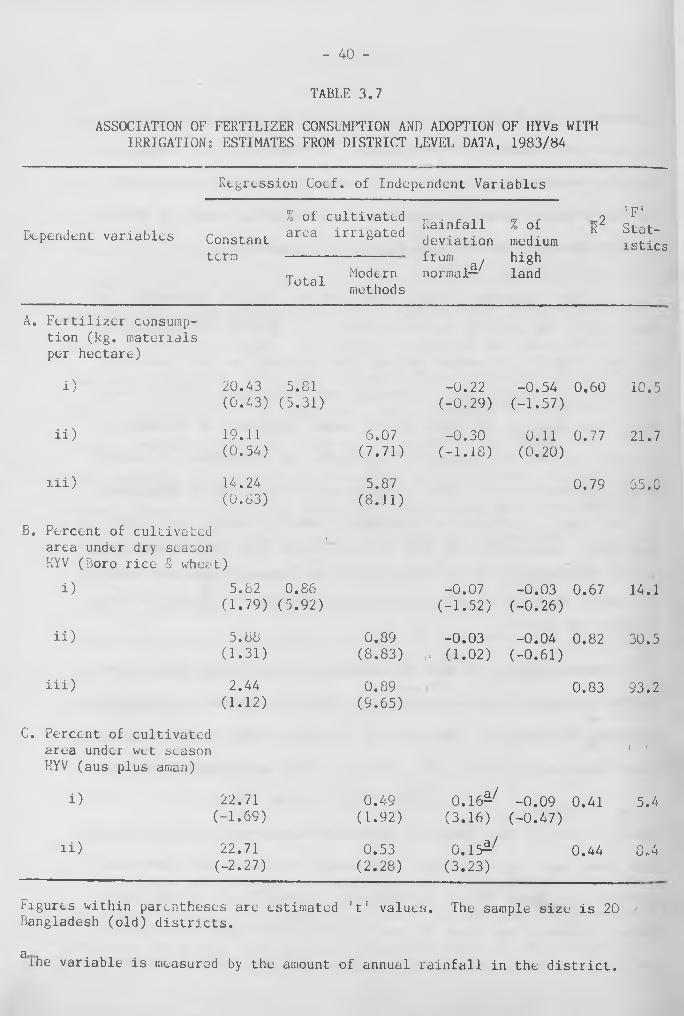
- 40 -
TABLE 3.7
ASSOCIATION OF FERTILIZER CONSUMPTION AND ADOPTION OF HYVs WITH IRRIGATIONS ESTIMATES FROM DISTRICT LEVEL DATA, 1983/84
Regression Coef,. of Indeipendent Variables
Dependent variables Constant
% of cultivated area irrigated
Rainfalldeviation
% of medium
R2
S p »
Statistics
term from /ia/normal—
highland
TotalModernmethods
A. Fertilizer consumption (kg. materials per hectare)
i) 20.43(0.43)
5.81(5.31)
-0.22(-0,29)
-0.54(-1.57)
0.60 10.5
ii) 19.11(0.54)
6.07(7.71)
-0.30(-1.18)
0.11(0.20)
0.77 21.7
lii) 14.24(0.S3)
5.87(8.11)
0.79 65.8
B. Percent of cultivated area under dry season
i
KYV (Boro rice S wheat)
i) 5.82(1.79)
0.86(5.92)
-0.07(-1.52)
-0.03(-0.26)
0.67 14.1
ii) 5.88(1.31)
0.89(8.83)
-0.03.i (1.02)
-0.04(-0.61)
0.82 30.5
iii) 2.44(1.12)
0.89(9.65)
0.83 93.2
C. Percent of cultivated area under wet season HYV (aus plus aman)
.1 1
i) 22.71(-1.69)
0.49(1.92)
0.16^(3.16)
-0.09(-0.47)
0.41 5.4
li) 22.71(-2.27)
0.53(2.28)
0.152/(3.23)
0.44 8.4
Figures within parentheses are estimated ft ' values. The sample size is 20 -Bangladesh (old) districts.
Qihe variable is measured by the amount of annual rainfall in the district.
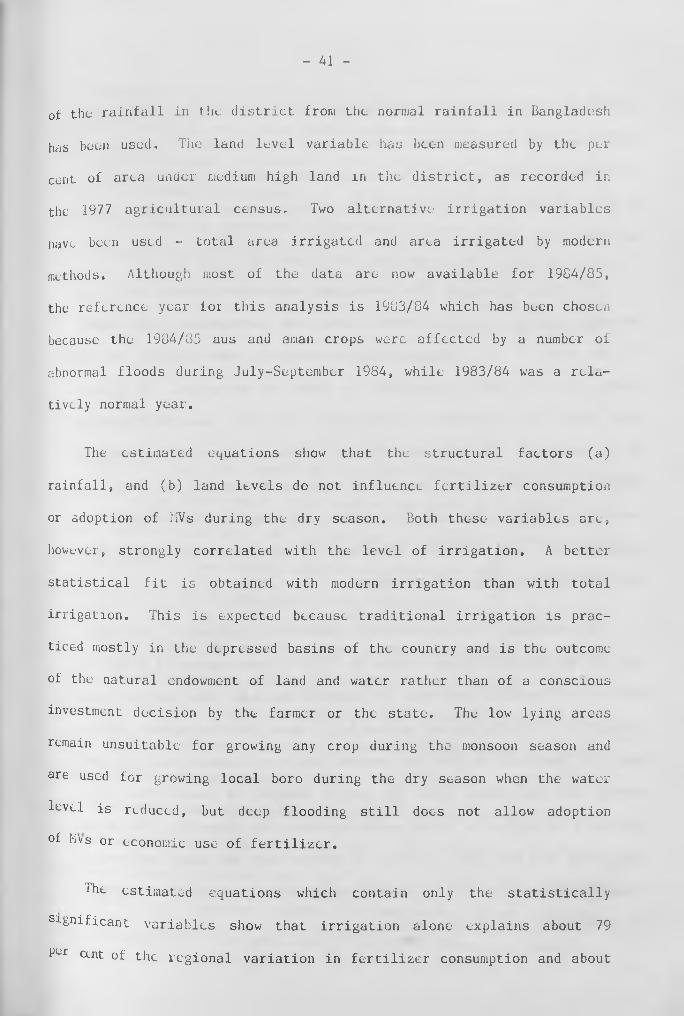
of the rainfall in the district from the normal rainfall in Bangladesh
has been used. The land level variable has bec-n measured by the per
cent of area under medium high land in the district, as recorded in
the 1977 agricultural census. Two alternative irrigation variables
have been used - total area irrigated and area irrigated by modern
methods. Although most of the data are- now available for 1984/85,
the reference year for this analysis is 1983/84 which has been chosen
because the 1984/85 aus and aman crops were affected by a number of
abnormal floods during July-Septembcr 1984, while 1983/84 was a rela
tively normal year.
The estimated equations show that the structural factors (a)
rainfall, and (b) land levels do not influence fertilizer consumption
or adoption of MVs during the dry season. Both those variables are,
however, strongly correlated with the level of irrigation. A better
statistical fit is obtained with modern irrigation than with total
irrigation. This is expected because traditional irrigation is prac
ticed mostly in the depressed basins of the country and is the outcome
of the natural endowment of land and water rather than of a conscious
investment decision by the farmer or the state. The low lying areas
remain unsuitable for growing any crop during the monsoon season and
are used for growing local boro during the dry season when the water
level is reduced, but deep flooding still does not allow adoption
of hvs or economic use of fertilizer.
The estimated equations which contain only the statistically
S18nificant variables show that irrigation alone explains about 79
for ant of the regional variation in fertilizer consumption and about
- 41 -

83 per cent variation in the diffusion of iiVs during the dry season,,
ihe elasticity of fertilizer consumption, with respect to irrigation,
is estimated from the equation at 0.90 at the mean level of the use
of these inputs and the elasticity of MV adoption during the dry season
at 0.89.
The area covered by MVs during the wet season is, however, more
strongly associated with rainfall than with irrigation. Only about
44 per cent of the interdistrict variation in the coverage of MVs
during the wet season is explained by these two variables. It appears
that some other important determinants have not been incorporated
in the analysis. One such variable may be the duration of the monsoon,
since early monsoon would facilitate adoption of aus MVs and districts
receiving adequate rainfall during the late monsoon period (September-
October) may have relative advantage in growing rainfed aman MVs.
The depth of flooding may be another.
The relatively weak relationship between irrigation and the expan
sion of wet season MVs may be due to (i) MVs first spread in districts
which have favorable endowment of rainfall and (ii) the low-lift pump
irrigation initially spread to low lying areas where adequate surface
water is available in the dry season, but deep flooding of such land
during the wet season does not permit raising of dwarf MVs. With
increased extraction of ground water resources by tubewells, irrigation
facilities are now being extended to medium high and high land areas,
which could be used for providing supplementary irrigation required
for raising MV aus and aman crops.
- 42 -

- 43 -
Development and use of modern irrigation facilities require prior
capital investment and institutional arrangements for the coordination
of actions among many cultivators. The adoption of MV seeds and appli
cation of chemical fertilizers are, however, current production deci
sions undertaken by individual cultivators. These special attributes
of irrigation and the high degree of complementarity among the three
inputs in the new technology package suggest that the development
of irrigation poses the key constraint to the diffusion of the modern
technology in the country (more on this in Chapter 6).
Impact on Growth
What has been the impact of the technological progress on the
growth of crop production? This section analyzes the official time
series data on sown area and production of different crops for the
period 1950-85 to see whether production growth has accelerated after
the introduction of the new agricultural technology.
A large number of crops are grown in Bangladesh, but three crops
- rice, wheat, and jute account for nearly 90 per cent of the total
sown area. For the present analysis, we have selected rice and wheat
(cereal group); and jute, sugarcane, tobacco, pulses, oilseeds, potato,
and chilli (non-cereal group) . These crops accounted for about 94
per cent of the sown area during the 1980-85 period, so the exclusion
of other crops should not seriously affect the results. The 1981/82
CroP levcl harvest prices have been used as weights for valuation
°1 production at constant prices. In Bangladesh, prices fluctuate
widely from year to year particularly for minor crops, the production

of which is highly responsive to changes in relative p r i c e s . T h e
1981/82 price level is chosen because it was found that for most of the
crops, the level of price in 1981/82 was very close to the trend for
the 1976-84 period.
The yield rates have been estimated by dividing the gross value
of production with the sown area. For assessing the impact of the
new technology on growth, we have divided the time series into two
parts, 1950-71 and 1971-85 periods and compared the growth performance
of the two periods. The crop year 1971/72 has been taken as the divi
ding line because (1) as noted earlier, there was little progress
of the new technology up to the end of the sixties and (2) Bangladesh
became independent from Pakistan in 1971 and it appears from a close
scrutiny of the official series that a downward adjustment has been
made in the crop yield figures since 1971/72.
To see whether the growth rate has accelerated in the latter
period with the diffusion of the new agricultural technology, the
following trend equation has been fitted on the data for the entire
period (1950-85): ;-
LnY = aQ + a^D + bQT + b^DT + u
where Y is the variable for which the rate of growth is estimated,
D is the dummy variable taking value one for the 1971-85 period and
zero otherwise and T is time. The rate of growth for the 1950-71
period is given by b^ and that for 1971-85 period is given by (bQ+bp.
The value of b^ is expected to be positive if there has been an accele
ration of growth during the 1971-85 period. The coefficient of the
- 44 -

- 45 -
dummy variable, a^, will indicate whether any adjustment has been
made in the time series since 1971.
The growth rates derived from the estimated equations arc presen
ted in Table 3.8. The growth of production has accelerated from about
2.5 per cent per annum during the 1950-71 period to about 2.9 per
cent during the 1971-85 period. This has taken place in spite of
a deceleration in the growth of cropped land in the later period.
The impact of technological progress should be felt on the growth
of land productivity. It is estimated that the growth of yield rates
has accelerated from 1.4 to about 2.0 per cent per annum for all crops.
The acceleration coefficient is found to be statistically significant
at about five per cent probability level.
TABLE 3.8
GROWTH IN CROP PRODUCTION BEFORE AND AFTER THE INTRODUCTION OFTHE MODERN TECHNOLOGY
(figures in percent per annum)
Crops PeriodCroppedland
Yield per unit of land
Production
Cereal crops 1950-71 1.10 1.52 2.621971-85 1.16 2.20 3.36
Non-cereal 1950-71 1.26 0.89 2.15crops 1971-85 -0.73 1.26 0.53
All crops 1950-71 1.12 1.40 2.521971-85 0.90 2,02 2.92

- 46 -
for investigation of the issue at hand, more important is to
look at the cereal sector since the technological progress has taken
place mainly in the production of rice and wheat. The production
of cereals has grown at faster rates than the non-cereal crops and
the difference in performance is particularly noticeable in the post
modern technology period. The growth of production for the cereal
crops has accelerated from about 2.6 per cent per annum during the
1950-71 period to about 3.4 per cent during 1971-85 period. The
acceleration in production is mainly on account of the growth in crop
yields, i.e., land productivity which has increased from 1.5 to 2.2
per cent per annum. The acceleration in the growth of productivity
in the post-modern technology period is almost twice was much for
the cereals compared to the non-cereal crops. The acceleration
coefficient for cereal yield is found to be statistically significant
at 10 per cent probability level.
The technological progress in cereal crops, however, has had
adverse effects on the production of non-cereal crops, many of which
cannot compete with MV rice and wheat. The most seriously affected
crops are jute, pulses, and oilseeds, the area under which declined
consistently since the late sixties. Jute competes for land with
aus rice, but owing to a secular declining in the price of jute rela
tive to a price of rice, large fluctuation in its prices, and techno
logical advances made in rice, some of the traditional jute land has
been shifted to MV aus and boro crops. The expansion of cropped land
under boro rice and wheat has been partly at the expense of pulses
and oilseeds. It will be noted from Table 3.8 that the cereal crops

- 47 -
have maintained the growth in cropped land at about 1.1 per cent per
annum largely at the expense of the non-cereal crops, the area under
w h i c h has declined absolutely at a rate of about 0.7 per cent per
annum during the 1971-85 period.
Level and Fluctuation of Food Prices
Technological progress implies a downward shift in the cost
function (Chapter 3), and depending on the nature of demand, some
of the benefits may be shifted to consumers in the form of lower prices.
It is argued in the literature that one of the important ways through
which the technological progress indirectly benefits the poor is the
18/lowering of the real food prices.— So a relevant empirical question
at this point is what happened to the prices of cereals compared
to the non-cereal crops after the introduction of the modern technology.
Table 3.9 presents the estimates of the rate of increase in the
retail prices of major commodities in the consumption basket for the
1950-71 and 1972-85 periods. Since there is considerable fluctuation
in prices from year to year, the rates of growth have been estimated'• j : • •
by fitting semi-logarithmic trend lines to the time series data.
The rate of inflation, as measured by the trend rate of growth in
the consumer price index, was only about three per cent per annum
during the decades of the fifties and sixties but increased to about
11 per cent since the independence of the country. So in comparing
the price changes for the two periods, one should look at relative
rather that absolute increase in prices.

- 48 -
TABLE 3.9
CHANGES IN THE FOOD AND NON-FOOD CONSUMER PRICES IN THE PRE AND POST NEW TECHNOLOGY PERIODS
(Per cent per annum)
1950-71 1972-85
Commodities
n _ c Standard Rate of r
error ofincrease
estimate
Instability index (per cent)
n r Standard Rate of £
error ofincrease
estimate
Instability index (per cent)
Food:Rice 5.42 0.47 12.9 10.98 0.76 9.0Pulses 3.89 0.47 12.8 12.16 1.47 14.5Potato 1.05 0.47 12.2 5.56 1.40 15.8Gur 3.51 0.59 17.0 8.99 1.24 14.1Fish 2.32 0.58 15.8 16.56 1.93 13.6Beef 3.86 0.27 7.6 16.17 2.51 16.9Oil 3.43 0.55 15.5 8.89 0.82 9.6
Non-food:Firewood 4.98 0.49 14.0 10.98 0.68 9.0Longcloth 1.52 0.58 13.8 9.21 0.66 5.7
Consumer price index
2.95 0.20 5.5 10.99 0.59 6.8
Source: Estimated by fitting semi-logarithmic trend lines on time series.
Notes : The retail prices are reported for major urban centres in Dhaka,Chittagong, Khulna, Rajshahi, Sylhet, and Rangpur. The figures in the table are based on the series for Dhaka. The consumer prices are for laborers in the industrial city of Narayangonj. The year, 1974/75, when famine conditions prevailed in the country was excluded in estimating trend for the later period.

- 49 -
During the two decades prior to the introduction of the new
technology, the rice prices increased at a much faster rate (80 per
cent higher) than the general rate of inflation in the country. In
fact, among the major commodities in the consumption basekt, the price
of rice increased at the fastest rate. The position, however, com
pletely reversed in the post-modern technology period. The prices
of rice increased at the same rate as the general rate of inflation
19/in the country.— Some of the commodities, such as pulses, beef,
and fish, which experienced slower rates of increase in prices than
rice during the earlier period had price increases at 10 to 50 per
cent higher rates compared to rice during the later period. Only
for oil, gur (raw sugar), and potato, did prices continue to increase
at a slower rate. The lower prices for oil and gur may have been
maintained by the government through imports of substitute commodities,
soybean oil, and sugar and by distributing them to urban consumers
through the rationing system and also by controlling the price of
sugar which is produced in government owned mills. Potato is the
only non-cereal food for which the long run growth in production has
been faster than in cereals. The growth rate is estimated at 8.2
per cent for the 1950-84 period and 3.5 per cent for the 1971-85
period.
A general problem with agricultural prices in Bangladesh is that
they arc very unstable. The new crop varieties ore less dependent
°n weather than the traditional ones, as the land on which they are
grown generally have access to irrigation facilities. So with a large
proportion of the production of cereals coming from the new varieties,
the weather induced fluctuations in production and prices are expected
t° be reduced.— Table 3.9 also presents a measure of the instability
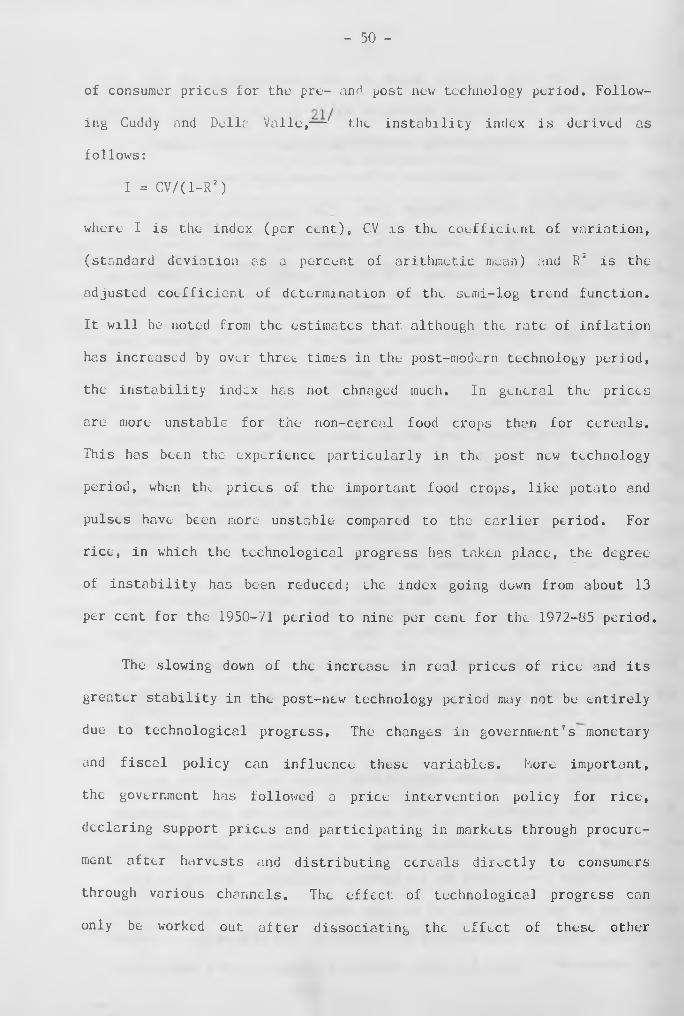
- 50 -
of consumer prices for the pre- and post new technology period. Follow
ing Cuddy and Della Valle,— 7 the instability index is derived as
follows:
I = CV/(1-R3)
where I is the index (per cent), CV is the coefficient of variation,
(standard deviation as a percent of arithmetic mean) and R3 is the
adjusted coefficient of determination of the semi-log trend function.
It will be noted from the estimates that although the rate of inflation
has increased by over three times in the post-modern technology period,
the instability index has not chnaged much. In general the prices
are more unstable for the non-cereal food crops than for cereals.
This has been the experience particularly in the post new technology
period, when the prices of the important food crops, like potato and
pulses have been more unstable compared to the earlier period. For
rice, in which the technological progress has taken place, the degree
of instability has been reduced; the index going down from about 13
per cent for the 1950-71 period to nine per cent for the 1972-85 period.
The slowing down of the increase in real prices of rice and its
greater stability in the post-new technology period may not be entirely
due to technological progress. The changes in government's monetary
and fiscal policy can influence these variables. More important,
the government has followed a price intervention policy for rice,
declaring support prices and participating in markets through procure
ment after harvests and distributing cereals directly to consumers
through various channels. The effect: of technological progress can
only be worked out after dissociating the effect of these other

factors, which in itself is an Important topic of research and has
not been pursued in this study.
Conclusions
In Bangladesh Agricultural growth is constrained by limited avail
ability of land. The amount of cultivated land has remained stagnant
since the early fifties. At present the wastu land which can be
reclaimed for cultivation is only - bout two per cent. But Bangladesh has vast
water resources which can be developed for adoption of the modern
rice technology for increasing foodgrain production. In fact, the
country has maintained the food population balance since its indepen
dence (1971) mainly through technological progress. About one—fifth
of the cultivated land has been brought under modern irrigation mostly
through public investment. This, together with improved flood control
and drainage, has made possible an expansion of the modern varieties
to about one-third of the sown area under cereals, and an increase
in fertilizer consumption from 4.5 to 18,2 kg of nutrients per acre
within the 1971-85 period. The growth of cereal production has accele
rated from 2.6 per cent per annum during 1950-71 to 3.4 per cent during
1971-85 period, mostly due to the acceleration in the growth of crop
yields. The productivity growth may hove been one of the factors
which has helped to keep the rice prices low. The retail price of
rice- which increased at about 80 per cent faster rate than the cost
°f living index during the 1950-71 period, has moved at par with the
general rate of inflation during the 1971-85 period. There is still
vast potential for further diffusion of the technology, the rate of
exploitation of which may depend on undertaking appropriate policies
by the government.
- 51 -
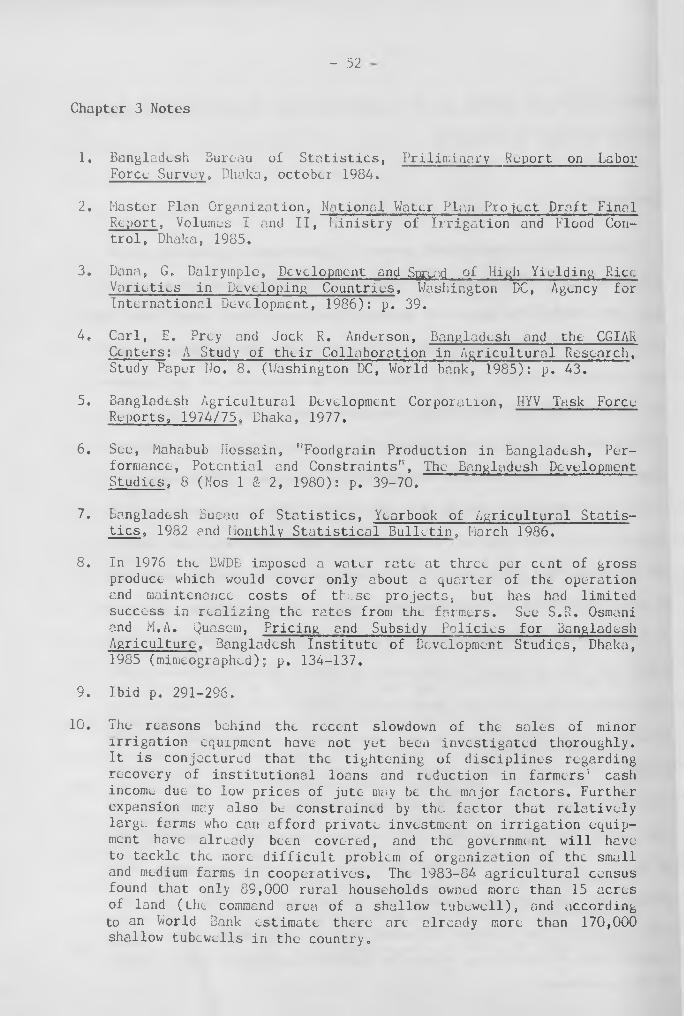
- 52
Chapter 3 Notes
1. Bangladesh Bureau of Statistics, Priliminary Report on Labor Force Survey, Dhaka, October 1984.
2. Master Plan Organization, National Water Plan Project Draft Final Report 3 Volumes I and II, Ministry of Irrigation and Flood Control, Dhaka, 1985.
3. Dana, G, Dalryinple, Development and Spread of High Yielding Rice Varieties in Developing Countries, Washington DC, Agency for International Development, 1986): p. 39.
4. Carl, E. Prey and Jock R. Anderson, Bangladesh and the CGIAR Centers: A Study of their Collaboration in Agricultural Research, Study Paper No. 8. (Washington DC, World bank, 1985): p. 43.
5. Bangladesh Agricultural Development Corporation, HYV Task Force Reports, 1974/75, Dhaka, 1977.
6. See, Mahabub Hossain, "Foodgrain Production in Bangladesh, Performance, Potential and Constraints", The Bangladesh Development Studies, 8 (Nos 1 & 2, 1980): p. 39-70.
7. Bangladesh Bueau of Statistics, Yearbook of Agricultural Statistics, 1982 and Monthly Statistical Bulletin, March 1986.
8. In 1976 the BWDB imposed a water rate at three per cent of grossproduce which would cover only about a quarter of the operation and maintenance costs of these projects, but has had limited success in realizing the rates from the farmers. See S.R. Osmani and M.A. Quasem, Pricing and Subsidy Policies for BangladeshAgriculture, Bangladesh Institute of Development Studies, Dhaka, 1985 (mimeographed); p. 134-137.
9. Ibid p. 291-296.
10. The reasons behind the recent slowdown of the sales of minorirrigation equipment have not yet been investigated thoroughly. It is conjectured that the tightening of disciplines regarding recovery of institutional loans and reduction in farmers’ cash income due to low prices of jute may be the major factors. Further expansion may also be constrained by the factor that relatively large forms who can afford private investment on irrigation equipment have already been covered, and the government will have to tackle the more difficult problem of organization of the small and medium farms in cooperatives. The 1983-84 agricultural census found that only 89,000 rural households owned more than 15 acres of land (the command area of a shallow tubewell), and according to an World Bank estimate there are already more than 170,000 shallow tubewells in the country.

- s a
11. See for example, M.A. Hamid, Low-Lift Pumps under IDA Credit in South-East Bangladesh; A Socio-Economic Study, Rural Development Studies, Series 12, Rajshahi University.
12. Master plan Organization, National Water Plan Project: Draft Final Report, op. cit.
13. F. Kahnert, et al, Agriculture and Related Industries in Pakistan, Paris, (OECD Development Center, 1970).
14. Raisuddin Ahmed, "Structure, Dynamics, and Related Policy Issues of Fertilizer Subsidy in Bangladesh15 in Bangladesh Institute of Development Studies and International Food Policy Research Institute joint report on Fertilizer Pricing and Foodgrain Production Strategy in Bangladesh, Technical Annex, (Washington DC,1985)T
15. Mahabub Hossain, '’Fertilizer Consumption, Pricing and Foodgrain Production in Bangladesh'1, in BIDS IFPRI joint report, op. cit. p. 149-150.
16. This section draws heavily from Mahabub Hossain, "Irrigation and Agricultural performance in Bangladesh: Some Further Results5’, The Bangladesh Development Studies, Vol. 14, (No. 4,1986), pp. 39-56. The main conclusions arc also supported by James K. Boyce, "Water Control and Agricultural Performance in Bangladesh”, The Bangladesh Development Studies, Vol. 14 (No. 4, 1986). pp. 1-35.
17. John, T. Cummings, "The Supply Response of Bengalee Rice and Cash Crop Cultivators”, Bangladesh Development Studies 2 (October 1974): 235-251^ Sultan H. Rahman, "Supply Response in Bangladesh Agriculture5', The Bangladesh Development Studies, Vol. 14 (No. 4, 1986), pp. 57-100.
18. See John, V/. Mellor, "Food Price Plocy and Income Distribution in Low-income Countries’5, Economic Development and Cultural Change, 22 (October 1978): 1-26; Yujiro Hayami and R.W. Herdt, 'Market Price Effects of Technological Change on Income Distribution in Semi-Subsistence Agriculture'1, American Journal of Agricultural Economics, 59 (May 1977): 245-256. For Bangladesh the issue has recently been studied by Alauddin M. and C. Tisdell, ’Market Analysis, Technical Change and Income Distribution in Semi-Subsistence Agriculture: The Case of Bangladesh", Agricultural Economics. Vol. 1, (No. 1. 1986): 1-18.
19. Since rice is a major commodity in the consumption basket it may be argued that the movement in the cost of living index is mainly determined by the rice prices. According to the 1983- o4 Household Expenditure Survey, rice accounted for 32 per cent °f the national consumption expenditure, so the rice price index ond the CPI may not necessarily increase at the same rate.

- 54 -
20. In Indio, instability in cereal production increased greatly in the post-new technology period. Hazel however shows that about 82 per cent of the increased variation can be attributed to increases in the covariances of production between crops grown in the same and in different states, which cannot be blamed to improved technologies. Only six per cent of the variances of total cereal production was attributed to variances of individual crop yields measured at the state level. Peter B.R. Hazell Instability in Indian Foodarain Production, Research. Report No. 30, International Food Policy Research Institute, May 1982.
21. dt D.A. Cuddy and P.A. Della Valle, ''Measuring the Instability 4(f Time Scries Data", Oxford Bulletin of Economics and Statistics, 40 (February 1978): 79-85.

Fig. 1* Trend in Cultivated Land and Cropped fired19B0-85
m sown an
T m i cm nLAHI
T m m m c tm is

Yew
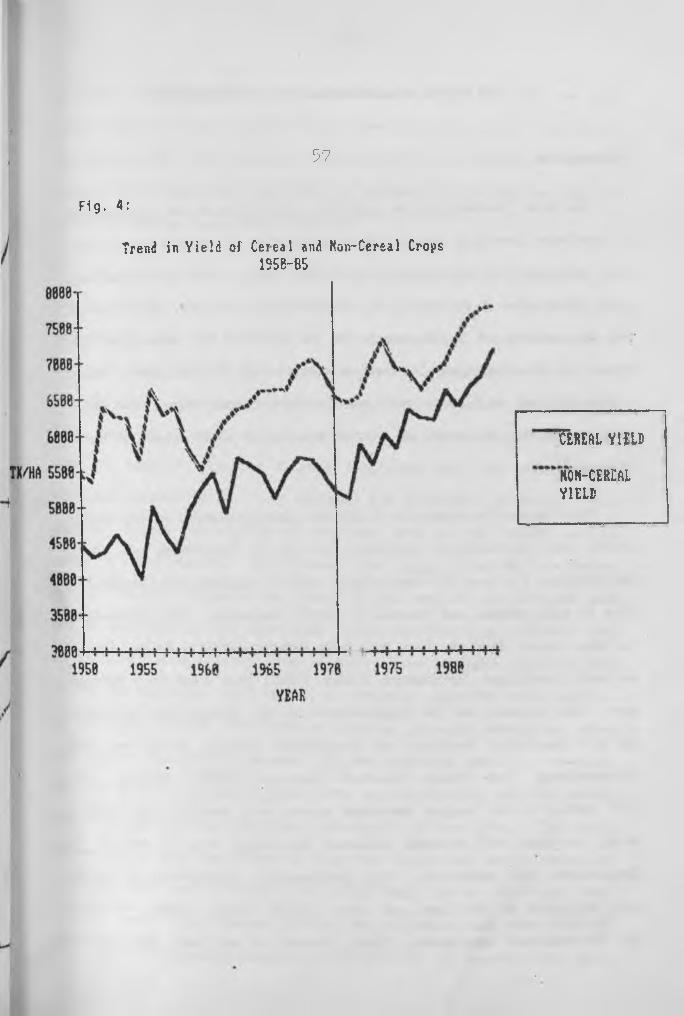
57
Trend in Yield of Cereal and Non-Cereal Crops 195B-85
Fig. 4:
TEMftl VlfW
KOH-CEREALYIELD

- 58 -
A: THE NATURE OF ALTERNATIVE RICE TECHNOLOGIES
Introduction
The term ' technology'' is generally used to mean the application
of knowledge involving the use of a combination of inputs for produc
tion of output through optimum use of the inputs«. The new technology
would thus means a change in the combination of inputs, their levels
and the methods of application. It is important to understand the
nature of these changes, because in underdeveloped agriculture, where
endowments and real costs of resources vary across farms, the suit-i
ability for the acceptance of the new technology would depend on these
changes.—
This chapter documents in detail the characteristics of the alter
native crop technologies currently in use in Bangladesh and theirt
implications for cost of production, capital requirements, profitabi
lity of cultivation, and returns to family resources. The information
is drawn mainly from the farm household survey conducted by the Inter
national Fertilizer Development Center (IFDC) from aman 1979 through
boro 1982 seasons and is supplemented by the information collected
by the Bangladesh Institute of Development Studies (BIDS) and the
International Food Policy Research Institute (IFPRI) Survey. The
IFDC survey is the largest household survey ever conducted in Bangla
desh, covering 2400 randomly selected households from 16 out of 21
Bangladeshi old districts. The input-output information on crops
was collected at the level of about 10,000 sample plots belonging
to the selected households. Since farmers do not keep any records

- 59 -
of their operation, the input use information collected at the plot
level tends to be more reliable than those collected at the farm level.
The findings of this study are expected to be representative for the
country os a whole and the level of accuracy is as much as one can
obtain by asking questions to farmers.
As noted earlier, the technological progress in Bangladesh is
mainly confined to the production of rice and wheat. Wheat was an
unimportant crop even up to the mid seventies, but a rapid increase in
the area since 1975/76 has turned it into the third major crop after
rice and jute. Wheat now occupies about five per cent of total cropped
land, most of it under modern varieties. The scope of further expan
sion is, however, limited because Bangladesh soil and the duration
of winter season is not very suitable for production of wheat. Rice
occupies nearly four-fifths of the sown area in the country and is
grown in three seasons. The monsoon rice, aman, harvested from Novem
ber to January, accounts for about 46 per cent of the cropped land
and 58 per cent of the rice land. About one-fourth of the aman land
is broadcast seeded (deep water variety) sown in March when the land
is dry and harvested in November and December when the water recedes.
On this type of land, the depth of flooding prevents raising any other
crop during the monsoon season. On the remaining aman land (medium-
low and medium-high level), the crop is transplanted and the modern
varieties have spread to about one-fourth of the area. ■ The early
monsoon rice, aus, harvested in July and August are mostly broadcast
arieties sown in March-April on either very low or very high land.
some areas transplanted rainfed aus varieties are also grown.—
Thiscrop traditionally competes with jute and now accounts for about

- 60 -
one-fourth of the total sown area in the country. MVs have spread
to about one-sixth of the aus land and has tended to stagnate at that
level since the late seventies. Aus MVs are mostly transplanted,
but in some areas broadcast MVs are also grown. The remaining one-
sixth of the rice land is under boro, the crop transplanted during
December to February and harvested from April to June and is grown
under irrigated conditions. The major impact of the new technology
has been on this boro rice crop. The cropped area increased from
1.56 million acres in the late 1960s to about 3.89 million acres by
1984/85, facilitated by expansion of modern irrigation. Nearly four-
fifths of the area under this crop is now under modern varieties.
The traditional boro is grown on extremely low lying land which are
unsuitable for growing any crop during the monsoon season owing to
very high levels of flooding. Modern varieties of boro are grown
on relatively high levels of land. Since boro and aus seasons are
overlapping, MV boro competes with aus and jute whose cropped area
has declined steadily in recent years and there is further possibility
of MV boro substituting for aus crops. The exclusive focus on the
alternative rice technologies in this chapter is dictated by the impor
tance of rice and the great potential of the expansion of area under
modern varieties.
Level and Fluctuation of Crop Yield
Bangladesh has little scope for increasing the supply of land
(Chapter 2). i or an .individual farmer also, it is difficult to accu
mulate more land, even if he has the means to do so, because in the
absence of adequate non-agricultural job opportunities, rural people

- 61 -
tend to cling to their holding, and the market for land tends to be
thin. Thus, for both the nation as well as the individual farmer,
the only scope for increasing production is either through increasing
the cropping intensity or increasing the crop yield. A new crop
variety which has intrinsic capacity to produce more per unit of land
would thus be widely accepted. It would give scope for increasing
production from the limited land base, through the reallocation of
land from the traditional to the new varieties.
Table 4.10 presents the findings of the two surveys on yield
rates (output per unit of land) in the alternative crop varieties
and compares them with the official statistics for the country as
a whole. Since the yields vary considerably from year to year, the
figures are presented as averages for a number of years which should
give a relatively normal picture. The IFDC survey estimated the yield
for three years from 1979-80 to 1981-82 and the BIDS/IFPRI survey
for two years, 1981 and 1982. The survey estimates are very close
to the official statistics, which supports the representativeness of
the surveys. The modern varieties produce more output per unit of
land than the traditional varieties in nil three seasons; about 1.5
times higher during the aus season, three-fourths higher during the
boro season, and about one-half higher during the aman season. On
average, the yield of the new varieties is about 100 to 120 per cent
higher than the traditional ones. The diffusion of the new technology
thus contributes to a substantial increase in rice production from
the limited land.

- 62 -
TABLE 4.1
ESTIMATES OF CROP YIELD FOR TRADITION AND MODERN VARIETIES OF RICE
(Tons of paddy per hectare)
Crops Weight—
IFDC Survey
Yearly average for 1980-82
BIDS/IFPR1Survey
Yearly average for 1981 8c 1982
GovernmentStatistics
Yearly average for 1982-85
Aus Season (early monsoon)TV 0.180 1.31 1.19 1.24MV 0.037 3.15 3.23 3.25
Aman Season (monsoon) TV Broadcast 0.103 1.54 1.71 1.51TV Transplanted 0.265 1.89 1.74 1.84MV Trnasplanted 0.089 2.73 2.86 2.90
Boro Season (Dry winter)TV 0.026 1.96 2.49 2.30MV 0.094 3.74 3.72 4.09
All Season^Traditional variety 0.574 1.65 1.60 1.61Modern variety 0.220 3.23 3.29 3.47Percent difference
in MV and TV — 96 106 116
J.J The area under the variety as a proportion of the total cropped area during 1985 for the country as a whole.
2/ Weighted averages.

- 63 -
A large majority of farmers in Bangladesh- operate around or below»'r jr*'
the subsistence level and so they may respond not only to the average
y i e l d — -but also t:o the level of fluctuations in yield which makes
i n v e s t m e n t in agricultural inputs a risky venture. Being risk averse,
a farmer may be willing to sacrifice a substantial amount of expected
income, as indicated by higher mean value of output in the modern
varieties, in exchange for a low probability of falling below the
subsistence level. The new crop varieties are less dependent on wea
ther than traditional ones since the land has access to irrigation
facilities, and during the monsoon season, they are generally grown
on higher level land, which is less susceptible to floods. So the
weather induced fluctuation in production is expected to be low for
the new varieties. However, they may be more susceptible to pest
attacks and the risk of crop damage on that account is expected to
be higher. Also for rainfed MVs (e.g., aman MVs) water stress may
reduce the yield more than in the case of a local variety.—
the estimates of variation in crop yields at the farm level arc
not available from the IFDC survey. The estimates obtained from the
Plot (1981) and farm level (1982) data collected by the IFPRI/BIDS
survey are presented in Table 4.2. The estimates of variation are
expected to be lower at the farm than at the plot level as the fluc
tuation is reduced by summing over the data for a number of plots
that the farm operates. In 1981, for which the estimates are obtained
from the plot level data, the standard deviation of yield as a per
Cent ^ e arithmetic mean is found to vary between 32 to 79 per cent
ut the magnitude of variation is, in general, lower for the modern
arietics. For MV boro and aman it is 48 per cent, and for aus 32
cent, compared to 69 per cent for traditional aman and 79 for

VARIATION IN YIELD FOR TRADITIONAL AND MODERN VARIETIES OF RICE, 1981, 1982
TABLE 4.2
Crop varieties
1901 (plot level data) 1982 (farm level data)
No. of
plots
Mean
yield
(ton
per ha)
Stand.
devia
tion
(ton/ha)
Coeff.
of vari
ation
(percent)
No. of
farms
Mean
yield
(ton
per ha)
Stand.
devia
tion
(ton/ha)
Cooff.
of vari
ation
(percent)
Aus Season:
TV Broadcast 584 1.3 1.0 78 152 1.1 0.5 48
MV Transplanted 281 3.1 1.0 32 86 3.4 0.6 19
Aman Seasons
TV Broadcast 379 1.8 1.0 54 144 1.6 0.7 45TV Transplanted 789 1.7 1.2 69 179 1.8 1.2 69CIV Transplanted 634 2.6 1.3 49 159 3.1 1.9 61
Boro Seasons
TV Transplanted 231 2.7 1.7 65 *. .94 2.3 0.8 35MV Transplanted 765 3.4 1.6 48 204 4.0 1.6 40
Source: BIDS/IFPRI Farm Survey.
traditional aus. For 1982 also, the magnitude of variation is lower
in modern varieties for aus and aman seasons and is similar for the
boro season. The boro crop was severely affected by hailstorm in
April 1982 in two of the villages, where HYV boro is a major crop.
For 1982, information was also collected from farmers about
the extent of crop damage from natural factors. During the year
the aus crops were affected by draught in the villages in Kushtia
and Jessore, the aman crops were affected by a flash flood in two
villages in Comilla and the boro crops were affected by hailstorm
in two villages in Dhaka and one village in Comilla. The farmer
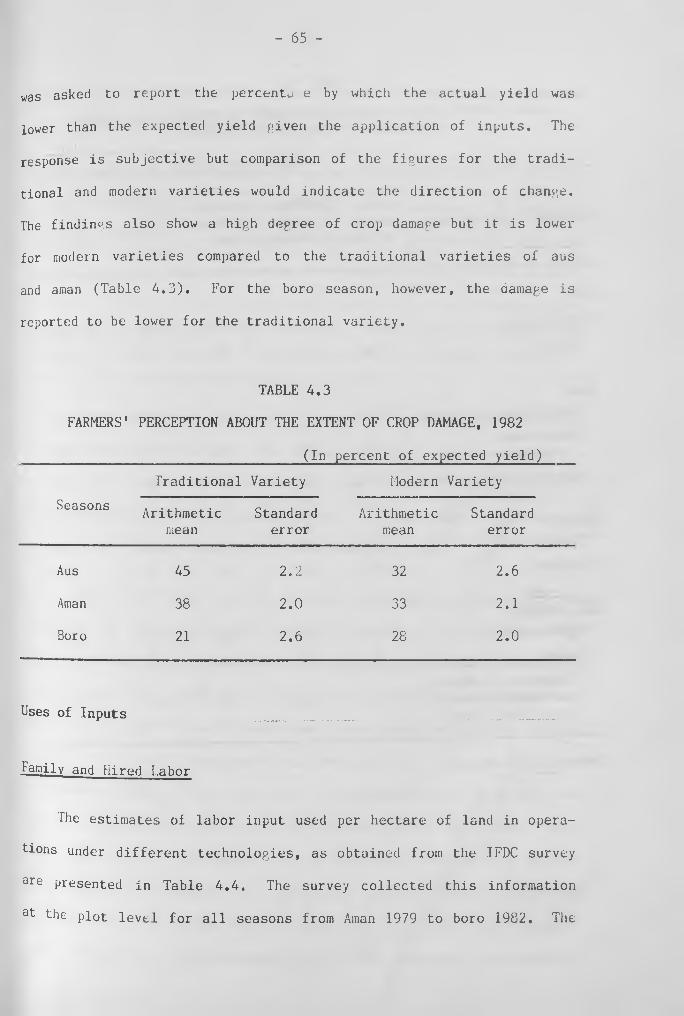
- 65 -
was asked to report the percents e by which the actual yield was
lower than the expected yield given the application of inputs. The
response is subjective but comparison of the figures for the tradi
tional and modern varieties would indicate the direction of change.
The findings also show a high degree of crop damage but it is lower
for modern varieties compared to the traditional varieties of aus
and aman (Table 4.3). For the boro season, however, the damage is
reported to be lower for the traditional variety.
TABLE 4.3
FARMERS' PERCEPTION ABOUT THE EXTENT OF CROP DAMAGE, 1982
________________________________ (In percent of expected yield)
Traditional Variety Modern Variety
SeasonsArithmetic
meanStandard
errorArithmetic
meanStandard
error
Aus 45 2.2 32 2.6
Aman 38 2.0 33 2.1
Boro 21 2.6 28 2.0
Uses of Inputs
Family and Hired Labor
... ....- • ..... - —...—
T h e estimates of labor input used per hectare of land in opera
tions under different technologies, as obtained from the IFDC survey
ate presented in Table 4.4. The survey collected this information
at the plot level for all seasons from Aman 1979 to boro 1982. The

- 66 -
TABLF 4.4
LABOR INPUT IN RICE CULTIVATION UNDER TRADITIONAL AND MODERN TECHNOLOGY, AVERAGES FOR 1980-82
(Days per hectare of cropped land)
Seasons & technologyLandpreparation
Sowing & transplanting
Weeding G other cultural operations
Harvesting & thresh- ing
Alloperations
Aus:
Traditional 35 4 47 53 139
Modern 38 32 57 70 197
Aman:
Traditional broadcast 28 2 37 61 128
Traditionaltransplanted
32 32 18 50 132
Modern transplanted 36 37 42 64 179
Boro:
Traditional 32 41 61 69 203
Modern 39 43 65 71 218
All Seasons:
Traditional 32 18 33 54 137
Modern 38 39 54 68 199
Increase in modern over traditional varieties (days)
6 21 21 14 62
Source: IFDC Survey.
- 67 -
figures in the table are averages for the three years estimates.
The following features emerge from the table.
Farmers use more labor per unit of land in modern varieties
compared to the traditional ones in all three seasons. The increase
is about 42 per cent for the aus season, 36 per cent for the aman
season, and seven per cent for the boro season. For all three seasons
together, labor use per hectare is about 45 per cent higher under5/
the modern varieties.— The diffusion of the new technology will
thuscrLato more employment from the limitLd land base through reallocation
of land from traditional to moucin Vcu.iecies,
The new varieties, however, economize on labor needed to produce
a given amount of output. The amount of labor used to produce a
ton of paddy was about 57 person days for the new varieties compared
to 85 days for the traditional crops. The unit cost of production
on account of labor would then be considerably less.
Only a small part of the increase in employment under the new
varieties is due to harvesting and threshing of the additional yield.
Employment mainly increases due to shifting from direct seeding to
transplanting of seedlings. For all new varieties, seedlings are
grown on a separate seed bed and then transplanted on the main fields.
On the other hand, inadequate rain and moisture in the soil in the
pi e-monsoon season does not permit transplanting of seedlings for
the aus crop and so the seeds are broadcast on the main field, which
°es not require much labor. For traditional aman varieties, the
seedlings are transplanted but mostly in a random manner, while for
ntW vari^ties, these are mostly transplanted in lines which requiresi •:
or - labor than random transplanting. The intensive intercultural

- 68 -
operations such as weeding, irrigation, and fertilizer use also gene
rate more demand for labor in the cultivation of the modern varieties,
j.V. ■The use of labor in land preparation is only marginally higher.
Table 4.5 shows that the modern varieties used 62 additional days
of labor of which 34 per cent was generated during sowing and trans
planting, 34 per cent during weeding and other intercultural opera
tions, 22 per cent during harvesting and threshing and only 10 per
cent during land preparation.
Transplanting and harvesting are busy agricultural operations
when most of the farm households hire labor, although they may have
surplus labor in the family during other times of the year. By raising
labor requirements during these operations, the modern varieties
would also increase the demand for hired labor. The IFDC survey
did not collect information on the use of hired labor. The estimates
obtained from the BIDS/IFPRI survey are presented in Table 4.14.
Nearly two-fifths of the total labor used in rice cultivation came
from hired workers and the proportion is almost the same under the
traditional and the modern varieties. The new technology thus appears
to be neutral with respect to the use of these two types of labor.
During the boro and aus seasons, however, the modern varieties use
proportionately more hired labor than family labor. The agricultural
operations during these two seasons cover January to June period
which are traditionally slack periods of agricultural activities.
The diffusion of the new technology during these seasons would thus
reduce the seasonality of underemployment particularly for the land
less who provide hired labor. It will be noted from the table that
the additional employment per unit of land generated by the modern

- 69 -
TABLE 4.5
USE OF HIRED LABOR UNDER TRADITIONAL AND MODERN VARIETIES OF RICE, 1932
Hired labor Season & Variety (person days
per hectare)
Family labor (person days per hectare)
Hired labor as percent of total labor
Aus Season:
Traditional 40 99 29
Modern 82 115 42
Aman Season:
Traditional broadcast 49 79 38
Traditional transplanted 54 78 41
Modern transplanted• r.
74 105 41
Boro Season:
Traditional 49 154 24
Modern 74 144 34
All Seasons:
Traditional 49 88 36
Modern 75 124 38
Percent difference(modern over traditional)
53 41 2
varieties is proportionately more (53%) for hired labor than for
family labor (41%). Thus, poor households who supply hired labor
also benefit from technological progress. (Sec, also Chapter 7.)
Animal and Mechanical Power
In Bangladesh, bullocks and cows are widely used for performing
heavy agricultural operations such as the ploughing and levelling

- 70 -
land, transportation of harvests from the field to the yard of the
homestead and threshing of the crop* The animals are used in pairs.
The extent of use of animal power in the cultivation of different
varieties of rice, as estimated by 1FDC survey, is shown in Table
4.6. The figures are averages for 1979/80 to 1982/33 crop years for
which the information was collected. For land preparation, the use
of animal power is higher for transplanted varieties compared to
TABLE 4.6
USE OF ANIMAL AND MECHANICAL POWER UNDER TRADITIONAL AND MODERN TECHNOLOGY: AVERAGES FOR 1980-82
Season &
Animal Power (hours per pair per hectare)
Mechanical Power (hours/hectare)
technologyLandpreparation
Harvesting and threshing
TotalLandpreparation
Irrigation
Threshing
Total
Aus Season: Traditional 282 59 341 nil nil 14 14Modern 304 64 368 nil 17 21 38
Aman Season: Traditional broadcast
220 89 309 nil nil 19 19
Traditionaltransplanted
262 35 297 nil 1 21 22
Moderntransplanted
284 59 343 nil 2 23 25
Boro Season: Traditional 252 89 341 nil 32 9 41Modern 309 72 381 nil 75 22 97
All Seasons: Traditional 260 55 315 nil 2 18 ~ 20Modern 298 65 363 nil 36 22 58Percent difference (modern over
15 18 15 — large 22 190
traditional)
Source: Compiled from IFDC Survey.
- 71 -
the broadcasted ones but for harvesting and threshing no systematic
pattern is observed. The average level of use under traditional
crop varieties is about 315 hours per hectare for a pair of animals.
On the basis of an eight hour working day, the employment for a pair
of animals comes to about 40 days per hectare of land, which is less
than one-third of the level of use of human labor (137 days).
The modern rice varieties generate more demand for animal power
due to the practice of transplanting of seedlings and the transporta
tion of additional harvest. The extent of increase is found at 15
per cent, about a third of the additional demand for human labor.
The animal power used per ton of output is 105 pair/hours for the
modern varieties, compared to 196 hours for traditional varieties.
In Bangladesh the market for animal labor is very thin partly
because of the high seasonal pattern in the demand for their services.
The BIDS/IFPRI survey collected information on cultivation expenses
on account of hired animals during 1982 crop seasons. Only one-fourth
of the farmers reported use of hired animals. The average level
of use was equivalent to about 11 pair days for those hiring animals,
and only three days for all farms. The practice of animal hiring
was found more confined among the very small farmers, presumably
because they cannot afford to invest on a pair of animals and bear
the maintenance cost. Some large land owners, whose main occupation
was non-agriculture, also hired animal power. Owing to the thinness
°f the market, most of the households who are engaged full time in
farming have to keep at least a pair of draft animals, which remains
substantially under-utilized. Thus, the animals are fixed costs

- 72 -
and the cost per unit of output on this account can be reduced by
increasing the rate of utilization. The diffusion of modern techno
logy allows more intensive use of animals since an additional crop
is grown on the same piece of land during the year.
In many parts of South Asia, diffusion of the new technology
followed substitution of animal arid human labor by machines. It
is often mentioned as an important factor behind the negative distri
bution effect of the new technology although the impact of inechaniza-
6 /tion on labor use remains controversial.— In Bangladesh mechaniza
tion of agricultural operations, except for irrigation, is rarely
visible. In some parts of the country, a few farmers use small mecha
nical threshers (mostly in the Comilla, Hoakhali, and Chittagong
belt), and power tillers (mainly in Dhaka region in the cultivation
of potato). The 1977 agricultural census noted that among 6.3 million
farm holdings, only 35,000 used tractors and 12,000 used power tiller
at sometime or other Farmers reporting mechanical cultivation
were only 0.66 per cent and the area cultivated was only 0.38 per
cent.
Ihe information cn the use of mechanical power in alternative
n e e technologies, as estimated by the IFDC survey, is reported in
fable 4.6. Mechanical power is used only for irrigation and thresh
ing. For traditional varieties, the mechanical power was used only
20 hours per hectare, about three per cent of the level of use of
animal power. Under moden varieties, the use is about three times
more but most of the increase is due to power used for irrigatione
For threshing, the level of use is only about one-fifth higher, and

- 73 -
for land preparation mechanization is yet to be introduced even for
the cultivation of the modern varieties.
Chemical Fertilizer and Manure
The use of chemical fertilizers is now widespread. The BIDS/
IFPRI survey has found that nearly 87 per cent of the farmers used
fertilizers, and in irrigated villages almost all farmers used it.
Only in four out of 1G villages studied, was the diffusion limited
to less than two-thirds of the farmers. Three of the villages are
i ■ 'located in the coastal district of Khulna, which has saline soil
and most of the land is single cropped with local transplanted aman.
The other village is located on the Brahmaputra active flood plain,
where most of the land is sown with deep water broadcast aman.
Many of the fertilizer using farmers, however, did not apply
fertilizers on all plots. The application depends on the type of
crop, and whether the plot has previously been treated with fertili
zers. The farmers argue that once they apply fertilizer on a plot,
for example to grow the high fertilizer-responsive MVs they will hav.e
fo continue using fertilizer on the same plot even for growing a
low fertilizer responsive local variety, otherwise yield would be
foss than normal. The IFDC survey found that during 1981/82, nearly
/ crpor cent of the land was not treated with fertilizers.
The findings of the two surveys on the extent of fertilizer
USG UIK*er alternative rice technologies are presented in Table 4.7.
The f *igures indicate a clear dualism in fertilizer application. Less

- 74 -
than one-fifth of the land under deep water aman and traditional
boro are treated with fertilizer. These crops are grown on deep
flooded land where local varieties are less fertilizer responsive
and fertilizer use is less effective. Even on flood free land, only
about a half of the plots are treated with fertilizers if they arc
sown with local varieties, but more than ninety per cent are treated
if they arc sown with modern varieties. The level of use on aus
and boro season hVs are about six times higher compared to the substi
tute traditional variety, and on aman season MV, the level of use
is about three times higher. On transplanted MV, the use of fertili
zers has reached quite a high level — over 280 kg of materials per
hectare of land. The higher yield on modern varieties is thus
achieved by substantially higher levels of use of chemical fertili
zers per unit of land.
In order to increase soil fertility Bangladesh farmers also
use manures and so a pertinent question is whether intensive fertili
zer application in modern varieties has led to the substitution for
the use of manures. The BIDS/IFPRI survey has found that nearly
two-thirds of the farmers applied farm yard manure, while the IFDC
survey has found that nearly one-third of the plots were treated
with manure. The application of manure was more common in traditional
varieties. The findings of the two surveys, however, do not agree
on the magnitude of application of manure (Table 4.7). The IFDC
surveyshows that the level of use is about 30 per cent lower under
the modern varieties, while BIDS/IFPRI survey indicates that farmers
used almost twice as much on modern varieties compared to the tradi
tional ones (Table 4.7).

- 75 -
TABLL 4.7
USE OF CHEMICAL FERTILIZERS AND MANURE UNDER TRADITIONAL AND MODERN TECHNOLOGY, AVERAGES, 1980-82
Crops and
Percent of plots treated (IFDC survey)
Level of use per hectare
(IFDC survey)
Level of use per hectare (BIB^
IFPRI survey)
TechnologyFertilizer
ManureFertilizer (Kg of materials)
Manure(tons)
Fertilizer (Kg of materials)
Manure ( Tk )
Aus Season: Traditional broadcast
Modernl/ boardcast
Modern transplanted
45
74
98
61
66
29
47
100
282.
4.46
4.76
1,50.
47
238
158
218
Aman Season: Traditional broadcast
Traditional transplanted Modern transplanted
18
54
84
15
24 1
9 ;
16
; 54* j I * .*»
169
0.36
0.62
0.43
11 *
45
208
58
10
23
Boro Season: Traditional transplanted
Moderntransplanted
12
96
3
34
22
288
0.14
1.54
3
322
nil
219
AH Seasons!traditionalModern
4391
3325
44231
1.761.22
38262
65140
J_/ 'Ccording to the IFDC Survey, about one-fourth of the MV aus area was broadcast seeded. Information on this is not available for the country as a whole.

- 76 -
Irrigation and Pesticides
According to the IFDC survey, irrigation was rarely practiced
in the cultivation of local aus and aman, but nearly two-thirds of
the plots under traditional boro and about 90 per cent of the plots
under modern boro were irrigated (Table 4,8). During the aman season,
the modern varieties are grown basically under rainfed conditions.
The intensity of use of irrigation, as measured by the average number
of times of irrigation, is also the highest in the cultivation- of
modern varieties of boro.
TABLE 4.8
USE OF IRRIGATION AND PESTICIDES UNDER TRADITIONAL AND MODERNVARIETIES OF RICE, AVERAGES FOR 1980-82
i ).
Season & Technology
Per cent of plots irrigated
Mean number Per cent of times of plots irrigated treated (average for with plots) pesticides
Average level of use (lbs) of pesticides per hectare
Aus Seasons: Traditional
broadcast Modern
broad cast Modern
transplanted
nil
3
51
nil
*
5.4
3
9
19
*
0.64
1.33
Aman Season: Traditional
broadcast Traditional
transplanted Modern
transplanted
nil
5
14
nil
0.1
0.8
nil
*•
17
nil
•K
0.65
Boro Season: Iraditional Modern
6589
4.47.4
350
•K
4.30
Sour^e: IFDC Survey.

- 77 -
The market for irrigation is imperfect and the cost of irrigation
per unit of land varies widely depending on the source of irrigation
and on the type of ownership of irrigation equipment.
Irrigation was provided free of cost to farmers in two of the
16 villages under BIDS/IFPRI survey,, as they happened to be under
the Ganges-Kobtak project area implemented by the Bangladesh Water
Development Board. Two of the villages used low lift pumps, rented
to farmers* cooperatives by the Bangladesh Agricultural Development
Corporation. In these villages the water charge paid by farmers varied
from Tk 560 to Tk 800 per hectare. In three villages where irrigation
has been practiced since the late sixties under the auspices of Comilla
type cooperatives, a combination of low lift pumps, shallow tubewells,
and deep tubewells have been used and the water charge came to about
Tk 1600 per hectare. In another three villages, irrigation was
recently introduced by private owners of shallow tubewells who sold
water to owners of adjoining plots at a charge varying from Tk 3500
to Tk 4500 per hectare. Thus the water charge observed at the farm
level in no way measures the level of irrigation input. The average
water charge in the cultivation of modern varieties of boro comes
to about Tk 1700 per hectare for the sample as a whole, about one-
eighth of the gross value of output.
Pestcides are rarely used on local varieties but some use in
uVs WdS not£-d (Table 4.8). the increase in cost on this account is
ly marginal. The highest level of use is on modern varieties grown
ng the aus and boro season. For these crops the cost on account
of #pesticides was reported at Tk 220 per hectare, only 1.5 per cent
the gross value of output.

- 78 -
Seeds
The amount of seed used per unit of land depends on whether the
seed is broadcast or whether a separate seedbed is prepared to grow
seedlings which are then transplanted on the main field. According
to the Bangladesh Bureau of Statistics, the normal seed requirement
for broadcast varieties is 80 to 92 kg per hectare, while for trans
planted varieties, it is about 20-25 kg.— The value of seedlings
is, however, higher than the cost of seeds used, because of the adding
of the cost of land and labor used in seedbed preparation. For tradi
tional varieties, seeds are generally kept from the harvest, but for
modern varieties a significant proportion of the seed may be purchased
from markets or government centers (particularly if the seed is new
in the area), and hence the cost may be higher.
The cost per unit of land was lower in transplanted varieties
compared to the broadcast ones (Table 4.9).
Among transplanted crops, the seed-cost per unit of land is found
to be higher for modern varieties by about 16 per cent for aman season
and nearly 55 per cent for boro season. For all seasons together,
the seed cost per hectare is almost the same, but because of higher
yield, the cost per unit of output for MV is only about one-half of
that for traditional varieties (Table 4.9).

- 79 -
TABLE 4.9
THE COST ON ACCOUNT OF SEEDS FOR TRADITIONAL AND MODERN VARIETIES OF RICE, 1982
Season & Technology
Cost
Taka
per hectare
Cost as a per cent of output
Aus Season:Traditional 452 9.8Modern 320 2.6
Aman Season:Traditional broadcast 433 6.5Traditional transplanted 334 4.9Modern transplanted 390 3.5
Boro Season:Traditional 264 2.7Modern 408 2.8
All Seasons:Traditional 386 6.3Modern 386 3.0
Source: BIDS/IFPRI Survey.
Unit Costs and profitability of Cultivation
This section estimates the effect of the changes in input-output
relationships described above on the costs and profitability of rice
cultivation. First, estimates are derived by applying national level
prices on the average input-coefficients for the 1980-82 periods (IFDC
urvey) except for seed for which the information is only available
1982. In order to dissociate the effect of climatic factors,
c-agc crop yield for the last three years (1982-85), as reported
ficial statistics, has been used for estimating the gross returns.

- 80 -
Then, BIDS/IFPRI survey data are used to estimate profits for different
groups of farms at the farm specific prices of inputs and output.
National level infrmation on farm level prices of inputs is not
available, except for wage rates. The IFDC survey estimated that
for urea, which accounts for over 70 per cent of tne chemical fertili
zers consumed in the country, the farm level prices were higher than
tdv. officially fixed prices in the range of 2.8 to 10.7 per cent for
the eight crop seasons for which the information was collected. In
calculating fertilizer costs, we have assumed that farmers pay about
10 per cent higher than the official prices set by the government,
the variable for which time series information is available. As men
tioned earlier, the unit cost of irrigation varies across locations
depending on the source of water. In order to standardize the cost,
we have taken the weighted average water charges paid by irrigators
to private owners of shallow tubwells, as found in a recent survey
by Quasem et al,— and using this as the standard, estimated the cost
for other crops by appling the IFDC survey information on the, mean
number of times the crop is irrigated. For other time periods, the
irrigation cost has been adjusted by the price index of diesel. The
farm level price of manure is available from IFDC survey for 1980.
Similarly, the cost of seed is available only for 1982 (Table 4.9).
For other time periods, the manure and seed costs are derived by
adjusting them by the price index of rice. It is reported by a 1980
survey of six villages in Comilla and Noakhali that the hiring charges
for a pair of animals, along with the worker who operates them, is
about 2,5 times higher than the wage rate paid to hired workers,-^^
On this basis, the cost of a pair of animals is assumed at 1.5 times
the wage rate since the hired worker is included in the input of human
labor. The family labor input is imputed by the wage rate of the
hired labor.
The cost of mechanical power could not be included due to non
availability of information on rental charges for machines. In any
case nearly two-thirds of the mechanical power input are on account
of irrigation, the costs of which arc included in irrigation charges.
The unaccounted input is only about 20 hours per hectare (in threshing)
the cost of which would be very low as a proportion of the value of
output.
Land is an important fixed asset, but the opportunity cost of
the investment in land has not been included in the cost of production.
The justification is that unlike other fixed assets, land does not
depreciate in value, particularly in contries where land is scarce.
According to the Bangladesh Bureau of Statistics during the 19,73-84
period, the price index of the single cropped unirrigated land (thef x .•' ;
type of land not affected by productivity raising investment) has
increased at on annual irate of about 17.6 per cent compared to the
ttate of inflation of 11 per cent during this period', and 14 per cent
rate of interest currently paid by the commercial banks on fixed depo
sits. Thus a person investing on land can get a higher return than
the interest on the money deposited in banks, even if he keeps the
hand fallow. In this sense, the use of the land for cultivation does
n°- involve any real cost to its owners. For tenants, however, the
r^nt paid to the landowner is a real cost and has to be included in
tstimating their profits.
- 81 -

Another cost element which has not been included in the estimates
in the rate of interest paid on working capital borrowed from outside.
In Bangladesh farmers borrow for agricultural purposes from various
institutional sources, which charge in general 16 per cent rate of
interest per annum. Borrowings from informal sources for extremely
short periods are widespread. These loans bear high rates of interest
(10 per cent per month is common) and as such may not be used for
financing production expenses. Also, the information on credit is
available at the household level and it is dificult to apportion it
to various crops. The IFPRI/BIDS survey found that the sample farmers
borrowed on average Tk 370 per ha of cropped land during 1982 from
institutional sources, which comprised only one-fourth of the total
borrowing. The cost has not been included because of the problem
of apportioning it to various crops.
The choice of an appropriate price for output is a problem. Here
we have used the growers' price of paddy as reported by the Bangladesh
Bureau of Statistics. The government also declares a procurement
price for paddy in advance of the harvest at which the farmers can
sell their produce at government operated purchasing centers. While
it is estimated that nearly 40 per cent of the rice is currently marke
ted, the average procurement of the government over the last five
years (1980-85) was only about two per cent of the domestic production.
The use of growers' price thus appears more appropriate. Another
problem is the quality differences for different varieties of rice.
The grain of modern varieties of rice produced during the aus and
boro seasons is coarse and fetches the lowest price in the market,
ijnong traditional varieties aus and boro are coarse while aman grains
- 82 -

- 83 -
are generally of superior quality end fetch the highest prices. Infor
mation provided by the Department of Agricultural Marketing shows. j ■
that the average price of fine quality araan rice for the 1980-84 period
was about 22 per cent higher than the price of IRRI rice.— For
the present calculation, we have applied the reported average growers'
prices for traditional varieties of aus and boro and modern varieties
of aman, and assumed prices to be 10 per cent higher for traditional
aman and 10 per cent lower for modern varieties of aus and boro.
Estimates of costs and returns have been made at the price level
for 1984/85, the most recent year for which the price information
is available. The relative input-output prices have, however, under
gone considerable changes over the last decade partly because of the
government policy of gradual withdrawl of subsidies from the modern
inputs such as fertilizers and irrigation, which are used more in
the cultivation of modern varieties. So, some of the profitability
gains of the new technology may have been eroded by such price changes.
In order to see the effect of price changes on protifitability, we
have also estimated costs and profits at 1975/76 price levels.
The estimates of costs and profits at 1984/85 level of prices
are presented in Table 4.10. The 'cash cost" includes the cost on
account of seed, fertilizer, manure, irrigation, pesticides, and hired
labor while the "total cost" also includes the imputed value of family
and animal labor. Small farmers and tenants who have surplus familyj !
labor and low opportunity cost of employing it elsewhere, may give
morL weight to cash costs in making production decisions than to total
Cost, which is a more relevant variable for the large farmers who
have high opportunity cost of family labor. The cash cost per unit
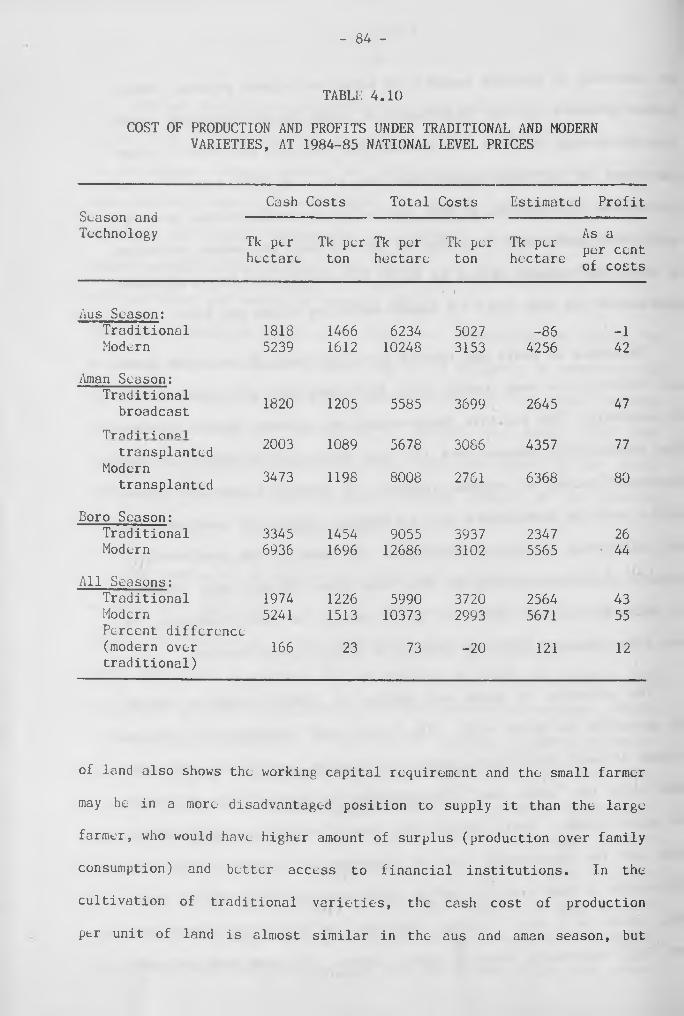
- 84 -
TABLE 4.10
COST OF PRODUCTION AND PROFITS UNDER TRADITIONAL AND MODERN VARIETIES, AT 1984-85 NATIONAL LEVEL PRICES
Season and Technology
Cash Costs Total Costs Estimated Profit
Tk per hectare
Tk per ton
Tk per hectare
Tk per ton
Tk per hectare
As a per cent of costs
Aus Season: Traditional 1818 1466 6234
( 1
5027 -86 -1Modern 5239 1612 10248 3153 4256 42
Aman Season: Traditional
broadcast1820 1205 5585 3699 2645 47
Traditional
transplanted2003 1089 5678 3086 4357 77
Moderntransplanted
3473 1198 8008 2761 6368 80
Boro Season:Traditional 3345 1454 9055 3937 2347 26Modern 6936 1696 12686 3102 5565 • 44
All Seasons: Traditional 1974 1226 5990 3720 2564 43Modern 5241 1513 10373 2993 5671 55Percent difference (modern over 166 23 73 -20 121 12traditional)
of land also shows the working capital requirement and the small farmer
may be in a more disadvantaged position to supply it than the large
farmer, who would have higher amount of surplus (production over family
consumption) and better access to financial institutions. In the
cultivation of traditional varieties, the cash cost of production
per unit of land is almost similar in the aus and aman season, but

- 85 -
about three-fourths higher in the boro season, due to the requirement
of irrigation. Per unit of output, however, the cost is the lowest
for the aman season crops. In transplanted aman, the cost is about
one-fourth lower than the aus (high land) or the boro (low land)
varieties.
In the cultivation of MV, the cash cost per unit of land is about
1.7 times higher than the traditional varieties - 1.9 times for the
aus season, 1.1 times for the boro season, and nearly three-fourths
for the aman season. The modern varieties have higher yields, but
per unit of output the cash cost is also higher in the cultivation
of modern varieties. For all three seasons, the weighted average
difference is about 23 per cent. The absolute cash cost on account
of purchased inputs in Tk 1513 per ton of paddy for modern varieties
and Tk 1226 for traditional varieties.
A different conclusion is reached if total cost of production
is considered. The cost per unit of land is higher by about three-
fourths in the cultivation of modern varieties compared to the tradi
tional 'ones, but the cost per unit of output is lower by about one-
fifth. The absolute cost per ton of paddy is Tk 3720 (US $ 124) for
traditional varieties and Tk 3000 (US $ 100) for modern varieties.
Compared to traditional aus, the main substitute crop which has the
highest unit cost of production (US $ 168 per ton), the cost of culti
vation of modern varieties is lower by about 40 per cent.
Since land is scarce, the farmer would be interested in maximizing
the net return per unit of land. It is found that at the assumed
aveiage prices the profit (Gross return minus total cost) is negative

in the cultivation of traditional aus vareity-=— and is substantially
lower for all other traditional varieties compared to the MVs. For
all seasons, the difference in net return per unit of land is Tk 3.1
thousand per hectare, about 1.2 times higher in the cultivation of
MVs than in TVs. The subsistence farmers may be interested in maximi
zing the net return to the family (Gross returns minus cost of pur
chased inputs). The new technology gives better return in this respect
also. The return to family inputs is estimated at Tk 10.8 thousand
per hectare for modern varieties compared to Tk 6.6 thousand for the
traditional ones, an increase of about 64 per cent. The family income
per day of labor is estimated at Tk 87 for modern varieties compared
to Tk 75 for local varieties. The wage rate of agricultural labor
prevailing in 1984/85 for the country as a whole was Tk 24.
Households who consider farming as an investment alternative
would base their decisions on thr rate of return on capital. The
estimates of total costs show that the new technology gives scope
for investment more capital on the fixed amount of land. The rate
of profit, measured as a per cent of total cost is also found higher
for the MVs, particularly, during the aus and boro seasons. For all
three seasons, the rate of profit is estimated at 55 per cent for
the new varieties compared to 43 per cent for the traditional ones.
Whether the farmers would consider the rate of profit as adequate
for maintaining a reasonable level of living is a separate issue.
Comparison of the rate of profit in farming with that in non-agricul-
tural activities is not justified because accumulation of capital
in farming is constrained by the amount of land owned, while in non-
- 86 -
12/

agriculture profits can be reinvested for further accumulation. In
Bangladesh only about five per cent of the households operate farms
over three hectare sizes. If a three hectare farm grows one tradi
tional and one modern variety on the land during a year, it would
have a profit of about Tk 24.7 thousand, which for a six member house
hold gives a per capita income of Tk 4110. For 1934/85 the per capita
income for the nation as a whole was estimated at Tk 3990, and the
13/poverty level income at Tk 3096.— Thus, even at this high rate
of profit, farming alone does not guarantee a decent level of living
for a three hectare farm family.
The impact of the changes in agricultural prices over the last' I i ‘ V; • '
decade on the cost and profitability in rice- cultivation is shown
in Table 4.11. Owing to the gradual withdrawal of subsidies, input
prices have increased faster than output prices. The cost of cultiva
tion in real terms increased by about one-third over the last decade
and the rate of increase was faster for modern varieties since they
are more fertilizer and water intensive. The rate of profit over
the investment in working capital has declined from about 55 per cent
in 1975/76 to 48 per cent by 1984/85; the rate of decline has been
faster for modern varieties from about 77 per cent to 55 per cent
aver this period. The profit per unit of the scarce factor, land
has also declined, particularly for the aus and boro season crops,
hut still the absolute level of profit in the cultivation of the MVs
ramains at a much higher level compared to the traditional varieties.
spite of the declining profits in individual crop varieties, the
timers have increased the level of profits per unit of land for all
cr°ps taken together, trhough reallocation of land from low to high
- 87 -

TABLE 4.11
THE EFFECT OF CHANGES IN PRICES ON COSTS OF PRODUCTION AND PROFITS, 1975/76 TO 1984/85
Season andCost of Production Profits
Technology1975/76(Tk./ha)
1984/85^(Tk/ha)
Percentchange
1975/76(Tk/ha)
1984/85^(Tk/ha)
Percentchange
Aus Season: Traditional 2292 2726 19 101 -38
largenegative
Modern 3463 4481 29 2181 1861 -15
Aman Season: Traditional
broadcast Traditional
transplanted Modern
transplanted
2053
2070
2826
2442
2483
3502
19
20
24
1149
1835
2769
1157
1905
2785
1
-4
1
Boro Season: Traditional Modern
31034122
39605547
2835
13342982
10262433
-23-18
All Seasons: Traditional Modern
21983517
26194536
1929
10792710
11212480
4-8
Total 2384 3150 32 1309 1498 14
a/ Estimated at 1984/85 prices of inputs and output and then converted at 1975/76 constant prices by using the consumer price index for 1975/76 and 1984/85.
Jb/ Weighted averages, using the share of crop variety of the total cropped area under iice for the country.
- 8 9 -
profit crops. The share of the modern varieties in the total sown
area under rice has doubled from about 1A per cent in 1975/76 to 28
per cent by 198A/85. The productivity growth as a result of this
reallocation of land has ensured farmers about 1A per cent higher
levels of profits, in spite of the adverse movement in the relative
input-output prices.
The government controls the supply of fertilizer and irrigation,
and the operation involves a considerable amount of subsidy. Since
these inputs are consumed more in the cultivation of MVs, a pertinent
question is what would happen to the difference in costs and profits
if the subsidies are fully withdrawn. As mentioned earlier, through
a number of consecutive price increases, the fertilizer subsidies
had been withdrawn by 1985. The fertilizer price used in the calcula
tion (US $ 167 per ton of materials) is close to the world prices.
The cost of irrigation would, however, increase if subsidies are with
drawn. The. Master Plan organization estimated that for 198A the annua
lized capital cost plus the operation and maintenance for irrigation
would come to Tk A250 per hectare for deep tubewells, and Tk 378A
for large scale irrigation projects (at economic prices)-^-^ In the
Cost calculation we assumed a water rate of Tk 3088 per hectare.
Thus, if th0 subsidies are withdrawn, the irrigation charge to farmers
niay inCrcasc by about 37 per cent.-— At this price the total cost
°f Production would be Tk 3168 per ton of paddy for MVs, compared
0 ^k 3738 for traditional varieties, still about 15 per cent lower.
^ net profit would be T k ' 5061 per hectare for MVs compared to
fk 253A for traditional varieties.

- 9 0 -
The estimates of costs and profits at farm specific prices, input
use and yield rates obtained from the IFPRI/BIDS survey are shown
in Table 4.12. For estimating total costs family labor was imputed
at the wage rate paid by the household to hired labor. For households
who did not have labor, the average wage rate for the village was
used to impute cost. Costs on account of animal labor supplied by
the family could not be included, as the survey did not collect infor
mation on this variable. Seeds, both household supplied and purchased,
are included in cash costs. The estimates show substantially higher
costs of production in the cultivation of MVs compared to local varie
ties, but the superiority of MVs with reard to profits and family
income per unit of land is clearly demonstrated. Cultivation of modern
varieties yielded Tk 3877 additional profits per hectare of land,
and Tk 4531 additional return to family labor and animals. The net
income per day of family labor is estimated at Tk 53 for local varie
ties and Tk 74 for modern varieties, while the hired labor was paid
an average wage of Tk 19.5.
Table 4.13 shows the estimates of profits for different size
and tenurial groups of farms. For modern varieties profits are higher
on larger farms, but for traditional varieties no systematic pattern
is found. The tenants pay 50 per cent of the gross produce as rent
for the sharecropped land. After deduction of the rent the profit
turns out to be very small on the sharecropped land, but the level
is higher in modern varieties than in local varieties. The net return
to tenants' family labor and draft animal was Tk 1848 per ha in local
varieties and Tk 2816 in modern varieties, or, about 52 per cent
higher. The net returns per day of tenants’ labor is estimated at

- 91 -
COSTS AND PROFITABILITY AT FARM SPECIFIC PRICES, PRODUCTION AND. INPUT USE, 1982
tabu; a. 12
(Figures in Tk/hectare)
Crop varieties
Grossvalueofoutput
Cash costs of production
Total costs of production
Returns to family labor
’Profits'
Aus Season:Traditions] 3,996 1,304 2,450 2,692 1,546Modern i 13,326 3,411 4,770 9,915 8,556
Aman Season: Traditional
broadcast6,412 1,405 2,527 5,007 3,886
Traditionaltransplanted
6,760 1,833 2,762 4,927 3,998
Moderntransplanted
11,990 2,947 4,389 9,043 7,601
Boro Season: Traditional 9,386 1,324 2,371 8,062 7,015Modern 14,245 5,194 7,274 9,051 !i 6,971
All Seasons: Traditional 6,203 1,546 2,594 4,657
■•) I ••
3,609Modern 13,165 3,997 5,679 9,188 7,486
Rice(All varieties) 4,187 6,687 _.5J45

- 92 -
PROFITS AND FAMILY INCOME AT SPECITIC PRICES FOR DIFFERENT SIZE AND TENURIAL GROUPS
TABLE 4.13
Profits (Tk/ha)Return to Family Labor
and Animals
Group of FarmersTraditionalvariety
Modernvariety
Percentdifference
Traditionalvariety
Modernvariety
Percentdifference
Land OwnershioGroups
Small(less than 2.0 3,347 6,469 93 4,169 9,255 100acre)
Medium(2.0 to 5,0 acres) * 6,592 73 4,859 8,272 70
Large(5.0 and over) 3,577 9,102 155 4,414 10,255 132
Tenurial groups
Owner-cultivator 3,265 7,563 132 4,439 9,095 105
Owner-cum-tenants 2,850 5,061 78 3,900 6,988 79
owned land 3,974 7,346 85 5,024 9,272 85
rented land 798 889 12 1,848 2,816 52
Source: IFPRI/BIDS Survey
Tk 21 for local varieties and Tk 23 for modern varieties, only margi
n a lly higher than the average rate of Tk 19.5 for the entire sample.
Thus, the rented land benefits tenant farmers mainly through reducing
the underutilization of family labor and animals.
Comparison of relative gains (compared to local varieties) from
the adoption of the modern varieties across different groups show
that owner farms gain more than the tenants, and large farmers gain
more than the small and the medium ones. But the gains of the small
farmers are also higher than the medium ones. Thus, the gains are
not systematically positively related with the size of landownership
of the household.
Conclusions
The modern varieties of rice have opened up an opportunity of
substantially increasing production from a given amount of land. The
yield of modern varieties on the farmer's field is twice that of the
traditional varieties. The fluctuations in yield caused by natural
factors are also lower for the modern varieties, indicating that the
new technology has reduced the risk of cultivation. Farmers use about
45 per cent more labor per unit of land in the cultivation of modern
varieties compared to the traditional ones* But per unit of output,
use of labor is about one-third lower, and use of draft power is about
P<~r cunt lower for the modern varieties. The new crops, however,
US<J 3lJkstantially more fertilizer, irrigation, and pesticides per
of output. The cash costs of production per unit of land are
0ut 1*7 times higher, and per ton of output are about one-fifth
- 93 -

- 94 -
higher for the modern varieties. The total cost of production per
ton of paddy is estimated (at 1984/85 prices) at US $ 100 for modern
varieties compared to US $ 124 for the traditional varieties. The
profit per hectare of land is estimated at Tk 5,57 thousand for modern
varieties, which is about 2,2 times compared to that for traditional
varieties (Tk 2,56 thousand). The rate of profit over the cost of
production is 55 per cent for the modern varieties compared to 43
per cent for the traditioal varieties. The gradual withdrawal of
subsidies from fertilizer and irrigation over the last decade has
reduced the profitability gap, but farmers have increased the profits
from the cultivation of rice through reallocation of land from tra
ditional to the modern varieties, since the absolute level of profit
for the latter crops is still higher. Even if subsidies are fully
withdrawn, the profit per unit of land, would still be about twice
as much in the cultivation of the new varieties compared to the tra
ditional ones, and the unit cost oi output would be about 15 per cent
lower.
i

- 95 -
Chapter 4 Notes
1. For details on the implications of the nature of the change of the technology on its adoption by different socio-economic groups, see Andrew Pears, Seeds of Plenty - and Seeds of Want.
2. See Noel P. Magor, Potential in Rainfed Transplanted Rice Production in North-East Bangladesh, Bangladesh Rice Research Institute, Dhaka 1984.
3. Magor found that a substantial reduction in rainfall in 1981 over 1980 reduced the yield of modern aman varieties by 30 per cent while the reduction in yield of local varieties was 25 per cent. Ibid, p. 32.
4. A cropping system research in an Upazilla in Sylhet districtfound that for the aman crop 62 per cent of the yield variation in 1981 was attributable to transplanting dote and water stress. The yield loss per water stress day was estimated at 75 kg/ha for MVs compared to 48 kg/ha for a local variety. Ibid. p. 2.
5. Ahmed estimated from a survey of 459 farms in three villagesduring 1975/76 that, compared to traditional varieties, the labor input per unit of land in the cultivation of modern varietieswas 28 per cent higher during the aman season and 50 per centhigher during the boro season. Iftekhar Ahmed, "Technological Change and labor Utilization in Rice Cultivation; Bangladesh, The Bangladesh Development Studies, 6 (No. 3, 1978); 359-366.
6. For a recent survey of he literature on the labor deplacingeffects of agricultural mechanization, see Michale Lipton, Modern Varieties. International Agricultural Research, and the Poor, CGIAR Study Paper No. 2, Washington, B.C. (World Bank, 1985);pp. 64-70.
7. Bangladesh Bureau of Statistics, The Statistical Yearbook ofBangladesh 1984-85. Ministry of Planning, Dhaka, 1985, p. 332.
8. Bangladesh Bureau of Statistics, The Statistical Yearbook ofBangladesh 1984-85, Ministry of Planning, Dhaka, 1985, p. 332.
9. Reported in S.R. Osmani and M.A. Quasem, Pricing and SubsidyPolicies for Bangladesh Agriculture, op. cit., p. 166.
10. Bangladesh Unnayan Parishad, A Socio-Economic Evaluation of the Chandpur II Irrigation Project, a report prepared for the World Bank, Dhaka, 1982, Appendix Table A.6.1, p. 6-25.
11. Department of Agricultural Marketing, Wholesale Prices of Agricultural and Animal Products in Bangladesh. 1972-85. Government of Bangladesh, Dhaka, 1986.

- 96 -
12, The traditional aus is a very low yield crop, and in areas in which it is a major crop, the wage rate is also found to be very low. For the BIDS/IFPRI sample, the wage rate paid for cultivation of local aus is estimated at Tk 12,92 per day compared to Tk 23.88 in the cultivation of MV boro. If the cost of labor is evaluated at the crop specific wage rate, the net profit in the cultivation of local aus would also be positive.
13. The Bangladesh Bureau of Statistics has recently made estimates of the poverty line income for 1981/82 from the returns of the national household expenditure survey. This figure is based on this estimate, adjusted for the changes in the cost of living index. For details see chapter 8 below.
14, Cited in Mahabub Hossain, '‘Fertilizer Consumption, Pricing and Foodgrain Production in Bangladesh5', op. cit., p. 224.
15. The actual subsidy on irrgation may in fact be higher than this proportion. A large part of irrigation subsidy is consumed by owners of irrigation machines, who charge substantially higher prices to water users than the capital and operation costs. For 1982/83 the mark-up (water charge paid by irrigators over the cost) is estimated at 62 per cent for deep tubewells, 34 percent for power pumps, and 10 per cent for shallow tubewells. SeeS.R, Osmani and M.A, Quasem, Pricing and Subsidy Policies for Bangladesh Agriculture, op. cit., p. 166.

- 97 -
5: PRODUCTIVITY AND EFFICIENCY OF RESOURCE USE
The effect of the new technology on the productivity of land
and labor and the efficiency in their utilization is assessed in this
chapter. Land is the most scarce input in Bangladesh. It could be
argued that the development of irrigation, which is the most critical
input in the modern technology package, could raise the effective
supply of land by creating conditions of growth of an extra crop on
the fallow land during the dry winter season,— In order to see whe
ther and to what extent this has happened in Bangladesh, the first
section compares the pattern and the intensity of land use in the
technologically developed and underdeveloped areas as well as on the
irrigated and unirrigated land. This is followed by an analysis of
the production function for estimating the factor shares and the margi
nal productivity of land and labor for the traditional and the modern
technology. The final section applies a profit function model to
study relative economic efficiency of the adopters of the new techno-
2 /logy compared to the farmers still growing only traditional crops.—
The analysis in this and the following chapters are based on disaggre
gated farm and plot level data collected by BIDS/IFPRI Survey.
Intensity of Land Use and Cropping Patterns
The effect of technological change on the pattern and intensity
°f land use can be seen from Table 5.1 and 5.2. The tables are based
on information collected at the plot level on the use of the land
during the three crop seasons in 1981 in the 16 villages covered by the
- JS/Tl ppj Survey. The survey enumerated 5255 plots belonging to
sample households (3.2 plots per household). About 68 per cent

- 98 -
TABLE 5.1
PATTERN AND INTENSITY OF USE OF IRRIGATED AND UNIRRIGATED LAND, 1981
Season and Crops
Irrigated Land Unirrigated Land
Sown Area (ha.)
% of cultivated land
Sown Area (ha.)
% of cultivated land
Aus Season: 28.68 21.0 80.24 3CL4
Local aus 5.19 3.8 60.19 22.8MV aus 22.03 16.1 1.71 0.6Jute 1.45 1.1 18.34 7.0
Aman Season: 92.21 67.6 166.84 63.2
Local B. aman 7.38 5.4 48.51 18.4Local T. aman 33.91 24.9 96.06 36.4MV aman 50.79 37.2 6.37 2.4Sugarcane 0.14 0.1 15.89 6.0
Boro Season: 104.33 75.4 101.87 38.6
Local boro 5.97 4.4 17.98 6.3MV boro 79.61 58.3 5.48 2.1Wheat 3.81 2.8 8.57 3.3Pulses 4.06 3.0 47.37 18.0Oilseeds 8.02 5.9 8.64 3.3Vegetables 2.17 1.6 6.15 2.3Species 0.61 0.5 5.82 2,2Others - - 1.66 0.6
Total Cropped Land 224.22 165.0 348.76 132.2
Total cultivated land 136.48 lOOoO 263.87 100.0

- 9 9 -
TABLE 5,2
PATTERN AND INTENSITY OF LAND USE IN TECHNOLOGICALLY DEVELOPED
AND UNDERDEVELOPED VILLAGES, 1981t •
Seasons and Crops
DevelopedVillages
UnderdevelopedVillages
AllVillages
Croppedland(ha.)
Percent of cultivated land
Cropped land (ha.)
Percent of cultivated land
Cropped land (ha.)
Percent of total cultivated land
Aus Season; 40.80 21,4 68.12 32.5 108.92 27.2Local aus 11.82 6.2 53.56 25.6 65.38 16.3HYV aus 20.92 11.0 2.82 1.3 23.74 5.9Jute 8.06 4.2 11.73 5.6 19.80 5.0
Aman Season; 126.64 66.4 132,41 63.2 259.06 64.7Local B, aman 23.72 12.4 32,17 15.3 55.89 14.0Local T, aman 44.67 23.4 85.31 40.7 129.98 32.5HYV aman 54.64 28.7 2.52 1.2 57.12 14.3Sugarcane 3.62 1.9 12.41 5.9 16.03 4.0
Boro Season; 118.80 62.3 87.20 41.6 206.00 51.6Local boro 16.08 8.4 7.87 3.8 23.95 6.0HYV boro 74.50 39.1 10.49 5.0 85.09 21.3Wheat 3.47 1.3 8.92 4.3 12.39 3.1Pulses 6.37 3.5 44.71 21.3 51.44 12.8OilseedsVegetables
10.653.85
5.62.0
6.014.47
2.92.1
16.66 •> 8.32
• 4.2 2.1
SpicesOthers
2.79 1.5 3.64 1.7 6.43 1.60.64 0,3 1.10 0.5 1.74 0.4
Total sown area 286.25 150.1 287.73 137.2 573.98 143.4
Total cultivated190.67area 100.0 209.68 100.0 400.35 100.0

- 100 -
of the plots were owner operated, 13 per cent rented out to others
mostly under sharecropping arrangements, six per cent under orchards
or bamboo bushes, two per cent under ponds and the reamining 11 per
cent under homesteads. Some of the land owners did not know about
the use of the rented-out plots operated by the tenants, and so com
plete information could not be obtained for this type of land. It
was also found during the survey that the practice of renting out
land for only one season was widely prevalent; the plot rented out
for cultivation during the boro season was resumed by some land owners
for self-cultivation during the aman season. In order to avoid prob
lems caused by these complications the information presented here
is based on the data obtained for the owner operated plots only.
The following main points can be noted from the information.
Irrigation has a significant impact on increasing the effective
supply of land during the dry winter season (boro). Only two-fifths
of the unirrigated land are cropea during the boro season, but with
irrigation the intensity of use increases to about three-fourths during
this season (Table 5.1). Part of the increase is at the expense of
the overlapping aus season crops, which are grown on 30 per cent of
the unirrigated land but on 21 per cent of the irrigated land. ITV
boro, for example, competes with land for local aus and jute. It
is harvested beginning of May when it is too late for broadcasting
aus and jute seeds on the same land. Nearly one-third of the land
remains fallow over these two seasons when the land is unirrigated,
but the proportion is reduced to only 14 per cent with access to irri
gation facilities. Irrigation, however, does not change the pattern
of utilization of land during the aman season, when crops arc grown

- 101 -
basically under rainfed conditions. Two-thirds of the cultivated
land are cropped during the aman season, one-third remains fallow
p r e s u m a b l y due to excessive flooding of land. Provision of irrigation
facilities does not change the proportion of aman season fallow land
much.
The adoption of the MVs is facilitated mostly by irrigation.
Only six per cent of the unirrigated land was used to grow MVs during
the three seasons. For irrigated land the proportion was about 112
per cent, which also indicates that some of the land was used to grow
two HYV rice crops during the same year. Out of 86 per cent of the
irrigated land cropped during the aus and boro seasons, 75 per cent
was used for growing MV rice. Only during the aman season was a large
proportion of the irrigated land used to grow local paddy.
Irrigation has an adverse impact on diversification of crops.
Except rice and oilseeds all other crops are grown less on irrigated
land compared to unirrigated land. Following the development of irri
gation facilities, rice varieties replace not only the low yielding
pulses but also the major cash crops, jute and sugarcane. These three
crops are grown on about one-third of the unirrigated land, but on
only about four per cent of the irrigated land.
Owing to the large scale replacement of the non-cereal crops
by rice, the impact of irrigation on intensity of land use is much
loss pronounced that the impact on cereal cultivation. The sown area
under cereals is about 87 per cent of the cultivated land for the
Unirrigated plots; with irrigation the proportion rises to about 153
Ptr cent — an increase of over 66 per cent. The total cropping

intensity is however estimated at 165 per cent for the irrigated land
compared to 132 per cent on unirrigated land — an increase of only
33 per cent.
Table 5.2 compares the pattern of land use in sample villages
classified into two equal size groups according to the scale of the
diffusion of new agricultural technology (see Chapter 2). lIV rice
is grown on about four-fifths of the cultivated land in the developed
villages compared to only on eight per cent of the land in underdeve
loped villages. For the aus and boro seasons together, the proportion
of cultivated land under MV rice in both groups of villages is almost
similar to the proportion of area irrigated, indicating an almost
unique relationship between irrigation and adoption of MV seeds.
This supports the findings of strong complementarity between the two
inputs reporte'd in Chapter 3 on the basis of regression analysis of
district level cross-section data. The intensity of land use is esti
mated at about 150 per cent for the technologically developed villages
compared to 137 per cent for the underdeveloped villages. Thus a
40 per cent increase in irrigation leads to a 13 per cent increase
in effective supply of land, indicating an elasticity of suply of
land to irrigation of 0.33.
i
Productivity of Land and Labor
A technique frequently used to analyze productivity and efficiency
of resource use is the Cobb-Douglas production function. The techni
cal coefficients of production estimated from the function are used
in various policy applications. The input coefficients of the function
- 102 -

represent production elasticities of the inputs. The sum of the elas
ticities is used as an indicator of the degree of returns to scale
in production. This section uses the farm level cross-section data
for 1982 to estimate production functions for the traditional and
modern varieties of rice in order to study the effect of the new tech
nology on the productivity of land and labor.
The production function for each crop was fitted in the following
form;
(1) LnY_ = Lnjbo + (8^ hnA^ + n (N/A)^
15+ H . . V . . + V . D.
ij ij 1 1j = 1
where Y. is the value added (Tk) for the ith farm in the cultivation
of the crop, as measured by the gross value of output net of the costs
on account of seeds, manure, fertilizer, pesticides and irrigation.
The cost of animal labor could not be included owing to non-availabi
lity of data. A, is the amount of land sown under the crop, and H
is the total number of labor days (hired plus family labor) used during
the production period (from land preparation to threshing). A number
of crops were affected by droughts, floods and hailstorms during the
year and the effect was not uniform across villages and across farms
within a village (owing to variations in land levels). Information
was collected from every farmer about the amount of crop damage as
a per cent of the harvest expected given the level of application
o- the inputs. This farm level variable, 5 , has been used to disasso-i
^late the effect of the natural calamities. Since the information
comes from 16 widely scattered villages from different ecological
- 103 -

zonts, it is expected that the variation in climate, soil type and
intensity of land use permitted by these agro-climatic factors would
contribute to some variation in output, irrespective of the level
of inputs used. Therefore 15 village level dummy variables, V., have
been used to disassociate the effect of the environmental factors.
The coefficient 3^ and are output elasticity of land and labor
respectively. The coefficient of LnA^ gives the sum of the elastici
ties which, along with its standard error of estimate, can be used
to test the hypothesis about the degree of returns to scale in the
specific crop production activity.
The equation (1) is a modified form of the general Cob-Douglas
production function
m(2) LnQ. = Lnjdo + £ 3. LnX. .
1=1
where for ith farm Q is the gross output and X^ is the amount of the
m different inputs used in its production. This particular functional
form assumes that the elasticity of substitution between any two inputs
is equal to one. Vie have used value added instead of gross output
and re.lat.cd it only to the primary inputs, land and labor, because
of the following reasons. Seed is an important material input but
it has a technologically fixed relationship with land which violates
the unit elasticity of substitution assumption. The variation in
the amount of fertilizer used per unit of land in individual ciop
varieites is limited to a certain range:. Changes in the use of ferti
lizer are realized more through choice of crop varieties. Animal
power is an important input, but it is used along with human labor,
which produces strong complementarity rather than substitutability
- 104 -

- 105 -
assumed in the production function. Inputs like fertilizer and irriga
tion are also complementary rather than substitutes. Fertilizer,
manure, pesticides and irrigation are not essential for production
of local varieties, which is indicated by a small proportion of farmers
applying these inputs (See Chapter 4 above). The log-linear production
function is not appropriate if these inputs are used as explanatory
variables. Thus deduction of the costs on account of the material
inputs from the gross value of production appears more appropriate
than using them as separate variables in the Cob-Douglas production
function framework.
The assumption of unit elasticity of substitution between land
and labor may be criticized as restrictive. In order to test the
validity of the assumption we also fitted the more general translog
3/(transcendental logarithmic) function of the following form.—
(3) LnY. = Lng + (3,LnA. + B 0LnII. + ft LnA.LnN.i po 1 1 2 l 3 i l
This form imposes on a priori restrictions on the elasticity of subs
titution between land and labor. For none of the crops was the esti
mated coefficient found to be statistically significant. An !F r
test using the residual sum of squares of regressions for the Cob-
Douglas and translog functions also rejected the hypothesis of superio-
4/nty of the translog fnctional form over the Cob-uouglas one.—
Since farm level cross-section data are used to estimate the
function, one expects the amount of land and labor to be highly corre
lated across farms. This creates the well-known problem of multi-
collinearity in estimating the parameters of the function. In order
to avoid this problem, the labor input has been measured per unit

- 106 -
of land, which breaks the high degree of correlation between land
and labor. This produces the modified form of the function as 3hown
in equation (1) in which the coefficient of logarithm of of the land
variable becomes the sum of the elasticities of land and labor.
The estimates of the parameters of the function obtained from
the use of the ordinary least square (GLS) method are reported in
Table 5.3. The following major conclusions can be drawn from the
findings.
Crops are significantly affected by damage due to natural factors.
The coefficient of damage is statistically significnat for all crop
varieties. This indicates the prevalence of a high degree of uncer
tainty in rice cultivation so the farmer cannot be sure about the
productivity of the inputs he applies on the land. Thus, the rate
of application of the inputs may depend not only on the level of prices
but also on the degree of risk aversion of the farmer. The regression
coefficient of crop damage is, however, found to be lower for the
modern varieties compared to the traditional ones in all three seasons.
The sum of the output elasticity (factor share) of land and labor
is less than one for HYV boro and greater than one for other varieties.
But except for local boro, the value is not statistically significantly
different from unity. This indicates the existence of constant returns
to scale in rice cultivation.
The elasticity of land is, in general, higher, and that of labor,
lower in the cultivation of MVs compared to the traditional ones.
Only in the case of boro season is the elasticity of labor found to

- 107 -
TABLE 5.3
ESTIMATES OF COB-DOUGLAS PRODUCTION FUNCTIONS FOR DIFFERENT VARIETIES OF RICE, 1982
ConstantElasticity of Coefficient
of crop damage
R 2StatisticsLand^/ Labor
(SEE)
Aus Season: Local Variety 5.640
(0.980)0.511(0.055)
0.555(0.19)
-1.41(0.19)
0.82(0.476)
59.0
Modern Variety 7.364(0.852)
0.701(0.062)
0.338(0.19)
-0.86(0.31)
0.89(0.443)
98.6
Aman Season:Local Variety 6.110
(0.474)0.570(0.060)
0.490(0.12)
-0.86(0.12)
0.82(0.454)
46.9
Modern Variety 7.701(0.417)
0.536(0.053)
0.374(0.10)
-0.54(0.18)
0.83(0.424)
66.9
Boro Season: , , Local Variety- 7.280
(0.298)0.787(0.028)
0.296(0.080)
-1.13(0.14)
0.96(0.202)
720.0
Modern Variety 7.196(0.262)
0.613(0.023)
0.371(0,063)
-0.69(0.08)
0.93(0.248)
669.4
Notes: Figures within parentheses are standard errors of the estimatedcoefficients. The regression coefficients of village dummies have not been reported.
Local boro is grown in only one ecological zone. Hence the village dummies have not been used.
fhe standard error of estimate is for the sum of the elasticity of land and labor. ----

- 108 -
be higher compared to the local varieties. In the boro season, MV
competes for land more with local aus (grown on high land) than with
local boro (grown on extreme low land). Compared to local aus, the
elasticity of labor is lower for MV boro.
The estimates of marginal productivity of land and labor, at the
mean level of application of the inputs, are reported in Table 5,A.
In estimating the marginal productivity of land, the output elasticity
of land is taken as the difference of the elasticity of labor from
TABLE 5.4
ESTIMATES OF AVERAGE AND MARGINAL PRODUCTS OF LAND AND LABOR, CROP LEVEL, 1982
Land (Tk/ha) Labor (Tk/day)
Ua?Ca/Crop Variety Average Marginal Average Marginal b/ rate-
produc- produe- produc- produ- (Tk/ha)tivity tivity tivity tivity
Aus Season;Local variety 3,216 1 ,431 23.25 12.90 2,078 12,92Modern variety 11,394 7,543 57.66 19.49 6,411 17.64
Aman SeasonLocal variety 5,856 2,987 43,91 21.52 3,5G2 20.09Modern variety 10,725 6,714 60.30 22.55 5,902 21.75
Boro Season;Local variety 8,959 6,307 44.23 13.09 4,994 20.00Modern variety 10,833 6,814 49.84 18.49 7,156 23,88
a/ These are average farm specific wage rate paid to hired workersin the cultivation of the crop.
J}/ The value of rent is based on actual production, share rentaland input shares received from the land owners in the cultivation of the rental land,

- 109 -
unity, since constant returns to scale prevails. The table also com
pares the value of the marginal productivity of land with the rent
paid by sharecroppers to landowners, and that of labor with the average
farm-specific wage rate paid to hired casual laborers in the cultivation
of the crops during the year of survey. The following major points
can be noted from the table.
Compared to local aus, the marginal product of land is about 5.3
times higher in the cultivation of MV aus and 4.8 times higher in the
cultivation of MV boro. In the aman season, the increase in the margi
nal product in the cultivation of modern variety is less, but it is
still higher by about 2.2 times compared to the local variety. In
the boro season, however, the increase in productivity from the use
of the modern technology is only about eight per cent, but compared
to local aus, which is the main substitute crop, the productivity dif
ference is about 4.8 times. Thus, the modern technology gives tremen
dous scope for increasing the net returns from the fixed endowment
of land that the farmer has.
The effect of the modern technology on increasing the productivity
of labor is small. Compared to local variety, the marginal product
of labor is higher for the MVs by about 51 per cent for the aus season,
41 per cent for the boro season, and only 5 per cent for the aman
season, fhc difference would not be statistically significant as indi
cated by the high standard error of estimate of the elasticity of labor
/'T i -i0 5,3), It may also be noted that most of the increase in the
mar g i n a l product of labor is passed on to workers in the form of higher

- 110 -
wages. The workers, however, gain more through more employment under
the new crops (Chapter 4).
The efficiency in the allocation of resources is determined by
comparing the marginal product of the factor with its price. According
to the neo-classical theory, allocation of the- resources is at optimum
when the marginal product of the resources is equal to their prices.
In Bangladesh under sharecropping, the most common tenancy arrangement,
the tenant pays 50 per cent of the gross produce as rent to the lond-
owner. In the cultivation of modern varieties, the landowner sometimes
shares half of the cost on account of fertilizer and irrigation.—
The survey found that less than one per cent of the cost of material
inputs was paid by the landowner. The value of rent reported in Table
5.4 is based on actual production and rental on tenanted and the input
cost shared by the landowners. For aus and aman season varieties, the
marginal product of land is lower than the rent for the local varieties,
indicating that the tenant has to pass on a portion of the return on
their labor in the form of rent, in order to get the land. For the
MVs, the marginal product of land is higher than the rent, 14 per cent
for the aman season, and 18 per cent for the aus season. Thus the
tenants tend to gain with the diffusion of the modern technology in
these seasons. For the boro season MVs however, the marginal product
of land is lower than the rent.• \
Labor seems to be optimally allocated during the aus and aman
seasons, as its marginal product is almost in line with the wage rate
for the four crop varieties grown during these seasons. During the
boro season, however, the marginal product is lower than the wage rate

- I l l -
indicating over utilization of this input. This is usually the slack
season of agricultural activity. Nearly one-half of the land remains
fallow during the season (Table 5.2). Only about one-fourth of land
is cultivated with rice, and pulses and oilseeds, which are low labor
intensive, are the major crops grown during the season. It appears
from the findings that farmers facing underemployment of family workers
are willing to accept low returns for the labor during this season.
Relative Econoic Efficiency
In recent economic literature, a profit function model, derived
by the application of duality relation between the cost and the produc
tion function, is used to mesure and compare economic efficiency and/ /
price efficiency for groups of farms." Although the model has been
7 /severely criticized,— the use of the model for empirical studies
remains popular. The model is appropriate for the present analysis,
as one can classify farm households into two groups, adopters and non
adopters of the modern technology, and compare relative economic effi
ciency.
In the model, farms are assumed to have fixed endowments of land,
L» and capital K, which cannot be varied in the short run, but farms
can choose variable inputs, labor, N, and fertilizer, F, whose prices
8/arc ; and 8 respectively.— The amount of the variable inputs that
the farm decides to use is determined by setting the marginal cost
°f the input i t© 1/P^ times the marginal value product where P is con-
S1der .d the opportunity cost of the input supplied from the farm family.
Farms are called price efficient if all the are equal to unity,
farm may be more technically efficient than another if it produces

larger quantity of output from the same quantities of measurable
inputs, Technical efficiency may differ between two groups of farms
by a multiplicative factor, 6 . Differences in economic efficiency
among groups of farms may be caused by differences in technical and/or
price efficiency.
Under the assumption of Cob-Douglas technology, the model yields
n /a unit output price (UCP) profit function;—
(4) Ln-rr = LnA + 6T + c^LnU + c^LnC + u^LnL + (^LnK
and input demand equations;
(5) - WN/tt = a n T + a 12(l-T)
(6) - CF/tt =-• a21T + a22(l-T)
where it is the unit output price profit (Gross revenue minus total
variable cost), W and C are respectively labor and fertilizer prices
normalized by the output price, and T is a dummy variable taking value
1 for MV adopter farms and 0 for non-cidopters.
The hypothesis of equal relative economic efficiency implies
that 6 is equal to zero. The hypothesis of equal relative price effi
ciency implies that =czi2 anc a21 ~ a22* hopothesis of absolute
price efficiency implies that for adopter farms, u ^ and c21 = a2
and for non-adoptor farms, cl = and a22 = ■■
The error terms are assumed to be additive with zero expectation
and finite variance for each of the three* equations. But the co-
variances of the error of either equation corresponding to different
- 112 -

- 113 -
farms aru assumed to be identically zero. Under this specification
of errors, Zellner’s seemingly unrelated regression equation (SURE)
i r /provides an asymptotically efficient method of estimation.—- The
efficiency of estimation can be increased by imposing known constraints
on the coefficients in the cquu tion.~—
In estimating the model from the data, profits have been measured
by deducting farm specific costs of variable inputs — seed, ferti
lizer, manure, pesticides, irrigation, and labor from the gross value
of output. The cost of animal labor could not be counted due to non
availability of data. It has b^cn treated as a fixed input and inclu
ded in farm capital. The cost of family labor has been imputed by
the wage rate paid to hired workers. It was mentioned earlier that
* ithe market for irrigation was very imperfect, and the irrigation charge
varied widely depending on the source of supply of water. Sines the
MV crops were irrigated (Chapter 4), the cost of irrigation was also
imputed by multiplying the area under MV with the average cost of
irrigation per unit of land for the entire sample. The prices of
variable inputs at the farm level could be computed only for labor
and fertilizer, since both quantity and cost information was available
only for these two inputs. For this reason, only fertilizer and labor
could be used as variable inputs on the right hand side of the profit
equation. A significant proportion of farmers (9.5 per cent) did
not hire labor or use chemical fertilizer, so prices could not be
computed for them. These cases have been dropped because of the non-
ovoilability of farm specific prices. The profits* wage rate, and
*-LrtiIizer price variables have been normalized by paddy prices. The
CaPital input has been measured in flow terms by multiplying the

-114 -
replacement cost of the stock of agricultural implements and draught
animals with the rate of interest charged on loans from the commercial
banks.
Owing to widespread crop damage from natural calamities during
the reference year of survey, and the use of the wage rate as the
opportunity cost of family labor, the profits turned out to be negative
for a large number of cases (99 out of 475 farms in the sample).
Since the UOP profit function is log linear, these cases had to be
excluded. Since lower profits may also be due to inefficiency of
resource use, this might introduce sample selection bias in the
results. It is found from the tests of the difference of arithmetic
means that farms making negative profits are one-third smaller in
sizes and use 48 per cent less fertilizer, but are not significantly
different with regard to the adoption of modern varieties and the
use of capital services, compared to farms making profits (Tabic 5,5).
A major cirticsm of the model is that the invariability of the
prices in the cross-section data vitiate the usefulness of the mctho-
12/dology.—■ This is not found to be a serious problem for the data
set used here. Since the sample was selected from a large number
of villages scattered throughout the country, and a number of villages
are located in interior areas with underdeveloped infrastructural
facilities, differences in prices acrooss locations were quite signi
ficant, particularly for labor and fertilizer. The coefficient of
variation of prices across villages was found at 24 per cent for labor,
13/14 per cent for fertilizer, and 7 per cent for paddy.—

- 115 -
SELECTED CHARACTERISTICS OF PROFITABLE AND LOSS MAKING SAMPLE FARMS
TABLE 5.5
Profit- „ _ _ .Farms Percent Esti- Level of
Variables Units tt r r making diffc- mated oign(N=331) (N=99) encc/a T-value canc<
Average Size Acresof Land Owned
Area under Percentmodern ofvarieties cropped
land
Fertilizer Kg peruse acre of
croppedland
Capitol Tk perservices acre of
croppedland
3.10
36
78
298
1.97
37
41
334
-37
-48
•2.95
0.28
-4.02
0.61
003
.777
.000
543
a/ Values for farms making less over those for farms earning profits.
The results of the tests of various hypotheses regarding the
absolute and relative price efficiency in the use of labor and ferti
lizer, and also of constant retuns to scale in production arc presented
in Table 5.6. The hypotheses that the price efficiency is the same
for the adoptor and non-adoptor farms is accepted for labor but rejec
ted for fertilizer. The chi-square value for the equality of the
Parameters in the fertilizer demand equation for the two groups is
highly statistically significant. Both groups are absolutely price
^efficient in the use of labor and fertilizer. But when the hypo
thesis of equal relative efficiency in the use of labor is maintained,

- 116 -
TABLE 5.6
TESTS OF HYPOTHESIS OF RELATIVE AND ABSOLUTE PRICE EFFICIENCY AND CONSTANT RETURNS TO SCALE
Tests Parameter Chi-Squan restriction value
Significancelevel
1. Relative efficiency in the use of labor
2. Relative efficiency in the use of fertilizer
3. Absolute efficiency in the use of labor
4. Absolute efficiency in the use of fertilizer
Absolute efficiency in the use of fertilizer for adoptor farms maintaining equal relative efficiency in the use of labor
'11
'21
1111
a2iU21
a 12 ^
= a22
al)u12)
= a = a2 ) 22)
ci„, " a'21~ a;2 ) 1 2 )
1.19
7.85
8.25
7.86
1.19
0.275
0.005
C.016
0.C20
Cr 549
6. Absolute efficiency in the use of fertilizer for non-adoptor farms maintaining equal relative efficiency in the use of labor
""22C11
«2 ) 12)
1.31 0.511
7. Constant returns to scale
21M1
= a = a
* ^2 ) = 1 )
12 ) 2 )
5.09 0,166

#- 117 -
both group appears to be absolutely price efficient in the us^ of
i t i :fertilizer. The hypothesis of constant return to scale is also
■/, • '•'accepted.
The estimates of the parameters of the profit function and the
factor share equations are presented in Table 5.7. The technology
dummy is found to be highly statistically significant and the value
of the parameter is positive, indicating that the adopter farms are
more economically efficient. Even under the assumption of equal price
efficiency for labor and constant returns to scale, the technology
dummy remains statistically significant, the value indicating that
the adopter farms are also more economically efficient, compared to
the non-adopter farms, by about 29 per cent.
In estimating profits the cost of family labor was imputed at
the wage rate paid to hired workers. This may be a very restrictive
assumption, as the opportunity cost of labor could vary across farms
depending on the availability of family labor. In order to 3...C the
bias created by this assumption we incorporated another explanatory
variable in the Profit function, FLBR, which is measured by the pro
portion of labor supplied from the farm family. If the opportunity
cost of labor depends on the availability of family labor, this .vari
able should be a proxy of the price of family labor. If the variable
statistically significant, the hypothesis that the opportunity
cost of family labor is equal to the wage rate can be rejected.

TABLE 5.7
- 118 -
JOINT ESTIMATES OF PROFIT FUNCTIONS AND INPUT DEMAND EQUATIONS, 1982
Variables (Parameters restrictions)
ParametersUnrestrictedequation
Restricted
= a12621 + '
= 1)
Restricted
(all " C'12p22 ‘7 a2Li + 02
== 1)
Profit function:
Constant LnA -0.368(-0.97)
-0.824 (-2.76) ,
-0.807(-2,71)
Technology dummy 6 0.258(2.50)
0.282(2.92)
0.288(2.98)
Log wage ratec i
-0.368(-2.52)
-0.312(-2.21)
-0.305(-2.15)
Log fertilizer price“2
-0.179(-0.52)
-0.158(-6.31)
-0.058 (-1,93)
Log land61
0.767(11.95)
0.882(33.14)
0-082(33.14)
Log capital services^2
0.128 (4.73)
0.118(4.44)
0.118(4.44)
Labor Demand
Adoptor dummy“ll -1.058
(-5.52)-0.953(-.582)
-0.956(-5.83)
Non-adoptor dummy a n -0.653(-2.06)
-0.953(-5.82)
-0.956(-5.84)
Fertilizer demand
Adoptor dummya21 -0.172
(-6.09)-0.158(-6.31)
-0.158(-5.31)
Non-adoptor dummya22 -C.019
(-0.40)-0.058(-1.89)
-0.058(-1,93)
Chi-square for restriction 5.08 5.32
Level of significance 0.166 ,150
Figures within parentheses are asymtoptic Jt' values, R = 0.50 and the sample size consists of 331 profit making farms.

The unrestricted joint estimate of the profit function and the
labor demand relations are as follows:
(7) Liitt = -0.274 + 0.343 T - 0.690 LnW - 0.195 LnC (0.71) (3.26) (-5.33) (-0.50)
+ 0.702 LnL + 0.122 LnK - 0.702 FLBR(10.6) (3.26) (3.05)
R2 = 0.52 N = 331
(0) WN/ir = -1.05 T - 0.65 (1-T)(-5.52) (-2.05)
09} V/C/tt = -0.171 T - 0.019 (1-T)(-6.09) (-0.40)
The figures witliin parentheses are asymptotic ft ? values.
The coefficient of FLBR is negative and highly statistically
significant. Thus* the estimated profits decline with increased use
of family labor, indicating that the opportunity cost of family labor
is lower than the wage rate. Inclusion of this variable increases
the value of the coefficient of the price of labor (LnW) from -0.37
in the previous estimate (Table 5.6) to -0.70. Since family labor
has been incorporated as a separate variable, VJ can not be interpreted
at the price of hired labor. The hypotheses that the value of para
meter ( q; ) is equal to the parameters of the labor dema.ee; relation
^ 11 a c:l2' was a^s0 tested. The tests produced a chi-squ. .: e value
of 2.59 with a significance level of C.17, which can be taken to inter
pret that the farmers are absolutely price efficient in tin use of
hired labor.
- 119 -

- 120 -
Maintaining the hypothesis that the farmers are both absolutely
and relatively price efficient in the use of hired labor and that
constant returns to scale prevails, produces the following estimate
of the profit function.
(10) Ln-nr » -1.378 + 0.331 T - 0.747 LnW - 0.073 LnC(-5.73) (3.28) (-7.38) (-0.20)
+ 0.895 LnL + 0.105 LnK - 0.570 FLBR (34.13) (3.28) (-3.24)
The coefficient of FLBR suggests that a 10 per cent increase
in the proportion of family labor reduces profits by 5.7 per cent.
Even after incorporating the effect of the lower cost of family labor,
the coefficient of the technology variable ( 6) remains positive and
highly statistically significant. The value of the coefficient indi
cates that the adoptor farms get about 33 per cent more output from
a given level of input than the non-adoptor farms.
The output elasticity of various inputs for the Cob-Douglas pro
duction function can be derived indirectly from joint estimates of
the parameters of profit function and input demand equations. The
estimates are statistically more consistent than the ones derived
from the direct estimates of Cobb-Bouglas production function} which
assumes all inputs to be exogenously determined, while in practice
the variable inputs may be simultaneously determined depending on
the prices, which is the maintained assumption in the profit function
model. Since and a, appear in both profit function and the respec
tive input demand equations, imposing the restriction that they are
equal in both equations, the efficiency of the estimates is improved.
The parameters can also be estimated imposing the condition of constant

returns to scale (6^ + 0^ = 1)» The estimates derived from equation
7 (unrestricted) are reported in Table 5.8. The elasticity of land
is 0.37 compared to 50 per cent share rental paid by share croppers
to landowners in the country. The elasticity of fixed non-land Ccpital
assets is estimated at 0.06, showing the relative unimportance of
this input. The elasticity for hired labor is 0.37, which yields
a marginal productivity of Tk 22 per day of labor against an average
wage rate of Tk 19.5 paid by the sample farms. The elasticity of
fertilizer is estimated at 0.10 which gives a marginal return of
Tic 2.1 per unit Taka investment on this input.
- 121 -
TABLE 5.8
INDIRECT ESTIMATES OF THE ELASTICITY AND MARGINAL PRODUCTIVITY OF INPUTS
Inputs Output Elasticity
Fixed Inputs:
LandCapital
0.370.06
Marginal Productivity
Unit Valu:
000 Tk/ha 4,9Tk/Unit 1.05Tk investment
Variable Inputs:
Hired labor Fertilizer
0.370.10
Tk/day Tk/Tk of investment
22,12.1

- 122 -
The estimate from the unrestricted profit function, thus shows
considerable inefficiency in the allocation of fertilizer. As indica
ted earlier, the inefficiency is mainly due to farms which produce
local varieties in which fertilizer is used in small amounts. The
new crops are not only more technically efficient, they allow farmers
to achieve higher levels of allocative efficiency by creating condi
tions to use more fertilizer per unit of land.
Conclusions
The diffusion of the modern technology increases the effective
supply of land by reducing the proportion of fallow land during the
dry season. The sown area under cereals is about 87 per cent of the
cultivated land for the unirrigated plots — on irrigated plots it
is 150 per cent. The increase in the intensity of cereal cultivation
is partly at the expense of other crops. Pulses, jute, and sugarcane
are grown on about one-third of the unirrigated land, but only four
per cent of the irrigated land is allocated to these crops. With the
provision of irrigation facilities, the cropping intensity of the
land increases by one-third.
1ochnological diffusion would increase marginal returns from
land many times and provide scope to the landowner to earn more from
this scarce resource through the gradual reallocation of land from
local to modern varieties. The increase is about five times for the
aus and boro season and 2.2 times for the aman season. The marginal
product of labor is almost the same for the alternate varieties in
the aman season, but in the aus and boro seasons the productivity

is higher by about 50 per cent for the modern varieties. Labor tends
to gain more from additional employment than from the increase in
marginal product.
The the new technology are absolutely price efficient
in the allocation of fertilizer compared to the non-adoptors, but
both groups are absolutely price inefficient in the use of labor.
The inefficiency in the use of labor is mainly due to low opportunity
— cost of family labor. The marginal product of hired labor is found
to bo clo6c to the wages paid. The adoptor farms are more technolo
gically efficient compared to the non-adoptor farms by about 33 per
cent. The diffusion of the new technology would thus improve the
efficiency of resource utilization in agriculture.
- 123 -

- 124 -
Chapter 5 Notes
1. S. Ishikawa, Economic Development in Asian Perspective, Tokyo, (Kinokuniya, 1977). For Bangladesh this hypothesis has been tested in J.K. Boyce, '‘Water Control and Agricultural Performance in Bangladesh5,, The Bangladesh Development Studies, 14 (Ho 2, 1986).
2. L.J. Lau and P. Youtopoulos, ‘Profit, Supply and Factor DemandFunctions'1, American Journal of Agricultural Economics, 54 (No1, 1972): 11-18; A Test for Relative Economic Efficiency: AnApplication to Indian Agriculture1', American Economic Review, 61 (No 1, 1971): 94-109.
3. L.R. Christensen, D.W. Jorgensen, and L.J. Lau, "Transcendental Logarithmic Production Functions, Review of Economics and Statistics, 55 (No 1, 1973): 28-45.
4. A study by Shahabuddin with data for 202 farm households surveyduring winter 1979 in four selected regions in Bangladesh also shows that the Cobb-Douglas restrictions are validated againstboth transcendental and translog functions for the majority of the- crops grown by farmers. See, Quazi Shahabuddin, "Testing of Cobb-Douglas Myths: An Analysis with Disaggregated Production Functions in Bangladesh Agriculture:, The Bangladesh Development Studies, 13 (No 1, 1985): 88-97.
5. M, Raquibuzzaman, "Sharecropping and Economic Efficiency inBangladesh1', The Bangladesh Economic Review. 1 (No 2, 1973).It is found from this survey that 39 out of 72 farmers who cultivated MV boro on rented land received some input from the landowner, but the value of the landowner supplied input was only 0,8 per cent of the cost on account of seeds, fertilizer, irrigation and pesticides. The incidence of cost sharing was even less for other crops.
6. P.A. fotopoulos and L.J. Lau, "A Test for Relative Economic Efficiency", The American Economic Review. 63 (No 1, 1973): 214-223.
7. See for example, John Quiggin and Arih Bui-Lan, "The Use of Cross- Sectional Estimates of Profit Functions for Tests of Relative Efficiency", Australian Journal of agricultural Economics, 28 (April 1984): 44-55; Remesh Chand and J.L. Kaul, "A Note or the Use of the Cobb-Douglas Profit Function", American Journal of Agricultural Economics, 68 (No 1, 1986): 162-164.

- 125 -
8. The profit function is estimated for the sample farm householdsfor all crops taken together, Since over 90 per cent of thefarmers used fertilizer on some crop or other, we decided toinclude fertilizer as a variable production input since output elasticity of fertilizer is often used as an important parameter in policy analysis (such as estimating costs and benefits of fertilizer subsidy). Also, information on farm capital was available at the household and not at the crop level. So this variable could be included in the profit but not in the crop-specific production function reported earlier.
9. For details of the derivation, see P.A. Youtopoulos and L.J.Lau ' A Test for Relative Economic E£ficiency'1, op. cit., pp 215- 218.
10. Zellner A., ?,An Efficient Method for Estimating Seemingly Unrelated Regressions and Test for Aggregation bias’5, Journal of theAmerican Statistical Association, 57 (No 2, 1962): 348-375.
11. P.A. Youtopoulos and L.J. Lau, op. cit., p. 219.
12. J. Quiggin and A. Bui-lan, op. cit.
13. The price variations are almost of a similar range to those reported in a study of Filipino rice growers by J. Flinn, K. Kalirajan, and L. Castillo, ’’Supply Responsiveness of Rice Farmers in Laguna, Philippines:, Australian Journal of Agricultural Economics, 26 (No 1, 1982): 39-48.

- 126 -
6. FARM SIZE, TENANCY AND ADOPTION OF MODERN TECHNOLOGY
A crucial factor determining equity implications of the new rice
technology is the extent and intensity of its adoption among different
groups of farmers. The literature is full of studies which analyze
adoption behavior of farmers to test the hypothesis that the gains
from the introduction of the new agricultural technology have been
unequally distributed.--^ The majority of the evidence for the early
period of the "green revolution'^ suggests that the incidence of adop
tion is positively related to farm size, which appears counter intutive
given the evidence that the new technology is seemingly scale neutral,. . . . . . • i .j_r. •:
It is argued that the new technology may entail some fixed costs in
the form of access to information and sources of supply of the new
inputs, and arrangements for marketing, which tend to discourage adop-i .
2/tion by small farmers.— The role of tenurial arrangements in the
adoption decision is also a subject GlT considerable controversy. A> * - • ,
number of recent studies, however, argue that even if small farmers
and tenants initially lag behind in adopting the new technology, even
tually, they catch up and ultimately, they may use it more than the
3/large owner farmers.— But even if this is the case, the early adop
ters can accumulate more wealth and power, which they can use for
further accumulation of land from the laggards, which can set in a
process of unequal distribution of income with the diffusion of the
new technology.
In order to assess the equity implications of the modern techno
logy for Bangladesh, this chapter studies the adoption behavior among
different size and tenurial groups of farmers and tests major

- 127 -
hypotheses put forward in the literature in this regard. Major issues
raised in the literature are outlined in the following section. The
next section gives a descriptive account of the intensity of adoption
among different groups of farmers. The factors affecting adoption
are then analyzed using multivariate regression techniques. The final
section investigates into the difference in land productivity and
prices faced by different groups of farmers, since these would also
have bearings on. the income distribution effect of the new technology
among farmers.
The Issues
The relationship between farm size and the adoption of the new
technology cannot be determined _a priori Farm size is often a surro
gate for a large number of factors— which may have important bearing
on the adoption decision. Since the importance of these factors varies
across space and over time, in empirical investigations it is possible
to observe variant relationships between farm size and the rate of
adoption.
An important factor is the degree of risk aversion among farmers.—
Apart from the objective risk of having uncertain returns from invest
ment under conditions of weather variation and pest attacks, the new
variety entails in the initial years a subjective risk of having an
uncertain yield wit an unfamiliar technique, the full intricacies
°f which have not yet been mastered by the farmer. The more risk
<~rse is the farmer, the less willing he will be able to adopt, and
even if ge adopts, he will try to minimize the risk by devoting a

- 128 -
smaller proportion of land to the new crop. The degree of risk aver
sion, may depend on the position of the farmer with respect to income.
If the farmer operates around the poverty level income, he would want
to ensure survival for self and the family by avoiding the risk of
falling below the subsistence level. Since farm size and income may
be highly correlated, small farmer may be more risk averse and may
adopt the technology less than the large farmer. In the case of
Bangladesh, a large majoity of farmers operate near the subsistence
level. But the new technology is now sufficiently known to the farmers
and the objective risk is found to be lower for the new crops (Chapter
4). So the risk aversion factor may not be important in explaining
the adoption behavior.
The need for working capital to cultivate a given amount of land
is higher for the new crop varieties (see Chapter 4). Farmers who
need to invest on indivisible irrigation equipments like tubewclls
and power pumps, to adopt the new crops woulci also require a large
initial fixed investment. So, unless the government bears the cost
of irrigation development, access to capital in the form of accumulated
savings or financial institutions may be an important determinant
of the rate of adoption. In many low income countries, small farmers
have limited access to financial institutions. Thus the credit cons
traint may induce farmers to borrow from the high cost non-institu-
tional sources. The working capital constraints may, however, be
eased considerably after a few years, if the small farmer could accu
mulate the incremental profits from the cultivation of the new crops.

Access to information about the sources of new inputs, the- know
ledge about how they could be optimally used, and the marketing of
the additional output, can also be an important factor in determining
the differential rate of adoption.— The level of education of the
farmer can be taken as a proxy of this variable. Since the opportunity
cost of sending children to school rises with poverty, education status
is generally found to be positively related with the farm size. The
larger farmer who is better educated may have more contact with the
extension agents who supply these information. So the large farmer
is expected to adopt more on this account.
A number of other factors may, however, operate to encourage
more adoption among the smaller farmers. The new crop use substan
tially more labor input per unit of land. In rice cultivation which
depends more on the use of casual workers (hired on a daily basis),
it makes the problem of labor management more difficult. This may
prevent adoption of the new crop by relatively labor scarce large
farmers. If the new crop increases the seasonal demand for labor,
it would be less attractive to farmers with a.limited supply of family
labor.
According to the Chayanovian theory of peasant economy,-^ the
consumption unit of the family in relation to the production unit,
i.e., land and worker may be an important determinant of the adoption’ *' 1 < *
of the new technology. The theory argues that the motive force behind
the economic activity of a peasant family is the consumption need
which increases with the growth of the family. The peasant responds
to the increased consumption requirement by substituting labor for
leisure and by acquiring more land. In land scarce countries, the
- 129 -

- 130 -
scope of accumulating land is limited for the peasant. In this situa
tion, the yield and income raising technology gives the scope for
increasing consumption from the same amount of land. Hence, the new
variety would be more attractive to small farmers who have more family
members relative to land.
The impact of tenurial arrangement on adoption decision is a
matter of considerable controversy in the theoretical literature.—
Bhaduri, citing the East Indian experience, argued that the landlord
who derives income from rent as well as from usury is interested in
keeping his tenants perpetually indebted. Under these circumstances,
it is in his interest not to allow the tenant to adopt the new techno
logy since higher incomes from cultivation of the same amount of land
would reduce the tenants' indebtedness to him, and the loss in usury
income would outweigh the gain in rental income accruing to the land-
lod. This hypothesis has, however, been criticized on the grounds
that if the landlord has sufficient monopoly power to withhold adoption
of the new technology, he should have power to siphon off the extra
income of the tenant by increasing the rent. Newberry argues that
under uncertain labor and product markets, sharecroppers would be
interested in adopting the new technology. But Bardhan shows through
a theoretical model that land-augmenting technical change and higher
labor intensity, the characteristics of the new rice varieties, would
induce a higher incidence of tenancy. The risk aversion theory implies
that share tenancy may be a preferred arrangement for adoption of
the new technology since the risk can be shared between the tenant
and the landlord. Also, since the tenant is usually a small farmer

- 131 -
with more surplus labor and higher subsistence pressure, he may adopt
the new technology more readily than the owner cultivator.
The availability of complementary inputs can also influence the
adoption behavior. In the case of the new varieties of rice, an impor-/
tant factor is the assured and regulated supply of water (that is
irrigation-)- without which the new variety would be more risky and
less profitable. In the Bangladesh case, with small farms and frag
mented and scattered holdings, irrigation seems to be exogenously
determined, since the facilities are developed by the government
largely with externally funded projects. Even with private ownership
on irrigation equipment by large landowners, which has proceeded some
what since the late-sevcnties, the small and medium farmers have equal
chance of having some of their plots located within the command area
because of the random location of the fragmented holdings. Under
these circumstances, the differential adoption among farmers and
regions would depend on the location of irrigation projects and on
access of the different groups of farmers to irrigation ’facilities*
Pattern of Adoption
Farm Size and Adoption of MV
Table 6.1 summarizes the observed pattern of adoption of the
new crop varieties among different groups of sample farmers in the
study villages. About three-fourths of the farmers cultivated the
varieties, although only about one—third of the sown area was
01 located to them. The proportion of adopter farmers is not found
to be significantly different among different size and tenurial

- 132 -
TABLE 6.1
ADOPTION OF MODERN VARIETIES OF RICE BY FARM SIZE AND TENANCY, 1982
Farmer Groups
Percent offarmersadoptingMV
Area Under MV Rice as a Percent of
Total cropped area
Rice area
Size of farm:
Small (up to 1.0 ha) 75 43.2 51.7
Medium (1.0 to 2.0 ha) 74 35.8 44.6
Large (2.01 & over) 77 32.5 42.4
Tenurial Status:
Owner 77 35.7 44.1
Tenant or owner-tenants 74 38.1 48.1
All Farms 75 36.8 46.0
groups. The gains from the new technology thus appears to be widely
distributed irrespective of the land holding and tenurial status of
the farmer.
The intensity of adoption is, however, found to vary inversely
with farm size. The farmers who own less than one hectare of landf' »“1
(henceforth called small farms) devoted about 43 per cent of the crop
ped area under modern rice varieties; among farmers who own more than
two hectares (large farms), the proportion is one-third. The same
pattern is observed even if the intensity of MV adoption is measured
as a proportion of sown area under rice. The result appears contra
dictory with the general findings on this issue in the South-Asian

» t ‘*1
* - 133 -*
context. The previous studies on the extent of adoption for Bangla
desh, however, found a similar pattern. One of the more rigorous
earlier studies (based on data for 1972) conducted by Asaduzzaman
found that small farmers devoted about 28 per cent of the aman rice
9 /area to the new crops compared to only .14 per cent by large farmers.—
Herdt and Garcia reviewed findings of seven studies conducted between
1969 to 1981 and noted that five of these reported higher intensity
of adoption among smaller f a r m e r s . ' T h e 1983-84 Agricultural Census
als.0 supports this finding. The census found about 26 per cent of
the net cropped area for the small farms were under modern varieties
of rice, compared to 23 per cent for medium farms and 18 per cent
for large farms.
Tenancy and Adoption of MV
The adoption of MVs is not found to be significantly different
between owner and tenant farmers. In Bangladesh, pure tenants, i.e.,
those who rent the entire holding, are rare. Most of the tenants
ore part tenants who own some land and rent some in order to make• ‘ - • '* ‘Y! \ X
the holding viable. As can be noted from Table 6.1, 75 per cent of
the owner-tenants cultivated some land with the modern variety compared
to 77 per cent for the owner cultivators. The intensity of adoption
was about 38 per cent for tenants compared to 36 per cent for owners.
FV) *i; rice, tenants devoted 48 per cent of the sown area under modern
varieties, compared to 46 per cent for owners.
Table 6,2 shows the incidence of tenancy in the cultivation of
different varieties of rice. It is found that tenants are larger

INCIDENCE OF TENANCY BY SEASON AND TECHNOLOGY, 1982
- 134 -
TABLE 6 .2
Season
Percent of farmers renting land
Rented area as a Percent of sown area
Traditionalvariety
Modernvariety
Traditionalvariety
Modernvareity
Aus 24.6 30.7 14.3 15.9
Aman 27.9 44.7 19.0 20.1
Boro 16.0 35.0 7.5 16.9
in proportion among farmers cultivating modern varieties in all three
rice growing seasons. The proportion of area under tenancy is also
found higher in the cultivation of modern varieties in all three sea
sons. This indicates a positive effect of the new technology on
tenancy cultivation. • j
In Bangladesh the predominant tenancy arrangement is sharecrop
ping under which the gross output is shared equally between the tenant
and the landowner, while most of the cost of cultivation is borne
by the tenant.— It can be argued that under these circumstances,
the tenant would be discouraged to adopt the new technology because
he would have to bear the large incremental cost on account of labor,
fertilizer, and irrigation while the incremental output would be shared
equally between the tenant and the landowner. The empirical observa
tion thus inconsistent with this hypothesis. Under certain circums
tances, the hypothesis cannot, however, be tested by comparing the
performance of the owner and tenant cultivator, particularly, when
the tenant also cultivates some owned land. If markets (such as of

- 135 -
labor and capital) arc imperfect, the resource position of the culti
vator may determine its opportunity cost which would vary among culti
vators, The tenant may hire in land because he has some underemployed
resource (human and animal labor) which he cannot sell in the market.
Since the new technology is labor-using, the tenant may want to maxi
mize his family income by devoting more land under new crops compared
to the owner cultivator. The disincentive effect of share tenancy
thus can only be assessed by comparing the rate of adoption on owned
and share cropped portion of the holding under the same cultivator.
This is done in Table 6.3, It would be noted that the tenants devoted
a larger proportion of their owned land under the modern varieties
compared to the owner-cultivators, which is a reflection of the nega
tive farm size effect on MV cultivation, since most tenants are smallj
farmers. But the tenants allocated a smaller proportion of the rented
land under the new crops compared to the owned land during the aman
and aus seasons, which supports th>. hypothesis of disincentive effect
. i l *
TABLE 6.3
ADOPTION OF MODERN VARIETIES ON OWNED AND RENTED LAND FOR MIXED-TENANT FARMERS: BY SESON, 1982
Owner farms Owner-cum-Tenant Forms
Season Percent of Percent of Percent ofland under owned land rented landHYV under MV Under MV
Aus 33.3 38.8 36.1
Aman 3 3 .5 42.1 3 5 . 1
Boro 76.7 82,6 89.0
AH Seasons 44.1 49.8 46.5

of crop sharing arrangements. Only during the boro season did the
tenants grow modern varieties more on the rented land compared to
owned land. This may be due to a stipulation by the landowner that
the land can be rented only if it is cultivated with modern varieties.
It was found during the field survey that in many cases the land is
only rented seasonally, and the seasonal tenancy is more prevalent
during the boro season.
Irrigation and Adoption of MV
The sample villages under study differ widely with respect to
access to irrigation, types of irrigation, and the age of experience
with irrigation. In three villages which; (belong to the Comilla dis-
district, irrigation facilities were developed and modern varieties
introduced in the late sixties during the experiment of the Comilla
model of 'cooperative capitalism*1. Two of the villages are under
the Ganges-Kobtak project, the first large scale irrigation project
developed in Bangladesh, where irrigation is provided by gravity
canals. These villages got access to the irrigation canals in 1972.
Two villages irrigated part of the land by fielding low lift pumps
on canals developed by the food for works program in 1978. In two
other villages, irrigation was introduced only two years before this
survey by a few large landowners who invested in shallow tubewells.
At the time of the survey, five villages did not have any access to
irrigation facilities, three of them located in the coastal district
of Khulna where intrusion of saline water during the dry season makes
irrigation development difficult. The diversity in the sample allows
- 136 -

• - v>* 2 4 i \ » 4 ‘ • \ .1 • Vt ' , f; ’ * • • %us to investigate the role of irrigation in adoption among different
groups of farmers in the early and late adopter villages.
The importance of irrigation in the adoption of the modern varie
ties has been shown earlier' (Table 5.1) from the analysis of the
pattern of land use for the irrigated and unirrigated plots. Furthcr
analysis of the use of the owner operated plots show the crucial impor
tance of the level of land and the access to irrigation in the inten
sity of adoption of modern varieties (Table 6.4). Only six per cent
of the unirrigated plots were used for growing MVs compared to 77 per
cent of the irrigated plots. MVs were grown much more on the plots
located on the medium level land compared to the extremely high and
extremely low lying plots, because the physical characteristics of
the latter do not generally allow regulation of water supply. About
a half of the plots located on the medium high land were reported
to be irrigated, compared to only one-sixth of the plots located on
the extreme high and low lying land. One-third of the irrigated plots
were used for growing MVs twice during the year, and it appears that
the land level is the most important factor determining the intnsity
of use. Almost one-fourth of the plots located on the medium high
land were used to grow MVs twice during the year compared to less
than four per cent for the other categories of land. The second MV
crop is grown during the monsoon season, and so the low lying plots
which remains deeply flooded cannot be used to raise the dwarf modern
varieties. Since the importance of the different types of plots in
the portfolio of landholding may vary across villages and farmers,
the above findings points to the importance of dissociating the effect
- 137 -

- 138 -
TABLE 6.4
ADOPTION OF MODERN VARIETIES BY LEVEL OF LAND AND ACCESS OF LAND TO IRRIGATION FACILITIES, 1981
Type of Land
No. of plots in thesample
Percent of the Plots
Irrigated
Not growing MV
Growing MV once
Growing MV twice
Land Level:
Extreme High 1063 14.6 89.6 ' 7.7 2.7
Medium High 1383 52.3 52.4 24.2 23.4
Medium Low 941 44.3 62.3 33.0 4.7
Extreme Low 181 16.0 83.4 13.3 3.3
Access to Irrigation:
Unirrigated 2242 Nil 94.0 5.5 0.5
Irrigated 1326 100.c 23.1 47.4 29.6
All Plots 3568 37.2 67.7 21.1 11.3
of the physical characteristics of the land in analyzing the impact
of the socio-economic factors on the adoption behavior of the farmer.
Table 6.5 compares the pattern of adoption among different farm
size groups between irrigated and unirrigated villages. About one-
fifth of the farmers in the unirrigated villages allocated some land
to modern varieties compared to about 90 per cent in the irrigated
villages, where the proportion of adopter farms is invariant across
farm size. Thus once irrigation facilities are developed in a village,
the gains are widely distributed across the farm size scalr. Even
in the late adopter villages where only about one-fourth of the cropped

- 139 -
TABLE 6.5
ADOPTION OF MODERN VARIETIES IN IRRIGATED AND UNIRRIGATED VILLAGES BY FARM SIZE, 1982
Size of farm
Percent of adopter farmers
Percent of cropped area under modern variety
Unirrigatedvillages
Irrigatedvillages
Unirrigatedvillages
Irrigatedvillates
Small 20 87 3.7 59.6
Medium • 20 93 2.7 51.4
Large 15 93 0.7 , 49.5
All Groups 19 90 2.2 53.5
land is cultivated with modern
•./■ -
varieties, more than 80 per cent of
the farmers are adopters (Table 6.6). In the late adopter villages,
the proportion of adopters is smaller among small farmers, while in
the early adopter villages, almost all farmers grew MVs even among
the small size groups,f This supports the contention that, with experi-• 'V i '\*‘ \,
ence, small farmers catch up with the large ones.
The intensity of adoption is observed to be inversely related
with farm size even in the irrigated villages. About 54 per cent
of the cropped land in these villages is allocated to MV rice; 60
Ptr cent for the small farms compared to 50 per cent among the large
ones (Table 6.5). The inverse size effect prevails even in the early
adopter villages (Table 6.6) indicating that the large farmers remained
loggards even with the passage of time, Presumably, facing shortage
°f family labor, the large farmers may have adopted MVs partly through
tenants. t

- 140 -
TABLE 6.6
ADOPTION 01- MODERN VARIETIES BY TYPE OF IRRIGATION AND THE AGE OF EXPERIENCE ,1982
Villagegroups
Percent of Adopter farmers
Percent of cropped area under modern variety
Smallfarm
Mediumfarm
Largefarm
Smallfarm
Mediumfarm
Largefarm
Type of Irrigation:
t f
Low Lift Pumps 84 95 87 32.6 33.6 23.2Canals 91 100 100 58.0 49.8 58.9Tubewells 87 89 92 68.9 60.7 61.3
Age of Experience:\!.! O / •, ••
Early Adopter 98 100 100 74.8 69.3 71.3Late Adopter 79 88 85 29.6 26.5 24.9
One can argue that the type of irrigation itself may contribute
to differential rate of adoption among farmers. If the irrigation
equipment is privately owned, as oiten is the case with tubewell irri
gation in Bangladesh, one can expect a large farmer monopoly in the
supply of water, since the size of the command area and the high ini
tial cost of investment would prohibit tubcwcll ownership by smaller
12/farmers.— In this case, one can expect a direct relationship between
farm size and adoption of the MV rice. On the other hand, the communal
development of irrigation, as in the case of the Water Development
Board’s large-scale canal irrigation project, may lead to a more egali
tarian system of distribution of water supply, and other things
remaining constant, the intensity of adoption would be invariant with
farm size. In order to test this hypothesis, we also estimated the
rate of adoption along the farm size scale for different types of

- 141 -
irrigation (Table 6.6). In the case of villages receiving water from
canals, no systematic pattern of adoption is found, but in the case
of both tubewell and low lift pump irrigation, the small farmers adop
ted more, which is contrary to the above hypothesis.
Adoption of Fertilizer
Nearly nine-tenths of the sample farmers used fertilizers during
1982 although only about a half of the plots were treated with ferti
lizers. The non-users were mostly among those who grew only . tradi
tional varieties of rice. All farmers growing MV boro and aus rice,
and 98 per cent of those growing MV aman used fertilizers. The propor
tion of user farmers was 74 per cent for local transplanted aman,
73 per cent for local aus, 19 per cent for' loc&l broadcast aman, and
only 6 per cent for local boro. The fertilizer adoption is thus very
much variety specific and depends on the type of land and environment.
The pattern of adoption of fertilizers among different groups
of farmers can be reviewed from Table 6.7. The adopter farmers are
proportionately more among the larger size groups. But the intensity
of use per hectare of land is inversely related with farm size. This
apparent inconsistency can be explained by the fact that the number
°f plots under cultivation is higher for the larger farmer and, hence,
the probability for one of he plots failing under the command area
°f irrigation and, therefore, being suitable for growing MV and appli
cation of fertilizer, is higher the larger the size of farm. The
at ount of use per unit of land is thus a more appropriate indicator
°f adoption behavior than the proportion of user farms. Table 6.7

- 142 ~
TABLE 6 .7
USE OF CHEMICAL FERTILIZERS BY FARM SIZE AND TENANCY , 1982
FarmerGroups
All crops Amount used in major crops (Kg/ha)
Farmersusingfertilizers(percent)
Amount used (Kg of nutrients per ha of sown area
MVboro
MVaus
MV Local aman aus
Localaman
Farm Size:
Small 85.5 60.3 169 117 93 22 20Medium 92.3 54.2 158 117 97 16 20Large 95.0 44.8 127 114 73 31 14
Tenurial Status:
Owner 87.0 54.7 156 117 89 25 26Tenant 90.8 53.3 161 114 93 17 9
All Farms 89.2 54.1 157 116 91 22 19
shows that compared to large farmers, the small farmers use about
35 per cent more fertilizer per u4iit of cropped land, and the medium
farmers about 20 per cent more. The extent of use is found similar
for the owner and tenant farmers. Similar findings on differential
adoption of fertilizer was noted by the IFDC from its countrywide
13/survey.—
A major factor behind the inverse farm size effect on fertilizer
use is that the small farmers grow a larger proportion of land under
MV (Table 6.1) which are much more fertilizer intensive compared to
the traditional varieties of rice. For dissociating the cropping
pattern effect, we have also reviewed the pattern of adoption in spe
cific crop varieties, which are reported in Table 6.7. The inverse
size effect prevails in the case of MV for all three seasons, and

it is highly pronounced in the cose of MV boro. For local varieties
in which fertilizers are used in small amounts, no systematic pattern
of use across the farm size scale is found. The owner farmers tend
to use more fertilizers than the tenants in local varieties, but for
MVs, no systematic pattern is found
Adoption Behavior: An Econometric Analysis
The size and tcnurial status of a farm is often a surrogate for
other factors which affect the adoption behavior of farmers. In order
to explain the observed pattern of adoption reported in the previous
sections, it is thus necessary to carry out a multi-variate analysis
of the factors determining the adoption behavior and the importance
of these factors for different groups of farmers. This is attempted
here through the use of the multivariate regression technique. First,
a probit model is used to identify the factors which affect the deci
sion to adopt MV rice, and then a tobit model is used to explain the
extent of adoption.
The following model was estimated using the profit method in
order to identify factors which affect the farmers’ decision of whether
to adopt MVs or not:
ADPT = f (OWNL, TNC, IRGP, CRDTI, CRDTN, LBR, LNDPC, NAGRI,
INFR)
where, ADPT = The dichotomous adoption variable which takes value
1 for adoptor farms and zero for non-adoptor farms,
OWNL = The amount of land owned by the household (in acres),
- 143 -

- 144 -
TNC = The proportion of rented in land,
IRGP = The proportion of land irrigated,
CRDTI = The amount of loan received from institutional sources
(hundred Tk per acre)
LBR = The amount of land cultivated per worker (acre)
LNDPC = The amount of land owned per member in the household
(acre)
NAGRI = The income from trade and industry per acre of cropped
land (hundred Tk/acre)
INFR = An index of underdevelopment of infrastructure at the
village level.'
LBR and LNDPC are measures of labor scarcity and subsistence
pressure in the household and arc expected to negatively influence
the decision to adoption MVs. CRDTI, CRDTN and NAGRI are expected
to ease the capital constraint and hence should have positive influ
ence on adoption decision.
.(! 1 ;iX '
The results of the exercise are presented in Table 6.8. Estiated
equation 1 incorporated only the farm size and tenancy variables and
-2they are found statistically insignificant with an extremely low R for
the regression equation (obtained in the OLS estimate of the parame
ters). The labor scarcity and the subsistence pressure variables
have right signs of the estimated parameters but they are also statis
tically insignificant. An alternative labor scarcity variable was
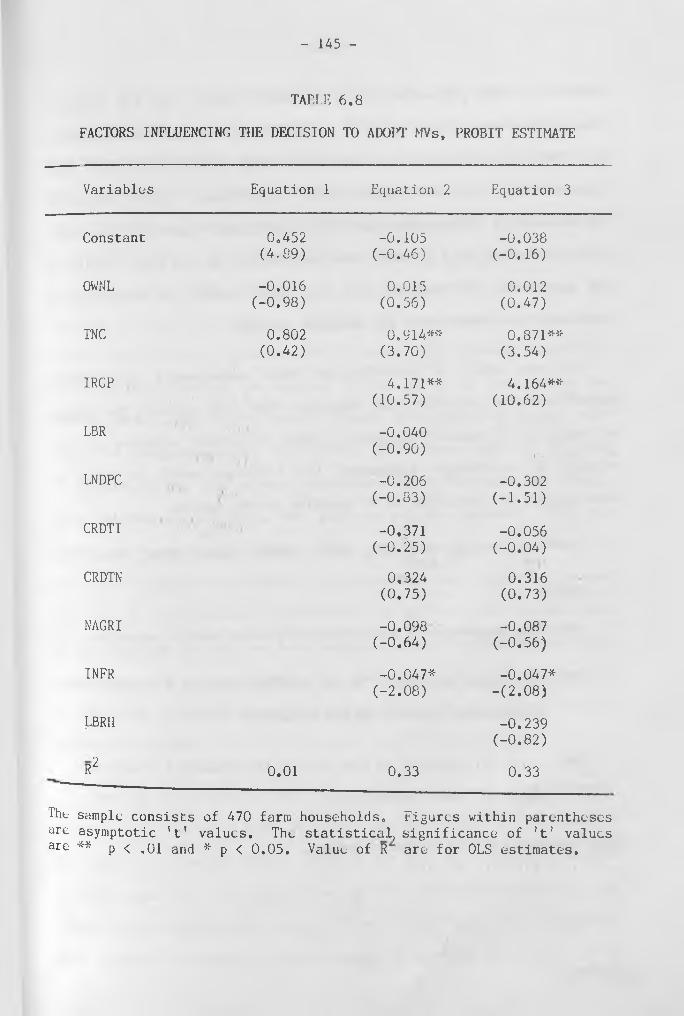
- 145 -
FACTORS INFLUENCING THE DECISION TO ADOIT MVs, PROBIT ESTIMATE
TABLE 6 ,8
Variables Equation 1 Equation 2 Equation 3
Constant 0.452 (4,89)
-0.105(-0.46)
-0.038(-0.16)
OWNL -0.016(-0.98)
0.015(0.56)
0.012(0.47)
TNC 0.802(0.42)
0.914**(3.70)
0.871**(3.54)
IRGP 4.171**(10.57)
4.164**(10.62)
LBR -0.040(-0.90) K* .
LNDPC.
-0.206(-0.83)
-0.302(-1.51)
CRDTI -0.371(-0.25)
-0.056(-0.04)
CRDTN 0,324(0.75)
0.316(0.73)
NAGRI -0.098(-0.64)
-0.087(-0.56)
INFR -0.047*(-2.08)
-0.047*-(2.08)
LBRH -0.239(-0.82)
R2 0.01 0.33 0.33
The sample consists of 470 farm households. Figures within parentheses are asymptotic 't’ values. The statistical-, significance of 't! values are ** p < ,01 and * p < 0.05, Value of R are for OLS estimates.
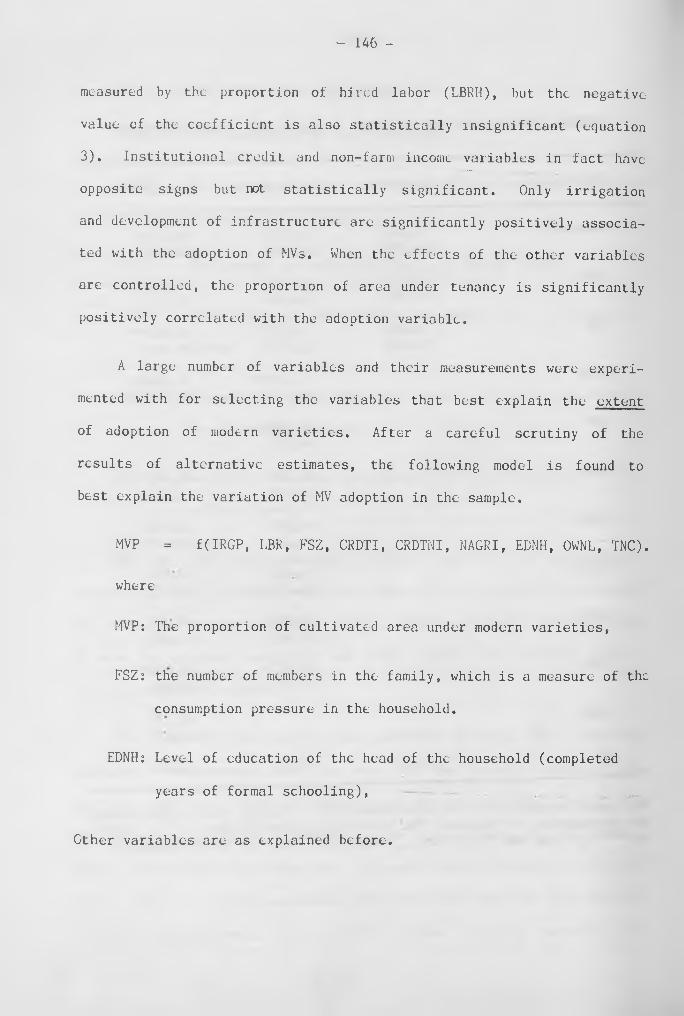
- 146 -
measured by the proportion of hired labor (LBRH), but the negative
value of the coefficient is also statistically insignificant (equation
3). Institutional credit and non-farm income variables in fact have
opposite signs but not statistically significant. Only irrigation
and development of infrastructure are significantly positively associa
ted with the adoption of MVs. When the effects of the other variables
are controlled, the proportion of area under tenancy is significantly
positively correlated with the adoption variable.
A large number of variables and their measurements were experi
mented with for selecting the variables that best explain the extent
of adoption of modern varieties. After a careful scrutiny of the
results of alternative estimates, the following model is found to
best explain the variation of MV adoption in the sample.
MVP = f(IRGP, LBR, FSZ, CRDTI, CRDTNI, NAGRI, EDNH, OWNL, TNC).
where
MVP: The proportion of cultivated area under modern varieties,
FSZ: the number of members in the family, which is a measure of the
consumption pressure in the household.
EDNH: Level of education of the head of the household (completed
years of formal schooling),
Other variables are as explained before.

The equation was estimated separately for two seasons. For the
overlapping aus and boro seasons, irrigation is a prerequisite for
adoption of the modern varieties because the rainfall is scanty and
paddling of soil for transplantation of seedlings cannot be done with
out irrigation. This is also a relatively slack season of agricultural
activities since a significant proportion of land remains fallow.
So factors like labor shortage may not be a binding constraint for
adoption during this season. During the aman season, rainfall is
plenty and so modern varieties can be grown under rainfed conditions,
but a physical control is imposed by the level of land, since the
low levels of land remains deeply flooded throughout the season which
makes the land unsuitable for growing MVs, Since most of the land
is cropped during this season, occasional labor shortages may appear.
Owing to thse differences, the analysis at the seasonal level was
thought to be more appropriate. The proportion of medium high land
was used as another explanatory variables but the coefficient was not
found to be statistically significant and in fact had negative sign
in the equation for aus and boro seasons. Since irrigation was highly
correlated with this variable, the land level variable was dropped
in the final estimated equation in order to avoid the problem of high
multicollinearity.
One has to be careful about the method of estimation of the para
meters of the specified model since the observed value of the dependent. • . j ■
variable has a limited range. This is the case of a limited dependent
variable model and the application of the least square method to the
observed data may lead to seriously biased estimates. Since the depen
dent variable is observed in the range of zero to one, i.e., it is
- 147 -

- 148 -
censored in both tails, the 'two limit probit" (Tobit) model appears
to be the most appropriate technique for its estimation. The software
LIMDEP developed by Greene*^ for estimation of the tobit model was
applied to the data set to get the values of the parameters of the
model.
The estimated parameters are reported in Table 6.9. As expected,
irrigation is found to be the most significant variable determining
the adoption rate. The asymptotic svt!v value for the estimated coeffi
cient is the highest for irrigation compared to all other variables
included in the model. The dropping of this variable from the equation
_oreduces the value of the adjusted coefficient of determination (R ) from
0.47 to 0.08. The comparison of the *'t5' value for this coefficient
for the two seasons indicates that for adoption of MV, irrigation
is more important for the boro and aus season than for the aman season.
The value of the coefficient (in the equation for all seasons) indi
cates that a 10 per cent increase in the area under irrigation may
increase the proportion of land under modern varieties of rice by
about 11 per cent.
The coefficient of the family worker variable is positive for
the aman season indicating that given the amount of land to be culti
vated, the higher the availability of the family labor, the more
is the tendency to cultivate the modern varieties. The value of the
coefficient, however, is not found to be statistically significant.
For the aus and boro season, the coefficient of this variable has
an opposite sign, but it is not statistically significant. As in
dicated earlier, this is the slack season of agricultural activities
and so households with less endowment of labor relative to land may

- 149 -
TABLE 6.9
DETERMINANTS OF ADOPTION OF liODERN VARIETIES OF RICE, 1982
Boro and Aus season Aman Season All Seasons
VariablesOLS
EstimateTobit
EstimateOLS
EstimateTobit
EstimateOLS
EstimateTobit
Estimate
OWNL -0.291(-0.65)
-0.484-0.99)
0.036(0.08)
0.002(0.004)
-0.255(-0.41)
-0.429(-0.47)
TNC 0.130***(2.74)
0.137***(2.99)
0.183***(4.00)
0.190*** (3.73)
0.314***(4.70)
0.283***(4.64)
IRGP 0.609***(14.09)
0.651***(11.10)
0.527***(12.57)
0.547***(10.02)
1.137***(18.69)
1.084***(12.56)
LBR -1.305(-0.95)
-1.639(-0.88)
0.733(0.55)
0.581(0.45)
-0.572(-0.30)
-0.550(0.25)
FSZ 0.539(0.92)
0.7431.07)
0.311(0.55)
0.264(.43)
0.850(1.04)
0.337(0.38)
EDNH -0.403(-1.02)
-0.396(-0.80)
-0.248(-0.65)
-0,269(-0.65)
-0.650(-1.169)
-0.416(-0.66)
CRDTI 0.351*(1.71)
0.518**(2.36)
0.442**(2.21)
0.459**(2.48)
0.793*** (2.74)
0.743***(2.74)
CRDTN 0.423***(4.64)
0.625***(5.07)
-0.108(-1.23)
-0.113(-0.87)
0.315***(2.46)
0,695***(3.82)
NAGRI 0.137(-1.44)
-0.165(1.46)
-0.126-(1.368)
-0.134-(1.10)
-0.264**(-1.97)
-0.290**(-1.99)
(Constant) 0.14***(3.36)
0.14***(2.38)
-0.004(-0.10)
-0.004(0.06)
0.14** (2.33)
0.17**(2.34)
(Sigma) 33.141***(24.58)
30.19***(25.88)
40.0***(19.67)
0.36 0.28 0.48
Log-L -2037 -2136<
-1768
Notes. Figures v/ithin parentheses are asymptotic "t" values.
Significance of "t" value, * P<0.10, ** P<C.05, *** P<0.01.
The sample consists of 470 farm households.

not be constrained in growing more labor-intensive crops, as they
can count on easy availability of hired labor.
The coefficient of family size is positive for both seasons sup
porting the Chayanovian hypothesis that the hiher the subsistence
pressure, the greater is the tendency to adopt the new technology.
The relationship, however, is weak. The value of the coefficient
is not statistically significant.
In the context of a small farmer peasant economy as in Bangladesh,
the shortage of working capital is often emphasized as a major cons
traint to adoption of the new technology. Jn this exercise, the amount
of loans received per unit of land has been taken as a proxy of the
availability of liquid funds, which may ease the capital constraint.
The variable, however, could not be measured season-specific and so,
it is difficult to interpret the value of the coefficient of this
variable in the equations for different seasons. The value of the
coefficient of institutional credit is positive for both seasons,
which suggests that the availability of institutional credit facili
tates adoption. The coefficient is found to be statistically signi
ficant in all the equations at less than five per cent probability
error. This results may, however, appear surprising in view of the
fact that the access of the small farmers to the agricultural credit
institutions is still limited although there has been rapid expansion
of short-term institutional loans in the country over the last
16/decade.— The credit is concentrated in the hand of the medium and
and large farmers. In the present sample only 13 per cent of the
- 150 -

- 151 -
farm households received institutional loans during 1982, and the
amount of institutional loans was about a quarter of the total loans
received by them. Households receiving institutional loans were 10
per cent among small farmers compared to 24 per cent for the large
ones.
The incidence of borrowing from the non-institutional sources
was found to be quite widespread. Nearly two-thirds of the farmers
borrowed from friends and relatives, most often without any interest,
and also from local moneylenders who charge very high rates of inte
rest. Nearly 40 per cent of the loans from non-institutional sources
were free of interest. The coefficient of the non-institutional credit
variable is found to be positive and statistically significant at
loss than five per cent probability error for the aus and boro season.
For the aman season, however, the coefficient has an opposite sign,
but it is not statistically significant. Because of the need for
irrigation and more-intensive use of fertilizer, the working capital
requirement for the cultivation of MV crop is significantly higher
for the boro and aus season compared to the aman season (Chapter 4).
The proportion of holding allocated to MVs is also less for the aman
season. Thus, farmers who do not have access to formal credit insti
tutions may tap non-institutional loans for cultivating the modern
variety during the dry season, while their own resources may be suffi
cient for growing the small amount of land that they currently allocate
to MV during the aman season.
Farmers who earn some income from non-agricultural sources may
have less liquidity constraint than those who depend mostly on agricul
ture. So access to non-agricultural income may ease"the capital cons
traint to adoption of MV. The amount of income earned from trade

and industry per unit of cultivated land was related to the intensity
of adoption in order to test this hypothesis. The value of the coeffi
cient is found to be negative irrespective of the season, which is
contrary to the hypothesis. The negative value is statistically signi
ficant for all seasons. In fact, it is found in further tests that
if the service incomes are added, the "t' value for the negative
coefficient increases. This indicates that farmers who cannot adopt
the modern varieties due to technical constraints (non-availability
of irrigation, etc) try to augment household incomes through alter
native ways, e.g., by self-employing themselves in various non-agricul-
tural activities and taking up temporary low income jobs (public works
program, etc)/(see Chapter 7 for further details).
Another variable for which the result is found to be contrary
to £ priori hypothesis is the level of education. The value of the.
coefficient is found to be consistently negative in all equations
indicating that the less educated adopt modern varieties more inten
sively. The finding tends to support the contention that the type
of education provided in schools is not agriculture oriented. Educa
tion provides better opportunities for non-agricultural employment
which may be higher paying and less arduous than agricultural employ
ment. Thus, although education gives better access to information
about the new technology, it may not necessarily facilitate its adop
tion.
When the effect of other socio-economic variables are controlled,
the size of landownership does not seem to affect the intensity of
adoption. The coefficient of the landownership variable is positive

- 153 -
for the aman and negative for the boro season, but the values are
not statistically significant. The estimated ‘'t?' values is less than
one for all cases. The tenancy variable, however, still remains highly
statistically significant. The positive value of the coefficient
indicates that the extent of adoption of MVs is higher on the rented
land than on owned land. Since the MVs arc labor-intensive, and
tenants rent in land for minimizing the under-utilization of family
workers, the large landowners may gain more by getting MVs cultivated
by sharecroppers than self-cultivating them with wage laborers. Sinc_
there is so much excess demand for land, the tenancy market may be
governmed more by the interests of the landowners than by those of
the tenants, who would be discouraged to cultivate MVs on rented land
under the crop-sharing arrangements.
The higher intensity of adoption on smaller farms, as reported
in the previous section, mainly comes through availability of irriga
tion, and the incidence of tenancy. Irrigation in Bangladesh is mostly
exogenously determined. It is developed by the government, often
with foreign assistance. Irrigation has spread mostly in areas where
the average farm size is generally low (eastern and south-eastern
parts of the country). In the coastal and flood prone districts where
there are physical constraints to development of irrigation, concen
tration of land in the hand of the large farmers is generally higher.
So the proportion of land irrigated is found higher on smaller farms
(Tabale 6.10). The some pattern is noted for the country as a whole
by the latest agricultural census of 1983-84. Tenancy cultivation
is also more prevalent among the smaller farmers. It was found in .
the present survey that about one-sixth of the cropped land was tenant
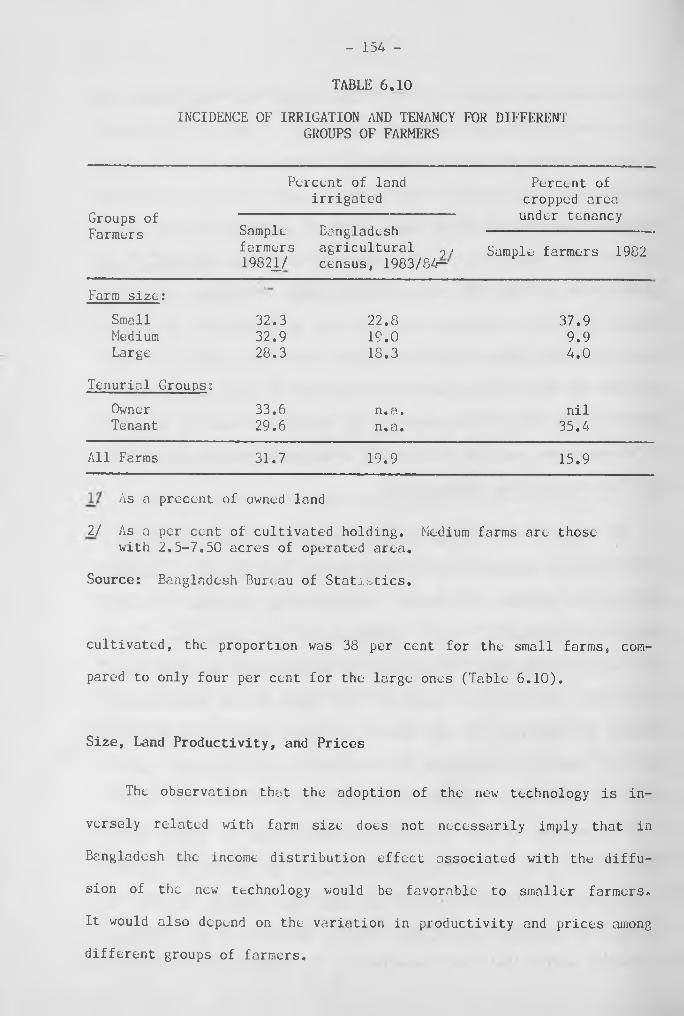
- 154 -
TABLE 6.10
INCIDENCE OF IRRIGATION AND TENANCY FOR DIFFERENT GROUPS OF FARMERS
Groups of Farmers
Percent of land irrigated
Percent of cropped area under tenancy
Samplefarmers19821/
Bangladesh agricultural 9 , census, 1983/84—
Sample farmers 1982
Farm size:
Small 32.3 22.8 37.9Medium 32.9 19.0 9.9Large 28.3 18.3 4.0
Tenurial Groups:
Owner 33.6 n.a. nilTenant 29.6 n.a. 35.4
All Farms 31.7 19.9 15.9
As a preccnt of owned land
2/ As a pc-r cent of cultivated holding. Medium farms arc those with 2.5-7c50 acres of operated area.
Source: Bangladesh Bureau of Statistics.
cultivated, the proportion was 38 per cent for the small farms, com
pared to only four per cent for the large ones (Table 6.10).
Size, Land Productivity, and Prices
The observation that the adoption of the new technology is in
versely related with farm size does not necessarily imply that in
Bangladesh the income distribution effect associated with the diffu
sion of the new technology would be favorable to smaller farmers.
It would also depend on the variation in productivity and prices among
different groups of farmers.

- 155 -
For Bangladesh, a large number of studies show an inverse rela
tionship between farm size and productivity of land.— Most of the
findings are however, for areas which did not experience significant
diffusion of the new technology and refer to time periods (mostly
late sixties and early seventies) when the technology was at its early
18/stages of adoption. Some of the studies for India,— where the size-
productivity relationship is also found to be inverse in the case
19/of traditional crops,— argue that this relationship may not hold
for the new technology, as it gives considerable scope for using
capital. Since the larger farmers have more accumulated savings and
also have better access to financial markets, they are in a better
position to apply purchased inputs like fertilizers and water more
intensively than the smaller farmers. Thus, one may even expect a
positive size effect on the yield rates for MVs, depending on the
importance of the new inputs in the cultivation of the variety.
The differences in land productivity among size groups of farms
observed from the survey can be reviewed from Table 6.11. Since the
productivity may also vary depending on the stage of development of
the new technology, the sample villages have been classified into
two equal groups according to the proportion of area under the modern
varieties. The developed villages have about 60 per cent higher rice
yields compared to the underdeveloped villages. In the cultivation
of modern varieties the yield is about 14 per cent lower in the deve
loped villages, which may be due to the diffusion of the varieties
to marginal farmers and marginal land, as well as raising of two rice
cr°ps per year on some land, which reduces the yield of each crop.

- 156 -
TABLE 6.11
FARM SIZE AND PRODUCTIVITY OF LAND BY TECHNOLOGY, 1982
______________________________ (Tons per Hectare)
Farm size Groups
Technologically developed Villages
Technologically Under-developed Villages
LocalVarieties
ModernVarieties
All Rice Varieties
Loca 1 Varieties
Modern All Rice Varieties Varieties
Small 1.79 3.21 2.72 1.56 3.77 1.80(0.08) (0.13) (0.11) (0.09) (0.38) (0.10)
Medium 1.76 2.80 2.32 1.30 3.39 1.43(0.09) (0.13) (0.08) (0.07) (0.41) (C.09)
Large 1.52 2.70 2.13 1.25 2.63 1.32(0.14) (0.24) (0.20) (0.12) (0.77) (0.13)
All Farms 1.75 3.03 2.55 1.44 3.52 1.59(0.06) (0.09) (0.08) (0.06) (0.26) (0.07)
Figures within parentheses are standard errors of estimate
In the cultivation of local varieties the yield is about one-fifth higher
for the developed villages.
The yield is found to be inversely related with farm size in both
groups of villages, and for both the traditional and modern varieties
of rice. The difference in yield between the small and large farmer is,
however, less pronounced for the technologically developed villages com
pared to the underdeveloped ones, suggesting that with the diffusion of
the technology, the productivity gap narrows down to some extent. Still>
in the developed villages, the productivity for the small farmers is about
one-fifth higher compared to the large ones and the difference is statis
tically significant.

- 157 -
The income from cultivation may also differ across farms due to varia
tion in prices. The new technology has increased the dependence of the
farmers on the market for acquisition of the new inputs and also for labor.
The prices of the inputs may vary across farms especially under condi
tions of underdeveloped infrastructure facilities and monopoly control
on the supply of the new inputs. The prices paid by different groups of
farmers for the major agricultural inputs can be reviewed from Table 6.12.
The fertilizer prices are reported separately for the dry and monsoon
seasons, because the prices which are government controlled were raised
on 1st of July, 1982, and so farmers growing aman crops faced higher prices
than those growing boro and aus crops, and the effect of this factor needs
TABLE 6.12
PRICES OF MAJOR AGRICULTURAL INPUTS - BY FARM SIZE AND TENANCY
Farmer Groups
Fertilizer Price (Tk/kg)
Irrigation charge per acre
Wage Rate (Tk/day)
Boro and Aus season
Amanseason
Loro season
Size of Farm:
Small 3.20 3.64 672 20.22Medium 3.23 3.55 583 19.43Large 3.18 3.51 544 17.73
Tenurial Status:
Owner 3.20 3.58 589 18.91ienant 3.22 3.62 698 O O on
Total 3.21 3.60 627 159
Source: BIDS/IFPRI Household Survey, 1982

- 158 -
to be dissociated. The fertilizer prices seem to be invariant with
the size and the tenurial status of the farm, But the water charge
and the wage rate varies considerably across farms. The small farmer
paid about one-fourth higher prices for v/ater compared to the medium
ones. Tenant farmers paid about 19 per cent higher water charge com
pared to owner farms, This is expected because the ownership and
management of irrigation equipment is controlled more by the larger
20/landowners.— The small farmers and tenants also pay substantially
higher wage rates compared to the large landowners. Since the tenants
and small farmers come to the labor market during busy periods, when
the wage rates are higher, the weighted average wage rate is expected
to be higher for them, although for a particular day, all farmers
may face the same wage rate. The cost of working capital may also
be higher for the small farmers because they have to borrow more from
the high-cost non-institutional sources. It is found from this survey
that nearly three-fourths of the small farmers took loans from the
non-institutional sources, compared to two-fifths among the large
farmers. The institutional credit accounted for 20 per cent of the
total loans taken by small farmers, compared to 44 per cent for the
large farmers.
Conclusions
In Bangladesh, small farmers and tenants have adopted the modern
technology at least as much as large farmers and owner cultivators.
The scale neutrality of adoption may have been the result of the
government investment for development of irrigation, which is the

main vehicle for the diffusion of the modern technology. Even under
private investment on tubewells and power pumps, small farmers have
as much access to irrigation facilities as the large ones because
of the randomness with which the extremely fragmented and scattered
farm holdings are distributed.
The small farmers, however, pay higher prices for inputs, parti
cularly for water, labor and working capital loans. The ownership
of privately owned machines and the management of the irrigation coope
ratives is controlled by large farmers, who take a sizeable mark-up
from the irrigation market. The small farmers paid about 25 per cent
higher water charge compared to the large farmers and 40 per cent
higher wage rate, presumably because they have to go to the labor
market during busier periods of agricultural operations. Since the
small farmers have to borrow more from the high-cost informal markets
than do the large farmers, the average cost of working capital may
also be higher for the former group. The variation in the prices
of agricultural inputs would thus put a negative pressure on income
distribution, which may outweigh the positive effect of the inverse
relationship between farm size and adoption rates.
- 159 -

- 160 -
Chapter 6 Notes
1. This is in fact an over-researched issue. There are also a large number of surveys of the literature. See among others, Michael Lipton, Modern Varieties, International Agricultural Research and the Poor,. CGIAR Study Paper No. 2, World Bank, Washington D.C., 1985; "Inter-Farm, Inter-Regional and Farm-Non-farm Income Distribution: The Impact of the New Cereal Varieties", WorldDevelopment 6, (No. 3, 1978): 319-337; G. Feder, R. Just andD. Silberman, "Adoption of Agricultural Innovations in Developing countries: A Survey", Economic Development and CulturalChange, 33 (No. 2, 1985): 255-298; Mr. Prahladachar, "Income Distribution Effects of the Green Revolution in mciia: A Reviewof Empirical Evidence1', World Development, 11 (No. 11, 1983);927-944; Richard Perrin and Don Winkelmann, "Impediments to Technical Progress on Small Versus Large Farms", American Journal of Agricultural Economic, 58 (December 1976)' 888-894.
2. Andrew Pears, op. cit., p. 120.
3. V.W. Button, "The Green Revolution: Seven Generalizations", International Development Review, 19 (No. 4, 1977): 16-23.
4. A. Berry and W. Cline, Agrarian Structure and Productivity in Developing Countries, Johns Hopkins Press, Baltimore, 1979.
5. G. Feder et. al., op. cit., pp. 262-265.
6. Andrew Pears, op. cit,
7. A.V. Chayanov, The Theory of Peasant Economy, (ed. D. Thorner), Irwin, Homewood, 1966.
8. Amit Bhaduri, "A Study in Agricultural Backwardness under Semifeudalism", Economic Journal, 83 (March, 1973): 120-137; DavidNewberry, 'Tenurial Obstacles to Innovations" Journal of Development Studies, 11 (July, 1975): A.K. Ghose and Ashwani Saith,"Indebtedness, Tenancy and the Adoption of New Technology in Semi-Feudal Agriculture", World Development. 4 (April, 1976): 305-320; P.IC. Bardhan, "Agricultural Development and Land Tenancy in a Peasant Economy: A Theoretical and Empirical Analysis",Amirican Journal of Agricultural Economics, 61 (No. 1, 1979):48-56; P.K. Bardhan and T.N. Srinivasan, "Crop Sharing Tenancy in Agriculture: A Theoretical and Empirical Analysis", American Economic Review. 61 (No. 1, 1971): 48-64.
9. M. Asaduzzainan, "Adoption of HYV Rice in Bangladesh", The Bangladesh Development Studies. 7 (No. 3, 1979): 23-49.
10. R.W. Herdt and L. Gracia, op. cit.

1 1 . Mahabub Hossain, ''Nature of Tenancy Markets in Bangladesh Agriculture", Journal of Social Stu cs (Dhaka), 3 (Mo. 1, 1979): F,T. Jannuzi and J.T. Peach, Agrarian Strucurc of Bangladesh: An Impediment to Development. West View Press, I960.
12. Andrew Pears, op. cit., 107.
13. For a summary of the findings of previous studies in this regard, see R.W. Hcrdt and L. Gracia, op. cit., and Mahabub Hossain, "Fertilizer Consumption, Pricing and Foodgrain Production in Bangladesh", op. cit., pp. 197-206.
14. This a compositive index of infrastructure underdevelopment cons- truced by R. Ahmed and M. Hossain from the village specific information on access to a number of elements such as roads, markets and financial and educational institutions, for a separate study of the effect of infrastructure on rural development. The infrastructure variable significantly affects a number of endogenous variables investigated in the present study, but the results have not been reported here in order not to preempt the findings of the other study. The conclusions of this study remain valid even after inclusion of the infrastructure variable. See, Raisuddin Ahmed and Mahabub Hossain, "Infrastructure and Development of a Rural Economy", IFPRI (Draft), 1987,
15. William, H. Green, LIMDEP: User's Manual, May, 1986; "On theAsymptotic Bias of the Ordinary Least Square Estimator of the tobit Model", Econometrica, 49 (No. 2, 1981): 505-513; G.S.Maddala, Limited Dependent and Qualitative variables in Econometrics, Cambridge, Cambridge University press, 1984.
16. The supply of agricultural credit from institutional sources increased about eight times (at real value) over the 1975-84 period. During 1983/84, the amount disbursed was about seven per cent of the value added in agriculture, and 2.3 times the cost of fertilizers consumed in the country. See tiahabub Hossain, "Institutional Credit for Rural Development: An Overview of the Bangladesh Case", The Bangladesh Journal of Agricultural Economics, 8 (No. 1, 1985): 1-16.
17. See, among others, Mahabub Hossain, "Farm Size, Tenancy, and Land Productivity: An Analysis of Farm Level Data in Bangladesh Agriculture", The Bangladesh Development Studies, 5 (No. 3, 1977): 285-348; Mandal, M.A.S., "Farm Size, Tenancy and Productivity in an Area of Bangladesh", The B angladesh Journal of Agricultural Economics. 3 (December 1980): 21-42.
16. P. Roy, "Transition in Agriculture: Empirical Studies andResults", Journal of Peasant Studis, 8 (No. 2, 1981): G.S. Bhalla and G.K, Chadha, Green Revolution and the Small Peasant, Concept, New Delhi, 1983.
- 161 -

- 162 -
19. Krishna Bharadwaj, Production Conditions in Indian Agriculturcr Department of Applied Economics, Occasional Paper No. 33, Cambridge University Press, 1974, Biplob Dasgupta, The New Agrarian Technology and India. Macmillan, New Delhi, 1972.; P.K. Bardhen~"Size, Productivity, and Returns to Scale: an Analysis of Farm Level Data in Indian Agriculture” Journal of Political Economy. 81 (No. 6, 1973).
20. The government started selling deep tubewclls and low-lift pumpts to individuals and cooperatives from 1979/80. By the end of 1983, some 43 per cent of the the operating deep tubewells and56 per cent of the low-lift pumps came to be owned by the privatesector. Nearly two-thirds of such machines were owned by households with more than five acres of land. See M.A. Quasem, "Impact of the New System of Distribution of Irrigation Machines in Bangladesh”, The Bangladesh Development Studies, 13 (September- December, 1985): 127-140.

- 163 -
7: LABOR MARKET AND EMPLOYMENT EFFECTS OF THE MODERN TECHNOLOGY
In Bangladesh, nearly a third of the rural households do not
own any cultivable land and about a half own less than 0.5 acresj
for them farming is only a marginal source of income.— Having no
access to land, most of these households arc at the bottom of the
rural income scale. Their income depends on the conditions in the
labor market i.e., the duration of employment and the wage rate.
The new technology would affect the agricultural labor market by chan
ging the labor-intensity of cultivation, the productivity of labor
which in turn would influence the wage rate, and the income of the
farmer which would affect his labor-leisure choice. It can also in
directly affect the non-agricultural labor market, since the expendi
ture of the increased agricultural income would generate additional
demand for non-agricultural goods and services, some of which may
2/produced within the locality.— The objective of this chapter is
to trace these employment effects of the new technology. Although
the main focus is on employment generation for the landless and the
marginal farmers, employment for the land-owning groups has also been
studied, since their behavior with respect to self-employment would
affect the labor market.
Employment in rural Bangladesh consists mainly of self-employment
and most of the agricultural workers are hired on a daily basis.
Workers change jobs from one day to another, from self-employment
to wage employment and from agriculture to other forms of employment.
Under these circumstances, accurate information on employment can
be obtained only through a large number of regular surveys covering

- 164 -
a short period, so that the respondent can recall what he did during
this period. To collect accurate information for the whole year,
it would be better to conduct 52 weekly surveys but that would have
been extremely expensive and taxing on the respondents. Considering
the trade-offs, this survey collected information for all members
of the sample households who participated in productive work for each
day of the week preceding the day of interview, for eight weeks
scattered throughout the year 1982. The periods were selected on
the basis of the a priori knowledge of the cropping pattern of the
area so as to represent the normal, busy, and slack periods of employ
ment. The supply of labor for the whole year and the;;camp0Qition of
employment has been estimated by extrapolating the data for the eight
weeks. The demand for agricultural labor has been estimated from
labor use in crops reported by farmers, which was collected through
three rounds of interviews conducted at the end of each of the crop
seasons during the year.
Participation in Economic Activities
A worker has been defined ss a person who was available for work
in an income earning or expenditure saving activities (henceforth .?
called economic activities) during any of the eight weeks of the sur
vey. These activities included supervision of farm labor, crop culti
vation, post harvest processing and marketing, livestock and poultry
raising, commercial and subsistence fishing, vegetable growing in
kitchen gardcns; cottage industry, house construction and repair, earth
work, collection of fuel, and trade transport and other services.
Domestic labor for women should also be regarded as expenditure saving

- 165 -
for the household but it was not considered in this definition. The
average number of workers, thus defined, is 1 ,8 8 persons per household
out of a household size of 6.34 persons for the entire sample. The
labor force participation rate (workers divided by members) thus comus
out at 29.7 per cent of the rural population, which is very close
to 29.4 per cent activity rate reported in the National labor Force
3/Survey of 1983/04.— The low rote of participation in economic acti
vities is partly because of the large proportion of the young popu
lation (up to age 15) but is mainly due to the virtual absence of
women from the country’s labor force. About one-third of the popula
tion in the sample was below age 1 0 , and only eight per cent of the
female population participated in economic activities. The rate of
participation of women in income earning activities is estimated at
5.1 per cent by the 1981 population census and 7.9 per cent by the
1983/84 labor force survey.
The labor force participation rates for different landholding
groups can be reviewed from Table 7.1. The impact of the new techno
logy is assessed by comparing the information for two groups of villa
ges equally divided according to the scale of the rate of adoption
of the new technology (see Chapter 2). The average number of persons
in the household was about five per cent higher in the developed,v
Ullages and the difference is found statistically significant. This
difference is however mainly due to the landless category. The diffe
rence for other groups is not significant. Presumably better economic
conditions in developed villages- reduces mortality rates and increases
family size.
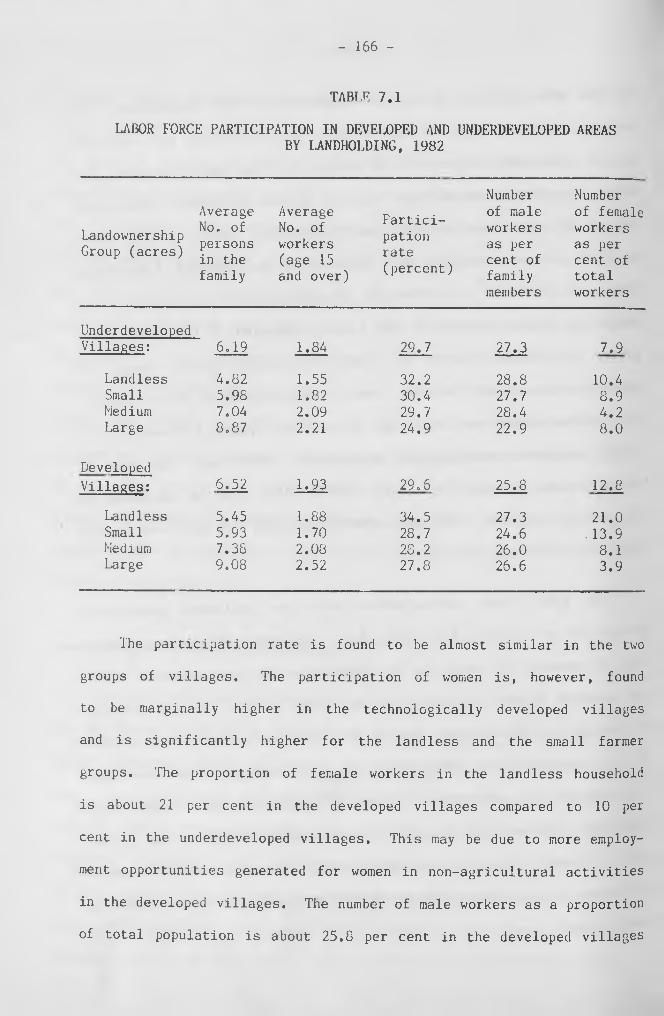
- 166 -
TABLE 7.1
LABOR FORCE PARTICIPATION IN DEVELOPED AND UNDERDEVELOPED AREASBY LANDHOLDING, 1982
Landownership Group (acres)
Average No. of persons in the family
Average No. of workers (age 15 and over)
Participationrate(percent)
Number of male workers as per cent of family members
Number of female workers as per cent of total workers
UnderdevelopedVillages: 6.19 1.84 29.7 27.3 7.9
Landless 4.82 1.55 32.2 28.8 10.4Small 5.98 1.82 30.4 27.7 8.9Medium 7.04 2.09 29.7 28.4 4.2Large 8.87 2 .2 1 24.9 22.9 8.0
Developed
Villages: 6.52 1.93 29.6 25.8 1 2 .8
Landless 5.45 1 .88 34.5 27.3 2 1 .0Small 5.93 1.70 28.7 24.6 . 13.9Medium 7.38 2.08 28.2 26.0 8 . 1Large 9.08 2.52 27.8 26.6 3.9
The participation rate is found to be almost similar in the two
groups of villages. The participation of women is, however, found
to be marginally higher in the technologically developed villages
and is significantly higher for the landless and the small farmer
groups. The proportion of female workers in the landless household
is about 21 per cent in the developed villages compared to 10 per
cent in the underdeveloped villages. This may be due to more employ
ment opportunities generated for women in non-agricultural activities
in the developed villages. The number of male workers as a proportion
of total population is about 25.8 per cent in the developed villages

- 167 -
compared to 27.3 per cent in the underdeveloped villages, i.e., about
six per cent lower for the former group.
The size of landholding has a strong influence on the participa
tion rate. In the underdeveloped villages, the participation rate
is about 32 per cent for the landless and marginal landowners compared
to 25 per cent for the large landowners. Similar differences are
also found in the developed villages. The female participation rate
is also higher among the landless' and the marginal landowners, signi
ficantly so in the developed areas. With technological advancement
the participation of male members in the labor force appears to
decline.
The participation rate can be taken as a proxy indicator of the
supply of labor in the stock sense. The findings that technological
advancement and the size of landownership has a negative influence
on the participation rate indicate that leisure is substituted for
labor at higher levels of income. It appears that the very poor house
holds supply as many workers as possible to the labor force in order
to earn a subsistence income for the family subject to job availability
4/and limitations imposed by socio-religious factors.— As income in
creases with technological progress and/or with larger amount of land,
the household may withdraw the women and the children from the labor
force in order to have higher social status and better education for
the children.

- 168 -
The above point is further demonstrated by Table 7.2 which shows
occupations of family members aged 10 to 25, the age group which parti
cipate in the labor force, attended educational institutions or take
up domestic duties as housewives. It can be noted that the labor
force participation rate in this age group is about 27 per cent in
the developed villages compared to 37 per cent in the underdeveloped
villages. Although a larger proportion of the female population in
that age group are married and take up domestic work, the main reason
behind the lower participation rate in the developed villages is larger
participation in educational institutions. The proportion of students
in the age group is 36 per cent in the developed villages compared
to 23 per cent in the underdeveloped villages. A larger proportion
of male members attend schools than the female. With technological
progress, the student population increases for both sexes, but the
increase is more pronounced for the male members; about 50 per cent
in the developed villages compar d to 30 per cent in the underdeve
loped villages. The size of landownership also significantly influ
ences the school attendance. In underdeveloped villages students
are less than one-fifth for households owning up to two acres, but
about a half for households with more than five acres of land. Even
after controlling for the effect of landownership group, the school
attendance is found higher in developed villages.
Education increases the quality of labor and provides opportunity
for taking up higher-paid non-agricultural employment. Even self-
employment in trade, services, and processing activities requires
functional literacy and numeracy. Considering the above, the downward

OCCUPATION OF FAMILY MEMBERS AGED 10 TO 25, BY LANDOWNERSHIP AND SEX
(Figures in percent of members in the group)
- 169 -
TABLE 7.2
Underdeveloped villages Developed villages
GroupsStudent
Housewife
Inactive
Worker StudentHousewife
Inac- TJ ,Worker
tive
Landownership:
Marginal 16.4 39.7 9.3 34.6 23.0 37.2 7.5 32.2
Small . 18.9 37.8 3.0 40.2 32.1 34.0 3.3 30.6
Medium 27,2 34.7 1.9 36.2 46.2 32.1 2.7 19.0
Large 50,0 24.0 6.0 20.0 57,5 21.3 4.3 17.0
Sex:
Male 29.9 - 3.6 66.5 49.6 - 7.1 43.3
Female 16.3 71.5 6.4 5.8 2 2 . 1 65.6 3.1 9.2
Total 23.1• • • J
36.4 4.9 35.7 36.0 32.9 v 4.7 26.5
pressure of the technological advancement on labor force participation should
be taken as a positive development. With improved economic conditions,
the lower income groups can afford to send more children to school and have
better education, which may promote occupational mobility and increase life
time earnings.
Extent and Composition of Employment
Since the number of hours of work put in during a day may vary across
vullages, and a worker may be. engaged in a number of activities during a
(lyy j the information on duration of employment was collected in the survey

- 170 -
in hours by activity for each of the workers belonging to the sample
households. The information was collected on a daily basis for seven
days preceding the date of interview and as such may contain some
margin of error due to the problem of memory recall. The estimate
of total employment at the household and worker level has been built
up from the data and is measured in average weekly employment hours
for the eight weeks of survey. The information can be converted to
standard eight-hour days of employment for the year 1982. It may
be mentioned here that the figures only measure the supply of labor
by the sample households both on own and other's account, which may
not necessarily be equal to total employment generated in the study
areas. The estimation of the later would have required data an in-
and out-migration of labor in flow terms, which were not collected
by the survey.
The average duration of employment estimated from the survey
is about 39 hours per week or about 253 standard eight-hour days during
the year of survey. About 62 per cent of the employment was generated
in agricultural activities. Self-employment accounted for about 68> C ‘ ' *
per cent of the total employment. The respondent workers reported
that they were available for work for 345 days a year. On this basis
c Ithe rate of underemployment is estimated at about 27 per cent.--
However, if six days of work a week is taken as a full employment
norm, then the rate of underemployment on the time criterion is esti
mated at only 19 per cent.
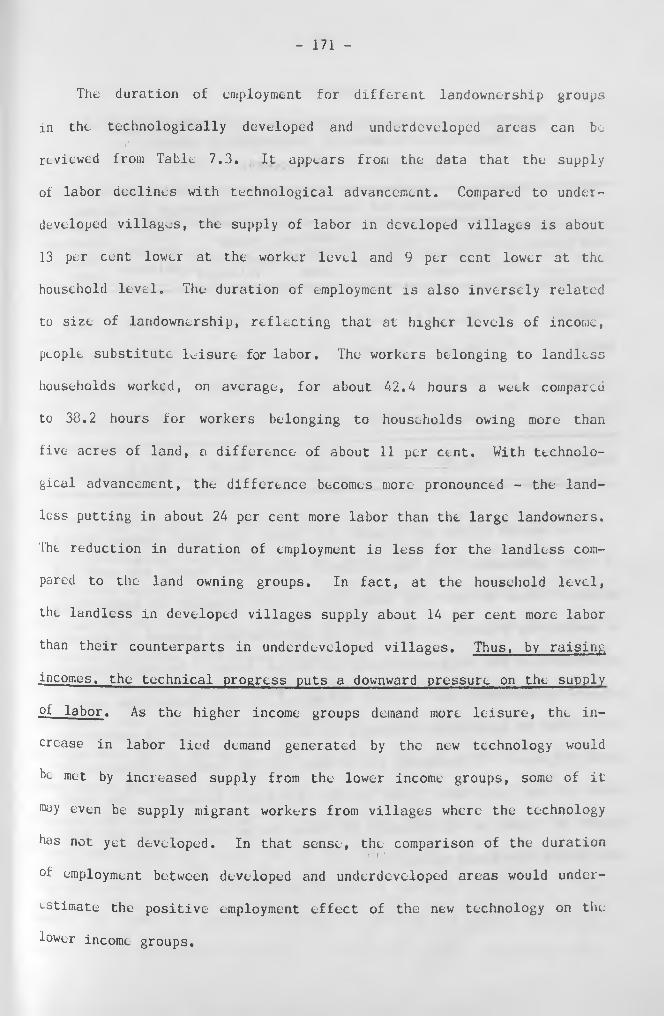
- 171 -
The duration of employment for different landownership groups
in the technologically developed and underdeveloped areas can bei* :
reviewed from Table 7.3. It appears from the data that the supply
of labor declines with technological advancement. Compared to under
developed villages, the supply of labor in developed villages is about
13 per cent lower at the worker level and 9 per cent lower at the
household level. The duration of employment is also inversely related
to size of landownership, reflecting that at higher levels of income,
people substitute leisure for labor. The workers belonging to landless
households worked, on average, for about 42.4 hours a week compared
to 38.2 hours for workers belonging to households owing more than
five acres of land, a difference- of about 11 per cent. With technolo
gical advancement, the difference becomes more pronounced - the land
less putting in about 24 per cent more labor than the large landowners.
The reduction in duration of employment is less for the landless com
pared to the land owning groups. In fact, at the household level,
the landless in developed villages supply about 14 per cent more labor
than their counterparts in underdeveloped villages. Thus, by raising
incomes, the technical progress puts a downward pressure on the supply
of labor. As the higher income groups demand more leisure, the in
crease in labor lied demand generated by the new technology would
be met by increased supply from the lower income groups, some of it
roay even be supply migrant workers from villages where the technology
has not yet developed. In that sense, the comparison of the duration* < * f 4
of employment between developed and underdeveloped areas would under
estimate the positive employment effect of the new technology on the
lower income groups.

- 172 -
TABLE 7.3
DURATION OF EMPLOYMENT IN TECHNOLOGICALLY DEVELOPED AND UNDERDEVELOPED AREAS BY LANDOWNERSHIP GROUPS
(Labour hours per week)
Landownership Group
Employment per household Employment per worker
Underdevelopedvillages
Developedvillages
Percentdifference
Under-Dcvelopedvillages
Developedvillages
PercentDifference
Landless 65.37 74.39 13.8 42.40 40.09 -5.5
Small 75.47 63.87 -15.4 42.36 37.26 - 1 2 .0
Medium 87.79 66.67 -24.1 41.34 32.53 -21.3
Large 83.87 80.83 -3.7 38.24 32.33 -15.5
Total 76.38 69.62 -8.8 41.59 36.12 -13.2
The substitution of leisure for labor at higher income levels
is more pronounced for agricultural activities where the work is
arduous. This is shown by Table 7.4. Labor supplied in agriculture
is positively related to the size of landownership because of greater
opportunities for self-employment on larger farms. But with techno
logical advancement the workers belonging to farm households put in
less labor in agriculture compared to their counterparts in underdeve
loped villages. In contrast the workers in the landless group supply
about 80 per cent more labor in the developed villages. The total
supply of labor in agriculture is found to be about seven per cent
more in the developed villages.

- 173 -
TABLE 7.4
DURATION OF EMPLOYMENT IN AGRICULTURE AND NON-AGRICULTURAL ACTIVITIES, BY TECHNOLOGY AND LANDOWNERSHIP GROUPS
(Weekly labor hours per household)
Landownership Group
Agriculture Non*-agriculture
Underdevelopedvillages
Developedvillages
Percentdifference
Underdevelopedvillages
Developedvillages
Percentdifference
Landless 23.61 42.43 79.7 41.76 31.96 -23.5
Small 42.16 41.03 -2.7 33.31 22.84 -31.4
Medium 60.66 53.24 - 1 2 . 1 27.13 13.43 -50.5
Large 65.42 60.53 -7.5 18.45 20.30 10 .0
Total 43.54 46.67 7.2 32.84 22.95 -31.1
The poor cannot afford to remain unemployed. Since the landless
do not get enough employment on the land, they tend to engage more
in non-farm rural activities. In underdeveloped villages, about 64
per cent of the employment for the landless households was generated
in non-agricultural activities compared to only 22 per cent for the
large landowncrship group (Tabic 7.3 and 7.4). As agricultural income
increases with technological advancement, more demand is generated
for non-farm goods services, some of which may be produced in rural
areas (see chapter 8 below). This may increase demand for labor in
non-agricultural activities. It appears from the data that the addi
tional employment is taken up by the households in underdeveloped
villages and by large landowning groups in developed villages. The
supply of labor in non-agricultural activities is about one-third
lower in the developed villages, the rate of decline increases with

the size of landowncrship but only up to the middle former group. The
supply of labor to non-agriculture from the large landowning group
is in fact greater in the developed villages.
Employment in some of the non-farm activities whose market is
expanded by increased rural incomes may require investment in working
capital and some basic skills like functional literacy and numeracy
which can be acquired in schools. The poor may be constrained in
taking up non-agricultural employment opportunities by widespread
illiteracy and the lack of access to financial institutions. Thus
they may be engaged more in farming and those non-farm activities
which require more manual labor than capital, physical or human. These
may often be distress employment, i.e., very low productivity jobs
taken up by a worker when he has nothing else to do. As technological
progress generates opportunities for additional employment in farming
and increases the productivity of agricultural labor, employment in
non-farm activities is substituted by employment in agriculture.
Table 7.5 gives a detail activity-wise breakdown of employment
for all workers in the sample. One is struck by a complete lack of
specialization in rural employment. Even farming does not generate
enough employment for a household to keep one worker busy throughout
the year. Rice farming has the additional problem of the seasonal
pattern of demand for labor, so even in large landowning households,
family workers may remain unemployed during slack seasons of the year*
A household may be engaged simultaneously in a number of agricultural
and non-agricultural activities, and a worker may be engaged in a
number of activities during the same week. It will be noted from

- 175 -
TABLE 7.5
LABOR SUPPLY IN DIFFERENT ACTIVITIES IN DEVELOPED AND UNDERDEVELOPED AREAS, ALL RURAL HOUSEHOLDS, 1982
Percent of households
participating
Average Weekly Employment Hours
For participa- , ,* . i > All Households
ting households
ActivityUnderdevelopedvillages
Developedvillages
Underdevelopedvillages
Developedvillages
Underdevelopedvillages
Developedvillages
Agriculture: 93.7 95.9 46.46 49.15 43^53 47.13
• Csltiy&ting• family• forms 81.1 8C.3 34.34 34.64 27.85 27.82
Wage labor 45.3 40.1 23.54 22.98 10.66 9.21
Livestock & poultry raising 41.2 53.2 8.25 9.73 3.40 5.18
Fishing 18.6 26.4 8.76 18.60 1.63 4.91
Non-agriculture: 92.5 90.5 35.52 25.62 32.86 23.19
Industry 12.3 7.3 27.14 8.83 ° O /. J o C.65
Trade and shopkeeping 31.1 26.1 24.74 21.31 7.70 5.56
Construction and Transport 41.2 38.2 20.09 15.80 8.28 6.04
Services 21.7 38.9 26.40 19.20 5.73 7.46
Earthwork 27.4 14.0 14.48 13.61 3.97 1.91
Others 56.0 43.6 6.67 3.56 3.85 1.55

tabic that although 95 per cxnt of the households participate in agri
cultural work, more than 96 per cent also have some non-agricultural
occupations. Nearly a half of the households in the underdeveloped
villages report engagement in miscellaneous non-agricultural activities
(these include, collection of fuel, fencing, etc.) which generate lessi U ..
than six hours of employment on average in a week, even for the parti
cipating households.
The activities for which the duration of employment declines
with technological advancement arc agricultural wage labor, cott^g;
industry, trade and shopkeeping, earthwork, and miscellaneous activi
ties. Agricultural labor and earthwork are arduous and are also con
sidered socially degrading if the work is performed on others’ account.
So with increases in incomes, some households can afford to avoid
them, 'miscellaneous activities may be performed when there is nothing
else to do. So with increased employment opportunities, these cir-
replaced by other work. The decline in labor supply to industry and
trade, however, appears to be surprising. Presumably with increases
in income, people tend to replace some low quality cottage industry
products, the so-called dying industries, with competing products
of formal industries, located mostly in urban areas. Also, the labor
productivity in many cottage industries and petty trade is very low,
6/even lower than the agricultural wage rate.— So when people do not
find any work, they engage in these activities as self-employed wor
kers. As the demand for and the productivity of agricultural labor
increases with technological progress, these activities may be reloca
ted to the underdeveloped villages where these may increase* employment
opportunities for the lower-incomc groups. Further investigation
is necessary to test this hypothesis.
- 176 -

- 177 -
Labor Market
General Conditions
The size of the labor market is found to be quite smell. Only
about 32 per cent of the labor hours were supplied against wages -
22 per cent in the agricultural and 49 per cent in the non-agriculture
(Table 7.6). This is not surprising since the typical holding in agri
culture is too small to provide full employment for family workers,
and many agricultural workers generate non-farm employment on their
own account in response to the lack of employment in the crop production
sector.
TABLE 7.6
THE SIZE OF THE LABOR MARKET FROM THE SUPPLY SIDE, BY SECTORS
Percent of households supplying labor in
the market
Wage labor as a per of total labor
cent
SectorsUnder- 1developed De^ loPed villages vllla8*s
Bothgroups
Underdevelopedvillages
Developedvillages
Bothgroups
Agriculture 49.9 40.1 43.0 25.0 19.9 22.3
Non-agriculture 56.3 v 50.0 53.2 48.2 • 49,1 48.6
Total 67.9 63.4 65.7 35.0 29.5 32.3

Although the labor market is small, most of the cultivators hire-
labor at some time or other during the year (Table 7.7). The labor
hiring households are a large majority even among small farmers culti
vating less than one hectare. This may be the result of seasonality
in the demand for agricultural labor. At busy periods labor must be
hired to supplement family labor, while during slack periods, members
of the same household will seek jobs in the labor market.
- 178 -
TABLE 7.7
THE NATURE AND THE SIZE OF AGRICULTURAL LABOR MARKET FROM THE DEMAND SIDE, BY LANDOWNERSHIP GROUP
Landownership group of farmers
Percent of farmers hiring
i attached workers
Percent of farmers hiring casual labor
Hired labor as a percent of tGtal labor
Under_developedvillages
Developedvillages
Underdevelopedvillages
Developedvillages
Underdevelopedvillages
Developedvillages
Small 4.6 2.0 76.2 87.1 30.3 34.4
Medium 17.5 14.3 90.2 96.0 36.0 47.1
Large 54.8 33.3 100.0 100 ..o 55.9 60.2
All 15.4 9.5 84.5 91.1 40.6 46.7
Because of the seasonal variation in the demand and . supply, the
rural labor market is, in general, informal in nature and most workers
are hired casually, on a daily basis, according to the need# Curing
the year of survey, only one-eighth of all farmers and one half of
the large farmers hired workers for a season or for the year. Two-
fifths of those hired on a regular basis were children looking after

- 179 -
livestock mostly employed for wag* in kind of free board, meals, and
clothin. Such employment is often determined by the level of absolute
poverty in the village concerned rather than by the demand for regular
workers by the employer.
The Impact of Technology
The tcchnoogical progress increases the demand for labor in the
agricultural sector. In the crop production activity, labor hired
in casual basis account for about 47 per cent of the total labor used
in the technologically developed villages compared to about 41 per
cent in the underdeveloped villages (Table 7.7). The proportion of
hired labor increases even for the small farmer group. So there is
a downward pressure on the supply of hired labor from the fanning house
holds. This is one of the reasons why the proportion of labor supplied
in the agricultural market is found to be lower in the technologically
developed villages (20%) compared to the underdeveloped villages (25%)
while the labor supplied in the non-agricultural market remains unchan
ged (Tabic 7.6).
It will be noted from Tabic 7.8 that most of the agricultural
labor in the market is supplied by the landless and the marginal land-
holding groups. In the underdeveloped villages, two-thiras of the
landless participate in the labor market and three-fourths of their
employment is generated on others’ account. The proportion are 13
and 3 per cent respectively for the large landownership group. In
the developed villages labor supplied against wage is lower than in
underdeveloped villages for all landholding groups and the difference

- 180 -
PARTICIPATION IN LABOR MARKET FOR DIFFERENT LANDOWNERSHIP GROUPS
TABLE 7.8
Agriculture Non-agriculture
LandownershipGroups
Percent of households supplying wage labor
Percent of labor sup
plied against wage
Percent of households supplying wage labor
Pcccnt of labor sup
plied against wage
Under- Deve- Under- Deve- Under- Deve- Under- Deve-developed loped developed loped developed loped developed lopedvillages vill- villages vill- villages vill- villages vill
ages ages ages ages
Landless and marginal owner 67.7 73.7 74.C 52.5 74.0 69.5 51.8 58.3
Small 50.9 39.4 29.0 15.0 66.4 51.9 54.2 47.3
Medium 27.2 17.3 7.8 2.9 37.9 32.1 41.7 40.8
Large 12.9 2.9 2.9 0.3 16.1 32.4 10 .0 27.1
is more pronounced for larger 1 'ndowners. In the non-agricultural
sector also, the participation rate in the market is inversely related
with the size of landownership. But unlike in agriculture, the supply
of labor in the market does not change much with technological advance
ment. In fact, the supply of wage labor in non-agricultural market
is higher in developed villages for the landless and the large landowner
groups. Thus, the tendency to avoid agricultural wage employment at
higher levels of income and to shift to non-agriculturc in response
to higher employment opportunities puts a downward pressure on the
supply of agricultural labor when the technology progresses* These
forces operate to provide more employment and income to the lower income
groups.

- 181 -
The wages received for hired-out labor (excluding payment in kind)
in the two groups of villages are shown in Table 7.9. The wage rate
was higher for non-agricultural labor than for agriculture and for
male workers than for female. The agricultural wage rate for women
was 44 per cent than for men in the underdeveloped villages. The com
parison suggests that technological progress has a positive impact
on the wage rate. For male workers, the agricultural wage rate in
developed villages was 19 per cent higher than in underdeveloped
villages, and the non-agricultural wage rate was 47 per cent higher.
TABLE 7.9
WAGE RAXE RECEIVED FOR HIRED LABOR: BY THECHNOLOGY,LANDHOLDING AND SEX OF WORKERS
(Tk per labor hour)
Technology and landholding of family (acres)
Male workers Female worker s
AgriculturNon-agriculture
AgricultureNon-agriculture
Underdeveloped villages 1.53 1.95 0.68 1.16
Less than 0.5 1.46 1.74 0.53 1 . 2 10.50 - 2.0 1.61 2.15 1.34 1.252.00 & above 1 .6 8 2.25 * 0.72
Developed villages 1.82 2.86 1 .2 2 1.52
Loss than 0 .5 1 .86 2.47 1 . 2 1 1.130.50 - 2.0 1.79 3.03 * 1.752.0 & above 1.63 3.29 * 1.91
Note: The wage exclude payments in kind of meals. The■'-'estimates for female workers for different landholding groups would be unstable, as it is based on a very small number of cases since female participation in the labor market is negligible.
“denotes that there was no case in the cell.

- 182 -
The wage rate paid by sample farmers for agricultural labor was
about 25 per cent higher in technologically developed villages that
in underdeveloped ones (Table 7.10)* The difference in wage rate was
higher for the small landowners (30 per cent) than the large cues (16
per cent). Thus, while the landless gain from the higher wages follow
ing technological progress, this factor would increase inequality in
agricultural incomes acrooss the farm size scale.
TABLE 7.10 1
WAGE RATE PAID BY SAMPLE FARMERS FOR AGRICULTURAL LABOR IN TECHNOLOGICALLY DEVELOPED AND UNDERDEVELOPED VILLAGES, 1982
Size of Landownership
Underdevelopedvillages
Developedvillages Percent
difference in wage rate (developed over (underdeveloped)
No. of cases hiring labor
Wage rate (Tk/day)
No. of cases hiring labor
Wage rate (Tk/day)
Small 86 17.19 128 22.26 30
Medium 74 17.63 72 21.28 21
Large 27 16.34 32 18.90 16
Note: The wage include imputed value of payments in kind. The mean wage rate for the entire sample was Tk. 19.95 and the standard error of estimate Tk 0.26. The difference in wage rate between developed and underdeveloped villages was statistically significant for all group. The Bangladesh Bureau of Statistics estimated the wage rate for the contry as a whole at Tk. 17.05 for 1982/83.

- 183 -
Operation of the Labor Market - A Multi-Variate Analysis
An important limitation of the analysis presented above is that
it is based on a partial approach since only two factors, the size
of landownership and technology are taken into account. The labor
market would be affected by a host of other factors including the wage
rates, whose effects also need to be controlled for in assessing the
impact of the new agricultural technology. This section attempts to
broaden the analysis by applying the multi-variate regression technique.
Determinants of Labor Supply
Following Yotopoulos and Lau, and Bardlian,~^ the supply of labor
by a rural household is assumed to be governed by the following function:
SLBR = f(OWNL, TECH, CPTL, FSZ, WRKR, FEM, EDCN, LVNG, WAGE)
where, SLBR = The average weekly hours of labor put in by the household
OWNL « The amount of land owned by the household (in acres)
TECh a The amount of land cropped with modern varieties (in acres)
CPTL « The amount of non-land fixed assets owned by the household (in thousand Taka)
FSZ = The number of members in the household (persons)
WRKR = The number of family workers in the household
FEM = The number of female workers in the household
EDCN = The educational level of the head of the household (completed years of schooling)
LVNG =* The standard of living in the village as measured by (the per capita consumption expenditure
VWAGE = The wage rate prevailing in the village (Tk per day)
\

In the utility function of an individual, leisure is considered
as one of the consumer goods. Its cost is the wage income which has
to be sacrificed if leisure is consumed. This would reduce the purchas
ing power of other consumer goods. So the choice between leisure and
consumer goods will be determined by their relative prices, i.e., the
wage rate and the prices of consumer goods. An increase in income
from non-wage sources will shift the indifference curve upwards and
hence the individual can have more of leisure and consumer goods at
the same level of relative prices. Thus labor, which is the residual
of the time available for work after the consumption of leisure, would
be determined mainly by the wage rate, the prices of consumer goods,
and the income from non-wage sources. It would be positively related
with the wage rate and negatively related with the prices of consumer
good. Owing to the difficulty of measuring the index of the prices
of a large number of consumer goods, we have not been able to
incorporate this variable in thv labor supply function. Since the
labor market is more fragmented, owing to the difficulty of mobility
of workers, one expects a much larger variation in the' wage rate
among the cross-section of households than in the prices of consumer
goods. The omission of this variable thus may not affect the results
seriously.
The main determinants of the non-wage income are the assets owned
by the household. The variables OWNL, TECK, CPTL, and EDCN have been
incorporated to take care of the effect of this factor. Non-labor
agricultural income would be higher the larger the amount of land owned
by the household and the larger is the proportion of the land devoted
to cultivation of modern varieties. The non-land fixed assets would
- 184 -

provide scope for generating self-employment in non-agricultural acti
vities, while education may open up opportunities for shifting to rela
tively higher paid employment in service activities, and hence for
earning higher income from the same amount of labor. Thus, while
capital and education may have a positive effect on non-agricultural
employment, the higher income effect would put a negative pressure
on the supply of labor. The net impact would depend on the magnitude
of these two opposite effects.
The decision regarding the consumption of goods and services and
the supply of labor is determined at the household level. So the compo
sition of the household and of the working members may also affect
he supply of labor. The higher the number of consumers (FSZ) relative
to workers, the lower would be the per capita income from labor in
the household and hence the higher would be the supply of labor. The
larger the proportion of female workers, the lower would be the supply
of labor since women also have to supply domestic labor and hence they
would have less time available for productive work. So other things
remaining constant, labor supply would be positively associated with
family size and negatively associated with the number of female workers.
In estimating labor supply functions, questions are raised about
8/appropriate measurement of the wage rate as an independnet variable.—
The wage rate derived from the information on wage earnings and labor
hours worked outside the household, if incorporated in the function
where the latter is used as the dependent variable, would pose well-
known measurement error problems. For households who do not sell labor,
the variable cannot be observed. The problem of simultaneity is also
- 185 -

involved because at the household level, both the amount of labor sup
plied and the wage rate may be jointly determined by other variables.
In order to avoid these problems, we have used the wage rate for agri
cultural labor prevailing in the village for all households. As Dardhan
points out, the village level wage rate may be more exogenous to the
individual household than the wage actually received, which may be
determined by the amount of labor supplied, the level of income of
the household, etc.
The labor supply functions estimated from the data for all house
holds in the sample, for agriculture and non-agriculture, and for
self- and wage employment, are reported in Table 7.1 1 . The total supply
of labor seems to be significantly related to all the variables included
in the function. The model explains about two-thirds of the variation
in the supply of labor among the sample households. A worker supplies
on the margin about 30 hours per week, about three-fifths of which
are on own account of the household (self-employment) and in the agri
cultural sector. A large number of dependents seems to necessitate
more work by the earner. This additional work is, however, generated
mainly in agriculture and on own account of the household. The coeffi
cient of the family size variable is statistically insignificant and
has opposite sign in the equation for non-agriculture and wage employ
ment, indicating that such employment may be demand-determined i.e.,
even if the household is willing to supply additional labor to satisfy
the consumption needs of a larger number of dependents, the employment
may not be available in the market. A female worker puts in about
1 1 hours less labor than an average worker if she is employed in agri
culture, but in non-agriculture the difference is insignificant.
- 186 -

- 187 -
The larger the size of land owned by the household, the less
is the supply of labor, which supports the a prior expectation about
labor-leisure substitution. Ownership of land, however, gives scope
of generating more employment in agriculture, particularly, on own
account. The value of the coefficient of land in the equation of
self-employment shows that an additional acre of land ownership gene
rates 1.36 hours of additional self-employment a week (about nine
days per year). But the positive income effect of land ownership
reduces the supply of labor in the market by about 2.45 hours a week.
(16 days a year). Thus, on balance, the total supply of labor is
9/r e d u c e d T h e results also indicate that the larger the size of
land, the less is the necessity for working in non-agricultural acti
vities. Education gives additional scope for working in the non-
agricultural sector, but the higher income effect of education, and
the higher social status of the educated worker operate to reduce
his supply of labor in agricultui.. On balance, the better educated
supply less labor in agriculture and on others* account. Among the
income variables, only capital seems to increase the supply of labor.
It reduces supply for the market, but the negative effect is more
than compensated by the positive effect on creation of employment
on own account, both in agriculture and in non-agricultural activities.
The supply of labor responds positively to the wage rate but
mostly for non-agricultural labor. For agricultural labor, the coeffi
cient of the wage variable is statistically insignificant. This is
found to be the case for all land ownership groups from separate esti
mates of the supply functions for agricultural labor. The estimated
coefficient of the wage rate, valued at the arithmetic mean of the

- 188 -
TABLE 7.11
ESTIMATES OF LABOR SUPPLY FUNCTIONS, ALL RURAL HOUSEHOLDS
VariablesAll activities
Agriculture
Non-agriculture
Self-employment
hirad-om-ploymcnt
WA G E 1 .10***(4.71)
0.07(0.29)
1.03***(3.73)
0.58**(2 .1 2 )
0.52*(1.93)
LVNG -1.47***(-6.51)
-0.97***(-4.00)
-0.50*(-1 .88)
-0.33(-1 .22)
- 1 .15*** (-4.44)
OWNL -1.09***(-2.80)
0.77*(1.83)
- 1 .86***(-4.04)
1.36*(2.97)
-2 .45*** (-5,49)
TECH -2.18***(-2.95)
1 .86***(2.34)
-4.04***(-4.65)
0.04(0.46)
-2.57***(-3.05)
CPTL 0.34***(3.89)
0.16*(1.74)
0.18*(1.72)
0.58***(5.58)
-0 c 23** (-2.31)
FSZ 1.28*** (3.34)
1.55***(3.78)
-0.27(-0.61)
1.99***(4.42)
-0,71(-1.63)
WRKR 31.06***(27.73)
18.34***(15.23)
12.72***(9.47)
18.03***(13.68)
13.03***(10.18)
FEM -11.27***(-4.76)
-11.13' * (-4.38)
-0.14(-0.05)
-2.39(-0 .86)
—o * oo‘v(-3.29)
EDCN -0.66**(-2.42)
-1.44***(-4.91)
0.78**(2.43)
-0.23(-0.71)
-0.43(-1,39)
Constant 32.60***(4.38)
28.34***(3.54)
4.26(0 .88)
-4.77(-0.54)
37.36***(4.39)
R2 0.67 0.47 0 .2 1 0.47 0.27
N 624 624 624 624 624
F 140.6 62.2 19.8 62.4 26.4
Figures within parentheses are estimated "tn values. The sample size consists of 624 households, with valid observations for all variables.
The level of significance of the * * t5 ‘ value * p<.0 1 , **- p<„055 and* p<0.1 0 .

- 189 -
variable, gives an elasticity of supply of non-agricultural labor
at 0.71.
Another variable which is found to significantly affect the supply
of labor is the standard of living in the village. This variable is
measured by the per capita consumption expenditure at the village level.
The value of the coefficient is negative and highly statistically signi
ficant, indicating that the higher the standard of living in the vill
ages, the less is the supply of labor by its households. This variable
affects mostly the supply of labor for the market - the negative coeffi
cient in the equation for wage employment is statistically highly signi
ficant. The coefficient for self-employment is also negative but not
statistically significant. This result suggests that improvement in
economic conditions in a village, from whatever sources it may be,
would reduce the supply of labor for the market which would give scope
for more employment for workers from neighboring low-income villages
and/or put an upward pressure on the wage rate.
For the present purpose, we are interested in the coefficient
of the technology variable. After controlling for the effects of other
variables, the coefficient of the technology variable is negative indi
cating that the diffusion of modern technology would depress the supply
of labor. The value of the coefficient suggests that an increase in
area under modern varieties by one acre would reduce the supply of
labor on the margin by 2.2 hours per week (14 days per year). The
technological progress creates opportunities for more employment in
agriculture. The value of the coefficient in the equation for agricul
ture is found to be positive and statistically significant. Tut by
raising incomes, it reduces the necessity for working in the non-agri
cultural activities. The negative effect on non-agricultural labor

- 190 -
is more pronounced than the positive effect on agricultural labor.
The difference is presumably due to the income effect of the technolo
gical progress. Technological progress also reduces the supply of
labor for the market. The value of the technology coeficient in the
equation for wage employment indicate that an increase in area under
the new technology by one acre would reduce the supply of wage labor
by 2.6 hours per week (17 days per year).
Table 7.12 reports the estimated labor supply functions for the
landless and marginal landowning households. A close scrutiny of the
results shows a behavioral pattern similar to that for all households
in the sample, with a few exceptions. The coefficient of the size
of landownership is not significant in either of the equations, which
is understandable as this group owns only up to 0 .5 acres of land,
A worker in this group supplies about 30 hours, only 2.2 per cent less
than for other groups, but unlike the landowning groups two-thirds
of the labor is supplied to the market, mostly in agricultural activi
ties. The total supply of labor is positively related to the wage
rate, but the response is mostly for labor on own account. It appears
that when the wage rates goes up, this group reduces biring-in of out
side labor, replaces it by more self-exploitation of family labor.
The technological progress generates additional agricultural
employment for the landless compared to the landowning groups. This
is achieved by substituting for non-agricultural labor. The positive
effect on agricultural labor is more pronounced than the negative effect
on the non-agricultural labor. On balance, the technology has a posi
tive effect on labor supply for this group, although it is not

- 191 -
TABLE 7.12
ESTIMATES OF LABOR SUPPLY FUNCTIONS, LANDLESS HOUSEHOLDS
VariablesAll acti vities
Agriculture
Non-agri-culture
Self-employment
Hired employment
VWAGE 1.40*** 0.57 0.89** 1 .55*** -0,15(3.25) (1.41) (1.67) (2.74) (-0.27)
LVNG -1.41*** -1.55*** 0.14 0.02 -1,42***(-3.92) (-3.71) (0.31) (0.03) (-3.00)
OWNL -5,00 -2 .2 1 -2.80 0.24 -5,25(0 .68) (0.26) (-0.30) (0.03) (-0.54)
TECH 1.14 8.24** -7.10*** 4.76 -3.61(0.36) (2 .2 1 ) (-1 .68) (1.13) (-0.85)
FSZ 3.52*** 3.12*** 0.40 3.96*** —G . 44(3.74) (2.85) (0.32) (3.20) (-0,36)
WRKR 30.38*** 19,93*** 10.45*** 10.43*** 19.95***(12.52) (7.07) (3.28) (3.27) (6.23)
FEM -2.41 -13.75*** 11.34** 14.85*** -17,26***(-0.58) (-2,89) (2.08) (2.71) (-3.14)
EDCN -0.15 -1.31* 1.15 0.88 -1,03(-0.23) (-1.76) (1.38) (1.05) (-1.23)
Constant 12.51 15,09 -2.58 -44.88*** 57,39***(0.99) (1 .02) (-0,16) (-2.67) (3,42)
R2 0.68 0.41 0.17 0.31 0.26
N 191 191 191 191 191
F 52.28 17.02 5.81 11.49 9.35
Figures in parentheses are
Level of significance of f't
estimated ;
“ value, *-:
’t"’ values.
** pC.Gl, ** p<.05, * p< .1 0 .

statistically significant. It is Iso interesting to note that like
the landowning groups, the landless also reduces the supply of labor
to the market in response to technological progress.
Determinants of Demand for Agricultural Labor
The survey collected information on the demand for labor only
for crop production activity. The information was collected from
the farming households at the crop level for three agricultural sea
sons, Table 7,13 presents the information for different groups of
farm households. The total demand for labor in the crop production
activity in the developed villages was about 27 per cent higher than
in underdeveloped villages. Most of the increase, however, is on
account of hired labor, compared to underdeveloped villages, an ave
rage household in the developed villages used 42 additional days of
labor, 34 days being met by employment of hired workers. The addi
tional self-employment for family labor is mostly on account of small
farm households. The demand for hired labor was about 56 per cent
higher in developed villages and the additional employment was gene
rated more on the smaller farms (131 per cent) than in the large ones
(19 per cent). It appears that large farmers kept the upward pressure
on the wage rate low (Table 7,10) by hiring in labor relatively less
than small and medium farmers.
- 192 -

- 193 -
TABLE 7.13
USE OF LABOR IN CROP PRODUCTION IN DEVELOPED AND UNDER-DEVELOPED VILLAGES, BY THE SIZE OF LAND OWNED BY FARMERS
(Number of days per household)
Family Labor Hired Labor Total Lcbor
Landownership
Group
Under
developed
villages
Deve
loped
vill
ages
% dif
ference
Under
developed
villages
Deve
loped
vill
ages
% dif
ference
Under
developed
villages
Deve
loped
vill
ages
'!■ dif
ference
Small 52.7 72.G 36. C 1S.0 45.8 131.1 72.5 117.o G2.5
fiediurn 11b.4 106,3 -10.2 56.5 54.0 42.G 104.S 201.1 0.8
Larye 155.1 155.5 0.3 1S6.6 234.4 19.3 351.7 5GC.C 10.L
Farm
HouseholdsCO.5 So.5 0.4 61 o 3 05.3 55.5 152.2 1 oo s O e?. j
Note: The table excludes the functionally landless households. A few c£ them were engaged in farming and used farm labor, which is not accounted for.
Tn? following demand function for hired labor was estimated ITor.i
the data.
DLBR a 68.29 + 8.72 LAND + 27,78 TECL - 1.64 WRKR(4.23) (10,74) (13.11) (-0.58)
- 2 , 2 1 VWAGE - 0.48 TNG(-2,99) (-4.00)
E2 = 0.49 F = 95,9 N = 461
where DLEE is the number of labor days hired in from outsiu the
household ir; the crop production activity, LAND is the total cropped
area n; acres; TECH is the area devoted to cultivation of modern
varieties;WRKR is the number of family workes in the household;
TNC is the number of cropped area under tenancy; and VWAGE is the
wage rate in Taka per day estimated at the village level. The figur s

- 194 -I I I B . \ \
within parentheses are the estimated st' values of the coefficientA &
As expected the demand for labor is p o s i lively associated with c ro p p e d land but xgatively associated with the proportion of area under ten
ancy. The wage rate, measured at the village level,, affects the demand
for labor. The coefficient of the var. able is statistically signified tj
at less than one per cent probability error. The value of the coeffi
cient evaluated at the mean level of the variable gives a wage, elas
ticity of demand for labor at -0,58. The coefficient of the teclu ology
variable suggests that technological progress would increase the demand
for labor significantly. The estimated v‘tu value of the regression
extremely high. The value of the coefficient indicates that an increase
in area under the new technology by one acre would increase the demand
for hiied labor m crop production uy about 28 days.
The labor demand function has also been estimated with the alter
native specification of the wage rate at the household level- The
results are the following!
ELTT - 73-19 - 8.70 LAND - 1.59 UTKR 28.06 TECH(4.80) (10.78) (-0.56) (13.48)
- 0.48 TNC - 2.53 HUAGE(-4.08) (-3,55)
Pz = 0.51 F = 97.4 N = 408
where, HUAGE is the wage rate in the Tk per day paid by the household
and other variables, as defined earlier. The results are similar oxc.pt
that the value of the coefficient for thu, wage rate increases and its
statistical significance improves. The wage elasticity of demand for
labor at this value is estimated at -0.65,

- 195 -
The Impact of Technology on the Wage Rate
As mentioned earlier, the survey die not collect information on
m-ndgration of labor from outside the sample and on demand for i i bor
in non-farm activities. So it is not possible to balance the supply
and demand for labor in order to estimate a simultaneous equation system
for determination of the wage rate.
The single equation estimation of the supply and demand for agri
cultural labor, however, indicate that technological progress may signi
ficantly affect the wage rate. It generates opportunities for addi
tional self-employment in agriculture which reduces the supply of labor
in the market by the landowning households. On the other hand, it
increases the ciemand for farm labor in the market and thus a gap deve
lops between the demand for and supply of labor by the landowning
households in the technologically developed villages. The gap may
be filled in by supply of more labor from the landless group within
the villages and/or by out-migration of labor from labor-surplus house
hold in villages where the technology has not yet progressed far.
In this way, the forces in the labor market may operate to redistribute
income from higher to lower income groups within the developed villages,
and from developed to relatively underdeveloped villages. The results
also show that as technology progresses even the landless in the deve
loped villages supply less labor to the market. This indicates the
possibility of considerable in-migration of labor from underdeveloped
villages, in the absence of which there would be an upward pressure
in the wage rate for clearing the labor market.

- 196 -
In ord(..r to see the impact of th*. technology on. the wage rate,
we estimated a wage equation incorporating all variables which signi
ficantly olfect the supply and demand for agricultural labor. After
elimination of the statistically insignificant variables, the following
wage equation has been obtained:
VWAGE = 19.32 - 0.26 LAND + 1,25 TECH + 0.44 TNC (46.95) (-4.19) (10.59) (2.38)
- 0.72 WRKR + 0.10 EDCW (-4.10) (1.71)
R2 - 0.22 F = 26.1 N = 408
Figures within parentheses are estimated ‘#tv* value. If wage s are
exogenously determined, we would have expected all variables to be
statistically insignificant. But nearly a fifth of the variation in
wage rate across the villages is explained by the above variable.
Technology seems to be the most important variable affecting th v/age
rate. ihis is also found to be the case when wage rate is measured
at the household level, as shown by the following equation:
HWAGE - 19.50 - 0.23 LAND + 1.24 TECH - 0.68 WRKR(51.12) (-3.56) (9.84) (- 3.72)
+ 0.39 TNC( 2 . 01 )
R2 0.18 F = 26.5 N = 408
VII. Conclusions
The modern technology affects the labor market mainly through
the income variable. At higher levels of income, households substitute
leisure for labor and supply less labor in the market. This redis
tributes employment rrom higher to lower income groups. Even the poor

- 197 -
supplies lss labor in the market <•»: income increases with technological
progress. But the demand for agricultural labor goes up because of
the higher labor intensity of modern varieties, which puts an upward
pressure on the wage rate and increases wage earnings from the saint,
amount oi labor. Ihese forces in the labor market may also op.rats
^redistribute some employment and income from technologically develop-d
to underdeveloped villages, by promoting rural-rural migration. Unfor
tunately, the present survey did not collect any information on migra
tion and so a direct testing of hypothesis is not possible.

- 198
Chapter 7 Notes
1. According to tlx land occupancy survey of 1978, the lirst attempt in tlx country to gct information on landowncrship, 15 per cent of rural households did not own any land, and 29 per cent owned only homestead land. But households who claimed no more than one-half acre of land other than the homestead, who are considered in Bangladesh as "functionally landless'', constituted 50 per cent of rural households in that year. According to the latest agricultural census, in 1983/84 nine per cent of the households did not own any land, and 46 per cent own less than one-half acre. About 40 per cent of the household reported agricultural wage labor as the main occupation, two-thirds of them belonged to households who owned less than 0.5 acres. See, F.T. Jannuzi and J.T Peach, The Agrarian Structure of Bangladesh op. cit. p. 110, and the Bangladesh Bureau of Statistics National Report on 1983-84 Census of Agriculture and Livestock Holdings in Bangladesh, Table i, 1and Tabic 2.6A.
2. John mellor, The New Economics of Growth: A Strategy for Indiaand the: Developing World, Ithaca, Cornell University Press, 1976. For detailed empirical investigations, see among others, P,L.R. Hazcll, and Alisa Roell, Rural Growth Linkages: Household Expenditure Pattern in Malaysia and Nigeria, Research Report 41,Washington DC, International Food Policy Research Institute, 1983: Mahabub Hossain, 'Agricultural Growth Linkages: The BangladeshCase1', The Bangladesh Development Studies 15 (No 1, 1987).
3. The crude activity rate is estimated at 30.0 percent for the country as a whole, 34,2 per cent for urban areas, and 29.4 per cent for rural areas. The Bangladesh Bureau of Statistics Preliminary Report of Labor Force Survey 1983-84, October 1984, Table 4, p.24,
4. In Bangladesh there is a social stigma against women working inthe field or performing manual labor on others' account. Thewomen from very poor families, however, try to earn or save expenditures by organiziang production around the homestead under pressure of poverty. About 70 per cent of the people who take loans from the Grameen Bank, an institution created for providing credit to landless households, are women. They take loans mostly for livestock and poultry raising, cottage industry, and shop-keeping activities, A large survey in 1979 found that nearly two-fifths of the workers employed in cottage industries were women and 84 pci cent of them were unpaid family laborers. As agricultural incomes increase, the demand for these activities in which the poor women can find employment may also go up. See, Hossain, Mahabub, "Credit for Alleviation of rural Poverty: The experienceof Gramccn Bank in Bangladesh", (mimco), IFPRI, September 1906;Employment and Labor in Bangladesh i\ural Industires'1, The La; jala- desh Development Studies, 12 (March-Junc 1984); 1-24,

- 199 -
5. In rural Bangladesh open unemployment is rare bc'cause family members share the household worl but underemployment is considcrobl . Estimates o£ tin rate o£ underemployment for the country as a whole are not available. The estimate fro> different micro-studies for the recent period varies from 28 to 43 percent. A part of the difference is, of course, due to regional variations as most of the: studies cover only a few villages and in different areas of the country, but a large part of the variation can also be attributed to differences in concepts and definitions particularly regarding the full employment norm. Sec, Atiq Rahman and R. Islam,Labor Use in Rural Bangladesh; A Study with Micro-Level Bata,Asian Regional Team for Employment Promotion, ILO, Bangkok, 1985 (mimeographed): Iqbal Ahmed, ‘'Unemployment and Underemploymentin Bangladesh Agriculture1', World Development 6 (December 1978): 1281-1296: Mahmud Khan, "Labor Absorption and Unemployment inRural Bangladesh1', The Bangladesh Development Studies, 13 (S_p- tcmber-Dcccmbcr 1985); 67-88.
6. On estimates of productivity of labor in cottage industries and petty trade sec, Mahabub Hossain, ''Productivity and Profitability of Bangladesh Rural Industries", The Bangladesh Development Studies, 12 (March-June 1984): 127-161 and Credit for the Rural Poor: The Gramesn Bank in Bangladesh, (Chapter 4), Research Monograph No. 4, The Bangladesh Institute of Development Studies, Lhako, 1984, The former study has found that if the cost family labor is imputed by the agricultural wag., rate, the profit becomes negative for a large number of cottage industries, such .as net and rope making, cane and bamboo works, mat making, and rice processing by indigenous methods, which account for about one-third of the cottage industry employment. These activities are undertaken to raise household income through employment of female labor and of mal-w labor during off-peak e.gricultural seasons, which have very little opportunity cost,
7. iotopoulos and Lau derives a labor supply function of the household from an .indirect utility fnction, while Bardhan employs a pragmatic apprcacii to explain the labor market participation behavior of peasant households. See, Pan, A. Yotopoulos and L.J. Leu, "On Modeling the Agricultural Sector in Developing Economics'1, Journal of Development Economics, 1 (1974) 105-127: Bardhan, P.K., '"Labor Supply Functions in a Poor Agrarian Economy", American Economic Review, 69 (March 1979): 73-83. Other major works which coverthis issue are, L.J. Lau ct al, 'The Linear Logarithmic Expenditure System: An Application to Consumption-Lcisure Choice", Econometrics 46 (July 1978): 843-868; M.R. Roscnweiz, "Rural Wages, Labor Supply and Reform: A Theortical and Empirical Analysis", The Arm ricanEconomic Re.view, 68 (December 1978): 847-861.
8. P.IC. Bardhan, "Labor Supply in a Poor Agrarian Economy", op cit.

Values of regression coefficients reported in the table ar.. those obtained by the OLS method. Jinca some of the cases have zero values for the dependent variable (the number was large for the category of hired employment) the censored regression method is more appropriate for estimation of the supply functions for different categories of employment. Wc estimated the equations using the Tobit method and found the parameter values somewhat different but the general conclusions remained valid. We chose to present the CLS estimates because the sum of the parameters of the specific variables in functions for different categories of labor add up to the parameter for that variably, m the supply function foi total labor.

- 201 -
8 : LINKAGE EFFECTS OF AGRICULTURAL GROWTH
Iintroduction
It Wens shown in Chapter 4 that the diffusion of the new technology
would substantially increase the income from crop production. The
crop sector accounts for about 77 per cent of the agricultural income
in the country. The technological progress is thus expected to have
a s ig n i f i c a n t .1.1 cl. cn the giowlli ol ursJ incomes.
Agricultural growth j nvolves linkages to no.-farm stxtois
the pooi lacy gy I • indirectly through i g'mi. Lion oi c r.qJoyt..
in tiic.se act i.vii;ics. The linkage s may be. generated 1 1 on. tlic sup, j.;
side through the investment of the new surpluses by the land-ownera,
and/or from the demand side through income induced expenditure on
non-farm goods and services. The growth of agricultural incomes may
also increase the opportunity for investment and employment in non
farm rural activities through its effects on (j) the demand for irriga
tion equipment and other modern agricultural inputs produced in no: -
agricultural sector; (li) the demand for services for processing and
marketing of the additional surplus produce; (iii) the demand for
trade and transport services arising out of the additional purchase
of non-farm products and so on.
Empirical studies for a number of developing countries show that
2/the linkage effects of agricultural growth can be substantial.— Bell,
Hazell, and Slade concluded from a study of Iiuda irrigation project
in Malaysia that for each dollar of agricultural income project in
Malaysia that for each dollar of agricultural income created directly

- 202 -
by the project, an additional 80 cents of value added was created
indirectly in the local non-farm sector. Ir, a study of interrelation
ships between agricultural and industrial growth performance in India,
K o o g a r a n j a n f o u n d t h a t a o n e p c i ct nt a d d i t i o n t o the a g r ixu iLuivl
growth induced a 0.5 per cent Incremental g r o w t h of industrial output
and 0,7 per cent additional growth of national income. Recognizing
the importance o f such expenditure induced growth linkages, Mellor
argued that contrary to the conventional wisdom, agriculture can play
3/the role of the leading sector in the process o £ development.—
This chapter attempts to assess the nature and extent of such
linkage effects b y analysizing the expenditure pattern of the sample
households in the technologically developed and underdeveloped villa
ges. The data on expenditures were collected from two types of inter
views. Information on daily necessities was collected on a weekly
basis asking households about consumption and purchases of these items
for the week preceding the date of interview. This survey was conduc
ted eight times during 1982 representing busy, normal, and slack
seasons of economic activities in the sample villages. The expendi
ture on these items for the whole year was then estimated on the basis
of the eight weeks' data. The information on expenditures on major
items, such as clothing, household effects, education, recreation,
and health and acquisition and repair of fixed assets was collected
four times during the year retrospectively on a quarterly basis.

- 203 -
Expansion of Market: An Analysis of Consumption Pattern
Methodology
The commodities and services consumed have been classified into
the following groups for studying the consumption induced linkages:
Crops : Rice, wheat, other grains, roots, vegetables, pulses,
fruits, spices, betel nut and betel leaves, rice
husk, jute stick.
Forestry : Firewood, leaves
Livestock : Heat, milk, eggs, cow dung
Fishery : Raw and dried fish
Rural Processing: Raw sugar (gur), bidi, tobacco, mustard oil, sweets,
handloom clothes, tailoring
Urban Processing: Sugar, tea, citarette, soyabean oil, coconut oii
kerosine oil, electricity, matches, soap, soda,
toiletry, mill made clothing, ready made garments,
imported new and old clothes, shoes
Services : Education, health, transport, personal services,
social services, religious seivices.
The impact of the growth of income on the demand for the various
goods and services has been studied by estimating an Engel function
of the following type on the cross section data.—
(1) E = a. + fci E + Y E log E = M. log F + A.E log F 1 1 1 i ° i i &
where, E is the per capita expenditure of the household, is the
amount of expenditure incurred on the consumption of goods in the
1th group, and F is the number of persons in the households. This

- 204 -
a non-linear function which allows for variation in the marginal budget
share for the ith groups IiES , ei different levels of income, which
can be delivan i« ij.iwe.can DC a c m c a 33 ICIIOBSI
(2) iIBS ^ Y (1 log E) A. log F
The size of the family would have an important bearing on the economic
\#position of the household at a given level of income and hence it
has been included m the equation as an important socio-economic vari
able influencing consumption behavior of the household.
In order to avoi the problem of hetaroscedasticity, that the
variability in the EH increases with the explanatory variable E, the
function has been fitted in the following expenditure shar*.. from which
is derived from (1 ).
(3) S. = e . i- u./E Jr Y. log E + M. log F/e v A. log Fi i i i ° i & i b
w^iere = E /2 is the share of the expenditure. The disadvantage
_2of estimating the share equation is that th . Value of F( is typically
small,--^ but ; t ensures the desirable property that the sum of the
marginal budget share is equal to unity
Since per capita income is a better measure of the economic stand
ing of the household, as compared to the household income, the expen
diture variable has been measured in per capita terms. But the house
hold size has been included so that the model permits this variable
to influence both the intercept and the slope of the individual Engel
functions.

- 205 -
Discussion of Results
The estimated parameters for the Engel function are reported
in Table 8.1. As the function is estimated in the expenditure share
_2from, the value of R is in general low. For forestry, livestock,
_2fishery, and rural processing, the value of R is less than 0.10 indi
cating the share of these commodities in total expenditure does not
vary much with the level of income, which suggests that the expenditur^
_2elasticity of demand is close to unity. But the value R is relatively
high for crop sector outputs and services, which indicates that the
expenditure elasticity of demand for them deviate significantly from
unity. The value of the coefficient, Y, shows what happens to the
marginal budget share as the level of income changes. The estimated
value of this variable is significantly negative for crop sector output
showing that the incremental expenditure on these commodities declines
with increases in income. The value is significantly positive for
livestock, manufacturing goods end services.
The estimates of marginal budget share and the. expenditure elas
ticity of demand derived from the parameters of the Engel's function
are reported in Table 8.2. About two-thirds of the expenditure is
allocated to commodities produced in the crop and forestry sector,
where the share of land in value added is very high. But the marginal
budget shar^ for these commdoties is 53 per cent, which suggests that
with increases in income, people spent proportionately much less on
these items. The expenditure elasticity of demand is estimated at
0.77 for crops and 0.79 for the forestry products.— Among agricul
tural commodities, livestock and fishery products have elastic demand,

- 206 -
TABLE 8.1
ESTIMATES OF ENGEL FUNCTION, RURAL HOUSEHOLDS, 1982
CommodityEstimated Values of 1:he Parameter
R2 SEEGroups
a P Y U A
Crop -230 (A.73)
2.779(18.15)
-0.2575(-14.86)
-2.251(-0.64)
-0.0017(-0.99)
0.44 0.073
Forestry 23.7(1.43)
0.031(0.60)
-0.0012(0.20)
-0.65(0.54)
-C .0021(-3.53)
0.08 0.025
Livestock -0.38(-0.02)
-0.116(-2.39)
0,0195(3.54)
1.286(1.157)
0.0004(0.76)
0.08 0.023
Fishery -40.9(-3.53)
0.061(1 .68)
-0.0007(-0.02)
2,66(3.18)
-0.0016(-3.93)
0.09 0 017
Ruralprocessing
92.8(3,79)
-0.342(-4,44)
0,0502(5.76)
—3 o 01(-1.71)
0.0020(2.25)
0.06 0.037
Urbanprocessing
39,9(1.41)
-0,409(-4,61)
0,0596(5.92)
1,53(C.75)
-0.0005(-0.49)
0 . 1 2 0.043
Services 114.7(3.29)
-0.990(-9.03)
0.1255H O , 1 0 )
0.38(0.15)
0.0033(2.64)
0.28 0.052
Figures within parentheses are estimated 'V* values.
Note: The function was estimated in the following form:
S. = 3. c:. / E + Y. log E + u . F/E + A. Fi l l i b 1 1
where S. is the share of the commodity group in total consumption expenditure, E1 is the per capita consumption expenditure and F is the number of persons in the household.

- 207 -
TABLE 8.2
ESTIMATES OF MARGINAL BUDGET SHARES AND EXPENDITURE ELASTICITY OF DEMAND
CommodityGroups
Average Budget Share (percent)
Marginal Budget Share (percent)
Expenditure Elasticity of Demand
Crops 64.94 50.26 0.77
Foresting 3.59 2.82 0.79
Livestock 4.22 5.80 1,38
Fishery 3.95 5.03 1.27
Rural Processing 9.51 1 1 . 2 2 1.18
Urban Processing 7.51 1 1 . 2 1 1.49
Services 6 .2 1 13.46 2.17
the marginal share of these products is 1 1 percent whil c the average
share is eight percent. Manufacturing goods have a share of 17 per
cent of the total budget, nearly 56 percent of which are produced
in rural areas. These commodities also have clastic demand, the
share of them in the incremental expenditure is nearly 23 percent.
The expenditure is, however, more elastic for goods produced in urban
areas ~ increase in income, the marginal share of manufactur
ing goods of rural origin increase less than proportionately.
But the highest elasticity of demand is for rural service sector
activities, in which the labor's share of income is very high. Nearly
13 percent of the enlarged market for goods and services go to the
Service activities. The expenditure elasticity is estimated at 2.2,

- 208 -
indicating that with a 10 percent m total expenditure, the demand
for the service sector activities would increase by about 22 percent.
All non-farm goods and services together share about 47 percent of
the incremental expenditure and has elasticity of 1.5.
For assessing the Impact of technological progress on the demand
for various types of commodities, Engel’s function hes been estimated
separately for the technologically developed and underdeveloped villa
ges. The estimates of demand derived from the parameters for the
two groups of villages arc reported in Table 8.3. It will be noted
from the results that for both groups of villages, the pattern of
expenditure is almost similar to that obtained earlier for the entire
sample. Crops and forestry products have inelastic demand while
services and urban manufacturing products have the most elastic demand.
With technological progress, tht difference becomes even more pronoun
ced due to the increase in the level of income.„ The per capita income
in developed villages was 22 percent higher than in underdeveloped
one (see Chapter 8 below). In the underdeveloped villages, 42 percent
of the incremental expenditure was spent on cereals, but in the deve
loped village, the share was 31 percent. The expenditure elasticity
of demand for cereal is 0.64 in the developed villages compared to
0.79 in underdeveloped villages. Roots and vegetables have inelastic
demand, the marginal budget share and the value of elasticity is
lower in the developed villages. Pulses have highly elastic demand
but its average and marginal consumption are lower in developed villa
ges presumably because of reallveation of land from pulses to MV
rice. Among food items meat, egg and milk have expenditure elasticity

- 209 -
TABLE 8.3
EXPENDITURE PATTERN OF HOUSEHOLDS IN DEVELOPED AND UNDERDEVELOPED VILLAGES, 1982
Under Developed Villages Developed Villages
Commodity Expen ExpenGroups Average Marginal diture Average Marginal diture
share share elasticity
share share elasticity
Crops: 67.0 56.5 0.84 62.9 45.0 0.71Cereal 53.0 42.1 0.79 49.1 31.2 0.64Pulses 1 . 1 1.3 1.24 0,8 1 . 2 1.56Roots and Vegetables 5.4 4.7 0.87 4.8 3.1 0.65Fruits 2 . 1 3.4 1.62 1.9 3.0 1.57Spices 3.4 2.9 0.84 3.7 3.3 0.91Betel nut and Betel leaves
0.9 1.4 1.55 1.3 1.3 1 .0 0
Rice husk and Jute sticks
1 . 0 0.7 0.70 1.3 1.7 1.30
Forestry: Firewood
4.12.0
3.22.6
0.781.29
3.11.5
2.72 . 1
0.881.30
Leaves 2 . 1 0.6 0.30 1 . 6 0.7 0.43
Livestock: 4., 4 5.7 1.29 4.0 6.4 1.59Meat and egg 1 .6 3.2 2.0 2 . 1 4.4 2 . 1 0Milk 0.9 1 . 8 1.93 1 . 2 2.4 1.92Cow dung 1.9 0.6 0.33 0.7 -0.4 -0.58
Fishery: 3.6 4.2 1.19 4,4 5.3 1 . 2 2
Manufacturing: 16.7 22.9 1.37 17.5 22.7 1.29Rural origin 9.5 12.4 1.30 9.5 10.3 1.09Urban origin 7.2 10.5 1.46 7.8 12.4 1.56
Services: 4.2 7.5 1.79 8,2 17.9 2.18
Note: Figures art, derived from commodity specific Egel functions estimatedfrom household level data. The figures may not add up due to rounding errors.

of 2 .0 and meir share of the marginal budget 6.8 per cent in developed
villages compared to 5 .0 per cent in underdeveloped villages. The
most significant difference in the marginal budget share is found
for service sector activities. In the underdeveloped villages only
nine per cent of the incremental expenditure was spent on these items,
in the developed villages, the share was about 18 per cent. Only
for rural monufacturing the value of the expenditure elasticity is
lower in the developed village but the absolute value is still greater
than unity. It is indicated by the above findings that the market
for livestock and fishery products, manufacturing and services expands
more than proportionately as technological progress increases rural
incomes., r"he most significant effect is on service activities, where
labor's share of income is high compared to other commodity groups0
Reinvestment of Surplus
Investment defined as additions to the value of fixed assets
and working capita.! is classified here into two broad groups —
dirctly productive investment and other investment. Investment in
agricultural and non-agricultural enterprises arc regarded as directly
productive investment. Agricultural investment includes expenditure
on land development (such as land levelling, fencing, clearing of
water hyacinth, raising small embankments in fields for improved water
control, digging field channels for irrigation, etc.); purchase of
agricultural machinery and tools, equipment ana draught animals, pur
chase of cattle and poultry for rearing, and expenditure on digging
of ponds and planting trees. Mon-agricultural investment includes
purchases of industrial mchinery and tools, transport equipment,
- 210 -

purchases of shares and debentures, and additions to the fixed and
working capital for trade and business. Changes in the stock of output
and raw materials for agriculture and industry could not be taken
into account due to lack of information. Non-monetary investment
in the form of the use of family labor has been imputed by the prevail
ing market wage rate.
Households also incur expenses on construction and improvement
of housing and cattle sheds, education of children, digging of wells
and tubewells; for drinking purposes, and on construction of latrines.
These may be termed as social investment for formation of human capital
which may increase the productivity of labor in the long runc Expen
ditures on household durables such as furniture and fixtures, electri
cal goods, metal and earthen utensils, etc. have also been treated
as investment.
A significant number of households have been engaged in transac
tions which may be termed as transit rs. These include purchases and
sales of land, receipts and repayments of loans and interests, expenses
on account of litigation, theft of property, etc. At the aggregate
level, the net transfers should be zero. For the sample under study,
however, the net transfer was found to be significantly positive,
indicating the possibility of an underreporting of negative transfers,
which people tend to suppress. Because of the conceptual problems
involved, these items have not been included in investment.
The pattern of investment in the technologically developed and
underdeveloped villages can be reviewed from Table 8.4. total invest
ment per households was almost the same for the two groups, but because
- 211 -

- 212 -
TABLE 0.4
THE PATTERN OF INVESTMENT IN TECHNOLOGICALLY DEVELOPED AND UNDERDEVELOPED VILLAGES, 1982
Amount per household
As a percent of gross
investment
As a percent of total
expenditure
Types of InvestmentUnderdevelopedvillages
Developedvillages
Underdevelopedvillages
Developedvillages
Under- Dcve- developcd loped villages vill
ages
Directly Productive Investment:
Agriculture: 1039 881 32.9 28.2 5.6 3.9
Land development 106 135 3.4 4.3 0.6 0.6
Agricultural tools and equipment
408 75 12.9 2.4 2 .2 0.3
Draft animals and livestock
494 645 15.6 20.6 2,6 2.9
Other agriculture 31 26 1 . 0 0.8 0 .2 0 . 1
Non-agriculture: 1132 769 35.9 24.6 6 . 1 3.4
Industry 225 29 7.1 0.9 1 . 2 0 . 1
Business 074 711 27.7 22.7 4.7 3 4
Transport 33 29 1 . 1 1 . 0 0.2 0 . 1
Other Investment 986 1477 31.2 47.2 5.3 6.5
Housing 727 1106 23.0 37.9 3.9 5.3
Sanitation 27 29 0.9 0.9 0 , 1 0 . 1
Consumer durables 232 262 7.3 8.4 1.3 1 . 2
Total Investment 3157 3127 100.0 100,0 16.9 13.9
Total Expenditure 1S640 22600 100 .0 100.0(Consumption plus ivestment)
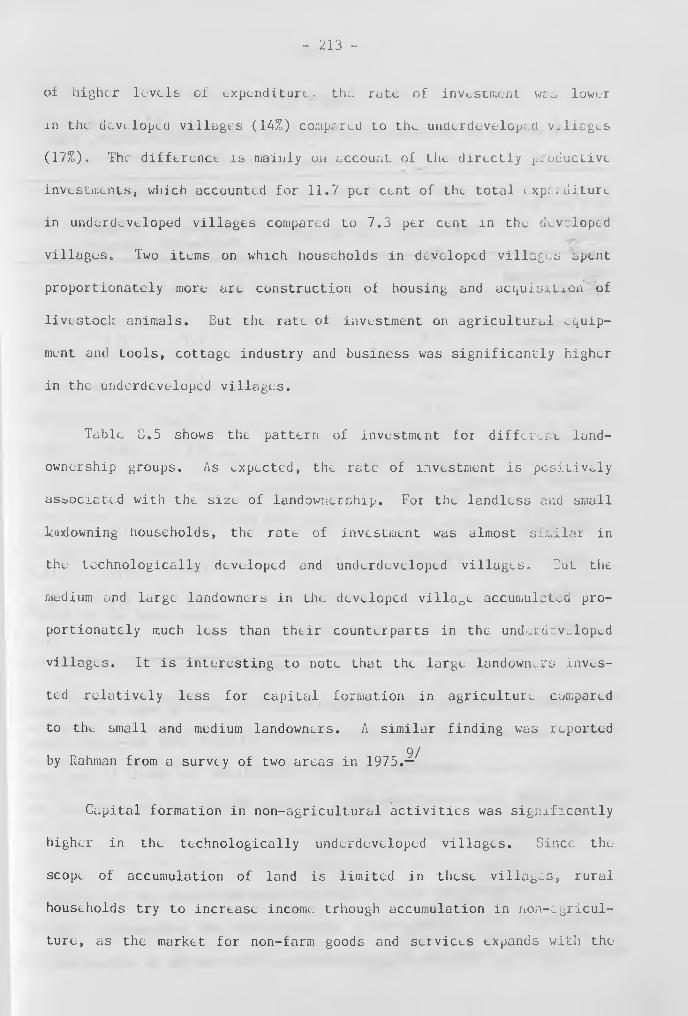
of higher levels of expenditure, the rate of investment wee lower
±n the devi.loped villages (14%) compered to the underdeveloped villages
(17%). The difference is mainly on account of the directly productive
investments, which accounted for 11,7 per cent of the total expc,dilure
in underdeveloped villages compared to 7.3 per cent in the developed
villages. Two items on which households in developed villages spent
proportionately more are construction of housing and acquisitxcn of
livestock animals. But the rate of investment on agricultural equip
ment and tools, cottage industry and business was significantly higher
in the underdeveloped villages.
Tabic C.5 shows the pattern of investment for different land
ownership groups. As expected, the rate of investment is positively
associated with the size of landownership. For the landless and small
landowning households, the rote of investment was almost similar in
the technologically developed and underdeveloped villages. But the
medium and large landowners in the developed village accumulated pro
portionately much less than their counterparts in the underdeveloped
villages. It is interesting to note that the large landowners inves
ted relatively less for capital formation in agriculture compared
to the small and medium landowners. A similar finding was reported
9/by Rahman from a survey of two areas in 1975.—
Capital formation in non-agricultural activities was significantly
higher in the technologically underdeveloped villages. Since the
scope of accumulation of land is limited in these villages, rural
households try to increase income trhough accumulation in non-agricul
ture, as the market for non-farm goods and services expands with the
- 213 -

- 214 -
TABLE 8.5
THE PATTERN OF INVESTMENT FOR DIFFERENT LANDOWNERSHIP GROUPS, 1982
Area and LandOwnershipGroups
Directly Productive Other Investment
Agriculture Non-agricultureHousing £ Sanitation
ConsumerDurables
Total
UnderdevelopedVillages:
Marginallandowner
2.3 3,8 1.7 0.7 8.5
Small 5.4 2 . 1 3.5 2,0 13.0
Medium -7.1 5.3 5.2 1 . 0 18.6
Large 5.8 14.3 4.9 2.0 26.3
Developed Villages:
Marginallandowner 1 . 2 2 .2 4.0 1 . 1 8.4
Small 6.2 1 . 6 3.6 1 . 1 12 .6
Medium 3.6 6.0 4.2 1 . 1 14.9
Large 3.5 2.7 10.4 1.4 18.0
technological progress. But the opportunity is taken up more by the upper
income households. In the underdeveloped villages the non-agricultural
investments as a proportion of total expenditure is about 14 per cent
for the large landowning households compared to two to five per cent for
the other landholding groups.
The information presented in this section thus leads to the following
main conclusions. First technological progress does not necessarily lead to
higher capital formation in agriculture. This may be a reflection of

the fact that investment in irri Lion, which is the main v hide,
of technological progress is done. by the government. Secc.id, the
expansion of market for non-farm goods arm services Stems to stimulate
more non-agricultural investment in th villages where the technology
has progressed less. This may tm explained by the fact that Lb new
technology provides an opportunity for increasing income from the
land for households in the developed villages. Since such an oppor
tunity is lacking in the underdeveloped villages, the households look
for opportunities in the farm sector to increase their incomes. Third,
the incom. from the investment induced linkages tends to be un ^ually
distributed. Because of the higher levels of income, accumulated• • , . ) t ■ )
savings and better access to financial institutions, the larg land
owners can respond more to opportunities of investment in eh... non-
farm sector than the landless and small landowners, although th-. latter
may gain from creation of additional employment in these activities.
Impact on the Land Market
A factor on which much emphasis has been given in the literatere-—
to explain the negative income distribution effects of th< modern
technology is the impact of agricultural surplus on the r u r d land
market. By increasing the profitability of cultivation, the new tech
nology inflates the surplus of the large landowners and increases
the value of land. On the other hand, it would mafce- cultivation diffi
cult or. the part of the marginal landowners, since the working capital
requirement for cultivation of the new varieties is substantially
higher, and the poor have little access to credit from finance 1 .ins
titutions, It is argued that with technological progress these forces
- 215 -

- 216 -
will operate to increase the transaction in the rural land market
and the large landowners would buy out the marginal farms, leading
to further accumulation of land in the hands of the rich and a higher
concentration of income.
Thu survey collected information on the source of acquisition
of each plot of land owned by the sample households. This inform.tion
can be used to empirically test the above hypothesis. If technological
TABLE 8 .6
SOURCES OF ACQUISITION OF LAND IN TECHNOLOGICALLYDEVELOPED AND UNDERDEVELOPED VILLAGES
i
Source of Acquisition of Ownedland
Underdeveloped Villages Developed Villages
Land owned per household(decimals)
Percent of total land
Land owned per household(de-ciinals)
Percent of total land
Inheritance from parents
162 72.0 142 f O r>0/ r U
Inheritance from m-laws
3 1,3 ; 7 3.1
Purchased 57 25.3 72 31.9
Others 3 1.3 5 2.2
Total 225 100.0 226 100.0
diffusion is associated with high transactions in the land market,
the proportion of land obtaied through the market would be higher
for households in the technologically developed villages, compared
to those in the underdeveloped villages. The findings reported in
Tabic 0.6 tend to support the hypothesis. In developed the time of
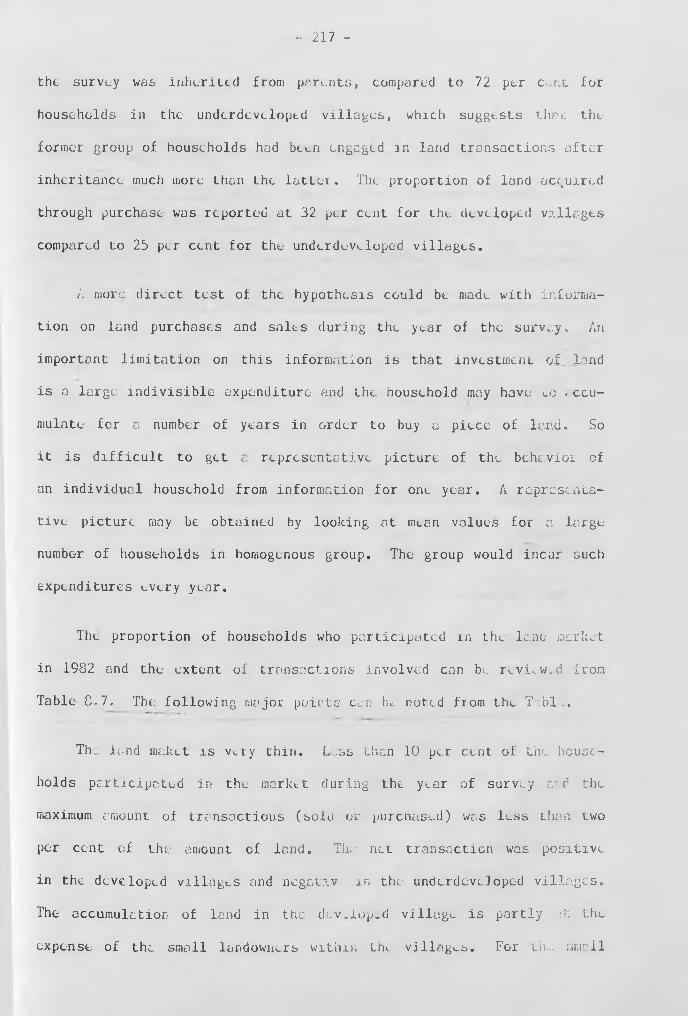
the survey was inherited from parents, compared to 72 per cent for
households in the underdeveloped villages, which suggests thee the
former group of households had bct~n engaged in land transactions after
inheritance much more than the latter. The proportion of land acquired
through purchase was reported at 32 per cent for the developed villages
compared to 25 per cent for the underdeveloped villages.
A more direct test of the hypothesis could be made with informa
tion on land purchases and sales during the year of the survey. An
important limitation on this information is that investment of., land
is a large indivisible expenditure and the household may have co accu
mulate for a number of years in order to buy a piece of land. So
it is difficult to get a representative picture of the behavior of
an individual household from information for one year. A representa
tive picture may be obtained by looking at mean values for a large
number of households in homogenous group. The group would incur such
expenditures every year.
The proportion of households who participated m the land market
in 1982 and the extent of transactions involved can be r vi,.w..d from
Table 8.7, The: following major points can be. noted from the Trbl-.
The land maket is Vv.ry thin. L;..ss than 10 per cent of the house
holds participated in the market during the year of survey red the
maximum amount of transactions (soiu or purchased) was less than two
per cent of the amount of land. The net transaction was positive
in the developed villages and ncgativ in the underdeveloped villages.
The accumulation of land in the developed village is partly T: the
expense of the small landowners within th<., villages. For tin. small
- 217 -

- 218 -
TABLE 8.7
TRANSACTIONS IN THE LAND MARKET IN TECHNOLOGICALLY DEVELOPED AND UNDERDEVELOPED VILLAGES, 1982
Amount Transacted as a Percent
Area and Land °f Gwncdland M n^ , , Households Net accumulationOwnership groups ---------------- ----------------
Purchased Sold Purchased Sold a J‘*'Land Land Land Land
of owned lend
UnderdevilopedVillages: 8.8 8.2 1 . 1 1 1.79 -0.6C
Marginal andsmall landowner 4.9 8.8 2.05 4.98 -2.93
Mediumlandowner 13.6 4.9 0.92 0.70 0.22
Largelandowner 22.6 2.9 0.85 1.31 -0.46
Devclop.-dVillages: 9.8 8.8 1.73 U 3 0 0^43
Marginal andsmall landowner 5.0 7.0 1.32 2.18 -G.G6
Mediumlandowner 16.3 13.8 1.47 2.09 -0.62
Largelandowner 2 1 .6 8 . 1 2.03 0.30 1 . 7 3

- 219 -
farmer group, the proportion of 1 id sold was much less in th< ri vc-
loped compared to the underdeveloped ones which suggests thee by
increasing income per unit of land, the technological progress reduces
the necessity to sell land. The highest accumulation, however, was
by the large landowning groups in the developed villages. They increa
sed the' size of landownership by 1,7 percent during the year of survey.
The result seem to support the hypothesis of the negative off., ct
of technological progress on income distribution through accumulation
of land. The impact, however, is very small. During 1982, the house
holds in the developed villages accumulated only 0.4 percent of the
holdings. At the rate of accumulation even the large landowners
would take 13 years to increase the size, of large holding by orly
a quarter. On the other hand, without technological progress the
small and marginal landholdings would get smaller at a faster rate.
Conclusions
The increase in agricultural incomes significantly expands the
market for non-farm goods services, many of which are locate a m
rural areas. The share of these commodities of the incremental budget
is 52 percent for the technologically developed villages compared
to 40 percent in the underdeveloped villages. The market of cottage
industry products and services which art located mostly in rural
areas also expands more proportionately than the increases in comes,
Thus, rural households may indirectly gain from employment generated
in these activities. But the income growth does not promote capital

- 220 -
accumulation in agriculture, presumably because the investment: on
irrigation, which is the main vehicle for technological progress,
is done by the government. The opportunity for additional investment
in non-agriculture is taken mainly by the higher income groups in
the technologically underdeveloped villages. The technologiCc1 pro
gress sterns to follow more investment on the formation of human
capital and also more- accumulation of land by large landowners in
the developed villages. This suggests that unless the higher income
groups are induced to invest in production activities, or their sur
plus is siphoned off for acceleration of public investment, the uiffu
sion of the new technology may led to further inequality in the dis
tribution of landholding and agricultural incomes both regionally
and across income scales.

- 221 -
1. J.W. Mellor, The New Economics of Growth, op.cit.
2. Pet^r Ilazcll and Alisa R o d Rural Growth Linkages, op,cit; C.Rangarajan, Agricultural Growth and Industrial Performance in India, Research Report No. 33, Washington DC, IFPRI, 1982.
3. J.U. Mcllor, The New Economics of Growth, op.cit.
A. For details of this form of the Engel Function and its characteri-stivcs sec, P. Hazcll and Alisa Rod, op.cit.
25. The value of R for this equation measures the extent to which
the variation of the average budget share of the commodity across the sample is explained by the variation in income. If the marginal budget share is equal to the average share, i.e., the expenditure elasticity of demand is unity, the average budget ahar^ would be the same across the income level and the value of R would be zero.
6. S.J. Press and U.S. Ilonthakcr, The Analysis of Family Budg-..ts,Cambridge University Press, Cambridge, 1971.
7. Not all commodities in this group have expenditure elasticityless than unity. Pulses and fruits have highly elastic demand, but their share of the budget was less than four percent. See supplementary table.
0. The manufactured goods which hav clastic demand are bidx, tobacco, kerosin oil, washing soda, and old readymade garments which areimported from aborad for the poor. As incomes increase, bidi and tobacco are substituted by cigarettes, washing soda is substituted by soaps, and the kerosin oil which is used as fuel is a basic necessity and is also substituted by electricity in areas of developed infrasturcture. The other substitute commodities arc gur and sugar, the former is produced in villages. While the expenditure elasticity of gur is lower than that of sugar, it is still higher than unity. See supplementary table.
9. Atiq Rahman, '‘Surplus Utilization and Capital Formation in Bangladesh Agriculture’', The Bangladesh Development Studies, C (iio.4, 1980).
10. See for example, Andrew Pears, Seeds of Plenty and Seeds of Want, op. cit.
Chapter 8 Notes

9. EFFECT ON INCOME DISTRIBUTION AND POVERTY
The impact of the differential rate of adoption of the n^w techno
logy among farmers, the prices of products and inputs faced by them
and the effect of the technology on production, employment, and expan
sion of the market for non-farm goods and services would ultimately
be felt on the changes in the level and distribution of rural incomes*
This chapter attempts to assess the impact from direct information
on household incomes.
Since rural households do not keep records of their activities,
it is difficult to estimate income accurately, particularly for activi
ties conducted on a self-employed basis. Host rural households arc
also involved in many expenditure saving activities such as production
of fruits and vegetables in kitchen gardens,, rearing of poultry, fish
ing from nearby creeks and canals, processing of food and manufacturing
of personal and household effects, basically -for consumption of the
family. There is a tendency to under-report these activities, since
the respondents do not generally consider these activities as sources
of income. i >;•
In this survey we have been careful to collect information as
comprehensive as possible for estimating income* A detailed question
naire on inputs and outputs for crop production activities, was adminis
tered three times during the year at the end of each cropping season
in order to reduce errors attributable to faulty memory. Input-output
information on processing, manufacturing, and trading activities was
collected through quarterly surveys. The wage income and the irregular

- 223 -
expenditure saving activities wer, recorded in the weekly consumption,
expenditure, and employment survey which was administered eight Limes
during the year. The annual incomes from these sources hrv . been
estimated by extrapolating from the estimates for the eight weeks.
The Level and Structure of Income
The estimates of income obtained from the survey for households
in technologically developed and underdeveloped villages can be r.„viv.w d
from Table 9.1. For thu untire sample, the average household income
is estimated for 1982 at Tk 21,00G and p._r capita income, Tk 3304.
The latest national levul household expenditure survey conducted by
the Bangladesh Bureau of Statistics estimates the per capita rural
income for 1983/84 at Tk 3883, which yields Tk 3347 at 1982 prices
which is very close to our estimate.^
The total household inocme was 29 percent higher in the technolo
gically developed villages compared to the underdeveloped villages,
indicating a positive effect of the technology on the level of income.
The number of persons pur household is also higher in the dev> iop^d
2area , so that the difference in per capita income is less, about
22 percent.
As expected, the new technology has a more pronounced effect
on agricultural incomes than on non-agricultural incomes. Ikarly
61 percent of the household income originates from the agricultural
sector, 52 percent from crop and vegetable production and 9 percent
from livestock and fishing. In developed villages, the crop sector
income (including agricultural wages) was 48 percent higher and total

- 224 -
TABI.r 9.1
STRUCTURE OF HOUSEHOLD INCOMES IN TECHNOLOGICALLY DEVELOPED AND UNDERDEVELOPED VILLAGES, 1982
Sources of Income
UnderdevelopedVillages
DevelopedVillages
Increases in Income in deve
Income perhousehold(Tk/annum)
Percentshareof thesource
Income per household (Tk/annum)
Percent share of the source
loped villages as % of that in underdeveloped villages
Agriculture: 11178 61.0 15644 66.2 40.0Crop cultivation 6258 34.1 9265 39.2 48.1Kitchen gardening 2465 13.5 2730 11.5 10,8Livestock and poultry rasing 1272 6.9 1511 6.4 1 r-)lu® O
Fishing 287 1.6 1099 4.6 283,0Agricultural Wages 896 4.9 1039 4.4 16.0
Non-agriculture: 7151 39.0 7994 33.8 11.CCottage Industry 726 4.0 268 1.1 -63.1Trade 886 4.8 1889 8.0 113,2Services 3268 17.8 4417 18.7 35.2Non-agriculturalWages 2271 12.4 1420 6.0 -37.5
Total household income 18329 100.0 23638 100.0 29.0
Family Size 6 19 5,52 5.3Per Capita Income 2961 • 3626 22.4

- 225 -
agriculture 1 income, 40 percent higher compered to underdeveloped
villages. The increase in agricultural i.neenu v/as 54 per cent for
crop cultivation, and 16 percent for agricultural wages. The absolute
level of non-agricultural income was also higher in the developed
villages, but the difference is substantially less than for agricul
tural income. The income from trade and other services was about
52 percent higher in the developed villages, but the income from cottage
industry and non-agricultural wage was lower by about 44 percent,
which pushed down the income difference from non-agricultural sources
between these two groups of households. many cottage industries arc
low productivity activities and part of the non-agricultural wages
arc earned from domestic service and earthwork, the jobs which are
not preferred at higher levels ol income. As argued m the chapter
on employment, the stimulus from agricultural growth for these activi
ties appears to be taken by households in underdeveloped villages
and by lower income groups.
Tabic 9.2 measures the income effect for different landownership
groups by comparing the estimates for the developed and underdeveloped
villages. It is found that among the farming households, the positive
income difference for developed villages is higher for the larger
landowning groups; 34 percent for the large landowner compared to
22 percent for the small and 28 percent for the medium owner, which
suggests a trend towards inequality in the, distribution of income
among farm households. But the group which have gained the most is
the functionally landless, the bottom onv..-thira of the rural households

IMPACT OF TECHNOLOGY ON INCOME FOR DIFFERENT LANDHOLDING GROUPS
- 226 -
TABLE 9,2
LandowncrshipGroup
Underdeveloped Villages (Tk/houschold)
Dev^lop^dVillages(Tk/housuhold)
Difference in developed villages as percent, of underdeveloped Villages
AgriculturalIncome:______Landless andmarginal owner 3,708 (3,549) 8,000 (6,151) 116 (73)Small 9,201 11,234 22Medium 16,190 20,685 28Large 29,437 39,435 34
Non-agriculturalIncome:_______Landless andmarginal owner 6,036 6,264 4Small 6,819 7,071 4Medium 8,119 7,618 -6Large 9,372 16,721 78
Total Income:Landless andmarginal owner 9,743 (9,585) 14,264 (12,415) 46 (30)Small 16,020 18,305 14Medium 24,309 28,303 16Large 38,809 56,156 45
Note: Figures within brockets art, house.hold incomes for the group excluding the income from fishing. One of the villages undt-r study has a high concentration of commercial fishermen most of whom belong to the landless and marginal landowcr group. The village is included in the developed area and so the high income of th u landless from fishing in the developed villages may show a spuriously high positive impact of the new technology on the iriccmc for this group.

- 227 -
on the landownership scale. For this group, the income from agricul
tural sources is more than double in the developed villages compared
to the underdeveloped villages. Further disaggregation cf results
for this group shows that a >major source of the difference in income
is due. 1:0 fishing (Supplementary Table). Commercial fishing i.; Nan gla-
desh is highly localized and in our sample, it was concentrated in
one village, where land per person is extremely low but a larg" propor
tion of land was irrigated and cultivated with high yielding varieties.
The poor in this village earn a large proportion of their inccm-- fiom
fishing, which cannot be attributed to the new technology. But even
if fishing is excluded, agricultural income for the landless w<:s 73
per cent higher for the developed villages compared to underdeveloped
villages, still higher than the income difference for the large land
owning groups. The difference is mostly on account of income from
cultivation (204 per cent) and agricultural wage (79 per cent) The
transfer of irrigated land to marginal landowners through the tenancy
market for cultivation of the modern varieties of rice was an important
mechanism for increasing the income of the poor from cultivation.
In the undeveloped villages a large proportion of marginal land owners
rented out their tiny holdings and we?re dependent on the agricultural
labor market and non-farm activities for their livelihood. Only 32
per cent of the sample households who own less than 0.5 acres of land
received income from crop cultivation in underdeveloped villages,
compared to 58 per cent in developed villages. For the farm households
m this group, the average income from crop cultivation was 65 per
cent higher in developed villages than in underdeveloped ones.

The figures in Table 9.2 show that the income gains from the
non-agricultural sources have remained confined mostly to the large
landowning group. Compared to underdeveloped villages, the income
from non-agricultural sources in developed villages is about 78 per
cent higher for the large landownei, but six per cent lower for the
middle landowning group. Because of this unequal distribution of
the incremental income from the non-agricultural sources, the diffe
rence in gains for the landless and the large landowning groups narrows
down. For these groups the household income in the developed villages
was about 45 per cent higher, about three times the gains foi the
small and medium landowning groups.
The transfer of incomes to various landholding groups through
the operation of the labor market can be assessed from wage, warnings
from agricultural and non-agricultural labor. The survey estimates
of the Income from this source for the two groups of villages are
reported in Table 9.3. The findings are similar to those reported
in Chapter 7 about employment effects of the new technology. The
agricultural wage income is inversely related with the size of land-
holding and large landowners earn very little from this source, The
agricultural wage income is about 16 per cent higher in developed
villages, but this is exclusively due to the functionally landless
group, whose income from this source was about 79 per cent higher
in the developed villages. With increases in income the landowning
group participate less in the agricultural labor market; their income
from this source was substantially lower in the developed villages
compared to the underdeveloped ones. Only for the large landholding
group was the wage income from non-agricultural labor higher in
- 228 -

- 229 -
TABLE 9.3
INCOMES EARNED THROUGH THE LABOR MARKET: TECHNOLOGY AND LANDHOLDING GROUPS
BY
Land-
Agricultural Wage Income (Tk per Household)
Non-agricultural T. / a g c
and Salary Incomes (Tk per Household)
ownersnip Groups Under
developedvillages
Developedvillages
Percentdifference
Underdevelopedvillages
Developedvillages
Percentdifference
Landless and marginal landowner
1,326 2,370 79 2,546 2,163
•
- -15
Small 1,147 753 -34 2,850 1,364 ‘ -52;
Medium 366 184 -50 1,835 761 -58
Large 31 94 n.e. 349 1,000 187; c
All Groups 897 1,039 1 c lu 2,271 1,420 -37
n.e. - not estimated due to very small income from wage earning for this group.
developed villages. The smaller landholding groups had lower non-
agricultural wage earnings in developed villages, indicating that
with increases in agricultural incomes they withdraw some of the labor
from the non-agricultural labor market. The income loss from this
source was more pronounced for the small' and meHium landowners than
for the landless.

- 230 -
Impact Effect of Technology: A Regression Estimate
The previous section assessed the income effect of the modern
technology by comparing the estimates of income for households in
technologically developed and underdeveloped area. A limitation of
the approach is that besides technology, a host of other factors deter
mine income, whose effects cannot be dissociated when comparing mean
values of the variables for the two groups. A more appropriate method
of assessing the income effect of the new technology would be to fit
•a regression model, relating income to its determinants and incorporat
ing technology as an additional explanatory variable.
The following regression model was fitted to explain household
income:
INCH = f(OWNL, TNC, CPTL, WRKR, EDCIJ, DPND, TECH, 0WNL-^)
where, INCH = Annual income of the household (Tk)
01/ML = Land owned by the household (acres)
TNC = Land rented in by the household (acres)
v ■CPTL = The value of non-land fixed assets (Tk)
WRKR = The number of family workers (persons)
EDCH = Educational level of the .head of the household (completed years of schooling)
DPND = Dependency ratio os measured by the number of consumers per worker in the household.
The adoption of the technology at the household level, TECH, has been
measured by three alternative specification of the variable, the amount
of land irrigated, LIRGN, the amount of land sown under the modern
varieties of rice, LMV, and the expenditure on chemical fertilizers
(in Tk), FERT. Owing to the strong correlation among these three

- 231 -
variables, each variable has been entered alternatively in the model
to explain agricultural incomes.
The dependency ratio has been included to test the Chayanovian
hypothesis that in a peasant economy, the motive force behind the
3/economic activity is the consumer-worker balance in the family.—
It has already been found to be a significant variable affecting the
labor supply of the household.
The square of owned land has been added to allow the marginal
return from land to vary with the size of landownership. It has
already been observed that crop yield varies inversely with farm size
and that larger landonwcrs prefer more leisure, which indicate that
the marginal return from land will decline with the increase in the
size of landownership.
The estimated values of the parameters of the income equation
for total household income, as well as for agricultural and non-
agricultural incomes are reported in Table 9.4. The model explains
about 55 percent of the variation in agricultural income and 52 percent
of the variation in total income within the sample households. Land,
both owned and rented, number of workers and the use of the new tech
nology is found to be significant determinants of agricultural income.
The value of non-land fixed assets does not significantly contribute
to agricultural incomes. The coefficient of this variable is not
statistically significant in either of the agricultural incoim-. equa
tions. The value of the regression coefficient for agricultural income
(Equation 1) indicate that an acre of owned land contributes at the

- 232 -
margin Tk. 3,200 while one family worker at the margin earns about
Tk. 1300 per annum. The marginal contribution of rented land is less
than one-third of that of owned land. This is understandable ±n view
, ‘ j
of the stringent conditions of th^ sharecropping arrangement that
the tenant bears all costs of non-land inputs and pays a half oi the
gross produce to the landowner.
The coefficient of all three technology variables in alternative
equations for agricultural inconk is statistically significant at
less than one percent probability error. As discussed in Chapter
3 and 6, irrigation, MV seeds and fertilizers are highly complementary
and so the separate effect of each of the variables is difficult to
tmeasure. The value of the regression coefficient of each of the three
technology variables thus measures the composite effect of all of
them.
The marginal return from an acre of irrigated land is estimated
at Tk. 5712 (3244 + 2468).— Thus irrigated land and the associated
.'jincrease in liV area and fertilizer use increases agricultural income
at the margin by about 76 percent over that of non-irrigatod land.
The value of the coefficients of land variables in the estimated equa-
» . I * j j '• 'tion (2) for agricultural income indicate that an acre of land under
modern varieties increases agricultural income on the margin by about
Tk. 5116; about 51 percent higher than the income earned at the margin
I : 1 1 _i J • : e. i '■ ■ ■’
from land devoted to traditional crop varieties (tk 3387). One taka
i i f . , ;; .!of expenditure on fertilizer seems to increase agricultural income
on the margin by Tk. 2.17

- 233 -
TABLE 9.4
DETERMINANTS OF RURAL HOUSEHOLD INCOMES: ' REGRESSION ESTIMATES, 1982
VariablesAgricultural Income Non-agri
culturalIncome
Total
Equation
(1)Equation
(2)Equation
(3)
Income
OWNL(14.24)
3244***(14.87)
3387***(14.63)
3486***(1.08)
2003459***(11.26)
(OWNL)2 -63***(7.54)
-43***(5.28) (-4.82)
-2.5(-0.36)
-43***(-3,93)
TOC 1067***(3.27)
627*(1.90)
708**(2.08)
-183(-0.66)
351(0.78)
CPTL-/ 0.021(0.54)
-0.005(-0.13)
0.015(0.35)
0.205***(6.04)
0.101***(2.66)
WRKR 1313***(3.64)
975*** (2.65)
1075***(2.82)
2095***(6.68)
3125***(6.22)
EDCN172 (-1.50)
-123(-1.37)
-113(-1.51)
-129(3.50)
249***(1.52)
DPND 636(1.41)
799*(1.75)
848*(1.79)
827**(2.13)
1649***(2,65)
LIRGN 2468***(7.87)
LMV 1729***(7.22)
375*(1.89)
1973***(6.13)
FERT(3.57)
2.17***
CONSTANT 1757(1.43)
1978(1.56)
1980(1.53)
256(0.24)
2045(1.20)
R2 0.55 0.55 0.53 0.19 0.52
1/ Capital is measured as agricultural capital for the agricultural increase income equation, non-agricultural capital - non-agricultural income, etc. The sample size consists of 629 households with valid observations for all variables in the equation.
Figures within parentheses are " t u values. The significance of ’’t" values *P<0.10, ** P<0.05, *** P<0.01

- 234 -
Tie main determinants of non-egricultural incomes are the number
of workers in the family, accumulation of non-agricultural assets,
education, and the consumption pressure of the family. The regression
coefficients of these variables arc statistically significant at less
than five percent probability error. The explanatory pow_r of the
model in however weak as indicated by the low value of R „ This sug
gests that there may be other variables which determines non-agricul
tural incomes and/or the estimate of non-agricultural income, at the
household level involves a large margin of error. Education increases\
household income mainly through involvement of the worker in the non-
agricultural sector. The estimated value of the coefficient suggests
that an additional year of schooling increases non-agricultural income-
on the margin by Tk 250 per annum, but it is achieved partly at the
expense of agricultural income, so its effect on total household income
is less. The rate' of return on accumulation of non-agricultural capi
tal appears to be 21 per cent. The households who cultivate more
land with modern varieties have higher levels of non-agricultural
income. This may be the effect of reallocation of family labor from
agricultural to non-agricultural activities, which has been explained
in Chapter 7. The value of this coefficient is statistically signi
ficant at less than 10 per cent probability error.
In the estimated equation for total household income, the coeffi
cient of the technology variable is found to be highly statistically
significant. The values of the coefficient of the land variable (CWNL
and LKV) show that a shift of land from traditional to modern varieties
would increase the marginal return from land by about 57 per cent.
The coefficient of the square term of land is negative and highly

- 235 -
statistically significant. It indicates that the marginal income
Irom land declines with increases in the size of landownership. This
may be Lhc result of the negative income effect on the supply of labor,
as reported in Chapter 7, which operates particularly in the agricul
tural sector. This finding also supports the hypothesis that when
income increases, the forces in the labor market may operate to redis
tribute some income from the upper to the lower income groups.
Distribution of Income
The sample households have been ranked on the basis ef the per
capita income and the incomes shares of successive dcclin, groups
have been estimated in order to see the pattern of distribution of
income in the sample. The impact of the technological progress on
income distribution has been assessed by comparing the income share
of various groups in the technologically developed and underdeveloped
villages. The results can be reviewed from Table 9.5 and also from
Figure 1 which shows Lorenz curve depicting the pattern of income
distribution across the landowncrship scale.
The income distribution is fairly unequal. The bottom 40 per
cent of the household in the per capita income scale get about 21
per cent of the total income, while about 24 per cent of the income
accrue to the top 10 per cent of the household. The pattern of distri
bution of income in developed villages was found almost similar to
that estimated for rural Bangladesh by the national level household
expenditure survey of 1981-82. The income, however, appears to be
more unequally distributed in the technologically developed villages.
The income share of the top 10 per cent of the household is about

- 236 -
TABLe 9.5
DISTRIBUTION OF HOUSEHOLD INCOME IN THE TECHNOLOGICALLY DEVELOPED AND UNDERDEVELOPED VILLAGES
Share of Income of the Group (Percent)
Ranking of households according to per capita income
Sample Households, 1982
Underdevelopedvillages
Developedvillages
RuralBangladesh1981/82/a
Bottom 20% 7.7 8.0 7,1
Second 20% 13.4 13.2 11.7
Third 20% 18.4 17.0 16.2
Fourth 20% 24.0 21.9 22.6
Top 20% 36.5 39.9 42.4
Top 10% 21.4 25.8 26.7
Top 5% 10.7 15.6 16.8
a/ Thv, house.holds have been ranked by total household income.• • J
Source: The figures for rural Bangladesh ore from the ^anglede shBureau of Statistics, Report of the Bangladesh HouseholdExpenditure Survey, 1981-82, Dhaka, March 1986.

- 237-
Figure I : Lorenz curve showing the pattern of distributionof Income in developed and undeer-developtdvillages along per capita Income scale
atlve 1'
tion of ne
8.9
1.6—
8 .1—
tevelopecjVillages
DevelopedTTTTaaes"
,..Ttl r . f .— rfwrill . pgiMiedL I™}.— £— {-— — ,
t 8 ^ 8 . i 6 . 1 S 8 . 2 8,2S8.38.368.40.458 S 8 .55 8 .6 6 .6 8 8 .7 8 .^ 8 .8 1.8S8.98.95 1Cumulative Proportion of Foliation

- 236 -
TABLe 9.5
DISTRIBUTION OF HOUSEHOLD INCOME IN THE TECHNOLOGICALLY DEVELOPED AND UNDERDEVELOPED VILLAGES
Ranking of households according to per capita income
Share of Incorme of the Group (Perce
Sample Households, 1982
Undcrdcvtloped villages
Developedvillages
RuralBanglad1981/82,
Bottom 20% 7.7 8.0 7,1
Second 20% 13. A 13.2 11.7
Third 20% 18.4 17.0 16.2
Fourth 20% 24.0 21.9 22.6
Top 20% 36.5 39.9 42.4
Top 10% 21.4 25.8 26.7
Top 5% 10.7 15.6 16.8
a/ ihw, households have been ranked by total household income.
Source: The figures for rural Bangladesh are from the Bangladesh Bureau of Statistics, Report of the Bangladesh Household Expenditure Survey, 1981-02, Dhaka, March 1986.

~ 237-
F1gur# 2: Lorenz curve showing the pattern of distributionof Income 1n developed and undeer-develcptdvillages along per capita income scale
Cumulative Proportion of Population

- 236 -
TABLe 9.5
DISTRIBUTION OF HOUSEHOLD INCOME IN THE TECHNOLOGICALLY DEVELOPED AND UNDERDEVELOPED VILLAGES
Ranking of households according to per capita income
Share of Income of the Group (Percent)
Sample Households, 1982
Underdevelopedvillages
Developedvillages
iaIii alBangladesh1981/82/a
Bottom 20% 7.7 8.0 7,1
Second 20% 13. A 13.2 11.7
Third 20% 18.4 17.0 16.2
Fourth 20% 24.0 21.9 22.6
Top 20% 36.5 39.9 42.4
Top 10% 21.4 25.8 26.7
Top 5% 10,7 15.6 16.8
a/ ih«_ households have been ranked by total household income.
Source: The figures for rural Bangladesh ore from the Bangladesh Bureau of Statistics, Report of the Bangladesh Household Expenditure Survey, 1981-82, Dhaka, March 1986.

- 237-
Figure I: Lorenz curve showing the pattern of distributionof Income 1n developed and undeer-develcptdvillages along per capita income scale
Cumulative Proportion of Population

- 236 -
TABLE 9.5
DISTRIBUTION OF HOUSEHOLD INCOME IN THE TECHNOLOGICALLY DEVELOPED AND UNDERDEVELOPED VILLAGES
Share of Income of the Group (Porcci
Ranking of households accor-Sample Households, 1982
ding to per capita incomeUndcrdcveloped
villagesDevelopedvillages
RuralLanglade1981/82/
Bottom 20% 7.7 8.0 7,1
Second 20% 13.A 13.2 11.7
Third 20% 18.A 17.0 16.2
Fourth 20% 2A.0 21.9 22.6
Top 20% 36.5 39.9 A2. A
Top 10% 21.A 25.8 26.7
Top 5% 10.7 15.6 16.8
aj Th^ households have•
been ranked by total household income.
Source: The figures for rural Bureau of Statistics,
Bangladesh arc Report of the
from the Bangladesh
BangladeshHousehold
Expenditure Survey, 1981-82, Dhaka, March 1986.

- 237 -
F1gur# I: Lorenz curve showing the pattern of distributionof Income in developed and undeer-develcptdvillages along per capita income scale

- 238 -
26 per cxnt in the developed villages, compared to 21 per cent in the
underdeveloped villages. But the position of the bottom 40 per cent
of the households does not change. Their share of income is 21 per
cent in the developed villages compared to 22 per cent in the under
developed villages. So the middle 40 per cent in the income scale
arc squeezed, the ir income share decline's from 42 to 39 per cent.
The degree of inequality in income distribution is often summa
rized by the Gini concentration coefficient. The estimated values
of the coefficients based on the individual household level data arc
presented in Table 9.6. The concentration ratio is estimated at 0.39
for household income, but since higher income households typically
have larger number of persons, the degree of concentration in per
capita income is less — at 0.35. Agricultural income is highly un
equally distributed — the concentration ratio is estimated at 0.62.
This is however related mostly to unequal distribution of land owner
ship, since land is the most important asset determining agricultural
incomes. The degree of inequality in the distribution of non-agricul- .
tural income is 0.44. Households who have less access to land and
hence to agricultural incomes, tend to make up by involving more in
non-agricultural activities, and hence the concentration of household
income is lower than that of either agricultural or non-agricultural
incomes.
The technological progress seems to improve the distribution
of agricultural income. The concentration ratio is estimated at 0.60
in developed villages compared to 0.63 in underdeveloped villages-
while the concentration in distribution of landownership is similar.
But the distribution of non-agricultural incomes becomes more
skewed, which leaves the distribution of total household income

- 239 -
TABLE 9,6
THE DEGREE OF INEQUALITY IN THE DISTRIBUTION OF INCOME AND LANDHOLDING, GINI RATIOS FOR SAMPLE HOUSEHOLDS, 1982
Var .tables Underd vclopcd Villages
DevelopedVillages
AilSample
Landown.cl 0,61 0.60 0.61
Agricultural income 0-63 0.60 0-62
Mon-<• gricultural inc ome 0.43 0.45 0.44
Household income. 0,39 0.38 C as
Per capita income C, 34 0.36 a 6s c: O-.
Per capita income with adjust~d household size-'* 0 33 0,34 0.34
Adjusted to adult equivalent of houS‘ hold members.
consumption unit from age-sex COiijpOS.L el Oil

- 240 -
unchanged, Uith increases in income, the family size of the lower
income group increases more than proportionately than higher income
groups, presumably due to decline m mortality rates, which males the
distribution of per capita income relatively more skewed in the deve
loped villages.
Alleviation of Poverty
from the welfare point of view the most appropriate indicator
of the effectiveness of a development policy is its Impact on the poor.
So m recent years, there is a great deal of interest in measuring
changes in the incidence of poverty and judging programs and policies
on the basis of their impact on the alleviation of poverty.
A conventional way to measure poverty is to establish a pov :rty
line defined as ehe threshhold level of income needed to sat. sfy the
basic minimum food and non-food quiremcnt and count the numb.;;: of
people living below that line, the so-called "head count method'' of
measuring poverty. For Bangladesh a number of studies used th .s m Lhcd
to mcasui- the changes in poverty ever time. The usual approach has
been to take the normative requirement of different kinds of food,
as recommended by the FAC as the minimum consumption bundle, whrd _ vcs
a per capita intake of 2100 kilo calori per day and estimate jIs cost
by applying retail prices for these items. Some adjustment is then
made for the requirement of the non-food necessities. Separate poverty
lines are estimated for rural and urban areas by taking into account
the. urban-rural differences in th _ pric« level. Using this method,
the. poverty line for rural household was estimated by the c.uthor™^

at Tk 1,800 per person for 1978/79. After adjustment for the changes
in the cost of living index for *ural area, the poverty line for 1982
is estimated at Tk 2392.
Recently the Bangladesh Bureau of Statistj.es has made alL.„ri^tive
estimates of poverty line for different levels of calorie consumption
of the population, on the basis of the household level data o.i come
and calorie intake of the population, obtained from the 1981/82 national
7 /household expenditure survey.— In order to avoid the problems of
(a) identification of the minimum needs of different types of food
iri the consumption basket and (b) choice of representative laems for
different consumers, the poverty line was estimated by fitting ar : auc
tion of per capita income to per capita calorie intake, and th.n deter
mining the income for the household calorie intake. For rural house
holds the method yielded a poverty line of Tk 2304 for a daily intake
of 2200 k. cal. per person, and Tk 1580 for an intake of 1800 k, cal.
for 1981/52, The first may be referred to as the threshold m come
for rnodf.rat.c-. poverty and the second for extreme poverty. After adjust
ment for the changes in the rural cost of living, the lines are esti
mated for 1982 at Tk 2374 and Tk 1731 per person per year for mod-"sate
and extreme poverty respectively.
It may be noted that the two methods described above yield <• .Imost
the same poverty threshold income for an intake of around 2250 k.
calorie per person per day. Since the BBS estimate is based on c > -cent
survey of a large number of households and is available for two alter
native intake of energy, we have decided to apply the BES norm to the
income distribution data for this sample to estimate the proportion
of population living below the poverr.y line.
- 241 -

The estimates are reported in Tabic- 9.7. For the sample as a
whole, a 9 per cent of the population were. b. low the line of mode rat j.ov .rty
and 21 per cent below the line of extreme poverty. The es timet as are
somewhat lower compared to those for rural Bangladesh derived from
the 1383/84 household expenditure survey data which show that 44 pei
cent of the population and income below the line of moderate poverty
and 29 per cent below the line of extreme poverty. The national level
estimates are however comparable to our findings lor the underdeveloped
villages.
Technological progress seems to have a significant impact c:i alle
viation of rural poverty. The proportion of population below th( line
of moderate poverty was 32 per cent in developed villages caompcred
to 47 per cent in the underdeveloped villages, i.e., about -third
of the poet has moved up the poverty line. The progress has been
achieved mainly at the bottom of the income scale. The population
under extieme poverty was only 15 per cent in the developed villages
compared to 27 per cent in the underdeveloped villages. For tiw, lerd-
1^oS gj.cup the proportion under moderate poverty was 63 per cent for
the entire sample; 51 per cent in developed area compared to 73 per
cent in underdeveloped area (Table 9-G). The proportion under extreme
poverty for this group is down from 54 to 28 per cent (Table 9,8),
The head count measure of poverty lias the limitation thec j t is
insensitive to changes in the level and distribution of income among
the poor, iwo other indicators are suggested to supplement the head
count measure, for a more meaningful assessment of the changes in
poverty. They are the poverty gap ratio, which measures tin: short
fall of ths mean income of the pool from the poverty line, a d the

- 243 -
TABLE 9.7
ESTIMATES OF THE INCIDENCE OF POVERTY IN TECHNOLOGICALLY DEVELOPED AND UNDERDEVELOPED VILLAGES, 1982
Moderate Poverty Extreme Puv.r oy
Indicators Underdevelopedvillages
Developedvillages
Allvillages
Underde-eveloped villages
Developed All villages villages
Proportion of population m poverty
0.467 0.317 0.390 0.273 0.151 0,211
Poverty gap r.rtio 0.329 0. 264 0.303 0.262 0.216 0.246
Concentration of income among the poor (gin± ratio)
0.17 0.14 0.16 0.14 0.13 0.14
Sen:s index ofnovert v 0.207 0.116 0.162 0.100 0.040 0-74
INCIDENCE OF
TABLE 9.0
POVERTY BY LANDOWi’ERSHIP GROUP AND TECHNOLOGY, 1902
(percent living below the poverty line)
Land owned Moderate Poverty Extreme Poverty
(acres)Underde veloped villages
Developsu All villages ..reus
Underd*veloped Develop a A H villages vilic-g c-reas
Less than 0,5 0.783 0.510 0.634 0.537 0.279 0.396
0.50 - 2.0 0.509 0.363 0.430 0.534 C.109 0.255
2.0 & c.bove 0.205 0.174 0.220 0.009 0,000 0.001

G n u concentration ratio of income for the poor. Sen has suggested
a weighted index of poverty imcorporatmg all three"■'indicators.—
The estimates of the supplementary indicators of poverty as well
as the Sen index are reported in Table 9.7, The results are similar
to that assessed by the head count measure. The Sen index of pov ray
for developed villages is almost a hall of that in the underdeveloped
villages, whether one takes the moderate or the extreme poverty lino
Conclusions
The potential of increasing rural incomes through the diffusion
of the modern technology is substantial- In technologically developed
villages, where nearly three-fifths of the cropped land was unu or
modern varieties of rice, income was about 40 per cent higher thani y . . .
it was in the villages where less than 10 per cent of the area had
been covered. Among farmers, the income gal: s were higher for large
landowners, indicating a trend t. wards inequality, but for the
landless, the income difference was as high as for the Large land
owners. The top 20 per cent m the per capita income scale have gained
in relative terms, the bottom 40 per cent h^ve remained unaffected,
while the middle 40 per cent have been squeezed, although the absolute
gain has been positive for al income groups. The Gini coefficient
of concentration for household income was found to be the same (0.39)
for both groups of villages, but the coefficient for per capita .inccui
was only marginally higher for developed villages.
- 244 -

- 245 -
Technological progress seems to have made a significant impact
on alleviation of rural poverty. The proportion of people livir_
below the poverty line, the poverty-gap ratio, and the concentrate
ratio of income of the poor are all lower in the technologically
developed villages compared to the underdeveloped villages. For
the landless, the proportion of population living below the line of
moderate poverty was estimated at 51 per cent for the developed a l l e
ges, compared to 78 per cent for the underdeveloped villages. The
Sen index of poverty was 0.116 for the dev-loped villages, a substan
tial reduction compared to the 0.207 estimated for the underdeveloped
villages.

- 246 -
1. The 19G1/C2 household expenditure survey however shows that tile estimated rural per capita income was less than our estimate for 19C2. This may be due to the selection of a larger propertie» on the technologically developed area m our sample than in the country. In Bangladesh 24 per cent of the cropped area and 2G per cent of the cereal area was under the modern varieties dur ng 19G2/G3. In our sample, the proportion was 37 and 46 per c arc respectively.
2. The difference was found mostly for thelandless group. Compered to underdeveloped villages, the average size of the family i.he developed villages was about 13 per cent for the landl ,s; group but only 3 per cent higher for other groups. It may bethe result of a reduction in mortality rates following the inc.3cs in income in very poor households.
3. A. V. Chayanov, The Theory of Peasant Economy, op. cit.
4. The equation is fitted in the form
i Uq v a^ ‘ X2J a2 x2
where, is the amount of unirrigated lend and is the amount
of irrigated land. It can be rewritten m the following form:
I — S q y a. j “*■ ^ ^ * 2 "■ ^ 2 *
Thus a. is the coefficient of unirrigated land and (a. + a.-.)1 1 z'
is the coefficient of irrigated land.
5. The estimate is close to the incremental-benefit cost ratio of fertilizer estimated by the IFTC from the crop-specific fertilizer response functions fitted on the farm survey data for 1979-82 periods. The weighted average value for six rice varieties evaluated at 1984 prices of fertilizer ana paddy is 2.5, Mahabub Hossain, "Fertilizer Consumption, Pricing and Foodgrain Production in Bangladesh*’, op. cit.., p. 195.
6. Mahabub Hossain, Atiur Rahman, and M.m, Akash,Agricultural Taxation in Bangladesh: Potential And Policies, Research Report No. 42, Bangladesh Institute of Development Studies, Dhaka, 1985.
7. Bangladesh Bureau of Statistics, Report of the Bangladesh household Expend1 1uro Survey, op. cit., p, 40-45-
Chapter 9 Notes

- 247 -
8. The Sen index is given by:
P « i:[I (1-1) G ]
where F is the Sen index, K is the head count ratio, I is the income gap ratio, and Go is the Gini coefficient of the income distribution of the poor,
A.K. Sen, ''Poverty: An Ordinal Approach to Measurement4,, Econo- metrica 44 (March 1976: 219-231), -----
- 1.

- 243 -
10: POLICY IMPLICATIONS
Technological progress is the key to overcoming the land cons
traint to the growth of foodgrain production in Bangladesh. Indeed,
the country has maintained the food-population balance in the post-i ..
independence period mainly through technological progress. Over the
last fifteen years (1970-85) the area cropped with modem varieties
has gone up by more than five times from 0.5 to 2.8 million hectares,
and consumption of chemical fertilizers from 0.15 million tons of
nutrients to 0.59 million tons. Although the land under cultivation
has remained stagnant at about 9.0 million hectares, the technological
progress has made possible an acceleration of the rate of growth of
crop production from 2.5 per cent per annum during 1950-71 period
to 2.9 per cent during 1971-85, and the growth of cereal production
from 2.6 to 3.4 per cent. The technological progress has cut the
unit cost of production of rice by about onc-fifth and increased gross
profits per unit of land by 1.2 times. The analysis of a detailed
household level data for 16 villages at different levels of technolo
gical development shows that all this may have been achieved with
somewhat neutral income distribution effect and a significant reduc
tion in the incidence of rural poverty.
There is a vast potential for further diffusion of the new tech
nology which will have to^exploited to fetd the fast growing population
of the country. The following major policy directions are suggested
by the study for realization of the potential.

Strengthening Agricultural Research and Extension
The credit fos the diffusion of the modern technology to present
levels is mainly due to the Langladesh Rice Research Institute, which
has done a commendable job to develop modern varieties suitable for
local agro-climatic conditions and to tastes of consumers. The
research effort has to be .supported to look continuously for higher
yielding varieties in order to increase production from the fixed
amount of land and to keep down the cost of production.
The new varieties have spread mainly during the ary season under
irrigated conditions. In Bangladesh however n o . is grown mainly
under rainfed conditions and the modern van.. tees have not spread
much for this production environment. More attention should be given
to the cropping system research to look for possibilities of adjust
ment in the existing cropping pattern to spread modern varieties in
the monsoon season and to develop higher yielding varieties suitable
for rainfed conditions.
The diffusion of the modern technology is also constrained by
some other agro-climatic factors, e.g., continuous deep flooding of
a large proportion of area during the rainy season, high levels of
salinity of the soil in the large coastal area etc. More attention
should be given to explore whether cost-affective higher yielding
varieties could be developed for these unfavourable production envi-
ronemtns.
- 249 -

The development of the mod or n technology for rice and wheat. has
reduced the competitiveness of some non-cereal crops like pulses and
oilseeds which are important as a source of protein for the poor.
It is found in thr s study that m technological developed villages
only 10 per cent of the cropped land are allocated to pulses,' oilseeds,
jute and sugarcane compared to about 26 per cent in underdeveloped
villages. Nationally, the sown area under non-ccreal crops declined
from 22 per cent during 1965-70 to 17 per cent during 1980-05 period.
Obvioulsly, additional support is needed for research to develop suit
able varieties for non-cereal crops in order to make them competitive
with modern varieties of rice and wheat.
Farmers have, cxpcrineced a faster increase m prices of modern
agricultural inputs relative to output, because initially these inputs
were introduced at highly subsized prices and gradually the subsidies
have been phased out. There is still considerable subsidies on irriga
tion and the reduction of subsidies may continue for some time in
the future. This phasing-out has increased the unit cost of production
and cut down the profits. The changes in the relative input-outpul
prices have affected the modern varieties more severely because they
are heavy consumers of fertilizer and irrigation. It has reduced
the profitability gap between the traditional and modern varieties.
It is estimated that over the period 1975/76 to 1984/65, the rate
of profit over the investment of working capital (cost of production)
has declined from 77 to 55 per cent for the new varieties and from
49 to 43 per cent for the traditional varieties (Chapter 4).
- 250 -i

The adverse effect of the price trends on profits can be mitigated
to some extent by increasing the efficiency of input use through more
effective extension services. Bangladesh has a long experience with
agricultural extension and recently it has been reorganized on the
lines of Training and Visit" system, and the number of extension
agents at lower administrative tiers has greatly increased. The effec
tiveness of agricultural extension however remains a controversial
issue. The gap m the yield of modern varieties and the response
of chemical fertilizers achieved in government experimental farms
compared to those realized by farmers is large. Results of BRRI expe
riments reported by Raman show that with 80 kg of nitrogen per hectare,
the yield lor modern varieties increase to 6 04 tons for the boro
season and 4,43 tons for the aman season.— 70th similar levels of
application of fertilizers, farmers actually produced, during 1960-
82 period, 3.74 and 2.73 tons respectively. The response of fertilizer
at farmers' field is estimated at 4.3 units of paddy per unit of nutri-
2/ent compared to 10:1 ratio under experimental conditions.— One cannot
expect that the gap would be completely eliminated since most experi
ments do not represent farmers' conditions, but more effective exten
sion service can reduce the gap and increase the profitability of
cultivation.
Public Investment for Irrigation
The main vehicle: for the diffusion of the knew technology has
been the development of irrigation facilities. It is the single most
important determinant of the adoption of the new technology. About
96 per cent of the plots growing the new crops are irrigated and the
- 251 -
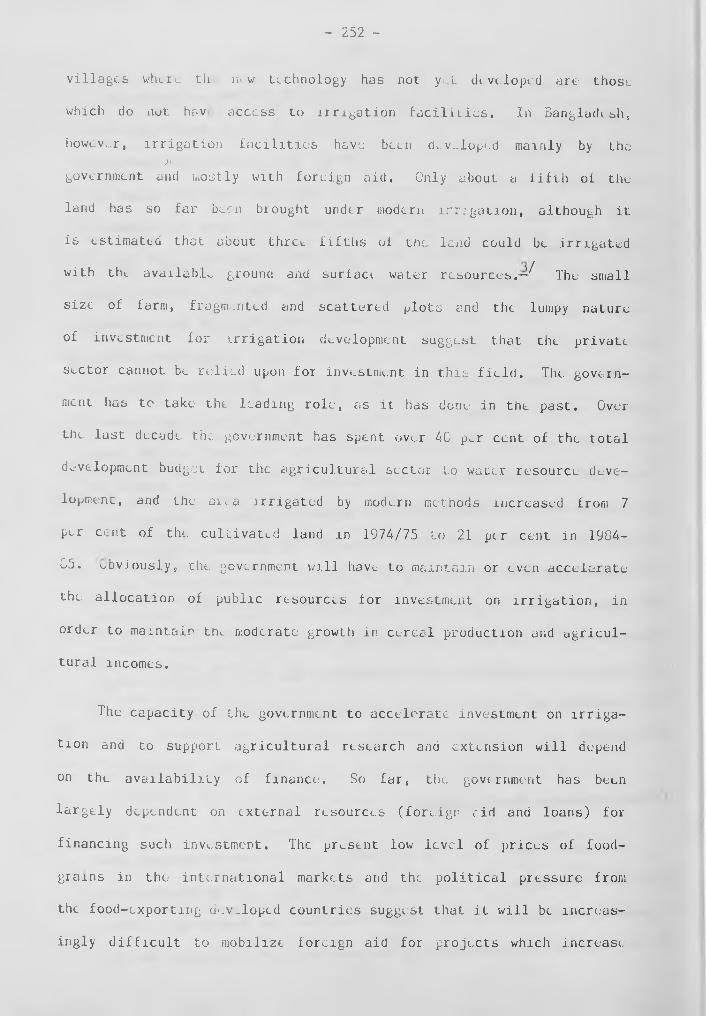
villages where th n- w technology has not yet developed are those
which do not hnv access to irrigation facilities. In Bangladesh,
however, irrigation facilities have been developed mainly by theJ * '
government and mostly with foreign aid. Only about a fifth of the
land has so far been brought under modern irrigation, although it
is estimated that about three fifths of the land could be irrigated
with the available ground and surface water resources.— The small
size of farm, fragmented and scattered plots and the lumpy nature
of investment for irrigation development suggest that the private
sector cannot be relied upon for investment in this field. The govern
ment has to take the leading role, as it has done in the past. Over
the last decade the government has spent over 40 p^r cent of the total
development budget for the agricultural sector to water resource deve
lopment, and the OK-a irrigated by modern methods increased from 7
per cent of the cultivated land in 1974/75 to 21 per cent in 1904-
85. obviously, the government will have to maintain or even accelerate
the allocation of public resources for investment on irrigation, in
order to maintain the moderate growth in cereal production and agricul
tural incomes.
The capacity of the government to accelerate investment on irriga
tion and to support agricultural research and extension will depend
on the availability of finance. So far, the government has been
largely dependent on external resources (foreign rid and loans) for
financing such investment. The present low level of prices of food-
grains in the international markets and the political pressure from
the food-exporting d‘.v..loped countries suggest that it will be increas
ingly difficult to mobilize foreign aid for projects which increase
- 252 -

foodgrain production. The uncertainty about the future availability
of foreign aid and the increased , ost of debt servicing suggest that
it is advisable for the government to seek out i tcrnal resources.
During the past, the government has had limited success in mobi
lizing resources from the agricultural sector.— Direct agricultural
taxes, collected mostly through land revenue, have lost considerable
ground as a major source of government revenue since the early sixties
— the real value of tax receipts during the 1979-82 period was only
about 30 per cent of the level reached in 1958-61. In recent years
direct tax tapped about 2,25 per cent of non-agricultural incomes,
whereas agriculture’s terms of trade during the last decade did not
show any consistent downward trend, and the present level of domestic
prices of rice and wheat is considerably higher than the price prevail
ing in the international markets, indicating that the producers are
protected at the expense of the consumer.
The government should take serious steps to mobilize additional
resources from the agricultural sector. A move in that direction
could be taken by recovering the cost of public investment from the
beneficiaries. Subsidies on fertilizer have been withdrawn, but sub
sidy on irrigation is still large. the shallow tubewells are sold
to farmers almost at a cost price, but in 1982-83 there was about
70 per cent subsidy on deep tubewells and 30 per cent on low-lift
p u m p s . F o r large scale irrigation projects implemented by the Water
Development Board, both the capital and the current costs are borne
almost entirely by the government. The benefits of the subsidy arc-
reaped mostly by the owners of the irrigation equipment who are large
- 253 -

villages where th m.w technology has not yet developed are those
which do not hove, access to irrigation facilities. In Bangladesh,
however, irrigation facilities have been developed mainly by the
government and mostly with foreign aid. Only about a fifth of the
land has so far been brought under modern irrigation, although it
is estimated that about threw fifths of the land could be irrigated
3 /with the available ground and suriact water resources.— The small
size of farm, fragmented and scattered plots and the lumpy nature
of investment for irrigation development suggest that the private
sector cannot be relied upon for investment in this field. The govern
ment has to take the leading role, as it has done in the past. Over
the last decade the government has spent over 40 p^r cent of the total
development budget for the agricultural sector to water resource deve
lopment, and the a i a irrigated by modern methods increased from 7
per cent of the cultivated land in 1974/75 to 21 per cent in 1984-
85. obviously, the. government will have to maintain or even accelerate
the allocation of public resources for investment on irrigation, in
order to maintain thw. moderate growth in cereal production and agricul
tural incomes.
The capacity of the government to accelerate investment on irriga
tion and to support agricultural research and extension will depend
on the availability of finance. So far, the government has been
largely dependent on external resources (foreign rid and loans) for
financing such investment. The present low level of prices of food-
grains in the international markets and the political pressure from
the food-exporting d‘.v.,lopcd countries suggest that it will be increas
ingly difficult to mobilize foreign aid for projects which increase
- 252 -

foodgrain production. The uncertainty about the future availability
of foreign aid and the increased .. jst of debt servicing suggest that
it is advisable for the government to seek out internal resources.
During the past, the government has had limited success in mobi
lizing resources from the agricultural sector.- Direct agricultural
taxes, collected mostly through land revenue, have lost considerable
ground as a major source of government revenue since the early sixties
— the real value of tax receipts during the 1979-82 period was only
about 30 per cent of the level reached in 1958-61. In recent years
direct tax tapped about 2.25 per cent of nan-agricultural incomes,
whereas agriculture’s terms of trade during the last decade did not
show any consistent downward trend, and the present level of domestic
prices of rice and wheat is considerably higher than the price prevail
ing in the international markets, indicating that the producers arc
protected at the expense of the consumer.
The government should take serious steps to mobilize additional
resources from the agricultural sector. A move in that direction
could be taken by recovering the cost of public .investment from the
beneficiaries. Subsidies on fertilizer have been withdrawn, but sub
sidy on irrigation is still large. the shallow tubewells are sold
to farmers almost at a cost price, but in 1982-83 there was about
70 per cent subsidy on deep tubcwells and 30 per cent on low-lift
pumps.— For large scale irrigation projects implemented by the Water
Development Board, both the capital and the current costs are borne
almost entirely by the government. The benefits of the subsidy are
reaped mostly by the owners of the irrigation equipment who are large
- 253 -

and medium landowners, the small farmers who buy water from the owners
of the machines are charged almost the market clearing rates. Indeed,
it is found in this study that the difference in the price of water
is a major source of inequality in the distribution of income from
he new technology (Chapter 6). The irrigation charge is found one-
fourth higher for the small farmers than the large ones. Thus, it
may be advisable to withdraw subsidy on sale of irrigation equipment,
and also to reduce the share of large scale irrigation prpjccts in
the budget for water resource development, since the cost recovery
of large scale projects proved to be extremely difficult. The initial
reaction of the farmers to withdrawal of subsidy may be adverse, which
may temporarily slow down the technological diffusion, but the adverse
reaction should not last long. The difference in the profits between
cultivation of modern (irrigated) and traditional varieties (unirriga
ted) is about Tk 3.1 thousand per hectare at 19G4-G5 prices, and the
withdrawal of irngaion subsidies would not eliminate this gap (Chap
ter 4)» On the othv_r hand, it would reduce the income disparities
owing to differential irrigation charge between farmers growing tradi
tional and modern varieties, between technologically developed and
underdeveloped regions, and between farmers with access to different
irrigation projects and equipments.
Provision of Credit
The amount of credit obtained from both institutional and non-
institutional sources is found to be a significant determinant of
the adoption of the new technology (Chapter 6). This is understandable
since the working capital needs on account of purchased inputs —
- 254 -

fertilizer, irrigation and even hired labor, ar much higher for the
modern varieties compared to the local varieties when the major por
tion of the inputs art supplied from within th household. The cash
cost of production at 1984-85 prices is estimated .-..t Tk 5241 p-..r hec
tare for the mod.ro varieties compared to Tk 1974 for traditional
varieties, an increase of about 166 per cent. It is difficult for
the small farmer »;o manage such a large inv stm p l from accumulated
Sc v i ngs.
The government of Bangladesh recognizes eh credit needs of th.;
farmers. Over tin last decade, institutions providing agricultural
credit have prolif rated and the number of book branches operating
in rural areas incr as d from 854 m 1975/76 e > over 3200 m 1983/84,
The supply of institu :.ional credit at l e d valu- increased about eight
times ov< r this p.oed. Credit disbursed during 1983/84 amounted
to seven per cent of the value aded in the agricultural sector, about
6/2,3 Limes the cost of chemical fertilizers consumed in the country.-
l u i owing to the weakness ol the. credit institutions and low interest
rates, credit has remained concentrated in the hands of the medium
and large farmers, and complicated loan sanci , :nir-g procedures have
led to untimely disbursement, which together with fir spread of corrup
tion among bonk officials, has piomot. d laxity in credit disciplines
and poor rccov y. The samll farmers who .• d credit badly hav.
suffered. They have to rely on the non-ir.sfitutionsl market, where
the- cost of a ioo.ii is substantially higher, and to that extent tlity
benefit 1. ss from t.t. tit j lization of th loan, compared tc the medium
and large farmers who hove access to cheap loans from the institutional
sources. Obviously, here is a need for overhauling the institutions
- 255 -

- 256 -
and management of agricultural credit so that credit can be better
targeted to small.r farmers. The government may consider elimination
of subsidies on agricultural credit and/or a policy of variable cost
of loan funds to banks depending on the proper cion of loan they give
to small and marginal farmers.
The findings of this study also point to the need for providing
working capital loans to the poor so that they can generate more employ
ment in the rural non-farm sector. The increase in agricultural income
from technological progress has a sigificant impact on the expansion
of the market for non-farm goods and services, which generates more
employment opportunities in the non-farm sector, Eut some working
capital is needed for self-employment in these activities. The dura
tion of self-employment in general and in non-agriculture in particular
is found to be significantly related the amount of non-land capital
owned by the household (Chapter 7). Owing to the lack of capital,
the poor cannot take full advanto0e of the employment opportunities
generated in non-farm activities. The findings show that the addi
tional employment in non-agriculture is taken up by large land-owning
groups rather than by the landless (Chapter 7), and that the incre
mental income from non-agriculture is distributed in favor of the
higher income groups (Chapter 9), The experiments conducted by the
Gramccn Bank show that if credit is provided to the poor they can
generate productiv. self-employment in the non-farm sector and signi
ficantly improve their levels of living.— The Gramten bank provides
loans to the landless without any collateral security and recovers
about 98 per cent of the loans on time. The borrowers utilize the
loan in family based enterprises for livestock raising, cottage

- 257 -
industry, and trade and shopkeeping, generating employment mostly
v ' *lor the women. Since technological progress stimulates demand for
these activities, the expansion of working capital loans for the poor
in technologically developed areas should be considered to help gene
rate more employment for the poor and improve income distribution.

- 258 -
SUPPLEMENTARY TABLE - 1
LONG-TERM CHANGE IN LAND ALLOCATION TO MAJOR CROPS, 1950-85
Yearly Averages Yearly Averages Yearly Averagesfor 1950-55 for 1965-70 lor 1900-85
CropsThousandhectares
Per cent of total
Thousandhectares
Per c^nt of toeal
Thousandhectares
Per cent of total
Rice: 8, 456 76.9 9,634 77.3 10,414 78.7
Aus 2,313 21.0 3,124 25.1 3,084 23.3
Aman 5,806 52.8 5,883 47.2 5,955 45.0
Boro 337 3.1 627 5.0 1,375 10.4
Wheat 40 0.4 89 0-7 574 4.3
Jute 616 5.6 918 7,4 600 4.3
Sugarcane 99 0.9 163 1.3 161 1.2
i ea 30 0.3 41 0.3 45 0.3
Tobacco 53 0.5 45 0,4 53 0.4
Pulses 380 3.5 360 2.9 297 2.2
Oilseeds 315 2.9 335 2,7 289 2.2
Potato 34 0.3 75 0,6 108 0.8
Chilli 73 0.7 84 0.7 74 0.6
Onion 25 0-2 33 0 3 33 0.3
Others 879 8.0 692 5,5 592 4.5
All crops 11,000 100.0 12,469 100.0 13,240 100.0
Compiled from figures published by th^ Bangladesh Bureau of Statistics.

- 259 -
SUPPLEMENTARY TABLE - 2
ESTIMATES OF GROWTH EQUATIONS FOR CROP PRODUCTION, 1950-85
Regression Coefficients of
CropsDependentvariables
Constantterm
Time(T-1949)
Dummy( 1 for 1971-85 period)
Time X Dummy
p:2t:pn
Statistics
Cereals Area 8.973 0.0110(8.52)
-0.0525(-0.75)
C.0006(0.22)
0.88 85.4
Yield 8.340 0.0152(8.10)
-0.2519(-2.46)
0.0068(1.73)
0.87 80.0
Production 10.405 0.0262(10.09)
-0.304(-2.16)
0.0074(1.36)
0.91 122.0
Noncereals
Area 7.289 0.0127(3.78)
0.335(1.83)
-0.0200(-2.84)
0.27 5.3
Yield 8.639 0.0089(4.78)
-0.1470(-1.46)
0.0038(0.97)
0.69 26.4
Production 9.021 0.0215(6.45)
0.1878(1.03)
-0.0162(-2.31)
0.59 17,6
AllCrops
Area 9.145 0.0112(8.59)
-0.0008(-0.01)
-0.0022(-0.82)
0.85 66.0
Yield 8.486 0.0140(9.38)
-0.233(-2.86)
-0.0062(1.96)
0.90 104.5
Production 10.631 0.0252(11.60)
0.234(-1.98)
0.0039(0.86)
0.92 140.7
Note: Dependent variables are measured in logarithms.Figures within parentheses are estimated ”tv< values.

- 260 -
VILLAGE LEVEL VARIATION IN THE USE OF FERTILIZERS IN TRADITIONAL AND MODERN VARIETIES
SUPPLEMENTARY TABLE - 3
Surveyvillages
Charkhamar 97.1 16 154 42.4 42.2
Dajarampur G6. G 10 141 33.7 41.3
Syedpur 79 -4 21 103 3.3 26.3
Govindapur 94,0 13 189 17-6 7.6
Bandabeel 90.6 43 254 29.G 11.7
Doakhali 96. G 70 123 14.1 12.6
iiarishpur 97-2 5 286 79.1 16.9
Gobrapara o p cou 33 nil 4.3
Birhat 33,3 11 nil nil
Tuliamara 35-0 5 * nil nil
Khejurdanga 81.0 10 391 17.2 m 1
Khunta 100-0 1G0 338 78.3 nil
Illashpur 100.0 120 404 72.1 nil
Chasapura 100,. 0 152 30G 79.3 nil
Fatgar i 60.0 10 272 10.6 42.7
Raotora 100.0 26 325 53.1 6.0
Per cent of farmers usingfertilizer
Fertilizer Use per hectare (Kg of materials per hectare)
Traditionalvarieties
Per cent of cropped land
under
,. , , Deepwateruodern Modern aman a[J(Jvarieties varreties local ,)oro

- 261 -
SUPPLEMENTARY TABLE - 4
ESTIMATES OF TRANSLOG PRODUCTION FUNCTIONS FOR DIFFERENTRICE VARIETIES, 1982
CroppedVariety
Constantterm
Regression Coefficiu its of
R2Logland
Loglabor
Log land 6 log labor
Per cent of crop damage
Aus Season:
Local 5.026(5.72)
0.445(1.80)
0.556(2.92)
0.036(0.40)
-1.42(-7.36)
0.82
HYV 7,452(8,60)
0.862(3.43)
0.323(1,70)
-0.085(-0.88)
-0.84(2.65)
0.89
Aman Season:
Local 6.156(12.09)
0.463(2,01)
0.473(3.80)
0.067 (0.80)
-0.85(-3.67)
0.82
HYV 7.562(16.55)
0,447(1-65)
0.299(2.09)
0.070(0.76)
-0,54
(-3.05)
0.83
A g i o Season;
Local 7, 4o2 0.917 0.247 -0.087 -1,30(23.73) (8.97) (2.93) (-1,54) (-7.76)
HYV 7.226 0.698 0.369 -0.047 -0.69(27.60) (8.00) (5.89) (-1.34) (-8.04)
0.95
0.93

- 262 -
MARGINAL BUDGET SHARES AND EXPENDITURE ELASTICITY OF DEMAND FOR DIFFERENT COMMODITIE
SUPPLEMENTARY TABLE - 5
CommodityGroups
Underdeveloped Villages Developed Villages
Averageshare
Marginalshare
Expenditureelasticity
Averageshare
Marginsshare
il Expenditure elasticity
Crops: 66.97 56.47 0.84 62,91 44.95 0.71 ,
Rice 44.55 42.33 0.95 43.78 32.81 0.75
Wheat 8.42 -0-27 -0.03 5.33 -1.57 -0.29
Pulses 1.07 1.32 1.24 0.75 1.16 1.56
Roots 1.75 1.33 0.76 1,55 1.19 0.77
Vegetables 3.68 3.39 0.92 3.27 1.95 0.60
Spices
Betelnut c
3.44 2.88 0,64 3.56 3.33 0.91
Leaves 0.91 1.42 1,55 1.34 1.34 1.00
Rice husk 0.53 0.35 0.65 0.21 0.24 1.16
Jute stick 0.51 0,30 0.59 1.11 1.47 1.33
Fruits 2.12 3,42 1.62 1.92 3.02 1.57
Forestr y i 4.12 3.21 0.76 3.08 2.72 0.88
Firewood 2.02 2,59 1.29 1.53 2.06 1.35
Leaves 2.10 0.62 0,30 1,55 0.66 0.43
Livestock; 4,43 5.70 1.29 4.00 6.35 1.59
Heat 1.12 2.47 2.20 ' 1,74 3.80 2.18
Hi lk 0.94 1,82 1.93 1.25 2.41 1.92
E8B 0.44 0,77 1.75 0.32 0.55 1.70
Cowdung 1.93 0,64 0.33 0.69 -0.41 -0.58
Fishery; 3.55 4.22 1.19 4,35 5.32 1.22
• • • / • • •

SUPPLEMENTARY TABLE - 5 (Contd.)
- 263 -
Underdeveloped Villages Developed VillagesCommodity — -......... ................. ...................................Groups Average Marginal Expenditure 'Average Marginal Expenditure
share share elasticity.. .share share " elasticity
Rural
i anufacturmg: 9.54 12-40 1.30 9.48 10.29 1.09
Gur 1.59 2.20 1.39 1.50 2.11 1.41
Bidi 1.46 0.72 0.46 1.37 0.79 0.57
Tobacco 0.17 0.25 1.42 0.17 -0.08 -0.44
Mustard oil 2.13 2.31 1.09 2.31 2.39 1.04
Sweets 0.06 0.15 2.44 0.06 0.14 2.48
Handloom Clothes
3.77 5.98 1.56 3.70 4.22 1.14
Tailoring 0.35 0.79 2.29 . 0,30- 0.7 T 1.94
Ur banManufacturing: 7.20 10.50 1.46 7.97 12,44 1,56
hi 11-made Clothing
0,52 1.38 2.63 0.97 1.69 1.94
ImportedClothing
0.81 2,57 3.19 0,48 1.28 2.69
Old garments 0.29 0.20 0.66 0.28 0.15 0.53
Ready-madegarments
0.42 0,79 1.86 0,51 0.87 1,73
Shoes 0.24 0.46 1.96 0.33 0.63 1.95
Sugar 0.28 0.30 1 . 0 0 0.35 0.88 2.50
Tea 0.06 0.06 1 . 0 0 0,35 0.70 2.01
Cigarette 0.13 C.34 2.60 0,35 0.90 2.58
Soyabin oil 0.34 0,19 0.57 0.13 0,25 1.90
Coconut oil 0,40 0.36 0.90 0,36 0.35 0,98
Kerosin oil 1.66 1.75 0,94 1,90 1.67 0.88
Electricity * Vi* ■jf 0,07 0.22 2.98
Matches 0.40 0,12 0.30 0-40 0.21 0.51
Soap 0.94 1.35 1.44 1.01 1.61 1.59
Washing soda 0.25 0.15 0.62 0,10 0.05 0.47
Toiletry and Cosmetics
0.07 C. 10 2.50 0,17 0.33 2.00
Others 0.19 0.30 1.56 0.21 0.45 2.14

- 264 -
SUPPLEMENTARY TABLE - 5 (Contd.)
CommodityGroups
Underdeveloped Villages Developed Villages
Averageshare
Laiginal share
Expenditureelasticity
Averageshare
Marginalshare
Expenditureelasticity
Services: 4.20 7.50 1.79 Q J 1 17.93 2.18
Education 0.63 1.72 2.74 1.00 2.58 2.57
Health 1.36 1.90 1.39 2.49 4.58 1.84
Transport 0.73 0.95 1.30 0.98 1.93 1.96
PersonalServices
0.35 0.39 1.11 0.50 0.53 1.06
ReligiousServices 0..60 1.25 2.10 2.38 5.48 2.30
OtherServices
0.53 1.30 2.44 0.86 2.83 3.28
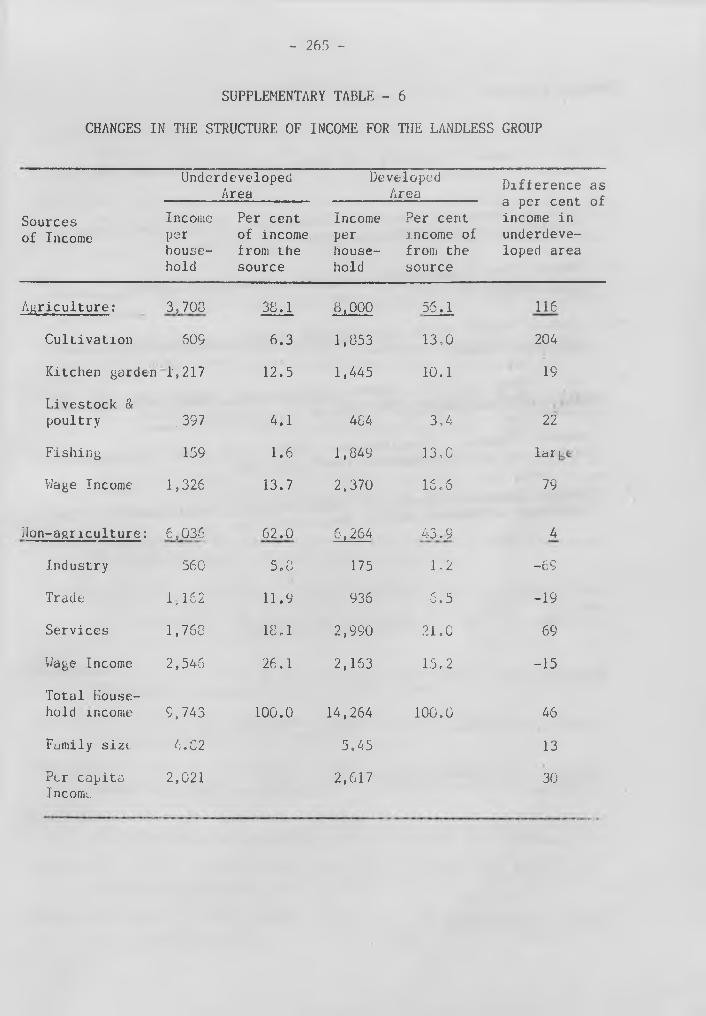
- 265 -
SUPPLEMENTARY TABLE - 6
CHANGES IN THE STRUCTURE OF INCOME FOR THE LANDLESS GROUP
Sources of Income
Agriculture: 3,708 38.1 8,000 56.1 116
Cultivation 609 6.3 1,853 13,0 204
Kitchen garden T, 217 12.5 1,445 10.1 19
Livestock & poultry ... . 397 4.1 484 3,4 22
Fishing 159 1.6 1,849 13,0 lar j
Wage Income 1,326 13.7 2,370 16 c 6 79
ilon-agriculture: 6,036 62.0 6,264 43.9. 4
Industry 560 5.8 175 1.2 -69
Trade 1,162 11.9 936 6.5 -19
Services 1,768 18,1 2,990 21.0 69
Wage Income 2,546 26.1 2,163 15,2 -15
Total Household income 9,743 100.0 14,264 100.0 46
Family size 4.82 5.45 13
Per capita Income
2,021 2,617 30
UnderdevelopedArea
Incomeperhousehold
Per cent of income from the source
DevelopedArea
Incomeperhousehold
Per cent income of from the source
Difference as a per cent of income in underdeveloped area

- 266 -
Chapter 10 Notes
1. S.fi.H. Zainan, "Agronomic and Environmental Constraints on Fertilizer Effectiveness", op. cit.
2. Mahabub Hossain, "Fertilier Consumption, Pricing and FoodgrainProduction in Bangladesh, op. cit.
3. Master Plan Organization, National Water Plan Project - DraftFinal Report, op. cit.
4. Mahabub Hossain et al, Agricultural Taxation in Bangladesh; Potential and Policies, op, cit.
5. S.K, Osmani and h’.A, Quasem, Pricing and Subsidy Policies for Bangladesh Agriculture, op. cit,
6. iiahabub Dossain, Institutional Credit for Aural Development:An Overview of the Bangladesh Case", op. cit,
7. iiahabub Hossain, "Credit for Alleviation of Rural Poverty: TheExperience of Grameen Bank in Bangladesh", op. cit.

- 267 -
References
Agarwal, B., "Tractors, Tubewells and Cropping Intensity in the Indian Punjab1’, Journal of Development Studies, 20 (No. A, 1984): 290-302.
Ahfnad "Q.K. and Mahabub Hossain, '’An Evaluation of Selected Policies and Programs for Alleviation of Rural Poverty in Bangladesh1' in R. Islam (ed) Strategies for Alleviation of Poverty in Rural Asia, ILO, ARTEP, Bangkok, 1985.
Ahmed, Iftikhar,'‘Technological Change and Labor Utilization: Bangladesh", The Bangladesh Development Studies, 6 (No. 3, 1978):359-66.
Ahmed, Iqbal, '’Unemployment and Under-employment in Bangladesh Agriculture", World Development 6 (December 1978): 1281-1296.
Ahmed, R., Agricultural Price Policies under Complex Socio-economicand Natural Constraints, Research Report No. 27, Washington
{j DC, International Food Policy Research Institute, 1981.
‘ t / JAhmed'" Raisuddin, "Structure, Dynamics and Related Policy Issues of
Fertilizer Subsidy in Bangladesh", in BIDS and IFPRI joint report on Fertilizer Pricing Policy and Foodgrain in Production Strategy m Bangladesh, Technical Annex, Washington DC, 1985. ».
Ahmed, Raisuddin and. Lahabub Hossain', 'Infrastructure and Development of a Rural Economy", (Draft) IFPRI, July 1987,
Alauddin, K. and C. Tisdell, "Market Analysis, Technical Change and Income Distribution in Semi-Subsistence Agriculture: The Caseof Bangladesh", Agricultural Economics, 1 (No. 1, 1986): 1-18. :
Asaduzzaman, h., '‘Adoption of HYV Rice in ..Bangladesh", The Bangladesh Development Studies, 7 (No, 3, 1979): 23-49.
Bangladesh Agricultural Development Corporation, HYV Task Force Report, 1974/75, 1975/76, Dhaka*- -1977;--""' ,s . -y
Bangladesh Bureau of Statistics, Report of the Bangladesh Household Expenditure Survey, 1981-82, Dhaka, Ministry of Planning, 1985.
Bangladesh Bureau of Statistics, National Report on the 1983-64 Censun of agriculture and Livestock, Dhaka, Ministry of Planning, 1985.
Bangladesh Bureau of Statistics, Pr: linrHe ry Deport: on Labor F o r e . Survey of Bangladesh, Dhaka, October 1984,
Bangladesh Bureau of Statistics, Report .a the Agricultural Census of Bangladesh, 1977, (National Volunu ) Dhaka, Ministry of Planning, 1981, p. 47.

- 268 -
Bangladesh Institute of Development Studies and International Food Policy Research Institute, Development Impact of the Food for* Work Program In Bangladesh, A report submitted to the World Food Program, Washington DC, 1985.
Bangladesh Unnayan Parishad, A Socio-Economic Evaluation of the Chandpur II Irrigation Project, A report prepared for the World Bank, Dhaka, 1982. v ' ;
Bardhan, P.K., ‘‘Agricultural Development and Land Tenancy in a Peasant Economy: A Theoretical and Empirical Analysis51, American Journal of Agricultural Economics, 61 (No. 1, 1979): 48-56.
Bardhan, P.K., ''Size, Productivity and Returns to scale: An Analysis of Farm Level Lata in Indian Agriculture5', Journal of Political Economy, 81 (No. 6, 1973).
Bardhan, P.K., "Labor Supply Functions in a Poor Agrarian Economy5’, American Economic Review, 69 (March 1979): 73-83.
Eardhan, P.K, and'T.N. Srinivasan, "Crop Sharing Tenancy in Agriculture:A Theoretical and Empirical Analysis", American Economic Review, 61 (No. 1, 1971): 48-64.
Barker, R,, R.W. Kerdt and Beth Rose, The Rice Economy of Asia, Resources for the Future, the Johns Hopkins University Press, 1985.
Berry, A. and W. Cline, Agrarian Structure and Productivity in Developing Countries, Johns Hopkins Press, Baltimore, 1979.
Bhaduri, A.,5,A Study in Agricultural backwardness under Semi-feudalism5’, Economic Journal, 83 (March 1973): 120-137.
Bhalla, G.S., and G.K, Chadha, Green Revolution and the Small Peasant, Concept, Mew Delhi, 1983.
Dharadwaj, K., Production Conditions in Indian Agriculture, Cambridge University Press, 1974.
Binswanger, Hans and V, Ruttan, Induced Innovation, Technology, Institutions and Development, Johns Hopkins University Press, Baltimore, 1978,
Jlyn, G., ’'The Green Revolution Revisited’’, Economic Development and Cultural Change, 31 (No. 4 1983): 705-725,
Joyce, J.K., ’Water Control and Agricultural Performance in Bangladesh", The Bangladesh Development Studies, 14 (Mo, 2, 1986).
Chand, R. and J,L0. Haul, "A Note on the Use of Cobb-Douglas Profit Function”, American Journal of Agricultural Economics, 68 (No. 1, 1986): 162-164.

- 269 -
Chayanov, A.V., The Theory of Peasant Economy (ed. by P. Thorner), Irwin, Homewood, 1966.
Christensen, L.R. and L.W. Jorgensen, and L.J. Lau, "Transcental Logarithmic Production Function1,, Review of Economic and Statistics, 55 (No. 1, 1973): 28-45.
Cuddy, J.D.A. and P.A., Leila Valle, "Measuring the Instability of Time Series Data", Oxford Bulletin of Economics and Statistics, 40 (February 1978): 79-85.
Cummings, J.T., "The Supply Response of Bnngnleo Rice and Cash Crop Cultivators", The Bangladesh Development Studies, 2 (October 1974): 235-251„
Dalrymple, E.G., Development and Spread of Nigh Yielding Rice Varieties in Developing Countries, Washington DC, Agency for International Development, 1986.
Dantwala, M.L., "Technology, Growth and Equity in Agriculture", in J.W. iiellor and G.K. Desai (ed) Agricultural Change and Rural Poverty, The Johns Hopkins University Press, baltimore and London, 1985: 110-123.
Dasgupta, B., The Hew Agrarian Technology and India, Macmillan, New Delhi, 1977.
Department of Agricultural Marketing, '’Wholesale Prices of Agricultural and Animal Products in Bangladesh" 1972-85", Government of Bangladesh, Dhaka, 1986.
Farmer, B. (ed), Green Devolution, Macmillan, London, 1977.
Feder, G.R. Just, and D. Silberman, "Adoption of Agricultural Innovations in Developing Countries: A Survey", Economic Developmentand Cultural Change, 33 (No. 2, 1985): 255-298.
Flinn, J., K. Kalirajan, and L, Castillo, "Supply Responsiveness of Rice Farmers in Laguna, Philippines", Australian Journal of Agricultural Economics, 26 (No. 1, 1982): 39-48.
Ghose, A.K. and Ashwani Saith, "Indebtedness, Tenancy and the Adoption of the New Technology in Semi-feudal Agriculture", World Development 4. (April 1976): 305-320.
Green, W.K., "On the Asymptotic Bias of the Ordinary Least Squares Estimator of the Tobit Model", Econometrics, 49 (No. 2, 1981): 505-513.
G'riffin, K., The Political Economy of Agrarian Change: An Essay onthe Green Revolution, Harvard University Press, Cambridge, 1974.

%
- 270 -
i.amid, H . A ., Luw-Lift rumps under IDA Credit in South-East Bangladesh;A Socio-Economic Study, In al Development Studies, Series 12,Rajs'hahi University.
hasan, N., and K, Ahmad, "Studies on Food and Nutrient Intake by Rural Population of Bangladesh", Ecology of Food and Nutrition, 15(No. 12, 1984) s 143-158.
Kayami, Y. and R.W, Kerdt, "Market Price Effects of Technological Change on Income Distribution in Semi-Subsistence Agriculture", -American Journal of Agricultural Economics, 59 (May 1977)s 245-256.
Hszell, Peter E. R 0, Instability in Indian Foodgrain Production, Research Report No. 30, IFPRI, May 1902.
Kazell, P.B.R. and Alisa Roell, Rural Growth Linkages; Household Expenditure Patterns in Malaysia and Nigeria, Research Report 41, Washington DC, IFPRI, 1983.
Kerdt R.W. and L. Garcia, "Adoption of Modern fdc£ Technology: The Impact of Size and Tenure in Bangladesh", International RiCO Research Institute, Manila, 1982 (mimeographed).
iiGrdt, R.W., and A.M. Hantfac, "Modern Technology and Economic Efficiency of Philippine Farms', Economic Development and Cultural Change, Vol. 29, 1982, pp. 374-399;
x.erdt, R.W. and I.E. Wickham, "Exploring the Gap Between Potential and Actual Rice Yields in the Philippines", Food Research Ins- titute Studies. Vol. 14, 1975, pp. 163-181.
hossain, iiahaub. Agricultural Development in Bangladesh: A Historical Perspective:, The Bangladesh Development Studies, 12 (December1984): 29-57. “
Hossain, Mahabub, "Foodgrain Production in Bangladesh Performance, Potential and Constraints", The Bangladesh Development studies, 8 (Nos. 1 and 2, 1980): 39-70,
aossain, Mahabub, 'Fertilizer Consumption, Pricing and Foodgrain Production in Bangladesh" in BIBS/IFPRI joint report on Fertilizer Pricing Policy and Foodgrain Production Strategy in Bangladesh, Technical Annex, Washington DC, 1985.
hossain, ^ahabub, Mature of ienancy Markets in Bangladesh Agriculture"', Journal of Social Studies, 3 (No. 1, 1977).
-ossain, mababub, Institutional Credit for Rural Development: An Overview of the Bangladesh Case", The Bangladesh Journal of Agricultural Economics. 8 (No. 1, 1985): 1-16.

•! 271 -
Hossain, Mahabub, ''Farm Size, Tenancy and Land Productivity: An Analysis of Farm Level Lata ii Bangladesh Agriculture’’, The Bangladesh Development. Studies, (ho. 3, 1977): 235-348.
Hossain, Mahabub, "Agricultural Growth Linkages: The Bangladesh Case", The Bangladesh Development Studies, 15 (Ho. 1, 1987).
Hossain, Mahabub, ’’Credit for Alleviation of Rural Poverty: The Experience of Grameen Dank in Bangladesh: (mirneo), IFPRI, September1906.
• ,e •Hossain,-'Mahabub, "Employment and Labor in Bangladesh Rural Industries”,
The Bangladesh Development Studies, 12 (iiarch-June 1984): 1-24.*
Hossain, Mahabub, ’‘Productivity and Profitability of Bangladesh Rural Industries5' , The Bangladesh Development Studies, 12 (March- Junc 1984> r 127-161.
*:'tGHossain, Mahabub, Credit for the Rural Poor: The Grameen Bank in
Bangladesh, Research Monograph ilo. .4, The Bangladesh Institute of Development Studies, Dhaka, 1904H
Hossain, Mahabub, At-iur. Rahman, and M.M. Akash, Agricultural Taxation in Bangladesh: Potential and Policies, Research Report No.42, Bangladesh Institute of Development Studies, Dhaka, 1985.
Hossain, Mosharraf, A. Rashid, and S. Jahan, Rural Poverty in Bangladesh: A Report to the Like-minded Group, Dhaka University,19816.
■ if ■ ;
International Fertilizer Development Centre, Agricultural production, Fertilizer Use and Euity Considerations: Results and Analysis of Farm Survey Data, 1979-80, Alabama, 1982.
• ■• *** I '
International Fertilizer Development Centre, Agricultural Production, Fertilizer Use and Equity Considerations: Pa suits and Analysis of Farm Survey Data, 1980-82, Alabama, 1984.
International Food Policy Research Institute and Bangladesh Institute of Development Studies, Fertilizer Pricing Policy and Foodgrain Production Strategy in Bangladesh, Report submitted to the Ministry of Agriculture, Government of Bangladesh, Technical Annex, Washington DC, 1985.
Ishikawa, S., Economic Development in Asian perspective, Tokyo, ICinokuniya, 1-967.
Januzi, F.T., and J.T. Peach, Agrarian Structure of Bangladesh: AnImpediment to Development, West View Press, Boulder, Colorado,1980.

- 272 -
Kahnert, F. ct al, Agriculture- and Related Industries in Pakistan, Paris, OECD Development Centre, 1970.
Khan, A.R., "Poverty end Inequality in Rural Bangladesh", in K. Griffin, and A,R. Khan (ed) Poverty and Landl^-ssness in Rural Asia, ILO, Geneva, 1977.
Khan, Mahmud M., "Labor Absorption and Unemployment in Rural Bangladesh", The Bangladesh Development Studies, 13 (September-December1985): 67-88.
Lau, L.J. and P. Yotopoulos, "Profit, Supply and Factor Demand Functions", American Journal of Agricultural Economics 54 (No.1, 1972): p. 11-18.
Lau, L.J. and P. Yotopoulos, "A Test for Relative Economic Efficiency: An Application to Indian Agriculture: American Economic Review
61 (Mo. 1, 1974): p. 94-109.
Lau, L.J., W.L. Lin, P.A. Yotopoulos, "The Linear Logarithmic Expenditure System: An Application to Consumption-Leisure Choice*',Econom^trica, 46 (July 1978): 843-868,
Lipton, M., Modern Varieties International Agricultural Research and the Poor, CGIAR Study Paper No. 2, Washington DC, World Bank, 1985.
Lipton, M., "Inter-farm, Inter-regional and Farm-nonfarm Income Distribution," World Development, 6 (No. 3, 1978): 319-337.
Maddala, G.S., Limited Dependent and Qualitative Variables in Econometrics, Cambridge, Cambridge University Press, 1984,
Mahmud, W., "Foodgrain Demand Elasticities of Rural Households in Bangladesh: An Analysis of Fooled Data", The Bangladesh Development Studies, 7 (March 1979).
Mandal, M.A.S., "Farm Size, Tenancy and Productivity in an Area ofBangladesh", The Bangladesh Journal of Agricultural Economics,3 (December 1980): 21-42.
Master Plan Organization, National Water Plan Project - Draft FinalReport, Volumes I and II, Ministry of Irrigation and Flood Control, Dhaka, 1985.
Mellor, J.W., "'Determinants of Rural Poverty: The Dynamics of Production, Technology and Price", in J.W. Mellor and G.M. Desa.i(ed) Agricultural Change and Rural Poverty, The Johns Hopkins University Press, baltimore and London, 1985: p. 21-40.
Mellor, J.W., "Food Price Policy and Income Distribution in Low-incorncCountries", Economic Development and Cultural Change, 27(October 1978): 1-26.
Mellor, John, The New Economics of Growth: A Strategy for India andthe Developing World, Ithaca, Cornull University Press, 1976.
Newberry, David, "Tenurial Obstacles to Innovation", Journal of Development Studies, 11 (July 1975).

- 273 -
Osmani, S.R. and Quascm, M.A., Pricing and Subsidy Policies for Bangladesh Agriculture, Bangl sh Institute of Development Studies, Dhaka, 1985 (mimco).
Pears, A ., Seeds of Plenty and Seeds of Pant: Social and EconomicImplications of the Green Revolution. Clarendon Press, Oxford, 1980.
Perrin, R. and D, Wmkelmann, ’'Impediments to Technical Progress on Small Versus Large Farms", American Journal of Agricultural Economics, 58 (December 1976); 888-894.
... - • ■ . j;
Prahladachar, M., "Income Distribution Effects of the Green Revolution in India: A Review of Empirical Evidence1’, World Development, 11 (Wo. 11, 1983): 927-944.
Press, S.J, and H.S. Konthaker, The Analysis of Family Budgets, Cambridge University press, Cambridge, 1971.
Prey, C.E. and J.A. Anderson, Bangladesh and the CGIAR Centres, StudyPaper No. 8, Washington DC, World Bank, 1985.
Quasem, M.A., '’Impact of the New System of Distribution of Irrigation Machines in Bangladesh", The Bangladesh Development Studies,13 (September-December 1985): 127-140.
Quiggin J. and Bui-Lan A. "The Use of Cross-Sectional Estimates of Profit Function for Test of Relative Economic Efficiency", Australian Journal of Agricultural Economics, 28 (April 1984): 44-55.
Rahman, Atiq, "Surplus Utilisat_on and Capital Fomation in 'Bangladesh Agriculture1', The Bangladesh Development Studies, 8 (No. 4,
...1980); 21-46.
Rahman, Atiq and R. Islam, "Labor Use in Rural Bangladesh: A Study with Micro-Level Data*’, (mimeo), Asian Regional Team for Employment Promotion, ILO, Bangkok, 1985.
Rangarajan, C., Agricultural Growth and Industrial Performance in India, Research Report No. 33, Washington DC, International Food Policy Research Institute, 1982.
Raquibuzzaman, M., "Share Cropping and Economic Efficiency in Bangladesh", The Bangladesh Economic Review, 1 (No. 2, 1973).
Rosenweig, M.R., "Rural Wages, Labor Supply and Land Reform: A Theoretical and empirical Analysis", The American Economic Review, 68 (December 1978): 847-861.
R°y» P., 'Transition in Agriculture: Empirical Studies and Results", Journal of Peasant Studies, 8 (No. 2, 1981).

Ruttan, V.W., "The Green Revolution: Seven Generalizations", Internet \onal Development Review,- 19 (No. 4, 1977): 16-23.
Shahabuddin, Quazi, "Testing of Cobb-Douglas Myths: An Analysis with Disaggregated Production Functions in Bangladesh Agriculture:,The Bangladesh Development Studies, 13 (No. 1, 1985): 88-97.
Shahid, A. and R.W. Lcrdt, "Land Tenure and Rice Cultivation in Four Villages of Dhaka District, Bangladesh", The Bangladesh Development Studies, 10 (No. 4, 1982): 113-124.
Sen, A.K., "Poverty: An Ordinal Approach to Measurement", Econometrica, 44 (March 1976): 219-231.
Van Schendel, W., Peasant Mobility: The Odds of Peasant Life in Bangladesh, Assen, The Netherlands, 1981.
Yotopoulos, P.A. and L.J. Lau, "A Test for Relative Economic Efficiency'1, The American Economic Review, 63 (No. 1, 1973): p. 214-223.
Yotopoulos, P.A. and L.J. Lau, w0n Modeling the Agricultural Sector in Developing Economics", Journal of Development Economics,1 (No. 1, 1974): 105-127.
Zaman, S.M.H., 'Agronomic and Environmental Constraints on Fertilizer Effectiveness", In IFPRI/BIDS joint report on Fertilizer Pricing and Foodgrain Production Strategy in Bangladesh, Washington DC, 1985.
^ellner, A., "An Efficient Method for Estimating Seemingly Unrelated Regressions and Test for 'ggregation Bias", Journal of the American Statistical Association, 57 (No. 2, 1962): 348-375.

( S ) ® © ®
This work is licensed under a Creative CommonsAttribution - Noncommercial - NoDerivs 4.0 License.
To view a copy of the license please see: http://creativecommons.Org/licenses/bv-nc-nd/4.0/
This is a download from the BLDS Digital Library on OpenDocshttp://opendocs.ids.ac.uk/opendocs/
i f ^ i Institute of Development Studies