MEKELLE UNIVERSITY - IDS OpenDocs
102
MEKELLE UNIVERSITY SCHOOL OF GRADUATE STUDIES THE IMPACT OF COMMUNITY MANAGED IRRIGATION ON HOUSEHOLD INCOME AND POVERTY REDUCTION (THE CASE OF SEHARTI SAMRE WEREDA, TIGRAY, ETHIOPIA) By SESEN HADUSH GEBREKIDAN Advisor: FREDU NEGA (PhD) Co-Advisor: HAFTOM BAYRAY (MA) A Thesis Submitted to the department of Economics of Mekelle University in Partial Fulfillment of the Requirements for the Degree of Science in Economics (Development Policy Analysis) May 2013 Mekell,Ethiopia
-
Upload
khangminh22 -
Category
Documents
-
view
1 -
download
0
Transcript of MEKELLE UNIVERSITY - IDS OpenDocs

MEKELLE UNIVERSITY
SCHOOL OF GRADUATE STUDIES
THE IMPACT OF COMMUNITY MANAGED IRRIGATION ON HOUSEHOLD
INCOME AND POVERTY REDUCTION
(THE CASE OF SEHARTI SAMRE WEREDA, TIGRAY, ETHIOPIA)
By
SESEN HADUSH GEBREKIDAN
Advisor: FREDU NEGA (PhD)
Co-Advisor: HAFTOM BAYRAY (MA)
A Thesis Submitted to the department of Economics of Mekelle University in Partial
Fulfillment of the Requirements for the Degree of Science in Economics (Development
Policy Analysis)
May 2013
Mekell,Ethiopia

Mekelle University
School of Graduate Studies
Mekelle University
As Thesis Research advisor, I hereby certify that I have read and evaluated this thesis Prepared,
under my guidance, by Sesen Hadush entitled The Impact of Community Managed
Irrigation on Household Income and Poverty Reduction: The Case of Sehartisamre
Wereda, Tigray, Ethiopia. I recommend that it be submitted as fulfilling the Thesis
requirement.
______________________ _________________ _______________
Major Advisor Signature Date
_________________ _________________ _______________
Co-advisor Signature Date
As member of the Board of Examiners of the MSc Thesis Open Defense Examination, We
certify that we have read, evaluated the Thesis prepared by SesenHadushand examined the
candidate. We recommended that the Thesis be accepted as fulfilling the Thesis requirement for
the Degree of MSC in ECONOMICS.
________________ ___________ _______________
Chairperson Signature Date
___________________ ______________ _______________
Internal Examiner Signature Date
_______________ ______________ _______________
External Examiner Signature Date

DEDICATION
I dedicate this to my Mother W/RO KINDAHAFTI EYASU she brought me up
with the heart of both a mother and father, who always instilling in the great value
of education. No words could express my gratitude and love to you.

STATEMENT OF THE AUTHOR
First, I declare that this thesis is my bona fide work and that all sources of materials used for this
thesis have been duly acknowledged. This thesis has been submitted in partial fulfillment of the
requirements for an advanced M.Sc. degree at the Mekelle University and deposited at the
University Library to be made available to borrowers under rules of the Library.
Brief quotations from this thesis are allowable without special permission provided that accurate
acknowledgement of the source is made. Requests for permission for extended quotation from or
reproduction of this manuscript in whole or in part may be granted by the head of the major
department or the Dean of the School of Graduate Studies when in his or her judgment the
proposed use of the material is in the interests of scholarship. In all other instances, however,
permission must be obtained from the author.
Name: SesenHadush Signature _______________
Place: Mekelle University
Submission Date: June 9

1
Table of Contents Acknowledgements .....................................................................................................................3
Acronyms ...................................................................................................................................4
List of Figures .............................................................................................................................7
ABSTRACT ...............................................................................................................................8
CHAPTER ONE: INTRODUCTION ..........................................................................................9
1.1. Poverty and Food Insecurity in Ethiopia ...........................................................................9
1.2. Statement of the Problem ................................................................................................ 12
1.3. Objectives of the Study ................................................................................................... 14
1.4. Significance of the Study ................................................................................................ 14
1.5. Scope and limitations of the Study .................................................................................. 15
1.6. Organization of the Thesis .............................................................................................. 15
CHAPTER TWO: LITERATURE REVIEW............................................................................. 16
2.1. Concept of irrigation ....................................................................................................... 16
2.2. Socioeconomic Impacts of Irrigation .............................................................................. 17
2.3. Estimation of poverty line ............................................................................................... 19
2.4. Overview of Ethiopia's Agricultural Development Policy/Strategy ................................. 19
2.5. Brief history of irrigation development in Ethiopia ......................................................... 20
2.6. Ethiopian water potential for Irrigation Development ..................................................... 22
2.7. The need for community managed small-scale irrigation in Ethiopia .............................. 23
2.8. Characteristics and Functioning of irrigation schemes .................................................... 23
2.9. Irrigation and Implications for Poverty Alleviation ......................................................... 24
2.10. Irrigation Development in Tigray Regional State ............................................................ 26
2.11. Empirical studies on irrigation ........................................................................................ 27
2.12. Socio-economic role of irrigation schemes in the study area ........................................... 28
CHAPTER THREE ................................................................................................................... 29
DESCRIPTION OF THE STUDY AREA ................................................................................. 29
3.1. Socio-economic profile of Tigray Regional State ............................................................ 29
3.2. Socio-economic profile of the study area ........................................................................ 30
3.3. Background of irrigation user Tabia‘s ............................................................................. 32
3.4. Methodology .................................................................................................................. 32
3.4.1. Selection of the study area .............................................................................................. 32

2
3.4.2. Sampling Techniques ..................................................................................................... 33
3.4.3. Data Collection mechanisms and types of data................................................................ 34
3.5. Method of Data Analysis ................................................................................................ 35
3.5.1. Descriptive Analysis ....................................................................................................... 35
3.5.2. Econometric Model ........................................................................................................ 35
3.5.3. Impact Measurement using Propensity Score matching method ...................................... 35
3.5.4. Poverty Profile Measurements ........................................................................................ 38
3.5.5. Measuring Poverty Index ................................................................................................ 39
3.5.6. Definition of Variables and Hypothesis Setting............................................................... 41
3.5.6.1. Definition of determinants of household income ...................................................... 41
3.6. Theoretical Framework of Impact of Irrigation on Poverty ............................................. 43
CHAPTER FOUR: RESULT AND DISCUSSION ................................................................... 45
4.1. Socio-economic Characteristics of the Sampled Households ........................................... 45
4.2. Contribution of Irrigation on Farmers‘ Livestock Holding .............................................. 50
4.3 Food and Non-Food Expenditures of Irrigation User and Non User ................................ 51
4.4 Propensity Score Matching Estimates of the Irrigation impact ........................................ 52
4.5 Impact of Irrigation on Poverty Reduction ...................................................................... 54
4.5.1 Impact of Irrigation on Household Consumption Expenditure ......................................... 55
4.6 Opportunities and Challenges of Irrigation ..................................................................... 56
4.6.1 Irrigation opportunities ................................................................................................... 56
4.6.2 Constraints of irrigation practices ................................................................................... 57
CHAPTER FIVE ...................................................................................................................... 58
CONCLUSIONS AND RECOMMENDATION ....................................................................... 58
5.1 CONCLUSIONS ............................................................................................................ 58
5.2 Recommendations .......................................................................................................... 63
REFERENCES ........................................................................................................................... 65
Appendix-A: PSM Result .......................................................................................................... 69
Appendix-B: Poverty Line ........................................................................................................ 73
Appendix-C: Questioner............................................................................................................ 75

3
Acknowledgements
I would like to express my deepest gratitude to my major advisor, Dr. FereduNega, for his advice
and guidance in the formulation of the M.Sc. research proposal from the beginning as well as
reshaping of the survey questionnaire and for his invaluable comments in my thesis work without
any reservation, and without whom the thesis would have not been materialized. I also extend
my thanks to, HaftomBayray, my co-advisor for his constructive comments and suggestions in
the formulation of the research proposal and during the write-up of the thesis.
I am very great full to AtoBrhanu Belayfor his invaluable help and technical guidance. Your
encouragement and advice was instrumental for the completion of this dissertation. Also I would
like to convey words of appreciation to my brother AtoBrhanu Belay and AtoBerhuEyasu for
their special help on collecting the primary data‘s. Thank you very much.
I owe the Seharti-Samre and the tabia‘s office heads for their help to collect the appropriate
data‘s regarding the study and others for their understanding of my situation and giving me a
continued moral and support.
My thanks would also go to my office bosses and my friends, who gave me support in entire
my thesis work and to my classmates who made my stay at Mekelle university enjoyable, simple
and unforgettable learning experience.
I would like to convey words of appreciation to my Mother W/r KndahaftiEyasu, my brother
HaftomTesfay, my sister Genet Hadush for their moral, love, financial and overall strong
support. Thanks you so much indeed.
Last but not least, I would like to thank all my friends and relatives who stood by me taking care
of my family during absence.

4
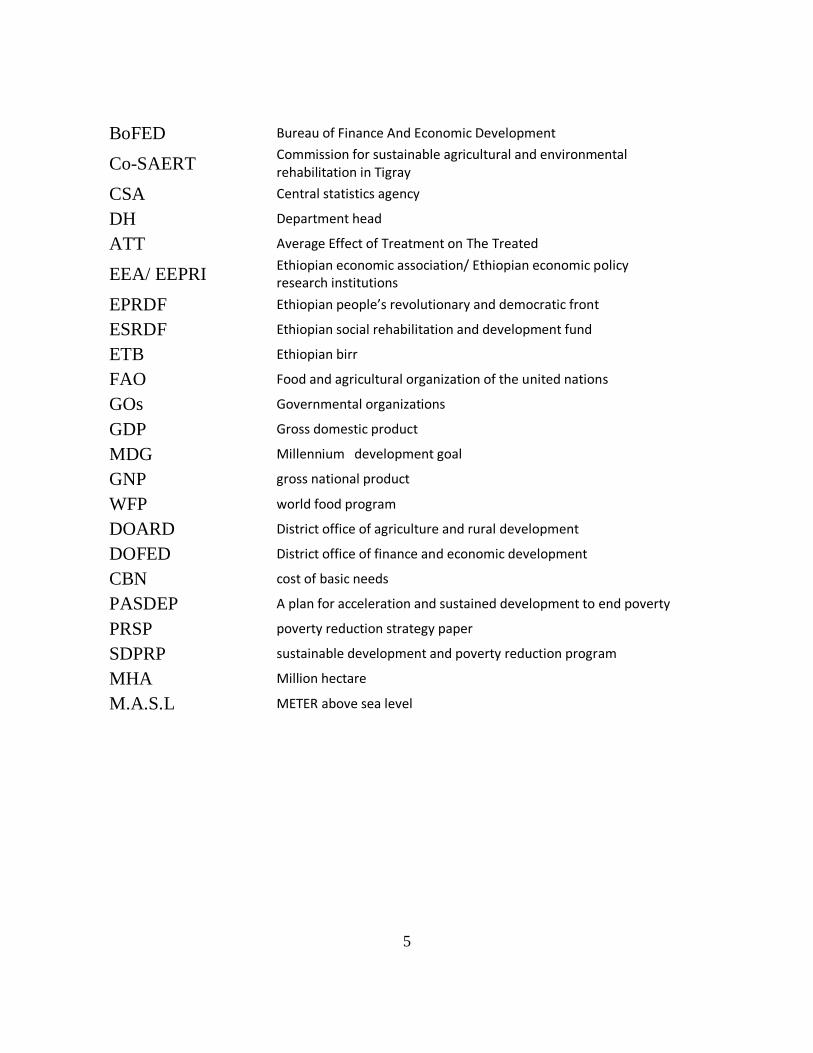
Acronyms
HH House holds
IDD Irrigation development department
IFAD International Fund for Agricultural Development
MoWRD Ministry of Water Resource Development
MoFED Ministry of Finance and Economic Development
MoA Ministry of Agriculture
MNRDEP Ministry of Natural Resources Development and Environmental Protection
NGOs Non-governmental organizations
OARD Office Agriculture and Rural Development
PSM Propensity score matching
PSNP Productive safety net program
REST Relief Society of Tigray
SAERT Sustainable Agriculture and Environmental Rehabilitation in Tigray
SSWoARD Seharti-SamreWoreda office Agriculture and Rural Development
SSWCUM Seharti-SamreWoreda Co-operative Union Manager
SWCD Soil and Water Conservation Department
TBoFED Tigray Bureau of Finance and Economic Development
TBoARD Tigray Bureau of Agriculture and Rural Development
TBoWRME Tigray Bureau of Water Resource Mining and Energy
WAC Woreda administration chairman
WOHFED Woreda office head of finance and economic development
WUAs Water users associations
ADCS Adigrat diocese of catholic secretariat
AWDH Andi-woyanedebrehaila
BoARD Bureau of Agriculture And Rural Development
BWMERD Bureau of Water, Mining And Energy Resources Development
BoPF Bureau of Plan And Finance
5
BoFED Bureau of Finance And Economic Development
Co-SAERT
Commission for sustainable agricultural and environmental rehabilitation in Tigray
CSA Central statistics agency
DH Department head
ATT Average Effect of Treatment on The Treated
EEA/ EEPRI
Ethiopian economic association/ Ethiopian economic policy research institutions
EPRDF Ethiopian people’s revolutionary and democratic front
ESRDF Ethiopian social rehabilitation and development fund
ETB Ethiopian birr
FAO Food and agricultural organization of the united nations
GOs Governmental organizations
GDP Gross domestic product
MDG Millennium development goal
GNP gross national product
WFP world food program
DOARD District office of agriculture and rural development
DOFED District office of finance and economic development
CBN cost of basic needs
PASDEP A plan for acceleration and sustained development to end poverty
PRSP poverty reduction strategy paper
SDPRP sustainable development and poverty reduction program
MHA Million hectare
M.A.S.L METER above sea level

6
List of Tables
Table:3.1. Sample households by kebelle .................................................................................. 33
Table: 4.1. Age of respondents in each category ........................................................................ 45
Table: 4.2. Sex of the Survey Respondents ................................................................................ 46
Table: 4.3.Family size of respondents in each category ............................................................. 47
Table: 4.4. Farm size (Land holding) of Respondents in each category ...................................... 47
Table: 4.5. Amount of fertilizer used Respondents in each category .......................................... 48
Table: 4.6. Educational level of respondents .............................................................................. 49
Table: 4.7. Extension service user on each category .................................................................. 50
Table: 4.8 Extension service frequencies ................................................................................... 50
Table: 4.9. Livestock owner sheep of respondents ..................................................................... 51
Table: 4.10. Food expenditures on both categories .................................................................... 52
Table: 4.11. Non-Food expenditures on both categories ............................................................ 52
Table: 4.12. Estimate PSM to Measure Impact of on irrigation Household income .................... 53
Table: 4.13. The estimated poverty line ..................................................................................... 54
Table: 4.14. Total consumption of the household ...................................................................... 55
Table: 4.15. Total monthly consumption of the household in each category............................... 55
Table: 4.16. Major irrigation opportunities ................................................................................ 56
Table: 4.17. Irrigation conflicts and constraints ......................................................................... 57

7
List of Figures
Figure: 3.1.Maps of Tigray And Wereda Seharti Samre............................................................. 23
8
ABSTRACT
Ethiopia is second populous county in Sub Saharan Africa with tremendous land and water
resources. However, most of the areas used by settlement are extremely degraded, per capita land
availability is dwindled and productivities of land and labor are reduced. Agricultural
productivity is also very much affected due to variability of rainfall and drought. Agricultural
production growth mainly comes through intensification and limited intensification. Since 1950s
there are mixed experiences with promoting irrigation and other modern agricultural
technologies in the effort of intensification. In the last decade, small-scale irrigation and
rainwater harvesting are central to Ethiopia‘s new policy and strategy on agricultural and rural
development.
This thesis explores the impact of irrigation income and poverty in northern Ethiopia. The
overall working hypothesis of the thesis is that irrigation has an impact in improving household
income and reduces the incidence, depth and severity of poverty in dry land areas of Ethiopia.
The analysis is based on primary household-level data collected from randomly selected
households in two Tabia of SaharitiSamre in the 2011/12 agricultural year. To analyses the
impact, descriptive statistics, poverty profile comparison, and econometrics matching method
were used.
Research results indicate that households‘ access to irrigation has a significant impact on poverty
reduction. Poverty among the user is less by 5% than poverty among the non-user. Irrigation has
appositive influence agricultural development through increasing productivity, income of
household and overall family employment.

9
CHAPTER ONE
INTRODUCTION
1. INTRODUCTION
1.1. Poverty and Food Insecurity in Ethiopia
Ethiopia is a landlocked country situated in the horn of Africa and consists of nine independent
regions and two city councils divided along ethnic lines. Occupying an area of 1.14 million
square kilometers the country shares its international borders with five African countries: Eritrea
in the North, Djibouti and Somalia in the East, Kenya in the South and Sudan in the west.
Generally speaking Ethiopia has a hilly terrain, with mountainous plateaus and an undulating
topography with maximum elevation of 4,600meters above sea level. The country is also split by
the East African Rift Valley (running NE to SW) which has numerous of lakes.
The population, according to CSA, is estimated at 79.22 million (about 83.3 percent of the total
live rural areas) and it is the second most populous country in sub-Saharan Africa. Almost one
third of the population is less than 10 years of age and nearly half of the population (47.2%) is
less than 15 years (CSA, 2007). The population distribution is related to factors such as altitude,
climate and soil. Around 14% live above 2,400 meters (cool climatic zone), 75% between 1,500
and 2,400 meters (temperate zone). And 11% below 1,500 meters (hot climatic zone), despite
this last category accounting for over 50% of the total land area (FRD, 2003). The overall
average population density is around 65.8 people per square kilometer. However, large variations
exist in Addis Ababa. Less than 10 people per square kilometer in the Ogden, Afar and the
western lowlands near Sudan (ibid). As in many African countries, Ethiopia‘s population is
growing at a rapid pace of 2.73% annually (CSA, 2007). If this trend continues Ethiopia
population will continue to spiral, which may lead to increased problem of food insecurity and
increased poverty.

10
Ethiopia has a number of factors including land that make it suitable for crop and livestock
production. Nearly 73.6 million hectares of arable agricultural land exists within Ethiopia‘s total
landmass of 1.1 million square kilometers, which are considered potentially suitable for
agricultural production. Out of the total land suitable for agriculture, only 22 percent (less than
16.5 million hectares) of arable land are utilized for agricultural cultivation annually.
Landholding in Ethiopia is characteristically small and fragmented with about 96 percent of the
cultivated land area being landed by small holder farming and the remaining by commercial
farming. The national average per capita of cultivated land holding is 1.02 ha per household.
Cultivable land area estimates vary between 30 to 70 Mha. Currently, high estimates show that
only 15 Mha of land is under cultivation. For the existing cultivated area, our estimate is that
only about 4 to 5 percent is irrigated, with existing equipped irrigation schemes covering about
640,000 hectares. This means that a significant portion of cultivated land in Ethiopia is currently
not irrigated,(IWMI, 2010) so well-managed irrigation development is a key in helping Ethiopia
to overcome major challenges including population pressure; soil and land degradation, high
climate variability, and low agricultural productivity.
In addition, agricultural water development is crucial to improve smallholder livelihood and
income in Ethiopia, since irrigation can help farmers increase their crop production, increase
crop variety, and lengthen their agricultural seasons. Despite its enormous human and natural
resource potential, the sad reality is that, Ethiopia is classified among the least developed
countries in the world; and is often associated with recurrent drought, poverty and famine.
According to 2007 World Human Development Report, the country has the lowest GNP per head
in the world, Reports from the Ministry of Finance and Economic Cooperation of Ethiopia also
attest to the seriousness and extent of poverty prevalence in the country.
Poverty is widespread in all parts of the country and 30.4% of the population lived below the
national poverty line in 2010/11.The proportions of people who are experiencing poverty are
highest in rural areas (30.4%), compared with the 25.7% in urban areas. The gap in poverty
between rural and urban areas was narrowing until 2004/05, but it slightly widened after
2004/05(MOFED2010/11). The proportion of food poor people (food poverty head count index)

11
in the country is estimated to be 33.6% in 2010/11 while it stood at 34.7% in rural areas and
27.9% in urban areas. Agriculture is heavily reliant on rainfall and productivity and production
are strongly influenced by climatic and hydrological variability that are reflected as dry spells,
drought and floods. Droughts and floods are endemic, with significant events every 3 to 5 years,
Awulachew et al (2005)
Ethiopian government gives emphases and design policies and strategies to improve the
livelihood of the rural population through agricultural development. Currently, government
provides special attention for agricultural sector by designing growth and transformation plan to
fastest economic growth throughout the country, and to improves the living standard at
household level and to set the country at middle level economic growth country‘s in the world in
the next 15 to 20 years. This plan designed and starts to apply in the whole sectors throughout
the country but particularly focused on the area that has been with high rainfall variability and
high moisture deficit to tackle the problem of food insecurity that has persisted for decades.
Then, one solution of poverty reduction strategy of the government is the use of supplementary
irrigation from either traditional or modern water harvesting structures is considered the primary
measure to be taken against the problem. In this direction government of Ethiopia is making
serious efforts by allocating a fairly large amount of budget for the development of irrigation
structures.
Irrigation development has been identified as an important tool to accelerate economic growth
and rural development, and is considered a cornerstone to food security and poverty reduction in
Ethiopia. Irrigation generates an average income of approximately US$323/hectare (ha) under
smallholder-managed irrigation systems compared to an average income of US$147/ha for rain
fed systems (Hagoset al., 2009). Irrigation contributed approximately 5.7 and 2.5% to
agricultural Gross Domestic Product (GDP) and the overall GDP, respectively, during the
2005/2006 cropping season. By the year 2009/2010, the contribution of irrigation to agricultural
GDP and overall GDP is estimated to be approximately 9 and 3.7%, respectively (Hagoset al.,
2009).Irrigation development is good for country like Ethiopia for three reasons. First it supports
the realization of food self-sufficiency and food security. Secondly, it improves the living quality

12
and standard of the people through the provision of sustainable agriculture and thirdly, it
enhances the contribution of irrigation in attaining development priorities, programs and
objectives (Taffa, undated).
Based on the above mentioned of irrigation benefits, the study were carried out in Andi-
woyaneDebrehaila and Addis-AlemTabias (kebelle‘s) at Seharti-SamreWoreda. These two
Tabias have benefited from irrigation due to this tabia have good access of water from Haiba
micro damand other water resource options. Thus, this study is intended mainly to identify the
impact of the poverty of irrigation on the house holds income and poverty reduction, To this end,
this particular study aims at investigating whether the access to community managed irrigation
has positive impact on rural household-income and improves the living standards of households,
so this indicates that a household has been above poverty line.
1.2. Statement of the Problem
Major constraints to agricultural growth of Ethiopia are population pressure coupled with the
dominance of the use of traditional agricultural production technology, including
traditional farm tools and farming practices, low application of modern inputs like
improved seeds and fertilizers, and poor animal breeds. The country‘s capacity to support
agriculture production through development of irrigation has been weak (Mengistu, 2000:
Destabeyere, 2004). For a country facing recurrent drought, with severe consequences for
development, the need for irrigated agriculture cannot be over-looked. Ethiopia cannot hope to
meet its large food deficit through rain-fed agriculture alone. Even under favorable weather
conditions with very low annual growth in only rain-fed agricultural production, the country
could still face millions of tons of cereal deficit for decades to come. The economic impact of
irrigation and the contribution of irrigation to food security and as an engine of development are
new themes in research programs. They have not been systematically addressed in the past. Most
research has sought to find ways to improve irrigation performances in the operational sense. But
currently, as the issues of food security and poverty reduction are becoming the global agenda, it
started giving emphasis on the importance of increasing yields and income from irrigated
agriculture to meet food needs and to reduce poverty. The rationale behind this is that with the
13
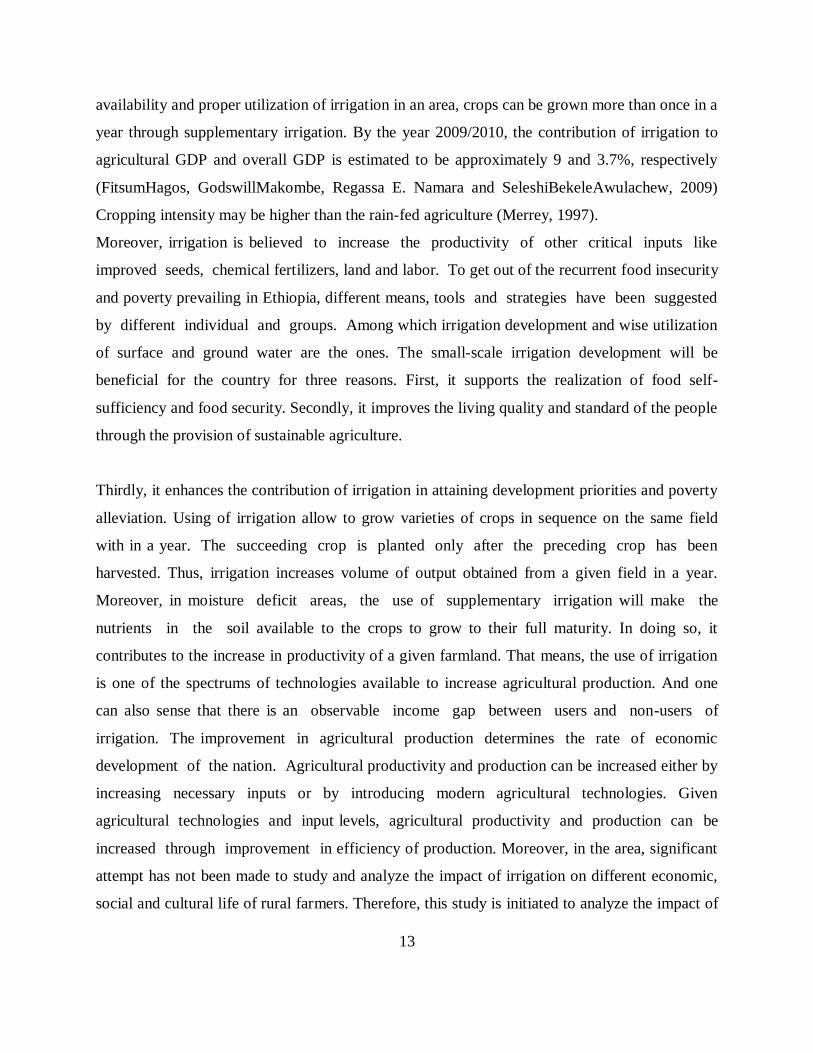
availability and proper utilization of irrigation in an area, crops can be grown more than once in a
year through supplementary irrigation. By the year 2009/2010, the contribution of irrigation to
agricultural GDP and overall GDP is estimated to be approximately 9 and 3.7%, respectively
(FitsumHagos, GodswillMakombe, Regassa E. Namara and SeleshiBekeleAwulachew, 2009)
Cropping intensity may be higher than the rain-fed agriculture (Merrey, 1997).
Moreover, irrigation is believed to increase the productivity of other critical inputs like
improved seeds, chemical fertilizers, land and labor. To get out of the recurrent food insecurity
and poverty prevailing in Ethiopia, different means, tools and strategies have been suggested
by different individual and groups. Among which irrigation development and wise utilization
of surface and ground water are the ones. The small-scale irrigation development will be
beneficial for the country for three reasons. First, it supports the realization of food self-
sufficiency and food security. Secondly, it improves the living quality and standard of the people
through the provision of sustainable agriculture.
Thirdly, it enhances the contribution of irrigation in attaining development priorities and poverty
alleviation. Using of irrigation allow to grow varieties of crops in sequence on the same field
with in a year. The succeeding crop is planted only after the preceding crop has been
harvested. Thus, irrigation increases volume of output obtained from a given field in a year.
Moreover, in moisture deficit areas, the use of supplementary irrigation will make the
nutrients in the soil available to the crops to grow to their full maturity. In doing so, it
contributes to the increase in productivity of a given farmland. That means, the use of irrigation
is one of the spectrums of technologies available to increase agricultural production. And one
can also sense that there is an observable income gap between users and non-users of
irrigation. The improvement in agricultural production determines the rate of economic
development of the nation. Agricultural productivity and production can be increased either by
increasing necessary inputs or by introducing modern agricultural technologies. Given
agricultural technologies and input levels, agricultural productivity and production can be
increased through improvement in efficiency of production. Moreover, in the area, significant
attempt has not been made to study and analyze the impact of irrigation on different economic,
social and cultural life of rural farmers. Therefore, this study is initiated to analyze the impact of

14
irrigation on production and income of rural households. It also, assesses issues with respect to
community managed irrigation systems that need government attention and interventions.
1.3. Objectives of the Study
The overall objective of this study is to examine the impact of irrigation on the household
income and poverty reduction. To meet this overall objective, the research has the following
specific objectives:
1. To compare the levels of income of irrigation user and non-user households.
2. To assess the contribution and impact of irrigation in poverty alleviation.
Beside the main objective the study examines the constraint and opportunities of the irrigation
users in the study area.
1.4. Significance of the Study
The attainment of the objectives mentioned above is important tool for agricultural development
of the country. This is because determining the contribution of irrigation to household income
improvement as well as determining the standard of living of the rural household and food
security program achievements. Ensuring adequate and reliable supply of water increases yields
of crops. Along with higher yields irrigation increases incomes and reduces hunger and poverty.
Where there is irrigation widely available under nourishment and poverty are less prevalent.
Even landless Laborers and small holder farmers who lack the resource to employ irrigation
themselves often benefit through higher wages, lower food prices and a more varied diet (FAO,
2003). To this end, identifying, analyzing and understanding the impact of small scale irrigation
on household income and poverty reduction.
15
1.5. Scope and limitations of the Study
The study covered two districts of south-east zone, Tigray region. It analyzed the impact of
irrigation on household income and poverty reduction. The study was limited to only two
districts due to limited resources and time. The research was undertaken in the two districts
assumed to have similar ecology, economic, social and demographic characteristics as compared
to the area and variations that exist within the region. In this study, household level production
data of only one-year period (2011/2012) was used. The sample size is also restricted to one
hundred thirteen farmers. In the course of survey work, it was found that farmers are very
reluctant to frankly respond to some of the questions, particularly to questions of resource
holdings such as number of livestock owned, land size, yield and household incomes. Also as
farmers do not keep records and due to memory lapse, some of the questions lack exact answers
and the respondents attempted by giving ranges or estimates.
1.6. Organization of the Thesis
The thesis has five chapters. The first chapter is concerned with the introductory part, which
comprises the background, statement of the problem, objectives of the study, significance of the
study, and scope and limitation of the study. The second chapter deals with the review of
literature. The third chapter focuses on the description of the study area and methodology of the
study is covered in the chapter. The chapter briefly discusses procedures followed in data
collection, estimation procedures, model used and hypothesis settings. Results and discussions
are given in chapter four. The last part of the thesis is the summary and conclusion.
16
CHAPTER TWO
LITERATURE REVIEW
2. LITERATURE REVIEW
2.1. Concept of irrigation
Water is the greatest source of humanity. It not only helps in survival but also helps to have
comfortable life. Besides various other uses of water, the largest use of water in the world is for
irrigating land. Irrigation in fact is nothing but is a continuous and reliable water supply to
different crops in accordance with their water requirement. The basic problem of water
distribution in the world is the temporal and spatial differences that exist in the supply and
demand of water. A crop requires certain amount of water at certain fixed intervals throughout its
period of growth. Irrigation is required at dry and last rainy period‘s .Because at dry period
irrigation give important role in order to produce food crops and cash crops, also at last rainy
period as Ethiopian situation especially country that rainy season as observed rainfall starts late
and ends early, so in order to supplement the crop irrigation provides a greatest role in order to
produce more yield.
In tropical countries like Ethiopia, the first two of three essential requirements of plant growth,
that is, moisture needs to be supplemented frequently by artificial application of water. Thus,
irrigation is supplementary to rainfall when it is either deficient or comes irregularly or at
unreasonable times. Irrigated agriculture is one of the critical components of world food
production, which has contributed significantly to maintaining world food security and to the
reduction of rural poverty. About 17 percent of global agricultural land is irrigated and
contributes about 40 percent of the global production of cereal crops (WCD 2000).
Community managed Small-scale irrigation can be defined as irrigation, usually on small plots,
in which small farmers have the controlling influence, using a level of technology which they
can operate and maintain effectively. Community managed small scale irrigation is, therefore,
farmer-managed: farmers must be involved in the design process and, in particular, with
decisions about boundaries, the layout of the canals, and the position of outlets and bridges.

17
Although some small-scale irrigation systems serve an individual farm household, most serve a
group of farmers.
2.2. Socioeconomic Impacts of Irrigation
In addition to increasing crop production and farm and family incomes, improved irrigation
access significantly contributes to rural poverty reduction through improved employment and
livelihood within a region (Chambers 1988; Barker et al., 2000). Indirect benefits, such as more
stable rural employment as well as higher rural wage rates, help landless farm laborers obtain a
significant share of the improved agricultural production. In addition to yield improvement and
intensive production practices, better irrigation infrastructure and reliable water supply also
enhance use of other inputs like fertilizers and HYV. This intensification of agricultural practices
generates additional employment opportunities in the rural sector. The irrigation induced benefits
are not limited to farming households but also affect broader sectors of the economy by
providing increase opportunities to growing rural service sectors and other off-farm employment
activities (Mello1966). Examples of such opportunities are additional employment creation for
landless laborer in agro-industries, rural marketing and other off-farm activities like house
construction and basic infrastructural building. In turn, this feedback process increases the
demand for employment many fold and generates additional wealth creation and/or capital
accumulation in the rural sector All of these benefit processes create transformation within rural
and urban sectors, and the feedback mechanism in an economy has significant importance in
designing location-specific poverty reduction strategies. The total beneficial impacts of irrigation
development, both direct and indirect, can be summarized under the following categories:
1. Increased crop production (yield improvement) and increased farm income.
2. Increased cropping intensity and crop diversification opportunities and the feasibility of year-
round crop production activities.
3. Increased farm employment—more employment opportunities for farming families as well as
for hired laborers in the locality.
18
4. Increased farm consumption and increased permanent wealth (permanent asset accumulation
due to irrigation). This has significant implications for reducing intrinsic food insecurity in a
region.
5. Reduced food (crop) prices allowing access to food for all, which is more beneficial to
landless and subsistence families and provides better nutrition intake. This is also equally
beneficial to urban poor and city dwellers, since they spend more than 50 percent of their
daily income on food items.
6. Reduced friction in the rural economy and reduced transaction costs including reduced farm
marketing costs due to increased access to farm link roads and to other improved farm and
non-farm related services in the region.
7. Increased farm income (for farmers) and increased farm and off-farm employment
opportunities for rural landless laborers result in better school attendance of children of farm
laborers and improved social capital in society. This is due to the income effects of irrigation,
since education is still a luxury compared to other basic needs: foods, clothes, health, etc.
Improved rural infrastructure always coincides with irrigation facilities. This greatly reduces
transaction costs and rural marketing costs and other frictions associated with the farming sector.
The benefits generated by these activities are also called indirect benefits of irrigation
investments. These indirect irrigation benefits, usually intangible, are not fully captured by
farming communities alone; rather, they are shared by larger sections of society. For example,
lower food grain prices benefit poor urban and rural landless communities more by enabling
them to purchase required food items at affordable prices. Keeping food prices at relatively low
levels also greatly assists the industrial sector to avoid the pressure of increasing the real wage
rate. In this process, improved agriculture indirectly subsidizes the industrial sector of the
economy as well.
19
2.3. Estimation of poverty line
The poverty indices comparison between irrigation users and non-irrigation users has been
performed using two poverty lines. These are the extreme poverty line (basic consumption
requirement poverty line) and moderate poverty lines. Extreme poverty line was estimated based
on the cost of fulfilling the minimum calorie intake for a healthy life being 2,200 calories, while
the moderate poverty line was derived based on a food poverty line of 2,750 calories (which is
125% of the 2,200 calories level); which is commonly used for welfare monitoring by the
Ethiopian Central Statistics Agency.
2.4. Overview of Ethiopia's Agricultural Development Policy/Strategy
During the last 17 years the government formulated and implemented a range of economic and
sartorial policies and strategies to re-energize the agriculture sector and accelerate economic
development of the country. This has occurred in the form of an agricultural –centered
development strategy known as the Agriculture Development Led Industrialization (ADLI). The
strategy (ADLI) revolves around making the small agricultural farmers the engine of growth. It
is argued that what the average farmer needs to kick start the growth process is access to a
combined provision of land, labor, water and capital (MO FED, 2000). The government also sees
ADLI as a strategy that will ensure the equitable sharing of growth benefits. Its essence is that
agricultural growth is taken as the driving force for ensuring household and national food
security and as engine for industrialization through its effects on demand for industrial goods,
supply of raw materials and exports.
Under ADLI emphasis is given to the transformation of the smallholder farmer from subsistence
to a more business and market-oriented agriculture producers. This has occurred through
agricultural extension which promotes the adoption of improved technological inputs and
practices, expansion of small and large scale irrigation schemes, and expansion of credit
schemes. Furthermore, the adoption of a development path compatible with different agro-
ecological zones and area based specialization as well as supporting diversification of
agricultural communities has been a strong feature. Furthermore, integrating farmers with
markets and expanding access to primary education, primary health care, rural water supply and
20
rural roads are some of the ADLI activities aimed to bring a positive change for Ethiopia‘s small
farmers and reduce their vulnerability to external shocks. The main criticism of ADLI is that the
strategy is biased against the development of the industrial and other non-agricultural sectors.
These sectors are also deemed as vital to providing livelihood strategy options for those leaving
the land. They argued that, without strong linkage between agriculture and the non-agricultural
sectors and equal policy support for the latter, sustainable development will not be realized in
long run. In line with ADLI‘s objectives a number of development programs have been put in
place in past years, among these is Sustainable Development and Poverty Reduction Program
me, formulated in 2006, and implemented from 2001/02 to 2005/06. Its successor, the Plan for
Accelerated and Sustained Development to End Poverty (PASDEP), runs from 2006/07 to
2010/11. In both programmers agricultural development was adopted as a central and strategic
direction for poverty eradication in Ethiopia. The program calls for the rapid growth of
agriculture in particular that of the small holder farming with the goal of extricating the economy
from dependence on food aid and the generation of rural employment opportunities and income.
PASDEP also provides a framework for the five-year national and sect oral development
programs which includes the agricultural sector strategies for the years 2006 – 2010. Under this
plan greater emphasis is given for the expansion of medium and large irrigation schemes,
commercialization of agriculture, diversification of production and exports, and private sector
investment in order to move farmers beyond subsistence farming to small-scale market-oriented
agriculture (Hail, 2008)
2.5. Brief history of irrigation development in Ethiopia
Irrigation is practiced in Ethiopia since ancient times producing subsistence food crops.
However, modern irrigation systems were started in the 1960s with the objective of producing
industrial crops in Awash Valley. Private concessionaires who operated farms for growing
commercial crops such as cotton, sugarcane and horticultural crops started the first formal
irrigation schemes in the late 1950s in the upper and lower Awash Valley. In the 1960s, irrigated
agriculture was expanded in all parts of the Awash Valley and in the Lower Rift Valley. The
Awash Valley saw the biggest expansion in view of the water regulation afforded by the
construction of the Koka dam and reservoir that regulated flows with benefits of flood control,

21
hydropower and assured irrigation water supply. The potential of irrigation water in Ethiopia is
quite high and its drainage pattern is of great importance to its neighboring countries. From the
total run off 110 billion m3 about 90% flows down to neighbors through eleven major rivers.
Traditional irrigation is very old in Ethiopia. These traditional small scale irrigation schemes are
in general simple river diversions which are subject to frequent damage by flood. From the total
potential area, the area irrigated is low and the reasons on the past regime is due to lack of fund,
data on different factors of natural resources, infrastructure, skill, research and suitable policy
and hydro-politics of the region. For much of the lifetime of the Derg, very little attention was
paid to small-scale and traditional irrigation schemes constructed and managed by peasant
farmers. With the nationalization of industrial and agricultural enterprises, the government's
emphasis was to promote high technology water development schemes managed by state
controlled agro-industrial and agricultural enterprises. It was only in the second half of the
1980s, as a result of devastating famine of 1984/85 that the Derg began to show interest in small-
scale water management schemes. The establishment of the Irrigation Development Department
(IDD) within MoA at the end of 1984, a body entrusted with the development of small-scale
irrigation projects for the benefit of peasant farmers, signaled a new approach to water
development by the military government. However, progress was slow. From the mid- 1980s to
1991, IDD was able to construct some 35 small schemes, of which nearly one-third was formerly
traditional schemes used by peasants (MoA, 1993; Desalegn, 1999).
Community managed Small-scale irrigation development was carried out by the surface water
division of the Soil and Water Conservation Department (SWCD) of the Ministry of Agriculture
(MoA). In 1984, the division was separated from SWCD and upgraded to IDD. In 1987, the
activities of MoA were being decentralized to zonal offices, and IDD staffs were being
transferred to strengthen the capacity of the zones. However, in 1992, a new Ministry of Natural
Resources Development and Environmental Protection (MNRDEP) was established, with the
responsibility for soil and water conservation, rural water supply and sanitation. Although the
Ministry retained responsibility for providing agricultural support services, the IDD was
dissolved and its responsibilities were transferred to regional Natural Resources Bureau. In
August 1995, MNRDEP was dissolved and its responsibilities were shared between MoA and the

22
Ministry of Water Resources (MoWR). Under the new arrangements, responsibility for irrigation
development was given to the Bureau of Water, Minerals, and Energy Resources Development
(BWMERD) while MoWR has an overall policy, planning and regulatory role in respect to water
resource development (JICA, and OIDA, 2001).
2.6. Ethiopian water potential for Irrigation Development
Ethiopia has an estimated 2.6 billion meter cube of usable ground water potential. Estimates
showed that there is sufficient water in the country to develop about 3.73 million hectares of
which only about 190,000 ha (4.3% of the potential) is actually irrigated land under full
irrigation in Ethiopia (MoWRD, 2006). However, irrigated agriculture has realized only 4.3% of
its estimated potential and in terms of output it accounts for approximately 3% of the total food
crop production (MoFED, 2007).
There is little information on the extent to which the so far developed irrigation schemes have
been effective in meeting their stated objectives by improving their household‘s income attaining
food self-sufficiency and eradicating poverty (Abonesh et al., 2006). Therefore, currently, the
government is giving more emphasis to the sub-sector by way of enhancing the food security
situation in the country. Efforts are being made to involve farmers progressively in various
aspects of management of small-scale irrigation systems, starting from planning, implementation
and management aspects, particularly, in water distribution and operation and maintenance to
improve the performance of irrigated agriculture.
Ethiopia cannot meet its large food deficits through rain-fed agricultural production alone.
Cognizant to this fact, the government has taken initiatives towards developing irrigation
schemes of various scales. This will continue and be further strengthened during the coming
years. Now on the EPRDF regime starts to focus expansion of irrigated land and uses the
potential of irrigation water sources. Therefore, careful planning and management of this
precious resource is inevitable for the overall development of Ethiopia economy.

23
In Ethiopia, irrigation schemes are classified into small, medium and large scale. Small-scale
schemes are those covering an irrigated area of less than 200 hectares and growing primarily
subsistence crops, Yosuf K (2004),
2.7. The need for community managed small-scale irrigation in Ethiopia
In Ethiopia, irrigation has a long tradition (Kloos, 1990). One of the main targets of irrigation
systems is to fortunate agricultural production in qualitative as well as in quantitative meaning
(Mengistu, 2003). Harvests shall be enlarged so that people either produce enough food for the
non-harvest time or to sell their overproduction and earn some money to buy food. Another
opportunity to produce more food crops is irrigated gardening, an activity mainly done by
women. In Ethiopia, there has been a revival of irrigation during the last decades in order to
enhance rural development and food security (FAO/WFP, 2006). Given that 85 percent of the
people are employed in agriculture (Mengistu, 2003), developing this sector could help to reduce
poverty and enhance food security of the majority of the Ethiopian people. The absence of off-
farm income in rural areas has also contributed to the high population pressure on arable land,
which leads to fast deterioration of natural resources. This situation will remain a challenge until
a high rate of agricultural transformation coupled with maximum and sustainable agricultural
productivity (per unit area of land-intensification) takes off from the present crisis. Realizing the
present socio-economic situations, it is evident that Ethiopia cannot meet its food security and
food self-sufficiency objectives using the prevailing land and water use systems (McCornick et
al, 2003). Then, this increased problem of food insecurity and increased poverty if sustainable
solutions are not found in the future.
2.8. Characteristics and Functioning of irrigation schemes
Before us discussing the survey results with respect to irrigation, it is essential to describe what
does community managed irrigation means in the context of this particular study. Community
managed irrigation system is an irrigation scheme in which the user community performs all or
part of the activities of irrigation management. The physical activities such as operation and
maintenance of the existing schemes, development of new schemes, organization and
formulation of by-laws for Water Users Associations (WUAs), ensuring equitable water
24
distribution and mobilization of community lab our and financial contributions for the sustenance
of the schemes are performed by the community. Moreover, the community delegates
representatives (irrigation committee) to deal with the government on issues of irrigation
development and managements. These are some of the major roles of the community in
community managed irrigation system.
2.9. Irrigation and Implications for Poverty Alleviation
The first direct impact is on output levels. Irrigation boosts total farm output and hence, with
unchanged prices, raises farm incomes. Increased output levels may arise for any of at least three
reasons. Firstly irrigation improves yields through reduced crop loss due to erratic, unreliable or
insufficient rainwater supply. Secondly, irrigation allows for the possibility of multiple-cropping,
and so an increase in annual output. Thirdly, irrigation allows a greater area of land to be used
for crops in areas where rain fed production is impossible or marginal. Hence irrigation is likely
to boost output and income levels. Labor income is a growing part of poor‘s income, and
laborers are growing share of the poor. Finally, output may be increased because irrigation
enables the use of complimentary inputs, such as high yielding varieties (Michael Lipton, 2003)
Declining real world market food prices is one of the main factors for the reduced rate of
expansion of irrigated areas during the late 1980s and the 1990s, unlike in earlier decades.
Declining food prices have also created less incentive for national governments and international
development agencies to provide additional funding to the irrigation sector. The real world price
of rice dropped from US$ 1,050/mt in 1974/75 to US$ 200/mt in 1998 (at 1995 US$ value); in
other words, thereal price of rice has dropped more than 75 percent during the last 25 years.
Similarly, the real price of wheat in the world market has declined from US$ 500/mt in 1975 to
US $ 175/mt in 1996, more than a 65 percent decline in real terms over the last 20 years. The
level of decrease in world food prices is, in fact, the result of the higher rate of expansion of
world food supply compared to the rate of increase of food demand caused by population
growth. During the period from 1960 to 1990, global cereal production has expanded by more
than 100 percent, whereas global population expansion is around 70 percent (FAO STAT 1998).
25
Timely access to irrigation infrastructures in the past was one of the main reasons for the level of
increase in food production worldwide, along with other contributory factors like timely
availability of HYV, fertilizers and other technologies. The reduced price of food grains in world
markets is one of the reasons for the recent reductionof rate of returns from irrigation projects,
limiting the incentives provided by governments, development agencies and private sector
investment to the irrigation sector. Kikuchi et al. (2001) have estimated that the benefit-cost ratio
of irrigation construction investment in Sri Lanka as a whole had picked up more than 3.5 points
in the mid-1970s and then sharply declined to a level of 1.5 in the mid-1990s.
The slack crop prices in Sri Lanka, and in the world market, was one of the major factors for
such a declining benefit cost ratio and declining additional investment in the irrigation sector in
the recent past. This is equally applicable to several other countries in the region. The benefit-
cost ratio of an irrigation project is in fact a very important criterion for the justification of new
investment in the sector, which is very sensitive to fluctuation in output prices. Declining real
world market food prices also have large implications for the level of cost recovery and service
charge set in a system. Issues like who should pay what for improved irrigation access in a
region are important. Due to the inelastic nature of demand for food, farmers are not the only
beneficiaries of increased food production in the face of declining food commodity prices.
Rather, a larger section of society benefits from improved irrigation and expanded crop
production. Direct benefits of irrigation accrued at farm level, such as increased crop yield and
farm income, are often only a small fraction of the total benefits to society. An irrigation impact
study in Alberta and Saskatchewan, Canada, reported that only 15 to 20 percent of the total
benefits of irrigation development go to the farming sector in terms of increased agricultural
production, with the remaining incremental benefits of irrigation projects realized by wider
sections of the society (Hill and Tollefson 1996). The widespread secondary benefits of irrigation
include rural employment and economic activities induced in the region. Their importance,
compared to direct benefits, has been increased in the face of declining real world market food
grain prices. This has large policy implications on cost recovery policy and the level of service
fee set in an irrigation system and in the efficient sharing of irrigation service costs across
different sectors of society.
26
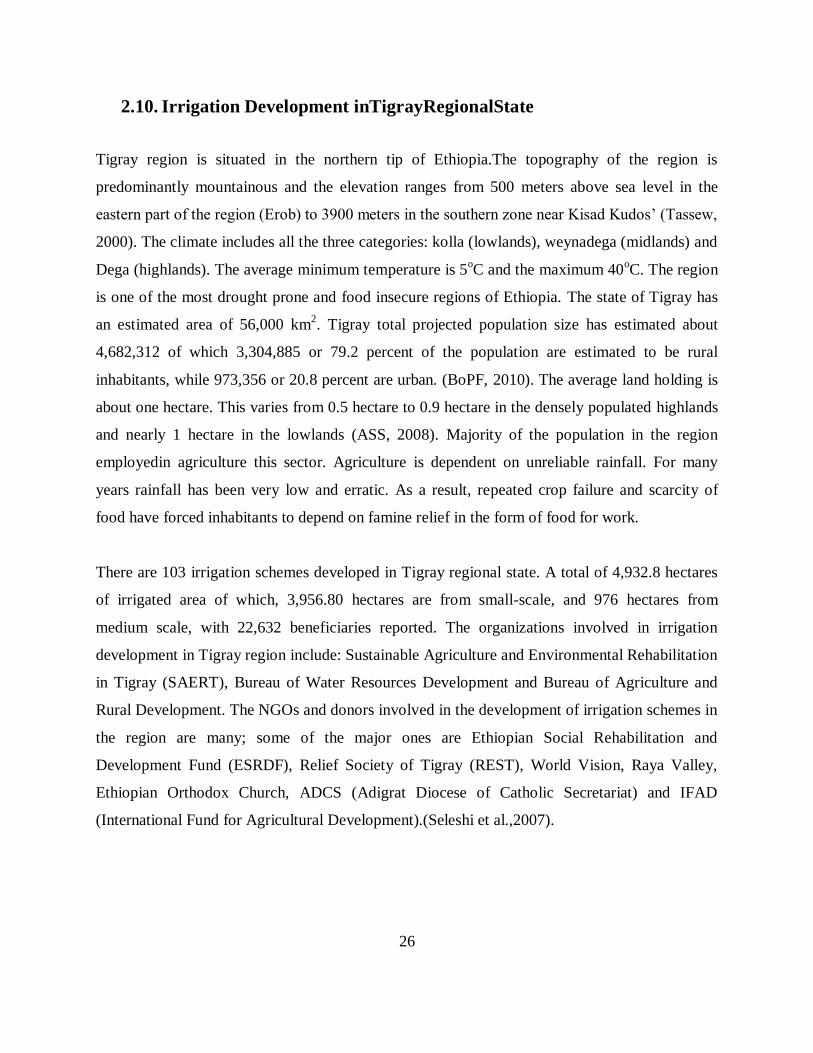
2.10. Irrigation Development inTigrayRegionalState
Tigray region is situated in the northern tip of Ethiopia.The topography of the region is
predominantly mountainous and the elevation ranges from 500 meters above sea level in the
eastern part of the region (Erob) to 3900 meters in the southern zone near Kisad Kudos‘ (Tassew,
2000). The climate includes all the three categories: kolla (lowlands), weynadega (midlands) and
Dega (highlands). The average minimum temperature is 5oC and the maximum 40
oC. The region
is one of the most drought prone and food insecure regions of Ethiopia. The state of Tigray has
an estimated area of 56,000 km2. Tigray total projected population size has estimated about
4,682,312 of which 3,304,885 or 79.2 percent of the population are estimated to be rural
inhabitants, while 973,356 or 20.8 percent are urban. (BoPF, 2010). The average land holding is
about one hectare. This varies from 0.5 hectare to 0.9 hectare in the densely populated highlands
and nearly 1 hectare in the lowlands (ASS, 2008). Majority of the population in the region
employedin agriculture this sector. Agriculture is dependent on unreliable rainfall. For many
years rainfall has been very low and erratic. As a result, repeated crop failure and scarcity of
food have forced inhabitants to depend on famine relief in the form of food for work.
There are 103 irrigation schemes developed in Tigray regional state. A total of 4,932.8 hectares
of irrigated area of which, 3,956.80 hectares are from small-scale, and 976 hectares from
medium scale, with 22,632 beneficiaries reported. The organizations involved in irrigation
development in Tigray region include: Sustainable Agriculture and Environmental Rehabilitation
in Tigray (SAERT), Bureau of Water Resources Development and Bureau of Agriculture and
Rural Development. The NGOs and donors involved in the development of irrigation schemes in
the region are many; some of the major ones are Ethiopian Social Rehabilitation and
Development Fund (ESRDF), Relief Society of Tigray (REST), World Vision, Raya Valley,
Ethiopian Orthodox Church, ADCS (Adigrat Diocese of Catholic Secretariat) and IFAD
(International Fund for Agricultural Development).(Seleshi et al.,2007).

27
The climate of Tigray is mainly semi-arid and for most of the region the major rainy season
(locally called kiremti) lasts for 3 to 4 months, between June and mid-September. The mean
annual rainfall ranges from 980 mm on the central plateaux to 450 mm on the north-eastern
escarpments of the region. The annual rainfall shows a high degree of variation with a coefficient
of variation ranging from 20% in western to 49% in eastern parts of Tigray. Temperature ranges
depend on altitude and vary from temperate type in the higher areas to tropical in the lower areas.
The average temperature in the region varies from 16oC in the south west to 25°C in the extreme
eastern areas. The economy of Tigray is dominated by peasant agriculture involving traditional
methods of crop production and livestock rearing. Agriculture accounts for 50.8% of the regional
Gross Domestic Product. However, the annual growth rate of production is 1.2%, which is below
the national average, while population is growing at 2.5% per annum. (BoPF, 2010)
The water resource of Tigray is not well studied. Available studies indicate that only about five
perennial streams have flow rates of more than 10litres/second. The loss of water through the
three major drainage systems of the region during the annual rainy season is immense. In total
through the Tekeze, Mereb and Dennakil basins 9 billion cubic meters of water goes from Tigray
to neighboring countries every year; this is almost equivalent to the 9.21 billion cubic meters of
the total estimated rainfall in the region. If 50% of the 9 billion cubic meters of runoff was used,
500 thousand hectares (ha) of land, which could feed three-times the present population of
Tigray, could be irrigated(TH,2010)
2.11. Empirical studies on irrigation
The study carried by Shumba and maposa (1996) revealed that, income generations and
food security are major reasons for joining the scheme. Employment creation was
considered as a secondary objective. Plot holders meet their objectives by growing crops in
the summer and vegetable in the winter. Notwithstanding the constraints, like unreliable water
supply, limited cash for input purchase, poor roads and limited market outlets, the plot holders‘
objectives have been met to some extent. They reported having achieved improved food security,
high incomes and increased employment opportunities in comparison to ―without irrigation‖
situation. The study also revealed that there was complementarily among the objectives of
food security, income generation and employment creation
28
2.12. Socio-economic role of irrigation schemes in the study area
The objective of irrigation projects is to increase agricultural production means it results increase
households income and consequently to improve the economic and social well-being of the rural
population on the study area. However, changing land use patterns may have other impacts on
social and economic structure of the project area. Small plots, communal land use rights, and
conflicting traditional and legal land rights all create difficulties when land is converted to
irrigate agriculture. These problems are faced on the study area on the first phase of construction
of dam before 14 years ago, but this problem is solved now a day by fair redistribution of land on
that period. Now after that there is no problem of land ownership right questions.
29
CHAPTER THREE
DESCRIPTION OF THE STUDY AREA
3. LITERATURE REVIEW
3.1. Socio-economic profile of Tigray Regional State
Physical Characteristics:-Tigray Regional State is found in the northern part of Ethiopia, It
extends between 120 15‘N and 14
0 57‘N latitude and 36
0 27‘ E and 39
0 59‘E longitude
(TBoFED, 2010). It has an area of 56,000Km2 and accounting for 5 percent of the country's land
area. This forms a total of two borderlines and physical contacts with other regional states such
as with Amhara Region in the South and West & Afar Region in the East and also shares with
international borderlines.
Population:- According to the 2010 report of Bureau of Finance and economic Development
projection of Population size( department of Plan and economic Development) Census result,
the population of the region is projected (population growth rate of 2.5 percent per annum) to be
4,682,312 million in the year 2010. The share of rural and urban population is 3,708,956 and
973,356 respectively. The average household size was estimated at persons are (3.4 and 4.6
Persons per household for urban and rural areas respectively). Regional average household size
was estimated at persons are 4.4 person per household. (TBoFED, 2010).The crude population
density of the region was 86 persons/ per km2.The regional 80.47% of the rural population has
living on farming activities.
Agriculture development in the region still at the subsistence level and it is the mainstay of the
economy the country and the region. It is the means of livelihood for almost all of the rural
population, and contributes to 50.8% of Regional Gross Domestic Product (GDP),industry
18.4% and services also contributes 30.8%. Moreover, agriculture is the main source of domestic
food production and major supplier of raw materials to domestic manufacturing industries and
source of foreign exchange earnings (TBoARD, 2010).The livestock population of the region is
estimated at, According to Bureau of Agriculture and Rural Development record in 2010 report,
these are 3,242,931cattle, 1,149,717 sheep, 2,621,227 goats,456,093 donkeys, - horse, 4,920
30
mules,32,288 camel,4,266,077 poultry and 195,662 bee hives are found throughout the region.
(TBoARD,2010). Land size in the highlands is increasingly diminishing due to high population
pressure. According to land utilization survey conducted in the year 2010, Tigray region has
around 891,187 peasant landholders and the average land holding is about one hectare. This
varies from 0.5 hectare to 0.9 hectare in the densely populated highlands and nearly 1 hectare in
the lowlands (ASS, 2008).The Regional average land holding per household was 1 hectare. This
is slightly greater than the national average.
3.2. Socio-economic profile of the study area
Seharti-SamreWoreda is one of the Woreda‘s in south-east zone, Tigray region. The capital town
of the woreda is Samre; found at south west direction of Mekelle at the distance of 60 Km. It
extends from130 02‘ 00‖ to 12
0 30‘ 00‖ of North latitude and from 38
0 59‘ 00‖ to 39
0 26‘ 00‖
longitude (SSOARD, 2010). It has an area of 1716.74Km2.
Seharti-Samre district are boundedat
the direction of South west with Regional State of Amhara such as with wage-kimera, at North
with Degua-Tembien, at West with central zone of Tigray such as Tanqua-Abergelle district, at
East with southern zone TigrayAlajie and from south eastern Zone of Tigray with Hintallo-
Wajirate and Enderta.
According to SSOARD the total population of the Woreda is 136,767 out of which
68,027(49.7%) are males and 68,740(50.3%) are female comprised in 27478 households 20892
being male headed and the remaining 6586 are female headed. Most of the woreda populations
(91.1%) live in rural areas and the remaining 8.1% live in urban areas. The political
administration of the district consists of 23 peasant associations (Tabia’s) and 87 villages
(Kushets). (SSOARD, 2010)
Most of the population of the area is agrarianand mixed farming is the dominant form of
agricultural activity. About 95% of the population in the woreda depends on farm activities and
5% of the population depends on earning from off-farm activities such as petty trading,
construction works, food for work on soil and water conservation and other developmental
projects, employment as daily laborers and sale of fuel wood. The household income from off-
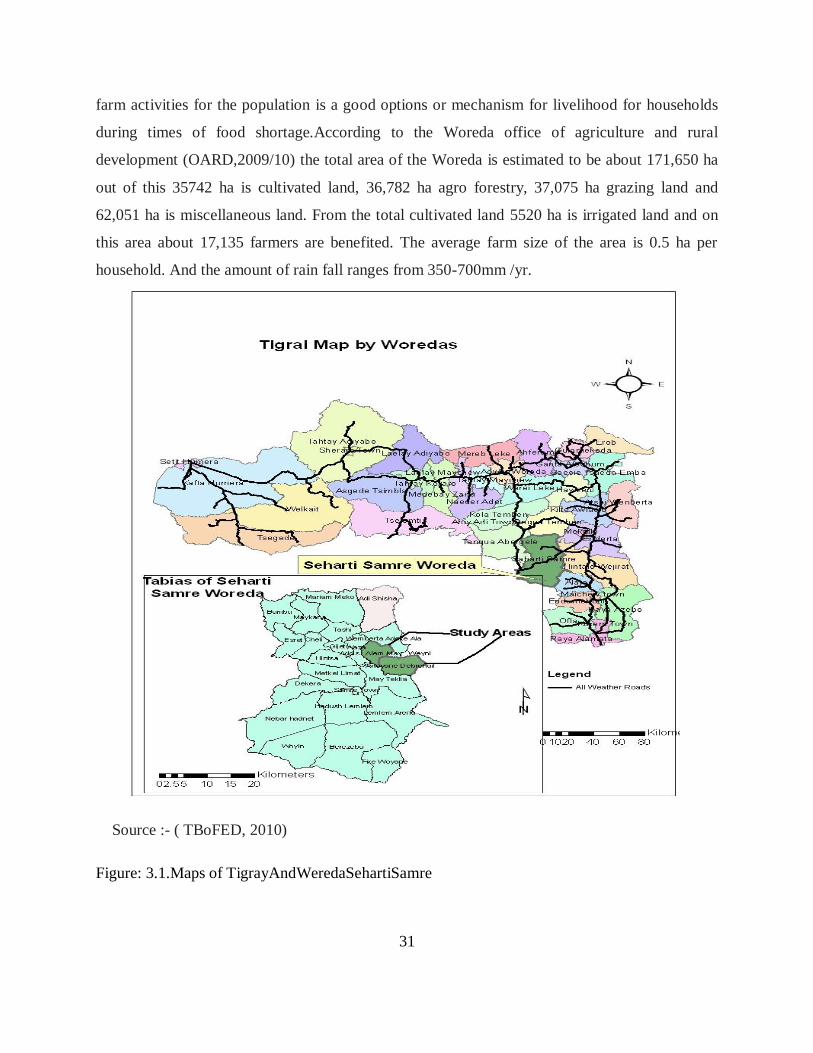
31
farm activities for the population is a good options or mechanism for livelihood for households
during times of food shortage.According to the Woreda office of agriculture and rural
development (OARD,2009/10) the total area of the Woreda is estimated to be about 171,650 ha
out of this 35742 ha is cultivated land, 36,782 ha agro forestry, 37,075 ha grazing land and
62,051 ha is miscellaneous land. From the total cultivated land 5520 ha is irrigated land and on
this area about 17,135 farmers are benefited. The average farm size of the area is 0.5 ha per
household. And the amount of rain fall ranges from 350-700mm /yr.
Source :- ( TBoFED, 2010)
Figure: 3.1.Maps of TigrayAndWeredaSehartiSamre

32
3.3. Background of irrigation user Tabia’s
Andi-WoyaneDebrehaila:- is located at an altitude of 2290 m.a.s.l. The total area of Andi-
Woyanedebrehailatabia is 4060.87 hectares. The cultivable land is 1466.5 ha (36.1%). There is
no rainfall gauge in the tabia, so only the estimated average rainfall ranges from 500-747
mm.The soil types are 55% vertisols (black soils), 10% luvisol(red soils) and camisole (bole
soils) 35%.In A/W/Debrehailatabia a total of 100 ha is irrigated benefiting 768 farmers.
Addis-Alem: - is located at an altitude of 1700-2200 m.a.s.l. The total area of Addis-Alemtabia
is 3440 hectares. The cultivable land is 914 ha (26.5%). There is no rainfall gauge in the tabia so
only the estimated average rainfall ranges from 550-750mm. The soil types are 65% vertisols
(black soils) and 35% luvisol (red soils). In this Tabia, a total of 121 ha is irrigated benefiting
1098 farmers. (Tekleyohans, 2010)
3.4. Methodology
3.4.1. Selection of the study area
The study was conduct in two kebelles of Samreworeda:Amdiweyanedebrehayla and
AdissAlemkebelles. The study woreda aswell as the Kebelles were chosen because of the
following reasons
*Thekebelle are located at the highlands of the region and they have relatively high population
densities, and water potential.
*Farmers in the area have long history of traditional irrigation practices as compare to other
areas.
*The kebelles have relatively better irrigation activitiesthat give opportunity to government in
developing modern small-scale irrigation schemes. In this area, in addition to seventeen
traditional schemes, six modern (2 Micro-dam and 4 Diversions) small-scale schemes were
constructed in the district and are operational. So it is better to check the income difference
among users and non-users in order to motivate non-users to use any water resource options.
*Finally the kebelles are accessible in terms of road, market etc.
33
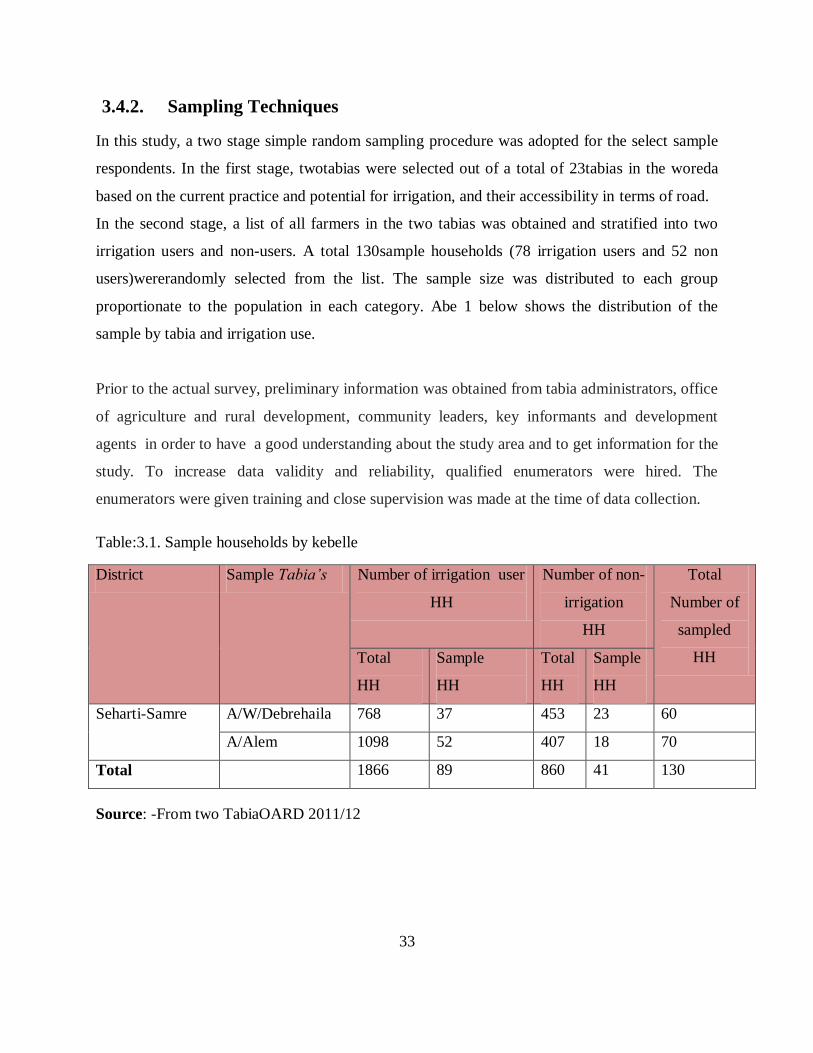
3.4.2. Sampling Techniques
In this study, a two stage simple random sampling procedure was adopted for the select sample
respondents. In the first stage, twotabias were selected out of a total of 23tabias in the woreda
based on the current practice and potential for irrigation, and their accessibility in terms of road.
In the second stage, a list of all farmers in the two tabias was obtained and stratified into two
irrigation users and non-users. A total 130sample households (78 irrigation users and 52 non
users)wererandomly selected from the list. The sample size was distributed to each group
proportionate to the population in each category. Abe 1 below shows the distribution of the
sample by tabia and irrigation use.
Prior to the actual survey, preliminary information was obtained from tabia administrators, office
of agriculture and rural development, community leaders, key informants and development
agents in order to have a good understanding about the study area and to get information for the
study. To increase data validity and reliability, qualified enumerators were hired. The
enumerators were given training and close supervision was made at the time of data collection.
Table:3.1. Sample households by kebelle
District Sample Tabia’s Number of irrigation user
HH
Number of non-
irrigation
HH
Total
Number of
sampled
HH Total
HH
Sample
HH
Total
HH
Sample
HH
Seharti-Samre A/W/Debrehaila 768 37 453 23 60
A/Alem 1098 52 407 18 70
Total 1866 89 860 41 130
Source: -From two TabiaOARD 2011/12

34
3.4.3. Data Collection mechanisms and types of data
Both primary and secondary data were used in this study. To obtain primary data, structured
questionnaire with both closed and some open-ended question was developed. Important
variables on economic, social and institutional aspect of the society in the sampled Tabia’s were
collected. Two enumerators, both from the sampled Kebeles, were recruited. Necessary care was
taken in recruiting the enumerators and strict supervision was made during the course of survey
work. The enumerators are allfluent speakers of the local language, (Tigrigna).the enumerator
were given intensive training ondata collection procedures, interviewing techniques and the
detailed contents of the questionnaire. The structured questionnaire was translated to (Tigrigna)
to allow enumerators better understand the questions and properly administer the interviews.
The questionnaire was pre-tested and adjusted accordingly before and after normal interview.
Then using the amended structured interview schedule, primary data were collected by using
personal interview technique from sampled farmers. In addition to this the study was supported
by photograph on specific and interesting issues. The survey work for the collection of primary
data was done in the month of December 2012.
Secondary data were collected from different sectors such as from Regional Bureau of Water
Resource, Mining and Energy (MWRME), Tigray Bureau of Finance and Economic
Development (TBoFED), particularly from Bureau of Agriculture and Rural Development
(BoARD).Moreover, secondary data were obtained from documents of the line officesof District
Offices of Agriculture and rural development (DoARD), District Offices of Finance and
Economic Development (DoFED), are also some of the data sources for secondary data that were
obtained.

35
3.5. Method of Data Analysis
3.5.1. Descriptive Analysis
To assessment and analysis the impact of irrigation on house hold income and poverty
alleviation, both descriptive analysis and econometric models were employed. The descriptive
analysis was made using frequencies, means, percent, maximum and minimum values of some
important variables. Econometric models were used to estimate the relationship between the
variables (dependent and independent variables) using the propensity score matching and linear
regression.
To compare the levels of poverty among irrigation users and non-users, the three measures of
poverty index developed by Foster et al. (1984) were used.
3.5.2. Econometric Model
It was hypothesized that irrigation is expected to have immediate effect on cropping intensity
resulting in larger production, higher income and poverty reduction from both crop outputs,
trading of outputs and inputs. To be specific, irrigation user households will have higher income
and consumption expenditure than the irrigation non-user households.
Propensity score matching model was employed to estimate the income difference of households
between irrigation users and non-irrigation users (rain fed users only).
3.5.3. Impact Measurement using Propensity Score matching method
The propensity score is defined by Rosenbaum and Rubin (1983) as the conditional probability
of receiving a treatment given pre-treatment characteristics:
P(X) ≡Pr {D = 1|X} = E {D|X}. (1)
Where D = {0, 1} is the indicator of exposure to treatment and X is the multidimensional vector
of pre-treatment characteristics. Rosenbaum and Rubin (1983) show that if the exposure to
treatment is random within cells defined by X, it is also random within cells defined by the
values of the mono-dimensional variable p(X). As a result, given a population of units denoted
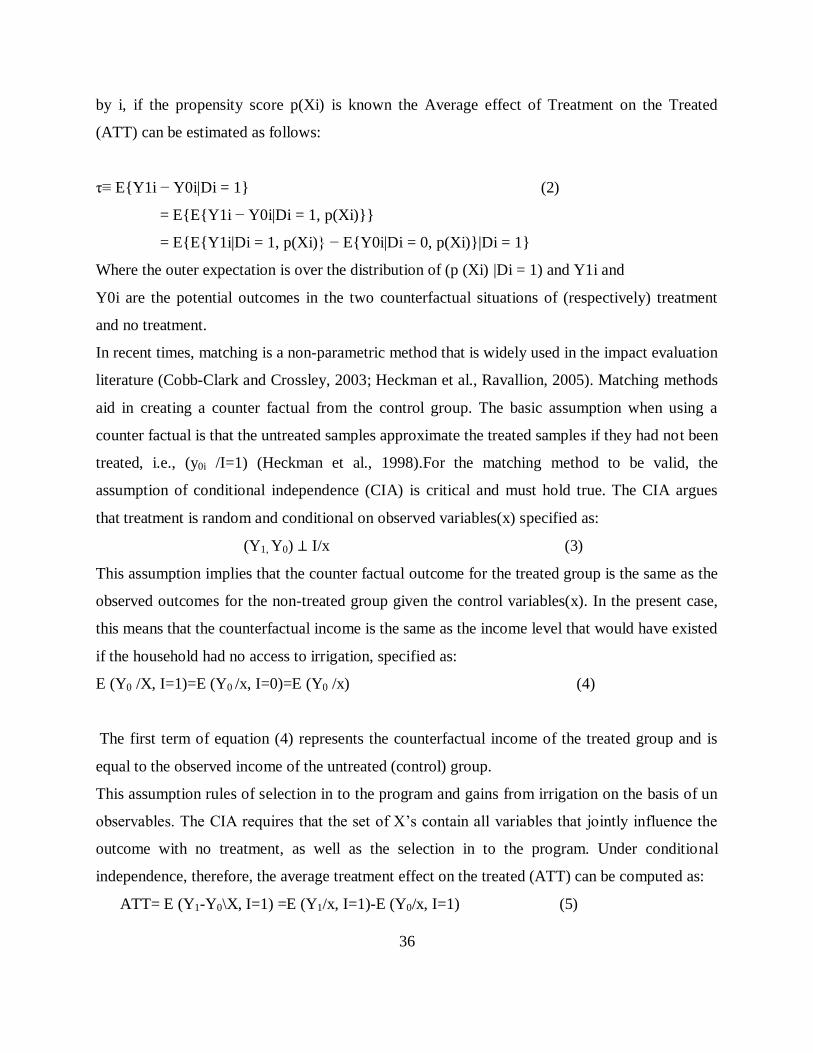
36
by i, if the propensity score p(Xi) is known the Average effect of Treatment on the Treated
(ATT) can be estimated as follows:
τ≡ E{Y1i − Y0i|Di = 1} (2)
= E{E{Y1i − Y0i|Di = 1, p(Xi)}}
= E{E{Y1i|Di = 1, p(Xi)} − E{Y0i|Di = 0, p(Xi)}|Di = 1}
Where the outer expectation is over the distribution of (p (Xi) |Di = 1) and Y1i and
Y0i are the potential outcomes in the two counterfactual situations of (respectively) treatment
and no treatment.
In recent times, matching is a non-parametric method that is widely used in the impact evaluation
literature (Cobb-Clark and Crossley, 2003; Heckman et al., Ravallion, 2005). Matching methods
aid in creating a counter factual from the control group. The basic assumption when using a
counter factual is that the untreated samples approximate the treated samples if they had not been
treated, i.e., (y0i /I=1) (Heckman et al., 1998).For the matching method to be valid, the
assumption of conditional independence (CIA) is critical and must hold true. The CIA argues
that treatment is random and conditional on observed variables(x) specified as:
(Y1, Y0) ⊥ I/x (3)
This assumption implies that the counter factual outcome for the treated group is the same as the
observed outcomes for the non-treated group given the control variables(x). In the present case,
this means that the counterfactual income is the same as the income level that would have existed
if the household had no access to irrigation, specified as:
E (Y0 /X, I=1)=E (Y0 /x, I=0)=E (Y0 /x) (4)
The first term of equation (4) represents the counterfactual income of the treated group and is
equal to the observed income of the untreated (control) group.
This assumption rules of selection in to the program and gains from irrigation on the basis of un
observables. The CIA requires that the set of X‘s contain all variables that jointly influence the
outcome with no treatment, as well as the selection in to the program. Under conditional
independence, therefore, the average treatment effect on the treated (ATT) can be computed as:
ATT= E (Y1-Y0\X, I=1) =E (Y1/x, I=1)-E (Y0/x, I=1) (5)
37
However, matching of households based on observables may not be feasible when the dimension
of control variables in large. To overcome this problem of dimensionality, Rosenbaum and
Rubin (1983) argued that one can match a long a single index variable given by the propensity
score, P(x), which summarizes the multi-dimensional variables.
For the propensity score matching (PSM) to be valid, the balancing properties need to
besatisfied. It is intuited that two households with the same probability access to irrigation will
be placed in the treated (with access to irrigation) and untreated (without access to irrigation)
samples is equal proportions. The propensity score is estimated by a binary choice model, which,
in this paper, is represented by a binary logit model. Once the propensity score (P score) is
estimated, the data is split in two equal spaced Pscore intervals, implying that, within each of
these intervals, the mean Pscore of each conditioning variable is equal for the treated and control
households, known as the balancing property. Since the Pscore is a continuous variable, exact
matching may not be possible, in which case a certain distance between households with and
without access to irrigation must be accepted. In the present study, households with and without
access to irrigation were, therefore, matched based on their propensity score (Pscore) using the
nearest neighbor, Kernel, Radius and stratification matching methods.
These methods identify the closest match for each irrigating house hold (i.e., with the closest
propensity score) among households that have no access to irrigation, and then compute the
effect of irrigation as a mean difference of household income between the two households. As
(Becker and Ichino, 2002) briefly mentioned that there are four types of matching methods as
follows. Each type of algorism has theirown strength and weakness. Based on this issue I can use
4 types of algorism. But mostly I need best to usenearest neighbor matching method.
a) Nearest neighbor matching method:-each treated observation is matched with an
observation in the control group that exhibits the closest propensity score. In nearest neighbor
matching, it is possible that the same household in the control group can neighbor more than
one household in the treated group. Therefore, after matching, the difference between their

38
incomes is calculated as the average effect of access to irrigation on household income
(ATT).
b) Kernel matching method:-all treated observations are matched with households in the
control group based on the weighted average that is inversely proportional to the distance
between the propensity scores of the treated and control groups.
c) Radius matchingmethod:-is each treated unit is matched only with the control units whose
propensity score falls in a predefined neighborhood of the propensity score of the treated unit. If
the dimension of the neighborhood (i.e. the radius) is set to be very small it is possible that some
treated units are not matched because the neighborhood does not contain control units. On the
other hand, the smaller the size of the neighborhood the better is the quality of the matches.
d) Stratification matching method:-the data set is divided in to intervals having, on average,
the same propensity score. The treated and control groups within that intervals are placed under
one block, and the mean difference of the outcome between the treated and control groups
provides the average treatment effect of irrigation on household income(ATT). In this study the
hypotheses research is described as follows.
Null hypothesis (Ho): There is no income difference between irrigation users and non-irrigation
users.
Alternate hypothesis (H1):There is income difference between irrigation users and non-irrigation
users. Access to irrigation improves household‘s income.
3.5.4. Poverty Profile Measurements
According to Sen (1976: 219-59), the measurement of poverty involves two distinct problems.
The first problem involves identifying a poverty line and identifying the poor. The second
challenge is regarding the construction of a poverty index that measures the intensity of poverty
suffered by those below the poverty line. These problems have attracted considerable attention
from economists (Ravallion, 1998; Kakwani 1980; 1986; Foster et al., 1984).

39
There are a number of conceptual methods for estimating the poverty line. The three most
common approaches are: the Direct Calorie Intake (DCI) Approach, the Food Energy Intake
(FEI) Approach and the Cost of Basic Needs (CBN) Approach. These methods differ in terms of
their approach, to estimate the threshold or poverty line.
The direct calorie intake method to measure poverty, considers as poor, any household not
meeting the minimum nutritional requirement that satisfies basic human consumption needs for
good health. The second approach is food energy intake approach: the premise of this method is
to find the actual value of per capita consumption at which a household can be expected to fulfil
its caloric requirement; this means that the poverty line is defined by the level of per capita
consumption at which people can be expected to meet this nutritional requirement. This
represents a methodological improvement in terms of representativeness because the food energy
intake method provides a monetary rather than purely nutritional concept of poverty. However,
the method suffers from major deficiencies in terms of overall consistency.
In current literature, the most popular method of estimating poverty lines is the Cost of Basic
Need (CBN) method. The CBN approach is anchored on estimating the cost of attaining a
predetermined level of food energy or calorie intake requirements and also meeting other basic
none food requirements.
3.5.5. Measuring Poverty Index
To compare the levels of poverty among irrigation users and non-users, the three measures of
poverty index developed by Foster et al. (1984) was used. These poverty measures P are based
on the following equation:
M
i
i
z
yz
NP
1
)(1 eq(1)
Where
z is the poverty line,
iy . is the consumption expenditure (standard of living) for individual i,
N is the number of people in the population, and
M is the number of people in poor households.
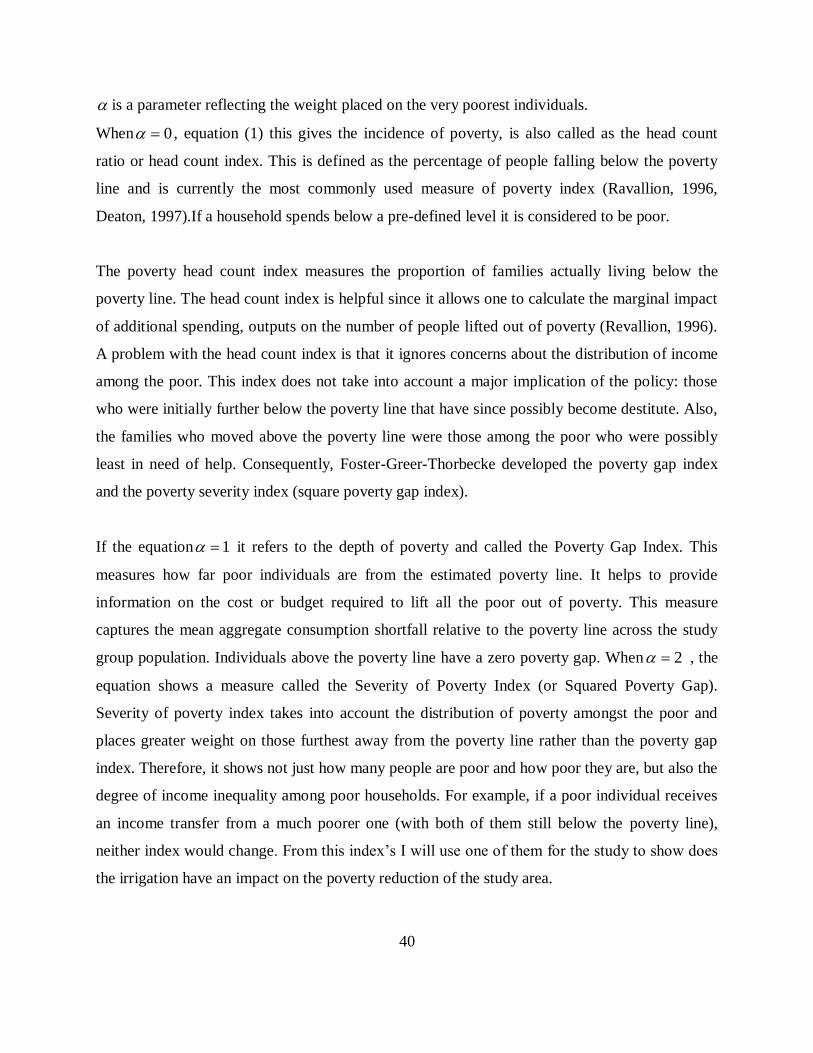
40
is a parameter reflecting the weight placed on the very poorest individuals.
When 0 , equation (1) this gives the incidence of poverty, is also called as the head count
ratio or head count index. This is defined as the percentage of people falling below the poverty
line and is currently the most commonly used measure of poverty index (Ravallion, 1996,
Deaton, 1997).If a household spends below a pre-defined level it is considered to be poor.
The poverty head count index measures the proportion of families actually living below the
poverty line. The head count index is helpful since it allows one to calculate the marginal impact
of additional spending, outputs on the number of people lifted out of poverty (Revallion, 1996).
A problem with the head count index is that it ignores concerns about the distribution of income
among the poor. This index does not take into account a major implication of the policy: those
who were initially further below the poverty line that have since possibly become destitute. Also,
the families who moved above the poverty line were those among the poor who were possibly
least in need of help. Consequently, Foster-Greer-Thorbecke developed the poverty gap index
and the poverty severity index (square poverty gap index).
If the equation 1 it refers to the depth of poverty and called the Poverty Gap Index. This
measures how far poor individuals are from the estimated poverty line. It helps to provide
information on the cost or budget required to lift all the poor out of poverty. This measure
captures the mean aggregate consumption shortfall relative to the poverty line across the study
group population. Individuals above the poverty line have a zero poverty gap. When 2 , the
equation shows a measure called the Severity of Poverty Index (or Squared Poverty Gap).
Severity of poverty index takes into account the distribution of poverty amongst the poor and
places greater weight on those furthest away from the poverty line rather than the poverty gap
index. Therefore, it shows not just how many people are poor and how poor they are, but also the
degree of income inequality among poor households. For example, if a poor individual receives
an income transfer from a much poorer one (with both of them still below the poverty line),
neither index would change. From this index‘s I will use one of them for the study to show does
the irrigation have an impact on the poverty reduction of the study area.
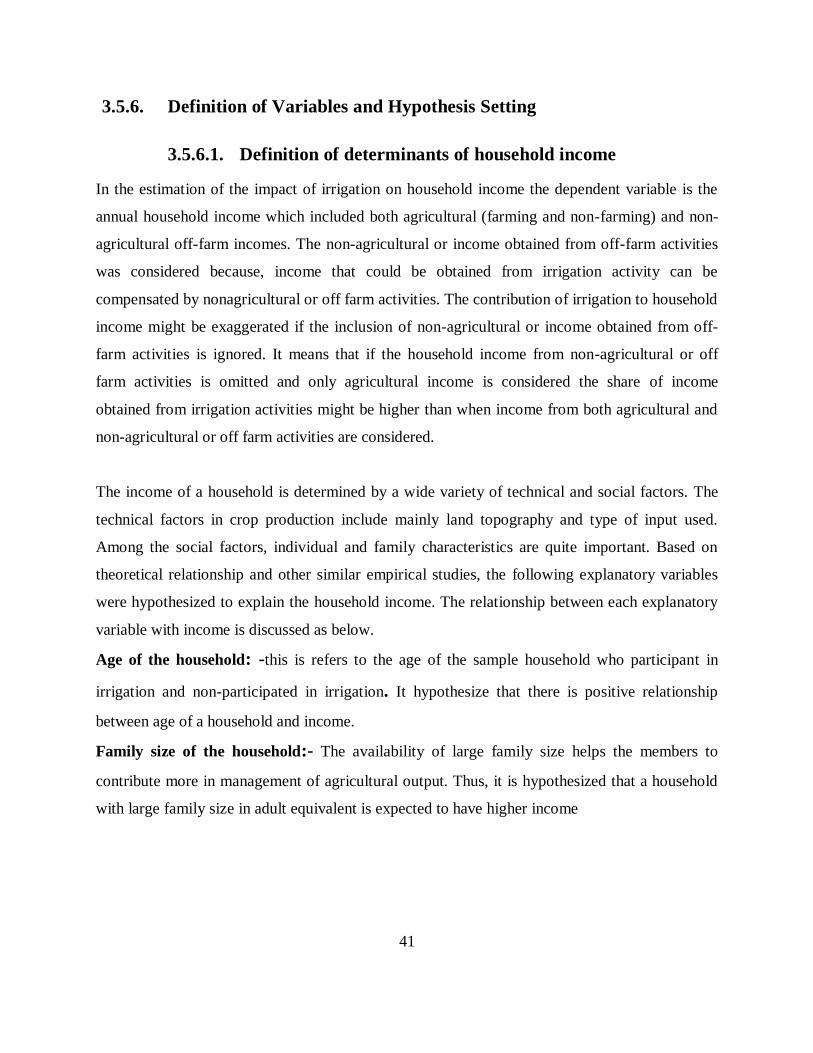
41
3.5.6. Definition of Variables and Hypothesis Setting
3.5.6.1. Definition of determinants of household income
In the estimation of the impact of irrigation on household income the dependent variable is the
annual household income which included both agricultural (farming and non-farming) and non-
agricultural off-farm incomes. The non-agricultural or income obtained from off-farm activities
was considered because, income that could be obtained from irrigation activity can be
compensated by nonagricultural or off farm activities. The contribution of irrigation to household
income might be exaggerated if the inclusion of non-agricultural or income obtained from off-
farm activities is ignored. It means that if the household income from non-agricultural or off
farm activities is omitted and only agricultural income is considered the share of income
obtained from irrigation activities might be higher than when income from both agricultural and
non-agricultural or off farm activities are considered.
The income of a household is determined by a wide variety of technical and social factors. The
technical factors in crop production include mainly land topography and type of input used.
Among the social factors, individual and family characteristics are quite important. Based on
theoretical relationship and other similar empirical studies, the following explanatory variables
were hypothesized to explain the household income. The relationship between each explanatory
variable with income is discussed as below.
Age of the household: -this is refers to the age of the sample household who participant in
irrigation and non-participated in irrigation. It hypothesize that there is positive relationship
between age of a household and income.
Family size of the household:- The availability of large family size helps the members to
contribute more in management of agricultural output. Thus, it is hypothesized that a household
with large family size in adult equivalent is expected to have higher income

42
Gender of household:-is a dummy variable for gender of household head 1 for male and zero
for female headed household. Sex of the household is important thing in the agricultural
production. Male headed household is more likely to adopt modern agricultural system than
female headed household; it is expected male headed household would have higher annul
income as compare to female headed household and it expected to have positive coefficient.
Total cultivated land:-This refers to the total area of farmland that a farm HH cultivated in
hectares. In agriculture, land is one of the major factors of production. The availability of
cultivable land enables the owner to earn more agricultural output, which implies more income.
Therefore, land holding and improvement in the income level are expected to have positive
relationship.
Amount of fertilizer used:-The use of fertilizer will increase the productivity of a given land.
Improvement in productivity will ultimately lead to improvement in income level. Thus, it is
hypothesized that a household using higher fertilizer amount is expected to have higher income.
Education level of the household head:-four dummy variable for educational level of a household
were included in the model, read and write, attend primary school (1- 8 grade), secondary school (9-
12 grade) and attend college. Household with not able to read and write (illiterate) was taken as a
reference category. It is expected that higher educational level of household would have a positive
contribution enhances farmers' ability to perceive, interpret, and respond to new events and
technologies in the context of risk. Education is, thus, hypothesized to increase the probability of
farmers‘ adoption of new technologies and hence increases household income.
Access to irrigation:-a dummy variable for access to irrigation plot was includes in the model
and none irrigation users were consider as benchmark category. Thus, it was hypothesized that
households‘ access to irrigation plot would increase household income via increase crop and land
productivity through adoption of yield enhancing input, increasing frequency of harvest and crop
intensity.

43
3.6. Theoretical Framework of Impact of Irrigation on Poverty
The development and utilization of water resources in agriculture through irrigation development
creates an economic environment that has direct and indirect benefits for the local and national
economy. However, many discussions of irrigation benefits have focused on direct production
effects such as increased crop yield and farm income. The debate often ignores a much wider
array of benefits ranging from increased labor demand and the creation of new opportunities for
non-irrigation water use. Furthermore the economic impacts such as decreases in food prices and
other economic multipliers effects associated with the provision of irrigation are also significant
(Hussein, 2007).Hussein also notes that the direct and indirect benefits of irrigation vary greatly
across systems, and are dependent on a range of factors that include local conditions, system
management, irrigation policy, and broader economic and political factors. The indirect irrigation
benefits are larger, and often substantially larger, than the direct benefits; and the distribution of
irrigation benefits varies greatly by type of benefit and socioeconomic status. He classified the
benefits of irrigation into five typologies:
Type 1: direct benefits related to expansion in employment from construction, rehabilitation and
maintenance of irrigation systems.
Type 2: direct benefits related to irrigation-induced expansion in crop productivity.
Type 3: localized indirect benefits related to productivity such as increases in employment,
wages, income generation and consumption in local communities.
Type 4: other localized benefits from multiple uses of water such as livestock watering and use
of water for household chores;
Type 5: broader-level multiplier benefits from the linkages with non-agricultural sectors,
(tekleyohans, and 2010)
Hence, it simplifies the analysis of linkage between irrigation and poverty at household and
community level. The assumption in this thesis is that access to reliable irrigation has a positive
impact on overall poverty reduction of a household.
44
The overall working hypothesis with respect to the impact of irrigation on poverty, is expressed
as follows
Ho : there is no difference in poverty incidence(head count and severity of poverty) between
irrigation uses and non-irrigation users.
H1: There poverty incidence difference between irrigation users and non-irrigation users
Increased in availability of irrigation in dry land areas has a significant effect in increasing
productivity of the land through intensive use of agricultural inputs; thereby contributing to
increased household income and poverty reduction.
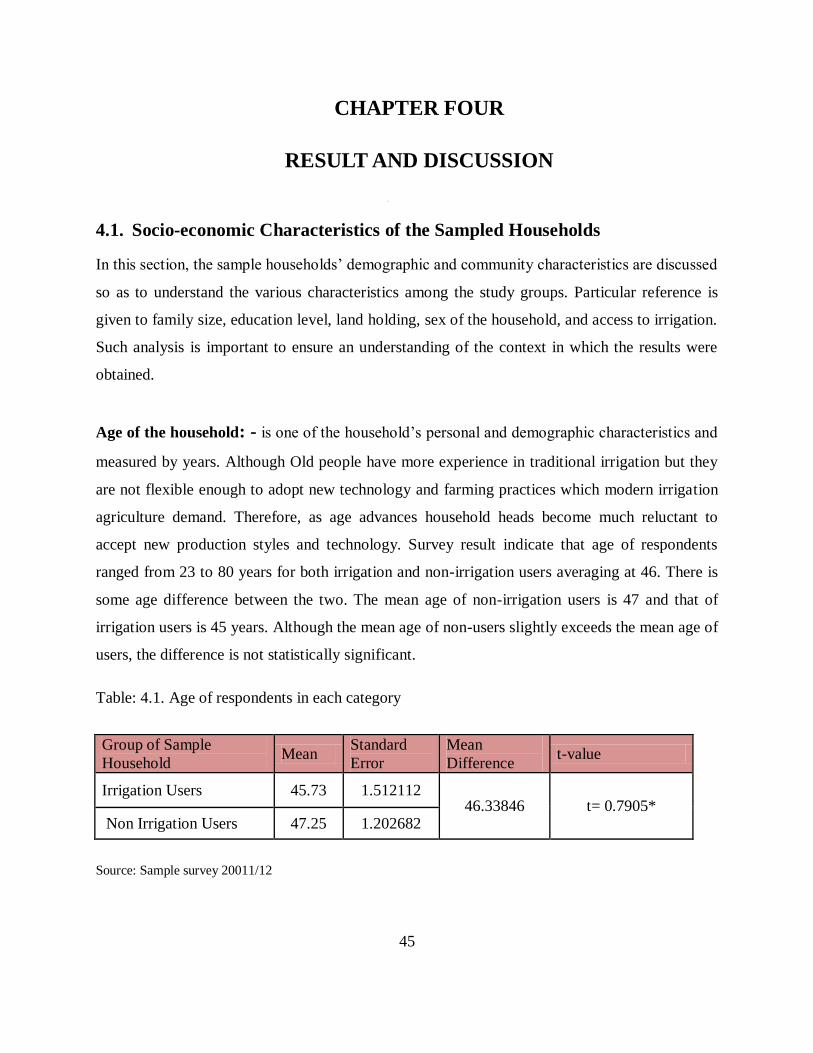
45
CHAPTER FOUR
RESULT AND DISCUSSION
4. LITERATURE REVIEW
4.1. Socio-economic Characteristics of the Sampled Households
In this section, the sample households‘ demographic and community characteristics are discussed
so as to understand the various characteristics among the study groups. Particular reference is
given to family size, education level, land holding, sex of the household, and access to irrigation.
Such analysis is important to ensure an understanding of the context in which the results were
obtained.
Age of the household: - is one of the household‘s personal and demographic characteristics and
measured by years. Although Old people have more experience in traditional irrigation but they
are not flexible enough to adopt new technology and farming practices which modern irrigation
agriculture demand. Therefore, as age advances household heads become much reluctant to
accept new production styles and technology. Survey result indicate that age of respondents
ranged from 23 to 80 years for both irrigation and non-irrigation users averaging at 46. There is
some age difference between the two. The mean age of non-irrigation users is 47 and that of
irrigation users is 45 years. Although the mean age of non-users slightly exceeds the mean age of
users, the difference is not statistically significant.
Table: 4.1. Age of respondents in each category
Group of Sample
Household Mean
Standard
Error
Mean
Difference t-value
Irrigation Users 45.73 1.512112 46.33846 t= 0.7905*
Non Irrigation Users 47.25 1.202682
Source: Sample survey 20011/12

46
Gender of household: - male headed households are more likely to adopt modern irrigation
system than female headed households. Since women in the study area like all other women in
the country have triple responsibility of female‘s in production, reproductive and childcare, and
also they have less access to information about the technology. It is expected that male headed
household easily adopt improved irrigation system than their female headed counterparts.
Among the 130 sample observations only 12.3% are females and the remaining 87.7% are males.
Out of the total surveyed household, only 78 respondents reported had access to irrigation, out of
this 19.2% females were irrigation users; the chi-square test revealed that the difference is
statistically significant at 1% level of significance.
Table: 4.2. Sex of the Survey Respondents
Sex of Sample
Household
Number
Male
Number
Female
Total
number (P value)
Irrigation Users 63 15 78
0.003***
Non Irrigation Users 51
1
52
Source: Sample survey 20011/12
Family size of the household: - Households who have large family size is more likely to
manage properly irrigation practices rather than households with less family size, because the
availability of large family size helps the members to contribute more in management of
irrigation activities. Therefore, family size of a household head has direct relationship with
adoption and intensity of modern irrigation activity. As the result explained below, the average
family sizes in the study area are 4 persons; also the minimum and maximum family size of the
sample house hold is 1 and 11 respectively. The number of family members involved on
agricultural activity ranges from 1 to 5. The average family size of irrigation users and non-users
are 4 and 3 respectively. And also it is statistically significant at 1% level of significance.
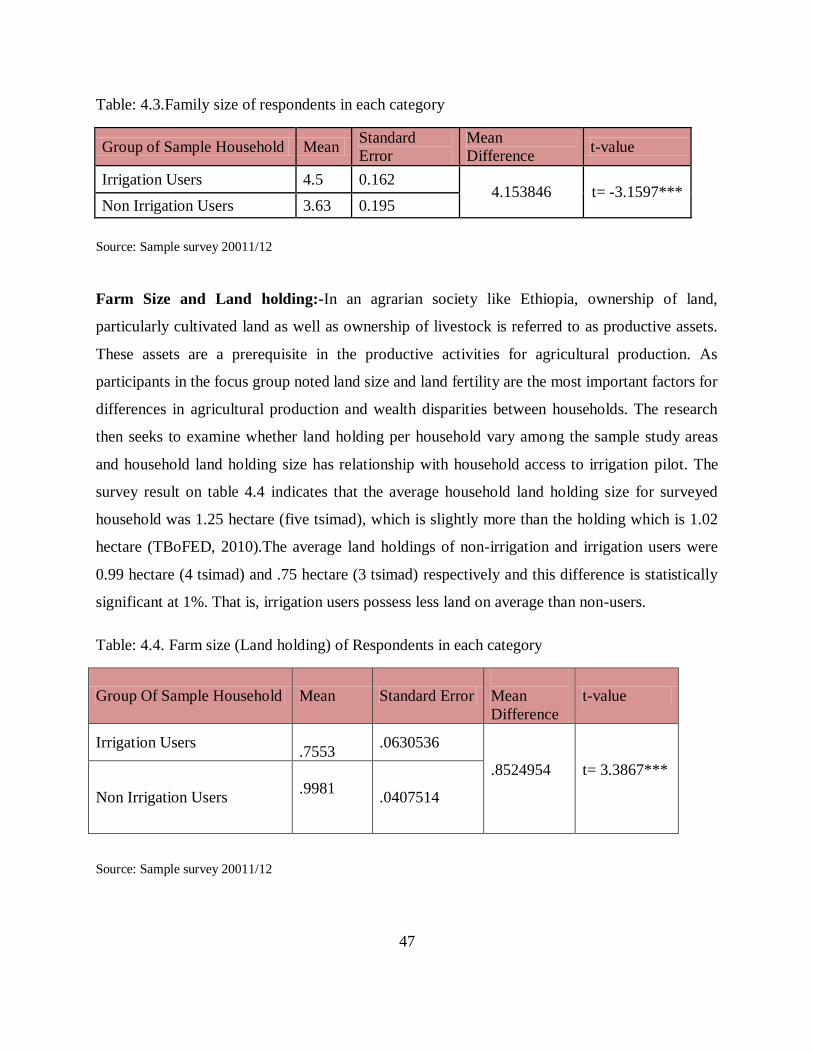
47
Table: 4.3.Family size of respondents in each category
Group of Sample Household Mean Standard
Error
Mean
Difference t-value
Irrigation Users 4.5 0.162 4.153846 t= -3.1597***
Non Irrigation Users 3.63 0.195
Source: Sample survey 20011/12
Farm Size and Land holding:-In an agrarian society like Ethiopia, ownership of land,
particularly cultivated land as well as ownership of livestock is referred to as productive assets.
These assets are a prerequisite in the productive activities for agricultural production. As
participants in the focus group noted land size and land fertility are the most important factors for
differences in agricultural production and wealth disparities between households. The research
then seeks to examine whether land holding per household vary among the sample study areas
and household land holding size has relationship with household access to irrigation pilot. The
survey result on table 4.4 indicates that the average household land holding size for surveyed
household was 1.25 hectare (five tsimad), which is slightly more than the holding which is 1.02
hectare (TBoFED, 2010).The average land holdings of non-irrigation and irrigation users were
0.99 hectare (4 tsimad) and .75 hectare (3 tsimad) respectively and this difference is statistically
significant at 1%. That is, irrigation users possess less land on average than non-users.
Table: 4.4. Farm size (Land holding) of Respondents in each category
Group Of Sample Household Mean Standard Error
Mean
Difference
t-value
Irrigation Users
.7553 .0630536
.8524954
t= 3.3867***
Non Irrigation Users .9981
.0407514
Source: Sample survey 20011/12

48
Amount of fertilizer used:-The use of fertilizer increases the productivity of a given land and
hence increases household income. Survey results indicate that irrigation users use more fertilizers
than non-users. The average use of fertilizer for irrigation user is 1.173quintal while for non-
irrigation user household is found to 0.7999 quintal and the difference is statistically significant
at 1% level of significance.
Table: 4.5. Amount of fertilizer used Respondents in each category
Group of Sample
Household Mean
Standard
Error
Mean
Difference t-value
Irrigation Users 1.17 0.078
1.023769 t= -3.7557***
Non Irrigation Users 0.78 622203
Source: Sample survey 20011/12
Educational level: - Education level of the respondents on the study area,the result indicated that
out of 78 irrigation users 53.85% were not attend any schooling neither read nor write, while
21.8% of them could read and write but without a formal education and 16.7 % of them
participated on irrigation practices had complete a primary school education and 7.7% had not
complete a primary school education. Out of 52 non- irrigation users 40.4% were not attend any
schooling neither read nor write respectively, while 13.5% of them could read and write but
without a formal education and 44.2% of the respondents complete a primary school education;
very few respondents had not complete a primary school education. The chi square test shows
that education level is statistically significant at 1 % level of significance.

49
Table: 4.6. Educational level of respondents
Highest Level Of Education Irrigation User
Non-Irrigation
Total Number
Never schooling 42 21 63
Religious or traditionally schooling 17 7
24
Primary schooling incomplete 6 1 7
Primary schooling complete 13 23 36
Source: Sample survey 2011/12
Access to Extension Services
The study result showed that 66.9 % of the sample households get extension service. When we
compare irrigation user and non-user households‘ majority of the user households get support
from extension agents when compared to non-users. According to the survey 67.9 % users and
65.4% non-users get extension service. Extension service here refers to advice, training,
demonstration and distribution of input. Extension agents in the study areas reported that there is
a program of training and orientation to irrigators and rain fed cultivators on various subjects.
Shortage of extension agents at kebelle level remains a problem in all study areas. In 2011/12,
three or four extension agents per kebelle were working to provide technical assistance, but it
was found that they were not adequately supplied with sufficient transport facilities to provide
adequate support. The survey result indicates that 32%of users and 34.6% non-users do not get
extension service. The farmers receive service 2-3 times per season. The average number of days
of extension service for irrigation user is 2.42 days and 2.38 days for nonuser. Irrigation practice
requires close follow up to aware farmers in order to use input and technical service. But in
practice in the ground reality the result shows that extension service is not significant difference
among users and non-users.
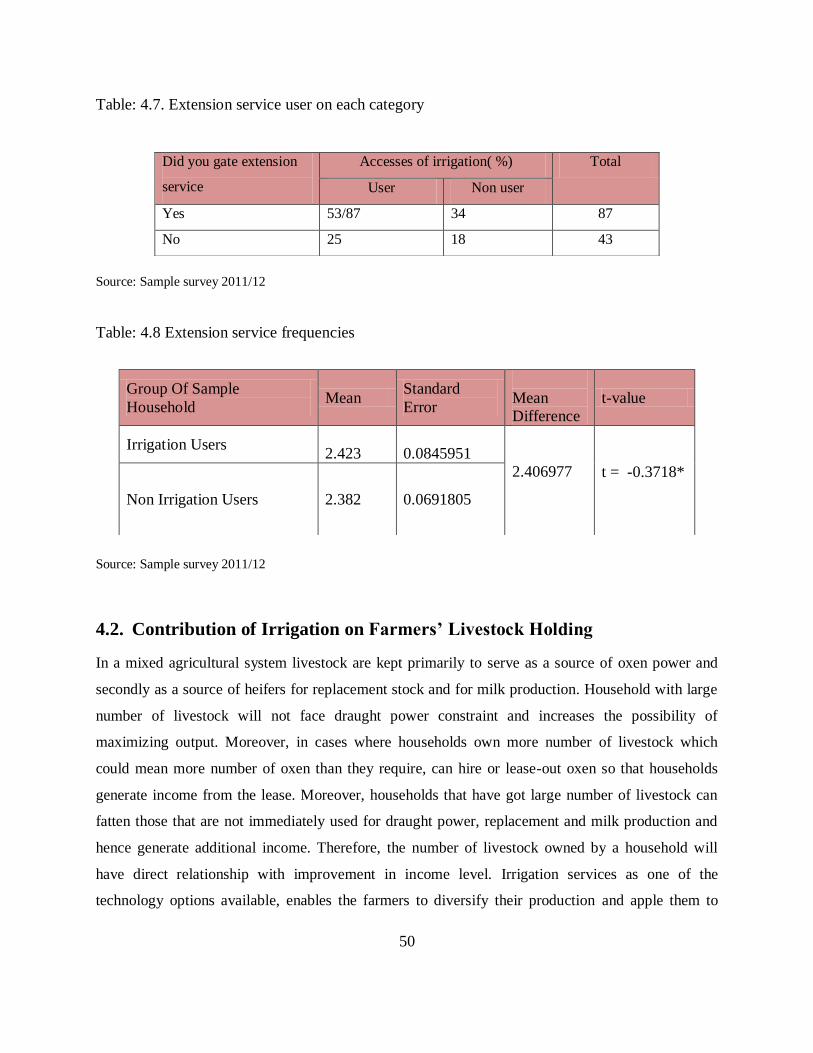
50
Table: 4.7. Extension service user on each category
Source: Sample survey 2011/12
Table: 4.8 Extension service frequencies
Source: Sample survey 2011/12
4.2. Contribution of Irrigation on Farmers’ Livestock Holding
In a mixed agricultural system livestock are kept primarily to serve as a source of oxen power and
secondly as a source of heifers for replacement stock and for milk production. Household with large
number of livestock will not face draught power constraint and increases the possibility of
maximizing output. Moreover, in cases where households own more number of livestock which
could mean more number of oxen than they require, can hire or lease-out oxen so that households
generate income from the lease. Moreover, households that have got large number of livestock can
fatten those that are not immediately used for draught power, replacement and milk production and
hence generate additional income. Therefore, the number of livestock owned by a household will
have direct relationship with improvement in income level. Irrigation services as one of the
technology options available, enables the farmers to diversify their production and apple them to
Did you gate extension
service
Accesses of irrigation( %) Total
User Non user
Yes 53/87 34 87
No 25 18 43
Group Of Sample
Household Mean
Standard
Error
Mean
Difference
t-value
Irrigation Users
2.423
0.0845951
2.406977
t = -0.3718*
Non Irrigation Users
2.382
0.0691805

51
have a large number of livestock ownership as camper to the non- irrigation users. In doing so, it
helps the farmer to increase production and income. Therefore, it was hypothesized that irrigation
activities have a positive impact in increasing the number of the livestock ownership. From the result
the irrigation user have more owner ship than those who doesn‘t the average livestock holding in
tropical livestock unit (TLU) for irrigation user is 4.12and 3.01 non user. The difference is
statistically significant at 1 % level of significance. This shows that irrigation activity has a direct
impact on the livestock holding which is in household income and living standard.
Table: 4.9.Livestock owner sheep of respondents
Group of Sample
Household Mean
Standard
Error
Mean
Difference t-value
Irrigation Users 4.124 0.3008
3.6815 t = -2.5941***
Non Irrigation Users 3.0173 0.2632
Source: Sample survey 2011/12
4.3 Food and Non-Food Expenditures of Irrigation User and Non User
The aim was toexamine the magnitude of change which had occurred in the annual consumption
expenditure by estimating the difference between irrigation users and non-irrigation. The average
household‘s total consumption for the study areas was estimated using the monthly food
expenditure per adult which includes food and non-food expenditure. According to the survey,
food expenditure for irrigation users was ETB 283.83 and for non-users it wasETB 210.765 and
the difference is statistically significant at 1 % level of significance. The non-food expenditure
for irrigation users is higher than the non-user it wasETB 48 for users and ETB 41.75 for non-
users. But, the difference was statistically insignificant.

52
Table: 4.10. Food expenditures on both categories
Group Of Sample
Household Mean Standard Error
Mean
Difference
t-value
Irrigation Users
283.83
27.28
254.6167
t = -1.9864**
Non Irrigation Users 210.78
18.69
Source: Sample survey 2011/12
Table: 4.11. Non-Food expenditures on both categories
Group of Sample
Household Mean
Standard
Error
Mean
Difference
t-value
Irrigation Users
48.028
5.76
45.52
t = -0.8606**
Non Irrigation Users 41.752
2.21
Source: Sample survey 2011/12
4.4 Propensity Score Matching Estimates of the Irrigation impact
To examine the impact of irrigation on household income further analysis was done using
Propensity score matching model econometric modeling. to generate propensity score first
analysis on decision to participate in irrigation was done by regressing variables that affect
participation of irrigation but does not affect income of the household which means that the
explanatory variable affects the dependent variable but does not the outcome. The logit estimates
of propensity score (pscore) are presented inTable 11with the help of STATA program output.
Table 11 reports the empirical evidence on the average treatment effect of irrigation on
household income using nearest neighbor, radius and the kernel matching estimator. Column 1
indicates the type of matching estimator, column 2-3 shows the number of treated and control
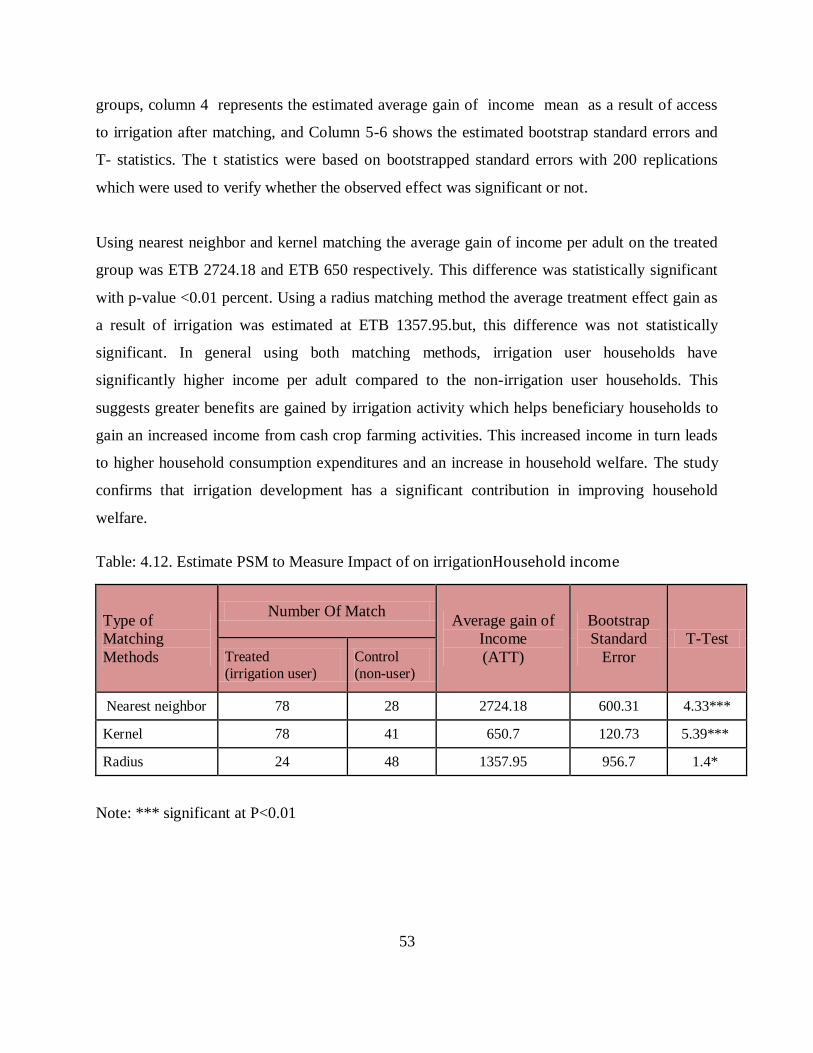
53
groups, column 4 represents the estimated average gain of income mean as a result of access
to irrigation after matching, and Column 5-6 shows the estimated bootstrap standard errors and
T- statistics. The t statistics were based on bootstrapped standard errors with 200 replications
which were used to verify whether the observed effect was significant or not.
Using nearest neighbor and kernel matching the average gain of income per adult on the treated
group was ETB 2724.18 and ETB 650 respectively. This difference was statistically significant
with p-value <0.01 percent. Using a radius matching method the average treatment effect gain as
a result of irrigation was estimated at ETB 1357.95.but, this difference was not statistically
significant. In general using both matching methods, irrigation user households have
significantly higher income per adult compared to the non-irrigation user households. This
suggests greater benefits are gained by irrigation activity which helps beneficiary households to
gain an increased income from cash crop farming activities. This increased income in turn leads
to higher household consumption expenditures and an increase in household welfare. The study
confirms that irrigation development has a significant contribution in improving household
welfare.
Table: 4.12. Estimate PSM to Measure Impact of on irrigationHousehold income
Type of
Matching
Methods
Number Of Match Average gain of
Income
(ATT)
Bootstrap
Standard
Error
T-Test Treated (irrigation user)
Control
(non-user)
Nearest neighbor 78 28 2724.18 600.31 4.33***
Kernel 78 41 650.7 120.73 5.39***
Radius 24 48 1357.95 956.7 1.4*
Note: *** significant at P<0.01

54
4.5 Impact of Irrigation on Poverty Reduction
Household income or consumption expenditure data canuse as one means to compare the welfare
level and the poverty level among households. However, in developing countries consumption is
typically preferred over income as the former better captures the welfare level of a household.
This is mainly due to the fact that households are likely to under report their income than they do
their consumption level (Ravalion, 1998). Thus, to determine the actual impact of the irrigation
on poverty, the expenditure approach was used and the total expenditure was estimated
separately for users and non-users. The table below compare that headcount, poverty gap and
poverty gap squared for users and non-user and the estimated poverty line taken was 165 for
food poverty and 315 for total poverty.
Table: 4.13.The estimated poverty line
Group of Sample
Household
Food Poverty Level Total Poverty Level
P(0) P(1) P(2) P(0) P(1) P(2)
Irrigation Participant 0.128 0.013 0.00025 0.012 0.021 0.007
Non Participant 0.170 0.052 0.029 0.442 0.091 0.027
Source: Sample survey 2011/12
From the study area the incidences of the food poverty of the participant in terms of the head
cont. is 12.8 % and 17%for the nonparticipant. Poverty gap of the sampled household is 1.3 %
for participant and 5.2 % for non-participant. The poverty severity of the sampled householdis
for the participant 0.025 % and for nonparticipant 2.9 %. Using asimple t test the irrigation user
has higher monthly per adult consumptionexpenses than those non irrigation users.Monthly
consumption expense per adult for irrigation user is ETB 331.85 and ETB 252.54 for non-
irrigation user. Themean difference between the two is statistically significant at 5 % level of
significance. This result shows that irrigation users are less poor as compared to non-users.
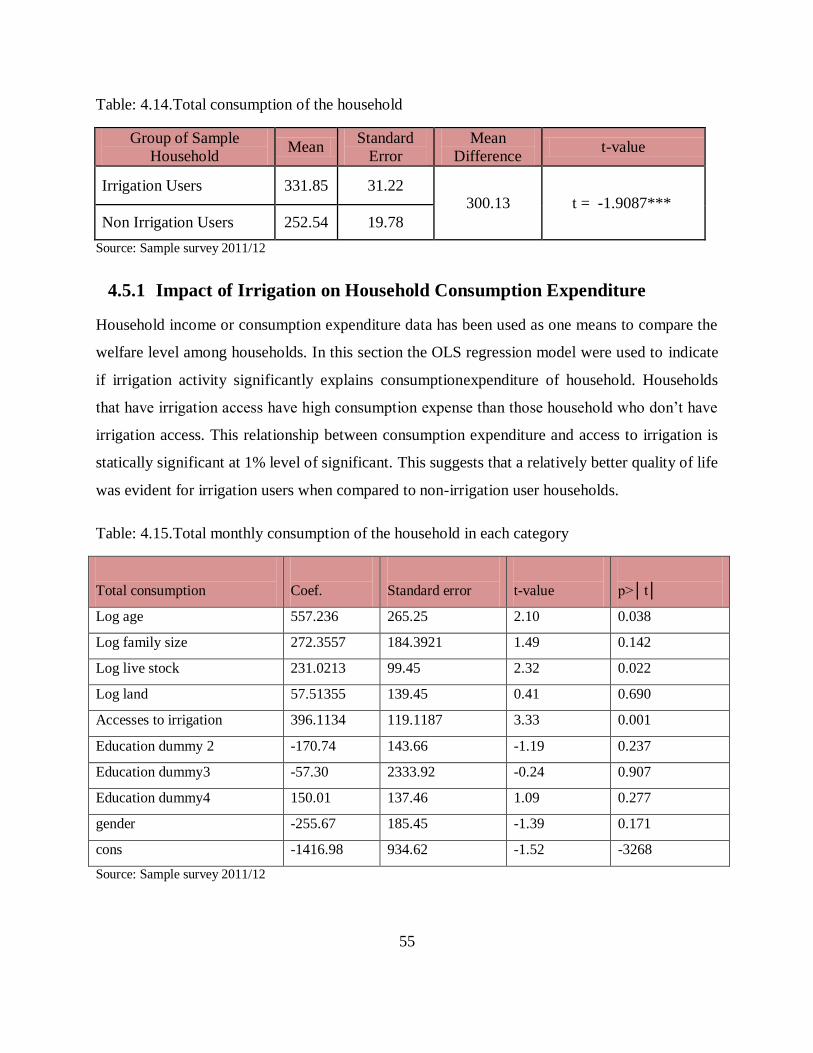
55
Table: 4.14.Total consumption of the household
Group of Sample
Household Mean
Standard
Error
Mean
Difference t-value
Irrigation Users 331.85 31.22 300.13 t = -1.9087***
Non Irrigation Users 252.54 19.78
Source: Sample survey 2011/12
4.5.1 Impact of Irrigation on Household Consumption Expenditure
Household income or consumption expenditure data has been used as one means to compare the
welfare level among households. In this section the OLS regression model were used to indicate
if irrigation activity significantly explains consumptionexpenditure of household. Households
that have irrigation access have high consumption expense than those household who don‘t have
irrigation access. This relationship between consumption expenditure and access to irrigation is
statically significant at 1% level of significant. This suggests that a relatively better quality of life
was evident for irrigation users when compared to non-irrigation user households.
Table: 4.15.Total monthly consumption of the household in each category
Total consumption
Coef.
Standard error
t-value
p>│t│
Log age 557.236 265.25 2.10 0.038
Log family size 272.3557 184.3921 1.49 0.142
Log live stock 231.0213 99.45 2.32 0.022
Log land 57.51355 139.45 0.41 0.690
Accesses to irrigation 396.1134 119.1187 3.33 0.001
Education dummy 2 -170.74 143.66 -1.19 0.237
Education dummy3 -57.30 2333.92 -0.24 0.907
Education dummy4 150.01 137.46 1.09 0.277
gender -255.67 185.45 -1.39 0.171
cons -1416.98 934.62 -1.52 -3268
Source: Sample survey 2011/12
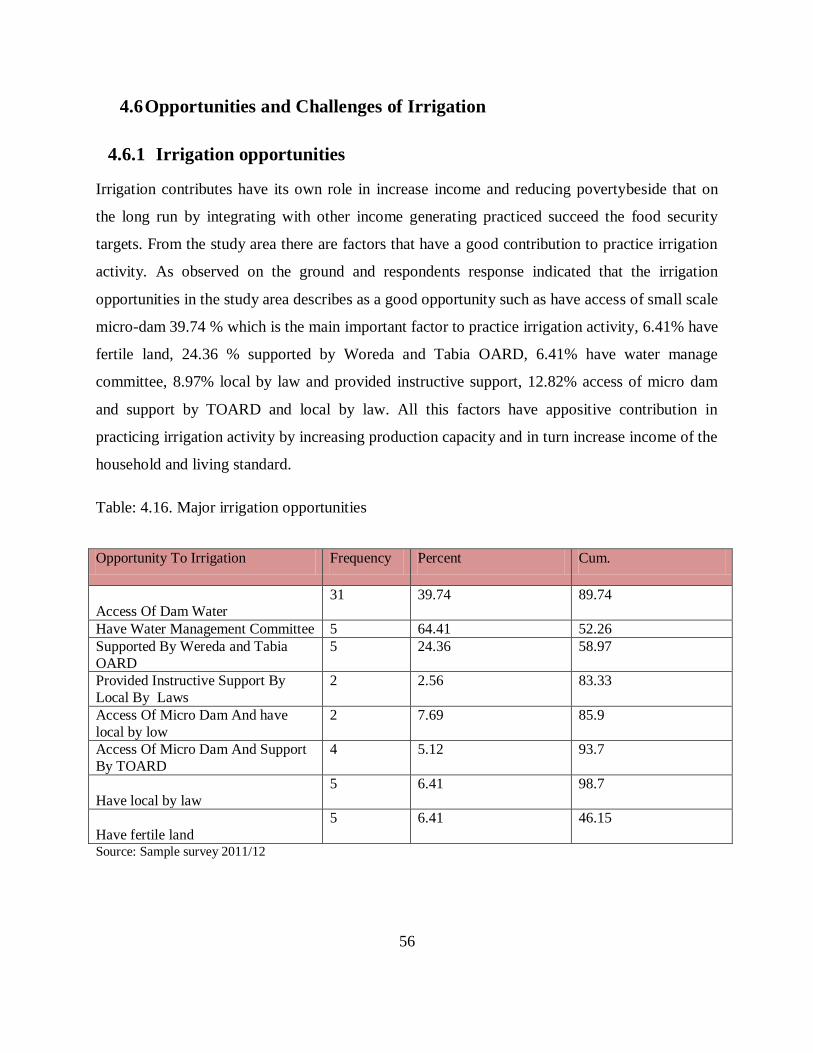
56
4.6 Opportunities and Challenges of Irrigation
4.6.1 Irrigation opportunities
Irrigation contributes have its own role in increase income and reducing povertybeside that on
the long run by integrating with other income generating practiced succeed the food security
targets. From the study area there are factors that have a good contribution to practice irrigation
activity. As observed on the ground and respondents response indicated that the irrigation
opportunities in the study area describes as a good opportunity such as have access of small scale
micro-dam 39.74 % which is the main important factor to practice irrigation activity, 6.41% have
fertile land, 24.36 % supported by Woreda and Tabia OARD, 6.41% have water manage
committee, 8.97% local by law and provided instructive support, 12.82% access of micro dam
and support by TOARD and local by law. All this factors have appositive contribution in
practicing irrigation activity by increasing production capacity and in turn increase income of the
household and living standard.
Table: 4.16. Major irrigation opportunities
Opportunity To Irrigation Frequency Percent Cum.
Access Of Dam Water
31 39.74 89.74
Have Water Management Committee 5 64.41 52.26
Supported By Wereda and Tabia
OARD
5 24.36 58.97
Provided Instructive Support By
Local By Laws
2 2.56 83.33
Access Of Micro Dam And have
local by low
2 7.69 85.9
Access Of Micro Dam And Support
By TOARD
4 5.12 93.7
Have local by law
5 6.41 98.7
Have fertile land
5 6.41 46.15
Source: Sample survey 2011/12
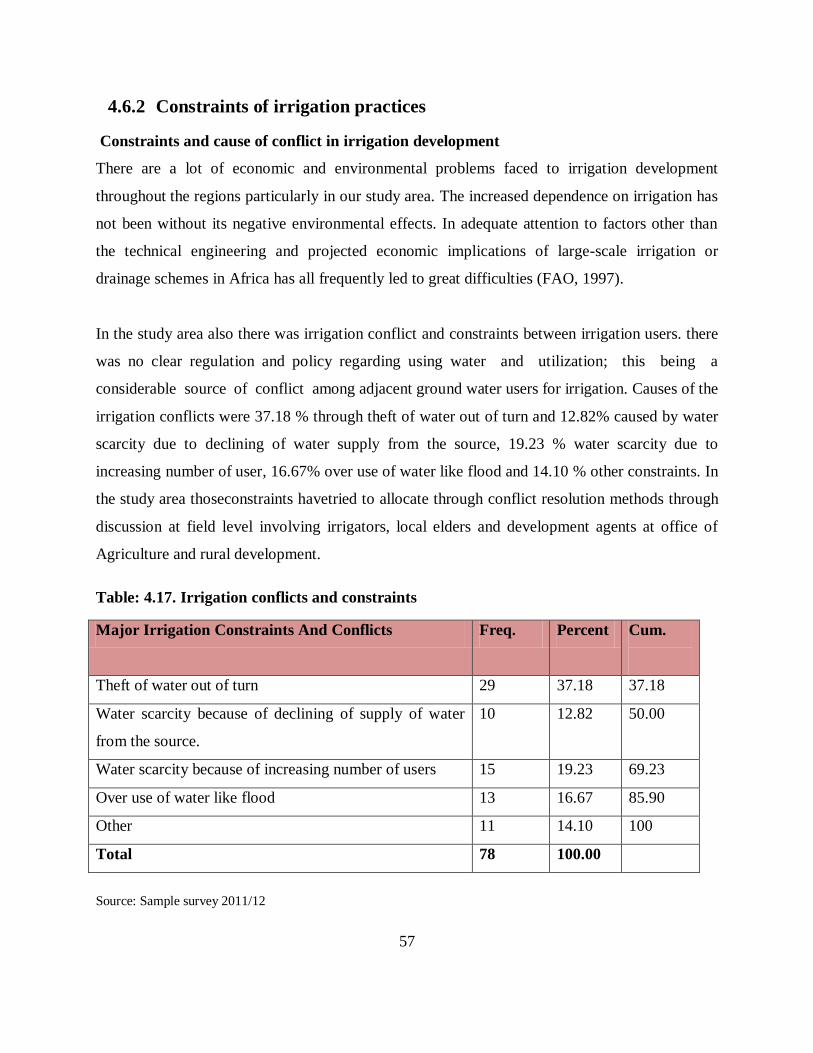
57
4.6.2 Constraints of irrigation practices
Constraints and cause of conflict in irrigation development
There are a lot of economic and environmental problems faced to irrigation development
throughout the regions particularly in our study area. The increased dependence on irrigation has
not been without its negative environmental effects. In adequate attention to factors other than
the technical engineering and projected economic implications of large-scale irrigation or
drainage schemes in Africa has all frequently led to great difficulties (FAO, 1997).
In the study area also there was irrigation conflict and constraints between irrigation users. there
was no clear regulation and policy regarding using water and utilization; this being a
considerable source of conflict among adjacent ground water users for irrigation. Causes of the
irrigation conflicts were 37.18 % through theft of water out of turn and 12.82% caused by water
scarcity due to declining of water supply from the source, 19.23 % water scarcity due to
increasing number of user, 16.67% over use of water like flood and 14.10 % other constraints. In
the study area thoseconstraints havetried to allocate through conflict resolution methods through
discussion at field level involving irrigators, local elders and development agents at office of
Agriculture and rural development.
Table: 4.17. Irrigation conflicts and constraints
Major Irrigation Constraints And Conflicts Freq. Percent Cum.
Theft of water out of turn 29 37.18 37.18
Water scarcity because of declining of supply of water
from the source.
10 12.82 50.00
Water scarcity because of increasing number of users 15 19.23 69.23
Over use of water like flood 13 16.67 85.90
Other 11 14.10 100
Total 78 100.00
Source: Sample survey 2011/12

58
CHAPTER FIVE
CONCLUSIONS AND RECOMMENDATION
5 LITERATURE REVIEW
5.1 CONCLUSIONS
Ethiopia is the second most populous country in sub-Saharan Africa (SSA) (and third on the
continent) population approaching 80 million and 85% dependent on agriculture and live in rural
areas. Agriculture employs 80% of the labor force and accounts 50% of the GDP Agriculture is
heavily reliant on rainfall and productivity and production are strongly influenced by climatic
and hydrological variability that are reflected as dry spells, droughts and floods. Droughts and
floods are endemic, with significant events every 3 to 5 years, with increasing frequency
compared to two or three decades ago. Droughts destroy watersheds, farmlands, and pastures,
contributing to land degradation and causing crops to fail and livestock to perish.
Although, the majority of cropping in Ethiopia is ‗rain fed agriculture‘ there are four major
categories of productive use of water in agriculture: (1) ‗rain fed agriculture‘, (2) ‗supplementary
irrigation‘, (3) ‗irrigated agriculture‘, and (4) ‗livestock‘. It is also important to note the
importance of coupling the soil fertility management and nexus of soil-water in the crop
production and productivity improvement, Awulachew et al (2005)
Ethiopia also covers 12 river basins with an annual runoff volume of 122 billion m3 of water
with an estimated 2.6 billion m3 of ground water potential. This amounts to about 1743 m3 of
water per person per year: a relatively large volume. But due to economic water scarcity which is
described through lack of water storage capacity and large spatial and temporal variations in
rainfall, there is not enough water for most farmers to produce more than one crop per year with
frequent crop failures due to dry spells and droughts. Moreover, there is significant erosion,
reducing the productivity of farmland.
Agriculture is by far the dominant sector. Most of Ethiopia‘s cultivated land is under rain fed
agriculture. Less than 40% of the arable area (13.2 million ha, or 12% of the total land area) is
currently under cultivation, AfDB (2003). There is progressive degradation of the natural
59
resource base, especially in highly vulnerable areas of the highlands, which aggravates the
incidence of poverty and food insecurity in rural areas. Ethiopia imports about 15% of its food.
The government has designed a comprehensive food security strategy that targets the chronically
food insecure especially in highly vulnerable areas: marginal and semi-arid areas that are largely
moisture deficient, including pastoral areas, with high population pressure. If such measures can
be effectively and sustainably implemented, they can make significant difference, Awulachew et
al (2005). Improving soil and water conservation is the first action to improve the water supply
for agriculture, i.e., making a higher percentage of rainwater that falls onto a field available for
plants, Rockström (2000). Water for agriculture is increasingly recognized as a major constraint
to improving the lives of the rural poor and is an important component of rural livelihood
programs that need to be yet strongly established in Ethiopia.
Agriculture in Ethiopia is highly dependent on rainfall, which is highly erratic and unpredictable.
Therefore, the productivity of the peasant agriculture is very low and it is not possible to attain
the required food security target of the government and the Ethiopian population as a whole.
Because of this, food self-insufficiency becomes a common manifestation in Ethiopia. The
productivity of rain fed agriculture is low and it is not possible to contribute to the overall
development of the country.
Ethiopian government's working hard on agricultural policies and strategies to improve the
income and living standard of the rural population. Part of the on-going debate on how to
transform agriculture focuses on improved technology, input levels and credit allocation
(Corppenstedt and Abbi, 1996).Currently, government provides special attention for agricultural
sector by designing growth and transformation plan to come fastest economic growth
throughout the country, and to be able the people food security and improves the living standard
at household level and to set the country at middle level economic growth country‘s in the world
in the next 15 to 20 years.
This plan designed and starts to apply in the whole sectors throughout the country but
particularly focused on the area that has been with high rainfall variability and high moisture

60
deficit to tackle the problem of food insecurity that has persisted for decades. Then, one solution
of poverty reduction strategy of the government is the use of supplementary irrigation from
either traditional or modern water harvesting structures is considered the primary measure to be
taken against the problem. In this direction government of Ethiopia is making serious efforts by
allocating a fairly large amount of budget for the development of irrigation structures.
In this study, a two stage simple random sampling procedure was adopted for the select sample
respondents. In the first stage, two tabias were selected out of a total of 23 tabias in the woreda
based on the current practice and potential for irrigation, and their accessibility in terms of road.
In the second stage, a list of all farmers in the two tabias was obtained and stratified into two
irrigation users and non-users. A total 130 sample households (78 irrigation users and 52 non
users)were randomly selected from the list. The sample size was distributed to each group
proportionate to the population in each category.
The quantitative and qualitative data provided in this paper are collected from secondary data source
and primary data of questionnaires based survey in the SehartiSamrewereda. Various grey and
published literatures are used. The actual and perceived impacts of irrigation on household income
and poverty reduction were assessed through interviews with various government bureaus, officials,
key informants and communities in the selected area. The survey data were analyzed using both
descriptive analysis and econometric model with the help of STATA software (version 12) for
the estimation of the impact of irrigation on improving household income and poverty reduction.
In this study, both primary and secondary data were collected. To obtain primary data, structured
questionnaire with both closed and some open-ended questions were developed. Important
variables on economic, social and institutional aspect of the society in the study area were
collected. The study primarily followed quantitative research design. However, in order to
facilitate the formal survey, exploratory survey was employed beforehand. Then three-stage
random sampling procedure was followed to select sampled households for the study. Two Tabia
were selected purposely and 130 farmers were randomly selected using probability proportional

61
to size sampling techniques from the sampling frame. Both primary and secondary data sources
were used. Primary data were collected from both 130 sample households.
The secondary data were collected from different sectors such as from Regional bureau of water
resource, mining and energy (MWRME), Tigray Bureau of Finance and Economic Development
(TBoFED), particularly from Bureau of agriculture and rural development (BoARD).Moreover,
secondary data were obtained through discussions with concerned expertise and officials of line-
offices of the respective districts. District Offices of Agriculture and Rural development
(DoARD), District Offices of Finance and Economic Development (DoFED), are also some of
the data sources for secondary data were obtained.
Different analytical techniques were applied to analyze the available information. Percentage and
cross tabulation was used to assess the significance of irrigation management practices.
Descriptive statistics such as mean, standard deviation, t-test and chi-square were employed to
compare between the independent variables the significant income difference among irrigation
users and non-users. Propensity score matching model was employed to analyze determinants of
income related variables among irrigation users and non-user households independently and also
the FGT and the simple liner regression model also employed to analyze the impact of the
irrigation on the poverty reduction. This study analyzed the impact of irrigation on household
income and poverty reduction in one purposively selected wereda of South east Zone of Tigray
National Regional State. The political administration of the Tigray region consists of 7 (seven)
administrative zones 46 districts and about 34 and 12 rural and urban dwellers association,
respectively and have over 767 kebelles (BoFED, 2010) and with an area of 56,000Km2 square
kilometers. The zone is characterized by mixed crop-livestock farming.
The result of t-test indicated that household family size, farm size and land holding, access
livestock holdings, education level and amount of fertilizer used has positive and significant
contributions to household income.The thesis hypothesis is that irrigation has an impact in
increasing household income, reducing poverty. Descriptive statistics, poverty profile analysis
and matching econometrics modeling approaches were used to analyze the empirical data. To

62
analyze the constraint and opportunity of the irrigation and economic analysis were also carried
out.This study has confirmed the profound role of irrigation development in alleviating poverty
and increasing income in Ethiopia. The (PSM) result indicated that, the average income of
irrigation users were ETB 4003.21 and their non-irrigation also ETB 797 the average income
difference between them was ETB 2720.88, it is also significant at 1% level of significance, and
hence there is significant mean income difference between irrigation users and non-users. This
income difference between irrigation users and non-users weretested properly by propensity
score matching (PSM).
Poverty decomposition results by irrigation type affirm that the incidence of poverty is
significantly lower among the sample population from irrigation users (12%) compared with
non-irrigation users (17%). Poverty Gap Index was also significantly lower for irrigation user
(1%) irrigated plots than non-irrigation user farmers (5%). Furthermore, the estimated poverty
severity indices show similar results. This significant impact is mainly due to the access of year-
round irrigation activity. Prior to the use of irrigation dry season cultivation was not common, as
most farm households participated on food for work activities to fill their food gap, but after the
introduction of irrigation farmers started to produce high value horticultural crops, both during
dry and wet seasons, which enabled them to create employment opportunities for a considerable
number of household family members and created additional labor employment for the local
people.
The ability to produce high value and marketable crops also enables these farmers to receive
increased cash income, own more productive assets and cover all their basic food and nonfood
needs for their family members. The research also concludes that in the study area the
assessment describes some of the major irrigation constraints were theft of water 48.33%,
scarcity due to declining of water supply 21.67%, and water scarcity due to increasing number of
user15%, and the remaining 15% are other constraints. This all problems were encountered to
smooth irrigation activity andresin for some parts of land to be out of production.
63
Moreover, irrigation user had better annual income and livestock ownership as compared to
irrigation non-user households. Having access to irrigation had significantly improved the living
standards of farming households. Moreover, it was found that there is a room to increase
production and productivity of irrigation user and irrigation non-user households at the current
levels of resources utilization.
5.2 Recommendations
Based on the above findings of the study, the following implications or recommendation remarks
can be drawn for further consideration and improvement of irrigation development in the district
in particular and in the country at large. The study revealed that access to irrigation has got a
significant and positive contribution to household‘s income and poverty reduction implying that
in a country like Ethiopia, irrigation development is crucial in improving the livelihood of the
population. It should, also, be noted that for proper handling and management of the modern
small-scale schemes continuous training andtechnical assistance are extended and should be
provided for the community. Specially, the culture of sowing unmanageable multiple cropping
was the big problem in the study area. But you should not only focus on providing training but
also you should require closefollow up on the application of the theoretical skill on their field.
Each stake holder moved on the district should create strong integration (bond) among them to
improving the final goal of house hold living standard by increasing household‘s income.
In the study area there were socio-economic and administrative major irrigation problems faced
on the irrigation practices. Out of these problems are theft of water out of turn, water scarcity due
to declining of water supply and scarcity due to increasing number of user, lack of strong local
by-law, have high accumulation silton the dam, unfair water distribution among irrigation users
and others. From those irrigation constraints I recommend, for that siltation problem on the dam
regional and woreda administrative members should give adequate attention to allocate for the
treatment of the upper catchments of the dam. But if they are not treated the catchment the dam
is on danger because it is phase out from irrigation practice after few years. For the rest problems
it requires strong administrative leadership and scientific technical help could be significant.

64
As observed from the result in the study area, farmers raised the problem of storageand post-
harvest processing mechanisms for their irrigation product due to this quality ofproduct
deterioration. According to the field observation and orally free discussion of local irrigation
users‘ were explained that, they sell their products by cheap price during harvest period due to
lack of storage and processing facilities. If they are not sold it at current price the product is
completely spoiled. Then, for this critical problem, by creating integration between OARD and
administration office allocate budget to construct a simple shade to store for short period of time
until address to market. In addition to this establish irrigation co-operative to solve the problem
of selling their products by unreasonable price.
Extension service is a corner stone of agricultural practices in general particularly for irrigation
development. But in practice in the study area it is not significant effect with irrigation and
increase households‘ income. This result indicates that there is a problem of extension service.
As respondents response and the result shows that there is in efficient technical assistance and
follow up appear on the area. The main issue that government should give emphasis is increasing
the number of the extension agents which help to training andgivetechnical assistance for the
farmers.
Farmers on the survey were planting mono-crop on irrigation fields, then this is also affect the
farmer, because he does not get reasonable price due to flooding of one type of product at the
market on the same period. So extension agent and administrative bodies you could aware it the
farmer to produce different crops for your benefit. Because if you produce diversify crops you
can harvest at different time and at this time there is high demand and low product. Then the
farmer can sell at reasonable price and the price encourages the farmer to produce next period in
the wide area. There were food self-sufficiency gap on mostly particularly on non-irrigation
users. This means the whole house holds does not feed their family year round without external
support except some of them. So to fill the food gap it requires strong extension service/ creates
awareness on the whole society about increasing their efficiency on using modern technologies
and efficient use of water resource options for irrigation activity.
65
REFERENCES
Awulachew, S.B,(2005), Experiences and Opportunities for Promoting Small-Scale/Micro
Irrigation and Rainwater Harvesting for Food Security in Ethiopia.
Awulachew,S.B.,Menker,M.,Abesha,D.,Atnafe,T.,Wondimkun,Y.,(2006).Background:About the
Symposium and Exhibition. Best Practices and technologies for small scale agricultural water
management in Ethiopia: MoARD/ MoWR/USAID/IWMI Symposium and Exhibition, held at
Ghion Hotel, Addis Ababa 7-9 March. International Water Management Institute (IWMI).
Andi-WoyaneDebrehaila and Addis-Alem(2010).Office of agriculture and Rural Development
report.
AboneshTesfaye (2006), the Impact of Small scale irrigation on house hold food security and
assessment of its management systems: the case of Filtino and Gudino irrigation schemes in
Liben District, east Shoa, A Master‘s thesis submitted to school of graduate studies of Alemaya
University, Alemaya
Becker, O. S., Ichino, A., (2002).Estimation of Average Treatment Effects based on Propensity
Scores. The Stata Journal. 2(4), 358-377
Berg, M. V.D., Ruben, R., 2006, Small-Scale Irrigation and Income Distribution in Ethiopia
Journal of Development Studies.42 (5), 868-880.
BoPF, 2010.Total Projected Population Size of Tigray by Age group, Sex, Urban and Rural 2010
EFY
SehartiSamreWoreda (2010). Agriculture and Rural Development report.
Cobb-Clark,D. A., Crossley, T., (2003). Econometrics for evaluations: An Introduction to Recent
Developments. The Economic Record. 79(247), 491-511

66
CSA (2007), Summary and Statistical report of the 2007 Population and Housing Census.
FEDERAL DEMOCRATIC REPUBLIC OF ETHIOPIA POPULATION CENSUS
COMMISSION, Addis Ababa, December, 2007.
Clambers 1988: barker, (2000). Irrigation impact on in come in equality.86 (36), 265-326
DestaBeyere (2004), Impact on Community Managed irrigation on farm production efficiency
and house hold income: the case of Weliso and Wenchi Districts of Oromiya regional state, A
Master thesis submitted to school of graduate studies of Alemaya University, Alemaya
EEA/EEPRI,(2002). Policy Reform, Implementation and Outcome in Ethiopia, 11th Annual
Conference (Nazareth), Nov. 2-4, 2001.
FAO (2003). Crops and Drops. Making the Best Use of Water for Agriculture. Rome. Also
available at http://www.fao.org/DOCREP/005/ Y3918E/Y3918E00.HTM
FAO, (1997). Irrigation Potential in Africa: A basin approach. FAO Land and Water Bulletin 4.
Rome, Italy.
Hagos, F., Makombe, G., Namara, R. &Awulachew, S. (2009). IWMI research report 128
Importance of Irrigated Agriculture to the Ethiopian Economy: Capturing the Direct Net Benefits
of Irrigation.InternationalWaterManagement Institute, Sri Lanka
Haile Tesfaye (2008), Impact of irrigation development on poverty reduction in Northern
Ethiopia, A Doctorate thesis submitted to the department of food business and development
National University of Ireland, corkJICA&OIDA, 2001. The study for Meki Irrigation and Rural
Development Project inOromia Region, Ethiopia; Draft Final Report, vol. III
Heckman, J. J., Ichimura, H., Todd, P., (1998). Matching as an Econometric evaluation estimator
the Review of Economic Studies 65(2), 261-294

67
Hussain,I.,(2007). does irrigation water matter for rural poverty alleviation: Evidence from South
and South-East Asia. Water Policy, 5 (5/6).
MOFED, (2000).annual report on Agriculture development for 1999/2000, Adissabeba,Ethiopia.
MoFED (2010), Annual Report on poverty level for 2009/10, Addis Ababa, Ethiopia
Ravallion,M, (2005). Evaluating anti-poverty programs. World Bank Policy Research,
Development Research Group. Working Paper 3625
Rosenbaum, P. R., Rubin, D. B., 1983.The Central Role of the Propensity Score in Observational
Studies for Causal Effects. Biometrika. 70(1), 41-55.
Seleshi,B.ekele, Aster, D., Mekonnen,L., Willibald,L., Mekonnen,A.,and Tenna, A.,2007. Water
Resource and Irrigation Development in Ethiopia: International Water Management Institute,
Working Paper 123
SeleshiBekeleAwulachew and Douglas J. Merrey (undated), International Water Management
Institute (IWMI)
Tekleyohannes(2011).The role of small scale irrigation in improving household income:
TBoARD (2010), estimated number of Livestock by type of Animal for Tigray Region
TBoWRME (2010).Feasibility study on Surface and Subsurface Water Potential for Flower
Investment
TBoFED,(2006). Five year strategic plan of the Regional Government of
Tigray,(TigrgnaVersion ). Mekelle, Ethiopia.

68
TBoPF, (2010).Total Projected Population Size of Tigray by Age group, Sex, Urban and Rural
World Bank Fact Book, (2004) https://www.cia.gov/library/publications/the-
worldfactbook/geos/et.html#People
YonasHyelmariyam.,(2010).Feasibility Study on Surface and Subsurface Water Potential for
Flower Investment .Bureau of Water Resource, Mining and Energy of Regional State of Tigray
Yusuf Kider (2004).Assessment of small scale irrigation using comparative performance
indicators on two selected schemes in Upper Awash Rift Valley, A Master‘s thesis submitted to
school of graduate studies of Alemaya University, Alemaya

69
Appendix-A: PSM Result

70

71

72
78 50 587.721 139.615 4.210
n. treat. n. contr. ATT Std. Err. t
Bootstrapped standard errorsATT estimation with the Stratification method
BC = bias-corrected P = percentileNote: N = normal 349.8143 898.2224 (BC) 344.7673 891.8768 (P) atts 200 587.7205 -.5809106 139.6151 312.4057 863.0354 (N) Variable Reps Observed Bias Std. Err. [95% Conf. Interval]
Replications = 200Bootstrap statistics Number of obs = 130
note: label truncated to 80 characters
> ............................................> ............................................................................................................................................................statistic: atts = r(atts)> (p) blockid(myblock) comsup> ercapita familysize3 educdummy2 educdummy3 educdummy4 hhage hhagesq1 , pscorecommand: atts incomepecpita acceirrigation genderhh landpercapita livestop
Bootstrapping of standard errors
78 50 587.721 133.072 4.417
n. treat. n. contr. ATT Std. Err. t
Analytical standard errorsATT estimation with the Stratification method
> kid(myblock) comsup boot reps(200) dot> a familysize3 educdummy2 educdummy3 educdummy4 hhage hhagesq1, pscore(p) bloc. atts incomepecpita acceirrigation genderhh landpercapita livestopercapit
nearest neighbour matchesNote: the numbers of treated and controls refer to actual
78 28 681.011 135.194 5.037
n. treat. n. contr. ATT Std. Err. t
Bootstrapped standard errors(random draw version)ATT estimation with Nearest Neighbor Matching method
BC = bias-corrected P = percentileNote: N = normal 391.4439 904.8571 (BC) 378.7016 896.6568 (P) attnd 200 681.0111 -8.716975 135.1943 414.4137 947.6085 (N) Variable Reps Observed Bias Std. Err. [95% Conf. Interval]
Replications = 200Bootstrap statistics Number of obs = 130
note: label truncated to 80 characters
> ............................................> ............................................................................................................................................................statistic: attnd = r(attnd)> e() comsup> percapita familysize3 educdummy2 educdummy3 educdummy4 hhage hhagesq1 , pscorcommand: attnd incomepecpita acceirrigation genderhh landpercapita livesto
Bootstrapping of standard errors
nearest neighbour matchesNote: the numbers of treated and controls refer to actual
78 28 681.011 155.266 4.386
n. treat. n. contr. ATT Std. Err. t
Analytical standard errors(random draw version)ATT estimation with Nearest Neighbor Matching method
This operation may take a while. The program is searching the nearest neighbor of each treated unit.
> eps(200) dots> ta familysize3 educdummy2 educdummy3 educdummy4 hhage hhagesq1, comsup boot r. attnd incomepecpita acceirrigation genderhh landpercapita livestopercapi
78 41 650.702 120.729 5.390
n. treat. n. contr. ATT Std. Err. t
Bootstrapped standard errorsATT estimation with the Kernel Matching method
BC = bias-corrected P = percentileNote: N = normal 442.9727 943.6263 (BC) 442.6207 930.3058 (P) attk 200 650.7021 6.374505 120.7291 412.6295 888.7748 (N) Variable Reps Observed Bias Std. Err. [95% Conf. Interval]
Replications = 200Bootstrap statistics Number of obs = 130
note: label truncated to 80 characters
> ............................................> ............................................................................................................................................................statistic: attk = r(attk)> bwidth(.06)> ummy3 educdummy4 livestopercapita landpercapita familysize3 , pscore() comsupcommand: attk incomepecpita acceirrigation hhage genderhh educdummy2 educd
Bootstrapping of standard errors
the bootstrap option to get bootstrapped standard errors.Note: Analytical standard errors cannot be computed. Use
78 41 650.702 . .
n. treat. n. contr. ATT Std. Err. t
ATT estimation with the Kernel Matching method
This operation may take a while. The program is searching for matches of each treated unit.
> t reps(200) dots> ucdummy4 livestopercapita landpercapita familysize3, comsup bwidth(0.06) boo. attk incomepecpita acceirrigation hhage genderhh educdummy2 educdummy3 ed
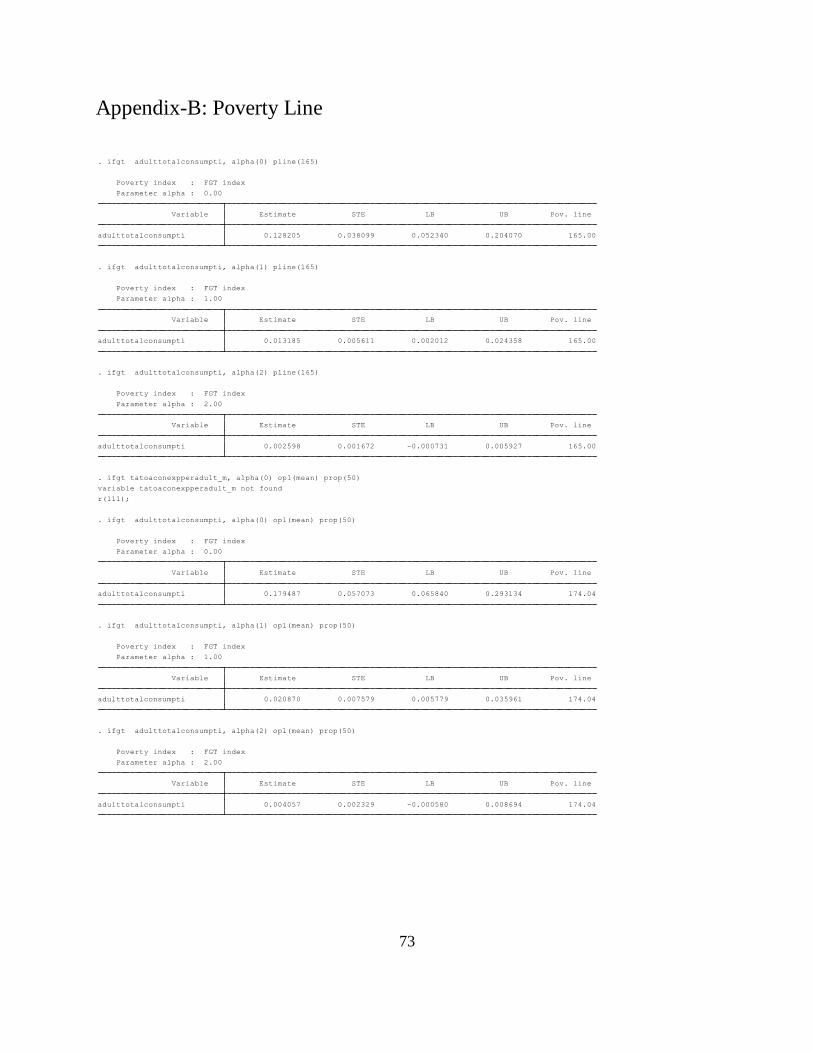
73
Appendix-B: Poverty Line
adulttotalconsumpti 0.004057 0.002329 -0.000580 0.008694 174.04
Variable Estimate STE LB UB Pov. line
Parameter alpha : 2.00
Poverty index : FGT index
. ifgt adulttotalconsumpti, alpha(2) opl(mean) prop(50)
adulttotalconsumpti 0.020870 0.007579 0.005779 0.035961 174.04
Variable Estimate STE LB UB Pov. line
Parameter alpha : 1.00
Poverty index : FGT index
. ifgt adulttotalconsumpti, alpha(1) opl(mean) prop(50)
adulttotalconsumpti 0.179487 0.057073 0.065840 0.293134 174.04
Variable Estimate STE LB UB Pov. line
Parameter alpha : 0.00
Poverty index : FGT index
. ifgt adulttotalconsumpti, alpha(0) opl(mean) prop(50)
r(111);
variable tatoaconexpperadult_m not found
. ifgt tatoaconexpperadult_m, alpha(0) opl(mean) prop(50)
adulttotalconsumpti 0.002598 0.001672 -0.000731 0.005927 165.00
Variable Estimate STE LB UB Pov. line
Parameter alpha : 2.00
Poverty index : FGT index
. ifgt adulttotalconsumpti, alpha(2) pline(165)
adulttotalconsumpti 0.013185 0.005611 0.002012 0.024358 165.00
Variable Estimate STE LB UB Pov. line
Parameter alpha : 1.00
Poverty index : FGT index
. ifgt adulttotalconsumpti, alpha(1) pline(165)
adulttotalconsumpti 0.128205 0.038099 0.052340 0.204070 165.00
Variable Estimate STE LB UB Pov. line
Parameter alpha : 0.00
Poverty index : FGT index
. ifgt adulttotalconsumpti, alpha(0) pline(165)

74
0.003931 0.000000 0.003931 0.000000
Population 0.014681 1.000000 0.014681 1.000000
0.004119 0.043047 0.002468 0.138396
1 0.006462 0.595420 0.003848 0.262093
0.007400 0.042911 0.003162 0.138396
0 0.027292 0.396947 0.010833 0.737907
share contribution contribution
Group FGT index Population Absolute Relative
Parameter alpha : 2.00
Group variable : acceirrigation
Poverty index : FGT index
Decomposition of the FGT index by groups
. dfgtg newtotalmonthlyexp_02, hgroup(acceirrigation) alpha(2) pline(315)
0.009722 0.000000 0.009722 0.000000
Population 0.048928 1.000000 0.048928 1.000000
0.008805 0.043047 0.005323 0.095518
1 0.021490 0.595420 0.012795 0.261516
0.019191 0.042911 0.008561 0.095518
0 0.091026 0.396947 0.036132 0.738484
share contribution contribution
Group FGT index Population Absolute Relative
Parameter alpha : 1.00
Group variable : acceirrigation
Poverty index : FGT index
Decomposition of the FGT index by groups
. dfgtg newtotalmonthlyexp_02, hgroup(acceirrigation) alpha(1) pline(315)
0.038074 0.000000 0.038074 0.000000
Population 0.251908 1.000000 0.251908 1.000000
0.037999 0.043047 0.023289 0.080308
1 0.128205 0.595420 0.076336 0.303030
0.069139 0.042911 0.033368 0.080308
0 0.442308 0.396947 0.175573 0.696970
share contribution contribution
Group FGT index Population Absolute Relative
Parameter alpha : 0.00
Group variable : acceirrigation
Poverty index : FGT index
Decomposition of the FGT index by groups
. dfgtg newtotalmonthlyexp_02, hgroup(acceirrigation) alpha(0) pline(315)
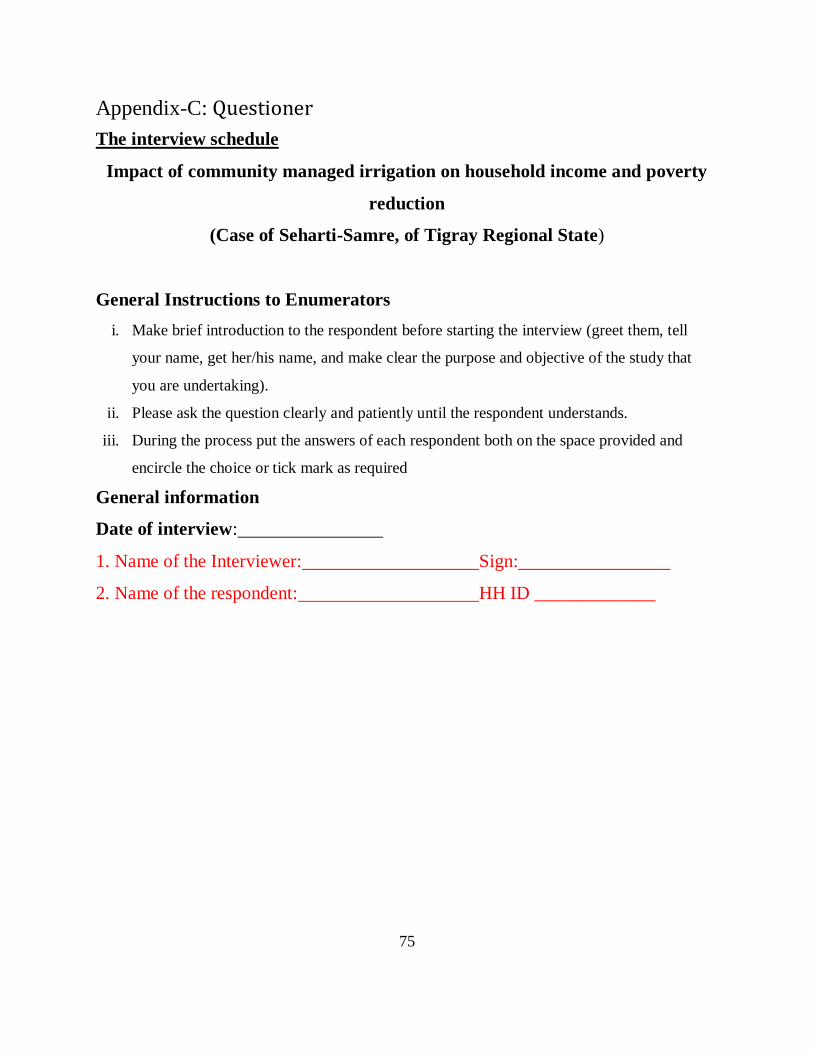
75
Appendix-C: Questioner
The interview schedule
Impact of community managed irrigation on household income and poverty
reduction
(Case of Seharti-Samre, of Tigray Regional State)
General Instructions to Enumerators
i. Make brief introduction to the respondent before starting the interview (greet them, tell
your name, get her/his name, and make clear the purpose and objective of the study that
you are undertaking).
ii. Please ask the question clearly and patiently until the respondent understands.
iii. During the process put the answers of each respondent both on the space provided and
encircle the choice or tick mark as required
General information
Date of interview:
1. Name of the Interviewer: Sign:
2. Name of the respondent: HH ID _____________
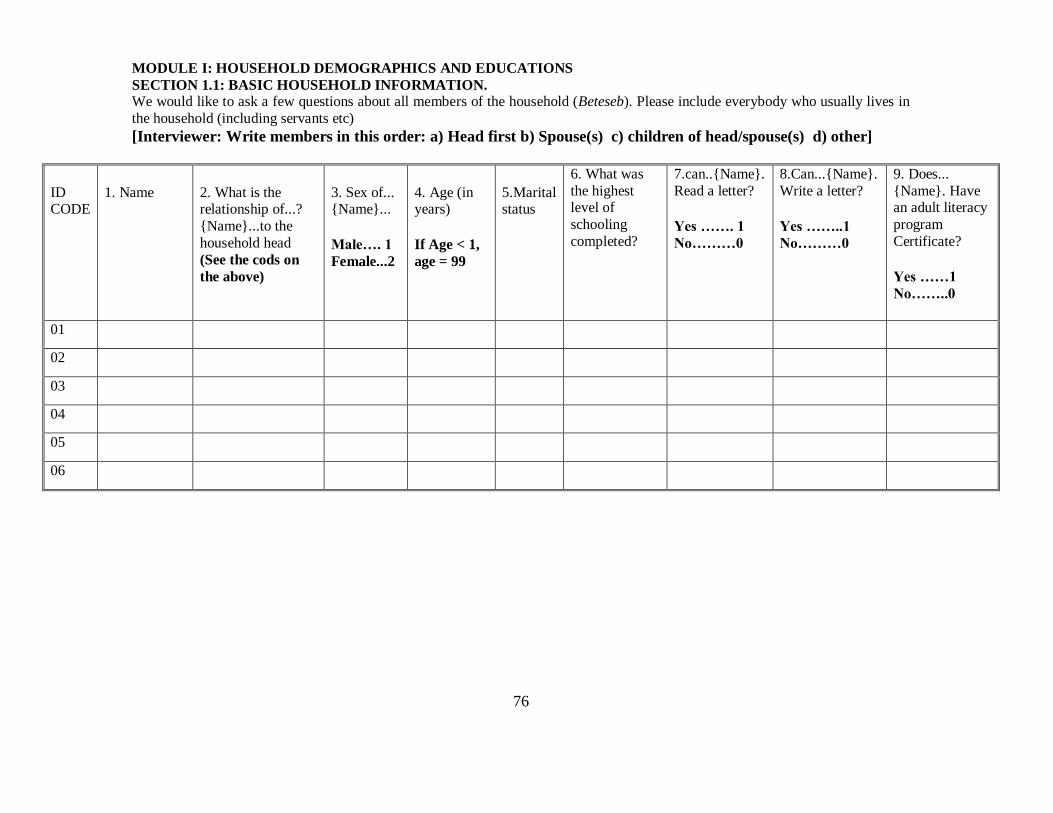
76
MODULE I: HOUSEHOLD DEMOGRAPHICS AND EDUCATIONS
SECTION 1.1: BASIC HOUSEHOLD INFORMATION. We would like to ask a few questions about all members of the household (Beteseb). Please include everybody who usually lives in
the household (including servants etc)
[Interviewer: Write members in this order: a) Head first b) Spouse(s) c) children of head/spouse(s) d) other]
ID CODE
1. Name
2. What is the relationship of...?
{Name}...to the
household head (See the cods on
the above)
3. Sex of... {Name}...
Male…. 1 Female...2
4. Age (in years)
If Age < 1,
age = 99
5.Marital status
6. What was
the highest level of
schooling
completed?
7.can..{Name}.
Read a letter? Yes ……. 1 No………0
8.Can...{Name}.
Write a letter? Yes ……..1 No………0
9. Does...
{Name}. Have an adult literacy
program
Certificate?
Yes ……1 No……..0
01
02
03
04
05
06

77
Code 1.2 Education codes
NEVER ANY SECHOOLING …………………………………………………………..A
RELIGIOUS/TRADITIONAL SCHOOL ………………………………………………..B
PRIMARY SCHOOL (INCOMPLETE)……………………………………………….. ...C
PRIMARY SCHOOL (COMPLETE) ………………………………………………….....D
GRADE 7 COMPLETE…………………………………………………………………...E
GRADE 8 COMPLETE……………………………………………………………………F
GRADE 9 COMPLETE…………………………………………………………………...G
GRADE 10 COMPLETE……………………………………………………………….....H
GRADE 11 COMPLETE…………………………………………………………………..I
GRADE 12 COMPLETE…………………………………………………………………..J
TECHNICAL/VOCATIONAL……………………………………………………………K
COLLEGE DIPLOMA………………………………………………………………….. ..L
FIRST DEGREE AT UNIVERSITY ……………………………………………………..M
POST GRADUATE ………………………………………………………………………N
OTHER ……………………………………………………………………………………O
SPECIFY…………………………………………………………………………..
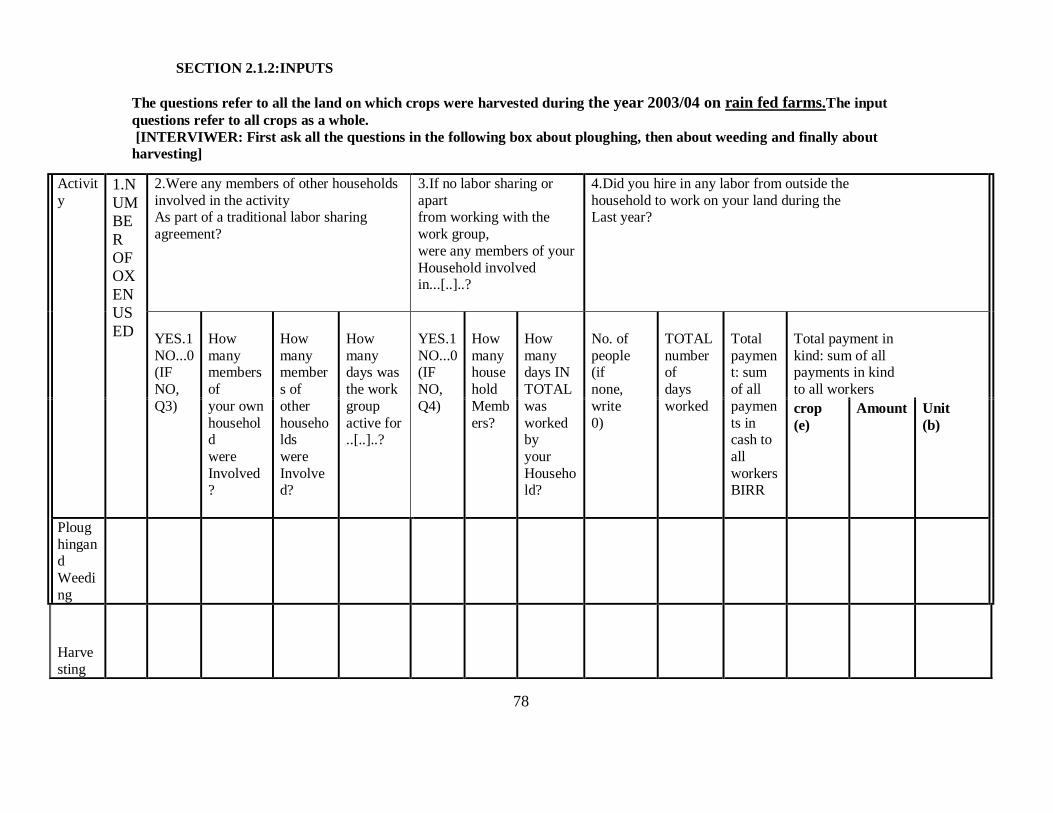
78
SECTION 2.1.2:INPUTS
The questions refer to all the land on which crops were harvested during the year 2003/04 on rain fed farms.The input
questions refer to all crops as a whole.
[INTERVIWER: First ask all the questions in the following box about ploughing, then about weeding and finally about
harvesting]
Activit
y 1.N
UM
BE
R
OF
OX
EN
US
ED
2.Were any members of other households
involved in the activity As part of a traditional labor sharing
agreement?
3.If no labor sharing or
apart from working with the
work group, were any members of your Household involved in...[..]..?
4.Did you hire in any labor from outside the household to work on your land during the Last year?
YES.1 NO...0 (IF NO, Q3)
How
many members
of your own household were Involved?
How
many member
s of other households were Involved?
How
many days was the work group active for ..[..]..?
YES.1 NO...0 (IF NO, Q4)
How
many house
hold Memb
ers?
How
many days IN TOTAL
was worked by your Household?
No. of people (if none, write 0)
TOTAL number of days worked
Total payment: sum of all paymen
ts in cash to
all workers BIRR
Total payment in kind: sum of all payments in kind to all workers
crop (e)
Amount
Unit (b)
Ploug
hingand
Weedi
ng
Harve
sting
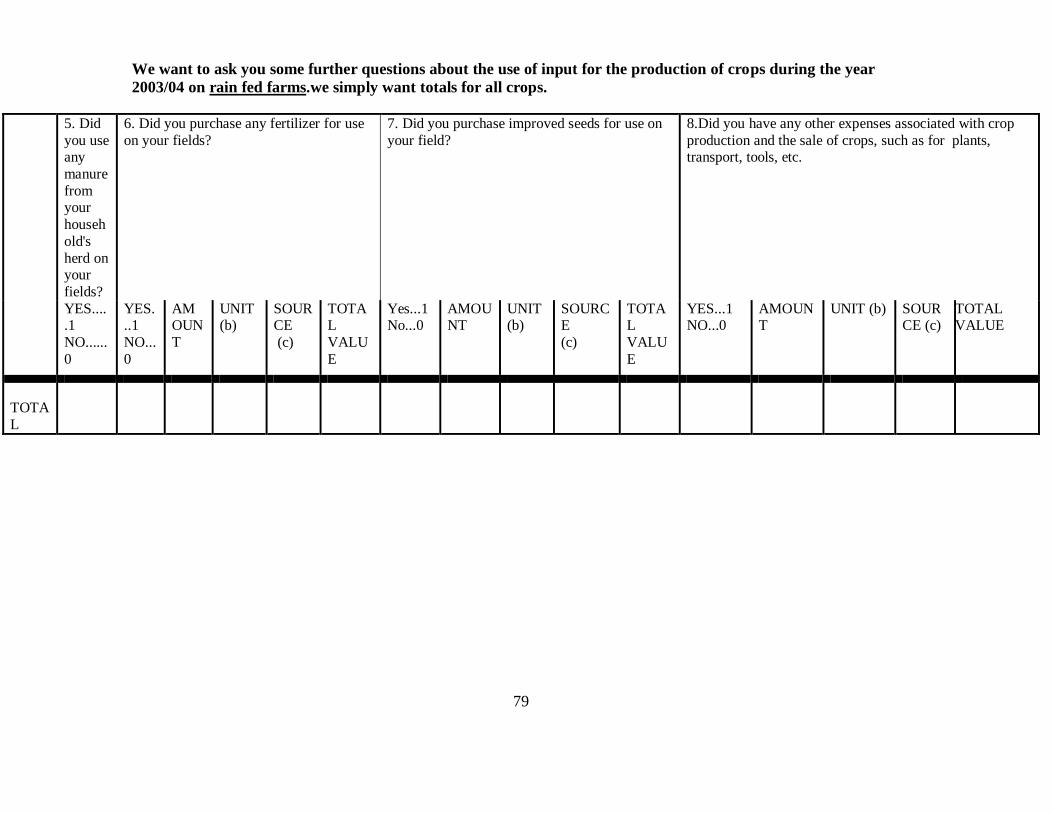
79
We want to ask you some further questions about the use of input for the production of crops during the year
2003/04 on rain fed farms.we simply want totals for all crops.
5. Did
you use any
manure
from your
househ
old's
herd on your
fields?
6. Did you purchase any fertilizer for use
on your fields? 7. Did you purchase improved seeds for use on
your field? 8.Did you have any other expenses associated with crop
production and the sale of crops, such as for plants, transport, tools, etc.
YES.....1
NO......
0
YES...1
NO...
0
AMOUN
T
UNIT (b)
SOURCE (c)
TOTAL
VALU
E
Yes...1 No...0
AMOUNT
UNIT (b)
SOURCE (c)
TOTAL
VALU
E
YES...1 NO...0
AMOUNT
UNIT (b) SOURCE (c)
TOTAL VALUE
TOTA
L

80
SECTION 2.1.3. INPUTS
The questions refer to all the land on which crops were harvested during the 2003/04usingirrigation. The input questions
refer to all crops as a whole.
[INTERVIWER: First ask all the questions in the following box about ploughing, then about weeding and finally about
harvesting
Activity 1.N
UM
BE
R
OF OX
EN
US
ED
2.Were any members of other households
involved in the activity
As part of a traditional labor sharing
agreement?
3.If no labor sharing or apart
from working with the work
group,
were any members of your
Household involved in...[..]..?
4.Did you hire in any labor from outside the
household to work on your land during the
Last year.
YES.1
NO...0
(IF
NO,
Q3)
How
many
members
of
your own
household
were
Involved?
How
many
members
of
other
househol
ds
were
Involved
?
How
many
days was
the work
group
active for
..[..]..?
YES.1
NO...0
(IF
NO,
Q4)
How
many
househ
old
Memb
ers?
How
many
days IN
TOTAL
was
worked
by
your
Househol
d?
No. of
people
(if
none,
write
0)
TOTAL
number
of
days
worked
Total
payment
: sum
of all
payment
s in
cash to
all
workers
BIRR
Total payment in
kind: sum of all
payments in kind
to all workers
crop
(e)
Amount
Unit
(b)
Ploughin
gWeedin
g
Harvestin
g

81
We want to ask you some further questions about the use of inputs for the production of crops during the last
2003/04season. We simply want totals for all crops.
5. Did you
use any
manure from
your
househ
old's herd on
your
fields?
6. Did you purchase any fertilizer for use on your fields?
7. Did you purchase improved seeds for use on your field?
8. Did you have any other expenses associated with crop production and the sale of crops, such as for plants,
transport, tools, etc.
YES....
.1
NO......0
YES.
..1
NO...0
AM
OUN
T
UNIT
(b) SOU
RCE (c)
TOTA
L
VALUE
Yes...1 No...0
AMO
UNT UNIT
(b) SOURC
E (c)
TOTA
L
VALUE
YES...1
NO...0 AMOUN
T UNIT (b) SOUR
CE (c) TOTAL
VALUE
TOT
AL

82
SECTION 2.1.4.CROP OUT PUT ANS SALE – RAIN FED FARM ANDIRRIGATION Each crop harvested during the last season [rain fed farm and irrigation harvest 20003/04 EC], can you answer the following questions?
P
l
o
t n
a
m
e
CR
OP
CO
DE (a)
see
the
abov
e
2.
Harv
ested
thro
ugh
Irrig
ation
… 1 Rain
fed
agric
ultur
…..2
3. Area of
land
cultivated in
Tsimad.
4. Did
you use
manure
from
your
househo
lds herd
on your
fields?
Yes --1 No ---0
5. Did
you
purch
ase
any
fertili
zer
for
use on
your
fields
? Yes –
1 (Q6) No ---
0 (Q7)
6. Use of fertilizer
7.How
much was
your
harvest
from last
season’s
crop?(2003/
04)
8.have you
given any
part of the
harvest to
others as
payment for
kiray /rent
and /or gift
9. Have
you sold
any of
the last
season’s
harvest
?
Yes...1
No...0
10.if you sale any part
of your harvest, answer
question on amount and
revenue
Own
land Rent
ed/sh
arecr
oppe
d in
Quant
ity
purch
ased/u
sed
Unit
price(B
irr)
Tot
al
cost
Quantit
y
Uni
t
(b)
Quanti
ty
Unit
(b) Amou
nt
Unit
(b) Total
revenu
e in
birr

83
CODES FOR SECTION 2.1.4 AND 2.1.2 AND 2.1.3
Code -A
Codes List 0f Crops Codes List 0f Crops
1 WHITE&TEFF 15 GRASS
2 BLACK &MIXED TEFF 16 EUCALYPTUS
3 BARLEY 17 POTATOES
4 WHEAT 18 SESAME
5 KARKA’ETA 19 ONION
6 MAIZE 20 Papaya
7 SORGHUM 21 ANANAS(PINEAPPLE)
8 BEANS 22 AVOCADO
9 ROUNDNUTS 23 ORANGE
10 PULSES 24 LEMON
11 VEGETABLES (kosta, selata, komidere etc) 25 GUAVA (ZEYTUNA)
12 COFFEE 26 SUGARCANE
13 CHAT 27 OTHER
14 BANANAS
Code -B
(C) SOURCE OF PURCHASED INPUTS
Code Source of Inputs
1 Service Cooperative
2 Ministry or Other Public Agency
3 Non-Governmental Agency
4 Friend/Relative
5 Trader/Market
6 Other
codes Measurement units 1 KILOGRAMMES 2 LEKOTA/ AKMADA 3 KAFER 4 MISHE 5 CHIRET 6 PIECES (FIKDI) 7 LITRES 8 SHEMBER 9 MINELIK
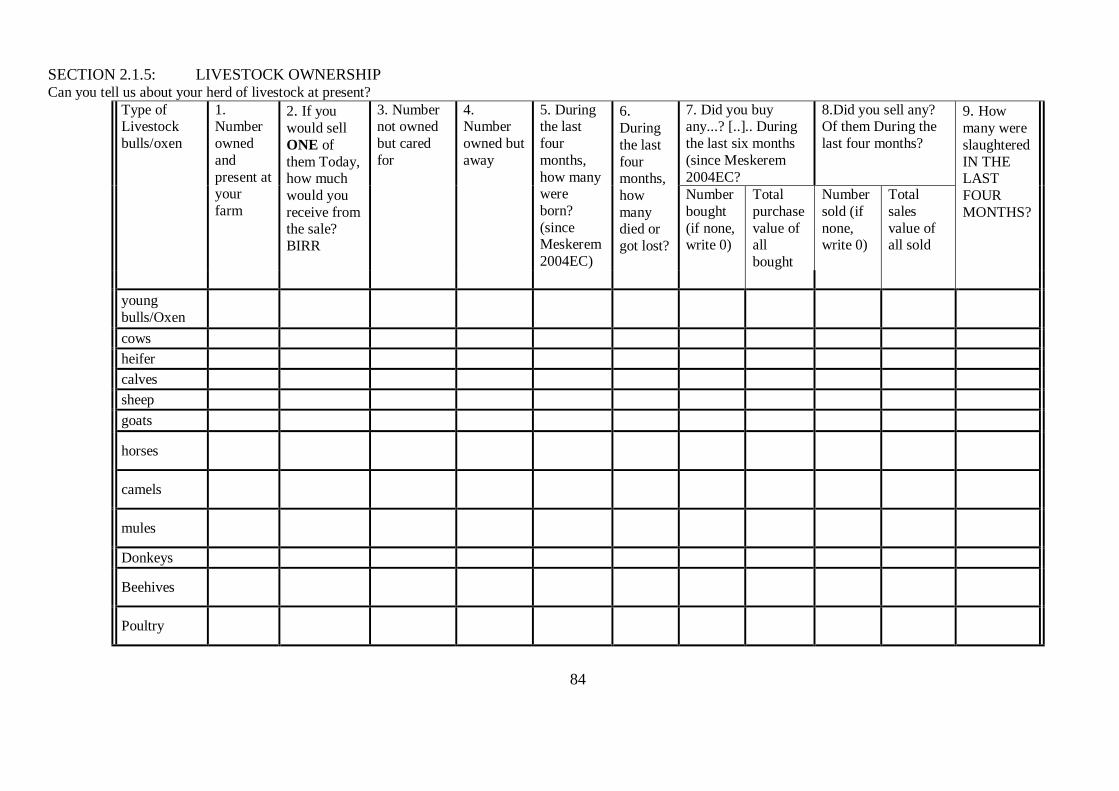
84
SECTION 2.1.5: LIVESTOCK OWNERSHIP Can you tell us about your herd of livestock at present?
Type of Livestock bulls/oxen
1. Number
owned
and
present at your
farm
2. If you
would sell
ONE of
them Today, how much
would you
receive from the sale?
BIRR
3. Number not owned
but cared
for
4. Number
owned but
away
5. During the last
four
months,
how many were
born?
(since Meskerem
2004EC)
6. During
the last
four months,
how
many died or
got lost?
7. Did you buy any...? [..].. During
the last six months
(since Meskerem
2004EC?
8.Did you sell any? Of them During the
last four months?
9. How
many were
slaughtered
IN THE LAST
FOUR
MONTHS? Number
bought
(if none, write 0)
Total
purchase
value of all
bought
Number
sold (if
none, write 0)
Total
sales
value of all sold
young
bulls/Oxen
cows
heifer
calves
sheep
goats
horses
camels
mules
Donkeys
Beehives
Poultry

85
SECTION 2.1.6: LIVESTOCK EXPENDITURE AND INCOME
1. During the last four months, have you had any of the following expenditures related to livestock?
NO Type of expenditure
3
cash value (if in kind, give estimated cash
value)
1 labor for herding
2 Feed, including salt
3 veterinary services/medicine
4 Transport of animals feed or
supplies
5 Commission on the sale of animals
6 Other expenses
2. Gross income from the sale of household's animal products during the last four months?
type 5
Did you sell
any..[..]..? YES...1
NO....0
6 Amount
sold?
7 Unit
(b)
8 Total revenue obtained from the
sale of... [..]..
meat
hides/skins
butter/cheese
milk/cream
dung cakes
Eggs
Honey
(b) KUBAYA.........1, FEKDI........3 , KILOGRAM........2, LITRES......4
OTHER................

86
CODE for section 2.7.1: EMPLOYMENT FOR WAGES
Code (a) Type of employment
Farm Worker (for pay) = 1; Traditional labour sharing = 2
Professional (teacher, government worker, administration, health worker, clerical) = 3
Labourer (skilled i.e. builder, thatcher, hair cutting or dressing) = 4
Trader = 5; Soldier = 6; Driver/Mechanic =7; unskilled worker = 8;
Domestic servant = (yebetagelgay) = 9; Food/cash for work = 10;
Others = 11, specify __________________________
SECTION 2.7: NON-FARM ACTIVITIES AND INCOME SECTION 2.7.1 EMPLOYMENT FOR WAGE
In the last twelve months, did any of the household members work off the household's land either on someone else's land or in some other employment or
Against payment in cash/kind? If yes give the following details. Yes ---- 1
No ----- 0
ID 1. Kind of 2. Is it 3. Total days worked in each season 4. Total amount earned in Birr
code of Work permanent
H.H [code a] (=1) or
Member temporary
(=2)
Work?
1st season 2nd season 3rd season
1st season 2nd season 3rd season
(Tir-Miazia,
2003EC)
(Ginbot-
Nehassie,
2003EC)
(Meskerem-
Tahisas, 2004EC)
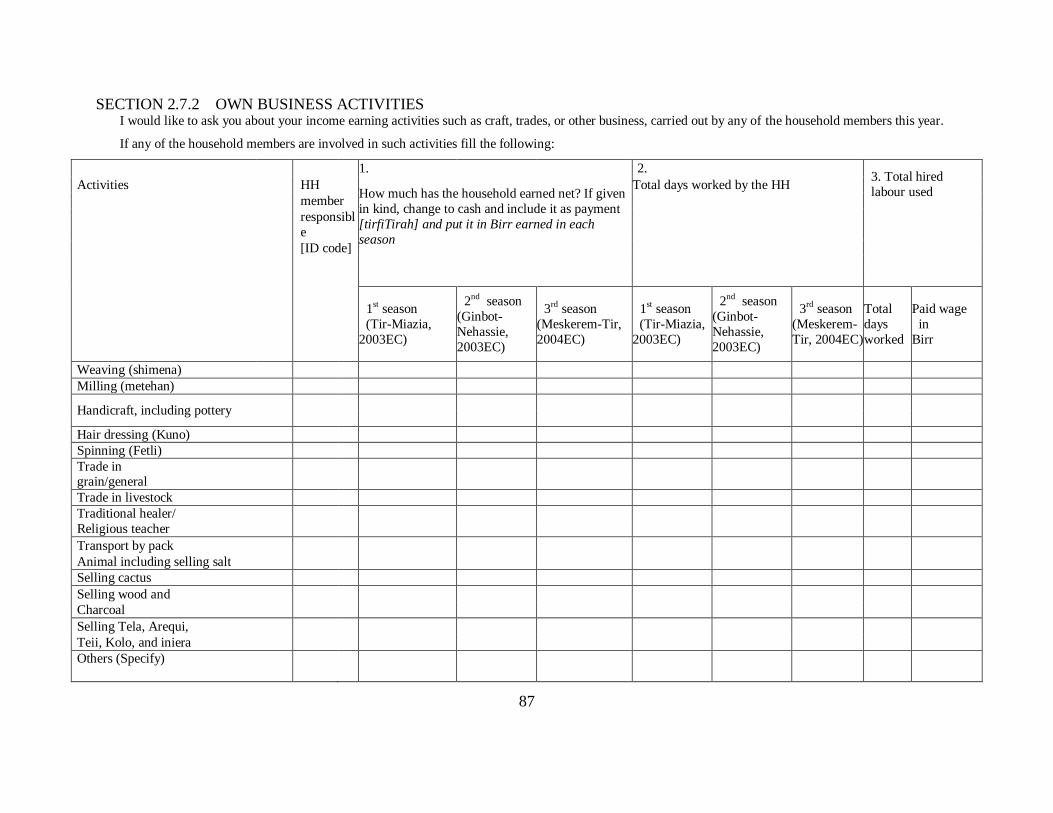
87
SECTION 2.7.2 OWN BUSINESS ACTIVITIES I would like to ask you about your income earning activities such as craft, trades, or other business, carried out by any of the household members this year.
If any of the household members are involved in such activities fill the following:
1. 2. 3. Total hired
labour used Activities HH
How much has the household earned net? If given
in kind, change to cash and include it as payment
[tirfiTirah] and put it in Birr earned in each
season
Total days worked by the HH
member
responsibl
e
[ID code]
1st season
(Tir-Miazia,
2003EC)
2nd
season
(Ginbot-
Nehassie,
2003EC)
3rd season
(Meskerem-Tir,
2004EC)
1st season
(Tir-Miazia,
2003EC)
2nd
season
(Ginbot-
Nehassie,
2003EC)
3rd season
(Meskerem-
Tir, 2004EC)
Total
days
worked
Paid wage
in
Birr
Weaving (shimena)
Milling (metehan)
Handicraft, including pottery
Hair dressing (Kuno)
Spinning (Fetli)
Trade in grain/general
Trade in livestock
Traditional healer/
Religious teacher
Transport by pack
Animal including selling salt
Selling cactus
Selling wood and
Charcoal
Selling Tela, Arequi,
Teii, Kolo, and iniera
Others (Specify)
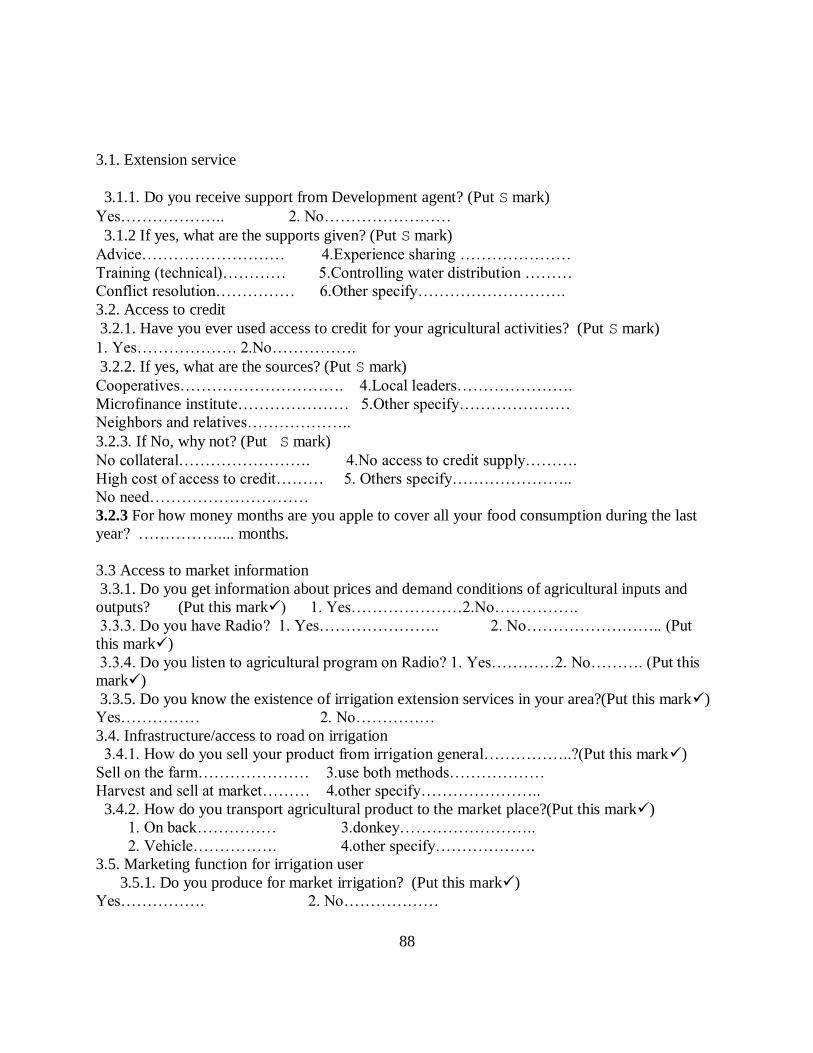
88
3.1. Extension service
3.1.1. Do you receive support from Development agent? (Put S mark)
Yes……………….. 2. No……………………
3.1.2 If yes, what are the supports given? (Put S mark)
Advice……………………… 4.Experience sharing …………………
Training (technical)………… 5.Controlling water distribution ………
Conflict resolution…………… 6.Other specify……………………….
3.2. Access to credit
3.2.1. Have you ever used access to credit for your agricultural activities? (Put S mark)
1. Yes………………. 2.No…………….
3.2.2. If yes, what are the sources? (Put S mark)
Cooperatives…………………………. 4.Local leaders………………….
Microfinance institute………………… 5.Other specify…………………
Neighbors and relatives………………..
3.2.3. If No, why not? (Put S mark)
No collateral……………………. 4.No access to credit supply……….
High cost of access to credit……… 5. Others specify…………………..
No need…………………………
3.2.3 For how money months are you apple to cover all your food consumption during the last
year? …………….... months.
3.3 Access to market information
3.3.1. Do you get information about prices and demand conditions of agricultural inputs and
outputs? (Put this mark) 1. Yes…………………2.No…………….
3.3.3. Do you have Radio? 1. Yes………………….. 2. No…………………….. (Put
this mark)
3.3.4. Do you listen to agricultural program on Radio? 1. Yes…………2. No………. (Put this
mark)
3.3.5. Do you know the existence of irrigation extension services in your area?(Put this mark)
Yes…………… 2. No……………
3.4. Infrastructure/access to road on irrigation
3.4.1. How do you sell your product from irrigation general……………..?(Put this mark)
Sell on the farm………………… 3.use both methods………………
Harvest and sell at market……… 4.other specify…………………..
3.4.2. How do you transport agricultural product to the market place?(Put this mark)
1. On back…………… 3.donkey……………………..
2. Vehicle……………. 4.other specify……………….
3.5. Marketing function for irrigation user
3.5.1. Do you produce for market irrigation? (Put this mark)
Yes……………. 2. No………………
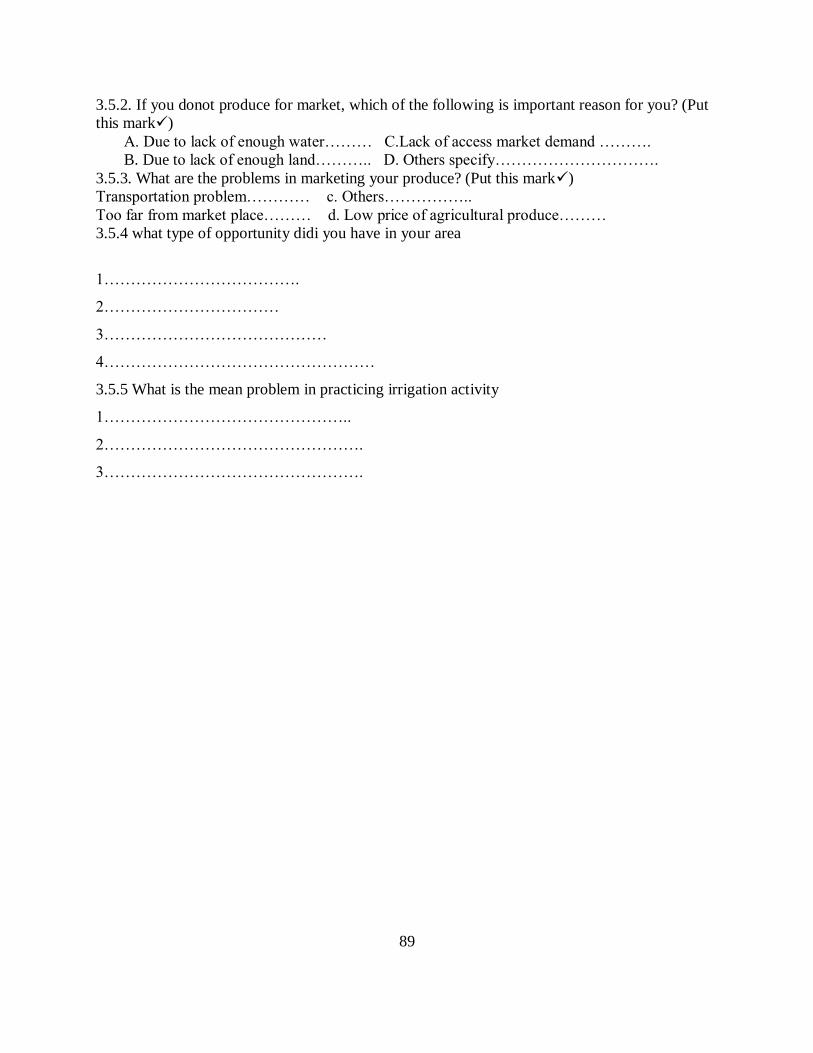
89
3.5.2. If you donot produce for market, which of the following is important reason for you? (Put
this mark)
A. Due to lack of enough water……… C.Lack of access market demand ……….
B. Due to lack of enough land……….. D. Others specify………………………….
3.5.3. What are the problems in marketing your produce? (Put this mark)
Transportation problem………… c. Others……………..
Too far from market place……… d. Low price of agricultural produce………
3.5.4 what type of opportunity didi you have in your area
1……………………………….
2……………………………
3……………………………………
4……………………………………………
3.5.5 What is the mean problem in practicing irrigation activity
1………………………………………..
2………………………………………….
3………………………………………….

90
43. Expenses category
4.1. FOOD CONSUMPTION OVER PAST 7 DAYS (IN 2003/04)
H1. Over the
past one week
item Code Yes=1,
No=2
How much in total did
your household eat in
the 7 days?
How much came from
purchases?
How much came from own
production?
How much came
from gifts and
other sources?
(a) (b)
Quantity
(c)
Unit
(d)
Quantit
y
(e)
Unit
(f)
Birr
(g)
Quantity
(h)
Unit
(i)
Birr(j)
Qua
ntit
y
(k)
Un
it
(l)
Birr
(m)
Cereals,
Grains and
Cereal
Products
1-9
Teff 01
Wheat 02
Barley 03
Maize 04
Sorghum 05
Millet 06

91
H1. Over the
past one week
item Code Yes=1,
No=2
How much in total did
your household eat in
the 7 days?
How much came from
purchases?
How much came from own
production?
How much came
from gifts and
other sources?
(a) (b)
Quantity
(c)
Unit
(d)
Quantit
y
(e)
Unit
(f)
Birr
(g)
Quantity
(h)
Unit
(i)
Birr(j)
Qua
ntit
y
(k)
Un
it
(l)
Birr
(m)
Vegetable
7-13
Onion 07
Garlic 08
Potato 09
Tomato 10
Cabbage 11
Carrot 12
Selata 13
Fruit 14-18
Banana 14
Mango 15
Orange 16
Avocado 17
Guava 18
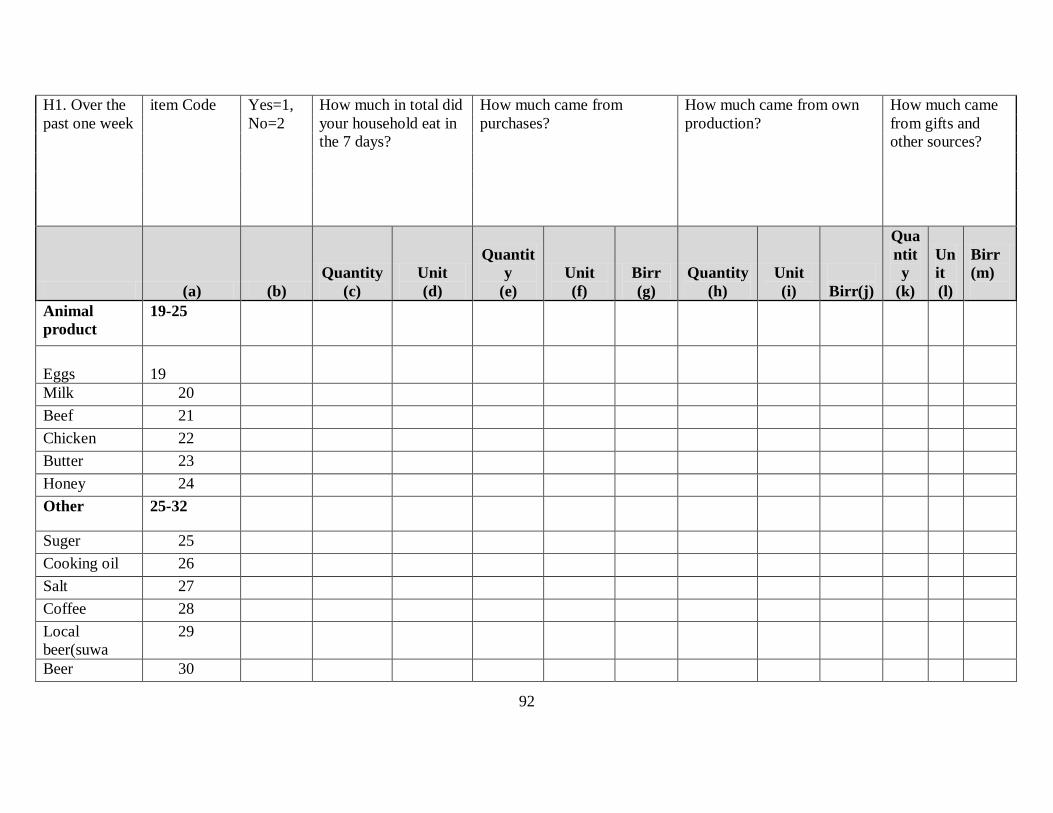
92
H1. Over the
past one week
item Code Yes=1,
No=2
How much in total did
your household eat in
the 7 days?
How much came from
purchases?
How much came from own
production?
How much came
from gifts and
other sources?
(a) (b)
Quantity
(c)
Unit
(d)
Quantit
y
(e)
Unit
(f)
Birr
(g)
Quantity
(h)
Unit
(i)
Birr(j)
Qua
ntit
y
(k)
Un
it
(l)
Birr
(m)
Animal
product
19-25
Eggs
19
Milk 20
Beef 21
Chicken 22
Butter 23
Honey 24
Other 25-32
Suger 25
Cooking oil 26
Salt 27
Coffee 28
Local
beer(suwa
29
Beer 30

93
H1. Over the
past one week
item Code Yes=1,
No=2
How much in total did
your household eat in
the 7 days?
How much came from
purchases?
How much came from own
production?
How much came
from gifts and
other sources?
(a) (b)
Quantity
(c)
Unit
(d)
Quantit
y
(e)
Unit
(f)
Birr
(g)
Quantity
(h)
Unit
(i)
Birr(j)
Qua
ntit
y
(k)
Un
it
(l)
Birr
(m)
Local areki 31
Hair food 32
CODES 1 = FOR KILOGRAM 2 = FOR MILILIK 3= FOR SHEMBER 4 =FOR LITER 5= FOR UNIt

94
4.1.2 NON-FOOD consumption expenditure
One month Recall in 2003/04
Non- Food Items Item code Yes=1
No=2>>Next
Item
How much did your household pay in
total?
?
H2. Over the past one month (30 days), did your household
use or buy or pay for any [ITEM]?
33-46
(a) (b)
BIRR
(c)
Matches 33
Batteries 34
Candles (tua'af), incense 35
Laundry soap/omo 36
Hand soap 37
Charcoal 38
Firewood 39
Cigarettes, tobacco, 40
Transport 41
House rent 42
Water fee 43
Electricity 44
Hear dressing 45
Other, specify 46
N
o
m
o
n
e
y
f
o
r
f
e
e
s
/
u
n
i
f
o
r
m
.
1
N
o
s
c
h
o
o
N
o
m
o
n
e
y
f
o
r
f
e
e
s
/
u
n
i
f
o
r
m
.
1
N
o
s
c
h
o
o

95
4.1.3 NON-FOOD EXPENDITURES OVER PAST 12 MONTH
Over the past 12 months, did your household purchase
or pay for any [ITEM]?
Item code Yes=1
No=2>>Next Item
How much did your household pay
in total?
(a) (b) BIRR
(c)
Over the past 12 months, did your household use or
buy any [...]?
47-64
Clothes/shoes/fabric for MEN
47
Clothes/shoes/fabric for WOMEN
48
Clothes/shoes/fabric for BOYS
49
Clothes/shoes/fabric for GIRLS
50
Kitchen equipment (cooking pots, etc.) 51
Lamp/torch
52
Contributions to IDDIR
53
Donations to the church/mosque
54
Blanket/bed sheet
55
Umbrella
56
School fee 57

96
Stationary Materials (exercise books, pen and books) 58
School Uniform 59
Land tax and other levies 60
Funeral expense 61
Health expense 62
Marriage ceremony- gift 63
House maintenance 64
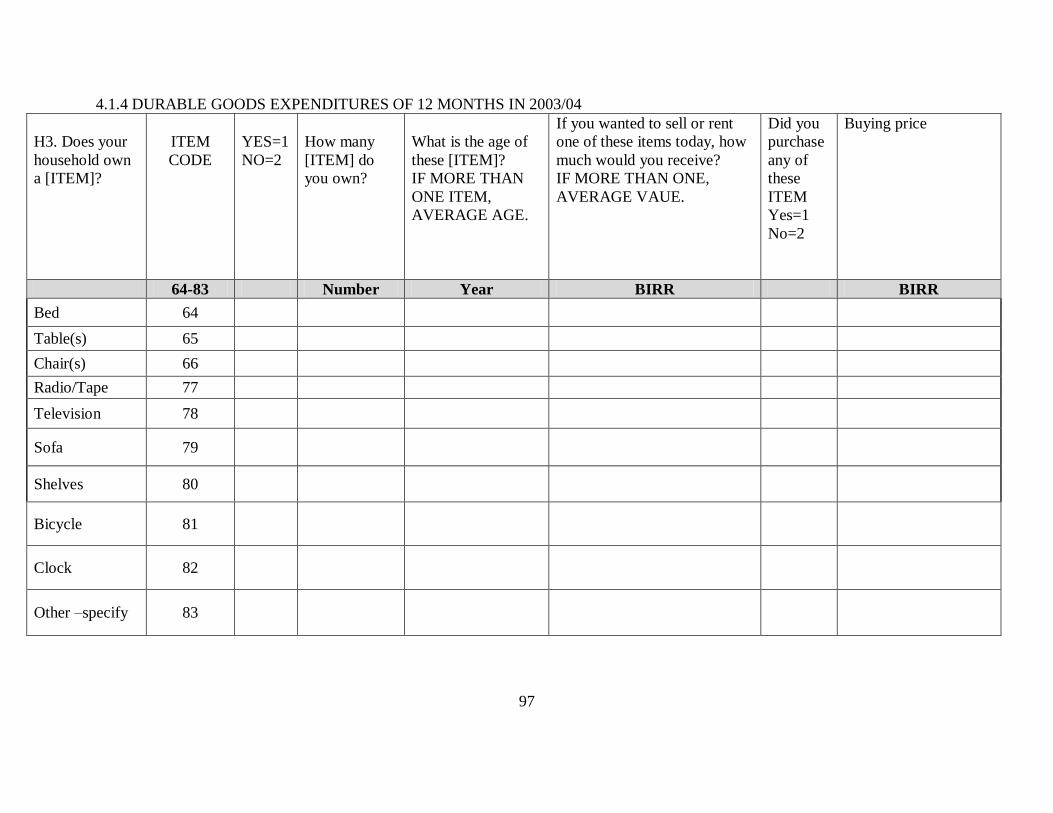
97
4.1.4 DURABLE GOODS EXPENDITURES OF 12 MONTHS IN 2003/04
H3. Does your
household own
a [ITEM]?
ITEM
CODE
YES=1
NO=2
How many
[ITEM] do
you own?
What is the age of
these [ITEM]?
IF MORE THAN
ONE ITEM,
AVERAGE AGE.
If you wanted to sell or rent
one of these items today, how
much would you receive?
IF MORE THAN ONE,
AVERAGE VAUE.
Did you
purchase
any of
these
ITEM
Yes=1
No=2
Buying price
64-83 Number Year BIRR BIRR
Bed 64
Table(s) 65
Chair(s) 66
Radio/Tape 77
Television 78
Sofa 79
Shelves 80
Bicycle 81
Clock 82
Other –specify 83

98