The Zimbabwe Bulletin of Teacher Education - IDS OpenDocs
22
1. The Zimbabwe Bulletin of Teacher Education An official journal of the Department of Teacher Education, University of Zimbabwe Editor: Dr B. Chenjerai Chisaka Department of Teacher Education University of Zimbabwe * P O Box MP167 Mount Pleasant Harare Email: [email protected] Editorial Board: DTE Advisory Board Dr I. Jeso Dr O. Shumba Mr. P. Kangai Prof. B.R.S Chivore Mr. O. Mavundutse Mr Q. Bhila Mr. S. Matiure Mr. C. Munetsi Mrs C. Muviiimi Mrs B. Vidovic Editorial Board Secretary: MsR.TMareya The ZimbabweBulletin of Teacher Education [ISSN: 1022-3800] is a journal that is published two times, one volume of two issues per year by the Department of Teacher Education, University of Zimbabwe. Subscription Rates The subscription rates per year and per volume (2issues) of the journal are as follows. These rates are subject to change without prior notice. Within Zimbabwe Outside Zimbabwe Individual Z$7 000.00 US$ 80.00 Institutions Z$8 000.00 • US$150.00 Single copies may be ordered for ZS3000.00 within Zimbabwe and for US$50.00 outside Zimbabwe.
-
Upload
khangminh22 -
Category
Documents
-
view
1 -
download
0
Transcript of The Zimbabwe Bulletin of Teacher Education - IDS OpenDocs
1.The Zimbabwe Bulletin of Teacher Education
An official journal of the Department of Teacher Education, University of Zimbabwe
Editor: D r B. Chenjerai Chisaka Department of Teacher Education
University of Zimbabwe * P O Box MP167
Mount Pleasant Harare
Email: [email protected]
Editorial Board: DTE Advisory Board
Dr I. Jeso Dr O. Shumba
Mr. P. Kangai Prof. B.R.S Chivore
Mr. O. Mavundutse Mr Q. Bhila
Mr. S. Matiure Mr. C. Munetsi
Mrs C. Muviiimi
Mrs B. Vidovic
Editorial Board Secretary:
MsR.TMareya
The ZimbabweBulletin of Teacher Education [ISSN: 1022-3800] is a journal that is published two times, one
volume of two issues per year by the Department of Teacher Education, University of Zimbabwe.
Subscription RatesThe subscription rates per year and per volume (2issues) of the journal are as follows. These rates are subject to change without prior notice.
Within Zimbabwe Outside Zimbabwe
Individual Z$7 000.00 US$ 80.00Institutions Z$8 000.00 • US$150.00
Single copies may be ordered for ZS3000.00 within Zimbabwe and for US$50.00 outside Zimbabwe.
The Zimbabwe Bulletin of Teacher Education
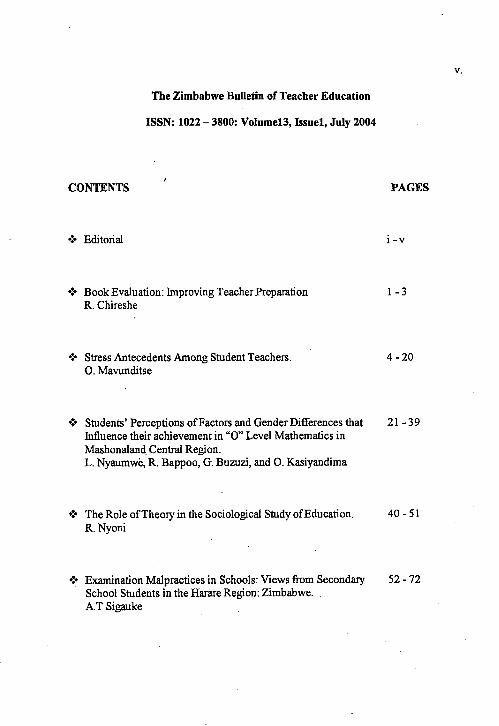
ISSN: 1022 - 3800: Volumel3, Issuel, July 2004
CONTENTS '■ PAGES
❖ Editorial i - v
❖ Book Evaluation: Improving Teacher Preparation 1 -3R. Chireshe
❖ Stress Antecedents Among Student Teachers. 4 -2 0O. Mavunditse
❖ Students’ Perceptions of Factors and Gender Differences that 2 1 -3 9 Influence their achievement in “O” Level Mathematics in Mashonaland Central Region.L. Nyaumwe, R. Bappoo, G. Buzuzi, and O. Kasiyandima
❖ The Role of Theory in the Sociological Study of Education. 40 -5 1R. Nyoni
❖ Examination Malpractices in Schools: Views from Secondary 52 - 72 School Students in the Harare Region: Zimbabwe. .A T Sigauke

Students' Perceptions of Factors and Gender Differences that Influence their Achievement in 'O’ Level Mathematics in Mashonaland Central Region.
L. Nyaumwe, R. Bappoo, G. Buzuzi. and 0 . Kasiyandima
Abstract
This paper reports on the factors and gender differences that affect performance in “0 ” Level (.Forms IH and IV) mathematics in Mashonaland Central Province. Fifteen point three percent (15.3%) of the students doing “O” Level from seven districts completed questionnaires comprising of students' demographic data, resources available in schools, mathematics teachers' competence combined with modified Fennema-Sherman attitude test. The results showed that students' attitudes toward mathematics were consistent with findings from other studies (Leder and Forgasz, 2000; Mathe, 1998 and Hart, 1989). Most secondary schools in the province did not have sufficient resources. Furthermore, most teachers used teacher-centered instructional methods that did not make students develop conceptual understanding of mathematics. Researchers recommended that schools should combine efforts with school development committees to acquire basic reading materials and that teachers should employ student-centered teaching methods that foster problem-solving skills in students.
Introduction
The purpose of this survey was to determine factors that affect students' achievement and gender differences in mathematics at “O” Level (Forms IH and IV) in Mashonaland Central Region. This study was imperative for students in the province because achievement in “O” Level mathematics has been generally unsatisfactory during the past few years. Prior to independence the pass rate was comparatively higher amongst the very few boarding schools present then. Passes in the subject (Grade C or better) for the 108 “O” Level centers in the province for four consecutive years are 17,9% for 2000; 18.2% for 1998; 22 % for 1997 and 22,6% for 1996 (Source: Education Regional Office for Mashonaland Central). The pass rate appears to be decreasing rather than improving (17,9% for 2000 versus 22,6% for 1996). A situation like this demands a closer look in order to determine factors leading to such unsatisfactory achievement in a subject that determines students' future lives. Mathematics has long been regarded as the single most important subject in the school curriculum where passing it is a prerequisite to entering many careers (Trafton, 1981; Mathe, 1998; Brumbaugh and Rock, 2001). Reyes (1981) cited mathematics as a critical filter for entrance into high paying and prestigious careers. A consequence of failing mathematics at “O” Level is that a student's job opportunities are minimized. This survey was important in that it informs students, teachers, curriculum developers and all people concerned about factors affecting students' performance in “O” Level mathematics.
21

L. Nyaumwe, R. Bappoo, G. Buzuzi. and O. Kasiyandima
Theoretical framework of the study
Resources in schools, background of students, teachers' instructional methods and students' attitudes toward a subject are some of the factors that influence achievement in the subject. Availability of a variety of instructional materials at students' disposal enables students to learn mathematics conceptually. A combination o f resources and a supportive home background influence students' motivation to learn mathematics. Students' attitudes towards a subject influence their achievement in that subject. Attitudinal surveys provide valuable information about students' perceptions of mathematics. Foigasz and Leder (2002) contend that attitudes arid beliefs have a strong impact on students' performance and influence decisions on persistence with studies in mathematics. Attitudes toward mathematics influence how often students use mathematics in different contexts, desire to study mathematics and choice o f prospective occupations. This explains why attitudes influence achievements rather than achievements influencing attitudes (Schibeci and Riley, 1986). Students with positive attitudes tend to produce higher scores on achievement measures (Weinburgh, 1994) as a result o f intrinsic motivation that drives them to study the subject. Awareness o f students' attitudes toward mathematics ought to be paramount to parents, teaqhers and curriculum developers. Teachers may only create classroom environments conducive to learning when they are aware of students' attitudes.
Purpose of the study
The purpose of this study was to determine the factors that affect achievements and gender differences in “0 ” Level mathematics in Mashonaland Central Province. The factors focused on are mathematics resources (at home and at school), teachers instructional methods as well as students' attitudes toward mathematics. The study sought to answer the two main questions:1) What are the students' perceptions of the factors that affect achievement in “0 ” Level
mathematics.2) What are the students' perceptions o f the factors that affect gender differences in “O”
Level mathematics scores.
Sampling procedures
Students drawn from 7 districts, attending 108 secondary schools registered as “O” Level centers in Mashonaland Central Region, formed the population o f this study. Schools were chosen from the year 2000 “O” Level mathematics results listed in descending order of percentage pass prepared by the Education Regional Office. The schools were chosen randomly from specified ranges. Stratified random sampling was used. Schools were divided into strata according to pass rate. The “O” Level centers were chosen from 37 schools in 0% to 10%; 59 schools in 10.1% to 30% and 12 schools in 30.1% to 49%. Due to financial and logistical constraints only 16.2% (n = 6) of the schools in the 0 to 10% range were visited and the two boarding schools that had pass rates o f 57,9% and 71,4% were not.
22

The Zimbabwe Bulletin o f Teacher Education
The percentages o f schools drawn from the 10.1% to 30% and 30.1% to 49% ranges were 18.1% (n = 12) and 33% (n = 4) respectively. A total o f 2150 (15,3%) students from 22 (20,3%) schools completed the questionnaire.
InstrumentsThe questionnaire for students was a three- page inventory comprising students' demographic data (A1 to A8), modified Fennema-Sherman mathematics attitude scales (SI to S47) and 3 structured questions (48 to 50). Demographic data about the students were necessary in order to identify possible factors that influenced their attitudes towards mathematics. The modified Fennema-Sherman attitude, scales were adapted for their established psychometric validity (Kyeleve and Williams, 1996; Goglin and Swartz, 1992; Weinburgh, 1994). A weakness of adapting established scales on the grounds of their long history of construct and content validity is possibly making an assumption that validity is timeless and objective rather than needing continual re-affirmation (Kyeleve and Williams, 1996). To overcome this weakness attitude scales were pre- tested before full implementation and some adjustments made to enable questions to suit the context o f the students. The scales comprised o f 47 randomly placed items that consisted of four sub-scales with twelve statements in each sub-scale. On each o f the four scales, six items measured positive attitudes and an equal number measured negative attitudes. Four specific attitudinal scales that influence students' achievement and easy to measure that were used in the study are confidence, usefulness, mathematics as a male domain and teacher perception scale. A five point-likert scale was used with A-strongly agree; B-agree, but not strongly; C-not sure; D-disagree, but not strongly and E-strongly disagree. For the purposes o f data analysis students' responses scored points on a sliding scale. On positive responses A scored 5 points and E scored 1 point and on negative responses the scoring was reversed. The questionnaire was administered to students during mathematics lessons or preparation periods. The mathematics teachers who administered them were given both written and verbal instructions in order that conditions be as similar as possible from one school to another (Weinburg, 1994).
Data Analysis
Students' demographic data and attitude scales were easy to code for use on a computer package EPI6. With regard to structured questions researchers had to recode some questions so that all responses by students are captured.
23
L. Nyaumwe, R. Bappoo, G. Buzuzi. and O. Kasiyandima
RESULTS
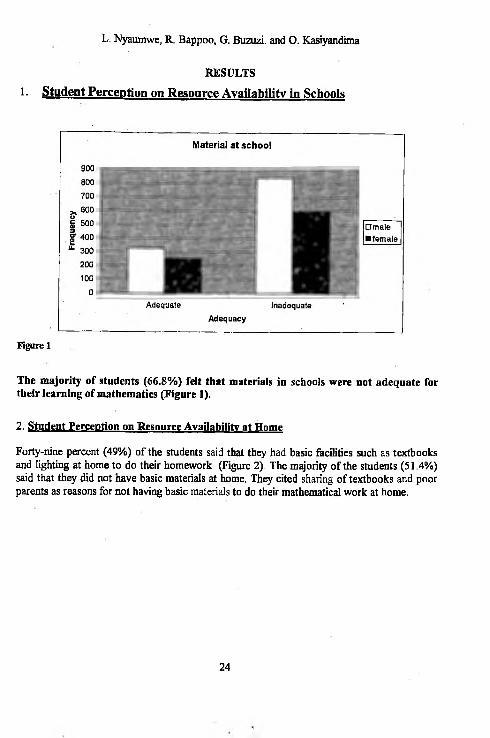
1- Student Perception on Resource Availability in Schools
Figure 1
The majority of students (66.8%) felt that materials in schools were not adequate for their learning of mathematics (Figure 1).
2. Student Perception on Resource Availability at Home
Forty-nine percent (49%) of the students said that they had basic facilities such as textbooks and lighting at home to do their homework (Figure 2). The majority of the students (51.4%) said that they did not have basic materials at home. They cited sharing of textbooks and poor parents as reasons for not having basic materials to do their mathematical work at home.
24

The Zimbabwe Bulletin of Teacher Education
Type of facility at home by gender
books light table
Type of facility
Figure 2
1. Analysis of Attitudes Toward Mathematics bv Gender
For each of the four scales of confidence, usefulness, male domain and teachers' perception of students, statistical tests were used to compare the responses of male and female students to see if there existed significant differences in students' responses. ANOVA was used to explore the differences in mean scores of the two sexes for each of the items on the modified Fennema-Sherman Attitude Scales. Application of the t-test for the comparison o f means gave the same results as those reflected by ANOVA.Figures 3 to 6 show bar charts of students' responses on the four scales.
Confidence Scale Means bv GenderAn overall mean of 3.6 on the confidence scale indicates that students agreed but not strongly about items on the scale (Figure 3). There was a significant difference at 0.05 level in the overall means of responses from male and female students. The students agreed and strongly agreed that they were sure of themselves in the learning of mathematics (S41), that they could do "A" level mathematics (SI) although they perceived mathematics to be their worst subject (S23). On six items (S8, S12, S19, S25, S33, and S43) students' responses were significantly different (p <0.01).
25
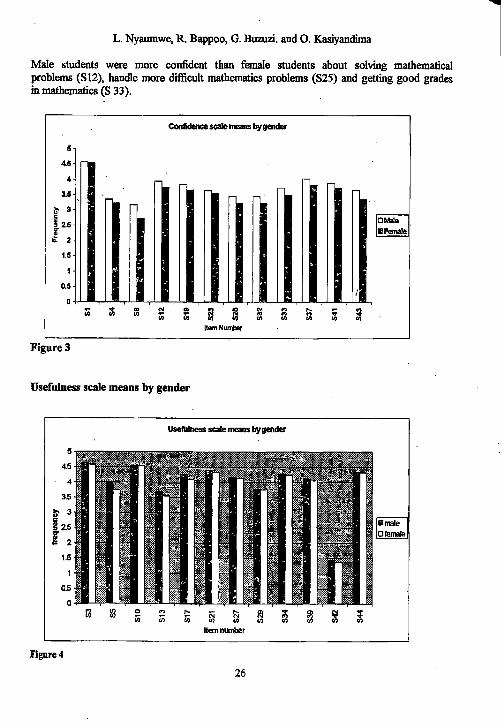
Male students were more confident than female students about solving mathematical problems (SI2), handle more difficult mathematics problems (S2S) and getting good grades in mathematics (S 33).
L. Nyaumwe, R. Bappoo, G. Buzuzi. and O. Kasiyandima
Confidence scale means by gender
□ Male B Female
Figure 3
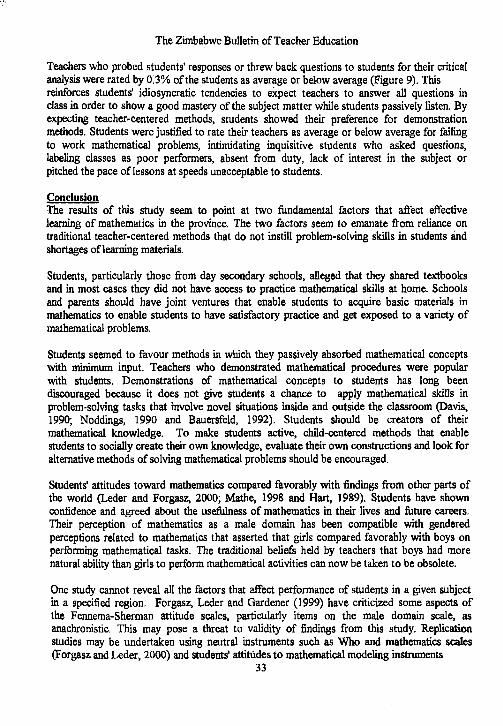
Usefulness scale means by gender
Figure 4
26

The Zimbabwe Bulletin of Teacher Education
There was no significant difference in the means of male and female students on the usefulness of mathematics on 75% of the items (Figure 4). Girls were less optimistic than boys that mathematics will be important in their careers (S5, p < 0.01), that mathematics was a worth while subject (S17, p < 0.01) and that they (girls) did not expect to use much mathematics when they go out of school (S13, p < 0.05).
Perception of mathematics as a male domain scale means by gender
Students' responses on the male domain scale appeared to stereotype their gender (Figure 5). Female students refuted that mathematics was a male domain. In 9 out o f 11 items (81.8%) there were very significant differences (p < 0.01) between females' and males' responses. Female students were more convinced than their male counterparts that women could do just as well as men in mathematics (SI5), females were as good as males in geometry (S28) and women certainly were smart enough to do well in mathematics (S31). Female and male students did not differ significantly on the perception of a woman mathematician as a forceful type of person (S36).
Figure 5
Perception of teachers' attitude scale means by gender
Figure 6 shows that the majority (75%) of the students' responses agreed (mean > 3.5) on their perceptions o f teachers' attitude towards them. In 66.7% of the cases there was no significant difference between male and female responses. Both sexes were convinced that

L. Nyaumwe, R. Bappoo, G. Buzuzi. and 0. Kasiyandima
teachers encouraged, them to study more mathematics (S20), wanted them to take all the mathematics lessons/courses that they could (S35) and made them feel that they had the ability to do further studies in mathematics (S45). Male students were significantly more convinced (p<0 .01) than female students that teachers were more interested in their progress in mathematics (S2), take them more seriously in mathematics (S7) and talk to them about a career in which mathematical knowledge has relevancy (S14).
Figure 6
2. Students' ratings of teachers
The majority of students (73.3%) rated their mathematics teachers as good or very good (Figure 7). Teachers were rated good or very good for showing a variety of professional skills (Figure 8). They were rated good or very good for explaining clearly (21.6 %) and teaching well (8.89 %). Teachers who gave challenging work and extra work were rated as good or very good by few students (1.14 % and 1.83% respectively).
28

The Zimbabwe Bulletin o f Teacher Education
Rating of teacher by gender
Oc3t r
very good good average below poor average
Rating
□ male H female
Figure 7
Twenty six point seven percent ( 26.7 %) of the students rated their teachers' performance as average or below average. According to Figure 9, teachers were labeled as underachievers for failing to explain (3.31%), absenteeism (3.02%), lack o f interest in the subject (1.58%), labeling class as under-achievers 0.5%), failing to work examples, on the board (3.5%) and showing favoritism towards good students (1.98%).
29

L. Nyaumwe, R. Bappoo, G. Buzuzi and O. Kasiyandima
Reasons for good/very good
toReasons
Figure 8
30

The Zimbabwe Bulletin of Teacher Education
Figure 9
Discussion
This study showed that most schools operated with meager resources (figure 1). The majority of students (66.8%) indicated that most day secondary schools had inadequate mathematics textbooks and instruments. This made it difficult for students to do mathematics at home (other-than questions copied as homework). Students acquire good mastery of mathematical concepts if they are exposed to a variety o f questions from different contexts. Some students (51.4%) said that they did not have basic facilities at home to practice mathematical concepts. They cited lack of books or lighting at home (Figure 2). Female students stated that they failed to find time to do school work at home because domestic overwhelmed them.
31

chores. They usually finished the chores late and on days when they finished early they were often tired to do meaningful studies.
The attitudes of students in Mashonaland Central toward mathematics did not differ from findings from other studies (Kelly, 1986; Hart, 1989; Leder and Forgasz, 2000; Fennema, 2002). Teachers could nurture students' positive attitudes by encouraging them to develop high self-esteem in the subject and by giving them motivational rewards instead of labeling them whenever they make errors. This study revealed that students in Mashonaland Central province are confident and know the usefulness o f mathematics (mean o f agree but not strongly on confidence and usefulness scales). Figure 3 shows that boys scored higher than girls on the confidence in mathematics scale. This concurs with Reyes (1984) who made a similar conclusion. Confidence in a subject has a significant positive correlation with mathematical achievement in all spectrums o f mathematics studies (Hart, 1989 and, Fennema and Sherman, 1978). Greenfield (1996) alleged that female students were not confident in mathematics because o f their low self-concept in the subject. Lack of confidence was caused by differential experiences during childhood not as a result o f a lack of interest (Kahle and Lakes, 1983 in Greenfield, 1996). Girls have much less out-of-school experiences that require skills involving mathematics than boys.
L. Nyaumwe, R. Bappoo, G. Buzuzi and O. Kasiyandima
On the male domain scale, girls showed more positive attitudes than boys (Figure 5). This . was contrary to previous findings which indicated that boys showed more positive attitudes towards mathematics as a male domain because they believed that they were highly motivated to study the subject and tended to perform well in it (Weinburgh, 1994). As a result of boys' high achievement in mathematics, girls tended to look down upon themselves and lost self-confidence in the subject. Leder and Forgasz (2000) reported changes in gendered perceptions related to mathematics that deny that boys had more natural ability for mathematics than girls. Changes in teachers' attitudes can manifest themselves when both sexes get equal opportunities to answer questions, get feedback and perform mathematical activities. Boys revealed that they were more likely than girls to have teachers' attention and receive positive comments (Figure 6). This was in contrast with findings from Weinburgh, (1994) that indicated that females want to please, and therefore are more aware of teachers interest to please them. This may be an indicator that teachers in Mashonaland Central province encourage boys more often to perform well in mathematics in order to support their traditional beliefs that boys perform better than girls.
Most students in the survey (73.3%) rated their teachers as good or very good (Figure 7). Twenty-one point six percent (21.6%) o f the students rated teachers as good or very good for explaining well, being available to assist them (8.89%) and teaching well (7.77%). Teachers who gave challenging work, gave extra work and provided a variety of examples were not popular with many students (1.07%, 1.72% and 2.23% respectively). From the teaching methods popular with studertts one can see that students rated highly teachers who used presentation methods. Reliance on presentation methods usually does not lead to success in summative examinations that normally require students to have conceptual understanding of concepts so that they are able to solve new problems.
32
The Zimbabwe Bulletin of Teacher Education
Teachers who probed students' responses or threw back questions to students for their critical analysis were rated by 0.3% of the students as average or below average (Figure 9). This reinforces students' idiosyncratic tendencies to expect teachers to answer all questions in class in order to show a good mastery of the subject matter while students passively listen. By expecting teacher-centered methods, students showed their preference for demonstration methods. Students were justified to rate their teachers as average or below average for failing to work mathematical problems, intimidating inquisitive students who asked questions, labeling classes as poor performers, absent from duty, lack of interest in the subject or pitched the pace of lessons at speeds unacceptable to students.
ConclusionThe results o f this study seem to point at two fundamental factors that affect effective learning of mathematics in the province. The two factors seem to emanate from reliance on traditional teacher-centered methods that do not instill problem-solving skills in students and shortages of learning materials.
Students, particularly those from day secondary schools, alleged that they shared textbooks and in most cases they did not have access to practice mathematical skills at home. Schools and parents should have joint ventures that enable students to acquire basic materials in mathematics to enable students to have satisfactory practice and get exposed to a variety of mathematical problems.
Students seemed to favour methods in which they passively absorbed mathematical concepts with minimum input. Teachers who demonstrated mathematical procedures were popular with students. Demonstrations of mathematical concepts to students has long been discouraged because it does not give students a chance to apply mathematical skills in problem-solving tasks that involve novel situations inside and outside the classroom (Davis, 1990; Noddings, 1990 and Bauersfeld, 1992). Students should be creators of their mathematical knowledge. To make students active, child-centered methods that enable students to socially create their own knowledge, evaluate their own constructions and look for alternative methods of solving mathematical problems should be encouraged.
Students' attitudes toward mathematics compared favorably with findings from other parts of the world (Leder and Forgasz, 2000; Mathe, 1998 and Hart, 1989). Students have shown confidence and agreed about the usefulness o f mathematics in their lives and future careers. Their perception o f mathematics as a male domain has been compatible with gendered perceptions related to mathematics that asserted that girls compared favorably with boys on performing mathematical tasks. The traditional beliefs held by teachers that boys had more natural ability than girls to perform mathematical activities can now be taken to be obsolete.
One study cannot reveal all the factors that affect performance of students in a given subject in a specified region. Forgasz, Leder and Gardener (1999) have criticized some aspects of the Fennema-Sherman attitude scales, particularly items on the male domain scale, as anachronistic. This may pose a threat to validity of findings from this study. Replication studies may be undertaken using neutral instruments such as Who and mathematics scales (Forgasz and Leder, 2000) and students' attitudes to mathematical modeling instruments
33

(Kyeleve and Williams, 1996) to measure students' attitudes while also verifying teaching methods used by teachers using classroom observation schedules.
REFERENCES
L. Nyaumwe, R. Bappoo, G'. Buzuzi and 0 . Kasiyandima
Ames, C. (1992). Classroom: Goals, structures and student motivation. Journal of Educational Psychology. 84:261 -271.
Bauersfeld, H. (1992) Classroom cultures from a social constructivist perspective.Educational Studies. Kluwer. The Netherlands
Brumbaugh, D.K and Rock, D. (2001). Teaching secondary mathematics. London. Lawrence Erlbaum Associates.
Davis, (1990) R. B. (1990) Constructivist views on the teaching and learning ofmathematics. National Council of Teachers of Mathematics. Reston.
Fennema, E. (2002) Gender equity for Mathematics and Science.http://www.Woodrow.org/teachers/math/Bender/02fennema.html
Fennema, E. and Sherman, J. (1978) Sex related differences in mathematics achievement and related factors: a further study. Journal of Research in Mathematics Education. 9(3) 189-203.
Forgasz, H. and Leder, G. (2002) Who canft) do mathematics - boys/girls? An international comparison. http://www.are.edu.au/99pap/for99029.htm.
Greenfield, T. A. (1996). Gender, ethnicity, science achievement and attitudes. Journal of Research in Science Teaching. 33(8) 901-933.
Goglin, L. and Swarz, F. (1992) A quantitative inquiry into the attitudes towards science on one science college students. Journal of Research in science
Teaching. 28(5) 487-504.
Hart, L.(1989). Classroom processes, sex of student and confidence in learningMathematics. Journal of Research in Mathematics Education. 20(3) 242 -260.
Kelly, A. (1986). The development o f girls' and boys' attitudes to Science: ALongitudinal study. European Journal of Science Education.8(4)399-412
34

Kloosterman, P. (1997). Assessing student motivation in High school mathematics. The American Educational Research Association. Chicago. March, 1997.
Kyeleve, I. J. and Williams J. S. (1996). Measures o f teachers' attitudes towards L. Nyaumwe, R. Bappoo, G. Buzuzi. and 0 . Kasiyandima
Mathematical modeling. Proceedings of the 20<h Conference of the International study group on Psychology of Mathematics Education. Valencia. Spain.
Leder, G and Forgasz, H. (2000) Mathematics beliefs are a changing. MathematicsEducation beyond 2000. Vol. 2. MERGA 23. Perth. Western Australia.
Mathe, M. M. (1998) Mathematics - about attitude and achievement in senior secondary schools in Soweto. Education as Change. 2(2) 65-71.
Noddings, N. (1990) Constructivism in Mathematics Education. National Council of teachers of Mathematics. Reston.
Reyes, L. H. (1981) Attitudes and Mathematics in Lindquist, M. M (ed) Selected Issues in Mathematics Education. McCutchan Publishing Coopration.
Schibecci, R. A. and Riley, J. P. (1986) Influence of students' background and perception on science attitudes and achievement. Journal of Research in Science Teaching. 23(3) 177-187.
Weinburgh, M. H. (1994) Achievement, grade level and gender as predictors o f students'attitudes towards .Science. Annual meeting of the American Association of Educational Research. New Orleans,April 1994.
Trafth, P. R. (1981) Assessing the Mathematics Curriculum today in Lindquist, M. M(ed) Selected Issues in Mathematics Education. McCutchan Publishing Coopration
Vinson, B. M; Haynes, J. and Sloan, J. (1997) A comparison o f pre-service teachers' mathematics anxiety before and after a methods class emphasizing manipulatives. httD://www.athens.edu/vinsobm/research-4.html
The Zimbabwe Bulletin o f Teacher Education
35

L. Nyaumwe, R. Bappoo, G. Buzuzi and O. Kasiyandima
Questionnaire for students
This questionnaire is designed to assess students attitude towards maths using foursubscales of confidence in maths, usefulness of maths, gender and maths and teacherperception. Students are encouraged to answer the questions that follows honestly. ResultsFrom this study will be used for educational purposes only.
Demographic data
Fill in the gap or circle/tick the appropriate response
A1. Name of school : ............................... ...... A 2. Type of school: Day/Boarding
A3. Form : 3/4 A 4. Sexmale/female
A5. Age : ................... A 6. Position in family:
A7. Do you have opportunities to do maths home work at home? Yes / No
If no give reasons 1. Dropped 2. Fatigue 3.Duties at home4. Need assistance to work maths problems
A8. Do you have facilities to do maths at home : Yes /No
If yes type of facilities : resourcebooks / light / table
If no give reasons 1. Parents too poor2. Parents/guardian not supportive3. School does not have enough textbooks to
take home
As you read the Sentence, you will know whether you agree or disagree.,If you strongly agree
36

The Zimbabwe Bulletin o f Teacher Education circle A next to the Question. If you agree, but not so strongly, or you only "sort of" agree,Circle B. If you are not sure about a question or you can't answer it, circle C. If you disagree,But not so strongly, circle D. If you disagree with the sentence very much,circle E for stronglyDisagree.Do not spend too much time with any statement, but make sure you answer every.
Statement.S1. lam sure that I can learn maths. A B C D ES2. My teachers have been interested in my progress in maths. A B C D ES3 Knowing mathematics will help me earn a living. A B C D E$4. I do not think I could do 'A' Level maths. A B C D ES5. Maths will not be important to me in my life's work. A B C D ES6. Males are not naturally better than females in maths. A B C D ES7. Getting a teacher to take me seriously in maths is a A B C D E
problem.S8. Maths is hard for me A B C D ES9. If s hard to believe a female could be a genius in A B C D E
MathematicsS10. I'll need mathematics for my future work A B C D E •S11. When a woman has to solve a maths problem, she should A B c D E
ask a man for help.S12 .1 am sure of myself when 1 do maths. A B c D ES13.1 don't expect to use much maths when 1 get out of school. A B c □ ES14.1 would talk to my maths teachers about a career that uses A B c D E
maths.S15. Women can do just as well as men in maths A B c D ES16. It’s hard to get maths teachers to respect me. A B c D ESi 7. Maths is a worthwhile, necessary subject A B c D ES18.1 would have more faith in the answer for a maths problem A B c D E
solved by a man than a woman.S19.1 am not the type to do well in maths A B c D ES20. My teachers have encouraged me to study more maths A B c D ES21 .Taking maths is a waste of time A B c D ES22.1 have a hard time getting teachers to talk seriously with me A B c D E
about maths.S23. Maths has been my worst subject A B c D ES24. Women who enjoy studying maths are a little strange A B c D ES25.1 think 1 could handle more difficult maths. A B c D ES26. My teachers think advanced maths will be a waste of time for
me.A B c D E
S27.1 will use mathematics in many ways as an adult37
A B c D E

L. Nyaumwe, R. Bappoo, G. Buzuzi and 0. KasiyandimaS28. Females are as good as males in geometry. A B C D ES29.1 see mathematics as something 1 won't use very often when
I get out of high school.A B C D E
S30.1 feel that maths teachers ignore me when 1 try to talk about something serious.
A B C D E
S31. Women certainly are smart enough to do well in maths A B C D ES32.1 can handle most subjects, but 1 just can't do a good job
with maths.A B C D E
S33.1 can get good grades in maths. A B c D ES34. I'll need a good understanding of maths for my future work. A B c D ES35. My teachers want me to take all the maths 1 can. A B c D ES36.1 would expect a woman mathematician to be a forceful type
of a person.A B c D E
537.1 know 1 can do well in maths. A B c D E538.Studying maths is just as good for women as for men. A B c D E539.Doing well in maths is not important for my future. A B c D E£40.My teachers would not take me seriously if 1 told them 1 was
. interested in a career inA B c D E
science and mathematics>41.1 am sure I could do advanced work in maths A B c D E>42. Maths is important for my life A B c D E>43. I'm no good in maths. A B c D E>44.1 study maths because I know how useful it is. A B c D E>45. Maths teachers have made me feel I have the ability to go on
in mathematics.A B c D E
4 6 .1 would trust a female just as much as I would trust a male to solve important maths problems.
A B c D E
47 My teachers think I'm the kind of person who could do well in Maths
A B c D E
8. If your parent/guardian has exam fees for five subjects only, would be one one of the subjects you would drop Yes / No
Yes . 1. Fear of failing the subject2. Not useful to my future career
No1. Career aspirations2. Importance of subject in life3. Mathematics enhances logical thinking4. Confidence in the subject
l. Oo you think that materials available at your school are adequate for your aming maths?
Yes / No7es 1.. Because I am passing it
38

L. Nyaumwe, R. Bappoo, G. Buzuzi. and 0. Kasiyandima
2. Adequate textbooks/No sharing3. Photocopying facilities available
If No 1. Shortage of textbooks and mathematical instruments
2. Because many students fail3. Variety of textbooks limited
50. in relation to the teaching & learning of maths, How do you rate your teacher?
Very Good / Good / Average / Below average / PoorReason for good/very good 1. Gives challenging work
2. Gives extra work3. Teaches well4. Available and assist students5. Shows good mastery of subject6. Explains well7. Students pass8. Encourages students to leam9. Provides variety of examples
Reasons for average/ below average/ poor 1. Fails to work problems at times
2. Throws backquestions to students
3. Concentrates on the goodstudents only
4.lntimidatesstudents
5. Perceives class as of lowachievers
6. Does not attendlessons regularly
7. Teaching pace toofast/slow
8. Fails to explain9. Lack interest in
the subject10. Jokes a lot
39

This work is licensed under a Creative CommonsAttribution - Noncommercial - NoDerivs 3.0 License.
To view a copy of the license please see: http://creativecommons.org/licenses/by-nc-nd/3.0/
This is a download from the BLDS Digital Library on OpenDocshttp://opendocs.ids.ac.uk/opendocs/
Institute of Development Studies