op68-213237.pdf - IDS OpenDocs
85
This work is licensed under a Creative Commons Attribution-NonCommercial- NoDerivs 3.0 Licence. To view a copy of the licence please see: http://creativecommons.0rg/iicenses/by-nond/3.0/
-
Upload
khangminh22 -
Category
Documents
-
view
3 -
download
0
Transcript of op68-213237.pdf - IDS OpenDocs

This work is licensed under a Creative Commons Attribution-NonCommercial-NoDerivs 3.0 Licence.
To view a copy of the licence please see: http://creativecommons.0rg/iicenses/by-nond/3.0/


Impact Assessment of the
WEDCO Enterprise Development Project
REME Financial Services Research Team: J. Maalu, M. Khayesi, P. Alila, P. Chitere, P. Kibas,
R. Karega, M. Bowen and J. Onjala
Research, Monitoring and Evaluation (REME) Project
Occasional Paper No.68
Institute for Development Studies University of Nairobi
August 1999

IDS Occasional Paper No. 68
© 1999 by Institute for Development Studies, University of Nairobi
The views expressed in this paper are those of the authors. They should not be interpreted as reflecting the views of the Institute for Development Studies or the University of Nairobi. This paper may be quoted without prior consent provided all such quotation is fully acknowledged.
Address all inquiries to: Director Institute for Development Studies University of Nairobi P.O. Box 30197 Nairobi, Kenya
Phone: 254-2-338741 Fax: 254-2-222036 E-mail: [email protected]
ii

IDS Occasional Paper No. 68
Contents Foreword vi Acknowledgements vii List of Abbreviations and Acronyms viii Executive Summary' ix
1 Introduction 1
Background to the Study 1 Purpose and Objectives 2 Structure of the Report 2
2 Small and Micro Enterprises in Kenya 3
The Role of Small and Micro Enterprises in the Economy 3 Policy Framework 5 Services Provided by NGOs and Other Institutions to SMEs 7
3 Potential Impact of Micro Finance on Kenyan Small and Micro 8 Enterprises
Conceptual, Empirical and Methodological Issues 8 Relationship Between Capital, Income Generation and Employment 10 Creation in SMEs Micro-finance Institutions and the Provision of Credit to SMEs 11 An Overview of Impact Assessment Studies 12
4 Profile of the W E D C O Enterprise Development Project 14
Mission 14 Target Group 15 Geographical Coverage 15 Lending Methodology 15
5 Impact Assessment Methodology 17
Research Design 17 Preparation for Fieldwork 20 Sampling 20 Data Collection and Analysis 22
iii

6 Profile of W E D C O Clients, Enterprises and Households 24
Profile of Clients 24 Enterprise Profile 28 Household Profile 29
7 Impact of Credit on Incomes and Employment 34 by James Copestake and Michael Godwin Performance and Participation in WEDCO 34 Impact on Personal Income. 37 Impact on Business Profitability 37 Impact on Employment 39
8 The Impact of Credit on Client Decision Making 42
Decision Making on New Business Activities 42 Decision Making on Borrowing Money 42 Decision Making on Household Savings 43 Decision Making on Use of Family Planning Methods 45
9 Conclusions 47
Findings 47 Recommendations 48
References 51
Appendices 53
1 REME W E D C O Impact Assessment—Client Questionnaire 53 2 Checklist for Focus Group Discussions 66 3 Checklist for Key Informants 67 4 Computed Variables Used in Regression Analysis 68
5 Tabulation of Business Profits 69
List of Tables 2.1 Employment in the formal and informal sectors in Kenya, 1992-1997 3 2.2 Services provided to small and micro enterprises in Kenya 6 5.1 Units, variables and indicators 18 5.2 Selection of RLF goups and individual clients 22 6.1 Age in categories by loan level 25 6.2 Clients' highest levels of education 26 6.3 Spouse's highest level of education 26 6.4 Nature of employment at enterprise level 30 6.5 Position of respondent in the household by loan level 31 6.6 Pattern of household expenditure 32
iv

IDS Occasional Paper No. 68
7.1 Monthly total personal income (1 year ago) by branch and loan 36 level (Ksh)
7.2 Monthly total personal income (1 year ago) by sector and loan 36 level (Ksh)
7.3 Growth in personal income 38 7.4 Growth in business profits 39 7.5 Growth in employment 40 8.1 Decision making on new business activities by loan level for all 43
respondents 8.2 Decision making on business activities for married women clients only 43 8.3 Decision making on borrowing money by loan level for all respondents 44 8.4 Decision making on borrowing money for married women clients only 44 8.5 Decision making on use of household savings by loan level for all 45
respondents 8.6 Decision making on use of household savings for married women 45
clients only 8.7 Decision making on use of family planning methods by loan level 46
for all respondents 8.8 Decision making on use of family planning methods for married 46
women clients only
v

IDS Occasional Paper No. 68
Foreword Impact assessment is a new and challenging form of micro-enterprise research. For many years, projects serving small and micro enterprises have been sub-jected to evaluation studies that focus mainly on organisational matters such as numbers of clients reached and operational effectiveness and efficiency. More recently, however, donors and others have begun to raise questions about the impact of project participation on clients, their households, their businesses and even the wider community. In response to concerns about impact, the Institute for Development Studies (IDS), University of Nairobi, with funding from the British Government's Department for International Development (DFID), formu-lated the Research, Monitoring and Evaluation (REME) Project in 1997. REME's aims were twofold: to build the capacity of local researchers in the techniques of impact assessment, and to carry out impact assessment studies of DFID-funded micro-enterprise projects.
The study of the WEDCO Enterprise Development Project is the first impact assessment undertaken by REME researchers. The study had two objectives. It was to provide information on the impact of the projfect participation and to test the impact assessment methodology that had been developed in a series of workshops organised by IDS and researchers from the University of Bath.
Researchers visited the WEDCO offices, interviewed staff and met with clients individually and in groups in an attempt to understand the project and its impact. This report summarises the information gathered and provides recom-mendations for future impact assessment research and a way forward for the WEDCO project. I believe that it will be a useful resource for researchers, NGOs and all who are concerned about improving services to small and micro enterprises in Kenya.
Prof. Patrick O. Alila Director, IDS
vi

IDS Occasional Paper No. 68
Acknowledgements This report is a product of many people some of whose names do not appear on the cover page. We hereby mention only a few. The researchers deeply acknowl-edge the great support and cooperation accorded by the WEDCO staff. Special thanks are extended to the Department for International Development (DFID) for providing the finances to undertake this work and to all the respondents who provided the information.
Dr. Dorothy McCormick, besides coordinating the entire REME project, read through the bulky and tedious first draft and provided very useful comments and ideas for improvement. Dorothy, we thank you.
We wish to record our appreciation to the Director and staff of the Institute for Development Studies for facilitating the technical coordination. Special thanks go to Mary Randiki of the REME coordinating office. We thank Dr. James Copestake and Mike Godwin from Bath University who commented on the first draft and carried out further analysis and write-up for Chapter 7 of this report. Thanks also to our project assistants and data analysts, respectively, for their time and efforts in data collection and analysis. Finally, we arc grateful to Mrs. Eva Ndavu for the capable editing that has put the report into its final form.
Jackson Maalu Team Leader .
vii


IDS Occasional Paper No. 68
List of Abbreviations and Acronyms BASE British Aid to Small Enterprise BRAC/RDP Bangladesh Rural Advancement Committee Rural Development
Programme DFID Department for International Development EPC Export Promotion Council EPPO Ministry of Finance—Export Promotion Programme Office EPZA Export Processing Zone Authority FGD FOCUS group discussion FPEAK Fresh Produce Exporters Association of Kenya GOK Government of Kenya HH Household ICDC Industrial and Commercial Development Corporation IDS Institute for Development Studies IPC Investment Promotion Centre K-MAP Kenya Management Assistance Programme K-REP Kenya Rural Enterprise Programme KIE Kenya Industrial Estates KIE/ISP Kenya Industrial Estates Informal Sector Programme KIRDI Kenya Industrial Research and Development Institute Ksh Kenya shillings MFI Micro-finance institution NCCK National Council of Churches of Kenya NGO Non-governmental organisation PRIDE Promotion of Rural Initiatives Development Enterprises REME Research, Monitoring and Evaluation Project RLF Revolving loan fund ROSCAs Rotating Savings and Credit Associations SEAD Small Enterprise Activity Development SECA Small Enterprise Credit Association SEPSO Small Enterprise Professional Service Organisation SMEs Small and micro enterprises UNDP United Nations Development Programme WEDCO Women's Enterprise Development Project
viii

IDS Occasional Paper No. 68
Executive Summary The Women's Enterprise Development (WEDCO) Project, based in Western and Nyanza Provinces of Kenya, provides credit to operators of small-scale enter-prises. WEDCO targets women entrepreneurs through women's groups and revolving loan fund groups. WEDCO secured a grant in January 1996 from the Department for International Development (DFID), under the British Aid to Small Enterprise (BASE) programme, to establish a self-sustaining financial services institution, independent of CARE, to deliver credit and savings services to at least 30,000 female participants in western Kenya and to increase institutional capacity.
The purpose of this study was to examine the extent to which DFID/BASE support to WEDCO has contributed to the realisation of enhanced off-farm, self-employment and increased household incomes.
The methodology for this study included three complementary approaches: a questionnaire-based survey of WEDCO clients to determine changes in income, employment and other variables at the individual, enterprise, household and community levels; a total of 389 clients were interviewed; a qualitative enquiry using focus group discussions, key informants and group interviews of 38 revolving loan fund groups; review of documents.
Both quantitative and qualitative analyses were carried out. The quantitative analysis that applied to the data from the questionnaire-based survey of WEDCO clients; it compared changes in income, employment and other relevant variables according to loan cycles of clients (pipeline, loan 1 and loan 2). Regression analysis, analysis of means and chi-square test techniques were used to test relationships and differences that emerged in the data. Qualitative analysis was applied to data collected through focus group discussions and group interviews.
Main Findings
Client, Enterprise and Household Profdes There were more household heads among loan 1 clients than among either pipeline or loan 2 and above clients. While on one hand there is a disproportionate number of loan 2 and above clients with primary and no formal education, on the other hand there is a disproportionate number of pipeline clients with secondary education, implying that pipeline clients are more educated. Some recent studies reveal that some of the participants in the informal sector have secondary level of education and beyond. A wide range of assets was reported at individual,
ix

household and enterprise level. A comparative analysis reveals that holding cash in the bank is most common at enterprise level and least common at the household level. An analysis of employment data by loan level has revealed that though there is no statistically significant variation in full-time and part-time enterprise employment as well as household members' employment, spouses' employment or employment of other workers, the means are significantly different, with hiahest full-time employment being at loan 1 clients.
A significant difference has been noted on average amount spent on education currently by sex, where men spend significantly more than women on education, probably reflecting the tendency for men in Kenya to assume responsibility for large, "lumpy" family expenditures. Another significant result is average amount spent on housing, with pipeline clients paying more than others. During focus group discussions, WEDCO clients emphasised that the loans they had received from WEDCO had helped them to increase their stocks and remain in business, earning some income, some of which was spent on household needs such as education, medical care and food.
Impachpf Credit on Incomes, Profits and Employment The regression analysis carried out provides weak evidence of a link between recipient of a first loan under WEDCO and growth in gross business profits, although this was barely sufficient to cover loan repayment costs. No direct significant impact was detected of participation in WEDCO on individual income growth or business employment growth. However, it should be noted that both of these variables were positively and significantly correlated with business profit growth. This suggests that impact (albeit undetectable within this sample) might eventually result, if the positive impact on profits could be sustained. The weakness of these findings can partially be attributed to data limitations. The major problem does not appear to have been use of pipeline participants for comparative purposes per se but the small overall and pipeline sample sizes. Results might also have been improved if more time had been allocated to pre-testing and refining recall-based questions. Given these limitations, it is perhaps more surprising that two weakly significant correlations were indeed estab-lished—between receipt of a first loan and profits, and between receipt of a second loan and employment. The low estimated coefficients for these relation-ships provide some tentative evidence that the "rules of thumb" for income and employment generation used in WEDCO and other micro-finance appraisal documents are likely to have been excessively optimistic.
Impact of Credit on Decision Making The analysis carried out in this study reveals that though a higher proportion of loan 2 and above clients reported that they make the final decision with respect to
x

new business activities, borrowing of money, household savings and use of family planning methods, the differences noted were statistically significant with respect to only decision making on household savings.
Recommendations Two sets of recommendations are made. The first set is from lessons learnt for future impact assessment and the second concerns lessons for WEDCO. The second set is based on information collected from the field through discussion as well as analysis of data collected.
• Future studies should have a larger overall sample as well as a larger pipeline sub-sample. The selection should be preceded by a thorough scrutiny of the clients in the programme as well as those on the waiting list to establish criteria for selection that reflects the central concern of impact assessment, namely determination of changes in employment and incomes.
• More time should be given to pre-testing instruments and refining recall-based questions during preparations for impact assessment.
• Results of focus group discussions and other assessment have revealed that the impact of credit goes beyond incomes and employment. Though the terms of reference emphasise incomes and employment, it is recommended that future studies should investigate impact on revolving loan groups of existing groups, households and community. Given the limitations of recall data, it is important to use both qualitative and quantitative measures when assessing impact.
• The respondents were of the view that WEDCO was overly concerned with timely repayment of loans. At the same time, women noted that in unique circumstances such as seasonality of business, it becomes difficult for them to repay loans in time. A number of respondents complained that the repayment period was too short. It is recommended that WEDCO review and find ways of making repayment schedules more flexible where there is such a need.
WEDCO lends to individual client through the revolving loan fund groups that arc formed by women entrepreneurs. There are now cases of individuals who have outgrown the group loans. Their businesses have expanded, and they would like to borrow from WEDCO on an individual basis. Whereas this development may pose logistical and loan guarantee challenges, it is recommended that WEDCO explore possibilities of lending both to revolv-ing loan fund groups and individual clients. An experimental or pilot project can be initiated with respect to individual client borrowing. If this proves
xi

IDS Occasional Paper No. 68
workable, the scheme can then be implemented.
• The links between receipt of a first loan under WEDCO and growth in gross business profits, and between receipt of a second loan and employment were weak, mainly because of data limitation. Nevertheless, the findings provide tentative evidence that the "rules of thumb" for income and employment generation used in WEDCO and other micro-finance appraisal documents may be excessively optimistic. It is recommended that WEDCO review the targets on employment creation and income generation in the log fame to make them more realistic.
xii


1
Introduction Background to the Study
The Women's Economic Development (WED) Project started in Siaya District in 1983 under the name Women's Income Generating (WIG) Project, with a focus on the development of group-managed goat rearing projects (Anyango and Allen 1994). The funding agency then was the Canadian International Development Agency (CIDA). The project was initially aimed at improving goat production by cross-breeding the local animals with exotic breeds to increase meat and milk production. As indicated by Anyango and Allen (1994), after some years, it became clear that the approach was not going to work because little attempt had been made to conduct a realistic economic analysis, based on an understanding of local markets, culture and family resource allocation; also, the technology was ill-adapted to most of the operating environment.
In 1989, the project was reviewed and completely overhauled. A credit programme was initiated that involved on-lending by women's groups to indi-viduals. The approach adopted, though locally conceived, is a variation of the Village Banking Methodology used in Asia and elsewhere. The project adopted this methodology and changed its name to Women's Economic Development (WED) Project. WED was started in 1992 as a project of C A R E Kenya within the portfolio of the Small Economic Activity Development (SEAD) sector. In 1994, CARE Kenya decided to extend W E D to a sustainable institution providing finance to micro enterprises, particularly those owned by women. W E D C O is now undergoing rapid geographical expansion, administrative restructuring and pro-gramme re-design.
WED is one of various intermediary financial institutions in Kenya that are receiving support from the Department for International Development (DFID). Others include Faulu Kenya, Kenya Women Finance Trust, Pride Limited, Barclays Bank of Kenya and Cooperative Bank of Kenya. DFID's strategy for its British Aid to Small Enterprise (BASE) programme is to provide additional employment and self-employment opportunities, especially for poor people, and to enhance their incomes through increased productive capacity. A component of this programme is capacity development of intermediary financial institutions on a sustainable basis. This strategy is consistent with the global DFID policy of
1

I
IDS Occasional Paper No. 68
working towards poverty alleviation by promoting labour-intensive economic growth, enhancing human resource development and protecting the natural and physical environment.
This report presents findings of an impact assessment on WEDCO. This study was carried out by the Research, Monitoring and Evaluation (REME) Project upon the request of DFID/BASE. The report was coordinated by the Institute for Development Studies, University of Nairobi.
Purpose and Objectives The purpose of this study is to examine the extent to which DFID/BASE support to W E D has contributed to the realisation of enhanced off-farm, self-employment and increased household incomes. The specific objectives are to:
• determine the extent to which credit to small and micro enterprises funded by W E D C O has led to employment creation, growth in incomes and profits;
• determine the impact of WEDCO credit on clients' decision making;
• derive policy implications from the study which could be useful in the design and management of micro-credit services;
• use WEDCO as a pilot impact assessment study to provide lessons for a wider multi-programme impact assessment of DFID-funded micro-finance institu-tions.
Structure of the Report Following the background given in Chapter 1, a discission is provided on SMEs in Kenya in Chapter 2. A review of literature is presented in Chapter 3 followed by a profile of WEDCO in Chapter 4. The impact assessment methodology is outlined in Chapter 5. A profile of WEDCO clients, enterprises and households is provided in Chapter 6. WEDCO impact on incomes and employment is presented in Chapter 7 while Chapter 8 presents findings on the impact of WED credit on client decision making. Conclusions are presented in Chapter 9.
2

3
Small and Micro Enterprises in Kenya
The Role of Small and Micro Enterprises in the Economy The important roles that small and micro enterprises (SMEs) play in the develop-ment of the economy of Kenya has been recognised and documented in a number of studies. A detailed review of the development of SMEs in Kenya is found in King (1996a and b) who identifies and discusses the critical turning points in the history of the sector. SME contributions to the economy of Kenya have been studied by ILO (1972), McCormick (1988), Parker and Torres (1994), Daniels et al. (1995) and King (1996b). Parker and Torres (1994) estimated that out of the roughly 13,000,000 Kenyans of working age in 1993, SMEs provided employ-ment for 16% of the labour force. Daniels et al. (1995) estimated that SMEs created jobs for 100,000 workers in 1994 and 130,000 in the first half of 1995. SMEs provide direct and indirect employment as well as part-time and full-time employment to households in rural and urban areas in Kenya.
A comparison of the trend in employment in the informal and formal sectors in Kenya (Table 2.1) indicates that the informal sector has the potential to employ a sizeable number of people. The table further illustrates that since 1994 the sector has provided most (54.3-64.5%) of the employment whereas that in the formal sector stagnated and dwindled from 45.7 to 35.5%.
In terms of employment growth, Daniels et al. (1995) found that trade had overwhelming importance in generating employment among SMEs. Hardware, retail and barber shops as well as beauty salons had negligible contribution to
Table 2.1 Employment in the formal and informal sectors, Kenya, 1992-1997
Year Formal Informal Total N % N %
1992 1,462,100 54.2 1,237,480 45.8 2,699,580 1993 1,474,500 50.1 1,466,512 49.9 2,941,012 1994 1,505,500 45.7 1,792,375 54.3 3,297,875 1995 1,557,000 41.0 2,240,466 59.0 3,797,466 1996 1,618,800 38.0 2,643,800 62.0 4,262,600 •1997 1,647,400 35.5 2,986,900 64.5 4,634,300
Source: Adapted and modified from Kenya (1996b and 1998)
3

IDS Occasional Paper No. 68
employment growth. Parker and Torres (1994) found that most SMEs do not grow fast in job creation; only 38% of those surveyed were found to have grown. This slow growth is due to lack of demand for SME products. In addition, the majority of entrepreneurs lack market information. Others prefer jobs which require skills even if such jobs are oversupplied. A survey of 40 garment firms in Nairobi by McCormick et al. (1997) found that between 1989 and 1993, 19.3% grew in employment creation, 10.5% were stagnant and 70.2% lost employees. The findings by Daniels et al. (1995) and McCormick et al. (1997) are an indication that though there may be rapid growth in the number of SMEs, their contribution to employment growth is limited by the high rate of closures and the low numbers of jobs created per unit.
In addition to employment creation and income generation, SMEs play other important roles in the economy, such as production of goods and services and development of skills. The major benefits of the small enterprises are clearly brought out in Kenya's Sessional Paper No. 2 of 1992 (Kenya 1992) and they include:
• significant contribution to the economy in terms of output of goods and services;
• creation of jobs at relatively low capital cost, especially in the fast-growing sector;
• development of a pool of skilled and semi-skilled workers who are the base for future industrial expansion;
• strengthening forward and backward linkages among socially, economically and geographically diverse sectors of the economy;
• creating demand as well as supply, as it has been established that 90% of rural enterprise products are marketed directly to rural households;
• contributing to increased participation of indigenous Kenyans n the economic activities of the country;
• offering excellent opportunities for entrepreneurial and managerial talent to mature, the critical shortage of which is often a great handicap to economic development;
• supporting industrialisation policies that promote rural-urban balance;
• increasing savings and investment by local Kenyans and encouraging use of local resources, thus leading to more effective use of capital;
• quick adaptation to market changes.
4

IDS Occasional Paper No. 68
Policy Framework The official (government) recognition of the role and importance of the SMEs in policy documents has gone through a numoer of stages as outlined in studies by King (1996a and b), Gichira (1998) and McCormick (1998). The support of the Government of Kenya for this sector is evident in development plans and sessional papers, particularly Sessional Paper No. 1 of 1986 (Kenya 1986), Sessional Paper No. 2 of 1992 (Kenya 1992) and Sessional Paper No. 2 of 1996 (Kenya 1996a).
"Sessional Paper No. 1 of 1986 on Economic Management for Renewed Growth" acknowledges the increasing importance of the informal sector in economic development with respect to employment creation, particularly in the face of economic crisis and structural adjustment policies. The 1989-1993 Kenya Development Plan (Kenya 1988) further underlined the importance of the infor-mal sector in employment creation. It was expected that 587,000 (31.0%) of the 1.9 million new jobs to be created were to come from the informal sector.
"Sessional Paper No. 2 of 1992 on Small Enterprise and Jua Kali Develop-ment in Kenya" set out a comprehensive policy framework to enhance direct assistance to individual entrepreneurs and small-scale enterprises, the transition of SMEs into medium size enterprises, and access to credit and information for the informal sector. The aim was to support an enabling policy environment by redressing licensing, tax, security of works and other regulatory restrictions on informal sector activities. This sessional paper further stressed the role of private sector enterprises and initiatives, with the government playing mainly a facilitative role. It underlines the need for adequate access to credit, provision of management and technical training and other non-financial support programmes in business counselling, consulting, marketing and extension services. The cumulative effect of these strategies is expected to be the creation of an entrepreneurial culture in Kenya. The government will give priority to university and polytechnic graduates when allocating resources to the informal sector entrepreneurs.
Sessional Paper No. 2 of 1996 noted that despite government efforts aided by a large number of donor agencies and NGOs, there remain four major constraints that restrain the expansion of the small-scale enterprise sector. These are access to credit, access to land and infrastructure, access to training and technical support, and access to technology and information. A concerted effort to overcome these constraints is a prerequisite to both expansion of the number of enterprises and transformation to larger scale concerns. While the sector as a whole must continue to expand to provide future employment, it is equally important that individual enterprises consolidate and expand to become medium-scale formal sector enter-prises.

IDS Occasional Paper No. 68
Table 2.2 Services provided to SMEs in Kenya
Type of service Examples of institutions offering the service
Financial (credit) Kenya Industrial Estates ICDC Barclays Bank of Kenya: Loan Guarantee Scheme Kenya Women Finance Trust WED Project K-REP PRIDE Faulu (Kenya) NCCK Undugu Society of Kenya
Handicrafts Jisaidie Cottage Industries Undugu Society of Kenya Tototo Home Industries
Training K-MAP SEPSO Kenya Institute of Business Training Directorate of Industrial Training
Technology Approtec Intermediate Technology KIRDI
Export Support EPZA EPC Ministry of Finance—EPPO IPC FPEAK
Institutional Support Technoserve Kenya Gatsby Society Trust LJNDP SECA Ministry of Technical Training and Technology—Small Scale Enterprises Training and Technology Project
Advisory Support IPC Institutions Vice President's Office and Ministry of Planning
Ministry of Commerce and Industry
Source: Project Finance Data Centre (undated), Kenya 1996a

IDS Occasional Paper No. 68
The 1997-2001 Development Plan (Kenya 1997) still underscores the impor-tance of the SME sector in employment creation. The actions planned by the government (in collaboration with other stakeholders) to enhance the rapid growth of this sector are to develop and review the legal and regulatory environment for the informal sector activities, formulate and develop programmes to improve access to credit and finance, support women and youth in the informal sector, encourage strong backward linkages with the manufacturing sector and review and harmonise licensing procedures. In the 1999/2000 budget speech, the Minister for Finance pointed out that the government will seek to create a conducive environment to promote the jua kali sector as part of the strategy to light poverty in Kenya (Kenya 1999). It is evident that the basic policy framework for the SME sector exists; the challenge is the full implementation of the provisions in this framework.
Services Provided by NGOs and Other Institutions to SMEs There are a number of institutions, both governmental and non-governmental, that offer services to the SME sector as summarised in Table 2.2. There are a number of constraints, however, to the provision of these services. Access to credit has been found to be a major constraint. As pointed out in Sessional Paper No. 2 of 1996, the entrepreneurs lack access to credit at start up, during operations and for expansion purposes. Even where credit is available, high-level collateral and documented cash flow requirements as well as general distrust by commercial banks of the small industrialist tend to inhibit access to credit. It is in an attempt to resolve some of these constraints that a number of NGOs and governmental institutions have set up special credit schemes to meet the diverse needs of small and micro entrepreneurs.

IDS Occasional Pacer No. 68
3
Potential Impact of Micro Finance on Kenyan Small and Micro Enterprises
Impact assessment is a component of project evaluation which focuses on the outcomes of interventions rather than inputs and outputs. The primary goal of impact assessment is to measure as accurately as possible the impacts of intervention, understanding the processes so as to improve them. Impact assess-ment answers the question: What changes have occurred that can be attributed to the intervention?
Conceptual, Empirical and Methodological Issues There exist a number of conceptual and methodological issues that require careful consideration when conducting impact assessment of credit. Some of the issues are contained in the broad questions: Should the units of assessment be individu-als, enterprises or households? Should the concentration be on household income, assets, consumption, sources of income, savings, household labour, children's education, health, nutrition or employment? There are also problems of fungibility, attribution, causality, nature of data required and methods of analysis (for example, use of quantitative, qualitative and participatory approaches).
The common units for impact assessment are the household, enterprise and institutional environment in which a project operates. Occasionally, studies have attempted to assess impact at an individual level. Some recent studies have attempted to assess impact at enterprise, individual, community and household level (Hulme and Mosley 1996). Each of these has its own merits and demerits.
Measurement variables in impact assessment must be precise and measurable. Economic indicators have historically and currently dominated micro-finance impact assessment, especially income, levels and patterns of expenditure, con-sumption and assets. Social indicators are recent additions. These include educa-tional status, access to health services, nutritional levels, anthropometric measures and contraceptive use. Social indicators have also been extended to the socio-political arena in an attempt to assess whether micro finance can promote empowerment. This has led to the measurement of individual control over resources, involvement in household and community decision making, levels of participation in community activities, social networks and electoral process participation.
One of the problems that arises in impact assessment is fungibility. Money is
8
IDS Occasional Paper No. 68
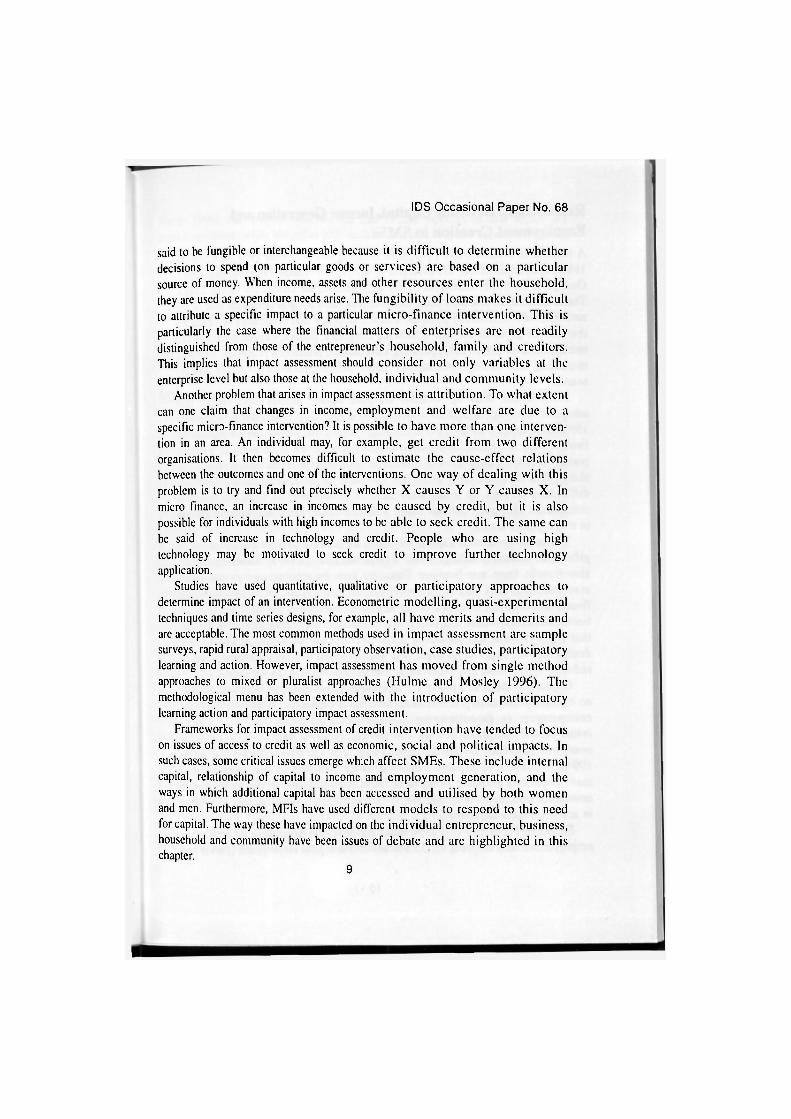
said to be fungible or interchangeable because it is difficult to determine whether decisions to spend ton particular goods or services) are based on a particular source of money. When income, assets and other resources enter the household, they are used as expenditure needs arise. The fungibility of loans makes it difficult to attribute a specific impact to a particular micro-finance intervention. This is particularly the case where the financial matters of enterprises are not readily distinguished from those of the entrepreneur's household, family and creditors. This implies that impact assessment should consider not only variables at the enterprise level but also those at the household, individual and community levels.
Another problem that arises in impact assessment is attribution. To what extent can one claim that changes in income, employment and welfare are due to a specific micro-finance intervention? It is possible to have more than one interven-tion in an area. An individual may, for example, get credit from two different organisations. It then becomes difficult to estimate the cause-effect relations between the outcomes and one of the interventions. One way of dealing with this problem is to try and find out precisely whether X causes Y or Y causes X. In micro finance, an increase in incomes may be caused by credit, but it is also possible for individuals with high incomes to be able to seek credit. The same can be said of increase in technology and credit. People who arc using high technology may be motivated to seek credit to improve further technology application.
Studies have used quantitative, qualitative or participatory approaches to determine impact of an intervention. Econometric modelling, quasi-experimental techniques and time series designs, for example, all have merits and demerits and are acceptable. The most common methods used in impact assessment arc sample surveys, rapid rural appraisal, participatory observation, case studies, participatory learning and action. However, impact assessment has moved from single method approaches to mixed or pluralist approaches (Hulme and Mosley 1996). The methodological menu has been extended with the introduction of participatory learning action and participatory impact assessment.
Frameworks for impact assessment of credit intervention have tended to focus on issues of access" to credit as well as economic, social and political impacts. In such cases, some critical issues emerge which affect SMEs. These include internal capital, relationship of capital to income and employment generation, and the ways in which additional capital has been accessed and utilised by both women and men. Furthermore, MFIs have used different models to respond to this need for capital. The way these have impacted on the individual entrepreneur, business, household and community have been issues of debate and are highlighted in this chapter.
9

Relationship Between Capital, Income Generation and Employment Creation in SMEs A number of studies (Hart 1973, ILO 1972, Ng'ethe and Ndua 1992, McCormick 1988, Kinyanjui 1992, McCormick et al. 1997, Masinde 1996, Wegulo 1997, Otunga et al. 1997, Macharia 1997) have outlined the constraints facing SMEs. These constraints not only stifle SME development but also limit their role in the national industrialisation process. These enterprises face constraints or obstacles that can be grouped into the following categories: finance, entrepreneurship and entrepreneurial behaviour, operating environment, production processes, location, marketing and selling, institutions, public policies, remedial strategies and re-search.
Most SMEs start up without adequate capital. Studies have shown that adequate start up capital is important in determining firm growth (Kinyanjui 1992, McCormick et al. 1997). Kinyanjui argues that small- and medium-sized firms which are financially handicapped at start up are more likely to perform poorly in employment growth than firms without financial handicaps. The study shows that 78% of both declining and static firms reported having financial difficulties at start up while only 22% of these firms had faced no financial constraints. However, 50% of firms with no financial handicaps reported growth in employment terms.
The main sources of capital for SMEs are personal savings and donations or gifts from friends (Ondiege 1996, Karega and Lodiaga 1997). Small enterprises also benefit from non-business financing from the rotating savings and credit associations (ROSCAs). This shows that the majority of SMEs are informally financed. However, it is not clear as to whether injection of capital after a firm has been established makes any difference. This is made more complicated by the fact that there is little understanding about the life cycle of SMEs. Although SME death rates are supposedly high, it is difficult to tell whether such rates could be reduced by financial interventions at start or somewhere in the life cycle.
Capital in SMEs is a proxy for informality as entrepreneurs start with little or no capital. Some enterprises start up with higher capital than others. For instance, entrepreneurs in manufacturing and commercial activities may require more initial capital than those in trade and services. However, most (89%) of entrepre-neurs in Kenya have a start-up capital of less than Ksh 10,000 (Parker and Torres 1994). Women tend to have lower capital for both start up and operation than men. Thus, they are more likely to be found in the trade and service sector than in commerce and manufacturing. When they venture into manufacturing, it is often in activities such as tailoring.
Sessional Paper No. 2 of 1996 noted that SMEs are dynamic in the creation of employment; they account for 52.8% and 29.5% of total employment (Parker and
10

Torres 19941. An analysis indicates that half of the workers in this sector are owner operators, while the other half tends to include unpaid family members , :o<; >. paid workers (24%) and trainees (6%). Most of these workers are women and a very small percentage are children (Parker and Torres 1994). The composi-tion of the workforce is also influenced by gender. Men entrepreneurs tend to hire more workers than their women counterparts: women rely more on their own and family labour. Parker and Torres (1994) found that 38% of SMEs had added workers, 4% had contracted and 58% had no net change in employment. Expansion was largely realised in manufacturing, metal products and chemical processing.
Micro-finance Institutions and the Provision of Credit to SMEs Micro-finance institutions (MFIs) have responded to the need for credit in SMEs in various ways. The major approaches to provision of credit in Kenya include group-based minimalist credit schemes, lending to individuals, lending to commu-nity-based enterprises and integrated credit models. There arc two categories of group based minimalist credit models. The first is based on groups that are formed by the organisation providing credit while the second is based on already existing groups of entrepreneurs. The former model is based on the principles of the Grameen Bank. It provides credit with little or no training or technical assistance. It operates on the premise that credit is the single most important limitation to the success of SMEs and it seeks to establish high volume, high repayment loan schemes that can become self-sustaining. Basically, credit is provided to small groups that guarantee the loans to their individual members and help each other resolve common business problems. When loans have been successfully repaid, clients may apply for larger ones. This model has a number of advantages. The responsibility for administering the loan lies within the client groups, the regular savings of which function as a loan guarantee fund. Members ' savings can be drawn upon after a period and be reinvested in SMEs. The outreach is larger and at minimal time and cost to the lending organisation. It is then possible to reach a high level of institutional sustainability. To be cost effective, the model is operated where there arc concentrations of small enterprises; thus, women in rural areas are not easily reached by this model.
The minimalist model based on existing groups (ROSCAs) is a source of credit to thousands of people. ROSCAs provide credit to those who would not be eligible to borrow from other resources. Their operations arc also simple and easily understood by illiterate people who form the bulk of their membership. ROSCAs develop a sense of ownership and embody a truly participatory develop-ment. One of the problems they face is a small capital base. NGOs lending to such groups operate on a contract basis. A loan is made to the group at interest rates
11

that can sustain the NGO. The group then lends to individual group members in turn. The repayments are made to the group and the group then repays the NGO. This arrangement is a cost effective method of extending credit in that much of the administrative work, usually done by the loan officer is done by the group members. These groups are cohesive since they have been in existence for some time.
The minimalist individual credit model consists of two types: Those that receive tangible collateral and those that do not. The former is cost-effective to pursue as it minimises costs of specialised staff and does not involve costly feasibility study, training or technical assistance. However, many SME owners do not have collateral, and access to such credit is minimal. The latter model is expensive but is appropriate in reaching SME owners.
Credit guarantee schemes are being implemented in order to persuade com-mercial banks to step up their lending to riskier sectors and to those entrepreneurs without the required formal securities. Integrated models combine training and technical assistance with providence of credit. Participation in a formal training workshop is a typical prerequisite to receiving the loan.
An Overview of Impact Assessment Studies Impact assessment studies have concentrated on the following issues: household incomes, asset accumulation, consumption, sources of incomes, savings and household labour supply. Buckley (1997) studied one of the K-REP supported credit programmes, Juhudi-Kibera and Kenya Industrial Estates Informal Sector Programme (KIE/ISP) in Kenya. Juhudi-Kibera is a group-based programme modelled on the Grameen Bank in Bangladesh. Borrowers must be members of a group of entrepreneurs in order to receive loans. The KIE/ISP gives loans to individuals with licensed and viable businesses. The respondents in this study had problems distinguishing between business and households, and between indi-vidual and household expenditures. This implied that the loans were used for a variety of purposes; hence, it was difficult to assess the impact of programme credit in terms of its stated purpose. The study further indicated that credit had positive impact on sales, limited impact on employment and little impact on assets and household expenditure. Buckley (1996) concludes that any impact will depend on the abilities, aptitudes and attitudes of the individual borrowers, hence the need to control for individual characteristics.
Mustafa et al. (1996) studied the impact of the Bangladesh Rural Advance-ment Committee (BRAC) Rural Development Programme (RDP) on the rural poor. The study established that loan size and membership age determined wealth and expenditure growth. The study concluded that women utilised the credit more efficiently than men and that credit programmes had a marked impact on the poor, especially those who entered with smaller endowments. There appeared to be
12

IDS Occasional Paper No. 68
ments. There appeared to be little or no difference between the villages where RDP is in operation and where RDP is not. This finding does not necessarily mean that there was no impact. It probably indicates the existence of other factors apart from the RDP.
13

14
Profile of the WEDCO Enterprise Development Project
This chapter provides the background on WEDCO. The mission, target group, geographical coverage and lending methodology are discussed .briefly. There is much information concerning institutional structure, trends in disbursement of credit, sustainability and the socio-economic setting of the project in the bench-mark study carried out by REME (Maalu et al. 1998) and WEDCO project reports (BASE and CARE Kenya 1995, CARE International in Kenya 1997).' As indicated earlier, WEDCO has grown from a CARE Kenya project to an institution that is now providing credit to small and micro entrepreneurs in western Kenya.
Mission The basic concern of WEDCO is to increase off-farm and self-employment opportunities and enhance household incomes by availing savings and credit services to the poor. The concern of WEDCO is succinctly captured in its mission and vision statement that reads:
WEDCO's mission is to increase incomes and social benefits, which permit improved family life by providing financial services and strengthening communities and individuals through a sustain-able institution (WEDCO, 1999)
WEDCO secured a grant from DFID in January 1996 to establish a self-sustaining financial services institution (independent of CARE) to deliver credit and savings services to at least 30,000 female programme participants in western Kenya and increase its institutional capacity (BASE and CARE Kenya 1995). In terms of targets and time frame, WEDCO is cxpcctcd to produce various outputs. It is to increase the number of groups from 360 to 1,200, with an average membership of 25 per group by the year 2000. It is hoped that client numbers will increase from 8,000 to 30,000. The project should expand geographically or spatially. The capital base of the loan fund should expand from Ksh 18 million to Ksh 158 million and the project should design and implement a voluntary savings programme tailored to client needs by the year 2000.
14

Target Group WEDCO targets operators, mainly women, of SMEs that are mainly in the informal sector. Though WEDCO was initially focused on women entrepreneurs, it hopes to adjust its policy to include men entrepreneurs in future. The reason for the intended change in this policy is because of the recognition by WEDCO that the economic condition of both women and men needs to be addressed. Further-more, men have been making requests to WTEDCO to be considered for credit.
Geographical Coverage WEDCO is located in western Kenya. The main offices are located in Kisumu town. WEDCO is currently making concerted efforts to expand its geographic coverage. For some time, WEDCO was concentrated in Siaya and Kisumu Districts. In the recent past, WTiDCO has expanded into Rachuonyo, Homa Bay, Migori, Vihiga, Kakamega and Bungoma Districts. Entrepreneurs supported by WEDCO are found in both rural and urban areas. WEDCO used to be more rural but it is now increasing its urban coverage because of the increasing importance of SMEs in the urban areas. The major urban centres, such as Kisumu, Kakamega and Siaya, are faced with the problems of unemployment and poverty. Many people have moved into these urban centres hoping to secure employment, but they have not always been successful. Some of these persons start SMEs to cam a living. WEDCO is therefore helping to partly solve the problem of urban unemployment and poverty by increasing its urban coverage.
Lending Methodology WEDCO has adopted the village banking methodology of lending which involves working with existing groups, mainly of women, registered with the Ministry of Culture and Social Services. WEDCO uses the minimalist approach in lending to these women 's groups. This means that credit is seen as the single most important factor in the development of SMEs.
The basic features of the lending system were described by Maalu et al. (1998). WEDCO lends to a revolving loan fund (RLF) group. Before receiving a loan from WEDCO, each RLF group is expected to be registered as a self-help group with the Ministry of Culture and Social Services. In addition, the group is required to raise some money (equity) that is deposited with WEDCO as some form of guarantee. This money is always given back to the group (with some interest) at the end of the loan repayment. The group lends to individual members. The RLF group appraises the individual member loan application and lends money after considering criteria of credit-worthiness and shares held. Members repay their loans to the RLF. As the first set of borrowers repays to the group, other members are able to borrow. Thus, the money rotates in the group until all
15

IDS Occasional Paper No. 68
members have been able to borrow. The RLF group repays the loan to WEDCO over a period of 18 months in nine instalments at 18% interest rate (since Octobcr 1997, the interest rate has been raised to 24%).
16

17
Impact Assessment Methodology
Research Design The research design used in this study was quasi-experimental in which a comparison of the impact indicators (income, employment, profits and decision making) is made between groups that have received credit and those that have not received credit from WEDCO. The groups that have received credit were at three loan levels or cycles: first loan, second loan and third loan. The groups that had not received were preparing to receive credit. They are referred to in this study as "pipeline". In essence, the assessment considers a comparison of a "before" and "after" situation between participating and pipeline clients.
Impact was assessed at four levels: individual, enterprise, household and community. The reason for selecting these four levels is because they have an inherent linkage. The individual client is indeed part of the household and the community. Hence, what happens to her has a spill-over effect on the household and community. It is also true that what happens to the household and community does affect, in varying degrees, the individual client and the enterprise.
According to the logical framework of WEDCO, there were two important variables that were specifically identified as the evaluation criteria. These were income and employment. Given that income and employment are much more than numbers, the study collected both quantitative and qualitative indicators of these two main variables. In addition, a number of other indicators of impact, reflecting the role of employment and income, were collected. Details of the variables and indicators are given in Table 5.1. Data were therefore collected on a wide range of impact variables at the individual, enterprise, household and community levels using a variety of methods.
The key variables in Table 5.1 that are examined for impact assessment are total personal income, business profitability, enterprise employment and client decision making. The rest of the variables are used to describe the profile of WEDCO clients, enterprises and households.
The data collected on the variables in Table 5.1 were based on recall by respondents. Such data cannot be accurate because of the problem of memory loss with the passing of time. It is not easy for a respondent to remember, for example, how much she earned from her enterprise one year ago. To partly deal with the limitation of recall data, use is made of qualitative responses from focus group discussions when discussing the quantitative recall data in this report. Thus,
17

I
IDS Occasional Paper No. 68
triangulation is used to corroborate data and findings.
Table 5.1 Units, variables and indicators
Unit Variable Indicator
Individual Income Amount and sources of income Change in income over the last 2 years
Time Any change in amount of time spent per day in business Other activities over the last 2 years
Decision making Level of involvement in HH decisions and conflicts Any change in influence over HH decisions
since receiving WEDCO loan Types of conflicts that have arisen in relation to WEDCO loan
Main occupation of HH members Monthly contribution of HH members to HH income Change in HH income now compared to the period before receiving loan Events leading to change in HH income Change in type of food and number of meals consumed over the last 2 years Change in amount of money spent on food per month Type and changes in sources of domestic water Types and changes in sources of health services Use of family planning practices Primary health care attendance Ownership of houses Ownership of plots Facilities in the house Source/type of fuel Type of roofing material
Household HH membership and income
HH diet
HH health status
Type of house
18

IDS Occasional Paper No. 68
Table 5.1 Continued
Unit Variable Indicator
Enterprise Business activity
Business practices/ management
Income, expenditure and profits
Employment
Assets and liabilities
Technology, markets and performance/ growth
Problems and constraints
Change in type of business activity and products Change in location of business Types of business records kept Change in record keeping Management of business Ownership of business Sources of starting capital Sources of funds for working capital and expansion Amount of income from main enterprise and other sources Use of profit from main enterprise No. of employees by sex and status (part-time or full-time) Change in employment Type and number of asse t s owned Nature and amount of money for liabilities No., amount and use of loans Type of technology used Change in the use of technology Nature of market outlets Any growth experienced in business Area of growth Type of problem/constraint Change in type of problem/constraint
General/ overall
Welfare
Borrowing habits
Change in welfare
Trend in amount of money spent on education, health and housing Reasons for the change/trend Three most important sources of cash in case a need suddenly arises for cash for personal, HH and enterprise use Personal qualitative assessment as to whether life is better or worse off now compared to the period before the loan
19

Preparation for Fieldwork The team of researchers developed three types of instruments to collect data. These were the structured interview questionnaires administered to the individual clients or entrepreneurs, a structured checklist for focus group discussions and a structured checklist for key informants (Appendices 1, 2 and 3).
The proposal and research instruments were presented for comments to the REME technical committee at IDS, University of Nairobi, the University of Bath Team and WEDCO staff. Apart from discussing the proposal and research instruments with WEDCO staff and other resource persons, the research team also closely involved WEDCO staff in planning and carrying out data collection. In this regard, the research team met the WEDCO staff in Kisumu for a consultative discussion in which the logistics of the fieldwork and other data collection aspects were worked out. The research plan was discussed and a consensus was reached on the dates for the fieldwork. In addition, the research team visited the WEDCO branches to discuss with branch managers and credit officers the details of the planned data collection process.
The research team required the service of research assistants, and these positions were advertised through IDS University of Nairobi. Research assistants who had worked well on earlier occasions with the IDS and in the benchmark study were encouraged to apply. In total, there were 30 applicants. They were interviewed on availability and ability to communicate in Dholuo and Luhya, among other issues. The research team selected and recruited 15 research assistants, three data entry clerks, two data cleaning assistants and one project assistant.
The assistants and data analyst were taken through a two-day training session in which they were briefed on the purpose and objectives of the study as well as the data collection and analysis methods. The training also involved them in familiarising themselves with the data collection instruments. There was special emphasis on the interviewing techniques and field logistics.
With the help of research assistants, the researchers pre-tested the research instruments using a sample of clients from WEDCO in Kisumu. The purpose of iisini^WTiDC^i-'Uiftntcj-wicj'aj'iTy'io gei i!ioser to the reality than would be possible if a sample was selected in Nairobi. The pre-testing was done just before the fieldwork started. In fact, the first two days of fieldwork were used for pre-testing and revision of research instruments.
Sampling A two-stage sampling procedure was followed. The first stage was the selection of revolving loan fund groups. The second stage was the selection of individual clients. A carefully selected sample of group and individual clients at different
20
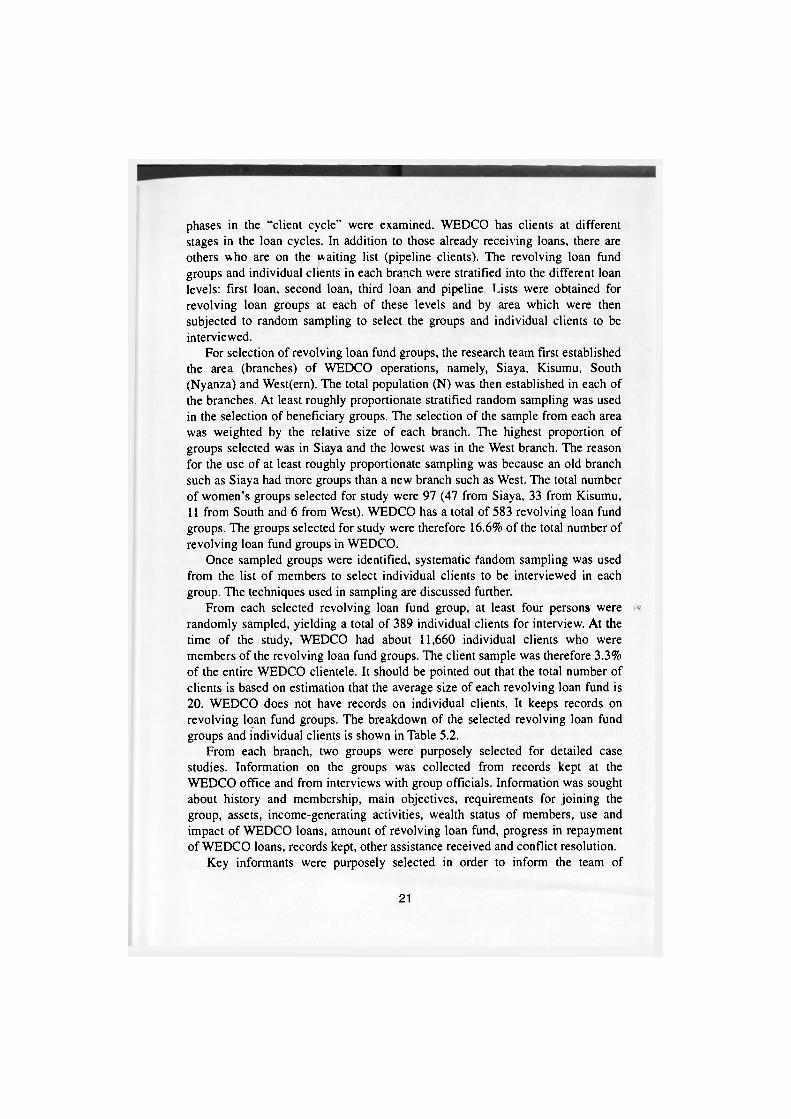
phases in the "client cycle" were examined. WEDCO has clients at different stages in the loan cycles. In addition to those already receiving loans, there are others who are on the waiting list (pipeline clients). The revolving loan fund groups and individual clients in each branch were stratified into the different loan levels: first loan, second loan, third loan and pipeline Lists were obtained for revolving loan groups at each of these levels and by area which were then subjected to random sampling to select the groups and individual clients to be interviewed.
For selection of revolving loan fund groups, the research team first established the area (branches) of WEDCO operations, namely, Siaya, Kisumu, South (Nyanza) and West(ern). The total population (N) was then established in each of the branches. At least roughly proportionate stratified random sampling was used in the selection of beneficiary groups. The selection of the sample from each area was weighted by the relative size of each branch. The highest proportion of groups selected was in Siaya and the lowest was in the West branch. The reason for the use of at least roughly proportionate sampling was because an old branch such as Siaya had more groups than a new branch such as West. The total number of women's groups selected for study were 97 (47 from Siaya, 33 from Kisumu, 11 from South and 6 from West). WTEDCO has a total of 583 revolving loan fund groups. The groups selected for study were therefore 16.6% of the total number of revolving loan fund groups in WHEDCO.
Once sampled groups were identified, systematic fandom sampling was used from the list of members to select individual clients to be interviewed in each group. The techniques used in sampling are discussed further.
From each selected revolving loan fund group, at least four persons were randomly sampled, yielding a total of 389 individual clients for interview. At the time of the study, WEDCO had about 11,660 individual clients who were members of the revolving loan fund groups. The client sample was therefore 3.3% of the entire WEDCO clientele. It should be pointed out that the total number of clients is based on estimation that the average size of each revolving loan fund is 20. WTEDCO does not have records on individual clients. It keeps records on revolving loan fund groups. The breakdown of the selected revolving loan fund groups and individual clients is shown in Table 5.2.
From each branch, two groups were purposely selected for detailed case studies. Information on the groups was collected from records kept at the W E D C O office and from interviews with group officials. Information was sought about history and membership, main objectives, requirements for joining the group, assets, income-generating activities, wealth status of members, use and impact of WT5DCO loans, amount of revolving loan fund, progress in repayment of WEDCO loans, records kept, other assistance received and conflict resolution.
Key informants were purposely selected in order to inform the team of
21

researchers on issues pertaining to the impact of credit on the individuals and the community. These were purposely selected because of their knowledge of WEDCO. They included community leaders and church elders, among others.
Table 5.2 Number of RLF groups and individual clients selected
Branch Loan 1 Loan 2 Pipeline Total Total clients groups groups groups groups (4 per group)
Siaya 24 20 3 47 188 Kisumu 21 8 4 33 132 South 8 0 3 11 44 West 3 0 3 6 24 Total 56 28 13 97 388
Data Collection and Analysis The techniques used to collect data included interview questionnaires and focus group discussions (FGDs). The client interview questionnaire was used to collect information from the selected respondents. As indicated (Table 5.1 and Appendix 1), the information collected was on personal details, enterprise level impact, individual level impact and household level impact. At least two revolving loan groups were selected from each branch for focus group discussions. With the help of the branch manager and credit officers, one well performing and one poorly performing group were selected. A few carefully selected members were brought together for an FGD. In all, 20 FGDs were conducted. The researchers used a structured checklist for discussion. The researcher introduced himself or herself. Participants introduced themselves also. The researcher explained to the partici-pants the purpose of the discussion and encouraged each one of them to participate fully. The researcher asked questions (Appendix 2) to guide the discussion. In particular, questions were asked on the performance of the busi-nesses owned by the clients, the effect of RLFs on employment creation, views on mixed group membership, impact of credit on relationships between spouses and problems facing the group. Notes were taken as the discussion proceeded. Areas of consensus and divergence were noted. When the discussion was over, the researcher thanked the participants.
At least two key informants were identified in each branch. The researchers held discussions with the key informants using structured interviews question-naires (Appendix 3) which focused on general development of their area, number of persons benefitting from WEDCO loans, wise use of WEDCO loans, extent to which W E D C O has solved the financial problems of small business people,
22

IDS Occasional Paper No. 68
impact of WEDCO loans on the individual, household, enterprise and community, other assistance required for business people.
Published and unpublished documents were examined to situate the study in the growing body of literature on impact assessment of micro-finance institutions. In addition, the researchers reviewed surveys to provide a basis for comparison.
Computerised data analysis using the SPSS Programme was employed. The initial stage of data processing and analysis involved questionnaire cleaning, coding, data entry and preparation of summary tables. Summary statistics such as percentages, means and standard deviation were used in the first stage of data processing and analysis. Data were also disaggregated and cross-tabulated by branch, loan cycle, type of business and sex of respondents. Following discussion of the first draft of the research report, data from both the full sample and the reduced sample of 314 clients were subjected to further quantitative analysis. Chi-square test, tests of means and regression analysis were used to test the signifi-cance of variation or trends noted. The process used in reducing the sample is described in Chapter 7.
In addition to the quantitative analysis, a qualitative assessment of the impact of credit was undertaken. The information collected through key informants, focus group discussions and RLF group interviews was synthesised to construct an overall picture of the impact that has been realised.
23

24
Profile of WEDCO Clients, Enterprises and Households
This chapter discusses profiles of WEDCO clients, enterprises and households which this study assumed had directly or indirectly experienced impact of credit. These units of impact assessment have been borrowed from the methods of analysis used by Hulme and Mosley (1996) and Sebstad and Chen (1996). Data analysis consisted of cross tabulations for qualitative variables and analysis of means for quantitative variables. In each case the loan level (pipeline, loan 1, loan 2 and beyond) was used as the independent variable. Various statistics were calculated, but unless otherwise indicated, the level of significance refers to the chi-square statistic for cross tabulations and the F-statistic for analysis of means. In addition to the quantitative data analysis, information gathered from focus group discussions and a case study are used to expand the discussion in this chapter. The findings are compared with results from existing studies to place this work appropriately in the growing body of literature on small and micro enterprises.
Profile of Clients The entire sample of 389 respondents was made up of 355 (91.3%) women and 34 (8.7%) men. The extremely high proportion of women is, as already explained, because W E D C O has focused on women since its inception. Men are allowed to join W E D C O RLF groups, but the women who dominate these groups tend to ensure that men do not exceed 25% of the membership and that they do not take up leadership roles. This then explains the high number of women clients.
The distribution of clients at different loan levels by age group and mean age is shown in Table 6.1. The dominant age group was 26^10, with 59.4% of the respondents falling in this age group. The mean age for the entire sample was 39 years. The mean age for clients at pipeline was 36, loan 1 was 40 and loan 2 was 38.
About 81.0% of the respondents were married, 1.5% were single, 1.0% were divorced or separated and 16.7% were widowed. During focus group discussions in Siaya, it was indicated that one reason why widows go into business is loss of economic support that resulted from the death of their husbands. Some respond-ents explained that when a husband dies at an early age, the wife has to find a way of providing for the family and this then explains why they end up starting small
24

businesses. The respondents who indicated that they were married were asked to respond to the question: If married, does spouse reside within? A total of 321 respondents answered this question, with 246 (76.6%) stating "yes" and 75 (23.4%) stating "no".
Table 6.1 Age in categories by loan level
Age group Loan level Pipeline Loan 1 Loan 2+ Total
N % N % N % N %
Up to 25 4 8.2 10 4.7 5 4.0 19 4.9 26-40 31 63.3 113 52.8 87 69.0 231 59.4 41-55 13 26.5 75 35.0 28 22.2 116 29.8 Over 55 1 2.0 16 7.5 6 4.8 2 3 5.9 Total 49 12.6 214 55.0 126 32.4 389 100.0
Mean 36.2 39.5 37.6 38 .5 Standard 8.4 10.2 8.9 9.7 deviation Chi-square statistic = 11.96 Significance = .0627 F-statistic for mean ages = 3.285 Significance = .0385
Source: Survey data 1998
While on one hand there is a disproportionate number of loan 2 and above clients with primary and no formal education, on the other hand there is a disproportionate number of pipeline clients with secondary education (Table 6.2). These differences were found to be statistically significant. Pipeline clients are generally more educated. An analysis of spouses' highest level of educat ion reveals that spouses are more educated than clients but the di f ference among loan levels is not significant (Table 6.3).
Only 42.9% of the pipeline clients had no training, compared with 57 .5% of loan 1 and 57.1% of loan 2 and above. The difference observed in training was found to be statistically significant (chi-square significance = 0.00449). Pipeline clients who have training are more likely to have a diploma or a degree than either loan 1 or loan 2 and above clients. The trend in highest level of formal educat ion and training should be looked at in the wider context of the employment situation prevailing in Kenya (discussed in Chapter 2). It is clear that the informal sector is no longer an activity for those who have less formal education or those who lack the relevant skills to secure jobs in the formal sector. Some recent studies reveal th/ft some of the participants in the informal sector have secondary level of education and even beyond (see for example, Otunga et al. 1997 and Wegulo 1997), The present study has also revealed that this pattern exists among W E D C O
25

Table 6.2 Clients' highest levels of education
Education level Client category Pipeline Loan 1 Loan 2+ Total N % N % N % N %
None 0 0.0 19 9.0 12 9.6 31 8.1 Lower primary 0 0.0 5 2.4 5 4.0 10 2.6 Upper primary 18 36.7 83 39.3 51 40.8 152 39.5 Some secondary 5 10.2 45 21.3 22 17.6 72 18.7 Completed 23 46.9 49 23.2 33 26.4 105 27.3 secondary Post secondary 3 6.1 10 4.7 2 1.6 15 3.9 Total 49 12.7 211 54.8 125 32.5 385 100.0
Chi-square statistic = 20.67003 Significance = 0.02352 Missing c a s e s = 4
Source: Survey data 1998
Table 6.3 Spouse's highest level of education
Education level Client category Pipeline Loan 1 Loan 2+ Total N % N % N % N %
None 0 0.0 7 3.9 2 1.8 9 2.7 Lower primary 0 0.0 2 1.1 5 4.4 7 2.1 Upper primary 6 14.6 50 27.8 29 25.7 85 25.4 Some secondary 1 2.4 16 8.9 9 8.0 26 7.8 Complete 27 65.9 82 45.6 57 50.4 166 49.7 secondary Post secondary 7 17.1 23 12.8 11 9.7 41 12.3 Total 41 12.3 180 53.9 113 33.8 334 100.0 Chi-square statistic = 15.28171 Significance = 0.12212 Missing c a s e s = 55
Source: Survey data 1998
clients. The implication of this trend is that an increasing number of persons who are leaving school and who do not secure employment in the formal sector are ending up in the informal sector. The push to the informal sector is contributed to by structural adjustment measures being implemented in Kenya, that have involved, among other things, retrenchment and a hold on new hires in the formal sector.
26

The main occupations reported by all the 389 respondents were distributed as follows: 92.8% in business, 5.9% in formal employment. 1.0% in farming, and 0.3% in informal employment. The main occupation of the spouses was distrib-uted as follows: 36.3% in business, 17.8% in farming, 38.5% in formal employ-ment. 1.0% in informal employment and 6.4%% in self-employment.
An analysis of the dates when clients joined WEDCO RLF groups reveals the following pattern: 63.7% of pipeline joined between 1987 and 1998; 59.6% of loan 1 clients joined between 1982 and 1998, and 76.2% of loan 2 and above clients joined between 1980 and 1998. A chi-square test revealed that this variation was significant (chi-square significance = 0.000). An analysis of means indicated that pipeline clients had been with the WEDCO programme since early 1997, loan 1 clients since late 1994 and loan 2 since late 1993. This variation was also found to be significant (F significance = 0.000).
A typical WEDCO loan 2 client
Mrs Omolo [not her real name] lives in Kondele, a slum in Kisumu town,
married to a lowly paid husband. Since her husband's income was not enough
to feed their chlidren and maintain the family, she decided to supplement it
by using her personal savings of Ksh 100 to buy green maize and sell it to
passersby from her verandah. Her main aim was not really to start a busi-
ness but to supplement the household income. With time, the small busi-
ness expanded. Mrs Omolo was able to increase the stock and move to the
roadside where she could reach a wider market. At the time of moving to the
roadside, she was able to join a women's ROSCA. She saved and secured
Ksh 2,000 from this group. She used this money to buy second-hand clothes
which she started selling at Otongolo market in Kisumu town. She could not
afford a stall and so she sold from the verandah. With time, she was able to
join another women's group which was getting a loan from WEDCO. She
received a first loan of Ksh 10,000 and used it to increase her second-hand
clothes stock and hire a stall in the market. She plans to get a second loan
of Ksh 10,000 and use it to expand her business to include shoes.
27

Enterprise Profile Current enterprise activities and products reported by the respondents were distributed as follows: food (1.5%), tobacco (0.3%), textile and leather (1.0%), forest products ( 0.3%), metal work (0.3%), other manufacturing (5.4%), whole-sale (11.6%), retail (69.3%), hotels and restaurants (5.2%), personal services (1.3%), professional services (3.4%) and repair services (0.5%). It is evident from the results that retail is the dominant business activity among the clients. The GEMINI baseline studies in Kenya (Parker and Torres 1994) found that about 25% of the respondents studied were in manufacturing, 61% in commerce and trade, and 14% in services.
Main sources of starting capital reported by 387 respondents revealed the following pattern: Own savings (44.4%), savings and partner's contribution (3.9%), gifts or loans from spouse (28.2%), gifts and loans from relatives (10.9%), NGO loan (5.2%), sale of assets (3.9%), wage/salary (0.5%), loan from employer (0.8%), farming (1.0%) and merry-go-round (1.3%). Other studies have revealed that capital for start up in SMEs is often obtained from similar sources as those used by W E D C O clients (Karega and Lodiaga 1997, Ondiege 1996, McCormick 1996).
The mean amount of money borrowed by clients as their first loans from their RLF groups was Ksh 32,504 for loan 1 clients and Ksh 14,309 for loan 2 and above clients. The mean for the entire sample was Ksh 26,789. There were 77 missing cases. An analysis of the means revealed that the differences observed were significant (F-significance = 0.0013). The difference between loan 1 and loan 2 and above clients might be because of inflation or a change in WEDCO procedures. It may also be an indication of different clients with different busineses. The mean for the second loan reported by those who were in loan 2 and above was Ksh 37,814.
When asked to indicate first major use to which they had put the first loan f rom WEDCO, the following responses were given from 122 respondents: Business expansion (95.1%), purchase of land (0.8%), paid creditors (0.8%) and others (3.3%). Though responses on uses other than business expansion have low percentages, they somehow reflect the shifting of financial resources between business and household or other needs. During focus group discussions, respond-ents reported that the credit they had secured from WEDCO had been extremely helpful as working capital which they had used to increase their business stock. They stressed that this credit had contributed to their remaining in business.
Approximately three-quarters of the respondents (77.4%) provided enough information to allow annual enterprise profits to be estimated. Half of these reported amounts of Ksh 30,000 or less. The other half reported amounts up to Ksh 472,000. No one reported a loss. The overall mean was Ksh 74,546.
28

A wide variety of enterprise assets were reported by 352 respondents. The four most common were cash at bank (44.6%), debtors (34.7%), stock (12.5%) and hand carts (3.1%). Each of the remaining items (for example, radios and bicycles) were reported by less than 2% of the respondents.
The results presented in Table 6.4 reveal that there are no significant differ-ences in full-time and part-time enterprise employment as well as household members' employment, spouses' employment or employment of other workers such as house help. The average values are low when compared to the GEMINI studies (Parker and Torres 1994) which found an average of 2.3 workers per enterprise.
Information gathered from focus group discussions revealed that employment creation by these enterprises is manifested in other forms, for example, hiring of transport service offered by operators of taxis and hand carts, thereby contributing to employment in this sector. Further, these enterprises are able to hire extra labour during business peak periods such as near Christmas time and new year celebrations when sales are said to go up.
Household Profile The average number of children was five for the entire sample, four for pipeline and five for both loan 1 and loan 2 and above clients. Pipeline clients have fewer children. In addition to their own children, the respondents cater for other regular dependants. The average number of dependants for the entire sample was two. The implication of the figures on household size is that the money generated from business is partly used to cater for the needs of the household (see below).
As shown in Table 6.5, there were more household heads among loan 1 clients. This difference was found to be statistically significant. Further analysis of data in Table 6.5 shows that the women in the loan 1 category are less likely to be married than those in either the pipeline or loan 2 and above categories. Only 77% of the loan 1 women are married compared with 80.8% of the pipeline women and 86.9% of the loan 2 women. The difference is significant at the 10% confidence level (significance of Pearson chi-square = 0.10). There is no apparent explanation for this, and it is not necessarily attributable to WEDCO intervention.
Contributions to household income were reported for clients as well as other members of their households (spouse, children, relatives). The mean monthly contribution by the clients (self) to household income (currently) was found to be Ksh 3,882 for the entire sample. The mean monthly contribution by spouse was Ksh 3,628 for the entire sample. Men's spouses contributed an average of Ksh 2,500 and women's spouses an average of Ksh 3,732. This difference was found to be significant (barely) at the 10% level. This pattern suggests that husbands of women respondents contributed more to the household than the wives of men respondents. This pattern should, however, be interpreted with caution given that
29

Table 6.4 Nature of employment at enterprise level
Nature of Results of analysis Significance Comments employment (F-statistic) HH member Overall mean = 0.3753 0.1007 At least loan 2 and full-time Pipeline = 0.4490 above
Loan 1 = 0.4065 Loan 2 and above = 0.2937
HH member Overall mean = 0.1208 0.3118 No significant differ-part-time Pipeline = 0.0816 ence by loan level
Loan 1 =0.1495 Loan 2 and above = 0.0873
Spouse full-time Men No significant differ-(married re- Overall mean = 0.1034 0.1409 ence by loan level spondents only) Pipeline = 0.0000
Loan 1 = 0.0625 Loan 2 and above = 0.1818 Women I Overall mean = 0.0421 Pipeline = 0.0811 Loan 1 = 0.0268 Loan 2 and above = 0.0505 Men and women: overall mean = 0.0478
Spouse part-time Men 0.2234 No significant differ-(married re- Overall mean = 0.0000 ence by loan level spondents only) Pipeline = 0.0000
Loan 1 = 0.0000 Loan 2 and above = 0.000 Women Overall mean = 0.491 Pipeline = 0.0811 Loan 1 = 0.0403 Loan 2 and above = 0.0505 Men and women: overall mean = 0.0446
Full-time Overall mean = 0.6067 0.2416 No significance BUT enterprise Pipeline = 0.3061 lowest at pipeline and employee Loan 1 = 0.6682 highest'at loan 1
Loan 2 and above = 0.6190 Part-time Overall mean = 0.1671 0.1210 No significance BUT enterprise Pipeline = 0.2449 lowest at loan 1 employee Loan 1 = 0.0981
Loan 2 and above = 0.2540 Note that this level has highest full-time employment
Other employee Overall mean = 0.2057 0.9610 No significant differ-(house help, Pipeline = 0.1837 ence by loan level gardeners, etc) Loan 1 =0.2103
Loan 2 and above = 0.2063
30
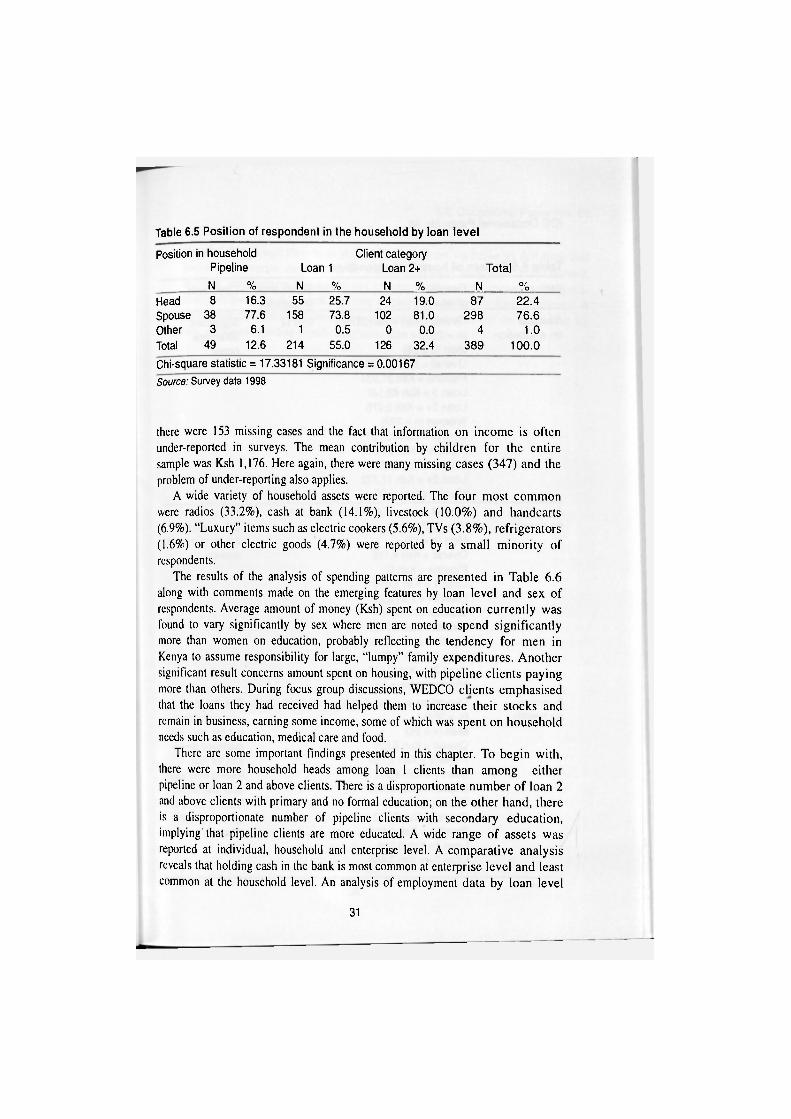
Table 6.5 Position of respondent in the household by loan level
Position in household Client category Pipeline Loan 1 Loan 2+ Total N % N % N % N 0/ o
Head 8 16.3 55 25.7 24 19.0 87 22.4 Spouse 38 77.6 158 73.8 102 81.0 298 76.6 Other 3 6.1 1 0.5 0 0.0 4 1.0 Total 49 12.6 214 55.0 126 32.4 389 100.0 Chi-square statistic = 17.33181 Significance = 0.00167 Source: Survey data 1998
there were 153 missing cases and the fact that information on income is of ten under-reported in surveys. The mean contribution by children for the entire sample was Ksh 1,176. Here again, there were many missing cases (347) and the problem of under-reporting also applies.
A wide variety of household assets were reported. The four most common were radios (33.2%), cash at bank (14.1%), livestock (10.0%) and handcarts (6.9%). "Luxury" items such as electric cookers (5.6%), TVs (3.8%), refrigerators (1.6%) or other electric goods (4.7%) were reported by a small minority of respondents.
The results of the analysis of spending patterns are presented in Table 6.6 along with comments made on the emerging features by loan level and sex of respondents. Average amount of money (Ksh) spent on education currently was found to vary significantly by sex where men are noted to spend significantly more than women on education, probably reflecting the tendency for men in Kenya to assume responsibility for large, "lumpy" family expenditures. Another significant result concerns amount spent on housing, with pipeline clients paying more than others. During focus group discussions, WEDCO clients emphasised that the loans they had received had helped them to increase their stocks and remain in business, earning some income, some of which was spent on household needs such as education, medical care and food.
There are some important findings presented in this chapter. To begin with, there were more household heads among loan 1 clients than among cither pipeline or loan 2 and above clients. There is a disproportionate number of loan 2 and above clients with primary and no formal education; on the other hand, there is a disproportionate number of pipeline clients with secondary education, implying'that pipeline clients are more educated. A wide range of assets was reported at individual, household and enterprise level. A comparat ive analysis reveals that holding cash in the bank is most common at enterprise level and least common at the household level. An analysis of employment data by loan level
31

IDS Occasional Paper No. 68
Table 6.6 Pattern of household expenditure
Item Results of analysis
Significance (F-statistic)
Comments
Average on education
Overall mean = Ksh 22,523 (n = 350) Men (n =28) Overall = Ksh 43,475 Pipeline = Ksh 21,333 Loan 1 = Ksh 63,147 Loan 2+ = Ksh 9,975 Women (n = 3 2 2 ) Overall = Ksh 20,701 Pipeline = Ksh 20,600 Loan 1 = Ksh 22,567 Loan 2+ = Ksh 17,732 Missing cases = 39
0.0212 Significant difference noted
Average on housing
Overall mean = Ksh 3,763 (n= 200)
Men (n = 16) Overall = Ksh 4,119 Pipeline = Ksh 0 Loan 1 = Ksh 1,013 Loan 2+ = Ksh 8,257 Women (n = 184) Overall = Ksh 3,732 Pipeline = Ksh 8,386 Loan 1 = Ksh 2,925 Loan 2+ = Ksh 3,016 Missing c a s e s = 189
0.8536 No significant difference be-tween men and women
Average on health
Overall mean = Ksh 5,210 (n = 301) Men (n = 26) Overall = Ksh 5,626 Pipeline = Ksh 2,750 Loan 1 = Ksh 8,321 Loan 2+ = Ksh 2,430 Women (n = 275) Overall = Ksh 5,172 Pipeline = Ksh 4,019 Loan 1= Ksh 6,238 Loan 2+ = Ksh 3,868
0.8469 Results are not very significant, but the very high standard devia-tion for loan 1 means may indi-cate that some loan 1 clients are spending high amounts
32
IDS Occasional Paper No. 68
revealed that though there is no statistically significant variation in full-time and part-time enterprise employment as well as household members ' employment, spouses' employment or employment of other workers, the means are signifi-cantly different, with highest full-time employment being by loan 1 clients. A significant difference has been noted on average amount spent on education by sex, w ith men spending significantly more than women.
33

34
Impact of Credit on Incomes and Employment
by James Copestake and Michael Godwin, University of Bath, UK
The initial analysis revealed that the mean personal income of first loan respond-ents before receiving their loan was much smaller than that of pipeline respond-ents. However, rigorous impact analysis of the data was limited because it was suspected that bias in the sample would restrict the scope for "before-after, with-without" comparisons. This section presents the results of further analysis that attempted to overcome this problem. The main purpose of this analysis was to investigate whether variation in the performance of respondents could be attrib-uted to the degree of their participation in the WEDCO programme.
Performance and Participation in WEDCO Further quantitative analysis attempted to examine the relationship between the performance of individuals and/or households and participation in the WEDCO programme. This first required defining both performance and participation and then re-examining the sample to ensure that sources of bias had, as far as possible, been eliminated.
Performance was measured by the growth of personal income, gross of loan payment during the period; business profits, gross of loan payment during the period; and business employment.
Participation was measured by whether respondents had received at least one loan (D = 1) or whether they were only in the pipeline to receive a loan at the time of interview (D = 0); and the value of the first and subsequent loans received. The method used was to regress performance indicators (as dependent variables) against participation indicators (as independent variables) controlling as necessary for other incidental influences on programme participation.
The focus on explaining growth in performance variables (or "differences in differences") can be justified on both theoretical grounds (Moffit 1991) and also because this specification yielded significant results in the comparable PULSE study, unlike comparison of absolute differences between participants (Copestake ct al. 1998). The chief potential methodological difficulty with the approach is that underlying characteristics of respondents (or missing independent variables) may influence both performance (the dependent variable) and programme partici-pation (the treatment variable). This may arise in three ways.
Firstly, WEDCO staff are likely to systematically select certain kinds of clients
34

and exclude others. However, this form of selection bias is reduced by using pipeline participants as a comparison group because they should also satisfy the same formal programme eligibility criteria.
Secondly, eligible business operators' own decisions to participate or not may reflect differences such as existing income or risk aversion which also independ-ently influences performance. In the case of pipeline participants, bias of this kind may arise from characteristics such as greater caution that independently influ-ence both their decision to delay participation and their business performance. However, even this bias can be reduced if there is some randomness in selection arising from different branch opening dates in different areas, where variation in performance arising from differences in locality can be controlled using dummy variables for different areas.
Thirdly, bias may arise from non-random selection of pipeline and borrower samples of respondents. Bias towards particular sectors or areas, or people of particular sex or educational background can all be corrected through use of dummy variables. But a problem with this particular sample arose because the average income of pipeline and first loan recipients was found to be significantly different even before the latter received their loans. However, it was found that most of this difference was attributable to a small number of relatively rich respondents. To eliminate the bias, all respondents whose income exceeded Ksh 20,0(X) in the reference month of either the current or the previous year were excluded from analysis.' This reduced the sample from 327 to 314. All the results presented in this chapter arc based on this restricted sample.
Table 7.1 summarises recall data on personal income for the resulting sample. While the average income of pipeline participants (Ksh 5,259) was still higher on average than that of first loan recipients (Ksh 4,545), the difference is small compared to that observed for the full sample. Much of it can also be explained by variation in the composition of pipeline and loan sample composition with respect to branch location (Table 7.2). Use of branch and sector dummy variables in the regressions should capture any systematic variation in rates of growth of income arising from these factors. It thus seems reasonable to assume that residual differences in initial income of pipeline and borrower respondents are not a major independent influence on programme participation or subsequent growth perform-ance.2
The discussion so far suggests that it should, in principle, be possible to make estimates of programme impact from the data collected. However, the tables also
' Correcting for this by introducing past year income as an independent variable is not possible because it would interact with the dependent variable (change in income).
2 Tables 1 and 2 in Appendix 5 repeat these tabulations for business profits rather than personal income.
35

Table 7.1 Monthly total personal income (1 year ago) by branch and loan
level (Ksh)
Loan level Statistic Kisumu Siaya West South Total Overall M 5,141 3,828 7,000 44,771 4,515
SD 4,608 3,670 4,570 3,811 4,143 N 112 150 14 38 314
Pipeline M 6,333 2,650 7,500 2,963 5,259 SD 4,641 1,567 4,375 3,535 4,333 N 15 6 8 8 37
Loan 1 M 5,025 3,972 6,333 48,997 4,545 SD 4,693 3,766 5,154 3,901 4,191 N 77 101 6 29 213
Loan 2 M 4,053 3,645 - 4,212 3,781 SD 3,330 3,726 - - 3,553 N 19 41 - 1 61
Loan 3/4 MN 16,834 3,900 - - 8,061 SD -
N 1 2 — — 3
Table 7.2 Monthly total personal income (1 year ago) by sector and loan
level (Ksh)
Loan level Manu-facture
Whole-sale
Retail Hotels/ bars
Other Total
Overall M 5,350 6,741 4,074 4,439 4,503 4,516 SD 5,646 5,052 3,796 <3,502 3,091 4,143 N 25 35 220 18 16 314
Pipeline M 17,000 9,125 4,343 - 4,875 5,259 SD - 6,250 3,310 - 3,705 4,333 N 1 4 28 - 4 37
Loan 1 M 4,429 6,756 4,197 4,438 4,322 4,545 SD 4,500 51,440 4,047 3,502 3,177 4,192 N 19 25 140 18 11 213
Loan 2 M 6,520 5,092 3,317 - 5,000 3,781 SD 7,775 3,938 2,807 - - 3,553 N 5 6 49 - 1 61
Loan 3/4 MN - - 8,211 - - 8,211 SD - - - - - -
N — — 3 — — 3
36

reveal that the total number of observations (314) is rather smaller than is desirable for this kind of analysis, and (more seriously) the number of pipeline observations (37) is very small and concentrated in the retail sector. It is recommended that future studies should have a larger overall and pipeline sub-sample.5
Impact on Personal Income The variable for impact on personal income was based on responses to the question: What are the main sources of your personal income (Ksh) per month? Respondents were invited to distinguish between income from six different sources, including business drawings "currently", "one year ago" and "two years ago".4 The total income figure was selected on the grounds that it would be more likely to pick up effects of loans even where these were diverted into non-business activities, although the question as asked leaves open the possibility of fungibility with the livelihood activities and income of other household members.
Table 7.3 shows results of regressing the differences in the logs of personal monthly income currently and one year ago for the restricted sample. Descriptions of all variables are to be found in Appendix 4. Widowhood emerges as the only significant incidental variable, with a dummy for respondents with hotel busi-nesses being the next more nearly significant.5 The value of first and second loans received were not significant in explaining income variation, and replacing this participation variables with a dummy variable for pipeline participants yielded even weaker results. Finally, the "r squared" and ANOVA results reveal that the equation explains a very small portion of total income variation. Very similar results were also obtained with the unrestricted sample (i.e., including respond-ents who had a monthly income either currently or one year ago of more than Ksh 20,000).
Impact on Business Profitability Respondents were asked to work out the gross profit on their main business during the previous month by subtracting all operating expenses from gross sales.
3 If this is impossible because of lack of lists of pipeline participants, then additional non-participation observations need to be drawn from the wider population that is first pre-screened for programme eligibility.
4 Specific reference months were not specified. Recall error also casts particular doubt on the "two years ago" data and so these data were not utilised.
5 The constant was also highly significant. This can probably be explained by real income resistance in the context of inflation, given that income was measured in nominal terms.
37

Table 7.3 Growth in personal income
I n d e p e n d e n t B S E B B e t a T S igT var iab les
Southdm -0.100212 0.074438 -0.075727 -1.346 0.1792 Widowed -0.132524 0.067650 -0.108824 -1.959 0 .0510 Hoteldm 0 .169727 0 .108003 0.088356 1.572 0.1171 Amount L1 4.44203E-07 5.2533E-07 0 .046992 0.846 0 .3984 Amount L2 -5.15997E-08 5.4183E-07 -0 .005303 -0.095 0.9231 Constant 0.119331 0 .031742 - 3 . 7 5 9 0 .0002
Multiple R 0.15257 R square 0.02328 Adjusted R square 0.00797 Standard Error 0.43830
Source of variance DF Regression 5 Residual 319
F = 1.52051 S i g F = 0.11829
Analysis of variance Sum of squares 1.46049 61.28154
Mean square 0.2910 0.19211
Having obtained this figure, they were then asked to estimate total profit for the year, and to repeat the exercise for one year and two years ago.''
Table 7.4 shows the results of regressing in the logs of business profit estimates for the year currently and one year ago for the restricted sample. Other things constant, il reveals that service scctor businesses and those loeated in Kisumu were more profitable. The value of the first loan received also had a positive impact on profits, though significant only at the 86% confidence level. The value of the coefficient suggests that the recipient of a Ksh 100,000 first loan with initial annual profits of Ksh 63,000 saw profits go up by 25% (or Ksh 16,000) compared to what they would otherwise have been.7 However, loan
8 With the PULSE study in Zambia (Copestake et. al. 1998), pre-testing questionnaires revealed that respondents had great difficulty recalling detailed costs even one year ago. However, many were willing to make an estimate of the overall monthly profit a year ago. The questionnaire used in this study may thus have been over-optimistic in the level of detailed recall that it sought to elicit.
7 The formula for calculating the mean absolute impact effect is as follows: 2 = [1-exp(B)]*L"S
where Z is the mean absolute impact (profits), B is the estimated coefficient, L is the mean value of the independent variable (first loan) and S is the mean value of profit before the loan.
38

repayments would have to be deducted from this incremental benefit before the borrower could be said to be better off overall. In contrast, the value of the second loan received was not significantly correlated with profits, and in some specifica-tions (not shown), it even had a negative coefficient. The overall results were nevertheless still better than obtained by including a dummy variable for pipeline participation. Finally, it should be noted that the regression again only explained a tiny proportion of variation in the change in profits.8
Table 7.4 Growth in bus iness profits
Independent B SE B Beta T Sig T variables
Kisdm 0.331737 0.103898 0.192543 3.193 0.0016 Servdm 0.323316 0.233411 0.084444 1.398 0.1633 AmountLI 2.26144E-06 t.5484E-06 0.088261 1.461 0.1453 AmountL2 3.51644E-07 1.5244E-06 0.014039 0.231 0.8177 Constant -0.144560 0.078793 - -1.835 0.0677
Multiple R 0.22423 R squared 0.05028 Adjusted R squared 0.03594 Standard error 0.84284
Analysis of variance Source of variance DF Sum of squares Mean square Regression 4 9.96615 2.49154 Residual 265 188.25012 0.71038
F = 3.50734 Sig F = 0.0082
Impact on Employment The third performance variable investigated was employment, measured by the total number of household and paid workers in the main business of the respondent, with part-time and casual workers (including guards and portc-rs) counted as equal to half of full-time employment.
8 Running the regression on the full sample gave only a marginally different coefficient on Amount L1. However, the dummy for Southern Branch also emerged a s negative and significant at the 88% level.
39

Table 7.5 shows the best regression obtained, using the reduced sample. Significant incidental variables are the two service sector dummies (both nega-tive) and male sex of the respondent (positive).9 The latter suggests that, other things equal, employment growth in men's businesses was 10% higher lhan in those of women.
The effect of both first and second loans on employment was found to be highly significant. Interestingly, however, the impact was negative (4.4%) for the first loan and positive (6.1%) for the second. One explanation for this is that borrowers are cautious in expanding employment on the strength of receiving the first loan but more confident about doing so after receiving a repeat loan. This might also explain the lower and less significant induced profit growth associated with the second loan.
Table 7.5 Growth in e m p l o y m e n t
Independent B SE B Beta T Sig T variables Servdm -0.090273 0.056468 -0.081765 -1.599 0.1108 Male 0.098017 0 .041614 0.120881 2.355 0 .0190 Hoteldm •0.099774 0 .053744 -0.095271 -1.856 0 .0642 Amount L1 •4.46268E-07 2.6887E-07 -0.084901 -1.660 0 .0978 Amount L2 5.95884E-07 2.7752E-07 0 .109974 2.147 0 .0324 (constant) 0.039377 0.014488 2.718 0 .0069
Multiple R 0.21542 R square 0.04641 Adjusted R square 0.03342 Standard error 0.22669
Analysis of variance DF Sum of squares Mean square
Regression 5 0.91781 0.18356 Residual 367 18.85947 0.05139
F = 3.57207 Sig F = .0.0036
* The sex coefficient can perhaps be explained by the greater ability of men to employ spouses and other household members in their businesses than vice versa. It could also be explained by sector specific characteristics (e.g., more women in petty retailing) except that one would then expect it to be picked up by sector dummies instead.
40

IDS Occasional Paper No. 68
The analysis carried out in this chapter provides weak evidence of a link between recipient of a first loan under W E D C O and growth in gross business profits, although this was barely sufficient to cover loan repayment costs. No direct significant impact was detected of participation in W E D C O on individual income growth or business employment growth.10 The weak measured impacts can partially be attributed to data limitations. The major problem does not appear to have been use of pipeline participants for comparative purposes per se but the small overall and pipeline sample sizes." Results might also have been improved if more time had been allocated to pre-testing and refining recall-based ques-tions.'-' Given these limitations, it is perhaps more surprising that two weakly significant correlations were indeed established—between receipt of a first loan and profits, and between receipt of a second loan and employment. But the low estimated coefficients for these relationships provide some tentative evidence that the "rules of thumb" for income and employment generation used in W E D C O and other micro-finance appraisal documents are likely to have been excessively optimistic.
10 Both these variables were, however, positively and significantly correlated with business profit growth. This suggests that impact (albeit undetectable within this sample) might eventually result, if the positive impact on profits could be sustained.
" Future studies should nevertheless weigh the advantages and disadvantages of including pipeline participants compared to alternative approaches, such as the "random walk" selection of matching control group members proposed in AIMS (1997).
" More care is also needed, than was possible here, in attributing loan participation variables (such as loan amounts disbursed) to the specific time period over which impact was measured.
41

42
The Impact of Credit on Decision Making
An assessment of the impact of receipt of credit on the decision making of respondents is presented in this chapter. Four main types of decision making are analysed: Decisions on new business activities, decisions on borrowing money, decisions on household savings and decisions on use of family planning methods. The findings are first reported for all the respondents, followed by disaggregation and cross tabulation of the data to show if any differences exist by loan level for all respondents and married women only. The choice of married women only is based on the fact that they are in a position to demonstrate whether or not they are gaining more influence in household decisions.
Decision Making on New Business Activities Out of a total sample of 389 respondents, 202 (52.1%) reported that they make joint decisions with their spouses or other members of their households on new business activities. However, 142 (36.6%) respondents stated that they make the final decision on whether or not to go into a new business. The category of informed only and not informed had frequencies of 32 (8.2%) and 6 (1.5%), respectively. The data were analysed further by loan level to find out if credit had an impact on decision making on new business activities (Table 8.1). Although more or less the same proportion (about 53%) reported that they made joint decisions in all the loan levels, it appears that loan 2 and above had the highest proportion (40.5%) that made the final decision compared to loan 1 (35.5%) and pipeline (31.3%). The data were analysed further for married women clients only, with similar results (Table 8.2).
Decision Making on Borrowing Money Out of the entire sample of 389 respondents, 207 (53.4%) indicated that they make joint decisions to borrow money while 138 (35.6%) reported that they made the final decision. The number of respondents with no say in the decision to borrow (that is, not informed and informed only categories) is 36 (9.3 %). The results of analysis by loan level presented in Table 8.3 reveal that the proportion at all the loan levels who reported that they make joint decisions is not markedly different—27 or 56.3% for pipeline, 109 or 50.9% for loan 1 and 71 or 56.3% for loan 2 and above. However, .differences occur in the proportion of loan 2 and above (48 or 38.1%) that reported making final decisions compared to those in
42
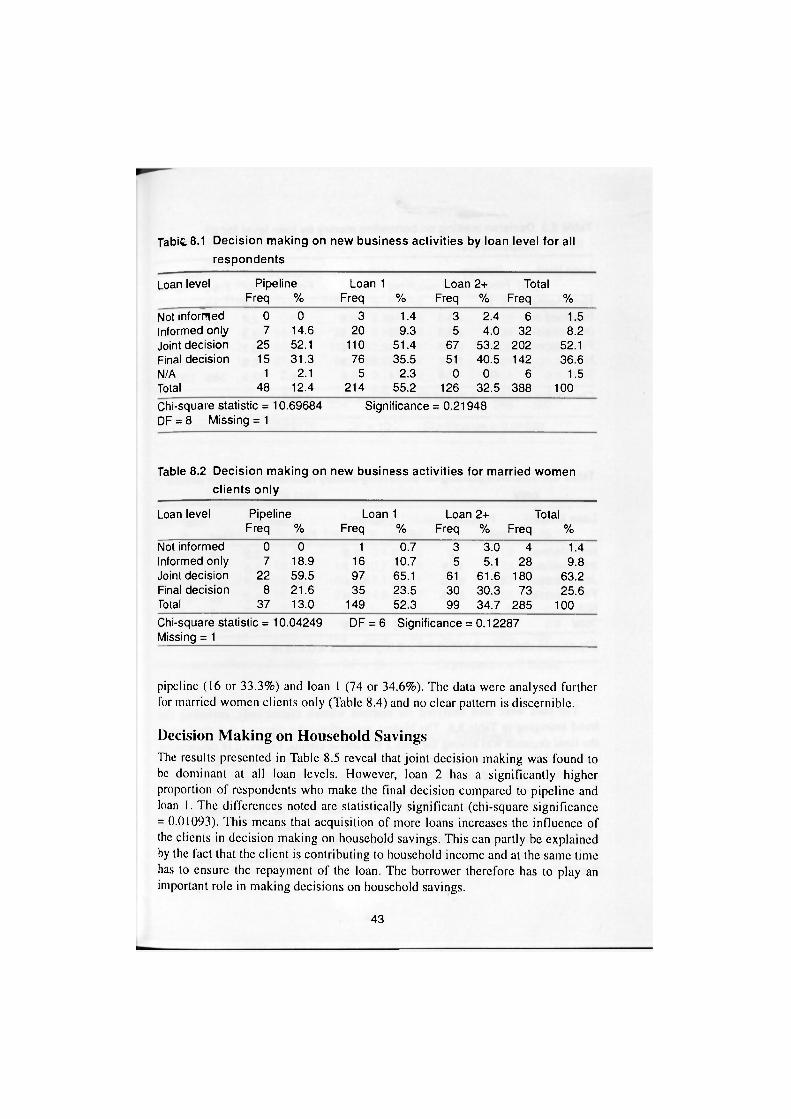
Tabic. 8.1 Decision making on new business activities by loan level for all
respondents
Loan level Pipeline Loan 1 Loan 2+ Total Freq % Freq % Freq % Freq %
Not informed 0 0 3 1.4 3 2.4 6 1.5 Informed only 7 14.6 20 9.3 5 4.0 32 8.2 Joint decision 25 52.1 110 51.4 67 53.2 202 52.1 Final decision 15 31.3 76 35.5 51 40.5 142 36.6 N/A 1 2.1 5 2.3 0 0 6 1.5 Total 48 12.4 214 55.2 126 32.5 388 100 Chi-square statistic = 10.69684 Significance = 0.21948 DF = 8 Missing = 1
Table 8.2 Decision making on new business activities for married women
clients only
Loan level Pipeline Loan 1 Loan 2+ Total Freq % Freq % Freq % Freq %
Not informed 0 0 1 0.7 3 3.0 4 1.4 Informed only 7 18.9 16 10.7 5 5.1 28 9.8 Joint decision 22 59.5 97 65.1 61 61.6 180 63.2 Final decision 8 21.6 35 23.5 30 30.3 73 25.6 Total 37 13.0 149 52.3 99 34.7 285 100 Chi-square statistic = 10.04249 DF = 6 Significance = 0.12287 Missing = 1
pipeline (16 or 33.3%) and loan 1 (74 or 34.6%). The data were analysed further for married women clients only (Table 8.4) and no clear pattern is discernible.
Decision Making on Household Savings The results presented in Table 8.5 reveal that joint decision making was found to be dominant at all loan levels. However, loan 2 has a significantly higher proportion of respondents who make the final decision compared to pipeline and loan I. The differences noted are statistically significant (chi-square significance = 0.01093). This means that acquisition of more loans increases the influence of the clients in decision making on household savings. This can partly be explained by the fact that the client is contributing to household incomc and at the same time has to ensure the repayment of the loan. The borrower therefore has to play an important role in making decisions on household savings.
43

Table 8.3 Decision making on borrowing money by loan level for all
respondents
Loan level Pipeline Loan 1 Loan 2+ Total Freq % Freq % Freq % Freq %
Not informed 0 0 7 3.3 3 2.4 10 2.6 Informed only 4 8.3 19 8.9 3 2.4 26 6.7 Joint decision 27 56.3 109 50.9 71 56.3 207 53.4 Final decision 16 33.3 74 34.6 48 38.1 138 35.6 N/A 1 2.1 5 2.3 1 0.8 7 1.8 Total 48 12.4 214 55.2 126 32.5 388 100
Chi-square statistic = 8.81437 DF = 8 Significance = 0.35820
Table 8.4 Decision making on borrowing money for married women clients
2I11Y
Loan level Pipeline Loan 1 Loan 2+ Total Freq % Freq % Freq % Freq %
Not informed 0 0 3 2.0 3 3.0 6 2.1 Informed only 4 10.8 16 10.7 3 3.0 23 8.1 Joint decision 24 64.9 96 64.4 66 66.7 186 65.3 Final decision 9 24.3 34 22.8 26 26.3 69 24.2 N/A 0 0 0 0 1 1.0 1 0.4 Total 37 13.0 149 52.3 99 34.7 285 100
Chi-square statistic = 8.17899 DF = 8 Significance = 0.41618
The data were also analysed for married women clients only, revealing the trend emerging in Table 8.6. The highest proportion who reported that they made the final decision was among the loan 2 and above clients, followed in descending order by loan 1 and pipeline clients. Joint decision making was reported by 56.8% of pipeline, 67.1% of loan 1 and 61.6% of loan 2 and above clients. At the same time, 18.9% of pipeline married women reported that they were simply informed of decisions compared with 10.7% of loan 1 and 5.1% of women with two or more loans. A chi-square test revealed that the results in Table 8.6 were statistically significant. These results suggest that women take a more active role in decisions on household savings as they move from pipeline loans to loan 1 and loan 2.
44

Table 8.5 Decision making on use of household savings by loan level for all
respondents
Loan level Pipeline Loan 1 Loan 2+ Total Freq % Freq % Freq % Freq %
Not informed 0 0 7 3.3 5 4.0 12 3.1 Informed only 7 14.6 21 9.8 6 4.8 34 8.8 Joint decision 24 50.0 113 52.8 68 54.0 205 52.8 Final decision 13 27.1 61 28.5 47 37.3 121 31.2 None 1 2.1 0 0 0 0 1 0.3 N/A 3 6.3 12 5.6 0 0 15 3.9 Total 48 12.4 214 55.2 126 32.5 388 100
Chi-square statistic = 22.95170 DF = 10 Significance = 0.01093
Table 8.6 Decision making on the use of household savings for married
women clients only
Loan level Pipeline Loan 1 Loan 2+ Total Freq % Freq % Freq % Freq %
Not informed 0 0 5 3.4 5 5.1 10 3.5 Informed only 7 18.9 16 10.7 6 6.1 29 10.2 Joint decision 21 56.8 100 67.1 61 61.6 182 63.9 Final decision 6 16.2 22 14.8 27 27.3 55 19.3 None 1 2.7 0 0 0 0 1 0.4 N/A 2 5.4 6 4.0 0 0 8 2.8 Total 37 13.0 149 52.3 99 34.7 285 100
Chi-square statistic = 23.26232 DF = 10 Significance = 0.00982
Decision Making on Use of Family Planning Methods The results for the entire sample reveal that a higher proportion of loan 2 clicnts make joint decisions compared to pipeline and loan 1 clients on the use of family planning methods (Table 8.7).
An analysis of the responses for married women clients only reveals that a relatively higher proportion of clicnts in loan 2 make the final decision compared to pipeline and loan 1 clients (Table 8.8). On the other hand, women at pipeline level have the highest incidence of final decisions. The reason for this is not clear and merits further investigation.
45
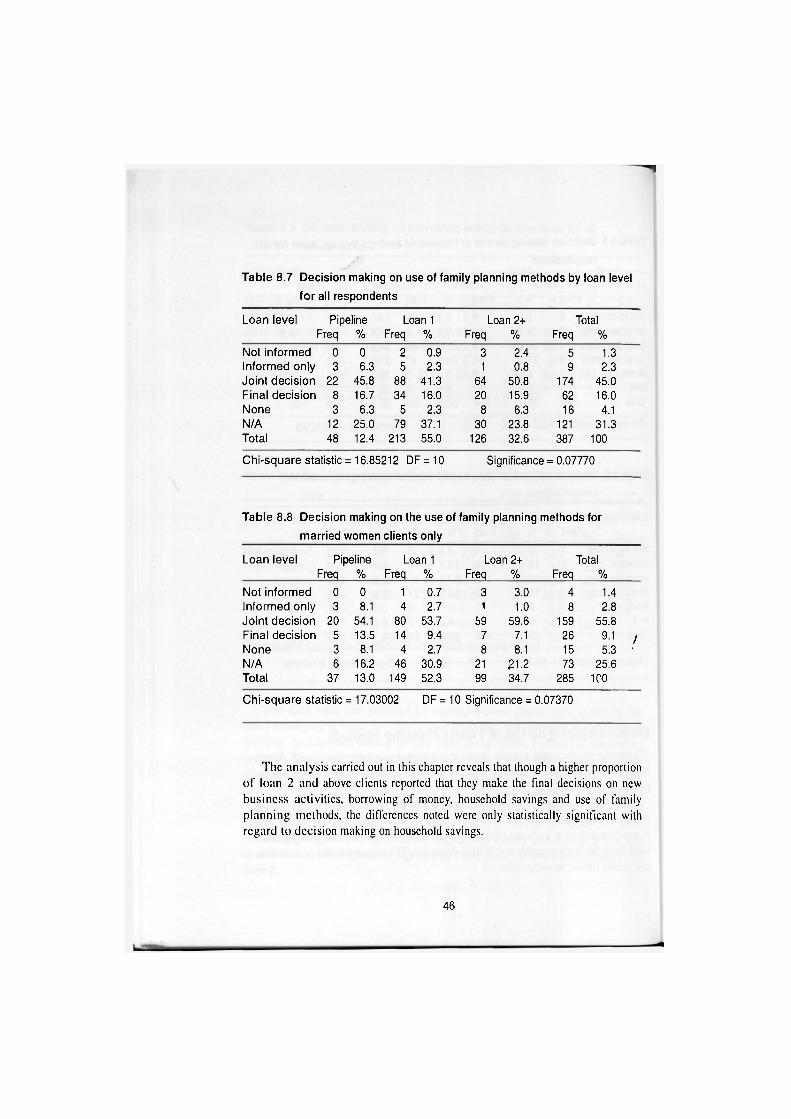
Table 8.7 Decision making on use of family planning methods by loan level
for all respondents
Loan level Pipeline Loan 1 Loan 2+ Total Freq % Freq % Freq % Freq %
Not informed 0 0 2 0.9 3 2.4 5 1.3 Informed only 3 6.3 5 2.3 1 0.8 9 2.3 Joint decision 22 45.8 88 41.3 64 50.8 174 45.0 Final decision 8 16.7 34 16.0 20 15.9 62 16.0 None 3 6.3 5 2.3 8 6.3 16 4.1 N/A 12 25.0 79 37.1 30 23.8 121 31.3 Total 48 12.4 213 55.0 126 32.6 387 100
Chi-square statistic = 16.85212 DF = 10 Significance = 0.07770
Table 8.8 Decision making on the use of family planning methods for
married women clients only
Loan level Pipeline Loan 1 Loan 2+ Total Freq % Freq % Freq % Freq %
Not informed 0 0 1 0.7 3 3.0 4 1.4 Informed only 3 8.1 4 2.7 t 1.0 8 2.8 Joint decision 20 54.1 80 53.7 59 59.6 159 55.8 Final decision 5 13.5 14 9.4 7 7.1 26 9.1 , None 3 8.1 4 2.7 8 8.1 15 5.3 ' N/A 6 16.2 46 30.9 21 21.2 73 25.6 Total 37 13.0 149 52.3 99 34.7 285 100
Chi-square statistic = 17.03002 DF = 10 Significance = 0.07370
The analysis carried out in this chapter reveals that though a higher proportion of loan 2 and above clients reported that they make the final decisions on new business activities, borrowing of money, household savings and use of family planning methods, the differences noted were only statistically significant with regard to decision making on household savings.
46

9
Conclusions
This study set out to examine the extent to which DFID/BASE support to WEDCO has contributed to the realisation of enhanced off-farm, self-employment and increased household incomes. The methodology for this study included three complementary approaches: a questionnaire-based survey of WEDCO clients to determine changes in income, employment and other variables at the individual, enterprise, household and community levels; a total of 389 clients were inter-viewed; a qualitative enquiry using focus group discussions, key informants and group interviews of 38 revolving loan fund groups; review of documents.
Both quantitative and qualitative analyses were carried out. The quantitative analysis that was applied to the data from the questionnaire-based survey of WEDCO clients compared changes in income, employment and other relevant variables according to loan cycles of clients (pipeline, loan 1 and loan 2). Regression analysis and chi-square test techniques were used to test relationships and differences that emerged in the data. Qualitative analysis was applied to data collected through focus group discussions and group interviews.
Findings
Client, Enterprise and Household Profiles There were more household heads among loan 1 clients than among either pipeline or loan 2 and above clients. While on one hand there is a disproportionate number of loan 2 and above clients with primary and no formal education, on the other hand there is a disproportionate number of pipeline clients with secondary education, implying that pipeline clients are more educated. Some recent studies reveal that some of the participants in the informal sector have secondary level of education and beyond. A wide range of assets was reported at individual, household and enterprise level. A comparative analysis reveals that holding cash in the bank is most common at enterprise level and least common at the household level. An analysis of employment data by loan level has revealed that though there is no statistically significant variation in full-time and part-time enterprise employment as well as household members' employment, spouses' employment or employment of other workers, the means are significantly different, with highest full-time employment being at loan I clients.
A significant difference has been noted on average amount spent on education currently by sex, where men spend significantly more than women on education,
47

probably reflecting the tendency for men in Kenya to assume responsibility for large, "lumpy" family expenditures. Another significant result is average amount spent on housing, with pipeline clients paying more than others. During focus group discussions, WEDCO clients emphasised that the loans they had received from WEDCO had helped them to increase their stocks and remain in business, earning some income, some of which was spent on household needs such as education, medical care and food.
Impact of Credit on Incomes and Employment The regression analysis carried out provides weak evidence of a link between recipient of a first loan under WEDCO and growth in gross business profits, although this was barely sufficient to cover loan repayment costs. No direct significant impact was detected of participation in WEDCO on individual income growth or business employment growth. However, it should be noted that both of these variables were positively and significantly correlated with business profit growth. This suggests that impact (albeit undetectable within this sample) might eventually result, if the positive impact on profits could be sustained. The weakness of these findings can partially be attributed to data limitations. The major problem does not appear to have been use of pipeline participants for comparative purposes per se but the small overall and pipeline sample sizes. Results might also have been improved if more time had been allocated to pre-testing and refining recall based questions. Given these limitations, it is perhaps more surprising that two weakly significant correlations were indeed estab-lished—-between receipt of a first loan and profits, and between receipt of a second loan and employment. The low estimated coefficients for these relation-ships provide some tentative evidence that the "rules of thumb" for income and employment generation used in WEDCO and other micro-finance appraisal documents are likely to have been excessively optimistic."
Impact of Credit on Client Decision Making The analysis carried out in this study reveals that though a higher proportion of loan 2 and above clients reported that they make the final decision with respect to new business activities, borrowing of money, household savings and use of family planning methods, the differences noted were statistically significant with respect to only decision making on household savings.
Recommendations Two sets of recommendations are made. The first is on lessons learnt for future impact assessment and the second is on lessons for WEDCO.
The impact assessment of WEDCO was intended to be a pilot or first study in a set of studies of impact assessment of BASE-funded micro-finance pro-
48

grammes. It was hoped that lessons learnt from WEDCO impact assessment would be incorporated in future impact assessment of the remaining micro finance institutions that REME is studying. It is within this context that the following recommendations are made for the next set of impact assessment studies.
An initial analysis of income and employment grow th revealed that the sample size was small, especially for pipeline respondents. The pipeline respondents were also concentrated in the retail sector. The following recommendations are there-fore made:
• Future studies should have a larger overall sample as well as a larger pipeline sub-sample. The selection should be preceded by a thorough scrutiny of the clients in the programme as well as those on the waiting list to establish criteria for selection that reflects the central concern of impact assessment, namely determination of changes in employment and incomes
• More time should be given to pre-testing instruments and refining recall-based questions during preparations for impact assessment.
• Results of focus group discussions and other assessment have revealed that the impact of credit goes beyond incomes and employment. Though the terms of reference emphasise incomes and employment, it is recommended that future studies should investigate impact on revolving loan groups of existing groups, households and community. Given the limitations of recall data, it is important to use both qualitative and quantitative measures when assessing impact.
• The respondents were of the view that WEDCO was overly concerned with timely repayment of loans. At the same time, women noted that in unique circumstances such as seasonality of business, it becomes difficult for them to repay loans in time. A number of respondents complained that the repayment period was too short. It is recommended that W E D C O review and find ways of making repayment schedules more flexible where there is such a need.
• WEDCO lends to individual client through the revolving loan fund groups that are formed by women entrepreneurs. There are now cases of individuals who have outgrown the group loans. Their businesses have expanded, and they would like to borrow from WEDCO on an individual basis. Whereas this development may pose logistical and loan guarantee challenges, it is recommended that WEDCO explore possibilities of lending both to revolv-ing. loan fund groups and individual clients. An experimental or pilot project can be initiated with respect to individual client borrowing. It this proves workable, the scheme can then be implemented.
• The links between receipt of a first loan under WEDCO and growth in gross
49

IDS Occasional Paper No. 68
business profits, and between receipt of a second loan and employment were weak, mainly because of data limitation. Nevertheless, the findings provide tentative evidence that the "rules of thumb" for income and employment generation used in W E D C O and other micro-finance appraisal documents may be excessively optimistic. It is recommended that WEDCO review the targets on employment creation and income generation in the log fame to make them more realistic.
50
References AIMS. 1997. "Research Plan for the AIMS Core Impact Assessments: Assessing the Impact
of Microenterprise Services." Washington D.C.: USAID Office of Microrenterprise Development.
Anyango, E. and Allen. H. 1994. "CARE Kenya: Future Strategy of the Women's Economic Development Project." CARE Kenya Discussion Paper. Christchurch,"England.
BASE and CARE Kenya. 1995. "ODA/BASE Support for the Development and Expansion of Women's Economic Development Project: Memorandum". Nairobi.
Buckley, G. 1997. "Microfinance in Africa: Is it Either the Problem or the Solution?" World Development 25 (7): 1081-1093.
CARE International in Kenya. 1997. WEDCO Enterprise Development: Sustainability Analysis for the Period Ending September 1997.
Copestake, L., Bhalotra, S., Godwin, M„ Grundel, H., Johnson. S. and Musona. D. 1998. "Impact Assessment of the PULSE Microfinance Programme in Lusaka, Zambia." Research Report: Centre of Development Studies, University of Bath.
Daniels, L., Mead, D. C. and Musinga. M. 1995. "Employment and Incomes in SMEs in Kenya: Results of a 1995 Survey." K-REP research paper no. 26. Nairobi: Kenya Rural Enterprise Programme.
Gichira, R. 1998. "Policies and Strategies for Enhancing Industrialisation Through the Development of the Jua Kali Sector." Paper prepared for ICEG.
Hart, K. 1973. "Informal Income Opportunities and Urban Employment in Ghana," Journal of Modern African Studies 11: 61-89.
Hulme, D. and Mosley, P. 1996. Finance Against Poverty, first edition, Vol. I. London: Routledge.
ILO. 1972. Employment, Incomes and Equality: A Strategy for Increasing Productive Employment in Kenya. Geneva: International Labour Office.
Karcga, R. G. M. and Lodiaga, M. J. 1997. "Gender Dimensions of Small Scale Enterprises in Kenya: A Comparative Analysis of Nairobi City, Kisumu and Kisii Towns." Paper presented at the Regional Conference on Education and Income among Poor Urban Households in Kenya and Uganda. 21-23 April 1997, Garden Hotel, Machakos.
Kenya, Republic of. 1999. "Budget Speech for the Fiscal Year 1999/2000 (1 July-30 June)" presented by Y. F. O. Masakhalia, Minister for Finance.
Kenya, Republic of. 1998. Economic Survey. Nairobi: Government Printer. Kenya, Republic of. 1997. National Development Plan 1997-2001. Nairobi: Government
Printer. Kenya, Republic of. 1996a. "Industrial Transformation to the Year 2020." Sessional Paper
No. 2 of 1996. Nairobi": Government Printer. Kenya, Republic of. 1996b. Economic Survey. Nairobi: Government Printer. Kenya, Republic of. 1992. "Small Enterprise and Jua Kali Development in Kenya." Sessional
Paper No. 2 of 1992. Nairobi: Government Printer. Kenya, Republic of. 1988. Development Plan, 1989-1993. Nairobi: Government Printer. Kenya, Republic of. 1986. "Renewed Growth for Sustainable Development." Sessional Paper
No. 1 of 1986. Nairobi: Government Printer. King, K. 1996a. "Re-ordering Kenya's Jua Kali Economy in the 1990s: External and Internal
Policy Agendas." In: McCormick, D. and Pedersen, P. O., eds., Small Enterprises:
51

Flexibility and Networking inanAfrican Context, pp. 290-300. Nairobi: Longhom Kenya. King, K. 1996b. Jua Kali Kenya: Change and Development in an Informal Economy, 1970-
95. Nairobi: EAEP. Kinyanjui, M. N. 1992. "Small and Medium Sized Manufacturing Enterprises in Central
Kenya: Structure Role and Location." Ph.D. Thesis, University of Cambridge. Maalu, J., Alila, P., Chitere, P., Kibas, P., Karega, R., Bowen, M., Onjala, J. and Khayesi, M.
1998. "Benchmark Study Report on SMEs Financial Services Projects." REME Project: IDS/BASE.
Macharia, K. 1997. Social and Political Dynamics of the Informal Economy in African Cities, Nairobi and Harare. New York: University Press of America.
Masinde, C. K. M. 1996. "Small Enterprise Development: Production and Distribution in Kenya's Motor Industry." In: McCormick, D. and Pedersen, P. O., eds., Small Enterprises: Flexibility and Networking in an African Context, pp. 18-39. Nairobi: Longhorn Kenya.
McCormick, D. 1998. "Enterprise Clusters in Africa: On the Way to Industrialisation?" Working Paper No. 518: IDS, University of Nairobi.
McCormick, D. 1988. "Small Manufacturing Enterprise in Nairobi: Golden Opportunity or Dead End?" Ph.D. dissertation. Baltimore: The Johns Hopkins University.
McCormick, D., Kinyanjui, M. N. and Ongile, G. 1997. "Growth and Barriers to Growth Among Nairobi's Small and Medium-sized Garment producers," World Development 25 (7): 1095-1110.
McCormick, D. and Pedersen, P. 0.,eds. (1996) Small Enterprises: Flexibility and Networking in an African Context. Nairobi: Longhorn Kenya.
Moffit, R. 1991. "Program Evaluation with Nonexperimental Data," Evaluation Review 15(3): 291-314.
Mustafa, S. et al. 1996. "Beacon of Hope: An Impact Assessment Study of BRAC's Rural Development Programme." Dhaka: BRAC, Research and Evaluation Division.
Ng'ethe, N. and Ndua, G. 1992. "Jua Kali, Education, Training and Welfare. A Study of Carpentry and Metal-Work in theEastlands of Nairobi Kenya." Nairobi: IDS. University of Nairobi.
Ondiege, P. O. 1996. "Capital and Performance of Small Enterprises in Kenya." In: McCormick, D. and Pedersen, P. O., eds., Small Enterprises: Flexibility and Networking in an African Context, pp. 161-174. Nairobi: Longhorn Kenya.
Otunga, R. N., Opata, G. and Muyia, F. N. 1997. "A Study of Socio-Economic Background of Women Entrepreneurs in the Informal Sector in Eldoret Town."Nairobi: IDS, University of Nairobi.
Parker, J. C. and. Torres, T. R. 1994. "SMEs in Kenya: Results of the 1993 National Baseline Survey." USAID/GEMINI Project, Final Draft.
Project Finance Data Centre, undated. "Small Enterprises: Sources of Finance and Other Support Services." Nairobi: Project Finance Data Centre.
Sebstad, J. and Chen, G. 1996. "Overview of Studies on the Impact of Microenterprise Credit." Washington D. C.: AIMS.
Wegulo, F. 1997. "Socioeconomic Characteristics of Participants in Small-Scale Enterprises in Nakuru Town, Kenya: A Gender Analysis." Nairobi: IDS, University of Nairobi.
52

Appendices
Appendix 1: REME WEDCO Impact Assessment-Client Questionnaire
Research Assistant Supervisor Date
AL CODING DETAILS 1. Branch 2. Category of Participant/Respondent (Tick)
(1) Pipeline (2) First Loan (3) Second loan (4) Third loan (5) Fourth or more loans [ ]
3. Studied at Benchmark? Yes [ ] No [ ]
A2 PERSONAL DETAILS OF RESPONDENT 1. Full name 2. Sex 1 = M 2 = F [ ] 3. Marital Status 1 = M 2 = S 3 = D/S4 = W [ ] 4. Position in the household ( l )head (2) spouse
(3) other household member [ ] 5. Your age in complete years 6. Highest level of education 7. Spouse's highest level of education 8. Training completed (Tick appropriately)
8.1 Technical (Artisan, Craft, Technician) 8.2 Business (Certificate, Diploma, Degree) 8.3 None
9. Main occupation of the respondent 10. Spouse's main occupation 11. Number of children 12. Number of other regular dependants 13. If married, does spouse reside within?
1 = Yes 2 = No [ ]
B ENTERPRISE LEVEL IMPACT
B1 BIODATA Bl.l a) Location of the enterprise Bl.l b) Name of loan group Bl.l c) When did you join the loan group? Bl.l d) Age of the main business (circle as appropriate)
1 = <1 yr 2 = 1 -2 yrs 3 = 3-4 yrs 4 = over 5 years
53

IDS Occasional Paper No. 68
B1.2a) Please indicate by ticking the main business activity engaged in and (b) the type of products or services offered in the table below:
BUSINESS ACTIVITY AND PRODUCTS
Currently 1 yr ago 2 yrs ago
1. Manufacturing (processing) Food, beverages, tobacco products textile/leather products, forest products, minerals, metal work
2. Other types of manufacturing (production)
3. Commerce and trade Wholesale Trade Retail Trade
4. Services Hotels/restaurants/bars Personal services
B1,3a) Do you keep records for the current business 1 = Yes 2 = No [ ] B1,3b) Were you keeping records before the loan was given? 1 = Yes 2 = No [ ] B1.3c) If yes, indicate by placing a tick [ ] in the table below.
RECORDS Currently 1 yr ago 2 yrs ago
1. Cashbooks/cash records
2 Ledgers/assets record
3 Invoices/receipts
4. Financial statement
5. Others (specify)
54

B1 4 Location of the business (place a lick where appropriate)
Currently (now) At loan 1 At start of business 1. At home
2. Market stall
3. Open air/roadside
4. Rented premises
5. Own permanent plot/premises
6. Others (Specify)
B1.5 Who manages the business/enterprise? 1 = self 2 = spouse 3 = paid worker 4 = others | |
B1.6 Ownership of the enterprise
Currently 1 yr ago 2 yrs ago
1. Sole owner
2. Family/household
3. Partnership
4. Company
B2 INCOME, EXPENDITURE AND PROFITS What was your main source of starting capital'' [ 1 I = own savings 2 = savings + partner's 3 = gifts/loan from spouse 4 = gifts/loans from relative 5 = loan from NGO/bank 6 = others (specify)
B2.1 Main sources of funds for working capital and expansion (place tick where appropriate)
MAIN SOURCES Currently 1 yr ago 2 yrs ago
2.1.1 Sales / fees earned
2.1.2 Fees from trainees
2.1.3 Rent from buildings
2.1.4 Interest on savings
2.1.5 Interest on loans
2.1.6 Other sources (Specify)
55

B2.2 Income from the main enterprise and other sources
Currently 1 yr ago 2 yrs ago
2.3 How much sa les do you make per month?
2.4 How much did you spend on inputs - R.m stock etc. monthly?
2.5 How much did you pay on salaries and wages monthly?
2.6 How much did you pay for monthly rent, security and storage
2.7 How much did you spend on market fees/licences per month
2.8 How much did you spend on electricity and water per month (if any)
2.9 How much did you pay monthly for transport?
2.10 How much did you spend on other operating costs (specify them) monthly
2.11 TOTAL MONTHLY COST (Add 2.4-2.10)
2.12 TOTAL PROFIT MONTHLY (Deduct 2.11 from 2.3) from the enterprise
2.13 Estimate profit for the year from the enterprise
2.14 Income from other sources (farming etc.)
B2.I5 If the profitability in 2.12 and income in 2.14 above have changed since the first loan. 1 = increased 2 = decreased 3 = unchanged [ ] Explain the changes.
B2.16 What have you done with the profit from the main enterprise in the last two years? 1 = Purchased assets [ ] 2 = paid fees etc [ ] 3 = Re-invested [ ] 4 = saved [ ] 5 = Used for daily expenditure [ ] 6 = Hospital bills [ ] 7 = Purchased land [ ] 8 = Leisure | ] 9 = others (specify) [ ]
56

B3 EMPLOYMENT RECORDS
B3.1 List all employees who are working in the business including those who have left.
CATEGORY Employment Status CATEGORY
Currently 1 yr ago 2 yrs ago
3.1.1 HH members
a) Full-time
Male
Female
b) Part-time
Male
Female
3.1.2 Spouse
Full-time
Part-time
3.1.3 Enterprise employees
a) Full-time
Male
Female
b) Part-time/Casual
Male
Female
3.1.4 Other employees
House help
Gardener
Guards
Porters
B3.2 Commenl on the overall change in employment between/from the time of entering the scheme (WEDCO) up to now. 1 = Increased [ 1 2 = Decreased [ ] 3 = Unchanged [ ]
57

B4 ASSETS AND LIABILITIES B 4.1 Indicate (by placing a tick), the assets owned currently and those owned 2 years ago.
Distinction should be clearly made between enterprise, individual and household ownership.
Assets owned Currently Individual Enterprise HH
2 years ago Individual Enterprise HH
1. Commercial buildings/premises
2. Land/plots (size) 3. Furniture/fixtures 4. Motor vehicles/taxis 5. Motor bikes 6. Bicycles 7. Equipment and
machinery 8. Sewing machine 9. Livestock 10. Stock/raw materials 11. TVs, videos 12. Radios 13. Electric cookers, gas
cookers 14. Refrigerators 15. Other electric goods
(iron box etc.) 16. Debtors 17. Handcarts 18. Cash at bank 19. Others (specify)
B4.2 Liabilities
Liabilities Currently (Ksh) Individual Enterprise HH
2 years ago (Ksh) Individual Enterprise HH
1. Creditors 2. Loans (WEDCO) 3.' Loans (relatives
and friends) 4. Moneylenders 5. Other liabilities TOTAL LIABILITIES
58

IDS Occasional Paper No. 68
B4.3 State the number of loans you received from WEDCO funds and indicate how you spent the money by listing three major uses from the list of five.
Loans acquired (Tick against the number)
Amount in Ksh Major uses of the loan
1. No loan 2. One loan 3. Two loans 4. Three loans 5. Four loans
Uses: 1 = business expansion 2 = purchase of land/buildings 3 = education 4 = paid creditors 5 = others (specify)
B.5 TECHNOLOGY, MARKETS AND PERFORMANCE/ GROWTH
B5.1 What type of technology do you use in your business? (Place a tick where appropriate)
TYPE OF TECHNOLOGY Currently 1 yr ago 2 yrs ago
1. Manual labour/use of hands 2. Simple hand tools and machines
3. Combination of manual labour and machines
B5.2 Nature of market outlets (Place a tick where appropriate)
TYPE OF MARKET Currently 1 yr ago 2 yrs ago
1. Individuals/neighbourhoods 2. Other businesses/middlemen 3. Urban centres/towns 4. Export markets
B5.3 PERFORMANCE/GROWTH IN OUTPUTS 1. Have you experienced any growth in your business? 1 = Yes 2 = No [ ] 2. If Yes, complete the table below (Place a tick where appropriate)
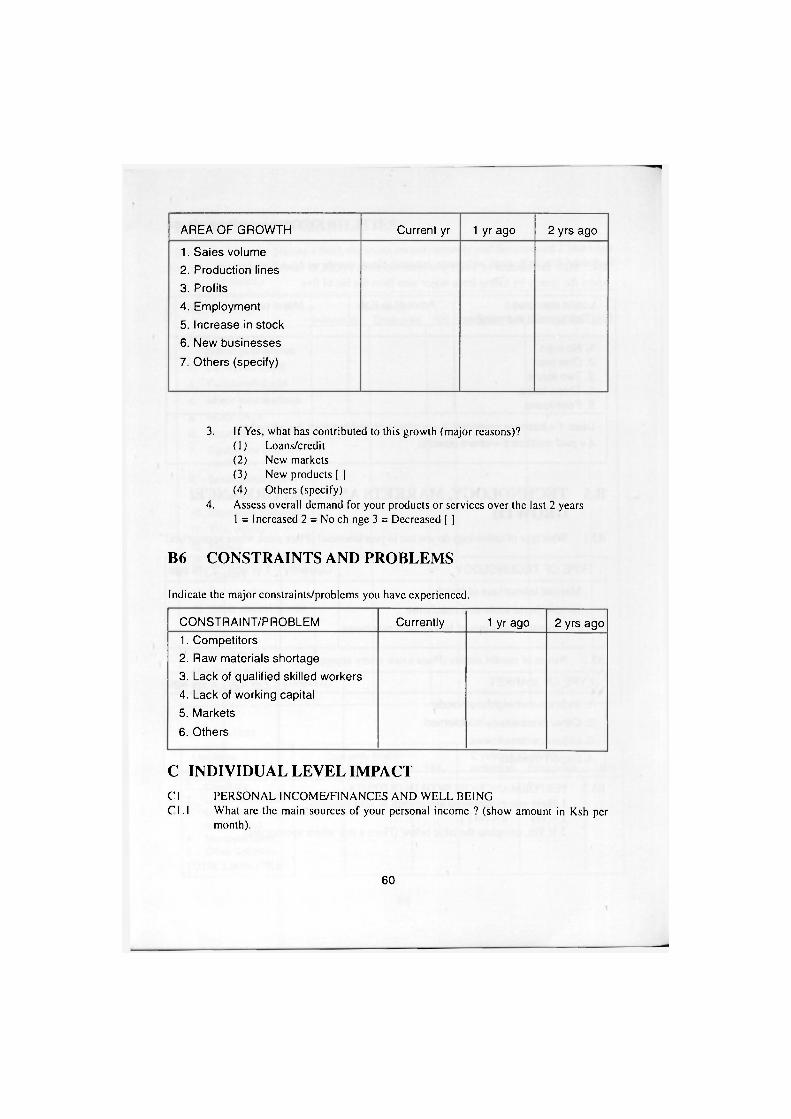
AREA OF GROWTH Current yr 1 yr ago 2 yrs ago
1. Saies volume 2. Production lines 3. Profits 4. Employment 5. Increase in stock 6. New businesses 7. Others (specify)
3. If Yes, what has contributed to this growth (major reasons)? (1) Loans/credit (2) New markets (3) New products [ ] (4) Others (specify)
4. Assess overall demand for your products or services over the last 2 years 1 = Increased 2 = No ch nge 3 = Decreased [ ]
B6 CONSTRAINTS AND PROBLEMS
Indicate the major constraints/problems you have experienced.
CONSTRAINT/PROBLEM Currently 1 yr ago 2 yrs ago 1. Competitors 2. Raw materials shortage 3. Lack of qualified skilled workers 4. Lack of working capital 5. Markets
6. Others
C INDIVIDUAL LEVEL IMPACT CI PERSONAL INCOME/FINANCES AND WELL BEING CI.I What arc the main sources of your personal income ? (show amount in Ksh per
month).
60

SOURCES Currently 1 yr ago 2 yrs ago
1.1.1 Salary/paid employment 1.1.2 Drawings from the business
(Income from business) 1.1.3 Sale of farm produce 1.1.4 Sale of livestock 1:1.5 Rent from ow n premises
CI.2 Overall, how does your own personal current income compare with the period before the first loan? 1 = better 2 = worse 3 = no change 4 = don't know [ 1 Explain
C1.3 Indicate in the given table the average time you spent in hours per day in the activities shown in Column 1.
ACTIVITIES Period ACTIVITIES Currently
weekdays weekends 1 year ago weekdays weekends
1. Business/Enterprise Activities 2. Family affairs 3. Social/Community Services 4. Personal interests 5. Other activities
CI .4 If there are any major changes in the time spent in the activities listed in CI.3 above, to what can these changes be attributed?
C2 SAVINGS
C2.1 If you had/have any savings, how do you mostly keep it? 1 = Bank 2 = Lent to relatives 3 = Post Office Savings A/c 4 = with businessmen 5 = Group savings 6 = Others (specify) [ ]
C2.2 How have your savings changed compared to one year ago? 1 increased 2=Decreased 3=No change ( ] Explain these changes
61
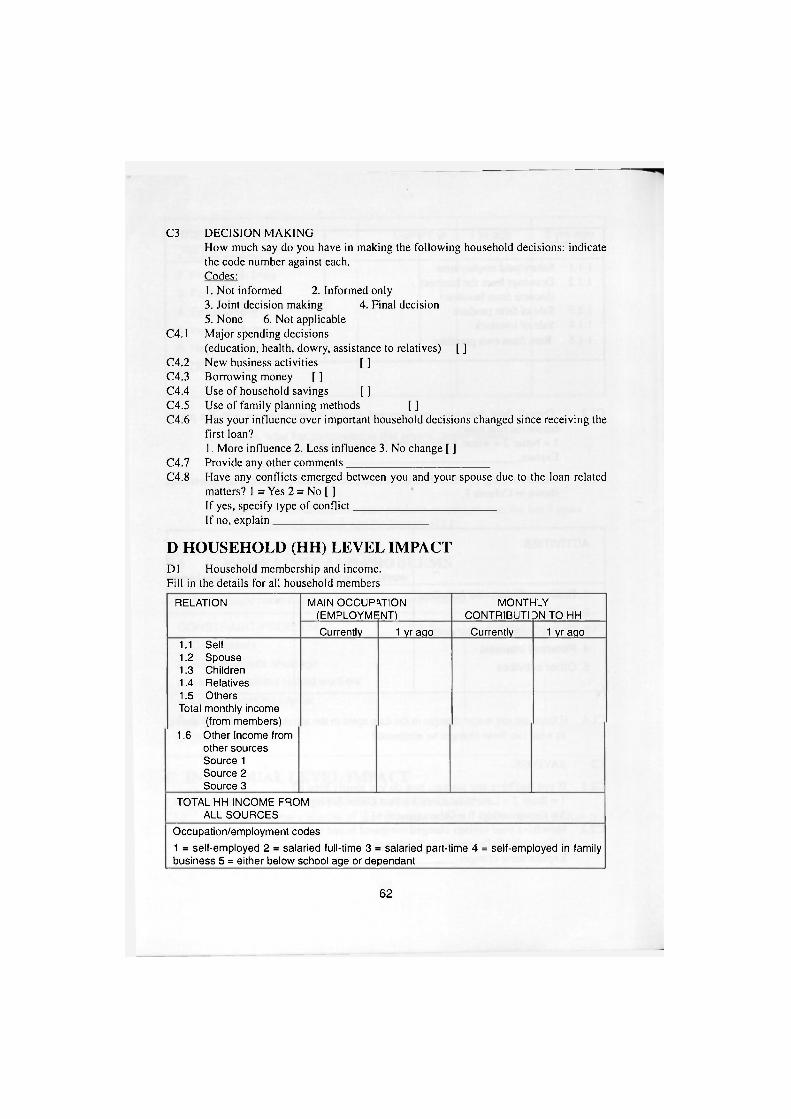
C3 DECISION MAKING How much say do you have in making the following household decisions: indicate the code number against each. Codes: 1. Not informed 2. Informed only 3. Joint decision making 4. Final decision 5. None 6. Not applicable
C4.1 Major spending decisions (education, health, dowry, assistance to relatives) [ ]
C4.2 New business activities [ ] C4.3 Borrowing money | ] C4.4 Use of household savings [ ] C4.5 Use of family planning methods [ ] C4.6 Has your influence over important household decisions changed since receiving the
first loan? 1. More influence 2. Less influence 3. No change [ ]
C4.7 Provide any other comments C4.8 Have any conflicts emerged between you and your spouse due to the loan related
matters? 1 = Yes 2 = No [ 1 If yes, specify type of conflict If no, explain
D HOUSEHOLD (HH) LEVEL IMPACT D1 Household membership and income. Fill in the details for all household members
RELATION MAIN OCCUR (EMPLOYME
MION INT)
MONTt CONTRIBUTI
HLY DN TO HH
RELATION
Currently 1 yraqo Currently 1 yr ago 1.1 Self 1.2 S p o u s e 1.3 Children 1.4 Relatives 1.5 Others Total monthly income
(from members) 1.6 Other Income from
other sources Source 1 Source 2 Source 3
TOTAL HH INCOME FROM ALL SOURCES
Occupation/employment c o d e s
1 = self-employed 2 = salaried full-time 3 = salaried part-time 4 = self-employed in family bus iness 5 = either below school age or dependant
62

D1 2 How does the monthh income of the HH currently (September 1998) compare to the month before you received the first loan? 1 = Increased 2 = Decreased 3 = No change { ]
D1.3 What major e\ents (if an>) helped to either raise ai lower the HH income?
D2A HOUSEHOLD DIET D2.1 Indicate in the table given, the number of different meals you have per week.
Type of meals per day Breakfast Lunch Supper/Dinner
One year ago
Currently (Now)
D2.2 Type of meals consumed most frequently (over 3 times per week) Tick where appropriate.
TYPE OF FOOD Currently 1 yr ago 2 yrs ago
1. Maize meal/sorghum/cassava 2. Rice 3. Wheat flour products 4. Meat/chicken/fish 5. Milk 6. Fruits 7. Vegetables
D2.3 How much do you estimate your household spends on food per month? Currently = Ksh Before first loan = Ksh
D2.B Household Health Status Indicate your choice by writing your answer in the space provided under current (now) and before first loan columns.
HEALTH INDICATOR (AND CHOICES)
Currently (now) 1 yr ago 2 yrs ago
1. Source of domestic water (well/borehole, river, piped water)
2. Places of health services (Dispensary/health centre, nursing home, private doctors, others)
3. Family planning practice (Yes, No, Not applicable)
4. Primary health care at tendance (Y, N, N/A)
63

D.3 H O U S I N G For questions D 3 . I - D 3 . 7 , respond by indicating either 1 = Yes, 2 = N o or 3 = D o not know.
Currently 1 yr ago 2 yrs ago
D3.1 Did you own the house you live in? D3.2 Did you rent the house you live in? D3.3 Did you own a house anywhere else? D3.4 Did you own a plot/land anywhere else? D3.5 Did the house have electricity? D3.6 Did/does the plot have its own toilet/
pit latrine? D3.7 Did/does the house have piped water? D3.8 How many rooms did/does the house
have? D3.9 What was the main fuel you used for
cooking? 1 = Wood 2 = Charcoal 3 = Gas 4 = Electricity 5 = Kerosene
D3.10 What was the main roofing materials? 1 = Tiles 2 = Iron sheets 3 = Asbestos sheets 4 = Grass thatched 5 = Others
D3.11 Approximately how much did/do you spend on maintaining and improving the value of your house(s) or plot(s)?
D 3 . 1 2 What is the type of house you own or live in? 1 = Temporary 2 = semi-permanent 3 = permanent) [ ]
D4 OVERALL ITEMS
4.1 Poverty Indicators 1. Indicate in the appropriate spaces the average amount of money spent
monthly (or yearly) in Ksh on education for children, health/medical, and housing.
Period Indicators Period
Education Health/medical Housing CURRENT YEAR
2 YEARS AGO
64

IDS Occasional Paper No. 68
2. What reasons would you attribute the changes to (if any) in expenditure on the above indicators? 4.2 If you unexpectedly and urgently needed cash say this week, from where would
you get it? Indicate up to 3 sources for the uses listed below. Sources: 1 = relatives 2 = friends 3 = church/mosque 4 = spouse 5 = bank 6 = moneylenders 7 = traders 8 = own savings 9 = group 10 = my business 11. employer
Uses Currently Before first loan
a) Personal
b) Household
c) Enterprise
4.3 Overall (taking into consideration income, free time, health, diet and housing) has your life been better or worse off during the current year than it was before the loans? 1 = Better 2 = Worse 3 = No change 4 = Not sure 5 = Others (specify) [ ] Explain.
65

IDS Occasional Paper No. 68
Appendix 2: Checklist for Focus Group Discussions
Historical background • 1. Number of members and the level of their participation (active, less active and
defaulters) • 2. Assets collectively owned by the group and approximate value • 3. Income-generating activities collectively carried out • 4. Misunderstandings with the group and how solved • 5. Amount of RLF acquired, when and progress in repayment
Amount of equity raised • 6. Number of group members who have so far been lent money
Group's share contributions Types of records kept by the group Frequency of meetings of RLF group
• 7. Business activities (types of businesses) carried out currently and in past two years—pros and cons
• 8. Sources of business capital—pros and cons • 9. Impact on relationship with spouse (negative or positive) • 10. Performance of their businesses and the role of RLF • 11. Problems facing the group (e.g., interest rates, short repayment period) • 12. Employment creation by group borrowers • 13. Use of RLF to support community-wide activities (e.g., schools, health facilities,
road repair, harambees) • 14. Assistance received by loanees from other MFIs and NGOs • 15. Relationship with DSS, chiefs and other stakeholders in relation to credit scheme • 16. Relationship of the men group members and other men within the community
(whether they support or antagonise) • 17. Whether WED loan scheme can be opened to mixed groups of men and women • 18. Access of group members to business training and other business information services • 19. Access of group members to input sources and markets or product improvement
66

IDS Occasional Paper No. 68
Appendix 3: Checklist for Key Informants
1. Name of researcher
2. Name of person interviewed
3. Position of key informant in society
4. Age in years
5. Educational level
6. Sex
7. Marital status
8. When did you get to know about WEDCO?
9. How did you get to know about this institution?
10. Do you have any relative benefitting from the credit availed by this institution?
Yes [ ] No [ ]
11. If yes, what is the relationship?
12. What has the development of this area been over time with respect to education, farming, business, employment and improvement in living standards?
13. Has there been a time when development in the community has been fast?
Yes [ ] No [ ]
14. What caused this acceleration in development?
15. How many people do you know that have received credit from WEDCO?
What is the impact of the credit these people have received on the individual, household and the community?
What has been the impact of the credit on gender relations given that WEDCO funds mainly women?
Do you think that those who receive the credit use it wisely?
16. Do you think WEDCO has solved the problems that small business people face in your community, especially financial problems?
If not, what other or more assistance is required for business people?
67

IDS Occasional Paper No. 68
Appendix 4: Computed Variables Used in Regression Analysis
INCGROW Growth in personal income over the last year = log of current income In(totinc) minus log income of one year ago in(totino).
BUSGROW Business profit growth over the last year = log of current business profit In(b2.13c).
EMPGROW Business employment growth over the last year =-log of current business employment In(busemplo) minus log of business employment 1 year ago In(busemplc).
AMOUNTL1 308 of the original 389 received a first loan and 122 received a second loan
AMOUNTL2 AMOUNTL1 and AMOUNTL2 are the amounts of these loans. By definition, pipeline respondents received zero in loans.
Region dummies Nearly half of respondents (48%) are in Siaya, so Siaya is taken as the "base case" branch.
KISDM takes value 1 if respondent is in Kisumu branch, otherwise zero
WESTDM takes value 1 if respondent is in West branch, otherwise zero
SOUTHDM takes value 1 if respondent is in South branch otherwise zero
Sector dummies The activities of respondents have been grouped into five sectors. The vast majority of the sample (69%) are in the retail sector; so the retail sector is taken as the "base case".
MANUDM takes value 1 if respondent is in manufacturing, otherwise zero
WHLDM takes value 1 if respondent is in wholesaling, otherwise zero
HOTELDM takes value 1 if respondent is in hotels/bars, otherwise zero
SERRVDM takes value 1 if respondent is in services, otherwise zero
Marital status dummy 81% of the sample are married, so this is taken as the "base case" marital status.
WIDOWED takes a I if the respondent is widowed, otherwise zero (6 single and 4 divorced; separated respondents also take the value zero)
( lender dummy More than 91% of the sample are female, so this is taken as the "base case" gender.
MALE takes the value I if the respondent is male, otherwise zero.
68

Appendix 5: Tabulation of Business Profit Tables Al and A2 indicate how business profits vary with WEDCO participation, and with branch location and business sector. In each case, the data refers to the restricted sample i excluding all respondents with current or one-year-ago income in excess of Ksh 20.000 per month). They also all refer to recall data for one-year-ago. Note that the difference in the overall average rate of profit between pipeline and first loan recipient was very small, but hid wide variation according to sector and branch. Table A1 Gross business profitability for the year(1 year ago) In thousand
Ksh
Kisumu Siaya West South Total
Overall M 55 5,877 80 79 60 SD 70 80 52 83 73 N 103 - 11 29 223
Pipeline M 42 28 101 108 63 SD 59 24 55 77 63 N 15 4 7 4 30
Loan 1 M 55 67 43 74 62 SD 72 85 15 84 78 N 73 49 4 25 151
Loan 2 M 71 46 - - 54 SD 71 67 - - 68 N 14 26 - - 40
Loan 3/4 M 20 30 - - 25 SD - - - - -
N 1 1 - - 2
Table A2 Total profit in thousand Ksh(1 year ago) by sector
Manu- Whole- Retail Hotel/ Services Total facture sale bars
Overall M 40 89 57 51 89 60 SD 51 85 73 59 95 74 N 22 25 154 11 11 223
Pipeline M 27 124 556 - 68 63 SD - 80 62 - 46 63 N 1 3 23 - 3 30
Loan 1 M 34 86 61 51 111 62 SD 40 88 79 59 111 78 N 18 17 98 11 7 151
Loan 2 M 80 81 50 - 1 54 SD 106 91 63 - - 68 N 3 5 31 - 1 40
Loan 3/4 M - - 25 - - 25 SD - - - - - -
N — — 2 — — 2
69