
CREATING INFRASTRUCTURE FOR URBAN MOBILITY
15
ABSTRACT In this paper, a methodology for creating and testing new proposed transport infrastructure is presented. It is based on microscopic traffic simulation of current and forecasted traffic demand and in-depth analysis of traffic flow. The most congested boulevard in Skopje has been chosen as a use case. Real-world traffic flow data was collected and used in the calibration and validation of a microscopic simulation model. Three possible configurations of new urban mobili- ty infrastructure have been proposed and best one chosen using appropriately defined criteria. The proposed configura- tions were evaluated from the aspect of traffic performanc- es, suitability for forecasted future traffic demand, and vehi- cle emissions. The obtained results prove the effectiveness of the presented methodology in reducing delays and vehi- cle emissions and significantly improving the level of service of the chosen use case. KEY WORDS urban mobility; infrastructure development; microscopic simulation; traffic congestion; evaluation; 1. INTRODUCTION Urban environments or cities are places with a high level of accumulation and concentration of activities related to the human population. These activities are connected to the economy, travel, education, indus- try, etc., requiring a good transportation system. Such system has to solve the problems of urban mobility, i.e., goods distribution and human travel in and out- side the urban area. Today’s underlying transportation systems cannot solve the problems of urban mobility effectively in many cities, and congestions occur dai- ly. They cause economic loss, increase environmental pollution, and reduce the overall quality of life in the urban environment [1]. According to [2], the most significant problems of urban mobility are: (i) traffic congestion; (ii) difficul- ties for non-motorized transport; (iii) environmental impacts and energy consumption; (iv) accidents and safety; and (v) parking difficulties. One of the main causes of urban mobility problems is related to the dominance of the car as the preferred transportation mode. To solve this problem, approaches related to transport mode shift, implementation of solutions for urban traffic control based on Intelligent Transporta- tion Systems (ITS), and infrastructural development are applied [3]. Transportation mode shift and infra- structural development are long-term strategies, and application of ITS-based traffic control is a more short- term strategy that can also be applied to support the mentioned long-term strategies. All three approaches are interconnected, since appropriate infrastructure has to be built and ITS-based services are needed to inform the traffic users about different travel opportu- nities. New infrastructure has to be built in order to re- solve traffic congestion when traffic demand exceeds a certain value. The threshold depends on the existing urban mobility infrastructure and how it is used. New infrastructure can include new roads, intersections, public transport stations, and paths for non-motorized DANIELA KOLTOVSKA NEČOSKA, Ph.D. 1 E-mail: [email protected] EDOUARD IVANJKO, Ph.D. 2 (Corresponding author) E-mail: [email protected] DANIEL PAVLESKI, B.Sc. 3 E-mail: [email protected] 1 Department of Traffic and Transport Faculty of Technical Sciences St. Kliment Ohridski University – Bitola Boulevard 1st of May b.b., Bitola 7000, Republic of Macedonia 2 Department of Intelligent Transportation Systems Faculty of Transport and Traffic Sciences University of Zagreb Vukelićeva 4, HR-10000 Zagreb, Croatia 3 Unit for Road Markings, Traffic Signs and Signals Traffic Department of the City of Skopje Boulevard Ilinden 82, Skopje 1000, Republic of Macedonia CREATING INFRASTRUCTURE FOR URBAN MOBILITY: CASE STUDY OF SKOPJE Koltovska Nečoska D, Ivanjko E, Pavleski D. Creating Infrastructure for Urban Mobility: Case Study of Skopje Traffic in the Cities Preliminary Communication Submitted: 2 Aug. 2017 Accepted: 12 Apr. 2018 Promet – Traffic & Transportation, Vol. 30, 2018, No. 4, 429-443 429
-
Upload
khangminh22 -
Category
Documents
-
view
0 -
download
0
Transcript of CREATING INFRASTRUCTURE FOR URBAN MOBILITY
ABSTRACT
In this paper, a methodology for creating and testing new proposed transport infrastructure is presented. It is based on microscopic traffic simulation of current and forecasted traffic demand and in-depth analysis of traffic flow. The most congested boulevard in Skopje has been chosen as a use case. Real-world traffic flow data was collected and used in the calibration and validation of a microscopic simulation model. Three possible configurations of new urban mobili-ty infrastructure have been proposed and best one chosen using appropriately defined criteria. The proposed configura-tions were evaluated from the aspect of traffic performanc-es, suitability for forecasted future traffic demand, and vehi-cle emissions. The obtained results prove the effectiveness of the presented methodology in reducing delays and vehi-cle emissions and significantly improving the level of service of the chosen use case.
KEY WORDS
urban mobility; infrastructure development; microscopic simulation; traffic congestion; evaluation;
1. INTRODUCTIONUrban environments or cities are places with a high
level of accumulation and concentration of activities related to the human population. These activities are connected to the economy, travel, education, indus-try, etc., requiring a good transportation system. Such system has to solve the problems of urban mobility, i.e., goods distribution and human travel in and out-side the urban area. Today’s underlying transportation
systems cannot solve the problems of urban mobility effectively in many cities, and congestions occur dai-ly. They cause economic loss, increase environmental pollution, and reduce the overall quality of life in the urban environment [1].
According to [2], the most significant problems of urban mobility are: (i) traffic congestion; (ii) difficul-ties for non-motorized transport; (iii) environmental impacts and energy consumption; (iv) accidents and safety; and (v) parking difficulties. One of the main causes of urban mobility problems is related to the dominance of the car as the preferred transportation mode. To solve this problem, approaches related to transport mode shift, implementation of solutions for urban traffic control based on Intelligent Transporta-tion Systems (ITS), and infrastructural development are applied [3]. Transportation mode shift and infra-structural development are long-term strategies, and application of ITS-based traffic control is a more short-term strategy that can also be applied to support the mentioned long-term strategies. All three approaches are interconnected, since appropriate infrastructure has to be built and ITS-based services are needed to inform the traffic users about different travel opportu-nities.
New infrastructure has to be built in order to re-solve traffic congestion when traffic demand exceeds a certain value. The threshold depends on the existing urban mobility infrastructure and how it is used. New infrastructure can include new roads, intersections, public transport stations, and paths for non-motorized
DANIELA KOLTOVSKA NEČOSKA, Ph.D.1E-mail: [email protected] IVANJKO, Ph.D.2(Corresponding author)E-mail: [email protected] PAVLESKI, B.Sc.3E-mail: [email protected] Department of Traffic and Transport Faculty of Technical Sciences St. Kliment Ohridski University – Bitola Boulevard 1st of May b.b., Bitola 7000, Republic of Macedonia2 Department of Intelligent Transportation Systems Faculty of Transport and Traffic Sciences University of Zagreb Vukelićeva 4, HR-10000 Zagreb, Croatia3 Unit for Road Markings, Traffic Signs and Signals Traffic Department of the City of Skopje Boulevard Ilinden 82, Skopje 1000, Republic of Macedonia
CREATING INFRASTRUCTURE FOR URBAN MOBILITY: CASE STUDY OF SKOPJE
Koltovska Nečoska D, Ivanjko E, Pavleski D. Creating Infrastructure for Urban Mobility: Case Study of Skopje
Traffic in the CitiesPreliminary Communication
Submitted: 2 Aug. 2017Accepted: 12 Apr. 2018
Promet – Traffic & Transportation, Vol. 30, 2018, No. 4, 429-443 429
Koltovska Nečoska D, Ivanjko E, Pavleski D. Creating Infrastructure for Urban Mobility: Case Study of Skopje
430 Promet – Traffic & Transportation, Vol. 30, 2018, No. 4, 429-443
Skopje and the implementation of the adaptive traffic control system UTOPIA have taken place recently. A sig-nificant improvement in some parts of Skopje’s urban traffic network has been achieved, but several main corridors in Skopje still suffer from severe congestions in rush hour periods.
The city authorities were forced by these traffic-re-lated problems to start solving the traffic congestion and pollution problem in a systematic approach. First, a traffic study was made covering the most congest-ed parts of the city [6]. One of its main goals was to create traffic simulation models which enable efficient selection of appropriate traffic control strategies and road design solutions in areas with detected signifi-cant traffic congestion. The city authorities have also introduced a new approach to decision-making aiming at a higher quality level of traffic management and reduction of congestion. A current state analysis and modeling of the proposed concept are required to en-able a simulation-based verification of the proposed design solutions, including an analysis of the impact of the future increase in traffic demand. One of the results of this approach is the methodology presented in this paper.
2. OBJECTIVES OF THE STUDYThe general objective of the research work report-
ed here is to create several proposals of possible con-figurations of a new urban mobility infrastructure for the city of Skopje to solve the present traffic problems. An additional objective is to present a methodology to create proposals for new infrastructure and evaluate the proposals using micro-simulations according to de-fined requirements and the forecasted future increase in traffic demand. The purpose is to obtain the best solution for implementation. Collected field traffic data (traffic demand, flow structure, and travel time) was used in the calibration and validation of a simulation model created in VISSIM for the base year 2014. The created simulation model was used to generate sim-ulation models for selected proposed configurations of new urban mobility infrastructure and test them regarding current and forecasted traffic demand, in-cluding the influence of the new solution on vehicle emissions. The obtained simulation results were also applied to make a comparative analysis using bench-mark criteria derived from the requirements defined for the new urban mobility infrastructure.
3. CURRENT APPROACHES AND APPLIED METHODOLOGYOne has to focus on movement of people and goods
to improve urban mobility, rather than movement of vehicles. Thus, the objective is to create a highly efficient, flexible, responsive, safe, and affordable
transport or parking places. It can be improved later by applying various ITS-based services in future aug-mentations. This article deals with such a case. Cre-ating new infrastructure for urban mobility that can be upgraded with ITS services later. The emphasis of this article is the methodology for the process of creating proposals for new infrastructure, their evaluation, and choosing the best configuration. Regarding ITS ser-vices, possible application of adaptive traffic control and travel information systems is in focus. Namely, in modern large cities, Traffic Management Control Cen-ters (TMCC) are built. In them, all traffic measurements are collected and optimal solutions to signal programs are found using adaptive traffic control systems [4]. The signal programs are changed according to the cur-rent traffic situation. They also include systems that inform the mobility users about the current traffic sit-uation and provide suggestions for choosing optimal travel routes and transport modes.
One example of a city where traffic demand signifi-cantly exceeds the capacity of the existing urban mo-bility infrastructure is the capital city of Skopje in the Republic of Macedonia. It will be the use case to apply the presented methodology. Skopje is Macedonia’s largest city with approximately 600,000 inhabitants (one-third of the total population). The estimated num-ber of people traveling daily to Skopje exceeds 90,000 commuters, causing significant congestions every day. This number of inhabitants and commuters is lower than the threshold of 1 million, when significant con-gestion problems typically begin in urban areas [2]. However, the city of Skopje is plagued by severe con-gestion every working day during the morning and af-ternoon peak hours. This is the consequence of a sig-nificant increase of vehicle-based mobility in the past decade and years of neglect of transport infrastruc-ture development. Additionally, many old diesel road vehicles (mostly cars) with EURO-I or -II norm engines were imported in the last decade due to the economic crisis [5]. This has resulted in an increased pollution due to vehicle emissions in the city of Skopje.
The existing traffic network in Skopje was formed after a disastrous earthquake in 1963. It is a favor-able combination of ring road, radial, and orthogonal infrastructural sub-segments around the city center. The total length of the major road network is 211 km. In combination with the inconvenient concentration of administrative, cultural, political, economic, and edu-cation services in the city center, most of the usual neg-ative phenomena of fast-growing cities, like traffic sat-uration, bottlenecks, queues, longer travel times, high energy consumption, and pollution appear. The lack of infrastructural backbone corridors (urban motorways and bypasses) also causes unwanted interference of transit traffic with non-transit traffic. This only increas-es the problem of traffic congestion. An attempt to re-duce the traffic congestion by establishing a TMCC in

Koltovska Nečoska D, Ivanjko E, Pavleski D. Creating Infrastructure for Urban Mobility: Case Study of Skopje
Promet – Traffic & Transportation, Vol. 30, 2018, No. 4, 429-443 431
infrastructure. The best values obtained in the micro-simulations are then proposed for future construction. For this reason, microsimulations will be used in this paper as well.
The requirements of separate lanes for bicyclists and public transportation are included to cover the needs of transport system users for non-motorized mobility options. One additional important issue in im-proving urban mobility is to identify how existing travel patterns are causing congestion and to test how the proposed infrastructure will perform with the expected future traffic demand. This part is lacking in the men-tioned approaches, and it is addressed in this paper with the applied micro-simulation based methodology described below. Microscopic simulations performed in VISSIM and computation of vehicle emissions in EnViVeR are used to analyze the future performance of the new infrastructure using realistically forecasted traffic demand values.
3.2 Applied methodology
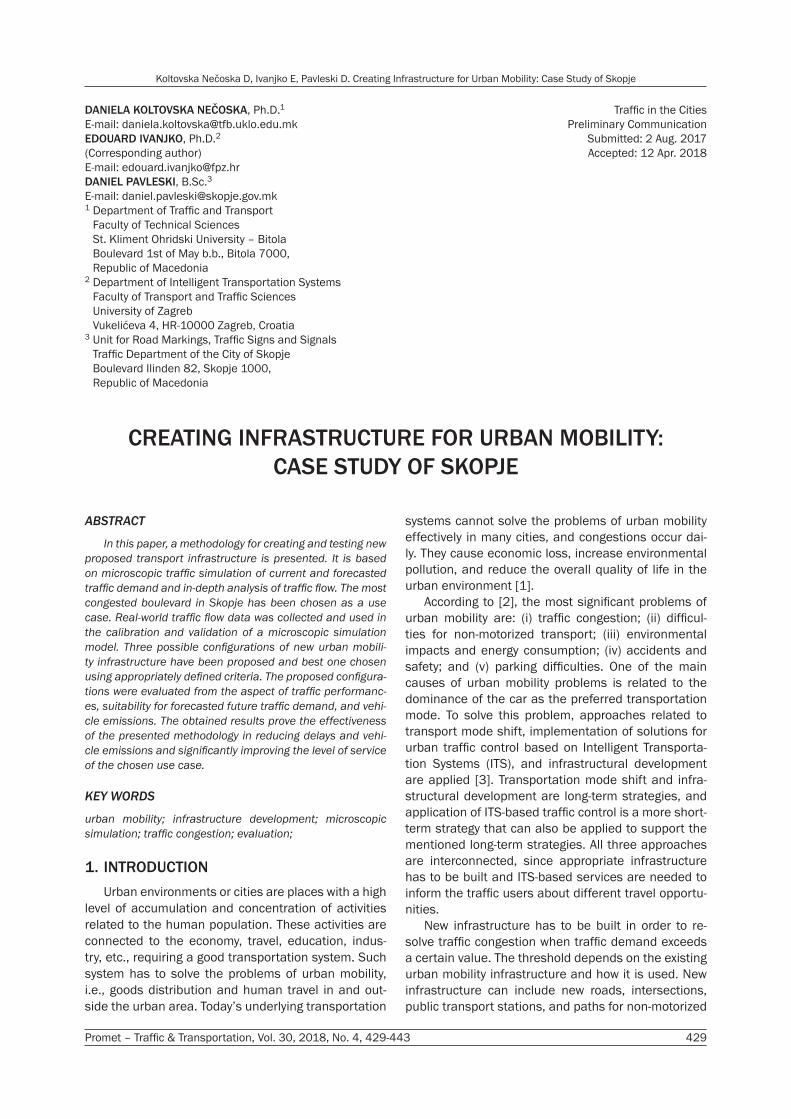
Available data for the city of Skopje was the basis to create the methodology used in this paper. This data was the transport model of the city of Skopje, the collected traffic demand and travel time data, re-quirements defined by the authorities, and forecasted traffic demand values for the years 2024 and 2034. A block scheme of the applied methodology is given in Figure 1 with the available data denoted by red-dashed rectangles.
Analysis of the existing and forecasted traffic de-mand at the macro level was performed by the PTV VISUM software tool for the morning (7:00 to 8:00) and afternoon (16:00 to 17:00) peak hours. The exist-ing IDOM model for the city of Skopje was used in this process [18]. In order to obtain the most realistic traf-fic flows of the transport network, origin/destination (O/D) matrix calibration was performed. The matrices for personal cars and heavy vehicles were used. The calibration was done based on traffic counting in 2014 during the morning and afternoon peak hours. The traffic counting was carried out at four intersections along the corridor Boulevard Goce Delchev (BGD). The needed O/D matrices were estimated using the TFlow-Fuzzy procedure [19]. The adjustment of the demand matrix was undertaken using VISUM’s TFlowFuzzy matrix estimation module. The entropy maximization method was applied for this estimation.
After O/D matrix calibration, the correlation be-tween the calibrated and measured traffic flows was examined. The calculated Pearson’s correlation factor was 0.99 both for morning and afternoon peak hours. This is an indicator of very good correlation between traffic flows assigned in the model and observed traf-fic flows. A detailed analysis of the traffic network by
urban mobility system with the least amount of traffic, travel, and effort while ensuring environmental sus-tainability [7]. There is no absolute solution to create such a transport system and to solve the problem of traffic congestion caused by the society itself. This all arises from the fact that the congestion problem is tightly related to individual land use patterns and existing transport policies of every urban area. All this significantly affects urban mobility. Therefore, to solve a particular traffic-related problem, appropriate meth-odology has to be chosen individually. Specifics of the country have to be taken into account [8]. Additionally, how the proposed new infrastructure will deal with the future increase in traffic demand has to be evaluated as well.
3.1 Literature review
There are various approaches and strategies de-veloped and implemented in order to improve urban mobility, i.e., to propose adequate solutions and eval-uate them. The main idea today is to consider how the existing transport infrastructure is used and adapt it for desired user behavior, and not just build new infra-structure [7]. The goal is to change the user’s behav-ior, and new infrastructure is a tool in this process. In order to do so, several scenarios have to be evaluated by applying an appropriate methodology [9, 10, 11]. The applied methodology depends on the transport mode, infrastructure type, and area size. To assess the transport infrastructure of a larger area, the factors of accessibility, regional economic potential, and predict-ed traffic demand become more important [12].
The usual approaches to propose adequate solu-tions are related to implementing ITS control services and encouraging mode shift. A detailed test that eval-uates the necessity of the new infrastructure is always done by using multiple criteria if new infrastructure is proposed [13]. Everything starts with the definition of long-term goals and a mix of policies or possible strategies to achieve the goals set [7]. In [14], a ques-tionnaire was created to estimate the risk, i.e., the willingness of respondents to use the proposed travel demand management strategies. An analytical net-work process model considering benefits, opportuni-ties, costs, and risks was developed using the results of the questionnaire to choose the best strategy.
It is important to know the details about the users of the transport system and their needs [15]. For this reason, in [15] and [16] an accessibility measure was introduced to take into account from what areas are users attracted to the transport infrastructure. A new slip ramp design for dedicated truck lanes was pro-posed and tested using microscopic traffic simulation in [17]. Microsimulations enabled deeper insight into how the proposed new infrastructure behaves with different parameters for crucial segments of the road
Koltovska Nečoska D, Ivanjko E, Pavleski D. Creating Infrastructure for Urban Mobility: Case Study of Skopje
432 Promet – Traffic & Transportation, Vol. 30, 2018, No. 4, 429-443
level. On the corridor level, particular attention was placed on identifying areas with multiple consecutive intersections, with vehicle queues that can join creat-ing a congestion shock wave that spreads upstream between two or more intersections (traffic spillback phenomena). Such congestion areas create the big-gest problems in urban areas because they accelerate the congestion build-up. All these identified traffic di-rections present candidates for building tunnels, un-derpasses, or overpasses. Consecutive intersections in the spillback area are candidates for building free uninterrupted traffic directions on the corridor level. Congested traffic directions on individual intersections are candidates for building free uninterrupted traffic directions on the intersection level. Free surrounding building space was estimated in this step also. Using the requirements for new infrastructure, spatial and geometrical features of the area, and results of the in-depth analysis, possible solutions for proposed new traffic infrastructure development were then created in the next step.
microsimulation software VISSIM is the next phase of this study, and more information on the analysis itself is given in section 4.
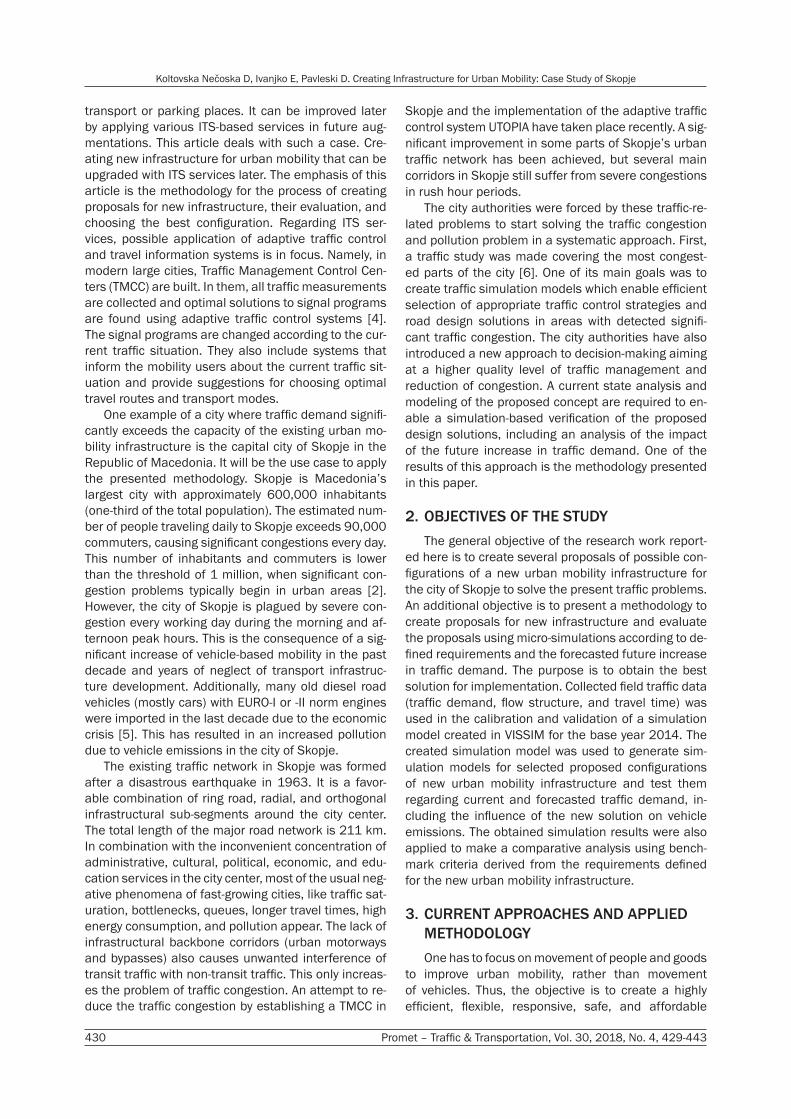
First, a microscopic simulation model was pro-duced using the collected traffic demand and travel time data, the transport model of the city of Skopje, and estimated O/D matrices for the defined study area. The obtained simulation model combined with the collected traffic demand and travel time data en-abled an in-depth analysis of the defined study area (block denoted with a dash-dot line in Figure 1). The methodology applied in this step is given in Figure 2. This is the crucial step of the presented methodology, since problematic areas and directions are identified. Every intersection of the study area was examined separately at the intersection and at the corridor lev-el in this in-depth analysis. The obtained results were used for creating possible solutions to resolve the ex-isting congestion development. Problematic traffic di-rections with high traffic demand were identified and sorted out for every intersection on the intersection
Traffi c demand and travel time data
Microscopic simulation model of current solution for base year 2014
Microscopic simulation model of proposed solutions for base year 2014
Microscopic simulation model of proposed solutions for years 2024 and 2034
Testing and correction of proposed solutions
Multirun simulational testing and collection of MoE
Analysis of results and evaluation of proposed solutions Defi ned benchmark
Conclusion and recommendations
Estimation of O/Dmatrices for AM/PM peak
periods
In-depth analysis of current traffi c state
Requirements for new solutions
Forecasted traffi c demand values for years 2024
and 2034
Creation of spatial/geometric features of proposed solutions
Transport model ofthe city of Skopje
Figure 1 – Block scheme of particular steps for creating and testing proposed solutions
Koltovska Nečoska D, Ivanjko E, Pavleski D. Creating Infrastructure for Urban Mobility: Case Study of Skopje
Promet – Traffic & Transportation, Vol. 30, 2018, No. 4, 429-443 433
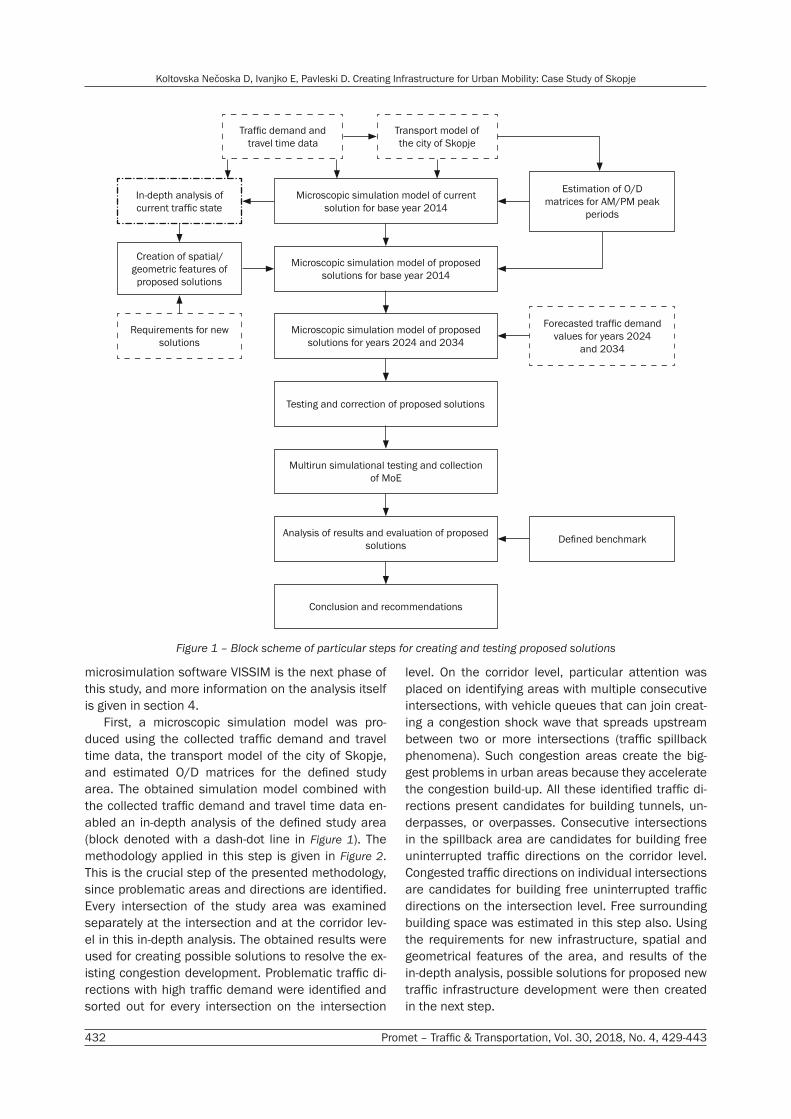
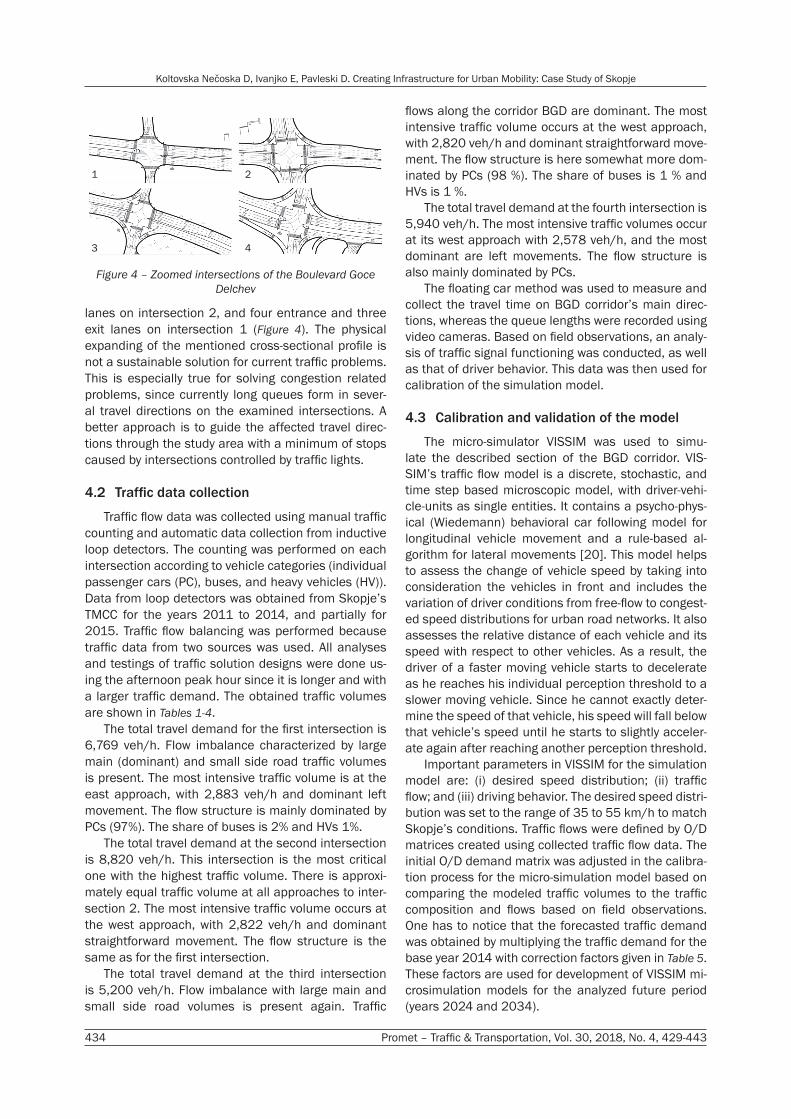
its location and the services it is used for. The BGD corridor is the main connection for all sorts of trans-port from the city center to the western city exit and vice versa since it is located in the center of Skopje. Thus, it is the most used corridor with a traffic flow of over 40,000 veh/day. The length of the BGD corridor analyzed in this paper is 1,021 m, and it contains four intersections (Figure 3).
12
34
Figure 3 – Spatial configuration of the Boulevard Goce Delchev
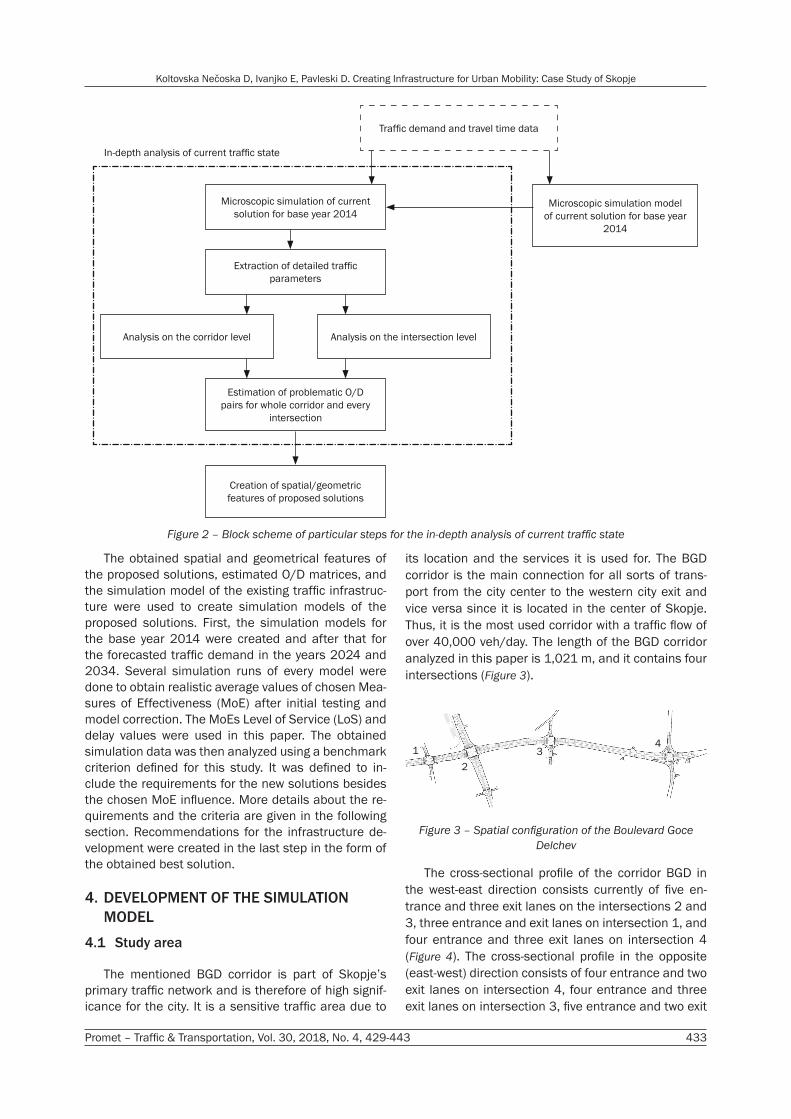
The cross-sectional profile of the corridor BGD in the west-east direction consists currently of five en-trance and three exit lanes on the intersections 2 and 3, three entrance and exit lanes on intersection 1, and four entrance and three exit lanes on intersection 4 (Figure 4). The cross-sectional profile in the opposite (east-west) direction consists of four entrance and two exit lanes on intersection 4, four entrance and three exit lanes on intersection 3, five entrance and two exit
The obtained spatial and geometrical features of the proposed solutions, estimated O/D matrices, and the simulation model of the existing traffic infrastruc-ture were used to create simulation models of the proposed solutions. First, the simulation models for the base year 2014 were created and after that for the forecasted traffic demand in the years 2024 and 2034. Several simulation runs of every model were done to obtain realistic average values of chosen Mea-sures of Effectiveness (MoE) after initial testing and model correction. The MoEs Level of Service (LoS) and delay values were used in this paper. The obtained simulation data was then analyzed using a benchmark criterion defined for this study. It was defined to in-clude the requirements for the new solutions besides the chosen MoE influence. More details about the re-quirements and the criteria are given in the following section. Recommendations for the infrastructure de-velopment were created in the last step in the form of the obtained best solution.
4. DEVELOPMENT OF THE SIMULATION MODEL
4.1 Study area
The mentioned BGD corridor is part of Skopje’s primary traffic network and is therefore of high signif-icance for the city. It is a sensitive traffic area due to
In-depth analysis of current traffi c state
Traffi c demand and travel time data
Extraction of detailed traffi c parameters
Estimation of problematic O/D pairs for whole corridor and every
intersection
Creation of spatial/geometric features of proposed solutions
Analysis on the corridor level Analysis on the intersection level
Microscopic simulation of current solution for base year 2014
Microscopic simulation model of current solution for base year
2014
Figure 2 – Block scheme of particular steps for the in-depth analysis of current traffic state
Koltovska Nečoska D, Ivanjko E, Pavleski D. Creating Infrastructure for Urban Mobility: Case Study of Skopje
434 Promet – Traffic & Transportation, Vol. 30, 2018, No. 4, 429-443
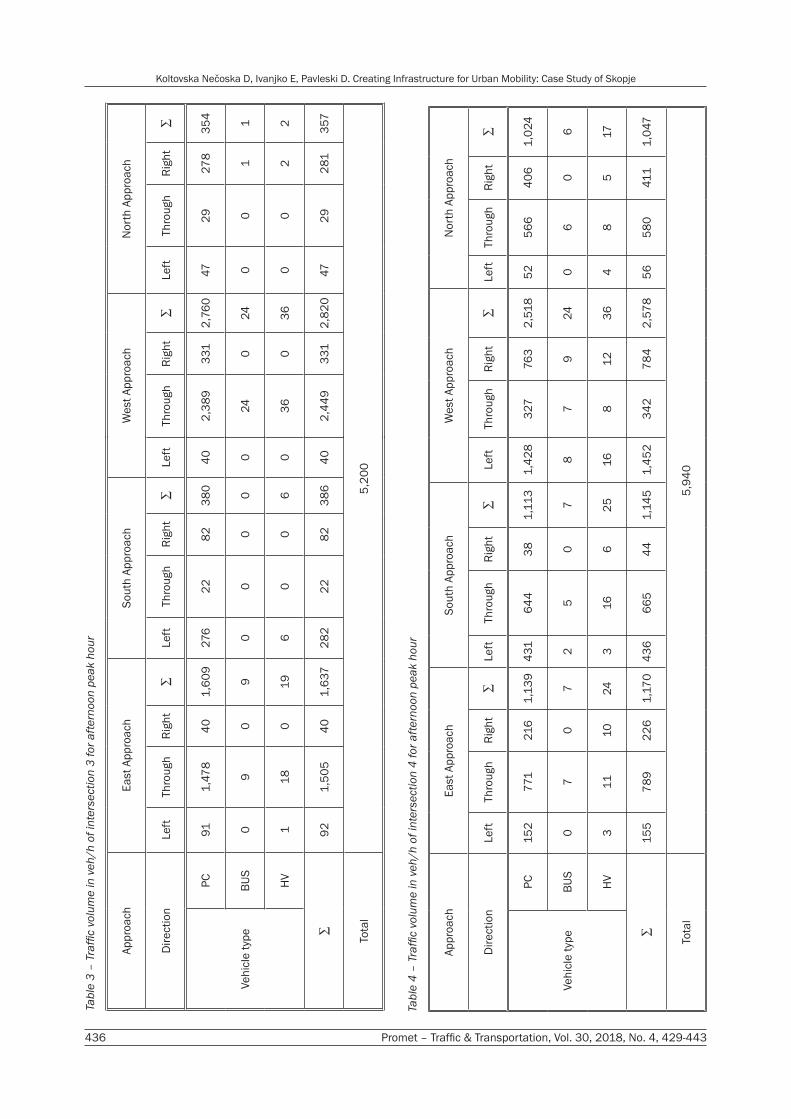
flows along the corridor BGD are dominant. The most intensive traffic volume occurs at the west approach, with 2,820 veh/h and dominant straightforward move-ment. The flow structure is here somewhat more dom-inated by PCs (98 %). The share of buses is 1 % and HVs is 1 %.
The total travel demand at the fourth intersection is 5,940 veh/h. The most intensive traffic volumes occur at its west approach with 2,578 veh/h, and the most dominant are left movements. The flow structure is also mainly dominated by PCs.
The floating car method was used to measure and collect the travel time on BGD corridor’s main direc-tions, whereas the queue lengths were recorded using video cameras. Based on field observations, an analy-sis of traffic signal functioning was conducted, as well as that of driver behavior. This data was then used for calibration of the simulation model.
4.3 Calibration and validation of the model
The micro-simulator VISSIM was used to simu-late the described section of the BGD corridor. VIS-SIM’s traffic flow model is a discrete, stochastic, and time step based microscopic model, with driver-vehi-cle-units as single entities. It contains a psycho-phys-ical (Wiedemann) behavioral car following model for longitudinal vehicle movement and a rule-based al-gorithm for lateral movements [20]. This model helps to assess the change of vehicle speed by taking into consideration the vehicles in front and includes the variation of driver conditions from free-flow to congest-ed speed distributions for urban road networks. It also assesses the relative distance of each vehicle and its speed with respect to other vehicles. As a result, the driver of a faster moving vehicle starts to decelerate as he reaches his individual perception threshold to a slower moving vehicle. Since he cannot exactly deter-mine the speed of that vehicle, his speed will fall below that vehicle’s speed until he starts to slightly acceler-ate again after reaching another perception threshold.
Important parameters in VISSIM for the simulation model are: (i) desired speed distribution; (ii) traffic flow; and (iii) driving behavior. The desired speed distri-bution was set to the range of 35 to 55 km/h to match Skopje’s conditions. Traffic flows were defined by O/D matrices created using collected traffic flow data. The initial O/D demand matrix was adjusted in the calibra-tion process for the micro-simulation model based on comparing the modeled traffic volumes to the traffic composition and flows based on field observations. One has to notice that the forecasted traffic demand was obtained by multiplying the traffic demand for the base year 2014 with correction factors given in Table 5. These factors are used for development of VISSIM mi-crosimulation models for the analyzed future period (years 2024 and 2034).
lanes on intersection 2, and four entrance and three exit lanes on intersection 1 (Figure 4). The physical expanding of the mentioned cross-sectional profile is not a sustainable solution for current traffic problems. This is especially true for solving congestion related problems, since currently long queues form in sever-al travel directions on the examined intersections. A better approach is to guide the affected travel direc-tions through the study area with a minimum of stops caused by intersections controlled by traffic lights.
4.2 Traffic data collection
Traffic flow data was collected using manual traffic counting and automatic data collection from inductive loop detectors. The counting was performed on each intersection according to vehicle categories (individual passenger cars (PC), buses, and heavy vehicles (HV)). Data from loop detectors was obtained from Skopje’s TMCC for the years 2011 to 2014, and partially for 2015. Traffic flow balancing was performed because traffic data from two sources was used. All analyses and testings of traffic solution designs were done us-ing the afternoon peak hour since it is longer and with a larger traffic demand. The obtained traffic volumes are shown in Tables 1-4.
The total travel demand for the first intersection is 6,769 veh/h. Flow imbalance characterized by large main (dominant) and small side road traffic volumes is present. The most intensive traffic volume is at the east approach, with 2,883 veh/h and dominant left movement. The flow structure is mainly dominated by PCs (97%). The share of buses is 2% and HVs 1%.
The total travel demand at the second intersection is 8,820 veh/h. This intersection is the most critical one with the highest traffic volume. There is approxi-mately equal traffic volume at all approaches to inter-section 2. The most intensive traffic volume occurs at the west approach, with 2,822 veh/h and dominant straightforward movement. The flow structure is the same as for the first intersection.
The total travel demand at the third intersection is 5,200 veh/h. Flow imbalance with large main and small side road volumes is present again. Traffic
1 2
3 4
Figure 4 – Zoomed intersections of the Boulevard Goce Delchev

Koltovska Nečoska D, Ivanjko E, Pavleski D. Creating Infrastructure for Urban Mobility: Case Study of Skopje
Promet – Traffic & Transportation, Vol. 30, 2018, No. 4, 429-443 435
Tabl
e 1
– Tr
affic
vol
ume
in v
eh/h
of i
nter
sect
ion
1 fo
r afte
rnoo
n pe
ak h
our
Appr
oach
East
App
roac
hSo
uth
Appr
oach
Wes
t App
roac
hN
orth
App
roac
h
Dire
ctio
nLe
ftTh
roug
hRi
ght
∑Le
ftTh
roug
hRi
ght
∑Le
ftTh
roug
hRi
ght
∑Le
ftTh
roug
hRi
ght
∑
Vehi
cle
type
PC41
42,
197
195
2,80
624
625
372
643
2,14
420
42,
348
258
6345
677
7
BUS
223
025
20
1113
315
360
00
0
HV
443
552
20
1921
471
480
00
0
∑42
02,
263
200
2,88
325
025
402
677
2,22
221
02,
432
258
6345
677
7
Tota
l6,
769
Tabl
e 2
– Tr
affic
vol
ume
in v
eh/h
of i
nter
sect
ion
2 fo
r afte
rnoo
n pe
ak h
our
Appr
oach
East
App
roac
hSo
uth
Appr
oach
Wes
t Ap
proa
chN
orth
App
roac
h
Dire
ctio
nLe
ftTh
roug
hRi
ght
∑Le
ftTh
roug
hRi
ght
∑Le
ftTh
roug
hRi
ght
∑Le
ftTh
roug
hRi
ght
∑
Vehi
cle
type
PC37
11,
463
196
2,03
083
983
150
52,
175
514
2,06
219
82,
774
199
885
504
1,58
8
BUS
19
010
518
023
1524
342
014
1125
HV
517
426
914
023
2136
966
012
2638
∑37
71,
489
200
2,06
685
386
350
52,
221
550
2,12
221
02,
882
199
911
541
1,65
1
Tota
l8,
820
Koltovska Nečoska D, Ivanjko E, Pavleski D. Creating Infrastructure for Urban Mobility: Case Study of Skopje
436 Promet – Traffic & Transportation, Vol. 30, 2018, No. 4, 429-443
Tabl
e 3
– Tr
affic
vol
ume
in v
eh/h
of i
nter
sect
ion
3 fo
r afte
rnoo
n pe
ak h
our
Appr
oach
East
App
roac
hSo
uth
Appr
oach
Wes
t App
roac
hN
orth
App
roac
h
Dire
ctio
nLe
ftTh
roug
hRi
ght
∑Le
ftTh
roug
hRi
ght
∑Le
ftTh
roug
hRi
ght
∑Le
ftTh
roug
hRi
ght
∑
Vehi
cle
type
PC91
1,47
840
1,60
927
622
8238
040
2,38
933
12,
760
4729
278
354
BUS
09
09
00
00
024
024
00
11
HV
118
019
60
06
036
036
00
22
∑92
1,50
540
1,63
728
222
8238
640
2,44
933
12,
820
4729
281
357
Tota
l5,
200
Tabl
e 4
– Tr
affic
vol
ume
in v
eh/h
of i
nter
sect
ion
4 fo
r afte
rnoo
n pe
ak h
our
Appr
oach
East
App
roac
hSo
uth
Appr
oach
Wes
t App
roac
hN
orth
App
roac
h
Dire
ctio
nLe
ftTh
roug
hRi
ght
∑Le
ftTh
roug
hRi
ght
∑Le
ftTh
roug
hRi
ght
∑Le
ftTh
roug
hRi
ght
∑
Vehi
cle
type
PC15
277
121
61,
139
431
644
381,
113
1,42
832
776
32,
518
5256
640
61,
024
BUS
07
07
25
07
87
924
06
06
HV
311
1024
316
625
168
1236
48
517
∑15
578
922
61,
170
436
665
441,
145
1,45
234
278
42,
578
5658
041
11,
047
Tota
l5,
940
Koltovska Nečoska D, Ivanjko E, Pavleski D. Creating Infrastructure for Urban Mobility: Case Study of Skopje
Promet – Traffic & Transportation, Vol. 30, 2018, No. 4, 429-443 437
1) Number of observed vehicles: affects how well ve-hicles in the network can predict other vehicles’ movement and react accordingly. The value of two was used;
2) Maximum look-ahead distance: defines the max-imum distance that a vehicle can see forward in order to react to other vehicles either in front or to the side of it (within the same link). The value of 300 m was set;
3) Waiting time before diffusion: defines the max-imum amount of time a vehicle can wait at the emergency stop position for a gap to change lanes in order to stay on its route. The value of this pa-rameter was set to 120 s.The two mentioned peak hour periods were used
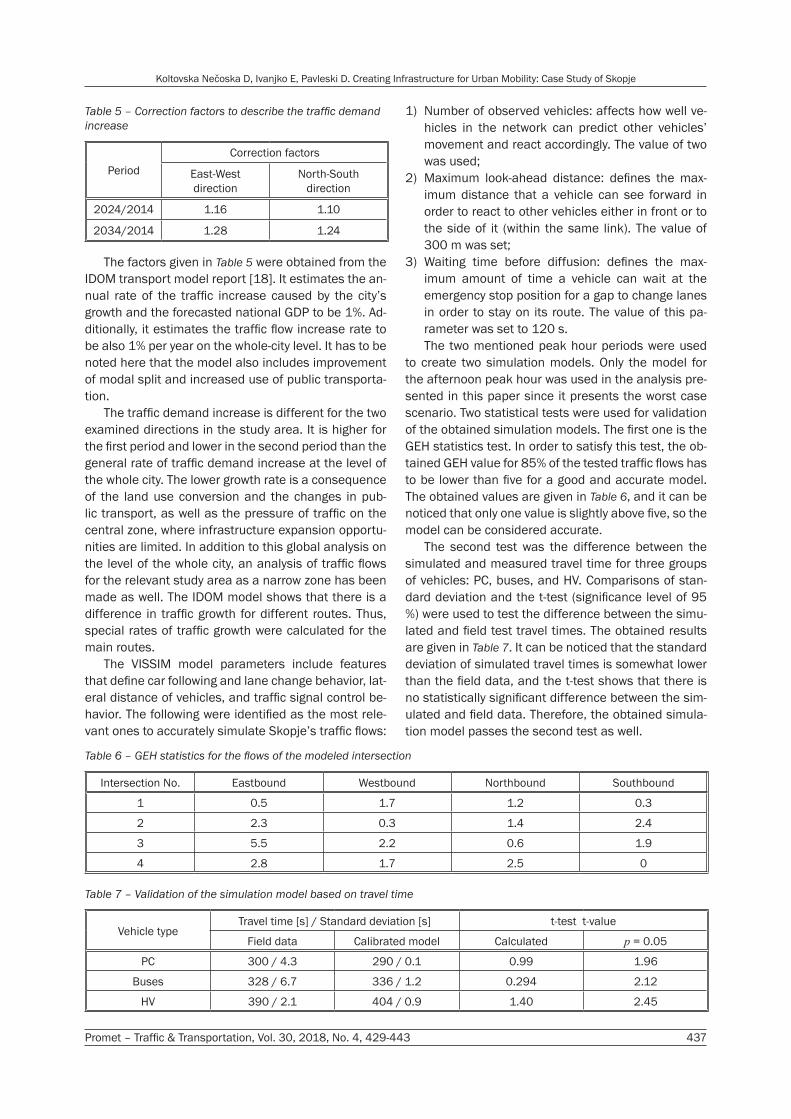
to create two simulation models. Only the model for the afternoon peak hour was used in the analysis pre-sented in this paper since it presents the worst case scenario. Two statistical tests were used for validation of the obtained simulation models. The first one is the GEH statistics test. In order to satisfy this test, the ob-tained GEH value for 85% of the tested traffic flows has to be lower than five for a good and accurate model. The obtained values are given in Table 6, and it can be noticed that only one value is slightly above five, so the model can be considered accurate.
The second test was the difference between the simulated and measured travel time for three groups of vehicles: PC, buses, and HV. Comparisons of stan-dard deviation and the t-test (significance level of 95 %) were used to test the difference between the simu-lated and field test travel times. The obtained results are given in Table 7. It can be noticed that the standard deviation of simulated travel times is somewhat lower than the field data, and the t-test shows that there is no statistically significant difference between the sim-ulated and field data. Therefore, the obtained simula-tion model passes the second test as well.
The factors given in Table 5 were obtained from the IDOM transport model report [18]. It estimates the an-nual rate of the traffic increase caused by the city’s growth and the forecasted national GDP to be 1%. Ad-ditionally, it estimates the traffic flow increase rate to be also 1% per year on the whole-city level. It has to be noted here that the model also includes improvement of modal split and increased use of public transporta-tion.
The traffic demand increase is different for the two examined directions in the study area. It is higher for the first period and lower in the second period than the general rate of traffic demand increase at the level of the whole city. The lower growth rate is a consequence of the land use conversion and the changes in pub-lic transport, as well as the pressure of traffic on the central zone, where infrastructure expansion opportu-nities are limited. In addition to this global analysis on the level of the whole city, an analysis of traffic flows for the relevant study area as a narrow zone has been made as well. The IDOM model shows that there is a difference in traffic growth for different routes. Thus, special rates of traffic growth were calculated for the main routes.
The VISSIM model parameters include features that define car following and lane change behavior, lat-eral distance of vehicles, and traffic signal control be-havior. The following were identified as the most rele-vant ones to accurately simulate Skopje’s traffic flows:
Table 5 – Correction factors to describe the traffic demand increase
PeriodCorrection factors
East-West direction
North-South direction
2024/2014 1.16 1.10
2034/2014 1.28 1.24
Table 6 – GEH statistics for the flows of the modeled intersection
Intersection No. Eastbound Westbound Northbound Southbound
1 0.5 1.7 1.2 0.3
2 2.3 0.3 1.4 2.4
3 5.5 2.2 0.6 1.9
4 2.8 1.7 2.5 0
Table 7 – Validation of the simulation model based on travel time
Vehicle typeTravel time [s] / Standard deviation [s] t-test t-value
Field data Calibrated model Calculated p = 0.05
PC 300 / 4.3 290 / 0.1 0.99 1.96
Buses 328 / 6.7 336 / 1.2 0.294 2.12
HV 390 / 2.1 404 / 0.9 1.40 2.45

Koltovska Nečoska D, Ivanjko E, Pavleski D. Creating Infrastructure for Urban Mobility: Case Study of Skopje
438 Promet – Traffic & Transportation, Vol. 30, 2018, No. 4, 429-443
services. Each component of the criteria is graded nu-merically using values from one (lowest grade) to five (highest grade).
5.2 Description of created solutions
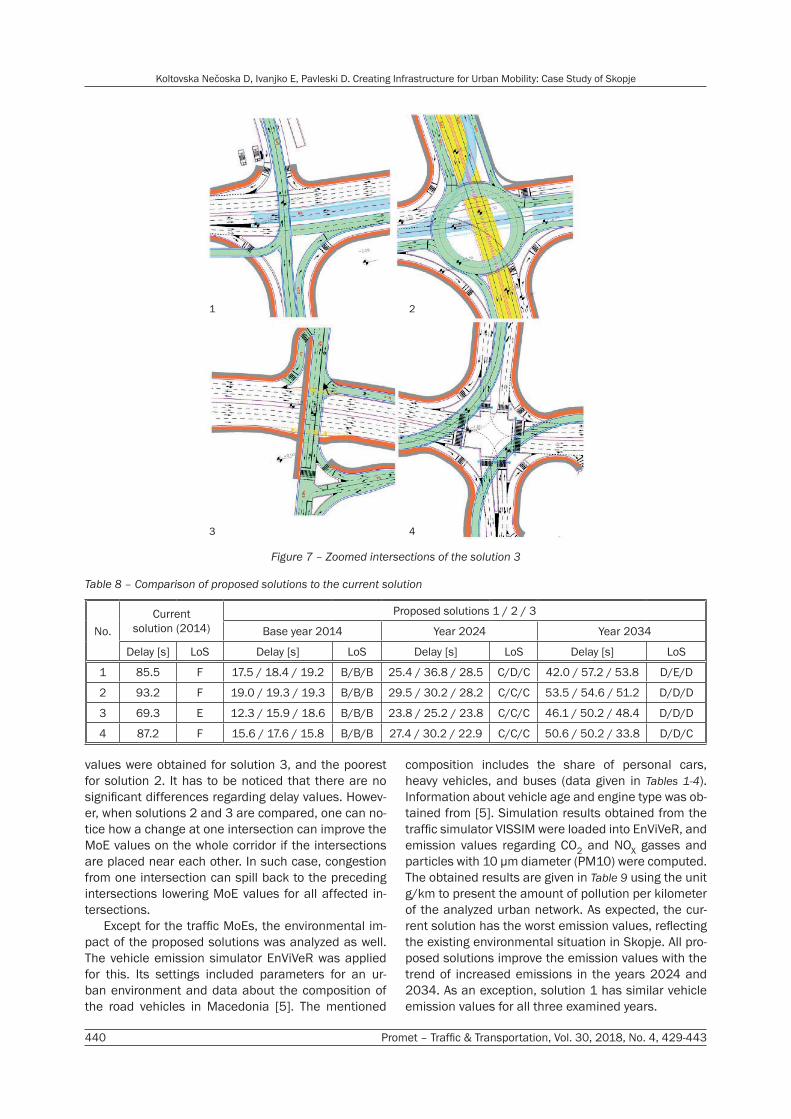
Details of all three proposed solutions are present-ed in Figures 5-7. Blue is used to denote tunnels, green to denote overpasses, orange to denote infrastructure for pedestrians and cyclists, and yellow is used to de-note underpasses. All roads on ground level are de-noted in white. Each solution contains uninterrupted traffic directions proposed to solve problematic traffic patterns identified during the in-depth analysis at in-tersection and corridor level.
Solution 1 The goal was to design an underground tunnel
for both traffic directions along the BGD corridor under intersection 2 and create elevated separate intersections using overpasses in the north-south di-rection over intersections 1, 2, and 3. An overpass for left turns over intersection 4 was designed as well. At the same grade as the boulevard, two three-lane roundabout intersections have been designed at in-tersections 2 and 4. Wide and safe infrastructure for pedestrians and cyclists has been designed as well. Advantages of this solution: adaptability of the existing traffic network infrastructure because of enough space available for construction, accessibility to all traffic flows on the urban network, and high level of pedestri-an and cyclist safety. Disadvantages are: banned left turns from the southern access of intersection 1, the three-lane roundabouts are not promising in terms of safety due to a more complex traffic situation caused by lane changing and weaving on the roundabout, and due to the fear among Macedonian drivers of using the inner circular lane. Most of the roundabouts in
5. PROPOSED URBAN MOBILITY SOLUTIONS AND TESTINGThe total number of created solutions was 10. Only
three fulfilled all of the requirements and could be evaluated from the aspect of envisaged performanc-es. The requirements and evaluated solutions are de-scribed in more details in continuation.
5.1 Requirements and evaluation criteria
Before the proposal of new traffic infrastructure can be made, requirements have to be defined. In this case, the city council of Skopje defined the follow-ing requirements to be fulfilled: (i) separate lanes for pedestrians and bicyclists; (ii) possible later upgrade with ITS services for traffic control; (iii) increased traffic safety; (iv) better environmental protection; and (v) the proposed solution is able to cope with the traffic de-mand increase in the coming 20 years. For the last re-quirement, the year 2014 was the base year because data for the whole year 2015 was not available when the analysis was done. Traffic demand was forecasted for the years 2024 and 2034, and used for additional testing of the proposed solutions.
The above requirements were used to define the criteria for comparison of proposed solutions. The cho-sen MoEs are augmented with the influence of future traffic demand on LoS, the level of traffic safety, avail-able construction space to build the proposed solution, the spatial configuration complexity, environmental in-fluence, and possibilities of applying advanced traffic control and user information systems. Since develop-ment of new infrastructure in Skopje was neglected for long periods, and the current LoS is low, the economic aspect (cost) was not examined in the criteria. The em-phasis of the criteria is on traffic throughput, suitability for future traffic demand and possible upgrades to ITS
1 2
3 4
Figure 5 – Zoomed intersections of the solution 1
Koltovska Nečoska D, Ivanjko E, Pavleski D. Creating Infrastructure for Urban Mobility: Case Study of Skopje
Promet – Traffic & Transportation, Vol. 30, 2018, No. 4, 429-443 439
system UTOPIA. This solution has the same elements as solution 2 except the changes on intersection 4, i.e., instead of a roundabout, a standard intersection with adaptive traffic signal control has been designed (Figure 7). Wide and safe infrastructure for pedestrians and cyclists is present as well. An advantage of this solution is better traffic control management by imple-menting adaptive signal control. A disadvantage is the same as that stated for solution 2.
5.3 Testing and discussion
All performed simulations to test the proposed solutions lasted one hour, and simulation resolution of 10 simulation steps per second was used. The sim-ulation time was chosen to take into account the af-ternoon congested period in a typical working day. A 900-second warm-up period was set up in each simu-lation run, before data collection for analysis started. The warm-up period is needed to fill the empty road network with vehicles and create a realistic traffic situ-ation for simulation testing.
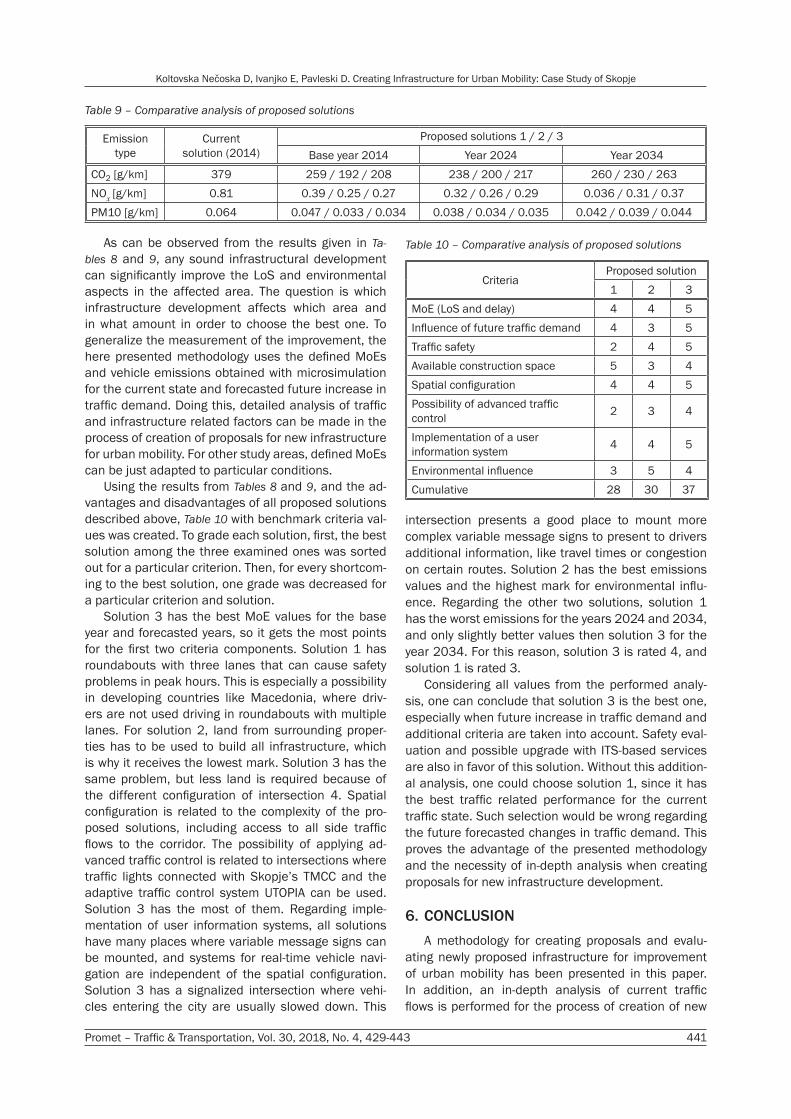
Table 8 contains the aggregated values of chosen MoEs for the current solution (base year 2014) and all of the proposed solutions (base year and years with forecasted traffic demand). It can be noticed that all proposed solutions significantly improve the delay and LoS values for all intersections. This is a direct result of the in-depth analysis of the current traffic state and creation of pass-through lanes for directions with sig-nificant traffic demand.
Differences between the proposed solutions be-come visible with the increase of traffic demand for the forecasted years 2024 and 2034. The best MoE
Macedonia are with only one lane in urban areas with low or medium traffic demand. Therefore, Macedonian drivers do not have the necessary driving skills to safe-ly use roundabouts with three lanes.
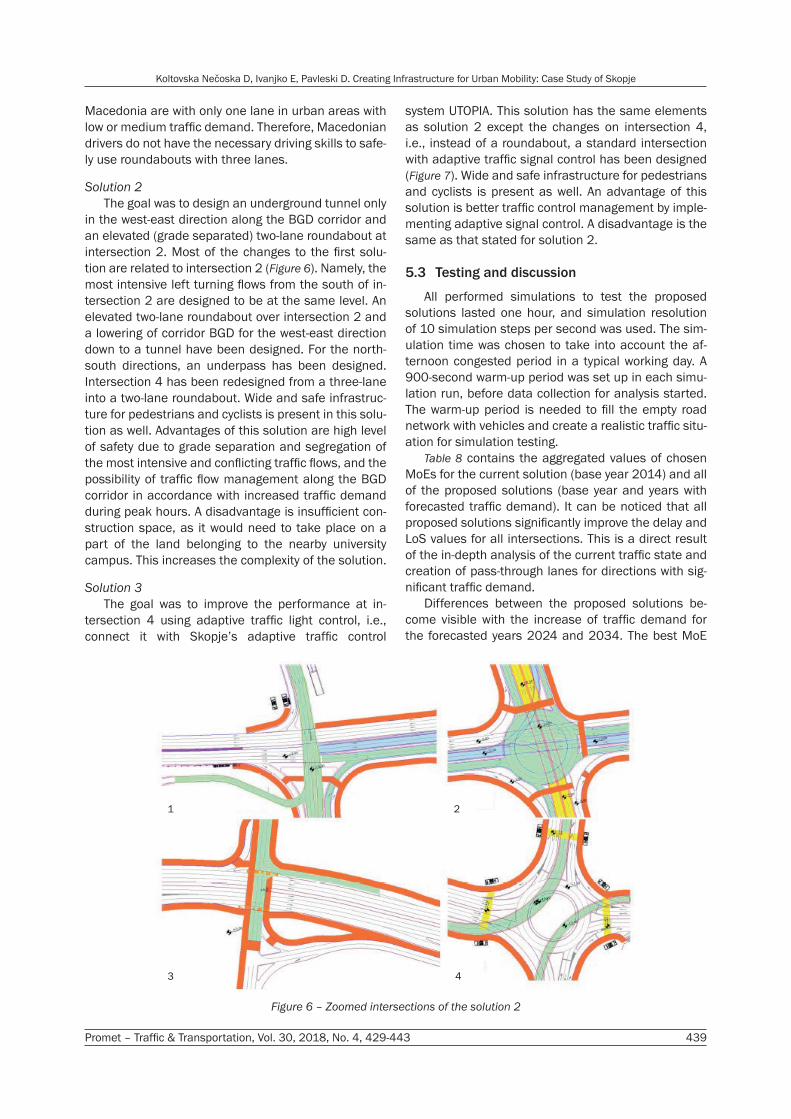
Solution 2The goal was to design an underground tunnel only
in the west-east direction along the BGD corridor and an elevated (grade separated) two-lane roundabout at intersection 2. Most of the changes to the first solu-tion are related to intersection 2 (Figure 6). Namely, the most intensive left turning flows from the south of in-tersection 2 are designed to be at the same level. An elevated two-lane roundabout over intersection 2 and a lowering of corridor BGD for the west-east direction down to a tunnel have been designed. For the north-south directions, an underpass has been designed. Intersection 4 has been redesigned from a three-lane into a two-lane roundabout. Wide and safe infrastruc-ture for pedestrians and cyclists is present in this solu-tion as well. Advantages of this solution are high level of safety due to grade separation and segregation of the most intensive and conflicting traffic flows, and the possibility of traffic flow management along the BGD corridor in accordance with increased traffic demand during peak hours. A disadvantage is insufficient con-struction space, as it would need to take place on a part of the land belonging to the nearby university campus. This increases the complexity of the solution.
Solution 3The goal was to improve the performance at in-
tersection 4 using adaptive traffic light control, i.e., connect it with Skopje’s adaptive traffic control
1 2
3 4
Figure 6 – Zoomed intersections of the solution 2
Koltovska Nečoska D, Ivanjko E, Pavleski D. Creating Infrastructure for Urban Mobility: Case Study of Skopje
440 Promet – Traffic & Transportation, Vol. 30, 2018, No. 4, 429-443
composition includes the share of personal cars, heavy vehicles, and buses (data given in Tables 1-4). Information about vehicle age and engine type was ob-tained from [5]. Simulation results obtained from the traffic simulator VISSIM were loaded into EnViVeR, and emission values regarding CO2 and NOX gasses and particles with 10 μm diameter (PM10) were computed. The obtained results are given in Table 9 using the unit g/km to present the amount of pollution per kilometer of the analyzed urban network. As expected, the cur-rent solution has the worst emission values, reflecting the existing environmental situation in Skopje. All pro-posed solutions improve the emission values with the trend of increased emissions in the years 2024 and 2034. As an exception, solution 1 has similar vehicle emission values for all three examined years.
values were obtained for solution 3, and the poorest for solution 2. It has to be noticed that there are no significant differences regarding delay values. Howev-er, when solutions 2 and 3 are compared, one can no-tice how a change at one intersection can improve the MoE values on the whole corridor if the intersections are placed near each other. In such case, congestion from one intersection can spill back to the preceding intersections lowering MoE values for all affected in-tersections.
Except for the traffic MoEs, the environmental im-pact of the proposed solutions was analyzed as well. The vehicle emission simulator EnViVeR was applied for this. Its settings included parameters for an ur-ban environment and data about the composition of the road vehicles in Macedonia [5]. The mentioned
1 2
3 4
Figure 7 – Zoomed intersections of the solution 3
Table 8 – Comparison of proposed solutions to the current solution
No.Current
solution (2014)Proposed solutions 1 / 2 / 3
Base year 2014 Year 2024 Year 2034
Delay [s] LoS Delay [s] LoS Delay [s] LoS Delay [s] LoS
1 85.5 F 17.5 / 18.4 / 19.2 B/B/B 25.4 / 36.8 / 28.5 C/D/C 42.0 / 57.2 / 53.8 D/E/D
2 93.2 F 19.0 / 19.3 / 19.3 B/B/B 29.5 / 30.2 / 28.2 C/C/C 53.5 / 54.6 / 51.2 D/D/D
3 69.3 E 12.3 / 15.9 / 18.6 B/B/B 23.8 / 25.2 / 23.8 C/C/C 46.1 / 50.2 / 48.4 D/D/D
4 87.2 F 15.6 / 17.6 / 15.8 B/B/B 27.4 / 30.2 / 22.9 C/C/C 50.6 / 50.2 / 33.8 D/D/C
Koltovska Nečoska D, Ivanjko E, Pavleski D. Creating Infrastructure for Urban Mobility: Case Study of Skopje
Promet – Traffic & Transportation, Vol. 30, 2018, No. 4, 429-443 441
intersection presents a good place to mount more complex variable message signs to present to drivers additional information, like travel times or congestion on certain routes. Solution 2 has the best emissions values and the highest mark for environmental influ-ence. Regarding the other two solutions, solution 1 has the worst emissions for the years 2024 and 2034, and only slightly better values then solution 3 for the year 2034. For this reason, solution 3 is rated 4, and solution 1 is rated 3.
Considering all values from the performed analy-sis, one can conclude that solution 3 is the best one, especially when future increase in traffic demand and additional criteria are taken into account. Safety eval-uation and possible upgrade with ITS-based services are also in favor of this solution. Without this addition-al analysis, one could choose solution 1, since it has the best traffic related performance for the current traffic state. Such selection would be wrong regarding the future forecasted changes in traffic demand. This proves the advantage of the presented methodology and the necessity of in-depth analysis when creating proposals for new infrastructure development.
6. CONCLUSIONA methodology for creating proposals and evalu-
ating newly proposed infrastructure for improvement of urban mobility has been presented in this paper. In addition, an in-depth analysis of current traffic flows is performed for the process of creation of new
As can be observed from the results given in Ta-bles 8 and 9, any sound infrastructural development can significantly improve the LoS and environmental aspects in the affected area. The question is which infrastructure development affects which area and in what amount in order to choose the best one. To generalize the measurement of the improvement, the here presented methodology uses the defined MoEs and vehicle emissions obtained with microsimulation for the current state and forecasted future increase in traffic demand. Doing this, detailed analysis of traffic and infrastructure related factors can be made in the process of creation of proposals for new infrastructure for urban mobility. For other study areas, defined MoEs can be just adapted to particular conditions.
Using the results from Tables 8 and 9, and the ad-vantages and disadvantages of all proposed solutions described above, Table 10 with benchmark criteria val-ues was created. To grade each solution, first, the best solution among the three examined ones was sorted out for a particular criterion. Then, for every shortcom-ing to the best solution, one grade was decreased for a particular criterion and solution.
Solution 3 has the best MoE values for the base year and forecasted years, so it gets the most points for the first two criteria components. Solution 1 has roundabouts with three lanes that can cause safety problems in peak hours. This is especially a possibility in developing countries like Macedonia, where driv-ers are not used driving in roundabouts with multiple lanes. For solution 2, land from surrounding proper-ties has to be used to build all infrastructure, which is why it receives the lowest mark. Solution 3 has the same problem, but less land is required because of the different configuration of intersection 4. Spatial configuration is related to the complexity of the pro-posed solutions, including access to all side traffic flows to the corridor. The possibility of applying ad-vanced traffic control is related to intersections where traffic lights connected with Skopje’s TMCC and the adaptive traffic control system UTOPIA can be used. Solution 3 has the most of them. Regarding imple-mentation of user information systems, all solutions have many places where variable message signs can be mounted, and systems for real-time vehicle navi-gation are independent of the spatial configuration. Solution 3 has a signalized intersection where vehi-cles entering the city are usually slowed down. This
Table 9 – Comparative analysis of proposed solutions
Emission type
Currentsolution (2014)
Proposed solutions 1 / 2 / 3Base year 2014 Year 2024 Year 2034
CO2 [g/km] 379 259 / 192 / 208 238 / 200 / 217 260 / 230 / 263NOx [g/km] 0.81 0.39 / 0.25 / 0.27 0.32 / 0.26 / 0.29 0.036 / 0.31 / 0.37PM10 [g/km] 0.064 0.047 / 0.033 / 0.034 0.038 / 0.034 / 0.035 0.042 / 0.039 / 0.044
Table 10 – Comparative analysis of proposed solutions
CriteriaProposed solution1 2 3
MoE (LoS and delay) 4 4 5Influence of future traffic demand 4 3 5Traffic safety 2 4 5Available construction space 5 3 4Spatial configuration 4 4 5Possibility of advanced traffic control 2 3 4
Implementation of a user information system 4 4 5
Environmental influence 3 5 4Cumulative 28 30 37
Koltovska Nečoska D, Ivanjko E, Pavleski D. Creating Infrastructure for Urban Mobility: Case Study of Skopje
442 Promet – Traffic & Transportation, Vol. 30, 2018, No. 4, 429-443
1 Отсек за сообраќај и транспорт Технички факултет - Битола Универзитет „Св. Климент Охридски“ - Битола Булевар 1ви Мај, 7000 Битола, Република Македонија 2 Zavod za inteligentne transportne sustave Fakultet prometnih znanosti, Sveučilište u Zagrebu Vukelićeva 4, HR-10000 Zagreb, Hrvatska3 Одделение за сообраќајна сигнализација и режим на сообраќај, Сектор за сообраќај во Град Скопје Булевар Илинден 82, 1000 Скопје, Република Македонија
КРЕИРАЊЕ НА ИНФРАСТРУКТУРА ЗА УРБАНА МОБИЛНОСТ: СТУДИЈА НА СЛУЧАЈ ЗА ГРАД СКОПЈЕ
АПСТРАКТ
Во овој труд е презентирана методологијата за креирање и тестирање на нова предложена сообраќајна инфраструктура. Се базира на микроскопски сообраќајни симулации за постојна и прогнозирана сообраќајна побарувачка и на длабинска анализа на сообраќајниот ток. Најпроблематичниот булевар во Скопје е избран како студија на случај. Податоците за сообраќајните токови беа прибрани и користени за калибрација и валидација на микроскопскиот симулациски модел. Три можни варијантни решенија на новата инфраструктура, за урбана мобилност, се предложени и извршен е избор на најдоброто решение, врз основа на соодветно дефинираните критериуми. Предложените варијатни решенија беа оценети, од аспект на сообраќајните перформанси, идна сообраќајна побарувачка и емисии на возила. Добиените резултати ја докажуваат ефективноста на презентираната методологија за намалување на доцнењата, емисиите на возила и значително подобрување на нивото на услугата.
КЛУЧНИ ЗБОРОВИ
урбана мобилност; изградба на инфраструктура; микроскопска симулација; сообраќајно задушување; евалуација;
REFERENCES
[1] Mahmud K, Gope K, Chowdhury SMR. Possible Caus-es & Solutions of Traffic Jam and Their Impact on the Economy of Dhaka City. Journal of Management and Sustainability. 2012;2(2): 112-135.
[2] Rodrigue JP. The Geography of transport systems. 3rd ed. New York, USA: Routledge; 2013.
[3] Solodkij A, Gorev A. System Approach to Elimination of Traffic Jams in Large Cities in Russia. World Applied Sciences Journal. 2013;23(8): 1112-1117.
[4] Wahlstedt J. Evaluation of the two self-optimising traffic signal systems Utopia/Spot and ImFlow, and comparison with existing signal control in Stockholm, Sweden. In: Proceedings of the 16th International IEEE Annual Conference on Intelligent Transportation Sys-tems (ITSC 2013), 6 - 9 October 2013, Hague, Nether-lands; 2013. p. 1541-1546.
[5] Trpevski I. Calculating emissions from road transport in Macedonia using the COPERT 4 model. Skopje,
infrastructure for urban mobility. Another goal was to obtain the traffic-related MoEs and environmental im-pacts for current and forecasted traffic demand. The obtained results have been evaluated with appropri-ately defined criteria that contain additional variables for evaluation after the simulation-based testing. The presented methodology and evaluation criteria can be adapted to available traffic/environmental data and defined requirements for any other urban environment.
The following findings can be summarized from this research: 1) In-depth analysis of traffic flows identifies critical
directions of traffic with largest traffic demand, enabling the creation of proposals for new mobility infrastructure that can cope with a larger increase in future traffic demand;
2) The overall methodology can be very useful for practitioners in traffic management in creating and evaluating the level of performance of proposed new infrastructure for urban mobility;
3) The results of the present study may be considered as an attempt toward a national level effort for es-tablishing a standardized methodology for similar studies in Macedonia and developing countries with comparative knowledge in the field of propos-ing new transport infrastructure. The most congested boulevard in the city of Skopje
has been used as a test case to demonstrate the ef-fectiveness of the presented methodology. The three proposed solutions include multi-level intersections and separate lanes for pedestrians and bicyclists. This can be considered as a shift from the current global trends to reduce car usage and increase modal split, biking and walking in urban areas. Looking more deep-ly, one can notice that there is a mix of the classical approach of just building more infrastructure for road traffic and building new infrastructure suitable to new trends in urban mobility. The proposed solutions fit well in the envisaged strategy for the development of urban mobility in the city of Skopje, especially since it includes improvement of the current infrastructure for cars due to long-standing neglect to repair/build urban mobility infrastructure and creation of a base for envis-aging the mentioned global trend in the development of urban mobility.
ACKNOWLEDGMENT
The authors wish to thank Krešimir Kušić for mak-ing the vehicle emissions simulations and helping with the analysis of the environmental influence.
Доц. др ДАНИЕЛА КОЛТОВСКА НЕЧОСКА1
E-mail: [email protected]. prof. dr. sc. EDOUARD IVANJKO2
E-mail: [email protected]ДАНИЕЛ ПАВЛЕСКИ, дис3
E-mail: [email protected]
Koltovska Nečoska D, Ivanjko E, Pavleski D. Creating Infrastructure for Urban Mobility: Case Study of Skopje
Promet – Traffic & Transportation, Vol. 30, 2018, No. 4, 429-443 443
economic and regional impact on national transport and infrastructure policies with accessibility variables. Transport. 2012;27(4): 414-427.
[13] Jakimavičius M, and Burinskienė M. Multiple criteria assessment of a new tram line development scenar-io in Vilnius City public transport system. Transport. 2013;28(4): 431-437.
[14] Šelmić M, Macura D. Model for Reducing Traffic Vol-ume: Case Study of Belgrade, Serbia. Journal of Trans-portation Engineering. 2013;140(2).
[15] Paniati J. Operational solutions to traffic congestion. Public Roads. 2004;68(3): 2-8.
[16] Gulhan G, Ceylan H, Ceylan H. Using accessibility mea-sures in transit network design. Transport. 2017;33(2): 510-519.
[17] Bham GH, Vallati M. Slip ramp design for dedicated truck lanes using microscopic traffic simulation. Trans-portation Letters. 2014;6(4): 226-239.
[18] IDOM SA. Traffic and Transport System of the City of Skopje. Study. Spain: IDOM, SA, 2011.
[19] Yousefikia M, Mamdoohi AR, Moridpour S, Noruzoliaee MH, Mahpour A. A study on the generalized TFlow-Fuzzy O-D estimation. In: Proceedings of Australasian Transport Research Forum 2013, Brisbane, Australia; 2013.
[20] Higgs B, Abbas M, Medina A. Analysis of the Wiede-mann Car Following Model over Different Speeds using Naturalistic Data. In: Proceedings of 3rd International Conference on Road Safety and Simulation, 14 – 16 September 2011, Indianapolis, Indiana, USA; 2011.
Republic of Macedonia, 2015. 10-11 Sep. Avail-able from: http://docslide.us/documents/calculat-ing-emissions-from-road-transport-in-macedonia-us-ing-the-copert-4-model.html [Accessed 21 September 2016].
[6] Koltovska Nechoska D. [Traffic study for the central urban area of the city of Skopje (Goce Delchev Boule-vard)], Book 1, Study. Bitola, Republic of Macedonia: Department for Traffic and Transport, Faculty of Tech-nical Sciences, Sv. Kliment Ohridski University; 2014. Macedonian
[7] Midgley P. Improving Urban Mobility. In: AITPM 2011 National Conference, Linking Communities: Growing liveability and accessibility, 10 – 11 August 2011, Mel-bourne, Australia; 2011.
[8] Dimitriou HT. Transport Planning for Third World Cities (Routledge Revivals). Routledge; 2013.
[9] Asensio J, Roca B. Evaluation of transport infrastruc-ture projects beyond cost-benefit analysis. An applica-tion to Barcelona's 4th ring road. International Journal of Transport Economics. 2001;28(3): 387-403.
[10] Van Acker V, van Cauwenberge B, Witlox F. MaxSumo: A new approach to the evaluation of mobility manage-ment projects. In: Trček, F., Kos, D. (ed.) Rethinking Ev-eryday Mobility. Ljubljana, Slovenia: Založba FDV/The Publishing House of the Faculty of Social Sciences; 2012. p. 133-154.
[11] Zhao J, and Deng W. Fuzzy multiobjective decision support model for urban rail transit projects in China. Transport. 2013;28(3): 224-235.
[12] Álvarez-Herranz MA, Martínez-Ruiz P. Evaluating the