Leapfrogging towards sustainable mobility
29
Leapfrogging towards sustainable mobility: Enablers of socio-technical transition towards Sustainable Urban Mobility System in developing country cities: The case of Bangalore and Jakarta Anteneh Getnet Dagnachew, 2013 Supervisors: Dr. Wina Graus and Dr. Niki Frantzeskaki
Transcript of Leapfrogging towards sustainable mobility
Leapfrogging towards sustainable mobility:
Enablers of socio-technical transition towards Sustainable Urban Mobility System in developing country cities: The case of Bangalore and Jakarta
Anteneh Getnet Dagnachew, 2013
Supervisors: Dr. Wina Graus and Dr. Niki Frantzeskaki
Leapfrogging towards sustainable mobility 2013
1
Chapter 1: Introduction and Research Methodology
1.1 Background & Problem definition
The current system of transport suffers from a number of intractable problems that include congestion, noise pollution, accidents, depletion of resources, and local air pollutants. The transport sector is also an important contributor to global greenhouse gases (GHGs) emissions. Hoen et al. (2009)argue that the contributions of the transport sector to global GHG emissions amounted to nearly 20% in 2009. These GHG emissions are causing severe changes of the world climate and are posing a serious threat for the environment and the human health. Moreover, the global transport energy use has shown steady increase in recent decades. From 1971 to 2006 energy consumption of the transport sector rose by between 2.0% and 2.5% annually (IEA, 2009).
The world population is set to grow from 7 billion today to 9.3 billion by 2050 (in the medium variant), while the proportion of the global population living in cities is expected to rise from 52% in 2011 to 67% in 2050 (Lerner, 2011; UN Population Division, 2011), in absolute numbers it grows from 3.6 billion in 2011 to 6,3 billion in 2050 (which is more than the total world population was in 2002) (UN, 2012). Cities are critical elements of unsustainable development because of the high level and ever growing consumption of resources that extend the ecological footprint beyond their geographic boundaries. The most fundamental impact of urbanization due to pressures from population increases is the direct increase in demands for all kinds of infrastructures(UTCE Ltd.- ALMEC Corporation, 2005; Economic and Social Commission for Asia and the Pacific, 2003; Satterthwaite, 2010; Iim, 2005). The transport sector is no exception; thus as cities grow in size and population, demand for mobility increases.
In most of the cities in developing countries public transport is heavily subsidized because of its large positive externalities (reduced need for roadways and reduced congestion) but also to ensure access by low-income households. Nevertheless, public transport service in some of these cities is not affordable for the poorest segment of the population. Thus cities face pressure to keep fares very low in order to serve all parts of the population, but in doing so, the quality and comfort of the public transport system will be sacrificed(Faiz, 2011; Sperling & Clausen, 2002). As the result, the middle-class riders react by buying cars as soon as they can afford one. This phenomenon results in diminishing transit revenues, and the quality of the service will be further reduced to keep the fares affordable to the poor. Although the quality of service suffers first, a decrease in quantity of service often follows. Consequently, rapid growth in demand for private vehicles or other motorized transport has swamped transport capacity in most of the cities in developing countries.
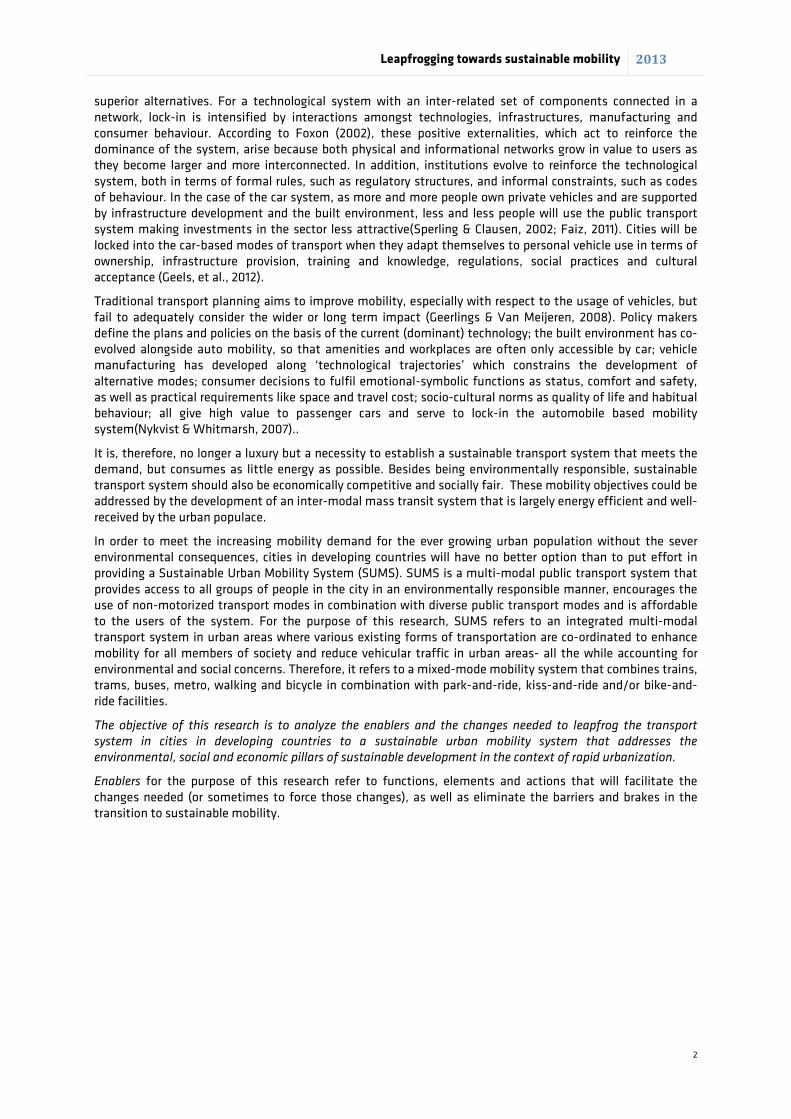
According to Schafer (2006), population and income growth are the two single most important factors that explain increase in passenger mobility; and the two fundamental variables that influence the demand for personal vehicles(Sivak & Tsimhoni, 2008). Several recent studies(UN-HABITAT, 2010; Annez & Buckley, 2009) that explored the link between urbanization and economic development in Africa and Asia found positive results that show indeed urbanization is the major factor behind economic growth, contributing to an overall reduction in poverty rates(UN-HABITAT, 2010). This link between urbanization and economic development can also be seen when countries are aggregated by income level: high income countries show highest GDP per capita and high level of urbanization while the low-income countries populate the opposite end of the list as shown in Figure 1 below.
Various studies (Dargay, et al., 2007; Ali & Dadush, 2012; Sivak & Tsimhoni, 2008; Newman, 2000; Dargay & Gately, 1998; Currie & Delbosc, 2009) explored the relation between Per Capita income (one of the most common measures of economic development) and vehicle ownership. This studies show that the relationship between the growth of vehicle ownership and per capita income is highly non-linear where vehicle ownership grows relatively slowly at the lowest levels of per capita income (GDP per capita less than 3,000USD), then twice as fast as Per Capita income at middle-income levels (GDP per capita between 3,000USD and 10,000USD) and as fast as per capita income at higher income levels (GDP per capita between 10,000USD and 20,000USD), before reaching saturation at the highest levels of income. Both Ali & Dadush (2012) and Dargeu, et al. (2007) indicate that the income elasticity of vehicle ownership starts low but increases rapidly over the range of USD 3,000 to USD 10,000, when vehicle ownership increases twice as fast as Per Capita income.
An article by Wolfgang Köhler (2006, p. 20) shows that in Bangkok 400 additional vehicles (including two-wheelers) are registered every day and Beijing adds 1000 vehicles (including two-wheelers) to the city every day. This inevitably leads to the lock-in in private car ownership. Lock-in, as defined by Tibbs (1998), is the phenomenon by which dominant technologies become established in spite of the existence of technically
Leapfrogging towards sustainable mobility 2013
2
superior alternatives. For a technological system with an inter-related set of components connected in a network, lock-in is intensified by interactions amongst technologies, infrastructures, manufacturing and consumer behaviour. According to Foxon (2002), these positive externalities, which act to reinforce the dominance of the system, arise because both physical and informational networks grow in value to users as they become larger and more interconnected. In addition, institutions evolve to reinforce the technological system, both in terms of formal rules, such as regulatory structures, and informal constraints, such as codes of behaviour. In the case of the car system, as more and more people own private vehicles and are supported by infrastructure development and the built environment, less and less people will use the public transport system making investments in the sector less attractive(Sperling & Clausen, 2002; Faiz, 2011). Cities will be locked into the car-based modes of transport when they adapt themselves to personal vehicle use in terms of ownership, infrastructure provision, training and knowledge, regulations, social practices and cultural acceptance (Geels, et al., 2012).
Traditional transport planning aims to improve mobility, especially with respect to the usage of vehicles, but fail to adequately consider the wider or long term impact (Geerlings & Van Meijeren, 2008). Policy makers define the plans and policies on the basis of the current (dominant) technology; the built environment has co-evolved alongside auto mobility, so that amenities and workplaces are often only accessible by car; vehicle manufacturing has developed along ‘technological trajectories’ which constrains the development of alternative modes; consumer decisions to fulfil emotional-symbolic functions as status, comfort and safety, as well as practical requirements like space and travel cost; socio-cultural norms as quality of life and habitual behaviour; all give high value to passenger cars and serve to lock-in the automobile based mobility system(Nykvist & Whitmarsh, 2007)..
It is, therefore, no longer a luxury but a necessity to establish a sustainable transport system that meets the demand, but consumes as little energy as possible. Besides being environmentally responsible, sustainable transport system should also be economically competitive and socially fair. These mobility objectives could be addressed by the development of an inter-modal mass transit system that is largely energy efficient and well-received by the urban populace.
In order to meet the increasing mobility demand for the ever growing urban population without the sever environmental consequences, cities in developing countries will have no better option than to put effort in providing a Sustainable Urban Mobility System (SUMS). SUMS is a multi-modal public transport system that provides access to all groups of people in the city in an environmentally responsible manner, encourages the use of non-motorized transport modes in combination with diverse public transport modes and is affordable to the users of the system. For the purpose of this research, SUMS refers to an integrated multi-modal transport system in urban areas where various existing forms of transportation are co-ordinated to enhance mobility for all members of society and reduce vehicular traffic in urban areas- all the while accounting for environmental and social concerns. Therefore, it refers to a mixed-mode mobility system that combines trains, trams, buses, metro, walking and bicycle in combination with park-and-ride, kiss-and-ride and/or bike-and-ride facilities.
The objective of this research is to analyze the enablers and the changes needed to leapfrog the transport system in cities in developing countries to a sustainable urban mobility system that addresses the environmental, social and economic pillars of sustainable development in the context of rapid urbanization.
Enablers for the purpose of this research refer to functions, elements and actions that will facilitate the changes needed (or sometimes to force those changes), as well as eliminate the barriers and brakes in the transition to sustainable mobility.
Leapfrogging towards sustainable mobility 2013
3
Figure 1: Income per capita and Urbanization, 2011
(The World Bank Data)
1.2 Research Methodology
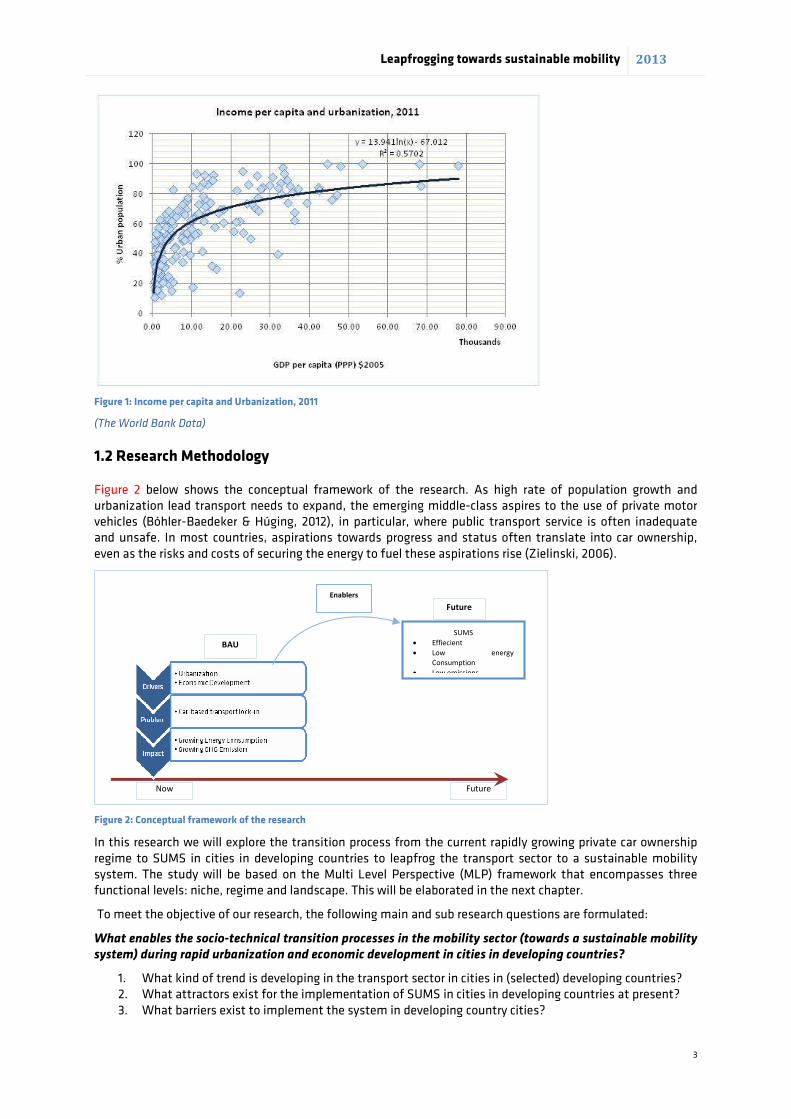
Figure 2 below shows the conceptual framework of the research. As high rate of population growth and urbanization lead transport needs to expand, the emerging middle-class aspires to the use of private motor vehicles (Bóhler-Baedeker & Húging, 2012), in particular, where public transport service is often inadequate and unsafe. In most countries, aspirations towards progress and status often translate into car ownership, even as the risks and costs of securing the energy to fuel these aspirations rise (Zielinski, 2006).
Figure 2: Conceptual framework of the research
In this research we will explore the transition process from the current rapidly growing private car ownership regime to SUMS in cities in developing countries to leapfrog the transport sector to a sustainable mobility system. The study will be based on the Multi Level Perspective (MLP) framework that encompasses three functional levels: niche, regime and landscape. This will be elaborated in the next chapter.
To meet the objective of our research, the following main and sub research questions are formulated:
What enables the socio-technical transition processes in the mobility sector (towards a sustainable mobility system) during rapid urbanization and economic development in cities in developing countries?
1. What kind of trend is developing in the transport sector in cities in (selected) developing countries? 2. What attractors exist for the implementation of SUMS in cities in developing countries at present? 3. What barriers exist to implement the system in developing country cities?
Future
SUMS
• Effiecient
• Low energy
Consumption
• Low emissions
Future
BAU
Now
Enablers
Leapfrogging towards sustainable mobility 2013
4
Data used in this study is collected through:
a. Desk research with literature review, review of organizational record (organizations where data is acquired include International Transport Forum, World Resource Institute, UN-HABITAT, The International Association of Public Transport, Nation Masters, World Bank, IEA Energy Technology Perspectives, Energy statistics IEA, PRIMES, CBS, Cities ACT, Global Transport Intelligence Initiative, ELTIS, European Platform on Mobility Management TEM, Census of India, Bangalore City Municipal Corporations, Bangalore City Bus Transport Corporations, Urban Development Authorities, Bangalore Traffic Police Departments, and other local and national records of the transport and energy sectors in the selected countries and cities),
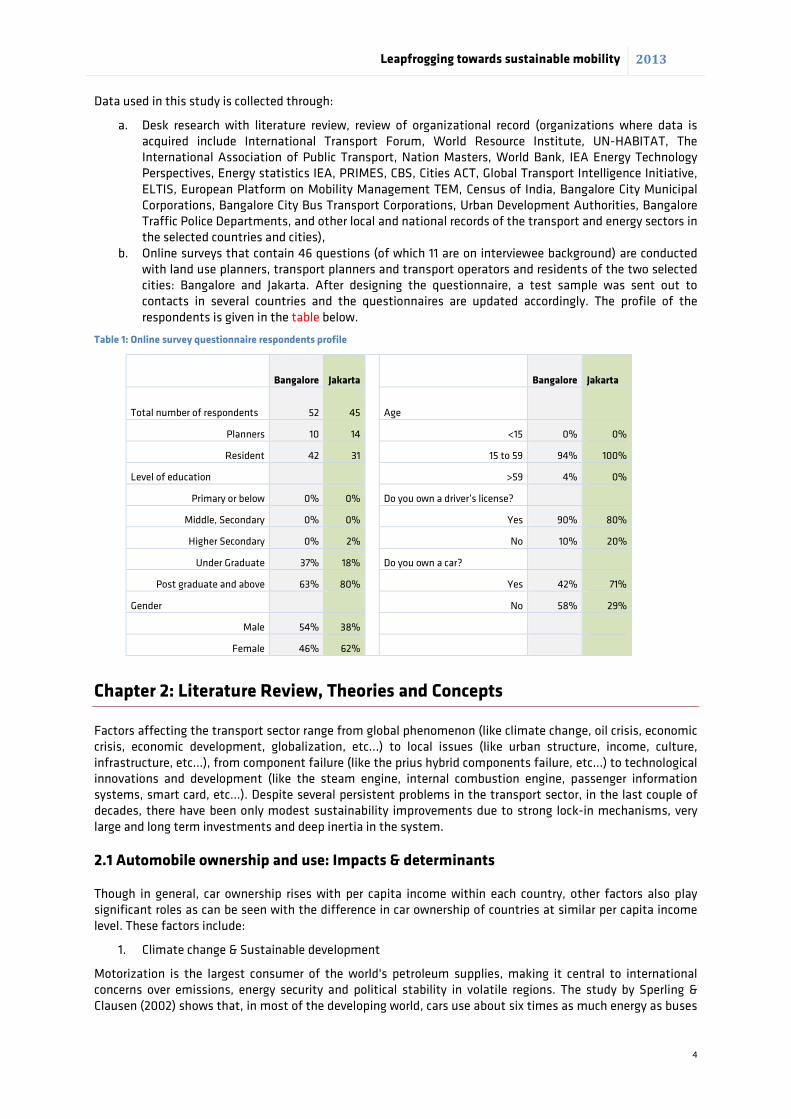
b. Online surveys that contain 46 questions (of which 11 are on interviewee background) are conducted with land use planners, transport planners and transport operators and residents of the two selected cities: Bangalore and Jakarta. After designing the questionnaire, a test sample was sent out to contacts in several countries and the questionnaires are updated accordingly. The profile of the respondents is given in the table below.
Table 1: Online survey questionnaire respondents profile
Bangalore Jakarta
Bangalore Jakarta
Total number of respondents 52 45 Age
Planners 10 14 <15 0% 0%
Resident 42 31 15 to 59 94% 100%
Level of education >59 4% 0%
Primary or below 0% 0% Do you own a driver’s license?
Middle, Secondary 0% 0% Yes 90% 80%
Higher Secondary 0% 2% No 10% 20%
Under Graduate 37% 18% Do you own a car?
Post graduate and above 63% 80% Yes 42% 71%
Gender No 58% 29%
Male 54% 38%
Female 46% 62%
Chapter 2: Literature Review, Theories and Concepts
Factors affecting the transport sector range from global phenomenon (like climate change, oil crisis, economic crisis, economic development, globalization, etc…) to local issues (like urban structure, income, culture, infrastructure, etc…), from component failure (like the prius hybrid components failure, etc…) to technological innovations and development (like the steam engine, internal combustion engine, passenger information systems, smart card, etc…). Despite several persistent problems in the transport sector, in the last couple of decades, there have been only modest sustainability improvements due to strong lock-in mechanisms, very large and long term investments and deep inertia in the system.
2.1 Automobile ownership and use: Impacts & determinants
Though in general, car ownership rises with per capita income within each country, other factors also play significant roles as can be seen with the difference in car ownership of countries at similar per capita income level. These factors include:
1. Climate change & Sustainable development
Motorization is the largest consumer of the world's petroleum supplies, making it central to international concerns over emissions, energy security and political stability in volatile regions. The study by Sperling & Clausen (2002) shows that, in most of the developing world, cars use about six times as much energy as buses
Leapfrogging towards sustainable mobility 2013
5
per passenger-kilometre. And it is an increasingly greater source of greenhouse gas (GHG) emissions contributing to climate change. Emissions from transport, and especially motor vehicles, add considerably to the levels of greenhouse gases in the atmosphere. Worldwide, GHGs are rising faster in transportation than in any other sector, and fastest of all in developing countries (Sperling & Clausen, 2002). Climate change and sustainable development policies are putting significant pressure on the transport sector.
2. Urbanization & economic development
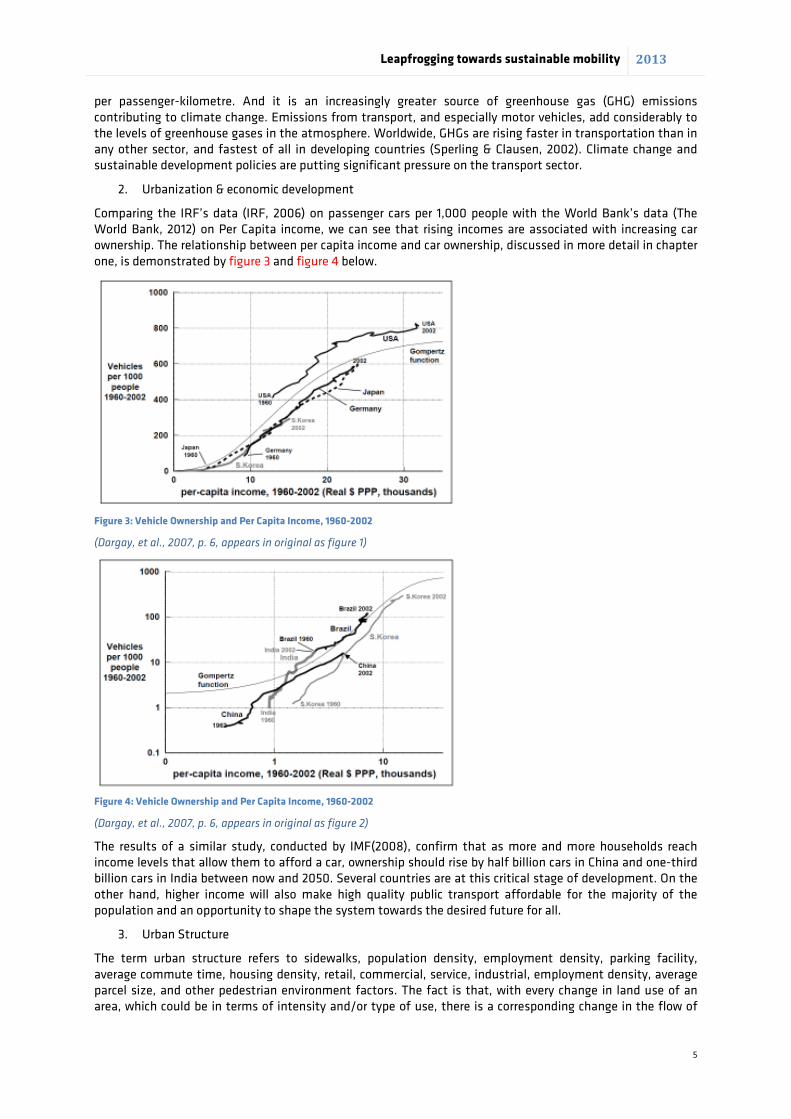
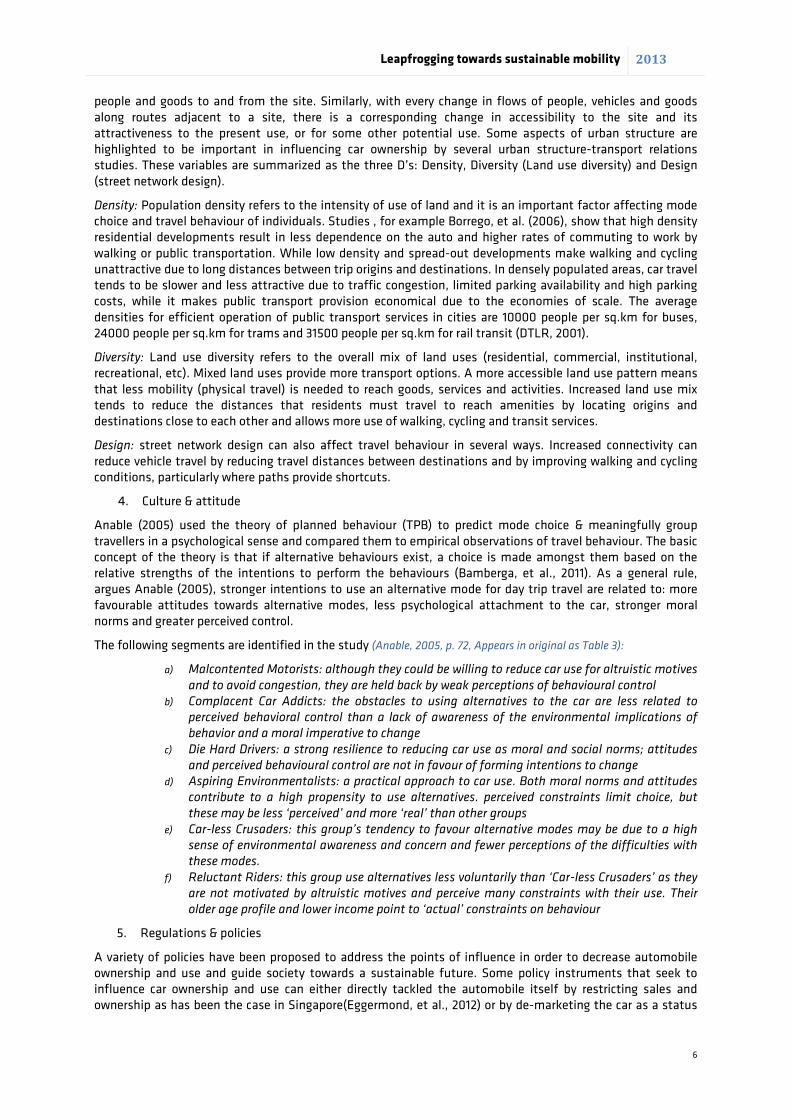
Comparing the IRF’s data (IRF, 2006) on passenger cars per 1,000 people with the World Bank’s data (The World Bank, 2012) on Per Capita income, we can see that rising incomes are associated with increasing car ownership. The relationship between per capita income and car ownership, discussed in more detail in chapter one, is demonstrated by figure 3 and figure 4 below.
Figure 3: Vehicle Ownership and Per Capita Income, 1960-2002
(Dargay, et al., 2007, p. 6, appears in original as figure 1)
Figure 4: Vehicle Ownership and Per Capita Income, 1960-2002
(Dargay, et al., 2007, p. 6, appears in original as figure 2)
The results of a similar study, conducted by IMF(2008), confirm that as more and more households reach income levels that allow them to afford a car, ownership should rise by half billion cars in China and one-third billion cars in India between now and 2050. Several countries are at this critical stage of development. On the other hand, higher income will also make high quality public transport affordable for the majority of the population and an opportunity to shape the system towards the desired future for all.
3. Urban Structure
The term urban structure refers to sidewalks, population density, employment density, parking facility, average commute time, housing density, retail, commercial, service, industrial, employment density, average parcel size, and other pedestrian environment factors. The fact is that, with every change in land use of an area, which could be in terms of intensity and/or type of use, there is a corresponding change in the flow of
Leapfrogging towards sustainable mobility 2013
6
people and goods to and from the site. Similarly, with every change in flows of people, vehicles and goods along routes adjacent to a site, there is a corresponding change in accessibility to the site and its attractiveness to the present use, or for some other potential use. Some aspects of urban structure are highlighted to be important in influencing car ownership by several urban structure-transport relations studies. These variables are summarized as the three D’s: Density, Diversity (Land use diversity) and Design (street network design).
Density: Population density refers to the intensity of use of land and it is an important factor affecting mode choice and travel behaviour of individuals. Studies , for example Borrego, et al. (2006), show that high density residential developments result in less dependence on the auto and higher rates of commuting to work by walking or public transportation. While low density and spread-out developments make walking and cycling unattractive due to long distances between trip origins and destinations. In densely populated areas, car travel tends to be slower and less attractive due to traffic congestion, limited parking availability and high parking costs, while it makes public transport provision economical due to the economies of scale. The average densities for efficient operation of public transport services in cities are 10000 people per sq.km for buses, 24000 people per sq.km for trams and 31500 people per sq.km for rail transit (DTLR, 2001).
Diversity: Land use diversity refers to the overall mix of land uses (residential, commercial, institutional, recreational, etc). Mixed land uses provide more transport options. A more accessible land use pattern means that less mobility (physical travel) is needed to reach goods, services and activities. Increased land use mix tends to reduce the distances that residents must travel to reach amenities by locating origins and destinations close to each other and allows more use of walking, cycling and transit services.
Design: street network design can also affect travel behaviour in several ways. Increased connectivity can reduce vehicle travel by reducing travel distances between destinations and by improving walking and cycling conditions, particularly where paths provide shortcuts.
4. Culture & attitude
Anable (2005) used the theory of planned behaviour (TPB) to predict mode choice & meaningfully group travellers in a psychological sense and compared them to empirical observations of travel behaviour. The basic concept of the theory is that if alternative behaviours exist, a choice is made amongst them based on the relative strengths of the intentions to perform the behaviours (Bamberga, et al., 2011). As a general rule, argues Anable (2005), stronger intentions to use an alternative mode for day trip travel are related to: more favourable attitudes towards alternative modes, less psychological attachment to the car, stronger moral norms and greater perceived control.
The following segments are identified in the study (Anable, 2005, p. 72, Appears in original as Table 3):
a) Malcontented Motorists: although they could be willing to reduce car use for altruistic motives
and to avoid congestion, they are held back by weak perceptions of behavioural control b) Complacent Car Addicts: the obstacles to using alternatives to the car are less related to
perceived behavioral control than a lack of awareness of the environmental implications of behavior and a moral imperative to change
c) Die Hard Drivers: a strong resilience to reducing car use as moral and social norms; attitudes and perceived behavioural control are not in favour of forming intentions to change
d) Aspiring Environmentalists: a practical approach to car use. Both moral norms and attitudes contribute to a high propensity to use alternatives. perceived constraints limit choice, but
these may be less ‘perceived’ and more ‘real’ than other groups e) Car-less Crusaders: this group’s tendency to favour alternative modes may be due to a high
sense of environmental awareness and concern and fewer perceptions of the difficulties with these modes.
f) Reluctant Riders: this group use alternatives less voluntarily than ‘Car-less Crusaders’ as they are not motivated by altruistic motives and perceive many constraints with their use. Their older age profile and lower income point to ‘actual’ constraints on behaviour
5. Regulations & policies
A variety of policies have been proposed to address the points of influence in order to decrease automobile ownership and use and guide society towards a sustainable future. Some policy instruments that seek to influence car ownership and use can either directly tackled the automobile itself by restricting sales and ownership as has been the case in Singapore(Eggermond, et al., 2012) or by de-marketing the car as a status

Leapfrogging towards sustainable mobility 2013
7
symbol and convenient accessory of modern life(Wright & Egan, 2000). Schuitema, et al., (2007) makes a distinction between push and pull policy measures. Push measures are aimed at directly reducing the attractiveness of car use, for example an increase in the costs of car use by increasing fuel taxes. Pull measures, on the other hand, are aimed at increasing the attractiveness of alternative transportation modes, and, consequently, at making car use relatively less attractive, for example by decreasing costs for public transport. Regulatory, physical and fiscal measures to control car ownership and use include; control and charging of parking spaces, permit schemes that allow access only for designated users or drivers with certain license plate numbers, bus only and high occupancy vehicle lanes, fuel price increases, and road pricing.
6. Transit service quality & fare
In order to stimulate transit service use or modal shifts from private automobile to transit services, high service quality of public transport system that is competitive in meeting travelling needs of the user is very important. Transit service quality may be considered as a function of rider comfort, cleanliness and appearance, safety and security, pedestrian environment, amenities, headway, hours of service, parking spaces, reliability, service coverage, transfer and cost(Litman, 2013).
Figure 5 below summarizes factors strengthening the car regime.
Figure 5: Factors in the vicious circle of the car regime
2.2. Multi Level Perspective (MLP): Socio-technical transition in the mobility sector
Transition in the mobility sector requires more than just innovation and technological fixes; it requires a broader structural change in technology, as well as in institutions. The many problems mentioned in the previous sections are too complex to address within existing institutions. In order to transcend our current way of thinking and escape the lock-in, according to Loorbach(2007), structural changes are needed at the level of our societal systems. Loorbach(2007) defined transition as:
Transitions are transformation processes in which existing structures, institutions, culture
and practices are broken down and new ones are established (Loorbach, 2007, p. 17).
Transportation in urban areas is highly complex because of the modes involved, the multitude of origins and destinations, the amount and variety of traffic, the number and variety of actors involved, and the number and variety of institutions involved. From a complex systems theory point of view, argues Rotmans, transitions could be considered as system transformations from slow equilibrium dynamics to quick
Increased car use
Congested roads and
parking shortage
Resource for more roads
and parking spaces
Lower density
developments and
dispersed activities
Greater distance
between activity nodes
Less Public transport use
Economic and practical
difficulty of providing
good PT
Higher fares and poorer
services of PT
Difficulty for NMT
infrastructure provision
Less use of NMT
NMT becomes less
interesting
Urbanization & Economic
Development Increased car ownership Car centered culture &
attitude
Car favoring policies and
regulations
Leapfrogging towards sustainable mobility 2013
8
development and instability, reverting to relative stability (Rotmans, 1994). This way transitions are generally recognized as fundamental changes to a more sustainable configuration of a socio-technical regime.
Recent technology innovation and transition studies use the concept of co–evolution to analyze socio–technical transformation and transition processes(Geels, et al., 2012; Geels, 2001; Hekkert, et al., 2006; Geerlings, et al., 2012). Most of these studies emphasize the crucial role of the interaction between various levels of actors, factors and institutions in the socio-technical system. This way, the different forces that are considered critical in the three deterministic paradigms are brought together in an inter-related inter-disciplinary dynamics. The name of the theory/framework, multi-level perspective (MLP), refers to the distinction that the perspective makes between several scale levels.
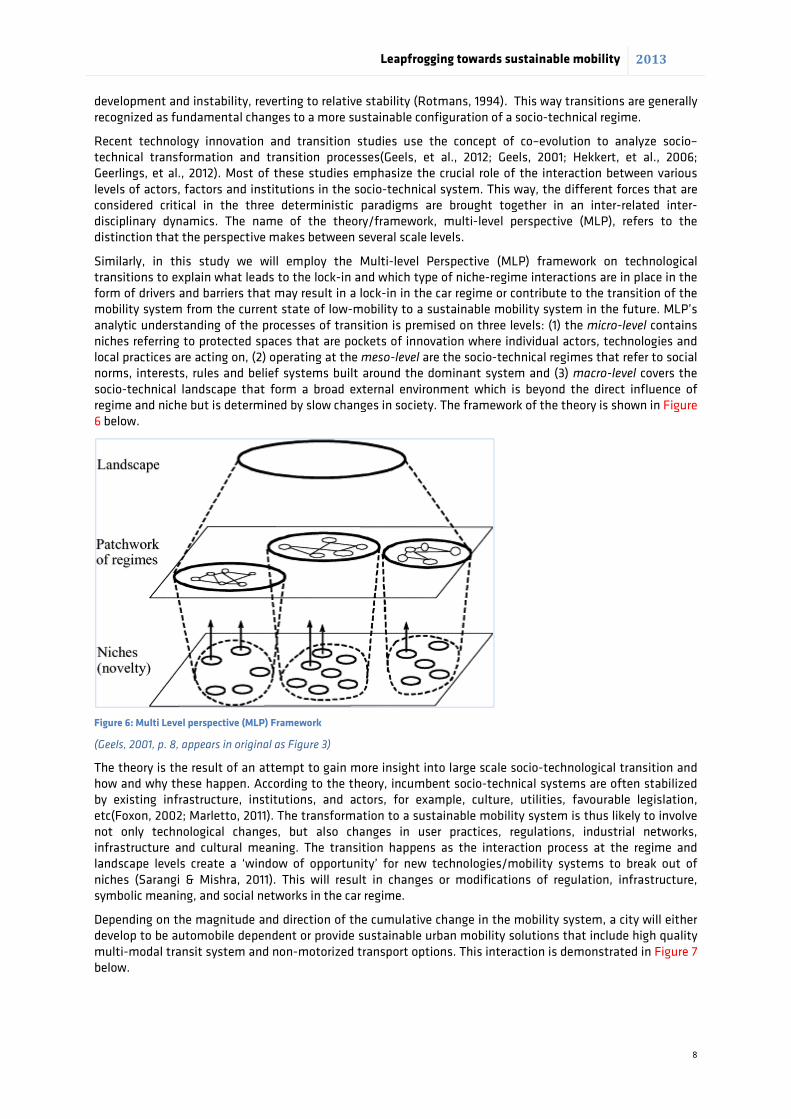
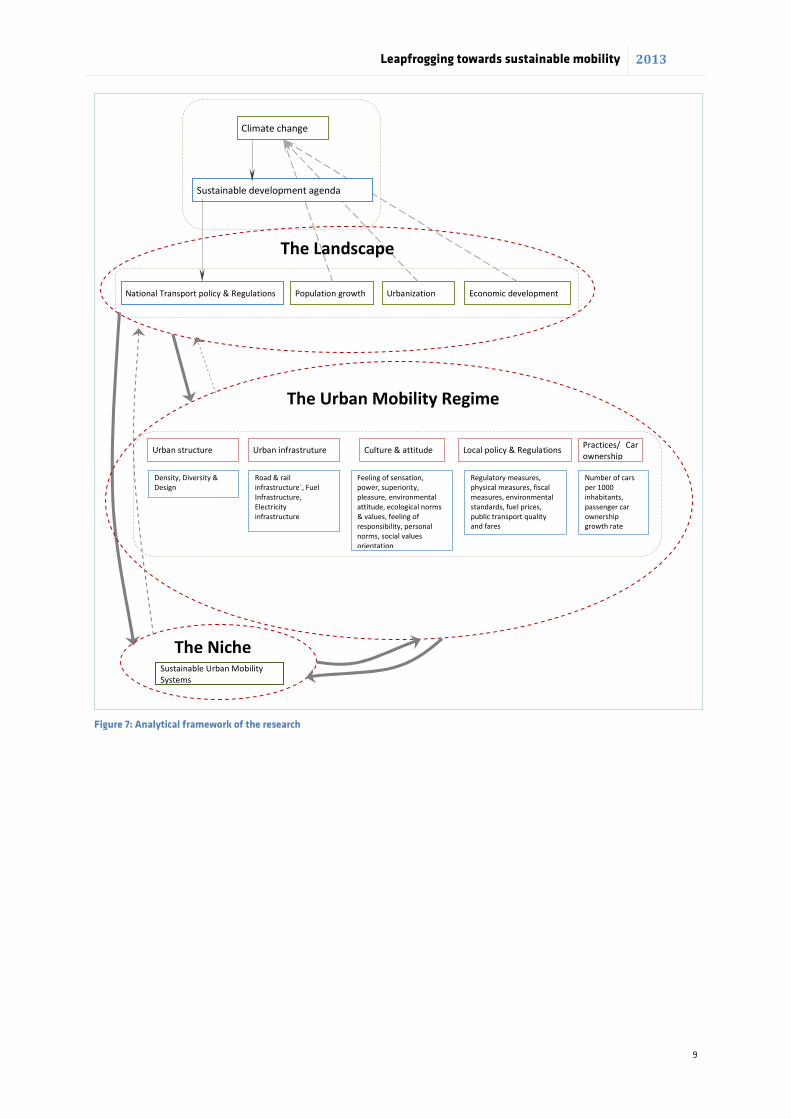
Similarly, in this study we will employ the Multi-level Perspective (MLP) framework on technological transitions to explain what leads to the lock-in and which type of niche-regime interactions are in place in the form of drivers and barriers that may result in a lock-in in the car regime or contribute to the transition of the mobility system from the current state of low-mobility to a sustainable mobility system in the future. MLP’s analytic understanding of the processes of transition is premised on three levels: (1) the micro-level contains niches referring to protected spaces that are pockets of innovation where individual actors, technologies and local practices are acting on, (2) operating at the meso-level are the socio-technical regimes that refer to social norms, interests, rules and belief systems built around the dominant system and (3) macro-level covers the socio-technical landscape that form a broad external environment which is beyond the direct influence of regime and niche but is determined by slow changes in society. The framework of the theory is shown in Figure 6 below.
Figure 6: Multi Level perspective (MLP) Framework
(Geels, 2001, p. 8, appears in original as Figure 3)
The theory is the result of an attempt to gain more insight into large scale socio-technological transition and how and why these happen. According to the theory, incumbent socio-technical systems are often stabilized by existing infrastructure, institutions, and actors, for example, culture, utilities, favourable legislation, etc(Foxon, 2002; Marletto, 2011). The transformation to a sustainable mobility system is thus likely to involve not only technological changes, but also changes in user practices, regulations, industrial networks, infrastructure and cultural meaning. The transition happens as the interaction process at the regime and landscape levels create a ‘window of opportunity’ for new technologies/mobility systems to break out of niches (Sarangi & Mishra, 2011). This will result in changes or modifications of regulation, infrastructure, symbolic meaning, and social networks in the car regime.
Depending on the magnitude and direction of the cumulative change in the mobility system, a city will either develop to be automobile dependent or provide sustainable urban mobility solutions that include high quality multi-modal transit system and non-motorized transport options. This interaction is demonstrated in Figure 7 below.
Leapfrogging towards sustainable mobility 2013
9
Figure 7: Analytical framework of the research
Sustainable Urban Mobility
Systems
The Niche
Population growth Urbanization Economic development National Transport policy & Regulations
Climate change
Sustainable development agenda
The Landscape
Urban structure Culture & attitude Practices/ Car
ownership Local policy & Regulations
Density, Diversity &
Design
Road & rail
infrastructure`, Fuel
Infrastructure,
Electricity
infrastructure
Feeling of sensation,
power, superiority,
pleasure, environmental
attitude, ecological norms
& values, feeling of
responsibility, personal
norms, social values
orientation
Regulatory measures,
physical measures, fiscal
measures, environmental
standards, fuel prices,
public transport quality
and fares
The Urban Mobility Regime
Urban infrastruture
Number of cars
per 1000
inhabitants,
passenger car
ownership
growth rate
Leapfrogging towards sustainable mobility 2013
10
Chapter 3: Scope
3.1 Selection criteria
Our selection criteria for the countries of focus are:
a. The country is an Emerging Market as classified by the International Monetary Fund b. The country has a GDP per capita PPP of between USD 3000 and USD 10,000 c. The country has a rapid economic growth (GDP growth rate greater than the Global average, i.e. 3.9%
in 2011(IMF, 2013)) d. The country has a rapidly growing middle-class e. The country has urbanization level lower than the global average (i.e. 52%) and rate of urbanization
higher than the global average (i.e. 1.9%) (UN Population Division, 2011)
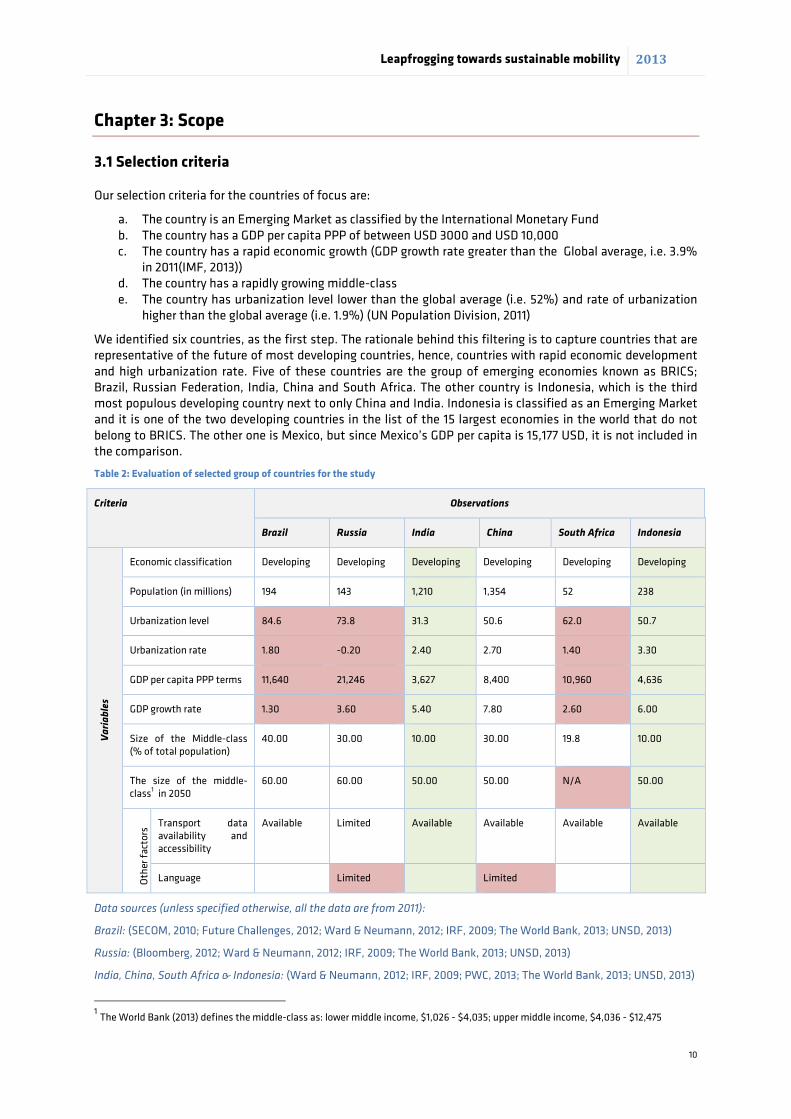
We identified six countries, as the first step. The rationale behind this filtering is to capture countries that are representative of the future of most developing countries, hence, countries with rapid economic development and high urbanization rate. Five of these countries are the group of emerging economies known as BRICS; Brazil, Russian Federation, India, China and South Africa. The other country is Indonesia, which is the third most populous developing country next to only China and India. Indonesia is classified as an Emerging Market and it is one of the two developing countries in the list of the 15 largest economies in the world that do not belong to BRICS. The other one is Mexico, but since Mexico’s GDP per capita is 15,177 USD, it is not included in the comparison.
Table 2: Evaluation of selected group of countries for the study
Criteria Observations
Brazil Russia India China South Africa Indonesia
Vari
able
s
Economic classification Developing Developing Developing Developing Developing Developing
Population (in millions) 194 143 1,210 1,354 52 238
Urbanization level 84.6 73.8 31.3 50.6 62.0 50.7
Urbanization rate 1.80 -0.20 2.40 2.70 1.40 3.30
GDP per capita PPP terms 11,640 21,246 3,627 8,400 10,960 4,636
GDP growth rate 1.30 3.60 5.40 7.80 2.60 6.00
Size of the Middle-class (% of total population)
40.00 30.00 10.00 30.00 19.8 10.00
The size of the middle-class1 in 2050
60.00 60.00 50.00 50.00 N/A 50.00
Other factors Transport data
availability and accessibility
Available Limited Available Available Available Available
Language Limited Limited
Data sources (unless specified otherwise, all the data are from 2011):
Brazil: (SECOM, 2010; Future Challenges, 2012; Ward & Neumann, 2012; IRF, 2009; The World Bank, 2013; UNSD, 2013)
Russia: (Bloomberg, 2012; Ward & Neumann, 2012; IRF, 2009; The World Bank, 2013; UNSD, 2013)
India, China, South Africa & Indonesia: (Ward & Neumann, 2012; IRF, 2009; PWC, 2013; The World Bank, 2013; UNSD, 2013)
1 The World Bank (2013) defines the middle-class as: lower middle income, $1,026 - $4,035; upper middle income, $4,036 - $12,475
Leapfrogging towards sustainable mobility 2013
11
Urbanization
level
(10%)
Urbanization
rate
(20%)
GDP per capita PPP
terms (10%)
GDP
growth
rate
(20%)
Size of the Middle-
class (% of
total
population)(10%)
The
size
of
the
middle-class in 2050
(10%)
Other factors (Data
availability, language,
contact), etc (20%)
Aggregate
Rank
Brazil 0.000 0.114 0.055 0.000 0.100 0.100 0.067 0.435 4
Russia 0.020 0.000 0.000 0.071 0.067 0.100 0.000 0.258 6
India 0.100 0.149 0.100 0.126 0.000 0.083 0.200 0.758 2
China 0.064 0.166 0.073 0.200 0.067 0.083 0.067 0.719 3
South Africa 0.042 0.091 0.058 0.040 0.033 0.000 0.133 0.398 5
Indonesia 0.064 0.200 0.094 0.145 0.000 0.083 0.200 0.786 1
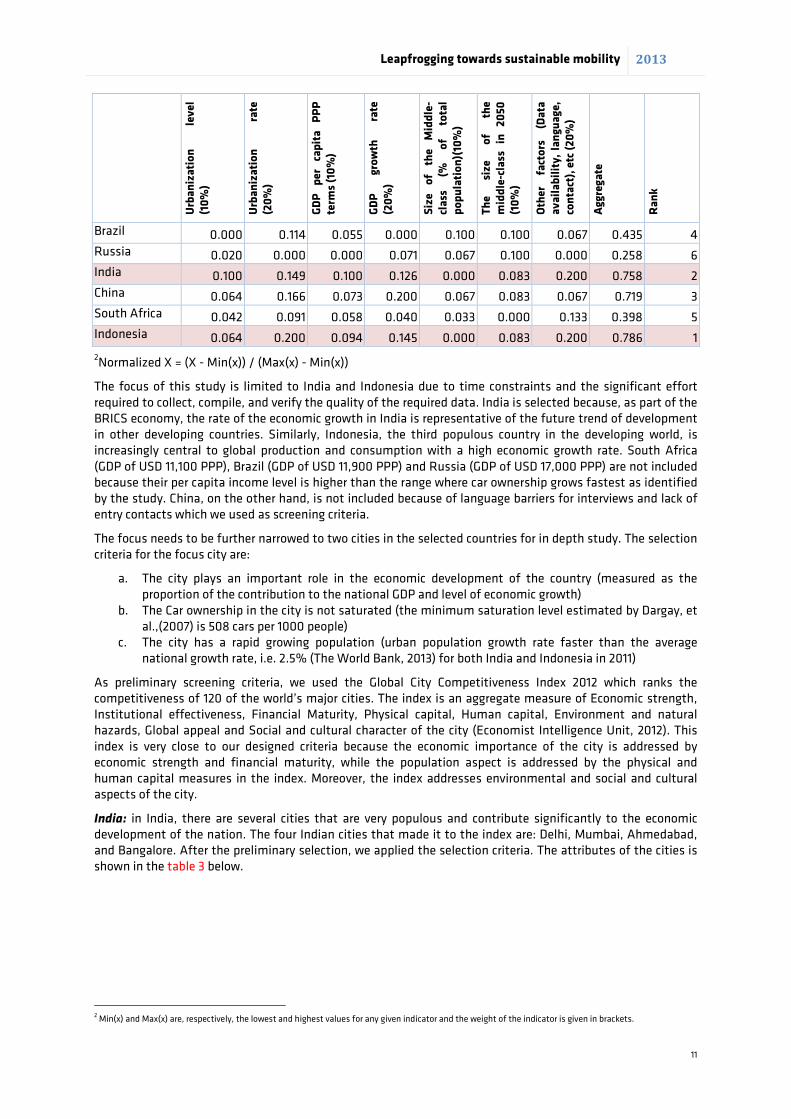
2Normalized X = (X - Min(x)) / (Max(x) - Min(x))
The focus of this study is limited to India and Indonesia due to time constraints and the significant effort required to collect, compile, and verify the quality of the required data. India is selected because, as part of the BRICS economy, the rate of the economic growth in India is representative of the future trend of development in other developing countries. Similarly, Indonesia, the third populous country in the developing world, is increasingly central to global production and consumption with a high economic growth rate. South Africa (GDP of USD 11,100 PPP), Brazil (GDP of USD 11,900 PPP) and Russia (GDP of USD 17,000 PPP) are not included because their per capita income level is higher than the range where car ownership grows fastest as identified by the study. China, on the other hand, is not included because of language barriers for interviews and lack of entry contacts which we used as screening criteria.
The focus needs to be further narrowed to two cities in the selected countries for in depth study. The selection criteria for the focus city are:
a. The city plays an important role in the economic development of the country (measured as the proportion of the contribution to the national GDP and level of economic growth)
b. The Car ownership in the city is not saturated (the minimum saturation level estimated by Dargay, et al.,(2007) is 508 cars per 1000 people)
c. The city has a rapid growing population (urban population growth rate faster than the average national growth rate, i.e. 2.5% (The World Bank, 2013) for both India and Indonesia in 2011)
As preliminary screening criteria, we used the Global City Competitiveness Index 2012 which ranks the competitiveness of 120 of the world’s major cities. The index is an aggregate measure of Economic strength, Institutional effectiveness, Financial Maturity, Physical capital, Human capital, Environment and natural hazards, Global appeal and Social and cultural character of the city (Economist Intelligence Unit, 2012). This index is very close to our designed criteria because the economic importance of the city is addressed by economic strength and financial maturity, while the population aspect is addressed by the physical and human capital measures in the index. Moreover, the index addresses environmental and social and cultural aspects of the city.
India: in India, there are several cities that are very populous and contribute significantly to the economic development of the nation. The four Indian cities that made it to the index are: Delhi, Mumbai, Ahmedabad, and Bangalore. After the preliminary selection, we applied the selection criteria. The attributes of the cities is shown in the table 3 below.
2 Min(x) and Max(x) are, respectively, the lowest and highest values for any given indicator and the weight of the indicator is given in brackets.
Leapfrogging towards sustainable mobility 2013
12
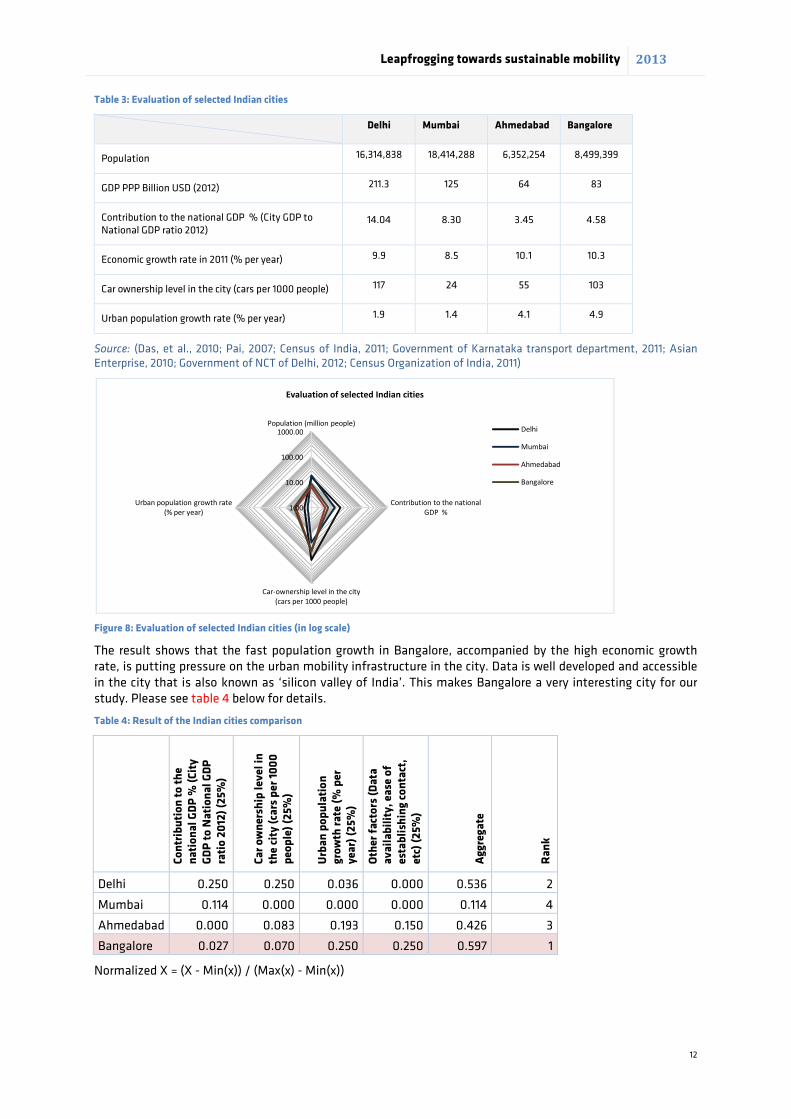
Table 3: Evaluation of selected Indian cities
Delhi Mumbai Ahmedabad Bangalore
Population 16,314,838 18,414,288 6,352,254 8,499,399
GDP PPP Billion USD (2012) 211.3 125 64 83
Contribution to the national GDP % (City GDP to National GDP ratio 2012)
14.04 8.30 3.45 4.58
Economic growth rate in 2011 (% per year) 9.9 8.5 10.1 10.3
Car ownership level in the city (cars per 1000 people) 117 24 55 103
Urban population growth rate (% per year) 1.9 1.4 4.1 4.9
Source: (Das, et al., 2010; Pai, 2007; Census of India, 2011; Government of Karnataka transport department, 2011; Asian Enterprise, 2010; Government of NCT of Delhi, 2012; Census Organization of India, 2011)
Figure 8: Evaluation of selected Indian cities (in log scale)
The result shows that the fast population growth in Bangalore, accompanied by the high economic growth rate, is putting pressure on the urban mobility infrastructure in the city. Data is well developed and accessible in the city that is also known as ‘silicon valley of India’. This makes Bangalore a very interesting city for our study. Please see table 4 below for details.
Table 4: Result of the Indian cities comparison
Contribution to the
national GDP % (City
GDP to National GDP
ratio 2012) (25%)
Car ownership level in
the city (cars per 1000
people) (25%)
Urban population
growth rate (% per
year) (25%)
Other factors (Data
availability, ease of
establishing contact,
etc) (25%)
Aggregate
Rank
Delhi 0.250 0.250 0.036 0.000 0.536 2
Mumbai 0.114 0.000 0.000 0.000 0.114 4
Ahmedabad 0.000 0.083 0.193 0.150 0.426 3
Bangalore 0.027 0.070 0.250 0.250 0.597 1
Normalized X = (X - Min(x)) / (Max(x) - Min(x))
1.00
10.00
100.00
1000.00Population (million people)
Contribution to the national
GDP %
Car-ownership level in the city
(cars per 1000 people)
Urban population growth rate
(% per year)
Evaluation of selected Indian cities
Delhi
Mumbai
Ahmedabad
Bangalore
Leapfrogging towards sustainable mobility 2013
13
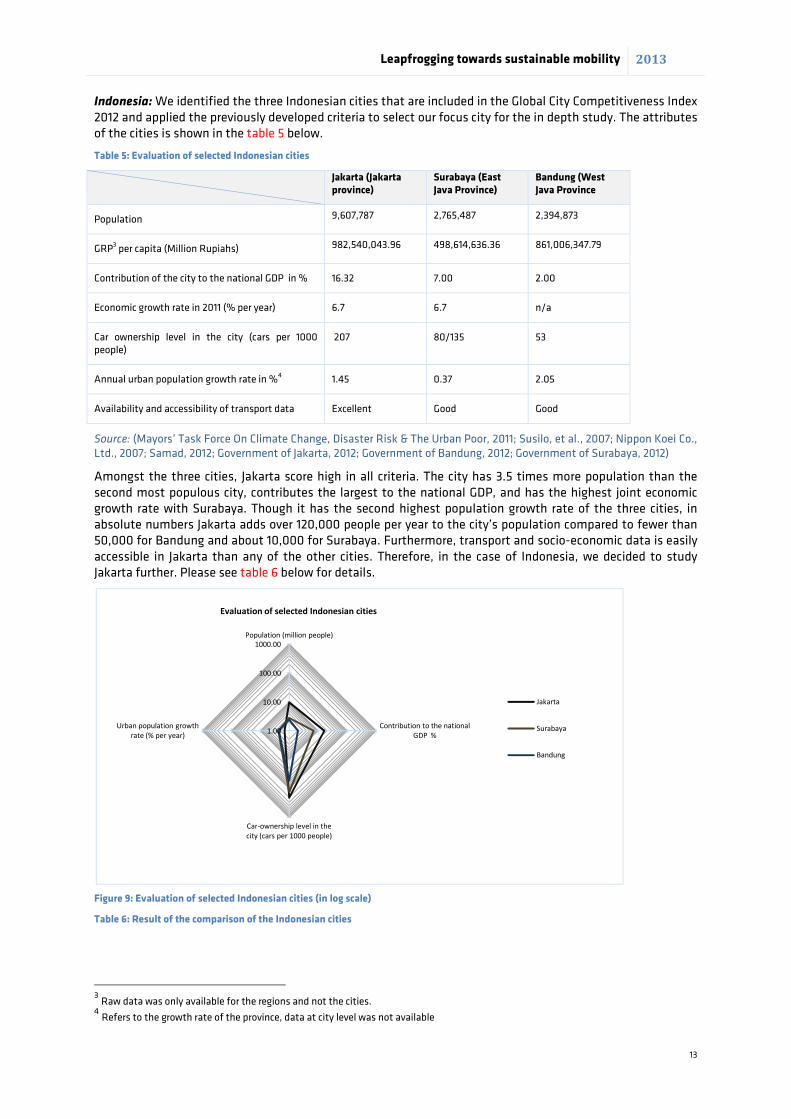
Indonesia: We identified the three Indonesian cities that are included in the Global City Competitiveness Index 2012 and applied the previously developed criteria to select our focus city for the in depth study. The attributes of the cities is shown in the table 5 below.
Table 5: Evaluation of selected Indonesian cities
Jakarta (Jakarta province)
Surabaya (East Java Province)
Bandung (West Java Province
Population 9,607,787 2,765,487 2,394,873
GRP3 per capita (Million Rupiahs) 982,540,043.96 498,614,636.36 861,006,347.79
Contribution of the city to the national GDP in % 16.32 7.00 2.00
Economic growth rate in 2011 (% per year) 6.7 6.7 n/a
Car ownership level in the city (cars per 1000 people)
207 80/135 53
Annual urban population growth rate in %4 1.45 0.37 2.05
Availability and accessibility of transport data Excellent Good Good
Source: (Mayors’ Task Force On Climate Change, Disaster Risk & The Urban Poor, 2011; Susilo, et al., 2007; Nippon Koei Co., Ltd., 2007; Samad, 2012; Government of Jakarta, 2012; Government of Bandung, 2012; Government of Surabaya, 2012)
Amongst the three cities, Jakarta score high in all criteria. The city has 3.5 times more population than the second most populous city, contributes the largest to the national GDP, and has the highest joint economic growth rate with Surabaya. Though it has the second highest population growth rate of the three cities, in absolute numbers Jakarta adds over 120,000 people per year to the city’s population compared to fewer than 50,000 for Bandung and about 10,000 for Surabaya. Furthermore, transport and socio-economic data is easily accessible in Jakarta than any of the other cities. Therefore, in the case of Indonesia, we decided to study Jakarta further. Please see table 6 below for details.
Figure 9: Evaluation of selected Indonesian cities (in log scale)
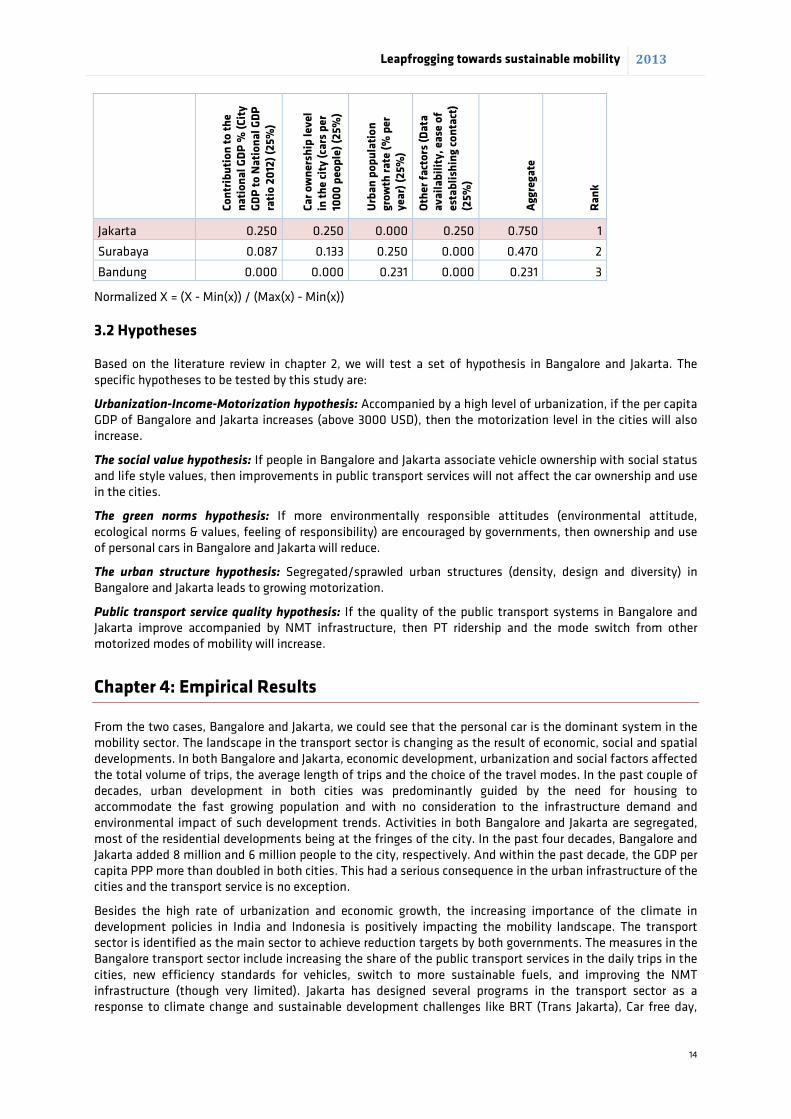
Table 6: Result of the comparison of the Indonesian cities
3 Raw data was only available for the regions and not the cities. 4 Refers to the growth rate of the province, data at city level was not available
1.00
10.00
100.00
1000.00
Population (million people)
Contribution to the national
GDP %
Car-ownership level in the
city (cars per 1000 people)
Urban population growth
rate (% per year)
Evaluation of selected Indonesian cities
Jakarta
Surabaya
Bandung
Leapfrogging towards sustainable mobility 2013
14
Contribution to the
national GDP % (City
GDP to National GDP
ratio 2012) (25%)
Car ownership level
in the city (cars per
1000 people) (25%)
Urban population
growth rate (% per
year) (25%)
Other factors (Data
availability, ease of
establishing contact)
(25%)
Aggregate
Rank
Jakarta 0.250 0.250 0.000 0.250 0.750 1
Surabaya 0.087 0.133 0.250 0.000 0.470 2
Bandung 0.000 0.000 0.231 0.000 0.231 3
Normalized X = (X - Min(x)) / (Max(x) - Min(x))
3.2 Hypotheses
Based on the literature review in chapter 2, we will test a set of hypothesis in Bangalore and Jakarta. The specific hypotheses to be tested by this study are:
Urbanization-Income-Motorization hypothesis: Accompanied by a high level of urbanization, if the per capita GDP of Bangalore and Jakarta increases (above 3000 USD), then the motorization level in the cities will also increase.
The social value hypothesis: If people in Bangalore and Jakarta associate vehicle ownership with social status and life style values, then improvements in public transport services will not affect the car ownership and use in the cities.
The green norms hypothesis: If more environmentally responsible attitudes (environmental attitude, ecological norms & values, feeling of responsibility) are encouraged by governments, then ownership and use of personal cars in Bangalore and Jakarta will reduce.
The urban structure hypothesis: Segregated/sprawled urban structures (density, design and diversity) in Bangalore and Jakarta leads to growing motorization.
Public transport service quality hypothesis: If the quality of the public transport systems in Bangalore and Jakarta improve accompanied by NMT infrastructure, then PT ridership and the mode switch from other motorized modes of mobility will increase.
Chapter 4: Empirical Results
From the two cases, Bangalore and Jakarta, we could see that the personal car is the dominant system in the mobility sector. The landscape in the transport sector is changing as the result of economic, social and spatial developments. In both Bangalore and Jakarta, economic development, urbanization and social factors affected the total volume of trips, the average length of trips and the choice of the travel modes. In the past couple of decades, urban development in both cities was predominantly guided by the need for housing to accommodate the fast growing population and with no consideration to the infrastructure demand and environmental impact of such development trends. Activities in both Bangalore and Jakarta are segregated, most of the residential developments being at the fringes of the city. In the past four decades, Bangalore and Jakarta added 8 million and 6 million people to the city, respectively. And within the past decade, the GDP per capita PPP more than doubled in both cities. This had a serious consequence in the urban infrastructure of the cities and the transport service is no exception.
Besides the high rate of urbanization and economic growth, the increasing importance of the climate in development policies in India and Indonesia is positively impacting the mobility landscape. The transport sector is identified as the main sector to achieve reduction targets by both governments. The measures in the Bangalore transport sector include increasing the share of the public transport services in the daily trips in the cities, new efficiency standards for vehicles, switch to more sustainable fuels, and improving the NMT infrastructure (though very limited). Jakarta has designed several programs in the transport sector as a response to climate change and sustainable development challenges like BRT (Trans Jakarta), Car free day,
Leapfrogging towards sustainable mobility 2013
15
Vehicles emissions control, Traffic restriction zone, Blue Bajaj program (run on compressed natural gas instead of diesel), Mass rapid transit, Electronic road pricing, Light rail transport, and Monorail transport.
Urbanization-Income-Motorization hypothesis:
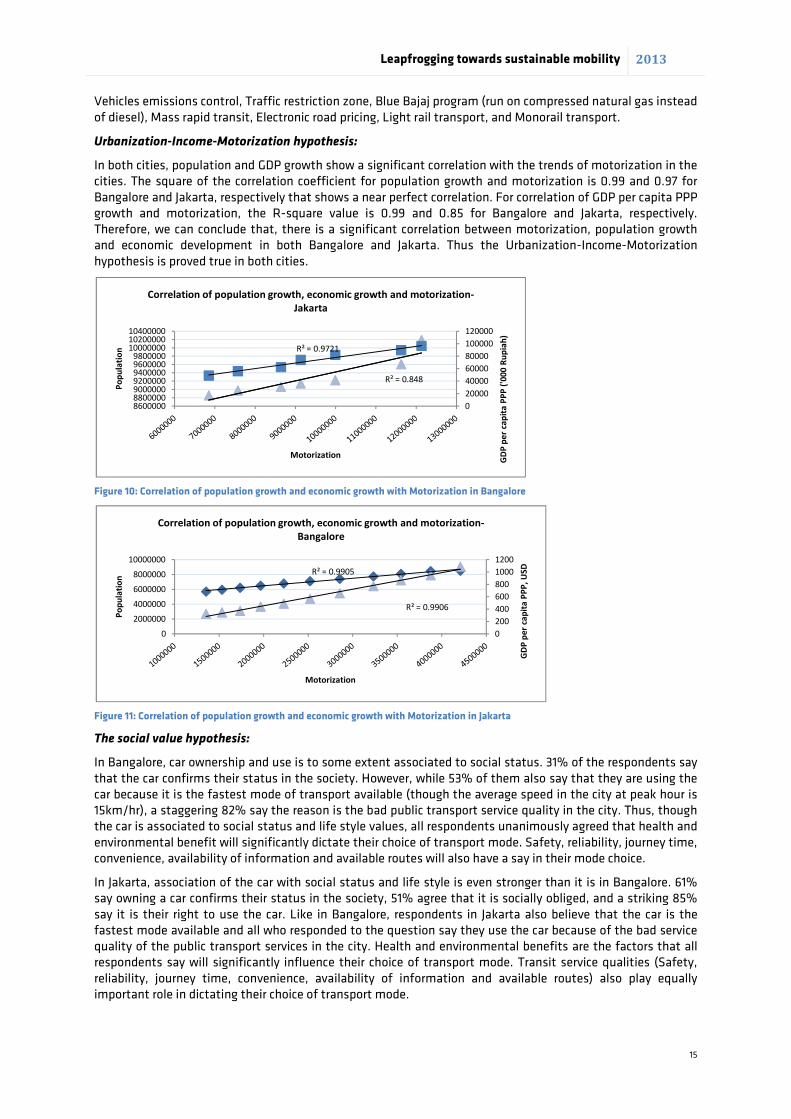
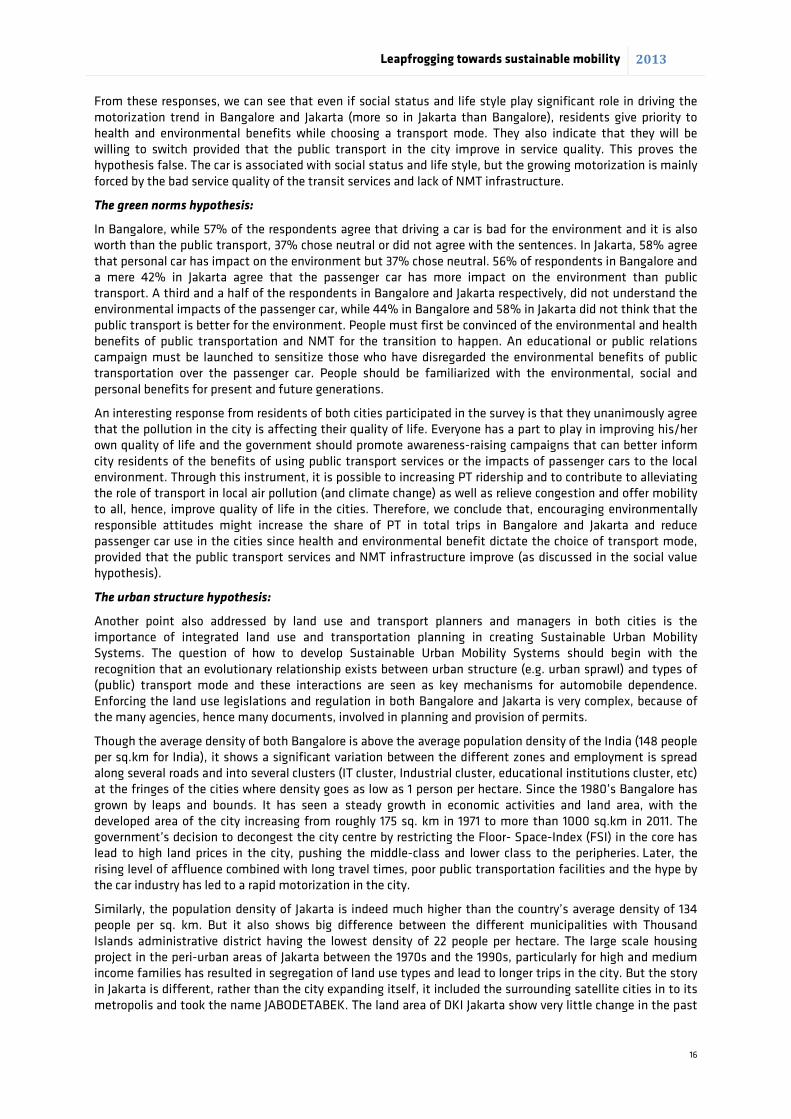
In both cities, population and GDP growth show a significant correlation with the trends of motorization in the cities. The square of the correlation coefficient for population growth and motorization is 0.99 and 0.97 for Bangalore and Jakarta, respectively that shows a near perfect correlation. For correlation of GDP per capita PPP growth and motorization, the R-square value is 0.99 and 0.85 for Bangalore and Jakarta, respectively. Therefore, we can conclude that, there is a significant correlation between motorization, population growth and economic development in both Bangalore and Jakarta. Thus the Urbanization-Income-Motorization hypothesis is proved true in both cities.
Figure 10: Correlation of population growth and economic growth with Motorization in Bangalore
Figure 11: Correlation of population growth and economic growth with Motorization in Jakarta
The social value hypothesis:
In Bangalore, car ownership and use is to some extent associated to social status. 31% of the respondents say that the car confirms their status in the society. However, while 53% of them also say that they are using the car because it is the fastest mode of transport available (though the average speed in the city at peak hour is 15km/hr), a staggering 82% say the reason is the bad public transport service quality in the city. Thus, though the car is associated to social status and life style values, all respondents unanimously agreed that health and environmental benefit will significantly dictate their choice of transport mode. Safety, reliability, journey time, convenience, availability of information and available routes will also have a say in their mode choice.
In Jakarta, association of the car with social status and life style is even stronger than it is in Bangalore. 61% say owning a car confirms their status in the society, 51% agree that it is socially obliged, and a striking 85% say it is their right to use the car. Like in Bangalore, respondents in Jakarta also believe that the car is the fastest mode available and all who responded to the question say they use the car because of the bad service quality of the public transport services in the city. Health and environmental benefits are the factors that all respondents say will significantly influence their choice of transport mode. Transit service qualities (Safety, reliability, journey time, convenience, availability of information and available routes) also play equally important role in dictating their choice of transport mode.
R² = 0.848
R² = 0.9721
0
20000
40000
60000
80000
100000
120000
8600000880000090000009200000940000096000009800000
100000001020000010400000
GD
P p
er
cap
ita
PP
P (
'00
0 R
up
iah
)
Po
pu
lati
on
Motorization
Correlation of population growth, economic growth and motorization-
Jakarta
R² = 0.9905
R² = 0.9906
0
200
400
600
800
1000
1200
0
2000000
4000000
6000000
8000000
10000000
GD
P p
er
cap
ita
PP
P,
US
D
Po
pu
lati
on
Motorization
Correlation of population growth, economic growth and motorization-
Bangalore
Leapfrogging towards sustainable mobility 2013
16
From these responses, we can see that even if social status and life style play significant role in driving the motorization trend in Bangalore and Jakarta (more so in Jakarta than Bangalore), residents give priority to health and environmental benefits while choosing a transport mode. They also indicate that they will be willing to switch provided that the public transport in the city improve in service quality. This proves the hypothesis false. The car is associated with social status and life style, but the growing motorization is mainly forced by the bad service quality of the transit services and lack of NMT infrastructure.
The green norms hypothesis:
In Bangalore, while 57% of the respondents agree that driving a car is bad for the environment and it is also worth than the public transport, 37% chose neutral or did not agree with the sentences. In Jakarta, 58% agree that personal car has impact on the environment but 37% chose neutral. 56% of respondents in Bangalore and a mere 42% in Jakarta agree that the passenger car has more impact on the environment than public transport. A third and a half of the respondents in Bangalore and Jakarta respectively, did not understand the environmental impacts of the passenger car, while 44% in Bangalore and 58% in Jakarta did not think that the public transport is better for the environment. People must first be convinced of the environmental and health benefits of public transportation and NMT for the transition to happen. An educational or public relations campaign must be launched to sensitize those who have disregarded the environmental benefits of public transportation over the passenger car. People should be familiarized with the environmental, social and personal benefits for present and future generations.
An interesting response from residents of both cities participated in the survey is that they unanimously agree that the pollution in the city is affecting their quality of life. Everyone has a part to play in improving his/her own quality of life and the government should promote awareness-raising campaigns that can better inform city residents of the benefits of using public transport services or the impacts of passenger cars to the local environment. Through this instrument, it is possible to increasing PT ridership and to contribute to alleviating the role of transport in local air pollution (and climate change) as well as relieve congestion and offer mobility to all, hence, improve quality of life in the cities. Therefore, we conclude that, encouraging environmentally responsible attitudes might increase the share of PT in total trips in Bangalore and Jakarta and reduce passenger car use in the cities since health and environmental benefit dictate the choice of transport mode, provided that the public transport services and NMT infrastructure improve (as discussed in the social value hypothesis).
The urban structure hypothesis:
Another point also addressed by land use and transport planners and managers in both cities is the importance of integrated land use and transportation planning in creating Sustainable Urban Mobility Systems. The question of how to develop Sustainable Urban Mobility Systems should begin with the recognition that an evolutionary relationship exists between urban structure (e.g. urban sprawl) and types of (public) transport mode and these interactions are seen as key mechanisms for automobile dependence. Enforcing the land use legislations and regulation in both Bangalore and Jakarta is very complex, because of the many agencies, hence many documents, involved in planning and provision of permits.
Though the average density of both Bangalore is above the average population density of the India (148 people per sq.km for India), it shows a significant variation between the different zones and employment is spread along several roads and into several clusters (IT cluster, Industrial cluster, educational institutions cluster, etc) at the fringes of the cities where density goes as low as 1 person per hectare. Since the 1980’s Bangalore has grown by leaps and bounds. It has seen a steady growth in economic activities and land area, with the developed area of the city increasing from roughly 175 sq. km in 1971 to more than 1000 sq.km in 2011. The government’s decision to decongest the city centre by restricting the Floor- Space-Index (FSI) in the core has lead to high land prices in the city, pushing the middle-class and lower class to the peripheries. Later, the rising level of affluence combined with long travel times, poor public transportation facilities and the hype by the car industry has led to a rapid motorization in the city.
Similarly, the population density of Jakarta is indeed much higher than the country’s average density of 134 people per sq. km. But it also shows big difference between the different municipalities with Thousand Islands administrative district having the lowest density of 22 people per hectare. The large scale housing project in the peri-urban areas of Jakarta between the 1970s and the 1990s, particularly for high and medium income families has resulted in segregation of land use types and lead to longer trips in the city. But the story in Jakarta is different, rather than the city expanding itself, it included the surrounding satellite cities in to its metropolis and took the name JABODETABEK. The land area of DKI Jakarta show very little change in the past
Leapfrogging towards sustainable mobility 2013
17
three decades with most of the residential settlements happening in the satellite cities surround it. Therefore, the problem for Jakarta is the spill-over of various socio-economic activities from DKI Jakarta to its peripheries that need huge tracts of land, including large scale housing areas and industrial estates, that creates one of the biggest urban agglomeration in the world, JABODETABEK. This has spread the socio-economic activities of Jakarta from 664sq.km to over 6400sq.km and contributed to a large increase in the number of commuters in to Jakarta.
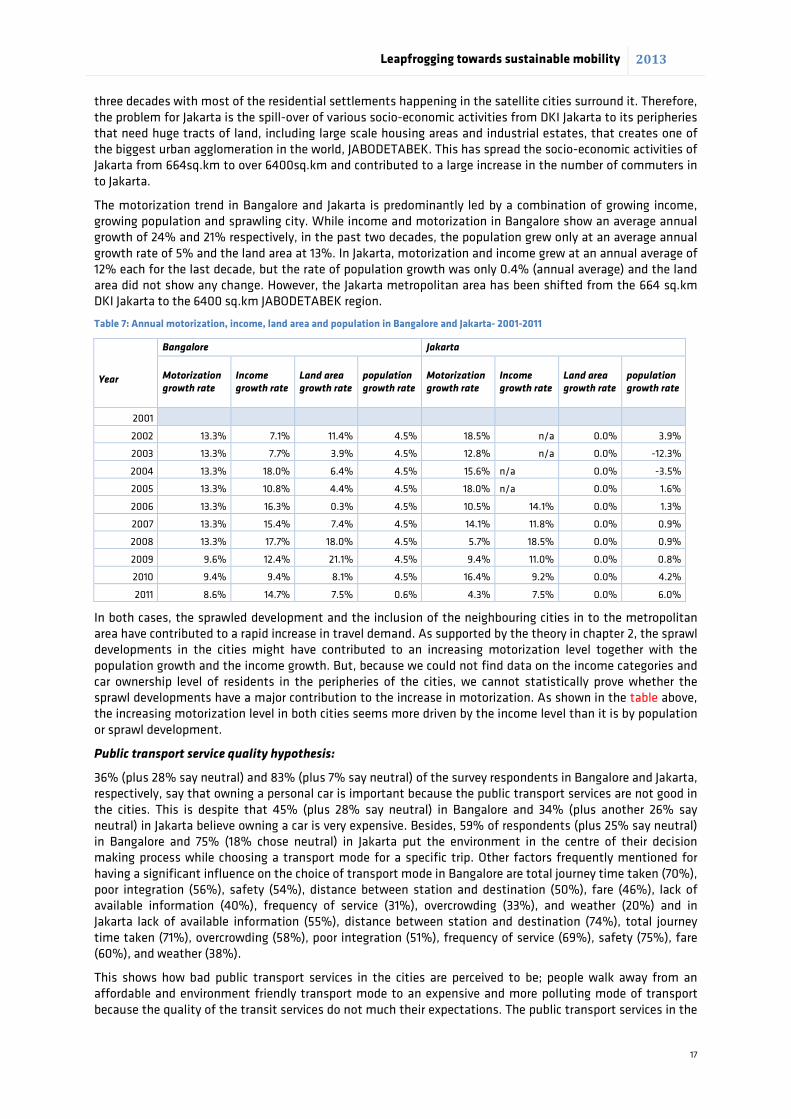
The motorization trend in Bangalore and Jakarta is predominantly led by a combination of growing income, growing population and sprawling city. While income and motorization in Bangalore show an average annual growth of 24% and 21% respectively, in the past two decades, the population grew only at an average annual growth rate of 5% and the land area at 13%. In Jakarta, motorization and income grew at an annual average of 12% each for the last decade, but the rate of population growth was only 0.4% (annual average) and the land area did not show any change. However, the Jakarta metropolitan area has been shifted from the 664 sq.km DKI Jakarta to the 6400 sq.km JABODETABEK region.
Table 7: Annual motorization, income, land area and population in Bangalore and Jakarta- 2001-2011
Year
Bangalore Jakarta
Motorization growth rate
Income growth rate
Land area growth rate
population growth rate
Motorization growth rate
Income growth rate
Land area growth rate
population growth rate
2001
2002 13.3% 7.1% 11.4% 4.5% 18.5% n/a 0.0% 3.9%
2003 13.3% 7.7% 3.9% 4.5% 12.8% n/a 0.0% -12.3%
2004 13.3% 18.0% 6.4% 4.5% 15.6% n/a 0.0% -3.5%
2005 13.3% 10.8% 4.4% 4.5% 18.0% n/a 0.0% 1.6%
2006 13.3% 16.3% 0.3% 4.5% 10.5% 14.1% 0.0% 1.3%
2007 13.3% 15.4% 7.4% 4.5% 14.1% 11.8% 0.0% 0.9%
2008 13.3% 17.7% 18.0% 4.5% 5.7% 18.5% 0.0% 0.9%
2009 9.6% 12.4% 21.1% 4.5% 9.4% 11.0% 0.0% 0.8%
2010 9.4% 9.4% 8.1% 4.5% 16.4% 9.2% 0.0% 4.2%
2011 8.6% 14.7% 7.5% 0.6% 4.3% 7.5% 0.0% 6.0%
In both cases, the sprawled development and the inclusion of the neighbouring cities in to the metropolitan area have contributed to a rapid increase in travel demand. As supported by the theory in chapter 2, the sprawl developments in the cities might have contributed to an increasing motorization level together with the population growth and the income growth. But, because we could not find data on the income categories and car ownership level of residents in the peripheries of the cities, we cannot statistically prove whether the sprawl developments have a major contribution to the increase in motorization. As shown in the table above, the increasing motorization level in both cities seems more driven by the income level than it is by population or sprawl development.
Public transport service quality hypothesis:
36% (plus 28% say neutral) and 83% (plus 7% say neutral) of the survey respondents in Bangalore and Jakarta, respectively, say that owning a personal car is important because the public transport services are not good in the cities. This is despite that 45% (plus 28% say neutral) in Bangalore and 34% (plus another 26% say neutral) in Jakarta believe owning a car is very expensive. Besides, 59% of respondents (plus 25% say neutral) in Bangalore and 75% (18% chose neutral) in Jakarta put the environment in the centre of their decision making process while choosing a transport mode for a specific trip. Other factors frequently mentioned for having a significant influence on the choice of transport mode in Bangalore are total journey time taken (70%), poor integration (56%), safety (54%), distance between station and destination (50%), fare (46%), lack of available information (40%), frequency of service (31%), overcrowding (33%), and weather (20%) and in Jakarta lack of available information (55%), distance between station and destination (74%), total journey time taken (71%), overcrowding (58%), poor integration (51%), frequency of service (69%), safety (75%), fare (60%), and weather (38%).
This shows how bad public transport services in the cities are perceived to be; people walk away from an affordable and environment friendly transport mode to an expensive and more polluting mode of transport because the quality of the transit services do not much their expectations. The public transport services in the
Leapfrogging towards sustainable mobility 2013
18
cities are characterized by unreliability, too long journey times, overcrowding, inaccessibility and insecurity. Accessibility, safety, journey time and integration, according to the respondents, are more important in attracting riders than transport fares and the effect of the weather. Thus, improvements in the service quality of public transport services together with NMT infrastructure will encourage more transit service use by the residents of Bangalore and Jakarta.
Chapter 5: Synthesis and conclusion
5.1 Enablers of transition towards SUMS: tackling barriers and creating attractors
Several barriers and attractors are identified in the literature review. Based on the theory we have identified the barriers against and attractors towards SUMS in Bangalore and Jakarta. Below are the enablers that will help tackle the barriers and create new attractors to encourage the implementation and adoption of SUMS in rapid urbanizing cities in developing countries. The Enablers are categorized under (1) Policy & regulation; (2)Attitude, (3)Structure (urban), (4)Safety & security, (5)Infrastructure & service quality, (6)Organizations and governance, and (7)Nexus of measures, abbreviated as PASSION:
Policy and regulations
Policy documents and development plans in Bangalore and Jakarta emphasize the need for infrastructure improvement in terms of more roads, more intersections and more parking places to facilitate the flow of traffic in the cities. The motorized mobility and specifically the personal car are given priority in the visions and missions of the documents guiding the cities development. This can only act as the positive feedback for the dominant automobile regime and lead to lock-in. Building more roads and more parking spaces, as recommended in both cities, will only make car journeys unfairly cheap. One of the ways to reduce car monopoly is making users pay the full costs of their individual trips by means of appropriate economic and regulatory measures. These measures could include ownership charges, fuel taxes, road pricing, congestion pricing, pollution pricing, etc. the measures should be used in combination with other measures that encourage the switch to public transport services like restricting access in certain areas (at certain hours) with private vehicle, public transport subsidies, park & ride schemes, and public transport priority measures. This will help weaken the stubborn regime of car dominance.
Though it is obvious that the motorized infrastructure needs improvements, it is also imperative that the NMT infrastructure is equally important. In both cities, pedestrians and cyclist are not-able to cope with the complex and hostile traffic conditions and are the most vulnerable road users. The trends established today, when the car ownership is still low, will determine the future of these cities for decades to come. We believe that the mobility system in Bangalore and Jakarta need a new attractor to shift the tide from the path to car monopoly to a new path to SUMS.
From the survey, we understood that 87% of Bangalore’s residents and 100 % of Jakarta’s residents are concerned about the impact of the current mobility system on local air quality, liveability and the global climate. This shift in the society towards environment as the core of quality of life and sustainability as the mission of development creates a new attractor for the mobility sector. So that, the transition towards SUMS requires developing a new vision for sustainable mobility focusing on improved quality of life to create new insights and starting points, therefore resulting in a change of attractor.
Any public transport policy can only succeed if it is effectively co-ordinated and integrated with other urban policies (e.g. land use, policing, parking, fiscal etc.). Lack of integration between land use and transport policies is one of the concerns of land use and transport planners in Bangalore and Jakarta. As discuss in the previous section 80% of respondents in Bangalore and 100% in Jakarta believe integration of the land use and transport policies is very important for a well functioning transport system. There is a complex relationship between transport and land use; transport related decision affects land use patterns of a city (transport infrastructures are also part of the land use of a city) and land use patterns also affects the form and modes of transport in the city. Thus it is very important to integrate transportation and land use planning decisions so they are complementary rather than contradictory.
Attitude
Culture and attitude characterize a society and determine individual’s personality and the decision making process (including destination and transport mode choices). Based on the results of the survey, most of the
Leapfrogging towards sustainable mobility 2013
19
Bangalore residents can be classified as aspiring environmentalists. Amongst most of the respondents, pro-environmental behaviour is seen as important and worthwhile, the negative effects of car use enter into the decision making process while choosing a mode, most show willingness to shift to PT provided that the service quality improves, and the large majority judge public transport to be problematic. The survey in Jakarta shows that most residents are somewhere between malcontented motorists and reluctant riders. Though, most of them still agree that their mode choice is motivated by health and environmental benefits, a larger majority associated the car with social status, life style and individual rights. Despite moderately high concern for the negative effects of car use, they perceive several difficulties in alternative modes of transport in the city.
The aspiring environmentalist majority in Bangalore suggests a practical approach to car use, where moral norms and attitudes contribute to a possible shift to sustainable mobility modes if high service quality alternatives could be provided. The case of Jakarta is more complicated than that. The malcontented motorists could be willing to reduce car use because of their concern for the environment and selflessness, but they are held back by their perceptions of the alternative modes available; bad transit service quality, lack of safety and security, inconvenience, and the perception that the PT services do not have better environmental performance than their cars. The reluctant riders do not show an interest in looking at other transport mode options and will not easily shift to other modes for pull measures but require strong push measures to take them out of their cars. Besides, acceptance of policy measures to reduce car dominance and shift from personal cars requires a strong moral suasion and environment-transport related education.
Structure:
The urban structure of a city is a stable component of the urban dynamics, as changes are likely to modify the land use structure over a rather long period of time since most buildings, sky scrapers, real estates, industrial complexes and commercial neighbourhoods are built to last at least several decades. We can see that, in Bangalore and Jakarta, land use is quite segregated as most of the developments are built either formally driven primarily by the demand for more housing or are built informally. The average population density in Bangalore and Jakarta is 8750 people per sq.km and 14476 people per sq.km, respectively, but with significant variations between the inner city and the fringes. Bangalore’s average density is even below the threshold value for efficient operation of bus transit services and density wise no part of the city is suitable for trams and rail transit. Jakarta, on the other hand, satisfies the minimum density requirement for an efficient operation bus transit services but still does not meet the threshold for trams and rail services. In both cases, density takes a central role in the future development of the cities. 90% and 85% of the planners, who participated in the survey in Bangalore and Jakarta, respectively, indicate that density targets are given priority in future development of the city to reduce sprawl developments, but with very few transit priority measures in place or under consideration. Respondents say that while only traffic signal priority is in place in Bangalore, bus only lanes and traffic signal priority are under consideration in Jakarta.
Considering the land use diversity in the cities, we have seen that Bangalore’s land use show heterogeneous pattern in general but activities are separated in location. We do not have enough data to calculate the entropy index for Jakarta; however, we understood from organizational records that activities in the city are spatially segregated. From this analysis, it is understood that in both cases land use activities are quiet segregated, and people have to travel from one part of the city to the other for several activities.
The segregation of activities in both Bangalore and Jakarta is acting as an attractor to the car monopoly in the transport system and it is also a barrier for the implementation of SUMS. As we can see from the conclusion of the urban structure hypothesis, the low density, segregated neighbourhoods of the cities will be dependent on the car. Accordingly, further development of the cities should focus on densifying the less dense areas between the core area and the fringes to make public transport and NMT attractive option for resident. The integration of residential, business, and institutional uses is mandated not only through zoning but also through planning and direct public investment in transit-oriented development. This mixed-use planning will not only make the transit services attractive for providers, but also makes it easy for a substantial fraction of residents to live in walking or biking distance of their jobs. However, it should be clear that, with the current level of travel demand in both cities, without significant transit service improvements, the higher density development of smart growth would yield more congestion, not less
Safety & security
Safety and security for pedestrians and cyclists is beyond the provision of infrastructure. There is no doubt that good design of infrastructures will help, but insuring safety and security requires awareness creation,
Leapfrogging towards sustainable mobility 2013
20
protection and law enforcement. The very low trip share of NMT in Bangalore and Jakarta is the result of lack of safe infrastructure together with social stigma.
The feeling of security is also an important factor in public transport system. Travelling on public transport should be a safe and comfortable experience but the feeling of safety and security in public transport services in Bangalore and Jakarta is very low. 87% and 88% in Bangalore and Jakarta mention safety and security as one of the important factors that determine their mode choice for their daily travel. For the public transport services in Bangalore and Jakarta to have an improved public image and to become an attractive alternative to the car, it is necessary to address the issues around security and safety in transit services.
Infrastructure and service quality
The transport network is one element of the complex mobility system considered to be a rather stable component of urban dynamics, as transport infrastructures are built for the long term. In general, cities in developing countries are characterized by low level of income and low car ownership relative to cities in developed countries which is a favourable condition for high levels of transit ridership. Bangalore and Jakarta are working very hard in building large volume transit systems to meet the growing mobility demands; buses and metro in Bangalore, and BRT and MRT in Jakarta. This will create another attractor in the transport system by building large transport terminals, subway systems and high ways that can operate for a very long period of time.
To make public transport services attractive and thereby reduce the growing motorization and car use, Bangalore and Jakarta should be keen to ensure a high quality of service on their public transport system. Transit information, reliability, frequency of services and integration are identified as the most important issues of the public transport services in Bangalore and Jakarta.
Information about transport services, like websites and real time information board, can serve as the bases for more rational decisions in mode choice and are appreciated by users. It is also a critical part of well functioning SUMS, as mentioned in the previous chapters, and lack of information is mentioned several times in factors that made transit services unattractive both in Bangalore and Jakarta.
(Un)Reliability of the public transport services is another quality factor mentioned several times by survey respondents in Bangalore and Jakarta that determines mode choice. Most fundamental is whether a service operates at all, and if it does, whether it operates on schedule, if it has one. Lack of reliability in public transport services, manifested by excessive waiting times due to late arrivals of transit services, results in uncertainty and delays reducing the attractiveness of the mode. To address this concern, transit services should be predictable, information on arrival and departure times must be available, and capacity should increase to match the demand to ensure competitiveness to car use such that it results in modal shift.
Frequency of services is another important factor affecting public transport ridership. Waiting too long for a bus, which is often overcrowded when it arrives, is a common problem in both cities. Only 10% of respondents from Bangalore say that PT services are frequent enough while all respondents from Jakarta say they are very infrequent. An increase frequency (and reliability) of services depend on the number of public transport vehicles and the traffic system in the city. On the average, there are 0.76 and 2.3 buses per 1000 population in Bangalore and Jakarta. On one hand, we cannot comment on the sufficiency of the number of vehicles as it depends on several factors including the operation and management practices. On the other hand, enough attention should be given to the way the transit services go around the daily traffic jams in the cities. The survey shows that, traffic signal priority in Bangalore and separate bus lanes in Jakarta are the only measures implemented in the two cities with other measures being under consideration or not thought about.
Transit services in Bangalore and Jakarta need to be better integrated to make it easier and more convenient for passengers to use more than one service or form of transport. This is important to support passengers who depend on more than one service to get to their final destination. Only 10% of respondents in Bangalore and 22% in Jakarta are satisfied with the integration of within the transit services and with other modes. Finally, public transport should be part of urban lifestyle: creating values aimed at a culture of ownership and pride by the citizens, and consequently creating a strong brand.
Organizations and governance
One of the problems identified in the transport sector in both Bangalore and Jakarta is the complexity and multiplicity of agencies involved in land use and transport planning and regulation in the cities. For a public transport system to function efficiently, an independent planning and regulatory organization/institution that is independent and capable of achieving its objectives is of crucial importance. There needs to be a clear
Leapfrogging towards sustainable mobility 2013
21
demarcation of mandates between national, state and local government organizations in Bangalore, and between provincial and national government in Jakarta. There are several approaches to managing transport systems in large metropolitan area worldwide that reflect cultural, political and social factors and the level of maturity of the transport system. But that is beyond the scope of this research and we will not discuss it in this study. The first step to an efficient public transport management is capacity building of organization at all levels of government.
Another feature of the public transport system is that small bus, taxi, and intermediary public transport services in Bangalore and the medium and small bus, taxi and intermediary services in Jakarta are provided by individual service providers that are hardly organized. The existence of these large loosely organized transport providers who depend on the transport services for their livelihood in both cities creates its own management problems when it comes to providing financial support and accounting for performance. But this does not mean that services should be centralized and government controlled, but rather it means providing alternatives (formally organized services and NMT infrastructure) and leaving the choice for services providers and users.
Political will and organizational capacity building are also crucial elements of a successful transition towards a sustainable mobility system in cities in developing countries.
Nexus of policy measures & enforcement
Imposing the full cost of individual trips on users cannot be achieved in a short time frame as structural changes in the mobility sector, behavioural changes, technological improvements and adjustment of the supply and demand patterns require time. These changes should also be politically and economically acceptable. Therefore, in avoiding the lock-in in the car dominant regime, appropriate timing and sequencing of measures are inherent. Few cities are successful (simply) because the steps they take are consistent. Singapore is perhaps an outstanding example of this consistency. Since the 1960s, the Singapore government has implemented programs and projects to keep car ownership and use at a very low level while improving the transit services in the city. The rules that are followed are very basic, restriction and management of ownership and use of private vehicles are preceded by the provision of good quality public transport services affordable by all segments of the society. Both Bangalore and Jakarta could, and may be should, use this same basic principle in order to prevent the personal vehicle from becoming the king of the road. This requires a clear planning, coordinating of activities from the different departments involved in land use and transport planning, institutional and financial support with an appropriate schedule, consistent law enforcement, competent regulators, and capable operators that serve as a foundation for implementing plans and projects. All this should happen at the right timing and sequence of activities.
5.2 Conclusion
In this study we have identified enablers for a successful transition of the mobility sector in developing countries to Sustainable Urban Mobility System based on the barriers and opportunities identified in Bangalore and Jakarta. For an effective transition to sustainable urban mobility systems in developing country cities requires a well functioning, good quality urban public transport system together with a safe and secure NMT infrastructure. Policies that put the environment and quality of life of citizens will help create a new attractor in the mobility system in favour of SUMS. Awareness creation of the impact of the personal motorized mobility on the environment is also an important element of the transition. These measures need to be accompanied by transit-oriented urban development policies and a good quality public transport services that meet the requirements of the fast growing economy and population. A reform in the organizational structure and the governance system is equally important to allow efficiency and increase synergy. Finally, the measures need to be implemented with the right sequence and timing and also need to be enforced.
5.3 Limitation of the study
Although this research was carefully prepared, I am still aware of its limitations and shortcomings.
Adequacy of the sample: we have managed to get roughly half the response we expected, thus only 52 respondents in Bangalore and 45 respondents in Jakarta replied the questionnaire. This is a small number of groups and might not be representative of the actual situation for generalization.
Leapfrogging towards sustainable mobility 2013
22
Representativeness of the sample: we established contacts with respondents through Erasmus University alumni networks that resulted in a profile of respondents where 98% are in the age category 15 to 59 and 72% have annual income of more than 3000USD. This too, is not representative of the average age and income category of the cities.
Availability of data: last but not least is the data limitation in most developing countries. In this study, it was difficult to find time series data for a number of variables which we tried to fill by extrapolation.
Readers should therefore approach the findings and conclusions of this study with caution.
Leapfrogging towards sustainable mobility 2013
23
Works Cited
Ali, S. & Dadush, U., 2012. A new measure of the global middle class. [Online] Available at: http://www.voxeu.org/article/new-measure-global-middle-class [Accessed 24 11 2012].
Anable, J., 2005. ‘Complacent Car Addicts’ or ‘Aspiring Environmentalists’? Identifying travel behaviour segments using attitude theory. Transport Policy, Volume 12, pp. 65-78.
Annez, P. C. & Buckley, R. M., 2009. Urbanization and Growth: Setting the Context. In: M. Spence, P. C. Annez & R. M. Buckley, eds. Urbanization and Growth. s.l.:The World Bank, pp. 1-46.
Asian Enterprise, 2010. Mumbai Unlimited. [Online] Available at: http://www.asianenterprise.biz/mumbai-unlimited-one-of-indias-most-thriving-cities/full.html [Accessed 16 04 2013].
Bamberga, S., Fujii, S., Friman, M. & Garling, T., 2011. Behaviour theory and soft transport policy measures. Transport Policy, Volume 18, pp. 228-235.
Best, M. H., 1982. The political economy of socially irrational products. Cambridge Journal of Economics, 6(1), pp. 53-64.
Bloomberg, 2012. Russian Middle Class to Number 74 Million by 2050, HSBC Predicts. [Online] Available at: http://www.bloomberg.com/news/2012-10-15/russian-middle-class-to-number-74-million-by-2050-hsbc-predicts.html [Accessed 15 03 2013].
Bóhler-Baedeker, S. & Húging, H., 2012. Urban Transport and Energy Efficiency, Berlin: GIZ.
Borrego, C. et al., 2006. How urban structure can affect city sustainability from an air quality perspective. Environmental Modelling & Software, 21(4), p. 461–467.
Census of India, 2011. Cities having population 1 lakh and above, Census 2011. [Online] Available at: http://censusindia.gov.in/2011-prov-results/paper2/data_files/India2/Table_2_PR_Cities_1Lakh_and_Above.pdf [Accessed 10 04 2013].
Census Organization of India, 2011. Urban Agglomeration5 Census India 2011. [Online] Available at: http://www.census2011.co.in/urbanagglomeration.php [Accessed 16 04 2013].
Cervero, R., 1996. Mixed land-uses and commuting: evidence from the American housing survey. Transportation Research A, 30(5), p. 361–377.
Cohen, B., 2006. Urbanization in developing countries: Current trends,future projections, and key challenges for sustainability. Technology in Society, Volume 28, pp. 63-80.
Currie, G. & Delbosc, A., 2009. Car ownership and low income on the urban fringe- Benefit or hindrance?. Auckland, Social Research in Transport (SORT) Clearinghouse.
Curtis, C. & Perkins, T., 2006. Travel Behaviour: A review of recent literature, s.l.: Urbanet: Curtin University.
Dargay, J. & Gately, D., 1998. Income's Effect on Car and Vehicle Ownership, Worldwide: 1960-2015. Transportation Research Part A, Volume 33, pp. 101-138.
Dargay, J., Gately, D. & Sommer, M., 2007. Vehicle Ownership and Income Growth, Worldwide: 1960-2030. Energy Journal, 28(4), pp. 143-170.
Das, D., Dutta, S. & Sharifuddin, 2010. Car Ownership Growth in Delhi. Decision, 37(2), pp. 51-61.
DMJM MARRIS/AECOM, 2007. New Jersey Long Range Transportation Plan 2030, New Jersey: The New Jersey Department of Transportation.
DTLR, 2001. Better Places to Live: By Design : a Companion Guide to PPG3. London: Thomas Telford.
Leapfrogging towards sustainable mobility 2013
24
Economic and Social Commission for Asia and the Pacific, 2003. Cities and Sustainable Development: Lessons
and Experiences from Asia and the Pacific, New York: United Nations.
Economist Intelligence Unit, 2012. Hot spots: Benchmarking global city competitiveness, LONDON: The Economist Intelligence Unit.
Eggermond, M. A. v., Erath, A. & Axhausen, K. W., 2012. Vehicle ownership in Singapore using revealed preference data and spatial measures. Toronto, Future Cities Laboratory.
Ewing, R. & Cervero, R., 2010. Travel and the Built Environment: A Meta-Analysis. Journal of the American Planning Association, 76(3), pp. 265-293.
Faiz, A., 2011. Transportation and the Urban Poor. ITE Journal, pp. 40-43.
Foxon, T. J., 2002. Technological and institutional ‘lock-in’ as a barrier to sustainable, London: Imperial College Centre for Energy Policy and Technology.
Foxon, T. J., Hammond, G. P. & Pearson, P. J., 2010. Developing transition pathways for a low carbon electricity system in the UK. Technological Forecasting & Social Change, Volume 77.
Future Challenges, 2012. Growth of the Brazilian Middle Class: A Tale of Things to come?. [Online] Available at: http://futurechallenges.org/searchlight/growth-of-the-brazilian-middle-class-a-tale-of-things-to-come/ [Accessed 15 03 2013].
Geels, F. & Kemp, R., 2010. Transport sector is NOT in transition. [Online] Available at: http://www.sustainabilitytransitions.com/nl/blog/2010/11/02/transport-sector-is-not-in-transition [Accessed 22 02 2013].
Geels, F. W., 2001. Technological transitions as evolutionary reconfiguration processes: A multi-level perspective and a case-study. Aalborg, DRUID.
Geels, F. W., 2001. Technological transitions as evolutionary reconfiguration processes: A multi-level perspective and a case-study. Aalborg, Denmark, DRUID (Danish Research Unit for Industrial Dynamics).
Geels, F. W., 2002. Technological transitions as evolutionary reconfiguration processes: a multi-level perspective and a case-study. Research Policy, 31(8-9), p. 1257–1274.
Geels, F. W., 2007. Transformations of Large Technical Systems. A Multilevel Analysis of the Dutch Highway System (1950–2000). Science, Technology & Human Values, Volume 32, pp. 123-149.
Geels, F. W., 2010. Ontologies, socio-technical transitions (to sustainability), and the multi-level perspective. Research Policy, Volume 39, pp. 495-510.
Geels, F. W., Kamp, R., Dudley, G. & Lyons, G., 2012. Automoility in Transition? A Socio-Technical Analysis of Sustainable Transport. New York: s.n.
Geels, F. W., Kemp, R., Dudley, G. & Lyons, G., 2012. Automobility in Transition: A Socio-Technical Analysis of Sustainabable Transport. First ed. New York: Routledge.
Geels, F. W. & Schot, J., 2007. Typology of sociotechnical transition pathways. Science Direct, Volume 36, p. 399–417.
Geerlings, H., Lohuis, J. & Shiftan, Y., 2012. Transition management: A new opportunity for Introducing More Sustainable Transport Policies?. In: H. Geerlings, Y. Shiftan & D. Stead, eds. Transition towards Sustainable Mobility: The Role of Instruments, Individuals and Institutions. Surey: Ashgate Publishing Limited, pp. 13-32.
Geerlings, H. & Van Meijeren, M. v. d. S., 2008. The dominance of the Lisbon agreement as a barrier for an environmentally oriented transport policy in Europe;the gap between theory and implementation in policy integration. European Transport, Volume 39, pp. 14-32.
Government of Bandung, 2012. Bandung Official Website. [Online] Available at: http://www.bandung.go.id/?fa=enbizworld.mechanism [Accessed 15 04 2013].
Leapfrogging towards sustainable mobility 2013
25
Government of Jakarta, 2012. The official site of Jakarta capital city. [Online] Available at: http://www.jakarta.go.id/english/ [Accessed 15 04 2013].
Government of Karnataka transport department, 2011. Vehicle statistics Bangalore. [Online] Available at: http://rto.kar.nic.in/ [Accessed 15 04 2013].
Government of NCT of Delhi, 2012. Statistical Abstract of Delhi 2012, Delhi: Directorate of Economics and Statistics.
Government of Surabaya, 2012. The official site of the city Government of Surabaya. [Online] Available at: http://www.surabaya.go.id/eng/index.php [Accessed 15 04 2013].
Hekkert, M. et al., 2006. Functions of innovation systems: A new approach for analysing technological change. Technological Forecasting & Social Change, Volume 74.
Hess, D. B. & Ong, P. M., 2002. Traditional neighbourhoods and automobile ownership. Transportation Research Record, pp. 35-44.
Hoen, A. et al., 2009. CO2 emission reduction in transport: Confronting medium-term and long-term options for achieving climate targets in the Netherlands, The Hague: Netherlands Environmental Assessment Agency.
IEA, 2009. Key World Energy Statistics 2009, s.l.: s.n.
IEA, 2012. Worl Energy Outlook 2012, Paris Cedex : OECD/IEA.
Iim, A., 2005. Urbanization and Development of Infrastructure in the East Asia Region. JBICI Review, Volume 10, pp. 88-109.
IMF, 2008. World Economic Outlook: Housing and the Business Cycle, Washington, DC: International Monetary Fund.
IMF, 2013. WEO Update, Washington: IMF.
International Transport Forum, 2011. Transport Outlook 2011: Meeting the Needs of 9 Billion People, Paris: OECD.
IPCC, 2007. Climate Change 2007 Mitigation; Contribution of Working Group III to the Fourth Assessment Report of the Intergovernmental Panel on Climate Change, Cambridge: Cambridge University Press.
IPCC, 2007. Fourth Assessment Report, Geneva: IPCC.
IRF, 2006. World Road Statistics, Geneva: International Road Federation (IRF).
IRF, 2009. World Road Statistics, Geneva: International Road Federation (IRF).
Kockelman, K. M., 1996. Travel behaviour as a function of accessibility, land-use mixing, and land-use balance: evidence from the San Francisco bay area. s.l.:University of California, Berkeley.
Köhler, W., 2006. Halting the vicious circle. Eschborn: Deutsche Gesellschaft für Internationale Zusammenarbeit (GIZ).
Leiby, P. & Rubin, J., 1997. Sustainable Transportation: Analyzing the Transition to Alternative Fuel Vehicles. s.l., s.n.
Lerner, W., 2011. The Future of Urban Mobility: Towards networked, multimodal cities of 2050, s.l.: Arthur D. Little.
Litman, T., 2013. Evaluating Public Transit Benefits and Costs: Best Practices Guidebook, s.l.: Victoria Transport Policy Institute.
Lo, H. K., Tang, S. & Wang, D. Z., 2008. Managing the accessibility on mass public transit: The case of Hong Kong. Journal of Transport and Land Use, 1(2), pp. 23-49.
Loorbach, D. A., 2007. Transition Management: New mode of governance for sustainable development. Rotterdam: s.n.
Leapfrogging towards sustainable mobility 2013
26
Manaugh, K. & Kreider, T., 2013. What is mixed use? Presenting an interaction method for measuring land use mix. The Journal of Transport and Land use, 6(1), pp. 63-72.
Marletto, G., 2011. Structure, agency and change in the car regime. A review of the literature. European Transport \ Trasporti Europei, Volume 47, pp. 1-18.
Mayors’ Task Force On Climate Change, Disaster Risk & The Urban Poor, 2011. Jakarta: Urban Challenges in a Changing Climate, Jakarta: The World Bank.
McKinsey Global Institute, 2007. The 'Bird of Gold': The rise of India's consumer market, s.l.: McKinsey & Company.
Mediavilla, M., Miguel, L. J. & Castro, C. d., 2011. Analysis of the energetic transition: the electric car. Istanbul, s.n.
Mehrotra, S. et al., 2011. Climate change and urban transportation systems. In: C. Rosenzweig, W. D. Solecki, S. A. Hammer & S. Mehrotra, eds. Climate Change and Cities: First Assessment Report of the Urban Climate Change Research Network. Cambridge: Cambridge University Press, p. 145–177.
Mitchel, W. J. & Casalegno, F., 2005. Smart Mobility: Rethinking the Paris Bus Line, Cambridg: Smart Cities Group/MIT Media Lab.
Moody, M., 2012. The case for transition to a sustainable transport system in Stellenbosch. s.l.:University of Stellenbosch.
Newman, P., 2000. Sustainable Transportation and Global Cities, Perth: s.n.
Newman, P. W. G. & Kenworthy, J. R., 1989. Gasoline Consumption and Cities: A Comparison of U.S. Cities with a Global Survey. Journal of the American Planning Association, 55(1), pp. 24-37.
Nippon Koei Co., Ltd., 2007. Project Formation Study: Surabaya Toll Ring Road Construction Project, s.l.: s.n.
Nykvist, B. & Whitmarsh, L., 2007. MATISSE Working Paper 7: Identifying opportunities and pathways for transitions to sustainable transport in Sweden and the UK, s.l.: MATISSE.
Ogden, J. o., 2005. The Transition to Hydrogen. Access, Volume 27, pp. 10-16.
Pai, M., 2007. Transport in Cities: 12 Indian Cities Transport Indicators, s.l.: EMBARQ & CST.
Peng, X., Chen, X. & Cheng, Y., 2010. Urbanization and its consequences. Demography, Volume 2.
PWC, 2013. World in 2050: The BRICs and beyond: prospects, challenges and opportunities, s.l.: s.n.
Raven, R., van den Bosch, S. & Weterings, R., 2010. Transitions and Strategic Niche Management: Towards a Competence Kit for Practitioners. International Journal of Technology Management, 51(1), pp. 57-74 .
RITES Ltd, 2007. Comprehensive Traffic & Transportation Plan for Bengaluru, Bangalore: Directorate of Urban Land Transport.
Rodrigue, J.-P., 2013. The Georgraphy of Transport Systems. [Online] Available at: http://people.hofstra.edu/geotrans/eng/ch1en/conc1en/table_transport_systems.html [Accessed 05 07 2013].
Samad, T., 2012. Indonesia’s Urban Development: Towards Inclusive and Sustainable Economic Growth, s.l.: The World Bank.
Sarangi, G. K. & Mishra, A., 2011. Multi-perspective Framework for System Innovations in India; An Analysis of
the Renewable Energy Development. Kuala Lampur, s.n.
Satterthwaite, D., 2010. The Role of Cities in Sustainable Development. Sustainable Development Insights, May, pp. 1-8.
Schäfer, A., 2006. Long-Term Trends in Global Passenger Mobility. The Bridge: Linking Engineering and Society, pp. 24-32.
Schiller, P. L., Bruun, E. C. & Kenworthy, J. R., 2010. An Introduction to Sustainable Transportation: Policy, Planning and Implementation. London: Earthscan.
Schot, J. & Geels, F. W., 2008. Strategic niche management and sustainable innovation journeys: theory, findings, research agenda, and policy. Technology Analysis & Strategic Management, 20(5), p. 537–554.
Leapfrogging towards sustainable mobility 2013
27
Schuitema, G., Steg, L. & Vlek, C., 2007. Are Pricing Policies Effective to Change Car Use?. IATSS Research, 31(1), pp. 1-11.
SECOM, 2010. Brazil's middle class in numbers. [Online] Available at: http://www.brasil.gov.br/para/press/press-releases/august-1/brazils-middle-class-in-numbers/br_model1?set_language=en [Accessed 15 03 2013].
Sivak, M. & Tsimhoni, O., 2008. Future Demand for New Cars in Developing Countries: Going Beyond GDP and Population Size, Ann Arbor: The University of Michigan.
SMART: Global Urban Mobility Solutions (2010) Nilima Achwal.
Song, Y. & Knaap, G.-J., 2004. Measuring urban form: Is Portland winning the war on sprawl?. Journal of the American Planning Association, Volume 70, pp. 210-225.
Spears, S., Boarnet, M. G. & Handy, S., 2010. DRAFT Policy Brief on the Impacts of Land Use Mix Based on a Review of the Empirical Literature, s.l.: California Environment Agency, California Air Resources Board.
Sperling, D. & Clausen, E., 2002. The Developing World's Motorization Challenge. Issues in Science and Technology, 19(1), pp. 59-66.
Sperling, D. & Salon, D., 2002. Transportation in Developing Countries: An Overview of Greenhouse Gas Reduction Strategies, s.l.: University of California.
Struben, J. & Sterman, J. D., 2008. Transition challenges for alternative fuel vehicle and transportation systems. Environment and Planning B: Planning and Design, Volume 35, pp. 1070 - 1097.
Susilo, Y. O., Joewono, T. B., Santosa, W. & Parikesit, D., 2007. A reflection of motorization and public transport in Jakarta metropolitan area. IATSS Research, 31(1), pp. 59-68.
The International Transport Forum, 2012. Transport Outlook: Seamless Transport for Greener Growth, s.l.: OECD.
The World Bank, 2012. GDP per capita (current US$). [Online] Available at: http://data.worldbank.org/indicator/NY.GDP.PCAP.CD [Accessed 24 11 2012].
The World Bank, 2013. Data. [Online] Available at: http://data.worldbank.org/indicator/NY.GDP.MKTP.KD.ZG [Accessed 15 02 2013].
Tibbs, H., 1998. Factors Shaping the Future of the Transport System. Canberra, Synthesys Strategic Consulting Pty Ltd.
Trans.21, 2010. Building a Sustainable Tomorrow with Smart Urban Mobility: Healing our communities, s.l.: Transportation Systems For The Twenty-First Century.
UN Population Division, 2011. World Urbanization Prospects, the 2011 Revision, s.l.: UN.
UN, 2011. Shanghai Manual – A Guide for Sustainable Urban Development in the 21st Century, s.l.: s.n.
UN, 2012. The World Urbanization Prospect: The 2011 Revision, New York: United Nations Department of Economic and Social Affairs, Population Division.
UN-DESA, 2011. Population Distribution, Urbanization, Internal Migration and Development: An international Perspective, s.l.: UN- Department of Economic and Social Affairs.
UN-HABITAT, 2001. Urbanization: Facts and Figures, New York: UN-HABITAT.
UN-HABITAT, 2006. Urbanization Facts and Figures. Vancouver, UN-HABITAT.
UN-HABITAT, 2010. State of the World Cities 2010/2011: Bridging the Urban Divide, s.l.: UN-HABITAT.
UNSD, 2013. UN DATA. [Online] Available at: http://data.un.org/Data.aspx?q=GDP&d=SNAAMA&f=grID%3a101%3bcurrID%3aUSD%3bpcFlag%3a1 [Accessed 18 03 2013].
Leapfrogging towards sustainable mobility 2013
28
Urban ITS Expert Group, 2013. Guidlines for ITS Deployment in Urban Areas- Multimodal Information, s.l.: European Commission, DG Mobility and Transport.
UTCE Ltd.- ALMEC Corporation, 2005. Infrastructure Development and Service Provision in the Process of Urbanization, s.l.: JBIC/ADB/World Bank.
Ward, K. & Neumann, F., 2012. Consumer in 2050: The rise of the EM middle class, s.l.: HSBC Global Research.
WEC, 2011. Global Transport Scenarios 2050, London: s.n.
Wright, C. & Egan, J., 2000. De-marketing the car. Transport Policy, Volume 7, pp. 287-294.
Zielinski, S., 2006. New Mobility: The Next Generation of Sustainable Urban Transportation. The Bridge: Linking Engineering and Society, pp. 33-38.