Sustainable Urban Mobility Planning (SUMP)
161
UNIVERSITY OF ZAGREB FACULTY OF TRANSPORT AND TRAFFIC SCIENSES Vukelićeva 4, HR-10000 Zagreb DELOITTE ADVISORY SERVICES D.O.O. Radnička cesta 80, HR-10000 Zagreb Sisak Urban Transport – Sustainable Urban Mobility Planning (SUMP) Zagreb, March 24 th , 2017
-
Upload
khangminh22 -
Category
Documents
-
view
0 -
download
0
Transcript of Sustainable Urban Mobility Planning (SUMP)

UNIVERSITY OF ZAGREB
FACULTY OF TRANSPORT AND TRAFFIC
SCIENSES
Vukelićeva 4, HR-10000 Zagreb
DELOITTE ADVISORY SERVICES D.O.O.
Radnička cesta 80, HR-10000 Zagreb
Sisak Urban Transport – Sustainable Urban Mobility
Planning (SUMP)
Zagreb, March 24th, 2017


GLOSSARY OF TERMS
ABBREVIATION FULL TITLE
AP Auto promet Sisak Ltd.
City The City of Sisak
Consortium Agreement
Consortium Agreement from December 21th, 2015, concluded by the Faculty of Transport and Traffic Sciences (Leader) and Deloitte Advisory Services Ltd. (Member)
Consultancy Contract
Consultancy Contract from December 21th, 2015, concluded by Auto promet Sisak Ltd and Faculty of Transport and Traffic Sciences of the University of Zagreb
Consultant, Consortium
Consortium of contractors consisting of: Faculty of Transport and Traffic Sciences of the University of Zagreb (Leader), and Deloitte Advisory Services Ltd. (Member)
DPU Detailed plan (Croatian: Detaljni plan uređenja)
DTT, Deloitte Deloitte Advisory Services Ltd.
EBRD, Bank European Bank for Reconstruction and Development
EC The Expert Choice software
EUR Eurozone Euro
FOPIP Financial and Operational Performance Improvement Programme
FPZ Faculty of Transport and Traffic Sciences of the University of Zagreb
GIS Geographic Information System
GUP General Urban Plan (Croatian: Generalni urbanistički plan)
HRK, kn Croatian kuna
Loan Agreement Loan Agreement from September 10th, 2014, concluded by the EBRD and AP
PPUG Municipal Spatial Plan (Croatian: Prostorni plan uređenja grada)
Project Sisak Urban Transport – Sustainable Urban Mobility Planning
PSC Public Service Contract
PSP Private Sector Participation
Sisak Urban Transport - FOPIP
Sisak Urban Transport – Implementation Support and Financial and Operational Performance Improvement
SUMP, Plan Sustainable Urban Mobility Plan
TOR Terms of Reference
UPU Urban Development Plan

TABLE OF CONTENTS
1 ABSTRACT .............................................................................................................................. 1 2 INTRODUCTION ...................................................................................................................... 6 3 THE CHOSEN VARIANT .......................................................................................................... 10 4 SUSTAINABLE URBAN MOBILITY PLAN ................................................................................... 12
4.1 The role of institutions ................................................................................................................... 12 4.2 Public transport ............................................................................................................................. 15
4.2.1 Visual identity ......................................................................................................................................... 15 4.2.2 Line route adjustment............................................................................................................................. 16 4.2.3 Service improvement by reducing interval between vehicles ................................................................. 18 4.2.4 Converting the bus stop Kolodvor into a terminal .................................................................................. 18 4.2.5 Bus stop renovation ................................................................................................................................ 18 4.2.6 Introducing real-time info displays ......................................................................................................... 19 4.2.7 Tariff system ........................................................................................................................................... 19 4.2.8 Introducing e-Ticketing system ............................................................................................................... 20 4.2.9 Introducing Wi-Fi in city buses ................................................................................................................ 20 4.2.10 Public transport promotion..................................................................................................................... 21 4.2.11 Further line route adjustments due to the new bridge ........................................................................... 21 4.2.12 Replacing the existing bus park with eco-friendly buses......................................................................... 23 4.2.13 On-demand transport ............................................................................................................................. 23 4.2.14 Bus priority at signalized intersections ................................................................................................... 24 4.2.15 Transport to the Zagreb Airport ............................................................................................................. 24 4.2.16 Park-and-ride system .............................................................................................................................. 24 4.2.17 Multi-modal public transport app........................................................................................................... 25 4.2.18 Public bicycle scheme ............................................................................................................................. 27 4.2.19 Tourist train ............................................................................................................................................ 28 4.2.20 Passenger transport by water (water taxi) ............................................................................................. 28 4.2.21 Public car scheme – Carsharing .............................................................................................................. 29 4.2.22 Taxi service improvements ..................................................................................................................... 33 4.2.23 Integrating public transport and railway systems .................................................................................. 33 4.2.24 Goals and indicators ............................................................................................................................... 33
4.3 Pedestrian and bicycle traffic ......................................................................................................... 38 4.3.1 The development of predestrian surfaces in the city centre for the purpose of protecting cultural and historical heritage and increasing quality of life .................................................................................................... 40 4.3.2 The development of independent walking routes (paths, sidewalks) and cycling network in accordance with examples of good practice ............................................................................................................................. 40 4.3.3 The definition of terminals intermodal transport (as Bike-and-Ride) ..................................................... 43 4.3.4 Measures for reconstruction of pedestrian and bicycle network ............................................................ 44 4.3.5 Indicators for non-motorized traffic ....................................................................................................... 45
4.4 Road infrastructure ........................................................................................................................ 46 4.4.1 Changing the regulation and organization of traffic flows in the city centre ......................................... 49 4.4.2 Optimization of traffic lights at intersections (ATM, TMS or ITS) ........................................................... 54 4.4.3 Reconstruction of critical intersections ................................................................................................... 60 4.4.4 Bridge construction ................................................................................................................................. 63 4.4.5 The construction of highly-important roads ........................................................................................... 65 4.4.6 Concluding observations on objectives and indicators of road network ................................................. 67
4.5 Parking policy management ........................................................................................................... 69 4.6 City logistics ................................................................................................................................... 74
4.6.1 Analysis of freight transport infrastructure in the City of Sisak .............................................................. 74 4.6.2 Basic city logistic concepts ...................................................................................................................... 76 4.6.3 Proposed solutions of City of Sisak city logistics ..................................................................................... 77 4.6.4 Measurable effects of city logistics ......................................................................................................... 82

4.7 Road safety .................................................................................................................................... 84 4.7.1 Analysis of compliance with EU directives and international standards ................................................. 85 4.7.2 Road safety and vulnerable road users ................................................................................................... 85 4.7.3 Road safety analysis according to the Plan ............................................................................................ 87 4.7.4 Analysis and proposals to improve safety during road works ................................................................ 89 4.7.5 The involvement of local authorities in the knowledge transfer with the aim of integrating road safety principles into transport planning .......................................................................................................................... 90 4.7.6 The involvement of non-governmental organizations in programs to improve road safety and to introduce education for vulnerable road users ...................................................................................................... 91 4.7.7 The measures and indicators for improving road safety in the City of Sisak .......................................... 92
4.8 The role of public and private sector in service provision ............................................................... 94 5 COST ESTIMATIONS ............................................................................................................. 100 6 STRATEGIC ENVIRONMENTAL ASSESSMENT ......................................................................... 109
6.1 The state of the environment and the possible impacts of the Plan ............................................. 110 6.1.1 Air quality ............................................................................................................................................. 110 6.1.2 Noise ..................................................................................................................................................... 111 6.1.3 Water quality ........................................................................................................................................ 112 6.1.4 Biodiversity ........................................................................................................................................... 113 6.1.5 Cultural heritage ................................................................................................................................... 114 6.1.6 Soil and agriculture ............................................................................................................................... 115 6.1.7 Landscape ............................................................................................................................................. 116 6.1.8 Forestry and Hunting ............................................................................................................................ 117 6.1.9 Waste management ............................................................................................................................. 118
6.2 Main Assessment of the Plan for the ecological network ............................................................. 119 6.3 Environmental protection measures ............................................................................................ 119 6.4 Proposal of the environmental monitoring program .................................................................... 123 6.5 A short overview of Plan variants, evaluation, and difficulties in the data collection process ...... 123
7 MEANS OF FINANCING ......................................................................................................... 125 7.1 Overview...................................................................................................................................... 125 7.2 Administration ............................................................................................................................. 126 7.3 Decentralisation ........................................................................................................................... 126 7.4 Budget ......................................................................................................................................... 127 7.5 SUMP overview ............................................................................................................................ 127 7.6 Overview of key assumptions & financial forecast ....................................................................... 128 7.7 Conclusion ................................................................................................................................... 132
8 THE COMMUNICATION AND PROMOTION OF THE PLAN ....................................................... 133 8.1 The goal and purpose of the communication plan ....................................................................... 133 8.2 Target groups and stakeholders ................................................................................................... 134 8.3 Communication channels ............................................................................................................. 136 8.4 Management and conduction ...................................................................................................... 137
LIST OF FIGURES AND TABLES .................................................................................................... 138 REFERENCES .............................................................................................................................. 141 ANNEXES................................................................................................................................... 143

Sisak Urban Transport – Sustainable Urban Mobility Planning – FINAL REPORT 1
1 ABSTRACT
The purpose of the Sustainable Urban Mobility Plan of the City of Sisak is to define the guidelines of
sustainable transport and urban space policy, while respecting the development of space, traffic,
economy and social plans of the City.
The objective of the Sustainable Urban Mobility Plan of the city of Sisak is to determine the City as a
successful dynamic regional center, in which public transport system will provide citizens with better
mobility and availability, while reducing the external costs of transport, thus enhancing economic
development, environmental protection, and better and healthier urban environment for all citizens -
transport system users, especially the most vulnerable ones (pedestrians, cyclists, children, people
with disabilities, and the elderly).
Better mobility in urban environment includes all forms of sustainable modes of transport such as
public transport, non-motorized modes (cycling and walking), while reducing the use of private cars
for travelling. Smaller usage of private cars for city trips will have an impact on reducing greenhouse
gas emissions, noise, traffic congestion and road accidents. Promoting public transport usage will result
in better social inclusion for all categories of inhabitants of the City and will also contribute to better
availability and quality of services of the other non-motorized modes of travel with less impact on the
environment.
The integration of transport modes, and especially non-motorized ones with public transport
contributes to the reduction of external costs of transport and increases the quality of life in the City
of Sisak.
Therefore, the main guidelines of the new sustainable transport policy of Sisak should be:
Changes in modal distribution in favour of public transport and non-motorized modes with
better environment and energy efficiency;
Reduced private car usage for city trips;
Encouraged non-motorized modes such as walking and cycling;
Encouraged public transport usage;
Pedestrian zone establishment with limited access for private cars;
Construction and improvement of the existing transport infrastructure;
Traffic management in the City by using ITS systems;

Sisak Urban Transport – Sustainable Urban Mobility Planning – FINAL REPORT 2
Road safety improvement;
Car park management (on-street and off-street) and parking charging scheme;
Urban logistics management and freight transport distribution;
Transport subsystem integration;
Improved quality of life and increased mobility and availability.
A new vision in implementing sustainable transport policies of the City of Sisak will provide a range of
benefits listed below:
Integrated approach in transport and spatial planning:
o Integrated transport and spatial approach in planning enables long-term strategic
vision for better mobility. It reinforces the effective integrated planning approach,
including policy level, competent institutions and neighboring conurbations, enabling
better realization of traffic, economic, social and environmental objectives of the City;
Better quality of life for residents:
o Integrated transport planning means planning for people rather than for motor
vehicles. The approach is reflected in the improved quality of public space usage,
greater security of vulnerable groups in traffic (children, disabled, elderly), lower
emission of greenhouse gas emissions, pollution and noise;
Positive effects on the environment and human health:
o Activities to improve air quality, reduce noise and impact on climate change,
encourage residents to use sustainable and healthy modes of transport (walking,
cycling), which ultimately contributes with external costs savings addressed to society,
cleaner environment and healthier citizens.
Improved mobility and accessibility:
o Sustainable and integrated transport and spatial planning provides residents greater
mobility and access to the areas of the City and better quality of services provided;
Better City image:
o The City that seeks the implementation of integrated transport and a sustainable
urban mobility plan improves its image as an innovative and progressive city, which
directly attracts younger residents to live in such a city;
Improved citizen involvement by making decisions supported by the citizens:
o Planning which is oriented at people - transport system users and every social
category, enhancing social inclusion of the majority of citizens and thus making city
administration obtaining a very high level of "public legitimacy";

Sisak Urban Transport – Sustainable Urban Mobility Planning – FINAL REPORT 3
Increased capacity to meet the City's obligations:
o Sustainable Urban Mobility Plan of the City of Sisak is an efficient way to meet the
obligations from EU legislation at national level, related to air quality and noise,
mobility, road safety, space, energy and environmental protection;
Better access to funds (EU and other development funds):
o Adoption and implementation of the Sustainable Urban Mobility Plan creates the
conditions for accessing EU financial resources and the possibility of applying tenders
for innovative transport, environment and energy solutions, which increases the
competitiveness and capacity of available funds of the City of Sisak.
Therefore, the strategic goals of the Sustainable transport policy of the City of Sisak should be:
To achieve for Sisak by 2020 to be the leading city in the county and among the leading cities
at national level regarding sustainable mobility;
To achieve the changes in the modal distribution of city trips in favour of public transport and
non-motorized modes;
To reduce the number of urban journeys by private vehicles;
To achieve a reduction in the number of road accidents in accordance with the National Road
Safety Programme of the Republic of Croatia;
To achieve GHG emission reduction in accordance with the EU Directive by 40% in 2030
compared to 1990.
Accordingly, the Sustainable Urban Mobility Plan (SUMP) of the City of Sisak is the essential transport
and spatial plan which in the mid-period term (by 2030) determines the development of transport, and
which should consequently affect the improved economy picture of the City (by increasing the number
of jobs and reducing the depopulation trend in the City).
The plan is worked out at the conceptual level, according to the selected three time horizons – 2017,
2020 and 2030, with a series of measures in the areas of: public transport, non-motorized traffic
(walking and cycling), road infrastructure, motorized traffic (traffic management, vehicle parking
management, raod safety management), and logistics.
According to these segments, measures and their holders (which have the responsibility for
implementation) are presented in tables, and detailed description of the measures and the related
indicators is specified in subsequent chapters. The cost of the plan sustainable urban mobility is
summarized in the tables given below:
Sisak Urban Transport – Sustainable Urban Mobility Planning – FINAL REPORT 4
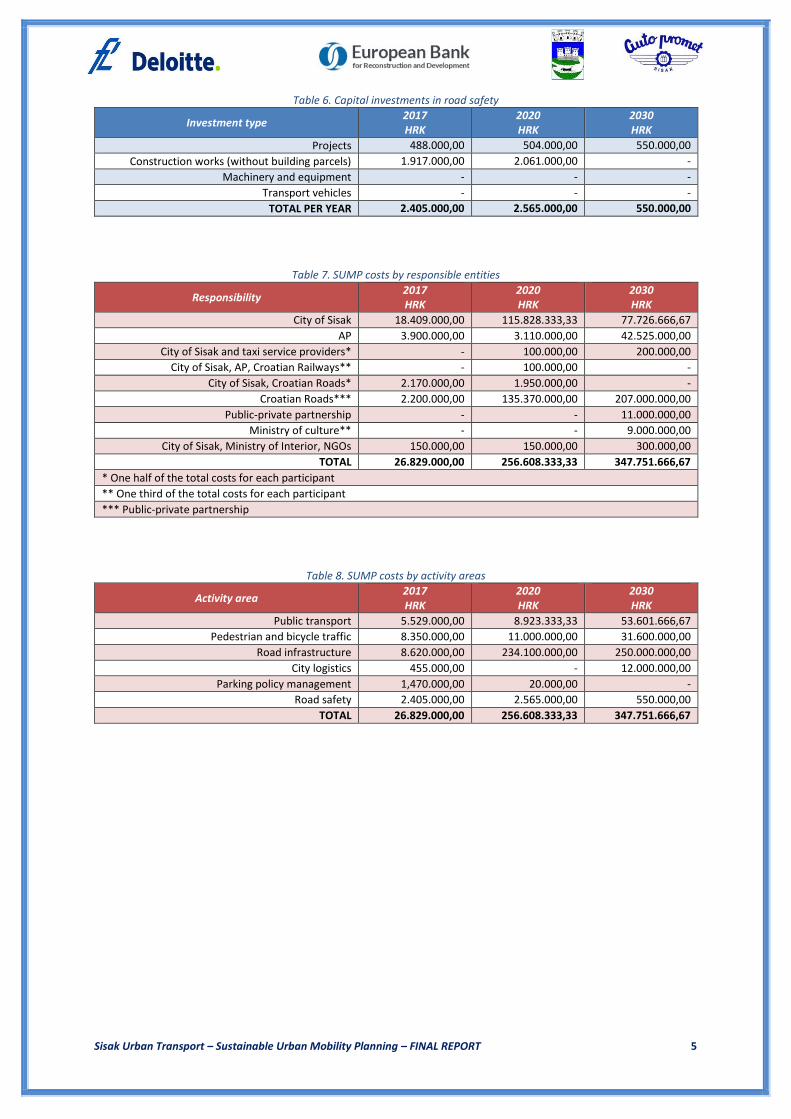
Individually according to areas: Table 1 – Table 6;
Total by areas and administration bodies: Table 7 and Table 8, respectively.
Table 1. Capital investments in public transport
Investment type 2017 HRK
2020 HRK
2030 HRK
Projects 1.204.000,00 893.333,33 2.226.666,67
Construction works (without building parcels) 725.000,00 7.650.000,00 8.800.000,00
Machinery and equipment 600.000,00 380.000,00 1.700.000,00
Transport vehicles 3.000.000,00 - 40.875.000,00
TOTAL PER YEAR 5.529.000,00 8.923.333,33 53.601.666,67
Table 2. Capital investments in pedestrian and bicycle traffic
Investment type 2017 HRK
2020 HRK
2030 HRK
Projects 525.000,00 3.600.000,00 -
Construction works (without building parcels) 7.825.000,00 7.400.000,00 31.600.000,00
Machinery and equipment - - -
Transport vehicles - - -
TOTAL PER YEAR 8.350.000,00 11.000.000,00 31.600.000,00
Table 3. Capital investments in road infrastructure
Investment type 2017 HRK
2020 HRK
2030 HRK
Projects 6.262.000,00 6.195.000,00 9.000.000,00
Construction works (without building parcels) 2.358.000,00 225.905.000,00 241.500.000,00
Machinery and equipment - 2.000.000,00 -
Transport vehicles - - -
TOTAL PER YEAR 8.620.000,00 234.100.000,00 250.000.000,00
Table 4. Capital investments in parking policy management
Investment type 2017 HRK
2020 HRK
2030 HRK
Projects 412.000,00 20.000,00 -
Construction works (without building parcels) 900.000,00 - -
Machinery and equipment 158.000,00 - -
Transport vehicles - - -
TOTAL PER YEAR 1.470.000,00 20.000,00 -
Table 5. Capital investments in city logistics
Investment type 2017 HRK
2020 HRK
2030 HRK
Projects 200.000,00 - 1.000.000,00
Construction works (without building parcels) 30.000,00 - 11.000.000,00
Machinery and equipment 225.000,00 - -
Transport vehicles - - -
TOTAL PER YEAR 455.000,00 - 12.000.000,00
Sisak Urban Transport – Sustainable Urban Mobility Planning – FINAL REPORT 5
Table 6. Capital investments in road safety
Investment type 2017 HRK
2020 HRK
2030 HRK
Projects 488.000,00 504.000,00 550.000,00
Construction works (without building parcels) 1.917.000,00 2.061.000,00 -
Machinery and equipment - - -
Transport vehicles - - -
TOTAL PER YEAR 2.405.000,00 2.565.000,00 550.000,00
Table 7. SUMP costs by responsible entities
Responsibility 2017 HRK
2020 HRK
2030 HRK
City of Sisak 18.409.000,00 115.828.333,33 77.726.666,67
AP 3.900.000,00 3.110.000,00 42.525.000,00
City of Sisak and taxi service providers* - 100.000,00 200.000,00
City of Sisak, AP, Croatian Railways** - 100.000,00 -
City of Sisak, Croatian Roads* 2.170.000,00 1.950.000,00 -
Croatian Roads*** 2.200.000,00 135.370.000,00 207.000.000,00
Public-private partnership - - 11.000.000,00
Ministry of culture** - - 9.000.000,00
City of Sisak, Ministry of Interior, NGOs 150.000,00 150.000,00 300.000,00
TOTAL 26.829.000,00 256.608.333,33 347.751.666,67
* One half of the total costs for each participant
** One third of the total costs for each participant
*** Public-private partnership
Table 8. SUMP costs by activity areas
Activity area 2017 HRK
2020 HRK
2030 HRK
Public transport 5.529.000,00 8.923.333,33 53.601.666,67
Pedestrian and bicycle traffic 8.350.000,00 11.000.000,00 31.600.000,00
Road infrastructure 8.620.000,00 234.100.000,00 250.000.000,00
City logistics 455.000,00 - 12.000.000,00
Parking policy management 1,470.000,00 20.000,00 -
Road safety 2.405.000,00 2.565.000,00 550.000,00
TOTAL 26.829.000,00 256.608.333,33 347.751.666,67

Sisak Urban Transport – Sustainable Urban Mobility Planning – FINAL REPORT 6
2 INTRODUCTION
Final Report is a fifth scheduled deliverable upon the signed consultancy contract by the parties Auto
promet and the Consortium consisting of the Faculty of Transport and Traffic Sciences of the University
of Zagreb and Deloitte Advisory Services Ltd. (hereinafter: Consultant) for the preparation of project
“Sisak Urban Transport – Sustainable Urban Mobility Planning”.
The goal of the Final Report is to establish the Sustainable Urban mobility Plan for the City of Sisak,
based on the Draft Final Report (in which the Plan was presented, and the City of Sisak decided upon
accepting the Plan according to the public hearing held in City Administration headquarters).
The City of Sisak decided, at the presentation of the Susatainable Urban Mobility Plan held in December
12th, 2016, and the public hearing after the presentation, to accept the presented SUMP solution for
2017, 2020 and 2030 time horizons. Therefore, the next task of the Consultant is to adjust the proposed
Sustainable Urban Mobility Plan of the City of Sisak according to the public hearing and stakeholder
remarks in written form.
Sustainable Urban Mobility Plan is the plan that includes a new vision in traffic and spatial planning,
taking into account the current traffic and zoning plans with integration, participation and evaluation
principles to satisfy the needs of urban residents for mobility, today and in the future, and to provide
a better quality of life in cities and their surroundings.
The goal of a SUMP in cities is to create a sustainable transport system by:
Ensuring the availability of job places and services to everyone;
Improving road safety and security in transport system;
Reducing pollution, greenhouse gas emissions and energy consumption;
Increasing efficiency and effectiveness in transport of people and goods;
Increasing the attractiveness, quality of life, and mobility in the city.
Transport policy and its measures set out in the sustainable urban mobility plan in cities should include
all forms and modes of transport in the entire city agglomeration such as public and private, passenger
and freight, motorized and non-motorized, moving and stationary. A special emphasis is put on the
role of the parking policy in managing total transport demand, aggravated by unfavorable modal split
and excessive private car usage. Therefore, the parking supply management and defined rule
management present powerful tools for achieving the reduction of the excessive private car usage in

Sisak Urban Transport – Sustainable Urban Mobility Planning – FINAL REPORT 7
urban space. Local administration units should perceive that the Sustainable Urban Mobility Plan is an
upgrade of the existing plans. The plan provides an effective way of solving problems related to
transport system in the observed area.
Furthermore, to the existing EU practice on member state regulations, the main SUMP features are
the following:
A clear vision, objectives and measurable targets;
Sustainability that will balance economic growth, social justice and environmental quality;
An integrated approach, which takes into account the practices and policies of different
sectors and administration levels;
A review of transport costs and benefits, taking into account the overall social costs and
benefits;
Participatory approach, involving citizens and stakeholders from the beginning to the end of
the planning process.
In the action plan for urban mobility published in 2009, the European Commission has supported the
rapid adoption of sustainable mobility plans in European cities by using general guidelines, promoting
the exchange of best practices, benchmarking and supporting educational activities for urban mobility
professionals.
EU transport ministers are supporting the process of developing SUMPs in cities. The conclusion of the
action plan for urban mobility of June 24th, 2010, states that the Council of the European Union
supports the development of sustainable urban mobility plans, and encourages the development of
incentives, such as professional assistance and information exchange, for the creation of such plans.
In order to develop SUMP of the City of Sisak, the methodology was implemented in accordance with
the following documents: Green Paper – Towards a new culture for urban mobility (COM 2007), Action
Plan on Urban Mobility (COM 2009), A call for smarter urban vehicle access reglation (SWD 2013),
Mobilising Intelligent Transport Systems for EU cities (SWD 2013), Targeted action on urban road safety
(SWD 2013), A concept for sustainable Urban Mobility Plans (COM 2013), Together towards
competitive and resource-efficient urban mobility (Com 2013), A call to action on urban logistics (SWD
2013), and GUIDELINES – Developing and implementing Sustainable Urban Mobility Plan (EU 2013), all
of them based on the EU traffic policy (White paper 2011 – Roadmap to a Single European Transport
Area – Towards a competitive and resource efficient transport system).
Based on the analysis of the current transport system in the City of Sisak, and in cooperation with the

Sisak Urban Transport – Sustainable Urban Mobility Planning – FINAL REPORT 8
City, the potential for creating a successful sustainable urban mobility plan is estimated, and the
purpose and objective of the Plan are defined. Then, a common vision of sustainable urban mobility
plan is defined based on previous transport planning documents. Three alternative variant solutions
were made, based on which the City administration of Sisak finally selected the alternative. In
accordance with the decision, priorities and measures were set. With the Interim Report 3, based on
clear priorities and measures, the development of effective packages of measures for certain structural
parts of the Sustainable Urban Mobility Plan was started, including: non-motorized transport, public
transport, logistics, road infrastructure, and road safety. The report also gives an estimate of the cost
in the time horizons of the Plan (2017, 2020, 2030), followed by the responsibility to implement the
parts and measures. Also, based on the precise indicators, a system for monitoring the implementation
of the plan is proposed.
After the adoption of the Sustainable Urban Mobility Plan for the City of Sisak by the city
administration, the final step follows - the plan adoption.
The City of Sisak is the centre of Sisack-Moslavina County which has over 4.468 km2 of space and, in
its territory 172.439 inhabitants live. The County includes 19 local governments, with 7 cities and 12
municipalities. The City of Sisak is the largest city in the county, with an 422,75 km2 area with 47.768
inhabitants, where in 35 urban areas 33.322 inhabitants live. The City was one of the biggest industrial
cities in Croatia with a rich cultural heritage, and a very favorable geographic position with transport
routes to the three rivers: Sava, Kupa and Odra. Sisak is one of the oldest cities in central Croatia whose
urban-based roots date to around the 4th century BC.
Today, the City of Sisak, due to the consequences of the Homeland War, the transition and the global
economic crisis, has weakened economy. The number of jobs has been in a decline in the past decade,
due to the reduction of economic activity. In the last year, the City recorded new economic prosperity,
which was a result of creating new jobs for citizens.
The current status is reflected in the transport system of the City of Sisak. The modal distribution of
travel is very unfavourable – about 47 % of trips are made by private cars, 36 % by walking, 8 % by
cycling, and only 8 % is done by public transport (3 % by train, 5 % by bus).
The private car usage dominates, but walking also has a very big share, as a result of the relatively small
inner city area. Low public transport percentage in the modal split is worrying.
During a day, according to the purpose, types of journeys are the following: commuting (42%),
shopping (21%), school (12%), recreation (10%) and other activities (15%).

Sisak Urban Transport – Sustainable Urban Mobility Planning – FINAL REPORT 9
A daily journey length by mode is following: by train 63.51 km (due to the distance of the gravitational
area of the City of Zagreb), by bus 13.05 km, by private car 12.37 km / 8.27 km, by motorcycle 7 km,
by bicycle 4.58 km and by walking 1.13 km. Private car usage and public transport usage is almost the
same. The relatively large distance (4.58 km) in cycling comes from the fact that the bike is used for
transport in broader areas and rural areas.
The reasons the excessive private car usage are speed, availablibity, lack of alternative transport and
joy of travelling.
When expressing the satisfaction of transport services, private car dominates, followed by walking and
cycling, while the public transport rating (train and bus) was significantly lower. This is confirmed by a
continuing decline in the number of passengers transported by bus from 2011 to 2015 by 21 % in city
traffic. Although the most recent data on passengers transported (from 2015 to 2016) imply positive
trends (the number of passengers increased by 3,6 %, the number of unemployed passengers is 5 %
lower, and the number of pasesngers with monthly employee tickets increased by 1,6 %), the survey
conducted indicates that it is necessary to take measures to improve the quality of public transport,
both bus and rail.
In conclusion, for the purpose of better economy and the future transport state in the City, continuing
the economic development, to create a sustainable urban mobility plan for the City of Sisak.
Sustainable Urban Mobility Plan should include a clear vision, goals and measures, with detailed
indicators of achievement as well as periods in which certain measures will be implemented, in order
to allow the City of Sisak economic prosperity, social inclusion, ensuring conditions for better quality
of life for all citizens.
Therefore, in the City of Sisak, a new vision of the transport system should include a change in modal
distribution in favor of public transport, the integration of transport systems in order to improve
mobility and access to town facilities by: reducing the private car usage in city traffic, improving road
infrastructure, encouraging the use of walking and cycling as modes of transport by expanding
pedestrian zones and improving cycling infrastructure, improving delivery traffic and city logistics,
improving parking policy, reducing the negative impact on the environment (noise and GHG
emissions), increasing road safety, and reducing external costs caused by the transport system.

Sisak Urban Transport – Sustainable Urban Mobility Planning – FINAL REPORT 10
3 THE CHOSEN VARIANT
In the process of drafting the Sustainable Urban Mobility Plan of the City of Sisak, the Consultant (FPZ
and DTT) have obliged to develop three alternative variant solutions. Based on the three proposed
variants, the stakeholders in the project have agreed on the implementation of all three variants and
corresponding measures, and therefore the Sustainable Urban Mobility Plan of the City of Sisak will be
implemented according to the following timeframes:
By the end of 2017;
By the end of 2020;
By the end of 2030.
The sustainable urban mobility plan covers the following activities:
Improving mobility and availability and modal shift;
Developing and promoting the usage of non-motorized transport (walking and cycling);
Improving public transport and the integrating transport subsystems (bus transport, taxi
transport, Park-and-Ride, public bicycles, tourist train, carsharing, railway transport);
Improving delivery transport;
Improving road safety;
Improving transport infrastructure;
Managing road infrastructure (automatic traffic management, intelligent transport systems,
public transport priority);
Creating solutions for a comprehensive parking policy;
Implementing measures of the sustainable urban mobility, and providing indicators and cost
estimations for the stakeholders;
Reducing the environmental impact;
Sugessting potential stakeholders from public and private sectors and public relations.
With the development of the proposals and measures aimed at promoting sustainable transport
modes in the scope of the existing transport policy, a sustainable, effective and energy-efficient
transport system in the City of Sisak has been attempted to define for the future. In this regard, the
development of chosen variants includes defining a road network, the concept of traffic flow
management (one-way streets) in the city centre, the concept of solutions for delivery and freight
traffic, the concept of pedestrian zones in which public transport is permitted, the concept of zones

Sisak Urban Transport – Sustainable Urban Mobility Planning – FINAL REPORT 11
exclusively for pedestrians and cycllists, bicycle traffic concept, street reconstruction proposals and
new intersection layouts to improve traffic flows and to increase road safety, proposals for improving
the signalling system at intersections, proposals of reconstructing the centre for maneuver traffic with
TMS and ITS, a comprehensive concept for planning off-street parking (Park-and-Ride) with proposed
tariff system. The solutions are primarily focused on road network in the city centre, but in accordance
with the identified problems, the solutions are also related to the secondary network (for example,
streets in which public transport operates). Special attention was paid to the areas that are important
attractors of travel such as the city marketplace, city hospital and shopping areas. The plan is specially
prepared for the mobility needs of the most vulnerable group of road users (schoolchildren, elderly
and people with disabilities).
Regarding public transport, the plan estimates the need for replacing rolling stock with more modern
and more environment-friendly vehicles. It was also suggested to introduce a system of informing
passengers in vehicles and at stops, and a proposal to improve the ticket sales system. Also, the
communication strategies of the plan are prepared with the idea of increasing sensibility of the public
to the proposed plan. In the following chapter, the detailed solutions are elaborated with proposed
plan measures, costs and indicators for monitoring the implementation of certain measures.
Figure 1. Modal split of city trips – goal for 2030
According to the survey, which was conducted in the first phase of the project, there is a very
unfavorable modal distribution of city trips – about 47% of travelling is done by car, by motorcycle 1%,
by walking 36 %, by cycling 8 %, and only 8 % was done by public transport (3 % by train, and 5 % by
bus). The aim of the sustainable urban mobility plan by 2030 for the City of Sisak is to reduce the private
car share from 47 % to 30 %. It is planned to increase urban public transport to 17 % (14 % by bus, 3 %
by train), 39 % by walking and 13 % by cycling (Figure 1).

Sisak Urban Transport – Sustainable Urban Mobility Planning – FINAL REPORT 12
4 SUSTAINABLE URBAN MOBILITY PLAN
The Sustainable Urban Mobility Plan of the City of Sisak encompasses seven main activity areas:
The role of institutions;
Public transport;
Pedestrian and bicycle traffic;
Road infrastructure;
City logistics;
Road safety;
The role of public and private sector.
4.1 The role of institutions
Institutional traffic ecosystem includes all bodies responsible for planning, financing, operations and
maintenance of transport infrastructure, services and transportation. Relations among these bodies
play a key role in ensuring efficient and reliable transport system, and the rules governing the entire
transport sector include administration, budget, regulation and other segments. As a result, the
successful implementation of the sustainable urban mobility plan is a complex interdisciplinary task
that requires coordination and cooperation of all relevant institutions based on the requirements of
the public and political consensus.
In the same way, cooperation on the implementation of the urban mobility plan is needed at different
levels: territorial, political, administrative and inter-department level. Due to this complexity, the Sisak
City Administration should appoint a management team for Plan project implementation and its role.
Therefore, it is necessary to devise a management concept for implementing SUMP, because in this
way, among other things, all relevant stakeholders at all times would know who, what and when is
working on a specific project. Therefore, by looking at the implementation of the Plan as a major
project, the role of project management is to become more important, when best practices suggest
the need for establishing a special administrative unit for project management within local authorities.
The head of the team for implementing and monitoring the progress of the project could be a
representative of the Department of Economy and municipal system of the City of Sisak, and the

Sisak Urban Transport – Sustainable Urban Mobility Planning – FINAL REPORT 13
representatives of other key city departments such as the Administrative Department of Planning and
Environmental Protection and the Administrative Department for Budget and Finance. Other members
could be three to five representatives of key external institutional stakeholders, and they can be
defined later (after identification) to join the team. It is necessary to clearly define the roles of team
members, in order to reduce the number of conflicts during interaction, and ensure the optimal usage
of available human resources (competence, working hours etc.). It is important to point out that the
work of the management team requires certain management and communication skills and, if they are
not part of the management and practices of the local authorities, then the team members must
actively develop them. At the same time, team members need to understand the national (or regional)
legal environment in terms of institutional cooperation which applies to plan carefully, and to respect
the legal requirements. Also, the team has to have the capacity to generate political support that has
competence over transport networks and services, as well as technical excellence in implementation.
The first task in implemeting Sustainable Urban Mobility Plan is to determine relevant institutional
partners for the implementation of the Plan. This is established by understanding functioning of
institutions by geographical jurisdiction, focus area and the possible financial contribution. An
attention to the institutions that enable inter-sectoral and inter-modal cooperation should be payed.
The key roles and responsibilities of the management team for Plan implementation are:
Coordination with all relevant authorities and utility companies in the City (different
departments, AP Sisak Sisak Projects Ltd., Komunalac, etc.) with respect to:
o Analysis of the current status of their KPIs and the need for updating the PSC;
o The coordination of public procurement associated with planned projects;
o The analysis of additional opportunities for involving private partners in the urban
mobility of Sisak;
Communication of roles and coordination with institutional partners such as ministries
(Ministry of Maritime Affairs, Transport and Infrastructure, etc.) of Sisak-Moslavina County,
especially in the context of:
o The integration of planning process and implementation of the identified measures
and compliance of local, regional and national activities;
o The adoption of legal forms or formal agreements by establishing responsibility in the
implementation of SUMP projects;
o The definition of procedures for public company participation in certain measures;
o SUMP project financing and analysis of available EU funds, etc;
Coordination with all relevant national public enterprises in the transport sector (Craotian
Railways, Croatian Highways, Croatian Roads, etc.);

Sisak Urban Transport – Sustainable Urban Mobility Planning – FINAL REPORT 14
Communication and understanding transport needs of municipalities in Sisak region;
Providing information to citizens on the activities related to sustainable urban mobility plan
and conduct their education in the field of urban mobility;
Determining the level and method of stakeholder involvement;
Harmonization of responsibilities and implementation of the package of measures;
Management participation and conflict resolutions related to Plan measures among the
institutions;
Collecting, monitoring, data analysis and evaluation indicators related to the implementation
of the Plan with result presentation (evaluated Plan implementation)
Such a structured approach to institutional cooperation can be seen as pragmatic cooperation with
key stakeholders to assist in achieving the set plan. Without institutional cooperation and their
commitment to achieving the objectives, the achievement of the Plan will be partial and therefore
realized with less benefit for the entire community.
After identifying the institutions and defining tasks, the task is to design and formalize cooperation
with key institutions. When it comes to public enterprises providing public transport services, as in the
case of AP Sisak, it is necessary to clearly define the Public Service Contract (PSC), which has to be in
accordance with Regulation No. 1370/2007 of the European Parliament and the Council on public rail
and road passenger transport services. Besides the amount and manner of financing, the contracting
between the City of Sisak and the carrier (AP Sisak) it is necessary to determine the scope and quality
of services of local transportation, and other issues that affect the need of co-financing. In other words,
the agreement should only cover the provision of the current state of public transport services, but
should include elements to encourage continuous improvement in financial efficiency and service
quality. At the time of this report, the agreement has been prepared and its finalization and signing is
expected shortly.
Also, pursuant to suggestions from this plan, it is necessary to provide a platform for a unique
integration of public transport. This means to include other public companies (and their departmental
institutions) like Croatian Railways and Croatian Roads, public transport carriers in neighboring local
governments and private entities involved in public transport. This could be achieved by unambiguous
and credible contract agreements on cooperation. Specifically, the long-term viability of the integrated
passenger transport concept at all relations between the involved parties in public transport, including
the relations between the government (in terms of connecting traffic of interest), should have a basis
in the contracts. In this context, the task for the implementation of the Plan should be to identify the
best forms of formalizing cooperation and to develop proposals for the agreement/contract.

Sisak Urban Transport – Sustainable Urban Mobility Planning – FINAL REPORT 15
4.2 Public transport
Public transport is the backbone of sustainable urban mobility in cities due to the high operating
capcity compared to the private car, availability for the majority of citizens, and the rationality in torms
of space, energy consumption and the environment. In terms of one passenger transported, public
transport requires the least amount of space, has the lowest transport costs and has the minimum
impact on the environment among the motorized modes of transport. The mentioned above makes
public transport the framework of the sustrainable urban mobility plans.
Despite the unsustainable massive private car usage, private car is the main competitor to public
transport because of shorter travel times and higher comfort. The majority of urban environemts in
the EU face excessive private car usage, and consequently, the external costs become higher (as well
as noise, pollution, traffic congestion, higher number of road accidents), causing the regressive
investment policy in terms of economy. Therefore, when developing sustainable urban mobility plans,
the cities aim to shift a certain amount of city trips from private car to public transport and non-
motorised modes of transport (walking and cycling). In accordance to the fact stated, public tanasport
needs to be made more attractive.
The goal of the sustainable urban mobility plan is not to go into detail with every proposed measure
(public transport network concept is shown only), so the recommended step is proposed for 2017 in
form of a a study called The analysis and solution proposal for the public transport in the City of Sisak.
The stated study would encompass an in-depth analysis of passenger flows, with the solutions for
public transport lines according to the passenger desires and the possibilities of the provider for both
2020 and 2030 horizons.
4.2.1 Visual identity
Visual identity of bus stops is crucial for encouraging public transport to be made attractive for
passengers, because of the image, which is represented as the desired public transport characteristic
to the passengers, in addition to the information, safety and simplicity. Bus stop with excellent visual
indentity is characterized by:
Easily-detectable stop location from large distances;
Recognizable road markings for vehicles and passengers;
Passenger information system (displays, schedules, map of the network, ticket sales
information);

Sisak Urban Transport – Sustainable Urban Mobility Planning – FINAL REPORT 16
Visible stop name with the list of lines belonging to the stop;
Markings of the exact vehicle stopping location;
Sense of security and comfort among passengers;
Characteristic design;
Totem with the sign, logo of the provider and the city, and other information.
The project which will contain a study of the visual identity is a condition for reconstructing bus stops
and making them more attractive to passengers.
4.2.2 Line route adjustment
The changes in the public transport network are suggested for the end of 2017, such that the line
routes would change according to the current transport demand by improving vehicle interval and the
new traffic regulation in the city centre. Since the routes for each line would be unchanged during a
day, it is suggested (due to simplicity) to rename Line 3(1) into Line 1, Line 4(2) into Line 2, and Line 5
into Line 3. Figure 2 shows the new transport network state.
Figure 2. Public transport network – proposed state for the end of 2017

Sisak Urban Transport – Sustainable Urban Mobility Planning – FINAL REPORT 17
The Line 1 route is shortened in the north-eastern part where, instead of Ivan Fistrović Street, it
changes to Nikola Šipuš Street and Franjo Lovrić Street, continuing to the Bus station over the
Gimnazija stop, in accordance with the new traffic regulation in the city centre. The route to Željezara
becomes 6,0 km long, and 10,6 km long to Kolodvor. The Line 2 route remains unchanged. The line
route length to Željezara is 7,5 km, and 12,0 km to Kolodvor.
The Line 3 is suggested to be extended over the Tomićev put neighbourhood by Ivo Rukavina Street,
Mijo Gorički Street and Nikola Tesla Street, to Ivan Fistrović Street, accompanied with the analysis of
stops, traffic and infrastructure. The line length with this route would be 9,7 km.
The public tranasport system is also suggested to be upgraded with a new line – Kolodvor-Galdovo-
Kolodvor, which would connect Galdovo neighbourhood and the city centre. The suggested route
passes through Ante Starčević Street, Franjo Lovrić Street, Kralj Tomislav Street, Vatrogasna Street,
Galdovačka Street, ending at the intersection with Stevo Berek Street. The line length would be 12 km,
both directions. The introduction of the new line is suggested to be a pilot for the first 6 months, and
afterwards, a decision on permanent introduction, route adjustment or cancellation would be made.
Figure 3. New public transport line Autobusni kolodvor – Galdovo
The new transport network state contributes to the better management of the existing network;
however, in order to make a comprehensive network reorganization, it is necessary to conduct detailed
research, and to design new line routes, which would certainly cause additional costs in terms of
infrastructrure (new bus stops).

Sisak Urban Transport – Sustainable Urban Mobility Planning – FINAL REPORT 18
4.2.3 Service improvement by reducing interval between vehicles
In the current state, the vehicle interval on lines 3(1) and 4(2) is 30 minutes. On joint corridors, the
average interval is 15 minutes. With these kind of intervals, passengers have to rely on timetables
when planning their journeys. Since the sustainable urban mobility plan has a goal to achieve modal
shif of city trips from private car to public transport, it is necessary to reduce the interval between
vehicles at least to 20 minutes on lines 3(1) and 4(2) by the end of 2017 (i.e. 10 minutes on the joint
corridor) in order to make waiting times at stops acceptable for passengers who arrive at stops
randomly. This could be done by adding one vehicle on each line. This kind of change would result in
inreased operating costs in peak periods; however, the increased quality of service would certainly
result in modal shift of city trips from private car to public transport, which results in the increased
number of city trips by public transport, and therefore, better public transport utilization and revenue
increase for the service provider (AP) as well as the decreased external costs produced by private car
usage (pollution, noise, road accidents, etc.).
4.2.4 Converting the bus stop Kolodvor into a terminal
In the current state, Sisak Bus Station serves as a regular bus stop for public transport lines only, and
therefore, the existing bus lines have only one terminal on their routes. In this manner, line route
length and cycle time are rather big, resulting in problems related to the timetable execution in terms
of punctuality and regularity of vehicles arriving at stops. The existing fare collection system in vehicles
causes long stop dwelling times, additionaly contributing to punctuality and regularity in terms of
timetable execution, which contributes to the declining public transport attractiveness. Therefore, it
is suggested to upgrade the Kolodvor stop to a terminal, considering cycle times as partial, which
results in reduction of irregularities in timetable execution and increased punctuality in arriving at
stops. This could have impact on the public transport attractiveness by encouraging passengers to use
public transport. In this manner, the current modal split of city trips would be changed in favour of
public transport.
Since Sisak Bus Station already has a bus stop for public transport lines, it is necessary to adjust the
location of the Kolodvor stop to act as a public transport terminal, which will enhance the role of Sisak
Bus Station as an intermodal passenger transfer point.
4.2.5 Bus stop renovation
After the establishment of stop visual identity, the following is the renovation of the existing bus stops
in the City of Sisak. Is is planned to rennovate 50 stops in two stages - in the first stage, 25 stops would

Sisak Urban Transport – Sustainable Urban Mobility Planning – FINAL REPORT 19
be renovated until the end of 2020, and the other 25 until the end of 2030. The costs to renovate one
bus stop consist of a conceptual solution, awning instalation, paving, and concreting. In addition, the
rennovation includes installing tactile surfaces for visually impaired persons.
4.2.6 Introducing real-time info displays
A large amount of information in public transport can often cause confusion among passengers.
Therefore, the role of the info displays at bus stops is to provide the passengers with additional help
in their journeys from origin to destination. The info displays provide passengers with information
about vehicle departures and arrivals in real-time. An info display should have a long lifespan with
minor necessity for maintenance, and the frame holding it should be sturdy enough to protect it from
vandalism or bad weather conditions. Info displays can be operated by cable or wiresselly with a
computer software. The types og messages showing on them can be adjusted to fit the needs of the
public traansport operator – usually, the minimum information requirement to be displayed are
vehicle arrivals in real-time.
Info panels have to be compatible with the other systems installed such as ticketing or automated
vehicle location in order to function reliably. The implementation costs consist of construction site
adjustment for the info display installation, and a GPRS modem for communicating wiressly with the
system.
It is planned to have 25 info panels installed until the end of 2020 (first stage) at the selected locations
in the City, and the other 25 in the second stage until the end of 2030.
4.2.7 Tariff system
In order to increase public transport usage, the existing tariff system in public transport should be
made as simple and attractive as possible to passengers. The tariff system needs to be simple with a
reasonable number of tickets considering user needs. The fare charging scheme should be transparent,
easily understanable, and efficient.
Ticket sales points should be widely available, on as many as possible distribution channels, sales points
located at the most important city locations, with ticket vending machines for automated ticket sales,
via Internet or smartphone app.
It is suggested to make corrections in the existing tariff system by introducing single tickets valid for
an hour, enabling passengers to use public transport independently of the direction or the route within
the City. In this manner, fare charging for commuting would remain unchanged, because commuters

Sisak Urban Transport – Sustainable Urban Mobility Planning – FINAL REPORT 20
mostly use public transport in different time periods; in addition, such decision would increase public
transport usage among tourists, visitors or citizents that need to make a return trip in short time
(shopping, private activities, etc.). This could increase public transport attractiveness additionally.
In order to integrate public trasnport into a joint passenger trasnport system (train, inter-city bus,
carsharing schemes, and similar), it is suggested to establish a project considering a joint tariff system
which could provide detailed solutions for fare charging.
4.2.8 Introducing e-Ticketing system
It is necessary to completely avoid fare charging systems based on buying tickets in the vehicle. These
kind of systems mainly cause longer stop dwelling times, which makes cycle times longer, and reflects
on cycle speed by reducing it, and this results in assuring higher transport supply because the dynamics
of the existing capacities are diminished. Therefore, if the fare charging system with ticket sales in
vehicles is chosen to be kept, it is necessary to reduce the number of sold tickets to minimum such
that ticket sales are encouraged through alternative distribution channels (kiosks or the Internet), or
the number of monthly sold tickets is increased (by interventions into tariff system). By introducing
stop voice announcements in vehicles as an component of the fare charging system, the public
transport attractiveness can be additionally increased with significantly improving conditions for
visually impaired persons.
4.2.9 Introducing Wi-Fi in city buses
Free wireless internet in bus transportation was used for the first time on buses operating on
international regular bus lines as an additional service. The comments of the passengers were very
satisfactory, so the service was applied also on intercity lines, and lately on city lines, thus raising public
transport attractiveness. The principle is quite simple – a router or multiple ones are needed for
transmitting free Wi-Fi signal inside the vehicle (depending on the vehicle configuration). The routers
can also be put on public transport stops. Figure 4 shows an example of a bus equipped with Wi-Fi
Internet.
The passengers can connect their smartphones with a password provided on a single ticket on the
monthly or yearly ticket. The installation of Wi-Fi Internet in city buses is planned to be completed until
the end of 2020.

Sisak Urban Transport – Sustainable Urban Mobility Planning – FINAL REPORT 21
Figure 4. A city bus equipped with Wi-Fi, Copenhagen, Denmark
4.2.10 Public transport promotion
The goal of promoting sustainable traffic is to inform and raise public awareness to use offered
sustainable modes of transport and simultaneously, to perform activities for the public. The promotion
should be conducted by the department of the city administration in charge of traffic together with
the civil associations dealing with traffic. The public transport service promotion is required to be
designed with originality and high quality, because such activity can significantly contribute to the
number of public transport users. It is possible to promote public trasnport at stops and on vehicles,
in order to avoid additional advertising space costs.
Citizen involvement increases the quality of sustainable mobility measures, and thus is increasingly
recognized as an important part of every decision-making process. In the scope of stakeholder consult
process, citizen involvement is a procedure which enables the people to participate in planning and
making solutions for local problems such that the solutions reflect their needs. The citizens are usually
(and often) the end-users of transport service. Although the decisions made by the decision-makers
finally have impact on the citizen lives, the significance of an active citizen involvement in the decision-
making process has been recognized only recently.
4.2.11 Further line route adjustments due to the new bridge
Due to the new bridge on the Kupa River, changes for 2030 are suggested for lines 1 and 2 (Figure 5).
Line 3 route would be extended to the Tomićev put neighbourhood The new bridge will enable high-
quality road infrastructure, and several possibilities for public transport by adjusting line routes to
match the passenger needs.

Sisak Urban Transport – Sustainable Urban Mobility Planning – FINAL REPORT 22
The modification of the Line 1 route is suggested, so that it becomes a completely circular line with the
bus station as the only terminal. Instead of the current continuation of the route along Ante Kovačić
Street after the main city cemetery, the buses would turn left in Antun Grahovar Street and by the new
bridge to Ivan Fistrović Street, Ferdo Hefele Street, Vlado Janjić Street and finally by Rimska Street to
the Bus Station, with 3 buses operating on the line which would then be 9,2 km long.
Figure 5. Public transport network – suggestion for the end of 2030
On Line 2, a shortening is recommended in direction towards the bus station so that, instead of
continuing towards Zeleni brijeg, the modified route turns right to Rimska Street and to the bus station.
Such a route would have a length of 7,4 km to Željezara, and 7,6 km to Kolodvor. Because of this,
passenger demand for transport to Zeleni brijeg would be taken over by Line 3.

Sisak Urban Transport – Sustainable Urban Mobility Planning – FINAL REPORT 23
4.2.12 Replacing the existing bus park with eco-friendly buses
As an additional encouragement for using sustainable transport modes, it is necessary to encourage
eco-friendly vehicles in the City of Sisak. Electric and hybrid vehicles are primarily considered as motor
vehicles friendly to the environment.
The buses procured in 2016 will have to be replaced by the end of 2030. Iti s necessary to develop a
feasibility study for the new envirnment-friendly buses. The stated study will be used to make
recommendations whether to choose CNG, hybrid or electric buses. Iti s planned to procure 15 buses
for public transport in the city area.
4.2.13 On-demand transport
On-demand transport is an advanced, user-focused public transport mode which is characterized by a
flexible route and the application of small, medium or large vehicles transporting from origins to
destination according to passenger needs. There are several synonims for on-demand transport:
Demand Responsive Transport or Demand-Responsive Transit (DRT), Demand Responsive Service, Dial-
a-ride and Flexible Transport Services.
The advantages of on-demand transport are: increased accessibility and social equity, transport cost
reduction, increased number of users due to the greater user satisfaction, reduction of need for using
priavte car (or a second car in the family) – all this have the effect of filling the gap between the private
car and conventional public transport.
The costs for introducing come from: capital investments (vehicles, management and control centre,
call centre), operations (salaries for drivers and employees in the call centre, vehicle maintenance, fuel,
insurance) and administration (marketing campaigns and office staff).
The users and target groups are the residents in less densely populated areas, and the users who need
transportation when transport demand is low (transport services during evenings or nights). The
stakeholders during the implementation process are public transport operators, local and regional
authorities, service providers for vehicle management and control, taxi companies and research
institutions. The possibilities to apply on-demand transport in the City of Sisak are most prominent in
suburban areas where population density is rather low. Before the implementation of on-demand
transport, additional research must be conducted, in which public-private partnership can be
considered as an option.

Sisak Urban Transport – Sustainable Urban Mobility Planning – FINAL REPORT 24
4.2.14 Bus priority at signalized intersections
In the scope of future public transport development into a mode that can offer a high-quality service
fore passengers, it is necessary to enable priority at intersections for it. Although the current priority
state in the City of Sisak is satisfactory (operating speed in public transport is 19 km/h), it is necessary
to have constant monitoring on potential intersections which could become problematic in the future,
and therefore, continuous analysis of priority within corridors and at intersections is recommented by
collecting vehicle speed data in the network.
In the case of detecting locations in the network with signficantly lower driving speeds compared to
the theoretical values (for example, below 50 % of the theoretical values), public transport priority by
the existing vehicle detection technology and technology for exchanging information between vehicles
and signalized intersections (for giving priority to pass the intersection) is suggested.
The majority of signalized intersections in the City of Sisak have microprocessing traffic light devices
installed, so the installation of modules for giving priority to public transport vehicles would not pose
a technical or technological problem when the necessity for introduction appears. The systems for
public transport priority have to also be taken into account when introducing automated traffic control
systems.
4.2.15 Transport to the Zagreb Airport
Passenger transport to the Zagreb Airport is currently not worthwile because of the insufficient
transport demand. The specific departures and routes of the existing intercity lines Zagreb – Velika
Gorica – Sisak, already passing by the Airport, can be used for adjustment if the necessity for it arrives
before 2020.
One of the possible solutions can be a carpooling service, which should be highly promoted in order to
be recognized as a valid service for passengers who travel to the Zagreb Airport. The information about
carpooling should be provided on the bus station, the railroad station, and on the web.
If there would be a significant increase in transport demand between the City of Sisak and Zagreb
Airport before 2030, besides the buses, the railroad transport has to be provided as a realistic
alternative to the inter-city bus transport, considering prices and travel times.
4.2.16 Park-and-ride system
Park-and-ride, as a system, includes parking spaces for vehicles located in the vicinity of public

Sisak Urban Transport – Sustainable Urban Mobility Planning – FINAL REPORT 25
transport stops or terminals with a joint tariff system. The condition to offer Park-and-ride as a service
includes unused space next to public transport stops which could be used for parking spaces. The trips
to Zagreb and from Zagreb are the main reason for developing park-and-ride systems in the City of
Sisak, for passengers who have to travel to the City of Zagreb for education or work.
It is proposed to build first multi-modal park-and-ride car park in the Kralj Zvonimir Street with the
capacity of 500 parking spaces until the end of 2020. A second multi-modal park-and-ride car park is
suggested for the area sorrounded by Ivan Fistrović Street, Nikola Tesla Street and the railroad, with
600 spaces capacity until the end of 2030. The necessity of the second park-and-ride car park should
be examined based upon the utilization of the first car park in Kralj Zvonimir Street.
Besides the two stated locations described in detail in chapter 4.5, it is suggested to examine the
possibility to implement a P+R car park at the Sisak-Caprag train station, as well as for the stations
Greda, Blinjski Kut and Stupno, also located in the city administration area. For further analysis and
provision of P+R parking spaces, it is necessary to conduct preliminary studies and traffic elaborates in
cooperation with the City of Sisak and Croatian Railways.
4.2.17 Multi-modal public transport app
The modal share of public transport is extremely low. The application of modern technologies in
transport, specifically, ITS services, can be used to achieve the sustainable mobility concept in the City
of Sisak. In this manner, intellgent transport systems offer a whole series of applications and services
as a support to deal with problems in transport. One of these services are passenger information about
travel possibilities. In contrast to static information systems, the dynamic ones enable a right-time
decision while choosing on travel mode and route.
The majority of minor and major European cities has incorporated advanced passenger information
systems, and the product of those systems are time savings, less road congestion, less pollution,
increased level of service, etc. It is necessary to make public trasport in the City of Sisak closer to
passengers, i.e. make it more attractive and accessible. One of the ways for achieving this is to make
passenger information transparent. The passengers want real-time and accurate information, pre-
travel and travel. Static information, in form of timetables, usually deviating, is not sufficient and
attractive anymore. Therefore, it is necessary to develop and offer an application which provides
advanced real-time information in public transport. The development and upgrade of the multi-modal
journy application is suggested in two stages. In the first stage, an application offering real-time public
transport (bus and train) would be developed with the information about pedestrian and cycling
routes. In the second stage, the application would be extended by adding carpooling information and

Sisak Urban Transport – Sustainable Urban Mobility Planning – FINAL REPORT 26
charging, public bicycle information and ticket sale information in public transport.
Multi-modal journey information systems provide users with dynamic, real-time information, which
would integrate the available modes of public transport in the City of Sisak. In this manner, the user
plans this or her journey according to preferences. In accordance to the stated, the systems provide
passengers better information when choosing the transport mode, making them opt for the best
choice for their needs, when choosing transport vehicles, routes, prices, travel time, and even the
environment-friendly option; and in the end, the option which can get them to a successful completion
of their journey (including the on-trip information, such as ticket sales, route changes, and similar).
Figure 6. An example of a multi-modal passenger information system
The basic function of the system is to solve the problem of getting from position A to position B in
specific time od departure/arrival with certain conditions. Basically, the system contains information
about departures and arrivals for vehicles integrated into public transport system of the City of Sisak –
information about buses, trains, incidents, road condition, ticket sales, etc. Fully equipped passsenger
information systems provide real-time information, e.g. cuurent vehicle departure time at a stop,
information about incidents which could have effect on travelling and travel times, with predictable
delays included. A multi-modal passenger information system (Figure 6) encompasses different data
the system is based upon. These data can be information about destinations (points of interest) for
users, timetables for different transport modes, schematic maps of transport nodes, points of interest
next to public transport stops, pricing, fare charging zones, gas emissions, etc. The stated data is
necessary to be standardized in compliance with the European directives. Multi-modal IT systems and
planng services also enable better modal integration and sustainability of traffic system in terms of
providing the best choice of transprt modes along the entire journey.

Sisak Urban Transport – Sustainable Urban Mobility Planning – FINAL REPORT 27
The introduction of a new information systems and a fare charging scheme is an important step to a
high-quality transport system. Joint tickets (which integrate all transport modes) are a functional
uprade of the multi-modal information system. Joint ticket is a key feature of an attractive, user-
friendly, multi-modal transport system and a condition for high-quality journeys. The usage of a joint
ticket during the transport process is a valuable encouragement for passengers whenn choosing to
travel by several modes.
4.2.18 Public bicycle scheme
Public bicycle systems provide bicycle rental services for short rides (less than 5 km long) in urban
areas. This kind of system consists of a bicycle fleet, automated bicycle park network (where bicycles
can be put away and distributed further), and the system maintenance program in addition to the
above stated.
The bicycles can be rented on one terminal, and returned on the other. The terminals with automated
self-service can hold from five to twenty bicycle located at main destination and transport centres. The
service is free of charge or very cheap if the usage time periods are considerably low (less than 30
minutes).
The advantages of public bicycle systems are the following:
It is cheap, simple, and flexible for private transport in the city;
It has a positive effect on urban mobility and enriches transport infrastructure;
It contributes to the public transport sustainability with low prices;
It encourages multi-modal journeys by making users change their modes;
It relieves traffic surfaces in the city;
It has a positive effect on air quality and noise;
Indirectly, it raises the health standard and decreases health-care costs.
The disadvantages of public bicycle systems are the following:
High investment costs, and it becomes cost-effective very late, even with simple
maintenance;
The service usage heavily relies on weather conditions;
Distance between terminals can be very high;
The number of bicycles can be small;
There is constant fear of vandalism, damage on bicycles or bicycle theft present.

Sisak Urban Transport – Sustainable Urban Mobility Planning – FINAL REPORT 28
For the City of Cisak, it is required to procure four terminals, 40 spaces and 30 bicycles until the end
of 2017. The following locations are suggested for placing the terminals:
Bus / rail station in the city centre;
City marketplace (with the new pedestrian zone on Ban Jelačić Square as an alternative);
Rail Station Sisak-Caprag;
Viktorovac (by the Faculty of Metallurgy).
4.2.19 Tourist train
The introduction of tourist train in the City of Sisak was conceived as an additional support to public
transport until the end of 2030. The tourist train would be an additional offer to tourist services for
increasing the attractiveness of the City of Sisak, and with such measure, the Old Town would be
constantly connected with the city centre.
Figure 7. An example of a tourist train
Technically, the train would consist of two parts – the first part is the motor vehicle powered by
electricity, and the second part are several smaller wagons with maximum capacity of 60 passengers,
as shown in Figure 7. The train route would have a length of maximum 5 km. The route would begin in
the pedestrian zone and end in the Old City.
The train can be managed as a part of the AP services or as and external service. Besides the tourists,
it can be suited for pre-schools and schoolchildren.
4.2.20 Passenger transport by water (water taxi)
Public transport service in cities alongside rivers or seas can be also provided by water. The service can
be managed as a public tranasport line or on-demand (as a taxi service). The transport service itself is

Sisak Urban Transport – Sustainable Urban Mobility Planning – FINAL REPORT 29
provided by boats which cah have different capacities.
The implementation of water transport in the City of Sisak is planned to be a taxi service until 2030
(on-demand). The main goal of establishing these kind of service is the new kind of mobility service
(passenger transport by water) in order to increase offer for tourists in the City of Sisak. The boats are
planned to be fully-electric, with the boat design that promotes natural beauties of the City. The
eastblishment of such a service is planned in form of public-private partnership.
Figure 8. Water taxi in New York City
4.2.21 Public car scheme – Carsharing
The public car service – carsharing, is one of the mobililty management measures in cities, representing
an alternative mode of transport, and in this manner, it is an encouragement for reducing private car
usage. Carsharing is one type of joint ride options based on using private cars already owned by third
persons (legal persons), which enables users to drive around the city and sorrounding areas by shared
cars, instead of their own cars, via standardized card at specific terminals with well-defined
compensation fee1. In order to include a greater number of users (citizens), mostly for daily migrations,
it is necessary to ensure availability of every element which act as a component of shared cars and
shared rides. This kind of measure can be started by designing a public car project in which private cars
could be used mainly by city administration employees or city company employees, and by citizens
pre-registered for the service in afternoon periods. The cars should be hybrid or electric. This kind of
model is attractive for people who use their private cars only occasionally, as well for those who want
to be able to use a car although they do not posses a private one, compensating for the service with
1 Grgurević, I.: Determining Carpooling Trip Origin Locations in Urban Areas, Ph.D. thesis, University of Zagreb, Faculty of Transport and Traffic Sciences, Zagreb, 2013

Sisak Urban Transport – Sustainable Urban Mobility Planning – FINAL REPORT 30
mothly or yearly subscriptions.
Due to its geographic location, the City of Sisak has a great potential to develop joint ride systems by
private cars, i.e. to develop carsharing service. This kind of measure can be encouraged by constructing
carsharing terminals which will offer free parking, by developing web and mobile applications to
exchange information about means of connecting the users etc. On an individual scale, carsharing can
cause reductions in travel time, need for car ownership, savings in travel costs and maintenance, all
making private car last longer, driver strees become less at journeys, thus creating greater social
interactions among citizens.
The City of Sisak has not had developed joint car systems yet; however, at non-formal level, private car
sharing among family members, friends, and working colleagues is common (such a form of joint rides
is known as casual carpooling). Joint rides for daily migrations between Sisak and Zagreb can be
noticeable, as well as for migrations between the City of Sisak and towns in the gravitational area:
Pertinja, Glina, Hrvatska Kostajnica, etc. The private car mode takes 47 % of the total modal split of the
City of Sisak, which is the highest percentage. After the private car, the following is walking with over
a third (36 %), which is an interesting piece of information, because carsharing users throughout the
world point point out walking as one of the two most common modes of transport. According to the
length of each transport mode in kilometres as an indicator, the results of the survey conducted
showed the following most common distances: 1,1 km for walking, 12,4 km for private car (as drivers),
and 8,3 km for private cars (as passengers). With every analysis conducted (modal split, motorisation
rate, number of registered vehicles, etc.), conclusions about possibility for application and the system
potential can be made.
According to the available relevant traffic data of the City of Sisak, the implementation of carsharing is
recommended. The goal of the carsharing project in the City of Sisak is to introuce a new, alternative,
and sustainable public transport mode. In order to make the system as attractive as possible to users,
its introduction could be planned according to the most recent experiences and trends in the world.
Before the introduction of carsharing in form of a standard service (make a reservation, drive, and
return to the same location), it is necessary to take into account different service models: Open end,
Instant access, One-way, Cashcar and others. The world trends in applying different service models are
focused on applying innovative solutions and systems from the domain of intelligent transport systems
in order to increase the usage of alternative and sustainable transport modes. The intensity of
developing traffic system as a whole and the intensity of developing carsharing demands significant
application of information and communication technology and services. By using different specialized
web portals and applications for mobile terminal devices, an efiicient usage of the exsting capacities

Sisak Urban Transport – Sustainable Urban Mobility Planning – FINAL REPORT 31
(private cars, carsharing terminals and carpooling stops, heavily-occupied lanes and similar) can be
achieved.
The key elements (activities) for the implementation of the efficient carsharing system are shown in
Table 9 and Table 10. The determination of the implementation area is very important due to a high-
quality locations of carsharing terminals as well as determining the number of available cars in the
carsharing system. Based upon the criteria for determining carsharing terminal locations,
implementation area and geografic traffic analysis of the City of Sisak and its surrounding areas, three
locations are suggested – first in the city centre in the vicinity of the bus station and the rail station,
the second next to the rail station in the Caprag neighbourhood, and the third one next to Zagrebačka
Street and Odranska Street.
Table 9. Gantt-chart for carsharing activities in 2017
No Activity 1 2 3 4 5 6 7 8 9 10 11 12
1 Project documentation, legislation activities x x
2 Determining the implementation area x
3 The choice on the number of carsharing
terminals x
4 Number and characteristics of the offered
vehicles (based on research) x x x
5 Terminal equipment and information support
for carsharing system x x x x x x
6 Tendering and tender conduction x x x x
7 Work contracts, equipment procurement,
project supervision x x
8 Promotion campaign x x x x x x x x
9 Continuous monitoring of each project activity x x x x x x x x x x
The definition of the number of available private cars for carsharing in the City of Sisak is preceeded
by the survey on citizens and data analysis. The data analysis will be used for detemining the number
of private cars that should be procured and used for for the service needs. For a more efficient
application of carsharing, it is important to spread relevant information about means of using the
service, terminal locations, potential users, and to make the information available on the visible service
plan (e.g. by a web portal or a mobile phone app). Table 9 shows the activity Gantt-chart for 2017, and
Table 10 for 2018.
Table 10. Gantt-chart for carsharing activities in 2018
No Activity 1 2 3 4 5 6 7 8 9 10 11 12
1 Carsharing terminal – construction, design x x
2 Promotion campaign x x x x x x x x x
3 Continuous monitoring of each project
activity x x x x x x x x x x x x

Sisak Urban Transport – Sustainable Urban Mobility Planning – FINAL REPORT 32
In the majority of the European cities which have had joint ride systems such as carsharing and
carpooling implemented, the project carriers are the private companies which operate based on
concession (e.g. carsharing operators). The cities encourage this mode of transport to be used more
frequently by cost deductions through concessions or by favouring system users in certain traffic
condition, such as assigning priority to public transport on a specific street (segregated lanes, priority
at intersections), parking privileges, cost subsidies for a percentage of transport costs, etc. Besides the
stated, financing the project of implementing carsharing and carpooling can be carried out with the
support of the EU funds which encourage the development of the sustainable alternative modes of
transport within the project.
Table 11. Carsharing activity carriers
No Required carsharing activity Activity carrier
1 Project documentation Chosen contractor, City of Sisak
2 Determining the implementation area Administration body, traffic consultants
3 The choice on the number of carsharing terminals Administration body, traffic consultants
4 Number and characteristics of the offered vehicles
(based on research) Administration body, traffic consultants
5 Terminal equipment and information support for
carsharing system
Management body, consultants in civil engineering, trafic engineering, and
electrotechnics
6 Tendering and tender conduction City of Sisak, traffic consultants
7 Work contracts, equipment procurement, project
supervision
City od Sisak, consultants in civil engineering, trafic engineering, and electrotechnics, chosen
contractor
8 Promotion campaign City of Sisak
9 Continuous monitoring (for each project activity) Supervising engineers in civil engineering,
trafic engineering, and electrotechnics, City of Sisak
10 Project evaluation Chosen contractor
The initiator and the carrier of every activity in the carsharing project initiation and its implementation
is the City of Sisak, which can delegate tasks and assignments related to the model establishment
conduction. The carriers of the specific activities on the project are suggested according to the
activities determined (Table 11).
Due to the numerous positive effects on urban transport, carsharing is the one of the most used joint
car models in a large number of cities throughout the world.
The carsharing service mostly depends on the demand by the end users – citizens. In order to achieve
noticeable results, it is necessary to conduct continuous mnonitoring of every activity within the
suggested project, and to have a right-time decicion on introduciong new or adjusted measures (the
strengthening of the information and promotion activities due to the decreased public interes tor
similar). The continuous monitoring of every project activity would be carried out in a functional

Sisak Urban Transport – Sustainable Urban Mobility Planning – FINAL REPORT 33
scheme and according to the belonging activities necessary to evaluate the results.
The purpose of monitoring the indicators of the carsharing system is to collect statistical data required
to analyse energy savings, gass emissions, evaluation of the results, the influence the system could
have on the existing traffic system in the City of Sisak, and the impact the system could have on the
environment and quality of life.
4.2.22 Taxi service improvements
Iti s required, by the City and the Environmental Protection and Energy Efficiency Fund, to co-finance
the procurement of eco-friendly taxi vehicles for the existing taxi service operators. The significance of
the measure comes from the fact that taxi vehicles cross large distances over a year and thus can have
a great impact on the environment.
Due to the lawbreaking competition, it is required to cooperate with the road inspection (the
Department of Road Traffic) if the problem of illegal taxi operators in the City of Sisak continues.
4.2.23 Integrating public transport and railway systems
The development of railroad infrastructure is the main objective of the EU transport strategy in order
to have minimum travel costs for the residents, and the increased mobility based on the sustainable
transport principles. The City of Sisak, due to its convenient location in the rail network, should be
additionally focused on railroad from both passenger transport and the City as a potential railway
centre for intermodal transport and logistics.
The solution for 2020 is the increased railroad transport usage for trips to work between Zagreb and
Sisak, such that timetables of the city buses in Sisak would be adjusted to match the ones in railways;
in addition, the land next to railroads would be used for buisiness activities related to manufacturing
and logistics in the vicinity of railway infrastructure.
4.2.24 Goals and indicators
The basic transport policy guidelines of the City of Sisak in public transport are: increased share of
public transport in the modal split, high-quality public transport service, better integration between
different public transport modes with other modes of transport and the increased availability for the
people with disabilities.
The analysis of the existing public transport state in the City of Sisak revealed areas wich require special

Sisak Urban Transport – Sustainable Urban Mobility Planning – FINAL REPORT 34
attention. One of the high-priority measures is a project for enhancing visual identity, in which public
transport stops should define a characteristic and familiar stop appearance, which includes a totem
with the sign, logo of the provider and the City, easily-detectable stop name with the list of lines
belonging to the stop and passenger information (displays, timetables, transport network map, city
map ticket sales information, etc.). After the visual identity solution, it is required to radically
rennovate the stops and to install real-time displays on them.
By adjusting routes of public transport lines and with decreasing intervals between vehicles in peak
periods, a significant service improvement in public transport can be achieved. Currently, public
trasnport service has a poor score of 2,3, and new vehices have also to be introduced if the service is
to be improved.
In order to achieve goals set, and to improve public transport, measures within Table 12 are suggested.
The basic goals are: increased public trasnport usage, enhanced public transport offer, better
integration of different public trasnport modes and other transport modes, and better accessibility for
people with disabilities.
Table 12. Goals and measures in public transport
Transport policy
guideline
Public transport goal
Measure for goal achieving Goal planned
Modal split
Increased public
tranasport usage
Visual identity
Line route adjustment
Service improvement by reducing interval between vehicles
Converting the bus stop Kolodvor into a terminal
Bus stop renovation
Introducing real-time information displays
Tariff system
Introducing e-Ticketing system
Introducing Wi-Fi in city buses
Public transport promotion
Further line adjustments due to the new bridge
Replacing the existing bus park with eco-friendly buses
On-demand transport
Bus priority at signalized intersections
Transport to Zagreb Airport
Park-and-ride system
Multi-modal public transport app
Public bicycle scheme
Tourist train
Public car scheme – Carsharing
TAXI service improvements
Integrating public transport and railway systems
Increase in the number of public transport users in the City by 10 % until 2020, and an another 10 % until 2030, compared to 2015;
Increase of the public transport share in modal split from the existing 5 % (2016) to 10 % (2030)
Public transport offer
Enhanced public transport
offer
Introduction of the enhanced fare charging system until the end of 2017
Reduction of the interval between buses on main corridors to 10 minutes until 2017 in peak periods
The introduction of the carsharing until 2017
The introduction of the public bicycle service until 2017
Increased quality of service in public transport and railroad transport

Sisak Urban Transport – Sustainable Urban Mobility Planning – FINAL REPORT 35
Transport policy
guideline
Public transport goal
Measure for goal achieving Goal planned
Integration
Better integration of
different public trasnport
modes and other transport
modes
Establishment of two Park-and-Ride car parks
Public bicycle locations at public transport terminals/stops and at railroad station
Developing a multi-modal spmartphone app which includes carpooling
Accessibility for people
with disabilities
Better accessibility for
people with disabilities
Equipping urban buses with folding ramps for people with disabilities
Adjusting every bus stop to meet the needs of visually impaired persons
There is a series of measures that can also have impact on the passenger number increase and the
increase of the quality of service in public transport such as: public tranasport promotion, Wi-Fi
Internet in city buses, multi-modal application and bus priority on signalized intersections.
In addition, the bus fleet has to be monitored properly, i.e. roadworthiness coefficients (age and
kilometres crossed), and the bus fleet has to be renewed on-time by eco-friendly buses, in order to
reduce the average bus fleet age to 10 years in 2030.
Tariff policy measures dealing with the fare charging system are highly important. Tariff policy, as a
part of the financing policy for public transport, can represent a significant obstacle for achieving a
certian level of service, and therefore, the financing policy has to serve quality of service and measures.
The existing ticket prices are suggested to be maintained, with an option to analyse reductions in ticket
pricing according to the Public Service Contract.
The ticketing system has to be reliable, enabling simple passenger monitoring. The basic system costs
come from: procurement and installation of the equipment, personnel training, and maintenance.
The analysis of the existing state in the City of Sisak reveals that the public bicycle, park-and-ride, and
carsharing do not exist, and that carpooling service does not have the right attention (it is sporadically
performed on the route Sisak-Zagreb by the initiatives of the people). The implementation of the
mentioned measures and the integration with public and railroad transport will result in a synergy of
sustainable mobility in the City of Sisak.
Considering high unemployment rates and the decreased number of unemplyeed people by 4 % until
2020, public transport has to offer a high-quality service in order to attract new users on their routes
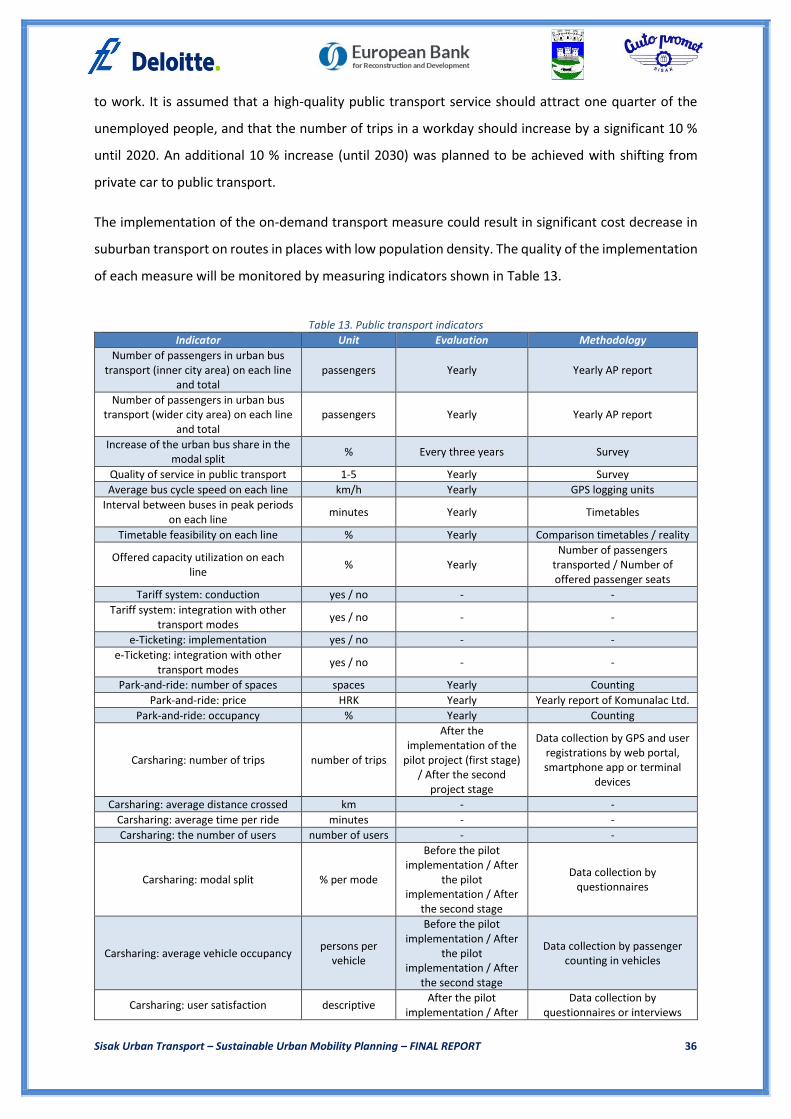
Sisak Urban Transport – Sustainable Urban Mobility Planning – FINAL REPORT 36
to work. It is assumed that a high-quality public transport service should attract one quarter of the
unemployed people, and that the number of trips in a workday should increase by a significant 10 %
until 2020. An additional 10 % increase (until 2030) was planned to be achieved with shifting from
private car to public transport.
The implementation of the on-demand transport measure could result in significant cost decrease in
suburban transport on routes in places with low population density. The quality of the implementation
of each measure will be monitored by measuring indicators shown in Table 13.
Table 13. Public transport indicators
Indicator Unit Evaluation Methodology
Number of passengers in urban bus transport (inner city area) on each line
and total passengers Yearly Yearly AP report
Number of passengers in urban bus transport (wider city area) on each line
and total passengers Yearly Yearly AP report
Increase of the urban bus share in the modal split
% Every three years Survey
Quality of service in public transport 1-5 Yearly Survey
Average bus cycle speed on each line km/h Yearly GPS logging units
Interval between buses in peak periods on each line
minutes Yearly Timetables
Timetable feasibility on each line % Yearly Comparison timetables / reality
Offered capacity utilization on each line
% Yearly Number of passengers
transported / Number of offered passenger seats
Tariff system: conduction yes / no - -
Tariff system: integration with other transport modes
yes / no - -
e-Ticketing: implementation yes / no - -
e-Ticketing: integration with other transport modes
yes / no - -
Park-and-ride: number of spaces spaces Yearly Counting
Park-and-ride: price HRK Yearly Yearly report of Komunalac Ltd.
Park-and-ride: occupancy % Yearly Counting
Carsharing: number of trips number of trips
After the implementation of the
pilot project (first stage) / After the second
project stage
Data collection by GPS and user registrations by web portal, smartphone app or terminal
devices
Carsharing: average distance crossed km - -
Carsharing: average time per ride minutes - -
Carsharing: the number of users number of users - -
Carsharing: modal split % per mode
Before the pilot implementation / After
the pilot implementation / After
the second stage
Data collection by questionnaires
Carsharing: average vehicle occupancy persons per
vehicle
Before the pilot implementation / After
the pilot implementation / After
the second stage
Data collection by passenger counting in vehicles
Carsharing: user satisfaction descriptive After the pilot
implementation / After Data collection by
questionnaires or interviews

Sisak Urban Transport – Sustainable Urban Mobility Planning – FINAL REPORT 37
Indicator Unit Evaluation Methodology
the second stage
Carsharing: greenhouse gas emissions g/km
Before the pilot implementation / After
the pilot implementation / After
the second stage
Automated stations for air quality monitoring and/or analysis based on traffic
volume
The number of bikes in the public bicycle system
bicycles Yearly Counting
The number of terminals in the public bicycle system
terminals Yearly Counting
The number of public bicycle rentals rentals / month Monthly Counting
The number of kilometres crossed by public bicycles
km / month Monthly GPS logging devices
Public bicycle price HRK / renting
hour Yearly -
Passenger information app in public transport
yes / no - -
Multi-modal smartphone app fpr public transport users
yes / no - -
Sisak Urban Transport – Sustainable Urban Mobility Planning – FINAL REPORT 38
4.3 Pedestrian and bicycle traffic
The construction of the pedestrian zone and the further development of bicycle network provides a
more efficient, more safe and more attractive infrastructure for the movement and the residence of
pedestrians and cyclists. Such transport infrastructure contributes to better connection of attractors,
provides space for communication of citizens, expression of opinion, leisure of citizens, revives trade
in the city centre and, therefore, humanizes the city centre. The basic purpose of urban roads in the
city is the multifunctionality of traffic, or substitute for the lack of living space – not just the omission
of motor vehicles. The increased number of motor vehicles in the city centre, which prevents
pedestrians and their free interaction, is an additional motive for the construction of the pedestrian
zone in the ciy centre. The pedestrian zone will allow the creation of diversity, strength the economy,
enable revival of retail trade and gastronomy, and finally, contribute to the revitalization of the City of
Sisak and increase the quality of life. The network of cycling roads in the city area will enable fast,
comfortable and safe travel from origins to destinations.
Figure 9 presents the development vision of the pedestrian zone in the city centre for 2017, 2020, 2025
and 2030.
In 2017, the pedestrian zone will consist of Silvije Strahimir Kranjčević Street and a section of Stjepan
Radić Street from Sivije Strahimir Kranjčević to Ivan Kukuljević Sakcinski Street. The proposed city
project is under implementation, and is accepted as a positive solution for the promotion of
sustainable mobility. The goal of costructing the pedestrian zone is to strengthen the city centre and
to create a city “for people”, not “for motor vehicles”. The pedestrian zone does not allow the
movement of motor vehicles, contributing to the reduction of negative influence of motor traffic.
Vehicles for residence, delivery, or public utilities will have to obtain permissions in order to get rights
to drive in the zone.
After the first phase of construction and implementation of pedestrian zone at Silvije Strahimir
Kranjčević Street and at section of Stjepan Radić Street from Sivije Strahimir Kranjčević to Ivan
Kukuljević Sakcinski Street (currently in progress), in the second phase planned for 2020, the
pedestrian zone will be expanded along the Stjepan Radić Street to the Ljudevit Posavski Square, and
to the railway station by 2025. This part of the pedestrian zone would be adapted for longer holdings
of citizens, and therefore it has to be equipped with benches, trees, flower beds, bicycle racks, trash
cans and a high-quality street lighting. The textured surfaces have to be used in order to divide the
space reserved for people in movement from the space that will be used for people while resting.

Sisak Urban Transport – Sustainable Urban Mobility Planning – FINAL REPORT 39
The longitudinal streets – Ivan Kukuljević Sakcinski Street, Franjo Lovrić Street and Ljudevit Posavski
Square will retain the existing orientation. At the intersection with the Antun and Stajepan Radić
Street, or, in contact with the proposed new pedestrian zone, the traffic regulation at these streets will
allow the possibility of a semi-circular rotation. In the zone including the intersection of Antun and
Stjepan Radić Street (pedestrian zone) and Frankopanska Street, a raised surface is proposed in order
to reduce the motor vehicle speed in Frankopanska Street. This would ensure a safe corridor for
walking and cycling between the bus station, train station, and the pedestrian zone.
Figure 9. The development concept of the pedestrian zone in the city centre

Sisak Urban Transport – Sustainable Urban Mobility Planning – FINAL REPORT 40
By the end of 2030, the continuation of the pedestrian zone is planned bellow the station, as proposed
by the Urban Development Plan2, and an underpass is planned under the Antun Cuvaj Street. In the
case of too complex construction process, a possibility is to construct pedestrian passageway over the
railway station. The construction of the future interpretation centre Siscia as a part of the Segestica
factory, serving for future “neighbourhood of museums” (representing archaeological findings and
industrial heritage, is planned. The new corridor will also contribute to the revitalisation and
reurbanization of the northern city parts. It is important to emphasize that the construction of the
pedestrian underpass or bridge can be excuted significantly earlier, if the project is adequately
incorporated within the mentioned Siscia-Segestica project, with the support of the EU funds and the
corresponding ministry of culture. In this manner, the City would get a high-quality pedestrian zone
which would serve as a central part for public space gatherings in the city centre.
To conclude, the implementation of such zone in the city centre would encourage non-motorized
modes of transport, discouraging private car usage, which would be a significant contribution to
sustainable transport and sustainable development of the City in general.
4.3.1 The development of predestrian surfaces in the city centre for the purpose of protecting cultural and historical heritage and increasing quality of life
The proposition for extending pedestrian zone until the end of 2020, together with enforcing the
development of bicycle network and the closure of the Old bridge, will result in encouraging walking
and cycling, and also in discouraging motor vehicle usage in the City. This will reduce negative impacts
of motor traffic (noise, emissions, acid rainfall, etc.), which will contribute to the preservation of
cultural and historical heritage, increase the offer for tourists, and return the positive image of the City
as a desirable destination for recreation and vacation. Further decrease in the number of motor
vehicles and increase in the percentage of non-motorised traffic will additionally contribute to the
quality of life for citizens, which will result in peole coming back (especially young ones) into the City
of Sisak.
4.3.2 The development of independent walking routes (paths, sidewalks) and cycling network in accordance with examples of good practice
The centre of the City of Sisak, where the city's main content is concentrated, covers an area of about
0,3 km2, and is the ideal area for a 5-minute walking which is the most natural form of movement. The
area located within a radius of 600 meters from the city centre is also ideal for the development of the
2 Urbanistički plan uređenja centra grada Siska, Službeni glasnik 12/04.

Sisak Urban Transport – Sustainable Urban Mobility Planning – FINAL REPORT 41
pedestrian (10 minutes) and bicycle traffic (up to 3-4 minutes), which means that the daily needs of
the citizens can be satisfied without using private cars.
The City of Sisak has a well-connected pedestrian infrastructure, which has local weaknesses due to
the failure of planning and lack of infrastructure maintenance. Local weaknesses are caused by spatial
concessions for motor traffic due to an increase in the motorization rate in the last two decades. The
potential for improving pedestrian traffic is the removal of "point" type barrier, the implementation of
measures for traffic calming, street greening, implementation of pedestrian crossings on main roads if
missing and the construction of the pedestrian zone in the city centre.
Figure 10. Proposal for developing bicycle paths/lanes in the City of Sisak (2017, 2020, and 2030)

Sisak Urban Transport – Sustainable Urban Mobility Planning – FINAL REPORT 42
Outside the city centre, where needed, it is necessary to provide walking paths and sideways
(especially around schools and kindergartens), such that is necessary to build a one-sided or two-sided
paths, and to provide additional traffic lights at pedestrian crossings. It is important for streets that all
legal measures should be taken in order to remove the parked cars from sideways, so they could be
used for safe and smooth pedestrian movement.
In order to further strengthen the bicycle traffic, it is necessary, in the immediate and wider area of
the centre, to design and implement an integrated (comprehensive) network of bicycle paths and
routes that will connect major attractors, and which will provide a safer and a more direct way to get
from one place to another. The existing cycling infrastructure needs horizontal and vertical traffic signs
and lighting, in order to increase the level of subjective safety among cyclists. The current bicycle
network in the City of Sisak is fragmented, unsafe at particular sections, and does not connect main
traffic attractors. Despite the mentioned, in the past several years, a significant progress has been
noticed in the bicycle infrastructure regarding construction; therefore, it can be expected that, in the
following period, some shortages would be eliminated, resulting in positive and service-friendly
environment for cyclists.
Until 2017 (Figure 10), the projects of the construction of cycling paths is proposed: in Rimska Street
(the construction of the southern bicycle connection in Rimska Street is in progress), Ivan Fistrović
Street in D36 corridor (currently in construction), Ante Kovačić Street in the corridor from the county
road Ž3205, and on the Odra River embankment. Further development of the planned bicycle network
of Sisak, which has to be complemented with new suggestions, is therefore proposed. In addition to
bicycle paths and lanes, it is necessary to install additional equipment, such as bike racks and other
equipment (compressors, repair shops, resting points, buffets) on the main points of interest in the
City.
As a basic proposal for upgrading bicycle infrastructure by 2020, a construction of bicycle paths/lanes
in the city centre is proposed, especially at the corridor of Frankopanska Street, Kralj Zvonimir Street
and Obrtnička street. It is necessary to build a corridor in Mihanovićeva street to the city stadium which
could be used for tourist and recreation purposes by linking existing cultural attractions. Besides the
lanes in the city centre, it is necessary to build (but also, to renew the existing in accordance with the
new standards of bicycle path design) continuous interrupted paths at D36 (bypass), Josip Juraj
Strossmayer Street (D37), and in Caprag neighbourhood. As an important measure to encourage
bicycle traffic, the existing regulation of bicycle traffic in the city centre is approved, such that the
pedestrian zone will continue to be used by cyclists in 2020 and 2025 construction phases.
By 2030, the proposal is to build cycling infrastructure throughout the administrative part of the City

Sisak Urban Transport – Sustainable Urban Mobility Planning – FINAL REPORT 43
of Sisak by the corridor of state roads D36 and D37 (towards Petrinja, Sela, Galdovo), Ž3120 and at
embankments of Kupa and Sava rivers. Also, the proposal includes construction of bicycle paths/tracks
in parallel of the capital new roads in the city, such as west bypass from Gromovi Bridge (DC37), trough
Zibel and further on route from Školska Street to the new bridge over the Kupa River and Ivan Fistrović
street (D36). This would create significant conditions for appropriately connecting neighbourhoods at
the left and right enbankments of the Kupa River and the city centre, and, in addition, for completing
a high-quality pedestrian and bicycle network in the City and sorroundings. This would also create
better image for tourists by the related content in the inner city parts, and raise the importance of the
Kupa River coastline, because the bicycle-pedestrian path would connect Zibel public beach, city centre
and the Old Town. Accordingly, it is necessary to examine the possibility of placing car parks on the
right bank of the Kupa River, similar to the park reconstruction project in Lađarska Street. In this
manner, the visitors of the centre could park their cars at the right coastline, and continue on foot or
by public bicycle over the bridge towards the city centre.
It is necessary to analyse the possibility of constructing tourist and recreational cycling route on the
crown of the abandoned railway line Caprag – Petrinja and towards to the other neighbourhoods. This
would contribute to the development of cycling tourism in the peripheral areas and other settlements
of the Banovina region.
4.3.3 The definition of terminals intermodal transport (as Bike-and-Ride)
The bicycle is primarily a mode of transport for short trips. It can play an important role in the longer
journeys, as an additional mode of transport. The integration of the bicycle and/or bicycle-sharing
schemes in the public transport system is an important way of encouraging intermadality in public
transport.
Intermodal connections of bicycles and public transport includes three levels:
Bicycle parking near public transport stops;
Bicycle transport by public transport;
Rental system.
In the case of Sisak, proposed position of the first bicycle park is in the city centre (bus and train station)
and the other one at the railway station in Caprag. The parking infrastructure should include standard
equipment (racks and holders), preferably covered or otherwise protected from all weather conditions
at all stations. Bicycle parks should be designed to enable smooth transfer from the bicycle to the train
and vice versa, should be located on accessible route, within a short walking distance from the

Sisak Urban Transport – Sustainable Urban Mobility Planning – FINAL REPORT 44
platform, with long working hours and with affordable price. Services may include all of the services
such as bicycle rentals and various accessories, showers, and cycling information. It is necessary to
arrange the transport of bicycles on trains with Croatian Railways and AP buses in accordance with
transport demand.
Figure 11. Bicycles in public transport vehicles: in train (left), in front of bus (centre), folded in train (right)
One option in the intermodal chain is to allow cyclists to take bicycles with them to public transport
vehicles (Figure 11). The advantage of this practice is that it allows cyclists to use their own bicycle
from "door to door". The application of this solution is limited, since only a small number of cyclists
will be able to use this service, due to the fact that bicycles take up space and can lead to overcrowding.
Also, loading and loading of the vehicle can take a lot of time. Bicycles in the vehicle can pose a security
problem if not attached firmly.
4.3.4 Measures for reconstruction of pedestrian and bicycle network
The length of the cycling network in Sisak at the end of June 2016 was 16 km. According to the
proposed plan, the total length of bicycle paths compared to the current would be doubled by 2020,
and increased almost four times to 60 km by the end of 2030. (Table 14). That will form a completed
bicycle network that could also, besides for daily commuting, be used for recreational purposes.
Table 14. Measures related to the bicycle network
measure period (length in km)
Existing paths and lanes, July 2016. (16 km)
New cycling infrastructure 2017 (10 km)
New cycling infrastructure 2020 (6 km)
New cycling infrastructure 2030 (28 km)
Construction of a pedestrian zone (work in progress) 2017
New pedestrian zone in Stjapan and Antun Radić Street connecting the rail station
2020
Pedestrian underpass beneath the railway station 2030
The costs of constructing pedestrian and bicycle infrastructure (Section 5) include costs for the
construction and expansion of the pedestrian zone in the city centre, and pedestrian underpass or

Sisak Urban Transport – Sustainable Urban Mobility Planning – FINAL REPORT 45
overpass over the railway station.
4.3.5 Indicators for non-motorized traffic
In order to increase the share of pedestrian and bicycle traffic in the modal distribution the City of
Sisak, solutions and measures have been proposed as parts of the Plan in periods until 2017, 2020, and
2030, with the purpose of improvement of health, reduction of medical treatment costs, increased
productivity, increased road safety, reduction of the negative environmental impacts (noise,
greenhouse gases, etc.), which will ultimately lead to the improved quality of life for all citizens of Sisak.
The aim of the sustainable urban mobility plan by 2030 for the City of Sisak is the reduction of private
car share from 47% to 30%, and increase of walking share to 39% and bicycle share to 13%.
In order to meet objectives set, it is necessary, during the forthcoming period, to continuously monitor
indicators of pedestrian and bicycle traffic, which are shown in Table 15.
Table 15. Indicators for non-motorized traffic
Indicator Measuring unit Evaluation Methodology
Bicycle network length km Yearly Annual report
Pedestrian surface area m2 Yearly Annual report
Number, length and purpose of travel by cycling
number of trips, km Yearly Counting, survey
Number, length and purpose of travel by walking
number of trips, km Yearly Counting, survey
Number of car parks at the points of interest in the City
number Yearly Annual report
Number of public bicycle terminals number of terminals,
number of bicycles Yearly Annual report
Number of road accidents with cyclists number of accidents Yearly Annual report
Number of road accidents with pedestrians
number of accidents Yearly Annual report

Sisak Urban Transport – Sustainable Urban Mobility Planning – FINAL REPORT 46
4.4 Road infrastructure
The road network of the City of Sisak is analyzed by the macro-simulation tool PTV Visum. PTV Visum
is the world's leading simulation tool for the analysis of the existing and forecasted traffic flows on the
macroscopic scale (city, county, state). A traffic model of the current situation was developed by the
household and cordon survey at the entrances/exits of the City. The traffic model was developed for
the morning and afternoon peak hours in order to highlight problematic areas of transport network
with a high saturation (Figure 12). The pictures show the model results for the afternoon peak hour
due to the more intense traffic flows. Significant traffic volume by motor vehicles is noticeable in the
narrow city centre, which is not in accordance with the sustainable urban mobility.
Figure 12. Traffic volume in 2015 – afternoon peak period, both directions
Despite the continued depopulation trends, and due to the expected mild recovery of the economy
(real GDP growth), it is expected that Sisak will have a slight upward trend in the number of private
cars. Although 2030 predicts changes in the modal split, it is expected that the private car share will
decline from the current 47 % to 30 %, and the volume is also expected to increase on the city road
network by 8 % (Figure 13), which is a result of an increased GDP (number of jobs) and the consequent
growth of the motorisation rate.

Sisak Urban Transport – Sustainable Urban Mobility Planning – FINAL REPORT 47
Figure 13. Traffic volume prediction for 2030 – “Do nothing”
In order to enhance traffic flows and to give priority to the sustainable forms of transport, the
proposals in the field of road transport and road network are based on:
Changing the regulation and organization of traffic flows in the city centre;
Optimization of traffic lights at intersections (ATM, TMS or ITS);
Construction of the new bridge over the Kupa River in the city centre (in parallel to the railroad
bridge);
Reconstruction of critical intersections and road sections (bottlenecks or hot spots);
Construction of other bridges;
Construction of underpasses;
Construction of roads with high importance.
Regulation and organization of traffic flows in the city centre includes the determination of the streets
in which road traffic is allowed, street direction determination (one-way or two-way), and the
definition of the directions in one-way streets.
The streets where traffic is forbidden and streets intended primarily for pedestrian traffic are defined
in the section describing the pedestrian traffic, so this chapter includes the definition of street direction

Sisak Urban Transport – Sustainable Urban Mobility Planning – FINAL REPORT 48
and determination of directions of streets in the contact area of the pedestrian zone in the city centre.
From the point of encouraging sustainable mobility in the segment of road traffic, one-way streets are
very positive solution for the city centre. The one-way street system in the city centre provides better
traffic flows, opening new opportunities for pedestrians, cycling surfaces and green spaces, because if
the majority of streets are converted from two-way to one-way, one lane can then be used for the
movement of one-way traffic flow, and the other for another purpose. In this way, the level of traffic
safety for motor vehicles, pedestrians and cyclists is significantly increased. One-way streets are much
easier for handling traffic at intersections. At the intersections of one-way streets, there are only two
incoming directions, so there are a lot less conflict areas, and it is necessary to regulate only two
incoming vehicle flows. A special advantage lies in left turns left because there is no oncoming traffic
flow in the opposite direction which is conflicting with the traffic flow turning left. This significantly
increases the capacity, level of service, and the road safety at the intersections. In intersections of one-
way streets, if the traffic flow turning left is high, then the separate lane for left turns is not necessary
because the vehicles turning left may leave the intersection without interference of the oncoming
traffic flow (traffic flow which turns left can be observed the same as the traffic flow which turns to
the right, and it is disturbed only by the pedestrians). With establishing optimal regulation and traffic
flow organization, it is certainly important to mention the positive environmental effects, because the
increased network flow eliminates a substantial number of start-stop operations which have
extremely adverse effect on emissions.
Light signalling system at intersections (traffic lights) is one of the most important and most widely
used system of ITS in cities. The system of traffic lights is closely linked to sustainable mobility. By
optimizing traffic light operations at intersections, corridors and traffic zones, then waiting time,
intersection passing time, road safety, and electricity consumption for traffic light operation can be
and will be improved. The reduction of waiting time and intersection passing time make a significant
contribution to the reduced fuel consumption and exhaust as positive effects on the environment and
give a boost to the sustainable mobility. By improving road safety, social costs and the cost for the
individuals due to the accidents are reduced, thus increasing the standard of living among citizens. The
funds saved due to reduction of the number of road accidents can be invested in the development of
sustainable transport or other useful purposes. The reduction of energy consumption for traffic light
operation also has a positive effect on the environment and this reduces the financial pressure.
The construction of the new bridge has a direct impact on improving transport system because it
shortens the length of the journey, fuel consumption, and gas emissions. The above has a significant
positive impact on sustainable mobility. The new bridge over the Kupa river parallel to the railway

Sisak Urban Transport – Sustainable Urban Mobility Planning – FINAL REPORT 49
bridge is one of the most important urban projects and it will solve one of the city's major traffic
problems, that is the lack of transport capacity between the left and right bank of the Kupa River.
The construction of this bridge will significantly reduce congestion in the entire City.
The reconstruction of critical traffic points also has a positive impact on sustainable mobility. Certain
points in traffic can be critical in terms of capacity and safety. If they are critical in terms of capacity,
they may create unacceptable traffic congestion. The remediation of these points increases their
capacity, which reduces congestion, fuel consumption, gas emissions and noise. If points are critical in
terms of safety, they have a large number of road accidents and they create huge costs to the society
and the individuals. If these points are remediated, reduced road accident costs can be invested in
improving transport system in other places.
The construction of other bridges and underpasses that are not as important as the main bridge over
the Kupa river in the city centre, also has a positive impact on the sustainability of the transport system
because it reduces trip length, energy consumption, and gas emissions.
The construction of new roads (although not a fundamental measure to encourage sustainable
mobility), can also give a boost to the sustainable mobility as new roads reduce the length of travel,
increase road safety and in case of detours, they relocate traffic from the city centre to the periphery.
4.4.1 Changing the regulation and organization of traffic flows in the city centre
In the present condition, traffic flow regulation on the network of one-way and two-way streets is well
organized. Rimska Street and Stjepan Radić Street are a pair of one-way street transversal to the
correct orientation. Such pair of one-way streets provides relatively good capacity and level of service.
Based on the analysis of traffic volume and level of service at the majority of intersections in the city
centre, it can be concluded that their level of service are satisfactory (A or B). Only at one analyzed
intersection (Stjepan Radić Street – Ivan Kukuljević Sakcinskin Street), level of service E, due to the high
concentration of pedestrians, was determined. However, in measures to improve pedestrian traffic,
Stjepan Radić Street was proposed as a pedestrian zone, so it can’t be in the system of one-way streets
for motor traffic. For this reason, it is necessary to propose changes in the regulation and organization
of traffic flows in the contact area of the pedestrian zone. Although the main purpose of developing
sustainable transport in cities encourages sustainable transport modes, in which private cars are out
of scope, the private car presence on the streets cannot be completely avoided. Research on the modal
split in the city centre has shown that 47 % of trips are made by car, and forecasts predict that in 2030,
still 30% of the journeys will be done by car. Measures to encourage sustainable transport modes will
ensure the reduction of this share, but private car will have a significant proportion of city trips,

Sisak Urban Transport – Sustainable Urban Mobility Planning – FINAL REPORT 50
because, for objective reasons, other modes of transport cannot or do will not be used. For this reason,
it is necessary to arrange adequate road infrastructure for motor traffic.
Figure 14. Traffic flow regulation – proposal for 2017
The changes in the traffic flow regulation in the city centre are proposed in two phases. In the first
phase, the construction of the pedestrian zone in the Silvije Strahimir Kranjčević Street and Stjepan
Radić Street from Silvije Strahimir Kranjčević Street to Ivan Kukuljević Sakcinski Street are planned, and

Sisak Urban Transport – Sustainable Urban Mobility Planning – FINAL REPORT 51
traffic flow regulation will be adjusted to the new pedestrian zone. The stated solution has been
implemented at the time of this Plan. The proposal for traffic flow regulaiton in the first phase is shown
in Figure 14.
Figure 15. Traffic flow regulation – proposal for 2020

Sisak Urban Transport – Sustainable Urban Mobility Planning – FINAL REPORT 52
Figure 16. Traffic flow regulation – proposal for 2025
In the second phase ending by 2025 (Figure 16), a significant change in terms of the implementation
of pairs of longitudinal and transversal street is suggested. It is proposed to implement one-way street
pairs:
Rimska street - direction from north to south (existing orientation remains);
Street Ante Starčević Street - one-way from south to north (change from two-way);
Longitudinal streets (Ivan Kukuljević Sakcinski Street, Matija Gubec Street and Ljudevit
Posavski Square) remain two-way, but with an important note for the intersection with the
Antun and Stjepan Radić Street, which will become dead-end at the pedestrian zone, with the
possibility of semi-circular rotation. It is proposed to allow the passage of a pedestrian zone

Sisak Urban Transport – Sustainable Urban Mobility Planning – FINAL REPORT 53
only by heavily-occupied vehicles, delivery, public transport, emergency services, and other
vehicles with the permission of the City only;
Fran Krsto Frankopan Street - one-way from Franjo Lovrić Street to Ante Starčević Street and
two-way from Ante Starčević Street to Rimska Street. Due to traffic safety, it is proposed to
arrange the intersection of Stjepan Radić Street (future pedestrian zone) and Fran Krsto
Frankopan Street such that the whole surface is elevated, in order for motor vehicle drivers to
have a clear signal that they are approaching the pedestrian zone and that they have to reduce
speed;
Antun and Stjepan Radić Street becomes a pedestrian zone in its entire corridor to the train
station (changes from one-way) - in a later stage, this street would be gradually transformed
into a pedestrian zone.
In the second phase, the closure of the Old bridge for motor traffic is proposed. This will allow greater
comfort and safety of pedestrians and cyclists when crossing the bridge, and on the other hand, this
will protect from further deterioration caused by the intense motor traffic at one of the main symbols
of the City of Sisak. On the other side, the closure will contribute to the preservation of cultural heritage
of the City, and it will allow further strengthening of the tourist offer with the City as a desirable
destination for pedestrian and bicycle traffic.
Following Rimska street to the Josip Jelačić Square, it is necessary to provide connections to Vrbina
neighbourhood and through in order to provide access to Kralj Tomislav Street towards the future new
bridge (the new bridge is the capital city project, necessary for the sustainability of the transport
system, and it will be addressed in a separate chapter below). This connection can be realized by an
underground tunnel below the park (less likely option because of the archeology) or by a road under
the Old bridge, lowering the vertical alignment of the existing road to allow bus passage under the
bridge. A possible solution can be suggested in form of a street at the western edge of the Vladimir
Nazor Promenade. After the construction of this connection and the construction of a new bridge, it is
possible to close the Old bridge for motor traffic and to convert it into a pedestrian and bicycle bridge
that will eliminate motor traffic, and to develop sustainable mobility in the city centre.
In the case of objective restrictions in the implementation when connecting Vrbina neighbourhood, an
alternative solution for public transport vehicles and delivery vehicles (which cannot pass under the
Old bridge in the current state) can be traffic flow reorganization in Ante Starčević Street, Franjo Lovrić
Street and Ivan Kukuljević Sakcinski Street near the Highs School and Franjo Tuđman Square. Delivery
vehicles and buses can be guided from Rimska Street by Ivan Kukuljević Sakcinski Street to Ante
Starčević Street. In this variant, Ante Starčević Street would be two-way for public transport, i.e. public

Sisak Urban Transport – Sustainable Urban Mobility Planning – FINAL REPORT 54
transport vehicles would be allowed to pass through Ivan Kukuljević Sakcinski Street to Franjo Lovrić
Street. Delivery vehicles could continue on Ivan Kukuljević Sakcinski Street to Franjo Lovrić Street, and
then continue in any direction.
The closure of Stjepan and Antun Radić Street and the Old Bridge will result in increased traffic volume
on the Vlado Janjić Street, the streets at the Vrbina neighbourhood, at the beginning of Rimska Street,
Frankopanska Street and Franjo Lovrić Street, but below the degree of saturation. The implementation
of the proposed changes in traffic flow management in the city centre and new traffic flow
management at intersections will eliminate waiting queues and congestion (Figure 17).
Figure 17. Traffic volume prediction for second stage in 2020 – afternoon peak period
4.4.2 Optimization of traffic lights at intersections (ATM, TMS or ITS)
On the roads of the City of Sisak, there are currently 15 traffic light intersections, where as many as 12
are located at the intersections of roads managed by the City of Sisak and state roads D36 and D37.
The City of Sisak manages the intersections completely independently with only three signal heads. It
should be noted that the busiest roads in the City of Sisak are D36 and D37 (Petrinjska Street, Josip

Sisak Urban Transport – Sustainable Urban Mobility Planning – FINAL REPORT 55
Juraj Strossmayer Street, Vlado Janjić Street, Zagrebačka Street, Ferdo Hefele Street and Ivan Fistrović
Street), where a part of the traffic flows transits (intercity), so intersections with traffic lights on these
roads have an especially high volume. The analysis of traffic flows and service levels at the selected
intersections with traffic lights have shown a very low level of service at intersections:
Josip Juraj Strossmayer Street (D37) - Hrvatski domobrani Street - Narodni heroji Street („Zibel
– by the Special police) have particularly low level of services when turning from Josip Juraj
Strossmayer Street towards the east;
Josip Juraj Strossmayer Street (D37)- Žitna Street (Old bridge) – particularly low level of service
at the turn from Žitna Street towards the south.
From the field analysis and the review of traffic light sytems at intersections, the following can be
concluded:
Almost all traffic signals have microprocessor technology, in addition to the traffic lights at the
intersection of Vlado Janjić Street (D37) – Rimska Street (new bridge) which is an older
technology (electronic traffic signals) which is positive, because these devices allow easy
adjustment of signal program for real-time traffic;
At most intersections, signal programs are not coordinated with traffic volume;
At most intersections, devices do not work according to traffic despite the detectors;
There is no traffic center or automatic traffic management system (ATM);
Traffic light lanterns are mainly halogen, which significantly increases power consumption
compared to the LED technology that has become a standard;
Technology used for detectors for vehicles is mostly based on inductive loops, except at
intersections Josip Juraj Strossmayer Street – Hrvatski domobrani Street and Ferdo Hefele
Street – Marijan Celjak Street, where microwave detectors are installed. The induction loops
are subject to frequent breakdowns, and therefore, most of the intersections with the
induction loops in Sisak do not have a traffic-dependent operation;
There is no coordination system of road sections (Josip Juraj Strossmayer Street).
Based on the analysis of the traffic light system, it is possible to conclude that the traffic light systems
at almost every intersection can be optimized in order to reduce the waiting time and intersection
passing time in order to improve road safety, and to reduce electricity consumption for traffic light
operations.
The proposed measures to optimize traffic light system in order to reduce waiting times and
intersection passing time, in order to increase safety and to reduce energy consumption for operation
Sisak Urban Transport – Sustainable Urban Mobility Planning – FINAL REPORT 56
of the traffic lights, is given for each traffic light intersections separately. As a measure that combines
several intersections, a proposal to implement coordination is given. As a general measure that
combines the entire traffic light system, it has been proposed to implement traffic control centre that
would combine all traffic lights with the implementation of automatic traffic management (ATM).
The system improvements for each intersection is proposed below:
Petrinjska Street (D37) – Caprag Street (by Konzum) (Figure 18):
o LED lantern installation;
o Overground detector installation;
o Signal program optimization;
o New road lanes;
Josip Juraj Strossmayer Street (D37) – Hrvatski domobrani Street – Narodni heroji Street (at
Zibel neighbourhood near the Special Police):
o Video detector installation;
o Signal program optimization;
o Cancellation of the flashing green light;
Josip Juraj Strossmayer Street (D37) – Ivan Mažuranić Street – Ivan Gundulić Street (next to
the hospital):
o LED lantern installation;
o Overground detector installation (microwave detectors recommended);
o Traffic light coordination with intersections 3 and 5 by an adaptive two-way
coordination system;
Josip Juraj Strossmayer Street (D37) – Hrvatski domobrani Street (by the “GOS”):
o LED lantern installation;
o Overground detector installation after the existing ones wear off;
o Traffic light coordination with intersections 3 and 5 by an adaptive two-way
coordination system;
Josip Juraj Strossmayer Street (D37) – Žitna Street (Old bridge):
o LED lantern installation;
o Overground detector installation after the existing ones wear off;
o Traffic light coordination with intersections 3 and 4 by an adaptive two-way
coordination system);
Vlado Janjić Street (D37) – Rimska Street (New bridge):
o Installation of the modern (microprocessor) device to replace the older one;

Sisak Urban Transport – Sustainable Urban Mobility Planning – FINAL REPORT 57
o LED lantern installation;
Ferdo Hefele Street (D36) - Marijan Celjak Street (by the County Road Administration):
o Cancellation of the flashing green light;
Ivan Fistrović Street (D36) - Nikola Mikec Street (by Interspar):
o Traffic light system adjustment after the reconstruction of the eastern driveway;
Ivan Fistrović Street (D36) – Ivan Kukuljević Sakcinski Street – Ivo Rukavina Street (by the
marketplace):
o Replacement and improvement of the existing traffic light devices;
o LED lantern installation;
o Detector installation (video detection);
o Installation of condition-dependent traffic light devices;
Franjo Lovrić Street - Ivan Kukuljević Sakcinski Street (by the hotel Panonija):
o Replacement and improvement of the existing traffic light devices;
o LED lantern installation;
o Detector installation (video detection);
o Installation of condition-dependent traffic light devices;
Franjo Lovrić Street – Matija Gubec Street (by the elementary school “22. lipnja“):
o Overground detector installation after the existing ones wear off;
Kralj Tomislav Street – Silvije Strahimir Kranjčević Street (by the Sisak High School):
o LED lantern installation;
o Detector installation (video detection);
Installation of condition-dependent traffic light devices.
Traffic light systems at intersections of Zagrebačka Street (D36) at Kaufland, Zagrebačka Street (D36)
at Lidl and Ivan Fistrović Street Street (D36) at Crodux gas station are brand new, but they are not
operational yet, so any new actions for them will not be proposed.
The proposal to implement (improvements) coordination is proposed for the roads between the
intersections of Josip Juraj Strossmayer Street (D37) – Ivan Gundulić Street (at the hospital), Josip Juraj
Strossmayer Street (D37) - Hrvatski domobrani Street (by the waste management company) and Josip
Juraj Strossmayer Street (D37) – Žitna Street (Old bridge).
Due to extreme traffic volume on minor approaches to the intersection of Josip Juraj Strossmayer
Street and Žitna Street (from the city centre), the position of intersections on the 250 m stretch, two-
way traffic (double coordination) and with the existing technology that isn’t recording traffic flow
characteristics and the traffic light system isn’t adaptive according to requirements, it is extremely

Sisak Urban Transport – Sustainable Urban Mobility Planning – FINAL REPORT 58
difficult to achieve both coordinations (green waves). As the implementation of adaptive traffic
management systems requires significant financial resources, the optimum would be, in the first stage,
to install a plan selection system, which, depending on the traffic volume in a particular period and
based on the historical traffic data, selects the optimal predefined signal program.
Figure 18. An example of the possible traffic light optimization by adding a road lane if there is space availyble (the
intersection of D37 and Capraška by the “Konzum”)
Therefore, first of all, it is necessary to create a traffic study to define the signal programs, algorithm
changes, location, traffic counters, and traffic counters installed on the critical points of the green
wave, to adjust the direction depending on the traffic volume with predetermined signal programs (a
minimum of five: for the morning and afternoon peak hour, daily traffic, Sunday afternoon period and
night periods).
At a later stage, it is possible to suggest:
Real-time system management;
Real-time system management based on traffic policies.
The management system in real-time operates such that traffic signals are connected with each other
and they are exchanging a large number of traffic data in only one second. Based on these data
(number of vehicles, waiting time, queue interval of following vehicles ...) the system for each traffic

Sisak Urban Transport – Sustainable Urban Mobility Planning – FINAL REPORT 59
signal determines green time duration the one-second resolution depending on the macro and micro-
location conditions. In order to adapt to the expected traffic requirements for a certain part of the day
of the week, historical data are also used by the system. This is extremely important in the morning
peak period, since traffic volume at night is negligible compared to the morning peak period, so in a
very short period, changes are going from minimum tom maximum in the signaling program.
The real-time management system based on the traffic policy works such that traffic signals operate
as a management system in real-time with the possibility of determining traffic policy, which means
that it is possible (in the ATM center) to assign different priorities during the day such as public
transport, pedestrians, private cars, etc.
As a general recommendation for significant optimization of the entire traffic light system, the
proposal of connecting all devices to a unique traffic centre is given. Traffic centre should be under the
jurisdiction of the city department in charge of traffic. Traffic center could performe traffic analytics
such as traffic system response to actual traffic demands, and based on that, the system could be
improved in real-time. This would result in additional savings in travel time and fuel consumption,
which would be a positive contribution to the energy efficiency of transport and sustainable mobility.
In addition, from the centre, traffic in the event of emergencies could be managed by giving priority to
public transport vehicles or to react promptly to eliminate the possible defects on system, which again
would result in more efficient traffic system.
Besides with traffic lights, the ATM system could unify more traffic systems in one place – the traffic
control centre. With the ATM, besides the traffic light system, it could be possible to connect parking
system, public transport, emergency services, suburban railway system, video surveillance, speed
control, variable traffic signs, information displays, road lightning and others (Figure 19 and Figure 20).
The data from these systems and devices are visible in the centre, allowing engineers to perform
adjustments in the system, and to optimize traffic by assigning different traffic policy. As a basis for
the phase implementation, the existing GIS system could be utilized, which is currently being used in
the City of Sisak.
Recently, the EU market has a whole series of low-cost solutions, which have all the features as the
previous relatively expensive systems, but the technologies and software solutions have significantly
reduced the cost of such systems. These solutions are based on web technologies that eliminate
expensive and complex IT infrastructure. In addition, the possibility of cloud solutions offers reliability
and automatic maintenance of software (software upgrade) without the expensive capital
investments. Initial problems related to the security of such systems are solved with multiple levels of
security in communications today.

Sisak Urban Transport – Sustainable Urban Mobility Planning – FINAL REPORT 60
Figure 19 The ATC scheme
Figure 20. The elements of the ATC system
4.4.3 Reconstruction of critical intersections
From the existing intersections of the traffic network of Sisak, there are especially emphasized
problems in traffic flow, capacity, level of service and traffic safety at two intersections. Below is an
analysis of the current situation, proposed measures, and the estimated costs of implementation,
construction, or reconstruction with associated indicators for two intersections:

Sisak Urban Transport – Sustainable Urban Mobility Planning – FINAL REPORT 61
Ivan Fistrović Street (D36) – Nikola Tesla Street;
Petrinjska Street (D37) i D224.
The intersection Ivan Fistrović Street (D36) – Nikola Tesla Street is located in the northeastern part of
the City on the significant Ivan Fistrović Street which stretches from north to south, and it is the state
road D36, representing the eastern bypass of the city centre. Nikola Teslea Street, which extends in
east-west direction connecting the eastern parts of the city which are limited to the east along the
Sava River and through Mijo Gorički Street is the only connection to the west to Ivan Fistrović Street
(D36) and the city centre. North from Nikola Tesla Street and west and east from Ivan Fistrović Street
(D36), lies the industrial and commercial zone of the City, which further emphasizes the importance of
roads and the intersection. South from Nikola Tesla Street and east and west from Ivan Fistrović Street,
residential buildings are located. The intersection is a one-level type and unsignalized. Along south
roadway from Nikola Tesla Street, the industrial railroad track connects the main train station with
industrial facilities around Nikola Tesla Street. This affects the classification of intersections as railway
crossings, but it has extremely unfavorable shape, with questionable sight distance and traffic flow
management at the intersection, particularly in terms of priority. Therefore, the level of service and
road safety are significantly low.
Because of its location and the role in the transport network of the City, and according to the current
and future traffic volume, the planned infrastructure traffic projects for the centre (Section 4.4.1) and
analyzed road safety (Section 4.7), it is necessary to reconstruct the intersection. For this purpose, two
stages are proposed:
Implementation of proper traffic lights and regulation of pedestrian and cycling traffic
management (plan for 2017);
Denivelation of the intersection (plan for 2030).
The first phase, as a temporary solution, includes the implementation of appropriate traffic lights and
regulation of pedestrian and cycling traffic according to the Section 4.2.16, which is the most effective
measure according to the planned period of time. A classic road-railway crossing with the appropriate
signalling and equipment (ramps) is suggested. If a detail traffic analysis show the possibility to
implement more appropriate solution (such as roundabout with traffic lights), such kind of solution
can be implemented. Any konf of solutions for the intersection would significantly contribute on
improving traffic flow and road safety at the intersection, and it would also prioritize sustainable
modes of transport.
The second stage requires significant financial resources, but it would be a final solution for the

Sisak Urban Transport – Sustainable Urban Mobility Planning – FINAL REPORT 62
intersection, meeting all the objectives of sustainable transport, mobility and safety. In the differenet
level version, Ivan Fistrović Street should be raised to the level +1 or reduced to the level -1, and Nikola
Tesla Street and the railroad should remain on the same level, such as the current situation. This
solution is complicated in terms of space, therefore, before the final decision, different design variants
should be studied. Financing assets for this variant should be provided mostly by Croatian Roads, and
in the minor extent by the City of Sisak and Croatian Railways – Infrastructure (land purchase, and the
reconstruction of the intersection environment, access roads, and the industrial railroad track).
The intersection Petrinjska Street (D37) – D224 is located in the southern part of the City of Sisak,
between Caprag in the north, Mošćenica in the west and Novo Pračno in the east. The intersection is
important because of its position and role in the transport network of the City and County, because it
connects Sisak to Glina and Topusko through Petrinjska Street in the west and Hrvatska Kostajnica and
Hrvatska Dubica (the border with Bosnia and Herzegovina) on the southeast. The intersection is has a
non-standard three-way Y-shape, and with the analyzed traffic volume, the shape significantly impairs
sight distance, level of service and safety.
Figure 21. The existing situation at the intersection D37 and D224 (left) and the situation after the suggested redesign into a
mini-roundabout (right)
According to the analysis, the reconstruction of the intersection into a mini-roundabout (Figure 21) in
order to reduce approach speeds (by making approaches perpendicular to the roadway) is proposed.
This would also significantly increase the sight distance on every approach and the intersection itself.
Due to the current situation, organization and location of pedestrian crossings, bicycle crossings and
bus stops, the intersection is extremely unsatisfactory in terms of road safety, organization, traffic
management at the intersection, and the capacity, so the following locations for the crossings are
proposed:

Sisak Urban Transport – Sustainable Urban Mobility Planning – FINAL REPORT 63
Northern approach on Petrinjska Street and along the west traffic lane;
Space between Petrinjska Street – north approach and D224, and the circulatory roadway.
The proposed intersection design, traffic management and the location of new pedestrian crossings,
bicycle crossings and bus stops would significantly increase the level of road safety, capacity and level
of service at the intersection. This would ultimately contribute significantly to the promotion of
sustainable modes of transport and mobility in the wider and narrower area of intersections and its
driveways.
4.4.4 Bridge construction
In the current state, the basic transport system characteristic of the city centre is the lack of road
connections between the left and right banks of the Kupa River in the city centre. The road links
between the two parts of the city separated by the Kupa river are based on Gromovi Brigde (D37) and
the Old bridge, which was opened for one-way traffic (for exiting the centre), and only for private cars.
This capacity is not sufficient for the current traffic demand, which is why the the city centre (left bank
of the Kupa River) is characterized by frequent traffic congestion and delays. This problem is known to
the City of Sisak for many years, and Croatian Roads has a ready project documentation for the
construction of a new bridge (Figure 22).
The construction of this bridge would solve the problem of connecting the city separated by the Kupa
River. This would be a significant contribution to the sustainable mobility, as it would significantly
reduce travel distances, fuel consumption, gas emissions, and time spent in traffic.
The influence of the construction of a new bridge over the Kupa River by 2020 and 2030 is tested with
analysis of traffic parameters, noise emissions, and harmful gases in the central part of the City of Sisak.
The central part of the City is bounded by Vlado Janjić Street on the east, Old Bridge and Kralj Tomislav
Street on the south, Ivan Fistrović Street on the west and Ferdo Hefele Street on the north. The analysis
was conducted for the afternoon peak hour due to higher traffic volume in comparison to the morning
peak hour.
According to the traffic model, if the bridge is built by 2020, traffic volume in the city centre will be
reduced by 15.8 %, the total delay time by 15.7 %, and the number of hours for passengers spent in
the car during peak hours will decrease up to 20 %. Total emissions of carbon monoxide will be reduced
by 17.6 %, and the total noise level by 0.39 %.
If the bridge is built in 2030 (assuming that all road infrastructure facilities that was planned were
built), a new bridge over the river Kupa will reduce traffic volume in the center of Sisak by 18 %, the

Sisak Urban Transport – Sustainable Urban Mobility Planning – FINAL REPORT 64
total vehicle delay time by 28.5 % and the number of hours passengers spent in the car during peak
hours will be reduced by 22.8 %. Total emissions of carbon monoxide will be reduced by 19.6 %, and
the total noise level by 0.45 %.
When these parameters are incorporated into the cost-benefit analysis of the new bridge project, they
will surely give a great contribution to the overall benefits of the bridge, increasing its feasibility.
Figure 22. The proposed location of the new bridge over the Kupa River related to the city centre
From the traffic aspect, is not important what type of an architectural or civil solution of the bridge will
be. He is traffic justified, necessary and can significantly contribute to the relief of the entire transport
system of Sisak. The financial assets for the bridge should be provided by Croatian Roads, with the
possibility to use assets from EU funds.
Among the bridges for motorized traffic, the construction of a road bridge over Sava River at Kratečko
or near Lukavec Posavski is proposed. This has great importance due to better city connectivity with
the eastern locations around the Sava River, or areas bounded by places Veliko Svinjičko on the north,
Sunja on the south and Lonjsko Polje on the east. This would enable an easier access to the attractors
of the tourist areas such as Lonjsko Polje and Čigoč, and encourage further development of these
tourist areas. These bridges do not have such a great importance, but it is necessary to have them in
plans, because every bridge improves traffic system, shortening the travel time. The financing assets
for the bridge should be entirely provided by the County Road Administration of the Sisak-Moslavina
County, with the possibility of using financial assets from EU funds.

Sisak Urban Transport – Sustainable Urban Mobility Planning – FINAL REPORT 65
4.4.5 The construction of highly-important roads
Given the present level of development and the condition of the road network of the City of Sisak and
the County, as well as on current and future traffic flow trends, it is necessary to build and reconstruct
new road routes. In this chapter, the current situation, proposed measures, and the estimated costs
of implementation, construction or reconstruction with associated indicators for the road section D36
and D37 passing through Sisak are analyzed.
In total, the existing road sections of State roads D36 and D37 have poor condition in terms of current
traffic demand, the level of service and road safety. The section of the road D36 of Žažina on the west
to Selsko Polje is in satisfactory condition. However, the section of the road D36 through Sela, Stupno,
and Odra at the entrance to the City of Sisak has to be repaired urgently. In particular, this applies to
existing Odra bridge with the connecting roads and approaches that have extremely unfavorable
condition, and the results are numerous road accidents and bad traffic flow.
The section of the road D36 in the eastern part of the City is in satisfactory condition, and it is necessary
to reconstruct certain intersections (e.g. Ivan Fistrović Street and Nikola Tesla Street), and the other is
discussed in Section 4.4.2). The section of the road D37 in satisfactory condition; however, it is
necessary to reconstruct certain intersections (Section 4.4.2), and especially in Petrinjska street (D37)
and D224 which was mentioned earlier.
A great importance for the entire geographic position, transport position, and the economic
development of the City of Sisak and the County, has the construction of the following roads:
1) D36 and the new Odra bridge (Phase 1);
2) D36 and the connection to the A11 highway (Phase 2);
3) D36 to Novo Selo Palanječkog (Phase 3);
4) D36 to Veliko Svinjičko and Gušće.
New road routes stated under 1), 2), and 3) should be built in 3 phases. In the first phase, it is needed
to build the road shorter, but still adequately long, considering the Odra bridge. Then, it is necessary
to construct a longer road which would connect to the road build in Phase 1 at the new crossroad of
Staro Pračno Street. The next phase is the construction of the new D36 section and the new bridge
over Sava River, which would in fact create a northern bypass for the City of Sisak. The construction of
1) to 3) would provide prerequisites for creating bypasses for transit traffic of the City and the County.
The construction of the roads would satisfy all transport needs of the City of Sisak and its close
surroundings. The construction stated under 4) would create a new connection to D36, and a complete
road reconstruction from the mentioned connection to Veliko Svinjičko and Gušće on the east,
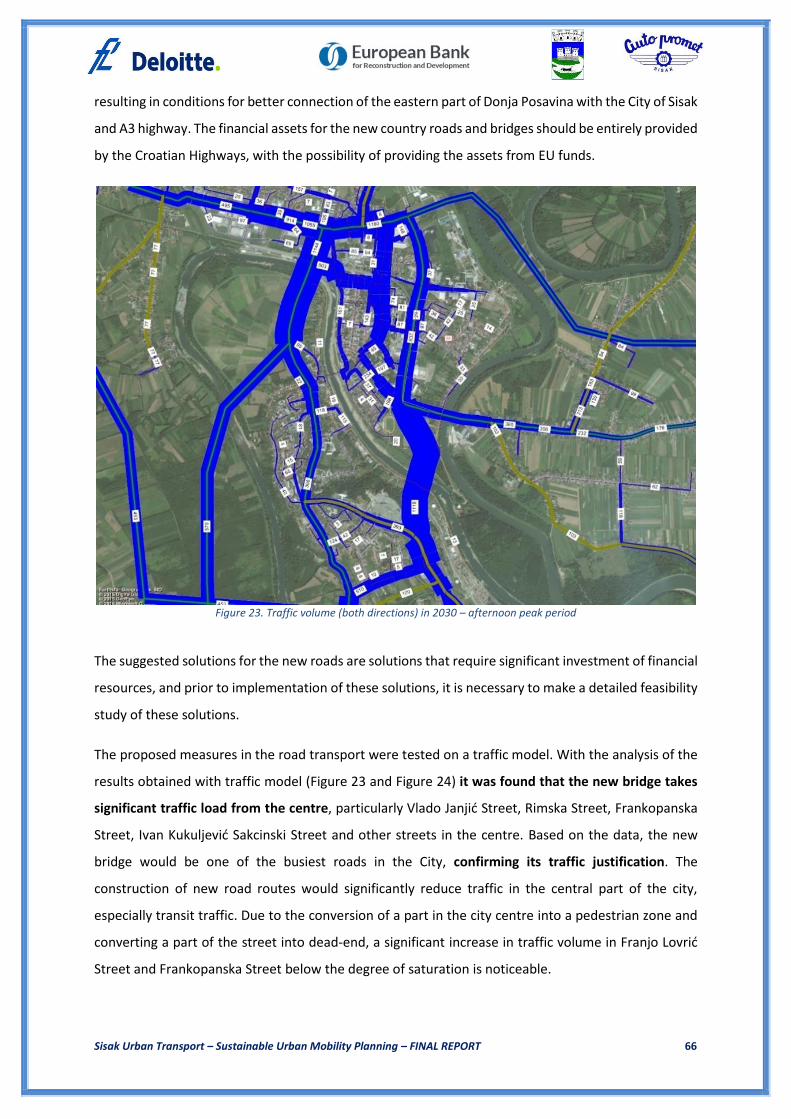
Sisak Urban Transport – Sustainable Urban Mobility Planning – FINAL REPORT 66
resulting in conditions for better connection of the eastern part of Donja Posavina with the City of Sisak
and A3 highway. The financial assets for the new country roads and bridges should be entirely provided
by the Croatian Highways, with the possibility of providing the assets from EU funds.
Figure 23. Traffic volume (both directions) in 2030 – afternoon peak period
The suggested solutions for the new roads are solutions that require significant investment of financial
resources, and prior to implementation of these solutions, it is necessary to make a detailed feasibility
study of these solutions.
The proposed measures in the road transport were tested on a traffic model. With the analysis of the
results obtained with traffic model (Figure 23 and Figure 24) it was found that the new bridge takes
significant traffic load from the centre, particularly Vlado Janjić Street, Rimska Street, Frankopanska
Street, Ivan Kukuljević Sakcinski Street and other streets in the centre. Based on the data, the new
bridge would be one of the busiest roads in the City, confirming its traffic justification. The
construction of new road routes would significantly reduce traffic in the central part of the city,
especially transit traffic. Due to the conversion of a part in the city centre into a pedestrian zone and
converting a part of the street into dead-end, a significant increase in traffic volume in Franjo Lovrić
Street and Frankopanska Street below the degree of saturation is noticeable.

Sisak Urban Transport – Sustainable Urban Mobility Planning – FINAL REPORT 67
Figure 24. Traffic volume (both directions) in the city centre in 2030 – afternoon peak period
4.4.6 Concluding observations on objectives and indicators of road network
Indicators related to the road network and related activities and frequencies are shown in Table 16.
Table 16. Road infrastructure indicators
Indicator Required measures Implementation Unit
Intersection reconstruction
Preparation of traffic studies of construction works and conceptual design, main and executive project
Phase one 2017 year, second phase by 2020. depending on financial
resources
Two intersections
Construction and reconstruction of the
new road routes
Preparation of traffic studies of construction works and conceptual design, main and executive project
Phase one by 2020 year, other phases until 2020. depending on financial
resources
One intersection, six roads and five bridges
Level of service Conduct traffic count on analyzed
intersections and road sections
In the existing state / after realization of the first phase
/ after the realization of another (other) phases
Average delay time of the vehicle d (s/veh);
A – best, F – worst
Road safety Analysis of the current state of road safety in quantitative and qualitative
In the existing state / after the implementation of the
Number of traffic accidents per year;

Sisak Urban Transport – Sustainable Urban Mobility Planning – FINAL REPORT 68
range first phase / after the realization of another
(other) phases
the number of injuries per year;
number of fatalities per year; cause of traffic accidents
Greenhouse Gas Emissions
Automatic station for air quality monitoring and / or analysis of the budget based on the intensity of
traffic flow
Before the start of implementation / after
each phase of implementation
g/km
Customer satisfaction Collecting data via survey method
and / or interview Realized after an each
phase Descriptively
Number of optimized traffic light
intersections
Preparation of transport studies and
construction works
Every year several intersections depending on
financial resources
Number descriptively of intersections
Level of service / volume to capacity on
signalized intersections
Conduct traffic count on the key intersections
In the existing state / after realization of the first phase
/ after the realization of another (other) phases
Level of service (A-F) / volume to capacity
Implemented AUP system
Preparation of transport studies
andconstruction works Immediately Yes/No
Traffic volume in the city centre / level of
service
Conduct traffic count on analyzed intersections and road sections
in the existing state / after realization of the first phase
/ after the realization of another (other) phases
Number of vehicles / level of service (A-F) /
volume to capacity

Sisak Urban Transport – Sustainable Urban Mobility Planning – FINAL REPORT 69
4.5 Parking policy management
In this part, a comprehensive parking policy proposals have been offered with the phases of the
implementation, including facilities, payment, time limits, penalties and instruments for enforcement.
The proposals are given in order to consider the possibility of introducing a system such as Park-and-
Ride at public transport terminals.
A sustainable transport policy for urban areas, in order to be successful in the implementation, should
include a complementary parking policy. Parking policy has become one of the most important factors
of transport policy in urban agglomerations. The imperatives of transport policy in urban areas are
identified as traffic congestion reduction, protection and preservation of the environment, reduction
of private car usage, and summarized, to adjust the entire urban transport to accommodate the life
and work of its people. The parking policy has been proven as a very good management tool for
transport demand, with a goal of changing the modal distribution and reduction of excessive private
car usage in the City. A series of policy measures regarding parking policy is used for the described
purpose: the introduction of on-street parking, the introduction of Park-and-Ride, introducing off-
street parks, parking time limitations, parking charging scheme and similar.
Private car traffic in the city centre is not reduced – it is actually stimulated to a certain level, due to
the fact that construction of the parking spaces at all suitable surfaces deprives surface for pedestrian
and bicycle traffic. The increased motorization rate has caused increased concentration of cars in the
city centre with a significant share of commuting purposes.
The City of Sisak has already implemented parking charging schemes on street parking spaces. Also, at
several locations in the City, off-street parking areas are also being used for parking. Illegal parking has
also been registered at several locations within the City. Therefore, for the implementation of a
sustainable urban mobility plan, as a means to reduce excessive private car usage in the city, traffic
and parking policy has to be supplemented with the following comprehensive measures:
At the end of 2017 (Figure 25):
o The existing concept of parking zones in the city centre is proposed to remain the
same, with a proposal to introduce other payment zones for parking around the city
marketplace – since the city marketplace is an important business and economy point
of interest, a parking charging model is proposed such that the flow of goods in the
vicinity of the marketplace would be interrupted, and parking spaces would be
available for visitors (e.g. free parking in the first hour with discouraging all-day

Sisak Urban Transport – Sustainable Urban Mobility Planning – FINAL REPORT 70
parking);
o Proposed introduction of payment zones for parking in Zibel, Josip Juraj Strossmayer
Street (opposite to the city hospital), in the park with around 40 spaces with two-hour
limit;
o In other parts of the City, such as Caprag, Zibel and Viktorovac, there was no significant
need for the introduction of paking charging detected, unless new conditions are met
following the construction of new attractors that will generate significant motor traffic
in the relevant areas;
o Eliminating the existing on-street parking in Silvije Strahimir Kranjčević Street and as
part of the Stjepan and Antun Starcevic street, i.e. in the current pedestrian zone. This
will result in eliminating 60 spaces;
o Around 50 parking spaces are currently under construction in the city marketplace,
which will compensate for the lack of parking spaces “lost” at the pedestrian zone;
Figure 25. Parking charging zones at the end of 2017
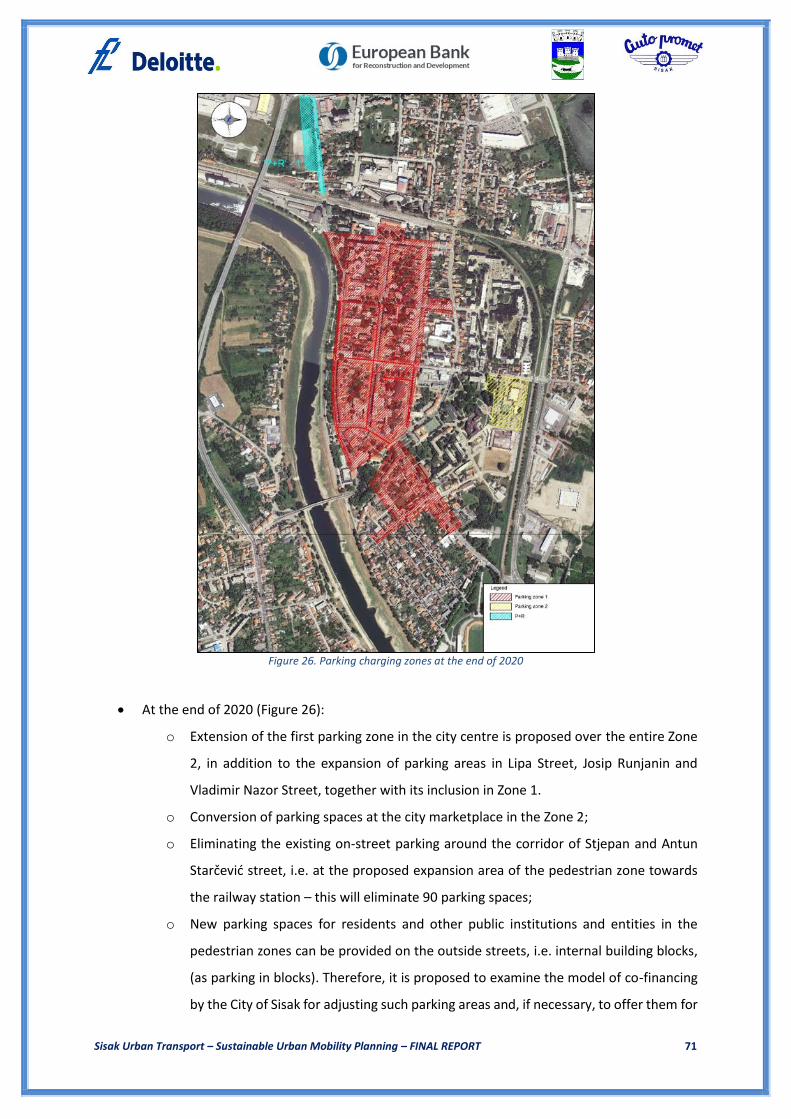
Sisak Urban Transport – Sustainable Urban Mobility Planning – FINAL REPORT 71
Figure 26. Parking charging zones at the end of 2020
At the end of 2020 (Figure 26):
o Extension of the first parking zone in the city centre is proposed over the entire Zone
2, in addition to the expansion of parking areas in Lipa Street, Josip Runjanin and
Vladimir Nazor Street, together with its inclusion in Zone 1.
o Conversion of parking spaces at the city marketplace in the Zone 2;
o Eliminating the existing on-street parking around the corridor of Stjepan and Antun
Starčević street, i.e. at the proposed expansion area of the pedestrian zone towards
the railway station – this will eliminate 90 parking spaces;
o New parking spaces for residents and other public institutions and entities in the
pedestrian zones can be provided on the outside streets, i.e. internal building blocks,
(as parking in blocks). Therefore, it is proposed to examine the model of co-financing
by the City of Sisak for adjusting such parking areas and, if necessary, to offer them for
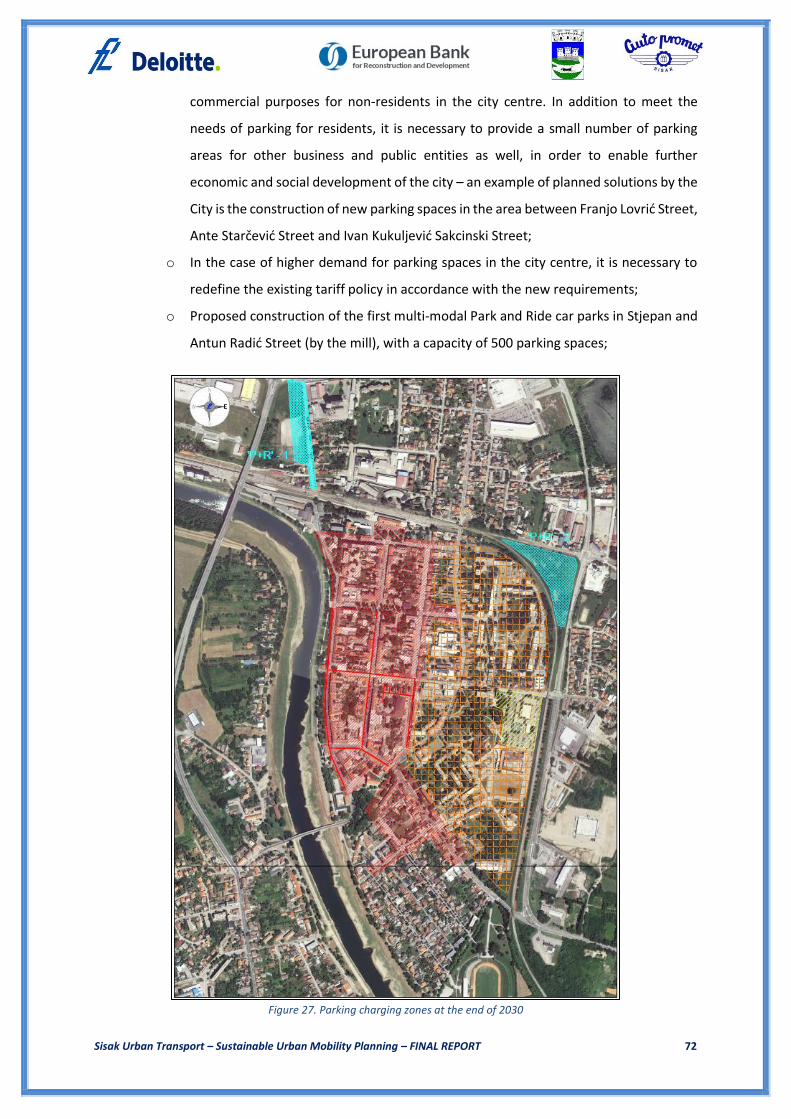
Sisak Urban Transport – Sustainable Urban Mobility Planning – FINAL REPORT 72
commercial purposes for non-residents in the city centre. In addition to meet the
needs of parking for residents, it is necessary to provide a small number of parking
areas for other business and public entities as well, in order to enable further
economic and social development of the city – an example of planned solutions by the
City is the construction of new parking spaces in the area between Franjo Lovrić Street,
Ante Starčević Street and Ivan Kukuljević Sakcinski Street;
o In the case of higher demand for parking spaces in the city centre, it is necessary to
redefine the existing tariff policy in accordance with the new requirements;
o Proposed construction of the first multi-modal Park and Ride car parks in Stjepan and
Antun Radić Street (by the mill), with a capacity of 500 parking spaces;
Figure 27. Parking charging zones at the end of 2030

Sisak Urban Transport – Sustainable Urban Mobility Planning – FINAL REPORT 73
Until the end of 2030 (Figure 27):
o In the city centre, the extension of the first zone is proposed to cover the entire second
zone. Proposal includes expansion of the capacity of the park in Lipa street, Josip
Runjanin i Vladimir Nazora Street and assimilation by the first zone;
o The construction of a second multi-modal Park-and-Ride car park in the area bounded
by Ivan Fistrović Street, Nikola Tesla Street and the railroad, with the capacity of 600
spaces. The need for construction has to been examined, depending on the availability
of the first Park-and-Ride park at Kralj Zvonimir street;
o Examining the possibility to introduce zonal parking charging on the remaining narrow
areas of the City bounded by the railroad in the north and east.
Table 17 shows the indicators of the parking policy management.
Table 17. Indikatori politike upravljanja parkiranjem
Indicator Unit Collection frequency
Methodology
Number of car parks car parks Annually Counting
Proportion of parking spaces by zones percentage Annually Counting
Parking price HRK / h Annually Parking policy of the City of
Sisak
Parking time limit h Annually Parking policy of the City of
Sisak

Sisak Urban Transport – Sustainable Urban Mobility Planning – FINAL REPORT 74
4.6 City logistics
Traffic in cities is a complex system conditioned by the interaction of many different factors - from the
intensity of traffic to the environmental impacts. Traffic in large or medium-sized Croatian cities (as
Sisak) from year to year is increasing rapidly, resulting in ever higher degree of pressure on the
infrastructure and environment at practically the same area.
Due to increasing number of vehicles in cities, especially the number of delivery vehicles, a systematic
approach in solving transport problems of light and heavy delivery vehicles on a wider and inner-city
area arises. Delivery vehicles, especially with larger dimensions and capacity, due to dimensions and
limited maneuverability are not suitable for transport in cities. The consequences of delivery transport
in urban areas are most often traffic jams or slow traffic on certain locations, as well as possible traffic
accidents, which, because of the vehicle characteristics, often have very serious consequences. In most
cases, solutions to distribution problems are partial and far from optimal, and therefore, this fact seeks
for an integrated system of goods distribution in certain urban areas.
4.6.1 Analysis of freight transport infrastructure in the City of Sisak
For the purposes of the project, the research included areas which connect the central part of the City.
Due to the concentration of population and economic activity, a large number of private as well as
light and heavy delivery vehicles concentrates in the City of Sisak. The emergence of light and heavy
delivery vehicles during peak periods additionally burden transport network, which slows down the
traffic. More detailed analysis is shown in Annex 1 and Annex 2.
Due to these characteristics, most of the light and havy delivery vehicles are not suitable for operations
in the inner-city area, especially in heavy traffic conditions throughout the day, as in the City of Sisak.
The transport system of the City of Sisak is extremely complex – in the metropolitan area, a large
number of different vehicles, from passenger vehicles to light and heavy delivery vehicles operate on
daily basis. Delivery transport can be distinguished based on the different delivery cargo types, mainly
carried out by using light and medium delivery vehicles, and heavy delivery vehicles that supply
different economic entities with large amount of goods.
According to detailed research conducted on 9 locations in the city centre, the main delivery transport
volume in Sisak is carried on the following areas (streets):
Rimska Street;
Stjepan and Antun Radića Street;

Sisak Urban Transport – Sustainable Urban Mobility Planning – FINAL REPORT 75
Ante Starčević Street;
Franjo Lovrić Street;
Ivan Kukuljević Sakcinski Street (City marketplace);
Ljudevit Posavski Street and Matija Gubec Street;
Zagrebačka Street (Supernova shopping mall);
bridges on Sava River.
In accordance with the obtained research, the main disadvantages of delivery transport are
determined. It can be noted that the majority of light and heavy delivery transport in the City takes
place in areas that are intended for residence, although these roads mainly border residential areas.
In the city centre, there are also the most important sites, and the the vast majority of administration
organizations, which generate daily flows of light and heavy delivery vehicles. Also, due to the fact that
these roads are used for public transportation, and the fact that the residential buildnigs are located
in immediate vicinity, it can be concluded that there is a definite impact of light and heavy delivery
vehicles on quality of life in neighbourhoods along the mentioned streets.
Delivery in the city centre is regulated by the Decision on the regulation of road transport in the City
of Sisak (Official Gazette of Sisak-Moslavina County No. 14/06, 6/09, 1/13). In Article 67 of the
mentioned Decision, heavy delivery traffic is forbiden except for the purpose of delivery and for
vehicles with total mass up to 3,5 tonnes in the period from 07:00 to 17:00, and the vehicles with total
mass up to 7,5 tonnes from 17:00 to 07:00 . Exceptionally, in period between 10:00 and 14:00, with
the special approval of the Governing Body in charge of traffic, transport of light and havy delivery
vehicles in the City of Sisk centre can be allowed. During 2015, the Administrative Department of
Planning and the Environmental Protection issued 14 approvals for exceptional transport for a total of
19 delivery vehicles. The approval stated that the exceptional transport does not apply to transport
across the Old Bridge, the future pedestrian zone, the streets with temporary transport regulation
during the construction and various events on the streets, and will be issued for a one-year period. It
should be noted that the number of delivery vehicles in the City of Sisak is much higher than the
number of approvals, and therefore, it is necessary to conduct a detailed analysis of the number of
light and heavy delivery vehicles with the goal to regulate delivery transport in the City of Sisak.
It is assumed that there is an increase in a number of delivery vehicles on city roads. The largest delivery
traffic increase can be expected exactly on routes where goods deliveryis being carried out today. It is
therefore important to conduct a series of measures in order to regulate the delivery transport flows
and thus to relieve the city roads.

Sisak Urban Transport – Sustainable Urban Mobility Planning – FINAL REPORT 76
To conclude, the following disadvantages of city logistics can be determined:
The traffic of light and heavy delivery vehicles takes place on city roads, where the largest
proportion occurs near or along the edge of residential areas;
The generators of delivery transport are dispersed throughout the metropolitan area;
however, the largest concentration of delivery vehicles is in the central part of the City of Sisak
(Figure 28);
There are no defined parks intended for delivery vehicles, nor plans for them, and this results
in occupation of parking spaces intended for private vehicles, delivery vehicles stopping on
marked pedestrian zones, sidewalks or at places intended for them, but they create traffic
congestion, worsened road traffic safety for pedestrians and cyclists and increasing air
pollution;
Delivery vehicle drivers (especially heavy delivery vehicles) do not comply with the Decision on
the Organization of road transport in the City of Sisak, and based on the conducted survey,
they are not properly introduced with it, and they are not familiarized with the transport time
limits in the city centre;
On the busiest city roads (e.g. Stjepan and Antuna Radića Street and Ante Starčević Street),
there are no markings for delivery time limits;
there is a continuous supervision over the compliance with the Decision on the regulation of
road transport in the City of Sisak related to transport of light and havy delivery vehicles on
the busiest city roads.
Figure 28. Delivery vehicles in the city centre
4.6.2 Basic city logistic concepts
The concepts of solving goods supply problems in urban areas cover all forms of activities related on
goods optimization and logistics in a particular metropolitan area. The individual city logistic concept
is affected by following factors: sociological, cultural and demographic characteristics of a particular

Sisak Urban Transport – Sustainable Urban Mobility Planning – FINAL REPORT 77
city, architecture, concept of transport infrastructure and the habits and expectations of the
population. The most common concepts of city logistics are:
Cooperative logistic systems;
Logistic centers;
Concentration of information;
Control of the utilization of vehicle cargo space;
Underground systems of goods transport;
Focusing on eco-friendly vehicles;
Logistics association;
City government regulation.
Measures of delivery regulations can be evaluated according to different criteria. The most important
criteria for evaluating the measures are the possibility of implementation, acceptability, sustainability
and the reduction of the negative impact on the environment. According to these criteria, the
mentioned logistics control systems in the City of Sisak will be evaluated.
The analysis of the mentioned regulation goods delivery system shows that, currently, the most
appropriate measure for application is the Regulatory concept of city government, which has the
highest degree of acceptability according to the criteria of implementation possibilities and acceptance
testing from the perspective of stakeholders and sustainability. The level of delivery vehicles impact
on air pollution reduction as a result of application of this method is estimated, and depending on the
delivery vehicle reduction degree, it can be significant. Similarly, other measures acceptable for
implementation of city logistics according to the set criteria are the following: centralized delivery
from logistic centres, the concept of focusing on eco-friendly vehicles and the concept of logistics
association.
Hereinafter, based of proposed and acceptable concepts, the suggested city logistics solutions for the
City of Sisak will be elaborated.
4.6.3 Proposed solutions of City of Sisak city logistics
The city logistics solutions can be achieved in two phases. First phase plans to modify the Decision on
the regulation of road transport in the City of Sisak (Official Gazette of Sisak-Moslavina County No.
14/06 6/09 1/13) and the definition of parking spaces for delivery vehicles in the city centre. The
implementation of the first phase is planned in 2017. The second phase of proposed solutions is the
construction of the distribution centre with implementation in 2025.
Sisak Urban Transport – Sustainable Urban Mobility Planning – FINAL REPORT 78
For a high-quality regulation of delivery transport in the City of Sisak, it is necessary to adopt or upgrade
legal documents (decisions) of the City of Sisak:
Decision on the regulation of road transport in the City of Sisak (Official Gazette of Sisak-
Moslavina County No. 14/06 6/09 1/13);
Decision on the method of collection and the definition of parking spaces for delivery vehicles
in the City of Sisak.
The proposed documents should complement each other, with the aim of complete regulation of
delivery transport in the City of Sisak, which will result in city roads disburdering and increase of citizen
safety (pedestrians and cyclists), and the reduction of air pollution caused by a large number of light
and havy delivery vehicles, i.e. increasing quality of life in the city centre.
Considering the above mentioned, it is proposed to improve measures to regulate delivery transport
in the city defined by the document "Urban Design Plan of City of Sisak centre" from 2004. (Rimska
Street, Silvije Strahimir Kranjčević Street, Kralj Tomislav Street, Mihanovićeva obala Street, Boris Brnad
Street, Ivan Fistrović Street, Ferdo Hefele Street, Kralj Zvonimir street). It is necessary to amend the
Article 67 of the Decision on the regulation of road transport in the City of Sisak (Official Gazette of
Sisačko-moslavačka County No. 14/06 6/09 13/01) in a way to ban entering into the city centre for
every delivery vehicle from 07:00 to 22:00. Exceptionally, in the period from 07:00 to 12:00, and with
the special approval of the Governing Body Sisak charge of traffic, exceptional transport of light and
havy delivery vehicles in the City of Siska centre may be allowed.
In order to ensure the supply and goods delivery in the city centre, the delivery traffic for vehicles up
to 3,5 tons and vehicles over 3,5 tons is allowed only with the specific approval of the Governing Body
Sisak in charge of traffic.
In the city centre, stopping and parking of delivery vehicles for the supply and goods delivery can be
achieved only on places designated for that purpose, which are marked by road signs and horizontal
markings. Delivery vehicles may be stopped with a maximum 15 minutes per ton of cargo.
The supervision of the implementation of the mentioned decisions can be achieved by introducing
municipal services monitoring by oficers who will charge fines for those who do not comply with the
proposed regulations. The proposed measure for introducing monitoring will result in recruiting new
employees as well as costs for the City administration; but in a long term, this will enable compliance
with the proposed decisions for all delivery vehicles in the city centre. Another method of supervision
is the introduction of video surveillance cameras, which will enable automatic registration of traffic
violations. For such a control method, it is necessary to develop a pilot project aimed for testing the

Sisak Urban Transport – Sustainable Urban Mobility Planning – FINAL REPORT 79
technical and technological capabilities of the proposed system.
The cost of introducing monitoring services and control through video surveillance cameras is shown
in detail in section 5.
As a part of the Sisak delivery transport strategy, it is necessary to define park locations for delivery
vehicles in the City centre. Taking into account the project of the pedestrian zone in the city centre,
the proposed location of delivery vehicles parking spaces are placed in accordance with the new
project of the pedestrian zone. The proposed locations pf delivery vehicle parks in the city centre are
shown in Figure 29.
Figure 29. Proposed delivery vehicle parks in in the city centre
At the intersection of Rimska Street – Ban Josip Jelačić Square - Silvije Strahimir Kranjčević Street
(delivery place no. 1), due to the need for frequent goods delivery to various business entities (about

Sisak Urban Transport – Sustainable Urban Mobility Planning – FINAL REPORT 80
15 fo them) in particular restaurants, newsstands, pharmacies and other service facilities, one parking
space for delivery vehicles is proposed. A longitudinal delivery park will be positioned on Rimska street
across to the location 6 on the east side of the roadway with a 15-minute time limit per ton of cargo.
The proposed park would serve to goods delivery to facilities in Rimska Street, partly for Ban Jelačić
Square and partly for facilities in Hemingway Street.
In Silvije Strahimir Kranjčević Street (delivery place no. 2), due to the frequent goods delivery to
various business entities (about 16 of them), especially the tailor shop, stores, restaurants and bars,
one parking space for delivery vehicles is suggested. Based on the research, the average daily load and
unload are approximately 1 ton of various goods. A longitudinal delivery park will be drawn in Silvije
Strahimire Kranjčević Street across the location 8 (before the passage) on the north side of the roadway
with a 15-minute time limit per ton of cargo. The proposed delivery park would serve for goods delivery
to facilities in Silvije Strahimir Kranjčević Street and Stjepan and Antun Radić Street.
In Ivan Kukuljević Sakcinski Street (delivery place no. 3), due to the need for frequent goods delivery
to various business entities (about 8 of them), especially shops, restaurants and bars, one parking
space for delivery vehicles is proposed. The mentioned objects everyday generate a large number of
delivery vehicles with an average amount of 500 kg tons of loaded and unloaded goods. The first
longitudinal delivery parking place will be located on the front of Ivan Kukuljević Sakcinski Street on
the northern side of the roadway with a 15-minute time limit per ton of cargo. The proposed delivery
park would serve for delivering goods to facilities in Ivan Kukuljević Sakcinski Street and Antun Radić
Street.
In Stjepan and Antun Radić Street (delivery place no. 4), due to the need for frequent goods delivery
to various business entities (about 19 of them), especially Konzum store, Tisak, few bakeries,
restaurants, bars and different shops, one parking space for delivery vehicles is suggested.The
mentioned objects everyday generate a large number of delivery vehicles with an average 2 tons of
loaded and unloaded goods. A longitudinal delivery park is suggested in Stjepan and Antun Radić Street
in the front of location 33 on the west side of the roadway with a 15-minute time limit per ton of cargo.
The proposed parking place would serve for goods delivery to facilities in Stjepan i Antun Radić Street.
The postponed parking for all delivery vehicles in in the city centre, should be introduced in 2017,
following the adoption of the proposed documents on the regulation of delivery transport in the City
of Sisak. Likewise, it is necessary to harmonize the delivery park locations with the following
documents:
„Smart energy City of Sisak, Object of delivery 2: A strategic framework for the development

Sisak Urban Transport – Sustainable Urban Mobility Planning – FINAL REPORT 81
City of Sisak“;
„City of Sisak Master plan (Official Gazette of Sisačko-moslavačka County 11/02, 5/06, 3/11 i
4/11 - revised text“);
The city pedestrian zone in City of Sisak no. 300/2 and southern part no. 945, Old Sisak.
The costs of the proposed delivery parking spaces marked by traffic signs and horizontal markings are
shown in Section 5.
A medium-term strategic solution of city logistics in the City of Sisak is the introduction of a centralized
goods distribution with the logistics distribution centre. This concept is primarily intended for the
business entities operating in the city centre, and for the ones who do not use a system of centralized
distribution (smaller economic operators, restaurants etc.,). By using this concept of distribution the
number of deliveries and delivery vehicles is reduced, while the quality of logistics services remain the
same. For users, this reduces the cost of transportation and the cost of goods storage. The reduction
of the number of delivery vehicles in the City of Sisak centre and shifting heavy delivery vehicles away
from the main city roads will increase the level of road safety for citizens. The construction of logistics
distribution centre will allow goods consolidation at one place, and distribution to end-users, i.e. goods
generators, by light-delivery vehicles.
For the construction of logistics distribution center Sisak., the following locations are proposed:
Southern industrial zone (Božidar Adžija 19, 41.1 ha, with a total available area 32,8 ha, and
the largest free area 20,2 ha) – the southern Industrial Zone has enough space to
accommodate logistics distribution centre and is very well connected with the central part of
the city;
The future truck terminal will be located near the southern industrial zone, large industrial
facilities, INA refinery in Sisak and TE Sisak, important city roads and the future location of the
river port – the location of the future terminal will be in the southern part of the City, north of
the Ž 3205 road to the bridge Crnac on the Sava River, which creates exceptional conditions
for good road access and logistics support; in addition, the location is directly linked to the
future transport junction of southern highway A11, which is currently under construction, and
the junction Popovača on highway A3.
The construction costs of modern logistics distribution centre Sisak are presented in Section 5. Given
the current state and dynamics of cargo flows in the City of Sisak, the period for the construction of
modern logistics distribution centre is during 2025.
After construction of logistics distribution centre, it is possible to develop the following city logistic

Sisak Urban Transport – Sustainable Urban Mobility Planning – FINAL REPORT 82
systems in the City of Sisak:
The concept of the logistics association with the aim of rational conducting of given functions
– it is proposed to implement Sisak logistical platform - alliance of all participants in urban
goods transport. This may involve representatives of local authorities, generators of logistics
flows, transport companies, citizens, etc. The objectives of such a system are: informing the
participants in the urban goods transport on the legal measures of the public administration,
introducing about possible solutions to the problem of urban goods transport, introduction to
technical systems that may be used in city logistics systems, and initiating of research studies
and projects in the area;
The concept of focusing on eco-vehicles – the implementation of electric or hybrid delivery
vehicles which can only be granted permission to enter the city centre; and other concepts
involving the usage of other transport systems, such as water transport, which is possible to
be developed in the City of Sisak.
4.6.4 Measurable effects of city logistics
Based on the proposed objectives and measures of the city logistics, measurable effects of proposed
measures are defined (Table 18):
Table 18. City logistics – objectives and proposed measures
Proposed measure Objective Planned objective
Modification of the Decision on the road transport regulation in the City of Sisak
Time limits for all delivery vehicles in the city centre
Reduction of delivery vehicles in the city centre;
Increasing quality of life and safety;
Air pollution reduction;
Decision on the method of collection and the definition of parking spaces for delivery vehicles in the City of Sisak
Development of the city logistics system
Quality improvement in city logistics
Improvement of fare collection system for delivery vehicles entering the city centre
Supervising the implementation of proposed measures
Regulation of delivery vehicles entrances/exits
Improving control over the delivery vehicles entering and exiting the city centre
Delivery vehicles park locations in the City centre
Development of city logistics system
Improving the accessibility to bussines entities by delivery vehicles
Quality improvement in city logistics
Increasing quality of life and safety
Logistics and distribution centre Sisak
Development of city logistics system
Improving control over delivery vehicles entering and exiting the city centre
Free city roads of delivery traffic
Quality improvement in city logistics
Increasing quality of life and safety;

Sisak Urban Transport – Sustainable Urban Mobility Planning – FINAL REPORT 83
Air pollution reduction;
The measurable effects of city logistics development will be gain by measuring indicators shown in
Table 19.
Table 19. City logistics – indicators and corresponding activities for the evaluation of the results
Indicator Methodology Evaluation Unit
Number of delivery vehicles entering city centre
Data collection via counting delivery vehicles or by
establishing monitoring by personnel or video surveillance
cameras
after the implementation of proposed delivery parks
number of trips
Delivery time in city centre min
Dwelling time for goods loading/unloading
min
Average occupancy in the vehicle Data collection via survey
(questionnaire) after the implementation of the
proposed delivery parks %
Customer satisfaction Data collection via survey or
interview after the implementation of the
proposed delivery parks descriptive
Air pollution
Automated station for air quality monitoring and / or budged
analysis based on traffic flow volume
after the implementation of the proposed delivery parks
g/km
The purpose of monitoring the indicators of city logistics is in gathering statistics on the
implementation of goods delivery in the city centre in order to perform an analysis of the impact on
the existing transport system. This will be a basis for developingt new solutions aimed at reducing of
air pollution and improving quality of life and safety.

Sisak Urban Transport – Sustainable Urban Mobility Planning – FINAL REPORT 84
4.7 Road safety
In the Republic of Croatia, including the City of Sisak, road safety problems are very expressed. Road
safety is a very important segment of road transport and one of the most frequently mentioned
measurable characteristic that indicates a numerous traffic management factors, particularly traffic
culture and attitude of participants in traffic. In the Republic of Croatia, there is no central body at a
national level that would systematically deal with the issue of road safety today. Because of the lack
on the national level, the existing problems are present in the City of Sisak. Due to the fact that, at the
state level, there is no effective system of road safety that would enable effective preventive
subsystem at the local level, it is obvious how it manifests on the management model and the way of
safety subsystem function in the City of Sisak.
Today, the control and management of road transport in Croatia is carried out exclusively by the
Ministry of Interior for the entire territory of the country, according to the internal territorial
organisation; therefore, the majority of the activities related to road safety is connected with the
Ministry. The Ministry of Interior is the carrier of the National Road Safety Programme of the Republic
of Croatia for the period 2011 – 2020, in accordance with the EU legislation.The Ministry of Interior is
a leader of institutional activities related to road safety throughout the country, and it contributes to
the existing framework and local government activities to improve road safety. Based on the existing
legal provisions, the Ministry of Internal Affairs, who systematically monitors the state of the road
safety, annually publishes basic information on road accidents (by the Road Safety Bulletin) to the
experts and public. The current road safety indicators, and relatively speaking, the ones on the local
level, are not satisfactory. The Republic of Croatia, compared to the other EU member states, belongs
to the group of countries with the worst road safety indicators.
According to the mentioned, since the road safety of the City of Sisak is a part of the Croatian road
safety system, it is obvious that the state of road safety reflects, and has a direct impact on road safety
in the City of Sisak. However, a significant involvement of the local government in the area of traffic
safety is required, which will encourage all social subjects relevant to road safety, as well as all road
users, to get as detailed and completed picture of the road safety in the City of Sisak witg all risk factors
endangering it. Therefore, the Plan proposes measures that would lead to the improvement of road
safety at the local level, which can be enforceable under the existing road safety system at the national
level. These are:
The infrastructure adaptation for people with reduced mobility – by lowering curbs and
constructing of ramps for people with disabilities;

Sisak Urban Transport – Sustainable Urban Mobility Planning – FINAL REPORT 85
Traffic calming measures;
Conducting continuous education of city services (for the implementation of road safety
analysis);
Construction of the educational walking and cycling training sites;
Conducting educational campaigns to raise road safety awareness.
4.7.1 Analysis of compliance with EU directives and international standards
Currently, the guidelines for the implementation of Directive 2008/96/EC on the road safety are in the
process of drafting and acceptance by the Republic of Croatia. The concerning guideline in the process
of preparating spatial and planning documentation is Road Safety Impact Assessment, as a part of the
impact assessment carried out on road safety in the planning stage. Since the need for the proposal
and selection of optimal transport solutions, as a part of regional plans, is not conditional to
preliminary design or study, it is not possible to conduct the RSIA process. Moreover, the guidelines
that are in the process of making for the Republic of Croatia are in contradiction to EU regulations. The
change of spatial and planning documents is a very time-consuming, costly process, especially for land
areas with a high value. In accordance with the above, it is necessary to change the conditions for
preparing regional plans with parts dealing with traffic based on positive international examples. The
analysis of the problems, which result from inadequate solutions as a part of spatial planning
documents, is shown within the case study.
4.7.2 Road safety and vulnerable road users
Vulnerable road users (pedestrians, cyclists, children, elderly and people with disabilities) are the most
endangered road users of the transport system. They are extremely vulnerable (vulnerable than
others) and have a higher risk of injury in a collision with vehicles, unprotected from the outside (by
the armor or shield), with no seat belts or air cushions to absorb the energy of the vehicle during a
collision. The main danger for vulnerable road users, in the collision, are higher speeds and vehicle
weights. In the narrowest sense, vulnerable road users are pedestrians (children, elderly, people with
disabilities) and cyclists (on pedelecs or electric bicycles).
In statistical reports, accidents that occurred as a result of collisions with motor vehicles are generally
recorded. Many accidents, involving vulnerable road users (falls, roadside hits, etc.), are not recorded,
and therefore, the real state is unknown.
According the obtained data from Ministry of the Interior, Sisak Police Station, an in-depth analysis of

Sisak Urban Transport – Sustainable Urban Mobility Planning – FINAL REPORT 86
vulnerable road users accidents in Sisak in the last five years has been conducted. Detailed analysis is
included in the annexes (Annex 3 - Annex 8).
Table 20. Accidents involving cyclists
Yea
r
Wit
h c
asu
alt
ies
Wit
h in
juri
es
Wit
h m
ate
ria
l da
ma
ge
Tota
l acc
iden
ts
Tota
l ca
sua
ltie
s
Seve
re in
juri
es
Min
or
inju
ries
Tota
l in
juri
es
Tota
l in
volv
ed
2011 0 31 5 36 0 13 15 28 28
2012 1 20 4 25 1 4 16 20 21
2013 1 21 3 25 1 9 11 20 21
2014 2 16 3 21 2 6 10 16 18
2015 0 13 6 19 0 2 11 13 13
Table 21. Accidents involving pedestrians
Yea
r
Wit
h c
asu
alt
ies
Wit
h in
juri
es
Wit
h m
ate
ria
l da
ma
ge
Tota
l acc
iden
ts
Tota
l ca
sua
ltie
s
Seve
re in
juri
es
Min
or
inju
ries
Tota
l in
juri
es
Tota
l in
volv
ed
2011 1 29 1 31 1 9 22 31 32
2012 2 11 1 14 2 3 10 13 15
2013 0 15 2 17 0 4 11 15 15
2014 1 19 0 20 1 10 9 19 20
2015 1 13 0 14 1 4 9 13 14
Table 20 and Table 21 show the total number of road accidents involving pedestrians and cyclists, and
the total number of pedestrian and cyclist casualties in the City of Sisak. In general, there has been a
decreasing trend in the number of injured pedestrians and cyclists. However, a positive decline in the
reduction of traffic accidents involving vulnerable road users is not accompanied by the decrease in
the number of traffic accidents considering drivers and passengers in motor vehicles on the national
level. The number of casualties in the City of Sisak, can be assigned to the continuous construction of
new road infrastructure, taking into account the pedestrian and cycling requirements.

Sisak Urban Transport – Sustainable Urban Mobility Planning – FINAL REPORT 87
4.7.3 Road safety analysis according to the Plan
According to the SUMP, the expansion the pedestrian zone primarily, and the application of the new
traffic flow regulation in the city centre will significantly reduce the number of road accidents for all
traffic participants, especially the most vulnerable road users (pedestrians and cyclists). With the in-
depth analysis of road accidents in the City of Sisak, accidents blackspots as the intersection in the city
centre (expressed by motor, pedestrian and cycling traffic) are obtained. Detailed analysis of the
location and the number of accidents is in the annexes (Annex 9 – Annex 12), and the confirmation of
the above is shown in the following two examples.
Extension of the pedestrian zone in the Stjepan and Antun Radić Street from the intersection with
Ivan Kukuljević Sakcinski Street to the railway station. Based on the traffic accidents collected data
and detailed analysis of the causes and consequences of road accidents in the city centre, the following
can be concluded:
The problems are not:
o The existing traffic flow on the road network – the existing capacity of the two-lane
street with unidirectioned traffic, where the pedestrian flow has medium intensity,
parking spaces are located on one side of the street, the participation of commercial
vehicles is relatively small, and the volume is about 2200 veh/h. On the other hand,
the average measured traffic flow during the afternoon peak hours is about 150 veh/h
and such volume is appropriate for the capacity;
o The number of pedestrian crossings on the road, where the pedestrian volume is
about 250 pedestrians;
The problems are:
o The large width of the corridor, with two lanes in one direction and space for on-street
parking;
o The roads are have excessive capaity (they are mostly unused);
o Based on the above, there is a possibility of achieving high-speed vehicle movement
in the city centre which poses a threat, especially for vulnerable road users.
The impact of SUMP in improving road safety in the city centre, is in the large extent by reducing the
existing negative impacts of road accidents. In fact, the SUMP proposed the extension of the
pedestrian zone in the entire corridor of the Stjepan and antun Radić Street to the railway station, in
which the motor vehicles (except for delivery vehicles and other emergency and municipal services
with special permissions) are proposed to be forbidden. Besides that, the longitudinal side streets
(east-west) that intersect the future pedestrian zone, Ivan Kukuljević Sakcinski Street and Matija Gubec
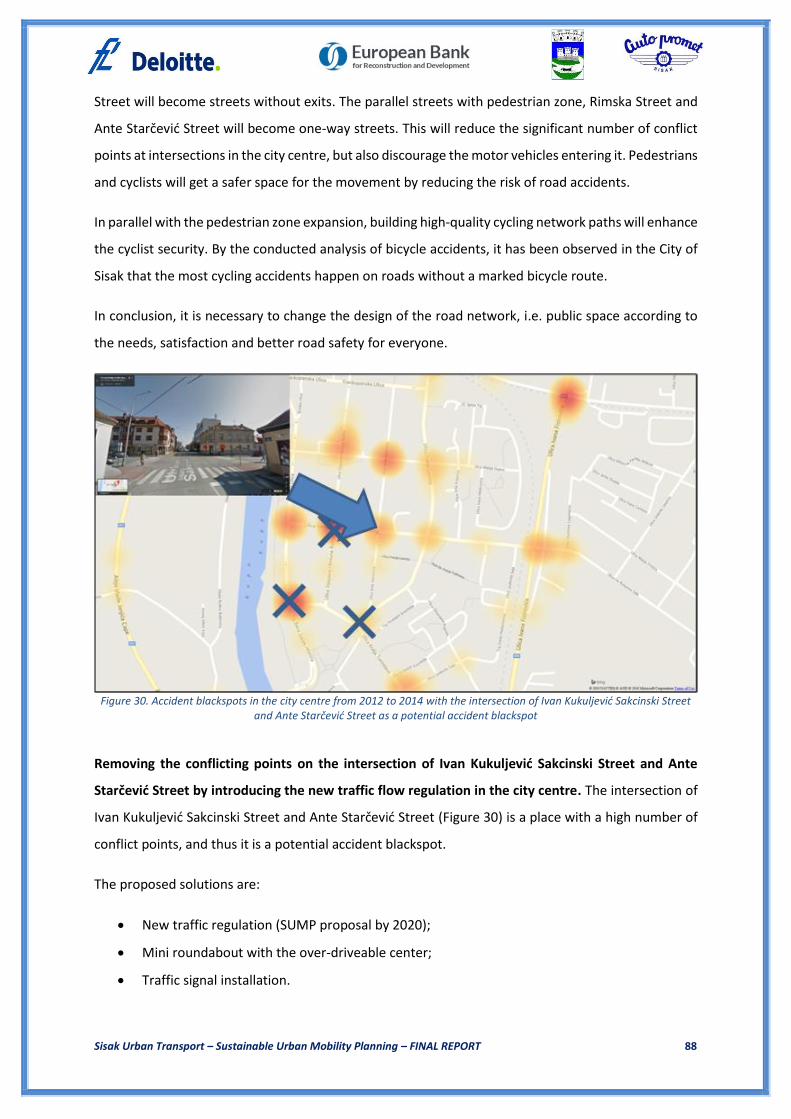
Sisak Urban Transport – Sustainable Urban Mobility Planning – FINAL REPORT 88
Street will become streets without exits. The parallel streets with pedestrian zone, Rimska Street and
Ante Starčević Street will become one-way streets. This will reduce the significant number of conflict
points at intersections in the city centre, but also discourage the motor vehicles entering it. Pedestrians
and cyclists will get a safer space for the movement by reducing the risk of road accidents.
In parallel with the pedestrian zone expansion, building high-quality cycling network paths will enhance
the cyclist security. By the conducted analysis of bicycle accidents, it has been observed in the City of
Sisak that the most cycling accidents happen on roads without a marked bicycle route.
In conclusion, it is necessary to change the design of the road network, i.e. public space according to
the needs, satisfaction and better road safety for everyone.
Figure 30. Accident blackspots in the city centre from 2012 to 2014 with the intersection of Ivan Kukuljević Sakcinski Street
and Ante Starčević Street as a potential accident blackspot
Removing the conflicting points on the intersection of Ivan Kukuljević Sakcinski Street and Ante
Starčević Street by introducing the new traffic flow regulation in the city centre. The intersection of
Ivan Kukuljević Sakcinski Street and Ante Starčević Street (Figure 30) is a place with a high number of
conflict points, and thus it is a potential accident blackspot.
The proposed solutions are:
New traffic regulation (SUMP proposal by 2020);
Mini roundabout with the over-driveable center;
Traffic signal installation.

Sisak Urban Transport – Sustainable Urban Mobility Planning – FINAL REPORT 89
Figure 31 shows the proposed solution in which the total number of conflict points at the intersection
of Ivan Kukuljević Sakcinski Street and Ante Starčević Street is reduced. Based on the newly-proposed
traffic flow regulation on the road network in the City (by 2020), the current situation in the
intersection zone is changing such that Ante Starčević Street becomes one-way. With this kind of
solution, the risk of road accidents is reduced, since it reduces the total number of conflict points
between vehicles and cyclists by 60%. In the scope of further improvements in intercsection capacity
and safety, it is necessary to examine the possibility to introduce mini-roundabouts with over-driveable
centre. Compared to the previously suggested regulation, the advantagre is better safety (the
reduction of the nuber of conflict points is from 16 to 10, which is 38 %). The greatest problem are
space limitations and space shortage. If the intersection cannot be constructed as a mini-roundabout
(due to previously-mentioned reasons), the intersection has to be properly solved by introducing traffic
lights.
Figure 31. The number of conflict points depending on traffic regulation at the intersection of Ivan Kukuljević Sakcinski Street
and Ante Starčević Street: existing (left) amd after the reconstruction (right)
4.7.4 Analysis and proposals to improve safety during road works
In the process of planning and organizing temporary traffic regulation in long-term and complex
situations, a large number of interested parties are involved – the owner of the infrastructure,
transport operators, traffic police and others. Their participation in every planning stage of temporary
traffic regulation is highly important for the whole society. In order not to ignore safety, all
stakeholders in traffic must comprehend that warnings have to be given or the attention has to be
drawn to the limitations and dangers that exist on the road in the process.
Temporary traffic regulation is the establishment of a new traffic setting of a temporary nature under

Sisak Urban Transport – Sustainable Urban Mobility Planning – FINAL REPORT 90
the influence of various factors. Road works may pose a hazard, not only for road users (drivers and
pedestrians), but also for the working staff that appears in the working zone.
With proper planning, organizing and implementing, temporary traffic regulation can improve road
safety – not only in the working areas, but also on the access and exit areas. In this way, a safer working
environment for all employees can be achieved. In order to achieve this, it is extremely important that,
in the planning and organizing process, all interested parties are involved. In this manner, every
problem that can arise can be solved properly. It is also important that, during the execution of works,
contacts in order to solve the problems that arised later are being held. According to the mentioned
above, during planning every operation on the infrastructure, it is necessary to create projects of
temporary traffic regulation in the construction zone.
Temporary traffic regulation projects can be divided into three types: point, line and zone. Point
temporary regulation can be simple - standard (e.g. with the reconstruction of the intersection in cities)
and complex point provisional regulation (e.g. with the reconstruction of the large intersection in level
in cities).
Temporary line regulation could be simpler - standard (e.g. with the reconstruction of streets in cities
or on short highway sections) and complex, where original solutions are applied (e.g. with redirecting
traffic on the highways partly or completely to the other roadway, keeping four lanes on a road with
temporary regulation according to the logarithmic distribution).
Zonal temporary regulation is one of the most complex types of traffic regulation, in which it is
necessary to harmonize traffic flows on the road sections with a high level of service, requiring specific
knowledge of traffic flow theory. The zonal temporary traffic regulation, with temporary signs on the
roads, extends over longer sections of highways and county roads.
4.7.5 The involvement of local authorities in the knowledge transfer with the aim of integrating road safety principles into transport planning
Assessment of Traffic Safety under the Directive is binding only for TEM roads, but it is recommended
that Directive should be applied to all other roads. In Republic of Croatia, TEM network makes about
1,600 km of roads, where about 1,300 km are highways and 300 km are national roads. Although the
backbone of the Sisak transport network are two state roads (D36 and D37), it is needed to make a
safety assessment for the other roads in the City.
The importance of the Directive protocol enlargement on urban transport network is visible through
to the road accident data. According to the traffic police data of the Republic of Croatia, in 2013, only

Sisak Urban Transport – Sustainable Urban Mobility Planning – FINAL REPORT 91
5 % of road accidents occurred on highways. Also, 57 % of accidents with casualties occurred in urban
areas, and 78 % of total accidents with injuries occurred in urban areas.
In accordance with the Directive, road safety assessment must be carried out by an authorized person
– auditor. The auditor is qualified person who independently assesses expert road solutions in terms
of road safety in the planning and design phases, and reviews the existing road in terms of safety
features. Because of the responsibility and complexity (especially when it comes to designing the urban
transport network), the person who is an auditor must meet certain requirements and pass an audit
examination.
4.7.6 The involvement of non-governmental organizations in programs to improve road safety and to introduce education for vulnerable road users
Today's trend in modern societies is conceived to educate road users on training sites. These are
individually designed and constructed areas that are not in physical contact with the real transport,
but give a very realistic picture of roads. There are different types of these sites, depending on the
purpose. Sites for motor vehicles are used for training new drivers without previous driving
knowledge. There are also specialized additional trainings of drivers who already have been driving
(safe driving school). Sites for non-motorized traffic have primarily purpose, which is to educate people
of school or pre-school age as well as the highest risk age groups in traffic. At a completely safe
situations, the children come in various conflict situations in traffic and thus acquire a car culture,
experience and knowledge that will be used in the entire life.
To increase the safety of bicycle and pedestrian traffic in Sisak, it is also necessary to conduct
continuous education, for younger and older ones, especially when it comes to bicycle traffic.
Education on traffic training sites is not the only solution, but it is essential to increase the safety of
every road user. Theoretical training in school is necessary, but it is insufficient. A practical approach
to the problem, with professional staff qualified for working with children, results in the real
impression, from which children can learn the most in controlled environment. The basic objectives
are:
Indication of threats in certain situations;
Correct thinking and response;
Adoption of correct and right-time decisions;
Acquisition of responsibility for one's actions.
Children as pedestrians or cyclists gain some new experiences and knowledge, and at the same time,

Sisak Urban Transport – Sustainable Urban Mobility Planning – FINAL REPORT 92
they are not exposed to any danger as in everyday life. The first contact with a new, to them unknown
traffic signs and signalised intersections, roundabouts, railway crossings, and even the traffic
policeman, will contribute to the overall understanding of the very complex traffic processes.
Because of this, it is realistic to expect that a training site significantly contributes to raising traffic
awareness among young people, and thus, the most desired effect – significant reduction of the
number of casualties in traffic, will be achieved.
As part of the Plan, the training sites for all primary schools and kindergartens in Sisak are predicted.
Site construction and training is scheduled for 2020. The education of young children about safety by
joining traffic with bicycles is not mandatory at the national level, but many stakeholders encourage
the introduction of such kind of training in order to reduce the number of traffic accidents involving
cyclists and to encourage children to use bicycles for daily commuting.
4.7.7 The measures and indicators for improving road safety in the City of Sisak
Regarding the improvement of road safety level in Sisak and its surrounding areas, the Police
Department of Sisak-Moslavina County (supported by the City of Sisak) occasionally co-finances
measures to improve road safety. These measures are primarily related to rasing the level of road
safety in the area of schools and playgrounds in the City of Sisak.
Table 22. Road safety measures
Measure Period
Adaptation of infrastructure for people with reduced mobility - lowering curbs and construction of ramps for people with
disabilities 2017 - 2020
Traffic calming measures 2017 - 2020
Conducting continuous education of city services for safety analysis and implementation
2017 - 2020
Construction of educational pedestrian and bicycle training site 2017 - 2020
Conducting educational campaigns to raise road safety awareness 2017 - 2020
Under this Plan, and for the purpose of further road safety improvement, measures are proposed,
stated in Table 22.
In order to increase the safety of all road users, it is necessary to continuously monitor the main
indicators, shown in Table 23.
Table 23. Road safety indicators
Indicator Measurement method Evaluation Methodology
Number of accidents (casualties, injuries and material damage)
Number Yearly Annual report
Types of vehicles in road accidents Type of vehicle Yearly Annual report

Sisak Urban Transport – Sustainable Urban Mobility Planning – FINAL REPORT 93
Indicator Measurement method Evaluation Methodology
Injured road users Type of user Yearly Annual report
Education of the city services Number of activities Yearly Annual report
Pedestrian and bicycle activities at the training site
Number of activities Yearly Annual report
Conducted activities in the field of safety Number of campaigns, workshops, lectures, working groups activities
Yearly Annual report

Sisak Urban Transport – Sustainable Urban Mobility Planning – FINAL REPORT 94
4.8 The role of public and private sector in service provision
Quality management in developing sustainable urban mobility requires the City, as the holder of such
a project, for close cooperation between the different stakeholders in businesses, citizens and other
stakeholders. In fact, the term "management" is a term for a culture of good cooperation in decision-
making, and this should be the modus operandi for connecting public and private entities in sustainable
urban mobility. The practice has shown that the private sector can encourage the public sector to
continuously provide quality and improve its services. So today, public institutions increasingly seek
cooperation with the real sector, which can contribute significantly to the quality of transport projects
primarily in the project planning and implementation by improving accessibility (closeness to
residence, work, etc.), accessibility (usable by the majority of the population), the adaptive prices
(reasonable costs for citizens), and comfort and safety in urban public transport.
These improvements in the private sector are achieved based on three key approaches: rational
operations and savings in public transport, the establishment of innovative concepts for urban
mobility, and by taking some of the responsibilities and risks in the public transport operations:
When the private sector is investing its own resources for the performance of public transport
services, it reduces the need for public sector resources, and then the resources can be
invested in the other development areas of the City. Also, private public transport operators
are more likely to have a rational resource management, achieving cost savings throughout
the value chain of the urban mobility;
The establishment of innovations relates to the improvement of public transport services
according to the world's best practices through knowledge and expertise of the private sector,
which is often much more agile in tracking new trends and technological improvements. As
examples, the improvement of rolling stock management and maintenance, new routes
establishment, more efficient resource utilization, and cost reduction can be pointed out;
When a private company, best suited and best equipped to perform services in public
transport, takes the role of bearer of services, then it takes the part of the responsibilities and
risks, which increases the overall value added in transport sector. Therefore, during the
selection of a private operator for the performance of public transport services, the cities take
into account the previous experience, the availability of the necessary resources and
implementation plan of public transport in order to determine whether a private operator is
willing to take responsibility and the expected risks in the public transport system.
To achieve and maintain the required expectations of private sector in sustainable urban mobility, and

Sisak Urban Transport – Sustainable Urban Mobility Planning – FINAL REPORT 95
ultimately, to achieve private interests, it is necessary that the city creates a platform for joint financial
initiatives. Such initiatives are realized in four general steps:
Identification of needs - including detailed scheduling of all needs in the field of sustainable
urban mobility that affect the success of providing services to citizens. It is necessary to
conduct a detailed review of the whole transport system and related financial indicators, and
to make comparison with transport services in comparable cities;
Choice between public financing and public-private partnerships - includes conducting
financial analysis as a basis for choosing between public financing and public-private
partnerships. Generally, the projects that have a higher value than the market rate of return
are suitable for public-private partnerships (PPP);
The development of public-private partnership structures - including the definition of owners
of involved property/resources, and consequently, the identification od risk allocation in the
project;
Preparation for the acquisition of services - in accordance with a defined structure, public
procurement services are prepared through a high-detail elaborated tender in accordance
with the before-made analysis of needs and the expected level of services.
As pointed out, the models involving the private partners in the provision of services as part of the
public transport services (eg. Parking services) can be a kind of institutional or contracted public-
private partnerships. In December 2014, the amendments of the Law on Public-Private Partnership
(NN 152/14) enabled contracts of public-private partnerships with value less than or equal to 5 million
EUR. This allowed the off-balance sheet financing of public infrastructure projects that, by definition
of Eurostat and the Budget Law, does not belong in public financial obligations.
Institutional PPP is based on the co-ownership relationship of local government and private partner,
which is considered as the alternative to privatization. Contractual PPP is concluded for a definite
period and represents all forms of partnership between local governments and private partners who
are defined by the contract, as in the case of parking construction and management. The most common
models of contractual PPPs are service contracts, management, leasing, concession, and the contract
to build-operate-trasfer / BOT infrastructure. It should be noted that the concession contracts are the
most common and are used in approximately 70 % of cases. When the goal of the PPPs is to increase
efficiency of service, a service contract or a management contract applies, and if a significant
investment by the private partner is expected, then the concession contract by BOT is used.
When selecting the PPP model, is extremely important to implement the following analysis as a

Sisak Urban Transport – Sustainable Urban Mobility Planning – FINAL REPORT 96
condition for the establishment of sustainable cooperation:
Legal analysis - includes the analysis of the existing laws governing jurisdiction and ways to
manage the services, describes how to perform control over the service, defines binding
quality standard services and price policy. Where appropriate, the legal analysis also includes
an analysis of the law on occupational safety and the law on foreign investment. Also, besides
taking care of respecting the laws of Croatia, cities or local governments must take into account
the adjustment of its own legal framework (statutes, regulations, etc.) for the implementation
of the selected PPP model in the performance of services in urban public transport;
Technical analysis - provides a snapshot of the current state of the required services,
contributing to the identification of possibilities to improve the same through the introduction
of PPP and ultimately defines the specifications of future services that will be entrusted to
private business partner;
Financial and economy analysis - enables the assessment of the financial viability and
justification for carrying out the required services and investment in facilities. The main
indicators of the profitability of the project include the net present value, internal rate of
return / refund and payback period;
Risk analysis - derives from the fundamental assumptions of establishing a PPP or the
assessment / calculation of demand that affects how the expected costs of the project and the
expected revenues (especially in the case if a major source of cash flow are user charges such
as tolls or parking payments). The creation of assumptions and making traffic forecast / model
present a significant risk of deviations from the actual level of traffic, no matter how good the
models / forecasts are. With such an element of uncertainty, defining and then the allocation
of risks between public and private partners is a key dimension of making high-quality public-
private partnerships.
The proposals of some of the segments, where the City recommends the consideration of active
involvement of private partners in the project, are described below.
The "smart city" project that greatly influences traffic segment. In addition to construction projects,
the framework of the PPP model provides the possibility to make additional budget revenues or savings
for cities in other areas and by implementing the concept of smart city. The wide involvement of
private partners can provide significant savings for example in the street / public lighting. The public
lighting is a part of the municipal infrastructure of each residential area whose construction and
maintenance is regulated by the Utilities Act in the last ten years under the jurisdiction of cities and
municipalities. One of the solutions for contracting PPPs with private companies is to offer a complete,

Sisak Urban Transport – Sustainable Urban Mobility Planning – FINAL REPORT 97
full service improvement of the urban traffic segment: designing, financing (partially or totally based
on savings), setting up and managing street lighting. In addition (or as part of the same project) to the
establishment of new lighting infrastructure, it is possible to implement systems such as surveillance
(monitoring consumption and cost, noise, traffic density, emissions), wireless telecommunication
systems, charging stations for electric cars and other systems that allow the creation of additional
revenue for the local economy and the city budget.
Road maintenance. A PPP town may also establish cooperation with the private sector in the field of
rehabilitation and maintenance of roads, which is used to maximize the efficiency of management and
maintenance of transport assets. The arrangement of such cooperation is mostly based on the
specifications of the output requirements and the required result, opposite to the means of
achievement. So this kind of private company engagement belongs to the category of contracts based
on performance (Performance-based contracting). Therefore, the effectiveness of agreements differ
significantly from traditional contracts for road rehabilitation and maintenance to avoid the tendency
of private partners to maximize the amount of work in order to increase revenue of the company. The
content of the effectiveness contract of the private partner is encouraged to provide more efficient
services by a small number of field tasks with respect to the agreed level of maintenance and
rehabilitation of roads (The Services Levels). The role of the City in such PPP is the monitoring
(quantitative and qualitative) of service levels in accordance with the contract, and monitoring the
compliance with laws and regulations. By the definition of such a contract, it is necessary to take into
account the following criteria: the volume and type of traffic, the current status (quality) and the type
of roads (urban, rural), type of terrain (mountainous, flat, etc.), the quality of the available building
materials, the capacity of potential private partners, and the restrictions related to the environmental
protection. It is also necessary to assess which level of service is financially justified for certain roads.
The implementation of the agreement on the service effectiveness provides savings from 10% up to
40% compared with traditional contracts for road rehabilitation and maintenance, and it shows the
improvement trend of road assets condition and reduction of the number of roads in poor condition.
The inclusion of private partners in offering public transport services. By increasing the number of
partners in public transport, the role of the City should be gradually changed from the operator to the
contractor, coordinator and supervisor of services. Such a role implies ensuring a common platform
for all interested partners / stakeholders of urban traffic able to connect with it, and to upgrade it. An
integral part of the platform would be the Integrated Transport Ticket, which includes measures and
activities to simplify and unify tariff schemes for different transport systems within a metropolitan area
or region. This aims to increase the interoperability of different networks and to encourage the growth
of the total number of users of public transport system. One of the practical possibilities for the City of

Sisak Urban Transport – Sustainable Urban Mobility Planning – FINAL REPORT 98
Sisak is the integration of passenger tickets for buses and railways with a system of public bicycles (e.g.
Nextbike) or car-sharing (e.g. Spin City) on a single card. Also, the same card could allow taxi and
parking payments. With such a card, users can make payment on the website / platform, where they
could be also offered a wide range of related information. Most of the services could be paid for by
subscriptions or an individual service (pay-per-use). In addition, subscribers / users could thus provide
a wide range of savings for every mode of transport. The Integrated Transport Ticket is a great example
of the integration of the private sector in public transport system which encourages more efficient and
more effective utilization of various vehicle types, and thus relieves traffic and reduces congestion in
the city which is in line with the guidelines of this document. Moreover, private partners may include
the regulation of bus stops, and, in return, they get the chance to rent marketing space at these
locations. There are a number of other practical examples, some of which were described earlier in
this document (Sections 4.2.9 and 4.2.17).
The inclusion of private partners in the segments of real estate and mobile property. When it comes
to private sector, the involvement in business activities of city enterprises in charge of public transport,
such as AP Sisak, it is possible in segments of property utilization, movable and non-core business (e.g.
marketing), and outsourcing certain non-core society functions.
Sisak Bus Station, as an important and frequent point of the City it has strategic value to AP Sisak,
which now tends to the coarsening stake in the business entity. In fact, one of the owners of Sisak Bus
Station, company Slavijatrans Ltd is in bankruptcy, and it is the best interest for AP and the City of Sisak
to acquire Slavijatrans Ltd by auction.
The estimation for the Sisak Bus Station, conducted in 2014 by a court expert (the Station is a buiding
with land included), resulted with value of 2.874.804,83 HRK or 375.300,89 EUR (1 EUR = 7,66 HRK).
By ownership, the value is divided into:
AP: 55 % (1.581.142,66 HRK);
Slavijatrans Ltd Petrinja (in bankruptcy): 40 % (1.149.921,93 HRK);
Autoprijevoz Dvor: 5 % (143.740,24 HRK).
Without the consolidation of ownership of Sisak Bus Station, it is not advisable to make further
investments in infrastructure, having significant participation of a new private entity in the station
processes. By addressing current barriers, opportunities open up, and they include new private
companies for the Stations via:
o Entering into the ownership structure and establishing a new management model fo
the Bus Station (by selling the AP share and separating operations management and

Sisak Urban Transport – Sustainable Urban Mobility Planning – FINAL REPORT 99
maintenance to external contractors);
o Renting the available office space for additional commercial activities inside the
Station, ATMs, etc.)
Other real estate owned by AP Sisak – for the property next to the company headquarters, the
AP has the proper documentation and the potential to be relatively quickly put into the
market. Also, the adjacent land is owned by the company in the bankruptcy which has one
million HRK debt to the AP. Therefore, there is a legitimate interest to purchase that land by
the AP and the City in order to complete the field adjacent to AP Sisak headquarters, and thus
to be more attractive to potential private investors, or even the City of Sisak, with the goal of
realocation of utilities from the centre and the formation of the utility holding company and
its realocation to this property;
Outsourcing - so far, the AP outsourced the cleaning services and security services, and a
percentage of the tickets are sold by kiosks. Other possibilities refer to outsourcing other non-
core business processes such as accounting, marketing and similar operations.
The inclusion of private partners in the field of electro-mobility. Given the growing presence of
electric vehicles and their rapid growth, it is believed that the installation of electric charging stations
has a great potential for the City, and as such investment would represent a great interest for private
partners.

Sisak Urban Transport – Sustainable Urban Mobility Planning – FINAL REPORT 100
5 COST ESTIMATIONS
Within the Sisak Urban Transport – SUMP project, an estimation of the investment costs for the
measures within specific areas was made according to the planning horizon. The cost estimation was
made for the measures within public transport, pedestrian and bicycle traffic, road infrastructure, city
logistics, road safety and parking policy management. At the end of the section, a cost estimation
according to the responsible bodies and areas was made for short-term (2017), mid-term (2020) and
long-term (2030) periods:
By areas in detail: Table 24 - Table 29;
By areas in general: Table 30 - Table 35;
By areas and responsibilities in total: Table 36 and Table 37, respecitvely.
Table 24. Investment cost estimations for public transport
Code Measure Estimated
costs in HRK
Difficulty Responsibilit
y 2017 HRK
2020 HRK
2030 HRK
1 PT visual identity - project 150.000 Low AP 150.000
1 Route adjustments (Line 1
shortening) Low AP
3 Route 3 extension to Tomićev put
– construction works 200.000 Medium City of Sisak 200.000
3 New pilot line to Galdovo 300.000 Medium City of Sisak 300.000
5
Service improvements (interval reduction from 15 to 10 minutes
on the route Kolodvor – Željezara by adding two buses)
3.000.000 Medium AP 3.000.000
1 Converting the stop Kolodvor into
a terminal - project 25.000 Medium AP 25.000
3 Converting the stop kolodvor into
a terminal – construction works 225.000 Medium AP 225.000
4 E-ticketing in public transport Medium AP
4 Public bicycle scheme 600.000 Medium City of Sisak 600.000
1 Tariff system - project 500.000 Low AP 500.000
4 Introducing wireless internet into
city buses 30.000 Low AP 30.000
1 Bus stop renewal – phase 1
(project) 250.000 High AP 250.000
3 Bus stop renewal – phase 1
(construction works) 2.250.000 High AP 2.250.000
1 Introducing real-time information
displays – phase 1 (project) 50.000 Medium AP 50.000
3 Introducing real-time information
displays – phase 1 (construction works)
100.000 Medium AP 100.000
4 Introducing real-time information
displays – phase 1 (devices) 350.000 Medium AP 350.000
1 Public transport promotion 40.000 Low City of Sisak 13.333 26.667
1 Taxi service improvements 300.000 Medium City of Sisak, 100.000 200.000

Sisak Urban Transport – Sustainable Urban Mobility Planning – FINAL REPORT 101
Code Measure Estimated
costs in HRK
Difficulty Responsibilit
y 2017 HRK
2020 HRK
2030 HRK
taxi service providers
1 Bus stop renewal – phase 2
(project) 200.000 High AP 200.000
3 Bus stop renewal – phase 2
(construction works) 1.800.000 High AP 1.800.000
1 Introducing real-time information
displays – phase 2 (project) 50.000 Medium AP 50.000
3 Introducing real-time information
displays – phase 2 (construction works)
100.000 Medium AP 100.000
4 Introducing real-time information
displays – phase 2 (devices) 350.000 Medium AP 350.000
1 Further line route adjustments due
to the new bridge 400.000 Medium AP 400.000
5 Replacing the existing bus park
with new eco-friendly buses until 2030
39.375.000 High AP 39.375.000
5 Tourist train 1.500.000 Medium City of Sisak 1.500.000
1 On-demand transport 900.000 Medium AP 900.000
1 Bus priority on signalized
intersection (project) 150.000 High AP 150.000
4 Bus priority on signalized
intersection (machinery and equipment)
1.350.000 High AP 1.350.000
INTEGRATED TRANSPORT
1 Public car scheme – Carsharing 529.000 Medium City of Sisak 529.000
1
Multimodal real-time app for journey planning in PT (bus and
train), public bicycle, walking, carpooling
80.000 Low AP 80.000
1 First Park-and-Ride car park in Kralj
Zvonimir Street (project) 300.000 High City of Sisak 300.000
3 First Park-and-Ride car park in Kralj
Zvonimir Street (construction works)
5.300.000 High City of Sisak 5.300.000
1 Integrating public transport and
railway system 100.000 High
City of Sisak, AP, Croatian
Railways
100.000
1
Second Park-and-Ride car park between Ivan Fistrović Streer,
Nikola Tesla Street and the railroad (project)
300.000 High City of Sisak 300.000
3
Second Park-and-Ride car park between Ivan Fistrović Streer,
Nikola Tesla Street and the railroad (construction works)
6.900.000 High City of Sisak 6.900.000
TOTAL PER YEAR, HRK 5.529.000 8.923.333 53.601.667
TOTAL, HRK 68.054.000
PUBLIC TRANSPORT
Responsibility 2017 HRK
2020 HRK
2030 HRK
TOTAL HRK
City of Sisak 1.629.000 5.613.333 10.876.667 18.119.000
AP 3.900.000 3.110.000 42.525.000 49.535.000
City of Sisak, taxi service providers 100.000 200.000 300.000
City of Sisak, AP, Croatian Railways 100.000 100.000
TOTAL PER YEAR 5.529.000 8.923.333 53.601.667 68.054.000

Sisak Urban Transport – Sustainable Urban Mobility Planning – FINAL REPORT 102
Table 25. Investment cost estimations for pedestrian and bicycle traffic
Code Measure Estimated
costs in HRK
Difficulty Responsibil
ity 2017 HRK
2020 HRK
2030 HRK
1 Pedestrian zone reconstruction –
in progress (project) Low City of Sisak
3 Pedestrian zone reconstruction – in progress (construction works)
Low City of Sisak 5.300.000
1 Bicycle path/lane construction
(project) 500.000 Low City of Sisak 500.000
3 Bicycle path/lane construction
(construction works) 7.600.000 Low City of Sisak 7.600.000
1 Removing the existing obstacles
fpr pedestrians and cyclists (project)
25.000 Medium City of Sisak 25.000
3 Removing the existing obstacles
fpr pedestrians and cyclists (construction works)
225.000 Medium City of Sisak 225.000
1 Pedestrian zone reconstruction –
(project) 300.000 Medium City of Sisak 300.000
3 Pedestrian zone reconstruction –
(construction works) 5.400.000 Medium City of Sisak 5.400.000
1 Bicycle path/lane construction
(project) 300.000 Low City of Sisak 300.000
3 Bicycle path/lane construction
(construction works) 4.700.000 Low City of Sisak 4.700.000
1 Pedestrian underpass 10 m wide
(project) 1.900.000 High City of Sisak 1.900.000
3 Pedestrian underpass 10 m wide
(construction works) 9.000.000 High City of Sisak 9.000.000
1 Bicycle path/lane construction
(project) 1.100.000 Low City of Sisak 1.100.000
3 Bicycle path/lane construction
(construction works) 19.900.000 Low City of Sisak 19.900.000
TOTAL PER YEAR, HRK 8.350.000 11.000.000 31.600.000
TOTAL, HRK 50.950.000
PEDESTRIAN AND BICYCLE TRAFFIC
Responsibility 2017 HRK
2020 HRK
2030 HRK
TOTAL HRK
City of Sisak 8.350.000 11.000.000 22.600.000 41.950.000
Ministry of culture 9.000.000 9.000.000
TOTAL PER YEAR 8.350.000 11.000.000 31.600.000 50.950.000
Table 26. Investment cost estimations for road infrastructure
Code Measure Estimated
costs in HRK Difficulty Responsibility
2017 HRK
2020 HRK
2030 HRK
1
Reconstruction of the intersection D36
Nikola Tesla Street – first phase of
introducing traffic lights (project)
42.000 High City of Sisak,
Croatian Roads 42.000
3
Reconstruction of the intersection D36
Nikola Tesla Street – first phase of
introducing traffic lights (construction
works)
378.000 High City of Sisak,
Croatian Roads 378.000

Sisak Urban Transport – Sustainable Urban Mobility Planning – FINAL REPORT 103
Code Measure Estimated
costs in HRK Difficulty Responsibility
2017 HRK
2020 HRK
2030 HRK
1
Reconstruction of the intersection
D37/D224 – change into a roundabout
(project)
220.000 High Croatian Roads 220.000
3
Reconstruction of the intersection
D37/D224 – change into a roundabout
(construction works)
1.980.000 High Croatian Roads 1.980.000
1
Reconstruction of the intersection D36 –
Nikola Tesla Street – second (denivelation)
stage (project)
3.000.000 Medium City of Sisak 3.000.000
3
Reconstruction of the intersection D36 –
Nikola Tesla Street – second (denivelation)
stage (construction works)
35.100.000 Medium Croatian Roads 35.100.000
3
Reconstruction of the intersection D36 –
Nikola Tesla Street – second (denivelation)
stage (construction works)
81.900.000 Medium Croatian Roads 81.900.000
1 D36 – Variant A,
Odra Bridge (project) 3.295.000 High Croatian Roads 3.295.000
3 D36 – Variant A,
Odra Bridge (construction works)
29.655.000 High Croatian Roads 29.655.000
1
D36 – Variant B, without the
connection to the highway A11
(project)
2.000.000 Medium Croatian Roads 2.000.000
3
D36 – Variant B, without the
connection to the highway A11
(construction works)
45.840.000 Medium Croatian Roads 45.840.000
1
Change in traffic flow regulation,
reconstruction of roads in the vicinity
of the pedestrian zone, with the Old Bridge underpass
(project)
500.000 Medium City of Sisak 500.000
3
Change in traffic flow regulation,
reconstruction of roads in the vicinity
of the pedestrian zone, with the Old Bridge underpass
(construction works)
8.410.000 Medium City of Sisak 8.410.000
1 Traffic light
optimization (project)
200.000 Medium City of Sisak 200.000

Sisak Urban Transport – Sustainable Urban Mobility Planning – FINAL REPORT 104
Code Measure Estimated
costs in HRK Difficulty Responsibility
2017 HRK
2020 HRK
2030 HRK
4
Traffic light optimization
(machinery and equipment)
140.000 Medium City of Sisak 140.000
4
Traffic light optimization
(machinery and equipment)
1.260.000 Medium Croatian Roads 1.260.000
1 Automated traffic
control (project) 200.000 Low
City od Sisak, Croatian Roads
200.000
4 Automated traffic
control (machinery and equipment)
480.000 Low City of Sisak,
Croatian Roads 200.000
4 Automated traffic
control (machinery and equipment)
120.000 Low Croatian Roads 120.000
1
Bridge over the Kupa River in the city
centre in parallel to the railroad bridge
(project)
4.000.000 High City of Sisak 4.000.000
3
Bridge over the Kupa River in the city
centre in parallel to the railroad bridge
(construction works)
76.000.000 High City of Sisak 76.000.000
1
Road bridge on the Kupa River next to
Kratečko or Lukavec Posavski (project)
2.000.000 Medium City of Sisak 2.000.000
3
Road bridge on the Kupa River next to
Kratečko or Lukavec Posavski
(construction works)
38.000.000 Medium City of Sisak 38.000.000
1
D36 to Novo Selo Palanječko and the
bridge over Sava River (project)
4.000.000 Medium Croatian Roads 4.000.000
3
D36 to Novo Selo Palanječko and the
bridge over Sava River (construction
works)
86.000.000 Medium Croatian Roads 86.000.000
1 D36 to Veliko
Svinjičko and Gušća (project)
2.000.000 Medium City of Sisak 2.000.000
3 D36 to Veliko
Svinjičko and Gušća (construction works)
66.000.000 Medium City of Sisak 66.000.000
TOTAL PER YEAR, HRK 8.620.000 234.100.000 250.000.000
TOTAL, HRK 492.720.000
ROAD INFRASTRUCTURE
Responsibility 2017 HRK
2020 HRK
2030 HRK
TOTAL HRK
City of Sisak 2.000.000 75.730.000 43.000.000 120.730.000
City of Sisak, Croatian Roads 420.000 200.000 - 620.000
Croatian Roads 6.200.000 158.170.000 207.000.000 371.370.000
TOTAL PER YEAR 8.620.000.00 234.100.000 250.000.000 492.720.000

Sisak Urban Transport – Sustainable Urban Mobility Planning – FINAL REPORT 105
Table 27. Investment cost estimations for parking
Code Measure Estimated
costs in HRK
Difficulty Responsibility 2017 HRK
2020 HRK
2030 HRK
1 Parking zone extension in the city centre
by the city marketplace - devices and signallization (project)
12.000 High City of Sisak 12.000
4 Parking zone extension in the city centre
by the city marketplace - devices and signalization (equipment)
108.000 High City of Sisak 108.000
1 Parking zone extension in the city centre
between Franjo Lovrić, Ante Starčević and Ivan Kukuljević Sakcinski streets - project
20.000 High City of Sisak 20.000
4 Introducing parking charging scheme by
Ivo Pedišić Hospital – devices and signalization
50.000 Medium City of Sisak 50.000
1 Co-financing model and parking surface construction within buildings as blocks
(project) 100.000 High City of Sisak 100.000
3 Co-financing model and parking surface construction within buildings as blocks
(construction works) 900.000 High City of Sisak 900.000
1 Corrections within the existing parking
tariff system 300.000 High City of Sisak 300.000
TOTAL PER YEAR, HRK 1.470.000 20.000
TOTAL, HRK 1.490.000
PARKING POLICY MANAGEMET
Responsibility 2017 HRK
2020 HRK
2030 HRK
TOTAL HRK
City of Sisak 1.470.000 20.000 1.490.000
TOTAL PER YEAR 1.470.000 20.000 1.490.000
Table 28. Investment cost estimations for city logistics
Code Measure Estimated
costs in HRK
Difficulty Responsibility 2017 HRK
2020 HRK
2030 HRK
1
Change in the Decision on road traffic in the City of Sisak (Ofiicial
Gazette on the Sisak-Moslavina County 14/06, 6/09, 1/13)
20.000 Low City of Sisak 20.000
1
Adoption of the Decision on means of charging and parking
space definition for delivery vehicles in the City of Sisak
20.000 Low City of Sisak 20.000
1 Video surveillance system –
introduction and maintenance (project)
25.000 High City of Sisak 25.000
4 Video surveillance system –
introduction and maintenance (equipment)
225.000 High City of Sisak 225.000
1 Introducing utility officers 130.000 Medium City of Sisak 130.000
1
Parking space marking for delivery and cargo vehicles by
traffic signs and horizontal markings (project)
5.000 Medium City of Sisak 5.000
3
Parking space marking for delivery and cargo vehicles by
traffic signs and horizontal markings (construction works)
30.000 Medium City of Sisak 30.000
1 The construction of the 1.000.000 High City of Sisak 1.000.000

Sisak Urban Transport – Sustainable Urban Mobility Planning – FINAL REPORT 106
Code Measure Estimated
costs in HRK
Difficulty Responsibility 2017 HRK
2020 HRK
2030 HRK
distribution centre in the City of Sisak (project)
3 The construction of the
distribution centre in the City of Sisak (construction works)
11.000.000 High City of Sisak 11.000.000
TOTAL PER YEAR, HRK 455.000 12.000.000
TOTAL, HRK 12.455.000
CITY LOGISTICS
Responsibility 2017 HRK
2020 HRK
2030 HRK
TOTAL HRK
City of Sisak 455.000 12.000.000 12.455.000
Public-private partnership
TOTAL PER YEAR 455.000 12.000.000 12.455.000
Table 29. Investment cost estimations for road safety
Code Measure Estimated
costs in HRK
Difficulty Responsibilit
y 2017 HRK
2020 HRK
2030 HRK
1
Infrastructure adjustments for people with disabilities –
curb lowering and ramps (project)
38.000 High City of Sisak 38.000
3
Infrastructure adjustments for people with disabilities –
curb lowering and ramps (construction works)
342.000 High City of Sisak 342.000
1 Traffic calming measures
(project) 350.000 Medium
City of Sisak, Croatian
Roads 175.000 175.000
3 Traffic calming measures
(construction works) 3.150.000 Medium
City of Sisak, Croatian
Roads 1.575.000 1.575.000
1
Continuous education of City administration for
conducting road safety analysis
500.000 High City of Sisak 125.000 125.000 250.000
1 Educational activities to raise
awareness of the public 600.000 High
City of Sisak, Ministry of
Interior, NGOs
150.000 150.000 300.000
1 Educational bicycle-
pedestrian training site (project)
54.000 Medium City of Sisak 54.000
3 Educational bicycle-
pedestrian training site (construction works)
486.000 Medium City of Sisak 486.000
TOTAL PER YEAR, HRK 2.405.000 2.565.000 550.000
TOTAL, HRK 5.520.000
ROAD SAFETY
Responsibility 2017 HRK
2020 HRK
2030 HRK
TOTAL HRK
City of Sisak 505.000 665.000 250.000 1.420.000
City of Sisak, Croatian Roads 1.750.000 1.750.000 3.500.000
City of Sisak, Ministry of Interior, NGOs 150.000 150.000 300.000 600.000
TOTAL PER YEAR 2.405.000 2.565.000 550.000 5.520.000

Sisak Urban Transport – Sustainable Urban Mobility Planning – FINAL REPORT 107
Table 30. Capital investments in public transport
Investment type 2017 HRK
2020 HRK
2030 HRK
Projects 1.204.000,00 893.333,33 2.226.666,67
Construction works (without building parcels) 725.000,00 7.650.000,00 8.800.000,00
Machinery and equipment 600.000,00 380.000,00 1.700.000,00
Transport vehicles 3.000.000,00 - 40.875.000,00
TOTAL PER YEAR 5.529.000,00 8.923.333,33 53.601.666,67
Table 31. Capital investments in pedestrian and bicycle traffic
Investment type 2017 HRK
2020 HRK
2030 HRK
Projects 525.000,00 3.600.000,00 -
Construction works (without building parcels) 7.825.000,00 7.400.000,00 31.600.000,00
Machinery and equipment - - -
Transport vehicles - - -
TOTAL PER YEAR 8.350.000,00 11.000.000,00 31.600.000,00
Table 32. Capital investments in road infrastructure
Investment type 2017 HRK
2020 HRK
2030 HRK
Projects 6.262.000,00 6.195.000,00 9.000.000,00
Construction works (without building parcels) 2.358.000,00 225.905.000,00 241.500.000,00
Machinery and equipment - 2.000.000,00 -
Transport vehicles - - -
TOTAL PER YEAR 8.620.000,00 234.100.000,00 250.000.000,00
Table 33. Capital investments in parking policy management
Investment type 2017 HRK
2020 HRK
2030 HRK
Projects 412.000,00 20.000,00 -
Construction works (without building parcels) 900.000,00 - -
Machinery and equipment 158.000,00 - -
Transport vehicles - - -
TOTAL PER YEAR 1.470.000,00 20.000,00 -
Table 34. Capital investments in city logistics
Investment type 2017 HRK
2020 HRK
2030 HRK
Projects 200.000,00 - 1.000.000,00
Construction works (without building parcels) 30.000,00 - 11.000.000,00
Machinery and equipment 225.000,00 - -
Transport vehicles - - -
TOTAL PER YEAR 455.000,00 - 12.000.000,00

Sisak Urban Transport – Sustainable Urban Mobility Planning – FINAL REPORT 108
Table 35. Capital investments in road safety
Investment type 2017 HRK
2020 HRK
2030 HRK
Projects 488.000,00 504.000,00 550.000,00
Construction works (without building parcels) 1.917.000,00 2.061.000,00 -
Machinery and equipment - - -
Transport vehicles - - -
TOTAL PER YEAR 2.405.000,00 2.565.000,00 550.000,00
Table 36. SUMP costs by responsible entities
Responsibility 2017 HRK
2020 HRK
2030 HRK
City of Sisak 18.409.000,00 115.828.333,33 77.726.666,67
AP 3.900.000,00 3.110.000,00 42.525.000,00
City of Sisak and taxi service providers* - 100.000,00 200.000,00
City of Sisak, AP, Croatian Railways** - 100.000,00 -
City of Sisak, Croatian Roads* 2.170.000,00 1.950.000,00 -
Croatian Roads*** 2.200.000,00 135.370.000,00 207.000.000,00
Public-private partnership - - 11.000.000,00
Ministry of culture** - - 9.000.000,00
City of Sisak, Ministry of Interior, NGOs 150.000,00 150.000,00 300.000,00
TOTAL 26.829.000,00 256.608.333,33 347.751.666,67
* One half of the total costs for each participant
** One third of the total costs for each participant
*** Public-private partnership
Table 37. SUMP costs by activity areas
Activity area 2017 HRK
2020 HRK
2030 HRK
Public transport 5.529.000,00 8.923.333,33 53.601.666,67
Pedestrian and bicycle traffic 8.350.000,00 11.000.000,00 31.600.000,00
Road infrastructure 8.620.000,00 234.100.000,00 250.000.000,00
City logistics 455.000,00 - 12.000.000,00
Parking policy management 1,470.000,00 20.000,00 -
Road safety 2.405.000,00 2.565.000,00 550.000,00
TOTAL 26.829.000,00 256.608.333,33 347.751.666,67
Sisak Urban Transport – Sustainable Urban Mobility Planning – FINAL REPORT 109
6 STRATEGIC ENVIRONMENTAL ASSESSMENT
The objective of the Sustainable Urban Mobility Plan for the City of Sisak (SUMP) is to define guidelines
for Sustainable urban transport policy, taking into account development of the spatial, economic and
social plans of the City.
The objective of the Sustainable Urban Mobility Plan for the City of Sisak is to determine the City as a
successful dynamic regional centre, where transport system will provide better mobility and
availability for its citizens while reducing the external costs of transport, provide economic
development and environmental protection, and as well, a better and healthier urban environment
for all of its citizens - users of the transport system, especially for the most vulnerable (pedestrians,
cyclists, children, persons with reduced mobility, and the elderly).
The main guidelines of the new Sustainable transport policy of Sisak should be:
Changes in modal distribution of travel in favour of public transport and non-motorized modes
of travel with better environmental and energy efficiency;
Reduced use of cars in urban travel;
Encouraging non-motorized modes of travel such as walking and use of bicycles;
Encouraging the use of public transport;
The establishment of pedestrian zones with limited access using personal vehicles;
Construction and improvement of existing transport infrastructure;
Management of traffic flows in the city using the ITS system;
Increasing road safety;
Management of parking system (street and out-street) and billing system;
Management of urban logistics and distribution of freight transport;
Integration of transport subsystems;
Improve the quality of life and work through increased mobility and availability.
Sustainable Urban Mobility Plan (SUMP) of the City of Sisak is the basic transport-spatial plan that
determines the development of its transport system in the medium term (until 2030).
The Plan was worked out at the conceptual level, according to the selected three time horizons; 2017,
2020 and 2030, with a series of measures in the areas of: public transport, non-motorized traffic
(pedestrian and cycling), road infrastructure, motorized traffic (traffic management and traffic flow

Sisak Urban Transport – Sustainable Urban Mobility Planning – FINAL REPORT 110
managing, parking management, traffic safety management), and logistics. The abstract and the
conclusions of the strategic environmental assessment are shown below, and the strategic
environmental assensment in complete form is in the form of an annex to this Report.
6.1 The state of the environment and the possible impacts of the Plan
The following describes the state of the environment and the potential impacts of the Sustainable
Urban Mobility Plan on the environment through the categories described below.
6.1.1 Air quality
In the area of the City of Sisak, air quality monitoring is conducted at three automatic measuring
stations (AMP): Sisak-1 in the settlement of Caprag, Sisak-2 Galdovo and Sisak-3, located in the centre
of the city. According to the results of air quality monitoring in the period from 2012 to 2015, in the
City of Sisak, at all monitoring stations, an air pollutions of suspended particles PM10 were measured
and at station Sisak-1, located in the settlement of Caprag, higher concentration of hydrogen sulphide
H2S were found, as well. Increased concentrations of hydrogen sulphide are due to the emissions of
hydrogen sulphide from the nearby oil industry INA Sisak Refinery.
Pollution of suspended particulate matter PM10 in the City of Sisak is the result of the emissions of
particulate matter PM10 from the industry (the largest sources of air pollutant emissions are ABS Sisak
d.o.o. (production of steel), INA Industrija nafte d.d. - Sisak refinery and Thermal Power plant Sisak),
small and medium-sized combustion installations, households, machinery and mechanization in
agriculture and transport sector.
The Sustainable Urban Mobility Plan of the City of Sisak proposed measures for further sustainable
development of the transport system of the City. The envisaged measures such as: improvement and
modernization of public transport, construction of walking zones and walking routes / tracks, changes
in the regulation of traffic flow and traffic lights system optimization will contribute to reducing the air
pollution within the City of Sisak, by reducing the emissions of pollutants from traffic, including
greenhouse gas emissions. An impact on the air quality can be expected during construction work of
new planned parking lots, cycling routes, carpooling terminals, charging stations for electric cars,
reconstruction and construction of local stations. It is primarily due to emissions of particulate matter
as a result of groundwork and construction work and the emissions of exhaust gases from operating
machines. These impacts are temporary and of local character. While respecting technological

Sisak Urban Transport – Sustainable Urban Mobility Planning – FINAL REPORT 111
protection measures (covering of trucks carrying bulk cargo, regular control of the vehicle, water
sprinkling of work surfaces in extremely dry conditions, the suspension of work in the case of strong
winds, ...) larger impact on the surrounding area is not expected.
The construction of bridges (new bridge over Kupa, new bridge over Odra as part of D36) and roads of
the major importance (D36 and new bridge over Odra (the first phase); D36 and connection to A11
(the second phase); D36 to Novo Selo Palanječko (the third phase); D36 to the settlements Veliko
Svinjičko and Gušće) are projects that are subject to the environmental impact assessment procedure.
The construction of a road bridge over Sava near Kratečko or near Lukavac Posavski and access roads
will have an effect on the air quality in the vicinity of the roads and the bridge due to the emission of
exhaust gases and particulates from vehicles with internal combustion engines. Construction of new
state roads will also have an impact on air quality in the vicinity of the road. However, construction of
bypasses that reduce traffic load in the centre of the city has a positive impact on air quality due to the
reduction of urban traffic where stopping of vehicles and increasing the density of the point sources in
one place and difficult dispersion cause highest emissions of air pollutants.
6.1.2 Noise
In the period from 2006 to 2010, under the program of noise protection (according to the Noise
Protection Act (OG 20/03) that was in force in that time), the City of Sisak has prepared noise maps of
noise from road traffic, railway traffic and from industry, a collective map of noise and conflict noise
map. Noise maps provide an overview of the existing and predicted noise emission levels at all
locations within the study area, depending on a particular source or all sources of noise. Maps can
provide day or night noise levels and the average 24-hour noise in all areas of the city with the precision
of street and house number level. It was estimated a relatively favourable situation in terms of
vulnerability of the population by noise from road and rail traffic and industry in the city of Sisak.
By comparing the situation with and without the implementation of the Plan, it can be concluded that
the implementation of the Plan will have an impact on the reduction of noise levels, not only by
opening pedestrian zones and cycling routes but also by increasing availability of parking space at the
edges of the city and better public transport connections. By improving the quality of public transport
(frequency and additional offer such as wireless Internet connection, a mobile application for reaching
the data on the current state of public transport, etc.) the attractiveness of public transport also
increases. Promoting forms of joint use of cars (car-pooling and car sharing) will also contribute on
reducing noise levels, but to a lesser extent. The concept of focusing on eco-friendly vehicles will help
to reduce noise levels. Construction of the city bypasses will help to reduce noise levels in the city, but

Sisak Urban Transport – Sustainable Urban Mobility Planning – FINAL REPORT 112
will contribute to an increase of local noise levels along the bypasses, which also applies to all other
planned roads and bridges. During construction of planned projects an increase in noise levels is
expected (a short-term impact) and these levels must comply with the noise levels in accordance with
the Regulations on maximum permissible noise levels in areas where people work and live (Official
Gazette 145/04).
6.1.3 Water quality
City of Sisak is surrounded by rivers Sava, Kupa and Odra and at the easternmost part of the city, by
river Lonja. More than half of 24 waterbodies (54,17%) in the Sisak City area is in good overall status.
The most of the waterbodies (83,33%) are in good chemical state. Waterbodies that are in very bad
condition are: CSRN0001_013 Sava, CSRN0007_002 Lonja Trebež, CSRN0007_001 Lonja Trebež i
CSRN0024_001 Odra and the causes of this bad condition are: elevated concentrations of
hexachlorobutadiene, degraded hydro-morphological conditions and physio-chemical indicators.
Moreover, sewage outlets from combined sewerage system of Sisak City are discharged in river Odra,
Sava and Kupa. Moreover, big pollutants are located near river Kupa.
Good overall status is achieved in both subsurface waterbodies (DSGNKCPV_28, Lekenik-Lužani and
DSGNKCPV_31, Kupa) and both waterbodies are not in risk in terms of quality or quantity. But, it has
to be mentioned that ground waterbodies are near surface, so the negative potential effect of the
pollution can’t be excluded. Water supply system of Sisak City is connected with water supply system
of Petrinja City. Within the area of Sisak City there are no sanitary protection zones of drinking waters
established by decisions on the sanitary protection zones which are used for public water supply since
water captions from river Kupa are located in the area of the City of Petrinja.
Nearly whole area of the City of Sisak, apart from the southernmost part, is situated in the area that is
at risk from floods. Some parts of wider area of riverflows have a high probability of being flooded.
Construction of pedestrian zones and improving of public transport contributes to the reduction of
pollution from the roads. Promoting the forms of joint use of personal vehicles will reduce the volume
of traffic on the existing roads which will have a positive effect since it will reduce emissions into the
water and the likelihood of accidents.
Construction of new parking spaces would increase the potential negative impact on the water. The
construction phase includes ground clearing (removal of natural cover), which increases the
vulnerability of groundwater or aquifer, and the possibility of contamination, whether accidental or
exceptional, becomes larger. At the locations where previously there was no emissions to water caused

Sisak Urban Transport – Sustainable Urban Mobility Planning – FINAL REPORT 113
by the traffic, they now exist. Depending on the position of the new roads in relation to surface water
bodies or water protection zones, the impact can be stronger or weaker.
The construction of bridges can lead to negative impacts on surface water and groundwater as well as
on hydro-morphological characteristics of the river, both during construction and during its use,
therefore detailed analysis of the optimal location and the feasibility of the construction is required.
Since the wider area of Sisak is located in the high, medium or low flood risk area, in order to avoid
negative impacts special attention should be given to potential risks of pollution and damage to the
infrastructure itself caused by flooding during construction and afterwards during use.
Although there are no sanitary protection zones of drinking waters in the City of Sisak established by
decisions on the sanitary protection zones which are used for public water supply, during project
planning, the area of the water spring on the Kupa River north of New Pračnog should be taken into
the consideration.
6.1.4 Biodiversity
Area of Sisak is dominated by anthropogenic habitats – agricultural surfaces and urban centre areas.
Through the centre of Sisak flows Kupa River, while Odra River and Sava River surround the city.
Various aquatic habitats are located along those rivers, e.g. wetlands and floodplains which are
inhabited by many animal and plant species. A lot of these species are rare and endangered.
Besides the disappearance and fragmentation of habitats caused by urbanization, expansion of cities
and invasive species, other problems concerning biodiversity in the area of Sisak include pollution of
habitats due to industrial production, spreading of chestnut bark cancer in sweet chestnut forests and
draining of wetlands for agricultural purposes.
Development of public transport and construction of sidewalks and cycling routes encourage citizens
to use alternative means of transportation thus, in the long term, reducing the pollution of habitats.
Road transport occupies, fragments and indirectly pollutes habitats by increasing the traffic load. Given
the fact that new routes will be built on widespread habitats already under anthropogenic influence,
significant negative impacts on biodiversity are not expected. Crossings of roads over the rivers should
be implemented in a way that rare and endangered riparian habitat types are impacted as little as
possible.
By the implementation of urban logistics system and traffic safety, negative impacts on biodiversity
are not expected.

Sisak Urban Transport – Sustainable Urban Mobility Planning – FINAL REPORT 114
6.1.5 Cultural heritage
The long urban history of Sisak and rich rural traditions of its surroundings created the actual identity
of the city and resulted in a large number of protected cultural monuments. In the area of the city Sisak
numerous protected cultural properties have been included in the State Register of Croatian Cultural
Assets as immovable cultural goods-individual and immovable cultural property- cultural and historical
complex. The industrial heritage of the city is represented by twenty three facilities divided into
following categories: complex within the protected cultural and historical entity of Sisak, individual
buildings within the protected cultural and historical entity of Sisak, individual protected cultural
objects and registered industrial heritage buildings/complexes. Overall, the Register contains 51
cultural heritage sites in Sisak, of which 49 protected and 5 preventively protected.
In addition to cultural assets registered in the State Register of Cultural Assets, cultural and historical
values are protected by Regional Plan of the City of Sisak, which recorded 153 sites/objects of cultural
heritage.
Impacts on cultural-historic heritage may occur during the construction works on planned roads
included in all variants. These impacts may occur especially in central part of Sisak because of
numerous cultural goods (for example numerous civil buildings in Rimska ulica) and also because Sisak
is defined as an inner zone of archaeological protection within Master plan (GUP). Considering the
density of cultural goods, is possible distortion of spatial and visual integrity of architectural heritage,
as well as damage to the archaeological sites in inner zone of archaeological protection. It is therefore
necessary during planning of interventions that are located near the cultural-historic heritage to obtain
the conditions from Ministry of Culture, Conservation Department in Sisak to ensure the protection
of the integrity of cultural property.
Besides that, considering historical continuity of settlement and use of these areas, there is a possibility
of discovering archaeological findings out of zone of archaeological protection, therefor archaeological
survey of the terrain and defining of eventual problematic spots is needed for applying specific
protection measures. During bigger construction works archaeological survey is mandatory. Projects
like construction of main roads and highways, and construction of logistics distribution centre require
environmental impacts assessment. Therefor detailed analysis of impacts on cultural heritage will be
conducted and based on that, adequate protection measures can be defined.
Interventions such as the planned construction of new parking lots, terminals for car sharing, "block
parking" zone in the pedestrian zone, the two "Park and Ride" parking lots, reconstruction and
construction of the local stations, construction of underpasses below the railway station and

Sisak Urban Transport – Sustainable Urban Mobility Planning – FINAL REPORT 115
roundabout should not have a significant negative impact on cultural heritage, unless the Conservation
Department in Sisak is included during planning and execution of construction works in the vicinity of
cultural goods, or conservation conditions for their protection are determined.
6.1.6 Soil and agriculture
In the wider area of Sisak most common pedosystematic units are marsh gley vertic soil, alluvial soil
(fluvisol, defended from flood), pseudogley on plain and pseudogley on slope. In addition to these soil
types, at the level of the dominant units to a lesser extent occur marsh gleys partially hydromeliorated
soil and pseudogley soil partly hydromeliorated. Present pedosystematic units belong to the
hydromorphic soils characterized by occasionally excessive wetting by superfluous underground
water, flood or stagnant rainwater. In the nearby area of the rivers Sava and Kupa, on unconsolidated
Holocene flood sediments composed of silt and sand, occur alluvial soils and fluvisol. On the surface
composed of Pleistocene loess sediments and alluvial terraces composed of sands, gravels, clays,
conglomerates and sandstones of Pliocene age, occur pseudogley soil on plain, pseudogley on slope
and partially hydromeliorated pseudogley.
According to the analysis and the inventory of the area given by the Spatial Plan of the City of Sisak
and the Spatial Plan of the City of Petrinja, it was found that main land categories in the subject area
are P2 (valuable arable land) and P3 (other arable land) and to a very small extent category P1
(particularly valuable arable land).
According to the data from ARKOD and in addition to the building areas, the wider area of Sisak (area
under General Urban Plan with surroundings) is under intensive agricultural use, of which most of
belongs to arable land and less to meadows.
One of the biggest problems is the lack of systematic monitoring of soil condition in the city. Sporadic
analysis of contamination, carried out at the sites of accidents in the industrial areas of the city and at
the location of traffic accidents indicates increased concentrations of heavy metals and other chemical
compounds that are not characteristic to the soils.
Fragmentation of agricultural land in this area prevents significant agricultural production.
The implementation of some of the measures of the plan, like construction of the planned roads, may
cause the permanent loss of the soil, changes in land use, permanent loss of agricultural land and its
fragmentation.
If it won’t be otherwise defined by further project documentation, a temporary loss of soil in the areas

Sisak Urban Transport – Sustainable Urban Mobility Planning – FINAL REPORT 116
used for disposal of excavated soil material during construction works for roads, bike and pedestrian
traffic can occur as well.
Degradation of soils in the working area (or disrupting their production capabilities, structural
characteristics and the consequent reduction or loss of their functions) during construction works on
the planned roads and supporting infrastructure area, can also occur.
In addition to the direct impact on the soil and vegetative cover (among other on the nearby crops),
inappropriate handling of various tools used in the construction (paints, solvents, fuels, lubricants, etc.)
can result in their infiltration into the soil and underground water. The likelihood of this negative
impact in the project area can be reduced by proper storage of waste and building materials, regular
maintenance and servicing of machines, banning the storage of fuel and lubricants in the construction
site and filling fuel at gas stations or by special vehicle from which oil can be refuelled into working
machines at the location of impermeable plateau with oil and grease separator.
Since the area of Sisak considered by this Plan is mainly the area where the soil has lost its function
(urban land) and to a smaller degree of gardens, fields and parks without the implementation of this
plan, the current state of soils in this area would remain similar to the present situation. This means
the continuation of all negative processes and impacts on ground that are now taking place such as
soil contamination by suspended particulate matter, heavy metals and other chemical products
produced during the transport, the possibility of accidents and contamination of soil.
6.1.7 Landscape
According to landscape regionalization of Croatia based on natural features (Bralic I, 1995), the wider
area of Sisak is located in the southwestern part of the landscape unit Lowland areas of northern
Croatia. This landscape unit is characterized by agrarian landscape complexes with oak forests and
floodplains. The main spatial and landscape complexity and excitement of this area consists of fluvial-
wetland environments such as Lonja ad Odra fields. The southern area of Sisak belongs to the
landscape unit Pannonian mountains characterized by an isolated wooded mountain ranges, the
diversity of forest types, preserved stream valleys and agricultural landscape. Considering the
geomorphological and natural features, land use, spatial organization, patterns of the landscape and
the typology of the village, the wider area of Sisak belongs to lowland urban-rural general type of
landscape (town of Sisak with surrounding agricultural areas and smaller settlements) surrounded by
natural landscape lowland fluvial area. The urban green spaces of Sisak represent natural green
corridors that connect protected areas and Natura 2000 areas in one unique green infrastructure
which is a base for tourism, sports and recreational activities linked in the bicycle and pedestrian

Sisak Urban Transport – Sustainable Urban Mobility Planning – FINAL REPORT 117
corridors.
The main problem in the area, that is relevant to the landscape, is the violation of the integrity and
authenticity of landscapes mainly by construction. This problem is particularly noticeable in the region
of Sisak and its surroundings and the natural landscapes along the river banks and forest edges. As
stated in the spatial plan of Sisak-Moslavina County, new settlements are in conflict with the tradition
and the architectural expression is incomplete. By the expansion of the intensive agricultural
production and existing and planned infrastructure routes, highly valuable wetlands of Lonja and Odra
fields are endangered and so are the forest areas and edges cut. Degradation of the landscape in the
terms of changes in landscape character, reduction of landscape diversity and its ecological functions
are especially visible in the southern area of the city where there are anthropogenic structures such as
refineries, landfills and steel plants.
Undesirable impact of the construction of planned projects on the landscape is reflected in changes of
the physical structure of landscape (land cover and/or morphology of the terrain) and consequently in
the changes of the appearance and perception of areas. The significance of these impacts vary
depending on the characteristics of the very procedure, the character, visual and environmental values
of landscape areas where interventions are foreseen, as well as the visual exposure of the planned
locations. Interventions such as the construction of state roads and the construction of logistical
distribution canter are subject to the procedure of environmental impact assessment. Therefore, a
detailed analysis of the impacts on the landscape, through the EIA procedure at the project level, must
be carried out, so the adequate measures can be recommended. Given that the impact of planned
projects are considered on the strategic level, it can be concluded that projects will not cause adverse
impacts on the landscape that could not be mitigated by the application of measures on the project
level. Therefore the planned projects can be considered as acceptable. In addition, for certain cases,
such as the construction and modernization of cycling and hiking trails, widening of pedestrian zones
adapted for citizens by landscaping, furnishing with the urban equipment, adaptation of the
infrastructure for people with disabilities, the landscape’s residential values in the relation to the
current situation will improve.
6.1.8 Forestry and Hunting
In the area covered by this Plan there are smaller areas mainly of lowland forests of willow, poplar,
ash, oak and several cultures of Euro-American poplar. These forests are located at the edge or in the
floodplain of the Sava River. Most of these forests is owned by the state and governed by Hrvatske
šume (Croatian Forests Ltd) (parts of the management units Brezovica, Kotar - Stari Gaj, Letovanički

Sisak Urban Transport – Sustainable Urban Mobility Planning – FINAL REPORT 118
lug and Petrinjski lug - Piškornjač). Forests in the inundation of the Sava river basin are managed by
Hrvatske vode (Croatian waters Ltd.). Most of these forests are for commercial purposes with a
reduced intensity of management.
In the inner city area of Sisak there is no hunting area. Therefore, most of the area covered by this Plan
is not defined as hunting area. This area is surrounded by three state hunting units (Belčićev gaj,
Brezovica and Šašna greda) and four county hunting units (Golo brdo, Ogransko polje, Petrinja i
Piškornjač). The peripheral parts of these hunting units that surround the city of Sisak make the edges
of the city and suburbs. These parts are almost completely non-hunting and hunting unproductive
areas in which occasionally enters small game (rabbit) and birds (pheasant).
Since this is the area of small forest enclaves, the biggest problem is access to forests for the purpose
of management and the pressure of the local population by illegal felling and disposal of waste.
Since these are peripheral parts of hunting grounds that are densely populated and where the traffic
is intense, sometimes during the migration of wild animals they get killed.
The forests in this area are independent enclaves located at the borders of the city and in the floodplain
of the Sava River and are not significantly burdened by traffic. The main transport corridors do not pass
through these forests, so the impact of traffic is negligible. In the case of not implementing this Plan,
the situation would not change significantly.
Parts of hunting grounds that are marginally covered by the area of the Plan are mainly non-hunting
and hunting unproductive areas and the impacts of traffic in those parts of the hunting grounds and
game and hunting management are relatively small. In the case of not implementing this Plan, the
situation would not change significantly.
6.1.9 Waste management
County Assembly of Sisak-Moslavina County adopted in 2005 the Waste Management Plan of Sisak-
Moslavina County for the period 2005-2013 (Official Gazette of Sisak-Moslavina County 14/05 and
2/06). The City Council of Sisak in March 2010 adopted the Waste Management Plan of the City of Sisak
for the period 2008-2015 (Official Gazette of the City of Sisak 3/10).
Based on the review procedures and identified facts, taking into account the objectives of audit, the
National Audit Office finds that waste management in Sisak-Moslavina County and local governments
of Sisak-Moslavina County is not effective enough. Namely, it is necessary to plan the construction of
recycling yards for municipal and construction waste as priority infrastructure projects.

Sisak Urban Transport – Sustainable Urban Mobility Planning – FINAL REPORT 119
During the construction phase, different types of waste such as construction waste are created, and to
a lesser extent municipal waste, packaging waste and hazardous waste from maintenance of
machinery and vehicles (used lubricating oils, grease, oil, etc.). If all generated waste is disposed of in
a proper manner and in the appropriate containers for different types of waste at the predetermined
surfaces that prevent the spill and spreading of waste material into the surrounding soil and water,
negative impact of produced waste is not expected. For all types of the created waste the operator
should keep the records and waste should be delivered only to the authorized collectors.
6.2 Main Assessment of the Plan for the ecological network
The aim of the Main Assessment of the Plan for the ecological network is to determine the probability
that the Plan (alone or in combination with other plans or projects) will have an impact on the target
species and habitats as well as on the integrity of the ecological network. Therefore, to assess the
impact of the Plan on the integrity of the ecological network, main features of the ecological network
in the area of Sisak and key environmental conditions and habitat features that are necessary to
preserve the integrity were considered. By analysing the characteristics of the ecological network and
the analysis of potential impacts of the plan objectives, planned activities and assessment of their
significance, the Main Assessment has identified and assessed the elements of the Plan that could have
a significant impact on the conservation objectives and integrity of the ecological network.
Several planned roads and bridges pass through the areas of ecological network, most of them over
the areas HR200642 Kupa, HR20000416 Lonjsko polje than over HR2001311 Sava nizvodno od Hrušćice
and HR1000004 Donja Posavina. Existing impacts in these areas include pollution from transport (cars
and trucks, public transport), noise, vibration and fragmentation of habitats.
Due to recognized character and assumed area of influence, it can be assumed that for all planned
operations possible negative impacts can be reduced or completely removed on the level of each
project. For some of the planned projects it will be necessary to carry out impact assessment for the
ecological network. But it is estimated that there is a small risk of significant negative impacts for which
it would be impossible to carry out the objectives of the Plan.
6.3 Environmental protection measures
Environmental protection measures and measures of mitigation of negative impacts on conservation

Sisak Urban Transport – Sustainable Urban Mobility Planning – FINAL REPORT 120
objectives and integrity of the ecological network were proposed based on the analysis of current state
and assessment of possible impacts of the objectives and measures defined in the Plan.
Recommendation at project level are proposed as well: (1) guidelines for project design and
development (2) recommendation for further research and/or analysis of the impacts through
Environmental Impact Assessment procedure in order to define all problematic points and to
implement specific environmental measures to mitigate impacts to negligible levels.
Table 38. Environmental protection measures at Plan’s level
Potential impacts on the environment Proposed measures to mitigate environmental impacts
AIR QUALITY
• Urban public transport • The concept of pedestrian and bicycle traffic in the
Transport policy of Sisak
• During the preparation of project documentation for the construction of parking lots include the measures for the retention of existing trees as much as possible and implement further greening of the area.
WATER QUALITY
• Construction of roads and parking spaces
• Avoid construction works in the area of the water spring. Within water protection zones carry out planned activities strictly in accordance with the regulations on water protection.
• Develop an appropriate system of collection and treatment of rainwater.
BIODIVERSITY
• Bridge construction • Construction of the roads of major importance
• During the designing phase of the construction of bridge over Sava near Kratečko or Lukavac Posavski, rare and endangered habitats which are situated in the area should be considered. Construction should be planned in a way that they are affected as little as possible.
• The planned routes pass over rivers Kupa and Sava. Therefore, the impact on rivers, endangered habitat types and riparian vegetation in that area should be kept at minimum. A more detailed analysis of cumulative impacts of these projects should be carried out through environment impact assessment procedure.
LANDSCAPE
• Construction of pedestrian zones • Widening of pedestrian zones and introduction of urban
equipment (benches, greenery, flower beds, bicycle racks, trash bins and street lighting)
• Selection of urban equipment and materials should be adjusted to the urban context.
• Native plant species and ornamental plants that are appropriate to the climate should be used in newly planned green areas and flower beds.
• Development of pedestrian and cycling routes • After completion of the construction work, it is
required to restore the disturbed area to its original conditions wherever it is possible.
• Urban public transport • Construction of „Park and Ride“ parking lot
Construction of terminal for car sharing
• Develop landscape design project with the solutions for the rehabilitation of areas affected by the construction works and for maximum visual integration of projects in the surrounding area.
• Proposal of a comprehensive parking management policy „bloc parking“, Construction of „Park and Ride“ parking lot in Kralja
Zvonimira street zone, Construction of second „Park and Ride“ parking lot
between I. Fistrović street, Nikola Tesla street and railroad

Sisak Urban Transport – Sustainable Urban Mobility Planning – FINAL REPORT 121
Potential impacts on the environment Proposed measures to mitigate environmental impacts
• Changes in regulation and organization of traffic directions Joint to Vrbina (tunnel or lowering of exiting road
level beneath the bridge) or construction of roads at the western periphery of the Perivoj Vladimira Nazora
CULTURAL HERITAGE
• Urban public transport (construction of planned parking lots, construction of car sharing terminal, reconstruction and construction of local public transport stops)
• Construction of pedestrian zones (construction of underpasses below the railway station and roundabout)
• Construction and modernization of bicycle routes (construction of terminals for change of transport mods)
• Proposal of a comprehensive parking management policy (construction of „bloc parking“ in pedestrian zone , construction of two „Park and Ride“ parking lots)
• When planning projects that are located near cultural properties it is necessary to obtain the conservational conditions to ensure the visual integrity of the architectural complex.
• Changes in regulation and organization of public transport routes (construction of tunnel, lowering existing road level below the bridge)
• Bridges for road traffic (construction of new bridge over Kupa river in city center, construction of bridge over Sava in Kratečko or in Lukavac Posavski)
• Before the construction works, archaeological survey of the terrain is needed for definition of possible problem areas and the implementation of specific protective measures to mitigate the impacts to cultural heritage to negligible level.
Changes in the regulation and organization of traffic flow (construction of roads at the western periphery of the Perivoj Vladimira Nazora)
• During planning of interventions that are located near the cultural-historic heritage to obtain the conditions from Ministry of Culture, Conservation Department in Sisak to ensure the protection of the integrity of cultural property.
Table 39. Environmental mitigation measures for Ecological Network
Code and the name of the area
Projects that can have a negative impact on Ecological
Network Proposed measures to mitigate negative impacts
HR1000004 Donja Posavina
- new road route D36 to Novo Selo -D36 to V. Svinjičko and Gušće
1. On the project level ensure measures to mitigate negative impacts of road construction on target bird species
HR2000642 Kupa - new bridge over Kupa River in the city centre (parallel to train bridge)
2. On the project level plan new road infrastructure in a way to minimize impacts on river habitats and habitats along the river, and prescribe protection measures as a part of the EIA process.
3. In the design phase of the bridge (before producing EIA study) it is necessary to plan research of target species to avoid negative impacts and mitigation measures prescribed
HR2000416 Lonjsko polje
- D36 to V. Svinjičko and Gušće - Bridge at Kratečko
4. In the design phase of the bridge (before producing EIA study) it is necessary to plan research of target species in order to avoid negative impacts and prescribe mitigation measures
HR2001311 Sava nizvodno od Hrušćice
- new road bridge over Sava River at Kratečko or at Lukavac Posavski - new road route D36 to Novo Selo
5. Plan new road infrastructure in a way to minimize the impact on river habitats and habitats along the river, and prescribe protection measures as a part of the EIA process.
6. In the design phase of the bridge (before producing EIA study) it is necessary to plan research of target species in order to avoid negative impacts and prescribe mitigation measures

Sisak Urban Transport – Sustainable Urban Mobility Planning – FINAL REPORT 122
Table 40. Recommendations to be taken into account during development of further design documentation
Potential impacts on the environment Proposed measures to mitigate environmental impacts
AIR QUALITY
• Urban public transport • The concept of pedestrian and bicycle traffic in the
Transport policy of Sisak
• During construction phase, implement the measures to reduce emissions of air pollutants (covering the trucks carrying bulk cargo, regular control of the vehicle, water sprinkling of work surfaces in the extremely dry conditions, the suspension of work in the event of strong winds, ...)..
• Bridge construction • Construction of the roads of major importance
• On the project level, carry out an analysis of the impact of emissions of air pollutants from vehicles on the air quality in the nearby area of the bridge, or access roads and, if necessary, propose appropriate mitigation measures.
NOISE
• Construction of the bridges • Construction of the roads of major importance
• On the project level, carry out an analysis of the noise emissions and possible cumulative impacts and, if needed, propose appropriate mitigation measures to reduce noise emissions at source and noise protection measures during construction and the use of the roads.
WATER QUALITY
• Conversion of the station Kolodvor into a separate terminal.
• Renovation of bus stations
• During the station reconstruction design a system of sanitary and sewerage facilities in accordance to current regulations
• Bridge construction • Construction of the roads of major importance
• In case of flooding stop the all the activities, securing the construction site and heavy equipment from possible accidental situations.
• Construction activities can be continued only after the water completely retreats from the site.
SOIL
• Construction of the roads of major importance
• During construction, separately store waste and building materials on impermeable surfaces to prevent their infiltration into the soil and groundwater
• Regular maintenance and service the machines, • Ban the storage of fuel and lubricants at the
construction site and fill the fuel at gas stations or by special vehicle with refuling into working machines at the location of impermeable plateau with oil and grease separator.
LANDSCAPE
• Bridges for road traffic - construction of new bridge over Kupa in city center, - construction of bridge over Sava in Kratečko or in Lukavac Posavski
• Construction of the roads of major importance D36 + new Odra bridge (I. Phase); D36 + joint to the A11 highway (II. Phase); D36 to Novo Selo Palanječko (III. Phase); D36 form V. Svinjičko to Gušće
• The basic characteristics of urban logistics - construction of logistical distributive center of Sisak
• On project level, a detailed analysis of the impacts on the landscape must be carried out, so that the adequate measures can be prescribed.
• Within Main design, develop landscape design project with the solutions for the rehabilitation of areas affected by the construction works and for maximum visual integration of projects in the surrounding area.
• Traffic safety construction of educational pedestrian-cycling
• After completion of the construction work, it is required to restore the disturbed area to its original conditions wherever it is possible.
CULTURAL HERITAGE
• Bridges for road traffic - construction of new bridge over Kupa in city center, - construction of bridge over Sava in Kratečko or in Lukavac Posavski
• Construction of the roads of major importance
• On project level, a detailed analysis of the impacts on cultural heritage must be carried out, based on which the possible impacts on cultural heritage will be defined and adequate mitigation measures will be prescribed

Sisak Urban Transport – Sustainable Urban Mobility Planning – FINAL REPORT 123
Potential impacts on the environment Proposed measures to mitigate environmental impacts
D36 + new Odra bridge (I. Phase); D36 + joint to the A11 highway (II. Phase); D36 to Novo Selo Palanječko (III. Phase); D36 form V. Svinjičko to Gušće
• The basic characteristics of urban logistics - construction of logistical distributive center of Sisak
• Considering historical continuity of settlement and use of these areas, there is a possibility of discovering archaeological findings out of zone of archaeological protection, therefor archaeological survey of the terrain and defining of eventual problematic spots is needed for applying specific protection measures.
During major construction works, archaeological survey is mandatory.
6.4 Proposal of the environmental monitoring program
This strategic study does not propose the establishment of new environmental monitoring program
besides those that are already established on the national, county and local level and whose results
are part of the Environmental Protection Information System that is govern by Croatian Agency for
Environment and Nature. These results are as well, part of the Environmental state report for specific
area.
Furthermore, in the Republic of Croatia, mechanisms for environmental monitoring program are
established through the procedure of environmental impact assessment and water rights permits for
specified projects.
6.5 A short overview of Plan variants, evaluation, and difficulties in the data
collection process
As a part of the consideration of future road transport development (Measure -Changes in the
regulation and organization of traffic flow) the Plan considered three alternative solutions.
After the establishment of one-way traffic in the street Rimska ulica, in the continuation of the street
Rimska ulica or on the square Trg bana Jelačića, it is necessary to enable the connection to the
settlement of Vrbina and through the settlement to provide access to the street Ulica kralja Tomislava
to future new bridge.
The realization of this connection was proposed through next alternatives:
Underground tunnel beneath Park;
Lowering of the vertical alignment of the existing road under the old bridge to allow the

Sisak Urban Transport – Sustainable Urban Mobility Planning – FINAL REPORT 124
passage of buses under the old bridge;
In a case of objective constraints in the implementation of this connection to the settlement
of Vrbina, alternative solution can be sought in the re-regulation of streets Ulica Dr. Ante
Starčevića, F. Lovrić and I. K. Sakcinskog in the zone of the Gymnasium and square Trg dr.
Tuđmana.
According to the results of the analysis of the environmental impacts of these alternatives, as the most
suitable solution, a third variant was proposed.
In addition to considering the alternatives proposed by the Plan itself, strategic study analyses an
alternative without the implementation of the Plan as well.
Based on the analysis, positive effects of implementing the Sustainable urban mobility plan of Sisak on
the environment are estimated, including improving the quality of air, water, soil and the status of
biological and landscape diversity, in relation to the alternative "without the implementation of the
Plan". Therefore, the implementation of the planned measures together with the environmental
protection measures and measures of mitigation of negative impacts on the ecological network, the
Plan is considered the most acceptable alternative solution.

Sisak Urban Transport – Sustainable Urban Mobility Planning – FINAL REPORT 125
7 MEANS OF FINANCING
This financial forecast has been prepared from publically available information and other sources and
the information contained here is accurate to the best of our knowledge. Since the information has
been collected from multiple sources prepared by different public and private research organisations
and according to different methodologies, some data sets may not be fully consistent with one
another. Further, this financial forecast has been prepared based on a number of operating/financial
assumptions from various sources that were assumed to be reliable by Deloitte However, Deloitte is
not responsible for, and Deloitte provides no assurance regarding, the accuracy of any such
information.
This financial forecast includes certain statements, estimates, assumptions and projections with
respect to the anticipated future performance of the City of Sisak as well as future performance of the
Croatian economy. Such statements, estimates, assumptions and projections reflect best estimates
made by various studies and by others concerning forecast results. Actual results generally differ from
forecast results and these differences can be material. Accordingly, such statements, estimates and
projections may not actually be realised (whether materially or otherwise), and no representations are
made by any party as to their accuracy, completeness or achievability.
7.1 Overview
Croatia has three tiers of government: local, regional and national (or central). Municipalities, towns
and cities represent the local level of government and counties represent the regional level of
government. The national or central government represents the highest and financially most powerful
level of government supporting the lower levels of government via the transfer of funds (“equalisation
grants”).
The territory of the Republic of Croatia at the local level is comprised of 429 municipalities and 126
cities/towns while at the regional level it is comprised of 20 counties and the City of Zagreb. In total,
there are 576 sub-national units of government. The City of Sisak is the 11th largest city in Croatia and
is the seat of the Sisak-Moslavina county. In 2011, the City of Sisak itself had a population of 47,768
(with 172,439 inhabitants in the county of Sisak-Moslavina making it the 10th largest county in
Croatia).

Sisak Urban Transport – Sustainable Urban Mobility Planning – FINAL REPORT 126
7.2 Administration
In Croatia, there exists a division of responsibility among different government levels. However, it
should be noted that there is overlap between these functions between for example the national and
local governments. These divisions of responsibility of the different levels of government are based on
provisions of the Law on Local and Regional Self-Government Units as well as other laws like the Law
of Primary Education, Law on Secondary Education, Law on Social Welfare, Law on Health Insurance
etc.
As a city, Sisak decides independently on a number of activities related to satisfying citizens’ needs
other than those delegated to government bodies, such as: the adoption of physical plans (e.g. urban
development plans); the organisation of: drinking water supply and wastewater management, the
collection and disposal of municipal waste, public transport, markets, cemetery maintenance,
chimney-sweeping, public lighting and other utilities; and the establishment of kindergartens, primary
schools, fire service organisations, etc.
7.3 Decentralisation
Decentralisation is a process in which selected functions of government are assigned to subnational
units and fiscal decentralisation is the assignment of revenue sources and expenditure functions to the
sub-national levels of government. It is generally accepted that higher levels of decentralisation with
respect to administrative power and responsibilities thereof results in: a strengthening of local
governance; an increase in local development; and a general increase in public sector efficiency.
In July 2001, Croatia launched a partial decentralisation of its public functions. The decentralisation
reforms have been directed in two areas:
Delegation of administrative and professional tasks from the national government (ministries)
to local and regional government units;
Fiscal decentralisation where a part of financing public needs was transferred from the
national government budget to regional and local government budgets.
Further decentralisation in Croatia is expected in the future in Croatia. However, it should be noted
that between 2013 to 30 June 2016, no further fiscal decentralisation had occurred impacting the City
of Sisak’s budget. Notwithstanding decentralisation, equalisation grants for decentralised functions

Sisak Urban Transport – Sustainable Urban Mobility Planning – FINAL REPORT 127
are ensured from the national budget to cover public expenses in the area of primary and secondary
education, social welfare and health care. Equalisation grants are transferred to local and regional
government units in the case they do not have sufficient revenues from the additional share of income
tax for the financing of decentralised functions.
The City of Sisak’s budget users are institutions established by the City, which are largely financed from
the budget. There are 17 users of the City budget (2 child care centres, 9 primary schools, 1 library, 1
museum, 1 gallery, 1 cultural centre, 1 sports centre and the fire brigade).
7.4 Budget
The budget consists of two parts:
Revenue and expenditure account which itself consists of two sub-parts:
o Revenues and expenditures from/for operations;
o Revenues and expenditures from/for the sale or acquisition of non-financial assets;
Financing account i.e. receipts from financial assets & borrowing and outlays for financial
assets and loan repayment.
The terms revenues and expenditures are used in the revenue and expenditure account when it comes
to business operations and the purchase and sale of non-financial assets. The terms receipts and
outlays are used in the financing account and relate to financial assets and the granting, taking out and
repayment of loans.
Level 22 financial statements of the City of Sisak (general or non-earmarked funds) are used in the
financial forecast of the City as they reflect funds that the City has the most discretion to spend. Level
23 or consolidated financials include non-general/earmarked funds that are earmarked by law and set
aside for specific purposes. Any surplus potentially generated and not earmarked (level 22) only can
be used to potentially repay loans taken to fund SUMP.
7.5 SUMP overview
Per discussions with the City of Sisak, it was confirmed that scenario 3 was chosen for the SUMP
project. Scenario 3 entails a thorough and more complete overhaul of Sisak’s traffic infrastructure than
that envisaged under scenario’s 1 and 2. Accordingly, scenario 3 involves the highest capex of the three

Sisak Urban Transport – Sustainable Urban Mobility Planning – FINAL REPORT 128
scenarios i.e. a total of HRK 631.2 million to be invested in the period 2017 to 2030. It should be noted
that while the total capex under scenario 3 is HRK 631.2 million, due to participation by other entities
(e.g. stakeholders like HC, MUP and others), the total share to be invested by the City of Sisak is
assumed to be only 29,7 % or HRK 187,6 million. The City of Sisak’s share of total capex is based on
the estimate by the Faculty (FPZ) of each stakeholder’s estimated share in the total cost of this SUMP
project.
7.6 Overview of key assumptions & financial forecast
In order to assess the financial capacity of the City of Sisak to undertake capital expenditures relating
to SUMP, a financial forecast (level 22) was prepared for the years 2016 to 2030. Items forecast
included: the revenue and expenditure account (which includes capex); various balance sheet items;
and cash flow. It should be remembered that in addition to capex related to SUMP, that other “non-
SUMP” (or “ordinary”) capex is included in the forecast relating to the addition or renewal of the City’s
stock of fixed assets.
There are a number of risks to the financial forecast. Some of these prominently include: relapse into
economic recession in Croatia; alteration to tax rates hence impacting City of Sisak’s revenues; further
decentralisation of functions without potential compensation from equalisation grants and/or ability
to raise revenue locally etc.
Notwithstanding the many real risks that could significantly impact the City of Sisak’s budget, a
financial forecast to the year 2030 was prepared based on the following main principles and
assumptions:
Economic forecast: Forecast economic parameters largely drive the financial model. This
economic forecast was obtained from the Economist Intelligence Unit - Croatia country
forecast June 2016. Forecast by the Economist is to the year 2020 which was extended to 2030
by assuming a mostly steady state between 2020 and 2030. Following the period of economic
recession/stagnation in Croatia between the end of 2008 and 2015, real GDP had declined by
a cumulative total of 12%. However, from 2015, Croatia has experienced economic recovery
which to the date of most recent economic statistics, has been sustained:
o Real GDP growth is forecast to accelerate and reach 1.9% per annum in 2020 which is
assumed to continue to 2030;
o Inflation is forecast to accelerate to 1.8% in 2020 and assumed to accelerate further

Sisak Urban Transport – Sustainable Urban Mobility Planning – FINAL REPORT 129
to 2.0% per annum in 2021 and thereafter stay constant to 2030 (note: ECB’s stated
inflation target is 2.0% per annum);
o Resulting nominal GDP growth forecast is 3.7% per annum in 2020 which is assumed
to continue to 2030;
o Average real wages is forecast to increase to 1.1% per annum (nominal 3.1% per
annum);
o Annex 13 shows an overview of the economic forecast & assumptions to 2030;
Revenue and expenditure account: The revenue and expenditure (“R&E”) account is largely
driven by the various economic parameters forecast per point 1. Specifically, the main
assumptions underlying the R&E account are:
o Tax revenues (actually net tax revenues adjusted for refunds) are forecast to increase
by the forecast nominal wages growth per annum. Tax rates including tax surcharge
currently levied at 10% are assumed to remain the same as we are not aware of any
changes in tax policies;
o Assistance from abroad and from subjects within the general budget; revenue from
assets; revenue from sale of products and goods, services rendered and revenue from
donations are assumed to increase by the forecast rate of growth in nominal GDP.
Further, additional grants are assumed to be obtained from the EU of HRK 7,5 million
per annum from 2017 which is increased by the forecast rate of growth in nominal
GDP;
o Revenue from management and administrative fees, fees based on specific
regulations and fees; penalties, administrative measures and other revenues are
forecast to increase by the forecast inflation rate per annum;
o Employee expenses are forecast and assumed to increase by the average expense per
employee multiplied by the total number of employees. The average expense per
employee is forecast to increase per the forecast and assumption in increase in
nominal wages. Currently, there are 129 employees of which, 109 are permanent
employees while 20 employees are on temporary contracts pending completion of
work related to legalisation of real estate properties assumed to be completed by the
end of 2020. Accordingly, from 2021 to 2030, only 109 employees are assumed to
remain in employment;
o Material expenses are forecast to be at 30.7% (average of 2014 and 2015) of operating
revenue through to 2030;
o Financial expense which mainly reflects the interest expense on loans, have been
calculated per the loan interest schedule of payments on loans currently held by the

Sisak Urban Transport – Sustainable Urban Mobility Planning – FINAL REPORT 130
City of Sisak (level 22). In addition, new loans totalling HRK 43 million have been
assumed to be taken by the City of Sisak from 2022 to 2030 to assist in financing capex
– the assumed interest rate of these loans is 4.50% with loan terms of 15 years and
loan instalments payable quarterly;
o Subsidies; and grants abroad and within the general budget are forecast to increase
by the nominal growth in GDP;
o Payments to citizens and households based on insurance and other fees; and other
expenses have been forecast to increase by the forecast inflation rate;
o Revenue from the sale of non-financial assets is forecast to be HRK 1.7 million in 2016
following the sale of housing units and then increase between 2017 and 2030 by the
forecast rate of inflation;
o Capex not related to SUMP (or “ordinary” capex) is assumed at a relatively steady state
of HRK 16.2 million per annum between 2018 and 2030. In 2016, capex of HRK 51.6
million and HRK 31,0 million in 2017 is assumed which is mainly financed by HBOR loan
proceeds (total of HRK 50 million). Note: the average capex per annum between 2013
and 2015 was HRK 18.4 million. No increase to allow for inflation was applied to this
“ordinary” capex during the forecast period;
o Capex related to SUMP (scenario 3) is estimated at HRK 631.2 million – this amount is
to be invested between the years 2017 and 2030.
o Of this, the City of Sisak will participate and invest HRK 187.607.333 (or 29,7 % of the
total). This amount to be invested by the City of Sisak per se is per the guideline
provided by the Faculty;
o Capex by the City of Sisak to be directed to three main asset categories: project
documentation HRK 17,2 million (9 % of capex); building/infrastructure works HRK
167,9 million (89% of capex); and plant & equipment HRK 2.5 million (1% of capex);
o The timing of the capex by the City of Sisak is approximately HRK 5,2 million per annum
in the years 2017 to 2019; and HRK 15,7 million per annum for the period 2020 - 2030;
o Overall, due to strongly increased capex mainly due to SUMP, the R&E account swings
from a position of being HRK 2.7 million in surplus in the year 2015 to either shortfalls
or minor surpluses in the years between 2016 and 2025. In 2026, the R&E account is
forecast to have a surplus of HRK 2,3 million and increase thereafter to 2030;
o Annex 14 shows an overview of the historical and forecast of the R&E account;
Balance sheet account: A number of line items were forecast as they impact the cash position
of the City of Sisak. Some of the more notable line items included:
o Deposits and guarantee deposits and receivables from employees and for overpaid

Sisak Urban Transport – Sustainable Urban Mobility Planning – FINAL REPORT 131
taxes and other. This was forecast by calculating in days, this line item divided by the
operating revenue 2015 and multiplying by 365 days. Day’s collection was 19 days in
2015 (13 days in 2013 and 12 days in 2014). We used 19 days as the collection period
throughout the period 2016 to 2030;
o Receivables for loans of HRK 7.2 million as at end of 2015 mainly to Sisački Vodovod
and Autopromet Sisak which are not likely to be repaid. Per advice from the City of
Sisak, there will likely be a debt/equity swap during 2017 with result of this line item
becoming zero while shares & equity held by City of Sisak increasing by the equivalent
amount;
o Receivables from sale of non-financial assets (i.e. housing units to citizens which are
repaid to the City of Sisak at concessional interest rates) are assumed to taper off over
10 years and be fully repaid by 2025;
o Liabilities for operations expenses was forecast by calculating in days, this line item
divided by the operating expense in 2015 and multiplying by 365 days. Day’s liabilities
for operations was 36 days in 2015 (40 days in 2013 and 42 days in 2014). We used 36
days as the payment period throughout the period 2016 to 2030;
o New loans have been assumed to be taken by the City of Sisak commencing in 2022 to
2030 mainly to assist in financing significant capex related to the SUMP project. The
total of these new loans to be taken is HRK 43 million. Due to continual repayment of
principal of existing loans, the maximum peak in loan outstanding is forecast to be HRK
57,4 million in 2025.
Per the Budget Act (Article 88), the City of Sisak (like other local governments) are limited in the
amount that they can borrow i.e. the total annual debt service (i.e. repayment of loan principal and
payment of loan interest) of the current year (debt service per level 23) can be up to a maximum of
20% of the adjusted total revenues realised in the previous year (adjusted total revenues per level 22).
Cash flow: The resulting cash flow is divided into cash flow from operations and cash flow from
financing activities. Note: cash flows from investment are included within the R&E account:
o Value adjustment of HRK 7.2 million in 2017 as already stated relates to a debt/equity
swap whereby no cash flows (in or out) are to occur;
o Loan repayments reflect loans on balance sheet as at 31 December 2015 as well as
new loans assumed to be taken from 2022 to 2030;
o Loan proceeds in 2016 and 2017 relate to HRK 44.9 million yet to be fully drawn down
to pay for capex not related to the SUMP project;
o EU grants are assumed at HRK 7,5 million in 2017 and increased thereafter to 2030 by

Sisak Urban Transport – Sustainable Urban Mobility Planning – FINAL REPORT 132
the forecast growth in nominal GDP;
o Annex 15 shows for an overview of cash flow from 2016 to 2030;
Ratios:: the highlights of the various ratios and key financial metrics are shown in Annex 16,
and they include:
o Increase in total revenues in nominal terms from HRK 257,8 million in 2015 to HRK
257,8 million in 2030;
o Operating surplus increasing from HRK 19.2 million in 2015 to HRK 36,8 million in 2030;
o Total surplus of HRK 2.7 million in 2015. However, from 2016 to 2025, there are mostly
shortfalls with four years of minor surpluses. From 2026 to 2030, the surpluses
increase to HRK 7,2 million in 2030.
7.7 Conclusion
The obvious conclusion with respect to the possibilities to finance SUMP are:
Based on the aforementioned assumptions and financial forecast thereof, the SUMP project
can be financed through a mixture of own funds and new loans (HRK 43 million) based on an
assumed willingness of banks to provide loan finance per the stated conditions:
In order to ensure that the SUMP project is able to be fully realised per the forecast, it is
essential that the City of Sisak ensure that its total capex does not exceed HRK 187,6 million.
Further, other stakeholders are required to adhere to their assumed respective minimum size
of capex in the SUMP project.

Sisak Urban Transport – Sustainable Urban Mobility Planning – FINAL REPORT 133
8 THE COMMUNICATION AND PROMOTION OF THE PLAN
Every strategy/plan has to ensure a clearly defined approach which will be used during the
communication and promotion of the strategy/plan itself, as well as the connected activities/projects,
which should result in the realization of the respective strategy/plan. The present communication and
promotion should be established in order to ensure continuous updating of all relevant stakeholders
and to increase public awareness of the important activities and projects by the supported Sustainable
Urban Mobility Plan. The communication plan with all the basic guidelines is presented and submitted
here. This communication plan aims to ensure that all the relevant stakeholders that should be
informed about the Sustainable Urban Mobility Plan of the City of Sisak are reached. Some of the major
groups that will be covered by this communication plan are the residents of the Sisak-County and the
City of Sisak, as well as Ministry of Maritime Affairs, Transport and Infrastructure, Croatian Railways
(Passenger Transport and the Infrastructure), Croatian Roads, Croatina Highways, AP, and the others.
Moreover, this plan clearly defines the communication tools that could be used for the promotion,
education and information of every relevant stakeholder, as well as their own roles and responsibilities
in the communication process.
8.1 The goal and purpose of the communication plan
Sustainable urban mobility plan (SUMP) of the City of Sisak focuses on the development and the
establishment of strategies that will help the City of Sisak in its efforts to become one of the European
cities aiming to promote the usage of intermodal transport, non-motorized transport vehicles and
walking, along with reduced private car usage for travel. The plan, strategy, and related projects should
attempt to affect all relevant stakeholders and the citizens, in order to encourage, and promote the
usage of intermodal transport, non-motorized modes of transport and walking, with the private car
usage as less as possible.
In order to achieve the main objectives of the SUMP, it is of utmost importance to use the
communication plan with the purpose to present the benefits of the proposed plan to the residents of
the City of Sisak and its surroundings, as well as all other relevant stakeholders, in order to motivate
them to actively contribute to the sustainable urban mobility. The communication with the
stakeholders should be ensured at all stages of the project, and stakeholders should perceive the

Sisak Urban Transport – Sustainable Urban Mobility Planning – FINAL REPORT 134
importance of the projects adopted by the Plan. Stakeholders should be also informed about the
project aims and goals, its implementation process and its benefits, beginning from the pre-project
activities, implementation, to the end – the completion of the project. These definitions and other
relevant information should be delivered to the stakeholders by the communication activities defined
by the communication plan.
The aim of the communication plan is to reach out to as many relevant stakeholders and citizens as
possible, and to include all age groups, from childhood and adolescence, to the working population
and elderly. The primary communication message that should reach the former mentioned age groups
is the usage of cycling, walking, and the public transport usage instead of private cars. Public
authorities, businesses and other stakeholders should encourage and motivate their employees and
try to adapt their business processes related to the traffic aiming to become more oriented towards
sustainable urban mobility.
The sustainable urban mobility plan encourages the development of transport infrastructure in a way
that all traffic participants in allow a high-quality transition from the present to the new sustainable
urban mobility form. The communication plan ensures an individual approach to each target group
and presentation of the unique segment of the Plan which will easily lead to a positive change.
8.2 Target groups and stakeholders
The population of the City of Sisak and its surroundings is a fundamental target group, where
individuals participate in daily transactions, and constitute a fundamental component of urban
mobility.
The youngest age group, which includes the population younger than 18 years of age, represents the
most important target group because they are the future working population. It is therefore extremely
important to insist on a high-quality education about sustainable urban mobility and the mode on how
this target population can actively contribute to it. Moreover, young population has a strong influence
on their parents and grandparents, which can be used to create the cumulative effect. This population
is accessible through new technologies, which allows fast and high-quality monitoring of stakeholders
feedback and can create a base for communication about projects and ideas from the Plan. The basic
communication messages for this population groups will be presentations of traffic safety policies, new
cycling and walking routes, green areas and related activities.
The second group of residents is defined as population aged from 18 to 65 years. This is an active

Sisak Urban Transport – Sustainable Urban Mobility Planning – FINAL REPORT 135
population that takes the largest part in the traffic of the City of Sisak, and whose actions will have the
highest impact on short-term sustainable urban mobility. This population group has limited amount of
time that can be set aside for education on sustainable mobility, thus the message to them should be
simple, short, easily understandable and motivating. New roads, better connections with the roads
outside the city centre, new public transport lines, and quality of service in urban mobility are some of
the messages that need to be transmitted to this target group. The use of digital media and new
technologies can also be easily accessed by this group.
The last group has population over 65 years of age. As previously indicated, this population group is
larger than the youngest one, and all projections indicate that this group will continue to grow. In
relation to the working population, the oldest group has more time, which open possibilities for
holding workshops and education projects supported by the Plan. This group is relatively inaccessible
by the digital channels of communication, and should be reached by more classical means such as
printed brochures, radio messages, TV programs and similar.
All legal entities indirectly participate in the trade, since their employees commute to and from work.
As individuals, all these employees will be covered by the communication campaign described in the
previous section. In this chapter, we will concentrate on communication towards legal entities whose
business processes generate traffic and whose business decisions can greatly contribute to positive
changes and encourage active participation in sustainable urban mobility.
The public administration, from the institutions such as the Ministry of Maritime Affairs, Transport and
Infrastructure to the county and city departments in charge of traffic, must add their contribution in
raising awareness of sustainable urban mobility. This target group, which is formally involved in the
development and implementation of the Plan, should take steps in project disseminations under the
Plan, and to actively participate in the implementation of the plan.
Public companies participating in the management of the traffic and transport infrastructure should
be thoroughly included and have a good understanding of the projects supported by the Plan.
Legal entities such as logistics and commercial enterprises, and similar companies that significantly
contribute to the generation of traffic transport of people and goods, should be completely familiar
with the idea, objectives and projects of the Plan. These companies should be acquainted with the
ideas of sustainable urban mobility and present those ideas and projects of the Plan that would bring
direct or indirect business benefit to their companies. Legal entities would be especially interested in
the apparatus that will ease traffic such as construction of new roads with bigger capacity, avoiding
transiting through the narrow city centre or usage of small commercial electric or hybrid vehicles.

Sisak Urban Transport – Sustainable Urban Mobility Planning – FINAL REPORT 136
8.3 Communication channels
In order to provide the maximum of the planned results, it is of utmost importance to clearly define
channels of communications at the very beginning of the process. After the Project completion and its
acceptance by the City, the Plan should be presented to the general public through all relevant
communication channels (local and regional radio and TV stations, local and regional relevant forums,
local and regional newspapers, Internet sites of Sisak and Sisak County, Facebook page of the City,
etc.). Introducing the Plan to the relevant stakeholders should be the prime step in starting the
communication process, which should then ensure that all stakeholders understand the meaning of
the sustainable urban mobility plan and the development resulting from it, in addition to the role of
each stakeholder in its realization.
In addition, the basic communication plan should be followed by a continuous communication which
will cover the implemented activities and projects of the Plan as well as the accomplished results. The
proposal is to establish a unique Web site that adjoins the City of Sisak website. The Web site should
be used for regular communication with all relevant stakeholders. Besides the abovementioned Web
page, the proposal is to establish a Facebook page, which would be an additional channel of
communication with stakeholders. It is of utmost importance to establish a two-way communication
with stakeholders, with the possibility of receiving stakeholder’s comments and suggestions not only
on the existing, but also the future projects and activities that could enhance sustainable urban
mobility of citizens. The main page of the Plan (Internet and Facebook) would be referenced to all
other communication channels that would be adapted by the target groups. Communication
campaigns should be organized for the target groups, and should use banners, printed or electronic,
to communicate key messages that would attract users to access the Internet or Facebook pages where
they could find more information about the project, activities and actions. The electronic mode of
communication is extremely convenient for gathering feedback information from stakeholders, which
should be used as a tool to adapt campaign according to the elements that share the greatest interest.
The use of Internet services such as Facebook and Twitter are ideal for presentations and
dissemination of information about the Plan, and they are also suitable for collecting customers or
stakeholders opinions and ideas.
Besides classic short printed materials such as brochures or banners, it would be advisable to organize
brief workshops and education for children in kindergartens and schools. For example, children could
be informed about current state of cycling and walking routes during the regular lectures on the traffic
in the City, and they could get familiar with the plans of further development and new routes.

Sisak Urban Transport – Sustainable Urban Mobility Planning – FINAL REPORT 137
The elderly population over 65 years could be informed through brochures placed in the health centers
and similar places where this population commute. Moreover, a collaboration could be made with the
health centers in order to organize trainings on benefits of sustainable mobility and positive effects of
walking and cycling on health and quality of life, in contrast to private car usage. However, the positive
health segment of the Project should not be reserved for the elderly population alone, but also to other
age groups.
The usage of other communication modes such as television and radio highly depends on the budget
provided for the communication plan, as this modes havee significantly higher price than
aforementioned ones.
8.4 Management and conduction
Another very important element of communication strategy and plan is defining the team and
organization responsible for the operational implementation of the communication plan. As the
implementation of the Plan is closely linked to the local public administration and public companies
which also have direct authority over its projects, it is believed that in the best solution, the same body
takes over the management of the communication plan implementation. Defining communication
messages, their review and final adoption certainly calls for professional communication experts to
communicate to the best of their professional and specialized knowledge to provide the best
proposals. As the sustainable urban mobility plan is planned to be large and long-term, the
implementation of a communication strategy requires the same long-term engagement. The bodies
responsible for the SUMP should be also responsible for the communication plan and dissemination
projects supporting the Plan. It is suggested that, in the scope of the current organizational structure,
a project should provide a communication expert who will ensure that the communications plan is
consistently implemented. Also, it is believed that it will be necessary to engage additional resources
in order to promptly update the respective websites and to provide answers to questions and ideas of
every stakeholder.

Sisak Urban Transport – Sustainable Urban Mobility Planning – FINAL REPORT 138
LIST OF FIGURES AND TABLES
Figure 1. Modal split of city trips – goal for 2030 .................................................................................. 11
Figure 2. Public transport network – proposed state for the end of 2017 ........................................... 16
Figure 3. New public transport line Autobusni kolodvor – Galdovo ..................................................... 17
Figure 4. A city bus equipped with Wi-Fi, Copenhagen, Denmark ........................................................ 21
Figure 5. Public transport network – suggestion for the end of 2030 .................................................. 22
Figure 6. An example of a multi-modal passenger information system ............................................... 26
Figure 7. An example of a tourist train .................................................................................................. 28
Figure 8. Water taxi in New York City .................................................................................................... 29
Figure 9. The development concept of the pedestrian zone in the city centre .................................... 39
Figure 10. Proposal for developing bicycle paths/lanes in the City of Sisak (2017, 2020, and 2030) ... 41
Figure 11. Bicycles in public transport vehicles: in train (left), in front of bus (centre), folded in train
(right) ..................................................................................................................................................... 44
Figure 12. Traffic volume in 2015 – afternoon peak period, both directions ....................................... 46
Figure 13. Traffic volume prediction for 2030 – “Do nothing” ............................................................. 47
Figure 14. Traffic flow regulation – proposal for 2017 .......................................................................... 50
Figure 15. Traffic flow regulation – proposal for 2020 .......................................................................... 51
Figure 16. Traffic flow regulation – proposal for 2025 .......................................................................... 52
Figure 17. Traffic volume prediction for second stage in 2020 – afternoon peak period..................... 54
Figure 18. An example of the possible traffic light optimization by adding a road lane if there is space
availyble (the intersection of D37 and Capraška by the “Konzum”) ..................................................... 58
Figure 19 The ATC scheme .................................................................................................................... 60
Figure 20. The elements of the ATC system .......................................................................................... 60
Figure 21. The existing situation at the intersection D37 and D224 (left) and the situation after the
suggested redesign into a mini-roundabout (right) .............................................................................. 62
Figure 22. The proposed location of the new bridge over the Kupa River related to the city centre .. 64
Figure 23. Traffic volume (both directions) in 2030 – afternoon peak period ...................................... 66
Figure 24. Traffic volume (both directions) in the city centre in 2030 – afternoon peak period ......... 67
Figure 25. Parking charging zones at the end of 2017 .......................................................................... 70
Figure 26. Parking charging zones at the end of 2020 .......................................................................... 71
Figure 27. Parking charging zones at the end of 2030 .......................................................................... 72
Figure 28. Delivery vehicles in the city centre ....................................................................................... 76

Sisak Urban Transport – Sustainable Urban Mobility Planning – FINAL REPORT 139
Figure 29. Proposed delivery vehicle parks in in the city centre ........................................................... 79
Figure 30. Accident blackspots in the city centre from 2012 to 2014 with the intersection of Ivan
Kukuljević Sakcinski Street and Ante Starčević Street as a potential accident blackspot ..................... 88
Figure 31. The number of conflict points depending on traffic regulation at the intersection of Ivan
Kukuljević Sakcinski Street and Ante Starčević Street: existing (left) amd after the reconstruction (right)
............................................................................................................................................................... 89
Table 1. Capital investments in public transport ..................................................................................... 4
Table 2. Capital investments in pedestrian and bicycle traffic ................................................................ 4
Table 3. Capital investments in road infrastructure ................................................................................ 4
Table 4. Capital investments in parking policy management ................................................................. 4
Table 5. Capital investments in city logistics ........................................................................................... 4
Table 6. Capital investments in road safety ............................................................................................ 5
Table 7. SUMP costs by responsible entities ........................................................................................... 5
Table 8. SUMP costs by activity areas ..................................................................................................... 5
Table 9. Gantt-chart for carsharing activities in 2017 ........................................................................... 31
Table 10. Gantt-chart for carsharing activities in 2018 ......................................................................... 31
Table 11. Carsharing activity carriers .................................................................................................... 32
Table 12. Goals and measures in public transport ................................................................................ 34
Table 13. Public transport indicators .................................................................................................... 36
Table 14. Measures related to the bicycle network .............................................................................. 44
Table 15. Indicators for non-motorized traffic ...................................................................................... 45
Table 16. Road infrastructure indicators ............................................................................................... 67
Table 17. Indikatori politike upravljanja parkiranjem ........................................................................... 73
Table 18. City logistics – objectives and proposed measures ............................................................... 82
Table 19. City logistics – indicators and corresponding activities for the evaluation of the results ..... 83
Table 20. Accidents involving cyclists .................................................................................................... 86
Table 21. Accidents involving pedestrians ............................................................................................ 86
Table 22. Road safety measures ............................................................................................................ 92
Table 23. Road safety indicators ........................................................................................................... 92
Table 24. Investment cost estimations for public transport ............................................................... 100
Table 25. Investment cost estimations for pedestrian and bicycle traffic .......................................... 102
Table 26. Investment cost estimations for road infrastructure .......................................................... 102
Table 27. Investment cost estimations for parking ............................................................................. 105

Sisak Urban Transport – Sustainable Urban Mobility Planning – FINAL REPORT 140
Table 28. Investment cost estimations for city logistics ..................................................................... 105
Table 29. Investment cost estimations for road safety ....................................................................... 106
Table 30. Capital investments in public transport............................................................................... 107
Table 31. Capital investments in pedestrian and bicycle traffic ......................................................... 107
Table 32. Capital investments in road infrastructure .......................................................................... 107
Table 33. Capital investments in parking policy management ........................................................... 107
Table 34. Capital investments in city logistics ..................................................................................... 107
Table 35. Capital investments in road safety ...................................................................................... 108
Table 36. SUMP costs by responsible entities ..................................................................................... 108
Table 37. SUMP costs by activity areas ............................................................................................... 108
Table 38. Environmental protection measures at Plan’s level ............................................................ 120
Table 39. Environmental mitigation measures for Ecological Network .............................................. 121
Table 40. Recommendations to be taken into account during development of further design
documentation .................................................................................................................................... 122

Sisak Urban Transport – Sustainable Urban Mobility Planning – FINAL REPORT 141
REFERENCES
[1] Action Plan on urban mobility [COM(2009) 490 . [Online. Available: http://eur-lex.europa.eu/legal-content/EN/TXT/PDF/?uri=CELEX:52009DC0490&from=EN. [Accessed: Jul 2015].
[2] Active Travel Discussion - Chapter 3: Economic analysis, 2012. [3] Broaddus, A., et.al., Transportation Demand Management. Eschborn, Germany: Federal
Ministry for Economic Cooperation and Development, 2009. [4] Brojenje prometa na cestama Republike Hrvatske godine 2011., Prometis d.o.o., 2012. [5] Brojenje prometa na cestama Republike Hrvatske godine 2012. - prosječni ljetni dnevni
promet, Prometis d.o.o., 2012. [6] Centar kompetencije za planiranje održive gradske mobilnosti za Jugoistočnu Europu (KC-
SUMP) u okviru projekta CIVITAS DYN@MO. [Online. Dostupno na: http://kc-sump.eu/wordpress/o-nama/. [Pristupljeno: 30 srpnja 2015.].
[7] CROW, Road safety manual, Record 26, 2009. [8] CROW. Design manual for bicycle traffic, 2007. [9] Crozet, Y.: The Future for Interurban Passenger Transport, International Transport Research
Symposium, Discussion Paper No. 2009-14, Madrid, Spain, 2009. [10] D. Brčić, M. Slavulj, Zbornik s okruglog stola Planovi održive urbane mobilnosti - SUMP,
Fakultet prometnih znanosti, Zagreb, lipanj 2014. [11] Directorate-General for Internal Policies. Policy Department, Sustainable Urban Transport
Plans - Note, 2010. [12] Eltis - Europe's main portal on urban mobility, http://www.eltis.org [pristupljeno: lipanj 2016]. [13] EMTA Barometer of public transport in the European metropolitan areas, European
Metropolitan Transport Authories, January 2009. [14] EU Commission: 2030 climate & energy framework,
http://ec.europa.eu/clima/policies/strategies/2030/index_en.htm [pristupljeno: rujan 2016]. [15] EU Commission: A call for smarter urban vehicle access regulations,
http://ec.europa.eu/transport/themes/urban/doc/ump/swd(2013)526-communication.pdf [rujan 2016].
[16] EU Commission: A call to action on urban logistics, http://ec.europa.eu/transport/themes/urban/doc/ump/swd(2013)524-communication.pdf [rujan 2016].
[17] EU Commission: A concept for Sustainable Urban Mobility Plans, http://ec.europa.eu/transport/themes/urban/doc/ump/com(2013)913-annex_en.pdf [rujan 2016].
[18] EU Commission: Mobilising Intellgent Transport Systems for EU cities, http://ec.europa.eu/transport/themes/urban/doc/ump/swd(2013)527-communication.pdf [rujan 2016].
[19] EU Commission, Study to support an impact assessment of the urban mobility package, Activity 31 Sustainable urban mobility Plans, Final report, October 2013.
[20] EU Commission: Targeted Action on urban road safety, http://ec.europa.eu/transport/themes/urban/doc/ump/com(2013)913_en.pdf [rujan 2016]
[21] Final Report of the Expert Working Group on Sustainable Urban Transport Plans, 2004. [22] Final report, Result of the public consultation ‘The urban dimension of the EU transport policy’,
European commision DG MOVE, April 2013. [23] Great Britain Department for Transport, Guidance on Local Transport Plans, 2009. [24] Green Paper, Towards a new culture for urban mobility, 2007.

Sisak Urban Transport – Sustainable Urban Mobility Planning – FINAL REPORT 142
[25] Guidelines - Developing and Implementing a Sustainable Urban Mobility Plan, 2011. [26] Handbook on estimation of external costs in the transport sector. Produced within the study
Internalisation Measures and Policies for All external Cost of Transport (IMPACT), 2008. [27] Hanson, S., Genevieve, G.: The Geography of Urban Transportation, Third Edition, The Guilford
Press, 2004. [28] Highway Capacity Manual, Transportation Research Board, National Research Council,
Washington, 2000. [29] Ison, S., Rye, T.: The Implementation and Effectiveness of Transport Demand Management
Measures: An International Perspective Ashgate Publishing Limited, United Kingdom; 2008. [30] Kutz, M.: Handbook of Transportation Engineering, McGraw-Hill Company, Columbus, 2004. [31] Maffii, S., et.al., Mobility management. Brussels: Directorate general for internal policies,
Policy department b: structural and cohesion policies, Transport and tourism, 2009. [32] Meyer, D. M., Miller, E. j.: Urban Transportation Planning, Second Edition, 2001. [33] Ministarstvo pomorstva, prometa i infrastrukture. Pravilnik o biciklističkoj infrastrukturi
(Narodne novine br. 28/2016). [34] Navodila za projektiranje kolesarskih površin, Ministarstvo za infrastrukturo in prostor,
Direkcija Republike Slovenije za ceste, 2012. [35] Optimising Bike Sharing European Cities OBIS, Handbook, June 2011. [36] Ortúzar, J. de D., Willumsen, L. G.: MODELLING TRANSPORT, Fourth Edition, John Wiley & Sons,
Ltd, 2011. [37] Porast biciklizma u malim i srednje velikim gradovima Srednje i Istočne Europe do 2020.
godine, Mobile 2020, 2012. [38] Roadmap to a Single European Transport Area – Towards a competitive and resource efficient
transport system, European White Paper, 2011. [39] Rodrigue, J.P., Comtois, C., Slack, B.: The Geography of Transport Systems, second edition,
Taylor and Francis Group, Abingdon, United Kingdom, 2009., ISBN 0-203-88415-9. [40] Rupprecht Consult, 2014: Guidelines on Developing and Implementing a Sustainable Urban
Mobility Plan. [Online. Available: http://www.eltis.org/sites/eltis/. [41] Sælensminde, K.: Cost-benefit analyses of walking and cycling track networks taking into
account insecurity, health effects and external costs of motorized traffic, Transportation Research Part A: Policy and Practice, 38 (8), pp. 593-606, 2004.
[42] Small, K.A., Verhoef, E.T., The Economics of Urban Transportation.: Taylor & Francis, 2007. [43] SUMP Challenges. [Online. Available: http://www.sump-challenges.eu/. [Accessed: Jul 2015]. [44] Sustainable Urban Transport Plans (SUTP) and Urban Environment: Policies, Effects, and
Simulations, 2005. [45] Sustainable Urban Transport Plans. Preparatory Document in relation to the follow-up of the
Thematic Strategy of the Urban Environment, 2007. [46] The State of the Art of Sustainable Urban Mobility Plans in Europe, Rupprecht Consult, 2011. [47] The State of the Art of Sustainable Urban Mobility Plans in Europe, Rupprecht Consult, Revised,
2012. [48] The State-of-the-Art Report of Sustainable Urban Mobility Plans in Europe, 2012. [49] Thematic Strategy on the Urban Environment, 2006. [50] Traffic Engineering Handbook 6th Edition, Institute of Transportation Engineers, 2009. [51] Urbanczyk R., PRESTO, Intelligent Energy Europe, Vodič za strategiju, 2010. [52] Victoria Transport Policy Institute, Canada. VTPI, Online TDM Encyclopedia,2010.
www.vtpi.org. [53] Vuchic, V. R.: Urban Transit Operations, Planning and Economics, John Wiley and Sons, Inc.,
2005. [54] White Paper: Roadmap to a Single European Transport Area – Towards a competitive and
resource efficient transport system [COM/2011/0144] final.
Sisak Urban Transport – Sustainable Urban Mobility Planning – FINAL REPORT 143
Sisak Urban Transport – Sustainable Urban Mobility Planning
Draft Final Report
Sisak Urban Transport – Sustainable Urban Mobility Planning
ANNEXES

Sisak Urban Transport – Sustainable Urban Mobility Planning – FINAL REPORT 144
Annex 1. Delivery vehicles - measurement locations.......................................................................... 145
Annex 2. The number of vehicles within vehicle categories at intersections ..................................... 146
Annex 3. Road accident comparison according to vehicle categories in the last five years ............... 147
Annex 4. Comparison of accident consequences in the last five years............................................... 147
Annex 5. The state of road safety, 1995 – 2015 .................................................................................. 148
Annex 6. The number of road accidents, comparison by months, 2012 – 2014 ................................ 148
Annex 7. The number of road accidents, comparison by days within a week, 2012 – 2014 .............. 148
Annex 8. The number of road accidents, comparison by hours within a day, 2012 – 2014 ............... 149
Annex 9. Road accidents on the specific roads in the City of Sisak, 2015 ........................................... 149
Annex 10. Road accidents at the specific intersection in the City of Sisak, 2015 ............................... 149
Annex 11.Road accidents involving casualties and injuries – locations in the City of Sisak during 2014
............................................................................................................................................................. 150
Annex 12. Accident focal points in the City of Sisak, 2012- 2014 ....................................................... 150
Annex 13. Financial forecast and assumptions - Croatia .................................................................... 151
Annex 14. Revenue and expenditure account (historic and forecast) ................................................ 152
Annex 15. Cash flow ............................................................................................................................ 153
Annex 16. Ratios and key metrics ....................................................................................................... 154

Sisak Urban Transport – Sustainable Urban Mobility Planning – FINAL REPORT 145
Annex 1. Delivery vehicles - measurement locations

Sisak Urban Transport – Sustainable Urban Mobility Planning – FINAL REPORT 146
Annex 2. The number of vehicles within vehicle categories at intersections
Zagrebačka Street - Vlado
Janjić Capa Street
Period Private car Light-duty Heavy-duty Total
05:30 - 06:30 88% 7% 1% 706
06:30 - 07:30 89% 7% 2% 1369
11:00 - 12:00 87% 8% 2% 1683
15:00 - 16:00 88% 7% 2% 2078
16:00 - 17:00 90% 7% 1% 1985
18:30 - 19:30 94% 5% 1% 1420
Ferdo Hefele Street – Marijan
Celjak Street - Antun Cuvaj
Street
Period Private car Light-duty Heavy-duty Total
05:30 - 06:30 91% 4% 2% 515
06:30 - 07:30 91% 4% 3% 986
11:00 - 12:00 88% 6% 3% 1261
15:00 - 16:00 89% 4% 3% 1456
16:00 - 17:00 91% 4% 2% 1280
18:30 - 19:30 95% 2% 1% 1052
Franjo Lovrić Street –
Frankopanska Street
Period Private car Light-duty Heavy-duty Total
05:30 - 06:30 82% 13% 1% 179
06:30 - 07:30 89% 9% 0% 465
11:00 - 12:00 82% 12% 1% 696
15:00 - 16:00 90% 7% 0% 784
16:00 - 17:00 90% 7% 0% 673
18:30 - 19:30 91% 8% 0% 581
Keltska Street – Josip Juraj
Strossmayer Street – Žitna
Street
Period Private car Light-duty Heavy-duty Total
05:30 - 06:30 84% 10% 1% 575
06:30 - 07:30 89% 7% 1% 1497
11:00 - 12:00 88% 7% 2% 1449
15:00 - 16:00 91% 5% 1% 1905
16:00 - 17:00 91% 6% 0% 1758
18:30 - 19:30 94% 4% 0% 1170
Franjo Lovrić Street – Ante
Starčević Street
Period Private car Light-duty Heavy-duty Total
05:30 - 06:30 74% 11% 0% 84
06:30 - 07:30 92% 2% 0% 399
11:00 - 12:00 86% 6% 1% 547
15:00 - 16:00 93% 3% 0% 626
16:00 - 17:00 91% 3% 0% 455
18:30 - 19:30 96% 3% 0% 507
Rimska Street – Frankopanska
Street
Period Private car Light-duty Heavy-duty Total
05:30 - 06:30 83% 9% 0% 270
06:30 - 07:30 92% 3% 0% 875
11:00 - 12:00 90% 4% 0% 943
15:00 - 16:00 92% 3% 0% 1206
16:00 - 17:00 93% 3% 0% 1113
18:30 - 19:30 96% 2% 0% 794
Ivan Fistrović Street –
Vatrogasna Street – Kralj
Tomislav Street
Period Private car Light-duty Heavy-duty Total
05:30 - 06:30 88% 4% 1% 361
06:30 - 07:30 91% 2% 3% 834
11:00 - 12:00 89% 4% 1% 920
15:00 - 16:00 89% 5% 2% 1084
16:00 - 17:00 91% 4% 2% 797
18:30 - 19:30 95% 3% 0% 502

Sisak Urban Transport – Sustainable Urban Mobility Planning – FINAL REPORT 147
Ivan Kukuljević Sakcinski Street – Stjepan and Antun Radić
Street
Period Private car Light-duty Heavy-duty Total
05:30 - 06:30 95% 2% 0% 520
06:30 - 07:30 94% 2% 0% 850
11:00 - 12:00 96% 1% 0% 801
15:00 - 16:00 97% 1% 0% 1055
16:00 - 17:00 94% 2% 0% 851
18:30 - 19:30 96% 1% 0% 919
Ivan Kukuljević Sakcinski Street – Ivo Rukavina
Street
Period Private car Light-duty Heavy-duty Total
05:30 - 06:30 83% 11% 2% 380
06:30 - 07:30 89% 5% 3% 857
11:00 - 12:00 86% 7% 2% 984
15:00 - 16:00 87% 9% 2% 1253
16:00 - 17:00 88% 7% 1% 1140
18:30 - 19:30 94% 4% 0% 900
Annex 3. Road accident comparison according to vehicle categories in the last five years
Vehicle type
2011 No
2011 (%)
2012 No
2012 (%)
2013 No
2013 (%)
2014 No
2014 (%)
2015 No
2015 (%)
change 2011-2015
Moped 1297 6.3% 1225 6.1% 1145 5.8% 1088 5.5% 1028 5.2% -20.7%
Motorcycle 474 2.3% 453 2.3% 455 2.3% 453 2.3% 447 2.3% -5.7%
Private car 15606 76.0% 15270 76.2% 15096 76.3% 15198 76.5% 15234 76.8% -2.4%
Bus 54 0.3% 51 0.3% 52 0.3% 50 0.3% 51 0.3% -5.6%
Cargo and duty
1392 6.8% 1323 6.6% 1256 6.3% 1260 6.3% 1289 6.5% -7.4%
Combined car
49 0.2% 39 0.2% 28 0.1% 22 0.1% 22 0.1% -55.1%
Working machines
88 0.4% 85 0.4% 99 0.5% 100 0.5% 96 0.5% 9.1%
Tractor 1217 5.9% 1215 6.1% 1212 6.1% 1215 6.1% 1193 6.0% -2.0%
Trailer 332 1.6% 349 1.7% 423 2.1% 461 2.3% 472 2.4% 42.2%
Light quadricycle
4 0.0% 4 0.0% 4 0.0% 4 0.0% 5 0.0% 25.0%
Quadricycle 11 0.1% 13 0.1% 14 0.1% 12 0.1% 10 0.1% -9.1%
Total 20524 100.0% 20027 100.0% 19784 100.0% 19863 100.0% 19847 100.0% -3.3%
Annex 4. Comparison of accident consequences in the last five years
Consequence 2011 No
2011 (%)
2012 No
2012 (%)
2013 No
2013 (%)
2014 No
2014 (%)
2015 No
2015 (%)
change 2011-2015
With casualties
3 0.6% 4 0.9% 5 1.2% 4 1.2% 2 0.5% -33.3%
With injuries 179 37.8% 151 35.8% 141 33.7% 116 34.0% 141 35.6% -21.2%
With material damage
291 61.5% 267 63.3% 273 65.2% 221 64.8% 253 63.9% -13.1%
Total 473 100.0% 422 100.0% 419 100.0% 341 100.0% 396 100.0% -16.3%

Sisak Urban Transport – Sustainable Urban Mobility Planning – FINAL REPORT 148
Annex 5. The state of road safety, 1995 – 2015
Annex 6. The number of road accidents, comparison by months, 2012 – 2014
Annex 7. The number of road accidents, comparison by days within a week, 2012 – 2014

Sisak Urban Transport – Sustainable Urban Mobility Planning – FINAL REPORT 149
Annex 8. The number of road accidents, comparison by hours within a day, 2012 – 2014
Annex 9. Road accidents on the specific roads in the City of Sisak, 2015
Ro
ad
sect
ion
Inju
ries
tota
l
Ma
teri
al
da
ma
ge
tota
l
Bic
ycle
inju
ries
Bic
ycle
m
ate
ria
l
da
ma
ge
Ped
estr
ia
n in
juri
es
No
tes
Josip Juraj Strossmayer Street
(DC37) 16 19 1 2 2
22 slight injuries (16 driivers, 4 passengers, 2 pedestrians)
Zagrebačka Street (DC36)
5 17 1 - - 1 severe injury (driver)
4 slight injuries (2 drivers, 2 passengers)
Ivan Kukuljvić Sakcinski Street
7 13 - - 1 2 severe injuries (1 driver, 1 pedestrian) 6 slight injuries (4 drivers, 2 passengers)
Rimska Street 5 13 - - 1 8 slight injuries (4 drivers, 3 passengers, 1
pedestrian)
Galdovačka Street (DC36)
7 8 1 - - 8 slight injuries (6 drivers, 2 passengers)
Stjepan and Antun Radić Street
3 12 - - 2 1 severe injury (pedestrian)
2 slight injuries (1 driver, 1 pedestrian)
Annex 10. Road accidents at the specific intersection in the City of Sisak, 2015
Inte
rsec
tio
n
Tota
l
inju
ries
Tota
l
ma
teri
al
da
ma
ge
Bic
ycle
inju
ries
Ped
estr
ian
inju
ries
No
tes
Ivan Kukuljević Sakcinski Street –
Stjepan and Antun Radić Street
2 3 - 1 2 slight injuries (1 passenger, 1
pedestrian)
Matija Gubec Street – Antun Starčević Street
2 2 - - 2 slight injuries (drivers)
Ivan Kukuljević Sakcinski Street – Antun
Starčević Street 1 3 - - 1 slight injury (driver)
Josip Juraj Strossmayer Street – Narodni heroji
Street 2 1 - - 3 slight injuries (drivers)
Ivan Kukuljević Sakcinski Street –
Franjo Lovrić Street 2 - - - 2 slight injuries (drivers)
Marijan Celjak Street – Ferdo Hefele Street
2 - 1 3 slight injuries (drivers)

Sisak Urban Transport – Sustainable Urban Mobility Planning – FINAL REPORT 150
Inte
rsec
tio
n
Tota
l
inju
ries
Tota
l
ma
teri
al
da
ma
ge
Bic
ycle
inju
ries
Ped
estr
ian
inju
ries
No
tes
Ivan Kukuljević Sakcinski Street -
Rimska Street 1 1 - - 1 slight injury (driver)
Ljudevit Posavski Square - Rimska Street
1 1 - - 1 slight injury (driver)
Annex 11.Road accidents involving casualties and injuries – locations in the City of Sisak during 2014
Annex 12. Accident focal points in the City of Sisak, 2012- 2014

Sisak Urban Transport – Sustainable Urban Mobility Planning – FINAL REPORT 151
Annex 13. Financial forecast and assumptions - Croatia
Econ
omic
indi
cato
rs20
1320
1420
1520
1620
1720
1820
1920
2020
2120
2220
2320
2420
2520
2620
2720
2820
2920
30
Real
GDP
gro
wth
/dec
line
(% p
er a
nnum
)-1
.1%
-0.4
%1.
6%1.
7%1.
7%1.
9%1.
9%1.
9%1.
9%1.
9%1.
9%1.
9%1.
9%1.
9%1.
9%1.
9%1.
9%1.
9%
Real
priv
ate
cons
umpt
ion
grow
th/d
eclin
e (%
per
ann
um)
-1.8
%-0
.7%
1.2%
1.3%
1.2%
1.5%
1.7%
1.7%
1.9%
1.9%
1.9%
1.9%
1.9%
1.9%
1.9%
1.9%
1.9%
1.9%
Cons
umer
pric
es (a
vera
ge, %
)2.
2%-0
.2%
-0.5
%-1
.0%
0.6%
1.5%
1.5%
1.8%
2.0%
2.0%
2.0%
2.0%
2.0%
2.0%
2.0%
2.0%
2.0%
2.0%
Nom
inal
GDP
gro
wth
/dec
line
(% p
er a
nnum
)1.
1%-0
.6%
1.1%
0.7%
2.3%
3.4%
3.4%
3.7%
3.7%
3.7%
3.7%
3.7%
3.7%
3.7%
3.7%
3.7%
3.7%
3.7%
Lend
ing
rate
(ave
rage
, %)
6.7%
6.3%
5.8%
6.5%
6.5%
6.6%
6.7%
6.9%
6.9%
6.9%
6.9%
6.9%
6.9%
6.9%
6.9%
6.9%
6.9%
6.9%
Depo
sit r
ate
(ave
rage
%)
3.9%
3.5%
3.2%
3.1%
3.0%
3.0%
3.2%
3.4%
3.4%
3.4%
3.4%
3.4%
3.4%
3.4%
3.4%
3.4%
3.4%
3.4%
Labo
ur c
osts
per
hou
r (HR
K)30
.630
.630
.731
.231
.531
.932
.633
.034
.035
.136
.237
.338
.539
.740
.942
.243
.544
.9
Ave
rage
real
wag
es g
row
th/d
eclin
e (%
per
ann
um)
-1.5
%0.
5%1.
6%3.
0%0.
9%0.
5%1.
0%0.
2%1.
1%1.
1%1.
1%1.
1%1.
1%1.
1%1.
1%1.
1%1.
1%1.
1%
Ave
rage
nom
inal
wag
es g
row
th/d
eclin
e (%
per
ann
um)
0.7%
0.3%
1.1%
2.0%
1.5%
2.0%
2.5%
2.0%
3.1%
3.1%
3.1%
3.1%
3.1%
3.1%
3.1%
3.1%
3.1%
3.1%
EUR:
HRK
exch
ange
rate
(ave
rage
)7.
577.
637.
617.
577.
597.
617.
637.
657.
657.
657.
657.
657.
657.
657.
657.
657.
657.
65
Sour
ce: T
he E
cono
mis
t Int
ellig
ence
Uni
t - C
roat
ia c
ount
ry fo
reca
st J
une
201
6

Sisak Urban Transport – Sustainable Urban Mobility Planning – FINAL REPORT 152
Annex 14. Revenue and expenditure account (historic and forecast)
in H
RK
2013
2014
2015
2016
(I-V
I)20
1620
1720
1820
1920
2020
2120
2220
2320
2420
2520
2620
2720
2820
2920
30
OPE
RATI
NG R
EVEN
UE16
3,24
8,52
116
6,19
4,32
716
5,42
0,14
785
,607
,105
171,
058,
418
180,
739,
704
184,
467,
848
188,
723,
063
192,
924,
968
198,
398,
529
204,
035,
305
209,
840,
362
215,
818,
929
221,
976,
398
228,
318,
339
234,
850,
497
241,
578,
802
248,
509,
377
255,
648,
538
1. T
ax re
venu
e85
,189
,727
83,2
86,5
2475
,818
,170
42,7
55,1
9885
,510
,396
86,7
93,0
5288
,528
,913
90,7
42,1
3692
,556
,979
95,4
44,7
5698
,422
,633
101,
493,
419
104,
660,
013
107,
925,
406
111,
292,
679
114,
765,
010
118,
345,
678
122,
038,
064
125,
845,
651
2. A
ssis
tanc
e fr
om a
broa
d an
d fr
om s
ubje
cts
with
in th
e ge
nera
l bud
get
13,1
23,3
7019
,167
,705
15,5
67,8
587,
603,
678
15,2
60,5
8223
,111
,575
23,8
97,3
6924
,709
,879
25,6
24,1
4526
,572
,238
27,5
55,4
1128
,574
,961
29,6
32,2
3530
,728
,627
31,8
65,5
8733
,044
,613
34,2
67,2
6435
,535
,153
36,8
49,9
53
3. R
even
ue fr
om a
sset
s3,
595,
865
5,37
0,81
36,
408,
029
3,29
7,10
86,
617,
296
6,76
9,49
46,
999,
656
7,23
7,64
57,
505,
438
7,78
3,13
98,
071,
115
8,36
9,74
68,
679,
427
9,00
0,56
59,
333,
586
9,67
8,92
910
,037
,049
10,4
08,4
2010
,793
,532
4. R
even
ue fr
om m
anag
emen
t and
adm
inis
trativ
e fe
es, f
ees
base
d on
spe
cific
regu
latio
ns a
nd fe
es60
,606
,497
57,8
30,8
2266
,811
,327
31,1
34,1
7962
,268
,358
62,6
41,9
6863
,581
,598
64,5
35,3
2265
,696
,957
67,0
10,8
9768
,351
,115
69,7
18,1
3771
,112
,500
72,5
34,7
5073
,985
,445
75,4
65,1
5376
,974
,456
78,5
13,9
4680
,084
,225
5. R
even
ue fr
om s
ale
of p
rodu
cts
and
good
s, s
ervi
ces
rend
ered
and
reve
nue
from
don
atio
ns31
7,00
026
7,70
549
6,76
739
3,29
678
9,34
580
7,50
083
4,95
586
3,34
389
5,28
792
8,41
396
2,76
499
8,38
61,
035,
327
1,07
3,63
41,
113,
358
1,15
4,55
21,
197,
271
1,24
1,57
01,
287,
508
6. P
enal
ties,
adm
inis
trativ
e m
easu
res
and
othe
r rev
enue
s41
6,06
227
0,75
831
7,99
642
3,64
661
2,44
161
6,11
662
5,35
763
4,73
864
6,16
365
9,08
667
2,26
868
5,71
369
9,42
871
3,41
672
7,68
574
2,23
875
7,08
377
2,22
578
7,66
9
OPE
RATI
NG E
XPEN
SES
154,
622,
237
149,
434,
331
146,
256,
093
68,2
88,3
0715
1,57
0,78
215
6,78
1,26
616
0,33
0,91
116
4,05
6,18
616
8,26
6,34
617
0,59
1,00
517
5,40
3,91
118
0,32
6,02
018
5,47
0,59
019
0,77
1,41
919
6,18
7,36
920
1,70
1,94
120
7,32
1,76
521
3,05
3,70
821
8,85
3,76
4
1. E
mpl
oyee
exp
ense
s56
,280
,407
15,5
31,8
7913
,676
,655
6,78
9,53
913
,579
,078
13,7
82,7
6414
,058
,419
14,4
09,8
8014
,698
,078
12,8
06,7
8813
,206
,360
13,6
18,3
9814
,043
,292
14,4
81,4
4314
,933
,264
15,3
99,1
8215
,879
,636
16,3
75,0
8116
,885
,984
2. M
ater
ial e
xpen
ses
57,0
96,8
0950
,559
,980
51,2
69,1
8221
,790
,106
52,5
28,2
0655
,501
,112
56,3
33,6
2957
,178
,634
58,2
07,8
4959
,372
,006
60,5
59,4
4661
,770
,635
63,0
06,0
4864
,266
,169
65,5
51,4
9266
,862
,522
68,1
99,7
7269
,563
,768
70,9
55,0
43
3. F
inan
cial
exp
ense
s65
3,16
773
1,47
01,
424,
345
412,
199
2,18
0,62
02,
644,
522
2,58
9,48
12,
542,
721
2,50
8,46
92,
489,
279
2,53
7,85
72,
549,
298
2,63
2,07
12,
715,
020
2,75
1,88
32,
720,
863
2,62
3,10
82,
459,
817
2,18
1,11
9
4. S
ubsi
dies
11,0
21,3
1210
,529
,795
8,29
0,29
32,
628,
591
9,94
7,13
310
,175
,917
10,5
21,8
9910
,879
,643
11,2
82,1
9011
,699
,631
12,1
32,5
1712
,581
,420
13,0
46,9
3313
,529
,670
14,0
30,2
6714
,549
,387
15,0
87,7
1515
,645
,960
16,2
24,8
60
5. G
rant
s ab
road
and
with
in th
e ge
nera
l bud
get
50,0
0044
,482
,568
46,0
54,8
2526
,505
,624
53,0
11,2
4854
,230
,507
56,0
74,3
4457
,980
,872
60,1
26,1
6462
,350
,832
64,6
57,8
1367
,050
,152
69,5
31,0
0772
,103
,655
74,7
71,4
9077
,538
,035
80,4
06,9
4283
,381
,999
86,4
67,1
33
6. P
aym
ents
to c
itizen
s an
d ho
useh
olds
bas
ed o
n in
sura
nce
and
othe
r fee
s6,
952,
101
8,17
3,14
57,
325,
422
3,60
4,55
87,
209,
116
7,25
2,37
17,
361,
156
7,47
1,57
47,
606,
062
7,75
8,18
37,
913,
347
8,07
1,61
48,
233,
046
8,39
7,70
78,
565,
661
8,73
6,97
48,
911,
714
9,08
9,94
89,
271,
747
7. O
ther
exp
ense
s22
,568
,441
19,4
25,4
9418
,215
,371
6,55
7,69
013
,115
,380
13,1
94,0
7213
,391
,983
13,5
92,8
6313
,837
,535
14,1
14,2
8514
,396
,571
14,6
84,5
0214
,978
,193
15,2
77,7
5615
,583
,311
15,8
94,9
7816
,212
,877
16,5
37,1
3516
,867
,878
SURP
LUS/
(SHO
RTFA
LL) F
ROM
OPE
RATI
ONS
8,62
6,28
416
,759
,996
19,1
64,0
5417
,318
,798
19,4
87,6
3623
,958
,438
24,1
36,9
3724
,666
,876
24,6
58,6
2327
,807
,524
28,6
31,3
9429
,514
,343
30,3
48,3
3831
,204
,979
32,1
30,9
7033
,148
,555
34,2
57,0
3735
,455
,669
36,7
94,7
74
7. R
even
ues
from
the
sale
of n
on-f
inan
cial
ass
ets
1,67
2,50
31,
822,
548
1,40
1,45
197
3,04
01,
673,
040
1,68
3,07
81,
708,
324
1,73
3,94
91,
765,
160
1,80
0,46
41,
836,
473
1,87
3,20
21,
910,
666
1,94
8,88
01,
987,
857
2,02
7,61
42,
068,
167
2,10
9,53
02,
151,
721
8. E
xpen
ses
for
proc
urem
ent o
f non
-fin
anci
al a
sset
s20
,877
,356
16,4
46,7
0017
,834
,815
8,74
2,27
651
,585
,853
30,9
71,3
3321
,371
,333
21,3
71,3
3331
,879
,444
31,8
79,4
4431
,879
,444
31,8
79,4
4431
,879
,444
31,8
79,4
4431
,775
,333
31,7
75,3
3331
,775
,333
31,7
75,3
3331
,775
,333
Tang
ible
ass
ets
- nat
ural
wea
lth (l
and)
59,1
2543
,050
274,
692
10,9
4420
,000
100,
000
100,
000
100,
000
100,
000
100,
000
100,
000
100,
000
100,
000
100,
000
100,
000
100,
000
100,
000
100,
000
100,
000
Inta
ngib
le a
sset
s53
,002
237,
713
2,07
0,69
975
7,02
61,
100,
000
2,89
5,83
32,
895,
833
2,89
5,83
32,
055,
528
2,05
5,52
82,
055,
528
2,05
5,52
82,
055,
528
2,05
5,52
82,
605,
333
2,60
5,33
32,
605,
333
2,60
5,33
32,
605,
333
8.2.
1 Bu
ildin
g ob
ject
s17
,971
,364
10,6
97,4
7611
,827
,242
5,68
9,65
047
,255
,853
24,9
57,8
3315
,357
,833
15,3
57,8
3326
,730
,583
26,7
30,5
8326
,730
,583
26,7
30,5
8326
,730
,583
26,7
30,5
8325
,880
,000
25,8
80,0
0025
,880
,000
25,8
80,0
0025
,880
,000
8.2.
2 Pl
ant a
nd e
quip
men
t40
9,00
421
4,23
324
4,68
619
3,39
730
0,00
037
7,66
737
7,66
737
7,66
735
3,33
335
3,33
335
3,33
335
3,33
335
3,33
335
3,33
355
0,00
055
0,00
055
0,00
055
0,00
055
0,00
0
8.2.
3 Tr
ansp
ort m
eans
(equ
ipm
ent)
36,0
3227
,911
-
-
10,0
00
40
,000
40,0
00
40
,000
40,0
00
40
,000
40,0
00
40
,000
40,0
00
40
,000
40,0
00
40
,000
40,0
00
40
,000
40,0
00
8.2.
4 Bo
oks,
artw
ords
and
oth
er e
xhib
its o
f val
ue-
-
-
-
-
-
-
-
-
-
-
-
-
-
-
-
-
-
-
8.2.
5 In
tang
ible
pro
duce
d as
sets
554,
833
946,
708
166,
797
238,
445
400,
000
400,
000
400,
000
400,
000
400,
000
400,
000
400,
000
400,
000
400,
000
400,
000
400,
000
400,
000
400,
000
400,
000
400,
000
Addi
tiona
l inv
estm
ents
in b
uild
ing
obje
cts
1,79
3,99
62,
038,
445
2,24
8,91
41,
641,
166
2,50
0,00
02,
200,
000
2,20
0,00
02,
200,
000
2,20
0,00
02,
200,
000
2,20
0,00
02,
200,
000
2,20
0,00
02,
200,
000
2,20
0,00
02,
200,
000
2,20
0,00
02,
200,
000
2,20
0,00
0
Addi
tiona
l inv
estm
ents
in o
ther
non
-fina
ncia
l ass
ets
-
2,
241,
164
1,00
1,78
521
1,64
8-
-
-
-
-
-
-
-
-
-
-
-
-
-
-
SURP
LUS/
(SHO
RTFA
LL) F
ROM
NO
N-FI
NANC
IAL
ASS
ETS
(19,
204,
853)
(1
4,62
4,15
2)
(16,
433,
364)
(7
,769
,236
)
(4
9,91
2,81
3)
(29,
288,
255)
(1
9,66
3,00
9)
(19,
637,
384)
(3
0,11
4,28
4)
(30,
078,
981)
(3
0,04
2,97
1)
(30,
006,
242)
(2
9,96
8,77
8)
(29,
930,
565)
(2
9,78
7,47
6)
(29,
747,
719)
(2
9,70
7,16
7)
(29,
665,
803)
(2
9,62
3,61
3)
TOTA
L RE
VEN
UE
164,
921,
024
168,
016,
875
166,
821,
598
86,5
80,1
4517
2,73
1,45
818
2,42
2,78
318
6,17
6,17
219
0,45
7,01
219
4,69
0,12
920
0,19
8,99
220
5,87
1,77
821
1,71
3,56
521
7,72
9,59
522
3,92
5,27
823
0,30
6,19
623
6,87
8,11
124
3,64
6,96
925
0,61
8,90
725
7,80
0,25
9
TOTA
L EX
PENS
E 17
5,49
9,59
316
5,88
1,03
116
4,09
0,90
877
,030
,583
203,
156,
635
187,
752,
599
181,
702,
245
185,
427,
520
200,
145,
790
202,
470,
449
207,
283,
355
212,
205,
464
217,
350,
035
222,
650,
863
227,
962,
702
233,
477,
275
239,
097,
098
244,
829,
042
250,
629,
098
SURP
LUS/
(SHO
RTFA
LL)
(10,
578,
569)
2,
135,
844
2,73
0,69
09,
549,
562
(30,
425,
177)
(5
,329
,817
)
4,
473,
928
5,02
9,49
2
(5
,455
,661
)
(2
,271
,457
)
(1
,411
,577
)
(4
91,9
00)
37
9,56
0
1,27
4,41
4
2,
343,
494
3,40
0,83
6
4,
549,
871
5,78
9,86
5
7,
171,
161

Sisak Urban Transport – Sustainable Urban Mobility Planning – FINAL REPORT 153
Annex 15. Cash flow
in H
RK
2016
2017
2018
2019
2020
2021
2022
2023
2024
2025
2026
2027
2028
2029
2030
Cash
flow
from
ope
ratio
ns
Surp
lus/(s
hortf
all) f
rom
R&E
(30,
425,
177)
(5,3
29,8
17)
4,47
3,92
8
5,02
9,49
2
(5,4
55,6
61)
(2,2
71,4
57)
(1,4
11,5
77)
(491
,900
)
379,
560
1,27
4,41
4
2,34
3,49
4
3,40
0,83
6
4,54
9,87
1
5,78
9,86
5
7,17
1,16
1
Decr
ease
/(inc
reas
e) in
dep
osits
and
gua
rant
ee d
epos
its a
nd re
ceiva
bles
(296
,005
)
(508
,261
)
(195
,725
)
(223
,396
)
(220
,597
)
(287
,358
)
(295
,927
)
(304
,762
)
(313
,871
)
(323
,263
)
(332
,948
)
(342
,934
)
(353
,232
)
(363
,851
)
(374
,801
)
Decr
ease
/(inc
reas
e) in
trad
e re
ceiva
bles
(1,6
52,3
08)
(2,8
37,1
24)
(1,0
92,5
41)
(1,2
47,0
01)
(1,2
31,3
78)
(1,6
04,0
40)
(1,6
51,8
70)
(1,7
01,1
86)
(1,7
52,0
33)
(1,8
04,4
61)
(1,8
58,5
20)
(1,9
14,2
64)
(1,9
71,7
46)
(2,0
31,0
21)
(2,0
92,1
48)
Decr
ease
/(inc
reas
e) re
ceiva
bles
for l
oans
-
7,
167,
609
-
-
-
-
-
-
-
-
-
-
-
-
-
Decr
ease
/(inc
reas
e) re
cevia
bles
from
sale
of n
on-fi
nanc
ial a
sset
s75
4,04
176
9,23
578
4,73
580
0,54
881
6,68
083
3,13
684
9,92
486
7,05
188
4,52
290
2,34
6-
-
-
-
-
(Dec
reas
e)/in
crea
se in
liabil
ities
for o
pera
tions
exp
ense
s51
7,68
4
50
7,53
4
34
5,75
8
36
2,86
5
41
0,09
6
22
6,43
6
46
8,80
8
47
9,44
5
50
1,11
4
51
6,33
4
52
7,54
8
53
7,15
4
54
7,40
6
55
8,32
8
56
4,96
2
(Dec
reas
e)/in
crea
se lia
bilitie
s fo
r pro
cure
ment
of n
on-fi
nanc
ial a
sset
s9,
289,
483
(5
,673
,847
)
(2
,642
,261
)
-
2,89
2,20
5
-
-
-
-
-
(2
8,65
5)
-
-
-
-
(Dec
reas
e)/in
crea
se a
ccru
ed e
xpen
ses
and
defe
rred
reve
nue
83,6
8914
3,70
055
,337
63,1
6062
,369
81,2
4483
,667
86,1
6588
,740
91,3
9694
,134
96,9
5799
,869
102,
871
105,
967
Value
adju
stme
nts
(non
-cas
h ite
ms)
-
(7
,167
,609
)
-
-
-
-
-
-
-
-
-
-
-
-
-
Net c
ash
flow
from
ope
ratin
g ac
tiviti
es(2
1,72
8,59
3)
(1
2,92
8,58
0)
1,
729,
231
4,
785,
670
(2
,726
,287
)
(3
,022
,037
)
(1
,956
,976
)
(1
,065
,187
)
(2
11,9
67)
65
6,76
6
74
5,05
3
1,
777,
750
2,
872,
169
4,
056,
192
5,
375,
141
Cash
flow
from
fina
ncin
g ac
tiviti
es
Loan
prin
cipal
repa
ymen
ts(2
,281
,300
)
(1
,138
,550
)
(1
,161
,430
)
(9
01,5
90)
(7
65,0
00)
(6
21,1
00)
(5
,665
,170
)
(5
,872
,587
)
(6
,192
,845
)
(6
,559
,043
)
(6
,925
,404
)
(7
,267
,708
)
(7
,564
,809
)
(7
,855
,511
)
(7
,289
,429
)
Loan
pro
ceed
s35
,255
,853
9,60
0,00
0-
-
-
-
3,
000,
000
6,00
0,00
07,
000,
000
7,00
0,00
06,
000,
000
5,00
0,00
04,
000,
000
3,00
0,00
02,
000,
000
Net c
ash
flow
from
fina
ncin
g ac
tiviti
es32
,974
,553
8,46
1,45
0
(1,1
61,4
30)
(901
,590
)
(765
,000
)
(621
,100
)
(2,6
65,1
70)
127,
413
807,
155
440,
957
(925
,404
)
(2,2
67,7
08)
(3,5
64,8
09)
(4,8
55,5
11)
(5,2
89,4
29)
Tota
l net
cas
h flo
w11
,245
,960
(4,4
67,1
30)
567,
801
3,88
4,08
0
(3,4
91,2
87)
(3,6
43,1
37)
(4,6
22,1
46)
(937
,774
)
595,
188
1,09
7,72
4
(180
,351
)
(489
,958
)
(692
,641
)
(799
,319
)
85,7
12
Cash
as
at 1
Janu
ary
5,54
3,78
2
16,7
89,7
42
12
,322
,612
12,8
90,4
13
16
,774
,493
13,2
83,2
06
9,
640,
068
5,
017,
922
4,
080,
148
4,
675,
336
5,
773,
060
5,
592,
709
5,
102,
751
4,
410,
110
3,
610,
792
Cash
at 3
1 De
cem
ber
16,7
89,7
42
12
,322
,612
12,8
90,4
13
16
,774
,493
13,2
83,2
06
9,
640,
068
5,
017,
922
4,
080,
148
4,
675,
336
5,
773,
060
5,
592,
709
5,
102,
751
4,
410,
110
3,
610,
792
3,
696,
504

Sisak Urban Transport – Sustainable Urban Mobility Planning – FINAL REPORT 154
Annex 16. Ratios and key metrics
Rat
ios
2013
2014
2015
2016
2017
2018
2019
2020
2021
2022
2023
2024
2025
2026
2027
2028
2029
2030
Tota
l deb
t (in
HRK
)21
,718
,673
19,2
80,3
56
20
,746
,851
53,7
21,4
04
62
,182
,854
61,0
21,4
24
60
,119
,834
59,3
54,8
34
58
,733
,734
56,0
68,5
64
56
,195
,977
57,0
03,1
32
57
,444
,089
56,5
18,6
85
54
,250
,978
50,6
86,1
68
45
,830
,657
40,5
41,2
28
Inte
rest
pai
d (in
HRK
)38
1,33
4
48
2,01
8
55
7,31
7
1,
966,
880
2,
429,
500
2,
371,
233
2,
321,
200
2,
282,
960
2,
259,
260
2,
303,
237
2,
309,
986
2,
387,
973
2,
466,
040
2,
497,
923
2,
461,
824
2,
358,
888
2,
190,
313
1,
906,
225
Loan
prin
cipa
l pai
d (in
HRK
)8,
285,
732
6,
548,
747
5,
020,
300
2,
281,
300
1,
138,
550
1,
161,
430
90
1,59
0
76
5,00
0
62
1,10
0
5,
665,
170
5,
872,
587
6,
192,
845
6,
559,
043
6,
925,
404
7,
267,
708
7,
564,
809
7,
855,
511
7,
289,
429
Debt
ser
vice
/tota
l inst
allm
ent p
aid
(in H
RK)
8,66
7,06
6
7,03
0,76
5
5,57
7,61
7
4,24
8,18
0
3,56
8,05
0
3,53
2,66
3
3,22
2,79
0
3,04
7,96
0
2,88
0,36
0
7,96
8,40
8
8,18
2,57
3
8,58
0,81
8
9,02
5,08
2
9,42
3,32
7
9,72
9,53
2
9,92
3,69
8
10,0
45,8
24
9,
195,
654
Surp
lus/
(sho
rtfal
l) fr
om o
pera
tions
in H
RK8,
626,
284
16
,759
,996
19,1
64,0
54
19
,487
,636
23,9
58,4
38
24
,136
,937
24,6
66,8
76
24
,658
,623
27,8
07,5
24
28
,631
,394
29,5
14,3
43
30
,348
,338
31,2
04,9
79
32
,130
,970
33,1
48,5
55
34
,257
,037
35,4
55,6
69
36
,794
,774
Tota
l sur
plus
/(sho
rtfal
l) in
HRK
(10,
578,
569)
2,13
5,84
4
2,73
0,69
0
(30,
425,
177)
(5,3
29,8
17)
4,47
3,92
8
5,02
9,49
2
(5,4
55,6
61)
(2,2
71,4
57)
(1,4
11,5
77)
(491
,900
)
379,
560
1,27
4,41
4
2,34
3,49
4
3,40
0,83
6
4,54
9,87
1
5,78
9,86
5
7,17
1,16
1
Tota
l rev
enue
s (in
HRK
)16
4,92
1,02
4
16
8,01
6,87
5
16
6,82
1,59
8
17
2,73
1,45
8
18
2,42
2,78
3
18
6,17
6,17
2
19
0,45
7,01
2
19
4,69
0,12
9
20
0,19
8,99
2
20
5,87
1,77
8
21
1,71
3,56
5
21
7,72
9,59
5
22
3,92
5,27
8
23
0,30
6,19
6
23
6,87
8,11
1
24
3,64
6,96
9
25
0,61
8,90
7
25
7,80
0,25
9
Ope
ratin
g re
venu
e (in
HR
K)16
3,24
8,52
1
166,
194,
327
16
5,42
0,14
7
171,
058,
418
18
0,73
9,70
4
184,
467,
848
18
8,72
3,06
3
192,
924,
968
19
8,39
8,52
9
204,
035,
305
20
9,84
0,36
2
215,
818,
929
22
1,97
6,39
8
228,
318,
339
23
4,85
0,49
7
241,
578,
802
24
8,50
9,37
7
255,
648,
538
Rev
enue
s fro
m th
e sa
le o
f non
-fina
ncia
l ass
ets
(in H
RK)
1,67
2,50
3
1,82
2,54
8
1,40
1,45
1
1,67
3,04
0
1,68
3,07
8
1,70
8,32
4
1,73
3,94
9
1,76
5,16
0
1,80
0,46
4
1,83
6,47
3
1,87
3,20
2
1,91
0,66
6
1,94
8,88
0
1,98
7,85
7
2,02
7,61
4
2,06
8,16
7
2,10
9,53
0
2,15
1,72
1
Tota
l exp
ense
s (in
HRK
)17
5,49
9,59
3
16
5,88
1,03
1
16
4,09
0,90
8
20
3,15
6,63
5
18
7,75
2,59
9
18
1,70
2,24
5
18
5,42
7,52
0
20
0,14
5,79
0
20
2,47
0,44
9
20
7,28
3,35
5
21
2,20
5,46
4
21
7,35
0,03
5
22
2,65
0,86
3
22
7,96
2,70
2
23
3,47
7,27
5
23
9,09
7,09
8
24
4,82
9,04
2
25
0,62
9,09
8
Ope
ratin
g ex
pens
es (i
n H
RK)
154,
622,
237
14
9,43
4,33
1
146,
256,
093
15
1,57
0,78
2
156,
781,
266
16
0,33
0,91
1
164,
056,
186
16
8,26
6,34
6
170,
591,
005
17
5,40
3,91
1
180,
326,
020
18
5,47
0,59
0
190,
771,
419
19
6,18
7,36
9
201,
701,
941
20
7,32
1,76
5
213,
053,
708
21
8,85
3,76
4
Expe
nses
for p
rocu
rem
ent o
f non
-fina
ncia
l ass
ets
(in H
RK)
20,8
77,3
56
16
,446
,700
17,8
34,8
15
51
,585
,853
30,9
71,3
33
21
,371
,333
21,3
71,3
33
31
,879
,444
31,8
79,4
44
31
,879
,444
31,8
79,4
44
31
,879
,444
31,8
79,4
44
31
,775
,333
31,7
75,3
33
31
,775
,333
31,7
75,3
33
31
,775
,333
Tota
l cap
ex (i
n HR
K)20
,877
,356
16,4
46,7
00
17
,834
,815
51,5
85,8
53
30
,971
,333
21,3
71,3
33
21
,371
,333
31,8
79,4
44
31
,879
,444
31,8
79,4
44
31
,879
,444
31,8
79,4
44
31
,879
,444
31,7
75,3
33
31
,775
,333
31,7
75,3
33
31
,775
,333
31,7
75,3
33
Ord
inar
y ca
pex
(in H
RK)
20,8
77,3
56
16
,446
,700
17,8
34,8
15
51
,585
,853
25,7
90,0
00
16
,190
,000
16,1
90,0
00
16
,190
,000
16,1
90,0
00
16
,190
,000
16,1
90,0
00
16
,190
,000
16,1
90,0
00
16
,190
,000
16,1
90,0
00
16
,190
,000
16,1
90,0
00
16
,190
,000
Rel
ated
to S
UMP
(in H
RK)
5,18
1,33
3
5,18
1,33
3
5,18
1,33
3
15,6
89,4
44
15
,689
,444
15,6
89,4
44
15
,689
,444
15,6
89,4
44
15
,689
,444
15,5
85,3
33
15
,585
,333
15,5
85,3
33
15
,585
,333
15,5
85,3
33
Ope
ratin
g su
rplu
s/de
bt s
ervi
ce ra
tio1.
00x
2.
38x
3.
44x
4.
59x
6.
71x
6.
83x
7.
65x
8.
09x
9.
65x
3.
59x
3.
61x
3.
54x
3.
46x
3.
41x
3.
41x
3.
45x
3.
53x
4.
00x
Tota
l sur
plus
/deb
t ser
vice
ratio
(1.2
2x)
0.
30x
0.
49x
(7
.16x
)
(1.4
9x)
1.
27x
1.
56x
(1
.79x
)
(0.7
9x)
(0
.18x
)
(0.0
6x)
0.
04x
0.
14x
0.
25x
0.
35x
0.
46x
0.
58x
0.
78x
Tota
l deb
t out
stan
ding
/tota
l rev
enue
s0.
13x
0.
11x
0.
12x
0.
31x
0.
34x
0.
33x
0.
32x
0.
30x
0.
29x
0.
27x
0.
27x
0.
26x
0.
26x
0.
25x
0.
23x
0.
21x
0.
18x
0.
16x
Tota
l deb
t ser
vice
to to
tal r
even
ues
0.05
x
0.04
x
0.03
x
0.02
x
0.02
x
0.02
x
0.02
x
0.02
x
0.01
x
0.04
x
0.04
x
0.04
x
0.04
x
0.04
x
0.04
x
0.04
x
0.04
x
0.04
x
Cape
x to
tota
l rev
enue
s 0.
13x
0.
10x
0.
11x
0.
30x
0.
17x
0.
11x
0.
11x
0.
16x
0.
16x
0.
15x
0.
15x
0.
15x
0.
14x
0.
14x
0.
13x
0.
13x
0.
13x
0.
12x
Ope
ratin
g su
rplu
s/to
tal r
even
ues
0.05
x
0.10
x
0.11
x
0.11
x
0.13
x
0.13
x
0.13
x
0.13
x
0.14
x
0.14
x
0.14
x
0.14
x
0.14
x
0.14
x
0.14
x
0.14
x
0.14
x
0.14
x

Sisak Urban Transport – Sustainable Urban Mobility Planning – FINAL REPORT 155