Recruitment of the auditory cortex in congenitally deaf cats
Upload
independentCategory
view
0download
0
Animal Conservation (2004) 7, 339–351 C© 2004 The Zoological Society of London. Printed in the United Kingdom DOI:10.1017/S1367943004001520
Craniological differentiation amongst wild-living catsin Britain and southern Africa: natural variation or the effectsof hybridisation?
Nobuyuki Yamaguchi1,†, Andrew C. Kitchener2, Carlos A. Driscoll1,3, Jennifer M. Ward2 and David W. Macdonald1
1 Wildlife Conservation Research Unit, Department of Zoology, South Parks Road, Oxford, OX1 3PS UK2 National Museums of Scotland, Chambers Street, Edinburgh, EH1 1JF UK3 Laboratory of Genomic Diversity, National Cancer Institute, Frederick, MD 21702-1201 USA
(Received 28 August 2003; accepted 20 February 2004)
AbstractThe natural morphological variation in the wildcat, Felis silvestris, and morphological changes possibly causedby introgressive hybridisation with the domestic cat, F. catus, were examined, based on up to 39 variablesconcerning cranial morphology. The samples of wild-living cats originated from Scotland and southern Africaand consisted of both classical wildcat and other pelage types. Principal component and cluster analysessuggested that introgressive hybridisation occurred in both areas, with the consequence that the characteristicsof local wildcat populations had been altered in terms of the frequencies of occurrence of certain characters,especially those concerning cranial capacity. In both regions the clustering patterns of wild-living cats canbe interpreted as containing four main groups. One of these consisted mainly of ‘non-wildcats’ and groupsfurthest from the ‘non-wild’ cluster consisted of the highest proportion of ‘wildcats’ (c. 80%). We proposethat where a population is heavily introgressed, the only feasible way to define a wildcat is on the basis ofinter-correlated features and conservationists must take a population-based approach to assess the extent ofintrogression. This approach may provide an operational standard for assessing the impact of hybridisationbetween wildcats and domestic cats throughout the species’ range; it suggests that the Scottish wildcats maybe critically endangered.
INTRODUCTION
The wildcat (Felis silvestris Schreber, 1777: concerningthe use of different Latin names for the wildcat and thedomestic cat, see International Commission on ZoologicalNomenclature, 2003) is distributed widely in Europe,Africa and Asia, and is sympatric with the domestic cat(F. catus Linnaeus, 1758) throughout its range (Nowell &Jackson, 1996). Although currently the wildcat may notbe regarded as highly endangered, hybridisation with theubiquitous domestic cat may be posing a serious threat toits conservation worldwide and may have already causedthe virtual extinction of some local wildcat populationsthrough almost complete introgression (Roberts, 1951;Smithers, 1983; Harrison & Bates, 1991; Hubbard et al.,1992; Nowell & Jackson, 1996; Kitchener, 1998). Theprocess of introgression between wildcats and domesticcats is not only fundamentally interesting, but legallyimportant: in Scotland and most other European countriesthe feral domestic cat is a pest, whereas the wildcat is fullylegally protected (Macdonald & Tattersall, 2001).
In order to understand the widespread problem ofhybridisation, studies have sought to find ways to
†All correspondence to: Nobuyuki Yamaguchi. E-mail: [email protected]
discriminate between pure wildcats, feral domestic catsand their hybrids based on morphological characteristics.Schauenberg (1969, 1977) reported that European wild-cats have a shorter intestinal length and that wildcats havea cranial index (greatest length of the skull divided bycranial volume) of less than 2.75, whereas domestic catshave a cranial index greater than 2.75. The Scottish wildcatwas reported to be distinguishable from the domesticcat and their hybrids based on its larger, more robustskull, especially the cranium, mandibles and occipitalregion (French, Corbett & Easterbee, 1988). These studiesappeared to assume the existence of pure wildcats,a priori. Therefore, it was considered that the observedmorphological variation in wild-living cats was causedby hybridisation and was not a reflection of naturalmorphological variation of the wildcat.
In contrast, other authors have assumed a differentstarting point regarding pure wildcats. Since wildcats havebeen sympatric with domestic cats for up to 4000 years insome areas, there is the possibility that all contemporarypopulations have been affected by introgression to varyingdegrees, so that pristine wildcats may no longer exist and,even if they do, there may be no basis on which to identifythem from the continuua in introgressed populations(Daniels et al., 1998). Based on the lengths of limb bonesand intestines, Daniels et al. (1998) identified two groups

340 N. YAMAGUCHI ET AL.
of wild-living cats (Group-1 and Group-2) in Scotland.Group-1 cats (longer limb bones and shorter intestines)have a smaller cranial index and stronger association withclassical wildcat pelage than the cats of Group-2, whichhave characteristics commonly associated with domesticcats. Reig, Daniels & Macdonald (2001) reported thatthe skulls of Group-1 cats are larger, have smaller cranialindices and show greater sexual dimorphism than thoseof Group-2 cats. Therefore, even without reference toa pristine wildcat, Scottish wild-living cats could bebroadly categorised into two groups, raising the possibilitythat the morphological characteristics of one of thesegroups might identify (and, indeed, define) wildcats.However, neither of the two groups matched well withthe pelage characteristics traditionally associated withScottish wildcats (Daniels et al., 1998, 2001). Thesestudies therefore suggested that the effects of hybridisationmay be complicated and might thwart simple approachesto protecting wildcats.
Against this background, molecular analyses, based onmitochondrial DNA (c. 1100 base-pairs (bp) includinga part of the cytochrome b region, the entire tRNA-Proand tRNA-Thr and part of the control region) and upto 12 nuclear microsatellite loci, have suggested that inScotland, Europe and southern Africa there are subsetsof wild-living cats that probably contained little or noevidence of very recent domestic cat ancestry (Wiseman,O’Ryan & Harley, 2000; Beaumont et al., 2001; Danielset al., 2001; Randi et al., 2001; Pierpaoli et al., 2003).These studies also suggested that differences inmorphology may reflect the existence of distinct genepools, although unlike the Scottish study, which probablydrew on a relatively broader sample of wild-living catphenotypes, the European and southern African studiesdeliberately selected classical wildcat phenotypes forcomparison with those of domestic cats.
A combination of molecular and morphological studiessuggests that it is very likely that some of the observedmorphological variation in wild-living cat populations isdue to introgressive hybridisation with domestic cats. Ifso, wild-living cats in an introgressed population shouldtheoretically consist of three types: wildcats, domesticcats and various hybrids. However, in heavily introgressedpopulations, such as the Scottish one, pristine wildcatsmay no longer exist or, even if they do, they may be difficultto find and identify by current methods and an operationaldefinition of the wildcat would be necessary for practicalconservation and legislation. Broader comparisons areessential to identify the morphological features that maybe attributed to introgression with domestic cats. As ithappens, most detailed studies have been carried outon wildcat populations either in Scotland or in Italy,although hybridisation must have occurred and mustbe occurring, elsewhere (Heptner & Sludskii, 1972;Smithers, 1983; Nowell & Jackson, 1996; Spassov,Simenovski & Spiridonov, 1997).
In this paper, we broaden the basis for studying variationby comparing samples of wild-living cats from Scotlandand southern Africa. We compare these geographicallyseparated populations in terms of their skull morphology
to seek evidence for hybridisation with domestic cats.Having found such evidence, we investigate whetherthe patterns of hybridisation with domestic cats aresimilar in both populations. Finally, we reveal the changesin morphological variation of wildcat populations thatare likely to be caused by hybridisation with domesticcats, and using that knowledge we propose a pragmaticapproach to wildcat conservation.
MATERIALS AND METHODS
Specimens
The morphological investigation was undertaken using188 skulls of presumed wild-living cats from Scotlandand 145 from southern Africa (South Africa, Namibia,Botswana, Zimbabwe, Malawi, Mozambique and Zambia)in the collections of the National Museums of Scotland,Edinburgh, the Natural History Museum, London, NaturalHistory Museum, Bulawayo, Zimbabwe, TransvaalMuseum, Pretoria and the Amathole Museum, KingWilliam’s Town, South Africa. The skulls of the Scottishcats were examined by two of the authors (N. Y. &J. M. W.) and the southern African cats by N. Y. Onlyadult and sub-adult skulls, assessed from the fusion ofsutures in the skull (Daniels et al., 1998), were includedin the analysis. Specimens were nominally classified,based on museum labels, either as ‘wildcat’ or ‘non-wildcat’ (the latter included those labelled as ‘hybrid’and ‘domestic’ cats in the collection for the Scottishpopulation). Throughout the text we use quotation markswhen referring to the classifications based on museumlabels. These specimens have been collected and labelledover a 100-year period, so it is impossible to know exactlyon what basis they were classified, but we assume that itwas based on pelage characteristics (e.g. Pocock, 1951;Smithers, 1983; Kitchener, 1998). Assuming that themuseum specimens were indeed labelled as ‘wildcat’ onthe basis of their pelage characteristics and knowing thedistribution of pelage categories associated with wild-living cats in the cats of Groups-1 & -2 (Daniels et al.,1998), we can estimate that only c. 15–20% of Group-1cats would be ‘wildcats’ as used here, the remainder being‘hybrid cats’ (c. 60–65%) and ‘domestic cats’ (c. 20%);none of the Group-2 cats were ‘wildcats’, which comprisesonly ‘hybrid cats’ (c. 70–80%) and ‘domestic cats’ (c. 20–30%). In addition to the two categories a southern Africanwild-living cat was nominally classified as a ‘farm’ cat ifthe specimen was known to have been collected in a farm,near a big city (e.g. Harare, Zimbabwe) or near an areaof contiguous human settlement (e.g. the southern part ofthe former Cape Provinces, South Africa).
Skull parameters
Five skull characters were scored (1–3: Fig. 1) for eachskull, following Pocock (1951) and Kitchener (1995).
(1) Shape of the anterior nasals(2) Extent of a pit at the posterior nasals

Hybridisation in wild-living cats 341
ScoreC
hara
cter
3 2 1
1
4
2
3
5
Fig. 1. How to score the five skull characteristics. Shape of theanterior nasals (character 1) was scored as either 1 (right), 2 (centre)or 3 (left); extent of a pit at the posterior nasals (character 2: 1, 2 or3); shape of the parietal suture (character 3: 1, 2 or 3); length of thenasals relative to the maxillae (character 4: 1, 2 or 3); whether themandibles tip over or stand up on a horizontal surface (character 5:either 1 or 3). Figure reproduced by courtesy of the BiologicalJournal of the Linnean Society.
(3) Shape of the parietal suture(4) Length of the nasals relative to the maxillae(5) Whether the mandibles tip over or stand up on a
horizontal surface
The scores assessed by the two measurers using 10randomly-selected skulls agreed totally for characters-3and -5, disagreed by a score of 1 in one case each forcharacters-1 and 4 and in two cases for character -2. Scoresnever deviated by a score of 2. All five character scoreswere summed for each skull to give the total skull score,which was used in the subsequent analyses.
Forty-four measurements were taken of the cranium andmandible, modified from French et al. (1988), using metalcallipers to an accuracy of 0.02 mm. Cranial volume wasmeasured using either steel shot of c. 1 mm diameter orglass beads of c. 2 mm diameter. The volume measuredwith the smaller steel shot was always very slightlygreater than that with the glass beads. Therefore, we
corrected cranial volumes measured by steel shot usingthe regression equation:
Volume (glass beads) = 1.017 × Volume (steel shot)
− 1.214 (R2 = 0.998, t = 70.63, P < 0.0001),
calculated from the cranial volumes measured in 10randomly-selected skulls by both methods. To test themeasurement errors both for a measurer and betweenmeasurers, six skulls were randomly selected and eachmeasurement was taken six times on each skull byeach person. Then the coefficient of variation (ME%)for each variable was calculated as described by Lynchet al. (1996). The variables with average ME%s, eitherfor a measurer or between the measurers, of more than2% were excluded from the analysis. As a result, 31measurements were retained for analysis (Fig. 2 & seeAppendix 1). Amongst those measurements retained, therewere significant differences between the two measurers inmaximum length of the nasals (measurement 22 in Fig.2: paired t-test, N = 6 skulls, d.f. = 5, t = 3.57, P = 0.016)and depth of the mandible behind M1 (measurement 27in Fig. 2: t =− 2.71, P = 0.042), although much lessconsistently compared to that in the cranial volume, sothat these too were removed from the analyses.
In addition to the 29 variables finally retained, five newvariables were calculated as follows.
(1) Cranial index: greatest length of skull divided bycranial volume
(2) Broadness of the muzzle: distance between the infra-orbital foramina divided by the lateral length of snout
(3) Ratio of palatal breadth to Pm2–M1
(4) Ratio of postorbital constriction to interorbital breadth(5) Ratio of the distance between pogonion and coronoid
process to that between pogonion and angular process.
Statistical analyses
All statistical analyses were carried out using the Statisticastatistics package (Statsoft, Tulsa, USA). A PrincipalComponent Analysis (PCA) was carried out using allcats together, mainly to reduce the numbers of variablesfor the subsequent analyses. Specimens with any missingvalues were removed from the analysis and, hence, fromthe subsequent analyses too, reducing the sample size to80 Scottish cats (39 ‘wild’, 24 ‘hybrid’ and 17 ‘domestic’)and 93 southern African cats (70 ‘wild’, 14 ‘wild &farm’, 8 ‘non-wild & farm’ and 1 ‘non-wild’). A multiplelinear regression model was used to investigate therelationship between the total skull score and the extractedprincipal components with eigenvalues greater than 1.A cluster analysis was carried out and summarisedusing UPGMA trees to investigate whether any groupingpatterns exist within a regional cat population withoutany a priori classification. Furthermore, to enable futureuse of standard measurements for the classification ofskulls, each variable for ‘wildcats’ and ‘non-wildcats’ wasalso analysed and statistically significant differences weredetected using Mann-Whitney U-tests and ANOVAs.

342 N. YAMAGUCHI ET AL.
12
3
4
567
8
9
10
11
12
13
14
15
16
17
18
19
202122
23
24
25
26
27
28
Fig. 2. Measured skull variables. The numbers correspond to those in Appendix 1, except for variables 29, 30 and 31, which are notshown in the Figure. Figure reproduced by courtesy of the Biological Journal of the Linnean Society.
RESULTS
Four principal components were extracted by a PCA basedon 29 measured and five derived variables. The firstcomponent of the PCA (PC1) accounted for 46.13% of thetotal variance with an eigenvalue of 15.18; PC2 accountedfor 14.67%, PC3 for 12.32% and PC4 for 5.18% of thetotal variance. PC1 was mostly related to the overall sizeof the skull along the antero-posterior axis, PC2 to therelative breadth of the skull along the medio-lateral axis,the size of teeth and certain features of the mandible, PC3to cranial capacity and the size of the posterior part ofthe skull along the medio-lateral axis, and PC4 to certaincharacteristics concerning the posterior half of the skullbehind the orbits, including tooth size, mainly along themedio-lateral axis.
There were statistically significant differences in allfive skull character scores between nominal ‘wildcats’and ‘non-wildcats’ in Scotland. However, no significantdifference was found between these two categories inthe southern African cats (see Appendix 2). A multiplelinear regression indicated that the total skull score (TS)was highly significantly predicted by the four principalcomponents (d.f. = 4, 75, F = 42.6, P < 0.0001) in the
wild-living cats in Scotland. This was summarised by thefollowing equation:
TS = 11.21 − 0.24 × PC1 + 1.35 × PC2 − 1.77
× PC3 + 0.35 × PC4
However, only PC2 (t75 = 3.0, P = 0.0037) and PC3(t75 =− 11.2, P < 0.0001) were statistically significantpredictors of the total skull score. The residual analysisshowed that the residuals of all specimens fell within± 3 standard deviations of the residual mean and weconsidered that there was no extreme outlier. Therelationship was not significant in the wild-living cats fromsouthern Africa (d.f. = 4, 84, F = 1.65, P = 0.17).
A cluster analysis, based on the standardised total skullscore and the four principal components, revealed thatthe wild-living cats in Scotland appeared to cluster intofour main groups, although clusters-3 and -4 consisted ofsmaller clusters (Fig. 3). One group (cluster-4) consistedmostly of ‘domestic cats’ with a greater mean cranialindex (CI) and 94% of the cluster had a CI above 2.75(see Table 1 & Fig. 3). One of the other groups (cluster-3)consisted mostly of ‘hybrid cats’, while the rest (clusters-1 & -2) contained mostly ‘wildcats’. Thirty percent of

Hybridisation in wild-living cats 343
1
2
3
4
1
2
3
4
Scotland Southern Africa
Euclidean distance
0 1.1 2.2 3.3 4.4
W (2.295)W (2.260)W (2.381)W (2.322)W (2.386)W (2.511)H (2.311)W (2.165)H (2.328)W (2.245)W (2.293)W (2.256)W (2.238)W (2.117)W (2.162)W (2.087)W (2.082)W (2.250)W (2.412)H (2.252)H (2.413)W (2.076)W (2.139)W (2.203)H (2.356)W (2.260)W (2.292)W (2.258)W (2.176)H (2.574)H (2.403)W (2.766)D (2.566)H (2.570)H (2.503)H (2.682)H (2.451)W (2.631)W (2.199)W (2.417)W (2.373)W (2.397)W (2.253)W (2.193)H (2.135)H (2.313)H (2.340)H (2.293)W (2.345)W (2.482)H (2.336)W (2.420)W (2.363)W (2.181)H (2.223)H (2.420)H (2.493)H (2.794)H (2.757)W (2.665)H (2.941)H (2.655)W (2.327)D (3.084)D (3.148)D (3.006)D (3.029)D (3.356)D (2.848)D (3.087)D (3.709)D (3.423)D (2.657)D (3.095)D (3.276)H (3.113)D (3.236)D (3.326)D (3.504)D (3.625)
(2.487) SA(2.458) SA*(2.477) ZA(2.635) ZI(2.499) BO(2.453) SA(2.384) ZI(2.452) NA(2.348) NA(2.468) BO(2.156) NA(2.331) ZI*n(2.473) ZI(2.332) BO(2.546) BO(2.303) NA(2.520) SA(2.418) BO(2.688) SA*(2.652) SAn(2.436) SA(2.445) MO(2.389) SA(2.514) NA(2.594) NA(2.706) ZI*n(2.758) SA(2.680) BO(2.796) ZA(2.593) BO(2.481) NA(2.318) SA(2.561) MA(2.358) ZI(2.351) NA(3.169) SA(2.928) SA*(2.854) ZA(2.694) BO(2.686) ZI(3.099) ZI*(2.589) SA(2.367) SA(2.440) BO(2.712) BO(2.483) BO(2.415) ZA(2.393) ZI(2.186) ZI(2.211) ZI(2.392) ZI(2.416) BO(2.373) ZA(2.655) BO(2.593) ZI(2.503) SA*(2.463) BO(2.435) BO(2.597) BO(2.443) NA(2.311) NA(2.362) ZA(2.540) BO(2.524) ZI*(2.568) SA*n(2.744) ZI(2.709) SA(2.541) NA(2.857) SA*(2.927) SA*(2.737) SA(2.904) ZI*n(2.868) BO(3.186) ZI*n(2.811) ZI*n(2.442) ZI*(2.558) ZI(2.705) SA(2.506) ZI*(2.786) ZI*(2.866) SA(2.989) SA*(2.900) ZI*n(2.712) SA*n(2.771) SA(2.196) SA*(2.192) SA*(2.435) BO(2.675) NA
3.6 2.7 1.8 0.9 0
Fig. 3. Cluster analysis of individual skulls of wild-living cats in Scotland and southern Africa. Trees were constructed using an UPGMAmethod from a similarity matrix of Euclidean distance for each pair of specimens based on the standardised total skull score and thefour principal components. Scottish cats were nominally classified as ‘wild’ (W), ‘hybrid’ (H) or ‘domestic’ (D). The southern Africancats were classified as ‘wild’ with this group consisting of cats that originated from Botswana (BO), Malawi (MA), Mozambique (MO),Namibia (NA), South Africa (SA), Zambia (ZA) and Zimbabwe (ZI) or ‘non-wild’ with this group consisting of cats originating fromSouth Africa (SAn) and Zimbabwe (ZIn). The asterisks indicate those southern African specimens that were known to have come fromfarms, near big cities or near contiguous human settlement areas. The numbers in brackets indicate the cranial indices of the individual.Although obtained clusters were sorted into four groups, Scottish clusters-3 and -4 and southern African cluster-4 probably consist ofsmaller clusters.

344 N. YAMAGUCHI ET AL.
Table 1. Differences in cranial indices between the four clusters shown in Fig. 3 of the wild-living cats in Scotland and in southern Africa
Region Cluster-1 Cluster-2 Cluster-3 Cluster-4
Scotland 2.28 ± 0.024 (21)a 2.37 ± 0.029 (32)b 2.53 ± 0.076 (11)c 3.18 ± 0.058 (17)d
S. Africa 2.49 ± 0.025 (32)a 2.55 ± 0.037 (36)a 2.80 ± 0.044 (17)b 2.37 ± 0.115 (4)a
Mean ± standard error is shown. The different letters indicate that the differences between clusters are statistically significant (p < 0.05)as detected by ANOVA. Sample sizes are shown in brackets.
cluster-3 had a CI greater than 2.75, 3% for cluster-2and 0% for cluster-1 (Fig. 3). Southern African catswere also clustered into four groups, although cluster-4was not as cohesive as the rest (Fig. 3). Cluster-3comprised mostly ‘farm’ cats and a higher proportionof ‘non-wildcats’ with a higher mean CI (65% > 2.75:Table 1 & Fig. 3). The remaining two main clusterscontained few skulls with CIs greater than 2.75. Except forcluster-3, cats originating from the same countries did notnecessarily cluster together. Also, notice that the overalllevel of branching based on Euclidean distances was lessfor southern African cats compared with that of Scottishcats, even though the southern African specimens werefrom a much wider geographical area.
Amongst the variables showing significant differencesbetween ‘wildcat’ and ‘non-wildcat’ in Scotland and insouthern Africa (Appendices 2 & 3), the width of the braincase, cranial volume and cranial index showed exactly thesame trends between them in both regions. Also, sexualsize dimorphism was greater in ‘wildcats’ than in ‘non-wildcats’ in both regions (Appendix 3).
DISCUSSION
Grouping wild-living cats
The results demonstrate that, for Scottish wild-living cats,the nominal museum classification (presumably basedon the pelage characters) appears to be fairly well reflectedindependently in the clustering pattern on the basis ofthe skull parameters. This pattern, in which one group ofskulls are associated with the ‘domestic cat’ whereas otherskulls are positioned furthest from this ‘domestic’ group,is consistent with the results of previous studies based onmorphology (French et al., 1988; Daniels et al., 1998;Reig et al., 2001) and genetics (Beaumont et al., 2001).The total skull score, which is traditionally suggested tobe useful for distinguishing the Scottish wildcat fromthe domestic cat (Kitchener, 1995) is well predicted byPC2 and, especially, PC3 in our study. The results suggestthat these two principal components concern the variablesthat show the most highly significant differences between‘wildcats’ and ‘non-wildcats’. Therefore, skull characterscores, skull features related to PC2 and PC3 and pelagecharacteristics may be mutually associated in Scottishwild-living cats, suggesting the importance of thesefeatures in investigating their morphology. Our results alsoshow that ‘wildcats’ in Scotland possess relatively broaderskulls with well-developed occipital regions compared to
those of ‘non-wildcats’, analogous to the morphologicaldifferences found in previous studies – between wildcatsand domestic cats in French et al. (1988) and betweenGroup-1 and Group-2 cats in Reig et al. (2001). However,above all, the most conspicuous and highly significantdifference between their skulls is that ‘wildcats’ havegreater skull measurements correlated with a larger cranialcapacity, again analogous to the reported differencesbetween two groups of cats in Schauenberg (1969) –wildcat versus domestic cat – and in Daniels et al. (1998)and Reig et al. (2001) – Group-1 versus Group-2 cats.
For southern African cats, the existence of the ‘farm’cat cluster may support the speculation that pure wildcatsare difficult to find anywhere in the vicinity of settlementsin southern Africa (Smithers, 1983; Nowell & Jackson,1996). Interestingly, skull character scores do not appearto show clear patterns associated with either ‘wildcat’ or‘non-wildcat’ of southern Africa. We expect this becausethere are distinct morphological differences between theskulls of forest wildcats, including the Scottish wildcat,and the steppe wildcats, including the southern Africanwildcat (Yamaguchi et al., 2004). Since the domesticcat was derived from the latter, much of the variationobserved in the steppe wildcat may be expected to occur indomestic cats. Nevertheless, the results show that the mostconspicuous and highly significant difference betweenthe skulls of ‘wildcats’ and ‘non-wildcats’ in southernAfrica, as well as in Scotland, is that the former havegreater skull measurements related to a larger cranialcapacity.
Natural variation and the effects of hybridisation
Morphological characteristics, in general, may not remainstatic through time, even in isolated populations (Todd,1965; Carvalho et al., 1996; Quinn, Kinnison & Unwin,2001). Furthermore, the range of morphological variationof pristine wildcats before they became sympatric withdomestic cats remains unknown (Daniels et al., 1998,2001), possibly making it difficult to identify themorphological characteristics in a wildcat population thathas been affected by introgressive hybridisation.
The grouping pattern of wild-living cats in Scotland,based on nine nuclear microsatellite loci, is notperfectly matched by any of the grouping patternspreviously proposed on the basis of various morphologicalcharacteristics (Beaumont et al., 2001; Daniels et al.,2001). However, possession of classical wildcat pelagealways puts an individual cat into the non-domestic genetic

Hybridisation in wild-living cats 345
group and, to slightly lesser extents, both the Group-1cats defined by Daniels et al. (1998) and cats with astriped tabby coat pattern are also associated with thenon-domestic genetic group (Beaumont et al., 2001;Daniels et al., 2001). Although this non-domestic geneticgroup does not necessarily mean that individuals in thisgroup do not carry domestic cat genes, it probably doesmean that they are unlikely to have very recent domesticancestry (Beaumont et al., 2001), suggesting that thereappear to be relationships between certain morphologicalcharacteristics (e.g. pelage) possessed by a cat and veryrecent hybridisation in its ancestry. This is independentlysupported by similar genetic studies in Europe andsouthern Africa (Wiseman et al., 2000; Randi et al., 2001;Pierpaoli et al., 2003). Therefore, we consider that ‘non-wildcats’ in our analyses probably consist of a higherproportion of cats with very recent domestic ancestry,compared to ‘wildcats’. If so, the highly significantdifferences in skull morphology between the two groupsmay be considered as evidence that at least the frequenciesof occurrence of those characters (e.g. smaller cranialcapacity) have been strongly influenced by introgressivehybridisation in either Scotland or southern Africa orboth, and are unlikely to be explained by the naturalmorphological variation in those wildcat populations.
Therefore, introgressive hybridisation by domestic catshas been and may still be, changing the morphologicaland genetic population characteristics of wild-living catsworldwide. The result is that certain morphologicalcharacters are probably observed in the present wild-livingcat populations at higher (others at lower) frequencies thanoccurred in pristine wildcat populations.
Definition of the wildcat
Our results suggest that the frequencies of some morpho-logical characters found in wild-living cat populationsresult from introgressive hybridisation with the domesticcat. However, at the individual level, possessing such char-acters may not necessarily be straightforward proof thatthe animal is a domestic cat or a hybrid, although thecurrent lack of understanding of the dynamics of intro-gressive hybridisation, along with possible misidentifi-cations of museum specimens, may confuse the issue.Beaumont et al. (2001) demonstrated that approximately28% of Scottish wild-living cats (n = c. 120) that belong tothe non-domestic genetic group possess domestic pelagecharacters, concluding that this is good evidence thatthe non-domestic genetic group, based on nine nuclearmicrosatellites, also contains introgressed domestic catgenes. It is possible, however, that many of those domesticphenotypes may be due to the presence of only a fewintrogressed domestic cat coat colour genes, and yet,an individual homozygous for any of such genes wouldautomatically be classified as domestic (Beaumont et al.,2001). Another explanation is that if coat colour mutationsoccur naturally in the wildcat population, it is impossibleto distinguish them from hybrids and domestics withsimilar phenotypes on pelage alone. These considerations
necessitate a new operational definition of the wildcatfor scientific and conservation purposes in introgressedpopulations.
The most straightforward answer may be to define aswildcats those whose characteristics are furthest fromthose of the domestic cat grouping (Reig et al., 2001).However, each of the different methods, both morphologi-cal (French et al., 1988; Daniels et al., 1998; Reig et al.,2001) and genetic (Beaumont et al., 2001; Daniels et al.,2001), identifies a somewhat different non-domestic catgrouping. In Fig. 3 we identified clusters (clusters-1 & -2for both Scottish and southern African cats) of cats thatcontain a large number of ‘wildcats’. If we accept thatthese clusters define the cat that is most similar to thepristine wildcat in terms of skull morphology, then 27%(17 out of 64) of Scottish wildcats were classified bymuseum curators as ‘hybrid’ or ‘domestic’. For thesouthern African cats, ‘non-wild’ and ‘farm’ categoriesmake up 15% (10 out of 68) of the two non-domesticclusters (clusters-1 & -2). Conversely 8% (3 out of 39) ofthe Scottish ‘wildcats’ do not belong to those two clustersand only 10% (8 out of 80) do not belong for the southernAfrican ‘wildcats’. These mismatches probably providea measure of error between skull-based and museumlabel-based (presumably pelage) groupings, although lesscohesive clusters, such as cluster-3 for the Scottish cats,may slightly change these figures depending on theinterpretation of the cluster trees. In short, ‘wildcats’are largely restricted to the wildcat skull group, but thereverse is less so, which is analogous to the relationshipsbetween classical wildcat pelage and either Group-1cats (Daniels et al., 1998) or the non-domestic geneticgroup (Beaumont et al., 2001; Daniels et al., 2001). Thismismatch occurs because many cats included in Group-1or the non-domestic genetic group would be identifiedas hybrids or even as domestic cats using a traditionalclassification. Compared to these two cases where eitherGroup-1 or the non-domestic genetic group completelyincludes cats possessing classical wildcat pelage, theskull-based classification matches the pelage-based onerelatively well. Two types of explanation may apply. First,this may indicate that the discriminating power of skullmorphology is powerful, indeed almost as powerful, as isclassical wildcat pelage. Second, in the past many hybridsmay not have been correctly classified in museums,because curators were unaware of the high incidence ofhybridisation. To the extent that those mismatches arisethrough disagreement or confusion or lack of awarenessover what constitutes classic wildcat pelage, this could beimproved by an analysis of a few key pelage charactersin wild-living cats (A. C. Kitchener et al., unpublishedresults). The results of this analysis aim to provide anoperational definition for determining which key pelagecharacteristics comprise the classical wildcat pelage.
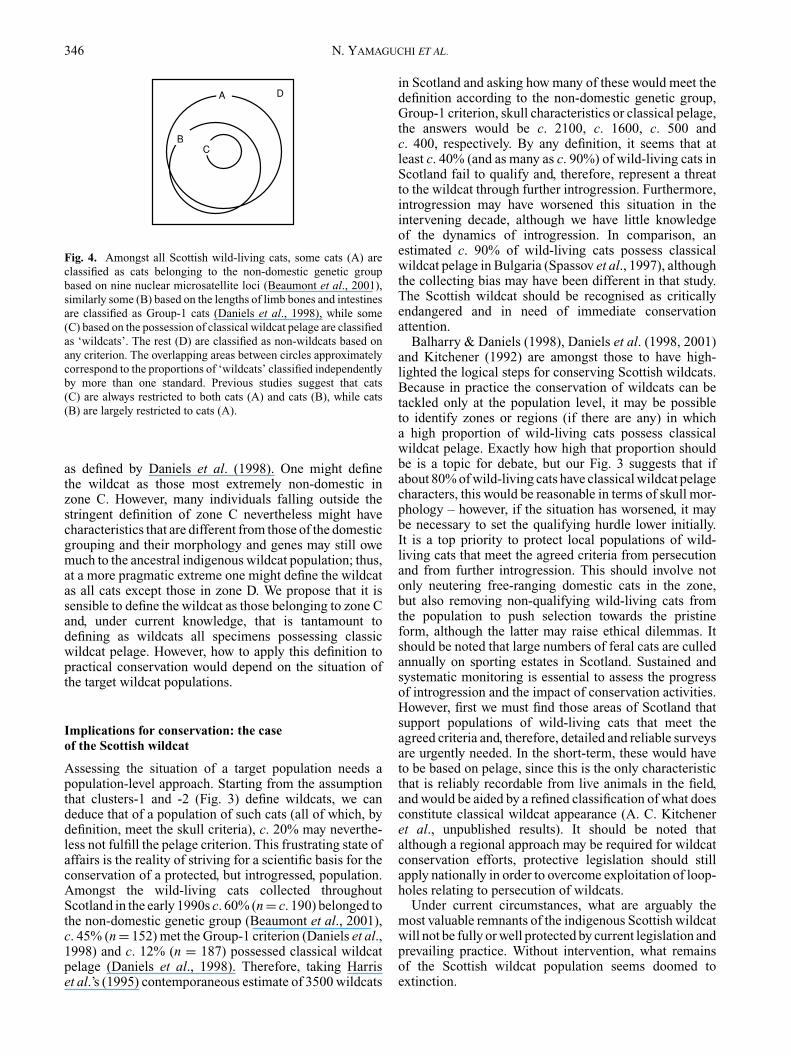
The situation concerning the classification of wild-living cats in introgressed populations can be schematisedas shown in Fig. 4. Cats at the centre qualify as non-domestic by all criteria – they have classic wildcat pelageand appearance, their genes and skulls are at an extremefrom the domestic values and they are also Group-1 cats
346 N. YAMAGUCHI ET AL.
DA
BC
Fig. 4. Amongst all Scottish wild-living cats, some cats (A) areclassified as cats belonging to the non-domestic genetic groupbased on nine nuclear microsatellite loci (Beaumont et al., 2001),similarly some (B) based on the lengths of limb bones and intestinesare classified as Group-1 cats (Daniels et al., 1998), while some(C) based on the possession of classical wildcat pelage are classifiedas ‘wildcats’. The rest (D) are classified as non-wildcats based onany criterion. The overlapping areas between circles approximatelycorrespond to the proportions of ‘wildcats’ classified independentlyby more than one standard. Previous studies suggest that cats(C) are always restricted to both cats (A) and cats (B), while cats(B) are largely restricted to cats (A).
as defined by Daniels et al. (1998). One might definethe wildcat as those most extremely non-domestic inzone C. However, many individuals falling outside thestringent definition of zone C nevertheless might havecharacteristics that are different from those of the domesticgrouping and their morphology and genes may still owemuch to the ancestral indigenous wildcat population; thus,at a more pragmatic extreme one might define the wildcatas all cats except those in zone D. We propose that it issensible to define the wildcat as those belonging to zone Cand, under current knowledge, that is tantamount todefining as wildcats all specimens possessing classicwildcat pelage. However, how to apply this definition topractical conservation would depend on the situation ofthe target wildcat populations.
Implications for conservation: the caseof the Scottish wildcat
Assessing the situation of a target population needs apopulation-level approach. Starting from the assumptionthat clusters-1 and -2 (Fig. 3) define wildcats, we candeduce that of a population of such cats (all of which, bydefinition, meet the skull criteria), c. 20% may neverthe-less not fulfill the pelage criterion. This frustrating state ofaffairs is the reality of striving for a scientific basis for theconservation of a protected, but introgressed, population.Amongst the wild-living cats collected throughoutScotland in the early 1990s c. 60% (n = c. 190) belonged tothe non-domestic genetic group (Beaumont et al., 2001),c. 45% (n = 152) met the Group-1 criterion (Daniels et al.,1998) and c. 12% (n = 187) possessed classical wildcatpelage (Daniels et al., 1998). Therefore, taking Harriset al.’s (1995) contemporaneous estimate of 3500 wildcats
in Scotland and asking how many of these would meet thedefinition according to the non-domestic genetic group,Group-1 criterion, skull characteristics or classical pelage,the answers would be c. 2100, c. 1600, c. 500 andc. 400, respectively. By any definition, it seems that atleast c. 40% (and as many as c. 90%) of wild-living cats inScotland fail to qualify and, therefore, represent a threatto the wildcat through further introgression. Furthermore,introgression may have worsened this situation in theintervening decade, although we have little knowledgeof the dynamics of introgression. In comparison, anestimated c. 90% of wild-living cats possess classicalwildcat pelage in Bulgaria (Spassov et al., 1997), althoughthe collecting bias may have been different in that study.The Scottish wildcat should be recognised as criticallyendangered and in need of immediate conservationattention.
Balharry & Daniels (1998), Daniels et al. (1998, 2001)and Kitchener (1992) are amongst those to have high-lighted the logical steps for conserving Scottish wildcats.Because in practice the conservation of wildcats can betackled only at the population level, it may be possibleto identify zones or regions (if there are any) in whicha high proportion of wild-living cats possess classicalwildcat pelage. Exactly how high that proportion shouldbe is a topic for debate, but our Fig. 3 suggests that ifabout 80% of wild-living cats have classical wildcat pelagecharacters, this would be reasonable in terms of skull mor-phology – however, if the situation has worsened, it maybe necessary to set the qualifying hurdle lower initially.It is a top priority to protect local populations of wild-living cats that meet the agreed criteria from persecutionand from further introgression. This should involve notonly neutering free-ranging domestic cats in the zone,but also removing non-qualifying wild-living cats fromthe population to push selection towards the pristineform, although the latter may raise ethical dilemmas. Itshould be noted that large numbers of feral cats are culledannually on sporting estates in Scotland. Sustained andsystematic monitoring is essential to assess the progressof introgression and the impact of conservation activities.However, first we must find those areas of Scotland thatsupport populations of wild-living cats that meet theagreed criteria and, therefore, detailed and reliable surveysare urgently needed. In the short-term, these would haveto be based on pelage, since this is the only characteristicthat is reliably recordable from live animals in the field,and would be aided by a refined classification of what doesconstitute classical wildcat appearance (A. C. Kitcheneret al., unpublished results). It should be noted thatalthough a regional approach may be required for wildcatconservation efforts, protective legislation should stillapply nationally in order to overcome exploitation of loop-holes relating to persecution of wildcats.
Under current circumstances, what are arguably themost valuable remnants of the indigenous Scottish wildcatwill not be fully or well protected by current legislation andprevailing practice. Without intervention, what remainsof the Scottish wildcat population seems doomed toextinction.

Hybridisation in wild-living cats 347
Acknowledgements
We thank the Nigel Easterbee Memorial Fund for financialsupport together with grants to D. W. M. from UFAW, Carefor the Rare (Justerini & Brooks) and the PTES. We alsothank M. J. Daniels and M. G. Mills for useful comments,S. Leitch for helping with data input, P. Johnson forstatistical advice, P. Jenkins, W. Cotteril, D. MacFadyenand F. Kigozi for their kind support.
REFERENCES
Balharry, D. & Daniels, M. J. (1998). Wild living cats in Scotland.Scottish Natural Heritage Research, Survey and Monitoring Report,No. 23. Edinburgh: Scottish Natural Heritage Research.
Beaumont, M., Barratt, E. M., Gottelli, D., Kitchener, A. C., Daniels,M. J., Pritchard, J. K. & Bruford, M. W. (2001). Genetic diversityand introgression in the Scottish wildcat. Mol. Ecol. 10: 319–336.
Carvalho, G. R., Shaw, P. W., Hauser, L., Seghers, B. H. &Magurran, A. E. (1996). Artificial introductions, evolutionary changeand population differentiation in Trinidadian guppies (Poeciliareticulata: Poeciliidae). Biol. J. Linn. Soc. 57: 219–234.
Daniels, M. J. (2001). What makes a wildcat wild? In The newencyclopedia of mammals: 38–39. Macdonald, D. W. (Ed.). Oxford:Oxford University Press.
Daniels, M. J., Balharry, D., Hirst, D., Kitchener, A. C. & Aspinall, R. J.(1998). Morphological and pelage characteristics of wild living catsin Scotland: implications for defining the ‘wildcat’. J. Zool. (Lond.)244: 231–247.
Daniels, M. J., Beaumont, M. A., Johnson, P. J., Balharry, D., Macdonald,D. W. & Barratt, E. (2001). Ecology and genetics of wild-living catsin the north-east of Scotland and the implications for the conservationof the wildcat. J. Appl. Ecol. 38: 146–161.
Driscoll, C. A., Menotti-Raymond, M., Nelson, G., Goldstein, D. &O’Brien, S. J. (2002). Genomic microsatellites as evolutionarychronometers: a test in wild cats. Genome Res. 12: 414–423.
French, D. D., Corbett, L. K. & Easterbee, N. (1988). Morphologicaldiscriminant functions of Scottish wildcats (Felis silvestris), do-mestic cats (F. catus) and their hybrids. J. Zool. (Lond.) 214: 235–259.
Harris, S., Morris, P., Wray, S. & Yalden, D. (1995). A review of Britishmammals: population estimates and conservation status of Britishmammals other than cetaceans. Peterborough: JNCC.
Harrison, D. L. & Bates, P. J. J. (1991). The Mammals of Arabia, 2ndedn. Sevenoaks: Harrison Zoological Museum.
Heptner, V. G. & Sludskii, A. A. (1972). Mammals of the Soviet Unionvolume II part 2 Carnivora (hyaenas and cats). Moscow: VysshayaShkola Publishers.
Hubbard, A. L., McOrist, S., Jones, T. W., Boids, R., Scott, R. &Easterbee, N. (1992). Is the survival of European wildcats Felissilvestris in Britain threatened by interbreeding with domestic cats?Biol. Conserv. 61: 203–208.
International Commission on Zoological Nomenclature (2003).Opinion 2027 (Case 3010) Usage of 17 specific names based on
wild species which are pre-dated by or contemporary with thosebased on domestic animals (Lepidoptera, Osteichthyes, Mammalia):conserved. Bull. Zool. Nomenclature 60: 81–84.
Kitchener, A. (1992). The Scottish wildcat Felis silvestris: decline andrecovery. In Cats: 21–41. Mansard, P. (Ed.). Hastings: The RidgewayTrust for Endangered Cats.
Kitchener, A. C. (1995). The wildcats. London: The Mammal Society.Kitchener, A. C. (1998). The Scottish wildcat – a cat with an identity
crisis? Brit. Wildl. 9: 232–242.Lynch, J. M., Conroy, J. W., Kitchener, A. C., Jefferies, D. J. & Hayden,
T. J. (1996). Variation in cranial form and sexual dimorphism amongfive European populations of the otter Lutra lutra (L.). J. Zool.(Lond.) 238: 81–96.
Macdonald, D. W. & Tattersall, F. (2001). Britain’s mammals: thechallenge for conservation. London: People’s Trust for EndangeredSpecies.
Nowell, C. & Jackson, P. (1996). Wild cats. Gland: IUCN.Pierpaoli, M., Biro, Z. S., Herrmann, M., Hupe, K., Fernandes, M.,
Ragni, B., Szemethy, L. & Randi, E. (2003). Genetic distinction ofwildcat (Felis silvestris) populations in Europe, and hybridisationwith domestic cats in Hungary. Mol. Ecol. 12: 2585–2598.
Pocock, R. I. (1951). Catalogue of the genus Felis. London: BritishMuseum.
Quinn, T. P., Kinnison, M. T. & Unwin, M. J. (2001). Evolution ofchinook salmon (Oncorhynchus tshawytscha) populations in NewZealand: pattern, rate, and process. Genetica 112: 493–513.
Randi, E., Pierpaoli, M., Beaumont, M., Ragni, B. & Sforzi, A. (2001).Genetic identification of wild and domestic cats (Felis silvestris) andtheir hybrids using Bayesian clustering methods. Mol. Biol. Evol. 18:1679–1693.
Reig, S., Daniels, M. J. & Macdonald, D. W. (2001). Craniometricdifferentiation within wild-living cats in Scotland using 3Dmorphometrics. J. Zool. (Lond.) 253: 121–132.
Roberts, A. (1951). The mammals of South Africa. South Africa: TheMammals of South Africa Book Fund.
Schauenberg, P. (1969). L’identification de chat forestier d’Europe Feliss. silvestris Schreber 1777 par une methode osteometrique. Rev.Suisse Zool. 76: 433–441.
Schauenberg, P. (1977). Longeur de l’intestin du chat forestier Felissilvestris Schreber. Mammalia 41: 357–360.
Smithers, R. H. N. (1983). The mammals of the southern Africansubregion. Pretoria: University of Pretoria Press.
Spassov, N., Simeonovski, V. & Spiridonov, G. (1997). The wild cat(Felis silvestris Schr.) and the feral domestic cat: problems of themorphology, taxonomy, identification of the hybrids and purity ofthe wild population. Hist. Nat. Bulgarica 8: 101–120.
Todd, N. B. (1965). Metrical and non-metrical variation in the skulls ofGir lions. J. Bombay Nat. Hist. Soc. 62: 507–520.
Wiseman, R., O’Ryan, C. & Harley, E. H. (2000). Microsatellite analysisreveals that domestic cat (Felis catus) and southern African wildcat( F. lybica) are genetically distinct. Anim. Conserv. 3: 221–228.
Yamaguchi, N., Driscoll, C. A., Ward, J. M., Kitchener, A. C. &Macdonald, D. W. (2004). Craniological differentiation amongst theEuropean wildcat (Felis silvestris silvestris), the African wildcat(F. s. lybica) and the Asian wildcat (F. s. ornata): implications fortheir evolution and conservation. Biol. J. Linn. Soc. 83 (in press).

348 N. YAMAGUCHI ET AL.
APPENDIX 1. Measurements of crania and mandibles.The numbers correspond to how these characters are measured as shown in Fig. 2
(1) Greatest length of skull(2) Condylobasal length(3) Facial length(4) Lateral length of snout(5) Length between Pm2 and M1
(6) Length between Pm2 and Pm4
(7) Greatest length of Pm4
(8) Greatest breadth of Pm4
(9) Anteroposterior diameter of the auditory bulla(10) Mastoid breadth(11) Greatest breadth of the occipital condyles(12) Greatest breadth of the foramen magnum(13) Greatest width of the braincase(14) Zygomatic breadth(15) Frontal breadth(16) Least breadth between the orbits(17) Greatest palatal breadth(18) Rostrum breadth: greatest breadth between the canine alveoli(19) Least breadth of the postorbital constriction(20) Breadth between the infraorbital foramina(21) Minimum length of the nasals(22) Maximum length of the nasals(23) Width of cranial suture(24) Maximum distance between pogonion and coronoid process(25) Maximum distance between pogonion and angular process(26) Length between mandibular Pm3 and M1
(27) Depth of the mandible behind M1
(28) Height of ramus(29) Maximum width of mandibular condyles (not shown in Fig. 2)(30) Maximum width of mandibular Pm4 (not shown in Fig. 2)(31) Cranial volume (not shown in Fig. 2)
APPENDIX 2. Differences in skull character scores between ‘wild’ and ‘non-wild’ cats in Britain and southern Africa.Statistically significant differences were detected using Mann-Whitney’s U -tests adjusted for ties
Average (range, number examined), Mann-Whitney’s U and P
Variables British wild British non-wild U P S.A. wild S.A. non-wild U P
Nasal shape 2.6 (1–3, 81) 1.8 (1–3, 100) 1806 < 0.0001 1.9 (1–3, 139) 1.6 (1–3, 15) 819 0.13Nasal pit 2.8 (2–3, 83) 1.8 (1–3, 100) 1633 < 0.0001 2.4 (1–3, 139) 2.5 (1–3, 15) 979 0.66Parietal suture 2.9 (2–3, 85) 1.8 (1–3, 103) 1338 < 0.0001 2.2 (1–3, 142) 2.1 (1–3, 17) 1012 0.23Nasal length 2.5 (1–3, 84) 2.2 (1–3, 102) 3137 0.0008 1.5 (1–3, 145) 1.8 (1–3, 18) 964 0.04Mandible 3 (75) 2.1 (1, 3, 95) 1988 < 0.0001 2.2 (1, 3, 132) 1.8 (1, 3, 18) 957 0.12Total 13.9 (11–15, 71) 9.8 (5–15, 93) 985 < 0.0001 10.1 (5–14, 121) 9.7 (7–13, 14) 716 0.33

Hybridisation
inw
ild-livingcats
349
APPENDIX 3. Differences in skull measurements between ‘wild’ and ‘non-wild’ cats in Britain and southern AfricaStatistically significant differences were detected using ANOVA (d.f. = 1 for all tests).∗Measurement was taken by N. Y. only and coefficient of variance (ME%) was 0.36%.∗∗Measurement was taken by N. Y. only and ME% was 0.71%.
Mean ± Standard Error (number examined), F and P
Variables British wild British non-wild F P S. Africa wild S. Africa non-wild F P
Measured variables (in mm unless stated)Greatest length
Male 99.54 ± 0.63 (30) 97.81 ± 0.95 (19) 2.49 0.12 103.55 ± 0.55 (73) 98.94 ± 1.34 (12) 9.81 0.0024Female 92.96 ± 0.78 (22) 93.20 ± 0.82 (24) 0.045 0.83 98.20 ± 0.52 (67) 96.40 ± 2.40 (4) 0.67 0.42
Condylobasal lengthMale 92.58 ± 0.67 (32) 91.34 ± 0.93 (23) 1.25 0.27 95.93 ± 0.60 (58) 92.33 ± 1.39 (11) 5.71 0.020Female 85.93 ± 0.58 (25) 85.45 ± 0.87 (26) 0.21 0.65 91.33 ± 0.50 (55) 89.47 ± 1.27 (4) 0.98 0.33
Facial lengthMale 37.13 ± 0.37 (32) 36.80 ± 0.42 (23) 0.35 0.55 37.98 ± 0.29 (56) 36.79 ± 0.60 (10) 2.59 0.11Female 34.01 ± 0.33 (25) 34.50 ± 0.35 (26) 1.04 0.31 36.17 ± 0.27 (54) 34.59 ± 0.88 (3) 1.85 0.18
Lateral snoutMale 24.82 ± 0.21 (33) 24.54 ± 0.34 (22) 0.52 0.47 25.70 ± 0.20 (57) 24.34 ± 0.55 (10) 6.54 0.013Female 22.69 ± 0.18 (25) 22.81 ± 0.26 (26) 0.13 0.72 24.37 ± 0.20 (55) 23.69 ± 0.80 (4) 0.77 0.38
Pm2–M1
Male 22.08 ± 0.12 (32) 21.54 ± 0.18 (18) 6.41 0.015 24.82 ± 0.16 (57) 23.88 ± 0.50 (11) 5.13 0.027Female 21.08 ± 0.12 (24) 21.25 ± 0.22 (26) 0.41 0.53 23.83 ± 0.13 (52) 22.95 ± 0.53 (3) 2.36 0.13
Pm2–Pm4
Male 21.10 ± 0.13 (33) 20.62 ± 0.17 (18) 4.69 0.035 23.76 ± 0.16 (57) 22.79 ± 0.44 (11) 5.81 0.019Female 20.06 ± 0.13 (24) 20.05 ± 0.23 (26) 0.001 0.97 22.72 ± 0.11 (52) 22.17 ± 0.66 (3) 1.26 0.27
Pm4 lengthMale 11.17 ± 0.07 (34) 10.80 ± 0.16 (20) 5.62 0.021 11.74 ± 0.08 (58) 11.32 ± 0.22 (11) 3.87 0.053Female 10.47 ± 0.08 (24) 10.37 ± 0.12 (26) 0.52 0.48 11.32 ± 0.08 (55) 11.05 ± 0.26 (4) 0.72 0.40
Pm4 breadthMale 6.01 ± 0.05 (34) 5.57 ± 0.10 (20) 17.43 0.0001 5.97 ± 0.07 (58) 5.71 ± 0.15 (11) 2.29 0.14Female 5.55 ± 0.06 (25) 5.31 ± 0.10 (26) 3.95 0.052 5.54 ± 0.06 (54) 5.57 ± 0.10 (4) 0.017 0.90
Auditory bullaMale 20.86 ± 0.17 (34) 20.58 ± 0.21 (22) 1.09 0.30 23.28 ± 0.17 (58) 22.13 ± 0.43 (11) 6.87 0.011Female 19.93 ± 0.19 (24) 19.53 ± 0.24 (26) 1.63 0.21 22.43 ± 0.13 (54) 20.94 ± 0.55 (4) 8.76 0.0045
Mastoid breadthMale 44.77 ± 0.23 (33) 43.91 ± 0.42 (21) 3.73 0.059 45.47 ± 0.23 (57) 44.24 ± 0.65 (11) 4.20 0.044Female 42.60 ± 0.25 (25) 41.98 ± 0.22 (26) 2.31 0.13 43.44 ± 0.23 (54) 42.90 ± 0.96 (4) 0.36 0.55
Occipoital condylesMale 24.79 ± 0.13 (33) 23.55 ± 0.32 (22) 16.26 0.0002 24.35 ± 0.13 (58) 23.71 ± 0.37 (11) 3.57 0.063Female 23.60 ± 0.14 (25) 22.96 ± 0.22 (26) 5.80 0.020 23.35 ± 0.13 (55) 23.84 ± 0.44 (4) 0.97 0.33

350N
.YA
MA
GU
CH
IE
TA
L.
APPENDIX 3. Continued
Mean ± Standard Error (number examined), F and P
Variables British wild British non-wild F P S. Africa wild S. Africa non-wild F P
Foramen magnumMale 15.18 ± 0.10 (33) 14.25 ± 0.17 (22) 24.68 < 0.0001 15.14 ± 0.09 (58) 14.46 ± 0.21 (11) 4.54 0.037Female 14.79 ± 0.12 (25) 14.36 ± 0.15 (26) 4.74 0.034 14.63 ± 0.09 (55) 14.71 ± 0.17 (4) 0.043 0.84
Brain caseMale 47.12 ± 0.21 (32) 44.88 ± 0.44 (19) 26.64 < 0.0001 47.36 ± 0.20 (58) 45.22 ± 0.65 (11) 16.03 0.0002Female 45.83 ± 0.26 (22) 44.18 ± 0.39 (24) 11.85 0.0013 46.28 ± 0.17 (55) 44.17 ± 0.41 (4) 10.51 0.0020
Zygomatic breadthMale 70.48 ± 0.57 (34) 70.54 ± 0.77 (21) 0.004 0.95 72.60 ± 0.51 (54) 69.87 ± 0.99 (11) 4.98 0.029Female 66.42 ± 0.63 (25) 66.29 ± 0.59 (26) 0.023 0.88 68.37 ± 0.37 (53) 68.07 ± 1.07 (4) 0.047 0.83
Frontal breadthMale 49.35 ± 0.44 (32) 49.91 ± 0.76 (19) 0.47 0.50 53.74 ± 0.44 (51) 51.03 ± 0.65 (11) 7.37 0.0087Female 48.23 ± 0.49 (24) 49.87 ± 0.73 (26) 3.40 0.071 51.85 ± 0.37 (51) 49.76 ± 1.05 (4) 2.39 0.13
Interorbital breadthMale 19.43 ± 0.25 (33) 18.77 ± 0.30 (22) 2.90 0.094 19.25 ± 0.20 (57) 18.30 ± 0.25 (11) 4.14 0.046Female 18.42 ± 0.21 (25) 17.65 ± 0.25 (26) 5.31 0.025 18.18 ± 0.15 (55) 17.55 ± 0.73 (4) 1.19 0.28
Palatal breadthMale 41.10 ± 0.25 (34) 39.94 ± 0.37 (20) 7.29 0.0093 40.73 ± 0.20 (55) 39.96 ± 0.54 (10) 2.16 0.15Female 38.85 ± 0.27 (25) 38.58 ± 0.32 (26) 0.41 0.52 38.94 ± 0.21 (54) 39.56 ± 1.01 (4) 0.56 0.46
Rostrum breadthMale 24.09 ± 0.18 (34) 23.89 ± 0.35 (20) 0.31 0.58 24.71 ± 0.17 (57) 24.30 ± 0.36 (9) 0.79 0.38Female 22.31 ± 0.20 (25) 22.08 ± 0.21 (26) 0.60 0.44 23.13 ± 0.17 (55) 23.32 ± 0.67 (4) 0.087 0.77
Postorbital constrictionMale 33.52 ± 0.26 (32) 32.01 ± 0.44 (22) 10.05 0.0026 35.18 ± 0.27 (55) 33.23 ± 0.79 (11) 8.09 0.0060Female 34.29 ± 0.32 (25) 33.07 ± 0.40 (26) 5.66 0.021 35.28 ± 0.22 (55) 31.27 ± 0.99 (4) 21.82 < 0.0001
Between infraorbital foramenaMale 29.22 ± 0.21 (33) 27.89 ± 0.43 (22) 9.42 0.0034 27.96 ± 0.20 (55) 26.29 ± 0.38 (11) 12.23 0.0009Female 27.08 ± 0.25 (25) 26.41 ± 0.32 (26) 2.70 0.11 26.59 ± 0.20 (55) 25.95 ± 1.46 (4) 0.65 0.43
Minimum nasalMale 22.52 ± 0.32 (30) 22.41 ± 0.35 (22) 0.060 0.81 21.62 ± 0.23 (54) 21.08 ± 0.40 (9) 0.89 0.36Female 20.83 ± 0.25 (23) 21.44 ± 0.32 (26) 2.16 0.15 20.81 ± 0.20 (53) 19.51 ± 0.58 (3) 2.13 0.15
Cranial sutureMale 15.86 ± 0.75 (32) 11.26 ± 1.13 (21) 12.46 0.0009 14.85 ± 0.65 (56) 12.65 ± 1.42 (10) 1.80 0.18Female 20.88 ± 0.62 (23) 16.58 ± 1.07 (24) 12.04 0.0011 18.47 ± 0.58 (54) 11.57 ± 2.14 (4) 9.78 0.0028
Pm3–M1 (mandible)Male 21.22 ± 0.14 (32) 20.46 ± 0.26 (18) 7.92 0.0071 23.37 ± 0.15 (54) 22.28 ± 0.50 (11) 7.07 0.010Female 20.33 ± 0.14 (23) 19.94 ± 0.20 (24) 2.57 0.12 22.43 ± 0.15 (54) 21.41 ± 0.55 (4) 3.21 0.079
Ramus (mandible)Male 30.60 ± 0.40 (32) 29.73 ± 0.59 (18) 1.55 0.22 30.03 ± 0.30 (55) 28.96 ± 0.64 (11) 2.18 0.14Female 27.38 ± 0.40 (23) 27.42 ± 0.29 (24) 0.006 0.94 27.77 ± 0.24 (54) 27.57 ± 0.95 (4) 0.049 0.82

Hybridisation
inw
ild-livingcats
351APPENDIX 3. Continued
Mean ± Standard Error (number examined), F and P
Variables British wild British non-wild F P S. Africa wild S. Africa non-wild F P
WMC (mandible)Male 14.85 ± 0.15 (29) 14.61 ± 0.27 (18) 0.75 0.39 15.43 ± 0.20 (55) 14.32 ± 0.30 (11) 5.64 0.021Female 13.57 ± 0.18 (20) 13.85 ± 0.21 (24) 1.01 0.32 13.91 ± 0.14 (55) 14.08 ± 0.33 (4) 0.099 0.75
Pm4 breadth (mandible)Male 3.18 ± 0.04 (31) 3.11 ± 0.06 (18) 1.13 0.29 3.53 ± 0.03 (54) 3.40 ± 0.10 (11) 2.25 0.14Female 3.03 ± 0.03 (23) 3.03 ± 0.05 (23) 0.002 0.97 3.40 ± 0.03 (55) 3.33 ± 0.11 (4) 0.38 0.54
Angular process (mandible)Male 66.29 ± 0.59 (32) 65.23 ± 0.84 (18) 1.10 0.30 67.22 ± 0.48 (55) 64.40 ± 0.85 (11) 6.07 0.016Female 61.49 ± 0.64 (22) 61.34 ± 0.56 (24) 0.028 0.87 63.38 ± 0.40 (54) 62.85 ± 1.47 (4) 0.12 0.73
Coronoid process (mandible)Male 64.33 ± 0.41 (32) 64.60 ± 0.67 (18) 0.14 0.71 68.86 ± 0.43 (55) 65.26 ± 1.01 (11) 11.59 0.0011Female 60.12 ± 0.57 (23) 61.46 ± 0.65 (24) 2.39 0.13 65.38 ± 0.43 (53) 64.26 ± 1.73 (4) 0.46 0.50
Cranial volume (ml)Male 42.93 ± 0.47 (32) 35.64 ± 1.21 (27) 35.68 < 0.0001 41.45 ± 0.45 (73) 35.45 ± 1.22 (12) 24.05 < 0.0001Female 41.06 ± 0.69 (21) 32.37 ± 0.92 (40) 39.96 < 0.0001 38.31 ± 0.43 (65) 32.55 ± 1.31 (4) 10.54 0.0018
∗M1 length (mandible)Male 8.07 ± 0.09 (19) 7.65 ± 0.16 (18) 5.76 0.022 9.15 ± 0.07 (53) 8.74 ± 0.28 (11) 4.19 0.045Female 7.55 ± 0.11 (14) 7.40 ± 0.09 (24) 1.09 0.30 8.81 ± 0.08 (55) 8.42 ± 0.26 (4) 1.77 0.19
∗∗M1 breadth (mandible)Male 3.73 ± 0.05 (19) 3.36 ± 0.08 (18) 20.49 < 0.0001 3.98 ± 0.04 (53) 3.72 ± 0.10 (11) 8.02 0.0062Female 3.40 ± 0.05 (14) 3.31 ± 0.05 (24) 1.58 0.21 3.83 ± 0.04 (55) 3.62 ± 0.05 (4) 2.07 0.16
Derived variablesCranial index 2.31 ± 0.022 (45) 2.74 ± 0.068 (43) 38.48 < 0.0001 2.55 ± 0.019 (141) 2.87 ± 0.069 (17) 28.13 < 0.0001IOF/snout 1.19 ± 0.005 (61) 1.15 ± 0.007 (65) 20.48 < 0.0001 1.09 ± 0.004 (112) 1.09 ± 0.014 (15) 0.003 0.96Palatal/Pm2-M1 1.85 ± 0.008 (58) 1.82 ± 0.013 (52) 4.68 0.033 1.64 ± 0.007 (109) 1.70 ± 0.021 (14) 9.76 0.0022POC/IOB 1.80 ± 0.019 (59) 1.79 ± 0.020 (61) 0.19 0.66 1.89 ± 0.015 (113) 1.83 ± 0.044 (16) 2.27 0.13CP/AP 0.97 ± 0.003 (55) 1.00 ± 0.006 (42) 13.90 0.0003 1.03 ± 0.002 (111) 1.02 ± 0.006 (16) 1.32 0.25
Abbreviations used: Pm2, premolar 2; Pm3, premolar 3; Pm4, premolar 4; M1, molar 1; WMC, maximum width of mandibular condyles; IOF/snout, distance between the infraorbital foraminadivided by the lateral length of the snout; Palatal/Pm2–M1, ratio of palatal breadth to Pm2–M1; POC/IOB, ratio of postorbital constriction to interorbital breadth; CP/AP, ratio of the distancebetween the coronoid process (C) and pogonion (P) to that between angular process (A) and pogonion.For further details, see Fig. 2 and Appendix 1.
Copyright © 2022 FDOKUMEN