cover FaysalBank-2015 copy - State Bank of Pakistan
118
Annual Report 2015
-
Upload
khangminh22 -
Category
Documents
-
view
6 -
download
0
Transcript of cover FaysalBank-2015 copy - State Bank of Pakistan

Annual Report 2015

01Annual Report 2015
CONTENTS
Introduction 02
Chairman's Message 05
Corporate DNA 06
Board of Directors – Profiles 10
Company Information 13
Board Meeting Attendance 15
Senior Management – Profiles 22
Shariah Board – Profiles 25
Senior Management and
Internal Committees 27
Organisational Structure 30
Six Year Financial Summary
(plus graphical presentation) 32
Statement of Value Added 52
Notice of the 21st Annual
General Meeting 54
Report of the Board Audit and
Corporate Governance Committee 61
Auditors' Review Report on Compliance
with Code of Corporate Governance 62
Statement of Compliance with
Code of Corporate Governance 63
Faysal Bank Financials
Directors' Report 66
Statement of Internal Controls 80
Auditors' Report to the Members 81
Statement of Financial Position 82
Profit and Loss Account 83
Statement of Comprehensive Income 84
Statement of Changes in Equity 85
Cash Flow Statement 86
Notes to the Financial Statements 87
Annexures 175
Shariah Board’s Report 2015 191
Other Information
Pattern of Shareholding 193
Branch Network - Conventional 199
Branch Network - Islamic 208
Code of Conduct 212
Glossary of Terms 221
Form of Proxy 227


05Annual Report 2015
Chairman’s Message
Assalam o Alaikum
The year 2015 was a year of consolidation and growth for Faysal Bank Limited. During the course of the
year, Faysal Bank saw significant growth in profitability as compared to last year which has allowed us to
further strengthen our franchise and establish a strong position as a key market player. Despite a declining
interest rate scenario and various other external factors, the Faysal Bank team was able to generate a
positive momentum and surpass the standards set for the year. Furthermore, during the course of this year,
the Bank enhanced focus on cross selling initiatives and institutionalised a multi-product sales approach.
This progressive strategy yielded results in the shape of strong bottom-line contribution from various
businesses including Retail Banking, Commercial Banking, Small Medium Enterprises and Corporate
Banking.
Faysal Bank Management Team under the guidance of the Board of Directors and the Sub-Committees
focused unified efforts towards generating value for customers through improvement in customer experience.
This was achieved through concerted focus on training and development of frontline staff. The year was
marked by numerous customer engagement initiatives and launches of specialised alliances which have
positioned the Bank as one of the leading players in the industry. On an internal level, the Management
Team, has inculcated a performance based culture with complete clarity on performance indicators such
that the team is fully geared up towards achieving common goals. Strong reporting tools and technological
support continue to be at the base of Faysal Bank’s growth and future strategy.
With this critical consolidation phase behind us, Faysal Bank is now well poised to leverage internal and
external synergies to move towards an aggressive expansion phase. In line with the Board’s directives, the
Bank has planned strong footprint growth in the Islamic Banking network with focus concentrated towards
asset and core deposit mobilisation. This would allow the Bank to penetrate into new customer segments
and further improve the deposit mix.
Our core strength will always be our people, our customers, stakeholders and our employees. We aim to
set ourselves apart through excellence in customer experience, achieved through highly trained and
professional staff along with robust technological platforms.
I am confident that the year 2016 will see Faysal Bank set new benchmarks in success while building upon
its existing brand equity.
Farooq RahmatullahChairman of the Board

06 Annual Report 2015
CORPORATE DNA
Our Vision
Excellence in all that we do
Our Values
Our daily code of conduct is exemplified by eight core values:Four threshold values - values at the heart of our brandFour differentiator values - values that set our brand apart
Threshold Values
Values at the heart of our brand
Integrity:
We are recognised by our reliability, credibility and characterWe believe in ethical, honourable, time-proven principles of uprightnessWe stand for and abide by honesty, truth and transparency
Our Integrity: Our Identity
Respect:
We hold our customers, investors and regulators in high esteemWe uphold our customers' rights to demand efficient serviceWe appreciate and respect our profession and, above all, our Bank
Our Respect: Our Duty
Teamwork:
We function as a team. Within functions,we cooperate Between functions, we collaborate Together, we aim for excellence and leadership in our chosen markets
Our Team: Our Asset
Professionalism:
We are proficient and efficient in all that we do We provide banking services knowledgeably and skillfully We uphold regulatory obligations
Our Professionalism: Our Competence
07Annual Report 2015
CORPORATE DNA
Our Mission
Achieve leadership in providing financial services in chosen markets through innovation
Differentiator Values
Values that set our brand apart
Passion
We bring zeal and enthusiasm for banking to work We are excited to provide customers with the best or the best-suited We go the extra mile in legitimate, acceptable ways
Our Passion: Our Worth
Responsiveness
We are receptive to the need for change and improvementWe are proactive and anticipate our customers' needs and wants We act quickly to modify, adjust or prepare for new realities
Our Responsiveness: Our Distinguisher
Innovation
We pioneer novel and more efficient ways to deliver solutionsWe are dedicated to a culture of improvement and modernisation We stand for originality, in thought, in action and in belief
Our Innovation: Our Strength
Compassion
Our concern for our colleagues, our customers, our communities, and our country sets us apart To each other, we are a family For each other, we are a meaningful source of shared humanity
Our Compassion: Our Gift

Farooq RahmatullahChairman
Ahmed Abdulrahim Mohamed Abdulla BucheeryVice Chairman
Nauman AnsariPresident & Chief Executive Officer
Mian Muhammad YounisDirector
Imtiaz Ahmad PervezDirector
Juma Hasan Ali AbulDirector
Abdulelah Ebrahim Mohamed Al-QasimiDirector
Left - Right:
BOARD OF DIRECTORS
Annual Report 2015
BOARD OF DIRECTORS
Annual Report 2015

10 Annual Report 2015
Mr. Farooq RahmatullahChairman
Farooq Rahmatullah is a Law graduate. He joined Burmah Shell Oil & Distribution Company in 1968 and worked in different roles in Chemicals, Human Resources, Marketing, Supply, Distribution, Retail, etc. He was transferred to Shell International London in 1994 as a Manager in the Business Strategy Division and was involved in various portfolios covering over 140 countries. On his return in 1998, he was appointed as Head of Operations of Shell Pakistan and was looking after Middle East and South Asia (MESA). In 2001, he was appointed as Chairman of Shell Companies in Pakistan and Managing Director of Shell Pakistan Limited.
He is currently leading an Expert Energy group which has developed a 25-year Integrated Energy Plan (first time ever in the history of energy planning) for the country. This plan has been in principle accepted by the Government, Pakistan Business Council, international agencies and some other stakeholders. The Expert Energy group continues to work in updating and revising the energy plan on an annual basis and engaging political leadership and other stakeholders.
Key Positions Held:
• Chairman of Shell Companies in Pakistan and Managing Director of Shell Pakistan Limited
• Founding Member of PAPCO (Pak Arab Pipeline Company Limited)
• Director General of Civil Aviation Authority of Pakistan
• Chairman of Oil and Gas Development Company Limited
• Chairman of LEADS Pakistan• Chairman of Pakistan Refinery Limited• Founding Member of Pakistan Human
Development Fund• Member of the Economic Advisory Council,
Ministry of Finance, Government of Pakistan• Member of National Commission of
Government Reforms• Director on the Boards of PCB, PIA and
Pakistan Stone Development Company
He is serving on the Boards of Directors of
• Faysal Bank Limited• Society for Sustainable Development• Resource Development Committee of Aga Khan
University Hospital• Pakistan Refinery Ltd.-Director and Chairman
of the Board
He is also a Trustee of Legends Trust (Formed by the Government of Sindh)
Mr. Ahmed Abdulrahim Mohamed Abdulla BucheeryVice Chairman
Ahmed Abdulrahim holds an MBA from the University of Glamorgan, Wales (UK), and is an Associate Financial Accountant from the Institute of Financial Accountants, London (UK). He also holds an Executive Management Diploma from the University of Bahrain and an Advance Banking Diploma from the Bahrain Institute of Banking and Finance. He is also a certified Director from the Pakistan Institute of Corporate Governance.
Ahmed Abdulrahim is the Chief Executive Officer of Ithmaar Bank B.S.C. He started his career with Aluminum Bahrain and, after five years of service ending up as Senior Supervisor, Cash and Banking, as well as one year with Chase Manhattan Bank where he was Head of Financial Control. He joined the National Bank of Bahrain where he served for 28 years in various executive levels and in different capacities, including Manager of Foreign Exchange and Funding, Chief Internal Auditor and Assistant General Manager of Corporate Serv ices Group.
Ahmed Abdulrahim held the dual roles of Deputy Chief Executive Officer at Shamil Bank and Chief Operating Officer at Ithmaar Bank for approximately four years. Following the reorganisation of Shamil Bank and Ithmaar Bank in 2010, he took charge of the Retail Banking Group as General Manager. He currently serves as board member of Faysal Bank Limited (Pakistan), Family Bank, The Benefit Company B.S.C. and Injaz Bahrain.
BOARD OF DIRECTORS – PROFILES
11Annual Report 2015
Mr. Nauman AnsariPresident & Chief Executive Officer
Nauman Ansari has over 22 years of rich Credit, Corporate and Investment Banking experience, having been associated with Standard Chartered Bank (Karachi), Bank of America (Karachi), ABN AMRO (in Pakistan, Middle East and Asia Pacific regions), Fortis Bank (Middle East) and Crescent Commercial Bank (Pakistan). Nauman holds a Bachelors of Science degree in Business Studies from the USA. He is also a certified Director from the Pakistan Institute of Corporate Governance.
Mian Muhammad YounisDirector
Mian Mohammad Younis has 37 years of experience in Public, Banking and Financial sectors and has retired as an Additional Secretary of the Ministry of Finance of the Government of Pakistan. In that capacity he has extensive knowledge of Corporate Sector Governance, Rules, Regulations and Audit Procedures. During his career, he was Head, Inter-Governmental Finance Wing, Regulation Wing, and Human Resource Wing of Finance Division as Additional Finance Secretary (AFS). He was Chief Operating Officer (CEO) of Khushal Pakistan Fund Limited and Secretary to National Finance Commission. He completed the process of liquidation of Federal Bank for cooperative (FBL) and Agriculture Marketing and Storage limited (AMSL) as liquidator (ASML).
Mr. Younis established new ventures and financial public Sector entities through mergers.He contributed towards policy formulation as member of Boards of various corporate sector entities, Banks and carried out financial restructuring of a number of non-banking Financial Corporations. Affected recovery of loans extended to Provincial Governments & other Public Sector entities by Federal Government and also assisted State Bank of Pakistan (SBP) in managing the over draft position of provinces, AJK, and various Public Sector Corporations. He supervised not only the Expenditure Budget of Federal Govt. but also implemented Social Sector Programs.
As Mr. Younis served in public sector for a long time, he gained vast experience in the management of HR through HR policies implementation, while holding positions in different Government, Semi Government and Autonomous Bodies i.e. FBR, BOI, Pakistan Software Export Board (PSEB). He established Relief Funds and framed their accounting procedures, Financial/Investment Rules in consultation with Controller General Accounts (CGA) and Auditor General of Pakistan Office.
He holds a Master’s Degree in Economics and is also qualified in Project Appraisal & Risk Management (Duke, USA), Assessing Financial System Stability (IMF Institute, Singapore), Promotion of Direct Foreign Investment (Osaka, Japan), Promotion of Agro Based Industry (Manila Philippines), and Islamic Banking (Kuala Lumpur, Malaysia). He is also a Certified Director from the Pakistan Institute of Corporate Governance.
Mr. Imtiaz Ahmad PervezDirector
Imtiaz Ahmad Pervez has more than 35 years of banking experience. Currently Mr. Pervez is serving as a Director of Ithmaar Bank BSC, Bahrain. His most recent position, from which he resigned in March 2012, was Director of the Al Baraka Bank Pakistan Limited.
He was, earlier, also a board member of the Faysal Islamic Bank of Bahrain; Faysal Investment Bank of Bahrain EC.; Faysal Bank Ltd. Pakistan; Faysal Investment Bank Ltd. Pakistan; Trust Leasing Corp. Limited and Namco Management Company Ltd. From 1959 to 1994, he held many senior positions in the banking industry including that of Chief Operating Officer of Faysal Islamic Bank of Bahrain EC. He was also CEO of Al Faysal Investment Bank Ltd. Pakistan in the year 1990.
He holds a B.A. degree from University of the Punjab, Pakistan and is a Fellow of the Institute of Islamic Banking & Insurance, London.
BOARD OF DIRECTORS – PROFILES

12 Annual Report 2015
Mr. Juma Hasan Ali AbulDirector
Key Positions Held
• Fellow member of the Chartered Association of Certified Accountants, England
• Certified Director from the Pakistan Institute of Corporate Governance• Graduated from Cairo, with a Bachelor Degree in
Accounting• Executive General Manager, Ithmaar Bank BSC,
Bahrain (2010-2013) responsible for the support functions: Financial Control, Strategic Planning, Information Technology, Banking Operations, Legal Affairs, Human Capital, Remedial Management, Administration, Shareholders Affairs, Corporate Communication
• General Manager MFAI (Jersey) (2000-2010), wholly owned subsidiary of the DMI group, providing investment and remedial advisory services to the Group
• Executive Senior Manager, Shamil Bank of Bahrain BSC (formerly: Faysal Islamic Bank of Bahrain) 1988-2000; held several senior positions: Head of Financial Control; Head of Internal Audit; Head of Administration, Operations; Head of Corporate Banking Group; Head of Investment Banking Group
• Board member of: Faysal Bank, Pakistan; Islamic Investment Company of the Gulf (under process); CITIC International Assets Management, Hong Kong; United Bank of Albania (until 2011); Gulf Investment Co., Egypt; in addition to sitting on the boards of directors of a number of entities including trading, industrial, real estate development entities in Bahrain, Cayman, Egypt and U.S.A.
• Worked with Touche Rose, London (now Deloitte) - Chartered Accountants. Peat Marwick Mitchell (now KPMG) Bahrain - Chartered Accountants
• Led and was involved in a number of mergers and acquisitions, restructuring of projects and spin offs
Mr. Abdulelah Ebrahim Mohamed Al-QasimiDirector
Mr. Al-Qasimi has more than 31 years of diversified management experience.
His previous positions include Chief Executive of the Labor Fund (Tamkeen), from which he resigned in May 2010, Deputy Chief Executive Officer of Labor Fund Project at the Bahrain Economic Development Board, Assistant Undersecretary for Training at the Bahrain Ministry of Labor and Social Affairs, Director of Engineering and Maintenance at the BahrainMinistry of Health. He has also served as the Chairman of the Bahrain Qualifications Framework Steering Committee and the Steering Committee of Career Expo and was a Board member of the Bahrain Society of Engineers and the Bahrain Consumer Protection Society.
He is currently a Member of the Board of Ithmaar Bank, Tamkeen, Solidarity Group Holding, Durah Resort Management Company, Naseej BSC, Faysal Bank Limited (Pakistan) and the Bahrain Development Bank, , as well as a Member of the Committee for HRH Princess Sabeeka bint Ibrahim Al Khalifa's Award for Women Empowerment (Supreme Council for Women, SCW).
Mr. Al-Qasimi holds a BSc in Civil Engineering from Queen Mary College, University of London, UK, and MSc in Health Facility Planning from the University of North London, UK, and a Diploma in Health Care Management from the Royal College of Surgeons in Ireland, Bahrain. He is also a certified Director from the Pakistan Institute of Corporate Governance.
BOARD OF DIRECTORS – PROFILES
13Annual Report 2015
COMPANY INFORMATION AS OF DECEMBER 31, 2015
Board of Directors
Mr. Farooq Rahmatullah Chairman/Independent Director
Mr. Ahmed Abdulrahim Mohamed Abdulla Bucheery Vice Chairman/Non-Executive Director
Mr. Nauman Ansari President & CEO
Mian Muhammad Younis Independent Director
Mr. Imtiaz Ahmad Pervez Non-Executive Director
Mr. Juma Hasan Ali Abul Non-Executive Director
Mr. Abdulelah Ebrahim Mohamed AlQasimi Non-Executive Director
Board Audit & Corporate Governance Committee
Mian Muhammad Younis Chairman
Mr. Ahmed Abdulrahim Mohamed Abdulla Bucheery Member
Mr. Juma Hasan Ali Abul Member
Board Risk Management Committee
Mr. Imtiaz Ahmad Pervez Chairman
Mr. Abdulelah Ebrahim Mohamed AlQasimi Member
Mr. Nauman Ansari Member
Recruitment Nomination and Remuneration Committee
Mr. Ahmed Abdulrahim Mohamed Abdulla Bucheery Chairman
Mr. Juma Hasan Ali Abul Member
Mian Muhammad Younis Member
Mr. Nauman Ansari Member

14 Annual Report 2015
COMPANY INFORMATION AS OF DECEMBER 31, 2015
Board Steering Committee for Conversion of Faysal Bank into Islamic Bank
Mr. Farooq Rahmatullah Chairman
Mr. Ahmed Abdulrahim Mohamed Abdulla Bucheery Member
Mr. Juma Hasan Ali Abul Member Mr. Nauman Ansari Member
Syed Majid Ali Chief Financial Officer
Mr. Aurangzeb Amin Company Secretary & Head of Legal
M/s. A.F. Ferguson & Co, Chartered Accountants Auditors
M/s. Mohsin Tayebaly & Co, Advocate Legal Advisors
Registered Office
Faysal Bank LimitedFaysal House, St-02, Commercial Lane,Main Shahrah-e-Faisal,Karachi-Pakistan
UAN: (92-21) 111-747-747Tel: (92-21) 3279-5200Fax: (92-21) 3279-5226Website:www.faysalbank.com
Share Registrar
M/s. Central Depository Company ofPakistan Limited(Share Registrar Department)CDC House, 99-B, Block-B,SMCHS, Main Shahrah-e-Faisal,Karachi-74400
Tel: (92-21) 111-111-500Fax: (92-21) 34326053Email: [email protected]
15Annual Report 2015
ATTENDANCE OF BOARD OF DIRECTORSMEETINGS DURING THE YEAR 2015
ATTENDED BY /MEETING DATE
26-02-15
28-04-15
10&11-05-15
26-08-15 23-12-1502-09-15 27&28-10-15 23-11-15
Farooq Rahmatullah
Ahmed AbdulrahimMohamed Abdulla Bucheery
Nauman Ansari
Mian Muhammad Younis
Juma Hasan Ali Abul
Imtiaz Ahmad Pervez
Muhammad Wasif Ijlal
Abdulelah Ebrahim Mohamed Al Qasimi
2 9 - 0 1 - 1 5
Co-opted on February
6, 2015
Leave of Absence
Leave of Absence
Resigned Effective
from December
3, 2015

16 Annual Report 2015
ATTENDANCE OF BOARD AUDIT & CORPORATE GOVERNANCE COMMITTEE MEETINGS DURING THE YEAR 2015
ATTENDED BY /MEETING DATE
2 7 - 0 4 - 1 5 04-08-15
25-08-15 26-10-15
Mian Muhammad Younis
Ahmed Abdulrahim Mohamed Abdulla Bucheery
Juma Hasan Ali Abul
25-02-15
17Annual Report 2015
ATTENDANCE OF BOARD RISK MANAGEMENT COMMITTEE MEETINGS DURING THE YEAR 2015
ATTENDED BY /MEETING DATE
2 7 - 0 4 - 1 5 25-08-15 26-10-15
Imtiaz Ahmad Pervez
Abdulelah Ebrahim Mohamed AlQasimi
Nauman Ansari
25-02-15

18 Annual Report 2015
ATTENDANCE OF RECRUITMENT, NOMINATION AND REMUNERATION COMMITTEE MEETINGS DURING THE YEAR 2015
Appointed onSeptember
2, 2015
Voluntarily Stepdown from RNRC
Voluntarily Stepdown from RNRC
Voluntarily Stepdown from RNRC
Voluntarily Stepdown from RNRC
Voluntarily Stepdown from RNRC
ATTENDED BY /MEETING DATE
26-02-15 28-04-15 01-07-15 25-08-15
Ahmed Abdulrahim Mohamed Abdulla Bucheery
Juma Hasan Ali Abul
Farooq Rahmatullah
Nauman Ansari
Mian Muhammad Younis
29-01-15 26-10-15 23-12-15
19Annual Report 2015
ATTENDANCE OF BOARD STEERING COMMITTEE FOR CONVERSION OF FAYSAL BANK INTO ISLAMIC BANK
MEETINGS DURING THE YEAR 2015
Appointed onSeptember
2, 2015
ATTENDED BY /MEETING DATE
2 7 - 0 4 - 1 5 25-08-15 26-10-15
Ahmed Abdulrahim MohamedAbdulla Bucheery
Juma Hasan Ali Abul
Nauman Ansari
Farooq Rahmatullah
25-02-15

Standing L - R:
Raheel IjazHead Compliance
Nasir IslamHead Internal Audit
Fouad FarrukhHead Retail Banking
Bilal AsgharHead Corporate & Investment Banking
Muhammad Aurangzeb AminCompany Secretary & Head Legal
Hasan Junaid NasirHead Islamic Banking
Syed Majid AliChief Financial Officer
AbadullahHead Operations
Khurram Gul AghaHead IT & Transaction Banking
Salman Ahmed UsmaniHead Treasury
Nauman AnsariPresident & Chief Executive Officer
Muhammad Merajuddin AhmedHead Human Resources
Yousaf HussainChief Risk Officer
Mohammad Zahid AhmedHead Strategy
Seated L - R:
SENIOR MANAGEMENT
Annual Report 2015
SENIOR MANAGEMENT
Annual Report 2015
Standing L - R:
Raheel IjazHead Compliance
Nasir IslamHead Internal Audit
Fouad FarrukhHead Retail Banking
Bilal AsgharHead Corporate & Investment Banking
Muhammad Aurangzeb AminCompany Secretary & Head Legal
Hasan Junaid NasirHead Islamic Banking
Syed Majid AliChief Financial Officer
AbadullahHead Operations
Khurram Gul AghaHead IT & Transaction Banking
Salman Ahmed UsmaniHead Treasury
Nauman AnsariPresident & Chief Executive Officer
Muhammad Merajuddin AhmedHead Human Resources
Yousaf HussainChief Risk Officer
Mohammed Zahid AhmedHead Strategy
Seated L - R:
SENIOR MANAGEMENT
Annual Report 2015
SENIOR MANAGEMENT
Annual Report 2015

22 Annual Report 2015
Nauman AnsariPresident & CEO
Nauman Ansari has over 22 years of rich Credit, Corporate and Investment Banking experience, having been associated with Standard Chartered Bank (Karachi), Bank of America (Karachi), ABN AMRO (in Pakistan, Middle East and Asia Pacific regions), Fortis Bank (Middle East) and Crescent Commercial Bank (Pakistan). Nauman holds a Bachelors of Science degree in Business Studies from the USA. He is also a certified Director from the Pakistan Institute of Corporate Governance.
Salman Ahmed UsmaniHead Treasury
Salman Ahmed Usmani has extensive experience of over 27 years in both the multinational and local banking sector, with expertise in Treasury and Risk Management, Asset and Liability Management, Strategic Planning, Corporate Restructuring, Strategic Negotiations, Acquisitions and Strategic Alliances and International Operations. Prior to joining Faysal Bank Limited, he was associated with MCB Bank Limited as Global Treasurer and Head Investment Banking Group. His past experience has been with organisations such as ANZ Grindlays, American Express, Bank of America, Mashreq Bank and United Bank Limited.
Syed Majid AliChief Financial Officer Syed Majid Ali has over 26 years of diversified experience, progressively responsible in the Accounts and Finance disciplines of banking with exposure in IT and HR activities. He has been associated as CFO with Emirates Bank International and Saudi Pak Commercial Bank, as well as KPMG as Partner. Majid is a Fellow member of the Institute of Chartered Accountants.
Yousaf HussainChief Risk Officer
Yousaf Hussain has over 21 years of professional experience, primarily at ABN AMRO Bank within the Corporate/Credit and Transaction Banking functions. He was previously Head of Corporate Banking (North) at Faysal Bank before assuming the portfolio of Special Assets Management where through his active support various strategic level initiatives were introduced. He has been with Faysal Bank since August 2008. His experience also entails senior assignments at Samba Bank, Mashreq Bank, Motorola/Mobilink and Siemens Pakistan. Yousaf has a Bachelor of Science degree in Electrical Engineering, and has done his MBA from LUMS.
Khurram Gul AghaHead Information Technology & Transaction Banking
Khurram Gul Agha's career spans 21 years, during which, he has held key roles in IT, Operations and Transaction Banking in both financial and non-financial sectors. Prior to joining Faysal Bank, Khurram has been associated with TCS (Pvt) Ltd, Citibank, UBL, First Data and NIB Bank. His last assignment was Group Head Operations & IT at NIB Bank. Khurram holds a Bachelor of Science degree in Computer Science and Mathematics from State University of New York at Binghamton.
Nasir IslamHead Internal Audit
Nasir Islam is a qualified Chartered Accountant with over 23 years of multifaceted experience. His first assignment was as Manager Finance in ANZ Grindlays (Karachi), after which he was posted at the ANZ HO (Melbourne, Australia), as Manager Commercial Banking System (CBS) Project. He returned to Pakistan in 1997 as Manager Audit, joined ABN AMRO Pakistan as Audit Manager in 2000, and was appointed as Country Head of Compliance in 2004.
SENIOR MANAGEMENT – PROFILES
23Annual Report 2015
Muhammad Merajuddin AhmedHead Human Resources Muhammad Merajuddin Ahmed has over 19 years of experience in the healthcare sector. During the course of his career, he has held senior roles indifferent organisations. Prior to joining Faysal Bank, he was associated with organisations such as Aga Khan University, Merck Sharp & Dohme of Pakistan. His last assignment was Head Human Resources at Novartis Pharma Pakistan Limited and Talent Management Lead Asia Cluster for Novartis. He was also the member Board of Directors, Novartis Pharma Pakistan Limited. Meraj is an MBA from Institute of Business Administration.
Bilal AsgharHead Corporate & Investment Banking
Bilal Asghar possesses over 20 years of multi-functional experience in the field of Corporate and Investment Banking, Islamic Banking, Special Assets and Credit/Risk Management. Bilal holds a Bachelor of Science degree in Business Administration from University of Southern California, Los Angeles.
Fouad FarrukhHead Retail Banking
Fouad Farrukh brings with him rich and broad-based experience of over 20 years, working in large banks, both in Pakistan and in the Middle East. After completing his BS - Finance from University of Maryland (USA) and MBA from LUMS, Fouad started his career with Faysal Bank as a Corporate Relationship Manager in 1996. He has previously worked as Gulf Risk Manager, Habib Bank Limited - Dubai, and as the Country Head, Habib Bank Limited - Bahrain, before joining BMI Bank B.S.C. (c) Bahrain as Head, Islamic Financial Services.
Mohammed Zahid AhmedHead Strategy
Mohammed Zahid Ahmed brings with him over 19 years of experience in both the financial and non-financial sectors where he has held leadership roles in Finance and Strategy. Prior to joining Faysal Bank, Zahid has been associated with organisations such as Allergan Pharmaceuticals Inc., Pak Kuwait Investment Company, ABN AMRO Bank, Dubai Islamic Bank, GIGA Group of Companies, Silk Bank and Meezan Bank. His last assignment was Head of Business Analytics, Strategy & Internal Control at Meezan Bank. Zahid is a Chartered Accountant from the Institute of Chartered Accountants Pakistan.
Raheel IjazHead Compliance
Raheel Ijaz has more than 36 years of work experience. Before assuming this position, heaccumulated rich banking experience ininstitutions like MCB Bank Limited as Group Head Compliance and Controls, Country Head Srilanka, Head Corporate North & Public Sector, United Bank Limited as Regional Chief Executive North and also held key positions in Faysal Bank, Prime Commercial Bank, and Emirates Bank International. His last role was with Faysal Bank Limited as Advisor Business Development & Regulatory Affairs. Raheel holds an MBA degreefrom Quaid-e-Azam International University.
AbadullahHead Operations
Abadullah brings with him over 30 years of diversified experience of Branch Banking, Trade, Cash Management and Operations. Prior to joining Faysal Bank Limited, Abadullah had worked with Standard Chartered, ANZ Grindlays and United Bank Limited. His last assignment with SCB was Head Cash Management Operations & Cash Product Service Delivery. Abadullah started his career from United Bank Limited. Abadullah holds a Master of Business Administration (Finance) degree from IBA, University of the Punjab.
SENIOR MANAGEMENT – PROFILES

24 Annual Report 2015
Hasan Junaid NasirHead Islamic Banking
Hasan Junaid Nasir has more than 15 years of work experience with exposure in Treasury, Finance, Information Technology, Product Development and Islamic Banking. He joined Faysal Bank in 2009. He holds a Master of Business Administration degree from College of Business Management along with ACCA and Post Graduate Diploma in Islamic Banking and Takaful. He is also NIBAF certified.
Muhammad Aurangzeb AminCompany Secretary & Head Legal Aurangzeb Amin brings with him over 20 years of experience in the financial sector and legal consultancies both in Pakistan and in the USA. During his career he has worked with NIB Bank and Pak-Kuwait Investment Co. as Company Secretary and Head Legal. He has also worked with law firms locally and internationally, namely Orr, Dignam & Co and Surridge & Beecheno. He has a Master of Laws degree from Temple University, USA.
SENIOR MANAGEMENT – PROFILES
25Annual Report 2015
SHARIAH BOARD – PROFILES
The Shariah Board at Faysal Bank Limited comprises of renowned Shariah Scholars, namely:
Mufti Muhammad Mohib ul Haq Siddiqui Chairman - Shariah Board
Mufti Mohib ul Haq is a prominent and a well-recognised Shariah scholar of international repute. His credentials include a specialised degree in Shahadat-ul-Aalamia (Masters in Arabic and Islamic Studies) and Takhassus fil Ifta (Specialisation in Islamic Jurisprudence and Fatwa) from the esteemed Jamia Darul Uloom, Karachi.
Mufti Mohib ul Haq has been associated with Faysal Barkat Islamic Banking since 2011 as the Shariah Advisor prior to his appointment as the Chairman of Shariah Board. Previously, he has served as the Shariah Advisor/Shariah Board Member at various Financial Institutions which include:
• Bank Al Habib Ltd
• Takaful Pakistan Limited
• Royal Bank of Scotland Berhad Malaysia
He has over twelve years of teaching experience at renowned institutions and is also a Faculty Member/ Visiting Faculty Member of various well known Institutions such as:
• Jamia Darul Uloom Karachi
• Centre for Islamic Economics
• National Institute of Banking and Finance – SBP
• Institute of Cost and Management Accountants of Pakistan
Dr. Mufti Khalil Ahmad AazamiShariah Board Member
Dr. Mufti Khalil Ahmad Aazami is a renowned Shariah Scholar in Islamic Banking industry. Dr. Aazami has graduated from Jamia Darul Uloom, Karachi. He obtained his Shahadat-ul-Aalamia (Masters in Arabic and Islamic Studies) and Takhassus fil Ifta (Specialisation in Islamic Jurisprudence and Fatwa) from Jamia Darul Uloom, Karachi. Dr. Aazami holds a Doctorate degree in “Islamic Jurisprudence” from Karachi University. Dr. Aazami was working with Bank Alfalah Islamic Banking since 2003 in the capacity of Shariah Advisor prior to joining Faysal Bank Ltd. He has served as a Shariah Board Member in different financial institutions which include:
• Takaful Pakistan Limited
• Alfalah GHP Islamic Fund

26 Annual Report 2015
SHARIAH BOARD – PROFILES
He has significant experience in teaching Islamic Finance, Banking and Takaful in the role of a Faculty Member/Visiting Faculty Member of various institutions including:
• Faculty member – Jamia Darul Uloom, Karachi
• Centre For Islamic Economics, Karachi
• National Institute of Banking and Finance - SBP
• Sheikh Zaid Islamic Research Centre - University of Karachi
Mufti Khawaja Noor ul Hassan Resident Shariah Board Member
Mufti Khawaja Noor ul Hassan possesses both contemporary as well as religious academic qualifications. He has obtained the Shahadat-ul-Aalamia (Masters in Arabic and Islamic Studies) and Takhassus fil Ifta (Specialisation in Islamic Jurisprudence and Fatwa) from Jamia Farooqia & Jamia Darul Uloom, Taleem ul Quran, Karachi. Additionally, he holds a Bachelors' Degree in Law (LLB), a Masters Degree in Islamic Studies and a Masters degree in Islamic History from University of Karachi & Federal Urdu University respectively.
Mufti Hassan has over 7 years of professional, on-the-job and extensive experience, in Islamic Banking, including Sharia-compliant Product Development, Credit/Finance Appraisal & Administration with prestigious institutions such as Faysal Bank, Meezan Bank, & Albaraka Bank (formerly Emirates Global Islamic Bank). In addition to above, Mufti Hassan has over 3 years experience, working as Assistant Company Secretary for a number of Public & Private Limited Companies.
27Annual Report 2015
SENIOR MANAGEMENT AND INTERNAL COMMITTEES
Senior Management
Nauman AnsariPresident & Chief Executive Officer
Salman Ahmed UsmaniHead Treasury Syed Majid AliChief Financial Officer
Yousaf HussainChief Risk Officer
Khurram Gul AghaHead IT & Transaction Banking
Nasir IslamHead Internal Audit
Muhammad Merajuddin AhmedHead Human Resources
Bilal AsgharHead Corporate & Investment Banking
Fouad FarrukhHead Retail Banking
Mohammed Zahid AhmedHead Strategy
Raheel IjazHead Compliance
AbadullahHead Operations
Hasan Junaid NasirHead Islamic Banking
Muhammad Aurangzeb AminCompany Secretary & Head Legal
Management Committee
Nauman AnsariChairman
Syed Majid AliMember & Secretary
Salman Ahmed UsmaniMember
Yousaf HussainMember
Khurram Gul AghaMember
Muhammad Merajuddin AhmedMember
Bilal AsgharMember
Fouad FarrukhMember
Raheel IjazMember
Mohammed Zahid AhmedMember
AbadullahMember
Asset & Liability Committee
Nauman AnsariChairman
Salman Ahmed UsmaniMember & Secretary
Syed Majid AliMember
Yousaf HussainMember
Khurram Gul AghaMember
Bilal AsgharMember
Fouad FarrukhMember
Mohammed Zahid AhmedMember
Syed Muhammad Fraz Zaidi Member*
*Effective 1st February 2016

28 Annual Report 2015
SENIOR MANAGEMENT AND INTERNAL COMMITTEES
Compliance Committee
Nauman AnsariChairman
Raheel IjazMember & Secretary
Syed Majid AliMember
Yousaf HussainMember
Nasir IslamMember
Mohammed Zahid AhmedMember
AbadullahMember
IT Steering Committee
Nauman AnsariChairman
Khurram Gul AghaMember & Secretary
Syed Majid AliMember
Yousaf HussainMember
Bilal AsgharMember
Fouad FarrukhMember
Mohammed Zahid AhmedMember
Raheel IjazMember
AbadullahMember
Iqbal AhmadMember
Investment Committee
Nauman AnsariChairman
Salman Ahmed UsmaniMember & Secretary
Syed Majid AliMember
Yousaf HussainMember
Bilal AsgharMember
Syed Muhammad Fraz Zaidi Member*
*Effective 1st February 2016
29Annual Report 2015
Enterprise Risk Management Committee
Nauman AnsariChairman
Syed Muhammad Fraz Zaidi Member*
Salman Ahmed UsmaniMember
Syed Majid AliMember
Yousaf HussainMember
Bilal AsgharMember
Fouad FarrukhMember
Raheel IjazMember
AbadullahMember
Country Credit Committee
Nauman AnsariChairman
Yousaf HussainMember
Bilal AsgharMember
Fouad FarrukhMember
SENIOR MANAGEMENT AND INTERNAL COMMITTEES
*Effective 1st February 2016
30 Annual Report 2015
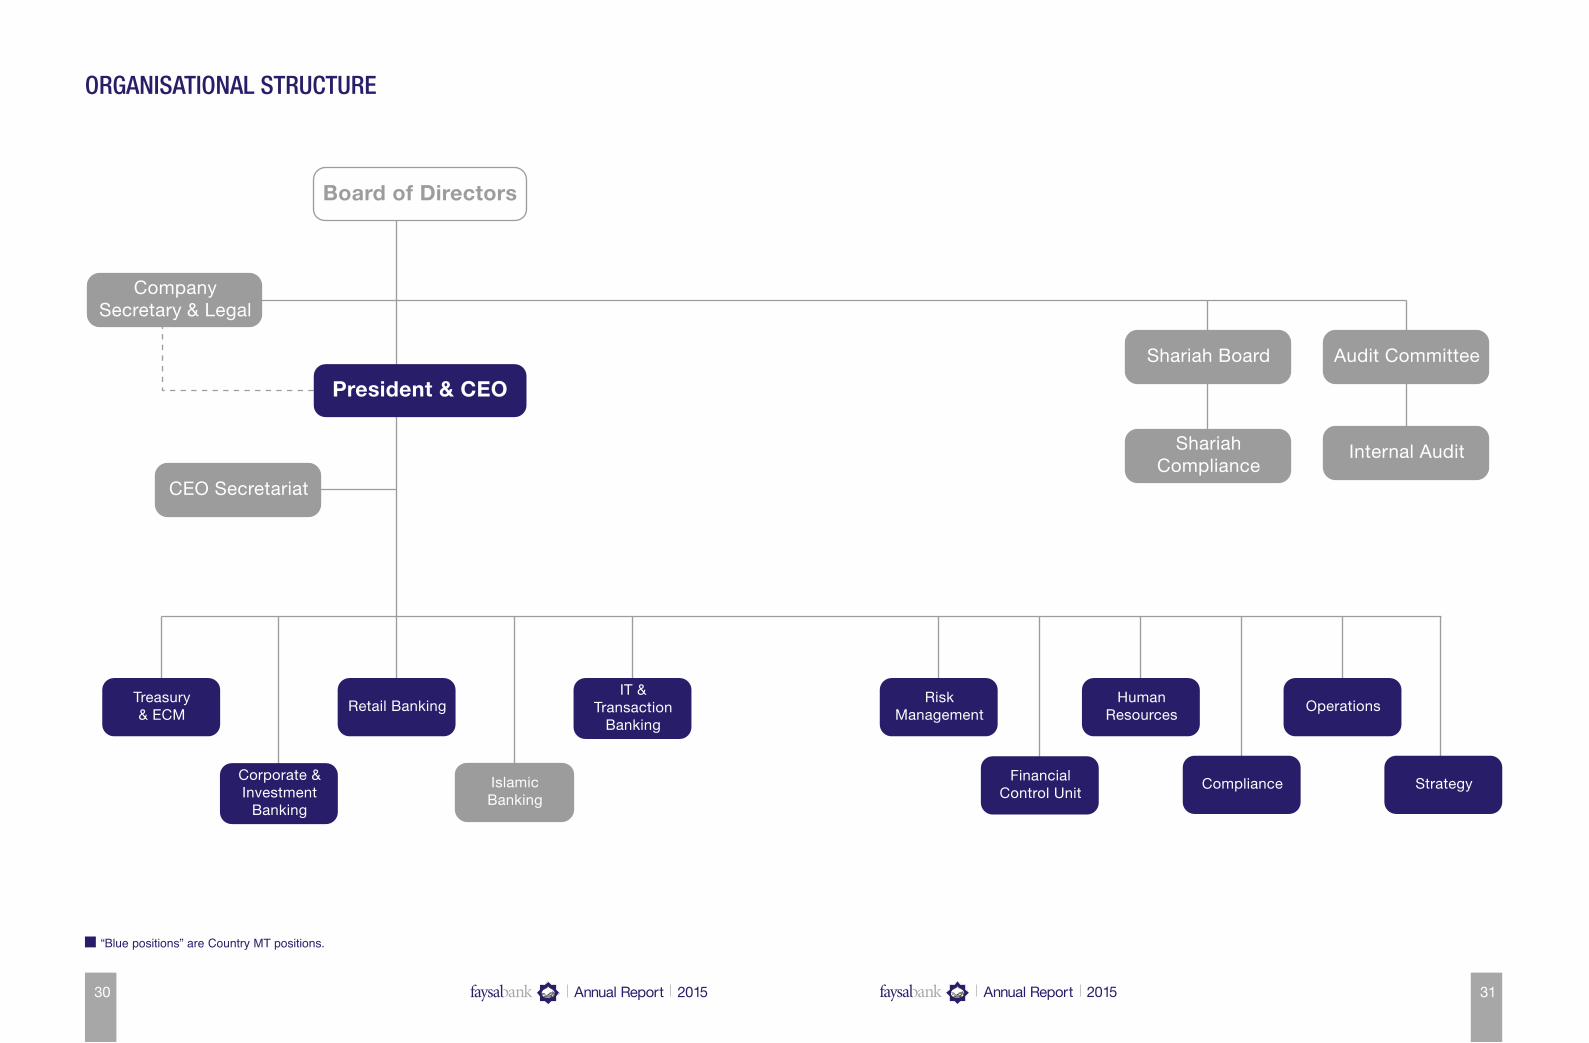
“Blue positions” are Country MT positions.
ORGANISATIONAL STRUCTURE
Company Secretary & Legal
CEO Secretariat
Shariah Board Audit Committee
Internal AuditShariah Compliance
Treasury& ECM
Corporate &Investment
Banking
Retail Banking
IslamicBanking
IT &Transaction
Banking
RiskManagement
FinancialControl Unit
HumanResources
Compliance
Operations
Strategy
Board of Directors
President & CEO
31Annual Report 2015
“Blue positions” are Country MT positions.
ORGANISATIONAL STRUCTURE
Company Secretary & Legal
CEO Secretariat
Shariah Board Audit Committee
Internal AuditShariah Compliance
Treasury& ECM
Corporate &Investment
Banking
Retail Banking
IslamicBanking
IT &Transaction
Banking
RiskManagement
FinancialControl Unit
HumanResources
Compliance
Operations
Strategy
Board of Directors
President & CEO

32 33Annual Report 2015 Annual Report 2015
SIX YEARS FINANCIAL SUMMARY
SIX YEARS FINANCIAL SUMMARY
2015 2014 2013 2012 2011 2010
OPERATIONAL RESULTS (Rupees in Million)
Mark-up / return / interest earned 32,313 32,313 27,790 28,802 28,825 19,710 Mark-up / return / interest expensed 18,358 18,480 16,945 19,839 19,619 13,919 Fee, commission, brokerage, FX income and
other income 3,507 3,731 3,740 3,635 3,708 2,337 Dividend and capital gains 2,057 643 786 1,646 363 1,675 Total income 19,519 18,207 15,371 14,245 13,277 9,804 Provisions / Write-offs 1,393 2,359 2,116 1,401 695 2,202 Operating expenses 11,198 12,295 11,101 11,004 11,103 6,775 Operating profit before tax and provision 8,314 5,911 4,277 3,236 2,173 3,029 Profit before taxation 6,920 3,552 2,161 1,835 1,478 827 Profit after taxation 4,222 2,477 1,850 1,420 1,280 1,190 Bonus shares % - 15.0 12.5 12.5 12.5 20.0
BALANCE SHEET (Rupees in Million)
Shareholders’ equity 26,059 21,832 20,588 18,788 17,808 16,643 Revaluation reserves 4,294 4,470 1,578 2,249 1,420 (125)Deposits 292,130 283,346 271,134 240,708 214,610 195,315 Borrowings from financial institutions 90,565 60,927 45,447 35,568 39,697 34,636 Advances - net of provision 178,079 181,225 184,190 172,299 148,162 133,707 Investments - net of provision 183,677 155,211 113,319 88,019 93,439 86,419 Total assets 430,073 388,126 355,280 313,123 292,583 267,321
CASHFLOWS (Rupees in Million)
Operating activities 55,375 13,479 28,733 (4,809) 5,912 8,882 Investing activities (49,705) (20,929) (25,110) 7,692 (5,842) 2,050 Financing activities (1) (500) (700) (200) (209) 3,004 Cash and cash equivalents at end of the year 26,336 20,666 28,617 25,694 23,011 23,150
OTHER KEY INFORMATION
Imports Rs Mln 98,591 120,614 157,183 120,269 103,766 73,116 Exports Rs Mln 53,150 59,719 88,128 83,525 69,033 44,646 Number of employees 3,141 3,036 3,610 3,465 3,435 3,582 Number of branches 280 274 269 265 257 226
PROFITABILITY RATIOS
Profit before tax ratio % 21.42 10.99 7.78 6.37 5.13 4.20 Gross spread ratio % 43.19 42.81 39.02 31.12 31.94 29.38
(Net mark up income / gross mark-up income)Return on capital employed % 3.17 1.72 1.13 1.15 1.30 0.80 Return on average equity (ROE) % 17.63 11.68 9.40 7.76 7.43 8.51 Return on average assets (ROA) % 1.03 0.67 0.55 0.47 0.46 0.53 Income to expense ratio Times 1.74 1.48 1.38 1.29 1.20 1.45
2015 2014 2013 2012 2011 2010LIQUIDITY RATIOS
Current ratio Times 1.37 1.26 0.77 0.68 0.75 1.08 CASA to total deposits % 67.25 65.66 64.90 60.93 54.50 53.22 Gross advances to deposit ratio (average) % 70.76 73.77 77.21 78.26 77.26 78.25 Net advances to deposit ratio (average) % 62.44 66.05 69.65 70.38 68.76 70.55 Non-performing loans to gross advances ratio % 14.97 14.31 13.52 14.44 15.74 16.34 Specific provision to non-performing loans ratio % 79.24 78.56 71.50 66.31 65.51 69.46
INVESTMENT / MARKET RATIOS
Price earning ratio % 4.38 8.82 7.39 9.00 7.62 15.71 Earning per share (EPS) Rs. 3.52 2.06 1.54 1.18 1.07 0.99 Market value per share Rs. 15.43 18.20 11.39 10.65 8.13 15.59 Market value per share - high Rs. 20.07 19.25 12.50 14.12 15.95 20.90 Market value per share - low Rs. 13.54 11.48 8.15 8.38 8.07 12.97
Book value per share - excluding surplus /(deficit) on revaluation of assets Rs. 21.72 20.93 19.73 20.26 21.60 22.77
Book value per share - excluding surplus onrevaluation of fixed assets Rs. 22.81 22.30 19.56 20.70 21.00 22.60
Book value per share - including surplus /(deficit) on revaluation of assets Rs. 25.30 25.21 21.25 22.68 23.33 22.60
CAPITAL STRUCTURE RATIOS
Capital adequacy ratio % 14.41 12.22 11.29 10.69 10.65 10.31
Weighted average cost of deposit % 4.27 5.33 5.24 6.60 7.04 6.70
Total assets turnover to fixed assets turnoverratio Times 37.92 33.62 34.66 28.83 26.97 30.63 (Total assets / Fixed assets)
Net assets per share Rs. 25.30 25.21 21.25 22.68 23.33 22.60
Earning assets to total assets ratio % 86.93 86.68 83.84 83.18 83.39 83.28
Net assets maturity wise: (Rupees in Million)
Upto one month (85,534) (60,796) (16,197) (28,485) (28,640) (77,873)Over one month to three months 53,767 27,569 45,394 8,976 (3,212) 17,346 Over three months to six months 5,606 29,650 18,264 3,729 12,261 8,387 Over six months to one year 88,379 37,653 4,165 30,994 29,662 (5,960)Over one year to two years 16,103 15,016 3,036 (2,525) (17,458) 18,886 Over two years to three years (1,738) 11,530 (5,978) 6,153 (139) 5,727 Over three years to five years 14,891 (10,065) (14,836) (5,183) 12,261 22,848 Over five years to ten years (66,060) (30,792) (16,962) (397) 4,736 17,006 Over ten years 4,940 6,538 5,281 7,774 9,743 10,149 Total net assets 30,354 26,303 22,167 21,037 19,214 16,516

34 35Annual Report 2015 Annual Report 2015
INCOME AND EXPENSE COMPOSITION STATEMENT OF FINANCIAL POSITION COMPOSTION
Fee, commission, brokerage & FX incomeFund based income
2010
22,000
20,000
18,000
16,000
14,000
12,000
10,000
8,000
6,000
4,000
2,000
-2011 2012 2013 2014 2015
Income CompositionRupees in Million
1,659
2,6242,627
3,186
3,1493,268
8,145
10,65311,618
12,185
15,05816,251
Employee CostOther Cost
Expense CompositionRupees in Million
14.000
12,000
10,000
8,000
6,000
4,000
2,000
-
2010
3,075
5,140 5,025 5,1175,671
2011 2012 2013 2014 2015
6,624
4,671
6,5275,9845,963 5,979
3,700
Advances
Cash & Bank Balances
Other assets
Investments
Lending to Financial Institutions
41%
7%
3%
6%
43%
Assets68%
3%
1%6%
1%
21%
Liabilities & Equity
Deposits & other accounts
Borrowing from Financial Institutions
Sub-ordinated loans
Shareholders' equity
Revaluation Reserve
Other Liabilities
Share Capital
Share Premium
Statutory Reserve
Reserve arising on amalgamation
Unappropriated Profit
Shareholders' Equity46%
29%
4%
21%
0%

36 37Annual Report 2015 Annual Report 2015
ADVANCES SEGMENT INFORMATION
Gross AdvancesRupees in Million
250,000
200,000
150,000
100,000
50,000
-
2010
151,206165,483
190,851204,343 204,676 202,543
2011 2012 2013 2014 2015
Loans, cash credits and running finances
Net investment in finance lease
Bills discounted & purchased
Reverse Repo transactions
Advances Categorisation92%0%2%6%
Local currency
Foreign currency
Advances by Currency
99%1%
Chemical and PharmaceuticalsAgricultureTextile Cement SugarConstruction Ready made garmentsFootwear and leather garmentsAutomobile and transportation equipmentFinancialOil Refining / MarketingDistribution / Trading
Electronics and electrical appliancesProduction and transmission of energy Iron and Steel Food and AlliedSynthetic and RayonPaper and BoardIndividualsTelecommunicationTransportation, Road and AirMining and QuarryingOthers
Gross Advances

38 39Annual Report 2015 Annual Report 2015
DEPOSITS SEGMENT INFORMATION
DepositsRupees in Million
283,346 292,130271,134
240,708214,610
195,315
2010 2011 2012 2013 2014 2015
300,000
250,000
200,000
150,000
100,000
50,000
-
Savings
Term
Current and margin accounts
Financial institutions
Deposits Categorisation
33%4%
32%31%
Deposits by Currency
Local currency
Foreign currency
8%92%
Chemical and PharmaceuticalsAgricultureTextile Cement SugarConstruction Ready made garmentsFootwear and leather garmentsAutomobile and transportation equipmentFinancialOil Refining / MarketingDistribution / Trading
Electronics and electrical appliancesProduction and transmission of energy Iron and Steel Food and AlliedSynthetic and RayonPaper and BoardIndividualsTelecommunicationTransportation, Road and AirMining and QuarryingOthers
Deposits

40 41Annual Report 2015 Annual Report 2015
TOTAL ASSETS AND NET ADVANCES TO DEPOSITS INVESTMENTS
267,321292,583 313,123
355,280388,126
2010 2011 2012 2013 2014 2015
Total Assets
-
50,000
100,000
150,000
200,000
250,000
300,000
350,000
400,000
450,000 430,073
Rupees in Million
133,707148,162
172,299 184,190 181,225
195,315214,610
240,708
271,134 283,346
-
50,000
100,000
150,000
200,000
250,000
300,000
350,000
2010 2011 2012 2013 2014 2015
Net Advances to Deposits
Advances Net Deposits
Rupees in Million
178,079
292,130
183,677
155,211
113,319
88,01993,43986,419
200,000
180,000
160,000
140,000
120,000
100,000
80,000
60,000
40,000
20,000
-2010 2011 2012 2013 2014 2015
InvestmentsRupees in Million
3%3%
94%
Investments Categorisation
Shares / Other UnitsTFCs / BondsGovernment Securities

42 43Annual Report 2015 Annual Report 2015
EQUITY EPS AND MATURITY PROFILE
-
2,000
4,000
6,000
8,000
10,000
12,000
14,000
2010 2011 2012 2013 2014 2015
Paidup Capital
7,3098,243
9,274
10,433 10,433
Rupees in Million
11,998
2010 2011 2012 2013 2014 2015-
5,000
10,000
15,000
20,000
25,000
30,000
16,643 17,808 18,788
20,58821,832
26,059
Shareholders' EquityRupees in Million
Earning Per ShareIn Rupees
-
0.50
1.00
1.50
2.00
2.50
3.00
3.50
4.00
2010 2011 2012 2013 2014 2015
0.99 1.07 1.18
1.54
2.06
3.52
AssetsLiabilities
Maturity ProfilePercentage
35
30
25
20
15
10
5
-Over 1 monthto 3 months
Upto 1 months
29
7
19
9 8
29
9 10
75 6 5
3 3
1310
21
7
Over 3 monthsto 6 months
Over 6 monthsto 1 year
Over 1 year to2 years
Over 3 year to5 years
Over 5 year to10 years
Over 10 yearsOver 2 year to3 years

44 45Annual Report 2015 Annual Report 2015
STOCK PRICE FINANCIAL RESULTS
FBL
Shar
e Pr
ice
Mov
emen
t 201
5 vs
201
4
Year
201
5Ye
ar 2
014
Share Price
25.
00
20.
00
15.
00
10.
00
5.0
0 -
-
1,000
2,000
3,000
4,000
5,000
6,000
7,000
2010 2011 2012 2013 2014 2015
827
1,4781,835
2,161
3,552
6,920
Profit before taxRupees in Million
Profit after taxRupees in Million
-
500
1,000
1,500
2,000
2,500
3,000
3,500
4,000
4,500
2010 2011 2012 2013 2014 2015
1,190 1,2801,420
1,850
2,477
4,222

46 47Annual Report 2015 Annual Report 2015
QUARTERLY PERFORMANCE 2015 AND 2014
STATEMENT OF FINANCIAL POSITION Rupees in Million2015 2014
4th Qtr 3rd Qtr 2nd Qtr 1st Qtr 4th Qtr 3rd Qtr 2nd Qtr 1st QtrASSETSCash and balances with
treasury banks 26,084 18,008 24,114 23,959 20,286 19,240 27,306 22,029 Balances with other banks 1,068 730 753 986 1,423 1,068 1,156 1,308 Lendings to financial institutions 12,088 5,128 7,820 1,200 - 6,761 - 9,960 Investments 183,677 198,499 201,217 170,838 155,211 108,537 111,192 93,802 Advances 178,079 179,715 186,143 176,722 181,225 174,548 175,596 178,747 Operating fixed assets 11,343 11,452 11,531 11,341 11,543 9,912 10,151 10,094 Deferred tax assets - net 3,087 2,727 2,964 2,587 2,429 4,425 4,312 3,866 Other assets 14,647 13,535 16,009 13,364 16,009 14,221 16,039 13,978
430,073 429,794 450,551 400,997 388,126 338,712 345,752 333,784 LIABILITIESBills payable 6,009 5,339 6,200 4,474 5,348 5,561 9,253 4,871 Borrowings 90,565 94,344 108,519 78,416 60,927 31,852 30,279 28,169 Deposits and other accounts 292,130 288,708 296,156 276,869 283,346 267,085 271,944 266,054 Sub-ordinated loans 2,994 2,995 2,995 2,995 2,995 3,245 3,245 3,495 Liabilities against assets
subject to finance lease - - - - - - - - Deferred tax liabilities - net - - - - - - - - Other liabilities 8,022 8,748 8,483 10,246 9,208 8,943 9,303 9,668
399,720 400,134 422,353 373,000 361,824 316,686 324,024 312,257 30,353 29,660 28,198 27,997 26,302 22,026 21,728 21,527
REPRESENTED BYShare capital 11,998 11,998 11,998 10,433 10,433 10,433 10,433 10,433 Reserves 6,423 5,610 5,641 7,237 5,703 5,239 5,270 5,301 Unappropriated profit 7,638 7,534 6,726 6,031 5,696 5,130 4,434 4,053
26,059 25,142 24,365 23,701 21,832 20,802 20,137 19,787 Surplus on revaluation of assets 4,294 4,518 3,833 4,296 4,470 1,224 1,591 1,740
30,353 29,660 28,198 27,997 26,302 22,026 21,728 21,527
PROFIT AND LOSS ACCOUNTMark-up / return / interest earned 7,719 8,057 8,103 8,433 8,759 7,874 7,904 7,776 Mark-up / return / interest
expensed 4,383 4,660 4,647 4,668 4,882 4,598 4,544 4,456 Net mark-up / interest income 3,336 3,397 3,456 3,765 3,877 3,276 3,360 3,320 Provision and write offs 179 230 750 234 448 439 833 639 Non mark-up / interest income 1,034 907 1,483 2,141 1,197 972 1,133 1,072 Non mark-up / interest expenses 2,855 2,848 2,701 2,794 2,949 2,803 3,419 3,125 Share of loss on associate (2) (4) 1 (2) 1 (2) 1 (1)Profit before taxation 1,334 1,222 1,489 2,874 1,678 1,004 242 627 Taxation charge / (reversal) 474 428 801 994 617 328 (66) 195 Profit after taxation 860 794 688 1,880 1,061 676 308 432

48 49Annual Report 2015 Annual Report 2015
HORIZONTAL ANALYSIS HORIZONTAL ANALYSIS
STATEMENT OF FINANCIAL POSITION
2015 2014 2013 2012 2011 2010 2015 vs 2014 vs 2013 vs 2012 vs 2011 vs 2010 vs
2014 2013 2012 2011 2010 2009
Rupees in Million Variance %
ASSETS
Cash and balances with treasury
banks 26,084 20,286 28,422 24,509 18,445 17,429 29 (29) 16 33 6 107
Balances with other banks 1,068 1,423 1,012 1,209 4,686 5,728 (25) 41 (16) (74) (18) 1,025
Lendings to financial institutions 12,088 - 300 - - - 100 (100) 100 - - (100)
Investments 183,677 155,211 113,319 88,019 93,439 86,419 18 37 29 (6) 8 53
Advances 178,079 181,225 184,190 172,299 148,162 133,707 (2) (2) 7 16 11 46
Operating fixed assets 11,343 11,543 10,251 10,860 10,850 8,726 (2) 13 (6) - 24 213
Deferred tax assets - net 3,087 2,429 3,981 4,387 5,180 5,017 27 (39) (9) (15) 3 292
Other assets 14,647 16,010 13,804 11,839 11,821 10,295 (9) 16 17 - 15 107
430,073 388,127 355,279 313,122 292,583 267,321 11 9 13 7 9 48
LIABILITIES
Bills payable 6,009 5,348 4,969 4,244 3,076 3,219 12 8 17 38 (4) 120
Borrowings 90,565 60,927 45,447 35,568 39,697 34,636 49 34 28 (10) 15 (1)
Deposits and other accounts 292,130 283,346 271,134 240,708 214,610 195,315 3 5 13 12 10 58
Sub-ordinated loans 2,994 2,995 3,495 4,195 4,395 4,595 - (14) (17) (5) (4) 360
Liabilities against assets
subject to finance lease - - - - - - - - - - - -
Deferred tax liabilities - net - - - - - - - - - - - -
Other liabilities 8,022 9,209 8,068 7,370 11,577 13,038 (13) 14 9 (36) (11) 87
399,720 361,825 333,113 292,085 273,355 250,803 10 9 14 7 9 49
30,353 26,302 22,166 21,037 19,228 16,518 15 19 5 9 16 29
REPRESENTED BY
Share capital 11,998 10,433 10,433 9,274 8,243 7,337 15 - 12 13 12 20
Reserves 6,423 5,703 6,554 6,309 6,591 7,355 13 (13) 4 (4) (10) 83
Unappropriated profit 7,638 5,696 3,601 3,205 2,974 1,951 34 58 12 8 52 61
26,059 21,832 20,588 18,788 17,808 16,643 19 6 10 6 7 47
Surplus on revaluation of assets 4,294 4,470 1,578 2,249 1,420 (125) (4) 183 (30) 58 (1,236) (109)
30,353 26,302 22,166 21,037 19,228 16,518 15 19 5 9 16 29
PROFIT AND LOSS ACCOUNT
2015 2014 2013 2012 2011 2010 2015 vs 2014 vs 2013 vs 2012 vs 2011 vs 2010 vs2014 2013 2012 2011 2010 2009
Rupees in Million Variance %
Mark-up / return / interest earned 32,313 32,313 27,790 28,802 28,825 19,710 - 16 (4) - 46 16 Mark-up / return / interest
expensed 18,358 18,480 16,945 19,839 19,619 13,919 (1) 9 (15) 1 41 16 Net mark-up / interest income 13,955 13,833 10,845 8,963 9,206 5,791 1 28 21 (3) 59 16
Provision against non-performingloans and advances - net 1,026 2,056 1,906 964 330 1,906 (50) 8 98 192 (83) (3)
(Reversal) / provision forconsumer and small enterpriseloans - general (7) 33 123 25 (77) (90) (121) (73) 392 (132) (14) 233
Provision against off balancesheet obligations 20 7 11 40 - - 186 (36) (73) 100 - -
Provision for diminution in valueof investments - net 455 397 111 415 409 287 15 258 (73) 1 43 14
Recoveries against written-offdebts - net (99) (134) (34) (42) 33 98 (26) 294 (19) (227) (66) -
1,395 2,359 2,117 1,402 695 2,201 (41) 11 51 102 (68) - Net mark-up / interest income
after provisions 12,560 11,474 8,728 7,561 8,511 3,590 9 31 15 (11) 137 28
Non mark-up / interest incomeFee, commission and brokerage
income 2,303 2,076 2,237 1,858 1,773 1,141 11 (7) 20 5 55 29 Dividend income 319 182 479 432 619 335 75 (62) 11 (30) 85 (50)Income from dealing in foreign
currencies 965 1,073 949 769 851 519 (10) 13 23 (10) 64 30 Gain on sale of securities - net 1,738 460 306 1,215 (256) 1,340 278 50 (75) (575) (119) 62 Unrealised (loss) / gain on
revaluation of investments classified as held for trading (27) 31 (19) 43 (58) 68 (187) (263) (144) (174) (185) (248)Other income 267 551 575 967 1,141 609 (52) (4) (41) (15) 87 671 Total non mark-up / interest
income 5,565 4,373 4,527 5,284 4,070 4,012 27 (3) (14) 30 1 43 18,125 15,847 13,255 12,845 12,581 7,602 14 20 3 2 65 36
Non mark-up / interest expensesAdministrative expenses 10,591 12,162 11,079 10,810 10,814 6,644 (13) 10 2 - 63 55 Other provisions / (reversal) - net 386 (89) (95) 91 225 62 (534) (6) (204) (60) 263 (1,133)Other charges 221 222 117 103 64 69 - 90 14 61 (7) 109 Total non mark-up / interest
expenses 11,198 12,295 11,101 11,004 11,103 6,775 (9) 11 1 (1) 64 57 6,927 3,552 2,154 1,841 1,478 827 95 65 17 25 79 (36)
Share of loss of associate (7) (1) 7 (5) - - 600 (114) (240) 100 - - Extraordinary / unusual items - - - - - - - - - - - - Profit before taxation 6,920 3,551 2,161 1,836 1,478 827 95 64 18 24 79 (36)
Taxation - Current 3,039 1,712 1,078 268 393 239 78 59 302 (32) 64 (79)Taxation - Prior years 265 (813) (1,613) (227) 289 192 (133) (50) 611 (179) 51 (93)Taxation - Deferred (606) 175 846 375 (484) (794) (446) (79) 126 (177) (39) (80)
2,698 1,074 311 416 198 (363) 151 245 (25) 110 (155) (467)Profit after taxation 4,222 2,477 1,850 1,420 1,280 1,190 70 34 30 11 8 (1)
Basic earnings per share 3.52 2.06 1.54 1.18 1.07 0.99 70 34 30 11 8 (1)

50 51Annual Report 2015 Annual Report 2015
VERTICAL ANALYSIS VERTICAL ANALYSIS
STATEMENT OF FINANCIAL POSITION
2015 2014 2013 2012 2011 2010 2015 2014 2013 2012 2011 2010
Rupees in Million Variance (%)
ASSETS
Cash and balances with treasury
banks 26,084 20,286 28,422 24,509 18,445 17,429 6 5 8 8 6 7
Balances with other banks 1,068 1,423 1,012 1,209 4,686 5,728 - - - - 2 2
Lendings to financial institutions 12,088 - 300 - - - 3 - - - - -
Investments 183,677 155,211 113,319 88,019 93,439 86,419 43 40 32 28 32 32
Advances 178,079 181,225 184,190 172,299 148,162 133,707 41 47 52 56 50 50
Operating fixed assets 11,343 11,543 10,251 10,860 10,850 8,726 3 3 3 3 4 3
Deferred tax assets - net 3,087 2,429 3,981 4,387 5,180 5,017 1 1 1 1 2 2
Other assets 14,647 16,010 13,804 11,839 11,821 10,295 3 4 4 4 4 4
430,073 388,127 355,279 313,122 292,583 267,321 100 100 100 100 100 100
LIABILITIES
Bills payable 6,009 5,348 4,969 4,244 3,076 3,219 1 1 1 1 1 1
Borrowings 90,565 60,927 45,447 35,568 39,697 34,636 21 16 13 12 13 12
Deposits and other accounts 292,130 283,346 271,134 240,708 214,610 195,315 68 73 76 77 73 73
Sub-ordinated loans 2,994 2,995 3,495 4,195 4,395 4,595 1 1 1 1 2 2
Liabilities against assets subject
to finance lease - - - - - - - - - - - -
Deferred tax liabilities - net - - - - - - - - - - - -
Other liabilities 8,022 9,209 8,068 7,370 11,577 13,038 2 2 2 2 4 5
399,720 361,825 333,113 292,085 273,355 250,803 93 93 94 93 93 93
30,353 26,302 22,166 21,037 19,228 16,518 7 7 6 7 7 7
REPRESENTED BY
Share capital 11,998 10,433 10,433 9,274 8,243 7,337 3 3 3 3 3 3
Reserves 6,423 5,703 6,554 6,309 6,591 7,355 1 2 2 2 3 3
Unappropriated profit 7,638 5,696 3,601 3,205 2,974 1,951 2 1 1 1 1 1
26,059 21,832 20,588 18,788 17,808 16,643 6 6 6 6 7 7
Surplus on revaluation of assets 4,294 4,470 1,578 2,249 1,420 (125) 1 1 - 1 - -
30,353 26,302 22,166 21,037 19,228 16,518 7 7 6 7 7 7
PROFIT AND LOSS ACCOUNT
2015 2014 2013 2012 2011 2010 2015 2014 2013 2012 2011 2010 Rupees in Million Variance (%)
Mark-up / return / interest earned 32,313 32,313 27,790 28,802 28,825 19,710 100 100 100 100 100 100 Mark-up / return / interest
expensed 18,358 18,480 16,945 19,839 19,619 13,919 57 57 61 69 68 71 Net mark-up / interest income 13,955 13,833 10,845 8,963 9,206 5,791 43 43 39 31 32 29
Provision against non-performingloans and advances - net 1,026 2,056 1,906 964 330 1,906 3 6 7 3 1 10
(Reversal) / provision forconsumer and small enterpriseloans - general (7) 33 123 25 (77) (90) - - - - - -
Provision against off balancesheet obligations 20 7 11 40 - - - - - - - -
Provision for diminution in valueof investments - net 455 397 111 415 409 287 1 1 - 1 1 1
Recoveries against written-offdebts - net (99) (134) (34) (42) 33 98 - - - - - -
1,395 2,359 2,117 1,402 695 2,201 4 7 7 4 2 11 Net mark-up / interest income
after provisions 12,560 11,474 8,728 7,561 8,511 3,590 39 36 32 27 30 18
Non mark-up / interest incomeFee, commission and brokerage
income 2,303 2,076 2,237 1,858 1,773 1,141 7 6 8 6 6 6 Dividend income 319 182 479 432 619 335 1 1 2 1 2 2 Income from dealing in foreign
currencies 965 1,073 949 769 851 519 3 3 3 3 3 3 Gain on sale of securities - net 1,738 460 306 1,215 (256) 1,340 5 1 1 4 (1) 7 Unrealised (loss) / gain on
revaluation of investments classified as held for trading (27) 31 (19) 43 (58) 68 - - - - - -Other income 267 551 575 967 1,141 609 1 2 2 3 4 3 Total non mark-up / interest
income 5,565 4,373 4,527 5,284 4,070 4,012 17 13 16 17 14 21 18,125 15,847 13,255 12,845 12,581 7,602 56 49 48 44 44 39
Non mark-up / interest expensesAdministrative expenses 10,591 12,162 11,079 10,810 10,814 6,644 33 38 40 38 38 34 Other provisions / (reversal) - net 386 (89) (95) 91 225 62 1 - - - 1 -Other charges 221 222 117 103 64 69 1 1 - - - -Total non mark-up / interest
expenses 11,198 12,295 11,101 11,004 11,103 6,775 35 39 40 38 39 34 6,927 3,552 2,154 1,841 1,478 827 21 10 8 6 5 5
Share of loss of associate (7) (1) 7 (5) - - - - - - - - Extraordinary / unusual items - - - - - - - - - - - - Profit before taxation 6,920 3,551 2,161 1,836 1,478 827 21 10 8 6 5 5
Taxation - Current 3,039 1,712 1,078 268 393 239 9 5 4 1 1 1 Taxation - Prior years 265 (813) (1,613) (227) 289 192 1 (3) (6) (1) 1 1 Taxation - Deferred (606) 175 846 375 (484) (794) (2) 1 3 1 (2) (4)
2,698 1,074 311 416 198 (363) 8 3 1 1 - (2)Profit after taxation 4,222 2,477 1,850 1,420 1,280 1,190 13 7 7 5 5 7

52 53Annual Report 2015 Annual Report 2015
STATEMENT OF VALUE ADDED STATEMENT OF VALUE ADDED
2015 2014Rupees ‘000 % Rupees ‘000 %
Mark-up / return / interest earned - net of provisions 30,912,091 103 29,953,051 108
Fee, commission and brokerage income 2,303,447 8 2,075,945 7
Dividend income 318,715 1 182,435 1
Income from dealing in foreign currencies 964,961 3 1,072,939 4
Derivative income, gain on sale of investments etc. 1,977,217 7 1,042,850 4
36,476,431 122 34,327,220 124
Administrative expenses 6,477,656 (22) 6,587,417 (24)
Value Added 29,998,775 100 27,739,803 100
Distributed as follows:
To EmployeesAs remuneration 4,671,188 16 5,670,829 20
To GovernmentAs income tax 2,697,713 9 1,074,826 4
To DepositorsAs profit on investments 11,911,428 40 13,990,871 50
To Finanacial InstitutionsAs profit on borrowings 6,446,543 21 4,489,320 16
To SocietyAs donations 49,539 - 36,998 -
To ShareholdersAs dividends / bonus 1,564,904 5 - -
Retained in BusinessAs reserves and retained profits 2,657,460 9 2,476,959 9
29,998,775 100 27,739,803 100
Income
Mark-up / return / interest earned - net of provisions Fee, commission and brokerage income Dividend income Income from dealing in foreign currencies Derivative income, gain on sale of investments etc. Administrative expenses
103%
-22%
7%
3%
1%
8%
Distribution9%
5%
0%
21%
40%
16%
9%
To Employees To Government To Depositors To Finanacial Institutions To Society To Shareholders
Retained in Business

54 55Annual Report 2015 Annual Report 2015
NOTICE OF THE TWENTY FIRST ANNUAL GENERAL MEETING NOTICE OF THE TWENTY FIRST ANNUAL GENERAL MEETING
Notice is hereby given that the 21st Annual General Meeting of Faysal Bank Limited (“FBL”) will be held on March 29, 2016 at 11:00 a.m. at Beach Luxury Hotel, Jasmine Hall, Karachi to transact the following business:
ORDINARY BUSINESS:
1. To confirm the minutes of the 20th Annual General Meeting held on March 27, 2015.
2. To receive and adopt Annual Audited Accounts, Statement of Compliance with Code of Corporate Governance of FBL for the year ended December 31, 2015 together with the Directors’ and Auditors’ Reports thereon.
3. To consider and approve as recommended by the Board of Directors 10% Final Cash Dividend for the year ended December 31, 2015.
4. To appoint External Auditors for the ensuing financial year 2016 at a mutually agreed rate of remuneration. The present Auditors, A.F. Ferguson & Co., Chartered Accountants, being eligible, offer themselves for re-appointment.
5. Any other business with the permission of the Chair.
SPECIAL BUSINESS:
1 To consider and approve FBL’s investment of up to PKR 500 Million into the funds of Faysal Asset Management Limited (FAML) to be launched during 2016 as seed money and pass the following Special Resolutions as required by Section 208 of the Companies Ordinance 1984 with or without modifications:
“RESOLVED that subject to compliance of all the regulatory requirements, investment of Faysal Bank Limited up to PKR 500 Million as seed money in the funds of FAML, an associated company of Faysal Bank Ltd be and is hereby approved.”
FURTHER RESOLVED that for the purpose of giving effect to this Special Resolution; 1) the President & CEO and / or 2) the Company Secretary and / or 3) Chief Financial Officer of the Bank be and are hereby singly or jointly authorised to take all necessary actions and do all acts, deeds and things in the matter.
2 To Consider and approve the amount of remuneration paid to the Non-Executive / Independent Directors of FBL during the year 2015 for attending the Board meetings / Sub-Committees and in that connection to pass the following resolution as an Ordinary Resolution, with or without
modification, addition or deletion:
RESOLVED THAT:
“The remuneration paid to the Chairman, Non-Executive and Independent Directors of Faysal Bank Limited for attending Board meetings and meetings of the Board Committees i.e. (Recruitment,
NOTICE OF THE TWENTY FIRST ANNUAL GENERAL MEETING
01 Annual Report 2015
Nomination and Remuneration Committee; Board Risk Management Committee; Board Audit & Corporate Governance Committee and Board Steering Committee for conversion of Faysal Bank Limited into Islamic Bank) as disclosed in Note 38 of the Audited Financial Statements of the Bank for the year ended December 31, 2015, be and is hereby approved.”
To transact any other Business with the permission of the Chairman.
Dated: March 6, 2016Karachi. By the order of the Board
Aurangzeb Amin Company Secretary & Head of LegalNotes:
1. The Share Transfer Books of the Bank shall remain closed from March 23, 2016 to March 29, 2016 (both days inclusive). Transfer received at the Share Registrar of the Bank, by the close of business on March 22, 2016 will be treated in time for attending Annual General Meeting will be held on March
29, 2016 at Karachi.
2. The Share Transfer Books of the Bank will now be closed from April 5, 2016 to April 11, 2016 (both days inclusive). Transfers received at the Office of our Share Registrar, M/s. Central Depository Company
of Pakistan Limited, CDC House 99-B, Block-B, S.M.C.H.S. Main Shahrah-e-Faisal, Karachi at the close of business on April 4, 2016 will be treated in time for the purpose of entitlement of 10% Final Cash Dividend for the year ended December 31, 2015.
3. A member entitled to attend and vote at the Meeting may appoint another Member as per his / her proxy to attend and vote for him / her provided that a corporation may appoint as its proxy a person who is not a member, but is duly authorised by the corporation. Proxies must be received at the Registered Office of the Bank not less than 48 hours before the time of the holding of the Meeting.
4. Members are required to timely notify any change in their address to Bank’s Shares Registrar M/s. Central Depository Company of Pakistan Limited, CDC House, 99-B, Block-B, S.M.C.H.S., Main Shahrah-e-Faisal, Karachi.
5. CDC Account Holders will further have to follow the under mentioned guidelines as laid down in Circular 1 dated January 26, 2000 issued by the Securities and Exchange Commission of Pakistan.
A. For attending the Meeting :
i) In case of individuals, the account holder or sub-account holder and / or the person whose securities are in group account and their registration detail are uploaded as per the regulations, shall authenticate his / her identity by showing his / her original Computerised National Identity
NOTICE OF THE TWENTY FIRST ANNUAL GENERAL MEETING
02Annual Report 2015

56 57Annual Report 2015 Annual Report 2015
NOTICE OF THE TWENTY FIRST ANNUAL GENERAL MEETINGNOTICE OF THE TWENTY FIRST ANNUAL GENERAL MEETING
Card (CNIC) or original passport at the time of attending the Meeting.
ii) In case of corporate entity, the Board of Directors’ resolution / power of attorney with specimen signature of the nominee shall be produced (unless it has been provided earlier) at the time of Meeting.
B. For appointing proxies:
i) In case of individuals, the account holder or sub-account holder and / or the person whose securities are in group account and their registration details are uploaded as per the regulations, shall submit the proxy form as per the above requirement.
ii) The proxy form shall be witnessed by two persons whose names, addresses and CNIC numbers shall be mentioned on the form.
iii) Attested copies of CNIC or the passport of the beneficial owners and the proxy shall be furnished with the proxy form.
iv) The proxy shall produce his / her original CINC or original passport at the time of the Meeting.
v) In case of corporate entity, the Board of Directors’ resolution / power of attorney with specimen signature shall be submitted (unless it has been provided earlier) along with proxy form to the Company.
6. Computerised National Identity Card (CNIC) / National Tax Number (NTN)
With reference to the Securities and Exchange Commission of Pakistan (SECP) Notifications SRO 19(I) / 2014 dated January 10, 2014 and SRO 831 (I) 2012 dated July 05, 2012, which mandates that the dividend warrants should bear CNIC number of the registered member or their authorised person, except in case of minor(s) and corporate members. All those individual members holding physical shares who have not yet recorded their CNIC No. are once again reminded to immediately submit the copy of their CNIC to Company’s Share Registrar M/s. Central Depository Company of Pakistan Limited, CDC House, 99-B, Block-B, S.M.C.H.S., Main Shahrah-e-Faisal, Karachi; Members while sending CNIC must quote their respective folio numbers.
The corporate members having CDC accounts are required to have their NTN updated with their respective participants, whereas corporate entities having physical shares should send a copy of their NTN certificate to Company’s Share Registrar. The corporate members while sending NTN or NTN certificates, as the case may be, must quote the company name and their respective folio numbers.
7. Dividend Mandate Option
In pursuance to the directions given by SECP vide Circular No. 8(4)SM / CDC 2008 dated April 5, 2013 the members may authorise the Company to directly credit in their bank account the dividend declared in the annual general meeting. In view of that, you are hereby encouraged to provide a duly filled and signed dividend mandate for e-dividend facility. The dividend mandate form has been uploaded on FBL’s website - www.faysalbank.com
The members who hold shares in physical form are requested to submit the dividend mandate form duly filled to our Share Registrar M/s. Central Depository Company of Pakistan Limited, CDC House,
NOTICE OF THE TWENTY FIRST ANNUAL GENERAL MEETING
01 Annual Report 2015
99-B, Block-B, S.M.C.H.S., Main Shahrah-e-Faisal, Karachi. The members who hold shares in dematerialised form are requested to submit the members who hold shares in dematerialised form are requested to submit the dividend mandate form duly filled to their participant / investor account services in the CDC.
8. Availability of Audited Financial Statements on Company's Website
The Company has placed the Audited Annual Financial Statements for the year ended December 31, 2015 along with Auditors and Directors Reports thereon on its website: www.faysalbank.com
9. Transmission of Financial Statements to the Members through e-mail
In pursuance of SECP notification S.R.O 787 (I) / 2014 dated September 08, 2014, the companies have been allowed to circulate their Annual Balance Sheet and Profit and Loss Account, Auditor's Report and Director's Report (Annual Financial Statements) along with Notice of Annual General Meeting (Notice) through e-mail to the members of the Company. Members desiring to avail this facility may provide the requisite information to the Company Share Registrar, M/s. Central Depository Company of Pakistan Limited, CDC House, 99-B, Block-B, S.M.C.H.S., Main Shahrah-e-Faisal, Karachi for which form may be downloaded from the Company's website: www.faysalbank.com
10. Deduction of Income Tax from Dividend for Filer and Non-Filer
Pursuant to the amendment in section 150 of the Income Tax Ordinance, 2001 through Finance Act 2015, the revised Income Tax Rates on Dividend Income are as follows:
I. Income Tax Return Filer 12.5%
II. Income Tax Return Non Filer 17.5%
Income Tax will be deducted on the basis of Active Tax Payers List posted on the Federal Board of Revenue website. The FBR has clarified that shareholders accounts jointly held by filers and No filers shall be dealt with separately and in such particular situation, each account holder is to be treated individually as either a filer or a non-filer and tax will be deducted according to his shareholding. If the share is not ascertainable then each account holder will be assumed to hold equal proportion of shares and the deduction will be made accordingly. Therefore, in order to avoid deduction of tax at a higher rate, the joint account holders are requested to provide the below details of their shareholding to the Share Registrar of the Company latest by the close of business on April 4, 2016.
NOTICE OF THE TWENTY FIRST ANNUAL GENERAL MEETING
02Annual Report 2015
Folio / CDSAccount No.
TotalShares
Principal Shareholder Joint Shareholder
Name andCNIC No.
ShareholdingProportion
(No. of Shares)
Name andCNIC No.
ShareholdingProportion
(No. of Shares)
CompanyName

58 59Annual Report 2015 Annual Report 2015
NOTICE OF THE TWENTY FIRST ANNUAL GENERAL MEETINGNOTICE OF THE TWENTY FIRST ANNUAL GENERAL MEETING
11. Consent for Video Conference Facility:
Members can also avail vide conference facility. In this regard, please fill the following and submit the registered address of the Company 10 days before holding of the AGM.
If the Company receives consents from members holding in aggregate 10% or more shareholding residing at a geographical location, to participate in the Meeting through video conference at least 10 days prior to date of the Meeting, the Company will arrange video conference facility in the city subject to availability of such facility in that city.
The Company will intimate members regarding venue of the video conference facility at least 10 days before the date of AGM along with complete information necessary to enable them to access such facility.
“I / We________ of_______ being a member of Faysal Bank Limited, holder of _____ Ordinary Shares
as per registered Folio # CDC ID & A/C No. _____ hereby opt for video conference facility at ________.
My email address___________”
Signature of Shareholder
12. Change of Address and Non Deduction of Zakat Declaration Form
The Zakat will be deducted from the dividend at source at the rate of 2.5% of the paid-up value of the shares (Rs.10/each) under Zakat and Ushr Laws and will be deposited in the prescribed time in the Government Treasury. Physical Shareholders are requested to notify any Change in their address immediately and if applicable provide their non-deduction of Zakat Declaration From to our Share Registrar, M/s. Central Depository Company of Pakistan Limited, CDC House, 99-B, Block-B, S.M.C.H.S., Main Shahrah-e-Faisal, Karachi. Members holding shares in CDC / Participants accounts are also requested to update their address and if applicable, to provide their non-deduction of Zakat Declaration Form to CDC or their Participants / Stock Broker
For any query / problem / information, members may contact our Share Registrar, M/s.Central Depository Company of Pakistan Limited, CDC House, 99-B, Block-B, S.M.C.H.S., Main Shahrah-e-Faisal, Karachi.
Statement of Material Facts under Section 160(1)(b) of the Companies Ordinance 1984
relating to the Special Business referred to in Clause 6 of the Notice above:
This statement sets out the material facts concerning the following Special Business to be transacted at the Annual General Meeting of Shareholders of FBL to be held on March 29, 2016.
To consider and approve FBL’s Investment of up to PKR 500 Million as seed money in certain funds of Faysal Asset Management Limited (FAML) with or without modifications.
FBL from time to time makes investment in funds launched by its associated company, FAML. For this purpose approval of PKR 500 Million is sought from shareholders.
NOTICE OF THE TWENTY FIRST ANNUAL GENERAL MEETING
01 Annual Report 2015
NOTICE OF THE TWENTY FIRST ANNUAL GENERAL MEETING
02Annual Report 2015
The Statement of material facts as required under the SRO 27(I) / 2012 dated January 16, 2012 appears herein below:
a) Name of the associated company along with criteria on which the associated relationship is established
Investment in new funds to be launched by FAML. Associated relationship established due to 30% shareholding of FBL in FAML.
b) Purpose, benefits and period of investment
This seed money investment will enable FAML to launch new funds and grow its business, the benefits of which will flow to FBL in the form of dividends on this investment in funds and also on investment in FAML equity.
c) Maximum amount of investment
Investment of up to PKR 500 Million
d) Maximum price at which securities will be acquired
Face value
e) Maximum number of securities to be acquired
Dependent upon number of funds launched by FAML.
f) Number of securities and percentage thereof held before and after the proposed investment
Not applicable
g) Fair market value of securities
Not applicable
h) Break-up value of securities intended to be acquired on the basis of the latest Audited financial statements
Not applicable
i) Earnings per Share of the associated company for the last three years
Not applicable
j) Source of funds from which securities will be acquired
Units will be purchased from FBL’s own sources.
k) Salient features of the agreements(s) if any, entered into with the associated company with regards to the proposed investment
Not applicable

60 61Annual Report 2015 Annual Report 2015
NOTICE OF THE TWENTY FIRST ANNUAL GENERAL MEETING REPORT OF THE BOARD AUDIT AND CORPORATE GOVERNANCE COMMITTEE
The Board of Directors of Faysal Bank Limited (FBL) reconstituted the Terms of Reference of the Board Audit Committee and renamed it as Board Audit and Corporate Governance Committee (BACGC) in September 2014 in the wake of functional changes being made in FBL. The BACGC comprises of three directors having vast experience and knowledge of banking, finance, audit and accounting. The Chairman is an independent director and the other two members are non-executive directors. The BACGC has been proactively focusing on the effectiveness of the internal control, compliance risk management systems and application of Corporate Governance best practices at FBL. The BACGC has approved the Charter of Internal Audit, providing resources and complete independence to the Head of Internal Audit along with free access to the BACGC.
During year 2015, five (5) BACGC meetings were held and the following major activities were performed by the BACGC in accordance with its terms of reference as approved by the Board of Directors of the Bank.
• BACGC reviewed quarterly, half yearly and annual financial statements of the Bank and recommended the same for the approval of the Board.
• BACGC not only reviewed the management letter issued by the external auditors and management’s response thereto but also held detailed discussions with external auditors on major observations. The appointment of external auditors and their fee was also recommended to the Board.
• BACGC reviewed and approved the scope and the extent of the work to be performed by Internal Audit (IAD) including Shariah Audit, reviewed high risk observations and ensured monitoring and timely implementation of IAD recommendation. BACGC also reviewed adequacy and quality of IAD resources.
• BACGC reviewed major findings of internal investigations with respect to fraud & forgery along with management’s action thereon. BACGC also reviewed quarterly update of frauds, forgeries and dacoities.
• BACGC reviewed related party transactions and recommended the same for Board’s approval.
• BACGC reviewed the Institutional Risk Assessment Framework (IRAF) – Self Assessment Questionnaire
• BACGC reviewed the implementation of Internal Controls over Financial Reporting (ICFR) program across the Bank.
• BACGC reviewed the quarterly Compliance Activity report.
• BACGC reviewed the SBP inspection report and SBP’s thematic review reports along with monitoring the compliance status of these reports.
• BACGC reviewed statement on internal control system and recommended the same for endorsement by the Board.
• BACGC conducted self-assessment of its performance to review compliance with SECP code of corporate governance. The self-assessment report was also presented to the Board.
Mian Muhammad YounisChairman - BACGC
NOTICE OF THE TWENTY FIRST ANNUAL GENERAL MEETING
01 Annual Report 2015
l) Direct or indirect interest of Directors, sponsors, majority shareholders and their relatives in the associated company or the transaction
There is no personal interest of the Directors, sponsors, majority shareholders or their relatives.
To Consider and approve the amount of remuneration paid to the Non-Executive / Independent Directors of FBL during the year 2015 for attending the Board meetings / Sub-Committees and in that connection to pass the following resolution as an ordinary resolution, with or without modification, addition or deletion:
RESOLVED THAT:
“The remuneration paid to the Chairman, Non-Executive and Independent Directors of Faysal Bank Limited for attending Board meetings and meetings of the Board Committees i.e. (Recruitment, Nomination and Remuneration Committee; Board Risk Management Committee; Board Audit & Corporate Governance Committee and Board Steering Committee for conversion of Faysal Bank Limited into Islamic Bank) as disclosed in Note 38 of the Audited Financial Statements of the Bank for the year ended December 31, 2015, be and is hereby approved.”

63Annual Report 2015
Name of Company: Faysal Bank LimitedYear Ended: December 31, 2015
This statement is being presented to comply with the of Code of Corporate Governance (CCG) contained in of Rule 5.19 of the Pakistan Stock Exchange Regulations issued by the Pakistan Stock Exchange Limited (formerly Karachi Stock Exchange Limited into which the Islamabad Stock Exchange Limited and the Lahore Stock Exchange Limited have merged) where the Bank is listed for the purpose of establishing a framework of good corporate governance whereby a listed company is managed in compliance with the best practices of the Corporate Governance.
The Board of Directors of Faysal Bank Limited (the Bank) has adopted and applied the principles contained in the Code of Corporate Governance in the following manner:
1. The Bank encourages representation of independent Non-Executive Directors and Directors representing minority interests on its Board of Directors. At present the Board includes:
Category Names
Independent Mr. Farooq Rahmatullah Directors Mian Muhammad Younis Executive Directors Mr. Nauman Ansari,
President & CEO
Non-Executive Mr. Ahmed Abdulrahim
Directors Mohamed Abdulla Bucheery Mr. Juma Hasan Ali Abul
Mr. Imtiaz Ahmad Pervez Mr. Abdulelah Ebrahim
Mohamed Al-Qasimi
The Independent Directors meet the criteria of independence under clause 5.19.1(b) of the CCG.
2. The Directors have confirmed that none of
them is serving as a Director on more than seven listed companies, including the Bank.
3. All the Resident Directors of the Bank are registered as taxpayers and to the best of our knowledge none of them has defaulted in payment of any loan to a banking company, a Development Financial Institution or a Non Banking Financial Institution or being a broker of a stock exchange, has been declared as
a defaulter by that stock exchange.
4. One casual vacancy due to resignation of Mr. Muhammad Wasif Ijlal occurred on the Board on 03-12-2015 which was filled by the Directors on 18/01/2016 by co-opting Mr. Abdulla Abdulaziz Ali Taleb subject to regulatory approvals. The same was filled
within 47 days of the casual vacancy.
5. The Bank has prepared a ‘Code of Conduct’ and has ensured that appropriate steps have been taken to disseminate it throughout the Bank along with its supporting policies and procedures.
6. The Board has developed a vision / mission statement, overall corporate strategy and significant policies of the Bank. A complete record of particulars of significant policies along with the dates on which they were
approved or amended has been maintained.
7. All the powers of the Board have been duly exercised and decisions on material transactions, including appointment and determination of remuneration and terms and conditions of employment of President & CEO, other Executive and Non-Executive Directors, have been taken by the Board / shareholders.
8. The meetings of the Board were presided over by the Chairman and in his absence, by a Director elected by the Board for this purpose. The Board of Directors met nine times in the year 2015, once in every quarter. Written notice of the Board meetings, along with agenda and working papers, were circulated atleast seven days before the meetings except in one emergency meeting where the notice period was reduced. The minutes of the
STATEMENT OF COMPLIANCEWITH THE CODE OF CORPORATE GOVERNANCE
62 Annual Report 2015
AUDITORS’ REVIEW REPORT TO THE MEMBERS ON THE STATEMENT OF COMPLIANCE WITH THE CODE OF CORPORATE GOVERNANCE
We have reviewed the enclosed Statement of Compliance with the best practices contained in the Code of Corporate Governance (the Code), prepared by the Board of Directors of Faysal Bank Limited (‘the Bank’) for the year ended December 31, 2015 to comply with the requirements of Rule 5.19 of the Listing Rulebook of the Pakistan Stock Exchange where the Bank is listed.
The responsibility for compliance with the Code is that of the Board of Directors of the Bank. Our
and report if it does not and to highlight any non-compliance with the requirements of the Code. A review is limited primarily to inquiries of the Bank’s personnel and review of various documents prepared by the Bank to comply with the Code.
not required to consider whether the Board of Directors’ statement on internal control covers all risks and controls, or to form an opinion on the effectiveness of such internal controls, the Bank’s corporate governance procedures and risks.
The Code requires the Bank to place before the Audit Committee, and upon recommendation of the Audit Committee, place before the Board of Directors for their review and approval its related party transactions distinguishing between transactions carried out on terms equivalent to those that prevail in arm’s length
for using such alternate pricing mechanism. We are only required and have ensured compliance of this requirement to the extent of the approval of the related party transactions by the Board of Directors upon recommendation of the Audit Committee. We have not carried out any procedures to determine whether the related party transactions were undertaken at arm’s length price or not.
Based on our review, nothing has come to our attention which causes us to believe that the Statement of
practices contained in the Code as applicable to the Bank for the year ended December 31, 2015.
Chartered AccountantsDated: March 4, 2016Karachi.

64 Annual Report 2015
meetings were appropriately recorded and circulated.
9. The Board arranged an Orientation Workshop for its Directors during the year.
10. The Board had approved the appointment of CFO, Company Secretary and Head of Internal Audit including their remuneration and terms and conditions of employment.
11. The Directors of Faysal Bank Limited are professionally qualified and experienced persons and are well aware of their duties and responsibilities. The entire Board of Directors of the Bank has completed Directors Training Program from the Pakistan Institute of Corporate Governance.
12. The Directors’ Report for this year has been prepared in compliance with the requirements of the CCG and fully describes the salient
features required to be disclosed.
13. The financial statements of the Bank were duly endorsed by the President & CEO and
CFO before approval of the Board. 14. The Directors, CEO and Executives do not
hold any interest in the shares of the Bank other than that disclosed in the pattern of shareholding.
15. The Bank has complied with all corporate and financial reporting requirements of the CCG.
16. The Board has formed a Board Audit & Corporate Governance Committee. It comprises of three members, all of whom are Non-Executive Directors and the Chairman of the Committee is an Independent Director.
17. The Board Audit & Corporate Governance Committee (BACGC) held five (05) meetings, one in every quarter prior to approval of interim and final results of the Bank as required by the CCG. The terms of reference have been formed and advised to the committee for compliance.
18. The Board has formed a Recruitment, Nomination and Remuneration Committee (RNRC). It comprises of four members, of whom three are Non-Executive / Independent and one is Executive Director. The Chairman of the Committee is a Non-Executive Director.
19. The Board Audit & Corporate Governance Committee members met with External Auditors of the Bank without CFO and Head of Internal Audit and also met with Head of Internal Audit and other members of the Internal Audit function without CFO as
required under the provisions of CCG.
20. The Board has set up an Internal Audit function. The staff of Internal Audit Department are suitably qualified and experienced for the purpose and are conversant with the policies and procedures of the Bank.
21. The Statutory Auditors of the Bank have confirmed that they have been given a satisfactory rating under the quality control review program of the Institute of Chartered Accountants of Pakistan (ICAP); that they or any of the partners of the firm, their spouses and minor children do not hold shares of Faysal Bank Limited or its associates and the firm and all its partners are in compliance with International Federation of Accountants (IFAC) guidelines on Code of Ethics as adopted by the ICAP.
22. The Statutory Auditors or the persons associated with them have not been appointed to provide other services except in accordance with the listing regulations and the Auditors have confirmed that they have
observed IFAC guidelines in this regard.
23. The ‘closed period’ prior to the announcement of interim / final results, and business decisions, which may materially affect the market price of Bank’s securities, was determined
STATEMENT OF COMPLIANCEWITH THE CODE OF CORPORATE GOVERNANCE
65Annual Report 2015
and intimated to Directors, employees and stock exchanges.
24. Material / price sensitive information has been disseminated among all market participants at once through stock exchanges.
25. We confirm that all other material principles enshrined in the CCG have been complied with.
LahoreDated: February 25, 2016
Nauman AnsariPresident & CEO
STATEMENT OF COMPLIANCEWITH THE CODE OF CORPORATE GOVERNANCE

66 Annual Report 2015
DIRECTORS’ REPORTFOR THE YEAR ENDED DECEMBER 31, 2015
On behalf of the Board of Directors, I am pleased to present the 21st Annual Report of Faysal Bank Limited along with Audited Financial Statements and the Auditors’ Report thereon for the year ended December31, 2015.
Economic Update: Pakistan’s economy performed rather well in CY’15 despite headwinds from sluggish global economic growth. Key macroeconomic indicators exhibited noteworthy improvements; Large scale manufacturing gained traction, inflation was benign, fiscal consolidation remained on track and the current account vulnerabilities were substantially reduced. These coupled with improvement in FX reserves and pick up in credit sector reflect the rise of investor and consumer confidence in Pakistan’s economy.
Large Scale Manufacturing (LSM) recorded noticeable improvement in first five months of FY’16 (4.43 percent compared to 3.14 percent in FY’15) aided primarily by better energy situation, low international prices of key inputs and monetary easing. These factors were also instrumental in escalating credit to private sector which increased by PKR 340 bln in FY’16 compared to PKR 225 bln in FY’15. The services sector which had witnessed stellar growth in FY’15 (5.0 percent YoY) is expected to grow at a similar pace going forward. In view of these advances, real GDP is set to maintain the previous year’s growth momentum. Going forward the uptick in economic activity shall continue to gain momentum on the back of infrastructure and energy related projects under China Pakistan Economic Corridor (CPEC).
The headline inflation continued its downward trajectory – reaching an average rate of 2.07 percent in 1st half of FY’16 against 4.56 percent for full FY’15. This was mainly due to a sharp fall in energy and commodity prices and a relatively stable PKR. This enabled the SBP to reduce the Discount Rate by a cumulative 350 bps during the course of the year. However, inflation is expected to rebound somewhat in the future (average 3.7 percent in FY’16 according to IMF) due to the bottoming out of the effects of low commodity and food prices and low base effect coming into play.
The overall budget deficit in 1st quarter of FY’16 was lower than that of last year, recorded at PKR 306 bln and well below IMF target of PKR 329 bln. It is pertinent to mention that government took additional tax measures in Oct’15 to boost FBR revenues which helped in containing fiscal deficit. However, going forward fiscal consolidation is challenged by lower than expected tax revenues. Pakistan’s current tax-to-GDP ratio of around 11 percent is too low to provide fiscal space for growth enhancing spending on infrastructure, health and education. The loss making PSEs continue to be a drain on the national exchequer. Swift government actions are required to mobilise additional revenue with focus on broadening tax base and expedite privatisation of loss making PSEs.
Improvements in the external sector witnessed in CY’14 consolidated further in CY’15 primarily due to a windfall from low international oil prices and modest growth in remittances (6.3 percent YoY). However, dwindling exports (11 percent YoY decline) continues to obscure the overall performance of the external sector. Lackluster performance of exports can be primarily attributed to sluggish global demand; energy shortages; and overvalued PKR parity as suggested by real effective exchange rate (recorded at approx. 120 in Dec’15) which is eroding our exports competitiveness in international arena. The PKR remained relatively stable against the USD during CY’15, depreciating by a meagre 4.18% against the Greenback.
67Annual Report 2015
DIRECTORS’ REPORTFOR THE YEAR ENDED DECEMBER 31, 2015
Bank’s Performance:
a) Corporate and Investment Banking The Corporate Banking continued to play its role of providing finance to promote economic activity
in the country. Their focus remained on selected growth of creditworthy advances with efficient usage of capital and consolidation of portfolio.
Project Finance and Syndications
During the period, Investment Banking managed several high profile transactions, some of the notable ones are highlighted below:
• FBL as part of the joint consortium has arranged and closed (as Lead Advisor and Arranger) PKR 16.7 bln conventional and Islamic mode of financing for the largest gas utility company operating in northern part of the country for its pipe line infrastructure in relation to LNG.
• FBL has participated as Joint Arranger in Islamic leg of PKR 25.5 bln financing split into Islamic and Conventional mode for construction and rehabilitation of 136 km Motorway connecting Hyderabad to Karachi.
• FBL has successfully closed its sole mandate for arranging Islamic financing of PKR 3.3 bln for a largest state owned marine transportation company for the purpose of refinancing an existing expensive and conventional loan.
• FBL has successfully closed its sole mandate for arranging PKR 1.1 bln working capital financing for a newly commissioned 62.4 MW bagasse based cogeneration power plant in Punjab.
• FBL has successfully achieved financial closure under a jointly mandated PKR 15 bln transaction for the gas utility and distribution company operating in the Southern part of the country for its pipe line infrastructure project in relation to LNG.
• FBL has successfully achieved financial closure under a joint mandate of PKR 12 bln for one of the oldest and largest telecom operators in Pakistan to support its infrastructure expansion.
• FBL as part of the Mandated Lead Arrangers group has structured and arranged PKR 55 bln split into Islamic and Conventional financing for the first ever coal mining company sponsored by some of the largest conglomerates in Pakistan. The project is for development of 6.5 MTPA coal mine in Thar. FBL participated in the Islamic tranche.
• FBL has participated as Joint Arranger for a financing mandate of PKR 22 bln which has an Islamic leg. The financing was arranged for a coal fired (mine mouth) power plant in Thar under an SPV put up by one of the largest and strongest conglomerate in the business sector along with a strong Chinese partner.
• FBL has successfully achieved financial closure under a joint mandate for PKR 10.5 bln for a 50MW wind power project based in Jhimpir, setup by one of the biggest groups in Pakistan in the business sector.

68 Annual Report 2015
DIRECTORS’ REPORTFOR THE YEAR ENDED DECEMBER 31, 2015
• FBL as Joint Arranger has participated in financing of PKR 21.86 bln for a 118 MW coal based power project which is setup for providing electricity and steam to the parent company as well as sale of electricity to KE.
b) Retail Banking:
Branch Distribution
This year saw an enhanced focus on deposit mobilisation and cross sell through branches, moving the Bank towards a performance based multiproduct sales model. To protect margins in wake of sharp decline in Discount Rate by 350 bps, the Bank re-profiled the savings book along with sharp focus on market competitive pricing and related discipline, consistent with our business strategy of growing the current and savings accounts (CASA) book. CASA deposits now stands at PKR 196.5 bln contributing 67.2% of total deposits as of December 31, 2015. This year, the Bank managed to increase CASA contribution of 160 bps from previous year level of 65.6%. Consequent to this, cost of funds dropped which contributed to profitability of Retail Banking.
The deposits growth effort was significantly hampered by Federal Board of Revenue’s (FBR) decision to impose withholding tax on non-filers on banking transactions in the 1st half of FY’16. This measure adversely affected customer-confidence across the industry as well as FBL. However, with the beginning of the new year, there is an increased level of acceptance around the new tax environment and we hope to leverage positive market sentiments to further grow our deposits base.
Consumer Finance
Consumer Finance shall continue to maintain focus on strategic objectives of further penetration into profitable segments, continued focus on risk management, maintenance of cost discipline and adhering to regulatory requirements. Consumer Finance continues to follow a growth trajectory in line with the objective of selling multiple products at optimum cost levels. The segment has worked on key initiatives to support the Bank meeting its business objectives. These include expansion of Bank’s premium product suite with the launch of “World Credit Card” and enhancing our existing value proposition with the launch of Lifestyles program, which includes over 100 alliances.
Wealth Management
The Wealth Management business performed remarkably well during the course of the year with over 40% growth in business volume and significant increase in product penetration within our customer base. The Bancassurance product menu was further enriched with the onboarding of IGI Life Insurance as our new business partner. Furthermore, the investments proposition was further strengthened with the introduction of new funds through the FBL branch network. Going forward, the FBL plans to evolve its Wealth Management platform as a comprehensive array of investment and insurance solutions to cater to both mass market segment as well as specialised offerings for our High Net Worth clients.
69Annual Report 2015
DIRECTORS’ REPORTFOR THE YEAR ENDED DECEMBER 31, 2015
Agri Business
FBL continues to maintain its leadership position amongst commercial banks in the industry through continued zeal for innovation and providing unique and tailored Agri solutions to the farming community of Pakistan. The farmers however, faced unprecedented price crash of Agri commodities specially Cotton and Rice. Cotton additionally suffered on yield side as a result of which the country is expected to harvest 33% lesser crop during the year. This situation has caused demand side issues resulting in lower disbursements and has also adversely affected the Agri portfolio’s health in terms of timely repayment of dues. The Bank has increased proactive monitoring and enhanced efforts for recovery of the portfolio.
SME and Commercial
FBL is one of the key players of the financial sector being actively involved in lending to Commercial and SME’s. Bank has strong presence in most major cities across Pakistan, catering to the financial needs of businesses in various industrial sectors. An aggressive strategy is developed for 2016 and we are fully geared up to grow the CBSME business with increased emphasis on the corporate value chain.
c) Islamic Banking
Barkat Islamic offer customised, wide range of shariah compliant products under one roof which addresses all Islamic Banking requirements of customers. Barkat Islamic Banking continued on its growth strategy by increasing its foot print across Pakistan by opening 5 new branches and converting 5 conventional branches into Islamic. Now Islamic Banking has 68 branches in 30 cities and 1 Islamic sub-branch.
Barkat enhanced its product menu which now includes: • Barkat Asaan Current and Savings Account, to extend benefits of financial services to the unbanked
market segment mainly consisting of low risk / income customers. • Barkat Islamic Banking launched two debit Cards: Barkat Visa Gold and Barkat Visa Platinum Debit cards.
The Barkat Islamic Banking acted as a Shariah Advisor for two of the syndicated transactions and also participated in several other syndicated Islamic transactions involving hybrids structures.
d) Treasury
2015 Proved to be a stellar year for FBL. The business units reaped the rewards from the investments made over the preceding years in the development and constant upgrading of the homegrown IT Platform as well as various financial models.

70 Annual Report 2015
DIRECTORS’ REPORTFOR THE YEAR ENDED DECEMBER 31, 2015
The Money Market Desk positioned itself for a steep fall in interest rates by increasing the quantum and duration of the securities portfolio. A significant portion of this position was funded from the secondary market. Once the discount rate moved downwards these positions enabled the Bank to substantially enhance both accrual income through carry trades as well as realise substantial capital gains. The Fixed Income sales and distribution business also witnessed significant growth. In addition to catering to the traditional client base of insurance companies, Provident and Pension Funds, Corporate and Asset Management Companies, the Treasury marketed fixed income investments to an array of individual customers as well. Since there was a substantial appreciation in the underlying value of these securities our customers reaped the benefits of timely investment advice given to them.
In addition to serving existing clients, the Derivatives and Structured Solution Desk offered an array of structures and balance sheet solutions to a multitude of new market entrants. There was a significant market interest in exploring Interest rate swaps due to the volatile behavior of interest rates. FBL’s Equity trading desk remained an active player in the capital markets despite significant headwinds from a global equity meltdown. The KSE 100 index grew by a mere 2.1% during CY’15 vs. 27% in CY’14. Despite these challenges our Equity desk managed to outperform the KSE100 index.
e) Special Assets Management (SAM)
Country’s overall sluggish economic condition coupled with hardcore relationships with delinquent customers and long drawn legal procedures, SAM’s business is even more difficult. By adopting new end-to-end tools to coup the complex issues and given the strategic importance of NPLs management, our team has maintained its tempo by putting in vigorous efforts thus managing to contribute P&L of Rs.1,097 million in 2015.
f) People
Human Resources (HR)
Several initiatives were introduced by Human Resource Function during 2015 to provide excellent banking experience to our customers. FBL has been investing in service quality and staff engagement interventions for improving staff quality, inviting people from different departments for their personal / professional views on building a stronger franchise.
“Business and Operations Talent Acquisition Plan” was launched to hire bright and competent trainee officers from Universities campus. In the 1st phase, campus drives were held at different universities wherein assessment tests and panel interviews were conducted. Bank continues to be the Bank of choice to many graduates.
71Annual Report 2015
DIRECTORS’ REPORTFOR THE YEAR ENDED DECEMBER 31, 2015
Learning & Development (L&D)
L&D endeavored the most in 2015 to cover product and process trainings keeping in view that these two aspects are critical to staff’s ability to perform their jobs. A total of 13,798 participants were successfully trained in 120 courses which included class room and on line training. Mystery shopping results stood from 75% to 78% for trained staff for most training programs. Bank induction programs such as the Branch Banking Certification Program and Branch Service Officer Development Program also covered 738 newly hired staff on product and process training. All staff hired in Barkat Islamic Banking attended newly introduced 5 day mandatory islamic certification program at various locations thereby complying with SBP directives.
L&D conducted training needs analysis exercise for the upcoming conversion of Faysal Bank’s business to Islamic and accordingly developed specific training program. A total of 3,226 participants have been trained since 2014 on various courses as part of the business transformation plan.
Internal Communication
The platform of Internal Communication was utilised effectively in 2015 disseminating information. Premium discounts made by many renowned organisations were offered to our staff. Two mega events FBL Family Fiesta and Movie Time, were successfully organised in the main cities. Further, exclusive interactive sessions were conducted in collaboration with Bayer Pakistan for our female staff in Karachi and Lahore to raise awareness on different health issues. Leading cellular operators also facilitated our staff with biometric verification at Faysal House.
Our home grown quarterly “The Blue Octagram” is uploaded for our employees.
g) Risk Management
The Risk Management function continued to play its role both on a strategic and operative level to ensure institution of risk awareness and management culture across the Bank which has helped improve overall control environment. It also ensured sound health of the Bank’s risk profile through both effective monitoring and proactive approach along with continuous improvement in risk management policies, processes & procedures.
Retail Risk Management assisted the business to launch new initiatives for acquisition of new customers, which included exploration of new low risk segments and tailor made policies to target preferred segments more effectively. Furthermore, various strategic initiatives were undertaken to streamline and simplify policies & processes to offer improved service standards to customers, while maintaining overall control. The Retail Risk Management function also ensured effective collection and recovery efforts.
The Enterprise Risk Management function ensured that the Bank remained fully compliant with SBP/Regulatory Basel related capital requirements while maintaining satisfactory capital adequacy levels, with comfortable cushion available to support its growth plans in the coming years. Obligor Risk Rating (ORR) and Facility Risk Rating (FRR) models for different business segments were updated to incorporate the impacts of latest available statistics. Monitoring of treasury activities was strengthened through Live Limit Monitoring for all key regulatory and internal limits. To further

72 Annual Report 2015
DIRECTORS’ REPORTFOR THE YEAR ENDED DECEMBER 31, 2015
strengthen Risk awareness culture, online training for Operational Risk Management (ORM)coordinators is now being undertaken via e-learning training module. The Bank implemented SBP’s regulatory ORM related guidelines which augment the Bank’s initiatives to further improve upon the internal control environment.
h) Support Services
Information Technology has endeavored to provide seamless and efficient services to internal as well as external customers. Key achievements are as follows:
• Establishment of IT Governance to create value for business stakeholders and building understanding to develop alignment between business and technology on priorities and resource allocation.
• Formulation of 24/7 Integrated Operations Monitoring Station (IOMS), the dedicated taxonomy
seeking to establish and execute mandatory procedure of 24 by 7 operations at Faysal House, Karachi as Primary Site whereas Lahore as DR Site. Video Walls have also been setup towards continuous visualisation and monitoring real-time dynamics, progress and health of enterprise IT resources.
• Implementation of a comprehensive centralised Islamic Pool Management solution thereby automating General LCY and FCY pools.
• Implementation of Bio-Metric Technology at the Branch Level for verification of particulars of prospective customers for opening of Accounts - in compliance with regulatory guidelines.
• Implementation of Data Mart extracting the data from eight different sources in order to orchestrate the comprehensive Customer View using Data Integration Framework (DIF) capable of accumulating data in various dimensions for Interfacing, Integration, MIS and BI prospective.
• Formulation of IT Help Hotline Service to reduce TAT for internal and external customers.
i) Financial Perspective
Management Information
The Financial Control Unit aims to provide timely and accurate MIS to business partners. In this regard, regular view and upgradation have been made in QlikView Business Intelligence system. The dashboards today not only provide data regarding deposits mobilisation, lending, documentary credit and CRM but also provide segment wise Monthly Profitability Report to user for reviewing their performance. Businesses have been provided with their customer wise profitability to evaluate their relationships and to explore cross sale opportunities.
Cost Efficiency
Bank’s strategy is to redefine processes and develop alternates to enhance core income and
73Annual Report 2015
DIRECTORS’ REPORTFOR THE YEAR ENDED DECEMBER 31, 2015
improve Cost Efficiency. The focus was on rationalising costs on sustainable basis without affecting smooth operations.
Energy Saving Measures
Special emphasis was given to Energy Saving Measures not only for controlling cost but also for saving natural resources. Staff members are advised to observe working hours to make maximum utilisation of natural light. Lifts operations in late hours are also restricted. Strategy of installing heavy duty UPS is working well whereby generators working at night are discontinued thus reducing fuel consumption.
j) Corporate Social Responsibility:
Faysal Bank made every best possible effort to spread its CSR work in 2015, making significant contribution in areas of great social importance. During the year our total spending in health sector was more than PKR 67 million whereas about PKR 10 million was disbursed to organisations involved in quality education and vocational training. New relationships were entertained with Non Profit Organisations while fulfilling our ongoing commitment with different organisations with whom we had long term association. Some notable health and educational organisations we worked with in 2015 are:
Health
• Aga Khan Hospital & Medical College Foundation • Patient’s Aid Foundation (Jinnah Hospital)
• Sindh Institute of Urology & Transplantation
• Poor Patients Aid Society (Civil Hospital)
• The Indus Hospital
• The Cardiovascular Foundation
Education / Vocational Training
• The Hunar Foundation
• Ida Rieu Welfare Association
• The Helpcare Society
Future Outlook:
The Bank has recently developed a strategy which has a strong focus on growing Islamic business and going forward branch expansion will be on Islamic side. Also in booking new assets preference will be given to Islamic structures.

74 Annual Report 2015
DIRECTORS’ REPORTFOR THE YEAR ENDED DECEMBER 31, 2015
The Bank has planned to aggressively grow its branch network during 2016 in financial hubs and agriculture areas to provide door step convenience to customers. These branches by generating low cost core deposits shall improve CASA mix and hence reducing average cost of funding and will also cater to the banking requirements of the businessess in that area. Moreover, branches have also been transformed to a multiproduct selling hub through facilitation, persuasion and training. Cross sell opportunities are being converted into business through synergies and partnerships between Corporate, Commercial, SME, Agri and Retail segments.
Financial Highlights: Operating profit 8,313 5,910Provision for non-performing advances (919) (1,954)Provision for diminution in value of investments (454) (397)Provision against off balance sheet obligations (20) (7) (1,393) (2,358)Profit before tax 6,920 3,552Provision for taxation (2,698) (1,075)Profit after tax 4,222 2,477Un-appropriated profit brought forward 5,696 3,601 9,918 6,078Appropriations / Transfers:
Issue of bonus shares @ 15% (1,565) -Transfer to statutory reserve (844) (496)Transfer from surplus on revaluation of fixed assets - net of tax 54 87 Re-measurement of post-employment obligation – net of tax 75 27
(2,280) (382)Un-appropriated profit carried forward 7,638 5,696
Earning per share – Rupees 3.52 2.06
Bank has earned healthy Profit after Tax (PAT) of PKR 4.222 bln during 2015 against PKR 2.477 bln (PAT) for 2014 thereby registering a 70.4% increase. Resultantly, EPS of the Bank has increased to PKR 3.52 from PKR 2.06 as compared to corresponding year. This achievement is due to the timely and effective initiatives taken for maintaining revenue stream in low interest rates and economic growth conditions.
To earn better spreads, Bank’s strategy is mobilization of low cost deposits, effective management of NPL’s and strict monitoring of administrative expenses. In all these areas, Bank has managed to excel and thereby net margins were protected, expenses were reduced and NPL charged was minimized.
2015 2014PKR in million
75Annual Report 2015
DIRECTORS’ REPORTFOR THE YEAR ENDED DECEMBER 31, 2015
The Banks non-funded income was higher than last year by 27.2% mainly due to realization of some gains on investment portfolio and higher fee and commission income.
Over the years, rigorous cost reduction efforts have enabled the Bank to bring administrative expenses to the level of year 2013. Bank has continued to keep the cost under strict control and alongside this drive, it has provided room to invest in normal business activities like deposit mobilization, launching new initiatives, opening branches and withstanding economic factors like inflation, ever increasing energy prices and indirect taxes on services.
NPL coverage has increased from 78.6% to 79.2%. This healthy coverage ratio reflects that the Bank has taken sufficient provision on impaired assets and there is less likelihood of higher provision charge in coming years.
The provision for tax is higher due to higher profitability and charge of 4% super tax on 2014 profits levied by the Finance Act, 2015.
On the balance sheet side capital base increased as a result of bonus issue. Advances level was maintained and surplus funds were invested in better yield government securities. Investments increased to PKR 183.7 bln which is higher by 18.3% from 2014 level of PKR 155.2 bln. Deposits were marginally improved as Bank concentrated on mobilizing low cost core deposits so as to maintain its cost of fund at desirable levels. Total assets of your Bank have increased from PKR 388 billion to PKR 430 billion.
The Board of Directors has recommended final cash dividend of PKR 1.00 per share (10%) for the year 2015.
Credit Rating:
JCR-VIS Credit Rating Company Limited (JCR) and Pakistan Credit Rating Agency Limited (PACRA) have re-affirmed the following entity ratings as on June 30, 2015:
Long-Term AA
Short-Term A1+
Stable outlook has been assigned to the ratings by both the rating agencies.
Definitions of JCR-VIS for the assigned ratings are reproduced below:
“AA: High Credit Quality. Protection factors are strong. Risk is modest but may vary slightly from time to time because of economic conditions.
A1+: High Certainty of Timely Payment. Short term liquidity including internal operating factors and / or access to alternative sources of funds; is outstanding and safety is just below risk free Government of Pakistan short-term obligations.”
Definitions of PACRA for the assigned ratings are reproduced below:

76 Annual Report 2015
DIRECTORS’ REPORTFOR THE YEAR ENDED DECEMBER 31, 2015
AA: Very High Credit Quality. “AA” rating denotes a very low expectation of credit risk. It indicates very strong capacity for timely payment of financial commitments. This capacity is not significantly vulnerable to foreseeable events.
A1+: Obligations supported by the highest capacity for timely repayment.”
Corporate Governance:
The Bank has implemented the requirements of the Code of Corporate Governance (the Code) relevant to the year ended December 31, 2015. A prescribed statement by the management along with the auditor’s review report thereon forms part of this Annual Report.
Statement under clause xix of the code:
a. The financial statements prepared by the management of the Bank present fairly the state of affairs, the results of its operations, cash flows and changes in equity;
b. Proper books of account of the Bank have been maintained;
c. Appropriate accounting policies have consistently been applied in preparation of the financial statements. Accounting estimates are based on reasonable and prudent judgement.
d. Approved accounting standards, as applicable to Banks in Pakistan, have been followed in preparation of financial statements;
e. The system of internal control is sound in design and has been effectively implemented and monitored.
f. There are no doubts about the Bank continuing as a going concern;
g. There has been no material departure from the best practices of corporate governance as detailed in the listing regulations;
h. Summarised key operating and financial data of the last six years is tabulated on the initial pages of this Annual Report;
i. The value of investment of provident and gratuity funds are PKR 888.381 million and PKR 491.594 million respectively as per the latest audited financial statements.
j. The details of the Board and Committees’ Meetings held and attended by the directors form part of this Annual Report;
k. All Board members have been certified from Pakistan Institute of Corporate Governance as ‘Certified Directors’.
l. The prescribed pattern of shareholding is given as a part of this Annual Report.
77Annual Report 2015
DIRECTORS’ REPORTFOR THE YEAR ENDED DECEMBER 31, 2015
m. No trades in the shares of the Bank were carried out by the Directors, CEO, CFO, Company Secretary, Head of Internal Audit and their spouses and minor children during the year 2015.
Statement of Internal Control:
This Board is pleased to endorse the statement made by the management relating to internal controls. The system of internal controls is sound in design and has been effectively implementedand monitored. The management’s Statement of Internal Controls is included in this Annual Report.
Risk Management Framework
Risk Management Group (RMG) organised under the Chief Risk Officer (CRO), has been authorised by the Board of Directors (BoD) to implement a Risk Management framework across the Bank. Risk Management framework is built around the principles of Integrated Risk Management for managing Credit Risk, Market Risk, Liquidity Risk and Operational Risk. The primary objective ofthis architecture is to inculcate risk management into the organisation flows to ensure that risks are accurately identified and assessed, properly documented, approved, and adequately monitored and managed in order to enhance long term earnings and to protect the interests of the Banks depositors and shareholders.
The salient features of the Risk Management Framework include:
• Clearly defined Risk Management policies and procedures covering risk identification, acceptance, measurement, monitoring, reporting and control.
• A well constituted Risk organisational structure clearly defining roles and responsibilities of individuals involved in risk taking as well as managing it.
• The Bank, in addition to Risk Management functions for various risk categories, has also setup committees for strategic oversight of risk management activities, including the Board Risk Management Committee (BRMC), Country Credit Committee (CCC), Enterprise Risk Management Committee (ERMC), Asset & Liability Management Committee (ALCO) & Fraud Risk Management Committee (FRMC).
• The effectiveness of the management information system is paramount to ensure flow of information from operational level to top management and a system to address any exceptions is meticulously observed based on clearly spelt out procedures to address such deviations.
• The framework emphasises ongoing review of risk policies and procedures.
The Risk Management framework is built on the following elements:-
Comprehensive Risk Governance:
• Credit and Counterparty - limits on country, industry, portfolio products/segments, risk ratings and group & single name exposures.
• Market Risk - dynamic and well-defined limits structure for money market, foreign exchange, equity and derivatives portfolios.

78 Annual Report 2015
DIRECTORS’ REPORTFOR THE YEAR ENDED DECEMBER 31, 2015
• Liquidity and Funding Risk - limits for liquid assets, liability diversification, credit and liquidity commitments and cash flow mismatches.
• Operational Risk Framework - built around the concept of event, effect and cause categorisation.
Risk Processes:
Rigorous Risk processes, under holistic oversight of RMG and subject to periodic review by Internal Audit/Compliance and facilitation by Fraud Risk Management are used across the Bank to:-
• Develop and update policies and limits for approval by Senior Management/Board
• Monitor policy compliance
• Maintain contingency plans
• Track variables for changing risk conditions and provide timely reports to Senior Management
• Generate a healthy critique on Asset Portfolio Quality and Credit Management Process
• Prevent and detect fraud incidents and investigate reported operational loss events due to acts intended to defraud, misappropriate property of the Bank or circumvent regulation, laws or Bank
policy
The Bank’s realigned Risk Management Framework has culminated in strengthened Risk Management controls through a renewed focus on overall Portfolio Management including Special Assets Management.
Holding Company:
Ithmaar Bank B.S.C., an Islamic Retail Bank listed in Bahrain and Kuwait is the holding company of Faysal Bank Limited. Dar Al-Maal Al-Islami Trust is the ultimate parent of the Bank.
Auditors:
The present auditors’, A. F. Ferguson & Co., Chartered Accountants, will retire on the date of next Annual General Meeting. They have completed five year of audit however, State Bank of Pakistan has allowed them to continue as auditor as per their approval letter reference BPRD/CS&MRPD/8106/3880/15 dated February 18, 2015 hence they are eligible for re-appointment. Accordingly, the Board of Directors endorses the recommendation of the Audit Committee for the appointment of A. F. Ferguson & Co., Chartered Accountants, as the Auditors of the Bank for the financial year 2016.
Acknowledgement:
I would like to take this opportunity to thank on behalf of the Board and Management of the Bank,
79Annual Report 2015
On behalf of the Board of Directors
President & CEOLahore
Dated: February 25, 2016
DIRECTORS’ REPORTFOR THE YEAR ENDED DECEMBER 31, 2015
the shareholders for the trust they have reposed in the Bank, I am also grateful to the State Bank ofPakistan and Securities and Exchange Commission of Pakistan for their continued support and guidance and the customers for their patronage. I would also like to express sincere appreciation for the employees of the Bank for their dedication and hard work.

STATEMENT ON INTERNAL CONTROLS
80 Annual Report 2015
This statement is presented to comply with the requirements of the State Bank of Pakistan (SBP) issued vide BSD Circular No. 07 dated May 27, 2004 “Guidelines on Internal Controls” and OSED Circular No. 01 of 2014 dated February 07, 2014 “Instructions on Inter Controls over Financial Reporting (ICFR)”.
The Management of Faysal Bank Limited is responsible for establishing and maintaining adequate and effective internal control system in the Bank.
The management of the Bank fully recognizes this responsibility, appreciates its value and significance and therefore, has designed the Bank’s Internal Control Program to provide reasonable assurance on the reliability of financial reporting, effectiveness of the operations and compliance with applicable laws and regulations.
Accordingly, policies and procedures encompassing various business and operational areas are in place, kept updated and communicated across all pertinent levels of the organization. The policies are approved by the Board of Directors and the procedures are approved by the Senior Management. The Bank’s Internal Audit function keeps monitoring of compliance with these policies and procedures and regularly apprises the management and the Board on the same through Board’s Audit and Corporate Governance Committee.
The management takes remedial measures to address weaknesses identified by internal and external auditors. These remedial measures, which include improvements in internal controls to ensure non recurrence of those exceptions, are monitored by Compliance Committee.
While the Internal Controls System is effectively implemented and monitored, there are inherent limitations in the effectiveness of any system, including the possibility of human error or system failure, circumvention and overriding of controls. Accordingly, even an effective internal control system can provide reasonable but not absolute assurance that the system’s objective will be achieved.
Additionally, the Bank has completed all stages of the ICFR roadmap, issued vide BSD Circular No. 05 dated February 24, 2009 of the State Bank of Pakistan (SBP). The Bank has adopted the “COSO Internal Control Integrated Framework” in relation to its Internal Control program in order to ensure consistency in the process of compliance with SBP’s Internal Control Guidelines involving documentation, risk assessment, gap analysis, controls testing and controls implementation. Furthermore, as per the instructions of State Bank of Pakistan on the subject, the Bank will submit the Long Form Report of statutory auditors on review for the ICFR program for the year ended December 31, 2015 within the regulatory deadline.
The management feels confident that through adoption of these measures, the Bank’s internal control environment is maintained at a satisfactory level.
The Board of Directors endorses the above stated management’s evaluation of internal controls and ICFR program.
Nauman AnsariPresident & CEO
LahoreFebruary 25, 2016
81Annual Report 2015
AUDITORS’ REPORT TO THE MEMBERS
Faysal Bank Limited (the Bank) as at
Noman Abbas Sheikh

82 83Annual Report 2015 Annual Report 2015
STATEMENT OF FINANCIAL POSITIONAS AT DECEMBER 31, 2015
PROFIT AND LOSS ACCOUNTFOR THE YEAR ENDED DECEMBER 31, 2015
Note 2015 2014
------------ Rupees ‘000 ------------ASSETS
Cash and balances with treasury banks 8 26,084,007 20,285,851 Balances with other banks 9 1,068,451 1,422,699 Lendings to financial institutions 10 12,088,403 - Investments 11 183,677,239 155,210,513 Advances 12 178,079,084 181,224,805 Operating fixed assets 13 11,342,980 11,543,356 Deferred tax assets - net 14 3,087,325 2,428,816 Other assets 15 14,645,371 16,009,744
430,072,860 388,125,784
LIABILITIES
Bills payable 16 6,009,238 5,347,774 Borrowings 17 90,565,242 60,926,863 Deposits and other accounts 18 292,130,258 283,345,739 Sub-ordinated loans 19 2,994,000 2,995,200 Liabilities against assets subject to finance lease - - Deferred tax liabilities - net - - Other liabilities 20 8,021,649 9,207,632
399,720,387 361,823,208 NET ASSETS 30,352,473 26,302,576
REPRESENTED BY
Share capital 21 11,997,601 10,432,697 Reserves 22 6,422,761 5,703,155 Unappropriated profit 7,638,330 5,696,366
26,058,692 21,832,218 Surplus on revaluation of assets - net of tax 23 4,293,781 4,470,358
30,352,473 26,302,576
CONTINGENCIES AND COMMITMENTS 24
The annexed notes 1 to 47 and Annexures I to IV form an integral part of these financial statements.
PRESIDENT & CEO DIRECTOR DIRECTOR DIRECTOR PRESIDENT & CEO DIRECTOR DIRECTOR DIRECTOR
Note 2015 2014 -------------Rupees ‘000-------------
Mark-up / return / interest earned 26 32,312,553 32,312,633 Mark-up / return / interest expensed 27 18,357,971 18,480,191 Net mark-up / interest income 13,954,582 13,832,442
Provision against non-performing loans and advances - net 12.4 1,026,128 2,055,820 (Reversal) / provision for consumer and small enterprise
loans - general 12.4 &12.5 (6,852) 33,159 Provision against off balance sheet obligations 20.2 19,929 6,981 Provision for diminution in value of investments - net 11.3 454,551 397,383 Recoveries against written-off debts - net 12.7.1 (100,296) (134,506)
1,393,460 2,358,837 Net mark-up / interest income after provisions 12,561,122 11,473,605
Non mark-up / interest incomeFee, commission and brokerage income 2,303,447 2,075,945 Dividend income 318,715 182,435 Income from dealing in foreign currencies 964,961 1,072,939 Gain on sale of securities - net 28 1,738,630 460,477 Unrealised (loss) / gain on revaluation of investments classified
as held for trading (27,230) 31,475 Other income 29 265,817 550,898 Total non mark-up / interest income 5,564,340 4,374,169
18,125,462 15,847,774 Non mark-up / interest expensesAdministrative expenses 30 10,591,053 12,162,034 Other provisions / (reversal) - net 15.3 386,126 (88,616)Other charges 31 221,204 221,826 Total non mark-up / interest expenses 11,198,383 12,295,244
6,927,079 3,552,530 Share of loss of associate 11.7.2 (7,002) (745)Extraordinary / unusual items - - Profit before taxation 6,920,077 3,551,785
Taxation - Current 32 3,038,627 1,712,150 Taxation - Prior years 32 264,797 (812,786)Taxation - Deferred 32 (605,711) 175,462
2,697,713 1,074,826
Profit after taxation 4,222,364 2,476,959
---------------Rupees----------------
Basic earnings per share 33 3.52 2.06
The annexed notes 1 to 47 and Annexures I to IV form an integral part of these financial statements.

84 85Annual Report 2015 Annual Report 2015
STATEMENT OF COMPREHENSIVE INCOMEFOR THE YEAR ENDED DECEMBER 31, 2015
Note 2015 2014 -------------Rupees ‘000-------------
Profit after taxation for the year 4,222,364 2,476,959
Other comprehensive income:
Items that will not be reclassified to profit and loss account
Components of comprehensive income reflected in equity
- Remeasurements of defined benefit plan 36.5 115,098 41,466 - Deferred tax liability on remeasurements of defined benefit plan (40,284) (14,513)
74,814 26,953
Comprehensive income transferred to equity 4,297,178 2,503,912
Items that may be reclassified subsequently toprofit and loss account
Components of comprehensive income not reflected in equity
- Net change in value of available for sale securities (148,259) 2,506,467 - Deferred tax asset / (liability) on change in value of
available for sale securities 25,845 (887,700) (122,414) 1,618,767
Total comprehensive income 4,174,764 4,122,679
The annexed notes 1 to 47 and Annexures I to IV form an integral part of these financial statements.
STATEMENT OF CHANGES IN EQUITYFOR THE YEAR ENDED DECEMBER 31, 2015
Share capital
Reserves
Unappro-priated profit
Total
Capital
Statutory reserve
(note 22.1)Total
Reserve for issue of bonus shares
Share premium
Non-distributable
capital reserve
(NCR) - gain on bargain purchase
Reserve arising on
amalgama-tion
----------------------------------------------------------------- Rupees ‘000 --------------------------------------------------------------------
Balance as at January 1, 2014 10,432,697 - 10,131 2,477,908 23,952 4,042,206 6,554,197 3,600,828 20,587,722
Profit after taxation for the year - - - - - - - 2,476,959 2,476,959
Other comprehensive income for the year- Remeasurements of defined benefit plan - - - - - - - 41,466 41,466 - Tax on remeasurements of defined benefit plan - - - - - - - (14,513) (14,513)
- - - - - - - 26,953 26,953 Amortisation of intangible assets -
customer relationship - net of tax (note 22.2) - - - (124,867) - - (124,867) - (124,867)
Transfer to statutory reserve - - - - - 495,392 495,392 (495,392) -
Provision against non-performing loans and advancesdirectly charged to equity as per SBP directive andadjusted against Non-distributable Capital Reserve - - - (1,221,567) - - (1,221,567) - (1,221,567)
Transfer from surplus on revaluationof fixed assets - net of tax - - - - - - - 87,018 87,018
Balance as at December 31, 2014 10,432,697 - 10,131 1,131,474 23,952 4,537,598 5,703,155 5,696,366 21,832,218
Profit after taxation for the year - - - - - - - 4,222,364 4,222,364
Other comprehensive income for the year- Remeasurements of defined benefit plan - - - - - - - 115,098 115,098 - Tax on remeasurements of defined benefit plan - - - - - - - (40,284) (40,284)
- - - - - - - 74,814 74,814 Transactions with owners recognised directly in equity
- Transfer to reserve for issue of bonus shares - 1,564,904 - - - - 1,564,904 (1,564,904) - - Bonus shares issued 1,564,904 (1,564,904) - - - - (1,564,904) - -
1,564,904 - - - - - - (1,564,904) - Amortisation of intangible assets -
customer relationship - net of tax (note 22.2) - - - (124,867) - - (124,867) - (124,867)
Transfer to statutory reserve - - - - - 844,473 844,473 (844,473) -
Transfer from surplus on revaluationof fixed assets - net of tax - - - - - - - 54,163 54,163
Balance as at December 31, 2015 11,997,601 - 10,131 1,006,607 23,952 5,382,071 6,422,761 7,638,330 26,058,692
The annexed notes 1 to 47 and Annexures I to IV form an integral part of these financial statements.
PRESIDENT & CEO DIRECTOR DIRECTOR DIRECTOR PRESIDENT & CEO DIRECTOR DIRECTOR DIRECTOR

86 87Annual Report 2015 Annual Report 2015
CASH FLOW STATEMENTFOR THE YEAR ENDED DECEMBER 31, 2015
NOTES TO AND FORMING PART OF THE FINANCIAL STATEMENTS FOR THE YEAR ENDED DECEMBER 31, 2015
Note 2015 2014 ---------------Rupees ‘000----------------
CASH FLOWS FROM OPERATING ACTIVITIESProfit before taxation 6,920,077 3,551,785 Less: dividend income (318,715) (182,435)
6,601,362 3,369,350 Adjustments for non-cash and other items:
Depreciation 602,292 734,477 Amortisation 218,683 234,088 Workers’ Welfare Fund 177,179 98,643 Provision against non-performing loans and advances - net 1,026,128 2,055,820 (Reversal) / provision for consumer and small enterprise loans - general (6,852) 33,159 Provision for diminution in value of investments - net 454,551 397,383 Provision / (reversal) of other provisions - net 386,126 (88,616)Provision against off balance sheet obligations 19,929 6,981 Unrealised loss / (gain) on revaluation of investments classified
as held for trading 27,230 (31,475)Net gain on disposal of property and equipment (14,009) (18,193)Net gain on disposal of non-banking assets (115,356) (145,108)Charge for defined benefit plan 100,814 65,434 Amortisation of prepaid employee benefits 94,200 322,426 Recoveries against written-off debts (100,296) (134,506)Share of loss from associate 7,002 745
2,877,621 3,531,258 9,478,983 6,900,608
Decrease / (increase) in operating assetsLendings to financial institutions (12,088,403) 300,000 Held for trading securities 20,488,129 (18,636,968)Advances - net 2,226,741 (210,541)Other assets (1,220,166) (2,404,914)
9,406,301 (20,952,423)Increase / (decrease) in operating liabilities
Bills payable 661,464 379,164 Borrowings 29,863,892 15,255,679 Deposits and other accounts 8,784,519 12,211,436 Other liabilities (1,205,870) 1,095,942
38,104,005 28,942,221 56,989,289 14,890,406
Income tax paid (1,585,982) (1,411,661)Contribution to gratuity fund (28,051) - Net cash generated from operating activities 55,375,256 13,478,745
CASH FLOWS FROM INVESTING ACTIVITIESNet investment in available for sale securities (49,096,036) (1,098,438)Net investment in held to maturity securities (495,861) (20,015,815)Dividend income received 329,947 181,715 Investment in operating fixed assets (819,436) (580,567)Proceeds realised on disposal of operating fixed assets 20,743 47,069 Proceeds realised on disposal of non-banking assets 356,052 536,940 Net cash used in investing activities (49,704,591) (20,929,096)
CASH FLOWS FROM FINANCING ACTIVITIESPayments of sub-ordinated loan (1,200) (500,200)Dividends paid (44) (32)Net cash used in financing activities (1,244) (500,232)
Increase / (decrease) in cash and cash equivalents 5,669,421 (7,950,583)Cash and cash equivalents at the beginning of the year 20,666,451 28,617,034
Cash and cash equivalents at the end of the year 34 26,335,872 20,666,451
The annexed notes 1 to 47 and Annexures I to IV form an integral part of these financial statements.
1 STATUS AND NATURE OF BUSINESS 1.1 Faysal Bank Limited (the Bank) was incorporated in Pakistan on October 3, 1994 as a public limited
company under the provisions of the Companies Ordinance, 1984. Its shares are listed on Pakistan Stock Exchange Limited. The Bank is mainly engaged in Corporate, Commercial and Consumer banking activities. The Bank has a network of 280 branches (2014: 274); including 68 Islamic banking branches (2014: 58) and 1 Islamic sub-branch (2014: 1) in Pakistan.
The Registered Office of the Bank is located at Faysal House, ST-02, Shahra-e-Faisal, Karachi.
Ithmaar Bank B.S.C., a Bahrain based retail bank, is the parent company of the Bank, holding, directly and indirectly through subsidiaries 66.78% (2014: 66.78%) of the shareholding of the Bank. Dar Al-Maal Al-Islami Trust (DMIT), (ultimate parent of the Bank) is the holding company of Ithmaar Bank B.S.C. The DMIT group owns and operates an international network of Islamic Banks, Investment Banks and Insurance Companies.
1.2 Based on the financial statements of the Bank for the year ended December 31, 2014, the Pakistan Credit Rating Agency Limited (PACRA) and JCR-VIS Credit Rating Company Limited have determined the Bank’s long-term rating as ‘AA’ (December 31, 2013: ‘AA’) and the short term rating as ‘A1+’ (December 31, 2013: ‘A1+’).
2 BASIS OF PRESENTATION
2.1 In accordance with the directives of the Federal Government regarding the shifting of the banking system to Islamic modes, the State Bank of Pakistan (SBP) has issued various circulars from time to time. Permissible forms of trade related modes of financing include purchase of goods by banks from their customers and immediate resale to them at appropriate mark-up in price on deferred payment basis. The purchases and sales arising under these arrangements are not reflected in these financial statements as such but are restricted to the amount of facility actually utilised and the appropriate portion of mark-up thereon.
2.2 The financial results of the Islamic banking branches have been consolidated in these financial statements for reporting purposes only. Inter branch transactions and balances have been eliminated.
2.3 In accordance with the directives issued by the SBP, the statement of financial position and the profit and loss account of Islamic banking branches of the Bank are disclosed in Annexure III to these financial statements.
3 STATEMENT OF COMPLIANCE
3.1 These financial statements have been prepared in accordance with the approved accounting standards as applicable in Pakistan. The approved accounting standards comprise of such International Financial Reporting Standards (IFRSs) issued by the International Accounting Standards Board (IASB) and Islamic Financial Accounting Standards (IFASs) issued by the Institute of Chartered Accountants of Pakistan, as are notified under the Companies Ordinance, 1984, the requirements of the Companies Ordinance, 1984, the requirements of the Banking Companies Ordinance, 1962, or the directives issued by the SECP and the SBP. Wherever the requirements of the Companies Ordinance, 1984, the Banking Companies Ordinance, 1962, the IFAS notified under the Companies Ordinance, 1984 or the directives issued by the SECP and the SBP differ with the requirements of IFRSs, the requirements of the Companies Ordinance, 1984, the Banking Companies Ordinance, 1962, IFAS notified under the Companies Ordinance, 1984 or the requirements of the said directives issued by the SECP and the SBP prevail.
PRESIDENT & CEO DIRECTOR DIRECTOR DIRECTOR

88 89Annual Report 2015 Annual Report 2015
3.2 The SBP has deferred the applicability of International Accounting Standard (IAS) 39, ‘Financial Instruments: Recognition and Measurement’ and International Accounting Standard (IAS) 40, ‘Investment Property’ for Banking Companies through BSD Circular Letter No. 10 dated August 26, 2002 till further instructions. Further, the SECP has also deferred the applicability of International Financial Reporting Standard (IFRS) 7, ‘Financial Instruments: Disclosures’ through its S.R.O. 633(I)/2014 dated July 10, 2014. Accordingly, the requirements of these standards have not been considered in the preparation of these financial statements. However, investments have been classified and valued in accordance with the requirements prescribed by the SBP through various circulars.
3.3 IFRS 8, ‘Operating Segments’ is effective for the Bank’s accounting period beginning on or after January 1, 2009. All banking companies in Pakistan are required to prepare their annual financial statements in line with the format prescribed under BSD Circular No. 4 dated February 17, 2006, ‘Revised Forms of Annual Financial Statements’, effective from the accounting year ended December 31, 2006. The management of the Bank believes that as the SBP has defined the segment categorisation in the above mentioned circular, the SBP’s requirements prevail over the requirements specified in IFRS 8. Accordingly, segment information disclosed in these financial statements is based on the requirements laid down by the SBP.
3.4 The SBP vide its BSD Circular No. 07 dated April 20, 2010 has clarified that for the purpose of preparation of the financial statements in accordance with International Accounting Standard - 1 (Revised), ‘Presentation of Financial Statements’, two statement approach shall be adopted i.e. separate ‘Profit and Loss Account’ and ‘Statement of Comprehensive Income’ shall be presented, and Balance Sheet shall be renamed as ‘Statement of Financial Position’. Furthermore, only the surplus / (deficit) on revaluation of available for sale (AFS) securities, may be included in the ‘Statement of Comprehensive Income’. However, it should continue to be shown separately in the statement of financial position below equity. Accordingly, the above requirements have been adopted in the preparation of these financial statements.
3.5 As more fully explained in note 3.6.1, the SECP has directed that the requirements of IFRS 10, ‘Consolidated Financial Statements’ are not applicable in case of investments by Companies in mutual funds established under Trust Deed structure.
3.6 Standards, interpretations and amendments to published approved accounting standards that are effective in the current year
3.6.1 IFRS 10, ‘Consolidated financial statements’, builds on existing principles by identifying the concept of control as the determining factor in whether an entity should be included within the consolidated financial statements of the parent company. The standard provides additional guidance to assist where the determination of control is difficult to assess. There is no impact of the applicability of this standard on the financial statements of the Bank.
3.6.2 IFRS 12, ‘Disclosures of interests in other entities’, includes the disclosures around significant judgments and assumptions used in determining whether an entity controls another entity and has joint control or significant influence over another entity. The standard also requires disclosures on the nature and risks associated with interest in un-consolidated structured entities. The application of this standard does not have an impact on these financial statements except for certain disclosures as mentioned in note 11.7.1 to these financial statements.
3.6.3 IFRS 13 ‘Fair Value Measurement’ (effective for annual periods beginning on or after 1 January 2015) establishes a single framework for measuring fair value and making disclosures about fair value measurements when such measurements are required or permitted by other IFRSs. It unifies the definition of fair value as the price that would be received to sell an asset or paid to transfer a liability in an orderly transaction between market participants at the measurement date. It replaces and expands the disclosure requirements about fair value measurements in other IFRSs, including IFRS 7 ‘Financial Instruments: Disclosures’. Accordingly, the Bank has included an additional disclosure in this regard in note 39 to the financial statements. Notwithstanding the above, the change had no impact on the measurements of the Bank’s assets and liabilities.
3.6.4 There are certain other new and amended standards and interpretations that are mandatory for the Bank’s accounting periods beginning on or after January 1, 2015 but are considered not to be relevant or do not have any significant effect on the Bank’s operations and are, therefore, not disclosed in these financial statements.
3.7 Standards, interpretations and amendments to published approved accounting standards that are not yet effective:
3.7.1 The following revised standards, amendments and interpretations with respect to the approved accounting standards would be effective from the dates mentioned below against the respective standard, amendments or interpretation:
Standard, Interpretations or Amendments Effective date (accounting periods beginning on or after)
- IFRS 10 - Consolidated Financial Statements - (Amendment) January 01, 2016
- IFRS 11 - Joint Arrangements - (Amendment) January 01, 2016- IAS 16 - Property, Plant and Equipment - (Amendment) January 01, 2016- IAS 27 - Separate Financial Statement - (Amendment) January 01, 2016- IAS 28 - Investments in associates and joint
ventures - (Amendment) January 01, 2016- IFRS 15 - Revenue from contracts January 01, 2018- IAS 38 - Intangible Assets - (Amendment) January 01, 2016
3.7.2 The SBP vide its BPRD circular No. 01 of 2016, dated January 01, 2016 has instructed Banks that any surplus arising on revaluation of non banking assets acquired in satisfaction of claims shall be transferred to “Surplus on Revaluation of Fixed Assets account” as required under section 235 of the Companies Ordinance, 1984.
The amendment highlighted in note 3.7.1 and note 3.7.2 may impact the financial statements of the Bank and management is in the process of assessing the full impact of the change.
3.7.3 There are certain other new and amended standards, interpretations and amendments that are mandatory for the Bank’s accounting periods beginning on or after January 1, 2016 but are considered not to be relevant or do not have any significant effect on the Bank’s operations and are therefore not detailed in these financial statements.
4 BASIS OF MEASUREMENT
These financial statements have been prepared under the historical cost convention, except that certain fixed assets are carried at revalued amounts and certain investments have been marked to market and are carried at fair value. In addition, obligations in respect of staff retirement benefits are carried at present value.
NOTES TO AND FORMING PART OF THE FINANCIAL STATEMENTS FOR THE YEAR ENDED DECEMBER 31, 2015
NOTES TO AND FORMING PART OF THE FINANCIAL STATEMENTS FOR THE YEAR ENDED DECEMBER 31, 2015

90 91Annual Report 2015 Annual Report 2015
5 CRITICAL ACCOUNTING ESTIMATES AND JUDGMENTS
The preparation of the financial statements in conformity with the approved accounting standards requires management to make judgments, estimates and assumptions that affect the reported amounts of assets and liabilities and income and expenses. It also requires management to exercise judgments in application of its accounting policies. The estimates and associated assumptions are based on historical experience and various other factors that are believed to be reasonable under the circumstances. These estimates and assumptions are reviewed on an ongoing basis. Revisions to accounting estimates are recognised in the period in which the estimates are revised if the revision affects only that period, or in the period of revision and future periods if the revision affects both current and future periods.
Significant accounting estimates and areas where judgments were made by the management in the application of the accounting policies are as follows:
i) classification and provisioning against investments (notes 7.4 and 11).ii) income taxes (notes 7.8, 14 and 32).iii) classification and provisioning against advances (notes 7.5 and 12).iv) depreciation / amortisation of operating fixed assets (notes 7.6 and 13).v) accounting for defined benefit plan (notes 7.11 and 36).vi) impairment of intangible assets (notes 7.6 and 13.3).vii) impairment of assets (note 7.7).
6 FUNCTIONAL AND PRESENTATION CURRENCY
Items included in the financial statements are measured using the currency of the primary economic environment in which the Bank operates. The financial statements are presented in Pakistani Rupees, which is the Bank’s functional and presentation currency.
7 SUMMARY OF SIGNIFICANT ACCOUNTING POLICIES
The significant accounting policies applied in the preparation of these financial statements are set out below. These policies have been consistently applied to all the years presented unless otherwise disclosed or specified.
7.1 Business Combination
Business combinations are accounted for by applying the acquisition method. The cost of acquisition is measured as the fair value of assets given, equity instruments issued and the liabilities incurred or assumed as at the date of acquisition. The consideration transferred includes the fair value of any asset or liability resulting from a contingent consideration arrangement, if any. Acquisition-related costs are expensed as incurred. Identifiable assets acquired and liabilities and contingent liabilities assumed in a business combination are measured initially at their fair values as at the acquisition date. The excess of the consideration transferred over the fair value of the Bank’s share of identifiable net assets acquired is recorded as goodwill. If this is less than the fair value of the net assets acquired in the case of a bargain purchase, the difference is recognised directly in the profit and loss account. However, as more fully described in note 22.2 to these financial statements, the gain on bargain purchase arising on an acquisition made in 2010 has been recognised directly in equity as per the directives of the SBP.
Goodwill acquired in a business combination is measured, subsequent to initial recognition, at its cost less accumulated impairment losses, if any. Goodwill acquired in a business combination is tested for impairment annually or whenever there is an indication of impairment as per the requirements of International Accounting Standard (IAS) 36, ‘Impairment of Assets’. Impairment charge in respect of goodwill is recognised in the profit and loss account and is not subsequently reversed.
Acquisition of non-controlling interests (NCI) is measured at the proportionate share of the NCI in the fair value of the net assets acquired by the Bank. The excess of the fair value of consideration transferred over the proportionate share of the NCI in the fair value of the net assets acquired is recognised in equity.
7.2 Cash and cash equivalents
For the purpose of the cash flow statement, cash and cash equivalents comprise of cash in hand, balances with treasury banks, balances with other banks in current and deposit accounts, national prize bonds, if any, and overdrawn nostro accounts.
7.3 Lendings to / borrowings from financial institutions
The Bank enters into repurchase agreement (repo) and reverse repurchase agreements (reverse repos) at contracted rates for a specified period of time. These are recorded as under:
(a) Sale of securities under repurchase agreements
Securities sold subject to a repurchase agreement (repo) are retained in the financial statements as investments and the counter party liability is included in borrowings. The difference between the sale and contracted repurchase price is accrued over the period of the contract and recorded as an expense.
(b) Purchase of securities under repurchase agreements
Securities purchased under agreement to resell (reverse repo) are not recognised in the financial statements as investments and the amount extended to the counter party is included in lendings. The difference between the purchase and contracted resale price is accrued over the period of the contract and recorded as income.
(c) Bai Muajjal
In Bai Muajjal, the Bank sells Shariah compliant instruments on credit to other financial institutions. The credit price is agreed at the time of sale and such proceeds are received at the end of the credit period. The difference between the sale and the credit price is recognised over the credit period and recorded as income.
7.4 Investments
The Bank classifies its investments as follows:
(a) Held for trading
These are securities, which are either acquired for the purpose of generating profit from short-term fluctuations in market prices, interest rate movements, or dealer’s margin or are securities included in the portfolio in which a pattern of short-term profit making exists.
NOTES TO AND FORMING PART OF THE FINANCIAL STATEMENTS FOR THE YEAR ENDED DECEMBER 31, 2015
NOTES TO AND FORMING PART OF THE FINANCIAL STATEMENTS FOR THE YEAR ENDED DECEMBER 31, 2015

92 93Annual Report 2015 Annual Report 2015
(b) Held to maturity
These are securities with fixed or determinable payments and maturity that the Bank has a positive intent and ability to hold to maturity.
(c) Available for sale
These are investments, other than those, in associates, that do not fall under either held for trading or held to maturity categories.
(d) Associates
Associates are all entities over which the bank has significant influence but not control.
Initial recognition and measurement:
All purchases and sales of investments that require delivery within the time frame established by the regulations or market convention are recognised at the trade date. Trade date is the date on which the Bank commits to purchase or sell the investment.
Investments other than those classified as held for trading are initially recognised at fair value which includes transaction costs associated with the investments. Investments classified as ‘held for trading’ are initially recognised at fair value and transaction costs associated with the transactions are expensed in the profit and loss account.
Subsequent measurement:
Held for trading
These are measured at subsequent reporting dates at fair value. Gains and losses on re-measurement are included in the profit and loss account.
Held to maturity
These are measured at amortized cost using the effective interest rate method, less any impairment loss recognized to reflect irrecoverable amounts.
Available for sale
Quoted securities classified as available for sale investments are measured at subsequent reporting dates at fair value. Any surplus or deficit arising thereon is kept in a separate account shown in the statement of financial position below equity and is taken to the profit and loss account when realized upon disposal or when the investment is considered to be impaired.
Unquoted equity securities are valued at the lower of cost and break-up value. The break-up value of these securities is calculated with reference to the net assets of the investee company as per the latest available audited financial statements. A decline in the carrying value is charged to the profit and loss account. A subsequent increase in the carrying value, upto the cost of the investment, is credited to the profit and loss account. Investments in other unquoted securities are valued at cost less impairment, if any.
Impairment
Impairment loss in respect of investments classified as available for sale (except term finance certificates and sukuk certificates) and held to maturity is recognised based on management’s assessment of objective evidence of impairment as a result of one or more events that may have an impact on the estimated future cash flows of the investments. A significant or prolonged decline in the fair value of a listed equity investment below its cost is also considered an objective evidence of impairment. Provision for diminution in the value of term finance certificates and sukuk certificates is made as per the requirements of the Prudential Regulations issued by the SBP. In case of impairment of available for sale securities, the cumulative loss that has been recognised directly in surplus / deficit on revaluation of securities on the statement of financial position below equity is removed therefrom and recognised in the profit and loss account. For investments classified as held to maturity, the impairment loss is recognised in the profit and loss account.
Gain or loss on sale of investments is included in the profit and loss account currently.
Premium or discount on acquisition of investments is amortised through the profit and loss account over the remaining period till maturity using the effective interest method.
Investment in associates
Investments in associates, where the Bank has significant influence, are accounted for using the equity method of accounting. Under the equity method of accounting, the investment in associate is initially recognised at cost, and the carrying amount is increased or decreased to recognise the investor’s share of net assets after the date of acquisition. The Bank’s share of post acquisition profit and loss of associates is accounted for in the profit and loss account with a corresponding adjustment to the carrying amount of the investment. When the Bank’s share of losses in associates equals or exceeds its interest in the associates, including any other unsecured receivables, the Bank does not recognise further losses, unless it has incurred legal or constructive obligation or made payments on behalf of the associates. Profit and losses resulting from upstream and downstream transactions between the Bank and its associates are recognised in the Bank’s financial statements only to the extent of unrelated investor’s interests in the associates. Accounting policies of associates have been changed where necessary to ensure consistency with the policies adopted by the Bank. Dilution gains and losses arising on investments in associates are recognised in the profit and loss account.
7.5 Loans and Advances
7.5.1 Advances are stated net of specific and general provisions. Specific provision for advances is made in accordance with the requirements of the Prudential Regulations and other directives issued by the SBP. The amount of provision is charged to the profit and loss account. General provision against consumer and small enterprises financings portfolio is maintained as per the requirements of the Prudential Regulations issued by the State Bank of Pakistan. Advances are written off when there is no realistic prospect of recovery. In addition to conventional products, the Bank also offers various Islamic financing products which mainly include:
(a) Murabaha
Murabaha financings are reflected as receivables at the invoiced amount. Actual sales and purchases are not reflected, as the goods are purchased by the customer as an agent of the Bank and all documents relating to purchase are in the customer’s name. However, the profit on that sale revenue not due for payment is deferred and is recognised on a time proportion basis. Funds disbursed under Murabaha financing arrangements prior to purchase of goods are recorded as “Advance Against Murabaha”.
NOTES TO AND FORMING PART OF THE FINANCIAL STATEMENTS FOR THE YEAR ENDED DECEMBER 31, 2015
NOTES TO AND FORMING PART OF THE FINANCIAL STATEMENTS FOR THE YEAR ENDED DECEMBER 31, 2015

94 95Annual Report 2015 Annual Report 2015
(b) Diminishing Musharaka
In Diminishing Musharaka based financing, the Bank enters into a Musharaka based on Shirkat-ul-milk for financing an agreed share of fixed asset (e.g. house, land, plant or machinery) with its customers and enters into periodic profit payment agreement for the utilization of the Bank’s Musharaka share by the customer.
(c) Ijarah assets
Ijarah assets are stated at cost less accumulated depreciation and impairment losses, if any. Depreciation is charged from the date of recognition of ijarah assets on a straight line basis over the period of Ijarah. Impairment of Ijarah assets is determined on the same basis as that of operating fixed assets.
Ijarah income is recognised in income on accrual basis as and when the rental becomes due. Impairment of ijarah rental is determined in accordance with the requirements of the Prudential Regulations and other directives issued by the SBP and charged to the profit and loss account.
(d) Bai Muajjal
In Bai Muajjal financing, the Bank sells Shariah Compliant instruments on credit to customers. The credit price is agreed at the time of sale and such proceeds are received at the end of the credit period.
7.5.2 Net investment in finance lease
Leases where the Bank transfers substantially all the risks and rewards incidental to the ownership of an asset are classified as finance lease. A receivable is recognised on the commencement of lease term at an amount equal to the present value of the minimum lease payments, including guaranteed residual value, if any. Unearned finance income is recognised over the term of the lease, so as to produce a constant periodic return on the outstanding net investment in lease. Specific and general provisions for net investment in finance lease are made in accordance with the requirements of the Prudential Regulations and other directives issued by the SBP and charged to the profit and loss account.
7.6 Fixed assets and depreciation
(a) Tangible assets - owned
Operating fixed assets other than land and buildings are stated at cost less accumulated depreciation and accumulated impairment losses, if any. Buildings are carried at revalued amount less any accumulated depreciation and subsequent impairment losses, if any. Land is carried at revalued amount less any subsequent impairment losses, if any.
Depreciation on operating fixed assets (excluding land which is not depreciated) is charged using the straight line method in accordance with the rates specified in note 13.2 to these financial statements after taking into account residual value, if significant. The asset’s residual values and useful lives are reviewed and adjusted, if required, at each balance sheet date. Depreciation on additions is charged from the month the assets are available for use. No depreciation is charged in the month of disposal.
Subsequent costs are included in the asset’s carrying amounts or recognised as a separate asset, as appropriate, only when it is probable that future economic benefits associated with the item will flow to the Bank and the cost of the item can be measured reliably. All other repairs and maintenance expenditure are charged to the profit and loss account as and when incurred.
Land and buildings are revalued by professionally qualified valuers with sufficient regularity to ensure that the net carrying amount does not differ materially from their fair value.
Surplus arising on revaluation is credited to the surplus on revaluation of fixed assets account. Deficit arising on subsequent revaluation of fixed assets is adjusted against the balance in the above mentioned surplus account as allowed under the provisions of the Companies Ordinance, 1984. The surplus on revaluation of fixed assets to the extent of incremental depreciation charged on the related assets is transferred to unappropriated profit.
An asset’s carrying amount is written down immediately to its recoverable amount if the asset’s carrying amount is greater than its estimated recoverable amount.
Gains / losses on disposal of fixed assets, if any, are taken to the profit and loss account in the period in which they arise except that the related surplus on revaluation of fixed assets (net of deferred taxation) is transferred directly to unappropriated profit.
(b) Tangible assets - leased
Leases are classified as finance lease wherever the terms of the lease transfer substantially all the risks and rewards of ownership to the lessee. All other leases are classified as operating lease. Lease payments, if any, under operating lease are charged to income on a straight line basis over the lease term.
Assets held under finance lease are stated at the lower of their fair value or present value of minimum lease payments at inception less accumulated depreciation and accumulated impairment losses, if any. Leasehold land and buildings on leasehold land are subsequently revalued. The outstanding obligations under the lease agreements are shown as a liability net of finance charges allocable to the future periods.
The finance charges are allocated to the accounting periods in a manner so as to provide a constant periodic rate of return on the outstanding liability.
Depreciation on assets held under finance lease, subsequent costs and gains / losses are recognised in a manner consistent with that for depreciable and other fixed assets which are owned by the Bank.
During the year, the management of the Bank has revised its estimate of the useful life of ‘Building on freehold land’ and ‘Building on leasehold land’. The revision has been accounted for as a change in accounting estimate in accordance with the requirements of International Accounting Standard (IAS) 8 ‘Accounting policies, changes in accounting estimates and errors’. The impact of this change is disclosed in note 13.2.3 to these financial statements.
(c) Capital work in progress
Capital work-in-progress is stated at cost less accumulated impairment losses, if any. All expenditure connected with specific assets incurred during installation and construction period are carried under this head. These are transferred to specific assets as and when assets become available for use.
NOTES TO AND FORMING PART OF THE FINANCIAL STATEMENTS FOR THE YEAR ENDED DECEMBER 31, 2015
NOTES TO AND FORMING PART OF THE FINANCIAL STATEMENTS FOR THE YEAR ENDED DECEMBER 31, 2015

96 97Annual Report 2015 Annual Report 2015
(d) Intangible assets
Intangible assets having definite lives are stated at cost less accumulated amortisation and accumulated impairment losses, if any. The intangible assets include directly attributable cost that are capitalised as part of the intangible asset. Amortisation, except for customer relationship is charged applying the straight-line method over the useful lives of the assets. Amortisation is calculated so as to write-off the assets over their expected economic lives at rates specified in note 13.3 to these financial statements. Amortisation is charged from the month in which the asset is available for use. No amortisation is charged for the month in which the asset is disposed of. The intangible asset comprising customer relationship is being amortised over the life expectancy of the deposits. The residual values and useful lives are reviewed and adjusted, if appropriate, at each balance sheet date.
Subsequent costs are included in the asset’s carrying amounts or recognised as a separate asset, as appropriate, only when it is probable that future economic benefits associated with the item will flow to the Bank and the cost of the item can be measured reliably.
Intangible assets having an indefinite useful life are stated at acquisition cost less accumulated impairment losses, if any.
Gains and losses on disposals, if any, are taken to the profit and loss account in the period in which they arise.
7.7 Impairment
The carrying amount of assets is reviewed at each balance sheet date for impairment whenever events or changes in circumstances indicate that the carrying amounts of the assets may not be recoverable. If any such indication exists, and where the carrying value exceeds the estimated recoverable amount, assets are written down to their recoverable amount. The resulting impairment loss is taken to the profit and loss account except for impairment loss on revalued assets, which is adjusted against related revaluation surplus to the extent that the impairment loss does not exceed the surplus on revaluation of asset.
An impairment loss is reversed except for impairment loss relating to goodwill, if there has been a change in the estimate used to determine the recoverable amount. Such reversals are only made to the extent that the asset’s carrying amount does not exceed the amount that would have been determined if no impairment loss had been recognised.
7.8 Taxation
Income tax expense comprises current and deferred tax. Income tax expense is recognised in the profit and loss account except to the extent that it relates to items recognised directly in equity or below equity, in which case it is recognised in equity or below equity.
Current
Provision for current taxation is based on taxable income for the year. Tax charge for the current year is determined in accordance with the prevailing laws for taxation. The charge for the current tax is calculated using tax rates enacted or substantively enacted at the balance sheet date. The charge for the current tax also includes adjustments relating to prior years, if necessary, arising from assessments finalised during the year.
Deferred
Deferred tax is recognised using the balance sheet liability method on all temporary differences between the carrying amounts of assets and liabilities used for financial reporting purposes and amounts used for taxation purposes. In addition, the Bank also records deferred tax asset on available tax losses. Deferred tax is calculated using the rates that are expected to apply to the period when the differences reverse based on tax rates that have been enacted or substantively enacted by the balance sheet date.
A deferred tax asset is recognised only to the extent that it is probable that future taxable profits will be available against which the asset can be utilised. Deferred tax asset is reduced to the extent that it is no longer probable that the related tax benefits will be realised.
The carrying amount of the deferred tax asset is reviewed at each balance sheet date and reduced to the extent that it is no longer probable that sufficient taxable profits will be available to allow all or part of the deferred tax asset to be utilised.
The Bank also recognises deferred tax asset / liability on deficit / surplus on revaluation of securities / fixed assets which is adjusted against the related deficit / surplus in accordance with the requirements of International Accounting Standard (IAS-12) Income Taxes.
7.9 Non-current assets held for sale and assets acquired in satisfaction of claim
The Bank classifies a non-current asset (or disposal group) as held for sale if its carrying amount will be recovered principally through a sale transaction rather than through continuing use.
A non-current asset (or disposal group) held for sale is carried at the lower of its carrying amount and the fair value less costs to sell. Impairment losses are recognised through the profit and loss account for any initial or subsequent write down of the non-current asset (or disposal group) to fair value less costs to sell. Subsequent gains in fair value less costs to sell are recognised to the extent they do not exceed the cumulative impairment losses previously recorded. A non-current asset is not depreciated while classified as held for sale or while part of a disposal group classified as held for sale.
Assets acquired in satisfaction of claim are stated at the lower of the financed amount and their market value at the time of acquisition. The Bank carries out periodic valuation of these assets and any decline in their value below the recognised amount is charged to the profit and loss account. These assets are disclosed in other assets as specified by the SBP.
7.10 Provisions and contingent assets and liabilities
Provisions are recognised when the Bank has a legal or constructive obligation as a result of past events, it is probable that an outflow of resources will be required to settle the obligation and a reliable estimate of the amount can be made. Provisions are reviewed at each balance sheet date and are adjusted to reflect the current best estimates.
Contingent assets are not recognised and are also not disclosed unless an inflow of economic benefits is probable. Contingent liabilities are not recognised and are disclosed unless the probability of an outflow of resources embodying economic benefits is remote.
NOTES TO AND FORMING PART OF THE FINANCIAL STATEMENTS FOR THE YEAR ENDED DECEMBER 31, 2015
NOTES TO AND FORMING PART OF THE FINANCIAL STATEMENTS FOR THE YEAR ENDED DECEMBER 31, 2015

98 99Annual Report 2015 Annual Report 2015
7.11 Staff retirement benefits
a) Defined contribution plan
The Bank operates a contributory provident fund for all its permanent employees to which equal monthly contributions at the rate of 10 percent of basic salary are made both by the Bank and the employees.
b) Defined benefit scheme
The Bank operates an approved funded gratuity scheme for all its permanent eligible employees and eligible employees who are on contractual service and are employed under non-management cadre. Contributions to the fund are made on the basis of actuarial recommendations. Projected Unit Credit Method is used for the actuarial valuation.
Amounts arising as a result of “Remeasurements”, representing the actuarial gains and losses and the differences between the actual investment returns and the return implied by the net interest cost are recognised in the Statement of Financial Position immediately, with a charge or credit to “Other Comprehensive Income” in the periods in which they occur.
Staff retirement benefits are payable to staff on completion of prescribed qualifying period of service under these schemes.
7.12 Borrowings / deposits and their costs
Borrowings / deposits are recorded at the proceeds received. Borrowing / deposit costs are recognised as an expense in the period in which these are incurred to the extent that they are not directly attributable to the acquisition of or construction of qualifying assets. Borrowing cost that is directly attributable to the acquisition, construction or production of a qualifying asset (one that takes a substantial period of time to get ready for use or sale) is capitalised as part of the cost of the asset.
7.13 Subordinated loans
Subordinated loans are initially recorded at the amount of proceeds received. Mark-up on subordinated loans is charged to the profit and loss account over the period on an accrual basis and is recognised separately as part of other liabilities.
7.14 Revenue recognition and other items
- Mark-up income / interest / profits on advances and returns on investments are recognised on a time proportion basis except that mark-up income / interest / returns / profits on non-performing advances and investments are recognised on receipt basis in accordance with the requirements of the Prudential Regulations issued by the State Bank of Pakistan. Interest / returns / mark-up income / profits on rescheduled / restructured advances and investments are recognised as permitted by the State Bank of Pakistan, except where, in the opinion of the management, it would not be prudent to do so.
- Financing method is used in accounting for income from lease financing. Under this method, the unearned finance income (excess of the sum of total lease rentals and estimated residual value over the cost of leased assets) is taken to income over the term of the lease so as to produce a constant periodic rate of return on the outstanding net investment in lease.
- Unrealised finance income in respect of non-performing lease finance is held in suspense account, where necessary, in accordance with the requirements of the Prudential Regulations issued by the SBP. Gains / losses on termination of lease contracts, documentation charges, front-end fee and other lease income are recognised as income when they are realised.
- Premium or discount on acquisition of debt investments is capitalised and amortised through the profit and loss account over the remaining period till maturity.
- Dividend income from investments is recognised when the Bank’s right to receive the dividend is established.
- Fee, commission on letters of credit / guarantee, other commission and brokerage income is recognised on accrual basis.
- Financial advisory fee is recognised when the right to receive the fee is established.
- Rent and other income is recognised on accrual basis.
- Profit on Bai Muajjal lendings are recognised on straight line basis.
7.15 Proposed dividend and transfer between reserves
Dividends and appropriations to reserves, except appropriations which are required by law, made subsequent to the balance sheet date are considered as non-adjusting events and are recorded in the financial statements in accordance with the requirements of International Accounting Standard (IAS) 10, ‘Events after the Balance Sheet Date’ in the year in which they are approved / transfers are made.
7.16 Foreign currencies
(a) Foreign currency transactions
Transactions in foreign currencies are translated into rupees at the foreign exchange rates prevailing at the transaction date. Monetary assets and liabilities in foreign currencies are expressed in rupee terms at the rates of exchange prevailing at the balance sheet date. Foreign bills purchased and forward foreign exchange contracts are valued at rates determined with reference to their respective maturities. Forward purchase contracts with the State Bank of Pakistan relating to foreign currency deposits are valued at the spot rate prevailing on the balance sheet date. The forward cover fee, if any, payable on contracts with the SBP is amortised over the term of the contract.
(b) Translation gains and losses
Translation gains and losses are included in the profit and loss account.
7.17 Commitments
Commitments for outstanding forward foreign exchange contracts are disclosed in the financial statements at committed amounts. Commitments for letters of credit and letters of guarantee denominated in foreign currencies are expressed in rupee terms at the rates of exchange prevailing at the reporting date.
NOTES TO AND FORMING PART OF THE FINANCIAL STATEMENTS FOR THE YEAR ENDED DECEMBER 31, 2015
NOTES TO AND FORMING PART OF THE FINANCIAL STATEMENTS FOR THE YEAR ENDED DECEMBER 31, 2015

100 101Annual Report 2015 Annual Report 2015
7.18 Acceptances
Acceptances comprise undertakings by the Bank to pay bills of exchange drawn on customers. The Bank expects most acceptances to be simultaneously settled with the reimbursement from the customers. Acceptances are accounted for as off balance sheet transactions and are disclosed as contingent liabilities.
7.19 Financial instruments
Financial assets and financial liabilities
Financial instruments carried on the balance sheet include cash and balances with treasury banks, balances with other banks, lendings to financial institutions, investments, advances, certain other assets, bills payable, borrowings, deposits, liabilities against assets subject to finance lease and certain other liabilities. The particular recognition methods adopted for significant financial assets and financial liabilities are disclosed in the individual policy statements associated with these assets and liabilities.
Derivative financial instruments
Derivative financial instruments are initially recognised at fair value on the date on which a derivative contract is entered into and are subsequently remeasured to fair value using appropriate valuation techniques. All derivative financial instruments are carried as assets when the fair value is positive and liability when the fair value is negative. Any change in the fair value of derivative financial instruments is taken to the profit and loss account.
Offsetting
Financial assets and financial liabilities are set off and the net amount is reported in the financial statements only when the Bank has a legally enforceable right to set off and the Bank intends to either settle on a net basis, or to realise the assets and to settle the liabilities simultaneously. Income and expense items of such assets and liabilities are also offset and the net amount is reported in the financial statements only when permitted by the approved accounting standards as applicable in Pakistan.
7.20 Earnings per share
The Bank presents basic and diluted earnings per share (EPS) for its shareholders. Basic EPS is calculated by dividing the profit attributable to ordinary shareholders of the Bank by the weighted average number of ordinary shares outstanding during the year. Diluted EPS is determined by adjusting the profit attributable to ordinary shareholders and the weighted average number of ordinary shares outstanding for the effects of all dilutive potential ordinary shares, if any.
7.21 Segment reporting
Segment reporting is based on operating (business) segments of the Bank. An operating segment is a component of the Bank that engages in business activities from which it may earn revenues and incur expenses, including revenues and expenses that relate to transactions with any of the Bank’s other components. The segment’s results are reviewed regularly, which have been presented according to the functional basis and the guidance of the SBP, to make decisions about resources to be allocated to the segment and assess its performance, and for which financial information is available. These have been presented as per the Bank’s functional structure and guidance of the SBP. The segments of the Bank are as follows:
(a) Business Segments
(i) Corporate finance
This includes investment banking activities such as mergers and acquisitions, underwriting, privatisation, securitisation, Initial Public Offers (IPOs), secondary private placements and etc.
(ii) Trading and Sales
It includes fixed income, equity, foreign exchanges, funding, own position securities, lendings and repos.
(iii) Retail banking
Retail banking provides services to small borrowers i.e. consumers, small enterprises, medium enterprises and agriculture sector. It includes loans, deposits, other transactions and balances with retail customers.
(iv) Corporate and commercial banking
This includes strategic partnership with Corporate and Commercial entities to provide working capital financing, trade financing, cash management services, project finance, export finance, leasing, guarantees, bills of exchange, deposits and other long term finance.
(b) Geographical segment
The operations of the Bank are currently based only in Pakistan.
Note 2015 2014 8 CASH AND BALANCES WITH TREASURY BANKS -------------Rupees ‘000-------------
In hand- local currency 5,672,674 5,493,911 - foreign currencies 1,785,085 1,935,347
With the State Bank of Pakistan in- local currency current accounts 8.1 8,903,843 4,446,559 - foreign currency current accounts 8.2 1,166,291 1,254,532 - foreign currency deposit accounts 8.3 3,413,193 3,672,057
With the National Bank of Pakistan in- local currency current accounts 5,125,097 3,455,114
National prize bonds 17,824 28,331 26,084,007 20,285,851
8.1 These include local currency current accounts maintained with the SBP as per the requirements of Section 36 of the State Bank of Pakistan Act, 1956. This section requires banking companies to maintain a local currency cash reserve in a current account with SBP at a sum not less than such percentage of the Bank’s time and demand liabilities in Pakistan as may be prescribed by the SBP.
8.2 This represents cash reserve of 5% maintained with the SBP in US dollars current account on deposits held under the New Foreign Currency Accounts (FE-25 deposits) as per BSD Circular No. 14 and 15 dated June 21, 2008.
NOTES TO AND FORMING PART OF THE FINANCIAL STATEMENTS FOR THE YEAR ENDED DECEMBER 31, 2015
NOTES TO AND FORMING PART OF THE FINANCIAL STATEMENTS FOR THE YEAR ENDED DECEMBER 31, 2015

102 103Annual Report 2015 Annual Report 2015
8.3 These represent special cash reserve of 15% maintained with SBP in US dollars deposit account under the requirements of BSD Circular No.14 dated June 21, 2008, local US dollars clearing account maintained with SBP to facilitate US dollars clearing and 6% special cash reserve requirement on FE-25 deposits maintained by Islamic Banking branches under the requirements of BSD Circular No.15 dated June 21, 2008. Profit rates on these balances are fixed on monthly basis by the SBP. The SBP has not remunerated any amount on these deposits during the current and the last year.
Note 2015 2014 9 BALANCES WITH OTHER BANKS -------------Rupees ‘000-------------
In Pakistan- Current accounts 573,956 868,011
Outside Pakistan- Current accounts 494,495 554,688 - Deposit account - -
1,068,451 1,422,699 10 LENDINGS TO FINANCIAL INSTITUTIONS
Call money lending 10.2 250,000 - Bai Muajjal 10.3 & 10.4 11,838,403 -
12,088,403 - 10.1 Particulars of lendings
In local currency 12,088,403 - In foreign currency - -
12,088,403 -
10.2 This represents lending to a commercial bank which carries mark-up at the rate of 6.5% per annum (2014: Nil) and it is due to mature on January 4, 2016.
2015 2014 -------------Rupees ‘000-------------
10.3 Bai Muajjal placements - gross 12,548,068 - Less: deferred income (624,116) - Less: profit receivable shown in other assets (85,549) - Bai Muajjal placements - net 11,838,403 -
NOTES TO AND FORMING PART OF THE FINANCIAL STATEMENTS FOR THE YEAR ENDED DECEMBER 31, 2015
NOTES TO AND FORMING PART OF THE FINANCIAL STATEMENTS FOR THE YEAR ENDED DECEMBER 31, 2015
11.1 Investments by type 2015 2014Note Held by
BankGiven as collateral Total Held by
BankGiven as collateral
Total
--------------------------------------------------- Rupees ‘000 ------------------------------------------------- Held for trading securitiesMarket Treasury Bills 11.2.1 3,204,619 - 3,204,619 16,355,610 7,918,016 24,273,626 Pakistan Investment Bonds 11.2.2 3,150,437 - 3,150,437 2,467,424 318,224 2,785,648 Fully paid up ordinary shares / certificates of closed end mutual funds 482,482 - 482,482 266,393 - 266,393
6,837,538 - 6,837,538 19,089,427 8,236,240 27,325,667 Available for sale securitiesMarket Treasury Bills 11.2.1 48,839,635 41,360,610 90,200,245 33,390,917 11,054,584 44,445,501 Pakistan Investment Bonds 11.2.2 19,778,584 28,710,039 48,488,623 15,333,043 19,890,625 35,223,668 Ijara Sukuk Bonds 11.2.3 5,919,200 - 5,919,200 17,579,035 - 17,579,035 Units of open end mutual funds
- Faysal Balanced Growth Fund * 12,480 - 12,480 12,480 - 12,480 - Faysal Income Growth Fund * 87,544 - 87,544 57,919 - 57,919 - Faysal Savings Growth Fund * 680,606 - 680,606 155,412 - 155,412 - Faysal Islamic Savings Growth Fund * 95,848 - 95,848 85,000 - 85,000 - Faysal Money Market Fund * 312,111 - 312,111 549,000 - 549,000 - Faysal Asset Allocation Fund * 75,947 - 75,947 15,491 - 15,491 - Faysal Financial Sector Opportunity Fund * 34,000 - 34,000 39,000 - 39,000
Fully paid up ordinary shares / modaraba certificates / certificates ofclosed end mutual funds 11.6 4,271,736 - 4,271,736 2,752,299 - 2,752,299
Fully paid up preference shares 122,490 - 122,490 197,490 - 197,490 Term finance certificates 11.3.2 839,801 - 839,801 932,300 - 932,300
81,069,982 70,070,649 151,140,631 71,099,386 30,945,209 102,044,595 Held to maturity securitiesPakistan Investment Bonds 11.2.2 19,776,284 - 19,776,284 19,606,773 - 19,606,773 Term finance certificates 2,364,514 - 2,364,514 2,798,791 - 2,798,791 Sukuk Bonds 4,760,365 - 4,760,365 3,999,738 - 3,999,738
26,901,163 - 26,901,163 26,405,302 - 26,405,302 Associate *Fully paid up ordinary shares of
Faysal Asset Management Limited 11.7 68,082 - 68,082 75,084 - 75,084
Investments 114,876,765 70,070,649 184,947,414 116,669,199 39,181,449 155,850,648
Less: provision for diminution in the 11.3 &value of investments 12.4.1 (3,282,763) - (3,282,763) (2,828,212) - (2,828,212)
Investments (net of provisions) 111,594,002 70,070,649 181,664,651 113,840,987 39,181,449 153,022,436
(Deficit) / surplus on revaluation of investments classified as held for trading - net 11.5 (10,646) - (10,646) 11,110 5,474 16,584
Surplus on revaluation of investments classified as available for sale - net 23.2 852,230 1,171,004 2,023,234 1,084,848 1,086,645 2,171,493
Total investments - net 112,435,586 71,241,653 183,677,239 114,936,945 40,273,568 155,210,513
* related parties
10.4 These carry profit at rates ranging between 5.9900% to 5.9995 % per annum and are due to mature latest by November 2016 (2014: Nil).
11 INVESTMENTS
Investments by type and segments, details of strategic investments and particulars of provisions are given below. The full break down of available for sale investments is given in Annexure I, which forms an integral part of these financial statements.

104 105Annual Report 2015 Annual Report 2015
NOTES TO AND FORMING PART OF THE FINANCIAL STATEMENTS FOR THE YEAR ENDED DECEMBER 31, 2015
NOTES TO AND FORMING PART OF THE FINANCIAL STATEMENTS FOR THE YEAR ENDED DECEMBER 31, 2015
Note 2015 2014
-------------Rupees ‘000-------------
11.1.1 Strategic Investments
Available for sale securities - Listed
Fully paid up ordinary shares / modaraba
certificates / units of closed end mutual funds - 105,469
Units of open end mutual funds 7,480 7,480
7,480 112,949
Available for sale securities - Unlisted
Fully paid up ordinary shares 568,755 568,755
Associate - unlisted 11.7.2 68,082 75,084
644,317 756,788
Provision for diminution in the value of investments (568,755) (464,030)
75,562 292,758
Surplus on revaluation of strategic investments
classified as available for sale 1,079 104,191
76,641 396,949
Strategic investments are those investments which the Bank makes with the intention of holding them for a long term duration and are marked as such at the time of investment. Disposals of such investments can only be made subject to the fulfilment of the requirements prescribed by the SBP. The overall exposure limit for equity investments prescribed by the SBP does not apply to these investments. Further, as per the SBP’s instructions in BPD Circular Letter No. 16 of 2006 dated August 01, 2006, investments marked as strategic have a minimum retention period of 5 years from the original purchase date. However, these can be sold before the stipulated period with the prior permission of the SBP.
Note 2015 2014 11.2 Investments by segments -------------Rupees ‘000-------------
Federal Government Securities- Market Treasury Bills 11.2.1 93,404,864 68,719,127 - Pakistan Investment Bonds 11.2.2 71,415,344 57,616,089 - Ijara Sukuk Bonds 11.2.3 5,919,200 17,579,035
170,739,408 143,914,251
Fully Paid up Ordinary Shares / ModarabaCertificates / Closed end Mutual Fund Units- Listed companies / modarabas / mutual funds 4,104,552 2,369,026 - Unlisted companies 717,748 724,750
4,822,300 3,093,776 Fully Paid up Preference Shares
- Listed companies 122,490 122,490 - Unlisted companies - 75,000
122,490 197,490
4,944,790 3,291,266 Term Finance Certificates
- Listed 131,970 224,189 - Unlisted 11.3.2 3,072,345 3,506,902
3,204,315 3,731,091
Units of Open end Mutual Funds 1,298,536 914,302
Sukuk Bonds 4,760,365 3,999,738
Total investments 184,947,414 155,850,648 Less: provision for diminution in the value of
investments 11.3 (3,282,763) (2,828,212)
Investments (net of provisions) 181,664,651 153,022,436
(Deficit) / surplus on revaluation of investmentsclassified as held for trading - net 11.5 (10,646) 16,584
Surplus on revaluation of investments classified asavailable for sale - net 23.2 2,023,234 2,171,493
Total investments - net 183,677,239 155,210,513
11.2.1 Market Treasury Bills have tenures of three months to one year. The Bank’s return on these instruments ranges from 6.25% to 7.95% per annum (2014: 9.35% to 12% per annum) with maturities up to November 2016.
11.2.2 Pakistan Investment Bonds have tenures of 3 to 10 years. The Bank’s return on these instruments ranges from 6.39% to 14.06% per annum (2014: 9.70% to 14.09% per annum) with maturities from May 2016 to March 2025.
11.2.3 GoP Ijara sukuk bonds have tenure of 3 years. The Bank’s return on these instruments ranges from 4.75% to 9.12% per annum (2014: 8.06% to 11.93% per annum) with maturities from March 2016 to June 2017.

106 107Annual Report 2015 Annual Report 2015
NOTES TO AND FORMING PART OF THE FINANCIAL STATEMENTS FOR THE YEAR ENDED DECEMBER 31, 2015
NOTES TO AND FORMING PART OF THE FINANCIAL STATEMENTS FOR THE YEAR ENDED DECEMBER 31, 2015
2015 2014 -----------Rupees ‘000-----------
11.3 Particulars of provision for diminution in thevalue of investments
Opening balance 2,828,212 2,430,829
Charge for the year 601,616 549,145 Reversals during the year (147,065) (151,762)
454,551 397,383
Closing balance 3,282,763 2,828,212
11.3.1 Particulars of provision for diminution in the value of investments by type and segment
Available for sale securities
- Fully Paid up Ordinary Shares / Modaraba Certificates /Certificates of Closed end Mutual Funds
- Listed companies / modarabas / mutual funds 488,203 461,243 - Unlisted companies 649,666 498,983
- Fully Paid up Preference Shares- Listed companies 22,490 22,490 - Unlisted companies - 18,750
- Units of Open end Mutual Funds 856 1,368
- Term Finance Certificates- Listed 70,781 162,976 - Unlisted 458,311 458,511
Held to maturity securities
- Term Finance Certificates- Unlisted 1,057,372 807,579
- Sukuk Bonds 535,084 396,312 3,282,763 2,828,212
11.3.2 These include Pre IPO investment of Rs 500 million made in the unlisted Term Finance Certificates (TFCs) of Dewan Cement Limited. The SBP through its letter BPRD/BLRD-3/DMG/2011-1035 dated January 26, 2011 had advised banks to maintain provision at least upto the level of 90% in five quarters (commencing from December 31, 2010) by December 31, 2011. The Bank, as per the above directive, had availed the relaxation and maintained a provision of Rs 450 million against this investment. Had the provision been made as per the time based criteria specified in the Prudential Regulations issued by the SBP, the provision for diminution in the value of investments for the year ended December 31, 2015 would have been higher by Rs 50 million (2014: Rs 50 million) and the profit before taxation for the year ended December 31, 2015 would have been lower by Rs 50 million (2014: Rs 50 million).
11.4 Quality of available for sale securities
The details regarding the quality of available for sale securities and their mark-up / interest and other terms are contained in Annexure I, which forms an integral part of these financial statements.
2015 2014 -----------Rupees ‘000-----------
11.5 (Deficit) / surplus on revaluation of investments classified as held for trading - net
Market Treasury Bills 685 2,694 Pakistan Investment Bonds 7,829 17,060 Fully paid up ordinary shares / certificates of
closed end mutual fund (19,160) (3,170) (10,646) 16,584
11.6 These include an investment of the Bank in unlisted shares of DHA Cogen Limited (DHA) (a related party of the Bank) representing 19.1% (2014: 19.1%) equity holding of DHA. The Bank acquired these equity shares in 2013 by exercising its rights over pledged shares of DHA after eventual non-compliance by DHA in respect of ‘Rehabilitation and Standstill Agreement’ made between the consortium banks (including the Bank) and DHA for repayment of liabilities.
11.7 This represents investment of the Bank in Faysal Asset Management Limited (FAML). This has been accounted for under the equity method of accounting as per the requirement of IAS 28. The Bank’s share of post acquisition profit or loss is recognised using the latest available financial statements of FAML which relate to the period ended December 31, 2015 with a corresponding adjustment to the carrying amount of investment.
11.7.1 Faysal Asset Management Limited (the Company) was incorporated in Pakistan under the requirements of the Companies Ordinance, 1984 on August 6, 2003 as an unlisted public limited company. The Company commenced its operations on November 14, 2003. The Company is a Non-Banking Finance Company (NBFC). The Company has obtained license to carry out asset management and investment advisory services under the requirements of Non-Banking Finance Companies (Establishment and Regulation) Rules, 2003 and the Non-Banking Finance Companies and Notified Entities Regulations, 2008.

108 109Annual Report 2015 Annual Report 2015
NOTES TO AND FORMING PART OF THE FINANCIAL STATEMENTS FOR THE YEAR ENDED DECEMBER 31, 2015
NOTES TO AND FORMING PART OF THE FINANCIAL STATEMENTS FOR THE YEAR ENDED DECEMBER 31, 2015
11.7.2 The details of the Bank’s investment and post acquisition changes relating to FAML are as under:
Note 2015 2014 -------------Rupees ‘000-------------
Faysal Asset Management Limited - percentageholding 30% (2014: 30%)
At January 1 75,084 75,829
Post acquisition changes during the year- Recognised in the profit and loss account (7,002) (745)
At December 31 68,082 75,084
Cost of investment 45,000 45,000
11.7.3 Particulars of the assets and liabilities of the associate
Assets 265,506 279,063
Liabilities 38,566 28,783
Revenue 128,988 114,775
Loss (23,340) (2,483)
2015 2014 -------------Rupees ‘000-------------
12.1 Particulars of advances (Gross)
12.1.1 In local currency 201,469,014 203,520,420 In foreign currencies 1,074,290 1,155,652
202,543,304 204,676,072
12.1.2 Short term (upto one year) 108,628,989 111,463,221 Long term (over one year) 93,914,315 93,212,851
202,543,304 204,676,072
12.1.3 Net investment in Ijarah - Ijarah accounted for under IFAS-2
Note 2015 2014 -------------Rupees ‘000-------------
Movement in the net book value of Ijarah assets
Assets under IjarahOpening balance 550,253 37,717 Disbursed during the year 637,786 512,536 Disposals during the year - - Closing balance 1,188,039 550,253
Accumulated depreciationOpening balance 35,721 9,179 Charged during the year 203,937 26,542 Adjustment during the year - - Closing balance 239,658 35,721
Net investment in Ijarah 12.1.4 948,381 514,532
12.1.4 Ijarah rentals receivable
12 ADVANCES
Loans, cash credits, running finances, 186,650,037 188,265,398 etc. – in Pakistan
Net investment in finance lease – in Pakistan 12.2 11,329,219 11,047,764 197,979,256 199,313,162
Bills discounted and purchased (excluding government treasury bills)
- Payable in Pakistan 3,376,937 4,136,469 - Payable outside Pakistan 1,098,911 1,130,241
4,475,848 5,266,710 Margin financing / reverse repo transactions 88,200 96,200 Gross advances 202,543,304 204,676,072
Provision against non-performing advances12.4, 12.4.1 &
12.4.2(24,031,548) (23,011,743)
Provision against consumer and small enterprise
loans - general12.4, 12.4.2 &
12.5(432,672) (439,524)
(24,464,220) (23,451,267)
Advances - net of provision 178,079,084 181,224,805
2015 2014
Not later than one
year
Later than one and less than five years
Over five years
TotalNot later than one
year
Later than one and less than five years
Over five years
Total
-------------------------------------------------- Rupees ‘000 ---------------------------------------------------
Ijarah rentals receivable 535,623 490,984 - 1,026,607 233,576 367,152 - 600,728
The difference between net investment in Ijarah and Ijarah rental receivable represents element of profit in receivable.

110 111Annual Report 2015 Annual Report 2015
NOTES TO AND FORMING PART OF THE FINANCIAL STATEMENTS FOR THE YEAR ENDED DECEMBER 31, 2015
NOTES TO AND FORMING PART OF THE FINANCIAL STATEMENTS FOR THE YEAR ENDED DECEMBER 31, 2015
12.2 Net investment in finance lease 2015 2014
Not later than one
year
Later than one and less than five years
Over five years Total
Not later than one
year
Later than one and less
than five years
Over five years
Total
---------------------------------------------------- Rupees ‘000 ---------------------------------------------------------
Lease rentals receivable 894,874 7,484,371 - 8,379,245 747,049 6,641,401 16,740 7,405,190
Residual value 851,555 2,837,093 - 3,688,648 871,622 3,860,117 9,608 4,741,347
Minimum lease payment 1,746,429 10,321,464 - 12,067,893 1,618,671 10,501,518 26,348 12,146,537 Finance charge for future periods (16,858) (721,816) - (738,674) (97,573) (994,302) (6,898) (1,098,773)
Present value of minimum lease payment 1,729,571 9,599,648 - 11,329,219 1,521,098 9,507,216 19,450 11,047,764
12.3 Advances includes Rs. 30,329 million (2014: Rs. 29,293 million) which have been placed under non-performing status as detailed below:
2015 Note Classified Advances Provision required Provision held
Domestic Overseas Total Domestic Overseas Total Domestic Overseas Total Category of classification -------------------------------------------------------------- Rupees ‘000 ----------------------------------------------------------------
Other Assets Especially
Mentioned (OAEM) 12.3.1 428,735 - 428,735 830 - 830 830 - 830 Substandard 2,691,103 - 2,691,103 373,023 - 373,023 373,023 - 373,023 Doubtful 1,652,037 - 1,652,037 428,652 - 428,652 428,652 - 428,652 Loss 25,556,979 - 25,556,979 23,229,043 - 23,229,043 23,229,043 - 23,229,043
30,328,854 - 30,328,854 24,031,548 - 24,031,548 24,031,548 - 24,031,548
2014
Note Classified Advances Provision required Provision held
Domestic Overseas Total Domestic Overseas Total Domestic Overseas Total Category of classification -------------------------------------------------------------- Rupees ‘000 ----------------------------------------------------------------
Other Assets Especially
Mentioned (OAEM) 12.3.1 206,095 - 206,095 36 - 36 36 - 36
Substandard 2,717,410 - 2,717,410 406,705 - 406,705 406,705 - 406,705
Doubtful 1,675,067 - 1,675,067 523,630 - 523,630 523,630 - 523,630
Loss 24,694,748 - 24,694,748 22,081,372 - 22,081,372 22,081,372 - 22,081,372 29,293,320 - 29,293,320 23,011,743 - 23,011,743 23,011,743 - 23,011,743
12.3.1 This represents non-performing portfolio of agricultural, housing and small enterprise financing classified as OAEM as per the requirements of the Prudential Regulations for agricultural, housing and small enterprise financing issued by the SBP.
12.4 Particulars of provision against non-performing advances and general provision 2015 2014
Specific General Total Specific General TotalNote 12.5 Note 12.5
-------------------------------------- Rupees ‘000 -----------------------------------------
Opening balance 23,011,743 439,524 23,451,267 19,746,517 406,365 20,152,882
Recognised in the profit & loss account
- Charge for the year 2,342,060 - 2,342,060 2,900,885 33,159 2,934,044 - Reversals during the year (1,315,932) (6,852) (1,322,784) (845,065) - (845,065)
1,026,128 (6,852) 1,019,276 2,055,820 33,159 2,088,979 Recognised in equity
- Provision against non-performing loans and
advances adjusted against NCR - - - 1,221,567 - 1,221,567
Net charge 1,026,128 (6,852) 1,019,276 3,277,387 33,159 3,310,546 Amounts written off - note 12.7.1 (6,323) - (6,323) (12,161) - (12,161)
Closing balance 24,031,548 432,672 24,464,220 23,011,743 439,524 23,451,267
12.4.1 As allowed by the SBP the Bank has availed benefit of Forced Sale Value (FSV) of collaterals held as security of Rs 2,730.690 million (2014: Rs 2,757.896 million) relating to advances, Rs 4.326 million (2014: Rs 28.324 million) relating to investments and Rs 9.308 million (2014: Rs 13.962 million) relating to off-balance sheet items while determining the provisioning requirement against non-performing financing (including investments) as at December 31, 2015. The additional profit arising from availing the FSV benefit - net of tax as at December 31, 2015 which is not available for distribution as either cash or stock dividend to shareholders and bonus to employees amounted to approximately Rs 1,783.813 million (2014: Rs 1,820.118 million).
12.4.2 Particulars of provision against non-performing advances:
2015 2014 Specific General Total Specific General Total
------------------------------------------Rupees ‘000 -----------------------------------------------
In local currency 24,031,548 432,672 24,464,220 23,011,743 439,524 23,451,267 In foreign currencies - - - - - - Total 24,031,548 432,672 24,464,220 23,011,743 439,524 23,451,267
12.5 The Bank maintains general provision in accordance with the applicable requirements of the Prudential Regulations for Consumer Financing, Housing Finance and Small and Medium Enterprise Financing issued by the SBP. As per these regulations, the Bank maintains general provision as follows:
2015 2014 Secured Unsecured Secured Unsecured
Housing Finance Portfolio 1.5% - 1.5% - Consumer Portfolio 1.5% 5.0% 1.5% 5.0%Small Enterprise Portfolio 1.0% 2.0% 1.0% 2.0%
12.6 Although the Bank has made provision against its non-performing portfolio as per the category of classification of the loans, however, the Bank still holds enforceable collateral against certain non-performing loans in the event of recovery through litigation. These securities comprise of charge against various tangible assets of the borrower including land, building and machinery, stock in trade, etc.
Note 2015 2014 ------------Rupees ‘000-------------
12.7 Particulars of write-offs
12.7.1 Against provisions 6,323 12,161
Bad debts written-off directly 6,919 13,604 Recoveries against written-off debt (107,215) (148,110)Net recoveries against written-off debt credited to profit
and loss account (100,296) (134,506)
(93,973) (122,345)
12.7.2 Write-offs of Rs. 500,000 and above 12.8 684 11,350 Write-offs below Rs. 500,000 12,558 14,415 Recoveries against write-offs (107,215) (148,110)
(93,973) (122,345)

112 113Annual Report 2015 Annual Report 2015
NOTES TO AND FORMING PART OF THE FINANCIAL STATEMENTS FOR THE YEAR ENDED DECEMBER 31, 2015
NOTES TO AND FORMING PART OF THE FINANCIAL STATEMENTS FOR THE YEAR ENDED DECEMBER 31, 2015
12.8 Details of loan write-offs of Rs 500,000 and above
In terms of sub-section (3) of section 33A of the Banking Companies Ordinance, 1962, the statement in respect of written off loans or any other financial relief of five hundred thousand rupees or above allowed to a person(s) during the year ended December 31, 2015 is given in Annexure - II to these financial statements. However, the write-off of loans does not affect the Bank’s right to recover the outstanding loans from these customers.
2015 2014 12.9 Particulars of loans and advances to directors, -------------Rupees ‘000-------------
associated companies, etc.
Debts due by directors, executives or officers of the Bankor any of them either severally or jointly withany other persons *
Balance at beginning of the year 2,322,652 2,602,261 Loans granted during the year 750,242 638,945 Repayments during the year (704,741) (918,554)Balance at end of the year 2,368,153 2,322,652
Debts due by companies or firms in which the directorsof the Bank are interested as directors, partnersor in the case of private companies as members **
Balance at beginning of the year 3,241,115 2,654,970 Loans granted during the year - 1,778,823 Repayments during the year (3,033) (1,192,678)Balance at end of year 3,238,082 3,241,115
Debts due by subsidiary companies, controlledfirms, managed modarabas and other related parties **
Balance at beginning of the year 800,735 800,735 Loans granted during the year - - Repayments during the year - - Balance at end of the year 800,735 800,735
* These represent loans given by the Bank to its employees as per the terms of their employment.
** Provision held against the loans provided to related parties amounted to Rs 2,963.060 million (2014: Rs 2,827.738 million).
12.9.1 Balances pertaining to parties that were related at the beginning of the year but ceased to be so related during any part of the current period are not reflected as part of the closing balance. The same are accounted for through the movement presented above.
12.9.2 Maximum total amount of advances (including temporary advances) outstanding at the end of any month during the year
Note 2015 2014 -------------Rupees ‘000-------------
Debts due by directors, executives or officers of theBank or any of them either severally or jointly withany other persons 2,414,994 2,614,902
Debts due by companies or firms in which the directorsof the Bank are interested as directors, case of privatepartners or in the companies as members 3,241,115 3,252,967
Debts due by subsidiary companies, controlled firms,managed modarabas and other related parties 800,735 800,735
13 OPERATING FIXED ASSETS
Capital work-in-progress 13.1 627,098 145,908 Tangible fixed assets 13.2 8,812,777 9,108,566 Intangible assets 13.3 1,903,105 2,288,882
11,342,980 11,543,356
13.1 Capital work-in-progress
Civil works 44,143 15,797 Equipment 504,765 99,834 Advances to suppliers and contractors 78,190 30,277
627,098 145,908

114 115Annual Report 2015 Annual Report 2015
NOTES TO AND FORMING PART OF THE FINANCIAL STATEMENTS FOR THE YEAR ENDED DECEMBER 31, 2015
NOTES TO AND FORMING PART OF THE FINANCIAL STATEMENTS FOR THE YEAR ENDED DECEMBER 31, 2015
13.2 Tangible fixed assets
2015
Particulars
COST ACCUMULATED DEPRECIATION
Book value at December 31,
2015
Rate of depreciation
(%)
As at January 1,
2015
Additions / revaluation surplus /
adjustments*
Deletions / write-off
As at December 31, 2015
As at January 1,
2015
Additions/ revaluation
surplus/ adjustments*
On deletions / write-off
As at December 31, 2015
-------------------------------------------------------------------------------------Rupees 000-------------------------------------------------------------------------------------OwnedFreehold land 1,348,838 - - 1,348,838 - - - - 1,348,838 -
- - - -
Leasehold land 2,495,430 - - 2,495,430 - - - - 2,495,430 - - - - -
Building on freehold 196,186 - - 195,243 34,189 7,153 - 40,399 154,844 2.78 to 10 - -
(943) * (943) *
Building on leasehold 4,174,299 595 - 4,155,058 270,991 120,789 - 371,944 3,783,114 2.33 to 12.5land - -
(19,836) * (19,836) *
Leasehold property and 1,669,597 111,496 (106,234) 1,695,638 1,289,807 140,127 (104,081) 1,346,632 349,006 5 to 20improvement - -
20,779 * 20,779 *
Office furniture, fixtures, 5,301,047 184,226 (87,494) 5,397,779 4,652,266 297,452 (85,191) 4,864,527 533,252 20 to 33.33equipment and computers - -
- -
Vehicles 290,281 16,920 (13,105) 294,096 119,859 36,771 (10,827) 145,803 148,293 20 - - - -
Total Owned 15,475,678 313,237 (206,833) 15,582,082 6,367,112 602,292 (200,099) 6,769,305 8,812,777
2014
Particulars
COST ACCUMULATED DEPRECIATION
Book value at December 31,
2014
Rate of depreciation
(%)
As at January 1,
2014
Additions / revaluation surplus /
adjustments*
Deletions / write-off
As at December 31, 2014
As at January 1,
2014
Additions/ revaluation
surplus/ adjustments*
On deletions / write-off
As at December 31, 2014
-------------------------------------------------------------------------------------Rupees 000-------------------------------------------------------------------------------------OwnedFreehold land 1,243,295 - (7,000) 1,348,838 - - - - 1,348,838 -
112,543 - - -
Leasehold land 2,253,080 - - 2,495,430 - - - - 2,495,430 - 242,350 -
- -
Building on freehold 234,796 - - 196,186 142,522 15,808 - 34,189 161,997 5 905 (84,649)
(39,515) * (39,492) *
Building on leasehold 3,457,850 2,970 (576) 4,174,299 768,568 249,905 (576) 270,991 3,903,308 5land 726,249 (734,728)
(12,194) * (12,178) *
Leasehold property and 1,525,264 128,017 (35,392) 1,669,597 1,140,743 124,987 (27,593) 1,289,807 379,790 5 to 20improvement - -
51,708 * 51,670 *
Office furniture, fixtures, 5,156,246 218,017 (73,216) 5,301,047 4,410,517 311,004 (69,255) 4,652,266 648,781 20 to 33.33equipment and computers - -
- -
Vehicles 261,907 60,760 (32,386) 290,281 109,356 32,773 (22,270) 119,859 170,422 20 - - - -
Total Owned 14,132,438 1,491,810 (148,570) 15,475,678 6,571,706 (84,900) (119,694) 6,367,112 9,108,566
13.2.1 Included in cost of operating fixed asset are fully depreciated items still in use having cost of Rs 5,147.123 million (2014: Rs 5,256.468 million).
13.2.2 The Bank’s freehold / leasehold land and building on freehold / leasehold land were last revalued on December 31, 2014 by Iqbal A.Nanjee & Co Private Limited on the basis of professional assessment of the market values. Had there been no revaluation, the net book value of the revalued assets as at December 31, 2015 would have been lower by Rs 3,884.740 million (2014: Rs 3,968.067 million).
13.2.3 Changes in accounting estimate
During the year, the management of the Bank has revised its estimate of the useful life of ‘Building on freehold land’ and ‘Building on leasehold land’. Previously, all buildings under the above categories were depreciated over 20 years and now these are being depreciated over useful lives ranging from 8 to 43 years. The revision is based on estimation of useful lives of buildings provided by professional property valuer and takes into account the expected pattern of economic benefits associated with the use of these assets.
The revision has been accounted for as a change in accounting estimate in accordance with the requirements of International Accounting Standard (IAS) 8 ‘Accounting policies, changes in accounting estimates and errors’. Had the revision in useful lives of buildings not been made, the depreciation expense for the year would have been higher by Rs. 428.652 million and consequently profit before tax would have been lower by the same amount.
13.3 Intangible assets
2015
Particulars
COST ACCUMULATED AMORTISATION
Book value at December
31, 2015
Rate of amortisation
% per annum
As at January 1,
2015Additions Deletions
As at December 31, 2015
As at January 1,
2015
Charge to profit and
loss account / transferred to
equity
Charge on deletions
As at December 31, 2015
-------------------------------------------------------------------Rupees 000------------------------------------------------------------
Computer software 1,739,103 25,009 - 1,764,112 1,190,951 218,683 - 1,409,634 354,478 20 to 33.33
Customer relationship 2,557,167 - - 2,557,167 816,437 - - 1,008,540 1,548,627 Note
13.3.2 - note 13.3.2 192,103
4,296,270 25,009 - 4,321,279 2,007,388 218,683 - 2,418,174 1,903,105 192,103
2014
Particulars
COST ACCUMULATED AMORTISATION
Book value at December
31, 2014
Rate of amortisation
% per annum
As at January 1,
2014Additions Deletions
As at December 31, 2014
As at January 1,
2014
Charge to profit and
loss account / transferred to
equity
Charge on deletions
As at December 31, 2014
-------------------------------------------------------------------Rupees 000------------------------------------------------------------
Computer software 1,493,883 245,220 - 1,739,103 956,863 234,088 - 1,190,951 548,152 20 to 33.33
Customer relationship 2,557,167 - - 2,557,167 624,334 - - 816,437 1,740,730 Note
13.3.2 - note 13.3.2 192,103
4,051,050 245,220 - 4,296,270 1,581,197 234,088 - 2,007,388 2,288,882 192,103

116 117Annual Report 2015 Annual Report 2015
NOTES TO AND FORMING PART OF THE FINANCIAL STATEMENTS FOR THE YEAR ENDED DECEMBER 31, 2015
NOTES TO AND FORMING PART OF THE FINANCIAL STATEMENTS FOR THE YEAR ENDED DECEMBER 31, 2015
13.3.1 The intangible assets include fully amortised items still in use having cost of Rs 910.757 million (2014: Rs 822.175 million).
13.3.2 The intangible asset - Customer relationship comprises of core deposits which were recognised at the time of acquisition of Ex-RBS Pakistan. These core deposits represent the funding benefit that would be available to the Bank on account of availability of funding through deposit customers rather than from the wholesale or interbank market. This benefit also considers the fact that the economic life time of these deposits is longer than their contractual life. Based on this assumption, this intangible asset has been valued using certain valuation techniques and is being amortised over the life expectancy of these deposits. As more fully explained in note 22.2 to the financial statements the SBP allowed the Bank to adjust the amortisation charge arising on this intangible assets against non-distributable capital reserve.
13.4 Details of disposal of fixed assets to executives, and other persons having cost of more than Rs 1 million or net book value of Rs 250,000 or above are disclosed in Annexure IV to these financial statements.
Note 2015 2014 14 DEFERRED TAX ASSETS - NET -------------Rupees ‘000-------------
Deferred credits arising due to:- Accelerated tax depreciation (12,901) (30,340)- Surplus on revaluation of securities 23.2 (708,130) (733,975)- Fair value adjustments relating to net assets
acquired upon amalgamation (542,020) (609,256)- Surplus on revaluation of fixed assets 23.1 (906,063) (935,227)- Remeasurement of defined benefit obligations (75,730) (35,446)- Share of loss from associate (8,079) (10,529)
Deferred debits arising due to:- Provision against non-performing advances 3,516,660 3,290,482 - Provision for diminution in the value of investments 1,152,693 984,070 - Provision against other assets 230,495 68,637 - Unused tax losses (including unabsorbed
depreciation) 440,400 440,400 3,087,325 2,428,816
15 OTHER ASSETS
Income / mark-up accrued in local currency 5,998,135 6,770,686 Income / mark-up accrued in foreign currencies 65,408 58,084 Advances, deposits, advance rent and other prepayments 748,468 726,148 Taxation (payments less provisions) 1,842,990 3,737,611 Branch adjustment account - 27,954 Non-banking assets acquired in satisfaction of claims 15.1,15.5
& 15.6 1,826,276 1,913,178 Credit cards and other products fee receivable 283,707 284,791 Fair value of derivative contracts - - Dividend receivable 83,881 95,113 Receivable from brokers against sale of shares 382,914 196,140 Prepaid employee benefits 15.2 112,721 206,921 Advance against Islamic financing 3,080,719 1,468,739 Others 895,528 842,762
15,320,747 16,328,127 Less: provision held against other assets 15.3 (675,376) (318,383)Other assets (net of provisions) 14,645,371 16,009,744
2015 2014 -------------Rupees ‘000-------------
15.1 Market value of non-banking assets acquired in satisfaction of claims - determined by professional valuers 2,642,251 2,595,165
15.2 The prepaid employee benefits represent the impact of fair value adjustment on employee loans and advances which was determined at the time of acquisition of Ex-RBS Pakistan and is being amortized over the loan periods.
Note 2015 2014 The movement of prepaid employee benefits is as follows: -------------Rupees ‘000-------------
Prepaid employee benefits at beginning of the year 206,921 529,347 Employee benefits expensed during the year (94,200) (322,426)Prepaid employee benefits at the end of the year 112,721 206,921
15.3 Provision against other assets
Opening balance 318,383 443,067
Charge for the year 397,602 187,845 Reversals (11,476) (276,461)
386,126 (88,616)Provision written off (29,133) - Transfer of provision 20.2 - (36,068)Closing balance 15.4 675,376 318,383
15.4 This includes a provision amounting to Rs 232.37 million in respect of fraud and forgeries .
15.5 Non- current assets held for sale
These include properties having carrying value of Rs 1,716.5 million (2014: 1,778.6 million) which have been classified as ‘Non-current assets held for sale’ as at December 31, 2015. A formal plan to dispose of these properties is in place and it is expected that the process of sale of these properties will be completed in the near future.
15.6 On one of these properties is a claim by an individual to the extent of Rs 35 million (2014: Rs 35 million).
2015 2014 16 BILLS PAYABLE -------------Rupees ‘000-------------
In Pakistan 6,009,238 5,345,594 Outside Pakistan - 2,180
6,009,238 5,347,774 17 BORROWINGS
In Pakistan 89,748,656 59,884,764 Outside Pakistan 816,586 1,042,099
90,565,242 60,926,863

118 119Annual Report 2015 Annual Report 2015
NOTES TO AND FORMING PART OF THE FINANCIAL STATEMENTS FOR THE YEAR ENDED DECEMBER 31, 2015
NOTES TO AND FORMING PART OF THE FINANCIAL STATEMENTS FOR THE YEAR ENDED DECEMBER 31, 2015
Note 2015 2014 -------------Rupees ‘000-------------
17.1 Particulars of borrowings with respect to currencies
In local currency 89,748,656 59,884,764 In foreign currencies 816,586 1,042,099
90,565,242 60,926,863 17.2 Details of borrowings secured / unsecured
SecuredBorrowings from the State Bank of Pakistan - Under export refinance scheme - Part I and II 17.3 13,900,738 15,315,794 - Under scheme for long term financing for export
oriented projects - 156,000 - Under long term financing facility 17.4 1,600,181 2,695,118 - Agri finance (Under scheme for revival of SME 17.5 2,000 -
and agricultural activities in flood affected areas)- Under scheme of financing facility for storage of
agricultural produce 17.6 305,103 273,564
Repurchase agreement borrowings 17.7 71,142,568 40,094,288 86,950,590 58,534,764
UnsecuredCall borrowings 17.8 2,798,066 1,350,000 Overdrawn nostro accounts 816,586 1,042,099
3,614,652 2,392,099 90,565,242 60,926,863
17.3 In accordance with the Export Refinance (ERF) scheme, the Bank has entered into agreements for financing with the SBP for extending export finance to customers. As per the agreement, the Bank has granted the SBP a right to recover the outstanding amount from the Bank at the maturity date of finances by directly debiting the current account of the Bank maintained with the SBP. Borrowing from the SBP under the export refinance scheme is secured by the Bank’s cash and security balances held by the SBP. The mark-up rate on this facility is 1.5% to 6.5% per annum (2014: 5.5% to 6.5% per annum) payable on quarterly basis with maturities upto 180 days from the date of grant.
17.4 These represent borrowings from the SBP under scheme for long term financing facility. The mark-up rates on these facilities are ranging from 2% to 10.10% per annum (2014: 6% to 10.10% per annum), payable on quarterly basis, with maturities upto December 2026. As per the agreement, the Bank has granted the SBP a right to recover the outstanding amount from the Bank at the maturity date of finances by directly debiting the current account of the Bank maintained with the SBP.
17.5 These represent borrowings from the SBP under scheme for revival of SME and agricultural activities in flood affected areas. The mark-up rate on these facilities is 4.5% (2014: Nil) payable on half yearly basis, with maturities upto June 2016. As per the agreement, the Bank has granted the SBP the right to recover the outstanding amount from the Bank at the date of maturity of the finances by directly debiting the current account maintained by the Bank with the SBP.
17.6 These represent borrowings from the SBP under scheme of financing facility for storage of agricultural produce. The mark-up rates on these facilities are ranging from 2.5% to 6.5% per annum (2014: 5.5% to 6.5% per annum) payable on quarterly basis with maturities upto September 2022. As per the agreement, the Bank has granted the SBP a right to recover the outstanding amount from the Bank at the maturity date of finances by directly debiting the current account of the Bank maintained with the SBP.
17.7 These represent collateralized borrowings against market treasury bills and Pakistan Investment Bonds. The mark-up rate on these borrowing is 6.21% per annum (2014: 9.40% to 9.50% per annum). These are payable by January 2016.
17.8 These borrowings are from the financial institutions. The mark-up rates on these borrowings are ranging from 5.75% to 6.05% per annum (2014: 9.25% per annum) payable on maturity with maturities upto January 2016.
2015 2014 18 DEPOSITS AND OTHER ACCOUNTS -------------Rupees ‘000-------------
CustomersFixed deposits 90,461,529 95,714,523Saving deposits 95,584,670 87,507,426Current accounts – Remunerative 2,054,101 2,572,655Current accounts – Non-remunerative 89,476,774 85,073,620Margin accounts 2,005,605 2,067,200
279,582,679 272,935,424Financial institutionsRemunerative deposits 12,204,384 10,167,344Non-remunerative deposits 343,195 242,971
12,547,579 10,410,315 292,130,258 283,345,739
18.1 Particulars of deposits
In local currency 268,474,490 258,385,068In foreign currencies 23,655,768 24,960,671
292,130,258 283,345,73919 SUB-ORDINATED LOANS
These represent rated and un-secured Term Finance Certificates (TFCs) issued by the Bank. The salient features of the issue are as follows:
Note 2015 2014 -------------Rupees ‘000-------------
Outstanding amount 19.1 2,994,000 2,995,200
Total issue amount 3,000,000 3,000,000

120 121Annual Report 2015 Annual Report 2015
NOTES TO AND FORMING PART OF THE FINANCIAL STATEMENTS FOR THE YEAR ENDED DECEMBER 31, 2015
NOTES TO AND FORMING PART OF THE FINANCIAL STATEMENTS FOR THE YEAR ENDED DECEMBER 31, 2015
19.1 Particulars TFC (issue date: 27-12-2010)
Outstanding amount Rs. 2,994.0 million (2014: Rs. 2,995.2 million)
Issue amount Rs. 3,000 million
Rating as at June 30, 2015 “AA-” (Double A Minus) by JCR-VIS [June 30, 2014: AA-(Double A Minus)]
Listing Unlisted
Rate Base Rate Plus 2.25%
The Base Rate is defined as the ask side of six months Karachi Inter bank Offered Rate (KIBOR) prevailing on the base rate setting date.
Subordination The TFCs are subordinated to all other indebtedness of the Bank including deposits.
Date of issue December 27, 2010
Tenure and maturity 7 years from the date of issue.
Principal repayment Semi annually as follows:
0.20% of principal in first 60 months and remaining principal in four semi-annual installments of 24.95% starting from 66th month.
Profit payment Profit is payable semi-annually in arrears.
Note 2015 2014 -------------Rupees ‘000------------
20 OTHER LIABILITIES
Mark-up / return / interest payable in local currency 1,609,054 2,172,969 Mark-up / return / interest payable in foreign currencies 7,315 7,658 Unearned commission / income 16,452 108,479 Accrued expenses 1,109,024 863,913 Unclaimed dividends 39,759 39,803 Branch adjustment account 8,556 - Unrealised loss on revaluation of forward foreign
exchange contracts 67,748 271,359 Fair value of derivative contracts 25.3 - 1,443 Withholding tax payable 90,266 81,178 Federal excise duty payable 27,296 26,485 Security deposits against finance leases 20.1 3,702,126 3,658,600 Provision against off-balance sheet obligations 20.2 113,943 94,014 Payable to brokers against purchase of shares 191,075 65,066 Others 1,039,035 1,816,665
8,021,649 9,207,632
20.1 These represent interest free security deposits received from lessees against lease contracts and are adjustable against residual value of leased assets at the expiry of the respective lease terms.
Note 2015 2014 ------------Rupees ‘000-------------
20.2 Provision against off-balance sheet obligations
Opening balance 94,014 50,965 Charge for the year 19,929 6,981 Transfer from provision against other assets 15.3 - 36,068 Closing balance 113,943 94,014
21 SHARE CAPITAL
21.1 Authorised share capital
2015 2014 2015 2014 ------Number of Shares------- ------------Rupees ‘000-------------
1,800,000,000 1,200,000,000 Ordinary shares of Rs. 10 each 18,000,000 12,000,000
21.2 Issued, subscribed and paid-up capital
2015 2014 Ordinary shares------Number of Shares-------
201,451,420 201,451,420 Fully paid in cash 2,014,514 2,014,514 980,836,453 824,346,006 Issued as bonus shares 9,808,365 8,243,461
17,472,226 17,472,226 Issued on amalgamation 174,722 174,722 1,199,760,099 1,043,269,652 11,997,601 10,432,697
21.3 As at December 31, 2015, Ithmaar Bank B.S.C. (the holding company of the Bank) through its subsidiaries and nominees held 801,164,993 ordinary shares of Rs. 10 each (2014: 696,666,196 ordinary shares).

122 123Annual Report 2015 Annual Report 2015
NOTES TO AND FORMING PART OF THE FINANCIAL STATEMENTS FOR THE YEAR ENDED DECEMBER 31, 2015
NOTES TO AND FORMING PART OF THE FINANCIAL STATEMENTS FOR THE YEAR ENDED DECEMBER 31, 2015
21.4 The movement in the issued, subscribed and paid-up capital during the year was as follows:
2015 2014 Note 2015 2014 ------Number of Shares------- ------------Rupees ‘000-------------
1,043,269,652 1,043,269,652 Opening balance at January 1 10,432,697 10,432,697 156,490,447 - Bonus shares issued during the year 1,564,904 -
1,199,760,099 1,043,269,652 Closing balance at December 31 11,997,601 10,432,697
22 RESERVES
Statutory reserve 22.1 5,382,071 4,537,598
Capital reserveReserve arising on amalgamation 23,952 23,952 Share premium 10,131 10,131 Non-distributable capital reserve - gain on bargain purchase 22.2 1,006,607 1,131,474
6,422,761 5,703,155
22.1 Appropriations are made to statutory reserve, as required by section 21 of the Banking Companies Ordinance, 1962, at the rate 20% of profit after tax for the year.
22.2 NON-DISTRIBUTABLE CAPITAL RESERVE- GAIN ON BARGAIN PURCHASE
As per the directive of the SBP through its letter BPRD (R&P-02)/625-99/2011/3744 dated March 28, 2011, gain arising on bargain purchase of Pakistan operations of Royal Bank of Scotland (ex-RBS Pakistan) was credited directly into equity as Non-Distributable Capital Reserve (NCR). The SBP allowed the Bank to adjust the amortisation of intangible assets against the portion of reserve which arose on account of such assets. Accordingly, the Bank has adjusted amortisation of intangible assets amounting to Rs. 124.867 million (2014: Rs. 124.867 million) (net of tax) from the Non-distributable Capital Reserve.
Note 2015 2014 ------------Rupees ‘000-------------
23 SURPLUS ON REVALUATION OF ASSETS - NET OF TAX
Surplus / (deficit) arising on revaluation of:- Fixed assets 23.1 2,978,677 3,032,840 - Available for sale securities 23.2 1,315,104 1,437,518
4,293,781 4,470,358
2015 2014 ------------Rupees ‘000-------------
23.1 Surplus on revaluation of fixed assets
Surplus on revaluation of fixed assets at January 1 3,968,067 2,196,311 Surplus on revaluation of fixed assets recognised during
the year - 1,901,424
Transferred to un-appropriated profit in respect ofincremental depreciation charged during the year (54,163) (87,018)
Related deferred tax liability in respect of incrementaldepreciation charged during the year (29,164) (42,650)
(83,327) (129,668) 3,884,740 3,968,067
Related deferred tax liability on surplus at January 1 (935,227) (436,591)
Related deferred tax liability on surplus recognised duringthe year - (541,286)
Related deferred tax liability in respect of incrementaldepreciation charged during the year 29,164 42,650
(906,063) (935,227) 2,978,677 3,032,840
23.2 Surplus / (deficit) on revaluation of investments classified as available for sale - net
Federal Government Securities- Market Treasury Bills 76,180 144,961 - Pakistan Investment Bonds 1,941,738 1,784,616 - Ijara Sukuk Bonds 5,797 (56,361)
Fully Paid up Ordinary Shares / Modaraba Certificates / Units of Closed end Mutual Funds
- Listed companies / modarabas / mutual funds (30,236) 244,793
Fully Paid up Preference Shares- Unlisted companies - 2,003
Term Finance Certificates- Listed 1,117 (434)- Unlisted 3,138 6,951
Units of Open end Mutual Funds 25,500 44,964 2,023,234 2,171,493
Related deferred tax liability (708,130) (733,975) 1,315,104 1,437,518

124 125Annual Report 2015 Annual Report 2015
NOTES TO AND FORMING PART OF THE FINANCIAL STATEMENTS FOR THE YEAR ENDED DECEMBER 31, 2015
NOTES TO AND FORMING PART OF THE FINANCIAL STATEMENTS FOR THE YEAR ENDED DECEMBER 31, 2015
2015 2014 ------------Rupees ‘000---------------
24 CONTINGENCIES AND COMMITMENTS
24.1 Direct credit substitutes
Contingent liability in respect of guarantees favouring:- Banking companies and other financial institutions 497,327 618,456
Acceptances- Others 6,609,326 10,719,676
24.2 Transaction-related contingent liabilities
Contingent liability in respect of performance bonds, bid bonds, shipping guarantees and standby lettersof credit etc. favouring:
- Government 8,994,355 8,098,193 - Banking companies and other financial institutions 12,267 12,765 - Others 2,846,359 1,870,207
11,852,981 9,981,165 24.3 Trade-related contingent liabilities
Letters of credit- Government 12,708,525 2,292,534 - Others 10,813,163 16,781,954
23,521,688 19,074,488 24.4 Other contingencies
(i) Suit filed by a customer for recovery of alleged lossessuffered which is pending in the High Court of Sindh. The Bank’s legal advisors are confident that theBank has a strong case 2,510,000 2,510,000
(ii) Indemnity issued favouring the High Court in the above case 457,543 457,543
(iii) Claims against the Bank not acknowledged as debt 31,539,971 30,404,910
These mainly represent counter claims filed by the borrowers for restricting the Bank from disposal of assets (such as mortgaged / pledged assets kept as security), cases where the Bank was proforma defendant for defending its interest in the underlying collateral kept by it at the time of financing and certain cases filed by ex- employees of the Bank for damages sustained by them consequent to the termination from the Bank’s employment. The above also includes an amount of Rs 25,299 million in respect of a suit filed against the Bank for declaration, recovery of monies, release of securities, rendition of account and damages.
Based on legal advice and / or internal assessments, management is confident that the matters will be decided in the Bank’s favour and the possibility of any outcome against the Bank is remote and accordingly no provision has been made in these financial statements.
(iv) Income tax assessments of the Bank have been finalised upto the tax year 2014 (Accounting year 2013). Return of income for tax year 2015 (Accounting year 2014) has been deemed assessed.
The department and the Bank have disagreements on certain matters in different tax years. These include disallowance on initial depreciation of leases, provision for bad debts, bad debts written off, provision against investments, taxability of dividend and profit accrued on deposits. The additional tax liability on these matters is Rs 2,035.424 million. Both the bank and the department have filed appeals with the Commissioner Inland Revenue (Appeals), Appellate Tribunal Inland Revenue and the High Court in the aforementioned matters. The management of the Bank is confident that the decision in respect of these matters will be in the Bank’s favour and accordingly no provision has been made in these financial statements in this respect.
(v) The Finance Act, 2015 has made certain amendments in the Income Tax Ordinance, 2001. Under these amendments, a one-time super tax at the rate of 4 percent of the taxable income of the Bank for the tax year 2015 (i.e. year ended December 31, 2014) has been introduced for rehabilitation of temporary displaced persons. In accordance with the amendments made through Finance Act, 2015, the Bank has recognised a prior year tax charge of Rs 198.411 million in respect of super tax in the current year, however, the Bank is contesting the legality of super tax at appellate forum.
24.5 Commitments to extend credits
The Bank makes commitments to extend credit (including to related parties) in the normal course of its business but these being revocable commitments do not attract any significant penalty or expense if the facility is unilaterally withdrawn except for Rs 10,951 million (2014: Rs 9,681 million) which are irrevocable in nature.
2015 2014 24.6 Commitments in respect of forward exchange contracts ------------Rupees ‘000---------------
Purchase - Customers 848,576 2,019,028 - Banks 23,268,341 33,335,629
24,116,917 35,354,657 Sale
- Customers 782,309 980,313 - Banks 9,166,680 17,398,632
9,948,989 18,378,945
24.7 Commitments for the acquisition of operating fixed assets 82,419 118,310
24.8 Commitments in respect of donation - 8,000
24.9 Commitments in respect of repo transactions
Repurchase 71,239,393 40,116,082
Resale 306,889 305,244
25 DERIVATIVE INSTRUMENTS
Interest rate swaps and cross currency swaps (notional principal) - 67,864

126 127Annual Report 2015 Annual Report 2015
NOTES TO AND FORMING PART OF THE FINANCIAL STATEMENTS FOR THE YEAR ENDED DECEMBER 31, 2015
NOTES TO AND FORMING PART OF THE FINANCIAL STATEMENTS FOR THE YEAR ENDED DECEMBER 31, 2015
Derivative instruments, such as Forward Rate Agreement, Interest Rate Swaps, Cross Currency Swaps and FX Options, are forward transactions that provide market making opportunities / hedge against the adverse movement of interest and exchange rates. Derivatives business provides risk solutions for the existing and potential customers of the Bank. All Derivative transactions are governed by the Financial Derivative Business Regulations (FDBR) issued by the State Bank of Pakistan (SBP).
25.1 Derivative Risk Management
The Bank’s derivatives risk management is performed under Market Risk Management which is an independent unit reporting to the Chief Risk Officer. The risk management policies are governed by regulatory and internal guidelines. Risk management department of the Bank reviews credit risk, market risk and other risks associated with the derivative transactions or related area of the activity and assigns limits within which the transactions / area of activity can be carried out. Adherence to these limits is ensured through independent monitoring and control functions.
There are a number of risks undertaken by the Bank, which need to be monitored and assessed. The management of risks includes the following primary components:
- Comprehensive risk measurement approach;- Detailed structure of limits, guidelines and other parameters used to govern risk taking; and- Strong management information system for controlling, monitoring and reporting risks.
Major risks associated with the derivative instruments are market risk, credit risk and liquidity risk. The Bank uses SunGard-Sierra to measure and manage these risks which provides end-to-end capability with respect to transaction life cycle.
Market risk
The risk that the value of a derivative contract will be adversely affected by movements in equity prices, interest rates, currency exchange rates and commodity prices. The authority for approving policies, limits and periodic reviews rest with the Board of Directors. The critical measures used to manage market risks are Interest Rate Delta, Currency Delta Basis and Value-at-Risk. These measures involve extreme shifts in a variety of parameters, such as FX rates, interest rates, equity prices, implied volatility levels and combinations of the above. These measures are calculated through the relevant systems.
Credit risk
The risk that a party to a derivative contract will fail to perform its obligation. There are two types of credit risk associated with the derivative transactions 1) settlement, and 2) pre-settlement risk. Pre-Settlement risk is monitored on daily basis. Risk management department of the Bank sets the policies and limits for counterparty risk based on a pre-defined criteria linked with the internal risk rating of the customer.
Liquidity risk
Liquidity risk is managed as part of the overall liquidity risk of the Bank. The risk management policies related to liquidity risk are explained in note 43.7 to these financial statements.
25.2 Product analysis 2015 2014
Cross Currency Swaps Cross Currency Swaps
No. of Contracts
Notional Principal
No. of Contracts
Notional Principal
Counterparties Rupees ‘000 Rupees ‘000
With Banks for Hedging - - - - Market Making - - - -
With other entities for Hedging - - - - Market Making - - 1 67,864
TotalHedging - - - - Market Making - - 1 67,864
- - 1 67,864 25.3 Maturity analysis
Cross currency swaps 2015
Remaining maturityNo. of
ContractsNotional Principal
Mark to MarketNegative Positive Net
-------------------- Rupees ‘000 -------------------------
Upto 1 month - - - - - 1 to 3 months - - - - - 3 to 6 months - - - - - 6 months to 1 year - - - - - 1 to 2 years - - - - - 2 to 3 years - - - - - 3 to 5 years - - - - - 5 to 10 years - - - - -
- - - - -
Cross currency swaps 2014
Remaining MaturityNo. of
ContractsNotional Principal
Mark to MarketNegative Positive Net
---------------------- Rupees ‘000 --------------------------
Upto 1 month - - - - - 1 to 3 months - - - - - 3 to 6 months - - - - - 6 months to 1 year 1 67,864 (70,705) 69,262 (1,443)1 to 2 years - - - - - 2 to 3 years - - - - - 3 to 5 years - - - - - 5 to 10 years - - - - -
1 67,864 (70,705) 69,262 (1,443)

128 129Annual Report 2015 Annual Report 2015
NOTES TO AND FORMING PART OF THE FINANCIAL STATEMENTS FOR THE YEAR ENDED DECEMBER 31, 2015
NOTES TO AND FORMING PART OF THE FINANCIAL STATEMENTS FOR THE YEAR ENDED DECEMBER 31, 2015
2015 2014 26 MARK-UP / RETURN / INTEREST EARNED ------------Rupees ‘000-------------
a) On financing to:i) customers 17,497,442 21,041,398ii) financial institutions 83,125 35,617
b) On investments in:i) held for trading securities 371,371 386,062ii) available for sale securities 11,395,228 8,645,104iii) held to maturity securities 2,896,474 1,643,252
c) On deposits with treasury bank and financial institutions 11,050 16,205
d) On securities purchased under resale agreements 57,863 137,176
e) Others - 407,81932,312,553 32,312,633
27 MARK-UP / RETURN / INTEREST EXPENSED
Deposits 11,911,428 13,990,871Securities sold under repurchase agreements 4,185,751 1,095,753Other short term borrowings 1,167,180 1,669,978SBP borrowings 779,477 1,319,496Sub-ordinated loans 314,135 404,093
18,357,971 18,480,191
28 GAIN ON SALE OF SECURITIES - NET
Gain / (loss) on sale of:Federal Government Securities- Market Treasury Bills 674,315 38,378 - Pakistan Investment Bonds 884,919 155,622 - Ijara Sukuk Bonds - 156 Fully Paid up Ordinary Shares / Modaraba Certificates /
Units of Closed end Mutual Funds 179,752 262,335 Units of Open end Mutual Funds (356) 3,986
1,738,630 460,477 29 OTHER INCOME
Rent on property 126,987 128,564 Net gain on disposal of operating fixed assets 14,009 18,193 Net gain on disposal of non-banking assets 115,356 145,108 Income on derivative contracts - net 362 249,707 Income from disposal of scrap 4,861 8,329 Miscellaneous charges recovered 4,242 997
265,817 550,898
Note 2015 2014 ------------Rupees ‘000-------------
30 ADMINISTRATIVE EXPENSES
Salaries, allowances and other employee benefits 30.1 & 30.2 & 30.3 4,447,746 5,474,022 Charge for defined benefit plan 36.7 100,814 65,434 Contribution to defined contribution plan 37 122,628 131,373 Non-executive directors’ fees 59,006 52,276 Rent, taxes, insurance, electricity, etc. 2,017,764 1,983,749 Legal and professional charges 157,773 291,122 Communications 295,247 308,508 Repairs and maintenance 821,676 780,667 Stationery and printing 220,759 264,768 Advertisement and publicity 154,708 137,010 Donations 30.4 49,539 36,998 Auditors’ remuneration 30.5 38,645 33,450 Depreciation 13.2 602,292 734,477 Amortisation 13.3 218,683 234,088 License and technical fee 279,095 274,213 Travelling, conveyance and entertainment 140,772 131,829 Vehicle running expenses 169,997 241,969 Books, periodicals and subscription 59,937 106,683 Brokerage and commission 41,852 42,599 Bank fees and charges 117,050 121,094 Security expenses 373,129 340,140 Public relation and sponsorship 85,613 131,989 Fee and documentation charges 8,603 88,479 Others 7,725 155,097
10,591,053 12,162,034
30.1 This includes charge amounting to Rs 94.2 million (2014: Rs 322.426 million) in respect of amortisation of prepaid employee benefits as disclosed in note 15.2 to these financial statements.
30.2 The Bank operates a performance management scheme which includes performance bonus for all employees including President and Chief Executive Officer of the Bank. Under this scheme, the bonus for all Executives, including the Chief Executive Officer and President of the Bank is determined on the basis of employees’ performance and the Bank’s performance during the year. The aggregate amount paid to eligible employees in respect of the above scheme relating to all Executives and the President of the Bank amounted to Rs 235.834 million and Rs 28 million respectively (2014: Rs 307.850 million and Rs Nil respectively).
30.3 This includes accrual of employee benefit in the form of bonus to all permanent employees including President and Chief Executive Officer amounting to Rs 450 million (2014: Rs 350 million).

130 131Annual Report 2015 Annual Report 2015
NOTES TO AND FORMING PART OF THE FINANCIAL STATEMENTS FOR THE YEAR ENDED DECEMBER 31, 2015
NOTES TO AND FORMING PART OF THE FINANCIAL STATEMENTS FOR THE YEAR ENDED DECEMBER 31, 2015
2015 2014 30.4 Donations made during the year were as follows: ------------Rupees ‘000-------------
Donee
Institute of Business Administration 8,000 - Waqf Faisal (Trust) 41,539 36,998
49,539 36,998
Directors or their spouse have no interest in any of the donee other than ‘Waqf Faisal (Trust)’ (a charitable public welfare project), where the President and Chief Executive Officer of the Bank is acting as trustee.
2015 2014 30.5 Auditors’ remuneration ------------Rupees ‘000-------------
Statutory audit fee 3,300 3,000 Fee for quarterly and annual group reporting 13,575 7,900 Fee for the review of the half yearly financial statements 900 825 Tax services 8,100 9,100 Special certifications and sundry advisory services 9,770 10,375 Out-of-pocket expenses 3,000 2,250
38,645 33,450
31 OTHER CHARGES
Penalties imposed by the State Bank of Pakistan 44,025 123,183 Workers’ Welfare Fund 177,179 98,643
221,204 221,826
32 TAXATION
For the yearCurrent 3,038,627 1,712,150 Deferred (605,711) (446,581)
2,432,916 1,265,569 For prior years
Current 264,797 (812,786)Deferred - 622,043
264,797 (190,743) 2,697,713 1,074,826
2015 2014 ------------Rupees ‘000-------------
32.1 Relationship between tax expense and accounting profit
Profit before tax 6,920,077 3,551,785
Tax calculated at the rate of 35% (2014: 35%) 2,422,027 1,243,125 Effect of: - permanent differences 15,234 116,702 - income chargeable to tax at reduced rate - (45,969)- prior year charge / (reversal) 264,797 (190,743)- others (4,345) (48,289)Tax charge for the year 2,697,713 1,074,826
33 EARNINGS PER SHARE
Profit after tax for the year 4,222,364 2,476,959
Number of shares in thousands
Weighted average number of ordinary shares outstandingduring the year 1,199,760 1,199,760
-----------------Rupees--------------
Earnings per share - basic 3.52 2.06
33.1 Diluted earnings per share has not been presented as the Bank does not have any convertible instruments in issue at December 31, 2015 and December 31, 2014 which would have any effect on the earnings per share if the option to convert is exercised.
Note 2015 2014 34 CASH AND CASH EQUIVALENTS ------------Rupees ‘000-------------
Cash and balances with treasury banks 8 26,084,007 20,285,851 Balances with other banks 9 1,068,451 1,422,699 Overdrawn nostros 17.2 (816,586) (1,042,099)
26,335,872 20,666,451

132 133Annual Report 2015 Annual Report 2015
NOTES TO AND FORMING PART OF THE FINANCIAL STATEMENTS FOR THE YEAR ENDED DECEMBER 31, 2015
NOTES TO AND FORMING PART OF THE FINANCIAL STATEMENTS FOR THE YEAR ENDED DECEMBER 31, 2015
Note 2015 2014 35 STAFF STRENGTH Number of employees
Permanent 3,125 3,024 Temporary / on contractual basis 16 12 Bank’s own staff strength at the end of the year 3,141 3,036 Outsourced 35.1 2,216 2,084 Total staff strength 5,357 5,120
35.1 Outsourced staff are employees hired by an outside contractor / agency and posted in the Bank to perform various tasks / activities of the Bank.
36 DEFINED BENEFIT PLAN
36.1 General description
The Bank operates an approved funded gratuity scheme for all its permanent employees and employees who are on contractual service in non-management cadre. The benefits under the gratuity scheme are payable on retirement at the age of 60 years or earlier cessation of service in lump sum. The benefit is equal to one month’s last drawn basic salary for each year of eligible service or part thereof. The minimum qualifying eligible service for gratuity is 1 year for employees who became members of the Fund before November 12, 2002. In the case of other members of the Fund the minimum qualifying eligible service is 5 years. The minimum qualifying eligible service for contractual employees not employed under the management cadre is 6 months. The latest actuarial valuation of the Bank’s defined benefit plan, based on the Projected Unit Credit Actuarial Cost Method, was carried out as at December 31, 2015.
The Gratuity scheme exposes the Bank to the following risks:
Mortality risksThe risk that the actual mortality experience is different. The effect depends on the beneficiaries’ service / age distribution and the benefit.
Investment risksThe risk of the investment underperforming and not being sufficient to meet the liabilities. This is managed by formulating proper investment plan in consultation with the investment advisors of the Fund.
Risk of insufficiency of assetsThis is managed by making regular contribution to the Fund as advised by the actuary.
Final salary risksThe risk that the final salary at the time of cessation of service is higher than what we assumed. Since the benefit is calculated on the final salary, the benefit amount increases similarly.
Withdrawal risksThe risk of higher or lower withdrawal experience than assumed. The final effect could go either way depending on the beneficiaries’ service / age distribution and the benefit.
36.2 Principal actuarial assumptions 2015 2014
Discount factor used (% per annum) 10.00 11.25Expected rate of salary increase (% per annum) 10.00 11.25Normal retirement age (years) 60 60
Note 2015 2014 36.3 The amount recognised in the statement of ------------Rupees ‘000-----------
financial position are determined as follows:
Present value of defined benefit obligations 36.5 504,297 528,773 Fair value of plan assets 36.5 (620,253) (602,394)
(115,956) (73,621)36.4 Plan assets consist of the following:
2015 2014 Quoted Non-Quoted Quoted Non-Quoted
--------------------------- Rupees ‘000 ---------------------------Balances with banks and financial
institutions - 70,626 - 7,054
Debt instruments:- Government 319,004 230,000 363,321 232,019 - Corporate 623 - - -
319,627 300,626 363,321 239,073
36.5 The movement in the defined benefit obligation over the year is as follows:
2015Present value of obligation
Fair value of plan assets Total
-------------------Rupees ‘000-------------------
At January 1 528,773 (602,394) (73,621)Current service cost 109,446 - 109,446 Past service cost - - - Interest expense / (income) 63,004 (71,636) (8,632)
172,450 (71,636) 100,814 701,223 (674,030) 27,193
Remeasurements:- Return on plan assets, excluding amounts
included in interest (income) / expense - 15,863 15,863 - Gain / (loss) from change in demographic
assumptions - - - - Gain / (loss) from change in financial
assumptions (1,536) - (1,536)- Experience (gains) / losses (129,425) - (129,425)
(130,961) 15,863 (115,098)
Contribution - (28,051) (28,051)Benefit payments (65,965) 65,965 - At December 31 504,297 (620,253) (115,956)

134 135Annual Report 2015 Annual Report 2015
NOTES TO AND FORMING PART OF THE FINANCIAL STATEMENTS FOR THE YEAR ENDED DECEMBER 31, 2015
NOTES TO AND FORMING PART OF THE FINANCIAL STATEMENTS FOR THE YEAR ENDED DECEMBER 31, 2015
2014Present value of obligation
Fair value of plan assets
Total
-------------------Rupees ‘000-------------------
At January 1 541,719 (639,308) (97,589)Current service cost 109,571 - 109,571 Past service cost (30,476) - (30,476)Interest expense / (income) 70,549 (84,210) (13,661)
149,644 (84,210) 65,434 691,363 (723,518) (32,155)
Remeasurements:- Return on plan assets, excluding amounts
included in interest (income) / expense - (8,588) (8,588)- Gain / (loss) from change in demographic
assumptions 16 - 16 - Gain / (loss) from change in financial assumptions 1,749 - 1,749 - Experience (gains) / losses (34,643) - (34,643)
(32,878) (8,588) (41,466)
Contribution - - - Benefit payments (129,712) 129,712 - At December 31 528,773 (602,394) (73,621)
36.6 An analysis of present value of defined benefit 2015 2014obligation -----------Rupees ‘000------------
Split by type of members
(i) Active employees 504,297 521,460 (ii) Deferred - - (iii) Retired members - 7,313
504,297 528,773 Split by vested / non-vested
(i) Vested benefits 425,157 466,589 (ii) Non-vested benefits 79,140 62,184
504,297 528,773 Split by cadre of members
(i) Management 499,228 524,702 (ii) Non-Management (Contractuals) 5,069 4,071
504,297 528,773 Split by benefits earned to date
(i) Present value of guaranteed benefits 216,852 202,624 (ii) Present value of benefits attributable to future increase in salary 287,445 326,149
504,297 528,773
2015 2014-----------Rupees ‘000------------
36.7 Charge for defined benefit plan
Current service cost 109,446 109,571 Past service cost - (30,476)Net interest cost (8,632) (13,661)
100,814 65,434
36.8 The plan assets and defined benefit obligations are based in Pakistan.
36.9 Assumptions regarding future mortality are set based on the actuarial advice in accordance with published statistics and experience in Pakistan. The rates assumed are based on the adjusted SLIC 2001 - 2005 mortality tables with one year age set back.
36.10 The sensitivities of the defined benefit obligation to changes in the weighted principal assumptions are as under:
Impact on defined benefit obligation - Increase / (decrease)
Change in assumption
Increase in assumption
Decrease in assumption
-----------Rupees ‘000------------
Discount rate 1% 453,250 564,688 Salary increase rate 1% 565,373 451,787
Increase by 1 year in assumption
Decrease by 1 year in assumption
-----------Rupees ‘000------------
Life expectancy / withdrawal rate 497,180 510,014
The above analysis is based on a change in an assumption while holding all other assumptions constant. When calculating the sensitivity of the defined benefit obligation to significant actuarial assumptions the same method (present value of the defined benefit obligation calculated with the projected unit credit method at the end of the reporting period) has been applied as when calculating the gratuity liability recognised within the statement of financial position.
36.11 The weighted average duration of the defined benefit obligation is 11.05 years.

136 137Annual Report 2015 Annual Report 2015
NOTES TO AND FORMING PART OF THE FINANCIAL STATEMENTS FOR THE YEAR ENDED DECEMBER 31, 2015
NOTES TO AND FORMING PART OF THE FINANCIAL STATEMENTS FOR THE YEAR ENDED DECEMBER 31, 2015
36.12 Expected maturity analysis of the undiscounted defined benefit obligation for the gratuity scheme is as follows:
At December 31, 2015Less than
a yearBetween 1-2 years
Between 2-5 years
Over 5 years
Total
----------------------- Rupees ‘000 ---------------------------
Gratuity 28,921 82,879 195,247 12,849,379 13,156,426
2015 2014 2013 2012 2011 ---------------------------- Rupees ‘000 ----------------------------
36.13 Historical information
Defined benefit obligation (504,297) (528,773) (541,719) (430,334) (374,945)Fair value of plan assets 620,253 602,394 639,308 534,886 368,641 Surplus / (deficit) 115,956 73,621 97,589 104,552 (6,304)
Remeasurements of plan liabilities 130,961 32,878 16,818 53,177 38,924
Remeasurements of plan assets (15,863) 8,588 (23,823) 19,778 (15,508)
36.14 Funding levels are monitored on an annual basis and are based on actuarial recommendations. Gratuity cost comprising the service cost and the net interest cost for the next year works out to Rs. 89.404 million as per the actuarial valuation report of the Bank as at December 31, 2015.
36.15 The disclosure made in notes 36.2 to 36.14 are based on the information included in the actuarial valuation report of the Bank as at December 31, 2015.
37 DEFINED CONTRIBUTION PLAN
The Bank operates an approved funded contributory provident fund for all its permanent employees to which equal monthly contributions are made both by the Bank and the employees at the rate of 10% of the basic salary. The financial statements of the fund are separately prepared and are not included as part of these financial statements.
38 COMPENSATION OF DIRECTORS AND EXECUTIVES
Particulars President & Chief Executive Officer Directors Executives
2015 2014 2015 2014 2015 2014----------------------------------- Rupees ‘000 -------------------------------------
Managerial remuneration 32,250 33,518 - - 689,061 708,944 Fees - - 59,006 52,276 - - Charge for defined benefit plan 2,687 2,688 - - 48,933 51,195 Contribution to defined contribution plan 3,225 3,226 - - 58,722 61,436 Rent and house maintenance 6,017 6,579 - - 268,339 276,047 Utilities - 1,745 - - 60,885 62,595 Medical 63 312 - - 41,869 43,708 Leave fare assistance - 140 - - 91,594 94,870 Others 837 608 - - 529,845 530,365
45,079 48,816 59,006 52,276 1,789,248 1,829,160
Number of persons 1 2 7 10 601 637
38.1 Executives mean employees, other than the chief executive and directors, whose basic salary exceeds five hundred thousand rupees in a financial year.
38.2 The President & Chief Executive and certain senior executives are provided with the Bank’s maintained cars in accordance with the terms of their employment.
38.3 In addition to the above, all executives, including the President & Chief Executive Officer of the Bank are also entitled to bonus which is disclosed in note 30.2 to these financial statements.
39 FAIR VALUE DISCLOSURES
Fair value is the amount for which an asset could be exchanged, or a liability settled, between knowledgeable willing parties in an arm’s length transaction.
39.1 Fair value hierarchy
The table below analyses financial and non-financial assets carried at fair value, by valuation method. The different levels have been defined as follows:
- Quoted prices (unadjusted) in active markets for identical assets or liabilities (Level 1).
- Inputs other than quoted prices included within level 1 that are observable for the asset or liability, either directly (that is, as prices) or indirectly (that is, derived from prices) (Level 2).
- Inputs for the assets or liabilities that are not based on observable market data (i.e. unobservable inputs e.g. estimated future cash flows) (Level 3).
Recurring fair value measurements 2015Level 1 Level 2 Level 3 Total
------------------------ Rupees ‘000 -------------------------Investments - net
Financial assets
Market Treasury Bills - 93,481,729 - 93,481,729 Pakistan Investment Bonds - 53,588,627 - 53,588,627 Ijara Sukuk Bonds - 5,924,997 - 5,924,997 Fully Paid up Ordinary Shares 3,566,953 - - 3,566,953 Term Finance Certificates - 314,964 - 314,964 Units of Open end Mutual Funds 1,323,180 - - 1,323,180
Non - financial assetsNon Banking Assets (NBA) * - 2,642,251 - 2,642,251
Non-recurring fair value measurementsOperating fixed assets (land and buildings)** - 7,782,226 - 7,782,226
Commitments in respect of forwardexchange contracts
Forward purchase of foreign exchange - 24,116,917 - 24,116,917 Forward sale of foreign exchange - 9,948,989 - 9,948,989
* Represent the market value of NBA as disclosed in note 15.1. However, these are carried at cost as per the accounting policy as disclosed in note 7.9 to these financial statements.
** The Bank carries out periodic revaluation of these assets as per the accounting policy disclosed in note 7.6 to these financial statements.
The Bank’s policy is to recognise transfers into and out of the different fair value hierarchy levels at the date when the event or change in circumstances require Bank to exercise such transfers.
There were no transfers between levels 1 and 2 during the year.

138 139Annual Report 2015 Annual Report 2015
NOTES TO AND FORMING PART OF THE FINANCIAL STATEMENTS FOR THE YEAR ENDED DECEMBER 31, 2015
NOTES TO AND FORMING PART OF THE FINANCIAL STATEMENTS FOR THE YEAR ENDED DECEMBER 31, 2015
Valuation techniques used in determination of fair values within level 2
Item Valuation approach and input used Pakistan Investment Bonds / Market Treasury Bills
Fair values of Pakistan Investment Bonds and Treasury Bills are derived using the PKRV rates.
Ijara Sukuk
Fair values of GoP Ijarah Sukuk are derived using the PKISRV rates announced by the Financial Market Association (FMA) through Reuters. These rates denote an average of quotes received from eight different pre-defined / approved dealers / brokers.
Operating fixed assets (land and building)
Land and buildings are revalued by professionally qualified valuers as per the accounting policy disclosed in note 7.6. The valuers are listed on the panel of the Pakistan Banks’ Association. The valuation is based on their assessment of market value of the properties.
Term Finance Certificates (TFCs) and Sukuk Certificates
Fair values of TFCs and Sukuk Certificates are determined using the MUFAP rates.
Non Banking Assets (NBA)NBA are valued by professional qualified valuers listed on the panel of the Pakistan Banks’ Association. The valuation is based on their assessment of market value of the properties.
Forward foreign exchangeThe valuation has been determined by interpolating the mid rates announced by the State Bank of Pakistan.
39.2 Fair Value of Financial Instruments
The book value and fair value of the Bank’s assets, liabilities and Off-balance sheet items are given below:
Book value Fair value 2015 2014 2015 2014
On-balance sheet financial instruments --------------------------- Rupees ‘000 -----------------------------
AssetsCash and balances with treasury banks 26,084,007 20,285,851 26,084,007 20,285,851 Balances with other banks 1,068,451 1,422,699 1,068,451 1,422,699 Lendings to financial institutions 12,088,403 - 12,088,403 - Investments 183,677,239 155,210,513 184,748,236 156,318,170 Advances 178,079,084 181,224,805 178,453,060 181,696,477 Other assets 10,431,698 9,741,901 10,431,698 9,741,901
411,428,882 367,885,769 412,873,855 369,465,098 LiabilitiesBills payable 6,009,238 5,347,774 6,009,238 5,347,774 Borrowings 90,565,242 60,926,863 90,565,242 60,926,863 Deposits and other accounts 292,130,258 283,345,739 292,130,258 283,345,739 Sub-ordinated loans 2,994,000 2,995,200 3,061,365 3,133,815 Other liabilities 7,429,910 8,750,766 7,429,910 8,750,766
399,128,648 361,366,342 399,196,013 361,504,957
Off-balance sheet financial instruments
Forward purchase of foreign exchange 24,116,917 35,354,657 24,085,193 34,721,465
Commitments in respect of repurchase transactions 71,239,393 40,116,082 71,239,393 40,116,082
Forward sale of foreign exchange 9,948,989 18,378,945 9,982,341 18,017,112
Commitments in respect of resale transactions 306,889 305,244 306,889 305,244
The fair value of quoted investments is based on quoted market prices. Unquoted equity securities are valued at lower of cost and break-up value as per the latest available audited financial statements. Other unquoted securities are valued at cost less impairment losses. The provision for impairment in the value of investments has been determined in accordance with the accounting policy as stated in note 7.4 to these financial statements.
In the opinion of the management, the fair value of the remaining financial assets and liabilities are not significantly different from their carrying values since these assets and liabilities are short term in nature or in the case of financings and deposits are frequently repriced.
40 SEGMENT DETAILS WITH RESPECT TO BUSINESS ACTIVITIES
Primary segment information
The Bank is organised into four major business segments:
- Corporate Finance- Trading and Sales- Retail Banking- Corporate & Commercial Banking
All assets, liabilities, off balance sheet items and items of income and expense are distributed in primary segments in accordance with the core functions performed by the business groups.
Corporate Finance
Trading & Sales
Retail Banking
Corporate & Commercial
Banking Total
------------------------------------------- Rupees ‘000 ----------------------------------------------December 31, 2015
Total income *** 171,314 10,511,436 23,968,640 3,218,501 37,869,891Total expenses (93,741) (7,460,330) (22,804,437) (3,289,019) (33,647,527)Net income / (loss) 77,573 3,051,106 1,164,203 (70,518) 4,222,364
Segment assets (Gross) - 195,988,770 92,575,975 169,930,474 458,495,219 Segment non performing loans - - 5,968,091 24,360,763 30,328,854 Segment provision required
against loans ** - - (3,150,015) (21,314,205) (24,464,220)Segment liabilities - (76,923,939) (300,294,580) (22,501,868) (399,720,387)
Segment return on assets (ROA) (%) * - 1.65% 1.33% (0.04%)
Segment cost of funds (%) * - 5.42% 4.75% 7.05%
December 31, 2014
Total income*** 142,849 6,713,312 24,545,026 5,284,870 36,686,057 Total expenses (84,123) (4,085,130) (24,291,630) (5,748,215) (34,209,098)Net income / (loss) 58,726 2,628,182 253,396 (463,345) 2,476,959
Segment assets (Gross) - 149,750,065 74,629,428 190,344,153 414,723,646 Segment non performing loans - - 3,599,658 25,693,662 29,293,320 Segment provision required
against loans ** - - (2,367,920) (21,083,347) (23,451,267)Segment liabilities - (42,447,414) (280,986,592) (38,389,202) (361,823,208)
Segment return on assets (ROA) (%)* - 2.43% 0.39% (0.25%)
Segment cost of funds (%)* - 5.59% 5.76% 9.07%
* These percentages have been computed based on average balances.** includes general provision
Net of share of loss of associate***

140 141Annual Report 2015 Annual Report 2015
NOTES TO AND FORMING PART OF THE FINANCIAL STATEMENTS FOR THE YEAR ENDED DECEMBER 31, 2015
NOTES TO AND FORMING PART OF THE FINANCIAL STATEMENTS FOR THE YEAR ENDED DECEMBER 31, 2015
41 RELATED PARTY TRANSACTIONS
The Bank has related party relationship with its holding company, associated undertaking, associated company, group companies, retirement benefit plans, directors, key management personnel and entities over which the directors or key management personnel are able to exercise significant influence.
Banking transactions with the related parties are executed substantially on the same terms, except transactions with directors and key management personnel that are as per their terms of employment, including mark-up rates and collateral, as those prevailing at the time of comparable transactions with unrelated parties and do not involve more than a normal risk.
2015
Directors and key
management personnel
Retirement Benefit Plans Associate
Group Companies
and associated
undertakings
---------------------------------- Rupees ‘000 ----------------------------------DepositsBalance at the beginning of the year 107,806 87,030 5,141 50,108 Placements during the year 1,274,531 2,212,848 3,810,108 4,635,457 Withdrawals during the year (1,326,863) (1,782,003) (3,812,984) (4,167,436)Balance at end of the year 55,474 517,875 2,265 518,129
Advances *Balance at the beginning of the year 58,293 - - 4,041,850 Disbursements during the year 25,193 - - - Repayments during the year (20,441) - - (3,033)Balance at end of the year 63,045 - - 4,038,817
2014
Directors and key
management personnel
Retirement Benefit Plans
Associate
Group Companies
and associated undertakings
---------------------------- Rupees ‘000 -------------------------------DepositsBalance at the beginning of the year 190,399 116,373 2,544 1,140,702 Placements during the year 2,206,535 1,638,924 3,882,338 67,752,154 Withdrawals during the year (2,289,128) (1,668,267) (3,879,741) (68,842,748)Balance at end of the year 107,806 87,030 5,141 50,108
Advances *Balance at the beginning of the year 24,901 - - 3,455,705 Disbursements during the year 50,123 - - 1,778,823 Repayments during the year (16,731) - - (1,192,678)Balance at end of the year 58,293 - - 4,041,850
* Provision held against advances in respect of group Companies and associated undertaking amounted to Rs 2,963.060 million (2014: Rs 2,827.738 million)
41.1 Balances pertaining to parties that were related at the beginning of the year but ceased to be so related during any part of the current period are not reflected as part of the closing balance. The same are accounted for through the movement presented above.
41.2 Details of outstanding investments and donations made during the year relating to related parties are given in note 11 and 30.3 to these financial statements. Details of advances to the companies or firms in which the directors of the Bank are interested as directors, partners or in case of private companies as members, loans due by directors, executives, subsidiary companies and other related parties are given in note 12.9 to these financial statements. Contributions to and accruals in respect of retirement benefit plans are made in accordance with the actuarial valuations / terms of the contribution plan (refer notes 36 and 37 to these financial statements for the details of the plans). Remuneration of the President and Chief Executive Officer, directors’ fee and certain related information are disclosed in note 38 and 30.2 to these financial statements. Such remuneration is determined in accordance with the terms of their employment. Details of disposal of vehicles to key management personnel and other executives are disclosed in Annexure IV to these financial statements. Details of shares held by the holding company are disclosed in note 21.3 to these financial statements. Details of assets held under trust arrangement on behalf of the related parties are given in note 44 to these financial statements.
2015
Particulars
Directors and key
managementpersonnel
RetirementBenefit Plans
Subsidiary Associate
GroupCompanies
and associated
undertakings
--------------------------------- Rupees ‘000 ---------------------------------
Shares / units purchased during the year - - - - 1,236,738
Shares / units sold during the year - - - - 853,213
Government securities purchased during the year 510,541 305,674 - - 67,719
Government securities sold during the year 567,764 - - - 3,225,165
Profit paid / accrued 2,670 17,417 - 294 18,091
Profit return / earned 4,429 - - - 141,680
Remuneration of the key management personnel
- Salaries and other short-term employee benefits 309,611 - - - -
- Post-employment benefits 17,823 - - - -
Contribution / charge relating to staff retirement benefits - 223,442 - - -
Guarantees issued favouring related parties or on
their behalf * - - - - 29,397
Dividend income - - - - 102,036
Capital gain - - - - 711
Shares issued as fully paid up bonus shares 142 - - - 1,044,998
* represents outstanding guarantee

142 143Annual Report 2015 Annual Report 2015
NOTES TO AND FORMING PART OF THE FINANCIAL STATEMENTS FOR THE YEAR ENDED DECEMBER 31, 2015
NOTES TO AND FORMING PART OF THE FINANCIAL STATEMENTS FOR THE YEAR ENDED DECEMBER 31, 2015
2014
Particulars
Directors and key
managementpersonnel
RetirementBenefit Plans
Subsidiary Associate
GroupCompanies
and associated
undertakings
--------------------------------- Rupees ‘000 ---------------------------------
Shares / units purchased during the year - - - - 55,000 Shares / units sold during the year - - - - 222,722 Government securities purchased during the year 1,039,295 1,148,989 - - - Government securities sold during the year 1,276,459 576,651 - - - Profit paid / accrued 9,101 7,440 - 449 20,610 Profit return / earned 2,218 - - - 15,971 Remuneration of the key management personnel - - Salaries and other short-term employee benefits 611,688 - - - - - Post-employment benefits 16,281 - - - - Contribution / charge relating to staff retirement benefits - 196,807 - - - Guarantees issued favouring related parties or on
their behalf * - - - - 29,397 Dividend income - - - - 56,723 Capital gain - - - - 3,722 Shares issued as fully paid up bonus shares - - - - -
* represents outstanding guarantee
Presently the Bank does not have any AT1 capital.
- Tier II capital, which includes subordinated debt, general provisions for loan losses (upto a maximum of 1.25% of credit risk weighted assets), reserves on revaluation of fixed assets and available for sale investments after deduction of deficit on available for sale investments (as per Basel III phase in approach requirement).
- The sub-ordinated debt is not entirely eligible under Basel III guidelines due to introduction of
Loss absorbency clause. This instrument will be phased out from Tier 2 capital as per the defined phase out arrangement in the regulatory guidelines.
- The deductions from Tier II capital mainly involves reciprocal crossholdings and investment in majority owned securities (to the extent of 30%, during transition phase).
Banking operations are categorized in either the trading book or the banking book and risk weighted assets are determined according to the specified requirements that seek to reflect the varying levels of risk attached to assets and off balance sheet exposures.
Capital Management The objective of capital management is to ensure the Bank’s ability to operate as a going concern
by maintaining appropriate capital base in line with minimum regulatory requirements. The Bank has implemented the applicable requirements of Basel III capital adequacy framework that applies to all Banks as prescribed under BPRD Circular No. 06 of August 15, 2013 and amendments made by State Bank of Pakistan through various circulars. The Bank has adopted Standardized Approach for Credit and Market Risks and Basic Indicator Approach for Operational Risk.
The Bank ensures that it: a) complies with the capital requirements set by the State Bank of Pakistan;
b) safeguards the Bank’s ability to continue as a going concern so that it can continue to provide returns to shareholders and benefits to other stakeholders; and
c) maintains a strong capital base to support the developments of its business.
Capital adequacy is regularly monitored by the Bank’s management, employing techniques based on the guidelines developed by the Basel Committee, as per the requirements of the SBP. The required information is submitted to the SBP on a quarterly basis.
As at December 31, 2015 the SBP requires each Bank or Banking group to: (a) hold the minimum level of the paid-up capital of Rs 10 billion; (b) maintain a ratio of total regulatory capital to the risk-weighted assets at or above the required minimum level of 10.00% and (c) maintain Common Equity Tier I (CET1) ratio and Tier 1 ratio of 6.0% and 7.5% respectively.
With effect from December 31, 2015 an additional Capital Conservation Buffer of 0.25% (to be met from CET1) has to be maintained over and above the minimum required level.
42 CAPITAL - ASSESSMENT AND ADEQUACY BASEL SPECIFIC The State Bank of Pakistan (SBP) has introduced new guidelines with respect to disclosure of
capital adequacy related information in the financial statements of Banks vide its communication dated November 05, 2014. These disclosures are based on the requirements of Basel III which were introduced earlier by the SBP in August 2013 for implementation by Banks in Pakistan. Basel III instructions have become effective from December 31, 2013. However, there is a transitional phase for implementation of Basel III requirements whereas the complete requirements would become applicable with full implementation by December 31, 2019.
The Basel III Capital Regulation (Basel III) is applicable to the Bank and its associate Faysal Asset Management Limited (FAML). The Bank has no subsidiary therefore as per regulatory guidelines, consolidation is not required for reporting / disclosure purpose.
Under Basel III framework, Bank’s regulatory capital has been analyzed into two tiers as follows:
- Tier 1 capital (going concern capital) which is sub divided into: a) Common Equity Tier 1 (CET1), which includes fully paid up capital, reserve for bonus
issue, general reserves and un-appropriated profits (net of losses), etc. after deductions for investments in majority owned securities (to the extent of 30%, during transition phase), threshold deductions on deferred tax assets, reciprocal crossholdings and deduction for book value of intangibles.
b) Additional Tier 1 capital (AT1), which includes instruments issued by the Bank which meet the specified criteria.

144 145Annual Report 2015 Annual Report 2015
NOTES TO AND FORMING PART OF THE FINANCIAL STATEMENTS FOR THE YEAR ENDED DECEMBER 31, 2015
NOTES TO AND FORMING PART OF THE FINANCIAL STATEMENTS FOR THE YEAR ENDED DECEMBER 31, 2015
The paid-up capital of the Bank for the year ended December 31, 2015 stood at Rs 11.99 billion (2014: Rs 10.43 billion). As at December 31, 2015 Bank’s CAR stood at 14.41% whereas CET1 and Tier 1 ratios both stood at 12.54%.
The Bank is also in compliance with the CCB requirements.
Book value of intangible assets including software are deducted from Tier 1 capital whereas investment in associate as disclosed in Note 11.1 is deducted from Tier 1 and Tier 2 capital to arrive at the regulatory capital. The SBP through BPRD Circular No. 06 of August 15, 2013 has introduced new capital deductions under Basel III framework, such as Deferred Tax Asset (DTA), surplus on revaluation of assets etc. The newly prescribed deductions are applicable in a phased manner requiring 20% of applicable deductions from December 31, 2014. The deductions will increase by 20% each year and will be fully implemented from December 31, 2019.
The risk-weighted assets are measured by means of a hierarchy of risk weights classified according
to the nature and reflection of an estimate of credit, market and operational risks associated with each asset and counterparty, taking into account any eligible collaterals or guarantees. A similar treatment is adopted for off balance sheet exposures, with some adjustments to reflect the more contingent nature of the associated risks.
The Bank will continue to maintain the required regulatory capital either through its risk management
strategies or by increasing the capital requirements in line with the business and capital needs.
The required capital adequacy ratio is achieved by the Bank through:
(a) Adequate level of paid up capital; (b) Adequate risk profile of asset mix; (c) Ensuring better recovery management; and
(d) Maintaining acceptable profit margins.
42.1 Capital adequacy ratio
The capital to risk weighted assets ratio, calculated in accordance with the SBP guidelines on capital adequacy, under Basel III and Pre-Basel III treatment using Standardized Approach for Credit and Market Risks and Basic Indicator Approach for Operational Risk is presented below:
Particulars 2015 2014
Amount ----------- Rupees ‘000 -----------
Common Equity Tier 1 capital (CET1): Instruments and reserves
- Fully paid-up capital / capital deposited with the SBP 11,997,601 10,432,697
- Balance in share premium account 10,131 10,131
- Reserve for issue of bonus shares - -
- Discount on issue of shares - -
- General / statutory reserves 6,412,630 5,693,024
- Gain / (losses) on derivatives held as cash flow hedge - -
- Unappropriated profit 7,638,330 5,696,366
- Minority interests arising from CET1 capital instruments issued to third party by
consolidated bank subsidiaries (amount allowed in CET1 capital of the consolidation group) - -
CET 1 before regulatory adjustments 26,058,692 21,832,218
Total regulatory adjustments applied to CET1 (Note 42.1.1) 2,165,687 2,397,151
Common Equity Tier 1 (a) 23,893,005 19,435,067
Additional Tier 1 (AT 1) Capital
- Qualifying Additional Tier-1 instruments plus any related share premium of which:
- classified as equity - -
- classified as liabilities - -
- Additional Tier-1 capital instruments issued by consolidated subsidiaries and held by third parties of which:
- instrument issued by subsidiaries subject to phase out - -
AT1 before regulatory adjustments - -
Total regulatory adjustment applied to AT1 capital (Note 42.1.2) - -
Additional Tier 1 capital after regulatory adjustments - -
Additional Tier 1 capital recognised for capital adequacy (b) - -
Tier 1 Capital (CET1 + admissible AT1) (c=a+b) 23,893,005 19,435,067
Tier 2 Capital
- Qualifying Tier 2 capital instruments under Basel III - -
- Tier 2 capital instruments subject to phase out arrangement 419,160 958,464
- Tier 2 capital instruments issued to third party by consolidated subsidiaries of which:
- instruments issued by subsidiaries subject to phase out - -
- General provisions or general reserves for loan losses-up to maximum of 1.25% of credit risk weighted assets 432,672 439,524
- Revaluation reserves of which:
- revaluation reserves on fixed assets 1,995,713 1,698,390
- unrealized gain / (loss) on AFS 881,120 805,011
- Foreign exchange translation reserves - -
- Undisclosed / other reserves (if any) - -
T2 before regulatory adjustments 3,728,665 3,901,389
Total regulatory adjustment applied to T2 capital (Note 42.1.3) 170,155 179,793
Tier 2 capital (T2) after regulatory adjustments 3,558,510 3,721,596
Portion of Tier 1 capital recognised in Tier 2 capital - -
Total Tier 2 capital admissible for capital adequacy (d) 3,558,510 3,721,596
TOTAL CAPITAL (T1 + admissible T2) (e=c+d) 27,451,515 23,156,663
Total risk weighted assets (for details refer note 42.4) 190,542,523 189,528,741

146 147Annual Report 2015 Annual Report 2015
NOTES TO AND FORMING PART OF THE FINANCIAL STATEMENTS FOR THE YEAR ENDED DECEMBER 31, 2015
NOTES TO AND FORMING PART OF THE FINANCIAL STATEMENTS FOR THE YEAR ENDED DECEMBER 31, 2015
Particulars 2015 2014
Percentage
Capital ratios and buffers (in percentage of risk weighted assets)
- CET1 to total RWA (a / i) 12.54% 10.25%
- Tier-1 capital to total RWA (c / i) 12.54% 10.25%
- Total capital to RWA (e / i) 14.41% 12.22%
- Bank specific buffer requirement (minimum CET1 requirement plus capitalconservation buffer plus any other buffer requirement) of which: 6.25% 5.50%
- capital conservation buffer requirement 0.25% -
- counter cyclical buffer requirement - -
- Domestic Systemically Important Banks (SIB) or Global SIB buffer requirement - -
- CET1 available to meet buffers (as a percentage of risk weighted assets) 6.29% 4.75%
National minimum capital requirements prescribed by SBP
- CET1 minimum ratio 6.00% 5.50%
- Tier 1 minimum ratio 7.50% 7.00%
- Total capital minimum ratio 10.25% 10.00%
Particulars
2015 2014
AmountPre - Basel
III treatment*Amount
Pre - Basel III treatment*
---------------- Rupees ‘000 --------------------- 42.1.1 Common Equity Tier 1 capital: Regulatory
adjustments
Goodwill (net of related deferred tax liability) - - - -
All other intangibles (net of any associated deferred tax liability) 1,439,276 - 1,709,903 -
Shortfall in provisions against classified assets - - - -
Deferred tax assets that rely on future profitability excluding those
arising from temporary differences (net of related tax liability) 176,160 264,240 88,080 352,320
Defined-benefit pension fund net assets - - - -
Reciprocal cross holdings in CET1 capital instruments of banking,
financial and insurance entities 212,894 - 426,733 -
Cash flow hedge reserve - - - -
Investment in own shares / CET1 instruments - - - -
Securitization gain on sale - - - -
Capital shortfall of regulated subsidiaries - - - -
Deficit on account of revaluation from bank’s holdings of fixed assets / AFS - - - -
Investments in the capital instruments of banking, financial and
insurance entities that are outside the scope of regulatory
consolidation, where the bank does not own more than 10%
of the issued share capital (amount above 10% threshold) - - - -
Significant investments in the common stocks of banking, financial
and insurance entities that are outside the scope of regulatory
consolidation (amount above 10% threshold) - - - -
Deferred tax assets arising from temporary differences
(amount above 10% threshold, net of related tax liability) 316,932 475,398 127,384 509,537
Amount exceeding 15% threshold - - - -
of which: significant investments in the common stocks of financial entities - - - -
of which: deferred tax assets arising from temporary differences - - - -
National specific regulatory adjustments applied to CET1 capital:
Investments in TFCs of other banks exceeding the prescribed limit - - - -
Any other deduction specified by SBP (mention details) - - - -
Adjustment to CET1 due to insufficient AT1 and Tier 2 to cover
deductions 20,425 20,425 45,051 45,051
Total regulatory adjustments applied to CET1 2,165,687 760,063 2,397,151 906,908
* This column highlights items that are still subject to Basel II treatment during the transitional period.

148 149Annual Report 2015 Annual Report 2015
NOTES TO AND FORMING PART OF THE FINANCIAL STATEMENTS FOR THE YEAR ENDED DECEMBER 31, 2015
NOTES TO AND FORMING PART OF THE FINANCIAL STATEMENTS FOR THE YEAR ENDED DECEMBER 31, 2015
Particulars
2015 2014
AmountPre - Basel
III treatment*Amount
Pre - Basel III treatment*
---------------- Rupees ‘000 ---------------------
42.1.2 Additional Tier-1 & Tier-1 Capital: regulatory adjustments
Investment in mutual funds exceeding the prescribed limit [SBP
specific adjustment] - - - -
Investment in own AT1 capital instruments - - - -
Reciprocal cross holdings in Additional Tier 1 capital instruments of
banking, financial and insurance entities - - - -
Investments in the capital instruments of banking, financial and insurance
entities that are outside the scope of regulatory consolidation,
where the bank does not own more than 10% of the issued share
capital (amount above 10% threshold) - - - -
Significant investments in the capital instruments of banking, financial
and insurance entities that are outside the scope of regulatory
consolidation - - - -
Portion of deduction applied 50:50 to Tier-1 and Tier-2 capital based
on pre-Basel III treatment which, during transitional period, remain
subject to deduction from additional tier-1 capital - - - -
Adjustments to additional Tier 1 due to insufficient Tier 2 to cover
deductions - - - -
Total regulatory adjustment applied to AT1 capital - - - -
42.1.3 Tier 2 Capital: regulatory adjustments
Portion of deduction applied 50:50 to Tier-1 and Tier-2 capital based
on pre-Basel III treatment which, during transitional period,
remain subject to deduction from tier-2 capital 20,425 20,425 30,033 30,033
Reciprocal cross holdings in Tier 2 instruments of banking, financial
and insurance entities 149,730 - 149,760 -
Investment in own Tier 2 capital instrument - - - -
Investments in the capital instruments of banking, financial and
insurance entities that are outside the scope of regulatory
consolidation, where the bank does not own more than 10%
of the issued share capital (amount above 10% threshold) - - - -
Significant investments in the capital instruments issued by banking,
financial and insurance entities that are outside the scope of
regulatory consolidation - - - -
Total regulatory adjustment applied to T2 capital 170,155 20,425 179,793 30,033
* This column highlights items that are still subject to Basel II treatment during the transitional period.
42.1.4 Additional Information
2015 2014
------------- Rupees ‘000-----------
“Risk Weighted Assets” subject to pre-Basel III treatment
Risk weighted assets in respect of deduction items (which during the transitional
period will be risk weighted subject to Pre-Basel III Treatment)
of which: deferred tax assets 739,638 861,857
of which: defined-benefit pension fund net assets - -
of which: recognized portion of investment in capital of banking, financial and
insurance entities where holding is less than 10% of the issued
common share capital of the entity - -
of which: recognized portion of investment in capital of banking, financial and
insurance entities where holding is more than 10% of the issued
common share capital of the entity - -
Amounts below the thresholds for deduction (before risk weighting)
Non-significant investments in the capital of other financial entities 565,007 582,076
Significant investments in the common stock of financial entities 27,233 -
Deferred tax assets arising from temporary differences (net of related tax liability) 2,396,612 2,470,287
Applicable caps on the inclusion of provisions in Tier 2
Provisions eligible for inclusion in Tier 2 in respect of exposures subject to
standardized approach (prior to application of cap) 432,672 439,524
Cap on inclusion of provisions in Tier 2 under standardized approach 1,748,942 1,894,054
Provisions eligible for inclusion in Tier 2 in respect of exposures subject to internal
ratings-based approach (prior to application of cap) - -
Cap for inclusion of provisions in Tier 2 under internal ratings-based approach - -

150 151Annual Report 2015 Annual Report 2015
42.2 Capital Structure Reconciliation
42.2.1 Reconciliation of each financial statement line item to item under regulatory scope of reporting
2015
Particulars Balance sheet
Under regulatory scope of reporting
-----------Rupees ‘000---------- AssetsCash and balances with treasury banks 26,084,007 26,084,007 Balances with other banks 1,068,451 1,068,451 Lendings to financial institutions 12,088,403 12,088,403 Investments 183,677,239 183,677,239 Advances 178,079,084 178,079,084 Operating fixed assets 11,342,980 11,342,980 Deferred tax assets - net 3,087,325 3,087,325 Other assets 14,645,371 14,645,371 Total assets 430,072,860 430,072,860
Liabilities and equityBills payable 6,009,238 6,009,238 Borrowings 90,565,242 90,565,242 Deposits and other accounts 292,130,258 292,130,258 Sub-ordinated loans 2,994,000 2,994,000 Liabilities against assets subject to finance lease - - Deferred tax liabilities - net - - Other liabilities 8,021,649 8,021,649 Total liabilities 399,720,387 399,720,387
Represented by:Share capital 11,997,601 11,997,601 Reserves 6,422,761 6,422,761 Unappropriated profit 7,638,330 7,638,330 Surplus on revaluation of assets - net of tax 4,293,781 4,293,781
30,352,473 30,352,473
Total liabilities and equity 430,072,860 430,072,860
NOTES TO AND FORMING PART OF THE FINANCIAL STATEMENTS FOR THE YEAR ENDED DECEMBER 31, 2015
NOTES TO AND FORMING PART OF THE FINANCIAL STATEMENTS FOR THE YEAR ENDED DECEMBER 31, 2015
42.2.2 Reconciliation of balance sheet to eligible regulatory capital
Particulars Reference
Balance sheet as in published
financial statements
Under regulatory scope of reporting
-----------Rupees ‘000------------ AssetsCash and balances with treasury banks 26,084,007 26,084,007 Balances with other banks 1,068,451 1,068,451 Lendings to financial institutions 12,088,403 12,088,403 Investments of which: 183,677,239 183,677,239 - non-significant capital investments in capital of other financial
institutions exceeding 10% threshold a - - - significant capital investments in financial sector entities exceeding
regulatory threshold b - - - mutual funds exceeding regulatory threshold c - - - reciprocal crossholding of capital instrument d 362,624 362,624 - others e - - Advances 178,079,084 178,079,084 - shortfall in provisions / excess of total EL amount over eligible
provisions under IRB f - - - general provisions reflected in Tier 2 capital g 432,672 432,672 Operating fixed assets of which: 11,342,980 11,342,980 - Intangibles k 1,439,276 1,439,276 Deferred tax assets of which: 3,087,325 3,087,325 - DTAs that rely on future profitability excluding those arising from
temporary differences h 440,400 440,400 - DTAs arising from temporary differences exceeding regulatory threshold i 792,330 792,330 Other assets of which: 14,645,371 14,645,371 - goodwill j - - - defined-benefit pension fund net assets l - - Total assets 430,072,860 430,072,860
Liabilities and EquityBills payable 6,009,238 6,009,238 Borrowings 90,565,242 90,565,242 Deposits and other accounts 292,130,258 292,130,258 Sub-ordinated loans of which: 2,994,000 2,994,000 - eligible for inclusion in AT1 m - - - eligible for inclusion in Tier 2 n 419,160 419,160 Liabilities against assets subject to finance lease - - Deferred tax liabilities of which: - - - DTLs related to goodwill o - - - DTLs related to intangible assets p - - - DTLs related to defined pension fund net assets q - - - other deferred tax liabilities r - - Other liabilities 8,021,649 8,021,649 Total liabilities 399,720,387 399,720,387

152 153Annual Report 2015 Annual Report 2015
NOTES TO AND FORMING PART OF THE FINANCIAL STATEMENTS FOR THE YEAR ENDED DECEMBER 31, 2015
NOTES TO AND FORMING PART OF THE FINANCIAL STATEMENTS FOR THE YEAR ENDED DECEMBER 31, 2015
Particulars Reference
Balance sheet as in published
financial statements
Under regulatory scope of reporting
-----------Rupees ‘000------------
Share capital 11,997,601 11,997,601 - of which: amount eligible for CET1 s 11,997,601 11,997,601 - of which: amount eligible for AT1 t - - Reserves of which: 6,422,761 6,422,761 - portion eligible for inclusion in CET1 - Statutory reserves
u 5,382,071 5,382,071
- portion eligible for inclusion in CET1 - General and other reserves 1,040,690 1,040,690 - portion eligible for inclusion in Tier 2 v - - Unappropriated profit w 7,638,330 7,638,330 Minority Interest of which: - - - portion eligible for inclusion in CET1 x - - - portion eligible for inclusion in AT1 y - - - portion eligible for inclusion in Tier 2 z - - Surplus on revaluation of assets of which: 4,293,781 4,293,781 - Revaluation reserves on fixed assets 2,978,677 2,978,677 - Unrealized gains / (losses) on AFS securities aa 1,315,104 1,315,104 - In case of deficit on revaluation (deduction from CET1) ab - -
Total liabilities and equity 430,072,860 430,072,860
42.2.3 Basel III Disclosure (with added column)
Particulars
Source based on reference number from
43.2.2
Component of regulatory
capital reported by
the Bank Rupees ‘000
Common equity Tier 1 capital (CET1): instruments and reserves
1 Fully paid-up capital(s)
11,997,601 2 Balance in share premium account 10,131 3 Reserve for issue of bonus shares - 4 General / statutory reserves
(u) 6,412,630
5 Gain / (losses) on derivatives held as cash flow hedge - 6 Unappropriated profit (w) 7,638,330 7 Minority interests arising from CET1 capital instruments issued to third
party by consolidated bank subsidiaries (amount allowed in CET1capital of the consolidation group) (x) -
8 CET 1 before Regulatory Adjustments 26,058,692
Common Equity Tier 1 capital: Regulatory adjustments9 Goodwill (net of related deferred tax liability) (j) - (s)10 All other intangibles (net of any associated deferred tax liability) (k) - (p) 1,439,276 11 Shortfall of provisions against classified assets (f) - 12 Deferred tax assets that rely on future profitability excluding those arising
from temporary differences (net of related tax liability) (h) - (r) * 40% 176,160
13 Defined-benefit pension fund net assets (l) - (q) * 40% - 14 Reciprocal cross holdings in CET1 capital instruments (d) 212,894 15 Cash flow hedge reserve - 16 Investment in own shares / CET1 instruments - 17 Securitization gain on sale - 18 Capital shortfall of regulated subsidiaries - 19 Deficit on account of revaluation from bank’s holdings of fixed assets / AFS securities (ab) - 20 Investments in the capital instruments of banking, financial and insurance
- entities that are outside the scope of regulatory consolidation, where the bank does not own more than 10% of the issued share capital (amount above 10% threshold)
(a) - (ac) - (ae) -
21 Significant investments in the capital instruments issued by banking,- financial and insurance entities that are outside the scope of regulatory
consolidation (amount above 10% threshold)(b) - (ad) - (af) -
22 Deferred tax assets arising from temporary differences (amount above10% threshold, net of related tax liability) (i) * 40% 316,932
23 Amount exceeding 15% threshold of which: - - significant investments in the common stocks of financial entities - - deferred tax assets arising from temporary differences -
24 National specific regulatory adjustments applied to CET1 capital of which: - - investment in TFCs of other banks exceeding the prescribed limit - - any other deduction specified by the SBP -
25 Regulatory adjustment applied to CET1 due to insufficient AT1 and- Tier 2 to cover deductions 20,425
26 Total regulatory adjustments applied to CET1 2,165,687 Common equity tier 1 23,893,005
Additional Tier 1 (AT 1) Capital27 Qualifying additional Tier-1 instruments plus any related share premium -
of which:- classified as equity (t) - - classified as liabilities (m) -
28 Additional Tier-1 capital instruments issued by consolidated subsidiariesand held by third parties (y) - - of which: instrument issued by subsidiaries subject to phase out -
29 AT1 before regulatory adjustments -
Additional Tier 1 Capital: regulatory adjustments30 Investment in mutual funds exceeding the prescribed limit (SBP specific
adjustment) - 31 Investment in own AT1 capital instruments - 32 Reciprocal cross holdings in additional Tier 1 capital instruments - 33 Investments in the capital instruments of banking, financial and insurance
entities that are outside the scope of regulatory consolidation, where the Bank does not own more than 10% of the issued share capital (amount above 10% threshold)
(ac) -
Particulars
Source based on reference number from
43.2.2
Component of regulatory
capital reported by
the Bank Rupees ‘000

154 155Annual Report 2015 Annual Report 2015
NOTES TO AND FORMING PART OF THE FINANCIAL STATEMENTS FOR THE YEAR ENDED DECEMBER 31, 2015
NOTES TO AND FORMING PART OF THE FINANCIAL STATEMENTS FOR THE YEAR ENDED DECEMBER 31, 2015
Particulars
Source based on reference number from
43.2.2
Component of regulatory
capital reported by
the Bank Rupees ‘000
34 Significant investments in the capital instruments issued by banking,financial and insurance entities that are outside the scope of regulatory consolidation
(ad) -
35 Portion of deduction applied 50:50 to core capital and supplementarycapital based on pre-Basel III treatment which, during transitional period, remain subject to deduction from tier-1 capital
-
36 Regulatory adjustments applied to additional Tier 1 due to insufficientTier 2 to cover deductions -
37 Total of regulatory adjustment applied to AT1 capital - 38 Additional Tier 1 capital - 39 Additional Tier 1 capital recognised for capital adequacy -
Tier 1 Capital (CET1 + admissible AT1) 23,893,005
Tier 2 Capital40 Qualifying Tier 2 capital instruments under Basel III
(n) -
41 Capital instruments subject to phase out arrangement from Tier 2 419,160 42 Tier 2 capital instruments issued to third party by consolidated subsidiaries (z)
- of which: instruments issued by subsidiaries subject to phase out - 43 General Provisions or general reserves for loan losses-up to maximum
of 1.25% of Credit Risk Weighted Assets (g) 432,672 44 Revaluation reserves eligible for Tier 2 of which: 2,876,833
- portion pertaining to fixed assets 1,995,713 - portion pertaining to AFS securities 881,120
45 Foreign exchange translation reserves (v) - 46 Undisclosed / other reserves (if any) - 47 T2 before regulatory adjustments 3,728,665
Tier 2 Capital: regulatory adjustments48 Portion of deduction applied 50:50 to core capital and supplementary
capital based on pre-Basel III treatment which, during transitional period, remain subject to deduction from tier-2 capital
20,425
49 Reciprocal cross holdings in Tier 2 instruments (d) 149,730 50 Investment in own Tier 2 capital instruments - 51 Investments in the capital instruments of banking, financial and insurance
entities that are outside the scope of regulatory consolidation, where the Bank does not own more than 10% of the issued share capital (amount above 10% threshold)
(ae) -
52 Significant investments in the capital instruments issued by banking,financial and insurance entities that are outside the scope of regulatory consolidation
(af) -
53 Amount of regulatory adjustment applied to T2 capital 170,155 54 Tier 2 capital (T2) 3,558,510 55 Tier 2 capital recognised for capital adequacy 3,558,510 56 Excess additional Tier 1 capital recognised in Tier 2 capital - 57 Total Tier 2 capital admissible for capital adequacy 3,558,510
TOTAL CAPITAL (T1 + admissible T2) 27,451,515
42.3 Main features of regulatory capital instruments
S.No Main Features Common Shares Subordinated Debt 3 billion
1 Issuer Faysal Bank Limited Faysal Bank Limited
2 Unique identifier (eg KSE Symbol or Bloomberg identifier etc.) FABL N/A
3 Governing law(s) of the instrument Relevant Capital
Market LawsRelevant Capital
Market LawsRegulatory treatment
4 Transitional Basel III rulesCommon Equity
Tier 1Tier 2
5 Post-transitional Basel III rulesCommon Equity
Tier 1Tier 2
6 Eligible at solo / group / group & solo Solo Solo
7 Instrument type Ordinary shares TFCs
8 Amount recognised in regulatory capital (Currency in PKR thousands, as of reporting date) 11,997,601 419,160
9 Par value of instrument 10 5,000
10 Accounting classification Shareholders’ equityLiability -
Subordinated loan
11 Original date of issuance Various December 27, 2010
12 Perpetual or dated Perpetual Dated
13 Original maturity date No maturity December 27, 2017
14 Issuer call subject to prior supervisory approval No No
15 Optional call date, contingent call dates and redemption amount N/A N/A
16 Subsequent call dates, if applicable N/A N/A
Coupons / dividends
17 Fixed or floating dividend / coupon N/A Floating
18 Coupon rate and any related index / benchmark N/A Kibor
19 Existence of a dividend stopper No No
20 Fully discretionary, partially discretionary or mandatory Fully Discretionary Mandatory
21 Existence of step up or other incentive to redeem No No
22 Non-cumulative or cumulative Non - Cumulative Non - Cumulative
23 Convertible or non-convertible Non - Convertible Non - Convertible
24 If convertible, conversion trigger (s) N/A N/A
25 If convertible, fully or partially N/A N/A
26 If convertible, conversion rate N/A N/A
27 If convertible, mandatory or optional conversion N/A N/A
28 If convertible, specify instrument type convertible into N/A N/A
29 If convertible, specify issuer of instrument it converts into N/A N/A
30 Write-down feature No No
31 If write-down, write-down trigger(s) N/A N/A
32 If write-down, full or partial N/A N/A
33 If write-down, permanent or temporary N/A N/A
34 If temporary write-down, description of write-up mechanism N/A N/A
35 Position in subordination hierarchy in liquidationCommon equity (ranks
after all creditors including depositors)
Refer 42.3.1
36 Non-compliant transitioned features N/A N/A
37 If yes, specify non-compliant features N/A N/A
42.3.1 The instrument is unsecured, subordinated as to payments of principal and profit to all other indebtedness of the Bank including deposits.

156 157Annual Report 2015 Annual Report 2015
NOTES TO AND FORMING PART OF THE FINANCIAL STATEMENTS FOR THE YEAR ENDED DECEMBER 31, 2015
NOTES TO AND FORMING PART OF THE FINANCIAL STATEMENTS FOR THE YEAR ENDED DECEMBER 31, 2015
42.4 Risk Weighted Assets Capital Requirements Risk Weighted Assets 2015 2014 2015 2014
Credit risk ------------------------- Rupees ‘000 ----------------------------
On-Balance sheet Portfolios subject to standardized approach (Comprehensive)
- Sovereign 4,369 3,507 42,628 35,071 - Public Sector entities 303,972 303,857 2,965,579 3,038,570 - Banks 108,429 76,707 1,057,845 767,074 - Corporate 6,585,853 8,091,516 64,252,224 80,915,155 - Retail 2,120,350 1,846,284 20,686,345 18,462,842 - Residential Mortgages 143,038 143,251 1,395,494 1,432,507 - Past Due loans 783,837 680,713 7,647,195 6,807,126 - Operating Fixed Assets 959,573 922,420 9,361,685 9,224,198 - Other assets 1,442,403 1,332,119 14,072,228 13,321,188
12,451,824 13,400,374 121,481,223 134,003,731 Off-Balance sheet
Non-market related- Loan Repayment Guarantees 893,002 1,069,138 8,712,215 10,691,384 - Purchase and Resale Agreements 10,894 9,021 106,284 90,206 - Performance Bonds etc 149,853 110,710 1,461,980 1,107,099 - Revolving underwriting Commitments 535,517 250,805 5,224,555 2,508,048 - Stand By Letters of Credit 228,950 196,591 2,233,662 1,965,905
Market related- Derivative Instruments - 68 - 679 - Foreign Exchange Contracts 19,850 47,931 193,660 479,308
1,838,066 1,684,264 17,932,356 16,842,629 Equity Exposure Risk in the Banking BookUnder simple risk weight method
- Listed Shares 51,429 66,799 501,746 667,992 - Unlisted Shares - 993 - 9,932
51,429 67,792 501,746 677,924 Total Credit Risk-Weighted Exposures 14,341,319 15,152,430 139,915,325 151,524,284
Market Risk - capital requirement for portfoliossubject to standardised approach
- Interest rate risk 1,242,047 454,073 12,117,531 4,540,725 - Equity position risk 659,539 338,700 6,434,526 3,387,000 - Foreign exchange risk 12,329 12,389 120,287 123,888
Total market risk 1,913,915 805,162 18,672,344 8,051,613
Operational Risk - Capital requirement for operational risksTotal operational risk 3,275,373 2,995,284 31,954,854 29,952,844
19,530,607 18,952,876 190,542,523 189,528,741
Capital Adequacy Ratio 2015 2014
Total Eligible Regulatory Capital held 27,451,515 23,156,663
Required Actual Required Actual
CET1 to total RWA 6.00% 12.54% 5.50% 10.25%
Tier-1 capital to total RWA 7.50% 12.54% 7.00% 10.25%
Total capital to total RWA 10.25% 14.41% 10.00% 12.22%
42.5 The SBP through its letter BPRD (R&P-02)/625-99/2011/3744 dated March 28, 2011 has advised the Bank that the deduction of intangible assets, as appearing under Tier-I capital, would be limited to the extent of the amount of the intangible assets recognized as negative goodwill. Whereas, the portion of Deferred Tax Liabilities (DTL) created due to such intangible assets would not be netted against Deferred Tax Assets (DTA) for calculation of CAR.
42.6 In accordance with the Regulatory Capital Framework under Basel III issued by the SBP, Banks are required to deduct from Common Equity Tier I capital - regulatory adjustments, any shortfall in provisions required against classified assets irrespective of any relaxation allowed by the SBP. However, SBP has granted exemption to the Bank from making deductions on account of shortfall in provision against outstanding facilities extended to Dewan Group from above vide its letter No. BSD/BAI-3/615/5296/2011 dated April 26, 2011.
42.7 The benefit of the FSV allowed by the SBP has not been deducted from Common equity Tier I capital - regulatory adjustments of the Bank based on a clarification issued by the SBP through its letter BSD/BAI-1/220/452/2009 dated April 27, 2009 in accordance with section 1.1 of the SBP Capital adequacy guidelines.
42.8 Leverage Ratio
SBP vide BPRD Circular No. 06 dated August 15, 2013 introduced leverage ratio (Tier 1 Capital to total exposure) under Basel III Framework. Banks are required to maintain minimum leverage ratio of 3% and to disclose the same from December 31, 2015. At Present, the leverage ratio is on parallel run till December 31, 2017. Based on the results of the parallel run period, the SBP intends to make any final adjustments to the definition and calibration of the leverage ratio with a view to set the leverage ratio requirements as a separate capital standard on December 31, 2018.
The leverage ratio of the Bank for the year ended December 31, 2015 stood at 4.26% (2014: 3.99%).
Particulars 2015 2014 ------------Rupees ‘000---------
On balance sheet exposuresOn-balance sheet items (excluding derivatives but including collateral) 427,907,173 385,728,631 Derivatives 89,518 402,498 A) Total On balance sheet exposures 427,996,691 386,131,129
Off balance sheet exposuresOff-balance sheet items (excluding derivatives) 133,162,562 100,175,570 Commitment in respect of derivatives
(derivatives having negative fair value are also included) 285,161 397,759 B) Total Off balance sheet exposures 133,447,723 100,573,329
Capital and total exposures
Tier 1 capital 23,893,005 19,435,067
Total Exposure (A+B) 561,444,414 486,704,458
Leverage ratio 4.26% 3.99%

158 159Annual Report 2015 Annual Report 2015
NOTES TO AND FORMING PART OF THE FINANCIAL STATEMENTS FOR THE YEAR ENDED DECEMBER 31, 2015
NOTES TO AND FORMING PART OF THE FINANCIAL STATEMENTS FOR THE YEAR ENDED DECEMBER 31, 2015
43 RISK MANAGEMENT
Risk Management Group (RMG) has been organized under the Chief Risk Officer (CRO). It has been authorized by the Board of Directors (BOD) to monitor the implementation of various risk policies via implementation of an integrated risk management framework across the Bank. As an ongoing exercise to integrate Risk related functions, RMG has been expanded, strengthened and entrusted to monitor the risk areas across the organization, with ultimate adoption of / convergence towards Basel guidelines on Risk Management.
The primary objective of this architecture is to inculcate risk management into the organization flows to ensure that risks are accurately identified and assessed, properly documented, approved and adequately monitored and managed in order to enhance long term earnings and to protect the interests of the Bank’s depositors and shareholders.
The “Risk Management Framework” at the Bank encompasses:
- Scope of risks to be managed;- Process, systems and procedures to manage risk, and - Roles and responsibilities of individuals involved in risk management.
The Bank has adopted an approach that gives an integrated view of the risks faced by the organization. This calls for aligning strategic vision, policy objectives and business processes / procedures with the Risk Management framework. The management of risk is integrated with the Bank’s management of capital and strategy. This ensures that risks taken in pursuit of the Bank’s strategic objectives are consistent with the desired return as well as the Bank’s desired credit rating and risk appetite.
With this in view, the Risk Management framework endeavours to be a comprehensive and evolving guidelines to cater to changing business dynamics. The Risk Management framework includes:
- Clearly defined risk management policies- Well constituted organizational structure- Mechanism for ongoing review of credit policies and procedures and risk exposures
The “Risk Management Framework” is built on the following elements:
- Comprehensive risk governance; and- Effective risk processes.
The Bank has developed and implemented a governance and management structure, processes surrounding each risk area, including credit risk, market risk, liquidity risk, capital management and operational risk.
The essential components which contribute in effective management of all these risks are as follows:
- Active Board / Senior Management strategic direction and centralized RMG oversight- Sufficient policies, procedures and limits - Adequate risk measurement, monitoring and management information systems- Comprehensive internal controls
The Board of Directors (BoD) monitoring and oversight is facilitated through the Board Risk Management Committee (BRMC); comprising of Directors including the President & CEO, it is appointed and authorized by the BoD to assist in the design, regular evaluation and timely updating of the Risk Management framework. The BRMC has further authorized management committees such as Country Credit Committee (CCC), Enterprise Risk Management Committee (ERMC) and Assets & Liabilities Committee (ALCO) to supervise risk management activities within their respective areas.
In order to have an effective and efficient risk assessment, and to closely align its functions with Business, RMG has separate Risk functions for Credit Risk Management (Corporate Risk Management, CBSME & Agri Risk Management and Retail Risk Management).
The common responsibilities of all three Credit Risk Management Units include:
- Conduct a thorough and independent due diligence of the proposed / existing exposures in the respective Risk portfolios.
- Work with Compliance to ensure conformity to the relevant Government regulations, SBP PRs as well as internal policies.
- Work with Business Units / Relationship teams to structure exposures such that they mitigate key risks, cater to customer requirements, remain economical in terms of risk weighted assets / capital allocation and result in maximization of overall returns from the relationship.
Retail Risk Management is responsible for managing the credit risk side of consumer finance products. This function operates on a program lending approach to manage, mitigate and approve risk on a portfolio level. The key role of this function is to manage the entire retail credit cycle and portfolio Key Performance Indicators (KPIs) in line with the business strategy. Retail credit cycle and its scope includes, Product Planning, Credit Acquisition & Underwriting, Portfolio & Account Management, Collections and Recovery.
The Risk Management architecture is further fostered by Enterprise Risk Management, Credit Administration and Risk Policy and Portfolio Management functions.
- The Enterprise Risk Management function is responsible for managing and controlling Market, Operational and Liquidity Risks at an enterprise level and monitoring regulatory capital requirements of the Bank.
- Credit Administration Department looks after the security, loan documentation, disbursement and post disbursement monitoring aspects of the credit portfolio.
- Risk Policy and Portfolio Management unit ensures formulation of synchronized and adhesive polices in conjunction with the Bank’s strategy and practices while adhering to the local and regulatory guidelines within Corporate, Commercial and Retail business segments. This also encompasses detailed review of macro risk factors, NPL status and monitoring of internal credit rating models including model documentation and the coordination of analytics within the Enterprise Risk Management functionalities.

160 161Annual Report 2015 Annual Report 2015
NOTES TO AND FORMING PART OF THE FINANCIAL STATEMENTS FOR THE YEAR ENDED DECEMBER 31, 2015
NOTES TO AND FORMING PART OF THE FINANCIAL STATEMENTS FOR THE YEAR ENDED DECEMBER 31, 2015
43.1 Credit Risk
Credit risk is the identification of probability that a counterparty will cause a financial loss to the Bank due to its inability or unwillingness to meet its contractual obligation. This credit risk arises mainly from both direct lending activities as well as contingent liabilities.
The Bank’s credit risk philosophy is based on the Bank’s overall business strategy / direction as established by the Board. The Bank is committed to the appropriate level of due diligence to ensure that credit risks have been properly analyzed, fully disclosed to the approving authorities and appropriately rated, appropriately structured, priced (in line with market practices) and documented.
The Bank deals with many different types of borrowers and borrowing structures across the corporate, commercial, wholesale and retail segments. The Bank manages customer credit risk exposures within appropriate limits to ensure that it does not provide a disproportionate level of credit to a single customer or group of connected clients. The Bank follows aggregation principles – summing of credit risk limits to the same customer, or group of connected clients – to identify and manage effectively all significant credit risk exposures to a single customer within an individual business and, where appropriate, across other business segments.
The Bank has well-defined credit approval and review processes under which senior officers with the requisite credit background, critically scrutinize and sanction financing. Besides financial, industry and transaction analysis, in order to quantify risks of counterparty, the credit evaluation also includes risk rating system to evaluate risk rating of the customers which is then monitored on a portfolio basis to gauge the Bank’s credit portfolio quality. To avoid risk concentration, counterparty limits, counterparty group limits and industry concentration limits are also established, monitored and assessed in the light of changing counterparty and market conditions.
With a view to develop and effectively manage a diversified credit portfolio within each Business segment (as an integral part of the Credit Risk Management process), the Bank has adopted the concept of an industry / sector-wise exposure concentration grid which dictates target market exposures. Risk concentration may arise where total exposure to a particular group or industry is high in relation to shareholders’ equity.
As part of the Bank’s Portfolio strategy and planning activity, these industry concentration limits are continually overseen by the management against the Bank’s approved exposures in these sectors and reviewed by the Board Risk Management Committee (BRMC) in its meetings with an aim to monitor the overall risk and to avoid high exposure to a single group or industry.
43.1.1 Segment by class of business
Credit Risk Management (CRM) Framework covers three areas: Corporate Risk Management, Commercial Risk Management and Retail Risk. Risk catering to the approvals of all exposures handled by the dedicated Risk Teams constituted for Business segments such as Corporate, Commercial, Retail and Agriculture. The common responsibilities of all three CRM Units include:
- Conduct a thorough and an independent due diligence of the proposed / existing exposures in the respective Risk portfolios.
- Work with Compliance to ensure conformity to the relevant Government regulations, SBP Prudential Regulations as well as internal policies.
- Work with the Business Units / Relationship teams to structure exposures such that they mitigate key risks, cater to customer requirements, remain economical in terms of risk weighted assets / capital allocation and result in maximization of overall returns from the relationship.
Retail Risk Management Framework covers and operates on a Program lending approach to manage, mitigate and approve risk on a portfolio level. Retail Risk Management is responsible for managing the entire retail credit cycle through the Retail Credit Policy and analytics teams in line with the business strategy on various Key Performance Indicators (KPIs). Retail credit cycle and its scope include, product planning, credit acquisition & underwriting, portfolio & account management, collections and recovery.
Segmental information in respect of the class of business, by sector including related provision and classified advances and geographical distribution of advances, deposits, and contingencies and commitments is given below:
2015Advances (Gross) Deposits Contingent liabilities *
Rupees ‘000 Percent Rupees ‘000 Percent Rupees ‘000 Percent
Chemical and pharmaceuticals 9,299,536 4.59 3,387,027 1.16 2,174,662 5.06 Agriculture 33,595,343 16.59 7,795,719 2.67 243,872 0.57 Textile 22,471,827 11.09 1,989,027 0.68 2,891,883 6.73 Cement 3,601,417 1.78 142,038 0.05 564,167 1.31 Sugar 3,033,405 1.50 103,112 0.04 33,101 0.08 Construction 1,920,419 0.95 4,221,349 1.45 1,038,829 2.42 Ready made garments 2,714,867 1.34 714,532 0.24 141,197 0.33 Footwear and leather garments 985,924 0.49 142,189 0.05 205,390 0.48 Automobile and transportation equipment 733,325 0.36 1,051,116 0.36 407,575 0.95 Financial 1,224,760 0.60 13,774,204 4.72 1,154,836 2.69 Oil refining / marketing 3,723,757 1.84 4,145,816 1.42 12,064,212 28.10 Distribution / trading 882,388 0.44 55,221,263 18.90 2,535,374 5.90 Electronics and electrical appliances 3,781,470 1.87 973,633 0.33 602,255 1.40 Production and transmission of energy 34,891,435 17.23 1,156,927 0.40 4,614,353 10.75 Iron and steel 4,445,513 2.19 1,315,373 0.45 1,555,000 3.62 Food and allied 7,952,089 3.93 2,926,597 1.00 1,051,381 2.45 Synthetic and rayon 1,026,286 0.51 80,584 0.03 1,136,853 2.65 Paper and board 1,927,538 0.95 181,382 0.06 539,352 1.26 Individuals 20,732,211 10.24 101,467,363 34.73 302,372 0.70 Telecommunication 3,145,802 1.55 746,933 0.26 3,326,101 7.75 Transportation, road and air 7,819,299 3.86 549,583 0.19 363,860 0.85 Mining and quarrying 2,511,272 1.24 55,575 0.02 9,858 0.02 Others 30,123,421 14.86 89,988,916 30.79 5,982,382 13.93
202,543,304 100.00 292,130,258 100.00 42,938,865 100.00
2014Advances (Gross) Deposits Contingent liabilities *
Rupees ‘000 Percent Rupees ‘000 Percent Rupees ‘000 Percent
Chemical and pharmaceuticals 9,900,992 4.84 4,241,398 1.50 3,296,819 8.07 Agriculture 21,506,407 10.51 8,395,179 2.96 584,823 1.43 Textile 22,481,071 10.98 1,479,472 0.52 1,740,534 4.26 Cement 1,638,788 0.80 102,162 0.04 822,530 2.01 Sugar 4,368,052 2.13 409,292 0.14 52,595 0.13 Construction 2,067,728 1.01 3,934,655 1.39 1,043,936 2.56 Ready made garments 3,177,515 1.55 658,686 0.23 151,726 0.37 Footwear and leather garments 1,566,656 0.77 163,389 0.06 90,158 0.22 Automobile and transportation equipment 229,112 0.11 1,106,423 0.39 183,716 0.45 Financial 920,602 0.45 11,636,941 4.11 1,070,677 2.62 Oil refining / marketing 6,857,587 3.35 4,974,868 1.76 10,689,971 26.17 Distribution / trading 8,920,687 4.36 55,223,333 19.49 1,993,229 4.88 Electronics and electrical appliances 4,668,354 2.28 1,370,677 0.48 1,188,792 2.91 Production and transmission of energy 32,262,855 15.76 2,358,286 0.83 3,934,879 9.63 Iron and steel 5,162,912 2.52 751,413 0.27 782,794 1.92 Food and allied 6,826,107 3.34 2,472,762 0.87 913,089 2.24 Synthetic and rayon 5,532,709 2.70 65,571 0.02 1,893,494 4.64 Paper and board 1,597,359 0.78 105,370 0.04 532,593 1.30 Individuals 20,709,833 10.12 103,148,012 36.40 99,674 0.24 Telecommunication 6,606,338 3.23 1,673,131 0.59 3,568,789 8.74 Transportation, road and air 10,972,683 5.36 1,944,695 0.69 411,435 1.01 Mining and quarrying 3,584,495 1.75 203,703 0.07 1,315 0.00** Others 23,117,230 11.30 76,926,321 27.15 5,803,760 14.20
204,676,072 100.00 283,345,739 100.00 40,851,328 100.00
* Contingent liabilities in this note are presented at cost and includes direct credit substitutes, transaction related contingent liabilities, trade related contingent liabilities and indemnity issued.

162 163Annual Report 2015 Annual Report 2015
NOTES TO AND FORMING PART OF THE FINANCIAL STATEMENTS FOR THE YEAR ENDED DECEMBER 31, 2015
NOTES TO AND FORMING PART OF THE FINANCIAL STATEMENTS FOR THE YEAR ENDED DECEMBER 31, 2015
43.1.2 Segment by sector2015
Advances (Gross) Deposits Contingent liabilities *Rupees ‘000 Percent Rupees ‘000 Percent Rupees ‘000 Percent
Public / Government 48,718,664 24.05 24,109,993 8.25 3,023,977 7.04 Private 153,824,640 75.95 268,020,265 91.75 39,914,888 92.96
202,543,304 100.00 292,130,258 100.00 42,938,865 100.00
2014Advances (Gross) Deposits Contingent liabilities *
Rupees ‘000 Percent Rupees ‘000 Percent Rupees ‘000 Percent
Public / Government 38,797,844 18.96 17,433,526 6.15 6,318,540 15.47 Private 165,878,228 81.04 265,912,213 93.85 34,532,788 84.53
204,676,072 100.00 283,345,739 100.00 40,851,328 100.00
* Contingent liabilities in this note are presented at cost and includes direct credit substitutes, transaction related contingent liabilities, trade related contingent liabilities and indemnity issued.
43.1.3 Details of non-performing advances and specific provisions by class of business segment
2015 2014
Classified Advances
Specific Provision
Held
Classified Advances
Specific Provision
Held
--------------------- Rupees ‘000 ------------------
Chemical and Pharmaceuticals 781,240 634,382 702,062 558,731 Agriculture 1,525,373 770,535 1,203,706 645,766 Textile 8,174,939 7,098,215 6,800,961 5,698,797 Cement 139,177 118,768 292,077 202,918 Sugar 34,228 7,066 58,898 14,041 Construction 630,536 468,437 772,810 535,679 Ready made garments 1,978,984 1,782,497 2,072,949 1,845,832 Footwear and leather garments 225,572 126,691 337,225 125,652 Automobile and transport equipment 429,022 390,533 174,462 101,749 Financial 105,853 105,309 105,852 105,308 Oil refining / marketing 171,800 171,800 91,761 82,427 Distribution / trading 24,781 20,409 1,085,123 899,153 Electronics and electrical appliances 1,424,593 1,408,986 1,426,084 1,225,849 Production and transmission of energy 2,934,005 2,934,005 2,958,787 2,954,414 Iron and steel 2,146,107 900,731 2,010,066 835,159 Food and allied 1,123,152 542,550 970,374 612,519 Synthetic and rayon 508,076 482,083 1,499,983 1,208,691 Paper and board 309,829 146,946 131,107 111,311 Transportation, road and air - - 152,492 117,302 Telecommunications 5,834 4,522 5,833 4,521 Individuals 2,190,764 1,671,869 2,213,683 1,480,590 Mining and quarrying 13,430 4,858 203,450 135,539 Others 5,451,559 4,240,356 4,023,575 3,509,795
30,328,854 24,031,548 29,293,320 23,011,743
43.1.4 Details of non-performing advances and 2015 2014
specific provisions by sectorClassified Advances
Specific Provision
Held
Classified Advances
Specific Provision
Held
----------------------------- Rupees ‘000 ------------------------
Public / Government - - - - Private 30,328,854 24,031,548 29,293,320 23,011,743
30,328,854 24,031,548 29,293,320 23,011,743
43.1.5 Geographical segment analysis2015
Profit before taxation
Total assets employed
Net assets employed
Contingent liabilities *
------------------------- Rupees ‘000 ----------------------------
Pakistan 6,920,077 430,072,860 30,352,473 42,938,865 Asia Pacific (including South Asia) - - - - Europe - - - - United States of America and Canada - - - - Middle East - - - - Others - - - -
6,920,077 430,072,860 30,352,473 42,938,865
2014
Profit before taxation
Total assets employed
Net assets employed
Contingent liabilities *
------------------------- Rupees ‘000 ----------------------------
Pakistan 3,551,785 388,125,784 26,302,576 40,851,328 Asia Pacific (including South Asia) - - - - Europe - - - - United States of America and Canada - - - - Middle East - - - - Others - - - -
3,551,785 388,125,784 26,302,576 40,851,328
* Contingent liabilities for the purpose of this note are presented at cost and includes direct credit substitutes, transaction related contingent liabilities, trade related contingent liabilities and indemnity issued.
43.2 Credit Risk: General disclosures Basel II specific
The Bank has adopted the Standardized Approach under Basel. According to the regulatory statement submitted under the Standardized Approach, the portfolio has been divided into claims on public sector entities in Pakistan (PSEs), claims on corporate (excluding equity exposure) and claims categorized as retail portfolio. Claims on corporate constitute 56.38% (2014: 62.21%) of the total exposure, 3.56% (2014: 3.44%) represents claims on PSEs and 16.40% (2014: 13.62%) exposure pertains to claims categorized as retail portfolio.

164 165Annual Report 2015 Annual Report 2015
NOTES TO AND FORMING PART OF THE FINANCIAL STATEMENTS FOR THE YEAR ENDED DECEMBER 31, 2015
NOTES TO AND FORMING PART OF THE FINANCIAL STATEMENTS FOR THE YEAR ENDED DECEMBER 31, 2015
43.2.1 Credit Risk: Disclosures for portfolio subject to Standardised Approach
For domestic claims, External Credit Assessment Institutions (ECAIs) recommended by the SBP, namely Pakistan Credit Rating Agency Limited (PACRA) and JCR-VIS Credit Rating Company Limited (JCR-VIS) are used. For claims on foreign entities, ratings assigned by Standard and Poor’s, Fitch and Moody’s are used. Exposures not rated by any of the aforementioned rating agencies were categorized as unrated.
Types of exposure for which each agency is used in the year ended December 31, 2015 are as follows;
Exposures PACRA JCR-VIS Standard and Poor’s Moody’s Fitch
Corporate √ √ - - -Banks √ √ √ √ √Sovereigns - - √ - -SMEs - √ - - -
The SBP indicative mapping process as instructed in the SBP’s circular “Minimum Capital Requirements for Banks and DFIs” (indicated in table below) was used to map alpha numeric ratings of PACRA, JCR-VIS, S&P’s, Moody’s, Fitch Ratings, and numeric scores of ECAs, to the SBP’s rating grades.
Long Term Rating Grades Mapping
SBP Rating
ECA Scores PACRA JCR-VIS S & P Moody’s Fitch
1 0,1 AA- and above AA- and above AA- and above Aa3 and above AA- and above2 2 A+ to A- A+ to A- A+ to A- A1 to A3 A+ to A-3 3 BBB+ to BBB- BBB+ to BBB- BBB+ to BBB- Baa1 to Baa3 BBB+ to BBB-4 4 BB+ to BB- BB+ to BB- BB+ to BB- Ba1 to Ba3 BB+ to BB-5 5,6 B+ to B- B+ to B- B+ to B- B1 to B3 B+ to B-6 7 CCC+ & Below CCC+ & Below CCC+ & Below Caa1 & Below CCC+ & Below
Short Term Rating Grades Mapping
SBP Rating PACRA JCR-VIS S & P Moody’s Fitch S1 A-1 & above A-1 & above A-1 & above P-1 F1S2 A-2 A-2 A-2 P-2 F2S3 A-3 A-3 A-3 P-3 F3S4 Others Others Others Others Others
For exposure amounts after risk mitigation subject to the standardized approach, amount of Bank’s / DFI’s outstanding (rated and unrated ) in each risk bucket as well as those that are deducted are as follows:
Exposures Rating Category
Amount Deduction NetOutstanding CRM Amount
--------------------------- Rupees ‘000 ---------------------
- Cash and Cash Equivalent 7,457,759 - 7,457,759
- Corporate 1 22,863,031 9,142 22,853,889 2 12,289,283 284,993 12,004,290
3,4 10,024 - 10,024 5,6 - - -
Unrated 31,314,281 1,862,961 29,451,320 Unrated-2 19,457,035 82,669 19,374,366
- Public Sector Entities 1 8,817,143 - 8,817,143 2,3 - - -
Unrated 2,404,301 - 2,404,301
- Banks 1,2,3 3,481,200 - 3,481,200 4,5,6 35,993 - 35,993
Unrated 31,911 - 31,911
- Sovereigns etc. 1 - - - 2 - - - 3 - - -
4,5 42,628 - 42,628 6 - - -
Unrated - - -
- Government of Pakistan 125,828,415 - 125,828,415 - SBP 4,536,856 - 4,536,856 - Retail 31,467,957 3,886,164 27,581,793 - Residential Mortgage 4,022,527 35,401 3,987,126 - Past Dues Loans 5,774,899 213,799 5,561,100 - Past Dues against Residential Mortgage 413,869 7,139 406,730 - Significant investment in Commercial entities - - - - Significant investment and DTAs above 15% threshold 2,423,845 - 2,423,845 - Unlisted Equity Investments - - - - Listed Equity Investments 651,477 149,731 501,746 - Operating Fixed Assets 9,361,685 - 9,361,685 - Other Assets 8,012,615 - 8,012,615
300,698,734 6,531,999 294,166,735
The Bank has adopted the Comprehensive Approach of Credit Risk Mitigation for the Banking Book. Under this approach, cash, lien on deposits, government securities and eligible guarantees etc. are considered as eligible collateral. Where the Bank’s exposure to an obligor is secured by eligible collateral, the Bank reduces its exposure for the calculation of capital requirement by the realizable amount of the collateral, adjusted for any applicable haircuts.
Collaterals used by the Bank for Credit Risk Mitigation (CRM) were as follows:
- Cash margin- Government securities- Guarantees of governments and banks- Shares listed on recognized stock exchange.

166 167Annual Report 2015 Annual Report 2015
NOTES TO AND FORMING PART OF THE FINANCIAL STATEMENTS FOR THE YEAR ENDED DECEMBER 31, 2015
NOTES TO AND FORMING PART OF THE FINANCIAL STATEMENTS FOR THE YEAR ENDED DECEMBER 31, 2015
43.3 Market risk
It is the risk that the value of on-balance sheet and off-balance sheet positions of the Bank will be adversely affected by movements in market rates or prices such as interest rates, equity prices and / or commodity prices resulting in a loss to earnings and capital. Market risks arise generally from trading activities, open foreign currency positions, holding common equity and other products. All such instruments and transactions are exposed to general and specific market movements.
The Bank seeks to mitigate market risk by employing strategies that correlate price, rate and spread movements of its earning assets, liabilities and trading activities. Treasury front office, Market risk management and Treasury middle office perform market risk management activities within the Bank. The Bank has Enterprise Risk Management Committee which is responsible for recommending market risk policies and strategies for the Board approval and its subsequent implementation and review.
43.4 Foreign exchange risk / currency risk
Foreign exchange risk / currency risk is the current or prospective risk to earnings and capital arising from adverse movements in currency exchange rates. It refers to the impact of adverse movements in currency exchange rates on the value of open foreign currency positions. Changes in currency rates affect the value of assets and liabilities denominated in foreign currencies and may affect revenues from foreign exchange dealing.
The Bank undertakes currency risk mostly to support its trade services and maintains overall foreign exchange risk position to the extent of statutory Foreign Exchange Exposure Limit (FEEL) prescribed by the SBP. Foreign exchange risk exposures are managed by matching future maturities.
Exposure limits such as counterparty, gap, net open position, dealer and bucket-wise currency delta limits are in place in accordance with the Bank’s approved policies in order to manage associated risk and concentration at the acceptable tolerance levels.
43.4.1 Currency Risk 2015
Assets Liabilities Off-balance sheet items
Net currency exposure
------------------------------------ Rupees ‘000 ----------------------------------
Pakistan rupee 421,429,701 375,203,461 (15,772,386) 30,453,854 United States dollar 7,101,625 18,687,862 11,465,949 (120,288)Great Britain pound 1,150,986 3,474,408 2,326,691 3,269 Japanese yen 4,810 29,132 24,368 46 Euro 371,822 2,325,524 1,955,378 1,676 Other currencies 13,916 - - 13,916
430,072,860 399,720,387 - 30,352,473
2014
Assets LiabilitiesOff-balance sheet items
Net currency exposure
------------------------------------ Rupees ‘000 ----------------------------------
Pakistan rupee 378,767,780 335,780,917 (16,582,867) 26,403,996 United States dollar 7,646,636 20,327,520 12,556,996 (123,888)Great Britain pound 1,229,262 3,407,647 2,183,267 4,882 Japanese yen 15,587 8,719 (6,727) 141 Euro 453,688 2,298,405 1,847,273 2,556 Other currencies 12,831 - 2,058 14,889
388,125,784 361,823,208 - 26,302,576
43.5 Equity position risk
Equity position risk is the risk arising from unfavourable fluctuations in prices of shares in which the Bank carries long positions as part of its trading book. It is a risk to earnings or capital that results from adverse changes in the value of equity related portfolios of the Bank. Price risk associated with equities could be systematic or unsystematic. Systematic risk is due to sensitivity of portfolio’s value to changes in overall level of equity prices, while unsystematic risk is associated with price volatility that is determined by the specific characteristics of the investee company.
The Bank’s equity position is governed by position limits imposed by State Bank of Pakistan for overall investment and per scrip exposure. Additionally, there are internal limits set to manage overall earnings in the form of stop loss limits and maintain a diverse portfolio through sector concentration limits.
43.6 Mismatch of Interest Rate Sensitive Assets and Liabilities / Yield / Interest Rate Risk
2015Exposed to Yield / Interest risk
Effective Yield /
Interest rate
TotalUpto one month
Over one month to
three months
Over three months to six months
Over six months to one year
Over one year to
two years
Over two years to
three years
Over three years to
five years
Over five years to
ten years
Over ten years
Non-interest bearing financial
instruments
----------------------------------------------------------------------------------- Rupees ‘000 ------------------------------------------------------------------------------------
On-balance sheet financial
instruments
Assets
Cash and balances with
treasury banks 26,084,007 - - - - - - - - - 26,084,007
Balances with other banks 1,068,451 - - - - - - - - - 1,068,451
Lendings to financial
institutions 6.8 12,088,403 250,000 - - 11,838,403 - - - - - -
Investments 8.7 183,609,157 96,449 51,103,504 4,231,187 66,530,683 16,902,556 13,765,410 23,177,027 2,812,208 - 4,990,133
Advances 8.7 178,079,084 48,408,355 47,123,492 29,528,194 25,636,726 2,299,150 3,787,142 10,769,284 2,138,120 2,091,315 6,297,306
Other assets 10,431,698 - - - - - - - - - 10,431,698
411,360,800 48,754,804 98,226,996 33,759,381 104,005,812 19,201,706 17,552,552 33,946,311 4,950,328 2,091,315 48,871,595
Liabilities
Bills payable 6,009,238 - - - - - - - - - 6,009,238
Borrowings 6.19 90,565,242 78,843,290 1,102,536 7,458,526 12,513 85,652 325,352 635,152 1,285,635 - 816,586
Deposits and other accounts 4.3 292,130,258 34,178,301 41,944,635 93,008,928 25,132,657 2,622,958 348,766 716,740 62,771 - 94,114,502
Sub-ordinated loans 10.5 2,994,000 - - 2,994,000 - - - - - - -
Other liabilities 7,429,910 - - - - - - - - - 7,429,910
399,128,648 113,021,591 43,047,171 103,461,454 25,145,170 2,708,610 674,118 1,351,892 1,348,406 - 108,370,236
On-balance sheet gap 12,232,152 (64,266,787) 55,179,825 (69,702,073) 78,860,642 16,493,096 16,878,434 32,594,419 3,601,922 2,091,315 (59,498,641)
Off-balance sheet financial instruments
Forward Lending
Cross currency and interest
rate swaps - - - - - - - - - - -
Forward foreign exchange
contracts 24,116,917 16,468,088 5,451,581 1,540,249 656,999 - - - - - -
24,116,917 16,468,088 5,451,581 1,540,249 656,999 - - - - - -
Forward Borrowing
Cross currency and interest
rate swaps - - - - - - - - - - -
Forward foreign exchange
contracts 9,948,989 7,269,014 2,661,399 15,130 3,446 - - - - - -
9,948,989 7,269,014 2,661,399 15,130 3,446 - - - - - -
Off-balance sheet gap 14,167,928 9,199,074 2,790,182 1,525,119 653,553 - - - - -
Total Yield / Interest Risk
Sensitivity Gap (55,067,713) 57,970,007 (68,176,954) 79,514,195 16,493,096 16,878,434 32,594,419 3,601,922 2,091,315
Cumulative Yield / Interest Risk
Sensitivity Gap (55,067,713) 2,902,294 (65,274,660) 14,239,535 30,732,631 47,611,065 80,205,484 83,807,406 85,898,721

168 169Annual Report 2015 Annual Report 2015
NOTES TO AND FORMING PART OF THE FINANCIAL STATEMENTS FOR THE YEAR ENDED DECEMBER 31, 2015
NOTES TO AND FORMING PART OF THE FINANCIAL STATEMENTS FOR THE YEAR ENDED DECEMBER 31, 2015
2014
Exposed to Yield / Interest risk
Effective Yield /
Interest rate
TotalUpto one month
Over one month to
three months
Over three months to six months
Over six months to one year
Over one year to
two years
Over two years to
three years
Over three years to
five years
Over five years to
ten years
Over ten years
Non-interest bearing financial
instruments
---------------------------------------------------------------------------- Rupees ‘000 -----------------------------------------------------------------------------
On-balance sheet
financial instruments
Assets
Cash and balances with treasury
banks 20,285,851 - - - - - - - - - 20,285,851
Balances with other banks 0.40 1,422,699 - - - - - - - - - 1,422,699
Lendings to financial institutions - - - - - - - - - - -
Investments 10.5 155,135,429 2,951,073 26,048,971 33,959,110 29,320,836 26,581,015 16,486,943 2,818,290 13,504,287 - 3,464,904
Advances 10.59 181,224,805 22,960,763 31,175,866 22,504,375 29,735,078 16,831,428 14,896,842 23,629,123 8,953,997 4,255,756 6,281,577
Other assets 9,741,901 - - - - - - - - - 9,741,901
367,810,685 25,911,836 57,224,837 56,463,485 59,055,914 43,412,443 31,383,785 26,447,413 22,458,284 4,255,756 41,196,932
Liabilities
Bills payable 5,347,774 - - - - - - - - - 5,347,774
Borrowings 9.4 60,926,863 42,761,677 11,965,756 3,075,024 69,812 63,055 197,301 583,544 2,210,694 - -
Deposits and other accounts 5.33 283,345,739 50,967,508 37,731,760 73,522,910 24,457,237 3,227,551 2,577,426 765,750 139,151 - 89,956,446
Sub-ordinated loans 11.2 2,995,200 - - 2,995,200 - - - - - - -
Other liabilities 8,750,766 - - - - - - - - - 8,750,766
361,366,342 93,729,185 49,697,516 79,593,134 24,527,049 3,290,606 2,774,727 1,349,294 2,349,845 - 104,054,986
On-balance sheet gap 6,444,343 (67,817,349) 7,527,321 (23,129,649) 34,528,865 40,121,837 28,609,058 25,098,119 20,108,439 4,255,756 (62,858,054)
Off-balance sheet financial
instruments
Forward Lending
Cross currency and interest rate
swaps - - - - - - - - - - -
Forward foreign exchange
contracts 35,354,657 14,482,846 16,626,167 4,096,549 149,095 - - - - - -
35,354,657 14,482,846 16,626,167 4,096,549 149,095 - - - - - -
Forward Borrowing
Cross currency and interest rate
swaps 67,864 - - - 67,864 - - - - - -
Forward foreign exchange
contracts 18,378,945 10,290,103 8,045,186 43,656 - - - - - - -
18,446,809 10,290,103 8,045,186 43,656 67,864 - - - - - -
Off-balance sheet gap 16,907,848 4,192,743 8,580,981 4,052,893 81,231 - - - - -
Total Yield / Interest Risk
Sensitivity Gap (63,624,606) 16,108,302 (19,076,756) 34,610,096 40,121,837 28,609,058 25,098,119 20,108,439 4,255,756
Cumulative Yield / Interest Risk
Sensitivity Gap (63,624,606) (47,516,304) (66,593,060) (31,982,964) 8,138,873 36,747,931 61,846,050 81,954,489 86,210,245
43.6.1 Yield curve risk is the risk that a financial instrument will suffer either a decline in income or capital because future changes in prevailing interest rates impact assets more or less than they impact liabilities.
43.6.2 The interest rate risk of the Bank arises when there is a mismatch between contractual maturities, which are subject to interest rate adjustment within a specified period or re-pricing of on and off-balance sheet assets and liabilities. Risk is addressed by Asset and Liability Management Committee that reviews the interest rate dynamics at regular intervals and decides re-pricing of assets and liabilities to ensure that the spread of the Bank remains at an acceptable level.
43.6.3 Major sources of Interest rate risk are;
i) differences between the timing of rate changes and the timing of cash flows (re-pricing risk);ii) changing rate relationships among different yield curves affecting Bank’s activities (basis risk);iii) changing rate relationships across the range of maturities (yield curve risk); iv) interest-related options embedded in Bank’s products (options risk); andv) changes in marked-to-market value of financial instruments which occur when interest rate
changes (price risk)
43.7 Liquidity Risk
Liquidity risk is the risk that the Bank is unable to meet its payment obligations associated with its financial liabilities when they fall due, and to replace funds when they are withdrawn.
The Bank’s Asset and Liability Management Committee manages the liquidity position on a continuous basis. The Bank’s liquidity risk management process, as carried out within the Bank and monitored by the management, includes:
- Day-to-day funding, managed by monitoring future cash flows to ensure that requirements can be met. This includes replenishment of funds as they mature or are borrowed by customers. The Bank maintains an active presence in money markets to enable this to happen;
- Maintaining a portfolio of highly marketable assets that can easily be liquidated as protection against any unforeseen interruption to cash flow;
- Monitoring balance sheet liquidity ratios against internal and regulatory requirements;
- Monitoring of overall balance sheet liquidity position against internal threshold;
- Managing the concentration and profile of debt maturities.
- Monitoring of next three months liquidity target, available internal liquidity, liquidity excess / shortfall and estimated overall liquidity; and
- Managing the liabilities both on a contractual and behavioural basis primarily by matching the maturity profiles of assets and liabilities;
Maturities of Treasury’s and Capital Market’s balances are monitored on monthly basis so as to provide management with cash flow measurement and projections.
Sources of liquidity are regularly reviewed to maintain a wide diversification by currency, geography, provider, product and term.

170 171Annual Report 2015 Annual Report 2015
NOTES TO AND FORMING PART OF THE FINANCIAL STATEMENTS FOR THE YEAR ENDED DECEMBER 31, 2015
NOTES TO AND FORMING PART OF THE FINANCIAL STATEMENTS FOR THE YEAR ENDED DECEMBER 31, 2015
43.7.1 Maturities of Assets and Liabilities (based on contractual maturities)
2015
TotalUpto one month
Over one month to
three months
Over three months to six months
Over six months to one year
Over one year to
two years
Over two years to
three years
Over three years to
five years
Over five years to
ten years
Over ten years
---------------------------------------------------------- Rupees ‘000 -----------------------------------------------------AssetsCash and balances with
treasury banks 26,084,007 26,084,007 - - - - - - - - Balances with other banks 1,068,451 1,068,451 - - - - - - - - Lendings to financial institutions 12,088,403 250,000 - - 11,838,403 - - - - - Investments 183,677,239 1,130,843 52,160,678 3,564,710 70,812,413 23,083,447 3,428,306 25,673,323 3,823,519 - Advances 178,079,084 37,547,557 23,273,316 25,610,372 28,754,010 16,030,461 15,598,510 19,571,377 8,256,422 3,437,059 Operating fixed assets 11,342,980 9,262 4,280 19,691 104,942 881,545 517,716 847,283 188,932 8,769,329 Deferred tax assets - net 3,087,325 - - - - - - 3,087,325 - - Other assets 14,645,371 4,497,201 2,705,475 2,735,685 952,413 470,152 335,625 2,948,820 - -
430,072,860 70,587,321 78,143,749 31,930,458 112,462,181 40,465,605 19,880,157 52,128,128 12,268,873 12,206,388 LiabilitiesBills payable 6,009,238 6,009,238 - - - - - - - - Borrowings 90,565,242 79,659,876 1,102,536 7,458,526 12,513 85,652 325,352 635,152 1,285,635 - Deposits and other accounts 292,130,258 221,410,617 25,347,806 16,487,941 25,132,658 2,622,958 348,766 716,741 62,771 - Sub-ordinated loans 2,994,000 - - 748,500 748,500 1,497,000 - - - - Other liabilities 8,021,649 3,120,297 664,094 2,875,034 1,352,548 1,113 2,154 6,409 - -
399,720,387 310,200,028 27,114,436 27,570,001 27,246,219 4,206,723 676,272 1,358,302 1,348,406 -
Net assets 30,352,473 (239,612,707) 51,029,313 4,360,457 85,215,962 36,258,882 19,203,885 50,769,826 10,920,467 12,206,388
Share capital 11,997,601 Reserves 6,422,761 Unappropriated profit 7,638,330
26,058,692 Surplus on revaluation of assets - net 4,293,781
30,352,473
2014
Total Upto one month
Over one month to
three months
Over three months to
six months
Over six months to one year
Over one year to
two years
Over two years to
three years
Over three years to
five years
Over five years to
ten years
Over ten years
------------------------------------------------------------------- Rupees ‘000 ---------------------------------------------------------------------AssetsCash and balances with
treasury banks 20,285,851 20,285,851 - - - - - - - - Balances with other banks 1,422,699 1,422,699 - - - - - - - - Lendings to financial institutions - - - - - - - - - - Investments 155,210,513 6,180,608 18,693,057 22,221,655 36,991,218 28,099,051 21,305,564 4,853,879 16,865,481 - Advances 181,224,805 24,946,553 35,471,653 22,504,375 29,735,078 16,831,428 14,896,842 23,629,123 8,953,997 4,255,756 Operating fixed assets 11,543,356 126,415 31,267 14,899 35,066 248,255 480,507 907,300 1,110,852 8,588,795 Deferred tax assets - net 2,428,816 - - - - - 212,760 1,517,878 698,178 - Other assets 16,009,744 1,735,110 2,109,752 5,948,514 2,193,213 - 73,919 3,740,058 209,178 -
388,125,784 54,697,236 56,305,729 50,689,443 68,954,575 45,178,734 36,969,592 34,648,238 27,837,686 12,844,551 LiabilitiesBills payable 5,347,774 5,347,774 - - - - - - - - Borrowings 60,926,863 42,761,677 11,965,756 3,075,024 69,812 63,055 197,301 583,544 2,210,694 - Deposits and other accounts 283,345,739 224,180,534 17,374,644 10,623,446 24,457,237 3,227,551 2,577,426 765,750 139,151 - Sub-ordinated loans 2,995,200 - - 600 600 2,994,000 - - - - Other liabilities 9,207,632 2,464,571 587,366 5,288,209 849,740 3,714 3,752 10,280 - -
361,823,208 274,754,556 29,927,766 18,987,279 25,377,389 6,288,320 2,778,479 1,359,574 2,349,845 -
Net assets 26,302,576 (220,057,320) 26,377,963 31,702,164 43,577,186 38,890,414 34,191,113 33,288,664 25,487,841 12,844,551
Share capital 10,432,697Reserves 5,703,155Unappropriated profit 5,696,366
21,832,218Surplus on revaluation of assets - net 4,470,358
26,302,576
43.7.2 Maturities of Assets and Liabilities (based on expected withdrawal pattern) In line with SBP BSD Circular Letter No. 02 and 03 of 2011 on “Maturity and Interest Rate Sensitivity Gap Reporting”, deposit withdrawal pattern analysis on Current and Saving Accounts (CASA) is conducted on four years weekly data. The outliers (seasonal variations) are adjusted from data using fourth spread statistical methodology. Subsequently, the data is analysed though regression analysis so as to capture the deposit withdrawal behaviour in higher maturity time bands. The regression analysis is used to investigate the relationship between time, the amount of deposits and deposits withdrawal in order to arrive at an estimated deposits withdrawal pattern. This methodology is in line with industry best practices and regulatory guidance.
2015
TotalUpto one month
Over one month to
three months
Over three months to six months
Over six months to one year
Over one year to
two years
Over two years to
three years
Over three years to
five years
Over five years to
ten years
Over ten years
---------------------------------------------------------- Rupees ‘000 -----------------------------------------------------
Assets
Cash and balances with
treasury banks 26,084,007 2,415,915 2,413,555 1,891,510 3,078,410 2,423,552 2,176,499 3,535,261 7,476,683 672,622
Balances with other banks 1,068,451 1,068,451 - - - - - - - -
Lendings to financial institutions 12,088,403 250,000 - - 11,838,403 - - - - -
Investments 183,677,239 1,130,843 52,160,678 3,564,710 70,812,413 23,083,447 3,428,306 25,673,323 3,823,519 -
Advances 178,079,084 20,309,461 25,051,390 29,379,153 37,675,392 17,733,122 16,665,709 19,571,376 8,256,422 3,437,059
Operating fixed assets 11,342,980 9,262 4,280 19,691 104,942 881,545 517,716 847,283 188,932 8,769,329
Deferred tax assets - net 3,087,325 - - - - - - 3,087,325 - -
Other assets 14,645,371 4,497,201 2,705,475 2,735,685 952,413 470,152 335,625 2,948,820 - -
430,072,860 29,681,133 82,335,378 37,590,749 124,461,973 44,591,818 23,123,855 55,663,388 19,745,556 12,879,010
Liabilities
Bills payable 6,009,238 6,009,238 - - - - - - - -
Borrowings 90,565,242 79,659,876 1,102,536 7,458,526 12,513 85,652 325,352 635,152 1,285,635 -
Deposits and other accounts 292,130,258 26,425,757 26,801,948 20,903,187 33,969,867 26,905,339 24,534,162 40,130,666 84,519,840 7,939,492
Sub-ordinated loans 2,994,000 - - 748,500 748,500 1,497,000 - - - -
Other liabilities 8,021,649 3,120,298 664,094 2,875,034 1,352,548 1,113 2,154 6,408 - -
399,720,387 115,215,169 28,568,578 31,985,247 36,083,428 28,489,104 24,861,668 40,772,226 85,805,475 7,939,492
Net assets 30,352,473 (85,534,036) 53,766,800 5,605,502 88,378,545 16,102,714 (1,737,813) 14,891,162 (66,059,919) 4,939,518
Share capital 11,997,601
Reserves 6,422,761
Unappropriated profit 7,638,330
26,058,692
Surplus on revaluation of assets - net 4,293,781
30,352,473

172 173Annual Report 2015 Annual Report 2015
NOTES TO AND FORMING PART OF THE FINANCIAL STATEMENTS FOR THE YEAR ENDED DECEMBER 31, 2015
NOTES TO AND FORMING PART OF THE FINANCIAL STATEMENTS FOR THE YEAR ENDED DECEMBER 31, 2015
Maturities of Assets and Liabilities (based on expected withdrawal pattern)
2014
Total Upto one month
Over one month to
three months
Over three months to
six months
Over six months to one year
Over one year to
two years
Over two years to
three years
Over three years to
five years
Over five years to
ten years
Over ten years
------------------------------------------------------------------- Rupees ‘000 ---------------------------------------------------------------------
AssetsCash and balances with
treasury banks 20,285,851 2,838,667 1,275,980 1,323,314 2,228,739 2,258,491 2,051,576 3,462,119 4,369,572 477,393 Balances with other banks 1,422,699 1,422,699 - - - - - - - - Lendings to financial institutions - - - - - - - - - - Investments 155,210,513 6,180,608 18,693,057 22,221,655 36,991,218 28,099,051 21,305,564 4,853,879 16,865,481 - Advances 181,224,805 17,319,867 36,820,533 23,891,972 32,351,782 18,066,250 15,935,525 23,629,123 8,953,997 4,255,756 Operating fixed assets 11,543,356 126,415 31,267 14,899 35,066 248,255 480,507 907,300 1,110,852 8,588,795 Deferred tax assets - net 2,428,816 - - - - - 212,760 1,517,878 698,178 - Other assets 16,009,744 1,735,110 2,109,752 5,948,514 2,193,213 - 73,919 3,740,058 209,178 -
388,125,784 29,623,366 58,930,589 53,400,354 73,800,018 48,672,047 40,059,851 38,110,357 32,207,258 13,321,944 LiabilitiesBills payable 5,347,774 5,347,774 - - - - - - - - Borrowings 60,926,863 42,761,677 11,965,756 3,075,024 69,812 63,055 197,301 583,544 2,210,694 - Deposits and other accounts 283,345,739 39,845,087 18,808,657 15,386,704 35,226,749 30,595,371 28,328,356 47,581,761 60,788,925 6,784,129 Sub-ordinated loans 2,995,200 - - 600 600 2,994,000 - - - - Other liabilities 9,207,632 2,464,571 587,366 5,288,209 849,740 3,714 3,752 10,280 - -
361,823,208 90,419,109 31,361,779 23,750,537 36,146,901 33,656,140 28,529,409 48,175,585 62,999,619 6,784,129
Net assets 26,302,576 (60,795,743) 27,568,810 29,649,817 37,653,117 15,015,907 11,530,442 (10,065,228) (30,792,361) 6,537,815
Share capital 10,432,697 Reserves 5,703,155 Unappropriated profit - restated 5,696,366
21,832,218 Surplus on revaluation of assets - net 4,470,358
26,302,576
43.8 OPERATIONAL RISK
Operational risk is the risk of direct or indirect losses resulting from inadequate or failed internal processes or systems, human factors or from external events. The Bank’s businesses are dependent on the ability to process a large number of transactions efficiently and accurately. Operational risks and losses originate from business / operational process failure, IT security failure, natural disasters, dependence on key suppliers, fraud, service quality compromises, regulatory non-compliance, loss of key staff and social and environmental impacts.
The operational risk management policy of the Bank is approved by the Board of Directors. Regular updates on operational risk status is presented to Enterprise Risk Management Committee (ERMC) and the Board of Directors through the Board Risk Management Committee (BRMC).
The Bank has implemented an effective Operational Risk Management (ORM) framework for managing operational risk. Each department has processes and system controls in place to address operational risks within their area. The Bank’s ORM framework consists of tools such as Risk and Controls Self Assessment (RCSA), Loss Database and Key Risk Indicators (KRIs). Additionally, known material Operational Risk issues and losses are escalated to Head ERM on a periodic basis.
44 TRUST ACTIVITIES
The Bank commonly acts as trustees and in other fiduciary capacities that result in the holding or placing of assets on behalf of individuals, trusts, retirement benefit plans and other institutions. These are not assets of the Bank and, therefore, are not included in the statement of financial position. The following is the list of assets held under trust:
2015
Category No. of IPS Accounts
Securities Held (Face Value)
Market Treasury
Bills
Pakistan Investment
Bonds
Government Ijara
SukuksTotal
------------------------- Rupees ‘000 ---------------------
Corporate 28 660,440 952,400 - 1,612,840 Insurance Companies 2 - - - - Asset Management
Companies 41 228,520 - - 228,520 Employees Funds 152 926,485 6,512,870 - 7,439,355 Charitable Institution / NGO’S 20 107,200 747,700 - 854,900 Individuals 319 346,640 930,090 10,800 1,287,530 Related Parties 10 35,500 1,057,800 - 1,093,300 Others 6 - 195,100 - 195,100
578 2,304,785 10,395,960 10,800 12,711,545
2014
CategoryNo. of IPS Accounts
Securities Held (Face Value)
Market Treasury Bills
Pakistan Investment
Bonds
Government Ijara
SukuksTotal
------------------------- Rupees ‘000 ---------------------
Corporate 29 3,068,340 888,900 - 3,957,240 Insurance Companies 2 - 25,000 - 25,000 Asset Management
Companies 40 2,468,500 1,064,700 - 3,533,200 Employees Funds 141 823,020 7,287,770 12,275 8,123,065 Charitable Institution/NGO’S 21 161,000 1,018,100 - 1,179,100 Individuals 309 321,420 1,359,580 21,400 1,702,400 Related Parties 10 - 1,195,800 - 1,195,800 Others 5 32,000 79,300 - 111,300
557 6,874,280 12,919,150 33,675 19,827,105

174 Annual Report 2015
NOTES TO AND FORMING PART OF THE FINANCIAL STATEMENTS FOR THE YEAR ENDED DECEMBER 31, 2015
45 NON-ADJUSTING EVENTS AFTER THE BALANCE SHEET DATE
46 DATE OF AUTHORISATION FOR ISSUE
47 GENERAL
47.1
47.2
47.3
175Annual Report 2015
ANNEXURE I TO THE FINANCIAL STATEMENTSFOR THE YEAR ENDED DECEMBER 31, 2015
QUALITY OF AVAILABLE FOR SALE SECURITIES
1. Details of investments in Government securities (Pakistan Investment Bonds, Market Treasury Bills and Ijara Sukuk Bonds) are as follows:
2015 2014 2015 2014 2015 2014
At Cost Market ValuesMedium to Long
Term Rating Assigned
--------Rupees ‘000------- --------Rupees ‘000------- (where available)
Market Treasury Bills 90,200,245 44,445,501 90,276,425 44,590,462 N/A N/A
Pakistan Investment Bonds 48,488,623 35,223,668 50,430,361 37,008,284 N/A N/A
Ijara Sukuk Bonds 5,919,200 17,579,035 5,924,997 17,522,674 N/A N/A
144,608,068 97,248,204 146,631,783 99,121,420
2.are as follows:
2015 2014
Name of company / modaraba / mutual fund
2015 2014 2015 2014 2015 2014
Ordinary shares /
each
At Cost Market Values Medium to Long Term Rating Assigned (where
available)--------Rupees ‘000------- --------Rupees ‘000-------
Equity Investment Instruments
- 523,176 NAMCO Balanced Fund - 4,890 - 5,123 - MFR 1-Star
Banks / Financial Services
1,762,772 1,762,772 Prudential Investment Bank Limited * / ** 12,528 12,528 - - - -
- 925,500 Bank AL Habib Limited - 28,666 - 44,933 - AA+
- 3,938,000 Habib Metropolitan Bank Limited - 76,816 - 146,887 - AA+
- 2,202,500 Askari Bank Limited - 49,656 - 50,812 - AA
157,500 1,255,000 Bank Al-Falah Limited 4,277 34,065 4,539 43,774 AA AA
371,936 352,700 Habib Bank Limited 70,576 71,757 74,432 76,275 AAA AAA
478,260 593,160 United Bank Limited 79,563 103,126 74,106 104,817 AA+ AA+
500,000 514,500 National Bank of Pakistan Limited 32,323 30,640 27,020 35,737 AAA AAA
325,500 - MCB Bank Limited 83,836 - 70,585 - AAA -
Construction, Materials,
Paints and Cements
10,600 10,600 Dadabhoy Construction Technology Limited *** 16 16 1 1 - -
508,500 599,000 Akzo Nobel Pakistan Limited 75,500 89,049 110,319 214,160 - -
970,000 129,500 D.G Khan Cement Company Limited 129,158 10,735 143,162 14,313 - -
420,800 25,000 Lucky Cement Limited 208,325 9,803 208,313 12,507 -
893,500 800,000 Fauji Cement Limited 29,680 17,366 32,899 20,672 - -
902,000 - Maple Leaf Cement Factory Limited 55,729 - 67,271 - A -
226,000 - Pioneer Cement Limited 18,156 - 20,534 - - -
560,000 - Cherat Cement Company Limited 50,104 - 50,501 - A -
1,000 - Quality Steel Works Limited 13 - - - - -
554,599 2,617,500 Lafrage Pakistan Cement Limited 9,625 45,226 9,445 45,413 A- A-
Oil and Gas
456,800 283,800 Pakistan State Oil Limited 160,540 98,958 148,812 101,575 AA AA+
1,228,500 311,100 406,732 146,774 329,263 118,019 - -
1,042,200 392,500 Oil & Gas Development Company Limited 151,503 99,825 122,292 80,804 AAA AAA
815,300 602,100 Pakistan Petroleum Limited 118,888 129,305 99,312 106,283 - -
Balance carried forward 1,697,072 1,059,201 1,592,806 1,222,105

176 177Annual Report 2015 Annual Report 2015
ANNEXURE I TO THE FINANCIAL STATEMENTSFOR THE YEAR ENDED DECEMBER 31, 2015
2015 2014
Name of company / modaraba / mutual fund
2015 2014 2015 2014 2015 2014
ordinary shares / certificates of Rs 10 each
at cost Market values Medium to long term rating assigned (where
available)--------Rupees ‘000------- --------Rupees ‘000-------
Balance brought forward 1,697,072 1,059,201 1,592,806 1,222,105
electricity and energy
- 1,491,000 Hub Power Company Limited - 96,279 - 116,835 - AA+
- 617,000 Kot Addu Power Company Limited - 37,571 - 48,706 - AA+
13,783,500 - K-Electric Limited 104,002 - 102,549 - aa- -
785,500 - Nishat Chunian Power Limited 43,900 - 43,242 - a+ -
Personal Goods, textile & spinning
53,500 53,500 (Colony) Sarhad Textile Limited ** 27 27 - - - -
1,500 1,500 Al-Qaim Textile Mills Limited ** 3 3 - - - -
178,645 178,645 Crown Textile Mills Limited ** 1,239 1,239 - - - -
80 80 Fateh Textile Mills Limited 29 29 6 6 - -
41,600 41,600 Hakkim Textile Mills Limited ** 10 10 - - - -
8,500 8,500 Mehr Dastgir Textile Mills Limited *** 2 2 13 13 - -
- 1,038,001 Pakistan Synthetic Limited - 20,417 - 15,591 - -
- 1,000 Service (Textile) Industries Limited ** - 1 - 18 -
69,000 69,000 Sunshine Cotton Mills Limited ** 69 69 - - - -
79,300 79,300 Zahoor Cotton Mills Limited ** 22 22 - - - -
2,567,046 2,567,046 Zahoor Textile Mills Limited ** 2,500 2,500 - - - -
1,250,500 1,727,500 Nishat Chunian Limited 52,307 85,184 42,517 78,463 a- A-
1,236,800 225,000 Nishat Mills Limited 134,641 27,513 117,335 27,222 aa AA
Non life insurance
820,500 500,000 Adamjee Insurance Company Limited 39,727 23,518 46,366 24,730 aa AA
food Producers
9,500 9,500 Morafco Industries Limited ** 126 126 97 97 - -
9,000 9,000 Suraj Ghee Industries Limited *** 117 117 - - - -
chemicals and fertilizers
15,868,843 15,868,843 Agritech Limited 519,824 519,824 148,374 122,984 D D
450,500 160,000 Engro Fertilizers Limited 38,566 9,812 37,901 12,496 aa- A+
783,500 879,700 Fauji Fertilizer Company Limited 97,622 101,960 92,437 103,022 - -
1,494,000 92,300 Engro Corporation Limited 403,421 16,220 417,409 20,446 aa AA-
1,080,000 - Fauji Fertilizer Bin Qasim Limited 63,927 - 56,892 - - -
transportation and automobiles
195,980 - Indus Motor Company Limited 210,515 - 198,269 - - -
150,000 - Honda Atlas Cars Pakistan Limited 34,281 - 35,841 - aa- A+
Health care equipment and services
48,000 48,000 Medi Glass Limited *** 38 38 - - - -
146,399 Al-Abid Silk Mills Limited - 4,082 - 1,757 - -
fixed line telecommunication
2,136,500 1,831,000 Pakistan Telecommunication limited 43,331 45,337 35,231 42,168 - -
Balance carried forward 3,487,318 2,051,101 2,967,285 1,836,659
ANNEXURE I TO THE FINANCIAL STATEMENTSFOR THE YEAR ENDED DECEMBER 31, 2015
2015 2014
Name of company / modaraba / mutual fund
2015 2014 2015 2014 2015 2014
Ordinary shares / certificates of Rs 10 each
at cost Market values Medium to long term rating assigned (where
available)--------Rupees ‘000------- --------Rupees ‘000-------
Balance brought forward 3,487,318 2,051,101 2,967,285 1,836,659
General industrials / others 900 225 VISA Incorporation - Class C Shares - - 7,386 6,032 - -
102,500 102,500 Fatima Enterprises Limited ** 1,789 1,789 - - aa- - 26,000 26,000 Hashmi Can Company Limited ** 156 156 - - - -
39,018 39,018 Siemens Pakistan Engineering Company Limited
49,584 49,584 35,116 43,489 - -
134,250 - Packages Limited 68,539 - 78,148 - aa - 223 223 Syed Match Company Limited ** 3 3 3 3 - -
1,462,500 - Dolmen City REIT 14,681 - 15,693 - rr1 - 3,622,070 2,102,633 3,103,631 1,886,183
** Delisted companies. However, in certain cases last available market value has been disclosed in the current and previous year.Provision for diminution in the value of investments against above shares amounts to Rs 488.203 million (2014: Rs 461.243 million)
Note: The Bank hold various delisted and non-traded shares, certificates of modarabas and units of closed end mutual funds having Nil carrying value which have not been disclosed individually.
3. Details of investments in unlisted companies classified as available for sale are as follows:
2015 2014 2015 2014 2015 2014
at cost Market values Medium to long term rating assigned (where
available)--------Rupees ‘000------- --------Rupees ‘000-------
Al Hamra Avenue (Private) Limited ** / + 265,937 265,937 Not applicable - - 28,812,500 (2014: 28,812,500 ) ordinary shares of Rs 10 eachThe Bank holds 17.99% (2014: 17.99%) of investee’s capital.Chief Executive: Mr. Habib AhmedBreak up value per share: Rs. 12.41 (2014: Rs 12.48)Period of financial statements: June 30, 2012 (audited)
Al Hamra Hills (Private) Limited * / + 5 5 Not applicable - - 500 (2014: 500 ) ordinary shares of Rs 10 each
DHA Cogen Limited * / +63,694,475 (2014: 63,694,475 ) ordinary shares of Rs 10 each 325,000 325,000 Not applicable - - The Bank holds 19.10% (2014: 19.10%) of investee’s capital.Chief Executive: Siraj ul HaqBreak up value per share: Rs. (29.1)Period of financial statements: December 31, 2013 (audited)
Himont Chemical (Private) Limited * 1,037 1,037 Not applicable - - 810,000 (2014: 810,000) ordinary shares of Rs 10 each
Pace Barka Properties Limited * 52,000 51,998 Not applicable - - 5,200,000 (2014: 5,200,000) ordinary shares of Rs 10 eachThe Bank holds 1.70% (2014: 1.70%) of investee’s capital.Chief Executive: Aamna TaseerBreak up value per share: Rs. 17.336Period of financial statements: June 30, 2012 (audited)
Pakistan Export Finance Guarantee Agency Limited * 5,687 5,687 Not applicable - - 568,044 (2014: 568,044) ordinary shares of Rs 10 each
649,666 649,664
* Fully provided investments
+ Strategic investments
** Includes 24,375,000 shares of Al Hamra Avenue (Private) Limited classified as strategic investment
Provision for diminution in the value of investments against above shares amounts to Rs 649.666 million (2014: Rs 498.983 million)

178 179Annual Report 2015 Annual Report 2015
ANNEXURE I TO THE FINANCIAL STATEMENTSFOR THE YEAR ENDED DECEMBER 31, 2015
4. Preference shares – listed companies
2015 2014
Name of company rate
2015 2014 2015 2014 2015 2014
share of rs 10 each at cost Market values Medium to long term rating assigned (where
available)--------Rupees ‘000------- --------Rupees ‘000-------
2,249,000 2,249,000 Azgard Nine Limited 8.95% Cumulative 22,490 22,490 - - D D
40,000,000 40,000,000 Silk Bank Limited 14% Non-cumulative 100,000 100,000 100,000 100,000 a- A-
convertible
122,490 122,490 100,000 100,000
Provision for diminution in the value of investments against above shares amounts to Rs 22.490 million (2014: Rs 22.490 million)
5. Preference shares – unlisted companies
2015 2014
Name of company rate
2015 2014 2015 2014 2015 2014
share of rs 10 each at cost Market values Medium to long term rating assigned (where
available)--------Rupees ‘000------- --------Rupees ‘000-------
- 7,700,302 Pak Elektron Limited 9.50% Cumulative - 75,000 Not applicable - A Chief Executive: Mr. Naseem Saigol
Covertible
The Bank holds Nil% (2014: 17.13%) of Class A preference shares in investee’s capital.
- 75,000
Provision for diminution in the value of investments against above shares amounts to Nil (2014: rs 18.750 million)
6. Details of investments in open ended mutual funds:
2015 2014
Name of the fund
2015 2014 2015 2014 2015 2014
ordinary shares / certificates of Rs 10 each
at cost Market values Medium to long term rating assigned (where
available)--------Rupees ‘000------- --------Rupees ‘000-------
open ended Mutual funds
820,936 542,665 Faysal Income Growth Fund 87,544 57,919 90,352 60,724 a(f) A+(f)
6,493,784 1,516,220 Faysal Savings Growth Fund 680,606 155,412 689,315 164,268 aa-(f) AA- (f)
949,369 850,000 Faysal Islamic Savings Growth Fund 95,848 85,000 99,048 90,177 a(f) AA- (f)
3,087,368 5,429,608 Faysal Money Market Fund 312,111 549,000 320,839 571,466 aa+(f) AA+(f)
1,046,129 227,692 Faysal Asset Allocation Fund 75,947 15,491 73,992 16,685 Mfr 3-star MFR 4-Star
203,373 203,373 Faysal Balanced Growth Fund 12,480 12,480 14,275 13,624 Mfr 3-star MFR 1-Star
339,322 389,222 Faysal Financial Sector Opportunity Fund 34,000 39,000 35,310 40,954 aa-(f) AA- (f)
4,602 - First Capital Mutual Fund - - 49 - Mfr 2-star -
1,298,536 914,302 1,323,180 957,898
Provision for diminution in the value of investments against the units of above funds amounts to Rs 0.856 million (2014: Rs 1.368 million)
ANNEXURE I TO THE FINANCIAL STATEMENTSFOR THE YEAR ENDED DECEMBER 31, 2015
7. Term Finance Certificates - Listed 2015 2014 2015 2014 2015 2014
at cost Market carrying values Medium to long term rating assigned (where
available)--------Rupees ‘000------- --------Rupees ‘000-------
azgard Nine limited * 51,476 51,476 - - D D31,640 (2014: 31,640) certificates of Rs 5,000 each Mark-up: Different spread over six months KIBOR rate in different years with no floor and capRedemption: 12 unequal semi annual installments, 2012-2015: 47% and 2016-2017: 53% of the outstanding amountMaturity: September 2017Chief Executive Officer: Mr. Ahmed H. Shaikh
telecard limited * 19,305 111,500 - - - - 70,233 (2014: 70,233) certificates of Rs 5,000 each Mark-up: 5.04% above three months KIBOR rate,
with no floor and no capRedemption: Ten unequal semi-annual installments commencing 18 months from the last date of public subscription. Maturity: May 2015Chief Executive Officer: Mr. Syed Aamir Hussain
bank alfalah limited - fifth issue 61,189 61,213 62,306 60,779 aa- AA- 12,250 (2014: 12,250) certificates of Rs. 5,000 eachMark-up: 1.25% above six months KIBOR rate with no floor and capRedemption: 0.30% semi annually in first 90 months, balance of 99.70%at maturity in the 96th MonthMaturity: February 2021Chief Executive Officer: Mr. Atif Aslam Bajwa
131,970 224,189 62,306 60,779 * Fully provided investments
Provision for diminution in the value of investments against above TFCs amounts to Rs 70.781 million (2014: Rs 162.976 million)
8. Term Finance Certificates - Unlisted2015 2014 2015 2014 2015 2014
at cost Market carrying values Medium to long term rating assigned (where
available)--------Rupees ‘000------- --------Rupees ‘000-------
Dewan cement limited (note: 11.3.2) 500,000 500,000 50,000 50,000 - D 100,000 (2014: 100,000) certificates of Rs. 5,000 eachChief Executive Officer: Mr. Dewan M. Yousuf Farooqui
bank alfalah limited - fourth issue 199,520 199,601 202,658 206,552 aa- AA- 40,000 (2014: 40,000) certificates of Rs. 5,000 eachMark-up: 2.50% above six months KIBOR rate with no floor and capRedemption: Three equal semi annual instalments commencing84th months after the issue dateMaturity: December 2017Chief Executive Officer: Mr. Atif Aslam Bajwa
Dewan sugar Mills limited * 8,311 8,511 - - - - 10,000 (2014: 10,000) certificates of Rs 5,000 eachMark-up: SBP discount rate less 2% p.a. with 6% floor and 12% capMaturity: June 2008Chief Executive Officer: Mr. Dewan M. Yousuf Farooqui
707,831 708,112 252,658 256,552
* Fully provided investmentsProvision for diminution in the value of investments against above TFCs amounts to Rs 458.311 million (2014: Rs 458.311 million)

180 181Annual Report 2015 Annual Report 2015
ANNEXURE II TO THE FINANCIAL STATEMENTSFOR THE YEAR ENDED DECEMBER 31, 2015
1S.
Atta
ulla
h / S
.Abi
d H
ussa
in
Bukh
ari
44-C
, Mod
el T
own,
Lah
ore.
S. A
ttaul
lah
/ S.A
bid
Hus
sain
Bu
khar
i35
2021
2316
659
Syed
Alta
f Hus
sain
Sha
h 7
9,97
7 9
2,34
7 -
172,
324
- 9
0,52
2 -
90,5
22
2H
ealth
Car
e H
ospi
tal (
Pvt)
Ltd
D-9
, Blo
ck-A
, Nor
th N
azim
abad
, Ka
rach
i.
1) F
arha
na Q
amar
2)
Qam
ar Z
aman
Kha
n 3)
Sal
man
Zam
an K
han
4) U
sman
Zam
an K
han
4230
1097
0890
4 42
3011
0800
225
4230
1108
0023
7 42
3011
1149
447
1) Q
amar
Zam
an K
han
2) Z
aman
Kha
n 3)
Zam
an K
han
4) Z
aman
Kha
n
26,
050
2,2
86
35,
922
64,2
58
- 1
,745
3
9,40
3 41
,148
3S.
K. In
tern
atio
nal
57-C
, Set
telit
e To
wn,
Raw
alpi
ndi.
1) K
haqa
n W
ahee
d Kh
awaj
a
2) S
aleh
a Kh
aqan
3740
5117
5173
5 37
4050
3926
982
1) W
ahee
d U
ddin
2)
Kha
qan
Wah
eed
- 3
5,26
4 -
35,2
64
- 3
5,26
4 -
35,2
64
4D
osts
ons
Cot
ton
Mills
(Pvt
) Ltd
101-
104,
Cha
pal P
laza
, Has
rat
Moh
ani R
oad,
Kar
achi
.
1) R
aees
Ifta
khar
2)
Zah
id If
takh
ar
3) J
amal
Ifta
khar
3520
2267
4846
1 42
3010
9327
719
4230
1093
2772
3Ift
akha
r Ahm
ed 3
2,04
3 3
0,87
4 -
62,9
17
- 3
4,18
3 -
34,1
83
5Ka
mra
n Fl
our &
Gen
.Mills
(Pvt
) Ltd
.1) 4
13, A
ltam
ash
Roa
d, G
ujja
r Kh
adda
, Mul
tan.
2)
214
7/H
b, In
side
Boh
ar G
ate,
M
ulta
n.
1) S
heik
h M
urat
ab A
li
2) M
st. R
izw
ana
Farh
at36
3020
4060
607
3630
2036
4224
21)
She
ikh
Muh
amm
ad A
kram
2)
Far
hat A
li 1
9,57
5 2
0,45
1 -
40,0
26
- 2
0,64
0 -
20,6
40
6M
ian
Sher
az A
hmed
Hou
se #
35-
D, P
hase
-iii,
Laho
re.
Mia
n Sh
eraz
Ahm
ed35
2012
9394
033
Mia
n Ja
vaid
Sal
eem
19,
600
18,
715
- 38
,315
-
18,
572
1,2
92
19,8
64
7C
are
Knitw
ear (
Pvt)
Ltd.
76/9
-B, A
rif J
an R
oad,
Lah
ore
Can
tt.1)
Om
ar A
shfa
q
2) M
uham
mad
Ash
faq
Mia
n 35
2011
3711
653
35
2011
3711
671
1) M
uham
mad
Ash
faq
Mia
n
2) M
ian
Abdu
l Maj
eed
3,2
83
18,
762
- 22
,045
-
18,
326
- 18
,326
8Sh
arif
Khan
Nai
mat
Hou
se #
657
, Stre
et #
103
, G-9
/4,
Isla
mab
ad.
Shar
if Kh
an N
aim
at37
4050
5047
965
Gul
Kha
n 1
4,16
5 1
5,72
0 -
29,8
85
- 1
5,85
1 9
32
16,7
83
9M
ohka
m F
urni
shin
g C
ompa
ny18
-C-1
, M.M
. Ala
m R
oad,
Gul
berg
, La
hore
.N
aum
an M
aqbo
ol
5440
0025
9965
5Kh
awaj
a M
aqbo
ol E
lahi
1,5
88
15,
842
- 17
,430
-
15,
107
- 15
,107
10Ya
rmou
k Pa
per &
Boa
rd In
d (P
vt) L
td10
8-G
, Mod
el T
own,
Lah
ore.
Mal
ik T
ause
ef-u
r-Reh
man
35
2023
3304
709
Mal
ik M
uham
mad
Han
if 1
9,85
5 1
4,13
5 -
33,9
90
- 1
5,05
5 -
15,0
55
11M
uham
mad
Akh
ter H
ookm
ani
B-19
7, B
lock
-C, N
orth
Naz
imab
ad,
Kara
chi.
Muh
amm
ad A
khte
r H
ookm
ani
4210
1166
7427
3M
. Iqb
al H
ukm
ani
12,
402
12,
644
- 25
,046
-
13,
000
810
13
,810
12M
alik
Ali
Zain
Hou
se #
83,
Kha
yaba
n-e-
Bahr
ia,
Phas
e-V,
DH
A Ka
rach
i.M
alik
Ali
Zain
4230
1337
5828
9M
alik
Nas
eem
Akh
tar
4,7
74
19,
193
- 23
,967
-
13,
316
- 13
,316
13Q
aim
Aut
omat
ive
203,
Prin
ce C
ente
r, Pr
eedy
Stre
et,
Sadd
ar, K
arac
hi.
1) A
bdul
Sat
tar
2) A
bdul
Sub
han
Mem
on
3) M
Abd
ul J
abba
r
4230
1896
1688
1 42
4011
3946
351
4230
1536
2869
1G
hula
m M
uham
mad
Mem
on 2
,980
1
0,43
5 6
,431
19
,846
-
6,2
57
6,4
77
12,7
34
14Sh
oaib
Ahm
ed /
Saim
a Sh
oaib
51-N
, DH
A, L
ahor
e.Sh
oaib
Ahm
ed
3520
1148
8777
9M
ian
Ghu
llam
Ahm
ed 1
6,69
8 1
2,00
8 -
28,7
06
- 1
2,42
7 -
12,4
27
15M
oham
mad
Akb
arE-
174/
A, Iq
bal P
ark,
Stre
et #
12,
D
HA
Laho
re C
antt.
Moh
amm
ad A
kbar
3520
1913
5331
3To
lay
Khan
13,
079
10,
860
- 23
,939
-
11,
071
791
11
,862
16Kh
alid
Mas
ood
B-18
6/6,
Gul
shan
-e-Iq
bal,
Bloc
k 17
, Kar
achi
.Kh
alid
Mas
ood
4230
1377
8143
9Sy
ed M
asoo
d H
assa
n Za
idi
17,
980
10,
414
- 28
,394
-
10,
508
1,3
23
11,8
31
17C
h. S
hahz
ad A
hmed
105
Aura
ngze
b Bl
ock,
New
Gar
den
Tow
n, L
ahor
e.C
h. S
hahz
ad A
hmed
3520
2886
0181
9C
h. G
hula
m N
abi
11,
304
9,7
66
- 21
,070
-
10,
757
962
11
,719
18Kh
adija
Mal
ikH
ouse
# 7
4, K
haya
ban-
e-Ba
hria
, Ph
ase-
V, D
HA
Kara
chi.
Khad
ija M
alik
4230
1088
8950
2M
alik
Nas
eem
Akh
tar
- 1
0,86
5 -
10,8
65
- 1
0,86
5 -
10,8
65
19Kh
awaj
a Im
ran
Saif
Hou
se #
11,
Hun
za B
lock
, Alla
m
Iqba
l Tow
n, L
ahor
e.Kh
awaj
a Im
ran
Saif
3520
2301
9525
3Kh
awaj
a Si
af U
ddin
1
1,60
4 9
,447
-
21,0
51
- 9
,556
8
81
10,4
37
20Sh
ah F
aisa
lPh
ase-
2 Ex
t, Sh
op #
2, P
lot #
59-
C, S
treet
-11,
Kar
achi
.Sh
ah F
aisa
l42
3016
8988
737
Abdu
l Reh
man
8,3
83
9,1
24
- 17
,507
-
9,6
07
602
10
,209
21Sh
ahza
d Iq
bal
106/
2-E,
DH
A La
hore
.Sh
ahza
d Iq
bal
3520
1446
7103
5M
uham
mad
Tuf
ail
12,
738
7,2
92
- 20
,030
-
8,0
52
859
8,
911
Stat
emen
t sho
win
g w
ritte
n-of
f loa
ns o
r any
oth
er fi
nanc
ial r
elie
f of fi
ve h
undr
ed th
ousa
nd ru
pees
or a
bove
pro
vide
d du
ring
the
year
end
ed D
ecem
ber 3
1, 2
015
as re
ferr
ed in
not
e 12
.9 to
thes
e fin
anci
al s
tate
men
ts.
s. N
o.N
ame
of th
e bo
rrow
era
ddre
ssN
ame
of in
divi
dual
s /
Part
ners
/Dire
ctor
sc
Nic
fath
er’s
/ H
usba
nd’s
Nam
e
out
stan
ding
lia
bilit
ies
at b
egin
ning
of y
ear
Prin
cipa
l w
ritte
n-of
f
inte
rest
/ M
ark-
up
writ
ten-
off
oth
er
fina
ncia
l r
elie
fs
prov
ided
tota
l
Prin
cipa
lin
tere
st /
Mar
k-up
oth
ers
tota
l (6
+7+8
)(1
0+11
+12)
12
34
56
78
910
1112
13
------
------
------
------
------
------
------
------
- rup
ees
‘000
-----
------
------
------
------
------
------
------
------
-
ANNEXURE II TO THE FINANCIAL STATEMENTSFOR THE YEAR ENDED DECEMBER 31, 2015
22Fa
shio
n Te
xFl
at #
A-3
07, R
ao H
ight
s, B
lock
-G
Nor
th N
azim
abad
, Kar
achi
.Im
ran
Haf
eez
4210
1653
7552
7Ab
dul H
afee
z -
583
1
0,78
8 11
,371
-
- 8
,269
8,
269
23S.
S C
orpo
ratio
nKo
kan
Mus
lim H
. Soc
iety
, Ala
mgi
r R
oad
Kara
chi.
Saee
d Ah
med
4220
1829
3913
5M
oham
mad
Sae
ed 9
,082
6
,357
2
,907
18
,346
-
4,0
59
4,1
97
8,25
6
24H
.M.F
. Ent
erpr
ises
649-
E-1,
Joh
ar T
own,
Lah
ore.
Ch.
Bas
hara
t Ali
3520
2620
3514
3C
h. A
bdul
Reh
man
3,3
00
8,0
89
- 11
,389
-
8,2
12
- 8,
212
25C
h. S
afda
r Hus
sain
Sah
iH
ouse
# 0
2, S
treet
# 0
2, M
ohal
lah
Shak
rial,
Man
di T
own,
Raw
alpi
ndi.
Ch.
Saf
dar H
ussa
in S
ahi
3740
5015
0850
9C
h. M
uham
mad
Sh
7,3
78
7,8
90
- 15
,268
-
7,5
09
597
8,
106
26Sh
adm
an T
iles
& Sa
nita
ry W
are
Reh
man
Sha
heed
Roa
d, G
ujra
t.Im
ran
Soha
il 34
2010
3939
387
Iftik
har B
hatti
9,7
90
4,6
23
- 14
,413
-
8,0
13
- 8,
013
27M
illeni
um In
dust
ries
(Pvt
) Ltd
.M
illinn
ium
Hou
se, N
oon
Aven
ue,
Mus
lim T
own,
Lah
ore.
1) Y
asir
Meh
moo
d
2) F
araz
Meh
moo
d
3) J
awad
Meh
moo
d
3520
1167
0558
9 35
2016
9137
885
3520
1681
8788
5
1) S
aada
t Meh
moo
d
2) S
aada
t Meh
moo
d
3) S
aada
t Meh
moo
d 1
0,00
0 7
,575
-
17,5
75
- 7
,880
-
7,88
0
28M
uham
mad
Zah
id Im
tiaz
P-42
-44,
Blo
ck Z
, Mad
ina
Tow
n,
Faro
oq S
hahe
ed R
oad
Fais
alab
ad.M
uham
mad
Zah
id Im
tiaz
3310
0927
5690
1C
h. F
azal
Muh
amm
ad K
han
6,0
63
5,8
41
- 11
,904
-
6,2
00
383
6,
583
29Sh
ah M
uham
mad
Kha
n Bo
zai
Flat
# A
-7, 3
rd F
loor
, Plo
t # 1
8-3,
Bl
k-2,
P.E
.C.H
.S K
arac
hi.
Shah
Muh
amm
ad K
han
Boza
i42
2012
8777
065
Ghu
lam
Muh
amm
ad K
han
Boza
i 7
,682
5
,775
1
61
13,6
18
- 6
,153
2
13
6,36
6
30Za
in E
nter
pris
esH
ouse
# 5
1-N
, DH
A La
hore
Can
tt.Ka
mra
n N
azir
3520
1126
2519
5N
azir
Ahm
ed C
haud
hry
6,4
98
7,2
82
- 13
,780
-
6,2
97
- 6,
297
31Fa
m P
harm
aceu
tical
s89
1-B,
Fai
sal T
own,
Lah
ore.
Faiz
-Ur-R
ehm
an F
aizi
35
2024
7099
265
Reh
mat
Ali
4,7
50
5,6
69
- 10
,419
-
5,6
71
- 5,
671
32Ka
shif
Ente
rpris
esH
ouse
#12
, Stre
et #
55, H
aji P
ark,
R
aj G
arh,
Lah
ore.
Muh
amm
ad K
ashi
f 35
2022
9440
337
Muh
amm
ad A
fzal
2,0
00
5,3
03
- 7,
303
- 5
,472
-
5,47
2
33In
terv
ogue
Mur
arap
ur R
oad,
Mal
ka Y
Laa
n D
efen
ce R
oad,
Sia
lkot
.
1) A
leem
Jav
eed
2)
Am
na A
leem
3)
Asi
f Naw
az
3460
3179
6914
3 30
0924
8387
9 30
0900
8005
5Am
in J
avee
d 5
,946
4
,827
-
10,7
73
- 5
,436
-
5,43
6
34Sy
ed A
ale
Raz
a Bu
khar
iH
ouse
# 1
0-A,
Stre
et #
26,
Ali
Park
, Pun
j Pir
Roa
d, Ic
hhra
, La
hore
.Sy
ed A
ale
Raz
a Bu
khar
i35
2029
9441
543
Syed
Fay
yaz
Bukh
ari
5,5
90
5,3
83
- 10
,973
-
5,3
06
- 5,
306
35Irf
an A
hmed
Hou
se #
24,
Blo
ck-A
, Vic
toria
Par
k,
Laho
re.
Irfan
Ahm
ed35
2022
3645
937
Fasi
h U
ddin
4,6
84
4,7
83
- 9,
467
- 4
,826
3
07
5,13
3
36Ja
mil
Perfu
mer
y W
orks
Shop
# U
/111
7, K
alan
Baz
ar,
Raw
alpi
ndi.
Sh. M
uham
mad
Idre
es37
4058
2559
747
Sh. M
uham
mad
Sha
reef
5,5
00
4,9
44
- 10
,444
-
5,0
61
- 5,
061
37Ah
med
Foo
ds (P
vt) L
tdD
-112
, Ahm
ed H
ouse
, Ahm
ed
Aven
ue, S
ite, K
arac
hi.
1) S
haik
h Sh
afiud
din
2) M
ian
Ziau
ddin
Sha
ikh
3) N
ajam
uddi
n Zi
a 4)
Am
adud
din
Zia
4220
1029
8478
5 42
2016
2467
489
4220
1625
5298
9 42
2016
3502
989
1) S
haik
h M
oham
mad
Din
2)
Zam
eer U
ddin
Ahm
ed
Shai
kh
3) M
ian
Ziau
ddin
Sha
ikh
4) M
ian
Ziau
ddin
Sha
ikh
22,
815
6,1
91
- 29
,006
-
4,8
11
- 4,
811
38Sh
eikh
Meh
moo
d Ah
med
204
/ Cha
k R
oad,
Kha
yaba
n C
olon
y #
03, F
aisa
laba
d.Sh
eikh
Meh
moo
d Ah
med
3310
0548
2115
7Sh
eikh
Chi
r 4
,451
3
,793
-
8,24
4 -
4,2
72
271
4,
543
39As
im N
oor
Hou
se #
419
, Blo
ck-B
, Toh
eed
Park
, Gul
shan
Rav
i, La
hore
.As
im N
oor
3520
2050
5813
3M
uham
mad
Bas
hir
4,8
83
4,8
21
- 9,
704
- 4
,466
-
4,46
6
40C
h. S
afda
r Hus
sain
Sah
iH
ouse
# 0
2, G
alli
# 01
, Moh
alla
h Sh
akria
l,Raw
alpi
ndi.
Ch.
Saf
dar H
ussa
in S
ahi
3740
5015
0850
9C
h. M
uham
mad
Sh
3,9
44
4,3
07
- 8,
251
- 4
,103
3
47
4,45
0
41As
hfaq
Ahm
edB-
122,
Blo
ck-1
3, G
ulis
tan-
e-Jo
har,
Kara
chi.
Ashf
aq A
hmed
4220
1802
8630
9M
usht
aq A
hmed
6,7
23
3,3
09
- 10
,032
-
3,7
46
672
4,
418
42Ta
hir L
alli
Hou
se #
329
-G, C
anal
Ave
nue,
M
.A J
ohar
Tow
n, L
ahor
e.Ta
hir L
alli
3320
1548
4051
7M
uham
mad
Hab
ib S
ulta
n La
li 3
,919
1
,370
-
5,28
9 -
1,3
87
2,9
64
4,35
1
Stat
emen
t sho
win
g w
ritte
n-of
f loa
ns o
r any
oth
er fi
nanc
ial r
elie
f of fi
ve h
undr
ed th
ousa
nd ru
pees
or a
bove
pro
vide
d du
ring
the
year
end
ed D
ecem
ber 3
1, 2
015
as re
ferr
ed in
not
e 12
.9 to
thes
e fin
anci
al s
tate
men
ts.
s. N
o.N
ame
of th
e bo
rrow
era
ddre
ssN
ame
of in
divi
dual
s /
Part
ners
/Dire
ctor
sc
Nic
fath
er’s
/ H
usba
nd’s
Nam
e
out
stan
ding
lia
bilit
ies
at b
egin
ning
of y
ear
Prin
cipa
l w
ritte
n-of
f
inte
rest
/ M
ark-
up
writ
ten-
off
oth
er
fina
ncia
l r
elie
fs
prov
ided
tota
l
Prin
cipa
lin
tere
st /
Mar
k-up
oth
ers
tota
l (6
+7+8
)(1
0+11
+12)
12
34
56
78
910
1112
13
------
------
------
------
------
------
------
------
- rup
ees
‘000
-----
------
------
------
------
------
------
------
------
-

182 183Annual Report 2015 Annual Report 2015
ANNEXURE II TO THE FINANCIAL STATEMENTSFOR THE YEAR ENDED DECEMBER 31, 2015 St
atem
ent s
how
ing
writ
ten-
off l
oans
or a
ny o
ther
fina
ncia
l rel
ief o
f five
hun
dred
thou
sand
rupe
es o
r abo
ve p
rovi
ded
durin
g th
e ye
ar e
nded
Dec
embe
r 31,
201
5 as
refe
rred
in n
ote
12.9
to th
ese
finan
cial
sta
tem
ents
.
s. N
o.N
ame
of th
e bo
rrow
era
ddre
ssN
ame
of in
divi
dual
s /
Part
ners
/Dire
ctor
sc
Nic
fath
er’s
/ H
usba
nd’s
Nam
e
out
stan
ding
lia
bilit
ies
at b
egin
ning
of y
ear
Prin
cipa
l w
ritte
n-of
f
inte
rest
/ M
ark-
up
writ
ten-
off
oth
er
fina
ncia
l r
elie
fs
prov
ided
tota
l
Prin
cipa
lin
tere
st /
Mar
k-up
oth
ers
tota
l (6
+7+8
)(1
0+11
+12)
12
34
56
78
910
1112
13
------
------
------
------
------
------
------
------
- rup
ees
‘000
-----
------
------
------
------
------
------
------
------
-
43Tr
ade
Valle
y54
-J-Ii
, Wap
da T
own,
Lah
ore.
Amja
d Bu
tt35
2024
0013
353
Bash
ir Ah
med
But
t 1
,129
4
,013
-
5,14
2 -
3,9
67
- 3,
967
44Pa
kist
an R
ice
Trad
ers
Shop
# 0
3, D
awoo
d Te
rrace
, Ze
1 B1
6, G
ulsh
an-e
-Iqba
l, Ka
rach
i.M
anso
or A
hmed
4220
1444
8522
7M
uham
mad
Sae
ed A
hmed
2,6
80
56
3,8
40
6,57
6 -
- 3
,957
3,
957
45M
uham
mad
Irfa
nH
ouse
# 3
5, M
umdo
ot B
lock
, M
usta
fa T
own,
Lah
ore.
Muh
amm
ad Ir
fan
3520
2036
8453
7C
h. M
uham
mad
You
saf
4,8
66
3,2
60
- 8,
126
- 3
,306
2
98
3,60
4
46Ja
hanz
eb M
irH
ouse
# 2
79, S
treet
# 0
2, L
ane
# 4,
Mul
tan.
Jaha
nzeb
Mir
3740
5464
2229
7Au
rang
zeb
Mir
3,7
48
3,1
65
- 6,
913
- 3
,246
2
73
3,51
9
47N
isar
Ahm
ed B
utt &
/Or
Plot
# 2
06, F
lat #
602
,Gol
den
Palm
App
artm
ent,
Baha
dura
bad,
Ka
rach
i.N
isar
Ahm
ed B
utt &
/Or
4220
1037
5060
1Ba
narv
s Kh
an 3
,267
3
,121
-
6,38
8 -
3,1
51
328
3,
479
48M
urta
za J
afri
143
H, M
odel
Tow
n, L
ahor
e.M
urta
za J
afri
3520
2707
8474
3Yo
usuf
Am
in 3
,556
7
47
- 4,
303
- 3
,080
3
78
3,45
8
49R
oyal
Tra
ders
Roy
al T
rade
rs, S
hhsh
Mah
al P
laza
, G
.T.R
oad,
Now
sher
a.Q
aise
r Zar
een
Afrid
i17
3014
3573
557
Zare
en G
ul A
fridi
2,9
99
3,0
50
- 6,
049
- 3
,361
-
3,36
1
50Ea
st W
est T
rave
l & Im
peria
l R
ent-A
-Car
Offi
ce #
119
-A, Q
uaid
-e-A
zam
C
how
k, M
ian
Muh
amm
ad R
oad,
M
irpur
A.K
.C
h. Im
tiaz
Raz
a81
3020
7700
879
Ch.
Ghu
lam
Ahm
ad R
aza
4,7
00
3,3
83
- 8,
083
- 3
,343
-
3,34
3
51N
eelo
fer A
dnan
Hou
se #
11
5-B,
Joh
ar T
own
Laho
re.
Nee
lofe
r Adn
an35
2022
6956
018
Adna
n Fa
rrukh
Has
san
4,1
80
2,8
34
- 7,
014
- 3
,035
2
82
3,31
7
52Su
ltan
Mah
moo
d Kh
an62
-B, A
rmy
Flat
s, S
arfa
raz
Rafi
qui
Roa
d, L
ahor
e C
antt.
Sulta
n M
ahm
ood
Khan
3520
1071
9160
9Ab
dul R
ehm
an K
han
814
3
,341
-
4,15
5 -
3,2
87
- 3,
287
53Em
pire
Pha
rmac
eutic
als
(Pvt
) Ltd
91-A
-III,
Joha
r Tow
n, L
ahor
e.
1) Z
afar
Ulla
h Kh
an
2) D
r. Am
eer H
amza
3)
Am
ar N
avee
d
4) M
rs. J
over
ia A
ltaf Q
azi
3430
2122
0850
3
3430
2122
1297
3 34
3021
2212
965
3430
2118
0350
2
Nas
r Ulla
h Kh
an, Z
afar
Ulla
h Kh
an 3
,497
3
,147
-
6,64
4 -
3,2
84
- 3,
284
54Sy
ed J
affa
r Ali
Naq
viH
ouse
# 5
47-C
, Gul
gash
t Col
ony,
M
ulta
n.Sy
ed J
affa
r Ali
Naq
vi36
3029
5130
559
Syed
Sho
ukat
5,5
03
2,9
96
- 8,
499
- 2
,936
2
76
3,21
2
55M
uham
mad
Kam
ran
6th
Zam
zam
a St
reet
, DH
A Ph
ase
V, K
arac
hi.
Muh
amm
ad K
amra
n42
3016
9863
045
Nis
ar A
hmed
She
ikh
4,7
48
2,8
42
- 7,
590
- 3
,195
-
3,19
5
56Sy
ed H
aroo
n Az
izAz
iz A
ssoc
iate
s, 1
/7-B
, Moh
amm
ad
Ali H
ousi
ng S
ocie
ty, K
arac
hi.
Syed
Har
oon
Aziz
4230
1429
9539
1Az
iz A
hmed
3,1
89
2,7
97
- 5,
986
- 2
,852
3
14
3,16
6
57M
alik
Nas
eem
Akh
tar
Hou
se #
74
Khay
aban
-e-B
ahria
, Ph
ase-
V, D
HA
Kara
chi.
Mal
ik N
asee
m A
khta
r42
3010
9800
535
Mal
ik A
bdul
Haq
3,2
00
3,0
70
- 6,
270
- 3
,075
-
3,07
5
58Ea
ster
n Te
ch &
HR
CP(
pvt)
Lim
ited
Off
5, 6
-22,
224
/A, S
abza
zar
Ran
ge, R
oad
Raw
alpi
ndi.
1) N
asir
Saud
Ahm
ad
2) S
yeda
Riff
at S
aud
3740
5237
7704
7 37
4058
3670
500
1) A
hmad
Sha
rif
2) N
asir
Saud
9,7
04
3,0
38
- 12
,742
-
2,9
91
- 2,
991
59Al
i Abi
d50
-A/1
1, L
awra
nce
Roa
d, L
ahor
e.Al
i Abi
d35
2022
4673
123
Akht
ar A
li 4
,443
5
,027
-
9,47
0 -
2,4
25
424
2,
849
60Ag
ha S
adaa
t Ali
B-14
5, B
lock
-18,
Gul
shan
-e-Iq
bal
Kara
chi,
Agha
Sad
aat A
li42
2012
6425
823
Asad
Ali
Agha
4,3
06
2,9
51
46
7,30
3 -
2,6
82
56
2,73
8
61Sh
abbi
r Ahm
edFl
# B
-7, 3
rd F
loor
, Sta
rt Sh
elte
r Bl-
18, G
ulis
tan-
e-Jo
har,
Kara
chi.
Shab
bir A
hmed
4220
1612
5540
5Q
adir
Bux
1,4
58
1,2
12
- 2,
670
- 1
,323
1
,324
2,
647
62M
uham
mad
Kha
lidH
ouse
# P
-137
0, S
treet
# 0
6, N
isar
C
olon
y, F
aisa
laba
d.M
uham
mad
Kha
lid33
1001
2108
159
Muh
amm
ad D
i 2
,724
2
,537
-
5,26
1 -
2,4
56
173
2,
629
63Ka
mal
ia P
oultr
y Br
eedi
ng F
arm
sR
ajan
a R
oad
Kam
alia
, Dis
tt. T
oba
Tek
Sing
h.
Muh
amm
ad Iq
bal
Sajid
Hus
sain
Kh
alid
Hus
sain
Fa
iz E
lahi
3330
2225
6246
1 33
3022
2562
463
3330
2225
6251
3 33
3022
1819
994
Mia
n Ah
mad
M
uham
mad
Iqba
l M
uham
mad
Iqba
l M
uham
mad
Iqba
l
13,
764
7,6
27
- 21
,391
-
2,6
00
- 2,
600
ANNEXURE II TO THE FINANCIAL STATEMENTSFOR THE YEAR ENDED DECEMBER 31, 2015
64Pr
ogre
ssiv
e En
gine
erin
gA-
68, A
rafa
t Tow
n, B
lock
-M, N
orth
N
azim
abad
, Kar
achi
.M
usht
aq H
ussa
in H
yder
i42
1016
4147
881
Ham
id H
ussa
in H
yder
i 1
,869
2
,201
-
4,07
0 -
2,4
30
- 2,
430
65R
asha
Flo
ur &
Gen
eral
Mills
(P
vt)
Ltd
Raj
ar, G
.T R
oad,
Sar
ai A
lam
gir
Khar
ian.
1) A
rsha
d R
asha
2)
Asg
har R
asha
3)
Nas
ira A
rsha
d
4) F
azal
Beg
um
5783
4238
1032
1 34
2020
8263
243
5783
4272
5417
2 34
2020
8055
742
Arsh
ad R
asha
1,5
94
2,6
99
- 4,
293
- 2
,422
-
2,42
2
66G
rand
hill
Mar
riage
Hal
lSi
alko
t Qila
, Sia
lkot
Mia
n Ja
veed
Ibra
r Ul H
aq34
6035
1084
711
Mia
n Fa
rzan
d Al
i 9
99
2,3
03
- 3,
302
- 2
,369
-
2,36
9
67N
avee
d Ej
az P
arac
haH
34,
Stre
et 2
7, V
alle
y R
oad,
W
esrb
ridge
Raw
alpi
ndi.
Nav
eed
Ejaz
Par
acha
3740
5371
3662
5Ej
az H
ussa
in P
arac
ha 1
0,00
0 1
,826
-
11,8
26
- 2
,196
-
2,19
6
68U
nite
d C
onst
ruct
ion
Com
pany
H #
24-
A, S
ecto
r B-1
, Blo
ck-1
0,
Tow
nshi
p, L
ahor
e.Fa
rooq
Ahm
ad34
1027
1765
587
Moh
amm
ad R
amza
n -
6,4
34
- 6,
434
- 2
,096
-
2,09
6
69H
ussa
in B
roth
ers
12- K
abir
Stee
r, U
rdu
Baza
r, La
hore
.M
uham
mad
Hus
sain
3520
2936
8350
1Sa
rdar
Muh
amm
ad 1
,765
1
,793
-
3,55
8 -
2,0
34
- 2,
034
70M
uham
mad
Irfa
nR
ufi L
ake
Driv
e Bl
k 1,
18
Gul
ista
n-e-
Jauh
ar K
arac
hi.
Muh
amm
ad Ir
fan
4220
1055
7227
5M
uham
mad
Isla
m 1
,744
1
,912
-
3,65
6 -
1,9
35
- 1,
935
71M
uham
mad
Arif
Man
di F
aiza
bad,
Teh
sil N
anka
na
Sahi
b.M
uham
mad
Arif
3540
2334
2899
9Ba
rkat
Ali
- 3
,049
-
3,04
9 -
1,9
17
- 1,
917
72Fa
lak
Naz
Nas
ir H
ashm
iS
4B/1
St.#
22,
Off
Khay
aban
-e-
Tanz
eem
, Pha
se V
DH
A Ka
rach
i.Fa
lak
Naz
Nas
ir H
ashm
i42
3011
2273
172
Nas
ir R
izw
an H
ashm
i -
- 3
,081
3,
081
- -
1,8
89
1,88
9
73Sh
ahid
Meh
moo
d71
-Stre
et, A
llam
a Iq
bal T
own
,Guj
ranw
ala
Can
tt.Sh
ahid
Meh
moo
d34
1012
6656
593
Muh
amm
ad A
bdul
lah
2,1
69
1,4
58
- 3,
627
- 1
,681
-
1,68
1
74Al
-Was
ay C
onst
ruct
ion
Co.
(P
vt) L
td44
-B-I,
Gul
berg
-Iii,
Laho
re.
1) S
yed
Asad
Sul
eman
H
aide
r 2)
Sye
d H
amid
Ria
z H
aide
r
3520
2354
4149
9
3520
2343
9744
9Sy
ed R
iaz
Hai
der
3,5
00
1,8
32
- 5,
332
- 1
,607
-
1,60
7
75Ta
bass
um C
opy
Hou
seH
ouse
# 2
86, B
lock
-D, G
ulsh
an
Rav
i, La
hore
.M
uham
mad
Am
jad
3520
2509
1579
3Ab
dul R
ashe
ed -
1,5
79
- 1,
579
- 1
,579
-
1,57
9
76At
tiq F
aroo
qH
ouse
# P
-81,
Meh
ar R
afee
q Bl
ock
-3, G
reen
Tow
n, M
illat R
oad,
Fa
isal
abad
.At
tiq F
aroo
q33
1001
6113
633
Muh
amm
ad F
aroo
q 2
,190
1
,346
-
3,53
6 -
1,3
96
177
1,
573
77O
baid
Cha
pra
H #
56/
2, S
treet
-5th
, Kha
yaba
n-e-
Mom
in, P
hase
-5 D
HA
Kara
chi.
Oba
id C
hapr
a42
3014
4343
241
Has
him
Cha
pra
7,2
39
1,3
91
- 8,
630
- 2
95
1,2
54
1,54
9
78Ba
bar G
ener
al S
tore
Hou
se #
152
-A, M
umta
z St
reet
, G
arhi
Sha
hu, L
ahor
e.M
uham
mad
Nas
eer B
abar
3520
2148
8892
7C
haud
hry
Taj D
in 1
,600
1
,474
-
3,07
4 -
1,5
33
- 1,
533
79C
h. N
asru
llah
Khan
War
riach
Hou
se, H
aira
wal
a C
how
k,
G.T
Roa
d, G
ujra
t.C
h. N
asru
llah
Khan
3420
1480
2514
7C
h. A
hmad
Kha
n 3
,960
1
,867
-
5,82
7 -
1,5
16
6
1,52
2
80Sh
eikh
Muh
amm
ad A
jaib
H #
87,
War
d #
8, M
ohal
la R
ajga
n,
Guj
ar K
han.
Shei
kh M
uham
mad
Aja
ib37
4010
5926
229
Shei
kh F
azal
Haq
1,6
52
1,4
28
- 3,
080
- 1
,313
-
1,31
3
81Sy
ed H
asna
t Ahm
ed B
okha
riH
# 1
27, S
t # 1
7-A,
Cha
kala
Sc
hem
e 3,
Raw
alpi
ndi.
Syed
Has
nat A
hmed
Bok
hari
1730
1154
8550
7Sy
ed M
umta
z Ah
med
Bo
khar
i 1
,564
1
,208
-
2,77
2 -
1,1
95
102
1,
297
82Fa
qir M
uham
mad
Hou
se #
129
-A, P
eopl
es C
olon
y #
02, M
uham
mad
i Cho
wk,
Fa
isal
abad
.Fa
qir M
uham
mad
3310
0088
2324
7At
ta M
uham
mad
2,4
07
1,1
20
- 3,
527
- 1
,150
9
2 1,
242
83Su
nny
Com
ress
or H
ouse
Hou
se #
3, S
treet
# 2
3, K
ashm
irian
M
ozan
g, L
ahor
e.Sh
eikh
Zah
oor A
hmad
3520
2078
7206
5Sh
eikh
Ghu
lam
Nab
i -
1,3
46
- 1,
346
- 1
,203
-
1,20
3
84Sh
ahab
Idre
esC
/O G
M, F
inan
ce, S
aps
Com
plex
, M
ali A
venu
e Ji
nnah
Int A
irpor
t, Ka
rach
i.Sh
ahab
Idre
es37
4050
2450
019
Shei
kh M
uham
mad
Idre
es 1
,371
8
43
- 2,
214
- 9
20
138
1,
058
85Sh
ell L
ogis
tics
Plot
# 1
/6, R
ow-N
, Blo
ck-6
, M
ehbo
ob M
anzi
l, P.
E.C
.H.S
, Ka
rach
i.
1) Z
ehra
She
eraz
2)
She
eraz
Ria
z42
3012
7957
778
4210
1892
2351
1R
iaz
Ahm
ed 3
,289
6
58
- 3,
947
- 1
,045
-
1,04
5
Stat
emen
t sho
win
g w
ritte
n-of
f loa
ns o
r any
oth
er fi
nanc
ial r
elie
f of fi
ve h
undr
ed th
ousa
nd ru
pees
or a
bove
pro
vide
d du
ring
the
year
end
ed D
ecem
ber 3
1, 2
015
as re
ferr
ed in
not
e 12
.9 to
thes
e fin
anci
al s
tate
men
ts.
s. N
o.N
ame
of th
e bo
rrow
era
ddre
ssN
ame
of in
divi
dual
s /
Part
ners
/Dire
ctor
sc
Nic
fath
er’s
/ H
usba
nd’s
Nam
e
out
stan
ding
lia
bilit
ies
at b
egin
ning
of y
ear
Prin
cipa
l w
ritte
n-of
f
inte
rest
/ M
ark-
up
writ
ten-
off
oth
er
fina
ncia
l r
elie
fs
prov
ided
tota
l
Prin
cipa
lin
tere
st /
Mar
k-up
oth
ers
tota
l (6
+7+8
)(1
0+11
+12)
12
34
56
78
910
1112
13
------
------
------
------
------
------
------
------
- rup
ees
‘000
-----
------
------
------
------
------
------
------
------
-

184 185Annual Report 2015 Annual Report 2015
ANNEXURE II TO THE FINANCIAL STATEMENTSFOR THE YEAR ENDED DECEMBER 31, 2015 St
atem
ent s
how
ing
writ
ten-
off l
oans
or a
ny o
ther
fina
ncia
l rel
ief o
f five
hun
dred
thou
sand
rupe
es o
r abo
ve p
rovi
ded
durin
g th
e ye
ar e
nded
Dec
embe
r 31,
201
5 as
refe
rred
in n
ote
12.9
to th
ese
finan
cial
sta
tem
ents
.
s. N
o.N
ame
of th
e bo
rrow
era
ddre
ssN
ame
of in
divi
dual
s /
Part
ners
/Dire
ctor
sc
Nic
fath
er’s
/ H
usba
nd’s
Nam
e
out
stan
ding
lia
bilit
ies
at b
egin
ning
of y
ear
Prin
cipa
l w
ritte
n-of
f
inte
rest
/ M
ark-
up
writ
ten-
off
oth
er
fina
ncia
l r
elie
fs
prov
ided
tota
l
Prin
cipa
lin
tere
st /
Mar
k-up
oth
ers
tota
l (6
+7+8
)(1
0+11
+12)
12
34
56
78
910
1112
13
------
------
------
------
------
------
------
------
- rup
ees
‘000
-----
------
------
------
------
------
------
------
------
-
86Kh
alid
Nae
em A
njum
44-W
-11,
Mad
ina
Tow
n,
Fais
alab
ad.
Khal
id N
aeem
Anj
um33
1000
5582
629
Ghu
lam
Muh
amm
ad 1
,084
8
56
- 1,
940
- 9
26
114
1,
040
87M
irza
Sham
im B
aig
Hou
se #
C-1
30, S
aman
abad
Fa
isal
abad
.M
irza
Sham
im B
aig
3310
0212
4362
1M
irza
Bash
ir 1
,311
8
53
- 2,
164
- 8
45
125
97
0
88H
aris
Tra
vel S
ervi
ces
Har
is T
rave
ls S
ervi
ces,
Rai
lway
R
oad,
Guj
jar K
han,
Dis
trict
R
awal
pind
i.C
h. M
ehm
ood
Hus
sain
6110
1815
5750
5C
h. S
hada
m H
ussa
in 1
,143
1
,080
-
2,22
3 -
917
-
917
89C
haud
hary
Pro
tein
Far
ms
F-1/
12 C
anal
Cot
tage
s, N
ew
Mus
lim T
own,
Lah
ore.
Yasi
r Jav
ed C
h35
2020
8539
697
Jave
d Ak
bar C
h. 7
,900
1
,997
-
9,89
7 -
900
-
900
90Ift
ikha
r Ahm
ed V
irkBa
ddo
Virk
an, P
O P
ir Ko
t, Te
hsil
& D
istri
ct S
heik
hupu
ra.
Iftik
har A
hmed
Virk
3540
4155
9210
5M
uham
mad
Mun
sha
Virk
2,1
22
1,5
83
- 3,
705
- 9
00
- 90
0
91M
oto
Trav
els
(Pvt
) Ltd
1) 1
0-A,
Mod
el C
olon
y, Q
-Blo
ck,
Mod
el T
own,
Lah
ore
2) 6
49, N
isht
er B
lock
, Alla
ma
Iqba
l To
wn,
Lah
ore
3) 6
49, N
isht
ar B
lock
, Alla
ma
Iqba
l To
wn,
Lah
ore
4) 1
85-D
, Fai
sal T
own,
Lah
ore
5) 3
73-A
-Iii,
Joha
r Tow
n, L
ahor
e 6)
29-
B-I,
Dav
is R
oad,
Lah
ore.
1) M
alik
Qas
eem
-Ud-
Din
Kh
alid
2)
Mal
ik B
ashi
r-Ud-
Din
Kha
lid
3) M
alik
Usa
ma
Bash
ir 4)
Mia
n Ab
dul S
atta
r 5)
Mal
ik W
asee
m-U
d-D
in
Khal
id
6) M
uham
mad
Ars
had
Hus
sain
1720
1847
1265
1 35
2029
2923
615
3520
2098
2211
9 35
2022
5150
947
3520
2811
2022
1 35
2001
4959
385
1) M
alik
Sal
ah-u
d-D
in K
halid
2)
Mal
ik S
alah
-ud-
Din
Kha
lid
3) M
alik
Bas
hir A
hmed
4)
Mia
n D
in M
uham
mad
5)
Mal
ik S
alah
-ud-
Din
Kha
lid
6) M
uham
mad
Ram
zan
Shah
4,8
62
1,4
90
- 6,
352
- 8
90
- 89
0
92M
uham
mad
Sha
hid
Offi
ce #
03,
2nd
Flo
or, S
ham
i Pl
aza,
D-G
roun
d, F
aisa
laba
d.M
uham
mad
Sha
hid
3310
0810
7336
7R
ehm
at A
li 1
,101
7
92
- 1,
893
- 7
95
83
878
93C
h. M
asoo
d Ah
med
But
tar
Hou
se #
77-
A, S
treet
# 0
9, S
arda
r St
reet
, Has
eeb
Shah
eed
Col
ony,
Fa
isal
abad
.C
h. M
asoo
d Ah
med
But
tar
3310
0273
9943
9C
h. S
haka
r Ul D
in 9
85
767
-
1,75
2 -
793
7
9 87
2
94N
asir
Saee
d Kh
anLa
l Bag
h Sh
ujaa
bad,
Dis
tt. M
ulta
n.N
asir
Saee
d Kh
an36
3045
6243
801
Muh
amm
ad S
aeed
Kha
n -
1,0
98
- 1,
098
- 8
48
- 84
8
95Ka
reem
Bux
Cha
h Ka
ri W
ala,
Qas
ba M
aral
, P/O
Ay
az A
bad
Mar
ral,
Teh.
& D
istt.
M
ulta
n.Ka
reem
Bux
36
3022
5361
285
Mal
ik M
uham
mad
Ram
zan
- 1
,260
-
1,26
0 -
842
-
842
96M
alik
Muh
amm
ad R
ashi
dN
a-21
0, N
ew M
alpu
r, S.
Tow
n R
awal
pind
i.M
alik
Muh
amm
ad R
ashi
d37
4050
4553
885
Al H
aj M
Ism
ail
2,9
01
544
-
3,44
5 -
751
6
7 81
8
97H
amee
dulla
h Sh
ahFl
at #
B-9
, Sup
er C
ente
r, Bl
ock-
7,
F.B.
Are
a Ka
rach
i.H
amee
dulla
h Sh
ah42
1019
9129
773
Ziar
at S
hah
1,0
67
548
-
1,61
5 -
612
1
00
712
98Fa
rzan
a Sh
ah J
ahan
Flat
# 4
04, M
arin
e H
eigh
ts-3
, Bl
ock-
2, C
lifto
n Ka
rach
i.Fa
rzan
a Sh
ah J
ahan
4220
1062
5419
6Sh
amsu
ddin
2,0
13
501
-
2,51
4 -
545
1
49
694
99M
uham
mad
Moh
sin
Khan
Bast
i Far
idab
ad, B
ahaw
alpu
r.M
uham
mad
Moh
sin
Khan
3620
2096
4912
7Kh
an U
mm
ar A
li Kh
an 1
,300
1
,280
-
2,58
0 -
685
-
685
100
Muh
amm
ad A
shra
f Kau
sar
33 J
/1, D
HA
Laho
re.
Muh
amm
ad A
shra
f Kau
sar
3520
1136
0170
7 Sh
er K
han
444
1
56
223
82
3 1
26
227
3
22
675
101
Was
eem
Raz
aPl
ot #
83
A-2,
Nea
r Cus
tom
Hou
se,
Sate
llite
Tow
n, R
awal
pind
i.W
asee
m R
aza
3740
5480
6637
9Ab
dul A
ziz
370
1
99
454
1,
023
- 1
55
511
66
6
102
Adee
la N
asre
en /
Ria
z Fa
ridD
hool
Faq
ir Bu
x, P
/O B
asirp
ur,
Tehs
il D
epal
pur,
Dis
trict
Oka
ra.
1) A
deel
a N
asre
en
2) R
iaz
Farid
3530
1121
5671
4 35
3010
7610
275
Ria
z Fa
rid -
1,0
26
- 1,
026
- 6
00
- 60
0
103
Muh
amm
ad S
ohai
l Cha
udar
yD
-12,
Blo
ck 4
, F.B
. Are
a Ka
rach
i.M
uham
mad
Soh
ail C
haud
ary
4210
1177
6110
5 C
h. F
arza
nd A
li 2
56
76
250
58
2 -
217
3
64
581
104
Fays
al J
amsh
aid
H #
333
, St #
16
G-1
0/2,
Is
lam
abad
.Fa
ysal
Jam
shai
d61
1016
9996
019
Jam
shai
d Kh
an 5
74
97
249
92
0 -
233
3
34
567
ANNEXURE II TO THE FINANCIAL STATEMENTSFOR THE YEAR ENDED DECEMBER 31, 2015
105
Um
er G
arm
ents
92 M
ain
Baza
r, C
-Blo
ck, V
ehar
i.M
uham
mad
Kal
eem
3660
3523
1842
9M
uham
mad
Qam
ar -
556
-
556
- 5
56
- 55
6
106
Muh
amm
ad A
hmed
/ M
aqso
odVi
llage
Sai
dra
Kala
n, P
/O A
hmal
Pu
r, Te
hsil
& D
istt.
Sia
lkot
.1)
Muh
amm
ad A
hmed
2)
Maq
sood
3460
3919
2136
3
3460
3496
4465
5Fa
zal H
ussa
in B
loch
3,3
59
410
-
3,76
9 -
547
-
547
107
Man
soor
Ahm
ed K
han
12 S
, Pha
se 2
, DH
A La
hore
.M
anso
or A
hmed
Kha
n35
2011
3550
035
Zam
ir Ah
med
Kha
n 4
31
29
66
526
431
2
9 7
2 53
2
108
Moh
amm
ad K
halid
Hou
se #
517
, Pha
se 1
, Mal
ir D
efen
ce S
ocie
ty, M
alir
Can
tt,
Kara
chi.
Moh
amm
ad K
halid
4230
1311
1565
9In
ayat
Ali
161
1
02
149
41
2 -
205
3
11
516
109
Irfan
Meh
tab
102/
Ii, 5
th S
treet
, Off
Khay
aban
-e-
Rah
at, P
hase
6, D
HA
Kara
chi.
Irfan
Meh
tab
4230
1642
5680
1M
ehta
b U
Ddi
n 4
69
164
2
20
853
127
1
68
217
51
2
634
,316
6
16,6
04
64,
787
1,3
15,7
07
684
5
97,1
74
87,
141
684
,999
Stat
emen
t sho
win
g w
ritte
n-of
f loa
ns o
r any
oth
er fi
nanc
ial r
elie
f of fi
ve h
undr
ed th
ousa
nd ru
pees
or a
bove
pro
vide
d du
ring
the
year
end
ed D
ecem
ber 3
1, 2
015
as re
ferr
ed in
not
e 12
.9 to
thes
e fin
anci
al s
tate
men
ts.
s. N
o.N
ame
of th
e bo
rrow
era
ddre
ssN
ame
of in
divi
dual
s /
Part
ners
/Dire
ctor
sc
Nic
fath
er’s
/ H
usba
nd’s
Nam
e
out
stan
ding
lia
bilit
ies
at b
egin
ning
of y
ear
Prin
cipa
l w
ritte
n-of
f
inte
rest
/ M
ark-
up
writ
ten-
off
oth
er
fina
ncia
l r
elie
fs
prov
ided
tota
l
Prin
cipa
lin
tere
st /
Mar
k-up
oth
ers
tota
l (6
+7+8
)(1
0+11
+12)
12
34
56
78
910
1112
13
------
------
------
------
------
------
------
------
- rup
ees
‘000
-----
------
------
------
------
------
------
------
------
-

186 187Annual Report 2015 Annual Report 2015
ANNEXURE III TO THE FINANCIAL STATEMENTSFOR THE YEAR ENDED DECEMBER 31, 2015
The Bank is operating 68 Islamic banking branches (2014: 58) and 1 Islamic sub-branch (2014: 1). The statement of financial position and profit and loss account of these branches for the year ended December 31, 2015 are as follows:
(a) Statement of financial position as at December 31, 2015 Note 2015 2014 ---------Rupees ‘000---------
assetsCash and balances with treasury banks 3,023,428 2,929,341 Balances with other banks 79,307 158,367 Due from financial institutions 11,923,951 - Investments 9,959,868 20,694,546 Islamic financing and related assets (A3) 20,286,653 11,373,893 Operating fixed assets 469,907 204,408 Deferred tax assets - 19,727 Other assets 338,394 825,349
46,081,508 36,205,631 liabilitiesBills payable 578,799 320,765 Due to financial institutions - 1,350,000 Deposits and other accounts (C) - Current accounts 13,060,570 12,482,760 - Saving accounts 10,145,581 7,781,254 - Term deposits 7,169,760 9,697,708 - Others 50,334 34,876 - Deposits from financial institutions - remunerative 1,327,324 355,698 - Deposits from financial institutions - non-remunerative 5,495 5,797 Due to head office 10,280,307 1,818,327 Deferred tax liabilities 2,029 - Other liabilities 515,807 593,652
43,136,006 34,440,837 Net assets 2,945,502 1,764,794
rePreseNteD byIslamic banking fund 1,380,000 880,000 Reserves - - Unappropriated profit 1,436,604 921,429
2,816,604 1,801,429 Surplus / (deficit) on revaluation of assets - net of tax 128,898 (36,635)
2,945,502 1,764,794
ANNEXURE III TO THE FINANCIAL STATEMENTSFOR THE YEAR ENDED DECEMBER 31, 2015
2015 2014 ---------Rupees ‘000---------
(a1) remuneration to shariah advisor 3,383 2,844
(a2) cHarity fuND
opening balance 337 233 Additions during the year 1,597 1,047 Payments / utilization during the year (900) (943)closing balance 1,034 337
Sector wise details of charity disbursementHealth 700 643 Education 100 200 Social Work 100 100
900 943
The charity has been paid by the Bank on account of late payment penalties received from customers and profit earned thereon.
Note 2015 2014 ---------Rupees ‘000---------
(a3) islamic financing and related assets (a3.1) 20,286,653 11,373,893
(a3.1) islamic Mode of financing
Murabaha 1,060,626 1,788,521 Musharika cum Ijara 5,914 2,752 Diminishing Musharika 15,261,012 7,637,270 Advance against Murabaha Financing 261,499 227,605 Advance against Murabaha ERF - - Advanced against Diminishing Musharika 2,164,556 1,198,877 Fixed Assets Ijara Financing (net) 948,381 514,532 Advance against Ijara 584,665 4,336
20,286,653 11,373,893

188 189Annual Report 2015 Annual Report 2015
ANNEXURE III TO THE FINANCIAL STATEMENTSFOR THE YEAR ENDED DECEMBER 31, 2015
(b) Profit and loss account 2015 2014 ---------Rupees ‘000---------
Profit / return earned on financing and investments 3,049,738 2,926,100 Profit / return expensed 1,506,158 1,377,042 Net spread earned 1,543,580 1,549,058
Provision against non-performing financings - net 32,064 25,156 Provision against consumer financings - general 9,848 8,548 Reversal against provision for diminution in value of
investments - - Recoveries against written off debts - (556)
41,912 33,148 1,501,668 1,515,910
other incomeFee, commission and brokerage income 122,543 92,188 Dividend income - - Income from dealing in foreign currencies - net 4,075 16,868 Gain on sale of securities - net - - Unrealized gain / (loss) on revaluation of investments
classified as held for trading - - Other income 1,887 3,760 Total other income 128,505 112,816
1,630,173 1,628,726
other expensesAdministrative expenses 909,325 1,128,647 Other provision / write-offs 205,673 - Other charges - - Total other expenses 1,114,998 1,128,647
515,175 500,079 Extraordinary items / unusual items - - Profit for the year 515,175 500,079
(c) sectors and avenues of deposits and funds
The deposits and funds accepted under the pools mentioned in note (D) are provided to diversified sectors and avenues of the economy / business.
2015 2014 ---------Rupees ‘000---------
Government and other securities 21,883,819 20,694,546 Textiles, chemicals, pharmaceuticals, food and allied 1,451,578 2,141,264 Production and transmission of energy 16,022,292 7,130,054 Transportation 2,240,896 1,575,048 Construction / Housing 817,391 731,120
42,415,976 32,272,032
Musharaka investments from the SBP under Islamic Export Refinance Scheme (IERS) are channelled towards the export sector of the economy.
ANNEXURE III TO THE FINANCIAL STATEMENTSFOR THE YEAR ENDED DECEMBER 31, 2015
(D) Pool management
The Bank’s Islamic Banking Division (FBL IBD) has maintained the following pools:
i. ‘General Pool’ for local and foreign currency depositsii. ‘Islamic Export Refinance Pool’ iii. ‘Treasury Musharaka Pool’
Key features and risk & reward characteristics of all pools
- The ‘General Pool’ for both local and foreign currency is catered for all FBL IBD depositors and provide profit / loss based on Modaraba and Musharaka.
- The IERS Pool caters the ‘Islamic Export Refinance’ requirements based on the guidelines issued by the SBP.
- The ‘Treasury Musharaka Pool’ is to provide Shariah compliant mechanism for Interbank Money Market transactions and manage the liquidity position of FBL IBD balance sheet by creating sub pools against each FBL IBD money market deals.
- The risk characteristics of each pool mainly depends on the asset and liability profile of each pool.
(D1) Profit / (loss) distribution to depositor’s pool
Parameters used for allocation of profit, charging expenses and provisions etc. along with a brief description of their major components:
Gross income generated from relevant assets, calculated at the end of the month is first divided between FBL IBD and investors / depositors in the ratio of FBL IBD’s equity commingled in a pool on pro rata basis, and then amongst FBL IBD and the depositors as per agreed mudarib fee and weightages declared before start of a month, respectively. All Modaraba and Musharika based deposits are fully invested in respective Pools to produce returns for them. In case where FBL IBD is unable to utilise all funds available for investment, priority is given to the deposit account holders.
All remunerative accounts such as savings account, term deposits, business kamil accounts are opened on the basis of Modaraba, Musharaka, Wakalah or a combination of Modaraba and Musharaka. Return on these deposits is calculated on the basis of Profit and Loss sharing (PLS). Unless specified, all remunerative local currency and foreign currency deposits are taken as General Modaraba and Musharaka pool.
Profit share is determined using weight and profit sharing ratio assigned to each category of deposit within a pool. These weightages and profit sharing ratios are declared by FBL IBD in compliance with the requirements of the SBP.
The allocation (of income and expenses to different pools) is based on pre-defined basis and accounting principles / standards. The direct expenses are charged to respective pool. The indirect expenses including the establishment cost is borne by FBL IBD as Mudarib. The direct expenses charged to the pool include depreciation of Ijara assets, cost of sales of inventories, insurance / takaful expenses of pool assets, stamp fee, documentation charges, brokerage fee for the purchase of securities / commodities, impairment / losses due to physical damages to specific assets in pools etc. Provisions against any non-performing assets of the pool are not passed on to the pool except on the actual loss / write-off of such non-performing asset and suspension of income against non-performing assets. The profit of the pool is shared between the members of the pool on pre-defined mechanism based on the weightages announced before the profit calculation period.
2015 2014Particulars Rupees ‘000 Percent Rupees ‘000 Percent
- Mudarib share amount and percentage of distributable income 980,170 50.27 922,162 50.5
- Amount and percentage of mudarib sharetransferred to depositors through Hiba 343,324 35.03 391,224 42.42
- Profit rate earned (annualised) - 8.12 - 9.77- Profit rate distributed (annualised) - 6.19 - 6.84

191Annual Report 2015
SHARIAH BOARD’S REPORT 2015
In the Name of Allah the Most Beneficent, the Most Merciful
By the Grace of Allah Subhanahu-wa-Taa’la, for the last six years Islamic Banking is operating in Faysal Bank under the brand name of Barkat Islamic Banking. Faysal Bank Limited is operating with 68 standalone Islamic Banking Branches (IBBs) and 01 sub-branch.
The Shariah Board of Faysal Bank was formed on 1st October, 2015. Thereafter 1st Shariah Board meeting was held on 26th November 2015.
While the Board of Directors and Executive Management are solely responsible to ensure that the operations of ‘Barkat Islamic Banking Faysal Bank Limited’ are conducted in a manner that comply with Shariah principles at all times, we are required to submit a report on the overall Shariah compliance environment of ‘Barkat Islamic Banking Faysal Bank Limited’.
During this year some new products, policies and processes were introduced, and some existing processes were streamlined and improved. Moreover, an automated profit distribution system, Al-Qist has also been implemented this year. All this was duly reviewed and approved by the Shariah Advisor/Shariah Board of the Bank. The Shariah Compliance Department and Internal Shariah Audit Unit have reviewed the operations which include review of assets transactions, liabilities, different agreements of financing products, and different process flows on a periodic and sample basis to ensure that all the products and services being offered conform to the injunctions of Shariah.
To form our opinion as expressed in this report, we have also reviewed the reports of Shariah Compliance and Internal Shariah Audit Unit and guidelines provided by the former Shariah Advisor.
Based on above, we are of the view that:
1. In our opinion the affairs of the Islamic Banking Division have been carried out in accordance with the rules and principles of Shariah, in the light of Rulings, Fatawa and the Guidelines issued by the Shariah Advisor/Shariah Board.
2. During review, any matters requiring corrective measures have been noted and were resolved by the management or ensured to be rectified in future. Subject to the foregoing, in our opinion the affairs of the Islamic Banking Division have been carried out in accordance with the rules and principles of Shariah, SBP regulations and guidelines related to Shariah compliance and other rules as well as specific fatawa and rulings issued by Shariah Board from time to time.
3. The Bank is in process of developing a comprehensive mechanism to ensure Shariah compliance in its overall operations.
4. Bank has a well-defined system in place in the form of Internal Shariah Audit and Shariah Compliance reviews to ensure that the earnings realised from sources or means prohibited by Shariah will be credited to Charity account and properly utilised. No earnings have been realised from sources or by means prohibited by Shariah rules and principles. The opening balance of Charity Funds was PKR 0.337 Million and during the year, an amount of PKR 1.597 Million was transferred to the charity
190 Annual Report 2015
ANNEXURE IV TO THE FINANCIAL STATEMENTSFOR THE YEAR ENDED DECEMBER 31, 2015
Description Cost Accumulated depreciation
Book value
Sale proceeds
Gain / (loss) on disposal
Mode of disposal
Particulars of purchaser / Insurer / addresses
(only in case of individuals)
-------------------------- Rupees ‘000 --------------------------
Owned - Vehicles
Honda Accord 2,750 2,200 550 1,666 1,116 Bid M.Tariq Hafeez - IndividualPlot No. 5-C, Suit No.706-B, 7th Floor West Land Trade Centre, Block 7/8, K.C.H.S Shaheed-e-Millat Road, Karachi.
Honda Civic 1,775 1,420 355 1,137 782 Bid Hassan Masood Kunwar
Karachi.
Honda Civic 1,686 1,349 337 337 - As per Bank
PolicyMr. Ali Raza - Executive
Honda Civic 1,668 1,334 334 1,125 792 Bid Mr. Ali Kashif Rizvi56 / II Khayaban-e-Shahbaz, Phase-VI, D.H.A, Karachi.
Honda City 1,429 1,143 286 1,000 714 Bid
F.B. Area Karachi.
Toyota Corolla 1,290 963 327 344 17 As per Bank
PolicyMr. Ali Raza - Executive
Mitsubishi Lancer 1,145 1,145 - 800 800 Insurance
ClaimEFU Insurance Company Limited
and computers
CISCO 3550 1,349 1,349 - 70 70 Bid
123 - Badami Bagh, 5400, Lahore.
ATM Machine 1,870 1,870 - 1,093 1,093 Insurance
ClaimAdamjeed Insurance Company Limited &EFU Insurance Company Limited
Owned - Leasehold improvement
Assets written off 83,489 81,859 1,630 - (1,630) Write off -
or net book value of Rs. 250,000 or above are as follows:

192 Annual Report 2015
SHARIAH BOARD’S REPORT 2015
account which was received due to delay in payments by the Bank’s Customers and the profit on charity saving account. Further, an amount of PKR 0.900 Million was disbursed from the charity account to various charitable institutions as per the directives of the Shariah Board of the Bank.
5. The allocation of funds, profit and loss distribution and pool management are in accordance with Shariah rules and principles and as per the instructions of State Bank of Pakistan.
6. During the year, Bank wide trainings on Islamic Banking have improved the level of awareness and sensitisation of the management and the staff in appreciating the importance of Shariah compliance in the products and processes of the Bank. However the Shariah Board feels that further improvement is required in this area so the management can be fully cognizant of the risk of Shariah non-compliance and its potential implications on the reputation and business of the Bank.
7. The Management of the Bank provided us adequate resources to perform our duties effectively.
Recommendations
Based on the above, we recommend that:
1. The Bank should continue to nominate key executives/Islamic Banking staff for certificate/diploma programmes of Islamic Banking and Finance. The management is also advised to increase trainings to front line staff on Islamic Banking & relevant Islamic products.
2. The Bank should arrange Islamic awareness training programs for its clients as well.
And Allah knows the Best.
Dated: February 15, 2016 | Jumada-ul-Awal 06, 1437 A.H.
Mufti Muhammad Mohib ul Haq SiddiquiChairman Shariah Board
Mufti Khawaja Noor ul HassanResident Shariah Board Member
Dr. Mufti Khalil Ahmad AazamiShariah Board Member
Annual Report 2015
COMBINED PATTERN OF CDC AND PHYSICAL SHAREHOLDINGAS ON DECEMBER 31, 2015
193
1 Associated Companies, undertakings and Related Parties
Ithmaar Bank B.S.C. 6 537,888,643
Faisal Finance (Luxembourg) S.A. 102,632,590
DMI (Jersey) Limited 51,316,293 801,164,993 66.78
Faisal Private Bank ( Switzerland) S.A. 38,686,633
MFAI (Jersey) Limited 70,640,834
2 Mutual Funds
CDC - Trustee JS Large CAP Fund 18 21,750
CDC - Trustee AKD Index Tracker Fund 79,952
CDC - Trustee NAFA Stock Fund 1,171
CDC - Trustee NAFA Multi Asset Fund 3,992
CDC - Trustee NIT-Equity Market Opportunity Fund 411,320
CDC - Trustee NAFA Asset Allocation Fund 2,168
CDC - Trustee NAFA Savings Plus Fund- MT 120,500
CDC - Trustee AKD Aggressive Income Fund- MT 25,500
CDC - Trustee PICIC Income Fund- MT 12,500 4,899,016 0.41
CDC - Trustee Alfalah GHP Income Fund- MT 43,000
MCBFSL - Trustee Pak Oman Advantage Asset Allocation Fund 150,000
CDC - Trustee Atlas Income Fund- MT 39,000
CDC - Trustee PIML Strategic Multi Asset Fund 109,625
CDC - Trustee First Capital Mutual Fund 210,185
CDC - Trustee National Investment (UNIT) Trust 3,549,853
CDC - Trustee Askari High Yield Scheme - MT 10,500
CDC - Trustee NAFA Income Opportunity Fund- MT 53,000
CDC - Trustee PIML Value Equity Fund 55,000
3 Directors and their spouse(s) and minor Children
Farooq Rahmatullah 7 1,129
Ahmed Abdulrahim Mohamed Abdulla Bucheery 575 108,266 0.01
Mian Muhammad Younis 575
Juma Hasan Ali Abul 575
Imtiaz Ahmad Pervez 105,412
Nauman Ansari - - - -
Abdulelah Ebrahim Mohamed Al-Qasimi - - - -
CategoryNo.
Categories of Share Holders Category Wise No. of
Share Holders
Category WiseNumber of
Shares Held
Percentage %
Number ofShares Held

194 Annual Report 2015
CategoryNo.
Categories of Share Holders Category Wise No. of
Share Holders
Category WiseNumber of
Shares Held
Percentage %
Number ofShares Held
4 Executives 10 14,121 14,121 0.00
5 Public Sector Companies and Corporations 13 73,912,834 73,912,834 6.16
6 Banks, Development Finance Institutions,
Non-Banking Finance Companies, 29 27,119,686 27,119,686 2.26
Insurance Companies, Takaful, Modarabas and Pension Funds.
7 Foreign Investors 44 111,347,270 111,347,270 9.28
8 General Public 17,805 131,427,444 131,427,444 10.95
9 Others 154 49,766,469 49,766,469 4.15
Total 18,086 1,199,760,099 100.00
Total Paid-up Capital 1,199,760,099 Shares
5% of the Paid-up Capital 59,988,005 Shares
1 Ithmaar Bank B.S.C 537,888,643 44.83
2 Faisal Finance (Luxembourg) S.A. 102,632,590 8.55
3 State Life Insurance Corporation of Pakistan 63,532,760 5.30
4 MFAI (Jersey) Limited 70,640,834 5.89
S. No. Shareholders Holding 5% or More Voting Rightsin the Listed Company
Percentage %
Number ofShares Held
COMBINED PATTERN OF CDC AND PHYSICAL SHAREHOLDINGAS ON DECEMBER 31, 2015
195Annual Report 2015
COMBINED PATTERN OF CDC AND PHYSICAL SHAREHOLDINGAS ON DECEMBER 31, 2015
1 Associated Companies, undertakings and Related Parties 6 801,164,993 66.78
2 Mutual Funds 18 4,899,016 0.41
3 Directors and their spouse(s) and minor Children 7 108,266 0.01
4 Executives 10 14,121 0.00
5 Public Sector Companies and Corporations 13 73,912,834 6.16
6 Banks, Development Finance Institutions,
Non-Banking Finance Companies,
Insurance Companies, Takaful, Modarabas and Pension Funds. 29 27,119,686 2.26
7 Foreign Investors 44 111,347,270 9.28
8 General Public 17,805 131,427,444 10.95
9 Others 154 49,766,469 4.15
Total 18,086 1,199,760,099 100.00
CategoryNo.
Categories of Share Holders Number ofShareholders
Percentage %
Number ofShares Held

196 Annual Report 2015
PATTERN OF SHAREHOLDINGAS OF DECEMBER 31, 2015
4626 1 to 100 140,342 5919 101 to 500 1,624,625 1339 501 to 1000 1,002,722 4091 1001 to 5000 10,198,472 788 5001 to 10000 5,798,186 322 10001 to 15000 3,994,912 175 15001 to 20000 3,112,851 142 20001 to 25000 3,240,248 88 25001 to 30000 2,451,035 64 30001 to 35000 2,132,339 33 35001 to 40000 1,259,303 41 40001 to 45000 1,746,101 55 45001 to 50000 2,659,811 25 50001 to 55000 1,311,843 30 55001 to 60000 1,731,202 11 60001 to 65000 695,185 16 65001 to 70000 1,073,681 14 70001 to 75000 1,009,899 13 75001 to 80000 1,015,465 7 80001 to 85000 577,847 9 85001 to 90000 786,004 6 90001 to 95000 564,517 30 95001 to 100000 2,989,528 11 100001 to 105000 1,135,069 13 105001 to 110000 1,395,156 11 110001 to 115000 1,256,470 9 115001 to 120000 1,058,189 7 120001 to 125000 859,149 7 125001 to 130000 890,977 2 130001 to 135000 262,544 2 135001 to 140000 270,417 3 140001 to 145000 429,143 7 145001 to 150000 1,039,560 3 150001 to 155000 455,198 3 155001 to 160000 474,863 1 160001 to 165000 160,670 2 165001 to 170000 337,000 1 170001 to 175000 172,087 3 175001 to 180000 535,000 2 180001 to 185000 364,067 2 185001 to 190000 380,000 1 190001 to 195000 193,080 15 195001 to 200000 2,991,204 1 200001 to 205000 201,007 3 205001 to 210000 625,235 2 210001 to 215000 425,185 2 220001 to 225000 449,572 6 225001 to 230000 1,378,120 4 235001 to 240000 952,619 2 240001 to 245000 486,353 3 245001 to 250000 749,155 1 250001 to 255000 250,125 2 260001 to 265000 525,308 1 265001 to 270000 270,000 3 275001 to 280000 828,134 4 280001 to 285000 1,132,727
Number of Shareholders Shareholdings' Slab Total Shares Held
197Annual Report 2015
PATTERN OF SHAREHOLDINGAS OF DECEMBER 31, 2015
1 285001 to 290000 288,390 2 295001 to 300000 600,000 1 305001 to 310000 306,828 1 310001 to 315000 311,804 1 315001 to 320000 318,750 1 320001 to 325000 324,500 1 325001 to 330000 325,377 1 330001 to 335000 330,772 2 340001 to 345000 687,750 2 370001 to 375000 743,043 2 375001 to 380000 759,500 3 380001 to 385000 1,150,959 1 385001 to 390000 387,307 3 395001 to 400000 1,199,276 1 410001 to 415000 411,320 1 435001 to 440000 435,871 1 450001 to 455000 455,000 1 465001 to 470000 468,500 2 470001 to 475000 943,526 1 495001 to 500000 500,000 2 515001 to 520000 1,035,500 1 525001 to 530000 529,339 2 550001 to 555000 1,101,456 1 555001 to 560000 556,799 1 595001 to 600000 600,000 1 625001 to 630000 630,000 3 665001 to 670000 1,996,035 1 695001 to 700000 698,781 1 715001 to 720000 720,000 2 745001 to 750000 1,500,000 2 750001 to 755000 1,501,718 1 765001 to 770000 768,339 1 770001 to 775000 774,950 1 795001 to 800000 799,673 1 920001 to 925000 921,000 1 925001 to 930000 927,610 2 995001 to 1000000 2,000,000 2 1005001 to 1010000 2,014,597 2 1065001 to 1070000 2,132,767 1 1095001 to 1100000 1,100,000 1 1145001 to 1150000 1,150,000 1 1180001 to 1185000 1,184,325 1 1210001 to 1215000 1,214,539 1 1380001 to 1385000 1,383,548 1 1485001 to 1490000 1,485,500 1 1520001 to 1525000 1,525,000 1 1565001 to 1570000 1,569,507 1 1650001 to 1655000 1,653,997 1 1695001 to 1700000 1,697,500 1 1705001 to 1710000 1,707,500 1 1895001 to 1900000 1,900,000 1 1985001 to 1990000 1,989,325 1 2290001 to 2295000 2,293,100 1 2380001 to 2385000 2,381,500 1 2455001 to 2460000 2,455,232 1 2560001 to 2565000 2,561,506 1 2830001 to 2835000 2,832,306
Number of Shareholders Shareholdings' Slab Total Shares Held

198 Annual Report 2015
PATTERN OF SHAREHOLDINGAS OF DECEMBER 31, 2015
1 2915001 to 2920000 2,918,000 1 2995001 to 3000000 3,000,000 1 3015001 to 3020000 3,019,900 1 3545001 to 3550000 3,549,853 1 3775001 to 3780000 3,776,410 1 4055001 to 4060000 4,056,574 1 5540001 to 5545000 5,542,227 1 5660001 to 5665000 5,664,618 1 6040001 to 6045000 6,041,215 1 6050001 to 6055000 6,051,000 1 7125001 to 7130000 7,126,557 1 7485001 to 7490000 7,489,405 1 7645001 to 7650000 7,645,175 1 7910001 to 7915000 7,912,150 1 9725001 to 9730000 9,727,277 1 10170001 to 10175000 10,170,500 1 10255001 to 10260000 10,256,275 1 12945001 to 12950000 12,948,500 1 14415001 to 14420000 14,418,375 1 15705001 to 15710000 15,709,500 1 30825001 to 30830000 30,826,472 1 38685001 to 38690000 38,686,633 1 39810001 to 39815000 39,814,362 1 49745001 to 49750000 49,747,912 1 51315001 to 51320000 51,316,293 1 63530001 to 63535000 63,532,760 1 102630001 to 102635000 102,632,590 1 537885001 to 537890000 537,888,643 18086 1,199,760,099
Number of Shareholders Shareholdings' Slab Total Shares Held
199Annual Report 2015
S.
NO
.B
RA
NC
HC
OD
ER
EG
ION
BR
AN
CH
NA
ME
CIT
YC
ON
TAC
TB
RA
NC
H A
DD
RE
SS
1 16
5 S
outh
G
reen
Bel
t R
esid
ency
Bra
nch
Kar
achi
02
1-35
8779
22-3
5375
103
Gre
en B
elt
Res
iden
cy, S
hop
No.
13-
16, P
lot
No.
Com
mer
cial
7/1
, Blo
ck
2,
K
DA
Sch
eme-
5, K
ehka
shan
, Clif
ton
Kar
achi
2 26
9 S
outh
C
lifto
n C
entr
e B
ranc
h K
arac
hi
021-
3583
0113
-5
Plo
t N
o. D
C-1
, 16-
A,1
6-B
, Blo
ck 5
Clif
ton
Cen
tre,
Keh
kash
an, K
arac
hi
3 33
0 S
outh
A
bd
ulla
h H
aroo
n B
ranc
h K
arac
hi
021
-111
-11-
22-3
3 16
-Ab
dul
lah
Har
oon
Roa
d, K
arac
hi
4 42
5 S
outh
Z
amza
ma
Kar
achi
02
1-35
8753
03-
13-C
, 7Th
Zam
zam
a, C
omm
erci
al L
ane
, Clif
ton,
Kar
achi
35
8753
23-3
5875
781
5 17
5 S
outh
P
hase
IV D
HA
K
arac
hi
021-
3580
2423
14
-C, S
unse
t C
omm
erci
al S
tree
t N
o. 2
, Pha
se IV
, DH
A, K
arac
hi
6 19
6 S
outh
S
aba
Ave
nue
Kar
achi
02
1-35
2453
77-3
5245
380
Sho
p N
o. 2
& 3
, Gro
und
Flo
or P
lot
No.
36-
C, B
adar
Com
mer
cial
Str
eet,
S
t. N
o. 6
, Pha
se V
, Kar
achi
7 21
6 S
outh
D
HA
Pha
se V
III
Kar
achi
02
1-35
2460
11
43-C
, Al-
Mur
taza
Com
mer
cial
Lan
e N
o. 4
, DH
A, P
hase
VIII
, Kar
achi
8 33
8 S
outh
D
efen
ce P
hase
VI
Kar
achi
02
1-35
3472
66-3
5341
761
22/C
, Lan
e-2,
Sha
hbaz
Com
mer
cial
, Pha
se V
I, D
HA
, Kar
achi
-3
5856
091
9 44
1 S
outh
B
ukha
ri C
omm
erci
al
Kar
achi
02
1-33
5149
595-
97
Gro
und
, Bas
emen
t A
nd F
irst
Floo
r, 19
-C B
ukha
ri C
omm
erci
al L
ane
No
5,
Pha
se V
I, D
HA
, Kar
achi
10
170
Sou
th
I. I.
Chu
ndrig
ar R
oad
I B
ranc
h K
arac
hi
021-
3263
8011
-13
11/1
3, T
rad
e C
entr
e, I.
I Chu
ndrig
arh
Roa
d, K
arac
hi
11
115
Sou
th
Sha
hrah
-e-A
dal
at
Que
tta
081-
2840
386-
87
Sha
hrah
-e-A
dal
at R
oad
, Que
tta
-2
8405
87-2
8420
28
12
118
Sou
th
Qua
lity
Hei
ght
Clif
ton
Kar
achi
02
1-35
8637
71-7
3-74
-75
32-A
, Gro
und
Flo
or, Q
ualit
y H
eigh
ts, K
.D.A
Sch
eme
No.
5, C
lifto
n B
lock
-
8,
Kar
achi
13
144
Sou
th
Kor
angi
Roa
d
Kar
achi
02
1-35
3881
61-3
5388
175
KM
Cen
tre,
130
/1, M
ain
Kor
angi
Roa
d, P
hase
I, D
efen
ce H
ousi
ng A
utho
rity,
-353
8816
0 K
arac
hi
14
172
Sou
th
Sta
diu
m L
ane,
Kha
yab
an-e
-Muj
ahid
K
arac
hi
021-
3534
9111
-12
43
-C, S
tad
ium
Lan
e II,
Kha
yab
an-e
-Muj
ahid
D.H
.A P
hase
V, K
arac
hi
15
173
Sou
th
Kha
yab
an-e
-Tan
zeem
K
arac
hi
021-
3587
7909
-10
Plo
t N
o. C
-4-D
-N, P
hase
V, K
haya
ban
-e-T
anze
em, D
HA
, Kar
achi
16
183
Sou
th
Fatim
a Ji
nnah
Roa
d
Que
tta
081-
2837
234-
2824
973
Yous
uf C
entr
e, F
atim
a Ji
nnah
Roa
d, Q
uett
a
-283
6943
-282
4807
17
209
Sou
th
Kor
angi
No.
2 K
arac
hi
021-
3507
1758
-59
Q-1
4, G
roun
d F
loor
, Sec
tor
33-A
, Kor
angi
No.
2, K
arac
hi
18
453
Sou
th
Turb
at
Turb
at
- M
ain
Baz
ar, T
urb
at
19
198
Sou
th
Kha
lid B
in W
alee
d R
oad
K
arac
hi
021-
3430
2250
P
lot
No.
89-
B, B
lock
-2, P
.E.C
.H.S
, Kar
achi
20
255
Sou
th
Meh
moo
dab
ad
Kar
achi
02
1-34
3763
46-3
4376
349
Plo
t N
o. S
A-8
5, B
lock
7, K
arac
hi A
dm
inis
trat
ion
Em
plo
yees
Coo
per
ativ
e
Hou
sing
Soc
iety
(KA
EC
HS
), K
arac
hi
21
281
Sou
th
Tariq
Roa
d B
ranc
h K
arac
hi
021-
3514
3538
-40
Sho
p N
o. 1
& 2
, Plo
t 9-
C, B
lock
2, M
ain
Tariq
Roa
d, P
.E.C
H.S
, Kar
achi
22
156
Sou
th
Kor
angi
Ind
ustr
ial A
rea
Kar
achi
02
1-35
1144
02-3
/ 7
P
lot
No.
51/
9, S
ecto
r 15
, Mai
n K
oran
gi R
oad
, Kar
achi
BRAN
CH N
ETW
ORK
- CO
NVEN
TION
AL

200 Annual Report 2015
S.
NO
.B
RA
NC
HC
OD
ER
EG
ION
BR
AN
CH
NA
ME
CIT
YC
ON
TAC
TB
RA
NC
H A
DD
RE
SS
23
424
Sou
th
I.I. C
hund
rigar
II B
ranc
h K
arac
hi
021-
3241
8300
-1
Nad
ir H
ouse
, I. I
. Chu
ndrig
ar R
oad
, Kar
achi
24
134
Sou
th
Clo
th M
arke
t B
ranc
h K
arac
hi
021-
3243
9021
-22
B
R-2
-1/1
, Ban
der
Qua
rter
s, N
ew N
eham
Roa
d K
hara
dar
, Kar
achi
-3
2438
150
25
164
Sou
th
Tim
ber
Mar
ket
Bra
nch
Kar
achi
02
1-32
7345
08-3
2734
490
Plo
t No.
6/2
Old
Haj
i Cam
p, S
iddi
que
Wah
ab R
oad
Lee
Qua
rter
s, K
arac
hi
26
217
Sou
th
AP
WA
Com
ple
x G
ard
en
Kar
achi
02
1-32
2947
79-8
0 S
hop
No.
SO
A ,
5 G
roun
d F
loor
Ap
wa
Com
ple
x, P
lot
No.
67-
AC
, Gar
den
R
oad
, Kar
achi
27
227
Sou
th
Bur
ns R
oad
Bra
nch
Kar
achi
02
1-32
2110
77-2
3-43
S
hop
No.
4 &
5, G
roun
d F
loor
, Lok
hat
Man
sion
, Sur
vey
No.
2, S
hahr
a-e-
Li
aqua
t , B
urns
Roa
d, K
arac
hi
28
236
Sou
th
Ele
ctro
nic
Mar
ket
Bra
nch
Kar
achi
02
1-32
7515
85-8
6 S
hop
No.
3, H
ashm
i Ele
ctro
nics
Cen
tre,
Ab
dul
lah
Har
oon
Roa
d, S
add
ar,
Kar
achi
29
290
Sou
th
Pak
Col
ony
Bra
nch
Kar
achi
02
1-32
5566
95-9
6-97
P
lot
No.
250
, 251
& 2
52 M
oder
n C
olon
y, M
angh
opir
Roa
d, K
arac
hi
30
422
Sou
th
Ab
dul
lah
Har
oon
Bra
nch
Kar
achi
02
1-35
6520
99
Sta
te L
ife B
uild
ing
No.
11,
Ab
dul
lah
Har
oon
Roa
d, K
arac
hi
-356
8452
5-35
6833
01
31
423
Sou
th
Jod
ia B
azar
II B
ranc
h K
arac
hi
021-
3252
2225
-8
NP
12/
74, M
oham
mad
Sha
h S
tree
t, K
arac
hi
32
436
Sou
th
Met
rovi
lle
Kar
achi
02
1-36
6613
00-3
6662
034
Str
eet
15, B
lock
3, M
etro
ville
Site
, Kar
achi
33
437
Sou
th
Den
so H
all
Kar
achi
02
1-32
7523
06-9
P
lot
No.
19,
Sur
vey
She
et N
o. W
O-0
7, W
adho
mal
Od
dha
ram
Qua
rter
s,
M.A
Jin
nah
Roa
d, S
add
ar T
own,
Kar
achi
34
123
Sou
th
Jod
ia B
azar
I B
ranc
h K
arac
hi
021-
3247
1440
-3
G-2
, Plo
t N
o. M
R-6
/52/
1, Is
mai
l Tra
de
Cen
tre,
Ram
Bha
rti
-3
2443
795-
3244
4073
S
tree
t, K
arac
hi
35
145
Sou
th
New
Cha
lli B
ranc
h K
arac
hi
021-
3221
4903
-04
Ab
id C
ham
ber
, Plo
t 3
SR
. 6/9
, Sha
hra-
e-Li
aqat
, Kar
achi
36
138
Sou
th
Sad
dar
, Hyd
erab
ad
Hyd
erab
ad
022-
2728
356-
59
Plo
t N
o. 3
39, M
ain
Boh
ra B
azar
Sad
dar
, Hyd
erab
ad
37
230
Sou
th
Suk
kur
Suk
kur
071-
5617
195-
97
City
Sur
vey
No.
D15
96 /
1-D
, Rac
e C
ourc
e R
oad
, S
ukha
Tal
ab, S
ukku
r
38
239
Sou
th
Latif
abad
H
yder
abad
02
2-38
2052
6-7
C -
489
, Uni
t N
o 8,
Latif
abad
, Hyd
erab
ad
39
258
Sou
th
Mirp
ur K
has
Mirp
urkh
as
0233
- 87
6472
-75
C
ity S
urve
y N
o. 7
15, 7
16 A
nd 7
18, W
ard
A, U
mer
kot
Roa
d, T
aluk
a A
nd
Dis
tric
t, M
irpur
khas
40
272
Sou
th
Naw
absh
ah
Naw
absh
ah
0244
-330
895-
97
CS
No.
555
,War
d B
, Mai
n M
ohni
Baz
ar, N
awab
shah
41
287
Sou
th
Lark
ana
Lark
ana
074-
4056
054-
56
City
Sur
vey
No.
201
6/ 4
-A W
ard
C, F
aysa
l Ban
k C
how
k, L
arka
na C
ity
42
291
Sou
th
Qas
imab
ad
Hyd
erab
ad
022-
2103
433-
34
Plo
t N
o. B
-1, R
.S.2
58/2
, Bila
l Vill
as H
ousi
ng S
chem
e, D
eh S
ari,
Talu
ka
Qas
imab
ad
43
292
Sou
th
Gho
tki
Gho
tki
0723
-600
807
Gro
und
Floo
r, C
ity S
urve
y N
o. 8
90, W
ard-
B, S
ituat
ed A
t Dev
ri S
ahab
Roa
d,
Gho
tki
44
297
Sou
th
Sha
hdad
kot
Sha
hdad
kot
074-
4014
227-
28
Plo
t City
Sur
vey
No.
520
War
d B
, Situ
ated
At S
haik
h M
ohal
a, S
hahd
adko
t
BRAN
CH N
ETW
ORK
- CO
NVEN
TION
AL
201Annual Report 2015
S.
NO
.B
RA
NC
HC
OD
ER
EG
ION
BR
AN
CH
NA
ME
CIT
YC
ON
TAC
TB
RA
NC
H A
DD
RE
SS
45
301
Sou
th
Kan
dhk
ot
Kan
dhk
ot
072-
2572
705-
7 P
lot
No.
130
, Mai
n B
azar
Sha
h A
bd
ul L
atif
Roa
d, N
ear
Pol
ice
Sta
tion,
Kan
dhk
ot
46
195
Sou
th
Naz
imab
ad B
ranc
h K
arac
hi
021-
3670
7420
P
lot
No.
16,
Row
No.
1, S
ub B
lock
A, B
lock
III (
III-A
,1 /
16)
, Naz
imab
ad,
Kar
achi
47
221
Sou
th
Pow
er H
ouse
UP
Mor
e K
arac
hi
021-
3696
1034
-36
R1,
Sec
tor
5C-4
, Nor
th K
arac
hi, N
ear
Agh
a K
han
Lab
, Pow
erho
use
Cho
wra
ngi,
Kar
achi
48
222
Sou
th
Buf
fer
Zon
e K
arac
hi
021-
3695
0081
-87
Plo
t N
o. R
-2, S
ecto
r 15
-A /
2, B
uffe
r Z
one,
Nor
th K
arac
hi, K
arac
hi
49
231
Sou
th
Gul
zar-
e-H
ijri
Kar
achi
02
1-34
6521
59
Plo
t N
o. A
-747
/C, B
lock
13-
A, K
DA
Sch
eme
33, P
akis
tan
Em
plo
ye
C
oop
erat
ing
Hou
sing
Soc
iety
, Kar
achi
50
265
Sou
th
F B
Are
a II
Kar
achi
02
1-36
3402
42-5
P
lot N
o. S
t-4/
A-1
, Blo
ck-2
0, S
chem
e-16
, Fed
eral
'B' A
rea,
Adj
acen
t Ban
k
Al H
abib
, Kar
achi
51
342
Sou
th
Nor
th N
azim
abad
K
arac
hi
021-
3672
1600
-4
D-4
, Blo
ck D
Nor
th N
azim
abad
, Kar
achi
52
428
Sou
th
Kar
achi
Nor
th N
azim
abad
K
arac
hi
021-
3664
8750
-51
Alm
as S
qua
re, P
lot
No.
Sd
-5, B
lock
G, N
orth
Naz
imab
ad, K
arac
hi
53
438
Sou
th
Fed
eral
B A
rea
Kar
achi
02
1-36
8006
94-3
6800
695
C-2
5, B
lock
17,
Fed
eral
B. A
rea,
Kar
achi
54
139
Sou
th
SIT
E
Kar
achi
02
1-32
5859
18-2
0 P
lot
No.
B-1
7, S
tate
Ave
nue,
Kar
achi
55
152
Sou
th
Nor
th K
arac
hi In
dus
tria
l Are
a K
arac
hi
021-
3695
7155
S
A-2
, St
1/1,
Sec
tor
12-B
, Nor
th K
arac
hi In
dus
tria
l Are
a, K
arac
hi
3695
4054
-363
5647
5
56
110
Sou
th
Kar
achi
Mai
n K
arac
hi
021-
111-
747-
747
Fays
al H
ouse
,St-
02,
Mai
n S
hahr
a-e-
Fais
al, K
arac
hi
-327
9520
0
57
119
Sou
th
Gul
shan
-e-I
qb
al
Kar
achi
02
1-34
99 4
262-
3 B
-35
, Blo
ck 1
3-A
, Mai
n U
nive
rsity
Roa
d, G
ulsh
an-e
-Iq
bal
, Kar
achi
58
127
Sou
th
Sha
heed
-e-M
illat
K
arac
hi
021-
3438
8104
-105
-106
Iq
bal
Arc
ade,
Plo
t N
o. 6
,3/7
, D.M
.C S
ocie
ty, K
arac
hi
59
131
Sou
th
Sha
hrah
-e-F
aisa
l K
arac
hi
021-
3431
5634
-37
Bus
ines
s A
venu
e C
entr
e, B
lock
No.
6, P
.E.C
.H.S
, Kar
achi
60
143
Sou
th
MA
CH
S
Kar
achi
02
1-34
3905
11-3
4390
516
Plo
t N
o. 2
, F C
omm
erci
al ,M
.A.C
.H.S
, Kar
achi
61
153
Sou
th
Gul
shan
Cho
wra
ngi
Kar
achi
02
1-34
81 5
319-
S
hop
No.
1-4
, Gro
und
Flo
or, S
ana
Arc
ade,
Plo
t N
o.,
ZC
-6, B
lock
No.
7,
34
8337
20-3
4833
718
K.D
.A S
chem
e 24
, Kar
achi
62
210
Sou
th
Gul
shan
Blo
ck-2
K
arac
hi
021-
3497
220
2-34
9729
98 A
-287
, Blo
ck-2
, K.D
.A S
chem
e -2
4, G
ulsh
an e
Iqb
al, K
arac
hi
63
333
Sou
th
Kar
achi
Sha
heed
-e-M
illat
K
arac
hi
021-
111-
321-
321
72
-A/Z
, Blo
ck 7
/8, A
l- R
iaz,
Kar
achi
-
3438
2595
64
335
Sou
th
Kar
achi
Gul
shan
K
arac
hi
021
-348
3011
0 S
B-2
5, B
lock
13/
C,
Mai
n U
nive
rsity
Roa
d, G
ulsh
an e
Iqb
al, K
arac
hi
-348
3011
1-34
8301
12
-3
4830
108-
3483
0109
65
442
Sou
th
Kar
achi
Tip
u S
ulta
n R
oad
K
arac
hi
021-
3430
1181
-3
Plo
t N
o. 1
10, Z
onal
Com
mer
cial
Are
a, K
arac
hi
BRAN
CH N
ETW
ORK
- CO
NVEN
TION
AL

202 Annual Report 2015
S.
NO
.B
RA
NC
HC
OD
ER
EG
ION
BR
AN
CH
NA
ME
CIT
YC
ON
TAC
TB
RA
NC
H A
DD
RE
SS
66
174
Sou
th
Gul
ista
n-e-
Jauh
ar
Kar
achi
02
1-34
0268
56
Sho
p N
o. 2
8 &
29,
Ruf
i Lak
e D
rive,
Blo
ck 1
8, K
.D.A
Sch
eme
No.
36,
Kar
achi
-3
4030
556-
7
67
252
Sou
th
Saf
oora
Got
h B
ranc
h K
arac
hi
021-
3402
3795
S
hop
No.
1,2
,3,4
, Plo
t S
V-9,
Blo
ck V
II, G
ulis
tan-
e-Ja
uhar
, KD
A S
chem
e
-340
2379
1-34
0237
93
No.
36,
Kar
achi
68
112
Cen
tral
I Th
e M
all -
Bra
nch
Laho
re
042-
3723
6014
-8
43, S
hahr
ah-e
-Qua
id-e
-Aza
m, L
ahor
e
69
132
Cen
tral
I C
ircul
ar R
oad
-B
ranc
h La
hore
04
2-37
6730
01-6
B
abar
Cen
ter,
51, C
ircul
ar R
oad
, Lah
ore
70
137
Cen
tral
I S
halim
ar G
ard
en-B
ranc
h La
hore
04
2-36
8447
14-1
7 B
ilal M
arke
t, C
how
k S
halim
ar B
agh,
G.T
.Roa
d, B
aghb
anp
ura,
Lah
ore
71
179
Cen
tral
I S
haha
lam
Mar
ket-
Bra
nch
Laho
re
042-
3767
5619
-376
5196
8 5
A-C
, Nea
r Fo
war
a C
how
k, S
hah
Ala
m M
arke
t, L
ahor
e
72
180
Cen
tral
I U
rdu
Baz
ar-B
ranc
h La
hore
04
2-37
3146
17-1
8 S
-38,
R-2
05-A
, Cat
tle S
tree
t, C
ircul
ar R
oad
, Urd
u B
azar
, Lah
ore
73
186
Cen
tral
I S
hahd
ara
-Bra
nch
Laho
re
042-
3790
2501
-04
G.T
.Roa
d, S
hahd
ara,
Lah
ore
74
197
Cen
tral
I M
cleo
d R
oad
-Bra
nch
Laho
re
042-
3637
0045
-363
7006
7 U
sman
Pla
za, O
pp
osite
: Lah
ore
Hot
el, M
cleo
d R
oad
, Lah
ore
75
205
Cen
tral
I M
ugha
lpur
a-B
ranc
h La
hore
04
2-36
5248
63-4
3/
15 J
ahan
gir
Roa
d, L
al P
ul, N
ear
AFC
, Mug
halp
ura,
Lah
ore
76
208
Cen
tral
I C
houb
urji-
Bra
nch
Laho
re
042-
3524
4832
50
, Cho
bur
ji C
how
k, L
ahor
e
-352
4489
8-35
2448
85
77
218
Cen
tral
I N
ila G
umb
ud-B
ranc
h La
hore
04
2-37
3600
32-3
4-38
8-
The
Mal
l, B
ank
Sq
uare
, Lah
ore
78
223
Cen
tral
I B
rand
reth
Roa
d-B
ranc
h La
hore
04
2-37
3672
25
78 B
rand
reth
Roa
d, O
ld N
isht
er R
oad
, Lah
ore
-3
7367
228-
3736
7227
-3
7367
231
79
253
Cen
tral
I Fr
uit
Mar
ket
-Bra
nch
Laho
re
042-
3772
0893
-4
136,
Far
ooq
Cen
tre,
Fru
it M
arke
t S
chem
e, R
avi L
ink
Roa
d, L
ahor
e
80
271
Cen
tral
I M
ain
Mul
tan
Roa
d
Laho
re
042-
3780
1910
-378
0190
9 23
5/1,
Bad
ar B
lock
, Alla
ma
Iqb
al T
own,
Lah
ore
81
273
Cen
tral
I D
arog
haw
ala
Laho
re
042-
3653
3526
38
6-C
, Mor
e S
alam
at P
ura,
Mai
n G
.T R
oad
, Dar
ogha
wla
, Lah
ore
82
276
Cen
tral
I S
had
bag
h B
ranc
h La
hore
La
hore
04
2-37
6148
14-3
7614
815
Tajp
ura
Cho
wk,
Nea
r P
TCL
Exc
hang
e, M
isri
Sha
h, S
had
bag
h, L
ahor
e
83
416
Cen
tral
I G
ulsh
an-e
-Rav
i-B
ranc
h La
hore
04
2-37
4045
11-1
2 2
/B, C
ivic
Cen
ter,
Gul
shan
-e-R
avi,
Laho
re
84
467
Cen
tral
I B
adam
i Bag
h-B
ranc
h La
hore
04
2-37
7081
72-4
34
3-C
ircul
ar R
oad
, Bad
ami B
agh,
Lah
ore
85
469
Cen
tral
I B
ilal G
unj-
Bra
nch
Laho
re
042-
3721
4085
16
-Sha
hjeh
an R
oad
, Bila
l Gun
j, La
hore
86
178
Cen
tral
I S
had
man
-Bra
nch
Laho
re
042-
3540
8506
11
-A, S
had
man
1, J
ail R
oad
, Lah
ore
87
187
Cen
tral
I Li
ber
ty M
arke
t-B
ranc
h La
hore
04
2-35
7521
08-9
37
-E, I
II S
aeed
Ala
m T
ower
, Lib
erty
Mar
ket,
Gul
ber
g III
, Lah
ore
88
188
Cen
tral
I Ic
hra-
Bra
nch
Laho
re
042-
3756
9934
-35
172,
Fer
ozp
ur R
oad
, Ich
ra, L
ahor
e
89
457
Cen
tral
I G
ulb
erg
Ind
ustr
ial A
rea-
Bra
nch
Laho
re
042-
3571
7142
-45
25-B
-2, G
ulb
erg
III, L
ahor
e
90
130
Cen
tral
I G
ard
en T
own-
Bra
nch
Laho
re
92-4
2-35
8898
10-1
4 4-
Aib
ak B
lock
, New
Gar
den
Tow
n, L
ahor
e.
BRAN
CH N
ETW
ORK
- CO
NVEN
TION
AL
203Annual Report 2015
S.
NO
.B
RA
NC
HC
OD
ER
EG
ION
BR
AN
CH
NA
ME
CIT
YC
ON
TAC
TB
RA
NC
H A
DD
RE
SS
91
142
Cen
tral
I A
llam
a Iq
bal
Tow
n-B
ranc
h La
hore
92
-42-
3780
6022
-25
18-H
unza
Blo
ck, M
ain
Roa
d, A
llam
a Iq
bal
Tow
n, L
ahor
e
92
150
Cen
tral
I M
odel
Tow
n-B
ranc
h La
hore
92
-42-
3588
4705
-07
13-B
ank
Sq
uare
Mar
ket,
Mod
el T
own,
Lah
ore
93
158
Cen
tral
I Fa
isal
Tow
n-B
ranc
h La
hore
92
-42-
3520
1990
, 92,
94
10-C
, Mai
n B
oule
vard
, Fai
sal T
own,
Lah
ore
94
182
Cen
tral
I Jo
har
Tow
n-B
ranc
h La
hore
92
-42-
3530
0897
43
5-G
-I, J
ohar
Tow
n, L
ahor
e
-353
1573
5-36
95
212
Cen
tral
I G
hazi
Cho
wk-
Bra
nch
Laho
re
92-0
42-3
5212
250-
54
8-A
, Aw
aisi
a C
oop
erat
ive
Hou
sing
Soc
iety
, Gha
zi C
how
k,Li
nk C
olle
ge
Roa
d, T
owns
hip
Lah
ore.
96
274
Cen
tral
I K
arim
Blo
ck
Laho
re
92-4
2-35
2955
72-4
, P
lot
No.
2-B
, 2-C
, Kar
im B
lock
, Alla
ma
Iqb
al T
own
Laho
re
352
9557
8-79
97
419
Cen
tral
I Fa
isal
Tow
n-B
ranc
h La
hore
92
-42-
3520
3881
59
4-A
, Fai
sal T
own
, Lah
ore.
-2
, 352
0389
2
98
459
Cen
tral
I Va
lanc
ia-B
ranc
h La
hore
92
-42-
3522
4791
-92
9-A
, C
omm
erci
al Z
one
Vala
ncia
Soc
iety
, La
hore
.
99
461
Cen
tral
I P
IA T
own-
Bra
nch
Laho
re
92-4
2 35
2270
86-9
B
uild
ing/
Plo
t 4
02, B
lock
No.
E, P
IA H
ousi
ng S
ocie
ty R
oad
, N
ear
BFC
,
La
hore
.
100
464
Cen
tral
I N
ew G
ard
en T
own-
Bra
nch
Laho
re
92-4
2-35
8611
11,
Aw
ami C
omp
lex,
Blo
ck N
o 2,
New
Gar
den
Tow
n, L
ahor
e
3586
8776
, 358
6801
0
101
122
Cen
tral
I S
ialk
ot M
ain
Sia
lkot
05
2-42
9250
1-3
Plo
t N
o.B
1-16
S-9
8B, 1
7-P
aris
Roa
d, O
pp
Cc
& I,
Sia
lkot
102
128
Cen
tral
I G
ujra
nwal
a G
ujra
nwal
a 05
5-37
3030
1-3
Zia
Pla
za, G
.T. R
oad
, Guj
ranw
ala
103
146
Cen
tral
I G
ujra
t G
ujra
t 05
3-35
3331
5-35
3678
1 N
obel
Fur
nitu
re P
laza
, G.T
Roa
d, G
ujra
t
-3-3
5338
55
104
238
Cen
tral
I D
aska
D
aska
05
2-66
1462
3-4
Plo
t N
o.3,
4 &
5, M
uslim
Mar
ket
, Guj
ranw
ala,
Das
ka
105
245
Cen
tral
I La
lam
usa
Lala
mus
a 05
3-75
1957
6-9
Fays
al B
ank
Lim
ited
, Sha
yan
Pla
za K
aira
, G.T
Roa
d, L
alam
usa
106
261
Cen
tral
I C
antt
Sia
lkot
S
ialk
ot
052-
4261
507
100
- A
, Azi
z S
hahe
ed R
oad
, Sia
lkot
Can
tt
-426
1709
-10
107
268
Cen
tral
I S
heik
hup
ura
Roa
d, G
ujra
nwal
a G
ujra
nwal
a 05
5-42
4015
5 -6
0 R
ehm
an M
arke
t, S
heik
hup
ura
Roa
d, G
ujra
nwal
a
108
279
Cen
tral
I W
azira
bad
W
azira
bad
05
5-66
0952
6-27
G
roun
d F
loor
, Al R
ehm
at P
laza
, Haj
ipur
a C
how
k, S
ialk
ot R
oad
,
Waz
irab
ad
109
148
Cen
tral
I M
ain
Bou
leva
rd G
ulb
erg-
Bra
nch
Laho
re
042-
3578
7839
-40-
50
69-B
, Mai
n B
oule
vard
, Gul
ber
g, L
ahor
e
110
233
Cen
tral
I C
MH
Cho
wk-
Bra
nch
Laho
re
042-
3660
2327
-29
1482
/14-
15, D
ay B
uild
ing,
CM
H C
how
k, S
arw
ar R
oad
, Lah
ore
Can
tt
111
331
Cen
tral
I U
pp
er M
all B
ranc
h La
hore
04
2-11
1-11
-22-
33
310-
Up
per
Mal
l, S
hahr
ah-e
-Qua
id-E
-Aza
m, L
ahor
e
- 35
7510
01-6
112
401
Cen
tral
I E
gert
on R
d-B
ranc
h La
hore
04
2-36
3711
11
Gro
und
Flo
or, A
iwan
-e-I
qb
al C
omp
lex,
Op
pos
ite H
olid
ay In
n
-363
7547
2-36
3754
73
Hot
el, L
ahor
e
BRAN
CH N
ETW
ORK
- CO
NVEN
TION
AL

204 Annual Report 2015
S.
NO
.B
RA
NC
HC
OD
ER
EG
ION
BR
AN
CH
NA
ME
CIT
YC
ON
TAC
TB
RA
NC
H A
DD
RE
SS
113
468
Cen
tral
I Ja
il R
oad
Bra
nch
Laho
re
042-
3742
0318
9-
Mai
n Ja
il R
oad
, Lah
ore
114
125
Cen
tral
I D
.H.A
H-B
lock
-Bra
nch
Laho
re
042-
3589
7712
-17
136/
1, B
lock
-H, C
omm
erci
al A
rea,
Pha
se-I
, DH
A, L
ahor
e C
antt
115
160
Cen
tral
I Th
okar
Nia
z B
aig-
Bra
nch
Laho
re
042-
3531
4020
-23
Jam
al M
arke
t, A
li To
wn,
Opp
.Lah
ore
Uni
vers
ity,T
hoka
r Nia
z B
aig,
Rai
wan
d
Roa
d
116
181
Cen
tral
I B
edia
n R
oad
-Bra
nch
Laho
re
042-
3716
5350
B
edia
n R
oad
, Nea
r D
HA
Pha
se V
I, La
hore
Can
tt
117
189
Cen
tral
I W
alto
n C
antt
.-B
ranc
h La
hore
04
2-36
6043
09-1
2 36
-Jin
nah
Pla
za, M
ain
Bou
leva
rd D
efen
ce L
ink
Roa
d, W
alto
n C
antt
, Lah
ore
118
211
Cen
tral
I N
ew A
irpor
t R
oad
-Bra
nch
Laho
re
042-
3591
0014
-15
Ad
join
ing
Div
ine
Meg
a-II
Pla
za, N
ew A
irpor
t R
oad
, Can
tt, L
ahor
e
119
256
Cen
tral
I E
ME
-Bra
nch
Laho
re
042-
3751
1081
-4
111-
D, C
omm
erci
al A
rea,
EM
E S
ocie
ty, D
HA
Mul
tan
Roa
d, L
ahor
e
120
282
Cen
tral
I Tu
fail
Roa
d
Laho
re
042-
3660
4909
-15
Gar
rison
Offi
cers
Mes
s 12
, Tuf
ail R
oad
, Lah
ore
Can
tt
121
334
Cen
tral
I C
aval
ry G
roun
d-B
ranc
h La
hore
04
2-11
1-32
1-32
1 4
/5 H
aroo
n P
laza
, Cav
alry
Gro
und
, Lah
ore
-3
6655
590
122
417
Cen
tral
I P
hase
V D
HA
La
hore
04
2-37
1823
56-5
8 P
lot
No.
10,
Com
mer
cial
Are
a, S
ecto
r C
-C-A
, Pha
se-V
, DH
A, L
ahor
e
123
462
Cen
tral
I D
HA
Z B
lock
-Bra
nch
Laho
re
042-
3572
6000
77
-Y, P
hase
III,
Com
mer
cial
Are
a, D
HA
, Lah
ore
124
111
Cen
tral
II
Civ
il Li
ne, M
ain-
Fais
alab
ad
Fais
alab
ad
041-
2644
481-
85
Bila
l Roa
d, C
ivil
Line
s Fa
isal
abad
125
121
Cen
tral
II
Bos
an R
oad
M
ulta
n 06
1-62
1490
5-09
1/
A-2
, Offi
cers
Col
ony,
Bos
an R
oad
, Mul
tan.
126
133
Cen
tral
II
Old
Bah
awal
pur
Roa
d
Mul
tan
061-
4783
391,
12
9/1,
Old
Bah
awal
pur
Roa
d, M
ulta
n.
061-
4783
523
127
149
Cen
tral
II
Bah
awal
pur
B
ahaw
alp
ur
062-
2730
691-
93
2 -
Reh
man
Soc
iety
, Noo
r M
ahal
Roa
d, B
ahaw
alp
ur.
128
154
Cen
tral
II
Veha
ri Ve
hari
067-
3366
401,
336
6123
47
-A, K
arkh
ana
Baz
ar, V
ehar
i.
129
155
Cen
tral
II
Oka
ra
Oka
ra
044-
2551
772,
255
1773
M
.A. J
inna
h R
oad
, Oka
ra.
130
157
Cen
tral
II
Rah
im Y
ar K
han
Rah
im Y
ar K
han
068-
5889
411-
14
27-
Tow
n H
all O
pp
. City
Par
k, R
ahim
Yar
Kha
n.
131
163
Cen
tral
II
Jhan
g Jh
ang
047-
7623
283-
84
P-1
0/1/
A, K
atch
eryi
Roa
d,N
ear
Ses
sion
Cho
wk,
Sad
dar
Jha
ng
132
176
Cen
tral
II
GM
Ab
ad, F
aisa
lab
ad
Fais
alab
ad
041-
2691
262,
39
-B, U
sman
Pla
za, S
adar
Baz
ar G
M A
bad
,Fai
sala
bad
04
1-26
9137
5
133
177
Cen
tral
II
D-G
roun
d, F
aisa
lab
ad
Fais
alab
ad
041-
8730
405,
44
7-D
, Peo
ple
s C
olon
y, F
aisa
lab
ad
041-
8730
443
134
200
Cen
tral
II
Bur
ewal
a B
urew
ala
067-
3773
011-
13
95-C
, Mul
tan
Roa
d, B
urew
ala.
135
201
Cen
tral
II
Sad
iqab
ad
Sad
iqab
ad
068-
5702
440
Sho
p #
567
,Alla
ma
Iqb
al R
oad
, Sad
iqab
ad.
136
202
Cen
tral
II
Sah
iwal
S
ahiw
al
040-
4224
060
-64
Sar
war
Sha
heed
Roa
d, S
ahiw
al.
137
203
Cen
tral
II
Gul
shan
Mar
ket
Mul
tan
061-
6784
277-
78
11 Y
-blo
ck G
ulsh
an M
arke
t, N
ew M
ulta
n M
ulta
n
BRAN
CH N
ETW
ORK
- CO
NVEN
TION
AL
205Annual Report 2015
S.
NO
.B
RA
NC
HC
OD
ER
EG
ION
BR
AN
CH
NA
ME
CIT
YC
ON
TAC
TB
RA
NC
H A
DD
RE
SS
138
224
Cen
tral
II
Mad
ina
Tow
n, F
aisa
lab
ad
Fais
alab
ad
041-
8723
365,
M
adin
a To
wn
Bra
nch
Fais
alA
bad
04
1-87
2331
7
139
225
Cen
tral
II
Chi
chaw
atni
C
hich
awat
ni
040-
5482
305
- 6
G.T
Roa
d C
hich
awat
ni
140
226
Cen
tral
II
Dep
alp
ur
Dep
alp
ur
044-
4540
766-
68-6
9 S
hop
# 1
& 2
, Gill
ani H
eigh
ts,M
adin
a C
how
k,D
epal
pur
.
141
228
Cen
tral
II
Tob
a Te
k S
ingh
To
ba
Tek
Sin
gh
046-
2517
801-
2 P
-356
A/1
5-5,
ST-
6, C
haud
hry
Par
k, F
aro
oq
Sha
heed
Ro
ad,
Tob
a Te
k S
ing
h
142
229
Cen
tral
II
Mia
n C
hann
u M
ian
Cha
nnu
065-
2664
262-
63
GT
Roa
d n
ear
T C
how
k, M
ian
Cha
nnu.
143
232
Cen
tral
II
Arif
wal
a A
rifw
ala
0457
-835
425-
26
173-
D T
hana
Baz
ar A
rifw
ala.
144
241
Cen
tral
II
Kha
new
al
Kha
new
al
065-
2553
610-
11
Plo
t N
o. 7
5, B
lock
12,
Sir
Sye
d R
oad
, Kha
new
al.
145
242
Cen
tral
II
Har
oona
bad
H
aroo
nab
ad
063-
2251
30-3
2 25
/C G
rain
Mar
ket
Har
oona
bad
Dis
tt B
ahaw
alna
ger.
146
247
Cen
tral
II
Pak
pat
tan
Pak
pat
tan
045-
7352
307-
09
Col
lege
Roa
d, P
akp
atta
n.
147
249
Cen
tral
II
Rab
wah
R
abw
ah C
hena
b
047-
6215
530-
32
Plo
t #
09, G
ol B
azar
Dar
ul S
add
ar C
hena
b N
agar
Rab
wah
.
N
agar
148
254
Cen
tral
II
Sam
anab
ad, F
aisa
lab
ad
Fais
alab
ad
041-
2563
671-
73
650
A, S
aman
abad
, Ind
ustr
ial L
abor
Col
ony,
Fai
sala
bad
149
260
Cen
tral
II
Veha
ri R
oad
, Mul
tan
Mul
tan
061-
6241
083-
84
She
ary
Com
mer
cial
Cen
ter,
Veha
ri R
oad
Mul
tan.
150
263
Cen
tral
II
Kha
npur
K
hanp
ur
068-
5577
411-
14
Fays
al B
ank
Ltd
, Doa
bb
a R
oad
Kha
npur
.
151
264
Cen
tral
II
Che
shtia
n
Che
shtia
n
063-
2507
809-
10
143
B -
Blo
ck M
ain
Baz
ar C
hesh
tian.
152
266
Cen
tral
II
Bah
awal
naga
r B
ahaw
alna
gar
063-
2279
338-
39
2-B
Gha
lla M
and
i ,B
ahaw
alna
gar.
153
270
Cen
tral
II
Has
ilpur
H
asilp
ur
062-
2441
403-
04
16-D
Bal
dia
Roa
d, H
asilp
ur.
154
275
Cen
tral
II
Kot
Ad
du
Kot
Ad
du
066-
2241
093-
96
GT
Roa
d K
ot A
dd
u.
155
280
Cen
tral
II
Goj
ra
Goj
ra
046-
3512
023-
25
Tesh
il O
ffice
Roa
d G
ojra
156
283
Cen
tral
II
Yazm
an M
and
i Ya
zman
Man
di
062-
2703
161-
62
56/A
-DB
Bah
awal
pur
Roa
d, Y
azm
an
157
284
Cen
tral
II
Ahm
ed P
ur E
ast
Ahm
ed P
ur E
ast
062-
2275
214-
15
22, D
era
Naw
ab R
oad
, Ad
jace
nt C
ivil
Hos
pita
l, A
hmed
Pur
Eas
t
158
285
Cen
tral
II
Liaq
aut
Pur
Li
aqau
t P
ur
068-
5792
451-
52
Sho
p #
9-1
0 A
bb
asia
Roa
d, L
iaq
uat
Pur
159
286
Cen
tral
II
Ren
ala
Khu
rd
Ren
ala
Khu
rd
044-
2635
781-
83
20-A
/2-L
, Gul
shan
Isha
q C
olon
y, W
elco
me
Roa
d, R
enal
a K
hurd
.
160
288
Cen
tral
II
Clo
ck T
ower
, Fai
sala
bad
Fa
isal
abad
04
1-26
3097
1-73
P
lot
No.
221
/A, C
lock
Tow
er, F
aisa
lab
ad.
161
293
Cen
tral
II
Pat
toki
P
atto
ki
049-
4421
950-
53
55-A
llam
a Iq
bal
Roa
d, P
atok
i.
162
298
Cen
tral
II
Hav
eli L
akkh
a H
avel
i Lak
kha
044-
4775
091-
94
Hea
d S
ulem
anki
Roa
d, H
avel
i Lak
ha, D
epal
pur
, Oka
ra
163
299
Cen
tral
II
Fact
ory
Are
a B
ranc
h Fa
isal
abad
04
1-25
4018
6-87
Fa
ctor
y A
rea
Tata
Mar
ket
,Fai
sala
bad
BRAN
CH N
ETW
ORK
- CO
NVEN
TION
AL

206 Annual Report 2015
S.
NO
.B
RA
NC
HC
OD
ER
EG
ION
BR
AN
CH
NA
ME
CIT
YC
ON
TAC
TB
RA
NC
H A
DD
RE
SS
BRAN
CH N
ETW
ORK
- CO
NVEN
TION
AL
164
341
Cen
tral
II
Can
tt B
ranc
h
Mul
tan
061-
4588
377-
79
44/D
Azi
z S
hahe
ed R
oad
, Mul
tan
Can
tt.
165
444
Cen
tral
II
Liaq
uat
Roa
d, F
aisa
lab
ad
Fais
alab
ad
041-
2636
341-
43
P-I
II, L
iaq
at R
oad
, Fai
sala
bad
166
448
Cen
tral
II
Der
a G
hazi
Kha
n D
era
Gha
zi K
han
064-
2474
175-
77
Blo
ck 1
8, H
osp
ital C
how
k, P
akis
tan
Pla
za, D
era
Gha
zi K
han
167
162
Nor
th
Kha
rian
Kha
rian
053-
7536
064
Fays
al B
ank
Lim
ited,
Riz
wan
Pla
za, F
irst F
loor
, GT
Roa
d, N
ear C
ity H
ospi
tal,
K
haria
n
168
215
Nor
th
Man
di B
ahud
din
. M
and
i Bah
aud
din
05
46-6
0072
2-23
K
hasr
a N
o.14
3/11
2/2
Rai
lway
Roa
d, M
and
i Bah
aud
din
169
243
Nor
th
Cha
kwal
C
hakw
al
0543
-553
932-
34
Fays
al B
ank
Lim
ited
, Tal
ha G
ang
Roa
d, O
pp
osite
Alli
ace
Trav
el, C
hakw
al
170
257
Nor
th
Sar
ai A
lam
gir
Sar
ai A
lam
gir
0544
-654
623-
4 R
MA
Com
ple
x, M
ain
GT
Roa
d, S
arai
Ala
mgi
r
171
405
Nor
th
Sar
god
ha
Sar
god
ha
048-
3726
647-
8 K
hayy
am C
how
k, R
ailw
ay R
oad
, Sar
god
ha
172
450
Nor
th
Bha
lwal
B
halw
al
048-
6642
405-
08
131-
A, L
iaq
at S
hahe
ed R
oad
, Bha
lwal
173
116
Nor
th
Mirp
ur (A
JK)
Mirp
ur
0582
7-44
5103
-445
683
Ch.
Sha
rif P
laza
, Mia
n M
uham
mad
Roa
d, O
pp
. Qua
id-e
-Aza
m S
tad
ium
,
-445
100-
2 M
irpur
, Aza
d K
ashm
ir
174
136
Nor
th
Guj
ar K
han
Guj
ar K
han
051-
3514
985
Fays
al B
ank
Lim
ited
, B-1
11, 2
15-D
, War
d 5
, G.T
. Roa
d, G
ujar
Kha
n
-351
4996
-351
4968
-3
5148
74
175
190
Nor
th
Din
a
Din
a 05
44-6
3682
4 Fa
ysal
Ban
k Li
mite
d, 1
880-
Al-
Bila
l Pla
za, G
t R
oad
, Din
a
176
204
Nor
th
Jhel
um
Jhel
um
0544
-626
001
Fays
al B
ank
Lim
ited
, Koh
inoo
r B
ank
Sq
uare
, Old
G.T
. Roa
d, J
hlem
Can
tt
177
235
Nor
th
Cha
ksaw
ari
Cha
ksaw
ari
0582
7-45
4800
-2
Fay
sal B
ank
Lim
ited
, K
halid
Pla
za,
Mai
n B
azar
, C
hak
Saw
ari,
Mir
pur
A
.J.K
.
178
259
Nor
th
Dud
ial
Dud
ial
0582
7-46
5813
-16
Hus
sain
Sho
pp
ing
Cen
tre,
Mai
n B
azar
Bra
nch,
Dud
ial,
Aza
d K
ashm
ir.
179
289
Nor
th
Raw
at
Raw
at
051-
4612
114-
6 O
ffice
No.
1, R
iaz
Hus
sain
Sha
h P
laza
, Mai
n G
t R
oad
, Raw
at
180
294
Nor
th
Gilg
it G
ilgit
0581
1-45
7380
-9
ZS
Pla
za, S
hahr
ah-e
-Qua
id-e
-Aza
m, O
pp
osite
Rad
io S
tatio
n P
akis
tan,
Ju
tial,
Gilg
it
181
295
Nor
th
Ska
rdu
Ska
rdu
0581
5-45
6400
-10
Plo
t O
wn
Kas
ra N
o. 6
58/2
5/12
3, S
kam
aid
an B
azar
Col
lege
Roa
d,
Nea
r
O
ld Y
adga
r C
how
k, S
kard
u
182
296
Nor
th
Chi
las
Chi
las
0581
2-45
0730
-40
Nea
r M
adni
Mas
jid, M
ain
Baz
ar C
hila
s, D
istr
ict
Dia
mer
, Chi
las
183
300
Nor
th
Das
su
Das
su
0998
-407
301-
9 S
hree
n P
laza
, Das
su, K
ohis
tan
184
113
Nor
th
Blu
e A
rea
Isla
mab
ad
051-
2275
096-
9 Fa
ysal
Ban
k Li
mite
d, 1
5-W
est,
Jin
nah
Ave
nue
Blu
e A
rea,
Isla
mab
ad
185
126
Nor
th
F-10
Mar
kaz
Isla
mab
ad
Isla
mab
ad
051-
2104
456-
8 Fa
ysal
Ban
k Li
mite
d, 2
-G, C
apita
l Bus
ines
s C
ente
r, F-
10 M
arka
z, Is
lam
abad
186
166
Nor
th
F-7
Mar
kaz
Isla
mab
ad
051-
2652
676-
2654
689
Fays
al B
ank
Lim
ited,
Sho
p 1,
Plo
t 12
D, J
inna
h S
uper
mar
ket,
F-7
Mar
kaz,
Is
lam
abad
187
169
Nor
th
I-10
Mar
kaz
Isla
mab
ad
051-
4102
105-
8 Fa
ysal
Ban
k Li
mite
d, 3
-G, M
onaw
war
Pla
za, C
10 M
arka
z I-
10, I
slam
abad
207Annual Report 2015
S.
NO
.B
RA
NC
HC
OD
ER
EG
ION
BR
AN
CH
NA
ME
CIT
YC
ON
TAC
TB
RA
NC
H A
DD
RE
SS
BRAN
CH N
ETW
ORK
- CO
NVEN
TION
AL
188
194
Nor
th
F-11
Mar
kaz
Isla
mab
ad
051-
2228
142-
4 Fa
ysal
Ban
k Li
mite
d, P
lot
14, F
-11,
Mar
kaz,
Isla
mab
ad
189
213
Nor
th
F-8
Mar
kaz
Isla
mab
ad
051-
2287
412
& 1
3 Fa
ysal
Ban
k Li
mite
d, N
PT
Bui
ldin
g, M
arka
z F-
8, Is
lam
abad
190
220
Nor
th
G-1
0, M
arka
z Is
lam
abad
05
1-23
5133
0-23
5135
3 Fa
ysal
Ban
k Li
mite
d, 2
0-A
Gro
und
Flo
or, S
ard
ar P
laza
, G-1
0 M
arka
z
Bra
nch,
Isla
mab
ad
191
262
Nor
th
Bar
a K
oh
Isla
mab
ad
051-
2304
041-
50
Sho
p N
o. 8
,11
Usm
an P
laza
, Mai
n M
urre
e R
oad
, Bar
a K
oh, I
slam
bad
192
452
Nor
th
Isla
mab
ad B
lue
Are
a II
Ros
hen
Cen
ter
Isla
mab
ad
051-
2275
250-
2 78
-W, R
osha
n C
ente
r, Ji
nnah
Ave
nue,
Blu
e A
rea,
Isla
mab
ad
193
332
Nor
th
F-7
II Is
lam
abad
05
1-11
1-11
-22-
33
15, M
arka
z F-
7, O
pp
osite
Fg
Col
lege
For
Wom
en, F
-7/2
, Isl
amab
ad
194
191
Nor
th
Uni
vers
ity R
oad
P
esha
war
09
1-57
1140
1-8
4652
-467
0, O
mer
Pla
za, J
ahan
gira
bad
, Uni
vers
ity R
oad
, Pes
haw
ar
195
192
Nor
th
Khy
ber
Baz
ar
Pes
haw
ar
091-
2220
471-
73
417-
D, O
utsi
de
Baj
ori G
te, S
hob
a C
how
k, K
hyb
er B
azar
, Pes
haw
ar
196
219
Nor
th
Ab
bot
tab
ad
Ab
bot
tab
ad
0992
-385
919-
20-3
8592
5 84
1 Fa
rooq
abad
Mai
n M
anse
hra
Roa
d, A
bb
otab
ad
197
246
Nor
th
Att
ock
Att
ock
057-
2602
061-
62
Fays
al B
ank
Lim
ited
, Plo
t N
o. 1
69 S
haik
h Ja
ffar
Pla
za, S
add
iqui
Roa
d,
Att
ock
198
248
Nor
th
Har
ipur
H
arip
ur
0995
-616
427-
9 A
kbar
Arc
ade,
Akb
ar K
han
Pla
za, S
hahr
ah-e
-Haz
ara,
Har
ipur
199
250
Nor
th
Pes
haw
ar U
nive
rsity
Cam
p
Pes
haw
ar
091-
5610
913,
G
roun
d Fl
oor,
Wes
tern
Cor
ner,
Aca
dem
ic B
lock
- II
, Uni
vers
ity O
f Pes
haw
ar,
09
1-56
1094
3 P
esha
war
200
277
Nor
th
Pee
pal
Man
di
Pes
haw
ar
091-
2592
802
Ash
raf C
hina
Tra
de
Cen
tre,
Pip
al M
and
i, P
esha
war
201
411
Nor
th
Pes
haw
ar F
akhr
-e-
Ala
m
Pes
haw
ar
091-
5285
289,
527
0176
-8
1 Fa
khr-
e- A
lam
Roa
d C
antt
, Pes
haw
ar
202
120
Nor
th
Hai
der
Roa
d
Raw
alp
ind
i 05
1-57
0101
8 -
22
32, H
aid
er R
oad
, Raw
alp
ind
i Can
tt. R
awal
pin
di
203
135
Nor
th
Sat
ellit
e To
wn
Raw
alp
ind
i 05
1-44
2496
9-72
5T
h R
oad
, City
Sho
pp
ing
Cen
tre,
Com
mer
cial
Mar
ket,
Sat
ellit
e To
wn
-
R
awal
pin
di
204
168
Nor
th
Raj
a B
azar
R
awal
pin
di
051-
5530
661
U-I
, Iq
bal
Roa
d, F
awar
a C
how
k, R
aja
Baz
ar, R
awal
pin
di.
-5
7756
25-2
3-27
205
184
Nor
th
Wes
trid
ge
Raw
alp
ind
i 05
1-51
6683
5-37
P
esha
war
Roa
d W
estr
idge
, RV
Arc
ade
- R
awal
pin
di
206
214
Nor
th
Sad
iqab
ad R
oad
R
awal
pin
di
051-
4257
745
Fays
al B
ank
Lim
ited
72-
C, S
atel
lite
Tow
n S
adiq
abad
Roa
d R
awal
pin
di
-
4573
741-
42
207
234
Nor
th
Kal
ma
Cho
wk
Raw
alp
ind
i 05
1-56
8305
3-4
Kal
ma
Cho
wk,
Kam
alab
ad, D
hok
Sye
dan
Roa
d, R
awal
pin
di
208
267
Nor
th
Gul
raiz
R
awal
pin
di
051-
5596
187-
9-10
2-10
6 P
lot
No.
27,
Gul
raiz
Sch
eme
II, R
awal
pin
di
209
278
Nor
th
PW
D
Isla
mab
ad
051-
5706
450-
51
Att
a A
rcad
e, G
roun
d F
loor
, Mai
n B
lwd
, Nea
r P
olic
e Fo
und
atio
n, P
WD
,
Is
lam
abad
210
337
Nor
th
Civ
il Li
nes
Raw
alp
ind
i 05
1-11
1321
321-
5795
105
CL/
55
- A
, Civ
il Li
nes,
Meo
Roa
d, R
awal
pin
di
211
409
Nor
th
Raw
alp
ind
i Gun
j Man
di
Raw
alp
ind
i 05
1-55
3911
5,-5
5359
88
Gun
j Man
di,
Raj
a B
azar
, Raw
alp
ind
i

208 Annual Report 2015
S.
NO
.B
RA
NC
HC
OD
ER
EG
ION
BR
AN
CH
NA
ME
CIT
YC
ON
TAC
TB
RA
NC
H A
DD
RE
SS
1 30
24
Nor
th
F 10
Mar
kaz
Isla
mab
ad
051-
2296
962-
3,
Gro
und
Flo
or, 7
-L, F
-10
Mar
kaz,
Isla
mab
ad
22
2287
3, 2
8090
56-8
,
2222
881,
210
6723
2 30
44
Nor
th
Aab
par
a M
arke
t Is
lam
abad
05
1 28
7047
4-76
U
nit N
o.71
5, K
amra
n R
esta
uran
t, A
abpa
ra M
arke
t, K
haya
ban-
e-S
uhar
war
dy,
Isla
mab
ad
3 30
48
Nor
th
I-8
Mar
kaz
Isla
mab
ad
051
4861
800-
802
P
lot
No.
33,
Ane
ek A
rcad
e, S
ecto
r N
o. I-
8 M
arka
z, Is
lam
abad
4 30
05
Nor
th
The
Mal
l R
awal
pin
di
051
5701
054-
57
Cen
tury
Tow
ers,
6 T
he M
all,
Raw
alp
ind
i
5 30
34
Nor
th
Man
sehr
a M
anse
hra
0997
308
302-
3,
Kha
ta/K
hato
oni N
o. 3
179/
6260
, Gro
und
Floo
r, R
ehm
an P
laza
, Abb
otta
bad
30
8305
-7, 3
0830
9-11
R
oad
, Man
sehr
a
6 30
19
Nor
th
Mirp
ur, A
zad
Kas
hmir
Aza
d K
ashm
ir 05
827
4484
12
Plo
t No.
2, S
ecto
r A/5
, Al-M
anza
r Bui
ldin
g, A
llam
a Iq
bal R
oad,
Mirp
ur, A
zad
Kas
hmir
7 30
62
Nor
th
Bah
ria T
own,
Raw
alp
ind
i R
awal
pin
di
051
5412
154-
55
Plo
t N
o. 1
77, S
ervi
ce A
venu
e, In
telle
ctua
l Vill
age,
Bah
ria T
own,
Pha
se 7
,
R
awal
pin
di
8 30
09
Nor
th
Min
gora
S
wat
09
46-7
2201
1-13
Lo
wer
Gro
und
& F
irst F
loor
, Aba
sin
Tow
ers,
Gre
en C
how
k, M
adya
n R
oad,
M
ingo
ra, S
wat
9 30
11
Nor
th
Mar
dan
M
ard
an
0937
870
256-
58
Gro
und
Flo
or, K
hatt
ak P
laza
, Mai
n B
azar
, Ban
k R
oad
, Mar
dan
10
3020
N
orth
C
hars
add
a C
hars
add
a 09
16 5
1101
1,
Gro
und
Flo
or, G
old
Min
es T
ower
s, N
owes
hera
Roa
d, C
hars
add
a
0916
511
013,
0916
512
013-
4
11
3028
N
orth
N
owsh
era
Can
tt.
Now
sher
a 09
23 6
1340
0-2
1s
t Fl
oor,
Am
in T
ower
, G.T
. Roa
d, N
owsh
era
Can
tt. N
owsh
era
12
3053
N
orth
B
uner
B
uner
09
39 5
5542
8 K
hasr
a N
o. 3
249,
Kha
toon
i No.
887
, Mar
dan
Roa
d, S
awar
i Mai
n B
azar
,
D
istr
ict
Bun
er
13
3055
N
orth
Ti
mer
gara
Ti
mer
gara
09
45 8
2135
1-52
S
hop
# 1,
2, F
akir
Pla
za O
ppos
ite G
ener
al B
us S
tand
, Mai
n G
T R
oad,
Low
er
Dir,
Tim
erga
ra
14
3058
N
orth
M
akan
Bag
h, M
ingo
ra
Sw
at
0946
700
801-
802
Mak
an B
agh
Cho
wk,
Nea
r S
wat
Con
tinen
tal H
otel
, Sai
du
Sha
rif R
oad
,
M
ingo
ra S
wat
15
3069
N
orth
B
atkh
ela
Bat
khel
a 09
32 4
1185
0-52
A
l-M
adin
a M
arke
t, N
ear
Khw
ar, M
ain
Baz
ar, B
atkh
ela,
Dis
tric
t M
alak
and
16
3035
N
orth
K
ohat
K
ohat
0
922
5224
51, 5
2245
4
Plo
t N
o. 1
4, S
urve
y N
o. 2
53-C
, Nea
r B
utt
Sup
er S
tore
, Kat
cher
y C
how
k,
Han
gu R
oad
, Koh
at C
antt
.
17
3036
N
orth
D
.I. K
han
D.I.
Kha
n 09
66 7
1890
3-6,
P
lot
No.
19, S
urve
y N
o.79
, Nea
r G
PO
30
8305
-7, 3
0830
9-11
C
how
k, E
ast
Circ
ular
Roa
d, D
.I. K
han
Can
tt.
09
66 7
1894
1, 0
966
7189
54,
09
66 7
1895
6
BRAN
CH N
ETW
ORK
- IS
LAM
IC
209Annual Report 2015
S.
NO
.B
RA
NC
HC
OD
ER
EG
ION
BR
AN
CH
NA
ME
CIT
YC
ON
TAC
TB
RA
NC
H A
DD
RE
SS
18
3049
N
orth
B
annu
B
annu
0
928
6115
40-4
1
Kha
sra
No.
146
2/18
33, M
ouza
Fat
ima
Khe
l, N
ear
Dur
rani
Pla
za, E
x G
TS
C
how
k, B
annu
Can
tt.,
Ban
nu
19
3002
N
orth
H
ayat
abad
P
esha
war
09
1-58
1139
5,
Indu
stria
l Sta
te K
arkh
ano
Mar
ket,
1st F
loor
, Sho
p N
umbe
r 1-7
, S.S
. Pla
za,
09
1-58
1063
8 Ja
mru
d R
oad
, Hay
atab
ad, P
esha
war
20
3041
N
orth
A
shra
f Roa
d
Pes
haw
ar
091
2593
364,
S
hop
No.
471
-472
/203
-204
, New
Ram
pura
Gat
e, A
shra
f Roa
d, P
esha
war
091
2593
164
21
3012
N
orth
G
.T. R
oad
Pes
haw
ar
Pes
haw
ar
091
2590
484-
7 G
roun
d F
loor
, Rah
eem
Med
ical
Cen
tre,
G.T
. Roa
d, P
esha
war
22
3013
N
orth
P
esha
war
Can
tt.
Pes
haw
ar
091
5273
091-
92 &
6,
Sad
dar
Roa
d, T
asne
em P
laza
, Pes
haw
ar C
antt
., P
esha
war
091
5275
182
23
3001
S
outh
S
harf
abad
K
arac
hi
021-
3492
3770
-4
Alh
aram
Tow
er 1
, BM
CH
S, A
lam
gir
Roa
d, S
harf
abad
, Kar
achi
24
3007
S
outh
N
azim
abad
K
arac
hi
021-
3661
3053
-55
1st
Floo
r, P
lot
#16
Row
#1,
Sub
Blo
ck A
,Blo
ck II
I (III
-A,1
/ 1
6) N
azim
abad
,
K
arac
hi
25
3046
S
outh
C
attle
Col
ony
Kar
achi
02
1-35
0801
25-2
7 P
lot
No.
3-A
, Com
mer
cial
Are
a, L
and
hi, C
attle
Col
ony,
Kar
achi
26
3059
S
outh
N
agan
Cho
wra
ngi
Kar
achi
02
1-36
9404
61
Plo
t No.
R-4
10, S
ecto
r No.
11-
C/1
, Nor
th K
arac
hi T
owns
hip,
Nor
th K
arac
hi,
K
arac
hi
27
3063
S
outh
G
ulb
ahar
K
arac
hi
021
3672
9805
– 0
7 P
lot
No.
476
, 477
, 478
, Gho
usia
Col
ony,
Gul
bah
ar, K
arac
hi
28
3064
S
outh
S
hah
Fais
al C
olon
y K
arac
hi
021
3468
6211
-12
Plo
t N
o. B
-09,
Mai
n E
lect
roni
c M
arke
t, S
hah
Fais
al C
olon
y N
o. 1
, Kar
achi
29
3066
S
outh
A
ysha
Man
zil
Kar
achi
02
1 36
3608
77-7
9 S
hop
No.
1 &
2, G
roun
d F
loor
, Kom
al C
lass
ic, P
lot
No.
C-1
0, B
lock
No.
4,
Fed
eral
‘B’ A
rea,
Nea
r A
ysha
Man
zil,
Kar
achi
30
3068
S
outh
S
hers
hah
Kar
achi
02
1 32
5801
75-7
7 G
odow
n N
o. D
-283
/21
& D
-283
/22,
Plo
t No.
D-2
83, S
ITE,
She
rsha
h, K
arac
hii
31
400
Sou
th
DH
A P
hase
I K
arac
hi
021-
3531
1473
, S
pee
dy
Tow
ers
129/
I & II
, Kor
angi
Roa
d, P
hase
I, D
HA
, Kar
achi
02
1-35
3114
82
32
3010
S
outh
Jo
dia
Baz
aar
Kar
achi
02
1-32
4632
65-6
8 S
hop
No.
G-1
, Gro
und
, Bas
emen
t &
Firs
t Fl
oor,
Plo
t N
o. M
.R. 3
/18/
II-B
-
14
3, M
arke
t Q
uart
ers,
Bol
ton
Mar
ket,
Kar
achi
33
3043
S
outh
G
ulsh
an-e
-Iq
bal
K
arac
hi
021-
3481
9572
-76
Plo
t N
o. F
L-2/
4, B
lock
-6, K
DA
Sch
eme
No.
24,
Gul
shan
-e-I
qb
al, K
arac
hi
34
3026
S
outh
D
hora
ji K
arac
hi
021-
3486
0851
,2,
Sho
p N
o. G
-1 t
o G
-4, T
alha
Arc
ade,
Plo
t N
o. 3
5/18
7, B
lock
48
6085
5,8
7/8,
C.P
. Ber
ar C
oop
erat
ive
Hou
sing
Soc
iety
, Kar
achi
35
3031
S
outh
K
haya
ban
-e-S
hahb
az
Kar
achi
02
1-35
3423
64-7
43
-C, K
haya
ban
-e-S
hahb
az,P
hase
VI,
DH
A, K
arac
hi
36
3050
S
outh
R
ashi
d M
inha
s R
oad
K
arac
hi
021
3483
2875
-77
P
lot N
o. 1
6, A
l Mus
avvi
r Cro
wn,
Blo
ck 1
0-A
, KD
A S
chem
e N
O. 2
4, G
ulsh
an
e
Iqb
al, K
arac
hi
37
3060
S
outh
D
HA
Pha
se II
Ext
. K
arac
hi
021
3531
9595
-97
Gro
und
Flo
or P
lot
No.
61-C
, 21s
t C
omm
erci
al S
tree
t P
hase
II E
xten
sion
,
D
HA
, Kar
achi
38
3042
S
outh
H
yder
abad
H
yder
abad
02
2 27
3007
4-77
C
.B. 4
1/47
4/2,
Sad
dar
, Hyd
erab
ad
BRAN
CH N
ETW
ORK
- IS
LAM
IC

210 Annual Report 2015
S.
NO
.B
RA
NC
HC
OD
ER
EG
ION
BR
AN
CH
NA
ME
CIT
YC
ON
TAC
TB
RA
NC
H A
DD
RE
SS
BRAN
CH N
ETW
ORK
- IS
LAM
IC
39
3018
S
outh
Q
and
hari
Baz
aar
Que
tta
081
2837
890,
284
3005
, 1-
25/1
4-15
, Qan
dha
ri B
azaa
r, Q
uett
a
28
2091
6, 2
8373
20
40
3052
S
outh
M
arke
t R
oad
(Hyd
) H
yder
abad
02
2 26
1340
6-08
C
ity S
urve
y N
o.12
84 &
129
6, W
ard
“A
”, M
arke
t R
oad
, Hyd
erab
ad
41
3004
S
outh
Z
argh
oon
Roa
d
Que
tta
081-
2443
177/
N
ear
Buk
hari
Pet
role
um, N
ew Z
argh
oon
Roa
d, Q
uett
a
081-
2443
265
42
3003
C
entr
al
D-G
roun
d
Fais
alab
ad
041-
8555
643/
44
7-D
, (1s
t Fl
oor)
Peo
ple
s C
olon
y 1,
D-G
roun
d, F
aisa
lab
ad
041-
8555
646
43
3014
C
entr
al
Min
erw
a R
oad
Fa
isal
abad
04
1-24
1628
1-85
S
hop
No.
1,2,
46-
50, N
ew G
rain
Mar
ket,
Min
erw
a R
oad
, Fai
sala
bad
44
3021
C
entr
al
Liaq
uat
Roa
d
Fais
alab
ad
041-
2617
403-
8,
3-Li
aqua
t R
oad
, Fai
sala
bad
26
1902
5, 2
6278
06-7
45
3022
C
entr
al
Ab
dal
i Roa
d
Mul
tan
061-
4571
768,
457
0768
, 80
- A
bd
ali R
oad
, Mul
tan
45
7039
8, 4
5174
08
4581
905-
6,
46
3047
C
entr
al
Cho
wk
Sha
heed
an
Mul
tan
061
4574
462-
64
Pro
per
ty #
177
1/S
H, W
ard
# V
III-M
, Cho
wk
Sha
heed
an, M
ulta
n
47
3039
C
entr
al
Bah
awal
pur
B
ahaw
alp
ur
062-
2731
115-
6,
Plo
t No.
29,
Blo
ck A
, Gha
llah
Man
di R
oad,
Mod
el T
own-
B, G
ener
al O
ffici
al
27
3111
8 C
olon
y, B
ahaw
alp
ur
48
3061
C
entr
al
Chi
niot
C
hini
ot
047
6333
561-
3
Pro
per
ty #
318
8/31
78, M
ain
Fais
alab
ad R
d, S
aghe
er T
own,
Nea
r N
AD
RA
O
ffice
, Cha
h K
arar
ri W
ala,
Chi
niot
No.
2, C
hini
ot
49
3017
C
entr
al
Eas
t C
ircul
ar R
oad
, Guj
rat
Guj
rat
053
3535
931-
2,
Sho
p #
B-1
0/25
1, N
ear
Sha
h D
oula
Gat
e, E
ast
Circ
ular
Roa
d, O
pp
osite
3533
143
Gre
en H
ouse
, Guj
rat
50
3023
C
entr
al
Das
ka R
oad
S
ialk
ot
052-
3240
200-
204,
P
lot
No.
651
, Das
ka R
oad
, Pul
Aik
, Sia
lkot
32
5299
6-8
30
23*
Cen
tral
C
iti H
ousi
ng S
ub B
r. S
ialk
ot
052-
6556
010
City
Hou
sing
Soc
iety
Lim
ited
, Sho
p N
o. 1
9, O
pp
osite
Mai
n O
ffice
, 6-K
m
05
2-65
5602
2
Das
ka R
oad
, Sia
lkot
51
3030
C
entr
al
Guj
ranw
ala
Guj
ranw
ala
055
3735
531-
5
157-
Al-
Maj
eed
Cen
tre,
Str
eet
No.
14,
Moh
alla
Fai
sala
bad
, G.T
. Roa
d,
Guj
ranw
ala
52
3045
C
entr
al
Tala
gang
Ta
laga
ng
0543
411
995-
97
BII-
278-
279,
Mad
ina
Pla
za, N
ear
Boy
s H
igh
Sch
ool N
o.1,
Cha
kwal
Roa
d,
Tala
gang
53
3008
C
entr
al
Aza
m C
loth
La
hore
04
2-37
6713
51-5
4 S
hop
No.
F-1
469,
156
6 &
156
7, A
kbar
Blo
ck, R
ahim
Cen
tre,
Aza
m C
loth
M
arke
t, L
ahor
e
54
3065
C
entr
al
Aza
m C
loth
II La
hore
04
2 37
6568
73-8
76
Pro
per
ty #
F-1
173,
Mul
tani
Moh
alla
h, K
ooch
a S
odaa
gran
, Chu
na M
and
i,
Laho
re
55
3025
C
entr
al
Alla
ma
Iqb
al T
own
Laho
re
042-
3781
1068
, 20
, Gul
shan
Blo
ck, A
llam
a Iq
bal
Tow
n, L
ahor
e
3781
1100
, 378
1107
4
56
3033
C
entr
al
Circ
ular
Roa
d
Laho
re
042-
3767
0600
-05
33
- C
ircul
ar R
oad
, Out
sid
e S
hah
Ala
m G
ate,
Lah
ore
211Annual Report 2015
S.
NO
.B
RA
NC
HC
OD
ER
EG
ION
BR
AN
CH
NA
ME
CIT
YC
ON
TAC
TB
RA
NC
H A
DD
RE
SS
57
3040
C
entr
al
Exp
o C
entr
e La
hore
04
2 35
3160
23-2
4
Plo
t No.
590
, Blo
ck H
-III,
Opp
osite
Exp
o C
entre
, M.A
Joh
ar T
own,
Lah
ore
58
3006
C
entr
al
Lead
s C
entr
e, G
ulb
erg
Laho
re
042-
3578
3955
-57-
59
Sho
p #
4, 4
A a
nd 4
B, L
eed
s C
ente
r,Mai
n B
oule
vard
, Gul
ber
g, L
ahor
e
59
3016
C
entr
al
Bag
hban
pur
a La
hore
04
2-36
8403
10-3
31
0/3/
1, B
ilal M
arke
t C
how
k, S
hala
mar
Bag
h, G
.T R
oad
, Bag
hban
pur
a,
Laho
re
60
3038
C
entr
al
Z-B
lock
, DH
A
Laho
re
042
3574
3741
–43
10
-Z, S
tree
t 1,
Pha
se II
I, D
HA
, Lah
ore
61
3054
C
entr
al
Kas
ur
Kas
ur
049
2760
780-
782
B
IV-9
R-2
20 A
, Out
sid
e La
hori
Gat
e, R
ailw
ay R
oad
, Kas
ur
62
421
Cen
tral
C
aval
ry G
roun
d
Laho
re
042-
3660
3412
-15
97-
Com
mer
cial
Are
a, C
aval
ry G
roun
d, L
ahor
e
63
3032
C
entr
al
Tow
nshi
p
Laho
re
042-
3517
6051
-3
894-
D, F
aisa
l Tow
n, P
eco
Roa
d, T
owns
hip
, Lah
ore
64
3037
C
entr
al
Rai
win
d R
oad
La
hore
04
2-35
3201
64,
131/
178,
Boh
bat
ein
Cho
wk,
Rai
win
d R
oad
, Lah
ore
35
3202
64, 3
5320
360
65
3051
C
entr
al
Bah
ria T
own
Laho
re
042
3545
2054
-58
P
lot
# 5/
A, S
ecto
r C
, Bah
ria T
own,
Lah
ore
66
3056
C
entr
al
She
ikhu
pur
a S
heik
hup
ura
056
3614
270-
71,
3-C
, Col
lege
Roa
d, C
ivil
Line
s, S
heik
hup
ura
05
6 36
1427
3
67
3057
C
entr
al
Sah
iwal
S
ahiw
al
040
4221
601-
03
Kha
ta N
o. 9
23, K
hato
oni N
umb
er 9
42, G
ali S
ukh
Cha
in, M
ohal
lah
Bal
och
Gan
j, S
ahiw
al
68
3067
C
entr
al
Fero
zpur
Roa
d
Laho
re
042
3582
7951
-53
Moh
alla
Mak
hdoo
m A
bad
, Chu
ngi A
mar
Sid
hu, M
ain
Fero
zpur
Roa
d,
Laho
re45
8190
5-6,
BRAN
CH N
ETW
ORK
- IS
LAM
IC

212 Annual Report 2015
CODE OF CONDUCT
INTRODUCTION
Faysal Bank’s reputation is a priceless asset that each of us is responsible for maintaining. Our reputation not only affects whether or not someone will be our customer; it also determines whether we are proud to be associated with this organisation — how we feel about coming to work.
The Code of Conduct is designed to guide the personal business ethics of all of us. It applies to every employee of Faysal Bank Limited and each of its subsidiaries. In addition, other persons performing services for the Company may be subject to the Code by contract or agreement. You are expected to read this document promptly upon receiving it. You also are expected to read and understand the Company policies that relate to sections of this Code.
Individual business units or staff groups may issue additional policies that provide more specific guidance about certain practices related to those particular businesses. You should speak with your leader for more information about any additional policies that may pertain to you.
In addition to the ethical guidelines included in the Code, you must comply with the requirements of all applicable laws and regulations. This is mandatory for everyone and is not subject to business priorities or individual discretion.
Adherence to the Bank’s Code of Conduct is a condition of employment. All employees are required to comply with the Code, and no waivers from its coverage may be granted.
BUSINESS ETHICS AND COMPLIANCE WITH LAW
You are expected to protect and enhance the assets and reputation of Faysal Bank Limited.
Our business is based on a strong tradition of trust. It is the reason our customers come to us. Honesty and integrity are cornerstones of ethical behavior. Trustworthiness and dependability are essential to lasting relationships. Our continued success depends on doing what we promise — promptly, competently and fairly.
In our rapidly evolving businesses, each of us is challenged by a complex environment, this often requires fast responses under pressure. No written policy can definitively set forth the appropriate action for all business situations. Accordingly, rather than a set of specific rules, this Code emphasises a standard of ethical conduct that must permeate all of our business dealings and relationships. Individual businesses may issue additional policies that provide more specific guidance about certain practices related to that business. You should speak with your leader for more information about any of those policies that pertain to you. You also should pay careful attention to compliance training programs to help you apply the Code in your daily activities.
The Code of Conduct provides guidelines for a variety of business situations. It does not try to anticipate every ethical dilemma you may face. Faysal Bank, therefore, relies on your good judgment.You must conduct business in accordance with applicable laws and regulations and the Code.
You should consult the Legal counsel whenever you have a question about the legality of a course of action. You must also exercise the utmost care to ensure that all statements you make, especially those made to the government bodies that regulate our businesses (or with which we do business), are accurate. If you are in doubt about any situation or behavior, you should speak to your leader, Compliance or your Human Resources representative.
213Annual Report 2015
CODE OF CONDUCT
Leaders, by virtue of their positions of authority, must be ethical role models for all employees.
An important part of a leader’s responsibility is to exhibit the highest standards of integrity in all dealings with fellow employees, customers, suppliers and the community at large. An equally important responsibility is to obtain employees’ commitment and develop their ability to make sound ethical judgments. Leaders must communicate the seriousness of the Bank’s expectations for ethical conduct and their own personal support of these expectations. Ethical leadership includes both fostering a work environment that encourages employees to voice concerns or otherwise seek assistance if faced with potentially compromising situations, and supporting those who speak out. Leaders must be alert to any situations and/or actions that may be unethical or potentially damaging to the Company’s reputation and to respond appropriately. Leaders must avoid giving even implicit approval of such situations and actions. For example, leaders must ensure that financial reports and product and service claims are honest and complete.
TREATMENT OF EMPLOYEES AND OTHERS
You are expected to treat colleagues, employees and others with whom you interact with respect and dignity.
Treating all employees with respect and dignity is an FBL Value that applies to everyone. This is particularly important for leaders who influence the work environment of their areas on a daily basis. Leaders must remember that they are role models for their employees and that these employees are likely to treat their colleagues, including employees whom they manage and others, as they themselves are treated.
The Company expects leaders to seek out the ideas of subordinates and to involve them in decisions whenever appropriate. At the same time, once a decision is made, everyone involved is expected to pull together and support it.
In addition, you must respect and maintain the confidentiality of information you learn about your employees and colleagues (e.g., salaries, performance reviews, disabilities or leaves of absence). You must not share this information with anyone either inside or outside your department, except as is necessary to perform your job.
RELATIONS WITH REGULATORS
All communications with regulators must be handled through the appropriate department/function. Where communication with the regulator is part of an employee’s job description (e.g. dealing with the regulators for filing regular financial returns which is the responsibility of the respective departmentsending the regular returns), in these cases, Compliance is only involved if there is a potential breach of regulations. Guidelines of SBP issued in this regard shall be strictly followed. A copy of all non-routine correspondence with the regulators must be provided to the Compliance Function.
Meetings with Regulators
Any visits to regulators by employees or senior management must be notified to and if required may be coordinated by the Compliance Function.

214 Annual Report 2015
CODE OF CONDUCT
Reporting to Regulators
Information provided to regulators by FBL must:
a) be accurate;
b) not omit any information that might result in the information provided being misleading;
c) be provided only after all reasonable enquiries are made to ascertain the accuracy and completeness of the information;
d) be reviewed by Head of the Department/Function.
Inspection by Regulators
Regulators may inspect FBL to enable regulators to inspect its activities, FBL must maintain all records in a form capable of being checked or audited. Employees must ensure that they do not amend, destroy, erase or make further entries to any record or file which is, or may be, relevant to a matter being inspected or investigated by a regulator or to any disciplinary process or appeal process. Employees must co-operate with any inspection carried out by the regulator to the fullest possible degree. Compliance may co-ordinate inspections but employees must:
a) make themselves readily available to the inspection team;
b) on receipt of a proper request by the regulator, produce to the inspection team any documents, files and computer data and other material in their possession or control;
c) give the inspection team access, at all times, to FBL’s premises and reasonable facilities;
d) to the extent that they are properly requested by the regulator, permit the inspection team to copy any documents or other material in FBL’s premises or elsewhere at FBL’s expense and to remove copies and hold them elsewhere; and
e) answer truthfully and fully all questions put to them by the inspection team. Failure to comply with a request by regulators to produce records and documents, give regulators access to the premises, staff or records of FBL for the purposes of supervision or inspection or to provide information relating to a transaction is an offence for which FBL and senior management may be punished by fine or imprisonment. Directors, officers or employees of FBL must comply with any fines, prohibitions, requirements, sanctions, penalties, orders and decisions of any regulator.
RELATIONS WITH CUSTOMERS
Employees must ensure that all communications are clear, fair and not misleading. FBL must manage conflicts of interests appropriately and ensure fair treatment of all affected clients.
Employees must not unfairly or unreasonably place the interests of FBL above those of a client. Employees must ensure they are aware of each client’s current financial situation and other relevant facts about the client appropriate to the services provided to or requested by the client. If FBL has control of client assets, it must ensure those assets are properly accounted for and safeguarded in accordance with regulatory, contractual or fiduciary responsibilities.
215Annual Report 2015
CODE OF CONDUCT
Every employee shall not divulge any information relating to the affairs of its customers except in circumstances in which it is, in accordance with law, practice and customary usage among Bankers, necessary or appropriate to divulge such information.
EMPLOYEES’ DUTY OF NON-DISCLOSURE & TIPPING OFF
Anti Money Laundering (AML) Act of 2010 forbids and makes it a crime, for the Bank or employee to alert a client or potential client (or any party involved in the transaction) to the fact that the Bank is investigating their actions or motives, or to tell them, or any other outside party, that a report of activity identified as suspicious has been prepared and/or filed. The same also applies for the Currency Transaction Reporting (CTR) to Financial Monitoring Unit. Such an act is known as Tipping Off and is a punishable crime under AML Act of 2010 which may lead to fine and/or imprisonment. Such an act may also subject an employee to disciplinary action by the Bank.
To protect against a violation of any non-disclosure requirements, employees should adhere to the following guidelines:
• Never disclose to the client or any third parties that information has been provided to any department within FBL or a government authority or that any suspicious activity investigation is contemplated or
underway.
• Never take any action that might otherwise alert the subject that FBL has suspicions that will result in a report or filing a Suspicious Transaction Reporting (STR) and treat the filing of an STR as a confidential matter, even within FBL.
CONFIDENTIALITY
It is the policy of FBL to honor all applicable laws, including AML, data protection, privacy and Bank confidentiality laws. Copies of STR filings and underlying documentation are maintained as confidential documents. This means they are shared within FBL only on a "need to know" basis. A summary or description of these reports (and supporting materials) may be shared with local regulators as required by applicable law. Generally, regulators are also required to treat as confidential any details that they are provided. In case of any uncertainty as to how to respond to such an inquiry, kindly contact the Compliance Function for guidance.
FBL EMPLOYEE REPORTING RESPONSIBILITIES
Every employee of FBL is responsible for identifying reportable events and adhering to the CAAML policy with respect to any suspicious activity he/she may observe in his/her job capacity. Consistent with FBL’s CAAML Policy, employees with client-related duties are responsible for understanding the nature of their clients’ transactions, business and source of wealth, and for using currently available FBL resources to monitor their clients’ activity for consistency with this understanding. This review activity is a formal means by which Reportable Events may be identified. In addition, employees must be diligent and alert in all aspects of their job functions, including but not limited to the use and review of any available reports and information databases, and must use common sense and experience to guide them in asking questions and spotting irregularities.
When a possibly suspicious activity or potential legal or regulatory violation is observed, the employee is responsible for calling the situation to the attention of his/her supervisor, who will notify the Functional

216 Annual Report 2015
CODE OF CONDUCT
Head and the Compliance Function. In extremely sensitive situations or in any instance where an employee is uncomfortable working with their supervisors on such matters, he/she may directly report to the Compliance Function.
Failure to follow the STR policy when a Reportable Event occurs is a breach of policy and may subject an employee to disciplinary action.
KNOW YOUR CUSTOMER & ANTI MONEY LAUNDERING
Every client must be owned by a relationship officer of the business line. Such relationship officer will be responsible for the client’s KYC, due diligence and ensuring that FBL is safeguarded against criminal activities like money laundering, terrorist financing and drug trafficking etc in this regard.
We must ensure that we have sufficient information about our customers to satisfy ourselves as to their reputation and standing and the nature of their business activities.
Money laundering is the process by which Banks are used as vehicles to disguise or “launder” the proceeds of criminal activity. Such activities undermine a Bank’s integrity, damage its reputation, deter honest customers and expose a Bank to severe sanctions. Faysal Bank fully supports the international drive against money laundering and is committed to assisting relevant authorities in preventing money laundering.
Faysal Bank’s success on this front is dependent upon the co-operation of all employees. Everyone must exercise prudence and vigilance when assessing potential new clients, handling client requests and processing client transactions. With everyone’s commitment and determination, it is possible to translate the spirit of FBL’s core values and business principles into daily practice, continue to protect the integrity of the Banking system, and maintain the Bank’s reputation as a respectable and trustworthy institution.
Accordingly, the following precautionary steps are to be adopted in this connection:
• The identity of every new customer with whom we deal must be established from reliable identifying documents.
• If you suspect that funds stem from illegal activities, this must be reported internally to your next Reporting Supervisor or Compliance who will liaise with competent authorities.
• Customers should not be warned when information relating to them is being reported.
• Detailed requirements on Bank’s due diligence policy and procedures are to be followed as given in the Compliance Manual.
INSIDER TRADING
Insider trading involves the improper use of unpublished price sensitive information for personal benefit when dealing in securities.
According to Sections 15A and 15B of Securities and Exchange Ordinance 1969, employees and other persons who have privileged price information about a company during the preceding six months should not deal in securities of the company. Those found guilty of contravening the provisions of the Ordinance can be awarded punishment up to three years and obliged to pay fine as well as compensation to any person who may have suffered on account of such insider trading.
217Annual Report 2015
CODE OF CONDUCT
SPECULATIVE DEALING
Personal dealing in speculative transactions can entail employees with risks to their financial standing, can distract them from the performance of their duties and can impact on the reputation of the Bank. For these reasons, employees should not engage in speculative transactions for their personal account.
Accordingly, no employee shall:
• borrow money from or in any way place himself under pecuniary obligation to a broker or money lender or any firm or persons having dealings with the Bank;
• buy or sell stocks, shares, commodities, foreign exchange or securities of any description without funds to meet the full cost thereof;
• lend money in his private capacity to a constituent of the Bank or have personal dealings with a constituent for the purpose of sale of bill of exchange, Government paper or any other securities.
In this connection, employees are advised to note that borrowing money from any source of placing themselves under pecuniary obligations beyond the capacity to repay or honor the commitment will be tantamount to speculative activity.
If employees are unclear whether any particular transaction/activity could be considered speculative they should seek guidance from their Executive Officer or Compliance. Please refer to the Compliance Manual Chapter 29 - Personal Account Dealing Policy on the intranet for details and for adherence.
CONFLICT OF INTEREST
You must be alert to any situation that could compromise the position of trust you hold as a Faysal Bank employee, and avoid any kind of conflict between your personal interests and those of Faysal Bank.
You may engage in outside activities that do not conflict with the interests of the Bank, interfere with the responsibilities of its employees, or damage or misuse the reputation, trademarks, relationships, confidential information or other property of the Bank. The Bank has adopted the following guidelines to protect both the Bank and employees against conflicts of interest, and from situations that create a perception of impropriety.
From time to time, situations will arise that are not clear-cut. If you are uncertain about the propriety of your conduct or business relationships, consult your supervisor, Legal or Compliance.
You should never use your position with the Bank, or information acquired during your employment, in a manner that may create a conflict — or the appearance of a conflict — between your personal interests and the interests of the Bank or its customers and clients. You also should be aware that actual or potential conflicts of interest can arise not just from dealings with external parties, such as customers or suppliers, but also from relationships or transactions with leaders, subordinates or other employees. If a conflict or potential conflict arises, you must report it immediately to your leader or the Compliance Function, who will review and any such discussion will be held in confidence to the extent possible and in a spirit of cooperation.
Employees must ensure that their personal interests do not conflict with the duties which are owed to the Bank or which the Bank owes to its customers. This includes engaging in any of the following activities

218 Annual Report 2015
CODE OF CONDUCT
without the prior written approval of the Management:
• Becoming personally involved in any transaction of the Bank/Group.
• Negotiating or contracting on behalf of the Bank with an entity in which you or a relative has an interest.
• Accepting any employment (whether part time, temporary or other), consultancy, directorship or partnership outside the Bank.
If you are in doubt about whether a certain circumstance might create a conflict of interest, you may consult the Compliance for guidance before taking action.
PERSONAL INVESTMENT POLICY
This policy covers Members of Investment Committee and Members of Investment Staff (Back Office) who are required to disclose their personal investments in stocks and shares and other securities.
Accordingly a staff member in the above category is required to obtain prior permission in writing from the Chief Executive for personal investments making sure that there is no case of conflict of interest. A copy should also be forwarded to Compliance.
In case prior approval could not be obtained for any reason, investment made should be reported to Compliance as and when investment is made.
EXTERNAL FUNCTIONS
You may not simultaneously work for any concern that does business with or competes with the Bank without the approval of the Head HR.
You must disclose the following outside positions to the HR, who will determine if a conflict exists:
• A member of your immediate family or household works for, and holds a position that can influence decisions at, a firm that directly competes with or does business with the Company.
• A member of your immediate family or household holds a position that interacts with positions of authority at a firm that directly competes with or does business with the Company.
• Further, you may not serve as a director, trustee, officer or similar position (paid or otherwise) of any business, other than with the Bank or one of its subsidiaries, without prior approval of the HR. This rule does not apply to charitable, civic, religious, educational, public or social organisations, or to residential boards whose activities do not conflict with the interests of the Bank and do not impose excessive demands on your time.
BOOKS AND RECORDS
ACCURACY AND COMPLETENESS
You must ensure that the accounting and financial records of the Bank meet the highest standards of accuracy and completeness.
Reporting accurate, complete and understandable information about the Bank’s business, earnings and financial condition is an essential responsibility of all employees. It is not the exclusive responsibility of
219Annual Report 2015
CODE OF CONDUCT
the Bank’s accounting personnel to ensure that the Bank’s accounting and financial records are accurate and complete. If you have reason to believe that any of the Bank’s books and records are not being maintained in an accurate or complete manner, you are expected to report this immediately to your leader, the Chief Financial Officer, Compliance or the HR. Similarly, the Bank relies on you to speak up if you feel that you are being pressured to prepare or destroy documents in violation of Bank policy. You also should speak up if you become aware that any misleading, incomplete or false statement has been made to an accountant, auditor, attorney or government official in connection with any audit, examination or filing with a government agency, such as the State Bank of Pakistan or Securities and Exchange Commission.
PROTECTION AND PROPER USE OF BANK’S PROPERTY
As Faysal Bank’s employee, you are entrusted with protecting the Bank’s property.
Acts of dishonesty against the Bank or its customers involving theft, destruction or misappropriation of money, property, office equipment, supplies or any other items of value, are, of course, prohibited. Falsification, alteration or substitution of records for the purpose of concealing or aiding such acts is also prohibited. If you suspect someone has committed such an act or you witness such an act, you should report it immediately to Security. If you prefer, you can speak informally and confidentially with Compliance.
You also must protect the use of the Bank’s computer equipment, including Internet access. You should follow the Bank’s procedures in connection with the disposition of personal computers, personal digital assistants, mobile phones or other Bank assets.
GIFTS AND ENTERTAINMENT
It is the policy of the Bank that gifts are not to be accepted from customers or suppliers and potential donors must be diplomatically informed of this.
Exceptions
In cases where refusal of a gift would be regarded as an affront or it would be impractical or impossible to return the gift then in certain cases it can be accepted provided the gift is:
• not in the form of cash,
• clearly not in return for any consideration or in the anticipation of such,
• of nominal value only.
Any departure or proposed departure from the above must be reported through the line to the Compliance Function for a ruling on acceptance.
Personal Gifts by Employees
Personal friendships developed on the basis of Banking relationships can sometimes encourage the exchange of gifts for personal account. Care must be taken in this regard as it must be realised that, unfortunately, what may be offered simply as a token of friendship and goodwill, may be construed, in some circumstances, as not only a breach of ethics but even a criminal action.
Presenting Gifts
Gifts may be given for promotional purposes or on special occasions where it may be appropriate while

220 Annual Report 2015
CODE OF CONDUCT
remaining within the jurisdiction of FBL management. The context in which such gifts are given is important and care must be exercised to avoid any such event that could be misinterpreted or construed as bribery or corruption.
CONFIDENTIAL INFORMATION AND TRADE SECRETS
You must protect confidential information and trade secrets, and prevent such information from being improperly disclosed to others inside or outside the Bank.
You may learn, to a greater or lesser degree, facts about the Bank’s business, plans, operations or “secrets of success” that are not known to the general public or to competitors. Sensitive information such as customer lists, the terms or fees offered to particular customers, marketing or strategic plans, or proprietary or product systems developments are examples of the Bank’s confidential information and trade secrets. Similarly, during the course of performing your responsibilities, you may obtain information concerning possible transactions with other companies or receive confidential information about other companies. You may not disclose any confidential information or trade secret of the Bank to others or use any such information for your own or someone else’s benefit. Within the Bank, confidential information and trade secrets should be divulged only to other employees who need the information to carry out their business responsibilities. You also are responsible for maintaining the confidentiality of sensitive employee information, such as salary, bonus or performance appraisal data. These obligations apply both during and subsequent to your employment with the Bank. You must be careful not to discuss such matters with family members, business or social acquaintances, or in places where you can be overheard, such as taxis, elevators, the Bank cafeteria or restaurants. In addition, you should not communicate or transmit confidential or sensitive information through external online communications services, such as the Internet.
BREACHES & DISCIPLINARY ACTION
In the event of an employee committing breach of this Code or any of the provisions of Employment Rules or contravenes instructions/orders issued to him/her in connection with official work or who displays negligence, inefficiency, indolence or criminal (riotous) behavior or does anything detrimental to the interests of the Bank or is guilty of any other act of fraud, misconduct or insubordination, the Competent Authority, in its sole discretion and without limitation may impose on him/her one or more of the following penalties:
• Postponement or stoppage of increment or promotion.
• Recovery from pay of the whole or part of any pecuniary loss caused to Bank by the employee.
• Demotion to a lower stage of pay in his/her Grade or to a lower Grade.
• Dismissal from service, which will involve permanent disqualification for future employment in the Bank without notice period.
• Termination from service.
• Compulsory retirement from Service.
221Annual Report 2015
GLOSSARY OF TERMS
ACCRUAL BASISRecognising the effects of transactions and other events when they occur without waiting for receipt or payment of cash or its equivalent.
BONUS ISSUE (SCRIP ISSUE)The issue of new shares to existing shareholders in proportion to their shareholdings. It is a process for converting a company’s reserves (in whole or part) into issued capital and hence does not involve an infusion of cash.
CAPITAL ADEQUACY RATIOThe relationship between capital and risk weighted assets as defined in the framework developed by the State Bank of Pakistan.
CASH DIVIDENDA cash dividend is money paid to shareholders, normally out of the company’s current earnings or accumulated profits.
CASH EQUIVALENTSShort-term highly liquid investments that are readily convertible to known amounts of cash and which are subject to an insignificant risk of changes in value.
CASH RESERVE RATIO (CRR)Cash Reserve Ratio is the amount of funds that the banks have to keep with SBP.
CONTINGENCIESA condition or situation existing at Balance Sheet date where the outcome will be confirmed only by occurrence of one or more future events.
CORPORATE GOVERNANCEThe process by which corporate entities are governed. It is concerned with the way in which power is exercised over the management and direction of entity, the supervision of executive actions and accountability to owners and others.
COST / INCOME RATIOOperating expenses as a percentage of total income.
DEFERRED TAXATIONSum set aside for tax in the Financial Statements that will become payable in a financial year other than the current financial year.
DERIVATIVESDerivative is a financial instrument or other contract which has the following characteristics:
(a) its value changes in response to the change in a specified interest rate, financial instrument price, commodity price, foreign exchange rate, index of prices or rates, credit rating or credit index or other variable, provided in the case of a non-financial variable that the variable is not specific to a party to the contract (sometimes called the ‘underlying’);
(b) it requires no initial net investment or an initial net investment that is smaller than would be required for other types of contracts that would be expected to have a similar response to changes in market factors; and
(c) it is settled at a future date.
222 Annual Report 2015
GLOSSARY OF TERMS
DIVIDEND PAYOUT RATIODividends (cash dividend plus bonus shares) paid per share as a fraction of earnings per share (EPS).
DIVIDEND YIELD RATIODividend per share divided by the market value of share.
EARNINGS PER SHAREProfit after taxation divided by the weighted average number of ordinary share in issue.
EFFECTIVE TAX RATENet tax charge divided by the profit before taxation.
FINANCE LEASEA contract whereby a lessor conveys to the lessee the right to use an asset for rent over an agreed period of time which is sufficient to amortise the capital outlay of the lessor. The lessor retains ownership of the asset but transfers substantially all the risks and rewards of ownership to the lessee.
FORCED SALE VALUE (FSV)Forced Sale Value means the value which fully reflects the possibility of price fluctuations and can currently be obtained by selling the mortgaged/pledged assets in a forced/distressed sale conditions.
FORWARD EXCHANGE CONTRACTAgreement between two parties to exchange one currency for another at a future date at a rate agreed upon today.
GUARANTEESAn agreement involving a promise by a person (the guarantor) to fulfill the obligations of another person owning debt if that person fails to perform.
HISTORICAL COST CONVENTIONRecording transactions at the actual value received or paid.
IASInternational Accounting Standards.
IFRSInternational Financial Reporting Standards.
IFRICInternational Financial Reporting Interpretation Committee.
INTEREST IN SUSPENSEInterest suspended on nonperforming loans and advances.
INTEREST SPREADRepresents the difference between the average interest rate earned and the average interest rate paid on funds.
223Annual Report 2015
GLOSSARY OF TERMS
LIQUID ASSETSAssets that are held in cash or in a form that can be converted to cash readily, such as deposits with other banks, bills of exchange, treasury bills.
LOAN LOSSES AND PROVISIONSAmount set aside against possible losses on loans, advances and other credit facilities as a result of their becoming partly or wholly uncollectible.
MATERIALITYThe relative significance of a transaction or an event or omission or misstatement of which could influence the economic decisions of users of Financial Statements.
NET ASSETS VALUE PER SHAREShareholders’ funds divided by the number of ordinary shares in issue.
NET DIVIDENDSDividend net of withholding tax.
NET INTEREST INCOMEThe difference between what a bank earns on assets such as loans and securities and what it pays on liabilities such as deposits, refinance funds and inter-bank borrowings.
NON PERFORMING LOAN-SUBSTANDARD CATEGORYWhere markup/interest or principal is overdue by 90 days or more from the due date.
NON PERFORMING LOAN-DOUBTFUL CATEGORYWhere markup/interest or principal is overdue by 180 days or more from the due date.
NON PERFORMING LOAN-LOSS CATEGORYWhere mark-up/interest or principal is overdue by one year or more from the due date and Trade Bill (Import/ Export or Inland Bills) are not paid/adjusted within 180 days of the due date.
NPLS TO GROSS ADVANCES/LOANSRepresents the infected portfolio of the bank and is calculated by dividing total non-performing loans by gross advances.
OFF BALANCE SHEET TRANSACTIONSTransactions that are not recognised as assets or liabilities in the balance sheet but which give rise to contingencies and commitments.
PRICE EARNINGS RATIO (P/E RATIO)Market price of a share divided by earnings per share.
PRUDENCEInclusion of a degree of caution in the exercise of judgement needed in making the estimates required under conditions of uncertainty, such that assets or income are not overstated and liabilities or expenses are not understated.

224 Annual Report 2015
GLOSSARY OF TERMS
REPURCHASE AGREEMENTContract to sell and subsequently repurchase securities at a specified date and price.
REVERSE REPURCHASE AGREEMENTTransaction involving the purchase of securities by a bank or dealer and resale back to the seller at a future date and specified price.
RETURN ON AVERAGE EQUITYNet profit for the year, less preference share dividends if any, expressed as a percentage of average ordinary shareholders’ equity.
RETURN ON AVERAGE ASSETSProfit after tax divided by the average assets.
REVENUE RESERVEReserves set aside for future distribution and investment.
REVERSE REPURCHASE AGREEMENTTransaction involving the purchase of securities by a bank or dealer and resale back to the seller at a future date and specified price.
RISK WEIGHTED ASSETSOn Balance Sheet assets and the credit equivalent of off balance sheet assets multiplied by the relevant risk weighting factors.
SHAREHOLDERS’ FUNDSTotal of Issued and fully paid share capital and revenue reserves.
STATUTORY RESERVE FUNDSA capital reserve created as per the provisions of the Banking Companies Ordinance, 1962.
WEIGHTED AVERAGE COST OF DEPOSITSPercentage of the total interest expensed on average deposits of the bank for the period.
225Annual Report 2015
JAMA PUNJI

Form of Proxy
I/We_______________________________________________________________________________________________of
________________________________________________________________________________________________________
a member (s) of FAYSAL BANK LIMITED and holding _________________________________ ordinary shares, as per
Register Folio No. / Participant’s ID/CDC sub Account No. _________________________________________________
hereby appoint ____________________________________________________________ Folio No. / Participant’s ID/CDC
sub Account No ______________________________________________________________________ or failing him/her
________________________________________________ of ________________________________________ as my / our
proxy to vote and act for me / us on my / our behalf at the Annual General Meeting of the Bank will be held on
March 29, 2016 and at any adjournment thereof.
Signed ______________________ day of ______________________, 2016
Witness:
1._________________________
2._________________________
Revenue StampRs. 5/-
Signature of Member(s)
Notes:
1. The Share Transfer Books of the Bank shall remain closed from March 23, 2016 to March 29, 2016 (both days inclusive). Transfer received at the Shares Registrar of the Bank, by the close of business on March 22, 2016 will be treated in time for attending Annual General Meeting will be held on March 29, 2016 at Karachi.
2. A member entitled to attend and vote at the Meeting may appoint another Member as per his/her proxy to attend and vote for him/her provided that a corporation may appoint as its proxy a person who is not a member, but is duly authorized by the corporation. Proxies must be received at the Registered Office of the Bank not less than 48 hours before the time of the holding of the Meeting.
3. Members are required to timely notify any change in their address to Bank’s Shares Registrar M/s. Central Depository Company of Pakistan Limited, CDC House, 99-B, Block-B, S.M.C.H.S., Main Shahrah-e-Faisal, Karachi.
4. CDC Account Holders will further have to follow the under mentioned guidelines as laid down in Circular 1 dated January 26, 2000 issued by the Securities and Exchange Commission of Pakistan.

Form of Proxy
A. For attending the Meeting:
i) In case of individuals, the account holder or sub-account holder and/or the person whose securities are in group account and their registration detail are uploaded as per the regulations, shell authenticate his/her identity by showing his/her original Computerized National Identity Card (CNIC) or original passport at the time of attending the Meeting.
ii) In case of corporate entity, the Board of Directors’ resolution/power of attorney with specimen signature of the nominee shall be produced (unless it has been provided earlier) at the time of Meeting.
B. For appointing proxies:
i) In case of individuals, the account holder or sub-account holder and /or the person whose securities are in group account and their registration details are uploaded as per the regulations, shell submit the proxy form as per the above requirement.
ii) The proxy form shall be witnessed by two persons whose names, addresses and CNIC numbers shall be mentioned on the form.
iii) Attested copies of CNIC or the passport of the beneficial owners and the proxy shall be furnished with the proxy form.
iv) The proxy shall produce his/her original CINC or original passport at the time of the Meeting.
v) In case of corporate entity, the Board of Directors’ resolution/power of attorney with specimen signature shall be submitted (unless it has been provided earlier) along with proxy form to the Company.


FAYSAL BANK LIMITED Registered Office:
Faysal HouseST-02, Shahrah-e-Faisal,Karachi. Pakistan
www.faysalbank.com
Bank on Ambition