Coupled Flow and Geomechanical Modeling, and ...
86
Juanes et al.: Assessment of Induced Seismicity at the Castor Project — Final Report 1 Coupled Flow and Geomechani cal Modeling, and Assessment of I nduced Seismicity, at the Castor Underground Gas Storage Project Final Report Ruben Juanes Massachusetts Institute of Technology David Castiñeira Massachusetts Institute of Technology Michael C. Fehler Massachusetts Institute of Technology Bradford H. Hager Massachusetts Institute of Technology Birendra Jha Massachusetts Institute of Technology John H. Shaw Harvard University Andreas Plesch Harvard University April 24, 2017
-
Upload
khangminh22 -
Category
Documents
-
view
2 -
download
0
Transcript of Coupled Flow and Geomechanical Modeling, and ...

Juanesetal.:AssessmentofInducedSeismicityattheCastorProject—FinalReport 1
CoupledFlowandGeomechanicalModeling,andAssessmentofInducedSeismicity,attheCastorUndergroundGasStorageProjectFinalReport
RubenJuanesMassachusettsInstituteofTechnologyDavidCastiñeiraMassachusettsInstituteofTechnologyMichaelC.FehlerMassachusettsInstituteofTechnologyBradfordH.HagerMassachusettsInstituteofTechnologyBirendraJhaMassachusettsInstituteofTechnologyJohnH.ShawHarvardUniversityAndreasPleschHarvardUniversity
April24,2017

2 Juanesetal.:AssessmentofInducedSeismicityattheCastorProject—FinalReport
TableofContentsExecutiveSummary1.Introduction
1.1.ObjectivesoftheStudy1.2.InducedSeismicityandStudyApproach1.3.BackgroundontheAmpostaFieldandtheCastorProject
2.GeologicStructuralModel
2.1.GeologicSettingoftheCastorField2.2.ModelConstruction2.3.3DVelocityModeling2.4.TectonicActivityoftheAmpostaFault2.5.PreparingtheModelforGridGeneration
3.SeismicityAnalysis
3.1.OverallApproach3.2.EarthquakeLocations3.3.SeismicEnergyReleasevs.TimeandLocationsoftheLargestEvents3.4.MomentTensorInversion3.5.SpatialandTemporalEvolutionoftheEarthquakeSequence3.6.SynthesisoftheSeismicityAnalysis
4.CoupledFlow-GeomechanicsModeling 4.1.OverallApproach
4.2.MathematicalFormulationofCoupledMultiphasePoro-Mechanics 4.3.ComputationalModelingandSimulationSoftware 4.4.ComputationalGrid 4.5.FlowModelingandHistoryMatching 4.6.CoupledFlow-GeomechanicsAnalysis:FaultStresses 4.7.SynthesisoftheFlow-GeomechanicsAnalysis5.IntegrationofResults 5.1.IdentifyingFaultsthatSourcedtheEarthquakes 5.2.FaultStressChangesComparedwithEarthquakeLocations6.Conclusions7.RecommendationsReferencesAcknowledgments

Juanesetal.:AssessmentofInducedSeismicityattheCastorProject—FinalReport 3
ExecutiveSummary
ObjectivesoftheStudyThe Castor Project is an underground gas storage facility that converted an abandonedoilfield located 22 km offshore from Vinarós in the province of Castellón (Spain) to anatural gas storage site. In September 2013, a few days after large-scale gas injectionstarted in Castor, activity in Castorwas halted after several hundredminor earthquakeswere detected in the area off the eastern coast of Valencia. The overall objective of ourproject is to perform an integrated structural, seismological and geomechanical study toassess theoccurrenceofseismicity inSeptember-October2013associatedwithreservoiroperationsattheCastorundergroundgasstorageproject.Thespecificobjectivesofthestudyare:
1. Toreviewandsynthesizetheavailablegeological,geophysical,geomechanical,wellandreservoirdata,togetherwiththerecordedseismicity.
2. To employ all the available data to develop a geological structural model of thestudyarea that includes theAmposta fault systemand faultswithin thereservoir.This3Dgeologicstructuralmodelenablestwolinesof inquiry:(1)aseismologicalanalysis,and(2)acoupledflow-geomechanicalanalysis.
3. Tore-analyzetheseismologicaldata,includingthedevelopmentofahigh-resolutionseismicvelocitymodel,relocationoftheseismicevents,assessmentoftheevolutionof the hypocenters of the earthquake sequence in space and in time, and anevaluationoffocalmechanismsofselectedevents.
4. To build a coupled flow-geomechanical computer model of the reservoir andsurroundingarea,includingtheAmpostafaultsystemandotherreservoirfaults.Bydeterminingchanges inCoulombstressonthedifferent faults thatmayhavebeenactivatedasaresultoffluidinjectionoperations,themodelprovidesaquantitativetool for thepostmortemanalysisof theSeptember-Octoberearthquakesequence,andfortheriskassessmentofinducedseismicityinthearea.Themodelcanalsobeused to explore possible future scenarios and mitigation strategies if reservoiroperationsweretocontinue.
5. Finally, to integrate the outputs of the geological, seismological and flow-geomechanicalanalysesinthe3Dstructuralmodel,andassessthemechanismsandpotentialgeologicstructureslinkingreservoiroperationswithrecordedseismicity.
GeologicStructuralModelTo analyze Castor Field operations in the context of regional faulting and seismicity,wedeveloped a comprehensive geologic structural model. This model provides a detailedrepresentation of the Castor reservoir properties and structure, embedded in a regionaldescriptionofmajorfaultsthatareconsideredpossiblecandidatesforthesourcesofpastor futureearthquakes.Wealsodevelopedacorresponding3Dvelocitymodel(Vp,Vs), tofacilitate depth conversion of seismic reflection data and help constrain earthquakelocations.Aspartofourstructuralanalysis,wealsoassessedgeologicalconstraintsontheactivityoftheAmposta faultsystem.Thesouthernsegmentof the faultsystemand itshangingwall
4 Juanesetal.:AssessmentofInducedSeismicityattheCastorProject—FinalReport
splays offsets geological strata to the seafloor, indicating recent (late Quaternary orHolocene)tectonicactivity,whichisconsistentwithregionalstudiesandfaultcompilationsthathavedescribedtheAmpostaasatectonicallyactivefault,withthesouthernAmpostafaulttransferringstrainontotheseriesofhanging-wallsplayfaultsthatwedocument.
SeismicityAnalysisThemaingoalsoftheanalysisthatweperformedontheseismicdatawere:
1. Toreviewtheresultsofworkbypreviousinvestigators.2. To estimate the uncertainties in the locations and faultingmechanisms (moment
tensors)oftheearthquakesequence;3. Todeterminetowhatextenttheseismicitycanbeassociatedwiththefaultsinthe
GeologicStructuralModel;4. Toevaluatetheevolutionoftheearthquakesequenceinspaceandtime;and5. To determine the relationship between the seismicity and the stress changes in
spaceandtimepredictedbythegeomechanicalmodel.Ourmajorconclusionsfromtheanalysisoftheseismicdataare:
1. Seismicityinitiatedneartheplatform,rapidlyexpandedintoaspatiallydistributedzone, then contracted to a tighter cluster surrounding the 6 largest events thatoccurredafterinjectionstopped.
2. Seismicenergyreleaseisdominatedbythesesixrelativelylargeevents.Theselargeeventsarelocatedveryclose-withinafewkmofeachother.ThelargeeventslikelyoccurredalongasingleNWdippingplanethatcouldbecoincidentwiththeAmpostafault.OurlocationsplacetheseeventsneartheCastorplatform.
3. Most events can be associated with faults that are represented in the geologicalmodeldevelopedforthisproject.
4. Event relocations and moment-tensor solutions, within uncertainties, agree withthose fromSpain’s InstitutoGeográficoNacional (IGN),butourpreferredmomenttensorhasaplanethatdipstotheNW,alignedwiththedistributionofthelargestevents.
5. There is very little evidence that the largest events occurred along a low-angleeastwarddippingfault.
CoupledFlow-GeomechanicsAnalysisWe developed a simulation model that couples the flow in the reservoir from fluidextractionandinjectionwiththedeformationandstresschangesintherock,basedonthetheory of coupled poromechanics. The computationalmodel consists in an unstructuredmesh that adapts to the faults and reservoir horizons identified and geologic structuralmodel.Itaccountsforthedetailedscheduleofproductionandinjectionoffluidsduringtheentire history of the reservoir—something that enables history matching the reservoirparametersandbuildsconfidenceinmodelpredictions.Ourcoupledflowandgeomechanicsanalysisleadstoadynamicquantitativesimulationofthe impactofsubsurfaceoperations(oilproductionandgas injection)on thestressesonthefaultstructurespresentinthemodel.Thekeyoutcomesfromthesimulationstudyare:

Juanesetal.:AssessmentofInducedSeismicityattheCastorProject—FinalReport 5
1. TheAmpostafaultissignificantlyde-stabilizedbyinjection,withmaximumchangeinCoulombstress(DCFF)ofabout0.5MPa.
2. Faults located on the hanging wall side of Amposta fault are also de-stabilized(maximumDCFFofabout0.04MPa),eventhoughtheyarenotsubjecttopressurevariationsdirectly–however,faultstressesarealteredviaporoelasticeffects.
3. Themostheavilyde-stabilizedfaults,accordingtothemodel,arereservoirfaultsincloseproximitytotheAmpostafault(maxDCFF~0.4MPa).Allofthesefaultsaresteeplydipping.
4. OtherreservoirfaultsfartherawayfromtheCastorplatformaresubjecttominimalCoulomb stress changes. This is the case, for example, of the EastBounding fault(known in some previous reports as the “Castor fault”), subject according to ourcoupledflow-geomechanicsmodeltoamaximumDCFFof<0.002MPa.
We conducted the coupled flow-geomechanics analysis for other injection scenarios.Wefind thatmaximumDCFF values decrease for scenarioswith reduced injection rate (andtherefore, reduced injection volume). We also simulated a more complex scenario thatmodels gas injection at a higher rate, followed by recovery of the injected gas and anadditionalinjectioncycle:wefindthatthiswouldresultinlargerde-stabilization(roughly,bya factorof two in termsofmaximumDCFF)of theAmposta fault andother reservoirfaults.
ConclusionsBy integrating the results of our geologic, seismologic, and reservoir flow-geomechanicalanalyses, we are able to assess the possible linkages between regional faults, the 2013earthquake sequence, and Castor reservoir operations. Fromour integrated analysis,weconcludethat:
1. Earthquake hypocentral locations determined in this study are consistent withactivityontheAmpostafaultsystem,itssplays,andfaultswithinthereservoirinthevicinityoftheinjectionsites.
2. Thehypocentersofthefirstseveraleventslocatednearthereservoir,followedbyasequenceofearthquakesclusteredalongand to thewestof the tectonicallyactiveportionsoftheAmpostafaultanditshangingwallsplays.
3. Earthquake focal mechanisms for the mainshock are consistent with theorientationsoftheAmpostafault,itssplays,andsteeplydippingreservoirfaults.
4. Manyrelocatedearthquakesmaptoregionsofthefaultsthataredestabilizedduetoinjectionoperations. Inparticular,ourcoupled flow-geomechanicsmodel suggeststhat Amposta, some of its splay faults and several of the reservoir faults in closeproximity to Amposta, were significantly de-stabilized by gas injection, inducedCoulombstresschangesofupto0.5MPa.Incontrast,theEastBoundingfault(alsoknownasthe“Castorfault”insomereports)experiencedchangesinCoulombstress<0.002MPa.Forreference,riskofde-stabilizationofafaultisbelievedtooccurforCoulombstresschangesintheorderof0.01MPa–0.1MPa,andperhapslower(thisisintherangeoftypicalstressdropsduringearthquakes)
5. The six largest earthquakes (M 3.8 to 4.3) occurred late in the sequence, afterinjectionceased.TheseeventsareclusteredinaregionoftheAmpostafaultsystemthatwassignificantlydestabilizedduringgasinjection.

6 Juanesetal.:AssessmentofInducedSeismicityattheCastorProject—FinalReport
6. OtherearthquakesextendfartherwestandsouthalongtheAmpostafaultsystemtoareasthatwerenotsignificantlyaffectedbyreservoiroperations.
Theseobservationssuggestthefollowingscenariofortheeventsequence:
1. Gas injection triggered seismicity on reservoir faults and nearby segments of theAmpostafaultsystem.
2. These earthquakes, in turn, triggered seismicity on theAmposta fault system andpossiblyotherreservoirfaultsthroughstaticordynamicstresschanges,wellafterinjection stopped (“aftershock sequence”). This sequence included the largestearthquakes,whichoccurredonsegmentsoftheAmpostafaultsystemdestabilizedbygasinjection.
3. Earthquakes largely occurred on the tectonically active (southern) portion of theAmpostafaultanditshangingwallfaultsplays.
RecommendationsCoupled flow-geomechanics simulations of additional injection scenarios suggest that,while reduced injection rates generally reduce themaximum Coulomb stress change onAmpostaandreservoirfaults,valuesremainhighandinriskofinducingseismicevents.Inparticular,themaximumCoulombstresschangeishigherthanthatestimatedforthepost-mortemanalysisinthecaseoffullcycleofgasrecoveryandinjection.Thispointstoanelevatedrisk ofresumingoperationsinCastor:
1. OccurrenceofM~4eventslikelyhavemovedportionsoftheAmpostafaultsystemcloser to failure through static stress changes: these eventsmight have increasedCoulombstresswithoutrelievingmuchmoment.
2. Given the fault structures and history of de-stabilization, there is a possibility ofearthquakes of significantly larger magnitude. It is worth noting that a completerupture of the Amposta fault system in the study area could produce a M ≥ 6.8earthquake,basedonstandardrupture-area-to-magnitudescalingrelations.
3. Defining safe operating injection limits (maximum pressures, rates, volumes) isdifficult.
Inthecasethatadeterminationismadetoresumeoperations,werecommend:
1. Deploymentofadedicatedseismicnetworkofoceanbottomseismicstationswithgoodproximityandazimuthalcoverage.
2. Slowramp-upof injection inseveralphases,withdedicatedanalysisof seismicity,reservoirpressure,andupdatingofgeomechanicsmodel,aftereachphase.
3. Developaprotocol foractions tobe taken if seismicityoccursor increasesduringinjection(e.g.,atraffic-lightsystem).
Finally, it is important to point out that this is a post-mortem evaluation of the Castorproject,whichemploysnewparadigms for integratinggeology, geophysics and reservoirgeomechanics. As such, it is unreasonable to expect that a studywith industry-standardmethodologies would have reached these conclusions ahead of the injection. Our study,however,pointstotheneedfornewstandardstoquantifytheseismicityrisksassociatedtoundergroundoperations,especiallyinareaswhereactivefaultsarepresent.

Juanesetal.:AssessmentofInducedSeismicityattheCastorProject—FinalReport 7
Chapter1.Introduction
1.1.ObjectivesoftheStudyThe overall objective of our project is to perform an integrated structural, seismologicaland geomechanical study to assess the occurrence of seismicity in September-October2013associatedwithreservoiroperationsattheCastorundergroundgasstorageproject.Thespecificobjectivesofthestudyareasfollows:
1. Toreviewandsynthesizetheavailablegeological,geophysical,geomechanical,wellandreservoirdata,togetherwiththerecordedseismicity.
2. To employ all the available data to develop a geological structural model of thestudyarea that includes theAmposta fault systemand faultswithin thereservoir.This3Dgeologicstructuralmodelenablestwolinesof inquiry:(1)aseismologicalanalysis,and(2)acoupledflow-geomechanicalanalysis.
3. Tore-analyzetheseismologicaldata,includingthedevelopmentofahigh-resolution
seismicvelocitymodel,relocationoftheseismicevents,assessmentoftheevolutionof the hypocenters of the earthquake sequence in space and in time, and anevaluationoffocalmechanismsofselectedevents.
4. To build a coupled flow-geomechanical computer model of the reservoir and
surrounding area, including the Amposta fault system and other reservoir faults.Themodeldefinestheprevalenttectonicstresses,andthereservoiroperationsthatcould have triggered the seismic events. Such amodel is crucial to determine thechangesinthestressfield—and,inparticular,changesinCoulombstress—onthedifferentfaultsthatmayhavebeenactivatedasaresultoffluidinjectionoperations.The model provides a quantitative tool for the post mortem analysis of theSeptember-October earthquake sequence, and for the risk assessment of inducedseismicity in the area. The model can also be used to explore possible futurescenariosandmitigationstrategiesifreservoiroperationsweretocontinue.
5. Finally, to integrate the outputs of the geological, seismological and flow-
geomechanicalanalysesinthe3Dstructuralmodel,andassessthemechanismsandpotentialgeologicstructureslinkingreservoiroperationswithrecordedseismicity.
1.2.InducedSeismicityandStudyApproachIn recent years, induced seismicity has emerged as a fundamental aspect surroundingsubsurfacetechnologies,bothfromanoperationalstandpointandfromthepointofviewofpublic perception (National Research Council, 2013; Galchen, 2015). Much of thedocumented evidence of triggered and induced seismicity is related to the subsurfacedisposal of wastewater produced during as a result of unconventional oil and gas

8 Juanesetal.:AssessmentofInducedSeismicityattheCastorProject—FinalReport
extraction,predominantlyshaleoil,shalegas,andmatureoilfieldsthatonceweredeemeduneconomical(Frohlich,2012;Ellsworth,2013;Keranenetal.,2013,2014;vanderElstetal., 2013; Weingarten et al., 2015). However, the anthropogenic origin of triggeredearthquakes has been linked to a wide range of subsurface technologies, includinggeothermalenergy(Majeretal.,2007;DeichmannandGiardini,2009,BrodskyandLajoie,2013),oilandgasproduction(Segall,1989;Suckale,2009;Zhangetal.,2009;Valorosoetal., 2009; Improta et al., 2015, Buttinelli et al., 2016), gas injection (Gan and Frohlich,2013),gasstorage(DostandHaak,2007;Cescaetal.,2014),andgroundwaterextractionfrom shallow aquifers (Gonzalez et al., 2012; Amos et al., 2014)—for a comprehensiverecentreview,seeFoulgeretal.(2017).Whilethepotentialforsubsurfacefluidinjectionandextractiontotriggerearthquakeshaslongbeenrecognized(Raleighetal.,1976;Segall,1989), thesharp increase in theextentandvigorof inducedseismicitycalls fordeeperunderstandingthaniscurrentlyavailable(Guglielmietal.,2015,Hornbachetal.,2015).Thisisparticularlyrelevantfromthepointofview of establishing workflows for reservoir management and decision-making, whichincorporate reservoir geomechanical processes, including subsidence, caprock integrity,reservoir compartmentalization, hydraulic fracturing and fault activation and associatedseismicity.It is likely that induced earthquakes may be better understood, modeled and forecast(and—eventually—perhaps managed) than natural earthquakes. The reason is twofold.First, usually there is a relatively dense set of subsurface measurements that providedetailed knowledge of the geologic structure before exploitation, and there is anopportunitytodeployamonitoringprogramthatquantifieschangeswithinthatstructure,including bottomhole pressures,water cuts and gas-oil ratios, surface deformation, andmicroseismicity. Second, the injection and extraction of fluids are causally linked tochangesinfluidpressuresandinthetensorstressstateofthesubsurface.Thislinkagecanbe quantified bymathematicalmodels that describe the coupling between flow throughrocksanddeformationofthoserocksinthepresenceoffracturesandfaults.Weproposethatgeologicallyrealisticcomputationalmodelsofcoupledreservoirflowandgeomechanicspermittheintegrationofseismic,welllog,fluidpressureandflowrateandother data thatmay be available (e.g., geodetic data) in away that enables quantitativeassessments of the likelihood of induced seismicity, strategies that prevent it, orremediation programs that mitigate it. Naturally, this would have important social,economic,andregulatoryconsequences.Previous work from our group has already illustrated the potential of predictivecomputationalmodelsofinducedseismicitypotential.Theseincludeadetailedcasestudyexploring potential connections between the May 2012 Emilia-Romagna sequence innorthern Italy and operations in the nearbyCavone oil field.Our analysis addressed thequestion of whether this earthquake sequence might have been triggered by fluidextraction and injection and, if it is not, whether it is plausible that future reservoiroperationscouldtriggerotherseismicevents(Juanesetal.,2016).

Juanesetal.:AssessmentofInducedSeismicityattheCastorProject—FinalReport 9
1.3.BackgroundontheAmpostaFieldandtheCastorProjectThe Castor Project is an underground gas storage field that converted an abandonedoilfield located 22 km offshore from Vinarós in the province of Castellón (Spain) to anatural gas storage site (Figure 1.1). Themain objective of the projectwas to store gastransferredfrommainlandSpainviaapipelineapproximately30kmlong,mostlyrunningalong the sea bottom. The gas storage project was designed for a series of fill-in andproduction cycles (aiming to better balance the variability in natural gas supply anddemand).TheCastorgasstoragefacilitywasmeanttocover30percentofSpain’sdailygasconsumption.TheCastorProject,andtherelatedexploitationconcession,wereownedanddevelopedbyEscalUGSS.L.
Figure 1.1: Location of the Amposta oil field—the geologic trap used for the Castor gas storageproject.FromSeemannetal.(1990).InSeptember2013,afewdaysafterlarge-scalegasinjectionstartedinCastor,theSpanishgovernmenthaltedactivityinCastoraftermorethan200minorearthquakesweredetectedin the area off the eastern coast of Valencia. A series of studieswere quickly conducted
- 4 4 ° 00'
-40°00'N
200m wertr d*fifl>
-36°00'
( 7 ) BETIC-BALEARIC TREND
( ? ) CATALAN COASTAL TREND
(T ) VALENCIA TROUGH
[ ^ AREA SHOWN ON Fig.2
Figure 1. Location map (Spain).
as possible water injectors, but were in reality never used as such, because the field maintained its 23,000 bbl/day production rate constant for 3 ^ years aided by natural water drive only. This strong natural water drive has persistently supported production from the beginning of the field until the present (there was a minimal formation pressure drop from the initial 2550 psi to the present 2536, with the same, low formation water salinity of 6-7000 ppm NaCl).
After the first 3% promising years of constant, high primary flow, continued water breakthrough forced a decrease in production rate. With persis-tently declining production, an additional effort was made to restore production levels by drilling addi-tional development wells AMB-7, 8 (1979) and
AMB-9 (1982). Of these three wells only AMB-7 proved to be a successful additional producer, drain-ing oil from the attic of the field. In 1981, with declining production, the fixed tanker was discon-nected from the SBM. Crude production and trans-portation were maintained with shuttle tankers only.
In an attempt to find additional, undrained reserves, an 80 km2, 3-D seismic survey was shot over the entire Amposta structure in 1983. Inter-pretation of the data indicated the possible exis-tence of undrained compartments mainly to the north and south of producer wells AMB-1 and 7. WellAMB-10(1984)andAMB-ll (1987) tested such compartments without success. From 1984 until 1988 additional attempts were undertaken to in-crease production by injecting gas into the reser-
2

10 Juanesetal.:AssessmentofInducedSeismicityattheCastorProject—FinalReport
(IGN, 2013; IGME, 2013; IGME, 2014) to analyze this seismic activity and to identify thepotentialrelationshiptotheCastoroperations.Fromaperspectiveofsubsurfaceoperations,wedistinguishthreetimeperiods:
i. AmpostaProductionPeriod(1970-1989):ii. CastorProjectDesignPeriod(1996-2012):iii. CastorInjectionPeriod(2012-2013):
AsdiscussedinSection1.1ofthisreport,themaingoalofthecurrentstudyistoemploystate-of-the-artmodelingtechniques(usingcoupledflowandgeomechanicssimulation)inordertomechanisticallyandquantitativelyevaluatethepotentialimpactofgasinjectiononfault slip potential and the risk of induced seismicity in the region around the Castorplatform. Naturally, this study is focused primarily on the third period described above(Castor Injection Period). However, it was necessary for our analysis to create a newsimulationmodel (i.e., a farmore extensivemodel andwith amore comprehensive andcomplex fault description) in order to properly evaluate the impact of the Castoroperations on the main faults in the region. Consequently, our model also intended tocapturethehistoricalbehavioroftheoldAmpostafieldthatwasreportedduringthe1970-1989.Hence,fromthatperspective,thisstudyalsocoversthefirstperioddescribedearlier(AmpostaProductionPeriod).These three timeperiodsarebrieflydescribedbelow,withanemphasisonkey technicalaspectsthatarerelevantforourstudy.
i. AmpostaProductionPeriod(1970-1989)The original Amposta reservoir was discovered by Shell Spain in 1970, and large-scaleproduction from this field started in 1973. This reservoir is described as aN-S orientedhorst that is tilteddowntotheeast.Fromageologicalperspectivethissystemisa lowerCretaceousdolomiticlimestonethatisfracturedandbrecciated.Herekarstificationofthelimestoneshaspotentiallycreatedlargecavitiesinthereservoir(whichhelpsexplainingitsobservedhighproductivity).Asformostnaturallyfracturedreservoirs,adistinctioncouldbemadebetweenamatrixsystem(characterizedbylowporosityrangingfrom0.2-2%andpermeabilitiesintheorderof0.01milliDarcy(mD))andafracture/karstsystem(withverylargeporosities,andpermeabilitiesintheDarcylevel).TheAmpostareservoir issealedon thewestby theAmposta fault (a large,deep,normalfaultlocatedbeneaththeCastorplatform).OntheSouth,EastandNorthsidesthereservoiris sealed by an aquifer. Bottom sealing is also given by the aquifer. On the other handvertical sealing is givenby stratigraphic closure (i.e., theMontsia isoverlainby some60metersofimpermeableformation).The initial pressure in this reservoirwas around2743psi. The volumeof original oil inplace(OOIP)wasestimatedat100MMbbl,althoughthisvolumewas laterupdatedtobemoreintheorderof~140MMbblbyanalyzingthereprocessed3DseismicdatathataShellunitacquiredin1982.

Juanesetal.:AssessmentofInducedSeismicityattheCastorProject—FinalReport 11
TheAmpostareservoir(Montsiaformation)wasproduceduntil itreacheditseconomicallimitin1989.Morethan12wellsweredrilledduringthisproductionperiod,andmaximumoilproductionrateinthefieldwasaround40,000bbl/din1975withjust3wells.Infact,wellsdrilledinkarstifiedzonesshowedveryhighproductivity(thosekarstifiedlimestoneintervalsaremostlylocatedintheupperpartoftheMontsiaformation).Alongtheentirereservoir production history most of the field production was materialized in 6 of theAmpostawells,leadingtoatotalcumulativeoilproductionofapproximately56MMstbby1989 (with less than1% cumulativewater cut). The strong aquifer limited the pressuredepletionfromthereservoir;themaximumpressuredeclinereportedinthefieldwas70psi in1976,and finalpressureat fieldabandonmentwasreportedtobeclose tooriginalvirginpressure.
ii.CastorProjectDesignPeriod(1996-2012)In 1996 Escal UGS became interested in the abandoned Amposta reservoir and thepossibility of using this reservoir for a natural gas storage project. A large number offeasibilityanddesignstudieswereconductedduringthisperiodof time, includinganew3Dseismicsurvey,analysisofdataobtainedfromanewdrilledwellin2004(Castor-1),aPetrelstaticmodel,a2Dgeomechanicalmodel,andaseriesofdynamicsimulationmodels(usingEclipseandmaterialbalancemodels).ThemaingoalofthesestudieswastobettercharacterizetheAmpostafieldandtopredictthebehavioroftheCastorsystemduringthegasstorageoperations.Startingin2010atotalof13newwells(theso-calledCastorwells)weredrilledinthisfield(alongwithpipelineandplatformconstruction).Thisrecountincludesthere-completionofCastor-1well,aseriesofobservationswellsthatwouldmonitortheCastoroperation,andawaterdisposalwell. All thenewwellsproduction/injectionwellswerecompleted in thereservoircrest. Initialplanscalledforthosewellstobepermanentlyexposedtogasafterthefirstgasfilling.Initialdesignplansproposedamaximumdeliveryof25MMm3/d(3.5MM m3/d per well plus one as a spare well); under the same plan eight wells wouldprovide8MMm3/dinjectioncapacity.The design and location of the observation wells was strategic. Well Castor-POB wasdesigned to record pressure and contact movement (using pressure gradient surveys)using16downholegaugescompletion.CastorOBSandOBNwellsweredesignedtorecordpressureandidentifypossiblegasleaksbythespillpoint(completionswith10downholegauges). Finally, CSM well was drilled to measure the pressure in the Castellon sealingformation, targeting the bottom sand series M5/M4. A water disposal well was alsodesigned(SWDwell)fortheCastoroperations.AgraphicalvisualizationforthelocationsofthesewellssuperimposedinoneoftheEscal-UGSmodelsisprovidedinFigure1.2.

12 Juanesetal.:AssessmentofInducedSeismicityattheCastorProject—FinalReport
Figure1.2:NewwellsdrilledfortheCastorproject.Sourceofbackgroundmodel:Escal-UGS.Potential geological risks associated to the Castor project were already identified andanalyzedduringthisperiod.Theserisksincluded:
1)Possiblegasleaksthroughold(ornew)wells:Informationwasespeciallyscarceand incompleteabout themechanical conditions (e.g., sealsandcementing)of theabandoned wells in Amposta. Hence it was proposed that potential gas leakagethroughthewellshadtobecarefullymonitoredinCastor.2)SealingcapacityofCastellonformation:Upwardleakageofgasthroughthesealwasconsideredunlikelyduetopresenceimpermeablesands.Ontheotherhandtherisk of fracturing the cap rock was analyzed using minifrac, log and core dataanalysis(andfromhereaminimumfracturingpressureof1400psiabovecurrentreservoirpressurewasestablished).3) Possible reactivation of the faults: A dedicated geomechanical study wasconducted (Nauroyetal.,2011) toanalyzekeyaspects suchasentrypressure forfluiddisplacement (methane/brine entrypressure tobe appliedbeforedisplacingany fluid into the formation), caprock strength (which showed a high strength),fracturing pressure (estimated up 1400 psi above initial pressure, in line withminifracttests).Furthermoresimulationsfroma2Dgeomechanicalmodeconcludethattheporepressureinthereservoircouldbeincreasedby710psi(toatotalof~3400 psi) without reactivating any fault. From here a conservative maximumdesignoperatingpressureof3225psiaatthetopmostgaugewasrecommended.
Several simulationmodelswerebuiltduring thisperiodof time (andbefore theonsetofoperations in Castor) in order to predict and characterize the dynamic response of theabandonedAmpostareservoirtonewgasinjectionandproduction.Bothmaterialbalancemodel (using MBAL software) and full-physics simulation studies (using Eclipse 300
OBN
OBS
POBSWD
CastorPlatform
C4
C7C6
C5
C8
C3
C2
C1

Juanesetal.:AssessmentofInducedSeismicityattheCastorProject—FinalReport 13
software)wereconducted.ThesesimulationsstudiesconcludedthatthepressureresponseinCastorwouldstaywithinoperationlimitsundertheproposedinjectionandproductionprograms.Inrealitythispredictedpressureresponseactuallyoverestimatedtheobservedpressure response during the injection period. This was later attributed, among otheraspects,totherelativelyunknownbehavioroftheformationtoptothenewconditions(sofillingcurve in thisareawasmainly theoretical),amodel thatwascalibratedwith(only)productionhistory(whichwascharacterizedbyimbibitionofrock-saturatedoilbywateraquifer,incontrasttoanewdisplacementmechanisminvolvinggasdrainage).Moreoveritwasproposedthatadualporositymodelwouldhavebeenperhapsnecessaryinordertobettermatchthegas-liquidresponseobservedduringtheCastorphase.iii.CastorInjectionPeriod(2012-2013)Aseriesof injection testswere conductedusing someof thenewCastorwells (Castor-1,Castor-2, Castor-4, …) from 2012 to August 2013. These tests were intended mainly toevaluateCastorinfrastructure,wellinjectivity,andkeyoperationalparameters.Large-scalegas injection began in Castor on September 2, 2013. Figure 1.3 shows the reported(individual well) gas injection rates and cumulative gas injection during the Castoroperation.
Figure 1.3: Individual well gas injection rates (left panel) and gas injection cumulatives (rightpanel)duringtheCastorfieldoperation.Source:Escal-UGS(ProyectoCastor,InformedeCampañadeInyección2013,GKI/IT-TE-035).StartingonSeptember5,2013aseriesofearthquakeswasdetectedintheproximityoftheCastorproject,andsomeof theseseismiceventswere felt inthenearbycoastal townsofVinarósandBenicarló(IGME,2014).GasinjectionwasofficiallyterminatedonSeptember17,2013.The largestearthquake(Mw=4.3)wasdetected in theareaonOctober1,2013.The lastearthquakes feltby thepopulationduring thissequencewereregisteredaroundOctober 4, 2013. Seismic activity in the area largely decayed after mid-October 2013.During the injectionperiod themaximumpressure increase observed in theCastor fieldwas 111 psi above the initial formation pressure, which was well below the maximumpressurethresholdforsafeoperationestimatedduringthepreviousfeasibilitystudies.
WellGasInjectionRate WellGasInjectionCumulative

14 Juanesetal.:AssessmentofInducedSeismicityattheCastorProject—FinalReport
Following theoccurrenceof theearthquake sequence, severalpost-mortemstudieswereconducted(IGN,2013; IGME,2013,2014;Cescaetal.,2014;Gaiteetal.,2016;Salóetal.,2017). Our current study builds on these studies, but follows a markedly differentapproach,whichhingesonthe integrationofstructuralgeology,seismology,andcoupledflow-geomechanicsfortheinterpretationoftherecordedseismicityfollowinggasinjection.Our results also provide amechanistic basis for exploring additional injection scenariosthatshedlightontherisksofresuminggasinjection/extractionoperations.

Juanesetal.:AssessmentofInducedSeismicityattheCastorProject—FinalReport 15
Chapter2.GeologicStructuralModelTo analyze Castor Field operations in the context of regional faulting and seismicity,wedeveloped a comprehensive geologic structural model. This model provides a detailedrepresentation of the Castor reservoir properties and structure, embedded in a regionaldescriptionofmajorfaultsthatareconsideredpossiblecandidatesforthesourcesofpastor futureearthquakes.Wealsodevelopedacorresponding3Dvelocitymodel(Vp,Vs), tofacilitate depth conversion of seismic reflection data and help constrain earthquakelocations.
2.1.GeologicSettingoftheCastorFieldTheCastorGasStorageProjectislocatedinValenciaTroughofthewesternMediterraneanSea(Figure2.1).ThisregionseparatestheIberianPeninsulafromtheBalearicIslands,andischaracterizedbyaseriesofnortheast-southwest trendingextensionalgrabensthatareboundedbynormalfaults.ThesegrabensformedintheLateOligocenetoNeogeneduringongoingconvergenceoftheEuropeanandAfricantectonicplates(RocaandGuimerà,1992;Bartrinaetal.,1992).TheboundingfaultsystemsoffsettheMesozoicpre-tectonicsection,including the Cretaceous platform carbonates that form the primary hydrocarbonreservoirsintheregion.ThegrabensarefilledwithsyntectonicAlcanarGroupsediments,whichinturnareoverlainbyCastellonandEbroGroupsiliciclasticsections(Bartrinaetal.,1992;Gessal,2013).SeveraloftheboundingnormalfaultsshowevidenceofongoinglateTertiarytectonicactivity(García-Mayordomoetal.,2012;Pereaetal.,2012).TheCastorfieldisahorstblocklocatedtotheeastoftheAmpostagraben.ThehorstblockandgrabenareformedbytheAmpostafault,whichdipstothewestandproducesupto≈1km of normal offset on the upper CretaceousMontsia reservoir units (Figure 2.2). Thereservoirunitsdipgentlytotheeast,formingafaultboundedtrap.Theculminationofthetrap defines the Amposta oil field and the Castor gas storage site, and coincides with aregionwhere the trendof theAmposta fault changes fromnorthwest tonortheast. Thisbend in the fault localizes a series of splay faults that cut the graben and extend to thenorthwest. In addition, the horst block and reservoir are cut by several southeast andnorthwestdipping faults thatexhibit10’s to100’sofmetersofnormalseparationontheMontsiareservoirandoverlyingTertiaryunits.

16 Juanesetal.:AssessmentofInducedSeismicityattheCastorProject—FinalReport
Figure2.1:MapofValenciaTroughshowinglocationofmajoroffshorefaultsandTertiarybasins(fromAlaya et al., 2015). Seismicity after the initiation of injection operations is shownwithin a10kmradiusoftheCastorplatform(IGN,2013).
Figure 2.2: Seismicreflectionprofile fromthe3DsurveyshowingAmposta faultandhorstblockthatprovidesthestructuraltrapfortheCastorfield.

Juanesetal.:AssessmentofInducedSeismicityattheCastorProject—FinalReport 17
2.2.ModelConstructionWedevelopedour3DstructuralmodelusingGocad(Mallet,1992;ParadigmGeophysical),and industry-standard structural modeling application that facilitated integration ofgeologic, geophysical, and seismological data. These datawere provided by Enagas, andincludea3Dseismicreflectionsurvey,41regional2Dseismicreflectionprofiles,formationtopsandlogsfrom29wells(Figure2.3).The3Dseismicsurveywasacquiredin2005,andprocessed using standard wave-equation migration techniques and converted to depthusing velocity data calibratedwithwell logs. This survey, in conjunctionwithwell datafrom the field, served as the basis for defining the reservoir model. Enagas provideddetailed fault and horizon interpretations from the 3D depth seismic volume. Theseinterpretationswerereviewedandfoundtobeofhighquality.Wemademodificationstothese fault andhorizon interpretationswhereappropriate, andextended themappingofthereservoirandregionalfaultsystemsusingboth3-Dand2-Dseismicreflectiondata.Inordertoincorporateinterpretationsofthe2-Dseismicdata,whichwereprovidedintwo-waytraveltime(TWTT),weconstructedaninitialvelocitymodelbasedonsoniclogsfromthefield.Thismodelwasusedtodepthconvertthe2-Ddata.Stratigraphicmarkersinthesedepth-converted 2-D data closely matched corresponding units in the 3-D survey,confirmingthevalidityofthevelocitymodel.
Figure 2.3: Perspective viewof datasets used to construct our 3-D structuralmodel. Castor andAmpostawellsareshown.ThecoloredsurfacerepresentsthetopMontsiareservoir.

18 Juanesetal.:AssessmentofInducedSeismicityattheCastorProject—FinalReport
Thenext step inouranalysiswas todevelop triangulatedsurface (tsurf) representationsfrom the fault interpretations. These surfaces were generated using discrete smoothinterpolation (DSI) in Gocad, in amanner that ensured consistency between the seismicinterpretationsandthefaultsidentifiedinwells.ThisprocessisillustratedfortheAmpostafault in Figure 2.4. In order to constrain the fault geometry below the effective imagingdepthoftheseismicreflectiondata,weusedaninclinedshearmethodtomodelthefaultbasedonthegeometryoffoldspresentinitshangingwall.Thesefold,knownasrollovers,forminresponsetodisplacementoncurvedorlistricnormalfaults(Hamblin,1965).Thesestructures are common in the Valencia Trough as well as in other extensional basinsaround the world. Inclined shear modeling techniques are well established as the mosteffectivemethodtodefinefaultgeometryinthesesystems(Gibbs,1983;Groshong,1990;Xiao and Suppe, 1992; Shawet al., 1997). Applicationof thesemethods to theAmpostafault demonstrate that it shallows froma 57°Wdip in the vicinity of the field to amoregentle(≈5W)westdipatadepthofabout7km.Weusedtheseconstraints,alongwiththefault interpretations from the 3-D and 2-D seismic surveys to generate a surface thatrepresentstheAmpostafaultthroughoutthestudyarea(Figure2.4b).WethendevelopedrepresentationsofthesplaysinthehangingwalloftheAmpostafault.Thesestructuresdonotexhibitwelldevelopedrolloversintheirhangingwalls,andappeartobeplanar.Thus,we extrapolated these faults from the seismic interpretations to depth and terminatedthemintotheAmpostafaultsurface.
Figure2.4:PerspectiveviewofselectdataconstraintsusedtoconstructtheAmpostafaultsurface.ThecompleteAmpostafaultrepresentationisshownwithdepthcontoursinmeterssubsea.

Juanesetal.:AssessmentofInducedSeismicityattheCastorProject—FinalReport 19
We followed similar procedure to develop surfaces that represent the major reservoirfaults (Figure2.5).These structures include a set of steeplydippingnormal faults in theimmediate vicinity of the Castor injectionwells (F10, 11,& 12), and extensions of thesefault systems along strike (e.g., F14, South fault). We also generated representations ofselectreservoirfaultsatgreaterdistancesfromtheinjectionwells.Wechosetorepresentthe largest and most laterally continuous of these faults, and included the east dippingCastor fault, which had been previously interpreted as a potential source of the 2013seismicity.Notably,allofthereservoirfaultsthatweinterpretandrepresentinthemodelare steeply (> 45°) east- or west-dipping structures and exhibit normal separation.Previous studies have represented some of these faults in TWTT displays, which showthem as more gently dipping structures (e.g., Seemann et al., 1990; Cesca et al., 2014).However, direct constraints (cut-offs, fault-plane reflections) from the3D seismic surveydisplayedindepthconfirmthatthesearemoresteeply(>45°)dippingfaults.Thiswillhavesignificance when we investigate focal mechanisms for the largest events in the 2013earthquake sequence and attempt to relate them to fault geometries represented in themodel.
Figure 2.5: Perspective view of reservoir faults mapped in the 3D seismic reflection data andextrapolatedtodevelopfaultsurfaces.Labeledfaultsarethoseincorporatedinthemodelusedforthecoupledflow-geomechanicalanalysis.
20 Juanesetal.:AssessmentofInducedSeismicityattheCastorProject—FinalReport
The final set of faults included in our model are located west of the Castor Field andAmpostafaultsurface.Thesefaults(Splay1A/B,Splay1Banti1/2,Splay2A/B/C,Splay2Banti1, Splay3, Splay4/5) trends approximatelynorth-south anddip to the east, and areconsidered tectonically active based of displacements of young, near surface sediments(e.g.,García-Mayordomoetal.,2012;Pereaetal.,2012).Weconstrainedthestrikeanddipof these faults using publishedmaps and 2-D seismic data. Surfaces were generated byextrapolated the fault traces to depth. We included these faults in the model, as theyrepresentpotentialearthquakesources.Thus,wecalculatestresschangesactingonthesefaults related to Castor Field operations, and consider these faults in our analysis of the2013earthquakesequence.Inadditiontorepresentingfaults,ourmodelincludedseveralgeologichorizonsthatdefinethe Castor reservoir and seal (caprock), aswell as influence seismicwavespeeds. ThesesurfacesincludebasePaleozoic,baseJurassic,andbaseTertiary.ThebaseTertiaryhorizoncorrespondstothetopMontsiareservoirunit,andisgenerallywellimagedinboththe3-Dand2-Dseismicdatasets.Weevaluateda setofhorizonpicksprovidedbyEnagas in thevicinity of the Castor wells, and deemed them to be of high quality. We revised theseinterpretations as needed to ensure consistency with the faults, and then extended themapping of these surfaces through the study region using well tops and the seismicreflection datasets (Figure 2.6). The top reservoir surface is offset by the Amposta faultsystem.Wemapped thisoffset,whichexhibitup to1000metersofnormal (downto thewest)faultseparationonthetopreservoirhorizon.Thisfaultdisplacementisrepresentedinourmodelasdiscretehangingwallandfootwallcutoffs.Basedonanticipatedchallengeswithgeneratingthecomputationalmesh, thechoicewasmadetonotexplicitlyrepresentoffsets for the smaller displacement faults in themodel. Rather, offsets on these smallerfaults that could be resolved in the seismic reflection datawere included as changes inelevation of the surfaces as they cross the faults. We do not feel that this choice ofrepresentationhadanymeaningfuleffectonoursubsequentanalysis.

Juanesetal.:AssessmentofInducedSeismicityattheCastorProject—FinalReport 21
Figure2.6:PerspectiveviewofthetopMontsiaFormationreservoirhorizon.In summary, our 3-D structural model includes three major categories of faults: TheAmpostafaultanditshangingwallsplays;reservoirfaults(inthefootwalloftheAmpostafault);andtwolargeregionalfaultsthatliewestoftheCastorfield.Inaddition,themodelincludesthetopMontsiaReservoirandotherstratigraphichorizons,whichwillbeusedtodefine seismic velocities for the seismological analyses and parameterize the reservoirpropertiesforthegeomechanicalsimulations.
2.3.3DVelocityModelingTo help support the seismological analysis of the 2013 earthquake sequence, we alsodeveloped a 3D velocity (Vp, Vs) model that incorporated components of our regionalstructuralanalysis.Theprimarydatasets that constrainedwavespeed inourmodelweresonic logs in the Amposta and Castor wells, along with results of previous studies thatconstrain velocities for older geologic units in the region (Torne et al., 1992, Vidal et al.1998). These data, alongwith the structural components of ourmodel (faults, horizons)were used to develop co-registered Vp and Vs parametrizations, which in turn wereembedded in regional tomographic velocitymodels (e.g., Bassin et al., 2000; Cesca et al.,2014;Gaiteetal.,2016).Theresultingvelocityrepresentationcovereda largerareathanthestructuralmodel,asitwasnecessarytoencompassseveralofthestationsusedinourseismologicalanalysis(Figure2.7).

22 Juanesetal.:AssessmentofInducedSeismicityattheCastorProject—FinalReport
Figure2.7:Perspectiveviewofthegeologicsurfacesusedtoconstrainour3-Dvelocitymodel.a–baseTertiary (topMontsiareservoir);b–base Jurassic; c–basePaleozoic;d-Moho;e–velocityprofilesfromregionalmodels.TheseismicwavespeedstructureintheCastorregionisdefinedbyfourprincipallithologicunits: Tertiary, dominantly siliciclastic section (Alcanar, Castellon, and Ebro Group);Cretaceous to Jurassiccarbonates (including theMontsiareservoir);Triassic toPaleozoicsiliciclastics, which may include some carbonates in the lower part of the section; andbasement.Thus,wedevelopedhorizons todefine thedepthandshapeof these lithologictransitions. These included a topography/bathymetry surface (Ryan et al., 2009), a baseTertiary surface, a base Cretaceous-Jurassic carbonate surface, a base Triassic-Paleozoicsurface,andtheMoho(Collieretal.,1994).TheAmpostaandCastorwelldatadirectlyconstrainVpandVsvaluesintheTertiaryandCretaceous-Jurassiccarbonatesections,withsomeadditionalmeasurementsintheTriassicand upper Paleozoic sections. Thus, we used these data to develop depth-dependentvelocity(Vp)modelforthesethreeunitsdescribedby:

Juanesetal.:AssessmentofInducedSeismicityattheCastorProject—FinalReport 23
Tertiary:Vp=<6000:Vp=1564m/s–1.28Z (2.1)Vp>6000:Vp=6000m/s+0.227(Z6000–Z) (2.2)
whereZ6000=(1564–6000)/1.28mandZiselevationinm(positiveup)
Cretaceous-Jurassic:
Vp=5340m/s–0.227Z (2.3)
Triassic-Paleozoic:Vp=1.92*VsCSIC
whereVsCSICisinterpolatedfromGaiteetal.(2016).
We developed a volumetric grid of the study area consisting of ≈ 35 million cells,corresponding toa spatial resolutionof1kmby1km(horizontal)and100m(vertical).The grid was parameterized using the sediment velocity relations. In parallel, we useddipolesoniclogstoconstraintherelationshipbetweenVpandVs,andusedthefollowingrelationshiptogenerateaparallelshearwavemodel:Tertiary:
Vs=<3000:Vs=500m/s–0.833Z (2.4)
Vs>3000:Vs=3000m/s+0.111(Z3000-Z) (2.5)
whereZ3000=(500–3000)/0.833andZiselevationinm(positiveup)Cretaceous-Jurassic:
Vs=2667–0.111Z (2.6)
Triassic-Paleozoic:Vs=VsCSIC (2.7)
whereVsCSICisinterpolatedfromGaiteetal.(2016)
WethenembeddedthevelocitymodelinthebackgroundmodelofGaiteetal.(2016).Toensure a smooth transition between these velocity structures, we define a several-kilometer wide transition zone around the local model over which velocities weresmoothed. This resulted in a model that describes velocity structure in both thesedimentarybasinandthemid-to lower-crustthatencompassestheCastor fieldandthelocalseismographstationsusedinouranalysis(Figure2.8).Notably,themodeldescribesadistinct velocity inversion beneath Castor that is consistent with the transition fromCretaceous-JurassiccarbonatestounderlyingTriassicclasticstrata.

24 Juanesetal.:AssessmentofInducedSeismicityattheCastorProject—FinalReport
Figure2.8:Perspectiveviewofour3-DvelocitymodelshowingVp.ThemodelisembeddedintheregionalvelocitymodelofGaiteetal.(2016),andencompassesseveraloftheseismicstationsusedinouranalysisofthe2013earthquakesequence.
2.4.TectonicActivityoftheAmpostaFaultAspartofourstructuralanalysis,wealsoassessedgeologicalconstraintsontheactivityoftheAmposta faultsystem.Thesouthernsegmentof the faultsystemand itshangingwallsplays offsets geological strata to the seafloor, indicating recent (late Quaternary orHolocene) tectonicactivity (Figure2.9).This is consistentwithregional studiesand faultcompilations that have described the Amposta as a tectonically active fault (García-Mayordomoetal.,2012;Pereaetal.,2012).Notably, thenorthernextentof theAmpostafaultdoesnotextendupwardandoffsettheseyounggeologicalstrata.Rather,itterminatesupwardintoolderTertiarystrataatadepthofabout2km.Thisindicatesthatthenorthernportionof the fault is tectonically inactive.Notably, thissouth-to-north transition in faultactivity occurs at the location where the map trace of the fault changes trend fromnorthwesttonortheastneartheCastorfield.Atthisjuncture,recentstratigraphicoffsetsonthesouthernAmpostafaultappeartotransferontotheseriesofhangingwallsplayfaultsthatwehavedocumented(Figure2.9).

Juanesetal.:AssessmentofInducedSeismicityattheCastorProject—FinalReport 25
Figure 2.9: (Left) Perspective view of a shallow (≈ 230mbelow sea level) stratigraphic horizonmappedinthe3-DseismicreflectiondatashowingoffsetsalongthesouthernAmpostafaultanditshanging wall splays. (right) 3D perspective of Amposta fault showing location of offset horizonalongitsactivetrace.Northofthisarea,theAmpostafaultbecomesinactive.Insubsequentstagesofouranalysis,wewillexplorethereservoirinducedfluidpressureandstresschanges,aswellastheoccurrenceofseismicity,relativetothetectonicactivityofthesevarioussegmentsoftheAmpostafault.
2.5.PreparingtheModelforGridGenerationInorder to facilitate the incorporationof the structuralmodel intoamesh that couldbeused for the coupled flow–geomechanical analysis, we were required to make somesimplificationstotherepresentationsofthefaults.ThesechangesareoutlinedinTable2.1andweremotivatedbythedesiretoavoidcomplexorelongatedtetrahedralelementsthatwould compromise the quality of the calculations. We made an effort to maintain therepresentations of the Amposta fault and key reservoir faults, while eliminating othersmaller fault segments. In addition, we merged select segments or splays of smalldisplacementfaultstogeneratecontinuoussurfacerepresentations.Mergedfaultsincludedsmaller segments of the Amposta fault splays and several reservoir faults. We considerthesechangestothefaultrepresentationsasnothavingasignificantimpactonourresultsorconclusions.Figure2.10illustratesthemodelcomponentsthatweusedtogeneratethecomputationalmesh.

26 Juanesetal.:AssessmentofInducedSeismicityattheCastorProject—FinalReport
Figure2.10:Perspectiveviewofthecompletestructuralmodel. Table 2.1: Summary of changes made to faults for mesh generation. Meshed faults were notmodifiedfromthestructuralmodel.Omittedfaultswerenotincluded.MergedandExtendedfaultsweregeneratedtosimplifythemeshrepresentations.
MeshedfaultsCastor-Amposta_faultCastor-W_Main_faultCastor-m1_F235Castor-m1_Splay1B_anti1Castor-m1_Splay1B_anti2Castor-m1_Splay2B_anti1Castor-m1_Splay3Castor-m2_Splay1ABCastor-m2_Splay2ABCastor-m_F10Castor-m_F11Castor-m_F14Castor-m_FEastBoundingCastor-m_SouthFault
OmittedfaultsF1F4/6/7/8/9/12/13(notmodeled)W_PlioQuF1Splay2CSplay4/5F1011moregentlydippingalternativesMergedfaultsF2,F3,F5,intoF235Splay1AandBintoSplay1ABSplay2AandBintoSplay2AB
combinedpicksofSplay3patchesmergedintosinglefaultSEFaultmergedwithAmpostaSouthFault1/2mergedintoSouthFaultExtendedfaultsSplay1/2/3acrossAmpostafaultNorthernAmpostatosealevel

Juanesetal.:AssessmentofInducedSeismicityattheCastorProject—FinalReport 27
Chapter3.SeismicityAnalysisThemaingoalsoftheanalysisthatweperformedontheseismicdatawere:
1. Toreviewtheresultsofworkbypreviousinvestigators,includingIGN(2013),Cescaetal.(2014),andGaiteetal.(2016);
2. To estimate the uncertainties in the locations and faultingmechanisms (momenttensors)oftheearthquakesequence;
3. TodeterminetowhatextenttheseismicitycanbeassociatedwiththefaultsintheGeologicStructuralModel;
4. Toevaluatetheevolutionoftheearthquakesequenceinspaceandtime;and5. To determine the relationship between the seismicity and the stress changes in
spaceandtimepredictedbythegeomechanicalmodel.The seismicity observedduring and subsequent to the terminationof injection at Castoroccurred offshore and there were no seismic stations specifically set up tomonitor theseismicity. This means that the distribution of seismic stations in the vicinity of therecordedseismicityispoor,whichleadstolargeuncertaintiesintheanalysisoftheseismicdata.Anoptimal scenario for observing seismicity iswhen stations completely surroundthezoneofseismicityandmanystationsarelocatedatdistancesofnogreaterthantwicethedepthoftheevents.SincetheeventdepthsatCastoraremostlylessthan10kmdeep,stations located within 10 km of the platform are required for reliable locations. Theclosest station to theCastorplatform is stationALCN,which is locatedapproximately27kmfromtheplatform. Inaddition, theazimuthaldistributionofstationssurrounding theevents is limited since most stations are located on land and are generally west of theplatform.Two islandstations,ETOSonMallorca,andEIBIonEivissa,are to theEastandSouthof theplatformbut are eachmore than100kmaway, so theydidnotobtainhighsignal-to-noiseratiorecordingsfortheearthquakes(islandstationsarenotoriouslynoisy).Ourability toreliablydetermine the locationsandmoment tensorsofeventsatCastor isseverelylimitedbytheinadequatestationdistribution.Wepresentadiscussionoftheworkthathasbeendonebyothersontheseismicdatatolocate events, to evaluate the temporal evolution of the seismicity, and to determine thesense of faulting, which is known as the focal mechanism or moment tensor. We thenpresentresultsofourownanalysisandinterpretationofthedata
3.1OverallApproachWebeganwithanassessmentofdataandanevaluationofworkbypreviousinvestigators.We received the EBRO Observatory earthquake catalog, including arrival time picks foreventswithintheCastorregion.Wealsoreceivedwaveformdata.AlldatawereprovidedtousbyEnagas.OurworkbeganwithanassessmentofqualityofthearrivaltimepicksintheEBROcatalog.WedecidedtoproceedusingtheEBROtraveltimepickstolocatetheevents.Eventswere located using a fit-for-purpose location algorithm that waswritten for thisproject.This algorithmuses a grid search, andweights theobservedS-P times (the time

28 Juanesetal.:AssessmentofInducedSeismicityattheCastorProject—FinalReport
difference between the arrivals of the first-arriving compressional wave and the laterarrivingshearwave)equallywiththeobservedPandStimes.ThereasonforthisrelativelyunconventionalapproachwasthatweinitiallyobservedthattheS-Ptimesduringaboutthefirst10daysofthesequenceshowedconsiderablevariation,butthatthetimedifferenceswere almost constant later in the sequence.Wewanted a location approach thatwouldmake use of this important observation. Locations were determined using two velocitymodels as will be described below. We also evaluated the moment tensor solutions(provide information about fault orientation and slip direction) obtained by previousinvestigators. We then proceeded to use a number of approaches for constraining themomenttensorsolutions.Finally,wediscusstheevolutionoftheseismicsequenceinspaceandtime.
3.2.EarthquakeLocations
3.2.1.PreviousStudiesLocationshavebeendeterminedbytheIGN(2013),bytheEBROObservatory,andbytwoindependentresearchgroups(Cescaetal.,2014;Gaiteetal.,2016).Figure3.1isamapofthe region showing the locations determined by IGN (2013). Cesca et al. (2014) locatedsubsets of the earthquakes using approaches that are intended to give either reliableabsolute locations or reliable relative locations of the events. They used a flat-layeredvelocitymodel to calculate expected arrival times. The velocitymodel is derived from aglobalearthmodel thathas informationspecific to theCastorregion(Laskeetal.,2000).The73event locationsthattheydeterminedusingtheirabsolute locationapproachwerefound to occur mostly to the north of the Castor platform, although a few occur to thesouth.Theeventdepthsrangefromabout1to3km.TheirresultsareverydifferentfromthosereportedintheEBROcatalog,whichshoweventstrendingNW-SEandlyingbotheastandwestof theplatform.The51events thatwere locatedbyCescaetal. (2014)usingarelative location techniquewere tightly clustered and followed a trend going NNE-SSW.Thedepthsoftheselocationswerealsoinarangeof1-3km.Gaiteetal.(2016)useda3Dvelocitymodelderivedfromsurfacewavedispersioncurvesdevelopedbyusingseismicinterferometryonnoise.TheirlocationsfallalongatrendthatismoresimilartothatoftheEBROcatalog locations,e.g.aNW-SEtrendsurroundingtheCastor platform. The depths of the locations determined by Gaite et al. (2016) areconsiderablylargerthanthosedeterminedbyCescaetal.(2014)andrangefromafewkmtoasgreatas15km.
3.2.2.EvaluationofArrivalTimesofPhasesWeusedseismicdatafromtheEBROObservatory.Weobtainedcontinuoustracerecordsfrom9stations(seemap,Figure3.1).Alimitedamountofdatawereprovidedforatenthstation but those datawerenot usedbecause of the small amount of data and the closeproximityofthatstationtoaclusterofotherstationsforwhichwehadconsiderablylargerdatasets.Inaddition,wewereprovidedwiththeEBROlocationcatalogthatcontainedthearrivaltimepicksatthestationsandthelocationsoftheeventsasdeterminedfromthose

Juanesetal.:AssessmentofInducedSeismicityattheCastorProject—FinalReport 29
picks by the EBROObservatory.We used thewaveforms for evaluating the arrival timepicksinthecatalogandfordeterminingthemomenttensor/focalmechanismofthelargestevent that occurred on October 1, 2013. The catalog contained picks and locations forapproximately1000eventsthatoccurredbetweenSeptember5andOctober30,2013.Weare not certain how the catalog picks were obtained from the trace data. However, ourvisual comparison of the picks with the waveforms leads us to believe that there is anuncertaintyofthepickedPandSarrivaltimesof0.1to0.5seconds,dependingontheeventsize,thestation,andthephase.Wedidnotattempttoquantifythepickuncertaintyandwedidnotattemptto improvethepickquality.Manualrepickingof thephases issomethingthat might improve the quality of the locations. However, given the poor stationdistribution and the large uncertainty in the velocity model, we decided that the pickqualitywasadequateforoursubsequentanalysis.
Figure 3.1: Map showing the locations of the stations in the seismic network that we used forlocating theevents atCastor.The locationof theCastorplatform is shownwitha red star.BlackdotsneartheplatformarethelocationsofeventsdeterminedbytheIGN.Earthquakes are generally located by matching the measured arrival times of variousphaseswithtimespredictedusingagivenvelocitymodel.Predictedtimesareafunctionoftheearthquake locationand thevelocitymodel.Webeginbyanevaluationof thearrivaltime data available in the EBRO catalog. Generally the arrival times of the P(compressional) and S (shear) phases are used. Since these waves travel at differentvelocities, the difference in the arrival times of the two phases depends strongly on thedistance between the recording station and the event. Figure 3.2 shows a plot of all

30 Juanesetal.:AssessmentofInducedSeismicityattheCastorProject—FinalReport
waveforms recorded at stationALCN, the closest station to the Castor platform. The leftside shows the vertical component waveforms and the right side shows the transversecomponent waveforms. Waveforms are organized by their chronological order ofoccurrence.Thus,event1occurredonSeptember5,2013andevent200occurred in themiddleofthedayonSeptember14.Event600occurredonOctober1,2013.Alltracesarealignedby theP-wavearrival time reported in theEBROcatalog.Time0 is the reportedarrival time. The change in character of the traces from before themarked P-wave at 0seconds arrival to after the P-wave arrival indicates that the pick quality is reasonablygood.ByevaluatingtherighthandplotinFigure3.1,weseethattheS-wavearrivaltimesdonotvarymuchrelativetotheP-wavetimes;e.g.thedifferencebetweentheParrivalandthe S arrival is roughly 4 seconds. The interesting observation is that the S-waves foreventsnumberedgreaterthanabout250appearatalmostthesametimerelativetotheP-wavearrivaltimes.Beforeevent250,thereseemstobeavariationintheS-timerelativetothePtime.Thismeansthattheeventsthatoccurredbeforemid-September,2013,occurredat a range of distances fromALCNbut that the later events occurred at almost identicaldistancesfromALCN.
Figure3.2:CompilationofwaveformsofearthquakesatCastorthatwererecordedatstationALCN(Figure 3.1). Each vertical line represents one earthquake. The traces are aligned on the P-wavearrivaltimelistedintheEBROseismiccatalog.ChangesinthecharacteroftheimageareobviousattheP-andS-arrivaltimes.LeftpanelshowsverticalcomponenttracesthathighlighttheP-arrivals.Rightpanelshowshorizontal transversecomponent traces thathighlight theS-arrivals.Note thattheS-arrivaltimesarealmostidenticalafteraboutevent250indicatingthateventsafterthatoneare locatedatanearlyconstantdistancefromstationALCN.Eventsbeforeaboutevent250showvariableS-arrivaltimesindicatingthattheirdistancesfromALCNvaryfromeventtoevent.WehaveexaminedplotssimilartotheoneshowninFigure3.2butforotherstations.Onenotableobservation is that theS-Ptimeforallevents isalmostconstantatstationEPOB,
-2
-1
0
1
2
3
4
5
6
7
Tim
e fro
m p
icke
d P
(sec
)
0 200 400 600 800Chronological event Number
Z Trace Envelopes Aligned by Picked P Arrival
P"arrival"
S"arrival"
-2
-1
0
1
2
3
4
5
6
7
Tim
e fro
m p
icke
d P
(sec
)0 200 400 600 800
Chronological event Number
Z Trace Envelopes Aligned by Picked P Arrival
P"arrival"
S"arrival"

Juanesetal.:AssessmentofInducedSeismicityattheCastorProject—FinalReport 31
that is located NNE of the Castor platform. Thismeans that the event distances did notchangemuchrelativetostationEPOB.Fromourbasicevaluationof arrival times from thewaveforms,weconclude thateventsbeforemidSeptemberoccurredat a rangeofdistances fromstationALCN,but that theyoccurredatalmostaconstantdistancefromstationEPOB.ThisisconsistentwithaNW-SEtrendoftheeventlocations.Suchsimpleobservationsfromtherawdatawillbeusedlatertosupportourconfidenceaboutourlocationsfortheseismiceventsandtheinterpretationthatwedrawfromthem.
3.2.3.VelocityModelIn addition to thedistributionof stations that recordearthquakes, reliableknowledgeofthevelocitystructureisessentialfordeterminingtheirlocations.Thesizeanddepthoftheregionoverwhichthevelocitymodelmustbeknownincreaseswiththedistancebetweentheearthquakeandtherecordingstations.Weinvestigatedseveralvelocitymodels:(1)theflatlayeredCrust2.0modelthatwasusedbyCescaetal.(2014),(2)the3DheterogeneousmodelthatwasderivedbyGaiteetal.(2016)fromanalysisofsurfacewavedispersion,(3)aflatlayeredmodelderivedfromthemodelinGaiteetal.(2016)fortheregionclosesttothe Castor Platform, and (4) a 3D heterogeneous model derived from the GeologicalStructuralModelthatwasdevelopedforthereservoir/geomechanicalmodelinthecurrentproject.Model4wasembeddedwithinalarger3DvelocitymodelderivedfromtheworkofGaite et al. (2016). The resultswewill discuss are those obtainedusingmodels 3 and4sincewefeelthattheyarethemostreliablerepresentationsofthevelocitiesintheregionunderinvestigation.Figure3.3showsverticalcrosssectionsoftheP-wavevelocitythroughthe flat layeredmodel (model3,Figure3.3a), theheterogeneousmodel (model4,Figure3.3b), and a smoothed version of the heterogeneousmodel (Figure 3.3c). The smoothedmodel is the one that we used to trace rays to determine travel times needed for thelocationstudyusingtheheterogeneousmodel.
(a)(b)(c)Figure 3.3: Vertical cross sectionsof theP-wavevelocitymodels. In each case, the cross sectioncorresponds to a slice trendingN59.4degreesWest.TheCastorPlatform is locatedathorizontalposition0km.Noteverticalexaggeration.(a)LayeredmodelderivedfromGaiteetal.(2016);(b)3Dmodeldeveloped for this studybasedondetailed geological andgeophysical information; (c)Smoothed3Dmodelusedintheraytracingthrough(b).
0
5
10
15
20
25
Dep
th (k
m)
-200 -150 -100 -50 0 50Horizontal Distance (km)
1
2
3
4
5
6
km/s
0
5
10
15
20
25
Dep
th (k
m)
-200 -150 -100 -50 0 50 100Distance NW on Grid (km)
P Velocity at X .32 km Refference is Castor Platform
1
2
3
4
5
6
km/s
0
5
10
15
20
25
Dep
th (k
m)
-200 -150 -100 -50 0 50 100Distance NW on Grid (km)
P Velocity at X .32 km Reference is Castor Platform
1
2
3
4
5
6
km/s

32 Juanesetal.:AssessmentofInducedSeismicityattheCastorProject—FinalReport
3.2.4.LocationMethodologyWe used a grid search technique for determining event locations. We chose a gridsurroundingtheCastorplatformextendingtodistancesofapproximately15kmfromtheplatform.Thehorizontalgridwasrotated59.4degreescounterclockwisefromNorth,inthesameorientationasthegridusedforthereservoir/geomechanicalmodel.Thedepthrangewas between 0.2 and 20 km. Grid increments were 0.2 km in the three orthogonaldirectionsalongthegrid,resultinginapproximately2.3millionpointsinthegrid.Foreachevent,wedeterminedthedifferencebetweentheobservedandpredictedarrivaltimes for each point on the grid.We calculated the fit to the P and S arrival times andseparatelythefittothedifferencebetweentheSandParrivaltimesforeachgridpointforstationswherebothPandSwavearrivaltimesareavailable.Thegridpointwiththebestfittothedatawastakenastheeventlocation.Afterdeterminingthelocationsofallevents,wedeterminedanaveragestationresidualforeachphaseateachstationfromtheaveragemisfitbetweenthedataforthatphaseatthatstationforalleventslocated.Thiswastakento be a station correction. This station correction was used as an adjustment to thepredictedtimeforthephaseatthestationinasubsequentiterationofeventlocations.Thestationcorrectionprocedurewasrepeatedseveraltimes.Usingstationcorrectionsinthismanner has been shown to yield more reliable relative locations of events as it takesaccount of uncertainties in the velocitymodel, particularly between the station and theevent cluster. For this method to work best, the velocity model in the vicinity of thelocationsshouldbemostreliable.Uncertaintiesinthevelocitymodelsbetweentheregioncontainingtheeventsandeachstationareaccommodatedbythestationcorrections.
3.2.5.LocationResultsWe show locations determined using the layered velocity model shown in Figure 3.3a.Between800and900eventswerereliablylocated.WeconsideredalocationtobereliableiftheRMSmisfitbetweenmeasuredandpredictedarrivaltimeislessthan1s.Figure3.4showsthelocationsobtainedusingtheFlatlayeredmodelTheeventslocatedusingvelocitymodels(3)and(4)discussedaboveshowbroadlysimilarepicenter distributions and fit the arrival time data almost equallywell. These locationsplace the majority of earthquakes west and northwest of the platform with the clusteralignedinaroughlynorthwest-southeastorientation. Notably,theIGN(2013)andEBROcatalog locations have a similar northwest-southeast orientation.However, our locationsplacemostearthquakesfartherwest,closertotheAmpostafaultsystemanditssplays.Thelocations determined in our analysis using the flat layeredmodel are located somewhatclosertotheCastorPlatformthanthosedeterminedusingourheterogeneousmodel,andgenerally less than about 5 km deep. In contrast, the locations determined using theheterogeneousmodelaredeeper,between5and15km.The locationsoccur in twogeneralregions: (1)adenseclusterofseismicity locatedneartheCastorplatformand(2)asparsedistributionthattrendssoutheastfromtheplatform.ThemajorityoftheeventslocatedtothesoutheastoccurredbeforemidSeptember.Theseare the events with larger S-P times that were discussed above and referred to in the
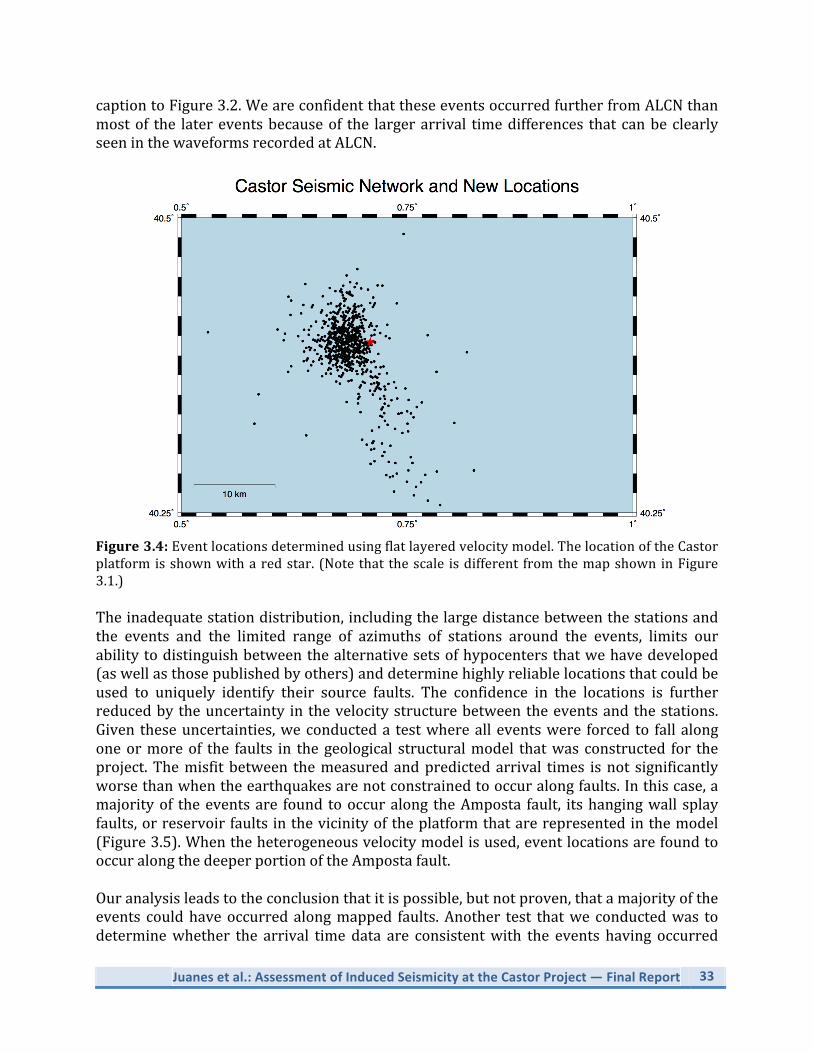
Juanesetal.:AssessmentofInducedSeismicityattheCastorProject—FinalReport 33
captiontoFigure3.2.WeareconfidentthattheseeventsoccurredfurtherfromALCNthanmostof the latereventsbecauseof the largerarrival timedifferences thatcanbeclearlyseeninthewaveformsrecordedatALCN.
Figure3.4:Eventlocationsdeterminedusingflatlayeredvelocitymodel.ThelocationoftheCastorplatformisshownwitharedstar. (Notethat thescale isdifferent fromthemapshowninFigure3.1.)Theinadequatestationdistribution,includingthelargedistancebetweenthestationsandthe events and the limited range of azimuths of stations around the events, limits ourabilitytodistinguishbetweenthealternativesetsofhypocentersthatwehavedeveloped(aswellasthosepublishedbyothers)anddeterminehighlyreliablelocationsthatcouldbeused to uniquely identify their source faults. The confidence in the locations is furtherreducedbytheuncertainty inthevelocitystructurebetweentheeventsandthestations.Given theseuncertainties,weconducteda testwherealleventswere forced to fallalongoneormoreof the faults in thegeological structuralmodel thatwas constructed for theproject.Themisfitbetween themeasuredandpredictedarrival times isnot significantlyworsethanwhentheearthquakesarenotconstrainedtooccuralongfaults.Inthiscase,amajorityof theeventsare found tooccuralong theAmposta fault, itshangingwall splayfaults,orreservoirfaultsinthevicinityoftheplatformthatarerepresentedinthemodel(Figure3.5).Whentheheterogeneousvelocitymodelisused,eventlocationsarefoundtooccuralongthedeeperportionoftheAmpostafault.Ouranalysisleadstotheconclusionthatitispossible,butnotproven,thatamajorityoftheevents couldhaveoccurredalongmapped faults.Another test thatwe conductedwas todeterminewhether the arrival timedata are consistentwith the events having occurred

34 Juanesetal.:AssessmentofInducedSeismicityattheCastorProject—FinalReport
along the shallow Eastward dipping fault in the moment tensor solution of Cesca et al.(2014). (There is no indication of this fault’s existence in the 3D seismic data, it is notcompatiblewith the geologic sequence in the region, and it is therefore absent fromourgeological structuralmodel. Cesca et al. (2014) sketched the fault basedon the two-waytraveltimefromactiveseismic imaging,butwhenconvertedtodepththis faultwouldbemore steeply dipping, which would then be incompatible with their preferred focalmechanism).We find that thearrival timedataarenotconsistentwithmore thanaverysmallnumberofeventshavingoccurredalongthispostulatedfault.
Figure3.5:3DperspectiveviewoftheCastorstructuralmodel,showingearthquakesrelocatedtothe fault surfaces using the layered velocity model. Earthquakes associated with each fault areassignedauniquecolor.NotethateventsoccuralongtheAmpostafaultsystemandselectreservoirfaults.
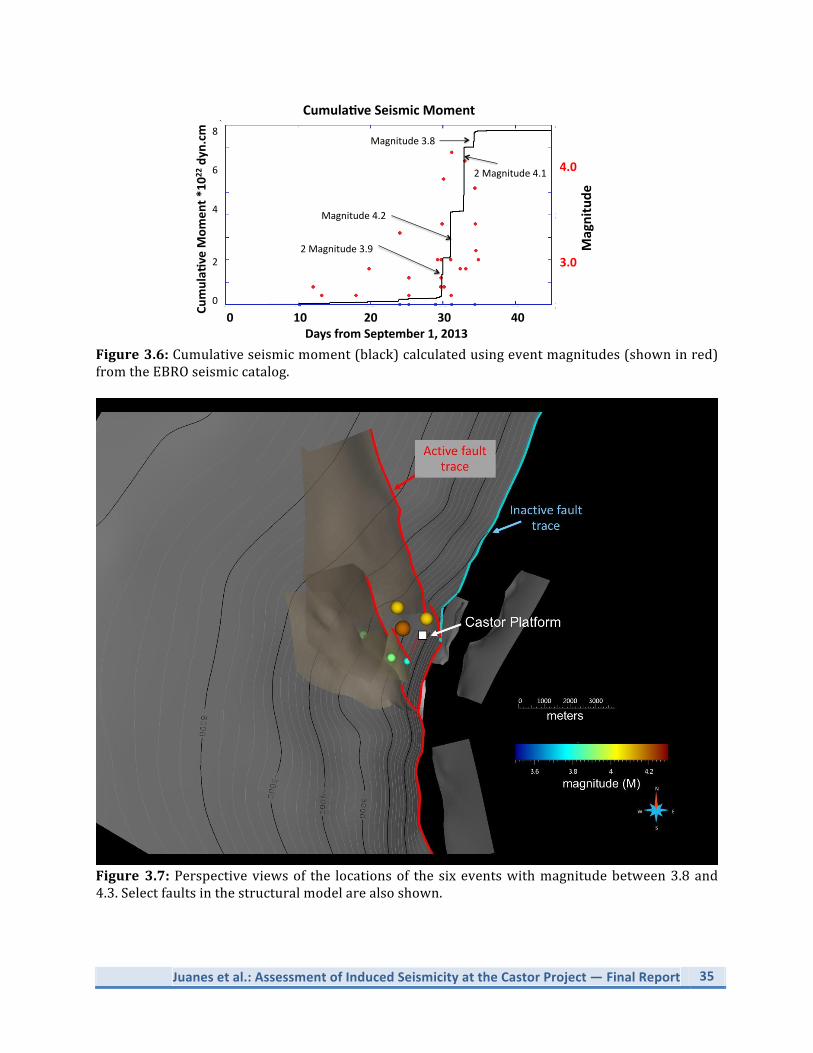
3.3.SeismicEnergyReleasevs.TimeandLocationsoftheLargestEventsTheseismicenergyreleasedduringanearthquakesequenceisgenerallydominatedbythelargestevents.Figure3.6showstheseismicenergyreleasevs.timefortheCastorsequence.ThefirstrecordedeventoccurredonSeptember5.Waveformsforthefirstfoureventsinthesequence,whichalloccurredonSeptember5,arealmostidentical,indicatingthattheirlocationsarenearlycoincident.Comparedtotheenergyreleasedbytheoverallsequence,theenergyreleasedthroughSeptember24wassmall.Theenergyreleasedidnotincreasesubstantially until the first large event on September 30. After that event, the energyreleaseisdominatedbyasmallnumber(6)ofratherlargeevents.Thesesixearthquakeshaveseismicwaveformswithalmostidenticallongperiodcomponents,indicatingthatthey(a)likelyhavethesamefocalmechanism,and(b)occurredveryclosetooneanother.ThelocationsofthesesixeventsareshowninFigure3.7.
Juanesetal.:AssessmentofInducedSeismicityattheCastorProject—FinalReport 35
Figure3.6:Cumulativeseismicmoment(black)calculatedusingeventmagnitudes(showninred)fromtheEBROseismiccatalog.
Figure 3.7:Perspectiveviewsof the locationsof the sixeventswithmagnitudebetween3.8and4.3.Selectfaultsinthestructuralmodelarealsoshown.
2Magnitude3.9
Magnitude4.2
2Magnitude4.1
Magnitude3.886420
Cumula&veSeismicMoment
Cumula&
veM
omen
t*10
22dyn.cm
DaysfromSeptember1,2013010203040
4.03.0
Magnitude

36 Juanesetal.:AssessmentofInducedSeismicityattheCastorProject—FinalReport
3.4.MomentTensorInversion
3.4.1.PreviousStudiesMoment tensors were determined by IGN (2013), Cesca et al. (2014), Villaseñor et al.(2016),andSalóetal.(2017).Figure3.8a-cshowsthemomenttensorsfoundforthemainshockonOctober1,2013bythreeofthefourstudies. Inall threecases,momenttensorswere obtainedbywaveform fitting. The results of IGN (2013) and Saló et al. (2017) arerathersimilar,whiletheresultobtainedbyCescaetal.(2014)issignificantlydifferentfromthe other two. Moment tensor solutions define two possible planes of slip for theearthquake.Seismicdatacanonlyprovide informationaboutwhichplanewas theactualplane of slip by considering a finite rupture model, which is possible only when theazimuthal distribution of stations is good. All three moment tensor solutions shown inFigure3.8haveonefaultthattrendsroughlyNWandisclosetovertical.AllthreemomenttensorsolutionsalsohaveaplanethattrendsNE.However,theplanefoundbyCescaetal.(2014)hasaveryshallowdip,whereastheplanesidentifiedbyIGN(2013)andSalóetal.(2017)arenearlyverticalanddippingtotheSE.Cescaetal.(2014)arguethattheshallow-dippingNE-trendingfaultwastheplaneofslipfortheevent.
Figure3.8:LowerhemisphereprojectionofmomenttensorsolutionsfortheMagnitude4.3eventthatoccurredonOctober1,2013.Thecompressiveanddilatationalquadrantsareshownaswhiteandblack,respectively.Resultdeterminedby(a)Cescaetal.(2014)usingwaveformfitting,(b)IGN(2013)usingwaveformfitting,(c)Salóetal.(2017)usingwaveformfitting.(d)SolutionobtainedbyCescaetal. (2014)overwhichwehavesuperimposed the firstmotiondirectionswhereblackmeans compressive firstmotionandopen circlemeansdilatational firstmotion. (e)Our solutionobtainedby fittingwaveformdatausingour layeredvelocitymodeland the locationof theeventdeterminedusingstationcorrections.
3.4.2.MomentTensorAnalysisofMagnitude4.3EventonOctober1,2013Wefindthatthelong-periodcomponentofthewaveformsfromthesixlargesteventswithmagnitudesbetween3.8and4.3arequitesimilar.Thesimilarityleadsustoconcludethatall of these events occurredonone fault. Thewaveformsaredifferent from thoseof thefour similar events at the beginning of the earthquake sequence.We evaluated the focalmechanism of the largest of these events, the magnitude 4.3 event that occurred on 1October, 2013 using two approaches. The first used the classical approach of fitting thedirectionsoffirstmotionsatthestations.Thesecondusedwaveformfitting.Fittingoffirstmotionsofeventsisarelativelystraightforwardapproachforfindingthefocalmechanism(asimplifiedmomenttensor)thatislessdependentonareliableknowledgeofthevelocity
(a) (b) (c) (d) (e)

Juanesetal.:AssessmentofInducedSeismicityattheCastorProject—FinalReport 37
structure than is waveform fitting. Firstmotion directions can be easilymeasured fromwaveform data and uncertainties in the measurements are easily incorporated into theanalysis.We use the term focal mechanism to represent the two possible slip planes for anearthquake.Amomenttensorsolutionincludesthefocalmechanismandsomeestimateofthesizeoftheearthquake.Firstmotionpolaritydatacannotprovideinformationabouttheearthquakesizeunlessthefirstmotionamplitudesarealsomeasuredandinterpreted.Figure 3.8d shows the observed first motions (up=compressive or down=dilatational)plottedonalowerhemispherefocalspherealongwiththemomenttensorfromCescaetal.(2014).Agoodfitofthemomenttensortothefirstmotiondatawouldrequirethatallblackandwhitedotsrepresentingdirectionsofmotionsatthestationsfallwithinthesamecolorregions of the focal sphere that are shaded and white, respectively. All observed firstmotion data are consistent with their moment tensor solution except that observed atstationCOBS.SincethemeasureddirectionoffirstmotionatCOBSisclearandstrong,wecannot ignore it andwemust conclude that themoment tensor is inconsistentwith thedata.ThedifferencebetweentheCescaetal.(2014)momenttensorandthefirstmotionatCOBSmaynotbe surprising since theydidnotuse thedata fromCOBS in theirmomenttensordetermination.IGN (2013) also determined focalmechanisms using firstmotions. Themechanism theyfindforthemainshockusingfirstmotionsissimilartothoseshowninFigure3.8band3.8cexcept that the NNE trending fault dips to theWest, rather than dipping to the East asshowninFigure3.6.Theirsolutionfoundusingfirstmotionsisverywellconstrainedandusesdata from farmorestations than is shown inFigure3.8d.Themechanismthat theyfindusing firstmotions is close,butnot identical to theone theyobtainusingwaveformfitting. The mechanism shown for IGN (2013) is taken from the report and is slightlydifferentfromtheonereportedbyCescaetal.(2014)ashavingcomefromtheIGNonlinecatalog.We examined a suite of possible focalmechanisms that fit all the observed firstmotiondata.WehavelessconfidenceinthemeasurementsoffirstmotionsatislandstationsETOSandEIBI.Thesestationsarelocatedfurtherfromtheearthquakesandthesignal-to-noiseofthe firstmotions is smaller thanat theother stations. Ifweconsider thatoneorbothofthesefirstmotionsareincorrectlydepictedinFigure3.8d,awiderrangeofpossiblefocalmechanisms are possible. The set of solutions that are consistent with all first motionsexceptthoseatETOSandEIBIlookquitesimilartothesolutionsshowninFigure3.8(b,c),themomenttensorsolutionsofIGN(2013)andSalóetal.(2017).WedonotfindanyfocalmechanismsolutionliketheoneobtainedbyCescaetal.(2014)thatisconsistentwiththehigh-qualityfirstmotiondata.Tofurtherinvestigatethemomenttensor,weperformedwaveformfittingofthedataat8stations(EIBI,ALCX,EMOS,ALCN,CMAS,ERTA,EPOB,COBS)andthefirstmotionatstationETOS.WeusedafittingapproachthatwasdevelopedbyLietal.(2011).Thewaveformswefitwerefilteredbetween2and5Hz.Thisismuchhigherfrequencyrangethanthatusedby

38 Juanesetal.:AssessmentofInducedSeismicityattheCastorProject—FinalReport
Cescaetal.(2013),whichwas0.05-0.1HzandtheoneusedbySalóetal.(2017),0.02-0.1Hz. The use of higher frequencies makes our result more dependent on the velocitystructure.Theadvantageofusinghigherfrequenciesisthatthesignalamplitudeinthe2-5Hzband ismore thananorderofmagnitudehigher than that in the lowerbandusedbyothers.Anotherreasonforchoosingthehigherfrequencybandisthatthewavelengthsinthe2-5Hzbandareontheorderofkilometerswhereasthewavelengthat0.1Hzisontheorderof10’sofkm,roughlythesameasthedistancesbetweentheeventandthestations.Usingthelongwavelengthrange(lowfrequencies)requirescarefulconsiderationofnearfield terms in the calculation of synthetic seismograms for use in the moment tensorsolution.Ourfitofthepredictedwaveformstothedata ismeasuredinseveralways,andtheweightedsumofthosemisfits isminimizedto findtheresultingmomenttensor(see,e.g., Li et al., 2011). We used a number of different weighting schemes to emphasizedifferentcharacteristicsofthefitstothedata.Figure3.8eshowsoneofthemechanismsweobtained.ThismechanismshowsafaultstrikingNE-SWthatdipstotheWestandaNW-SEstriking fault that isalmostverticalbutwhichdips slightly to theNE.Thismechanism isverysimilartotheonefoundbyIGN(2013)usingfirstmotiondatafromalargenumberofstations.TheNE-SWstrikingfaultorientationisconsistentwiththeAmpostaFault,aswellasbeingconsistentwiththe3Drelativelocationsofthesixlargestevents,whichalignonaplane dipping northwest. This mechanism differs somewhat from those determined byothers who usedwaveform inversion, with the steep NW-SE plane dipping to the west,ratherthantotheeast.However,withinuncertainties,ourresultagreeswiththesolutionsbyIGN(2013)andbySalóetal.(2017),butnotwiththesolutionofCescaetal.(2014).
3.5.SpatialandTemporalEvolutionoftheEarthquakeSequenceThedistributionofhypocenters shown inFigure3.4correlateswellwith the tectonicallyactivesectionsoftheAmpostafaultsystem.However,seismicityisdistributedoveralargerregionthanisaffectedsignificantlybythestresschangesassociatedwithpressurizingthereservoir.This raises thequestionofwhether the initiation of the sequence is related tooperations. Toanswerthisquestion,weexaminedthehypocenterlocationsasafunctionoftimeduringthesequence.Wefoundthattheearliesteventsinthesequencewerelocatedwithina fewkilometers(comparable touncertainties inabsolute locations)of theCastorplatform and therefore have a high probability of being triggered. The more broadlydistributed earthquakes in the approximately 10 days immediately following these“inducedforeshocks”appeartobeanaftershocksequence,withtheinitialeventstriggeringsubsequent earthquakes, predominantly along the tectonically active segments of theAmposta fault system, in contrast to far fewer events triggered along the tectonicallyinactive segments. Finally, the six largest events, in which most of the moment wasreleased,wereconcentratedintheregionaffectedbyproduction(Figure3.7).

Juanesetal.:AssessmentofInducedSeismicityattheCastorProject—FinalReport 39
3.6.SynthesisoftheSeismicityAnalysisOurmajorconclusionsfromtheanalysisoftheseismicdataareasfollows:
1. Seismicityinitiatedneartheplatform,rapidlyexpandedintoaspatiallydistributedzone, then contracted to a tighter cluster surrounding the 6 largest events thatoccurredafterinjectionstopped.
2. Seismicenergyreleaseisdominatedbythesesixrelativelylargeevents.Theselargeeventsarelocatedveryclose-withinafewkmofeachother.ThelargeeventslikelyoccurredalongasingleNWdippingplanethatcouldbecoincidentwiththeAmpostafault.OurlocationsplacetheseeventsneartheCastorplatform.
3. Most events can be associated with faults that are represented in the geologicalmodeldevelopedforthisproject.
4. Event relocations and moment-tensor solutions, within uncertainties, agree withthosefromIGN,butourpreferredmomenttensorhasaplanethatdipstotheNW,alignedwiththedistributionofthelargestevents.
5. There is very little evidence that the largest events occurred along the low-angleeastwarddippingfaultthatwasproposedbyCescaetal.(2014).

40 Juanesetal.:AssessmentofInducedSeismicityattheCastorProject—FinalReport
Chapter4.CoupledFlow-GeomechanicsModeling
4.1.OverallApproachOurdynamicsimulationstrategyisbasedoncouplingflowandgeomechanicalmodelsintoone simulation framework. The role of the coupled reservoir flow and geomechanicalsimulationintheintegratedapproachforthisprojectinshowninFigure4.1.
Figure4.1:Coupledflow-geomechanicssimulationwithinintegratedapproachforthisproject.In what follows we first present the mathematical and computational aspects of thesimulation approach, and then describe the specific computational model for Castor,includingthemesh, thesimulationparameters,andtheperformanceof themodelduringthedifferentperiodsofreservoiroperationsintheAmpostafieldandCastorgasstorage.
4.2MathematicalFormulationofCoupledMultiphasePoro-Mechanics
4.2.1.MathematicalFormulationAnimportantaspectofthemodelingisthecouplingbetweenflowanddeformation.Thesetwo physical problems are coupled both ways, as described in the classical theory ofporomechanics(Biot,1941;Coussy,1995,2004;JhaandJuanes,2014).Under the quasistatic assumption for earth displacements, the governing equation forlinearmomentumbalanceofthesolid/fluidsystemcanbeexpressedas
∇ ∙ 𝝈+ 𝜌!𝒈 = 𝟎, (4.1)
Geologicalstructuralmodel
FlowDynamicmodel
Geomechanicalmodel
• This static model provides the correct geologicalframework to facilitate the coupled flow andgeomechanical modeling analysis in Castor
• Here we add dynamic components (wells,permeabilities, relperms, etc) to existing staticmodel in order simulate fluid and pressure behaviorin Castor. We also conduct a data assimilationexercise.
• Geomechanical simulation is used to characterizestresses in Castor.
• Coupling with pressures obtained from flowdynamic model is critical.
SeismologicalAnalysis• To re-analyze seismological data, including
development of high-resolution seismic velocitymodel, relocation of the seismic events, and anevaluation of focal mechanisms of selected events
COUPLED

Juanesetal.:AssessmentofInducedSeismicityattheCastorProject—FinalReport 41
where𝝈istheCauchytotalstresstensor,𝒈isthegravityvector,and𝜌! = 𝜙 𝜌!𝑆!!phase! +
(1− 𝜙)𝜌!isthebulkdensity,𝜌! and𝑆! arethedensityandsaturationoffluidphaseβ,and𝜌!isthedensityofthesolidphase,𝜙isthetrueporosity,andnphaseisthenumberoffluidphases.Thetrueporosityisdefinedastheratiooftheporevolumetothebulkvolumeinthecurrent (deformed)configuration.Assuming that the fluidsare immiscible, themass-conservationequationforeachphase𝛼is
𝑑𝑚!
𝑑𝑡 + ∇ ∙𝒘! = 𝜌!𝑓! , (4.2)
wheretheaccumulationterm𝑑𝑚!/𝑑𝑡describesthetimevariationoffluidmassrelativetothemotionof the solid skeleton,𝒘! is themass-fluxof fluidphase𝛼relative to the solidskeleton,and𝑓! isthevolumetricsourcetermforphase𝛼.Thetwobalanceequations(4.1)and(4.2)arecoupledbyvirtueofporomechanics.Ononehand,changesintheporefluidpressure lead to changes in effective stress, and induce deformation of the porousmaterial—such as ground subsidence caused by groundwater withdrawal. On the otherhand,deformationoftheporousmediumaffectsfluidmasscontentandfluidpressure.Thesimplest model of this two-way coupling is Biot’s macroscopic theory of poroelasticity(Biot,1941;Geertsma,1957;Coussy,1995).Intheremainderofthissectionweprovidethemathematicaldescriptionofporoelasticityformultiphasefluidsystems.In the multiphase or partially saturated fluid system, it is not possible to linearize theequationsofporoelasticityaroundareferencestatebecause(Coussy,1995):
1. Gasesareverycompressible,2. Capillarypressureeffectsareintrinsicallynonlinear,and3. Phasesaturationsvarybetween0and1and, therefore,a typicalproblemsamples
theentirerangeofnonlinearity.Therefore,followingCoussy(1995),weusetheincrementalformulationofporomechanicsformultiphasesystems,whichdoesnotassumephysical linearizationoftotalstressfromthe initial state to the current (deformed) state. We make a modeling assumption thatallows us to express the deformation of a multiphase porous material in terms of theincrement in applied total stresses and internal fluid pressures. We adopt an effectivestress formulation in the multiphase poromechanics (Bishop, 1959; Bishop and Blight,1963)because constitutivemodelingof porousmaterials is usuallydone in termsof theeffectivestress.Underthisformulation,wesplitthetotalstressontheporousmaterialintotwo parts: one that is responsible for deformation of the solid skeleton (the effectivestress),andanothercomponentthatisresponsibleforchangesinthefluidpressures,
𝛿𝝈 = 𝑪!": 𝛿𝜺− 𝑏!!
𝑝!𝟏, (4.3)
where𝑏! aretheBiotcoefficientsforindividualphasessuchthat 𝑏!! = 𝑏,wherebistheBiotcoefficientofthesaturatedporousmaterial.Itiscommontofurtherassumethat𝑏! are

42 Juanesetal.:AssessmentofInducedSeismicityattheCastorProject—FinalReport
proportional to the respective saturations𝑆! (Lewis and Sukirman, 1993; Coussy et al.,1998;LewisandSchrefler,1998).The effective stress concept allows us to treat a multiphase porous medium as amechanically equivalent single-phase continuum (Khalili et al., 2004; Nuth and Laloui,2008).Theappropriateformoftheeffectivestressequationinamultiphasesystemisstillanactiveareaofresearch(GrayandSchrefler,2001;Coussyetal.,2004;NuthandLaloui,2008;Vlahinicetal.,2011;Nikooeeetal.,2013;Kimetal.,2013).Hereweusetheconceptofequivalentpressure(Coussyetal.,2004)intheeffectivestressequation(Eq.(4.3)),
𝑝! = 𝑆!𝑝!!
− 𝑈, (4.4)
where𝑈 = 𝑝!𝑑𝑆!! is the interfacial energy computed from the capillary pressurerelations (Kimetal., 2013).Theequivalentpressureaccounts for the interfaceenergy inthe free energy of the system, and leads to a thermodynamically consistent andmathematically well-posed description of the multiphase fluid response to the soliddeformation(Kimetal.,2013).Forasystemwithtwophases,thewettingphasewandthenon-wettingphaseo,thecapillarypressureis
𝑃! 𝑆! ≡ 𝑃!" 𝑆! = 𝑝! − 𝑝! , (4.5)
and the interfacial energy is𝑈 = 𝑃!"𝑑𝑆!!!
. Assuming𝑏! = 𝑏𝑆! (Lewis and Sukirman,1993;Coussyetal.,1998;LewisandSchrefler,1998),andusingEq.(4.4) inEq.(4.3),weobtainthestress-strainrelation-shipformultiphaselinearporoelasticity:
𝛿𝝈 = 𝛿𝝈! − 𝑏𝛿𝑝!𝟏, 𝛿𝝈! = 𝑪!": 𝛿𝜺. (4.6)
Oncewehaveadefinitionoftheeffectivestressinmultiphasesystems,wenowexpressthechangeinthefluidmassintermsofthemechanicaldeformationandthechangeinthefluidpressures. In thedeformedconfiguration, themassofphase𝛼perunitvolumeofporousmediumis
𝑚! = 𝜌!𝑆!𝜙 1+ 𝜀! , (4.7)
Notethat,bydefinition,thesumofallfluidphasesaturationsaddsupto1.Formultiphasesystems(Coussy,1995,2004),wehave
𝑑𝑚𝜌 !
= 𝑏!𝑑𝜀! + 𝑁!"𝑑𝑝! , (4.8)
where𝑵 = 𝑴!!istheinverseBiotmodulus.Inamultiphasesystem,theBiotmodulusisasymmetric positive definite tensor𝑴 = 𝑀!" , and the Biot coefficient is a vector. Todetermine the coupling coefficients𝑁!" as a function of the primary variables (pressure,

Juanesetal.:AssessmentofInducedSeismicityattheCastorProject—FinalReport 43
saturations, and displacements) and rock and fluid properties we develop an alternateexpressionforthedifferentialincrementinfluidmass.UsingEq.(4.7),
𝑑𝑚! = 𝑑 𝜌!𝑆!𝜙 1+ 𝜀! , (4.9)
whichcanbeexpandedas
𝑑𝑚𝜌 !
= 𝜙𝜕𝑆!𝜕𝑃!"
𝑑𝑃!" + 𝜙𝑆!𝑐!𝑑𝑝! + 𝜙𝑆!𝑑𝜀! + 𝑆!𝑑𝜙, (4.10)
where𝑐! is thecompressibilityof the fluidphase𝛼,and𝜕𝑆!/𝜕𝑃!" is the inversecapillarypressure derivative. Above, repeated indices do not imply summation and we haveassumed infinitesimal deformations. We can express the increment in porosity𝑑𝜙as afunction of the volumetric effective stress𝑑𝜎′!to obtain a closed-form expression of Eq.(4.10).Let𝑉! = 𝑉! − 𝑉!be thevolumeof thesolidmatrix,and𝑑𝜀!" = 𝑑𝑉!/𝑉! = 𝑑𝜎!"/𝐾!bethevolumetricdilationofthesolidmatrix,where𝜎!"isthevolumetricmatrixstress.Fromanexpansionof𝑑𝜙wecanwritetheincrementalformofstrainpartitionas
1− 𝜙 𝑑𝜀! = 1− 𝜙 𝑑𝜀!" + 𝑑𝜙. (4.11)
Similarly,thevolumetricCauchytotalstresscanbepartitionedintothevolumetricmatrixstressandthefluidpressureas
𝑑𝜎! = 1− 𝜙 𝑑𝜎!" − 𝜙𝑑𝑝! . (4.12)
Substituting𝑑𝜎!"fromEq.(4.12)intoEq.(4.11),weobtain
𝑑𝜙 =𝑏 − 𝜙𝐾!"
𝑑𝜎′! + 1− 𝑏 𝑑𝑝! . (4.13)
Equation(4.13)impliesthatanincrementinporosityisrelatedtoincrementsinvolumetriceffectivestressandfluidpressures.Substituting𝑑𝜀!fromEq.(4.6)and𝑑𝜙fromEq.(4.13)intoEq. (4.10)allowsus toexpress the increment in thephasemassasa functionof theincrements in the total volumetric stress andphasepressures. Equating this toEq. (4.9)yieldsthedesiredexpressionsforthecouplingcoefficients𝑁!! .Finally, we obtain themultiphase flow equation for phase𝛼in a poroelasticmedium bysubstitutingthetwoconstitutiverelations,theeffectivestressequation,Eq.(4.6),andthefluidmassincrementequation,Eq.(4.8),inthemassbalanceequation,Eq.(4.2):
𝜕𝜕𝑡 𝜌! 𝑁!" +
𝑏!𝑏!𝐾!"
𝑝!!
+1𝐾!"
𝜕𝜕𝑡 𝜌!𝑏!𝜎! + ∇ ∙𝒘! = 𝜌!𝑓! , ∀𝛼 = 1,… ,𝑛phase
(4.14)

44 Juanesetal.:AssessmentofInducedSeismicityattheCastorProject—FinalReport
Theroleof𝑁and𝑏asthecouplingcoefficientsamongdifferentfluidphasesandthesolidphase is evident from the above equation. The bulk density,𝜌! , in the mechanicalequilibriumequation,Eq.(4.1),alsoactsasacouplingparameterbecauseitisafunctionoftheporosityandthephasesaturations.Becauseweassumethatthefluidsareimmiscible,the mass-flux of phase𝛼is𝒘! = 𝜌!𝒗! , where we adopt the traditional multiphase-flowextensionofDarcy’slaw(Muskat,1949;Bear,1972):
𝒗! =𝒌𝑘!!
𝜇!∇𝑝! − 𝜌!𝒈 , (4.15)
where𝜇! and𝑘!! are the dynamic viscosity and the relative permeability of phase𝛼inpresenceofotherfluidphases.Poromechanicsof faults.Therearetwobasicapproachestorepresentfaults inathree-dimensionalmedium:eitherasathree-dimensionalfaultzone(e.g.,Rutqvistetal.,2008)oratwo-dimensionalfaultsurface(e.g.,Juanesetal.,2002;Molineroetal.,2002;Ferronatoetal.,2008).Theadvantageofrepresentingfaultsassurfacesofdiscontinuityisthattheycanmore faithfully describe the localized (discontinuous) displacement at the fault, and thatonecanincorporatemodelsofdynamicfrictionalstrength(liketherate-andstate-frictionmodel)capableofreproducingrunawayfaultslipcharacteristicofearthquakes.Moreover,introducingdiscretefaultsurfacesdoesnotprecludemodelinganadjacentfaultzonewithappropriaterheology.Acentralfeatureofourworkisthatwetreatfaultsassurfacesofdiscontinuityembeddedin the continuum.We use zero-thickness elements, also known as interface elements orcohesiveelementsinthefiniteelementliterature(Goodmanetal.,1968;Beer,1985;Carolet al., 1985; Gens et al., 1988; Lei et al., 1995), to represent the fault surfaces.Mathematically, the fault surface is treated as an interior boundary between the twoadjacent domains. The two sides of the fault surface, which need not be planar, aredesignatedas the ‘+’sideandthe ‘−’side,andthe faultnormalvector,n,points fromthenegativesidetothepositiveside.Traditionally,intheAndersonianfaultingtheory(Anderson,1951),faultslipismodeledina“dryenvironment,”thatis,intheabsenceoffluids.While,insomecases,thepresenceoffluidhasbeen recognized through theeffective stress concept, thedynamicsof flowwasnot included for reasons of conceptual and computational simplicity, as well as for thebelief that fluid flowplayeda secondaryrole in the releaseof tectonic stresses (Hubbertand Rubey, 1959; Reasenberg and Simpson, 1992). The effect of pore pressure wasaccounted forbymodifying thecoefficientof fault friction𝜇!(HarrisandSimpson,1992;Harrisetal.,1995),anapproachlatersuggestedtobe“unwise”(Beeleretal.,2000).Inthecaseofmaturefaults,thefaultcorepermeabilitycanbelowduetocomminutionofgrainswhile the damaged host rock permeability can be high due to fractures (Sibson, 1977,1986;Chesteretal.,1993;CaineandForster,1999).Inaddition,thepermeabilitycanvarysubstantially across the fault during the seismic cycle (Sibson, 1981, 1990). As a result,

Juanesetal.:AssessmentofInducedSeismicityattheCastorProject—FinalReport 45
pore pressures can be significantly different across the fault (Sibson, 1994; Rice, 1992;Chesteretal.,1993).A difference in fluid pressure across the fault leads to a pressure jump 𝑝 !! = 𝑝! − 𝑝!,where𝑝!and𝑝!aretheequivalentmultiphasepressures(Equation(4.4))onthe“positive”and the “negative” side of the fault.Oneof the key features of the2-D representationoffaultsistheabilitytoreproduceafinitejumpinthepressure, 𝑝 !! ,acrossthefault.Thispressurejumpleadstoadiscontinuityintheeffectivestressacrossthefault,suchthatthetotalstressiscontinuous
𝝈′! ∙ 𝒏− 𝑏𝑝!𝒏 = 𝝈!! ∙ 𝒏− 𝑏𝑝!𝒏, (4.16)
arequirementformomentumbalanceonthefault.Thisgivesrisetothequestionofhowtoincorporateintheformulationthepressurejumpacrossafault.Thisisimportantbecauseitdeterminesthestabilityofthefault.Faultstabilitycanbeassessedbyevaluatingthestabilitycriteriononbothsidesofthefaultseparately. The side of the fault where the criterion is met first determines the faultstability.Equivalently,thiscanbeachievedbydefiningafaultpressurethatisafunctionofthe pressures on the two sides,𝑝!and𝑝!. Introducing the fault pressure allows us touniquely define the effective normal traction on the fault,𝜎′!, and determine the faultfriction𝜏! .Sincethestabilitycriterion,𝜏 ≤ 𝜏! ,isfirstviolatedwiththelargerpressure,wedefinethefaultpressure,𝑝! ,as
𝑝! = max 𝑝!,𝑝! . (4.17)
Ourdefinitionoffaultpressureisanaturalresultofourfaultrepresentation,ratherthanaconservativeassumption.Notethatestimatingthefaultpressureasthearithmeticaverageofthepressuresonthetwosides,asproposedinthecaseoftensilefractures(SeguraandCarol,2004,2008a,2008b),mayincorrectlydelaytheonsetofshearfailure.Fault tractionsat faults.Themostimportantoutputfromthemodelisthecalculationofstresses on faults. From the regional state of stress and the initial pressures, one cancompute the initialstressonthe faults.This is important todeterminewhethera fault is(or,rather,portionsofafaultare)closetode-stabilization.Thepotential forde-stabilizationof a fault ismeasuredby the evolutionof theCoulombstress,orCoulombForceFunction(CFF),definedas:
CFF = 𝜏left-lat! + 𝜏updip! − 𝜇! −𝜎!! , (4.18)
where𝜏left-lat! and𝜏updip! are the left-lateral and up-dip components of shear stress on the
fault,

46 Juanesetal.:AssessmentofInducedSeismicityattheCastorProject—FinalReport
𝜎!! = 𝜎! + 𝑏𝑝 (4.19)
is the effective normal stress on the fault (positive tensile), which is equal to the totalnormal stress plus the equivalent pore pressure (positive compressive), b is the Biotcoefficient,andµfisthecoefficientoffrictiononthefault.Asaresultofpressurechangesaswellasporoelasticdeformation,allcomponentsofstressvaryalongeachfault.VariationsintheCFFbetweenanytwotimes,e.g.,
∆CFF 𝑡! → 𝑡! = CFF 𝑡! − CFF 𝑡! (4.20)
indicate if those changes are stabilizing (ΔCFF < 0) or de-stabilizing (ΔCFF > 0). Largepositive changes in CFF over extended areas of a fault are indicative of substantial de-stabilizationofafault,andpotentialforfaultslipandearthquaketriggering.Changesintheorderof0.1MPa(1bar)areconsideredworrisomefromthepointofviewofthepotentialfor earthquake triggering (Freed, 2005). For some, but not all earthquakes, aftershockshavebeendocumented tobe triggeredby increases inCoulombstressofas littleas0.01MPa(0.1bar,Hardebecketal.,1998).
4.3.ComputationalModelingandSimulationSoftware
4.3.1.NumericalDiscretizationThe interactions between flow and geomechanics have been modeled computationallyusing various coupling schemes (Dean et al., 2006; Jeannin et al., 2007; Jha and Juanes,2007; Mainguy and Longuemare, 2002; Minkoff et al., 2003; Settari and Mourits, 1998;SettariandWalters,2001;Thomasetal.,2003;Tranetal.,2004,2005;Kimetal.,2011a,2011b, 2011c, 2013). In the fully implicit method, one solves the coupled discretenonlinearsystemofequationssimultaneously,typicallyusingtheNewton-Raphsonscheme(Sukirman and Lewis, 1993; Pao and Lewis, 2002; Lewis et al., 2003; Li et al., 2005;Ferronatoetal.,2010).Thefullyimplicitmethodguaranteesunconditionalstabilityifthemathematical problem is well posed, but the simulation of flow and geomechanics forrealistic fields becomes computationally very expensive (Settari and Mourits, 1998;Thomas et al., 2003; Jha and Juanes, 2007). Sequential approaches tomodeling coupledflow and geomechanics are highly desirable because they offer the flexibility of usingseparate simulators foreach subproblem (FelippaandPark,1980;SamierandGennaro,2007; Minkoff et al., 2003; Rutqvist et al., 2002). The design and analysis of sequentialmethods with appropriate stability properties for poromechanics and thermomechanicshasalonghistory(Zienkiewiczetal.,1988;ArmeroandSimo,1992,1993;Armero,1999;SettariandMourits,1998;MainguyandLonguemare,2002;Jeanninetal.,2007).Recently,anewsequentialmethodforcoupledflowandgeomechanics,termedthe“fixed-stress split,” has been proposed and analyzed (Kim et al., 2011a, 2011b, 2013). Stabilityand convergence analyses have shown that the fixed-stress split inherits the dissipationpropertiesof thecontinuumproblemand is thereforeunconditionally stable,both in thelinear(poroelastic)andnonlinear(poroelastoplastic)regime.Theanalysishasshownthat

Juanesetal.:AssessmentofInducedSeismicityattheCastorProject—FinalReport 47
the fixed-stress split enjoys excellent convergence properties, even in the quasi-incompressible limit. It has also been shown recently that the stability and convergencepropertiesofthefixed-stresssplitforsingle-phaseflowcarryovertomultiphasesystemsifaproperdefinitionofporepressure,the“equivalentporepressure”(Coussy,2004),isused(Kimetal.,2013).Inthissection,wedescribeourcomputationalmodelforcoupledflowandgeomechanicsoffaultedreservoirs.Wecoupleaflowsimulatorwithamechanicssimulatorusingthefixed-stress scheme (Kim et al., 2011b). We employ a rigorous formulation of nonlinearmultiphasegeomechanics(Coussy,1995)basedontheincrementinmassoffluidphases,insteadof themore common, but less accurate, schemebasedon the change inporosity(Settari and Mourits, 1998; Minkoff et al., 2003; Thomas et al., 2003; Tran et al., 2004,2005; Rutqvist et al., 2002). Our nonlinear formulation is required to properly modelsystemswithhighcompressibilityorstrongcapillarity(Coussy,1995).
4.3.2.SimulationSoftwareWe developed a coupled multiphase flow and geomechanical simulator by coupling theGeneral PurposeResearch Simulator (GPRS) (Cao, 2002;Pan andCao, 2010) as the flowsimulator,andPyLith(Aagaardetal.,2012,2013)as themechanicssimulator.Belowwedescribethemajorfeaturesofthiscoupledsimulator.The flow simulator.GPRS is a generalpurpose, object-oriented, reservoir simulator formultiphase/multicomponent subsurface flows. It treats element connections through ageneralconnection list,whichallowsforbothstructuredandunstructuredgrids.GPRS iscapableofhandlingcomplexproductionandinjectionscenariosinthefield,suchaswellsperforatedatmultipledepthsandflowingundervariablerateandpressurecontrols.Theoriginalsimulator(Cao,2002;PanandCao,2010)doesnotaccountforcouplingwiththemechanicaldeformation, and itmodels themechanicalbehaviorof the system throughauser-providedrockcompressibility(AzizandSettari,1979).Wemodifiedandextendedtheoriginal code to implement the couplingwith themechanics simulator. In particular,weimplemented the functionality to compute the modified accumulation term in the fluidphase mass balance equations. We also modified the setup of the linear system toimplementtheflowstepofthefixed-stresssequentialsolutionscheme(Kimetal.,2011a).Thegeomechanicssimulator.PyLithisafiniteelementcodeforthesimulationofstaticand dynamic large-scale deformation problems (Aagaard et al., 2012, 2013).Much of itsdevelopment has been motivated by the modeling of earthquake physics; however, itsapplicability extends to problems at any other scale, such as the reservoir scale or thelaboratoryscale.SomeoftheadvantagesofPyLithare(1)itisanopen-sourcecodeandcanbemodifiedforspecificpurposes;(2)itiswrittenusingC++andPythonlanguagesandisextendable; (3) it is suitable for parallel computing; (4) it allows localized deformationalong discrete features, such as faults; and (5) it iswell integratedwithmeshing codes,suchasLaGriTfortetrahedralmeshes(LaGriT,2013)andTrelis forbothtetrahedralandhexahedralmeshes(CUBIT,2013).PyLithusesanimplicitformulationtosolvequasi-staticproblemsandanexplicitformulationtosolvedynamicruptureproblems.Originally,PyLith

48 Juanesetal.:AssessmentofInducedSeismicityattheCastorProject—FinalReport
isnotcoupled toany fluid flowmodel.Wemodified thecodeofPyLithversion1.8.0andcoupleditwiththeflowsimulator,GPRS.Inparticular,weimplementedaC++class,iGPRS,toallowcommunicationbetween the flowand themechanicssimulators. iGPRSprovidesthe functionality required for exchanging information (pressures, saturations, andvolumetrictotalstress)betweenthetwosimulators.PyLith supports distributed memory parallelization (Message Passing Interface or MPI)whereas GPRS’s parallelization is based on the shared memory architecture(Multiprocessing or OpenMP).We integrated the two such thatwe can run the coupledsimulator on a cluster with multiple compute nodes (distributed memory) whereindividualnodeshavemultiplecoresorprocessors(sharedmemory).Grid.WeuseasinglegridforbothGPRSandPyLith.ThegridisgeneratedusingtheTrelis(CUBIT, 2013)mesh generation software.We define geologic surfaces,material regions,faults,andpinch-outsduringthegeometrycreationstage.Thenwemeshthedomainwithhexahedralelementsusingafinemeshinthereservoirdomainandanincreasinglycoarsemesh in the overburden, underburden, and sideburden regions.We export the grid in afiniteelement formatsuchas theExodus-II format (CUBIT,2013) forPyLith.Weprocessthe grid file using aMATLAB script to generate the equivalent finite volume grid in thedomain with element centroid coordinates, element bulk volumes, and facetransmissibilities in the Corner Point Geometry format (Schlumberger, 2016). Any gridelements lyingoutside the flowregionof interest (e.g., inoverburdenandunderburden)canbedeactivatedforthesolutionof theflowproblem.GPRSusesthefinitevolumegridfor simulating flow in the region of interest. The two simulators exchange pressures,saturations,andvolumetricstressinformationinsidethisregion.Implementation of faults. To support relative motion across fault surfaces, PyLithmodifies the grid topology to create zero-thickness fault elements and adds additionaldegreesoffreedomtoholdtheLagrangemultipliersandfaultslipvectorsattheLagrangenodes (Aagaard et al., 2012, 2013) (Figure 4.2). PyLith solves the contact problemiteratively in two steps. In the first step, the elasticity problem is solved over the entiredomain to update the displacements and the fault tractions (Lagrange multipliers)correspondingtothecurrentestimateoftheslip.TheLagrangemultipliersarecomparedwith the friction stress on the fault and are adjusted to be compatible with the faultconstitutive model. In the second step, the fault slip is updated corresponding to theadjustmentintheLagrangemultiplierswhileassumingthatthedeformationduetoslipislocalizedtotheelementsadjacenttothefault,thatis,thatdisplacementsatnon-faultnodesdonotchangefromtheirvaluesatthecurrentNewtoniteration.Ifthefaultslipsovertheentire domain, such that the assumption of deformation being limited to the adjacentelements is not met, the convergence of the iterative scheme is poor. Also, if the faultfriction coefficient changes significantly with slip (e.g., in rate- and state-dependentmodels),itleadstolargechangesin𝜏!ateveryiterationandconvergencemaydegrade.Toimproveconvergence,a line-searchroutineisusedaspartoftheiterativeschemetofindthe optimum perturbation in the Lagrange multipliers that minimizes the combinedmismatch between the fault friction and the fault shear traction at all the fault nodes

Juanesetal.:AssessmentofInducedSeismicityattheCastorProject—FinalReport 49
(Aagaard et al., 2013). We modified PyLith’s original line-search routine such that theinequalityconstraint,𝜏 ≤ 𝜏! ,isalwayshonored.
Figure4.2:Explodedviewofourcomputationalrepresentationofafault,illustratingdifferentnodetypes, locationsofdifferentvariables,andthezero-thicknessfaultelement.Fluidpressurespiandsaturations Si are located at the element centers as they are discretized using the finite volumemethod.DisplacementsandLagrangemultipliersatthefaultarediscretizedusingthenodal-basedfiniteelementmethod.Therearetwotypesofnodesinthedomain:thedisplacementnodesandtheLagrange nodes. The displacement nodes carry the displacementsUbr at the regular nodes, thedisplacementsUb+onthepositivesideofthefault,andthedisplacementsUb−onthenegativesideofthefault.TheLagrangenodescarrytwotypesoffaultvariables:theLagrangemultipliersLb(relatedtofaulttractions),andthefaultslipDb.Thedisplacementnodesonthepositiveandnegativesides,andtheLagrangenodesarecollocatedintheinitialgrid.
4.4.ComputationalGridOurmodelingstrategyforCastorissubstantiallydifferentinmanyrespectsfrompreviousmodelingefforts.Thesimulationdomain ismuch larger thanprevioussimulationmodels(inparticular,apreviousEclipsesimulationmodel,seeFigure4.3).Thisallowsus to: (1)incorporateallthemainfaultsinthevicinityoftheCastorplatform,and(2)directlymodelalargeanddeepaquifer,and(3)incorporatethetectonicstressesintheregionsuchthatthoseboundaryconditionsareunaffectedbyreservoiroperations.
Figure 4.3: Simulation domain for coupled flow-geomechanics simulation (red color) vs Eclipsesimulation(graycolor).Leftpanelfortopview,rightpanelforlateralview.
- +
U
p , S L
b
a
Ub+
Ub-
i i
negative side, C f- positive side, C f+
zero-thickness fault element

50 Juanesetal.:AssessmentofInducedSeismicityattheCastorProject—FinalReport
Oursimulationmodelwasbuiltusinganunstructuredgridoftetrahedralcells,necessaryto adapt to the stratigraphic and fault representations defined in the geologic structuralmodel(Chapter2ofthisreport).ThecomputationalmeshhadtobefineenoughtocapturethekeyflowandgeomechanicalresponsesassociatedtobothAmpostaandCastoroperations,butitalsohadtobalancethenumberofresultinggridcells inorder toavoidexcessivecomputationalburden.For thisparticularstudythemeshingprocesswasnottrivialduetotheneedtoembedsomeofthecomplex geometries for the faults that exist in the vicinity of the Castor platform. As aresult, thesimulationmodelhadarelatively lowresolutionaroundtheoriginaloil-watercontact inAmposta—incontrast, itextendstodepthswellbelowtheoil-watercontact todirectlymodeltheaquifer.Theoverallsizeofthecomputationaldomainwasapproximately25×30×10km.Thetotalnumber of grid cells was 217,711. The reservoir zone included 86,638 cells, with amaximum depth ofmore than 9000m. A snapshotwith themodel depth alongwith thelocationoftheAmpostawellsisshowninFigure4.4.
Figure 4.4: Depth of simulation domain of the coupled flow-geomechanics model. The originalAmpostawellsatthetopcentralpartofthereservoirareshown.
4.5.FlowModelingandHistoryMatchingWhile the description and resolution of our model was very different from previousstudies,someelementsrequiredforthemodelingofmultiphasefluidflowinthereservoirwere derived from the existing Eclipse simulation deck (Geostock Iberia, 2011). Forinstance, PVT tables, fluid densities, relative permeability curves and connate watersaturationswere imported and adapted from existing Eclipsemodels.We also extractedfromtheEclipsemodelthewellschedulesforthesimulationoftheAmpostaphase.Onthe

Juanesetal.:AssessmentofInducedSeismicityattheCastorProject—FinalReport 51
otherhand,othermodelparameters(e.g.,wellcompletioncells,wellschedulesduringtheinjection phase) were derived from existing data and discussions with Enagas. Rockproperties(permeabilities,porositiesandcompressibilities)werere-definedinourmodel.Table 4.1 provides all the well completions that were implemented in our simulationmodel.Furthermore,forvisualizationpurposes,Figure4.5showsaY-Zcross-sectionofthesimulationmodelwithallthecompletioncellsfortheoldAmpostawells.Table 4.1: Coordinates (X,Y,Z) and Measured Depth (MD) for all well completion intervalsimplementedinthesimulationmodel.Allunitsinmeters.
WellName X Y Z MD AMB_10 306121.2 4475185 -1773.77 2016.5824 AMB_10 306123.6 4475190 -1782.54 2026.5824 AMB_1 305438.6 4473684 -1797.78 1797.7752 AMB_1 305438.6 4473684 -1822.78 1822.7752 AMB_2A 305604.4 4473930 -1812.49 1854.8828 AMB_2A 305616.3 4473945 -1890.28 1934.8828 AMB_3 305816.5 4474467 -1805.05 2063.1912 AMB_3 305849.2 4474540 -1935 2215.5912 AMB_5 305918 4472499 -1884.71 2400.6047 AMB_5 305926.1 4472449 -1978.49 2507.0349 AMB_6 305197.4 4473299 -1765.49 1840.6873 AMB_6 305189.1 4473292 -1801.92 1878.6873 AMB_7 305404 4474138 -1742.63 1857.756 AMB_7 305403.2 4474140 -1749.25 1864.756 C1 305417.1 4474306 -1741.43 1843.2576 C1 305412.9 4474312 -1751.26 1855.5576 C2 305180.2 4473683 -1723.05 1879.7017 C2 305172.1 4473675 -1744.66 1904.3016 C3 305084.5 4473253 -1749.73 2126.2849 C3 305084.1 4473239 -1771.14 2151.8848 C4 306030.1 4475089 -1773.78 2257.7105 C4 306046.4 4475132 -1814.54 2319.2105 C5 305291 4474031 -1748.25 1824.892 C5 305288 4474030 -1761.17 1838.192 C6 305649.4 4474410 -1815.35 1905.7712 C6 305652.2 4474421 -1863 1954.8712 C7 305869.6 4474627 -1837.94 2028.0288 C7 305878.7 4474644 -1869.49 2065.0288 C8 304946 4472919 -1774.72 2425.1792 C8 304940.6 4472908 -1782.8 2439.7793 POB 305394.2 4473793 -1766.32 1860.804 POB 305370 4473710 -1999.6 2110

52 Juanesetal.:AssessmentofInducedSeismicityattheCastorProject—FinalReport
Figure4.5:Cross-section(Y-Z)ofcoupledflow-geomechanicsmodelshowingcompletioncellsforAmpostawells.Locationoftheoriginaloil-watercontact(OOWC)isalsoshownat1940m.Weconductedasensitivityanalysisofthedynamicflowmodeltokeymodelparameterstobetter understand the model behavior and to constraint the model description. Theseparameters included rock compressibility, location of the Original-Oil-Water-Contact(OOWC),fluiddensities,waterinjectorsintheaquifer(locationandnumber),generalrockpermeabilityandporositymultipliers,amongothers.Within this sensitivity analysis the OOWC (1940m) was re-adjusted in our model tominimizetheamountofwaterproduction(whichresultedmainlyfromhavingpartsofthecompletioncellsforsomeproducersbeinglocatedbelowtheOOWC).TheadjustedOOWC(2009m)was shown to havemarginal impact on the reservoir pressure responsewhilesignificantlyreducingthewatercut(whichismorealignedwiththeofficialsmallwatercutsreportedforthisfieldduringitsproductionphaseinthe70s-80s).Ontheotherhand,thepossibility of having artificial water injectors in the aquifer (to increase the aquifersupport)wasalsoanalyzedandfinallydeemedunnecessary(oncerockpermeabilitiesandporositieswere readjusted). Small changes in fluiddensitieswerealso considered to seetheirimpactonmodelresponse.Ingeneralrockpermeabilitiesandporositiesinthismodelwere regarded as very uncertain due to the lack of reliable prior information; oursensitivity analysis allowed us to constraint their values before amore detailed historymatching.Thus we implemented a formal history matching approach to better reproduce theobservedfielddata.Whilebothproduction(Amposta)andinjection(Castor)phaseswereconsideredforthehistorymatchingquality,moreemphasiswasputintorepresentingtheobserved pressure response during the Castor injection phase. A total of 10 layerswasdefinedinthemodel(5layersaboveOOWCand5layersbelow)withtheircorrespondinghorizontal and vertical permeability and porosity multipliers. History matching wasachieved by using a sequential Monte Carlo process, and the resulting model is namedModel1hereafter.AsdiscussedBayesiansolutionswereruledoutdueto lackofreliableprior information on the model parameters. Other history matching approaches (e.g.,

Juanesetal.:AssessmentofInducedSeismicityattheCastorProject—FinalReport 53
MCMC)weredisregardedduetotheirexcessivecomputationalrequirementsforthistypeofcoupledflow-geomechanicsmodels.The improvement in the pressurematch for the Castor phase resulting from the historymatchingexerciseisclearlyshowninFigure4.6.Thisadjustedpressureresponse,togetherwiththeobservedfieldpressuredata,isshowninFigure4.7.Clearlythereisaverygoodagreementbetweenboth.Simulationresults for thesimulationof theAmpostaphaseareprovidedinFigure4.8(forpressureandcumulativewaterproduction).Somemismatchforbothpressureand,moreespecially,waterproductionisobservedduringthisphase.Mostof theexcessivewaterproductionoriginates inone singlewell (AMB6, as seen inFigure4.9).ItisworthnoticingthattheobservedmismatchinwaterproductionisrelativelysmallincomparisontosomepreviousmodelingeffortsandevencomparingtoourinitialmodelattemptforCastor(baselinemodel).HavinganaccuraterepresentationofthepressureresponseintheCastorphasewasgiventhehighestpriorityforourhistorymatchingstudy. Giventhemodelcomplexityand,toacertainextent, theuncertaintiesassociated tosomeof thedatareportedback in the70’sand 80’s the mismatch during this production phase was regarded as acceptable. Oilproduction and gas injection volumes were honored in the model during Amposta andCastor phases respectively. Alternative models that better represent the Ampostaproduction phase were also derived in this study (they are not presented here), but ingeneral they show a tendency to deteriorate the pressure response during the Castorinjectionphaseand,therefore,theywerenotpursued.
Figure 4.6: Simulatedpressure response inCastorbefore (Baseline) and after (Model 1) historymatchingusingasequentialMonteCarloapproach.Thesubstantialimprovementishighlightedbytheblueshadedarrow.

54 Juanesetal.:AssessmentofInducedSeismicityattheCastorProject—FinalReport
Figure4.7:SimulatedpressureresponseinCastorafterHistoryMatching(Model1)togetherwiththeobservedfieldpressuredata.
Figure4.8:SimulatedpressureresponseduringAmpostaphaseafterHistoryMatching(Model1)togetherwiththeobservedfielddata.Thesmallredarrowsindicatetheresultingmismatch.

Juanesetal.:AssessmentofInducedSeismicityattheCastorProject—FinalReport 55
Figure 4.9: Simulated individual well production rates (oil and water) for the Amposta wells.Noticethatmostwaterproductioncomesfromonesinglewellinthemodel(AMB6).ThesimulatedpressurefieldatSeptember16,2013acrosstheentiresimulationdomainisshowninFigure4.10forModel1.Theresultingrockpermeabilities(PERM-X,PERM-YandPERM-Z) and rock porosities for this same model are provided in Figure 4.11 (onlyreservoircellsaboveOOWCaredisplayed)
Figure4.10:Simulatedpressureresponseacrossentiredomain(Model1)inCastoratSeptember16,2013.Unitsaregiveninpsi.

56 Juanesetal.:AssessmentofInducedSeismicityattheCastorProject—FinalReport
Figure4.11:Rockpermeability(inX,YandZdirection;unitsinmD)andporosity(%)afterhistorymatching.OnlyreservoircellsabovetheOOWCareshown.Oursimulatedpressurefieldfortheentiresimulationdomainwasthenusedtoguidethegeomechanical simulation in a one-way coupled formulation (see next section forgeomechanicalresults).AnimportantpracticalconsiderationinourstudywastoevaluatethepotentialbehaviorinCastor fordifferent injectionscenarios.Forexample,weusedthehistory-matchedmodeldiscussed above (Model 1) to quantify the expected changes in pressure response forseveralreducedgasinjectionrates.Asexpected,oursimulationsclearlyshowareductionin thepressure increaseduring the injectionphaseas thegas injectionratewasreduced(Figure4.12).
Figure 4.12: Simulated pressure response in Castor for reduced injection scenarios. Left:cumulative gas injection. Right: estimated pressure response. A total of 3 such scenarios isconsidered(reducinggasinjectionratesbyfactorsof~3,5and10).

Juanesetal.:AssessmentofInducedSeismicityattheCastorProject—FinalReport 57
Wehavealsoevaluatedotherinjectionscenariosofinterest,aswellasthecorrespondingimpact of pressure variations on the geomechanical behavior of the system and faultsstability.Forinstance,wesimulatedthefollowingscenariothatwasproposedinanEscalUGS 2012 report (“Proyecto Castor: Informe Geológico de Final de Campaña dePerforación”; the scenario is referenced thereas “EscenarioCaseBase”).This scenario isillustratedhereinFigure4.13.
Figure4.13:ScenariodescribedinEscalUGS2012report“ProyectoCastor:InformeGeológicodeFinaldeCampañadePerforación”;thescenarioisreferencedthereas“EscenarioCaseBase”.Ourgoalinthisscenariowastoapproximatelysimulatestages1,2and3,whichcomposewhatEscalUGScalled“FASE1”(seeFigure5.12).Thesestagesarebrieflydescribednow:i. TotalvolumeofgasinjectedinCastorbeforeshutdownonSeptember17,2013was
~103MMm3.Thisincludesallthevolumeofgasinjectedin2012and2013,anditrepresents only~17%of the total volumeof gas thatwas originally designed forinjection.Inthisnewscenariowesimulatenowtheinjectionofthetotalvolumethatwasoriginallydesigned(i.e.,~600MM3).ThisiscalledStage1inthisscenario.
ii. Afterthatwesimulatetheproductionofalltheinjectedgas.ThisiscalledStage2.iii. Finallywesimulate(Stage3)anewinjectioncyclewithatotalgasinjectionvolume
of 1300MMm3 (notice this is 10 times larger than the volume injected in Castorbeforeshutdown).ForthisstagewesimulatealowerinjectionratethanCastor(i.e.,~1/5ofthemaximumrateimposedduringtheCastorphase).
Oursimulatedpressureresponse for this scenario is shown inFigure4.14,whichclearlyyieldstheexpectedbehaviorofaninitialpressureincreaseduetogasinjection(Stage1),followedbyapressuredecreaseduetotheproductionofthatgas(Stage2)andafinalnew

58 Juanesetal.:AssessmentofInducedSeismicityattheCastorProject—FinalReport
pressureincreaseassociatedtothelatestgasinjectionphase(Stage3).Thegeomechanicalresults for this samescenarioarebrieflydiscussed later in this reportwithin theoverallgeomechanicaldiscussion.
Figure 4.14: Simulatedpressureresponse inCastor for “EscenarioCaseBase”described inEscalUGS2012 report “ProyectoCastor: InformeGeológicode Final deCampañadePerforación”; thisscenarioinvolvesahypotheticalsequenceofinjection,productionandnewinjectionphases.
4.6.CoupledFlow-GeomechanicsAnalysis:FaultStressesOurcoupledflowandgeomechanicsanalysisleadstoadynamicquantitativesimulationofthe impactofsubsurfaceoperations(oilproductionandgas injection)on thestressesonthefaultstructurespresentinthemodel.Geomechanical initialization and boundary conditions. The model is initialized intermsofstressesandpressures,suchthatitisinmechanicalequilibriumwithgravityandtectonic stresses.The tectonic stress regime isdominatedbynormal-faultingmechanismonNWorientedplanes(Pereaetal.,2012).Alongthatdirection,theratioofhorizontaltoverticalstressis<1.Theboundariesofthemodeldomainwereoriginallyalignedwiththeprincipaldirectionsofthetectonicstress,inanticipationthattheywouldleadtoaneasierimposition of boundary conditions for the geomechanics problem.We impose the stressboundaryconditionsonagrid that is rotated59.4degrees counterclockwise toalign themodel theprevalent tectonic stresses in the region (and themodelboundaries)with thecoordinatesystem.Wechoosethehorizontalstressesasfollows:themaximumhorizontalstress equal to the vertical stress and points to the NE; the minimum horizontal stressequalto0.7×verticalstressandpointstotheNW(Figure4.15).

Juanesetal.:AssessmentofInducedSeismicityattheCastorProject—FinalReport 59
Figure4.15:Schematicofthemodelwithrotatedgridforimpositionoftectonicboundarystresses.Thex-directionpointsNEandcoincideswiththemaximumhorizontalstress(=verticalstress);they-directionpointsNWandcoincideswiththeminimumhorizontalstress(=0.7×verticalstress).Anaïvewaytoimposethemechanicalboundaryconditionsistoimposerollersonthreefaces(x-,y-andz-),andnormalstressesontheotherthree(withgeostaticstressesonthex+andy+faces,andnormalstressfromthewatercolumnonthez+topography).Wehavedetected,however,thatimposinggeostaticstressesleadstobendingmomentthatinducesthruststressesatthetopportionofthedomain.Thus,weimposethemechanicsconditionsasfollows:
(1) Weimposeapre-stress𝝈!withthedesiredtargettectonicstresses,
𝝈! =𝜎!!! 0 00 𝜎!!! 00 0 𝜎!!!
,
where𝜎!!! = 𝜌!𝑔 𝑑𝑧!
!!,𝜎!!! = 𝜎!!! ,𝜎!!! = 0.66 𝜎!!! .
(2) Weprescribethedisplacementsonthelateralfaces,asrollerswithimposednormal
displacements(𝑢!! = 𝑢!! = 0,and𝑢!! = 𝑢!! = 0),whichresultinthepre-stressedstatewithnear-zerostrains.
Poromechanicalparameters.Basedonpreviousgeomechanicalanalysis(e.g.,Nauroyetal.,2011)andconsistencywithvaluesofVpandVsfromthegeologicstructuralmodelbuiltaspartofthisstudy,wetookporomechanicalparametersthatarerepresentativeofthecarbonatereservoir:- Matrixbulkmodulus(static):K=14GPa- Poissonratio(drained):ν=0.26- Biotcoefficient:b=1.0

60 Juanesetal.:AssessmentofInducedSeismicityattheCastorProject—FinalReport
Fromtheseparametersandfromtherockdensities,wecomputetheinputsforPyLith(VpandVs):
𝐺 = 3𝐾(1− 2𝜈)2(1+ 𝜈) , 𝜆 = 3𝐾
𝜈1+ 𝜈 ,
and
𝑉! =𝜆 + 2𝐺𝜌 , 𝑉! =
𝐺𝜌
4.6.1.AnalysisoftheInjectionPeriodOurmodelprovidesthemeanstocomparetheimpactofreservoiroperationsonallfaultsincludedinthemodel(Figure4.16).
Figure 4.16: Two views of all the faults included in the coupled flow-geomechanicsmodel. Left:viewof the entiredomain from the footwall (reservoir) side.Right: detailedviewwith labels foreachfault.Here we focus exclusively on the injection period and, in particular, on the periodSeptember1–September16,2013,given that the latterdatecorresponds to the timeofhighestreservoirpressure(seeFigure4.7).Amposta fault.Given that theAmposta fault is the largeststructure,and isknowntobesubjecttorecent(Quaternary)activity,itisparticularlyimportanttodeterminetheimpactofreservoiroperationsonthisfault.Weillustrateboththeinitialstressescomputedbythemodel, and thechanges in stress, forall three stress components (left-lateral,updip, andeffectivenormal),alongwiththecorrespondingimpactontheCoulombstress.Thechangeintheleft-lateralcomponentispositivetowardstheEastandnegativetowardstheWest,asaresultofreservoirinflationfromgasinjection(Fig.4.17).Thechangeinthe

Juanesetal.:AssessmentofInducedSeismicityattheCastorProject—FinalReport 61
up-dip component is negative (i.e., in the senseof favoringnormal faulting) towards theoverburden, and positive (i.e., in the sense of favoring thrust faulting) towards theunderburden, also as a result of reservoir inflation (Fig. 4.18). The change in effectivenormalismostlypositive,indicatingunclampingofthefaultasaresultofpressureincreaseonthereservoirsideofthefault(Fig.4.19).TheoveralleffectofthesestresschangesisanincreaseintheCoulombstressontheAmpostafaultintheproximityoftheinjectionwells,indicative of a de-stabilization of the fault as a result of injection. In our model, theCoulombstresschangesreachesamaximumofabout0.5MPa–asignificantstresschange(Fig.4.20).

62 Juanesetal.:AssessmentofInducedSeismicityattheCastorProject—FinalReport
Figure 4.17: Illustration of initial stresses and stress changes on the Amposta fault during theperiodSeptember1–September16,2013,asaresultofgasinjection.Left-lateralstress.
Figure 4.18: Illustration of initial stresses and stress changes on the Amposta fault during theperiodSeptember1–September16,2013,asaresultofgasinjection.Updipstress.

Juanesetal.:AssessmentofInducedSeismicityattheCastorProject—FinalReport 63
Figure 4.19: Illustration of initial stresses and stress changes on the Amposta fault during theperiodSeptember1–September16,2013,asaresultofgasinjection.Effectivenormalstress.
Figure 4.20: Illustration of initial stresses and stress changes on the Amposta fault during theperiodSeptember1–September16,2013,asaresultofgasinjection.Coulombstress.Reservoir faults.Thestructures thatarepredicted tobemostde-stabilizedby injectionareseveralofthemodelfaultswithinthereservoirandinproximityoftheinjectionwells.As an illustration, we plot here the stress changes in one of these structures: fault F11(Figure4.21).Changes in left-lateral stress (Fig. 4.21a) arede-stabilizing to theEast and

64 Juanesetal.:AssessmentofInducedSeismicityattheCastorProject—FinalReport
stabilizingtotheWestofinjectionasaresultofreservoirinflationbutthesestresschanges(asisthecasewithchangesintheupdipcomponent,Fig.4.21b)arerelativelysmall,intheorderoftensofkPa.Themaindriverforstresschangesonreservoirfaultsisthereductionin compressive effective normal stress as a result of pore-pressure increase from gasinjectioninthereservoir(Fig.4.21c).ThesechangesareontheorderofhundredsofkPa,andlargelydeterminetheuniformlyde-stabilizingchangesinCoulombstress,withvaluesofupto0.4MPa(Fig.4.21d).
(a) (b)
(c) (d)
Figure4.21:IllustrationofinitialstressesandstresschangesonthereservoirfaultF11duringtheperiod September 1–September 16, 2013, as a result of gas injection. (a) Left-lateral stress; (b)Updipstress;(c)Effectivenormalstress;and(d)Coulombstress.Splay faults.TheAmpostafaultsystemincludes,inadditiontothemainfaulttrace,othersplay faults that connect to the main fault and extend to the hanging wall side.Geometrically, these faults are a natural extension of theWest segment of the Ampostafault(Fig.2.9),andarelikelyaccommodatingmuchoftherecenttectonicstraininthefaultsystem. From amodeling point of view, these structures are hydraulically disconnectedfromthereservoirduetothecaprockoffsetacrosstheAmpostafault.However,thisdoesnot mean that they are free from experiencing stress changes. By virtue of the flow-geomechanicscoupling,ourmodelcapturestheporoelasticstresschangesthatoccurasaresult of reservoir inflation. It is natural to expect that these poroelastic stresses willtransfertothesplayfaultsonthehangingwalloftheAmpostafault,andmayresultinde-stabilizationofthosefaults.

Juanesetal.:AssessmentofInducedSeismicityattheCastorProject—FinalReport 65
InFigure4.22,weshowthestresschangesintheSplay1ABfault.ThekeyeffectcontrollingchangesinCFFistheupdipcomponent(Fig.4.22b),whichisde-stabilizingforportionsofthe fault above the reservoir, and stabilizingbelow the reservoir,withmagnitudesup toseveraltensofkPa(Fig.4.22d).Thisillustratesthat,indeed,portionsofthesplayfaultscanbede-stabilizedbystresstransferandporoelasticeffects.
(a) (b)
(c) (d)
Figure4.22:IllustrationofinitialstressesandstresschangesonfaultSplay1ABduringtheperiodSeptember 1–September 16, 2013, as a result of gas injection. (a) Left-lateral stress; (b) Updipstress;(c)Effectivenormalstress;and(d)Coulombstress.The “Castor fault”. It is interestingtoanalyzethestresschangesinfaultFEastBounding,whichisanSoutheast-dippingreservoirfaultlocatedfartherawayfromtheinjectionarea.This faulthasbeentermedthe“Castor fault” insomepreviousreports(IGME,2014).WeshowthestresschangesforthisfaultinFigure4.23.Theleft-lateralandupdipcomponentsof stress change are both stabilizing (Fig. 4.23a and Fig. 4.23b, respectively), while thenormal effective component is de-stabilizing as a result of pore-pressure increase (Fig.4.23c).Thekeyobservation,however,isthatstresschangesonthisfault,andinparticularCoulomb stress changes (Fig. 4.23d) are in the order of 1 kPa, almost three order ofmagnitude smaller than for the Amposta fault and some of the reservoir faults in closeproximitytoinjection.Thisistheresultofbothpressurechangesandporoelasticstressesdecayingstronglywithdistance.

66 Juanesetal.:AssessmentofInducedSeismicityattheCastorProject—FinalReport
(a) (b)
(c) (d)
Figure4.23:IllustrationofinitialstressesandstresschangesontheFEastBoundingfault(“Castorfault”) during the period September 1–September 16, 2013, as a result of gas injection. (a) Left-lateralstress;(b)Updipstress;(c)Effectivenormalstress;and(d)Coulombstress.All faults in themodel.Theseoutputsexistforallfaultsinthemodel,andareevaluateddynamicallyover time.We summarize the results as a table that compiles themaximumstresschangesonallfaults(Table4.2).WhilethepointwisemaximumchangeinCFFisnot,necessarily, a fundamental measure of destabilization of a portion of a fault, it isnevertheless indicativeof thepropensityofreservoiroperations towardsde-stabilizationofindividualfaults.InTable4.2,wecomplementthatinformationwithotherpercentilesofCFFchangeoneachfault.

Juanesetal.:AssessmentofInducedSeismicityattheCastorProject—FinalReport 67
Table4.2:SummaryofCoulombstresschanges(inPa)onallfaultsincludedinthemodel,duringtheperiodSeptember1–September16,2013.
4.6.2.SummaryoftheAnalysisforOtherInjectionScenariosWe have performed the coupled flow-geomechanics analysis for the other injectionscenarios considered and described in Section 4.5. A summary of the results is given inTable 4.3,wherewe compile themaximumDCFF values predicted by themodel on tworepresentative faults: the Amposta fault, and the F10 reservoir fault. The reference casecorresponds to thebase-casemodel resultsdescribedabove. It isnot surprising that themaximumDCFFvaluesdecreaseforscenarioswithreducedinjectionrate(andtherefore,reducedinjectionvolume).Themorecomplexscenariothatmodelsmoregasinjectionatahigher rate, followed by recovery of the injected gas and an additional injection cycle,resultsinlargerde-stabilization(roughly,byafactoroftwointermsofmaximumDCFF)ofthetwofaults.Table 4.3:SummaryofmaximumDCFFvaluesat tworepresentative faults fordifferent injectionscenarios.
Fault minDCFF P50DCFF P90DCFF P99DCFF maxDCFF
Amposta_fault -182838.4 724.3 1169.9 16329.6 560728.8
W_Main_fault -314.5 -244.8 -217.7 -199.7 -196.7
F235 -10908.0 1112.9 2194.9 4338.6 5880.9
Splay1B_anA1 -1090.4 -708.2 1862.6 2068.0 2068.0
Splay1B_anA2 -313.6 -245.9 -178.3 -178.3 -178.3
Splay2B_anA1 -496.0 -351.7 -218.0 -162.4 -162.4
Splay3 -3567.4 -489.9 814.5 2134.5 2740.4
Splay1AB -126233.6 -129.4 2231.5 28200.8 39733.8
Splay2AB_anA1 -14537.2 -438.1 1295.6 4175.0 6477.2
F10 -118972.4 5897.6 167913.8 315828.4 315828.4
F11 2056.2 6866.7 271291.9 416308.2 418104.7
F14 -579.7 403.4 572.7 1179.5 1179.5
FEastBounding -1613.6 187.4 383.2 1185.8 1382.8
SouthFault -129181.2 946.8 4734.5 87154.1 92023.3
Fault Reference Rate 3 times smaller
Rate 5 times smaller
Rate 5 times smaller
(longer inj.)
Recovery and additional
injection cycle
Amposta_fault 5.6×10⁵ 1.6×10⁵ 4.2×10⁴ 4.3×10⁴ 9.8×10⁵
F10 3.2×10⁵ 2.2×10⁵ 2.2×10⁵ 2.7×10⁵ 7.3×10⁵

68 Juanesetal.:AssessmentofInducedSeismicityattheCastorProject—FinalReport
4.7.SynthesisoftheFlow-GeomechanicsAnalysisBased on the modeling results presented and discussed above, we make the followingobservations:
1. TheAmpostafaultissignificantlyde-stabilizedbyinjection,withmaximumDCFFofabout0.5MPa.
2. FaultslocatedonthehangingwallsideofAmposta,suchastheSplay1ABfault,arealso de-stabilized (maximumDCFF of about 0.04MPa), even though they are notsubject to pressure variations directly – however, fault stresses are altered viaporoelasticeffects.
3. Themostheavilyde-stabilizedfaults,accordingtothemodel,arereservoirfaultsincloseproximitytotheAmpostafault(F11withmaxDCFF~0.4MPa,F10withmaxDCFF~0.3MPa,andSouthFaultwithmaxDCFF~0.09MPa).Allofthesefaultsaresteeplydipping,insomecasestotheSoutheast(F10andF11),insomecasestotheNorthwest(SouthFault).
4. OtherreservoirfaultsfartherawayfromtheCastorplatformaresubjecttominimalCoulomb stress changes. This is the case, for example, of the EastBounding fault(known in some previous reports as the “Castor fault”), subject according to ourcoupledflow-geomechanicsmodeltoamaximumDCFFof<0.002MPa.

Juanesetal.:AssessmentofInducedSeismicityattheCastorProject—FinalReport 69
Chapter5.IntegrationofResultsHere we integrate the results of our geologic, seismologic, and reservoir flow-geomechanicalanalyses toassess thepossible linkagesbetweenregional faults, the2013earthquakesequence,andCastorreservoiroperations.Notably,thestructuralanalysisandfaultmodelingwerebasedonseismicreflectionandwelldata,anddidnotuseearthquakelocations to constrain the faults. Similarly, the geomechanical analysiswas based on thestructural model and well production and injection schedules. Thus, a comparison ofearthquake locations and focal mechanisms with the faults, as well as theproduction/injection induced pressure and stress changes, provides an objectiveway toevaluatetherelationshipbetweentheseismicityandCastorfieldoperations.
5.1.IdentifyingFaultsthatSourcedtheEarthquakesEarthquake locations for the2013 sequenceobtainedprior to this studygenerally occurneartheCastorplatform.TheCescaetal.(2014)locations,whichareprovidedforasubsetof the events, lie north-northwest of platform (Figure 5.1A), whereas the IGN (2013)locations occur both to the north and south of the platform along a roughly northweststrikingtrend(Figure5.1B). Incontrast, theGaiteetal. (2016) locationsoccurnorthandeastoftheplatform(Figure5.1C).Ourresults,usingtwodistinctvelocitymodels,aremoreclosely aligned with the IGN (2013) and Cesca et al. (2014) locations. Specifically, ourlocationsdefinearoughly15by15kmareacenteredslightlywestof theplatformwithageneralnorth-northwesttrend.Moreover,ourpreferredlocations(Figure5.1D)placethemajority of the earthquakes in the area of Amposta fault, its hanging wall splays, andreservoirfaultsinthevicinityoftheinjectionwells.The Amposta fault system and its active splays trend northwest-southeast and exhibitoblique, right-lateral strike-slip and normal displacements. This is, in general, consistentwith the earthquake focal mechanisms for the largest earthquake in the sequencedeterminedbyIGN(2014)andinthisstudy.Incontrast,thefocalmechanismsofCescaetal. (2014) include both steeply dipping, northwest striking and gently east dipping,northeaststrikingnodalplanes.Wefindnofaults,withintheAmpostasystemorreservoir,thatarecompatiblewiththeselow-angleorientations.Thus,mindfuloftheuncertaintiesinthefocalmechanismdeterminationsoutlinedinChapter3,wesuggestthatthenorthweststriking nodal planes in the IGN (2014), Cesca et al., (2014), and our solutions areconsistent with the seismic activity of the Amposta fault system that is implied by theearthquakelocations.

70 Juanesetal.:AssessmentofInducedSeismicityattheCastorProject—FinalReport
Figure5.1:Mapviewsofthe2013earthquakesequencerelativetotheCastorPlatformandfaultsrepresentedinourstructuralmodel.A)Cescaetal.(2014)absolutelocations(green)andrelativelocations(red)forselectevents;B)IGN(2013)locations;C)Gaiteetal.(2016)locationsforselectevents;D)locationsobtainedinthisstudyusingthelayeredvelocitymodel.Finally,weconcludefromouranalysisoftheearthquakelocationsthatmanyoftheeventsoccur at considerable (>10 km) distances from one another. This is driven by cleardifferences in the P and Swave arrival times at the stations. Unlike the uncertainties inabsolute earthquake locations, we cannot reasonably ascribe these large differences inarrival times to uncertainties in the velocity field. Thus,while some earthquakes appearlocatedonreservoir faults inthevicinityofthe injectionsites,nosinglereservoir fault issufficientinsizetoexplainalloftheseismicity.ThisfurthersupportsourconclusionthattheAmpostafaultanditssplayssourcedsomeoftheearthquakes.

Juanesetal.:AssessmentofInducedSeismicityattheCastorProject—FinalReport 71
5.2.FaultStressChangesComparedwithEarthquakeLocationsThechangeinCoulombForceFunction(DCFF)valuescalculatedfromourcoupleflowandgeomechanical analysis are resolved onto the faults represented in our structuralmodel(Figure5.2). PositiveDCFFvalues, corresponding to changes that tend todestabilize thefaults,occurduringtheinjectionperiodonanumberofreservoirfaultsandportionsoftheAmpostafaultsystem.Asexpected,thesevaluesarelargestinthevicinityofinjectionwellsanddecreaseasafunctionofdistanceawayfromthem. Withinthereservoir,theF10-11faultsexhibitthelargestpositiveDCFFvalues(locallyexceeding1MPa),withotherfaults(e.g, South Fault) showing smaller positive DCFF values. Notably, the EastBounding orCastorfault,whichwassuggestedasapossiblesourceoftheseismicity(Cescaetal.,2014),shows only modestly positive DCFF values (< 0.0014 MPa). The section of the mainAmpostafaultlyingimmediatelywestoftheinjectionwellsalsoexhibitshighpositiveDCFFvalues(locallyexceeding0.5MPa),asdoseveralofitshangingwallsplays.Thesesplaysarenot in theregionof themodelwhere fluid flowwassimulated.Thus, theirpositiveDCFFvaluesarearesultofreservoirexpansionduetofluidinjection.
Figure 5.2: Two views of the Coulomb stress change (DCFF) on the model faults, betweenSeptember1andSeptember16,2013.Comparison of the earthquake locations with the DCFF values shows that relocatedhypocentersoftheSeptember-October2013earthquakesequenceareconcentratedintheregionwherethefaultsweresignificantlydestabilizedbyreservoiroperations(Figure5.3).Specifically,theearthquakesarecenteredonthedestabilizedportionsoftheAmpostafaultsystemaswellastheF10-11reservoirfaults.This,combinedwiththetemporalassociationof gas injection and the occurrence of the earthquakes, confirms that these eventsweretriggeredbyfieldoperations.Notably,notalloftheearthquakesoccuronportionsoffaultsthatweredestabilized.Rather,manyof theseearthquakesare locatedup to10kmawayfromtheinjectorwells,nearareasoffaultswithnegligibleDCFFvalues.Thisimpliesthatsomeoftheseeventswereaftershocksoftriggeredearthquakes.Thispatternalsosupportsour interpretation that portions of the Amposta fault system were activated in thisearthquakesequence,asnoreservoirfaultsextendoverthislargearea.
ΔCFF (9/1 – 9/16/2013)
Amposta fault system
(red trace active)
Reservoir faults
ΔCFF (pascals)
meters
Amposta fault system
(red trace active)
Reservoir faults
ΔCFF (pascals)
meters
ΔCFF (9/1 – 9/16/2013)
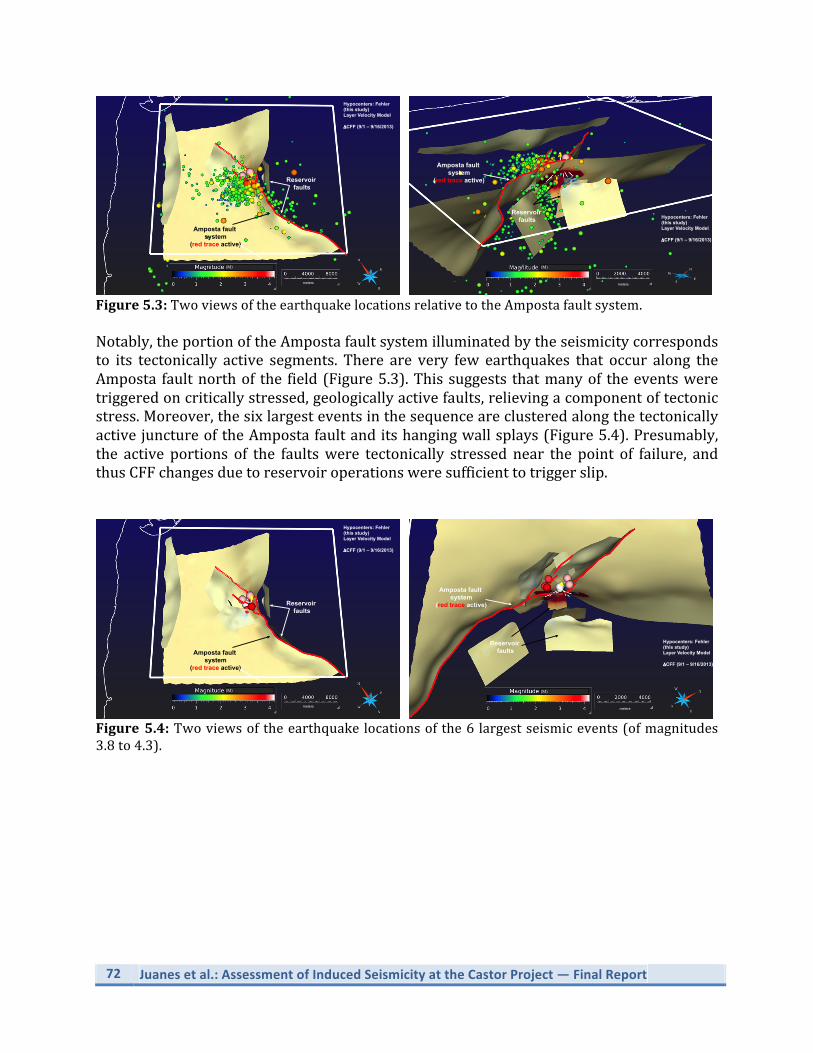
72 Juanesetal.:AssessmentofInducedSeismicityattheCastorProject—FinalReport
Figure5.3:TwoviewsoftheearthquakelocationsrelativetotheAmpostafaultsystem.Notably,theportionoftheAmpostafaultsystemilluminatedbytheseismicitycorrespondsto its tectonically active segments. There are very few earthquakes that occur along theAmposta faultnorthof the field (Figure5.3).Thissuggests thatmanyof theeventsweretriggeredoncriticallystressed,geologicallyactivefaults,relievingacomponentoftectonicstress.Moreover,thesixlargesteventsinthesequenceareclusteredalongthetectonicallyactivejunctureoftheAmpostafaultanditshangingwallsplays(Figure5.4).Presumably,the active portions of the faultswere tectonically stressed near the point of failure, andthusCFFchangesduetoreservoiroperationsweresufficienttotriggerslip.
Figure5.4:Twoviewsoftheearthquakelocationsofthe6 largestseismicevents(ofmagnitudes3.8to4.3).
Amposta fault system
(red trace active)
Reservoir faults
(Μ)
meters
Hypocenters: Fehler (this study) Layer Velocity Model ΔCFF (9/1 – 9/16/2013)
Amposta fault system
(red trace active)
Reservoir faults
meters
(Μ)
Hypocenters: Fehler (this study) Layer Velocity Model ΔCFF (9/1 – 9/16/2013)
Amposta fault system
(red trace active)
Reservoir faults
(Μ)
meters
Hypocenters: Fehler (this study) Layer Velocity Model ΔCFF (9/1 – 9/16/2013)
Amposta fault system
(red trace active)
Reservoir faults
meters
(Μ)
Hypocenters: Fehler (this study) Layer Velocity Model ΔCFF (9/1 – 9/16/2013)

Juanesetal.:AssessmentofInducedSeismicityattheCastorProject—FinalReport 73
Chapter6.ConclusionsTakentogether,theoutcomesfromouranalysispointtothefollowingassessment:
1. Earthquake hypocentral locations determined in this study are consistent withactivityoftheAmpostafaultsystem,itssplays,andfaultswithinthereservoirinthevicinityoftheinjectionsites.
2. Thehypocentersofthefirstseveraleventslocatednearthereservoir,followedbya
sequenceofearthquakesclusteredalongand to thewestof the tectonicallyactiveportionsoftheAmpostafaultanditshangingwallsplays.
3. The earthquake locations are clustered along and to the west of the tectonically
activeportionsontheAmpostafaultanditshangingwallsplays.4. Manyrelocatedearthquakesmaptoregionsofthefaultsthataredestabilizeddueto
injectionoperations. Inparticular,ourcoupled flow-geomechanicsmodel suggeststhat Amposta, some of its splay faults and several of the reservoir faults in closeproximitytoAmposta,weresignificantlyde-stabilizedbygasinjection,withinducedCoulomb stress changes of up to 1MPa. In contrast, the EastBounding fault (alsoknownasthe“Castorfault”insomereports)experiencedchangesinCoulombstress<0.002MPa.
5. The six largest earthquakes (M 3.8 to 4.3) occurred late in the sequence, after
injectionceased.TheseeventsareclusteredinaregionoftheAmpostafaultsystemthatwassignificantlydestabilizedduringgasinjection.
6. OtherearthquakesextendfartherwestandsouthalongtheAmpostafaultsystemto
areasthatwerenotsignificantlyaffectedbyreservoiroperations.Theseobservationssuggestthefollowingscenariofortheeventsequence:
1. Gas injection triggered seismicity on reservoir faults and nearby segments of theAmpostafaultsystem.
2. These earthquakes, in turn, triggered seismicity on theAmposta fault system and
possiblyotherreservoirfaultsthroughstaticordynamicstresschanges,wellafterinjection stopped (“aftershock sequence”). This sequence included the largestearthquakes,whichoccurredonsegmentsoftheAmpostafaultsystemdestabilizedbygasinjection.
3. Earthquakes largely occurred on the tectonically active (southern) portion of the
Ampostafaultanditshangingwallfaultsplays.

74 Juanesetal.:AssessmentofInducedSeismicityattheCastorProject—FinalReport
Chapter7.RecommendationsCoupled flow-geomechanics simulations of additional injection scenarios suggest thefollowing:
1. While reduced injection rates generally reduce the maximum Coulomb stresschangeonAmpostaandreservoirfaults,valuesremainhighandinriskofinducingseismicevents.Forreference,riskofde-stabilizationofa fault isbelievedtooccurforCoulombstresschangesintheorderof0.01MPa–0.1MPa,andperhapslower(thisisintherangeoftypicalstressdropsduringearthquakes).
2. Themaximum Coulomb stress change is higher than that estimated for the post-
mortemanalysisinthecaseoffullcycleofgasrecoveryandinjection.Thispointstoanelevatedrisk ofresumingoperationsinCastor:
1. OccurrenceofM~4eventslikelyhavemovedportionsoftheAmpostafaultsystemcloser to failure through static stress changes: these eventsmight have increasedCoulombstresswithoutrelievingmuchmoment.
2. Given the fault structures and history of de-stabilization, there is a possibility ofearthquakes of significantly larger magnitude. It is worth noting that a completerupture of the Amposta fault system in the study area could produce a M ≥ 6.8earthquake,basedonstandardrupture-area-to-magnitudescalingrelations.
3. Defining safe operating injection limits (maximum pressures, rates, volumes) isdifficult.
Inthecasethatadeterminationismadetoresumeoperations,werecommend:
1. Deploymentofadedicatedseismicnetworkofoceanbottomseismicstationswithgoodproximityandazimuthalcoverage.
2. Slowramp-upof injection inseveralphases,withdedicatedanalysisof seismicity,reservoirpressure,andupdatingofgeomechanicsmodel,aftereachphase.
3. Developaprotocol foractions tobe taken if seismicityoccursor increasesduringinjection(e.g.,atraffic-lightsystem).
Finally, it is important to point out that this is a post-mortem evaluation of the Castorproject,whichemploysnewparadigms for integratinggeology, geophysics and reservoirgeomechanics. As such, it is unreasonable to expect that a studywith industry-standardmethodologies would have reached these conclusions ahead of the injection. Our study,however,pointstotheneedfornewstandardstoquantifytheseismicityrisksassociatedtoundergroundoperations,especiallyinareaswhereactivefaultsarepresent.

Juanesetal.:AssessmentofInducedSeismicityattheCastorProject—FinalReport 75
ReferencesAagaard,B.,S.Kientz,M.Knepley,L.Strand,andC.Williams(2012),PyLithUserManual,
Version1.8.0,Comput.Infrastruct.forGeodyn.,Univ.ofCalif.,Davis,Calif.Aagaard,B.T.,M.G.Knepley,andC.A.Williams(2013),Adomaindecompositionapproach
toimplementingfaultslipinfinite-elementmodelsofquasi-staticanddynamiccrustaldeformation,J.Geophys.Res.SolidEarth,118,3059–3079,doi:10.1002/jgrb.50217.
Amos,C.B.etal.(2014),Upliftandseismicitydrivenbygroundwaterdepletionincentral
California.Nature509,483–486.Anderson,E.M.(1951),TheDynamicsofFaultingandDykeFormationWithApplicationto
Britain,OliverandBoyd,NewYork,N.Y.Armero, F. (1999), Formulation and finite element implementation of a multiplicative
model of coupled poro-plasticity at finite strains under fully saturated conditions,Comput.MethodsAppl.Mech.Eng.,171,205–241.
Armero,F.,andJ.C.Simo(1992),Anewunconditionallystablefractionalstepmethodfor
non-linearcoupledthermomechanicalproblems,Int.J.Numer.MethodsEng.,35,737–766.
Armero, F., and J. C. Simo (1993), A priori stability estimates and unconditionally stable
product formulaalgorithmsfornonlinearcoupledthermoplasticity, Int. J.Plasticity,9,749–782.
Ayala,C.,Torne,M.andRoca,E.(2015),Areviewofthecurrentknowledgeofthecrustal
and lithospheric structure of the Valencia Trough Basin. Boletín Geológico yMinero,126(2-3):533-552
Aziz,K.,andA.Settari(1979),PetroleumReservoirSimulation,Elsevier,London,U.K.Bartrina,M.T., Cabrera, L., Jurado,M.J., Guimera, J. and Rota, E. (1992). Evolution of the
central Catalanmargin of the Valencia trough (westernMediterranean). In: E. Bandaand P. Santanach (Editors), Geology and Geophysics of the Valencia Trough,westernMediterranean.Tectonophysics,203:219-247.
Bassin,C.,Laske,G.&Masters,T.G.(2000).Thecurrentlimitsofresolutionforsurfacewave
tomographyinNorthAmerica,EOS,Trans.Am.Geophys.Un.,81(48),FallMeet.Suppl.,AbstractS12A-03.
Bear,J.(1972),DynamicsofFluidsinPorousMedia,JohnWiley,NewYork,N.Y.Beeler,N.M.,R.W.Simpson,S.H.Hickman,andD.A.Lockner(2000),Porefluidpressure,

76 Juanesetal.:AssessmentofInducedSeismicityattheCastorProject—FinalReport
apparentfriction,andCoulombfailure,J.Geophys.Res.,105,25,533–25,542.Beer,G.(1985),Anisoparametricjoint/interfaceelementforfiniteelementanalysis,Int.J.
Numer.MethodsEng.,21,585–600.Biot, M. A. (1941), General theory of three-dimensional consolidation, J. Appl. Phys., 12,
155–164.Bishop,A.W.(1959),Theprincipleofeffectivestress,TekniskeUkeblad,39,859–863.Bishop, A.W., and G. E. Blight (1963), Some aspects of effective stress in saturated and
partlysaturatedsoils,Geotechnique,13,177–197.Brodsky, E. E., and L. J. Lajoie (2013). Anthropogenic seismicity rates and operational
parametersattheSaltonSeaGeothermalField.Science,341,543–546.
Buttinelli,M.,L.Improta,S.Bagh,andC.Chiarabba(2016).Inversionofinheritedthrustsbywastewater injection induced seismicity at the Val d’Agri oil eld (Italy). ScientificReports,6,37165,doi:10.1038/srep37165.
Caine,J.S.,andC.B.Forster(1999),FaultsandSubsurfaceFluidFlowintheShallowCrust,Geophys.Monogr.Ser.,vol.113,editedbyW.C.Hanebergetal.,AGU,Washington,D.C.
Cao, H. (2002), Development of techniques for general purpose simulators, PhD thesis,
StanfordUniv.,Stanford,Calif.Carol,I.,A.Gens,andE.E.Alonso(1985),Athreedimensionalelastoplasticjointelement,in
FundamentalsofRockJoints,pp.441–451,Centek,Lulea,Sweden.CescaS.,Grigoli,F.Heimann,S.,Gonzalez,A.,Buforn,E.,Maghsoudi,S.,BlanchE.,andDahm,
T. (2014). The 2013 September–October seismic sequence offshore Spain: A case ofseismicitytriggeredbygasinjection?Geophys.J.Int.,198:941–953.
Chester, F. M., J. P. Evans, and R. Biegel (1993), Internal structure and weakening
mechanismsoftheSanAndreasFault,J.Geophys.Res.,98,771–786.Collier,J.S.,Buhl,P.,Torne,M.,andWatts,A.B.(1994).Mohoandlowercrustalreflectivity
beneath a young rift basin: results from a two-ship,wide-aperture seismic-reflectionexperiment in the Valencia Trough (westernMediterranean).Geophys J Int.,118 (1):159-180.doi:10.1111/j.1365-246X.1994.tb04681.x
Coussy,O.(1995),MechanicsofPorousContinua,JohnWiley,Chichester,U.K.Coussy,O.(2004),Poromechanics,JohnWiley,Chichester,U.K.

Juanesetal.:AssessmentofInducedSeismicityattheCastorProject—FinalReport 77
Coussy, O., R. Eymard, and T. Lassabatere (1998), Constitutive modeling of unsaturateddryingdeformablematerials,J.Eng.Mech.,124(6),658–557.
Coussy,O.,P.Dangla,T.Lassabatere,andV.Baroghel-Bouny(2004),Theequivalentpore
pressureandtheswellingandshrinkageofcement-basedmaterials,Mater.Struct.,37,15–20.
CUBIT(2013),CUBIT13.2UserDocumentation,SandiaNatl.Lab.,Albuquerque,N.M.Dean,R.H., X.Gai, C.M. Stone, andS. E.Minkoff (2006),A comparisonof techniques for
couplingporousflowandgeomechanics,Soc.Pet.Eng.J.,11,132–140.Deichmann,N.,andD.Giardini(2009),EarthquakesinducedbythestimulationofanenhancedgeothermalsystembelowBasel(Switzerland),Seismol.Res.Lett.80(5),784-798.Dost, B., andH.W.Haak (2007).Natural and induced seismicity. In Th. E.Wong,D. A. J.
Batjes, and J. de Jager, editors, Geology of the Netherlands, pages 223–229. RoyalNetherlandsAcademyofArtsandSciences.
Ellsworth,W.L.(2013),Injection-inducedearthquakes.Science341,1225942.Felippa,C.A., andK.C.Park (1980),Staggered transientanalysisprocedures forcoupled
mechanicalsystems:Formulation,Comput.MethodsAppl.Mech.Eng.,24,61–111.Ferronato,M.,G.Gambolati,C.Janna,andP.Teatini(2008),Numericalmodelingofregional
faults in land subsidence prediction above gas/oil reservoirs, Int. J. Numer. Anal.MethodsGeomech.,32,633–657.
Ferronato, M., N. Castelletto, and G. Gambolati (2010), A fully coupled 3-D mixed finite
elementmodelofBiotconsolidation,J.Comput.Phys.,229(12),4813–4830.Foulger, G. R.,M.Wilson, J. Gluyas, B. R. Julian, andR.Davies (2017). A global reviewof
human-inducedearthquakes.EarthScienceReviews,inpress.Frohlich, C. (2012), Two-year survey comparing earthquake activity and injection-well
locationsintheBarnettShale,Texas.Proc.NatlAcad.Sci.USA109,13934–13938.Freed,A.(2005).Earthquaketriggeringbystatic,dynamic,andpostseismicstresstransfer:
Ann.Rev.EarthPlanet.Sci.,33,335–67.Gaite,B.,Ugalde,A.,Villaseñor,A.,andBlanch,E.(2016).Improvingthelocationofinduced
earthquakesassociatedwithanundergroundgasstorageintheGulfofValencia(Spain).Phys.EarthPlanet.Inter.,254,46-59.
Galchen,R.(2015),Weatherunderground–thearrivalofman-madeearthquakes.TheNew
Yorker,April13,2015.

78 Juanesetal.:AssessmentofInducedSeismicityattheCastorProject—FinalReport
Gan,W.andC.Frohlich(2013),GasinjectionmayhavetriggeredearthquakesintheCogdell
oilfield,Texas.Proc.NatlAcad.Sci.USA110,doi:10.1073/pnas.1311316110.
García-Mayordomo, J.etal. (2012).Thequaternaryactive faultsDatabaseof Iberia(QAFIv.2.0),J.Iber.Geol.,38:285–302.
Geertsma, J. (1957), The effect of fluid pressure decline on volumetric change of porousrocks,Trans.AIME,210,331–340.
Gens,A.,I.Carol,andE.E.Alonso(1988),Aninterfaceelementformulationfortheanalysis
ofsoil-reinforcementinteraction,Comput.Geotech.,7,133–151.Geostock Iberia (2011). Castor Underground Gas Storage Project, Dynamic Modeling
Report.Gibbs,A.D.(1983),Balancedcross-sectionconstructionfromseismicsections inareasof
extensionaltectonics:JournalofStructuralGeology,5,153–160.Gonzalez,P. J.,K. F.Tiampo,M.Palano,F.Cannavo, J. Fernandez (2012),The2011Lorca
earthquake slip distribution controlled by groundwater crustal unloading. NatureGeosci.5,821-825.
Goodman,R.E.,R.L.Taylor,andT.L.Brekke(1968),Amodelforthemechanicsofjointed
rock,J.SoilMech.,94,637–659.Gray, W. G., and B. A. Schrefler (2001), Thermodynamic approach to effective stress in
partiallysaturatedporousmedia,Eur.J.Mech.-A/Solids,20,521–538.Groshong,R. (1990),Uniquedeterminationofnormal fault shape fromhanging-wall bed
geometryindetachedhalfgrabens:EclogaeGeologicaeHelvetiae,83:455–471.Guglielmi,Y.,F.Cappa,J.-P.Avouac,P.Henry,andD.Elsworth(2015),Seismicitytriggered
byfluidinjection–inducedaseismicslip.Science3481224-1226.
Hamblin,W.K.(1965).Originof“reversedrag”onthedownthrownsideofnormalfaults:GeologicalSocietyofAmericaBulletin,76:1145–1164.
Hardebeck,J.L.,Nazareth,J.J.,andHauksson,E.(1998).Thestaticstresschangetriggeringmodel:ConstraintsfromtwoSouthernCaliforniaaftershocksequences.J.Geophys.Res.,103(24),427-37.
Harris, R. A., and R.W. Simpson (1992), Changes in static stress on southern California
faultsafterthe1992Landersearthquake,Nature,360,251–254.

Juanesetal.:AssessmentofInducedSeismicityattheCastorProject—FinalReport 79
Harris,R.A.,R.W.Simpson,andP.A.Reasenberg(1995),InfluenceofstaticstresschangesonearthquakelocationsinsouthernCalifornia,Nature,375,221–224.
Hornbach,M. J.,H.R.DeShon,W.L.Ellsworth,B.W.Stump,C.Hayward,C.Frohlich,H.R.
Oldham,J.E.Olson,M.B.Magnani,C.Brokaw,andJ.H.Luetgert(2015).CausalfactorsforseismicitynearAzle,Texas.NatureComm.,doi:10.1038/ncomms7728.
Hubbert,M.K.,andW.W.Rubey(1959),Roleoffluidpressureinmechanicsofoverthrust
faulting. I. Mechanics of fluid-filled porous solids and its application to overthrustfaulting,Geol.Soc.Am.,70,115–166.
IGME– InstitutoGeológicoyMinerodeEspaña(2013). InformeGeológicosobre laCrisis
SísmicaRelacionadaconelAlmacénSubterráneodeGasDenominadoCastor(Castellón,NoroestedeEspaña).
IGME– InstitutoGeológicoyMinerodeEspaña(2014). InformeGeológicosobre laCrisis
SísmicaRelacionadaconelAlmacénSubterráneodeGasdenominadoCastor(Castellón,NoroestedeEspaña)–Revisión.
IGN–InstitutoGeográficoNacional(2013).InformesobrelaactividadsísmicaenelGolfo
deValencia,38pp.
Improta, L., L. Valoroso, D. Piccinini, and C. Chiarabba (2015). A detailed analysis ofwastewater-inducedseismicityintheVald’Agrioilfield(Italy).Geophys.Res.Lett.,42,doi:10.1002/2015GL063369.
Jeannin, L., M. Mainguy, R. Masson, and S. Vidal-Gilbert (2007), Accelerating theconvergence of coupled geomechanical–reservoir simulations, Int. J. Numer. Anal.MethodsGeomech.,31,1163–1181.
Jha,B.,andR.Juanes(2007).Alocallyconservativefiniteelementframeworkformodeling
coupledfluidflowandreservoirgeomechanics.ActaGeotechnica,2(3):139–153.Jha, B., and R. Juanes (2014). Coupled multiphase flow and poromechanics: A
computationalmodelofporepressureeffectson fault slipandearthquake triggering.WaterResour.Res.,50(5),3776-3808.
Jha,B.,F.Bottazzi,R.Wojcik,M.Coccia,N.Bechor,D.McLaughlin,T.A.Herring,B.H.Hager,
S. Mantica, and R. Juanes (2015). Reservoir characterization in an underground gasstoragefieldusing joint inversionof flowandgeodeticdata. Int. J.Numer.Anal.Meth.Geomech.,39(4),1619-1638.
Juanes, R., J. Samper, and J. Molinero (2002), A general and efficient formulation of
fracturesandboundaryconditionsinthefiniteelementmethod,Int.J.Numer.MethodsEng.,54(12),1751–1774.

80 Juanesetal.:AssessmentofInducedSeismicityattheCastorProject—FinalReport
Juanes, R., B. H. Hager, B. Jha, J. H. Shaw , A. Plesch, L. Astiz, J. H. Dieterich, C. Frohlich(2016). Were the May 2012 Emilia-Romagna earthquakes induced? A coupled flow-geomechanicsmodelingassessment.GeophysicalResearchLetters,43(13),6891-6897.
Keranen, K. M., H. M. Savage, G. A. Abers, and E. S. Cochran (2013). Potentially induced
earthquakesinOklahoma,USA:Linksbetweenwastewaterinjectionandthe2011Mw5.7earthquakesequence.Geology,doi:10.1130/G34045.1.
Keranen,K.,Weingarten,M.,Abers,G.A.,Bekins,B.A.andGe,S.(2014),Sharpincreasein
central Oklahoma seismicity since 2008 induced by massive wastewater injection.Science345,448–451.
Khalili,N.,F.Geiser,andG.E.Blight(2004),Effectivestressinunsaturatedsoils:Areview
withnewevidence,Int.J.Geomech.,4,115–126.Kim, J., H. A. Tchelepi, and R. Juanes (2011a). Stability and convergence of sequential
methods for coupled flow and geomechanics: Drained and undrained splits. Comput.MethodsAppl.Mech.Engrg.,200:2094–2116.
Kim, J., H. A. Tchelepi, and R. Juanes (2011b). Stability and convergence of sequential
methods for coupled flow and geomechanics: Fixed-stress and fixed-strain splits.Comput.MethodsAppl.Mech.Engrg.,200(13–16):1591–1606.
KimJ.,H.A.Tchelepi,andR.Juanes(2011c).Stability,accuracyandefficiencyofsequential
methodsforcoupledflowandgeomechanics.Soc.Pet.Eng.J.,16:249–262.Kim, J., H. A. Tchelepi, and R. Juanes (2013). Rigorous coupling of geomechanics and
multiphaseflowwithstrongcapillarity,Soc.Pet.Eng.J.,18(6),1123–1139.LaGriT(2013),LaGriTManual,LosAlamosNatl.Lab.,LosAlamos,N.M.Laske, G., G. Masters, and C. Reif (2000), CRUST 2.0: A New Global Crustal Model at 22
Degrees.InstituteofGeophysicsandPlanetaryPhysics,TheUniversityofCalifornia,SanDiego.
Lei,X.Y.,G.Swoboda,andG.Zenz(1995),Applicationofcontact-frictioninterfaceelement
totunnelexcavationinfaultedrock,Comput.Geotech.,17,349–370.Lewis, R. W., and B. A. Schrefler (1998), The Finite Element Method in the Static and
Dynamic Deformation and Consolidation of Porous Media, 2nd ed., John Wiley,Chichester,U.K.
Lewis, R. W., and Y. Sukirman (1993), Finite element modelling of three-phase flow in
deformingsaturatedoilreservoirs,Int.J.Numer.Anal.MethodsGeomech.,17,577–598.

Juanesetal.:AssessmentofInducedSeismicityattheCastorProject—FinalReport 81
Lewis, R. W., A. Makurat, and W. K. S. Pao (2003), Fully coupled modeling of seabedsubsidenceandreservoircompactionofNorthSeaoilfields,Hydrogeol.J.,11(1),142–161.
Li, J.,Kuleli,H.S.,Zhang,H.,andToksöz,M.N.(2011).Focalmechanismdeterminationof
inducedmicroearthquakes inanoil fieldusing fullwaveformsfromshallowanddeepseismicnetworks,Geophysics,76(6),WC87-WC101.
Li, X., Z. Liu, and R.W. Lewis (2005),Mixed finite elementmethod for coupled thermo-
hydro-mechanical process in poro-elastic-plasticmedia at large strains, Int. J.Numer.MethodsEng.,64(5),667–708.
MajerE.L,etal.(2007),Inducedseismicityassociatedwithenhancedgeothermalsystems.
Geothermics36(3):185–222.Mainguy, M., and P. Longuemare (2002), Coupling fluid flow and rock mechanics:
Formulationsof thepartial couplingbetweenreservoirandgeomechanicssimulators,OilGasSci.Technol.,57,355–367.
Mallet,J.L.(1992),GOCAD:acomputeraideddesignprogramforgeologicalapplications.In
K. Turner (Ed.), Three-dimensional modeling with geoscientific information systems(pp.123-141).SpringerNetherlands.
Minkoff,S.E.,C.M.Stone,S.Bryant,M.Peszynska,andM.F.Wheeler(2003),Coupledfluid
flowandgeomechanicaldeformationmodeling,J.Pet.Sci.Eng.,38,37–56.Molinero, J., J. Samper, and R. Juanes (2002), Numerical modeling of the transient
hydrogeologicalresponseproducedbytunnelconstructioninfracturedbedrocks,Eng.Geol.,64(4),369–386.
Muskat,M.(1949),PhysicalPrinciplesofOilProduction,McGraw-Hill,NewYork,N.Y.National Research Council (2013), Induced Seismicity Potential in Energy Technologies.
NationalAcademiesPress,WashingtonDC.Nauroy,J.-F.,A.Baroni,andN.Guy(2011),GeomechanicalStudyforCastorGasStorage,IFP
–Energiesnouvelles,Report#62034.
Nikooee,E.,G.Habibagahi,S.M.Hassanizadeh,andA.Ghahramani(2013),Effectivestressin unsaturated soils: A thermodynamic approach based on the interfacial energy andhydromechanicalcoupling,Transp.PorousMedia,96,369–396.
Nuth,M., andL. Laloui (2008), Effective stress concept inunsaturated soils: Clarificationandvalidationofaunifiedframework,Int.J.Numer.Anal.MethodsGeomech.,32,771–801.

82 Juanesetal.:AssessmentofInducedSeismicityattheCastorProject—FinalReport
Pan,H.,andH.Cao(2010),UserManualforGeneralPurposeResearchSimulator,StanfordUniv.Pet.Eng.Inst.,Stanford,Calif.
Pao,W.K.S.,andR.W.Lewis(2002),Threedimensionalfiniteelementsimulationofthree-phase flowinadeformingfissuredreservoir,Comput.MethodsAppl.Mech.Eng.,191,2631–2659.
Perea, H., Masana, E., and Santanach, P. (2012). An active zone characterized by slownormalfaults,thenorthwesternmarginoftheValenciatrough(NEIberia):areview,J.Iber.Geol.,38:31–52.
Raleigh,C.B.,J.H.Healy,andJ.D.Bredehoeft(1976),AnexperimentinearthquakecontrolatRangely,Colorado.Science191,1230–1237.
Reasenberg,P.A.,andR.W.Simpson(1992),ResponseofregionalseismicitytothestaticstresschangeproducedbytheLomaPrietaearthquake,Science,255,1687–1690.
Rice, J. (1992), Fault Stress States, PorePressureDistributions, and theWeakness of theSanAndreasFault,pp.475–503,AcademicPress,London,U.K.
Roca, E., and J. Guimerà (1992). The Neogene structure of the eastern Iberian margin:structural constrains on the crustal evolution of the Valencia trough (westernMediterranean),Tectonophysics,203:203–218.
Rutqvist, J., Y. S. Wu, C. F. Tsang, and G. Bodvarsson (2002), A modeling approach foranalysisof coupledmultiphase fluid flow,heat transfer, anddeformation in fracturedporousrock,Int.J.RockMech.Min.Sci.,39,429–442.
Rutqvist, J., J. T. Birkholzer, and C. F. Tsang (2008), Coupled reservoir–geomechanicalanalysisof thepotential for tensileandshear failureassociatedwithCO2 injection inmultilayeredreservoir–caprocksystems,Int.J.RockMech.Min.Sci.,45,132–143.
Ryan,W.B.F., Carbotte, S.M., Coplan, J.O., O'Hara, S.,Melkonian,A., Arko,R.,Weissel, R.A.,Ferrini, V., Goodwillie, A., Nitsche, F., Bonczkowski, J., and Zemsky, R. (2009). GlobalMulti-Resolution Topography synthesis, Geochem. Geophys. Geosyst., 10, Q03014,doi:10.1029/2008GC002332.
Saló,L.,T.Frontera,XGoula,LPujades, andA.Ledesma (2017).Earthquakestatic stresstransferinthe2013ValenciaGulf(Spain)seismicsequence,SolidEarthDiss.,inreview.
Samier,P.,andS.Gennaro(2007),Apracticaliterativeschemeforcouplinggeomechanics
withreservoirsimulation,paperSPE107077presentedatSPEEuropec/EAGE,SocietyofPetroleumEngineers,London,U.K.
Schlumberger(2016),Eclipse100ReferenceManual2016.1,Schlumberger Inf.Solutions,
Houston,Tex.

Juanesetal.:AssessmentofInducedSeismicityattheCastorProject—FinalReport 83
Segall,P.(1989),Earthquaketriggeredbyfluidextraction.Geology17,942–946.
Seemann,U.,Pumpin,V.F., andCasson,N. (1990).Ampostaoil field, inProceedingsoftheAAPGTreatiseofPetroleumGeology:AtlasofOilandGasFields,StructuralTrapsII:TrapsAssociatedwithTectonicFaulting,AmericanAssociationofPetroleumGeologists,Tulsa,Oklahoma,USA,A-016,20pp.
Segura, J. M., and I. Carol (2004), On zero-thickness interface elements for diffusionproblems,Int.J.Numer.Anal.MethodsGeomech.,28,947–962.
Segura, J. M., and I. Carol (2008a), Coupled HM analysis using zero-thickness interface
elements with double nodes. Part I: Theoretical model, Int. J. Numer. Anal. MethodsGeomech.,32,2083–2101.
Segura, J. M., and I. Carol (2008b), Coupled HM analysis using zero-thickness interface
elements with double nodes. Part II: Verification and application, Int. J. Numer. Anal.MethodsGeomech.,32,2103–2123.
Settari,A.,andF.Mourits(1998),Acoupledreservoirandgeomechanicalsimulationsystem,
Soc.Pet.Eng.J.,3,219–226.Settari, A., and D. A. Walters (2001), Advances in coupled geomechanical and reservoir
modelingwithapplicationstoreservoircompaction,Soc.Pet.Eng.J.,6,334–342.Shaw, J.H., S.C. Hook, and E. Sitohang (1997). Extensional fault-bend folding and synrift
deposition:AnexamplefromtheCentralSumatraBasin,Indonesia,AmericanAssociationofPetroleumGeologistsBulletin,81(3):367-379.
Sibson,R.H.(1977),Faultrocksandfaultmechanisms,J.Geol.Soc.London,133,191–213.Sibson, R. H. (1981), Fluid flow accompanying faulting: Field evidence and models, in
EarthquakePrediction:AnInternationalReview,MauriceEwingSer.,vol.4,pp.593–603,AGU,Washington,D.C.
Sibson, R. H. (1986), Brecciation processes in fault zone: Inferences from earthquake
rupturing,PureAppl.Geophys.,124,159–175.Sibson,R.H. (1990),Rupturenucleationonunfavorablyoriented faults,Bull. Seismol. Soc.
Am.,80,1580–1604.Sibson,R.H.(1994),Crustalstress,faultingandfluidflow,Geol.Soc.Spec.Publ.,78,69–84.Suckale, J. (2009), Induced seismicity in hydrocarbon fields. InR.Dmowska, editor, Adv.
Geophys.,volume51,pages55–106.AcademicPress,USA.

84 Juanesetal.:AssessmentofInducedSeismicityattheCastorProject—FinalReport
Sukirman,Y.,andR.W.Lewis(1993),Afiniteelementsolutionofa fullycoupledimplicitformulation for reservoir simulation, Int. J. Numer. Anal. Methods Geomech., 17(10),677–698.
Thomas,L.K., L.Y.Chin,R.G.Pierson, and J. E. Sylte (2003),Coupledgeomechanics andreservoirsimulation,Soc.Pet.Eng.J.,8(4),350–358.
Torne,M.,Pascal,G. ,Buhl,P. ,Watts,A.B., andMauffret,A.(1992). Crustalandvelocitystructure of the Valencia trough (western Mediterranean), Part I. A combinedrefraction/wide angle reflection and near-vertical reflection study, Tectonophysics,203,1-20.
Tran, D., A. Settari, and L. Nghiem (2004), New iterative coupling between a reservoirsimulatorandageomechanicsmodule,Soc.Pet.Eng.J.,9(3),362–369.
Tran,D.,L.Nghiem,andL.Buchanan(2005),Improvediterativecouplingofgeomechanicswith reservoir simulation, paper SPE 93244 presented at SPE Reservoir SimulationSymposium,SocietyofPetroleumEngineers,Houston,Tex.
Valoroso,L.,L.Improta,L.Chiaraluce,R.DiStefano,L.Ferranti,A.Govoni,andC.Chiarabba(2009).ActivefaultsandinducedseismicityintheVald’Agriarea(SouthernApennines,Italy).Geophys.J.Int.,178,488–502.
vanderElst,N. J.,H.M.Savage,K.M.Keranen,andG.A.Abers (2013),Enhancedremoteearthquaketriggeringat fluid-injectionsites inthemidwesternUnitedStates,Science,341,164–167.
Vidal,N.,Gallart,J.andDañobeitia,J.J.(1998).AdeepseismiccrustaltransectfromtheNEIberian Peninsula to thewestern Mediterranean, Journal of Geophysical Research,103,12381-12396.
Vlahinic,I.,H.M.Jennings,J.E.Andrade,andJ.J.Thomas(2011),Anovelandgeneralformof effective stress in a partially saturated porous material: The influence ofmicrostructure,Mech.Mater.,43,25–35.
Villaseñor, A., Herrmann, R. B., Gaite, B., and Ugalde, A. (2016). Source parameters of
inducedearthquakesusingregionalearthmodels:Applicationtothe2013sequenceoffthenortheastcoastofSpain.Personalcommunication.
Weingarten, M., S. Ge, J. W. Godt, B. A. Bekins, and J. L. Rubinstein (2015). High-rate
injection is associated with the increase in U.S. mid-continent seismicity. Science348:1336-1340.
Xiao,H.,andJ.Suppe(1992),Originofrollover.AAPGBulletin,v.76,p.509-525.

Juanesetal.:AssessmentofInducedSeismicityattheCastorProject—FinalReport 85
Zhang, H., S. Sarkar, M. Toksoz, S. Kuleli, and F. Al-Kindy (2009). Passive seismictomography using induced seismicity at a petroleum field in Oman. Geophysics,74:WCB57–WCB69.
Zienkiewicz, O. C., D. K. Paul, andA.H. C. Chan (1988), Unconditionally stable staggered
solutionprocedureforsoil–porefluidinteractionproblems,Int.J.Numer.MethodsEng.,26(5),1039–1055.

86 Juanesetal.:AssessmentofInducedSeismicityattheCastorProject—FinalReport
AcknowledgmentsWethankEnagasforprovidingallthedatathatmadethisstudypossible.Inparticular,wethankAnaMaríaGarcíaDomínguezandBorjaGonzálezCansadofortheirexceptionalhelpin all matters related to data availability for the project and for following the technicalworkwithinterest,andRosaMaríaNietoPrietoforherpersistence(andpatience)toseethisstudytocompletion.