A multi-scale flow analysis in hydrogen separation membranes using a coupled DSMC-SPH method
9
A multi-scale flow analysis in hydrogen separation membranes using a coupled DSMC-SPH method Jianjun Ye a , Jian Yang a, *, Jinyang Zheng a , Xianting Ding b , Ieong Wong b , Weizhong Li c , Cong Chen c a Institute of Process Equipment, Zhejiang University, Hangzhou 310027, China b Department of Mechanical and Aerospace Engineering, University of California, Los Angeles 90095, USA c School of Energy and Power Engineering, Dalian University of Technology, Dalian 116024, China article info Article history: Received 16 November 2010 Accepted 24 March 2011 Available online 6 May 2011 Keywords: Proton exchange membrane fuel cell (PEMFC) Membrane separation Multi-scale flow Direct simulation Monte Carlo (DSMC) Smoothed particle hydrodynamics (SPH) abstract The membrane separation process has been developed as an effective and efficient method for obtaining ultra-high purity hydrogen from impure feed streams. A typical membrane gas flow possesses multi-scale flow characteristics, comprising a macroscopic flow regime on both sides of the membrane and a microscopic flow regime in the pores within the membrane. A better understanding of the fundamentals of such flow behaviors and mass transfer at a multi-scale level is therefore crucial for a better membrane architecture design, which could lead to better membrane separation efficiency and reliability for hydrogen productions in fuel cells. In this paper, a novel numerical analysis method combining the direct simulation Monte Carlo (DSMC) method with the smoothed particle hydrodynamics (SPH) method is presented for the multi-scale flow prediction in a membrane. Using the coupled method, the rarefied flow behaviors within a micro-orifice pore can be predicted by the DSMC method, while the continuum flow behaviors on both sides of the membrane can be simulated by the SPH method simultaneously. To investigate the various flow behaviors and mass transfer between different components, such as H 2 and CO in the membrane, the pressure, velocity, molar concentration, mass flowrate and rarefaction of the H 2 and CO components are compared in details. The influences to the multi-scale flow from the orifice feature and size are discussed. Some unique phenomena are observed to be quite different from that observed in either a solely macroscopic or microscopic flow. The results can be greatly beneficial for the understanding of the mechanism of membrane separation, and the designing of the membranes for hydrogen productions in fuel cell applications. Copyright ª 2011, Hydrogen Energy Publications, LLC. Published by Elsevier Ltd. All rights reserved. 1. Introduction Due to the scarcity of fossil fuels and fossil fuels’ environ- mental impacts, hydrogen is regarded as one of the most important energy carrier for its renewable and non-polluting nature [1,2]; it may become the main fuel for all energy- related applications in the future. The continuing develop- ment of a hydrogen economy based on the hydrogen fuel cell has generated growing interests [3]. Proton exchange membrane fuel cell (PEMFC) is a type of fuel cell being * Corresponding author. Tel.: þ86 571 87953098; fax: þ86 571 87953393. E-mail address: [email protected] (J. Yang). Available at www.sciencedirect.com journal homepage: www.elsevier.com/locate/he international journal of hydrogen energy 37 (2012) 894 e902 0360-3199/$ e see front matter Copyright ª 2011, Hydrogen Energy Publications, LLC. Published by Elsevier Ltd. All rights reserved. doi:10.1016/j.ijhydene.2011.03.163
-
Upload
independent -
Category
Documents
-
view
1 -
download
0
Transcript of A multi-scale flow analysis in hydrogen separation membranes using a coupled DSMC-SPH method
i n t e rn a t i o n a l j o u r n a l o f h y d r o g e n en e r g y 3 7 ( 2 0 1 2 ) 8 9 4e9 0 2
Avai lab le at www.sc iencedi rect .com
journa l homepage : www.e lsev ie r . com/ loca te /he
A multi-scale flow analysis in hydrogen separationmembranes using a coupled DSMC-SPH method
Jianjun Ye a, Jian Yang a,*, Jinyang Zheng a, Xianting Ding b, Ieong Wong b, Weizhong Li c,Cong Chen c
a Institute of Process Equipment, Zhejiang University, Hangzhou 310027, ChinabDepartment of Mechanical and Aerospace Engineering, University of California, Los Angeles 90095, USAcSchool of Energy and Power Engineering, Dalian University of Technology, Dalian 116024, China
a r t i c l e i n f o
Article history:
Received 16 November 2010
Accepted 24 March 2011
Available online 6 May 2011
Keywords:
Proton exchange membrane fuel cell
(PEMFC)
Membrane separation
Multi-scale flow
Direct simulationMonte Carlo (DSMC)
Smoothed particle hydrodynamics
(SPH)
* Corresponding author. Tel.: þ86 571 879530E-mail address: [email protected] (J. Yan
0360-3199/$ e see front matter Copyright ªdoi:10.1016/j.ijhydene.2011.03.163
a b s t r a c t
Themembrane separation process has been developed as an effective and efficient method
for obtaining ultra-high purity hydrogen from impure feed streams. A typical membrane
gas flow possesses multi-scale flow characteristics, comprising a macroscopic flow regime
on both sides of the membrane and a microscopic flow regime in the pores within the
membrane. A better understanding of the fundamentals of such flow behaviors and mass
transfer at a multi-scale level is therefore crucial for a better membrane architecture
design, which could lead to better membrane separation efficiency and reliability for
hydrogen productions in fuel cells. In this paper, a novel numerical analysis method
combining the direct simulation Monte Carlo (DSMC) method with the smoothed particle
hydrodynamics (SPH) method is presented for the multi-scale flow prediction in
a membrane. Using the coupled method, the rarefied flow behaviors within a micro-orifice
pore can be predicted by the DSMC method, while the continuum flow behaviors on both
sides of the membrane can be simulated by the SPHmethod simultaneously. To investigate
the various flow behaviors and mass transfer between different components, such as H2
and CO in the membrane, the pressure, velocity, molar concentration, mass flowrate and
rarefaction of the H2 and CO components are compared in details. The influences to the
multi-scale flow from the orifice feature and size are discussed. Some unique phenomena
are observed to be quite different from that observed in either a solely macroscopic or
microscopic flow. The results can be greatly beneficial for the understanding of the
mechanism of membrane separation, and the designing of the membranes for hydrogen
productions in fuel cell applications.
Copyright ª 2011, Hydrogen Energy Publications, LLC. Published by Elsevier Ltd. All rights
reserved.
1. Introduction nature [1,2]; it may become the main fuel for all energy-
Due to the scarcity of fossil fuels and fossil fuels’ environ-
mental impacts, hydrogen is regarded as one of the most
important energy carrier for its renewable and non-polluting
98; fax: þ86 571 87953393g).2011, Hydrogen Energy P
related applications in the future. The continuing develop-
ment of a hydrogen economy based on the hydrogen fuel cell
has generated growing interests [3]. Proton exchange
membrane fuel cell (PEMFC) is a type of fuel cell being
.
ublications, LLC. Published by Elsevier Ltd. All rights reserved.
i n t e r n a t i o n a l j o u rn a l o f h y d r o g e n en e r g y 3 7 ( 2 0 1 2 ) 8 9 4e9 0 2 895
developed for portable transportation applications, as well as
for large-scale fuel cell stack applications. The fuel cell is
regarded as one of the most efficient and pollutant-free
technologies for power generation, because it produces only
water as the waste product, with zero discharge [4,5]. Pure
hydrogen is the most preferred fuel for fuel cells. A variety of
technologies have been developed for pure hydrogen
productions, such as steam-methane reforming (SMR), water
electrolyzing, partial oxidation of hydrocarbons and
photovoltaic-electrolysis. At present, the steam-methane
reforming (SMR) method is the most efficient and econom-
ical method to obtain ultra-high purity hydrogen from impure
feed streams [6]. The basic principle of SMR for hydrogen
extraction can be represented as follows
CH4 þH2O/COþ 3H2 (1)
COþH2O/CO2 þH2 (2)
In addition to hydrogen, the resulting reformer gas also
contains a trace amount of CO, which has a devastating effect
on the energy conversion efficiency of the fuel cells via CO-
induced damage of the Pt anode catalyst [7,8]. There are
several technologies to purify hydrogen produced from an
SMR process, such as cryogenic separation, pressure swing
adsorption (PSA), preferential oxidation (PROX) and
membrane separation [9e13].
Cryogenic separation is based on the difference in boiling
temperatures (relative volatility) of the feed components.
Since hydrogen has a relatively higher volatility compared to
hydrocarbons, the hydrogen steam can be separated from
hydrocarbons with a high purity (90%). To further purify the
hydrogen content, the PSA purification process is typically
used where impurities in the feed gas is adsorbed to a fixed
adsorbent bed at a high pressure. This process can eventually
produce a pure hydrogen product with purities in excess of
99.999%. However, the cryogenic separation and the PSA
technologies are energy intensive, and therefore are not
economical for hydrogen production. Their prohibitive cost
would deter the popularization and application of fuel cells.
As for the preferential oxidation (PROX) method, a catalyzer
preferentially oxidizes carbon monoxide (CO) using a hetero-
geneous catalyst placed on a ceramic support. The PROX
process allows the reaction of the CO in a water gas shift
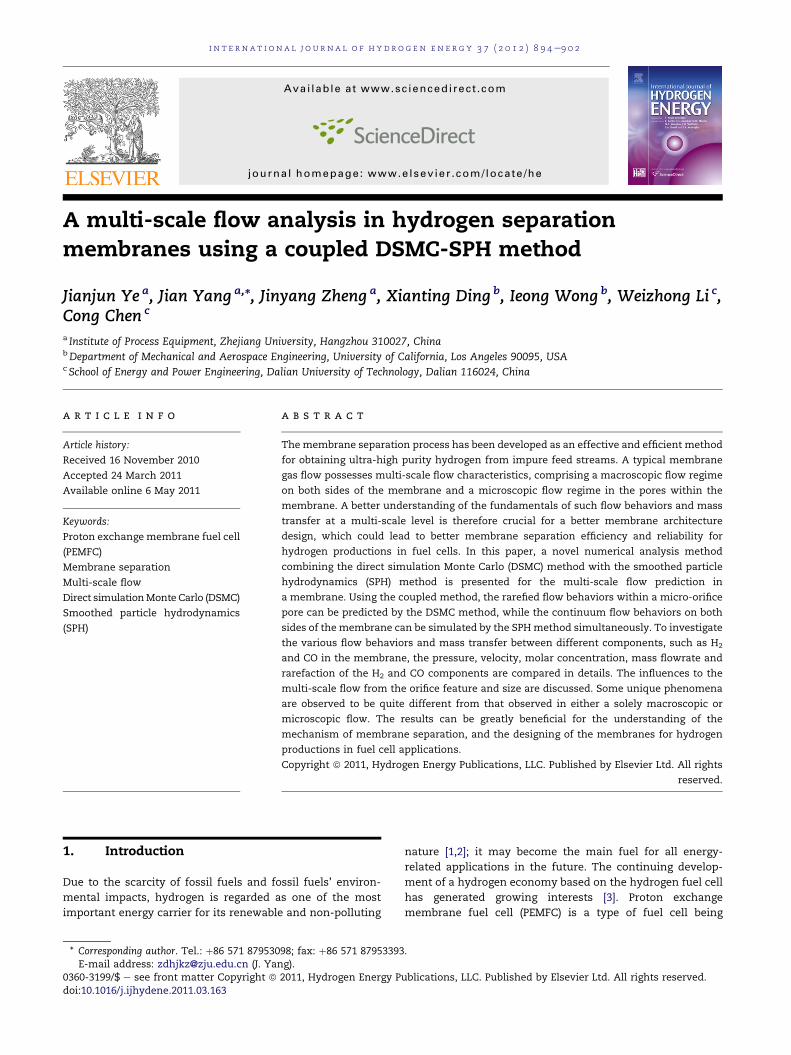
Fig. 1 e SEM photographs of the substrates. (a) surface of
reaction (WGS). Using this technology can reduce CO
concentration from approximately 0.5e1.5% to less than
10 ppm in the feed gas, but it induces undesirable H2 oxidation
and the complexity of having to add precisely-controlled
amounts of gaseous oxygen to the system. Membrane sepa-
ration, which is the production of pure hydrogen using
palladium membranes, is a new method appeared in the
second half of the 1990s. A membrane, which is often fabri-
cated by a Pd film, is a barrier that can selectively permit mass
transfer between the two phases. Based on this technology, an
extremely pure hydrogen product with a purity of 99.9999%
can be achieved. Due to its high efficiency and low power
consumption for hydrogen purification, the membrane sepa-
ration is potentially the most economic and straightforward
method to reduce the CO contamination to the parts per
million level. Furthermore, this separation technology can
also satisfy the growing need for ultra-high-purity gases for
other applied fields [14].
The hydrogen permeability and selectivity are key factors
for the membrane separation. Recently, studies demon-
strated that a hydrogen flux is observed to be inversely
proportional to the membrane thickness, indicating inter-
stitial diffusion as the rate limiting mechanism of hydrogen
permeation. This knowledge, along with the high cost of
palladium, has motivated continuous efforts to decrease the
membrane thickness. Advancements of microfabrication
technology have pushed the defect-free membrane thick-
ness into a sub-micrometer range [15]. However, recent
theoretical and experimental results show that as the
thickness is reduced into the micrometer range, atomic
hydrogen desorption from the permeable surface of the
membrane becomes the dominant mass transfer resistance.
In order to increase mass transfer for a thin Pd membrane,
carrier materials are being studied increasingly both exper-
imentally and numerically, since it is a direct method to
influence flow behavior and improve mass transfer in the
membrane separation technique [16]. The traditional
carriers are mainly porous ceramics, molecular sieves,
porous stainless steel, etc [17]. These carriers work fine in
a macro scale. However, in a micrometer scale, it is
extremely challenging to make pores of a uniform size,
directly abating the efficiency of the membrane. In recent
applications, silicon based carriers have received great
porous TiAl alloy, (b) top view of the porous silicon.
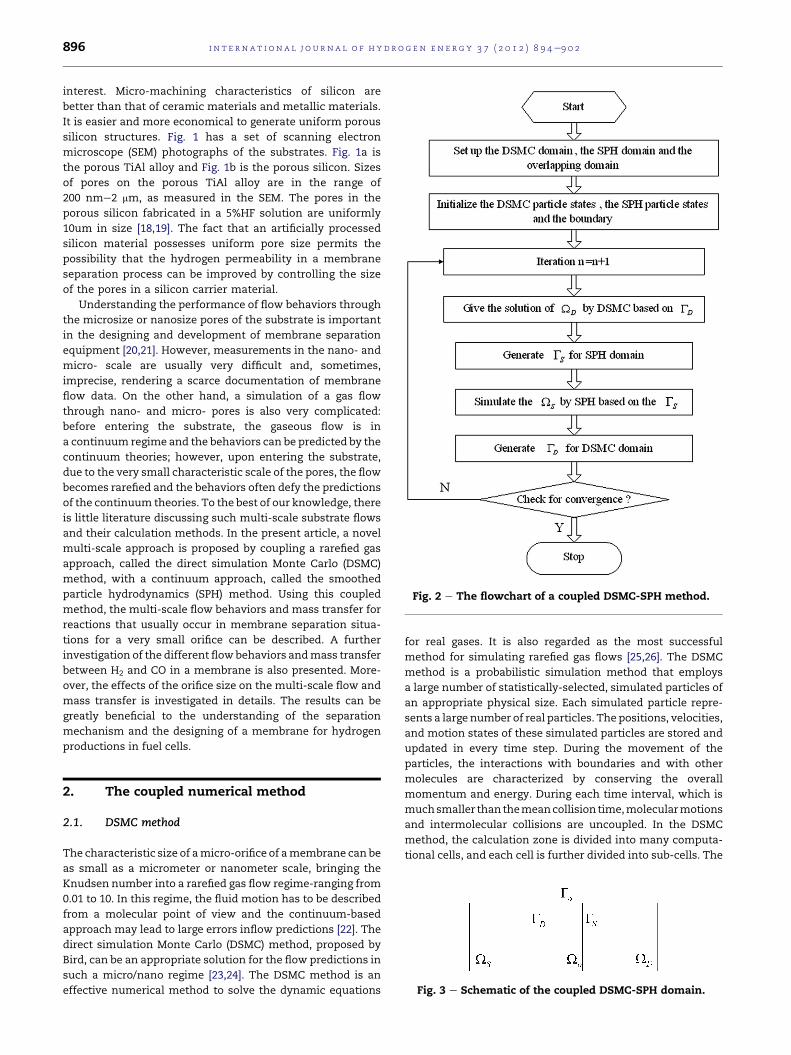
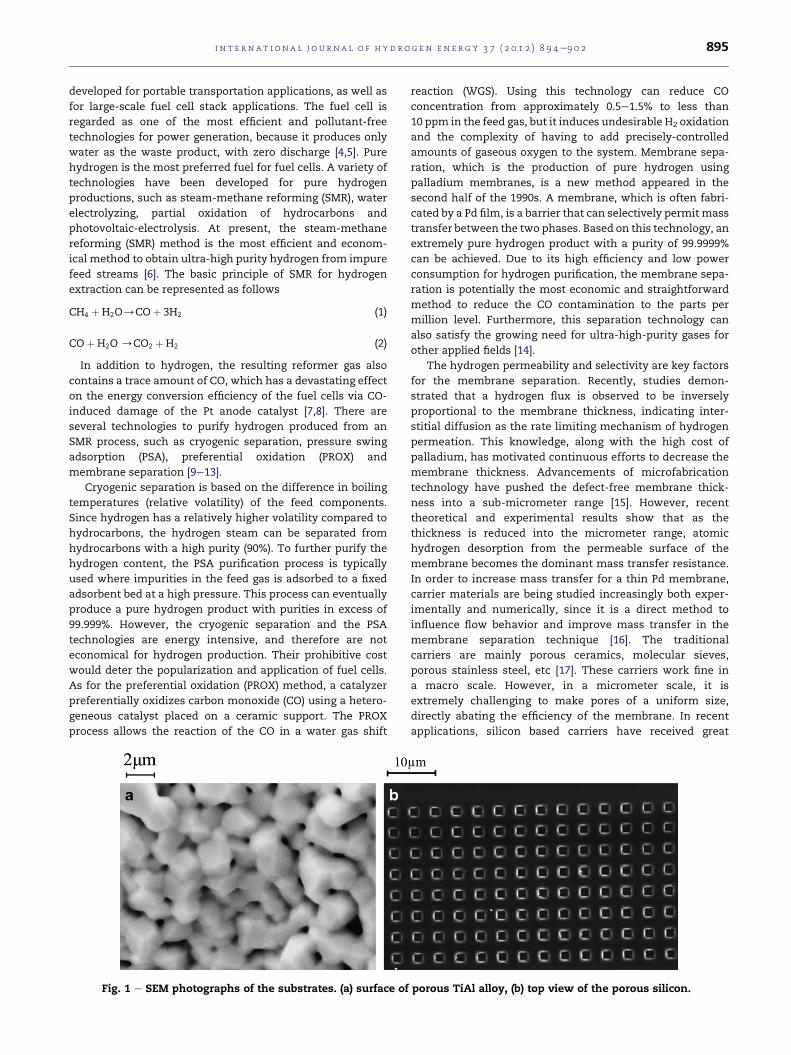
Fig. 2 e The flowchart of a coupled DSMC-SPH method.
i n t e rn a t i o n a l j o u r n a l o f h y d r o g e n en e r g y 3 7 ( 2 0 1 2 ) 8 9 4e9 0 2896
interest. Micro-machining characteristics of silicon are
better than that of ceramic materials and metallic materials.
It is easier and more economical to generate uniform porous
silicon structures. Fig. 1 has a set of scanning electron
microscope (SEM) photographs of the substrates. Fig. 1a is
the porous TiAl alloy and Fig. 1b is the porous silicon. Sizes
of pores on the porous TiAl alloy are in the range of
200 nme2 mm, as measured in the SEM. The pores in the
porous silicon fabricated in a 5%HF solution are uniformly
10um in size [18,19]. The fact that an artificially processed
silicon material possesses uniform pore size permits the
possibility that the hydrogen permeability in a membrane
separation process can be improved by controlling the size
of the pores in a silicon carrier material.
Understanding the performance of flow behaviors through
the microsize or nanosize pores of the substrate is important
in the designing and development of membrane separation
equipment [20,21]. However, measurements in the nano- and
micro- scale are usually very difficult and, sometimes,
imprecise, rendering a scarce documentation of membrane
flow data. On the other hand, a simulation of a gas flow
through nano- and micro- pores is also very complicated:
before entering the substrate, the gaseous flow is in
a continuum regime and the behaviors can be predicted by the
continuum theories; however, upon entering the substrate,
due to the very small characteristic scale of the pores, the flow
becomes rarefied and the behaviors often defy the predictions
of the continuum theories. To the best of our knowledge, there
is little literature discussing such multi-scale substrate flows
and their calculation methods. In the present article, a novel
multi-scale approach is proposed by coupling a rarefied gas
approach, called the direct simulation Monte Carlo (DSMC)
method, with a continuum approach, called the smoothed
particle hydrodynamics (SPH) method. Using this coupled
method, the multi-scale flow behaviors and mass transfer for
reactions that usually occur in membrane separation situa-
tions for a very small orifice can be described. A further
investigation of the different flowbehaviors andmass transfer
between H2 and CO in a membrane is also presented. More-
over, the effects of the orifice size on the multi-scale flow and
mass transfer is investigated in details. The results can be
greatly beneficial to the understanding of the separation
mechanism and the designing of a membrane for hydrogen
productions in fuel cells.
Fig. 3 e Schematic of the coupled DSMC-SPH domain.
2. The coupled numerical method
2.1. DSMC method
The characteristic size of amicro-orifice of amembrane can be
as small as a micrometer or nanometer scale, bringing the
Knudsen number into a rarefied gas flow regime-ranging from
0.01 to 10. In this regime, the fluid motion has to be described
from a molecular point of view and the continuum-based
approach may lead to large errors inflow predictions [22]. The
direct simulation Monte Carlo (DSMC) method, proposed by
Bird, can be an appropriate solution for the flow predictions in
such a micro/nano regime [23,24]. The DSMC method is an
effective numerical method to solve the dynamic equations
for real gases. It is also regarded as the most successful
method for simulating rarefied gas flows [25,26]. The DSMC
method is a probabilistic simulation method that employs
a large number of statistically-selected, simulated particles of
an appropriate physical size. Each simulated particle repre-
sents a large number of real particles. The positions, velocities,
and motion states of these simulated particles are stored and
updated in every time step. During the movement of the
particles, the interactions with boundaries and with other
molecules are characterized by conserving the overall
momentum and energy. During each time interval, which is
muchsmaller than themeancollision time,molecularmotions
and intermolecular collisions are uncoupled. In the DSMC
method, the calculation zone is divided into many computa-
tional cells, and each cell is further divided into sub-cells. The
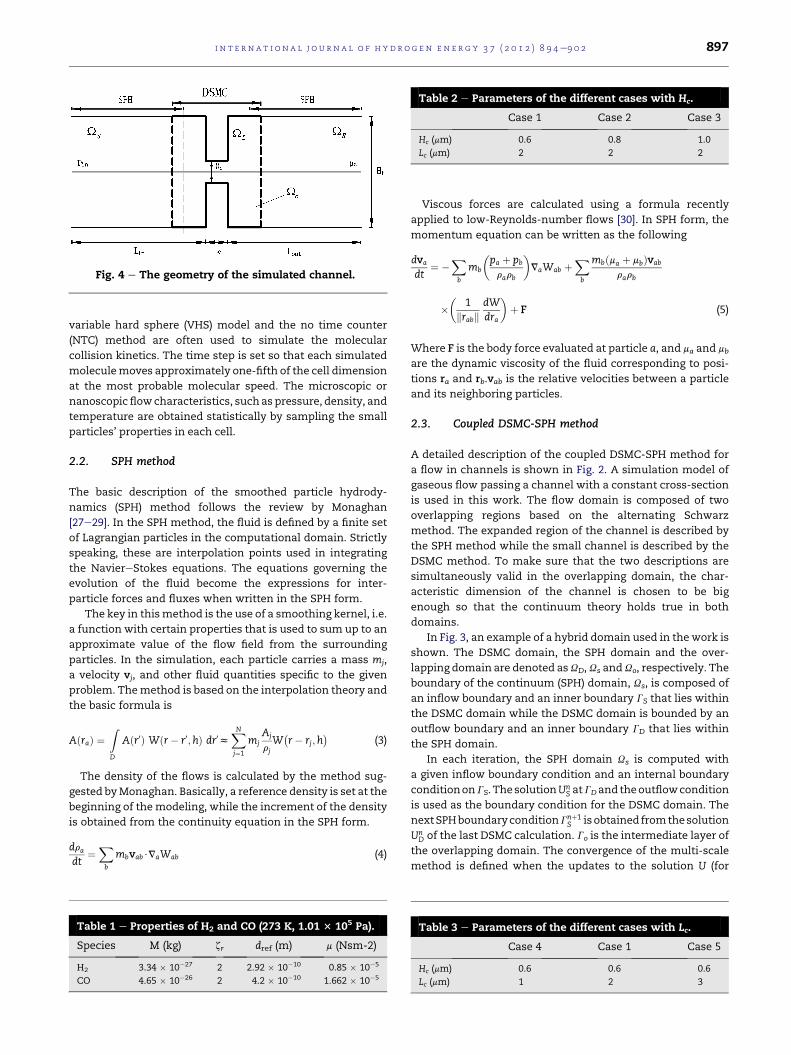
Table 2 e Parameters of the different cases with Hc.
Case 1 Case 2 Case 3
Hc (mm) 0.6 0.8 1.0
Lc (mm) 2 2 2
Fig. 4 e The geometry of the simulated channel.
i n t e r n a t i o n a l j o u rn a l o f h y d r o g e n en e r g y 3 7 ( 2 0 1 2 ) 8 9 4e9 0 2 897
variable hard sphere (VHS) model and the no time counter
(NTC) method are often used to simulate the molecular
collision kinetics. The time step is set so that each simulated
moleculemoves approximately one-fifth of the cell dimension
at the most probable molecular speed. The microscopic or
nanoscopic flowcharacteristics, suchas pressure, density, and
temperature are obtained statistically by sampling the small
particles’ properties in each cell.
2.2. SPH method
The basic description of the smoothed particle hydrody-
namics (SPH) method follows the review by Monaghan
[27e29]. In the SPH method, the fluid is defined by a finite set
of Lagrangian particles in the computational domain. Strictly
speaking, these are interpolation points used in integrating
the NaviereStokes equations. The equations governing the
evolution of the fluid become the expressions for inter-
particle forces and fluxes when written in the SPH form.
The key in thismethod is the use of a smoothing kernel, i.e.
a function with certain properties that is used to sum up to an
approximate value of the flow field from the surrounding
particles. In the simulation, each particle carries a mass mj,
a velocity vj, and other fluid quantities specific to the given
problem. Themethod is based on the interpolation theory and
the basic formula is
AðraÞ ¼ZD
Aðr0Þ Wðr� r0;hÞ dr0zXNj¼1
mjAj
rjW
�r� rj;h
�(3)
The density of the flows is calculated by the method sug-
gested byMonaghan. Basically, a reference density is set at the
beginning of themodeling, while the increment of the density
is obtained from the continuity equation in the SPH form.
dradt
¼Xb
mbvab$VaWab (4)
Table 1 e Properties of H2 and CO (273 K, 1.01 3 105 Pa).
Species M (kg) zr dref (m) m (Nsm-2)
H2 3.34 � 10�27 2 2.92 � 10�10 0.85 � 10�5
CO 4.65 � 10�26 2 4.2 � 10�10 1.662 � 10�5
Viscous forces are calculated using a formula recently
applied to low-Reynolds-number flows [30]. In SPH form, the
momentum equation can be written as the following
dva
dt¼ �
Xb
mb
�pa þ pb
rarb
�VaWab þ
Xb
mbðma þ mbÞvab
rarb
��
1krabk
dWdra
�þ F (5)
Where F is the body force evaluated at particle a, and ma and mb
are the dynamic viscosity of the fluid corresponding to posi-
tions ra and rb.vab is the relative velocities between a particle
and its neighboring particles.
2.3. Coupled DSMC-SPH method
A detailed description of the coupled DSMC-SPH method for
a flow in channels is shown in Fig. 2. A simulation model of
gaseous flow passing a channel with a constant cross-section
is used in this work. The flow domain is composed of two
overlapping regions based on the alternating Schwarz
method. The expanded region of the channel is described by
the SPH method while the small channel is described by the
DSMC method. To make sure that the two descriptions are
simultaneously valid in the overlapping domain, the char-
acteristic dimension of the channel is chosen to be big
enough so that the continuum theory holds true in both
domains.
In Fig. 3, an example of a hybrid domain used in the work is
shown. The DSMC domain, the SPH domain and the over-
lapping domain are denoted asUD,Us andUo, respectively. The
boundary of the continuum (SPH) domain, Us, is composed of
an inflow boundary and an inner boundary GS that lies within
the DSMC domain while the DSMC domain is bounded by an
outflow boundary and an inner boundary GD that lies within
the SPH domain.
In each iteration, the SPH domain Us is computed with
a given inflow boundary condition and an internal boundary
conditiononGS. ThesolutionUnS atGDand theoutflowcondition
is used as the boundary condition for the DSMC domain. The
nextSPHboundaryconditionGnþ1S is obtained fromthesolution
UnD of the last DSMC calculation. Go is the intermediate layer of
the overlapping domain. The convergence of the multi-scale
method is defined when the updates to the solution U (for
Table 3 e Parameters of the different cases with Lc.
Case 4 Case 1 Case 5
Hc (mm) 0.6 0.6 0.6
Lc (mm) 1 2 3
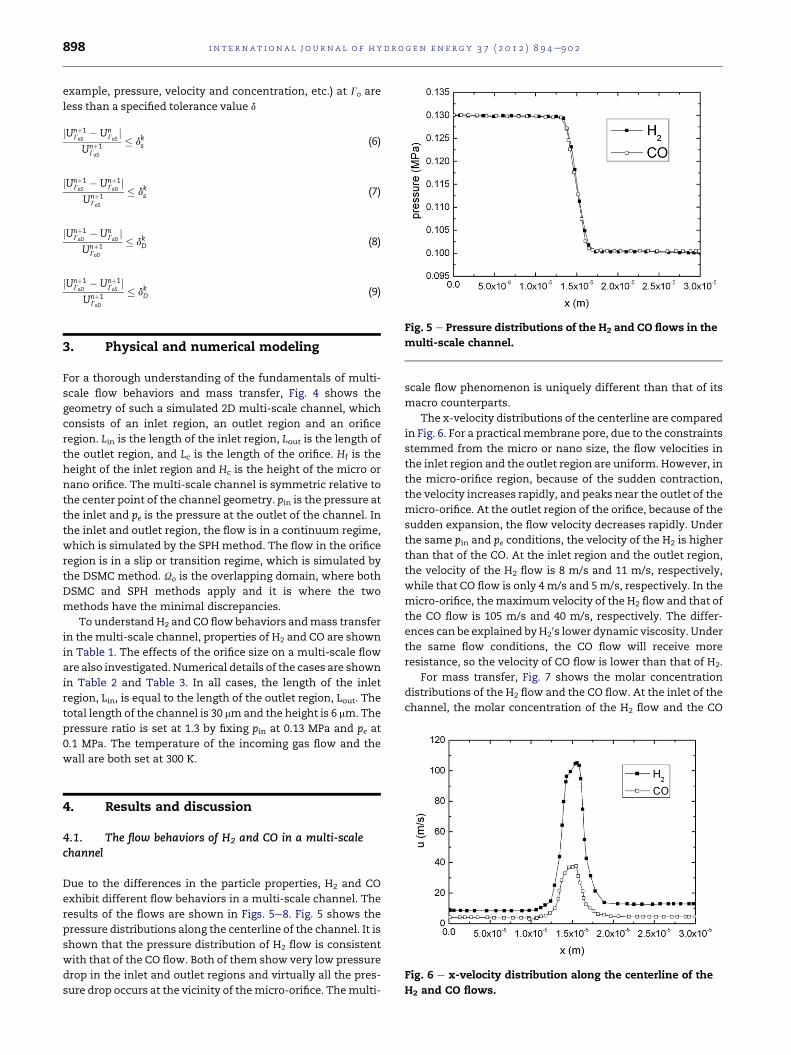
Fig. 5 e Pressure distributions of the H2 and CO flows in the
multi-scale channel.
i n t e rn a t i o n a l j o u r n a l o f h y d r o g e n en e r g y 3 7 ( 2 0 1 2 ) 8 9 4e9 0 2898
example, pressure, velocity and concentration, etc.) at Go are
less than a specified tolerance value d
jUnþ1GoS
� UnGoS
jUnþ1
GoS
� dks (6)
jUnþ1GoS
� Unþ1GoD
jUnþ1
GoS
� dks (7)
jUnþ1GoD
� UnGoD
jUnþ1
GoD
� dkD (8)
jUnþ1GoD
� Unþ1GoS
jUnþ1
GoD
� dkD (9)
3. Physical and numerical modeling
For a thorough understanding of the fundamentals of multi-
scale flow behaviors and mass transfer, Fig. 4 shows the
geometry of such a simulated 2D multi-scale channel, which
consists of an inlet region, an outlet region and an orifice
region. Lin is the length of the inlet region, Lout is the length of
the outlet region, and Lc is the length of the orifice. Hf is the
height of the inlet region and Hc is the height of the micro or
nano orifice. The multi-scale channel is symmetric relative to
the center point of the channel geometry. pin is the pressure at
the inlet and pe is the pressure at the outlet of the channel. In
the inlet and outlet region, the flow is in a continuum regime,
which is simulated by the SPH method. The flow in the orifice
region is in a slip or transition regime, which is simulated by
the DSMC method. Uo is the overlapping domain, where both
DSMC and SPH methods apply and it is where the two
methods have the minimal discrepancies.
To understand H2 and CO flow behaviors andmass transfer
in themulti-scale channel, properties of H2 and CO are shown
in Table 1. The effects of the orifice size on a multi-scale flow
are also investigated. Numerical details of the cases are shown
in Table 2 and Table 3. In all cases, the length of the inlet
region, Lin, is equal to the length of the outlet region, Lout. The
total length of the channel is 30 mmand the height is 6 mm. The
pressure ratio is set at 1.3 by fixing pin at 0.13 MPa and pe at
0.1 MPa. The temperature of the incoming gas flow and the
wall are both set at 300 K.
Fig. 6 e x-velocity distribution along the centerline of the
H2 and CO flows.
4. Results and discussion
4.1. The flow behaviors of H2 and CO in a multi-scalechannel
Due to the differences in the particle properties, H2 and CO
exhibit different flow behaviors in a multi-scale channel. The
results of the flows are shown in Figs. 5e8. Fig. 5 shows the
pressure distributions along the centerline of the channel. It is
shown that the pressure distribution of H2 flow is consistent
with that of the CO flow. Both of them show very low pressure
drop in the inlet and outlet regions and virtually all the pres-
sure drop occurs at the vicinity of themicro-orifice. Themulti-
scale flow phenomenon is uniquely different than that of its
macro counterparts.
The x-velocity distributions of the centerline are compared
in Fig. 6. For a practical membrane pore, due to the constraints
stemmed from the micro or nano size, the flow velocities in
the inlet region and the outlet region are uniform. However, in
the micro-orifice region, because of the sudden contraction,
the velocity increases rapidly, and peaks near the outlet of the
micro-orifice. At the outlet region of the orifice, because of the
sudden expansion, the flow velocity decreases rapidly. Under
the same pin and pe conditions, the velocity of the H2 is higher
than that of the CO. At the inlet region and the outlet region,
the velocity of the H2 flow is 8 m/s and 11 m/s, respectively,
while that CO flow is only 4m/s and 5m/s, respectively. In the
micro-orifice, themaximum velocity of the H2 flow and that of
the CO flow is 105 m/s and 40 m/s, respectively. The differ-
ences can be explained byH20s lower dynamic viscosity. Under
the same flow conditions, the CO flow will receive more
resistance, so the velocity of CO flow is lower than that of H2.
For mass transfer, Fig. 7 shows the molar concentration
distributions of the H2 flow and the CO flow. At the inlet of the
channel, the molar concentration of the H2 flow and the CO
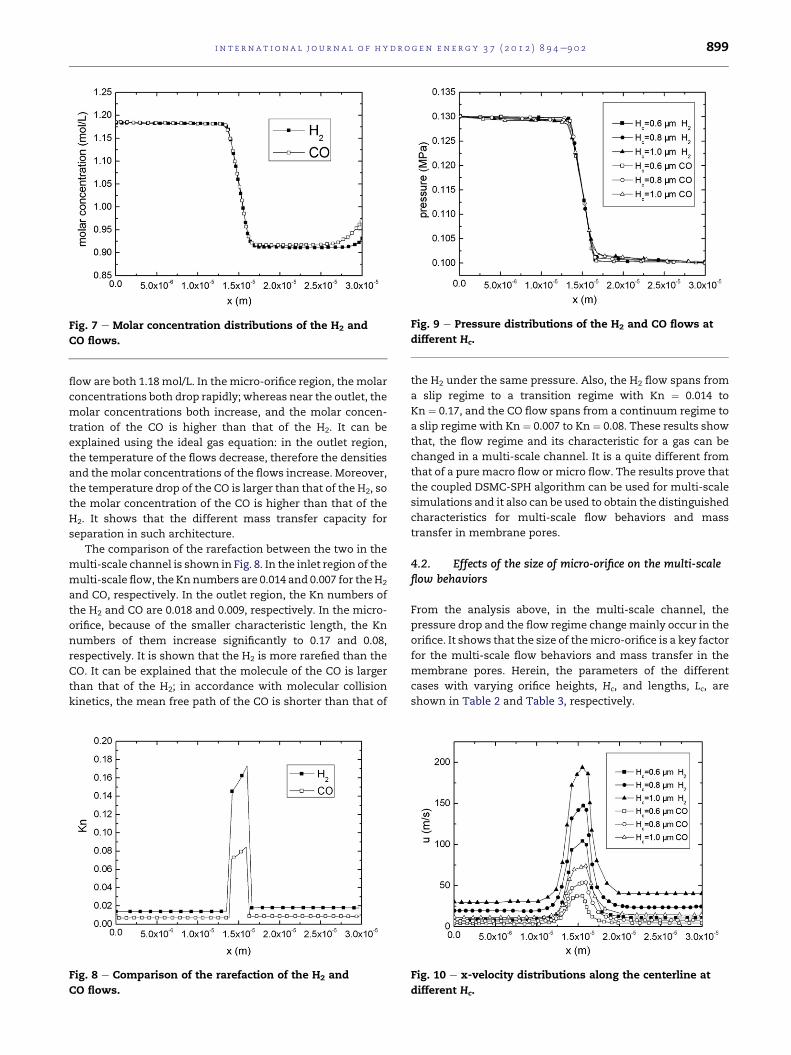
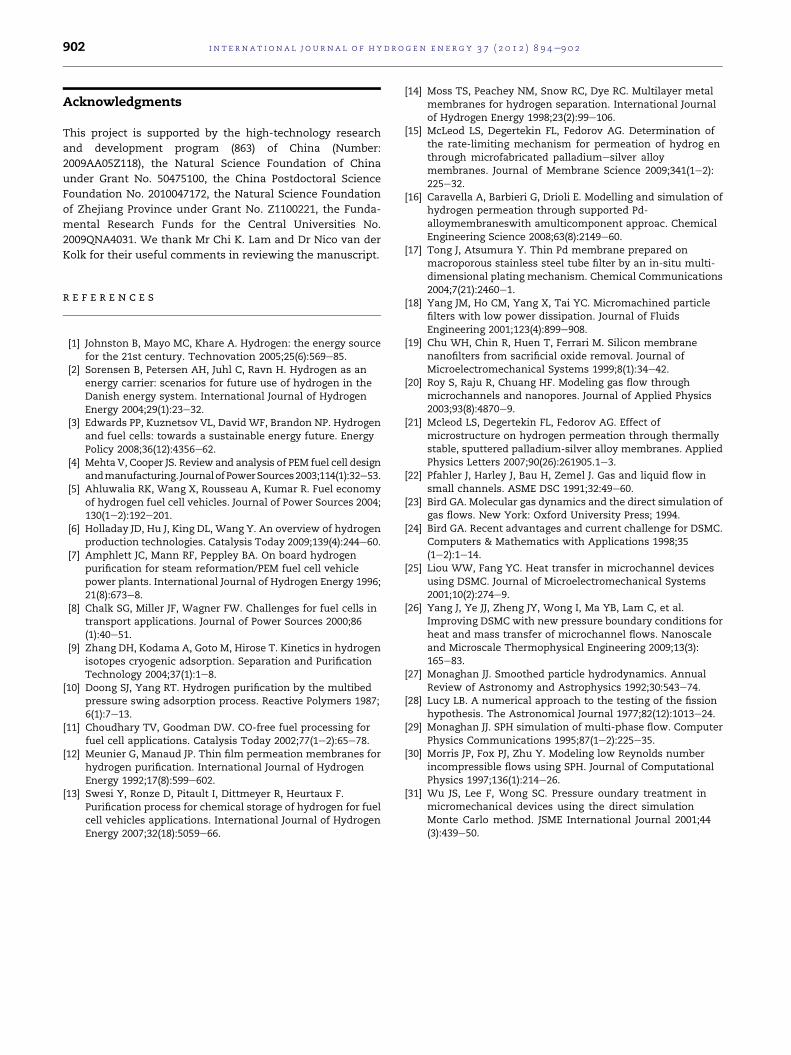
Fig. 9 e Pressure distributions of the H2 and CO flows at
different Hc.Fig. 7 e Molar concentration distributions of the H2 and
CO flows.
i n t e r n a t i o n a l j o u rn a l o f h y d r o g e n en e r g y 3 7 ( 2 0 1 2 ) 8 9 4e9 0 2 899
flow are both 1.18 mol/L. In themicro-orifice region, themolar
concentrations both drop rapidly; whereas near the outlet, the
molar concentrations both increase, and the molar concen-
tration of the CO is higher than that of the H2. It can be
explained using the ideal gas equation: in the outlet region,
the temperature of the flows decrease, therefore the densities
and themolar concentrations of the flows increase. Moreover,
the temperature drop of the CO is larger than that of the H2, so
the molar concentration of the CO is higher than that of the
H2. It shows that the different mass transfer capacity for
separation in such architecture.
The comparison of the rarefaction between the two in the
multi-scale channel is shown in Fig. 8. In the inlet region of the
multi-scale flow, the Kn numbers are 0.014 and 0.007 for theH2
and CO, respectively. In the outlet region, the Kn numbers of
the H2 and CO are 0.018 and 0.009, respectively. In the micro-
orifice, because of the smaller characteristic length, the Kn
numbers of them increase significantly to 0.17 and 0.08,
respectively. It is shown that the H2 is more rarefied than the
CO. It can be explained that the molecule of the CO is larger
than that of the H2; in accordance with molecular collision
kinetics, the mean free path of the CO is shorter than that of
Fig. 8 e Comparison of the rarefaction of the H2 and
CO flows.
the H2 under the same pressure. Also, the H2 flow spans from
a slip regime to a transition regime with Kn ¼ 0.014 to
Kn ¼ 0.17, and the CO flow spans from a continuum regime to
a slip regime with Kn ¼ 0.007 to Kn ¼ 0.08. These results show
that, the flow regime and its characteristic for a gas can be
changed in a multi-scale channel. It is a quite different from
that of a puremacro flow or micro flow. The results prove that
the coupled DSMC-SPH algorithm can be used for multi-scale
simulations and it also can be used to obtain the distinguished
characteristics for multi-scale flow behaviors and mass
transfer in membrane pores.
4.2. Effects of the size of micro-orifice on the multi-scaleflow behaviors
From the analysis above, in the multi-scale channel, the
pressure drop and the flow regime changemainly occur in the
orifice. It shows that the size of themicro-orifice is a key factor
for the multi-scale flow behaviors and mass transfer in the
membrane pores. Herein, the parameters of the different
cases with varying orifice heights, Hc, and lengths, Lc, are
shown in Table 2 and Table 3, respectively.
Fig. 10 e x-velocity distributions along the centerline at
different Hc.
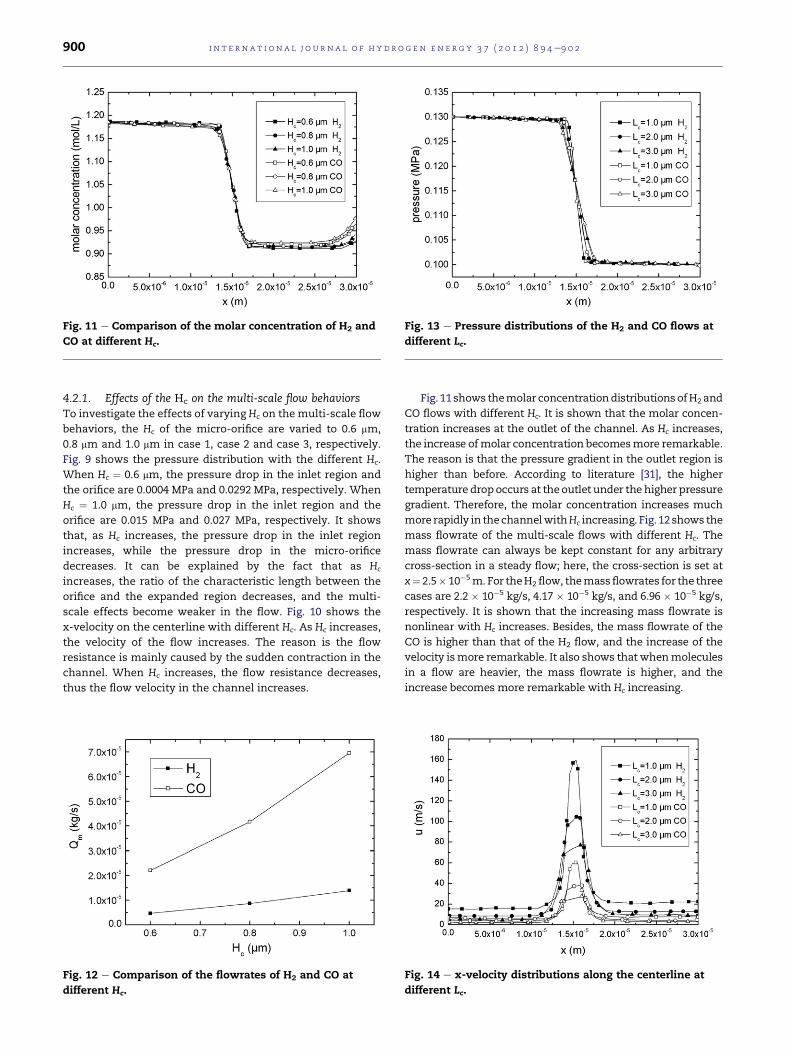
Fig. 13 e Pressure distributions of the H2 and CO flows at
different Lc.
Fig. 11 e Comparison of the molar concentration of H2 and
CO at different Hc.
i n t e rn a t i o n a l j o u r n a l o f h y d r o g e n en e r g y 3 7 ( 2 0 1 2 ) 8 9 4e9 0 2900
4.2.1. Effects of the Hc on the multi-scale flow behaviorsTo investigate the effects of varying Hc on themulti-scale flow
behaviors, the Hc of the micro-orifice are varied to 0.6 mm,
0.8 mm and 1.0 mm in case 1, case 2 and case 3, respectively.
Fig. 9 shows the pressure distribution with the different Hc.
When Hc ¼ 0.6 mm, the pressure drop in the inlet region and
the orifice are 0.0004 MPa and 0.0292 MPa, respectively. When
Hc ¼ 1.0 mm, the pressure drop in the inlet region and the
orifice are 0.015 MPa and 0.027 MPa, respectively. It shows
that, as Hc increases, the pressure drop in the inlet region
increases, while the pressure drop in the micro-orifice
decreases. It can be explained by the fact that as Hc
increases, the ratio of the characteristic length between the
orifice and the expanded region decreases, and the multi-
scale effects become weaker in the flow. Fig. 10 shows the
x-velocity on the centerline with different Hc. As Hc increases,
the velocity of the flow increases. The reason is the flow
resistance is mainly caused by the sudden contraction in the
channel. When Hc increases, the flow resistance decreases,
thus the flow velocity in the channel increases.
Fig. 12 e Comparison of the flowrates of H2 and CO at
different Hc.
Fig. 11 shows themolar concentrationdistributionsofH2and
CO flows with different Hc. It is shown that the molar concen-
tration increases at the outlet of the channel. As Hc increases,
the increase ofmolar concentration becomesmore remarkable.
The reason is that the pressure gradient in the outlet region is
higher than before. According to literature [31], the higher
temperature dropoccurs at theoutlet under thehigher pressure
gradient. Therefore, the molar concentration increases much
more rapidly in thechannelwithHc increasing. Fig. 12 shows the
mass flowrate of the multi-scale flows with different Hc. The
mass flowrate can always be kept constant for any arbitrary
cross-section in a steady flow; here, the cross-section is set at
x¼ 2.5� 10�5m. For theH2flow, themassflowrates for the three
cases are 2.2 � 10�5 kg/s, 4.17 � 10�5 kg/s, and 6.96 � 10�5 kg/s,
respectively. It is shown that the increasing mass flowrate is
nonlinear with Hc increases. Besides, the mass flowrate of the
CO is higher than that of the H2 flow, and the increase of the
velocity ismore remarkable. It also shows that whenmolecules
in a flow are heavier, the mass flowrate is higher, and the
increase becomes more remarkable with Hc increasing.
Fig. 14 e x-velocity distributions along the centerline at
different Lc.

Fig. 15 e Comparison of the molar concentration of H2 and
CO at different Lc.
i n t e r n a t i o n a l j o u rn a l o f h y d r o g e n en e r g y 3 7 ( 2 0 1 2 ) 8 9 4e9 0 2 901
4.2.2. Effects of Lc on the multi-scale flow behaviorsTo investigate the effects of Lc on the multi-scale flow
behaviors, three cases with different Lc are also given. As
shown in Table 3, the Lc of the micro-orifice is varied to 1 mm,
2 mm, and 3 mm in case 4, case 1 and case 5, respectively. Fig. 13
shows the pressure distribution with different Lc. As the Lcincreases, the pressure gradient in the orifice becomes less
significant. According to the Fig. 13, the pressure drop mainly
occurs in the orifice region. It shows that a longer orifice will
lead to a lower pressure drop. As shown in Fig. 14, when
Lc ¼ 1.0 mm, the x-velocity in the inlet region is 17 m/s for the
H2 flow, and the maximum velocity in the orifice is 160 m/s;
when Lc is increased to 3.0 mm, the velocity at the inlet
decreases to 6 m/s, and the maximum velocity in the orifice
also decreases to 75 m/s. This similar flow behavior also
occurs in the CO flow. This result presents that in a multi-
scale flow, the velocity is sensitive to the length of the micro-
orifice: when the length of the orifice increases, the pressure
gradient in the micro-orifice decreases, and then causes
a decrease in the flow velocity.
Fig. 16 e Comparison of the mass flowrate of the H2 and CO
flows at different Lc.
Fig. 15 shows the effect of varying Lc on the molar
concentration distributions. In the inlet region of the channel,
there is little difference of the molar concentration in the
channels with different Lc. In the micro-orifice region, the
molar concentration drops slowly in the longer Lc case. Near
the outlet of the channel, it is shown that the molar concen-
tration increases much more remarkable as Lc increases. The
main reason is that the pressure gradient is steeper than that
of the shorter Lc case in the outlet region, and the temperature
drop is also larger in the longer Lc case. These phenomena
raise the molar concentration with longer Lc.
The effect of varying Lc on the mass flowrate is shown in
Fig. 16. Here, the mass flowrate at the cross-section
x¼ 2.5� 10�5 m is investigated in detail. For the H2 flow, when
Lc¼ 1 mm, 2 mm, and 3 mm, themass flowrates of the H2 flow are
0.73 � 10�5 kg/s, 0.47 � 10�5 kg/s, and 0.35 � 10�5 kg/s,
respectively. For the CO flow, when Lc ¼ 1 mm, 2 mm and 3 mm,
the mass flowrates are 3.7 � 10�5 kg/s, 2.2 � 10�5 kg/s, and
1.54 � 10�5 kg/s, respectively. As the Lc increases, the mass
flowrate decreases: it is caused by the lower velocity in the
multi-scale channel. Furthermore, the relationship between
the mass flow and Lc is nonlinear. The decrease of the mass
flowrate becomes less significant as Lc increases.
5. Conclusions
A novel numerical analysis method for a multi-scale
membrane flow simulation is presented in this paper by
coupling two particle-base algorithms: the DSMC and the SPH
methods. To combine the DSMC and SPH domains, a serial
Schwarz alternating method is employed. The coupled
DSMC-SPH method is used to simulate a multi-scale flow,
which is encountered in the membrane separation process
for hydrogen production. The H2 flow and the CO flow
behaviors and mass transfer are compared in the multi-scale
channel. The results show that, the pressure distributions of
H2 flows and CO flows are consistent; compared with a CO
flow, the velocity of a H2 flow is higher, but the mass flowrate
of the H2 is lower. At the outlet of the channel, the molar
concentration of a CO is higher than that of a H2 flow. In
a multi-scale flow channels, the H2 flow jumps from the slip
regime to the transitional regime and the CO flow jumps
from the continuum regime to the slip regime. Such change
of the flow regime is quite different from that observed in
typical macro flows with conventional numerical methods.
To facilitate future novel membrane designs or membrane
selections, further investigation of the effects of varying
micro-orifice size on the multi-scale flow was conducted:
a few examples with varying orifice height and length (Hc and
Lc) are demonstrated. As Hc increases, the pressure drop
increases in the expanded region but decreases in the orifice,
while the velocity and mass flowrate increase. Also, the
increase of the molar concentration at the outlet becomes
much more remarkable. As Lc increases, the pressure
gradient decreases in the orifice, the velocity and mass
flowrate decrease, and the molar concentration distributions
for both H2 and CO flows increase much more rapidly at the
outlet.
i n t e rn a t i o n a l j o u r n a l o f h y d r o g e n en e r g y 3 7 ( 2 0 1 2 ) 8 9 4e9 0 2902
Acknowledgments
This project is supported by the high-technology research
and development program (863) of China (Number:
2009AA05Z118), the Natural Science Foundation of China
under Grant No. 50475100, the China Postdoctoral Science
Foundation No. 2010047172, the Natural Science Foundation
of Zhejiang Province under Grant No. Z1100221, the Funda-
mental Research Funds for the Central Universities No.
2009QNA4031. We thank Mr Chi K. Lam and Dr Nico van der
Kolk for their useful comments in reviewing the manuscript.
r e f e r e n c e s
[1] Johnston B, Mayo MC, Khare A. Hydrogen: the energy sourcefor the 21st century. Technovation 2005;25(6):569e85.
[2] Sorensen B, Petersen AH, Juhl C, Ravn H. Hydrogen as anenergy carrier: scenarios for future use of hydrogen in theDanish energy system. International Journal of HydrogenEnergy 2004;29(1):23e32.
[3] Edwards PP, Kuznetsov VL, David WF, Brandon NP. Hydrogenand fuel cells: towards a sustainable energy future. EnergyPolicy 2008;36(12):4356e62.
[4] Mehta V, Cooper JS. Review and analysis of PEM fuel cell designandmanufacturing. JournalofPowerSources2003;114(1):32e53.
[5] Ahluwalia RK, Wang X, Rousseau A, Kumar R. Fuel economyof hydrogen fuel cell vehicles. Journal of Power Sources 2004;130(1e2):192e201.
[6] Holladay JD, Hu J, King DL, Wang Y. An overview of hydrogenproduction technologies. Catalysis Today 2009;139(4):244e60.
[7] Amphlett JC, Mann RF, Peppley BA. On board hydrogenpurification for steam reformation/PEM fuel cell vehiclepower plants. International Journal of Hydrogen Energy 1996;21(8):673e8.
[8] Chalk SG, Miller JF, Wagner FW. Challenges for fuel cells intransport applications. Journal of Power Sources 2000;86(1):40e51.
[9] Zhang DH, Kodama A, Goto M, Hirose T. Kinetics in hydrogenisotopes cryogenic adsorption. Separation and PurificationTechnology 2004;37(1):1e8.
[10] Doong SJ, Yang RT. Hydrogen purification by the multibedpressure swing adsorption process. Reactive Polymers 1987;6(1):7e13.
[11] Choudhary TV, Goodman DW. CO-free fuel processing forfuel cell applications. Catalysis Today 2002;77(1e2):65e78.
[12] Meunier G, Manaud JP. Thin film permeation membranes forhydrogen purification. International Journal of HydrogenEnergy 1992;17(8):599e602.
[13] Swesi Y, Ronze D, Pitault I, Dittmeyer R, Heurtaux F.Purification process for chemical storage of hydrogen for fuelcell vehicles applications. International Journal of HydrogenEnergy 2007;32(18):5059e66.
[14] Moss TS, Peachey NM, Snow RC, Dye RC. Multilayer metalmembranes for hydrogen separation. International Journalof Hydrogen Energy 1998;23(2):99e106.
[15] McLeod LS, Degertekin FL, Fedorov AG. Determination ofthe rate-limiting mechanism for permeation of hydrog enthrough microfabricated palladiumesilver alloymembranes. Journal of Membrane Science 2009;341(1e2):225e32.
[16] Caravella A, Barbieri G, Drioli E. Modelling and simulation ofhydrogen permeation through supported Pd-alloymembraneswith amulticomponent approac. ChemicalEngineering Science 2008;63(8):2149e60.
[17] Tong J, Atsumura Y. Thin Pd membrane prepared onmacroporous stainless steel tube filter by an in-situ multi-dimensional plating mechanism. Chemical Communications2004;7(21):2460e1.
[18] Yang JM, Ho CM, Yang X, Tai YC. Micromachined particlefilters with low power dissipation. Journal of FluidsEngineering 2001;123(4):899e908.
[19] Chu WH, Chin R, Huen T, Ferrari M. Silicon membranenanofilters from sacrificial oxide removal. Journal ofMicroelectromechanical Systems 1999;8(1):34e42.
[20] Roy S, Raju R, Chuang HF. Modeling gas flow throughmicrochannels and nanopores. Journal of Applied Physics2003;93(8):4870e9.
[21] Mcleod LS, Degertekin FL, Fedorov AG. Effect ofmicrostructure on hydrogen permeation through thermallystable, sputtered palladium-silver alloy membranes. AppliedPhysics Letters 2007;90(26):261905.1e3.
[22] Pfahler J, Harley J, Bau H, Zemel J. Gas and liquid flow insmall channels. ASME DSC 1991;32:49e60.
[23] Bird GA. Molecular gas dynamics and the direct simulation ofgas flows. New York: Oxford University Press; 1994.
[24] Bird GA. Recent advantages and current challenge for DSMC.Computers & Mathematics with Applications 1998;35(1e2):1e14.
[25] Liou WW, Fang YC. Heat transfer in microchannel devicesusing DSMC. Journal of Microelectromechanical Systems2001;10(2):274e9.
[26] Yang J, Ye JJ, Zheng JY, Wong I, Ma YB, Lam C, et al.Improving DSMC with new pressure boundary conditions forheat and mass transfer of microchannel flows. Nanoscaleand Microscale Thermophysical Engineering 2009;13(3):165e83.
[27] Monaghan JJ. Smoothed particle hydrodynamics. AnnualReview of Astronomy and Astrophysics 1992;30:543e74.
[28] Lucy LB. A numerical approach to the testing of the fissionhypothesis. The Astronomical Journal 1977;82(12):1013e24.
[29] Monaghan JJ. SPH simulation of multi-phase flow. ComputerPhysics Communications 1995;87(1e2):225e35.
[30] Morris JP, Fox PJ, Zhu Y. Modeling low Reynolds numberincompressible flows using SPH. Journal of ComputationalPhysics 1997;136(1):214e26.
[31] Wu JS, Lee F, Wong SC. Pressure oundary treatment inmicromechanical devices using the direct simulationMonte Carlo method. JSME International Journal 2001;44(3):439e50.