county government of kiambu department of finance and ...
138
COUNTY GOVERNMENT OF KIAMBU DEPARTMENT OF FINANCE AND ECONOMIC PLANNING ANNUAL DEVELOPMENT PLAN 2017/18 AUGUST 2016
-
Upload
khangminh22 -
Category
Documents
-
view
3 -
download
0
Transcript of county government of kiambu department of finance and ...

COUNTY GOVERNMENT OF KIAMBU
DEPARTMENT OF FINANCE AND
ECONOMIC PLANNING
ANNUAL DEVELOPMENT PLAN 2017/18
AUGUST 2016

2
VISION
Success and prosperity for everyone in a safe and harmonious County
MISSION
Make Kiambu County the best County in which to grow live and work.

3
ACKNOWLEDGEMENT
The preparation of this Annual Development Plan (ADP) was achieved through a consultative
process involving key department’s stakeholders. The process was coordinated by County
Executive Committee member in charge of Finance and Economic Planning, Ms. Mary Nguli
and a team of technical experts from the department namely; Ms. Sophiah Kamau, Mr.
Stephen Mungai, Mr. Joseph Ng’ang’a, Mr. Samuel Muthondu, Ms.Faith Kiragu, Ms. Charity
Mwangi, Mr. Arnold Nderitu, Mr. Jackson Kasomo and Ms. Nduta Kahiu,. Their relentless
commitment and teamwork is duly acknowledged. We further express our appreciation to all
section directors and the department staff whose invaluable contribution enriched this
document.
Special thanks go to His Excellency, the Governor William Kabogo & Deputy Governor
Hon. Gerald Githinji for their leadership and support in the preparation of this plan.
Lastly, i take this opportunity to thank all our partners who supported preparation of this plan
either directly or indirectly.
Mr. John Gicaci
Chief Officer
Finance and Economic Planning

4
TABLE OF CONTENTS
ACKNOWLEDGEMENT ......................................................................................................... 3
1.1 Introduction ...................................................................................................................... 9
1.2 County Background Information ..................................................................................... 9
1.2.1 Position and Size ....................................................................................................... 9
1.2.2 Physiographic and Natural Conditions ..................................................................... 9
1.2.3 Administrative and Political Units .......................................................................... 13
1.2.4 Demographic Features ............................................................................................ 14
1.2.5 Population density and distribution ........................................................................ 19
1.2.5 Human Development Indicators ............................................................................. 22
1.2.6 Political Units.......................................................................................................... 25
1.2.7 Infrastructure and Access ........................................................................................ 27
1.2.8 Land and Land Use ................................................................................................. 30
1.2.9 Community Organizations/Non –State Actors ....................................................... 30
1.2.10 Crop and Livestock Production ............................................................................ 31
1.2.11 Forestry and Agro-Forestry................................................................................... 33
1.2.12 Environment and Climate Change ........................................................................ 35
1.2.13 Mining ................................................................................................................... 37
1.2.14 Tourism ................................................................................................................. 37
1.2.15 Industry ................................................................................................................. 38
1.2.16 Employment and Other Sources of Income .......................................................... 38
1.2.17 Water Resources ................................................................................................... 40
1.2.18 Health Access and Nutrition ................................................................................. 41
1.2.19 Education and Literacy ......................................................................................... 42
CHAPTER TWO: COUNTY DEVELOPMENT ANALYSIS ............................................... 45
2.1 Introduction .................................................................................................................... 45
2.2 Major Developmental Challenges.................................................................................. 45
2.2.1 Poor Rural Access Roads ........................................................................................ 45
2.2.2 High Cost of Farm Inputs ....................................................................................... 46
2.2.3 Poor Marketing Channels ....................................................................................... 46
2.2.4 Small Land Sizes..................................................................................................... 46
2.2.5 Insecurity................................................................................................................. 47
2.2.6 Low School Enrolment ........................................................................................... 47

5
2.2.7 Inadequate Health Facilities .................................................................................... 47
2.2.8 Inadequate Water (for consumption and irrigation), ............................................... 48
2.2.9 High Unemployment Levels ................................................................................... 49
2.2.10 Drug and Substance Abuse ................................................................................... 49
2.3 Cross-cutting Issues in the county ................................................................................. 49
2.3.1 Poverty .................................................................................................................... 49
2.3.2 HIV and AIDS ........................................................................................................ 51
2.3.3 Gender Inequality.................................................................................................... 53
2.3.4 Environment and Climatic Change ......................................................................... 54
2.3.5 Disaster Management & Resilience ........................................................................ 56
2.3.6 Youth....................................................................................................................... 58
2.3.7 Persons with Disabilities ......................................................................................... 59
2.3.8 Information Communication Technology (ICT) .................................................... 60
2.4 Potential Strategic Policy Thrusts .................................................................................. 61
CHAPTER THREE: LINKAGES WITH OTHER PLANS .................................................... 72
3.1 Introduction .................................................................................................................... 72
3.2 Linkage with the Constitution of Kenya, 2010 .............................................................. 72
3.3 Linkages with Kenya Vision 2030 and its Medium Term Plans ................................... 72
3.4 Linkages with County Plans .......................................................................................... 74
CHAPTER FOUR: RESOURCE MOBILIZATION............................................................... 75
4.1 Introduction .................................................................................................................... 75
4.2 Principles Guiding Resource Mobilization Strategies ................................................... 81
4.3 Sources of Resources to the County .............................................................................. 83
4.3.1 Internally Generated Revenues ............................................................................... 83
4.3.2 National Government .............................................................................................. 83
4.3.3 Current and New Development Partners ................................................................ 84
4.3.4 The Corporate Sector .............................................................................................. 84
4.3.5 Foreign Governments.............................................................................................. 85
4.4 Management of Public Funds ........................................................................................ 85
4.5 Management of Assets and Liabilities ........................................................................... 85
4.6 Implementation Plan ...................................................................................................... 86
4.6.1 Strengthening Governance, Management and Organisational Structure and
Systems ............................................................................................................................ 86
4.6.2 Communication ....................................................................................................... 86
4.6.3 Implementation of Cost-saving Measures .............................................................. 86

6
CHAPTER FIVE: DEPARTMENTAL PRIORITY PROJECTS AND PROGRAMMES
2017-18 FY .............................................................................................................................. 87
5.1 County Executive ...................................................................................................... 87
5.2 County Public Service Board .................................................................................... 89
5.3 Finance and Economic Planning ............................................................................... 90
5.4 Administration and Public Service ............................................................................ 94
5.6 Water, Environment and Natural Resources ........................................................... 104
5.7 Health services ........................................................................................................ 112
5.8 Education, Culture, ICT and Social Services .......................................................... 116
5.9 Youth and Sports ..................................................................................................... 123
5.10 Lands, Physical Planning and Housing ............................................................... 126
5.11 Trade, Tourism, Industry and Co-Operative ....................................................... 131
5.12 Roads Transport Public Works & Utilities Department ...................................... 134
CHAPTER SIX: CONCLUSION .......................................................................................... 137

7
LIST OF TABLES
Table 1: Area of the County by Sub Counties ......................................................................... 13
Table 2: Population Projections by Age Cohort ...................................................................... 15
Table 3: Population Projections for Selected Age Groups ..................................................... 16
Table 4: Population Projections by Urban Centres ................................................................. 20
Table 5: Population Distribution and Density by Constituency .............................................. 21
Table 6: Population Projections by Constituency .................................................................... 21
Table 7: County Electoral Wards by Constituencies ............................................................... 25
Table 8: Number of Registered and Eligible Voters by Constituencies (as at 18th December
2012) ........................................................................................................................................ 26
Table 9: County Revenue Estimate Projections ....................................................................... 76
Table 10: County Executive Projects/Programmes ................................................................. 88
Table 11: County Public Service Board Projects/Programmes ............................................... 89
Table 12 : Finance and Economic Planning projects/programmes .......................................... 91
Table 13: Administration and public services projects / programmes ..................................... 94
Table 14: Agriculture, Livestock and Fisheries projects/programmes .................................... 97
Table 15: Water, Environment and Natural resources projects/programmes ........................ 104
Table 16: Health Services Projects/Programmes ................................................................... 112
Table 17: Education, Culture, ICT and Social Services projects/programmes ...................... 117
Table 18:Youth and Sports Projects/Programmes ................................................................. 123
Table 19: Lands, Physical Planning and Housing projects/ programmes .............................. 127
Table 20: Trade, Tourism, Industry and Co-operative Projects/Programmes ....................... 132
Table 21: Roads, Transport and Public Works projects/programmes ................................... 135

8
ABBREVIATION AND ACRONYMS
ADP Annual Development Plan
CIDP County Integrated Development Plan
CPSB County Public Service Board
ECDE Early Childhood Development Education
CFSP County Fiscal Strategy Paper
FY Financial Year
ICT Information Communication Technology
KeNHA Kenya National Highway Authority
KERRA Kenya Rural Roads Authority
KURA Kenya Urban Roads Authority
MTEF Medium Term Expenditure Framework
MTP Medium Term Plan
PFMA Public Finance Management Act
CBO Community based organization
NGO Non Governmental Organization
TOWA Total War against AIDS

9
CHAPTER ONE: INTRODUCTION AND COUNTY BACKGROUND
1.1 Introduction
Article 126(1) of the Public Finance Management Act 2012, requires that County
Governments prepare Annual Development plans, which become the guiding development
blueprints in any given financial year. The ADP should include priorities for the medium
term that reflects the county government’s priorities and plans, a description of how the
county government is responding to changes in the financial and economic environment and
the programmes to be delivered in each financial year. the programmes to be delivered should
include details like the strategic priority to which the programme will contribute,services or
good to be provided, measurable indicators of performance where feasible and the budget
allocated to each programme.
1.2 County Background Information
1.2.1 Position and Size
Kiambu County is one of the 47 counties in the Republic of Kenya. It is located in the central
region and covers a total area of 2,543.5 Km2 with 476.3 Km2 under forest cover according to
the 2009 Kenya Population and Housing Census. Kiambu County borders Nairobi and
Kajiado Counties to the South, Machakos to the East, Murang‘a to the North and North East,
Nyandarua to the North West, and Nakuru to the West as indicated in Map 1. The county lies
between latitudes 00 25‘ and 10 20‘ South of the Equator and Longitude 360 31‘ and 370 15‘
East.
1.2.2 Physiographic and Natural Conditions
1.2.2.1 Physical & Topographic Features
Kiambu County is divided into four broad topographical zones viz, Upper Highland, Lower
Highland, Upper Midland and Lower Midland Zone. The Upper Highland Zone is found in
Lari Constituency and it is an extension of the Aberdare ranges that lies at an altitude of
1,800-2,550 metres above sea level. It is dominated by highly dissected ranges and it is very
wet, steep and important as a water catchment area. The lower highland zone is mostly found

10
in Limuru and some parts of Gatundu North, Gatundu South, Githunguri and Kabete
constituencies. The area is characterized by hills, plateaus, and high-elevation plains. The
area lies between 1,500-1,800 metres above sea level and is generally a tea and dairy zone
though some activities like maize, horticultural crops and sheep farming are also practiced.
There are also large plantations of pineapples owned by Del Monte in parts of Thika sub
county.
The upper midland zone lies between 1,300-1,500 metres above sea level and it covers mostly
parts of Juja and other constituencies with the exception of Lari. The landscape comprises of
volcanic middle level uplands. The lower midland zone partly covers Thika Town
(Gatuanyaga), Limuru and Kikuyu constituencies. The area lies between 1,200-1,360 metres
above sea level. The soils in the midland zone are dissected and are easily eroded. Other
physical features include steep slopes and valleys, which are unsuitable for cultivation. Large
parts of Lari, Gatundu north and south sub counties are covered by forests.
The county is covered by three broad categories of soils which are: high level upland soils,
plateau soils and volcanic footbridges soils. These soils are of varying fertility levels with
soils from high-level uplands, which are from volcanic rocks, being very fertile. Their fertility
is conducive for livestock keeping and growth of various cash crops and food crops such as
tea, coffee, horticultural products, pyrethrum, vegetables, maize, beans, peas and potatoes.
These soils are found in the highlands, mostly in Gatundu South, Gatundu North, Githunguri,
Kiambu, Kiambaa, Lari, Kikuyu, Kabete and Limuru Constituencies. Low fertility soils are
mainly found in the middle zone and the eastern part of the county which form part of the
semi-arid areas. The soils are sandy or clay and can support drought resistant crops such as
soya beans and sunflower as well as ranching. These soils are mostly found in parts of Juja,
Thika Town, Ruiru, Kabete, Limuru, Gatundu North and Gatundu South Constituencies.
Most parts of the county are covered by soils from volcanic footbridges. These are well
drained with moderate fertility. They are red to dark brown friable clays, which are suited for
cash crops like coffee, tea and pyrethrum. However, parts of Thika Town, Ruiru, Juja and
Lari constituencies are covered by shallow soils, which are poorly drained, and these areas

11
are characterized by low rainfall, which severely limits agricultural development, although
they are suitable for ranching and growth of drought resistant crops.
Map 1: Location of Kiambu County in Kenya

12
1.2.2.2 Ecological Conditions
Water in the county is from two principal sources- surface and sub-surface. About 90 percent
of the county‘s water resource comprises of both surface water resources and ground water
potential. The county is divided into several sub-catchments areas. The first one is Nairobi
River Sub-catchment which occupies the southern part of the county with the major rivers
being Nairobi, Gitaru, Gitahuru, Karura, Ruirwaka, and Gatharaini. The second one is Kamiti
and Ruiru Rivers Sub-catchment which is located to the north of the Nairobi river sub-
catchment. It has eight permanent rivers which include Riara, Kiu, Kamiti, Makuyu, Ruiru,
Bathi, Gatamaiyu and Komothai. The third one is the Aberdare plateau that contributes to the
availability of two sub-catchments areas comprising of Thiririka and Ndarugu Rivers. The
main streams found in the two areas include Mugutha, Theta, Thiririka, Ruabora, Ndarugu
and Komu. They flow from Nairobi, Kamiti, Ruiru, Thiririka, and Ndarugu sub-catchments to
form Athi River sub-catchment. The fourth is the Chania River and its tributaries comprising
of Thika and Kariminu Rivers which rise from the slopes of Mt. Kinangop in the Aberdares
range. Last one is Ewaso Kedong sub catchment which runs in the North-South direction and
occupies the western part of the county. It has several streams that normally form swamps.
1.2.2.3 Climatic Conditions
The county experiences bi-modal type of rainfall. The long rains fall between Mid-March to
May followed by a cold season usually with drizzles and frost during June to August and the
short rains between Mid-October to November. The annual rainfall varies with altitude, with
higher areas receiving as high as 2,000 mm and lower areas of Thika Town constituency
receiving as low as 600 mm. The average rainfall received by the county is 1,200 mm.
The mean temperature in the county is 26o C with temperatures ranging from 7oC in the upper
highlands areas of Limuru and some parts of Gatundu North, Gatundu South, Githunguri and
Kabete constituencies, to 340C in the lower midland zone found partly in Thika Town
constituency (Gatuanyaga), Kikuyu, Limuru and Kabete constituencies (Ndeiya and Karai).
July and August are the months during which the lowest temperatures are experienced,
whereas January to March are the hottest months. The county‘s average relative humidity

13
ranges from 54 percent in the dry months and 300 percent in the wet months of March up to
August.
1.2.3 Administrative and Political Units
This section provides information on the administrative subdivisions including the area by
sub counties.
1.2.3.1 Administrative Units
Currently, the County is divided into twelve (12) sub-counties namely Limuru, Kikuyu,
Kabete Lari, Gatundu South, Gatundu North, Githunguri, Kiambu, Kiambaa, Ruiru, Juja and
Thika Town. These are further divided into 60 wards.
Table 1: Area of the County by Sub Counties
Sub County Area (km2) No. of Wards
Gatundu South 192.4 4
Gatundu North 286.0 4
Ruiru 201.4 8
Thika Town 217.5 5
Juja 326.6 5
Githunguri 173.5 5
Kiambu 105.9 4
Kiambaa 83.2 5
Limuru 281.7 5
Kikuyu 175.7 5
Kabete 60.3 5
Lari 439.2 5
TOTAL 2543.5 60
Source: Kiambu County Economic Planning Unit, 2013

14
Map 2: Administrative Subdivisions of Kiambu County
1.2.4 Demographic Features
1.2.4.1 Population Size and Composition
According to the 2009 Kenya Population and Housing Census, Kiambu County population
for 2012 was projected to be 1,766,058 with 873,200 males and 892,857 females. Further, the
population is expected to reach 2,032,464 people by the end of 2017. This is influenced by
the county‘s high population growth rate, which is at 2.81 per cent and the influx of people
working in the city who prefer to stay in Kiambu and its environs where there is less
congestion and well developed infrastructure.
In terms of gender, the sex ratio of male to female is approximately 1:1.02.
The table below gives population projections for 2012, 2015 and 2017 by gender and
different age cohorts using 2009 as the base year.

15
Table 2: Population Projections by Age Cohort
AGE
GROUP
2009 CENSUS 2012 PROJECTIONS 2015 PROJECTIONS 2017 PROJECTIONS
MALE FEMALE TOTAL MALE FEMALE TOTAL MALE FEMALE TOTAL MALE FEMALE TOTAL
0-4 102,566 101,269 203,835 111,587 110,176 221,763 121,402 119,867 241,269 128,420 126,796 255,216
05-09 93,358 92,840 186,198 101,569 101,006 202,575 110,503 109,890 220,393 116,891 116,242 233,133
10-14 84,262 85,230 169,492 91,673 92,726 184,400 99,736 100,882 200,619 105,502 106,714 212,216
15-19 71,345 77,095 148,440 77,620 83,876 161,496 84,447 91,253 175,700 89,329 96,529 185,858
20-24 82,088 97,187 179,275 89,308 105,735 195,043 97,163 115,035 212,198 102,780 121,685 224,465
25-29 84,618 90,428 175,046 92,061 98,382 190,442 100,158 107,035 207,193 105,948 113,222 219,170
30-34 72,159 68,700 140,859 78,506 74,743 153,248 85,411 81,317 166,727 90,348 86,017 176,366
35-39 58,391 53,513 111,904 63,527 58,220 121,747 69,114 63,340 132,455 73,110 67,002 140,112
40-44 42,264 39,008 81,272 45,981 42,439 88,420 50,026 46,172 96,197 52,918 48,841 101,758
45-49 34,363 31,417 65,780 37,385 34,180 71,566 40,674 37,187 77,860 43,025 39,336 82,361
50-54 22,379 20,781 43,160 24,347 22,609 46,956 26,489 24,597 51,086 28,020 26,019 54,039
55-59 16,784 15,891 32,675 18,260 17,289 35,549 19,866 18,809 38,676 21,015 19,897 40,911
60-64 13,125 13,164 26,289 14,279 14,322 28,601 15,535 15,582 31,117 16,433 16,482 32,916
65-69 8,389 10,210 18,599 9,127 11,108 20,235 9,930 12,085 22,015 10,504 12,784 23,287
70-74 6,298 7,742 14,040 6,852 8,423 15,275 7,455 9,164 16,618 7,886 9,694 17,579
75-79 3,891 5,342 9,233 4,233 5,812 10,045 4,606 6,323 10,929 4,872 6,689 11,560
80+ 5,792 10,474 16,266 6,301 11,395 17,697 6,856 12,398 19,253 7,252 13,114 20,366
NS 537 382 919 584 416 1,000 636 452 1,088 672 478 1,151
TOTAL 802,609 820,673 1,623,282 873,203 892,855 1,766,058 950,005 971,387 1,921,392 1,004,924 1,027,542 2,032,466
Source: Kiambu County Planning Unit, 2013
From Table 2, it is clear that in ages 0–4, and 5 – 9, the population of males is more than that
of females while from age 10 to age 30 years females are more than males. However, from
age 30 to 60 years, the population of males is more than that of females. This could be
attributed to the fact that the county is a peri-urban area and thus there is an influx of people
in this age group who work in Nairobi but reside in Kiambu County. Table 3 gives population
projections for special age groups for both males and females using 2009 as the base year.

16
Table 3: Population Projections for Selected Age Groups
2009 Census 2012 Census 2015 Projections 2017 Projections
AGE Male Female Total Male Female Total Male Female Total Male Female Total
Under 1 22,091 22,084 44,175 23,812 23,804 47,616 25,666 25,658 51,324 26,982 26,973 53,955
Under 5 102,566 101,269 203,835 110,554 109,156 219,711 119,165 117,658 236,822 125,274 123,690 248,965
Pre-
School
(3-5)
40,985 40,280 81,265 44,177 43,417 87,594 47,618 46,799 94,416 50,059 49,198 99,257
Primary
School
(6-13)
124,689 125,369 250,058 134,400 135,133 269,534 144,868 145,658 290,526 152,295 153,126 305,422
Seconda
ry
School
(14-17)
58,375 60,926 119,301 62,921 65,671 128,593 67,822 70,786 138,608 71,299 74,415 145,715
Youth
Populati
on (15-
29)
223,074 249,671 472,745 240,448 269,116 509,564 259,175 290,076 549,251 272,463 304,949 577,412
Reprodu
ctive age
(15-49)
- 437,297 - - 471,356 - - 508,067 - - 534,116 -
Labour
Force
(15-64)
475,149 486,112 961,261 512,156 523,972 1,036,12
8
552,044 564,782 1,116,826 580,348 593,739 1,174,087
Aged
Populati
on (65+)
24,907 34,150 59,057 26,847 36,810 63,657 28,938 39,677 68,614 30,421 41,711 72,132
Source: Kiambu County Planning Unit, 2013
Under 1 year
In 2009, the population of this age group was 44,175 as indicated in Table 3. This represents
2.72 percent of the total population. The population was projected to be 47,617 in 2012,
whereby in 2015, the population is projected at 51,324 and 53,955 in 2017. This implies that

17
child survival strategies should be enhanced to reduce infant mortality such as improved
nutrition measures to enhance better health for the infants.
Under 5 years
The population of children less than 5 years was 203,835 in 2009. This forms 12.6 percent of
the total population. This population was projected to be 219,711 children by 2012. By 2015,
the population is projected to reach 236,822 children and 248,965 children in 2017. The
projected growth of children in this segment of the population implies that more Early
Childhood Development (ECD) centres and programmes should be developed to meet the
increasing population.
Pre – Primary School Age (3 – 5 years)
In 2009, the population of this age group was 81,265 which represent 5.01 percent of the total
county population as indicated in Table 3. This population was projected to be 87,594 by
2012. By 2015, it is projected to be 94,416 and 99,257 in 2017. There are 1,063 private ECD
centres and 532 public ECD centres. There is need for more ECD centres, especially public,
and more qualified teachers to handle this increasing population. The existing public ECD
centers are dilapidated and they need refurbishements. Most of the existing latrines are
sinking and we need to put up modern toilettes to improve hygiene during this tender age.
Primary School Age (6–13 years)
In 2009, the population of this age group was 250,058 as indicated in Table 3. This represents
15.44 percent of the total county population. The population was estimated to be 269,534 in
the year 2012, and 290,526 by 2015 and 305,422 at the end of 2017. This increase is likely to
create pressure on the available education facilities in the county. The implication is that
more primary schools would have to be constructed and more teachers employed to cater for
the increasing number of children in this age-group. The existing infrastructure is in bad state
and it requires refurbishment.

18
Secondary School Age (14–17 years)
The population of the secondary school going age as at 2009 was at 119,301. This age group
forms 7.4 percent of the total population. It was projected to reach 128,593 in the year 2012,
138,608 in 2015 and 145,715 people in 2017. This will require additional physical facilities
for secondary schools and employment of more teachers. In addition, the county would be
required to improve on the facilities available in vocational training centres and the youth
polytechnics.
Youth Age Group (15–29 years)
In 2009, the population of the youth was 472,745 and was expected to reach 509,564 in 2012,
549,251 in 2015 and 577,412 by the end of year 2017. The youth forms 29.1 percent of the
total county population. To cater for this population, more investment in vocational trainings,
youth empowerment centres and tertiary institutions is crucial so as to equip the youth with
necessary skills and knowledge for gainful employment and job creation. In addition,
institutions of higher learning such as technical colleges will need to be equipped and
upgraded to offer competitive skills particularly to those who cannot proceed to the
university. There is also need to create facilitative mechanisms for the youth to access loans
such as those available through the Youth Enterprise Fund to assist them engage in income
generating activities rather than joining illegal groupings or engaging in drug and substance
abuse.
Female Reproductive Age Group (15–49 years)
The female in the reproductive age (15-49 years) form 26.9 percent of the total population.
This population was 437,297 in 2009 and was expected to reach 471,356 in the year 2012,
508,067 in 2015 and 534,116 in 2017. This increase indicates a need for intensive family
planning campaigns in the county to address the high population growth rates. There is need
to have health facilities which are well equipped and with adequate staff who are
knowledgeable about family planning methods and techniques. This will ensure that they are
able to handle equipment related to family planning so as to increase and improve maternal
and child health care services. Nutrition standards need to be improved in areas of the county

19
considered to be poor through proper utilization of the resources available. There will be need
to make deliberate efforts to invest resources in food-deficient areas in order to ensure food
security for the residents in these areas.
Labour Force (15–64 years)
In 2009, the labour force in the county was 961,261, which comprised of 475,149 males and
486,112 females which translates to 59.2 percent of the population. It was projected to rise to
1,036,128 in 2012, 1,116,826 in 2015 and 1,174,087 at the end of 2017. With the steady
growth of the labour force, there will be a major challenge of creating employment
opportunities especially in the formal sector. Employment in the formal sector has been on
the decrease with the only major employer being the informal Jua Kali‘ sector.
Aged Population (65 and above)
In 2009 this population was 59,057 in the entire county. This represents 3.64 percent of the
total population. In the year 2012, this population was projected at 63,657, and 68,614 in
2015 and 72,132 in 2017. This increase calls upon enhancement of the social security
programmes such as Cash Transfer Programme for the elderly to ensure their welfare is well
taken care of.
1.2.5 Population density and distribution
The 2009 Population and Housing Census indicate that the county had an urban population
of 936,411 in 2009 and in 2012 was projected to be 1,018,773. Urban population is expected
to reach 1,108,380 in 2015 and 1,172,453 by the end of 2017. The county urban population
distribution per urban centres is as illustrated in table 4 below which shows that Ruiru and
Kikuyu towns have the highest number of people living in urban areas, followed by Thika
and Karuri towns respectively. This high population in urban centres can be attributed to the
proximity of the county to Nairobi as most of the people work in Nairobi and reside in the
county. In addition, industrial development in some districts like Thika West and Ruiru
attract more labour force. In these areas, urban planning should be effectively undertaken to
avoid strain on the physical amenities from growth of informal settlements. In addition,
community policing should be enhanced to reduce insecurity. Also, more infrastructural

20
facilities like transport network, housing, schools and health centres should be built. The
population distribution by urban centres is shown below.
Table 4: Population Projections by Urban Centres
2009 Census 2012 Census 2015 Projections 2017 Projections
Town Male Female Total Male Female Total Male Female Total Male Female Total
Gatundu 2,580 2,970 5,550 2,807 3,231 6,038 3,054 3,515 6,569 3,230 3,719 6,949
Githung
uri 4,843 5,164 10,007 5,269 5,618 10,887 5,732 6,112 11,845 6,064 6,466 12,529
Juja 20,488 19,958 40,446 22,290 21,713 44,003 24,251 23,623 47,874 25,652 24,989 50,641
Limuru 39,433 40,098 79,531 42,901 43,625 86,526 46,675 47,462 94,137 49,373 50,206 99,579
Kiambu 41,247 42,908 84,155 44,875 46,682 91,557 48,822 50,788 99,610 51,644 53,724 105,368
Karuri 53,735 53,981 107,716 58,461 58,729 117,190 63,603 63,894 127,498
67,280 67,588 134,868
Thika 68,408 68,509 136,917 74,425 74,535 148,960 80,971 81,090 162,061
85,652 85,778 171,430
Ruiru 119,147 119,711 238,858 129,627
130,240 259,867 141,028 141,696 282,723
149,181
149,887 299,067
Kikuyu 114,357 118,874 233,231 124,415
129,330 253,745 135,358 140,705 276,063
143,183
148,839 292,022
Total 464,238 472,173 936,411 505,07
0 513,703 1,018,77
3 549,494 558,886 1,108,
380 581,26
0 591,195 1,172,454
Source: Kiambu District Planning Unit, 2011
Kabete Constituency has the highest population density which currently is 2,534 persons/Km2
followed by Kiambaa Constituency which has 2,153 persons/Km2. This is due to their proximity to
the city of Nairobi. The least densely populated constituency is Lari with 307 persons/Km2, mainly
due to the fact that a considerable part of the constituency is covered by forests. High population
density exerts pressure on the available land leading to subdivision of land into uneconomical units.

21
Table 5: Population Distribution and Density by Constituency
2009 Census 2012 Census 2015 Projections 2017 Projections
Population Density
(Km2) Population Density
(Km2) Population Density
(Km2) Population Density
(Km2)
Gatundu
South 114,180 593 124,223 645 135,149 702 142,962 742
Gatundu
North 100,611 352 109,460 383 119,088 417 125,972 441
Juja 118,793 365 129,241 397 140,609 432 148,737 457
Thika
Town 165,342 760 179,885 827 195,706 900 207,020 952
Ruiru 201,986 1,003 219,752 1,091 239,080 1,187 252,901 1,256
Githunguri 147,763 852 160,760 927 174,899 1,008 185,010 1,067
Kiambaa 145,053 1,979 157,811 2,153 171,691 2,342 181,617 2,478
Kiambu 108,698 1,026 118,259 1,116 128,660 1,214 136,098 1,285
Kabete 140,427 2,329 152,778 2,534 166,216 2,757 175,825 2,916
Kikuyu 125,402 713 136,432 776 148,432 844 157,012 893
Limuru 131,132 466 142,666 507 155,214 552 164,187 583
Lari 123,895 282 134,792 307 146,648 334 155,125 353
Total 1,623,282 638 1,766,058 694 1,921,392 755 2,032,466 799
Source: Kiambu District Planning Unit, 2011 Table 6 gives population projections by constituency from the baseline year 2009 to 2017.
Table 6: Population Projections by Constituency
2009 Census 2012 Census 2015 Projections 2017 Projections
Male Female Total Male Female Total Male Female Total Male Female Total

22
Gatundu
South 54,995 59,185 114,180 59,832 64,391 124,223 65,095 70,054 135,149 68,858 74,104 142,962
Gatundu
North 48,727 51,884 100,611 53,013 56,447 109,460 57,676 61,412 119,088 61,010 64,963 125,972
Juja 60,114 58,679 118,793 65,401 63,840 129,241 71,154 69,455 140,609 75,267 73,470 148,737
Thika
Town 82,680 82,662 165,342 89,952 89,933 179,885 97,864 97,843 195,706 103,521 103,499 207,020
Ruiru 101,257 100,729 201,986 110,163 109,589 219,752 119,853 119,228 239,080 126,781 126,120 252,901
Githunguri 72,845 74,918 147,763 79,252 81,507 160,760 86,223 88,676 174,899 91,207 93,803 185,010
Kiambaa 72,421 72,632 145,053 78,791 79,020 157,811 85,721 85,971 171,691 90,676 90,941 181,617
Kiambu 53,375 55,323 108,698 58,070 60,189 118,259 63,177 65,483 128,660 66,829 69,268 136,098
Kabete 69,186 71,241 140,427 75,271 77,507 152,778 81,892 84,324 166,216 86,626 89,199 175,825
Kikuyu 61,184 64,218 125,402 66,565 69,866 136,432 72,420 76,011 148,432 76,607 80,406 157,012
Limuru 65,193 65,939 131,132 70,927 71,739 142,666 77,165 78,048 155,214 81,626 82,560 164,187
Lari 60,632 63,263 123,895 65,965 68,827 134,792 71,767 74,881 146,648 75,916 79,210 155,125
Total 802,609 820,673 1,623,282 873,203 892,855 1,766,058 950,005 971,387 1,921,392 1,004,924 1,027,542 2,032,466
Source: Kiambu District Planning Unit, 2011
Ruiru constituency had the highest population with a total of 219,752 people while Gatundu
North constituency had the lowest population of 109,460 people. The county‘s population is
projected to be 1,921,392 in 2015, and 2,032,466 in 2017.
1.2.5 Human Development Indicators
The human development approach emerged in response to the growing criticism of the use of
economic development as a measure in the standard of living. The approach examines
broader human development issues and is concerned with both building up human
capabilities and with using those human capabilities fully. It underlines the expansion of
opportunities so that the disadvantaged can do more for themselves through economic, social
and political empowerment.

23
Human development approach recognizes that there is no automatic link between economic
growth and human development. The link has to be made through deliberate policies at all
levels. Economic growth is a necessary but not sufficient prerequisite to enlarge human
choices .Economic growth provides resources to support health care, education, and
advancement in other Millennium Development Goals (MDGs). In turn, achievements in
human development make critical contribution in assuring quality human capital to spur
economic growth via productivity gains.
The use of human development Index (HDI), normally in the Hunan Development Reports
(HDR) measure a country‘s development which is a composite index measuring average
achievement in three basic dimensions of human development to reflect a country‘s
achievements in health and longevity (as measured by life expectancy at birth), education
(measured by adult literacy and combined primary, secondary, and tertiary enrolments), and
living standard (measured by GDP per capita in purchasing power parity terms).
Achievement in each area is measured by how far a country has gone in attaining the
following goal: life expectancy of 85 years, adult literacy and enrolments of 100 percent, and
real GDP per capita of $40,000 in purchasing power parity terms.
National human development reports provides a tool for analysis, reflecting people‘s
priorities, strengthening national capacities, engaging national partners, identifying inequities
and measuring progress at country level. The basic objectives of NHDRs are to raise public
awareness and trigger action on critical human development concerns, strengthen national
statistical and analytic capacity to assess and promote people-centred development; and shape
policies and programmes by providing options and broad recommendations based on concrete
analysis. It would be important in future, for counties to measure their development by
calculating and using the specific Human Development Index (HDI) and Gender
Development Index (GII)
1.2.5.1 Human Development Index
One of the main objectives under the Kenya‘s economic blue print, Vision 2030, is to provide
a high quality of life for all Kenyans. Various human development indices will be applied to

24
measure the broad level of social economic wellbeing. These indices uses three basic
dimensions namely education, health and income.
The HDI emphasizes that people and their capabilities should be the ultimate criteria for
assessing the development of a country and not economic growth alone since two
countries/regions with the same level of GNI per capita can end up with such different human
development outcomes.
The Constitution of Kenya, 2010 in Article 27 recognizes that measures should be put in
place to encourage affirmative action programmes and policies to address past inequalities.
Economic and social rights to all are also recognized in Article 43. These include the right to
health care services, adequate housing, and sanitation, adequate food of acceptable quality,
clean and safe water and appropriate social security to vulnerable groups in the society. The
6th Kenya Human Development Report of 2009, Introduced a new measure for youth
development in Kenya, the Youth Development Index (YDI). The index was at 0.5817
nationally but also depicted variations across the regions. The index is a composite of
education, income and survivorship (health) dimensions. Therefore, it is critical to look at
youth as a resource and a potential wealth for a nation. However, a large group of youths are
potentially at risk of engaging in harmful anti-social behaviours, including risky sexual
behaviour, substance use, and crime.
The constitution requires measures to be undertaken to ensure the youth access relevant
education and training, have opportunities to participate in political, social, economic
activities, and access to employment as well as protection from harmful cultural practices.
1.2.5.2 The Gender Inequality Index (GII)
It reflects gender-based disadvantage in three dimensions—reproductive health,
empowerment and the labour market. The index shows the loss in potential human
development due to inequality between female and male achievements in these dimensions. It
varies between 0—when women and men fare equally—and 1, where one gender fares as
poorly as possible in all measured dimensions. Kenya has an overall GII of 0.651(Draft 7th
Human Development Report). This is however, not equal everywhere as there are regional
25
disparities with counties located in Arid and Semi Arid Lands (ASALS) having high Gender
Inequality Indices. In addition, there are certain groups which are more likely to experience
poverty. These vulnerable groups include children living in poor households, the disabled and
the youth. Improving equity in gender issues and reducing gender disparities will benefit all
sectors and thus contribute to sustainable economic growth, poverty reduction and social
injustices.
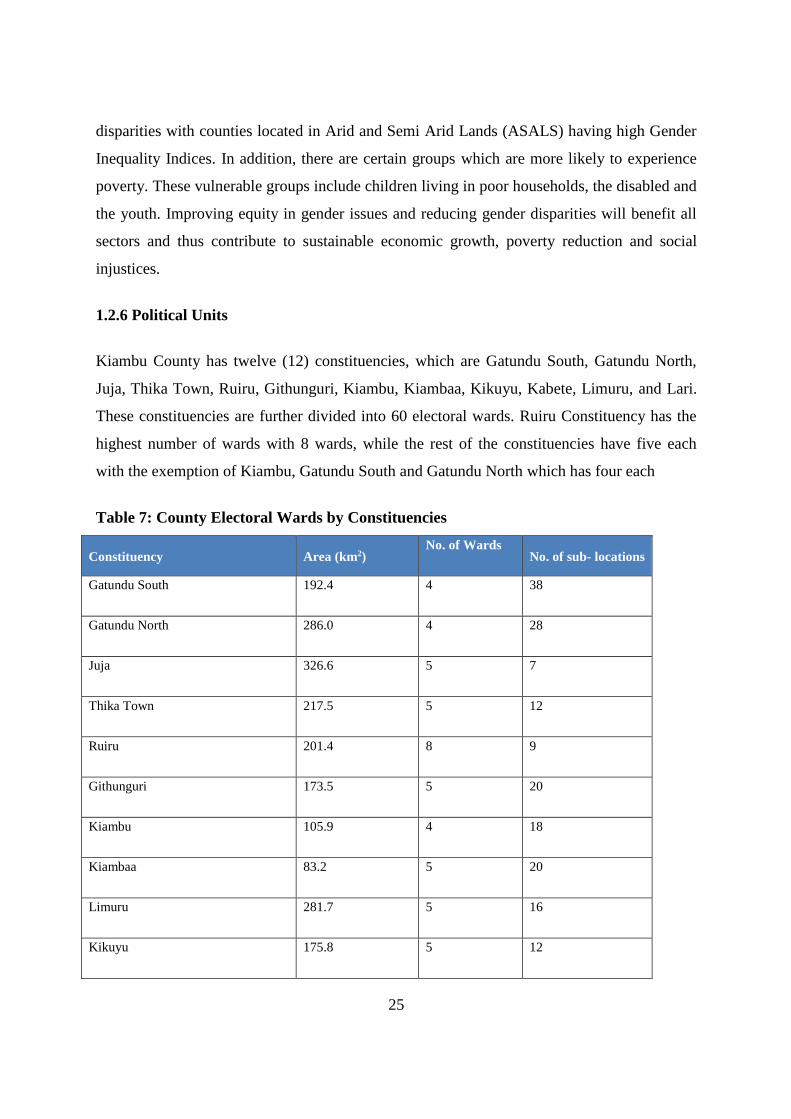
1.2.6 Political Units
Kiambu County has twelve (12) constituencies, which are Gatundu South, Gatundu North,
Juja, Thika Town, Ruiru, Githunguri, Kiambu, Kiambaa, Kikuyu, Kabete, Limuru, and Lari.
These constituencies are further divided into 60 electoral wards. Ruiru Constituency has the
highest number of wards with 8 wards, while the rest of the constituencies have five each
with the exemption of Kiambu, Gatundu South and Gatundu North which has four each
Table 7: County Electoral Wards by Constituencies
Constituency Area (km2) No. of Wards
No. of sub- locations
Gatundu South 192.4 4 38
Gatundu North 286.0 4 28
Juja 326.6 5 7
Thika Town 217.5 5 12
Ruiru 201.4 8 9
Githunguri 173.5 5 20
Kiambu 105.9 4 18
Kiambaa 83.2 5 20
Limuru 281.7 5 16
Kikuyu 175.8 5 12

26
Kabete 60.3 5 13
Lari 439.2 5 40
TOTAL 2543.5 60 233
Source: 2009 Kenya Population and Housing Census
1.2.6.1 Eligible and Registered Voters by Constituency
The county has a total of 860,716 registered voters against an estimated number of 980,049
voters. Ruiru constituency has the highest number of registered voters while Gatundu North
constituency has the lowest as at 18th December 2012.
Table 8: Number of Registered and Eligible Voters by Constituencies (as at 18th
December 2012)
Constituency Eligible Voters Number of Registered Voters
Gatundu South 64,192 58,183
Gatundu North 55,967 53,259
Juja 75,178 72,000
Thika Town 103,138 104,204
Ruiru 125,085 112,266
Githunguri 86,784 77,396
Kiambu 69,598 58,517
Kiambaa 88,741 70,087
Kabete 88,761 62,174
Kikuyu 80,736 65,235
Limuru 75,231 68,411

27
Lari 66,638 58,984
TOTAL 980,049 860,716
1.2.7 Infrastructure and Access
1.2.7.1 Road and Rail Network
The county has a good road network. It has a total of 2,033.8 km of roads under bitumen
standards, 1,480.2 km under gravel surface and 430.1 km under earth surface. There is a great
need in improving the condition of the roads since during the rainy season, most of the roads
become impassable. However, the terrain poses a great challenge for road maintenance. There
has been a lot of improvement in the roads subsector with the example of Thika-Nairobi
highway.
It also has 131 km of railway line and four railway stations in Ruiru, Thika, Kikuyu and
Limuru towns. The rail is not fully utilized in the county and only passenger trains operate in
the morning and evenings between the City of Nairobi and the four stations. However, there
is a great potential in the sector and hence efforts need to be put in place to ensure the
infrastructure is improved which will encourage introduction of modern efficient trains.
1.2.7.2 Posts and Telecommunications
Kiambu County is well covered by mobile network which is estimated at 98 percent even
though landline coverage is very poor with only 214 connections in the entire county. This
might be attributed to the fact that landlines are becoming obsolete and have a high
maintenance cost. There are 19 post offices and 14 sub-post offices which are fairly
distributed within the county. Distances to the nearest post office vary from one part of the
county to another. Most of the residents (70.4 percent) are within the range of 5 Km and
above while 22.5 percent of the population are in the range of 1.1-4.9 Km and only 7.2
percent of the residents are within the range of 0-1 Km. Currently there are 149 cyber cafes

28
and eight private courier services operating within the county which are mostly located in the
urban centres of Thika, Ruiru, Karuri, Kiambu, Limuru and Kikuyu.
1.2.7.3 Financial Institutions
There are a total of 17 commercial banks with branches well distributed within the county. In
addition, there are eight microfinance institutions, one building society, four village banks
and 12 insurance companies. The institutions are well distributed within the county and hence
they are easily accessible. This is an indication of vibrant economic activities that are able to
sustain the financial sector making it one of the fastest growing sectors in the county over the
last five years.
1.2.7.4 Education Institutions
The county is well endowed with education institutions which are well distributed within the
county. It has about 1,595 ECD centres out of which 1,063 are private and 532 are public.
They are well distributed within the county and hence children do not have to travel long
distances. The county has 934 primary schools which are equally distributed between the
private and the public where each category has 467 schools. There are 303 secondary schools
out of which 227 are public and 76 are Private. The County has one public University, Jomo
Kenyatta University of Agriculture and Technology located in Juja Constituency and two
satellite campuses namely University of Nairobi, Kikuyu campus in Kikuyu sub county and
Kenyatta University , Ruiru campus in Ruiru Sub County. There are six private universities
which include Gretsa University, Mount Kenya University, St. Paul‘s University, Kiriri
Women‘s Science and Technology University and Presbyterian University of East Africa,
Zitech University in Ruiru and a number of tertiary colleges. The county has some of the best
national secondary schools such as Alliance Boys High School, Alliance Girls School, Loreto
Girls High School, Limuru Girls High School, Mary Hill Girls and Mangu High School. This
does not give the county any advantage as the schools admit pupils from the entire nation. It
therefore implies that great efforts need to be put in place to ensure performance at the
primary level is improved hence giving a chance for majority of pupils within the county to
exploit the opportunities available in the national schools, locally and around the nation.

29
1.2.7.5 Energy Access
The main source of cooking energy in the county is firewood which accounts for about 47.3
percent, while paraffin is the major source of lighting fuel. This poses a great challenge to the
realization of 10 percent forest cover within the county. Connection to the national grid is
good with 98 percent of all trading centres connected and only 4 percent of public institutions
currently not connected. However, connection to individual homes is low and there is need
for up-scaling of the rural electrification programme. Kiambu County is endowed with a
number of big rivers which can be exploited for power generation. As indicated in the photo
below the presence of fourteen falls and a number of other small falls like Thika falls presents
a big opportunity for hydropower generation, as the country gears towards adoption of green
energy.
1.2.7.6 Markets and Urban Centres
The county has a total of 2,517 trading centres with 6,634 registered retail traders and 750
registered wholesale traders. There are also a number of urban centres with the largest being
Thika Town which is one of the largest industrial towns in the country. Other urban centres
include Kiambu in Kiambu Sub county, Karuri in Kiambaa sub county, Kikuyu in Kikuyu
sub county, Limuru in Limuru Sub County Gatundu in Gatundu South sub county and Ruiru
in Ruiru Sub County.
1.2.7.7 Housing
According to 2009, Kenya Population and Housing Census, 48.3 percent of all homes in the
county are stone –walled, 4.9 percent are brick/block, 4.8 percent are mud/wood. There are
74.6 percent of the houses that have cemented floors and 87.5 percent have corrugated iron
sheets. Only 0.1 percent has used other forms of roofing materials. The proximity of the
county to the city of Nairobi has seen transformation of large pieces of land into residential
houses. The presence of good all weathered roads have given an opportunity to those working
in Nairobi to reside within the county. This has led to the establishment of residential estates
with the Tatu city being one of the major housing projects currently under implementation.

30
1.2.8 Land and Land Use
1.2.8.1 Mean holding size
The size of arable land in the county is 1,878.4 Km2 and the non-arable land is 649.7 Km2
and 15.5 Km2 is under water mass. The average holding size of land is approximately 0.36
Ha on small scale and 69.5 Ha on large scale. The small land holdings is mostly found in
upper parts of Gatundu North, Gatundu South, Kiambaa, Limuru and Kikuyu constituencies.
The fragmentation of the land has made it uneconomical and hence majority of the farmers
are converting their farms into residential plots to supplement the meagre income from the
farms. The large land holdings are usually found in the lower parts of the county especially in
Juja constituency and the upper highlands in Limuru and Lari constituencies.
1.2.8.2 Percentage of land with title deeds
Plans indicated that 85 percent of the population with land in the county have title deeds to
their land and there are no recorded cases of incidences of landlessness. The remaining 15
percent have not received their title deeds due to unfinished land adjudication process and
non payment of the necessary levies.
1.2.9 Community Organizations/Non –State Actors
1.2.9.1 Co-operative Societies
The co-operative movement in the county is well established with societies covering several
sectors. The county has 254 active co-operatives societies and 22 dormant ones. The total
membership is 258,198 and the annual turnover is approximately KShs. 5,069,560,000. Types
of co-operatives found in the county include dairy co-operatives, coffee co-operatives,
transport SACCOs and housing SACCOs among others. The marketing co-operatives are
engaged in production, processing and marketing of members‘ produce. The savings and
credit co-operative societies give loans to members at affordable interest rates.

31
1.2.9.2 Non – Governmental Organizations
The county has about 38 Non Governmental Organisations that operate in the entire county.
However there is greater concentration in Kiambu and Thika towns within Kiambaa and Juja
constituencies. Majority of them, concentrate in the fight against HIV and AIDS, children
welfare and women empowerment.
1.2.9.3 Self Help, Women and Youth Groups
The county boasts of having one of the biggest numbers of registered Community Based
Organizations (CBO‘s). Though actual data is not available, they are estimated to be more
than 10,000. The groups are engaged in a wide variety of activities which include: Micro-
finance, HIV and AIDS, Drugs and substance abuse campaign, Environmental conservation,
Training and advocacy and other income generating activities. The county has over 3,746
active women groups and 1,664 youth groups.
Through these groups, women and youths are able to access loans through the Women
Enterprise Fund and Youth Enterprise Fund that assist them to engage in income generating
activities. Over 467 youth groups have already benefited from the Fund, while a total of 1,193
women groups have benefited from the Women Enterprise Fund. The youths engage in
activities such as Jua kali sector, Micro-Finance (Revolving Loan Fund), HIV and AIDS and
drug abuse campaign and Home Based Care, Environmental conservation e.g. tree planting,
training and advocacy, entertainment, drama and theatre and income generating activities.
1.2.10 Crop and Livestock Production
1.2.10.1 Main Crops Produced
Agriculture is the predominant economic activity in the county and contributes 17.4 per cent
of the county‘s population income. It is the leading sub sector in terms of employment, food
security, income earnings and overall contribution to the socio-economic well being of the
people. Majority of the people in the county depend on the sub sector for their livelihood,
with 304,449 directly or indirectly employed in the sector. Coffee and tea are the main cash
crops in the county. The main food crops grown in the county are maize, beans, pineapples

32
and irish potatoes. These are mainly grown in small scale in the upper highlands of Limuru,
Kikuyu, Gatundu North and South Constituencies
1.2.10.2 Acreage under Food Crops and Cash Crops
The county has a total arable land of 1,878.4 Km2 of which a total of 21,447 Ha is under food
crops and a total of 35,367.41 Ha is under cash crops. The main food crops grown in the
county include maize, beans, irish potatoes and cabbages. Coffee and tea form the major cash
crops grown in the county especially in the upper and lower highlands. Pineapples are also
being produced in large quantities in the county especially in Gatundu North and South
Constituencies.
1.2.10.3 Average Farm Sizes
With the increased population growth, there has been continuous decrease in average farm
sizes. Currently the average farm size under small scale farming is 0.36 Ha and 69.5 Ha under
large scale farming. The areas with small land holdings are mostly found in the upper parts of
Gatundu North, Gatundu South, Kiambaa, Limuru and Kikuyu constituencies.
1.2.10.4 Main Storage Facilities
The main storage facilities of the food crops are the National Cereals and Produce Board
silos, on-farm storage, granaries and also in-house storage. Due to the fact that farms have
been subdivided into small units, majority of the food crops produced is consumed within the
family and hence no problems associated with storage have been documented.
1.2.10.5 Main Livestock Bred
According to 2009 Population and Housing Census, the numbers of livestock in the county
were as follows: 230,294 cattle, 120,056 Sheep, and 89,817 goats. In addition, there were
2,600,837 poultry, 46,493 pigs, 13,662 donkeys and 127 camels. In the year 2010, the county
produced 267.5 million Kgs of milk valued at Kshs. 5.0 billion; and 36.2 million Kgs of beef
valued at Kshs. 6.5 billion. Production of mutton was at 106,686 Kgs valued at Kshs. 42.7
33
million. Further, the county recorded production of 266.9 million Kgs of eggs, valued at
Kshs. 699.2 million; poultry meat produced was 76.2 million Kgs, valued at Kshs. 142.9
million, honey produced was 134,332 Kgs valued at Kshs. 67.2 million and 1.8 million Kgs
of pork valued at Kshs. 631.1 million. Growth in this sub-sector has been encouraged by a
ready urban market in Thika, Ruiru, Kiambu and Nairobi and the availability of local food
processing factories such as Farmers´ Choice Ltd, Kenchic Co. Ltd, Brookside Dairies,
Githunguri Dairies, Ndumberi Dairies, Limuru Milk and Palmside Dairies, among others.
There are no ranches within the county.
1.2.11 Forestry and Agro-Forestry
1.2.11.1 Main Forest Types and Size of Forests
The main forests types in the county are natural/indigenous and plantation forests. Exotics are
mainly planted in private farm forests but the data on the specific forest size is not available
though plans to carry out a survey are in process. The county has six obiliz forests with the
major ones being Kieni and Kinale forests occupying an area of 426.62 Km2.
1.2.11.2 Main Forest Products from Gazetted and Ungazetted Forests
The main products from gazetted forests are poles for transmission of electricity and
construction, timber and firewood. On the other hand, main products from un-gazzetted
forests (Farm Forests) include poles, timber (sawn timber), charcoal (mainly from wattle
trees) and firewood, honey, and fruits.
1.2.11.3 Promotion of Agro-forestry and Green Economy
The main income generating activity in the county is commercial forestry where farmers
plant trees for commercial purposes in the form of timber and poles. Other activities that
generate income are tree nurseries where farmers sell tree seedlings. Dairy farmers also plant
fodder trees like Calleindra, Sesbania sesban, Leucaena leucacephella which they use to feed
their livestock. There is also bee keeping. Farmers also plant fruit trees where they produce
mangoes, avocados, macadamia, oranges, guava and loquats for sale.

34
The obilizati trees are planted around identified water catchment sites in order to protect these
areas. There is also the enforcement of Environmental Coordination and Management Act
(2002) and Forest Act 2005 to discourage cutting down of trees. This is expected to enhance
protection of water catchment areas. Efforts are being made to curb soil erosion in the county
through embracing the vision of attaining 10 percent forest cover from the current 6.5 percent
in the county. Efforts are being made to encourage farmers to plant 10 percent of total land
area with trees which can be fruit trees, fodder trees or any other plantation. This way, soil
erosion from water and wind is reduced as trees hold the soil together and act as wind
breakers. Degraded sites are also identified and planted with trees to rehabilitate them.
Industries are major consumers of wood fuel and this result to felling down of trees in large
quantities. To address this, some industries that have large parcels of land have established
woodlots plantations with fast growing tree species for provision of firewood. In this case,
there is need to encourage planting of eucalyptus trees in the upper zones to sell to industries.
For instance, Kieni forest has several hectares of eucalyptus trees which are sold to tea
factories around the area. The county is mainly agricultural and there is need to ensure
continuous improvement on soil fertility. In this regards, agro forestry trees like Calliandra
Calothyrsus and Leucaena species are grown in alley cropping for their nitrogen fixing
properties and cut back for green manure. These trees have deep roots and easily access
nutrients that are deep in the soil and pump the nutrients up to the leaves. Decayed
leaves/litter that has dropped from the trees also improves the soil fertility.
The public is also sensitized to grow Grevviea robusta in their farms which is good at
improving soil fertility. Fruits trees are planted in various parts of the county. Grafted fruit
trees are supplied to farmers and they are taught about their management. Fruits like
mangoes, guavas and avocadoes, plums, pears among others are grown and the fruits
consumed at household level and the surplus sold in the local market and in the neighboring
counties. This contributes to improvement in nutritional levels. Trees are also grown to act as
carbon sinks where different types of trees are planted within the county although
compensation through carbon trading has not started yet. However, plans are underway to
ensure carbon sinks available are exploited and carbon-trading mechanisms are put in place.
Trees are also used for beautification purpose. In the county, beautification activities include
trees planting in schools, urban tree planting in urban towns and road side tree planting along

35
roads and highways. These activities are done by the forestry department, schools, local
authorities, other organizations and volunteers such as NGOs, FBOs, CBOs, Self-help groups,
women and youth groups.
The county is known for its livestock production especially dairy farming. There is need
therefore to ensure adequate animal feeds production. The public through Ministry of
Agriculture, Ministry of Livestock Development and Kenya Forest Service through NALEP‘s
focal area approach have encouraged farmers to plant fodder trees which include Calleindra,
Sesbania sesban, Leucaena leucacephella especially for the dairy farmers. The county has
plenty of Croton megatocepus (mukinduri), Prunus africanum (muiri) and neem tree Melliaa
azandiachr which are of high value although extraction is done in small-scale. However, these
trees are endangered and must be protected. Therefore harvesting of the trees needed for
medicinal or other purposes have to be done with care so that the trees are not damaged.
Therefore people are first educated on how to harvest them in order to ensure conservation of
these trees.
1.2.12 Environment and Climate Change
1.2.12.1 Major Contributors to Environmental Degradation
Environmental degradation has been rampant in the county whereby there is massive felling
of trees in forests like Kinare forest, leading to high risk of soil erosion and desertification.
This has been brought about by increased population pressure and fuel demand by most
industries. The development of industries coupled with population pressure has significantly
increased the pollution levels including air pollution that the existing facilities are unable to
handle. Pollution especially from industries for example: tea factories and coffee industries
are real danger to the environment because of disposing effluents into air and the rivers in the
county. The poor farming methods, pesticides and chemicals used in agricultural activities
have also led to pollution of rivers and the environment. Other environment issues of concern
in the county include; the mushrooming of slums and destruction of water catchments areas
particularly because of farming on hillsides and on marginal areas.

36
1.2.12.2 Effects of Environmental Degradation
The degradation of the environment has resulted in soil erosion and decreased food
production. Pollution of rivers by factories may increase water borne diseases. Presence of
quarries in some parts of the county like Ndarugu and Kilimambogo has changed the
landscape leaving many openings which poses dangers to the motorists and residents.
Another challenge is related to insecurity where the openings have been used as hiding places
by thugs.
Another area of concern is solid waste management within the County where the established
dump sites are located near water bodies and pose great pollution threat. Community attitude
towards refuse dumping is very wanting as very few people take seriously responsibility of
their domestic waste.
Lack of sewerage systems within most of the urban areas despite the rapid increase in
population pose a great threat to environmental degradation. In most of the urban areas
residents dispose foul water in open drains which lead to bodies of water and generally
pollute the environment.
1.2.12.3 Climate Change and its Effects in the County
The main effect of climate change in the county is the unpredictability of the timing and
amount of rainfall received. However there is no documented evidence on the impact of the
climate change in the county and hence the need for a comprehensive study in order to adopt
effective strategies to address the problem.
1.2.12.4 Climate Change Mitigation Measures and Adaptation Strategies
In order to address the effects of climate change in the county, the following measures and
strategies should be in place. NEMA should enforce the Environment Management and
Coordination Act (EMCA) by ensuring that industries and other stakeholders operating
within the towns of the county treat their effluents to the required standards so as to reduce
pollution to the environment. All stakeholders should be sensitized to put proper and

37
sustainable environmental conservation measures to make the county environmentally clean.
This can be possible through the use of Institutions such as the National Soil and Water
Conservation Programme that uses individual farmer extension approach to teach farmers on
proper farming methods that lead to reduction in soil erosion and pollution from chemicals.
The County should emback on elaborate system to construct sewerage system in urban and
peri- urban areas. A county landfill should be constructed to deal with solid waste disposal.
1.2.13 Mining
1.2.13.1 Ongoing Activities
Mining involves extraction of minerals from the ground/earth. The main mining activities
include natural gas exploitation in Lari constituency by Carbacid Company Limited and
extraction of ballast, hardcore, gravel, murram, sand and building stones in darugo Juja,
Gatundu South and Gatundu North Constituencies.
1.2.13.2 Mining Potential
The arid parts of the county mainly Ndeiya and Karai in Limuru and Kabete constituencies
contain diatomite deposits that are unexploited. There is therefore great need for investment
in the area to determine economical viability of the deposits.
Exploration for other mineral deposits also needs to be enhanced to determine whether other
deposits are available especially in the arid areas of Ndeiya and Karai.
1.2.14 Tourism
1.2.14.1 Main Tourist Attractions, National Parks/Reserves
The county does not have national parks or game reserves apart from tourist attraction sites
which are unexploited. These sites include Kinare Forest in Lari Constituency, Chania Falls
and Fourteen Falls in Juja Constituency, Paradise Lost and Mugumo Gardens in Kiambaa
Constituency, Mau Mau Caves, Gatamaiyu Fish Camp and historical sites in Gatundu and
Githunguri Constituencies.

38
1.2.14.2 Main Wildlife
Kiambu County has few wildlife resources since many gazetted forests were allocated
illegally to individuals. An example is Kinare forest in Lari Constituency, whose ecosystem
constitutes of a dense forest with elephants, hyenas, bush baby, baboons, colobus monkeys,
dik-dik, bush pigs, tree and ground squirrels, porcupines and many species of birds such as
weaver, guinea fowls, sparrow among others.
1.2.14.3 Tourist Class Hotels/Restaurants, Bed Occupancy
The county has 682 unclassified hotels and 694 bars and restaurants which are well
distributed within the county. Availability of such facilities in this county is affected by its
close proximity to Nairobi where tourist facilities of all classes exist in abundance.
1.2.15 Industry
The county is well endowed with industries mostly located in Thika and Ruiru
Constituencies. Thika Town constituency has several industries namely Bidco Oil Industries,
Thika Motor Vehicle dealers, Thika Pharmaceutical Manufacturers Limited, Devki Steel
Mills, Broadway Bakeries, Kenblest Industry, Kel Chemicals, Thika Rubber Industries
Limited, Macadamia Nuts, Campwell Industry and Kenya Tanning Extracts Limited. In Ruiru
constituency, the major industries include Clay Works as well as Spinners and Spinners. The
Bata Shoe Factory which is the country‘s major producer of leather products is located in
Limuru constituency. These industries act as a major source of employment and market outlet
for agricultural and non-agricultural products both for domestic use and export. The agro
proceesing includes Farmers´ Choice Ltd, Kenchic Co. Ltd, Brookside Dairies, Githunguri
Dairies, Ndumberi Dairies, Limuru Milk and Palmside Dairies, among others.
1.2.16 Employment and Other Sources of Income
1.2.16.1 Wage Earners
The county has 902,848 persons who are wage earners representing 51.6 per cent of the total
households income in the county. These people are either skilled or unskilled and most of

39
them are employed in coffee plantations, tea farms, industries, quarry sites and other
agricultural farms. In order to ensure the county‘s economy remains vibrant there is need for
expansion of the job market to ensure great percentage of the population becomes wage
earners.
1.2.16.2 Self Employed
Due to dwindling availability of formal jobs in the county, most of the people have reverted
to self employment which contributes to 31 per cent of households‘ income in the county. In
rural areas, 157,473 persons are self employed whereby they engage in agricultural activities
for their livelihoods. On the other hand 384,935 of the persons in urban centres are self
employed, having set up businesses and small scale industries.
1.2.16.3 Labour Force
The labour force in the county was 961,261 people in 2009, which comprised of 475,149
males and 486,112 females translating to 59.2 percent of the population. It was projected to
rise to 1,036,128 in 2012, 1,116,826 in 2015 and 1,174,087 people at the end of 2017. With
the steady growth of the labour force, there will be a major challenge of creating employment
opportunities in the county.
1.2.16.4 Unemployment Levels
The county‘s labour force comprises of 59.2 percent of the total population. Due to high rate
of population growth estimated at 2.81 per cent, the labour force is growing rapidly, while
existing resources remain the same. Unemployment rate is high with 17 percent of the
population unemployed. There is need to revive the collapsed industries such as dairy and
establish new ones to provide job opportunities to the growing labour force majority of whom
are unemployed.

40
1.2.17 Water Resources
1.2.17.1 Water Provision
After coming into Law of the Water Act 2002, Athi Water Services Board (AWSB), a
parastatal in the Ministry of Water and Irrigation which licensed nine (9) Water Service
Providers (WSPs) Companies namely: Limuru Water and Sewerage Company, Kikuyu Water
and Sewerage Company, Kiambu Water and Sewerage Company, Karuri Water and
Sewerage Company, Githunguri Water and Sewerage Company, Ruiru- Juja Water and
Sewerage Company Limited, Gatundu South Water and Sanitation Company, Karimenu
Water and Sanitation Company and Thika Water and Sewerage Company Limited. The
Water Companies mainly cover the areas which had Water Schemes operated by Government
or Municipalities and they had mainly concentrated in extending and improving water and
sanitation services in their areas of operation.
Therefore areas outside the jurisdiction of these Companies either have no water
infrastructure or are served by community water projects. Most of these water projects are
either not operational or are poorly managed and thus limiting their water coverage. To
mitigate this issue, there is a proposal to extend the service area of each WSP so as to ensure
there is no area left out. Once any new project is constructed, it will be handed over to
respective WSPs for operation and maintenance. The well managed Community Water
Projects will sign third party agreements with respective water companies, to enable the
WSPs monitor their service delivery.
1.2.17.2 Water Sources
About 90 percent of the county’s water resources comprise of both surface and ground water
resource potential. Domestic water supply has recorded a noticeable growth over the last 5
years; 35 percent of the population have access to potable water.
1.2.17.3 Garbage Collection and Disposal
Garbage disposal around the urban centres within the county of Kiambu cover a small
percentage of waste/garbage collection as only 2.6 percent of the total population has
facilities for waste disposal, about 0.7 percent of the total population uses private firms, 29.1
percent use garbage pits, 29.6 percent use farm gardens, 12.1 use public garbage heap and

41
25.9 percent opt to burn the waste/ garbage. This has a negative effect on the environment
and hence proper mechanisms for waste disposal need to be put in place to ensure the county
remains clean.
There is a proposal to construct a county landfill which will handle all solid waste from sub-
counties which should be accompanied by modern incinerators to burn hazardous waste as
well as waste that cannot be decomposed. With this kind of think the County can use solid
waste to generate revenue through generation of electricity, biogas, compost manure etc. The
County will formulate policies to increase efficient of collection of solid waste to incorporate
stakeholder participation and private players.
1.2.18 Health Access and Nutrition
1.2.18.1 Health Access
There are a total of 364 health facilities spread across the county. Under the public facilities,
the county has one level-five hospital namely Thika District Hospital, three level-4 in
Gatundu South, Kiambaa and Kikuyu Constituencies, four level-three in Gatundu North, Juja,
Kiambaa and Limuru Constituencies. There are 20 level-two (Health Centres) and 54 level-
ones also known as dispensaries which are well distributed within the county. The rest of the
facilities are private with 17 Mission Hospitals, five nursing homes, 36 dispensaries and 169
private clinics. The doctor/population ratio in the county is 1:17,000 and the nurse/population
ratio stands at 1:1,300. The average distance to the health facility is seven Km and the
facilities are well accessed since the road network is good.
1.2.18.2 Morbidity
The most prevalent diseases in the county are Flu which accounts for 35.3 per cent of the total
hospital visits, Malaria accounts for 18.6 percent of the total hospital visits, Respiratory Tract
Infections (RTI) at 9.7 percent, and Ear Nose and Throat Infections account for 3.1 percent of
hospital visits.

42
1.2.18.3 Mortality and Nutritional Status
Generally, the county does not have serious health problems and this is indicated by low
infant mortality rate, which stand at 48/1,000 and under five mortality rates, which stands at
58/1,000. Due to high rate of delivery at health institutions which stands at 80.4 per cent,
children‘s health is fair and data available for stunted growth is negligible.
1.2.18.4 Immunization Coverage
The county immunization coverage stands at 90 per cent with the remaining population not
being covered due to various reasons such as religious beliefs. All public institutions provide
immunization services hence the high rate of immunization coverage.
1.2.18.5 Access to Family Planning Services/Contraceptive Prevalence
Acceptance of family planning methods currently stands at 85 per cent in the county. This
partially explains the lower population growth rate in the county as most of the women in the
reproductive age group understand the importance of and practice family planning. However
more efforts need to be put in place to ensure that the remaining women of reproductive age
accept and start using various methods of family planning.
1.2.19 Education and Literacy
1.2.19.1 Pre-School Education
The county has a total population of 87,594 children falling within the age group of 3 to 5
(pre-school). This consists of 44,177 males and 43,417 females. The total number of ECD
teachers is 1,843 and the teacher to pupil ratio is 1:40. However, most of the teachers are paid
by parents and this is likely to compromise quality since not all are qualified to handle the
young ones during the formative stages. We are optimistic that the court case filed by KNUT
will soon be over so that we can bring qualified teachers on board. Total enrolment for ECD
in the county is 73,730. Public ECD centres have an enrolment of 29,655 comprising of
15,563 males and 14,092 females. Private ECD centres have a total enrolment of 44,075
children comprising of 22,134 males and 21,941 females. There is therefore need for more

43
investments in public ECD centres to ensure children from poor background get access to
early education without much strain.
1.2.19.2 Primary Education
There are 1,225 primary schools in Kiambu County out of which 576 are public and 349 are
private. The total number of primary school teachers is 21,090 and the teacher to pupil ratio is
1:38. The total enrolment rate stands at 295,409 pupils comprising of 115,375 males and
113,910 females. The gross enrolment rate stands at 109.6 percent, while the net enrolment
rate is 99.7 percent. This could be attributed to the introduction of Free Primary Education
programme. Infrastructure in schools has also improved through devolved funds e.g.
Constituency Development Fund (CDF) and Local Authority Transfer Fund (LATF).
However, the county still needs to invest in the provision of additional education facilities
because of the increasing number of school going population.
1.2.19.3 Literacy
The percentage of people within the county who can read stands at 95.6 percent while 3.8
percent of the total population cannot read. Also, 95.2 percent of the total population can
write while 4.2 percent cannot write. About 95.4 percent of the total population within the
county can read and write while 4.6 percent cannot read and write. Those who can read and
write stand at 95.4 per cent. The high literacy rates are as a result of continued investment in
the education sector and there is need for more investment to ensure the literacy levels gets to
100 percent.
1.2.19.4 Secondary Education
There are 303 secondary schools consisting of 227 public and 76 private schools. The total
enrolment rate is 89,065 out of which 44,777 are males and 44,288 are females. The gross
enrolment rate is 69.3 percent and the net enrolment rate is 61.8 percent. The number of
teachers in the county stands at 3,479 and the teacher/pupil ratio is 1:25. As indicated in the
fact sheet, the completion rate is 92.5 percent and therefore there is need for great investment
in the education sector to ensure the rate reaches 100 percent.

44
1.2.19.5 Tertiary Education
The County has one public University, Jomo Kenyatta University of Agriculture and
Technology located in Juja Constituency and two satellite campuses namely University of
Nairobi, Kikuyu campus in Kikuyu sub county and Kenyatta University , Ruiru campus in
Ruiru Sub County. There are six private universities which include Gretsa University, Mount
Kenya University, St. Paul‘s University, Kiriri Women‘s Science and Technology University
and Presbyterian University of East Africa, Zitech University in Ruiru and a number of
tertiary colleges. The county also has two Teacher Training Colleges namely Kilimambogo
Teachers in Thika Sub County and Thogoto Teachers in Kikuyu sub county. These
institutions have gone a long way in ensuring secondary school graduates get access to higher
education therefore ensuring the availability of necessary skills required in the job market.

45
CHAPTER TWO: COUNTY DEVELOPMENT ANALYSIS
2.1 Introduction
The chapter describes the developmental strategies the county will adopt during the
2017/2018 plan period. This plan proposes specific policies that the county government will
put in place to address the current challenges and previous development shortfalls in
consideration of locally defined priorities. The chapter also details the strategies to mitigate
the effects of cross-cutting issues such as climate change, environmental degradation,
HIV/AIDS, gender inequality among others. These strategies should be based on the
developmental needs of the county as identified by the stakeholders and prioritised over the
implementation period taking into account the available resources and any other challenges.
Section 126 of PFMA requires every county government to prepare annual development plan
in accordance with Article 220(2) of the Constitution. The County Government Act also
mandates the County Governments to develop the CIDP in consultation with the public. The
preparation of plans should adhere to the requirements of Part VIII of the County
Government Act which is devoted to principles of citizen participation in county budgeting,
planning and decision making.
2.2 Major Developmental Challenges
This section highlights the major development challenges and cross cutting issues that the
county faces. The challenges include; declining enrolment in secondary schools, poor
infrastructure, low prices for agricultural produce and poor marketing, inadequate health
facilities, inadequate water (for consumption and irrigation), high unemployment levels,
rising insecurity/crime.
2.2.1 Poor Rural Access Roads
The total length of all classified roads in the county is 3,944.1 Km with bitumen surface
covering 2,033.8 Km, gravel surface covering 1,480.2 Km and 430.1 Km being surface.

46
Some of these road networks are not in good condition to enhance effective movement of
goods and services in the county and they worsen during the rainy season. In the county, 17.4
percent of households depend on farm produce for both food and income, however, the
accessibility of markets by farmers to sell their produce and acquire inputs is hindered by the
poor state of roads, especially when farmers cannot deliver their perishable produce (e.g.
horticulture, milk and vegetables) to the market. Soils in some parts of the county are black
cotton or clay which tends to hinder development of the road network in those areas. The
road network therefore requires regular maintenance to make it passable throughout the year.
2.2.2 High Cost of Farm Inputs
It is estimated that over 70 percent of the county‘s population depends on agriculture as their
source of livelihoods. However, the cost of farm inputs has been increasing making them
unaffordable for majority of the farmers. In this case, there is need to reduce the prices of the
various farm inputs like fertilizer so that the farmers can access them, hence improving
agricultural production.
2.2.3 Poor Marketing Channels
Inability of small scale farmers to form strong co-operative societies has led to middlemen
exploiting their situation and offering low prices for their produce. Horticultural crops such as
avocadoes, pineapples and bananas are perishable and need to be delivered to the market on
time to fetch good prices but farmers channel their produce through middlemen who pay
them low prices. There is therefore need for farmers to be encouraged to form cooperative
societies or groups to increase their bargaining power. Further, investment in value addition
industry may impact positively to the marketing of farm produce.
2.2.4 Small Land Sizes
Population pressure and increased land market value in the county has led to sub-division of
land to small uneconomical units (average of 0.36 Ha) and this, coupled with poor soil
fertility, has led to low agricultural production. The small land sizes do not produce sufficient
food to feed the population of the county. This therefore calls for intensive agricultural
practices as opposed to extensive practices. Thus, there is need to intensify training of farmers
47
on modern farming techniques to enable them produce sufficient food and cash crops with the
limited space. Farmers also need to diversify food production especially in the marginal areas
of the county where rainfall is irregular by planting drought resistant and early maturing food
crops. The relevant departments will need to intensify their extension activities in an effort to
make the county realize SDG Goal No 2 which aims to end hunger, achieve food security and
improved nutrition and promote sustainable agriculture. The other problem facing the
subsector is the competing land use patterns where most of the land is changing to residential
and commercial estates which are perceived to be more rewarding than farming.
2.2.5 Insecurity
Insecurity is a major challenge in the county and this can be attributed to factors such as
unemployment, illegal associations, declining education standards and proximity to Nairobi
and above all, poverty. This has discouraged the potential investors in the county, hence
leading to increased unemployment and a persistent vicious cycle of poverty. There is
therefore need to improve on security by strengthening community policing in the county.
2.2.6 Low School Enrolment
Despite the introduction of free public primary education, enrolment rate in the county is still
wanting, more so at the secondary level. The gross enrolment rate in primary schools stands
at 109.6 percent while for secondary it is at 69.3 percent. Thus the need for the education
department to put measures to increase the enrolment of all school age-going children (both
males and females) for the county to attain SDG Goal No. 4 on inclusive and equitable
quality education and learning opportunities for all.
2.2.7 Inadequate Health Facilities
The county has one level five hospital, 3 level four hospitals, 4 level three, 17 mission/ NGO
hospitals, 5 nursing homes, 20 health centres, 86 dispensaries and 169 private clinics. With
the county population of 1,766,058 and coverage area of 2,543.5 Km2, these facilities within
the county cannot adequately serve the population. There is need for the county government
to consider upgrading some of these health facilities to efficiently serve the growing

48
population. Other stakeholders such as NGOs who are implementing programmes on health
to invest more on health facilities.
2.2.8 Inadequate Water (for consumption and irrigation),
The county has 16 permanent rivers originating from Aberdare ranges, which are its main
water tower. These include: Gatamaiyu, Bathi, Kiu, Nyamwera, Ndarugu, Ruabora, Thiririka,
Kahuga, Chania and River Athi among others. Despite the existence of these rivers only
172,872 out 469,244 households have access to piped water and 296,371 with access to
potable/safe water. This represents a very low percentage of population that has access to safe
and adequate water at reasonable distances to their homesteads.
The eastern part of the county that include Thika, Gatundu, Ruiru and Juja is well endowed
with surface water where major rivers like Chania, Thika, Karimenu, Ruabora, Ndarugu,
Thiririka, Theta, Mukuyu, Ruiru and many others traverse the area. The Nairobi and its
environs Water Master Plan has proposed dams which when constructed will provide gravity
systems for both domestic and irrigation purposes, thus reducing on electricity costs which is
a major bottleneck to service delivery and highly impacts on the cost of water. The pipe
distribution network within the current surface area of the Water Service Providers (WSPs) is
fairly well done, however the major challenge especially for the rural WSPs is high
Unaccounted for Water (UFW) which arises from the perception that water is a social good
and hence should not be sold. Some of the customers connect themselves illegally while
others irrigate with water that is meant for domestic use which denies people on the
downstream side access to water. A comprehensive policy to deal with illegal connections,
interference with the meter etc is underway.
The western part of the county covers Limuru, Kikuyu, Kiambu, Karuri, Lari and Githunguri
areas which have limited surface sources except for Lari which has surface sources. Therefore
majority of the water systems here rely on boreholes as the main source of water supply.
Some of the areas like Kiambu and its environs have groundwater with high fluoride content.
Due to inadequate groundwater exploitation and high cost of operation and maintenance due
to high electricity costs, the water coverage in the eastern part is very low with areas like
Ndeiya having no supply although is the driest part of the County. It is important to construct
the proposed dams like Riara, Ruiru II, Tigoni, Kamiti and others to solve the problem in

49
these areas. To ensure that the county benefits from the abundance of the water resources
there is need for major investment in dam construction and distribution of pipe network.
2.2.9 High Unemployment Levels
There has been a rapid growth in the labour force while the existing job opportunities remain
unchanged thus resulting in an increase in unemployment levels. In this case, revival of
collapsed industries such as dairy and establishing new ones would provide job opportunities
to the ever growing labour force, majority of whom are unemployed.
2.2.10 Drug and Substance Abuse
Drug abuse and local brew has emerged as a major threat to development in the county. This
has mainly been due to the high unemployment rates of the youths due to dwindling returns
of the coffee and tea sector. Secondly, the drug abuse problem has resulted in poor transition
rates as well as school drop-outs. This in turn has resulted in deteriorating security and
accelerated unemployment as youth abandon meaningful economic activities. Drug abuse
affects the health of the person adversely. The youth who abuse drugs are at risk of suffering
from many forms of diseases especially HIV and AIDS. Campaigns against drug abuse and
substance as well as sensitization need to be intensified in the county.
2.3 Cross-cutting Issues in the county
The cross-cutting issues identified include: Information Communication and Technology
(ICT), population growth issues, widespread poverty, HIV and AIDS, gender inequality,
disaster management, literacy levels, crime/insecurity, climate change and environmental
degradation.
2.3.1 Poverty
The major factors which contribute to poverty are: rising unemployment, high cost of
agricultural inputs, population pressure, poor yields, low agricultural products prices,
landlessness, poor infrastructure, lack of credit, rise in HIV and AIDS, and insecurity.

50
The poverty level in the county is estimated at 21.75 percent. The most affected areas by
poverty are in the eastern part of the county for instance Thika East, which is semi-arid and
with low rainfall. Pockets of poverty are also found in informal settlements of Thika , Ruiru
and Juja sub counties.
Inadequate access to credit facilities for the community reduces economic empowerment
hence increasing economic dependence. This increases the poverty cycles among families.
Besides, security must also be improved so that investment can take place in the county in
order to absorb the ever rising unemployment levels and boost economic growth and
development of the county in general.
SWOT ANALYSIS: POVERTY
Strength Weakness
● An enterprising community;
● Markets for agricultural produce;
productive land for crops;
● Large quarries;
● Availability of labour;
● Diversification of agricultural
produce;
● Poverty alleviation programmes.
● Large families put pressure on social
amenities;
● Inadequate utilization of water and other
natural resources;
● Insecurity;
● Un-economical small land size.
Opportunities Threats
● Strengthened cooperatives to market
produce;
● Proximity to Nairobi presence of
agro processing industries;
● Micro-Finance Institutions and
banks; Training on business development
in youth polytechnics;
● Availability of small scale trade and
business loans;
● Market access through internet;
● Existence of poverty targeting
● High cost of agricultural inputs;
● Long dry spells in the eastern part of the
county;
● Presence of IDPs in the county;
● Environmental degradation;
● Over use of available water resources;
● Climatic change, illegal groups, national
macroeconomic instability.

51
programmes in the county such as
Biashara Fund, Poverty Eradication Fund,
Youth Enterprise Fund, Women Enterprise
Fund;
● Presence of Thika superhighway;
● Presence of a number of NGOs
addressing unemployment.
2.3.2 HIV and AIDS
The HIV and AIDS prevalence poses a serious socio-economic challenge to the county as the
scarce resources available are directed towards treating or caring for those infected or
affected. The most infected age group is between 15-49 years. This has serious implications
because this group is the productive labour force of the county. This declining and weakening
of labour force will have adverse effects on both agricultural and industrial outputs.
The resultant effect of this situation is that most of the resources that should be allocated to
development are directed towards purchase of drugs and campaign against the epidemic. This
would require relevant stakeholders to be involved in the fight against HIV and AIDS which
was declared a national disaster. The identified stakeholders in the county which include:
Private Sector, NGOs, CBOs, Government departments and Faith Based Organisations will
be called upon to intensify the campaign against the spread of HIV and AIDS. However,
with HIV and AIDS awareness in the county being over 98 percent, and prevalence is still
high at 4.6 percent. The challenge that faces the county is to translate the awareness into
practice so that the rate of prevalence is reduced.
Several programmes have been put in place to address and curb the spread of the pandemic in
the county based on the National HIV and AIDS Strategic plan 2009/10-2012/13. They
address 3 priority areas: prevention of new infections (reducing the number of new HIV
infections in both vulnerable groups and the general population); Improvement of the quality
of life of people infected and affected by HIV and AIDS (improving treatment and care,
protection of rights and access to effective services for infected and affected people); and
Mitigation of the socio-economic impact of HIV and AIDS (adapting existing programmes
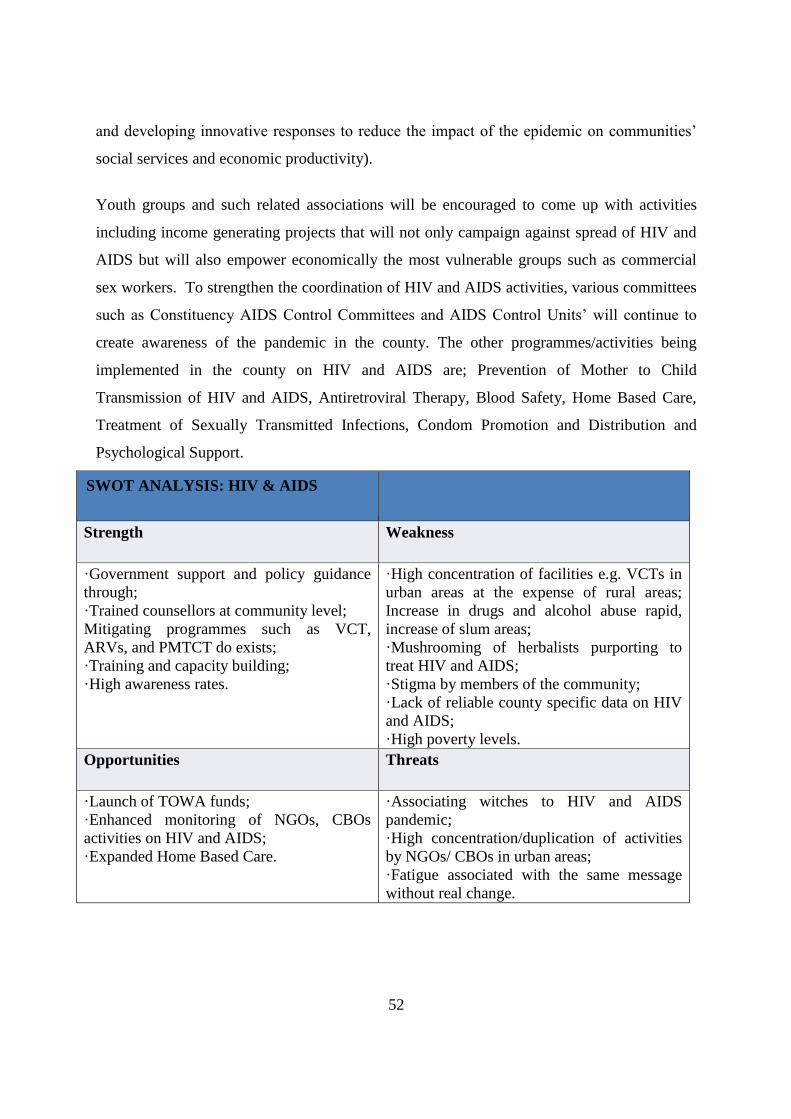
52
and developing innovative responses to reduce the impact of the epidemic on communities’
social services and economic productivity).
Youth groups and such related associations will be encouraged to come up with activities
including income generating projects that will not only campaign against spread of HIV and
AIDS but will also empower economically the most vulnerable groups such as commercial
sex workers. To strengthen the coordination of HIV and AIDS activities, various committees
such as Constituency AIDS Control Committees and AIDS Control Units’ will continue to
create awareness of the pandemic in the county. The other programmes/activities being
implemented in the county on HIV and AIDS are; Prevention of Mother to Child
Transmission of HIV and AIDS, Antiretroviral Therapy, Blood Safety, Home Based Care,
Treatment of Sexually Transmitted Infections, Condom Promotion and Distribution and
Psychological Support.
SWOT ANALYSIS: HIV & AIDS
Strength Weakness
·Government support and policy guidance
through;
·Trained counsellors at community level;
Mitigating programmes such as VCT,
ARVs, and PMTCT do exists;
·Training and capacity building;
·High awareness rates.
·High concentration of facilities e.g. VCTs in
urban areas at the expense of rural areas;
Increase in drugs and alcohol abuse rapid,
increase of slum areas;
·Mushrooming of herbalists purporting to
treat HIV and AIDS;
·Stigma by members of the community;
·Lack of reliable county specific data on HIV
and AIDS;
·High poverty levels.
Opportunities Threats
·Launch of TOWA funds;
·Enhanced monitoring of NGOs, CBOs
activities on HIV and AIDS;
·Expanded Home Based Care.
·Associating witches to HIV and AIDS
pandemic;
·High concentration/duplication of activities
by NGOs/ CBOs in urban areas;
·Fatigue associated with the same message
without real change.

53
2.3.3 Gender Inequality
Gender inequality emanates from retrogressive cultural practices which seem to favour men.
Gender disparities are manifested through political preference for men, decision making,
property ownership, access to credit and land ownership among others.
The sex ratio of male to female is estimated to be 1:1.02 in the county according to the 2009
Census. This ratio must therefore be recognized and integrated in planning and decision
making to ensure equitable distribution of social, economic and political resources.
Lack of ownership and control of productive assets such as land by women, discrimination
against inheritance of wealth from parents and property ownership, inability to access credit
facilities from banks due to lack of collateral have greatly contributed to poverty amongst
women and in the county in general. In the county, men dominate access and they are the
main decision makers. It should however be recognized that no meaningful and sustainable
success in the fight against poverty in both urban and rural areas is achievable without
appreciating the roles and contribution by both women and girls in the county. The challenge
therefore facing the county is how to involve women in planning and decision-making
positions.
To attain gender balance, the county should uphold the spirit of the constitution and the bill of
rights which requires 30 percent representation of at least one gender in any development
activity/programmes. There is need to build women’s capacity to take part in major decision
making. Women should also be encouraged to apply for funds set aside for women such as
Biashara fund, WEF, Uwezo fund so that they can boost their capital base and be able to
increase the scope of their businesses hence boost their savings. For effective policy
formulation in the county, gender disaggregated statistics should be provided in all sectors.

54
SWOT ANALYSIS: GENDER INEQUALITY
Strength Weakness
● Representation of women at various
county and constituency forums;
● Strong women groups;
● Community training on income generating
activities.
● Wrangles in groups lead to breakup and loss
of funds;
● Ignorance on the availability of funds like
Kiambu Biashara fund, WEF, YEF and
Uwezo;
● Insecurity;
Opportunities Threats
● Availability of revolving women
funds;
● Free primary education;
● Micro -finance e.g. KWFT, Faulu
which targets women Sufficient micro
finance institutions in the county;
● Expansion of county adult education;
Constitution that guarantee 30 percent
representation.
● Rigid cultural practices;
● Political interference;
● Cultural attitudes and beliefs;
● Insecurity and violence directed to
women especially during campaign times.
2.3.4 Environment and Climatic Change
Environmental degradation has been rampant in the County with massive felling of trees in
forests like Kinale and Aberdare Forests. This has led to destruction of water towers/
catchment areas and thus reducing the volume of water flowing in the rivers that originate
from these natural forests. Uncontrolled quarry activities in places like Juja has also led to
land degradation. Poor farming methods and deforestation has led to high soil erosion and
desertification which has brought about environmental degradation and climate change.
Climate change effects in the County are mostly experienced through lack of predictability of
the timing and the intensity of rainfall, as well as increased flooding and prolonged dry spells.
55
The development of industries coupled with population pressure has significantly increased
the pollution levels including water and air pollution that the existing facilities are unable to
handle. Pollution emanating from industries such as tea and coffee factories is a real danger to
the environment because they discharge effluents into the rivers within the county.
Pesticides and chemicals used in agricultural undertakings have also led to pollution of rivers
and the environment due to poor farming methods. Other environmental issues of concern in
the county include; rapid increase of the slum areas and the destruction of forests and water
catchment areas mainly through farming on hillsides and in marginal areas.
National Environment Management Authority (NEMA) should invoke the Environment
Management Coordination Act of 1999 (EMCA) in ensuring that industries operating within
the towns treat their effluents to the required standards so as to reduce pollution to the
environment. With the devolution of environment, water and natural resource functions to the
County Government, the County should formulate policies that will help to reverse the
activities that increase environmental degradation.
The major challenge faced by the county is to ensure that all stakeholders put proper and
sustainable environmental conservation measures in place to make the county
environmentally clean. The county will benefit from the National Soil and Water
Conservation Programme that use individual farmer extension approach to teach farmers
proper farming methods to reduce soil erosion and pollution from chemicals. It is also
important to enforce the Forest Act to control illegal logging and unplanned cutting down of
trees on the farms. Agro-forestry should be practised at the farm level.
In addition, the sub-counties should have designated garbage holding receptors before
transportation to a centralised County Landfill site that should observe proper environmental
management.

56
SWOT ANALYSIS: ENVIRONMENT &
CLIMATE CHANGE
Strength Weakness
● Existence of Laws and institutions
governing Environment e.g. NEMA,
EMCA, Forest Act, KFS, Water Act;
● Growing culture in tree planting;
● Forest cover in some areas like Gatundu;
● Forest station and forest warden.
● Weak enforcement of environmental laws;
● Poor drainage systems;
● Inappropriate farming methods used;
● Destruction of water catchments areas
● Random quarrying;
● Illegal settlements in the forest land;
● Many quarries not rehabilitated;
● Flouting of NEMA rules;
● Forest depletion through logging and
charcoal burning.
Opportunities Threats
● Communities taking up environmental
conservation;
● Training on early warning systems and
signs; Close all unlicensed quarries by
NEMA;
● Re-afforestation on catchments areas;
● Training on proper farming methods to
reduce soil erosion;
● Proactive industries in matters
concerning environmental conservations.
● Arid areas in the county, landslides,
droughts;
● Pollution;
● Conflicting policies on land use;
● Rising population;
● Global warming;
● Deforestation;
● Fires.
2.3.5 Disaster Management & Resilience
The county is prone to disasters such as floods in Kilimambogo along Athi River, landslides
in Gatundu, road accidents and fire. In this case the respective stakeholders like the

57
Government, Red Cross, Faith Based Organizations, NGOs, the community and other players
will be coordinated to address various strategies to manage the disasters.
The county recognizes disasters as a challenge for development and hence there should be
strategies to minimize the risks. The county is highly vulnerable to natural hazards
particularly floods along Athi River, HIV and AIDS, livestock diseases, drugs abuse among
the youth leading to reduced productivity, road accidents and environmental degradation.
In addition, road accidents are common especially along Thika superhighway and other roads
in the county. In this case, the government formulated traffic rules and regulation that should
be adhered to by all the road users. More recently, there are many footbridges that enhance
pedestrian movement hence reducing accidents.
To mitigate against more disasters happening in the county, the county disaster management
committee within the office of the Governor will strengthen the respective measures that will
reduce the risk of disasters. The committee will also enhance the decision making process on
priorities, requirements and perceptions of those at risk such as the vulnerable community
living in disaster prone areas such as the riparian zone along rivers, the slums and near
forests. The County Emergency Fund will construct fire stations to address disaster
occurrences. A key priority of the County Government will be mapping and evaluating the
key disaster issues within the County in order to develop a comprehensive Resilience and
Disaster Management Framework that is strengthened through County legislations.
SWOT ANALYSIS: DISASTER
MANAGEMENT & RESILIENCE
Strength Weakness
● Existence of disaster management
committees and emergency funds;
● Creation of awareness campaign;
● Proximity to Nairobi;
● Good networks for roads
● Presence of good health facilities;
● Existence of strong traffic rules and
● Poor road maintenance;
● Poor enforcement of traffic rules and
regulations;
● Poor disaster management skills;
● Lack of disaster warning signs;

58
regulations
Opportunities Threats
● Presence of programmes and funding
agencies on disaster management;
● Draft disaster management policy.
● Increased population;
● unpredictable weather;
● Global warming and climate change
● Quarrying
2.3.6 Youth
The youth is estimated to comprise 29.1 percent of the total population in the county.
However, there are youths who are trained yet are unable to be absorbed by the existing
labour market while others lack necessary skills. Inadequate capital for them to start
businesses has worsened the situation and has led to widespread insecurity as indicated by
increasing number of crimes and illegal youth groups. Unemployment and poverty have
contributed to moral decay in the society because an important group of the population is idle.
Insecurity is indeed a challenge as it discourages potential investors in the county hence
leading to further unemployment.
The Government wishes to address these issues with the same urgency as it would address a
disaster. Given the high demand in addressing youth unemployment, the high levels of
insecurity and the high demand for other safety-net services, the Government will increase
the County Youth and Women Enterprise Fund in order to create more access to cheap credit
by the youth. This fund will provide seed money for establishment of businesses which will
complement the money by the national government under the Youth Enterprise Fund. More
youth groups should be formed to facilitate access the Youth Development Funds and other
credit facilities. This will reduce unemployment levels and engage the youth in contributing
to economic growth.

59
SWOT ANALYSIS: YOUTH
Strength Weakness
● Youth Empowerment Centers;
● Active youth population;
● Availability of good agricultural land;
● Ready market for farm outputs;
● Trained labour force.
● Insecurity;
● Inadequate entrepreneurial and vocational
skills;
● Preference by youth of white collar jobs.
Opportunities Threats
● Youth Development Funds like YEF;
● Micro – finance institutions;
● Tenders at the county (consideration
of 30 percent to the youth proposal in
tendering);
● Flexibility of the youth to exploit
new ventures in ICT.
● Economic recession;
● Existence of illegal extortion gangs;
● Involvement of youth in illicit drinks and
drug abuses.
2.3.7 Persons with Disabilities
The population of Persons with Disabilities is estimated to comprise of: visual – 0.47 percent,
hearing – 0.23 percent, speech 0.42 percent, physical/self-care 0.79 percent, mental 0.32
percent and others 0.15 percent. The total percentage is approximately 2.38 percent of the
total population. These groups of people are vulnerable and experience low capital base,
inappropriate entrepreneurial and vocational skills and unemployment. This leads to increase
in dependency ratio.
The groups should be incorporated in development planning so that their needs are
implemented. Currently, these groups live in various parts of the county and implement their
activities individually. The Kiambu Biashara fund should be enhanced to ensure members are
empowered economically to make them independent.

60
SWOT ANALYSIS: PERSONS WITH
DISABILITIES
Strength Weakness
● Existence of schools for Persons with
Disabilities;
● Policies on physically challenged persons
exists;
● Existence of Disabilities Act;
● Trained teachers on special education.
● Biashara fund and cash transfer funds
● Stigma;
● Inadequate institutions for people with
disabilities.
Opportunities Threats
● NGOs interested in helping Persons with
Disabilities;
● Availability of devolved funds;
● Growing number of briefcase NGOs
purporting to support Persons with
Disabilities;
● Cultural issues make their numbers
difficult to establish.
2.3.8 Information Communication Technology (ICT)
Information Communication Technology is an important sector in the development of the
county. It is the way information is accessed through internet, IEC materials, and use of
mobile phones, computers and business process outsourcing. This enables the population to
get information on various areas like market trends, both locally and internationally through
information accessed on the internet. There is great need for the upcoming urban centres in
the county to acquire ICT equipments and materials. At the moment, most cyber cafés are
based in towns where demand is high and there is need to spread them out and hence enhance
ICT village. There is need to intensify training of the county’s population on ICT to make
them globally competitive.

61
SWOT ANALYSIS: ICT
Strength Weakness
● Sufficient supply of power in the urban
centres;
● Literate youths;
● Existence of IT training centres;
● High mobile coverage;
● High number of cyber cafes.
● Concentration of IT only in urban areas;
● Few residents are computer literate;
● Insecurity.
Opportunities Threats
● Sourcing of IT expertise from nearby
Nairobi;
● Introduction of IT in all schools;
Employment opportunities both locally
and abroad through BPO;
● Availability of telecom firms, Safaricom,
Airtel and Orange.
● On-going fibre optic cabling
● Upcoming of briefcase commercial
colleges;
● Most of the youths venture exclusively on
IT at the expense of other professional
courses;
● High cost of IT equipment;
● Vandalism of Telephone lines;
● Cyber crimes.
2.4 Potential Strategic Policy Thrusts
The matrix below provides a summary of the main development issues affecting the county,
their causes, development objectives and proposed strategies. It also maps the development
issues with their respective sectors.

Agriculture and Rural Development Sector
Sub Sector
Link to
national/county
functions
Issues/Problems Causes Development Objectives Immediate Objectives Potential Strategic policy thrusts
Agriculture
Food security, Crop
husbandry; Plant
disease control; Soil
and water
conservation,
Low agricultural
productivity
Low adoption of new
technologies; Use of
uncertified seeds; High
cost of inputs; Diminishing land sizes;
Poor prices for farm
products; Poor
infrastructure; Poor access
to credit facilities;
Reduced effectiveness of
extension services.
Increase agricultural
productivity; Lower
fertilizer prices; Improve
rural access roads; Enhance farmers accessibility to credit;
Improve extension
services
Improve efficiency of
farmers through
education; Use of
certified seeds; Encourage use of alternative inputs;
Improved management
capacity of crops; Use of
alternative pest control
measures; Intensify land
use; Promote contract and
strategic farming;
Improve infrastructure
Promote value addition in agriculture;
Revitalize extension services; Encourage
direct importation of inputs; Training on Production management; Collaboration
with stakeholders.
Food insecurity
Erratic rainfall; Poor soil;
Low acreage; High cost of
inputs; Inadequate
extension services; High
cost of production; High
dependency of cash crops;
Post- Harvest loss. Sub
division of agricultural
land.
Improve the supply of
inputs, marketing and
credit facilities
Drill more boreholes for
irrigation water; Develop
more water pans to store
rainwater; Use of dams
for irrigation; Increase
accessibility of
agricultural inputs;
Increase farmer access to
credit facility. Control
land division.
Encourage cultivation of traditional
drought tolerant crops; Introduce post-
harvest technology training through
demonstration and field days; Intensify
extension services especially in dry areas.
Poor marketing
Inadequate storage
facilities for agricultural
products; Poor
management of
cooperatives
Improve management of
cooperative societies;
Regular agricultural
exhibitions; Relevant
marketing infrastructure;
setting; quality of
assurance of products.
Encourage marketing
group formation; Provide
efficient marketing
infrastructure for
agriculture products; Reinstatement of Karatu
and Kirigiti Agricultural Show ground; Improve
storage systems.
Improve storage systems; Restructure
operations of the farmers‘ cooperatives;
Train farmers on proper management of
societies; Conduct market research; Value addition and quality assurance to agricultural products.

63
High production
cost
High cost of inputs; High
cost of credit; Poor
irrigation systems.
Reduce cost of
agricultural production
Upscale drip irrigation;
Improve accessibility to
agricultural inputs and
credit.
Revamp irrigation; Insurance cover for
farmers; Zero rating of Agriculture
inputs/subsidies/grants; Government Aid
to co-operative societies via friendly
credits Inadequate
training
Inadequate funding of
training for officers as well
as farmers
Capacity building of
officers and farmers.
Intensify farmer training;
Upgrading of the
Waruhiu Farmers
Training Centre; Re-
introduce of 4-K clubs in
primary schools; Increase
staffing and facilities.
Establish capacity building programmes
for farmers; Setting up of County
Agriculture Information Centre; Increase
funding; Procure more equipment and
facilities.
Inadequate
Financing
Inadequate allocation from
the government
Increase funding to
agriculture sector.
Allocate more resources
to the sector; Enhance
Private and public
partnership; Encourage
farmers to join SACCOs
Lobby for increase in Government
funding to agriculture; Enhance public-
private partnership.
Livestock
Development
Livestock sale yards;
county abattoirs;
animal disease
control;
Low Livestock
productivity
Low adoption of new
technologies; Use of
uncertified seeds;
Diminishing land sizes; Poor infrastructural
development; Poor access
to credit facilities;
Reduced effectiveness of
extension services.
Increase livestock
production; Improve rural
access roads; Enhance
farmers accessibility to
credit; Improve extension services.
Use of certified seeds;
Encourage marketing
group formation;
Livestock movement
control; Use of alternative pest control
measures; Improvement
of infrastructure; Increase
accessibility of cattle and
poultry feed to all
farmers.
Revitalise extension services; Centralise
marketing of animals; Integrated Pest
Management System; Carry out regular
vaccination; Introduction of superior breeds of
livestock; Promotion of suitable fodder
Forestry and
Wildlife
Forest conservation;
Soil and water
conservation
Low forest cover
Deforestation
Increase forest cover
Increase tree coverage by
tree planting;
Enforcement of the
Forest Acts
Encourage tree planting; Establishment
of tree nurseries.
Energy, Infrastructure and ICT

64
Sub
Sector
Link to national/county
functions Issues/Problems Causes Development
Objectives Immediate Objectives Potential Strategic policy thrusts
Roads
County roads; Street lighting;
Traffic and parking; Public
road transport. Stormwater
management systems in built
up areas; Water and
sanitation services.
Poor rural roads
Network
Poor maintenance and
Rehabilitation; Poor road
coverage; Bad terrain;
Encroachment on road reserves;
Inadequate funding for
construction; Poor drainage
system; Inadequate
construction equipment
Provide an
efficient, adequate
and reliable road
network
Improve routine maintenance of
3,000 Km of the various road
categories by 2018; Gravel 600
Km of the road per FY; Increase
funding for development of road
infrastructure by 30 percent; Train
available staff; Construction of 10
more bridges by 2018.
Ensure proper drainage system
along all roads; Use Road
Maintenance Levy Funds and
KRB funds for road construction;
Incorporate local mobilization in
road maintenance; Cleaning of
meters & drains equipment;
Increase and contribute equipment.
Energy
Electricity and gas
reticulation and energy
regulation
Insufficient
energy.
Generation and distribution.
Exploit the
waterfalls in the
county for hydro
energy generation.
Enhance rural electrification
Connect all public institutions to
the public grid.
Trade & Industry, Tourism Sector
Sub Sector
Link to
national/county
functions
Issues/Problems Causes Development
Objectives Immediate Objectives Potential Strategic policy
thrusts
Industrialization
Inadequate agro-
processing industries
Inadequate funds to put
up agro-processing
industries
To improve industrial
output
Establish Agro-
processing Industry in
Lari, Gatundu, Kikuyu,
Limuru, Githunguri and
Thika by 2018.
Establish agro-processing
industries.
Labour
Village polytechnics;
Homecraft centres Inadequate vocational
training centers to
offer entrepreneurial
skills.
Inappropriate
entrepreneurial skills.
Increase vocational
training centres.
Increase vocational
training centres by 20
percent by 2018.
Provision of funds. Revival of
vocational training centres.

65
Increased
unemployment.
Increase in population
Improve employment
level.
Decrease unemployment
rate by 5 percent by 2018.
Establish jua kali sheds and
fully equip them to create
employment opportunities.
Trade
Issuing of trade
licences; Fair trading
licences
Unaffordable access
to SME credit.
High interest rate on
loans
Improve credit access
Improve credit access by
30 percent by 2018.
Provision of credit facilities at
a lower interest rate.
Provision of grants.
Poor market access.
Inadequate proper
markets to enhance
trading activities
Improve marketing
structures
Construction of 1 open air
market per sub county in
the county by 2018.
Provision of funds for
construction; Training.
Complexity In the
licensing procedures Lower demand and
requests for licences than
optimal
Improve investment
climate Creation of a one stop
shop for licensing by
2018
Provision of funds for
implementation and manning
Tourism
Promotion of local
tourism; County
parks, beaches and
recreation facilities;
Museums
Untapped tourist sites.
Low tourist attraction
centers/sites
Improve tourist
attraction
Improve tourism
attraction centers like
Mugumo, Ondiri swamp,
Githunguri Gallows and
14 Falls.
Publicize tourist attraction
sites. Invest in upgrading existing
and new tourist sites
Health Sector
Sub Sector
Link to
national/county
functions
Issues/Problems Causes Development Objectives Immediate Objectives Potential Strategic policy
thrusts
Public Health and
sanitation
County health
facilities; Ambulance
services; Promotion
of primary health
care; Licensing and
control of
undertakings that sell
food to the public;
Cemeteries, funeral
parlours and
Inadequate access to
quality Health care.
Poorly equipped
health facilities; High
Human disease
incidences;
Inadequate hygiene
and sanitation;
Inadequate health
education;
Understaffing;
Inadequate
Increase access to quality
health care
Increase the number of
well-equipped health
facilities; Increasing the
number of trained health
workers; Intensify
community health
education; Provide
ambulances, utility
vehicles, motorbikes and
bicycles;
Provide adequate equipment
and drugs; Promote
preventive health services and
community health education;
Increase training for
community health workers;
Rehabilitate and upgrade
health facilities.

66
crematoria; Refuse removal,
refuse dumps and
solid waste disposal.
specialized dental
care; Inadequate
transport; Lack of county
referral centers.
Provide specialized equipment for dental care;
Upgrade and equip 1
county referral hospital by
2018. Implement community
health strategy Prevalence of HIV and
AIDS Stigma; Inadequate
guidance and
mobilization of
personnel; High
number of OVCs
Reduce HIV prevalence
rate.
More awareness creation;
Reduction of stigma;
Improved care for people
infected with the virus.
Intensify and change
communication; Improve
networks among stakeholders;
Capacity build community
organization fighting the
scourge; Encourage couple
testing; Increase access to
eMTCT service; Economic
empowerment; Target group
specific interventions e.g.
youth friendly centres.
Education
Sub Sector
Link to
national/county
functions
Issues/Problems Causes Development Objectives Immediate Objectives Potential Strategic policy
thrusts
Education
Inadequate staffing level. Inadequate
deployment of
teachers.
Improve staffing level Hire more teachers and
education staff. Ministry of Education to
liaise to recruit teachers.
Inadequate school
infrastructure. High number of
enrolment rate.
Improve school
infrastructural facilities. Rehabilitate the existing
classroom; constructing classrooms.
Enhance devolved funding mechanism.
High dropout rates of the
boy child. Drug and substance
abuse; Poor nutrition. Advocate for the boy child
education. Hold sensitization
meeting and campaigns
on the importance of boy
child education.
Education of students on
dangers of drug and
substance abuse

67
Pre-primary education
and childcare facilities Child labour, low
enrolment High pockets of
poverty levels. Enhance implementation
of the Children Act.
Provide free pre-primary
education, provide quality
education by employing
qualified teachers
Sensitize the parents on
the contents of children
Act; Assist poor
Household to start
Income Generating
Activities.
Initiate more poverty
eradication programmmes;
Devolve more funds
Social Protection Culture and Recreation
Sub Sector
Link to
national/county
functions
Issues/Problems Causes Development Objectives Immediate Objectives Potential Strategic policy
thrusts
Youth Affairs and
Sports
Unemployment and talent
wastage
Disguised
employment of youth;
Unexploited talent
among the youth;
Poorly developed
entrepreneurship
skills.
Reduce unemployment
levels. Skills development;
Nurturing of youth talent;
Community
empowerment programs.
Develop youth capacity on
entrepreneurship, leadership
and management; Provide
credit to the youth;
Construction of youth
resource and recreational
facilities.
Drugs and substance
abuse Unemployment; Peer
group influence. Reduce level of drugs and
substance abuse. Create awareness on
drugs and substance
abuse and the effects.
Establish centers and mobile
clinics for drug/substance
abuse rehabilitation; Law
enforcement; Introduce drugs
and substance abuse
programs in schools
curriculum. Gender, Children and
Social Development
Inadequate care and
support for special groups
(OVC‘s, older persons
with disability)
Stigma; Inadequate
institutions for special
groups.
Improve care and support
for special groups Improve education and
training to special
groups; Cover all needy
households by the cash
transfer programmes.
Upscale cash transfer
programs for OVC‘s, PWD
and OPCT; Establish rescue
centers in all urban areas;
Establish special schools at
district level for PWD;
Enhance accessibility of
PWD‘s in public buildings;
Proper representation of

68
special groups in leadership
and policy making levels.
Gender based violence Poverty Cultural
beliefs Create awareness on
gender based violence Reduce incidences of
gender based violence. Establish counseling and
guidance centers; Establish 1 rescue center in every sub
county; Training of mentors. Special programmes
Inadequate disaster
prevention and
management plan.
Inadequate disaster
preparedness;
Inadequate disaster
prevention equipment
and facilities
Create awareness on
disaster prevention and
management; Establish
and operationalize disaster
prevention and
management plan.
Improve disaster
prevention and
management.
Establishment of a disaster
management and prevention
committee at sub county
level
Culture
Betting, casinos and
other forms of gambling
control; Racing; Liquor
licensing; Cinemas;
Video shows and
hiring; Libraries;
Museums; Sports and
cultural activities and
facilities.
Inadequate cultural and
library recreational
centers.
Inadequate funds
allocated for
construction of
cultural and recreation
centers.
Construction of cultural,
recreational, libraries and
resource centers in the
county.
Documentation and
preservation of cultural
heritage
Provision of funds for
promoting positive culture;
Construction of recreation
and cultural centres
Governance, Justice Law and Order
Sub Sector
Link to
national/county
functions
Issues/Problems Causes Development Objectives Immediate Objectives Potential Strategic policy
thrusts
Information,
Communication and
Technology.
The county will develop
county law to
implement county
policy on ICT
Accessibility
of modern
communicatio
Lack of
government wide
IT/ICT policy
Adopt e-government
policies and improve
communication network in
all parts of the county.
Modernize and embrace
ICT in communication
and in systems by
working to phase out all
manual systems
Fibre optic cabling, increased
levels of literacy
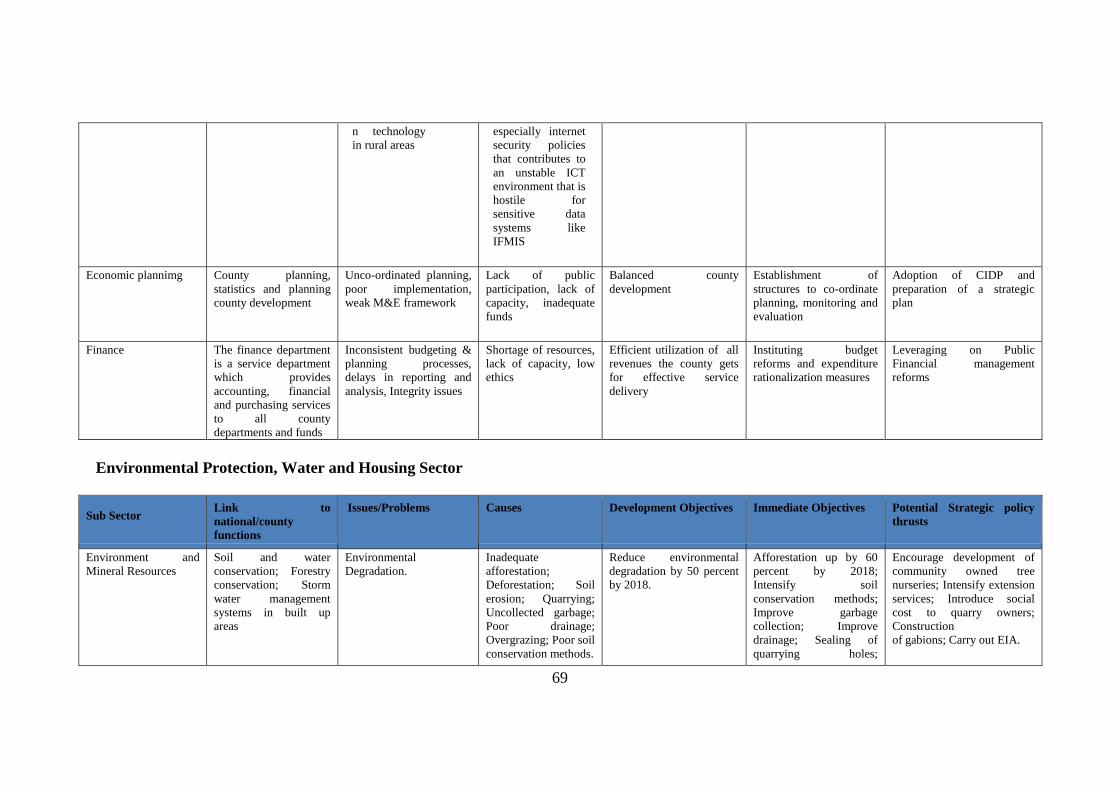
69
n technology
in rural areas
especially internet
security policies
that contributes to
an unstable ICT
environment that is
hostile for
sensitive data
systems like
IFMIS
Economic plannimg County planning,
statistics and planning
county development
Unco-ordinated planning,
poor implementation,
weak M&E framework
Lack of public
participation, lack of
capacity, inadequate
funds
Balanced county
development Establishment of
structures to co-ordinate
planning, monitoring and
evaluation
Adoption of CIDP and
preparation of a strategic
plan
Finance The finance department
is a service department
which provides
accounting, financial
and purchasing services
to all county
departments and funds
Inconsistent budgeting &
planning processes,
delays in reporting and
analysis, Integrity issues
Shortage of resources,
lack of capacity, low
ethics
Efficient utilization of all
revenues the county gets
for effective service
delivery
Instituting budget
reforms and expenditure
rationalization measures
Leveraging on Public
Financial management
reforms
Environmental Protection, Water and Housing Sector
Sub Sector
Link to
national/county
functions
Issues/Problems Causes Development Objectives Immediate Objectives Potential Strategic policy
thrusts
Environment and
Mineral Resources
Soil and water
conservation; Forestry
conservation; Storm
water management
systems in built up
areas
Environmental
Degradation. Inadequate
afforestation;
Deforestation; Soil
erosion; Quarrying;
Uncollected garbage;
Poor drainage;
Overgrazing; Poor soil
conservation methods.
Reduce environmental
degradation by 50 percent
by 2018.
Afforestation up by 60
percent by 2018;
Intensify soil
conservation methods;
Improve garbage
collection; Improve
drainage; Sealing of
quarrying holes;
Encourage development of
community owned tree
nurseries; Intensify extension
services; Introduce social
cost to quarry owners;
Construction of gabions; Carry out EIA.
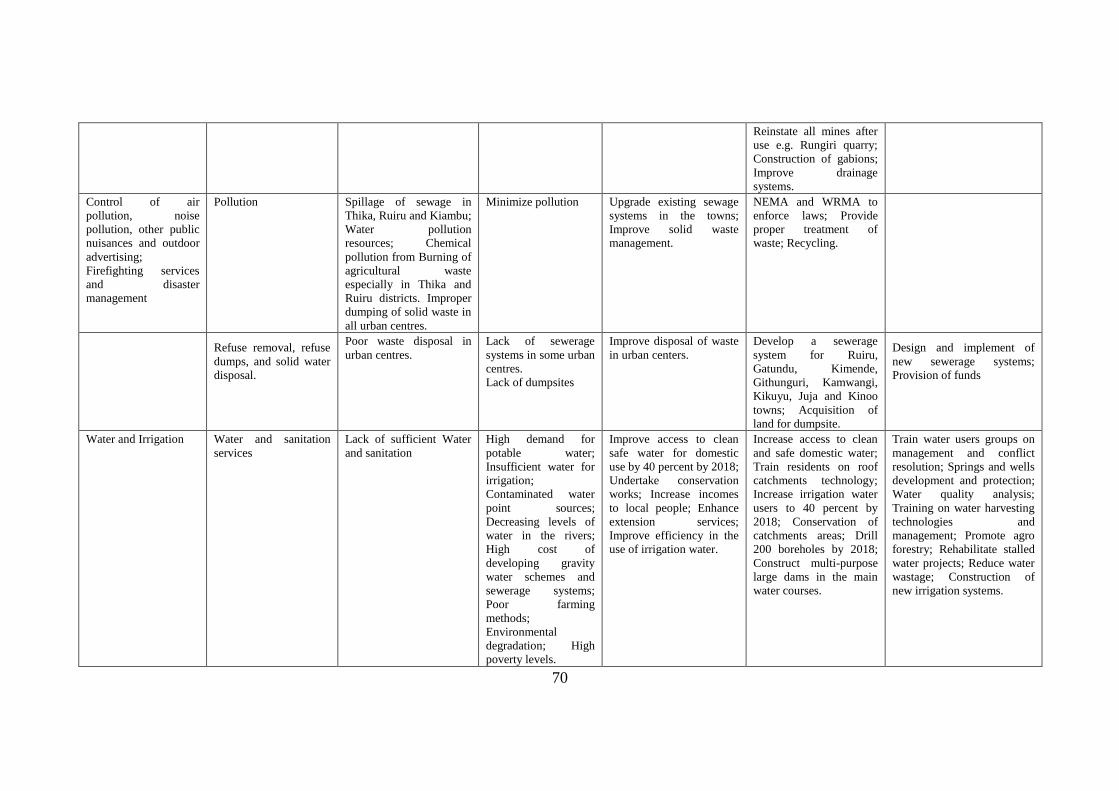
70
Reinstate all mines after
use e.g. Rungiri quarry;
Construction of gabions;
Improve drainage
systems. Control of air
pollution, noise
pollution, other public
nuisances and outdoor
advertising;
Firefighting services
and disaster
management
Pollution Spillage of sewage in
Thika, Ruiru and Kiambu;
Water pollution
resources; Chemical
pollution from Burning of
agricultural waste
especially in Thika and
Ruiru districts. Improper
dumping of solid waste in
all urban centres.
Minimize pollution Upgrade existing sewage
systems in the towns;
Improve solid waste
management.
NEMA and WRMA to
enforce laws; Provide
proper treatment of
waste; Recycling.
Refuse removal, refuse
dumps, and solid water
disposal.
Poor waste disposal in
urban centres. Lack of sewerage
systems in some urban
centres. Lack of dumpsites
Improve disposal of waste
in urban centers. Develop a sewerage
system for Ruiru,
Gatundu, Kimende,
Githunguri, Kamwangi,
Kikuyu, Juja and Kinoo
towns; Acquisition of
land for dumpsite.
Design and implement of
new sewerage systems;
Provision of funds
Water and Irrigation
Water and sanitation
services Lack of sufficient Water
and sanitation High demand for
potable water;
Insufficient water for
irrigation;
Contaminated water
point sources;
Decreasing levels of
water in the rivers;
High cost of
developing gravity
water schemes and
sewerage systems;
Poor farming
methods;
Environmental
degradation; High
poverty levels.
Improve access to clean
safe water for domestic
use by 40 percent by 2018;
Undertake conservation
works; Increase incomes
to local people; Enhance
extension services;
Improve efficiency in the
use of irrigation water.
Increase access to clean
and safe domestic water;
Train residents on roof
catchments technology;
Increase irrigation water
users to 40 percent by
2018; Conservation of
catchments areas; Drill
200 boreholes by 2018;
Construct multi-purpose
large dams in the main
water courses.
Train water users groups on
management and conflict
resolution; Springs and wells
development and protection;
Water quality analysis;
Training on water harvesting
technologies and
management; Promote agro
forestry; Rehabilitate stalled
water projects; Reduce water
wastage; Construction of
new irrigation systems.

71
Housing
Land survey and
mapping; Boundaries
and fencing; Housing
Poor services in housing
estates. Inadequate services
and social amenities
in the estates; Existing
housing not well
maintained
Improve services in the
housing estate s and
therefore housing
standards.
Renovate and maintain
existing housing;
Improve services like
lighting, roads and social
amenities in the estates.
Provision of funds for
renovation.
Affordability of housing facilities
High cost of housing materials
Improve on the
affordability of housing
facilitate and ease housing problem.
Reduce cost of housing. Subsidize cost of building
materials; Advocate the use
of cost effective materials in
the construction industry;
Establish centers for
appropriate building
materials technology.
Unplanned development
of commercial/residential
houses in the county;
Informal settlement.
Poor physical
planning of urban
centres; Mushrooming
of slum areas;
Encroachment of
water catchment
areas, water courses
and riparian areas.
Improve the physical
planning in urban centres. Improve physical
planning in the 12 sub
counties.
Enforce the physical
planning acts; Slum
upgrading.

CHAPTER THREE: LINKAGES WITH OTHER PLANS
3.1 Introduction
This chapter presents the linkage of the County Annual Development Plan with the Kenya
Vision 2030, the second Medium Term Plan, County Sectoral Plans, Sustainable
Development Goals, the Constitution of Kenya 2010 and other legal frameworks.
3.2 Linkage with the Constitution of Kenya, 2010
A two-tier government namely national government and 47 county governments was created
under the Constitution of Kenya 2010. The fourth schedule of the Constitution outlined the
functions allocated to each level of government as a way of ensuring a clear separation of
powers. County governments were charged with a total of 14 functions while the rest remain
with the national government. The 2017/18 ADP is focused on implementing the functions
allocated to County Government which include; road and transportation network; welfare
protection; enhancement of County health facilities; establishment and refurbishment/
renovations of ECDE centers among others. The County Government is committed to
ensuring adherence to other key laws enacted to provide a framework for devolved
governance. namely: Urban Areas and Cities Act, 2011; The County Governments Act, 2012;
The Transition to Devolved Government Act, 2012; The Intergovernmental Relations Act,
2012 and The Public Finance Management Act, 2012
3.3 Linkages with Kenya Vision 2030 and its Medium Term Plans
Kenya Vision 2030 is the Country’s blueprint and focuses on the long term development
strategy. The Vision aims to transform Kenya into a modern globally competitive middle
income country providing a high quality of life to all its citizens. County Governments came
into place after the elapse of the first MTP (2008-2012) of the Vision 2030.County
Governments visions are therefore linked with priority areas as outlined in the second
MTP(2013-2017) which include; employment creation; development of human resource
through expansion and improvement in quality education, health and other social services;

73
reducing the dependence of the economy on rain-fed agriculture through expansion of
irrigation; higher investment in alternative and green sources of energy; improving the
economy’s competitiveness through increased investment and modernization of infrastructure
amongst others. The Kenya Vision 2030 is anchored on three key pillars namely:
a) The Economic Pillar
This pillar aims to achieve an average GDP growth rate of 10 percent per annum and sustain
the same till 2030. This pillar key sectors include: tourism, agriculture and livestock,
manufacturing, wholesale and retail trade, Business Process Outsourcing (BPO) and financial
services. Kiambu County government established a statistical unit under Finance and
Economic Planning department which has been in collaboration with KNBS to collect and
analyse data for purposes of economic projections and decision making processes. The same
has been contributing towards achievement of vision 2030 at the devolved level and
formulating a framework for carrying out baseline surveys.
b) The Social Pillar
This pillar seeks to build a just and cohesive society with social equity in a clean and secure
environment. Kiambu County has a clear vision on welfare support amongst the aged, PWD
and vulnerable groups within the County. The County launched a cash transfer fund for the
aged who are 70 years and above, aimed at improving their living conditions given their
inability to be economically productive.
c) The Political Pillar
This pillar aims at realizing a democratic political system founded on issue-based politics that
respect the rule of law and protects the fundamental rights and freedoms of every individual
in the Kenyan society. The County Government of Kiambu has been involving the
public/residents in all development matters. This is done through a participatory form of
governance that engages with the community in decision making, prioritization of projects
and actual implementation, monitoring and evaluation of identified projects as guided by the
Constitution of Kenya and other legal provisions such as the PFMA 2012.

74
3.4 Linkages with County Plans
Section 107(2) of the County Government Act acts a the basis of all budgeting and spending
in the county. Further, Section 109(1) of the County Government Act states that the County
Sectoral plans shall be the basis for budgeting and performance management. Given this Act,
Kiambu County Government has ensured that all sectoral plans are based on the actual
projects listed in the CIDP to guarantee county budgetary allocations.

75
CHAPTER FOUR: RESOURCE MOBILIZATION
4.1 Introduction
In order for the County to achieve its goals as set out in this ADP, the county will need to
prioritise its resource allocation. This chapter highlights the current financial status of the
County, which includes the projected revenue for 2016/17 financial year and a projection for
the period of the plan 2017/18 FY. It also identifies the sources of revenue for the county and
highlight the resource mobilisation strategy and implementation plan. It seeks to inform and
guide the County government’s efforts towards sustainable financing of its programmes and
operations. It provides guiding principles, and proposes strategies for mobilizing resources to
support the implementation of the County Departments Strategic Plans and the ultimate
fulfilment of the county's vision and mission.
The implementation plan proposed details actions to be taken and the entities responsible for
execution. An effective governance and management policy for resource mobilisation is also
proposed. This Strategy will ensure sufficient resources are available to implement relevant
activities in this annual plan.
In order to enhance service delivery and development within the County, the following
priorities will continue to be the leading focus for the County Government:
Efficient and effectiveness in public resources utilization and budget execution.
Capitalizing in County infrastructure and social welfare services in order to unlock the
county’s potential and improve competitiveness.
Enhancing local revenues collection capacity.
Strengthening capacity-building in public financial management to ensure good
governance and effective service delivery
Entrenching program budget and promoting execution of the development budget as
planned.
While the County has already finalised its Finance Bill, 2016, it is expected that significant
work will need to be undertaken in this financial year towards the development of a County

76
Tariff Policy which will provide the framework for tariff setting within the County. Such
policy will be premised on the following basic principles:
● Equity: all users of County services should be treated equitably in the application
of tariffs, fees, levies or charges and the amount individual users pay for services
should generally be in proportion to their use of that service;
● Efficiency: the implementation and collection of the tariffs, fees, levies or charges
should be easy to effect and enforce;
● Certainty: the tariffs should be predictable and predetermined and the rules for
effecting changes should be clear and reliable;
● Economy: the cost of rendering the service and collection of related tariffs should
be kept minimal;
● Simplicity: the laws and regulations giving effect to the implementation and
enforcement of tariff policies should be simple and encourage compliance; and
● Convenience: systems should be implemented to promote compliance through
multiple and convenient payment channels by citizens.
Table 9: County Revenue Estimate Projections
Item Code Details Estimates
2016/2017
Projected
Estimates
2017/2018
Projected
Estimates
2018/2019
(Receiver of Revenue - Chief Officer
for Finance)
Kshs. Kshs. Kshs.
Land Rates(Management Unit) 676,400,000 716,984,000 760,003,040
1130104 Land Rates charges 676,400,000 716,984,000 760,003,040
Total Taxes on Property 676,400,000 716,984,000 760,003,040
1110104
Cess Receipts(Cess Management
Unit) 162,000,000 171,720,000 182,023,200

77
Item Code Details Estimates
2016/2017
Projected
Estimates
2017/2018
Projected
Estimates
2018/2019
Of Which: -
Quarry Cess 125,000,000 132,500,000 140,450,000
Other Cesses(transportation of other
goods) 2,000,000 2,120,000 2,247,200
1420345 Agriculture Cess 35,000,000 37,100,000 39,326,000
Crop 5,000,000 5,300,000 5,618,000
Dairy 15,000,000 15,900,000 16,854,000
market/produce cess 5,000,000 5,300,000 5,618,000
Meat 10,000,000 10,600,000 11,236,000
Total Cess Receipts 162,000,000 171,720,000 182,023,200
1140500 Receipts from Permission to
Use Goods or to Perform Services and
Activities
1140501 Liqour Licence (management unit) 110,000,000 116,600,000 123,596,000
Total Receipts from Permission to
Use Goods or to Perform Services and
Activities 110,000,000 116,600,000 123,596,000
1140800 Other Taxes on Goods and
Services
1300000 Grants
1330203
Grants from other levels of
Governments 8,902,293,572 9,367,170,260 9,929,200,475
Of Which:
Unconditional Grants 8,053,256,819 8,536,452,228 9,048,639,362
Conditional Grant- 849,036,753 830,718,031 880,561,113
Thika Level 5 393,063,584 416,647,399 441,646,243
Free maternal health care Allocation 221,521,352 234,812,633 248,901,391
Road maintenance fuel levy fund 123,738,238 131,162,532 139,032,284
Compensation of User Fees Forgone 35,773,082 37,919,467 40,194,635

78
Item Code Details Estimates
2016/2017
Projected
Estimates
2017/2018
Projected
Estimates
2018/2019
DANIDA 9,600,000 10,176,000 10,786,560
Donor Funds-World Bank for Kenya
Devolution Support Programme 35,253,497 - -
Donor Funds- Un habitat (Environment) 30,087,000 - -
8,902,293,572 9,367,170,260 9,929,200,475
1410000 Property Income
1410402
Lease / Rental of Councils
Infrastructure Assets 20,000,000 21,200,000 22,472,000
1410404 Housing management Unit) 77,000,000 81,620,000 86,517,200
of which:
County rental Housing property
management 70,000,000 74,200,000 78,652,000
stalls/shops/hotels 5,000,000 5,300,000 5,618,000
Transfer fee 2,000,000 2,120,000 2,247,200
Total Property Income 97,000,000 102,820,000 108,989,200
1420000 Sales of Goods and
Services -
1420102 Other Revenues(Various Fees) 60,000,000 63,600,000 67,416,000
1420203
Registration of Private Schools/Self
Help Groups/Education inspection 10,000,000 10,600,000 11,236,000
1420328
Single Business Licences management
Unit 300,000,000 318,000,000 337,080,000
of Which: -
Business Permits 300,000,000 318,000,000 337,080,000
1420404
Parking Fees(Vehicle parking
management unit) 336,000,000 356,160,000 377,529,600
Of which: -
Public Service Vehicle Seasonal Tickets 200,000,000 212,000,000 224,720,000
Registration fee 6,000,000 6,360,000 6,741,600
Reserved Parking 10,000,000 10,600,000 11,236,000

79
Item Code Details Estimates
2016/2017
Projected
Estimates
2017/2018
Projected
Estimates
2018/2019
Street parking 120,000,000 127,200,000 134,832,000
Market Management unit 150,000,000 159,000,000 168,540,000
1420405 Market Entrance fee/hawkers fee 60,000,000 63,600,000 67,416,000
Other market fees 90,000,000 95,400,000 101,124,000
Total Sales of Goods and Services 856,000,000 907,360,000 961,801,600
1430000 Fines, Penalties and
Forfeitures
1430101 Impounding Charges
of which;
vehicle parking Impounding Fee 2,000,000 2,120,000 2,247,200
Vehicle parking Penalties 4,500,000 4,770,000 5,056,200
Market impounding fee 2,000,000 2,120,000 2,247,200
Total Fines, Penalties and Forfeitures 8,500,000 9,010,000 9,550,600
1450000 Other Receipts Not
Elsewhere Classified
1450105 Other County Government Revenue 1,858,072,188 1,969,556,519 2,087,729,910
Car Loan & Mortgage Loan interest 120,000,000 127,200,000 134,832,000
Slaughtering House Management
Unit 55,760,000 59,105,600 62,651,936
of which:
Hides & Skins 260,000 275,600 292,136
Meat inspection 30,000,000 31,800,000 33,708,000
Overnight Livestock Holding Fee per
Head 500,000 530,000 561,800
Slaughter fee per head in County
Slaughter House / Abattoir 25,000,000 26,500,000 28,090,000
Roads Transport Public Works unit 30,000,000 31,800,000 33,708,000
Of which:

80
Item Code Details Estimates
2016/2017
Projected
Estimates
2017/2018
Projected
Estimates
2018/2019
Firefighting & other services 30,000,000 31,800,000 33,708,000
Health management unit 550,000,000 583,000,000 617,980,000
of which:
medical services 350,000,000 371,000,000 393,260,000
Public health services 200,000,000 212,000,000 224,720,000
Agriculture, Livestock & Fisheries
Management Unit 72,312,188 76,650,919 81,249,974
of which:
County Agricultural Machinery for Hire 300,000 318,000 337,080
Cultivation of Land per year on County
Government Land 100,000 106,000 112,360
Livestock Landing Fee / Cess (per
Animal) 40,000,000 42,400,000 44,944,000
General Services 30,000,000 31,800,000 33,708,000
Certification of animal disease tests 12,188 12,919 13,694
Movement permits 400,000 424,000 449,440
Veterinary Services 1,500,000 1,590,000 1,685,400
Trade Tourism, industry &
Cooperatives Unit 10,000,000 10,600,000 11,236,000
of which:
Fourteen Falls Sanctuary Entry Fees 7,500,000 7,950,000 8,427,000
Fees for Cooperative Services 2,500,000 2,650,000 2,809,000
Water, Environment & Natural
Resources Management Unit 111,500,000 118,190,000 125,281,400
of which:
Burial Charges (Temporary graves) 500,000 530,000 561,800
Environmental impact
Assessment/Audit Approval fees 3,000,000 3,180,000 3,370,800
Tipping Charges 8,000,000 8,480,000 8,988,800
Solid Waste manangement 100,000,000 106,000,000 112,360,000

81
Item Code Details Estimates
2016/2017
Projected
Estimates
2017/2018
Projected
Estimates
2018/2019
Physical Planning Unit 908,500,000 963,010,000 1,020,790,600
of which:
Fees for Evaluation of Building Plans
and Permits 350,000,000 371,000,000 393,260,000
Fees for Physical Planning Services
250,000,000 265,000,000 280,900,000
Fees for Construction inspection,
Enforcement and occupation 150,000,000 159,000,000 168,540,000
Public works and utility charges 10,000,000 10,600,000 11,236,000
Fees for Land surveying 8,000,000 8,480,000 8,988,800
Estate & Property Development services 500,000 530,000 561,800
Outdoor Advertisement 120,000,000 127,200,000 134,832,000
Registration Fees 15,000,000 15,900,000 16,854,000
Fees for Land Valuation services 5,000,000 5,300,000 5,618,000
Total Other Receipts Not Elsewhere
Classified 1,858,072,188 1,969,556,519 2,087,729,910
Total Revenue 3,767,972,188 3,985,040,519 4,224,142,950
Total Grants 8,902,293,572 9,367,170,260 9,929,200,475
Unspent Revenue from Previous FY 0 0 0
Net Domestic Borrowing 0 0 0
GRAND TOTAL 12,670,265,760 13,352,210,779 14,153,343,426
Source: Kiambu County Revenue Unit, 2016
4.2 Principles Guiding Resource Mobilization Strategies
Under the Constitution 2010, counties are the primary sub-national political and
administrative units. The Public Financial Management Act 2012 stipulates that the counties
will receive at least 15% of the revenues generated at the national level. Challenges in
revenue performance requires the county government to put up structures in place to seal
loopholes and widen the tax base. Generating revenue locally has proved not an easy task for
the county governments in Kenya who have always struggled with sustaining sufficient

82
revenue for their recurrent and development budgets. In the past County revenue collection
did not meet the County expectations though it was impressive. However, the County was
able to meet 92.2 percent of the revised budget estimates in the 2015/16 financial year. With
the automation of revenue collection in place, revenue enhancement plans revenue
performance has been on an upward trajectory enabling the county to collect a significant
percentage of the projected annual local revenue target. This remarkable improvement has
made the County emerge as the Second Best County in revenue mobilization as per third
quarter report on 2015/16 financial year on Counties budget implementations review.
To enhance revenue collection in Kiambu, the county will continue with the implementation
of the finance reforms that have been put in place. Pursuance of this reforms which addresses
revenue collection inefficiencies and broaden revenue collection base have seen the local
revenue collection increase tremendously over the last three years. Despite this reforms the
County has not maximized the revenue generation potential of its jurisdiction and revenue
collection have been below projections. To enhance the revenue generation of the County
and increase its ability to deliver services, the county has undertaken a comprehensive
revenue enhancement study so as to meet its budgetary objectives.
The principles below shall guide the county in its efforts to raise resources. The County shall:
● Enhance human and systems capacity;
● Institutionalize and adopt a modernization and revenue administration reform
programme;
● Seek to diversify its donor base while retaining and deepening its relationship with the
current (very supportive) donors e.g. the World Bank;
● Nurture partnerships and alliances as a strategic approach in raising resources e.g with
financial institutions, organized groups, private sector through Public Private
Partnerships(PPPs);
● Ensure governance and management systems and structures are in place to manage
and grow acquired resources and assets.

83
4.3 Sources of Resources to the County
4.3.1 Internally Generated Revenues
The Constitution specifies that a county can charge property rates, entertainment tax; and, any
other tax specifically authorized by an Act of Parliament. The county may also raise revenues
from user-charges and fees levied on services they render. This category includes business
licenses such as single business permits, fees for various approvals and plot rents, among
others.
In the very short term, the county will ensure there is adequate capacity, both human and non
human, to ensure proper receipt and accounting of all money received, recording and
accounting, proper collection, banking and accounting of all revenues collected on behalf of
the county government, and effective delivery of target outputs and results are achieved.
Further to these, the government will continue with its modernization reforms to improve
revenue collection.
The County will continue to focus on revenue mobilization while ensuring resource allocation
shifts from recurrent to capital expenditures while ensuring efficiency and effectiveness of
public resources. The government will continue to emphasis on fiscal policy strategy that
recognizes the need to strike a balance between service delivery and fiscal sustainability, with
emphasis on higher investments in human health, infrastructure development, agriculture and
good governance for a stronger and more robust growth for the future.
4.3.2 National Government
The Constitution provides for mandatory transfer of at least 15 percent of nationally collected
revenues of the last audited account and approved by the national assembly. The county will
continue to negotiate for increased allocations of the equitable share from the National
Government to ensure that the county can deliver on its functions. As functions are devolved,
the amount allocated to the county must be commensurate to the actual cost of financing the
functions. This is based on the principle of sustainable devolution which requires that
resources should follow functions. The approach here will be to have accurate statistics of the
current status of the county. Where there are clear areas of collaboration on a win-win basis,

84
the county government will seek to partner with the government to implement its
programmes. Such areas include undertaking joint research.
The constitution provides for other transfers from national revenue, both conditional and
unconditional. The county will put in place a credible system of public financial management
system. In the meantime, the county will suggest design models for conditional transfers that
avoid unnecessary interference with the autonomy of the county government. The managing
and the capacity of the county to implement the target programmes and projects will be
ensured. The county will also need from the national government to be provided with
knowledge and information about timing of financial transfers.
4.3.3 Current and New Development Partners
In the short and medium terms, the county government will continue to engage current donors
for funding of ongoing programmes. These donors have demonstrated interest and
commitment to support development initiatives that will ensure the success of devolution in
Kenya. The World Bank (WB), in particular, has been extremely supportive to the County
Government's programmes.
In the medium to long terms, the county government shall increase the number of donors
participating in its programmes. Potential donors will include other international
organizations, foreign governments, NGOs, etc. Also, among the new development partners
to be targeted include “friends” of current donors such as International Monetary Fund (IMF)
that could be approached to provide technical assistance in their areas of expertise. These will
be identified through researching to identify those whose areas of interest and strategic plans
are similar to the county government programmes. This of course requires a dedicated human
resource established in the form of a unit, to be called Debt Management & External
Resources Unit.
4.3.4 The Corporate Sector
Success in mobilizing resources from the corporate sector will depend on how the county can
market the qualitative and quantitative needs of its programmes. Moreover, the fact that
corporations have tight decision-making processes for donations should not be overlooked.

85
4.3.5 Foreign Governments
The county government also intends to Partner with foreign Governments who have so far
promised fund development initiatives in the county. Further engagement is expected to yield
support for various projects the county will be proposing.
4.4 Management of Public Funds
The government will put in place effective public financial management systems to ensure
full compliance with revenue mobilization, resource allocation, utilization, reporting and
accounting. In particular the county will use the Integrated Financial Management System
(IFMIS) and the internet banking to promote prudent public finance management.
To further ensure effective public financial management, the county government will adopt
the principles of openness, accountability and citizen participation in financial matters. These
principles are critical to ensuring continued links between citizen needs, budgeting or
resource allocation and budget execution.
With regard to borrowing, the government will promote equitable sharing of the benefits and
burden of the use of resources between current and future generations. This means that the
government will use borrowing to ensure a reasonable balance between the benefits created
by the borrowed resources and the burden of servicing the debt. To run a budget deficit,
county governments are expected to ensure three conditions; first, they get guarantees from
the national government, secondly, they should get approval of the same from the county
assembly; and third, they should ensure borrowed funds are used for purposes that comply
with debt equity principle
4.5 Management of Assets and Liabilities
The county is in the process of undertaking an audit on the assets and liabilities. To further
safeguard these assets, a proper management of county assets policy will be developed. An
asset register shall be developed where all county assets shall be recorded and availed for
monitoring. The county shall ensure all assets are used efficiently and only for the benefit of
the county. Moreover, assets shall only be used up to the end of their economic useful life to
minimise asset maintenance costs. The county shall enact an asset replacement / disposal

86
policy. This will ensure the cost of maintaining an asset does not outweigh the economic/
social benefits accruing as a result of its use.
4.6 Implementation Plan
4.6.1 Strengthening Governance, Management and Organisational Structure and
Systems
Donors and residents are often interested in the level of effectiveness of governance and
management arrangements in an institution. Specifically, clear roles and responsibilities will
be assigned, presence of transparent and accountable systems using internal controls and
external audits will be instituted, and cultivation of enabling working climate that fosters
innovation and minimizes wrangles and suspicion that drag many an institution backwards.
Efforts towards strengthening governance systems and structures have already started.
Sufficient resources (human and funds) will be allocated to Resource Mobilization Strategies.
4.6.2 Communication
Finance Department will move on to allocate responsibilities on who should do what activity,
when, how, where, and develop parameters to measure success. The unit must monitor
progress, through a Communication and Research Officer who will be in charge of this task.
Developing a Communication Strategy is of immense urgency.
4.6.3 Implementation of Cost-saving Measures
Another way of mobilizing resources will be by reducing cost through rationalizing
expenditures and im3proving efficiency. The county plans to develop measures to achieve
this.

87
CHAPTER FIVE: DEPARTMENTAL PRIORITY PROJECTS AND PROGRAMMES
2017-18 FY
5.1 County Executive
Vision
Excellence in County leadership for a competitive and prosperous Kiambu County
Mission
To provide overall policy and leadership direction in the management of public affairs for the
prosperity of Kiambu County
Strategic Overview
The County Executive is responsible for implementation of county legislation; implementing
national legislation within the county; managing and coordinating the functions of the county
administration and its departments. The Committee also proposes legislation for
consideration by the County Assembly; provides information to the County Assembly on
matters relating to the County; maintaining good governance in the performance of the
county functions and offering strategic direction of the county.
The core mandate of the county executive is to implement the county legislation, manage and
coordinate the functions of the county administration and its department. The main challenge
facing the county executive is the appropriate human resource to be able to carry its mandate
effectively and efficiently. The major services/output for the FY 2015/16 is to ensure all the
county legislation is well implemented as required and coordinate the functions of the county
administration and its department. It also involves issuance of policy guidelines and
statements, cabinet circulars and security interventions.

88
Table 10: County Executive Projects/Programmes
Project/Programme Objective Expected outputs Indicators Targets Estimated cost
General administration
and support services
Promote
efficient and
effective
service
delivery to the
residents of
Kiambu
County.
Assenting to county
assembly bills
No. of bills
assented
10
375,793,804
Charing of county
executive
committee meeting
No. of
meetings held
12
Delivering an
annual state of the
county address
No. of annual
state of the
county speech
1
Policy guidelines No. of policy
guidelines
issued to
departments
10
Generating agendas
for cabinet meeting
No. of memos
generated
12
Issuance of cabinet
circulars
No. of
circulars
issued
5
Assistance offered
to institutions and
individuals in need
No of
donations
beneficiaries
50
Public sector advisory
services
Promote
efficient and
effective
service
delivery to the
residents of
Kiambu
county
Attending
intergovernmental
forums
No. of
meetings
attended
4 21,000,000
Attending Council
of Governors
meeting
No. of
meetings
attended
4
Security
intervention
No. of
interventions
made
3
Executive policy
formulation
No. of policy
statements
12
No. of press
release made
4

89
5.2 County Public Service Board
Vision
To be a leading agency of excellence in County Public Service Management and
Development.
Mission.
To provide policy direction in human resources management and development, advice on the
appropriate organization structures initiative and coordinate human resource reforms to
improve service delivery in County Public Service for sustainable social-economic
development.
Strategic overview
1) To provide policy strategic leadership and direction to the County Government structures
and institutional frameworks for optimal public service delivery and response to the Kiambu
County needs,
2) To ensure continuous development, retention and productive human resources and
application of best practices in the management of public service for improved performance.
3) To promote good governance, transparency and accountability in the public service.
Table 11: County Public Service Board Projects/Programmes
Project/Programme Objective Expected outputs Indicators Targets Estimated
cost
General
Administration and
support services
To improve
service delivery in
the public sector
through increased
productivity of
human resources
Provision of safety
measures relating to
personnel documents
and other relevant
data
Data safety policy 1 55,424,121
Human Resource
development and
management
services
To improve
service delivery in
the public sector
through increased
productivity of
human resources
Harmonization of
salary scales/grades
Standard job
groups report
1 45,500,000
Employee satisfaction
report
No. of Employee
satisfaction report
1
Human Resource
Management policies
and guidelines
Policies and
guidelines
implemented
2
Performance
management
guidelines/tools and
Performance
management
1
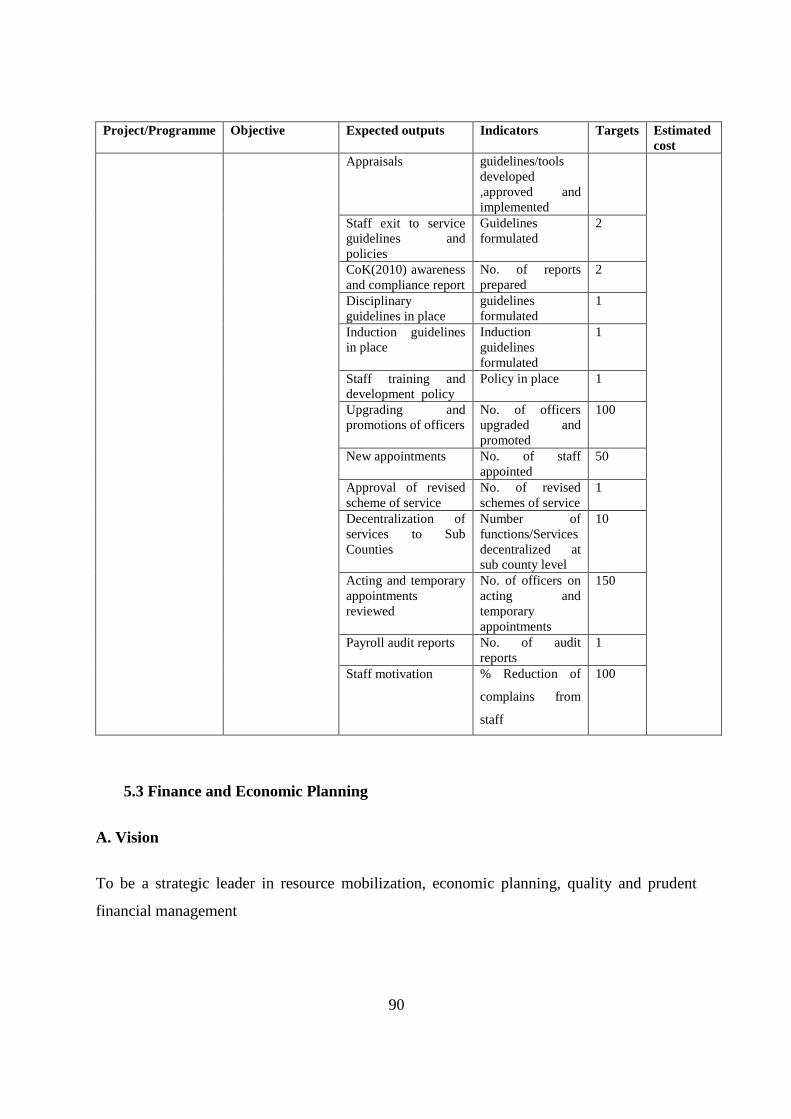
90
Project/Programme Objective Expected outputs Indicators Targets Estimated
cost
Appraisals guidelines/tools
developed
,approved and
implemented
Staff exit to service
guidelines and
policies
Guidelines
formulated
2
CoK(2010) awareness
and compliance report
No. of reports
prepared
2
Disciplinary
guidelines in place
guidelines
formulated
1
Induction guidelines
in place
Induction
guidelines
formulated
1
Staff training and
development policy
Policy in place 1
Upgrading and
promotions of officers
No. of officers
upgraded and
promoted
100
New appointments No. of staff
appointed
50
Approval of revised
scheme of service
No. of revised
schemes of service
1
Decentralization of
services to Sub
Counties
Number of
functions/Services
decentralized at
sub county level
10
Acting and temporary
appointments
reviewed
No. of officers on
acting and
temporary
appointments
150
Payroll audit reports No. of audit
reports
1
Staff motivation
% Reduction of
complains from
staff
100
5.3 Finance and Economic Planning
A. Vision
To be a strategic leader in resource mobilization, economic planning, quality and prudent
financial management

91
B. Mission
To be an effective and efficient department in resource mobilization, management of finance,
coordination, economic planning and development for a safe and harmonious county.
C. Strategic Overview and Context for Budget Intervention;
The Department is mandated with the preparation of annual estimates of revenues and
expenditures including the preparation of supplementary estimates as the need arises. It is the
County's think tank responsible for policy analysis on a wide range of issues including: fiscal
issues, trade issues and private sector development issues. It also ensures that external
resources (grants, loans, donations) are effectively mobilized, disbursed and effectively
utilized and that there is prudent public debt management. It is responsible for the
administration and enforcement of revenue laws and for that purpose collecting and
accounting for all rates, taxes, fees and charges payable by or under any laws in the County;
collection of statistical data needed for planning purposes; County budget implementation,
monitoring and evaluation.
The Department’s objectives includes revenue mobilization, effective and efficient
management of public resources, improved allocation of county allocation of funds and
creating conducive environment for the private sector investment. The sector is also the link
of all other sectors with the National government in matters of finance and resource
mobilization.
Table 12 : Finance and Economic Planning projects/programmes
Project/Progra
mme
Objectives Expected outputs Indicators Targets Estimated
cost
General
Administration
and support
service
Predictable
revenue
collection and
efficient
allocation of the
resources to the
county
expenditure
priorities
Improved prudence
in the management
of public resources
Percentage reduction in
the incidences of
corruption and audit
queries
No. of officers trained
on Public Finance
Management
No. of staff trained on
ISO implementation
80%
70
35
1,053,356,833
County Emergency
Fund
%Allocation of county
emergency fund
0.5%

92
Project/Progra
mme
Objectives Expected outputs Indicators Targets Estimated
cost
Mortgage/ Housing
for civil servant
Amount Allocated
No. of staff accessing
mortgage
100M
50
Staff Health
Insurance Fund
Amount allocated
No. of staff with
medical cover
10M
50
Implementation of
Revenue
administration
systems
% implementation of
revenue administration
systems
100
Financial
management
services
Predictable
revenue
collection and
efficient
allocation of the
resources to the
county
expenditure
priorities
Officers in all
department trained
on MTEF,
programme based
budgeting, and
implementation of
budget
No. of officers trained
80 372,115,000
Stakeholders
involved in budget
making process
No. of stakeholders
involved per Sub
County
150
Budget Prepared
and Approved
No. of budget prepared
and approved
1
Increased budgetary
resources allocated
towards
development
projects
Percentage change
towards development
expenditure to total
budget
40%
Legal and
regulatory
framework
governing
preparation and
implementation of
budget adhered to
No. of budget circular
released
1
No. of budget Review
and outlook paper
prepared
1
No. County Fiscal
strategy paper prepared
1
No. of formulated
Appropriation and
Finance bill
2
Local Sources
mobilized
Local revenue
mobilised as a
percentage of total
budget
38%
Monitoring and
evaluation report on
local resources
mobilized
No. of reports
Monthly
Quarterly
Annually
12
4
1
Revenue No. of enhancement
plan prepared and
1

93
Project/Progra
mme
Objectives Expected outputs Indicators Targets Estimated
cost
Enhancement plan implemented
Establishment of
County Revenue
Commission
No. of appointment of
the commissioners
done
1
Preparation of
Annual
procurement
No. of Procurement
plan prepared
1
General
procurement
administration
No. of tender
committee meeting
held
12
Accounting systems
and Financial
regulations
reviewed and
developed
No. of accounting
systems regulations
reviewed and
developed
1
Financial
Information and
reports produced
No. of reports
produced
Monthly
Quarterly
Annually
12
4
1
Risk based audit;
Institutional risk
management
framework rolled
out
No. of audit reports 10
Audit committees
training manuals
and regulations
No. of audit committee
trained
1
No. of audit manual
developed and
implemented
1
Economic
Planning
services
Predictable
revenue
collection and
efficient
allocation of the
resources to the
county
expenditure
priorities
Development of
economic policies
and Sector specific
medium term plans;
No. Of economic
policies
No. Of sector specific
medium term plans
developed
5
10
50, 000,000
Research papers
under various
policy topics
Prepared and
published
No. Of Research
papers developed
4
Prepare and
produce Quarterly
and annual M&E
report
No. Of reports
prepared
5
County Integrated
Development plan
No. of County
Integrated
1

94
Project/Progra
mme
Objectives Expected outputs Indicators Targets Estimated
cost
prepared Development plan
prepared
5.4 Administration and Public Service
Vision
Excellence in Public Service Management, Leadership and Governance
Mission
To create harmonious conducive functioning structures that ensures quality service delivery.
Strategic Overview and Context for Budget Intervention;
The core mandate of the department is to ensure there is improved performance, consistent
and Harmonized Human Resource Management rules and procedures, optimum use of human
resource and implementation of computerized registry.
The major services / output for the Financial Year 2017/18 are to ensure that sub county
offices are constructed, ward administrators offices are well furnished and equipped,
Implementation of Medical insurance scheme, procure enough vehicles are for ward offices
use, ensure Governor’s Residence is constructed and ensure that sub county offices are
funded for efficient operations.
Table 13: Administration and public services projects / programmes
Project/Programmes Objective Expected outputs Indicators Targets Estimated
cost
General administration
and support services.
To provide
quality
administrative
services and
availing
competent
Harmonized
public service
functions.
Percentage of
duplicated
functions
eliminated in
the public
service.
70% 536,403,61
9

95
Project/Programmes Objective Expected outputs Indicators Targets Estimated
cost
skilled and
accountable
human resource
for effective
and efficient
service
delivery.
Approved service
structures & job
descriptions
manuals
No. of
Structures
approved
10
No. of
approved Job
Description
Manuals
1
No. of schemes
of service
revised
30
Development and
implementation of
affirmative policy
document
No. of
affirmative
policy
developed and
implemented
1
Employee
satisfaction survey
No. of survey
reports done
1
Construction of
sub ward offices
and county
headquarters
No. onward
offices
constructed
15 ward
offices and 1
headquarter
(Kiambu
offices)
Coordination of
public and special
community
programmes
No. of public
participation
and
community
programmes
forums held
4
Implementation of
public
participation Act
No of public
participation
acts
implemented
1
Coordination of county
policy formulation
To provide
quality
Reduces number
of litigations
Percentage
reduction in
45% 15,900,000

96
Project/Programmes Objective Expected outputs Indicators Targets Estimated
cost
administrative
services and
availing
competent
skilled and
accountable
human
resources for
effective and
efficient
service delivery
litigations
Formulation of
county bills and
revision of
existing county
laws
No, of county
bills
formulated
10
No. of revised
county laws
2
Drafting of
conveyance and
contractual
documents
No. of
conveyance
and contractual
document
drafted
5
Assessment of
compliance of
county laws
% reduction of
cases of non-
compliance
45%
Investigation of
complains
No. of
complaints
investigated
700
Decentralization
of county services
No. of
functions/servi
ces
decentralized
at sub county
level
10
No. of relevant
officers trained
100
Staff skills and
competence
Skills and
competences
inventory
1
Human resource
development and
management
To provide
quality
administrative
services and
availing
competent,
skilled and
accountable
human
resources for
effective and
efficient
service delivery
New appointments
and promotions
No. of staffs
appointed
and/or
promoted
100 72,960,000
Capacity building No. of training
needs
identified
150
Staff
redeployment
No. of staffs
redeployed
50
Group personal
insurance
No. of staffs
insured
4200

97
5.5 Agriculture, Livestock and Fisheries
Vision:
A food secure and prosperous County
Mission
To promote innovative and sustainable agriculture for job creation, equitable wealth and food
security in Kiambu County.
Strategic Overview
The strategy of the Department of Agriculture, livestock and fisheries is to transform the
sector for social and economic development of Kiambu residents. It is aligned to the County
Integrated Development Plan (CIDP), the vision 2030 and Agricultural sector development
strategy (ASDS 2010-2020). The strategy is to jointly with other stakeholders through private
public partnership (PPP) to transform the agricultural sector into an innovative, commercially
oriented, competitive and modern industry. The strategy takes into account the current and
future capacity of the department to deal with routine and emerging issues.
Table 14: Agriculture, Livestock and Fisheries projects/programmes
Project/programme Objective Expected outputs Indicators Targets Estimated
cost
Construction of Sub
County Offices
Improvement of
public service
delivery
Construction of
Offices at Kabete,
Juja and Kiambaa
Sub Counties
No of offices
constructed
3 Offices 36M
Slaughter house
electrification
Improvement of
public service
delivery
Electrification of
slaughter house at
Gatundu South
Slaughter house
connected to
electricity
1 slaughter
house
0.5M
Purchase of motor vehicles Provide transport to
staff to improve
service delivery
5 Vehicles
purchased
No of vehicles
purchased
5 vehicles 30M
Purchase of motor cycles Provide transport to
staff to improve
service delivery
5 Motor cycles
purchased
No of motor
cycle purchased
5 M/cycles 2M
Enhance ICT technology To improve
efficiency and
effectiveness in
service delivery and
implementation
90 computer
system purchased
for the 12 Sub
Counties
Printers
Website
development
LAN and WIFI
No of Computers
and laptops
40 Desktops
50 Laptops
10M
Establishment and
equipping of information
desks in the wards
To enhance
Extension
Information desks
in all wards
equipped with
-tables
-chairs
-tablets
No of
information
desks established
and equipped
60 desks 5M

98
Project/programme Objective Expected outputs Indicators Targets Estimated
cost
-branded banners
-tents
Develop an agricultural
information resources
centre
To enhance extension
outreach to Farmers
One agricultural
information
resources centre
developed at
Waruhiu
No of
agricultural
information
resources centre
developed
1 centre 2M
Soil testing Equipments To increase soil
productivity
13 equipments, 1
per sub County
No of soil
equipment
12 Sub
counties &
Hqs
2.6M
Milk Coolers, Pasteurizers
and Dispensers
To increase the
household income of
dairy farmers
Milk coolers &
Pasteurizers
purchased and
installed at
- Limuru
-Kikuyu
-kabete
-Gikambura
4 of milk
Coolers, 3
Pasteurizers and
5 Dispensers
Four Milk
coolers
&Pasteurizers
and
Dispensers
70M
Rehabilitation of cattle dips To improve animal
husbandry and vector
control
2 cattle dips
rehabilitated per
Sub County
No of cattle dips
rehabilitated
24 cattle dips 6M
Animal feeds factory To promote livestock 01 animal feeds
factory developed
at Lari Sub county
No of factories
developed
1 animal feed
factory
100M
D Disease Control Prevention
and Control programme
t To reduce incidences of
notifiable diseases
e.g.FMD Anthrax
Rabies
Vaccinate livestock
50,000 H/C
10000
Sheep&goats
against FMD,
anthrax , Lsd
Number of
livestock
vaccinated
i Increase
vaccination
coverage from
50% to 75 %.
30 M
Disease control and
surveillance in animals
To prevent animal
diseases
To rehablitate
laboratory for
disease diagnosis in
Limuru
No of
laboratories
01 mini
laboratories
established
10M
v Veterinary Public Health
E Ensure the public
consume wholesome
meat
LiLicencing of
slaughter houses
and meat
containers;
Number of
Slaughter houses
and meat carriers
licensed
Licence all 60
slaughter
houses and
900 meat
carriers
1.2 M
Hides and skins
development
To improve the
quality of the hides
and skins for value
addition
500 youths capacity
built County wide
No of youths
capacity built
500 youths 20 M
A.I and clinical services To increase animal
productivity for more
milk production
T upgrade and improve
the dairy animals
by increasing AI
inseminations
AI inseminations
done
AI
inseminations
from 10,000 to
15,000
2 M
Poultry Rabbit Slaughter
House
To improve poultry
& rabbit slaughter
hygiene
Completion of
the phase II of
the slaughter
House
Slaughter
1000 Birds
and 500
Rabbits
10 M

99
Project/programme Objective Expected outputs Indicators Targets Estimated
cost
Veterinary inspectorate
services
To supervise and
inspect agro-vets and
clinics
Improved services
to the farmers
Improved
livestock
industry
Inspect all the
agro-vets in
Kiambu
2 M
Livestock development and
improvement
To increase animal
production for
increased yields and
farm income
Develop an embryo
transfer laboratory
at Waruhiu
No of
laboratories
established
01 laboratory
established
25 M
To improve poultry
rearing
Purchase of local
poultry chicks
No of farmers
benefiting
10000 farmers 10 M
Pig farming
development
Increased pork
production
No of farmers
trained
2400 farmers 6 M
To promote bee
keeping and rabbit
rearing
Increased emerging
livestock
productivity
No of bee houses
and rabbit
farmers
10 bee houses
1200 rabbit
farmers
24 M
Construction of fish ponds,
stocking, fencing and
installation of fish ponds
liners
To promote fish
production
Fish ponds in all
Sub Counties (6 per
S/County) lined
and stocked
No of fish ponds
lined and stocked
72 fish ponds 9.2M
Procurement of fishing nets To promote fish
farming
Fishing nets for 72
fish ponds procured
No of fishing
nets
72 fishing nets
procured
0.7M
Construction of green
house fish farming
To promote fish
farming
fish farming
greenhouses in all
wards constructed
in 5 Sub Counties
No of fish
farming
greenhouses
5 fish farming
greenhouses
4M
Recirculatory fish farming
(solar energy)
To promote fish
farming
Recirculatory fish
farming system
constructed in Juja
and Gatundu South
Sub Counties
No of
Recirculatory
fish farming
system
constructed
2 recirculatory
fish farming
system
constructed
7M
Cage fish farming To promote fish
farming
Cage fish farming
developed at Ruiru,
Juja, Kiambu
(Kiamumbi dam)
No of cages
installed
6 cages
installed
4M
Fish stocking in selected
rivers
To promote fish
farming
Fish stocking at
Gatamayu river,
Thiririka river,
karimenu and
Rwambora
No of rivers
stocked
04 rivers
stocked
1.5M
Establishment of fish
collection centre
To promote fish
marketing
Thika and Kiambu
subcounties
No. of collection
centre
two centres
established
2M
Establishment of fish feed
making centre
To promote fish
production
Two centres
established
No. of feed
making centres
Two groups
issued with
pelletisers
2M
Establishment of agro
processing cottage
industries for value
addition
To promote market
access and product
development
01 avocado value
addition equipment
established at
Githunguri,
Gatundu north and
Kiambu
No of groups 6 groups 5M

100
Project/programme Objective Expected outputs Indicators Targets Estimated
cost
Establishment of agro
processing cottage
industries for value
addition
Agricultural markets and
marketing development
To promote market
access and product
development
A pineapple
marketing and
agroprocessing
outlet at
Githobokoni
A marketing and
agroprocessing
outlet at
Githobokoni
1 pineapple
agroprocessin
g
4M
Value addition for
fruits and
vegetables
developed at Lari
and Limuru
No of processing
equipment
01 vegetables
processing
plant
5M
01 hides and skins
cottage industry
established at
Kikuyu
No of hides and
skins cottage
industry
established
01 hides and
skins cottage
industry
20M
01 coffee mill
established at
Gatundu North
No. of coffee
mills established
01 coffee
mills
established
5M
01 honey
processing cottage
industry established
at Kikuyu Karai
ward
No. of honey
processing
cottage industry
established
01 honey
processing
cottage
industry
5M
04 fish cooling
facilities
established at Lari
and Githunguri
No. of fish
cooling facilities
established
04 fish
cooling
facilities
4M
Marketing and
grading
sheds/centres
developed
-Bibirioni
-Ikinu
-Kijabe
No of
marketing/gradin
g sheds
developed
03 collection
& grading
centres/sheds
15M
Farmers facilitated
to access
subsidized
Fertilizer
No of farmers
reached
10,000
farmers access
subsidized
fertilizer
5M
A farm inputs
warehouse
established
No of
warehouses
established
01 warehouse
established
20M
Establishment of a
manure shed and
fencing at Dagoretti
market
No. of manure
shed
01 manure
shed
established
and fenced
10M
Crops development
improvement
Root Crops
Promotion of Irish
potato, Cassava and
sweet potato
production
Irish potato
certified seeds
bulking site
established
No of bulking
sites established
10 potato seed
bulking sites
0.5M
Cassava and sweet
potato cuttings
purchased, bulked
and distributed to
No of bulking
sites established
12 bulking
sites
established
2M

101
Project/programme Objective Expected outputs Indicators Targets Estimated
cost
farmers
Stevia production
improved
No of farmers
doing stevia
production
500 farmers
growing stevia
2M
Coffee and Tea
Production
Promotion & coffee
& tea production
Grafting and top-
working with
superior varieties
(Ruiru11, Batian)
in Githunguri,
Gatundu
South&North)
Coffee nursery
established at
Gatundu North
No.of farms
topworked with
superior vatieties
No of nurseries
500farms
Nursery
5M
Tea nursery
established at
Limuru
No of Nurseries Nursery 1M
Horticulture
Promotion of
Traditional High
Value crops crops
Bulking sites for
cow peas, beans
and pigeon peas
established at
Ruiru, Thika, Juja,
Limuru, Kikuyu
No of bulking
sites established
bulking sites 5M
Promotion of Fruit
trees crops(
Avocadoes,
Mangoes, Tree
Tomatoes)
Avocado
Mango nurseries
established at
Gatundu,
Kiambu,Thika,
Juja, Lari, Limuru)
No of nurseries
established
12 nurseries
established
6M
Oil Crops Development Promotion of oil
crops
Sunflower and soya
beans and
Macadamia bulking
sites established at
Thika, Juja
No of bulking
sites
11 soya beans
bulking sites
established
2M
Design and Construction
of irrigation projects
To provide water to
farmers for irrigation
purpose
Njuno irrigation
project design
completed, main
pipeline and
storage tank
constructed and
hydrum pump
installed
Survey data,
profiles, plans
and other
drawings,
list of benefiting
farmers,
construction
completed and
installations
done
Water
reaching
storage tank
and 10
farmers (5%)
connected to
the irrigation
system
10 M
Karia irrigation
project canal
converted to main
pipeline
Survey data,
profiles, plans
and other
drawings,
list of benefiting
Rehabilitation
of Karia
irrigation
project main
line
5 M

102
Project/programme Objective Expected outputs Indicators Targets Estimated
cost
farmers, meters
of water
pipeline
constructed
Gatina irrigation
project main
pipeline
construction
Survey data,
profiles, plans
and other
drawings,
list of benefiting
farmers, meters
of pipeline
constructed
pipeline
constructed
•Low pressure
pipes along
the mainline
replaced with
higher
pressure pipes.
•75 farmers
connected to
the irrigation
system
4.5 M
Drip irrigation and Green
house farming technology
promotion
To promote Drip
irrigation and
appropriate Green
house farming
technology
Six (6) groups
women groups
provided with drip
irrigation systems
and greenhouses
Plans and other
drawings,
list of benefiting
farmers/groups,
number of drip
irrigation
systems and
number of green
houses
constructed
Six groups
provided with
drip irrigation
systems and/or
greenhouses
5M
Design and construction
of farm water storage
structures
To harvest rain water
for irrigation and
other farm activities
Mathuri water pan
designed and
Constructed
Survey data,
profiles, plans
and other
drawings,
list of benefiting
farmers and pan
constructed
Water pan
constructed
9.5 M
Design and construction
of irrigation projects
To provide water to
farmers for irrigation
purpose
Kamwamba
irrigation project
main pipeline
section surveyed
and pipes installed
Survey data,
profiles, plans
and other
drawings, meters
of water
pipeline
constructed
Section of
main pipeline
constructed
4 M
Soil and water
conservation
To prevent soil
erosion and conserve
water in the soil
•Riparian areas
marked in sections
of the county
•Soil and water
conservation
structures
constructed
•Conservation farm
practices adopted
•Reports on
riparian area
marked
•Reports on
constructed
terraces, check
dams, CODs and
others
•Reports on
Conservation
farm practices
adopted
•1000km
pegged
•6000 km of
terraces and
CODs
constructed
•Types of
Conservation
farm practices
adopted
1M
Farmers and front line
staff training on
To educate and train
farmers on irrigation,
Trainings
conducted
Reports on
trainings
Trainings held
Number of
2 M

103
Project/programme Objective Expected outputs Indicators Targets Estimated
cost
irrigation, drainage and
soil and water
conservation technology
drainage and soil and
water conservation
technology
conducted farmers
trained
Number of
staff trained
Promoting Smart
Agriculture
To establish
demonstrations on
smart Agriculture
10 demonstration
sites Established
Demonstration
sites, Reports
No. of demo
sites
5M
Coffee pulper installation
at Waruhiu ATC
Pulping cherry to
parchment to
improve value
through direct sales
-improved
productivity
-Increased
revenue/income
-pulper house
-pulper installed
-drying beds
-coffee volume
-payment rates
- revenue
remittance
One pulping
unit completed
1.5M
Water Valley Reservoir
dam and pumping works
at Waruhiu ATC
Water harvesting for
domestic and
irrigation
-improved water
availability
-improved
enterprise
productivity
-water
availability
-valley dam
completed
One valley
reservoir dam
capacity
20,000m3
9 M
Hostel expansion at
Waruhiu ATC
Improved capacity
for residential
training
-increased self
contained rooms
- number of self
contained rooms
10 self
contained
rooms hostel
3.8M
Dining hall and kitchen
expansion/ renovation at
Waruhiu ATC
Enhance catering
services at the centre
spacious dining hall
to host 80 persons
modernized kitchen
-Modernized
kitchen
- Improved
kitchen services
- 80 person
capacity
dining hall
completed
3.5M
On farm service road
murram
To facilitate efficient
on farm operation
Improve on farm
accessibility
-Improved farm
operations and
diversification
-service road
marrumed and
maintained
-improved on
farm service
400m of
service road
completion
1,500,000
Promote development of
agricultural
infrastructure
Developed water
storage structures
agricutural resource
base maintained Design and survey
dams
No of dams
surveyed and
designed
2 waterpans/
dams
constructed
3,300,000
Conserved environment
and sustainable land use
To facilitate efficient
on farm operation
Plant and
machinery repaired
No of plant and
machinery
repaired
3 Heavy
machinery
repaired
Increased adoption of
farm mechanization
technologies
Increased production
per unit area
efficient production
system achieved
New equipment
and implement
acquired
1 mould board
plough 450,000
1 disc
plough/disc 700,000
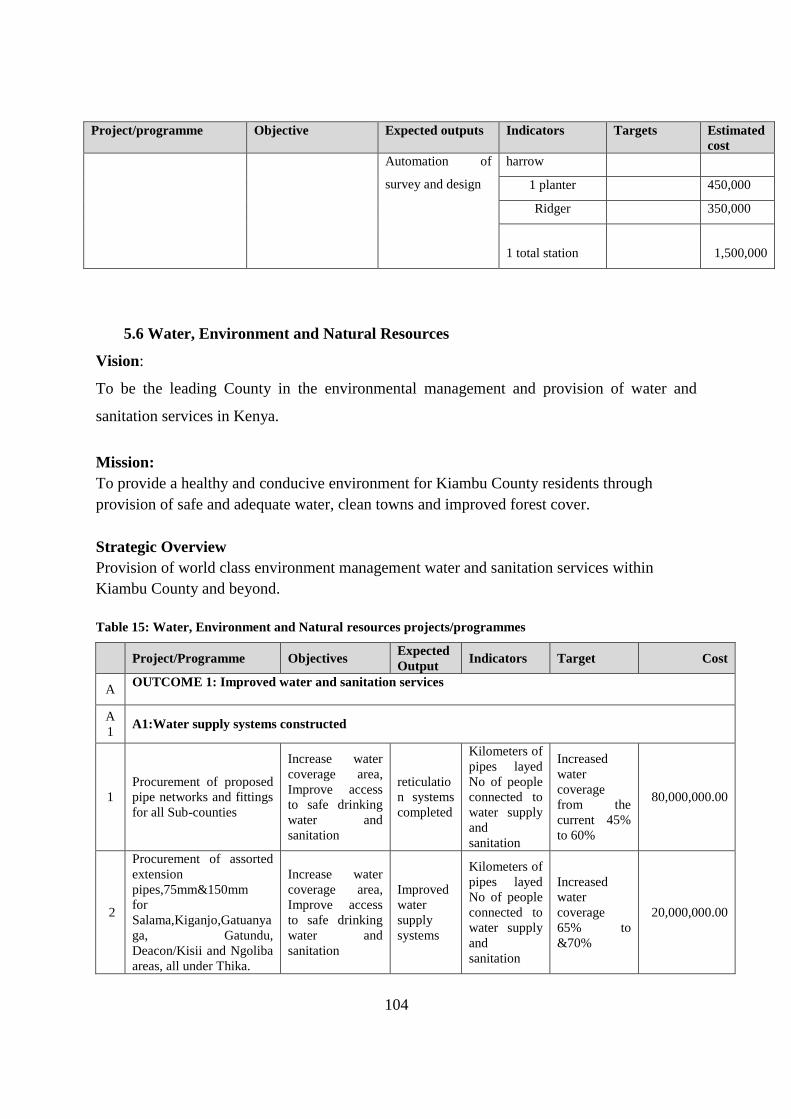
104
Project/programme Objective Expected outputs Indicators Targets Estimated
cost
Automation of
survey and design
harrow
1 planter 450,000
Ridger 350,000
1 total station 1,500,000
5.6 Water, Environment and Natural Resources
Vision:
To be the leading County in the environmental management and provision of water and
sanitation services in Kenya.
Mission:
To provide a healthy and conducive environment for Kiambu County residents through
provision of safe and adequate water, clean towns and improved forest cover.
Strategic Overview
Provision of world class environment management water and sanitation services within
Kiambu County and beyond.
Table 15: Water, Environment and Natural resources projects/programmes
Project/Programme Objectives Expected
Output Indicators Target Cost
A OUTCOME 1: Improved water and sanitation services
A
1 A1:Water supply systems constructed
1
Procurement of proposed
pipe networks and fittings
for all Sub-counties
Increase water
coverage area,
Improve access
to safe drinking
water and
sanitation
reticulatio
n systems
completed
Kilometers of
pipes layed
No of people
connected to
water supply
and
sanitation
Increased
water
coverage
from the
current 45%
to 60%
80,000,000.00
2
Procurement of assorted
extension
pipes,75mm&150mm
for
Salama,Kiganjo,Gatuanya
ga, Gatundu,
Deacon/Kisii and Ngoliba
areas, all under Thika.
Increase water
coverage area,
Improve access
to safe drinking
water and
sanitation
Improved
water
supply
systems
Kilometers of
pipes layed
No of people
connected to
water supply
and
sanitation
Increased
water
coverage
65% to
&70%
20,000,000.00

105
Project/Programme Objectives Expected
Output Indicators Target Cost
3
Complete construction of
water intake, Karinde in
Kikuyu
Improve
reliability of
water services in
the area.
A reliable
source of
water.
Weir,
reservoir
To supply
water to
about 200
households.
5,000,000.00
4 Drilling of large diameter
well at ondiri.
Improve water
quality from the
swamp and
provide a
pumping source
Wide
diameter
well
developed
well and
associated
structures.
To supply
water to
about 150
households.
3,000,000.00
5 Distribution Network for
Roromo BH project
Increase water
coverage area,
Improved access
to safe drinking
water and
sanitation
A reliable
and
accessible
pipe line
network.
Kilometers of
pipes layed
No of people
connected to
water supply
and
sanitation
To supply
water to
about 150
households.
3,000,000.00
6 Reticulation system for
Mbioni BH project
Increase water
coverage area,
Improved access
to safe drinking
water and
sanitation
pipes laid
and in use
Kilometers of
pipes layed
No of people
connected to
water supply
and
sanitation
To supply
water to
about 150
households.
3,000,000.00
A
2 A2:Springs Developed
7
Development of Kambara
Karia and Gathiri springs
in Karuri
Increase water
coverage area,
Improved access
to safe drinking
water and
sanitation
Protection
structures
Pipeline
laid
2 No.
operational
spring water
system
To supply
water to
about 250
households.
15,000,000.00
8 protection of Mbauini and
Karaini spring
Increase water
coverage area,
Improved access
to safe drinking
water and
sanitation
Protection
structures
and
Pipeline
laid
2 No.
operational
spring water
system
To supply
water to
about 250
households.
15,000,000.00
A
3 A3:Boreholes drilled
and Developed
9
Drilling and equipping of
Boreholes in Karuri at
Karura and Kiriaini
Increase water
coverage area,
Improved access
to safe drinking
water and
sanitation
BH drilled
and
equipped
operational
BH
To supply
water to
about 150
households.
10,000,000.00
10
Drilling, equipping of
Borehole at Mbioni for
Limuru water Company
Increase water
coverage area,
Improved access
to safe drinking
water and
sanitation
BH drilled
and
equipped
operational
BH project
To supply
water to
about 150
households.
5,000,000.00

106
Project/Programme Objectives Expected
Output Indicators Target Cost
11
Drilling, equipping of
Borehole at Lari (Ass
Commissioner's office)
Limuru water
Increase water
coverage area,
Improved access
to safe drinking
water and
sanitation
BH drilled
and
equipped
operational
BH project
To supply
water to
about 150
households.
5,000,000.00
A
4 A4:Storage tanks
Constructed or installed
1
2
Construction of 225 m3
masonary tank for Mbiuni
and Nderu water projects
in Limuru
Increase water
storage capacity
for the water
projects for
reliable supply
constructe
d storage
tanks
No. of
complete
storage tanks.
About 750
h/h to
benefit.
10,000,000.00
1
3
Construction of storage
tank in Karai
Increase water
storage capacity
for the water
projects for
reliable supply
constructe
d storage
tanks
A complete
storage tank`.
About 750
h/h to
benefit.
1,800,000.00
1
4
Procurement and
distribution of 10No
plastic water storage tanks
for community water
projects (24,000 Ltrs
capacity)
Improved water
storage capacity
to balance water
supply services.
tanks
procured
and
delivered
to
beneficiar
y projects
No. of tanks
procured
to improve
the water
storage
capacity by
about
240,000litres.
2,500,000.00
A
5 A5: Rain water
harvesting tanks
15
Procurement and
distribution of
30No.plastic rain water
harvesting tanks for
institutions (10,000 Ltrs
capacity)
Enhanced storage
capacity of rain
water for used
during dry
periods
tanks
procured
and
delivered
to
beneficiari
es
installed
tanks
To benefit
about 30
number of
institutions.
2,000,000.00
16
Procurement and
distribution of
60No.plastic rain water
harvesting seed tanks for
individuals (10,000 Ltrs
capacity)
Enhanced storage
capacity of rain
water for used
during dry
periods
tanks
procured
and
delivered
to
beneficiari
es
installed
tanks
To benefit
about 60
number of
people .
4,000,000.00
A
6 A6:Dams constructed
1
7
Construction of Thika 111
A Dam
To have a large
water reservoir.
Volume
of water
produced.
A functional
dam.
17
Construction of propossed
Kinari dam
To have a large
water reservoir.
Volume
of water
produced.
A functional
dam.
To benefit
people
around
Kinari and
Kijambe
escarpment
500,000,000

107
Project/Programme Objectives Expected
Output Indicators Target Cost
A
7: A7:water treatment
enhanced
Construction of Ultra
Filtration Unit in four
areas, with raw and clean
water reservoirs.
To meet the
water quality
standard is met.
Quality of
water
produced.
Function 4-
water
treatment
units.
All the
supply
beneficiaries
are served
with clean
water.
48,000,000.00
A
8 A8:Sewer systems
constructed
Extension of distribution
of sewer lines for,
Kiambu, Githunguri,
Kikuyu, Thika, Limuru
To improve
sewer services to
the community.
A
complete
sewer line
done.
No. of KM of
sewerlines
installed.
No. of people
connected to
sewer lines.
To increase
the sewer line
cover by
35%.
100,000,000.0
0
A
9 A9:Acquisition of Land
Acquisition of Land for
proposed dams, leeways
for water and sewer lines.
To ensure
intended works is
done without
interference.
land or
area
acquired
Number of
people
compensated
& Amount
spend in
compensation
.
To take care
of the people
whose land
had been
acquire.
10,000,000.00
B
Compensation of existing
water facilities on private
land
To improve the
water
infrastructures.
Addition
of water
infrastruct
ure
facilities.
No. of
infrastructure
s acquired
and amount
of funds
spend.
To take care
of the people
whose land
had been
acquire.
10,000,000.00
A
10 A10: Design and
supervision of projects.
Design and supervision of
all intended projects.
To have a report
to plan and
implementation
of projects are as
required.
A report No. of
projects
designed, and
supervised.
Complete
projects.
3,000,000.00
B Outcome 2 :Improved Environmental services
B1:Improved solid waste Management
Landfills Constructed

108
Project/Programme Objectives Expected
Output Indicators Target Cost
• A segregation unit at
Kang’oki landfill to be in
place
a full operation semi-
aerobic landfill at
Kang’oki
• upscale compositing
facility at Kang’oki.
• -Rehabilitate and
decommissioned Kangoki
open dumpsite
To establish
Integrated solid
waste
management
within Kiambu
county
fully
functional
segregatio
n unit
compostin
g facility
No open
dumping
in
Kangoki
Separation
unit
established
1No unit 30,000,000.00
Installation of
weighbridges at the
dumpsites
To monitor the
quantity of waste
collected over
time
Functional
weighbrid
ges
weighbridge
installed Data
gathered,
2No. 4,000,000.00
Dump Sites improved
Limuru& Kiambu
dumpsite perimeter wall
and gate
limit access to
the public and
unauthorized
dumping
Secured
dumpsites
within
wall and
controlled
dumping
walls
completed
2 No
dumpsites
Garbage collection
Trucks and equipment
Acquired
Procurement of garbage
collection trucks
To increase solid
waste collection
to 80%
Improved
efficiency
and
coverage
trucks
procured
3No.
Garbage
Trucks
(2Side
Loaders& 1
skip loader)
purchased
30,000,000.00
Procurement of waste
compactor
Enhanced
compaction
capacity in the
landfill to
accommodated
more material
compactor
procured
1 No 18,000,000.00
Purchase of a standard
utility vehicle with cabin
cover for enforcement
purposed
To enhance
supervision for
efficient service
delivery
Enhanced
supervisio
n
1No.standard
utility
vehicle(
cover board)
purchased
1 No 3,000,000.00
Procurement of skips Improve garbage
collection and
management at
collection centres
Skips 20No. Skips
purchased
20No. 4,000,000.00
B
2
B2:Public Sanitation
facilities constructed or
improved

109
Project/Programme Objectives Expected
Output Indicators Target Cost
Construction of public
sanitation facilities with
bio digesters in market
centers within Kiambu
county
To increase
public access to
sanitation
services
Improved
public
sanitation
public
sanitation
blocks in
place
bio digesters
installed
6 No 24,000,000.00
Rehabilitation of public
sanitation facilities within
Kiambu county
To increase
public access to
sanitation
services
Improved
public
sanitation
rehabilitated
and
Improved
sanitation
facilities
5 No 400,000.00
B
3 B3:Incenrators
constructed
Establishment of a
commercial incinerator
center
Incinerator will
to handle toxic
waste like
medical waste
Toxic and
medical
waste
taken care
of by a
functional
incinerato
r
Incinerator
established
1No 40,000,000.00
B
4 Transfer stations
established
Establishment of transfer
station at Kiambu, Ruiru
and Limuru sub county
To establish
Integrated solid
waste
management
within Kiambu
county
Clean
towns free
from litter
Transfer
station
established
All major
towns &
trading
centers
within the12
Sub counties
100,000,000.0
0
B
5 Public Parks
Established
Rehabilitation of public
gardens in the towns
Christina, Mama Ngina,
mugumo garden
To beautify our
County &
increase
recreation
facilities
Improved
aesthetics
of the
towns
rehabilitated
gardens
4No.
gardens
rehabilitated
6,000,000
Procurement of a Lawn
mower
Ease work in
trimming grass
within the public
gardens
Well
maintaine
d lawns
within the
public
gardens
Mower
acquired
1 No 450,000.00
B
6
Pollution control
Enhanced

110
Project/Programme Objectives Expected
Output Indicators Target Cost
Air pollution control To reduce air
pollution to
recommended
standards
Reduced
air
pollution
Air pollution
control
county policy
& regulation
in place
Air quality
control
equipment
purchased
Trained
personnel
All
industries&
commercial
establishment
s with
emissions
within
Kiambu
county
Purchase of
2No. kit
Train 6no.
Environment
officers
7,000,000.00
Noise pollution &
excessive vibration
control
To control noise
pollution &
excessive
vibrations within
the Kiambu
county
- To create
awareness
Reduced
noise
pollution
&
enhanced
requireme
nts
• Noise
pollution
control
county policy
& regulation
in place
• No. of noise
levels
measurement
s recorded
• Notices
served and
cases
prosecuted
community
institutions
800,000.00
B
7 Awareness created
Environmental Awareness To increase
public
participation in
sustainable
environment
management
Well
informed
members
of public
Reduced
environme
nt
degradatio
n &
increased
restoration
of
environme
nt
No. 0f road
shows held
Informed
community
& attitude
change
signage/billb
oards
50 No.
signage/billb
oards in
Kiambu
county
2,500,000.00
C
OUTCOME 3:
Improved Natural
resources Conservation
services
C
1
C1: Trees Planted in
catchment and river lines
conservation

111
Project/Programme Objectives Expected
Output Indicators Target Cost
Increase of tree cover • To increase the
tree cover
towards
attainment of
10% country
wide
• To provide
affordable energy
in terms of
biomass at the
farm level
• To secure
county open
areas in the rural
areas
• All
public
schools in
the county
• Open
county
lands
• Farmers
with
farms
over 1acre
• All public
schools in the
county
• Open
county lands
• Farmers
with farms
over 1acre
• The no. of
schools that
have grown
trees
• No. of trees
grown in the
county open
spaces
• No. of
farmers with
woodlots
10,000,000.00
Urban forestry and
beautification
• To increase
aesthetics of the
county parks and
the major roads
leading to the
major urban
centres of the
county
• Provide secure
resting areas
• To deter land
grabbing of the
county open
spaces
• All
county
parks and
urban
open
spaces are
fenced, lit,
mown and
watered
• All
major
roads
sides
leading to
the county
are
planted
with
grass,
flowers
and trees
and
shrubs
• All county
parks and
urban open
spaces are
fenced, lit,
mown and
watered
• All major
roads sides
leading to the
county are
planted with
grass, flowers
and trees and
shrubs
All parks
and urban
open spaces
within the
county and
all major
roads leading
to the urban
centres
within the
county
10 ,000,000
Establishment and
improvement of county
tree nursery
To enable the
department to
have its own tree
seedlings, fruit
tree seedlings ,
flowers and
cuttings
• One
nursery to
be
establishe
d and one
nursery to
be
rehabilitat
ed
• Tree
seeds to
be sown
and
propagate
d in the
nurseries
• No. of
nurseries
established
and
rehabilitated
• No. of tree
seedlings in
the nurseries
• Thika sub-
county
nursery
rehabilitation
• Limuru
sub-county
nursery
establishment
4,500,000.00

112
5.7 Health services
Vision
To achieve an efficient and cost effective public and medical care system for a healthy county
Mission
To promote and participate in the provision of integrated and high quality curative and
preventive services to all
Strategic Overview
The main goal of the department is to provide curative and preventive health services by
strengthening the available health services to all. In this financial year the department aims at
improving access to quality health care to all the residents of Kiambu by funding basic health
care, promotion of healthy behaviors and health life styles in order to reduce disease burden
and premature death; prevention of illness and disability, enhancement of quality life
Table 16: Health Services Projects/Programmes
Project/programme Objective Expected
output
Indicators Target Cost (KSH)
Equip (medical, surgical
equipment and furniture) 275
bed capacity reproductive unit
in thika level 5 hospital.
To improve the
reproductive health
care in the facility.
Operationalize
the
reproductive
health unit.
Fully
functional
reproductive
unit
275 bed
capacity
150,000,000
Equip ( medical, surgical
equipment and furniture) 200
bed capacity ward in lari level
4 hospital
To operationalize
lari hospital as a
level 4 health
facility.
Increase the
bed capacity.
Fully
functional
level 4
hospital
200 bed
capacity
100,000,000
Equip ( medical ,surgical
equipment and furniture) 200
bed capacity ward in tigoni
level 4 hospital
To improve the
health care by
increasing the bed
capacity.
Increase the
bed capacity.
Bed
occupancy
rate
200 bed
capacity
100,000,000
Equip (medical , surgical To operationalize Increase the Fully 150 bed 100,000,000

113
Project/programme Objective Expected
output
Indicators Target Cost (KSH)
equipment and furniture) 150
bed capacity ward in kikuyu
level 4 hospital
the new level 4
hospital in kikuyu
sub county.
bed capacity
in the sub
county.
functional
level 4
hospital.
capacity
Equip ( medical , surgical
equipment and furniture) 200
bed capacity ward in wangige
level 4 hospital
To operationalize
wangige hospital as
a level 4 health
facility.
Increase the
bed capacity
Fully
functional
level 4
hospital.
200 bed
capacity
100,000,000
Construction and equip 100
bed capacity ward in
githunguri health centre
To upgrade the
facility to a level 4
hospital.
Inpatient
department.
Fully
functional
level 4
hospital
100 bed
capacity
180,000,000
Construction of 150 bed
capacity ward in ruiru level 4
hospital
To reduce the
patient congestion
in the facility.
Increase the
bed capacity.
Bed
occupancy
rate.
150 bed
capacity
200,000,000
Construction of limuru east
dispensary
To improve the
physical access of
the health care to
resident of limuru
east ward.
Reduce
distance to a
health facility.
Distance to the
nearest health
facility.
Less than
5 km.
10,000,000
Construction of kahawa
wandani dispensary
To improve the
physical access of
the health care to
resident of kahawa
wendani ward.
Reduce
distance to a
health facility
Distance to the
nearest health
facility
Less than
5 km.
10,000,000
Construction of kahawa sukari
dispensary
To improve the
physical access of
the health care to
resident of kahawa
sukari ward.
Reduce
distance to a
health facility
Distance to the
nearest health
facility
Less than
5 km.
10,000,000
Construction of mwihoko
dispensary
To improve the
physical access of
the health care to
resident of
mwihoko ward.
Reduce
distance to a
health facility
Distance to the
nearest health
facility
Less than
5 km.
10,000,000
Construction of mwiki To improve the Reduce Distance to the Less than 10,000,000

114
Project/programme Objective Expected
output
Indicators Target Cost (KSH)
dispensary physical access of
the health care to
resident of mwiki
ward.
distance to a
health facility
nearest health
facility
5 km.
Construction of gitaru
dispensary
To improve the
physical access of
the health care to
resident of gitaru
ward.
Reduce
distance to a
health facility
Distance to the
nearest health
facility
Less than
5 km.
10,000,000
Construction of bibirioni
dispensary
To improve the
physical access of
the health care to
resident of bibirioni
ward.
Reduce
distance to a
health facility
Distance to the
nearest health
facility
Less than
5 km.
10,000,000
Construction of ndumberi
dispensary
To improve the
physical access of
the health care to
resident of
ndumberi ward.
Decongest
kiambu level 4
hospital.
Distance to the
nearest health
facility
Less than
5 km.
10,000,000
Construction of gitothua
dispensary
To improve the
physical access of
the health care to
resident of gitothua
ward.
Decongest
ruiru level 4
hospital
Distance to the
nearest health
facility
Less than
5 km.
10,000,000
Construction of rehabilitation
centre in lusigetti level 4
hospital
To improve the
mental health care
services in the
county.
Establish a
rehabilitation
centre for
drugs and
substance
abuse victims.
% of mental
health
disorders fully
recovered
Drug and
substanc
e
abusers.
40,000,000
Construction and equip a
public health laboratory in
ruiru level 4 hospital
To have an active
surveillance of
food, water,
alcoholic drinks and
other consumable
Increased and
timely
analysis of
food, water,
alcoholic
Number of
tests and
analysis done
Fully
functiona
l public
health
laborator
10,500,000

115
Project/programme Objective Expected
output
Indicators Target Cost (KSH)
products in the
county.
drinks.
Reduced cases
of consuming
contaminated
food which
sometimes
leads to
deaths.
y
Construction and equip
CSSD in Mugutha dispensary
To ensure the
sterilization of the
medical and
surgical items in a
centralized site.
Cost effective
sterilized
medical and
surgical items.
Number of
items and
equipment
sterilized.
Fully
functiona
l CSSD.
EOI to advice
Construction of county store
for commodities in ruiru level
4 hospital
To receive, hold
and dispatch
pharmaceutical
stock to health
facilities within
ruiru sub county.
An inventory
control system
that ensures
the right drugs
are acquired in
the correct
quantities and
quality with
minimal cost.
A warehouse
management
system
monitoring
physical flow
of drugs.
Timely receipt
and
distribution of
health
commodities.
Fully
functiona
l store.
10,000,000
Routine maintenance of health
facilities
To ensure the
preventive
maintenance of
buildings in the
health facilities
Well-
maintained
health
facilities
buildings
% of Well-
maintained
buildings
Health
facilities.
40,000,000
Procure 10 ALS ambulances To improve the
referral of the
Increase the
number of the
No of the
ambulances
10 90,000,000

116
Project/programme Objective Expected
output
Indicators Target Cost (KSH)
patient in the
county.
ambulances.
Procure 2 utility vehicles
To improve the
transportation of the
CHMT members
during the
supervision
Increase the
utility vehicles
No of the
utility vehicles
2 10,000,000
5.8 Education, Culture, ICT and Social Services
Vision
To ensure access to quality pre-primary education to all to promote culture and art, leverage
technology and promotion of social services to vulnerable individuals in the county.
Mission
To promote quality pre-education to all, promote use of technology in the county and
improve culture and social services to Kiambu residents
Strategic Overview
The department has been carrying out its mandate effectively. During the previous years, the
department had a number of achievements such as increase in early childhood enrolment,
increased number of schools with school feeding program; refurbishment, construction and
equipping of ECD centres and polytechnics; construction and equipping one library, a social
hall, two cultural centres, one rehabilitation centre, and one children’s home/rescue centre;
and, establishment of Data Centre among others. Other key activities/achievements that the
department can pride in were; the award for the most progressive county in diversity and
inclusion of the disadvantaged groups; selected to represent Kenya in Paris after the Kenya
UNESCO @50 celebrations; held a successful Miss World Kenya Beauty Pageant and also
the Kiambu County Mr. and Miss Disability contest and fashion show. In this financial year,
the department seeks to pursue strategies and measures to improve on service delivery.

117
Table 17: Education, Culture, ICT and Social Services projects/programmes
PROJECT/
PROGRAMME
OBJECTIVE EXPECTED
OUTPUT
INDICATOR
S
TARGET COST
SP1 GENERAL
ADMINISTRATI
ON AND
SUPPORT SERV
ICES
Capacity
building of
staffs
No of capacity
building
forums held
No of officers
capacity built.
4
50
350,000,000
Trade Shows
and Exhibitions
No of trade
shows held
No of
exhibition
held
2
2
Social
contributions
Amount in
Ksh allocated
to Social
contributions
5000,000
Acquisition of
non financial
assets
No of non
financial
assets
acquired
100
SP2 PRE-
PRIMARY
EDUCATION
AND YOUTH
POLYTECHNIC
S
To improve
infrastructure in
the YPs
To promote
quality and
relevance in
training
To integrate ICT
in training and
management of
YPS
To sensitize the
community and
market YP
product
Constructions,
Refurbishment
and renovations
No. of
constructed
and renovated
cms
15 322,000,000
Availability of
modern tools
and equipment
for quality
training
No. of tools
purchased and
YPS Equipped
35
Recruitment of
instructors
No of
instructors
recruited
60
YPS connected
to internet and
trainees
receiving ICT
No of YPS
net- worked
Number of
trainees
15 Youth
polytechni
cs

118
skills receiving ICT
skills
1000
trainees
Classrooms and
toilets
rehabilitated
and constructed
No. of
classrooms
constructed
and put to use
50
Increased
number of
ECDEE centre
under feeding
program
No. of ECDE
centers under
feeding
program
High retention
rate in %
493
45%
Centre provided
with teaching
learning
materials
Conduct
capacity
building for
ECDE teachers
and care givers
Number of
ECDE centre
provided with
teaching
learning
materials
Number of
ECDE
officers/teache
rs and
caregivers
trained
120
1047
Recruitment of
ECDE teachers
Number
recruited
1035
Established and
monitoring and
evaluation
system
Number of
ECDE centre
monitored and
evaluated
Monitoring
reports
493
Developed
advocacy and
communication
strategy.
No. of
strategies
developed
2
SP3 ICT
To improve
infrastructure
and
connectivity
Construction/Im
provement of
LAN in
polytechnics
No. of Youth
Polytechnics
connected
10 100,000,000
Construction/im
provement of
LAN in
hospitals
No. of
hospitals
connected
3
Construction/im
provement of
LANs in county
offices
Number of
offices
connected
10

119
Office 365
subscription
payments
Have staff on
emails
Number of
people on
emails
500 30,000,000
To provide
Wide Area
and Internet
Services
Have county
offices
interconnected
No of county
offices
interconnected
100 50,000,000
Data Center
Disaster
Recovery
Construction/Es
tablishment of
Data center
disaster
recovery center
No of Data
center disaster
recovery
centers
1 30,000,000
Establishment
of e-wastage
management
and disposal
mechanism
Identified
number of
electronics to be
disposed of
Policy on e-
wastage
management
and disposal
1 10,000,000
Establishment
of a business
and
information
centre
An equipped
centre to serve
as an
information
centre
Number of
services being
accessed from
the
information
centre
1 30,000,000
SP4 CULTURE
AND SOCIAL
SERVICES
-To reduce the
level of alcohol
and drug abuse in
the county.
-To empower the
community and
PLWDs
-Civic Education
-To reduce the No
of street families
within Kiambu
-Disability
Mainstreaming
-To enhance
collaboration with
stakeholders
-Assistance and
benevolence
donations
Capacity
building
programs for
Youth and other
vulnerable
groups affected
by drugs and
substance abuse
No of
residents
reached
1200
residents
1.5M
Life skills
training
No of
Trainings
Held
12 1.5M
Construction of
a rehab center
No of rehab
centers
constructed
1 10M
Public
Sensitization
Programmes
No
sensitization
programme
held
12 1M
Equipping of
the Matron’s
House at
Equipping
House
1 3M

120
Jamhuri
Children’s
Home
Training
Trainers of
Trainers in
Civic education
No of Trainers
Trained
24 2.5M
No of
Workshop/Semi
nars held on
Civic Education
No of
Workshop/Se
minars held
12 10M
Equipping
renovated
existing social
halls
No of social
halls equipped
3 5M
Training Social
Dvpt officers on
Disability
mainstreaming
No. of
trainings held
24 1.5M
Sensitizing
departmental/di
rectorate heads
on Disability
mainstreaming
No of HODs
sensitized
All 2M
Translation of
all county
Policies and
Service charters
No. of
document
Translated
All 5M
Purchase of
Sanitary Pads
No. of
sanitary Pads
Purchased
96000 3M
Empowering
vulnerable/fami
lies in distress
No of families
Assisted
3600 2M
Issuance of
assistive
devices
No. of people
assisted
2M
CULTURE AND
ART
-To promote
preserve and
maintain positive
and dives culture
for national
identity, pride
integration and
cohesion.
-To harness,
preserve and
promote Kenyan
heritage and
develop the art
industries.
-To improve and
modernize record
Kenya music
and cultural
festivals:
- Sub-
countie
s
compet
itions
- County
compet
itions
- Nation
al
compet
itions
No. of music
and cultural
festivals
conducted.
Sub
coun
ties
Coun
ty
com
petiti
on
Natio
nal
com
petiti
200
100
24
6540000

121
archive
management
practices and
enhances access
to library and
information
services.
-Promotion of
cultural tourism.
on
African herbal
medicine day
celebrations
No. of
capacity
building
workshop
s.
No. of
herbal
medicine
exhibition
held
No of
cultural
exchange
visits
done
4
4
2
100000
Kiambu County
visual artists
capacity
building
workshop
No. of
capacity
building
workshop held
for visual
artists
4 200,000
Kiambu County
visual artist
exhibitions
No. of visual
artists
exhibitions
held
2 210,000
Kiambu county
traditional food
cooking
competitions
No. of
competitions
held
1 200,000
Identification
and formation
of the Kiambu
county
Mwomboko
team – The
UNESCO
chapter
nomination as
an ICH element
No. of
Mwomboko
team formed
1 5,220,000
Ngecha
children visual
artists
exhibition and
training
programme
No. of
trainings held
2 200,000

122
Kiambu county
drama festivals
No of drama
conducted
Sub counties
festivals
County
festivals
12
1
342,000
Formation of
the Kiambu
county cultural
development
committee
County
cultural
committee
formed
1 190,000
Kiambu county
music artists
extravaganza
County music
artists
extravaganza
performed
1 300,000
Visits to sights
and monuments
gazzetted in
Kiambu county-
reports
forwarded by
the Kenya
museums
Nairobi.
No. of visits
conducted to
the
monuments
and sight
10 100,000
Mr. &Miss
world Kiambu
County chapter
No. of models
participating
in sub
counties,
semifinals and
finalists
120
48
24
5M
Mr. And Mrs.
Disability
No. of models
participating
sub
counties,
finalists
48
24
1.3M
Miss Tourism
cultural
exhibitions
Kiambu County
chapter.
No. of cultural
exhibitors
participating
in sub
counties,
semifinals and
finalists
24
3M
Cultural
exchange
programme by
the county
cultural
development
committee to
Mombasa
county
No. of cultural
exchange visit
conducted
1 485,000
Production of
county cultural
magazine
No. of
magazines
produced.
2 165,000

123
5.9 Youth and Sports
Vision
To create enabling environment for the promotion and development of youth empowerment,
sporting excellence and effective County communication.
Mission
To transform and inspire the community using platforms that empower the youth, enhance
sporting excellence and provision of relevant information.
Strategic Overview
Improve access to employment information and employment opportunities for the youths by
establishing data and information centers;
Promote youth participation in the county decision making process through youth
forums;
Improve access to equality, relevance and equity in education in youth polytechnic;
Reduce crime, drug and substance abuse among youth by involving them in
alternative and productive activities;
Promote youth participation in protection, conservation and environmental
management by involving them in organized environmental activities;
Promote positive leisure and recreational facility within the county;
To develop and promote a sporting culture in the County through identification,
nurturing sporting talents, developing and upgrading sports infrastructure;
Promote linkages wit sports bodies by partnering with them in sporting activities.
Table 18:Youth and Sports Projects/Programmes
Project/programme Objective Expected
output
Indicators Target Cost (KSH)
Construction & equiping To nurture youth Operational Fully Training 80,000,000
Facilitate the
domestication
of the 2003
UNESCO
convention on
safeguarding of
intangible and
tangible cultural
heritage
No. of
tangible and
intangible
cultural
heritage
programmes
presented to
UNESCO.
1 2M
Kiambu cultural
center
Cultural
center
rehabilitated
1 14M

124
Project/programme Objective Expected
output
Indicators Target Cost (KSH)
kiambu talent academy talents and provide
an exposure
platform.
multitalented
center that
enhances
talent
development
functional
talent center
center with
recording&
post
production
Ruiru stadium( const.
perimeter wall, offices, pitch,
track & terraces)
Upgrade the ground
to a stadium status
with outdoor and
indoor sporting
facilities.
A state of the
art stadium
that can host
international
competition
A fully
equipped
facility &
functional
stadium
40,000
capacity
multi sports
center.
50,000,000
Limuru stadium( const.
perimeter wall, offices, pitch,
track & terraces)
Upgrade the ground
to a stadium status
with outdoor and
indoor sporting
facilities.
A state of the
art stadium
that can host
international
competition
A fully
equipped
facility &
functional
stadium
20,000
capacity
multi sports
center.
30,000,000
Kirigiti stadium( const.
perimeter wall, offices, pitch,
track & terraces)
Upgrade the ground
to a stadium status
with outdoor and
indoor sporting
facilities.
A state of the
art stadium
that can host
international
competition
A fully
equipped
facility &
functional
stadium
100,000
capacity
multi sports
center.
100,000,000
Thika stadium track Upgrade Thika
stadium track from
murrum to tartan
track.
A tartan track A marked
tartan track
An athletics
tartan track
of
international
standard.
35,000,000
Sub county multipurpose
training grounds
Construct &
equip12
multipurpose
training ground(
one per sub county)
Operational
training
ground per sub
county
A fully fitted
facility per sub
county
A multi
sport
training
ground per
sub county
144,000,000
(12*12M)
Repair & Maintenance of
sports facilities.
Rehabilitation of
stadiums and ward
playing grounds.
Well
maintained
and
operational
sports
Functional
sports
facilities.
4 stadium
and 60
sports field.
15,000,000

125
Project/programme Objective Expected
output
Indicators Target Cost (KSH)
facilities.
Kiambu allstars & starlets
Football Clubs
Fully sponsored
men & ladies
county teams
Selection,
training,
tournament &
competition
sponsorship.
Fully
functional
teams with a
representative
of all wards.
Best talented
athletes
enrolled in
the camp.
10,000,000
Purchase of sports
equipments.
Facilitation of all
county teams with
sports equipment
and uniforms.
Fully
equipped
sports
club/teams
around the
county.
List of
purchased and
issued
equipments.
Sport clubs
from grass
root to
county level.
20,000,000
Kiambu biashara fund Provide county
youth, women &
PWDs with
entrepreneur
development loans.
Improved
entrepreneur
activities and
general
economic
empowerment
of the county
residents
Increased self
employment
and upgrading
of small scale
enterprise in
various sectors
County
youths,
women and
PWDs.
100,000,000
County talent development Nurture & expose
youth talents
through talent
shows, competition
& exhibitions
Identification
of talented
youths &
establishment
of a role
model
network to
nurture and
expose them
Platform,
talent shows,
and number of
youth
employed by
their talents.
Couth
youths from
grassroots
level.
10,000,000
Kiambu Youth congress Establishment of
county youth
leaders association
that give youth a
voice in county
leadership and
Youth
participation
in county
development,
leadership role
model &
Congregation
of youth
leaders from
around the
county &
increased
County
youths.
20,000,000
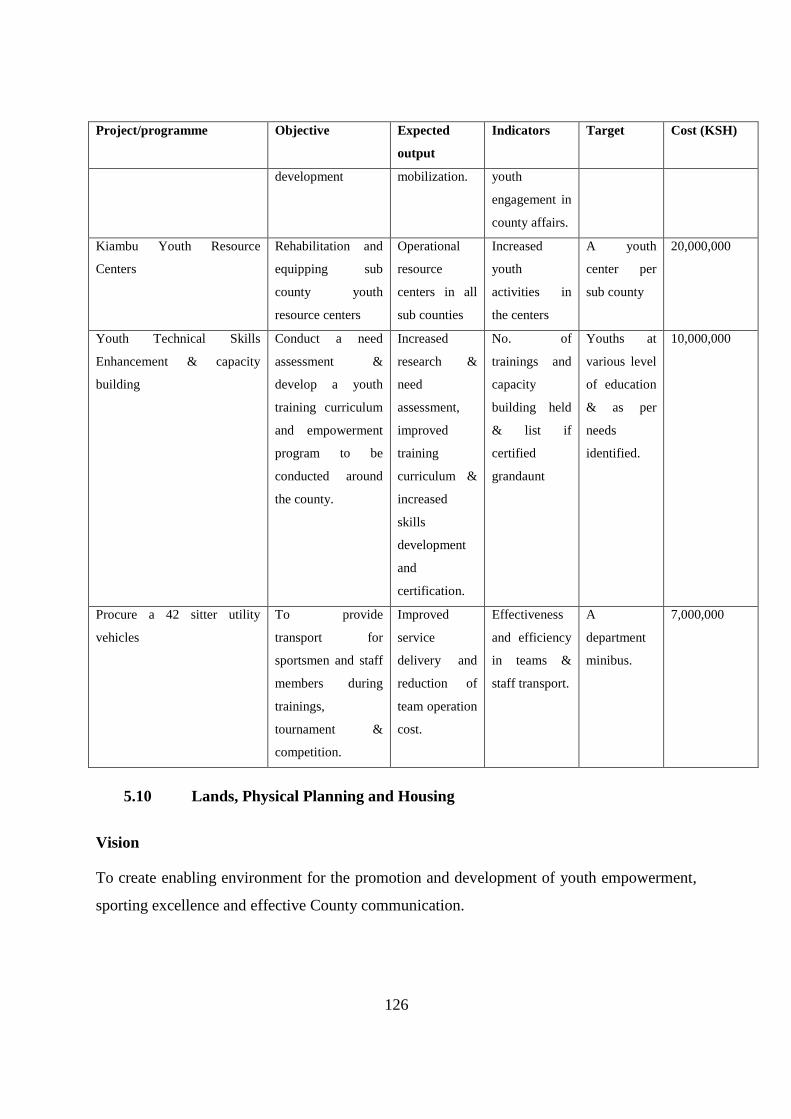
126
Project/programme Objective Expected
output
Indicators Target Cost (KSH)
development mobilization. youth
engagement in
county affairs.
Kiambu Youth Resource
Centers
Rehabilitation and
equipping sub
county youth
resource centers
Operational
resource
centers in all
sub counties
Increased
youth
activities in
the centers
A youth
center per
sub county
20,000,000
Youth Technical Skills
Enhancement & capacity
building
Conduct a need
assessment &
develop a youth
training curriculum
and empowerment
program to be
conducted around
the county.
Increased
research &
need
assessment,
improved
training
curriculum &
increased
skills
development
and
certification.
No. of
trainings and
capacity
building held
& list if
certified
grandaunt
Youths at
various level
of education
& as per
needs
identified.
10,000,000
Procure a 42 sitter utility
vehicles
To provide
transport for
sportsmen and staff
members during
trainings,
tournament &
competition.
Improved
service
delivery and
reduction of
team operation
cost.
Effectiveness
and efficiency
in teams &
staff transport.
A
department
minibus.
7,000,000
5.10 Lands, Physical Planning and Housing
Vision
To create enabling environment for the promotion and development of youth empowerment,
sporting excellence and effective County communication.

127
Mission
To transform and inspire the community using platforms that empower the youth, enhance
sporting excellence and provision of relevant information.
Strategic Overview
Improve access to employment information and employment opportunities for the youths by
establishing data and information centers;
Promote youth participation in the county decision making process through youth
forums;
Improve access to equality, relevance and equity in education in youth polytechnic;
Reduce crime, drug and substance abuse among youth by involving them in
alternative and productive activities;
Promote youth participation in protection, conservation and environmental
management by involving them in organized environmental activities;
Promote positive leisure and recreational facility within the county;
To develop and promote a sporting culture in the County through identification,
nurturing sporting talents, developing and upgrading sports infrastructure;
Promote linkages wit sports bodies by partnering with them in sporting activities.
Table 19: Lands, Physical Planning and Housing projects/ programmes
PROJECT/
PROGRAMME
OBJECTIVE EXPECTED
OUTPUT
INDICATOR
S
TARGET COST
Staff Hiring and
welfare (HR
Management)
To hire and retain
qualified and
competent staff
Increased
technical
capacity and
productivity in
all sub counties
The number
of staff hired
and retained.
2 deputy director
6professional
staff
8technicians
12 support staff
3.4 M
Capacity Building
/training (HR
Development)
To attain best
professional and
management
practices
Efficient and
effective
delivery of
services.
Number of
training
programs,
conferences,
peer forums
and team
building
activities
attended.
2 SLDP
5 SMC
5 administrative
2 prosecution
course
4 conferences
20 M

128
Research and
Innovation
To be responsive
to the emerging
urbanization and
development
dynamics
Innovation in
development
projects and
urbanization
opportunities
for better
performance
Number
Innovation
proposals.
2 10M
Feasibility Studies To establish
viability and
impact of major
social urban
capital investment
proposals.
Implementation
strategies,
funding options
of major public
programmes
and projects
Number of
studies and
reports
prepared
1 Infrastructural
Provisions
1 urban renewal
and
development
40 M
Preparation of
Integrated
Strategic Urban
Development
Plans (ISUDPs)
To facilitate and
manage urban
growth in all
major County
towns
Policy
guidelines to
transform
County urban
centres/towns
into sustainable
economic and
socially
integrated
zones
Number of
ISUDPs
finalized
Launch of 6
ISUDPs
10 M
Preparation of
advisory plans/
Part Development
Plans (PDP) per
sub-county
To plan and
document land for
public amenity
Development of
Social/Commun
al facilities and
open spaces that
promote
community
welfare
Number of
completed
PDPs per sub
county.
24 PDP’s (2 per
month)
2 M
Planning
Awareness and
Community
Outreach
Participation
To create staff
exposure to/and
public
engagement with
local community
in planning
literacy and
decision
processes.
Increased
inclusive
stakeholder’s
awareness on
the county’s
planning
mandate and
development
control.
Number of
neighborhood
meetings, land
clinics/barazas
and
exhibitions
conducted.
24
meetings/clinics
2 exhibitions
10 M
Safety and
Compliance Audit
of Buildings
To ensure safety
during
construction,
quality control of
materials and
post-occupation
security of all
category of
buildings
Safe and secure
buildings and
high levels of
disaster
preparedness
up-to-date
existing and
on-going
building
inventory
12 inventories
(each per sub
county)
15 M

129
Drafting of
Legislative Bills
To enhance
regulatory and
institutional
functions and
operations
Streamlined
regulatory
processes for
development
control, housing
development,
public amenity,
land taxation
and
infrastructural
investment
Number of
land related
bills tabled in
the county
assembly.
4 Bills 20M
Evaluation and
Determination of
Development
Applications
To
comprehensively
vet all
developments
applications and
hold regular
County Planning
Technical
Committee(CPTC
) Meetings to
make
determinations
Efficient, fair
and reliable
development
approval
process
Consistency
of (CPTC)
meetings and
number of
tabled items
12 CPTC’s. 2 M
Taking Possession
and Secure of
public Land
To carryout
survey on
unregistered
plots, fence and/or
monument to
ward off grabbers
and facilitate
issuance of title
deeds
Development of
Social/Commun
al facilities and
open spaces that
promote
community
welfare
Number of
PDPs
prepared
Number of
land Parcels
surveyed
Number of
Titles Issued
36 Market
Centres
18M
Storage of Survey
& Land Data
To establish GIS
based Land
Information
Management
System (LIMS)
Efficient and
effective geo-
referenced
survey and
land records
Enhanced
revenue on
land rates.
Number of
survey maps
and land
record
digitized
300,000 Parcels
of land
10M
Resolution of Land
Boundary Disputes
To hear and settle
boundary disputes
and re-
establishment of
disputed
boundaries
Well
maintained
parcel
boundaries
No of disputes
resolved and
parcels
secured
250
1M

130
Identification of
land set aside for
Public Use
To investigate
from records and
other sources land
surrendered
during land sub
division for public
use
Development of
Social/Commun
al facilities and
open spaces that
promote
community
welfare
Number of
public purpose
plots
identified
200 10M
Asset Management
Policy
To enable a long
term optimized
management of
County physical
assets
Reliable and
effective
physical asset
tracking and
management
system
A portfolio or
inventory of
physical assets
Initial Portfolio
with 10,000
physical assets
30,000,0
00/-
Land Rates
Revenue
Enhancement
To create a system
for the storage and
processing of
property
information for
implementation of
a property tax
regime
An automated
property tax
catalogue for
augmentation
and enhanced
compliance in
collection/paym
ent of rates
Number of
properties
captured and
valued for
rating
purposes
200,000
properties
10,000,0
00/-
Audit of County
Duty and Rental
Residential Houses
and office spaces
To establish the
physical location
of duty/staff and
tenancy of county
houses and offices
A proper
housing
tenancy
management,
Equitable
office
allocation
and
enhanced
tenancy
revenue
Number of
houses and
offices
audited,
Tenancy
revenue
collected
Number
housing
audited (500)
and renovated
(100)
%age of
revenue
increase from
previous year
5M
Maintenance of
County Operations
Buildings and
offices
To establish the,
maintenance
status of county
operations
buildings and
offices
Well
maintained
county
buildings
Number of
offices space
refurbished
4 Houses In
section 2 Thika
10 Houses in
Kiambu
15.0M
Improvement of
informal
settlements
To develop
planning
strategies for land
tenure and better
living conditions
in informal
settlements
Improved
access to land
with tenure
security and
improved
shelter
Number of
informal
settlements
planned
Umoja in Thika
sub-county and
Dagoretti,Ruthi
mitu in Kikuyu
sub-county
10.0M

131
Application of
Appropriate
Building
Technology (ABT)
To facilitate
access to decent
shelter by the
economically
vulnerable
Improve access
to affordable
building
materials
Number of
hydra foam
machines
procured.
Number of
people in
trained ABT
2 Hydra foam
machines.
Train citizens in
Lari and Lower
parts of Thika
Sub-counties
15.0M
Preparation of type
plans
To facilitate
acquisition of
decent house
designs
Properly
designed safe
and pre-
approved
houses designs
Number of
zones with
pre-
approved
designs
Number of
variety of
designs pre-
prepared
Revenue
generated
upon issue
of pre-
approved
designs.
4 2BR units
3 BR units
4 BR units
2.5M
5.11 Trade, Tourism, Industry and Co-Operative
Vision
To be a Strategic Leader in transforming Kiambu County as the Preferred County of Choice
for Investments in Trade, Industry, tourism and Cooperative Development.
Mission
To promote investments in Trade, Industry, Tourism and Cooperative Development Sub-
sector by providing an enabling environment for sustainable socio-economic development
Strategic Overview
The strategic role of the department is to promote trade, industry, Tourism and cooperatives
development through adoption of technology and innovation in facilitating investments for

132
employment creation while fostering both backward and forward linkages through
partnerships with the Private Sector under the Public Private Sector Partnerships.
Table 20: Trade, Tourism, Industry and Co-operative Projects/Programmes
Project/Programme Objective Expected outputs Indicators Targets Estimated
cost
Construction of
office block
Office Space Office constructed Office 1 100M
Refurbishment of
Office Blocks
To provide a
conducive working
office space
Refurbishment of
Office Blocks
No. of office
Blocks
Refurbished
10 25M
Establishment and
construction of new
Markets
Providing an
enabling
environment for
entrepreneurship
trade and
investments
Markets
Constructed
No. of Markets
Constructed
7 250M
Establishment of
Boda Boda Sheds
Providing a good
working business
environment for
operators in the
Boda Boda Sector
Boda Boda Sheds
constructed
No of Boda
Boda Sheds
constructed
120 60M
Refurbishment and
renovation of
existing markets
Providing an
enabling
environment for
investments in
trade
No of markets
refurbished and
renovated
No of markets
refurbished and
renovated
24 50M
Establishment of
Modern Model
Kiosks
Providing a
conducive
business
environment for
vendors and other
SMEs
Modern Model
Kiosks established
No of Modern
Model Kiosks
established
240 50M
Support Training on
Value addition
among MSME s, Co-
operatives, Tourism
and Business Groups
Facilitating trade
and investments
through capacity
building and value
addition on
various products
MSMEs capacity
built
no of MSMEs
trained on Value
Addition and
M&E reports
120 20M
Participating in
Exhibitions and
Expos both Local
and International to
market Kiambu
County as an
Investment Hub,
(4 -Trade,
Providing a
platform for
market networking
and linkages
Exhibitions and
expos held
No of
exhibitions and
Expos held
10 20M

133
Project/Programme Objective Expected outputs Indicators Targets Estimated
cost
4- Tourism,
2 – Co-operative)
Establishment of
Livestock Markets
Providing a
holding ground for
livestock dealers
livestock Markets
established
No of livestock
Markets
established
3 13M
Establishment of an
Investor Enabling
Centre
Facilitating trade
and Investment
Investor Enabling
Centre in place
No of Investor
Enabling Centre
established
2 20M
Verification and
inspection of
weighing and
measuring
equipments
Ensuring fair
Trade Practices
and consumer
Protection
Verification and
inspection of
weighing and
measuring
equipments in
place
% Increase in no
of measuring
and weighing
equipment
verified and
inspected
30% 3M
Establishment of
Weights and
Measures
workshop/Block
Providing a
working place at
the headquarters
for verification
and inspection of
weighing and
measuring
equipments
Weights and
Measures
workshop/Block
in place
Weights and
Measures Block
1 10M
Rehabilitation and/or
construction of
Historical, Heritage
and Tourist
Attraction sites
Increasing
numbers of
Tourists and
Tourists attraction
sites
Rehabilitation
and/or
construction of
Historical,
Heritage and
Tourist Attraction
sites done
No. of Centers
rehabilitated
and/or
constructed
6 50M
Landscaping works
and Construction of
ablution blocks in
tourism attraction
areas
Creating a
platform for more
attractions
Landscaping
works and
Construction of
ablution blocks
done
Works on
landscaping and
Construction of
Ablution Blocks
Completed
6 50M
Mapping of Tourism
Attraction sites
To create a
baseline data base
of all attraction
sites to help in
planning
Mapping of
Tourism
Attraction sites
No. of Sites
mapped and
identified
12 30M
Marketing and
Branding
Marketing and
Branding
Purchase of
branded materials
Branding
Materials
20 20M
Purchase Coffee for
Branding, Marketing
and Export
To Brand, Market
and Export
Kiambu County
Coffee
Branded,
Marketed and
Exported Kiambu
County Coffee
Quantity of
Kiambu County
Coffee Branded,
Marketed and
Exported
20 20M
Purchase of one acre
of land in Ndeiya,
Lari Sub County
Concealed graves Built a monument
for Mau Mau
heros
Land purchased
and monument
done
1 25M
Construction of
Central County
Warehouse
To provide a
Warehouse facility
for Co-operatives
Constructed
Central
Warehouses
No. of
Warehouses
constructed
4 20 M

134
Project/Programme Objective Expected outputs Indicators Targets Estimated
cost
Purchase of coffee
Parchment Milling
Machines to be
installed at Komothai
area
To facilitate
Coffee Milling
Coffee Milling
Plant in place
Coffee Milling
Plant in place
1 500M
Construction of milk
collection centers for
co-operative societies
To provide milk
collection Centres
Milk collection
Centres in place
Number of
collection
centers in place
35 7M
Creation of revolving
funds for co-
operatives
Prompt payment to
farmers / on
delivery
Increase in coffee
production
Existence of the
revolving fund
1 300M
Capacity building in
areas of Trade,
Tourism, Co-
operatives, Audit,
Weight and Measures
To build capacity Enhanced skills,
good corporate
governance and
improved
performance
Number trained 1500 50M
Workshops, Forums
and Seminars on
Trade, Tourism, Co-
operatives, Audit,
Weight and Measures
To sensitize the
stakeholders
Awareness Good
Management
practice, Client
satisfaction,
Increased
Productivity,
Streamlined
systems,
Increased
transparency &
Accountability,
1,000 50M
5.12 Roads Transport Public Works & Utilities Department
Vision
A national leader in infrastructural development, maintenance and provision of technical
services
Mission
To provide, maintain and regulate quality infrastructure technical services in Kiambu County
Strategic overview
Roads-To improve status of rural access roads and urban roads within the County
Transport-To enhance transportation within the county

135
Public Works-To facilitate planning, documentation and supervision of public
buildings
Fire and Rescue Services- To assist in prompt response to fire and other related
hazards within the county
Energy-To improve lighting of our centres and explore use of alternative energy
sources
Table 21: Roads, Transport and Public Works projects/programmes
Project/Programmee Objective Expected Output Indicators Target Cost
Construct 15 Km of
bituminous roads To provide a safe
,efficient, reliable and
sustainable transport
Improved road network
Increased road safety.
No. of KM
upgraded to
bitumen
status
15Km
Bitumen
road
360M
Construct 240 km of
gravel rural access
roads
To provide a safe
,efficient, reliable and
sustainable transport
Improved road network
Increased road safety.
No of KM
upgraded to
gravel road
network
240KM
gravel road
390M
Construct or
rehabilitate 5No.
motorable bridges
To promote
connectivity
Improved connectivity and
good passable bridges
No of
motorable
bridges
constructed.
5 No.
bridges
15M
To construct 10 KM
of NMT facility To provide a safe
,efficient, reliable and
sustainable pedestrian
walkways
Improved safe walkways
for the pedestrians.
No of KM
of NMT
constructed
10KM
NMT
20M
Preparation of
master plan for the
roads and storm
water drainage
systems
To provide strategic
context
Developed Long-vision for
road policy framework for
decisions that affect the
physical, social and
economic environment of
the Towns in the County
Master Plan
produced
and
Published
1No.
master
plan
5M
Construct 50KM
storm water
drainages
To provide free flow
of runoff water and
control flooding
Improved drainage systems
and clean environment
No of KM
of drain
constructed
50KM of
storm
water drain
26M

136
Project/Programmee Objective Expected Output Indicators Target Cost
Construct Bus parks
(Kiambu,
uthiru,Kikuyu,Thika)
To increase parking
space for PSV
vehicles for efficient
management,
coordination, planning
and control
Increased parking space for
PSV vehicles. Improved
service delivery and also
enhances revenue
collection.
No. of Bus
parks
constructed
4No. Bus
Parks
75M
Construct Street
parkings with the
County Towns
To increase parking
space for PSV
vehicles for efficient
management,
coordination, planning
and control
Increased parking space for
PSV vehicles. Improved
service delivery and
enhances revenue
collection
No of street
parkings
constructed
Street
parking
constructed
15
Construct 6 No.
footbridges To promote
connectivity
Improved connectivity and
good passable bridges
No of
footbridges
constructed.
6No.
footbridges
15M
Construct 60
Number, 30 metres
flood masts within
the County
To provide a suitable
visual environment
and promote security
Improved lighting and
enhanced security
No of flood
masts
constructed
60No.
flood
masts
240M
Construct streetlight
within the Count
12,000 poles
To provide a suitable
visual environment
and promote security
Improved lighting and
enhanced security
No of street
lights
constructed
12,000 No.
streetlights
300M
Construct 3No.Fire
stations at Kikuyu,
Ruiru and Kiambaa
To strengthen Fire
prevention capability
and welfare of the
Staff
To enhance safety and
response to disasters
No of fire
stations
constructed
3No. Fire
stations
50M
Purchase of Motor
Vehicles and
equipment
To enhance capacity
of the department for
service delivery
Improved mobility and
operations for the
Department
Project
Management
Vehicles
Double
Cabins.
Pick-ups,
trucks &
grader
80M
No. of

137
Project/Programmee Objective Expected Output Indicators Target Cost
Lorries
No of
graders
CHAPTER SIX: CONCLUSION
The outlined projects/programmes in this Annual Development Plan is a reflection of the
County departmental priorities that are in line with the fiscal responsibility principles as
stated in the PFM law. They are also in line with the national strategic objectives which are

138
provided in the CIDP and second Medium Term Plan. These objectives are pursued by the
County Government as a basis of allocation of public resources.
Kiambu County has been ensuring compliance with the constitutional requirement of at least
30% of resource allocation to development. The budget estimates for 2016/17 Financial Year
gives the allocation for development expenditure as 30.4% and the same will be replicated in
the Financial year 2017/18 budget estimates.
Finally, the timely and adequate release of funds will ensure a successful implementation of
this plan.