Economic Efficiency Analysis of Banana Farmers in Kiambu ...
10
Journal of Developments in Sustainable Agriculture 4: 118-127 (2009) Economic Efficiency Analysis of Banana Farmers in Kiambu East District of Kenya: Technical Inefficiency and Marketing Efficiency Stephen Mutuku Nzioka Graduate School of Life and Environmental Sciences, University of Tsukuba, Tsukuba, Ibaraki 305-8572, Japan Approximately 80% of Kenya's population lives in rural areas and derives its livelihood largely from agriculture. Agriculture makes up about 26% of Kenya's gross domestic product, and banana production occupies 2% of Kenya's arable land. Bananas are grown both as a source of food and household income to millions of rural Kenyans; however, production has been declining in the last 2 decades. My objective was to examine banana production and marketing in Kiambu East District, with the aims of improving levels of banana production by small-scale farmers and making recommendations to improve marketing efficiency. A structured questionnaire was given to farmers in 3 Divisions of Kiambu East District: Githunguri, Municipality, and Kiambaa. A frontier production function was established, and results indicated that farmers operated at about 60% of the optimum production level because of technical inefficiency, resulting in low levels of production by individual farmers. If farmers received training on how to manage their traditional bananas and organized into marketing groups, they could improve their bargaining power and increase household income to as much as 3 times current levels. Farmers therefore should form production and marketing groups to grow and market their bananas collectively. Farmers also need to be given management training and financial assistance to grow higher yielding varieties of bananas (e.g., Tissue Culture bananas). In addition farmers need to be trained on indigenous post-harvest technology to realize increased household incomes. Key words: Frontier production function, marketing groups, Bargaining power, Household income, Technological change 1. Introduction 1. 1 Background Agriculture makes up 26% of Kenya's gross domestic product, 60% of export earnings (flowers, fruits, vegetables and tea mainly), and 45 % of government revenue (Muturi et al., 2001). Ap- proximately 80% of Kenya's population lives in rural areas, and they derive their livelihoods largely from agriculture. The majority of the urban poor also earn a living doing agriculture-related work. There are an estimated 4.5 million small-scale farmers in Kenya, and they account for 75% of total agricultural output (Kimenyi, 2008). Bananas (Musa spp.) are grown mainly by many Received: October 1, 2009, Accepted: November 2, 2009 subsistence and small-scale farmers in Kenya. They occupy 2% of the total arable land and are widely grown in areas with adequate rainfall. The crop is grown as a source of both food and income to millions of rural Kenyans, and with the collapse of what used to be major cash crops in Kenya, especially coffee and tea, banana production has become an important source of household income (Mbogoh et al., 2002). Production, however, has been on the decline for the past 2 decades (Wanzala, 2005). This decline has threatened food security and household incomes in rural com- munities and also has reduced employment op- portunities. Corresponding author's current address: P.O. Box 433, 90131 Tala, Kenya. E-mail: [email protected]
-
Upload
khangminh22 -
Category
Documents
-
view
0 -
download
0
Transcript of Economic Efficiency Analysis of Banana Farmers in Kiambu ...

Journal of Developments in Sustainable Agriculture 4: 118-127 (2009)
Economic Efficiency Analysis of Banana Farmers in Kiambu East District of Kenya:
Technical Inefficiency and Marketing Efficiency
Stephen Mutuku Nzioka
Graduate School of Life and Environmental Sciences, University of Tsukuba, Tsukuba, Ibaraki 305-8572, Japan
Approximately 80% of Kenya's population lives in rural areas and derives its livelihood largely from agriculture. Agriculture makes up about 26% of Kenya's gross domestic product, and banana production occupies 2% of Kenya's arable land. Bananas are grown both as a source of food and household income to millions of rural Kenyans; however, production has been declining in the last 2 decades. My objective was to examine banana production and marketing in Kiambu East District, with the aims of improving levels of banana production by small-scale farmers and making recommendations to improve marketing efficiency. A structured questionnaire was given to farmers in 3 Divisions of Kiambu East District: Githunguri, Municipality, and Kiambaa. A frontier production function was established, and results indicated that farmers operated at about 60% of the optimum production level because of technical inefficiency, resulting in low levels of production by individual farmers. If farmers received training on how to manage their traditional bananas and organized into marketing groups, they could improve their bargaining power and increase household income to as much as 3 times current levels. Farmers therefore should form production and marketing groups to grow and market their bananas collectively. Farmers also need to be given management training and financial assistance to grow higher yielding varieties of bananas (e.g., Tissue Culture bananas). In addition farmers need to be trained on indigenous post-harvest technology to realize increased household incomes.
Key words: Frontier production function, marketing groups, Bargaining power, Household income, Technological change
1. Introduction
1. 1 Background Agriculture makes up 26% of Kenya's gross
domestic product, 60% of export earnings (flowers, fruits, vegetables and tea mainly), and 45 % of government revenue (Muturi et al., 2001). Approximately 80% of Kenya's population lives in rural areas, and they derive their livelihoods largely from agriculture. The majority of the urban poor also earn a living doing agriculture-related work. There are an estimated 4.5 million small-scale farmers in Kenya, and they account for 75% of total agricultural output (Kimenyi, 2008).
Bananas (Musa spp.) are grown mainly by many
Received: October 1, 2009, Accepted: November 2, 2009
subsistence and small-scale farmers in Kenya. They occupy 2% of the total arable land and are widely grown in areas with adequate rainfall. The crop is grown as a source of both food and income to millions of rural Kenyans, and with the collapse of what used to be major cash crops in Kenya, especially coffee and tea, banana production has become an important source of household income (Mbogoh et al., 2002). Production, however, has been on the decline for the past 2 decades (Wanzala, 2005). This decline has threatened food security and household incomes in rural communities and also has reduced employment opportunities.
Corresponding author's current address: P.O. Box 433, 90131 Tala, Kenya. E-mail: [email protected]

Nzioka: Economic Efficiency Analysis of Banana Fanners in Kiambu East District of Kenya 119
1. 2 Banana Production in Kenya Banana is the most popular fruit in Kenya and is
often consumed as a desert whereas the cooking variety also serves as a staple food. Bananas are grown in a mixed farming system and are often seen as a security crop, which provides continuous household income under a low input regime (Qaim, 1999). Banana production, however, is often neglected in terms of supplying input factors such as fertilizer and water and is primarily managed by women who have limited amounts of education and are also responsible for domestic activities such as raising children and providing for other family needs. Women also provide labor for incomegenerating activities such as growing tea, coffee, and vegetables and for dairy farming. They therefore have little time to concentrate on banana production, which is treated as a subsistence activity and given very little attention.
Banana production in Kenya has been on the decline in the past 2 decades for many reasons. Indigenous bananas take 2 years to mature, require more space to grow than high-yield varieties (HYV s), produce small bunches, and yields are uneven. Although high-yield disease-resistant varieties (e.g., Tissue Culture bananas) have been developed by research institutions, many farmers continue to use low-yield bananas because highyield banana plants (stools) are expensive. Farmers are not able to access credit to purchase HYV bananas because loans require collateral and farmers think they will be unable to repay the loans (New Agriculturist 2009). Hence, most of the technologies to improve production appear to be beyond the reach of small-scale farmers in Kenya. Moreover, farmers have limited crop management knowledge of HYV bananas, and land under banana production has continuously been reduced because of the expanding population in urban centers (Wanzala, 2005).
Most farmers in Kiambu East District conduct agriculture on a small scale. Farmers have an average land holding of 2 acres (Kiambu East District Annual Report, 2008). On this piece of land, a farmer has a house, grows a variety of crops, and keeps dairy cattle. It is quite difficult for farmers in Kiambu East District to increase banana production because the amount of land is restricted, especially with the expansion of nearby Nairobi,
but they could increase production efficiency by using new technology to increase technical efficiency.
Banana production in Kiambu East District is rain fed, and the district has two rainy seasons. Banana plants produce continuously, and production reaches a peak during the rainy seasons. Production of bananas in Kiambu East District could be increased through irrigation initiatives, but most farmers cannot afford irrigation infrastructure. As a result, bananas are grown in high rainfall areas that have been under cultivation for a very long time, leading to soil infertility and hence contributing to reduced banana production (Wambugu, 2004).
1. 3 Banana Marketing in Kenya Unlike other major cash crops produced in
Kenya for which cooperative marketing exists, banana marketing in Kenya uses middlemen who buy bananas directly from the farmers at the farm gate and then transport them to a collection center where they can be transported to Nairobi on hired trucks. Most of the intermediary "middlemen" are actually women who purchase bananas from female farmers (Qaim, 1999). Distance from markets and poor transportation infrastructure makes it difficult for farmers to deliver bananas to local markets or to the Nairobi market, but farmers directly sell ripe bananas to consumers at local markets in a few cases. Retail prices of bananas in Nairobi are about 3 to 4 times those in rural areas, indicating a high demand for bananas in Nairobi. Banana demand in Nairobi is strong from urban consumers with no access to "home grown" produce (USAID Kenya, 2006). Moreover, individual farmers in Kiambu East District have little negotiation power because they produce small amounts of bananas and do not act cooperatively (Mbogoh et ai., 2002; New Agriculturist 2009).
Mukhebi (2004) indicated that agricultural markets have not worked efficiently in Kenya since market liberalization occurred in the late 1980's and early 1990's and identified 4 reasons for inefficient markets: long transaction chains between the farm gate and consumers, poor access to appropriate and timely market information, small volumes of products of highly varied quality offered by individual small-scale farmers, and poorly struc-

120 J. Dev. Sus. Agr. 4 (2)
tured and inefficient marketing systems. Kinyua (2008a) identified the following causes of inefficiency in the banana value chain: a large number of intermediaries, a lack of comprehensive knowledge of the market by all value players, policy and institutional failures (e.g., no agreed upon grades and standards), low technical capacity for ripening, high costs in the chain (e.g., for transportation, transactions, and intermediaries), lack of consistency in supply, and difficulties in changing the mindset of farmers from subsistence to commercial farming.
1.4 Objective of the Study Very little research has been conducted on the
technical inefficiency and marketing efficiency of banana farmers in Kenya. Colman and Young (2002) defined technical efficiency as the output from a given set of inputs. In this study, the production unit is the banana stool. Colman and Young (2002) also defined technological change as an improvement in the state of knowledge such that production possibilities are enhanced. With technological change, the production function can shift such that more output can be produced with the same quantity of inputs.
My objective was to examine banana production and marketing in Kiambu East District, with the aims of improving levels of banana production by small-scale famers and making recommendations to improve marketing efficiency. Kiambu East District was selected as the target area because bananas are grown by almost all households in this area both for consumption and for income generation. Bananas are the most commonly grown crop by farmers in Kiambu East District and have a greater contribution to household incomes as compared with other food crops and fruits.
2. Materials and Methods
2. 1 Study Area Kiambu East District is 1 of 11 districts in
Kenya's Central Province. It borders Nairobi City to the south and east, Kiambu West District to the west, Thika District to the northeast, and Gatundu District to the northwest. The district is located at about 1°10'0" South, 36° 50'0" East, has an elevation of 1720 m above sea level (asl), and covers 365.7 km2
• Kiambu East District has a population
of 381,694, with an average population density of 1,044 persons per km2
, and 80% of the popUlation lives in rural areas. Because of the high population density, land has been fragmented into small parcels and agricultural productivity has declined.
The district has 2 broad topographical regions, the upper midland and lower highland, and is divided into 3 divisions: Githunguri (21 km from Nairobi), Municipality (13 km from Nairobi), and Kiambaa (10 km from Nairobi).
The rainfall regime is bimodal and reliable. The "long" rains occur in April and May (range 250-1600mm), whereas the "short" rains occur in October and November (range 1000-1200mm). The mean daily minimum and maximum temperatures in the district vary between 8 to 30°C. Soils are generally fertile, but over-application of synthetic fertilizers has made the soils acidic and crop productivity pas fallen as a result. The main economic activities are farming and small business (self employment). The main staple crops grown in Kiambu East District are maize, beans, potatoes, and bananas. Other vegetable crops are also grown, including tomatoes and cabbage. The main cash crops grown are coffee and tea. Livestock production is the mainstay of the population in Kiambu East District. Agriculture in Kiambu East District is mainly rain fed, but high value crops such tomatoes, cabbage, and flowers are irrigated.
2. 2 Data Collection Data were collected from two sources: (1) a
household survey describing personal characteristics, banana production and marketing, and agroprocessing of bananas, and (2) the Kenya Bureau of Statistics.
A research survey design was used and a structured questionnaire developed. The questionnaire was administered by 6 agriculture officers based in the 3 divisions of Kiambu East District. The questionnaire was divided into two major parts. Part A covered the personal profile of respondents (name, gender, age, highest educational level, locality, and occupation). Part B covered agricultural information, including land size, acreage under banana production, number of banana plants (stools), number of bananas (bunches) harvested annually, and price per bunch. A total of 115 farmers were selected randomly and interviewed
Nzioka: Economic Efficiency Analysis of Banana Fanners in Kiambu East District of Kenya 121
during the last week of January and the first week of February 2009: 33 in Githunguri, 38 in Municipality, and 44 in Kiambaa Division.
Data on Kiambu East District infrastructure were obtained from the Kenya Bureau of Statistics.
2. 3 Data Analysis 2.3. 1 Banana Frontier Production Function
In many economic articles much attention has been paid to the estimation of productive efficiency by means of frontier production functions, which was initiated by Farrell (1957) and has the ability to compare levels of efficiency across observations.
A linear programming method was used to develop the following frontier production function and to analyze banana production levels and technical efficiency (Farrell, 1957):
(1)
Where Qj is the production quantity of traditional bananas harvested, ".Xj is the number of banana stools, a is a constant, b is the coefficient of input Xj
and Uj is a disturbance term. This function will usually be linear in the logs of
the variables, so equation (1) can be rewritten as
qi=a' +bxj-Ej, (2)
where qj=logQj; xj=logQj and - Ej=uj
350
a 300 ..a
(J.l -I-' U)
250 (J.l
> J... C':I
...c:: U) 200 (J.l
...c:: u \:: ;:;
150 ....0 C':I \:: C'd \:: 100 C':I
....0 "+-< 0
J... 50 (J.l
....0 0 0 S
;:; °eo z 0 0 20 40 60 80
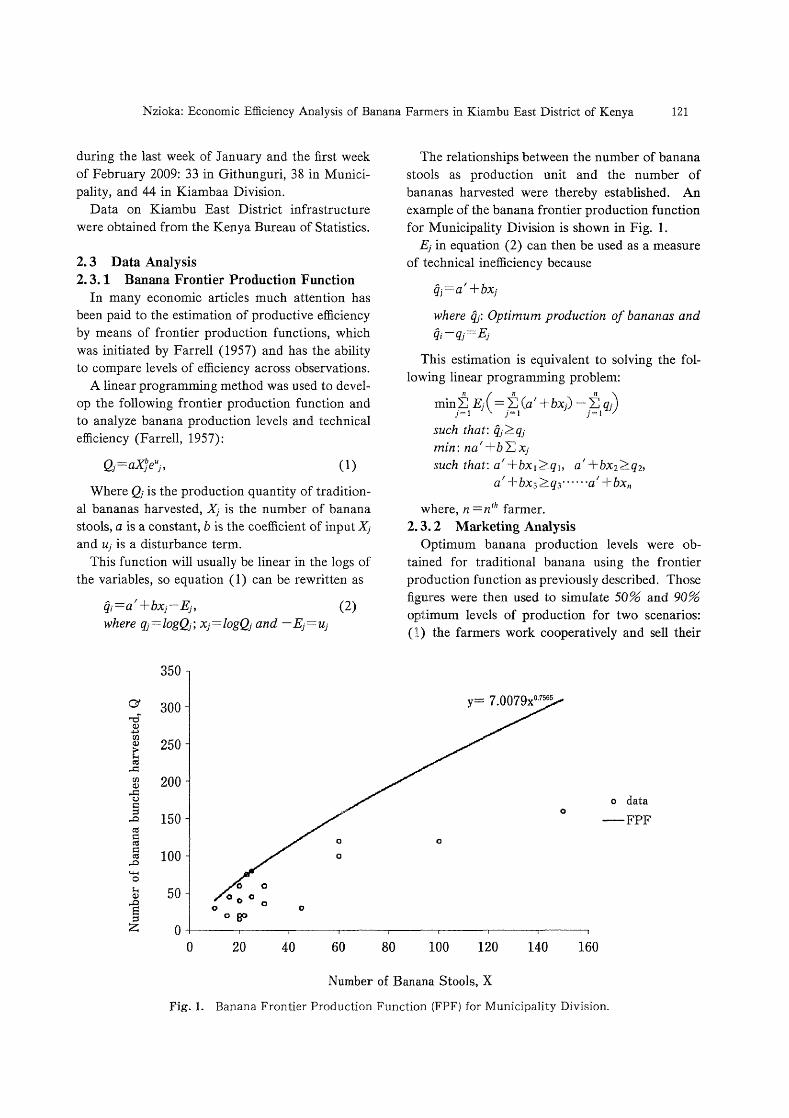
The relationships between the number of banana stools as production unit and the number of bananas harvested were thereby established. An example of the banana frontier production function for Municipality Division is shown in Fig. 1.
Ej in equation (2) can then be used as a measure of technical inefficiency because
qj=a' +bxj
where q/ Optimum production of bananas and q;-qj=Ej
This estimation is equivalent to solving the following linear programming problem:
mint Ej(= t Cal +bxj) - t qj) )=1 )'=1 ),"'1
such that: qj?::'qj min: nat +b:L: Xj
such that: a' +bxI ?::.qh a' +bX2?::.Q2, a' +bX32q3·· .. ··a' +bxn
where, n =ntlr farmer. 2. 3. 2 Marketing Analysis
Optimum banana production levels were obtained for traditional banana using the frontier production function as previously described. Those figures were then used to simulate 50% and 90% optimum levels of production for two scenarios: (1) the farmers work cooperatively and sell their
o data
-FPF
100 120 140 160
Number of Banana Stools, X
Fig.1. Banana Frontier Production Function (FPF) for Municipality Division.
122 J. Dev. Sus. Agr. 4 (2)
bananas as a group at the Nairobi market (the "group marketing" scenario) and (2) the farmers continue to sell their bananas individually to middlemen at the farm gate (the "individual marketing" scenario). 50% optimum level was chosen in the simulation because it is easier to achieve by technological change in management of traditional banana production by farmers, while 90% optimum level was the desired improvement of banana incase the extension agents played their role. Optimum level is the maximum production achievable by use of the economic model. The simulation was done to observe the change in farmers household income from banana marketing from current situation ("individual marketing scenario") through technological change on traditional banana production through training of farmers and then marketing as a group ("group marketing scenario"). Individual marketing scenario was pegged at the current situation of banana production.
In the group marketing scenario, transportation costs were estimated on the basis of the following current costs to hire a 3-t truck at the different divisions (distance from Nairobi influences the cost): 4000 Kenya Shillings (Ksh) for Githunguri Division and 3000 Ksh for Municipality and Kiambaa Divisions (Kiambu East District Annual Report, 2008). Other estimated marketing costs (per bunch) included assembling and loading at the source, 2.70 Ksh; Nairobi council fee, 7.50 Ksh; and offering cost at the Wakulima market (the main market for bananas in Nairobi), 0.60 Ksh (Acharya et aI., 2008). The total transaction cost was estimated to be 30.80 Ksh per bunch for Githunguri and 25.80 Ksh for Municipality and Kiambaa. Average price was obtained by assuming an average banana bunch weight of 20 kg and a Nairobi market price of 30 Ksh per kg (USAID Kenya, 2006). The average gross group marketing household income per farmer was then estimated using the current average banana price per bunch (600 Ksh) at Nairobi multiplied by the average number of bunches harvested and marketed per farmer less the total transaction costs.
In the individual scenario, household income was calculated from the farm gate price and current production level at each household.
The average gross group marketing household income were estimated at the different simulated
levels of optimum production. The resulting average gross household incomes were used to calculate the net group household income by comparing banana production and marketing information from Mbogoh et al. (2002), which estimated average annual gross production costs to be 36.6% of the expected annual gross income for years 1 and 2 for Tissue Culture bananas. The average net group marketing income was therefore calculated to be 63.4% of the average gross group income obtained from the simulation. The absolute and relative differences and also the ratio between two systems are presented in the results.
3. Results and Discussion
3.1 Technical Inefficiency Any farmer producing 5 banana bunches per
stool per year was considered to be above the optimum production level, and 5 farmers who were shown to produce above this level in the frontier production function were not included in the technical inefficiency analysis, but they were included in the marketing efficiency analysis.
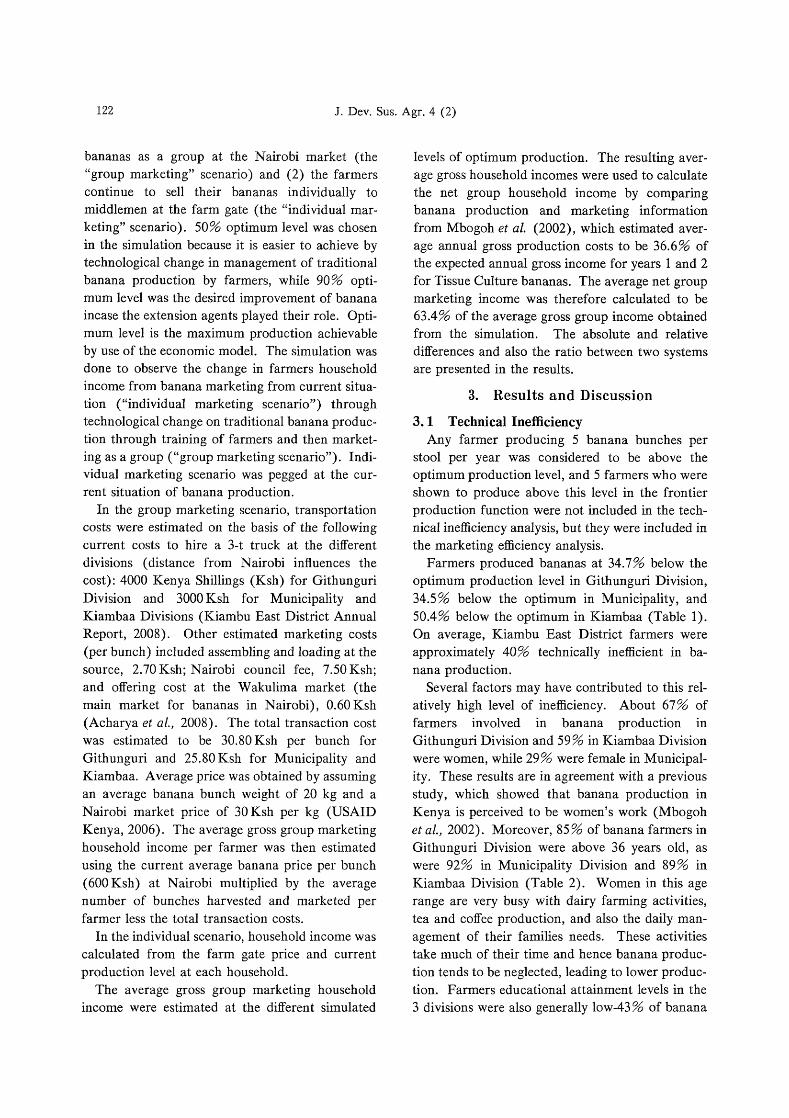
Farmers produced bananas at 34.7% below the optimum production level in Githunguri Division, 34.5% below the optimum in Municipality, and 50.4 % below the optimum in Kiambaa (Table 1). On average, Kiambu East District farmers were approximately 40% technically inefficient in banana production.
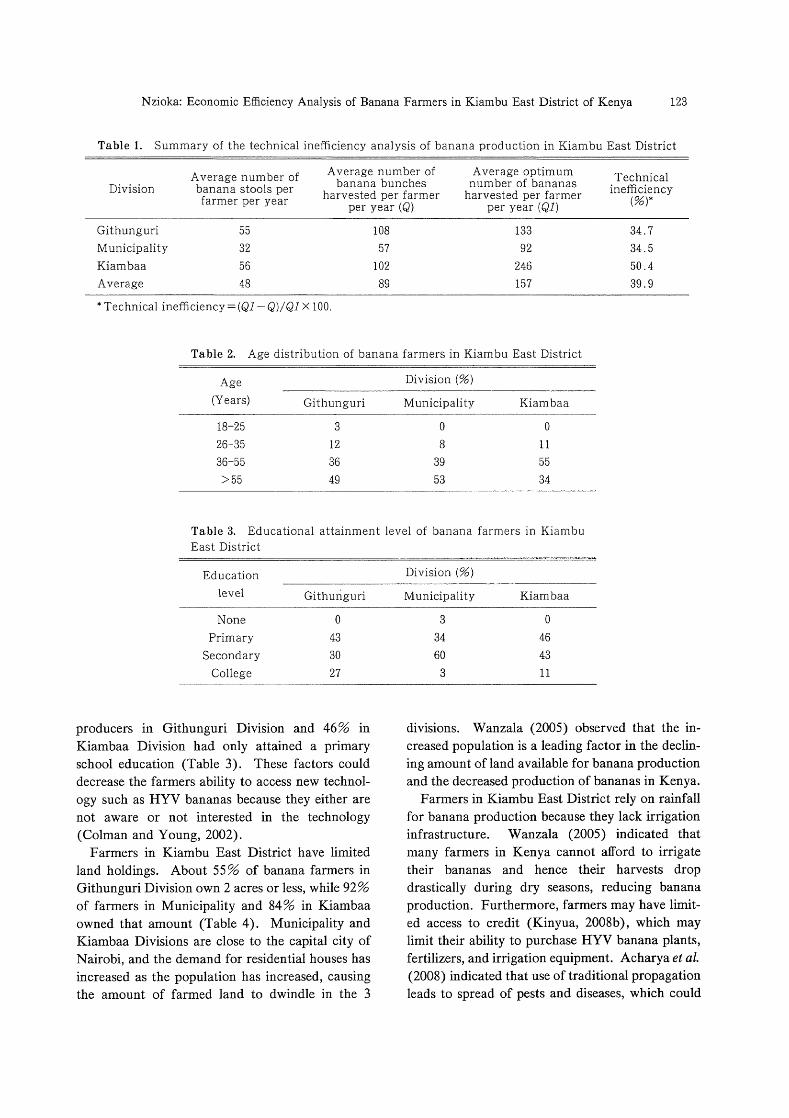
Several factors may have contributed to this relatively high level of inefficiency. About 67% of farmers involved in banana production in Githunguri Division and 59% in Kiambaa Division were women, while 29% were female in Municipality. These results are in agreement with a previous study, which showed that banana production in Kenya is perceived to be women's work (Mbogoh et aI., 2002). Moreover, 85 % of banana farmers in Githunguri Division were above 36 years old, as were 92% in Municipality Division and 89% in Kiambaa Division (Table 2). Women in this age range are very busy with dairy farming activities, tea and coffee production, and also the daily management of their families needs. These activities take much of their time and hence banana production tends to be neglected, leading to lower production. Farmers educational attainment levels in the 3 divisions were also generally low-43 % of banana
Nzioka: Economic Efficiency Analysis of Banana Fanners in Kiambu East District of Kenya 123
Table 1. Summary of the technical inefficiency analysis of banana production in Kiambu East District
A verage number of Average number of Average optim urn Technical Division banana stools per banana bunches number of bananas inefficiency
farmer per year harvested per farmer harvested per farmer (%)* per year (Q) per year (Ql)
Githunguri 55 108 133 34.7 Municipality 32 57 92 34.5 Kiambaa 56 102 246 50.4 Average 48 89 157 39.9
* Technical inefficiency=(Ql-Q)/Ql X 100.
Table 2. Age distribution of banana farmers in Kiambu East District
Age Division (%)
(Years) Githunguri M unicipali ty Kiambaa ---------
18-25 3 0 0 26-35 12 8 11
36-55 36 39 55 >55 49 53 34
Table 3. Educational attainment level of banana farmers in Kiambu East District
Education
level Githunguri
None 0 Primary 43
Secondary 30 College 27
producers in Githunguri Division and 46% in Kiambaa Division had only attained a primary school education (Table 3). These factors could decrease the farmers ability to access new technology such as HYV bananas because they either are not aware or not interested in the technology (Colman and Young, 2002).
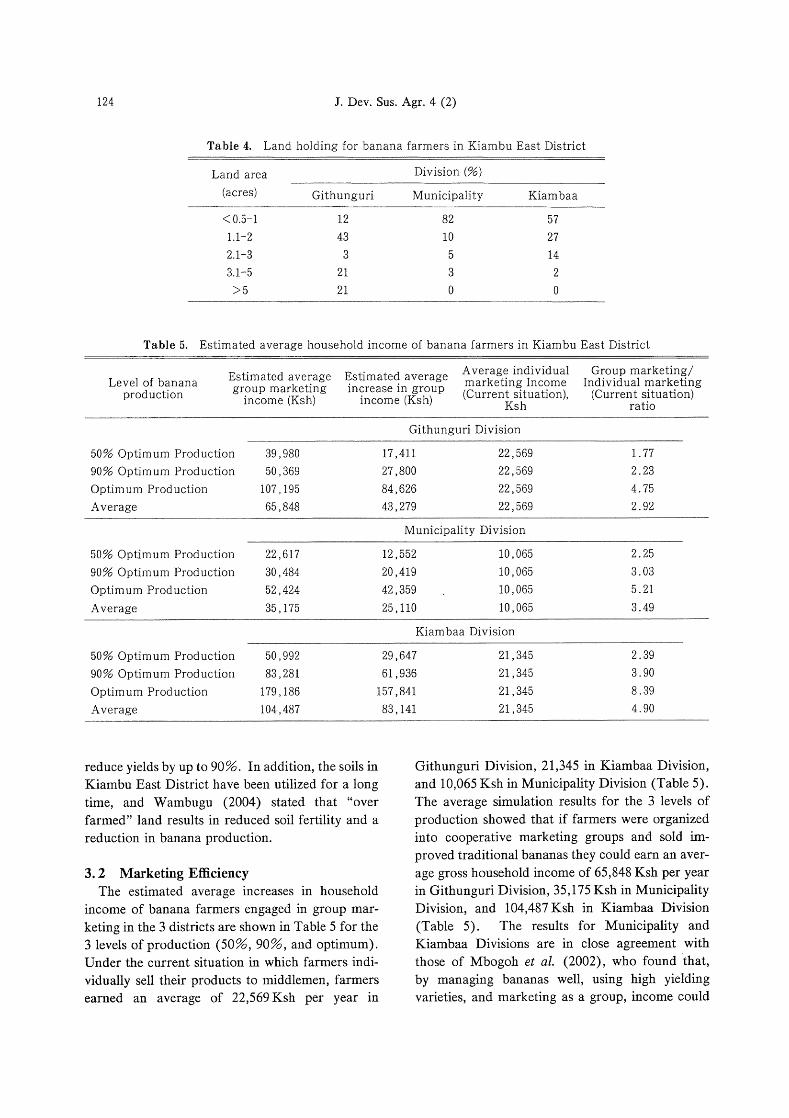
Farmers in Kiambu East District have limited land holdings. About 55% of banana farmers in Githunguri Division own 2 acres or less, while 92% of farmers in Municipality and 84 % in Kiambaa owned that amount (Table 4). Municipality and Kiambaa Divisions are close to the capital city of Nairobi, and the demand for residential houses has increased as the population has increased, causing the amount of farmed land to dwindle in the 3
Division (%)
M unicipali ty Kiambaa
3 0 34 46 60 43 3 11
divisions. Wanzala (2005) observed that the increased population is a leading factor in the declining amount of land available for banana production and the decreased production of bananas in Kenya.
Farmers in Kiambu East District rely on rainfall for banana production because they lack irrigation infrastructure. Wanzala (2005) indicated that many farmers in Kenya cannot afford to irrigate their bananas and hence their harvests drop drastically during dry seasons, reducing banana production. Furthermore, farmers may have limited access to credit (Kinyua, 2008b), which may limit their ability to purchase HYV banana plants, fertilizers, and irrigation equipment. Acharya et al. (2008) indicated that use of traditional propagation leads to spread of pests and diseases, which could
124 J. Dev. Sus. Agr. 4 (2)
Table 4. Land holding for banana farmers in Kiambu East District
Land area Division (%)
(acres) Githunguri Municipality Kiambaa
< 0.5-1 12 82 57 1.1-2 43 10 27
2.1-3 3 5 14
3.1-5 21 3 2
>5 21 ° ° Table 5. Estimated average household income of banana farmers in Kiambu East District
Level of banana production
Estimated average group marketing
income (Ksh)
Estimated average increase in group
income (Ksh)
A verage individual marketing Income (Current situation),
Ksh
Group marketing/ Individual marketing
(Current situation) ratio
Githunguri Division
50% Optimum Production 39,980 17,411 22,569 1. 77
90% Optimum Production 50,369 27,800 22,569 2.23
Optim um Prod uction 107,195 84,626 22,569 4.75
Average 65,848 43,279 22,569 2.92
Municipality Division
50% Optimum Production 22,617 12,552 10,065 2.25
90% Optimum Production 30,484 20,419 10,065 3.03
Optimum Production 52,424 42,359 10,065 5.21
Average 35,175 25,110 10,065 3.49
Kiambaa Division
50% Optimum Production 50,992 29,647 21,345 2.39
90% Optimum Production 83,281 61,936 21,345 3.90
Optimum Production 179,186 157,841 21,345 8.39
Average 104,487
reduce yields by up to 90%. In addition, the soils in Kiambu East District have been utilized for a long time, and Wambugu (2004) stated that "over farmed" land results in reduced soil fertility and a reduction in banana production.
3.2 Marketing Efficiency The estimated average increases in household
income of banana farmers engaged in group marketing in the 3 districts are shown in Table 5 for the 3 levels of production (50%,90%, and optimum). Under the current situation in which farmers individually sell their products to middlemen, farmers earned an average of 22,569 Ksh per year in
83,141 21,345 4.90
Githunguri Division, 21,345 in Kiambaa Division, and 10,065 Ksh in Municipality Division (Table 5). The average simulation results for the 3 levels of production showed that if farmers were organized into cooperative marketing groups and sold improved traditional bananas they could earn an average gross household income of 65,848 Ksh per year in Githunguri Division, 35,175 Ksh in Municipality Division, and 104,487 Ksh in Kiambaa Division (Table 5). The results for Municipality and Kiambaa Divisions are in close agreement with those of Mbogoh et al. (2002), who found that, by managing bananas well, using high yielding varieties, and marketing as a group, income could

Nzioka: Economic Efficiency Analysis of Banana Fanners in Kiambu East District of Kenya 125
Table 6. Distribution of the Kiambu East District community: distance to the nearest daily market, to the nearest bus stop, and the most common road surface
Nearest daily Distance to the nearest Most common road market bus stop
Distance (km) % Distance (km)
<0.5 0 <1 0.5-1 6.5 1. 0-2.9
1-2.9 4.4 3.0-4.9
3-4.9 0 5.0-10
>5 89.0 >10
be increased by 3.4 times on average in 2001 and this had increased with improved Tissue Culture banana production technology to 4.8 times in 2002 (Mbogoh et aI., 2002).
Mbogoh et al. may have obtained higher values than those obtained for Githunguri and Municipality Divisions because in the simulation (group marketing scenario) it is assumed that extension agents and banana stakeholders would improve farmers' knowledge on how to better technically manage their traditional banana orchards so as to increase production and market as a group, while Mbogoh et al used HYV bananas. Banana marketing efficiency improvement decreased with distance from the Nairobi market because of increase in the transaction costs. Githunguri Division, which is located farthest from Nairobi (21 km), had the lowest relative improvement (2.92 times income increase), whereas both of the other closer divisions had higher gains.
Farmers earned lower incomes in the individual scenario for several reasons that have been previously discussed. They grow small amounts of bananas (Table 1), and these low volumes may force them to sell to middlemen at lower prices. There are also long transaction chains between the farm gate and consumers and each middleman takes profit at each level before bananas reach consumers. Farmers in the 3 divisions may also not have access to appropriate and timely market information (Mukhebi, 2004). Githunguri farmers sold their bananas at 172 Ksh per bunch, compared to 180 Ksh in Municipality and 216 Ksh in Kiambaa. These prices depended on the type of buyer and the perceived quality, which was determined by eye. The bananas are sold in bunches, not by weight.
surface
% Surface %
0 Tarmac 7.6 4.1 Gravel 0
0 Earth poorly maintained 81.9
95.9 M urram track 0
0 Others 10.5
New Agriculturist (2009) indicated that many farmers in Kenya have to accept the prices that buyers offer and have little or no bargaining power. Farmers also face poorly structured and inefficient marketing systems: 89 % of the farming community in Kiambu East District lives 5~ 1 0 km from the nearest daily market, nearly 82% of the Kiambu East District community is connected by unmaintained dirt roads and nearly 96 % of farmers live 5-10 km from nearest bus stop (Table 6). All of these factors could contribute to farmers selling their bananas to middlemen who have means of transport or who hire trucks to transport bananas to Nairobi.
4. Conclusions and Recommendations
4. 1 Conclusions Kiambu East District farmers produced bananas
at an average of 60% of the optimum production level, or in other words, they were 40% technically inefficient. Similar results were obtained by Mbogoh et al. (2002). If the farmers were organized into marketing cooperatives and improved their production through technological change in managing their traditional banana, they could increase their marketing efficiency by more than 3 times the current average, which is also similar to the results of Mbogoh et al. (2002).
Age, education level, and gender appeared to have an effect on the technical inefficiency of banana farmers in Kiambu East District. In general, banana farmers were female, older, and had low levels of education. These factors could have contributed to the farmers' ability to access technology on HYV s because they were either not aware or not interested in the technology.
126 J. Dev. Sus. Agr. 4 (2)
The volume of banana production by individual farmers appeared to have an effect on marketing efficiency of banana farmers. Since the farmers were not organized into marketing groups, they lacked bargaining power, which led to low marketing efficiency. Farmers may have relied on middlemen for marketing information, which could have led to the varied and low banana prices observed and also to low marketing efficiency. The poor infrastructure in Kiambu East District also appeared to have an effect on marketing efficiency of banana farmers.
4.2 Recommendations Banana research institutions should focus on
building the technical knowledge of extension providers, which will in tum help banana farmers improve production. There is a great need for collaboration between extension agents and the private sector and research institutes to provide the best services to farmers. The government should provide subsidies to facilitate farmers' access to HYV banana plants and other inputs. There is also a need to establish a micro-credit facility for farmers to enable them to acquire the necessary inputs.
If Kiambu East District farmers were organized into marketing groups, they could increase their bargaining power and hence improve their household incomes. This could empower women in rural areas because other cash crops are considered to be the men's source of income. Empowering women will lead to rural development because women work extensively in agricultural production in rural areas.
The government should promote banana production and marketing by regulating quality and standards. It should also provide infrastructure, communication, and infornlation to facilitate marketing. However, government assistance should be short term, whereas the pUblic-private sector partnership should be strengthened in the long run. Farmers could improve household incomes if they were trained on indigenous processing technologies so as to add value to their bananas at the fann level. Such training and processing could create employment for rural women and youth and in turn retain youth in rural areas.
In a future study the role of extension agents in
knowledge dissemination should be clarified, so as to enable the farmers to improve their banana production and marketing efficiency.
Acknowledgements
Foremost, I wish to acknowledge the tireless efforts of Professor Sushuke Matsushita of Tsukuba University whose guidance, inspiration, and encouragement were paramount to the success of this study. I wish to thank Professor Hiroshi Gemma of University of Tsukuba for providing valuable insights on production and processing of bananas. I am grateful to Japanese International Cooperation Agency (JICA) for financial support, which enabled me to study at the University of Tsukuba and conduct this study. I also wish to thank Ms Sachiyo Akiyama and Ms Makiko Nakano both of Japanese International Cooperation Centre (JICE) and Mr. Aizawa Eishi of JICA for their continuous encouragement and support during the period of writing this paper. I appreciate Ms Shinoda Kimiko of University of Tsukuba for her efforts in ensuring that I had the necessary materials and schedules. Finally, I thank the staff of Kiambu East District who helped collect the data.
References
Acharya S.S. and Mackey M.G.A., 200S. Socio-Economic Impact Assessment of the Tissue Culture Banana Industry in Kenya. Africa Harvest Biotech Foundation International (AHBFI). Nairobi, Kenya; Johannesburg, South Africa; Washington DC, USA. http:// www. africaharvest. org / files / tcBanana. pdf; accessed on 16 October 2009.
Colman, D. and Young T., 2002. Markets and prices in less developed countries. Cambridge University Press, UK: 50-51, 53 and 61.
District Agricultural Office, 200S. Kiambu East District Annual Report, 200S.Kiambu East District Profile and Crop situation, Ministry of Agriculture, Kiambu, Kenya.
Farell M. J., 1957. The Measurement of Productive Efficiency. Journal of the Royal Statistical Society. Series A (General), Vol. 120, No. 3 (1957). Published by: Blackwell Publishing for the Royal Statistical Society: 253-290. http://www.jstor.org/stable/2343100; accessed on 19 November 2009.
Kimenyi, E., Kenyan Extension Services. A paper presented at the nCA training program on Rural Development by Songa Mbele Community Development Initiative approach in Nairobi, 2008.
Kinyua, H., 2008a. Transformed Banana Value ChainTechno Serve. http://www.banana200S.com/cms/

Nzioka: Economic Efficiency Analysis of Banana Farmers in Kiambu East District of Kenya 127
posters/kinyua.pdf; accessed on 12 August 2009. Kinyua, H., 2008b. How private standards designed for
export produce also influence Kenyan domestic markets. Fresh perspectives 2008. Agri food standards and pro poor growth in Africa. http://www.agrifood standards.netl enlfilemanagerl active?fid = 126; accessed in November 2009.
Mbogoh, S.G., Wambugu F.M. and Wakhusama, S., 2002. Socio-economic impact of biotechnology applications: some lessons from the pilot Tissue Culture banana production promotion project in Kenya (1997-2002). A Contributed Paper Submission for the XXV IAAE Conference August 2003, Durban, South Africa. http:// ageconsearch. umn. edu/bitstream/25929 11 I cp 03mb01.pdf; accessed on 22 May 2009.
Mukhebi A., 2004. Reaching the poor in rural Kenya with market information: a case study of market information system. A paper presentation at the CTA Seminar 2004 on the Role of Information Tools in Food Security, Maputo, Mozambique, November 8-12, 2004. http://www. cta.intl ctaseminar2004/MukhebiKACE. pdf; accessed 31 May 2009.
Muturi S.N., Kilungo J.K., Muendo K.M., Mairura Z. and Kariuki G.K., 2001. Marketing of smallholder produce: A synthesis of case studies in the highlands of Central Kenya. Technical Report No.26. Regional Land Management Unit (RELMA)/Sida, 2001. ISBN
9666-696-56-2. http://www.worldagroforestry.org/ . ../ TR % 2026%20 Marketing % 20 low % 20 res. pdf; accessed on 23 April 2009.
New Agriculturist, 2009. Improving the banana "value chain" in East Africa. http://www.new-ag.info/09/ 01lfocusonlfocuson3.php; accessed on 24 April 2009.
Qaim M., 1999. Assessing the impact of banana biotechnology in Kenya. ISAAA Briefs No. 10. ISAAA: Ithaca, NY. http://www.isaaa.org/Briefs/lO/briefs.htm; accessed on 11 May 2009.
USAID Kenya, 2006. Horticultural development program, Marketing News, November-December 2006. http:// www.fintrac.com/cpanelx_pu I Kenya % 20 KHDP I KHDP % 20 Market % 20 News % 20 Nov-Dec % 2006. pdf; accessed on November 2009.
Wambugu F., 2004. Food, nutrition and economic empowerment: the case of scaling up the Tissue Culture banana project to the rest of East Africa. NEP AD Conference Paper No.13. Paper presented at the NEPAD/IGAD regional conference "Agricultural Successes in the Greater Horn of Africa", Nairobi, November 22-25, 2004.
Wanzala B.J., 2005. Small scale farmers make it big from bananas. http://www.islamonline.net/servlet I Satel lite?c = Article_ C&cid = 1158321461232&pagename = Zone-English -HealthScience % 2FHSELayout; accessed on November 2009.