Postharvest improvement of Cavendish banana quality and ...
255
t6.tz. oz Postharvest improvelnent of Gavendislr banana gualit¡r and shelf life Annunziata (Nancy) Teresa Bagnato B.Ag.Sc. (Ilorticulhral Science, Hons. The University of Adelaide) A thesis submitted in fulfilment of the requirements forthe degree of Iloctoro,f PHlosophy The University of Adelaide Departrnent of Horticulture, Viticulture and Oenology Facuþ ofSciences Waite Campus November 2002
-
Upload
khangminh22 -
Category
Documents
-
view
1 -
download
0
Transcript of Postharvest improvement of Cavendish banana quality and ...

t6.tz. oz
Postharvest improvelnentof Gavendislr bananagualit¡r and shelf life
Annunziata (Nancy) Teresa Bagnato
B.Ag.Sc. (Ilorticulhral Science, Hons. The University of Adelaide)
A thesis submitted in fulfilment of the
requirements forthe degree of
Iloctoro,f PHlosophy
The University of Adelaide
Departrnent of Horticulture, Viticulture and Oenology
Facuþ ofSciences
Waite Campus
November 2002


Table of Contents
TABLE OF CONTENTS
Ansrnlcr
Drcr,¡,mrroN........
IV
III
IX
XI
Lrsr on Frcrnns...........
LrsrorTABr,ns
Ac¡crowr.nDcMENTS...........
ArnnnvnrroNs...... XItr
CHAPTER 1........ 1
1. Gn¡wn¡,r,I¡rrRoDUCTIoN
CHAPTER 2.
1
...................4
2. LrrrnrrunnRnvrew....
2.1 Banana classification
2.2 Climactericfruit.
2.3 The ripeningprocess of bananas.....
2.4 Temperature in relation to ripening
2.4.1 Low temperatures
2.4.1.1 Chlorophyll fluorescence
2.4.1.2 Polyphenoloúdase activity in chilled fruit
4
5
4
5
10
t4
l6
.. 11
I

Table of Contents
2.4.1.3 Peroxidase activrty.........
2.4.2 High temperature...........
2.5 Ethylene in relation to ripening-...'-.
2.6 Humidity in relationto ripening......
2.7 Post ripening storage
3.I
3.2
3.3
3.4
19
19
2.7 .1 Controlled atrnosphere and modified atmosphere storage ........23
2.7 .l.l Nifogen atnosphere storage.'....... """""""24
2.7 .1.2 Ethanol aÍnosphere storage
2.7.2 Ethylene antagonist 26
2.8 Summary... 30
2.9 Research aims..... 31
22
25
Plant material.....
P re parat ion of fruit pri or t o expe rim ent at i on ... -.
Monitoring ethylene levels .........
Monitoring carbon dioxide ønd oxygen in storage atmospheres
3.5 External quality assessment....
3.5.1 Green life
)z
32
JJ
a1JJ
34
343.5.2 Shelf life

Table of Contents
3.5.3 Discolouration index
3.5.4 Weight loss ............
3.6 Intemal quality assessments
3 .6 .1 Pulp firmness . .. . . . .. . .. .. . ..
3.6.2 Soluble solid content
3.6.3 Aroma analysis
3 .6.3 .l Chemical nose statistical analysis ... ... ...... ..
CITAPTER 4.........
4. Pnn-NTPUXNGDETECTION OF CIilI ,NGINJURY
4.1 Introduction.
4.2 Materialsandmethods........
4.2.1 Chlorophyllfluorescence
4.2.2 Pollphenoloúdase activity
4,3 Results.......
4.3.1 Chlorophyllfluorescence
4.3.2 Polyphenoloxidase...........
4.4 Discussion.
4.5 Conclusion
..36
38
38
38
41
4t
42
44
44
44
46
48
50
50
53
54
57

Table of Contents
5. OPTNTNSTXGRIPENIINGTEIæNN¡.TURESA¡{DETI{YIJNE
CoNCnNTUTTONS THROUGHOUT TTru YEAR. .......58
5.1 Introduction 58
5.2 Materials and methods...
s.2.1
s.2.2
s.2.3
s.2.4
s.2.5
Plant material and procedure
Effect of ripening temperature and harvest months...".
Effect of ethylene concentrations and harvest months.
Quality assessments
Statistical assessment
59
59
60
60
61
61
62
62
64
75
83
88
5.3 Results
5.3.1 Climatic data for Tully, North Queensland
5 .3 .2 Effect of ripening temperature and harvest months.......'.'......
5.3.3 Effect of ethylene concenfiations and harvest months
5.4 Discussion.
5.5 Conclusion
6. Posr-nrpnxncc: NrrnocrN ArMosPrrERE ExPosuRE ...................... 89
6.1 Introduction ...""'89

Table of Contents
6.2 Materials andmethods """"'90
6.2.I Plantmaterial andpreparation """""""90
6.2.2 Nitrogen application for various periods of time at different
ripening stages
6.2.3 Nitrogen atrnosphere storage in the presence of low or high
relative humidiq, 9
6.2.4 Assessments...
6.3 Results 93
6.3.1 Nihogen application for various periods of time at difÊerent
npemng stages
6.3.2 Nitrogen atnosphere exposure in the presence of low or higþ
93
relative humidtty 99
6.4 Discussion........ ...102
6.5 Conclusion 106
7. Posr-nrpnNnlc: ETHANoLAruosprmREExPosuRE ..'108
9 1
1
7.1 Introduction
7.2 Materials and methods
7 .2.1 Plant material and preparation.'..'
7.2.2 Determination of ethanol volume
108
109
110

Table of Contents
7 .2.3 Effect of ethanol vapour and holding times after repressurising
on the quahfy andripening of bananas
7.2.4 Application of ethanol atmosphere
7.2.5 Volatileanalysis
7 .2.6 Banana and statistical assessments.....
7.3 Results.......
8.1 Introduclion...
8.2 Materials and methods
8.2.1
8.2.2
8.2.3
8.2.4
Plant material and preparation
I -Methylcyclopropene exposure after ethylene initiation
l-MCP detection....
Banana assessment
8.2.5 Statistical analysis ........
8.3 Results
8.4 Discussion
110
112
113
..tr4
115
7.4 Discussion 119
7.5 Conclusion .. t21
8. Posr-nrpnxnc: l-Mnrrrvr-cYCLoPRoPENE ExPosuRE .........----.... 122
122
123
723
124
124
t2s
125
126
t3s
1378.5 Conclusion

Table of Contents
9. Gnxnnlr.DrscussroN..
9.1 Background into industry requiremenls.....'....".... ...138
9.2 Pre-ripening detection of chilling tniury.... .. '....-... 139
9.3 Optimisingripeningtemperatures and ethylene concentrations
throughout the year..... ..........'.-........ 140
9.4 Post-climacteric extension of shelf \fe.............. --....' 142
138
9.4.1
9.4.2
9.4.3
Nitrogen atrnospheres........................
Ethanol afnospheres ...... .. ... ........ .. .. ..
1 -Methylcyclopropene atrnospheres.
Commercial b enefits from this research...
Future research
...142
143
144
9.5
9.6
(a) PUBLICÄTISNS FR6M TIIIS TIIESIS (nnrnrNrs L6CATED AT BACK).150
,Iournal articles....... .-...150
Conference abst racts..... ...1s/1
Miscellaneous
lsz

Abstract
Abstract
Banana quality and shelf life are variable and often inzufficient for marketing.
This study examined the effect of ripening temperatures and ethylene
concenüations t}roughout the year on quality and shelf life. To frlrther extend
banana shelf life, when fruit are eating ripe, post-climacteric exposure to
nitrogen, ethanol or I -methylcyclopropene atrnospheres was studied.
Additionally, detection of chilling exposure in unripe fruit was examined before
visual symptoms developed in order to guide ripening and marketing decisions.
Techniques examined include chlorophyll fluorescence and measuring the
polyphenoloxidase @PO) activity in bananas.
All Cavendi sh cv. II/illiams bananas utilised in the study were grown on a
single property in Tully, North Queensland, harvested at7 5%o maturity when
they were hard and green and transported above 13"C to Adelaide. Pre-
climacteric bananas were exposed to temperatures of 5oC for 4 or 5 days or
stored at room temperature (22"C),but neither chlorophyll fluorescence nor
PPO activity varied in response to chilling injury.
Ripening bananas at 14, 16, I 8 or 20"C with 300 pL Lt of ethylene gas until
they reached colour stage 4 (more yellow than green) had an impact on fruit
quality and shelf life at22"C that varied with the harvesting months of January,
March, May, July, September or November. Shelf life of bananas ripened at 14
and l6"C were extended by up to 50Yo and32%o,respectiveþ, but peel
discolouration also increased, especially on bananas that grew and developed
duringwinter or experienced cyclones. Those ripened at 18 or 20'C throughout
the year averaged a6 day shelf life with consistently lowpeel discolouration.
1

Abstract
Other fruit quality parameters (lirmness, sugar content and aroma) were
generally unaffected.
All ethylene concentrations studied resulted in quality fruit. Ripening fruit at
16"C using 50, 300 or 1000 pL L1 of ethylene did not affect fruit quality or
shelf life, but the use of 50 pLLl of ethylene would minimise commercial
ethylene costs.
Post-climacteric bananas \ùere exposed to a nihogen atmosphere for 6, 12 or 24
hours at ripening stage 3 or 4. Nihogen atmospheres did not extend banana
shelf life, but did cause brown patches on the peel, which increased with
exposure time. The aroma of bananas was also affected, with over-ripe
('alcoholic') profiles detected in fully yellow fruit exposed to nitrogen
atmospheres, compared to the ripe ('fruity') profiles detected in control fruit.
Vacuum infiltration of ethanol afinospheres after ethylene-initiation at 18"C did
not extend banæra shelf life and did not affect the quality of ripening bananas.
However, vacuum infiltation was unsuccessful in forcing ethanol into the pulp,
with increases in ethanol only found in the peel of fruit.
Doubling of banana shelf life occurred with exposure to an atmosphere of 300
nL Ll l-methylcyclopropene (I-MCP) after ethylene-induced ripening at20"C
without negativeþ affecting banana quality, compared to control fruit. Fruit
treated with 30,000 nL Ul I-MCP were unacceptable for human consurnption
as they developed crown rot before full ripening and a lower level of 3 nL Lt l-
MCP had no effect on shelf life.
1r

Decla'ration
Declaration
I, ANNUNZIATA (NANCÐ TERESA BAGNATO, certfi that this thesis
does not incorporate without acknowledgement anymaterial submitted for the
award of any degree or diploma in any university or other tertiary institution,
and that to the best of my knowledge, contains no material previously published
or written by any other person, except where due reference is made in the text.
I give consent to this copy of my thesis, when deposited in the University
Library, being available for loan and photocopying.
2oF Nlov 2"Q
Annurziata Q{anÐ Teresa Bagnato Date
lll

List ofFieures
List of Figures
Number Pøge
Figure 2.lzBananaresponses to temperatures below l2'Cthatlead to the
appearance of chilling injury on fruit (after Wills et a1., 1998)... '. '...... ' . '13
Figure 2.2zThereaction mechanism for oxidation of dopamine bybanana
polyphenoloxidase (Palmeq 1963). . ...18
Figure 2.3: Simplified ethylene biosynthetic pathway in ripening fruit (after
Wang, 1989). -....21
Figure 2.4: Tlte structure of l-methylcyclopropene... . . . . - - -. ....28
Figure 2.5: Model of ethylene and I-MCP probable action on the ethylene
receptor. Elecfion donormetal (M) with ligands of tmknown sfucture (L)
binds to ethylene (E) or I-MCP. Ethylene completes its electron transfer
and is released leavingthe resulting complex active while I-MCP binds so
tightly to the complex it remains attached resulting in an inactive complex
(Sisler and Serek, 1997). . ' .. - ...28
Figure 3.1: The 8 ripening colour stages (CSIRO, 1972). . ... .. . .35
Figure 3.2: The twist tester. . -. -.. . '..40
Figure 4.1: Peel appearafìce of Cavendish bananas cv. Williams after a holding
periodof 5 daysat(Ð5'Cand @)22"C. ............51
Figure 5.1: The daily minimum air temperatures ("C) from South Johnstone
Research Station @ureau of Meteorolory, 2000-01) for the month prior to
harvest. Minimum daily temperatgres were not recorded on days missing
appropriate symbols. .. ... '.. .. '.63
Figure 5.2: Green life (ripening stage l4) of Cavendish bananas cv. Williams
harvested bimonthly and ripened at 14,16,18 or 20'C with 300 pL Lt
lV

List ofFþures
ethylene. Each column represents the mean of 3 replicates consisting of 6
bananas each; the bar denotes least significant differences between
temperatures within months (P<0.05). Climatic events are shown above.65
Figure 5.3: Shelf life (ripening *age 4-7) of Cavendish bananas cv. [ililliams
harvested bimonthly and ripened at74,16,18 or 20"C with 300 pL Ll
ethylene. Each column represents the mean of 3 replicates consisting of 6
bananas each; the bar denotes least significant differences between
temperatures within months (P<0.05). Climatic events are shown above.67
Figure 5.4: Dscolouration index of Cavendish bananas cv. Williams harvested
bimonthly and ripened at 74, 16, 1 8 or 20"C with 300 pL L 1 ethylene
where, (0) represents healtþ or yellow peel, (1) slight yellow grey peel, (2)
red/brown vascular sfieaking along banana neck or (3) red/brown vascular
streaking along length of peel. Each column represents the mean of 3
replicates consisting of 6 bananas each; the bar denotes least significant
differences between temperatures within months (P<0.05). Climatic events
are shown above. ... ......69
Figure 5.5: Pulp firmness of Cavendish banana pulp cv. Williams at ripening
stage 6, harvested bimonthly and ripened at14,16,18 or 20"C with 300 FL
Ll ethylene. Each column represents the mean of 3 replicates consisting of
6 bananas each; the bar denotes least significant differences between
temperatures within harvest months e<0.05). -. -....70
Figure 5.6: Soluble solid concentration of Cavendish banana pulp cv. Williams
at ripening stage 6, harvested bimonthly and ripened aI 14, 76, I 8 or 20'C
\Mith 300 pL Lr ethylene. Each column represents the mean of 3 replicates
consisting of 6 bananas each; the bar denotes least significant differences
between temperatures within harvest months (P<0.05). - ....11

List ofFþures
Figure 5.7: Principal component analysis chemical nose score plot tlf
Cavendish bananas cv. Williams ripened atI4,16,18 or 20'C in January
(J), March (M), May(MY), July (JU), September (S) orNovember (N)'
Each data point represents means of banana samples for a single replicate.
Ripeningtreatmentsconsistedof 3 replicates..... -...'..-- -..73
Figure 5.8: Principal component analysis chemical nose loading plot of ions
(variables) derived from Cavendish bananas cv. [4/illioms ripened at 14,16,
18 or 20'C in January, March, May, July, September or November. -. -....74
Figure 5.9: Green life (ripening stage 14) of Cavendish bananas cv. Williams at
ripening stage 6, harvested bimonthly and ripened at 16oC with 50, 300, or
1000 pL Lr ethylene. Each column represents the mean of 3 replicates
consisting of 6 bananas each; the bar denotes similarities between ethylene
concentrations within months (P<0.05). Climatic events are shown
above. -. -..76
Figure 5. l0: Shelf life (ripening stage 4-7) of Cavendish bananas cv. Wil liams
at ripening stage 6, harvested bimonthly and ripened at 16'C with 50, 300,
or 1000 VLLI ethylene. Each column represents the mean of 3 replicates
consisting of 6 bananas each; the bar denotes similarities between ethylene
concentrations within months (P<0 05). Climatic events are shown above.
' ""'77
Figure 5.11: Dscolouration index of Cavendish bananas cv. Williams harvested
bimonthly and ripened at l6"C with 50, 300 or 1000 pL L I ethylene
where, (0) represents healthy or yellow peel, (l) slight yellow grey peel, (2)
red/blown vascular streaking along banana neck or (3) rcd/brown vascular
sfeaking along length of peel. Each column represents the mean of 3
replicates consisting of 6 bananas each, the bm denotes similarities
vl

Lnt ofFþures
between ethylene concenfations within months (P<0.05). Climatic events
are shown above. .. - - - -...78
Figure 5.12: Pulp firmness of Cavendish banana pulp cv. Williams at ripening
stage 6, harvested bimonthly and ripened at 16"C with 50, 300, or 1000 pL
L1 ethylene. Each column represents the mean of 3 replicates consisting of
6 bananas each; the bar denotes least significant differences between
ethylene concentrations within months (P<0.05). . ... - - - - -...79
Figure 5.13: Soluble solid concentrations of Cavendish banana pulp cv.
Williams at ripening stage 6,harvested bimonthly and ripened at 16"C with
50, 300, or 1000 ,rLLr ethylene. Each column represents the mean of 3
replicates consisting of 6 bananas each; the bar denotes least significant
differences between ethylene concentrations within months (P<0.05) . . . ..80
Figure 5.14: Principal component analysis chemical nose score plot of
Cavendish bananas cv. Williams ripened at 16"C with 50 (5), 300 (3) or
1000 (l) pL Lr ethylene gas in January (J), March (M), May (NIY), July
(JU), September (S) or November (IÐ. Each data point represents means
of banana samples for a single replicate. Ripening treaÍnents consisted of
3 replicates ... ......82
Figure 6.1 : Brown discolouration observed on nitrogen üeated Cavendish
bananas cv. Williams increased with exposure periods; (A) att ripened, @)
6, (C) 12 and (D) 24 hrs of nitrogen exposure . . . . . . .. .95
Figure 6.2zThe score plot of ripe Cavendish bananas cv. Willioms exposed to
nifiogen aünospheres for 0 hrs (air) at stage 3 or 4 (4, g, - ) at stage 3 for
6, l2,24hrs (C, D, E,- -) ot at stage 4 lor 6,72 or 24hrs (F, G, If ')
.. ... .....97

List ofFþures
Figure 6.3: The loadings plot of ions (variables) derived from ripe, nitogen
exposed Cavendish bananas cv.Williams at ripening stage 3 or 4 for 0, 6,
12 or 24 hrs. .. . ... ... ......98
Figure 6.4: Ascore plot of ripe Cavendish banæras cv. Williams exposed to
(A -)
nitogen for 0 hrs (air), (8, -)
nifiogen for 24 hrs in a low
humidity or (C, -)
nifrogen for 24 hrs in a high humidity. . . ...100
Figure 6.5: The loadings plot of ions (variables) for ripe Cavendish bananas cv.
Williams exposedto nitrogen for 0 hrs (aÐ,24 hrs in a lowhumidity or for
24Iusin a high humidity. ....101
Figure T.lzDiagran of air evacuation set up, consisting of (A) 10-L glass
desiccator, @) vacuum pump, (C ) measuring cylinder and (D) Funnel
(covering a single banana). ....111
Figure 7.2: Vacuun (A) infilfiation of ethanol atnosphere generated from I
mL absolute ethanol (B) in a 10-L glass desiccator (C ) into 6 ripening
initiated bananas (D), in the presence of 160 g Ca(OÐ2 @) . , .. . ..113
Figure 8.1: Cavendish banana (cv. Williøms) appearance on day I of the l-
MCP experiment. Bananas were initiated \4rith 300 þL L-l ethylene gas for
48 hrs at2}'Candthen exposedto l-MCP for (A) 0 (air), @) 3 oLUt, (C )
300 nL Lt or @) 30,000 nL L-r . . . ....131
Figure 8.2: The chemical nose score plot of volatiles produced by Cavendish
bananas cv. Williams held for 24,48 or 72hrs in 3 rú- L-t I-MCP (4,- ),
300 nL L 1 l-tr¡Cp (8, - ) or in air (C,- ) after ripening
initiation. . ... .....133
Figure 8.3: The loadings plot of ions (variables) for ripe Cavendish bananas cv.
Williams exposed to 3 nL L 1 I-MCP, 300 nL L 1 I'MCP or held in air after
ripeninginitiation for24,48or72hrsin. ...-134
vlll

List of Tables
List of Tables
Number Page
Table 2.1:The standard colour guide of Cavendish banana ripening stages
(csrRo, 1972). . ... ... ...8
Table 3.1: Discolouration score chart. . -...'.37
Table 4.1: Ctrlorophyll fluorescence measurements on Cavendish bananas cv.
Williams recorded daily during chilling exposure treatment at 5oC for 5 days
and ripeningat2}"C at ripening stage I .. ...51
Table 4.2zThe daily change in chlorophyll fluorescence parameters measured
on Cavendish bananas cv. William.s that were stored at 5oC for 5 days followed
by storage at22'C until ripening stage 4, or stored at room temperature only
(22'C) until ripening stage 4 (more yellow than green) .. . -. .. ' .. -.52
Table 4.3: The polyphenoloxidase activity in the vascular tissue from the peel
of Cavendish bananas cv. Williams stored at ripening stagel at 5'C for 4 days,
compared to bananas stored at22"C for 1 day at ripening stagel . ... '...53
Table 6.1: Assessments of Cavendish bananas cv. Williams at ripening stage 6,
after expostue to a nitrogen atmosphere for 0, 6, 72 or 24 hrs at ripening stage 3
or 4 at22"C. .........--94
Table 6.2: Assessments of Cavendish bananas cv. Williams at ripening stage 6,
after being ripened at ripening stage 4 in air or nifiogen atmospheres for 24 hrs
with a beaker of water or without a beaker of water at22"C. . ...99
Table 7.1: Ripe characteristics of Cavendish bananas cv. Williams after
ripening with ethylene (300 pL L1) at l8oC, treated by vacuum infilfiation over
air or ethanol and held in the resulting atmosphere for 10 min. or 3 hrs. After
lX

List of Tables
the holding period the bananas were held at l8"C until they reached stage 4 and
then were ripened at22"C turtil assessed. . . . . .. . -. .116
Table 7 .2: Peel and pulp tissue ethanol concentrations of Cavendish bananas cv.
williams after ripening with ethylene (300 pL L 1¡ at 18"C, fteated by vacuum
infiltration over air or ethanol and held in the resulting atmosphere for 10 min.
or 3 hrs. After the holding period, bananas were held at l8"C until they reached
stage 4 ærdripened at22"Cwrtil assessed..... .."'118
Table 8.1: SheHlife of Cavendish bananas cv. Williams following ripening at
20"C with 300 pL L1 ethylene gas for 48 hrs then subsequently exposed to 0, 3
or300nLL1 1-MCP for24,48or72hrsat20'C -..'.....127
Table 8.2: Green life of Cavendish bananas cv. Williams following ripening at
20"C with 300 pL Ll ethylene gas for 48 hrs then subsequently exposed to 0, 3
or300nLLr 1-MCP for24,48or72hrsat20'C ........'128
Table 8.3: Pulp fimtness of Cavendish bananas cv. Williams at ripening stage 6
following rþening at 20'C with 300 pL Ll ethylene gas for 48 hrs then
subsequently exposed to 0, 3 or 300 nL Lr I-MCP for 24,48 or 72fus at
20"c. ...128
Table 8.4: Soluble solid concenfiation of Cavendish bananas cv. Williams at
ripening stage 6 following ripening at2)"Cwith 300 tLLLt ethylene gas for 48
hrs then subsequently exposed to 0, 3 or 300 nL L1 1-MCP for 24,48 or 72 hrs
at2o"c' " """129
Table 8.5: Weight loss (7o) of Cavendish bananas cv. Williams from rlpening
stage 1 to 6 following ripening at2lc\À/ith 300 pLL' ethylene gas for 48 hrs
then subsequently exposed to 0, 3 or 300 nL L-t I-MCP for 24, 48 or 72hts at
20"c. ...129
X

Acknowledgments
Acknowledgments
This research was made possible thanks to an ARC SPIRT grant rn associatron
with Chiquita Brands South Pacific (Australia). The project would not have
been possible without the help and support of the following people:
I would like to thank my supervisors Dr Andreas Klieber, Mr Robert (Bob)
Barrett and Professor Margaret Sedgley for the opportunity to work on this
fantastic project and for their continual guidance and encouragement.
I'd also like to sincerelythank Chiquita Brands South Pacific (Australia)
especially, Mr John Evans, Mr Ted Johnson, Mr Ben Franklin, Mr Bill Chartres,
Mr Joe Trimboli, Mr Ian Trimboli, Mr Adam Gallarello and all the staff at the
Pooraka market Chiquita warehouse (Adelaide), for their enthusiasm, advice
and dedication to the improvement of banana quality. Thanks also to all staffat
the Tully, north Queensland plantation (especially Neville) for their assistance
in providing fruit throughout this research.
Thanks to Dr Graham Jones and Dr Michelle Wirthensohn for their technical
advice and help with the chemical nose. A special thanks also to Mr Adrian
Dahlenburg, Mr Michael Rettke, Mrs Maria Nechvoglod and all other members
of the SARDIpostharvest goup for their continual support, technical advice
and loan of the twist-tester. Furthermore, thanks are also expressed to Dr Edna
Pesis, Dr Amanda Able, Mr Andrew Macnish and Michelle Lorimer for their
advice on thcir specific fields of expertise.
I would also like to express my gratitude towards all the staffand students in
the Horticulture, Oenology and Viticulture Deparhnent of Adelaide University,
xl

Acknowledgments
especially, Kerry Porter, Margaret Muchui, Dr Toby Knight, Ermimnawati
Wuryatuno, Dr Mayuree Krajayklang, Darren Alexandra, Zwanyadza Soroti,
Viswanath Pinapati, Brad llarvey (the past and present members of the
postharvest laboratory).
A special thanks to my wonderfül friends, Joanne 'Hippy Chick', Rosa,
Belinda, Franca, Steve, Helen, Toby, Learure, Joyce, Tony, Ho|ly, Mary, Lisa,
Kerry,, Veronica, Lizandall the grls atthe VirgrniaRamsNetball clubwho
saved me many a time from goin' bananas. I'd also like to thank Guido for
taking a chance and for gr"i"g me the inspiration to finish this thesis.
Finally I'd like to thank my loving family especially; Nonna Francesca, Mum,
Dad, my sisters; Franca artd Joatrna and brother in-laws, Paul and Greg (ory)
and nephews and niece, Dean, Thomas and Alexandra.
Thanks for putting up with me through the good, bad and indifferent times!
This thesis is dedicated to Christina 'Chrissi' Musolino, thânk you for watching
over me.
xü

Abbreviations
a
AA
1.MCP
ACC
AdTI
ANOVA
Area
b
CA
Ca(otr)2
COz
CSIRO
cv.
Abbreviations
l- methylcyclopropene
radius of twist tester blade
acetaldehyde
I -aminocyclopropene-l -carboxylic acid
alcohol dehydrogenase
anaþis of variance
the total size of the elecfion acceptors on the
reducirtg side of photosystem II
width of twist tester blade
controlled atmosphere
calcium hyd'roúde
carbon dioxide
Commonwealth Scientifi c and Industrial
Research Organisation
cultivar
degrees Celsius
day
Denver
oc
d
DE
xltl

Abbreviations
Dept.
DOPA
et oL
EtOH
FID.GC
FIM
Fn
Fo
F¡
Fv
FvÆm
Department
dihydroxyphenylalanine
et alia
ethanol
flame ionisation detector- gas chromatography
fl uorescence induction monitor
the maximum fluorescence level
the level at which fluorescence begins to rise
the fluorescence rate
the variable fluorescence level
the level of effrciency with which the energised
electrons can be transferred through the electron
transport chain
gfam
gram of fresh weight
hour/ hours
Hewlett Packa¡d
internal diameter
Incorporated
kilograms
g. f. wt
hr/ hrs
(tb
HP
Inc.
kg
id
xlv

Abbreviatiors
K*
tûn
kPa
L
KNO3
MA
min.
InL
mm
mM
MV
mlz
N,
nL
nmoles
binding constant
kilomefes
potassium nitate
kilo Pascals
litres
least signifi cant differences
limited
metre
molar or maximum moment produced by amr of
twist tester
modified atmosphere
minute
millilitre
millimetre
millimolar
millivolts
mass to charge ratio
nitrogen
nanolitres
nanomoles
LSD
Ltd.
h
M
xv

Abbreviatiors
NSW
NZ
Oz
OD
Pa
PCA
trrefs. comm.
pH
New SouthWales
New Zealand
oxygen
outer diameter
Pascals
principal component analysis
personal commrurication
A qmbol denoting the concentration of hydrogen
ions in a solution
pollphenoloxidase
photosystem II
non-significance level ofover 5%o
significance level of 5%o
electron acceptor site
Queensland
registered fademark
randomised complete block design
relative humidity
Royal Horticultural Society
reverse osmosis
PPO
PSII
P{.0s
P<0.05
QLD
RCBD
RHS
Q¿.
@
RH
RO
xvl

Abbreviatiors
SDS
SSC
Tf max
USA
WA
wlv
pmol
vlv
sodium dodecyl sulphate
soluble solid concentration
the time frame at which the maximum
fluorescence occurred
United States of America
volume to volume
Washington
weight to volume
microlitres
micromoles
percent
crushing sfrength
maximum arm angle before tissue failure
pL
otfo
6
e
xvll


Clreptec I
1. Getteral Introduction
Bananas are transported to most markets green in their pre-climacteric state and
are then ripened according to market demand. The ripening process of
transforming the physiologrcally mature, but inedible green fruit into a visually
appealing sweet tasting product (Wills et a1.,1998) is a very important stage in
the overall marketability of bananas.
The marketability of bananas is detennined by a number of consumer
preferences. Visual appearance of food is a major influence in consumer
acceptance (Francis, 1977) and bananas are no exception, with peel
discolouration, caused by enzymatic browning, being the main consumer
concern affectingbanana acceptability and causing a significant impact on fruit
marketability (Omuaru and Izonfuo, 1990). Another consumer concern is the
speed of banana deterioration. The short shelf life of bananas can be as low as
onlythree days (8. Chartres, ChiquitaBrands SouthPacific, pers. comm',
1999). Research into the buying habits of people has concluded consumers
would purchase more bananas if they had longer shelf lives (Ausfralian Banana
Grower's Council, 1999). These main concems in the banana industry
emphasize the need for research into the pre-climacteric, climacteric and post-
climacteric stages of postharvest life, to improve the shelf life and quality of
ripening bananas.
1

Chapter 1 : General Introduction
Banana appearance is negatively affected bypre-climacteric chilling in the field
or during transpott, and early detection of chilling ittj.t y synptoms that become
visible after the onset of ripening would allow marketers to re-grade and re-
direct affected fruit to appropriate altemative markets.
Uniform ripening can be accomplished by controlling temperature, ethylene
and humidity (Scott and GandanegaÍa,197 ;Peacock, 1980; Kim and Lee,
1988; Wills , L990; Seberry and llarris, 1993). However, banana quality does
varythroughout the year @. Chartres, ChiquitaBrands South Pacific, pers.
comm., lggg),bUt little research has focussed on optimising commercial
ripening protocols párticularly in relation to banana ripening temperatures,
ethylene concentratidns and different harvesting times of the year.
Most postharvest research has been performed to extend green life of pre-
climacteric bananas to transport them to distant mafkets. For example,
postharvest treatments such as controlled or modified atmosphere storage
(Yahia, 1998), nitrogen ahrosphere storage (Wills et a|.,1990) andthe ethylene
antagonist l-methylcyclopropene (l-MCP) (Golding et a1.,I998;Macrrjsh et al.,
1998) have all been reported to slow down the onset of the ripening process in
bananas. Few studies have focussed on extending the shelf life of eating ripe
fruit and often have not investigated the effect on banana quality thoroughly.
To ensure improvedmarketing of bananas with better consumer characteristics
in this highly competitive industry, frirther research is required into the
posthawest management of bananas. The main aim of this research was to
extend the posthawest life of bananas without compromising banana
appearance or eating quahty. Screening techniques of chlorophyll fluorescence
and polyphenoloxidase activity measures were examined for early detection of
2

Chapter I : General Introduction
chilling injury. Ripening and postharvest procedures for Cavendish bananas cv
l4lilliams were also studied throughout the year by applying different
concentrations of ethylene and various ripening temperatres to optimise
industryripening procedures. Furthermore, the use of nitrogen atmospheres,
ethanol atrnospheres and l-methylcyclopropene (l-MCP) during the post-
climacteric stage were examined to extend banana shelf life while maintaining
visual and eating quality.
J


Chnprer 2
2. Literrture Review
2.I Banana classiflcation
Bananas along with grapes, oranges and apples are fruit that are easily
recognised in countries around the world. The banana belongs tothe Musaceae
family and is gIo\MIt in many tropical and subtropical regions world wide (Johns
and Stevenson , 1979 Salunldre and Desai, 1984). A popular edible banana that
has been derived from wild ancestors is the Cavendish cultivæ (Johns and
Stevenson, lgTg).Bananas are classified as a berry fruit. The commercially
grov,nMusa cavendishii is a six sided, seedless, angular berry that ripens from a
green to a bold yellow colour.
Cavendish is the main cultivar used for world trade (Seymour, 1993, Wills e/
al.,\998) and'Williams' is the principal clone grown in Australia, contributing
to 95%o of all bananas harvested @aniells, 1986). Harvesting usually takes
place when the fruit is 7 5%o mahre and has ¿ hard and green appearance.
During the postharvest period, the fruit becofnes soft, edible, yellow and
aromatic.
4

Chapter 2: Literature Revrew
2.2 Climacteric fruit
Fruit that are able to produce ethylene autocatalytically after harvest are
classified as climacteric fruit (Tucker, 1993). Climacteric fruit, such as
bananas, have a sizeable increase in their respiration rate from 20 mgCO2 kgl
hr-l prior to ripening initiation to a climacteric peak of 125 mg CO2 kg1 hr-l. As
ripening progresses the respiration rate reduces again to about 100 mg CO2 k91
hr-l lPalmer ,l97l; Salunkhe and Desai, 1934). However, the respiration rate in
bananas increases only after endogenous ethylene production increases from
0.05 to 3 ¡rL ethylene kgr hr-l (Se¡nnour, 1993). This increase in ethylene
production after harvest coincides with physiological mahrration and the onset
of ripening. hritiation of the ripening phase in bananas begins commercially
with the exogenous application of ethylene to fruit attheT5o/omature, green
stage (Taiz and Zeiger, I 998).
Climacteric and non climacteric fruit will both respond to exogenous ethylene
with an increased respiration rate, but non climacteric fruit will respond only
proportionally to the level of exogenous ethylene applied and respiration rate
will decrease as soon as they are removed from the ethylene enhanced
atmosphere (Wills et al., 1998). Therefore, only climacteric fruit produce
ethylene autocatalytically, and this is triggered commercially by the exogenous
application of ethylene to bananas, ensuring that all fruit ripen uniformly when
required.
2.3 The ripening process of bananas
The process of ripeningbananas involves physiological, biochemical and
physical changes to fruit (Wills, 1990). Ethylene is a plant hormone that
initiates the ripening process of bananas (Sjaifullah and Dasuki , 1992 Taiz and
5

Chapter 2: Literature Revrew
Zeiger,1998). While mature fruit are attached to the plant, the sensitivity to
exogenous ethylene is inhibited by other plant growth regulators such as auxins,
although their exact regulatory role is unclear. However, ftuit that me removed
from the plant become ethylene sensitive soon after harvest (Stover and
Simmonds, 1987; Septour, 1993).
Ethylene sensitivity may be a problem when fruit æe in transit, especially
travelling interstate or internationally. To delay the effect of any ethylene
contamination that mây oçcur, batranas are transported at l3"C (8. Chaltres and
T. Johnson, Chiquita Bmtrds South Pacific, pers. comm .,1999-2000). The low
temperature (13'C) reduçes fruit metabolism and prevents ripeqing from
occurring in bananas (Wills et al., 1998). Upon arrival at the intended market,
the application of high (>300 ¡rL Lt) levels of ethylene at temperatures between
l4-20'Cto induce ripening are common among commercial distributors (8.
Chartres and T. Johnson, Chiquita Brands South Pacific, pers. comm -,1999-
2000).
The biochemical breakdown of starch and changes to pulp cell wall structure
bypectin degrading enzynes decreases the cellular rigdity of banana tissue and
therefore physically softens the pulp (Seymour, 1993; Thompson, 1996). Other
non pectic polysaccharide degrading enrymes like cellulase have also been
identified in ripening bananas, which may also contribute to the softening of the
pulp (Palmer,l97l; Seymour, 1993). These processes may occur independentþ
of each other, but to ripen a fruit uniformly and correctly the initiation of each
process must occur (Thompson, 1996).
The most identifiable difference that consumers associate with unripe and ripe
fruit is the peel colour change that occurs during the ripening of bananas. The
6

Cløpter 2: Literature Revrew
CSIRO banana ripening chart (1972) used by most commercial businesses,
shows bananas converting from green fruit into yellow fruit with brown areas, in
atotal of eightnpening stages (Table 2.1). Bananasbetweenripening stage 4
(more yellow than greÐ to s{age 7 (yellow with some brown flecks) are
preferred by 96% of consumers (Anonymous, Your guide to geater profits,
undated).
7

Chapter 2: Literature Revrcw
Tabte 2.Lz The standard colour guide of Cavendish banana ripening stages
(cslRo, 1972).
Stage
Peel colour Approximateo/o slarchcontent
Approximate %sugar conten!
Comments
I Green
SPRUNG Green
20
19.5
18
76
13
2.5
1.5
1.0
0.5
1.0
25
4.5
7.5
13.5
18
t9
t9
Hard, rigid;no ripening
Bends slightly,ripening started
Peels readily;firm ripe
Fully ripe;aromatic
Over-ripe; pulpvery soft anddarkening, highlyaromatic
2
J
4
75
6
7
Green, trace
of yellow
More green
than yellow
More yellowthan green
Yellow,green tþFull yellow
Yellow,lightlyflecked withbrown
Yellow withincreasingbrownflecks
8
8

Cl:øptr' 2: Literatwe Revrew
Coloured pigments that are found in bananas throughout their various stages of
development include chlorophylls (green), carotenoids, xanthophylls (yellow)
andmelanins (brown) (Stover and Simmonds, 1987; Thompson, 1996). A
change in peel colour during ripening occurs due to the degradation of
chlorophylls, even though there is a constant carotenoid level throughout the
banana ripening stages (Thompson ,1996).
The appearance of unsightlypigments or the failure of yellowpigments being
revealed at specific stages in banana development can occur, if adequate
ripening conditions are not provided (Thompson,7996). Problems associated
with inadequate ripening conditions include the delay of banana ripening, lack
of taste and flavour on ripening, peel colour changes such as the red-brown
discolouration of fruit that have been affected by low temperature sfesses, or
the failure of fruit peel to ripen due to high temperature stresses Qvlwata,1969;
Moris, 1982; Torasker and Modi, 1984; Thompson, 1996; Wills e/ a|.,1998).
Various changes to banana volatile components also occur during the ripening
process. Major volatile components of green bananas are hexanal and tans-2-
hexenal (I\4arriott, 1930). Alcohols and carbonyls give the gieen dnd woody
aroma of unripe bananas, whereas esters make up the main fraction (70%) of
ripe banana ¿ìroma (Tressl and Jennings,l972;Marriott, 1980; Stover and
Simmonds, 1987; Seyrnour, 1993). Although the exact composition of esters,
alcohols, ketones, aldehydes and phenol esters making up the aroma and flavour
of bananas is cunentþ unclear (Seymour, 1993), it is known that the 'banana
like' ærd 'fruity' aromas are associated with the amyl esters and butyl esters,
respectively (Tressl and Jennings,l972;Marriott, 1980). Volatile production
increases during ripening, but levels off and decreases during senescence
9

Chapter 2: Literature Reuew
(ripening stage7 and 8)
Aroma constituents are different at the various stages of ripening depending on
ripening temperatures (Marriott, 1980). Therefore, the analysis of volatile
constituents to examine the effect of various ripening conditions on the aroma
of ripe bananas will be useful in determining undesirable aroma differences
between bananas growTì at various times of the year and ripened using different
ripening procedures.
Temperature, ethylene and humidity levels are tlree factors regulated during
ripening of bananas and these are believedto have a determining effect on final
product quality and storage life (Peacock, 1980; Paull, 1993; Wills et a1.,1998);
therefore knowing the optimal levels of these factors will also be beneficial for
increasing product quality
2.4 Temperature in relation to ripening
Extreme temperatures (<13"C or >26"C) are a critical factor that influences the
quality of the final ripened product (Thompson,1996 Turner, 1997;Wills et
al.,1998). Temperature control of banana fruit while in the field is diffrcult and
therefore differences in field temperatures between winter and summer seasons
occur. This field temperafure difference leads to visual appearance differences
between bananas (Turner, 1997), although the severity of visual appearance in
relation to the commercial ripening procedures used after harvest has not been
explored.
Unlike in the field, temperatures of fruit after harvest can be controlled.
Regulating temperature is the principal way to confiol respiration rate, ripening
and senescence. As temperahres drop, so too do reqpiration rates in produce
l0

Chapter 2: Literature Revrew
which increases theirpostharvest life (Paull,1993). In addition lowering of
storage temperatures decreases fungal growth, tissue softening and water loss
(Patterson, 1980). Ripening temperature experiments performed on Cavendish
bananas found that temperatures between 13.9 and 32.2"C do not affect the
eating quahty of bananas (Peacock, 1980), but importantly shelf life decreased
exponentially with increasing temperatures. Skin colour was found to be dull
(yelloWgrey) in appearance and without total chlorophyll degradation at stage 6
at26.7'C or above. This research therefore suggests that only a nalrow
temperature range (14-24"C) would be suitable for the ripening of Cavendish
barianas.
2.4.1 Low tpmperatures
Even though most produce benefits ftom storage at low tempetatures, topical
and subtropical fruit react adversély to temperatures between 0 dnd 13"C
(Maniott, 1980; Israeli and I^ahav, 1986; Wills et a\.,1998) Bananas in
particular show the negative effects of low temperatrue at l2"C and below
(Wills et aI.,1998). This temperature stress causes the physiologrcal disorder
chilling injury, which is not only a postharvest problem, but can also occur in
plants throughout their development inclucling in the field, during üansport, as
well as in storage (Saltveit and Morris, 1990; Kays, 1991; Kays, 1999). Couey
(1932) reported that the sensitivity of ripe bananas to chilling ittjury is less than
that of unripe bananas. Therefore, lower temperatures could possibly be used to
store ripe bananas to extend banana shelf life without compromising banana
quality.
Temperatures of l2oC and below cause a rapid primary response tn unnpe
bananas. The primary response is a physical change in membrane lipids
11

Chapter 2: Literatwe Revrew
including ion movements and protoplasmic sfreaming and a dissociation of
en4lmes or proteins (Wills et al., 1998). This response is reversible if the
temperature returns above the critical temperature of l2"C before secondary
responses like membrane breakdown occur (Saltveit and Morris, 1990; Wills ef
at.,I998). If temperahres continue to remain below 72"C to the point where
secondary responses occur, then irreversible injury will become evident (Figure
2.1).
t2

Chapter 2: Literatwe Revrew
Time below Iz"C
Primarv Response
Reversible
+ Imrnediate response
= Physical membrane changes
* Protein and lipid changes
Secondarv Resnonses
= Cellular membrane integnty disrupted
* Reduction in protoplasnic sh'earning
* Recluction in respiratíon and protein syrthesis
+ Decreases ion movements tlu'ough membranes
x Disruption of enzymes and rnetabolic
processes
+ Iæads to appearance of visible syrnptoms
* Browning in vascular tissne
* DulVyellow/grey peel appearance
* Loss offlavour
Necrosrs death
lïgure 2.lzBananaresponses to temperatures below l2"C thatlead to the
appeararìce of chilling injury on fruit (after Wills et al.,1998).
Irreversible
t3

Chapter 2: Literature Revrew
At the irreversible stage, secondary responses in the form of visible chilling
injury synptoms occur. These s)..rnptoms include subepidennal bror¡¡n
streaking in the vasculm tissue of the fruit, loss of flavour, delayed ripening,
hardening of the cental placenta, a build up of tannins, skin discolouration,
slow starch to sugar conversion, decrease in ascorbic acid level, watery dark
green patches on the skin and brittleness of the banana fingers @antastico et al.,
1975; Morris, 1982; Paull, 1993).
Many of these symptoms negatively affect the visual appearance of the bananas
and as the appearance of the fruit is a major criterion for consumer buying,
chilling injury of bananas is of major concern. Chilling injury is very easy to
observe on bananas, as they are uzually a dull grey yellow colotn or in severe
circumstances, show large red-brown discoloured areâs. However, these
symptoms may not appear until the fruit is subjected to non chilling conditions
(Saltveit and Morris, I 990).
2.4. IJ Chlorophyll tluorescence
Changes in chlorophyll levels in banana peels usilrg fluorescence induction,
may offer a means of detecting damage caused by environmental stresses such
as low temperatures before visual s5imptoms appear @eEll et al. , 1999).
Chlorophyll fluorescence induction is an easy, quick and non destructive
measurement that can be perfonned to measure various chlorophyll
fluorescence pararneters including:
o Fo - the level at which fluorescence begins to rise
o Fm - the maximum fluorescence level
14

Chapter 2: Literature Review
o Fv - the variable fluorescence level
o FvlFm - the level of efficiency with which the energised electrons can be
transferred through the electron fansport chain
o Tf max - the time frame at which the maximum fluorescence occurred
o Area - the total size of the electron acceptors on the reducing side of
photosystem tr (PS tr)
@eEll et a1.,L999).
The reasoning behind using chlorophyll fluorescence as a measure of this
environmental stress on plants, is that functional properties of the chloroplast
thylakoid membranes change during chilling injury, which influences the
emission of chlorophyll fluorescence (Smillie, 1979; Smillie and Hetherington,
1990). Fluorescence induction occurs because chlorophyll fluorescence mirrors
the processes of photosynthesis in the chloroplast of the plants, including light
absorption by carotenoids and the photosynthetic energ¡'transfer in photosystem
tr (PS tr) that results in a release of fluorescence emission (Goodwin, 1980;
DeEll et al.,\999). The fluorescence measurement takes place in PS tr.
Fluorescence is induced by illumination of the plant material with red light.
The primary reaction site of the fluorescence is believed to be at the electron
acceptor site (QÐ of PS tr, where a rise in induced fluorescence directly relates
to the reduction of the QA in PS tr (Smillie, 1979, Smillie and Hetherington,
r ee0)
Fluorescence emission from chlorophyll a is susceptible to disruption due to
cellular injury caused by low temperature stress (Smillie and Hetherington,
15

Chapter 2: Literature Reuew
1990). Chilling injury causes inhibition to develop on the photo-oxidising side
ofPS tr and so reduces the induced chlorophyll fluorescence, whereas plant
tissue that had not previously been chilled would inhibit the photoryarthetic
electron transfer on the photo-reducing side of PS tr increasing the yreld of
fluorescence (DeEll et al.,1999). This means there would be an expected
difference in chlorophyll fluorescence emission between cell-disrupted, chilled
fruit and cell-intact, non-chilled fruit.
However, there has been very little research in the determination of the useful
chlorophyll fluorescence parameters for chilling injry analysis. The
chlorophyll fluorescent parameter presumed to be of most value when
measuring membrane altering damage like the darnage caused by chilling injury
is the FvlFm parameter, because it can be measured within one second (DeF,ll et
a1.,1999). A recent study @eEll et a1.,1999) reported that bananas stored
between 5'C and l5'C showed a decreasingFvÆo ratio, similar to that of
conftol bananas during ripening as chlorophyll degades. This finding suggests
that perhaps the Fv and Fo parameters may not be very useful in determining
chilled bananas from non chilled bananas, contrary to a report by Jacobi et al.
(1998) who found the Fo measurement was very important in determining
abnonnal skin ripening in mangoes. Therefore, further study of this method of
analysis is required to observe the effectiveness ofusing chlorophyll
fluorescence parameters as an early chilling rnjury detection method on mature,
green banana peel.
2. 4. 1. 2 Polyp heno loxidas e activily in c hilled frait
Another possible early measurement of chilling injury in Cavendish bananas
may be the analysis of polyphenoloxidase ePO) activity present in chilled
16

Cløpter 2: Literature Rwrew
Cavendish bananas, compared to the PPO activity in non chilled Cavendish
bananas. Polyphenoloxidase activity in the peel of bananas, is reported to be an
indication of browning, which is a symptom of chilling injury (Murata 1969).
Two types of reactions can result from the activity of the copper containtng
enz¡ime PPO:
l) Monophenolase - the hydroxylation of monophenols to odiphenols and
2) Diphenolase - the dehydroxylation of monophenols to o-quinones
Bananas undergo only the second reaction producing o-quinones. These o-
quinones then undergo a sequence ofpol¡rnerisation reactions that produce the
brown pigments characteristically found in chilled fruit (Zawistowsl<t et al.,
199 I ; Whitaker and læe, I 995). This reaction can be achieved by PPO as well
as other enz¡nnes like peroxidase (Kalyanar¿ünan et a1.,1984).
In healthy fruit cells, PPO is found in plastids, whereas phenolic compounds are
located in the vacuoles. However, upon cellular disruption the plastid and
vacuole contents are able to combine, resulting in an enrymatic reaction that
leads to brorvning. PPO activity in bananas was found with gamma irradiation
to conelate with peel and pulp browning, suggesting conforrnational changes
increased PPO activity (Amiot et a1.,I997). Therefore it is probable that
cellular disruption caused by low temperatures will increase PPO activity.
The oxidation of phenolic compounds such as dihydroxlphenylalanine (DOPA)
occurs due to PPOs in the presence of oxygen (Figure 2.2) (Jones et a1.,1978;
Eskin, 1990; Amiot et a1.,1997). As aresult of low temperatures breaking
down cellular structures, the en-ryme and substrate are able to interact to
t7

Chapter 2: Literature Revrew
produce unstable quinones. Low temperatures also encourage the conversion of
quinones to phenols by ascorbic acid, rather than following alternative pathways
(Abd El-Wahab and Nawwar ,1977). Those phenols are then able to undergo
en-rymatic reactions that lead to an accumulation of quinones and
polyrnerisation reactions forming the brown discolouration in chilled fruit.
OH
HO
FA,SÏ+*rçoCFh
N
D OPAMIHE
MELA}IIN(ûEHEEAL
ABSOR PTION)
Nl+ rr
23.0IHYDR OIND OLE-5Ë oulN[]HE (RED)
D OPAhrllNEOUINOHE
LOW
o
{-NH H
IND ÛLE-5ÉtrurNDHE (FU ÊPr-E)
5,Ê DIHYDR OXYHD OLE
Figure 2.2:The reaction mechanism for oxidation of dopamine by banana
pollphenoloxidase (Palmer, 1963).
18

Chapter 2: Literature Revrcw
2.4. 1.3 Peroxidase activity
Toraskar and Modi, (1984) found that chilled fruit showed a lower peroxidase
activity than non chilled fruit. Peroxidase is an enzyme that is associated with
ripening processes in fruit. Peroxidase activity does not directly relate to
chilling ioj,rry symptoms, but it is directly related to the ripening process
(Torasker and Modi, I 984; Dilley, L97 0).
In fact, fruit that have been chilled once ripening has been initiated may not
show any significant differences in peroxidase activity compared to non chilled
fruit, but may showphysical signs of chilling injury. This would explain why
Zatberman et al. (1988), found that even though peroxidase activity was
inítially lower in the peel of mango stored at low temperatures, it increased after
chilling injury synptoms began to occur on the ripened fruit even though fruit
remained in low temperatures. Therefore, peroxidase activity is unlikely to
provide a method of early chilling injury detection.
2.4.2 Hightemperature
Temperatures of 25oC and above cause a physiological disorder in Cavendish
bananas known as 'pulpa creme' or 'yellow pulp'. 'Pulpa creme' is the failure
of the banana peel to completely degreen, even when the pulp tissue is at the
soft and edible stage (Thompson, 1996) due to an inhibition in the breakdown of
chlorophyll in the peel. Consequently, ripeningtemperatures below 25oC are
required to ripen bananas for consumer appeal.
2.5 Ethylene in relation to ripening
Ethylene (CzII+) is recognised as an important plant growth regulator of plant
functions and biosynthetic pathways, particularly influencing the ripening
l9

Chapter 2: Literature Revrew
process in ftiit (sjaifullah and Dasuki ,1992;Taiz and zniger, 1998;wills et al.,
1998). Ethylene is recognised as having a number of roles to perform during the
ripeningprocess of climacteric fruit (Rhodes, 1980).
1. Controlling the initiation of ripening.
2. Increasing the internal production of itself as a ripening response.
3. Changes in colour, texture and flavour
4. The promotion of other ripening processes.
Pre-climacteric bananas have a constant endogenous ethylene production level
(0.05 pL ethylene kgt ht-t), although this level increases sharply (3 pL ethylene
kdt ht-t) prior to the respifation rise that occurs at the onset of ripening (Paull,
1993, Seyrnour, 1993). The autocatalytic biosynthesis of ethylene @gure 2.3)
that occurs in pre-climacteric bananas can be initiated by exogenous ethylene
application (Tucker, I 993).
20

Clmpter 2: Literature Revrew
ATP
Methionine S-adenosylmeth ionine (SAM)
ACC synthase
1 -aminocyclopropene- 1 -carboxyl ic acid (ACC)
ACC oxidase
Figure 2.3: Simplified ethylene biosynthetic pathway in ripening fruit (after
Wang, 1989).
Ethylene levels of 100 to 1000 pL Ll for 24hrs, applied either as a single shot
of ethylene gas or in a frickle mechanism, are used for initiating rþening in
climacteric fruit in commercial situations, although levels as low as 0.1 or 1 ¡rI
I,r for 24ltrs are equally as effective in initiating ripening (Seymour, 1993;
Dominguez and Vendrell,l994;Wills e/ a1.,1998). Despite this, the optimum
amount of exogenous ethylene gas to initiate ripening while resulting in the best
quality produce with an extended shelf life is not known.
Scriven et al. (1989) found that fiained panellists detennined distinct flavour
and aroma differences between Cavendish bananas ripened with ethylene
Ethylene
2t

Chapter 2: Literature Review
compafed to those ripened on the plant. The flesh from naturallyripened fruit
was described as being 'more fruity, less green and softer than ethylene treated
fruit.' However, the eating quallty of bananas exposed to lower (<300 pL Lt)
ethylene levels were not compared to those exposed to higher (>300 FI Lt)
ethylene levels. This may be a useful evaluation to observe whether quality
difference can be detected in fruit. If eating quality is affected by the exposure
to different ethylene levels, the industry may choose to regulate the addition of
ethylene more closely.
2.6 Humidity in relation to ripening
The relative humidity (RII) of storage facilities can be adjusted to satisfu fresh
produce requirements. This is essential for bananas, as they are removed from
their constant water supply at harvest. If excessive transpiration in low humidity
is allowed to proceed unchecked, water loss will rezult in banana shrinkage
(Grierson and'Wardowski, I 978).
Akkaravessapong et al. (1992) and Blankenship and Herdeman (1995) have
researched the effect of relative hunidity on banana fruit quality and their
susceptibility to mechanical damage. They found that low relative humidity
(50%) is detrimental to fruit quality, increasing the rate of water loss in bananas
three to four times over bananas stored lrr.90% RH. In fact, Blankenship and
Herdennan (1995) recommend ahighhunidity of 95%RHthroughout the
ripening period. This results in reduced banana peel scarring and so generally
gives a more visually appealing banana compared to those ripened at lower
humidities (<65n.
A disadvantage of storing bananas at a humidity level of 95% is the
22

Ctøpter 2: Literature Revrew
encouragement of the growth of undesirable micro-organisms leading to fruit
decay. Decay occurs mainly when fruit are soft or damaged prior to storage and
accelerates in high humidity storage (Sharkey and Peggie, 1984). Sharkey and
Peggie (1984), however, observed a higher incidence of peeling injury on
peaches (where the skin becomes separated from the flesh of ripe fruit when
hærdled) when stored in high humidity compared to low humidity for 4 weeks.
The thickness of banana peels as opposed to peach peel would reduce this
problem with bananas.
2.7 Post ripening storâge
Higþ ethylene levels and respiratory rates in bananas hasten the ripening
process and reduce storage life (Paull, 1993;TaizandZeiger,1998). Banana
sheHHfe often can be as short as three days, when stored at supermafket
temperatures of 23oC, compared to seven to 28 days when stored atl4oC @aull,
1993; J. Evans, Chiquita Brands South Pacific, pers. comm., 1998). Continual
temperature regulation at l4"C within the superrnarket is unlikeþ. This poses a
dilemma for suppliers wanting to speedup the ripening process while extending
storage life by slowing down senescence. Bananas need to be maintained at the
'ideal' eating stage for as long as possible, to ensure consumer satisfaction and
maximum profit. As 40% of consumers prefer to eat bananas at stage 5 (yellow
with green tips) and 32o/oprefer ripening stage 6 (all yellow) (Anonynous, Your
gUide to greater profits, turdated), post ripening treatments need to be used to
extend banana shelf life for as long as possible.
2.7.L Controlled atmosphere and modified atmosphere storage
Fruit metabolism can be slowed down during postharvest storage by appþing
an atmosphere that has an increased carbon dioxide (5o/o) andlot reduced
z)

Chapter 2: Literature Revrew
oxygen (2Y")levelcompared to normal ar (0.03% CO2 and 2l%Où (Yahia,
1993). This modification of the atrnosphere reduces the banana's sensitivity to
externally applied ethylene and decreases the deterioration of fruits by inhibiting
endogenous ethylene production and consequently prevents a rise in the
respiration rate (McGlasson and Wills, I 972 ; Wills, 1990 ; Kader, 1992;
Elyatem et a1.,1994). Additional benefits are the reduction of the fruit's
softening rate and composiúonal changes, which slow down senescence (Kader,
tee2).
Previous experiments (McGlasson and Wills, 1972; Wills, 1990), have
concentrated on using controlled or modified atmospheres (CA/MA) to delay
banana ripening while in transit. However, storage in controlled or modified
atrnospheres after ripening may also be beneficial for the extension of sheHlife.
According to CO2 and 02 tolerance levels stated by Yahia (1998) and Kader
(1993), green bananas can withstand long periods of storage in2o/o Oz and 5%o
COz at 15'C. However, they did not mention the effect of controlled or
modified atrnosphere storage of bananas applied at post ripening stages, such as
ripening stage 4,the exact duration of storage or the overall effect that CAAvIA
storage has on fruit quality. A disadvantage of MA storage is the need for the
packaging to stay intact throughout storage to maintain the internal aûnosphere,
which would be costþ due to the labotr required to repackage damaged MA
bags during the ripening period.
2.7. 1.1 Nitrogen atmosphere storoge
A cheaper ærd easier mcthod of extending banana shelf life than MA packaging
may be the storage of bananas in nitrogen atmosphere (i.e. ultra-low oxygen, 0-
1.5'/ù promptly after harvest. It would be cheaper and easier, because there
u

Cløpta 2: Literature Review
would be only one application of nitrogen required. Wills et al. (1990), found
that storing bananas in nitogen for three days at 20'C within three days after
harvest (ripening stage l), extended the total time taken to ripen (to stage 5,
yellow with green tips) by eight days. However, fruit that were damaged prior
to being treated with nitrogen tended to have increased peel injury (Wllls et al.,
1990). These findings are an encouraging sign for further research into nitogen
storage in relation to the extension of shelf life.
Importantly, banana storage in nitrogen prior to ripening (stage l) must occur
no later than three days after harvest (Wills et a1.,1990). Treating
preclimacteric fruit with nitogen could occur on-farm prior to ripening, to
ensure long distance shipping of green bananas. However, instead of treating
bananas prior to ripening, flrther research on the effect nitrogen alnospheres
have on post-ripened banana shelf life is required. The storing of bananas at a
post-ripened stage in nitrogen would be a convenient way of handling bananas
with the intention of extending fruit shelf life (from ripening stage 4 to *age 7),
instead of green life.
2.7. 1.2 Ethanol atmosphere storoge
Ethanol (EtOÐ atmosphere storage is another method available to extend
banana sheHlife. The biosynthesis of ethanol occurs naturally during the
senescence phase of banana ripening (Tressl and Jennings,L972;Marriott,
1930). However, endogenous levels of ethanol can also be induced earlier in
the ripening phase by storing fruit tmder anaerobic conditions (Pesis and
Marinansþ, 1993; Pesis,1996). The induction of endogenous ethanol while
under anaerobic conditions is an effective method of inhibiting or delaying the
ripening processes. In fact Podd and Van Staden (1998) reported the inhibition
25

Clmpter 2: Literature Revrew
of ripening by ethanol is associated \Mith a decrease in ethylene production, by
preventing the conversion of ACC to ethylene. These inhibitory effects of
endogenously synthesised ethanol can and have been simulated by exogenousþ
applyrng ethanol (Ratanachinakom et a1.,1999); a volatile that is a natural
ripening product of bananas.
The storage of fruit in an ethanol atrnosphere has been found to delay ripening
of breaker stage tomatoes (Salweit and Sharaf, 1992). Similarly low oxygen
atmospheres that induce an accumulation of ethanol promote anaerobic
metabolism and delay ripening. @esis and Avissar, 1989, Pesis and Marinansþ,
1993; Pesis,1996). Consequently, studies into the application of ethanol
atrnospheres to climacteric fruit is of considerable interest to researchers.
Hewage et al. (1995) and Ritenour et al. (1997) have since reported that the
application of an ethanol atmosphere to bananas prior to or after the climacteric
rise is not effective in extending banana green or shelf life. Ethanol was applied
through ethanol soaked filter paper in a treatment chamber, however, neither
reported endogenous ethanol levels of bananas before or after ethanol treatment.
This would be an important measurement as bananas have thicker peels than
tomatoes and uptake is therefore not ensured (Hong et al., 1995).
Ratanachinakorn et al. (1999) used ethanol vapour vacuum infilnation to force
ethanol into tomatoes which ensured ethanol was absorbed through the tomato
skin and taken up through the fruit calyx. This method may be a useful option
in the effort to drive ethanol into the banana peel and pulp tissue, and to extend
banana shelf life.
2.7.2 Ethylene antagonist
Exposure to ethylene is a common practice in most commercial markets to
26

Chapter 2: Literature Revrew
promote even ripening in bananas. However, even though exogenous ethylene
atmospheres are beneficial for fruit ripening uniformity, it also hastens ripening
and senescence. Recentþthe discovery of l-methylcyclopropene (I-MCP), an
organic molecule that blocks the ethylene receptor preventing ethylene
production, has been identified as an ethylene antagonist with potential use in
the commercial fruit industry.
I-MCP is a planar, strained olefin with a methyl goup adjacent to the double
bond (Figure 2.4) (Sisler et o1.,1996; Sisler,2000). Olefins compete with
ethylene to bind to ethylene receptors, but unlike ethylene, the süained olefins
bind tightly to the receptors preventing an active response (Sisler et a1.,1996;
Sisler and Serek, 1997 ; Jiang et al., 1999b). The ethylene receptor is believed to
contain an unidentified electron donor metal, that olefins bind to. The theory of
why ethylene forms an active response and 1-MCP does not, relates to the
ability of I-MCP to bind tightly to the ethylene receptor (I-MCP was bowrd for
12 days in bananas teated at24"C). This is unlike ethylene, which leaves the
complex after withdrawing its electrons from the metal, causing ligand
substitution that induces an active response @igure 2.5) (Sisler and Serek,
1997). An advantage of 1-MCP is that it seems to be non toxic at active
concentrations (Sisler and Serek, 1997). Currently, I-MCP can be applied to
indoor non-food crops in the USA (Environmental Protection Agency, 7999),
such as fresh cut flowers, and its availability commercially for use on food crops
such as bananas is likely in the future.
27

Chapter 2: Literature Revrew
Cru
1-methylcyÊlopropene
Figure 2.42 T\e structure of I -methylcyclopropene
Inactive
L2
Active
L3
+[+Ç] ----l+ -Dt Lt- kE' l-4
Inactive
L3L1 L1
J=
ü
,,-J, +f
lnactive
L2
+ 1-MtP+h +
lnactive
L¡ L3
t..'L1-¡i4: - --.
1-MCP 14
2q
J-
Figure 2.5: Model of ethylene and I-MCP probable action on the ethylene
receptor. Electron donor metal (M) wrth ligands of unknown structure (L) binds
to ethylene (E) or I-MCP. Ethylene completes its electon fransfer and is
releasedleavingthe resultrng complex active while I-MCP binds so tightlyto
the complex itremains attached resulting in an inactive complex (Sisler and
Serek, 1997).
28

CIøpter 2: Literature Reuew
The anti-ethylene agent I-MCP has been tested on green (stage l) Cavendish
bananas prior to ethylene initiation and has been found to effectively slow
ripening by a factor of four compared to untreated fruit (Golding et al.,1998;
Macnish et a1.,1998;Jianget al.,l999a;Jianget al.,l999b;Harris et al-,2000;
Jiang et a1.,2000;Macnish et a1.,2000b), allowing extended storage of green
bananas. 1-MCP inhibited the production of endogenous ethylene by
suppressing the critical ethylene producing enrymes ACC synthase and ACC
oxidase or by forcing the production of the inactive malonyl ACC (Golding er
aL.,1998).
A nunber of studies has also investigated the effect 1-MCP has on banana
ripening, applied afterripeninginitiation (Macnish et a1.,1997;Goldinget al-,
1998; Goldinget a1.,1999;Jianget al.,l999b; Joyce et a1.,1999;Macnish er
at.,2000a). The studyby Golding et al. (1998) showed the application of l-
MCP prior to or 12 hrs after the application of propylene, a comparable and
effective analogue of ethylene (Rhodes, 1980), affected some biochemical
processes compafed to normally ripened fruit. I-MCP caused the suppression
ofvolatile production, uneven peel colouring, reduced respiration rates, an over-
production of ethylene and an extension in green life. The same studyreported
the application of I-MCP 24hrs after the initiation of ripening did not affect the
development of ethylene and respiration peaks, but delayed colour changes and
total volatile production. Further research into I-MCP application after
ethylene initiation is required to explain if the reduction in volatile production
would have any impact on consumers and industry.
Continued research would also allow studies to concentrate on extending
banana shelf life (stage 4-7)rather than the thoroughly researched banana green
life (stage 14). Extensions in the shelf life of banatras treated with I-MCP after
29

Chapter 2: Literature Rwiew
ethylene initiation have been fourd by Joyce et al. (1999), but additional
examination into the effects I-MCP has on banana eating quahty would benefit
the commercial market.
The use of 1-MCP as an ethylene antagonist is beneficial in prolonging banana
shelf life when applied early after ethylene application (Macnish et al., 1997 ;
Jiang et a\.,7999b;Joyce et al.,1999). However, the definition lvlzcnish et al.
(1997) and Jiang et al. (1999b) glve for their assessments of shelf life are from
green to eating ripe or using fruit softening, respectively, but these assessments
do not gauge the effect I -MCP has on consumer shelf life (stage 4 to 7).
Therefore a comprehensive study into the effect that I-MCP has on banana
colour (tureven degreening) and reduced volatile production with regards to the
commercial marketability of 1-MCP exposed fruit requires frirther investigation
2.8 Summary
As most bananas are harvested in an unripe state, the early detection of chilling
irUury would prevent unnecessary harvesting of unsaleable fruit. Early detection
could also allow for appropriate marketing and handling decisions to be made
preventing sub-standard fruit being sold to markets. Therefore, if either
ctrlorophyll fluorescence or PPO activity are determined to be signrficantly
different in chilled fruit compared to non chilled fruit, the findings would be
very useful to the banana industry.
Examining various temperature and ethylene regimes throughout the year may
reveal the need to use different ripening procedures when ripening bananas in
summer, compared to winter. This would allow the industry to optimise banana
quality and shelf life all year round.
30

Cløpta 2'. Literature Review
Fu¡thermore, posthalvest treatrnents applied to bananas such aS controlled and
modified atrnospheres, nihogen atnospheres, the application of l-MCP and
ethanol abnosphere storage after ripening have potential for extending product
shelf life. Extending the shelf life after ripening would greatly benefit the
industry as would delivering a better quality product to the consumer.
2.9 Research aims
The aim of this research project was to improve the postharvest quality and
extend the shelf life of bananas, by optimising the effect of temperatures and
ethylene levels in ripening rooms throughout the year. Quick and easy methods
for the early detection of chilling inju¡y among bananas were also investigated.
In addition, post riþening treahnents such as confolled and modified
atmosphere packaging, niüogen storage, the application of l-
methylcyclopropene at att early ripening stage and the storage of bananas in
ethanol ahospheres at later ripening stages were examined. These experiments
aimed to double the existing shelf life of bananas of from three to six days.
Banana quality was determined through a range of internal and external
measurements. Internal measurements included pulp firmness, soluble solid
concentrations and the determination of differences in banana aroma with the
use of a chemical nose. External measurements included visually assessing fruit
for chillinginjury, recordingthe general appearance of the peel andthe shelf life
(days from colour stage 4 to stage 7). The ultimate aim was to improve the
postharvest quality of bananas for industry and consumer satisfaction and to
continue the search for the 'perfect' banana, a banana that lasts longer all year
round.
31


Cheprer I
3. General Materials and Methods
3.1 Plant material
Cavendish bananas of the 'Williams' variety, were used for all of the
experiments in this project. Theywere grown using commercial growing
practices (8. Chartres, Chiquita Brands South Pacific, pers. comm., 1999) on a
single Tully property in North Queensland. The bananas were harvested at75Yo
maturity, at rþening stage I (hard, green appearance). They were harvested
from the middle of the banana bunch (hands 2 or 3) to ensure all were of a
wriform size and shape. Produce was then packed in cartons, layered with
plastic to protect the hands from rubbing against one another and transported
over 3 or 4 days in monitored refrigerated trucks above l3oC, to the Adelaide
Produce Markets at Pooraka before being delivered to the Plant Research Centre
at the University of Adelaide, V/aite Campus.
3.2 Preparation of fruit prior to experimentation
Upon arrival at the Plant Research Centre all banana fingers were separated
from their hands, deflowered and crowns were cleanly cut offusing a sterile
surgical blade. Bananas chosen were of a similar size and shape to reduce
variation ¿tmong fingers. Each banana was assessed prior to experimentation for
disease and defects (defected fruit >2cm ffea per firger, T. Johnson, Chiquita
5¿
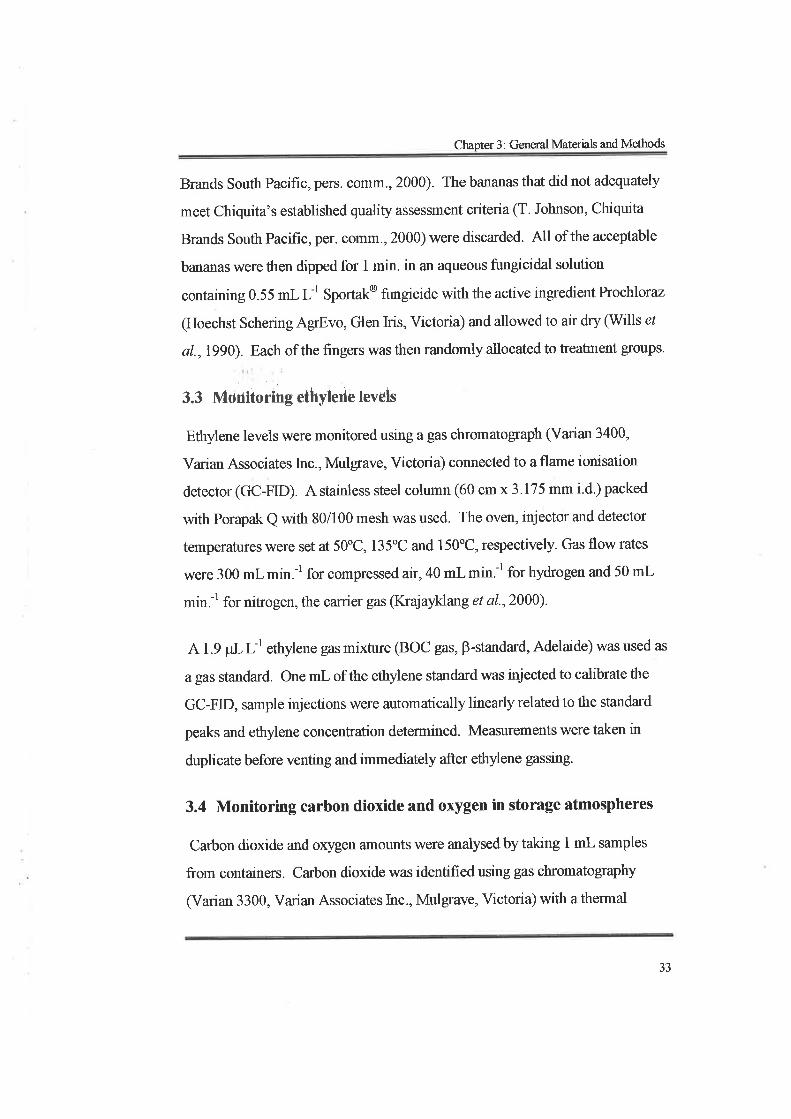
Chapter 3: General Materials and Methods
Brands South Pacific, pers. comm., 2000). The bananas that did not adequately
meet Chiquita's established quality assessment criteria (T. Johnson, Chiquiø
Brands South Pacific, per. coÍìm., 2000) were discarded. Al1 of the acceptable
bananas were then dipped for 1 min. in an aqueous frrngicidal solution
containing 0.55 mL L I Sportak@ fungrcide with the active ingredient Prochloraz
(Hoechst Schering AgrEvo, Glen kis, Victoria) and allowed to air dry (Wills er
a1.,1990). Each of the fingers was then randomly allocated to treatnent groups.
3.3 Möilttoring ethylerle levels
Ethylene levels were monitored using a gas chromatograph (Varian 3400,
Varian Associates Inc., Mulgrave, Victoria) connected to a flame ionisation
detector (GC-FID). A stainless steel column (60 cm x3.175 rtrm i.d.) packed
with Porapak Q \r/ith 80/100 mesh was used. The oven, injector and detector
temperatures were set at 50"C, 135"C and 150oC, respectively. Gas flow rates
were 300 mL min.-l for compressed air, 40 mL min.-l for hydrogen and 50 mL
min.-l for nitrogen, the carrier gas (Ikajayklanget a1.,2000).
A 1.9 FL Ll ethylene gas mixture (Boc gas, p-standard, Adelaide) was used as
a gas standard. One mL of the ethylene standard was injected to calibrate the
GC-FID, sample injections were automatically linearly related to the standard
peaks and ethylene concentration detemrined. Measurements were taken in
duplicate before venting and immediately after ethylene gassing.
3.4 Monitoring carbon dioxide and oxygen in storage atmospheres
Carbon dioxide and oxygen amounts were analysed by taking 1 mL samples
from containers. Carbon dioxide was identified using gas chromatogaphy
(Varian 3300, Vmian Associates Inc., Mulgrave, Victoria) with a thermal
^tJ

Chapter 3: General Matenals and Møhods
conductivity detector (GC-TCD). The GC-TCD had a45.7 mm x 1.5 m stainless
steel column containing a molecular sieve (Tlpe 5A\40160 mesþ, with 5 mL
min.-r heliurn as the carrier gas. Temperatures were set at28"C for the column
and 90"C for the injector and detector ports. The GC was calibrated using a
standardmixture of 20.9Yoo2,0.03o/o COz and 79o/oN2@OC gas, B-standard,
Adelaide). Meastrements were taken in duplicate and performed immediately
after gassing and prior to opening of the contarner.
3.5 External quality assessment
3.5.L Green life
Surface colour of banana peels was evaluated daily. Classification of each
banana ripening stage was according to the CSIRO banana ripening chart (1972;
Figure 3.1). Green life of bananas was a subjective measurement which
assessed the number of days it took bananas at ripening stage 1 (green, hard) to
ripen to stage 4 (more yellow than green).
3.5.2 Shelflife
Shelf life of bananas was evaluated using the surface colour of banana peels. It
was measured by recording the number of days bananas at ripening stage 4
(more yelloq than green) took to reach ripening stage 7 (yellow, lightly flecked
with brown; CSIRO, 1972).
34

Chapter 3: General Materials and Methods
ã;.ti-
þ
I
3
t\
il.
\-
Figure 3.1: The 8 ripening colour stages (CSIRO, 1972)
,,
a
35

Chapter 3: General Materials and Methods
3.5.3 Discolouration index
A chart (Table 3.1) was used to score the peel appearance of bananas at
ripening stage 6 (fully yellow, CSIRO, 1972). The scores were weighted and
averagedinto a discolouration index @t), usingthe formula (3.1) from Schina
et al. (1999), as data for each üeatrnent was normally distibuted and fell within
a naffow range. The fomrula uses the number of bananas with no
discolouration (a), slight (b), mild (c), or severe discolouration (d) compared to
the total number of bananas in each ûeatment (n).
(axo) + (¿xl) + (cxz) +(dxt)Dscolouration index (DI) =
"..(3 1)
36

Chapter 3: General Materials and Methods
Table 3.1: Discolouration score chart.
0
Peel score Visualsymptom
Assessment
Healthyfruit
Slishttydiscoloured orchilled
Milddiscolourationor chillinginjury
Severe
discolourationor chilling injury
Appearance
Yellow, nodefects
Dullgrey/yellowcoloured fruit
Red/brownscarring alongvascular tissue
Red/darkbrown marksall overbanana
1
2
J
5t

Chapter 3: General Materials and Methods
3.5.4 Weight loss
Bananas were initially weighed prior to ripening as well as at ripening stage 6,
allowing total weigþl loss over the ripening and heatunent periods to be
assessed.
3.6 Internal quallty assess¡mehts
3.6.1 Putp flrnness
Pulp firmness w¿ts assessed at ripening stage 6 (full yellow), the preferred
eating stage by consumers (Anonymous, Your gUide to greater profits, undated),
and the final stage of ripening before signs of senescence (brown flecks) appear.
Each bdnana was tested using a twist tester Gtgo.e 3.2,Departrnent of
Agricultural Engineering, Massey Univefsity, NZ). The twist tester is claimed
to be easier and more reliable then a penetroSeter on soft fleshed fruit
(Studman and Yuwan a, 1992).
For the twist tester measurements, each banána were cut ttansversely. One half
of the banana was then pushed (exposed prllp end first) onto the fixed blade and
rotated in an anticlockwise direction until the pulp tissue failed. The arm
attached to the blade lifted against gravity and the highest angle prior to tissue
failtue was recorded. This procedure was replicated using the second half of the
banana. All measurements were then converted into a crushing strength value,
using the formula below (3.2). Soft fruit have a lower crushing strength than
hard fruit (Hopkirk et aI.,7996).
M sin?a'b
.(3.2)
38

Chapter 3: General ll4aterials and Methods
crushing süength (Pa)
M: mÐdmum moment produced by the arm when e : 90' 0{.m)
radius of the blade (m)
b: width of the blade (m)
0 : maximum arm angle before tissue failure occuned o
39

Chapter 3 : General lVfi.terials and Methods
Figure 3.2: The twist tester
40

Chapter 3: General Mat€rials and Methods
3.6.2 Soluble solid codtent
Ameasure of soluble solid concentration (SSC %) was used to measure total
sugar content of banana pulp. All of the banana halves used in the pulp
firmness tests (section 3.6.1), were used in these SSC tests. Firstly a banana half
was trimmed so that the twist tester damaged pulp was removed. Atransverse
slice of the banana was then cut and this pulp was squeezed through muslin
cloth onto the glass surface of a hand held refractometer (range 0-30% sugar
w/w, Bellingham and Stanley Ltd., England). The SSC (7o) measurement was
then recorded and temperáture calibrated. This process was replicated with a
slice of the second half of the banana and repeated for each of the fingers in the
treaünents. When all measurements were recorded the banana halves were
retumed to their treaûnent for use in the banana aroma analysis using a
chemical nose.
3.6.3 Aroma analysis
Banana ¿roma was evaluated using a Hewlett Packard Chemical Sensor (IIP
4440, Hewlett Packard Company, Ltd., 1998, DE, U. S.A.), commonly lnown as
a 'chemical nose'. This instrument consists of a headspace autosarnpler (lIP
7694),linked to a quadruple mass sensor and comprising its own data collection
and Piroutte analysis package (Infometrix Inc., Woodenville, WA U.S'A)
After removing the exposed banana tissue by slicing a transverse section down
the exposed end of the banana halt 10 - l5 g of pulp from the freshly cut end
was removed from each bananahaff (I2 banana halves per replicate - 120 -180
g of pulp each replicate) and placed into a Moulinex blender (Model D721Q50,
Robinson Industries Ltd., Auckland, NZ.). The pulp from one treatment
replicate was blended for six, I second pulses to simulate chewing. Five g of
4t

Chapter 3: General lrdaterials and Methods
banana homogenate was added to a20 mL headspace vial, this step was
repeated for 10 replicate vials. Heptadecane was used as an internal standard,
with 5 pL of heptadecane was added to each of the l0 vials prior to their clostre
with black butyl rubber seals in aluminium crimp caps. Vials were then
randomly allocated into the headspace autosampler and left to equilibrate for 5
min. The sample preparation procedure was then repeated for the remaiting2
treatment replicates. An extra headspace vial was prepared as a 'dummy' and
placed in the first position of the headspace autosampler afm as a trial run to
prevent the initial false reading that occurs immediately after start-up.
Headspace autosample configurations used for the bananas included; an oven
temperature of 42oC,a 3 mL sample loop temperature of 50'C, a transfer line
temperature of 60oC, a headspace cycle time of 3.5 min., a vial equilibration
time of 20 min., a pressurisation time of 0.3 mirt., a loop fiIl time of 0.15 min., a
loop equilibrium time of 0.02 min. and an injection time of 0.5 min. Helium
gas was set as the carrier gas at 13.1 kPa with a flow rate of 30 mL min.-r and
vial pressure was set at96.5 kPa. The headspace autosampler/mass
spectrometer interface temperature was set at 90'C and mass spectrometer
parameters were set to scan a mass/charge (mlz) range of 49-200. The low m/z
was chosen to avoid signals from water, oxygen and less discriminating ions
produced by volatile chemicals.
3.6.3.1 Chemícsl nose statisticøl analysís
The raw data collected from the headspace and mass spectrophotometer was
analysed using the multivariate data analysis package, Piruotte. Principal
Component Analysis (PCA) was used to detennine aroma similarities in the
collected data and organise it into a PCA model. The PCA model forrned from
42

Chapter 3: General Materials and Methods
the chemical nose data was nofmalised and cross validated to ensure the
principal components (or factors) accoufited for greater than 80% of the total
variation between banana sÍtmples (Wirthensohn et a|.,1999)-
Score plots from the PCA model mapped the original data samples onto
principal component (factor) axes specified by loadings. The loading plots
represent the relative contribution ofevery original variable (ion) to a factor
axis. A loading of one meant that the variable (ion) coincided with a principal
component. Fruit with similar volatile profiles were grouped together on plots,
but separated from fruit that had different volatile profiles (Wirthensohn ef a/.,
teee).
Aroma compounds were identified using the variables (ions) that were
associated with the extreme ends of the factors from loading plots and matching
those variables with aroma compounds from an establishedvolatile compound
library.
43


Cheptëü 4
4. ire-ribenine Detection of Chilline IniurY
4.1 Introduction
Physiological changes occur within bananas when they are subjected to
temperatures below 13"C (Olorunda et a\.,1978; Patterson, 1980; Paull, 1993;
Wills e/ at.,1998). Breakdown of tissue andthe disruption of metabolic
pathways caused by exposure to low (<13'C) temperatures affects banana taste,
flavour, appearance and their nutritive composition (Stover and Simmonds,
l9S7). This physiological disorder is commonlyknown as chilling tnjury'
A chilling irijury sSmptom that is visible to the naked eye is the browning of
vascular tissue (Maniott, 1980, Stover and Simmonds, 1987; Kays, 1991; Wang
and Gemma,1994). This syrnptom appears as either red or brown coloured
streaks dlong the peel of mild to sevetely affected fruit or as a dull yello#grey
colouring on the entire peel of slightly affected fruit. These obvious symptoms
reduce the commercial acceptability of bananas, because consumers relate
colow to the overall quality of produce 6ays, 1999). Consequently, early
detection of chilling rnjury would enable the market to redirect chilled fruit to
either markets that accept lower gade fruit or dispose of them accordingly.
44

Chapter 4: Pre-ripentng Detection of Chi[ing Injury
While many studies have been concerned with preventing chilling injury (Jones
et at.,1978) and understanding what occurs in fruit to cause chilling ittj.ny
(Wills et a1.,7975;Torasker andModi, 1984; Wang and Gemma, 1994)' few
studies have researched methods for the early detection of chilling injury'
The biochemical processes which lead to the browning or discolouration of
chilled fruit have been reported to be enzymatic oxidation by
polyphenoloúdases (PPOs) in the cytoplasm, after phenolic compounds like
dihydroxyphenylalanine (DOPA) leak out of the vacuole (Jones et a1.,1978;
Amiot et al.,1997). PPOs have also been found to be inüacellularly bound to
chloroplasts (Shomer et a1.,1979;Amiot et aI.,1997) and cell walls QVIarques ef
al. , 1995). Amiot et at . (1997) also reported that browning in fruit always
occurs after physical changes to plastidic and vacuolar membranes, allowing
enzqe and strbstrate to interact. This then leads to browning due to the
formation of dark brown pigments,lnown as melarrins @almer, 1963). A good
correlation between browning and higher PPO activity was found in inadiated
bananas (Thomas andNair, 1971; Amiotet a1.,1997). This srlggeststhatPPO
activity mdy be a usehrl method of detecting chilling injury which affects
conformational changes of cells within tissues that produce browning as a
result. However, datahave also been reportedby Gooding et al. (2001)that
show peel PPO activity is high during early development and then declines
when ripening begins, where it remains constant' They also found no
differences in PPO activity after induced wounding. As these studies found
conflicting results, fi¡ther study into banana PPO activity is required.
As membranes are disrupted by chilling injo.y, the chloroplasts may also be
disrupted resulting in changes to the photosynthetic ability of the tissue. This
disruption may be detected via chlorophyll fluorescence, which is a non-
45

Chapter 4: Preripening Detection of Chilling Injury
destructive, eflective method of measuring the primary processes of
photosynthesis that take place in the chloroplasts @eEll et al.,1999). In fact
there is some evidence to suggest chlorophyll fluorescence does detect chilling
injury in bananas, with Smillie et al. (1987) using aFp(maximal rate of increase
in induced chlorophyll fluorescence) measurement. Smillie et al. (1987)
indicated bananas held at 0"C had significantly decreased rates oflog Fp than
those at 13oC, but the severity of the injury induced at OoC may have aided in
the detection of the change in measurements. Milder cases of chilling injury
that commonly appear on fruit in indusfy have not been investigated using
chlorophyll fluorescence. Since this research smaller, easier and portable
fluorescence detectors have become accessible making industry use a possibility
by measuring various parameters (detailed in section 2.4.1.1) that have yet to be
examined in relation to detecting chilling injury in bananas.
Chilling injury is currently identified in industry by the visual qrnptoms
mentioned previously, but these signs often do not aþþear ptior to riþening
unless severe chilling (eg. 5 days at 5"C) occurs in the preclimacteric phase
(Stover and Simmonds, 1987). The aim of this studywas to use chlorophyll
fluorescence and PPO activity measurements as possible alternative methods for
the detection of chilling injury in bananas that could be used by indusûy prior to
the appearance of visual symptoms.
4.2 Materials and methods
These two experiments were conducted lli'7999. All bananas were harvested
and prepared as described in sections 3.1 and 3 .2,but were not ethylene treated
in either of the following experiments.
46

Chapter 4: Prerþening Detection of Chilling Injury
4.2.1 Chlorophyll flüorescence
Chlorophyll fluorescence induction was measured on chilled and non-chilled
Cavendish bananas cv. William.s. Initially the bananas at ripening stage 1 (hard,
geeÐ were assessed using the Royal Horticultural Society ßHS) coloru charts.
Areas on the banana of the same colour were used for the chlorophyll
fluorescence measurements. Those areas \ilere dark adapted for 30 min. prior to
fluorescence induction, using a dark adaptor clip þreventing light from
accessing the surface area of the banana prior to fluorescence induction). After
dark adaptation the fluorescence measurement was taken with a Fluorescence
Induction Monitor (FIM 1500) (ADC. Bioscientific Ltd., Hoddesdon, England)
ata7\o/olight level. The dark adaption period of 30 min. andthe 70%lig!Í
level were found to be suffrcient in prelimiharytrials.
After initial fluorescence mea$rement, bananas were placed into unsealed
polyethylene bags and stored either at 5"C (chilled) ot at22"C (non-chilled).
Chilled bananas were stored at 5"C for 5 days, but removed daily for chlorophyll
fluorescence measurements. After the 5 day cool storage, chilled bananas were
stored at22'C (room temperature) until the end of the experiment.
Chlorophyll fluorescence measurements were done daily; with bananas stored
at 5oC brought out to 22"C to equilibrate to room temperature prior to
measurements ensuring accurate and comparable fluorescence measurements
with fruit held continually at 22"C. Visual assessment of banana ripening stages
as well as the chlorophyll fluorescence measurements, were recorded dailyuntil
all bananas reached ripening stage 4 (more yellow than green).
ARandomised Complete Block Design (RCBD) was established with six
hands representing six replicates. Each of the six hands were separated into
47

Chapter 4: Preripening Detection of Chi[ing Injury
halves and randomly allocated into either chilled or non-chilled treatrnent
groups. Treatrnent groups consisted of either two or three experimentål units
depending on the number of fingers makingup the hand.
Replicates were analysed for changes in each of the chlorophyll fluorescence
parameters @o, Fv, Fm, FvÆm, Tf max and area detailed in section 2.4.1.1), on
chilled and non-chilled bananas from ripening stage I to ripening stage 4. Each
replicate was analysed in a simple linear regression (with gfoups) to eliminate
the variability between the hands. Regression results were then analysed in a
one-way ANOVAwith replicates using a t-test. Results from ripening stage 1
were also analysed separatelyusing a general analysis of variance with
replication. The number of days it took for the chilled or non-chilled bananas to
reach ripening stage 2 was the covariate factor. A simple t-test was used for the
analysis with the Genstat 5.41 program (Release 41,4h ediion, 1998, Lawes
Agricultural Trust, Rothamsted Exþerimental Station).
4.2.2 P olyphenoloxidase actlvlty
Polyphenoloxidase (PPO) activrty was measured using a digltal oxygen
electrode system (Model 10, Rank Brothers Ltd., Cambridge, England).
Bananas at ripening stage 1 were assigned to either a chilled treatment and
stored at 5oc for 4 days (until visible symptoms of chilling injury appeared)
prior to PPO evaluation or to a control (time 0), non-chilled treatnent where
PPO activity was tested immediately. The PPO activity of each banana was
examined in duplicate.
Two pH 6.8 buffer solutions were required for the measurement of PPO. The
first 100 mL solution was an 'extract' buffer made up of l:4 v/v of 0.1 M citric
acid and 0.2 M di-sodium hydrogen orthophosphate dihydrate. The second pH
48

Chapter 4: Preripening Detection of Chilling Injury
6.8 buffer prepared was the 'run' buffer, it was made exactly the same way as
the extract buffer above, with the only difference being the addition of 1% (wþ
sodium dodecyl sulphate (SDS) to the solution.
Each reaction took place in the 'run' buffer at pH 6.8. The 'run' buffer (1950
¡rL) was initially added to the reaction cell of the digital oxygen electrode
system. The 'run' buffer was constantly stirred and warmed to 25"C by a
continuous flow of thermostatically controlled water.
Preparation of the peel sample excised from the neck of the bananaproceeded
by gnnding 0.3 g of the tissue into a paste using a mortar, pestle and liquid
nitrogen. To the paste, I mL of extract buffer was mixed and a further 2 mL of
extract buffer added to the mixture until a fine slurry was formed. A 1 mL
quantity of the sample mixture was then added to the pre-warmed reaction cell
and the oxygen electrode stabilised at95o/o 02 content.
The substrate used for this PPO analysis was 100 mM 4-methyl catechol.
Oxygen consurnption by PPO in the banana sample was initiated when 50 pL of
100 mM 4-methyl catechol was added to the stabilised reaction cell. The
oxygen cell ouþut (mV) was then plotted onto a chart recorder (Omni Scribe,
Austin, Texas). PPO reaction rates were calculated into nmoles min.-l g.f.ú.-l.
The reaction cell (3 mL) held 774 nmoles of dissolved oxygen and the resulting
plot was dependent on the PPO activity in the banana sample (g.f.wt.). The rate
of the reaction (nmoles oxygen consumed mitt.-t) was determined using the
initial slope of the resulting plot (formul a 4 .l). After each reaction the cell was
cleaned with deionised water and the entire procedure repeated.
49

Chapter 4: Preripening Detection of Chi[tng Injuy
PPO activity (nmoles min.-l g.f.!vt-t)
:774 nmoles oxygen / rate of reaction I g f.wt (4 l)
The experiment was aRCBD with six replicates. One hand comprised one
replicate. Each hand was randomly divided into chilled and non chilled
treatrnent groups similm to the chlorophyll fluorescence design. Measurements
were onlyperformed on peel from the neck of the banana as visual s5rmptoms of
browning (PPO activrty) could be clearly seen. The PPO measurement for each
finger was performed twice. PPO reaction rates from each of the measurements
were analysed using a t-test with the Genstat 5.41 program (Release 4.1 , 4ú
edition, 1998, Lawes Agricultural Trust, Rothamsted Experimental StatioÐ.
4.3 Results
4.3.1 Chtorophyll fluorescence
The heated bananas held at 5oC for a period of 5 days displayed chilling
injury symptoms of brown vascular streaking on the peel of the bananas. All
chilling treated fruit after 5 days were affected with red or brown vascular
streaking. Fruit held at room temperature (22"C) did not have any visible
browning s5rmptoms of chilling injury $igure 4.1). Similar chlorophyll
fluorescence measurements for chilled ætd non-chilled fruit were recorded
throughout ripening stage 1 (Table 4.1).
50

Chapter 4: Pre-rþening Detection of Chi[ing kiury
Figure 4.1: Peel appeafance of Cavendish bananas cv. Williams after a holding
period of 5 days at (Ð 5"C afid (B) 22'C.
Table 4.1: Chlotophyll fluorescence rheasurements on Cavendish bananas cv
Wliams recorded daily duting chilling exposure treafnent at 5oC for 5 days
and ripenin g at 22'C at ripening stage 1.
Average chlorophyll fluorescence measurement at
ripening stage l"
Chlorophyll fl uorescence
parameter
Chilled bananas
(5"C for 5 days)
Non-chilled bananas
Q2"C)
Fo
Fm
Fv
Fv/Fm
Tf max (ms)
Area
382 a
1799 a
l4l7 a
0.785 a
718 a
21,035 a
368 a
162l a
1253 a
0167 a
929 a
23,866 a
"Means are of 6 replicates; the same subscript \ rithin rows denotes similar
chlorophyll fluorescent measurements at P>0.05.
51

Chapter 4: Preriperiing Detection of Chdlmg Injury
All fluorescence parameters declined \Mith time as the fruit lost chlorophyll
during ripening from stage I to 4. However, the rates of decline of the
chlorophyll fluorescence pmameters did not vary in response to chilling injury
of bananas (Table 4.2).
Table 4.2zThe daily change in chlorophyll fluorescence parameters measured
on Cavendish bananas cv. Williams that were stored at 5oC for 5 days followed
by storage at22"C until ripening stage 4, or stored at room temperature only
(22"C) until ripening stage 4 (more yellowthan greÐ.
Change in parameter per daf
Chlorophyll fl uorescence
paræneter
Chilledbananas
(5"C for 5 days)
Non*hilledbananas
(22"C only)
Fo
Fm
Fv
FvÆm
Tf max (ms)
Area
-39 a
-481 a
431a
-0.172 a
-1.42 a
4,864 à
-18 a
-437 a
-437 a
-0.147 a
-1.42 a
4,864 a
'Means are of 6 replicates; the same superscript within rows denotes similar
changes in parameters at P >0.05.
52

Chapter 4: Preripening Detection of Chillmg Injury
4.3.2 P olyphenoloxidase
Polyphenoloxidase (PPO) activrty was measured in banana peel of chilled and
non-chilled bananas. Hoyever, the activity of PPO in chilled fruit was not
different to that of non-chilled fruit (Table 4.3).
Table 4.3: The pollphenoloxidase activity in the vascular tissue from the peel
of Cavendish bananas cv. Williams stored at ripening stagel at 5oC for 4 days,
compared to bananas stored at22"C for 1 day at ripening stagel.
Storage feátment Polypherioloxidase rate atripening stage I'
(nmoles min.-l g.f.wt-t)
Chilled bananas
Non chilled bananas
263 a
252 a
'Mearts are of 6 replicates; the same subscript denotes sittrilar
polyphenoloxidase activity at P>0.05.
53

Chapter 4: Preripening Detection of Chi[ing Injury
4.4 Discussion
Chlorophyll fluorescence measurements reported in this chapter could not be
used to detect chilling i"j".V in Cavendish bananas cv. William,s, even where
visual symptoms of the disorder were obvious. The localisation of the browning
pigments associated with chilling injury was in the sub-epidermal vascular
tissue, whereas chlorophyll fluorescence measurements were taken on
epidermal+hlorophyll containing tissues. It seems likely that the photosynthetic
chloroplasts which are located in epidennal cells are less chilling sensitive than
the vascular tissues where the enz¡mes and substrates required for browning are
localised. Therefore enzymatic browning is unlikely to be associated with
photosynthetic changes, and so chlorophyll fluorescence measurements are not
a good indication of mild chilling in compárison to severe chilling where
chloroplast disruption can be measured by fluorescence (Smillie et al., 1987).
Chloroplast function deteriorated in cells due to severe chilling injury, leading
to decreases in chlorophyll fluorescence emissions (Smillie and Hetherington,
1990). A change in chlorophyll fluoiescence due to ripetting rather than chilling
injury was observed; this may have been due to the parameters measured
(Smillie and Hetherington, 1990). The chlorophyll fluorescence instrument
available for this experiment determined which parameters could be measured.
Fp that was determined to indicate severe chilling inj".V (Smillie et aL.,1987)
could not be measured. However, results in section 4.3.1 indicate that F6, Fy,
F¡a, FyÆ¡a, Tf*u* and Area parameters were unsuitable chilling itjory indicators
for mafine green bananas.
PPOs are bound to chloroplasts and cell walls (Shomer et al., 1979 Marques e/
al. , 1995;Amiot et al., 1997), but browning reactions ensue when the enzqe
54

Chapter 4: Prerþening Detection of Ct"tlglryty
becomes mobile and able to interact with substrates from plaSids and vacuoles
due to chilling rn:ury and subsequent membrane leakage (Stover and
Simmonds, 1987; Wills et al., 1998). The resulting brown substances are
distributed around the vascular tissues (sieve tubes) of banana peels (Mwata,
1969). Similarly chilling injury in tomatoes was also observed around the
vascular tissue of fruit (Hong and Gross, 2000). Therefore, it seems likely that
the sieve tubes that are present in the phloem Íre sensitive to chilling stress.
The sensitivity of sieve tubes to chilling shess maybe due to their cell anatomy
consisting only of cytoplasm without a nucleus (Salisbury andRoss, 1985) and
therefore little ability to carryout cellular repairs after chilling stress has
occurred.
The visible build-up of brown pigments in the sieve tubes around the vascular
tissues of the fruit increase in ntrmber with chilting severity (Murata, 1969)
gving rise to the various degrees of chilling injury symptoms observed on
banana peels. A low build-up causes slight discolouration with a higher build-
up causing severe discolouration, although the peel in severely chilled fruit is
generally discoloured as well as the vascular tissue. Apossible method
investigated to detect the early appearance of this discolourdtion was to measure
the PPO enzyme activity in the peel of chilled fruit.
PPO activities in chilled as well as non-chilled mature green bananas at stage 1
were similar, contary to studies by Thomas and Nair (1971) that reported a
correlation between browning and the activity of PPO in bananas upon injury
with gamma irradiation. This was thought to be due to chilling injury causing
cellular leakage after cell membrane degradation, allowing the PPO enzyme to
mix freelywith its subsfiates, rather than increasingPPO activity.
55

Chapter 4: Preripemng Detection of Chi[ing Injury
Changes in PPO activity in bananas \À/ero reported by Ornuaru and Izonfuo
(1990), where ripe peel had an 18-fold increase in PPO activity, compared to
green peel. This was thought to be due to cellular leakage after cell membrane
degradation, allowing the PPo en'4lme to mix freely with its subsfrates'
However, Amiot et al. (1997) and Goodinget al. (2001) reportedthatPPO
activity does not increæe during storage, so Omuaru et al. (1990) may have
confirsed PPO activity with an increase in the browning reaction due to substrate
leakage during ripening. Gooding et al. (200I) reported that banana PPO
activity retnained constant at all ripening stages, arrd after 72hrs after inducing
mechanical wounding only a slight increase irt banana peel PPO activity and no
increase in flesh PÞO activity was found. They concluded that as the peel
increase was negligible in wounded fruit when compared to non-wounded fruit
the wound defence response of increased PPO activity is not present in bananas.
This possibly explains why PPO activity did not increase in chilled fruit as.:
reported in sectioh 4.3.2.
It is also posslble that the PÞO activity o!'tron-chilled' fruit used in this
experiment had béen increased in the field by being exposed to in-field chilling
temperatures. Bananas were háfVested in JUly after a month where the daily
temperature dropped below the cfitical chilling temperature of 13"C on two
consecutive days @ureau of Nrleteorology, 2000-01). This mayhave already
increased the PPO activity in the peel similarly to that of the postharvest chill-
induced fruit. Howevet, as both þeet anO flesh contain high levels of PPO
isorymes throughout their deveibpthent (Goodifi g et a1.,2001); it is still unlikely
that this technique would be usefril for eady detection of chilling injury.
56

Cløpter 4: Pre-rþening Detection of Chilling Injury
4.5 Conclusion
Meastring chlorophyll fluorescence levels or PPO activity didnot allow
discrimination between chilled or non-chilled bananas. Mild chilling injury is
of most concem to wholesalers and markets, but unlike severe chilling injury,
the chloroplast disruption caused by mild chilling is not measurable using
fluorescence. Measuring PPO activity was also found to be an unsuitable
method of chilling injury detection, as PPO activity is alreadyhigh and is little
affected by physical and physiological stresses. Further research into the early
detection of chilling injury is required to ensure Australian winter grown
produce most susceptible to chilling injury are handled appropriately. This may
mean lowering prices, discarding produce (if better produce is around) or
ripening fruit at higher temperatures (see chapter 5).
57


Chapter I
5.1 Introduction
Ripening of bananas in commercial practice is regulated by adjusting npening
temperature, ethylene concentration and humidity to achieve a zuitable ripeness
within a planned period of time to satisfu retailer demand. Suggested banana
ripening temperahres differ, including I 4-21' C (Palmer, I97 I), 16-17 " C
(Maniott, I 980), 14-24" C @eacock, I 980), I 8-20"C (Salunkhe and Desai,
1984), 16-21'C (Israeli andLahav, 1986) and 16-18'C (Turner, 1997). These
are all adequate ripenitrg temperatufes for Cavendish bananas (cv. Williams),
but maynot be optimal in all seasons of the year.
Palmer (I97I) suggests th¿t there is considerable diffrcuþ when predicting the
ripening behaviour of h¿rvested baflanas in Australia due to large temperature
variations between seasons. The e$ect of summer and wirtter harvesting on
optimun ripening temperatures of bananas in Ausüalia (QLD and NSW) was
briefly investigated by Young and colleagues between 1929-31 (Yowtg et al.,
1932),and later by Rippon and Trochoulias (1976). Young et al' (1932)
recommended ripening temperatures of 20 or 2l"C in sunmer and l9'C for
58

Chapter 5: Optimising Ripemng Temperatures and Ethylene Concentrations Tlroughout the Year
winter. Rippon and Trochoulias (1976) agreed that in Australia l9"C was best
used for winter bananas, but found that harvested summer bananas should be
ripened at 17"C. However, only two quality parameters (shelf life and pulp
firmness) were measured @ippon and Trochoulias,l9T6). Other important
commercial parameters, such as visual peel appearance and eating quality,
should also be considered (Israeli and Lahav, 1986).
Bananaripening is sensitive to exogenous ethylene gas @eacock,l972),:urrilr
levels of as little as 0.1 pL Lr for Z4hrsable to induce ripening (W1l7s et al.,
l99S). However, commercial npening enterprises use the higher rate of 300 ¡rL
L 1 of ethylene to ensure a uniform and rapid rate of ripening initiation
@.Charhes, Chiquita Brands South Pacific, pers. comm .,1999). There is no
evidence, however, of the effect various levels of ethylene may have on the
quality of bananas ripened throughout the year
The aim of this study was to reþort the quality effects of various ripenltrg
temperatures and exogenously applied ethylene levels on fruit harvested in
different months of the yeaf. Extefnal dnd internal quality parameters including
banana green life, shelf life, peel appearance, pulp firmness, soluble solids and
aroma were measured to détermine optimal banana quallty results from industry
ripening procedures.
5.2 Materials and méthods
5.2.1 Plant material and procedure
Cavendish bananas cv. Williams were harvested in altemate months of the year
from January to November 2000. Fruit from one property in Tully, North
Queensland, were hansported and prepared as detailed in sectíons 3.1 and3.2.
59

Chapter 5: OptimisirE Ripening Temperatures and Ethylene Concentratiors Throughout the Year
After fingerpreparation, bananas were randomly allocated to ripening
treatrnents.
Treatnents were applied in sealed 10-L plastic containers that cont¿ined six
banana fingers, a carbon dioxide scavenger (160 g ofCa(OII)2) and a saturated
KNO3 solution to maintain a relative humidity of 95o/o. Containers were
randomly allocated to monitored, temperature confrolled rooms.
5.2.2 Etrect of ripening temperature and harvest months
Similar to commercial practice @. Chartres, Chiquita Brands South Pacific,
pers. comm.,lggg),bananas were ripenedatl4,16, 18 or20"C after ethylene
gas injections produced a calculated concentration of 300 ttl- Ut ethylene in
each container. After 24hrs,the containers \ilere vented for 30 min., and
ethylene was reapplied. Thereafter, containers were vented daily, without
ethylene application, until fruit were more yellow than green Gtage 4). Bananas
were then placed into vented poþthylene bags at22"C and assessed daily until
fruit staned to senesce, showirtg a yellow peel colour with light brown flecks
(stage 7).
5.2.3 Effect of ethylbde concedtþations and h¿fvest months
Bananas were ripened at l6'C with 50, 300 or 1000 pL L1 ethylene gas. After
24hrsthe containers were vented for 30 min. and ethylene was reapplied.
Ethylene levels applied were monitored as described in section 3.3, using a gas
chromatograph connected to a flame ionisation detector. Containers were
vented daily after 48 hrs of ethylene gas, without frirther ethylene reapplication.
At ripening stage 4 (more yellow than green) batranas were removed from their
containers and placed into polyethylene bags at22'C and assessed daily until
60

Chapter 5: Optimising Ripening Temperatures and Ethylene Concentrations Tlnoughout the Year
they reached ripening *age 7 (full yellow with light brown flecks)
5.2.4 Quality assessilents
Treated bananas were assessed for green life, shelf life, peel discolouration,
total weight loss, pulp firmness, soluble solid concentrations and aroma analysis
as outlined in the general materials andmethods (sections 3.5 and 3.6).
5.2.5 Statistical assbssiledt
Every 2 months of the year 20001 2 simultaneousþ run experiments were set up
with bananas placed atthe 4 temperatures or 3 ethylene concentrations, with 3
different plantation blocks froln I property acting as replicated, randomised
complete blocks. Every ripenirrg temperature and ethylene concentration
treatnent for each reþli,cate contditred l2bananafngers; 6 were used for
extemal assessments ând the remâining 6 were used for intemal assessrnents.
Data, except aroma dáta, were analysed with the Genstat 5 program @elease
4.!,4ú edition, 1998, Lawes Agricultural Trust, Rothamsted Experimental
Station) using the Gener¿l ANOVA directive for two factors, harvest date and
ripening temperature or haivest ddte and ethylene concenfiation. A least
significant difference test (LSb) dtthe 5o/olevel was used to determine
signif,rcant differences between means.
APirouette analysis package (Infometrix Inc, Woodenville, WA, USA) using a
Principal Component Analysis (PCA) was used to detennine any ¿ìroma
differences as describedin section 3.6.3.1.
6l

Chapter 5: Optimising Ripening Temperatures and Ethylene Concentrations Tlroughout the Year
5.3 Results
5.3.1 Climatic data for Tully, North Queensland
Dailyminimum temperatures were recorded at the South Johnstone research
station for the month prior to harvest; the graph is missing some data as not all
dailymeasurements were recorded @gure 5.1, Bureau of Meteorology, 2000-
2001). The months before the July and September harvests show 4 and 9 days,
respectively, on which the daily minimurn temperature dropped to l3oC or
below. All other minimum field temperatures recorded in the months prior to
harvest were between 15 and 25"C.
Two cyclones crossed the northern Queensland coast betwe en25-29hEebruary
and l-3'd April 2000 (cyclones indicated on Figure 5.2-5.4). Cyclone Steve, a
category 2 cyclone, hit the coast on the25h February, with wind gusts of 125-
170 lan hr 1, causing considerable structural darnage to banana plants used in
this research project (T. Johnson, Chiquita Brands South Pacific, pers. comm.,
2000). The second cyclone, Cyclone Tessi, was a category I cyclone with
winds that did not reach above 125 kn hr I resulting in minimal sfuctural
damage.
62

Chapter 5: Optimising Ripening Temperatu¡es and Ethylene Concentrations Throughout the Year
-+January 20OO
-+ May 2000 4l-July 2000{-November20002000
nt 13'Cti
30
25
6,20oãa!
8-EI 'tsEaEE.E
àrooo
5
31 29 27 25 23 21 19 17 15 13 11
Days þliot to harvest lnonth
97531
Figure 5.1: The daily minimurh air tdrhpe¡afures ("C) from South Johnstone
Research Station @ureau of Meteorology, 2000-01) for the month prior to
harvest. Minimum daily temperatures were not recorded on days missing
appropriate synbols.
q
63

Chapter 5: Optimising Ripening Temperatures and Ethylene Concentrations Thrroughout the Year
5.3.2 Effect of ripening temperature and harvest months
Increased green lives (ripening stage I - 4) were observed for lower riperung
temperatures throughout the year (Figure 5.2), with bananas ripened atl4"C
requiring 30{,0% longer to ripen to stage 4 than bananas ripened at 16, l8 or
20oC. Green lives of bananas ripened at 18 and 20oC were similar within
months, but were l-2 days longer in September and November compared to
other harvest months. Similarly bananas ripened at 14 and l6oC, had slightly
longer green lives in September andNovember compared to those ripened in
January, March, May and July. The maximum green life of ll days was
achieved in September using a ripening temperature of l4oC, and the minimum
green life of 3 days was achieved in January using a ripening temperature of 18
or 20oC.
&

Chapter 5: Optimlsing Ripening Ternperatures and Ethylene Concentrations Tluoughout the Year
Autumn \üinter Spring
Cyclone I Cydone 2
Summer
14
12
10
8
6
oot,oEtrd,oo
4
2
0
January March May July
Month hdrvested
September November
Figure 5.2: Green life (ripening stage 14) of Cavendish bananas cv. Williams
harvested bimonthly and ripened at 14, 16,18 or 20"C with 300 pLLl ethylene.
Each column represents the mean of 3 replicates consisting of 6 bananas each;
the bar denotes least significant differences between temperatures vvithin
months e<0.05). Climatic events are shown above.
a14"C I16"C tr18"C n20'CJ rsd (0.e)
65

Chapter 5: Optimlsing Ripening Temperatr¡res and Ethylene Concentrations Tlroughout the Year
Bananas ripened at higher temperatures (18 and 20'C) in January, May and
November hada16-370lo shorter shelf life than those ripened at lower
temperatures (14 and 16"C) (Frgure 5.3). In March and July, ripening atl4"C
resulted n a20-50%o increase in shelf life, compared to those ripened at 16, l8
or 20oC. Bananas ripened at the various temperatures during September had
similar shelf lives of about 6 days The maximum shelf life of 9 days was
achieved in May using a ripening temperature of 14oC, and the minimum shelf
life of 4 days was achieved in March using a ripening temperature of 20C.
66

Chapter 5: Optimísing Ripening Temperatures and Ethylene Concentrations Tkoughout the Year
Summer Autumn Winter Spring
12Cyclone 1 Cydone 2
10
I
4
0
January fllarch liay July
Month harvested
Septenùer Àlovenöer
Figure 5.3: Shelf life (ripening stage 4-7) of Cavendish bananas cv. Williams
hmvested bimonthly and ripened at 14, 16,18 or 20"C \ rith 300 t I Ut ethylene
Each column represents the mean of 3 replicates consisting of 6 bananas each;
the bar denotes least significant differences between temperatures within
months (P<0.05). Climatic events are shown above.
6o(!tto
=oa
2
t14"C r 16'C tr 18"C a2O'CJ .o ro.nl
67

Chapter 5: Optimising Rip€ning Temperatures and Ethylene Concentrations Throughout the Year
Fruit in January, May and November had a healthy, bright yellow peel
appearance indicated by the low (0 - 0.5) discolotuation index scores (Figure
5.4); these readings were similar for all ripening temperatures used. Ripening
temperatures in March, July and September affected banana peel appearance
(Figure 5.4), with ripening temperatures of 14 or l6oC resulting in more
discolouation than 18 or 20"C. Fruit harvested in March and July appeared a
geylsh yellow colour compared to those harvested in January, May and
November, while fruit ripened in September had a similar grey/yellow peel as
well as distinct red,/brown vascular streaking.
68

Chapter 5: Optimising Ripening Temperatures and Ethylene Concentrations Tlroughout the Year
Summer Autumn Winter Spring
Cyclone I Cyclone 2
3
2xott.E
.9a!
-9ottoi5
0
January $larch Itihy Juty
Month harvested
Septenber ltvenöer
Figure 5.4: Dscolouration index of Cavendish bananas cv. Williams harvested
bimonthly and ripened at 14,16,18 or 20"C with 300 pLLl ethylene where, (0)
represents healthy or yellow peel, (l) slight yellow grey peel, (2) red/brown
vascular sfreaking along banana neck or (3) red/brown vascular streaking along
length of peel. Each column represents the mean of 3 replicates consisting of 6
bananas each, the bar denotes least significant differences between temperatures
withinmonths (P<0.05). Climatic events are shown above.
J14"C ¡ 16'C
tr18"C a2O"C
lsd (0.6)I
69

Chapter 5: Optimising Ripening Temperatures and Ethylene Concentrations Tlroughout the Year
Bananas ripened at2}'Cwere 5-15%0 firmer than those ripened at l4"C nJanuary, March and May, but had similar f,rmness readings in July, September
and November (Figure 5.5). Average finmess readings were similm between
most months.
120
0
January March May July
Month harvested
September November
Figure 5.5: Pulp fimrness of Cavendish banana pulp cv. [lilliams at ripening
stage 6, harvested bimonthly and ripened at 14,16,18 or 20'C with 300 pLLr
ethylene. Each column represents the mean of 3 replicates consisting of 6
bananas each; the bar denotes least significant differences between temperatures
within harvest months (P<0.0 5).
140
00
6'È580.Dø(,trEÈ60_o.)À
40
20
a14"C I16"C tr18"C 120"C= lsd 15.4)
70

Chapter 5: Optimising Ripening Temperatures and Ethylene Concentrations Tlroughout the Year
Overall, SSC varied between ripening temperatures, with bananas ripened at 14
or 16oC having a higher average of 23.0- 23.4% than those ripened at 18 or 20"C
with an average of 22.0Yo. Monthlytends showed an increase in SSC levels
dnringJulyand September (24%)with lower SSC in othermonths (21.0-
22.s%).
10
35
30
25
¡20õU'u, 15
5
0
January March May July
Month harvested
September November
Figure 5.6: Soluble solid concentration of Cavendish banana pulp cv. Williams
at ripening stage 6, harvested bimonthly and ripened aI14,16,l8 or 20'C with
300 FL Ll ethylene. Each coltunn represents the mean of 3 replicates consisting
of 6 bananas each; the bar denotes least significant differences between
temperatures within harvest months (P<0.05).
a14'C r 16"C tr 18"C tr20"C1. lsd (0.9)
7t

Chapter 5: Optimisrng Ripenine Temperatures and Ethylene Concentrations Throughout the Year
Weight loss of bananas after ripening at various temperatures throughout the
ye¿ìr was significant with increased weight loss of 2.1% when ripened at the low
temperature of 14oC, comparedto 1.6%o atl6-20"C. This weight loss
difference was statistically signifrcant but not visually obvious.
Aroma of bananas ripened at 14, 16, I 8 and 20 oC were analysed by mass
spectroscopy at ripening stage 6. The PCA model used to compare these data
between ripening temperatures within and between months explained 92Yo of
the total variance with two factors, where 79%o and l3%o related to Factor I and
2, respectively. The majority of the vmiation between treatments was identified
by Factor I and so the results will focus on Factor I (refer to section 3.6.3.1).
All bananas ripened in July and September as well as bananas ripened at 14 and
16'C in November and those ripened atl|'C in March and May, were located
on the negative side of Factor I and correlated to ion 55 @gure 5.7 and 5.8).
All January ripened bananas, as well as those ripened at 16, 18 and 20"C during
March and May, and bananas ripened at l8 and 20"C in November, were
located on the positive side of Factor I and correlated with ion 61. Aroma
compounds were identified with the aid of an established volatile compound
libraryused in conjunction with the chemical nose loadingplot @gure 5.8).
Volatiles identified included, l-butanol, 3-methylbutyl ester, 2-hexenal, butyl
esters arìd ethyl acetate.
72

Chapter 5: Optimising Ripening Temperatures and Ethylene Concentrations Throughout the Year
4
n
t&
0
-n Ripe andunripe aroma Ripe and over-ripe aroma
0
w
Figure 5.7: PCA chemical nose score plot of Cavendish bananas cv. [4/illiams
September (S) or November (N). F,ach data point represents means of banana
samples for a single replicate. Ripening treatments consisted of 3 replicates.
2
n-n
1€M
1til/
14ûû(
73

ñtooõr
Chapter 5: Optimising Ripenirig Temperatures and Ethylene Concentmtions Tluoughout the Year
Factorl
Figure 5.8: PCA chemical noss loading plot of ions (variables) derived from
Cavendish bananas cv. Williams ripened at14,16,18 or 20'C in January,
March, May, July, September orNovember.
74

Chapter 5: Optimising Ripening Temperatures and Ethylene Concentrations Throughout the Year
5.3.3 Effect of ethylene concentrations and harvest months
Ethylene concentrations did not affect green life, shelf life or discolouration
indexes, but quality results were variable throughout the year (Flgure 5.9, 5 . l0
and 5.11). Similarly to previous harvest month results September harvests had
significantþ higher discolouration indexes and green lives, but lower shelf lives,
compared to bananas harvested in other months of the year. Banana weight loss
varied between ethylene concentration and harvest months, with higher weight
losses found when fruit were ripened with the lower 50 pL L 1 ethylene
concentration averaging l.9o/o, compared to 1.7%o and I.60/o weight loss when
ripened \A¡ith 300 and 1000 lt[- L*\ ,reqpectively. Total weight loss from ripening
stage 1 to 6 averaged between 1.5 -2.1% of total banana weight, but it was not
visually obvious.
75

Chapter 5: Optimising Ripening Temperatures and Ethylene Concentrations Throughout the Year
Summer Autumn \üinter Spring
Cyclone 1 Cydone 2
E9
lsd (0.3) El50 pUL I300 pL/L 11000 ¡tUL
January March May July
Month harvested
September November
Figure 5.9: Green life (rþening stage 14) of Cavendish bananas cv. [üilliams at
ripening stage 6, harvested bimonthly and ripened at l6"C with 50, 300, or 1000
pL L-t ethylene. Each colurnn represents the mean of 3 replicates consisting of 6
bananas each; the bar denotes similarities between ethylene concenfrations
within months (P<0.05). Climatic events are shown above.
10
II7ø'
lú^tt
ÊsEE4O3
2
1
0
76

Chapter 5: Optimising Ripening Temperatures and Ethylene Concentrations Throughout the Year
Summer Autumn Winter Spring
Cyclone I Cvdone 2
12
10
Eil Fil E
I lsd(1.0) 850 ¡.rL/L I300 pL/L t 1000 pL/L
January March May July
Month harvested
September November
Figure 5. 10 : Shelf life (ripening stage 4 -7) of Cavendish bananas cv. Williams
at ripening stage 6, harvested bimonthly and ripened at 16"C with 50, 300, or
1000 pL Ll ethylene. Each column represents the mean of 3 replicates
consisting of 6 bananas each; the bar denotes similarities between ethylene
concentrations within months (P<0.05). Climatic events are sho\iln above.
8
6
ø,
(!ttú,!=
õat) 4
2
0
77

Chapter 5: Optimising Ripening Temperature and Ethylene Concentrations Throughout the Year
Summer Aufumn Winter Spring
Cyclone 1 Cyclone 2
3
2
xott.EEoo
=oõooo t il rlI
H tI
tr50 pL/L 1300 UL/L I1000 pUL
lsd (0.7)
0
January March May July
Month harvested
September November
Figure 5.11: Discolouration index of Cavendísh bananascv. Williarms harvested
bimonthly and ripened at l6"Cwith 50, 300 or 1000 pL L 1 ethylene where, (0)
represents healthy or yellow peel, (1) slight yellow grey peel, (2) redibrorvn
vascular steaking along banana neck or (3) red/brown v¿rscular streaking along
length of peel. Each column represents the mean of 3 replicates consisting of 6
bananas each; the bar denotes similarities between ethylene concenfrations
withinmonths (P<0.05). Climatic events are shown above.
78

Chapter 5: Optimisrng Ripening Temperatures and Ethylene Concentrations Tlroughout the Year
Similarly, average SSC were similar for bananas ripened with 50 and 300 pL LI of 23%o compared to 22o/owhen ripened with 1000 pL Ll . However, bananas
from July and September harvests averaged higher SSC of 24%, compared to
those harvested in January, March, May and November of 22-23Yo (Figo.e
5.13).
January March May July
Month harvested
September November
Figure 5.13: Soluble solid concenfations of Cavendish banana pulp cv.
Williams at ripening stage 6, harvested bimonthly and ripened at l6'C with 50,
300, or 1000 pL Lr ethylene. Each colunn represents the mean of 3 replicates
consisting of 6 bananas each; the bar denotes least significant differences
between ethylene concenfrations \ /ithin months (P<0.05).
35
30
25
Szo8rcal,
10
5
0
r 1000r300UL850
80

Chapter 5: Optimising Ripening Temperatures and Ethylene Concentrations Throughout the Year
Banana ¿ìromas after ripening with 50, 300 and 1000 pLLl ethylene gas at
16oC were analysed when fully ripe using a chemical nose. A PCA model was
used to compare data of bananas ripened with the various ethylene
concentrations within and between harvest months, with the resulting plot
(Figure 5.14) explainng92% of the total variance with 2 factors. Factor I
related to 84Yo, while Factor 2 relatedto 8o/o of the variance. Again Factorl
comprised the majority of the variation, so it will be the focus of the results
(refer to section 3.6.3.1).
Ethylene concentrations did not affect banana aroma, as all ethylene treated
fruit from the same harvest month clustered in groups on the score plot
(Figure 5.I4), indicating similar profiles. However, similarly to Figure 5.7
and 5.8, July, September and November ripened fruit aromas clustered on
the negative side of Factor I correlating to ion 55, while January, March and
May harvested fruit aromas clustered on the positive side of Factor 1 relating
to ion 61. The loading plot for ethylene concentrations was the same as
observed in Figure 5.8. Aroma compounds identified in the ripening
temperature experiments including, 1 -butanol, 3 -methylbutyl ester, 2-
hexenal, butyl esters and ethyl acetate were similarly identified in this data
analysis.
8l

NoûL
Chapter 5: Optimising Ripening Temperatures and Ethylene Concentrations Throughout the Year
-20 0
Factorl
20
Figure 5.14: PCA chemical nose score plot of Cavendish bananas cv. Williams
ripened aI"l6'C\4'ith 50 (5), 300 (3) or 1000 (1) pL Lr ethylene gas in January
(J), March (M), May (MY), July (JU), September (S) or November (N). Each
datapoint represents means of banana sarnples for a single replicate. Ripening
treatments consisted of 3 replicates.
1MY
tì,1Ysr'fiM
82

Chapter 5: Optimising Ripening Temperatures and Ethylene Concentrations Ttroughout the Year
5.4 Discûssion
Green life and shelf life are important commercial pa.r¿rmeters, but visual
appearance is equally as important. Even though ripening temperatures of 14
and 16'C extended shelf life in most months, the resulting fruit appearance was
not always appealing. Low temperatures slow down respiration and metabolic
rates which ultimately extends the entire ripening and senescence process
(Couey, 1982; Wills et a1.,1998).
Rippon and Trochoulias (1976) reported ripening temperatures were critical in
determining shelf life of bananas harvested throughout the year from NSW,
Australia. Holding temperatures after ripening had little influence on shelf life,
although holding temperatures of 10'C or higher than the initial ripening
temperatures prevented fruit from ripeningnonnally. Contrary to the previous
observations, fruit harvested in September had similar shelf lives when ripened
at74-20"C. Fruit harvested in September grew and developed during winter
and were affected by field chilling @tueau of Meteorology,2000-2001), which
has been found to directly or indirectlyreduce the shelf life of bananas (Seberry
and Harris, 1993). This would account for the similar shelf lives in September
when ripenedatl4-20"C compared with other months, when ripeningat14 and
16"C extendedbanana shelf life byup to 50%.
Chilling injury is a physiological disorder of bananas caused by temperatures
below l3"C for cv. Williams that lowers their visual appearance due to, for
example, subepidermal browning upon fruit ripening (Olorunda et a1.,1978;
Israeli and Lahav, 1986; Stover and Simmonds, 1987; Wills er a1.,1998).
Subepidemral browning is caused by enzymatic oxidation of dopamine
generally by polyphenoloxidase (Murata,1969). This accowrts for the high
83

Chapter 5: Optimising Ripening Temperatures and Ethylene Concentrations ThLroughout the Year
levels of peel discolouration observed in July and September harvested fruit that
grew and developed during winter. Field temperatures in the month before
these harvests dropped to near or below l3"C on 4 and9 days, respectively
(Bureau of Meteorolory, 2000-200 I ).
Bananas ripened at14 or 16'C in July and September all had significantly
higher levels of discolouration, compared with those ripened at 18 or 20"C.
Iængthy development in winter and ripening periods at low temperatures caused
an increase in peel discolouration, compared with that observed on bananas that
developed in warmer periods of the year, or on those that were ripened at higher
temperatures (18 or 20'C). This is due to a complex Fme-temperature
relationship, where long exposure periods to temperatures at or near the critical
chilling temperature give a similar induced injury response to that of extremely
low temperatures for short periods of time (l\4arriott, 1980; Wills et aL.,1998).
Fruit that were stressed prior to ripening and that were further sfressed when
ripened at near chilling temperatures were not able to recover from the initial
chilling exposure period. This explains the high discolouration index recorded
in bananas harvested in July and September when ripened at above chilling
temperaftres (14 and l6"C).
March harvested bananas also had higher levels of discolouration when
ripened at 14 and 16"C, compared with 18 and2}"C, even though they grew
largely during summer months, and so were not affected by chilling in the
field. However, they had been subjected to wind gusts of 125-l70lan hr-l
due to a category 2 cyclone only weeks before harvest (Bureau of
Meteorology,2000-2001), causing visual injury due to excess physical stress.
Peel appearance of March harvested fruit was also influenced by low light
84

Chapter 5: Optimisrrg Ripening Temperatures and Ethylene Concentrations Thnoughout the Year
levels due to cloud cover during late January and February, a common
occurrence in Queensland (T. Johnson, Chiquita Brands South Pacific, pers.
comm., 2002). The low light levels may also be influenced by the use of
blue bunch covers in the field, which are generally used to increase day
temperafures and reduce mechanical damage of bunches, but may also
prevent light penetration. Low light levels cause dulling of the bloom (a
waxy coating) on bananas, which has a similar appearance to mild chilling
injury synptoms on the peel (T. Johnson, Chiquita Brands South Pacific,
pers. comm.,200l).
Bananas ripened between 14 and 20'C in January, May and November all
had relatively low discolouration indexes, because their development
occurred during autumn, spring or summer when field temperatures were
above the chilling temperature of 13"C and light levels were high.
Green life, shelf life and peel discolouration was not affected by ethylene
concentrations during the initiation of ripening. This is supported by Quazi
and Freebairn (1970), who suggest the critical ethylene level required for
ripening is produced by autocatalytic ethylene production in the fruit tissues
after ripening initiation and not by the exogenous ethylene initially applied.
Ripening temperatures of 14 and 16"C and ethylene concentrations of 50
and 300 pL Ll generally resulted in higher SSC levels (l-2%) and up to a
15oá softer pulp. Similar firrnness results were reported by Rippon and
Trochoulias (1976), but were not observed by Peacock (1980). Low ripening
temperatures reduce metabolic rates and delay ripening (Wills et aL.,1998),
consequently extending the time fruit have for textural changes in the pulp as
well as for starch to sugar conversions to occur. This would only affect
softening and sugars if those en4lmes were to be affected less than visual
85

Chapter 5: Optimising Ripening Temperatures and Ethylene Concentrations Tlroughout the Year
ripening (Rhodes, 1980). Even though SSC levels were significantly lower
when bananas were ripened at higher temperatures or higher ethylene
concentrations, SSC was always above 18olo, which is the lowest acceptable
level for fully ripe bananas (CSIRO, 1972). Also consumer detection of
these SSC differences would be unlikely, as people differ in their perception
and sensitivity to sweetness in various foods (Land, 1988). Also, Stevenson
et al. (1999) reported odours influence the perception of sweetness in foods,
so as banana profiles are not affected by the ripening temperatures and
ethylene levels; the SSC differences are unlikely to be detected due to the
similar banana aromas.
Weight loss occurs continually through transpiration (Turner, 1997) and so
the amount of weight loss varied, with bananas ripened at l4"C requiring the
longest ripening periods, therefore resulting in the highest weight losses. It
did not, however, affect the visual appeardnce of the fruit.
All bananas analysed had ripe banana aromas, such as fruity esters found in
fully ripe bananas (Marriott, 1980). However, my bananas also had either
unripe or over-ripe aromas at stage 6 Ripe aroma compounds (l-butanol
and 3-methylbutyl ester) and to a lesser extent unripe aroma compounds (2-
hexenal) were found to be related to the negative values of Factor 1, while
ripe (butyl esters) and overly ripe aromas (ethyl acetate) were related to the
positive values of Factor l. No off odours or reduced aroma preferences
were found due to mild chilling (Klieber and Muchu|2002), and therefore
varying ripening temperatures of l4-20oC, ethylene levels of 50-1000 pL L-t
as well as different harvesting times of the year are unlikely to have caused
aroma acceptability differences. This is in contrast with severe chilling,
where banana aroma lacks flavour and sweetness (Palmer, l97l).
86

Chapter 5: Optimising Ripening Temperatures and Ethylene Concentrations Tlroughout the Year
Even though different months of the year and ripening temperatures resulted
in varying banana aroma, this aroma difference does not include unpleasant
banana aromas and so would not influence consumer acceptability. The
detection of a less ripe aroma would depend on individual consumer
preferences (Land, 1988), which for 960/o of consumers varies between
banana stage 4 (more yellow than green) and 7 (fully yellow with light
brown flecks) (Anonymous, Your guide to greater profits, undated). As
banana aroma acceptability is critical to industry, it was essential for banana
aromas to be unaffected by ripening procedures throughout the year, because
of the continual market demand.
While Peacock (1980) found that ripening temperatures between 14 and
24'C did not affect banaria weight, pulp finnness, shelf life or eating quality,
we found that ripening temperatures of bananas harvested at various times of
the year had a substantial effect on banana shelf life and visual peel
appearance. My results support Rippon and Trochoulias (1976) and Young
et al. (1932) who recommend a ripening temperature of 19"C for winter
harvested fruit. However, our findings do not support the recommendations
by Young et al. (1932) of using the higher ripening temperatures of 20 or
2l"C during summer compared to 19"C in winter.
Changes in seasonal temperatures, weather patterns and Cavendish clones
since 1932 as well as differences between the New South Wales and
Queensland growing locations may account for the slight differences in
ripening recommendations in the current study. A summer ripening
temperature of 17oC was recommended by Rippon and Trochoulias (1976)
which is similar to our recommendation. However, my results would also
support the use of ripening temperatures as low as l4"C to extend the shelf
87

Chapter 5: Optimising Ripening Temperatures and Ethylene Concentrations Throughout the Year
life of summer harvested bananas, as long as close monitoring of field
conditions (i.e. storms, cyclones) occurs throughout the banana growing
period to avoid visual quality reduction by ripening at these low
temperatures.
5.5 Codcltlsion
Commercial ripening of bananas throughout the year at 18 or 20'C
consistently resulted in fruit with a better peel appearance than ripening at
14 or 16'C. Ripening of bananas at14 andlíoc,when fruit grew and
developed over summer, generally produced good quality fruit with extended
shelf lives, whereas bananas gro\iln during winter and ripened at 14 or l6"C
did not. However, the commercial viability of using ripening temperatures
of 14 and 16"C in summer would rely on the constant mohitoring of climatic
conditions during the banana growing period, as peel appearance can be
negatively affected by sudden climatic changes such as cyclones.
Using 50pL L-l of ethylene in commercial ripening instead of the higher
concentrations currently used, would be cost efficient without decreasing
fruit quality, although the use of higher ethylene corlcentrations of 300 or
1000 FL L-r would not be detrimental to fruit quality and shelf life.
88


Cheptes 6
6. Post-ripening: Nitrogen Atmosphere Exposure
6.1 Introduction
A consumer product survey prepared for the Aushalian Banana Grower's
Council (1999) found that if bananas had a longer shelf life, Ausfalians would
be likely to purchase more. Cunently Australians consume over 15 kg of
bananas per capita per annum (Australian Banana Grower's Council, 1999).
Bananas generally have a relatively short shelf life of only 3 days @. Charhes,
Chiquita Brands South Pacific, pers. comm .,1999),when compared to other
fruit such as apples. Banana shelf life is ended by the senescence process,
causing the visual appearance ofthe fruit peel to degrade from yellow to a
'muddy' brown colour. An extension of banana shelf life between ripening
stage 4 (more yellow than greÐ and 7 (yellow with light brown flecks)
(CSIRO, 1972) wrll appeal to consumers and result in higher purchase
quantities at one shopping occasion.
Currentþ, ripened bananas ¿ìre precooled to 13'C prior to their distribution to
supermarkets (T. Johnson, Chiquita Brands South Pacific, pers. comm., 2000)
This procedure is used to slow down fruit metabolism and therefore delay
senescence (Rippon and Trochoulias, 1976). However, this is costly, and fruit
rewarm rapidly on the shelf, thereby reducing shelf life.
89

Chapter 6: Post-rþening: NiÍogen Atmosphere Exposure
Previous research has focussed on ways to extend banana green life. For
example, modified aÍnosphere packagtng has been suggested as a substitute to
low temperature storage (Scott et a1.,1970); however, this storage is costþ as it
requires ethylene absorbent packaging and carefü handling to prevent damage
to bags and consequently their inner atrnosphere. Wills ¿/ al. (1990)
successfully used short-term nitrogen treafinents to increase the green life (from
harvest to yellow with green tips) of bananas, with nitrogen atmospheres of 3
day duration applied immediately after harvest, increasing their green life by
42%. Nitrogen atmospheres will reduce the availability of oxygen to the fruit
and will in turn inhibit ethylene production and ripening (Thompson, 1998) in
an inexpensive and easily applied method.
A method for slowing the rate of senescence in ripening bananas to extend
shelf life from the point of sale to consumption is required. The aim of this
research was to examine whether storing fruit temporarily in nihogen
atmospheres after partial ripening could extend the sheHlife of bananas without
affecting their appearance or aroma. Results from this study have been
published by Klieber et al. (2002, see attached publications).
6.2 Materials and methods
6.2.1 Plant material and preparation
All fruit was harvested and prepared as described in chapter 3. After
preparation, bananas were randomly allocated to l0-L plastic ripening
containers in the presence of a carbon dioxide scavenger (160 g of Ca(OÐz)
and using a saflrated KNO3 solution to maintain 95o/orelative humidity. All
fruit were ripened at l6"C with 300 pL L1 ethylene gas on two consecutive days
and ventilated daily. At ripening stage 3 (more green than yellow) or 4 (more
90

Chapter 6: Post-ripening: Nitrogen Atmosphere Exposure
yellow than green) fruit were held for various periods in nitrogen (l{z) or
ripened nonnally at room temperature (2lo/o, at22"C).
6.2.2 Nitrogen application for various periods of time at different
ripening stages
Bananas at ripening stage 3 or 4 were held in nitrogen atmospheres (0%
oxygen) for 0, 6, 12 or24 hrs. The two control (0 hrÐ treatments were ripened
normally in air until ripening stage 3 or 4, then removed from the plastic
containers, placed into unsealed polyethylene bags and ftuther ripened at22'C
until the end of the trial. Nitrogen treated bananas were placed in containers
that were flushed with high puntyN2 (BOC gases, Adelaide) for five min.,
before being sealed for the allotted treaûnent periods of 6,12 or 24 hrs at22C.
Afnosphere samples were taken from sealed containers and analysed using a
thermal conductivity detector gas chromatograph (Varian 3300, Varian
Associates Inc., Mulgrave, Victoria) to ensure oxygen (O) and carbon dioxide
(COt levels were ( lo/o and 0% (Wills et al., 1990), respectively, as explained
in section 3.4. On completion of treaünents, fruit were placed in vented
polyethylene bags at22"C to complete ripening.
6.2.3 Nitrogen atmosphere storage in the presence of low or high
relative humidity
A second nitrogen atrnosphere experiment was performed to observe whether
humidity stress was a factor in the results obtained from the previous
experiment. Bananas were prepiled as above and held continuously in air in
folded polyethylene bags (95% RIÐ or were pre-treated in nifrogen for 24hrs.
The atmospheric composition was again monitored. Nitrogen pre-treated
9l

Chapter 6: Post-ripening: Nitrogen Atmosphere Exposure
bananas were then subdivided into two lots; one was held in open polyethylene
bags (65o/oRII) or in open bags with saturated KNO3 solutions added(95%
RII). The relative humidity inside polyethylene bags was measured using a
hand held humidity probe (IIM34C, Vaisala, Helsinki).
6.2.4 Assessments
Atreafnent unit consisted of 12 fruit, six of which were used to assess external
characteristics of the fruit and the ¡srnaining six were used to assess intemal
properties of the bananas. All bananas were assessed for weight loss, shelf life,
discolouration, ftrmness, SSC and aroma as described in sections 3.5 and 3.6.
Statistically, the first experiment was set up as a 4x2factonal randomised
complete block design with 3 replicates. Treatnents included the effect of 0
(air storage) , 6, 12 or 24 hrs of nitrogen storage applied to bananas at ripening
stage 3 (more green than yellow) or 4 (more yellow than green). Replicates of
the experiment were conducted in 3 consecutive weeks on bananas that were
randomly allocated to all freatments.
The second experiment was established as a 3 x2 randomised complete block
design with three replicates and two humidity treafinent levels. Each replicate
consisted of the following nitrogen storage treatnents, 0 (air storage),24hrs
with a high hunidity and24 hrs with a low humidity. All experimental units
were randomly distributed to treatments.
Analysis of most data (shelf life, SSC, firmness and discolouration) was
conducted using the General ANOVA directive in Genstat 5, @elease 41,4ú
edition, 1998, Lawes Agricultural Trust, Rothamsted). Shelf life data for the
first experiment was squared, but has been transformed into original data units
92

Chapter 6: Post-rþening: Nitrogen Atmosphere Expostue
for Table 6.1. Treafnent effects were examined for significance using a least
significant difference test (-SD) at the 5olo level.
Finally aroma data was analysed by principal component anaþis @CA) using
the Pirouette analysis package (Infometrix Inc, Woodenville, WA). Each model
was validated using a cross validation method, which indicated the principal
components that totalled greater than 80% of the variation. Fruit with similar
volatile compounds were grouped together and separated from fruit with
different volatiles on plots.
6.3 Results
6.3.1 Nitrogen application for various pefiods of time at different
ripening stages
Bananas stored in nifiogen atmospheres at ripening stages 3 or 4 for 6,12,24
hrs had similar shelf lives and SSC readings to bananas ripened in air (Table
6.1). The amount of discolouration observed on banana peels varied
significantly with the nitrogen atrnosphere applied (Table 6.1). Nitrogen
exposed bananas had large patches of brown discolouration, which were not
present oh bananas ripened in air. However, air-ripened bananas did have the
appearance of brown vascular sfieaking similar to that found on chilled fruit and
the appearance of the brown discolouration patches on nitrogen-exposed fruit
increased with the length of nitogen exposure (Figure 6.1).
93

Chapter 6: Post-rþening: Nitrogen Atmosphere Exposwe
Table 6.1: Assessments of Cavendish bananas cv. Williams at ripening stage 6,
after exposure to a nitrogen atmosphere for 0, 6, 12 or 24 hrs at ripening stage 3
or 4 at22"C.
Ripening stage and period of time (hrs) for which bana¡ras were stored mnitrogerf
Banana
assessment
Ripening stage 3 Riperung stage 4
0 6 1224067224
Shelf lfe(days)t
Firmness(kPa)-
Solublesolidcontent (%)
Weight loss(%)
Discolourlncex
l0l a 104 b
23.6a 23.0a 23.2a 23.3a 23.2a 23.5a 23.3a 23.1a
2.0 a 2.O a 2.1& 2.2 c 2.1 ab 2.1 ab 2.O ab 2.1b
7.4a 7.4a 6.7a 7.3a 7.3a 7.6a 7.2a 7.6a
0.0 a l.4b 20 c 2.7 d 0.0 a 1.4b 7.9 c 2.8 d
'Dataare averages of 3 replicates and different superscripts within arow denote
significant differences at P< 0.05 using a LSD test.
v Average shelf life (dayÐ data has been back transformed from squared
analysis data.
* Only ripening stages are significarft at the 5Yo level, therefore the averagefirmness of bananas stored at ripening stages 3 or 4 were the only averagesglven.
* Discolouration index where, (0) healthy fruit, (1) slight, (2) mild, (3) severe
discolouration.
94

Chapter 6: Post-ripening: Nitrogen Atmosphere Exposure
E
Figure 6.1 : Brown discolouration observed on nitrogen treated Cavendish
bananas cv. Williams increased with exposure periods; (A) air ripened, (B) 6,
(C) 12 and (D) 24fus of nitrogen exposure.
95

Chapter 6: Post-ripening: Nitrogen Atmosphere Exposwe
Bananas exposed to nitrogen or air at ripening stage 3 hada3Yo lower pulp
firmness than those exposed at ripening stage 4 (Table 6.1). However, pulp
firmness was similar for all bananas from one ripening stage. Nitrogen
aÍnospheres also had a significant effect on weight loss of bananas stored at
stage 3, with longer periods of nitrogen exposure resulting in slightly higher
weight loss. However, this was not observed for fruitremoved at colour stage 4
(Table 6.1).
Bananas at ripening stage 6 had different aroma characteristics after various
periods of air and nitrogen storage. The PCA models built to compare mass
spectrometric chemical nose data of all nitrogen exposed as well as air ripened
bananas explained glYo of the total variance present with 2 factors; as 85% of
the total variance related only to Factor 1, so too will the focus of the results.
Score plots with the 2 factor elements showed discrimination between nitrogen
held and air-stored fruit (Figure 6.2). However, some nitrogen exposed fruit had
a central value disfibution within the plot (eg. C, Figure 6.2), while some (eg.
D) were located to the left of the plot. This zuggests some variability between
nitrogen treated fruit, even though no clear fend for exposure period was
apparent.
96

Chapter 6: Post-ripening: Nitrogen Atmosphere Exposure
raêJÉr--e\
'E.Ë'ËE\/
1!oõlf
It\
a'l'1"
Fadorl
Figure 6.2: The score plot of ripe Cavendish bananas cv . Williamr exposed to
nitrogen atrnospheres for 0 hrs (air) at stage 3 or 4 (,\ g, - ) at stage 3 for 6,
l2,24hrs (C, D, E, - -) or at stage 4 for 6,12 or 24hrs (F, G, II, ..." )
Observations between the plot of the mass to charge ratios of ions (variables)
that contribute to sample discrimination @igure 6.3) and the sample positions in
the score plot @igure 6.2) are evident, with a strong correlation between ion 55
and air stored bananas, while nitogen held fruit largely correlated to ion 6l.
10
97

Chapter 6: Post-ripening: Niüogen Atmosphere Exposwe
ôt
f;
F#
Figure 6.3: The le¿dings plot of ions (variables) derived from ripe, nitrogen
exposed Cavendish bananas cv. William,s at ripening stage 3 or 4 for 0,6,12 or
24tus.
98

Chapter 6: Post-ripening: Nitrogen Atmosphere Exposure
6.3.2 Nitrogen atmosphere exposure in the presence of low or high
relative humidity
Nitrogen ahospheres with high or lowhumidity and conftol (air) treatments
resulted in similar banana shelf life, pulp flrmness, SSC and weight loss when
ripe. Low Oz injury appeared equally on bananas exposed to low or high
relative humidity, but not in the control treatment (Table 6.2).
Table 6.2: Assessments of Cavendish bananas cv. Williams at ripening stage 6,
after being ripened at ripening stage 4 in air or nitrogen atmospheres for 24 hrs
with a beaker of water or without a beaker of water at22"C.
Banana assessment
at ripening stage 6
Control
(Air,95%RII)
24hrN2 storage Iwater(95%oRÐ
24hr N2 storage -water (657oRÐ
Shelf life (davÐ
Firmness (kPa)
Soluble solid
concentration (o/o)
Weightloss (7o)
Dscolouration
index
7.0 a
104 a
24.2 a
1.7 a
0.0a
8.0 a
103 a
23.4 a
2.0 a
1.1b
7.4 a
102 a
24.0 a
1.8 a
1.4 b
' Data are averages of 3 replicates and different superscripts within a row
denote signiflrcant differences at P< 0.05 using a LSD test.
99

Chapter 6: Post-rþening: Nifiogen Atmosphere Exposure
The PCA model explainedST%o of the total variance among featments with 2
factors; both Factors I and 2 willbe observed in these results as both contribute
alargeproportiontothetotalvariance(Frgure6.4). Factor I consisted of57o/o
of the total variance with distinct discriminating aroma gtoupings, with one
cluster containing bananas ripened in air as well as those exposed to nifogen
with a low humidity and the other cluster consisting of bananas held in nitrogen
with ahighhumidity.
10
Facbrl
Figure 6.4: A score plot of ripe Cavendish bananas cv . Williams exposed to
(4, -;
nifiogen for 0 hrs (air), (8, -
) nitrogen for 24 hrs in a low humidity
or (C, -)
niúogen for 24 hrs in a high humidity.
c{ooõL
'cU
j$.
c c
E
c
c
'dc
'o;%
100

Chapter 6: Post-ripening: Ninogen Atmosphere Exposure
The cluster containing air-ripened bananas as \Mell as nitrogen atrnosphere held
bananas in a low humidity were closely associated to the ion with a mass to
charge ratio of 56 (Figufe 6.5). Niüogen exposedbananas in ahigh humidity
produced aromas that clustered around the ion with a mass to charge ratio of 70
Factor 2 consisted of 30o/o of the total variance. Bananas held in nitrogen in a
high or low humidity were related to ions with a mass to charge of 61 and 55,
whereas air ripened bananas were generally only associated with 55 (Figure
6.s).
o
soñL 88
R7
87'71
Facbr,|
Figure 6.5: The loadings plot of ions (variables) for ripe Cavendish bananas cv
Williams exposed to nitrogen for 0 hrs (nr),24 hrs in a low humidity or for 24
hrs in a high humidity.
l0l

Chapter 6: Post-ripening: Nihogen Atmosphere Exposure
6.4 Discussion
Short-term nitrogen exposure after ethylene initíation did not slow fruit
deterioration or extend banana shelf life, and so further research into post
ripening treatrnents to extend shelf life is required.
Liu (1976ab) found ethylene initiatedbananas stored nalo/o 02 atrnosphere at
14"C ripened soon after beingfiansferred to air at 21"C. These findings support
the observation that storage of ethylene treated produce in oxygen depleted
atmospheres leads to a faster rate of ethylene production and therefore ripening
upon returning to a normal (air) afnosphere, than fruit held only in aerobic
conditions (Wang et aL.,1990).
This increased rate of ethylene production after the anaerobic nifrogen
treatnent causes an acceleration of ripening after the nitrogen treahnent, so that
nitrogen treated fruit have a similar shelf life to that of air-stored fruit.
However, this response was conüadictory to that shown in breaker tomatoes,
where nitrogen treaûnents delayed ripening by increasing intemal ethanol and
acetaldehyde production via anaerobic respiration, without causing any
discolouration to the fruit @esis and Marinansþ 1993; Ratanachinakom et al.,
1997). Anaerobic atmospheres may have formed in the pulp, but bananas may
not be as sensitive to ethanol (refer to ethanol chapter) or are able to
remetabolise ethanol faster than tomatoes and so the anaerobic effect was not
apparent.
Short-terrn nitrogen storage did, however, cause dark discolouration on the peel
of fruit. Similar discolouration has previously been observed on bananas stored
between 5 attdlfYo CO2(Thompson, 1998). Thompson (1998) compiled data
102

.-- :l
Chapter 6: Post-ripening: Nitrogen Atmospherg Pxpqqllg
from a number of sources and foturd that levels of < lo/o 02 in bananas exposed
for an unspecified time period cause low Oz injury symptoms such as dull
yellow or brown peel discolouration, failure to ripen as well as 'ofP aromas.
Wills e/ at. (1990) also found some discolouration on nitrogen treated green
fruit. Brown peel discolowation was observed in this investigation on bananas
that had been stored in nifiogen for 6 hrs and the appearance of the
discolouration increased progressively as the storage period in nitogen
increased. Therefore, the skin discolouration on bananas stored in nitrogen
atmospheres for 6 hrs or longer probably was due to the low 02 stress in the peel
damagtng cellular membranes and allowing the en4matic browning reaction to
occur
Even though there was a statistically significant difference between the pulp
firmness of bananas held in niüogen atmospheres at ripening stage 3 and 4 this
difference would probably not be detected by consumers during consumption,
as most consumers eat bananas ranglng between ripening stage 4 andT
(Anonyrnous, Your guide to greater profits, undated) which vary in firmness.
All SSC readings reported in the studywere above the 78Yo level (when fully
yellow) set by CSIRO (1972) guidelines. There were only slight differences
between total weight loss readings measured between nitrogen exposed and air-
ripened fu:/rt (2.0-2.1%o) astranspirational losses during ripening are part of the
normal ripening process @almer, l97I).
The chemical nose was used as Ím easy, quiclq reliable andrepeatable method
of aroma analysis as opposed to human nose detection, which tends to be time
consuming and may have been exhausting for human judges due to continuous
and multiple aroma sampling (Muchui, 2000).
103
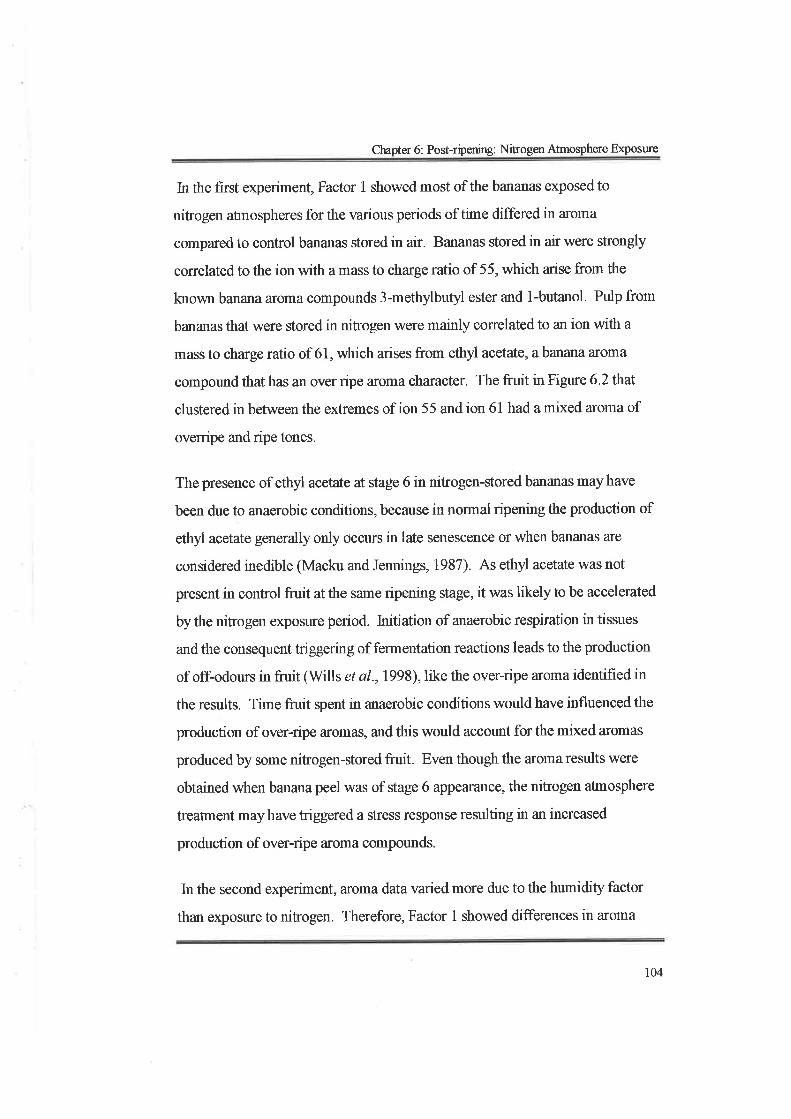
Chapter 6: Post-rþening: Nitrogen Atmosphere Exposure
In the first experiment, Factor I showed most of the bananas exposed to
nifiogen aûnospheres for the various periods of time differed in aroma
compared to control bananas stored in air. Bananas stored in air were strongly
correlated to the ion with a mass to charge ratio of 55, which arise from the
known banana aroma compounds 3-methylbutyl ester and l-butanol. Pulp from
bananas that were stored in nitrogen were mainly correlated to an ion with a
mass to charge ratio of 61, which arises from ethyl acetate, a banana aroma
compound that has an over ripe aroma character. The fruit in Figure 6.2 that
clustered in between the extremes of ion 55 and ion 6l had amixed aroma of
overripe and ripe tones.
The presence of ethyl acetate at stage 6 in nitogen-stored bananas may have
been due to anaerobic conditions, because in normal ripening the production of
ethyl acetate generally only occurs in late Senescence or when bananas are
considered inedible (Macku and Jennings, 1987). As ethyl acetate was not
present in control fruit at the snme ripening stage, it was likely to be accelerated
by the nitrogen exposure period. Initiation of anaerobic respiration in tissues
and the consequent triggering of fermentation reactions leads to the production
of off-odours in fruit (Wills et a1.,1998), like the over-ripe aroma identified in
the results. Time fruit spent in anaerobic conditions would have influenced the
production of over-ripe aromas, and this would account for the mixed aromas
produced by some nifogen-stored fruit. Even though the aroma results were
obtained when banana peel was of stage 6 appearance, the nitrogen afnosphere
treaÍnent may have triggered a stress reqponse resulting in ær increased
production of over-ripe aroma compounds.
In the second experiment, aroma data varied more due to the humidity factor
than exposure to nifiogen. Therefore, Factor I showed differences in aroma
704

Chapter 6: Post-rþening: Nitrogen Atmosphere Exposure
profile caused by the humidity factor, whereas the impact of nitrogen exposure
on aroma was observed through Factor 2. Interestingly, Factor I and2 appeared
in the reverse compared to the previous experiment, that is Factor I became
Factor 2 when considering the ions that contributed to each factor.
Air-ripened and nitrogen held bananas in low humidity had aromas related to
the ion with a mass to charge ratio of 56 associated with the known banana
compound l-hexanol that gives an unripe green tone. Unlike those held in
nifrogen with high humidity that had aromas relating to ion 70 that is largely
associated to ripe aroma profiles and compounds like 3-methylbutyl ester, 1-
butanol and propanoic acid; these volatile compounds are also strongly
correlated to ion 55. Bananas held in nitrogen in high or low humidities were
also related to both ions 61 and 55, while air-ripened bananas were only further
associated with ion 55.
Ion 6l is present in the volatile compound ethyl acetate, which is known to be
attributedto overripe banana arom4 whereas ion 55 is identified in compounds
like 3-methylbutyl ester and l-butanol that are associated with ripe aroma
profiles. Ions 55 and70 are both highly correlated to ripe aroma compounds
like 3-methylbutyl ester and 1-butanol, but ion 55 is also associated with 2-
hexenal, while ion 70 is collectively associated with ethyl acetate. Therefore,
even though the ions with a mass to charge ratio of 55 and 70 are predominantly
associated with ripe aroma compounds, they are also correlated to a lesser
extent with unripe or overripe aromas, respectively.
Therefore, the aroma profiles for this second nitrogen experiment consisted of
air ripened bananas having an unripe or green aroma with some ripe tones.
Nitrogen exposed bananas in low humidity also had an unripe green aroma but
105

Chapter 6: Post-ripening: Nitrogen Atmosphere Exposure
also had both ripe and overripe tones present. Finally nitrogen held bananas in
high hurnidrty had a ripe to ovempe aroma.
I¡sses in aroma volatiles have been reported to occur in climacteric fruit when
held in low relative humidities (Grierson and Wardowski,l9TS). The water
stress can cause changes in the strucfire and conf,rguration of en4rmes and as a
result en4me activities charrge, adversely affecting metabolic rates and other
chemical pfocesses such as aroma production (Noggle and Fritz, 1983).
Over-ripe volatiles corfélated sirorrgly with bahanas stored in nitrogen in a high
or low humidity; this can againbe related to anaerobic respiration accelerating
the pfoduction of alternative aroma compounds. The production of over-ripe
volatiles at ripening stage 6 (fullyyellowpeel), instead of at ripeningstageT
(yellow with light brown flecks), when over-ripe volatiles are generally
expected, suggests that an off-odour may have formed as a result of nitrogen-
storage and the stress it caused. The fermentative production of over-ripe
volatiles during anaerobiosis is similar to the aromas commonly produced
during senescence, where cell walls start to be degraded, leading to a reduction
in gas exchange in fruit (TaizandZniga,1998). This causes localised
anaerobiosis in bananas as gas diffiision throughout the fruit decreases with
increased resistance to gas exchange @erez and Beaudry, 1998).
6.5 Conclusion
Nitrogen abnosphere exposure after ethylene initiation prior to commercial
marketing of bananas is not a viable postharvest option to extend shelf life. The
exposure caused peel browning without delaying ripening or senescence.
Aroma compowrds were also found to differ among air-stored and nitrogen-held
106

Chapter 6: Post-rþening: Niüogen Atmosphere Exposure
bananas when fully ripe, but these differences did not necessmily have an
adverse effect on flavour, as aromas produced are all naturaþ produced in
bananas at some stage during ripening. Therefore, iloma acceptability would
depend on the consumer's individual aroma preference. Overall it was
concluded that niüogen aÍnosphere storage is not an effective method for
extending the shelf life of ripening bananás and filrther research on alternative
treahnents is required.
to1


Chnfter 7
7. Ethanol Atmosnhere Exposure
7.1 Introduction
Appropriate handling and management of bananas is essential during
distribution, as bananas ripen and senesce quickly after initiation with ethylene
(Marriott, 1980; Israeli and Lahav, 1986). Methods of slowing the onset of
ripening of bananas prior to initiation have been researched using controlled
atmospheres (Wills et a\.,1982) or nitrogen aûnosphere storage (Wllls et al.,
1990). These types of storage conditions induce anaerobic metabolism and
ethanol production (Pesis and Avissar, 1989; Pesis and Marinansky, 1993),
which prolongs the storage of pre-climacteric fruit. However, industry also
requires techniques to slow senescence of ripe bananas to satisfii consumer
demands of a shelf life longer than 3 or 4 days (T. Johnson, Chiquita Brands
South Pacific, pers. coÍìm., 2000). Very low oxygen afnospheres for short
periods of time after ethylene initiation of ripening has been reported in chapter
6, but this post-ripening storage treatnent did not extend banana shelf life and
promoted discolouration on fruit.
Drect application of ethanol has been suggested as a possible alternative
rnethod to disrupt the ripening and senescence processes of climacteric fruit
(Salweit, 1989; Beaulieu and Saltveit, 1997; Podd and Van Staden, 1998), and
108

Chapter 7: Post-ripening: Ethanol Atmosphere Exposure
of delaying banana ripening (Ilewage et al., 199 5 ; Ritenour et al., 1997 ).
However, banana ripening was not delayed in the latter studies in which ethanol
was exogenously applied on soaked filter paper in a sealed container; neither
study reported whether bananas actually absorbed ethanol. A possible way to
force ethanol into bananas is via vacuum infiltration, a technique effectively
used by Ratanachinakorn et al. (1999) on tomatoes and so vacuum infiltation
of ethanol was examined in this study, to extend banana shelf life.
The first objective of this study was to determine whether vacuum infiltration
of ripening initiated bananas with ethanol atmospheres could prolong banana
ripening and shelf life without affecting quahty. Secondly, the studywas
performed to show the effect of vacuum infiltration on the absorption of ethanol
by fruit that have thick skins, like bananas.
7.2 Matenals and methods
7.2.1 Plant materlal and preparation
Bananas (Cavendish cv. Williams) were harvested twice during September
2001, from a single plantation in Tully, Northern Queensland. Theywere
transported and prepared using the procedure described in section 3.1 and3.2.
All bananas were labelled and randomly assigned to five treatment groups each
containing 18 bananas.
Ripeningwas initiated at 18"C atg1Yorelative humidityin an atmosphere of
300 pL L I ethylene gas in the presence of a carbon dioxide scavenger (160 g of
Ca(OII)2per container). Containers were vented after 24 hrs ærd ethylene
reapplied.
109

Chapter 7: Post-rþening: Ethanol Atmosphere Exposure
7.2.2 Determination of ethanol volume
The ethanol volume neededto provide a saturated ethanol atmosphere was
measured byplacing 1, 0.5, 0.25, 0.185, 0.05, 0.015 mL of absolute ethanol into
a 10-L vacuum desiccator with 6 bananas. The desiccator was evacuated to 10
kPa pressure for 5 min. and then repressurised with bananas left in the
atmosphere for 1 or 30 min. After this time the volume of ethanol liquid left in
the bottom of the desiccator was obsered. For each volume of ethanol tested
residual ethanol was present, suggesting that suffrcient ethanol was present to
allow the atmosphere to become saturated. In frrther experiments I mI of
ethanol was used.
7.23 Effect of ethanol vapour and holding times after repressurising on
the quality and ripening of bananas
To determine the relationship between pressure and volume of air removed
frorn bananas, pres$ile was reduced to70,40 or l0 kPa as described by
Ratanachinakorn (2000). The amount of air expelled from bananas was
measured by submerging individual bananas in water in a 10-L desiccator. The
banana was covered with a funnel corurected to a graduated measuring cylinder
filled with water before desiccator evacuation at the various pressures for 5 min.
@igure 7.1). Air evacuated from the fruit replaced the water in the cylinder and
its volume was thus measured.
ll0

Chapter 7: Post-ripening: Ethanol Atmosphere Exposure
Figure 7.|:Dtagran of air evacuation set up, consisting of (Ð 10-L glass
desiccator, @) vacuurn pump, (C ) measuring cylinder and (D) Funnel (covering
a single banana).
The effect pressure had on visual appe¿ìrance (discolouration), shelf life and
weigþt loss of badanas was also observed. Apreliminary studywas performed
where 2 replicates of 6 fruit were ripened normally (in air) or vacuum treated in
air for 5 min. at 10, 40 or 70 kPa pressure after 48 hrs of norrnal ripening at
l8"C with 300 ¡rL Lr ethylene gas on 2 consecutive days. After vacuum
infiltration the treated bananas were held in the aÍnosphere for 30 min., then
placed into polyethylene bags at20"C where they were ventilated daily until
assessment as described in section 3.5. Results showed no significant
differences between shelf life, discolouration or weight loss of bananas ripened
nonnally or vacuum infiltrated. Therefore 10 kPa pressure, the maximum
lll

Chapter 7: Post-rþening: Ethanol Atmosphere Exposure
vacuum, was used in the following ethanol vacuum infiltration experiments
7.2.4 Ãpplication of ethanol atmosphere
After 48 hrs of ripening, bananas were removed from their containers and
vacuum infilfiated in a 10-L desiccator at 10 kPa. The vessel contained air only
or 1 mL of absolute ethanol in a Petri dish @gure 7 .2). The vacuum was
applied for 5 min., then the vessel was repressurised and kept in the atrnosphere
for a further 10 min. or 3 hrs at22"C. After the treatment period, bananas were
assessed and the remainder allowed to continue ripening at 18"C until they
reached ripening stage 4 (more yellow than green, CSIRO, 1972). They were
then placed into polyethylene bags and ripened at22"C until final assessments at
stage 6 or 7.
112

Chapter 7: Post-rþening: Ethanol Atmosphere Exposure
Figure 7.2: Vacuum (A) infrlfiation of ethanol atrrosphere generatedfrom 1
mL absolute ethanol (B) in a l}-L glass desiccator (C ) into 6 ripening initiated
bananas (D), in the presence of 160 g Ca(OÐz@).
7.2.5 Y olatile analysis
Banana peel and pulp were analysed for ethanol concentrations immediately
after treatment application, as well as after ripening at colour stage 6. Peel and
pulp samples were excised from the middle of each of the treated fruit, using the
method described by Ratanachinakom et al. (1999). Excised tissues were cut
into 5 mm cubes, with I g sænples of both peel and pulp being separately frozpn
in liquid N2 The samples were then placed into pre-cooled 5 mT. capped test-
tubes and stored at -18 to -20"C until analysis.
Ethanol analysis began with the thawing of the frozpntissue samples at0-2C
for 60 min., after which theywere heated at 30'C for a fiuther 60 min. One mL
113

Chapter 7: Post-ripening: Ethanol Atmosphere Exposure
headspace samples were u/ithdrawn from the test-tubes and analysed using
flame ionisation gas chromatogaphy (FID-CC, Varian 3400. Varian Australia,
Mulgrave, Victoria), with a stainless steel colunn (1.8 m x 3.2 mm OD) packed
with Gas Chrom@ 254 of 801100 mesh. The column temperahre was set at
l40oc, with injector and detector temperatures at 150"C and 160oC,
respectively. Flow rates of air, hydrogen and the carrier gas nitrogen were 300,
40 and 50 mL min.-l, respectively. The volatilisable tissue content of ethanol
was expressed as nL g.f.\ú.-I.
The ethanol stærdard used to calibrate the GC wÍrs prepiled according to Shaw
et al. (1991) and Ratanachinakorn (2000). Five pL of analytical grade ethanol
was precooled at -18"C due to its volatility and injected into a sealed 2 L flask
that had previously been preflushed for 5 min. \ 'ith high purity nitrogen and
contained a magnetic stirrer. The gases were mixed with the magnetic stirrer at
20"C for 60 min. before being used to calibrate the GC.
7.2.6 Banana and statistical assessments
Banana shelf life and peel discolouration was visually assessed, while pulp
firmness, SSC and weight loss were also assessed as detailed previously in
sections 3.5 and 3.6.
Each of the September hmvests were considered as one of two experimental
replicates. The experimental replicates consisted of five treatment groups,
where bananas were normallyripened in air (control), vacuum infrlrated with
air or over lml- of absolute ethanol, with the latter two freatments kept in the
atrnosphere for l0 min. or 3 hrs after vacuum infiltration.
All treafinent groups consisted of l8 banana fingers, where six fingers were
1,t4

Chapter 7: Post-rþening: Ethanol Atmosphere Exposure
used for shelf life and discolouration assessments, six fingers for firmness, SSC,
weight loss and ethanol concentration measurements at stage 6 and the final six
fingers for ethanol concentration analysis immediately after treatnents. Only
six bananas from a single treatment could be vacurÍn infiltated at one time, so
that bananas for different assessments had to be prepared on different days. The
fruit that were held for experimental preparation on different days were stored at
14oC, similar to bananas stored in industryprior to ripening initiation (T.
Johnson, Chiquita Brands South Pacific, pers. comm., 2000). All data were
analysed using general analysis ofvariance and a least significant difference test
(LSD) atthe 5%olevel, using the Genstat 5 program (Release 4.1.,4h edn., 1998,
I¿wes Agncultural Trust, Rothamsted Experimental Station).
7.3 Results
Bananas that were vacuum infilffated and exposed to ethanol atmospheres did
not have an extended shelf life, but ripened similarly to those ripened with or
without vacuum infiltration in air (Table 7.1). Firmness, SSC and discolouration
were similar for all treatments at about 110 kPa, 24% and 1.5, respectively, but
weight loss did vary between treatrnents with those that were vacuum infiltrated
losing less weight than bananas ripened without vacuum expo$ne.
lls

Chapter 7: Post-rþening: Ethanol Atmosphere Exposwe
Table 7.1: Ripe characteristics of Cavendish bananas cv. Williams after
ripening with ethylene (300 pL Ll) at 18oC, treated by vacuum infilfiation over
air or ethanol and held in the resulting atmosphere for 10 min. or 3 hrs. After
the holding period the bananas were held at 18'C until they reached stage 4 and
then were ripened at22'C until assessed.
Vacuum treaf,nen(
No
vacuum
Vacuum
+ l0min.
holding
Vacuum +
3hrs
holding
Vacuum
overEtOH
+ 10min.
holding
Vacuum
overEtOH
+ 3hrs
holding
Shelf life
(davÐ
Firmness
(kPa)
Soluble
solid
concent (%)
Discolour.
index
Weight loss
(%)
ll2a 107 a lll a
' Dataare averages of 2 replicates where different superscripts within arow
denote significant differences at P< 0.05 using aLSD test.
3.8 a 4.3 a 3.8 a 4.2 a 4.4 a
110 a ll3 a
245 a 23.9 a 24.5 a 24.I a 24.5 a
1.8 a 1.6 a 1.4 a 1.3 a 1.4 a
2.3 c 1.9 ab 2.0b 1.8 a 1.8 a
i16

Chapter 7: Post-rþening: Ethanol Atmosphere Exposure
Banana peel and pulp ethanol concenftations, measured immediately after
vacunrn feaûnents as well as at rþening stage 6 are shown nTable7.2.
Ethanol concentrations were seven and 40 times higher at 78 and 473 rtL g.f.
wt.-t, in the peel of bananas held for l0 min. and 3 hrs in ethanol, respectively,
compared to concentrations in the peel of bananas ripened normally or vacuum
infiltrated with air. Pulp ethanol concentrations of bananas measured
immediately after vacuum infiltration with ethanol were similar to those ripened
normally and those vacuum infiltrated with afu. Also, ethanol concentations of
banahas held in ethanol ahnospheres were significantþ higher in the peel tissue
compared to the pulp tissue of the bananas measured immediately after their
treatrnent. At colow stage 6, ethanol concenfiations of pulp tissues were higher
than those found in peel tissues for all banana treatnents, and all were higher
conrpared to levels immediately after treaünent. Ethanol levels in the peel
reached 547 íl-g. f. !vt.-t and in the pulp 778 nl'g. f. wt.-t.
tt7

Chapter 7: Post-rþening: Ethanol Atmosphere Exposure
Tabte 7.2zPeel and pulp tissue ethanol concentations of Cavendish bananas cv
Williams after ripening with ethylene (300 pL L 1) at 18oC, teated by vacuum
infiltration over air or ethanol and held in the resulting atmosphere for l0 min.
or 3 hrs. After the holding period, bananas were held at l8"C until they reached
stage 4 andripened at22'C until assessed.
EtOH concentration (nL g.f.wt.-])'
Immediately after vacuum
treaûnent
At ripening stage 6 Y
Vacuum
treaûnents
Peel tissue Pulp tissue Peel tissue Pulp tissue
No vacuum
Vacuum + held
for 10min.
Vacuum + held for
3hrs
Vacuum overEtOH
+ held for 10min.
Vacuum over
EtOH + held for
3hrs
l0a
lla
4a
78b
413 c
14a
14a
13a
13a
2la
699 a
525 a
953 a
800 a
484 a 676 a
454 a 695 a
573 a 767 a
' Dataare averages of 2 replicates where different superscripts in tissue
columns denote significant differences at P< 0.05 using a LSD test.
ll8

Chapter 7: Post-ripening: Ethanol Atmosphere Exposure
7.4 Discussion
After ripening initiation, fruitwere vacuum infilfiated over either air or ethanol,
with or without prolonged holding periods, but banana shelf life was not
affected. Firmness, SSC and discolouration were also similar and in the norrnal
range for colour stage 6 bananas harvested after awinter growing period (as
observed in section 5.4). Even though weight loss results were variable between
vacuum and non vacurrrn featments, the overall effect on banana appearance
would be minimal, as banana senescence is identified by consumers as over
maturityrather than weight loss or shrinkage (Grierson and Wardowski, 1978).
All bananas ripened similarly, with exogenously applied ethylene initiating the
banarìa ripening process followed by autocata$ic endogenous ethylene
production (Seyrnour, 1993; Oetiker and Y*g, 1995). Contaryto myfindings
with bananas, Saltveit (1989) using tomatoes reported that ethanol vapour
application delayed mature green tomatoes ripening by delayng ethylene
production. A possible reason for the ineffectiveness of ethanol vapour on
banana ripening is that acetaldehyde (AA) not ethanol is the active component
in inhibiting ripening (Beaulieu et al.,1997;' Beaulieu and Saltveit,1997;
Ritenour et al., 1997} If ripening initiated bananas had insufficient alcohol
dehydrogenase (ADIII activity to metabolise ethanol into physiologlcally active
levels of acetaldehyde, ripening would not slow @itenour et al.,1997).
However, this is not the case as ripening initiated bananas do have suffrcient
ADH activity at stage 2 (greenwith traces of yellow) of 0.5 ¡rmol min.-l g t that
increases each day during banana ripening to 1.2 pmol min.-r gl by stage 7
(Hyodo et al. , 1983; Seymotn, 1993) . In tomatoes ADH ranges from I .5 - 4
pmol min.-lgl lRatanachinakorn, 2000). Arecent studyperformed on breaker
tomatoes (Beaulieu and Salweit,1997) found that climacteric fruit tissues after
ll9

Chapter 7: Post-rþening: Ethanol Atmosphere Exposure
ripening initiation were sensitive to ripening inhibition by ethanol
While vacurÍn infiltration with or without prolongedholding forced ethanol
absorption into the banana peel, it is unlikely ethanol infiltrated into pulp tissue,
due to the thickness of banana peels. Unlike tomatoes, where ethanol was able
to diffuse readily through the tomato stem scar and skin into the pericarp and gel
of the tomatoes (Ratanachinakorn et a1.,1999). This failure to penefrate into
pulp tissue was critical in the inability of ethanol to slow the ripening process in
bananas, becáuse pulp tissues play an irtrportant role in ethylene production and
consequently through internal ethylene diffusion into the peel (Vendrell and
McGlasson ,l97l). Peel degreerting is regulated by pulp riperling and ethylene
production (Vendrell and McGlasson, 1971), which was not inhibited by the
ethanol treatment, as vacuum infiltration did not force ethanol into the pulp.
Consequently banana peel colour did not respond to applied ethanol @itenour
et aL.,7997).
Peel and pulp ethanol concentrations were measured immediately after bananas
were treated and were initially low, except for banana peel that had been
infiltrated and held over ethanol for 10 min. or 3 hrs. However, peel ethanol
concentrations were comparable for all batranas when fully ripe and were higher
than immediately after treatrnent. A similar trend was found for the pulp, but
pulp ethanol concentrations \ryere significantþ higher than in the peel when
bananas were fully ripe. The increase in peel and pulp ethanol levels in ripe
fruit was observed in all bananas and can be attributed to the production of
ethanol during the later stages of ripening (Marriott, 1980; Hyodo et aL,1983;
Seymour, I 993 ; Pesis , 1996). My results support the previous studies that found
ripening climacteric fruit like bananas have initiallylow ethanol concentrations
which increase during the post-climacteric phase. The normally high ethanol
120

Chapter 7: Post-ripening: Ethanol Atmosphere Exposure
levels during ripening may also explain that the high peel ethanol levels did not
influence ripening. It is also possible that ethanol declined initially after
treatnents due to re-metabolism or volatilisation @esis and Avissar, 1989), thus
allowing fruit to start ripening at relatively low ethanol levels that increase as
ripening progresses.
7.5 Co[cluslon
In sünmary, vacuum infiltration with ethanol did not delay ripening of
banahas, in contrast to the situation in tomatoes that take up ethanol into the
pulp through the stem scaf 4fld the skin. There is scope, however, for testing
other ethanol increásing methods that affect the pulp, such as ntodified
atrrrosphetes.
721


Ch"pt''br I
8. Post-ripening: l-Methvlcvcloproþene Exposure
8.1 Introduction
The distinct ripening pattern of bananas ensures that once ripening has been
initiated, subsequent deterioration is rapid, which is of concem to marketers and
conswners alike (T. Johnson, Chiquita Brands South Pacific, pers. coÍìm.,
2000).
I-MCP is an ethylene antagonist that has recently generated interest for its use
on bananas. Golding et al. (1998), Jiang et al. (7999 a), Jiang et al. (1999b),
Harris et al. (2000), Jiang et al. Q000) and Macnish et al. (2000b) have
observed I-MCP effects on green bananas before ethylene initiation of ripening,
showing delayed ripening as measured by colour development, volatile
production and fruit softening.
Further I-MCP studies investigating extensions of shelf life (or eating life of
ripe fruit) have also been conducted on bananas that were ethylene-treated prior
to 1-MCP application (Macnish et a1.,1997; Golding et a|.,1999;Jianget al.,
1999b;Joyce et a1.,1999;Macnish et ø1.,2000a). These studies suggest that 1-
MCP applied to fruit after ethylene initiation of ripening extends banana shelf
life, but the studies have not provided sufficient evidence about the quality of
122
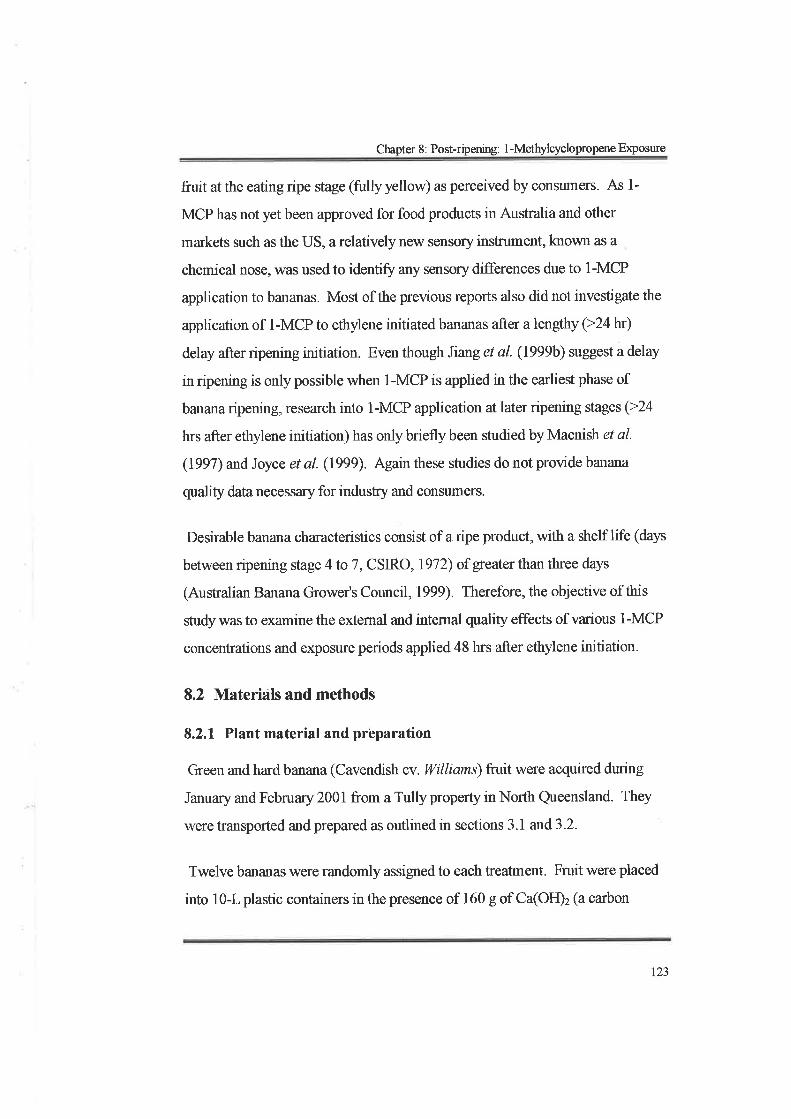
Chapter 8: Post-ripening: I -Methylcycloproper, e Exposure
fruit at the eating ripe stage (fully yellow) as perceived by consumers. As l-
MCP has not yet been approved for food products in Australia and other
markets such as the US, a relatively new sensory insfument, lnown as a
chemical nose, was used to identiff any sensory dif[erences due to I-MCP
application to bananas. Most of the previous reports also did not investigate the
application of I-MCP to ethylene initiated bananas after alengthy (>24hr)
delay after ripening initiation. Even though Jiang et al. (1999b) suggest a delay
in ripening is only possible when I-MCP is applied in the earliest phase of
banana rþening, research into 1-MCP application atlater ripening stages (>24
hrs after ethylene initiation) has only briefly been studied byMacnish et al'
(1991) and Joyce et al. (1999) Again these studies do not provide banana
quality data necessary for industy and consumers.
Desirable banana characteristics consist of a ripe product, with a shelf life (days
between ripening stage 4 to 7, CSIRO,1972) of greater than three days
(Ausüalian Banana Grower's Council, 1999). Therefore, the objective of this
studywas to examine the external and internal quallty effects of various I-MCP
concentrations and exposure periods applied 48 hrs after ethylene initiation.
8.2 Materials and methods
8.2.1 Plant material and preparation
Green and hard banana (Cavendish cv. Williams) fruit were acquired during
January and February 2001 from a Tully property in North Queensland. They
were transported and prepared as outlined in sections 3.1 and3.2.
Twelve batranas were randomly assigned to each fieatment. Fruit were placed
into l0-L plastic containers in the presence of 160 g of Ca(OIÐ2 (a carbon
123

Chapter 8: Post-ripening: 1 -Methylcyclopropene Exposure
dioxide scrubber) and a saturated KNO3 solution that established at 95o/o relative
humidity. The containers were placed randomly in temperature-confolled
rooms at 20"C and banana ripening was initiated \Mith 300 pL Lr of ethylene gas
injected into the containers on two consecutive days. All containers were
ventilated for 30 min. each day, for the entirety of the experiment.
8.2.2 l-Methylcyclopropene exposure dfter ethylene initiation
After 48 hrs of ripening initiation, containers were ventilated and bananas were
treated with 0 (non-treated), 3 nL L r, 300 nL Lr or 30,000 nL Lr of I-MCP at
20"C. These I-MCP atmospheres were created from Ethylbloc@ 13.3% active
ingredient I-MCP, Rohm andHaas, Melbourne). Measured amounts of
Ethylbloc@ were placed into small plastic cups and placed into the lO-L
containers. Reverse osmosis (RO) water at 40'C in a ratio of I g Ethylbloc@ to
16 mL RO water (G. Baynon, Rohm and llaas, pers. coÍìm., 2000) was added to
Ethylbloc@ containers to release I-MCP. Al1 containers were sealed
immediatelyupon mixing and placed into 20"C controlled environments.
Fruit were exposed to 1-MCP atmospheresfor 24,48 or 72 hr. Containers were
ventilated daily and I-MCP reapplied as appropriate. At the end of the
treaünent period, bananas \¡/efe removed from containers, placed into unsealed
polyethylene bags, and rehrned to20"C for daily assessment until the end of the
experiment.
8.2.3 I-MCP detection
1-MCP concentation was quantified using a Varian gas chromatogaph model
3400 (Varian Ausfralia, Mulgrave, Victoria) fitted with a flame ionisation
detector and a stainless steel column (60 cm x3.ll5 mm id) packed with
124

Chapter 8: Post-ripening: l-Methylcyclopropene Exposure
80/100 mesh Porapak Q (Alltech). Column temperature was set at7Ùoc, while
the injector and detector temperatures were 135'C and 150oC, respectively.
Flowrates of air, hyd'rogen and the carrier gas nitrogen were 300,40 and 50 mL
ilh.-I, respectively, and the standard gas used to calculate I-MCP
concentrations was iso-butylene (103 pL U1; Oiang et al.,l999a).
8.2.4 Banana assessment
Six fruit from each treatment were used to measure external characteristics,
such as peel colour (green and shelf life), weight loss and discolouration, as
detailed in section 3.5. The remaining six bananas assigned to each treatnent
were used to assess internal quality parameters at colour stage 6; assessments
included pulp firmness (kPa), soluble solid concentrations (SSC o/Ð and aroma.
All internal qualitymethods were described in section 3.6.
8.2.5 Statistical analysis
The experiment was established as a 4 x 3 randomised complete block design
with three replicates. Four I-MCP concentations including 0 (non-treated), 3
oL Lt, 300 nI L 1 and 30,000 nL Lr were applied to bananasfor 24,48 or 72
hrs. Fruit in weekly replicates were randomly allocated to treatments. One
treaûnent unit for each replicate consisted of T2bananas, with six bananas used
for external quality assessments and the remaining six for internal quahty
assessments. Analysis of all data was performed using the General ANOVA
command in Genstat 5, (Release 41,4h edition, 1998, Lawes Agricultural
Trust, Rothamsted Experimental Station). Total weight loss data were
hansformed into reciprocd, data, firmness data were squared and all shelf life
data were logi¡ transformed for analysis purposes. Means, however, have been
back transformed for presentation purposes. A least signif,rcant difference test
),25

Chapter 8: Post-ripening: I -Methylcyclopropene Exposure
(LSD) atthe 5o/o level was used to examine all teatment effects. Chemical nose
results were analysed using the Pirouette multivariate dataanalysis package
(Infometrix Inc, Woodenville, WA USA), as described previousþ in section
3.6.3.1.
8.3 Results
I-MCP exposure periods did affect banana shelf lives with those exposed to 3
nL L:l I-MCP for 24 and 48 hrs having a single extra day of life, compared to
those exposed for 72hrs (Table 8.1). Shelf life judged as days to ripen from
ripening stage 4 to 7 of contol bananas was 3.3 days. 1-MCP at3 nLLt did not
increase this shelf life period, and 30,000 nL Lr I-MCP prevedted the ripening
of peel and flesh of most fruit and a shelf life could not be calculated.
Therefore the 30,000 nL L1 fieatment is absent from the following tables.
However, applications of 300 nL Lr 1-MCP doubled the shelf life of bananas to
an average ofgreater than six days.
t26

Chapter 8: Post-rþening: l-Methylcyclopropene Exposure
Table 8.1: Shelf life of Cavendish bananas cv. Williams following ripening at
20'C with 300 pI L I ethylene gas for 48 hrs then subsequently exposed to 0, 3
or 300 nL Lr I-MCP for 24,48 or 72 hrs at 20'C.
Exposure period ftns)
I -MCP concenúation (oL Lt) 48 7224
0
J
300
7,5.5 A
4.4 abc
7.3 d
3.6 ab
5.1 bc
7.2d
3.1 a
3.2 a
5.8 cd
"Dataare means of 3 replicates, where different superscripts denote significant
differences at P<0.05 using a LSD test. The data has been back transformed
from data that has been lo916 fansformed.
Green life and pulp firmness át colour stage 6 was similar for bananas treated
with 0, 3, or 300 tiL L-r I-MCP and for all exposure periods (Table 8.2 and 8.3).
Soluble solid readings át stage 6 averaged between 22-24% for all treated
bananas, except those exposed to 300 nL Ll I-MCP for 72hrs, which had lower
SSC values of an average of I 8.8% (Table 8.a). Weight loss readings for
bananas treated with 0, 3, or 300 nL Lr I-MCP were betwe enl.7-2.0%oand did
not impact on the visual presentation of the fruit (Table 8.5).
127

Chapter 8: Post-ripening: l-Methylcyclopropene Exposure
Tabte 8.2: Green life of Cavendish banan as cv . Williams following ripening at
20'C \¡/ith 300 pL L I ethylene gas for 48 hrs then subsequently exposed to 0, 3
or 300 nL L-l 1-MCP for 24,48 or 72 hrs at 20"C.
Exposure period (hrs)
I -MCP concenfration (nL Lr) 48 7224
0
3
300
4.0 f3.8 a
4.2 a
4.3 a
4.3 a
3.4 a
4.0 a
3.6 a
3.9 a
'Datzare means of 3 replicates, where similar superscripts denote non
significance at Þ0.05 using a LSD test.
Table 8.3: Pulp finnness of Cavendish bananas cv. Williams at ripening stage 6
following ripening at 20'C with 300 pL Lr ethylene gas for 48 hrs then
subse{uentþ exþosed to 0, 3 or 300 nL L1 I-MCP for 24,48 or 72 hrs at 20'C.
Exposure period (hrs)
I -MCP concentration (oL L-t) 48 7224
0
aJ
tt4 f143 a
125 a
109 a
Ill a
146 a
126 a
140 a
ll2 a300
" Dataare means of 3 replicates, where similar superscripts denote non
significance at P>0.05 using a LSD test. These data have been back
transformed from squared data.
128

Chaper 8: Post-ripentng: l-Methylcyclopropene E¡posure
Table 8.4: Soluble solid concentation of Cavendish bananas cv. Williams at
ripening stage 6 following ripening at20"C with 300 pL Ll ethylene gas for 48
hrs then subsequently exposed to 0, 3 or 300 nL L-r I-MCP for 24,48 or 72lvs
at20"C.
Expostre period (hrs)
I -MCP concentration (oL L-t) 48 7224
0
a--)
23.3 f22.1a
23.7 a
23.1a
23.0 a
22.7 a
23.0 a
22.2 a
18.8 b300
'Dataare means of 3 replicates, where different superscripts denote significant
differences at P<0.05 using a LSD test.
Table 8.5: Weight loss (7o) of Cavendish bananas cv. Williams from ripening
stage I to 6 followingripening at2}"Cwith 300 þLLr ethylene gas for 48 hrs
then subsequentþ exposed to 0, 3 or 300 nL Ll I-MCP for 24,48 ot 72 hrs at
20"c.
Exposure period (hrs)
1 -MCP concenûation (nL Lt) 48 7224
r.7 * 1.7 a 1.8 ab
1.7 a 1.8 ab 1.8 ab
300 2.0 c 2.0 c 1.9 bc
'Datzare means of 3 replicates, where different superscripts denote significant
differences at P<0.05 using a LSD test. This data has been back transformed
from reciprocal data analysis.
0
J
129

Chapter 8: Post-rþening: l-Methylcyclopropene Exposure
Bananas exposed to 30,000 nL Lr 1-MCP showed significant quality
differences compared to all other treaûnents, because they had to be examined
at ripening stage 2 þeel was green with a fface of yellow, Figure 8.1) as fruit did
not ripen before fungal spoilage (crown rot) ocourred. Firmness and SSC were
596 kPa andSo/o,respectively, but weight loss (2%) was not dissimilar to those
treated with 0, 3 nL I;1, or 300 nL Lr I-MCP. Shelf life and aroma could not be
measured, as fruit did not ripen.
130

Chapter 8: Post-rþening: l-MethylcyclopropøT e Exposwe
Figure 8.1: Cavendish banana (cv. Williams) appearance on day 8 of the l-
MCP experiment. Bananas were initiated with 300 FL Lt ethylene gas for 48
hrs at 20'C and then exposed to 1-MCP for (A) 0 (air), (B) 3 nL Lt, (C ) 300 nL
Lt or @) 30,000 nLLl.
131

Chapter 8: Post-ripening: l-Methylcycloproper, e Exposwe
Banana aromas of all treatments that could be analysed at ripening stage 6 were
similar (Figure 8.2). The PCAmodel identified 86% of the total aroma variance
between treatnents to consist of two factors; 7 5%io of the variance was related to
Factor I andlL%oto Factor 2. My remaining factors each made ap < 5o/o of the
total variance. Variability attributable to treatments was limited when
compared to non-treaûnent factors, as expressed by the similar dispersal of
values around Factor 7 and2 for all fieatments shown (Figure 8.2). Therefore
when observingthe loadingplot (F go.e 8.3), the ions (61, 71,70 and 57 or
variables) present at the exüeme ends of the factors are similar in all samples.
Aroma compounds were identified with the aid of an established volatile
compound library used in conjunction with the chemical nose loading plot
(Figure 8.3). Volatiles identified from the banana samples were butanoic acid,
butyl ester, l-butanol, 3-methylbutyl esters and ethyl acetates, giving bananas a
fruityripe aroma with a slight over-ripe note.
132

Chapter 8: Post-rþening: l-Møhylcyclopropene E4osure
6A
f^
A
A
(\ãlg
-10
Fadol
Figure 8.2: The chemical nose score plot of volatiles produced by Cavendish
bananas cv. Williams held for 24,48 or 72hrs in 3 nLL-1 I-MCP (4,- ),
300 nL Lr I-MCP (8, -
) or in air (C,- ) after ripening initiation.
133

Chapter 8: Post-ripenurg: l-À¿tetloylcyclopropene Exposure
ôtoo6L
Factorl
Figure 8.3: The loadings plot of ions (væiables) fot ripe Cavendish bananas ov
Williams exposed to 3 nL L1 I-MCP, 300 nL Lt I-MCP or held in air after
ripening initiation for 24,48 or 72 hrs in.
t34

Chapter 8: Post-ripening: I -Methylcyclopropene Exposure
8.4 Discussion
The process of ripening and senescence of banarias is influenced by their
production of endogenous ethylene. I-MCP stops ethylene action, including the
promotion of fi.uther ethylene production, by binding to the ethylene receptors
(Sisler and Serek, 1997). As mentioned in section 8.2.2,a1lbananas were
ripening initiated with ethylene before 1-MCP application. Therefore,
endogenous ethylene production and the ripening process was in progress when
I-MCP was applied.
Only in bananas treated with 300 nL Ll I-MCP was ethylene action slowed to
gtrve acommercial extension at shelf life. The ripening of peel and flesh of all
fruit was qmchronous as seen from the typical and concurrent ripening changes
observed in the peel and flesh. This is encouraging, because previous research
by Jiang et al. (1999a) had reported uneven peel degreening in batranas treated
with I-MCP prior to ripening. Uneven degreening or ripening of fruit is
undesirable and would be unacceptable to industry. Ripening uniformity may
have been aided in our experiment by elevating bananas in treafnent chambers
to allow all-over airflow and therefore chemical absorption to all sides of the
bananas; this would be established commercially using fan-forced airflow in
ripening chambers.
Low concentrations of I-MCP (3 nL Lr) applied after ethylene initiation were
not successful in extending shelf life, possibly as ethylene was able to
successfully compete with I-MCP for ethylene binding sites as reported by
Sisler and Serek (1997). Jianget al. (1999b),however, showed that ethylene
inhibition by I-MCP was non-competitive by measuring the affinity of I-MCP
and ethylene to binding sites, and observing that I-MCP had a lower binding
135

Chapter 8: Post-ripening: l-Methylcyclopropene Exposure
constant (Ç) than ethylene. Therefore, I -MCP has the grcater athaction for
ethylene binding sites. However, there may have been more binding sites than
l-MCP molecules available to bind to them, or I-MCP did not persist in the
tissues to block the continuously forming ethylene receptors (Jiang et al.,
1999b). This consequently allowed ethylene to continue to promote ripening.
The ethylene induced ripening process of bananas treated with 30,000 nL Lt 1-
MCP was delayed, with many fruit failing to ripen before crown rot infection
detracted from their appearance. Failure of fruit treated with a high I-MCP
concentration (30,000 oL Lt) to ripen, can be explained by the limited
fonnation of new ethylene receptor binding sites (Jiang et al.,1999b), the full
occupation of existing binding sites or persistence of 1-MCP in tissues. During
the period of ethylene insensitivity and inhibited ripening, infection of fruit by
fungi is not uncommon (Sisler and Serek, 1997),as with the crown rot
infectiohs observed on 30,000 nL Ll 1-MCP treated fruit during the prolonged
storage period. Fruit infected with crowlr rot continue to deteriorate as ripening
advances (Jones et al.,1993), reducing banana saleability.
The chemical nose was used because it is a quick, easy and reliable instrument
that produces comparable results to time consuning sensory panel findings
(Klieber and Muchui,2002). Also the use of I-MCP on food products in
Australia has yet to be approved, so taste panels could not be used. The similar
score plots for all ripe fruit suggest that bananas that were or were not I-MCP
treated all had similar aroma profiles. It is therefore unlikely that consumers
would be able to detect aroma differences from I-MCP treatedfruit.
The momas identified in the analyses were butanoic acid, butyl ester, l-butanol,
3-methylbutyl ester and ethyl acetate, which exhibit the bananalike and fruity
136

Chapter 8: Post-rþening: I -Methylcyclopropene Exposure
aromas (Tressl and Jennings,l972;Marriott, 1980) that are expected from ripe
bananas. Chemical nose results presented in section 8.3 showed that the
treatonents of 1300 nL I;l I-MCP on ethylene initiated bananas for various
exposure periods had no apparent qualitative effects on the composition of
banana aroma profiles when compared to normallyripened bananas and so
similar banana aromas would be perceived by consumers, although Golding er
al. (1999) reported significantly reduced quantitative production rates in
volatiles that evolve in ripeningbananas using GC-FID after I-MCP ûeaünent.
8.5 Conclusion
l-Methycyclopropene is a pfotTrising postharuest üeatrnent for the extension of
banana shelf life to more than 6 days at 20oC when apþlied dfter ripening
initiation. Qality of banana flesh as well as visual appeatance was not affected
by 1-MCP treafnents of <300 nL L-l. However, the I-MCP concenftation used
is critical, as low cohcerittations (<3 nL Lt) did not extend banána shelf life and
high cohcentrations (30,000 oL Lt) caused fruit to be u-râbceþtable for
consurnption. I-MCP is not yet approved for use on fruit and vegetables in
Australia, but is approved on food products in Chile and on cut flowers in the
USA.
137


ëhàpter 9
9. General Discussion
9.1 Bacþround into iildustry re{uifements
Asian and in particular the Philippine's interest in establishing a banana export
market to Australia has become apparent in recent years. This has increased the
need for research into local banana production and management, focussing on
consumer and market demands such as extending banana shelf life and
maintaining a yellow peel appearance on ripe fruit all year round. Cavendish
cv. Williams barìanas were used throughout this research because they account
for 95o/o of banana production in Aushalia @aniells, 1986).
This study was ai¡red at improving the quality and overall posthafvest life and
in párticular the shelf life of bananas. This included looking at suitable
conrmercial methods for the eady detection of chilling injury, a physiological
disorder that decreases the appearance and the value ofbananas. This would
allowmarkets to redisü'ibute chilled and discoloured fruit to appropriately
graded markets and prevent the sale of lower quality fruit to premium markets.
Investigation into current commercial ripening procedures was also required, as
the quality of bananas varies throughout the year, so the posthawest
management of ripening temperaflnes and ethylene concenfration throughout
the year should be considered as possible influential factors in seasonal banana
138

General Disct¡ssion
quality. Furthermore, changes to existing ripening procedures such as exposure
periods to nitrogen, ethanol and l-methylcyclopropene afinospheres were also
investigated to extend banana shelf life.
9.2 Pre-ripening detection of chilling injury
Chilling injury is a physiological disorder that causes browning of the vascular
tissue and is clearly visible on ripe bananas (Marriott, 1980; Stover and
Simmonds, 1987, Kays, 1991; Wang and Gemma,I994). It is of importance to
the banana industry, because consumers relate the general appearance of the
peel with overall quahty(Kays, 1999). Mild chilling symptoms onlybecome
apparent after ripening, which causes problems for the industry. Early detection
of chilling injury would allow industry to identifu chilled fruit and market them
by grading them and allowing quality fruit to reach premium priced mækets.
This study was based on finding and testing a suitable method that could detect
chilling injury on bananas. It needed to be relatively quick, easy and suitable for
industry use. Chlorophyll fluorescence was targeted, as a result of findings by
DeEll et al. (1999); they described chlorophyll fluorescence as an easy method
of measuring processes that take place in chloroplasts. Smillie (1979) had
previously reported chilling injury to cause disruption to chloroplasts.
Therefore, theoretically, chlorophyll fluorescence measurements could detect
changes to the photosyrthetic ability of chloroplasts from any disruption due to
chilling injury. PPO activity in bananas after chilling was also investigated.
En4mratic oxidation byPPOs is the cause of the brown pigment formed in
vascular tissues of chilled fruit (Palmer,1963 Jones ef a1.,1978). As PPOs are
bound to chloroplasts especially on the inner surface of the thylakoid membrane
(Shomer et a1.,1979;Amiot et a1.,1997) and chloroplasts are disrupted by
139

General Discussion
chilling the activity of PPO in chilled fruit could be different to that of non-
chilled fruit. However, Gooding et al. Q00l) found almost no change in PPO
expression during ripening even after induced mechanical injury and found a
relatively constant PPO activitythroughout all ripening stages.
No differences were observed in chlorophyll fluorescence between chilled and
non-chilled fruit, as the measurement of chlorophyll fluorescence was on
epidermal chlorophyll not the sub-epidermal tissue where chloroplast
breakdown led to browning. PPO activity was also found to be unsuitable for
the early detection of chilling iojury, because bananas did not show a wound
defence response in the form of an increase in PPO activity after chilling.
Therefore, a method for the early detection of chilling injury was not found.
9.3 Optimisltg ripening tempèfâtüles dild ethylene concentrations
throughout the year
Optimising ripening temperatures and ethylene concentrations used by
commercial enterprises throughout the year was investigated. Ripening
temperatures used commercially vary between 14 and 20"C,with market
demand for faster or slower ripening rather than banana quality being the
temperature detennining factor. Industry also currently uses 300 FL Ll of
ethylene to initiate ripening but no evidence has been found why this exact
concentration is used (8. Charfes, Chiquita Brands South Pacific, pers. comm.,
leee).
Seasonal effects on banana ripening quality have briefly been studied by Young
et al. (1932) and Rippon and Trochoulias (1976),but a detailed study had not
been undertaken. This is the main reason ripening procedures were investigated
740

General Discussion
throughout the year. The aim of this studywas to observe the ripening
treaÍnent effects on the intemal and external quality of bananas throughout the
year.
This study found the lower temperatures of 14 and l6'C slowed the rate of
respiration (Couey, 1982; Wills et aL.,1998), which extendedbanana shelf life
to 9 days, but produced symptoms of mild and severe peel discolouration in the
July and September harvests. Bananas ripened with the higher ripening
temperatures of l8 and 20'C had the appearance of slight peel discolouration
only after a winter growth period and generallyhad sheHlives of between 4-6
days. Impoftantly, it also showed the effect seasonal development had on
postharvest quahty, with bananas that grew and developed during winter
affected by in-field chilling which becarne apparent after ripening. The severity
of the in-f,eld winter chilling was álso found to be affected by postharvest
ripening procedures, with lower ripening temperatures increasing the severity of
peel discolouration. Ethylene concefltratiohs between 50 and 1000 pL Ll used
to itliti¿te ripening did not affect ripeititlg plocesses or banana quality, so the use
of less or more than 300 pL Lr of ethylene in industry through ripening room
leakages or accidental additional gases, respectively, would not be defimental
to the quality of ripened bananas.
This research identifies the need for commercial enterprises to monitor in-field
temperatures throughout banana growth and development, to ensure visually
acceptable bananas. Monitoring is especially essential for those in the banana
indusfythat continue ripening fruit upon market demand, as this is when lower
ripening temperatwes are used to manipulate the ripening process. The use of
lower ripening temperatures in this study was fourd to influence the degree of
t4t

General Discussion
discolouration found on bananas, especially during winter developmental
periods and sudden climatical events such as cyclones.
9.4 Post-climacteric extension of shelf life
9.4.1 Nitrogen atmospheres
Nitrogen exposure after ethylene initiation was investigated in this study to
extend research by Wills et al. (1990) who used this approach to extend green
life of bananas. Their research found stage I bananas exposed to nitrogen
storage for 3 days showed a42%o increase in green life. Furtherrnore a study by
Parsons et al. (1964) detected onlynegative affects on aroma if bananas were
stored under nifrogen for longer than 4 days. Therefore, nitrogen atmospheres
were used in this study to displace oxygen and in the process to reduce
respiration rates, ethylene s5mthesis and ethylene receptor affinity after ripening
initiation to extend banana shelf life rather than green life.
Unfortunately, nitrogen exposure after ethylehe initiation cannot be
recommended based on this research. Exposure to nitogen atmospheres after
48 hrs of ripening initiation did not extend banana shelf life, but exposure
periods of as little as 6 hours caused discolouration of banana peels, which is
unacceptable in the markeþlace.
A further experiment established that low oxygen injury was the cause of the
peel discolouration observed and not low humidity. Research by
Akkaravessapong et al. (1992) had foturd that lowhumidity caused
mechanically damaged tissues to dry causing black discolouration. However,
the work on humidity effect in combination with nitrogen exposure confirmed
initial conclusions that peel discolouration was due to the low oxygen
142

General Discussion
atmosphere (Wills et a\.,1990; Thompson, 1998).
9.4.2 Ethanol atñospheres
Ethanol is a product of anaerobic respiration, which can be indirectly increased
via modified or controlled atmospheres @esis and Avissar,1989; Pesis and
Marinansþ , 1993; Pesis, I 994; Pesis , 1996). Studies have focussed on better
control over the process by directþ applytng ethanol to tomatoes (Salreit,
1989; Saltveit and Sharaf, I992;Hong et a1.,1995; Beaulieu and S¿ltveit,1997),
bananas and otherproduce (llewage et aL.,L995;Ritenour et aL.,1997).
However, ripening inhibition was not found in bananas, unlike in tomatoes
where ethanol was absorbedthrough the stem scar or fruit peel. In both banana
experiments, fruit were heid in atrnospheres created by the application of
ethanol to filter pdper. However, no measurements of ethanol concentrations in
banana peel or pulp were conducted, so the absorption of ethartol into the
bdnanas was not clear.
A recéht improvement in the application of ethanol to tomatoes was repofted
by Ratanachinakorn et al. (1999), using vacuurn infiltation. This method is a
rapid and forceful way of increasingthe volatile content of fruit tissues.
However, unlike irr the tomato study, ethanol was not absorbed into the pulp of
bananas and consequently ripening was unaffected. This suggests that further
research into forcing exogenously applied ethanol atnospheres into thick
skinned produce is needed, but also encourages the use ofindirect approaches
such as modified and conüolled atrnospheres to increase internal ethanol
concentrations in bananas, as Pesis and Marinansky (1993), Pesis (1996) and
Ratanachinakorn et al. (1997) did with tomatoes.
143

General Discussion
9.4.3 l-Methylcyclopropene atmosphefes
The quality of bananas a.fter exposure to I-MCP, an ethylene antagonist, that
irreversible binds to ethylene receptors and prevents the production of
endogenous ethylene, effectively preventing ripening (Sisler and Serek, 1997),
was examined.
Use of I-MCP on ethylene initiated bananas, as in this study, has been
investigated before byMacnish et al. (1997), Golding et al. (1999),Jianget al.
(1999b), Joyce et al. (1999) and Macnish et al. Q000a). However, even though
the studies did provide infomration on banana shelf life and in one case on
aroma volatile production, the research did not provide infonnation on the
quality of bananas in relation to consumer preferences.
Investigation into the lengttr of I-MCP exposure was also conducted in this
study, as Jiang et al. (1999) reported the availability of new ethylene binding
sites for the recurrence of ethylene synthesis after I-MCP treaÍnent. The
extended periods of l-MCP exposure after initial ethylene contact was aimed at
delaying ripening for as long as possible
In this study, bananas held in 300 nL Lt I-MCP after ethylene initiation were
found to double in shelf life without negatively affecting quality. However, the
1-MCP concentation applied is critical, as the lower (3 nL Ll) and higher
(30,000 oL I;t) concenfations used were not successñrl in extending shelf life
or totally inhibited fruit ripening and were susceptible to crown rot infection,
respectively. A more detailed analysis into the concentrations between 3 nI- L-1
and 30,000 nLLl wouldbe usefrrl, as further shelf life extension maybe
possible.
t44

General Discussion
The longer I-MCP exposure periods Q-2a hrs) investigated in this studywas
examined to observe whether the longer exposure periods also increased the
shelf life of bananas. Extended exposrre did not affect the efficacy of the
treatrnent, wifh24 hr treaÍnents equally as effective as72hr teahnents.
However, researchers have yet to determine a standard length of exposure
suitable for commercial enterprises with reported holding times and I-MCP
concentrations varying from 1 to 24 hrs and 300 to 45,000 nL L1, respectively.
Jiang et al. (1999b) found the effectiveness of I-MCP was dependent on the
length of I-MCP exposure and concenhation, with higher concentrations
required if short exposure periods were used. Before commercial markets can
use this ethylene antagonist, a study into a standardised application progranìme
for industry is essential, preferably using a high I-MCP concenhation for a short
exposure period to allow the treatnent of large quantities of produce in the
shortest time possible. However, quality of fruit must be monitored if the use of
higher I-MCP concenfiations is to be used, as uneven peel degreening was
observed on bananas after24 hr exposure to concenfrations of 500 and 1,000 nL
Lr of I-MCP (Jiang et al.,I999a). Uneven degreening in the previous study
may have been influenced by the lack of 1-MCP diffirsion into peel by
inadvertentlyblocking surface pores @erez and Beaudry, 1998). Even
degreening was promoted in this study by raising the fruit, thus allowing I-MCP
exposure to the entire banana surface.
Further investigations into using I-MCP throughout the year need to be
conducted to determine whether bananas grown during difÊerent seasons react
differently to I-MCP exposure, as their ripening behaviours varied at different
times of the year in this study. Also lower temperatures have been shown to
reduce the effectiveness of 1-MCP binding of ethylene receptors (Sisler e/ a/.,
t45
General Discussion
1996; Sisler and Serek, 1997) andtherefore winter grown produce may react
differently to I-MCP exposure compared to summer grown produce.
9.5 Commercial benefits from this research
This study has allowed a better understanding of ripening procedures in relation
to shelf life, visual appearance and internal quahty of bananas, when grown
under various climatic conditions. Currently industry ripens bananas at
temperatures between 14 and2O"C with 300 pL L1 of ethylene apptied for the
first two days of ripening, but ripening temperature depends entirely on market
demand. Higher temperatures are used to speed up rþening and lower ones to
delay ripening. Findings have identified the importance of recording in-field
climatic data and events to assist in deciding the optimal ripening conditions of
bananas. A ripening procedute suitable for any time of the yem would consist
of ripening mâture, hard, green, stage I barranas at 18'C with between 50-300
pL Lr ethylene on two consecutive days, resulting in a banana shelf life of
approximately 6 days. Ripening bananas at20"C would also result in a good
visual appearance, but would reduce shelf life (a dayÐ in some months of the
year. If monitoring of field temperatures is conducted throughout the growth
and development period and temperatures are fotrrd to be above l3"C without
any occuffence of sudden climactic changes, such as cyclones, ripening
temperatures of 14 or 16oC would increase shelf life of bananas without
increasing peel discolouration. The use of between 50-300 gL Lt of ethylene to
ripen bananas will avoid excessive ethylene use and associated costs, with
similar banana quality resulting from the lower concentrations.
Apromising post-climacteric treatment for extending banana shelf life of
ethylene-initiated bananas was exposure to 300 nL Lr of l-methylcyclopropene.
146

General Discussion
This level significantly improved banana shelf life without affecting peel or
pulp quality. I-MCP is approved on food products in Chile and approved on cut
flowers in the USA. It is yet to be authorised on food products in Australia, but
will prove veryusefrrl if its approval is granted, which is likelyto occur in the
near future.
9.6 Future research
Even though this research has allowed an insight into the physiology of
bananas, fuither research into the following areas is required.
Continued research into an early detection of chilling injury is required. This
remains the prirnary cause for peel discolouration and while we now know the
severity of the discolouration is affected by postharvest managemettt, the early
detection of chilled fruit would allow management of those affected to be
ripened separátely from those not affected by in-field chilling. Investigation
into the use of the chetnical nose in association with the early detection of
chillitrg injury in bananas would be of benefit to wholesalers. Banana peels at
the green, mature stage, may indicate differences in aroma profiles, as the
presence of browning substances may cause a change in peel arolna (Mabrouk,
1979). Earlier research by Murata (1969),found higher acetaldehyde and
ethanol concentrations in severely chilled green banana peels compared to
healttry green banana peels, which possibly influenced their aroma profiles.
Furttrer analysis into the early detection of peel discolouration may focus on the
differences observed bywholesalers between bananas growTt in low compared
to high sunlight hours (T. Johnson, Chiquita Brands South Pacific, pers. comm.,
2001). Seasonal variation in PPO activity of bananas may be a method for early
147

General Discrssion
peel discolouration detection. The effect oflfV or sunlight hours during
seasonal growth may influence banana PPO activity, because gamma irradiation
on bananas has been found to positively correlate with PPO activity and skin
discolouration (Thomas and Nair, l97l). This may in-tum lead to further study
into the types of bunch covers used by industry to protect bananas from peel
discolouration due to changes in sunlight hours during seasons.
Field applications of bunch covers (different materials or thicknesses at
different times of the years) require some investigation. Light peneüation is
especially important dtring flìe months of January and February when low
sunlight hours affect peel coloutation (T. Johnson, Chiquita Brands South
Pacific, pers. cornm .,2001),reducing peel appearance. This could lead to
various bunch covefs being trialled throughout the year depending on weather
patterns.
Future investigation into the extension of banana shelf life needs to focus on the
indirect increase of ethanol in the early stages (1-4) of ripening using modified
ahnospheres. However, continual study into developing an exogenously applied
technique which is able to force ethanol into the pulp of bananas would be
beneficial; as it would allow commercial markets confol over the ripening
process.
Additional research must also be conducted into the application of I-MCP in a
commercial environment, ensuring total banana exposure to I-MCP preventing
the uneven degreening that has been previously observed. This research is
essential during the time before its approval on foods. During this time,
investigation should also include the use of different levels of I-MCP
148

General Discussion
throughout the year, to ensure its effectiveness all year round.
All of these areas will provide the banana industry with extra data that will
ultimately lead to better management practices in the field as well as
postharvest. Únproved management will ensure bananas with the best
appeârance, taste and aroma are distfibuted to consumers worldwide. It will
also encourage Aushalian consumers to buyAusfralian produced quality
bananas, rather than bananas which may become available through Philippine
imports iil the near futtlre.
149

,Biblíogiepbü
(a) Puhlications from this thesls (reprints located at back)
Jorlrhal artlcles
Klieber, 4., Bagnato, N., Barrett, R. and Sedgley, M. (2002). Effect of post-
ripening nitrogen aÍnosphere storage on banana shelf life, visual appearance
and aroma. Postharvest Biologt and Technolog,t,25: 15-24.
Bagnato, N., Klieber,4., Barrett, R. and Sedgley, M. (2002). Optimising
ripening ternþeratures of Cavendish bananas var.' Wil liams' harvested
throughout th3 Vear. Australian Journal of Experimental Agriculture, Az Qn
press).
Bagnato, N., Klieber,4., Barfett, R. and Sedgley, M. (2002). Effect of ethanol
vacunm infilhation on the ripehing of Cavendish bananas var. 'Williams'.
P o stha w e st B io lo gt and Te chnol o g,t, (tn press).
Bagnato, N., Barett, R., Sedgley, M. and Klieber, A. Q002). Quahly effects of
I -methylyclopropene exposure on ethylene-treated Cavendish bananas.
Intemational Joumal of Food Science ond Technologt (in press).
150

Bibliosaphy
Conference abstracts
Bagnato, N., Muchui, M., Klieber, 4., Barrett, R. and Sedgley, M. (2001).
Optimisingripening procedures of Cavendish bananas throughout the year.
Australasian Postharvest Conference ,23-23t' September, Adelaide, Ausüalia.
Kliebeq 4., Bagnato, N., Barrett, R. and Sedgley, M. (2001). Effect of post-
ripening atnosphere treatrnents on banana. Contolled Atnosphere Conference,
8-l 31h Jdy, Rotterdam, Netherlands.
Klieber, A., Bagnato, N., Sedgley, M. and Barrett, R. (2002). Banana Ripening:
Supporting the Art with Science. International Horticulh¡ral Congress, l1-16d'
August, Toforlto, Canada.
Miscellnnbbús
Bagnato, N., Klieber,4., Bâffett, R. äiid Sëdgley, M. (2001). Optiñising
Cavendish riþetring procedtlres year round. Good Fruit and Vegetables, l2z 29
l5l

Bibliography
AbdEl-Wahab, F. K. andNawwar, M. A. M. (1977). Physiological and
biochemical studies on chilling injury of bananas. Scientia
Horticalaturae. 1 : 37 3-37 6.
Akkaravessapong, P., Joyce, D. C. and Turner, D. W. (1992). The relative
humidity at which bananas are stored or ripened does not influence their
susceptibility to mechanical damage . Scientia Horticulturae. 522 265-
268.
Arriot, M. J., Fleuriet,4., Cheynier, V. andNicolas, J. (1997). Phenolic
compounds and oxidative mechanisms in fruit and vegetables. In:
Tomas-Barberan, F. A. andRobins, R. J. (eds.). Phytochemistry of Fruit
and Vegetables. Clarendon Press, Oxford, pp. 51-85.
Anonymous (undated). Your guide to greater profits. Chiquita Brands, Inc,
Cincinnati.
Australian Banana Grower's Council (1999). The banana industry in Australia,
online access 8th Sept at htÞ ://www. abec. org. aulbanana.lrtml.
Beaulieu, J. C., Peiser, G. and Saltveit, M. E. (1997). Acetaldehyde is a causal
agent responsible for ethanol-inducedripening inhibition in tomato fruit.
P lønt P hysiolog,t. ll3 : 431439
152

Bibliography
Beaulieu, J. C. and Saltveit, M.E. (1997). Inhibition or promotion of tomato
fruit ripening by acetaldehyde and ethanol is concentration dependent
and vmies with initial fruit maturity. Joumal of the American Societyfor
Horticultural Scimce. 122: 392-398.
Blankenship, S. M. and Herdeman, R. W. (1995). High relative humidity after
ethylene gassing is important to banana fruit quality. HortTechnologt,
5:150-151.
Bureau of Meteorology (2000-01). Climatic data for South Johnstone Research
Station number: 032037 . Australian Bureau of Meteorolory,
Queensland.
Couey, H. M. (1982). Chilling injury of crops of nopical and subtopical origin.
HortScience. 17 z 162-165.
CSIRO (197 2). Banana ripening gurde. Commonwealth Scientifi c Industrial
Reseárch Organisation Division of Food Research Circular 8, North
Ryde,NSW,pp. 13.
Daniells, J. W. (1986). Banana cultivars in Ausfralia. Queensland Agricultural
JoumaL March-April: 75-85.
DeEll, J. R., van Kooten, O., Prange, R. K. and Murr, D. P. (1999). Applications
of chlorophyll fluorescence techniques in postharvest physiolory, vol.
23.In. Janick, J. (eds.). Horticultural Reviews. John Wiley and Sons,
New York, pp. 69-108.
153

Bibliography
Dilley, D. R. (1970). En4zmes, vol. 1. In:Hulme, A. C. (eds.). The
biochemistry of fruit and their products. Academic Press, London, pp
179-207.
Dominguez, M. and Vendrell, M. (1994). Effect of ethylene treatuent on
ethylene production, EFE activity and ACC levels in peel and pulp of
banana fruit. Postharvest Biologt and Technologt. 4: 167-177 .
Elyatem, S. M., Banks, N. H. and Cameron, A.C.(1994). Oxygen concentration
effects on ethylene production by ripening banana tissue. Postharvest
B iolo gt and Technolog,,. 4: 343 -351 .
Environmental Protection Agency (1999). Registration eligibility documeht: l-
Methylcyclopropene, online access llth August at
http //www.epa. gov/oppbppdl ibiopesticideVreds/red_224459.htm
Eskin, N. A. M. (1990). Biochernisty of foods. Academic Press, San Diego.
Francis, F. J. (1977). Colour and appeatance as dominating sensoryproperties of
food. In: Birch, G. G., Brennan, J. G. and Parker, K. J. (eds.). Sensory
properties of food. Applied Science Publishers Ltd., I¡ndon, pp. 27 -43 .
Golding, J. B., Shearer, D., McGlasson, W. B. and Wyllie, S. G. (1999).
Relationships between respiration, ethylene arìd aroma production in
ripening banana. Joumal of Agriculturol and Food Chemistry. 47:
1646-1651.
154

Bibliography
Golding J. 8., Shearer, D., Wyllie, S. G. and McGlasson, W. B. (1998).
Application of I-MCP andpropylene to identifu ethylene-dependent
ripening processes in mature banana ftuit. Posthawest Biologt and
Technologt. 14: 87-98.
Gooding, P. S., Bir{ C. and Robinson, S. P. (2001). Molecular cloning and
characterisation of banâna fruit polyphenol oxidase. P I anta. 213 : 7 48-
757.
Goodwin, T. W. (1980). The biochemistryof the carotenoids. Chapman and
Hall, London.
Grierson, W. and Wardowski, W. F. (1978). Relative humidity effects on the
postharvest life of fruits and vegetables. Hortscience. l3z 570-574.
Harris, D. R., Seberry, J. 4., Wills, R. B. H. and Spohr, L. J. (2000). Effect of
fruit maturity on efficiency of l-methylcyclopropene to delaythe
ripening of bananas. Posthawest Biologt and Technologt. 202 303-308
Hewage, K. S., Wainwright, H. and Luo, Y. (1995). Effect of ethanol and
acetaldehyde on banana ripening. Joumal of Horticultural Science.l0z
s1-55.
Hong, J. H. and Gross, C. (2000).Involvement of ethylene in development of
chilling injury in fresh-cut tomato slices during cold storage. Journal of
the American Society for Horticultural Science. 125: 736-7 41.
155
Hong, J. H.,Iæe, S. K. and Kim, J. K. (1995). Ethanol inhibits ripening of
tomato fruit, vol. 398, Hyodo, H. and Watada, A. E. (eds.) International
Society for Horticultural Science, Kyoto, pp.147-757 .
Hopkirk, G., lvlaindonald, J. H. and White, A. (1996). Comparison of four new
devices for measuring kiwifruit flrmness. New Zealand of Crops ond
horticultural Science. )42 2t 3-286.
Hyodo, H., Ikeda, N., Nagatâni, A. and Tanaka" K. (1983). The increase in
alcohol dehydrogenase activity and ethanol content during ripening of
banana fruit. Journal of the Japanese Societyfor Horticultural Science.
522196-199.
Israeli, Y. and Lahav, E. (1986). Banana. In: Monselise, S. P. (eds.). CRC
Handbook of Fruit Set arid Development. CRC Press, Boca Raton, pp.
45-73.
Jacobi, K. K., MacRae, E. A. and Hetherington, S. E. (1998). Early detection of
abnormal skin ripening characteristics of Kensington' mango
(Mangfera indica Linn). Scientia Horticulturae. 722 215-225.
Jiang, Y., Joyce, D. C. and Macnish, A. (2000). Effect of abscisic acid on
banana fruit ripening in relation to the role of ethylene. Joumal of Plant
Growth Regulation. 19: 106-1 1 1.
i56

Biblioeraphy
Jiang, Y., Joyce, D. C. and Macnish, A. J. (1999a). Extension of the shelf life of
banana fruit by 1-methylcyclopropene in cornbination with polyethylene
bags. Posthowest Biologt and Technologt. 16: 187-193.
Jiang, Y., Joyce, D. C. and Macnish, A. J. (1999b). Responses of banana fruit to
treatment with 1 -methylcyclopropen e. P lant Grow th Re gulation. 28: 7 7 -
82.
Johns, L. and Stevenson, V. (1979). The complete book of fruit Angus and
Robertson Publishers, Sydney, NSW.
Jones, D. R., Pegg, K. G. and Thomas, J. E. (1993). Banana. In: Persely, D
(eds.). Diseases of fruit crops. Departnent of Primary Industries
Queensland, Brisbane, pp. 25 -35.
Jones, R. L., Freebaim, H. T. and McDonnell, J. F. (197d). The prevention of
chilling injury, weight loss reduction, and ripening retardation in
banana. Joumal of the Americøn Societyfor Horticultural Science. l03z
2t9-22r.
Joyce, D. C., Macnish, A. J., Hofman, P. J., Simons, D. H. and Reid, M. S.
(1999). Use of l-methylcyclopropene to modulate banana ripening. In:
Kanellis, A. K., Chang C., Klee, H., Bleecker,4.8., Pech, J. C. and
Grierson, D. (eds.). Biolory and Biotechnology of the Plant Hormone
Ethylene II. Kluwer Academic Publishers, Dordrecht, pp. 189-190.
757

Bibliography
Kader, A. A. (1992). Modified afnospheres during transport and storage. In:
Kader, A. A. (eds.). Postharvest technolory of horticultural crops.
University of California, Oakland, pp. 85-92.
Kader, A. A. (1993). Modified and contolled atmosphere storage of tropical
fruits.In: Champ, B. R., Highley, E. and Johnson, G.I. (eds.).
Postharvest handling of tropical fruits: Proceedings of an
Intemational conferen ce, l9-23'd July, Chiang Mai, Thailand, pp.239-
249.
Kalyanaraman, B., Felix, C. C. and Sealy, R. C. (1984). Electron spin
resonance-spin stabilization of semiquinones produced dwing oxidation
of epinephrine and its andlogues. Joumal of Biological Chemistry.2S9z
3s4-358.
Kays, S. J. (1991). Postharvest physiolory of perishable plant products. Van
Nostrand Reinhold, New York.
Kays, S. J. (1999). Preharvest factors affecting appearance . Postharvest Biolog,t
and Technolog,,. l5:233-247 .
Kim, M. H. and Iæe, S. K. (1988). Effects of storage temperatures on mature-
green bananas. Journal of the Korean Societyfor Honicultural Science.
29:64-70.
158

Bibliography
Klieber, A. and Muchui, M. Q002). Preference of banana flavour and aroma are
not affected by time of year or'winter chilling. Australian Joumal of
Experimental Agriculture. 42: 20I-205 .
Krajayklang, M., Klieber, A. and Dry, P. R. (2000). Colour at harvest and
postharvest behaviour influenece paprika and chilli spice quality.
P ostharvest B iolo gt qnd Technologt. 20: 269 -27 8.
Larìd, D. G. (1988). Negative influences on acceptibility and their control. In
Thomson, D- M. H. (eds.). Food acceptibility. Elsevier Science
Publishers, London, pp. 47 5-483.
Liu, F. W. (1976a). Bananaresponse to low concentrations of ethylene.Joumal
of the American Socieþþr Horticultural Science. l0l:222-224.
Liu, F. W. (1976b). Storing ethylene-pre-treated bananas in confrolled
atrnosphere and hypobari c afu. Joumøl of the American Society þrHorticultural Science. 101 : 198-20 1.
Mabrouk, A. F. (1979). Flavour of browning reaction products. In: Boudreau, J
C. (eds.). Food taste chemistry. American Chemical Society,
Washington, D. C., pp.205-246.
Macku, C. and Jennings, W. G. (1987). Production of volatiles bynpemng
bananas. Joumal of Agricaltural and FoodChemis'try. 35: 845-848
159

Bibliography
Macnish, A. J., Joyce, D., Hofrnan, P. and Simons, D. (2000a). I-MCP gas can
be used to control when and how fast banana fruit ripen. Good Fruit and
Vegetobles.l0: 56.
Macnish, A. J., Joyce, D. C. and Hofman,P. J. (1997). l-Methylcyclopropene
delays ripening of 'Cavendish'banana frtljt. Proceedings of the
Australasian Posthamest Conference, 28th Sept.-3rd Oct., University of
Western Sydney, Høwkesbury, 282-284.
Macnish, A. J., Joyce, D. C., Hofman, P. J. and Simons, D. H. (1998).
Regulation of banana fruit ripening by I -methylcycloproprene. In:
(eds.). Horticulture Postharvest Group Biennial Review, Info series
Q198095. Departrnent of Primary Industries, Queensland, pp. l5
(Abstract only).
Macnish, A. J., Joyce, D. C., Hofitialt, P. J., Sirnons, D. H. andReid, M. S.
(2000b). 1 -Methylcyclopropêne treafüeht effrcacy in preventing
ethylene perception in banana frûit and grevillea and waxflower flowers.
Australian Journal of Experimental Agriculture. 40: 471481.
Marques, L., Fleuriet, A. and Macheix, J. J. (1995). Fruit poþhenol oxidases,
Vol. In: Lee, C. Y. and Whitakeq J. R. (eds.). Enzymatic browning and
its prevention. American Chemical Society, Washington, pp. 90-102.
Marriott, J. (1980). Bananas - Physiology andbiochemistry of storage and
ripening for optimun quality. CRC Critical Reviøts in Food Scimce
and Nutrition 13: 4l-88.
160

Bibliography
McGlasson, W. B. and Wills, R. B. H. (1972). Effects of oxygen and carbon
dioxide on respiration, storage life, and organic acids of green bananas
Au stral i on J oumal of B io I o gical S c ience s. 25: 3 5 42.
Morris, L. L. (1982). Chilling injury of horticultural crops: An overvrew
HortScience. l7 z 16l-162.
Muchui, M. (2000). The effect of seasons andpostharvest chilling on the eating
quality of bananas. Master of Horticulture. The University of Adelaide.
Murata, T. (1969). Physiological and biochemical studies of chilling injury in
bananas. Physiologia Plantarum. 22: 40l4ll.
Noggle, G.R. and Fritz, G. J. (19S3). ItthoductoryPlant Physiology,2d edn.
Prentice-Hall, Inc., Englewood Cliffs.
Oetiker, J. ËI. and Yang, S. F. (1995). The role of ethylene in fruit ripenlng, vol
398. Hyodo, H. and Watada, A. E. (eds.). International Societyfor
Horticultural Science, Kyoto, pp. 167 -17 8.
Olorunda, A. O., Meheriuk, M. andLooney, N.E. (1978). Some postharvest
factors associated with the occrurence of chilling injury in banana.
Journal of the Sci ence of F o od and Agriculture. 29 : 2I3 -218.
Omuaru, V. O. T. and Izonfuo, W. A. L. (1990). Some endogenous factors
influencing browning in plantain peels during ripening. Discovery ønd
Innovation.2z 52-56.
161

Bibliography
Palmer, J. K. (1963). Banana polyphenoloxidase: Preparation and properties.
P lant Physiology. 38: 508-5 13.
Palmer, J. K. (1971). The banana. In: Hulme, A. C. (eds.). The Biochemistry of
Fruits and their Products. Academic Press, London, pp. 65-105.
Pantastico, E.8., Mattoo, A. K., Murat4 T. and Ogata,K. (1975). Chilling
injury. In: Pantastico, E. B. (eds.). Postharvest physiolory, handling and
utilization of tropical and subtropical fruits and vegetables. AVI
Publishing, Wesþort, pp. 339-362.
Parsons, C. S., Gates, J. E. and Spalding, D. H. (1964). Quality of some fruits
and vegetables after holding in nifogen atmospheres. American Society
for Horticultural Science. B4z 549-556.
Patterson, B. D. (1980). Refrigeration of ftuits and vegetables: Benef,tts and
problems in the use of low temperatures. CSIRO Dvision of Food
Research, Nofh Ryde, NSW.
Paull, R. E. (1993). Tropical fruit physiology and storage potential. In: Champ,
B. R., Highley, E. and Johnson, G. L. (eds.). Postharvest Hærdling of
Tropical Fruits. AClARProceedings, Canbera, NSW, pp. 198-204.
Peacock, B. C. (1972). Role of ethylene in the initiation of fruit ripening.
Queensland Journal of Agriculture and Animal Sciences. 292 137 -145
162

Bibliography
Peacock, B. C. (1980). Banana ripening - Effect of temperature on fruit quatlty
Queensland J ournal of Agri cultural and Animal Science s. 37 z 39 45 .
Pereq R. and Beaudry, R. M. (1998). Fractional surface coating modifies gas
diffirsion and ripening in bananas. Joumal of the American Societyfor
Horticultural Science. 123: I I 5-l 1 8.
Pesis, E. (1994). Enhancement of fruit aroma and qualityby acetaldehyde or
anaerobic teatments before storage, vol. l. In: Sass, P. (eds.).
Intemational symposium on postharvest treatment of hottlculhnal crops.
Intemátional Society for Horticultural Science, Kecskerhet, pp. 365-373.
Pesis, E. (1996). Induction of fruit aroma and qualitybyposthawest apþlication
of natural metabolites or anaerobic conditions, vol. 18. In: Lihskens, H.
F. âhd Jacksotr, J. F. (eds.). Modern methods of plant analysis: Fruit
Atralysis. Sþrittger-Verlag Berlin, Heidelberg, pp. I 9-3 5.
Pesis, E. andAvissar, I. (1989). The postharvest qualrty of orange fruits as
affected by pre-storage treatnents with acetaldehyde vapour or
anaerobic conditions. Joumal of Horticultural Science. 642107-713
Pesis, E. and Marinansky, R. (1993). Inhibition of tomato ripening by
acetaldehyde vapour or anaerobic conditions prior to storage. Joumol of
P lant Physiology. l42z 7 17 -721.
163

Bibliography
Podd, L. A. and Van Staden, J. (1998). The role of ethanol and acetaldehyde in
flower senescence and fruit ripening - Areview. Plant Growth
Regulation. 26: 183-189.
Quazi, M. H. andFreebaim, H. T. (1970). The influence of ethylene, oxygen
and carbon dioxide on the ripening of bananas. Botønical Gazette.l3l:
5-14.
Ratanachinakorn, B. (2000). Effects of brief controlled atrnospheres and ethanol
vacuum infiltation on sensory quahty and physiolory of tsermuda'
tomatoes. Universrty of Queensland, Gatton.
Ratanachinakorn,8., Klieber, A. and Simons, D. H. (1997). Effect of short-term
cofholled atmospheres and maturity on ripening and eating gality of
toTnatoes. Postharvest Biolog,t ønd Technolog. llz 149-754.
Ratanachinakorn,8., Klieber, A. and Simons, D. H. (1999). Ethanol vapor
vacuum infiltration of tomatoes:Morphological analysis and effect on
ripening and eating quality. Joumal of the American Societyfor
Hort icuhural Sc ience. 124: 283 -288.
Rhodes, M. J. C. (1980). Respiration and senescence of plant hormones, vol. 2
In. Davies, D. D. (eds.). The biochemistry of plants: Metabolism and
respiration. Academic Press, New York, pp.419-462.
164

Bibliography
Rippon, L. E. and Trochoulias,T. (1976). Ripening responses of bananas to
temperature . AustralianJoumal of Experimental Agriculture and
Animal Husbandry. 16z 140-144.
Ritenow, M. 4., Mangrich, M. E., Beaulieu, J. C., Rab, A. and Saltveit, M. E.
(I997).Ethanol effects on the ripening of climacteric fruit. Posthart¡est
Biologt and Technologt. 12:3542.
Salisbury, F. B. and Ross, C. W. (1985). Plant Physiolory, 3'd edition.
Wadsworth Publishing Company, Behnont.
Saltveit, M. E., Jr. (1989). Effect of alcohols and their interaction with ethylene
on the ripening of epidermal pericarp discs of tomato fruit. Plant
P hysiolog,t. 902 167 -17 4.
Salweit, M. E., Jr and Morris, L. L. (1990). Overview on chilling injury of
horticultural crops. In: Wang, C. H. (eds.). Chilling Injury of
Horticultural Crops. CRC Press, Èioca Raton, pp. 3-16.
Saltveit, M. 8., Jr. and Sharaf, A. R. (1992). Ethanol inhibits ripening of tomato
fruit harvested at various degrees of ripeness without affecting
subsequent quahty. Joumal of the American Societyþr Horticultural
Science. ll7:793-798.
Salunkhe, D. K. and Desai, B. B. (1984). Postharvest biotechnolory of fruits
CRCPress, BocaRaton.
165

Bibliography
Schirra, M., Dhallewin, G., Inglese, P. and La Mantia, T. (1999). Epicuticular
changes and storage potential of cactus pear fOpuntiaficus-indica
Miller (L.)l fruit following gibberellic acid preharvest sprays and
postharvest heat treatnent. Posthawest Biologt and Technologt. l7z
79-88.
Scott, K. J. and Gandanegar4 S. (1974). Effect of temperature on the storage
life of bananas held in poþthylene bags with ethylene absorbent.
Tropical Agriculture. Slz 23 -26.
Scott, K. J., Mc Glasson, W. B. andRoberts, E. A. (1970). Potassium
permanganate as an ethylene absorbent in polyethylene bags to delay
ripening of bananas during storage. Australian Joumal of Experimental
Agriculture and Animal Husbandry. l0: 237 2A0.
Scriven, F. M., Gek, C. O. and Wills, R. B. H. (1989). Sensory differences
between bananas ripened without and with ethylene. HortScience.24:
983-984.
Seberry, J. A. and Harris, D. R. (1993). Factors affecting shelf life of Cavendish
bananas. Australasian Postharvest Conference. Gosford, NSW, pp. 387-
391.
Seymour, G. B. (1993). Banana.In: Selmrour, G.8., Taylor, J. E. and Tucker, G
A. (eds.). Biochemistry of Fruit Ripening. Chapman and llall, London,
pp. 83-106.
166

Bibliography
Sharkey, P. J. and Pegge, I. D. (1984). Effects of high humidity storage on
quality, decay and storage life of cherry,lemon and peach fruits.
Scientia Horticulturae. 23: I 8l-190.
Shaw, P. E., Moshonas, M. G. and Pesis, E. (1991). Changes during storage of
oranges pretreated with nitrogen, carbon dioxide and acetaldehyde in
ur. Joumal of Food Science. 56: 46947 4.
Shomer, I., Ben-Shalom, N., Harel, E. and Mayer, A. M. (1979). The
inftacellular location of catechol oxidase in the olive fruit. Annals of
Botany. 442 261-263.
Sisler, E. C. (2000). Research: Plant hormone binding, plant hormone action,
online access 2nd Feb. at
http://www.cals.ncsu.edu/biochern/facult)'/sisler/sisler.htrnl.
Sisler, E. C., Dupille, E. and Serek, M. (1996). Effect of l-methylcyclopropene
and methylenecyclopropane on ethylene binding and ethylene action on
cut carnations. Plqnt Growth Regulation.lS: 79-86.
Sisler, E. C. and Serek, M. (1997). Inhibitors of ethylene responses in plants at
the receptor level: Recent developments. Physiologia Plantarum. l00z
577-582.
Sjaifirllah, S. and Dasuki, I. M. (1992). Ripening process of banana. Indonesian
167

Bibliography
Agricultural Research and Development Joumal. 14: 59-62.
Smillie, R. M. (1979). The useful chloroplast: Anew approach for investigating
chilling stress in plants. In: Lyons, J. M., Graham, D. and Raison, J. K.
(eds.). Low temperáture shess in crop plants: The role of the membrane.
Academic Press, New York, pp.187202.
Smillie, R. M. and Hetherington, S. E. (1990). Screening for stress tolerance by
chlorophyll fluorescence. In: (eds.). Measruement Techniques in Plant
Science. Academic Press, San Diego, pp.229-261.
Smillie, R. M., Hetherington, S. E., Nott, R., Chaplin, G. R. and Wade, N. L.
(19S7). Applications of chlorophyll fluorescence to the postharvest
physiology add storage of mango and banana fruit and the chilling
tolerdttce of mango cultivars. ASEAN FoodJournal.31 55-59.
Stevedson, R. J., Prescott, J. and Boakes, R. A. (1999). Confilsiltg tástes and
smells: How odours can influence the perception of sweet and sour
tastés. Chemical Senses. 242 627 -635.
Stover, R. H. and Simmonds, N. W. (1987). Bananas. Longman Scientific and
Technical, Harlow
Studman, C. J. and Yuwana (1992). Twist test for measuring fruit firmness.
Joumal of texture Studies. 23:215-227 .
TuaL. andZeiger,E. (1998). Plant Physiology. Sinauer Associates, Inc.,
168

Bibliography
Publishers, St¡nderl and.
Thomas, P. andNair, P. M. (1971). Effect of gammairradiation onpolyphenol
oxidase activity and its relation to skin browning in bananas.
Phytochemistry. l0z 771-777 .
Thompson, A. K. (1996). Postharvest technolory of fruit and vegetables.
Blackwell Science, Oxford.
Thompson, A. K. (1998). Corltrolled aÍnosphere storage of fruits and
vegetables. CAB Intemational, Oxon.
Toraskeq M. and Modi, V. V. (1984). Peroxidase and chilling injury in banana
frút. Joumal of Agricultural ønd Food Chemistry.32l. 1352-1354.
Tfessl, R. and Jenttitrgs, W. G. (1972).Production of volatile compoutlds in the
ripening báhana. Journal of Agricultural and Food Chemistry. 2b: 1S9-
192.
Tucker, G. A. (1993).Introduction.In: Selmrour, G.8., Taylor, J. E. and Tucker,
G. A. (eds.). Biochemistry of Fruit Ripening. Chapman and Hall,
London,pp.1-51.
Turner, D. V/. (1997). Bananas and plantains. In: Mifr4 S. K. (eds.). Postharvest
Physiology and Storage of Tropical and Subfropical Fruits. CAB
Intemational, Nedlands, pp. 47 -83.
),69

Bibliography
Vendrell, M. and McGlasson, W. B. (1971). hhibition of ethylene production in
banana fruit tissue by ethylene treaûnent. Australian Joumal of
Biological Sciences. 24: 885-895.
Wang, C. Y. (1939). Relation of chilling stress to ethylene production. In:Li, P.
H. (eds.). lnw temperature stress physiolory in crops. CRC Press, Boca
Raton, pp.l77-189.
Wang, H. G. and Gemma, H. (1994). Ripening characteristics and chilling
injury of banana fruit: tr. Chatrges in degree of unsaturation of fatty
acids during exposure to chilling. Japanese Journol of tropical
Agriculture. 38; Z+e-2s0.
Wahg, S. Y., Wang, C. Y. arrd Weilburn, A. R. (1990). Role of ethylene under
stress conditions. In:Alscher, R. G. and Cumming, J. R. (eds.). Sfess
responses in plants: Adaptation and acclimation mechanisms, vol. 12.
Wiley-Liss, Inc., New York, pp. 147-173.
Whitaker, J. R. and Lee, C. Y. (1995). Recent advances in chemistry of
anzymaticbrowning.In: Lee, C. Y. andWhitaker, J. R. (eds.).
Enzymaticbrowning and its prevention. American Chemical Society,
Washington,pp.2:7 .
Wills, R. B. H. (1990). Postharvest technolory of banana and papaya in
ASEAN: An Overview. ASEAN FoodJoumal. 5z 47-50.
170

Bibhosraphy
V/ills, R. B. H., Klieber, 4., David, R. and Siridhata, M. (1990). Effect of brief
pre-marketing holdirtg of bananas in nitrogen on time to ripen.
Australisn Joutnal of Experimental Agriculture. 30: 579-58 1 .
Wills, R. B. H., McBailey, W. and Scott, K. J. (1975). Possible involvement of
a-Farneserle in the development of chillirtg injury Plant Physiology. 56z
550-551.
Wills, R. B. H., McGlasson, B., Graham, D. and Joyce, D. (1998). Postharvest:
An introduction to the physiolory and handling of fruit, vegetables and
ornârhefltals, 4ü edn. IINSW Press, Sydney.
Wills, R. B. H., Pitalséritul S. ahd Scott, K. J. (1932). Effects of pte-storage in
low oxygetl or high carbon dioxide concenfiations on delaying the
ripening of bananas. Australian Journal of Agricultural Research.33:
1029-1036
Wirthensohn, M. G., Francis,I. L., Gawel, R. and Jones, G. (1999). Sensory -
Instrumental correlation of extra virgn olive oil aromas using a
'Chemical Nose'. Vol. Melbourne, Victoia, pp. 7 5 -7 8.
Yahia, E. M. (1998). Modified and controlled afnospheres for fopical fruits.
Horticultural Rev iø,y s. 222 123-184.
Young, W. J., Bagster, L. S., Hicks, E. W. and Huelin, F. E. (1932). The
771

Bibliography
ripening and tranqport of bananas in Australia. Commonwealth of
Australia, C.^S.LR. 64: 1-52.
Zatberman G., Fuchs, Y., Rot, I. and Wexler, A. (1988). Chilling injury,
peroxidase, and cellulose activities in the peel of mango fruit at low
temperature . HortScience. 232 7 32-7 33 .
Zawistowski, J., Biliaderis, C. G. and Eskin, N. A. M. (1991). Polyphenol
oxidases. In: Robinson, D. S. andEskin, N. A. M. (eds.). Oxidative
en4rmes in foods. Elsevier Appted Science, New York, pp.2l7-274
t72

Bagnato, N., Muchui, M., Klieber, M., Barrett, R. & Sedgley, M. (2001,
September). Optimising ripening procedures of Cavendish bananas throughout
the year. 2001 Australasian Postharvest Conference, (program and abstracts).
Kent Town, S. Aust., Festival City Conventions.
NOTE:
This publication is included in the print copy
of the thesis held in the University of Adelaide Library.

Klieber, A., Bagnato, A., Barrett, R. & Sedgley, M. (2001, July). Effect of
post-ripening atmosphere treatments on banana. Proceedings of the 8th
International Controlled Atmosphere Research Conference. Leuven, Belgium,
ISHS.
NOTE:
This publication is included in the print copy
of the thesis held in the University of Adelaide Library.

Klieber, A., Bagnato, N., Sedgley, M. & Barett, B. (2002, August). Banana
ripening: supporting the art with science. Acta Horticulturae, 628. A
Proceedings of the XXVI International Horticultural Congress. ISHS, p. 475-
480.
NOTE:
This publication is included in the print copy
of the thesis held in the University of Adelaide Library.

Bagnato, N., Klieber, A., Barrett, B. & Sedgley, M. (2001). Optimising
ripening procedures of Cavendish bananas throughout the year. Good Fruit
and Vegetables, 12, 29, [5].
NOTE:
This publication is included in the print copy
of the thesis held in the University of Adelaide Library.

ELSEVIER Posllrarvest Biotogy and Technology 25 (2002) I5-24
PostharvestBioloqv andTechñólogy
lvlvw.elsevie r.com/loca te/posttrar.v bio
Effect of post-ripening nitrogen atmosphere storage onbanana shelf life, visual appeatance and aroma
A. Klieber *, N. Bagnato, R. Barrett, M. Sedgley
Depffttnent of Horticutture' t/iticutture '"'' oä:,:"Ij:,:,,::;.::{'; i;;i,"';':,:,,:,:f;:""
ctunpLts' Ptcmt Research centre' PMB I'
Received 2l February 2001; accepted 2l August 2001
Abstract
Bananas (ù[Lrsct ctcturrinata Colla, Cavendish cv. 'Vy'iiliams') were stored in nitrogen at 22 oC lor 6, 12 and 24 h ata more gleen than yellow (stage 3) or: more yellow than gr:een (stage 4) r:ipening stage. Shelf life in nitroge¡ at22."C,that is the time taken lrom a more yellow than gleen colour stage 4 to yellow with slight brorvn flecking stage 7, rvas
not extended when compared to air-stored bananas. However, areas of brown discolouration appealed oLr banauasplaced in nitlogen-storage. The aroma of ripe bananas was assessed ',vith a mass spectrometly-based chemical nose.
Bananas stored in nitrogen genelally had a riper aroma prof,le compared with air-stolage. An ion with a mass tocharge ratio of 6I was strongly associated with nitrogen-treated bananas; this ion is a decomposition prodLrct of a
known banana aroma colnpound, ethyl acetate that produces an over-ripe banana note. An ion witl-r a mass to chat'ge
latio ol55 was associated with air-stored bananas; this ion is a decomposition product of ripe bananas (3-methylbutylester and 1-butanol). Post-climacteric nitrogen storage is not a suitable method fol incleasing shelf life, as it causes
skin browning. @ 2002 Elsevier Scieuce B.V. All rights reserved.
Keyworcls: Nitrogen storage; Btrnanas; Shelf life; Chemical nose; Aroma
1. Introduction
A consumer product survey prepared for theAustralian Banana Grower's Cor.rncil (1999)for-rnd that if bananas had a longer shelf life thanthe current 3 days, Ar"rstralians would be likely topurchase more of these fruit. CLrrrently, Aus-
* Corresponding author. Tel.: * 6l-8-8303-6651; fax: + 6L-8-8303-71 16.
E-ttail address: [email protected] (4.Klieber).
0925-521410215 - see lront rnatter O 2002 Elsevier Science B.V. All rights leserved
PII: S0925-52 t 4(0 t )00 I 63-6
tralians consrrme over l5 kg olbarranas per capitaper allnum (Australian Battana Grower's Council,1999). The short shelf lile is due lo a rapidsenescence process lhat causes the visual appear-
ances of the fruit peel to clegrade from yellow to a'muddy' brown colour telminating banana shelflife. Wholesalet's waut to extend the banana shelflife between ripening stage 4 (more yellor.v thangreen) and 7 (yellow with light brown flecks)(CSIRO, 1972) to inc¡ease appeal to consnmers togain higher purchase quantities at one shoppingoccaslon.

t6
Currently, ripened bananas are pre-cooled tol3 iC before their clistribution to supermarkets(T. Johnson, Chiquita Brands South Pacific,pers. commun., 2000), to slow down fruitmetabolism and therefore prolong senescence(Rippon ancl Trochoulias, 1976). However, this is
costly, and fruit rewarm rapidly on the displayshelves, thereby reducing shelf lifle.
Most research has focused on ways to extendthe gleeu lile of unripe lrr,rit. Modified atmo-sphere packaging has been suggested as a substi-tute for low temperature storage (Scott et al.,1970); however, this storage is costly as it in-volves labour as well as ethylene absorbent pack-aging and also requires carefr.rl handling toprevent damage to bags and loss of the modifiedatmosphere. Wills et al. (1990) successfully usedshort-term nitrogen treatments to increase thegreen life (fi:om harvest to yellow with green tips)of bananas, with nitrogen atmospheres of 3-dayduratiou applied immediately alter harvest in-creasing their green life by 42%. Nitrogen atmo-spheres are inexpensive and easy to apply tolarge qr.rantities ol fi'uit. A nitrogen atmospherewill reduce the level of oxygen available to thefruit, which in ttun will inhibit ethylene produc-tion and ripening (Thompson, 1998):
A method is required for slowing the rate olsenescence of ripening bananas to extend theirshelf life from' the point of sale to consurnptiou.The aim of this study was to examine whetherstoring fruit temporarily in nitrogen atmospl-reresafter partial ripening conld extend the shelf lifeof bananas wilhor"rt aflecting their appearance oraIoma.
2. Materials and methods
2.1. Pktnt materictl ancl prepa.ration
Chiquita Brands South Pacific Ltd. Pty. sr.rp-plied Cavendish bananas cv. eWilliams' used forthis study. Fruit were harvested during themonths of June and July 2000 in the Cairnsregion of north Queensland and transported at13 'C to the Plant Reseatch Centre (Waite Carn-pus, Adelaide University) within 3 days of har-
A. Klieber ct ttl. / Postlruruest Biolog¡, tutcl Tecltnology 25 (2002) l5-24
vest. All hands were harvested from plantswithin a single block. Only hands from the mid-dle of the bunch were used, to ensure an evenmatLrrity of frr.rit. At arrival a[ h.uit were stillgleen and hard. Once delivered, the bananaswere dehanded ancl dipped lor I min in hrngicide(0.55 ml/l Sportak, Hoechst Schering AgrEvo,Gler-r lris, Vic.) and allowed to air dry. Matchedfingers were then landomly allocated to tl.eat-ment groups. A treatment unit consisted ol 12flrtLit, six of which were nsed to assess externalcharacteristics of the fruit and the remaining sixwere nsed to assess internal properties of thebananas.
Bananas were ripened in l0-1 plastic containersin the pr'esence of a CO, scavenger (160 g ofCa(OH)r) ensr-rring a \Yo CO2 level, and a 95o/"relative humidity was maintained r-rsing a satu-rated KNO. solution. All fruit were ripened ac-cording to common industry practice to r-ipeningstage 3 (more green than yellow) or 4 (moreyellow than gleen) at 16 'C with 300 pl/l erhyl-ene gas on the fir'st two consecutive days ofripening (T. Johnson, Chiquita Blands Sor-rthPacif,c, pers. çommr-rn., 2000).
2.2. Nitrogen application for uarious periods oftitne at different ripening stages
Alter initiation of ripening, bananas werestored in a nitrogen atmosphere at ripening stage3 or 4. Storage peliods were 0, 6, 12 or 24 h.The two control (no nitrogen) treatments werestored in vented polyetl-rylene bags at 22 "C oncethe appropriate ripening stage had been reachedat 16 'C. Treatcd bananas were placed in con-tainers that were flushed with high purity nitro.gen (BOC gases, Adelaide) for 5 min, belolebeing sealed for the allotted tteatment periods of6, 12 or 24 h. Atmosphere samples were takenftom sealed containers and anaiysed using a thel-mal conductivity detector gas chromatograph(Varian 3300, Walnut Creek, CA) to ensure O,and CO, levels were < I and 0%0, respectively(Wills et al., 1990). On completion of treatments,lruit were placed in vented polyethylene bags at22 "C to complete ripening under simulated retailmarketing conditions.

2.3. Nin'oget1 ettllosphere sl.oroge in the presenceof low or hÌgh relatiue ltumidity
A second nitlogeu atmosphere expeliment wasperformed to observe whether humidity stresswas a factor in the results obtained fi-om theprevions experiment. Bananas were ripened tostage 4 as above and held in nitrogen lor 0 or 24h withor-rt humidity control. In addition, a simi-lar lot of bananas was held in nitrogen for 24 \tin the presence of a satul'ated KNO, solution(95% RH). The atmospheric composition wasagain monitored. After nìtrogen treatment, ba-r.ìanas were removed from stolage containel's andplaced in polyethylene bags. To regulate humid-ity, fruit were held in the presence or- absence ofa beaker of water in the unsealed bags. Air-stored fruit were stored in closed bags that werefolded under the bananas without a beaker ofwater. The relative humidity inside polyethylenebags was tleasured using a hand-held humidityprobe (HM34C, Vaisala, Helsinki) as > 95% RHfor high (beakers of water present) or <75o/,RH for low humidity treatnrellts.
2.4. Assessntents of bqncuzcts
2.4:. 1. Extentttl assessmenÍsAll bananas were weighed at ripening stage I
and at ripening stage 6 to determine the percentweight loss. In addition, silelf life was determinedby observing banana peel colour changes as de-termined by the CSIRO Banana Ripening Chart(CSIRO, 1972) and calculating the number ofdays ìt took for the peel to change lrom ripeningstage 4 (more yellow than green) to ripeningstage 7 (yellow with light brown flecks), exclnd-ing tleatment periods.
Discolouration of the banana peel was ob-served at lipening stage 6 (fully yellow). Thediscolouration severity scale used consisted of 0,1ro discolouration; 1, slightly discoloured; 2,mildly discolouled; 3, severely discoloured. Asfi-uit from a given treatmerìt displayed similarsymptoms, scores were weighted and averagedinto ar.r O, injury discolouration index (DI) foreaclr treatment, using a fol'mula modified fromSchin'a et al. (1999):
A. Klieber et ol. fPosrharuest Biologv mù Tethnolog¡, 25 (2002) l5-24
(a x 0) * (ó x l) + (c x 2) -r (d x 3)(t)
t'7
11
where r¡ is the number of fi'r.rit with no dis-color.rration, å the nurlber ol fi'uit with slightdiscolouration, c the number of fruit with ruilddiscolouration, r/ the uullber of fruit with sevel'ediscolouration, and ¡l the total nullber of fruitobserved.
2.4.2. Intental fruit assessm etxts
Pulp firmness is a measure of the crushingstr-ength of pulp tissue aud v/as n-ìeasured using atwist tester (Depaltrnent of Agricr-rltural Engi-neering Massey University, NZ) as desclibed byHarker et al. (1996). This method is destructiveto fi-uit tissue; however', it is very easy to use andgives reliable ¡esults wheu used on soft tissue,unlike a hand-held penett'ometer (Studman andYuwana, 1992). The penetrometer's action con-presses the flesh against flesh within the fruit,whereas the twist tester rotates the flesh within asingle tissue layer allowing for differences in tex-tural character-istics within that layer to be mea-sured (Griessel and Cr-ouch, 1996).
Soluble solid concentr-ations (SSC) were alsomeasured on pulp tissue using a conventionalrefractonreter (0-30% sugar w/w, Bellinghamand Stanley Ltd., UK). A sample from the mid-dle of the banana was squeezed thlough muslincloth onto the refiactometer glass, aud the SSC(%) recorded after calibration to room tempera-ture.
Arona was neasuled using a l.ìlass spectron-ìe-try-based chemical nose, to determine whetherthere were any characteristic al'oma differences.Pulp (20-30 g) from each of the internal assess-
ment bananas fi-om a single treatment was com-bined and pureed for 6 s in a blender. For eachtl'eatment l0 2O-ml headspace vials were thenfilled with 5 g of the puree and 5 ¡-rl of heptade-cane (an internal standard) was added to thevial. The vials were immediately sealed and ran-dorlly allocated to the Hewlett Packard Chemi-cal Sensor (HP440, Wilmiugton, DE), whichcorlsists of a modif,ed HP 7694 headspace atttosanrpler and a mass sensor based on a HP 5913
MSD. Paraneters for the chemical sensor vi/ere
set as by Muchui (2000).

l8
2.5. Statistical analysis
Tlre first experiment was designed as a 4 x 2
factorial ranclornised complete block with threereplicates. Treatments included the effect ol 0
(air-stolage), 6, 12 or 24 h of nitrogen storagewhen applied to bananas at ripening stage 3
(more green than yellow) or 4 (more yellow thangleen). Harvests on thlee consecutive weeks werereplicales aLrd bananas were ranclomly allocatedto all treatments.
The second experimenl was established in arandomised complete block design with' threereplicates ancl a single treatment. factor., Eachreplicate consisted oF the following nitrogen-stor-age treatnents, 0 (air-storage), 24 h witti a highhurnidity or 24 h with a low humidity during shelflile assessment. All experimental units were t:an-domly distributed to treatments. .. ' ., ,:
Analysis of nosl dzrta (shelf [ile, SSC,;tlmnessand discolouration) was condncted r"rsing the Gen-etal ANOVA directive in Genstat.5 (Release 4.1,4th ecln., 1998, Lawes Agricnltural ,'Trust,Rotharnsted Experimental Station, UK). Strelf lifedata for the first experiment lvere translormed forstatistical analysis by squaring, but were con-vertecl to lhe original units for presentation inTable l. Tleatment eflects were examined forsignificance using a leasl significant difference test(LSD) at the 5olo level.
A. IQieL¡er et ul. / Postlnruesr Biology trtttl Tecltnolog¡' 25 (2002) l5-24
Finally, data on arona were analysed usingstandard principal component analysis (PCA)(Wirthensohn et al., 1999) using the Pirouetteanalysis package (Inlometrix Inc., Woodenville,WA, USA). Each model was validated using across-validation method, which indicated the prin-cipal components that accounted for more thanB0% ol the variation. Fruit with similar volatilecompor-rnds were grouped and separated on plotsfi'om fruit with diffe|ent volatile patterns.
3. Results
3:1. Nitrogen appliccttionfor ucu'ious periods oftime at cliJJerent ripening stcryes
. : . . .1 .
Shelf lile and SSC readings were similar inbananas stored in nitrogen atmospheres at ripen-ing stages 3,or 4 for 6, 12 or 24 h and in bananasstored in air, (Table l). The amount of, surfacediscolouration observed on banana peels variedsignificantly among nitrogen atmosphere treat-ments applied, but incleased in severity withlonger exposure. No slLrlace discolouration was
observed on air-stored bananas; however, brownstreaking developed along tl-re vascltlar tissues iuthe peel of air-stored fruit. This discoloulatiou is
a symptom of mild in-fleld or postharvest chiilinginjury. The injury from nitlogen treatments was
Table I
Assessmenl ol Cavendish bananas cv. Williams at ripening stage 6, alter being stored in a nitrogen attnosplrere lor 0, 6, 12 or 24
lr at ripening stzrge 3 or 4 at 22 "C
Banana ¿rssessn-ìelìt Ripening stage and period of tin-re (h) for which b¿rnanas were stored in uittogen atmosphere
Ripening stage 3 Ripening stage 4
0 6 T2 t2 2424 0 6
Shetf lile (days)"Firmness (kPa)bssc (%)Weight loss (%)
Discolour. index
'7.4¿t 7.4a
l0l a
23.0a2.0a1>
L4b
6.7 ¿
23.2a2.16c2.0c
23.3a2.2c2.7d
23.2it2.tab0.0a
23 5¿
2.labt.4b
7.2aI 04b
23.3a2.0abl.9c
73a 7.3a 7.6a 7.6a
23.|a2.tbc2.8d
23.62t
2.0a0.0a
Datâ are averages of three replicales ¿rnd dillerent letters within a row denote signìfrcant diflerences at P<0.05 using a LSD test.
" Average shelf life (days) data have been back-translormed fror¡ squared analysis data.b Only ripening stages are significant at the 5'% level, therefore the average finlness of bananas stored at r:ipening staþes 3 or 4
were the only nverages given.

A I(licber cr ul f Pttstltctrt'e'tt Biolog' rtnd Tccltnologl' 25 (2002) l5-24 19
Faclo r1
Fig. l. Ttre score plot of barar¡as stored i¡ nitr.ogen for 0 h (air') at stage 3 or' 4 (4, B) at stage 3 for 6' 12' 24 lt (C' D' E) or at
stâge 4 for 6, 12 or 24 h (F' G' H)'
No
oI
clifferent. resltltillg in lar-ge patches of brown dis-
coloLuatioll similal to that fouucl on fruit affected
by iow O, injuly (Wills et ai., 1990; Thompsou'
at stage 3, with lorlgel periods of nitrogen storage
tesultiug in higher weight loss. However, this was
not obselved in fruit relroved at colotlr stage 4
(Table 1).
Fluit analysed at riper-ring stage 6 after stolage
in air or nitrogen fol'variotts pel'iods had differeut
arona characteristics. The PCA models bnilt tocol]-ìpare mass spectlonetric chemical nose data
of all nitlogen-stored as welì as air-stored ba-
llallas explained 91% of the total val'iance present
with two factols, of wl-rich 85% was related to
Factol 1 only. Score plots with the two factor
con-rpoÌ1el.ìts
nitrogen-storl). However,larly those s
have a rlixed aroma- Comparing the plot of the
mass to charge ratios of the ions (variables) that
contlibuteci tã tliis discrirlination (Fig' 2) to the
score plot (Fig. 1), it is clear that ion 55 stt-ongly
correlåted to air--stored bananas, while nitro-qen-
stored frr.tit Inainly correlated to ion 6l'
3.2. Nitrogen crtrtto'sphere storoge in the presettce
o.f lotv or hi.gh relcttioe hLuniditl'
did
n life'
P bo-
tt ttâ
dull yellow peel colour at stage 6' Skin discoloura-
tion ïas sinrilal' iu bananas stolecl in low ol high
lelativeThe 7n/o of the total
valiauc two factors (Fìg'
3). Fac he total v¿rt'iance
with dlstinct discrin-iinatir-rg alorl.l¿ì groupings'
witli one cluster containitlg balrauas stored in air
as well as tlrose stoled ìtr nittoger.r witl-r a low
hlulicitty, ¿rlld the other- cluster consisting of ba-
'¡ ^Æhi
'o "F'þ*.
A
.;].J¡fr"" .'.' " " rqf"'':FÉ
'e'6! cc
È+E€.æ
D

20 A. Klieber et ul. / Posthuruest Biology antl Technolog¡, 25 (2002) t5-24
nanas stored in nitrogen with a high humidity.The clusters containing air-stored bananas andnitrogen-stored bananas in a low hr.rmidity wereclosely associated with iotr 56 (Fig. 4). Ar.omasfrom nitrogen-stored bananas in a high humidityclrrstered around ions 70 and 55. Factor 2 con-sisted of 30% of the total variance. Bananasstoled in nitrogen in a high or low humidity wererelated to ion 6l and 55, whereas air-stored ba-nanas were generally only associated with ion 55(Fig. a).
4. Discussion
Post-climacteric, short-term nitrogen storagedid not extend banana sl-relf life and thereforefurther research into post-ripening tr:eatments toextend sheif life is required. Liu (1976a,b) alsofound that bananas that were initiated with ethyl-ene and then stored in a lo/o O, atmosphere at 14"C ripened soon after being transferred to air at2l "C. This means lhat any reduced O, atmo-sphere eflect is only tlansient once ripening ofbananas has been initiated. In contrast, the gr-een
life of bananas coLrld be extended by short-termlow O, treatments (Wills et al., 1990). [ncreasedethanol and acetaldehyde contents were lound inbananas alter exposure to ethylene, and duringsubsequent continuous low O, exposure, frr-rit ac-cumulated more ethanol and ripening ceased(Imahori et al., 1998). Transient changes were alsolound after short-term low O, exposure of ripen-ing tomatoes (Klieber et a1., 1996), whele it in-duced transient increases in ethanol andacetaldehyde content; howéver', in that case theripening period was extended. Therefore, thereappear to be differences in response to low O,stress based on species, severity of low O, stressand ripeness during application.
However, increasing the sever:ity ol shorl-termlow O' treatments is not an option, as nitlogentreatment in this stucly car.rsed dark discolourationon the peel of fruit. Similar discolouration haspreviously been observed by Wei and Thompson(1993) on bananas stored between 5 and l4o/"COr. Thompson (1998) reported that exposure ofbauanas to < lo/o Oz for an unspecified periodcauses low O, injury in the folm of a dull yellowbr brown peel discolouration, failure to ripen and
NooõL
-0
5
. ,, _. Factorl
Fig. 2. Thd loadings plot of ions (value: mass to charge ratio) stored in nitrogen at stage 3 or 4 for O, 6, L2 or 24 h. Extrsmepositions correlate with similar positioning ol lreatments on the score plot (Fig. l).
61
'86
'Bz
ffir60 = ãg '7't

A. I(liebet et ol. f Po:;rltaruest Biologv und Tecltnolog¡, 25 (2002) l5-24 zl
Table 2
beakel of water oì- without a beakel' of watei' àl 22 "C
Banan¿t ¿ìssessment at ripeningstage 6
Storage of baììanas at lipeningslage 4
Conttol (air') 24 li N, stolage+rvate:: (95%,
RH)24 h N. storage-water (<75%,RH)
Slreli lile (days)
Filmness (kPa)ssc (zù'Weìght loss ('%)
Discolour'. ìndex
70a104.0a
24 2a
17a0.0a
8.0a
103 0a
23.4a2.0a
Llb
74a102.0a
24.0al8a1.4b
Data are avel'ages of three replicates and different letters within a row denote significant dìflerences at P<0 05 using a LSD test
'offl aromas. Wills et al. (1990) also found some
discolouration in nitrogen-treated green fruit.This brown peel discolouration was observed dur-ìng assessment of bananas that had been stored innitlogell for 6 h, and severity increased progres-sively as the stor-age period in nitlogen increased.
A dull peel colour was also observed in the
controls in the second experiment that was con-ducted during winter. The injury is related toslight in-field chilling injury (Marriott, 1980;
Turner, 1997), since fruit wer-e not chilled afterharvest.
Even though there were statistically sigr-rificant
dilfelences in pulp firrnness arnollg banauasstored in nitrogen atn.lospllel'es at ripening stage 3
and 4, these differences would probably not be
detected by consurlers. Tl'ìe largest difference ob-served was less lhan 2o/o of readings, with allbananas being eating soft.
The chemical nose was a simple and reliablemethod for- r'epeated arolr-ìa arìalyses as opposedto lrullan nose detection, which tends to be te-dious for hnman judges (Muclrui, 2000).
The aloma of most of the bananas exposed tonitrogen atrnospheres for the valiorìs peilods oftime was diffelent to the arorna of control ba-nanas stored in air (Fig. 1). The mass to charge
ratios of the ions (variables) that were most in'ì-portant in the discrimination between banana aro-mas had high absolute loading vallÌes, al'rd these
relate to rrìore extreme positions of groups oilscore plots (Fig. 2). Therefore, bananas stored in
air were strorlgiy correlated with an ion with a
mass to cllarge ratio of 55, which arise from the
known banana arolna cotlpounds 3-methylbutylester and l-butanoi that relate to the aroma offully lipe bananas (Malriott, 1980). Pulp frornbananas that were stored in nitrogen were n'iainlycorrelated with an ion with a trass to charge ratioof 61, which alises from ethyl acetate, a banatra
arona componnd that lias au over-ripe arolracharacter. Therefore, the t¡eatments in Fig. 1 thatclustered in between the exttelnes of ion 55 and
ion 61 had a mixed aron-ìa of over-t'ipe and ripe
tones.The presence of ethyì acetate in nitlogen-stoled
banauas at colotu stage 6 may have been due toanaerobic conditions, because ploduction of ethyl
acetate in battanas generally only occtlrs in late
senescence or whell bananas are collsidel'ed inedi-ble (Macku and Jennings, 1987), The initiation ofanaerobic r-espiration in tissues and the tliggeringof feln-ientation reactious, leads to the ploductionof off-odours in fruit (Wills et al., 1998), like the
over-ripe aronla identified in this study. Storage
time in anaelobic conditions would have influ-elìced tlle production of over-ripe aronias, and
this would accourlt for tlie mixed alomas pro-
duced by some nitrogen-stored fruit. Even thoughthe aloma lesults were obtained for bananas at
cololrr stage 6, the nitrogen atmosphere tleatl'ì1el.ìt
nay have tliggered a stl-ess respollse resulting inan increased production of over-ripe al'ollla
cor'ì.ìpourlds,

))
The second experiment had more variablearoma resnlts. The clusters containing air-storedbananas and nitrogen-stored banauas in a lowhun'riclity were closely associated with the ion witha mass to charge ratio of 56 (Figs. 3 and 4), whichis the known banana compotud l-hexanol thatgives an unripe green lone. Aromas ltom nitro-gen-stored bananas in a high humidity clustered
around the ion wilh a mass to charge ol70 that is
largely associatecl with ripe arolna profiles and
compounds like 3-rnethylbr"rtyl ester, [-butanoland propanoic acid; these volatile compounds are
also strongly correlated with ion 55.
Losses in aloma volatiles have been reported inclimacteric fi'uit when stored in low relative hu-mictity (Grierson and Wardowski, 1978), so un-
ripe aromas mentioned previously are iikely to be
duc to water stress preventing the total produc-tion of ripe aromas expected for fully ripe fruit.
Over-ripe volatiles were associated with ba-
nanas stored in nitrogen in a high or low hurnid-ity and this was related lo anaerobic respiration
A. Klieber et trl. f Pttsthurt,est Biology antl Technology 25 (2002) l5-24
inclucing the ploductior-r of alternative aromacompounds. The production of over-ripe volatiles
by lruit at color.tr stage 6, instead of by fruit at
colour stage 7 when lhese volatiles are generally
expected, suggests that an off-odour may have
folmed as a result of nitrogen-stofage and the
stress it caused.
5. Conclusion
Post-ripening storage in a nitrogen attnosphere
priol to commet'cial marketing of bananas did notextend shelf life. This treatment caused skin
browning without delaying tipening or senes-
cence. Although differences in aroma compoundswere found among air-stored and nitrogen-storedbananas when fully ripe, these dillerences did notneceséarily have an adverse effect on flavour' Itwas concluded that storage in a nitrogen atmo-
sphere is not an elfective method f,or extending
the shelf life of ripening bananas.
N
o
6I
Factorl
Fi$. :. fne score plor o[ bananas srored in (A) nitcogen for 0 h (air), (B) 24 h with a low humidity or tor (C) 24 h with a high
humidity.
Ae¡A
B
BA
.B
I.B.B
B
'rb 'ia
'e
'Bqs "E
&B.B
'0""'
c c
'c B
'c
:Ë"
'c'c
'"::'dc

73
Acknowledgements
The autirols wish to thank Chiquita Brands
South Pacific atrd affiliates for their coustaut sup-
polt aud supply of produce. Thanks also to the
Postharvest Departnet.rt of the South Austr-alian
Researci.r and Developmettt Institute for tire tlse
of tl-reil tlvist tester'.
References
Anstralial Banana G¡ower''s Council, 1999 Tlie banaua ltl-dustry in Austlalia, ouline access 8/9/2000 at ltttp://www.abgc olg.au/balana.html.
Courrnonwealth Scientific Industlial Reseal'ch Organìsittion,
1972 Banana Ripening Guide. CSIRO Div Food Res.,
Circular B, North Ryde, NSW, pp. 13.
Glressel. H.M., Crouch, I., 1996 The tolque tester: A newdevelopmerrt to deter'r.ì.rir'ìe liu jt fir'lnness Decid. FrnitGrow 46, 92-99.
Grielsolt. W.. Wardowski, lM.F., 1978. Reìative ìtunicìity e1--
fects on the postharvest lil'e ol- fruìts and vegetables
HortSciencc 1).570-574 ì
H¡rker. F f1., Ir4aindonald, J.H., Jackson, P.J , .199(r. Pcn-
etron-Ieter D1e¿ìsurenrent of apple and kiwifnrit lìnlrncssrìnd instruncnt
23
'86 '57
hlahori. Y, I(ota, M., Ueda. Y., Chachin, K'' 1998 Effects
ol low-oxygen attttosphetes on quaJity ¿rnd etharlol atrd
acetaÌdehyde fortnatiotl ofetllyleue tl'eated ballauas J Jap
Soc Food Sci Tecb¡ol 45,512-576Kliebe¡, 4., Ratalachinakonr, B.' Sinrons, D.H', 1996 Ellect
ol Iow oxygen and higll c¿u'boll dioxide on torl.l¿ìto cultivar
'Berrluda' frtit physiology a:rd conlposition' Sci' l-lort 65'
25r -26t .
Liu, F.W., 1976a. Storing etllylelle-pretreated bauatl¿ls in corl-
tl'olled atnìospliele aud hypobalic air J Atn Soc Hort'
Sci l0l,198-201.Liu, F W , 1976b Banalla respol'ìse 1o lo\j\¡ collcelltl'ations ol
ethyÌerre J, Am. Soc. Hort. Sci l0l' 2??-224'
Macku, C., Jenrlings' W.G.' 1987 Productior.l of voÌatiles by
r-ipenirg banatras. J Agric. Food Clter¡ 35, 845-848'
Malriott. J., 1980. Ban¿rnas - Physiology alrd bioclìerllistry
of storage attd riperling fol optìmunr qrìality CRC Crit'
Rev. Food Sci. Nutr. l3' 4l -88Muchuì, Nt, 2000. The elfect of seasorrs and postharvest
chilÌing on the eating quality oI barlarras Master ol Holti-
ct-tltule, Adelaide UnìversitY,
Rippon, L.E., Trochoulias, T., 1976. Ripening resporrses oi
l:zrnarlas to tenìpel'alure. Aust. J. Exp Aglic' Anir¡ Hllsl¡'
16.140-144Schir:'iL. M, D'hallervi¡, G, Inglese' P, La MLlntia. T" 1999
Epicuticular chattges and storage potential ol cactus ¡reat'
lO ¡ n t t t t i u fi c u s - i n d i t' rt Mt\ler ( L.)l litÌ i t lolì orvin g gib bereì lic
acid prcharvcst spravs trtrd poslhlìrvest lìeât tre¿rtlì.lelll.Postlrtrvest Biol. Technol 17. 79-88.
À. Kliettcr et ul. f Pttsrlttttttesl Biologt' tnd Technologl' 25 (2002) l5-24
0
N
o
GL '98
87"71
Fa cto 11
Fig. 4 The loadi¡gs plot of ions (value : n.ìass [o chalge latio) stoled in nitrogen for 0 h (air')' 24 h with a low htrmidity or for 24
n witl a high humidity. Extrel¡e positìous colrelate with similar positioning of tleatl.ì.ìents otr lhe scole ploL (Fig 3)'
0u4
Operalot'Sci. 121' 927-936.
differences. J. Anr. Soc. Lloitic.

24
Scott, K.J., McGlasson, W.8., Robe¡ts, E.4., t970. Potasstum
permanganate as an ethylene ¿rbsorbent in polyethylene
bags to delay ripeuing of b¿rnanas duting storage. Aust. J.
Exp. Agric. 10, 237 -240.Studmarr, C.J., Yuwana, 1992. Twist test for me¿rsttring lruit
firrnness, J. Text. Stud. 23, 215-227.Thompson. 4.K., t998. Controlled Atmosphere Storage of
Fruits and Vegetables. CAB Intetnational, Oxon.
Tulner, D.W., 1997. Bananas and plantains. In: Mitra, S.K.(Ed.), Postha¡vest Physiology and Storage ofTropical and
Subtropical Fruits. CAB Inreruational, Nedlands, pp.47-83
Wei, Y., Thompson, A.K , 1993. Ivfodifred att-t-rosphere pack-
aging oldiploid bauanas Musa AA. Post-harvest treatment
A. Klieber et al. / Posthru'uest Biology antl Technolttgl' 25 (2002) l5-24
of fruit and vegetables. COST'94 Workshop, 14-t5 Sep-
tenrber 1993, Leuven, Belgiurn, pp.235-246.Wills, R.B.H., Klieber, 4., David, R., Siridltata, M., t990.
Ellect ol brief pre-marketing holding ol bananas in nitro-gen on time to ripen. Aust. J. Exp. Agric.30,579-581.
Wills, R., McGlassou, 8., Graham, D., Joyce, D., t998.
Postharvest: An introduction to the physiology and Lran-
dLing of fuuit, veget¿rbles and ornameutals, 4. Uuiversity olNSW Press, SydneY
Wirthensohn. lvl.G., Francis, I.L., Gawel, R , Jones, G.P.,
1999. Sensory-instrumental correlation of extra vir:gin
olive oil aromas usiug ¿r 'Chemical Nose' Australian Inter-nalional Symposium on Analytical Science, 4-9 July 1999,
Melbourne, Vic., pp. 75-78.

Australian Journal of Experimental Agriculrure, 2002. 42: (in press)
Optimising ripening temperatures of Cavendish bananas var.
''William.s'hanrested throughout the year in QLD, Australia
Bagnato, N., xKlieber, ,A.., Barrett, R. and Sedgley, M.
*Department of Horticulture, Viticulture and Oenology, Adelaide University,'Waite
Campus, Plant Research Centre, PMB. 1, Glen Osmond, S. A. 5064, Australia'
Telephone : (0 S) 8 3 03 66 53, E-mail : andreas.kli eb erfD,adelaide. edu. au
Fax no: (08) 8303 7116
Abstract. Varying bananaripening temperatures were examined throughout the year
to ensure optimum quality and shelf life of commercially ripened fruit in Australia.
Cavendish bananas (var. 'Williams') were harvested throughout the year 2000 and
were ripen ed at 14,16, 18 or 20oC with 300 pL L-l ethylene on 2 consecutive days
until fruit were more yellow than green and then subsequently stored at22"C until the
end of the experiment. Ripening bananas at 14 and 16oC extended shelf life by up to
50Yo and32o/o,respectively. However, ripening bananas at 1'4 or 16"C did increase
peel discolouration, especially on bananas chilled in the field in winter. Bananas
ripened at 18 or 20'C throughout the year had an avenage shelf life of 6 days and
consistently lower peel discolouration. Therefore ripening at 18 or 20"C throughout
the year result in a better visual appearance of the fruit, which is essential for
consumers.
Keywords: temperature, seasons, banana, quality, shelf life
Introduction
Ripe dessert bananas quickly deteriorate in appearance and quality, lasting only a few
days (Israeli and Lahav,1986). Ripening of bananas in commercial practice is
regulated by adjusting ripening temperature, ethylene concentration and humidity to
achieve a suitable ripeness within a planned period of time to satisfy retailer demand.
Suggested banana ripening temperatures differ from l4-21"C (Palmer, 7971), l6-17"C
(Marriott, 1980), l4-24'C (Peacock, 1980), 18-20'C (Salunkhe and Desai, 1984), 16-
21'C (Israeli and Lahav, 1986) and 16-18'C (Turner, 1997). These are all adequate
ripening temperatures for Cavendish bananas (cv. Williams), but may not be optimal'

Optimising ripening temperatures of Cavendish bananas
Palmer (1971) suggests that there is considerable difficulty when predicting the
ripening behaviour of harvested bananas in Australia due to large temperature
variations between seasons. The effect of summer and winter harvesting on optimum
ripening temperatures of bananas in Australia (QLD and NSV/) was briefly
investigated by Young and colleagues between 1929-31(Young et al., 1932), and later
by Rippon and Trochoulias (1976). Young et al. (1932) recommended ripening
temperatures of 20 or 2loC in summer and 19'C for winter. Rippon and Trochoulias
(1g76) agreed that in Australia 19"C was best used for winter bananas, but found that
harvested summer bananas should be ripened at 77oC. However, only two quality
parameters (shelf life and pulp firmness) were measured (Rippon and Trochoulias,
1976). Other important commercial parameters, such as visual peel appearance and
eating quality, should also be measured (Israeli and Lahav, 1986), but were not in the
above study.
This paper reports the effects of ripening tempeiature for harvests in different months
of the year on bananashelf life, peel appearance, pulp firmness, soluble solids and
aroma to allow industry to optimise ripening procedures.
Materials and Methods
Plant Material and Proc e durc
Cavendish bananas var. Williams were harvested from one property in Tully, North
Queensland, and transported at 13"C to the Plant Research Centre (Adelaide
University,'Waite Campus) within three days of harvest. Fruit were harvested atl5o/o
maturity, when green (stage 1) and hard. Evenly sized bananas were dehanded,
deflowered and dipped for one minute in fungicide (0.55 mL L-l Sportak@, Hoechst
Schering AgrEvo, Glen kis, Victoria), then air-dried prior to ripening. After finger
preparation, bananas were randomly allocated to ripening treatments.
Treatments were applied in sealed 10 L plastic containers that contained six banana
fingers, a carbon dioxide scavenger (160 g of Ca(OH)z) and a saturated KNO¡ solution
to maintain a relative humidity of 95%o. Containers were randomly allocated to
monitored, temperature controlled rooms.
2

Optimising ripening temperatures of Cavendish bananas
Effect of ripening temperature on bananra quality
Similar to commercial practice (B. Chartres, Chiquita Brands South Pacific, pers.
comm., 1999),bananas were ripenedat14,16, 18 ot20"C after ethylene gas
injections produced a concentration of 300 pL L-l ethylene in each container. After 24
hrs, the containers were vented for 30 minutes, and ethylene was reapplied.
Thereafter, containers were vented daily, without ethylene application, until fruit were
more yellow than green (stage 4). Bananas were then placed into vented polyethylene
bags at 22"C andassessed daily until fruit started to senesce, showing a yellow peel
colour with light brown flecks (stage 7). This experiment was performed in each of
the months of January, March, May, July, September and November 2000.
Statis tical As s es sment
Every 2 months of the year 2000,bananas were placed at 1 of the 4 temperatures, with
3 different plantation blocks from 1 property acting as replicated, randomised
complete blocks. Every ripening temperature treatment for each replicate contained
12bananafingers; 6 were used for external assessments and the remaining 6 were
used for internal assessments.
Data, except aroma data, were analysed with the Genstat 5 program (Release 4),4th
edition, 1998, Lawes Agricultural Trust, Rothamsted Experimental Station) using the
General ANOVA directive for two factors, harvest date and ripening temperature. A
least significant difference test (LSD) at the 5o/olevelwas used to determine
significant differences between means.
A Pirouette analysis package (Infometrix lnc, Woodenville, WA, USA) using a
Principal Component Analysis (PCA) was used to determine any aroma similarities'
The PCA model formed from banana sample data was cross validated to ensure the
principal components (or factors) accounted for greater than 80% of the variation
between banana samples (V/irthensohn et al.,1999). Therefore samples that were
clustered on plots represented fruit with similar aroma compounds and those that were
separated had dissimilar aromas (V/irthensohn et al., 1999)'
3

Optimising ripening temperatures of Cavendish bananas
Quality assessments
External Assessments
Banana shelf life was recorded by calculating the number of days it took for bananas
to ripen from stage 4 (more yellow than green) to stage 7 (full yellow with light brown
flecks), using the CSIRO banana ripening colour index (CSIRO, 1972). Peel
discolouration was observed visually at ripening stage 6 (full yellow) as follows: 0, no
discolouration present; 1, slight discolouration or dull yellow/grey colouring; 2, mild
discolouration or dull yellow/grey colouring as well as red/brown vascular streaking
along the neck of the banana;3, severe discolouration or grey peel with red/brown
vascular streaking along the length of the peel. Fruit scores (0, l' 2,3) were weighted
and averaged into a discolouration index (DI), using the formula (1) from Schirra er
at. (1999), as data for each treatment was nonnally distributed and fell within a
naffow range. The formula uses the number of fruit with no discolouration (a), slight
(b), mild (c), or severe discolouration (d) compared to the total number of fruit in each
treatment (n).
(a x o) + (å x 1) +(c x 2) +(¿ " z)11¡ ù =
Internal Fruit Assessments
A twist tester (Department of Agricultural Engineering, Massey University, NZ) was
used to measure banana pulp firmness and a hand held refractometer (0-30% sugar
w/w, Bellingham and Stanley Ltd., England) was used to measure soluble solid
concentrations (SSC) of the flesh. All SSC data were adjusted according to laboratory
temperature. Aroma was measured using a chemical nose (HP4440, Hewlett Packard,
V/ilmington, DE) consisting of a modified HP 7694headspace auto sampler on a HP
5973 mass selective detector. A homogenised puree (I20 Ð was taken from the 6
internally assessed bananas for each of the 3 replicates. Ten 5 g samples of the puree
were then measured into 20 mL headspace vials with the addition of an internal
standard, heptadecane (5 pL) prior to sealing. All vials were then randomly placed
into the headspace autosampler for analysis. Headspace sampling parameters were the
same as used by Klieber and Muchui (2002, in press).
4

Optimising ripening temperatures of Cavendish bananas
Results
Daily minimum temperatures were recorded at the South Johnstone research station
for the month prior to harvest (Figure 1, Bureau of Meteorology, 2000-2001). The
months before the July and September harvests show a number of days on which the
daily minimum temperature drops to 13"C or below. Bananas ripened at higher
temperatures (18 and 20"C) in January, May and November had a 16-31% shorter
shelf life than those ripened at lower temperatures (14 and 16"C) (Figure 2). In March
and July, ripening at 14'C resulted in a20-50o/o increase in shelf life, compared to
those ripen ed at 16,18 or 20'C. Bananas ripened at the various temperatures during
September had similar shelf lives of 6 days. Overall banana shelf life ranged from 4-9
days throughout the year and was influenced by ripening temperatures during ethylene
application, as well as harvesting times.
Fruit in January, May and November had a healthy, bright yellow peel appearance
indicated by the low (0 - 0.5) discolouration index scores (Figure 3); these readings
were similar for all ripening temperatures used. Ripening temperatures in March, July
and September did affect banana peel appearance (Figure 3), with ripening
temperatures of 14 or 16'C resulting in more discolouration than 18 or 20"C.
Bananas ripened at20'C were 5-15% firmer than those ripened at l4'C in January,
March and May, but had similar firmness readings in July, September and November
(Figure 4). Firmness readings were similar between most months. Overall, SSC
varied between ripening temperatures, with bananas ripened at 14 or 16"C having a
higher average of 23.0- 23.4% than those ripened at 18 or 20'C'with an average of
22.0%. Monthly trends showed an increase in SSC levels during July and September
(24%) with lower SSC in other months (21.0-22.5%).
Aromas of bananas ripened at 14,16, 18 and20 "C were analysed by mass
spectroscopy at ripening stage 6. The PCA model used to compare these data between
ripening temperatures within and between months explained 92o/o of the total variance
with two factors, where 79o/o and l3o/o related to Factor 1 and 2, respectively. The
majority of the variation between treatments was identified by Factor 1 and so the
results will focus on Factor 1.
5

Optimising ripening temperatures of Cavendish bananas
All bananas ripened in July and September as'well as bananas ripened at 14 and 16'C
in November and those ripened at 14'C in March and May, were located on the
negative side of Factor 1 (Figure 5). All January ripened bananas, as well as those
ripened at 16,18 and 20'C during March and May, and bananas ripened at 18 and
20"C in November, were located on the positive side of Factor 1.
Discussion
Shelf life is an important commercial parameter, but visual appearance is just as
important. Even though ripening temperatures of 14 and 16"C extended shelf life in
most months, the resulting fruit appearance was not always appealing. Low
temperatures slow down respiration and metabolic rates which ultimately extends the
entire ripening and senescence process (Couey, 1982; Wills et al',1998). Rippon and
Trochoulias (1976) reported ripening temperatures 'twere critical in determining shelf
life of bananas harvested throughout the year from NSW, Australia' Holding
temperatures after ripening had little influence on shelf life, although holding
temperatures of 1OoC or higher than the initial ripening temperatures did cause
adverse affects on fruit. Contrary to the previous observations, fruit harvested in
September had similar shelf lives when ripened at 14-20'C. Fruit harvested in
September grew and developed during winter and were affected by field chilling
(Bureau of Meteorology, 2000-2001), which has been found to reduce shelf life of
bananas (Seberry and Harris, 1993). This would account for the similar shelf lives in
September when ripened at l4-20"C compared with other months, when ripening at
14 and 16"C extended banana shelf life by up to 50o/o.
Chilling injury is a physiological disorder of bananas caused by temperatures below
13"C that lowers their visual appearance due to, for example, subepidermal browning
upon fruit ripening (Olorunda et a\.,1978; Israeli and Lahav, 1986; Stover and
Simmonds,1987; Wills et a1.,1998). Subepidermal browning is caused by enzymatic
oxidation of dopamine generally by polyphenoloxidase (Murata, 1969). This accounts
for the high levels of peel discolouration observed in July and September harvested
fruit grown and developed during winter, when field temperatures in the month before
harvest dropped near or below 13'C a total of4 and 9 days, respectively (Bureau of
Meteorology, 2000-200 1 ).
6

Optimising ripening temperatures of Cavendish bananas
Bananas ripened at 14 or 16'C in July and September all had significantly higher
levels of discolouration, compared with those ripened at 18 or 20"C. Lengtþ
development and ripening periods at low temperatures caused an increase in peel
discolouration, compared with that observed on bananas that developed in waÍner
periods of the year, or on those that were ripened at higher temperatures (18 or 20"C).
This is due to a complex time-temperature relationship, where long exposure periods
to temperatures at or near the critical chilling temperature give a similar induced
injury response to that of extremely low temperatures for short periods of time
(Marriott, 1980; V/ills et a\.,1998). Fruit that were stressed prior to ripening and that
were further stressed when ripened atnear chilling temperatures were not able to
recover from the initial chilling exposure period. This explains the high
discolouration index recorded in bananas harvested in July and September when
ripened at above chilling temperatures (14 and 16"C).
March harvested bananas also had higher levels of discolouration when ripened at 14
and 16oC, compared with 18 and2}"C, even though they grew largely during summer
months, and so were not affected by chilling in the held. However, they had been
subjected to wind gusts of 125-170 km hr-l due to a category 2 cyclone only weeks
before harvest (Bureau of Meteorology, 2000), causing visual injury due to excess
physical stress. Peel appearance of March harvested fruit would also have been
influenced by low light levels due to cloud cover during late January and February, a
common occuffence in Queensland. The low light levels may also be influenced by
the use of blue bunch covers in the field, which are generally used to prevent low
temperature stress in banana bunches, but may also prevent light penetration. Low
light levels cause dulling of the bloom (a waxy coating) on bananas, which has a
similar appearance to mild chilling injury symptoms on the peel (T. Johnson, Chiquita
Brands South Pacific, pers. comm., 2001).
Bananas ripened between 14 and 20'C in January, May and November all had
relatively low discolouration indexes, because their development occurred during
autumn, spring or summer when field temperatures were above the chilling
temperature of 13"C.
Ripening temperatures of 14 and 16'C generally resulted in higher SSC levels (I-2%)
and up to 75o/o softer pulp. Similar firmness results were reported by Rippon and
1

Optimising ripening temperatures of Cavendish bananas
Trochoulias (1976), but were not observed by Peacock (1980). Low ripening
temperatures reduce metabolic rates and decreases the rate of respiration (Wills et al.,
1998), consequently extending the time fruit have for textural changes in the pulp as
well as for starch to sugar conversions. Even though SSC levels were significantly
lower when bananas were ripened at higher temperatures, SSC was ahvays above
18%, which is the lowest acceptable level for fully ripe bananas (CSIRO, 1972). Also
consumer detection of these SSC differences would be unlikely, as people differ in
their perception and sensitivity to various foods (Land, 1988).
All bananas analysed had ripe banana aromas, such as fruity esters found in fully ripe
bananas (Marriott, 1980). Horvever, our bananas also had either unripe or over-ripe
aromas at stage 6. Ripe aroma compounds (1-butanol and 3-methylbutyl ester) and to
a lesser extent unripe aroma compounds (2-hexenal) were found to be related to the
negative values of Factor 1, while ripe (butyl esters) and overly ripe aromas (ethyl
acetate) were related to the positive values of Factor I . No off odours or reduced
aroma preferences were found due to mild chilling (Klieber and Muchui,2002), and
therefore varying ripening temperatures of 14-20oC and different harvesting times of
the year are unlikely to have caused aroma acceptability differences. This is in
contrast with severe chilling, where banana aroma is negatively affected (Palmer,
reTr).
Therefore, even though different months of the year and ripening temperatures
resulted in varying banana aroma, this aroma difference does not include unpleasant
bananaaromas and so would not influence consumer acceptability. As banana aroma
acceptability is critical to industry, it was essential for consumer acceptability to be
unaffected by ripening temperatures or harvesting periods, as contrary to ripening
temperatures, harvesting throughout the year cannot be regulated due to continuous
market demand.
V/hile Peacock (1980) found that ripening temperatures between14 and24"C did not
affect banana weight, pulp firmness, shelf life or eating quality, we found that ripening
temperatures of bananas harvested at various times of the year had a substantial effect
on banana shelf life and visual peel appearance. Our results support Rippon and
Trochoulias (1976) and Young et al. (1932) who recommend a ripening temperature
of 19oC for winter harvested fruit. However, our f,rndings do not support the
8

Optimising ripening temperatures of Cavendish bananas
recommendations by Young et al. (1932) of using the higher ripening temperatures of
20 or 2l'C during summer compared to 19'C in winter. Changes in seasonal
temperatures, weather pattems and Cavendish clones since 1932 as well as differences
between the New South Wales and Queensland growing locations may account for the
slight differences in ripening recommendations in 2001. A summer ripening
temperature of 17'C was recommended by Rippon and Trochoulias (1976) which is
similar to our recommendation. However, our results would also support the use of
ripening temperatures as low as 14oC to extend the shelf life of summer harvested
bananas, as long as close monitoring of field conditions occurs throughout the banana
growing period to avoid visual quality reduction by ripening at these low
temperatures.
C-onclusion
Commercial ripening of bananas throughout the year at 18 or 20oC consistently
resulted in fruit with a better peel appearance than ripening at 14 or 16oC. Ripening
of bananas at 14 and 16oC, when fiuit grew and developed over sununer, generally
produced good quality fruit with extended shelf lives, whereas bananas grorwn during
winter and ripened at 14 or 16'C did not. However, the commercial viability of using
14 and 16"C would rely on the constant monitoring of climatic conditions during the
banana growing period, as peel appearance can be negatively affected by sudden
climatic changes such as cyclones.
Acknowledgments
The authors thank Chiquita Brands South Pacific (Adelaide and Queensland) for their
continual supply of fruit and constant support, and the South Australian Research and
Development Institute (Postharvest Group) for their research advice and the use of
their twist tester. Thanks also to Dr Graham Jones and Dr Michelle Wirthensohn for
the use of the chemical nose and for their technical advice.
9
Optimising ripening temperatures of Cavendish bananas
References
Bureau of Meteorology (2000-2001) Climatic data for South Johnstone Research
Station number: 032037, Queensland. Australian Bureau of Meteorology,
Australia.
Couey HM (1982) Chilling injury of crops of tropical and subtropical origin.
HortScience 17, 162-165.
Commonwealth Scientific Industrial Research Organis ation (1972) Banana ripening
guide. cslRo Division of Food Research, circular 8, North Ryde, NSV/, pp.
13.
Israeli Y, Lahav E (1986) Banana. In 'CRC Handbook of Fruit Set and Development'.
(Ed. SP Monselise) pp.45-73. (CRC Press: Boca Raton)
Klieber A, Muchui M. (2002) Preference of banana flavour and aroma are not affected
by time of year or'winter' chilling. Australian Journal of Experimental
Agriculture 42 (in press).
Land DG (1938) Negative influences on acceptability and their control. In 'Food
Acceptability.' (Ed. DMH Thomson) pp.475-483. (Elsevier Science
Publishing: London)
Marriott J (1930) Bananas - Physiology and biochemistry of storage and ripening for
optimum quality. CRC Critical Reviews in Food Science and Nutrition l3r 4l-
88.
Murata, T (1969) Physiological and biochemical studies of chilling injury in bananas.
Physiologia Plantarum 22, 401 -4I1.
Olorunda AO, Meheriuk M, LooneyNE (1973) Some postharvest factors associated
with the occurïence of chilling injury in banana. Journal of the Science of
Food and Agriculture 29r2I3-2I8.
Palmer JK (1971) The banana. In 'The Biochemistry of Fruits and their Products.'
(Ed. AC Hulme) pp. 65-105. (Academic Press: London)
Peacock BC (1980) Banana ripening - effect of temperature on fruit quality.
Queensland Journal of Agricultural and Animal Sciences 37,39-45.
10

Optimising ripening temperatures of Cavendish bananas
Rippon LE, Trochoulias T (1976) Ripening responses of bananas to temperature.
Australian Journal of Experimental Agriculture and Animal Husbandry 16,
140-144.
Salunkhe DK, Desai BB (19S4) 'Postharvest biotechnology of fruits.' (CRC Press:
Boca Raton, Florida)
Schina M, D'hallewin G, Inglese P,LaMantia T (1999) Epicuticular changes and
storage potential of cactus pear lopuntia ficus-indica Mriller (L.)] fruit
following gibberellic acid preharvest sprays and postharvest heat treatment.
Postharvest Biology and Technology 11,79-88'
Seberry JA, Harris DR (1993) 'Factors affecting shelf life of Cavendish bananas.' pp.
387 -39 L (Australasian Postharvest Conference : Gosford, NSW)
Stover RH, Simmonds NW (1987) 'Bananas'. (Longman Scientific and Technical:
Harlow)
Turner DW (1997) Bananas and plantains. In 'Postharvest Physiology and Storage of
Tropical and Subtropical Fruits.' (Ed. SK Mitra) pp. 47-83. (CAB
lntemational : Wallingford)
Wills R, McGlasson B, Graham D, Joyce D (1998) 'Postharvest: An introduction to
the physiology and handling of fruit, vegetables and ornamentals (4th edn.).'
(University of New South'Wales Press: Sydney, NSW)
Wirthensohn MG, Francis IL, Gawel R, Jones GP (1999) Sensory -
Instrumental correlation of extra virgin olive oil aromas using a 'Chemical
Nose'. In 'Proceedings of the Australian International Syrnposium on
Analytical science.' p. 7 5 -7 8. (Australian Intemational Symposium on
Analytical Science: Melbourne, Vic)
Young WJ, Bagster LS, Hicks EW, Huelin FE (1932) 'The ripening and transport of
bananas in Australia.' Council for Scientific Industrial Research, Bulletin No.
64,pp.l-52.
11

Optimising ripening temperatures of Cavendish bananas
^30o9-925J
Ëroo.cblsE210È'-'E5àEo 1 3 5 7 I 11 13 15 17 19 21 23 25 27 29 31
Days of the month
Figure I
*December 1999+April 2000-+August 2000
Chilling point 13'C
-4-February 2000
+June 2000*--E- October 2000
t2

Optimising ripening temperatures of Cavendish bananas
Summer Autumn \ilinter SPring
Cyclone
t\toC"tút,ttGtt0)È
=(,an
2
0
8
6
4
2
0
January March
Figure 2
May July
Month of harvest
Septem ber Novem ber
ø16"Ce20'C
114"Co 18"C
I tsd
l3

Optimising ripening temperatures of Cavendish bananas
Summer Autumn Winter Spring
Cyclone
3
x(,tc'¿2ofi,
aoolo.9o
0
Figure 3
January March May July
Month of harvest
September November
114"C Øl 1¡6"C
tr 18"c E2o"c
lsdI
l4

oo-.Y
tt,U'0)
E
_cL
o-
120.00
100.00
80.00
60.00
40.00
Optimising ripening temperatures of Cavendish bananas
I'14"C ø16'C tr 18'C 820'C
January March May July September November
Month of harvest
20.00
0.00
Figure 4
I lsd
15

s.9o(ú
LL
Optimising ripening temperatures of Cavendish bananas
Factorl
Figure 5
Ripe and unripe aroma
"?ßì 'i
'14M
''14M
6JU
'i¿tw¡v .14tvty
'"fru'iîffiqd.,1",.,
Ripe to over-ripe aroma
''t8N1ev
'16M
'18M'18M
t6

Optimising ripening temperatures of Cavendish bananas
Figure captions
Figure 1: The daily minimum air temperatures ("C) from the South Johnstone
Research Station (Bureau of Meteorology, 2000-2001) for the month prior to harvest.
Figure 2: Shelf life of bananas harvested bimonthly and ripened at 14,16, 18 or 20oC
with 300 pL L-l ethylene. Each column represents the mean of 3 replicates with each
replicate consisting of 6 bananas, and the bar denotes least significant differences
between temperatures within months (P<0.05). Climatic events are shown above.
Figure 3: Chilling index of bananas at ripening stage 6 harvested bimonthly and
ripened at 14,16, 18 or 20"C with 300 pL L-1 ethylene. Each column represents the
mean of 3 replicates with each replicate consisting of 6 bananas, and the bar denotes
least significant differences between temperatures within months (P<0.05). Climatic
events are shown above.
Figure 4: Pulp firmness readings of Cavendish bananas at ripening stage 6, harvested
bimonthly and ripened at 14,16, 18 or 2O"C with 300 pL L-t ethylene. Each column
represents the mean of 3 replicates with each replicate consisting of 6 bananas, and the
bar denotes least significant differences between temperatures within months
(P<0.05).
Figure 5: PCA chemical nose score plot of bananas ripened at 14,16, 18 or 20'C in
January (J), March (M), May (MY), July (JU), September (S) or November (N).
t'7

Postharvest Biology and Technolog¡ 2002., (in press).
Research Note
Effect of ethanol vacuum infiltration on the ripening of Cavendish
bananas cv. Villiams
Bagnato, N., Sedgley, M., Bartett, R. and xKlieber, A'
xDepartment of Horticulture, Viticulture and Oenology, The University of Adelaide, Waite
Campus, Plant Research Centre, PMB. 1, Glen Osmond, 5.4.5064, Australia.
Telephone: (+6 1 8) 8303 665 3, E-mail: [email protected]
Fax no: (+618) 8303 7116
Abstract
Bananas have a short shelf life after ripening, with marketers and consumers alike desiring a
longer period before the fruit senesces. To extend shelf life, ripening-initiated bananas were
vacuum-infiltrated with air or ethanol at 10 kPa and subsequently held for 10 min' or 3 h in
the resultant atmosphere. Fruit were then held at 22'C until the conclusion of the
experiment. Shelf life of 4 days and other quality measurements were not affected by the
ethanol treatment as ethanol was only infiltrated into the peel but not the pulp. Therefore,
ethanol vacuum-infiltration is not suitable to extend shelf life of bananas.
Keywords: Musa acuminata Colla, Ethanol atmospheres; Post-ripening; Shelf life; Quality
1. Introduction
Appropriate handling and management of bananas is essential during distribution, as they are
harvested unripe and ripened near their market. An important consideration is that bananas
ripen and then senesce quickly once ripening has been initiated with etþlene (Marriott,
1980; Israeli andLahav,1986). Methods of slowing the onset of ripening of bananas prior to
ripening initiation are controlled atmospheres (Wills et a\.,1982) that induce anaerobic
metabolism and ethanol production (Pesis and Avissar, 1989).
Exogenous application of ethanol has also controlled ripening and senescence of climacteric
fruit (Saltveit, 1989), but not for bananas (Hewage et a\.,1.995; Ritenour et a\.,1997). In the
latter studies, ethanol atmospheres were generated from soaked filter paper in a sealed

container, but neither study reported whether bananas actually absorbed ethanol. A way to
force ethanol absorption into bananas is vacuum infiltration, a technique effectively used by
Ratanachinakom et al. (1999) on tomatoes. The aim of this study was to determine whether
vacuum infiltration of ripening initiated bananas with ethanol atmospheres could extend
bananashelf life without affecting quality and whether ethanol was able to penetrate into
thick skirured fruit such as bananas.
2. Matenals and Methods
Bananas (Musa acuminata Colla Cavendish cv. Williams) of an even maturity (stage 1, hard
and green, CSIRO, 1972) were harvested twice during September 2001, from a single
property in the Tully region of Northem Queensland, Australia. They were transported at 13
oC to the Plant Research Centre (The University of Adelaide, Waite Campus) within three
days of harvest and prepared as described by Klieber et al. (2002).
Ripening of fruit was initiated at 18 'C at 95o/o relative humidity in an atmosphere of 300 pL
L-r ethylene gas in the presence of a carbon dioxide scavenger (160 g of Ca(OH)z). After 48
h, bananas were ripened normally or exposed to a vacuum for 5 min. in a 10 L desiccator (10
kPa pressure) and held after repressurisation in air or over 1 mL of absolute ethanol for 10
min. or 3 h at 22 "C. After treatment periods, bananas were assessed or left to ripen at 18 "C
until they reached ripening stage 4 (CSIRO, 1972). They were then stored at22oC until final
assessments at ripening stage 6 or 7 . Each of the 5 treatments was applied to 2 replicates of
18 fruit. Six of the fruit were used to assess banana shelf life and discolouration, 6 fi:uit were
used to assess frrmness, soluble solid concentrations (SSC), weight loss and ethanol
concentrations in peel and pulp at ripening stage 6, and 6 fruit were assessed for ethanol
concentrations in peel and pulp, immediately after treatments.
Banana shelf life, discolouration, firmness, SSC, and weight loss were assessed as detailed in
Klieber et at. (2002), the hrmness being measured by the use of a twist tester (Department of
Agricultural Engineering, Massey University, NZ). Peel and pulp ethanol concentrations
were analysed immediately after treatment application, as well as after ripening at colour
stage 6, using the method described by Ratanachinakorn et al. (1999). Ethanol
concentrations,ñ/ere analysed using flame ionisation gas chromatography (FID-GC, Varian
3400, Varian Australia, Mulgrave, Victoria), with a stainless steel column (1.8 m x 3.2 mm
OD) packed with Gas Chromt 254 of 80/100 mesh. All data were analysed using general
2

analysis of variance and a least significant difference test (LSD) at the 5o/oleveI, using the
Genstat 5 program (Release 4.I,4rh ed., 1998, Lawes Agricultural Trust, Rothamsted
Experimental Station).
3. Resuls and discussion
Bananas that were or were not vacuum-inhltrated and exposed or not to ethanol atmospheres
had similar pulp firmness of 107- I 13 kPa, SSC of 23.9-245olo, discolouration values of 1 .3-
1.8 and shelf lives of 3.8-4.4 days. Weight loss was slightly higher for control fruit at2.3%o
compared to vacuum-treated fruit at 1.8-2.0% (P<0.05), but this was not visually apparent.
All bananas therefore ripened similarly, with the ethylene-induced ripening process not being
affected. Contrary to our findings with bananas, tomato ripening was slowed by ethanol
vapour application (Ratanachinakorn et al, 1999), by delaying ethylene production (Saltveit,
1e8e).
The reason for this becomes apparent when considering bananapeel and pulp ethanol
concentrations (Table 1). Ethanol concentrations immediately after vacuum infiltration were
seven and 40 times higher at78 and 413 nL g. f. wt.-l, in the peel of bananas held for 10 min
and 3 h in ethanol, respectively, compared to concentrations in the peel of bananas ripened
normally or vacuum-infiltrated with air. However, pulp ethanol concentrations of bananas
measured immediately after vacuum infiltration were similar for all treated fruit. Also
ethanol concentrations of bananas held in ethanol atmospheres were significantly higher in
the peel tissue compared to the pulp tissue of the bananas measured immediately after their
treatment. At colour stage 6, ethanol concentrations of pulp tissues were higher than those
found in peel tissues for all banana treatments, and all were higher compared to levels
immediately after treatment, although no differences were observed between vacuum
treatments.
V/hile vacuum-infiltration with or without prolonged holding forced ethanol into the banana
peel, ethanol did not infiltrate into pulp tissue. This failure to penetrate into pulp tissue was
critical in preventing ethanol-delayed ripening, because pulp tissues play an important role in
ethylene production (Vendrell and McGlasson, 1971). Peel degreening is regulated by pulp
ripening and ethylene production; consequently banana peel colour changes also were not
delayed by applied ethanol (Ritenour et aL.,1997).
3

The high peel and pulp ethanol levels in all ripe bananas can be attributed to the production
of ethanol during the later stages of ripening (Marriott, 1980; Hyodo et a1.,1983; Seymour,
1993;Pesis, 1996). Similar to previous studies, we found that ripening climacteric fruit such
as bananas have initially low ethanol concentrations which increase during the post-
climacteric phase. The normally high ethanol levels during ripening may also explain why
the high peel ethanol levels did not influence ripening. It is, however, also possible that
ethanol declined initially after treatments due to re-metabolisation or volatilisation (Pesis and
Avissar, 1989), thus allowing fruit to start ripening at relatively low ethanol levels, but with
ethanol levels then increasing during ripening.
In summary, vacuum-infiltration with ethanol did not delay ripening of bananas as the
ethanol did not penetrate into pulp tissues, contrary to tomatoes that take up ethanol in the
pulp through the stem scar and the skin. There is scope, however, for testing other indirect
ethanol inducing methods that affect the pulp, such as modified atmospheres'
5. Acknowledgments
The authors wish to thank Chiquita Brands Australia Pty. Ltd. for the supply of all fruit, as
well as the South Australian Research and Development Institute (Postharvest Group) for the
use of their twist tester. Thanks also to the Australian Research Council for funding this
research. Finally a special thanks to Mr Ted Johnson and Dr Edna Pesis for their advice'
References
CSIRO, 1972.Banana ripening guide. Commonwealth Scientific Industrial Research
Organisation Div. Food Res., Circular 8, North Ryde, NSW, pp. 13.
Hewage, K.S., V/ainwright, H., Luo, Y.,1995. Effect of ethanol and acetaldehyde onbanana
ripening. J. Hort. Sci. 70, 51-55.
Hyodo, H., Ikeda, N., Nagatani,4., Tanaka, K., 1983. The increase in alcohol dehydrogenase
activity and ethanol content during ripening of banana fruit. J. Jpn. Soc. Hortic. Sci. 52, 196-
r99.
Israeli, Y., Lahav, E., 1986. Banana. In: Monselise, S. P. (Ed.), CRC Handbook of Fruit Set
and Development. CRC Press, Boca Raton, pp.45-73.
4

Klieber, 4., Bagnato, N., Barrett, R., Sedgley,M.,2002. Effect of post-ripening nitrogen
atmosphere storage on banana shelf life, visual appearance and aroma. Postharvest Biol.
Technol. 254,15-24.
Marriott, J., 1980. Bananas - Physiology and biochemistry of storage and ripening for
optimum quality. CRC Crit. Rev. Food Sci. Nutr. 13, 41-88.
Pesis, 8,., 1996.Induction of fruit aroma and quality by post-harvest application of natural
metabolites or anaerobic conditions. In: Linskens, H. F., Jackson, J. F.' (Eds.), Modern
methods of plant analysis: Fruit Analysis, 18. Springer-Verlag Berlin, Heidelberg, pp. 19-35.
Pesis, E., Avissar, I., 1989. The post-harvest quality of orange fruits as affected bypre-
storage treatments with acetaldehyde vapour or anaerobic conditions. J. Hort. Sci. 64, 107-
1 13.
Ratanachinakorn, B., Klieber, 4., Simons, D. H., 1999. Ethanol vapor vacuum infiltration of
tomatoes: Morphological analysis and effect on ripening and eating quality. J. Am. Soc.
Hortic. Sci. 124, 283-288.
Ritenour, M. 4., Mangrich, M. 8., Beaulieu, J. C., Rab, 4., Saltveit, M. E., 1997.Ethanol
effects on the ripening of climacteric fruit. Postharvest Biol. Technol. 12,35-42'
Saltveit, M. E. J., 1989. Effect of alcohols and their interaction with ethylene on the ripening
of epidermal pericarp discs of tomato fruit. Plant Physiol. 90, 167-114.
Seymour, G.8., 1993. Banana.In: Se¡rmour, G. B., Taylor, J. E., Tucker, G. 4., (Eds.),
Biochemistry of Fruit Ripening, Chapman and Hall, London, pp. 83-106.
Vendrell, M., McGlasson, W. 8.,1971. hhibition of ethylene production in banana fruit
tissue by ethylene treatment. Aust. J. Biol. Sci. 24, 885-895.
V/ills, R. B. H., Pitakserikul, S., Scott, K. J., 1982. Effects of pre-storage in low oxygen or
high carbon dioxide concentrations on delaying the ripening of bananas. Aust. J. Agric. Res.
33, 1029-1036.
5

Table 1: Peel and pulp tissue ethanol concentrations of Cavendish bananas cv. Williams after
ripening with ethylene (300 pL L-t) at 18 oC, treated by vacuum-infiltration with air or
ethanol and held in the resulting atmosphere for 10 min. or 3 h. After the holding period,
bananas were held at 18 "C until they reached stage 4 and ripened at22"C until assessed.
EtOH concentration (nL g.f.wt.-t)'
Immediately after vacuum At ripening stage 6
treatment
Vacuum treatments Peel tissue Pulp tissue Peel tissue Pulp tissue
No vacuum
Vacuum + held for 10min.
Vacuum + held for 3h
Vacuum over EtOH + held
for 10min.
Vacuum over EtOH + held
for 3h
10a
11a
4a
78b
74a
14a
13a
13a
699 a
525 a
484 a
454 a
953 a
800 a
676 a
695 a
413 c 2la 573 a 767 a
' Dataare avefages of 2 replicates where different superscripts in columns denote significant
differences at xP< 0.05 using a LSD test.
6

International Jourrral of Food Science and Technology,2002, (in press).
Quality effects of 1-methylcyclopropene exposure on ethylene-treated
Cavendish bananas
Bagnato, N., Barrett, R., SedgleY,M., and xKlieber, A'
*Postal address: Department of Horticulture, Viticulture and Oenology, Adelaide
University,'Waite Campus, Plant Research Centre, PMB. 1, Glen Osmond, 5.A'5064,
Australia.
Corresponding author's telephone number: (+618) 8303 6653, E-mail address:
andre as. klieb er@,ad e I ai de. edu. au and fax numb er (+618) 8303 7116
Present postal addresses of all authors: same as coresponding author
Abstract
After 48 hrs of ethylene treatment (300 FL L-1) to induce ripening of mature, green
bananas (Musa sp., AAA type, Cavendish subgroup, cv. V/illiams), fruit were exposed
to 0 (non-treated), 3 nL L-l, 300 nL L-r, or 30 ¡rL L-r 1-methylcyclopropene (1-MCP)
for 24,48 or 72hrs at 20'C. Bananas treated with 300 nL L-r 1-MCP had a 6 day shelf
life compared with 3 days for non-treated fruit, and 4 days for fruit treated with 3 nL L-
t l-MCp. lncreased shelf life (half-ripe to over-ripe) occurred without affecting the
green life (unripe to half-ripe) of bananas, peel appearance, pulp texture, soluble solid
concentrations or aroma profiles. Fruit treated with 30 ¡rL L-1 were externally and
internally commercially unacceptable, as fruit developed crown rot prior to ripening.
Application of I-MCP at suitable concentrations could extend banana shelf life, by
enhancing marketing and consumer expectations without compromising banana
quality.
Keywords: 1-MCP, bananas, shelf life, ethylene antagonist, quality
1. lntroduction
Bananas, like other climacteric fruit have a distinct ripening pattern (Marriott, 1980;
Dominguez and Vendrell, 1994; Jíang et a1.,2000). Ethylene, a gaseous plant
hormone, is used in industry to regulate this ripening pattern (Proctor and Caygill,
1985; Seynour, 1993). However, once the ripening process in bananas has been
1

Quality effects of I-MCP on ethylene-initiated bananas
initiated, subsequent deterioration is rapid, which is of concern to marketers and
consumers alike (T. Johnson, Chiquita Brands South Pacific, pers. comm., 2000).
1-MCP is an ethylene antagonist that has recently generated a lot of interest in its use
on bananas. Golding et at. (1998), Jiang et al. (1999a), Jiang et al. (1999b), Harris er
at. (2000), Jiang et al. (2OOO) and Macni sh et al. (2000b) have observed I -MCP effects
on green bananas before ethylene initiation, showing delayed ripening as measured by
colour development, volatile production and fruit softening. Further 1-MCP studies
investigating extension of shelf life (or eating life of ripe fruit) have also been
conducted on bananas that were ethylene-treated prior to 1-MCP application (Macnish
et al,, 1991; Golding et al.,1999; Iiang et al.,1999b; Joyce et al., 1999; Macnish et al.,
2000a). These studies suggest that 1-MCP applied to fruit after ethylene initiation of
ripening extends banana shelf life, but the studies have not supplied suffrcient evidence
to industry and consumers that the quality of fruit at the eating ripe stage is not altered.
Most of the previous reports also did not investigate the application of l-MCP to
bananas after a lengthy period of ethylene initiation (>24hr) that is common in industry
Even though Jiang et at. (1999b) suggest an extension of ripening is only possible
when 1-MCP is applied in the earliest phase of banana ripening initiation, research into
1-MCP application at later ripening stages (>24 hrs after ethylene initiation) has only
briefly been studied by Macnish et al. (1997) and Joyce et al. (1999). Again these
studies do not provide banana quality data necessary for industry and consumers. 1-
MCP use has not been approved on food in Australia or other markets such as the US;
therefore a relatively new sensory instrument known as a chemical nose will be used to
identify potential sensory differences due to banana exposure to I-MCP'
Desirable banana characteristics consist of a ripe product, with a shelf life (days
between ripening stage 4 to 7, Paull, 1996) of >3 days (Australian Banana Grower's
Council, 1999). Therefore, the objective of this study was to examine the external and
internal quality as well as the extension in shelf life due to exposure to various 1-MCP
concentrations and exposure periods applied to bananas 48 hr after ethylene initiation
of ripening.
2

Quality effects of 1-MCP on ethylene-initiated bananas
2. Materials and methods
2.1 Plant møteriøl ønd preparation
Green and hard banana (Cavendish cv. V/illiams) fruit were acquired during January
and February 2001 from a Tullyproperty, North Queensland, and transported at 13"C
to the Plant Research Centre on the Adelaide University Waite Campus. All fruit were
of a closely related maturity, as they were harvested from hands two and three from the
top of the bananabunches. Upon arrival all hands were separated, deflowered, dipped
for 1 min in fungicide (0.55 mL L-r Sportak, Hoechst Schering AgrEvo, Glen kis,
Victoria) and allowed to air dry. Twelve bananas were randomly assigned to each
treatment
Fruit were placed into 10-L plastic containers in the presence of 160 g of Ca(OH)2 (a
carbon dioxide scrubber) and a saturated KNO¡ solution that established a 95o/o relative
humidity. The containers were placed randomly in temperature-controlled rooms at
20"C and banana ripening was initiated with 300 ¡rL L-1 of ethylene gas injected into
the containers on two consecutive days. All containers \¡/ere ventilated for 30 min each
day, for the entirety of the experiment.
2. 2 1 -M ethylcycloprop ene exp o s ure after etlrylen e initicttio n
After 48 hrs of ripening initiation, containers were ventilated and bananas were treated
with 0 (non-treated), 3 nL L-1, 300 nL L-r or 30 ¡rL L-r of 1-MCP at20"c. A 1-MCP
atmosphere was created from Ethylbloc@ (3.3% active ingredient 1-MCP, Rohm and
Haas, Melbourne). Measured amounts of Ethylbloc@ *ere placed into small plastic
cups and placed into the 10-L containers. Reverse osmosis (RO) water at 40oC in a
ratio of 1 g Ethylbloc@ to 16 mL distilled water (G. Baynon, Rohm and Haas, pers.
coÍun., 2000) was added to Ethylbloc@ containers to release 1-MCP. All containers
were sealed immediately upon mixing and placed into 20'C controlled environments.
Fruit were exposed to I-MCP atmospheres for 24,48 or 72 hrs. Containers were
ventilated daily and 1-MCP reapplied as appropriate. At the end of the treatment
period, bananas were removed from containers, placed into unsealed polyethylene bags,
and returned to 20oC for daily assessment until the end of the experiment.
J

Quality effects of I-MCP on ethylene-initiated bananas
2.3 I-MCP quantfficøtion
I-MCP concentration was quantified using aYanan gas chromatograph model 3400
(Varian Australia, Mulgrave, Vic) fitted with a flame ionisation detector and a stainless
steel column (60 cm x3.175 mm id) packed with 80/100 mesh Porapak Q (Alltech,
Sydney, NSW). Column temperature was set at 70'C, while the injector and detector
temperatures \Mere 135'C and 150oC, respectively. Flow rates of air, hydrogen and the
carrier gas nitrogen were 300, 40 and 50 mL min-1, respectively, and the standard gas
used to calculate 1-MCP concentrations was iso-butylene (103 pL L-t) (Jiang et al.,
1999a).
2.4 Bønana assessment
Six fruit from each treatment were used to measure external characteristics, such as
peel colour and discolouration. Banana green life and shelf life were determined
visually by recording the number of days required for bananas to ripen from ripening
stage 1 (green, hard) to stage 4 (peel is more yellow than green) and from stage 4 to
stage 7 (peel is yellow with light brown flecks) (Paull, 1996), respectively. Total
weight loss (%) of fruit was also measured by weighing bananas at ripening stage 1
(peel is hard, green) and 6 (peel is yellow).
The remaining six bananas assigned to each treatment were used to assess internal
quality parameters at colour stage 6. Pulp firmness (kPa) was measured using a twist
tester (Dept. of Agricultural Engineering, Massey University, NZ), because of its
consistency and reliability when measuring soft flesh (Studman and Yuwana,1992).
Soluble solid concentrations (SSC %)'were measured on pulp from the middle of the
banana that had been squeezed through muslin gaùze onto the glass of a conventional
hand-held refractometer (0-30% sugar w/w, Bellingham and StanleyLtd., England).
All refractometer recordings were calibrated to room temperature. Finally banana
aroma was determined using a chemical nose (HP 440, Wilmington, DE) consisting of
a modilred HP 7694 headspace autosampler and a mass sensor based on a HP 5973
mass sensor detector.
Samples of 5 g from a homogenised puree (120 g) taken from the six intemally
assessed bananas and were measured into ten, 20 mL headspace vials. An intemal
standard, heptadecane (5 ¡rL), was also added to each vial prior to sealing. Chemical
nose parameters used were the same as those used by Klieber and Muchui (2002).
4

Quality effects of 1-MCP on ethylene-initiated bananas
2.5 Statísticøl analysis
The experiment was established as a 4 x 3 randomised complete block design with
three replicates. Four I-MCP concentrations including 0 (non-treated), 3 nL L-1, 300
nL L-l and 30 pL L-r were applied to bananas for 24,48 or 72hrs. Fruit in weekly
replicates were randomly allocated to treatments. One treatment unit for each replicate
consisted of twelve bananas, with six bananas used for external quality assessments
and the remaining six for internal quality assessments. Analysis of all data was
performed using the General ANOVA command in Genstat 5, (Release 4-1l,4th edition,
1998, Lawes Agricultural Trust, Rothamsted Experimental Station). Data plots were
normalised by transforming total weight loss data into reciprocal data, squaring
firmness data and 1o916 transforming shelf life data. Green life data did not require
transforming. Means, however, have been back transformed for presentation purposes.
A least significant difference test (LSD) at the 5o/olevelwas used to examine all
treatment effects.
Aroma data were analysed using the Pirouette multivariate data analysis package
(lnfometrix Inc, Woodenville, WA, USA), with principal component analysis (PCA).
All data were nonnalised and the PCA model formed was then validated using the
cross-validation method (V/irthensohn et a\.,1999). This indicated the most suitable
factors (principal components) explaining greater than 80% of the variation between
banana samples, with grouped data representing samples with similar volatile profiles
and separating samples for those with dissimilar profiles (Wirthensohn ¿/ al., 1999).
3. Results and Discuss¡on
Exposure periods from24 to 72fus did not affect the efficacy of I-MCP (,Þ0'05, data
not shown). Shelf life, judged as days to ripen from ripening stage 4 to 7 of control
bananas was 3.4 days (Table 1). 1-MCP at3 nLL-l did not increase this shelf life
period, but 30 pL L-t I-MCP completely stopped the ripening of peel and flesh of most
fruit. However, application of 300 nL L-t 1-MCP increased the shelf life of bananas to
6.8 days, while still allowing fruit to ripen.
Green life, pulp firmness and soluble solid readings at colour stage 6 were similar for
bananas treated with 0, 3 nL L-l, or 300 nL L-l I-MCP. V/eight loss readings for
bananas treated with 0, 3 nL L-I, or 300 nL L-1 1-MCP were similarly low, and did not
impact on the visual presentation of the fruit. Therefore, peel and pulp ripening
5

Quality effects of 1-MCP on ethylene-initiated bananas
progressed at synchronous rates for these treatments. However, bananas exposed to 30
pL L-l 1-MCP showed significant quality differences compared to all other treatments,
because they had to be examined at ripening stage 2 (peel was green with a trace of
yellow), as fruit did not ripen before fungal spoilage (crown rot) occurred. Firmness
and SSC were 596 kPa and 8olo, respectively, but weight loss (2%) was not dissimilar
to those treated with 0, 3 nL L-r, or 300 nL L-r 1-MCP. Shelf life and aroma could not
be measured as fruits did not ripen.
The process of ripening and senescence of bananas is influenced by their production of
endogenous ethylene. 1-MCP stops ethylene action, including the promotion of further
ethylene production, by binding to the ethylene receptors (Sisler and Serek, 1997). Irr
our experiment, all bananas were ripening-initiated with ethylene before 1-MCP
application. Therefore, endogenous ethylene production and the ripening processes
were in progress when I-MCP was applied.
In bananas treated with 300 nL L-l 1-MCP ethylene action was blocked, slowing down
ripening and senescence without slowing them excessively. The ripening of peel and
flesh of all fruit was synchronous, contrary to Jiang et al. (1999a) who reported uneven
peel degreening in bananas treated with 1-MCP prior to ripening. IJneven degreening
or ripening of fruit is undesirable and would be unacceptable to industry. Ripening
uniformity may have been aided in our experiment by elevating bananas in treatment
chambers to allow all-over gas exchange, as bananas are known to have limited lateral
gas exchange within their tissues (Perez and Beaudry, 1998).
Low concentrations of 1-MCP (3 nL L-1) applied after ethylene initiation were not
successful in extending shelf life. Jiang et al. (1999b), showed that ethylene inhibition
by 1-MCP was non-competitive by measuring the affinity of 1-MCP and ethylene to
binding sites, and observing that 1-MCP had a lower binding constant (K,n) than
ethylene. Therefore, 1-MCP has the greater attraction for ethylene binding sites.
However, there may have been more binding sites than 1-MCP molecules available to
bind to them (Sisler and Serek,1997), or I-MCP did not persist in the tissues to block
the continuously forming ethylene receptors (Jiang et a\.,1999b). This consequently
allowed ethylene to continue to promote ripening.
The etþlene induced ripening process of bananas treated with 30 pL L-l I-MCP was
excessively delayed, with many fruit failing to ripen before crown rot infection reduced
their appearance. The failure of fruit treated with a high 1-MCP concentration (30 ¡tL
6

Quality effects of I-MCP on ethylene-initiated bananas
L-l¡ to ripen, can be explained by limited formation of new ethylene receptor binding
sites (Jiang et al.,I999b), the full occupation of existing binding sites or persistence of
1-MCP in tissues. During the period of ethylene insensitivity and inhibited ripening,
infection of fruit by fungi is not uncommon (Sisler and Serek, 1997), similarly to the
crown rot infections observed on bananas treated with 30 pL L-l 1-MCP. Fruit infected
with crown rot continue to deteriorate as ripening advances (Jones et al., 1993),
reducing banana saleability.
The chemical nose provided reproducible and reliable data, with aroma results
comparable to time-consuming sensory panels (Klieber and Muchui,2002); also as 1-
MCP is not yet approved in Australia, taste panels could not be used. Similar or
dissimilar aroma profiles obtained by the chemical nose give a good indication of
whether consumers are likely to detect differences in aroma between treated and non-
treated bananas.
The PCA model identified 86% of the total aroma variance between treatments to
consist of 2 factors; any remaining factors each made up 3 5%o of the total variance.
Factor 1 explained 75Yo of the variance shown on the x-axis and Factor 2llo/o, shown
on the y-axis (Figure 1). The overall dispersal of treatment data points between Factor
I was found to be similar using a general analysis test. Therefore all bananas analysed
at ripening stage 6 had similar aroma characteristics regardless of 1-MCP level applied,
which can be seen with the overlapping of clustered data values on the plot (Figure 1).
The main aroma compounds identified in the analyses were butanoic acid, butyl ester,
1-butanol, 3-methylbutyl ester and ethyl acetafe, which exhibit banana-like and fruity
aromas (Tressl and Jennings,1972; Marriott, 1980) that are expected from ripe
bananas. Therefore, the application of low concentrations (< 300 nL L-1) of 1-MCP to
ethylene-treated bananas for various exposure periods did not affect the qualitative
composition of banana aromaprofiles obsewed by the chemical nose and so would not
be detected by consumers. Golding et al. (1999) who reported significantly reduced
quantitative production of volatiles using GC-FID in bananas treated'ù/ith 1-MCP,
suggested the reduction in volatile production may affect banana aroma; however, it is
difficult to make any inferences on perceived aroma by consumers using such data, as
consumers tastes and preferences differ.
7

Quality effects of 1-MCP on ethylene-initiated bananas
4. Gonclusion
1-Methycyclopropene is a promising postharvest treatment for the extension of banana
shelf life to more than 6 days at 20"C when applied after ripening initiation. Quality of
banana flesh as well as visual appearance was not affected by 1-MCP treatments of
<300 nL L-l. However, the 1-MCP concentration used is critical, as low concentrations
(<3 nL L-1) did not extend bananashelf life and high concentrations (30 pL L-1) caused
fruit to be unacceptable for consumption. I-MCP is not yet approved for use on fruit
and vegetables in Australia, but is approved on food products in Chile and on cut
flowers in the USA. Continual studies are required to assess the effect of various 1-
MCP levels on bananas harvested in different seasons. Larger scale experiments in
commercial enterprises are required to ensure that 1-MCP treatments, when more
widely approved for food use, can be effectively and reliably applied.
Acknowledgments
Special thanks go to Chiquita Brands Australia Pty. Ltd., for supplying all fruit used in
this research and to Mr Ted Johnson for his expert advice. Thanks also to Mr Gregg
Baynon (Rohm and Haas, Australia), Dr Amanda Able and Mr Andrew Macnish for
their technical advice regarding the use of Ethylbloct. A special thanks to Dr Graham
Jones and Dr Michelle Wirthensohn for their guidance on the use of the chemical nose
References
Australian Banana Grower's Council (1999), The Banana Industry in Australia. [V/WV/
do cument] . URL http : //www. ab gc. org. aulb anana. html.
Dominguez, M., & Vendrell, M. (1994). Effect of etþlene treatment on ethylene
production, EFE activity and ACC levels in peel and pulp of banana fruit.
Postharvest Biology and Technology, 4, 167 -177 .
Golding, J. B., Shearer, D., McGlasson, W.8., & Wyllie, S. G. (1999). Relationships
between respiration, ethylene, and aroma production in ripening banana.
Journal of Agricultural and Food Chemistry,47,1646-1651.
Golding, J. B., Shearer, D., Wyllie, S. G., & McGlasson, W. B. (1998). Application of
l-MCP and propylene to identify ethylene-dependent ripening processes in
mature banana fruit. Postharvest Biology and Technology,14,87-98.
8

Quality effects of 1-MCP on ethylene-initiated bananas
Harris, D.R., Seberry, J.4., Wills, R. B. H., &. Spohr, L. J. (2000). Effect of fruit
maturity on efficiency of I-MCP to delay the ripening of bananas. Postharvest
B iolo gy and Tecltnolo gy, 20, 3 03 -3 08.
Jiang, Y., Joyce, D. C., & Macnish, A. J. (1999a). Extension of the shelf life of banana
fruit by I-MCP in combination with polyethylene bags. Postharvest Biology
and Technology,16,, I87 -193.
Jiang, Y., Joyce, D. C., & Macnish, A. J. (1999b). Responses of banana fruit to
treatment with I-MCP. Plant Growth Regulation,z&,77-82.
Jiang, Y., Joyce, D. C., & Macnish, A. (2000). Effect of abscisic acid on banana fruit
ripening in relation to the role of ethyl ene. Journal of Plant Growth Regulation,
19,106-111.
Jones, D. R., Pegg, K. G., & Thomas, J. E. (1993). Banana. In: Diseases offruit crops
(edited by D. Persely). Pp.25-35. Brisbane: Queensland Department of Primary
Industries.
Joyce, D. C., Macnish, A. J., Hofman, P. J., Simons, D.H., & Reid, M. S. (1999). Use
of l-methylcyclopropene to modulate banana ripening. In: Biology and
Biotechnology of the Plant Hormone Ethylene 11(edited by A. K. Kanellis, C.
Chang, H. Klee, A. B. Bleecker, J. C. Pech, & D. Grierson). Pp. 189-190.
Dordrecht: Kluwer Academic Publishers.
Klieber, A., 8. Muchui, M. (2002). Preference of banana flavour and aroma are not
affected by time of year or 'winter chilling'. Australian Journal of
Exp erimental Agriculture, 42, 201 -205 .
Macnish, A. J., Joyce, D. C., & Hofman, P. J. (1997).l-Metþlcyclopropene delays
ripening of 'Cavendish' banana fruit. In: Proceedings of the Australasian
P o stharvest Conference, 2 8'h Sept. - 3"t Oct. Pp.282-2 84. Hawkesbury:
University of Westem Sydney.
Macnish, A. J., Joyce, D.C., Hofman, P. J., & Simons, D. H. (2000a). 1-MCP gas can
be used to control banana ripening. Good Fruit and Vegetables, 10r 56'
Macnish, A. J., Joyce, D. C., Hofman, P. J., Simons, D. H., & Reid, M. S. (2000b). 1-
MCP treatment efficacy in preventing ethylene perception in banana fruit and
grevillea and waxflower flowers. Australian Journal of Experimental
Agriculture, 40, 47 l-481.
9

Quality effects of I-MCP on ethylene-initiated bananas
Marriott, J. (1980). Bananas- Physiology and biochemistry of storage and ripening for
optimum quality. CRC Critical Reviews in Food Science and Nutrition,13,4I-
88.
Paull, R. E. (1996). Ethylene, storage and ripening temperatures affect Dwarf Brazilian
banana finger drop. Postharvest Biology and Technology,Sr65-74.
Perez,R., & Beaudry, R. M. (1998). Fractional surface coating modifies gas diffusion
and ripening in bananas. Journal of the American Society for Horticultural
Science,123, 115-1 18.
Proctor, F. J., & Caygill, J. C. (1985). Ethylene in commercial post-harvest handling of
tropical fruit. In: Ethylene and Plant Development (editedby J. A. Roberts, &
G. A. Tucker). Pp. 317-332. London: Butterworths.
Seyrnour, G. B. (1993). Banana. In: Biochemistry of Fruit Ripening (edited by G. B.
Seymour, J. E. Taylor, & G. A. Tucker). Pp. 83-106. London: Chapman and
Hall.
Sisler, E. C. and Serek, M. (1997). Inhibitors of ethylene responses in plants at the
receptor level: Recent developments. Phys iologia Plantarum, 100, 57 7 -582.
Studman, C. J., & Yuwana (1992). Twist test for measuring fruit firmness. Journal of
Texture Studies, 23, 215-227 .
Tressl, R., & Jennings, V/. G. (1972). Production of volatile compounds in the ripening
banana. Journal of Agricultural and Food Chemistry,20,189-192'
V/irthensohn, M. G., Francis, I. L., Gawel, R., & Jones, G. P. (1999). Sensory -
Instrumental correlation of extra virgin olive oil aromas using a 'Chemical
Nose'. Australian International Symposium on Analytical Science, 4-9 July
1999, Melbourne, Vic. Pp. 75-78.
10

Quality effects of I-MCP on etþlene-initiated bananas
Figure 1: Chemical nose data score plot of banana volatiles of fruit at ripening stage 6
after being held for 24 to T2hours in 3 nL L-l l-MCp (4, -),
300 nL L-l I-MCP (8, -
- - ) or in air (C, ""') after ripening initiation.
A
\
III
.2t.
ac
B
tB,\.\
B1
I
II
Factor'1
-10 10
c{
€o
'1
1
1
11

Quality effects of I-MCP on ethylene-initiated bananas
Table 1: Internal and external assessments of Cavendish bananas cv. [4/illiams at
ripening stage 6 (full yellow) following ethylene exposure (300 pL L-r) for 48
hours fruit were subsequently exposed to 0, 3 or 300 nL L-l 1-MCP for 24,48
or 72 hours" at20"C. Fruit were kept at 20"C prior to assessment.
1-MCP concentration
Banana assessment 0 nL L-' 3 nL L-r 300 nL L-'
Green life (days)
Shelf life (days) Y
Firmness (kPa)*
Soluble solid concentration (%)
Total weight loss (%) "
4.1+0.1 a*
3.4+0.1 a
116 a
23a
1.7 a
39+0.2 a
4.3+0.2 a
133 a
22a
1.7 a
3.9+0.2 a
6.8+0.3 b
148 a
22a
2.0 a
' Duration of 1-MCP exposure for all assessments (except shelf life) was not
significant (P>0.05), therefore duration data has been averaged.
v Average data has been back transformed from data that has been log1e transformed.
* Data are means of 3 replicates, where different superscripts within a row denote
significant differences at P<0.05 using a LSD test; * SEM is shown for shelf life and
green life.* Average data has been back transformed from datathat has been squared.
u Average data has been back transformed from reciprocal analysis data.
12