9 Full Development System - Banana Shire Council
36
! 5 0 5 & $ 5 26 $ " 7 8 9 Full Development System 9.1 Preliminary Sizing Table 9.1 provides an estimate of the expected infrastructure requirements based on the projected demands included in Table 4.14. It has been assumed that the bores will continue to operate at a combined capacity of 26L/s with the remaining water sourced from Callide Dam. Table 9.1 – Full Development Preliminary Sizing Design Criteria Requirement Existing Infrastructure Average Day 6.4 ML/d 74 L/s - - Mean Day Max Month 9.6 ML 111 L/s - - Max Day 14.4 ML 167 L/s - - Raw water pumps MDMM in 20hrs 135 L/s (3) 180 L/s Borefield retain existing 26 L/s 26 L/s Water Treatment Plant MDMM in 20 hrs 135 L/s (3) 120 L/s Ground Level Reservoirs (Biloela) (1) 3(MD-MDMM) 14.3 ML 10.5 ML Elevated Storage (HLZ) – 39L/s AD 6(MH-MDMM/12)+FF 1.6 ML 1.95 ML Elevated Storage (LLZ)- 29L/s AD (2) 6(MH-MDMM/12)+FF 1.2 ML 1.35 ML Pumping to elevated storage (HLZ) Operating capacity = 200kL (6MH-operating capacity)/6x3600 174 L/s 208 L/s Pumping to elevated storage (LLZ) Operating capacity = 110kL (6MH-operating capacity)/6x3600 131L/s 90 L/s Note: (1) Includes Thangool (2) Includes Thangool and extended LLZ (3) Less 26L/s for the bores plus 33L/s for Callied PS The table shows that the existing system components generally have sufficient capacity to cater for the future development. The table indicates that the WTP will require upgrading, that there is insufficient GL storage capacity and that the booster pumps for the LLZ will need to be upgraded. The above table should be used as a guide only and actual infrastructure requirements will be based on providing 3MDMM plus 3MD capacity as outlined in the DNRM Guidelines (DNRM, 2005). 9.2 Future Development Area – Pressure/Level Implications The proposed future development areas are shown on Figure 9.1.
-
Upload
khangminh22 -
Category
Documents
-
view
0 -
download
0
Transcript of 9 Full Development System - Banana Shire Council

�� � � � � �� � �� � � � � ��������� �� �� � � � �� � � � �� �� �� � � �� � �� � � � ��
� �� � � �� �� � �� � � �� � ! � ������
� � �5 0 � 5 � � & $ ��5 � � �� 26 $ � � " � 7 8 ����
9 Full Development System
9.1 Preliminary Sizing Table 9.1 provides an estimate of the expected infrastructure requirements based on the projected demands included in Table 4.14. It has been assumed that the bores will continue to operate at a combined capacity of 26L/s with the remaining water sourced from Callide Dam.
� Table 9.1 – Full Development Preliminary Sizing
Design Criteria Requirement Existing Infrastructure
Average Day 6.4 ML/d 74 L/s - -
Mean Day Max Month 9.6 ML 111 L/s - -
Max Day 14.4 ML 167 L/s - -
Raw water pumps MDMM in 20hrs 135 L/s(3) 180 L/s
Borefield retain existing 26 L/s 26 L/s
Water Treatment Plant MDMM in 20 hrs 135 L/s(3) 120 L/s
Ground Level Reservoirs (Biloela) (1) 3(MD-MDMM) 14.3 ML 10.5 ML
Elevated Storage (HLZ) – 39L/s AD 6(MH-MDMM/12)+FF 1.6 ML 1.95 ML
Elevated Storage (LLZ)- 29L/s AD(2) 6(MH-MDMM/12)+FF 1.2 ML 1.35 ML
Pumping to elevated storage (HLZ)
Operating capacity = 200kL (6MH-operating capacity)/6x3600 174 L/s 208 L/s
Pumping to elevated storage (LLZ)
Operating capacity = 110kL (6MH-operating capacity)/6x3600 131L/s 90 L/s
Note: (1) Includes Thangool (2) Includes Thangool and extended LLZ (3) Less 26L/s for the bores plus 33L/s for Callied PS
The table shows that the existing system components generally have sufficient capacity to cater for the future development. The table indicates that the WTP will require upgrading, that there is insufficient GL storage capacity and that the booster pumps for the LLZ will need to be upgraded. The above table should be used as a guide only and actual infrastructure requirements will be based on providing 3MDMM plus 3MD capacity as outlined in the DNRM Guidelines (DNRM, 2005).
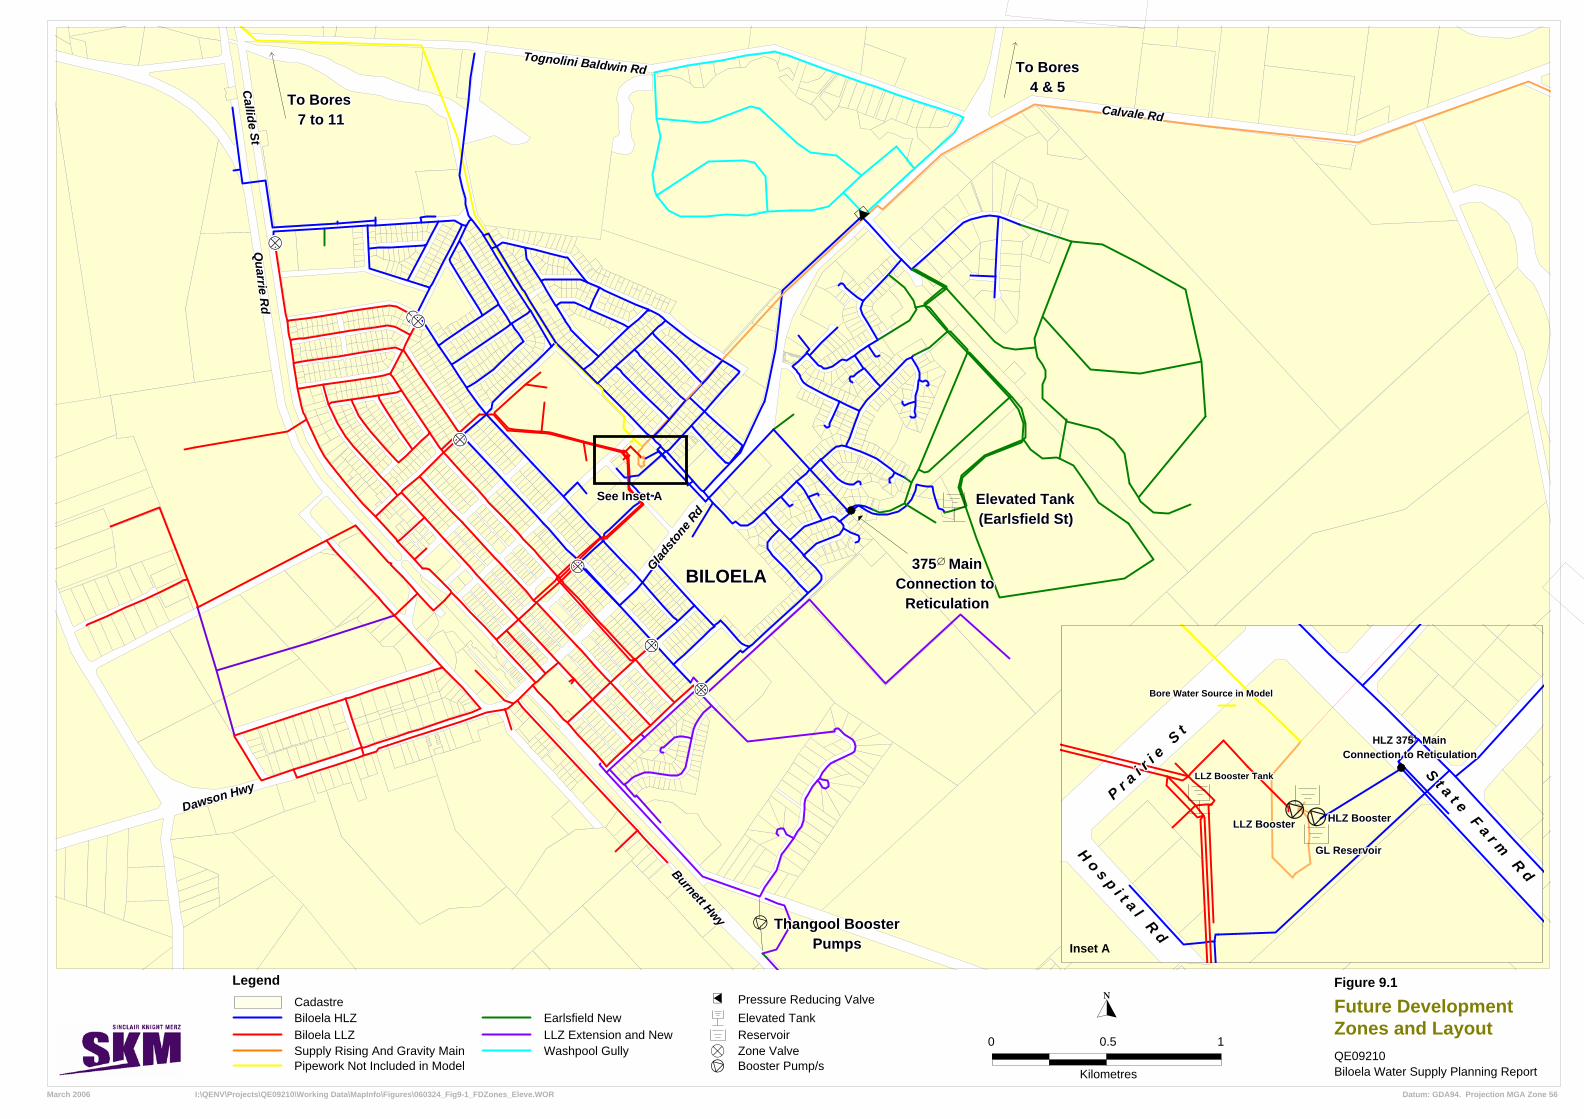
9.2 Future Development Area – Pressure/Level Implications The proposed future development areas are shown on Figure 9.1.

�� � � � � �� � �� � � � � ��������� �� �� � � � �� � � � �� �� �� � � �� � �� � � � ��
� �� � � �� �� � �� � � �� � ! � ������
� � �5 0 � 5 � � & $ ��5 � � �� 26 $ � � " � 7 8 ���
The figure shows that the TWL of Earlsfield St reservoir is 234.1m and some areas of the proposed development have elevations up to 210, this leaves little scope for friction losses, particularly when the operating level of the reservoir is lower than 232m.
The proposed Washpool Gully development is in an area with a lower elevation. It is therefore proposed to supply this area directly from the 300mm diameter treated water main entering the town.
The Hills Avenue and Jo Kooyman Drive areas have a lower elevation and do not need to be included on the HLZ. It is considered appropriate to convert these areas to the LLZ to increase the capacity of the HLZ (this will be referred to as the LLZ extension). The timing of the change in zones will depend on the performance of the system as the town develops.
t
Elevated TankElevated TankElevated TankElevated TankElevated TankElevated TankElevated TankElevated TankElevated Tank(Earlsfield St)(Earlsfield St)(Earlsfield St)(Earlsfield St)(Earlsfield St)(Earlsfield St)(Earlsfield St)(Earlsfield St)(Earlsfield St)
375 Main375 Main375 Main375 Main375 Main375 Main375 Main375 Main375 MainConnection to Connection to Connection to Connection to Connection to Connection to Connection to Connection to Connection to
ReticulationReticulationReticulationReticulationReticulationReticulationReticulationReticulationReticulation
∅
Burnett Hwy
Burnett Hwy
Burnett Hwy
Burnett Hwy
Burnett Hwy
Burnett Hwy
Burnett Hwy
Burnett Hwy
Burnett Hwy
ªªªªªªªªªªªªªªªªªªªªªªªªªªªªªªªªªªªªªªªªªªªªªªªªª
Gladsto
ne R
d
Gladsto
ne R
d
Gladsto
ne R
d
Gladsto
ne R
d
Gladsto
ne R
d
Gladsto
ne R
d
Gladsto
ne R
d
Gladsto
ne R
d
Gladsto
ne R
d
Thangool BoosterThangool BoosterThangool BoosterThangool BoosterThangool BoosterThangool BoosterThangool BoosterThangool BoosterThangool BoosterPumpsPumpsPumpsPumpsPumpsPumpsPumpsPumpsPumps
ªªªªªªªªªªªªªªªªªªªªªªªªªªªªªªªªªªªªªªªªªªªªªªªªª
Calvale RdCalvale RdCalvale RdCalvale RdCalvale RdCalvale RdCalvale RdCalvale RdCalvale Rd
To BoresTo BoresTo BoresTo BoresTo BoresTo BoresTo BoresTo BoresTo Bores4 & 54 & 54 & 54 & 54 & 54 & 54 & 54 & 54 & 5C
allide StC
allide StC
allide StC
allide StC
allide StC
allide StC
allide StC
allide StC
allide St
To Bores To Bores To Bores To Bores To Bores To Bores To Bores To Bores To Bores 7 to 117 to 117 to 117 to 117 to 117 to 117 to 117 to 117 to 11
Tognolini Baldwin RdTognolini Baldwin RdTognolini Baldwin RdTognolini Baldwin RdTognolini Baldwin RdTognolini Baldwin RdTognolini Baldwin RdTognolini Baldwin RdTognolini Baldwin Rd
w
Dawson HwyDawson HwyDawson HwyDawson Hwy
Dawson HwyDawson HwyDawson HwyDawson HwyDawson Hwy
ªªªªªªªªªªªªªªªªªªªªªªªªªªªªªªªªªªªªªªªªªªªªªªªªª
ªªªªªªªªªªªªªªªªªªªªªªªªªªªªªªªªªªªªªªªªªªªªªªªªª
Quarri e R
dQ
uarri e Rd
Quarri e R
dQ
uarri e Rd
Quarri e R
dQ
uarri e Rd
Quarri e R
dQ
uarri e Rd
Quarri e R
d
ªªªªªªªªªªªªªªªªªªªªªªªªªªªªªªªªªªªªªªªªªªªªªªªªªªªªªªªªªªªªªªªªªªªªªªªªªªªªªªªªªªªªªªªªªªªªªªªªªª
ªªªªªªªªªªªªªªªªªªªªªªªªªªªªªªªªªªªªªªªªªªªªªªªªª
Legend
I:\QENV\Projects\QE09210\Working Data\MapInfo\Figures\060324_Fig9-1_FDZones_Eleve.WORMarch 2006
Future Development Zones and Layout
Figure 9.1
Datum: GDA94. Projection MGA Zone 56
QE09210 Biloela Water Supply Planning Report
Biloela LLZ
HLZ BoosterHLZ BoosterHLZ BoosterHLZ BoosterHLZ BoosterHLZ BoosterHLZ BoosterHLZ BoosterHLZ Booster
GL ReservoirGL ReservoirGL ReservoirGL ReservoirGL ReservoirGL ReservoirGL ReservoirGL ReservoirGL Reservoir
HLZ 375 MainHLZ 375 MainHLZ 375 MainHLZ 375 MainHLZ 375 MainHLZ 375 MainHLZ 375 MainHLZ 375 MainHLZ 375 MainConnection to ReticulationConnection to ReticulationConnection to ReticulationConnection to ReticulationConnection to ReticulationConnection to ReticulationConnection to ReticulationConnection to ReticulationConnection to Reticulation
Bore Water Source in ModelBore Water Source in ModelBore Water Source in ModelBore Water Source in ModelBore Water Source in ModelBore Water Source in ModelBore Water Source in ModelBore Water Source in ModelBore Water Source in Model
∅
t tLLZ BoosterLLZ BoosterLLZ BoosterLLZ BoosterLLZ BoosterLLZ BoosterLLZ BoosterLLZ BoosterLLZ Booster
LLZ Booster TankLLZ Booster TankLLZ Booster TankLLZ Booster TankLLZ Booster TankLLZ Booster TankLLZ Booster TankLLZ Booster TankLLZ Booster Tank S t a t e F a r m R d
S t a t e F a r m R d
S t a t e F a r m R d
S t a t e F a r m R d
S t a t e F a r m R d
S t a t e F a r m R d
S t a t e F a r m R d
S t a t e F a r m R d
S t a t e F a r m R d
P r a i r
i e S
t
P r a i r
i e S
t
P r a i r
i e S
t
P r a i r
i e S
t
P r a i r
i e S
t
P r a i r
i e S
t
P r a i r
i e S
t
P r a i r
i e S
t
P r a i r
i e S
t
H o s p i t a l R d
H o s p i t a l R d
H o s p i t a l R d
H o s p i t a l R d
H o s p i t a l R d
H o s p i t a l R d
H o s p i t a l R d
H o s p i t a l R d
H o s p i t a l R d
Inset A
See Inset ASee Inset ASee Inset ASee Inset ASee Inset ASee Inset ASee Inset ASee Inset ASee Inset A
Biloela HLZ
Supply Rising And Gravity MainPipework Not Included in Model
ªt
ReservoirElevated Tank
Zone ValveBooster Pump/s
Cadastre
0 0.5 1
Kilometres
BILOELABILOELABILOELABILOELABILOELABILOELABILOELABILOELABILOELA
LLZ Extension and NewEarlsfield New
Washpool Gully
w Pressure Reducing Valve

�� � � � � �� � �� � � � � ��������� �� �� � � � �� � � � �� �� �� � � �� � �� � � � ��
� �� � � �� �� � �� � � �� � ! � ������
� � �5 0 � 5 � � & $ ��5 � � �� 26 $ � � " � 7 8 ��9�
10 Full Development System Model Results
10.1 Full Development System Model The adopted full development model diameters and augmentations are shown in Figure 10.1. The layout is based on existing development applications for the various areas. Only major mains have been included in the model and where sub-division plans are not available for an area the mains have been arbitrarily included.
A break up of the modelled demands in each of the areas is included in Table 10.1.
� Table 10.1 – Model Demand Break Up
Development Area AD Demand
(ML/d)
AD Demand
(L/s)
Existing LLZ area, plus LLZ extension and new industrial/commercial development 2.23 25.8
Exising HLZ, less LLZ extension 2.00 23.2
Washpool Gully New Development
(including Togolini Baldwin Rd development) 0.47 5.4
Earlsfield Reservoir New Development 1.3 15.5
Thangool 0.26 3.0
Callide 0.04 0.5
Total demand in Model 6.4 73.5
Total from Table 4.14 6.4 73.7 Note: (1) Includes Thangool and extended LLZ

Calvale RdCalvale RdCalvale RdCalvale RdCalvale RdCalvale RdCalvale RdCalvale RdCalvale Rd
To BoresTo BoresTo BoresTo BoresTo BoresTo BoresTo BoresTo BoresTo Bores4 & 54 & 54 & 54 & 54 & 54 & 54 & 54 & 54 & 5
Dia
ne C
tD
iane
Ct
Dia
ne C
tD
iane
Ct
Dia
ne C
tD
iane
Ct
Dia
ne C
tD
iane
Ct
Dia
ne C
t
Elevated TankElevated TankElevated TankElevated TankElevated TankElevated TankElevated TankElevated TankElevated Tank(Earlsfield St)(Earlsfield St)(Earlsfield St)(Earlsfield St)(Earlsfield St)(Earlsfield St)(Earlsfield St)(Earlsfield St)(Earlsfield St)
375 Main375 Main375 Main375 Main375 Main375 Main375 Main375 Main375 MainConnection to Connection to Connection to Connection to Connection to Connection to Connection to Connection to Connection to
ReticulationReticulationReticulationReticulationReticulationReticulationReticulationReticulationReticulation
∅
Gregory Ct
Gregory Ct
Gregory Ct
Gregory Ct
Gregory Ct
Gregory Ct
Gregory Ct
Gregory Ct
Gregory Ct
Ebon
y W
ayEb
ony
Way
Ebon
y W
ayEb
ony
Way
Ebon
y W
ayEb
ony
Way
Ebon
y W
ayEb
ony
Way
Ebon
y W
ay
Lawrence Ave
Lawrence Ave
Lawrence Ave
Lawrence Ave
Lawrence Ave
Lawrence Ave
Lawrence Ave
Lawrence Ave
Lawrence Ave
wwwwwwwwwwwwwwwwwwwwwwwwwwwwwwwwwwwwwwwwwwwwwwwww Valley View
Valley View
Valley View
Valley View
Valley View
Valley View
Valley View
Valley View
Valley View
DveDveDveDveDveDveDveDveDve
Dawso
n Hwy
Dawso
n Hwy
Dawso
n Hwy
Dawso
n Hwy
Dawso
n Hwy
Dawso
n Hwy
Dawso
n Hwy
Dawso
n Hwy
Dawso
n Hwy
Thangool BoosterThangool BoosterThangool BoosterThangool BoosterThangool BoosterThangool BoosterThangool BoosterThangool BoosterThangool BoosterPumpsPumpsPumpsPumpsPumpsPumpsPumpsPumpsPumps
Hills A
ve
Hills A
ve
Hills A
ve
Hills A
ve
Hills A
ve
Hills A
ve
Hills A
ve
Hills A
ve
Hills A
ve
ªªªªªªªªªªªªªªªªªªªªªªªªªªªªªªªªªªªªªªªªªªªªªªªªª
ªªªªªªªªªªªªªªªªªªªªªªªªªªªªªªªªªªªªªªªªªªªªªªªªª
Joe Joe Joe Joe Joe Joe Joe Joe Joe Kooyman DveKooyman DveKooyman DveKooyman DveKooyman DveKooyman DveKooyman DveKooyman DveKooyman Dve
Burnett Hwy
Burnett Hwy
Burnett Hwy
Burnett Hwy
Burnett Hwy
Burnett Hwy
Burnett Hwy
Burnett Hwy
Burnett Hwy
t
Gladsto
ne R
d
Gladsto
ne R
d
Gladsto
ne R
d
Gladsto
ne R
d
Gladsto
ne R
d
Gladsto
ne R
d
Gladsto
ne R
d
Gladsto
ne R
d
Gladsto
ne R
d
Tognolini Baldwin RdTognolini Baldwin RdTognolini Baldwin RdTognolini Baldwin RdTognolini Baldwin RdTognolini Baldwin RdTognolini Baldwin RdTognolini Baldwin RdTognolini Baldwin Rd
WASHPOOLWASHPOOLWASHPOOLWASHPOOLWASHPOOLWASHPOOLWASHPOOLWASHPOOLWASHPOOLGULLYGULLYGULLYGULLYGULLYGULLYGULLYGULLYGULLY
Valentine Plains Rd
Valentine Plains Rd
Valentine Plains Rd
Valentine Plains Rd
Valentine Plains Rd
Valentine Plains Rd
Valentine Plains Rd
Valentine Plains Rd
Valentine Plains Rd
Barrett
St
Barrett
St
Barrett
St
Barrett
St
Barrett
St
Barrett
St
Barrett
St
Barrett
St
Barrett
St
Kroombit St
Kroombit St
Kroombit St
Kroombit St
Kroombit St
Kroombit St
Kroombit St
Kroombit St
Kroombit StMelton St
Melton St
Melton St
Melton St
Melton St
Melton St
Melton St
Melton St
Melton St
ªªªªªªªªªªªªªªªªªªªªªªªªªªªªªªªªªªªªªªªªªªªªªªªªª
ªªªªªªªªªªªªªªªªªªªªªªªªªªªªªªªªªªªªªªªªªªªªªªªªª
Callide St
Callide St
Callide St
Callide St
Callide St
Callide St
Callide St
Callide St
Callide St
To Bores To Bores To Bores To Bores To Bores To Bores To Bores To Bores To Bores 7 to 117 to 117 to 117 to 117 to 117 to 117 to 117 to 117 to 11
ªªªªªªªªªªªªªªªªªªªªªªªªªªªªªªªªªªªªªªªªªªªªªªªªªªªªªªªªªªªªªªªªªªªªªªªªªªªªªªªªªªªªªªªªªªªªªªªªªª
Tiam
by S
t
Tiam
by S
t
Tiam
by S
t
Tiam
by S
t
Tiam
by S
t
Tiam
by S
t
Tiam
by S
t
Tiam
by S
t
Tiam
by S
tQuarri e R
dQ
uarri e Rd
Quarri e R
dQ
uarri e Rd
Quarri e R
dQ
uarri e Rd
Quarri e R
dQ
uarri e Rd
Quarri e R
dªªªªªªªªªªªªªªªªªªªªªªªªªªªªªªªªªªªªªªªªªªªªªªªªª
Readon AveReadon AveReadon AveReadon AveReadon AveReadon AveReadon AveReadon AveReadon Ave
Dunn St
Dunn St
Dunn St
Dunn St
Dunn St
Dunn St
Dunn St
Dunn St
Dunn St
Oxley St
Oxley St
Oxley StOxley St
Oxley StOxley St
Oxley St
Oxley StOxley St
Dawson HwyDawson HwyDawson HwyDawson Hwy
Dawson HwyDawson HwyDawson HwyDawson HwyDawson Hwy
Legend
I:\QENV\Projects\QE09210\Working Data\MapInfo\Figures\060324__Fig10-1_FDAug.WORMarch 2006
Full Development Augmentations and Extensions
Figure 10.1
Datum: GDA94. Projection MGA Zone 56
QE09210 Biloela Water Supply Planning Report
150mm dia extension/augmentation
HLZ BoosterHLZ BoosterHLZ BoosterHLZ BoosterHLZ BoosterHLZ BoosterHLZ BoosterHLZ BoosterHLZ Booster
GL ReservoirGL ReservoirGL ReservoirGL ReservoirGL ReservoirGL ReservoirGL ReservoirGL ReservoirGL Reservoir
HLZ 375 MainHLZ 375 MainHLZ 375 MainHLZ 375 MainHLZ 375 MainHLZ 375 MainHLZ 375 MainHLZ 375 MainHLZ 375 MainConnection to ReticulationConnection to ReticulationConnection to ReticulationConnection to ReticulationConnection to ReticulationConnection to ReticulationConnection to ReticulationConnection to ReticulationConnection to Reticulation
Bore Water Source in ModelBore Water Source in ModelBore Water Source in ModelBore Water Source in ModelBore Water Source in ModelBore Water Source in ModelBore Water Source in ModelBore Water Source in ModelBore Water Source in Model
∅
t tLLZ BoosterLLZ BoosterLLZ BoosterLLZ BoosterLLZ BoosterLLZ BoosterLLZ BoosterLLZ BoosterLLZ Booster
LLZ Booster TankLLZ Booster TankLLZ Booster TankLLZ Booster TankLLZ Booster TankLLZ Booster TankLLZ Booster TankLLZ Booster TankLLZ Booster Tank S t a t e F a r m R d
S t a t e F a r m R d
S t a t e F a r m R d
S t a t e F a r m R d
S t a t e F a r m R d
S t a t e F a r m R d
S t a t e F a r m R d
S t a t e F a r m R d
S t a t e F a r m R d
P r a i r
i e S
t
P r a i r
i e S
t
P r a i r
i e S
t
P r a i r
i e S
t
P r a i r
i e S
t
P r a i r
i e S
t
P r a i r
i e S
t
P r a i r
i e S
t
P r a i r
i e S
t
H o s p i t a l R d
H o s p i t a l R d
H o s p i t a l R d
H o s p i t a l R d
H o s p i t a l R d
H o s p i t a l R d
H o s p i t a l R d
H o s p i t a l R d
H o s p i t a l R d
Inset A
See Inset ASee Inset ASee Inset ASee Inset ASee Inset ASee Inset ASee Inset ASee Inset ASee Inset A
Existing Biloela
200mm dia augmentation300mm dia extension
ªt
ReservoirElevated Tank
Zone ValveBooster Pump/s
Cadastre
0 0.5 1
Kilometres
BILOELABILOELABILOELABILOELABILOELABILOELABILOELABILOELABILOELA
w Pressure Reducing Valve

�� � � � � �� � �� � � � � ��������� �� �� � � � �� � � � �� �� �� � � �� � �� � � � ��
� �� � � �� �� � �� � � �� � ! � ������
� � �5 0 � 5 � � & $ ��5 � � �� 26 $ � � " � 7 8 �� �
10.2 Hydraulic Analysis The same Hazen Williams coefficients have been used for the full development model as were used for the existing system model. Operating levels for existing reservoirs have been left unchanged.
10.2.1 Upgrade Requirements In order to provide sufficient water to the town to meet the increase in demand and to meet Council’s desired standards of service in terms of pressure, it is proposed to augment the system as follows:
- Upgrade the WTP to Stage 1A which has a capacity of 160L/s.
- Construct a booster pump on the existing 300mm diameter town water main on Calvale Road down stream of the Callide off-take (with a 300mm diameter bypass with a non-return valve).
- Upgrade the LLZ booster pumps from 20kw to 30kw.
- Construct 1.2 km of 200mm diameter main from the LLZ elevated tank, down Melton St and along Kroombit St to Barrett Street.
- Construct 500 m of 150mm diameter water main to connect the Hills Avenue water main to Jo Kooyman Drive.
10.2.2 Residual Pressures
Max Day Max Hour The range of MH pressures in the future development model are shown graphically in Figure 10.2.
The figure shows that all areas except for the high level areas near the Earlsfield Street Reservoir meet the 22m standard of service during MH on MD. Pressures in this area range from 18.8m to 21.6m on MD. Pressures are above 22m at MH when the AD scenario is run in the model. Given that they are in an isolated elevated area the slightly lower pressures obtained on peak days are considered acceptable.
In order to provide sufficient pressures to the new development near Earlsfield Street Tank a 300 mm diameter trunk main is needed from the reservoir to the connection at the end of Valley View Drive (see Figure 10.1). As this main is required for all new development in the area Council is responsible for its construction through “headworks charges”.

ªªªªªªªªªªªªªªªªªªªªªªªªªªªªªªªªªªªªªªªªªªªªªªªªª
ªªªªªªªªªªªªªªªªªªªªªªªªªªªªªªªªªªªªªªªªªªªªªªªªª
ªªªªªªªªªªªªªªªªªªªªªªªªªªªªªªªªªªªªªªªªªªªªªªªªª
ªªªªªªªªªªªªªªªªªªªªªªªªªªªªªªªªªªªªªªªªªªªªªªªªª
ªªªªªªªªªªªªªªªªªªªªªªªªªªªªªªªªªªªªªªªªªªªªªªªªªªªªªªªªªªªªªªªªªªªªªªªªªªªªªªªªªªªªªªªªªªªªªªªªªª
t
HLZ Elevated TankHLZ Elevated TankHLZ Elevated TankHLZ Elevated TankHLZ Elevated TankHLZ Elevated TankHLZ Elevated TankHLZ Elevated TankHLZ Elevated Tank(Earlsfield Rd)(Earlsfield Rd)(Earlsfield Rd)(Earlsfield Rd)(Earlsfield Rd)(Earlsfield Rd)(Earlsfield Rd)(Earlsfield Rd)(Earlsfield Rd)
Burnett Hwy
Burnett Hwy
Burnett Hwy
Burnett Hwy
Burnett Hwy
Burnett Hwy
Burnett Hwy
Burnett Hwy
Burnett Hwy
ThangoolThangoolThangoolThangoolThangoolThangoolThangoolThangoolThangoolBooster PumpsBooster PumpsBooster PumpsBooster PumpsBooster PumpsBooster PumpsBooster PumpsBooster PumpsBooster Pumps
Togolini Baldwin RdTogolini Baldwin RdTogolini Baldwin RdTogolini Baldwin RdTogolini Baldwin RdTogolini Baldwin RdTogolini Baldwin RdTogolini Baldwin RdTogolini Baldwin Rd To BoresTo BoresTo BoresTo BoresTo BoresTo BoresTo BoresTo BoresTo Bores
4 & 54 & 54 & 54 & 54 & 54 & 54 & 54 & 54 & 5
Calvale RdCalvale RdCalvale RdCalvale RdCalvale RdCalvale RdCalvale RdCalvale RdCalvale Rd
Dawson HwyDawson HwyDawson HwyDawson HwyDawson HwyDawson HwyDawson HwyDawson HwyDawson Hwy
To BoresTo BoresTo BoresTo BoresTo BoresTo BoresTo BoresTo BoresTo Bores7 to 117 to 117 to 117 to 117 to 117 to 117 to 117 to 117 to 11
wwwwwwwwwwwwwwwwwwwwwwwwwwwwwwwwwwwwwwwwwwwwwwwww
Dawson HwyDawson HwyDawson HwyDawson HwyDawson HwyDawson HwyDawson HwyDawson HwyDawson Hwy
ªªªªªªªªªªªªªªªªªªªªªªªªªªªªªªªªªªªªªªªªªªªªªªªªª
Quarrie R
dQ
uarrie Rd
Quarrie R
dQ
uarrie Rd
Quarrie R
dQ
uarrie Rd
Quarrie R
dQ
uarrie Rd
Quarrie R
d
Legend
I:\QENV\Projects\QE09210\Working Data\MapInfo\Figures\060324__Fig10-2_FD_MHPressures.WORMarch 2006
Full Development System MH Pressures
Figure 10.2
Datum: GDA94. Projection MGA Zone 56
QE09210 Biloela Water Supply Planning Report
0.1 - 0.5
ReservoirReservoirReservoirReservoirReservoirReservoirReservoirReservoirReservoir
Burnett Hwy
Burnett Hwy
Burnett Hwy
Burnett Hwy
Burnett Hwy
Burnett Hwy
Burnett Hwy
Burnett Hwy
Burnett Hwy
Aerod
rom
e Rd
Aerod
rom
e Rd
Aerod
rom
e Rd
Aerod
rom
e Rd
Aerod
rom
e Rd
Aerod
rom
e Rd
Aerod
rom
e Rd
Aerod
rom
e Rd
Aerod
rom
e Rd
THANGOOLTHANGOOLTHANGOOLTHANGOOLTHANGOOLTHANGOOLTHANGOOLTHANGOOLTHANGOOLTOWNTOWNTOWNTOWNTOWNTOWNTOWNTOWNTOWNKariboe Creek
Kariboe Creek
Kariboe Creek
Kariboe Creek
Kariboe Creek
Kariboe Creek
Kariboe Creek
Kariboe Creek
Kariboe Creek
CALLIDECALLIDECALLIDECALLIDECALLIDECALLIDECALLIDECALLIDECALLIDETOWNTOWNTOWNTOWNTOWNTOWNTOWNTOWNTOWN
Inset B - Thangool TownInset B - Thangool TownInset B - Thangool TownInset B - Thangool TownInset B - Thangool TownInset B - Thangool TownInset B - Thangool TownInset B - Thangool TownInset B - Thangool Town
Inset A - Callide TownInset A - Callide TownInset A - Callide TownInset A - Callide TownInset A - Callide TownInset A - Callide TownInset A - Callide TownInset A - Callide TownInset A - Callide Town
NTSNTSNTSNTSNTSNTSNTSNTSNTS
NTSNTSNTSNTSNTSNTSNTSNTSNTS
0.5 - 11 - 2
0 - 0.1> 5 2 - 5Cadastre
ªªªªªªªªªªªªªªªªªªªªªªªªªªªªªªªªªªªªªªªªªªªªªªªªª Zone ValveElevated Tank
Existing Water Network Pipe Velocity (m/s)
Existing Water Network Pipe Pressure (m)
16 - 2020 - 2222 - 80
0 - 16> 12080 - 120
0 0.5 1
Kilometres
BILOELABILOELABILOELABILOELABILOELABILOELABILOELABILOELABILOELA
w Pressure Reducing Valve

�� � � � � �� � �� � � � � ��������� �� �� � � � �� � � � �� �� �� � � �� � �� � � � ��
� �� � � �� �� � �� � � �� � ! � ������
� � �5 0 � 5 � � & $ ��5 � � �� 26 $ � � " � 7 8 ���
The pressures shown are for the worst case scenario when the Earlsfield Tank booster pump is off and the Thangool Booster pump is on. The proposed extension of the LLZ has contributed to the reduced sensitivity of the system to booster operation.
Average Day The Washpool Gully area has an off-take directly from the 300mm dia treated water main. As a result there are excessive pressures in the system when the reservoir is not being filled and the booster pump is off. To prevent excessive pressures during low demand periods a PRV has been included in the model set at a pressure of 30m. This PRV should be provided by the Washpool Gully area developer.
Minimum Hour Pressures in the system are all below 80m during low flow periods.
10.2.3 Fire Fighting Requirements A summary of the fire fighting results at full development is included in Table 10.2. The nodes where Fire Flows have been included are shown on Figure 10.3. � Table 10.2 –Full Development System Fire Fighting Model Results
MH + Fire Fighting Demands 2/3 MH + Fire Fighting demands
Critical Area Nodes(1) Total
Demand (L/s)
Head with Fire Flow (m)
Available Flow (L/s)
@ 12m head
Total Demand
(L/s)
Head with Fire Flow (m)
Available Flow
(L/s) @ 12m head
Hills Avenue J658
J844
15.0
15.0
6.6
11.41
11.4
14.3
-
-
-
-
OK
OK
Valentine Plains Rd J654 16.7 3.7 12.9 16.1 10.8 15.6
The Bruce Highway (near Countryman’s Motel)
J848 30.5 -ve 8.0 30.4 -ve 8.8
Commercial and industrial area near Readon Avenue and Dawson Highway
J466
J476
31.0
30.2
9.3
-ve
28.4
18.9
-
30.2
-
-ve
OK
20.9
End of Oxley St J314
J318
16.2
15.2
3.3
2.5
14.0
12.7
15.8
15.1
7.3
5.5
14.5
13.5
Eastern end of Dee St (near the zone valve)
J1098 15.0 -ve 10.7 15.0 -ve 11.3
End of State Farm Rd past the Council Depot
J708 15.0 5.7 13.7 - - OK
Earlsfield Res New Development J1200 17.72 10.3 15.4 - - OK

�� � � � � �� � �� � � � � ��������� �� �� � � � �� � � � �� �� �� � � �� � �� � � � ��
� �� � � �� �� � �� � � �� � ! � ������
� � �5 0 � 5 � � & $ ��5 � � �� 26 $ � � " � 7 8 ���
MH + Fire Fighting Demands 2/3 MH + Fire Fighting demands
Critical Area Nodes(1) Total
Demand (L/s)
Head with Fire Flow (m)
Available Flow (L/s)
@ 12m head
Total Demand
(L/s)
Head with Fire Flow (m)
Available Flow
(L/s) @ 12m head
Thangool JT16
JT20
JT56
JT60
15.7
15.7
15.6
30.6
-ve
-ve
5.2
-ve
7.4
9.1
12.2
7.9
15.5
15.5
15.4
30.4
-ve
-ve
0.4
-ve
7.0
8.0
10.2
7.5
Callide Town JC230
JC234
JC244
15.2
15.2
15.2
7.9
-ve
-ve
12.6
7.2
6.2
15.2
15.2
15.2
11.45
-ve
-ve
17.9
9.6
7.3 Note: (1) Only nodes with fire fighting demands that don’t meet the requirements at MH are included here

To BoresTo BoresTo BoresTo BoresTo BoresTo BoresTo BoresTo BoresTo Bores4 & 54 & 54 & 54 & 54 & 54 & 54 & 54 & 54 & 5
Calvale RdCalvale RdCalvale RdCalvale RdCalvale RdCalvale RdCalvale RdCalvale RdCalvale Rd
HLZ Elevated TankHLZ Elevated TankHLZ Elevated TankHLZ Elevated TankHLZ Elevated TankHLZ Elevated TankHLZ Elevated TankHLZ Elevated TankHLZ Elevated Tank(Earlsfield Rd)(Earlsfield Rd)(Earlsfield Rd)(Earlsfield Rd)(Earlsfield Rd)(Earlsfield Rd)(Earlsfield Rd)(Earlsfield Rd)(Earlsfield Rd)
By DeveloperBy DeveloperBy DeveloperBy DeveloperBy DeveloperBy DeveloperBy DeveloperBy DeveloperBy Developer
ThangoolThangoolThangoolThangoolThangoolThangoolThangoolThangoolThangoolBooster Booster Booster Booster Booster Booster Booster Booster Booster PumpsPumpsPumpsPumpsPumpsPumpsPumpsPumpsPumps
Hills A
ve
Hills A
ve
Hills A
ve
Hills A
ve
Hills A
ve
Hills A
ve
Hills A
ve
Hills A
ve
Hills A
ve
Dawson Hwy
Dawson Hwy
Dawson Hwy
Dawson Hwy
Dawson Hwy
Dawson Hwy
Dawson Hwy
Dawson Hwy
Dawson Hwy
Dia
ne C
tD
i ane
Ct
Di a
ne C
tD
i ane
Ct
Di a
ne C
tD
i ane
Ct
Di a
ne C
tD
i ane
Ct
Di a
ne C
t
Lawren
ce St
Lawren
ce St
Lawren
ce St
Lawren
ce St
Lawren
ce St
Lawren
ce St
Lawren
ce St
Lawren
ce St
Lawren
ce St
Ebon
y W
ayEb
ony
Way
Ebon
y W
ayEb
ony
Way
Ebon
y W
ayEb
ony
Way
Ebon
y W
ayEb
ony
Way
Ebon
y W
ay
Gregory Ct
Gregory Ct
Gregory Ct
Gregory Ct
Gregory Ct
Gregory Ct
Gregory Ct
Gregory Ct
Gregory CtValley View
Valley View
Valley View
Valley View
Valley View
Valley View
Valley View
Valley View
Valley View
DveDveDveDveDveDveDveDveDve
WASHPOOL WASHPOOL WASHPOOL WASHPOOL WASHPOOL WASHPOOL WASHPOOL WASHPOOL WASHPOOL GULLYGULLYGULLYGULLYGULLYGULLYGULLYGULLYGULLY
Caravan
Caravan
Caravan
Caravan
Caravan
Caravan
Caravan
Caravan
Caravan
ParkParkParkParkParkParkParkParkPark
t
Burnett Hwy
Burnett Hwy
Burnett Hwy
Burnett Hwy
Burnett Hwy
Burnett Hwy
Burnett Hwy
Burnett Hwy
Burnett Hwy
Joe Kooyman DveJoe Kooyman DveJoe Kooyman DveJoe Kooyman DveJoe Kooyman DveJoe Kooyman DveJoe Kooyman DveJoe Kooyman DveJoe Kooyman Dve
Valentine Plains Rd
Valentine Plains Rd
Valentine Plains Rd
Valentine Plains Rd
Valentine Plains Rd
Valentine Plains Rd
Valentine Plains Rd
Valentine Plains Rd
Valentine Plains Rd
Beak PBeak PBeak PBeak PBeak PBeak PBeak PBeak PBeak P
Countrymans
Countrymans
Countrymans
Countrymans
Countrymans
Countrymans
Countrymans
Countrymans
Countrymans
MotelMotelMotelMotelMotelMotelMotelMotelMotel
Barrett S
t
Barrett S
t
Barrett S
t
Barrett S
t
Barrett S
t
Barrett S
t
Barrett S
t
Barrett S
t
Barrett S
t
Council Council Council Council Council Council Council Council Council DepotDepotDepotDepotDepotDepotDepotDepotDepot
Togolini Baldwin RdTogolini Baldwin RdTogolini Baldwin RdTogolini Baldwin RdTogolini Baldwin RdTogolini Baldwin RdTogolini Baldwin RdTogolini Baldwin RdTogolini Baldwin Rd
Tiam
by S
t
Tiam
by S
t
Tiam
by S
t
Tiam
by S
t
Tiam
by S
t
Tiam
by S
t
Tiam
by S
t
Tiam
by S
t
Tiam
by S
t
State Farm Rd
State Farm Rd
State Farm Rd
State Farm Rd
State Farm Rd
State Farm Rd
State Farm Rd
State Farm Rd
State Farm Rd
Dunn St
Dunn St
Dunn St
Dunn St
Dunn St
Dunn St
Dunn St
Dunn St
Dunn St
Melton St
Melton St
Melton St
Melton St
Melton St
Melton St
Melton St
Melton St
Melton St
Quarrie R
dQ
uarrie Rd
Quarrie R
dQ
uarrie Rd
Quarrie R
dQ
uarrie Rd
Quarrie R
dQ
uarrie Rd
Quarrie R
d Dee StDee StDee StDee StDee StDee StDee StDee StDee St
To BoresTo BoresTo BoresTo BoresTo BoresTo BoresTo BoresTo BoresTo Bores7 to 117 to 117 to 117 to 117 to 117 to 117 to 117 to 117 to 11
Oxley St
Oxley St
Oxley StOxley St
Oxley StOxley St
Oxley St
Oxley StOxley St
Dawson HwyDawson HwyDawson HwyDawson HwyDawson HwyDawson HwyDawson HwyDawson HwyDawson Hwy
Readon Ave
Readon Ave
Readon AveReadon Ave
Readon AveReadon Ave
Readon Ave
Readon AveReadon Ave
J376J376J376J376J376J376J376J376J376
J1098J1098J1098J1098J1098J1098J1098J1098J1098
J394J394J394J394J394J394J394J394J394
J708J708J708J708J708J708J708J708J708
J1096J1096J1096J1096J1096J1096J1096J1096J1096
J956J956J956J956J956J956J956J956J956
J522J522J522J522J522J522J522J522J522
J800J800J800J800J800J800J800J800J800
J806J806J806J806J806J806J806J806J806
J692J692J692J692J692J692J692J692J692J900J900J900J900J900J900J900J900J900 J398J398J398J398J398J398J398J398J398
J860J860J860J860J860J860J860J860J860
J366J366J366J366J366J366J366J366J366
J370J370J370J370J370J370J370J370J370
J658J658J658J658J658J658J658J658J658
J844J844J844J844J844J844J844J844J844
J1200J1200J1200J1200J1200J1200J1200J1200J1200
J654J654J654J654J654J654J654J654J654
J526J526J526J526J526J526J526J526J526
J518J518J518J518J518J518J518J518J518
J378J378J378J378J378J378J378J378J378
J952J952J952J952J952J952J952J952J952
J804J804J804J804J804J804J804J804J804
J314J314J314J314J314J314J314J314J314
J322J322J322J322J322J322J322J322J322
J344J344J344J344J344J344J344J344J344
J374J374J374J374J374J374J374J374J374
J406J406J406J406J406J406J406J406J406J416J416J416J416J416J416J416J416J416
J426J426J426J426J426J426J426J426J426
J430J430J430J430J430J430J430J430J430
J434J434J434J434J434J434J434J434J434
J440J440J440J440J440J440J440J440J440
J452J452J452J452J452J452J452J452J452
J458J458J458J458J458J458J458J458J458
J466J466J466J466J466J466J466J466J466
J468J468J468J468J468J468J468J468J468
J476J476J476J476J476J476J476J476J476
J486J486J486J486J486J486J486J486J486
J490J490J490J490J490J490J490J490J490
J536J536J536J536J536J536J536J536J536
J544J544J544J544J544J544J544J544J544
J592J592J592J592J592J592J592J592J592
J606J606J606J606J606J606J606J606J606
J644J644J644J644J644J644J644J644J644
J648J648J648J648J648J648J648J648J648J650J650J650J650J650J650J650J650J650
J686J686J686J686J686J686J686J686J686
J694J694J694J694J694J694J694J694J694
J744J744J744J744J744J744J744J744J744
J748J748J748J748J748J748J748J748J748
J766J766J766J766J766J766J766J766J766
J770J770J770J770J770J770J770J770J770
J788J788J788J788J788J788J788J788J788
J796J796J796J796J796J796J796J796J796
J798J798J798J798J798J798J798J798J798
J814J814J814J814J814J814J814J814J814
J848J848J848J848J848J848J848J848J848
J930J930J930J930J930J930J930J930J930
J934J934J934J934J934J934J934J934J934
J308J308J308J308J308J308J308J308J308
J1178J1178J1178J1178J1178J1178J1178J1178J1178
J1242J1242J1242J1242J1242J1242J1242J1242J1242
J1162J1162J1162J1162J1162J1162J1162J1162J1162
J1146J1146J1146J1146J1146J1146J1146J1146J1146
J318J318J318J318J318J318J318J318J318
Legend
I:\QENV\Projects\QE09210\Working Data\MapInfo\Figures\060324__Fig10-3_FD_FireFightingDemands.WORMarch 2006
Full Development Fire Fighting Augmentations
Figure 10.3
Datum: GDA94. Projection MGA Zone 56
QE09210 Biloela Water Supply Planning Report
Burnett Hwy
Burnett Hwy
Burnett Hwy
Burnett HwyBurnett Hwy
Burnett Hwy
Burnett Hwy
Burnett Hwy
Burnett Hwy
Kariboe Creek
Kariboe Creek
Kariboe Creek
Kariboe Creek
Kariboe Creek
Kariboe Creek
Kariboe Creek
Kariboe Creek
Kariboe Creek
THANGOOLTHANGOOLTHANGOOLTHANGOOLTHANGOOLTHANGOOLTHANGOOLTHANGOOLTHANGOOLTOWNTOWNTOWNTOWNTOWNTOWNTOWNTOWNTOWN
Aerod
rom
e Rd
Aerod
rom
e Rd
Aerod
rom
e Rd
Aerod
rom
e Rd
Aerod
rom
e Rd
Aerod
rom
e Rd
Aerod
rom
e Rd
Aerod
rom
e Rd
Aerod
rom
e Rd
ReservoirReservoirReservoirReservoirReservoirReservoirReservoirReservoirReservoir
JT20JT20JT20JT20JT20JT20JT20JT20JT20
JT22JT22JT22JT22JT22JT22JT22JT22JT22
JT44JT44JT44JT44JT44JT44JT44JT44JT44
JT56JT56JT56JT56JT56JT56JT56JT56JT56
JT60JT60JT60JT60JT60JT60JT60JT60JT60
JT16JT16JT16JT16JT16JT16JT16JT16JT16
Calvale RdCalvale RdCalvale RdCalvale RdCalvale RdCalvale RdCalvale RdCalvale RdCalvale Rd
CALLIDECALLIDECALLIDECALLIDECALLIDECALLIDECALLIDECALLIDECALLIDETOWNTOWNTOWNTOWNTOWNTOWNTOWNTOWNTOWN
To Calvale RdTo Calvale RdTo Calvale RdTo Calvale RdTo Calvale RdTo Calvale RdTo Calvale RdTo Calvale RdTo Calvale Rd
JC230JC230JC230JC230JC230JC230JC230JC230JC230
JC234JC234JC234JC234JC234JC234JC234JC234JC234
JC244JC244JC244JC244JC244JC244JC244JC244JC244
Inset B - Thangool TownInset B - Thangool TownInset B - Thangool TownInset B - Thangool TownInset B - Thangool TownInset B - Thangool TownInset B - Thangool TownInset B - Thangool TownInset B - Thangool Town
Inset A - Callide TownInset A - Callide TownInset A - Callide TownInset A - Callide TownInset A - Callide TownInset A - Callide TownInset A - Callide TownInset A - Callide TownInset A - Callide Town NTSNTSNTSNTSNTSNTSNTSNTSNTS
NTSNTSNTSNTSNTSNTSNTSNTSNTS
Cadastre
ªªªªªªªªªªªªªªªªªªªªªªªªªªªªªªªªªªªªªªªªªªªªªªªªª Zone ValveElevated Tank
Able to provide Fire Flow0 0.5 1
Kilometres
BILOELABILOELABILOELABILOELABILOELABILOELABILOELABILOELABILOELA
Unable to provide Fire Flows at 2/3 MHUnable to provide Fire Flows at MH
100mm Augmentation150mm Augmentation200mm Augmentation
Full Development NetworkExisting Water Network Pipe Diameters (mm)Fire Fighting demand locations

�� � � � � �� � �� � � � � ��������� �� �� � � � �� � � � �� �� �� � � �� � �� � � � ��
� �� � � �� �� � �� � � �� � ! � ������
� � �5 0 � 5 � � & $ ��5 � � �� 26 $ � � " � 7 8 ���
To meet the required standard of service at MH for all areas in the existing system the augmentations shown on Figure 10.3 are required.
� Table 10.3 –Full Development Augmentations for MH Fire Fighting
Critical Area Nodes(1) Augmentation Description
Diameter (mm)
Length
(m)
Hills Avenue J658 Connect cul-de-sac to Hills Avenue main
100 60
Valentine Plains Rd and the Bruce Highway (near Countryman’s Motel)
J654
J844
J848
Connect the two 150mm dia pipes (previously in the HLZ) to J848.
100 170
Commercial and industrial area near Readon Avenue and Dawson Highway
J466
J476
Connect 200mm dia main from the 225mm delivery main in the sports fields to the 200mm dia main in Dunn St
200 800
End of Oxley St J314
Augment Oxley St with 100 dia main
100 440
Near Oxley St J318 Augment with 100mm dia main.
100 320
Eastern end of Dee St (near the zone valve)
J1098 Cross connect the two LLZ dead ends at the zone boundary
100 50
End of State Farm Rd past the Council Depot
J708 Augment the 100 mm dia main with a 150mm dia pipe from the corner of Auburn St and State Farm Road
150 200
Earlsifield Rd New Development J1200 Connect main from cul-de-sac to other main in area
150 220
Thangool JT16
JT20
JT56
JT60
Augment the 150mm main from the reservoir past the Burnett Highway.
Augment the 100mm dia main with a 150mm main to the air port.
Augment the 100mm main with a 150mm dia pipe to node JT56
200
150
1350
1150
Callide Town JC230
JC234
JC244
Augment the existing 150mm main from Calvale Rd to the end of Callide Town
150 2000

�� � � � � �� � �� � � � � ��������� �� �� � � � �� � � � �� �� �� � � �� � �� � � � ��
� �� � � �� �� � �� � � �� � ! � ������
� � �5 0 � 5 � � & $ ��5 � � �� 26 $ � � " � 7 8 ��
11 Infrastructure Cost Recovery
11.1 Cost Estimates and Augmentation Summary A summary of the augmentation requirements and cost estimates are shown in Table 11.1. Rates include a 30% allowance for contingencies, survey, planning, design, construction supervision and contract administration.
� Table 11.1 –Augmentation and Cost Summary
Item Description Qty Unit Rate* Amount
1. Delivery and Water Treatment Plant Infrastructure All New Development
Upgrade WTP to Stage 1A
Replace Filter Media 1 item 60000 $60 000
Inlet inline mixer modification 1 item 7000 $7 000
Inlet control valve settings 1 item 3000 $3 000
Flash Mixer weirs 1 item 5000 $5 000
Clarifier downpipes 1 item 20000 $20 000
Sub-Total $95 000
Construct a 20kw booster pump on Calvale Road with bypass and NRV (duty & standby) 1 item 209000 $209 000
Total say $300 000
2. Delivery Infrastructure - LLZ development
Upgrade LLZ Booster Pumps from 20kw to 30kW 1 item 198000 $198 000
Construct 200mm dia main from LLZ elevated tank 1200 m 198 $237 600
Total say $440 000
3. Delivery Insfrastructure - HLZ development
Construct 300 mm dia main through the new high level zone development 1500 m 304 $456 000
Total say $460 000
4. Council Reticulation Upgrade
Construct 150mm dia main between Hills Avenue and Joe Kooyman Drive 500 m 176 $88 000
Total say $90 000
5. Council Fire Fighting Upgrades
Hills Avenue - 100 mm dia 60 m 133 $7 980
Valentine Plains Road - 150 mm dia 170 m 176 $29 920
Commercial and Industrial Area - 200 mm dia 800 m 198 $158 400
End of Oxley St - 100mm dia 440 m 133 $58 520
Near Oxley St - 100 mm dia 320 m 133 $42 560
Dee St - 100mm dia 50 m 133 $6 650

�� � � � � �� � �� � � � � ��������� �� �� � � � �� � � � �� �� �� � � �� � �� � � � ��
� �� � � �� �� � �� � � �� � ! � ������
� � �5 0 � 5 � � & $ ��5 � � �� 26 $ � � " � 7 8 ���
Item Description Qty Unit Rate* Amount
End State Farm Road - 150mm dia 200 m 176 $35 200
Earlsifield Rd New Development (Needs to be included in development plan) - - - -
Thangool - 200mm dia 1350 m 198 $267 300
Thangool - 150mm dia 1150 m 176 $202 400
Callide Town - 150mm dia 2000 m 176 $352 000
Total say $1 160 000 *June 2004 dollars plus 10%
11.2 Water Supply The water supply infrastructure costs calculated on a per lot basis can be summarised as follows.
� Table 11.2 – Delivery and Treatment Cost Distribution
Description All Development HLZ Development LLZ Development
Delivery & WTP infrastructure $300 000 $460 000 $440 000
Less 40% state govt subsidy $120 000 n/a n/a
Net cost $180 000 $460 000 $440 000
Lots 990 622 424(1)
Cost per lot $182 $740 $1 037
Total Cost Per Lot - $922 $1 219 Note: (1) Councils LLZ extension (127 lots), new LLZ development (140lots) and Thangool (157lots)
The developer contribution for the low level zone (140lots) will be about $145 000 based on the cost per lot cost for rezoning the area. The remaining $295 000 is for upgrading the service to existing lots and the cost will need to be met by Council.
Fire fighting augmentations total $1 160 000. This includes $340 000 for Biloela, $470 000 for Thangool and $350 000 for Callide Town.
11.3 Cost Recovery from Developers It is assumed that developers will provide all water supply mains less than 300mm dia as part of their developments.
Trunk water mains (ie 300mm diameter and larger) plus water treatment plant augmentation service more than one development and their cost can be apportioned between developments.

�� � � � � �� � �� � � � � ��������� �� �� � � � �� � � � �� �� �� � � �� � �� � � � ��
� �� � � �� �� � �� � � �� � ! � ������
� � �5 0 � 5 � � & $ ��5 � � �� 26 $ � � " � 7 8 �9�
In this respect it has been assumed that these costs could be apportioned on a per lot basis.
Council will need to develop the formal mechanisms for infrastructure cost recovery under IPA legislation - these include a priority infrastructure plan (PIP) and an infrastructure charges schedule (ICS).

�� � � � � �� � �� � � � � ��������� �� �� � � � �� � � � �� �� �� � � �� � �� � � � ��
� �� � � �� �� � �� � � �� � ! � ������
� � �5 0 � 5 � � & $ ��5 � � �� 26 $ � � " � 7 8 ���
12 References Australian Bureau of Statistics, Australian Social Trends 2002, Housing – National Summary Tables (www.abs.gov.au/ausstats). Banana Shire Council (BSC), Planning Scheme, December 2004. Department of Natural Resources and Mines (DNRM), Planning Guidelines for Water Supply and Sewerage, March 2005. Draft Banana Shire, IPA Planning Scheme, December 2004 Valley View Infrastructure Agreement Ullman & Nolan Pty Ltd Consulting Engineers, Banana Shire Council - Revised Report on Augmentation of Biloela Water Supply Storage and Reticulation, January 1981.
Water Resource Commission (WRC), Guidelines for Planning and Design of Urban Water Supply Schemes, October 1989.

�� � � � � �� � �� � � � � ��������� �� �� � � � �� � � � �� �� �� � � �� � �� � � � ��
� �� � � �� �� � �� � � �� � ! � ������
� � �5 0 � 5 � � & $ ��5 � � �� 26 $ � � " � 7 8 �� �:��
Appendix A – 2001 Census Collector Districts

�� � � � � �� � �� � � � � ��������� �� �� � � � �� � � � �� �� �� � � �� � �� � � � ��
� �� � � �� �� � �� � � �� � ! � ������
� � �5 0 � 5 � � & $ ��5 � � �� 26 $ � � " � 7 8 �� �:��
Appendix B – Water Supply Unit Entitlement
WATER SUPPLY - UNIT ENTITLEMENT PER ANNUM SCHEDULE 2004/2005
Units (1 Unit = 1 kL) Class Use
Biloela Thangool
1 Private dwelling 600 600
2 Flats (per flat) 360 300
3 Boarding House, Lodging House 1200 900
4 Hospital 18000 ---
5 Schools (per 100 students - nearest 100) 2400 2400
6 Convent 1200 ---
7 Halls Association, Lodge Acc, Rooms 300 240
8 Church 240 120
9 Picture Theatre 600 600
10 Sawmill 1200 ---
11 Bowling Club 6000 ---
12 Hotel 4800 3120
13 Post Office 240 240
14 Garage, Service Station 900 720
15 C.W.A Rest Room 300 240
16 Butchery, Bakery 720 720
17 Cafe, Restaurant 1200 960
18 Railway Station 900 600
19 Caravan Park 1800 1200
20 Cordial Factory 1800 ---
21 Retail Shop, Office, Bank, Warehouse or bulk store 600 600
(if building is used for more than one of such purposes - for each purpose)
360 300
22 Motel (per unit) 240 240
23 Any other land, building or other structure whatsoever 600 600
24 Swimming Pool --- ---
25 Dry Cleaners & Laundry Service 8000 ---
26 Blue Nurses Depot 240 ---
29 As determined by Council resolution specific to the site
Note: In any case where a building is used for a dual or multiple purpose, other than the purpose enumerated in classification No. 21 of this schedule, the combined charges for the various classifications herein mentioned shall be payable.
�� � � � � �� � �� � � � � ��������� �� �� � � � �� � � � �� �� �� � � �� � �� � � � ��
� �� � � �� �� � �� � � �� � ! � ������
� � �5 0 � 5 � � & $ ��5 � � �� 26 $ � � " � 7 8 �; �:���
Appendix C – Land Use Zones and Water Supply Categories
Water Supply Category Rating Data Land Use Name Rating Data Land
Use Number
Residential Vacant Urban Land 1
Single Unit Dwelling 2
Multi Unit Dwelling (Flats) 3
Outbuildings 6
Building Units - Private use o 8
Group Title - Primary use only 9
Rural Residential Large Home Site - Vacant 4
Large Home Site - Dwelling 5
Commercial Shop single 11
Shops - group (more than 6 sho 12
Shopping Group (2 to 6 shops) 13
Shops - main retail (Central B 14
Drive in Shopping Centre 16
Special Tourist attraction 18
Car Parks 22
Retail Warehouse 23
Sales area outdoors (Dealers b 24
Professional Offices 25
Funeral parlours 26
Transport Terminal 29
Service Station 30
Hotel/tavern 42
Motel 43
Licensed Club 47
Sports clubs/facilities (Minor water users) 48
Other clubs (Non - business) 50
Religious 51
Library 55
Educational include Kindergarten (Minor Water Users) 58
Community Protection Centre 99
Industrial Warehouse & Bulk Stores 28
Oil Depot & refinery 31
Builders yard, contractors 33
General Industry 35
Light Industry 36
Noxious/Offensive Industry 37

�� � � � � �� � �� � � � � ��������� �� �� � � � �� � � � �� �� �� � � �� � �� � � � ��
� �� � � �� �� � �� � � �� � ! � ������
� � �5 0 � 5 � � & $ ��5 � � �� 26 $ � � " � 7 8 �; �:���
Water Supply Category Rating Data Land Use Name Rating Data Land
Use Number
Agricultural Cattle Breeding & Fattening 65
Agricultural – Grains 73
Agricultural -Small Crop/Fodder 83
Other Rural -Animal Special 89
Other Rural -Transformers 91
Individual Shop single (Major Water User Only) 11
Residential Institution 21
Retail Warehouse (Major Water User Only) 23
Hospitals, Convalescent homes 27
Service Station (Major Water User Only) 30
Child care ex Kindergarten 41
Hotel/tavern (Major Water Users Only) 42
Motel (Major Water User Only) 43
Licensed Club (Major Water User Only) 47
Sports clubs/facilities (Major Water Users) 48
Caravan Parks 49
Show Ground, Racecourse 56
Parks, gardens 57
Educational include Kindergarten 58
Public Hospital 96
Welfare home/institution 97
Not In Biloela Rates Data Guest House/Private Hotel 7
Comb. Multi Dwelling & Shops 10
Restaurant 17
Extractive 40
Cemeteries (Include Crematorium) 52
Vacant Rural Land 94
Reservoir, dams, bores 95

�� � � � � �� � �� � � � � ��������� �� �� � � � �� � � � �� �� �� � � �� � �� � � � ��
� �� � � �� �� � �� � � �� � ! � ������
� � �5 0 � 5 � � & $ ��5 � � �� 26 $ � � " � 7 8 �* �:���
Appendix D – Biloela WTP Equipment List 1 Raw Water Pumps
- Axially split single stage centrifugal, Thompsons Byron Jackson
- Super Titan 200 x 250-6300
- 120L/s x 95m
- 200kW TECO motor, 415V, 3Ø, 50Hz, 1460rpm
- Fitted with variable speed drives with a range up to 180L/s
- Pump capacity is also limited on the suction size when the Callide Dam water levels are low.
2 Flash Mixer (1 No)
Tank - 29m3, 3.5m deep, 8.29m2 area
3 Sludge Blanket Clarifiers with Tube Settlers (2 No)
Tank - 2/7.5m wide, 7.5m breadth, 56.25m2 area
- Side wall 2.4m, hopper height 2.4m
- 4 hoppers/clarifier
- Upflow rate 3.84m/hr
4 Filters (4No)
Tank - 4/3.6m wide x 3.6m breadth, 12.5m2 area
- 0.9m sand (No.4) depth, 0.25m gravel depth
- Filtration rate 8.64 m/hr
- Backwash rate 54m/hr
- Air scour rate 32m/hr
5 Treated Water Reservoir (1No)
Tank - 2.15ML volume, 24m diameter, 4.80m depth
- 260.0m TWL
6 Backwash Collection Surge Tank (1 No)
Tank - 120m3 volume, 6m diameter
- Straight height 2.5m, straight volume 92m3
- Hopper height 3m, hopper volume 28m3
7 Backwash Pumps (2No)
- Centrifugal back pull-out, Ajax 250 x 200 - 250
- 194.4 L/s x 18m, 268mm impellor (maximum 288mm)
- 45 kW Toshiba motor, 415V, 3Ø, 50Hz, 1465 rpm

�� � � � � �� � �� � � � � ��������� �� �� � � � �� � � � �� �� �� � � �� � �� � � � ��
� �� � � �� �� � �� � � �� � ! � ������
� � �5 0 � 5 � � & $ ��5 � � �� 26 $ � � " � 7 8 �* �:���
8 Superintendent Recycle Pumas (2No)
- Centrifugal back pull-out, Ajax 65 x 40 – 250
- 8.6L/s x 56m, 238mm impeller (maximum 262mm)
- 15kW Toshiba motor, 415V, 3Ø, 50Hz, 2900 rpm
9 Service Water Pumas (2No)
- Centrifugal back pull out, Ajax 80 x 50-200
- 8.5L/s x 48m, 197mm impeller (maximum 208mm)
- 11kW Toshiba motor, 415V, 3Ø, 50Hz, 2900 rpm
10 Filter Air Scour Blower (1No)
- Roots, Powermax – Robusihi
- 318m3/hr, 50kPa delivery
- 7.9kW blower shaft, 3240 rpm
11 Alum Feeder (1 No) Alum/Lime Standby Feeder (1No)
- Volumetric 43.2m3/hr feed rate
- 115L solution tank
- 2.55m3 storage hopper
12 Lime Feeder (1No)
- Volumetric 21.6m3/hr feed rte
- 115L solution tank
- 2.55m3 storage hopper
13 Chlorinators (3No) pre, post, standby
- V notch, 2.2kg/hr feed rate, automatic changeover.
14 Sodium Fluoride Batch Tank (1No)
- 2,300L polyethylene, 1.46m diameter, 1.425m high
- 2.5% sodium fluoride solution.

�� � � � � �� � �� � � � � ��������� �� �� � � � �� � � � �� �� �� � � �� � �� � � � ��
� �� � � �� �� � �� � � �� � ! � ������
� � �5 0 � 5 � � & $ ��5 � � �� 26 $ � � " � 7 8 �8 �:���
Appendix E – Booster Pump Curves Biloela LLZ Pumps Performance Curves

�� � � � � �� � �� � � � � ��������� �� �� � � � �� � � � �� �� �� � � �� � �� � � � ��
� �� � � �� �� � �� � � �� � ! � ������
� � �5 0 � 5 � � & $ ��5 � � �� 26 $ � � " � 7 8 �8 �:���
Thangool Booster Pump Performance Curves (CR16-40U)

�� � � � � �� � �� � � � � ��������� �� �� � � � �� � � � �� �� �� � � �� � �� � � � ��
� �� � � �� �� � �� � � �� � ! � ������
� � �5 0 � 5 � � & $ ��5 � � �� 26 $ � � " � 7 8 ��/ �:���
Appendix F – Existing System Reservoir Results The results of running 3 MDMM (initial water levels at 90%) directly followed by 3MD for each of the storages is included below.
� Figure E.12.1 – WTP Clear Water Storage
� Figure E.12.2 – GL Reservoirs, State Farm Road
WTP Clear Water Storage
70
75
80
85
90
95
100
105
0:00
6:00
12:0
0
18:0
0
0:00
6:00
12:0
0
18:0
0
0:00
6:00
12:0
0
18:0
0
0:00
6:00
12:0
0
18:0
0
0:00
6:00
12:0
0
18:0
0
0:00
6:00
12:0
0
18:0
0
0:00
Time
% F
ull
Ground Level Reservoirs
0
20
40
60
80
100
120
0:00
6:00
12:0
0
18:0
0
0:00
6:00
12:0
0
18:0
0
0:00
6:00
12:0
0
18:0
0
0:00
6:00
12:0
0
18:0
0
0:00
6:00
12:0
0
18:0
0
0:00
6:00
12:0
0
18:0
0
0:00
Time
% F
ull

�� � � � � �� � �� � � � � ��������� �� �� � � � �� � � � �� �� �� � � �� � �� � � � ��
� �� � � �� �� � �� � � �� � ! � ������
� � �5 0 � 5 � � & $ ��5 � � �� 26 $ � � " � 7 8 ��/ �:���
� Figure E.12.3 – State Farm Road Elevated Tank (LLZ)
� Figure E.12.4 – Earlsfield Street Elevated Tank (HLZ)
State Farm Road Elevated Tank
80
85
90
95
100
0:00
6:00
12:0
0
18:0
0
0:00
6:00
12:0
0
18:0
0
0:00
6:00
12:0
0
18:0
0
0:00
6:00
12:0
0
18:0
0
0:00
6:00
12:0
0
18:0
0
0:00
6:00
12:0
0
18:0
0
0:00
Time
% F
ull
Earlsfield Street Elevated Tank
85
90
95
100
105
0:00
6:00
12:0
0
18:0
0
0:00
6:00
12:0
0
18:0
0
0:00
6:00
12:0
0
18:0
0
0:00
6:00
12:0
0
18:0
0
0:00
6:00
12:0
0
18:0
0
0:00
6:00
12:0
0
18:0
0
0:00
Time
% F
ull

�� � � � � �� � �� � � � � ��������� �� �� � � � �� � � � �� �� �� � � �� � �� � � � ��
� �� � � �� �� � �� � � �� � ! � ������
� � �5 0 � 5 � � & $ ��5 � � �� 26 $ � � " � 7 8 ��/ �:���
� Figure E.12.5 – Thangool GL Reservoir
Thangool GLStorage
50
60
70
80
90
100
110
0:00
6:00
12:0
0
18:0
0
0:00
6:00
12:0
0
18:0
0
0:00
6:00
12:0
0
18:0
0
0:00
6:00
12:0
0
18:0
0
0:00
6:00
12:0
0
18:0
0
0:00
6:00
12:0
0
18:0
0
0:00
Time
% F
ull

�� � � � � �� � �� � � � � ��������� �� �� � � � �� � � � �� �� �� � � �� � �� � � � ��
� �� � � �� �� � �� � � �� � ! � ������
� � �5 0 � 5 � � & $ ��5 � � �� 26 $ � � " � 7 8 �7 �:���
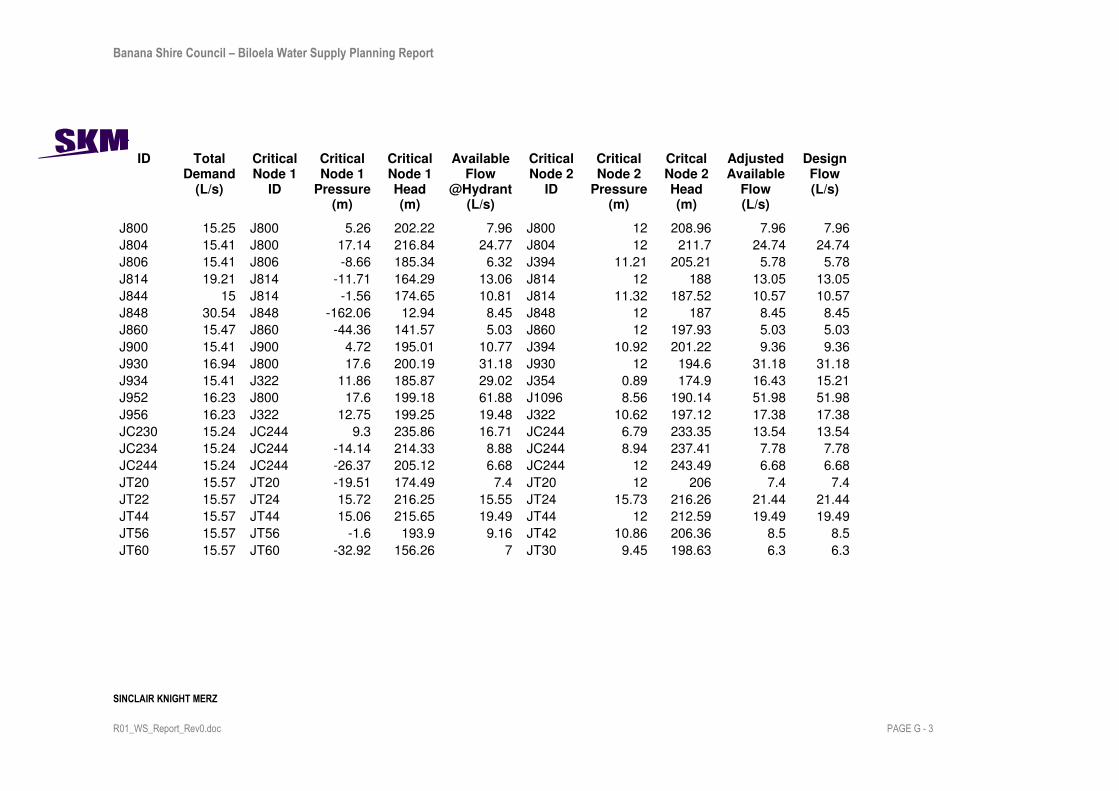
Appendix G – Existing System Fire Fighting Results MH Demands
ID Total Demand
(L/s)
Critical Node 1
ID
Critical Node 1
Pressure (m)
Critical Node 1 Head (m)
Available Flow
@Hydrant (L/s)
Critical Node 2
ID
Critical Node 2
Pressure (m)
Critcal Node 2 Head (m)
Adjusted Available
Flow (L/s)
Design Flow (L/s)
J1094 15 J800 17.6 203.08 36.75 J1094 12 197.49 36.75 36.75 J1096 15 J800 17.6 202.62 38.9 J1096 12 197.03 38.9 38.9 J1098 15 J1098 -2.62 171.59 10.99 J1098 12 186.21 10.99 10.99 J308 16.37 J308 -51.29 119.21 8.57 J308 12 182.5 8.57 8.57 J314 16.23 J314 3.29 170.29 13.95 J314 12 179 13.95 13.95 J322 15.41 J322 11.62 200.62 14.89 J322 12 201 14.89 14.89 J344 15.15 J800 17.6 188.1 28.54 J344 12 182.5 28.54 28.54 J366 15.61 J366 -40.49 140.67 6.36 J860 8.29 189.44 5.34 5.34 J370 15.9 J860 -23.89 155.61 8.21 J860 6.85 186.35 6.53 6.53 J374 16.09 J860 8.33 184.33 21.6 J860 0.15 176.15 13.33 13.33 J376 15.56 J382 9.36 181.36 25.39 J860 -3.67 168.33 13.81 12.6 J378 15.41 J382 8.47 189.15 14.02 J382 9.84 190.53 11.75 11.75 J394 15 J394 -11.12 184.37 4.95 J394 12 207.49 4.95 4.95 J398 15.41 J398 -3.7 190.67 6.82 J394 11.6 205.97 6.49 6.49 J406 15.41 J406 0.82 191.32 9.56 J394 11.86 202.36 9.37 9.37 J416 15.41 J322 13.31 199.31 21.86 J322 9.29 195.29 17.54 17.54 J426 16.63 J322 12.72 198.08 22.38 J322 8.96 194.32 17.76 17.76 J430 30.15 J800 17.6 193.6 50.12 J510 11.05 187.05 47.88 47.88 J434 30.32 J738 13.73 186.73 44.8 J736 7.27 180.27 34.62 34.58 J440 15.65 J800 17.6 192.6 34.76 J440 12 187 34.76 34.76 J452 16.63 J800 17.6 192.6 25.16 J452 12 187 25.16 25.16 J458 30.32 J458 -4.75 168.25 21.23 J458 12 185 21.23 21.23 J466 30.54 J466 -3.71 170.29 21.49 J466 12 186 21.49 21.49

�� � � � � �� � �� � � � � ��������� �� �� � � � �� � � � �� �� �� � � �� � �� � � � ��
� �� � � �� �� � �� � � �� � ! � ������
� � �5 0 � 5 � � & $ ��5 � � �� 26 $ � � " � 7 8 �7 �:���
ID Total Demand
(L/s)
Critical Node 1
ID
Critical Node 1
Pressure (m)
Critical Node 1 Head (m)
Available Flow
@Hydrant (L/s)
Critical Node 2
ID
Critical Node 2
Pressure (m)
Critcal Node 2 Head (m)
Adjusted Available
Flow (L/s)
Design Flow (L/s)
J468 30.49 J468 2.96 176.96 24.2 J468 12 186 24.2 24.2 J476 30.22 J476 -15.56 160.26 17.51 J476 12 187.82 17.51 17.51 J486 30 J486 -56.41 114.59 13.97 J486 12 183 13.97 13.97 J490 15 J800 17.6 193.6 22.59 J490 12 188 22.59 22.59 J518 15.41 J518 4.56 194.51 10.94 J394 10.7 200.65 9.25 9.25 J522 15.41 J522 2.58 199.51 7.32 J522 12 208.93 7.32 7.32 J526 15.82 J526 0.79 194.16 9.75 J526 12 205.37 9.75 9.75 J536 15.41 J800 16.57 217.57 73.16 J800 11.08 212.08 65.11 65.11 J544 15.25 J800 11.42 201.81 19.44 J800 9.43 199.82 13.96 13.96 J592 31.25 J800 17.6 198.1 63.66 J1094 9.53 190.03 55.36 55.36 J606 31.42 J606 6.82 198.66 23.51 J800 11.56 203.4 22.04 22.04 J644 15.82 J800 15.53 193.41 63.9 J918 0.95 178.83 44.41 35.9 J648 16.72 J800 15.53 192.03 24 J814 10.53 187.04 23.01 23.01 J650 15.9 J650 12.17 189.55 15.96 J650 12 189.39 15.96 15.96 J654 16.72 J654 -0.47 175.2 13.12 J654 12 187.66 13.12 13.12 J658 15 J658 -10.42 165.58 9.23 J658 12 188 9.23 9.23 J686 30.44 J930 17.29 194.86 55.06 J930 8.6 186.18 46.21 46.21 J692 15 J394 6.24 199.14 11.6 J394 9.31 202.21 8.32 8.32 J694 15.82 J394 7.09 184.59 25.4 J394 -2.06 175.44 9.74 9.74 J708 15 J708 -4.43 164.57 11.52 J708 12 181 11.52 11.52 J744 16.23 J800 17.6 200.87 27.26 J744 12 195.27 27.26 27.26 J748 17.45 J800 13.68 199.39 29.35 J800 10.22 195.93 23.38 23.38 J766 15.82 J800 13.96 200.71 25.05 J322 8.81 195.57 19.57 19.57 J770 16.23 J800 13.9 202.9 19.93 J770 12 201 19.93 19.93 J788 15.82 J800 14.92 210.64 41.12 J800 8.57 204.29 28.82 28.82 J796 16.63 J800 7.5 199.48 17.28 J800 7.01 198.99 10.41 10.41 J798 18.58 J800 12.52 202.8 27.78 J800 8.86 199.15 19.94 19.94
�� � � � � �� � �� � � � � ��������� �� �� � � � �� � � � �� �� �� � � �� � �� � � � ��
� �� � � �� �� � �� � � �� � ! � ������
� � �5 0 � 5 � � & $ ��5 � � �� 26 $ � � " � 7 8 �7 �:���
ID Total Demand
(L/s)
Critical Node 1
ID
Critical Node 1
Pressure (m)
Critical Node 1 Head (m)
Available Flow
@Hydrant (L/s)
Critical Node 2
ID
Critical Node 2
Pressure (m)
Critcal Node 2 Head (m)
Adjusted Available
Flow (L/s)
Design Flow (L/s)
J800 15.25 J800 5.26 202.22 7.96 J800 12 208.96 7.96 7.96 J804 15.41 J800 17.14 216.84 24.77 J804 12 211.7 24.74 24.74 J806 15.41 J806 -8.66 185.34 6.32 J394 11.21 205.21 5.78 5.78 J814 19.21 J814 -11.71 164.29 13.06 J814 12 188 13.05 13.05 J844 15 J814 -1.56 174.65 10.81 J814 11.32 187.52 10.57 10.57 J848 30.54 J848 -162.06 12.94 8.45 J848 12 187 8.45 8.45 J860 15.47 J860 -44.36 141.57 5.03 J860 12 197.93 5.03 5.03 J900 15.41 J900 4.72 195.01 10.77 J394 10.92 201.22 9.36 9.36 J930 16.94 J800 17.6 200.19 31.18 J930 12 194.6 31.18 31.18 J934 15.41 J322 11.86 185.87 29.02 J354 0.89 174.9 16.43 15.21 J952 16.23 J800 17.6 199.18 61.88 J1096 8.56 190.14 51.98 51.98 J956 16.23 J322 12.75 199.25 19.48 J322 10.62 197.12 17.38 17.38 JC230 15.24 JC244 9.3 235.86 16.71 JC244 6.79 233.35 13.54 13.54 JC234 15.24 JC244 -14.14 214.33 8.88 JC244 8.94 237.41 7.78 7.78 JC244 15.24 JC244 -26.37 205.12 6.68 JC244 12 243.49 6.68 6.68 JT20 15.57 JT20 -19.51 174.49 7.4 JT20 12 206 7.4 7.4 JT22 15.57 JT24 15.72 216.25 15.55 JT24 15.73 216.26 21.44 21.44 JT44 15.57 JT44 15.06 215.65 19.49 JT44 12 212.59 19.49 19.49 JT56 15.57 JT56 -1.6 193.9 9.16 JT42 10.86 206.36 8.5 8.5 JT60 15.57 JT60 -32.92 156.26 7 JT30 9.45 198.63 6.3 6.3

�� � � � � �� � �� � � � � ��������� �� �� � � � �� � � � �� �� �� � � �� � �� � � � ��
� �� � � �� �� � �� � � �� � ! � ������
� � �5 0 � 5 � � & $ ��5 � � �� 26 $ � � " � 7 8 �7 �:���
2/3 MH Demands
ID Total Demand
(L/s)
Critical Node 1
ID
Critical Node 1
Pressure (m)
Critical Node 1 Head (m)
Available Flow
@Hydrant (L/s)
Critical Node 2
ID
Critical Node 2
Pressure (m)
Critcal Node 2 Head (m)
Adjusted Available Flow (L/s)
Design Flow (L/s)
J1094 15 J1094 22.4 207.89 43.71 J1094 12 197.49 43.71 43.71 J1096 15 J1096 22.96 207.99 45.97 J1096 12 197.03 45.97 45.97 J1098 15 J1098 1.67 175.88 12.18 J1098 12 186.21 12.18 12.18 J308 15.91 J308 -37.86 132.64 9.79 J308 12 182.5 9.79 9.79 J314 15.82 J314 8.45 175.45 14.88 J314 12 179 14.88 14.88 J322 15.27 J606 19.24 208.24 26.85 J322 12 201 26.85 26.85 J344 15.1 J744 23.42 193.92 32.28 J344 12 182.5 32.28 32.28 J366 15.41 J366 -25.9 155.26 8.71 J860 9.14 190.3 7.99 7.99 J370 15.6 J860 -10.36 169.14 10.9 J860 8.06 187.56 9.72 9.72 J374 15.72 J800 17.62 193.62 28.05 J860 1.16 177.16 20.93 20.93 J376 15.38 J800 17.76 189.76 32.3 J860 -2.11 169.89 22.31 22.31 J378 15.27 J800 17.51 198.19 18.28 J378 12 192.68 18.28 18.28 J394 15 J394 -2.19 193.3 9.2 J394 12 207.49 9.2 9.2 J398 15.27 J398 5.15 199.52 11.71 J398 12 206.37 11.71 11.71 J406 15.27 J406 9.54 200.04 14.04 J406 12 202.5 14.04 14.04 J416 15.27 J606 19.4 205.4 33.62 J322 11 197 31.98 31.98 J426 16.09 J606 19.32 204.68 33.66 J322 10.32 195.67 31.11 31.11 J430 30.1 J1094 21.51 197.51 59.81 J430 12 188 59.81 59.81 J434 30.21 J744 19.56 192.56 52.58 J744 11.55 184.55 51.44 51.44 J440 15.44 J800 23.61 198.61 38.93 J440 12 187 38.93 38.93 J452 16.09 J744 23.35 198.35 28.5 J452 12 187 28.5 28.5 J458 30.21 J458 1.31 174.31 24.32 J458 12 185 24.32 24.32 J466 30.36 J466 2.33 176.33 24.7 J466 12 186 24.7 24.7

�� � � � � �� � �� � � � � ��������� �� �� � � � �� � � � �� �� �� � � �� � �� � � � ��
� �� � � �� �� � �� � � �� � ! � ������
� � �5 0 � 5 � � & $ ��5 � � �� 26 $ � � " � 7 8 �7 �:���
ID Total Demand
(L/s)
Critical Node 1
ID
Critical Node 1
Pressure (m)
Critical Node 1 Head (m)
Available Flow
@Hydrant (L/s)
Critical Node 2
ID
Critical Node 2
Pressure (m)
Critcal Node 2 Head (m)
Adjusted Available Flow (L/s)
Design Flow (L/s)
J468 30.33 J468 8.81 182.81 28.07 J468 12 186 28.07 28.07 J476 30.15 J476 -9.7 166.12 20.05 J476 12 187.82 20.05 20.05 J486 30 J486 -51.5 119.5 15.16 J486 12 183 15.16 15.16 J490 15 J1094 23.46 199.46 25.7 J490 12 188 25.7 25.7 J518 15.27 J518 13.08 203.03 15.9 J518 12 201.95 15.9 15.9 J522 15.27 J522 10.5 207.43 14.02 J522 12 208.93 14.02 14.02 J526 15.54 J526 8.25 201.63 13.59 J526 12 205.37 13.59 13.59 J536 15.27 J800 22.74 223.74 87.49 J536 12 213 87.49 87.49 J544 15.16 J800 18.25 208.64 25.08 J544 12 202.39 25.08 25.08 J592 30.83 J1094 20.87 201.38 77.29 J1094 9.69 190.19 68.96 68.96 J606 53.45 J606 3.74 195.59 43.14 J606 12 203.84 43.14 43.14 J644 15.54 J800 21.87 199.75 77.29 J814 9.78 187.65 73.99 72.35 J648 16.14 J800 21.87 198.37 30.32 J650 11.09 187.59 29.81 29.81 J650 15.6 J800 21.87 199.26 19.75 J650 12 189.39 19.75 19.75 J654 16.14 J654 13.19 188.85 16.49 J654 12 187.66 16.49 16.49 J658 15 J658 5.98 181.98 13.41 J658 12 188 13.41 13.41 J686 30.29 J1094 21.25 198.82 66.61 J930 9.67 187.24 60.22 60.22 J692 15 J394 14.71 207.61 20.98 J394 9.36 202.26 18.14 18.14 J694 15.54 J394 15.46 192.96 32.72 J406 -0.53 176.97 22.45 19.94 J708 15 J708 3.99 172.99 13.35 J708 12 181 13.35 13.35 J744 15.82 J744 21.97 205.25 33.67 J744 12 195.27 33.67 33.67 J748 16.63 J606 15.99 201.7 27.67 J606 8.35 194.05 22.6 22.6 J766 15.54 J606 19.52 206.28 37.73 J322 9.65 196.4 33.93 33.93 J770 15.82 J606 19.55 208.55 29.86 J770 12 201 29.86 29.86 J788 15.54 J800 21.28 217 53.47 J788 12 207.72 53.47 53.47 J796 16.09 J800 15.29 207.27 27.29 J800 7.02 199 20.85 20.85 J798 17.39 J800 19.42 209.71 34.69 J798 12 202.29 34.69 34.69

�� � � � � �� � �� � � � � ��������� �� �� � � � �� � � � �� �� �� � � �� � �� � � � ��
� �� � � �� �� � �� � � �� � ! � ������
� � �5 0 � 5 � � & $ ��5 � � �� 26 $ � � " � 7 8 �7 �:��
ID Total Demand
(L/s)
Critical Node 1
ID
Critical Node 1
Pressure (m)
Critical Node 1 Head (m)
Available Flow
@Hydrant (L/s)
Critical Node 2
ID
Critical Node 2
Pressure (m)
Critcal Node 2 Head (m)
Adjusted Available Flow (L/s)
Design Flow (L/s)
J800 15.16 J800 13.14 210.09 16.39 J800 12 208.96 16.39 16.39 J804 15.27 J800 23.22 222.92 26.29 J804 12 211.7 26.29 26.29 J806 15.27 J806 0.33 194.33 10.41 J806 12 206 10.4 10.4 J814 17.8 J814 5.59 181.59 16.08 J814 12 188 16.08 16.08 J844 15 J814 14.56 190.77 15.94 J814 11.79 188 15.87 15.87 J848 30.36 J848 -153.75 21.25 9.29 J848 12 187 9.29 9.29 J860 15.31 J860 -29.82 156.12 7.57 J860 12 197.93 7.57 7.57 J900 15.27 J900 13.43 203.73 16.16 J900 12 202.29 16.16 16.16 J930 16.29 J930 23.04 205.64 38.12 J930 12 194.6 38.12 38.12 J934 15.27 J606 19.22 193.23 38.51 J322 3.28 177.29 27.48 27.48 J952 15.82 J1096 23.57 205.15 73.1 J1096 8.56 190.14 62.89 62.89 J956 15.82 J606 18.96 205.46 29.53 J956 12 198.5 29.52 29.52 JC230 15.16 JC244 12.01 238.57 18.17 JC244 6.94 233.49 15.16 15.16 JC234 15.16 JC244 -10.34 218.13 9.78 JC244 8.96 237.43 8.71 8.71 JC244 15.16 JC244 -22.31 209.18 7.44 JC244 12 243.49 7.44 7.44 JT20 15.38 JT20 -11.29 182.71 9.04 JT20 12 206 9.04 9.04 JT22 15.38 JT22 14.81 215.34 18.26 JT22 12 212.53 18.26 18.26 JT44 15.38 JT44 17.82 218.42 24.46 JT44 12 212.59 24.46 24.46 JT56 15.38 JT56 6.29 201.79 12.42 JT56 12 207.5 12.42 12.42 JT60 15.38 JT60 -22.33 166.85 8.5 JT60 12 201.18 8.5 8.5

�� � � � � �� � �� � � � � ��������� �� �� � � � �� � � � �� �� �� � � �� � �� � � � ��
� �� � � �� �� � �� � � �� � ! � ������
� � �5 0 � 5 � � & $ ��5 � � �� 26 $ � � " � 7 8 �' �:���
Appendix H – Full Development Fire Fighting Results MH – Full Development Fire Fighting Results
ID Total Demand
(L/s)
Critical Node 1
ID
Critical Node 1
Pressure (m)
Critical Node 1
Head (m)
Available Flow
@Hydrant (L/s)
Critical Node 2
ID
Critical Node 2
Pressure (m)
Critcal Node 2 Head (m)
Adjusted Available
Flow (L/s)
Design Flow (L/s)
J1094 15 J1200 18.79 204.28 40.33 J1094 12 197.49 40.33 40.33 J1096 15 J1200 18.79 203.82 38.5 J1096 12 197.03 38.5 38.5 J1098 15 J1098 -3.5 170.71 10.68 J1098 12 186.21 10.68 10.68 J1146 16.13 J1200 18.79 189.79 36.32 J1146 12 183 36.32 36.32 J1162 18.4 J1200 18.79 191.51 35.05 J1162 12 184.72 35.05 35.05 J1178 15 J1200 14.92 193.92 65.49 J1200 -4.31 174.69 24.16 24.16 J1200 17.72 J1200 10.33 218.28 15.42 J1200 12 219.95 15.41 15.41 J1202 19.72 J1200 18.46 221.04 359.75 J1200 3.27 205.85 202.45 202.45 J1224 31.05 J1224 13.85 186.85 33.1 J1224 12 185 33.09 33.09 J1242 17.83 J1200 13.94 197.13 58.18 J1200 -5.29 177.9 22.92 22.91 J1264 17.13 J1200 17.58 224.98 35.71 J1264 12 219.4 35.71 35.71 J1276 19.25 J1200 18.7 198.7 27.07 J1276 12 192 27.07 27.07 J308 16.37 J1200 18.79 189.29 27.98 J308 12 182.5 27.98 27.98 J314 16.23 J314 3.28 170.28 13.8 J314 12 179 13.8 13.8 J318 15.19 J318 2.51 169.42 12.74 J318 12 178.91 12.74 12.73 J322 15.41 J1200 18.69 207.69 29.36 J322 12 201 29.36 29.36 J344 15.15 J738 18.11 188.61 28.14 J344 12 182.5 28.14 28.14 J366 15.61 J1200 15.4 196.56 17.53 J366 12 193.15 17.53 17.53 J370 15.9 J1200 15.06 194.56 55.88 J1200 1.57 181.07 26.05 26.05 J374 16.09 J1200 18.4 194.4 438.63 J1200 -9.44 166.56 171.43 171.43 J376 15.56 J1200 18.48 190.48 109.51 J376 12 184 109.51 109.51 J378 15.41 J1200 18.43 199.11 34.8 J378 12 192.68 34.8 34.8 J394 15 J394 17.79 213.28 17.73 J394 12 207.49 17.73 17.73

�� � � � � �� � �� � � � � ��������� �� �� � � � �� � � � �� �� �� � � �� � �� � � � ��
� �� � � �� �� � �� � � �� � ! � ������
� � �5 0 � 5 � � & $ ��5 � � �� 26 $ � � " � 7 8 �' �:���
ID Total Demand
(L/s)
Critical Node 1
ID
Critical Node 1
Pressure (m)
Critical Node 1
Head (m)
Available Flow
@Hydrant (L/s)
Critical Node 2
ID
Critical Node 2
Pressure (m)
Critcal Node 2 Head (m)
Adjusted Available
Flow (L/s)
Design Flow (L/s)
J398 15.41 J1200 18.48 212.85 24.27 J398 12 206.37 24.27 24.27 J406 15.41 J1200 18.52 209.02 24.07 J406 12 202.5 24.07 24.07 J416 15.41 J1200 18.69 204.69 38.29 J322 10.97 196.97 36.57 36.57 J426 16.63 J1200 18.69 204.05 37.62 J322 10.47 195.83 35.27 35.27 J430 30.15 J1128 17.79 193.79 52.69 J510 11.37 187.37 50.89 50.89 J434 30.32 J738 13.31 186.31 44.81 J736 7.26 180.26 33.85 33.79 J440 15.65 J1200 18.79 193.79 34.44 J440 12 187 34.44 34.44 J452 16.63 J736 17.73 192.73 24.65 J452 12 187 24.65 24.65 J458 30.32 J476 14.07 187.07 33.3 J476 11.95 184.95 33.24 33.24 J466 30.98 J466 9.27 183.27 28.42 J466 12 186 28.41 28.41 J468 30.49 J468 13.58 187.58 32.34 J468 12 186 32.34 32.34 J476 30.22 J476 -7.89 167.93 18.91 J476 12 187.82 18.91 18.91 J486 30 J486 15.08 186.08 33.12 J486 12 183 33.12 33.12 J490 15 J1200 18.79 194.79 22.67 J490 12 188 22.67 22.67 J518 15.41 J1200 18.53 208.48 28.35 J518 12 201.95 28.35 28.35 J522 15.41 J1200 18.54 215.47 38.09 J522 12 208.93 38.09 38.09 J526 15.82 J1200 18.59 211.96 21.18 J526 12 205.37 21.18 21.18 J536 15.41 J1200 18.74 219.74 104.18 J536 12 213 104.18 104.18 J544 15.25 J1200 18.63 209.02 38 J544 12 202.39 38 38 J592 31.25 J1200 18.79 199.3 75.55 J1128 10.31 190.81 68.24 68.24 J606 31.42 J1200 18.59 210.44 51.64 J606 12 203.84 51.64 51.64 J644 15.82 J1200 18.71 196.59 111.58 J918 7.47 185.35 93.21 93.21 J648 16.72 J650 12.82 189.32 18.32 J650 11.07 187.57 17.48 17.47 J650 15.9 J650 2.82 180.21 11.37 J650 12 189.39 11.36 11.36 J654 16.72 J654 3.7 179.37 12.9 J654 12 187.66 12.9 12.9 J658 15 J658 6.57 182.57 11.4 J658 12 188 11.4 11.4 J686 30.44 J1128 17.57 195.15 61.61 J1128 10.12 187.7 54.44 54.44

�� � � � � �� � �� � � � � ��������� �� �� � � � �� � � � �� �� �� � � �� � �� � � � ��
� �� � � �� �� � �� � � �� � ! � ������
� � �5 0 � 5 � � & $ ��5 � � �� 26 $ � � " � 7 8 �' �:���
ID Total Demand
(L/s)
Critical Node 1
ID
Critical Node 1
Pressure (m)
Critical Node 1
Head (m)
Available Flow
@Hydrant (L/s)
Critical Node 2
ID
Critical Node 2
Pressure (m)
Critcal Node 2 Head (m)
Adjusted Available
Flow (L/s)
Design Flow (L/s)
J692 15 J1200 18.51 211.41 105.27 J692 12 204.9 105.26 105.26 J694 15.82 J1200 18.52 196.02 76.49 J406 1.68 179.18 63.55 63.55 J708 15 J708 5.7 174.7 13.72 J708 12 181 13.72 13.72 J744 16.23 J744 17.62 200.89 26.32 J744 12 195.27 26.32 26.32 J748 17.45 J1200 18.69 204.4 56.61 J750 11.84 197.55 56.36 56.36 J766 15.82 J1200 18.69 205.45 44.94 J322 9.3 196.05 40.36 40.36 J770 16.23 J1200 18.69 207.69 36.02 J770 12 201 36.02 36.02 J788 15.82 J1200 18.68 214.4 73.31 J788 12 207.72 73.31 73.31 J796 16.63 J1200 18.55 210.53 122.96 J796 12 203.98 122.96 122.96 J798 18.58 J1200 18.65 208.93 55.71 J798 12 202.29 55.71 55.71 J800 15.25 J1200 18.54 215.5 103.04 J1214 9.66 206.62 93.31 93.31 J804 15.41 J1200 18.56 218.26 66.68 J804 12 211.7 66.68 66.68 J806 15.41 J1200 18.48 212.48 19.45 J806 12 206 19.45 19.45 J814 19.21 J1128 13.22 189.22 21.24 J1128 11.68 187.68 20.81 20.81 J844 15 J1128 11.41 187.62 14.93 J1128 11.47 187.68 14.34 14.34 J848 30.54 J848 -161.2 13.8 8.05 J848 12 187 8.04 8.04 J860 15.47 J860 14.29 200.22 16.23 J860 12 197.93 16.23 16.23 J900 15.41 J1200 18.5 208.79 31.01 J900 12 202.29 31 31 J930 16.94 J1200 18.79 201.39 55.11 J930 12 194.6 55.11 55.11 J934 15.41 J1200 18.69 192.7 39.92 J354 2.39 176.4 29.44 29.44 J952 16.23 J1200 18.79 200.38 63.75 J1096 8.56 190.14 52.93 52.93 J956 16.23 J1200 18.69 205.19 33.12 J956 12 198.5 33.12 33.12 JC230 15.24 JC244 7.89 234.45 15.89 JC244 6.79 233.35 12.58 12.58 JC234 15.24 JC244 -15.55 212.92 8.39 JC244 8.94 237.41 7.23 7.23 JC244 15.24 JC244 -27.78 203.71 6.22 JC244 12 243.49 6.22 6.22 JT16 15.74 JT16 -28.27 164.14 7.41 JT16 12 204.42 7.41 7.41 JT20 15.74 JT20 -13.01 180.99 9.1 JT20 12 206 9.1 9.1

�� � � � � �� � �� � � � � ��������� �� �� � � � �� � � � �� �� �� � � �� � �� � � � ��
� �� � � �� �� � �� � � �� � ! � ������
� � �5 0 � 5 � � & $ ��5 � � �� 26 $ � � " � 7 8 �' �:���
ID Total Demand
(L/s)
Critical Node 1
ID
Critical Node 1
Pressure (m)
Critical Node 1
Head (m)
Available Flow
@Hydrant (L/s)
Critical Node 2
ID
Critical Node 2
Pressure (m)
Critcal Node 2 Head (m)
Adjusted Available
Flow (L/s)
Design Flow (L/s)
JT22 15.74 JT22 17.47 218 21.31 JT22 12 212.53 21.31 21.31 JT44 15.74 J1200 18.79 219.38 29.15 JT44 12 212.59 29.13 29.13 JT56 15.62 JT56 5.24 200.74 12.24 JT42 11.62 207.12 12.01 12.01 JT60 30.62 JT60 -156 33.18 7.85 JT30 9.66 198.83 7.2 7.2