Country Study Report on “Banking Sector Analysis of Sri Lanka”
680
1| Page A GLOBAL / COUNTRY STUDY REPORT ON “Banking Sector Analysis of Sri Lanka” Submitted to Gujarat Technological University IN PARTIAL FULFILLMENT OF THE REQUIREMENT OF THE AWARD FOR THE DEGREE OF MASTER OF BUSINESS ADMINISTRATION UNDER THE GUIDANCE OF Project Guide Asst. Prof. Nilesh Ankleshvariya SUBMITED BY Mahipal Zala, Tejas Khakhkher, Chirag Kapadia, Trupti Vansajaliya, Dipika Trivedi (C. C. Gardi Institute of Management) [Batch: 2011-13] MBA SEMESTER III/IV MBA PROGRAMME Affiliated to Gujarat Technological University Ahmadabad
-
Upload
khangminh22 -
Category
Documents
-
view
2 -
download
0
Transcript of Country Study Report on “Banking Sector Analysis of Sri Lanka”
1 | P a g e
A
GLOBAL / COUNTRY STUDY REPORT
ON
“Banking Sector Analysis of Sri Lanka”
Submitted to
Gujarat Technological University
IN PARTIAL FULFILLMENT OF THE REQUIREMENT
OF THE AWARD FOR THE DEGREE OF
MASTER OF BUSINESS ADMINISTRATION
UNDER THE GUIDANCE OF
Project Guide
Asst. Prof. Nilesh Ankleshvariya
SUBMITED BY
Mahipal Zala, Tejas Khakhkher, Chirag Kapadia,
Trupti Vansajaliya, Dipika Trivedi
(C. C. Gardi Institute of Management)
[Batch: 2011-13]
MBA SEMESTER III/IV
MBA PROGRAMME
Affiliated to
Gujarat Technological University
Ahmadabad
2 | P a g e
STUDENT’S DECLARATION
We,MahipalZala(117880592001),ChiragKapadia(117880592002),Trupti Vansajaliya(117880592003),
Dipika Trivedi(117880592004),Tejas Khakher(117880592005) are students of C.C. Gardi Institution
of Management, hereby declare that the report for Global/ Country Study Report entitled
“GLOBAL / COUNTRY STUDY REPORT ON BANKING SECTOR ANALYSIS” in SRI
LANKA is a result of our own work and our indebtedness to other work publications,
references, if any, have been duly acknowledged.
Place: ……..
(Signature)
Date:
(Name of Student) - Mahipal Zala
- Chirag Kapadia
- Trupti Vansajaliya
- Dipika Trivedi
- Tejas Khakher
3 | P a g e
PREFACE
Today we are at the door step of 21st century. The world is widening without having a
New and new developments are coming these days in all fields all over India to make
the people life more comfortable and luxurious. The industries are growing so fast in
India in order to satisfy all the needs of people. Similarly Gov. has supported to these
companies for their development and progress of private companies.
Thus in order to survive in the market one should have theoretical as well as Practical
knowledge about all different fields prevailing in market. For this we have chosen SRI
LANKA country for Global country report.
4 | P a g e
ACKNOWLEDGEMENT
We feel pleasure to submit this report, which includes the practical aspect of study. We
are very happy to express our deepest gratitude to all the persons who spared their
valuable time & helped us in preparation of this Global Country Report.We might like to
thank our project guides Asst. Prof. Pratik Gandhi, Prof. Nilesh Anklesvariya for our
moral support & guidance.
DATE:
PLACE: Rajkot
Signature of Student
5 | P a g e
6 | P a g e
EXECUTIVE SUMMARY
Today in course like MBA, project is very important with the theoretical knowledge. The importance of project work has greater role in business world. Combination of practical knowledge with theoretical knowledge makes student perfect in his work. we have prepared our global country report on “BANKING SECTOR ANALYSIS OF SRI LANKA”.
Sri Lanka is a country of the southern coast of the Indian subcontinent. Known until
1972 as Ceylon, Sri Lanka is an island surrounded by the Indian Ocean, the Gulf of
Mannar and the Palk Strait, and lies in the vicinity of India and the Maldives. It is part of
South Asia.
The Official Name of Sri Lanka Democratic Socialist republic of Sri Lanka and its capital
is Sri Jayewardenapura Kotte. And Colombo, the former capital is the commercial
capital and largest city of Sri Lanka.
Sri Lanka and India trade relations with existing business volume for various products
Lanka. India, Sri Lanka, the nearest neighbor. The relationship between these 2
countries for more than 2,500 years old, and both sides of the intellectual, cultural,
religious and linguistic intercourse is built on a legacy.
India and Sri Lanka Sri Lanka bilateral trade in the last decade and a leading Indian
private sector investment and a rapidly growing number of companies establishing a
presence in the country with a vibrant and growing economic and commercial
partnership, enjoy. Sri Lanka is India's largest trading partner in SAARC. 19.52% and
5.69% respectively in 2012, India's share of global imports and exports in Sri Lanka.
India's exports to Sri Lanka in 2012 largely reduced excise duty on imported vehicles
twice a steep rise in the year 2012 that a serious competitive advantage enjoyed by
Indian auto companies and affected the entire volume of the imposition of imported
vehicles in India in 2012 50-60% declining In India, the largest in the whole of Sri Lanka
(nine months as above) $ 210 million on U.S. emerged as the investor with investments
7 | P a g e
In this global country report, we have include five banks of India as well as Sri Lanka
from that we make comparisons of Interest income, Interest expense, Net interest
income, Net profit, Equity Dividend (%) from profit and loss account and Equity Share
Capital, Reserves, Net worth, Deposits, Borrowings, Total Debt, Balance with RBI/
banks, Investments and Total Assets from balance sheet.
Other than that we have include in Sri Lankan banking sector, licensing policies &
standards, Licensing procedures, exporting and importing policies etc. we also include
rules and regulation of banking sector of both the countries.
In such a way, we completed our Global Country Report. Almost all of our faculties,
colleagues and our friends given us good co-operation and help us to collect various
types of information too.
8 | P a g e
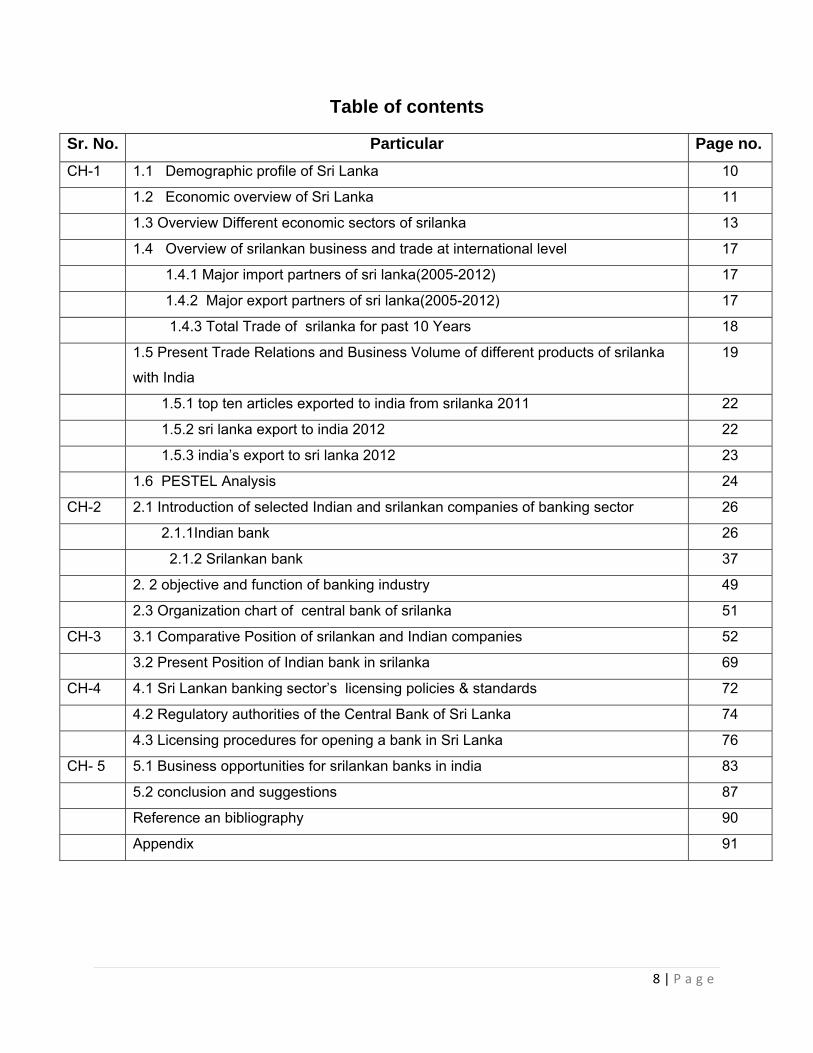
Table of contents
Sr. No. Particular Page no.
CH-1 1.1 Demographic profile of Sri Lanka 10
1.2 Economic overview of Sri Lanka 11
1.3 Overview Different economic sectors of srilanka 13
1.4 Overview of srilankan business and trade at international level 17
1.4.1 Major import partners of sri lanka(2005-2012) 17
1.4.2 Major export partners of sri lanka(2005-2012) 17
1.4.3 Total Trade of srilanka for past 10 Years 18
1.5 Present Trade Relations and Business Volume of different products of srilanka
with India
19
1.5.1 top ten articles exported to india from srilanka 2011 22
1.5.2 sri lanka export to india 2012 22
1.5.3 india’s export to sri lanka 2012 23
1.6 PESTEL Analysis 24
CH-2 2.1 Introduction of selected Indian and srilankan companies of banking sector 26
2.1.1Indian bank 26
2.1.2 Srilankan bank 37
2. 2 objective and function of banking industry 49
2.3 Organization chart of central bank of srilanka 51
CH-3 3.1 Comparative Position of srilankan and Indian companies 52
3.2 Present Position of Indian bank in srilanka 69
CH-4 4.1 Sri Lankan banking sector’s licensing policies & standards 72
4.2 Regulatory authorities of the Central Bank of Sri Lanka 74
4.3 Licensing procedures for opening a bank in Sri Lanka 76
CH- 5 5.1 Business opportunities for srilankan banks in india 83
5.2 conclusion and suggestions 87
Reference an bibliography 90
Appendix 91
9 | P a g e
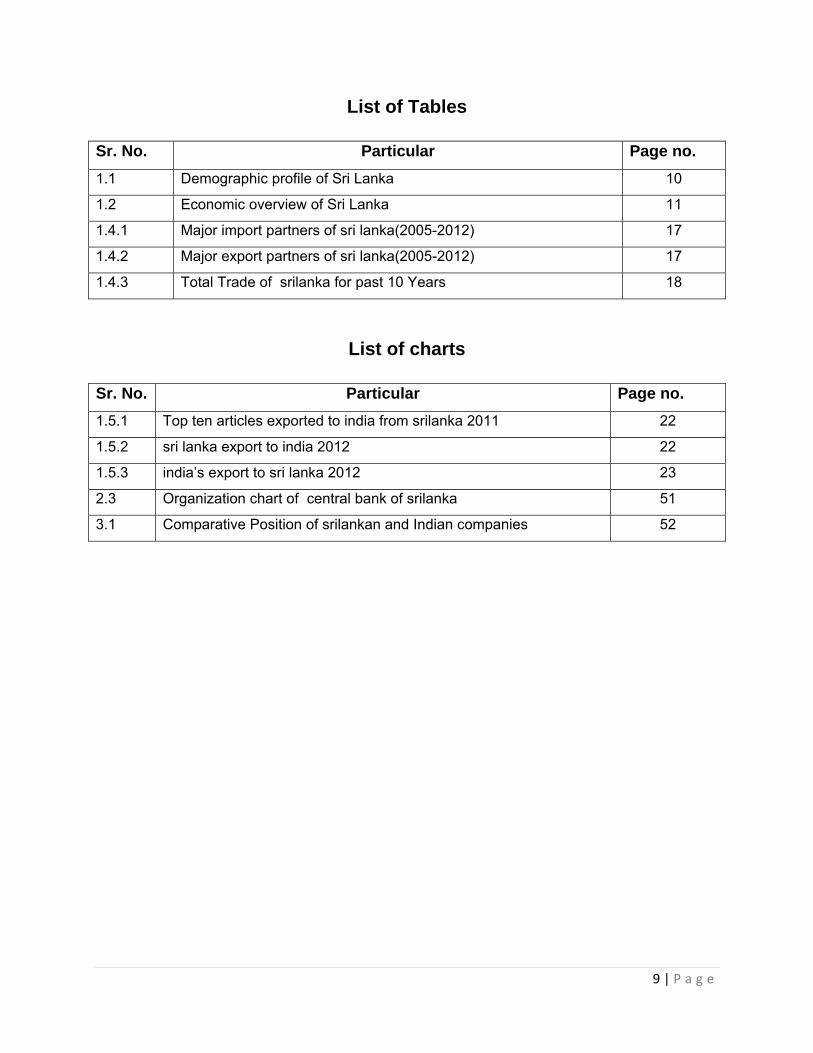
List of Tables
Sr. No. Particular Page no.
1.1 Demographic profile of Sri Lanka 10
1.2 Economic overview of Sri Lanka 11
1.4.1 Major import partners of sri lanka(2005-2012) 17
1.4.2 Major export partners of sri lanka(2005-2012) 17
1.4.3 Total Trade of srilanka for past 10 Years 18
List of charts
Sr. No. Particular Page no.
1.5.1 Top ten articles exported to india from srilanka 2011 22
1.5.2 sri lanka export to india 2012 22
1.5.3 india’s export to sri lanka 2012 23
2.3 Organization chart of central bank of srilanka 51
3.1 Comparative Position of srilankan and Indian companies 52
10 | P a g e
CHAPTER-1
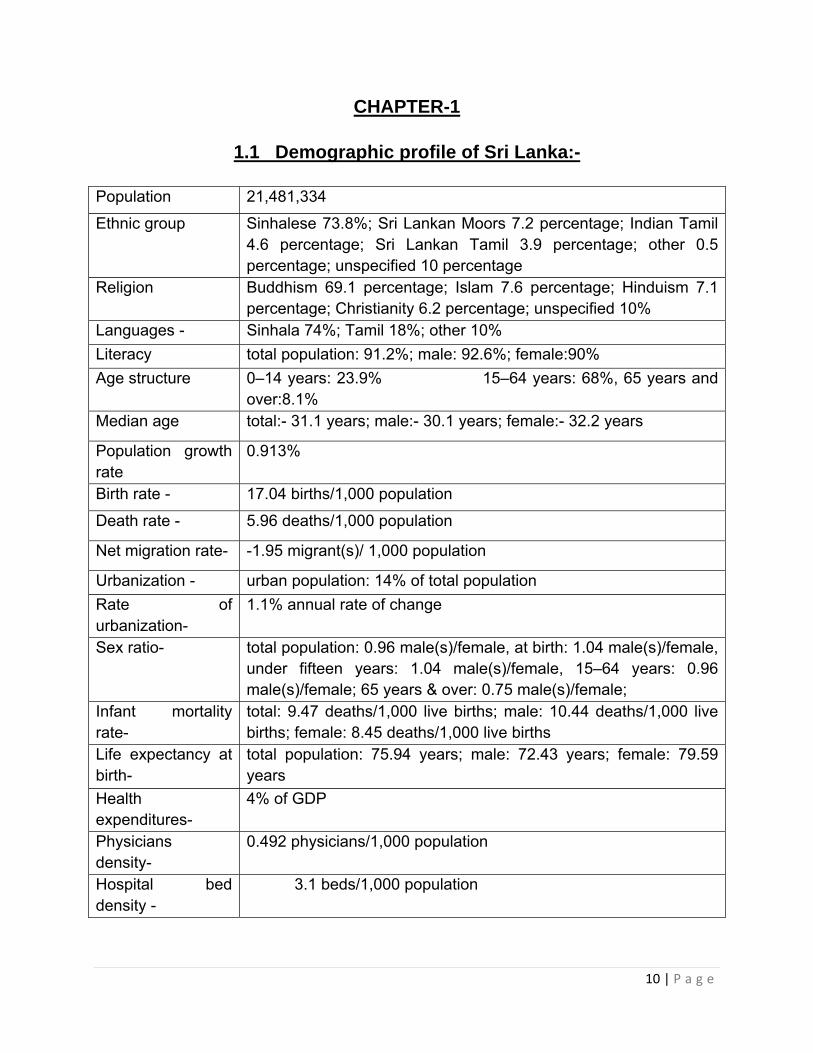
1.1 Demographic profile of Sri Lanka:-
Population 21,481,334
Ethnic group Sinhalese 73.8%; Sri Lankan Moors 7.2 percentage; Indian Tamil 4.6 percentage; Sri Lankan Tamil 3.9 percentage; other 0.5 percentage; unspecified 10 percentage
Religion Buddhism 69.1 percentage; Islam 7.6 percentage; Hinduism 7.1 percentage; Christianity 6.2 percentage; unspecified 10%
Languages - Sinhala 74%; Tamil 18%; other 10%
Literacy total population: 91.2%; male: 92.6%; female:90%
Age structure 0–14 years: 23.9% 15–64 years: 68%, 65 years and over:8.1%
Median age total:- 31.1 years; male:- 30.1 years; female:- 32.2 years
Population growth rate
0.913%
Birth rate - 17.04 births/1,000 population
Death rate - 5.96 deaths/1,000 population
Net migration rate- -1.95 migrant(s)/ 1,000 population
Urbanization - urban population: 14% of total population
Rate of urbanization-
1.1% annual rate of change
Sex ratio- total population: 0.96 male(s)/female, at birth: 1.04 male(s)/female, under fifteen years: 1.04 male(s)/female, 15–64 years: 0.96 male(s)/female; 65 years & over: 0.75 male(s)/female;
Infant mortality rate-
total: 9.47 deaths/1,000 live births; male: 10.44 deaths/1,000 live births; female: 8.45 deaths/1,000 live births
Life expectancy at birth-
total population: 75.94 years; male: 72.43 years; female: 79.59 years
Health expenditures-
4% of GDP
Physicians density-
0.492 physicians/1,000 population
Hospital bed density -
3.1 beds/1,000 population
11 | P a g e
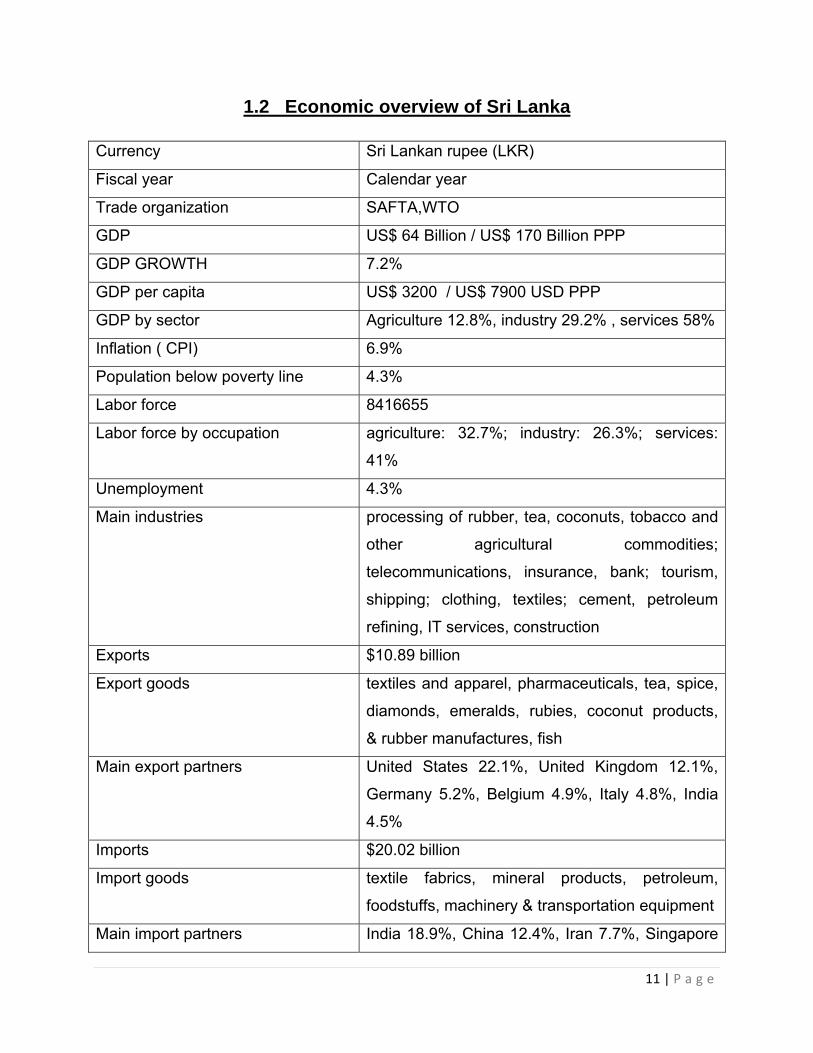
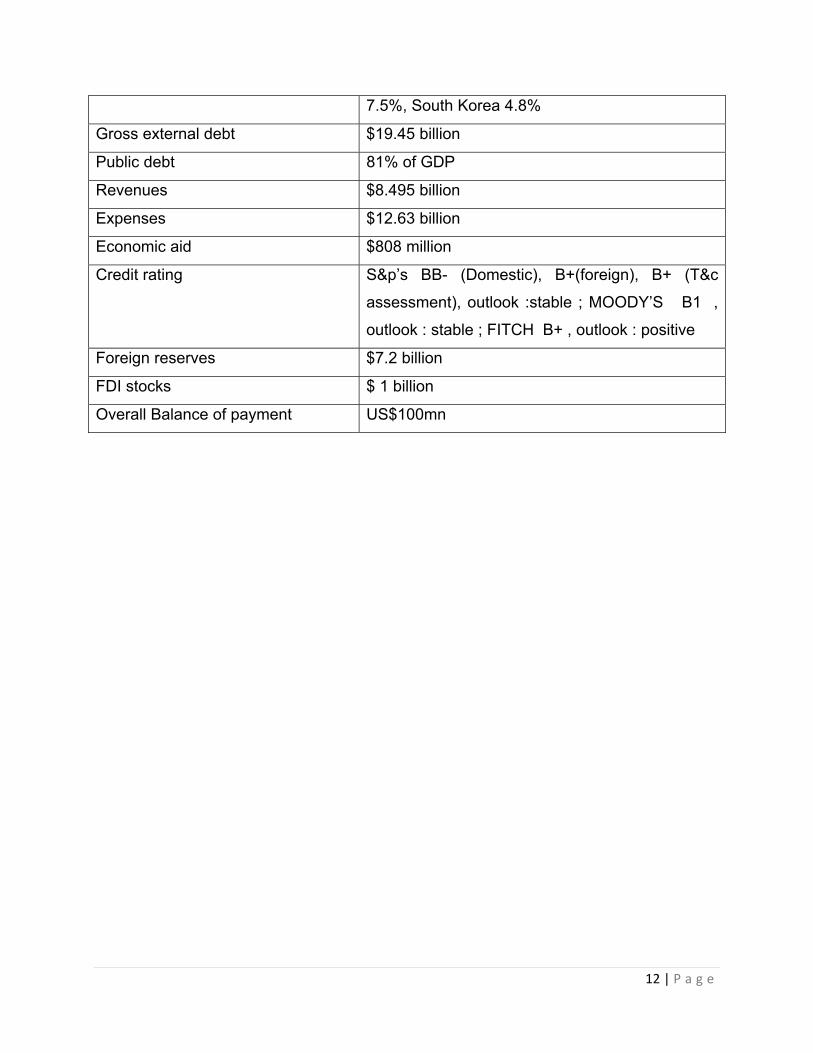
1.2 Economic overview of Sri Lanka
Currency Sri Lankan rupee (LKR)
Fiscal year Calendar year
Trade organization SAFTA,WTO
GDP US$ 64 Billion / US$ 170 Billion PPP
GDP GROWTH 7.2%
GDP per capita US$ 3200 / US$ 7900 USD PPP
GDP by sector Agriculture 12.8%, industry 29.2% , services 58%
Inflation ( CPI) 6.9%
Population below poverty line 4.3%
Labor force 8416655
Labor force by occupation agriculture: 32.7%; industry: 26.3%; services:
41%
Unemployment 4.3%
Main industries processing of rubber, tea, coconuts, tobacco and
other agricultural commodities;
telecommunications, insurance, bank; tourism,
shipping; clothing, textiles; cement, petroleum
refining, IT services, construction
Exports $10.89 billion
Export goods textiles and apparel, pharmaceuticals, tea, spice,
diamonds, emeralds, rubies, coconut products,
& rubber manufactures, fish
Main export partners United States 22.1%, United Kingdom 12.1%,
Germany 5.2%, Belgium 4.9%, Italy 4.8%, India
4.5%
Imports $20.02 billion
Import goods textile fabrics, mineral products, petroleum,
foodstuffs, machinery & transportation equipment
Main import partners India 18.9%, China 12.4%, Iran 7.7%, Singapore
12 | P a g e
7.5%, South Korea 4.8%
Gross external debt $19.45 billion
Public debt 81% of GDP
Revenues $8.495 billion
Expenses $12.63 billion
Economic aid $808 million
Credit rating S&p’s BB- (Domestic), B+(foreign), B+ (T&c
assessment), outlook :stable ; MOODY’S B1 ,
outlook : stable ; FITCH B+ , outlook : positive
Foreign reserves $7.2 billion
FDI stocks $ 1 billion
Overall Balance of payment US$100mn
13 | P a g e
1.3 Overview Different economic sectors of Sri-lanka
• Tourism:-
Tourism is a major industry in Sri Lanka. The main tourist attraction is the famous
southern islands and mountainous regions of the country and the ancient heritage of the
country and country resort is located in the eastern parts of the interior is sites is located
about warning the coast. Rubies and sapphires were also frequently found in the
Ratnapura and its nearby areas, such as mined precious stones, they are a major
tourist attraction.
2004 Indian Ocean tsunami and the advent of tourism has declined in the past civil war,
however, the number of tourists visiting the new increase, starting in early 2008. 8.6%
by March 2008 and Sri Lanka in 2012, 1,003,000 tourists, according to the Central Bank
of Sri Lanka 2013 roadmap. 2012 one billion ($ U.S.) and 16% increase in earnings for
2011 compare to year. The Sri Lankan government is key to growth is to attract guests
to 2.5 million by 2016, with an ambitious target for the development of post-conflict area
known as the tourism sector.
Significant growth in this industry, the most important travel magazines around the
world, and the world leading travel guide "Lonely Planet" book, a digital media publisher
in mind, Sri Lanka is ranked as the best country to visit in 2013. The main advantage of
Sri Lanka as a tourist destination and is currently engaged in a variety of accessible
infrastructure development under the government's accessible attraction.
14 | P a g e
• Tea industry:-
Tea industry, operating under the Ministry of Public Estate Management and
Development, one of the main industries in Sri Lanka. A 23% share of the global tea
exports, which Kenya with more than 22% share of the world's leading exporter in 1995
to become. The country's central highlands of the year and the annual rainfall and
moisture levels are suitable for growing tea in the low-temperature climate. The industry
in 1867, James Taylor, the British planter who entered the country in 1852 was by
inwards.
Recently, Sri Lanka is a fair trade tea in the UK, and additional countries in exporting
countries. It is believed that such a project can reduce rural poverty.
• Apparel and textile industry:-
The Sri Lanka apparel industry primarily in the United States and Europe of exports. Sri
Europe due to the high cost of labor in Europe ever more dependent on textiles. There
are countries, such as Pierre Cardin Liz Claiborne, Nike, Gap and Tommy Hilfiger
serving around 900 factories of the company.
The apparel sector is the most industrial employment generator and the largest foreign
swap film. The field for the year 2011 the amount of 39.6% of the export revenue was
USD 4.2Bn $.24% year on year growth of exports in 2011. These allows the output
exporters of apparels locally to dispose of 40% of all comprehensive tax payment Sri
Lankan rupees (Rs) 25 and are restricted for sale to the general corporate income tax of
12% per Piece tax is subject to 28%.
Find employment increased by 283,000 in 2011. Originally, the industry savanna
(contract manufacturer) offered by the operator and textile USA and the EU as a quota
based on the start and now it is converted into a full apparel solution provider.
15 | P a g e
• Agriculture:-
The country's agricultural sector is mostly mostly for local consumption and export to
rare coconut rice, and grain products. Agriculture sector contributes 11% of the
country's GDP, total export earnings 23.9% and 32.9% in 2011 year national
employment.
The three main traditional export crops of tea from Sri Lanka in the Rubber and
Coconut. Because these industries are already well established, BOI's central focal
point increase local value addition to agricultural crops has increased, especially in
terms of another. Particular type of technology to advance the efficiency levels of
government, to improve access to global markets for investment looks, quality seeds
and planting material use and overall value adding recover. Some of the opportunities
include:
Horticulture
Fisheries
livestock
• Knowledge Services:-
The knowledge of the services sector in the IT software development, knowledge
process processing / outsourcing business include the outsourcing industry, and it
enabled services and information technology training center, it is possible to hold a key
growth area appears as Sri Lanka. Students, English and literacy height, and looking at
the quality of its proximity to India, Sri Lanka is ideal for high value added IT / KPO
services, supplier development mode.
ITEs and software development:-
There are 100 on the software development work in Sri Lanka which provides both
independent and captive markets. Sri Lankan companies are internationally recognized
in their own software products that they have been able to build.
16 | P a g e
B / KPO BPO industry:-
The industry / KPO BPO is an emerging area of Sri Lanka. Still a nascent industry, its
small history since 2000 within / KPO BPO sector is a significant difference in the world
/ BPO KPO to attract some of the giants. Sri Lanka state financial and other
professional services, transaction processing and document management specialist
areas is increasing, and high literacy rate (about 92%) rate and a growing pool of
accounting graduates, call center services for credit.
IT Training Center:-
The education industry is a knowledge services in key areas have been identified as
one of the Sri Lanka government is trying to develop the Sri Lanka. Continuing the work
force flow in order to ensure that the needs of the growing knowledge of the service
industry personnel, information technology and training have been individually identified
and given priority. There are about 20 IT training center under the BOI.
• Infrastructure:-
Progress in infrastructure development in the medium and long term to support the
country's drive to a higher and sustainable growth is expected to maintain. To help
improve economic efficiency for the timely development of the economic structure of the
economy will expand production capacity, increase efficiency and reduce the regional
differences
Construction cost by 14.2% compared to 9.3% in 2010, significantly expanding field
conditions added in 2011. Construction activity increased 8.6% during the year by the
goods to domestic production growth. Cement availability of 21.5 per cent in 2011 to
18.9% in 2010, compared with a contraction. Construction in the private sector
increased by 15.8% during the year for the purpose of private sector credit growth was
reflected by.
17 | P a g e
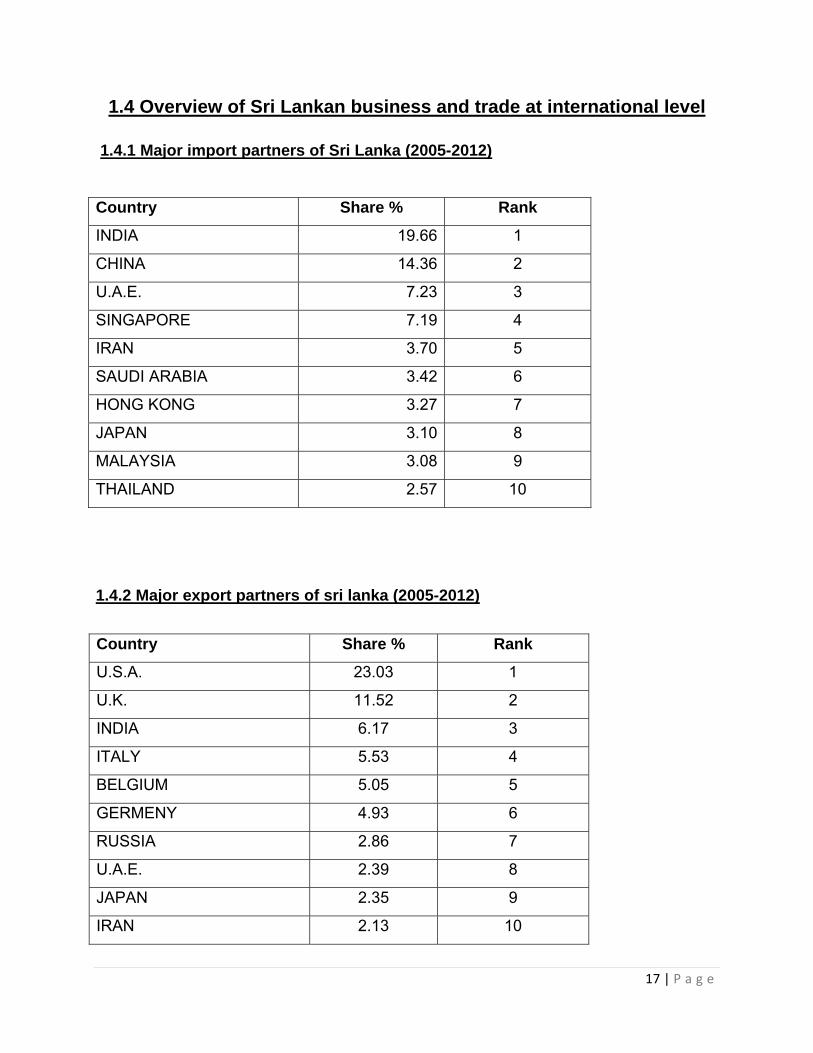
1.4 Overview of Sri Lankan business and trade at international level
1.4.1 Major import partners of Sri Lanka (2005-2012)
1.4.2 Major export partners of sri lanka (2005-2012)
Country Share % Rank
INDIA 19.66 1
CHINA 14.36 2
U.A.E. 7.23 3
SINGAPORE 7.19 4
IRAN 3.70 5
SAUDI ARABIA 3.42 6
HONG KONG 3.27 7
JAPAN 3.10 8
MALAYSIA 3.08 9
THAILAND 2.57 10
Country Share % Rank
U.S.A. 23.03 1
U.K. 11.52 2
INDIA 6.17 3
ITALY 5.53 4
BELGIUM 5.05 5
GERMENY 4.93 6
RUSSIA 2.86 7
U.A.E. 2.39 8
JAPAN 2.35 9
IRAN 2.13 10
18 | P a g e
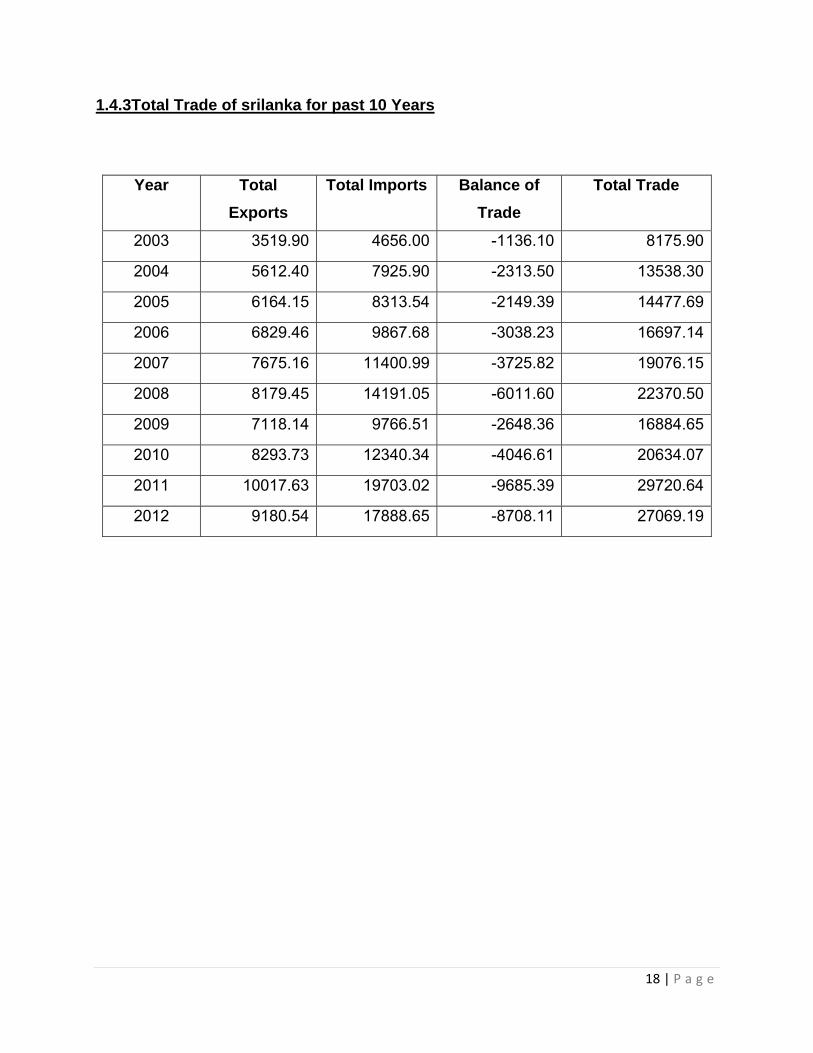
1.4.3Total Trade of srilanka for past 10 Years
Year Total
Exports
Total Imports Balance of
Trade
Total Trade
2003 3519.90 4656.00 -1136.10 8175.90
2004 5612.40 7925.90 -2313.50 13538.30
2005 6164.15 8313.54 -2149.39 14477.69
2006 6829.46 9867.68 -3038.23 16697.14
2007 7675.16 11400.99 -3725.82 19076.15
2008 8179.45 14191.05 -6011.60 22370.50
2009 7118.14 9766.51 -2648.36 16884.65
2010 8293.73 12340.34 -4046.61 20634.07
2011 10017.63 19703.02 -9685.39 29720.64
2012 9180.54 17888.65 -8708.11 27069.19
19 | P a g e
1.5 Present Trade Relations and Business Volume of different products of srilanka with India.
India, Sri Lanka, the nearest neighbor. The relationship between these 2 countries for
more than 2,500 years old, and both sides of the intellectual, cultural, religious and
linguistic intercourse is built on a legacy. But relations between the 2 countries and
spend time with mature and diversified, including all areas of current importance.
Cultural and cultural heritage shared by the two countries and their citizens and build
the foundation for people to interact Multilateral Partnership provides a wide range of
people.
India and Sri Lanka Sri Lanka bilateral trade in the last decade and a leading Indian
private sector investment and a rapidly growing number of companies establishing a
presence in the country with a vibrant and growing economic and commercial
partnership, enjoy. Sri Lanka is India's largest trading partner in SAARC. 19.52% and
5.69% respectively in 2012, India's share of global imports and exports in Sri Lanka.
India's exports to Sri Lanka in 2012 largely reduced excise duty on imported vehicles
twice a steep rise in the year 2012 that a serious competitive advantage enjoyed by
Indian auto companies and affected the entire volume of the imposition of imported
vehicles in India in 2012 50-60% declining In India, the largest in the whole of Sri Lanka
(nine months as above) $ 210 million on U.S. emerged as the investor with investments
. Compiled by the Sri Lankan Board of Investment as a share basis, Sri Lanka, India is
the second largest foreign direct investor in 2011 to $ U.S. 147 million (out of the total
inbound FDI in 1057 million U.S. dollars) of investment in between.
Bilateral agreements: -
Relation to the legal framework Free Trade Agreement, removing the Double Taxation
Agreement, a bilateral investment protection and promotion agreement are provided.
Bilateral Air Services, Small Development Projects, Small Scale Industries and Tourism
in cooperation and in cooperation in science and technology cooperation agreements /
contracts memorandum of understanding also exist. A Comprehensive Economic
Partnership Agreement (CEPA) is under negotiation.
20 | P a g e
India Sri Lanka Free Trade (ISFTA) contract: -
The main framework for bilateral trade in India, Sri Lanka Free Trade (ISFTA) contract
that was in 1998 and entered into force in March 2000 has been through. ISFTA As a
result, 4150 is currently the Indian tariff lines of Sri Lanka's exports to India has been a
zero duty. Similarly, the 3932 tariff lines, Indian exports to Sri Lanka has been to provide
a zero duty.
South Asian Free Trade (SAFTA) Area: -
South Asian Free Trade Area (SAFTA) Agreement on 1 January, has been operational
since 2006. India, Pakistan and Sri Lanka non-least developed contracting (NLDCS
States) and Bangladesh, Bhutan, the Maldives are classified as, Afghanistan and Nepal
as the least agreement States (eladisio) are classified as Developed. Article 7 of the
SAFTA agreement phased tariff liberalization (TLP) in which a programmer, 2 years,
NLDC recession brought a 20% tariff, while eladisio will bring them down to 30%
provides. After 5 years, 20% are from non eladisio 0-5% tariff (Sri Lanka 6 years) will,
when will eladisio so 8 years.
Comprehensive Economic Partnership (CEPA) Agreement:-
Following the positive results of the FTA and FTA of success emboldened by
governments, felt that more action was needed to loose our bilateral economic
relationship, full of potential. CEPA to build on the momentum generated by the FTA
and further integration of the two economies in the direction of trade in goods and fresh
impetus to bilateral economic interaction and wanted to give Synergy. Discussion on
CEPA began in December 2010.
21 | P a g e
Major Indian Investments in:-
1) Lanka IOC PLC
2) Bharti Airtel Lanka
3) Piramal Glass Ceylon
4) Taj Hotels
5) UltraTech Cement
6) JVGokal Ceylon Pvt Ltd.
7) Tata Communications Ltd. Lanka
8) From India Banks
9) Asian Paints Ltd. (Lanka)
10) Ceat - Kelani Associated Holdings Ltd. (Pvt)
Other economic functions:-
1) Civil Aviation Agreement
2) S & T cooperation
3) On the ferry service contract
4) Agriculture Agreement
5) agreements on telecommunication...
22 | P a g e
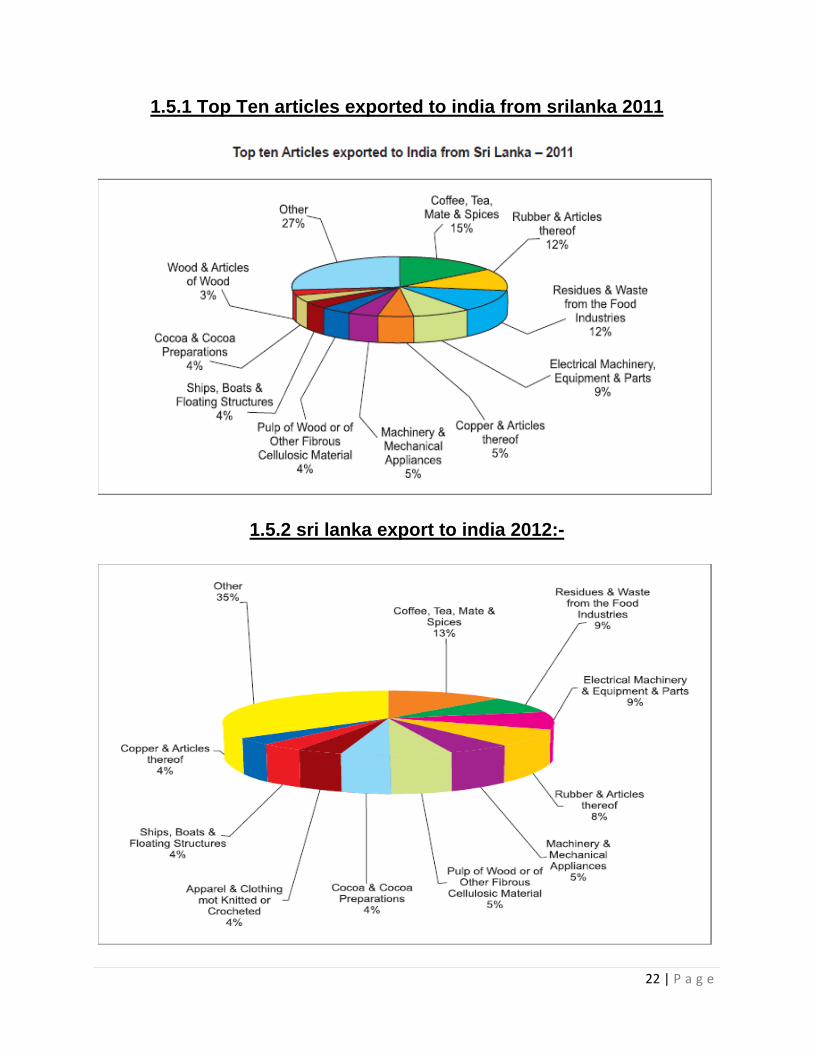
1.5.1 Top Ten articles exported to india from srilanka 2011
1.5.2 sri lanka export to india 2012:-
23 | P a g e
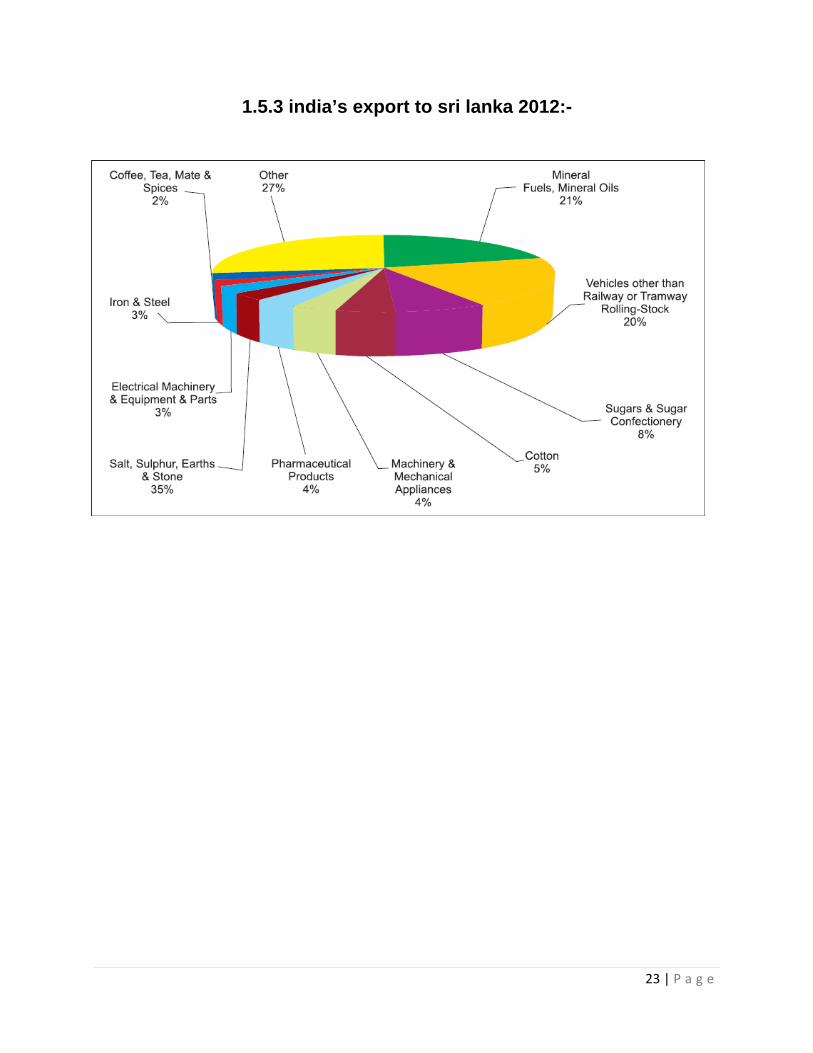
1.5.3 india’s export to sri lanka 2012:-
24 | P a g e
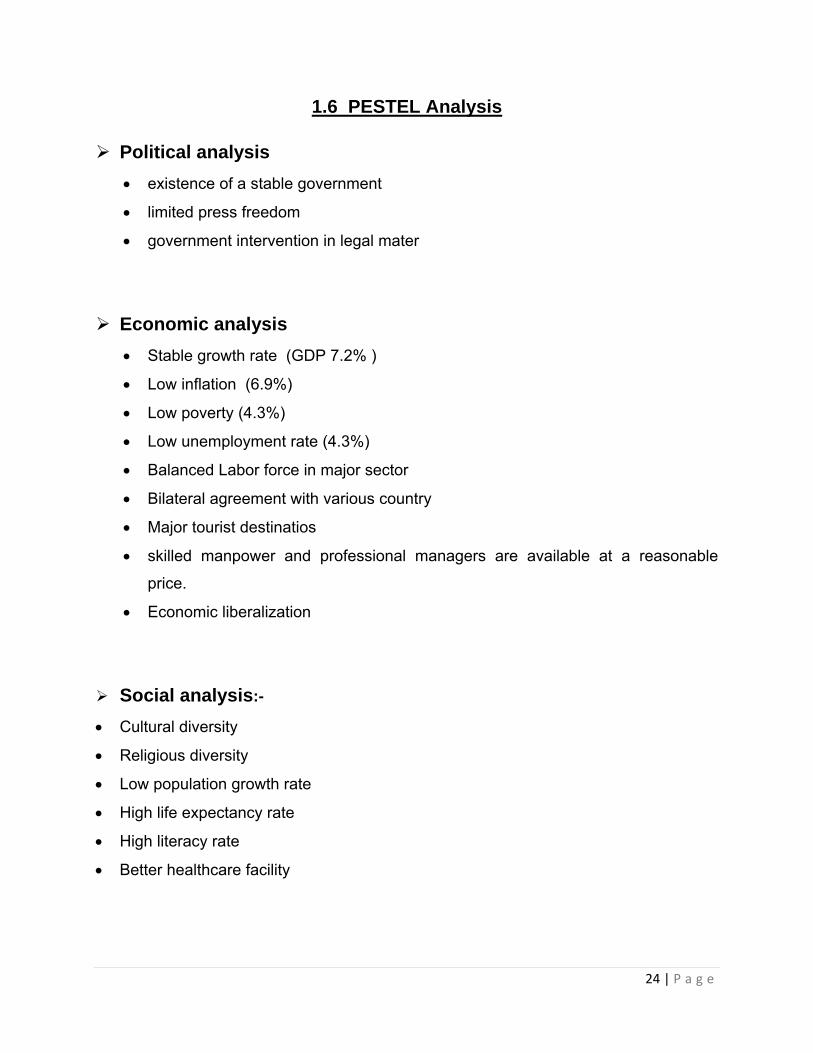
1.6 PESTEL Analysis
Political analysis
existence of a stable government
limited press freedom
government intervention in legal mater
Economic analysis
Stable growth rate (GDP 7.2% )
Low inflation (6.9%)
Low poverty (4.3%)
Low unemployment rate (4.3%)
Balanced Labor force in major sector
Bilateral agreement with various country
Major tourist destinatios
skilled manpower and professional managers are available at a reasonable
price.
Economic liberalization
Social analysis:-
Cultural diversity
Religious diversity
Low population growth rate
High life expectancy rate
High literacy rate
Better healthcare facility
25 | P a g e
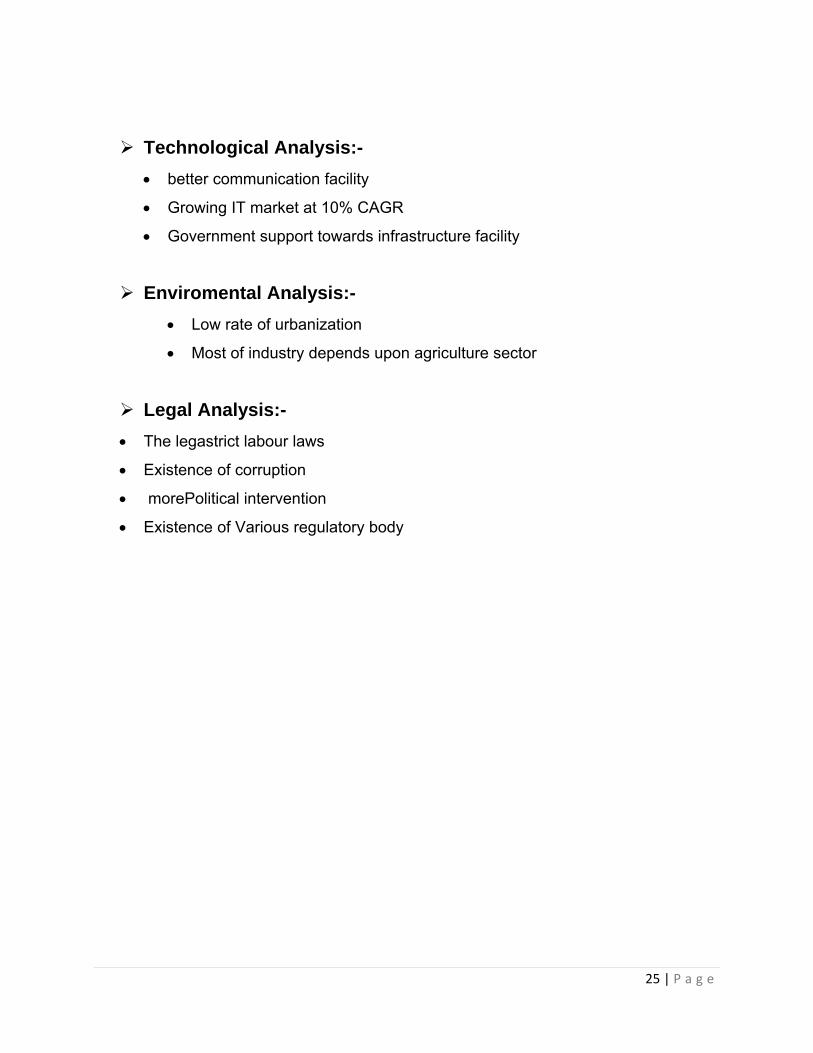
Technological Analysis:-
better communication facility
Growing IT market at 10% CAGR
Government support towards infrastructure facility
Enviromental Analysis:-
Low rate of urbanization
Most of industry depends upon agriculture sector
Legal Analysis:-
The legastrict labour laws
Existence of corruption
morePolitical intervention
Existence of Various regulatory body
26 | P a g e
CHAPTER -2
2.1 Introduction of selected Indian and srilankan companies of
banking sector
2.1.1Indian bank
Bank of Baroda
History:-
Vision and enterprise.It a saga in 25 countries throughout nearly a century has been a
long and eventful journey. Baroda small increase in the HI-high-tech Baroda Corporate
Centre in Mumbai building new and starting in 1908, a veteran of vision, enterprise,
financial prudence and corporate governance.
It is a story scripted in corporate wisdom and social pride. It is a private capital, princely
patronage and state ownership crafted story. It is common for bankers and their
corporate spectacle of Bank of Baroda's extraordinary contribution in the ascent on the
towering height of a story. Customers, stakeholders, employees and the public at large -
who in ample measure, have contributed to building an organization that is a story that
needs to be shared with all the people in the millions.
532134 Maharaja Sayajirao Gaekwad and at its headquarters in Vadodara, India,
established in1908 by: Bob Banking Financial Services in BSE traded as a public
company. The area served Worldwide. Who is the chairman and managing director SS
Mundra their key people. Its products, credit cards, consumer banking, corporate
banking, finance and insurance, investment banking, mortgage loans, private banking,
private equity, wealth management. Bob revenue 345.88 billion ($ 6.3 U.S.) (2012), and
its net income 52.48 billion (U.S. $ 955.14 million) (2012). Total assets 4.574 trillion
(U.S. $ 83.25 billion) (2012), the
27 | P a g e
Our Mission Statement:-
Care is a top international concern, and through the ability of 'holding value of
augmenting ranking National Bank is committed to standards.
Our logo:-
Our new logo is a unique representation of a universal symbol. It has dual 'B' letterforms
that the rays of the rising sun. We call this the Baroda Sun.
Achievement:-
Bank of Baroda Bank award for best PSU
Award for Excellence in Financial Reporting.
Bank of Baroda Bank award for the best public sector.
bag Baroda Bank of The Sunday Standard FINWIZ 2012 Awards.
Baroda for the prestigious Indira Gandhi Rajbhasha Shield Bag of Bank.
HDFC Bank
Background:-
Housing Development Finance Corporation Limited (HDFC) was in 1977 and in 1981
introduced its first retail deposit product. In 1996, HDFC its first international office
opened in Dubai. HDFC mainly associated with housing loans.
Profile:-
HDFC Bank was announced in August 1994 and is currently a nationwide network of
branches and ATMs of Indian towns and cities.
28 | P a g e
HDFC's product range of home loans, home improvement loans, home extension loans
short-term bridge loans, home equity loans and land purchase loans among others are
included. HDFC distribution network of 250 outlets across the country in 2400 on
chavayelo and provides customer locations. It also project management services,
investment consultancy and property related services are provided. During FY08, the
company worth Rs 425.200 MN loans approved, representing a 28% increase yoy.
During FY08, HDFC 16 lowincome and community micro-finance for the EWS housing
schemes approved for a new loan. 31 2008 Mar on, the company said CAR 16.8% and
gross NPAs at 0.77% as against 0.68% in the previous year. During FY08, HDFC
HDFC Chubb General Insurance Ltd and 100% of the 26% stake in the company and
also International AG, Germany, with the joint venture was entered in the insurance
business.
HDFC Bank traded as a public type and BSE: 500180, NSE: HDFCBANK, NYSE: HDB,
BSE Sensex included. And their Industries Banking, Financial 1994And in Mumbai,
Maharashtra, India is headquartered established services in August. Worldwide service
and their key people in the area, Mr Aditya Puri (MD) of the products, credit cards,
consumer banking, corporate banking, finance and insurance, investment banking,
mortgage loans, private banking, private equity, wealth management .. The RevenueUS
6,487 billion (2012), operating income of 1.451 billion USD (2012), Profit 978.3 million
dollars U.S. (2012), the total of $ 70.17 billion assetsUS (2012), and his total of $ 7.793
billion equityUS (2012). They are up employment 66,76 (2012) is.
Business focus:-
HDFC Bank deals with three major business segments. - Wholesale banking services,
retail banking services, treasury. The working capital finance, trade services, corporate
finance, and merchant banking to provide 50 top companies of the banking consortia
entered. It also foreign exchange and derivatives, money markets and debt trading and
equity research in the field of providing sophisticated product structures.
29 | P a g e
Award:-
Euromoney Poll India 2012 - Best Super Affluent Private Bank.
Best Performing Bank - UTI MF and CNBC TV18 Financial Advisor Awards 2011
by private.
best year for the 2011 Asian Banker Excellence in Retail Financial Services
Awards 2012 by the International Bancassurance provider.
Euromoney Poll India 2011 - Best Super Affluent Private Bank.
The Banker and Professional Wealth Management (PWM), the Financial Times
Publications, Global Private Banking Awards 2010 - Best Private Bank in 2010.
Property Forum Advisor Awards 2010
• Highest Net Sales - Income Statement
• AUM highest increase (non-hybrid +)
• Highest Live cusakio
• Highest Live Investor Folios
• Highest AUM (Non Hybrid +)
Career and Corporate Governance:-
India's leading private sector bank that won accolades from top national and
international magazines, join the workforce, opportunities and explore the world. HDFC
Bank's corporate governance policy is to consider suitability for all participants, as well
as the importance of maintaining organizational efficiency has been achieved.
30 | P a g e
Shareholding in Bank:-
Our well as browse through the entire previous allotment of shares detailed records.
ICICI Bank
Background
Profile:-
ICICI Bank, the retail banking, corporate banking, international banking, project finance
SME financing, rural and ICICI Bank Limited (ICICI Bank) in 1994 and was promoted in
2001 by ICICI Limited, the business acquired Bank of Madura and ICICI Ltd. in 2002
and its subsidiaries engaged in retail lending, has been merged with the Bank. In 2007,
ICICI Bank, The Sangli Bank Ltd. The business acquired
Agricultural banking business and treasury operations. Under the deposit and loan
accounts in the retail banking and wealth management services are provided. Corporate
banking, cash management and structured finance, including such services. ICICI Bank
also mutual such products, life insurance and general insurance distribution of. In
addition, the bank money transfer, loans under the NRI segment, international banking
and property solutions for clients such as providing banking services. 31 2008 Mar on,
the bank had a total business of Rs. 4,700.5 billion and 10% yoy growth. For FY08, the
priority sector advances for RNBC at 50.3%, while 17% were RNBC for agricultural
lending. 31, 2008 1,249 3,881 bank branches and ATMs in a network.
ICICI Bank is the bank of a public nature and traded as BSE: 532174, NSE: ICICIBANK,
NYSE: IBN, BSE Sensex included. The Corporate Banking, Financial Services that is
established in1954 and its Mumbai, Maharashtra, India, the headquarters is located.
Area served Worldwide Key people and Chanda Kochhar (MD & CEO) is. Their
products, credit cards, consumer banking, corporate banking, finance and insurance,
investment banking, mortgage loans, private banking, wealth management.their $ 13.52
billion in revenue U. (2012), operating income of 2.117 billion USD (2012), Yu profit of
1.597 billion (2012), $ U.S. 98.99 billion (2012) announced their total equity billion USD
12.62 (2012) total assets. His 81,254 Employment (2012).
31 | P a g e
Objective:-
ICICI Bank's Green initiatives in the organization of a healthy environment;
interpersonal skills to build and customer understanding between an organization's
employees amongs.
The ICICI broad goals:
(A) the creation, expansion and modernization of private affairs to help;
(B) internal and external capital took part in the promotion of private matters;
(C) to promote industrial investment in private ownership
Awards and achievements:-
For the third consecutive year
ICICI Bank by Businessworld BW Quote 500 in "India's 50 Biggest Financial
Companies" in figured.
ICICI Prudential Insurance Domain Series, All India (AIMA) Management and
Delhi Management Association (DMA) 2012 by 2 G. Shared Services
Excellence Awards, and won the recognition.
ICICI Bank tops the list of most fans and global social media study conducted
by Ketchum Sampark in connection to Facebook ranks fifth among financial
institutions.
Airtel, the top 100 global brands, ICICI between.
Polaris Financial Technology Banking Awards –
ICICI Bank Best Global Business Development, Rural Reach Dun & Bradstreet
and SME lending by banks to the private sector categories.
ICICI Lombard series 'Creating Shared Value', the famous 'Porter Prize' was
awarded. Porter Prize, the most prestigious award in the field of strategy and
competitiveness. Competitiveness of the Indian Institute Professor Michael E.
32 | P a g e
Porter, named for the award by the gift and economically weaker sections of
society are responsible for mass and micro-insurance sector in achieving
economic success of ICICI Lombard recognizes the efforts.
Punjab National Bank
Background:-
Punjab National Bank (PNB) 1895 was established in 1969, and was subsequently
nationalized bank. The bank primarily operates in the banking and corporate, retail and
treasury space.
Business Profile:-
PNB individual, corporate, social, international and business banking services are
provided. Its personal banking services, savings accounts, and credit schemes among
others include fixed deposit schemes. PNB corporate banking services provided by the
EXIM finance, cash management services, etc., and the business sector, including
services, including trade and finance to SSIs. Provide for its social banking services to
farmers and women. On 31 Mar, 2008 the bank had a total business of Rs. 2859.6
billion, registering a growth of 20% yoy. For FY08, priority sector advances bank ANBC,
where as only 18% of agricultural credit constituted of 44% above formed. During FY08,
PNB 150 322 31 new branches opened in the 2008, including extension counters, 4,589
offices, taking its total branch network. The bank also has three foreign branches.
Fired by the spirit of nationalism and founded on the idea that Indians should own a
National Bank, Punjab National Bank Ltd. far-sighted visionaries and patriotic, between
the efforts of those were the result of individuals like Lala Lajpat Rai, Mr. EC Jessawala,
Babu 1882 Article VI of the Act Prasono under Roy, Lala Harkishan Lal and Sardar Dyal
Singh Majithia.Incorporated Kali, the Indian Act companies, 2 r, with an authorized total
capital on April 12, 1895 in Lahore, on the bank commencedoperations, million and
20,000 r of workingcapital. Prophetically, bank telegraphic address as its "stability"
select, as proved in the course of events in the future - in the form of Bank of India
33 | P a g e
Partition trauma when the bank was closed 92 offices (33% of the financial crisis,
including withstood West Pakistan) and its deposits 40% whichconstituted and 15 of its
staff for the victims of the typhoon. All registered office in Delhi wasshifted and bank
deposit base ofwhatever there is little evidence they honored produce.Subsequently,
Bank impressiveperformance can register and also on the increase in the strength of
the refugee claim.
Awards and RECOGNIZITION:-
2011 the year of the "Golden Peacock Award for Corporate Social Responsibility"
Instituteof Directors (IOD).
"CSRE xcellence a Ward 2 0 1 0" by Assocham.
Wind Power 2011 Awards - Second India
By World Institute of Sustainable Energy � "Best Wind PowerProject Financier" under
the category Prize in 2011.
"RRBs computer" to SKOCH 2010 Award.
SKOCH Financial Inclusion Award 2010.
500Indian companies ranked among the top 24 best as per Economic Times
Company.
2010 for the 3rd and 5th Best Big Bank FastestGrowing Bank Ranked by
Business World.
2010 14 Most Valuable announced today by the Business Ranked
SectorCompany.
34 | P a g e
State bank of india
Background:-
In 1959, the State Bank of India (Subsidiary Banks) Act was passed by Parliament in its
subsidiary SBI associated banks as are the eight former state. Today, SBI extensive
administrative structure to oversee the largest network of branches in India and abroad.
State Bank of Saurashtra, State Bank of India FY09 feet, a wholly-owned associate
acquired.
Business Profile:-
SBI Banking services are provided by default unless it ventured into many new
industries such. Pension funds, general insurance, custodial services, private equity,
mobile banking, point of sale merchant acquisition, advisory services, structured
products and many more. SBI personal banking products and services segment, which
deposit scheme such as term deposits, recurring deposits include bank also collected a
wide range of government debt and pension payments, e railway freight payment,
online storage, such as a state government business in the 31 Mar 2009, government
receipts, etc., the bank's total business in the previous year's growth of 23.38% as
against 34.63% in yoy growth. 31 Mar 2009 11,448 branches and 8,581 ATMs, the
Bank had a network.
SBI Bank is traded as a public type NSE: sbin, BSE: 500112, LSE: SBID BSE Sensex
included. Industry, banking, financial services by 1 July 1955 and established its
headquarters in Mumbai, Maharashtra, India is situated. Worldwide service in their area
and their key people isPratip (Chairman), Chaudhry their products. Credit cards,
consumer banking, corporate banking, finance and insurance, investment banking,
mortgage loans, private banking, wealth management.their revenue 36.950 billion USD
(2012), the profit 3.202 billion USD (2012), total 359.237 billion USD (2012) Assets,
Total Equity USD 20.854 billion (2012). India and their 292.215 Employibility their owner
(s) Government (2012).
35 | P a g e
State Bank of India, the Frankfurt office as a representative in 1965 and completed in
1974 as a branch was started. We are also part of the Indo-German trade with India as
a part of the European trade in the purchase. Our representative liabilities Scandinavian
countries and some of the Eastern European States. SBI Frankfurt, we also Milan,
Italy.In a representative office in Germany to support the independent Bank of status.
We are individual, institutional and corporate attractive interest rate deposit products
offered. Under the German Deposit Insurance our customer deposits are covered up to
61.7 million per customer.
The associate banks with SBI:-
• State Bank of Bikaner and Jaipur
• State Bank Hyderabad
• State Bank Mysore
• State Bank of Patiala
• State Bank of Travancore
Logo and slogan:-
The bank's business in the middle of - • India State Bank of logos at the bottom of the
completion of the common man and small man with a small cut in the blue circle.
"The common man a bank", "every Indian Banker", "U on the nation's banks" "Pure
Banking, nothing else", "All the Way With You": • sources.
Recent awards and honors:-
Best Online Banking Award, Best Customer Initiative Award & IBA Banking
Technology Award 2010 by the Best Risk Management Award (runner-up).
year, Bank of 2009, India The Banker magazine (won the second year in a row).
Best Bank - Business Bank Awards 2009 by the largest and most socially
responsible bank.
Best Bank 2009 by Business India
36 | P a g e
Most Trusted Brand 2009 The Economic Times.
The most favorite and most preferred home loan provider by CNBC Bank.
by FINO financial benefit of the Visionaries.
IBA Banking Technology Award of the Year by Technology Bank.
Virtual Corporation SKOCH 2010 category awards for its payment solution e.
37 | P a g e
2.1.2 Srilankan bank
Seylan Bank PLC
History:-
Seylan Bank PLC was established in 1987, and its doors opened for business on 24 th
March 1988, Colombo, Sri Lanka's largest city is Fort traditional banking district.
Originally named Seylan Trust Bank Limited was appointed a licensed commercial bank
and the shareholders as a publicly traded company with a comprehensive support
structure .. It was established to, a new organization companies in the Ceylinco Group,
one of the main industries in a large variety of Sri Lankan group operating divisions.
Bank founder Chairman Dr. Lalith Kotelawala, the more welcome retail customers, and
the general disciplined banking culture which is usually, but this was seen as a bit
austere provide an alternative service was friendly. Initially to, Seylan Bank itself
aelastic, selection offered as a customer friendly gatherings - the service formula that
was soon corrected in consideration of potential customers agree: 'One Heart with a
bank.
Seylan Bank, for the first time in history, records 2 billion rupees profit post tax
Seylan Bank 12 31 months ended December 2012 report to the pre-tax profit of 3.18
billion rupees, published on Friday, according to the bank results, but in a historical
profit post tax.
"Post-tax profit of Rs. Was surpassed. Billion footage of its history. 1 Lee-time, 2. 2.049
billion, which is 208% of the 665 million rupees / SLFRS LKAS reported under
accounting standards adopted this year, compared to an increase of the bank statement
issued by the Media , "he said.
Interest margins on lending and pressure control industry, despite the huge growth, net
interest income by 4.76% Rs 9 billion for the period under review, more value was the
result of advances in selective growth.
38 | P a g e
During the period under review, the bank said it had focused its considerable overhead
cost control. Many buildings in and around Colombo such functions were moved to a
central location. Hard work on humanizing cost efficiency improvements result directly
as a result of specified end of this year, it said.
The bank's deposits and Rs 22.7 billion and Rs 18.3 billion increase in net advances
portfolio basis, respectively deposits and a rising interest rate environment, competitive
despite anger. The bank said it also focused, consistent and effective reform efforts
through its asset quality has been able to improve every time since 2009. By Nihal
Jayamanne Bank chairman, said, "These results prove that the desired results of our
strategy and we started bright idea of sustainable development for the platform
provided".
During 2012, 15 new bank branches / appropriate centers opened, fully 17 branches /
appropriate centers, refurbish and more customer-friendly places in many other
branches of science.
Preparing for the future growth of the Bank in February, despite a successful debenture
issue was that the difference between the funds collected over subscribed. "Over the
next year, the bank identified the key areas of the bank's new product expansion,
branch expansion, increase service quality, staff guidance and strategy for future
growth, including expansion and IT infrastructure in line with the intent to invest," he
said.
Achievement:-
Seylan Bank Slim brand of excellence on the 'Brand of the Year turns around
with a gold cover "
01 October 2010, his winning streak, Seylan Bank continues, the prestigious
"brand that is most beneficial to the bottom of a recession or crisis as" Slim
Brand Excellence Awards at "The Year of the brand around a turn," won the Gold
Award.
Slim brand quality brand conservators for now the single most important measure
of quality in event marketing helpfulness.
39 | P a g e
Bank with a Heart
Bank or Just Farr, and reliable
Vision Statement:-
Sri Lanka has become the most important source of financial services - we are
recognized by all stake holders.
Mission Statement:-
We provide financial services that are of value, pricing flexibility, and terms of service
for our customers, providing them with needed
We do Seylan Bank, which is also known as a team and the results will be satisfied with
the direction
We will ensure that our hard work at the same time the prospect of our shareholders, as
interpreted by the always reliable for meeting performance as corporate citizens
Values:-
High ethical and professional behavior
Brilliancy for the exorcism
Editing balanced Heroic
Steady growth
General praise and trust
Creating a permanent deal
Milestones:-
In 1988, our parent Deshamanya Dr. Lalith Kotelawala, chairman began a mission to Sri
Lanka for a really long felt requirement for commercial banks. Its foundation to, bank
customer service attention and now offers a variety of appropriate banking services.
The total number of service centers in Sri Lanka is now one of the one hundred leading
role in the financial sector increased.
40 | P a g e
The bank is going to state technology-based goods and services marketing. Seylan
Bank's social responsibility and the obligation has grown significantly. Bank of benefit
programs such projects and the promotion of sport, festivals, and those who
participated in the service project a major role in group...
Hatton national Bank
History:-
Hatton of Hill Station in 1888 saw the Bank of origin; tea plantations in Ceylon then
contained by its rapidly growing population of the first. Properly named Hatton Bank, the
Bank became a lifeline for thousands of plantation workers.
Great disappointment of 1930 as a result of two world wars and by the damage, Ceylon
desire to free colonization began. Realising that Ceylon will soon become an
independent country, Brown and Company, Edmund J. Cooray, Chairman of visionary
business opportunity, he began laying the foundation for the self-conception of the post.
Hatton Bank's owners, RD Banks and AT Aitkin, after discussions with the success,
Brown & Company Bank acquired and 'Ceylonisation' process that permeated the entire
management and operations began.
Kandy, Nuwara Eliya and the nationalization process in 1970, the National Bank of
branches acquired Grindlays Bank saw, Hatton National Bank name change heralding,
as it is known today. Only one year later, HNB Gampola 1 branch opened its continued
and extended branches Pussellawa and Maskeliya. The expansion is still in Sri Lanka
HNB's largest network of branches among private commercial banks, continues.
Acquisition that will increase its presence and business, was adopted in 1974, the main
office and the Mercantile Bank of Pettah Branch acquisition and long before, both
Emirates International Bank and banque Indosuez of Colombo branches. In 1983, the
Bank de mail Mawatha, 3 spacious locale of its main office in Colombo are encouraged.
In mid-1980, HNB service that prevails throughout the country for the banking distorted.
1993 saw the most successful product innovate HNB, HNB Pathum Vimana, an

41 | P a g e
incentive-based savings product savings habit instilled in the population and encourage
savers idle money in the banking system to create economic growth through the
channel. These awards are presented to a large bank Rs 1 billion until 2009, the
country's largest banking history, perhaps with the prize money.
HNB its product portfolio in the country's first Housing Finance Scheme for peace, which
they distributed to LKR 15 billion and 154 banking centers on the student, including the
establishment undermines a number, arrangement continued. To 1980 and a large
population of Sri Lankan expatriates in the Middle East saw the creation of employment
reported HNB Pathum Udanaya The savings and advanced economic development
award scheme which impel immigrants satisfaction.
Various communities in the country Gami Pubuduwa (Village Awakening) was
introduced to serve the rural Sri Lanka and HNB social stability for the World Bank from
liability to income in respect of more than 50,000 families create a livelihood for some
250,000 people.
Award:-
Awards bank navajya Recognition
In Sri Lanka 'Bank of the Year 2012' for the Bracken Award.
Retail Bank in Sri Lanka for a great performance in 2011.
Our Target
Our Vision;-
Choose a well-known leader and partner in providing financial solutions that inspire
people.
Our mission:-
People and leading-edge technology, continuous stakeholder power to go forward with
the entrepreneurial energy mix of the future.
42 | P a g e
Our Values:-
Wealth of professional and personal honesty at all times
All communication demonstrates our mutual respect Passionate in all
weCommitted to being customer centric Courage to change the challenge, and
varies Displays various solidarity.
Sampath Bank PLC
History:-
Bank Origin "Investment and Credit Bank Ltd." in 1987 became chairman of the bank at
the same time as Mr.'s Jayawardhana was integrated. Bank popular way, "Sampath"
became known. In 1988, Sampath Bank Automated Teller Machines in the country for
the 1st time (ATM) network for multi-point work and the service "Sampath Electronic
Taylor" or "set" became popular. After the popularity of ATM Banking (1989),
MasterCard, PBU (Personal Banking Unit) and University - to enter the banking system.
Bank Introduction to South Asia, "debit card" for the first time in 1997 and was the
opening of Sri Lanka's first account was issued a debit card immediately. Sri Lanka in
the first Cheque Imaging and truncated site (CIT) was in 2004 by Sampath Bank. Since
2009, the bank's largest private sector bank in Sri Lanka is the third in terms of total
assets. London, the second successive year and the "National Business Excellence
Awards 2010" for - Recently, Sampath Bank Financial Times Limited, "The Banker" by
the "Bank of the Year" award.
Company Description:-
Sampath Bank PLC, together with its subsidiaries, Sri Lanka, and related financial
services to its customers provides various commercial banking. The company also
engages in accepting deposits, trade finance, banking to shore resident and non-
resident foreign currency operations related services, corporate and retail lending,
import and export financing, project financing, lease, financing, pawning, local and
international debit cards issued travel and credit card, chip card, telebanking facilities,
43 | P a g e
Company analysis:-
According to the Consolidated - Audited Financial Statements for the year 2011 was
11.48%, with an increase in total net operating income, LKR 9.839.820 10,969,444 for
hundreds of thousands of LKR. Operating result LKR 4.794.208 hundreds of thousands
of LKR 5.983.518, which means an increase of 24.81% change. Results for the period
increased 19.12% as against LKR 3.484.466 hundreds of thousands of reach LKR
4.150.618 at the end of last year. Equity (Net / Income Total Equity) went back to
2293.98% and 6928.44%, return on asset (net gain / income total asset), 1.85% to
1.67% and net profit margin (net income / net sales) in from 37.84% to 35.41% when
compared to the same period last year
Our Vision:-
"Growing Force in Sri Lankan Financial Services"
Our Values:-
• a learning culture that encourages personal and organizational development as well as
to promote and create value for customers reform.
• All internal and external customers are treated like how we behave.
• All aspects of behavior, encourage and promote teamwork.
• Open the response and enthusiasm of individual development.
• Monitor and the results show an impressive responsibility.
• inflexible moral and professional standards of behavior.
Award:-
1996: 1996 Year by "Asiamoney" "Best Commercial Bank"
1997: by "Asia Banking Digest" "Best in South Asia Small Cap Bank"
44 | P a g e
1997: 1997, the Year by "Asiamoney" "Best Commercial Bank"
1998: the year 1998 by "Asiamoney" "Best Commercial Bank"
1998: by "Asia Banking Digest" "Outstanding New Business Venture Project in 1998"
1999: by "Forbes Global" under the "300 World's Best Small Companies" List
2000: "The 2000 Year Bank of" "The Banker" ("Financial Times group" by the Sri
Lankan Bank award for the first event) by
2004: National HRM Awards 2004 in the "Best Service Category in HR Practice"
2005: "by the South Asian Federation of Accountants (SAFS)" Best Presented
Accounts Award Runner-up "
2005: "Annual 2004 reports Excellence Award", "Chartered Accounts Institute of Sri
Lanka" by
2005: "Best Corporate Citizen"
2006: "The best economic performance for the year 2005"
2005: by "Chartered Accounts Institute of Sri Lanka" "Best Financial Application"
2005: by "Chartered Accounts Institute of Sri Lanka" "Gold Award in the financial
category"
2005: Sri Lanka National Chamber of Commerce's "Business Excellence, second
runner-up for the banking sector"
2008: by "the Ceylon Chamber of Commerce," Sri Lanka between the 4th
consecutive year, "The Top Ten Best Corporate Citizens" put
2008: "National Business Excellence Award" for "Best Performance Management
Practice Excellence" Sri Lanka National Chamber of Commerce by
2008: by "Asia Brand Congress, Mumbai, India" "Brand Leadership Award"
45 | P a g e
2009: "National Business Excellence Silver Award for the overall competition"
2009: Excellence in Business and Financial Performance Award Winner
2009: "Financial Times - London of The Banker" by the "Bank of the Year 2009"
2009: 2009 for Corporate Responsibility Award (Best Corporate 2009 Citizen)
2010: "Bank of the Year 2010" by the "Financial Times of The Banker - London"
2011: ARC Awards - Sampath Bank Annual 2010 report "National Banks" under the
category 25 th "ARC Awards Ceremony" held in New York a "Gold Award" won.
2012: World Finance Award - Sampath Bank in the prestigious World Finance
magazine's Best of Sri Lanka in 2012, the Banking Group awarded the accolade
achieved...
Growth:-
Sampath and later in 1997 Wijewardhana Mawatha, 10 is the Bank's first office in
Colombo, the Sir James Peiris Mawatha, 02 Colombo, Sri Lanka It was enthused. On
the end of the first year, 94 members of staff.
Powered by First Bank ATM was installed in 1986 and the year 2007 marks the end of
the 150 islands and 220 ATMs operating exceeded the bank.
In 1996, the Bank "Tele-Banking" facility was introduced. Internet Banking in July 2000
launched the facility - this has motivated IT 1998 "SampathNet" re-engineering was in
banking technology.
The 209 bank branches and 260 ATMs, including a total of 8 to site ATM operates.
Technology:-
Sri Lanka Sampath Bank was the first bank is fully computerized and its birth in 1986
was to work with database technologies.
46 | P a g e
Sampath Bank for "Automated Teller Machine" Mr. "set", MasterCard, personal banking
unit facility, Uni banking system and debit cards (Maestro and Cirrus and Visa begin
with) was the first brand to enter Lanka. Major re-engineering of its IT banking
technology inspired by the work for the bank after Bank Internet Banking, Internet
payment gateways and mobile banking services with the launch of the on-line 24x7.
First of all check for Bank of Sri Lanka "One day clearing" any Sampath Bank branch on
the dimmer, the islan collected by any commercial bank in Sri Lanka Automated
Clearing House (SLACH) is presented.
Cheque in Sri Lanka was first conceived and truncated (CIT) site was made by the Bank
in October 2004.
Sampath Bank National "Credit Approval System" (CAS) and "Electronic Money
Transfer" (EMTS) best quality software for in-house application development category
at the Awards 2008 Gold and Merit Award.
It is also a "local Developed New Technologies", which has been successfully marketing
/ product "Sampath Payment System" for lead generation service category prizes
awarded to the National Science and Technology 2008.
South Asia's first - Cheque Deposit ATM was launched online in real time.
ATMs are able to access nearly 1,500 islands - the country's largest ATM (iConnect)
network operated.
Financial Highlights:-
At the end of 2011
4.1bn GROUP profit (18.5% growth tax notice)
Advances in 34.9% growth (31.9%, surpassing the industry growth)
Deposit growth of 27.3% (18.7% increase across the industry)
Assets 32.2% growth (19.5% of the growth in cross-industry)
47 | P a g e
Pan Asia Banking Corporation
Company Description:-
Pan Asia Banking Corporation PLC commercial banking and related financial services
in Sri Lanka provides. Various accounts of the company, the individual current and
savings accounts, small accounts, Nonresident and resident foreign currency accounts,
foreign currency accounts of non-resident, Security investment accounts, especially
foreign investment deposit accounts, share investment external rupee accounts, rupee
accounts include it offers Nonresident Sri investment, treasury investment consortium
Company analysis:-
According to the Consolidated - Audited Financial Statements for the year 2011 was
39.75%, with an increase in total net operating income, LKR 1.708.342 2,387,442 for
hundreds of thousands of LKR. Operating result LKR 693.927 hundreds of thousands of
LKR 1.182.866 change means an increase of 70.46%. Results for this period of time
against LKR 361.794 thousand at the end of last year, an increase of 127.76% success
LKR 824.012 thousand. Equity (Net / Income Total Equity) went up 0.00% from 0.00%
return, return on asset (net gain / income total asset), 1.16% from 1.75% and net profit
margin (net income / Net Sales) went up from 21.18 % 34.51% when compared to the
same period last year.
Mission and Vision:-
Our Vision:-
"Sri Lanka's largest commercial bank to become a preferred customer"
Our Mission:-
"We are professional, personal, safe, quality banking and financial services are
provided, using modern technology and innovative products to create the most satisfied
customer base., We delight our customers, employees and partners to create a better
future price increase "
48 | P a g e
Nations Trust Bank
History:-
Nations Trust Bank was established in July 1999 when it acquired Overseas Bank Trust
Ltd. Colombo branch of the initial public offering (IPO) of oversubscription admission
considerable emphasis in our market.
Since then, we have gone from strength to strength, with a client base quickly
expanding our portfolio in our following strategic acquisitions. Waldock Mackenzie Ltd.
Acquisition Standard Chartered Bank of candy Branch Acquisition Deutsche Bank's
private banking portfolio of acquisition The commercial banking business and foreign
exchange of business acquisition Colombo, American Express, Bank of Mercantile
Leasing Company with the merger in January 2006 In September 2007, Fitch Ratings
Lanka Ltd. A (lka) or the issuer issues a firm in another country qualify for the credit risk
rating assigned to the dictates of the bank confirmed.
Mission and Vision:-
Our Vision:-
Making life simple by being the benchmark of convenience
Our Mission:-
Try innovative customer centric solutions continues to grow in our team is constantly
trying to loose market share of the best talent in the industry to grow and by 2015 the
most profitable and respected in Sri Lanka, try to let the bank.
49 | P a g e
2. 2 objective and function of banking industry
Objectives Banking industry :-
The Central Bank has two main goals:
1. Maintaining Economic and price stability:-
Price constancy safeguards the value of the currency in terms of what it will buy at
home and in terms of other currencies. Price constancy or stable prices means low
price raises. Experience has revealed that the economy performs better when inflation
is low and is probable to be low. Interest rates are too low in this situation. Such an
situation allow an nation to attain its development prospective and foster high
employment opportunities. Free from the disrupting effects of high and changeable
inflation, both customers and producers make financial decisions with self-confidence.
Low inflation or price stability fosters sustainable long-term financial growth and
employment opportunities. The Central Bank uses monetary guidelines measures to
manage inflation.
Financial system stability:-
A stable economic structure creates a positive atmosphere for depositors and investor,
encourages competent monetary intermediation and the efficient operation of markets,
and therefore, promotes investment and economic expansion. Financial system
steadiness means the efficient functioning of the financial system (economic institutions
and markets) and the deficiency of banking, currency and balance of payments crisis.
Financial unsteadiness is caused by bank failures, too much asset price instability, and
fall down of market liquidity or a disturbance to the payments system. Financial system
stability requires a stable macro-economic atmosphere, efficient authoritarian structure,
well prepared financial markets, sound financial organizations and secure and healthy
payments infrastructure. The maintenance of financial stability entail the avoidance,
recognition and lessening of fear to the financial system as a whole, through the
observation of markets and financial organizations, oversight of the payments system
and crisis declaration.
50 | P a g e
Functions of banks:-
The CBSL, so as to achieve its core objectives and discharge its responsibilities as a
financial advisor and banker.
Core functions:-
1.Economic and price stability
2. Financial system stability
The core functions related to:-
Currency issuance and management
agency functions:-
1. Employees' Provident Fund Management
2. Foreign Exchange Management
3. Public debt management
4. Regional development
5. Financial Intelligence
6. Provincial Office Monitoring
51 | P a g e
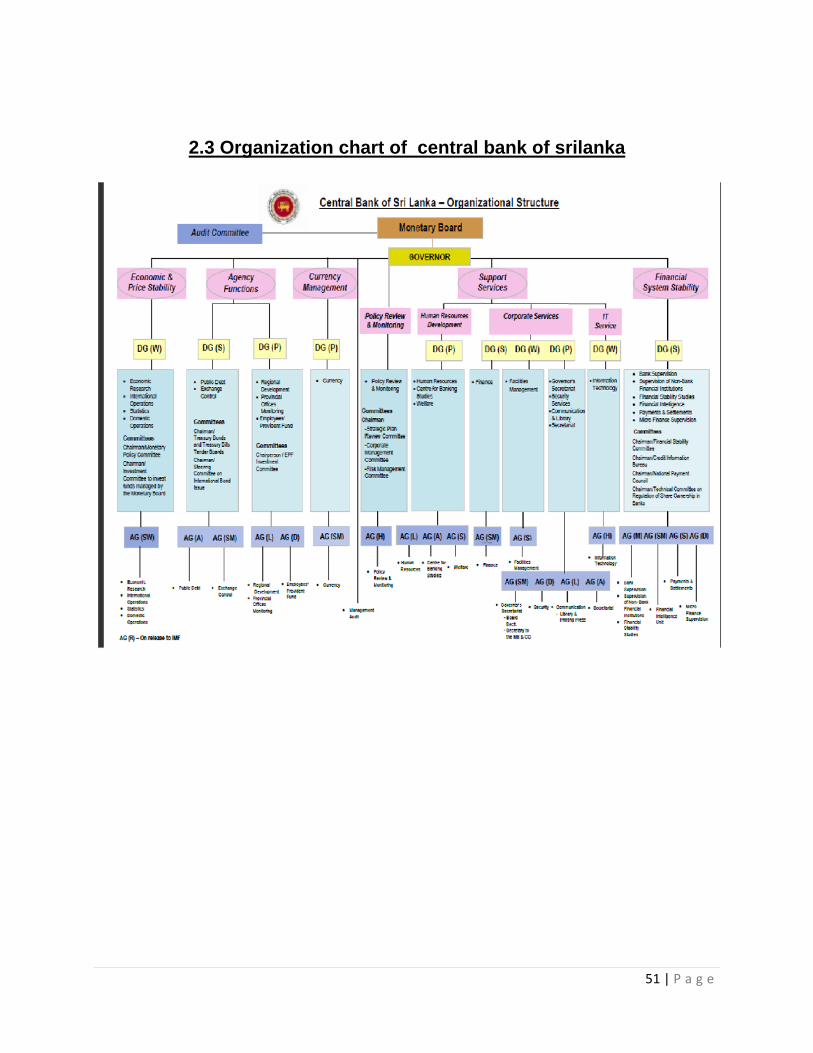
2.3 Organization chart of central bank of srilanka
52 | P a g e
CHAPTER -3
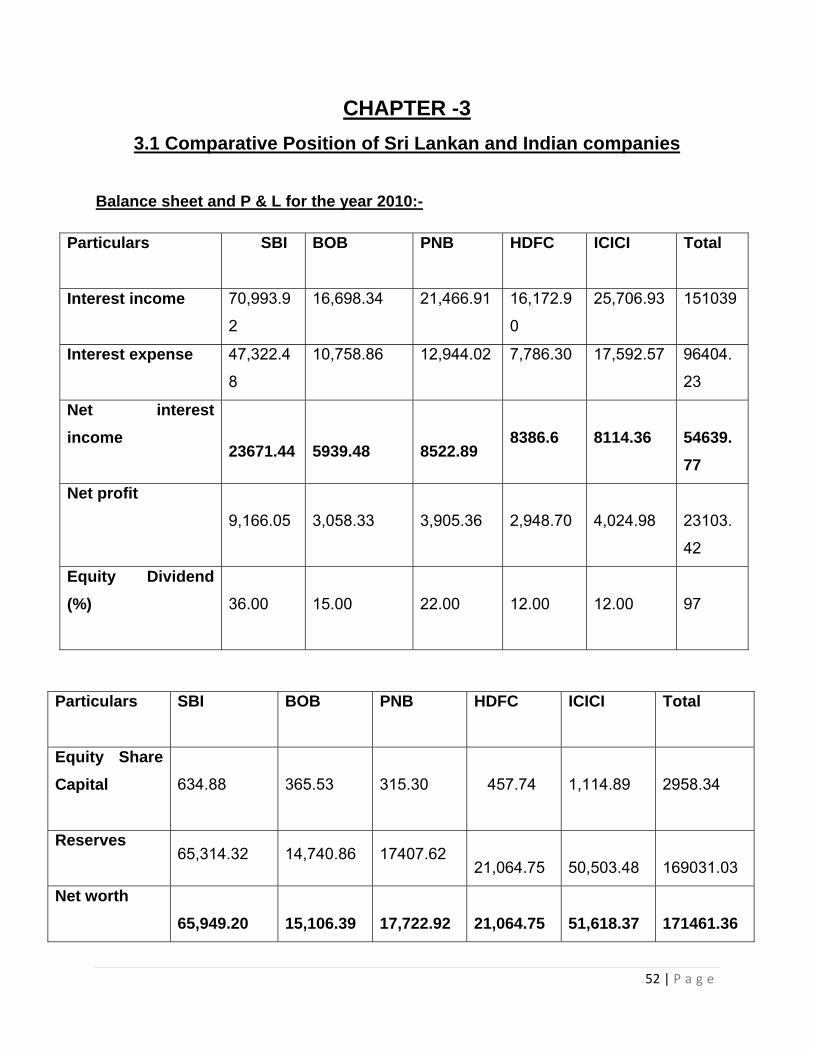
3.1 Comparative Position of Sri Lankan and Indian companies
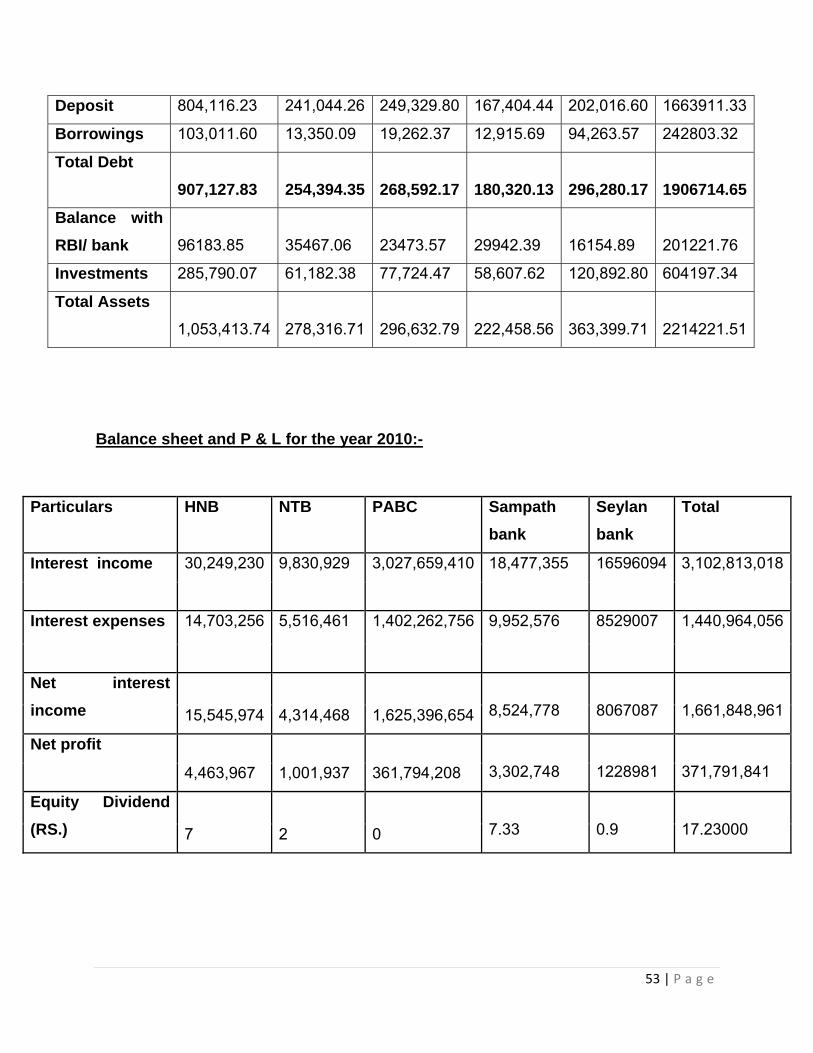
Balance sheet and P & L for the year 2010:-
Particulars
SBI BOB PNB HDFC ICICI Total
Interest income 70,993.9
2
16,698.34 21,466.91 16,172.9
0
25,706.93 151039
Interest expense 47,322.4
8
10,758.86 12,944.02 7,786.30 17,592.57 96404.
23
Net interest
income
23671.44
5939.48
8522.89
8386.6
8114.36
54639.
77
Net profit
9,166.05 3,058.33 3,905.36
2,948.70
4,024.98
23103.
42
Equity Dividend
(%)
36.00 15.00 22.00
12.00
12.00
97
Particulars
SBI BOB PNB HDFC ICICI Total
Equity Share
Capital
634.88 365.53 315.30
457.74
1,114.89
2958.34
Reserves
65,314.32 14,740.86 17407.62
21,064.75
50,503.48
169031.03
Net worth
65,949.20
15,106.39
17,722.92
21,064.75
51,618.37
171461.36
53 | P a g e
Deposit 804,116.23 241,044.26 249,329.80 167,404.44 202,016.60 1663911.33
Borrowings 103,011.60 13,350.09 19,262.37 12,915.69 94,263.57 242803.32
Total Debt
907,127.83
254,394.35
268,592.17
180,320.13
296,280.17
1906714.65
Balance with
RBI/ bank
96183.85
35467.06
23473.57
29942.39
16154.89
201221.76
Investments 285,790.07 61,182.38 77,724.47 58,607.62 120,892.80 604197.34
Total Assets
1,053,413.74
278,316.71
296,632.79
222,458.56
363,399.71
2214221.51
Balance sheet and P & L for the year 2010:-
Particulars HNB NTB PABC Sampath
bank
Seylan
bank
Total
Interest income 30,249,230 9,830,929 3,027,659,410 18,477,355 16596094 3,102,813,018
Interest expenses 14,703,256 5,516,461 1,402,262,756 9,952,576 8529007 1,440,964,056
Net interest
income 15,545,974 4,314,468
1,625,396,654
8,524,778
8067087
1,661,848,961
Net profit
4,463,967 1,001,937 361,794,208
3,302,748
1228981
371,791,841
Equity Dividend
(RS.) 7 2 0
7.33
0.9
17.23000
54 | P a g e
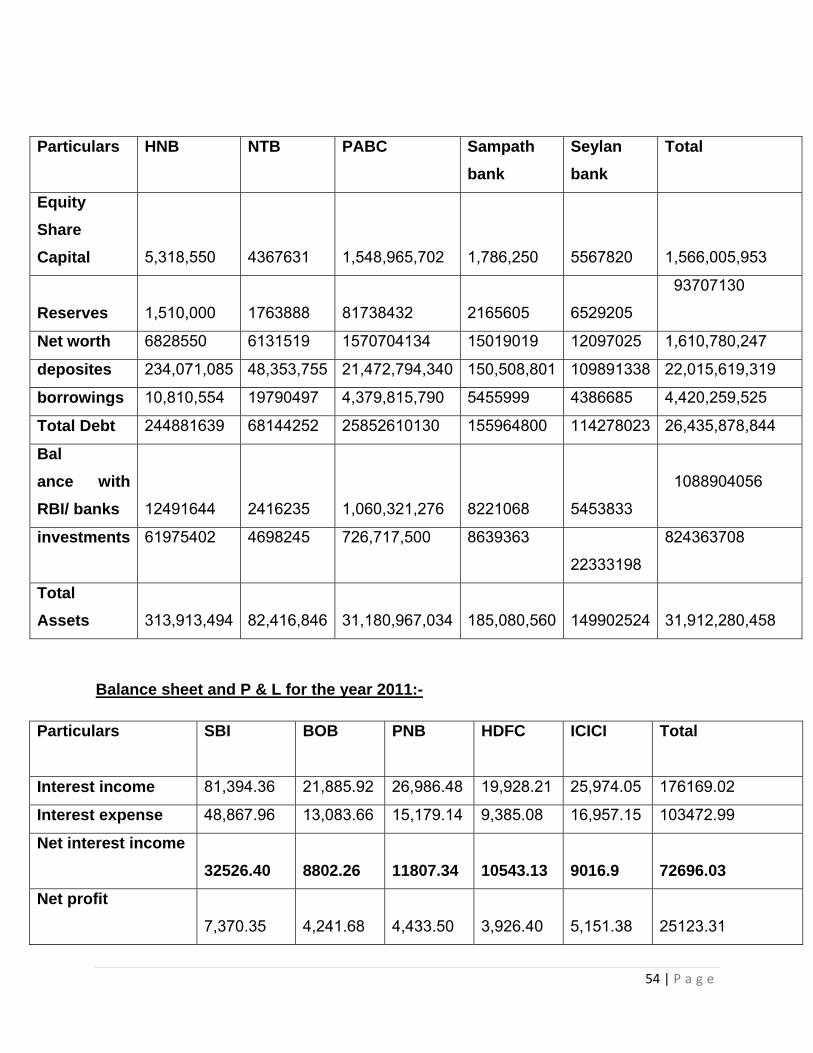
Particulars HNB NTB PABC Sampath
bank
Seylan
bank
Total
Equity
Share
Capital 5,318,550 4367631 1,548,965,702
1,786,250
5567820
1,566,005,953
Reserves 1,510,000 1763888 81738432
2165605
6529205
93707130
Net worth 6828550 6131519 1570704134 15019019 12097025 1,610,780,247
deposites 234,071,085 48,353,755 21,472,794,340 150,508,801 109891338 22,015,619,319
borrowings 10,810,554 19790497 4,379,815,790 5455999 4386685 4,420,259,525
Total Debt 244881639 68144252 25852610130 155964800 114278023 26,435,878,844
Bal
ance with
RBI/ banks 12491644 2416235 1,060,321,276
8221068 5453833
1088904056
investments 61975402 4698245 726,717,500 8639363
22333198
824363708
Total
Assets 313,913,494 82,416,846 31,180,967,034 185,080,560
149902524
31,912,280,458
Balance sheet and P & L for the year 2011:-
Particulars
SBI BOB PNB HDFC ICICI Total
Interest income 81,394.36 21,885.92 26,986.48 19,928.21 25,974.05 176169.02
Interest expense 48,867.96 13,083.66 15,179.14 9,385.08 16,957.15 103472.99
Net interest income
32526.40
8802.26
11807.34
10543.13
9016.9
72696.03
Net profit
7,370.35
4,241.68
4,433.50
3,926.40
5,151.38
25123.31
55 | P a g e
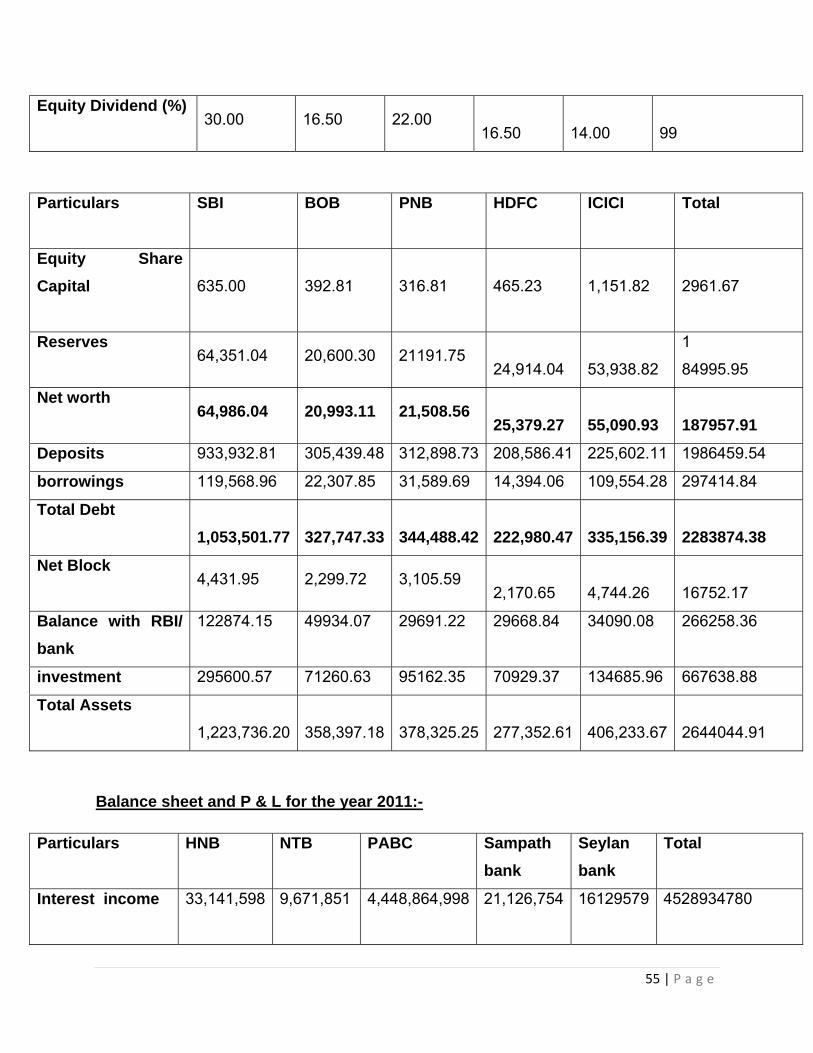
Equity Dividend (%)
30.00 16.50 22.00
16.50
14.00
99
Particulars
SBI BOB PNB HDFC ICICI Total
Equity Share
Capital
635.00 392.81 316.81
465.23
1,151.82
2961.67
Reserves
64,351.04 20,600.30 21191.75
24,914.04
53,938.82
1
84995.95
Net worth
64,986.04 20,993.11 21,508.56
25,379.27
55,090.93
187957.91
Deposits 933,932.81 305,439.48 312,898.73 208,586.41 225,602.11 1986459.54
borrowings 119,568.96 22,307.85 31,589.69 14,394.06 109,554.28 297414.84
Total Debt
1,053,501.77
327,747.33
344,488.42
222,980.47
335,156.39
2283874.38
Net Block
4,431.95 2,299.72 3,105.59
2,170.65
4,744.26
16752.17
Balance with RBI/
bank
122874.15 49934.07 29691.22 29668.84 34090.08 266258.36
investment 295600.57 71260.63 95162.35 70929.37 134685.96 667638.88
Total Assets
1,223,736.20
358,397.18
378,325.25
277,352.61
406,233.67
2644044.91
Balance sheet and P & L for the year 2011:-
Particulars
HNB NTB PABC Sampath
bank
Seylan
bank
Total
Interest income
33,141,598 9,671,851 4,448,864,998 21,126,754 16129579 4528934780
56 | P a g e
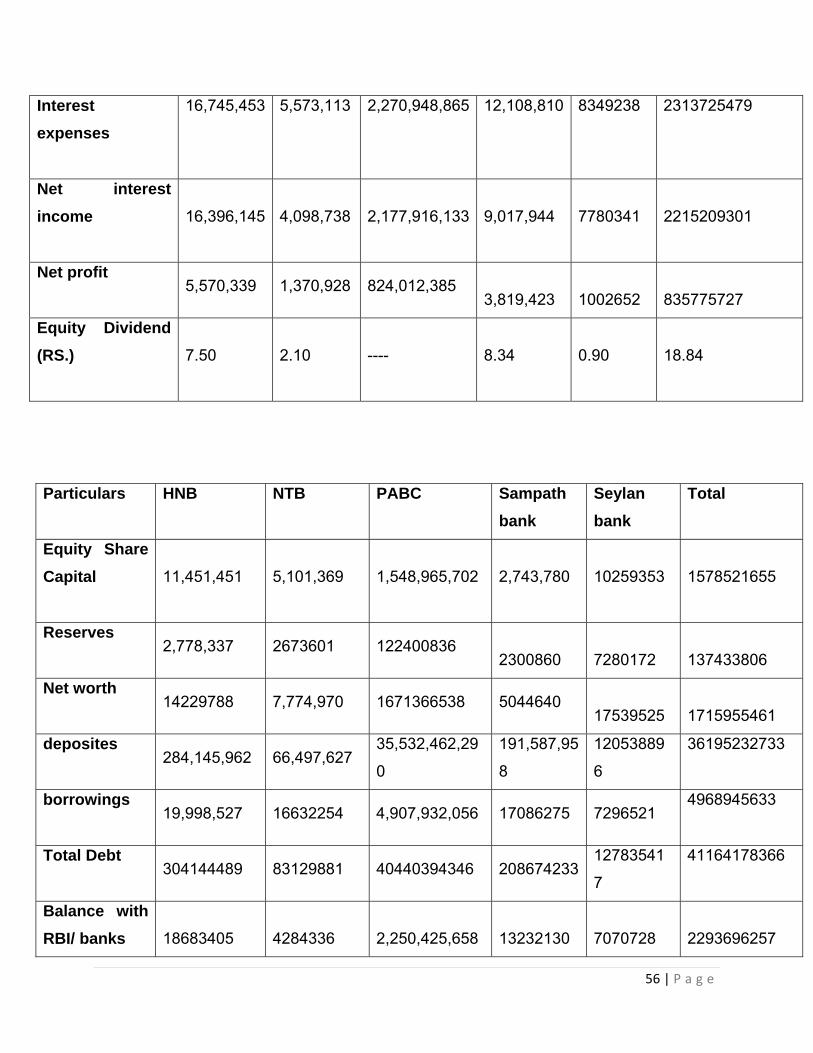
Interest
expenses
16,745,453 5,573,113 2,270,948,865 12,108,810 8349238 2313725479
Net interest
income
16,396,145 4,098,738 2,177,916,133
9,017,944
7780341
2215209301
Net profit
5,570,339 1,370,928 824,012,385
3,819,423
1002652
835775727
Equity Dividend
(RS.)
7.50 2.10 ----
8.34
0.90
18.84
Particulars
HNB NTB PABC Sampath
bank
Seylan
bank
Total
Equity Share
Capital
11,451,451 5,101,369 1,548,965,702
2,743,780
10259353
1578521655
Reserves
2,778,337 2673601 122400836
2300860
7280172
137433806
Net worth
14229788 7,774,970 1671366538 5044640
17539525
1715955461
deposites
284,145,962 66,497,627
35,532,462,29
0
191,587,95
8
12053889
6
36195232733
borrowings
19,998,527 16632254 4,907,932,056 17086275 7296521
4968945633
Total Debt
304144489 83129881 40440394346 208674233
12783541
7
41164178366
Balance with
RBI/ banks
18683405
4284336
2,250,425,658
13232130
7070728
2293696257
57 | P a g e
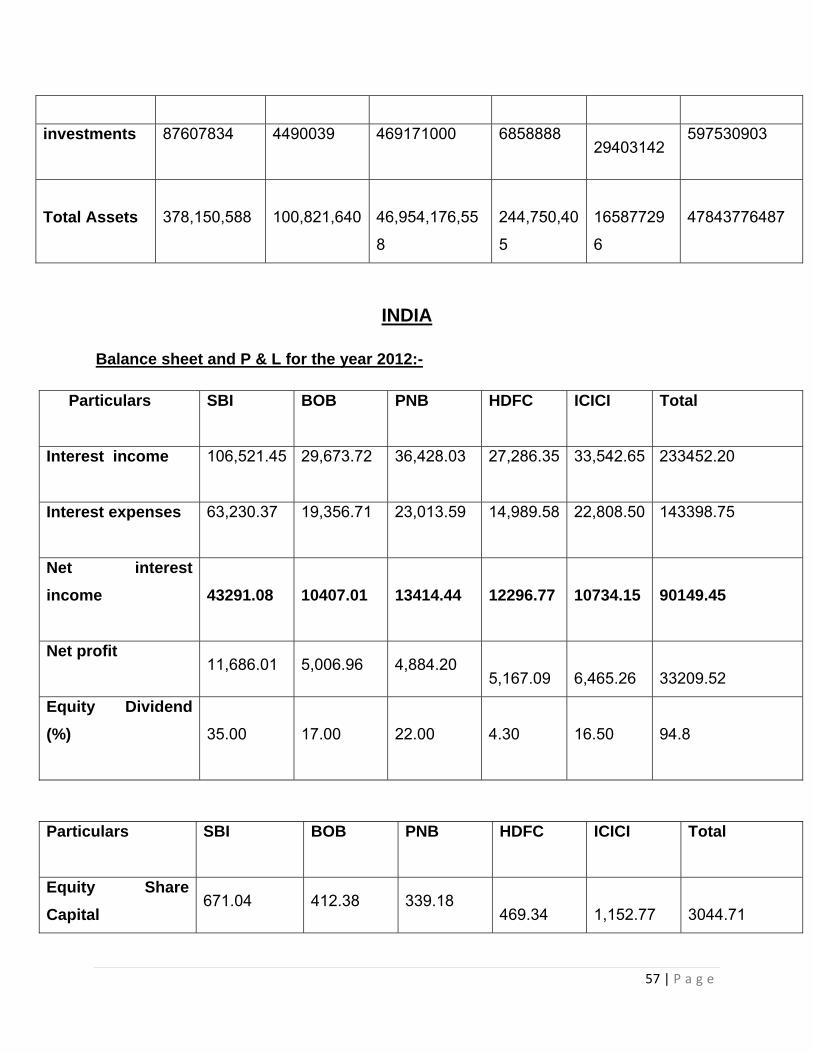
investments 87607834 4490039 469171000 6858888 29403142
597530903
Total Assets
378,150,588 100,821,640
46,954,176,55
8
244,750,40
5
16587729
6
47843776487
INDIA
Balance sheet and P & L for the year 2012:-
Particulars
SBI BOB PNB HDFC ICICI Total
Interest income
106,521.45
29,673.72 36,428.03 27,286.35 33,542.65 233452.20
Interest expenses
63,230.37 19,356.71 23,013.59 14,989.58 22,808.50
143398.75
Net interest
income
43291.08 10407.01 13414.44
12296.77
10734.15
90149.45
Net profit
11,686.01 5,006.96 4,884.20
5,167.09
6,465.26
33209.52
Equity Dividend
(%)
35.00 17.00 22.00
4.30
16.50
94.8
Particulars
SBI BOB PNB HDFC ICICI Total
Equity Share
Capital 671.04 412.38 339.18
469.34
1,152.77
3044.71
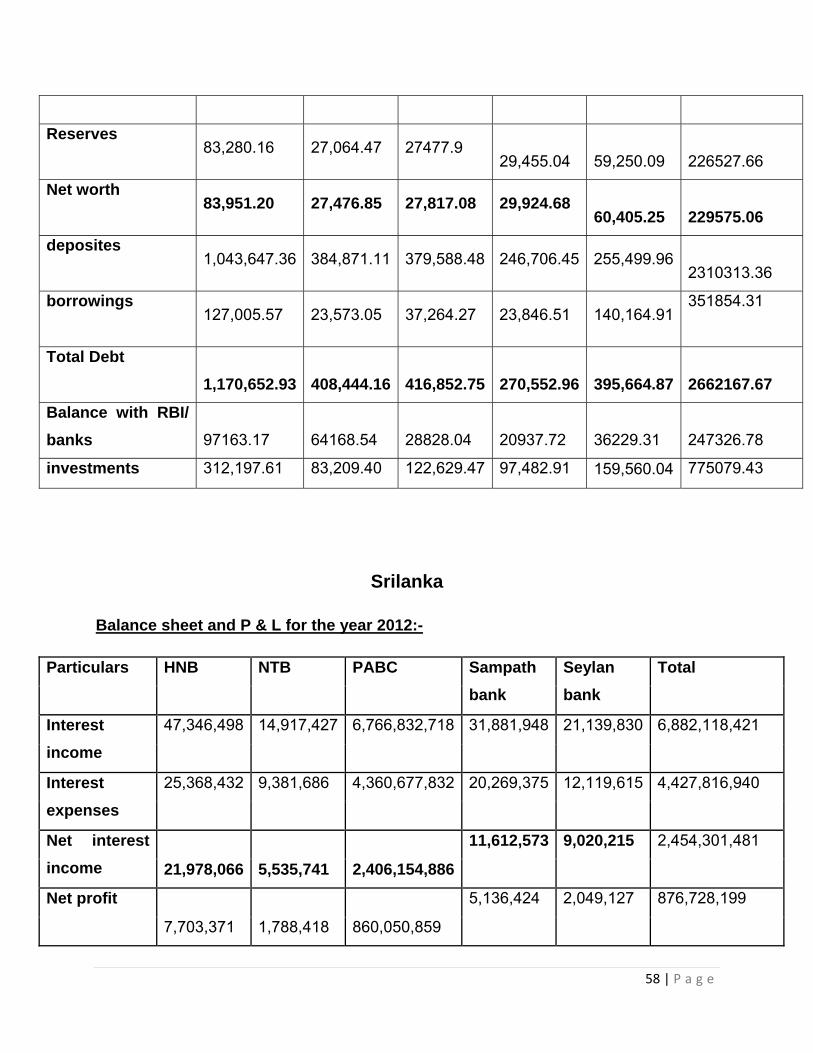
58 | P a g e
Reserves
83,280.16 27,064.47 27477.9
29,455.04
59,250.09
226527.66
Net worth
83,951.20 27,476.85 27,817.08 29,924.68
60,405.25
229575.06
deposites
1,043,647.36 384,871.11 379,588.48 246,706.45 255,499.96
2310313.36
borrowings
127,005.57 23,573.05 37,264.27 23,846.51 140,164.91
351854.31
Total Debt
1,170,652.93
408,444.16
416,852.75
270,552.96
395,664.87
2662167.67
Balance with RBI/
banks
97163.17
64168.54
28828.04
20937.72
36229.31
247326.78
investments 312,197.61 83,209.40 122,629.47 97,482.91 159,560.04 775079.43
Srilanka
Balance sheet and P & L for the year 2012:-
Particulars HNB NTB PABC Sampath
bank
Seylan
bank
Total
Interest
income
47,346,498 14,917,427 6,766,832,718 31,881,948 21,139,830 6,882,118,421
Interest
expenses
25,368,432 9,381,686 4,360,677,832 20,269,375 12,119,615 4,427,816,940
Net interest
income 21,978,066 5,535,741 2,406,154,886
11,612,573 9,020,215 2,454,301,481
Net profit
7,703,371 1,788,418 860,050,859
5,136,424 2,049,127 876,728,199
59 | P a g e
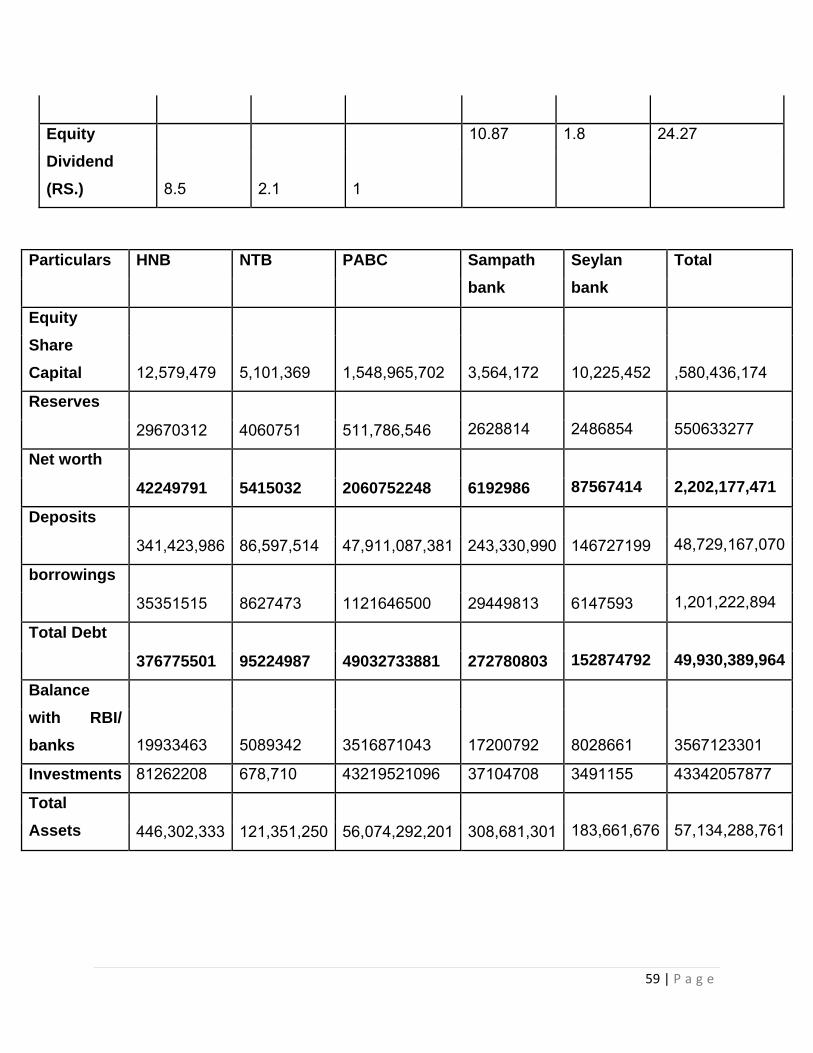
Equity
Dividend
(RS.) 8.5 2.1 1
10.87 1.8 24.27
Particulars HNB NTB PABC Sampath
bank
Seylan
bank
Total
Equity
Share
Capital 12,579,479 5,101,369 1,548,965,702
3,564,172
10,225,452
,580,436,174
Reserves
29670312 4060751 511,786,546
2628814
2486854
550633277
Net worth
42249791 5415032 2060752248 6192986
87567414
2,202,177,471
Deposits
341,423,986 86,597,514 47,911,087,381 243,330,990 146727199
48,729,167,070
borrowings
35351515 8627473 1121646500 29449813 6147593
1,201,222,894
Total Debt
376775501 95224987 49032733881 272780803
152874792
49,930,389,964
Balance
with RBI/
banks 19933463 5089342 3516871043
17200792 8028661
3567123301
Investments 81262208 678,710 43219521096 37104708 3491155 43342057877
Total
Assets 446,302,333 121,351,250 56,074,292,201 308,681,301
183,661,676
57,134,288,761
60 | P a g e
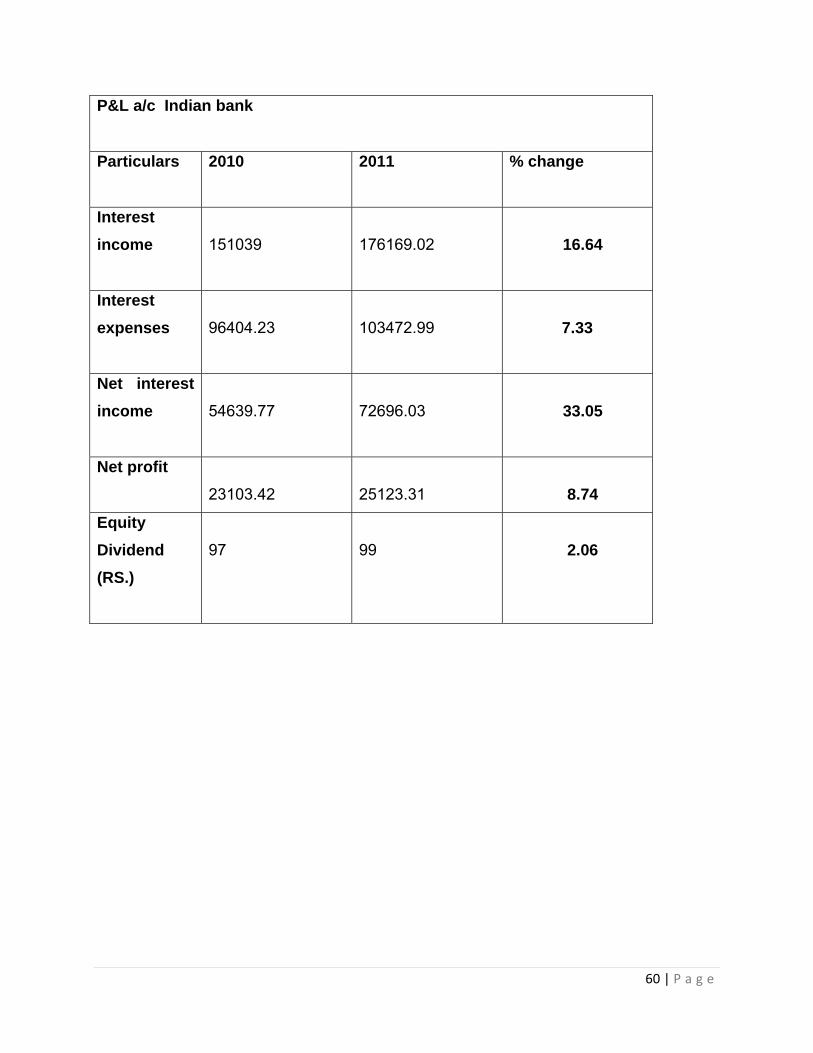
P&L a/c Indian bank
Particulars
2010 2011 % change
Interest
income
151039
176169.02
16.64
Interest
expenses
96404.23
103472.99
7.33
Net interest
income
54639.77
72696.03
33.05
Net profit
23103.42
25123.31
8.74
Equity
Dividend
(RS.)
97
99
2.06
61 | P a g e
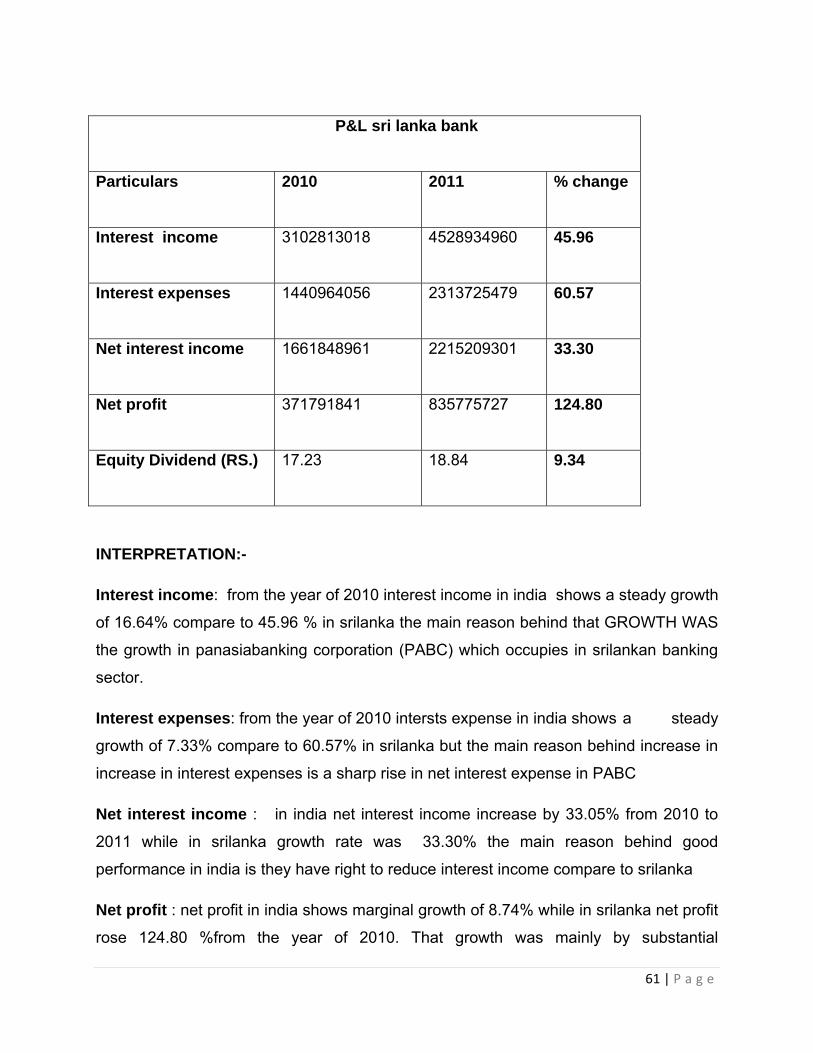
INTERPRETATION:-
Interest income: from the year of 2010 interest income in india shows a steady growth
of 16.64% compare to 45.96 % in srilanka the main reason behind that GROWTH WAS
the growth in panasiabanking corporation (PABC) which occupies in srilankan banking
sector.
Interest expenses: from the year of 2010 intersts expense in india shows a steady
growth of 7.33% compare to 60.57% in srilanka but the main reason behind increase in
increase in interest expenses is a sharp rise in net interest expense in PABC
Net interest income : in india net interest income increase by 33.05% from 2010 to
2011 while in srilanka growth rate was 33.30% the main reason behind good
performance in india is they have right to reduce interest income compare to srilanka
Net profit : net profit in india shows marginal growth of 8.74% while in srilanka net profit
rose 124.80 %from the year of 2010. That growth was mainly by substantial
P&L sri lanka bank
Particulars
2010 2011 % change
Interest income
3102813018 4528934960
45.96
Interest expenses
1440964056 2313725479 60.57
Net interest income
1661848961 2215209301 33.30
Net profit
371791841 835775727
124.80
Equity Dividend (RS.)
17.23 18.84
9.34
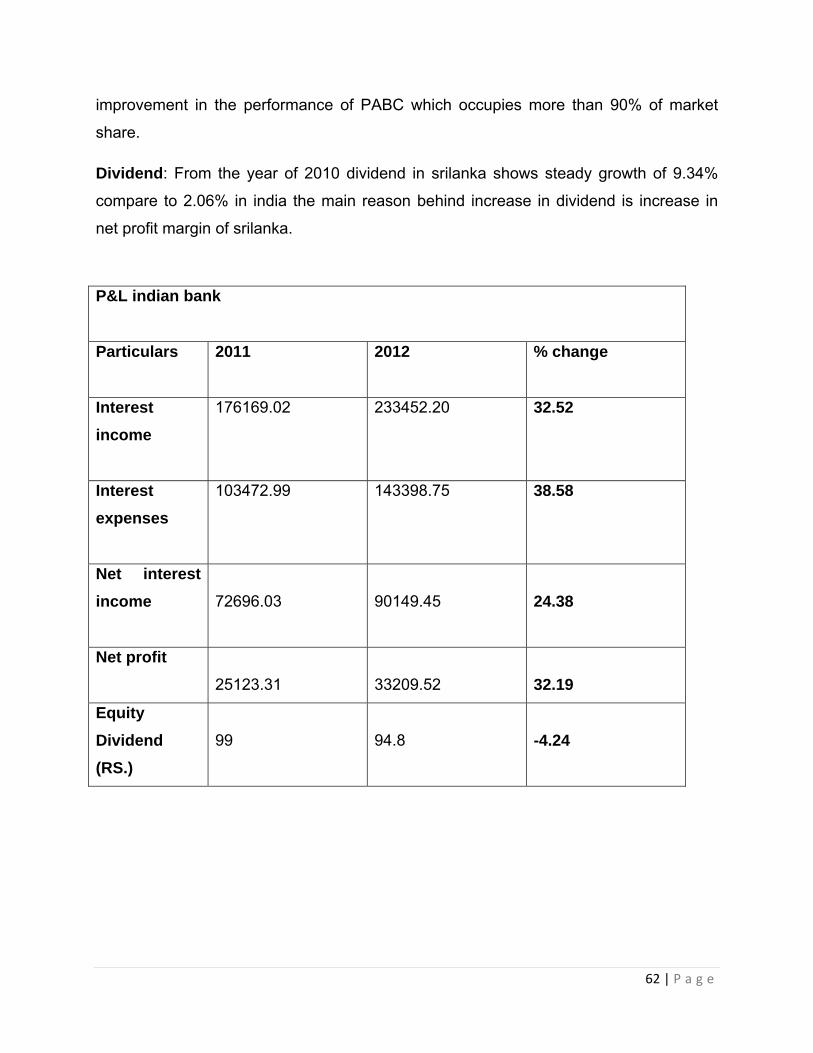
62 | P a g e
improvement in the performance of PABC which occupies more than 90% of market
share.
Dividend: From the year of 2010 dividend in srilanka shows steady growth of 9.34%
compare to 2.06% in india the main reason behind increase in dividend is increase in
net profit margin of srilanka.
P&L indian bank
Particulars
2011 2012 % change
Interest
income
176169.02
233452.20 32.52
Interest
expenses
103472.99 143398.75 38.58
Net interest
income
72696.03
90149.45
24.38
Net profit
25123.31
33209.52
32.19
Equity
Dividend
(RS.)
99
94.8
-4.24
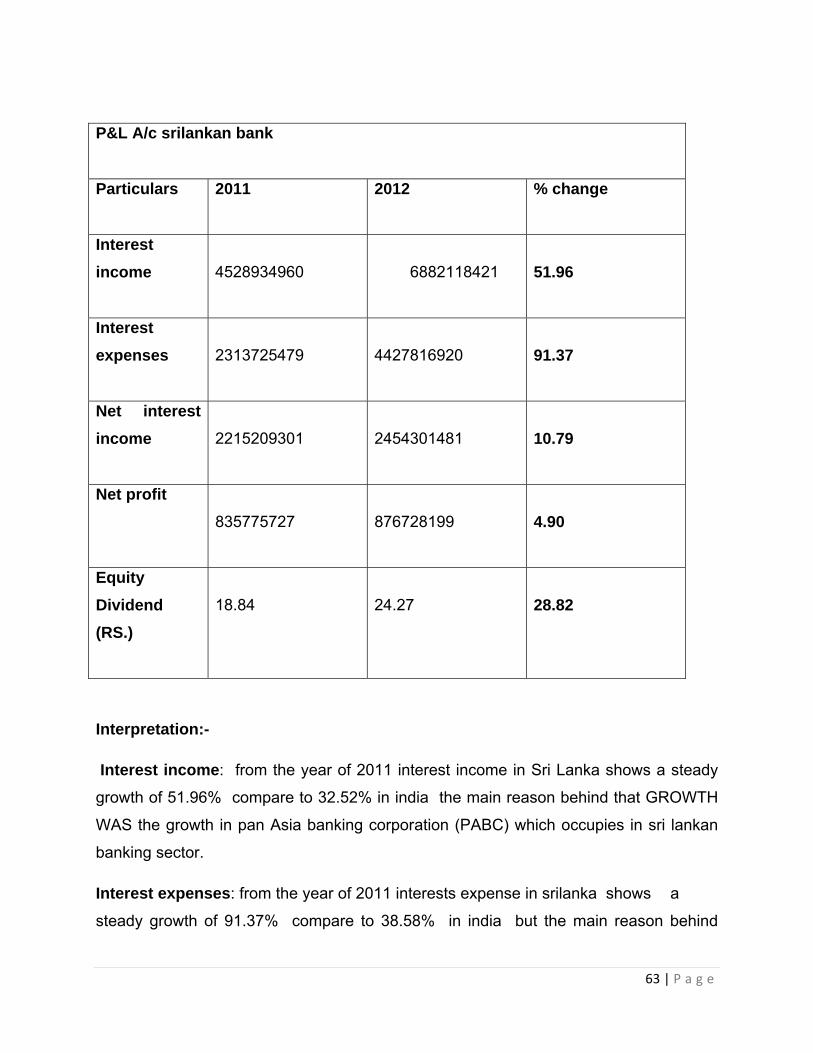
63 | P a g e
Interpretation:-
Interest income: from the year of 2011 interest income in Sri Lanka shows a steady
growth of 51.96% compare to 32.52% in india the main reason behind that GROWTH
WAS the growth in pan Asia banking corporation (PABC) which occupies in sri lankan
banking sector.
Interest expenses: from the year of 2011 interests expense in srilanka shows a
steady growth of 91.37% compare to 38.58% in india but the main reason behind
P&L A/c srilankan bank
Particulars
2011 2012 % change
Interest
income
4528934960
6882118421
51.96
Interest
expenses
2313725479
4427816920
91.37
Net interest
income
2215209301
2454301481
10.79
Net profit
835775727
876728199
4.90
Equity
Dividend
(RS.)
18.84
24.27
28.82
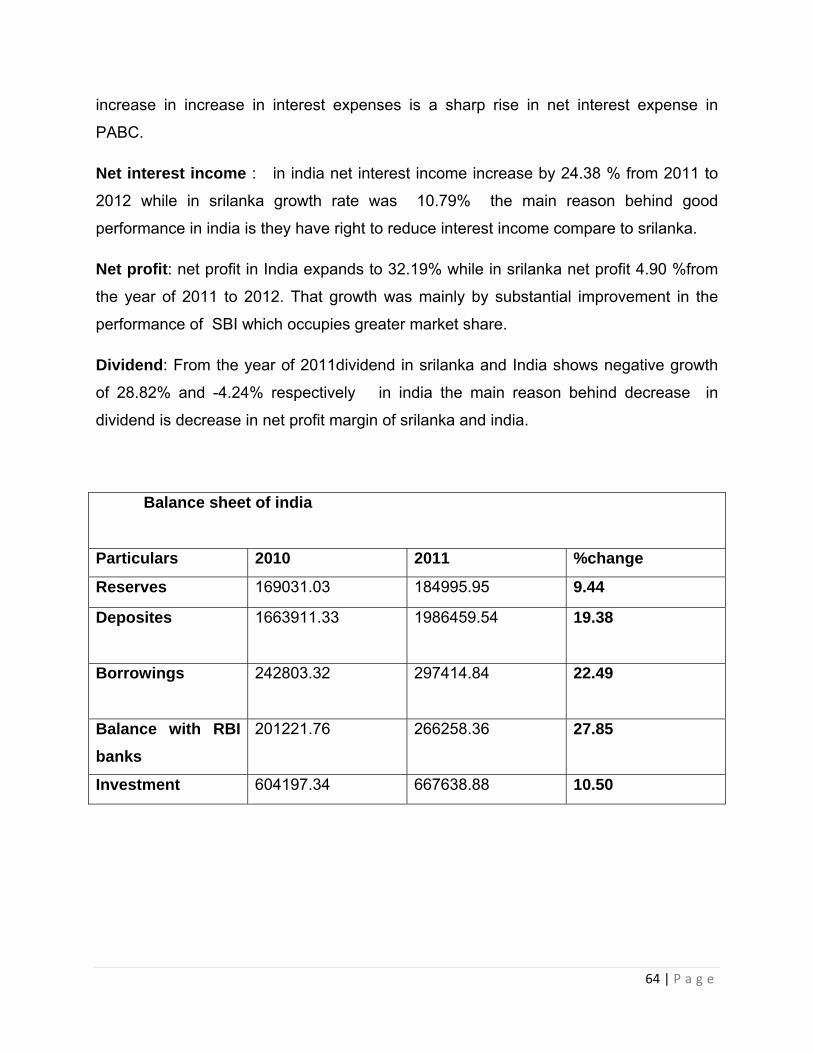
64 | P a g e
increase in increase in interest expenses is a sharp rise in net interest expense in
PABC.
Net interest income : in india net interest income increase by 24.38 % from 2011 to
2012 while in srilanka growth rate was 10.79% the main reason behind good
performance in india is they have right to reduce interest income compare to srilanka.
Net profit: net profit in India expands to 32.19% while in srilanka net profit 4.90 %from
the year of 2011 to 2012. That growth was mainly by substantial improvement in the
performance of SBI which occupies greater market share.
Dividend: From the year of 2011dividend in srilanka and India shows negative growth
of 28.82% and -4.24% respectively in india the main reason behind decrease in
dividend is decrease in net profit margin of srilanka and india.
Balance sheet of india
Particulars 2010 2011 %change
Reserves 169031.03 184995.95 9.44
Deposites
1663911.33 1986459.54 19.38
Borrowings
242803.32 297414.84 22.49
Balance with RBI
banks
201221.76 266258.36 27.85
Investment 604197.34 667638.88 10.50
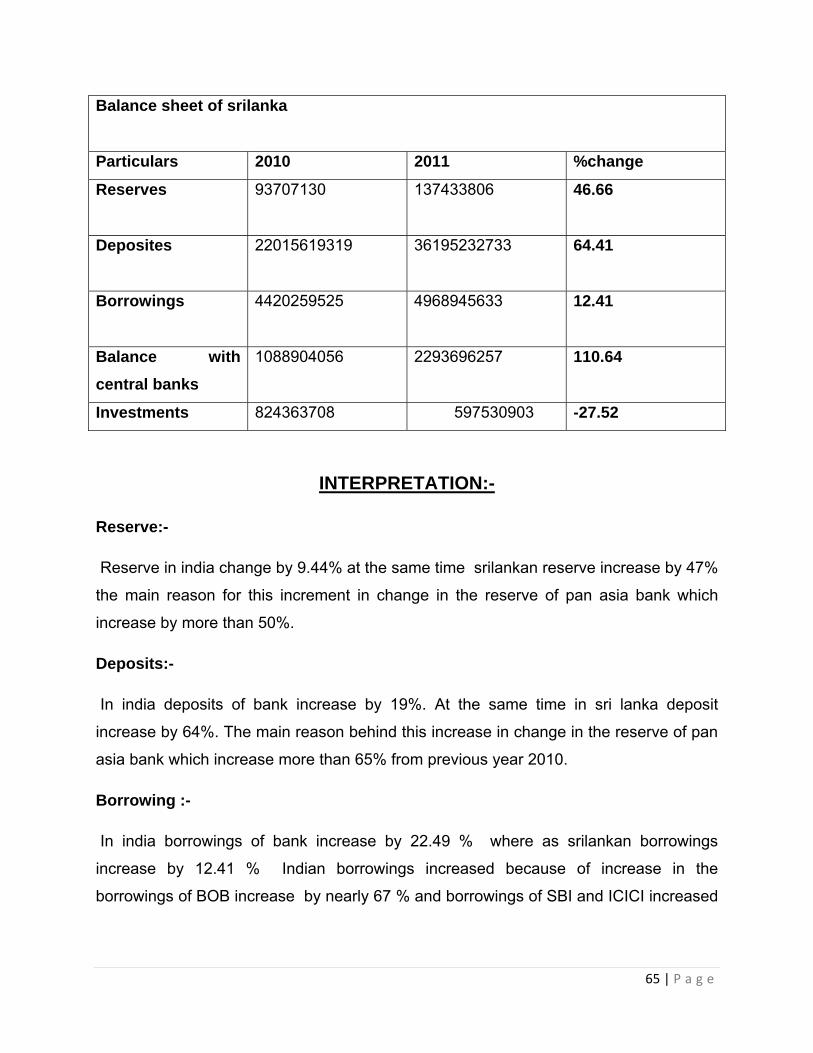
65 | P a g e
Balance sheet of srilanka
Particulars 2010 2011 %change
Reserves 93707130
137433806 46.66
Deposites
22015619319 36195232733 64.41
Borrowings
4420259525 4968945633 12.41
Balance with
central banks
1088904056
2293696257 110.64
Investments 824363708 597530903 -27.52
INTERPRETATION:-
Reserve:-
Reserve in india change by 9.44% at the same time srilankan reserve increase by 47%
the main reason for this increment in change in the reserve of pan asia bank which
increase by more than 50%.
Deposits:-
In india deposits of bank increase by 19%. At the same time in sri lanka deposit
increase by 64%. The main reason behind this increase in change in the reserve of pan
asia bank which increase more than 65% from previous year 2010.
Borrowing :-
In india borrowings of bank increase by 22.49 % where as srilankan borrowings
increase by 12.41 % Indian borrowings increased because of increase in the
borrowings of BOB increase by nearly 67 % and borrowings of SBI and ICICI increased
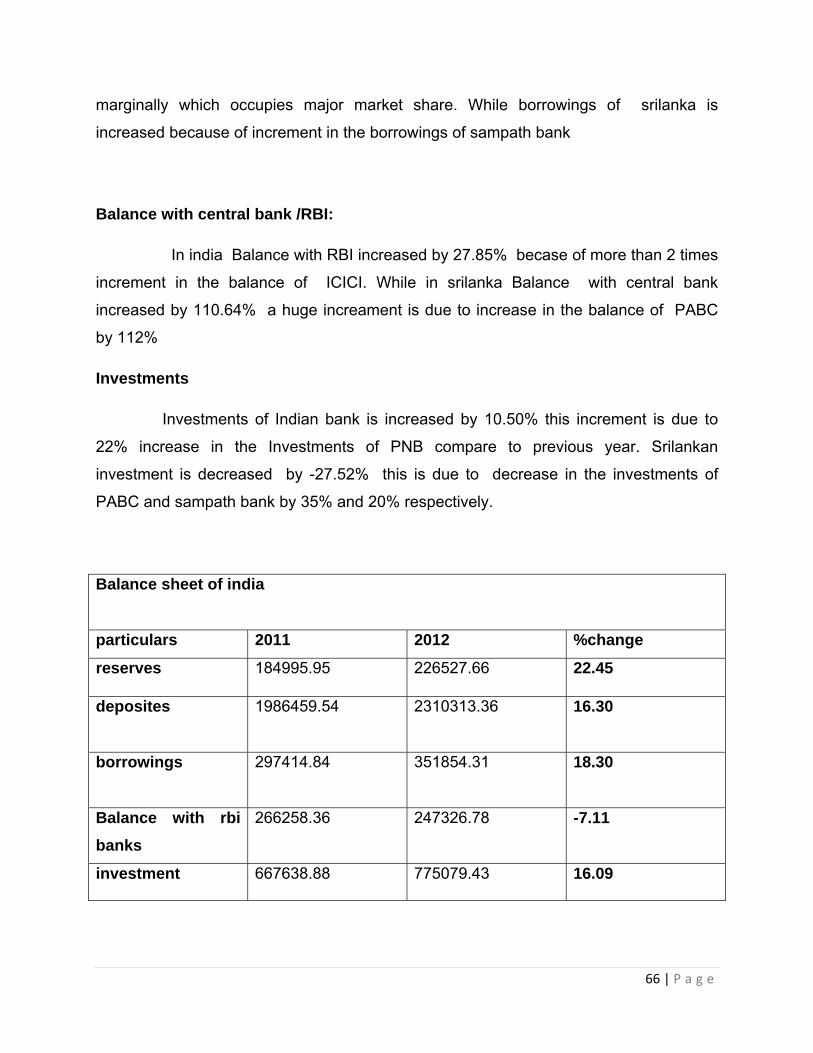
66 | P a g e
marginally which occupies major market share. While borrowings of srilanka is
increased because of increment in the borrowings of sampath bank
Balance with central bank /RBI:
In india Balance with RBI increased by 27.85% becase of more than 2 times
increment in the balance of ICICI. While in srilanka Balance with central bank
increased by 110.64% a huge increament is due to increase in the balance of PABC
by 112%
Investments
Investments of Indian bank is increased by 10.50% this increment is due to
22% increase in the Investments of PNB compare to previous year. Srilankan
investment is decreased by -27.52% this is due to decrease in the investments of
PABC and sampath bank by 35% and 20% respectively.
Balance sheet of india
particulars 2011 2012 %change
reserves 184995.95 226527.66 22.45
deposites
1986459.54 2310313.36 16.30
borrowings
297414.84 351854.31 18.30
Balance with rbi
banks
266258.36 247326.78 -7.11
investment 667638.88 775079.43 16.09
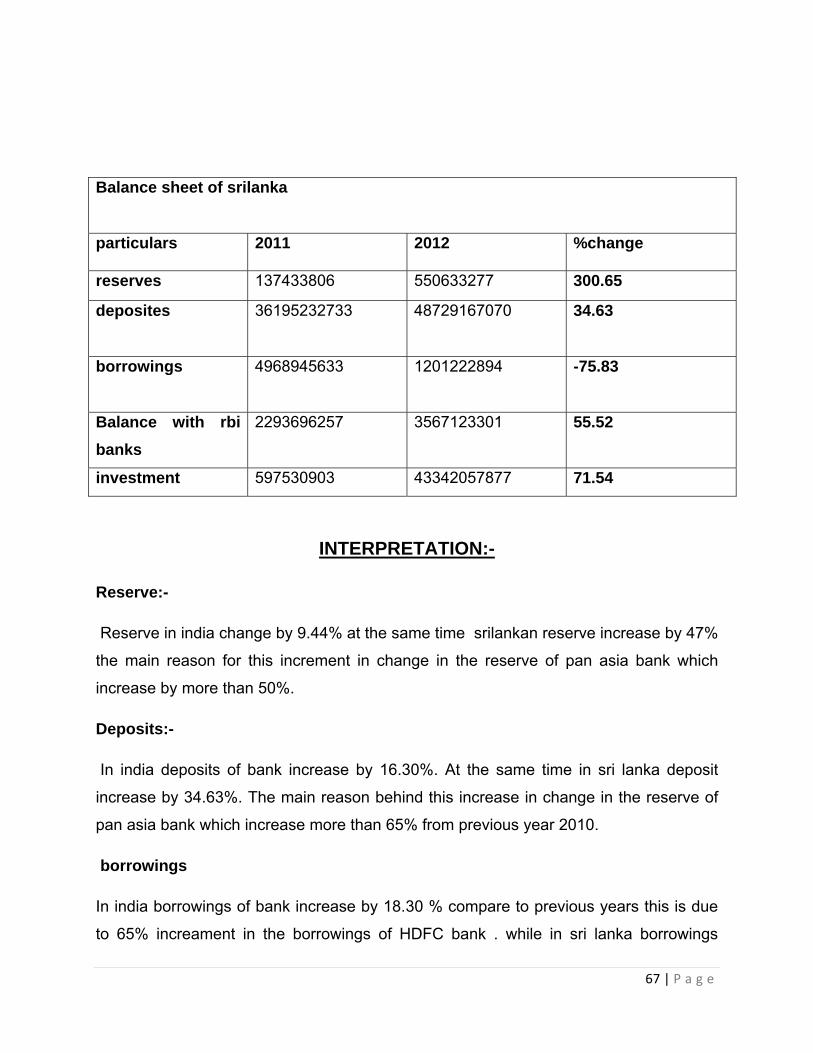
67 | P a g e
Balance sheet of srilanka
particulars 2011 2012 %change
reserves 137433806 550633277 300.65
deposites
36195232733 48729167070 34.63
borrowings
4968945633 1201222894 -75.83
Balance with rbi
banks
2293696257 3567123301 55.52
investment 597530903 43342057877 71.54
INTERPRETATION:-
Reserve:-
Reserve in india change by 9.44% at the same time srilankan reserve increase by 47%
the main reason for this increment in change in the reserve of pan asia bank which
increase by more than 50%.
Deposits:-
In india deposits of bank increase by 16.30%. At the same time in sri lanka deposit
increase by 34.63%. The main reason behind this increase in change in the reserve of
pan asia bank which increase more than 65% from previous year 2010.
borrowings
In india borrowings of bank increase by 18.30 % compare to previous years this is due
to 65% increament in the borrowings of HDFC bank . while in sri lanka borrowings
68 | P a g e
decreased by 75.83% compare to previous year this is due to 77% decrease in the
borrowings of pan asia bank.
Balance with RBI/central banks:
In India Balance with RBI decreased by 7.11% compare to 27.85% previous year. This
is mainly due to decrease in the balance of SBI by 21%. While in sri lanka Balance with
central banks increased by 55.52% this is mainly due to increments in the Balance of
pan Asia bank by 57%
Investments
Investments of Indian bank is increased by 16.09% this increment is due to 37%
increase in the Investments of HDFC compare to previous year. Srilankan investment is
increase by 71.54% this is due to increase in the investments of PABC and sampath
bank by 9 times and 4 times respectively.
69 | P a g e
3.2 Present Position of Indian bank in srilanka
HDFCBankplansfuture:-
HDFC currently serve various sectors of society that provides many products.
HDFC loan facilities offered. Bank customers in all regions of our country to
make available the benefits plans.
"In addition, HDFC offer their customers the benefits of gold loans. The process
is really easy. Once you are logged in gold bank. Bank and the cost will be
immediately eligible loan amount. Gold loan provides partial payment relief.
Future Initiatives: -
businesses, emerging entrepreneurs to start or expand micro-credit facility
provided by the loans.
Bank to help the clients to offer savings and insurance plans.
Micro-credit can help create new employment opportunities
HDFC enable the Central Bank to help refinance plans will be enough money in the
northern province of residence. In addition, remittances Micro Finance Bank seeks to
expand the business with a commitment to another area. "
its clients with guidance on the construction of their homes.
ICICIBank
ICICI Bank to focus on retail lending and remittance business in 1988 under the
Banking Act of Sri Lanka (CBSL) Central Bank with the approval of the Monetary Board,
in January 2006 by a branch office started its operations in Sri Lanka.
Personal, corporate, investment, treasury and bank technological strength, global
financial markets are backed by understanding the needs of business in the ICICI
branch in Sri Lanka offers world-class banking solutions. Bank focused on corporate
finance in India is linked to the cooperation of local and prominent local companies.
Sri Lanka was LKR ICICI branch total assets. 10,831 million in 2012 to LKR 2.643
million loan book for the remainder of the financial assets of LKR 3,253 million net
70 | P a g e
worth, except as to liability on the (government securities and inter-bank lending) were
deployed in liquid investments, when in 2012.
ICICI Bank Ltd, Sri Lanka branch are rated AAA by ICRA Lanka. ICICI Bank Ltd, India's
second largest bank and the Brandz Top 100 Most Valuable Global Brands report 100
brands across all brand categories are ranked in the 45 th.
AxisBankinSriLanka
A licensed commercial bank supervised by the Central Bank of Sri Lanka as Axis Bank,
India's third largest private bank, in Colombo in October 2011, opened its first branch.
Colombo branch, Mr. Ajith Nivard Cabraal, Governor, Sri Lanka, and Mrs. Shikha
Sharma, Axis Bank, Axis Bank, India's Managing Director and CEO, Chairman of the
Central Bank was in October 2011.
Axis Bank, Sri Lanka SME enterprises, agriculture, retail banking,
infrastructure projects and Sri Lanka looks forward to participating in the Offering
Report.
Statebankofindia
State Bank of India, Colombo operational since1864. This branch mainly coffee export
business and government business was opened to handle. This branch of its 148-year
presence in Sri Lanka, the country's oldest bank. This branch is the financial center of
Sri Lanka, the Colombo's Fort area is located in a heritage building. The branch
perfectly with modern technology and all the branches and extension counters to
network with each other, such as SWIFT, etc. are equipped with modern communication
facilities. The working capital financing, deposit accounts and the production of all kinds
of corporate and retail clients are mainly catering, term loans, vehicle loans, housing
loans and trade finance.SBI Mr. Anka branch of the Year in 2012, earned a net profit of
363.02LKR.
71 | P a g e
IndianBank
The Indian bank to open a branch in Colombo in 1932, began its international
expansion. Jan 2011. Open the Jaffna branch. In addition to his two bank branches in
Jaffna and Colombo from Chennai-based Indian Bank by the end of fiscal year 2012, Sri
Lanka open three more branches. The Sri Lankan Indian Bank branches all traditional
banking services, international trade finance, social banking rapid outward remittance
facilities, world-wide correspondent banking relationship, and easy income remittances
mainly focus on the bank provides. In Sri Lanka, Indian Bank has achieved a business
level. Rs 13,723 million in 2012, and deposits increased during the period under view.
7,732 million. Sri Lanka will now stand in the bank loan advances. 5,991 million and
total investments increased by RS. 6726 milion.
IndianOverseasBank
Indian Overseas Bank extended its operations to Sri Lanka in 1945 and has been
operating successfully since the country. Indian Overseas branches in Sri Lanka's
southern region mainly focus on extending the bankwould. Bank in a foreign currency
banking unit in Colombo will start again this year. Indian Overseas Bank to expand its
branches will be more than 2013 years.
72 | P a g e
CHAPTER- 4
Policies and Norms of srilankan banking industry
4.1 Sri Lankan banking sector’s licensing policies & standards:-
Sri Lanka Central Bank was established in 1950. It established under the laws of any
financial Monetary inception in 1949, the 58, the Central Bank is responsible for the
country's financial system is regulated by the Act in the area of highest organization.
Some 1key legislative enactments Central out its tasks to undertake economic and price
stability and financial system stability achieved its primary objective to provide bank
authority. Under these powers, and its supervisory and regulatory functions under the
purview of the Central Bank issues financial institutions established directions in all
categories. In addition, the Central Bank carries out other legislative enactments
functions under the authority of a particular agency.
The country's financial system is regulated by a number of legislative enactments. Key
regulatory role of the Central Bank of the Monetary Law Act, the Local Treasury Bills
Ordinance, Registered Stocks and Securities Ordinance, payment of the Exchange
Control Act, Banking Act, Finance Business Act, Finance Leasing Act, and Settlement
Systems Act related Acts and the Financial Transactions Reporting Act .
Regulatory and supervisory framework for banks mainly Banking Act, the Monetary Law
Act and the Exchange Control Act specified. Central Bank Banks, Commercial Banks
and Licensed Specialised Banks that license (which is a savings and development
banks), banking issues licenses for the two classes.exchange transactions range, while
the latter permits the Central Bank in the foreign exchange allowed for limited events.
73 | P a g e
Institution regulated by the central bank:-
Deposits organization taking
• Licensed Commercial Banks
• Licensed Specialized Banks
• Licensed finance companies
other financial institutions:-
• Primary Dealers
• Specialized Leasing Companies
74 | P a g e
4.2 Regulatory authorities of the Central Bank of Sri Lanka:-
• supervising and regulating banking institutions are mainly governed by 1949 Law
No.58 of the Finance Act, No.30 of 1988 Banking Act and the Exchange Control Act 24
number 1953.and finance companies are carried out in terms of regulatory
supervisionFinance Business Act, No 42 of 2011.
• leasing and finance institutions are regulated under the supervision of Finance Leasing
Act No.56 2000's.
• supervision of government securities primary dealers are regulated Local Treasury
Bills Ordinance No.8 in 1923 and registered in terms of capital And Securities
Ordinance 1937, No.7.
Empower the Central Bank following the law:-
• licensing of new commercial and specialized banks.
• Issue prudential directions, and orders under this Act constancy banks.
• Fill the constant monitoring and examination of banks.
• Resolution to comply with regulatory measures and weak banks.
The regulatory and supervisory banks licensed by the Monetary Board of the Central
Bank in relation to work-out by the Bank of supervision department. Accepted
international standards for bank supervision, supervision of banks issued by the Basel
Committee on Banking Supervision is based on the set.
Continuous system / supervision under the supervision of, licensed commercial banks
and licensed specialized banks, the financial position periodically on the basis of the
information provided by banks on their performance is monitored. This magazine as
deposits and advances weekly interest rates, assets and liabilities, income and
expenses, and advances classified as bad and doubtful debt provision, statutory liquid
assets, capital adequacy on a quarterly return, monthly return on total investment,
including housing provided related parties , interest spreads, foreign currency
75 | P a g e
exposures, maturity gap analysis and audit of financial statements and annual return on
abandoned properties.
Internal bank supervisory rating system in place, capital adequacy, asset quality,
management, profit and liquidity (ie the CAMEL model components) and the Bank
complied with statutory requirements assessment, taking into account such other
qualitative measures, such as quantitative measures, applicable laws and regulations ,
internal controls and corporate governance of the standards, so they are classified
under different risk ratings and the necessary regulatory and supervisory actions to take
to improve the weak banks.
In terms of the provisions of the Banking Act and the Monetary Law Act, all licensed
commercial and Specialised banks are subject to regulatory examinations, at least once
in two years. A new approach has now been adopted by banks for examination - risk-
based examination process, which focuses on banking, risk identification, risk
management and the adequacy of resources in order to reduce this risk assessment.
Prudential requirements and non-compliance with any of the financial condition and
weaknesses deficiencies related matters, restrictions and Bank of systems has brought
to the notice of the board of directors, by the Central Bank to ensure that corrective
action is taken by the bank.
76 | P a g e
4.3 Licensing procedures for opening a bank in Sri Lanka: -
applicable provisions of the Banking Act: 2 sections 76A and 76D in terms of the
Banking Act, the LCB or LSB, respectively business, under the authority of a
license issued by the Monetary Board can only be carried on, with the approval
of the Finance Minister. Licensing process are contained in Sections 3 to 5 of the
Banking Act.
Application Format: Application for a license CBSL Bank of supervision section
(Attachment IIa and IIB) obtained from a sample basis, the Monetary Board of
CBSL will be written.
documents / data with application to the information:
the purpose of carrying on a banking business case for the formation of the
company –
the draft memorandum and / or draft of the Constitution or any other company,
can be designed such that the company is associated with the creation of a
document or a certified copy of the Articles of Association; and
The names, addresses, occupations and qualifications of persons proposed as
directors, and if a Chief Executive Officer (CEO) have been identified that officer,
containing details of the statement.
In case of an application date and the previously formed company intends to
commence banking business
The memorandum and / or a certified copy of the Articles of Association
Company or associated with the creation of the Constitution or any other
document Like;, if any, together with the proposed amendment Company
Documents;
The names, addresses, occupations and qualifications containing the statement
Current directors and any proposed directors nominated or appointed, and
Such as the company's CEO;
77 | P a g e
A copy of the audited balance sheet and profit and loss account for the company Over
the next three years; and
Incorporation of a certificate, a certified copy of the company.In addition, a case of an
application by a bank incorporated outside Sri Lanka The documents specified in 3.3.2
above
written guarantee, supported by a resolution passed by the Board of Directors,
theStating that the company or body corporate shall be that, by the Central Bank on
demand Sri Lanka, such as fund-raising may be needed to cover all obligations
andCarrying on banking business in Sri Lanka liabilities incurred by the branch;And
The regulatory authority of the country in which the bank is a certificate Stating that
permission has been given for the bank to establish a corporate Branch in Sri Lanka In
addition to the above
a feasibility report is supported by at least five years of businessShould be submitted
with the plans for the establishment of the proposed bank With the application.
application, the Director of Bank Supervision may, where considered on receipt
Required, such as the applicant other documents, information or other care necessary
Particulars
Temporary approval of Latter issue:-
After consideration of the documents and other investigations •, if monetary Boardis
satisfied that the application be approved in principle, the Board may issue a temporary
approval of aLetter. This is such a letter, which exceeds twelve-month period will be
valid for the stated period. During this period, the applicant must take all necessary
steps early in the clear. Issue a letter of approval issued temporary licenses for
Monetary Board did not bind.
• a letter issued in respect of a company which has been granted a temporary license,
the issue should be decided not in the banking business. Each advertisement, Prospect
notice prior to issuing a license, etc. should be clear that it has not been issued a
license on banking business.
78 | P a g e
A license issued:-
o To comply with the conditions specified in the letter of the temporary
approval of a license issued to the applicant may request the CBSL.
o The Monetary Board is satisfied that the license may be issued to an
applicant can carry on banking business, such as the applicant for the
license, the Minister of Finance approved the issue.
o Bank banking license to issue a license within nine months of the
business should be started.
o Licensed banks shall pay the annual license fee. The applicable fees for
the year 2012 based on the proposed Bank of Total Asse The Prudential
Requirements compliance by licensed banks
o All LCBs and LSBs of the Banking Act and other relevant laws and
circulars Directions to the provisions in terms of time to comply with the
guidelines issued by the CBSL. All locally incorporated banks and foreign
bank branches in the same prudential requirements applicable to it.
o With all licensed banks, inter alia, the following prudential and regulatory
compliance requirements are necessary.
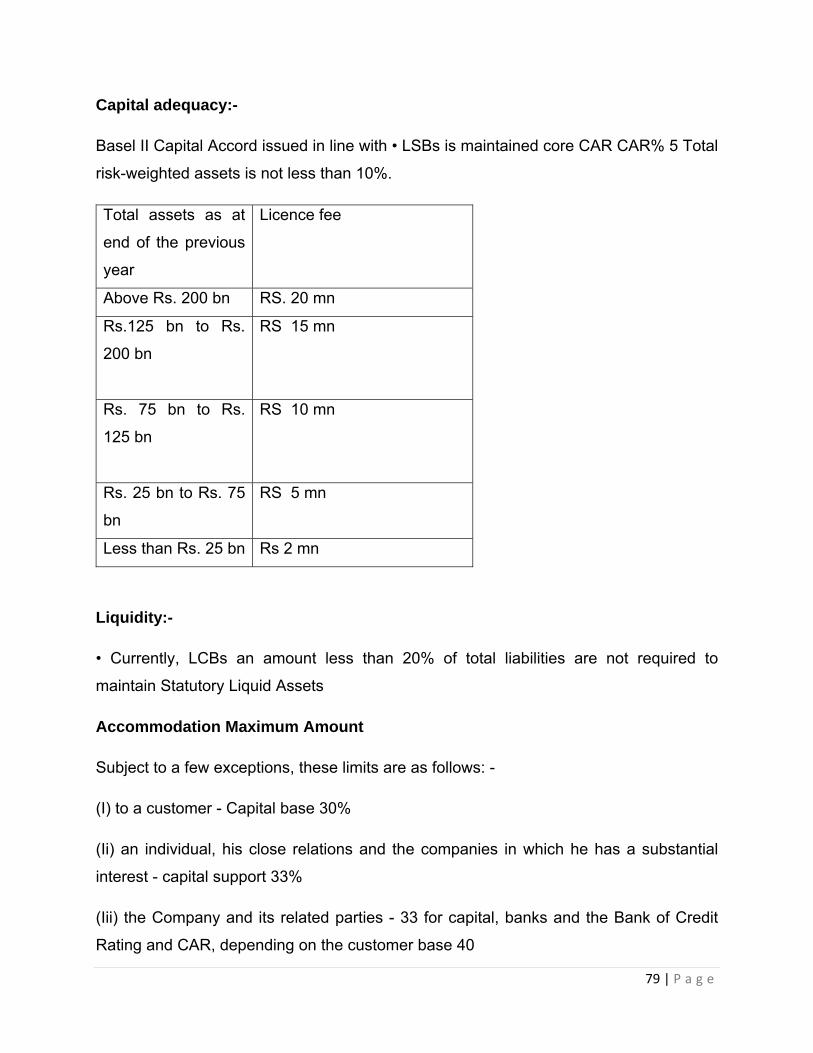
79 | P a g e
Capital adequacy:-
Basel II Capital Accord issued in line with • LSBs is maintained core CAR CAR% 5 Total
risk-weighted assets is not less than 10%.
Total assets as at
end of the previous
year
Licence fee
Above Rs. 200 bn RS. 20 mn
Rs.125 bn to Rs.
200 bn
RS 15 mn
Rs. 75 bn to Rs.
125 bn
RS 10 mn
Rs. 25 bn to Rs. 75
bn
RS 5 mn
Less than Rs. 25 bn Rs 2 mn
Liquidity:-
• Currently, LCBs an amount less than 20% of total liabilities are not required to
maintain Statutory Liquid Assets
Accommodation Maximum Amount
Subject to a few exceptions, these limits are as follows: -
(I) to a customer - Capital base 30%
(Ii) an individual, his close relations and the companies in which he has a substantial
interest - capital support 33%
(Iii) the Company and its related parties - 33 for capital, banks and the Bank of Credit
Rating and CAR, depending on the customer base 40
80 | P a g e
Rule
The main aspects covered are: the Board of Directors of the extensive responsibilities;
This board design; criteria to assess fitness and proprietary directors; management
board is authorized by the act.
Forced Landing:-
All banks, to ensure that at least 10% of their personal credit directed to the agricultural
sector Expatriate employees employment
(I) foreign banks
• Banks whose staff strength is less than 75 to 3
• 75 to 400 banks with a staff strength of 5
• 400 staff strength of more than 10 banks
(Ii) approved on a case by case basis to a local incorporated keeping in mind the
requirements of the banks, the fields of employment on the foreign share of banks with
particular attention to: Basel II risk-based management; International Accounting
Standards;
Rules on "Know Your Customer and Customer Due Diligence"
Financial Transactions Reporting Act's provisions perspective, all banks and their
customers with detailed information on the nature and sources of financial transactions
is required.
Interest rate and exchange rate indicators:-
Interest rates on their deposits and advances of all banks must be displayed and the
buying and selling all of their banking outlets for foreign currency rates for the general
public information.
81 | P a g e
Risks relating to Foreign Exchange Trade System:-
Foreign Exchange Risk Management Policy, the Board and senior management
responsibilities and all other staff involved, Risk Monitoring and Control, Limits of the
framework, Risk measurement and reporting, stress testing: Main cover aspects of
Branch Expansion:-
Monetary Board decided to allow all banks to get anywhere with their trade. Currently,
CBSL banks for each new branch was opened in Western Province Western Province
out of two is required to open 15 branches.
Financial disclosure:-
All banks in their quarterly financial statements in the press, as well as the audit of the
financial statements in accordance with the format prescribed by the CBSL is required.
Sri Lanka Deposit Insurance Scheme:-
All banks in Sri Lanka Deposit Insurance 1 October 2010 are required to join the
scheme. Sri Lanka, shareholders, directors, key management personnel, other related
parties, in terms of any approved accommodation and deposits falling within the
meaning of abandoned property held as collateral against deposits, all deposits
excluding deposits of member banks and financial companies, Government Banking
Act. This premium levied on eligible deposits will range from 0.10% to 0.15% per annum
and will be paid quarterly.
Integrated Risk Management Framework:-
Integrated Risk Management Framework for Licensed Banks 2011on 7 number of
guidelines are effective from 5 October 2011. The direction of the IRM framework
directive principles and minimum standards for licensed banks to adopt as a guide has
been issued with.
82 | P a g e
Customer Charter:-
2011 Licensed Banks in the direction of the customer charter No.8 effective from 5
October 2011. This, rights, and banks and consumers, the restrictions specified in the
'licensed banks of the Customer Charter', a banking operation, a 'code of conduct' has
been introduced as a compulsory Directive.
83 | P a g e
CHAPTER- 5
5.1 Business opportunities for srilankan banks in india
India's banking market is one of the world's fastest-growing. There are a number of
reasons: a burgeoning national economy, financial sector reform, regulatory
environment, one simple step with the increase of foreign investment and a highly
favorable demographic profile, a few names. Some of the leading international banks
have already established a presence in India and the local competition is possible to
achieve profitable growth that have demonstrated. But potentially significant opportunity
in India still have not explored the country awaits the foreign banks that are so large. It
is an opportunity that few can afford to ignore.
Recently, RBI, Indian banking industry to create more sustainable and healthy has
taken some important steps. The savings rate de - regulation, banking reform bill, etc. ..
A large section of the Indian population is still unbanked. Overall, the percentage of
households availing banking services in 2011, the general lack of access to banking
services, which means that 40% of the total households still had around 59%.
INDIAN Banking Association report of 2025, the local banking industry, by turning its
assets size poised to touch USD 28,500 billion, with an exponential growth in the
coming years is set to
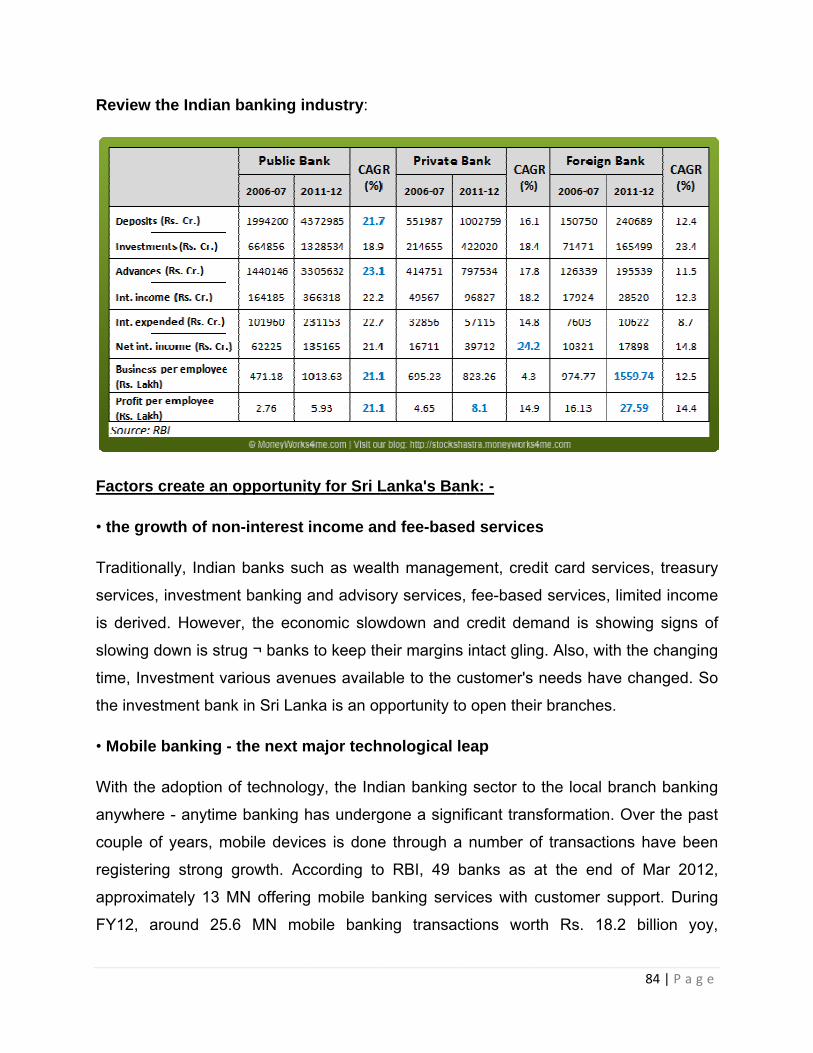
Review
Factors
• the gro
Tradition
services
is derive
slowing
time, Inv
the inve
• Mobile
With the
anywher
couple o
registeri
approxim
FY12, a
the Indian
s create an
owth of no
nally, Indian
s, investme
ed. Howeve
down is str
vestment va
stment ban
e banking -
e adoption
re - anytim
of years, m
ng strong
mately 13 M
around 25
n banking i
opportuni
on-interest
n banks su
nt banking
er, the eco
rug ¬ banks
arious aven
nk in Sri Lan
- the next m
of technolo
e banking
mobile devic
growth. Ac
MN offering
.6 MN mo
ndustry:
ity for Sri L
income an
uch as wea
and adviso
onomic slow
s to keep th
nues availa
nka is an op
major tech
ogy, the Ind
has underg
ces is done
ccording to
g mobile b
obile bank
Lanka's Ba
nd fee-bas
alth manage
ory services
wdown and
heir margins
able to the
pportunity t
hnological
dian bankin
gone a sign
e through a
o RBI, 49
anking ser
king transa
ank: -
ed service
ement, cred
s, fee-base
d credit dem
s intact glin
customer's
to open the
leap
ng sector to
nificant tran
a number o
banks as
rvices with
actions wor
es
dit card se
ed services,
mand is sh
ng. Also, wi
s needs hav
eir branches
o the local
nsformation
of transacti
at the end
customer s
rth Rs. 18
84 | P
rvices, trea
, limited inc
howing sign
th the chan
ve changed
s.
branch ban
n. Over the
ons have b
d of Mar 2
support. Du
8.2 billion
a g e
asury
come
ns of
nging
d. So
nking
past
been
2012,
uring
yoy,
85 | P a g e
respectively, recorded growth of 198% yoy and 174%, were treated. The rapid growth of
smart phones and the growing number of economic data access packages offer many
telecom companies are driven by the availability of the 3G/4G network.
Through ATMs and Internet banking is still a tremendous growth in the growth phase, is
shown. ATM then the branchless banking can be seen as the physical infrastructure
and human resources to do so will reduce the cost. Technology and infrastructure
issues. The IBA-FICCI-BCG report that mobile banking and ATM banking, will become
the second largest of the Channel forecasts.
• Financial Inclusion Program
The issue of financial inclusion is emerging as economic growth in the New Paradigm.
Financial inclusion in the country, one way to play a major role in driving poverty.
Financial and privileged and disadvantaged people at an affordable terms and
conditions, including those to be used for banking services. The basic concept of
financial inclusion in a savings or current account with the bank being. In fact the loans,
insurance services and more includes. 100 countries to learn the extent of the reach of
banking services to the financial benefit of the Index, India is ranked 50. Recently, the
Government of India for rural people to access banking services in Uttar Pradesh, has
announced the opening of 300 bank branches. Only 34% of Indian people still have
access to or receive banking services. 66% of Indian people are still deprived of the
banking sector. So Sri Lankan banks have the opportunity to tap the market.
Banking Laws (Amendment) Bill:
The Banking Regulation Act, 1949, the Banking Companies (Acquisition and Transfer of
Undertakings) Act, 1970/1980 to amend the Indian government recently Banking Laws
(Amendment) Bill 2011 was passed. RBI for the private sector to issue new banking
licenses and the way it will attract more foreign investment.
Banking Laws Amendment Bill which attract the foreign banks in India are the main
features:
86 | P a g e
• Bonus and right shares issued by public sector banks:
So far, the private sector banks, according to the Companies Act, all private sector
banks are allowed to issue bonus shares in the banks, especially the older generation,
as bonus shares to its shareholders are given free shares in which they are involved.
But the public sector banks, holding huge reserves, but so far not issued any bonus
shares. They were nationalized, the compositions in the bonus shares were issued
because of any provision of this mainly. The current bill, therefore, lower by public
sector banks, including the bonus and rights shares into shares in the denomination,
which provides for the issue. So the Sri Lankan public sector bank to open its branch in
India can use their reserves
• Private and public sector bank raising of voting rights:
The 10 per cent cap on voting rights in private banks has increased to 26 per cent. The
Promoters and their group now has 26 percent of the power to be on the ballot.are.
• Mergers and Acquisitions
Competition Commission of India (CCI) troubled banks, all banks except in the case of
mergers and acquisitions (M & A) will be approved. In such cases, the RBI will have
final authority. Therefore, the acquisition of the merger process becomes easier.
• stamp duty for foreign banks
The law of local subsidiaries of foreign banks without having to pay stamp duty or
convert their Indian operations of the bank holding company's shareholding to allow
transport. Foreign banks in India, this move will help to expand their business
operations.
87 | P a g e
5.2 Conclusion and suggestions
Sri Lanka is a nation off the southern shore of the Indian subcontinent. Recognized until
1972 as Ceylon, Sri Lanka is an island bounded by the Indian sea, the Gulf of Mannar
and the Palk Strait, and lies in the surrounding area of India and the Maldives. It is
element of South Asia. As a outcome of its place in the path of main ocean routes, Sri
Lanka is a tactical marine connection between West Asia and South East Asia. It was a
significant stop on the early Silk Road. Sri Lanka has also been a midpoint of the
Buddhist religion and culture from ancient times and is one of the few remaining abodes
of Buddhism in South Asia besides Ladakh, Bhutan and the Chittagong mount tracts.
The Sinhalese people forms the majority of the population; Tamils, who are
concentrated in the north and east of the island, shape the largest racial minority Sri
Lanka is a nation and a unitary state which is governed by a semi-presidential system
with its administrator seat of government in Sri Jayawardenapura-Kotte, the capital. The
normal attractiveness of Sri Lanka has led to the title the gem of the Indian sea. Sri
Lanka is a origin member state of South Asian Association for Regional Coperation and
a associate United Nations, Commonwealth of Nations, G77 and Non-Aligned
Movement. As of 2010, Sri Lanka was one of the rapidly growing economies of the
world. Its stock exchange was Asia's top performing stock market during 2009 and
2010.
Srilanka has relatively stable government but have a limited press freedom. The
economy of srilanka is growing steadily with low inflation and unemployment rate. There
is a balance deployment of labour force in major sectors. The literacy rate and life
expectancy rate is high because of avalibility of better healthcare facility. Labor laws in
srilanka is very strict while issue of corruption and government intervention in legal
matters is an area of concern.
The main economic sectors of srilanka are Tourism, Tea Industry, Apparel and textile
industry, Agriculture, ITEs and software development. The main EXIM partners of
srilanka are India, china, U.A.E., Singapore, U.S.A.,U.K. ,Italy, Belgium Germany and
Russia.
88 | P a g e
The relationship between India and srilanka is more than 2,500 years old, and both
sides of the intellectual, cultural, religious and linguistic intercourse is built on a legacy.
But relations between the 2 countries and spend time with mature and diversified,
including all areas of current importance. Cultural and cultural heritage shared by the
two countries and their citizens and build the foundation for people to interact
Multilateral Partnership provides a wide range of people. Srilanka has signed various
bilateral trade relation agreements for healthy development of the country like
Comprehensive Economic Partnership Agreement, India Sri Lanka Free Trade
agreement, South Asian Free Trade area.
Many Indian companies has invested in srilanka like Airtel, Ultratech and Taj group of
hotels. The major products which are traded between this two countries are tea, coffee,
spice,machineries, sugar and confectionary and salt sulpher and earth stone
The major banks of srilanka’s banking sectors are hatton national bank, sampth bank,
seylan bank, nations trust bank and pan Asia banking corporation. While major banks of
Indian banking sector are state bank of India, Punjab national bank, bank of Baroda,
Housing Development Finance Corporation and industrial credit and investment
corporation of India limited.
SBI , ICICI, Axis bank, Indian bank and Indian overseas bank has its branches in
srilanka. But no srilankan bank has its branch in India.
In srilanka central bank is the apex bank and financial system of whole country is
regulated by it under the Banking Act, Monetary Law Act and the Exchange Control Act.
The central bank of srilanka can give license to any bank to start its business. There are
mainly Three types of financial organizations are allowed under Banking Act and the
Finance Companies Act to function in Sri Lanka by the Central Bank of Sri Lanka.They
are
89 | P a g e
Licensed Commercial Banks
Registered Finance Companies
Licensed Specialized Banks
These organizations can accept deposits from the public. The number of approved
specific banks decreased from 14 to 9 and the number of registered financial institutions
improved from 31 to 36 during the period of 2007 to 2010.The present list of banks in
Sri Lanka is published by Central Bank of Sri Lanka from time to time. The licensing
fees are from RS. 2 to 20 million depending upon the size of assets.
Sri Lankan bank has opportunities to star its branches in India. The factors that create
opportunities are growing non interest income and fee based services, financial
inclusion program in India and banking amendment bill.
So Sri Lankan banking sector has huge opportunities and incentive to start their
business in India.
90 | P a g e
REFERENCE & BIBLIOGRAPHY:-
www.wikipedia.org
www.cia.gov
www.Doingbusiness.org
www.worldbank.org
www.customs.gov.lk
www.Cbsl.gov.lk
www.investsrilanka.com
www.sbi.org.in
www.hdfc.com
www.icici.com
www.moneycontrol.com
Annexure:-
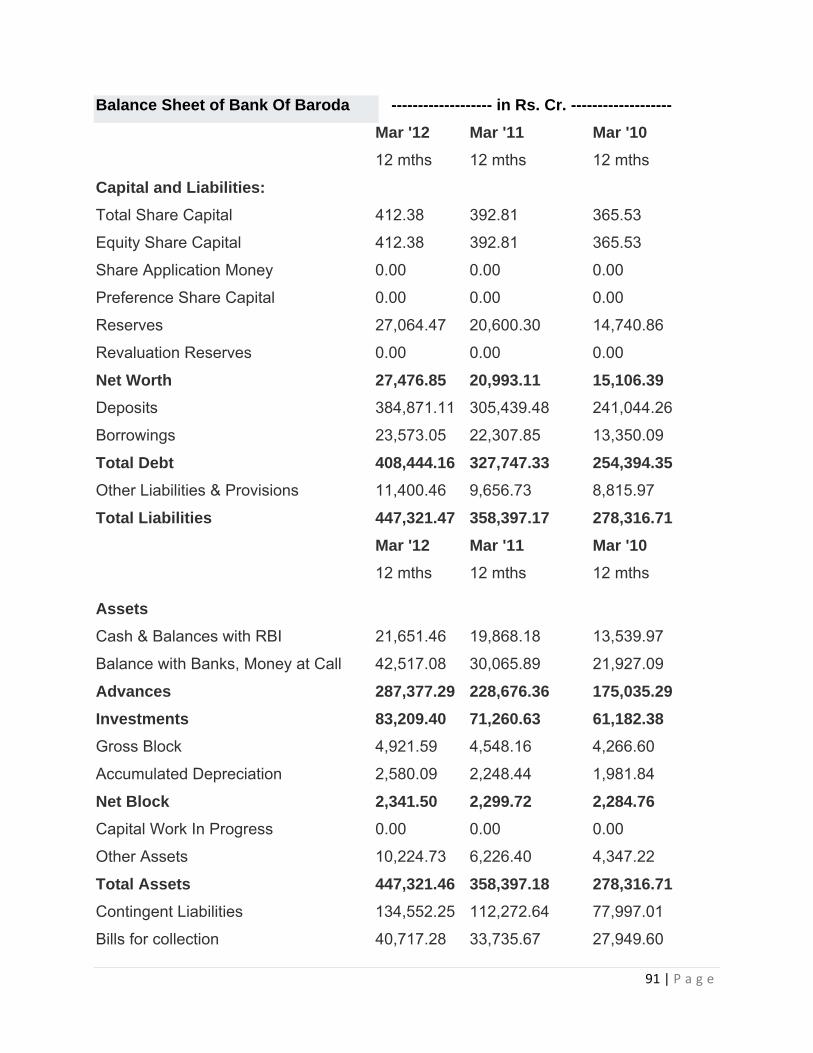
91 | P a g e
Balance Sheet of Bank Of Baroda ------------------- in Rs. Cr. -------------------
Mar '12 Mar '11 Mar '10
12 mths 12 mths 12 mths
Capital and Liabilities:
Total Share Capital 412.38 392.81 365.53
Equity Share Capital 412.38 392.81 365.53
Share Application Money 0.00 0.00 0.00
Preference Share Capital 0.00 0.00 0.00
Reserves 27,064.47 20,600.30 14,740.86
Revaluation Reserves 0.00 0.00 0.00
Net Worth 27,476.85 20,993.11 15,106.39
Deposits 384,871.11 305,439.48 241,044.26
Borrowings 23,573.05 22,307.85 13,350.09
Total Debt 408,444.16 327,747.33 254,394.35
Other Liabilities & Provisions 11,400.46 9,656.73 8,815.97
Total Liabilities 447,321.47 358,397.17 278,316.71
Mar '12 Mar '11 Mar '10
12 mths 12 mths 12 mths
Assets
Cash & Balances with RBI 21,651.46 19,868.18 13,539.97
Balance with Banks, Money at Call 42,517.08 30,065.89 21,927.09
Advances 287,377.29 228,676.36 175,035.29
Investments 83,209.40 71,260.63 61,182.38
Gross Block 4,921.59 4,548.16 4,266.60
Accumulated Depreciation 2,580.09 2,248.44 1,981.84
Net Block 2,341.50 2,299.72 2,284.76
Capital Work In Progress 0.00 0.00 0.00
Other Assets 10,224.73 6,226.40 4,347.22
Total Assets 447,321.46 358,397.18 278,316.71
Contingent Liabilities 134,552.25 112,272.64 77,997.01
Bills for collection 40,717.28 33,735.67 27,949.60

92 | P a g e
Book Value (Rs) 668.34 536.16 414.71
Bank Of Baroda
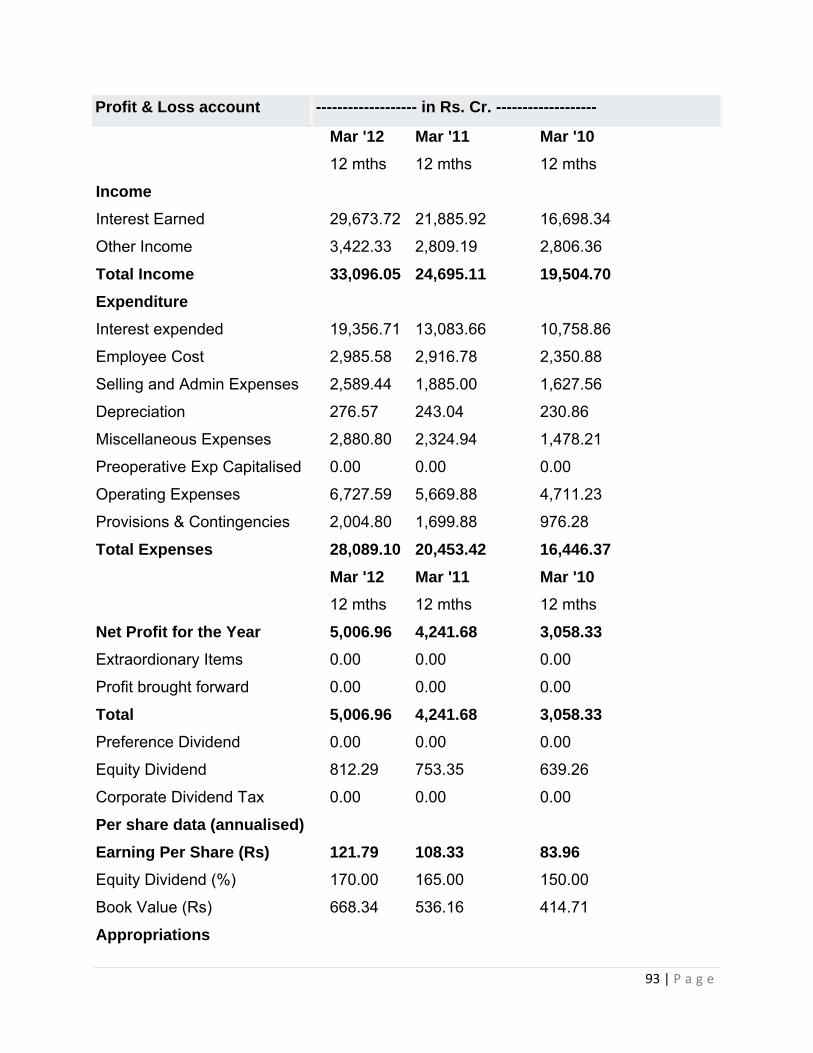
93 | P a g e
Profit & Loss account ------------------- in Rs. Cr. -------------------
Mar '12 Mar '11 Mar '10
12 mths 12 mths 12 mths
Income
Interest Earned 29,673.72 21,885.92 16,698.34
Other Income 3,422.33 2,809.19 2,806.36
Total Income 33,096.05 24,695.11 19,504.70
Expenditure
Interest expended 19,356.71 13,083.66 10,758.86
Employee Cost 2,985.58 2,916.78 2,350.88
Selling and Admin Expenses 2,589.44 1,885.00 1,627.56
Depreciation 276.57 243.04 230.86
Miscellaneous Expenses 2,880.80 2,324.94 1,478.21
Preoperative Exp Capitalised 0.00 0.00 0.00
Operating Expenses 6,727.59 5,669.88 4,711.23
Provisions & Contingencies 2,004.80 1,699.88 976.28
Total Expenses 28,089.10 20,453.42 16,446.37
Mar '12 Mar '11 Mar '10
12 mths 12 mths 12 mths
Net Profit for the Year 5,006.96 4,241.68 3,058.33
Extraordionary Items 0.00 0.00 0.00
Profit brought forward 0.00 0.00 0.00
Total 5,006.96 4,241.68 3,058.33
Preference Dividend 0.00 0.00 0.00
Equity Dividend 812.29 753.35 639.26
Corporate Dividend Tax 0.00 0.00 0.00
Per share data (annualised)
Earning Per Share (Rs) 121.79 108.33 83.96
Equity Dividend (%) 170.00 165.00 150.00
Book Value (Rs) 668.34 536.16 414.71
Appropriations
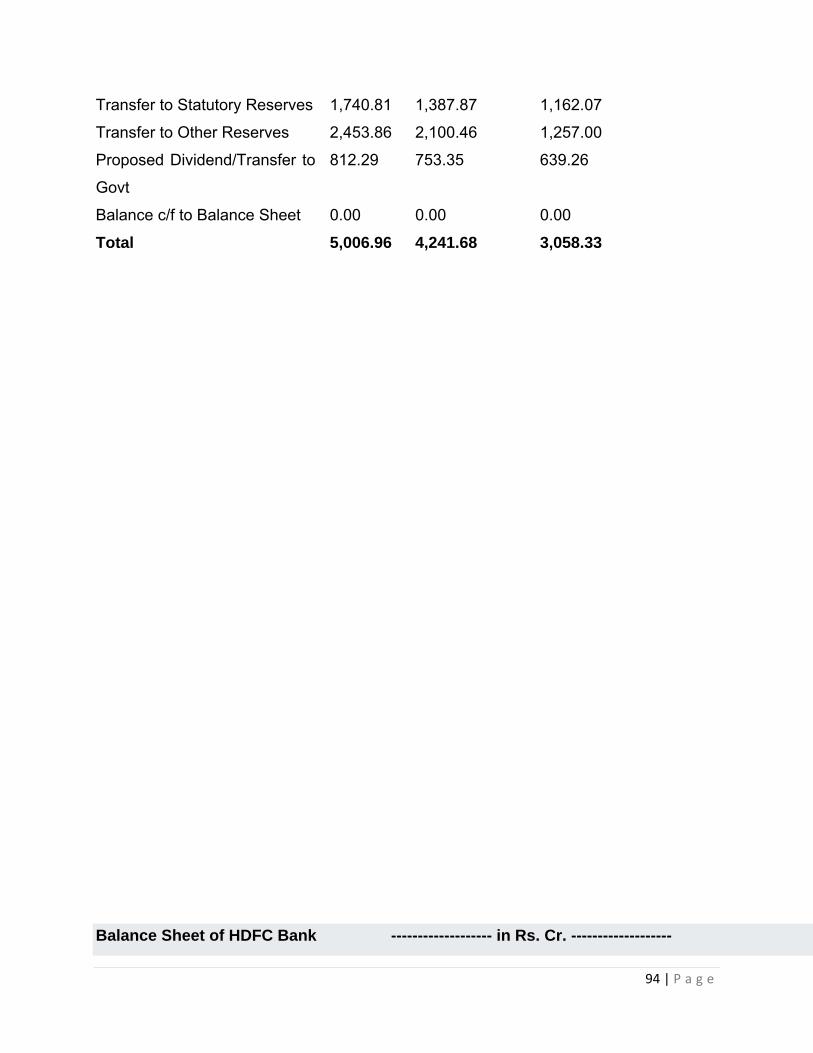
94 | P a g e
Transfer to Statutory Reserves 1,740.81 1,387.87 1,162.07
Transfer to Other Reserves 2,453.86 2,100.46 1,257.00
Proposed Dividend/Transfer to
Govt
812.29 753.35 639.26
Balance c/f to Balance Sheet 0.00 0.00 0.00
Total 5,006.96 4,241.68 3,058.33
Balance Sheet of HDFC Bank ------------------- in Rs. Cr. -------------------
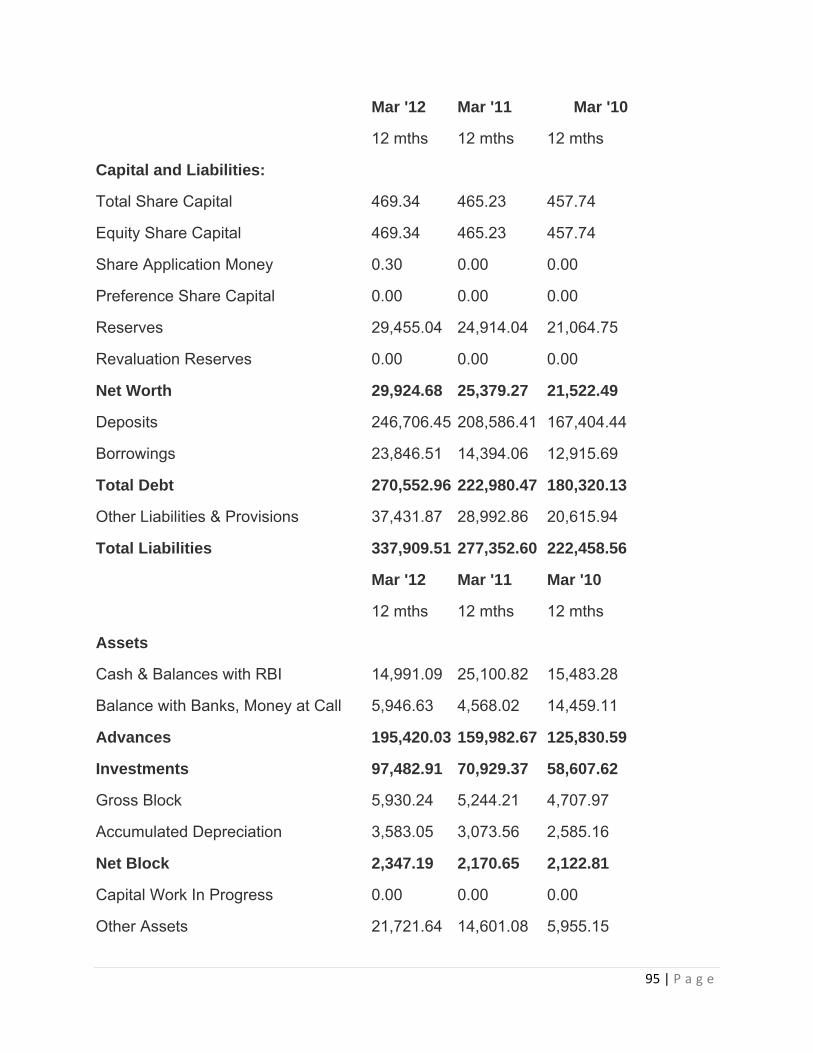
95 | P a g e
Mar '12 Mar '11 Mar '10
12 mths 12 mths 12 mths
Capital and Liabilities:
Total Share Capital 469.34 465.23 457.74
Equity Share Capital 469.34 465.23 457.74
Share Application Money 0.30 0.00 0.00
Preference Share Capital 0.00 0.00 0.00
Reserves 29,455.04 24,914.04 21,064.75
Revaluation Reserves 0.00 0.00 0.00
Net Worth 29,924.68 25,379.27 21,522.49
Deposits 246,706.45 208,586.41 167,404.44
Borrowings 23,846.51 14,394.06 12,915.69
Total Debt 270,552.96 222,980.47 180,320.13
Other Liabilities & Provisions 37,431.87 28,992.86 20,615.94
Total Liabilities 337,909.51 277,352.60 222,458.56
Mar '12 Mar '11 Mar '10
12 mths 12 mths 12 mths
Assets
Cash & Balances with RBI 14,991.09 25,100.82 15,483.28
Balance with Banks, Money at Call 5,946.63 4,568.02 14,459.11
Advances 195,420.03 159,982.67 125,830.59
Investments 97,482.91 70,929.37 58,607.62
Gross Block 5,930.24 5,244.21 4,707.97
Accumulated Depreciation 3,583.05 3,073.56 2,585.16
Net Block 2,347.19 2,170.65 2,122.81
Capital Work In Progress 0.00 0.00 0.00
Other Assets 21,721.64 14,601.08 5,955.15
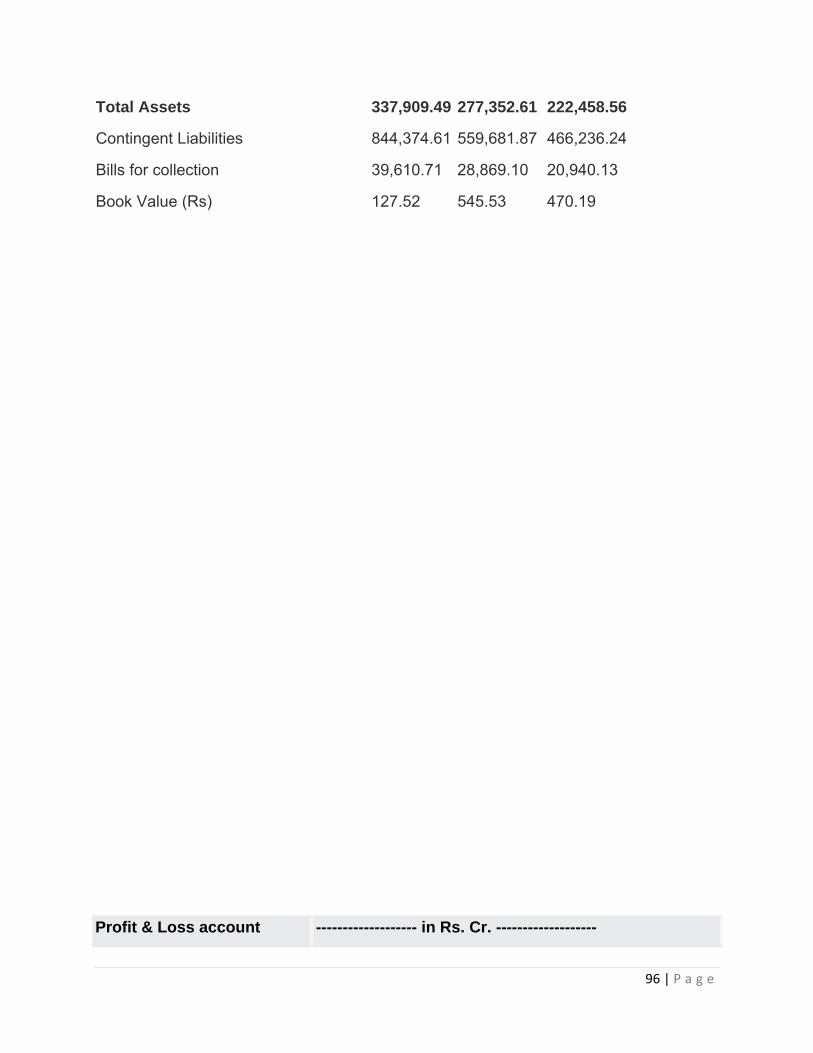
96 | P a g e
Total Assets 337,909.49 277,352.61 222,458.56
Contingent Liabilities 844,374.61 559,681.87 466,236.24
Bills for collection 39,610.71 28,869.10 20,940.13
Book Value (Rs) 127.52 545.53 470.19
Profit & Loss account ------------------- in Rs. Cr. -------------------
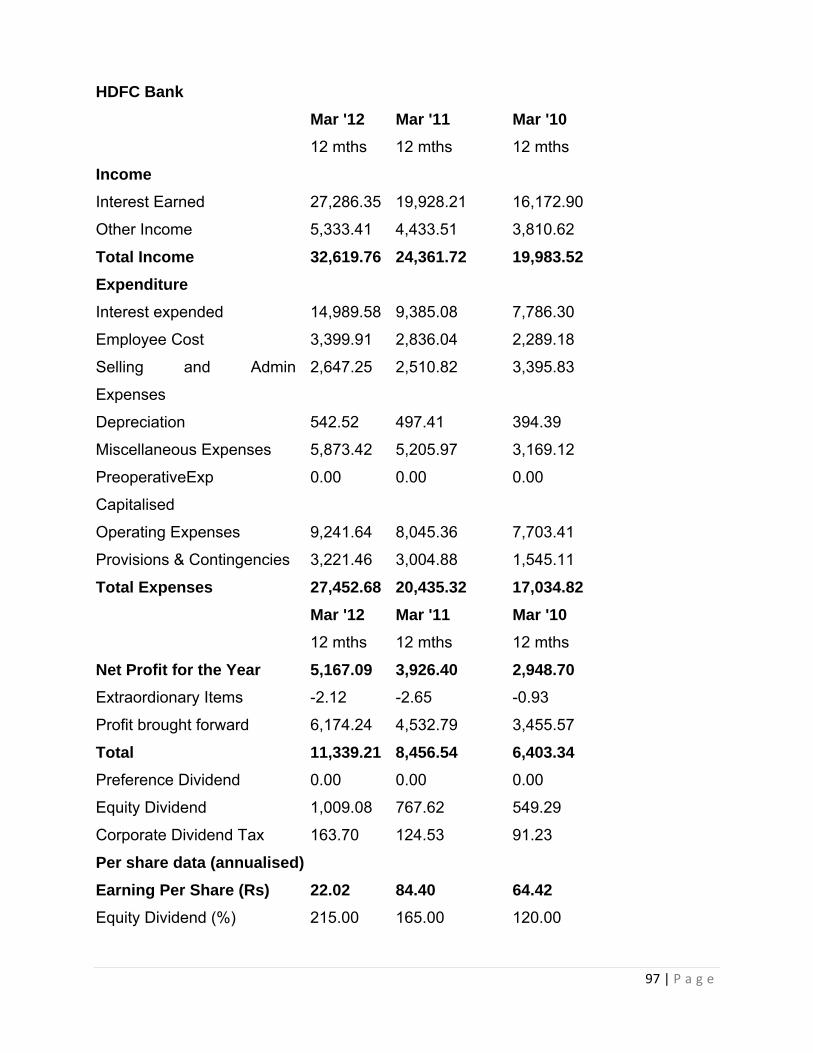
97 | P a g e
Mar '12 Mar '11 Mar '10
12 mths 12 mths 12 mths
Income
Interest Earned 27,286.35 19,928.21 16,172.90
Other Income 5,333.41 4,433.51 3,810.62
Total Income 32,619.76 24,361.72 19,983.52
Expenditure
Interest expended 14,989.58 9,385.08 7,786.30
Employee Cost 3,399.91 2,836.04 2,289.18
Selling and Admin
Expenses
2,647.25 2,510.82 3,395.83
Depreciation 542.52 497.41 394.39
Miscellaneous Expenses 5,873.42 5,205.97 3,169.12
PreoperativeExp
Capitalised
0.00 0.00 0.00
Operating Expenses 9,241.64 8,045.36 7,703.41
Provisions & Contingencies 3,221.46 3,004.88 1,545.11
Total Expenses 27,452.68 20,435.32 17,034.82
Mar '12 Mar '11 Mar '10
12 mths 12 mths 12 mths
Net Profit for the Year 5,167.09 3,926.40 2,948.70
Extraordionary Items -2.12 -2.65 -0.93
Profit brought forward 6,174.24 4,532.79 3,455.57
Total 11,339.21 8,456.54 6,403.34
Preference Dividend 0.00 0.00 0.00
Equity Dividend 1,009.08 767.62 549.29
Corporate Dividend Tax 163.70 124.53 91.23
Per share data (annualised)
Earning Per Share (Rs) 22.02 84.40 64.42
Equity Dividend (%) 215.00 165.00 120.00
HDFC Bank
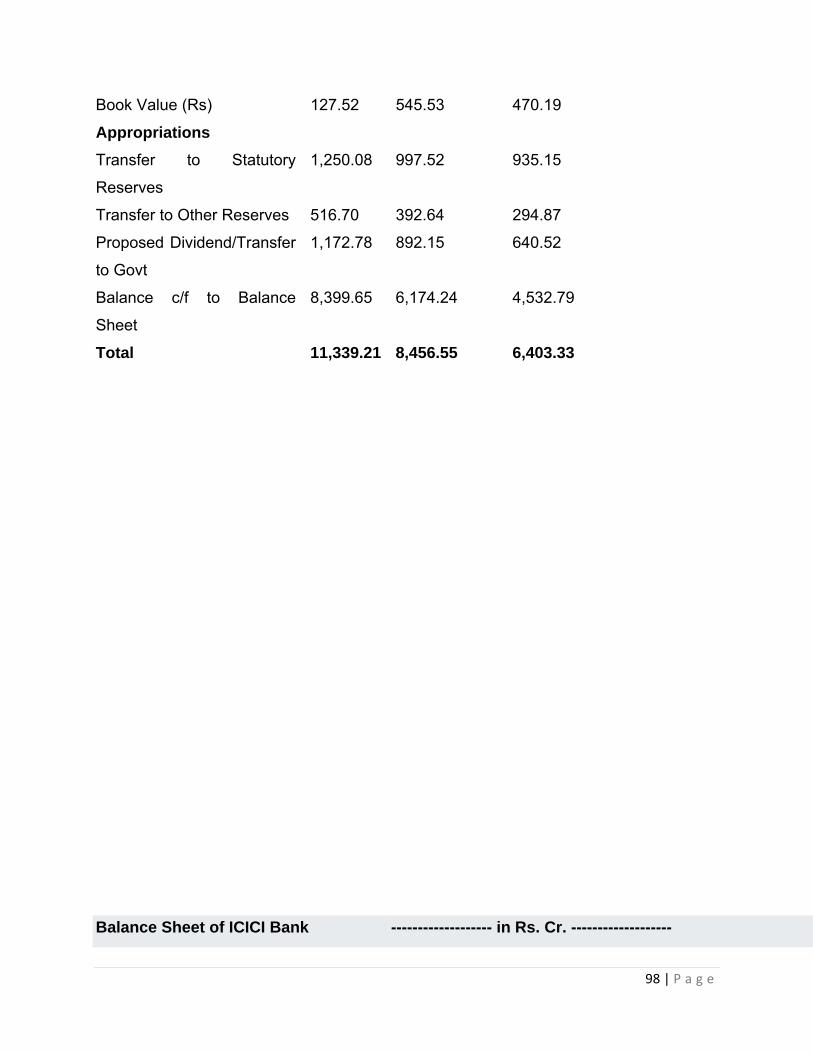
98 | P a g e
Book Value (Rs) 127.52 545.53 470.19
Appropriations
Transfer to Statutory
Reserves
1,250.08 997.52 935.15
Transfer to Other Reserves 516.70 392.64 294.87
Proposed Dividend/Transfer
to Govt
1,172.78 892.15 640.52
Balance c/f to Balance
Sheet
8,399.65 6,174.24 4,532.79
Total 11,339.21 8,456.55 6,403.33
Balance Sheet of ICICI Bank ------------------- in Rs. Cr. -------------------
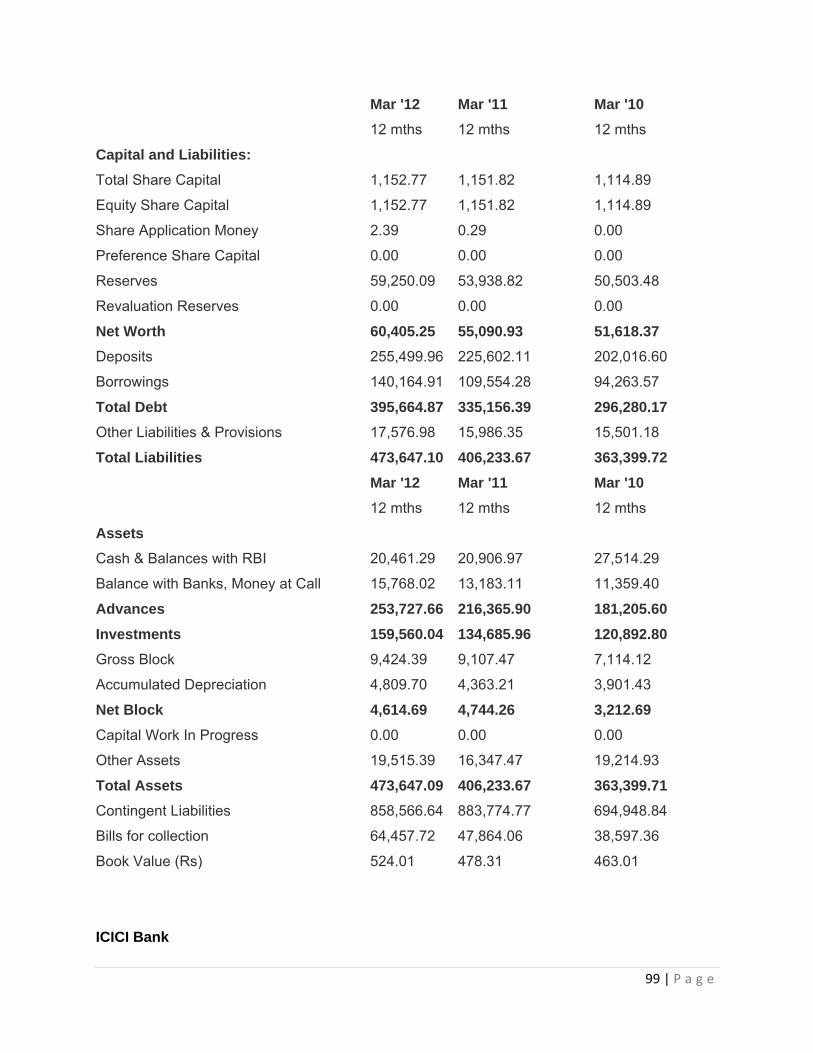
99 | P a g e
Mar '12 Mar '11 Mar '10
12 mths 12 mths 12 mths
Capital and Liabilities:
Total Share Capital 1,152.77 1,151.82 1,114.89
Equity Share Capital 1,152.77 1,151.82 1,114.89
Share Application Money 2.39 0.29 0.00
Preference Share Capital 0.00 0.00 0.00
Reserves 59,250.09 53,938.82 50,503.48
Revaluation Reserves 0.00 0.00 0.00
Net Worth 60,405.25 55,090.93 51,618.37
Deposits 255,499.96 225,602.11 202,016.60
Borrowings 140,164.91 109,554.28 94,263.57
Total Debt 395,664.87 335,156.39 296,280.17
Other Liabilities & Provisions 17,576.98 15,986.35 15,501.18
Total Liabilities 473,647.10 406,233.67 363,399.72
Mar '12 Mar '11 Mar '10
12 mths 12 mths 12 mths
Assets
Cash & Balances with RBI 20,461.29 20,906.97 27,514.29
Balance with Banks, Money at Call 15,768.02 13,183.11 11,359.40
Advances 253,727.66 216,365.90 181,205.60
Investments 159,560.04 134,685.96 120,892.80
Gross Block 9,424.39 9,107.47 7,114.12
Accumulated Depreciation 4,809.70 4,363.21 3,901.43
Net Block 4,614.69 4,744.26 3,212.69
Capital Work In Progress 0.00 0.00 0.00
Other Assets 19,515.39 16,347.47 19,214.93
Total Assets 473,647.09 406,233.67 363,399.71
Contingent Liabilities 858,566.64 883,774.77 694,948.84
Bills for collection 64,457.72 47,864.06 38,597.36
Book Value (Rs) 524.01 478.31 463.01
ICICI Bank
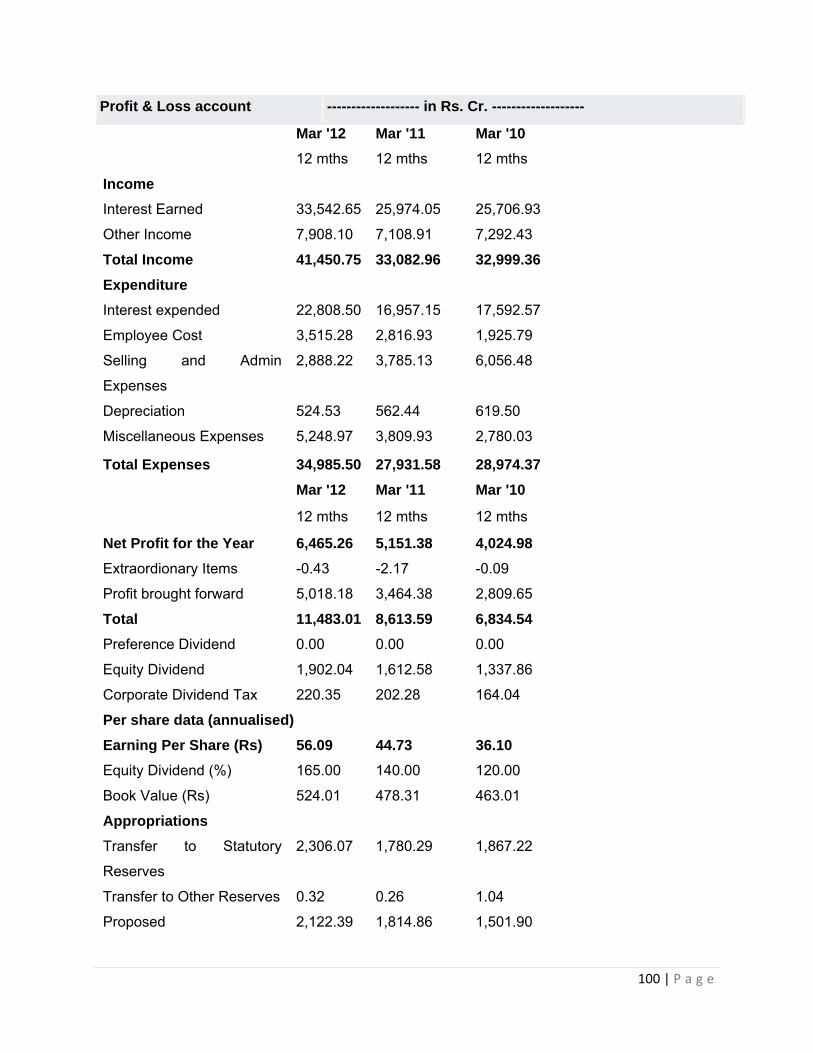
100 | P a g e
Profit & Loss account ------------------- in Rs. Cr. -------------------
Mar '12 Mar '11 Mar '10
12 mths 12 mths 12 mths
Income
Interest Earned 33,542.65 25,974.05 25,706.93
Other Income 7,908.10 7,108.91 7,292.43
Total Income 41,450.75 33,082.96 32,999.36
Expenditure
Interest expended 22,808.50 16,957.15 17,592.57
Employee Cost 3,515.28 2,816.93 1,925.79
Selling and Admin
Expenses
2,888.22 3,785.13 6,056.48
Depreciation 524.53 562.44 619.50
Miscellaneous Expenses 5,248.97 3,809.93 2,780.03
Total Expenses 34,985.50 27,931.58 28,974.37
Mar '12 Mar '11 Mar '10
12 mths 12 mths 12 mths
Net Profit for the Year 6,465.26 5,151.38 4,024.98
Extraordionary Items -0.43 -2.17 -0.09
Profit brought forward 5,018.18 3,464.38 2,809.65
Total 11,483.01 8,613.59 6,834.54
Preference Dividend 0.00 0.00 0.00
Equity Dividend 1,902.04 1,612.58 1,337.86
Corporate Dividend Tax 220.35 202.28 164.04
Per share data (annualised)
Earning Per Share (Rs) 56.09 44.73 36.10
Equity Dividend (%) 165.00 140.00 120.00
Book Value (Rs) 524.01 478.31 463.01
Appropriations
Transfer to Statutory
Reserves
2,306.07 1,780.29 1,867.22
Transfer to Other Reserves 0.32 0.26 1.04
Proposed 2,122.39 1,814.86 1,501.90
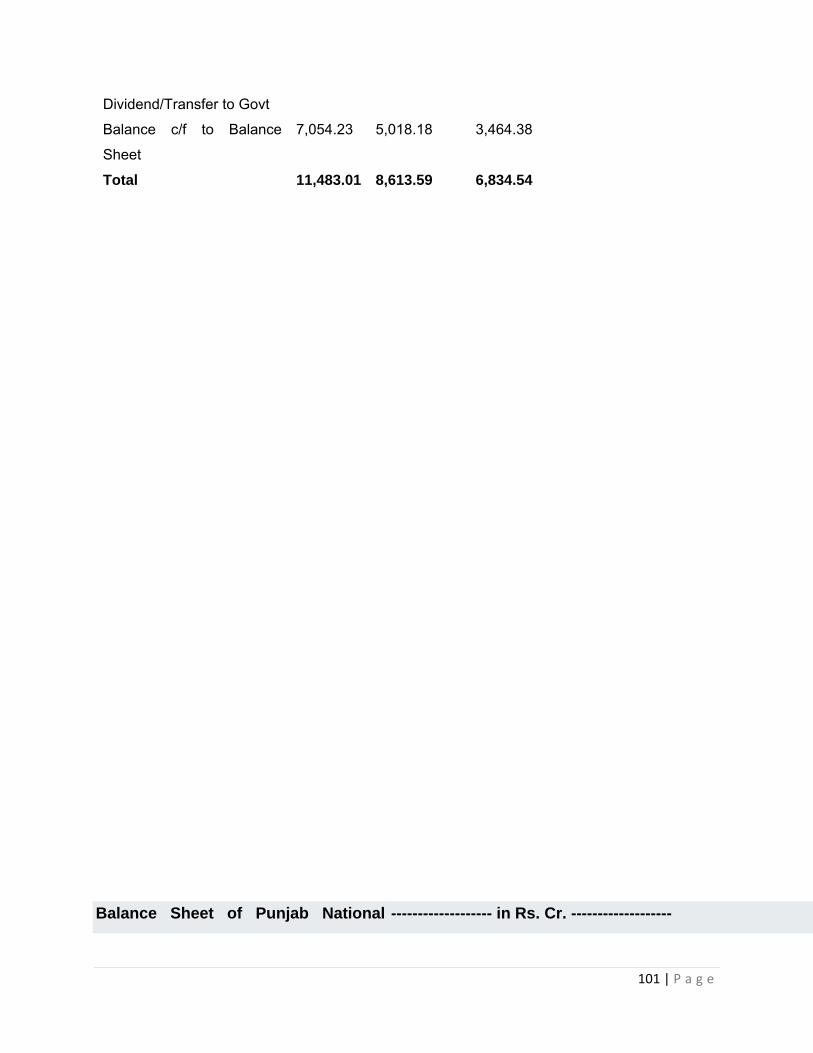
101 | P a g e
Dividend/Transfer to Govt
Balance c/f to Balance
Sheet
7,054.23 5,018.18 3,464.38
Total 11,483.01 8,613.59 6,834.54
Balance Sheet of Punjab National ------------------- in Rs. Cr. -------------------
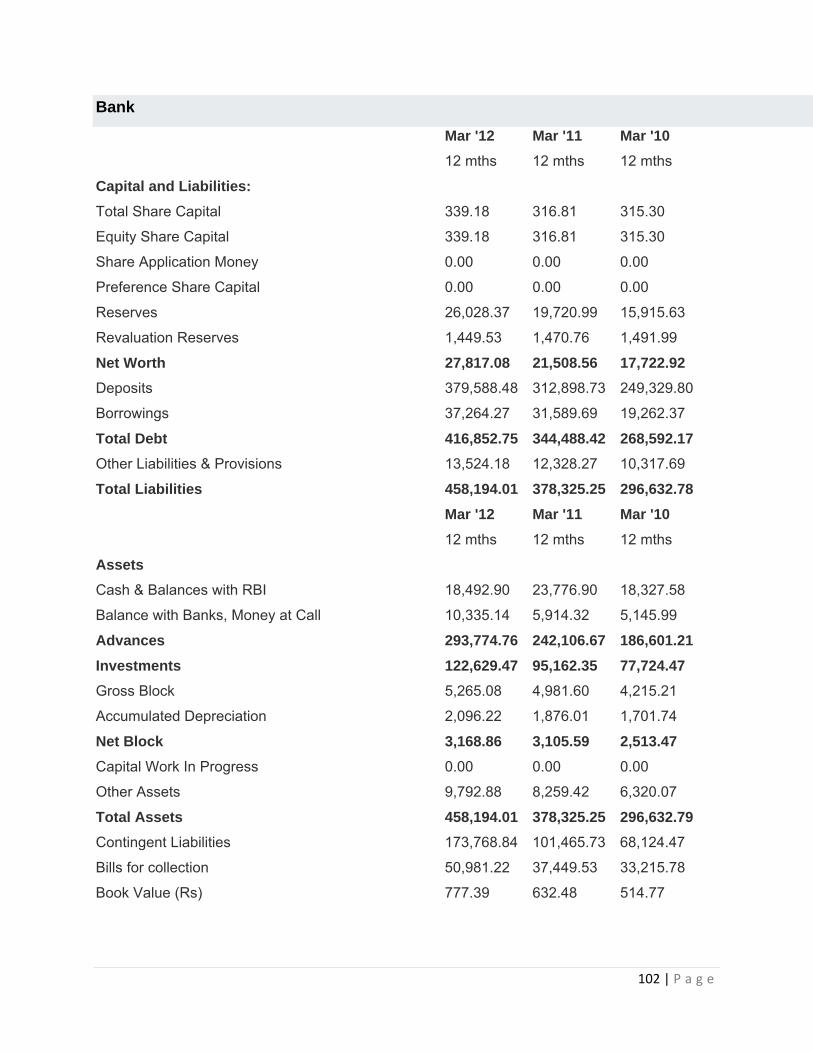
102 | P a g e
Bank
Mar '12 Mar '11 Mar '10
12 mths 12 mths 12 mths
Capital and Liabilities:
Total Share Capital 339.18 316.81 315.30
Equity Share Capital 339.18 316.81 315.30
Share Application Money 0.00 0.00 0.00
Preference Share Capital 0.00 0.00 0.00
Reserves 26,028.37 19,720.99 15,915.63
Revaluation Reserves 1,449.53 1,470.76 1,491.99
Net Worth 27,817.08 21,508.56 17,722.92
Deposits 379,588.48 312,898.73 249,329.80
Borrowings 37,264.27 31,589.69 19,262.37
Total Debt 416,852.75 344,488.42 268,592.17
Other Liabilities & Provisions 13,524.18 12,328.27 10,317.69
Total Liabilities 458,194.01 378,325.25 296,632.78
Mar '12 Mar '11 Mar '10
12 mths 12 mths 12 mths
Assets
Cash & Balances with RBI 18,492.90 23,776.90 18,327.58
Balance with Banks, Money at Call 10,335.14 5,914.32 5,145.99
Advances 293,774.76 242,106.67 186,601.21
Investments 122,629.47 95,162.35 77,724.47
Gross Block 5,265.08 4,981.60 4,215.21
Accumulated Depreciation 2,096.22 1,876.01 1,701.74
Net Block 3,168.86 3,105.59 2,513.47
Capital Work In Progress 0.00 0.00 0.00
Other Assets 9,792.88 8,259.42 6,320.07
Total Assets 458,194.01 378,325.25 296,632.79
Contingent Liabilities 173,768.84 101,465.73 68,124.47
Bills for collection 50,981.22 37,449.53 33,215.78
Book Value (Rs) 777.39 632.48 514.77
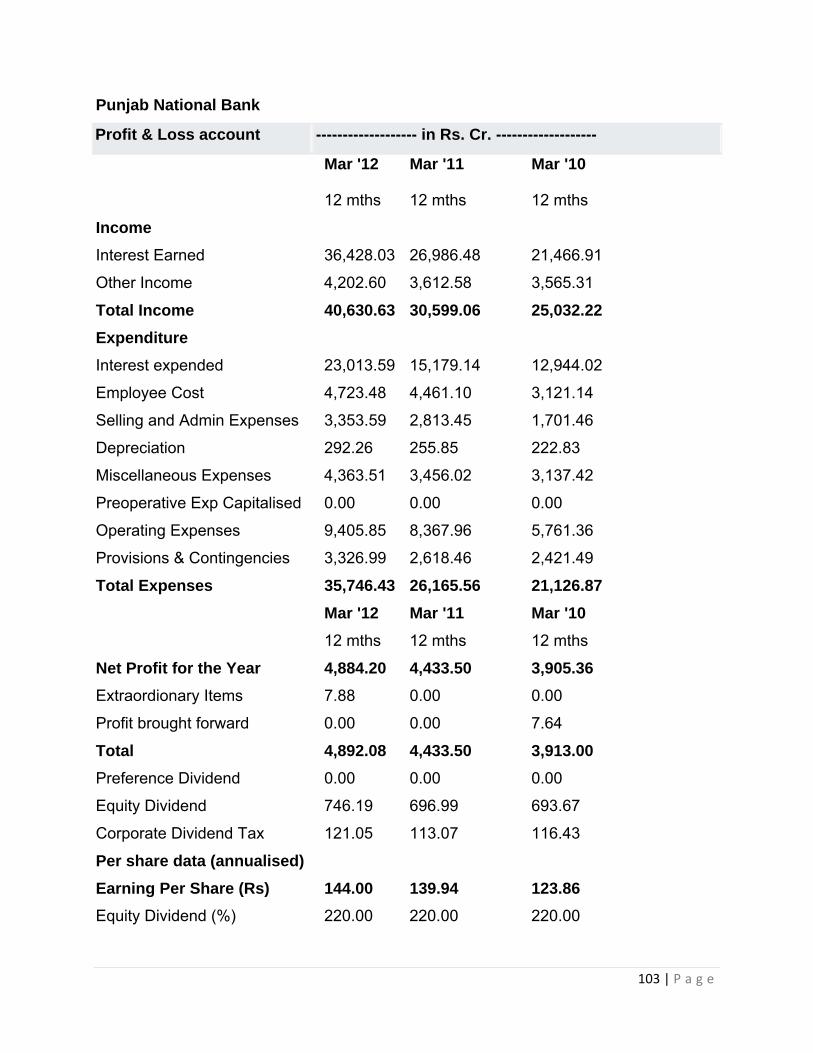
103 | P a g e
Punjab National Bank
Profit & Loss account ------------------- in Rs. Cr. -------------------
Mar '12 Mar '11 Mar '10
12 mths 12 mths 12 mths
Income
Interest Earned 36,428.03 26,986.48 21,466.91
Other Income 4,202.60 3,612.58 3,565.31
Total Income 40,630.63 30,599.06 25,032.22
Expenditure
Interest expended 23,013.59 15,179.14 12,944.02
Employee Cost 4,723.48 4,461.10 3,121.14
Selling and Admin Expenses 3,353.59 2,813.45 1,701.46
Depreciation 292.26 255.85 222.83
Miscellaneous Expenses 4,363.51 3,456.02 3,137.42
Preoperative Exp Capitalised 0.00 0.00 0.00
Operating Expenses 9,405.85 8,367.96 5,761.36
Provisions & Contingencies 3,326.99 2,618.46 2,421.49
Total Expenses 35,746.43 26,165.56 21,126.87
Mar '12 Mar '11 Mar '10
12 mths 12 mths 12 mths
Net Profit for the Year 4,884.20 4,433.50 3,905.36
Extraordionary Items 7.88 0.00 0.00
Profit brought forward 0.00 0.00 7.64
Total 4,892.08 4,433.50 3,913.00
Preference Dividend 0.00 0.00 0.00
Equity Dividend 746.19 696.99 693.67
Corporate Dividend Tax 121.05 113.07 116.43
Per share data (annualised)
Earning Per Share (Rs) 144.00 139.94 123.86
Equity Dividend (%) 220.00 220.00 220.00
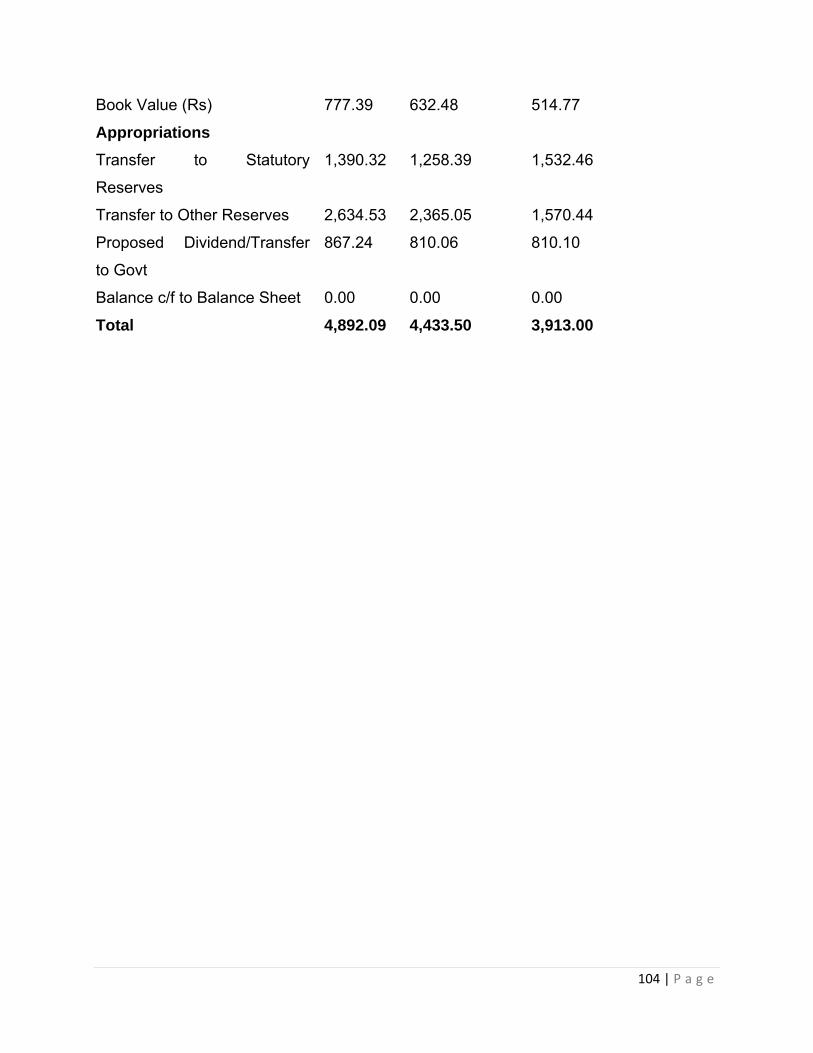
104 | P a g e
Book Value (Rs) 777.39 632.48 514.77
Appropriations
Transfer to Statutory
Reserves
1,390.32 1,258.39 1,532.46
Transfer to Other Reserves 2,634.53 2,365.05 1,570.44
Proposed Dividend/Transfer
to Govt
867.24 810.06 810.10
Balance c/f to Balance Sheet 0.00 0.00 0.00
Total 4,892.09 4,433.50 3,913.00
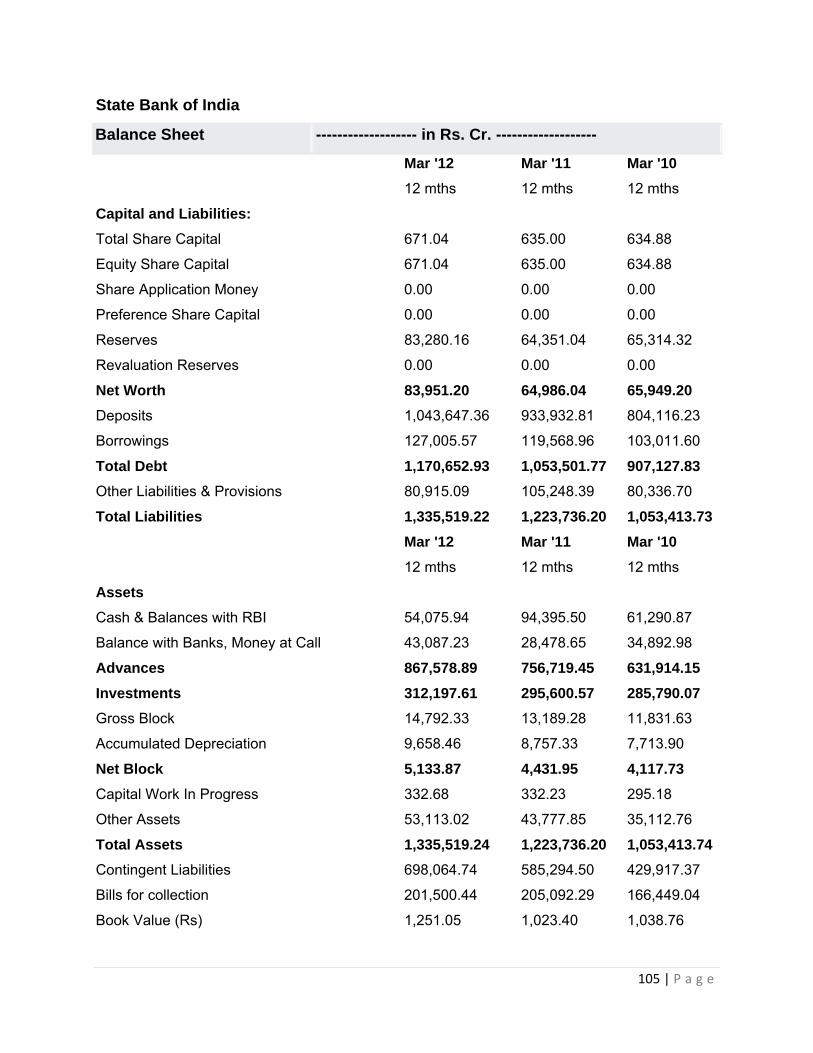
105 | P a g e
State Bank of India
Balance Sheet ------------------- in Rs. Cr. -------------------
Mar '12 Mar '11 Mar '10
12 mths 12 mths 12 mths
Capital and Liabilities:
Total Share Capital 671.04 635.00 634.88
Equity Share Capital 671.04 635.00 634.88
Share Application Money 0.00 0.00 0.00
Preference Share Capital 0.00 0.00 0.00
Reserves 83,280.16 64,351.04 65,314.32
Revaluation Reserves 0.00 0.00 0.00
Net Worth 83,951.20 64,986.04 65,949.20
Deposits 1,043,647.36 933,932.81 804,116.23
Borrowings 127,005.57 119,568.96 103,011.60
Total Debt 1,170,652.93 1,053,501.77 907,127.83
Other Liabilities & Provisions 80,915.09 105,248.39 80,336.70
Total Liabilities 1,335,519.22 1,223,736.20 1,053,413.73
Mar '12 Mar '11 Mar '10
12 mths 12 mths 12 mths
Assets
Cash & Balances with RBI 54,075.94 94,395.50 61,290.87
Balance with Banks, Money at Call 43,087.23 28,478.65 34,892.98
Advances 867,578.89 756,719.45 631,914.15
Investments 312,197.61 295,600.57 285,790.07
Gross Block 14,792.33 13,189.28 11,831.63
Accumulated Depreciation 9,658.46 8,757.33 7,713.90
Net Block 5,133.87 4,431.95 4,117.73
Capital Work In Progress 332.68 332.23 295.18
Other Assets 53,113.02 43,777.85 35,112.76
Total Assets 1,335,519.24 1,223,736.20 1,053,413.74
Contingent Liabilities 698,064.74 585,294.50 429,917.37
Bills for collection 201,500.44 205,092.29 166,449.04
Book Value (Rs) 1,251.05 1,023.40 1,038.76
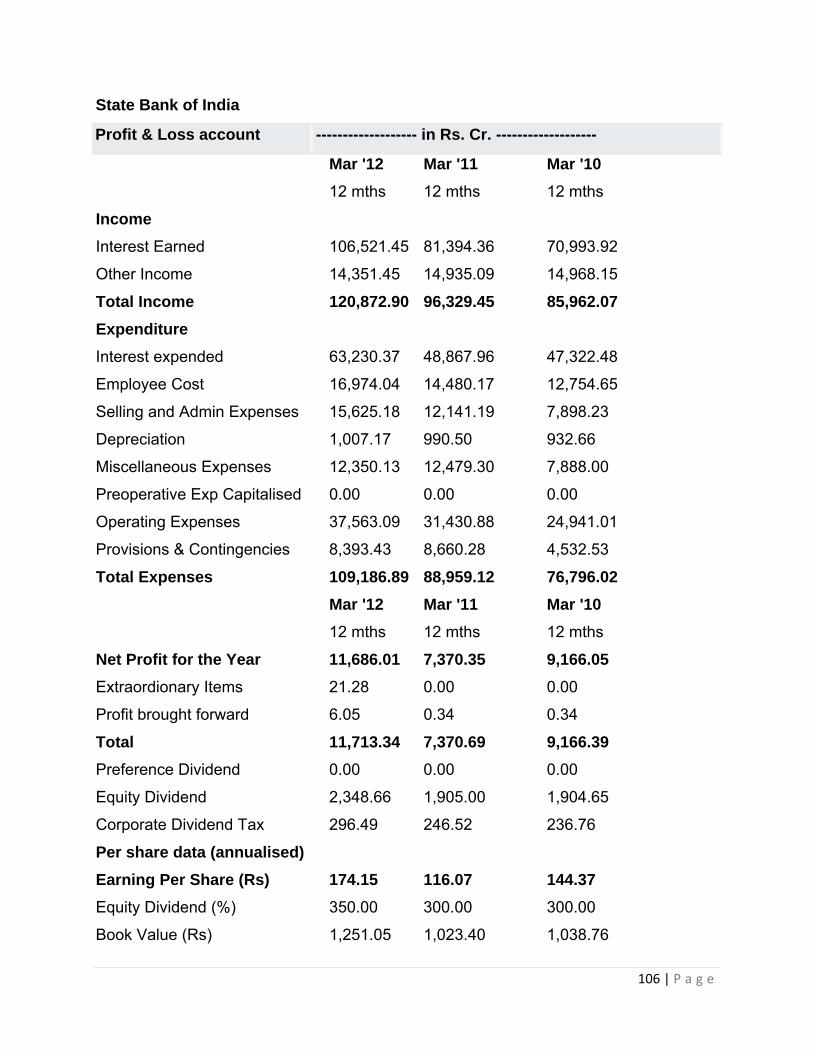
106 | P a g e
State Bank of India
Profit & Loss account ------------------- in Rs. Cr. -------------------
Mar '12 Mar '11 Mar '10
12 mths 12 mths 12 mths
Income
Interest Earned 106,521.45 81,394.36 70,993.92
Other Income 14,351.45 14,935.09 14,968.15
Total Income 120,872.90 96,329.45 85,962.07
Expenditure
Interest expended 63,230.37 48,867.96 47,322.48
Employee Cost 16,974.04 14,480.17 12,754.65
Selling and Admin Expenses 15,625.18 12,141.19 7,898.23
Depreciation 1,007.17 990.50 932.66
Miscellaneous Expenses 12,350.13 12,479.30 7,888.00
Preoperative Exp Capitalised 0.00 0.00 0.00
Operating Expenses 37,563.09 31,430.88 24,941.01
Provisions & Contingencies 8,393.43 8,660.28 4,532.53
Total Expenses 109,186.89 88,959.12 76,796.02
Mar '12 Mar '11 Mar '10
12 mths 12 mths 12 mths
Net Profit for the Year 11,686.01 7,370.35 9,166.05
Extraordionary Items 21.28 0.00 0.00
Profit brought forward 6.05 0.34 0.34
Total 11,713.34 7,370.69 9,166.39
Preference Dividend 0.00 0.00 0.00
Equity Dividend 2,348.66 1,905.00 1,904.65
Corporate Dividend Tax 296.49 246.52 236.76
Per share data (annualised)
Earning Per Share (Rs) 174.15 116.07 144.37
Equity Dividend (%) 350.00 300.00 300.00
Book Value (Rs) 1,251.05 1,023.40 1,038.76
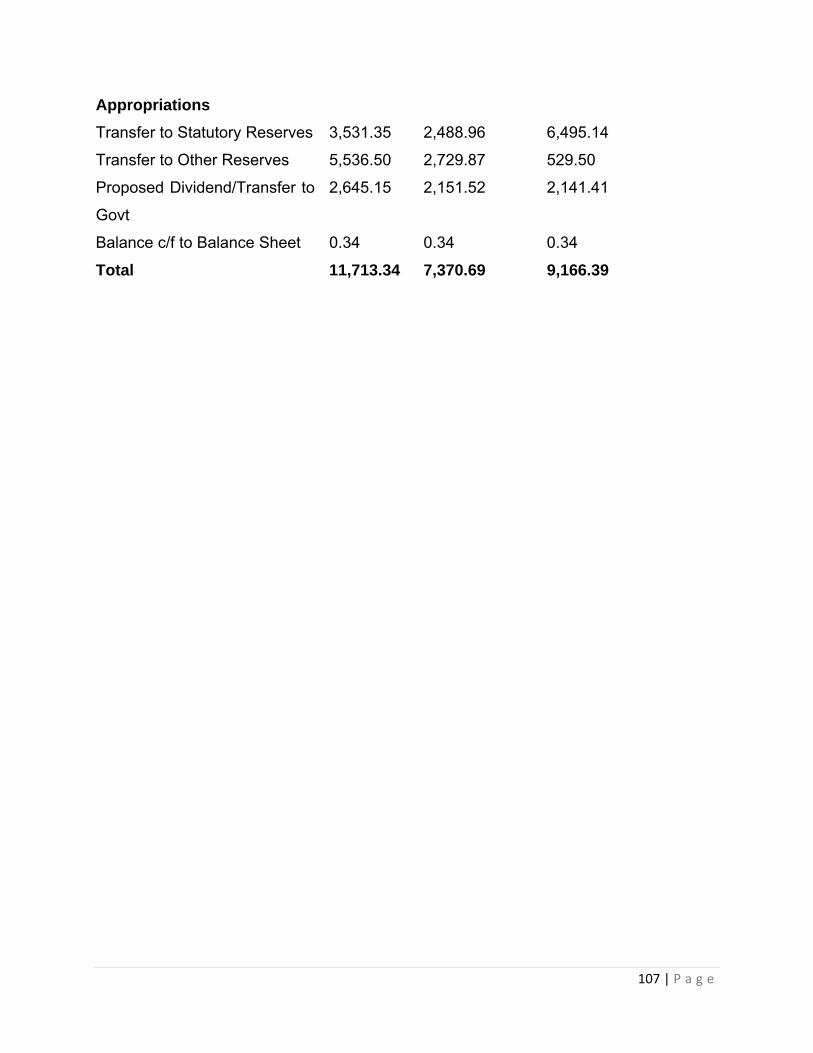
107 | P a g e
Appropriations
Transfer to Statutory Reserves 3,531.35 2,488.96 6,495.14
Transfer to Other Reserves 5,536.50 2,729.87 529.50
Proposed Dividend/Transfer to
Govt
2,645.15 2,151.52 2,141.41
Balance c/f to Balance Sheet 0.34 0.34 0.34
Total 11,713.34 7,370.69 9,166.39
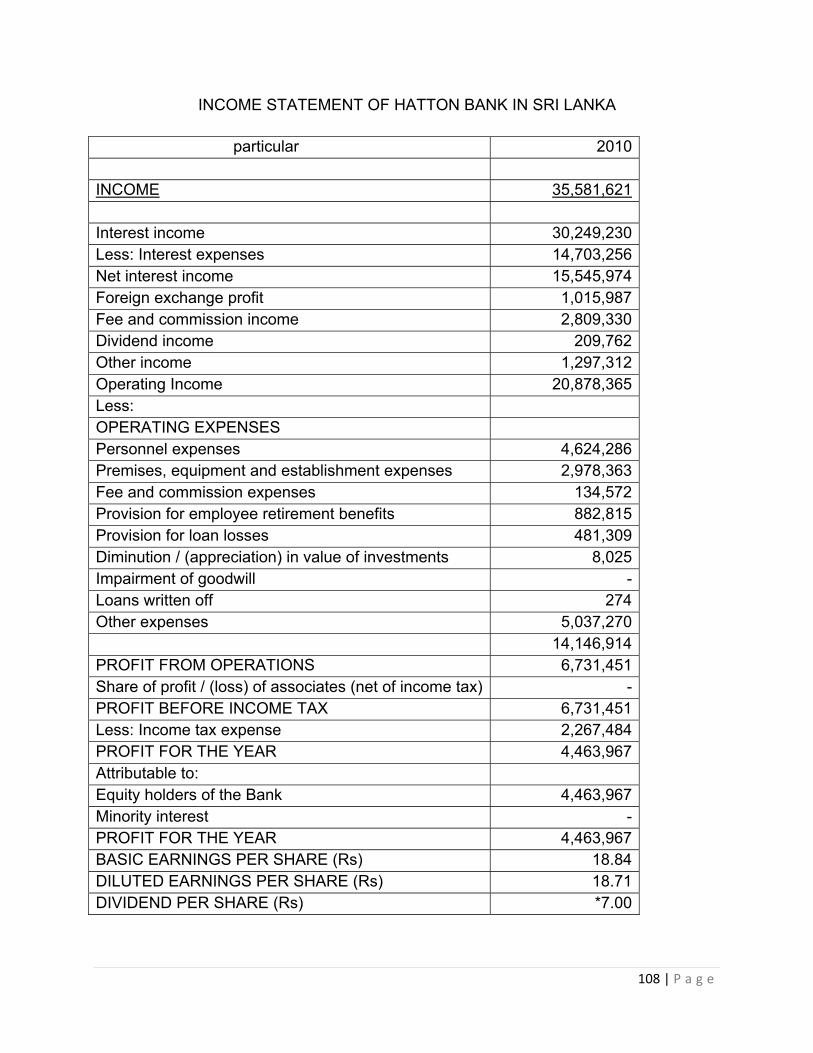
108 | P a g e
INCOME STATEMENT OF HATTON BANK IN SRI LANKA
particular 2010 INCOME 35,581,621 Interest income 30,249,230 Less: Interest expenses 14,703,256 Net interest income 15,545,974 Foreign exchange profit 1,015,987 Fee and commission income 2,809,330 Dividend income 209,762 Other income 1,297,312 Operating Income 20,878,365 Less: OPERATING EXPENSES Personnel expenses 4,624,286 Premises, equipment and establishment expenses 2,978,363 Fee and commission expenses 134,572 Provision for employee retirement benefits 882,815 Provision for loan losses 481,309 Diminution / (appreciation) in value of investments 8,025 Impairment of goodwill - Loans written off 274 Other expenses 5,037,270 14,146,914 PROFIT FROM OPERATIONS 6,731,451 Share of profit / (loss) of associates (net of income tax) - PROFIT BEFORE INCOME TAX 6,731,451 Less: Income tax expense 2,267,484 PROFIT FOR THE YEAR 4,463,967 Attributable to: Equity holders of the Bank 4,463,967 Minority interest - PROFIT FOR THE YEAR 4,463,967 BASIC EARNINGS PER SHARE (Rs) 18.84 DILUTED EARNINGS PER SHARE (Rs) 18.71 DIVIDEND PER SHARE (Rs) *7.00
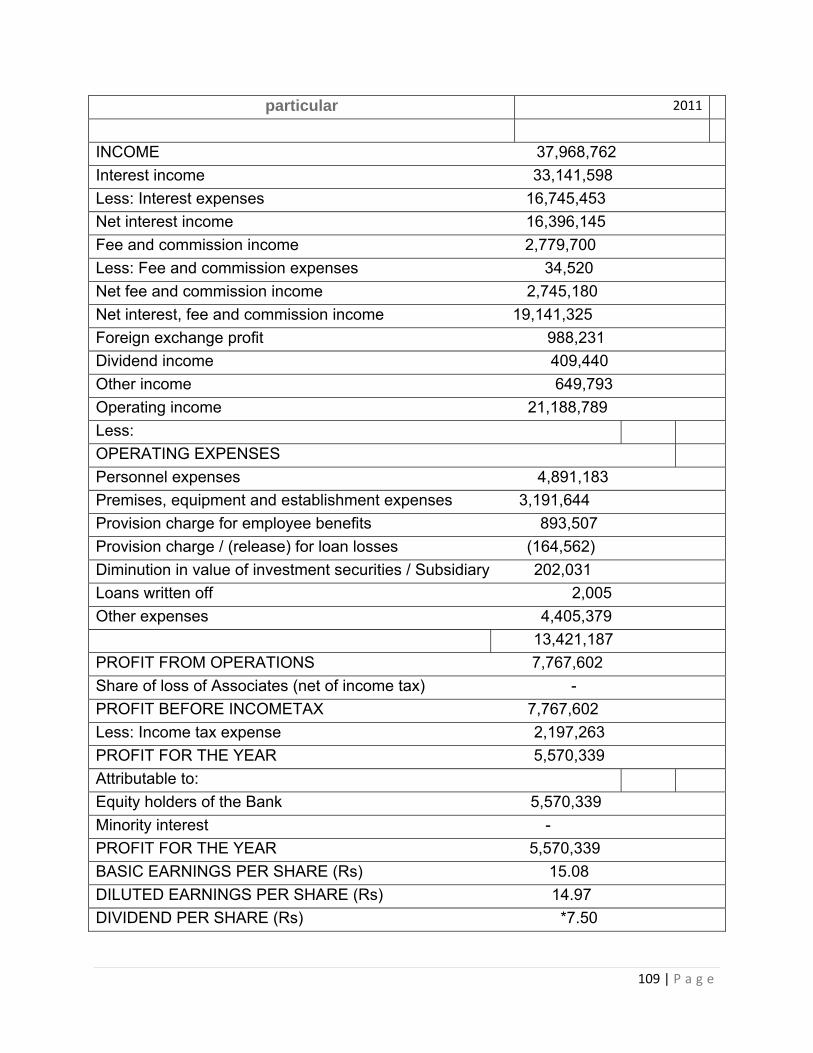
109 | P a g e
particular 2011
INCOME 37,968,762
Interest income 33,141,598
Less: Interest expenses 16,745,453
Net interest income 16,396,145
Fee and commission income 2,779,700
Less: Fee and commission expenses 34,520
Net fee and commission income 2,745,180
Net interest, fee and commission income 19,141,325
Foreign exchange profit 988,231
Dividend income 409,440
Other income 649,793
Operating income 21,188,789
Less:
OPERATING EXPENSES
Personnel expenses 4,891,183
Premises, equipment and establishment expenses 3,191,644
Provision charge for employee benefits 893,507
Provision charge / (release) for loan losses (164,562)
Diminution in value of investment securities / Subsidiary 202,031
Loans written off 2,005
Other expenses 4,405,379
13,421,187
PROFIT FROM OPERATIONS 7,767,602
Share of loss of Associates (net of income tax) -
PROFIT BEFORE INCOMETAX 7,767,602
Less: Income tax expense 2,197,263
PROFIT FOR THE YEAR 5,570,339
Attributable to:
Equity holders of the Bank 5,570,339
Minority interest -
PROFIT FOR THE YEAR 5,570,339
BASIC EARNINGS PER SHARE (Rs) 15.08
DILUTED EARNINGS PER SHARE (Rs) 14.97
DIVIDEND PER SHARE (Rs) *7.50
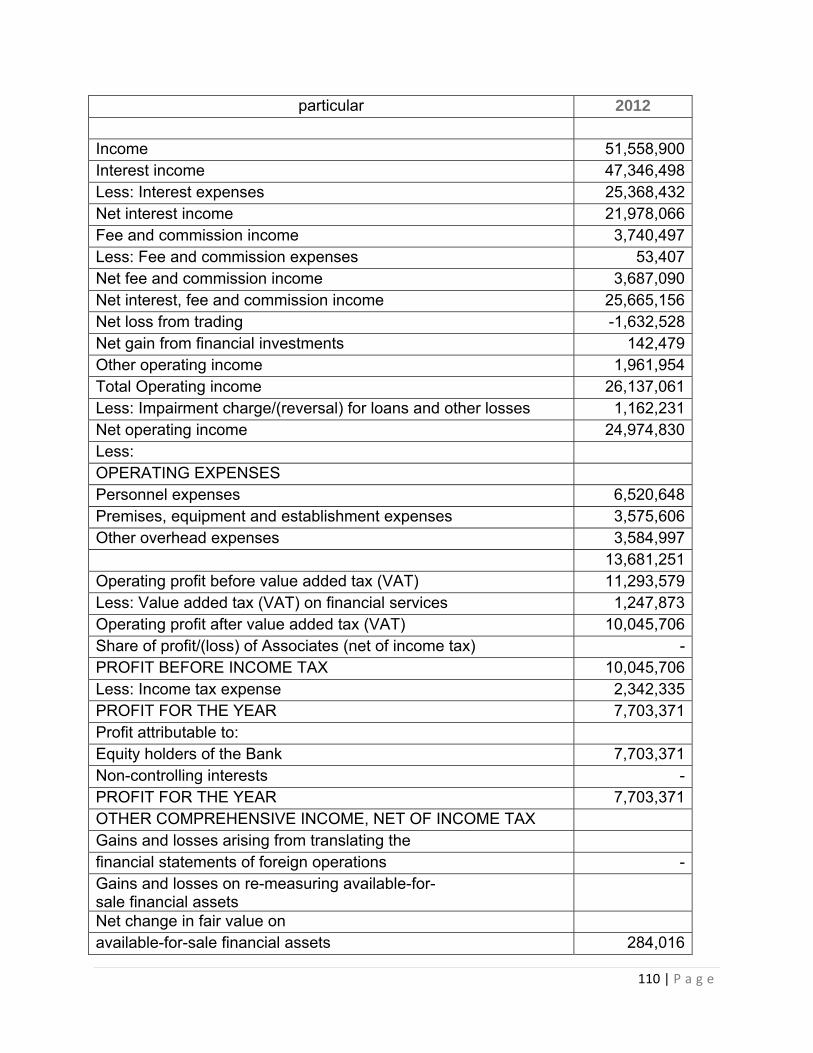
110 | P a g e
particular 2012
Income 51,558,900Interest income 47,346,498Less: Interest expenses 25,368,432Net interest income 21,978,066Fee and commission income 3,740,497Less: Fee and commission expenses 53,407Net fee and commission income 3,687,090Net interest, fee and commission income 25,665,156Net loss from trading -1,632,528Net gain from financial investments 142,479Other operating income 1,961,954Total Operating income 26,137,061Less: Impairment charge/(reversal) for loans and other losses 1,162,231Net operating income 24,974,830Less: OPERATING EXPENSES Personnel expenses 6,520,648Premises, equipment and establishment expenses 3,575,606Other overhead expenses 3,584,997 13,681,251Operating profit before value added tax (VAT) 11,293,579Less: Value added tax (VAT) on financial services 1,247,873Operating profit after value added tax (VAT) 10,045,706Share of profit/(loss) of Associates (net of income tax) -PROFIT BEFORE INCOME TAX 10,045,706Less: Income tax expense 2,342,335PROFIT FOR THE YEAR 7,703,371Profit attributable to: Equity holders of the Bank 7,703,371Non-controlling interests -PROFIT FOR THE YEAR 7,703,371OTHER COMPREHENSIVE INCOME, NET OF INCOME TAX Gains and losses arising from translating the financial statements of foreign operations -Gains and losses on re-measuring available-for-sale financial assets Net change in fair value on available-for-sale financial assets 284,016
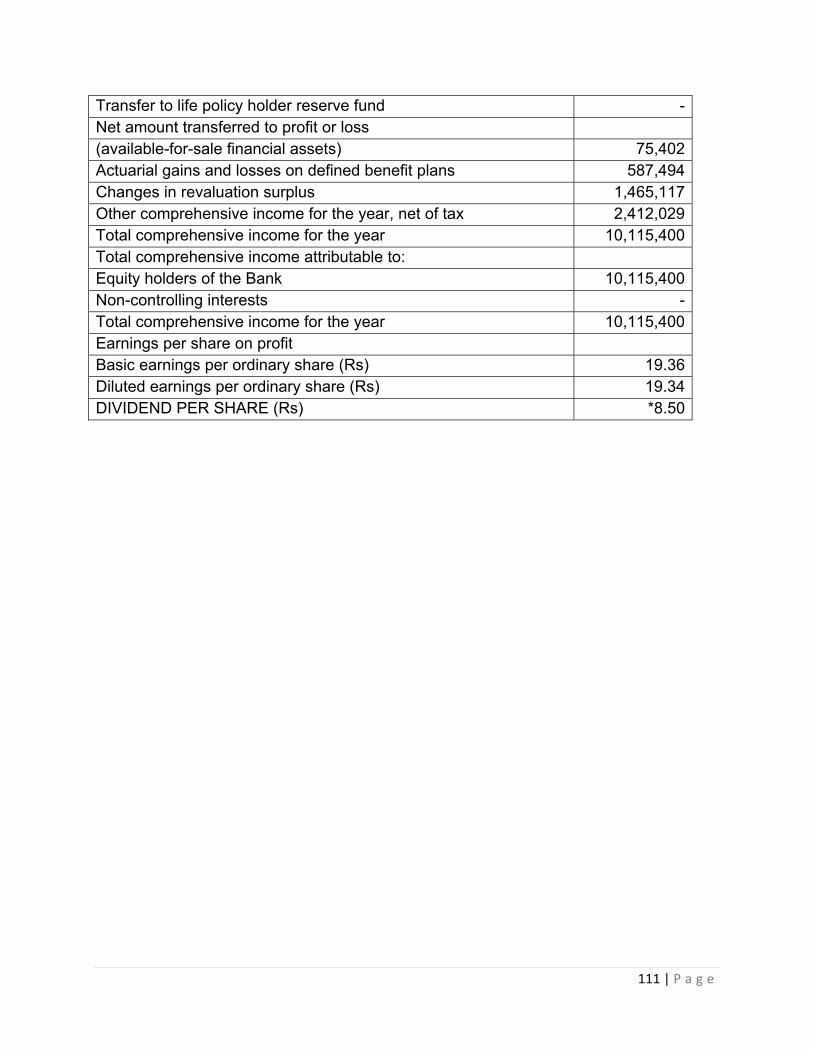
111 | P a g e
Transfer to life policy holder reserve fund -Net amount transferred to profit or loss (available-for-sale financial assets) 75,402Actuarial gains and losses on defined benefit plans 587,494Changes in revaluation surplus 1,465,117Other comprehensive income for the year, net of tax 2,412,029Total comprehensive income for the year 10,115,400Total comprehensive income attributable to: Equity holders of the Bank 10,115,400Non-controlling interests -Total comprehensive income for the year 10,115,400Earnings per share on profit Basic earnings per ordinary share (Rs) 19.36Diluted earnings per ordinary share (Rs) 19.34DIVIDEND PER SHARE (Rs) *8.50
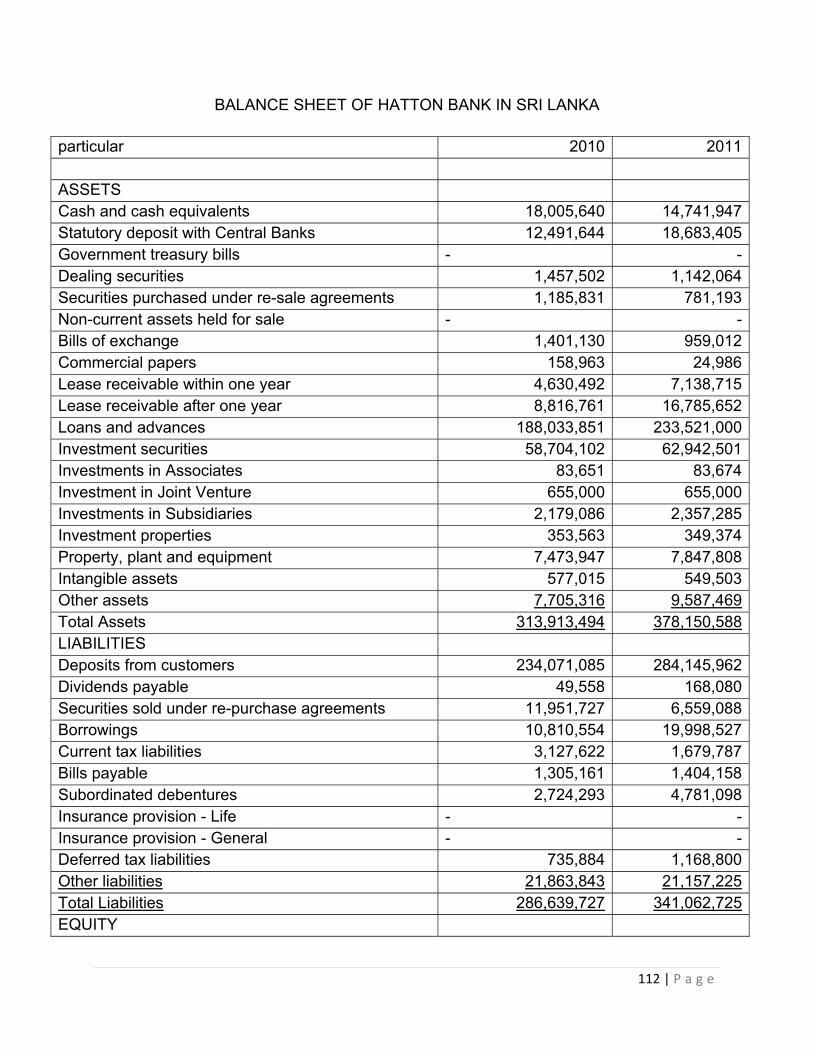
112 | P a g e
BALANCE SHEET OF HATTON BANK IN SRI LANKA
particular 2010 2011 ASSETS Cash and cash equivalents 18,005,640 14,741,947Statutory deposit with Central Banks 12,491,644 18,683,405Government treasury bills - -Dealing securities 1,457,502 1,142,064Securities purchased under re-sale agreements 1,185,831 781,193Non-current assets held for sale - -Bills of exchange 1,401,130 959,012Commercial papers 158,963 24,986Lease receivable within one year 4,630,492 7,138,715Lease receivable after one year 8,816,761 16,785,652Loans and advances 188,033,851 233,521,000Investment securities 58,704,102 62,942,501Investments in Associates 83,651 83,674Investment in Joint Venture 655,000 655,000Investments in Subsidiaries 2,179,086 2,357,285Investment properties 353,563 349,374Property, plant and equipment 7,473,947 7,847,808Intangible assets 577,015 549,503Other assets 7,705,316 9,587,469Total Assets 313,913,494 378,150,588LIABILITIES Deposits from customers 234,071,085 284,145,962Dividends payable 49,558 168,080Securities sold under re-purchase agreements 11,951,727 6,559,088Borrowings 10,810,554 19,998,527Current tax liabilities 3,127,622 1,679,787Bills payable 1,305,161 1,404,158Subordinated debentures 2,724,293 4,781,098Insurance provision - Life - -Insurance provision - General - -Deferred tax liabilities 735,884 1,168,800Other liabilities 21,863,843 21,157,225Total Liabilities 286,639,727 341,062,725EQUITY
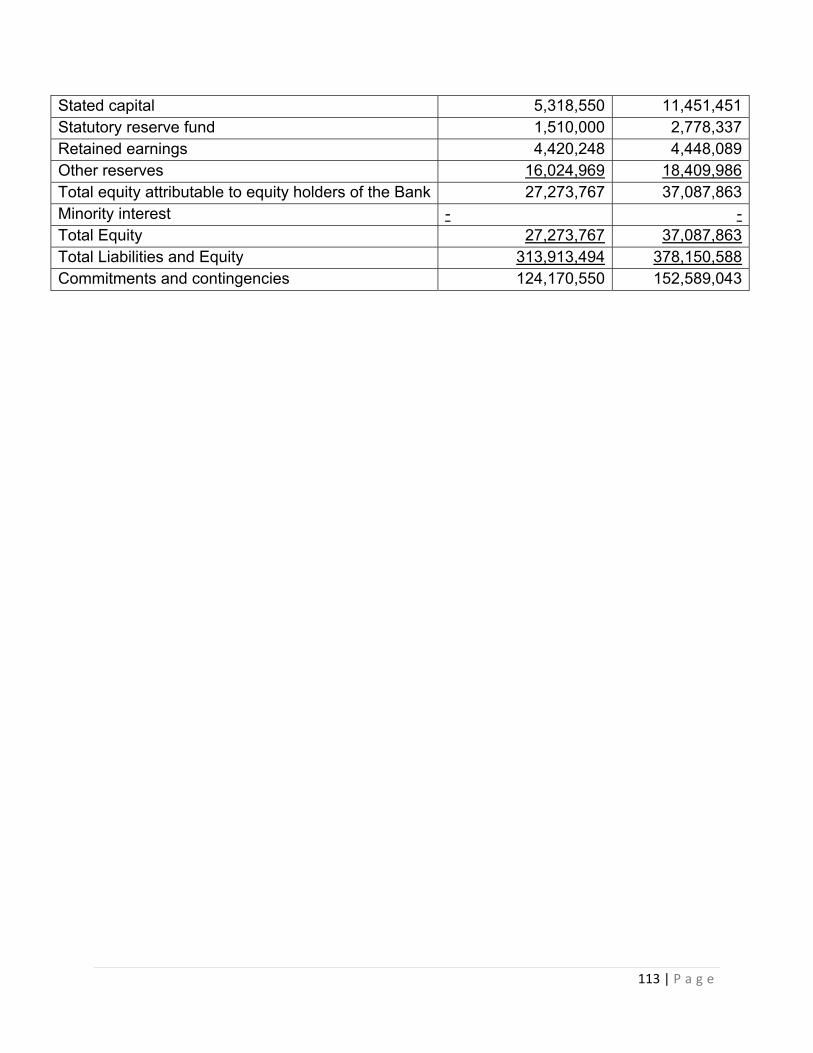
113 | P a g e
Stated capital 5,318,550 11,451,451Statutory reserve fund 1,510,000 2,778,337Retained earnings 4,420,248 4,448,089Other reserves 16,024,969 18,409,986Total equity attributable to equity holders of the Bank 27,273,767 37,087,863Minority interest - -Total Equity 27,273,767 37,087,863Total Liabilities and Equity 313,913,494 378,150,588Commitments and contingencies 124,170,550 152,589,043
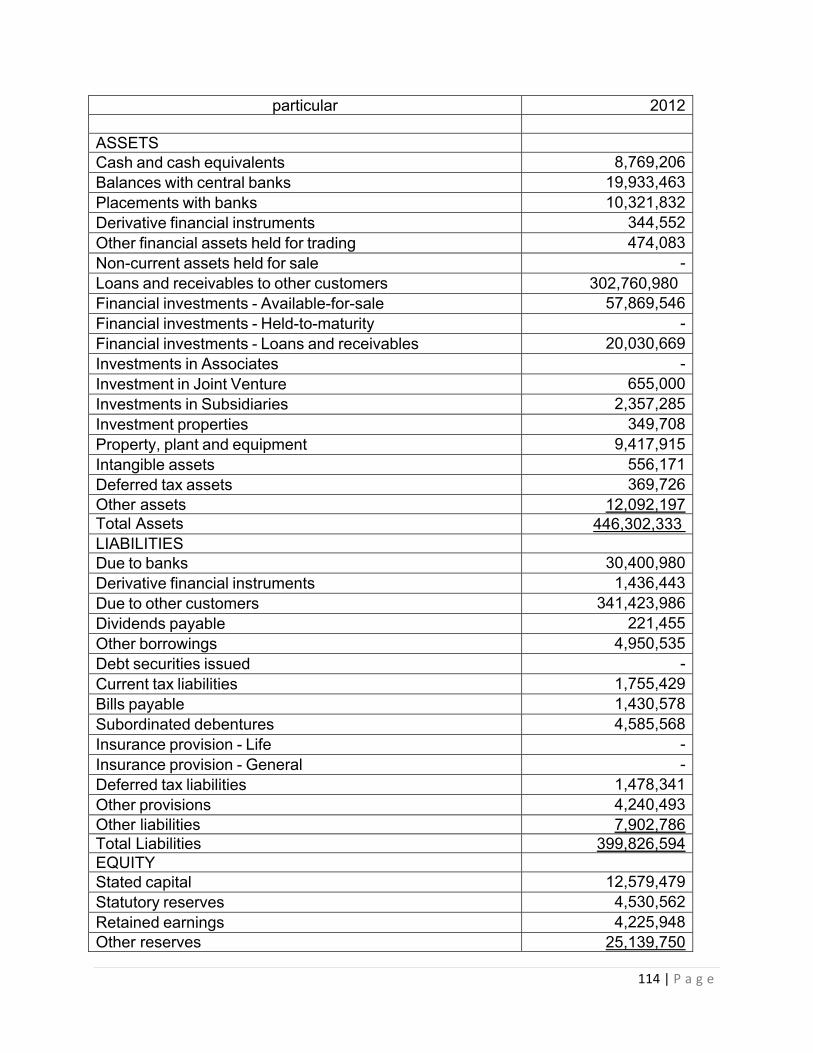
114 | P a g e
particular 2012 ASSETS Cash and cash equivalents 8,769,206Balances with central banks 19,933,463Placements with banks 10,321,832Derivative financial instruments 344,552Other financial assets held for trading 474,083Non-current assets held for sale -Loans and receivables to other customers 302,760,980 Financial investments - Available-for-sale 57,869,546Financial investments - Held-to-maturity -Financial investments - Loans and receivables 20,030,669Investments in Associates -Investment in Joint Venture 655,000Investments in Subsidiaries 2,357,285Investment properties 349,708Property, plant and equipment 9,417,915Intangible assets 556,171Deferred tax assets 369,726Other assets 12,092,197Total Assets 446,302,333 LIABILITIES Due to banks 30,400,980Derivative financial instruments 1,436,443Due to other customers 341,423,986Dividends payable 221,455Other borrowings 4,950,535Debt securities issued -Current tax liabilities 1,755,429Bills payable 1,430,578Subordinated debentures 4,585,568Insurance provision - Life -Insurance provision - General -Deferred tax liabilities 1,478,341Other provisions 4,240,493Other liabilities 7,902,786Total Liabilities 399,826,594EQUITY Stated capital 12,579,479Statutory reserves 4,530,562Retained earnings 4,225,948Other reserves 25,139,750
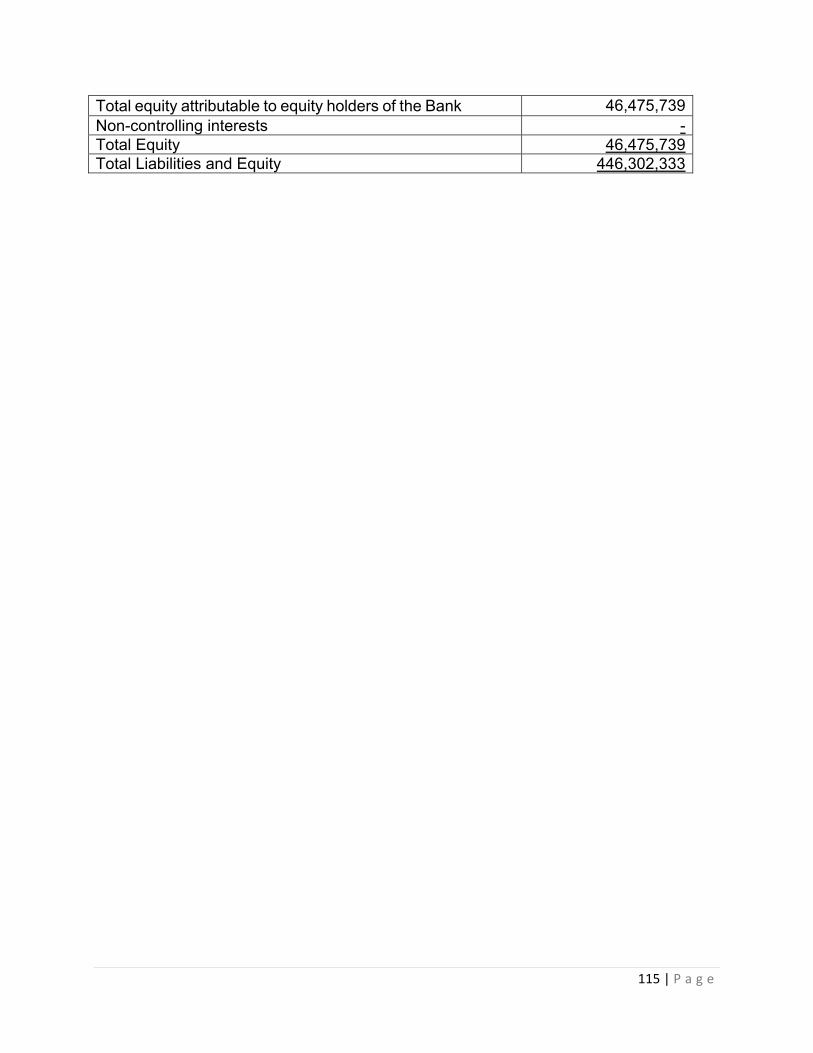
115 | P a g e
Total equity attributable to equity holders of the Bank 46,475,739Non-controlling interests -Total Equity 46,475,739Total Liabilities and Equity 446,302,333
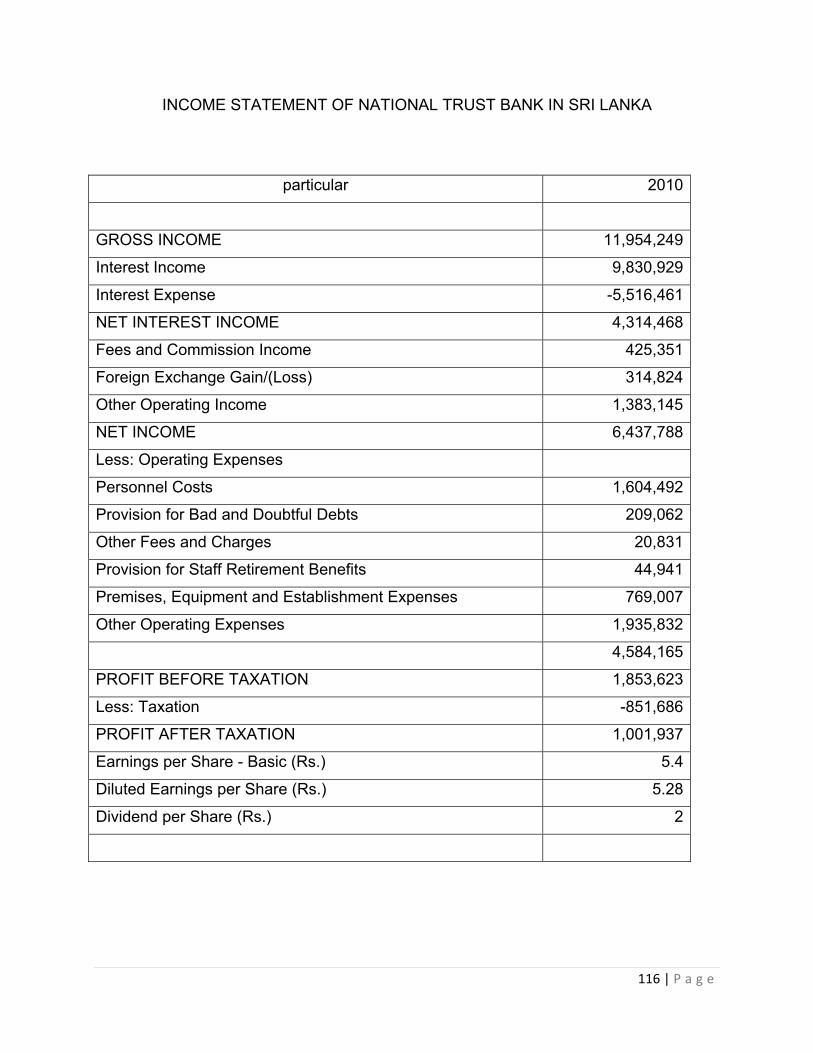
116 | P a g e
INCOME STATEMENT OF NATIONAL TRUST BANK IN SRI LANKA
particular 2010
GROSS INCOME 11,954,249
Interest Income 9,830,929
Interest Expense -5,516,461
NET INTEREST INCOME 4,314,468
Fees and Commission Income 425,351
Foreign Exchange Gain/(Loss) 314,824
Other Operating Income 1,383,145
NET INCOME 6,437,788
Less: Operating Expenses
Personnel Costs 1,604,492
Provision for Bad and Doubtful Debts 209,062
Other Fees and Charges 20,831
Provision for Staff Retirement Benefits 44,941
Premises, Equipment and Establishment Expenses 769,007
Other Operating Expenses 1,935,832
4,584,165
PROFIT BEFORE TAXATION 1,853,623
Less: Taxation -851,686
PROFIT AFTER TAXATION 1,001,937
Earnings per Share - Basic (Rs.) 5.4
Diluted Earnings per Share (Rs.) 5.28
Dividend per Share (Rs.) 2
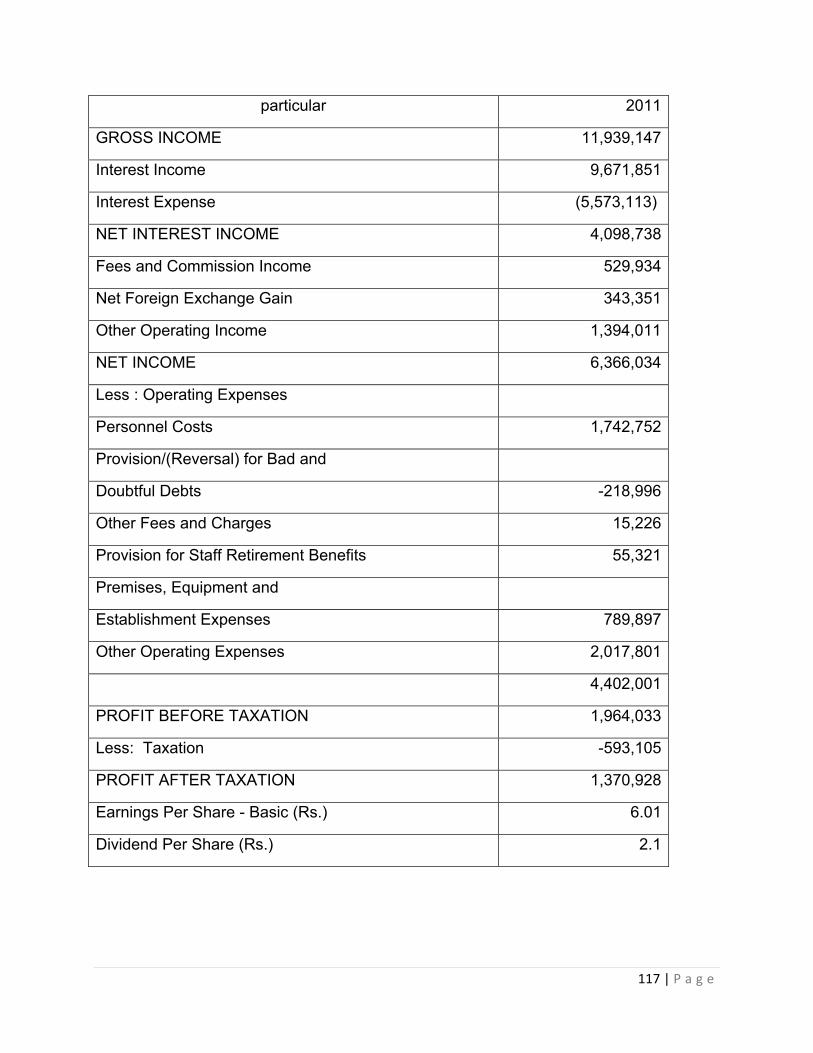
117 | P a g e
particular 2011
GROSS INCOME 11,939,147
Interest Income 9,671,851
Interest Expense (5,573,113)
NET INTEREST INCOME 4,098,738
Fees and Commission Income 529,934
Net Foreign Exchange Gain 343,351
Other Operating Income 1,394,011
NET INCOME 6,366,034
Less : Operating Expenses
Personnel Costs 1,742,752
Provision/(Reversal) for Bad and
Doubtful Debts -218,996
Other Fees and Charges 15,226
Provision for Staff Retirement Benefits 55,321
Premises, Equipment and
Establishment Expenses 789,897
Other Operating Expenses 2,017,801
4,402,001
PROFIT BEFORE TAXATION 1,964,033
Less: Taxation -593,105
PROFIT AFTER TAXATION 1,370,928
Earnings Per Share - Basic (Rs.) 6.01
Dividend Per Share (Rs.) 2.1
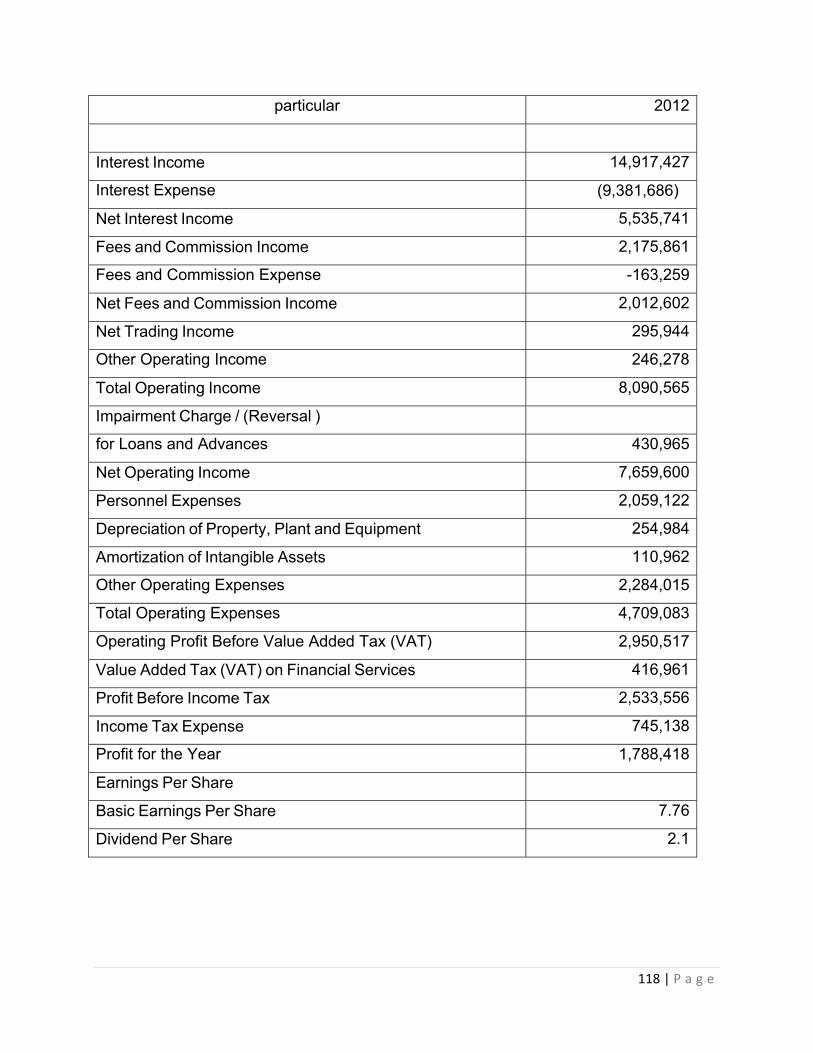
118 | P a g e
particular 2012
Interest Income 14,917,427
Interest Expense (9,381,686)
Net Interest Income 5,535,741
Fees and Commission Income 2,175,861
Fees and Commission Expense -163,259
Net Fees and Commission Income 2,012,602
Net Trading Income 295,944
Other Operating Income 246,278
Total Operating Income 8,090,565
Impairment Charge / (Reversal )
for Loans and Advances 430,965
Net Operating Income 7,659,600
Personnel Expenses 2,059,122
Depreciation of Property, Plant and Equipment 254,984
Amortization of Intangible Assets 110,962
Other Operating Expenses 2,284,015
Total Operating Expenses 4,709,083
Operating Profit Before Value Added Tax (VAT) 2,950,517
Value Added Tax (VAT) on Financial Services 416,961
Profit Before Income Tax 2,533,556
Income Tax Expense 745,138
Profit for the Year 1,788,418
Earnings Per Share
Basic Earnings Per Share 7.76
Dividend Per Share 2.1
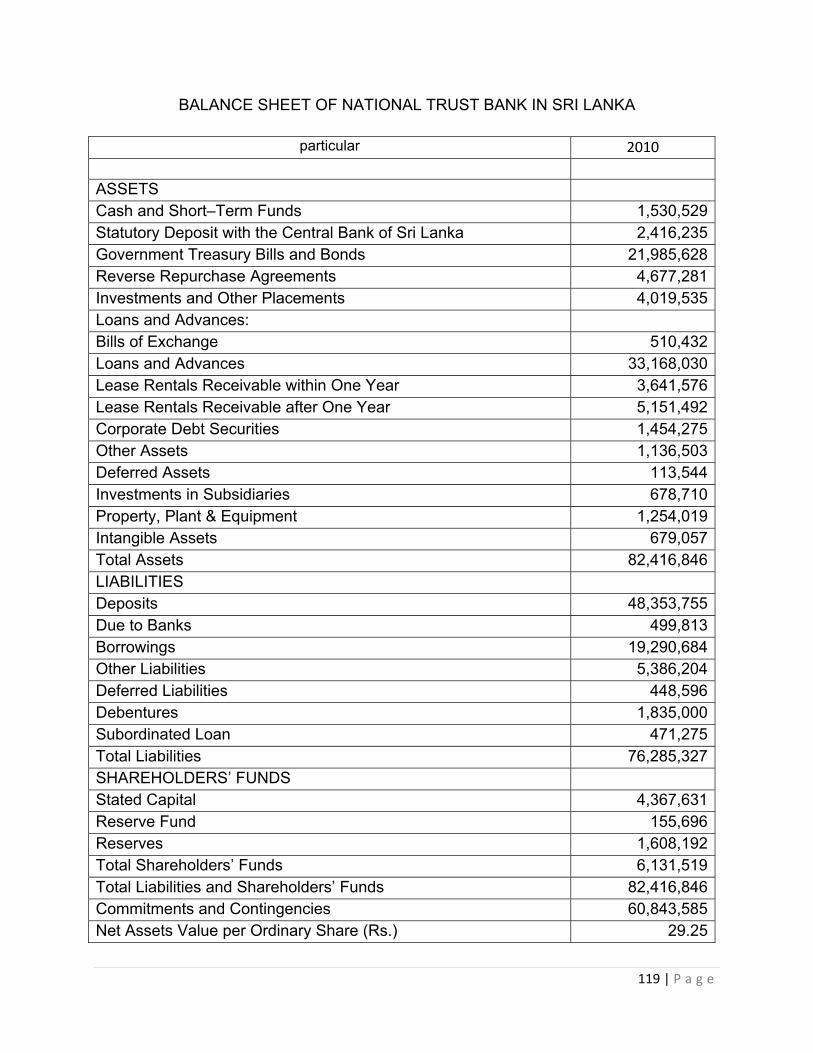
119 | P a g e
BALANCE SHEET OF NATIONAL TRUST BANK IN SRI LANKA
particular 2010
ASSETS Cash and Short–Term Funds 1,530,529Statutory Deposit with the Central Bank of Sri Lanka 2,416,235Government Treasury Bills and Bonds 21,985,628Reverse Repurchase Agreements 4,677,281Investments and Other Placements 4,019,535Loans and Advances: Bills of Exchange 510,432Loans and Advances 33,168,030Lease Rentals Receivable within One Year 3,641,576Lease Rentals Receivable after One Year 5,151,492Corporate Debt Securities 1,454,275Other Assets 1,136,503Deferred Assets 113,544Investments in Subsidiaries 678,710Property, Plant & Equipment 1,254,019Intangible Assets 679,057Total Assets 82,416,846LIABILITIES Deposits 48,353,755Due to Banks 499,813Borrowings 19,290,684Other Liabilities 5,386,204Deferred Liabilities 448,596Debentures 1,835,000Subordinated Loan 471,275Total Liabilities 76,285,327SHAREHOLDERS’ FUNDS Stated Capital 4,367,631Reserve Fund 155,696Reserves 1,608,192Total Shareholders’ Funds 6,131,519Total Liabilities and Shareholders’ Funds 82,416,846Commitments and Contingencies 60,843,585Net Assets Value per Ordinary Share (Rs.) 29.25
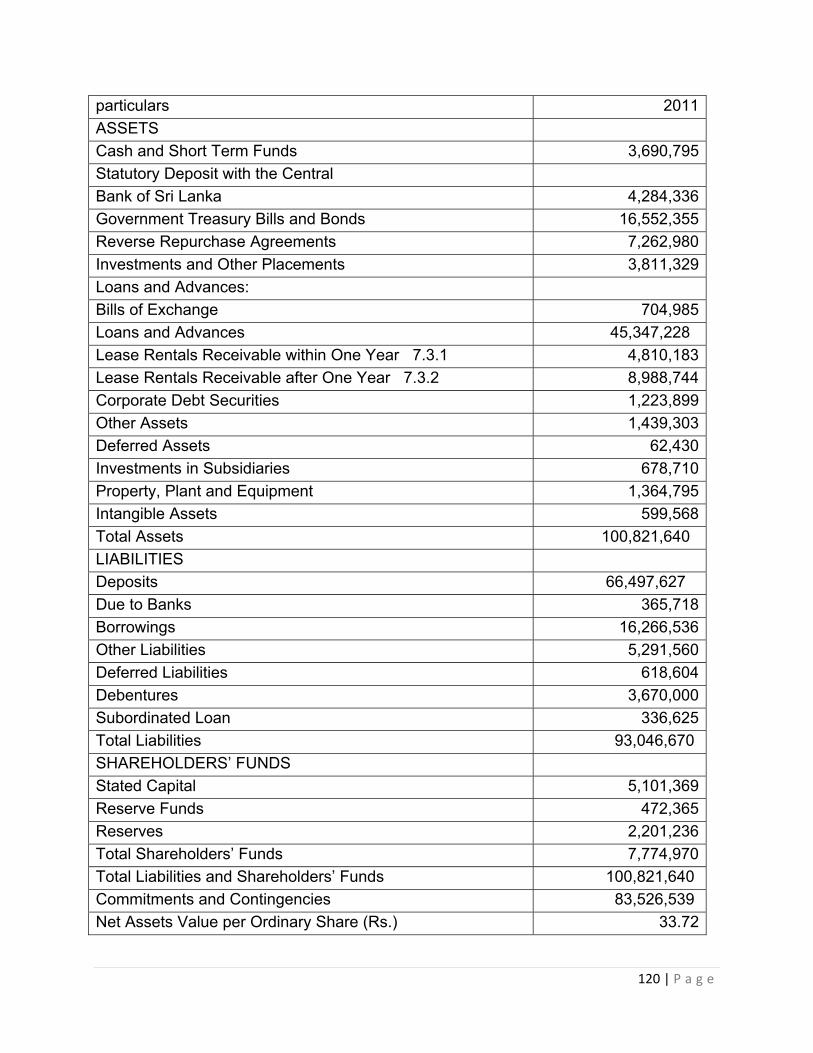
120 | P a g e
particulars 2011
ASSETS
Cash and Short Term Funds 3,690,795
Statutory Deposit with the Central
Bank of Sri Lanka 4,284,336
Government Treasury Bills and Bonds 16,552,355
Reverse Repurchase Agreements 7,262,980
Investments and Other Placements 3,811,329
Loans and Advances:
Bills of Exchange 704,985
Loans and Advances 45,347,228
Lease Rentals Receivable within One Year 7.3.1 4,810,183
Lease Rentals Receivable after One Year 7.3.2 8,988,744
Corporate Debt Securities 1,223,899
Other Assets 1,439,303
Deferred Assets 62,430
Investments in Subsidiaries 678,710
Property, Plant and Equipment 1,364,795
Intangible Assets 599,568
Total Assets 100,821,640
LIABILITIES
Deposits 66,497,627
Due to Banks 365,718
Borrowings 16,266,536
Other Liabilities 5,291,560
Deferred Liabilities 618,604
Debentures 3,670,000
Subordinated Loan 336,625
Total Liabilities 93,046,670
SHAREHOLDERS’ FUNDS
Stated Capital 5,101,369
Reserve Funds 472,365
Reserves 2,201,236
Total Shareholders’ Funds 7,774,970
Total Liabilities and Shareholders’ Funds 100,821,640
Commitments and Contingencies 83,526,539
Net Assets Value per Ordinary Share (Rs.) 33.72
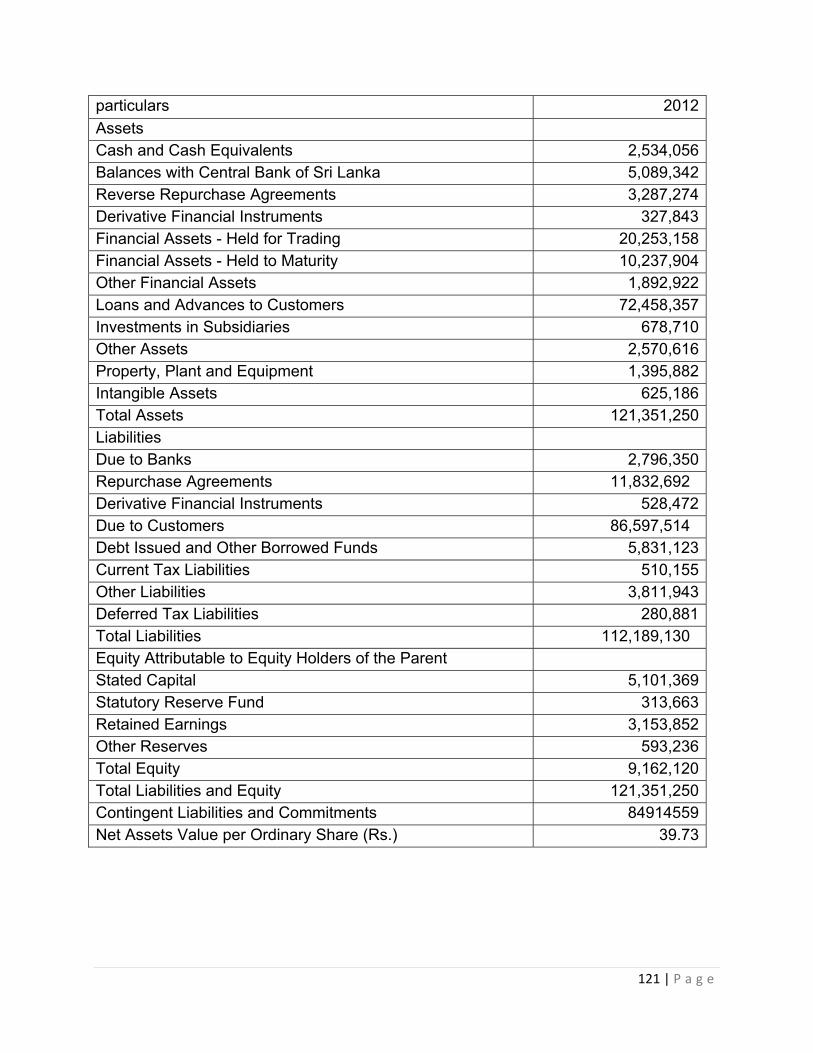
121 | P a g e
particulars 2012
Assets Cash and Cash Equivalents 2,534,056Balances with Central Bank of Sri Lanka 5,089,342Reverse Repurchase Agreements 3,287,274Derivative Financial Instruments 327,843Financial Assets - Held for Trading 20,253,158Financial Assets - Held to Maturity 10,237,904Other Financial Assets 1,892,922Loans and Advances to Customers 72,458,357Investments in Subsidiaries 678,710Other Assets 2,570,616Property, Plant and Equipment 1,395,882Intangible Assets 625,186Total Assets 121,351,250Liabilities Due to Banks 2,796,350Repurchase Agreements 11,832,692 Derivative Financial Instruments 528,472Due to Customers 86,597,514 Debt Issued and Other Borrowed Funds 5,831,123Current Tax Liabilities 510,155Other Liabilities 3,811,943Deferred Tax Liabilities 280,881Total Liabilities 112,189,130 Equity Attributable to Equity Holders of the Parent Stated Capital 5,101,369Statutory Reserve Fund 313,663Retained Earnings 3,153,852Other Reserves 593,236Total Equity 9,162,120Total Liabilities and Equity 121,351,250Contingent Liabilities and Commitments 84914559Net Assets Value per Ordinary Share (Rs.) 39.73
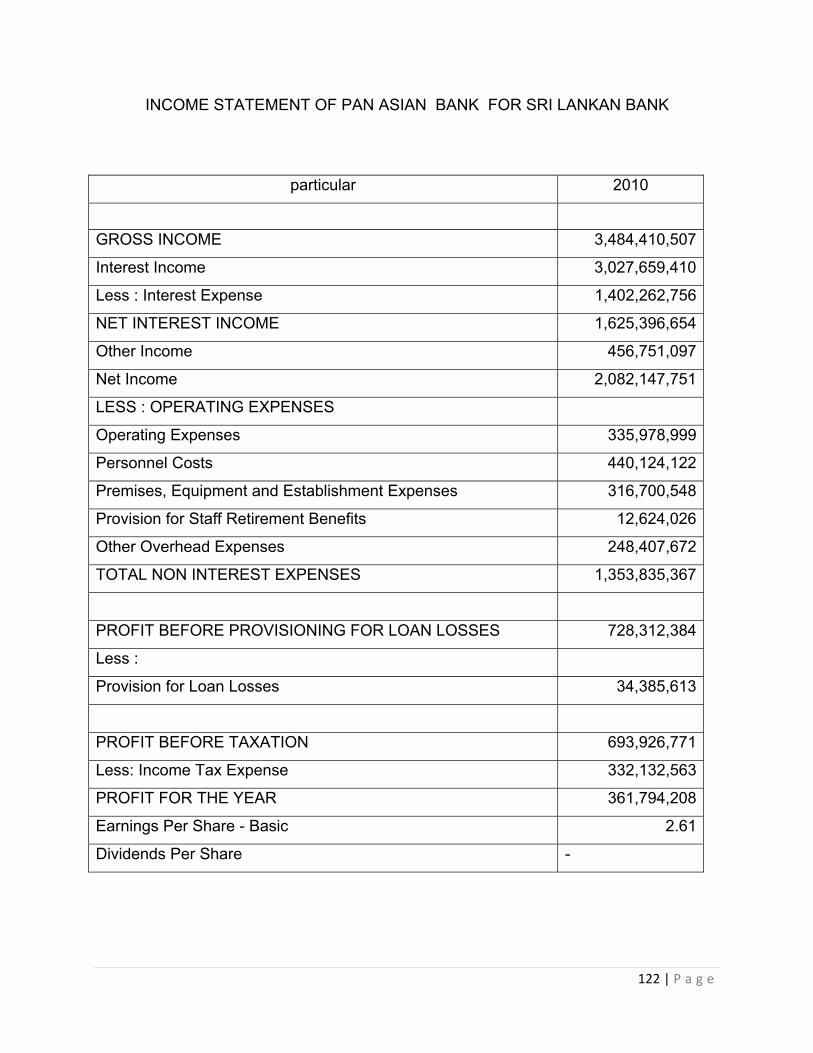
122 | P a g e
INCOME STATEMENT OF PAN ASIAN BANK FOR SRI LANKAN BANK
particular 2010
GROSS INCOME 3,484,410,507
Interest Income 3,027,659,410
Less : Interest Expense 1,402,262,756
NET INTEREST INCOME 1,625,396,654
Other Income 456,751,097
Net Income 2,082,147,751
LESS : OPERATING EXPENSES
Operating Expenses 335,978,999
Personnel Costs 440,124,122
Premises, Equipment and Establishment Expenses 316,700,548
Provision for Staff Retirement Benefits 12,624,026
Other Overhead Expenses 248,407,672
TOTAL NON INTEREST EXPENSES 1,353,835,367
PROFIT BEFORE PROVISIONING FOR LOAN LOSSES 728,312,384
Less :
Provision for Loan Losses 34,385,613
PROFIT BEFORE TAXATION 693,926,771
Less: Income Tax Expense 332,132,563
PROFIT FOR THE YEAR 361,794,208
Earnings Per Share - Basic 2.61
Dividends Per Share -
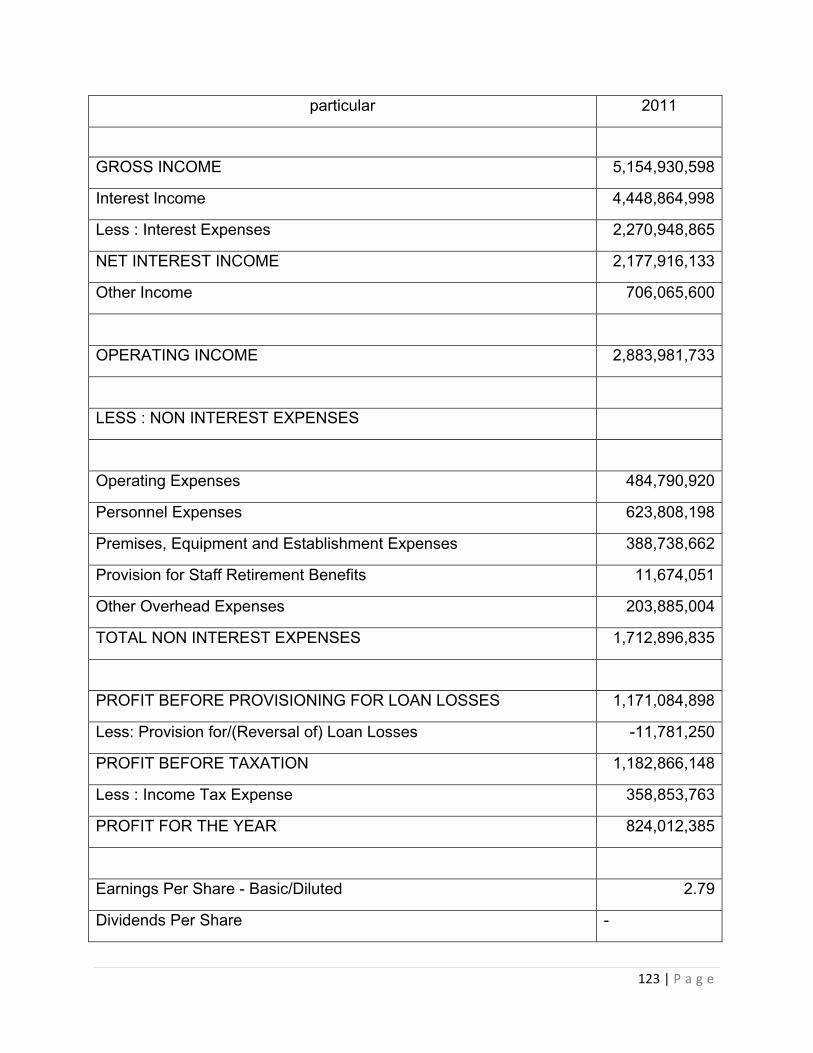
123 | P a g e
particular 2011
GROSS INCOME 5,154,930,598
Interest Income 4,448,864,998
Less : Interest Expenses 2,270,948,865
NET INTEREST INCOME 2,177,916,133
Other Income 706,065,600
OPERATING INCOME 2,883,981,733
LESS : NON INTEREST EXPENSES
Operating Expenses 484,790,920
Personnel Expenses 623,808,198
Premises, Equipment and Establishment Expenses 388,738,662
Provision for Staff Retirement Benefits 11,674,051
Other Overhead Expenses 203,885,004
TOTAL NON INTEREST EXPENSES 1,712,896,835
PROFIT BEFORE PROVISIONING FOR LOAN LOSSES 1,171,084,898
Less: Provision for/(Reversal of) Loan Losses -11,781,250
PROFIT BEFORE TAXATION 1,182,866,148
Less : Income Tax Expense 358,853,763
PROFIT FOR THE YEAR 824,012,385
Earnings Per Share - Basic/Diluted 2.79
Dividends Per Share -
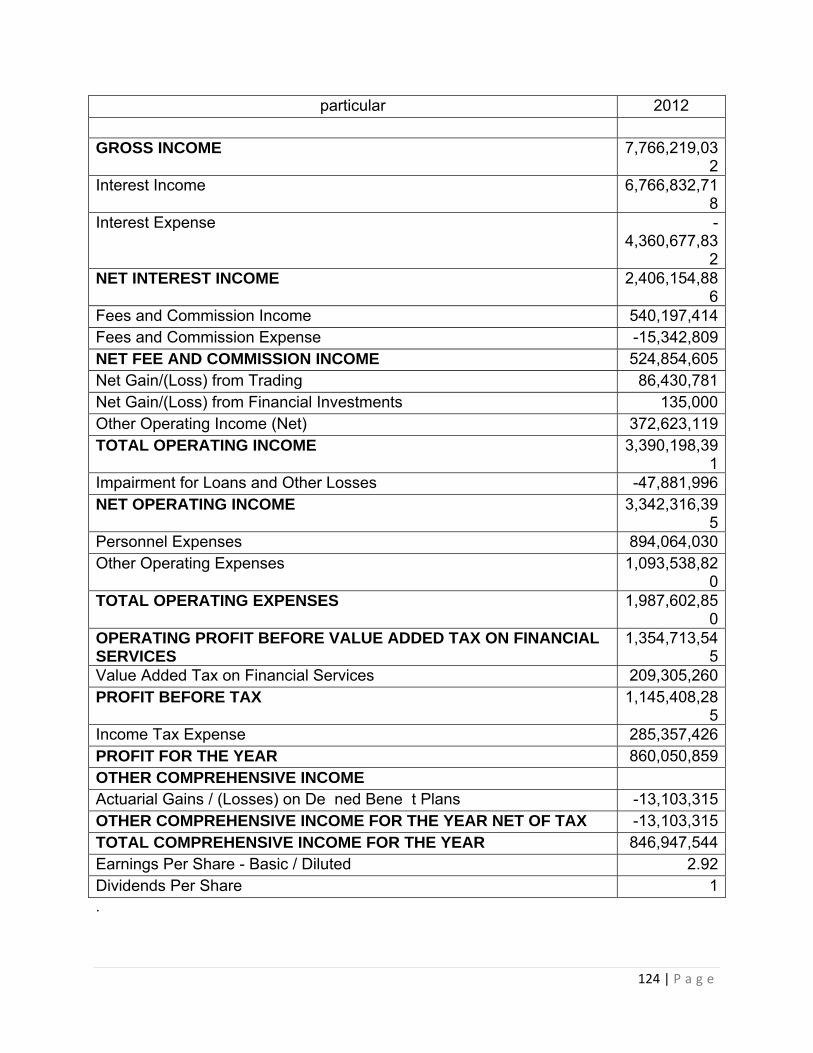
124 | P a g e
particular 2012
GROSS INCOME 7,766,219,032
Interest Income 6,766,832,718
Interest Expense -4,360,677,83
2NET INTEREST INCOME 2,406,154,88
6Fees and Commission Income 540,197,414Fees and Commission Expense -15,342,809NET FEE AND COMMISSION INCOME 524,854,605Net Gain/(Loss) from Trading 86,430,781Net Gain/(Loss) from Financial Investments 135,000Other Operating Income (Net) 372,623,119TOTAL OPERATING INCOME 3,390,198,39
1Impairment for Loans and Other Losses -47,881,996NET OPERATING INCOME 3,342,316,39
5Personnel Expenses 894,064,030Other Operating Expenses 1,093,538,82
0TOTAL OPERATING EXPENSES 1,987,602,85
0OPERATING PROFIT BEFORE VALUE ADDED TAX ON FINANCIAL SERVICES
1,354,713,545
Value Added Tax on Financial Services 209,305,260PROFIT BEFORE TAX 1,145,408,28
5Income Tax Expense 285,357,426PROFIT FOR THE YEAR 860,050,859OTHER COMPREHENSIVE INCOME Actuarial Gains / (Losses) on De ned Bene t Plans -13,103,315OTHER COMPREHENSIVE INCOME FOR THE YEAR NET OF TAX -13,103,315TOTAL COMPREHENSIVE INCOME FOR THE YEAR 846,947,544Earnings Per Share - Basic / Diluted 2.92Dividends Per Share 1.
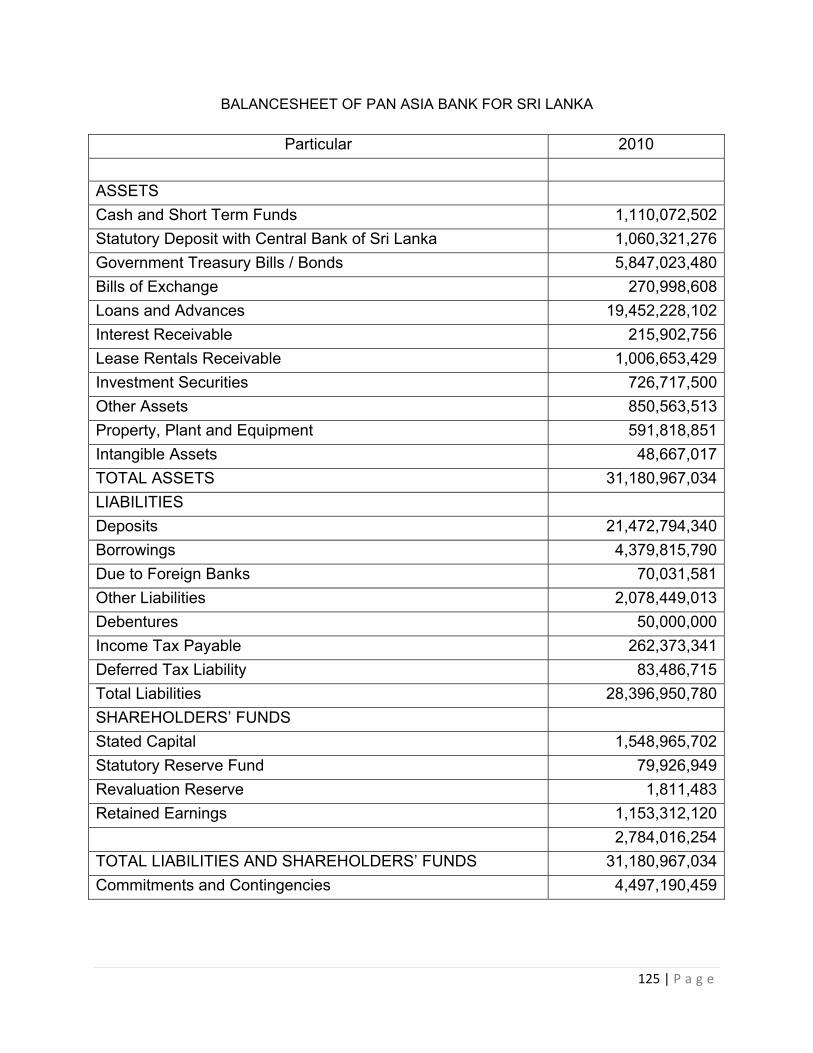
125 | P a g e
BALANCESHEET OF PAN ASIA BANK FOR SRI LANKA
Particular 2010
ASSETS
Cash and Short Term Funds 1,110,072,502
Statutory Deposit with Central Bank of Sri Lanka 1,060,321,276
Government Treasury Bills / Bonds 5,847,023,480
Bills of Exchange 270,998,608
Loans and Advances 19,452,228,102
Interest Receivable 215,902,756
Lease Rentals Receivable 1,006,653,429
Investment Securities 726,717,500
Other Assets 850,563,513
Property, Plant and Equipment 591,818,851
Intangible Assets 48,667,017
TOTAL ASSETS 31,180,967,034
LIABILITIES
Deposits 21,472,794,340
Borrowings 4,379,815,790
Due to Foreign Banks 70,031,581
Other Liabilities 2,078,449,013
Debentures 50,000,000
Income Tax Payable 262,373,341
Deferred Tax Liability 83,486,715
Total Liabilities 28,396,950,780
SHAREHOLDERS’ FUNDS
Stated Capital 1,548,965,702
Statutory Reserve Fund 79,926,949
Revaluation Reserve 1,811,483
Retained Earnings 1,153,312,120
2,784,016,254
TOTAL LIABILITIES AND SHAREHOLDERS’ FUNDS 31,180,967,034
Commitments and Contingencies 4,497,190,459
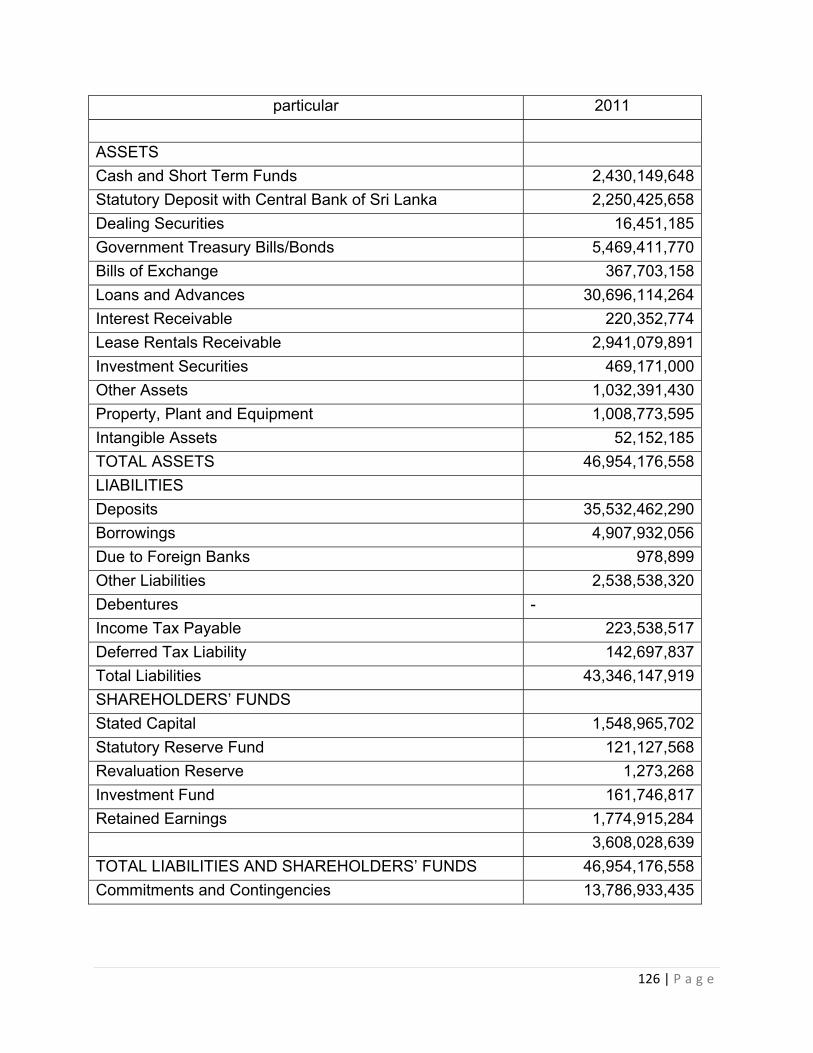
126 | P a g e
particular 2011
ASSETS
Cash and Short Term Funds 2,430,149,648
Statutory Deposit with Central Bank of Sri Lanka 2,250,425,658
Dealing Securities 16,451,185
Government Treasury Bills/Bonds 5,469,411,770
Bills of Exchange 367,703,158
Loans and Advances 30,696,114,264
Interest Receivable 220,352,774
Lease Rentals Receivable 2,941,079,891
Investment Securities 469,171,000
Other Assets 1,032,391,430
Property, Plant and Equipment 1,008,773,595
Intangible Assets 52,152,185
TOTAL ASSETS 46,954,176,558
LIABILITIES
Deposits 35,532,462,290
Borrowings 4,907,932,056
Due to Foreign Banks 978,899
Other Liabilities 2,538,538,320
Debentures -
Income Tax Payable 223,538,517
Deferred Tax Liability 142,697,837
Total Liabilities 43,346,147,919
SHAREHOLDERS’ FUNDS
Stated Capital 1,548,965,702
Statutory Reserve Fund 121,127,568
Revaluation Reserve 1,273,268
Investment Fund 161,746,817
Retained Earnings 1,774,915,284
3,608,028,639
TOTAL LIABILITIES AND SHAREHOLDERS’ FUNDS 46,954,176,558
Commitments and Contingencies 13,786,933,435
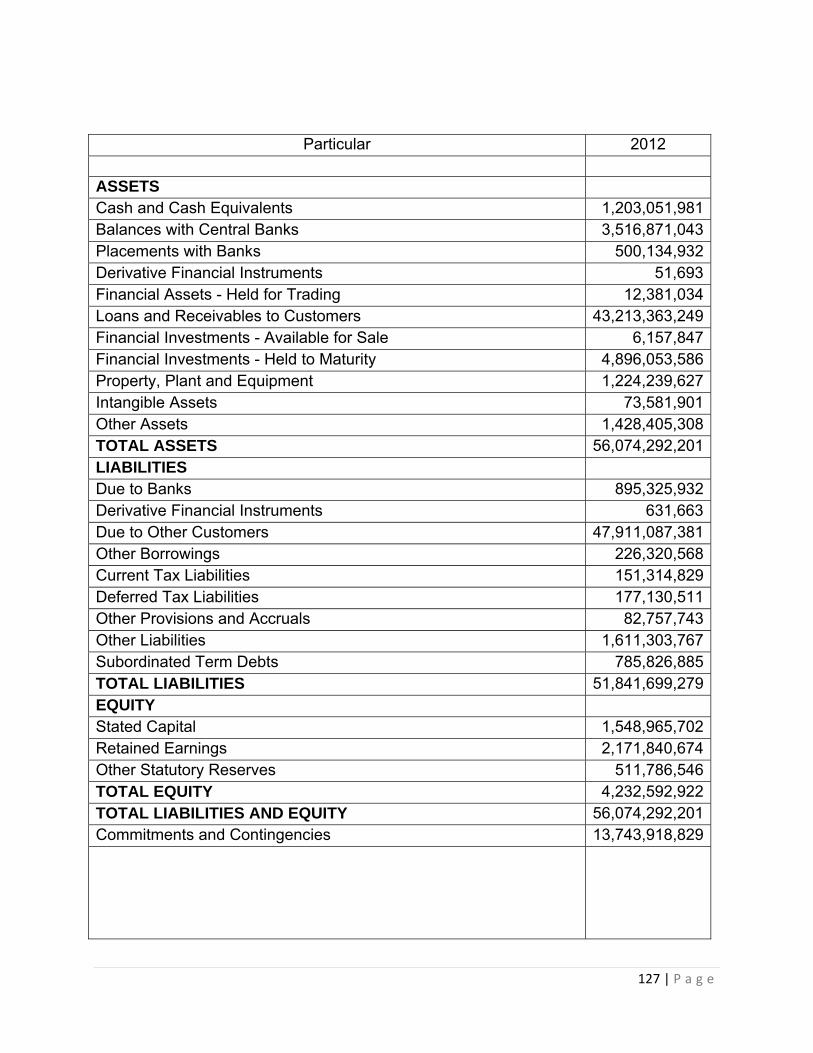
127 | P a g e
Particular 2012
ASSETS Cash and Cash Equivalents 1,203,051,981Balances with Central Banks 3,516,871,043Placements with Banks 500,134,932Derivative Financial Instruments 51,693Financial Assets - Held for Trading 12,381,034Loans and Receivables to Customers 43,213,363,249Financial Investments - Available for Sale 6,157,847Financial Investments - Held to Maturity 4,896,053,586Property, Plant and Equipment 1,224,239,627Intangible Assets 73,581,901Other Assets 1,428,405,308TOTAL ASSETS 56,074,292,201LIABILITIES Due to Banks 895,325,932Derivative Financial Instruments 631,663Due to Other Customers 47,911,087,381Other Borrowings 226,320,568Current Tax Liabilities 151,314,829Deferred Tax Liabilities 177,130,511Other Provisions and Accruals 82,757,743Other Liabilities 1,611,303,767Subordinated Term Debts 785,826,885TOTAL LIABILITIES 51,841,699,279EQUITY Stated Capital 1,548,965,702Retained Earnings 2,171,840,674Other Statutory Reserves 511,786,546TOTAL EQUITY 4,232,592,922TOTAL LIABILITIES AND EQUITY 56,074,292,201Commitments and Contingencies 13,743,918,829
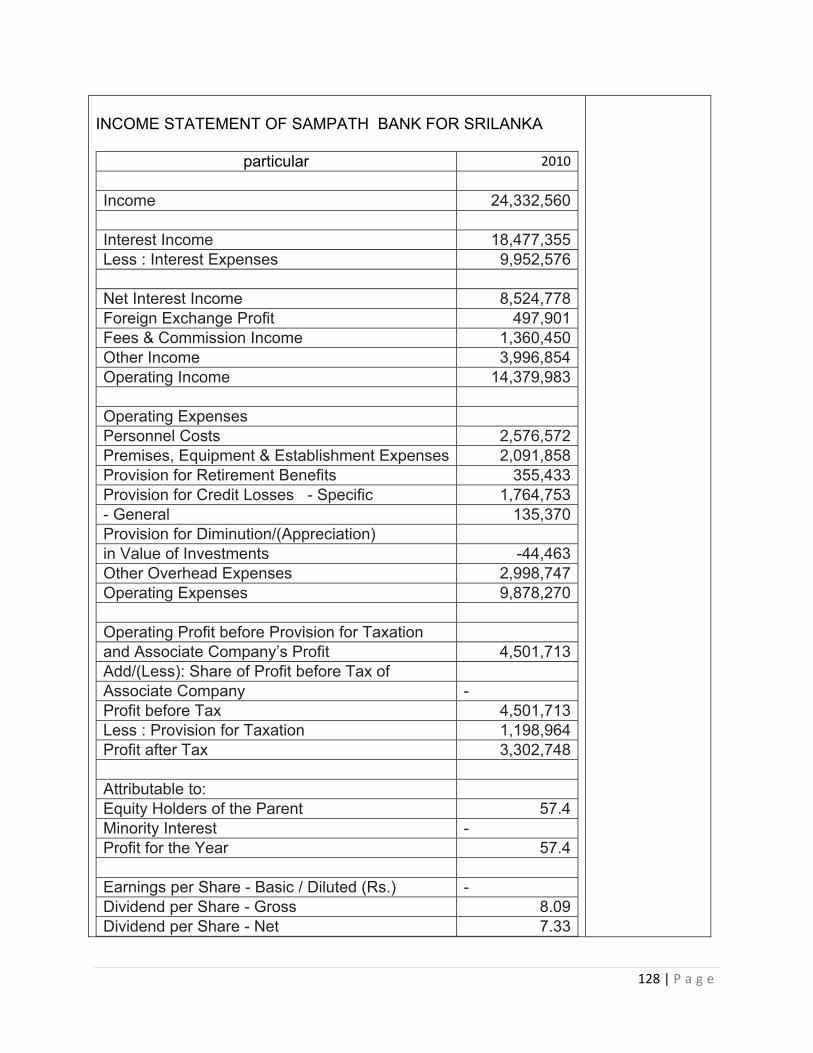
128 | P a g e
INCOME STATEMENT OF SAMPATH BANK FOR SRILANKA
particular 2010
Income 24,332,560 Interest Income 18,477,355 Less : Interest Expenses 9,952,576 Net Interest Income 8,524,778 Foreign Exchange Profit 497,901 Fees & Commission Income 1,360,450 Other Income 3,996,854 Operating Income 14,379,983 Operating Expenses Personnel Costs 2,576,572 Premises, Equipment & Establishment Expenses 2,091,858 Provision for Retirement Benefits 355,433 Provision for Credit Losses - Specific 1,764,753 - General 135,370 Provision for Diminution/(Appreciation) in Value of Investments -44,463 Other Overhead Expenses 2,998,747 Operating Expenses 9,878,270 Operating Profit before Provision for Taxation and Associate Company’s Profit 4,501,713 Add/(Less): Share of Profit before Tax of Associate Company - Profit before Tax 4,501,713 Less : Provision for Taxation 1,198,964 Profit after Tax 3,302,748 Attributable to: Equity Holders of the Parent 57.4 Minority Interest - Profit for the Year 57.4 Earnings per Share - Basic / Diluted (Rs.) - Dividend per Share - Gross 8.09 Dividend per Share - Net 7.33
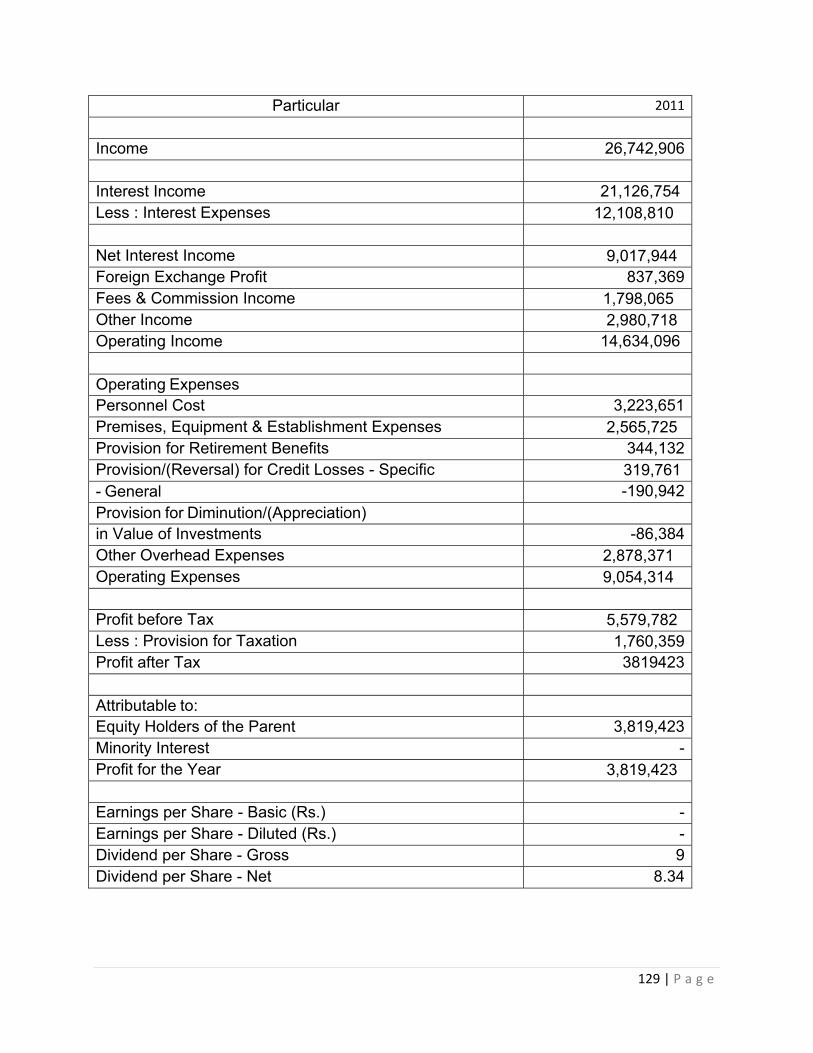
129 | P a g e
Particular 2011
Income 26,742,906
Interest Income 21,126,754 Less : Interest Expenses 12,108,810
Net Interest Income 9,017,944 Foreign Exchange Profit 837,369Fees & Commission Income 1,798,065 Other Income 2,980,718 Operating Income 14,634,096
Operating Expenses Personnel Cost 3,223,651Premises, Equipment & Establishment Expenses 2,565,725 Provision for Retirement Benefits 344,132Provision/(Reversal) for Credit Losses - Specific 319,761 - General -190,942Provision for Diminution/(Appreciation) in Value of Investments -86,384Other Overhead Expenses 2,878,371 Operating Expenses 9,054,314
Profit before Tax 5,579,782 Less : Provision for Taxation 1,760,359Profit after Tax 3819423
Attributable to: Equity Holders of the Parent 3,819,423Minority Interest -Profit for the Year 3,819,423
Earnings per Share - Basic (Rs.) -Earnings per Share - Diluted (Rs.) -Dividend per Share - Gross 9Dividend per Share - Net 8.34
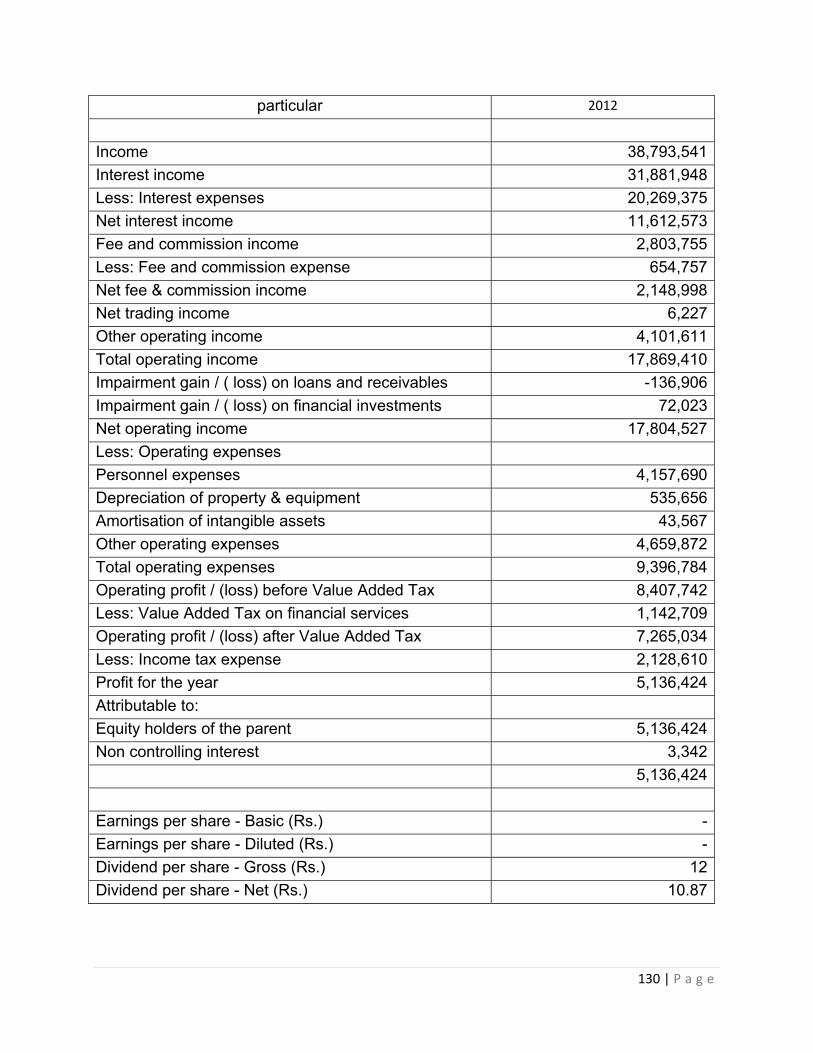
130 | P a g e
particular 2012
Income 38,793,541
Interest income 31,881,948
Less: Interest expenses 20,269,375
Net interest income 11,612,573
Fee and commission income 2,803,755
Less: Fee and commission expense 654,757
Net fee & commission income 2,148,998
Net trading income 6,227
Other operating income 4,101,611
Total operating income 17,869,410
Impairment gain / ( loss) on loans and receivables -136,906
Impairment gain / ( loss) on financial investments 72,023
Net operating income 17,804,527
Less: Operating expenses
Personnel expenses 4,157,690
Depreciation of property & equipment 535,656
Amortisation of intangible assets 43,567
Other operating expenses 4,659,872
Total operating expenses 9,396,784
Operating profit / (loss) before Value Added Tax 8,407,742
Less: Value Added Tax on financial services 1,142,709
Operating profit / (loss) after Value Added Tax 7,265,034
Less: Income tax expense 2,128,610
Profit for the year 5,136,424
Attributable to:
Equity holders of the parent 5,136,424
Non controlling interest 3,342 5,136,424
Earnings per share - Basic (Rs.) -
Earnings per share - Diluted (Rs.) -
Dividend per share - Gross (Rs.) 12
Dividend per share - Net (Rs.) 10.87
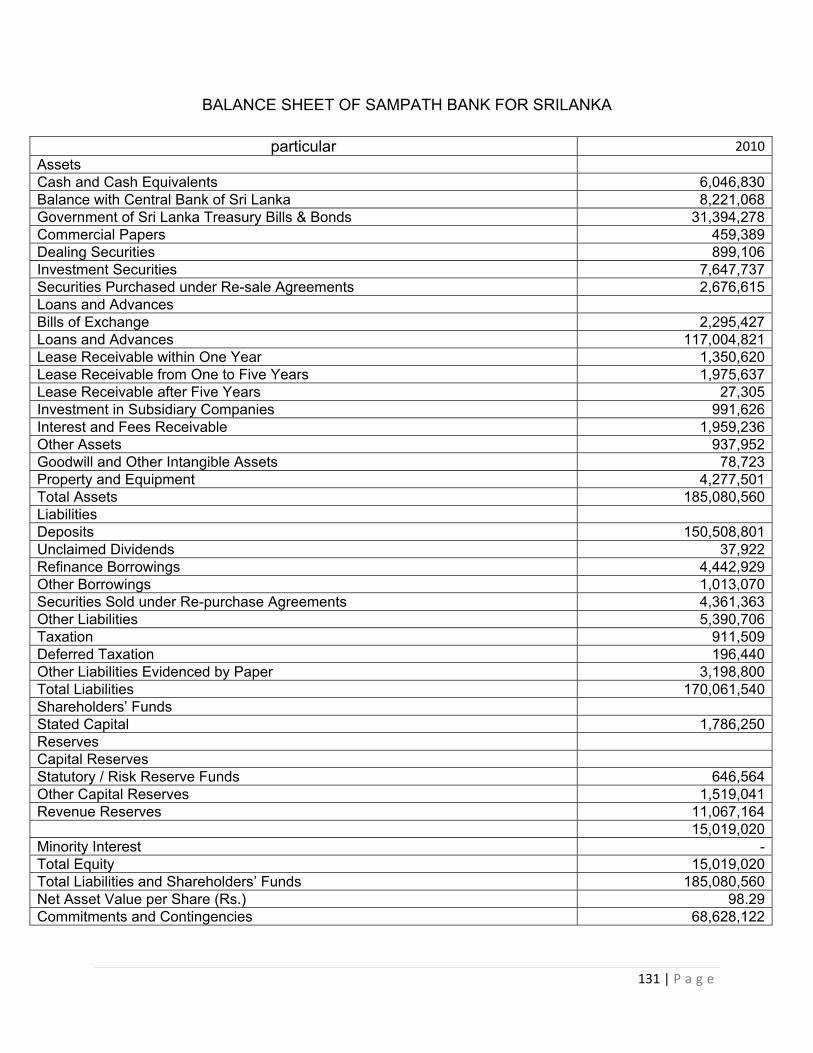
131 | P a g e
BALANCE SHEET OF SAMPATH BANK FOR SRILANKA
particular 2010
Assets Cash and Cash Equivalents 6,046,830Balance with Central Bank of Sri Lanka 8,221,068Government of Sri Lanka Treasury Bills & Bonds 31,394,278Commercial Papers 459,389Dealing Securities 899,106Investment Securities 7,647,737Securities Purchased under Re-sale Agreements 2,676,615Loans and Advances Bills of Exchange 2,295,427Loans and Advances 117,004,821Lease Receivable within One Year 1,350,620Lease Receivable from One to Five Years 1,975,637Lease Receivable after Five Years 27,305Investment in Subsidiary Companies 991,626Interest and Fees Receivable 1,959,236Other Assets 937,952Goodwill and Other Intangible Assets 78,723Property and Equipment 4,277,501Total Assets 185,080,560Liabilities Deposits 150,508,801Unclaimed Dividends 37,922Refinance Borrowings 4,442,929Other Borrowings 1,013,070Securities Sold under Re-purchase Agreements 4,361,363Other Liabilities 5,390,706Taxation 911,509Deferred Taxation 196,440Other Liabilities Evidenced by Paper 3,198,800Total Liabilities 170,061,540Shareholders’ Funds Stated Capital 1,786,250Reserves Capital Reserves Statutory / Risk Reserve Funds 646,564Other Capital Reserves 1,519,041Revenue Reserves 11,067,164 15,019,020Minority Interest -Total Equity 15,019,020Total Liabilities and Shareholders’ Funds 185,080,560Net Asset Value per Share (Rs.) 98.29Commitments and Contingencies 68,628,122
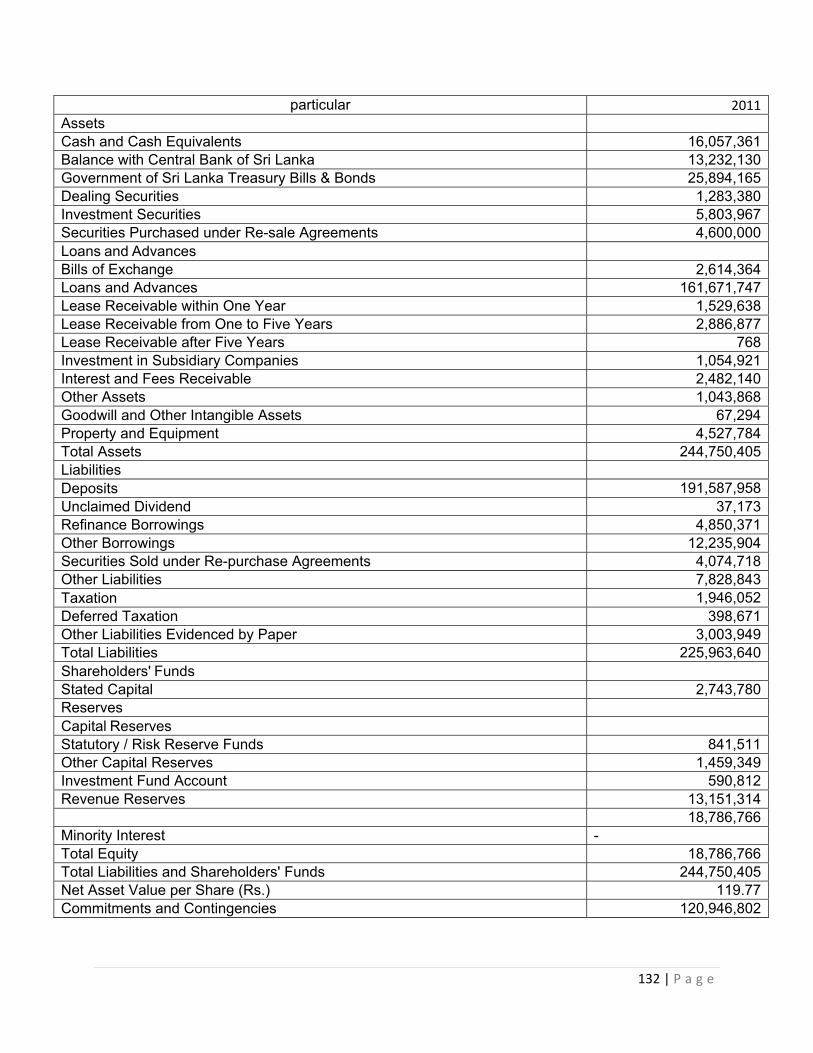
132 | P a g e
particular 2011Assets Cash and Cash Equivalents 16,057,361Balance with Central Bank of Sri Lanka 13,232,130Government of Sri Lanka Treasury Bills & Bonds 25,894,165Dealing Securities 1,283,380Investment Securities 5,803,967Securities Purchased under Re-sale Agreements 4,600,000Loans and Advances Bills of Exchange 2,614,364Loans and Advances 161,671,747Lease Receivable within One Year 1,529,638Lease Receivable from One to Five Years 2,886,877Lease Receivable after Five Years 768Investment in Subsidiary Companies 1,054,921Interest and Fees Receivable 2,482,140Other Assets 1,043,868Goodwill and Other Intangible Assets 67,294Property and Equipment 4,527,784Total Assets 244,750,405Liabilities Deposits 191,587,958Unclaimed Dividend 37,173Refinance Borrowings 4,850,371Other Borrowings 12,235,904Securities Sold under Re-purchase Agreements 4,074,718Other Liabilities 7,828,843Taxation 1,946,052Deferred Taxation 398,671Other Liabilities Evidenced by Paper 3,003,949Total Liabilities 225,963,640Shareholders' Funds Stated Capital 2,743,780Reserves
Capital Reserves Statutory / Risk Reserve Funds 841,511Other Capital Reserves 1,459,349Investment Fund Account 590,812Revenue Reserves 13,151,314 18,786,766Minority Interest - Total Equity 18,786,766Total Liabilities and Shareholders' Funds 244,750,405Net Asset Value per Share (Rs.) 119.77Commitments and Contingencies 120,946,802
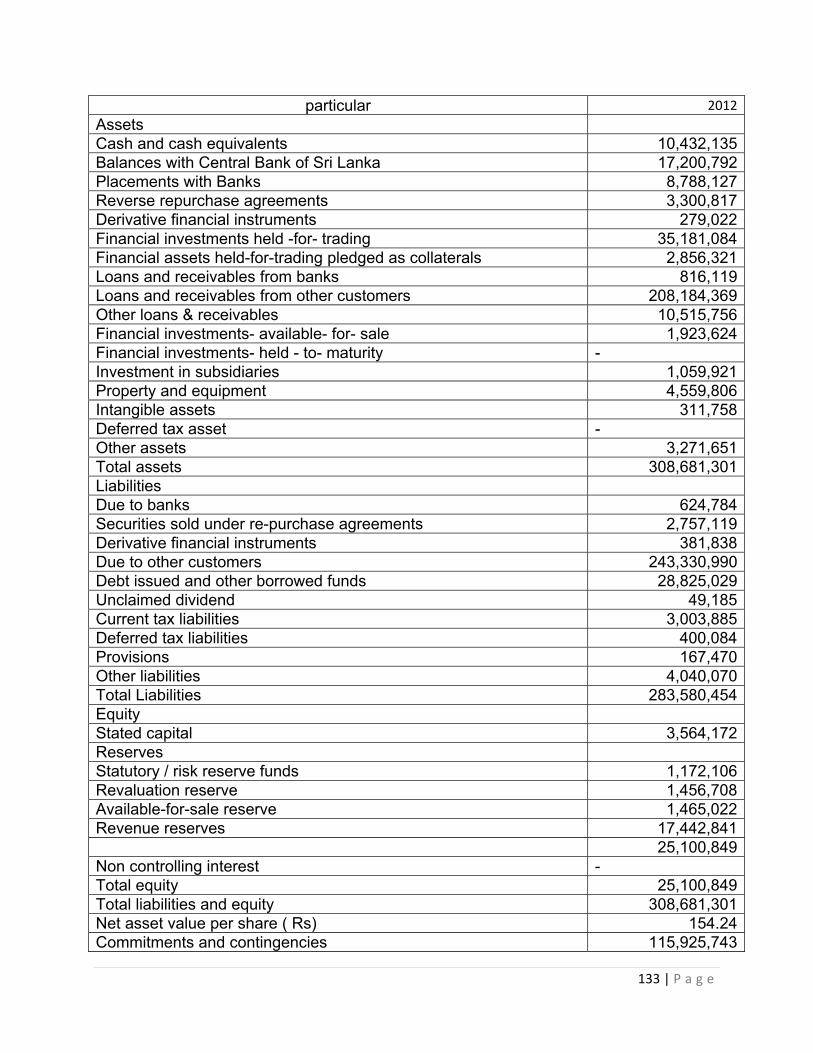
133 | P a g e
particular 2012
Assets Cash and cash equivalents 10,432,135Balances with Central Bank of Sri Lanka 17,200,792Placements with Banks 8,788,127Reverse repurchase agreements 3,300,817Derivative financial instruments 279,022Financial investments held -for- trading 35,181,084Financial assets held-for-trading pledged as collaterals 2,856,321Loans and receivables from banks 816,119Loans and receivables from other customers 208,184,369Other loans & receivables 10,515,756Financial investments- available- for- sale 1,923,624Financial investments- held - to- maturity - Investment in subsidiaries 1,059,921Property and equipment 4,559,806Intangible assets 311,758Deferred tax asset - Other assets 3,271,651Total assets 308,681,301Liabilities Due to banks 624,784Securities sold under re-purchase agreements 2,757,119Derivative financial instruments 381,838Due to other customers 243,330,990Debt issued and other borrowed funds 28,825,029Unclaimed dividend 49,185Current tax liabilities 3,003,885Deferred tax liabilities 400,084Provisions 167,470Other liabilities 4,040,070Total Liabilities 283,580,454Equity Stated capital 3,564,172Reserves Statutory / risk reserve funds 1,172,106Revaluation reserve 1,456,708Available-for-sale reserve 1,465,022Revenue reserves 17,442,841 25,100,849Non controlling interest - Total equity 25,100,849Total liabilities and equity 308,681,301Net asset value per share ( Rs) 154.24Commitments and contingencies 115,925,743
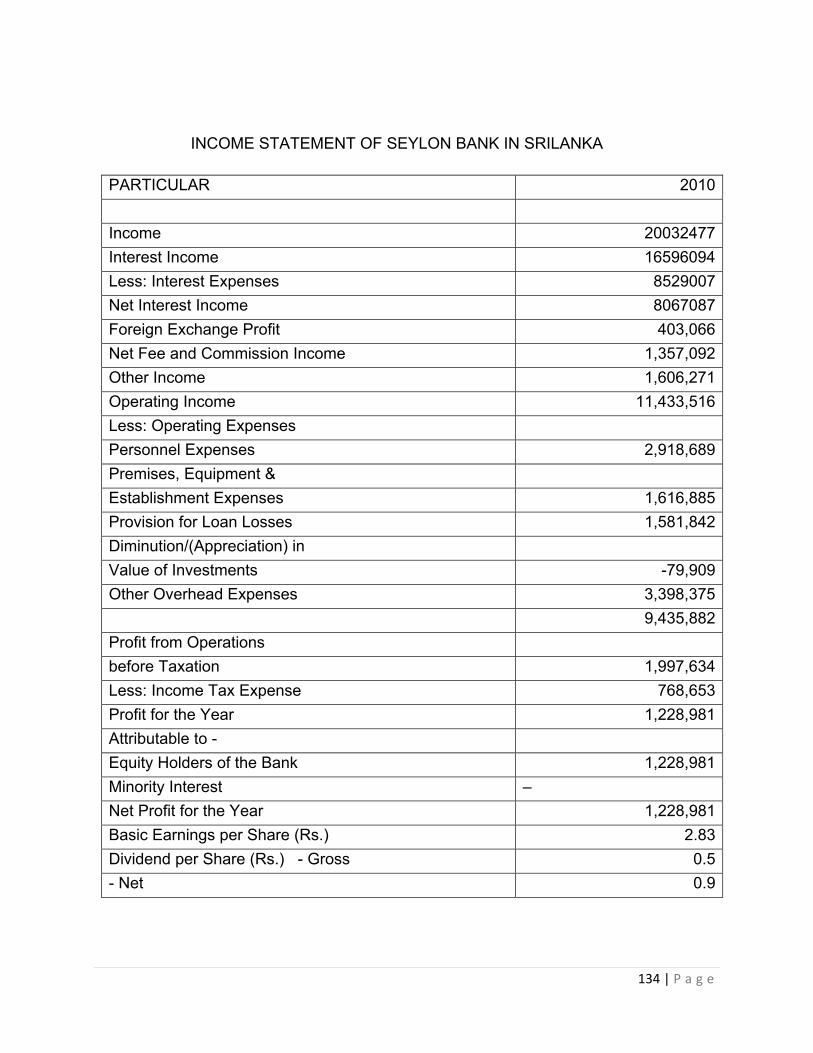
134 | P a g e
INCOME STATEMENT OF SEYLON BANK IN SRILANKA
PARTICULAR 2010
Income 20032477
Interest Income 16596094
Less: Interest Expenses 8529007
Net Interest Income 8067087
Foreign Exchange Profit 403,066
Net Fee and Commission Income 1,357,092
Other Income 1,606,271
Operating Income 11,433,516
Less: Operating Expenses
Personnel Expenses 2,918,689
Premises, Equipment &
Establishment Expenses 1,616,885
Provision for Loan Losses 1,581,842
Diminution/(Appreciation) in
Value of Investments -79,909
Other Overhead Expenses 3,398,375
9,435,882
Profit from Operations
before Taxation 1,997,634
Less: Income Tax Expense 768,653
Profit for the Year 1,228,981
Attributable to -
Equity Holders of the Bank 1,228,981
Minority Interest –
Net Profit for the Year 1,228,981
Basic Earnings per Share (Rs.) 2.83
Dividend per Share (Rs.) - Gross 0.5
- Net 0.9
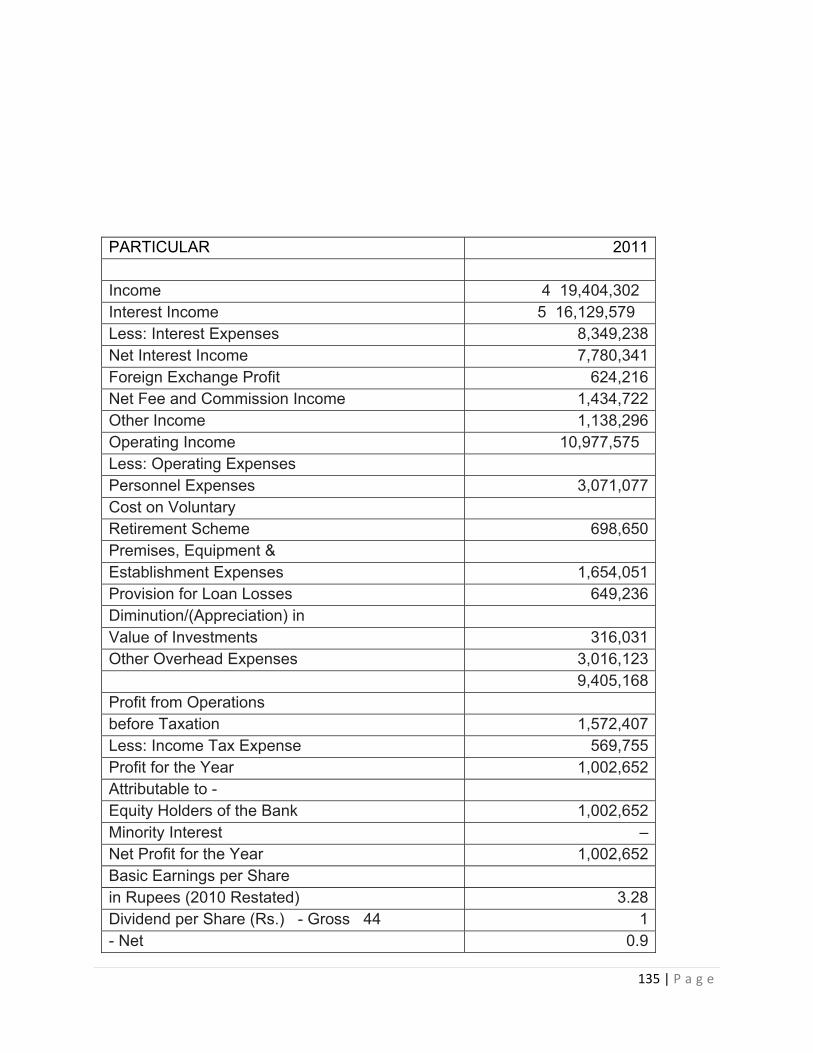
135 | P a g e
PARTICULAR 2011
Income 4 19,404,302 Interest Income 5 16,129,579 Less: Interest Expenses 8,349,238 Net Interest Income 7,780,341 Foreign Exchange Profit 624,216 Net Fee and Commission Income 1,434,722 Other Income 1,138,296 Operating Income 10,977,575 Less: Operating Expenses Personnel Expenses 3,071,077 Cost on Voluntary Retirement Scheme 698,650 Premises, Equipment & Establishment Expenses 1,654,051 Provision for Loan Losses 649,236 Diminution/(Appreciation) in Value of Investments 316,031 Other Overhead Expenses 3,016,123 9,405,168 Profit from Operations before Taxation 1,572,407 Less: Income Tax Expense 569,755 Profit for the Year 1,002,652 Attributable to - Equity Holders of the Bank 1,002,652 Minority Interest – Net Profit for the Year 1,002,652 Basic Earnings per Share in Rupees (2010 Restated) 3.28 Dividend per Share (Rs.) - Gross 44 1 - Net 0.9
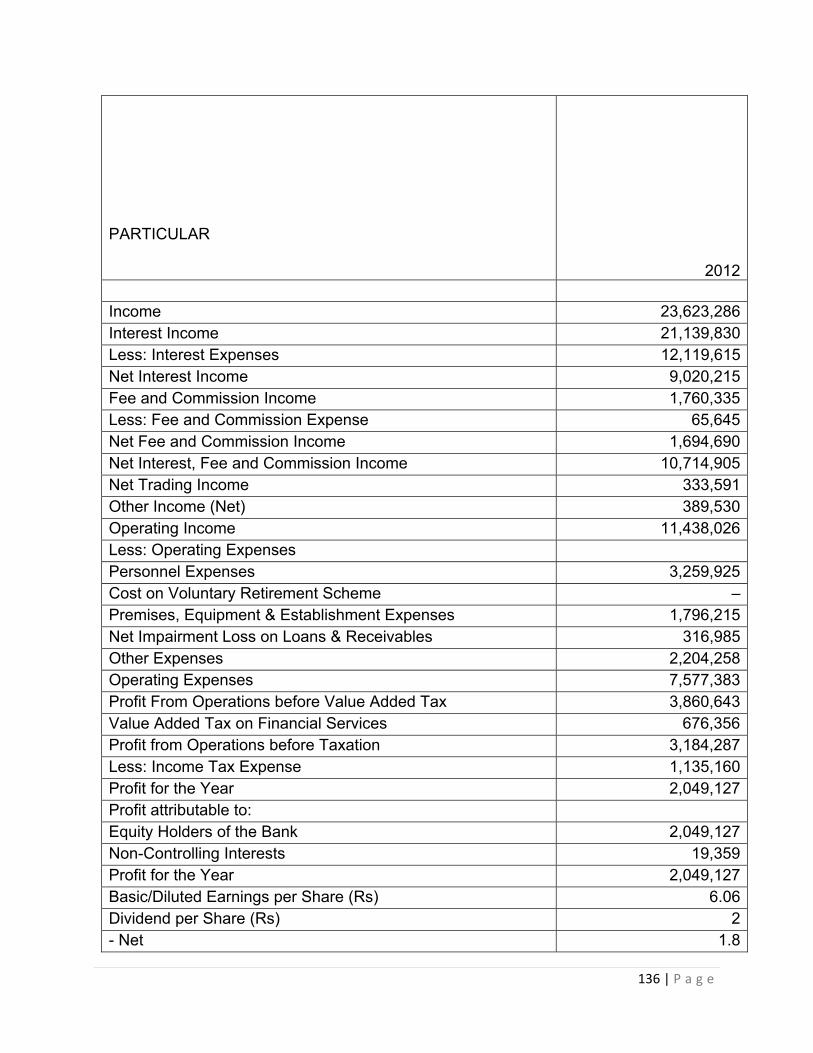
136 | P a g e
PARTICULAR
2012
Income 23,623,286Interest Income 21,139,830Less: Interest Expenses 12,119,615Net Interest Income 9,020,215Fee and Commission Income 1,760,335Less: Fee and Commission Expense 65,645Net Fee and Commission Income 1,694,690Net Interest, Fee and Commission Income 10,714,905Net Trading Income 333,591Other Income (Net) 389,530Operating Income 11,438,026Less: Operating Expenses Personnel Expenses 3,259,925Cost on Voluntary Retirement Scheme –Premises, Equipment & Establishment Expenses 1,796,215Net Impairment Loss on Loans & Receivables 316,985Other Expenses 2,204,258Operating Expenses 7,577,383Profit From Operations before Value Added Tax 3,860,643Value Added Tax on Financial Services 676,356Profit from Operations before Taxation 3,184,287Less: Income Tax Expense 1,135,160Profit for the Year 2,049,127Profit attributable to: Equity Holders of the Bank 2,049,127Non-Controlling Interests 19,359Profit for the Year 2,049,127Basic/Diluted Earnings per Share (Rs) 6.06Dividend per Share (Rs) 2- Net 1.8
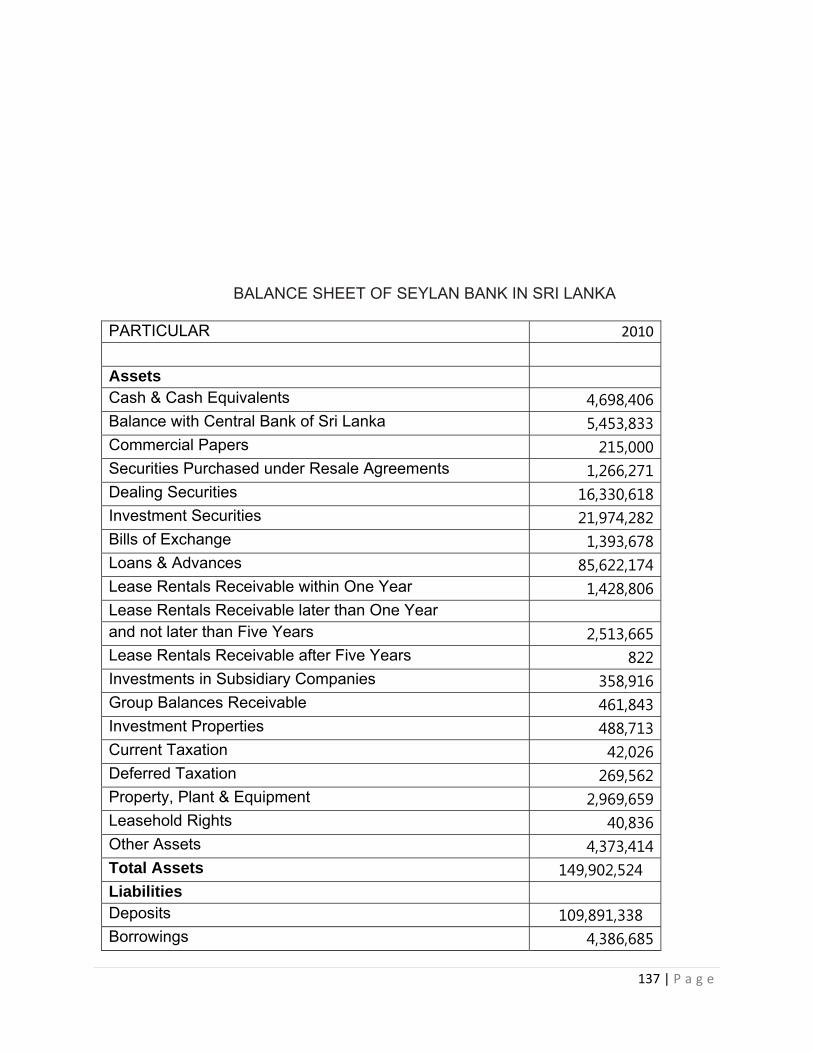
137 | P a g e
BALANCE SHEET OF SEYLAN BANK IN SRI LANKA PARTICULAR 2010
Assets
Cash & Cash Equivalents 4,698,406 Balance with Central Bank of Sri Lanka 5,453,833 Commercial Papers 215,000 Securities Purchased under Resale Agreements 1,266,271 Dealing Securities 16,330,618 Investment Securities 21,974,282 Bills of Exchange 1,393,678 Loans & Advances 85,622,174 Lease Rentals Receivable within One Year 1,428,806 Lease Rentals Receivable later than One Year
and not later than Five Years 2,513,665 Lease Rentals Receivable after Five Years 822 Investments in Subsidiary Companies 358,916 Group Balances Receivable 461,843 Investment Properties 488,713 Current Taxation 42,026 Deferred Taxation 269,562 Property, Plant & Equipment 2,969,659 Leasehold Rights 40,836 Other Assets 4,373,414 Total Assets 149,902,524 Liabilities
Deposits 109,891,338 Borrowings 4,386,685
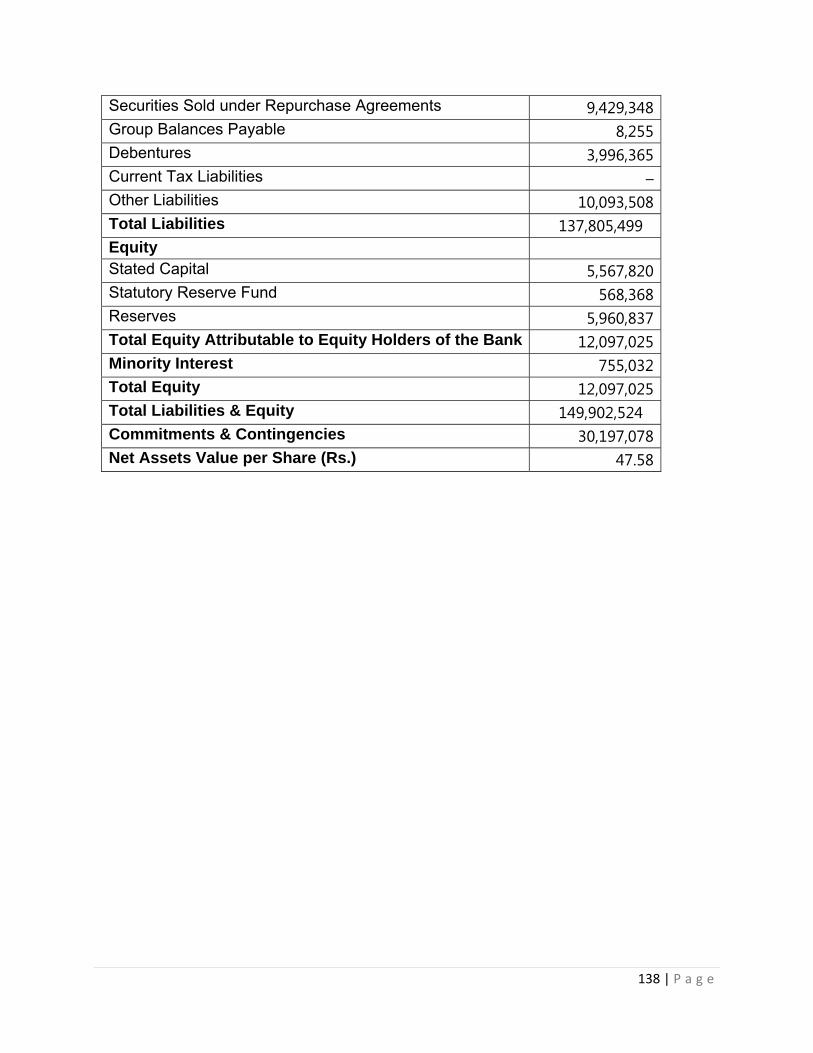
138 | P a g e
Securities Sold under Repurchase Agreements 9,429,348 Group Balances Payable 8,255 Debentures 3,996,365 Current Tax Liabilities – Other Liabilities 10,093,508 Total Liabilities 137,805,499 Equity
Stated Capital 5,567,820 Statutory Reserve Fund 568,368 Reserves 5,960,837 Total Equity Attributable to Equity Holders of the Bank 12,097,025 Minority Interest 755,032 Total Equity 12,097,025 Total Liabilities & Equity 149,902,524 Commitments & Contingencies 30,197,078 Net Assets Value per Share (Rs.) 47.58
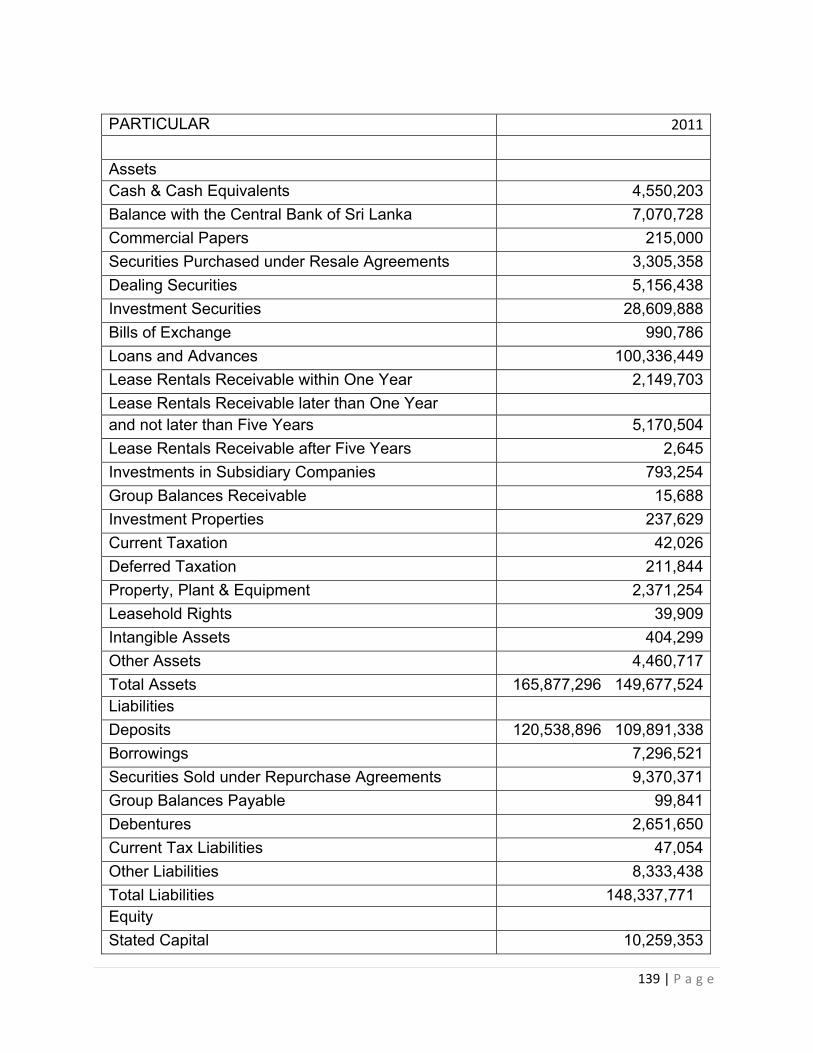
139 | P a g e
PARTICULAR 2011
Assets Cash & Cash Equivalents 4,550,203
Balance with the Central Bank of Sri Lanka 7,070,728
Commercial Papers 215,000
Securities Purchased under Resale Agreements 3,305,358
Dealing Securities 5,156,438
Investment Securities 28,609,888
Bills of Exchange 990,786
Loans and Advances 100,336,449
Lease Rentals Receivable within One Year 2,149,703
Lease Rentals Receivable later than One Year and not later than Five Years 5,170,504
Lease Rentals Receivable after Five Years 2,645
Investments in Subsidiary Companies 793,254
Group Balances Receivable 15,688
Investment Properties 237,629
Current Taxation 42,026
Deferred Taxation 211,844
Property, Plant & Equipment 2,371,254
Leasehold Rights 39,909
Intangible Assets 404,299
Other Assets 4,460,717
Total Assets 165,877,296 149,677,524Liabilities
Deposits 120,538,896 109,891,338
Borrowings 7,296,521
Securities Sold under Repurchase Agreements 9,370,371
Group Balances Payable 99,841
Debentures 2,651,650
Current Tax Liabilities 47,054
Other Liabilities 8,333,438
Total Liabilities 148,337,771 Equity
Stated Capital 10,259,353
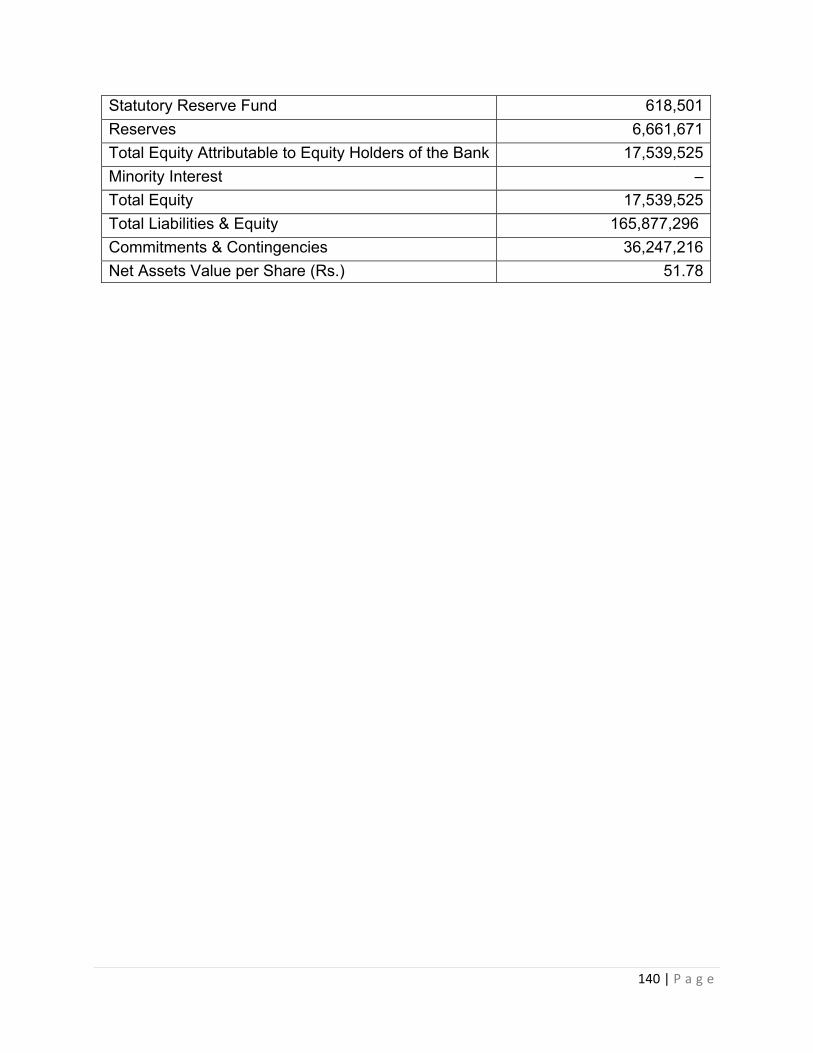
140 | P a g e
Statutory Reserve Fund 618,501
Reserves 6,661,671
Total Equity Attributable to Equity Holders of the Bank 17,539,525
Minority Interest –
Total Equity 17,539,525
Total Liabilities & Equity 165,877,296
Commitments & Contingencies 36,247,216
Net Assets Value per Share (Rs.) 51.78
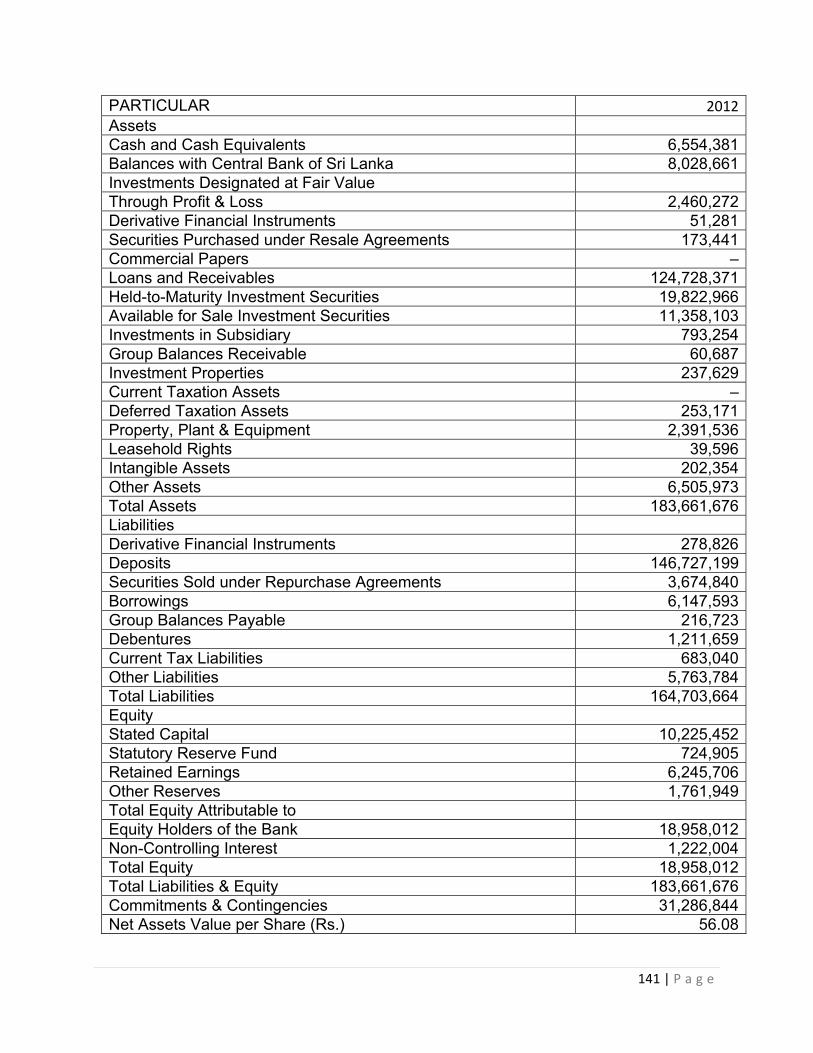
141 | P a g e
PARTICULAR 2012Assets Cash and Cash Equivalents 6,554,381Balances with Central Bank of Sri Lanka 8,028,661Investments Designated at Fair Value Through Profit & Loss 2,460,272Derivative Financial Instruments 51,281Securities Purchased under Resale Agreements 173,441Commercial Papers –Loans and Receivables 124,728,371Held-to-Maturity Investment Securities 19,822,966Available for Sale Investment Securities 11,358,103Investments in Subsidiary 793,254Group Balances Receivable 60,687Investment Properties 237,629Current Taxation Assets –Deferred Taxation Assets 253,171Property, Plant & Equipment 2,391,536Leasehold Rights 39,596Intangible Assets 202,354Other Assets 6,505,973Total Assets 183,661,676Liabilities Derivative Financial Instruments 278,826Deposits 146,727,199Securities Sold under Repurchase Agreements 3,674,840Borrowings 6,147,593Group Balances Payable 216,723Debentures 1,211,659Current Tax Liabilities 683,040Other Liabilities 5,763,784Total Liabilities 164,703,664Equity Stated Capital 10,225,452Statutory Reserve Fund 724,905Retained Earnings 6,245,706Other Reserves 1,761,949Total Equity Attributable to Equity Holders of the Bank 18,958,012Non-Controlling Interest 1,222,004Total Equity 18,958,012Total Liabilities & Equity 183,661,676Commitments & Contingencies 31,286,844Net Assets Value per Share (Rs.) 56.08
0
A
GLOBAL / COUNTRY STUDY REPORT
ON
“FINANCIAL SECTORS OF SRILANKA”
Submitted to
Gujarat Technological University
IN PARTIAL FULFILLMENT OF THE
REQUIREMENT OF THE AWARD FOR THE DEGREE OF
MASTER OF BUSINESS ADMINISTRATION
UNDER THE GUIDANCE OF
Faculty Guide
Mr. Nilesh Anklashvariya
Submitted by
(C. C. Gardi Institute of Management)
[Batch: 2012-13]
MBA SEMESTER III/IV
C.C.GARDI SCHOOL OF MANAGEMENT
MBA PROGRAMME __________________________________________________
Affiliated to Gujarat Technological University
Ahmedabad
May, 2013
1
Students‘ Declaration
We, Doshi Vidhi,Bhut Kishan,Zulasana
Dilip students of C. C. Gardi School of Management, hereby declare that the
report for Global/ Country Study Report entitled ―GLOBAL / COUNTRY STUDY
REPORT ON FINANCIAL SECTORǁ in SRILANKA is a result of our own work and
our indebtedness to other work publications, references, if any, have been duly
acknowledged.
Place : …….. (Signature)
Date :(Name of Student)
DOSHI VIDHI BHUT KISHAN ZULASANA DILIP
2
Institute‘s Certificate
―Certified that this Global /Country Study and Report Titled ―GLOBAL/ COUNTRY
STUDY REPORT ON FINANCIAL SECTOR IN SRILANKAǁ is the bonafide work of
students of C. C. Gardi School of Management who carried out the research
under our supervision. We also certify further, that to the best of our knowledge
the work reported herein does not form part of any other project report or
dissertation on the basis of which a degree or award was conferred on an earlier
occasion on this or any other candidate.
Dr. Sunil Mishra,
Asst. Prof. Niraj Vyas,
Asst. Prof. Pratik Gandhi

3
PREFACE
Today we are at the door step of 21st century. The world is widening without
having a New and new developments are coming these days in all fields all over
India to make the people life more comfortable and luxurious. The industries are
growing so fast in India in order to satisfy all the needs of people. Similarly Gov.
has supported to these companies for their development and progress of private
companies.
Thus in order to survive in the market one should have theoretical as well as
Practical knowledge about all different fields prevailing in market. For this we have
chosen SRILANKA country for Global country report.
4
Acknowledgement
We feel pleasure to submit this report, which includes the practical aspect of
study. We are very happy to express our deepest gratitude to all the persons who
spared their valuable time & helped us in preparation of this Global Country
Report.
We might like to thank our project guides Prof.Nilesh
Ankleshvariya&Asst. Prof. Pratik Gandhi for our moral support & guidance.
DATE:
PLACE: Rajkot
(Signature of Student.)
Doshi Vidhi
Bhut Kishan
Zulasana Dilip
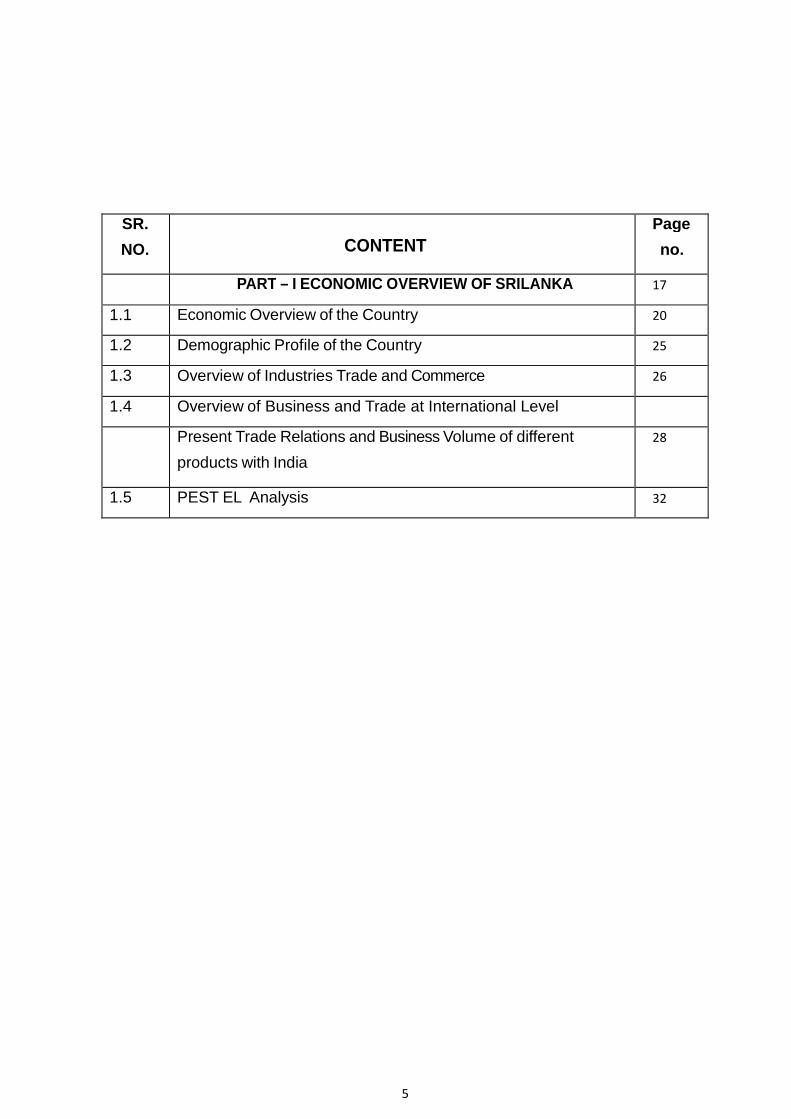
5
SR.
NO.
CONTENT
Page
no.
PART – I ECONOMIC OVERVIEW OF SRILANKA 17
1.1 Economic Overview of the Country 20
1.2 Demographic Profile of the Country 25
1.3 Overview of Industries Trade and Commerce 26
1.4 Overview of Business and Trade at International Level
Present Trade Relations and Business Volume of different
products with India
28
1.5 PEST EL Analysis 32
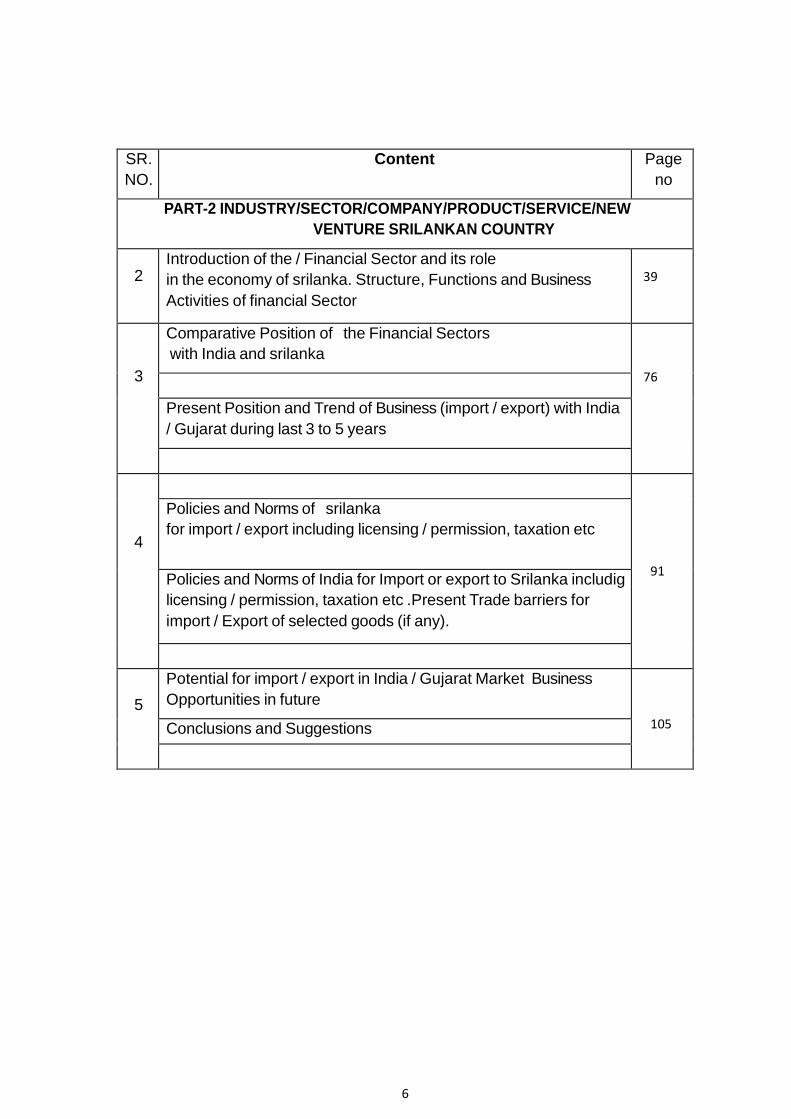
6
SR. NO.
Content Page
no
PART-2 INDUSTRY/SECTOR/COMPANY/PRODUCT/SERVICE/NEW
VENTURE SRILANKAN COUNTRY
2
Introduction of the / Financial Sector and its role
in the economy of srilanka. Structure, Functions and Business
Activities of financial Sector
39
3
Comparative Position of the Financial Sectors
with India and srilanka
76
Present Position and Trend of Business (import / export) with India
/ Gujarat during last 3 to 5 years
4
91
Policies and Norms of srilanka
for import / export including licensing / permission, taxation etc
Policies and Norms of India for Import or export to Srilanka includig
licensing / permission, taxation etc .Present Trade barriers for
import / Export of selected goods (if any).
5
Potential for import / export in India / Gujarat Market Business
Opportunities in future
105 Conclusions and Suggestions
7
Executive Summary
A thriving and vibrant banking system requires a well developed financial structurewith multi
ple intermediaries operating in markets with different risk profiles. There
will a segregation of financial intermediation among banks, resulting in competitive
efficiency, depth and resilience to the financial system.
Other types of financial intermediaries will complement banks and act as counter-
parties, in syndications and co-financing strategies, as also in the sharing of risk.
Markets will acquire greater depth and liquidity, especially in the money and debt
segments. Rigidities in the market microstructure will be removed so that prices of
financial instruments will respond flexibly to different phases of the business cycle.
The spectrum of financial institutions will bring about financial deepening and
broad based intermediation, encouraging financial saving in the community.
While the direction in which reforms will be carried forward is reasonably clear, the
pace of reforms will be uncertain. This stems from the need to balance the many
diverse opinions on the role of Government in development and the role of public
policy.
8
1 Introduction
India’s Financial Sector Reforms can be characterized as slow, careful steps and
Avoidance of “shock therapy”. The reforms have focused on five areas key to the
Financial sector:
1) Money, capital and debt markets
2) Financial Mediators (banks, NBFCs, DFIs, Insurance etc.)
3) Supervisory, regulatory systems for reducing systemic risk
4) Decoupling the regulatory from fiscal policy by deregulating interest rates,
scaling down of interest rate subsidies, SLR, CRR and mandatory
creditAllocation
5) External sector reforms the performance of the financial sector and the health of the
economy are intertwined and this is to be taken into account while the outlook for
financialSector is investigated. For instance, care is to be taken that as the
financialsectorexchanges forward, credit creation slowdown does not occur because of
supplyProblems or due to rationing of credit.I look at the financial intermediaries (primarily
Banks), markets, regulatory &supervisory framework, structure and the evolving Role of
RBI to paint aPicture of what the Indian financial sector might look like
1. Overview. Sri Lanka is a well-known outlier among developing nations. It was one of
the first developing countries to understand the importance of investing in Human
Resources and promoting gender equality. As a result, Sri Lanka has achieved human
Development outcomes more consistent with those of high revenue countries. It also
liberalized its economy in the late 1970s, ahead of new developing Nation-states. Despite
acceleration of the civil conflict in the 1990s, economic growth has been strong due to good
macroeconomic management and progress in trade liberalization, transfer, and financial
sector reform. Sri Lanka is today South Asia’s most open economy, and has a
relatively well developed Capital market infrastructure. Its per capita revenue (US$ 820)
remains the highest in the region, after Maldives. Unemployment and inflation have fallen to
historical Lows, the external current account has strengthened, exports have diversified
and Expanded, and foreign direct investment has increased.
2. There is increasing realization, however, that Sri Lanka’s development has been well
Belowitspotential. In the 1960s, Sri Lanka had the same per capita income
As Korea, Malaysia, and Singapore. Thirty years later these three countries have Per
capita Incomes that are several times higher than Sri Lanka's. Several reasons explain

9
this Divergence in economic performance. The first and most obvious one is the 17-year
Long war. This has taken a heavy social and economic toll on the countries Performance.
Second, relative to the early 1970s, public institutions And governance have Weakened
gradually finished the years. Third, Sri Lanka has for many years given the public Sector a
significant role in creating jobs and transferring resources across groups. The size of the
public subdivision has declined slightly over the years, but it continues to dominate the
financial sector and utilities, while owning a large number of commercial Enterprises. Per
capita Employment in the public sector is the largest in Asia. With productivity in the public
sector typically well below that of the private sector, this has meant predetermined
opportunities In terms of growth and employment. Regulations regarding land
transmissions and exit policies in the labormarket have exacerbated the situation by
constraining Efficiency in the private sector. It istestimony to the private sector’s strength
that employment in the private sector has increasedsignificantly during the last Decade
despite these constraints.
3. Realizing Sri Lanka's enormous potential will first require an end to the war. In addition,as
indicated in the 2000 Budget speech, the country wants to engage in a second wave of
reformsthat will increase opportunities, put the economy on a Great growth path, and
improve governance. Of particular importance are initiatives Highlighted in the Budget
aimed at acceleratingprivatization and strengthening Public institutions.
4. Recent political developments. Since late 1998 elections have slowed the Momentum
Forintroducing key important reforms.Provincial Council Elections Were held in the First
half of 1999, and Presidential elections inDecember 1999. Since her
re-election,PresidentKumaratunga has made new efforts at resolving the conflict. The
opposition United NationalParty (UNP) haspledged its support to the Government’s peace
initiatives, and Norway isassisting the process. These developments have however been
OutdidBy a volatile security situation with intensified military offensives, High profile
Shootings, attemptedassassinations, suicide bombings and a run Of Smaller bus bombings.
Parliamentary electionslisted for mid-2000 add an Additional layer of uncertainty to the
speed of policy reforms.
5. Resilience in the face of adversities. Despite the problematic domestic political conditions,
the intensified civil conflict, and turbulence in world monetary markets, the economy has
continued to show resilience over the last 18 months. The first half of 1999 was
10
mostlytesting, with exports falling for the first time by as much as 10 percent due to weak
globaldemand for tea and garments. This wasinverted inthe second half of the year. Real
GDPgrowth for 1999 was 4.3%, slightly lower than the long-standing trend but comparing
favorablywith growth Performance in other rising countries. Unemployment has fallen to a
historical Low (8.8 percent). Foreign direct investments increased somewhat. Combined
with falling Domestic and international commodity prices, macroeconomic policies have
reduced Inflation byhalf relative to 1998 (4.7%). The favorable trends have continued
during the first quarter of2000 with exports and industrial production growing by 24 And 12
percent, respectively, andinflation continuing on a downward trend.
6. Short-term vulnerabilities. Despite these successes, vulnerabilities remain on the external
front. Sri Lanka’s current account has better considerably over the last Decade,although
there was a wide of the deficit to 3.3% of GDP in 1999. The Capital accountwhich has
weakened steadily since 1990 was further affected in 1999.Net money flows fell to
ahistorical low of US$ 330 million, compared with an average of about
US$ 600millionduring 1990-98.The long-term deterioration in the capital Account is due to
rising amortization ofofficial debt and a reversal in short-term capital Flows (which have
been large and negative in thelast four years). This underlying Trend was aggravated in
1999 when gross disbursements of concessional aid fell to a very low level (US$ 350 million
compared with US$ 520 million in1990-98) due to the completion of several large donor
financed projects and continued delays in Procurement. Large privatization receipts
(US$ 430 million) over 1995-99 and sustained Levels of long-term capital from the private
sector helped mitigate the impact of this continued weakening in the capital account. As
a result, outside reserves have been partially protected,although falling steadily for six
years. The balance of payments registered a deficit of US$ 260million in 1999, and gross
official reserves floor to 2.9 months of weights. The challenge in thefuture is to maintain
sustainable long-term increases in private capital as well as maximize the useof foreign
Concessional assistance.
7.Another vulnerability relates to the fiscal situation. The budget deficit was reduced to
percent of GDP in 1999. The 2000 Budget introduced in February aimed at maintaining
thedeficit at the same level as in 1999. However, the escalation of the conflict in
the Jaffna peninsula since May has called for an increase in defense expenditures of about
1 percent ofGDP. Additional revenue and expenditure measures were taken to offset part of
these military expenditures, and the aim is to contain the deficit to below 8 percent of GDP.
Realizing this objective will however remain a challenge for Sri Lanka as it is based on
ambitious revenuetargets and early realization of privatization receipts. A extra difficult task
is to reduce the deficitover the medium-term as this calls for both revenue and expenditure

11
improvements. The deficitdeclined by about 2-3 percentage points of GDP over 1990-99,
but was accompanied by a fall of 3-4 percentage points of GDP in revenues (due in part to
tax concessions). As a result,expenditures declined by 6-7 percentage points of GDP.
Half of the reduction was in capitalspending in acountry greatly in need of better
infrastructure. On the other hand, the gains made in reducing current expenditures over
the decade were undermined by the increasing share ofdefense outlays and debt servicing.
In addition, the wage bill was abridged by about 2% points of GDP between 1990-99,in the
face of a great expansion in the cadre of public servants. This fiscal situation could be
adversely affected if the highly positive real interest rates of 1999continue to persist.
8. Prudent monetary policy was successful in lowering inflation in 1999. It was
Howeverunable to reduce interest rates because of the large borrowing needs of the
Government to make up for the shortfall in external financing. The financial sector has
benefited from severalstructural enhancements in New Year’s. However, continuing
governance weaknesses at the twostate banks undermine the efficiency of the sector. Their
portfolios remain weak (15-20 percentnon-performing assets) and theirManagement was
unable to meet the targets specified under theperformance contracts signed with the
Government in July 1998. The poor performance of thesetwo state banks remains a
serious concern for the Government, and some reform initiatives have recently been
launched. As in the past, argument rate policy in 1999 aimed at protecting SriLanka’s
external competitiveness.
9. Sri Lanka’s future economic and social development will depend not merely on maintaining
sound macroeconomic management and accelerating privatization, but additional
importantlyon the country’s ability to resolve the on-going conflict and move quickly
intoimplementing key structural reforms to enhance economic growth and reduce poverty.
The mostdifficult long-term challenge is resolving the conflict. The civil conflict has already
taken a hugetoll on the economy and its society, estimate at least two years of GDP. Even
more important, thestruggle has caused a humanitarian problem of great proportions, taken
the lives of several of itspolitical leaders, and forced a generation of children to grow up in
an environment of insecurity and conflict. Sri Lanka’s social fabric is below stress due to the
poverty and deteriorating health and education outcomes in war-torn parts, psychological
trauma associated with the conflict,displacement, as well as increasing levels of crime and
violence. There are serious risks to futureeconomic and social development if the conflict
persists. Experiences of other countries around the world show that prolonged civil
conflicts, especially those with ethnic undercurrents,ultimately lead to economic and social
decline.
12
10. In restoring the health of its public finances, Sri Lanka will also want to rethink its Poverty
decrease strategy. Poverty remains a concern in Sri Lanka. Emerging analysis shows
that despite healthy economic growth, there has been slow development in poverty
reduction between 1990 and 1996. More worrisome is the perseverance and exacerbation
of regional disparitiesduring that period. The battle affected areas in the North-East are
undoubtedly the best deprived, while even the North Central and North Western provinces
have experienced a neardoubling of poverty rates. Without the North-East, one-fourth of
the population lives below the poverty line. While the simple drought of 1996 could partially
explain this poverty trend, it is evident that income fluctuations especially inrural areas
create considerable vulnerabilities. Women and children bear a disproportionate burden
of the conflict and some consequences ofpoverty such as alcoholism, national violence,
and child abuse.
13
11. The large poverty programs of the 1990s have suffered from design and
Implementationweaknesses which have affected their success. The political bias in the
implementation ofsuccessive state sponsored poverty programs has rendered the poor
very vulnerable to changes in the political climate. The programs have not
createdoccasions and empowered the poor to liftthemselves out of poverty in a sustained
manner. Most poverty plans in Sri Lanka have hadpoor targeting as the transfers usually
cover around 50 percent of the population. Emerging evidence indicates that 44 percent of
the benefits from the Government’s poverty program (Samurdhi) go to the top three income
quintiles. The large expenses on poorly directed incometransfers, the high long-term
administrative costs of hiring poverty workers into the public sector,and the weak exit
mechanisms are some examples of the problems that need to be addressed.
12. There is today also a high degree of consensus that prevailing public sector institutions
Arein need of fundamental reforms. Sri Lanka’s public administration has some positive
Aspects ofgood governance such as a well-developed human resource base and a
dedicated cohort of expert staff. However, a gradual deterioration in public sector
institutions and governancestarted in the early 1970s, which joint with the civil conflict and
youth rebellions of the past, have resulted in Sri Lanka’s low ranking in Asia in
governance (Human Development Center,1999).The greatest returns to economic
governance would arise from reintroducing stronginstitutional controls and incentives in the
management of the public administration which is currently oversized, expensive and
suffers from low efficiency. Politicization of recruitment by succeeding governments has
become well established and expected. Financial accountability hasweakened
considerably over the years due primarily to insufficient parliamentary oversight and poor
institutional structures or watchdog bodies. The administrative device remains
verycentralized despite efforts since 1987 to devolve functions to the Provincial Councils. In
all these areas, there are on-going initiatives by the Government to address the
fundamental problems.However much remains to be done.
14
13. One area where there has been considerable improvements is in reducing the role of
government in certain sectors of the economy. An impressivesale program has
beenimplemented since 1995, with the main accomplishments being in the plantation and
telecommunication sectors. Private sector participation has been encouraged in electricity
production and the ports. Large privatization proceeds have been obtained which helped
contain rising government debt.Realizing the benefit of increased private sector role in the
economy, the Government announcedits intentions to reinvigorate the privatization and
liberalization program with a strong regulatoryframework in place in the 2000 Budget. It has
also expressed its notice in addressing some ofthe structural rigidities in the labor market to
facilitate the planned restructuring of the economy. By undertaking such crucial and well
sequenced reforms, in the context of a transparent andconsultative process, Sri Lanka will
be able to recall the missed opportunities of the past andbetter meet the aspirations of its
people.
Notes:
1. Finance and Development – Which Way Now? by Bimal Jalan at the Managerial
StaffInstitution of India, Hyderabad
2. G. Darbha and S. Dutta Roy (2001), “Is There a Free Yield Curve? Evidence
From the T-Bill Marketplace”G. Darbha, S. Dutta Roy and V. Pawaskar (2000), “Term
Structure of Interest Rates inIndia: Issues in Estimation and Pricing”
3. Reddy at the Asian Session on March 11, 2002
Bibliography:
1. RBI Report on Trend and Progress of Banking in India 2000-01
2. www.rbi.org.in
3. www.adb.org
4. www.bis.org
5. www.worldbank.org
6. Vijay Joshi and I. M. D. Little (1996).
7. Ajay Shah and Susan Thomas (Various articles)
15
PART – I ECONOMIC OVERVIEW OF THE
SRILANKAN COUNTRY
CONTENTS
SR.
NO.
Page
no .
Chapter 1
PART – I ECONOMIC OVERVIEW OF THE SRILNAKAN
COUNTRY
1.1 Economic Overview of the Country 17
1.2 Demographic Profile of the Country 20
1.3 Overview of Industries Trade & Commerce 25
1.4 Overview of Business and Trade at International Level 26
1.5 Present Trade Relations & Business Volume of different
products with India
28
1.6 PEST EL Analysis 32

16
CHAPTER-1
17
1.1 Economic Overview of Sri Lanka
The country context has changed dramatically in rec ent years . A 26-year conflict
finished in May 2009, and relocation of internally displaced persons is largely complete.
The macroeconomic condition is much better. Sri Lanka has become a middle-income
country, and its credit-worthiness has unlocked its access to International Bank for
Reconstruction and Development (IBRD), allowing for significantly increased financial
support from the World Bank during the coming years.
A look back at growth performances of other comparable economies, post-Global Financial
Crisis (GFC), shows Sri Lanka maintaining relatively stronger growth of over 8% in both
2010 and 2011, mostly spurred by private-sector demand. Sri Lanka posted the wildest
growth in South Asia in 2011 and is expected to achieve the same in 2012. Growth
remained solid in the first half of 2012 at 7.2%, but for the year as a whole it is expected to
decline to around 6.5% – largely owing to the weakening external demand and tighter credit
conditions domestically.
Sri Lanka was able to maintain relatively strong gr owth (about 5% per year) even
during the war , though growth dropped to 3.5% in 2009 during the final military campaign,
which coincided with the GFC. The post-conflict rebound helped all sectors both on the
supply side and the demand side: Agricultural land in conflict-affected areas could once
again be cultivated; double shifts in manufacturing became possible as workers no longer
had to worry about security restrictions; domestic consumers’ and investors’ confidence
revived; and services related to tourism picked up as tourist arrivals surged after the end of
the war.
As Sri Lanka’s economy grew, unemployment and pover ty rates fell . As of the second
quarter of 2011, joblessness was only 4.2%, though higher among youth, females, and the
more educated. Poverty rates have also fallen, from 15 percent of the population in 2006-07
to 9% in 2009-10. The most dramatic declines have been in the estate sector (from 32% to
11%) following a major wage increase at the beginning of 2010. Poverty rates in Colombo
District are under 4%, though there are pockets of poverty in all other parts of the country
18
Sri Lanka is on track to meeting most of the Millen nium Development Goals . UNDP
has identified Sri Lanka as an early achiever on 10 of the 21 indicators, including those
related to the areas of universal primary education and gender equality. Sri Lanka is also
likely to meet the goals of maternal health and HIV/AIDS. However, Sri Lanka is making
gentler progress on the goals related to malnutrition and child mortality. Indicators are
mixed on the setting goal: While Sri Lanka is an early achiever on indicators of protected
range, ozone-depleting substance eating, safe drinking water, and basic sanitation, it has
stagnated or is falling backward on forest cover and CO2 emissions.
As with all prolonged conflicts, social addition ha s been slow to be established . A
long-lasting solution to the cultural problem and putting in place effective means of
addressing grievances of minority communities is vital for sustained peace. The Lessons
Learnt and Settlement Commission (appointed by President Rajapaksa to investigate the
final phase of the war), presented its final report to Assembly in December 2011.
Sri Lanka’s demographic transition is having dramat ic impacts on education and
health as well as the economy . By 2036, more than 22% of the population will be over 60
and there will be 61 dependents per 100 adults. Unless labor force and employment rates
rise, a very small number of employed persons will need to provide for a very large number
of non-working people – straining the budgets of families and the government. As the
populace becomes older and has a higher income, the types of public facilities required will
change. The education arrangement will need to increase emphasis on computer, English,
and higher-level reasoning skills. The health system will need to deal (both preventively and
curatively) with the growing burden of non-communicable diseases, including damages and
mental health problems, and provide restoration and long-term care, especially for the
elderly. Social defense for the elderly will need to be enhanced. Growing urbanization will
require investments in mass transit; expanded water and sewage networks; improved road
safety; better control of air pollution, noise pollution, and additional environmental hazards;
and better town planning to allow for elderly-friendly design aspects.
19
Economy - overview: Sri Lanka continues to experience strong economic growth
following the end of the 26-year conflict with the Liberation Tigers of Tamil Ellam (LTTE).
The government has been pursuing important reconstruction and development projects
supplemented with private investment in its efforts to spur growth in war-torn and poor
areas, develop small and medium enterprises and increase agricultural output. The
government's high debt payments and bloated civil service have contributed to historically
high budget deficits, but economic improvements in recent years in line with IMF
recommendations have helped bring down the government's fiscal shortage. The 2008-09
global financial crisis and recession exposed Sri Lanka's economic vulnerabilities and
nearly caused a balance of payments crisis. Growth slowed to 3.5% in 2009. Economic
activity rebounded strongly with the end of the war and an IMF agreement, resulting in three
traditional years of high growth in 2010-12. Per capita income of $6,100 on a purchasing
power parity basis is among the highest in the region.
Definition: This entry briefly describes the type of economy, including the degree of market
location, the level of economic development, the most important likely resources, and the
unique areas of specialism. It also characterizes major economic events and policy
changes in the most recent 12 months and may include a statement about one or two key
future macroeconomic trends.
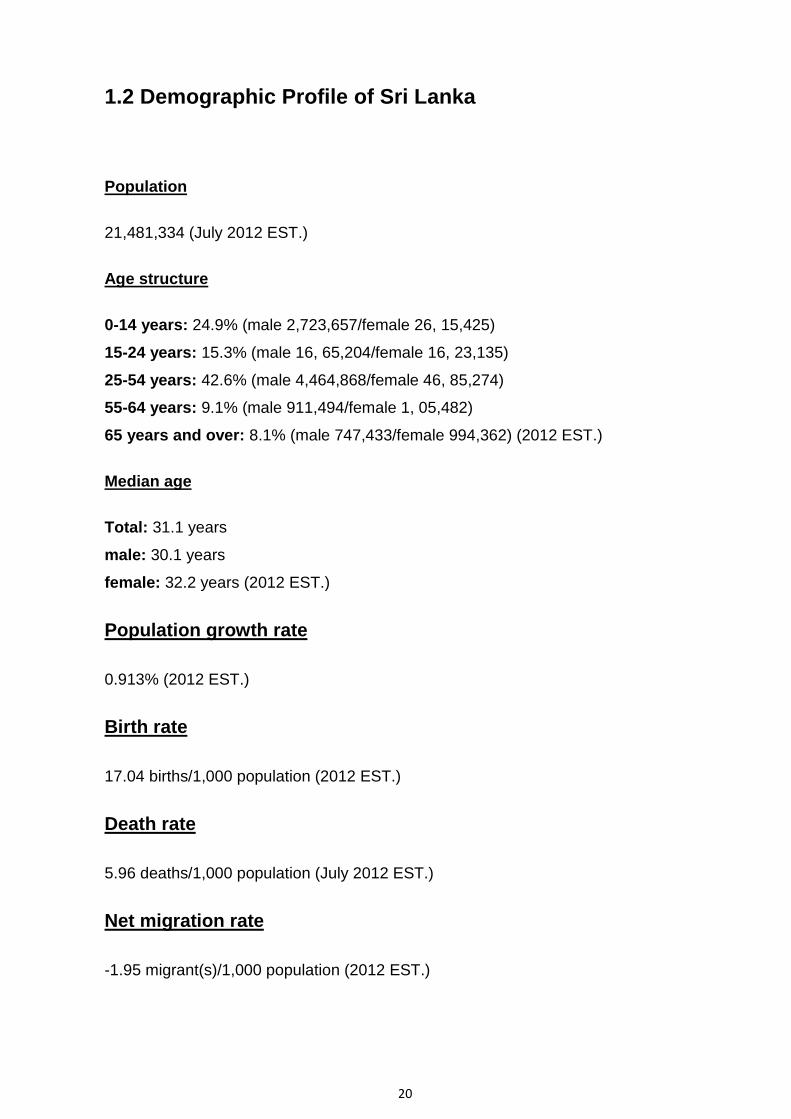
20
1.2 Demographic Profile of Sri Lanka
Population
21,481,334 (July 2012 EST.)
Age structure
0-14 years: 24.9% (male 2,723,657/female 26, 15,425)
15-24 years: 15.3% (male 16, 65,204/female 16, 23,135)
25-54 years: 42.6% (male 4,464,868/female 46, 85,274)
55-64 years: 9.1% (male 911,494/female 1, 05,482)
65 years and over: 8.1% (male 747,433/female 994,362) (2012 EST.)
Median age
Total: 31.1 years
male: 30.1 years
female: 32.2 years (2012 EST.)
Population growth rate
0.913% (2012 EST.)
Birth rate
17.04 births/1,000 population (2012 EST.)
Death rate
5.96 deaths/1,000 population (July 2012 EST.)
Net migration rate
-1.95 migrant(s)/1,000 population (2012 EST.)
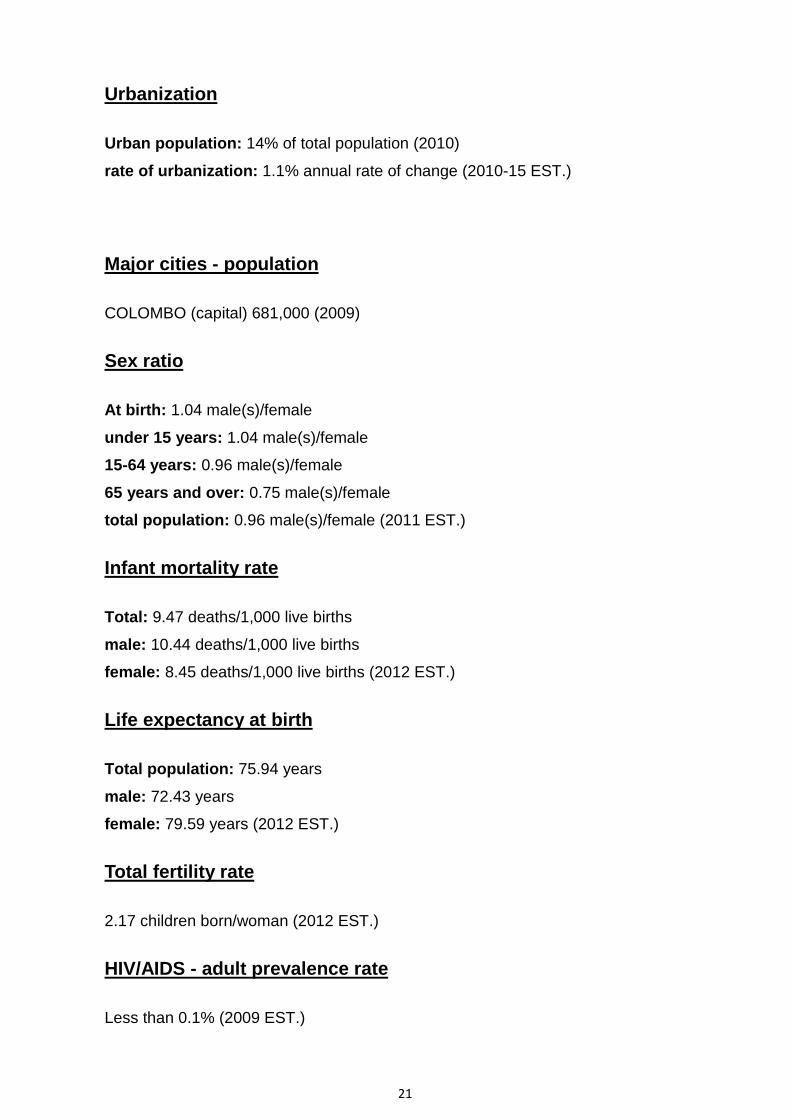
21
Urbanization
Urban population: 14% of total population (2010)
rate of urbanization: 1.1% annual rate of change (2010-15 EST.)
Major cities - population
COLOMBO (capital) 681,000 (2009)
Sex ratio
At birth: 1.04 male(s)/female
under 15 years: 1.04 male(s)/female
15-64 years: 0.96 male(s)/female
65 years and over: 0.75 male(s)/female
total population: 0.96 male(s)/female (2011 EST.)
Infant mortality rate
Total: 9.47 deaths/1,000 live births
male: 10.44 deaths/1,000 live births
female: 8.45 deaths/1,000 live births (2012 EST.)
Life expectancy at birth
Total population: 75.94 years
male: 72.43 years
female: 79.59 years (2012 EST.)
Total fertility rate
2.17 children born/woman (2012 EST.)
HIV/AIDS - adult prevalence rate
Less than 0.1% (2009 EST.)
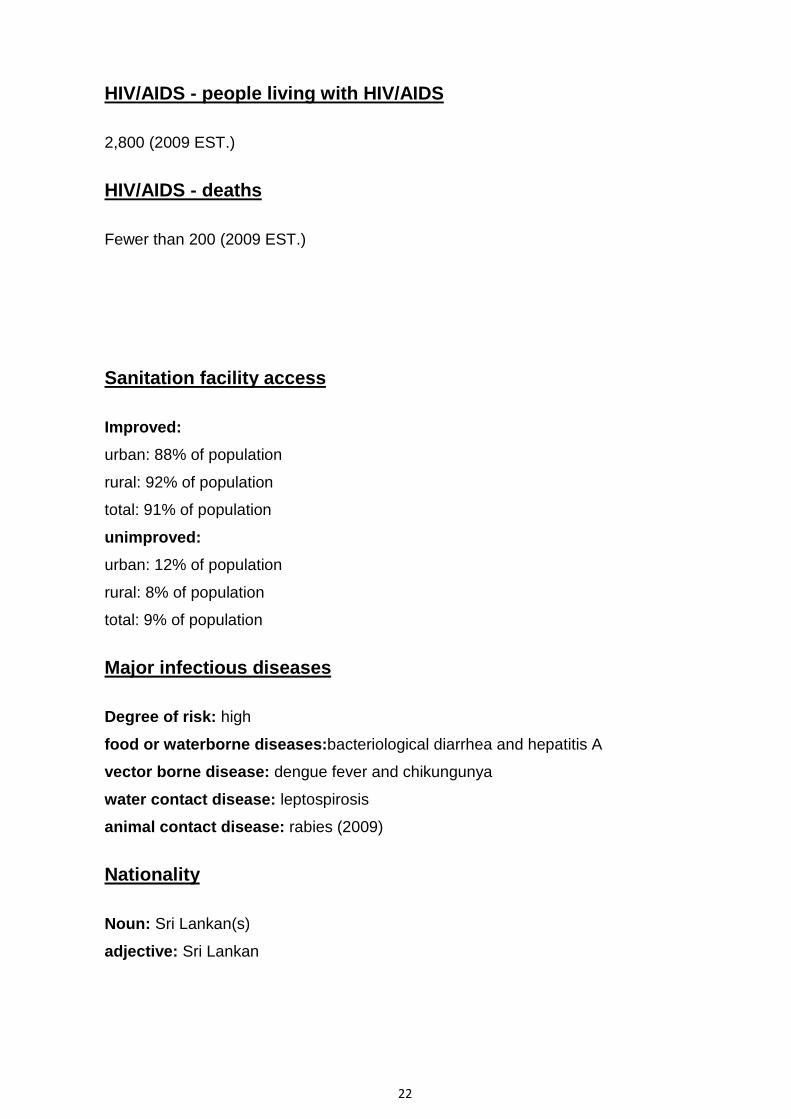
22
HIV/AIDS - people living with HIV/AIDS
2,800 (2009 EST.)
HIV/AIDS - deaths
Fewer than 200 (2009 EST.)
Sanitation facility access
Improved:
urban: 88% of population
rural: 92% of population
total: 91% of population
unimproved:
urban: 12% of population
rural: 8% of population
total: 9% of population
Major infectious diseases
Degree of risk: high
food or waterborne diseases: bacteriological diarrhea and hepatitis A
vector borne disease: dengue fever and chikungunya
water contact disease: leptospirosis
animal contact disease: rabies (2009)
Nationality
Noun: Sri Lankan(s)
adjective: Sri Lankan
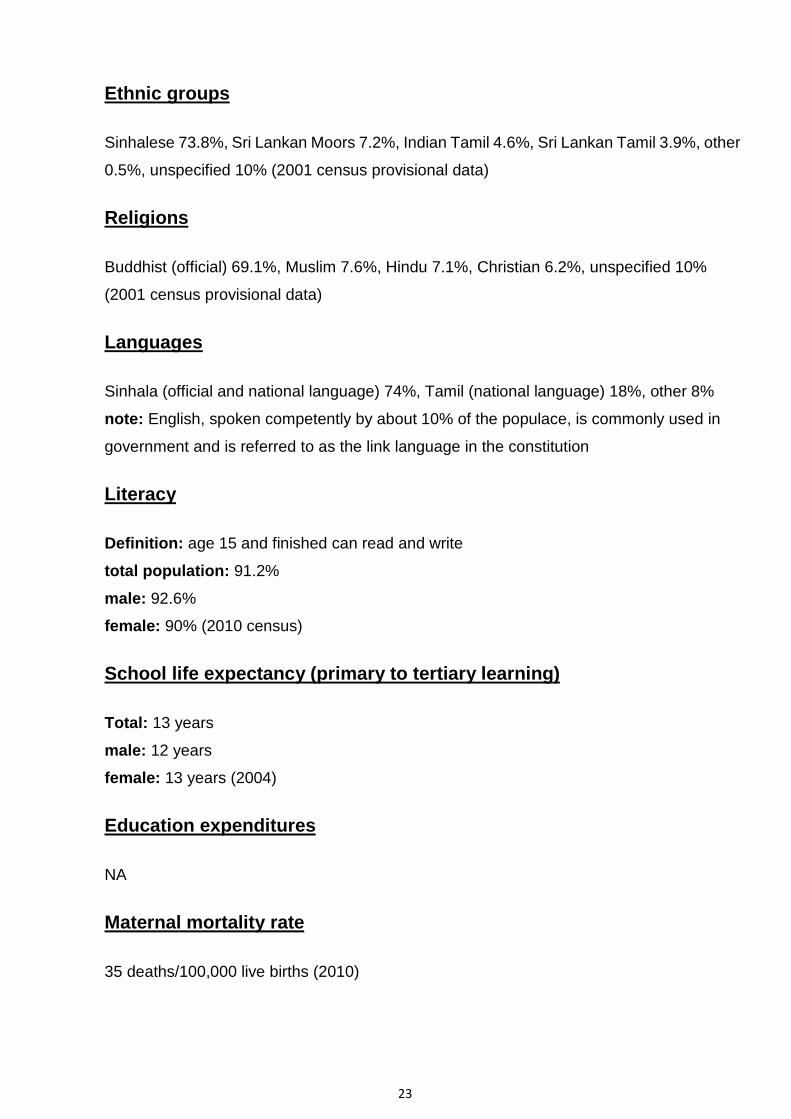
23
Ethnic groups
Sinhalese 73.8%, Sri Lankan Moors 7.2%, Indian Tamil 4.6%, Sri Lankan Tamil 3.9%, other
0.5%, unspecified 10% (2001 census provisional data)
Religions
Buddhist (official) 69.1%, Muslim 7.6%, Hindu 7.1%, Christian 6.2%, unspecified 10%
(2001 census provisional data)
Languages
Sinhala (official and national language) 74%, Tamil (national language) 18%, other 8%
note: English, spoken competently by about 10% of the populace, is commonly used in
government and is referred to as the link language in the constitution
Literacy
Definition: age 15 and finished can read and write
total population: 91.2%
male: 92.6%
female: 90% (2010 census)
School life expectancy (primary to tertiary learnin g)
Total: 13 years
male: 12 years
female: 13 years (2004)
Education expenditures
NA
Maternal mortality rate
35 deaths/100,000 live births (2010)
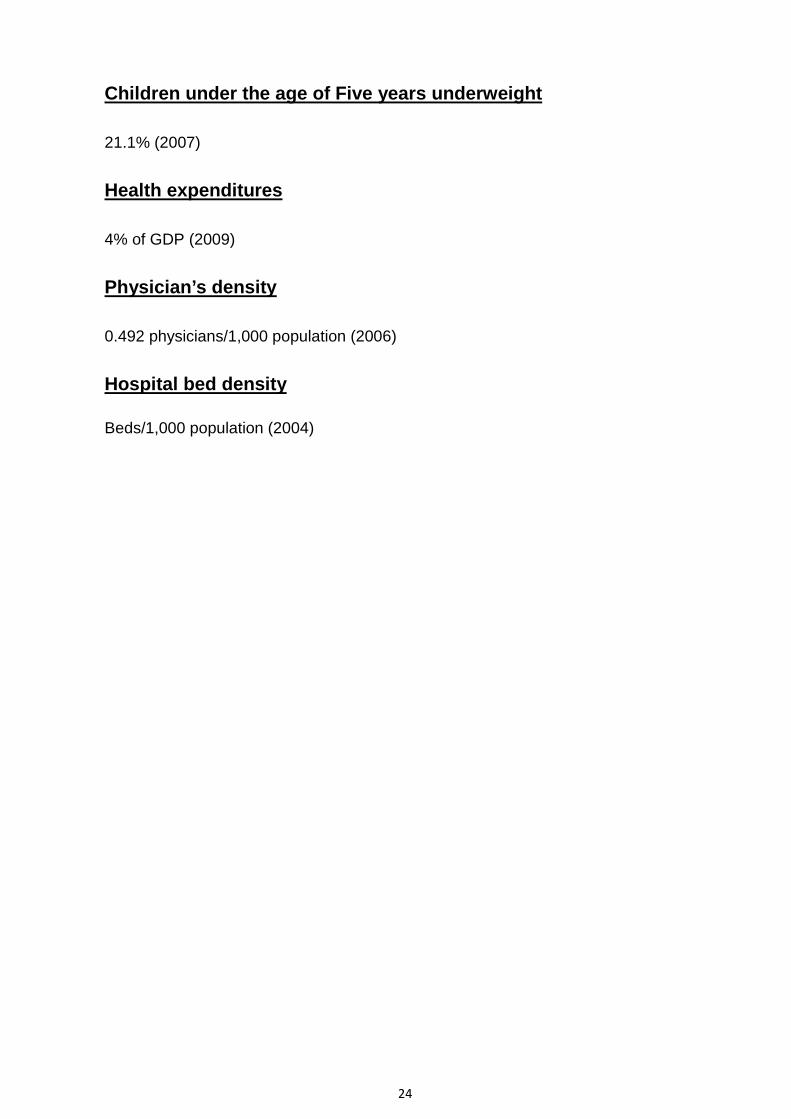
24
Children under the age of Five years underweight
21.1% (2007)
Health expenditures
4% of GDP (2009)
Physician’s density
0.492 physicians/1,000 population (2006)
Hospital bed density
Beds/1,000 population (2004)
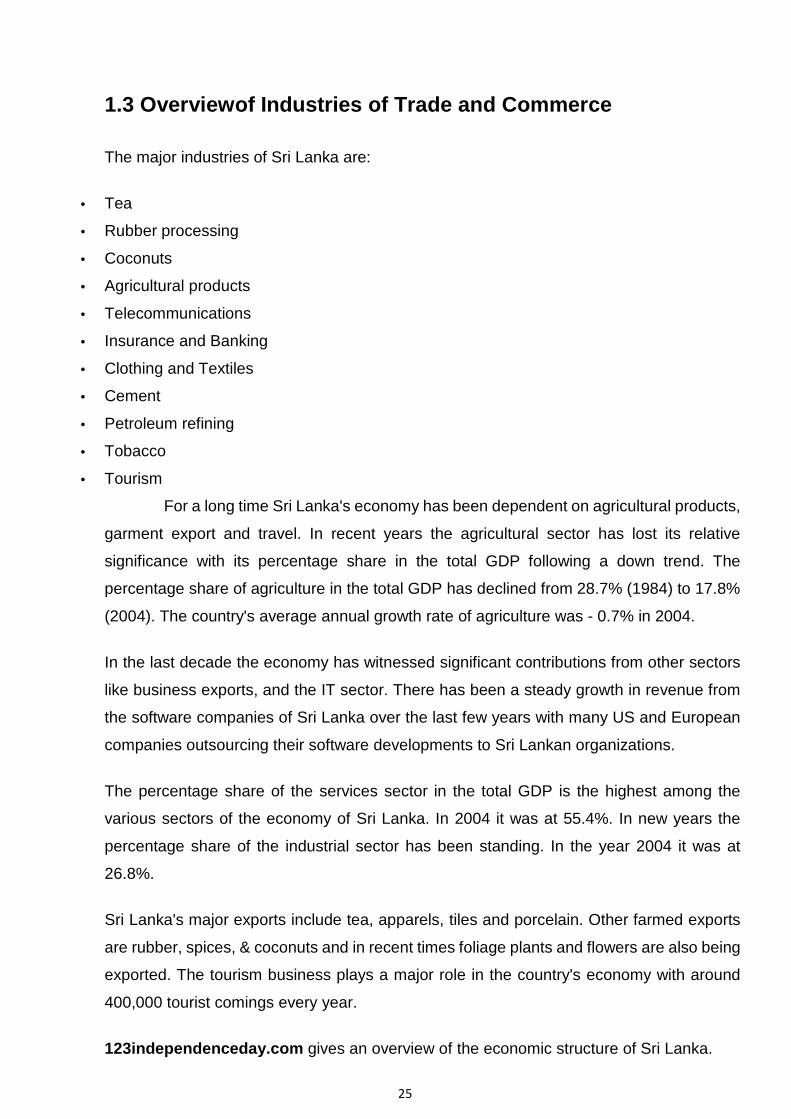
25
1.3 Overviewof Industries of Trade and Commerce
The major industries of Sri Lanka are:
• Tea
• Rubber processing
• Coconuts
• Agricultural products
• Telecommunications
• Insurance and Banking
• Clothing and Textiles
• Cement
• Petroleum refining
• Tobacco
• Tourism
For a long time Sri Lanka's economy has been dependent on agricultural products,
garment export and travel. In recent years the agricultural sector has lost its relative
significance with its percentage share in the total GDP following a down trend. The
percentage share of agriculture in the total GDP has declined from 28.7% (1984) to 17.8%
(2004). The country's average annual growth rate of agriculture was - 0.7% in 2004.
In the last decade the economy has witnessed significant contributions from other sectors
like business exports, and the IT sector. There has been a steady growth in revenue from
the software companies of Sri Lanka over the last few years with many US and European
companies outsourcing their software developments to Sri Lankan organizations.
The percentage share of the services sector in the total GDP is the highest among the
various sectors of the economy of Sri Lanka. In 2004 it was at 55.4%. In new years the
percentage share of the industrial sector has been standing. In the year 2004 it was at
26.8%.
Sri Lanka's major exports include tea, apparels, tiles and porcelain. Other farmed exports
are rubber, spices, & coconuts and in recent times foliage plants and flowers are also being
exported. The tourism business plays a major role in the country's economy with around
400,000 tourist comings every year.
123independenceday.com gives an overview of the economic structure of Sri Lanka.
26
1.4 Overviewof Business and Trade at International Level
Economic Overview
Even though the economic growth of Sri Lanka has been showing a steady rhythm during
these last years (more than 6%), the global economic crisis combined with the impact of the
latest conflicts between the government and the Tamil nationalist forces, have caused an
evident economic slowdown in 2009 (3.5%). In 2010, the growth rebounded attaining 7%
thanks to the revival in exports, the regain of depositors' confidence and the dynamics of
the agricultural and tourism services sectors.
The financial difficulties affronted by Sri Lanka due to the global economic slowdown, led
the specialists to sign a stand-by agreement with the IMF in July 2009. The objects of the
program are to reinforce competitiveness in the export sectors and to improve the financial
system. In respects of public finances, the impartial for 2011 is to bring down the deficit to
6.8%. The control of the public debt, which makes the country very vulnerable to
international surprises, is also a priority. The ten-year development program presented by
the government emphasizes the urgency of updating public infrastructures in order to reach
a growth level higher than 10% by 2020.
A market-oriented bank...
Business outline for Sri LankaEconomic Overview
Even though the economic growth of Sri Lanka has been showing a steady rhythm during
these last years (more than 6%), the global economic crisis combined with the impact of the
latest conflicts between the government and the Tamil separatist forces, have caused an
evident economic slowdown in 2009 (3.5%). In 2010, the growth rebounded attaining 7%
thanks to the revival in exports, the regain of investors' confidence and the dynamics of the
agricultural and tourism services sectors.
The financial difficulties affronted by Sri Lanka due to the global economic slowdown, led
the establishments to sign a stand-by agreement with the IMF in July 2009. The objectives
of the program are to support competitiveness in the export sectors and to improve the
financial system. In respects of public finances, the objective for 2011 is to bring depressed
the shortage to 6.8%. The control of the public debt, which makes the country very
vulnerable to international shocks, is also animportance. The ten-year development
program presented by the government emphasizes the urgency of updating public
infrastructures in order to reach a growth level higher than 10% by 2020.
A market-oriented banking system, anexpert labor force, a restored political stability and
27
the remittances from the Sri Lankan diaspora (mainly from the Middle East) are positive
factors to the country's economic growth. However, great poverty levels, low agricultural
productivity, poor infrastructure facilities and incompetent public companies are obstacles
that the country has to confront.
FDI in Figures
FDI inflows in Sri Lanka have been in a constant increase during the last recent years. After
a go-slow provoked by the global recession, the flows have resumed to increase in 2010,
stimulated by the end of the civil battle and the economy revival.
For many years, the civil war had been a significant hindrance to the development of FDI.
But, later the peace has been restored, the country offers many helpful features that can
attract FDI such as: the measures taken by the government (creation of free-zones,
discount of food subsidies and other consumption goods), the physical strategic location of
the country near two regions of high growth (India and Southeast Asia), and the tourism
possible, which is yet to be fully exploited.
Electricity, textiles and communications are the sectors that attract most of the foreign
investments from countries like Japan, Australia and Germany, which are the main investor
countries.
Foreign Trade Overview
Sri Lanka is open to foreign trade, which represented nearly 60% of the country's GDP in
the 2007-2009 period. The country's trade policy aims at moving towards a trade system
based on exchanges, with the objective of support and increasing international market
access for Sri Lankan products. In outlook of this, the government has signed several
bilateral and multilateral trade agreements, especially at a regional level.
Customs duties are not very high and the country is easily accessible. Nevertheless, there
are some non-tariff trade barriers restricting speculative trading by profitable banks, a VAT
on profits before taxes and salaries and the inadmissibility of electronic documents in
courts.
After having been abridged under the effects of the global economic crisis, the trade deficit
became larger again in 2010 and it is estimated that trade will remain unfavorable during
the next coming years.
Sri Lanka exports textiles and clothes, tea, interests, precious stones, coconut product’s,
rubber products and fish to the United Conditions, the United Kingdom, India, Germany,
Belgium and Italy. It imports cloths, mining products, fuels, food, machinery and transport
tools from India, China, Iran, Singapore and South Korea.
28
1.5 Present Trade Relations and Business volume of different
products with India.
India-Sri Lanka Bilateral Relations
India is Sri Lanka's closest neighbour. The association between the two countries is more than 2,500 years childhood and both sides have built upon a legacy of intelligent, cultural, religious and linguistic communication. Relations between the two countries have also matured and diversified with the passage of time, surrounding all areas of contemporary importance. In recent years, the relationship has been marked by close contacts at the highest political level, increasing trade and investment, cooperation in the fields of development, education, culture and defense, as well as a broad understanding on major issues of international interest. Today, the India-Sri Lanka relationship is strong and poised for a quantum jump by building on the rich legacy of historical linkages and strong economic and development partnerships that have been forged.
Political Relations:
Political relations have been marked by high-level interactions of visits. Prof. G.L. Peiris, Minister of External Affairs of Sri Lanka visited India for the eighth meeting of the India-Sri Lanka Joint Commission which was held on 22 January 2013. Prof. Peiris termed on Prime Minister Dr. Manmohan Singh and had a mutual meeting with Minister of External Affairs Shri Salman Khurshid during his visit. During the Joint Charge meeting, several important decisions were taken to further intensify economic engagement between the two countries. The two sides also signed aContract on Combating International Terrorism and Illicit Drug Trafficking and a Revised Double Taxation Avoidance Agreement.
President Mahinda Rajapaksa visited India from 19-22 September 2012 and met President Pranab Mukherjee and Prime Minister Dr. Manmohan Singh. He also stayed Sanchi to lay the foundation for the University of Buddhist and Indic Studies.
Then Minister of External Matters Shri S.M. Krishna visited Sri Lanka from 16-19 January 2012. Through his visit, he called on President Mahinda Rajapaksa and Prime Minister D.M. Jayaratne. In his conference with his counterpart, Minister of External Activities Prof. G.L. Peiris, Minister Krishna reviewed the comprehensive agenda of the bilateral relationship. Minister Krishna stayed Kilinochchi and Jaffna in northern Sri Lanka and Galle in southern Sri Lanka in connection with Government of India assisted projects.
Former President of India, Dr. A.P.J. Abdul Kalam stayed Sri Lanka from 20-24 January 2012 to launch the ‘National Plan for a Trilingual Sri Lanka’, at the offer of the President of Sri Lanka.
Shri Anand Sharma, Minister of Market, Industry & Textiles visited Sri Lanka and inaugurated “The India Show - Land of Limitless Opportunities” at Colombo on 3 August 2012. About 108 Indian companies contributed in the Show. Shri Jairam Ramesh, Minister of Rural Development and Drinking Water and Sanitation paid an official visit to Sri Lanka from 11-13 July 2012. National Safety Adviser Shivshankar Menon visited Sri Lanka on 29 June 2012 and met President Mahinda Rajapaksa, Minister of Economic Growth Basil Rajapaksa and Defence Secretary Gotabaya Rajapaksa.
29
Japan – Sri Lanka Economic Relations: 60 Years and Beyond
Q: How do you see the 60 years economic relations b etween Sri Lanka and Japan?
A:It evolved from cultural ties that were built created on Buddhism, which then moved on to
Sri Lanka becoming an aid recipient from Japan, and then on to job and investment
linkages between the two countries over the last 60 years. Japan was the major aid donor to
Sri Lanka up until 2007, and was a major sponsor to Sri Lanka’s infrastructure progress.
This led to the transformation of Sri Lanka’s relationship with Japan from aid to trade and
then asset. In the year 2000, Sri Lanka was the 8th largest recipient of Japanese aid. Now
Japan is Sri Lanka’s 8th largest trading partner, 2nd largest aid giver, and the 10th largest
source of FDI (in 2011).
Q: As a major donor what are the key missions that Japan supported in Sri Lanka?
A: Since 1982, Japan has been the largest aid donor to Sri Lanka till 2007. Japanese
assistance originates to Sri Lanka through two major institutions in Japan: JICA (Japan
Investment Cooperation Agency) and JBIC (Japan Bank for International Co-operation).
The former manages grant support and technical cooperation, while the end manages the
soft loan components of support flow. The last noteworthy project with JBIC assistance was
the Upper Kotmale Hydro Electric Project. Extra key Japanese funded projects included the
Colombo Port expansion, parts of Mahaweli Progress, Samanalaweva, Kukulegaga
Missions, Colombo Airport Aerobridges and Expansion, telecom network growth, and the
railway and road rehabilitation projects. Besides organization, Japanese aid has
contributed to a number of institutional building projects such as, Sri Jayawardenapura
Clinic, Peradeniya Teaching Hospital, Medical Study Institute, Institute of Computer
Technology at the University of Colombo, Airport Quarantine Centre, andRupavahini
Corporation.
30
Q: As a trading partner, is Japan still important, given the emergence of China and
India as big powers in Asia?
A: Sri Lanka’s biggest trading wife is India, with nearly US$ 5 billion in trade. Trade with
China is near worth US$ 2 billion. In 2011, Sri Lanka’s trade with Japan amounted to
US$ 1.2 billion. Japan is Sri Lanka’s 5th largest source of imports, and its 10th largest
export endpoint. Sri Lanka’s imports from Japan are dominated by automobiles, machinery,
electronic goods, and audio/camera equipment; while Sri Lanka’s exports to Japan are
controlled by tea, fish, rubber products, apparel and cloths, and ceramics.
When trading with a nation like Japan, it is not sensible to give status to the existing trade
imbalance between the two countries, with Sri Lankan exports being far fewer than
Japanese imports. Exchange with the world means that with some trading countries Sri
Lanka will have a deficit, and with others anextra. The benefits to Sri Lankan consumers
and producers from Japanese imports are enormous, and that is what matters in the end.
U.S. Relations with Sri Lanka
U.S.-SRI LANKA RELATIONS
Relations between the United States and Sri Lanka are based on mutual interests and a
shared commitment to the ideals of independent governance. U.S. policy toward Sri Lanka
is characterized by respect for its independence, sovereignty, and reasonable nonaligned
foreign policy; support for the country's unity, territorial honesty, and democratic institutions;
and encouragement of its social and economic development. The Joint States is a strong
supporter of ethnic reconciliation in Sri Lanka following the 2009 end of decades of civil
conflict.
U.S. Assistance to Sri Lanka
U.S. assistance has totaled more than $2 billion since Sri Lanka's individuality in 1948.
Through the U.S. Agency for International Development (USAID), the U.S. has contributed
to Sri Lanka's economic growth with projects designed to reduce joblessness, improve
housing, develop the Colombo Stock Exchange, renovate the judicial organization, and
improve competitiveness. The United States provided nearly $20 million to support the
post-conflict humanitarian situation in Sri Lanka in FY 2011. The International Broadcast
Bureau (IBB) operates a radio-transmitting station in Sri Lanka. U.S. Armed Forces
maintain a limited military-to-military relationship with the Sri Lanka defense creation. U.S.
also provides technical assistance/training opportunities to Sri Lanka in many areas
including biotechnology, intellectual property rights safety, and cyber security.
31
Bilateral Economic Relations
For 2011, Sri Lanka's exports (mainly clothing, tea, rubber, gems and jewelry) were
estimated at $10.6 billion, and imports (mainly oil, textiles, food, and machinery) were
estimated at $20.3 billion. Exports to the United States, Sri Lanka's most important
single-country market, were estimated at $2.09 billion for 2011, or 20% of total exports. The
United States is Sri Lanka's second-biggest market for garments, taking almost 40% of total
garment exports. United States transfers to Sri Lanka were estimated at $302 million for
2011, consisting mostly of wheat, aircraft and parts, machinery and mechanical
applications, plastics, and medical and scientific gear, Sri Lanka's Membership in
International Organizations
Sri Lanka traditionally follows a nonaligned foreign rule. It participates in multilateral
diplomacy, particularly at the United Nations, where it pursues to promote sovereignty,
individuality, and development in the increasing world. Sri Lanka and the United States
belong to a number of the same international governments, including the UN, World Bank,
and International Monetary Fund.
32
1.6 PESTEL Analysis of Sri Lanka
Introduction
Sri Lanka, officially the Democratic Socialist Republic of Sri Lanka, is country in South Asia.
Known until 1972 as Ceylon, Sri Lanka is an island enclosed by the Indian Ocean. As a
result of its place in the path of major sea routes, Sri Lanka is a planned naval link between
West Asia and South East Asia and was colonized by Portuguese, Dutch and English and
the latter ruled the country till 1948 and thesis Lanka was given Independence.
As of 2010, Sri Lanka was one of the fastest growing economies of the world. Itsstore
exchange was Asia's best performing stock market during2009 and 2010. (International
Monitory Fund, 2011)
Political and Legal Factors
Political System :
Sri Lanka is a democratic, socialist republic and a unitary state which is governed by a
semi-presidential system, with a mixture of a presidential system and a parliamentary
system. Itorganizes a parliamentary system governed under the Constitution of Sri Lanka.
Most supplies of the Constitution of Sri Lanka can be amended by a two-thirds majority.
Sri Lanka has gone through a changing political scenario over the years and especially after
the end of the civil war in 2009 and have gained a considerable political stability as the
present government has a majority in the parliament. However there is a fear that too much
power is centered among few individuals in the present governing regime and had been
instances where politicians having interferences with the businesses and policy changes
either to assist or restrict company operations.
33
Legal System:
The Legal system of Sri Lanka is a highly complex mixture of several laws. In fact, it shows
the absolute possibility for the coexistence of diverse elements of several legal systems for it
gather together with a common outline, laws as diverse in their origin as those of Rome and
England, Holland plus South Africa, Arabia, South India and old Ceylon .The ethnic and
religious diversity of the nation and the colonial history, which traced back to1505– 1948 are
the major factors which had contributed to this difficulty. Sri Lankan Legal system is
influenced by English common law and Roman-Dutch owing to its colonial history. In
addition, same is unfairby the ancient local system of laws of Sri Lanka - customary and
personal laws such Kandy an, Thesawalamai rule and Muslim law due to the varied
character of the nation.
The fundamental legal framework is also most similar to that of England. However the lawful
proceedings take a long time and at present 650,000cases awaiting before the judges.
(Ministry of Justice of Sri Lanka, 2011) In new years in Sri Lanka, there have been many
important legal changes that have affected firms' behavior. The introduction of age
discrimination and disability discrimination legislation, andrise in the minimum wage and
greater requirements for firms to recycle are examples of relatively recent laws that affect an
organization’s activities. In addition there are instances where the executive powers of the
president have interfered with the local and international businesses which have created a
negative outlook in general country ratings.
Labour Laws
Sri Lanka has strong labour policies which clearly stipulates the working hours, age limits,
exclusion of child labour, industrial care etc. and the salaries are paid monthly. In adding if
an employee works on a Sunday not less than 11/2 times the daily rate of wages should be
waged. According to the Sri Lanka Labor Force Survey 4th quarter
2010, the population working is 7.9 million, of which 5.2 million are men and 2.7million are females
out of a population of 20.6million people.
34
Company Law
Sri Lanka has a strong company law framework which dates back to 1963Finance Act No
11 and it had been updated under a special provision toaccomodate the legislature for
Foreign Businesses in 1974. (The World Law Guide, 2011) However there is also the
Import and Export Control Act of 1969which regulates the international businesses in Sri
Lanka.
Environmental Laws
Sri Lanka has many government authorities to regulate and protect the environment and
many amendments were made to the constitution over the years. The Central
Environmental Authority (CEA) was established in August 1981 under the provision of the
National Environmental Act No: 47of 1980.The Ministry of Environment and Natural
Resources (ME&NR) which was established in December 2001 has the overall
responsibility in the affairs of theca with the objective of integrating environmental
considerations in the development process of the country. The CEA was specified wider
regulatory powers under the National Environment (Amendment) Acts No: 56of 1988
and No: 53of 2000. (Central Conservation Authority, 2012)
Corruption
In the annual Corruption Perception Index (CPI) in 2010, Sri Lanka has increased its score
slightly by 0.1 from last year to reach 3.2 points and is placed in the 91 set position among
178 states. Last year Sri Lanka was placed at 97 among180 countries. The Index, which
focuses on corruption in the public sector, is directed by Transparency Global (TI), the
global civil society organization leading the fight against corruption. The CPI Index though
perception has been accepted as the most recognized and often quoted international index
on corruption. In the sub-region, except for Bhutan (5.7), Sri Lanka’s neighboring countries
have failed to record a significant increase. India’s score is 3.3 while Maldives (2.3),
Bangladesh (2.4), Pakistan (2.3) and Nepal (2.2) continue to be below 3.0.The reform it is
evident though corruption is a concern in Sri Lanka, it is justly better and is improving
compared to other regional states. (Transparency International, 2010)
35
Economic Factors
Sri Lanka is recognized as a fast growing middle income state. According tithe International
Financial Fund, Sri Lanka has a yearly gross domestic output of US $64 billion as
of 2012.It has a GDP of US $158 billion in terms of purchasing power parity. Sri Lanka is
in positions of per capita income, with nominal value of US $2,435 and PPP value of US
$5,220. It recorded a GDP growth of 8.3% in 2011.
In the 19 the and 20th centuries, Sri Lanka became anestate economy, famous for its
production and export of cinnamon, rubber and Ceylon tea, which remainders a trademark
national export. The development of current ports under British rule raised the strategic
importance of the island as a center of trade. In 1977 the free market economy was
introduced to the country, incorporating privatization, deregulation and the promotion of
private enterprise. While the manufacture and export of tea, rubber, coffee, sugar and other
farming commodities remains important, the nation has moved steadily towards
unindustrialized economy with the development of food processing, textiles,
telecommunications and finance. (Nubbin, 2002)In addition to these economic sectors,
overseas service contributes highly in foreign altercation, most of them from the Middle
East.
As of 2010, service sector makes up 60% of GDP, manufacturing sector 28% and
agriculture sector 12%.Private sector accounts for 85% of the economy. India is the largest
trading partner of Sri Lakethe per capita income of Sri Lanka has doubled since 2005.
Through the same period, poverty has dropped from 15.2% to 7.6%, unemployment has
dropped from 7.2% to 4.9%, market capitalization of CSE has quadrupled and budget
deficit has doubled. 90%of the households in Sri Lanka are electrified. Income inequality
has also dropped in New Year’s, indicated by a ginicoefficient of 0.36 in 2010.
The Global Competitiveness Report published by the World Economic Forum has listed Sri
Lanka as a transitive reduced, from factor-driven stage to efficiency-driven stage, ranking
52nd in the global competition vines and 41 set in goods market efficiency out of the 142
countries surveyed. Dow Jones classifieds Lanka as an emerging market in 2010, and
Citigroup classified it as a 3G country in February 2011. Sri Lanka ranks well overhead
other South Asian countries in Human Development Index (HDI) with 0.658 facts.
Social Factors
Sri Lanka has a population of little over 20 million people and is far ahead of her South
Asian neighbors in the accomplishment of human growth goals. Life expectancy at birth is
currently.
75 yrs., and is close to the projected lifespan in the developed countries. A
36
high literacy rate of 92.5% has helped the nation to build a skilled labor market. Low
mortality rates of 14 in 2010 and the steadily declining population growth of below 1%;
reflect the country’s progress in the sphere of social development. More than 67% of the
population is in between 15 to 64 years old and as a result the country has a big
skilledlabour Force.
As a result, Redox has a better chance even if they manufacture the products insure Lanka
and they would be able to garner much profits from the relatively cheap skilled labor
compared to other South Asian countries. At present 95%of Unilever products are
manufactured in Sri Lanka and using the economy of scale Redox could do the same.
(Unilever, 2012)In adding a large workforce means that they are ones who would be
spending money and it is another indication that this tropical labor market would reach the
herbal products from Britain even though the cost is high.
After the war, with the rapid development of private financial area, many young people have
absorbed modern trends and fashion a spending large amounted money for pleasure and
beauty. The increasing number of TV channels and other digital mass media networks are a
fine indicator to showcase such developments taking place in the changing attitudes and
consciousness of people.
All these human development
Indicators are a tribute to Sri Lanka’s social service network, which was recognized
In the latter part of the 1940 time, ensuring sound educational policies, an extensive health
care programmer and ineffective medical system for all sectors of the nation.
Technological Factors
“Besides the human and natural resources available in a country market, the technical
resources in that market may influence its attractiveness.”
Transport:
Sri Lanka has an A and B class road network exceeding 12,000 kilometers (7,460 mi). The
railway network, operated by the state-run national railway operator, Sri Lanka Railways,
spans1, 447kilometres (900 mi). The recently opened Southern Motorway has link
Colombo and the down south to bolster the economy of the southern province. In addition
the government has taken many initiatives to repair and develop the countries road network
after the way, which itself has paved the way for a staggering growth rate of 8.3%in2011
Use of Internet and Mobile:
37
Sri Lanka has around 2 million internet users in 2011 and telecommunication is one of the
fastest growing sectors in Sri Lanka. Sri Lanka's cellular subscriber improper has shown a
staggering 550% growing, from
2005 to 2010.
Environmental Factors
Sri Lanka enjoys a tropical climate with varying temperatures according to place. Coastal or
upland areas benefit from Cool Mountain or sea breezes all year round.
Monsoon season is between May to September in the South & West and October to April in
the North & East of the country. These rains give Sri Lanka its only seasons as it is located
so near to the Equator. Temperatures average 27°C ( 80°F) in Colombo and 16°C (61°F) in
Numara Elisa, which is on higher ground, all year round. However with the better number of
development plans, there are many issues that have taken the attention. Deforestation,
pollution, filling the marshlands and in fact the unauthorized buildings have caused
numerous environmental problems in Sri Lanka.
Sri Lanka being close to the equator and having a tropical rainy climate have influenced the
life pattern of Sri Lankans tremendously. The hot weather and having enough water in the
country give chance to have body wash regularly and this could be why the cosmetic
industry has developed in Sri Lankacontinously. Then Redox having its British and
European background has a better chance of establishing itself in the Sri Lankan market.
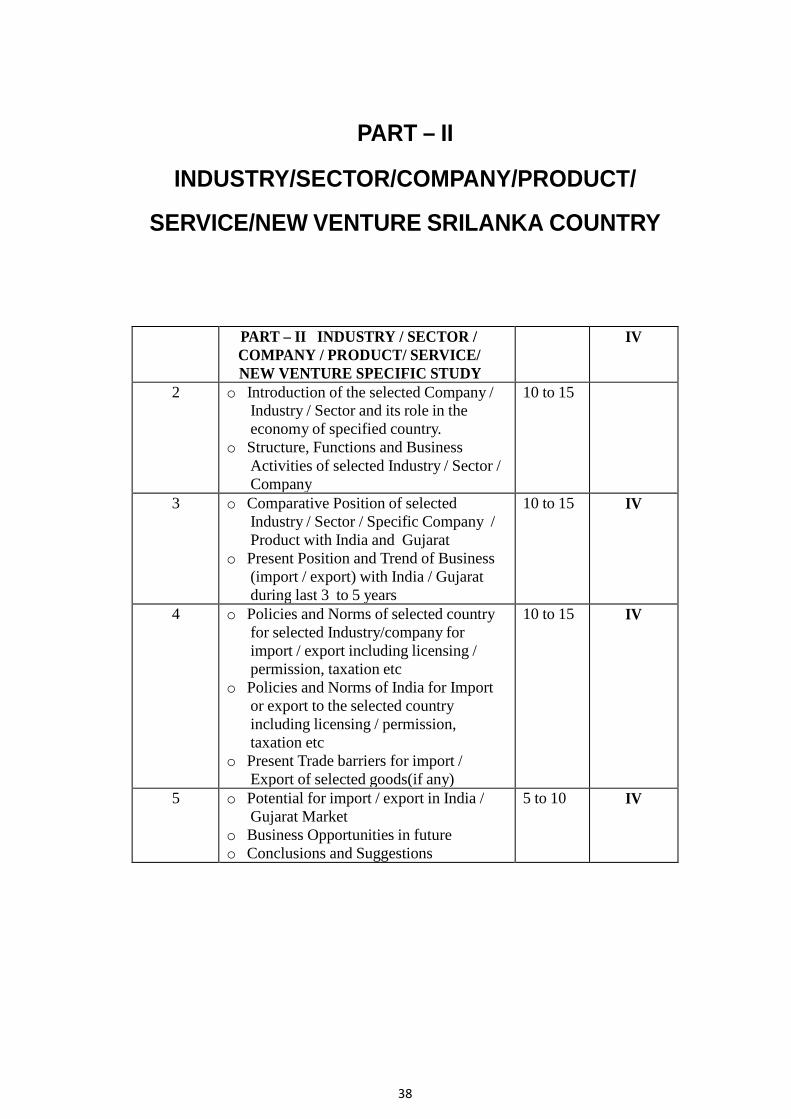
38
PART – II
INDUSTRY/SECTOR/COMPANY/PRODUCT/
SERVICE/NEW VENTURE SRILANKA COUNTRY
PART – II INDUSTRY / SECTOR / COMPANY / PRODUCT/ SERVICE/
NEW VENTURE SPECIFIC STUDY
IV
2 o Introduction of the selected Company / Industry / Sector and its role in the
economy of specified country. o Structure, Functions and Business
Activities of selected Industry / Sector / Company
10 to 15
3 o Comparative Position of selected
Industry / Sector / Specific Company / Product with India and Gujarat
o Present Position and Trend of Business
(import / export) with India / Gujarat during last 3 to 5 years
10 to 15 IV
4 o Policies and Norms of selected country
for selected Industry/company for
import / export including licensing / permission, taxation etc
o Policies and Norms of India for Import or export to the selected country
including licensing / permission, taxation etc
o Present Trade barriers for import / Export of selected goods(if any)
10 to 15 IV
5 o Potential for import / export in India / Gujarat Market
o Business Opportunities in future
o Conclusions and Suggestions
5 to 10 IV
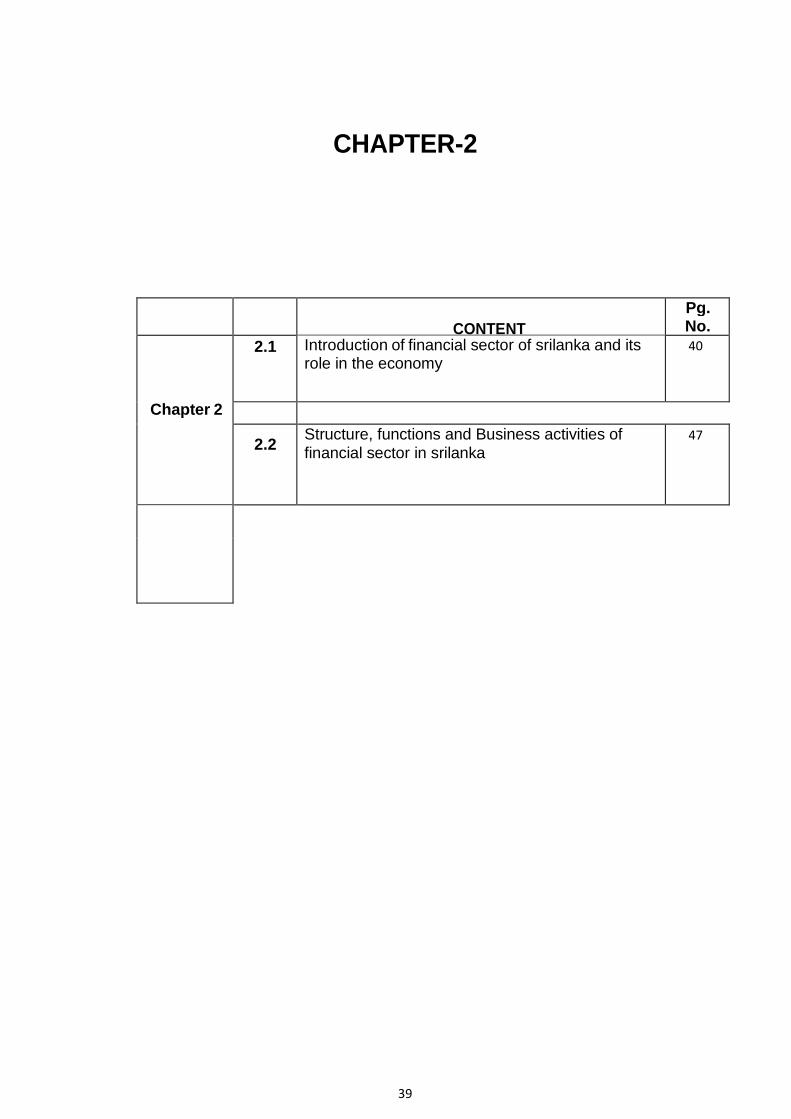
39
CHAPTER-2
CONTENT
Pg.
No.
Chapter 2
2.1 Introduction of financial sector of srilanka and its role in the economy
40
2.2 Structure, functions and Business activities of financial sector in srilanka
47
40
2.1 Introduction Of Financial Sector In Srilanka and its role in the
economy
� Abstract
Financial reforms in Sri Lanka began in 1977 with the introduction of open economic
policies. The aim of this paper is to summarize the major reforms and evaluate their
influence on the banking industry in Sri Lanka. The analytical discussions presented in this
paper demonstrate that market structure and scope in the banking industry have drastically
changed after the reforms. Further, the study found that the depth of the banking industry
has improved significantly as a result of the reforms.
� Introduction ©
In the late 1970s, most developed and developing countries began to introduce
financial deregulation to promote involvement of private sector in economic decision
making (Harper and Leslie, 1993; Hogan, 1992; Maghyereh, 2004). During the same period
Sri Lanka embarked on her financial reforms. Since a large proportion of the assets of the
financial service sector is held by the banking sector in Sri Lanka, those reforms affected
the banking industry to a greater degree. In this backdrop, the main objective of this paper is
to examine financial deregulation in Sri Lanka and its consequences on the banking
industry during the last three decades.
The evolution of financial systems is not isolated from that of the other socio-economic
environments. In part, continual evolution of financial sectors may have resulted from the
natural evaluation of the economy. According to Davis (2007), feasible and desirable reform
paths are likely to be country specific, not always readily apparent, and are subjected to
opposition from powerful forces who stand to lose as a result of change. This phenomenon
has been clearly demonstrated by the environment and the reform process adopted in Sri
Lanka. Especially, political interference, corruption, bureaucratic rigidities, political and
social ideologies, ethnic issues, financial illiteracy and many other factors have affected the
reform process in Sri Lanka (Edirisuriya, 2007). These issues have also affected the types
of reforms that were introduced and the phases of reforms throughout the last 30-year
period. Therefore, this unique environment provides a comprehensive laboratory to
investigate the reforms and their outcomes in an emerging economy. The results of such an
investigation will be helpful to policy makers to re-shape the reform process.
This paper is structured as follows. The first section focuses on the basic research
approach adopted in the paper. The next section dwells on the financial sector reforms in
41
Sri Lanka. The third section analyzes the impact of financial sector reforms on the banking
industry in Sri Lanka. The last section presents policy implications and conclusions of the
paper.
1.1.1.1. Analytical approach
This paper investigates the consequences of financial reforms during the post liberalization
period (1977-2008). The required data for the analysis have been collected mainly from the
annual reports of the Central Bank of Sri Lanka during this period. To illustrate
consequences of the financial reforms, this study uses graphical and tabular forms of data
presentation techniques. Further, to identify the overall impact of the reforms, this paper
uses the market concentration ratio of the Sri Lankan banking industry, which is measured
using Herfindahl-Hirshman index (HHI). It is true that the recorded data in the above period
have been influenced by other economic forces. Those influences are difficult to separate
from the impact of financial reforms. However, notable unexpected changes in the recorded
data which were not expected under normal circumstances may represent the
consequences of financial reforms.
2.2.2.2. Financial sector reforms in Sri Lanka In the early 1880s, the British planters commenced
the banking industry in Sri Lanka for the comfort of their trading activities. Until 1948, there
was a liberal economic system in Sri Lanka which had little direct government involvement
in economic activities. Before 1948 there was neither government intervention in
international trade nor exchange controls (Karunasena, 1999). Subsidiaries of foreign
banks dominated the banking sector which mainly met the financial requirements of
international trade and the working capital requirements of Sri Lanka’s plantation sector.
Direct government intervention in the banking industry began after the country gained its
independence from Britain in 1948. The goal of a self-sufficient economic system led the
government to set priority areas for development, namely: to control the allocation of loan
funds; to intervene in setting interest rates; and to introduce strict foreign exchange
regulations. The government used banking industry as the main vehicle for mobilizing
financial resources in the process of economic development and for providing the most
fundamental financial intermediary and payment functions. In 1950, Government of Sri
Lanka established the Central Bank of Sri Lanka (CBSL) as the main regulatory body which
governs the financial services sector. During this period, government was able to increase
its control over the banking sector assets by owning two large commercial banks, namely,
the Bank of Ceylon1’ and the People’s Bank (Fernando, 1991). The government sponsored
the expansion of operations of these two banks by legislating them to allow into new areas
such as specialized lending facilities, international trade finance and as the bankers for the
government (Karunasena, 1999). During the same period, operations of the private sector
42
banks were restricted.
The inefficient allocation of financial resources which was a result of government
intervention in the industry had undermined the economic development of the country.
Particularly, the economic hardships experienced in the early 1970s due to the rigid
government intervention in the economy highlighted the need for less regulatory
intervention in the financial services market.
Three phases are evident in the deregulation of the financial services sector in Sri Lanka
(i.e. 19771988; 1988-1995 and after 1995 to date). Initial reforms from 1977 to 1988 were
mainly related to economic regulations which imposed controls over the economic capacity
of decision-making units in the financial services sector. Those reforms were aimed at
promoting financial intermediation through the establishment and promotion of sound
financial infrastructure. During this period, reforms were directed to the removal of entry
barriers to the sector, allowing bank branch expansion, introduction of new forms of
financial institutions, removal of interest rate ceilings and reducing preferential credit
facilities.
� History
Sri Lanka is an Island republic with a total land area of 65,610 square kilometers. It is
located on the southeast side of India which is its closest neighbor. It is a multi-racial
country which has a total population of 19.4 million at present. The life expectancy at birth is
73 years and literacy rate which is 91.4 is the second highest in Asia. Giving to the World
Bank classification Sri Lanka is a lower-middle income country with one of the highest per
capita income in the South Asian region of Rs.63, 752.00(US$ 841) in the year
2000.Despite the well-documented ethnic crisis which resulted in a culturally based civil war,
with high defense expenditures and increased level of foreign debts, Sri Lanka has been
able to maintain an average growth rate of 5 percent over the last 5 decades. The Human
Development Index which is 73.0 in 1999 highlight the significant positive changes in the
real living standard of Sri Lank where there has been high level of satisfaction of basic
needs although GDP per capita is relatively low. As in most Asia and pacific, Sri Lanka too,
has a majority portion of population living in rural areas which is estimated to be 78 percent
of the country’s total population. The small industries in the rural areas are the major source
of employment and production of food and, therefore, the Sri Lankan villagers’livelihood.So,
almost all the governments that came to power since independence in 1948, seem to have
been understood the great need for developing this vital sector. According to the Central
Bank of Sri Lanka(1998),the cottage and Small Scale Industries (CSSI)sector plays an
important role in economic development through creation of employment opportunities, the
43
mobilization of domestic savings, poverty alleviation, income distribution, regional
development, training of workers and entrepreneurs, creating an economic environment in
which large firms flourish and contribute to export earnings. Having understood the positive
impact of SMEs development and economic growth, successive governments in Sri Lanka,
have taken various steps to develop this vital sector (Gamage, 2000). But when analyzing
the present contribution of this sector to the national economy, it seems that it has not yet
produced desired results when compared with the other developed and developing
countries in the region. So,it seems that there is a vast opportunity for Sri Lanka to develop
this sector, thereby harnessing the benefits deriving from it.So,the aim of this paper is to
give a brief overview of the current state of SMEs in Sri Lanka and to examine the measures
taken to develop this sector thereby making recommendations for further develop-ment.It
will start by examining the definitions and reviewing the factors influencing the development
of SMEs in Sri Lanka.Having overviewed the current state of SME sector in the economy,
study attempts to identify SME policies followed since independence and institutional
support measures taken by successive governments to develop this sector. Finally, by
examining the problems associated with developing this sector, the study attempts to
present policy implications for developing the sector.
SRI LANKA'S HISTORICAL AND CULTURAL HERITAGE shields more than 2,000
years. Known as Lanka--the "resplendent land"--in the ancient Indian epic Ramayana, the
island has numerous other positions that testify to the island's natural beauty and wealth.
Islamic folklore keeps that Adam and Eve were offered refuge on the island as solace for
their expulsion from the Garden of Eden. Asian poets, noting the physical location of the
island and lauding its beauty, called it the "pearl upon the brow of India." A troubled country
in the 1980s, torn apart by common violence, Sri Lanka has more recently been called
India's "fallen tear."
Sri Lanka claims a democratic tradition matched by few other developing countries,
and since its freedom in 1948, successive governments have been freely elected. Sri
Lanka's citizens enjoy a long life belief, advanced health standards, and one of the highest
literacy rates in the world despite the fact that the country has one of the lowest per capita
incomes.
In the years since freedom, Sri Lanka has experienced severe communal clashes between
its Buddhist Sinhalese majority-- approximately 74 percent of the population--and the
country's largest minority assembly, the Sri Lankan Tamils, who are Hindus and comprise
nearly 13 percent of the population. The communal strength that attracted the harsh
scrutiny of the international media in the late 1980s can best be understood in the context of
the island's complex historical development--its ancient and intricate relationship to India's
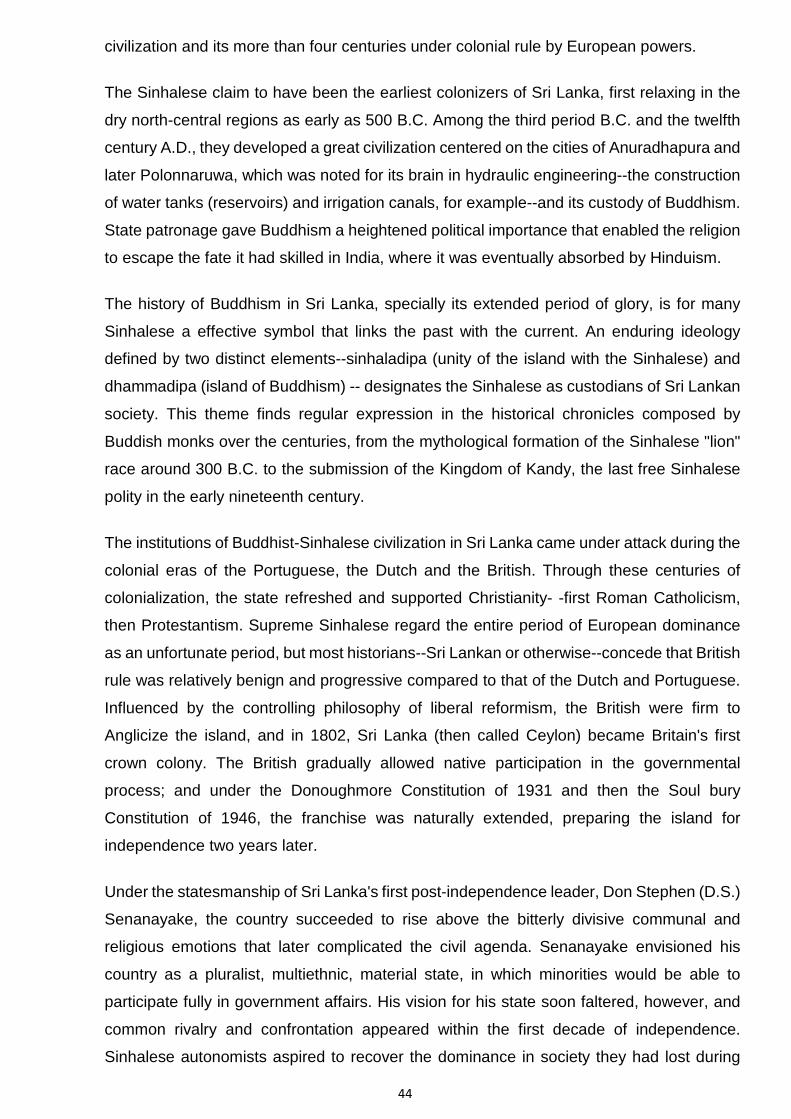
44
civilization and its more than four centuries under colonial rule by European powers.
The Sinhalese claim to have been the earliest colonizers of Sri Lanka, first relaxing in the
dry north-central regions as early as 500 B.C. Among the third period B.C. and the twelfth
century A.D., they developed a great civilization centered on the cities of Anuradhapura and
later Polonnaruwa, which was noted for its brain in hydraulic engineering--the construction
of water tanks (reservoirs) and irrigation canals, for example--and its custody of Buddhism.
State patronage gave Buddhism a heightened political importance that enabled the religion
to escape the fate it had skilled in India, where it was eventually absorbed by Hinduism.
The history of Buddhism in Sri Lanka, specially its extended period of glory, is for many
Sinhalese a effective symbol that links the past with the current. An enduring ideology
defined by two distinct elements--sinhaladipa (unity of the island with the Sinhalese) and
dhammadipa (island of Buddhism) -- designates the Sinhalese as custodians of Sri Lankan
society. This theme finds regular expression in the historical chronicles composed by
Buddish monks over the centuries, from the mythological formation of the Sinhalese "lion"
race around 300 B.C. to the submission of the Kingdom of Kandy, the last free Sinhalese
polity in the early nineteenth century.
The institutions of Buddhist-Sinhalese civilization in Sri Lanka came under attack during the
colonial eras of the Portuguese, the Dutch and the British. Through these centuries of
colonialization, the state refreshed and supported Christianity- -first Roman Catholicism,
then Protestantism. Supreme Sinhalese regard the entire period of European dominance
as an unfortunate period, but most historians--Sri Lankan or otherwise--concede that British
rule was relatively benign and progressive compared to that of the Dutch and Portuguese.
Influenced by the controlling philosophy of liberal reformism, the British were firm to
Anglicize the island, and in 1802, Sri Lanka (then called Ceylon) became Britain's first
crown colony. The British gradually allowed native participation in the governmental
process; and under the Donoughmore Constitution of 1931 and then the Soul bury
Constitution of 1946, the franchise was naturally extended, preparing the island for
independence two years later.
Under the statesmanship of Sri Lanka's first post-independence leader, Don Stephen (D.S.)
Senanayake, the country succeeded to rise above the bitterly divisive communal and
religious emotions that later complicated the civil agenda. Senanayake envisioned his
country as a pluralist, multiethnic, material state, in which minorities would be able to
participate fully in government affairs. His vision for his state soon faltered, however, and
common rivalry and confrontation appeared within the first decade of independence.
Sinhalese autonomists aspired to recover the dominance in society they had lost during
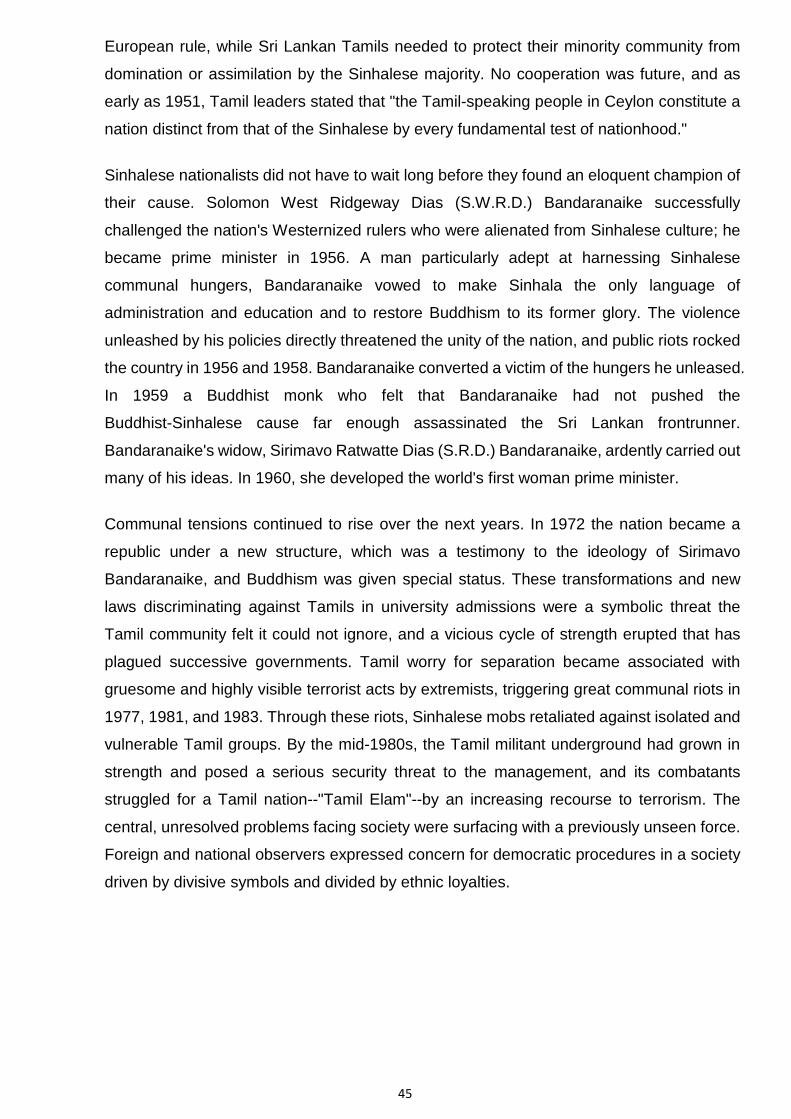
45
European rule, while Sri Lankan Tamils needed to protect their minority community from
domination or assimilation by the Sinhalese majority. No cooperation was future, and as
early as 1951, Tamil leaders stated that "the Tamil-speaking people in Ceylon constitute a
nation distinct from that of the Sinhalese by every fundamental test of nationhood."
Sinhalese nationalists did not have to wait long before they found an eloquent champion of
their cause. Solomon West Ridgeway Dias (S.W.R.D.) Bandaranaike successfully
challenged the nation's Westernized rulers who were alienated from Sinhalese culture; he
became prime minister in 1956. A man particularly adept at harnessing Sinhalese
communal hungers, Bandaranaike vowed to make Sinhala the only language of
administration and education and to restore Buddhism to its former glory. The violence
unleashed by his policies directly threatened the unity of the nation, and public riots rocked
the country in 1956 and 1958. Bandaranaike converted a victim of the hungers he unleased.
In 1959 a Buddhist monk who felt that Bandaranaike had not pushed the
Buddhist-Sinhalese cause far enough assassinated the Sri Lankan frontrunner.
Bandaranaike's widow, Sirimavo Ratwatte Dias (S.R.D.) Bandaranaike, ardently carried out
many of his ideas. In 1960, she developed the world's first woman prime minister.
Communal tensions continued to rise over the next years. In 1972 the nation became a
republic under a new structure, which was a testimony to the ideology of Sirimavo
Bandaranaike, and Buddhism was given special status. These transformations and new
laws discriminating against Tamils in university admissions were a symbolic threat the
Tamil community felt it could not ignore, and a vicious cycle of strength erupted that has
plagued successive governments. Tamil worry for separation became associated with
gruesome and highly visible terrorist acts by extremists, triggering great communal riots in
1977, 1981, and 1983. Through these riots, Sinhalese mobs retaliated against isolated and
vulnerable Tamil groups. By the mid-1980s, the Tamil militant underground had grown in
strength and posed a serious security threat to the management, and its combatants
struggled for a Tamil nation--"Tamil Elam"--by an increasing recourse to terrorism. The
central, unresolved problems facing society were surfacing with a previously unseen force.
Foreign and national observers expressed concern for democratic procedures in a society
driven by divisive symbols and divided by ethnic loyalties.
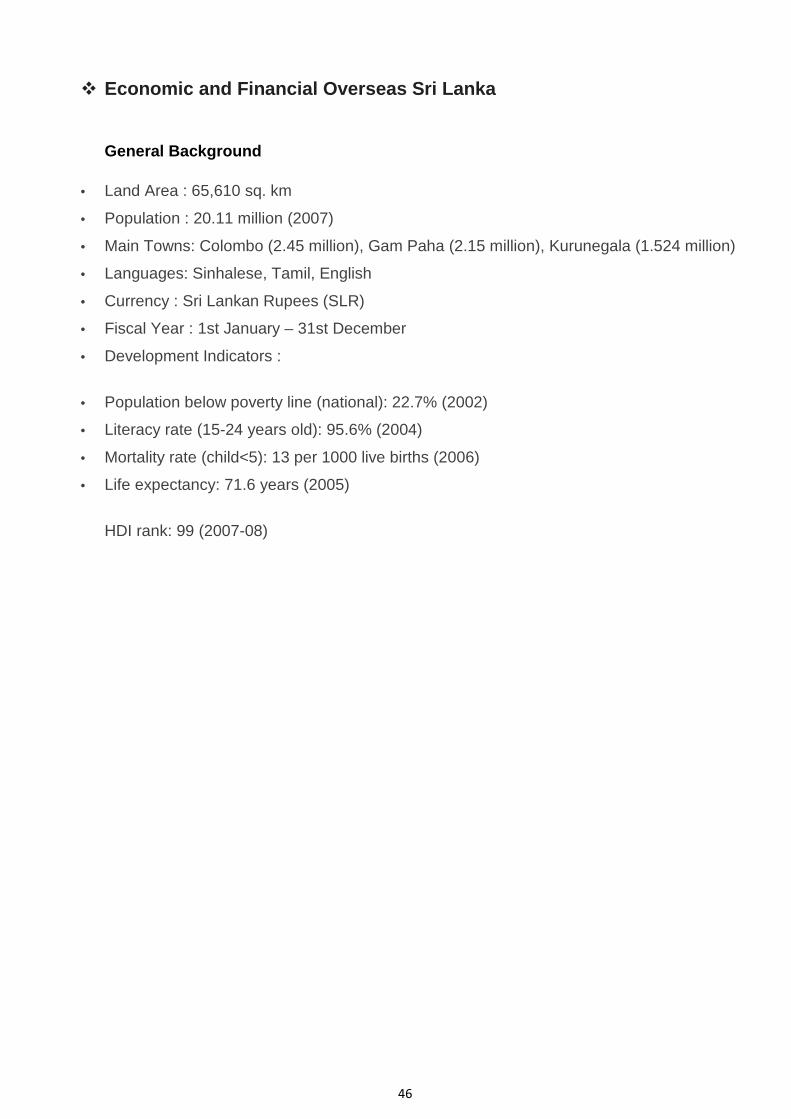
46
� Economic and Financial Overseas Sri Lanka
General Background
• Land Area : 65,610 sq. km
• Population : 20.11 million (2007)
• Main Towns: Colombo (2.45 million), Gam Paha (2.15 million), Kurunegala (1.524 million)
• Languages: Sinhalese, Tamil, English
• Currency : Sri Lankan Rupees (SLR)
• Fiscal Year : 1st January – 31st December
• Development Indicators :
• Population below poverty line (national): 22.7% (2002)
• Literacy rate (15-24 years old): 95.6% (2004)
• Mortality rate (child<5): 13 per 1000 live births (2006)
• Life expectancy: 71.6 years (2005)
HDI rank: 99 (2007-08)
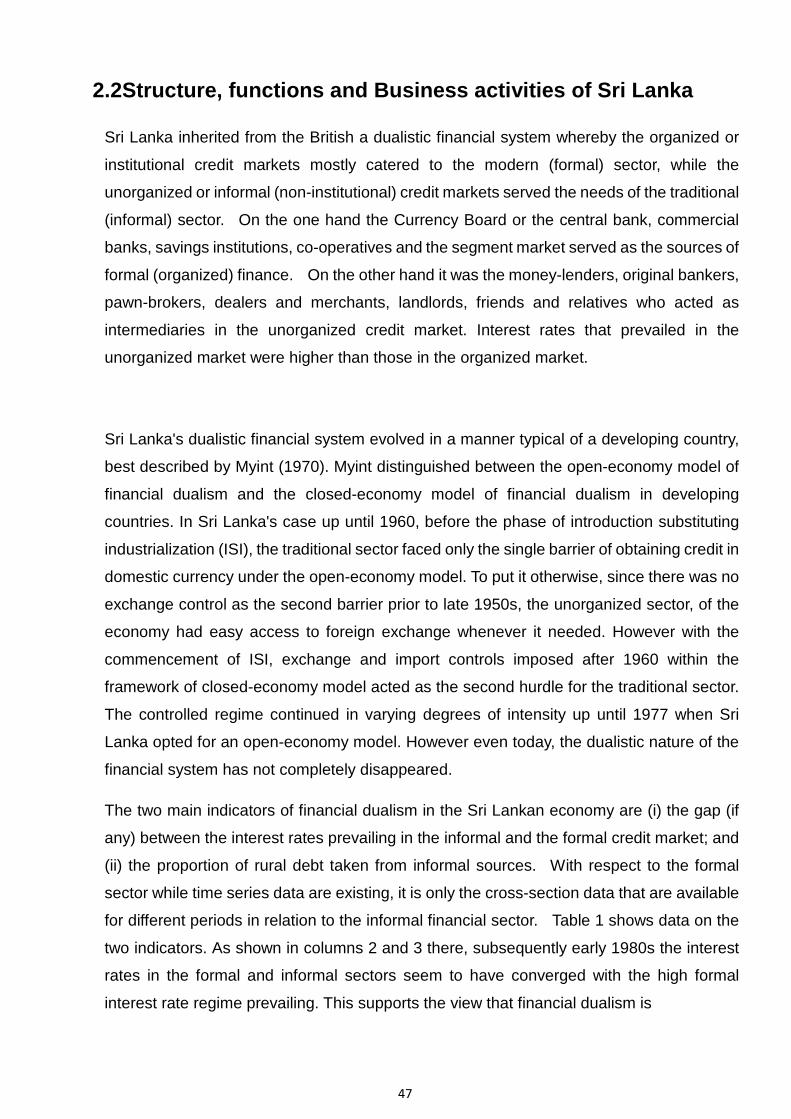
47
2.2Structure, functions and Business activities of Sri Lanka
Sri Lanka inherited from the British a dualistic financial system whereby the organized or
institutional credit markets mostly catered to the modern (formal) sector, while the
unorganized or informal (non-institutional) credit markets served the needs of the traditional
(informal) sector. On the one hand the Currency Board or the central bank, commercial
banks, savings institutions, co-operatives and the segment market served as the sources of
formal (organized) finance. On the other hand it was the money-lenders, original bankers,
pawn-brokers, dealers and merchants, landlords, friends and relatives who acted as
intermediaries in the unorganized credit market. Interest rates that prevailed in the
unorganized market were higher than those in the organized market.
Sri Lanka's dualistic financial system evolved in a manner typical of a developing country,
best described by Myint (1970). Myint distinguished between the open-economy model of
financial dualism and the closed-economy model of financial dualism in developing
countries. In Sri Lanka's case up until 1960, before the phase of introduction substituting
industrialization (ISI), the traditional sector faced only the single barrier of obtaining credit in
domestic currency under the open-economy model. To put it otherwise, since there was no
exchange control as the second barrier prior to late 1950s, the unorganized sector, of the
economy had easy access to foreign exchange whenever it needed. However with the
commencement of ISI, exchange and import controls imposed after 1960 within the
framework of closed-economy model acted as the second hurdle for the traditional sector.
The controlled regime continued in varying degrees of intensity up until 1977 when Sri
Lanka opted for an open-economy model. However even today, the dualistic nature of the
financial system has not completely disappeared.
The two main indicators of financial dualism in the Sri Lankan economy are (i) the gap (if
any) between the interest rates prevailing in the informal and the formal credit market; and
(ii) the proportion of rural debt taken from informal sources. With respect to the formal
sector while time series data are existing, it is only the cross-section data that are available
for different periods in relation to the informal financial sector. Table 1 shows data on the
two indicators. As shown in columns 2 and 3 there, subsequently early 1980s the interest
rates in the formal and informal sectors seem to have converged with the high formal
interest rate regime prevailing. This supports the view that financial dualism is
48
Gradually disappearing in Sri Lanka. There is also further evidence from columns 4 and 5 in
Table that financial dualism has been disappearing gradually over the years as the
proportion borrowed from the informal sources in the rural sector has declined.
On financial development involving financial dualism and financial urban bias (discussed in
the following section), Stieglitz and Weiss (1981) raised the theoretical argument that root
causes of the gap between demand and supply of financial services are high transaction
costs and risks due to information asymmetries and moral hazard. They emphasized
building sustainable institutions, official innovation to reduce costs and risks thus improving
market-driven provision of financial resources.

49
Economic structure
In the economic structure of the country, agriculture, though decreasing in share of
GDP, remainders critical as over a third of workforce is employed in agriculture and has
externalities associated with manufacturing and services. The main agriculture gather is rice
that accounts for one fifth of total agriculture output. The growing in agriculture is low compared
to industry and services (average real growth rate 2.8% in 2003-07) and is stifled by factors
such as fragmented holdings, lack of maintenance services such as research and extension,
poor pre- and post-harvest organization and government intervention through subsidy and
price setting. The plantation sector products three transfer crops, tea, rubber and coconut and
accounts for approximately 20% of export income. Agriculture, including plantation, is
concerted in southern, central, north-western plus Sabaragamuwa province, accounting for
approximately 60% of output.
The industrial sector is export oriented and dominated by manufacturing which has
more than 60% share in industrial output. Three activities generate nearly 90% of outputs by
value: textile and garments (21.7%), food, beverages and tobacco (46.7%) and chemicals,
petroleum rubber and plastic products (18.6%). However, the sector is heavily dependent on
imported machinery and inputs, linking it closely with global prices and exchange rates. Mining
accounts for 2% of GDP and approximately the same ratio in export earnings. Precious and
semi-precious stones are the main output of mining.
The service sector has more than 50% share in GDP (58% share in GDP during
2003-07) and is the main driver of growth with average 7.1 % a year in 2003-07.
Telecommunication, trading, port and fiscal services are main contributors to the growth.
Physically, industry and services are concentrated in the western province, accounting for 50%
of GDP, 55% of industrial and 57% of services output.
50
� Financial Sector Overview In Sri Lanka
Key reforms
Beginning in the early 1990s, the financial sector in Sri Lanka has undergone several reforms
aimed at strengthening institutional framework and decreasing government direct involvement
in financial distribution. These reforms have led to important legislative and regulatory changes,
improved capacity for financial sector managements, improved system, process and
performance and strengthening of central banking operations. However, the state lasts to
dominate the financial system with two large state-owned profitable banks. The state-owned
banks account for nearly half of banking system assets and quarter of total financial sector
assets. These banks are not due to be sold but they would soon operate under a strictly
commercial basis.
The Central Bank of Sri Lanka (CBSL) focuses on maintenance of macro-economy and
financial system stability. The CBSL has improved its volume over the years in supervision and
enforcement and has taken steps in implementing risk managing, BASEL II, for tight corporate
governance in Banks. The CBSL regulates and manages commercial and particular banks,
finance and leasing companies and primary dealers and introduction of Acts on anti-money
laundering and financial transaction reporting
Financial services providers
The financial sector contains of a wide variety of actors.
Banking sector:
The banking sector has grown over the years and accounts for two-thirds of the sector assets
in 2007. The banking sector contains:
• Licensed Commercial Banks (LCBs): There are 23 LCBs. Among LCBs, the two largest (Bank
of Ceylon and People’s Bank) banks are state-owned, 9 privately possessed and 12 are
foreign bank branches.
• Licensed specialized banks (LSBs): There are 16 specialized banks consisting of long-term
lending organizations, development banks, savings banks, local development banks etc. They
are generally state owned with market share of about one fifth of LCBs. The single main LSB is
the state owned National Savings Bank.
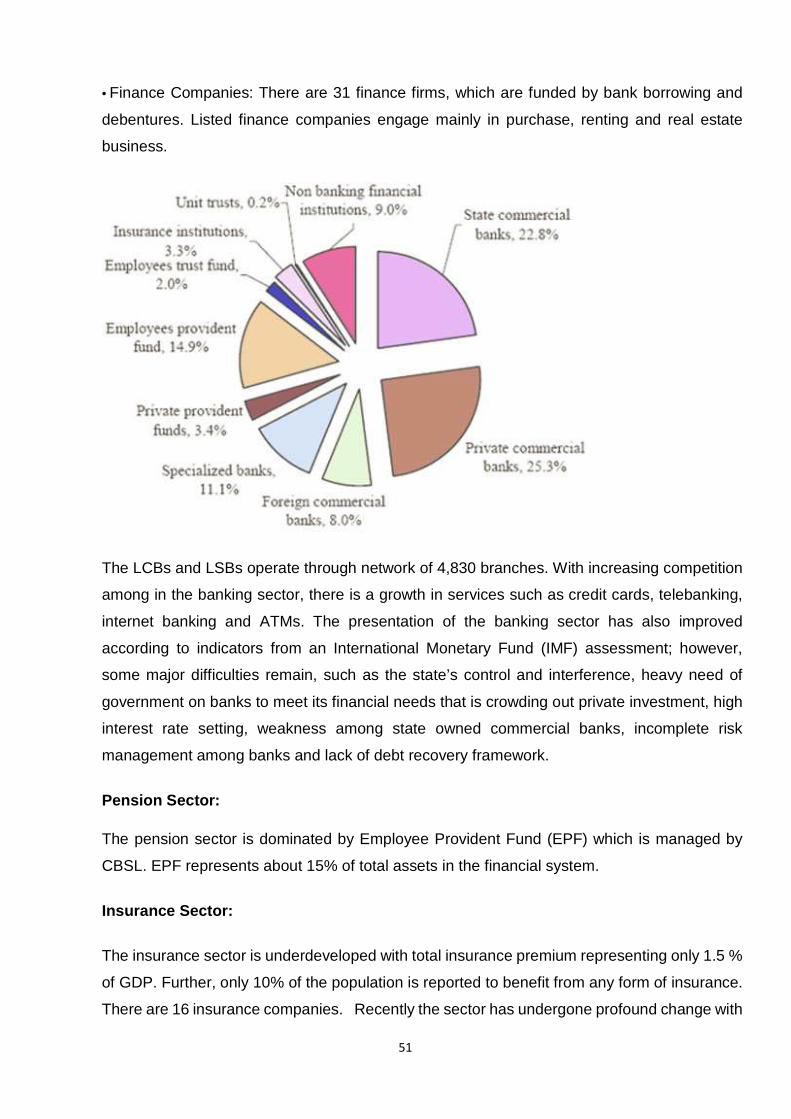
51
• Finance Companies: There are 31 finance firms, which are funded by bank borrowing and
debentures. Listed finance companies engage mainly in purchase, renting and real estate
business.
The LCBs and LSBs operate through network of 4,830 branches. With increasing competition
among in the banking sector, there is a growth in services such as credit cards, telebanking,
internet banking and ATMs. The presentation of the banking sector has also improved
according to indicators from an International Monetary Fund (IMF) assessment; however,
some major difficulties remain, such as the state’s control and interference, heavy need of
government on banks to meet its financial needs that is crowding out private investment, high
interest rate setting, weakness among state owned commercial banks, incomplete risk
management among banks and lack of debt recovery framework.
Pension Sector:
The pension sector is dominated by Employee Provident Fund (EPF) which is managed by
CBSL. EPF represents about 15% of total assets in the financial system.
Insurance Sector:
The insurance sector is underdeveloped with total insurance premium representing only 1.5 %
of GDP. Further, only 10% of the population is reported to benefit from any form of insurance.
There are 16 insurance companies. Recently the sector has undergone profound change with
52
privatization of state owned insurance companies and setting up of Insurance Board of Sri
Lanka as independent supervisor.
Equity and debt markets:
The stock market has performed well over the years and current market capitalization is
approximately 30% of GDP. The corporate debt market is small.
Other companies in financial sectors are primary dealers of government securities, investment
banks, savings and loans associations, cooperatives, microfinance (MF) providers, venture
capital companies, trusts and a large number of informal money lenders.
In analysis of financial sector, it is important to repeat that with “its management of the two
main providers of financial services, the Government controls nearly 40% of all financial sector
assets. Moreover, government debt signifies largest single exposure to the financial system
accounting for nearly quarter of banks assets (loans and investment) and more than 90% of
investment of pension and insurance institutions”. As an outcome, the share of credit to the
private sector is only one third of GDP.
Financial inclusion
In terms of outreach of financial services, it is quite extensive with 82.5% of households having
accessed financial institutions for savings (75%) and credit (47%). Sri Lanka performs
reasonably well in terms of rate of deposit accounts and loans compared to other countries in
the area. While there are 1118 and 364 deposits and loan accounts singly per 1,000 people in
the country, India has 443 and 78 deposits and loan accounts. Additional, there are 16
branches and 17 ATMs per 1,000 sq. km in Sri Lanka while in India, statistics amount to 23 and
7 respectively. However, overall figures hide the differences at various levels. For example 25%
household in estate sector have not utilized financial services of financial institution compared
to 17.5% and 15% of rural and urban households respectively. Moreover, branches of LCBs
are focused in Western Area. At the end of 2007, there were 678 banking outlets of LCBs in the
Western Province out of a total branch network of 1,697 in the total country.
53
� Nature of the Economy
Sri Lanka's economic prospects in early 1988 were linked at least in part to the political and
security situation. If political strength could be brought below control, the government had
commitments from foreign investors and donors to finance a reconstruction program that
would ensure economic growth in the short term. If the violence were to continue, the
diversion of capitals into defense and the negative impact on tourism and foreign
investment appeared likely to result in economic stagnation.
Agriculture, both subsistence and commercial, has played a main role in Sri Lanka's
economy for many periods. The Portuguese and Dutch, who ruled the coastal regions of
the island from the sixteenth through the eighteenth centuries, were primarily involved in
profiting from cinnamon and other spices. Occupation with India, Sri Lanka's nearest
national, was also important during this period. Sri Lanka distributed pearls, areca nuts,
shells, monsters, and coconuts, and in return established rice and textiles.
The island's economy began to assume its modern form in the 1830s and 1840s, when
coffee estates were established in the Central Uplands. Coffee soon became the dominant
force in the economy, its proceeds giving for increasingly large imports of food, particularly
rice. When coffee fell victim to a leaf disease in the 1870s, it was quickly substituted by tea,
which soon covered more land than had coffee at its height. Coconut estates also
expanded rapidly in the late nineteenth century, trailed by rubber, another cash crop
introduced in the 1890s. Moved by demand generated by the development of the
automobile industry in Western Europe and North America, rubber soon passed coconuts
in position. These three products--tea, coconuts, and rubber-- providing the export earnings
that enabled Sri Lanka to import food, textiles, and other buyer goods in the first half of the
twentieth century. At freedom in 1948, they generated over 90 percent of export proceeds.
Wet rice was grown extensively as a subsistence crop throughout the colonial period. In the
nineteenth period, most of it was consumed in the villages where it was grown, but in the
final periods of British rule the internal market in rice expanded. However, more than half of
the rice consumed was imported, and the island be contingent on the proceeds of
plantation crops for its food supply.
The economy gradually became more diverse after the late 1950s, partly as a effect of
54
government policies that encouraged this trend. The main reason succeeding
administrations tried to reduce the country's need on tea, rubber, and coconuts was the
long-term decline in their value relative to the cost of imports. Even when Sri Lanka
improved the production of its major cash crops, the volume of imports that could be bought
with their proceeds declined.
Much of the diversification of the economy, especially in the 1960s and the early 1970s,
took the form of importance substitution, manufacturing for the local market goods that the
island could no longer afford to import. Sri Lanka also had some realization in diversifying
exports after 1970. The ratio of exports linked to the three traditional cash crops fell from
over 90 percent in the late 1960s to 71 percent in 1974 and 42 percent in 1986. Cloths,
which made up only 0.7 percent of transfers in 1974, accounted for over 28 percent in 1986.
In 1986 agriculture, forestry, and fishing made up 27.7 percent of the gross national product
(GNP), down from 39.4 percent in 1975. In 1956 comprehensive and retail trade accounted
for 19.9 percent of GNP, and engineering for 15.6 percent. Transport, storage, and
transportations stood at 11.2 percent of GNP, and structure at 7.7 percent. The relative
importance of the various sectors of the economy was fairly stable during the 1980s.
Role of Government
The role of government in the economy during the final decades of British colonial rule was
considerable. The estate economy required extensive infrastructure; the colonial state
developed and owned railroad, electrical, postal, compressed, telephone, and water supply
services. Quasi-state monetary institutions served the colony's commercial needs, and
through World War II the government set up production items for plywood, quinine, drugs,
leather, coir, paper, tiles, acetic acid, glass, and steel. Well-being policies also began
during colonial rule, with a network for free and subsidized rice and flour recognized in
1942. Free education, relief for the poor, and sponsored medical care were introduced in
the late British period. Moreover, after 1935 the management took an active role in the
planning and subsidizing of colonization schemes. This policy was calculated to remove
landless peasants from heavily populated areas to newly irrigated tracts in the dry zone.
Economic policy since Independence is divided into two periods. Through the first, which
lasted from 1948 to 1977, government involvement was often seen as the solution to
economic problems. The growth of government participation in the economy was fairly
steady, resulting in a closely regulated system. This trend was specifically marked during
55
the period of S.R.D. Bandaranaike's another government, from 1970 to 1977, when the
state came to dominate international trade and payments; the plantation, financial, and
industrial engineering sectors; and the major trade unions outside the estate sector. It also
played a major role in the domestic wholesale and retail trade.
The trend toward greater government involvement was largely a response to the
deteriorating terms of trade. The estate economy had financed social programs such as
subsidized food in the late colonial historical, but when the value of exports failed after
1957, the economy's capacity to support these programs was nervous. When the foreign
exchange reserves of the early 1950s dwindled, import-substituting vprogress was seen as
a solution. For the private sector viewed industrial growth as risky, the government took up
the slack. When poise of payment deficits became chronic, certain nationalizations were
justified by the need to stem the drain of foreign exchange. Similar worries led to the tighter
regulation of private business and the establishment of state-owned trading corporations.
When there were famines of necessities, government’s expanded state control over their
distribution in order to make them available at low prices.
The 1977 elections were largely a referendum on the perceived failures of the closed
economy. The UNP, which maintained a deregulated, open economy, won finally. The new
government rejected the economic policies that had evolved over the previous twenty
years. Some observers thought that the economy had been shackled by excessive
regulation, an excess of feeding expenditure over investment, and lavish state initiatives.
Under the UNP, market forces were to play a greater role in allocating resources, and state
creativities were to compete with the private sector.
The main elements of the new policy were investment incentives for foreign and domestic
capital, a shift in the configuration of public spending from subsidies to infrastructure
investment, and a slackened international trade policy designed to encourage export-led
growth. Service creation was a central objective, both done encouragement of domestic
and foreign capital investment, and done an ambitious public works program, with the
Accelerated Mahaweli Program, which intended to bring new land under irrigation and
substantially increase hydroelectric producing capacity. Two other policies that sought to
create employment were the establishment of investment promotion zones (free trade
zones) and extensive government investment in housing.
The role of government during the decade after 1977 remained significant; the public
56
investment program, for instance, was applied on a greater scale than anything attempted
before, and in early 1988 the state remained heavily involved in many areas of economic
activity. But while the government augmented its efforts to develop the nation's
infrastructure, it summary its role in regulation, commerce, and manufacture. Its initiatives
received the enthusiastic support of the international development civic. As a result, Sri
Lanka received generous amounts of foreign aid to finance its post-1977 development
program. This external assistance was integral to the government's economic strategy.
Because cheap deficits were large even before 1977, external financial incomes were
necessary to pay for the increased spending on infrastructure and to make up for the
revenue lost as a result of the tax incentives given business. Similarly, reducing import
controls put pressure on the balance of payments, which could be thankful only with the
help of foreign aid.
Development Planning
During the early years of independence, succeeding governments placed little emphasis on
development planning, in part because the direct economic problems appeared to be
manageable. The General Planning Council was established in 1956 as part of the Ministry
of Finance. Between 1957 and 1959, the association and the Central Bank of Sri Lanka
invited a number of foreign economists to visit Sri Lanka and offer the government both
their diagnoses of the country's economic problems and their prescriptions for the planning
and implementation of recommended remedies. These studies providing many of the
rationales for economic policies and planning in the 1960s.
In 1959 the National Planning Council issued a Ten-Year Plan, the most determined
analysis of the economy and projection of planning that had yet been officially published.
This plan sought to growth the role of industry in the economy. Unluckily, its forecasts were
based on faulty projections of population and labor force growth rates. Moreover, efforts to
implement it collided with the exchange and price crunch of 1961 and 1962, and the plan
became progressively out of touch with the changing economic situation.
A new Ministry of Planning and Economic Affairs (no longer in existence) was established
in 1965. The ministry absolute not to draft another single long-term plan involving a five- or
10-year period. Instead, it drew up a number of separate, detailed, well-integrated, 5-year
plans involving different ministries. The government beset agriculture, especially wet rice,
as the area in which growth could best be achieved.
57
The UNP government that came to power in 1970 shifted toward a more formal and
comprehensive state direction of the economy. The 5-Year Plan for 1972-76 had two
principal aspects. First, it sought to remove gaps in incomes and living standards. Second,
the plan sought to help economic growth and to reduce unemployment. It envisioned rapid
growing in agriculture, not only in the old yields of wet rice, tea, rubber, and coconut, but in
such minor crops as sunflower, manioc, cotton, cashew, pineapple, and cocoa. Like the
Ten-Year Strategy of 1959, this plan proved to be based on overly optimistic assumptions,
and it soon ceased to use influence on the government's economic policy. In 1975 it was
replaced by a 2-Year Plan that placed even greater emphasis on agricultural growth and
less on industrial development.
After 1977 the government continued to accept the principle of state direction of economic
activity, but in difference to the 1970-77 period the government encouraged the private
sector to participate in the economy. Its first Five-Year Plan (1978-83) included an
ambitious public investment program to be financed largely by overseas grants and loans.
Its direct objective was to reduce unemployment, which had risen during the contract of the
previous government.
A series of five-year rolling investment plans was set in motion by the Ministry of Finance
and Planning in the 1980s. The plan for the 1986-90 period pictured investment of Rs268
billion with the emphasis on infrastructure projects such as roads, irrigation, ports, airports,
communications, and plantations. Of this total, 50 percent was to be consumed by the state
sector. External sources were to supply Rs69 billion. The target annual average
development for the gross domestic product (GDP) was 4.5 percent, a decrease from the
5.2 percent saw by the plan for the 1985-89 period and the 6 percent actually achieved
between 1977 and 1984.
58
The Economy in the Late 1980s
Growth in GDP was estimated at 3 percent in 1987, depressed from 4.3 percent in 1986,
and the bottom level in a decade. By 1987 it was strong that the ongoing civil unrest was
causing serious economic difficulties, mainly because rapidly growing defense outlays
forced the government to cut back capital expenditure and to run a large budgetary deficit.
Concern over the failure in foreign investment and extensive damage to infrastructure
mounted as sectors such as tourism, transportation, and wet rice agricultural suffered
production losses directly related to the decline in security.
By early 1988, the ethnic conflict had resulted in extensive property damage. Infrastructure
loss in Northern and Eastern provinces was valued at Rs7.5 billion in August 1987 and was
expected to be revised upwards to include the widespread destruction in the Jaffna
Peninsula. In the mostly Sinhalese areas, riots in contradiction of the 1987 Indo-Sri Lankan
Accord caused damage to government property valued at Rs4.8 billion.
In early 1988, future economic prospects were closely linked to the safety situation. Late
the previous year, the government succeeded in obtaining commitments from foreign
nations and international organizations to finance an extensive reconstruction program for
the 1988-90 period. If there were a marked ebb in the political violence plaguing the island
nation, it would be possible that the official target of Rs80 billion foreign aid over this
three-year period would be reached. Aid on this ruler, which would be a substantial
increase on the already generous levels received, would not only allow the rebuilding of
infrastructure destroyed by the violence but also fuel growth and allow the large trade and
budget deficits to continue. Hence, the 1988 budget foresaw a sharp decline in defense
spending and an increase in capital outflow. These economic plans, however, depended on
a peaceful result to the country's political difficulties. If political violence escalated in
following years, not only would the government have to shift its spending back to defense,
but some of the probable foreign aid probably would be suspended.
59
� Sri Lanka Economic Structure
Sri Lanka has emerged as a strong developing economy in South Asia in the first decade of the
21st century. Sri Lankan stock market was among the world’s best performing markets with
100% gain in 2009. By November 2009, its official foreign conversation reserves rose to over
$5 billion. A number of reconstruction and development projects are in pipeline in the northern
and eastern provinces. However, high budget shortages and debt interest payments pose
major challenges in the growth of the economy.
Sri Lanka Economic Structure: Division by Sector
The economic structure of Sri Lanka can be separated into the following sectors:
Primary Sector: Sri Lankan primary agriculture sector can be divided into three major
categories .i.e. farming, fishing and aquaculture. As of 2008, 32.7% of the labor force was
employed in the sector. Some main crops are rice and the main cereal. Coconut, tea and
rubber plantation is done extensively. Tea is one of the country’s major foreign exchange
earners. To endorse Sri Lankan Ayurveda, ganja or cannabis is also full-grown. The fishing
sector of Sri Lanka is still recovering from the throes of 2004 tsunami that damaged 90% of the
country’s fishing boats.
Secondary Sector: The industrial sector provides employment to 26.3% of the workforce (as
of 2008). Around 18% of the GDP comes from manufacturing which is also the country’s
largest industrial subsector. The construction sector contributes 7% to the GDP followed by
mining and quarrying that account for 1.5%. Measured by value addition food, beverage, and
tobacco contribute 44% followed by textiles, garment, and leather that pay 20%. Some other
major manufacturing industries comprise petroleum, chemical, plastic rubber and non-metallic
mineral-based products products.
60
Tertiary Sector: Sri Lankan services sector is the major employer as 41% of the country’s
labor force is engaged in it (as of 2008). The growth rate in 2006-07 was 7% and dropped to
5.6% in 2008 due to recession. The major contributory sectors to growth were the financial
services, telecom, trading and carriage. The information technology sector is growing steadily
in Sri Lanka. Travel, which has been one of the major foreign exchange earners for decades, is
also taking off post-civil war. The target of the country’s tourism development board is to attract
2.5 million tourists and earn $2 billion by 2016.

61
� OVERVIEW OF THE ECONOMY AND FINANCIAL SECTOR
A. Overview of the economy
Sri Lanka is a country with a small open economy and an estimated population of 19.9
million growing at an annual average growth rate of 1.1 per cent. The economy has grown at
an average of 5 per cent over the past 15 years. The gross domestic product (GDP) in 2006
was estimated to be $23.2 billion with a per capita income of $1,340 which places the country
in the group of lower middle income countries in the world. The economy has moved to a path
of high growth and has been able to maintain growth in real terms of over 6 per cent in the
recent past. The economy achieved a growth rate of 8 per cent in the first half of 2006 and is
estimated to grow by over 7 per cent in real terms during the year as a whole. The country
expects to maintain an annual growth rate exceeding 8 per cent over the next 10 years
enabling it to reach a per capita income level of around $3,000.
The economic activities are broad-based and overall production is dependent on the
performance of the three main sectors in the economy - services, industry and agriculture.
The services sector has shown a steady growth in its share of overall production and at present
accounts for over 55 per cent of the output of the economy. The main activities of this sector
are international and domestic trade, financial services and transportation which account for 70
per cent of the output. The share of industry in total output has remained around 27 per cent
during last three decades. At present, the factory, industry and construction sub-sectors
account for over 75 per cent of total industrial output. The agriculture sector which was the
major sector five decades earlier contributes only 17 per cent of the total output. The food and
plantation crops sub-sectors account for over 80 per cent of the sector output which is highly
sensitive to the prevailing weather conditions. Although Sri Lanka is an island economy with
unlimited marine resources, the share fish production in overall output is less than 2 per cent.
The economy has been operating continuously with a domestic resource gap where the
country’s investments are higher than national savings with the gap being financed from
foreign sources. Both investments and national savings are on an upward trend and reached
62
26.5 per cent and 23.3 per cent of GDP respectively in 2005. This level of savings and
investment is not adequate for the economy to achieve the targeted growth path in a
sustainable manner. In view of this, the medium-term macroeconomic strategy expects to
increase the country’s investment to over 30 per cent of GDP giving higher priority to the more
productive sectors of the economy.
The Government has reiterated the necessity of improving the fiscal position to ensure
fiscal and debt sustainability in the country. Persistent high government budget deficits which
were mainly financed by commercial domestic borrowings resulted in the stock of public sector
debt mounting in recent years. Consequently, servicing of public debt became a major issue
in the government budget and the management of publicdebt became a complex task which
required drastic changes in the overall fiscal management of the economy. In view of the
emerging threat to the fiscal position, the Government approved the Fiscal Management
Responsibility Act (FMRA) in 2003 to improve fiscal discipline through rule-based fiscal
management.
Under the FMRA, the government is committed to bring down the overall deficit to below 5
per cent of GDP in the medium-term and lower the total debt-to-GDP ratio to 60 per cent by
2013. The government expects to achieve these targets by enhancing revenue measures that
could be sustained and streamlining recurrent expenditure while allocating more funds for
public investment. The government budget for 2007 was formulated to generate a surplus in
current account operations thereby limiting government borrowings for public investment
activities of the government. The debt-to-GDP ratio that rose to over 105 per cent in 2004 is
already on a downward path and estimated to decline below 90 per cent during 2007.
The external sector recorded a substantial expansion in external trade and financial flows
that helped the country to achieve a surplus in the balance of payment (BOP) in most of the
recent years. Although the export sector maintains a high growth rate with a continuous
diversification of products, the country’s trade balance remained in deficit of over 10 per cent of
GDP in the recent past mainly due to the sharp increase in the price of petroleum imports.
However, the steady growth in the inflow of private remittances, which have become a
permanent and growing source of foreign exchange, helped lower the current account deficit of
the BOP to around 3 per cent of GDP. Even though the economy has had a persistent current
account deficit, the overall balance has been mostly positive due to the inflow of funds received
63
for government budgetary operations and foreign direct investment into the country. The
overall balance of the BOP was estimated to be $180 million in 2006. The gross official
reserves of the country had increased to $2.7 billion in 2005 which was equivalent to three
months imports of goods and services based on recent experience. Total external reserves of
the country grew to $4.2 billion in 2005 which was equivalent to five months of imports of goods
and services. The maintenance of external reserves at these levels enables the economy to
withstand unforeseen external shocks.
Sri Lanka entered into an Article VIII agreement with the IMF under which current account
transactions were fully liberalized in 1994. Since then some of the capital account transactions
have also been liberalized with the intention of continuing this policy gradually in the future.
Sri Lanka has made continuous efforts to strengthen the external trade relations through
bilateral, regional and mutual trade arrangements to boost economic activities. Of these,
agreements with the European Union (EU) and India are the major ones. Even though a
series of measures were taken to encourage foreign direct investment (FDI) by granting
various incentives and creating an enabling environment, FDI has remained low at around 1
per cent of GDP in the past. The government formulated a new strategy to increase FDI to
over 2 per cent of GDP in 2006 and further in the future.
The Central Bank conducted a tight monetary stance in the recent past with the objective
of containing inflationary pressures and lowering the rapid growth of monetary aggregates to
facilitate high growth in the economy. The Central Bank relies more on market-based
instruments such as Open Market Operations (OMO) to conduct the monetary policy and
maintain price stability in the economy. The financial sector has expanded continuously with
stability and resilience in the past. The performance of financial institutions improved in terms
of profits and a widening in the array of financial products and services offered. The market
infrastructure covering the regulatory and payment and settlement systems has been
substantially improved to enhance the efficiency of the financial system while ensuring
protection to all stakeholders. Banking sector intermediation in the corporate sector is high
whose funding requirements are almost entirely met from the banking system in the country.
64
B. Policy environment
Macroeconomic management in Sri Lanka has focused on fiscal and monetary policies to
enable the economy to achieve sustainable high economic growth with balanced regional
development. Fiscal policy has been formulated to achieve fiscal consolidation while monetary
policy focused on prudent monetary management and an independent floating exchange rate
system. This process has been complemented by broadening and deepening structural
reforms to ensure efficiency in policy transmission and targeted outcomes are achieved in the
future.
The fiscal policy framework has focused on fiscal consolidation which is compatible with
the medium-term fiscal and debt sustainability strategy outlined under the FMRA. The work
plan incorporated in the medium-term fiscal consolidation programmed includes the
turnaround of the current account deficit (or dissaving of the government which has been a
permanent feature in the last two decades) to a surplus by expanding the tax base, high
non-tax revenue efforts from state enterprises, a cost-effective expenditure management
system together with a prudent debt management policy and phasing out of budgetary
transfers to public enterprises. While achieving the medium-term fiscal consolidation targets,
fiscal policy is also designed to support economic growth, implement structural reforms and
generate productive employment in the economy. A pro-poor, pro-growth and regional
development strategy has been introduced to improve the standard of living of low income
people and vulnerable groups in the society to address regional imbalances and the high
degree of poverty in the economy. This programmed is expected to be implemented through
the development of socio-economic infrastructure facilities, creating employment and income
opportunities for the poor, minimizing imbalances in regional development and the distribution
of benefits of growth. In support of this programmed, the Government has decided to
increase the allocation of resources for medium-term public investments giving more priority to
infrastructure development needed to create a supporting environment for private sector
investment.
In line with the medium-term fiscal strategy, the training of the government budget is an
annual process for a rolling period of three years. Accordingly, the Medium-term Fiscal
Framework (MTFF) has been developed consistent with the overall medium-term
macroeconomic framework. Further, the MTFF directs financial flows to achieve specific
65
targets set out in sectorial policy strategies. Since the annual economical is published as a
rolling plan, the implementation agencies have flexibility to revise their work plans in advance
when required, thereby ensuring the implementation of the medium-term programmer as
proposed originally.
Monetary policy aims to achieve a low and predictable level of inflation which supports
economic activities in the country. The Central Bank as the monetary authority of the country
formulates a policy framework to guide the monetary policy operations. At present, the key
policy instrument is the Central Bank Policy interest rates (Repo and Reverse Repo rates)
based on active OMOs. These enable the Central Bank to manage market liquidity actively to
achieve its monetary policy targets. The Central Bank conducts auctions, establishes standing
facilities and sell or purchase to maintain the liquidity position in the market at the desired level.
In this process, government safeties, i.e., Treasury bills and Treasury bonds, plays an
important role in the OMOs. In addition, the Statutory Reserve Requirement (SRR) on
Licensed Commercial Banks (LCBs) is used as a direct instrument to support monetary policy
operations.
Since 2003, the Central Bank has been adopting a tight monetary policy to curtail credit
growth as it is the cause of rising inflation in the economy. Accordingly, the Central Bank
revised its policy rates upwards nine times during the period 2003 to 2006, increasing the repo
and reverse repo rate structure by 300 bps from 7.0–8.5 to 10.0–11.5 per cent. A cautious
approach has been adopted in OMOs to restrict the injection of funds from the Central Bank to
the financial system while maintaining market liquidity at the required level to ensure smooth
transactions in the economy. In addition, several specific practical requirements have been
imposed on commercial banks in the recent past to curb the growth in credit in the banking
system. The Central Bank has issued its Roadmap for Monetary and Financial Sector Policies
for 2007 and beyond which explains the policy strategy to be introduced to maintain economic
and price stability and that of the financial sector.
The replacement of the managed float exchange rate regime by an independent floating
exchange rate regime in 2001 was a major policy change. The new regime is expected to
strengthen the stability of the exchange rate, deepen the foreign exchange market and
improve the country’s competitiveness in international markets. The effectiveness of the new
exchange rate policy was illustrated by the increase in the country’s total external assets
measured in terms of months of imports of goods and services to 5.7 at the end of 2005 from
3.5 months in 2001. Current account transactions are fully liberalized while the capital account
is partially liberalized allowing foreign investors to enter selected markets and sectors in the
66
economy. Although, the equity market is almost fully liberalized for foreign investors, the
money market is still restricted for foreigners. The government bond market was opened to
foreign investors in 2006 subject to a limit of 5 per cent of the stock of bonds outstanding.
However, a more restricted policy has been adopted on local investors investing in foreign
markets which is permitted only on a case by case basis.
The financial system plays an important role in financial intermediary functions by
borrowing from surplus institutions and lending to deficit ones. The financial institutions
comprise the Central Bank which is the apex institution responsible for monetary policy and
regulation of the financial system and other financial institutions dominated by LCBs. The
financial markets in the country consist of the inter-bank call money market, domestic foreign
exchange market, government securities market, equity market and corporate debt securities
market. Except for the company bond market, all other financial markets are active and
operate through various instruments. The financial infrastructure, which covers the regulatory
framework and payment and settlement system, facilitates smooth and efficient transactions in
the financial market and provides safety to all stakeholders in the financial system (Appendix
Table 2).
1. Central Bank
The Central Bank established in 1950 under the Monetary Law Act has been responsible
for the administration, supervision and rule of the monetary, financial and payment and
settlement system in the country. Until 2002, the Central Bank had multiple objectives relating
to the stabilization of domestic monetary value, preserving the constancy of the exchange rate,
promotion of a high level of production, employment and real revenue and the encouragement
and promotion of the development of the productive resources in the country. The evaluation of
the operations of the economic and financial sector led to the realization that the achievement
of multiple objectives was difficult due to conflicts and inconsistencies among them. The
Central Bank recognized price stability as a principle objective that required stable
macroeconomic conditions in the economy. Accordingly, economic and price Stability was
designated as the core objective of the Central Bank in 2002. Since the stability of the financial
system is crucial in preventing economic crises in the country, financial stability was also
added as a core objective.
67
In keeping with the change in objectives of the Bank, a new managerial structure was
established with departments serving the primary objectives or by function groups such as
price stability, financial system stability, agency functions and corporate services. These
changes in the organizational structure were accompanied by the establishment of advisory
technical committees to streamline the decision-making process in the Bank. Accordingly,
committees were appointed to advise the Monetary Board on monetary policy, financial system
stability and auditing. The Monetary Policy Committee (MPC) is responsible for monetary
policy, the Financial System Stability Committee (FSSC) is responsible for the regulatory
aspects of banking and financial institutions and the Audit Committee (AC) is responsible for
financial accountancy and risk aspects of banks. In addition, the membership of the Monetary
Board was increased from 3 to 5 to enable two private sector representatives to be appointed.
The formulation and conduct of monetary policy also underwent significant changes
during the past four years. The Central Bank moved towards market-oriented measures for
monetary management and OMOs become the principle tool. In the interests of financial
sector stability, a series of new measures were adopted to improve liquidity and strengthen the
supervisory and regulatory functions in the bond market. Acceptance of treasury bonds for
transactions in the secondary window of the Central Bank to improve liquidity in the bond
market, the introduction of new accounting standards and technological advancement in the
payment and settlement system in the market. Changes were introduced to the legal
framework in the financial system to accommodate these reforms.
The Central Bank has played a vital role as a market maker by designing new debt
instruments and the necessary market infrastructure and establishing an effective monitoring
and regulatory mechanism for the bond market. The development of the market has enabled
the Central Bank to strengthen its market oriented monetary management strategy. The new
policies adopted to create a liquid bond market and the use of bonds as tradable instruments at
the Central Bank windows enabled it to use Treasury bonds in OMOs and manage monetary
operations in a more effective manner.
2. Banking system
The banking sector is the most important and dominant sector in the financial system. The
banking sector comprises LCBs and Licensed Specialized Banks (LSBs) which account for
over 58 per cent in terms of the asset base and 94 per cent of total deposits in the financial
system.
68
There are 23 LCBs operating in the country with island-wide networks. They have a market
share of 81 and 48 per cent of the assets of the banking sector and the entire financial system
respectively. In terms of ownership, 11 domestic banks and 12 foreign banks are in operation
in the country. The banking system is dominated by the performance and financial strength of
the six largest LCBs, comprising two state banks and the four largest domestic private
commercial banks. These six banks are recognized as Systemically Important Banks (SIBs),
accounting for 78 per cent of the LCB sector assets and 65 per cent of the banking sector
assets. In terms of deposits, the SIBs have a market share of 83 per cent of LCBs and 68 per
cent of banking system deposits. The two state LCBs continue their dominance in the banking
system having a market share of 37 per cent of assets and 44 per cent of deposits of the LCBs.
There are 14 LSBs conducting banking business excluding acceptance of demand
deposits and dealing in foreign exchange. Their share in the assets and deposits of the
financial system are 9.5 per cent and 17.2 per cent respectively. In this sector, the state
owned National Savings Bank (NSB) is the largest LSB accounting for over 50 per cent of the
assets. The two large LSBs account for 83 per cent of the assets and 88 per cent of the
deposits. In comparison to the LCBs, the activities of the LSBs are diverse and the risks are
consequently spread out. The systemic importance of the LSBs is less than that of the LCBs
and their share in the financial system has been declining continuously due to the rapid
expansion of other sub-sectors.
3. Non-bank financial institutions
The market share of the non-bank financial institutions (NBFIs) registered with the Central
Bank and comprising Licensed Finance Companies (LFCs) and specialized leasing
companies is about 6 per cent of the assets of the financial sector. There are 28 LFCs and 18
specialized leasing companies and most are privately owned institutions. These institutions
mobilize funds offering relatively high interest rates to depositors who are ready to bear a
higher risk. Further, lending rates charged by NBFIs are also high due to the high cost of funds
and the greater risk associated with each advance. These institutions mostly lend to leasing
and hire purchase businesses.
The other financial institutions account for 26 per cent of the assets of the financial sector.
The contractual saving institutions dominate this sector with a share of over 80 per cent in
terms of total assets. The Employees Provident Fund (EPF) for which Central Bank plays a
custodian role is the largest contractual saving fund in the country representing 50 per cent of
69
the asset base of this sector. The other institutions include insurance companies, private
provident funds, the Employees Trust Fund (ETF) and primary dealers (PDs).
The financial system plays a multiple role in the operations of the bond market acting as
issuers, investors, intermediaries and providers of liquidity to the market. The primary dealer
system (11 in number) and LCBs mainly operate as intermediaries in the bond market in
addition to holding bonds in their portfolios for trading and investment purposes. Contractual
savings institutions which own long-term capital are major institutional investors in the bond
market accounting for over 60 per cent of the total stock of bonds outstanding in the market.
The ability of bond holders to undertake discount or repo operations improves the liquidity in
the bond market.
C. Financial markets
Financial markets play an important role in the efficient allocation of financial resources
and diversifying risks in the economy. The administration has given high priority to develop
financial markets that help lower the cost of raising liquidity and capital. Since financial markets
denote a key segment of the overall financial system, safety and productivity of financial
markets are important to ensure its stability.
1. Money market
Money market operations in Sri Lanka comprise two active markets. The first is the
interbank call money market and the second is the Treasury bill (primary and secondary)
market. Other money market operations such as those for commercial paper and central bank
securities are not significant in the domestic market.
The interbank call money market is a vibrant market that enables licensed commercial
banks to meet their liquidity needs arising from day to day operations thereby reducing the
liquidity risks in the banking system. The stability in the liquidity situation in the call market is
supported by the provision of repo and reverse repo facilities of the Central Bank. The
borrowing and lending operations in this market are largely for an overnight period. The call
market interest rate varies with the liquidity situation and the Central Bank policy rates act as
benchmarks. The lending rate in the call market is set between the two policies rates under
normal market conditions.
70
Treasury bills are short-term government debt instruments issued under a multiple
bidding system to raise funds from the domestic market for government budgetary operations.
They are highly liquid money market instruments and considered as an alternate source of
liquidity and investment vehicle. Under the existing debt management strategy, new issues of
Treasury bills to raise funds for budgetary operations are limited to a maximum level to reduce
the share of short-term public debt in the total debt portfolio to lower the volatility in the debt
market. However, the re-issue or roll-over of the existing stock of Treasury bills through a
regular weekly auction process helps maintain liquidity in the market. The primary market
operations are limited to PDs who are permitted to access to the auctions at the Central Bank
through the electronic bidding system. The Treasury bill is the only government debt
instrument that the Central Bank is permitted to purchase from the primary market. The
secondary market for Treasury bills is very active and covers outright sales and purchases and
repo and reverse repo transactions. With the introduction of the scripless form issue under the
Scrip less Securities Settlement System (SSSS) with the Real Time Gross Settlement (RTGS)
system and Central Depository System (CDS), the Treasury bill market has achieved
significant improvements.
2. Equity market
Sri Lanka has one of the oldest share markets in the world. Its operations began during
the British colonial period with the inception of the Colombo Share Brokers’ Association in 1896.
It has evolved over the past 110 years period and was renamed the Colombo Stock Exchange
(CSE) in 1990. During the last two decades, the CSE has undergone significant changes to
develop the activities in the equity market. These developments include the establishment of
a public trading floor and inauguration of trading on the open outcry system in 1984,
liberalization of investment for non-nationals in 1990, automation of the clearing system with
the establishment of CDS in 1991 and automation of trading with the inception of the screen
based trading system in 1997. At the end of 2006, 238 companies were listed on the CSE and
their market capitalization was in excess of Rs. 840 billion equivalent to 32 per cent of the
estimated GDP for 2006. On several occasions in the recent past, the CSE was ranked as the
most active stock market in the region.
71
Both local individuals and institutions play a dominant role in the equity market in terms of
market value. However, foreign investors, mainly formal investors played a significant role until
recently increasing their share in the market to 43.3 per cent in 2000. Since then, their share
has declined to below 14 per cent by end of 2005 due to the rapid increase of local participation
in the market. Although the share has declined, foreign investment in value terms has
gradually increased during this period. The equity market is not fully liberalized for foreign
investors and some restrictions remain prohibiting or limiting foreign investors from entering
certain sectors.
The equity market comprises 20 sub-sectors. In terms of market capitalization, the
telecommunications sector dominates followed by financial institutions, diversified holdings,
hotel facilities and food and beverage sector accounting for over 77 per cent of the market.
The CDS acts as the depository for all securities traded and is responsible for the post trade
clearing and settlement of transactions. Trades are in scrip less form that enables the
recording of trading transactions as bookkeeping entries by making corresponding debit and
credit entries in client accounts. The settlement of transactions in the equity market differs for
buyers and sellers with the T+3 and T+4 settlement dates system. Inter-participatory
settlement takes place through the nominated settlement bank of the CDS. In addition to
normal transaction in the market, the stock borrowing and lending system was announced in
2001. This is similar to the collateral loans of securities for a limited period of time under which
the lender can transfer securities to the borrower with an agreement from the borrower to
replace them on an agreed date.
The operations of the equity market are highly sensitive to changes in the political and
peace environment in the country as in most of other markets. In addition, the market
performance is closely related to sound economic fundamentals and profitability of key
institutions in the market. The exposure of financial institutions to the equity market through
investment and lending activities is low and consequently the impact of equity market
operations on the stability of the financial system is relatively low.
3. Bond market
The bond market in Sri Lanka commenced active operations in the 1990s with the
issuance of medium- and long-term oaths, both by the Government and the corporate sector.
This process has been accelerated with the financial sector reforms and restructuring
programmer implemented in the last decade. The debt management policy of the
72
Government was substantially reformed by shifting from issuing non-marketable instruments
(such as Rupee loans) and short-term marketable instruments (such as Treasury bills) to
medium- and long-term marketable instruments. As a result, the Government was compelled
to introduce a new type of marketable debt instrument that was long-term and fixed income.
The Treasury bond was launched in 1997 to meet this demand and raise funds from the
domestic market to finance government budgetary operations. Subsequently, government
borrowings through non-marketable instruments and short-term marketable instruments have
been gradually reduced. Furthermore, the Government has exercised the early retirement
facility or ‘call option’ of the existing stock of non-marketable securities and replaced them with
Treasury bonds to accelerate the development of the bond market. The gradual increase in
the maturity structure of the Treasury bonds enabled the market to establish a medium-term
yield curve which has provided a benchmark for the domestic corporate bond market.
Along with these developments, steps have also been taken to develop the market
infrastructure. These included the improvement of primary and secondary markets,
computerization of market infrastructure, scrip less form issuing system and improvement of
the payments and settlements systems. The legal framework has been strengthened to
support the development of the bond market and achieve a smooth transition to market-based
debt management. The Government has strengthened the monitoring and regulatory work at
the central level to ensure the safety and security of investments made by the public and the
overall stability of the financial system. The continuous commitment to this process and the
state of the domestic money market helped develop the bond market, especially the
government bond market within a relatively shorter time period.
Although an active market exists for government bonds, the company bond market is still
at an underdeveloped stage. The Government has recognized the importance of developing
the corporate bond market to diversify the funding sources to reduce the high reliance on the
banking system and the equity market. Further, it would lower the vulnerability of the
corporate sector to unforeseen shocks such as those experienced by some of the Asian
countries during the Asian financial crisis. In this regard, a number of policy measures have
been implemented to develop the corporate bond market. They included the mandatory
requirement of credit rating and publication of such ratings for all varieties of debt instruments,
the registration requirement for all corporate bonds, entrusting the regulatory functions of
corporate bonds to the CSE and providing facilities to trade corporate bonds in the stock
market. This process has to be continued with a well-designed awareness programmer to
educate both corporate players and investors about the important role that could be played by
73
the bond market.
4. Foreign exchange market
The foreign exchange market which plays an important role in the financial system by
redistributing liquidity within the banking system consists of two main subsectors – the retail or
client market and wholesale or inter-bank market. In Sri Lanka, all LCBs are registered as
authorized foreign exchange dealers in the country and inter-bank market operations take
place between LCBs. The businesses in the inter-bank foreign exchange market partly result
from transactions in the selling market.
In the inter-bank market, transactions occur in various forms such as spot, cash or
forward basis. Total transactions in this market have been growing in value terms and the daily
average turnover increased to about $45 million in 2006 compared to $30 million in 2005 and
$18 million in 2004. The spot market continues to dominate in the forex market accounting for
over 60 per cent of total operations while the forward market, which has shown steady growth
in the past, accounts for about 35 per cent of total inter-bank transactions. Although, there are
23 LCBs operating in the forex market, four foremost banks account for over 60 per cent of the
transactions. Increase in international trade and foreign private remittances are the main
contributory factors that are increasing transactions in the forex market.
Sri Lanka introduced a floating exchange rate regime in 2001 replacing the managed
floating rate. The exchange rate, i.e., the value of the Sri Lankan rupee against the United
States Dollar (USD), is determined in the inter-bank market through market operations. Since
excessive volatility in the forex market could have a negative impact on the stability of the
financial system and the performance of the economy, the Chief Bank intervenes on both sides
of the forex market to curb excessive exchange rate fluctuations. In addition, the Central Bank
plays a regulatory role in the forex market to maintain safe, logical and stable forex market
conditions in the economy.
D. External debt and foreign exchange reserves
1. External debt
In Sri Lanka, the outstanding external debt consists of Central government debt, public
corporation debt, private sector debt and drawings from the IMF. The external debt in United
States dollar terms has been on an upward trend and increased to $11,368 million at end 2005.
However, total external debt as a percentage of GDP has declined in recent years reaching 48
per cent in 2005 from 56 per cent in 2004.
74
Medium- and long-term external debt accounts for 94 per cent of total external debt
outstanding. The central government accounts for 85 per cent of medium- and long-term
external debt while the public corporations and the private sector accounts for the balance and
the entire short-term external debt. The objective of raising medium- and long-term external
debt is for funding investments in the public and private sectors. The short-term external debt
consists mainly of trade credit facilities, widely used for the importation of raw materials. Since
the country’s capital account is largely closed, the private sector is not permitted to issue rupee
denominated corporate bonds to foreign investors or issue foreign currency denominated
corporate bonds in the international market.
Most of the government external debt is concessional from multilateral sources such as
the IDA and ADB and bilateral donors, mainly Japan. A large share of these loans was for
specific development projects included in the public investment programme. The
Government maintained a very cautious approach in dealing with international capital markets
and made its first international bond issue in 2007 amounting to $500 million while public
corporations have not accessed international capital markets as yet.
2. Foreign exchange reserves
The Central Bank in Sri Lanka has adopted a very cautious approach in managing foreign
exchange reserves to stabilize the markets in the unlikely event of additional foreign currency
requests from the financial system. The Central Bank recognized the need for a minimum
level of gross official reserves of the country to be maintained that was set at the equivalent of
three months of imports of goods and services. Since commercial banks also maintain a
substantial amount of external assets, the country’s total external reserves were maintained at
a higher level of around 5 months of import cover in the recent past. In value terms, gross
official reserves and total reserves of the country at end 2005 amounted to $2,735 million
(equivalent to 3.3 months of imports of goods and services) and $4,201 million (equivalent to 5
months of imports of goods and services).
75
E. Foreign direct investment in the financial secto r
In Sri Lanka, foreign direct investments in the financial system is mainly concentrated in
LCBs and insurance companies while foreign investor participation in financial markets is
almost entirely in the equity market.
In the LCB system consisting of 23 banks, 12 banks are foreign owned accounting for 27
per cent of the total assets of the banking system. Foreign banks are mostly involved in lending
to international trading businesses and actively operate in the forex market. In the insurance
industry consisting of 16 companies the share of foreign ownership in the local market is still
low.
Except for the equity market, all other financial markets are closed to foreign direct
investment due to restrictions that apply to capital account transactions. Towards the end of
2006, the rupee denominated Treasury bond market was opened to foreign investors who
were provided limited access (up to 5 per cent of total bonds outstanding). Since the
long-term macroeconomic strategy expects to liberalize the capital market, more foreign direct
investment in the financial system is expected in the future.
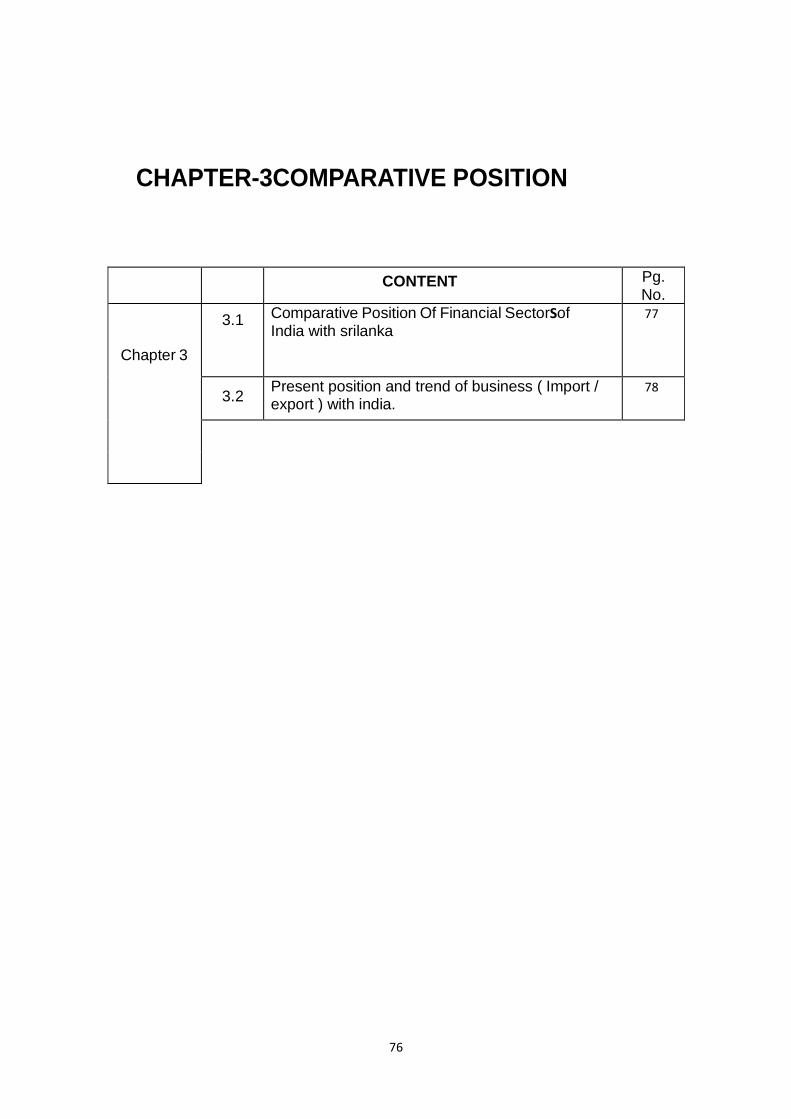
76
CHAPTER-3COMPARATIVE POSITION
Pg. No.
Chapter 3
3.1 Comparative Position Of Financial SectorSof India with srilanka
77
3.2 Present position and trend of business ( Import / export ) with india.
78
CONTENT
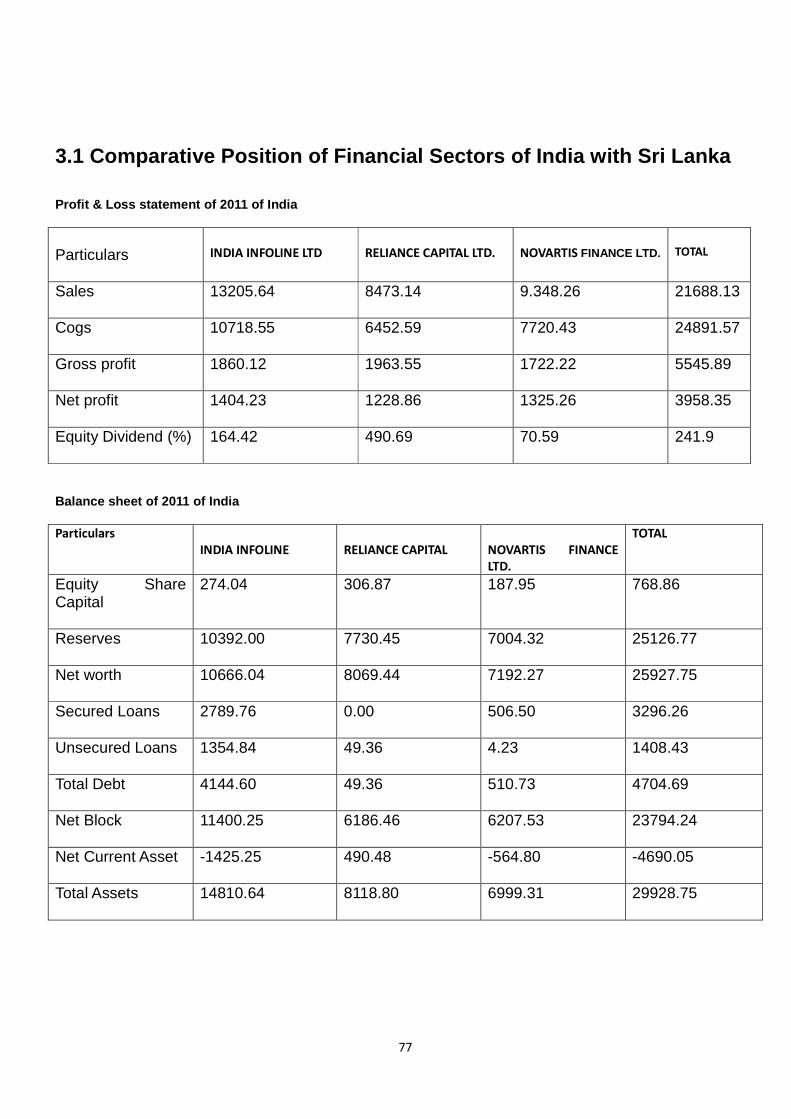
77
3.1 Comparative Position of Financial Sectors of In dia with Sri Lanka Profit & Loss statement of 2011 of India
Particulars
INDIA INFOLINE LTD
RELIANCE CAPITAL LTD.
NOVARTIS FINANCE LTD.
TOTAL
Sales
13205.64 8473.14 9.348.26 21688.13
Cogs
10718.55 6452.59 7720.43 24891.57
Gross profit
1860.12 1963.55 1722.22 5545.89
Net profit
1404.23 1228.86 1325.26 3958.35
Equity Dividend (%)
164.42 490.69 70.59 241.9
Balance sheet of 2011 of India
Particulars
INDIA INFOLINE
RELIANCE CAPITAL
NOVARTIS FINANCE
LTD.
TOTAL
Equity Share Capital
274.04 306.87 187.95 768.86
Reserves
10392.00 7730.45 7004.32 25126.77
Net worth
10666.04 8069.44 7192.27 25927.75
Secured Loans
2789.76 0.00 506.50 3296.26
Unsecured Loans
1354.84 49.36 4.23 1408.43
Total Debt
4144.60 49.36 510.73 4704.69
Net Block
11400.25 6186.46 6207.53 23794.24
Net Current Asset
-1425.25 490.48 -564.80 -4690.05
Total Assets
14810.64 8118.80 6999.31 29928.75
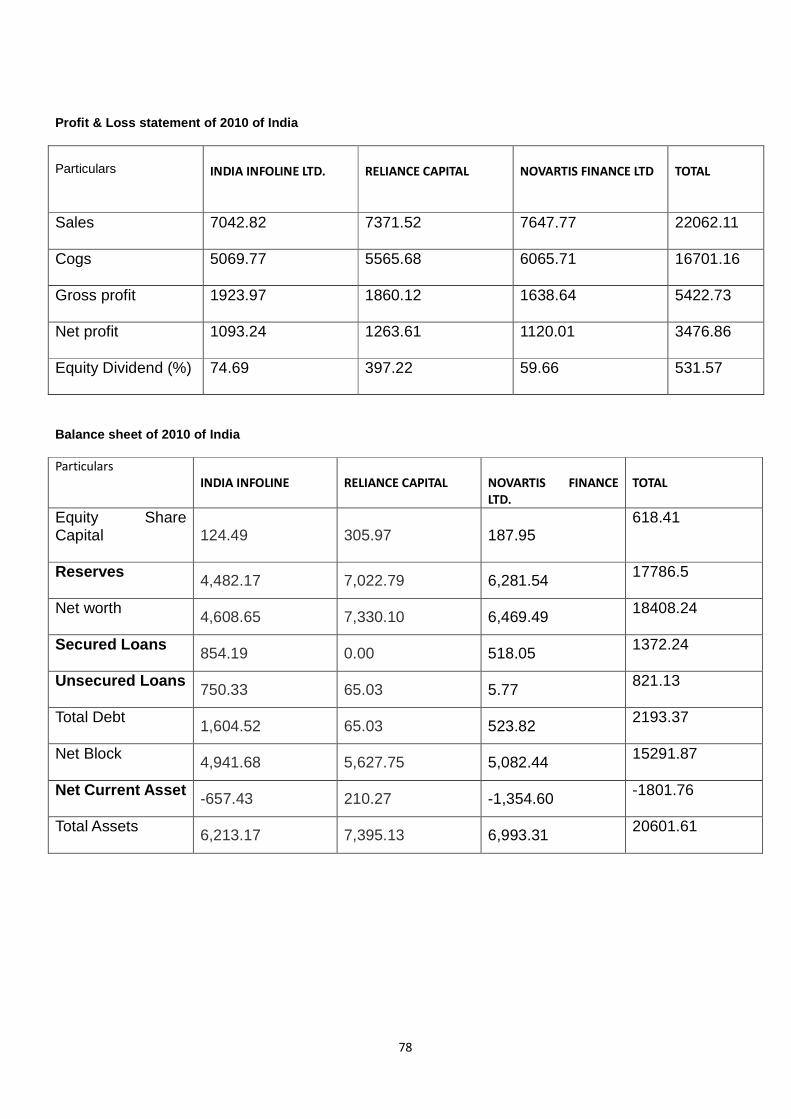
78
Profit & Loss statement of 2010 of India
Particulars
INDIA INFOLINE LTD.
RELIANCE CAPITAL
NOVARTIS FINANCE LTD
TOTAL
Sales
7042.82 7371.52 7647.77 22062.11
Cogs
5069.77 5565.68 6065.71 16701.16
Gross profit
1923.97 1860.12 1638.64 5422.73
Net profit
1093.24 1263.61 1120.01 3476.86
Equity Dividend (%)
74.69 397.22 59.66 531.57
Balance sheet of 2010 of India
Particulars
INDIA INFOLINE
RELIANCE CAPITAL
NOVARTIS FINANCE
LTD.
TOTAL
Equity Share Capital
124.49 305.97 187.95
618.41
Reserves 4,482.17 7,022.79 6,281.54 17786.5
Net worth 4,608.65 7,330.10 6,469.49 18408.24
Secured Loans 854.19 0.00 518.05 1372.24
Unsecured Loans 750.33 65.03 5.77
821.13
Total Debt 1,604.52 65.03 523.82
2193.37
Net Block
4,941.68 5,627.75 5,082.44 15291.87
Net Current Asset -657.43 210.27 -1,354.60 -1801.76
Total Assets 6,213.17 7,395.13 6,993.31 20601.61
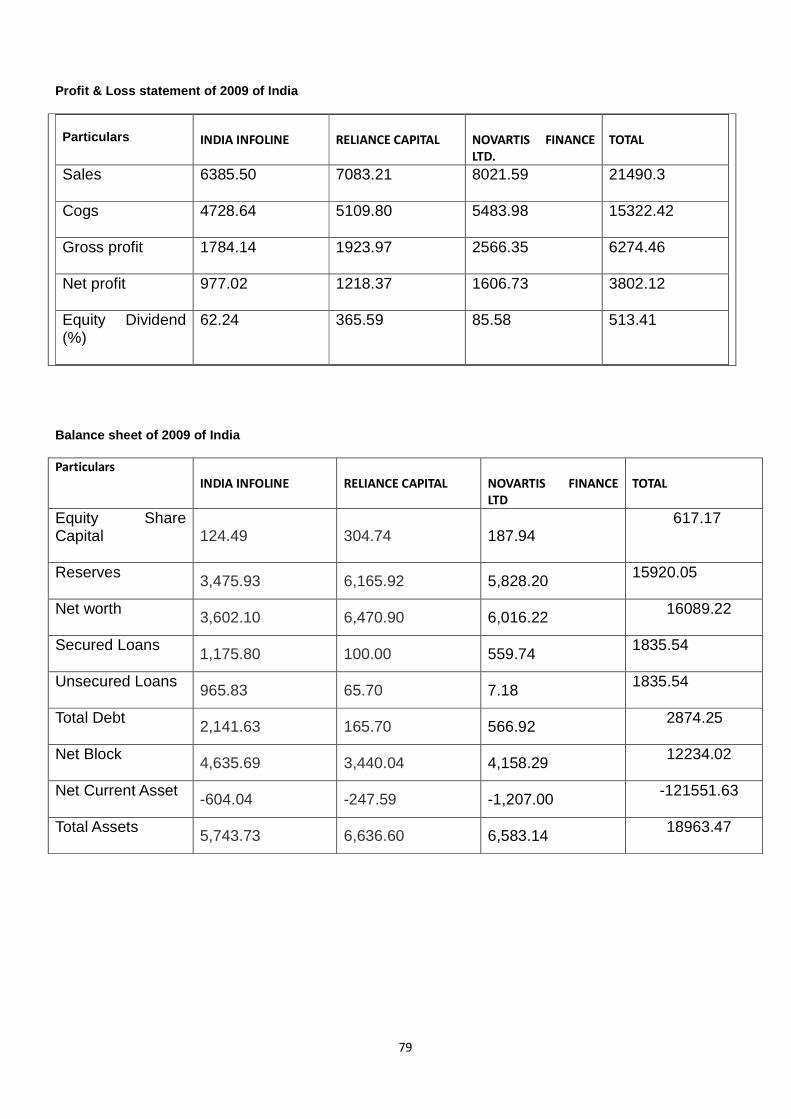
79
Profit & Loss statement of 2009 of India
Particulars
INDIA INFOLINE
RELIANCE CAPITAL
NOVARTIS FINANCE
LTD.
TOTAL
Sales
6385.50 7083.21 8021.59 21490.3
Cogs
4728.64 5109.80 5483.98 15322.42
Gross profit
1784.14 1923.97 2566.35 6274.46
Net profit
977.02 1218.37 1606.73 3802.12
Equity Dividend (%)
62.24 365.59 85.58 513.41
Balance sheet of 2009 of India
Particulars
INDIA INFOLINE
RELIANCE CAPITAL
NOVARTIS FINANCE
LTD
TOTAL
Equity Share Capital
124.49 304.74 187.94 617.17
Reserves
3,475.93 6,165.92 5,828.20 15920.05
Net worth
3,602.10 6,470.90 6,016.22 16089.22
Secured Loans 1,175.80 100.00 559.74
1835.54
Unsecured Loans 965.83 65.70 7.18
1835.54
Total Debt 2,141.63 165.70 566.92 2874.25
Net Block 4,635.69 3,440.04 4,158.29 12234.02
Net Current Asset -604.04 -247.59 -1,207.00 -121551.63
Total Assets 5,743.73 6,636.60 6,583.14 18963.47
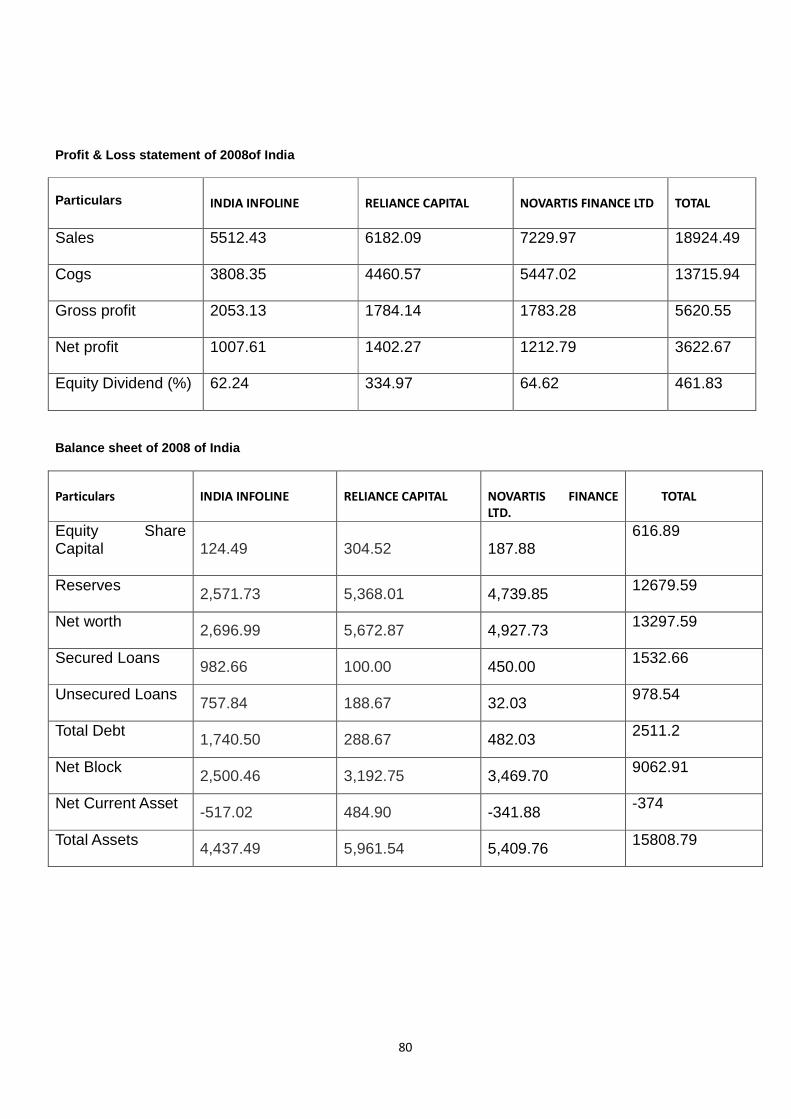
80
Profit & Loss statement of 2008of India
Particulars
INDIA INFOLINE
RELIANCE CAPITAL
NOVARTIS FINANCE LTD
TOTAL
Sales
5512.43 6182.09 7229.97 18924.49
Cogs
3808.35 4460.57 5447.02 13715.94
Gross profit
2053.13 1784.14 1783.28 5620.55
Net profit
1007.61 1402.27 1212.79 3622.67
Equity Dividend (%)
62.24 334.97 64.62 461.83
Balance sheet of 2008 of India
Particulars
INDIA INFOLINE
RELIANCE CAPITAL
NOVARTIS FINANCE
LTD.
TOTAL
Equity Share Capital
124.49 304.52 187.88 616.89
Reserves
2,571.73 5,368.01 4,739.85 12679.59
Net worth 2,696.99 5,672.87 4,927.73 13297.59
Secured Loans 982.66 100.00 450.00 1532.66
Unsecured Loans 757.84 188.67 32.03 978.54
Total Debt 1,740.50 288.67 482.03 2511.2
Net Block 2,500.46 3,192.75 3,469.70 9062.91
Net Current Asset -517.02 484.90 -341.88
-374
Total Assets
4,437.49 5,961.54 5,409.76 15808.79
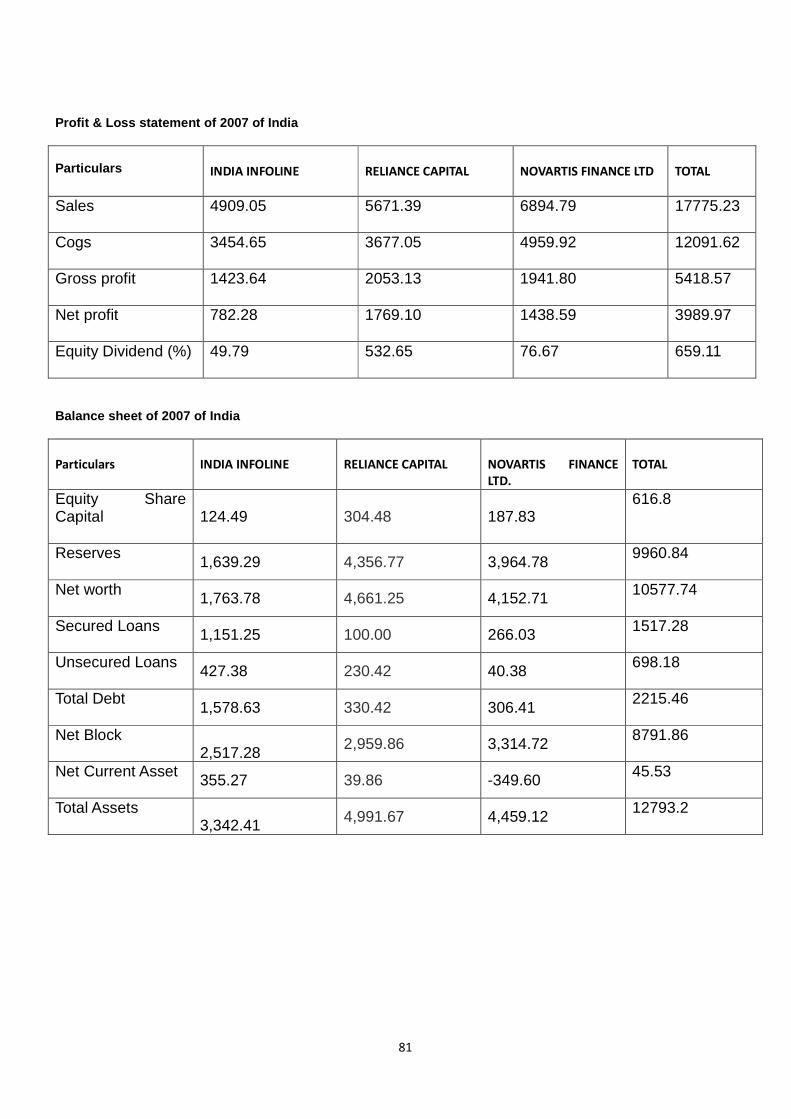
81
Profit & Loss statement of 2007 of India
Particulars
INDIA INFOLINE
RELIANCE CAPITAL
NOVARTIS FINANCE LTD
TOTAL
Sales
4909.05 5671.39 6894.79 17775.23
Cogs
3454.65 3677.05 4959.92 12091.62
Gross profit
1423.64 2053.13 1941.80 5418.57
Net profit
782.28 1769.10 1438.59 3989.97
Equity Dividend (%)
49.79 532.65 76.67 659.11
Balance sheet of 2007 of India
Particulars
INDIA INFOLINE
RELIANCE CAPITAL
NOVARTIS FINANCE
LTD.
TOTAL
Equity Share Capital
124.49 304.48 187.83
616.8
Reserves 1,639.29 4,356.77 3,964.78
9960.84
Net worth
1,763.78 4,661.25 4,152.71 10577.74
Secured Loans
1,151.25 100.00 266.03 1517.28
Unsecured Loans 427.38 230.42 40.38 698.18
Total Debt 1,578.63 330.42 306.41
2215.46
Net Block
2,517.28 2,959.86 3,314.72 8791.86
Net Current Asset 355.27 39.86 -349.60 45.53
Total Assets
3,342.41 4,991.67 4,459.12 12793.2
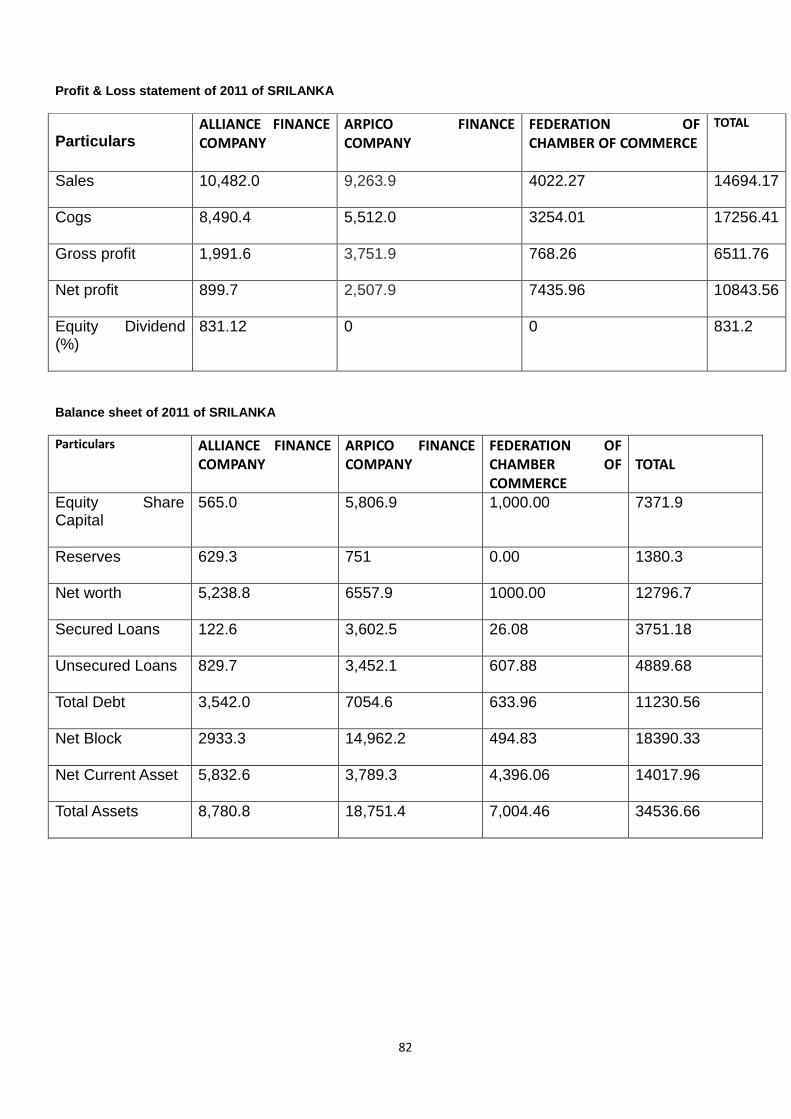
82
Profit & Loss statement of 2011 of SRILANKA
Particulars
ALLIANCE FINANCE
COMPANY
ARPICO FINANCE
COMPANY
FEDERATION OF
CHAMBER OF COMMERCE
TOTAL
Sales
10,482.0
9,263.9
4022.27 14694.17
Cogs 8,490.4
5,512.0
3254.01 17256.41
Gross profit
1,991.6
3,751.9
768.26 6511.76
Net profit
899.7
2,507.9
7435.96 10843.56
Equity Dividend (%)
831.12 0 0 831.2
Balance sheet of 2011 of SRILANKA
Particulars
ALLIANCE FINANCE
COMPANY
ARPICO FINANCE
COMPANY
FEDERATION OF
CHAMBER OF
COMMERCE
TOTAL
Equity Share Capital
565.0
5,806.9
1,000.00 7371.9
Reserves
629.3 751 0.00 1380.3
Net worth
5,238.8
6557.9 1000.00 12796.7
Secured Loans
122.6 3,602.5
26.08 3751.18
Unsecured Loans
829.7
3,452.1
607.88 4889.68
Total Debt
3,542.0
7054.6 633.96 11230.56
Net Block
2933.3 14,962.2
494.83 18390.33
Net Current Asset
5,832.6
3,789.3
4,396.06 14017.96
Total Assets
8,780.8
18,751.4
7,004.46 34536.66
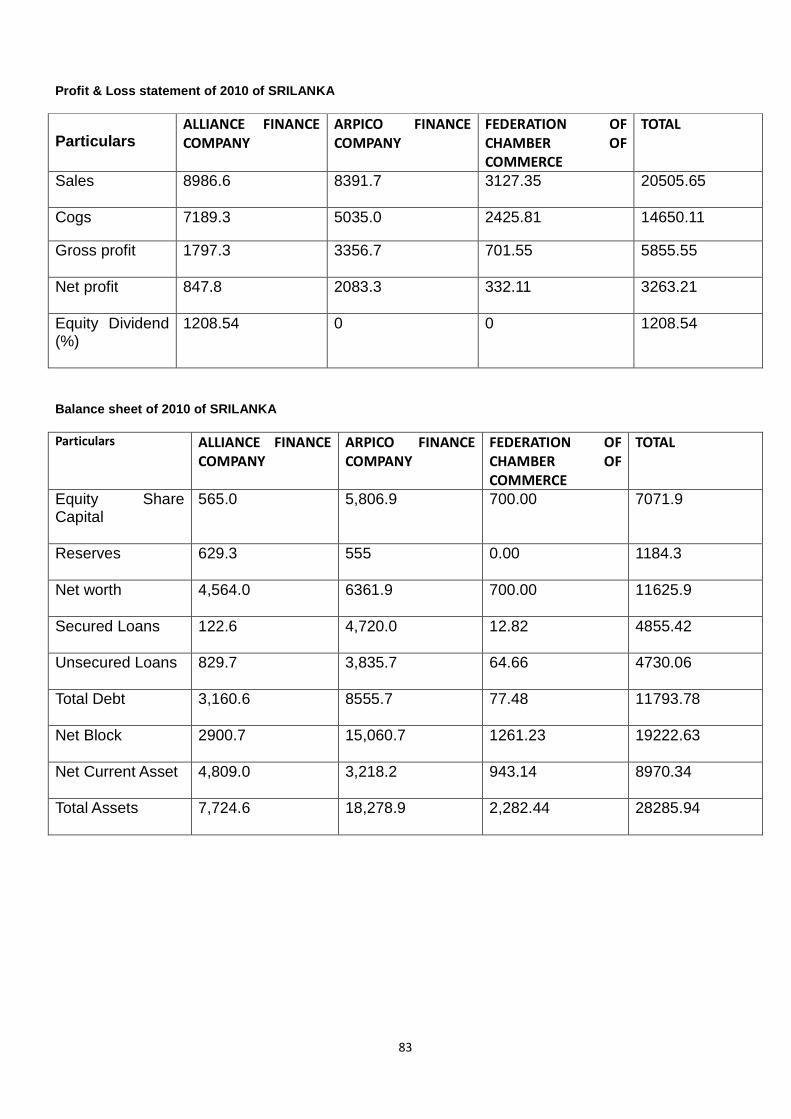
83
Profit & Loss statement of 2010 of SRILANKA
Particulars
ALLIANCE FINANCE
COMPANY
ARPICO FINANCE
COMPANY
FEDERATION OF
CHAMBER OF
COMMERCE
TOTAL
Sales
8986.6 8391.7 3127.35 20505.65
Cogs 7189.3 5035.0 2425.81 14650.11
Gross profit
1797.3 3356.7 701.55 5855.55
Net profit
847.8 2083.3 332.11 3263.21
Equity Dividend (%)
1208.54 0 0 1208.54
Balance sheet of 2010 of SRILANKA
Particulars
ALLIANCE FINANCE
COMPANY
ARPICO FINANCE
COMPANY
FEDERATION OF
CHAMBER OF
COMMERCE
TOTAL
Equity Share Capital
565.0
5,806.9 700.00 7071.9
Reserves
629.3 555 0.00 1184.3
Net worth
4,564.0 6361.9 700.00 11625.9
Secured Loans
122.6 4,720.0
12.82 4855.42
Unsecured Loans
829.7 3,835.7
64.66 4730.06
Total Debt
3,160.6
8555.7 77.48 11793.78
Net Block
2900.7 15,060.7
1261.23 19222.63
Net Current Asset
4,809.0
3,218.2
943.14 8970.34
Total Assets
7,724.6
18,278.9
2,282.44 28285.94
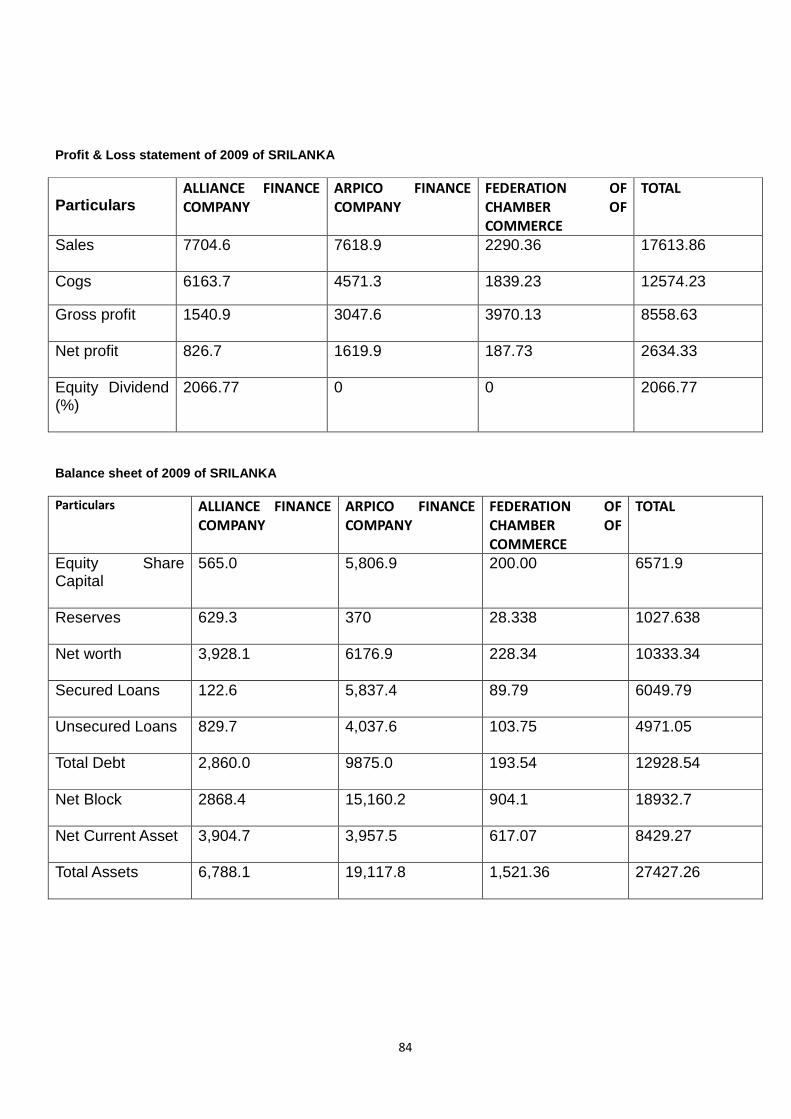
84
Profit & Loss statement of 2009 of SRILANKA
Particulars
ALLIANCE FINANCE
COMPANY
ARPICO FINANCE
COMPANY
FEDERATION OF
CHAMBER OF
COMMERCE
TOTAL
Sales
7704.6 7618.9 2290.36 17613.86
Cogs 6163.7 4571.3 1839.23 12574.23
Gross profit
1540.9 3047.6 3970.13 8558.63
Net profit
826.7 1619.9 187.73 2634.33
Equity Dividend (%)
2066.77 0 0 2066.77
Balance sheet of 2009 of SRILANKA
Particulars
ALLIANCE FINANCE
COMPANY
ARPICO FINANCE
COMPANY
FEDERATION OF
CHAMBER OF
COMMERCE
TOTAL
Equity Share Capital
565.0
5,806.9
200.00 6571.9
Reserves
629.3 370 28.338 1027.638
Net worth
3,928.1
6176.9 228.34 10333.34
Secured Loans
122.6 5,837.4
89.79 6049.79
Unsecured Loans
829.7 4,037.6
103.75 4971.05
Total Debt
2,860.0
9875.0 193.54 12928.54
Net Block
2868.4 15,160.2
904.1 18932.7
Net Current Asset
3,904.7
3,957.5
617.07
8429.27
Total Assets
6,788.1
19,117.8
1,521.36 27427.26
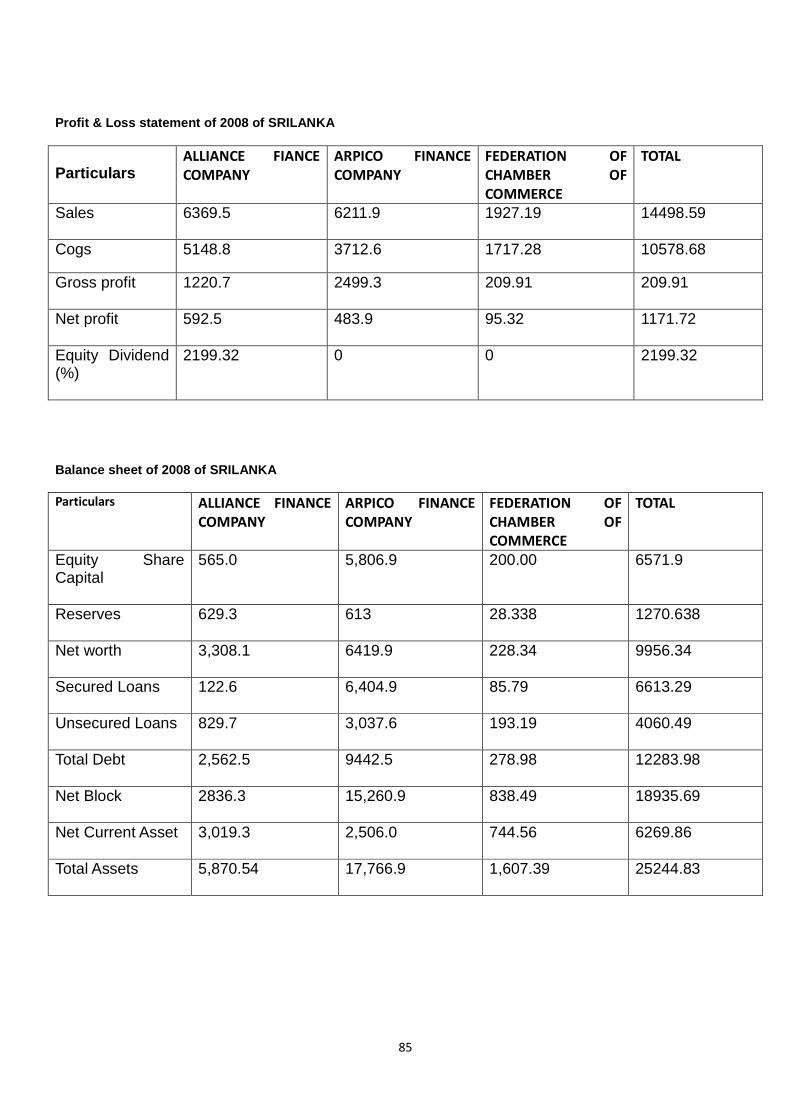
85
Profit & Loss statement of 2008 of SRILANKA
Particulars
ALLIANCE FIANCE
COMPANY
ARPICO FINANCE
COMPANY
FEDERATION OF
CHAMBER OF
COMMERCE
TOTAL
Sales
6369.5 6211.9 1927.19 14498.59
Cogs 5148.8 3712.6 1717.28 10578.68
Gross profit
1220.7 2499.3 209.91 209.91
Net profit
592.5 483.9 95.32 1171.72
Equity Dividend (%)
2199.32 0 0 2199.32
Balance sheet of 2008 of SRILANKA
Particulars
ALLIANCE FINANCE
COMPANY
ARPICO FINANCE
COMPANY
FEDERATION OF
CHAMBER OF
COMMERCE
TOTAL
Equity Share Capital
565.0
5,806.9
200.00 6571.9
Reserves
629.3 613 28.338 1270.638
Net worth
3,308.1
6419.9 228.34 9956.34
Secured Loans
122.6 6,404.9
85.79 6613.29
Unsecured Loans
829.7 3,037.6
193.19 4060.49
Total Debt
2,562.5
9442.5 278.98 12283.98
Net Block
2836.3 15,260.9
838.49 18935.69
Net Current Asset
3,019.3
2,506.0
744.56 6269.86
Total Assets
5,870.54
17,766.9
1,607.39 25244.83
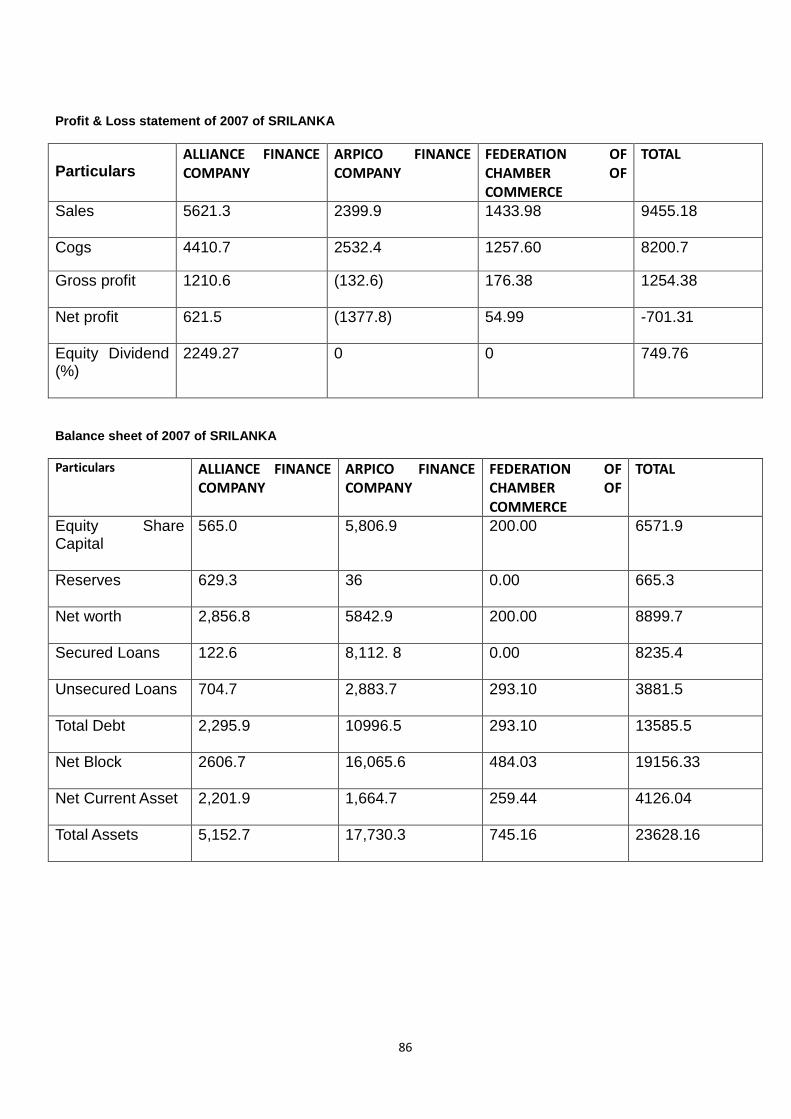
86
Profit & Loss statement of 2007 of SRILANKA
Particulars
ALLIANCE FINANCE
COMPANY
ARPICO FINANCE
COMPANY
FEDERATION OF
CHAMBER OF
COMMERCE
TOTAL
Sales
5621.3 2399.9 1433.98 9455.18
Cogs 4410.7 2532.4 1257.60 8200.7
Gross profit
1210.6 (132.6) 176.38 1254.38
Net profit
621.5 (1377.8) 54.99 -701.31
Equity Dividend (%)
2249.27 0 0 749.76
Balance sheet of 2007 of SRILANKA
Particulars
ALLIANCE FINANCE
COMPANY
ARPICO FINANCE
COMPANY
FEDERATION OF
CHAMBER OF
COMMERCE
TOTAL
Equity Share Capital
565.0
5,806.9
200.00 6571.9
Reserves
629.3 36 0.00 665.3
Net worth
2,856.8 5842.9
200.00 8899.7
Secured Loans
122.6 8,112. 8
0.00 8235.4
Unsecured Loans
704.7
2,883.7
293.10 3881.5
Total Debt
2,295.9
10996.5 293.10 13585.5
Net Block
2606.7 16,065.6
484.03 19156.33
Net Current Asset
2,201.9
1,664.7
259.44 4126.04
Total Assets
5,152.7
17,730.3
745.16 23628.16
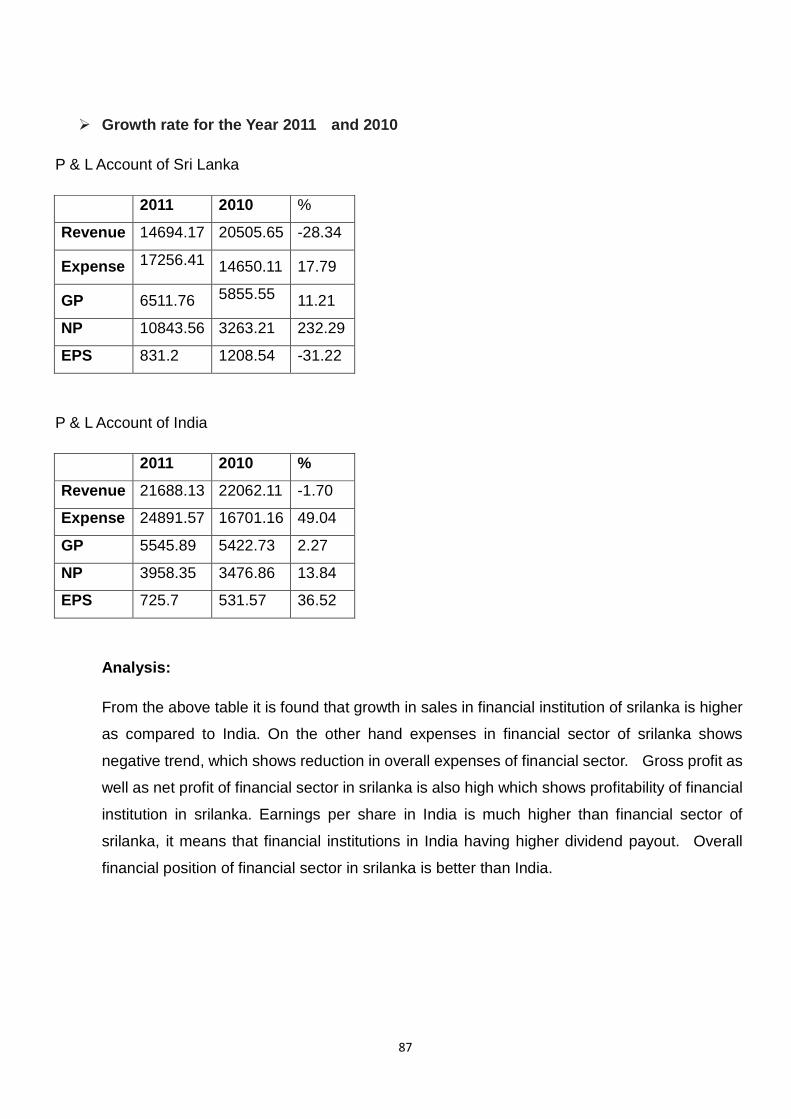
87
� Growth rate for the Year 2011 and 2010
P & L Account of Sri Lanka
2011 2010 %
Revenue 14694.17 20505.65 -28.34
Expense 17256.41 14650.11 17.79
GP 6511.76 5855.55 11.21
NP 10843.56 3263.21 232.29
EPS 831.2 1208.54 -31.22
P & L Account of India
2011 2010 %
Revenue 21688.13 22062.11 -1.70
Expense 24891.57 16701.16 49.04
GP 5545.89 5422.73 2.27
NP 3958.35 3476.86 13.84
EPS 725.7 531.57 36.52
Analysis:
From the above table it is found that growth in sales in financial institution of srilanka is higher
as compared to India. On the other hand expenses in financial sector of srilanka shows
negative trend, which shows reduction in overall expenses of financial sector. Gross profit as
well as net profit of financial sector in srilanka is also high which shows profitability of financial
institution in srilanka. Earnings per share in India is much higher than financial sector of
srilanka, it means that financial institutions in India having higher dividend payout. Overall
financial position of financial sector in srilanka is better than India.
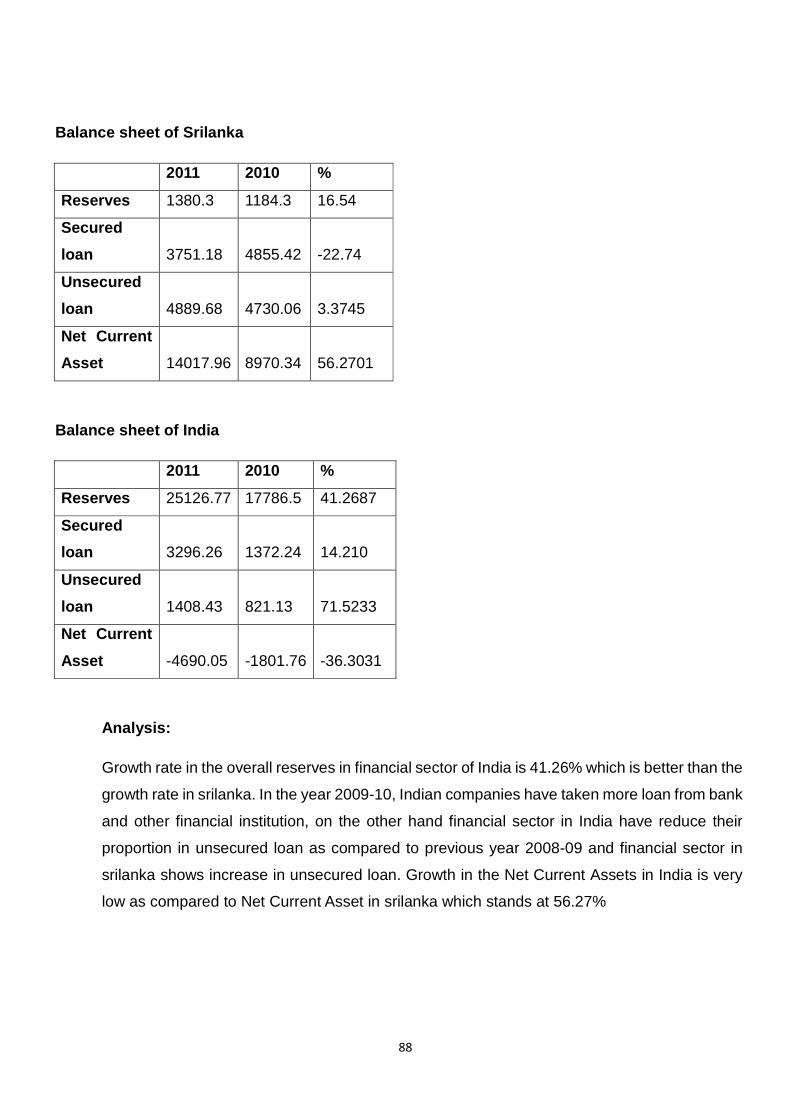
88
Balance sheet of Srilanka
2011 2010 %
Reserves 1380.3 1184.3 16.54
Secured
loan 3751.18 4855.42 -22.74
Unsecured
loan 4889.68 4730.06 3.3745
Net Current
Asset 14017.96 8970.34 56.2701
Balance sheet of India
2011 2010 %
Reserves 25126.77 17786.5 41.2687
Secured
loan 3296.26 1372.24 14.210
Unsecured
loan 1408.43 821.13 71.5233
Net Current
Asset -4690.05 -1801.76 -36.3031
Analysis:
Growth rate in the overall reserves in financial sector of India is 41.26% which is better than the
growth rate in srilanka. In the year 2009-10, Indian companies have taken more loan from bank
and other financial institution, on the other hand financial sector in India have reduce their
proportion in unsecured loan as compared to previous year 2008-09 and financial sector in
srilanka shows increase in unsecured loan. Growth in the Net Current Assets in India is very
low as compared to Net Current Asset in srilanka which stands at 56.27%
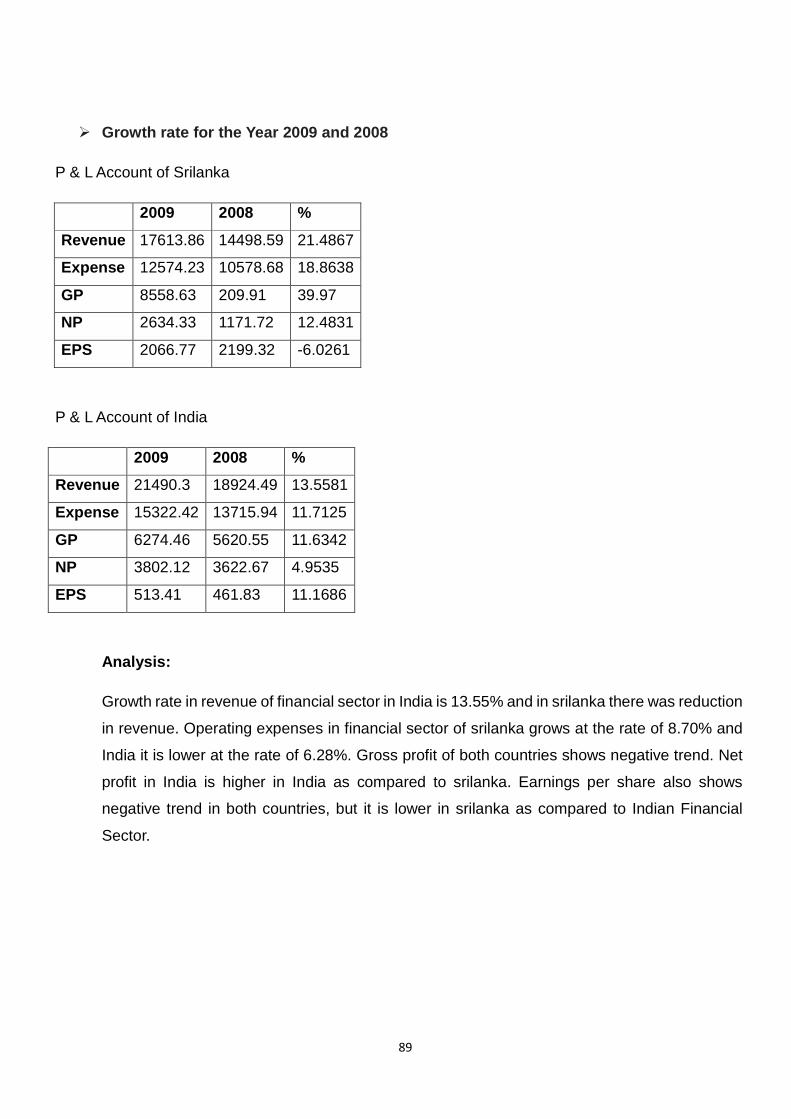
89
� Growth rate for the Year 2009 and 2008
P & L Account of Srilanka
2009 2008 %
Revenue 17613.86 14498.59 21.4867
Expense 12574.23 10578.68 18.8638
GP 8558.63 209.91 39.97
NP 2634.33 1171.72 12.4831
EPS 2066.77 2199.32 -6.0261
P & L Account of India
2009 2008 %
Revenue 21490.3 18924.49 13.5581
Expense 15322.42 13715.94 11.7125
GP 6274.46 5620.55 11.6342
NP 3802.12 3622.67 4.9535
EPS 513.41 461.83 11.1686
Analysis:
Growth rate in revenue of financial sector in India is 13.55% and in srilanka there was reduction
in revenue. Operating expenses in financial sector of srilanka grows at the rate of 8.70% and
India it is lower at the rate of 6.28%. Gross profit of both countries shows negative trend. Net
profit in India is higher in India as compared to srilanka. Earnings per share also shows
negative trend in both countries, but it is lower in srilanka as compared to Indian Financial
Sector.
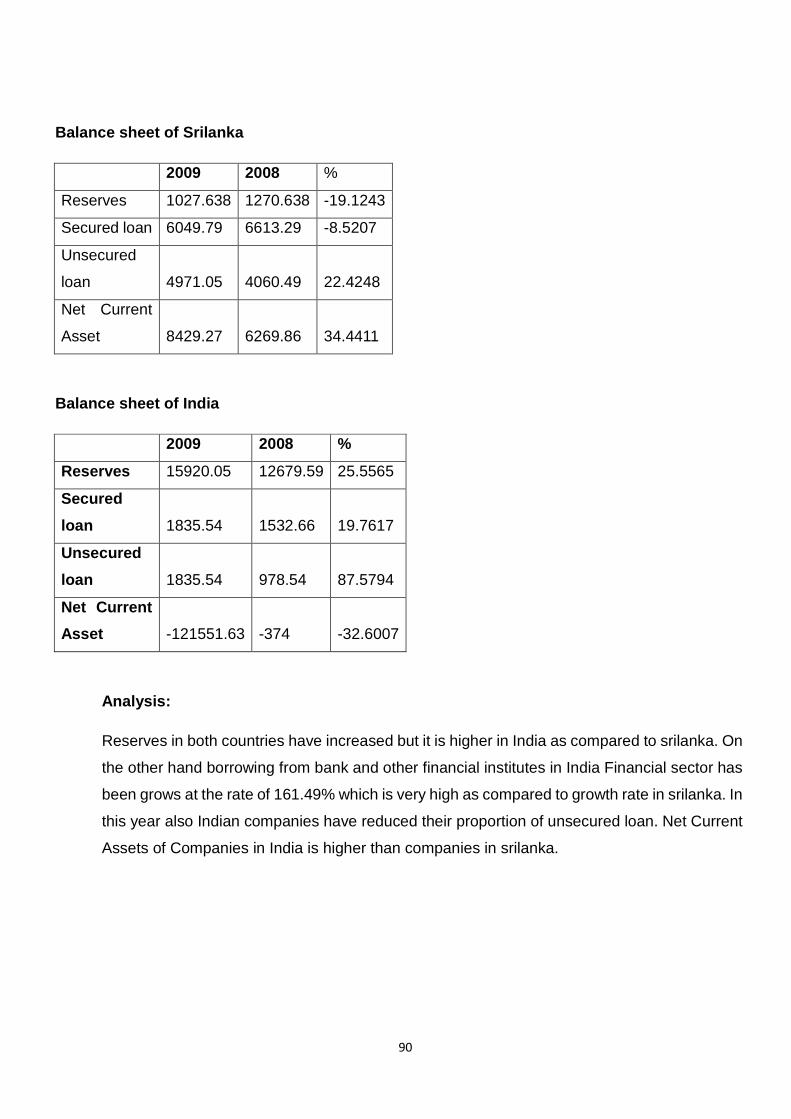
90
Balance sheet of Srilanka
2009 2008 %
Reserves 1027.638 1270.638 -19.1243
Secured loan 6049.79 6613.29 -8.5207
Unsecured
loan 4971.05 4060.49 22.4248
Net Current
Asset 8429.27 6269.86 34.4411
Balance sheet of India
2009 2008 %
Reserves 15920.05 12679.59 25.5565
Secured
loan 1835.54 1532.66 19.7617
Unsecured
loan 1835.54 978.54 87.5794
Net Current
Asset -121551.63 -374 -32.6007
Analysis:
Reserves in both countries have increased but it is higher in India as compared to srilanka. On
the other hand borrowing from bank and other financial institutes in India Financial sector has
been grows at the rate of 161.49% which is very high as compared to growth rate in srilanka. In
this year also Indian companies have reduced their proportion of unsecured loan. Net Current
Assets of Companies in India is higher than companies in srilanka.
91
CHAPTER-4
POLICIES AND NORMS OF SELECTED
COUNTRY
CONTENT
Pg.
No.
Chapter
4.1 Policies & Norms Of Srilanka in
Financial sector for Import/ Export including licensing / permission, taxation etc.
92
4.2 Policies and Norms of India for Import/ Export including licensing/permission, taxation etc.
102
92
4.1POLICIES AND NORMS OF SRI LANKA COUNTRY FOR FINA NCIAL
INDUSTRY
Monetary Policy
One of the core objectives of the Central Bank of Sri Lanka is economic and price stability. The
Central Bank verbalizes and implements its monetary policy, i.e. actions to effect cost and
availability of money, to achieve this objective. The Monetary Law Act (MLA), the legislation
under which the Central Bank has been established and operates, has providing a wide range
of instruments for monetary management. At current, the monetary policy framework of the
country places greater reliance on market based policy instruments and the use of market
forces to achieve the desired objectives.
Monetary Aggregates
The changes in money supply are a primary causal factor affecting price stability. In general,
three meanings of monetary aggregates are used in analyzing monetary developments in Sri
Lanka. The first is 'reserve money' consisting of currency issued by the Central Bank and
commercial banks' deposits with the Central Bank. This is also called base money or
successful money, as commercial banks can create deposits based on reserve money which
are components of a broader definition of money supply, finished their process of creating
credits and deposits. The second is slight money, defined as the sum of currency held by the
public and demand deposits held by the public with commercial banks. The third is broad
money clear as the sum of currency held by the public and all deposits held by the public with
commercial banks. Educations have shown that the most appropriate monetary variable to
analyze the relationship between the money supply and the general price level is the broad
money supply.
93
Monetary Policy Framework
At present, monetary management in Sri Lanka is based on a monetary targeting framework.
In this basis, the final target, price stability, is to be achieved by manipulating changes in broad
money supply which is linked to reserve money through a multiplier. Reserve money is the
working target of monetary policy. The monetary directing framework is operated through a
monetary programmed.
The monetary programmed is prepared by the Central Bank taking into account economic
factors such as the expected fiscal and balance of payments growths, economic growth,
desired levels of growth in credit and increase. Based on these factors, the monetary
programmed sets out the desired path for monetary growth and determines the path of
quarterly reserve money targets necessary to achieve this monetary growth. The Bank would
then behavior it’s Open Market Operations (OMO) within a corridor of interest rates formed by
its policy rates i.e. the repurchase rate and the opposite repurchase rate, to reach the reserve
money target. Policy rates are periodically studied and adjusted appropriately, if necessary, to
transport the reserve money to the targeted path.
94
Monetary Policy Instruments and Implementation
the Central Bank possesses a wide range of tools to be used as instruments of monetary policy.
The main monetary policy tools currently used are (a) policy interest rates and open market
operations (OMO) and (b) the statutory reserve requirement (SRR) on commercial bank
deposit liabilities.
(a) Policy Interest Rates and Open Market Operation s (OMO)
At present, the Central Bank conducts its monetary policy under a system of active
Open Market Operations. The key elements of the system are (I) an interest rate corridor
formed by the main policy rates of the Bank i.e. the repurchase rate and the opposite
repurchase rate, (ii) a daily auction both to absorb or inject liquidness, (iii) a standing facility
at interest rates at the bounds of the corridor and (iv) outright transactions.
The main tools to achieve the path of the reserve money targets are the
Repurchase rate and the reverse repurchase rate of the Central Bank which form the lower
and upper bounds for the comparable overnight interest rates in money markets. These
rates, which are the Bank's signaling mechanism on its monetary policy stance, are reviewed
on a fixed basis, usually once a month, and revised if necessary.
A daily auction is conducted either to absorb liquidity through repurchase transactions, if
There is excess liquidity, or to inject liquidity through reverse repurchase transactions, if
there is a deficiency of liquidity and thereby to maintain overnight interest rates stable around
a level considered consistent with the path of reserve money goals. The auction is on a
multiple bid, multiple price system. Contributors could make up to three bids at each auction
and the successful bidders would receive their requests at the rates quoted in the relevant
bid.
Standing facilities are existing for those participating institutions which were unable to
Obtain their liquidity requirements at the daily auction. That is, even after the daily sale, if a
participant has excess money he could enter into a repurchase transaction under the
standing facility. Similarly, if a participant wants liquidity to cover a shortage, he could borrow
95
capitals on reverse repurchase basis under the standing capability. Accordingly, these
facilities help containing wide fluctuations in interest rates
Outright transactions are conducted at the decision of the Central Bank to address long
Term liquidity issues. If a relatively large liquidity surplus exists and is likely to persist for a
long period it is absorbed by selling Treasury bills outright out of the holdings of the Central
Bank, and if a adequate stock of Treasury bills is not available, by issuing the Central
Bank's individual securities. Similarly, a long term liquidity shortage would be removed by
purchasing Treasury bills and bonds in the secondary market and buying Treasury bills in
the primary market.
There also exists another policy rate known as the Bank Rate. It is the amount at which the
Central Bank provides credit to commercial banks as a lender of last resort. These are
collateralized loans and government securities are accepted as securities. The Bank rate is
usually a penalty rate and it is higher than other market amounts. Therefore, at present this
rate is just an indicative rate as commercial banks can borrow from the Central Bank at the
reverse repurchase rate which is less than the Bank rate.
(b) Statutory Reserve Requirement (SRR)
The statutory reserve ratio (SRR), i.e., the proportion of the deposit liabilities that
Commercial banks are required to keep as a cash deposit with the Central Bank,
also has been generally used to influence money supply in the past. However, the
reliance on SRR as a day to day monetary management measure has been
gradually reduced with a view to enhancing market orientation of monetary policy
and also reducing the implicit cost of funds which the SRR would entail on
commercial banks.
Under the MLA, commercial banks are required to maintain reserves with the
Central
96
Bank at rates determined by the Bank. At present, demand, time and investments deposits of
commercial banks denominated in rupee terms are subject to the SRR and the applicable
ratio is 8 per cent on all deposit liabilities.
Monetary Policy Committee (MPC)
A primary function of the Central Bank, as stated in the Financial Law Act, is the
determination and implementation of monetary policy for the country. Over the years, the
budget, and in particular the financial sector has deepened and become more sophisticated.
So, the Bank's tasks in determining and implementing monetary policy have also increased
in complexity. Hence, as a share of the Bank's ongoing process of adapting itself to meet new
tests, and as a step towards improving the transparency of the decision making process, a
formal monetary policy committee (MPC) was established in early 2001, to study and make
references on monetary policy for the consideration of the Monetary Board.
The Monetary Policy Committee (MPC) is chaired by the Deputy Governor in charge of Price
Stability and includes the following members:
Chairperson
Deputy Governor responsible for Price Stability
Members
� Deputy Governor liable for Financial Stability
� Assistant Governor liable for Price Stability
� Assistant Governor liable for Financial Stability
� Director of Economic Research
� Additional Director of Economic Research liable for Money and Banking
� (Alternate, Deputy Director, Economic Research responsible for Money and
Banking)
Director, International Operations (Alternate, Deputy Director, International
Operations)
97
Director, Domestic Operations (Alternate, Deputy Director, Domestic Operations)
The Deputy Director, Economic Research responsible for Money and Banking
(Alternate, Head of Partition, Money and Banking).
The primary purpose of the MPC would be to forecast and evaluate emerging monetary and
macro-economic developments and make recommendations on appropriate future directions
of monetary policy for consideration by the Governor and the Monetary Board.
The MPC would meet at regular intermissions, at least once a month. At these meetings,
members would study reports prepared by the Economic Research Department and other
departments on monetary, foreign discussion market and price developments, together with
advances in the fiscal, external and actual sectors, which would serve as the bases for the
deliberations of the MPC, in the preparation of recommendations to the Governor and the
Monetary Board.
Appointment of the Monetary Policy Consultative Com mittee
As per the "Road Map for Monetary and Financial Sector Policies for 2007 and Beyond"
announced on 2 January 2007, a Monetary Policy Review Committee has been set up by the
Central Bank of Sri Lanka. The nine member committee consists of a cross section of
stakeholders and academics so that the Bank could benefit by their expertise and experience
in its monetary policy decision making process.
Dissemination of Information
Changes in monetary policy, including information on the rationale for such changes, are
informed to the public, including all market participants, through press issues, press
statements made by senior officials of the Central Bank and posting on the Bank's website.
The Central Bank's website is updated whenever essential. Usually, press conferences are
held by senior Central Bank officials if the changes are important. In addition, senior officials
of the Central Bank are frequently interviewed by the media.
98
ABOUT THE CENTRAL BANK OF SRI LANKA
Objectives of the Bank
The Central Bank's focus and functions have evolved since its creation, in response to the
changing economic environment. In care with trends in central banking, the objects of the
Central Bank were streamlined by amending the Monetary Law Act (MLA) in 2002, to enable
it to follow its core objectives and to free it of the multiple objectives that were originally
assigned to it. The Central Bank has 2 core objectives:
Maintaining economic and price permanence
Maintaining financial system permanence
Economic and Price Stability
Price stability safeguards the value of the currency in terms of what it will purchase at home
and in terms of other currencies. Price permanence or stable prices means low inflation.
Experience has exposed that the economy performs well when inflation is low and is
expected to be little. Interest rates are also low in these situations. Such an environment
allows an economy to achieve its growth potential and fosters high employment. Free from
the disruptive effects of high and variable inflation, both customers and producers make
economic decisions with confidence. Low rise or price stability fosters sustainable long-term
economic growth and employ. The Central Bank uses monetary policy measures to control
inflation.
Financial System Stability
A stable financial system creates a favorable environment for depositors and investors,
encourages effective financial intermediation and the effective functioning of markets, and
hence, promotes asset and economic growth. Financial system permanence means the
effective functioning of the financial system (financial institutions and markets) and the
absence of banking, currency and stability of payments crisis.
99
Functions of the Bank
In order to achieve its core objectives as well as to discharge its responsibilities as economic
advisor and banker to, and agent of the GOSL, the CBSL assumes the following functions.
Core functions
� Economic and Price Stability
� Financial System Stability
Ancillary to core functions
� Currency Issue and Management
Agency functions
� Employees' Provident Account Management
� Foreign Exchange Management
� Public Debt Management
� Regional Development
� Financial Intelligence
� Provincial Office Monitoring
Laws & Regulations
The Central Bank of Sri Lanka was established in 1950 under the Monetary Law Act No 58 of
1949 and is the apex institution in the financial sector. Since start, the Central Bank has been
responsible for regulating the financial system of the country. Several key legislative
enactments deliver powers to the Central Bank to carry out its functions to achieve its
primary objectives of economic and price stability and financial system permanence. Under
these powers, the Central Bank issues directions for the establishment and operations of all
100
categories of financial institutions under its supervisory and regulatory purview. In addition,
the Central Bank has stayed empowered to carry out certain agency functions under other
legislative enactments.
Legislative Enactments
The financial system of the country is regulated by several legislative performances. The key
Acts relevant to the regulatory role of the Central Bank are the Monetary Law Act, the Local
Treasury Bills Law, Registered Stocks and Safeties Ordinance, Exchange Control Act,
Banking Act, Finance Business Act, Finance Charter Act, Payment and Settlement Systems
Act and Financial Transactions Reporting Act.
Regulations, Directions, Rules, Guidelines, Circula rs and Operating Instructions
Some departments of the Central Bank have been empowered to carry out functions directly
by statute, while other departments transport out functions and duties imposed by statute on
the Central Bank itself. Accordingly, powers are conferred with those departments to issue
regulations through the Minister and directions, strategies, circulars and operating
instructions from time to time to achieve its objective of financial system stability.
Licensing, Registration, Appointment and Authorizat ion Procedures
Requirements and actions to be followed by a person to establish a local bank, foreign bank
branch, a finance company, a finance leasing company, a primary dealership, a dealership in
foreign currency and as a money changer have been issued by the Central Bank from time to
time.
POLICIES AND NORMS OF SRI LANKA FOR TEA INDUSTRY FO R IMPORT/EXPORT
INCLUDING LICENSING, PERMISSION & TAXATION
The tea sector in Sri Lanka has always been an important component of her economy. It is
also the republic's largest employer providing employment both, directly and indirectly to
ended one million people. It also pays a significant amount to Government revenue as well
as to the gross domestic product.
101
Sri Lanka as the 3rd biggest tea producing country generating US$673 million in 2000. It also
pays to political, economic, and social permanence by providing a livelihood for many of Sri
Lanka’s rural dwellers, especially women. Sri Lanka has 9% production share in the global
sphere, and one of the world's leading exporters with a share of around 19% of the global
demand. The total level of land under tea cultivation has been assessed at 187,309 hectares
almost.
Shipping roughly 21% of international trade in tea, Sri Lanka is the world’s main exporter.
Since the mid-1990s, it has received higher price than other origins and adds more value
between the auction and the port than other tea-producing states.1 Its main product is
orthodox tea, 90 to 92 percent of which is transferred. 90% of exports are in packet form for
eventual consumption as loose tea, or in bulk deliveries, most of which is further processed,
merged, or packaged offshore.
Sri Lanka produces tea throughout the year and the growing areas are mainly concentrated
in the central highlands as well as southern areas of the island. They are broadly assembled
under these headings according to their elevations, with full-grown ranging from 1200 m
upwards, medium grown cover between 600 m to 1200 m. and low grown from sea equal up
to 600 m.
High grown teas from Sri Lanka are supposed for their taste and aroma.
The medium grown teas provide a thick color variety, which is popular in Australia, Europe,
Japan and North America.
102
4.2 POLICIES AND NORMS OF INDIA IN FINANCE
The implications of the norms for Indian banking in dustry- The Monetary Policy
One of the major concerns about Basel norms implication is effect on the monetary policy.
Leases suppose if contractionary monetary policy is applied and no. of unconstrained bank
is high then these banks can flow money in the market and purpose of policy will be
vanished. Equally in purpose of expansionary monetary policy will not be achieved if no. of
constrained bank is high [binding on regulatory capital can lead banks to reduce money flow
in the market]
To mitigate these unwanted results RBI should make a balance between constrained and
unconstrained banks. RBI can put Control or norms on banks for lending.
11 Implication of Basel norms for India’s financial inclusion agenda: Particularly, financial
sector reform in 90s didn’t consider credit structure for rural areas. So, farm communities,
rural artists and micro enterprises remained non-benefited by financial sector reform.
Basel Norm will control regulatory capital by high risk coverage standards. Three supports of
Basel II will ensure a huge capital fund against the risks which banks are taking; also these
institutions will become sensitive to market perception. But performance of these norms can
be affected by bank management’s reluctance for informal sectors and small borrowers.
Serious chances costs lying in this norm, as Banks will need to distract funds from industrial
sectors to previously excluded rural sector {MSE}
Basel norms are expected to improve conditions for credit flow for agriculture and for SMEs
by system of Easy deposit accounts and voluntary general credit cards (GCC). Although lack
of Branches & staff in rural areas can affect execution of Basel norms, but a focused
approach with complementary norms and genuinely inclusive with well spread services can
overcome these hurdles in implications.
103
Implications of Basel Norms: Loan growth, GDP growt h, Loan Loss Provisioning
Loan Loss Provision: Bank keeps reserve to compensate risks which it bare by giving loans.
These risks include poor losses to default losses.
Change in loan loss provisions with change in economic situation reduces bank profit
volatility and prevent capital by negative shock. Banks measures likely loss by default
premium rate wharf, and tries to compensate it by keeping reserve capital. Research and
education on Indian banking sector found that public sector banks had provisions as 30% of
NPAs {only five have more than 50%}. So Basel Norms are being expected to bring a
change in this pattern [it should be up to 50%].
SWOT analysis of Basel norms implications on Indian banking industry
Implication of Basel norms on Indian banking industry has benefits and concerns on sides.
Although some of fears can be mitigated by RBI’s approach by regulations but still some
factors remain questioned. We will discuss it finished a SWOT analysis
Strengths
Weakness
Basel norms requirement on regulatory capital &RBI’s proposed norms will bring an
approach towards development of Indian economy especially for SMEs and rural areas.
Basel norms will improve banking standards &intellectual capital of banks.
Currently Indian banking sector is artificial by poor technology, infrastructure.
Risk management practices are not up to standard in Banking
No. of small banks in India is very high, &Basel norms implications can impact their progress
Opportunities
104
Threats
Effective risk management actions and use of advanced technology can bring positive
outcome of Basel norms
Indian banking industry is helped by strong asset base
Basel norms effect will lead to bring it in to economic growth
High regulatory capital requirement can lead banks to fight with managing capital to growth
of the industry ( due to high no. of unimportant banks)
High Opportunity costs [lending money to SMEs]
54.2.1 POLICIES AND NORMS OF INDIA FOR IMPORT / EXP ORT IN INDIAN MARKET
Gujarat business directory providing a comprehensive database of Gujarat Export & Import
Consultants Manufacturers Exporters Suppliers Wholesalers & Suppliers. Gujarat and all
world Buyers can find the catalogs of Export & Import Consultants manufacturers exporters
also post your Requirement to Sellers. Find Export & Import Advisers Buy Sell Offers at
Gujarat B2b Marketplace
105
CHAPTER-5
CONTENT Pg.
No.
Chapter 5
5.1 Potential for Import/ Export in India 106
5.2 Business Opportunities In future 116
Conclusion & Suggestion 123
References 126
106
5.1 Potential for Import / Export in India
Import export businesses, also known as international trading, are one of the newest
commercial trends of this time. American companies trade in over 2.5 trillion dollars a year in
produce, of which small businesses control over 95 percent. As the vendor of an import export
enterprise, you can work as a supplier by focusing on exporting and importing goods and
services that cannot be obtained on national soil (e.g., Russian caviar and French perfumes) or
those that are cheaper when imported from other countries (e.g., Chinese electronics). In
adding, you can also open an export management company (EMC), where you can help an
existing corporation market its products in a foreign country by arranging the shipping and
storing of the merchandise for them without doing the actual selling. EMCs can specify in one
industry or work with different types of import export manufacturers. It is also potential to act as
a broker for a company, working on contract over the actual sales. This is a excessive choice
for products that are guaranteed to sell because of high demand or an established brand
name.
While basically any country can offer opportunities for import export skill, Canada, Mexico,
Japan, and China have topped the trading chart for the past two periods. In the last few years,
countries in the former Soviet Union and South America have become major players, but
there's still much to learn about exchange with these new markets.
Opening an import export business requires an initial investment of $5,000 or more, depending
not only on the type of merchandise you're setting up to marketplace, but also on whether you
plan on working from home or chartering an office, hiring employees, etc. Compared to other
trades, however, import export companies have a very low startup cost. While most goods can
be exported without the need for licenses, some field products or high-risk items, such as
firearms or drugs, may require special government permits. If that's the case, prices may run
considerably higher.
To get started, it may be sensible to consult with the local Board of Trade (or the Chamber of
Commerce in smaller cities) or call Consulates and Embassies to find out if they have import
export programs set up. Many delegations even have a special department to promote the
export of their goods to other countries and are more than happy to help potential import export
traders.
107
Exports
Export means the moving of any Good
From one country to another country in a legal way for the drive of trade. Export goods are
provided to the foreign consumers by the domestic producers.
Indian Exports: A History
The history of Indian exports is very old. During early times India exported spices to the other
parts of the world. India was also famous for its cloths which were a chief item for export in the
16th century. Cloths and cotton were exported to the Arab countries from Gujarat. Through the
Mughal era India exported various precious stones such as ivory, pearls, tortoise stones etc.
But during the British era, Indian exports weakened as the East India Company took control of
foreign trade.
Markets
Though India has seen some product change in its export basket, it has not expanded
significantly in the two big markets-Africa and Latin America.
India’s business with South Asian countries is also small. This region has not been integrated
with the global economy, though political and financial initiatives have been taken in the recent
past in this direction.
Leading Export Items of India
in the past ten years, Indian exports have grown at a rate of nearly 22%. Some commodities
have enjoyed faster export development than others. Some of India's main export items are
cotton, cloths, jute goods, tea, coffee, cocoa products, rice, wheat, pickles, mango pulp, juices,
jams, conserved vegetables etc. India transfers its goods to some of the leading countries of
the world such as UK, Belgium, USA, China, Russia etc.
108
Restriction on the Exports of Items
However there are some restrictions on the export of goods. Under sub section (d) of section
111 and sub section (d) of section 113, any good exported or tried to be exported, contrary to
any exclusion imposed by or under the customs act or any other law is liable for confiscation.
Export Trends
If the Indian economy produces at the same pace, India would most definitely export goods
worth US $500 billion by 2013 and may supersede the exports of other large developing
countries like Brazil.
The Way Ahead
India needs the right mix of policy design sector focus and industry led initiatives to move up
the value chain in the global export basket
The Opportunity
It is very clear that Indian exports have still not achieved their true potential and there exists
immense opportunities for expanding the basket of India’s exports. With a strategic care on the
new markets that are evolving due to free trade, India is seeing a boom in both manufacturing
and services.
Problems of the Indian Export Sector
There are few problems which need to be solved before India makes a mark for itself in the
export sector. The Indian goods have to be of larger quality. The packaging and branding
should be such that countries are interested to export from India. At the same time India
necessity look for potential market to sell their goods. The government should border policies
which gives boost to the exports.
Directional Change In Exports
India has seen massive directional change in the context of origin of demand for Indian goods.
Till 2001-02 North America and the EU markets shared nearly 21% and 23.2 % respectively of
total exports and the remaining to the rest of the earth. By 2006-07, North America had a share
of only 16% of the total exports and the EU's share was 21.2%.
109
EXIM Policy, 2002 – 2007
1. Let me first extend my warm welcome to all of you.
2. I am here with you today to announce the first Five Year EXIM Policy of the New Millennium.
But I want to be realistic and state that if some commentators feel that the presentation of Five
Year EXIM Policy is just a ritual, they may be right because every year at the end of March, we
attempt to make about 200 amendments in the full policy-set of 5 volumes and other
Departments to have their own contribution of changes which they deem fit.
3. Nonetheless, the fact remains that this ritual underscores the necessity of taking a
telescopic view of the future and reformulate the goals accordingly, after due introspection.
Naturally, we have to take into account the changing dynamics of international trade.
Sometimes, even one incident like September 11 of last year had catastrophic effect which
necessitated mid-course changes and needs necessary corrections even now.
4. I had constituted a High Level Committee headed by former Commerce Secretary Thiru P.P.
Prabhu comprising eminent economists, business-leaders representing the Chambers of
Commerce, the Export Promotion Councils and experienced professionals. This Committee
had made important recommendations regarding various schemes and procedures of different
departments handling exports. Those recommendations of the Committee have guided us as
the pole star in formulating this EXIM Policy. In addition, the report of the Medium Term Export
Strategy (2002-2007) of our Ministry released in January, 2002 provides a mine of Market
Intelligence Information and industry-specific initiatives. I think that both the documents may
make the ‘ritual’ meaningful and effective by providing the substance, parameters, direction,
and strategy for the Five Year Policy.
OUR MISSION
5. The Prime Minister has directed the Planning Commission to examine the feasibility of
doubling our per capita income in the next ten years. The Approach Paper to the Tenth Five
Year Plan aims at an intermediate indicative target of 8.0% (instead of 8.7% needed). Almost
all the experts are of the opinion that 8 to 9 % annual growth for the next ten years while
technically feasible, cannot be achieved through "a business as usual" approach. We will need
to take radical steps. In line with this approach, our Medium Term Export Strategy has
amission to capture 1% of the global share of trade by 2007, up from the present level of
110
0.67%. Translated in value, the projected growth wi ll mean doubling the present exports
of 46 billion dollars to more than 80 billion dolla rs over the Tenth Five Year Plan,
needful a Compound Annual Growth Rate (CAGR) of 11. 9% in dollar relations.
6. To achieve this, we should wake up from the stupor of export fatalism of the past years,
release ourselves from the feelings of export pessimism and apathy and employ international
trade as an engine of growth. Although the observed debate on the growth effects of trade
policy reforms remains worried, there is a strong co-movement between exports and
output growth in a liberalized trade environment. T his lends support to the basic for
persisting with an open trade system. Anti-export b ias - both in policies and mind-set -
needs to be corrected. Unless sizes are created in India specifically for the export
market, it is doubtful that the export growth expec tations can be met.
- Therefore, there should be obligation of the fact that international trade is a vital part of
development strategy, and it can be an effective instrument of economic growth, employment
generation and poverty alleviation.
7. With this Mission Statement, let me proceed with my proposals.
A. REMOVAL OF QRs ON EXPORTS
8. Last year’s EXIM Policy evoked a lot of interest, because we indifferent the QRs on imports
and the ‘Quota Raj’ it symbolized. We created an Inter-Ministerial Standing Group to track
300 sensitive items and to swing into immediate action, if required. I appreciate the vigilant
attitude of this "War-Room" . Contrary to the apprehensions stated, I find that there has not
been any surge in imports during the year.
9. This year we propose to remove all Quantitative Res trictions on exports – except a
few complex items. Only a few items have been retained for exports through State Trading
Enterprises.
111
B. AGRICULTURE
10. It is estimated by some economists that everyone pe r cent switch in the terms of
trade in favor of agriculture will result in divers ion of about Rs.8,500 chores annually in
favor of agriculture from the non-agriculture secto r. This other rural purchasing power will
create a phenomenal effective demand. Upgrade of agricultural exports is important for
creating conditions for providing remunerative prices to farm products. I have no disbelief that
our farmers will rise to the occasion, and that we will be able to make a mark in international
trade in agriculture with a farm-to-port approach as reflected in the Agree Exp ort Zones
Scheme and in the proposed agree-Export Policy which are but small steps forward in the
right way. I am happy to state that the actions initiated in earlier years have begun to bear fruits.
11. Government have made major break-through in the export of food grains. As against the
projected export of 80 lakh MTs of food grains during the year we have exported about 73 lakh
MTs. India is now exporting food grains to about 16 countries of the world and according to
the International Grain Council reports, in respect of wheat export, we are at the 7th
position amongst the wheat exporting countries.
12. The major initiatives being planned in the EXIM Policy are as follows:
i. Export restrictions like registration and packaging requirement are being removed today on
Butter, Wheat & Wheat Goods, Coarse Scraps, Groundnut Oil and Cashew exports to Russia
under Rupee Debt Repayment Scheme. Measurable and packaging restrictions on wheat and
its goods, Butter, Pulses, Grain and flour of Barley, Maize, Bajra, Ragi and Jowar have now
been removed arranged 5th March, 2002.
ii. To transform select rural regions as regional rural motors of e xport economy by
promoting export of agro products and agro-based pr ocessed products, 20 Agri Export
Zones have been certified so far. (The Zones and their specialty agri-products are given in
Annexure-I.) This will provide greater international market access to Indian farmers. On
invitation and in conference with the State Governments, we will catalyze development of
necessary infra-structure, flow of credit and other services for promoting agro exports.
iii. Transport assistance is proposed to be made available for ex port of fresh and
processed fruits, tubers, floriculture, poultry, da iry goods and products of wheat & rice.
This will also lead to change of agriculture activi ty. Further, it is also future to work out
suitable Transport Assistance for export of accumul ated stocks of rice and wheat from
FCI to facilitate their liquidation.
112
C. SPECIAL FOCUS ON COTTAGE SECTOR AND HANDICRAFTS
13. The word ‘Exports’ brings to our mind sophisticated articles, urban centers and a privileged
few at the upper crest of the society. But it is the small measure sector, which forms 50% of our
exports. Therefore, with a view to support them we have embarked on a programmer this year
called "SPECIAL FOCUS ON COTTAGE SECTOR AND HANDICRAFTS ".
14. The following facilities will be made available to them:-
i. Initially an amount of Rs. 5 crores has been earmarked for promoting cottage sector exports
coming under the KVIC.
ii. The units in the handicrafts sector can also access funds from Market Access Initiative (MAI)
scheme for normally permissible activities including development of website for virtual
exhibition.
iii. Under the EPCG scheme, these units will not be required to maintain average level of exports.
iv. These units shall be entitled to the benefit of export house status on achieving lower average
export show of Rs.5 crores as against Rs. 15 crores for others; and
v. The units in handicraft sector shall be entitled to duty free imports of specified items as
embellishments up to 3% of FOB value of their exports.
15. In addition, since they have a very strong propensity for economic activities with export
possibilities, we are embarking on a programmed of identifying those places. To begin with,
places like Khurja (U.P.) famous for its pottery will be undertaken for an in-depth study for their
revealed and potential special characteristics for developing an export market.
113
DETAILS OF AGRI EXPORT ZONES
S. No. Location Name of Product(s) Status
1. West Bengal Pineapple Work already started
2. Karnataka Gherkins Work already started
3. Uttaranchal Lychee Work already started
4. Punjab Vegetables Work already started
5. Uttar Pradesh Potatoes Work already started
6. Uttar Pradesh Mangoes Work already started
7. Punjab Potatoes Work already started
8. Uttar Pradesh Mangoes Work already started
9. Maharashtra Grapes and Grape Wine Work already started
10. Andhra Pradesh Mango Pulp & Fresh Vegetables Work already started
11. Tripura Pineapple Work already started
12. Madhya Pradesh Potatoes, Onion & Garlic Work already started
13. Maharashtra Mangoes Work already started
14. Jammu & Kashmir Apples Work already started
15. Tamil Nadu Flowers Work already started
16. Maharashtra Kesar Mango
Approved on 5.3.02. Draft of MoU sent to State Government and APEDA is awaiting their concurrence
17. Maharashtra Flowers Approved on 5.3.02. Draft of MoU sent to State Government and APEDA is awaiting their concurrence
18. Jammu & Kashmir
Walnuts Approved on 5.3.02. Draft of MoU sent to State Government and APEDA is awaiting their concurrence
19. West Bengal Lychee Approved on 5.3.02. Draft of MoU sent to State Government and APEDA is awaiting their concurrence
20. Bihar Lychee Approved on 5.3.02. Draft of MoU sent to State Government and APEDA is awaiting their concurrence
Import and Export Business on wise GEEK:
• In the last few years, countries in the former Soviet Union and South America have become
major companies, but there's still much to learn about trading with these new markets. Opening
an importexportbusiness requires an initial investment of $5,000 or more, depending not
only on the type of merchandise you're setting up to shop, but also on whether you plan on
working from home or renting an office, appointment employees, etc.
114
• The most difficult part of starting an importexportbusiness is also among the most important.
To successfully start an importexportbusiness , you will have to figure out which companies
you want to target.
Agricultural and processed Food Products Export Dev elopment Authority (APEDA)
Agricultural and managed Food Products Export Development Authority is an autonomous
organization attached to the Ministry of Commerce of the Government of India. The main
meaning of APEDA is to build links between Indian producers and the global markets. APEDA
undertakes the conference of potential sources on government policy and producers. Along
with if referred services and suggesting suitable partners for joint ventures. Besides ordering
buyer-seller meets.
Apparel Export Promotion Council
The Apparel Export Promotion Council (AEPC) is a nodal agency sponsored by the Ministry of
Textiles, Govt. of India trusted with the dual responsibility of monitoring garment exports quotas
and promotion of exports of readymade clothes from India. Over the last 25 years, the council
has been continuously involved in the task of promoting exports by organizing buyer-seller
meets, chief trade delegations to potential markets globally, sharing in specialized international
fairs, establishing the India International Garment Fair biannually, and organizing sessions on
fashion and workshops on technical aspects of the industry.
Cashew Export Promotion Council of India (CEPC)
The Cashew Export Promotion Council of India (CEPC) was established by the Government of
India in the year 1955, with the active support of the cashew industry with the object of
promoting exports of cashew kernels and cashewnut shell liquid from India. By its very set up,
the Meeting provides the necessary institutional frame-work for performing the different
functions that serve to intensify and promote exports of cashew kernels and cashewnut shell
liquid.
115
Chemical Allied Products Export Promotion Council
CAPEXIL, a non-profit making group, was setup in March 1958 by the Ministry of Export,
Government of India to promote export of Chemical and Allied Products from India. And later
then has been the voice of Indian business community.
Cotton Textiles Export Promotion Council
Cotton Textiles Export Upgrade Council is a self-directed, non-profit export upgrade body,
TEXPROCIL has become the international face of Indian Cotton Textiles successfully
facilitating exports. Ordering and dissemination of information, returning of trade enquiries,
administering quotas, enabling an interface between domestic manufacturers and the global
market and settling of disputes are some of the activities of the Council.
116
5.2. BUSINESS OPPORTUNITIES IN FUTURE
Here are ten different classes of business ideas that you can safely bet on for the future.
1. Environmental. Any business with a positive effect on the Environment. Solar drive,
recycle, alternate power etc.
2. Debt Advice. With the ever growing awareness of people in debt, any sort of fiscal
counselling, education or debt regulation will do very well over the next 5 years. Just make sure
you can quiet get paid for this, as most of your regulars will be broke.
3. Convenience. Any product or service that adds a form of convenience to the lives of the
hard working and lazy has a huge developing market. Services such as readymade home
cooked suppers, wash services, garden facilities, walk the dog, pay your bills, and wash your
car. You get the point.
4. Services for the Aged. There is a huge sector of the population that is getting older and
not dieing. Any services that are intensive at looking after these people will blossom. Again
look at costs and facility ability. These could be a simple bus service to the shops. Outings to
places of notice. Entertainment activities. Sporting packages. Skydiving – only kidding.
5. Cellular Communication. Any add-on product or service that moves with the times of
the huge cellular market will do well. We have seen many new goods come out recently that
adds convenience and ease of use. Moneyless business, online chat, booking services, status
enquiries etc.
6. Home Entertainment. We are spending more time at home in the evening, give us
effects to do. Wii, movies, Pizza, uniform up, dress down…
7. Online Shopping. I think that SA is on the brink of the online shopping revolution that
other countries have come to see. As self-confidence grows with online banking transactions
the 2.4 million employers in SA will begin to shop.
8. Beauty and Body Care. Lipstick, gym, private training, loose fat, look good, touch sexy.
Any product that does that for me, I’m purchasing.
117
9. African Development. The doors are initial into Africa. (Except Zim.) A lot of our large
retailers have paved the road up north. Small business requests to follow and claim the
markets.
10. Low Life Expectancy. The flip side to #4. We are also seeing a huge death rate due to
HIV, TB and possibly next year N1H4. Any services linked to death will be booming. Starts,
coffin makers, funeral policies and related services.
Future solutions and corporate opportunities
Business opportunities
By 2030, CCS could be a standard part of coal and gas power plants. The current EU rule, for
example, already prescribes that all new power plants are built CCS-ready after 2020 and soon
after that all existing power plants will be CCS-retrofitted. This embodies a huge future market
for building CO2 capture plants, transporting CO2, injecting CO2 and operating the storage
sites.
There are more than 8000 factories and power plants worldwide that each emit more than
100 000 tonnes of CO2 each yearly to the heaven. These factories and power plants could be
equipped with CCS to eliminate their CO2 emissions. It is very likely that the cost of emitting
CO2 will increase in the near future. The energy sector will have to answer either by switching
to more climate-friendly fuel or retrofitting fossil fuelled power plants with CCS or by co-firing
biomass with fossil fuels to achieve net ‘carbon-negative’ results and remove CO2 from the
atmosphere.
When the CCS cost becomes less expensive than paying for CO2 emission allowances there
will be a market for CCS technology. This could ensue now by 2020, according to ZEP.
There are also other strong indications that there will be a future marked for CCS. In 2007
California recommended a regulation for base load power production that includes an
Emission Performance Standard (EPS) of 500 grams per kWh. This excludes construction of
traditional coal power plants without CCS because they would emit more than the EPS limit.
Introduction of EPS is discoursed worldwide, and wherever it might be included in laws and
regulations it will be an incentive for a CCS technology market.
118
Technology providers
Who will provide the CCS technology that thousands of factories, manufacturing plants and
fossil fuelled power plants might need by 2030, is tough to say. There are several companies
investing in CCS technology growth, but it is not possible to say who will be the future
technology leaders.
At the moment, it is difficult to predict which CO2 capture technology will be the most effective
by 2030 or 2040. Companies have reserved different strategic decisions on which technology
to invest in. Some firms have plans to develop post-combustion CO2 internment technology,
while others put their efforts into developing ox fuel or pre-combustion CO2 capture
technology.
Most likely, there will be niches for several different technologies. Existing CO2 sources will
have to install post-combustion CO2 capture, while pre-combustion or oxyfuel CO2 capture
might turn out as the preferred option for new fossil fuel power plants. By 2050, new fresh
technologies, like skins and chemical looping could be the most cost effective alternatives.
As there is international consensus that CCS is one of the essential parts of the portfolio to fight
dangerous climate change, many companies have realized that an early start will give them a
future advantage.
Transporting and storing CO2
Capturing and storing CO2 will require ships or pipelines to transport the CO2. The 8000 CO2
sources mentioned above emit in total about 15 billion tons CO2 annually, and if a CO2 capture
plant is mounted to each of these sources there must be built thousands of kilometers of
pipelines.
Ship transport of CO2 is an alternative to pipelines, and transport companies that start to build
ships that can transport CO2 will probably get a head start into a new market.
Injection and storage of CO2 will be carefully regulated and can only be performed by skilled
experts. Companies that have already started to invest in building knowledge and expertise in
operating CO2 storage sites will face a huge market when billions of tones could be stored
annually by 2030 or 2050.
119
Possible CCS success stories by 2050:
Carbon negative
Large biomass power plants combined with CCS will take us carbon negative and ensure that
CO2 is removed from the atmosphere and stored underground. The CO2 is removed from the
atmosphere when the biomass grows as well as when the biomass is combusted in a power
plant with CCS and the CO2 is stored underground.
Industrial factories free of CO2 emissions
The first CCS plants were built for coal and gas power flowers, but by 2050 CCS is also a
standard part of industrial factories with large CO2 emissions. As a result the power sector and
the industrial sector have eliminated most of their CO2 emissions by 2050.
Technology transfer
The costs of developing CCS technology was shared by the industrialized countries, and an
effective technology transfer to developing countries has taken place, confirming that CCS is
available worldwide.
Large scale CCS infrastructures
The initial projects were mainly on CO2 capture plants linked by ship or pipelines to a storage
site. But as there were nonstop new CCS plants popping up from 2020 and onwards, the
projects became related into large networks of CO2 pipelines. Now in 2050 there are large
infrastructures for CO2 transport universal, just like there were natural gas infrastructures back
in 2009.
Hydrates and coal bed methane recovery
CO2 is injected into hydrate reservoirs and deep coal beds to replace methane with CO2. The
methane is used for power making, with CCS of course.
120
Hydrogen production with CCS
The hydrogen society is finally here. Hydrogen for control plants and vehicles is produced in
large-scale plants with CCS
Transport without CO2
The transport sector has reduced most of its CO2 emissions due to vehicles successively on
hydrogen, biofuel or electricity, which are produced in large plants with CCS.
Fuel cells combined with CCS
Fuel cells are the most effective power production technology, and mutual with CCS they
represent one of the most environmentally friendly ways to produce power.
Extinction of coal mine fires
In 2009 coal mine fires were the origin of 1 to 2 percent of global CO2 emissions. Today most
of these fires are extinct thanks to CO2 capture technology that created a pure CO2 stream to
blow out the fires.
Business Opportunity in India 2012
India has always been in the limelight in terms of the business opportunities available. The
India business chance is huge in possibly every sector - financial services, telecom, IT,
vehicles, media, real estate and alike. India is still considered to be one of the most enviable
destinations for doing business. Now it is counted among those nations which has been least
affected by the global recession – thus it clearly proves that India’s business potential is huge.
India's general band of engineers, scientists, technicians, executives and skilled manpower
are among the best in the world.
One who wishes to travel the business opportunity in India wouldn’t only look at the theoretical
aspect of exploring the potential but also try to excavate the potential in the right manner.
121
India Business Opportunity in 2012
The Indian business market is large and bubbling with newer opportunities. Increased buying
power and consumerism is what drives the business scenario in India. Thus, there is a chance
for competitive advantage (low cost sourcing of products and services). It has been observed
that savings in India have been capable of yielding lucrative returns and thus companies have
started to capture the domestic market business opportunities. The large flair pool of India also
offers extensive opportunities to the Multi-National corporations (MNCs).
To explore the opportunities widely, MNCs need to build up strategic partnerships with the
Indian industry. Both can really complement each other if they bring in their global best
practices for solving the domestic business problems. Payable to this, there would also be free
movement of capital and business and therefore better business innovation from human
resources.
Steps to explore Indian business opportunities -
1. For a successful business environment in India, the MNCs should first save India as a key
focus
2. After that, they should develop bold, long term targets
3. The entire decision-making process should be extensive
4. Integrate localization with globalization
5. Set up standards to meet market challenges
6. Practice best HR practices and maintain strong relationship with stakeholders
7. The business opportunities in India should be leveraged beyond the product market
8. Build up India-specific business models relating to product, value, pricing
The India business opportunity is getting quite exciting and innovative with the passing of every
year. People are filling new opportunities such that international investments might flow into the
country. There are a lot of business ideas for tycoons who are interested to set up business in
India through Internet schemes, outsourcing technology, e-commerce opportunities, and
software growth opportunities.
India has a huge market with the middle class group driving the consumerism. This is really a
good base for the overall business development of India. The vast pool of knowledge workers

122
should be optimized in a manner that it attracts global companies for doing business in India.
All the issues that have helped create the India business opportunity, surely assures a hopeful
future.
123
CONCLUSION
The financial facilities industry in Sri Lanka has been subjectedto changes due to the
reform measuress taken by the government andthe industry. Changes in the national and
international marketenvironments, pressure applied by international organizations suchas the
IMF and the World Bank and the introduction of newtechnologies have forced
authorities to relax controls making thefinancial sector more competitive and efficient.
Beginning withreform policies introduced in early 1980s Sri Lankan banks haveevolved
to a more efficient and competitive market. However,financial market in Sri Lanka needs
to go further to improve theirefficiencies to bring them up to the standard of international
financialmarkets. One major issue is the leading role played by the twostate banks within
the financial system of the country. Lack offinancial literacy among the people of Sri Lanka an
d lack of cleardirections from the government to the financial market has hampered
improving efficiencies further.
It is obvious that changes areprogressing but slowly towards a more competitive
financial servicesindustry in the country. Furthermore, substantial empirical studies
are needed to examine the impact in a more robust way however,lack of necessary
micro as well as macro level data has been a majorobstacle. For instance, more analysis
on debt and equity markets,electronic services markets and micro finance markets
in Sri Lankawould have been more useful to identify competitive improvements
Has the global fiscal crisis necessitated a change in India’s approach and commitment tofinan
cial sector development on the lines of recommendations of certain recent
Governmentcommittees? I am of the opinion that it has not. As can be seen
from the discussion in thesection of this chapter, which drawn the development of
various segments of India’s financialmarkets, the Indian approach to development
of financial markets has focused on gradual,phased, and calibrated opening of
the domestic financial and external sectors, taking intoaccount reforms in other
sectors of the economy.
124
This continues to be the overall stand onreforms, even after the global crisis,
Though policies for the financial sector seem to be a littlemore cautious. However,
given that a lot of the agenda of financial sector reforms in Indiahas consisted of
permitting formerly banned financial markets, strengthening regulation,plugging
regulatorygaps,andstrengtheningregulatorycoordination,recentglobaldevelopments
in no way have diluted this agenda.An important issue that is being debatedvarious
domestic and international forums
Following the crisis is the perils of OTC products.There is a move toward mandating a
transparent trading framework for these products and more regulatory oversight.India h
asalways favored exchange-traded financial products over OTC products due
to the firm beliefthat OTC markets carry with them large and unknown counterparty
credit risks, are nottransparent, hinder competition, and, given all this, have
systemic implications for financialstability.
Among the right teachings that can be drawn from the crisis are:
i. Innovation in financial markets should not be strangled. However, it
should beensured that the complexities of new products are understood,
especially if theyare traded off exchanges, as OTC products. When
widely distributed and poorlysilent, such products are dangerous to
systemic stability.
ii. Toomuchriskaversion onpartofregulatorscanimpedegrowthand
development.
iii. There is no perfect regulatory architecture, but institutional design needs to
be intune with markets and requirements.Inclusion, growth, and stability
are the three objectives of any reform process, and theseobjectives are
contradictory. With the right reforms, the financial sector can be an enormous
source of job creation both directly as well as indirectly, through the enterprise
andconsumption it can support with financing. Without reforms, however,

125
the financial sectorcould become an increasing source of risk, as the mismatches
between the capacity andneeds of the real economy and the capabilities of the
financial sector widen. India has beena case study of how financial sector
reforms can play a supporting role in the growth of anemerging market economy.
The contest is how to bootstrap from these past successes toescalate to the next
level of financial sector development, so that it can continue to support
the growth that India faces successful forward.
126
References
1. Report on Energy Information Administration (EIA), International Energy
Outlook (IEO).
2. Report of the Working Group on Petroleum & Natural Gas Sector for the XI Plan (2007-2012)
3. International Trade Department, IOC
4. Dr. V. Krishnamurty‘s Report on Restructuring of Petroleum Sector
5. http://www.economywatch.com/companies/petroleum-companies.html
6. Report of planning commission
7. planningcommission.nic.in/about us/committee
8. www.vibrantgujarat.com/companies/pdf/oil-gas
9. www.kpmg.co.il/Events/india/conference/.../Gujarat
10. Research paper on indo-Iranian ties: thicker than oil: prepared by
c. Christine fair
11. www.economist.com/article on export & import of crude
12. www.importexportsstatistics .com
13. www.petroleum.nic.in
14. www.india.Govt.in
15. www.indexmundi.com/petroleum industry of iran
16. www.touchoil&gas.com
17. www.ipeconsultants.com
18. www.unitedagainstnucleariran.com
19. www.indiainbusiness.nic.in
20. www.niir.org/information/gas-&-petroleum
21. www.iranprimer.usip.org/resources/oil-&-gas industry
22. www.bis.doc.gov
23. Report of Gujarat Chamber of Commerce
127
24. Gujarat Socio-Economic Review Report 2008-2011
25. Public Sector Undertakings/DGCI&S, Kolkata /Ministryof
Finance/Petroleum Planning & Analysis
26. http://www.iloveindia.com/economy-of-india/oil-gas-industry.html
27. economictimes.indiatimes.com/news/article list/
28. economictimes.indiatimes.com/news/article list/
29. www.vibrantgujarat.com/images/pdf/oil-gas-details.pdf
30. en.wikipedia.org/ministry of petroleum of iran
31. www.niir.org/information/gas & petroleum
32. www.iranprimer.usip.org/respurces/oil & gas industry
33. www.eximguru.com/exportimpotsnews
34. www.mystart.pdf
35. Research paper of Biswajit Nag (Associates Professor of Indian Institute of
Foreign Trade, Delhi)
A
GLOBAL / COUNTRY STUDY REPORT
ON
“HEALTHCARE SECTOR OF SRI-LANKA”
Submitted to
Gujarat Technological University (GTU)
In partial fulfillment of the requirement Of the award for the degree
OF
MASTER OF BUSINESS ASMINISTRATION
UNDER THE GUIDANCE
OF
Faculty Guide
Prof. Nilesh Ankelashwariya
Submitted by
(C.C. Gardi Institute of Management)
[Batch: 2011-13]
MBA SEMESTER III/IV
STUDENTS DECLARATION
We Vaghasiya sajal(117880592025),Jadav Rajeshwari(117880592023),Dhanani
Haresh(117880592024),Bajaniya Nilesh(117880592026).Students of C.C Gardi
School of Management. Hereby declare that the report for Global/ Country Study
Report entitled ― GLOBAL/COUNTRY STUDY REPORT ON HEALTHCARE
SECTOR in SRI-LANKA is a result of our own work & our indebtedness to other
work publications, references, if any, have been duly acknowledged.
Place: - …….
(Name of student)
Date:-………
Vaghasiya Sajal
Jadav Rajeshwari
Bajaniya Nilesh
Dhanani Haresh
INSTITUTE„S CERTIFICATE
PREFACE
Today we are at the door step of 21st century. The world is widening without
having a New & new developments are coming these days in all fields all over
India to make the people life more relaxed & luxurious. The industries are
growing so speedy in India in order to satisfy all the needs of people. Similarly
Govt. has supported to these companies for their development & progress of
private companies.
Thus in order to survive in the market one should have theoretical as well as
Practical knowledge about all different fields prevailing in market. For this we
have chosen sri-lanka country for Global country report.
ACKNOWLEDGEMENT
We feel pleasure to submit this report, which includes the practical aspect of
study. We are very happy to express our deepest gratitude to all the persons who
spared their valuable time & helped us in preparation of this Global Country
Report.
We might like to thank our project guides Asst. Prof. Nilesh Ankelashwariya for
our moral support & guidance.
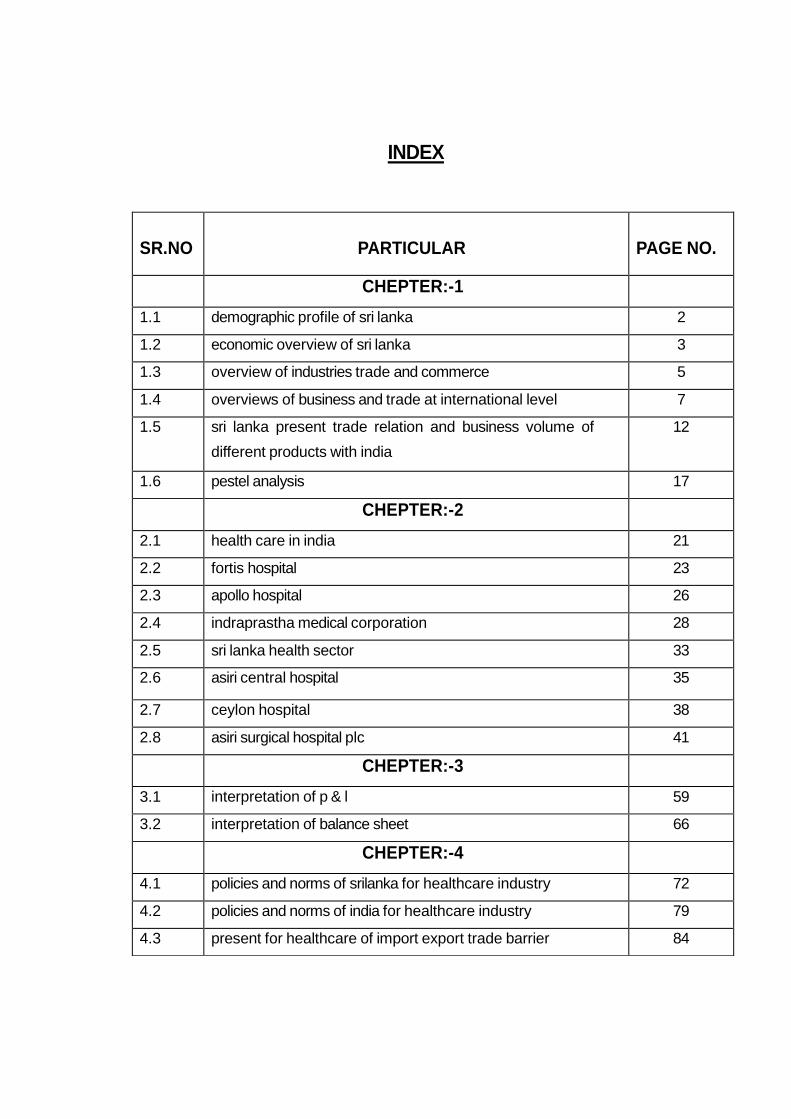
INDEX
SR.NO PARTICULAR PAGE NO.
CHEPTER:-1
1.1 demographic profile of sri lanka 2
1.2 economic overview of sri lanka 3
1.3 overview of industries trade and commerce 5
1.4 overviews of business and trade at international level 7
1.5 sri lanka present trade relation and business volume of
different products with india
12
1.6 pestel analysis 17
CHEPTER:-2
2.1 health care in india 21
2.2 fortis hospital 23
2.3 apollo hospital 26
2.4 indraprastha medical corporation 28
2.5 sri lanka health sector 33
2.6 asiri central hospital 35
2.7 ceylon hospital 38
2.8 asiri surgical hospital plc 41
CHEPTER:-3
3.1 interpretation of p & l 59
3.2 interpretation of balance sheet 66
CHEPTER:-4
4.1 policies and norms of srilanka for healthcare industry 72
4.2 policies and norms of india for healthcare industry 79
4.3 present for healthcare of import export trade barrier 84
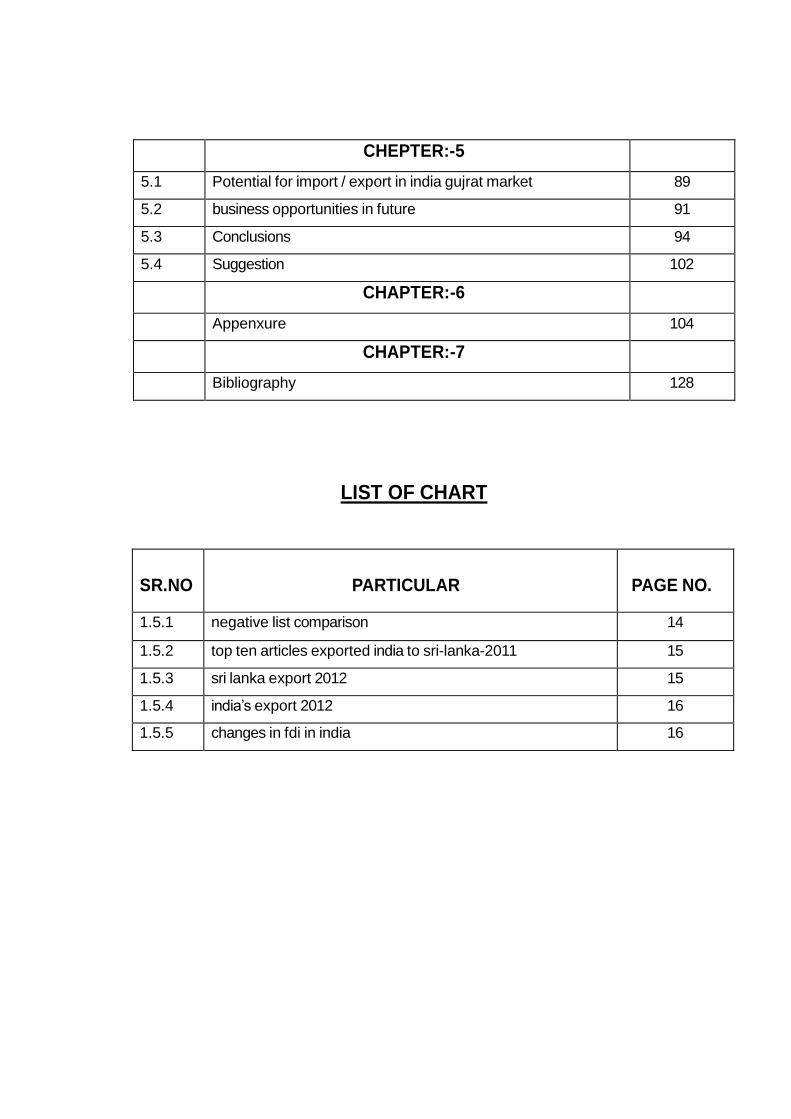
LIST OF CHART
SR.NO PARTICULAR PAGE NO.
1.5.1 negative list comparison 14
1.5.2 top ten articles exported india to sri-lanka-2011 15
1.5.3 sri lanka export 2012 15
1.5.4 india‟s export 2012 16
1.5.5 changes in fdi in india 16
CHEPTER:-5
5.1 Potential for import / export in india gujrat market 89
5.2 business opportunities in future 91
5.3 Conclusions 94
5.4 Suggestion 102
CHAPTER:-6
Appenxure 104
CHAPTER:-7
Bibliography 128
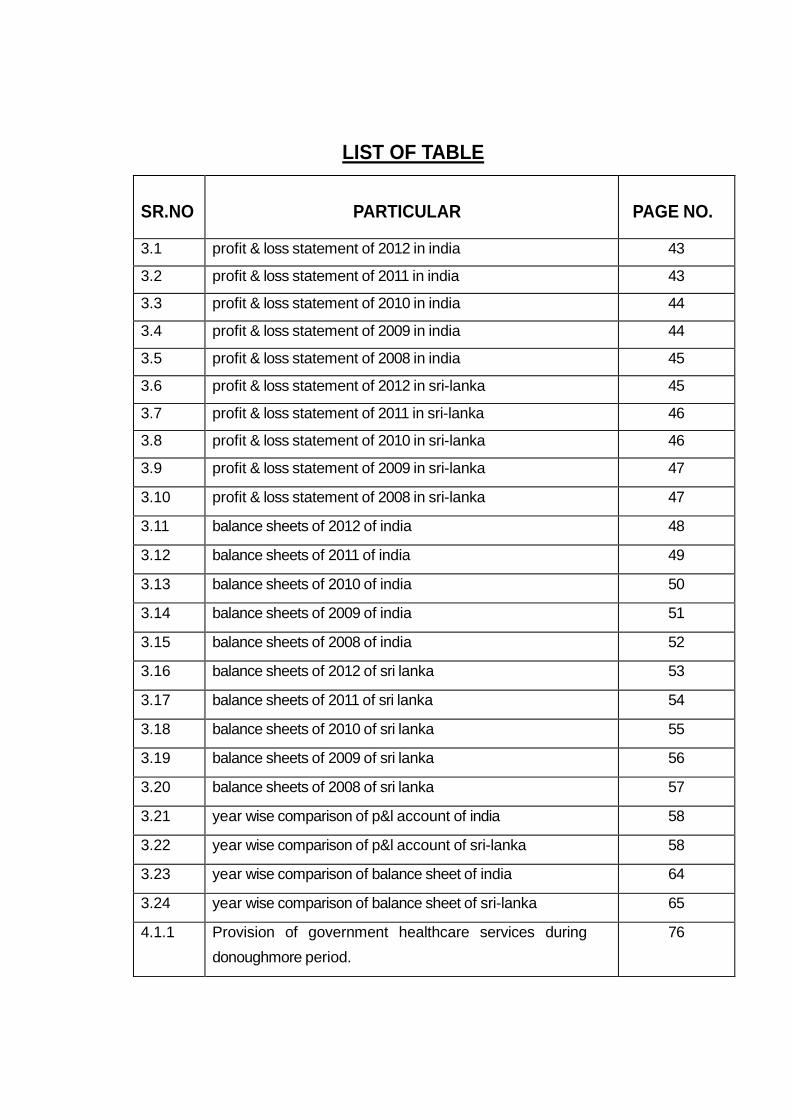
LIST OF TABLE
SR.NO PARTICULAR PAGE NO.
3.1 profit & loss statement of 2012 in india 43
3.2 profit & loss statement of 2011 in india 43
3.3 profit & loss statement of 2010 in india 44
3.4 profit & loss statement of 2009 in india 44
3.5 profit & loss statement of 2008 in india 45
3.6 profit & loss statement of 2012 in sri-lanka 45
3.7 profit & loss statement of 2011 in sri-lanka 46
3.8 profit & loss statement of 2010 in sri-lanka 46
3.9 profit & loss statement of 2009 in sri-lanka 47
3.10 profit & loss statement of 2008 in sri-lanka 47
3.11 balance sheets of 2012 of india 48
3.12 balance sheets of 2011 of india 49
3.13 balance sheets of 2010 of india 50
3.14 balance sheets of 2009 of india 51
3.15 balance sheets of 2008 of india 52
3.16 balance sheets of 2012 of sri lanka 53
3.17 balance sheets of 2011 of sri lanka 54
3.18 balance sheets of 2010 of sri lanka 55
3.19 balance sheets of 2009 of sri lanka 56
3.20 balance sheets of 2008 of sri lanka 57
3.21 year wise comparison of p&l account of india 58
3.22 year wise comparison of p&l account of sri-lanka 58
3.23 year wise comparison of balance sheet of india 64
3.24 year wise comparison of balance sheet of sri-lanka 65
4.1.1 Provision of government healthcare services during
donoughmore period.
76

1
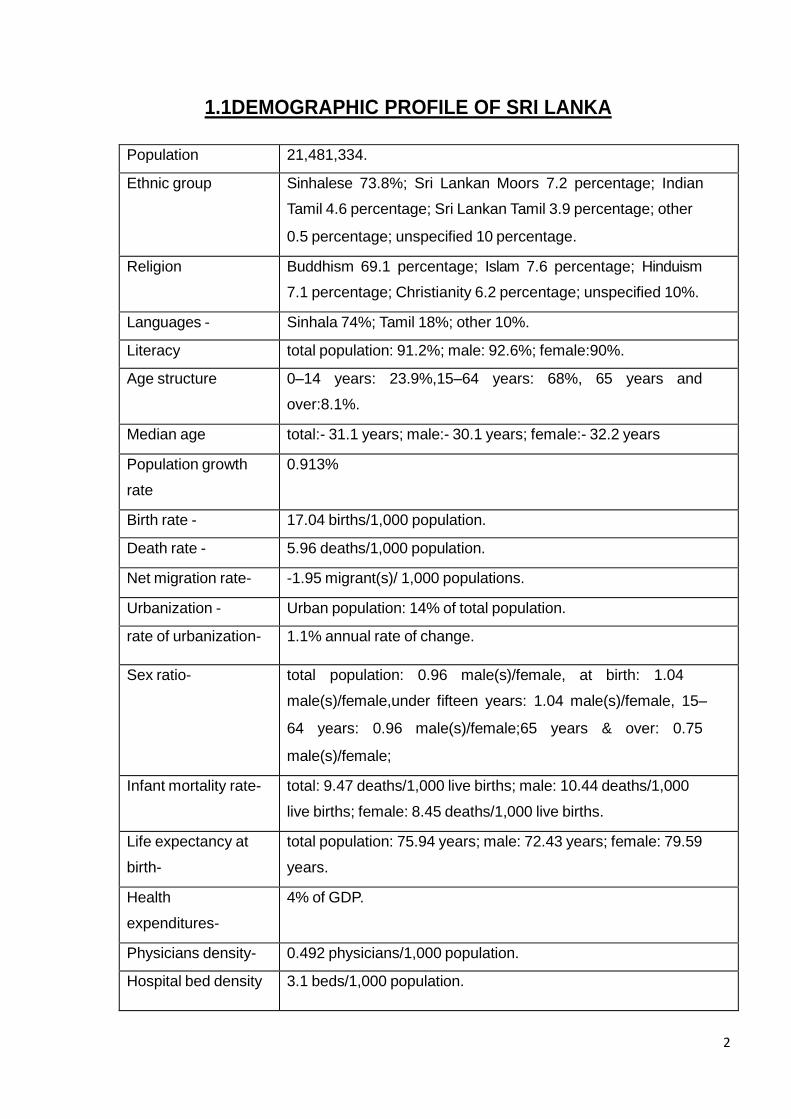
1.1DEMOGRAPHIC PROFILE OF SRI LANKA
2
Population 21,481,334.
Ethnic group Sinhalese 73.8%; Sri Lankan Moors 7.2 percentage; Indian
Tamil 4.6 percentage; Sri Lankan Tamil 3.9 percentage; other
0.5 percentage; unspecified 10 percentage.
Religion Buddhism 69.1 percentage; Islam 7.6 percentage; Hinduism
7.1 percentage; Christianity 6.2 percentage; unspecified 10%.
Languages - Sinhala 74%; Tamil 18%; other 10%.
Literacy total population: 91.2%; male: 92.6%; female:90%.
Age structure 0–14 years: 23.9%,15–64 years: 68%, 65 years and
over:8.1%.
Median age total:- 31.1 years; male:- 30.1 years; female:- 32.2 years
Population growth
rate
0.913%
Birth rate - 17.04 births/1,000 population.
Death rate - 5.96 deaths/1,000 population.
Net migration rate- -1.95 migrant(s)/ 1,000 populations.
Urbanization - Urban population: 14% of total population.
rate of urbanization- 1.1% annual rate of change.
Sex ratio- total population: 0.96 male(s)/female, at birth: 1.04
male(s)/female,under fifteen years: 1.04 male(s)/female, 15–
64 years: 0.96 male(s)/female;65 years & over: 0.75
male(s)/female;
Infant mortality rate- total: 9.47 deaths/1,000 live births; male: 10.44 deaths/1,000
live births; female: 8.45 deaths/1,000 live births.
Life expectancy at
birth-
total population: 75.94 years; male: 72.43 years; female: 79.59
years.
Health
expenditures-
4% of GDP.
Physicians density- 0.492 physicians/1,000 population.
Hospital bed density 3.1 beds/1,000 population.
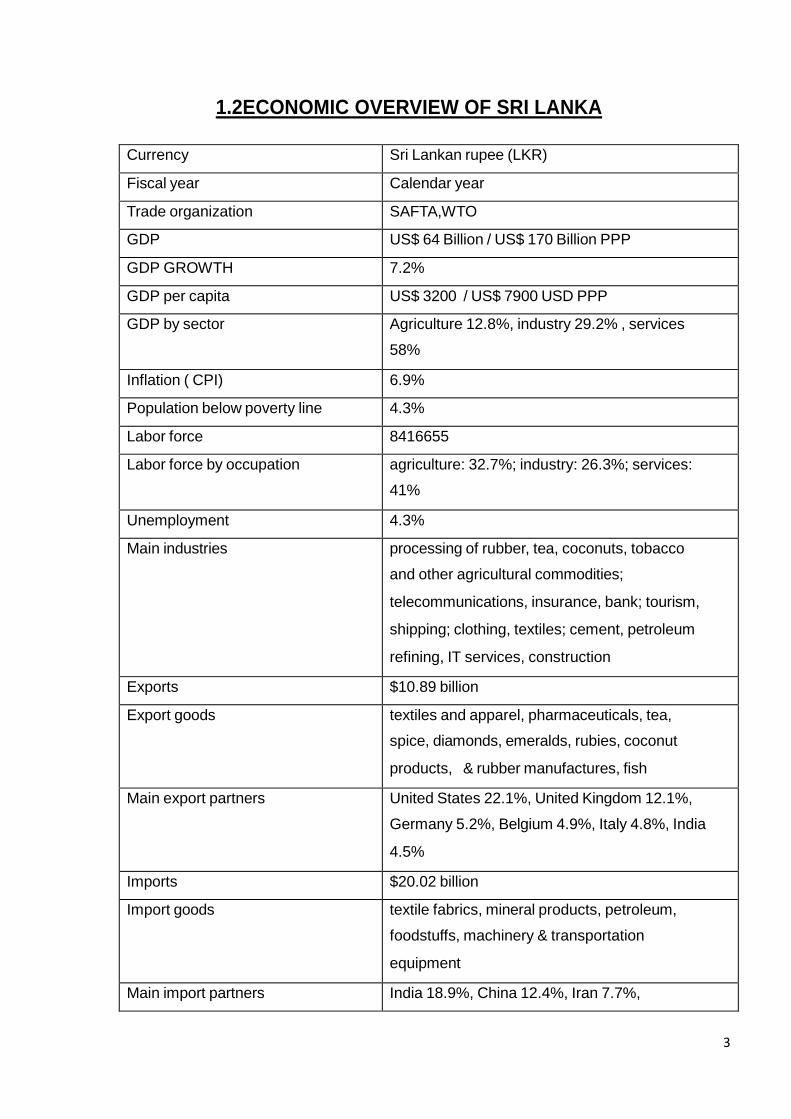
1.2ECONOMIC OVERVIEW OF SRI LANKA
3
Currency Sri Lankan rupee (LKR)
Fiscal year Calendar year
Trade organization SAFTA,WTO
GDP US$ 64 Billion / US$ 170 Billion PPP
GDP GROWTH 7.2%
GDP per capita US$ 3200 / US$ 7900 USD PPP
GDP by sector Agriculture 12.8%, industry 29.2% , services
58%
Inflation ( CPI) 6.9%
Population below poverty line 4.3%
Labor force 8416655
Labor force by occupation agriculture: 32.7%; industry: 26.3%; services:
41%
Unemployment 4.3%
Main industries processing of rubber, tea, coconuts, tobacco
and other agricultural commodities;
telecommunications, insurance, bank; tourism,
shipping; clothing, textiles; cement, petroleum
refining, IT services, construction
Exports $10.89 billion
Export goods textiles and apparel, pharmaceuticals, tea,
spice, diamonds, emeralds, rubies, coconut
products, & rubber manufactures, fish
Main export partners United States 22.1%, United Kingdom 12.1%,
Germany 5.2%, Belgium 4.9%, Italy 4.8%, India
4.5%
Imports $20.02 billion
Import goods textile fabrics, mineral products, petroleum,
foodstuffs, machinery & transportation
equipment
Main import partners India 18.9%, China 12.4%, Iran 7.7%,
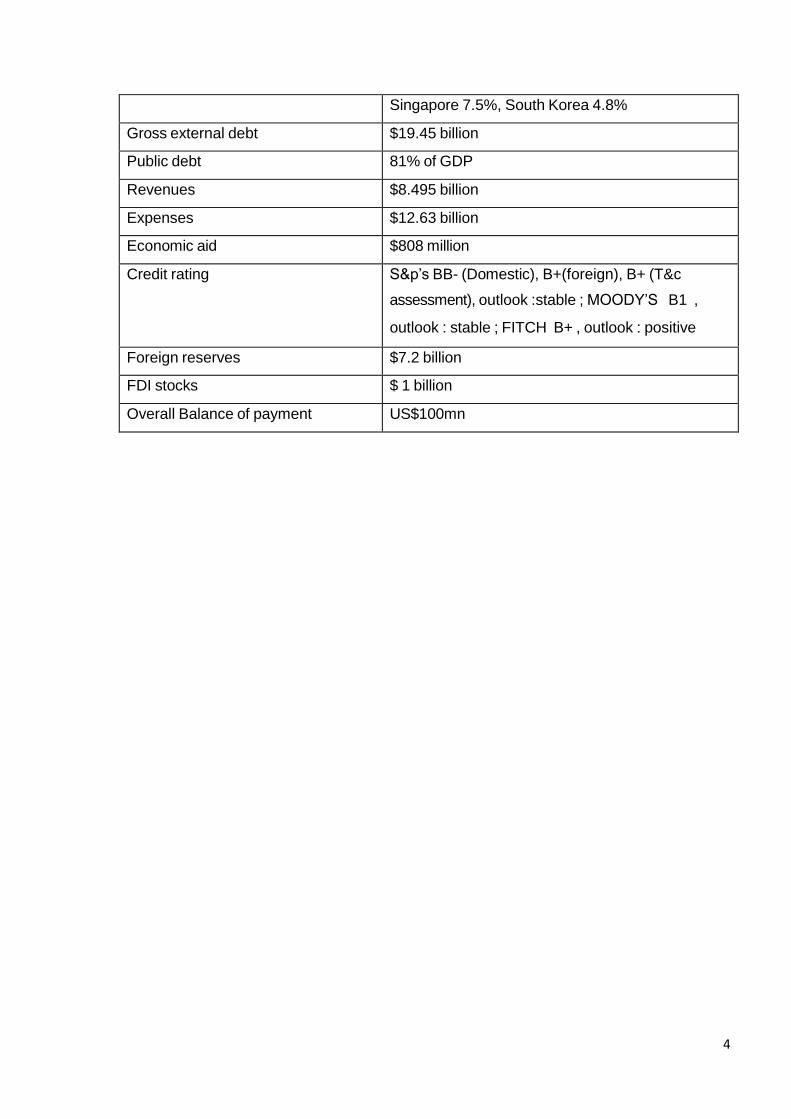
4
Singapore 7.5%, South Korea 4.8%
Gross external debt $19.45 billion
Public debt 81% of GDP
Revenues $8.495 billion
Expenses $12.63 billion
Economic aid $808 million
Credit rating S&p‟s BB- (Domestic), B+(foreign), B+ (T&c
assessment), outlook :stable ; MOODY‟S B1 ,
outlook : stable ; FITCH B+ , outlook : positive
Foreign reserves $7.2 billion
FDI stocks $ 1 billion
Overall Balance of payment US$100mn
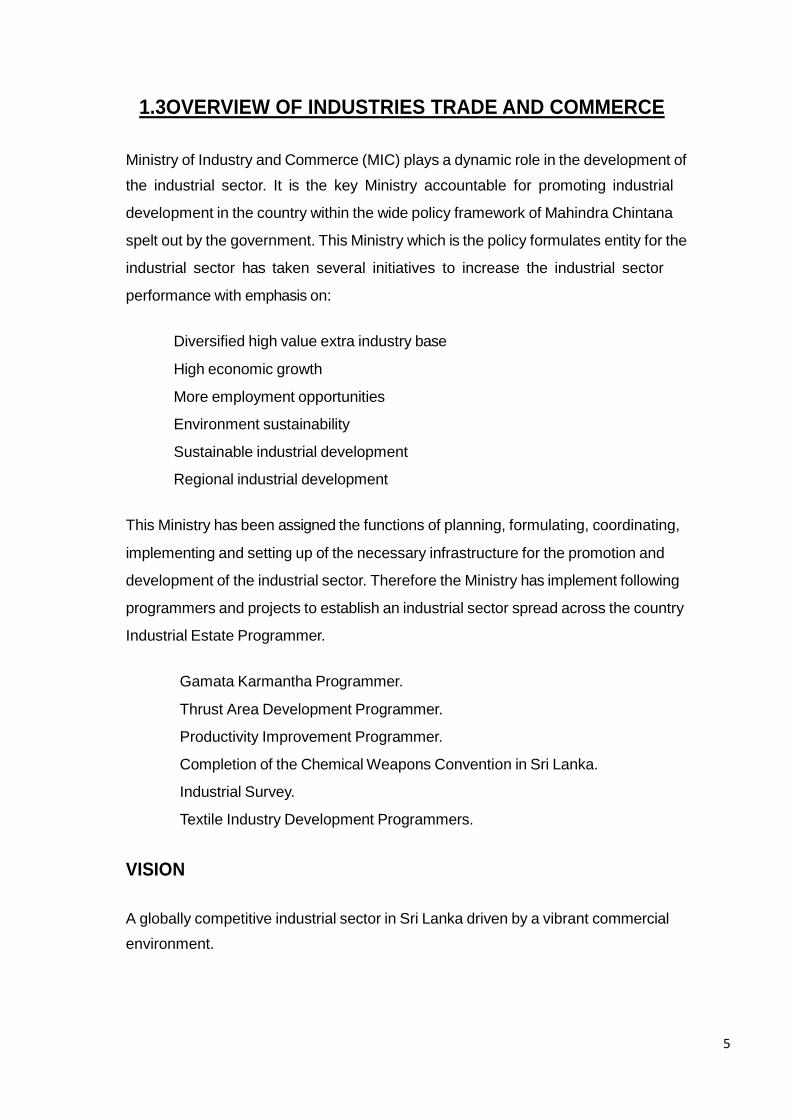
1.3OVERVIEW OF INDUSTRIES TRADE AND COMMERCE
Ministry of Industry and Commerce (MIC) plays a dynamic role in the development of
the industrial sector. It is the key Ministry accountable for promoting industrial
development in the country within the wide policy framework of Mahindra Chintana
spelt out by the government. This Ministry which is the policy formulates entity for the
industrial sector has taken several initiatives to increase the industrial sector
performance with emphasis on:
Diversified high value extra industry base
High economic growth
More employment opportunities
Environment sustainability
Sustainable industrial development
Regional industrial development
This Ministry has been assigned the functions of planning, formulating, coordinating,
implementing and setting up of the necessary infrastructure for the promotion and
development of the industrial sector. Therefore the Ministry has implement following
programmers and projects to establish an industrial sector spread across the country
Industrial Estate Programmer.
Gamata Karmantha Programmer.
Thrust Area Development Programmer.
Productivity Improvement Programmer.
Completion of the Chemical Weapons Convention in Sri Lanka.
Industrial Survey.
Textile Industry Development Programmers.
VISION A globally competitive industrial sector in Sri Lanka driven by a vibrant commercial
environment.
5
MISSION Creation of a conducive environment for sustainable, commercially aggressive,
manufacturing entities, producing high value-added products and a vibrant
commercial regime capable of contributing to the enhancement of living standards of
the people
TRADE & TARIFF RELATED ACTIVITIES The Macro Policy Division is primarily engaged in providing policy support for
industrial development with a special focus on growth and international
competitiveness of the industry. In performing these tasks, the Ministry needs to
interact with public sector organizations and bilateral and multilateral agency. It is a
highly complex process and requires continued monitoring and following up with
various stakeholders in industry. Considering the significance of maintain a stable &
predictable macro economic environment conducive for the growth of manufacturing
sector, the Division prioritized its universal policy support in following areas.
INDUSTRY & ENVIRONMENT Facilitating the industry to adhere to international conventions and regulations within
the overall framework of sustainable development also falls within the purview of
Ministry actions. In the background of the current day worldwide environment, the
produce of a globally marketable environment friendly industrial product has become
essential owing to obligations arising from international conventions including signals
given under the WTO Agreements. Most urban countries have joined environmental
standards with other economic and non-economic conditions as pre-requisites for
entry into their markets. Therefore catering to his principles has become important.
These have become important not only from the point of view of protecting the
environment but also for the survival and growth of industry. Countries in the
European society have been particularly rigid about conformity to such standard.
These comprise product standards for bottled water, baby food, etc., Eco labels, ISO
standards such as ISO 17025, HACCP (Hazardous Analysis Critical Control Point),
Eco-Tex 1000 for the garment & the textile industry and the proposed global initiative
6
on environment reporting. A few of this standard are not implemented at current.
However, they will positively be implemented within the then decade. As such, if Sri
Lankan industry is to be competitive in world markets, they should be geared to meet
these specific requirements in the near future.
This has necessitated technological innovation and adaptation within the industries to
accommodate environmental concerns. In line among these necessities, the Ministry
of Industry & Commerce has promoted industrialists to adopt strategies such as
application of cleaner production while inculcating principles such as waste
minimization and technological upgrading for sustainable industrial development.
7
1.4OVERVIEWS OF BUSINESS AND TRADE AT
INTERNATIONAL LEVEL
The main economic sectors of the country are tourism, tea export, clothes, textile,
rice production & other farming products. In adding to these economic sectors,
overseas employment contributes extremely in foreign exchange, 90% of expatriate
Sri Lankans reside in the Middle East.
ECONOMIC SECTORS
Tourism:
Tourism is one of the main industries in Sri Lanka. Major tourist attraction are alert
about the islands famous beaches located in the southern and the eastern parts of
the country and ancient heritage sites located in the interior of the country and resorts
located in the mountainous regions of the country. Also, due to valuable stones such
as rubies and sapphires being frequently found and mined in Ratnapura and its
nearby areas, they are a main tourist attraction.
The 2004 Indian Ocean Tsunami and the past civil war have reduced the tourist
arrival, though the number of tourists visiting have been newly rising, beginning in
early 2008. March 2008 by 8.6% and Sri Lanka involved 1,003,000 tourists in 2012
according to the Central Bank of Sri Lanka's 2013 roadmap. The earnings for 2012
over one billion (US$) and have increased by 16% compare to year 2011. The Sri
Lankan government has identified the Tourism sector as a key growth area I post-
conflict development with an ambitious target of attracting 2.5 million guests by 2016.
Considering significant growth in the industry, single of the most important worldwide
travel magazine, the main travel guide book & digital media publisher in the world
“Lonely Planet”, has rank Sri Lanka as the most excellent Country to visit in 2013.
One of the main advantages of Sri Lanka as a tourism destination is the varied
attraction accessible, & currently increasingly accessible among the development of
the underlying infrastructure by the government.
8
Tea industry
The tea industry, operating under the Ministry of Public Estate Management &
Development, is one of the major industries in Sri Lanka. It become the world's
leading exporter in 1995 with a 23% share of global tea export, higher than Kenya's
22% share. The central highlands of the country have a low temperature climate
throughout the year and annual rainfall and the humidity levels that are suitable for
rising tea. The industry was introduce to the country in 1867 by James Taylor, a
British planter who inwards in 1852.
Recently, Sri Lanka has become one of the countries exporting fair trade tea to the
UK and extra countries. It is thought that such projects could reduce rural poverty.
Apparel and textile industry
The apparel industry of the Sri Lanka mainly exports to the United States & Europe.
Europe ever more relies on Sri Lankan textiles due to the high cost of labor in
Europe. There are on 900 factories throughout country serving company such as, Liz
Claiborne Pierre Cardin, Nike, Gap and Tommy Hilfiger.
The apparel sector is the highest industrial employment generator and the highest
foreign swap earner. The sum export income of the sector for the year 2011 was US$
4.2Bn which is equivalent to 39.6%. The export growth in 2011 is 24% Year on Year.
The apparels exporters are permitted in to dispose 40% of the output locally subject
to the payment of all inclusive levies of Sri Lankan Rupees(Rs.) 25 per Piece &
income tax for such restricted sales is 12% as against the normal corporate tax of
28%.
The employment inventions exceed 283,000 in 2011. Originally, the industry
commence as a sewing operator (contracted Manufacturer) and dependent on textile
quota offered by USA and EU and currently it has transformed into a full apparel
solution provider.
Agriculture:
The agricultural sector of the country produces mostly rice, coconut & grain, mostly
for domestic consumption and rarely for export. The tea industry which has existed
since 1867 is not usually regarded as part of the farming sector, which is mostly
9
focused on export rather than domestic use in the country. The agriculture sector
contributes 11% to the GDP of the country, 23.9% of total export earnings and 32.9%
of national employment in the year 2011.
The three main traditional export crops from Sri Lanka are Tea, Rubber & Coconut.
Since these industries are already well established, the central focal point of BOI is in
terms of rising other agricultural crops particularly by enhancing domestic value
addition. The government looks for specialized investment to improve efficiency, level
of technology advance, entrance to global markets, utilize of quality seeds and
planting materials & recover overall value adding. A few of the opportunities include:
Horticulture
Fisheries
Livestock
Knowledge Services:
The Knowledge Services sector which encompasses IT software development,
Knowledge Process Outsourcing / Business Process Outsourcing industry, IT & IT
enabled services & Information Technology Training Centre, has tremendous
possible to appear as a key growth sector in Sri Lanka. Given the quality of students,
altitude of English & literacy, & the proximity to India, Sri Lanka is in an ideal position
to develop into a high value added IT / KPO services supplier. The Industry has set
the target of Export revenues of US$ 1 by and Employment of 100,000 by 2015 &
healthy on the way to achieving them.
A. IT Software Development
There are over 100 software developments operations in Sri Lanka which caters to
both independent and captive markets. Sri Lankan companies have been capable to
build up software products of their own which have earned them international
recognition.
B. KPO / BPO Industry
The KPO / BPO industry is an emerging sector in Sri Lanka. A still nascent industry,
inside its small history since 2000, KPO / BPO sector has come a considerable
distance while being able to attract some of the BPO / KPO giants in the world. Sri
10
Lanka is rising in status for niche areas of Financial and other Professional Services,
Transaction processing & Document management, & call center services credit to tall
literacy rates (approximately 92%) and growing accounting graduates pool.
C. IT Enabled Services
IT enabled and IT related Services sector identify projects which require extensive
use of information technology for the provision of services such as Server farms,
Business Services etc. present there are close to 30 companies operating under the
Board of Investment of Sri Lanka.
D. IT Training Centre
In an effort to develop Sri Lanka to a Knowledge Services the education industry has
been identified as one of the key areas of interest to the government of Sri Lanka. In
order to ensure a consistent work force flow to meet the growing employee
requirement of the knowledge services industry, Information Technology Training has
been recognized individually and has been given priority. Here is around 20 IT
Training Centre under the BOI.
Infrastructure
The massive infrastructure development drive currently in progress is expected to
support the country to maintain a high and sustainable growth in the medium &
lengthy term. Timely development of economic infrastructure will help to increase
economic efficiency while expanding the production capacity of the economy,
facilitate efficiency enhancement & reduction of regional disparity.
The construction sector expanded significantly by 14.2% in value added terms in
2011 compared to 9.3% in 2010. Increased activity in construction was depicted by
the growth in domestic production of building material by 8.6% during the year.
Cement availability grew by 21.5 percent in 2011 compare to a contraction of 18.9%in
2010. The increased involvement in the private sector was reflected in the growth of
private sector credit for construction purposes by 15.8% during the year.
11
1.5 SRI LANKA PRESENT TRADE RELATION AND
BUSINESS VOLUME OF DIFFERENT PRODUCTS WITH
INDIA.
India is Sri Lanka´s closest neighbor. The relationship among the 2 countries is more
than 2,500 years old & both sides have build upon a legacy of intellectual, cultural,
religious & linguistic intercourse. Relations among the 2 countries have also matured
and diversified with the passage of time, encompassing all areas of current
significance. The shared cultural & civilization heritage of the two countries and the
extensive people to people interaction of their citizens provide the foundation to build
a multi-faceted partnership.
India and Sri Lanka enjoy a vibrant and growing economic and commercial
partnership, with bilateral trade growing rapidly in the last decade and a number of
leading Indian private sector companies investing in Sri Lanka and establishing a
presence in this country. Sri Lanka is India´s largest trade colleague in SAARC. India
had a share of 19.52% and 5.69% respectively in the global imports and exports of
Sri Lanka during 2012. The decline in exports from India to Sri Lanka in 2012 is
largely due to steep increase in the excise duty imposed on the import of vehicles on
two occasions during the year 2012 that has seriously affected the competitive
advantage enjoyed by Indian auto companies and overall volume of vehicles
imported from India has declined by 50-60%.In 2012, India emerged as the largest
overall investor (as per the nine months data) in Sri Lanka with investments of over
US$ 210 million. As per figures compiled by the Sri Lankan Board of Investment,
India was the second largest foreign direct investor in Sri Lanka in 2011, among an
investment of US$ 147 million (out of a total inbound FDI of US$ 1057 million).
bilateral agreements:-
The juridical framework for the relationship is provided by a Free Trade Agreement, a
Double Taxation Avoidance Agreement, a Bilateral Investment Protection and
Promotion Agreement. Bilateral agreements/Mouse on Air Services, Small
Development Projects, Cooperation in Small Scale Industries and Cooperation in
Tourism and an Agreement on Cooperation in Science and Technology also exist. A
Comprehensive Economic Partnership Agreement (CEPA) is under negotiation.
12
India-Sri Lanka Free Trade Agreement (ISFTA):-
The main framework for bilateral trade has been provided by the India-Sri Lanka Free
Trade Agreement (ISFTA) that was signed in 1998 and entered into force in March
2000. As a result of ISFTA, currently 4150 Indian tariff lines have been made zero
duty for Sri Lankan exports to India. Similarly, 3932 tariff lines have been finished
zero duty for Indian exports to Sri Lanka.
South Asian Free Trade Area (SAFTA):-
The Agreement on South Asian Free Trade Area (SAFTA) came into force from 1st
January, 2006. India, Pakistan & Sri Lanka are categorized as Non-Least Developed
Contracting States (NLDCS) and Bangladesh, Bhutan, Maldives, Afghanistan &
Nepal are categorized as Least Developed Contracting States (LDCS). Article 7 of
the SAFTA Agreement provides for a phased tariff liberalization programmer (TLP)
under which, in 2 years, NLDC would bring downward tariffs to 20%, while LDCS will
bring them down to 30%. Non-LDCS will then bring down tariffs from 20% to 0-5% in
5 years (Sri Lanka 6 years), while LDCS will perform so in 8 years.
Comprehensive Economic Partnership Agreement (CEPA):-
Following the FTA, the two Governments emboldened by the positive outcomes and
success of the FTA, felt that more action was required to unleash the full potential of
our bilateral economic relations. CEPA seeks to build on the momentum generated
by the FTA and take the two economies beyond trade in goods towards greater
integration and impart renewed impetus and synergy to bilateral economic
interaction. The discussion on CEPA has resumed in December 2010.
MAIN INDIAN INVESTMENTS ARE
1) Lanka IOC PLC.
2) Bharti Airtel Lanka.
3) Piramal Glass Ceylon.
4) Taj Hotels.
5) UltraTech Cement.
6) J.V.Gokal Ceylon Private Limited.
13
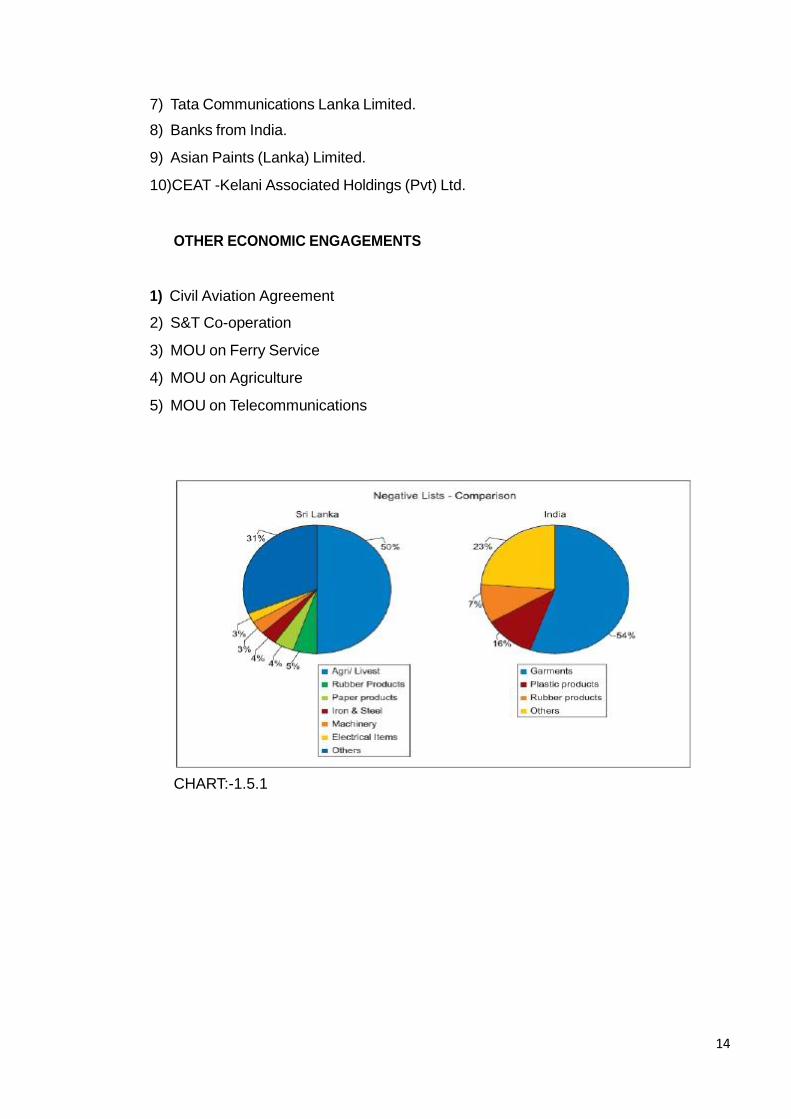
7) Tata Communications Lanka Limited.
8) Banks from India.
9) Asian Paints (Lanka) Limited.
10)CEAT -Kelani Associated Holdings (Pvt) Ltd.
OTHER ECONOMIC ENGAGEMENTS
1) Civil Aviation Agreement
2) S&T Co-operation
3) MOU on Ferry Service
4) MOU on Agriculture
5) MOU on Telecommunications
CHART:-1.5.1
14
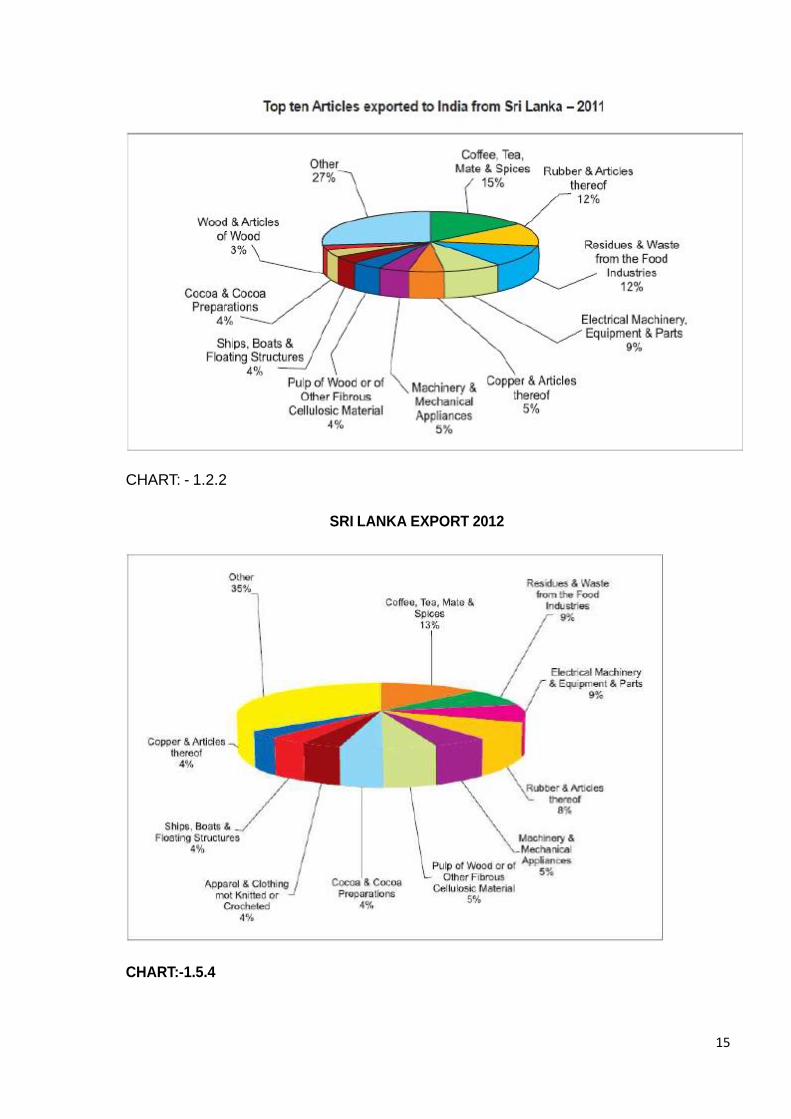
CHART: - 1.2.2
SRI LANKA EXPORT 2012
CHART:-1.5.4
15
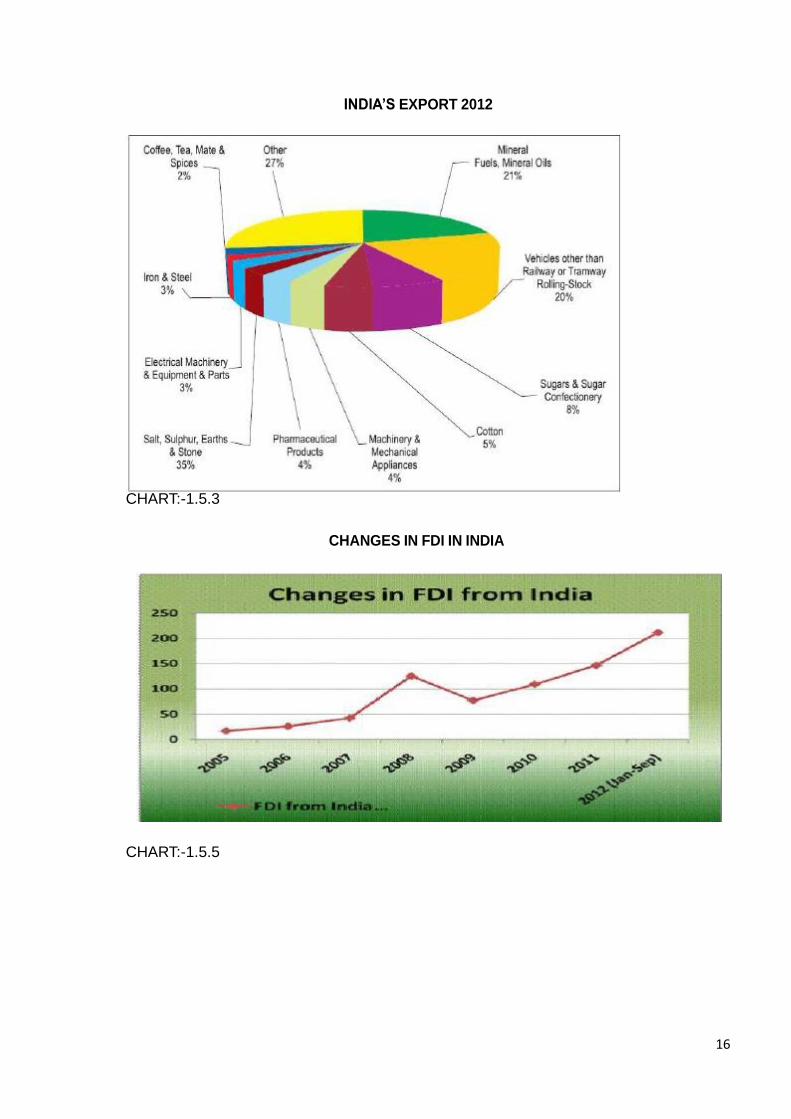
INDIA’S EXPORT 2012
CHART:-1.5.3
CHANGES IN FDI IN INDIA
CHART:-1.5.5
16
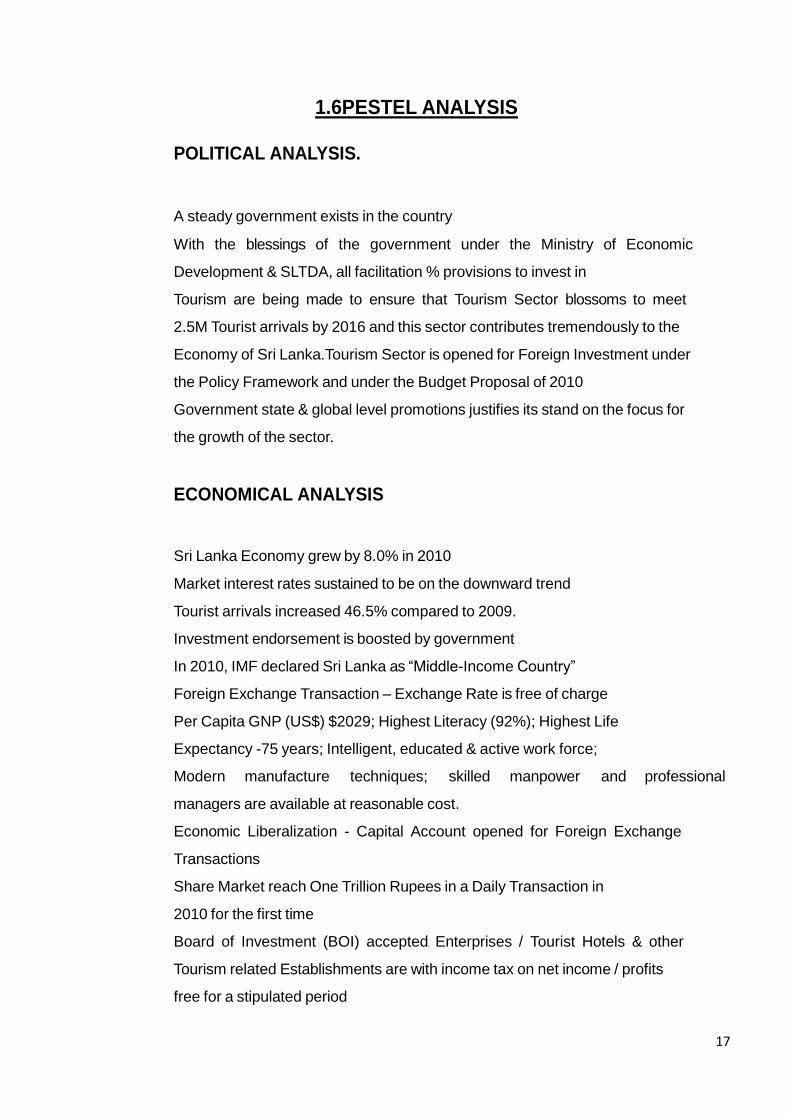
1.6PESTEL ANALYSIS
POLITICAL ANALYSIS.
A steady government exists in the country
With the blessings of the government under the Ministry of Economic
Development & SLTDA, all facilitation % provisions to invest in
Tourism are being made to ensure that Tourism Sector blossoms to meet
2.5M Tourist arrivals by 2016 and this sector contributes tremendously to the
Economy of Sri Lanka.Tourism Sector is opened for Foreign Investment under
the Policy Framework and under the Budget Proposal of 2010
Government state & global level promotions justifies its stand on the focus for
the growth of the sector.
ECONOMICAL ANALYSIS
Sri Lanka Economy grew by 8.0% in 2010
Market interest rates sustained to be on the downward trend
Tourist arrivals increased 46.5% compared to 2009.
Investment endorsement is boosted by government
In 2010, IMF declared Sri Lanka as “Middle-Income Country”
Foreign Exchange Transaction – Exchange Rate is free of charge
Per Capita GNP (US$) $2029; Highest Literacy (92%); Highest Life
Expectancy -75 years; Intelligent, educated & active work force;
Modern manufacture techniques; skilled manpower and professional
managers are available at reasonable cost.
Economic Liberalization - Capital Account opened for Foreign Exchange
Transactions
Share Market reach One Trillion Rupees in a Daily Transaction in
2010 for the first time
Board of Investment (BOI) accepted Enterprises / Tourist Hotels & other
Tourism related Establishments are with income tax on net income / profits
free for a stipulated period
17
Inward remittance for investment, outward remittance of earnings dividends,
royalties & other present account payments and capital proceeds on
liquidation / transfer at shares are permitted.
Social Analysis
The country had gone through the practice of tourism over many decades.
Thus, the country and all religious / racial groups have recognized the value it
generates to the development of Sri Lanka.
At the same time, a lot of efforts are put nationally and in tourism based
regions to make sure Sri Lankans are not becoming victims of social problems
created in connection with tourism. Thus, the trade runs smoothly without any
factions / group / organized protests against the industry.
Also, tourism happens to be at very specific locations in the country, which
creates value to the industry. These locations are mostly utilized for tourism
related economic activities than for residence.
Overall, since the country‟s present focus is towards tourism development, the
entire nation‟s focus is towards it and the mind-setof the people are to get
involved in the economic operations of tourism.
Technological Analysis
Sri Lankan Structure has a number of Narrow and Authoritative Bodies to look
after the application of technology in the economic sphere, mainly for industry and
commercial purposes.
The purpose of technology in the Tourism Sector will be governed by the relevant
bodies / authorities mentioned above
Most of the technology necessary for the tourism trade has to be imported from
international suppliers through Sri Lankan agents / distributors.
Environmental Analysis
18
Large Scale Hotels & Other Venues for the Tourists to enjoy can be a concern
for environment as its construction and continuous operations may exert
pressure on the environment.
Sri Lankan legislature, body shaped from the legal systems and practice allow
such large investment based intensive structures and operations under the
assessment, supervision, guidance, license and approvals.
The Central Environmental Authority is the certified agency in this regard.
Legal Analysis
Government‟s legal structure facilitates the incoming of investments for the legalized
economic activities, enjoying its returns and the provisions for the remittance of
surplus to the desired destinations, under terms and conditions applicable, set out by
the Board of Investment (BoI) of Sri Lanka.
19

20
2.1HEALTH CARE IN INDIA
In the past two decades, India has made considerable progress in improving public
health. Smallpox and guinea worm were completely eradicate polio and leprosy, and
health care experts, millions afflictions as recently as 1980, is expected to end in the
near future. However, the challenges are enormous public health. Both infant
mortality and morbidity significantly compared to other developing countries were
higher in India. Indian health care spending to gross domestic product (GDP) 5.2% -
South (6.7%), Korean and Brazilian (6.5%) is lower than the Chinese (2.7%) is higher
than. However, the cost (64%) came out of the pockets of the people. Only about
15% of the Indian population was covered by some type of insurance. As a result,
access to health care for many remained out of reach. In addition, the government
has provided quality care, while inexpensive compared to private services, often
wanted. Brigham and Women's Hospital in Boston surgeon, Dr.Atul Gawande,
Nanded, 400 miles from Mumbai, a visit to a public hospital is described in Check in
Nanded rooms are much like those I found in India and elsewhere. Oven in the heat
of the summer.Jagged strips paint flakes from the walls.
Sinks are stained brown and faucets do not work ... Each room four, six is a crowd,
sometimes eight patients jockeying for attention ... Everywhere I asked people what
they did when they had a serious health problem. Patients borrow from family, to sell
your property, whatever they are, which no waiting list is and generally clean and well
supplied ... Even the Prime Minister, his government hospitals are not known to pay
For care in private hospitals. Spending pattern publicly reflect these concerns with the
quality of care provided. For example, private, for-profit hospitals and more than 30%
of total health care spending occupied. In marked contrast to the importance of India
to benefit players stood for many other countries, where health care was dominated
by nonprofit or governmental entities. Exhibit 1 compares the health care industry in
India and the value chain in the United States.
While health maintenance organizations (HMOs) to provide access to health care in
the United States has played a major role in India is the absence of such
organizations. Minority of Indians who are covered by insurance, large corporations
21
that offer health benefits to their employees with a network of clinics to use third-party
administrators (TPAs) prices negotiated. TPA processed medical bills from their
network of clinics, but they did not offer insurance. With the financial risk of providing
health care corporations remained.
Of course, the industry organization shown in Exhibit 1 was not set in stone. For
example, in the 1990s, hospitals in the United States, hospital mergers and strategic
alliances with other hospitals in a wave of horizontally integrated. An integrated
delivery networks (IDNs) in an attempt to U.S. hospitals integrated part of the patient.
They acquired the practices of primary care physicians, physician organizations,
hospital physicians (phos) developed and entered into an alliance with HMOs.
Horizontal and vertical integration, however, proved to be financially disastrous for
the U.S. industry. In fact, more integration, investment in hospitals that have suffered
sharp financial decline. As a result of these negative experiences, American hospitals
and their phos dissolved at the end of the 1990s started to abandon their HMO
products in the late 1990s.
22
2.2FORTIS HOSPITAL
Malvinder Mohan Singh
Chairman
INTRODUCTION
Fortis Hospital, Bannerghatta, Bangalore, a 400 bed, JCI certified and NABH
accredited multi-specialty tertiary care hospital. Over 150 consultants and 800 other
staff Para - medical support facility by the cardiology, cardiac surgery, Urology,
orthopedics, neurology, and neuron - surgery, such as super specialty tertiary care
services to approximately 40 specialty offers. We started operations way back in
1999, and since then a familiar, trusted and sent her presence, ministering to the
healthcare needs of patients in the immediate community and the world. We touch
the lives of about 12,000 per month, and a custom fit knee and prostate cancer, HIFU
technology to India, such as the technology has been instrumental to enter.
Bangalore is ranked as the best hospital for cardiac care with the 8th Annual Hospital
Survey Outlook, by 2012.
Our approach, patient centricity, the state of the art emergency response, integrity,
teamwork, and innovation based on ownership, with clinical excellence with
compassionate patient care, with a goal of achieving a single ... Saving and Enriching
life.
OVERVIEW
Fortis Healthcare Limited's Investor Relations efforts functionality of existing and
potential shareholders to continue dialogue and other market participants in order to
engage them in the company's strategy, and financial and operational parameters
tell. On various aspects of the company's operations in timely, accurate and relevant
information it can provide, as it seeks to enable investors to take informed decisions.
Direct channel of communication with investors, giving them their concerns allays, the
company creates a better understanding of the industry, and let them share in the
Company management with their perspective and feedback.
23
The Company Investor Relations function of investor interactions uses media to
reach out and communicate effectively with the investment community. The
magazine quarterly earnings calls, international and local investor forum, direct one-
on-one meetings and conference calls, press, healthcare field trips, and more Fortis
Healthcare Ltd., a leading, Asia-Pacific, also, is an integrated healthcare delivery
provider participation include Span Diagnostics company, primary care, specialty
care, day hospitals asset base with 11 countries, many of the world's fastest growing
healthcare Markets represent the delivery of healthcare verticals.
Currently, the healthcare company with 76 hospitals in Australia, Canada, Dubai,
Hong Kong, India, Mauritius, New Zealand, Singapore, Sri Lanka, Nepal and Vietnam
in the distribution network, over 12,000 beds, 600 primary care centers, operates
specialty centers for 191 days 230 diagnostic centers and more than 23,000 people
on a talent Pool, care.
Fortis Healthcare Global leader in integrated health care delivery and saving space
and prosperous life through clinical excellence is driven by a vision of becoming a
major objective.
VISION
Distinctive Clinical Excellence and Patient Care is a globally respected healthcare
Organization known to us.
OUR VALUES
PATIENT CENTUEICITY
'Best results and experience' commitment to our patients Compassion, care and
understanding and treat patients their caregivers come to our patients needs first.
INTEGRITY
Principled, Open and honest attempt ... Model and our 'values' live...Moral courage to
speak and the right things.
24
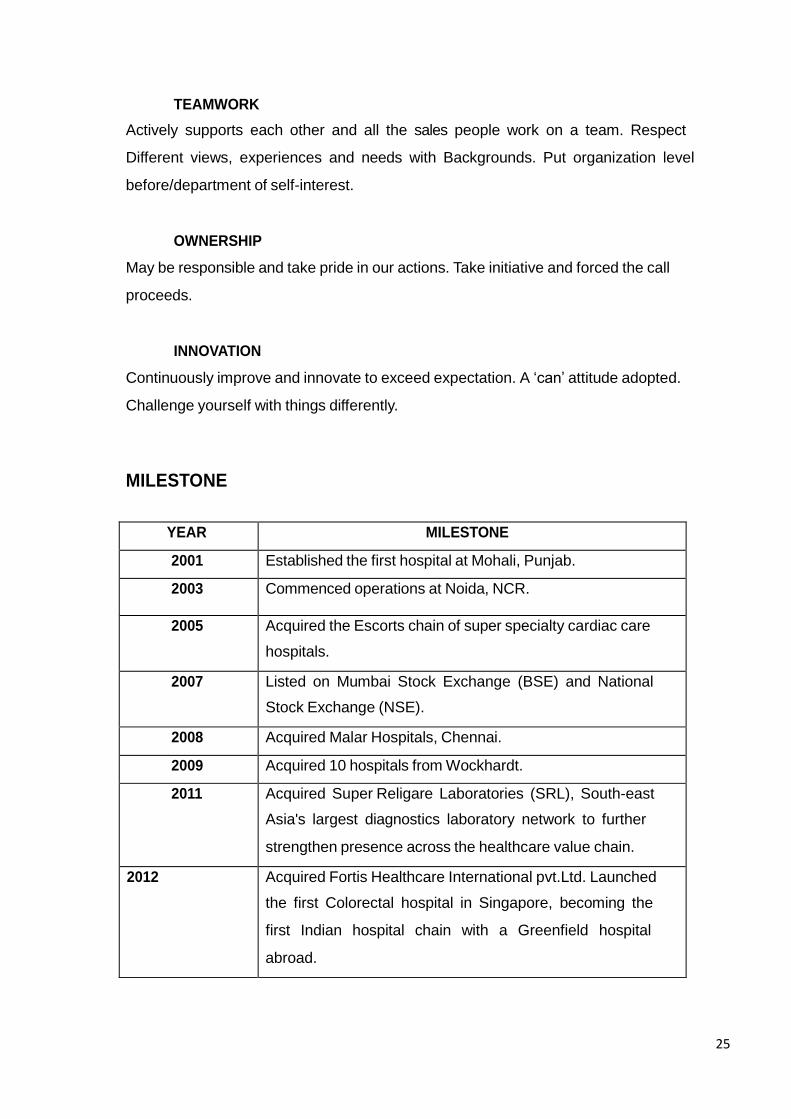
TEAMWORK
Actively supports each other and all the sales people work on a team. Respect
Different views, experiences and needs with Backgrounds. Put organization level
before/department of self-interest.
OWNERSHIP
May be responsible and take pride in our actions. Take initiative and forced the call
proceeds.
INNOVATION
Continuously improve and innovate to exceed expectation. A „can‟ attitude adopted.
Challenge yourself with things differently.
MILESTONE
25
YEAR MILESTONE
2001 Established the first hospital at Mohali, Punjab.
2003 Commenced operations at Noida, NCR.
2005 Acquired the Escorts chain of super specialty cardiac care
hospitals.
2007 Listed on Mumbai Stock Exchange (BSE) and National
Stock Exchange (NSE).
2008 Acquired Malar Hospitals, Chennai.
2009 Acquired 10 hospitals from Wockhardt.
2011 Acquired Super Religare Laboratories (SRL), South-east
Asia's largest diagnostics laboratory network to further
strengthen presence across the healthcare value chain.
2012 Acquired Fortis Healthcare International pvt.Ltd. Launched
the first Colorectal hospital in Singapore, becoming the
first Indian hospital chain with a Greenfield hospital
abroad.
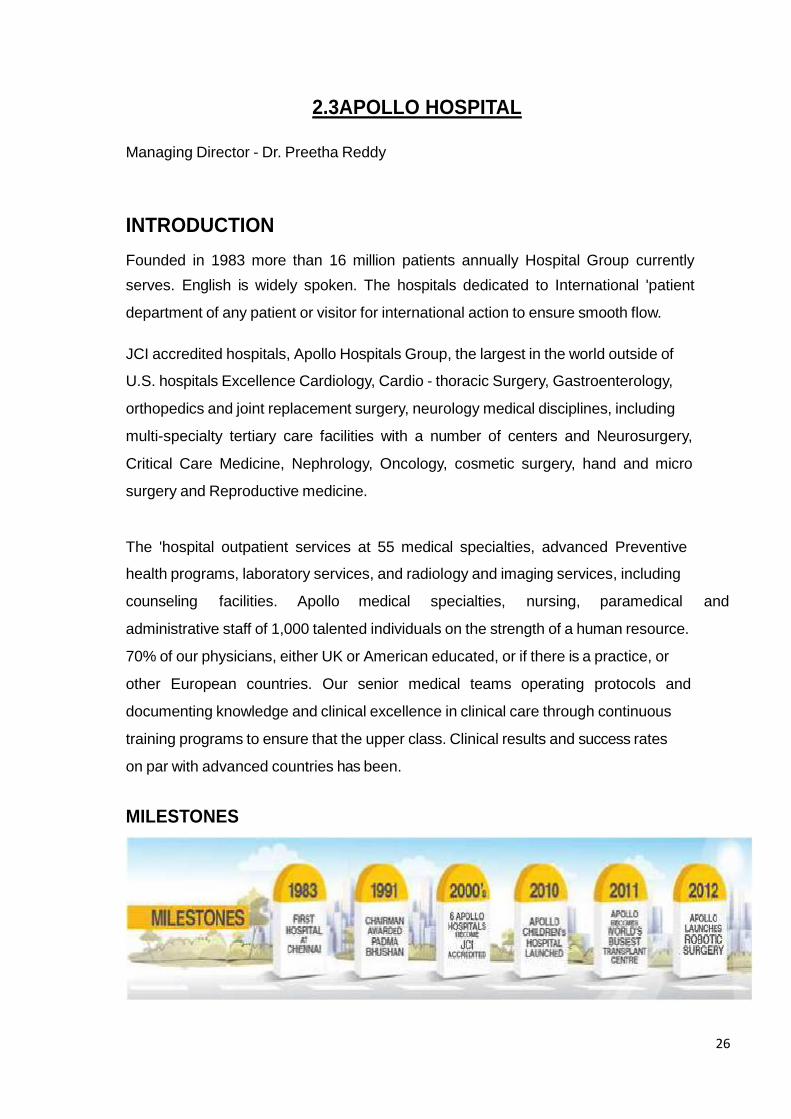
2.3APOLLO HOSPITAL
Managing Director - Dr. Preetha Reddy
INTRODUCTION
Founded in 1983 more than 16 million patients annually Hospital Group currently
serves. English is widely spoken. The hospitals dedicated to International 'patient
department of any patient or visitor for international action to ensure smooth flow.
JCI accredited hospitals, Apollo Hospitals Group, the largest in the world outside of
U.S. hospitals Excellence Cardiology, Cardio - thoracic Surgery, Gastroenterology,
orthopedics and joint replacement surgery, neurology medical disciplines, including
multi-specialty tertiary care facilities with a number of centers and Neurosurgery,
Critical Care Medicine, Nephrology, Oncology, cosmetic surgery, hand and micro
surgery and Reproductive medicine.
The 'hospital outpatient services at 55 medical specialties, advanced Preventive
health programs, laboratory services, and radiology and imaging services, including
counseling facilities. Apollo medical specialties, nursing, paramedical and
administrative staff of 1,000 talented individuals on the strength of a human resource.
70% of our physicians, either UK or American educated, or if there is a practice, or
other European countries. Our senior medical teams operating protocols and
documenting knowledge and clinical excellence in clinical care through continuous
training programs to ensure that the upper class. Clinical results and success rates
on par with advanced countries has been.
MILESTONES
26
COMPANY VISION.
Apollo's vision for the next phase of development 'Touch a Billion Lives' is.
Mission Statement
COMPANY MISSION
"Our mission is to bring healthcare of international standards within the reach of every
individual we are for the benefit of humanity and the Education, Research and
Healthcare is committed to the achievement and maintenance of excellence."
APOLLO HOSPITAL OF THE NEW VISION
STATEMENT Dr Reddy gave his daughters Preetha Suneeta, and Sangita Apollo for a month with
a new vision. The group faced enough opportunities. But the most promising
strategies that were? Much depends on the future development of the health care
market. Health care is a basic local business? However, the global opportunities,
which is the best hospital in the world that is why - institutions such as the Mayo
Clinic, for example - only a few locations, working as one organization? In addition,
the Reddy family acutely aware those medical services were in contrast to other
professional services. Caring for patients with such a great responsibility, and public
health of all family members care deeply about. Given the enormous challenges at
the local front, it's probably best to focus on developing the Indian market?
27
2.4INDRAPRASTHA MEDICAL CORPORATION
CHAIRMAN MR. P. THAT TRIPATHI
HISTORY
1988
The Company as a public limited company on March 16 was the roc and April 7th
business certificate from the start.4 heart and chest surgery operation theaters in the
hospital (OTS) is 2 neurosurgery OTS, 5 main OTS, 4 small
OTS, 2 and 1 birth OT emergency OTS. The OTS variety of specialties services that
is available in the hospital.
1990
The company signed a contract with an Indian hospital, 17 July, Ltd. Corporation.
IHCL to set up, commissioning and technical consultancy and project consultancy for
the work of the hospital provides. The company has a capacity of 2 750 KVA DG set
is installed as a standby arrangement.
Three 2000 kg / hour capacity each, with the necessary storage and distribution
system
For the steam boilers of steam needs to be installed.
1992
MCS Ltd. with the company to resolve an investor dissatisfaction of allotment / advice
share certificates / refund orders last date of dispatch of the letter agreement entered
forA period of six months.
1996
The Cardiology and Cardiothoracic surgery, cardiac care and treatment in the state of
the art facilities. 3 digital imaging and electrophysiology facilities have been set up
withThe Catheterization laboratories.
28
The neuro science department at a few centers in Asia, providing an advanced neuro
Surgery facilities.
Since August, 300 beds including 200 beds with an average occupancy.
The company is a 695 bed multi-disciplinary Delhi Mathura Sarita Vihar, New Delhi,
close to the road on one site super specialty tertiary care hospital with state of art
facilities "Indraprastha Apollo Hospitals" is set.
The Company and around Delhi satellite centers in strategic locations in the 8-10
consulting rooms and basic facilities will be set in motion an investigation.
125 kg per hour incinerator with a capacity of combustible waste, infectious waste,
human tissue, and bandage has been installed for disposal, linen, dressing, etc.
IMCL compressors for compressed air and medical gases installed.
The company hired for specific medical equipment, equipment lease agreement
withThe IHCL.
1997
Indraprastha Medical Corporation Ltd. for 2,29,18,900 Rs.10 each equity share of
public cash equivalents aggregating to Rs.22, 91,83,000 issue has entered the
capital market.
Indraprastha Medical Corporation is a multi-specialty hospital is a 600-bed corporate
has been set up in New Delhi. Hospital complex in addition to a corporate hospital
also Plans to establish five satellite centers.
The first joint venture in the country's health sector up Delhi NCT (National Capital
Territory) was decided, together, with a strategic focus and the private sector to bring
operational benefits.
1998
Recently, a joint team of cardiologists and neurologists have successfully secured the
vital circulation without affecting the rest of the heart muscle and arteries bahyadala
29
embolizing a new technology is developed. Hardware material mixture coronary
angioplasty and cerebral AVM was in repair. This process has been the first time in
the world.
A new technique "thrombolysis" devised by the neuroradiology unit early treatment
for stroke victims can dissolve the clot within the artery in the brain, including the
direct injection of a particular drug.
Palliative Medicine, dedicated to the country for the first time as a feature of the
service is being offered by hospitals, medical care that is provided for people who are
terminally Ill is a concept.
The Assisted Reproductive highly skilled and experienced specialist is a team of UK
and USA training unit has been included.
A 3 - day conducted by the International Neurosciences Division, the first of its kind in
the country, despite council 8 nationally and internationally renowned faculty
conferences held in ten countries with the highest being 98 OPTIMA important
bharana They are drawn.
a qualified registered nurse for 6 months, Operation Theatre Technology and Tertiary
Care Nursing Certificate Course on graduating from various institutions in the July
1start two clinical and theoretical study of each semester. The hospital is a
multicentre drug hypertension drug for the control of a multinational trial centers.
The hospital is now on the Internet, inter alia, the hospital is an animated
walkthrough, all available online services and appointments with improvements to the
facility's most comprehensive website.
1999
The group also Ludhiana, Lucknow, Ahmedabad, Vizag and Kolkata and Mumbai in
hospitals may have set an ambitious project. Abroad after Dubai and Muscat, the
company remains at the East Africa and Sri Lanka, and Bangladesh.
30
Consolidation continues entity in remanning process involving the merger of three
group companies - Indraprastha Medical Corporation Limited (IMCL) - The Apollo
Hospitals Group has no immediate plans to include the Delhi-based associate
company.
In addition to the Delhi government, IMCL and the UK, together with Dr Reddy
recipients per 49 per cent stake in the company has been promoted by Shrodders
ventures announced a 25 per cent stake in IMCL.
The agreement between the promoters of the Delhi government in 1998 in a choice
of three tranches of 26 per cent of its IMCL Indraprastha Apollo Hospital is fully
operational once to get rid of. Compounded rate or the prevailing market rate of
return on a predetermined cross Leigh be taken that high.
2003
M/S Vasudev & Co. has been appointed as the company's portfolio
2005
Delhi Stock Exchange Association Limited will WEF Delist 20 January, 2005.
2008
Indraprastha Medical Corporation Ltd has appointed Shri. Rakesh Mehta, Chief
Secretary, Govt. Delhi is an additional and company directors as chairman of the
boardOf directors of the national capital.
2009
Indraprastha Medical Corporation Limited Dividend @ 15% i.e. Rs recommend the
payment 1.50per share
2010
Indraprastha Medical Corporation Limited Dividend paid @ 16% i.e. Rs are
recommended 1.60per share.
31
2011
Expansion of the company Indraprastha Medical Corporation Ltd. as part of the
project undertaken by, 50 additional beds in the hospital were included.
Indraprastha Medical dividend paid @ 16% i.e. Rs are recommended. 1.60 per share
2012
Indraprastha Medical dividend paid @ 16% i.e. Rs are recommended. 1.60 Per share
INTRODUCTION
Indraprastha Apollo Hospital is also the world's largest corporate. It is the third super
specialty tertiary care hospital set by the Apollo Hospitals Group, jointly in New Delhi,
India's capital with the government. The 695 bedded hospital provision for future
expansion to 1000 beds.
The hospital is at the forefront of medical technology and expertise. Care for its
patients the latest diagnostic, medical and surgical facilities provide a full range.
The hospital started functioning from July 1996, Mission of Medical Excellence with a
Human touch
32
2.5SRI LANKA HEALTH SECTOR
Public and private health care services in Sri Lanka in the health system. Public
health and eight provincial Councils. Major services are central ministry responsible
for municipal services also provide a limited nature. Public sector delivers
facilities. Private health care services through an island wide network of outpatient
services in both inpatient and Rotating mostly full-time private practitioners,
government services have been provided by Medical staff and private work
pharmacies. There small but growing private hospital but sector. The historic
plantation estates employees their own facilities to perform, but most recently they
have been incorporated in the MOH decided system. Historically, public health care
services were centrally managed by the Ministry Health.1Following constitutional
amendment in 1987, devolved to 8 provincial council is responsible for health
services, each of which has its own provincial health.
Ministry said the provincial councils are responsible for the management of Health
facilities and programs, while health central Ministry of national facilities, medical
education is responsible for the management Health policy and medical requisites
formation of bulk purchase MOH Entire Island operates an extensive network of
facilities these are organized into Multi-tiered referral system features maternity
homes.
And dispensaries from above and other national hospitals are teaching hospitals.
ThisIs mostly modern western type of care provided?
But under the responsibility of Ayurvedic care provided by different government
facilities Ministry of local medicine. In 1995, there were 510 hospitals with 54,641
beds and 386 we republic health care system dispensaries. Outpatient care is mostly
provided by the inpatient facilities, outpatient departments connected, although some
freestanding outpatient.
Facilities also exist. In 1995, these facilities treat over 3 million inpatients and 36
33
million Patients (Central Bank, 1996). This amounted to 95% of all inpatient
admissions, and nearly half of all outpatient consultations in the country.
Doctors employed in the public health care services to 4,480 in 1995. They usually
work as a full time Employees, though most of their time during the holiday is allowed
Private practice. In addition, the health ministry, 1,324 Assistant Medical (AMPS)
Practitioners, who are employed during the three-year program of training, was
received Basic medical training, diagnosis, and allow the Can, and often more
peripheral units to work unsupervised. Doctors and AMPS are supported by the
presence of over 13,000 nurses and 5,000.
Private health care services are often circulated. 500-1,000 about private full-time
General practitioners a fee for service basis from private clinics provide outpatient
care. This is Government doctors in private practice, who works at home, clinics or
supplied Private hospitals. There are approximately 10,000 traditional practitioners.
34
2.6ASIRI CENTRAL HOSPITA
MR.A.K.PATHIRAGE
Chairman /Managing Director
INTRODUCTION
Asiri Central has specialized in Colombo, Sri Lanka in the heart of the hospital. The
latest Hospitals of Asiri Group, the largest chain in the country within the health care
industry. We investigate the state of the art therapeutic and intensive care facilities in
a one-stop medical setting offers We have our patients' well-being at the Central
Hospital, our drive for excellence, which is the main fan. Best Doctors, surgeons with
a team of experts and consultants, central Quality talent and rich experience.
Central Hospital of the human touch and attention and takes care of the importance
of pride.In addition, it is also modern technology, training and research to improve the
health services for the next great investment.
State of the art that the same technology used in medical waste, the Central Hospital
for work on international standards and world class medical facilities at a cost of a
fraction-of-art technology and experienced medical staff provided us with the utmost
care of the patients the best care and a.
OUR VISION
A leading HEATHCARE BE by our power supply in the region Wellness care and
patient
OUR MISSION
To care and ethical medical care and education to improve the quality of human life
by the provision of Excellence
MILESTONES.
35
263-bed facility 2010, 2 April
Opened an outpatient clinic: 2010, 2 April
MAIN FACILITY.
1 of the largest private hospital in Southeast Asia.
14 stories plus basement parking and internationally approved / building fire
standards and 450.000 square feet.
Softlogic Amalga Hospital Information System.
Hospital-wide Wi-Fi network coverage.
OUT PATIENT CLINIC FACILITY.
The private sector outpatient clinic.
300 car parking spaces.
Each clinic and pharmacy cashier stations on the floor with the convenience of
one-stop, Directories and LCD TV.
Wi-Fi technology features such as automated faster, more re responsible for
providing lab results; and online registration, medical records, and diagnostic
images to doctor‟s immediate access to patient information from computers in
their exam room, allowing.
A spacious 3rd floor Atrium restaurants.
OUT PATIENT FACILITIES.
Ambulance and Mobile Critical Care fleet.
Emergency 24 - hour emergency care, including cardiac catheterization.
Capacity: 1500 OPD patients per day.
Out patient surgery center.
36
SPECIAL FACILITIES
Laboratories.
12 operating theaters.
MRI, CT and Lithotripsy.
Nuclear medicine.
PACS radiology.
16-Slice CT scanner.
CT scanner.
Sleep Lab (within the set).
Digital X-Ray.
Neonatal Critical Care Transport.
Preventive Healthcare Center.
37
2.7CEYLON HOSPITAL
HISTORY
After our story in the British colony of Ceylon at the beginning of World War II begins.
British military personnel serving in a military hospital and eventually Durdans
Hospital sited where the present will remain in the hospital now.
After our story in the British colony of Ceylon at the beginning of World War II begins.
British military personnel serving in a military hospital and eventually Durdans
Hospital sited where the present will remain in the hospital now.
In 1945, a group of doctors as a private organization recognized the opportunity to
develop fledgling healthcare sector, and the former military hospital in Ceylon Ltd.
Hospitals establish. A new age of patient care for those in need of medical care
dawned, recovery, and was attended with all the care of a concept. Special attention
in 1968 when Durdans its first maternity care and an outpatient facility opened in
maternity care was given.
The hospital gradually offer more services and modernization and remodeling
program was launched. In 1997, a strategic alliance was formed with the Regional
Center for excellence in cardiology. The Durdans Heart Centre was opened in 1999,
for the first time in Sri Lanka Unmatched for patients and brings a dedicated cardiac
care. Ceylon Hospitals Ltd was listed in 2003 on the Colombo Stock Exchange, the
gradual expansion of Phase II, launched in 2007, followed in 2004 by starting the
program.
Durdans is now the third leading medical institution in the country is considered. The
solid support was expressed by a great staff, modern facilities and cutting-edge
medical technology; we are guided by the constant attention given to our patients. Sri
Lanka private health at the top of our goal remains undiminished.
A military hospital treatment Ceylon British Opens and present employees of the
hospital predecessor
38
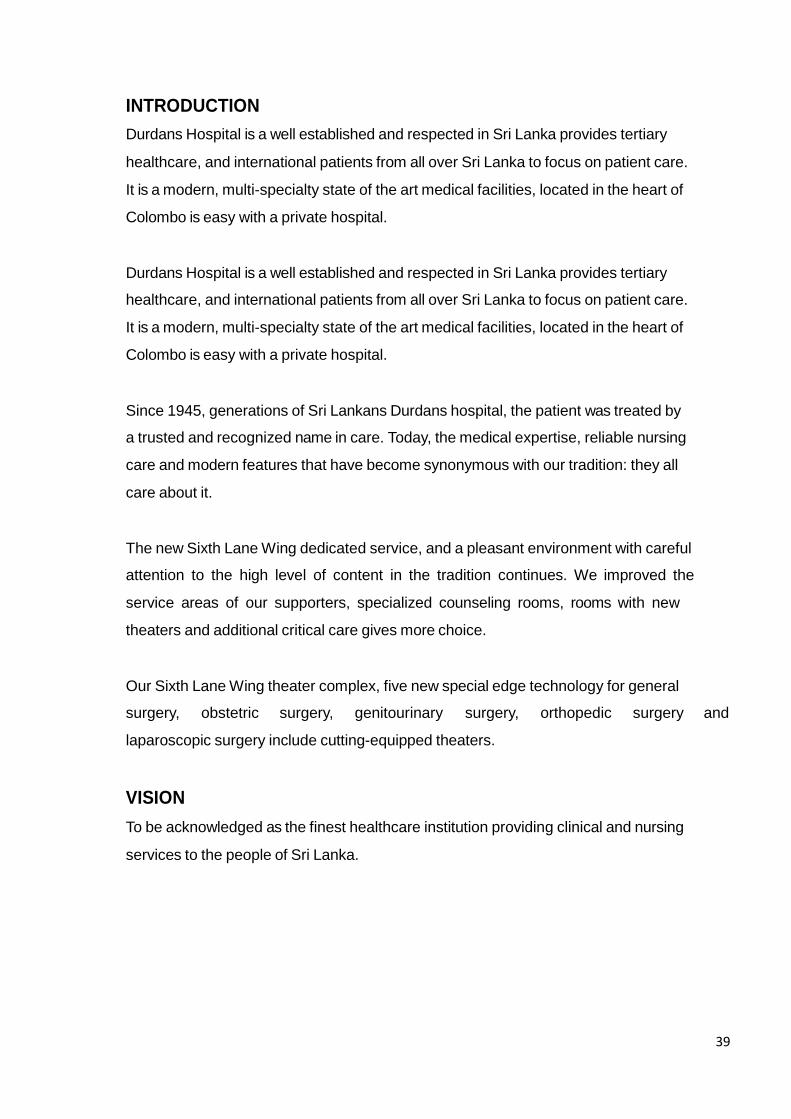
INTRODUCTION
Durdans Hospital is a well established and respected in Sri Lanka provides tertiary
healthcare, and international patients from all over Sri Lanka to focus on patient care.
It is a modern, multi-specialty state of the art medical facilities, located in the heart of
Colombo is easy with a private hospital.
Since 1945, generations of Sri Lankans Durdans hospital, the patient was treated by
a trusted and recognized name in care. Today, the medical expertise, reliable nursing
care and modern features that have become synonymous with our tradition: they all
care about it.
The new Sixth Lane Wing dedicated service, and a pleasant environment with careful
attention to the high level of content in the tradition continues. We improved the
service areas of our supporters, specialized counseling rooms, rooms with new
theaters and additional critical care gives more choice.
Our Sixth Lane Wing theater complex, five new special edge technology for general
surgery, obstetric surgery, genitourinary surgery, orthopedic surgery and
laparoscopic surgery include cutting-equipped theaters.
VISION
To be acknowledged as the finest healthcare institution providing clinical and nursing
services to the people of Sri Lanka.
39
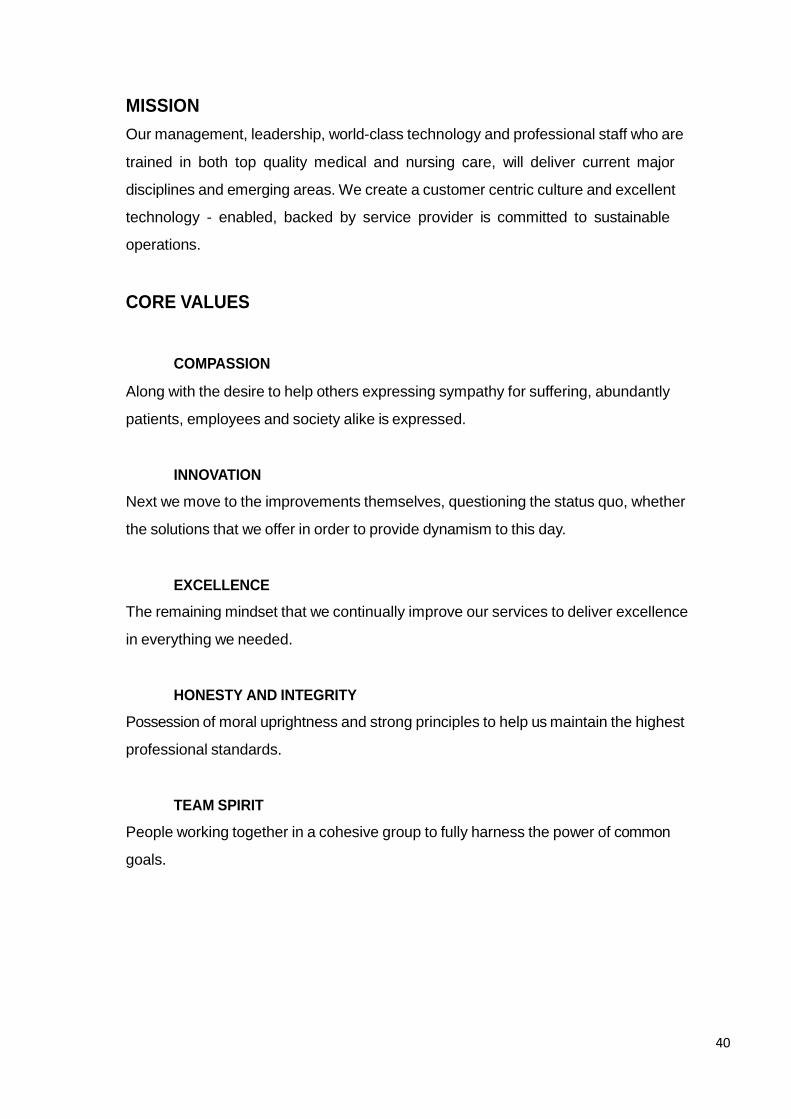
MISSION
Our management, leadership, world-class technology and professional staff who are
trained in both top quality medical and nursing care, will deliver current major
disciplines and emerging areas. We create a customer centric culture and excellent
technology - enabled, backed by service provider is committed to sustainable
operations.
CORE VALUES
COMPASSION
Along with the desire to help others expressing sympathy for suffering, abundantly
patients, employees and society alike is expressed.
INNOVATION
Next we move to the improvements themselves, questioning the status quo, whether
the solutions that we offer in order to provide dynamism to this day.
EXCELLENCE
The remaining mindset that we continually improve our services to deliver excellence
in everything we needed.
HONESTY AND INTEGRITY
Possession of moral uprightness and strong principles to help us maintain the highest
professional standards.
TEAM SPIRIT
People working together in a cohesive group to fully harness the power of common
goals.
40
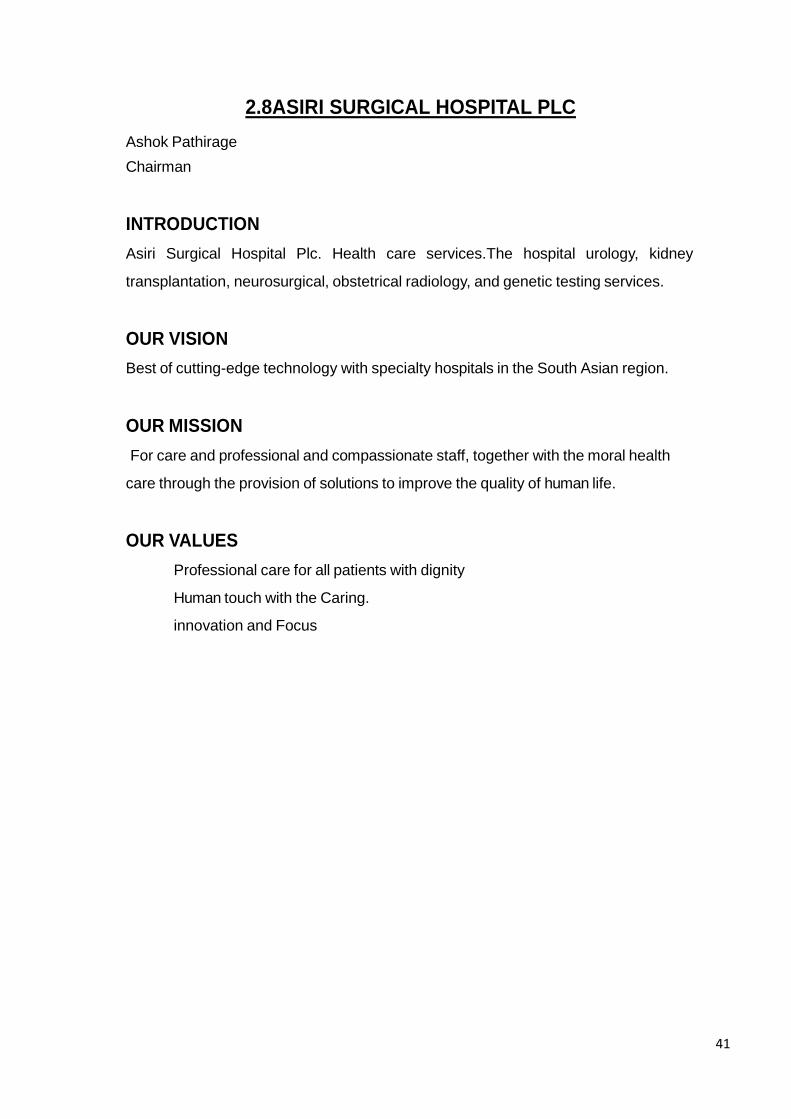
2.8ASIRI SURGICAL HOSPITAL PLC
Ashok Pathirage
Chairman
INTRODUCTION
Asiri Surgical Hospital Plc. Health care services.The hospital urology, kidney
transplantation, neurosurgical, obstetrical radiology, and genetic testing services.
OUR VISION
Best of cutting-edge technology with specialty hospitals in the South Asian region.
OUR MISSION
For care and professional and compassionate staff, together with the moral health
care through the provision of solutions to improve the quality of human life.
OUR VALUES
Professional care for all patients with dignity
Human touch with the Caring.
innovation and Focus
41

42
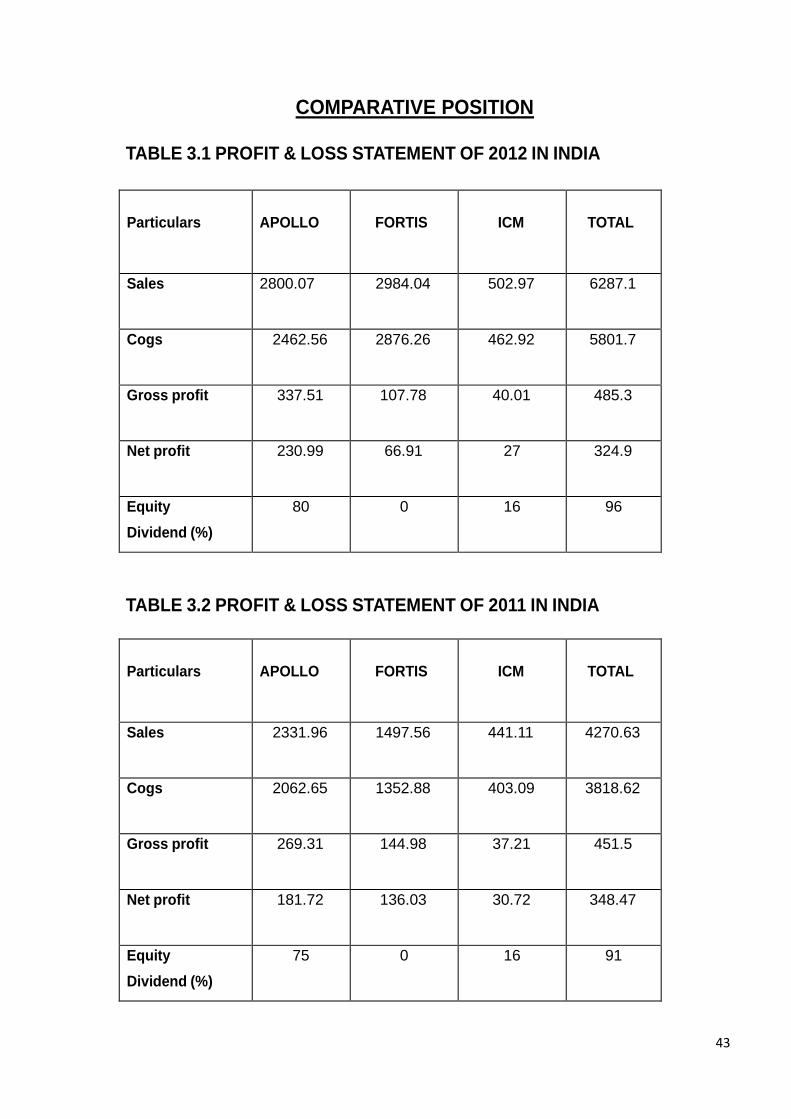
COMPARATIVE POSITION
TABLE 3.1 PROFIT & LOSS STATEMENT OF 2012 IN INDIA
TABLE 3.2 PROFIT & LOSS STATEMENT OF 2011 IN INDIA
43
Particulars APOLLO FORTIS ICM TOTAL
Sales 2331.96 1497.56 441.11 4270.63
Cogs 2062.65 1352.88 403.09 3818.62
Gross profit 269.31 144.98 37.21 451.5
Net profit 181.72 136.03 30.72 348.47
Equity
Dividend (%)
75 0 16 91
Particulars APOLLO FORTIS ICM TOTAL
Sales 2800.07 2984.04 502.97 6287.1
Cogs 2462.56 2876.26 462.92 5801.7
Gross profit 337.51 107.78 40.01 485.3
Net profit 230.99 66.91 27 324.9
Equity
Dividend (%)
80 0 16 96
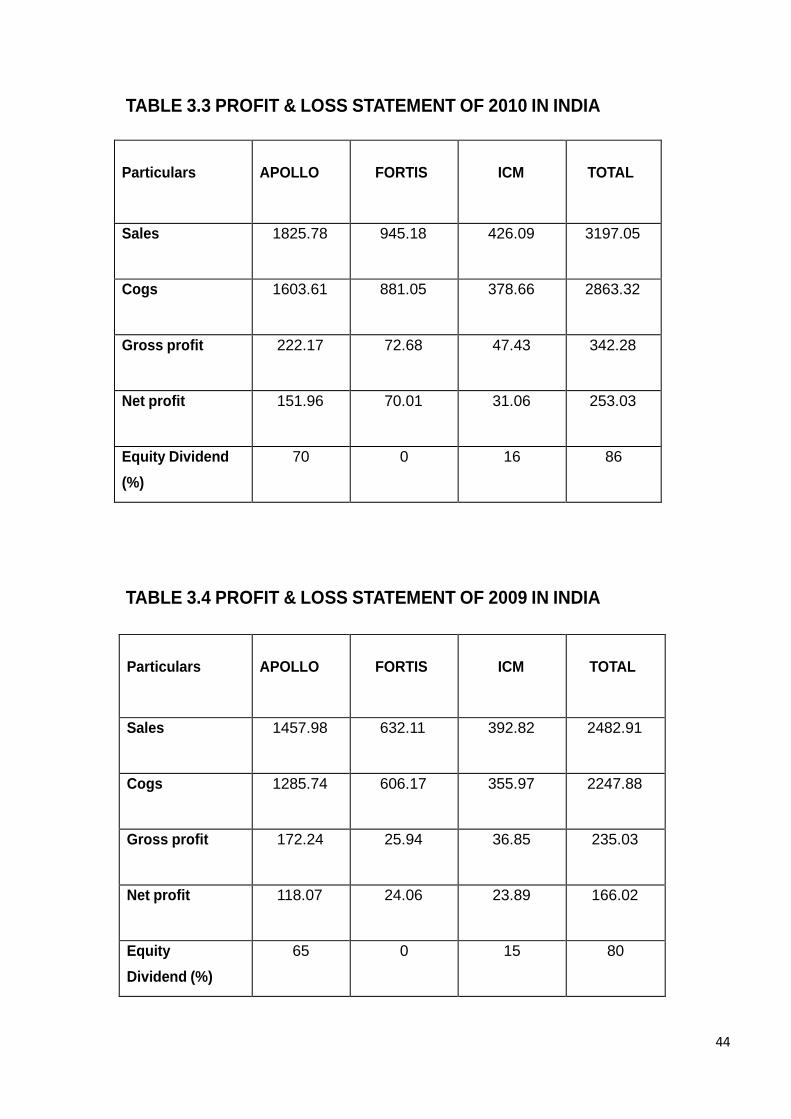
TABLE 3.3 PROFIT & LOSS STATEMENT OF 2010 IN INDIA
TABLE 3.4 PROFIT & LOSS STATEMENT OF 2009 IN INDIA
44
Particulars APOLLO FORTIS ICM TOTAL
Sales 1825.78 945.18 426.09 3197.05
Cogs 1603.61 881.05 378.66 2863.32
Gross profit 222.17 72.68 47.43 342.28
Net profit 151.96 70.01 31.06 253.03
Equity Dividend
(%)
70 0 16 86
Particulars APOLLO FORTIS ICM TOTAL
Sales 1457.98 632.11 392.82 2482.91
Cogs 1285.74 606.17 355.97 2247.88
Gross profit 172.24 25.94 36.85 235.03
Net profit 118.07 24.06 23.89 166.02
Equity
Dividend (%)
65 0 15 80
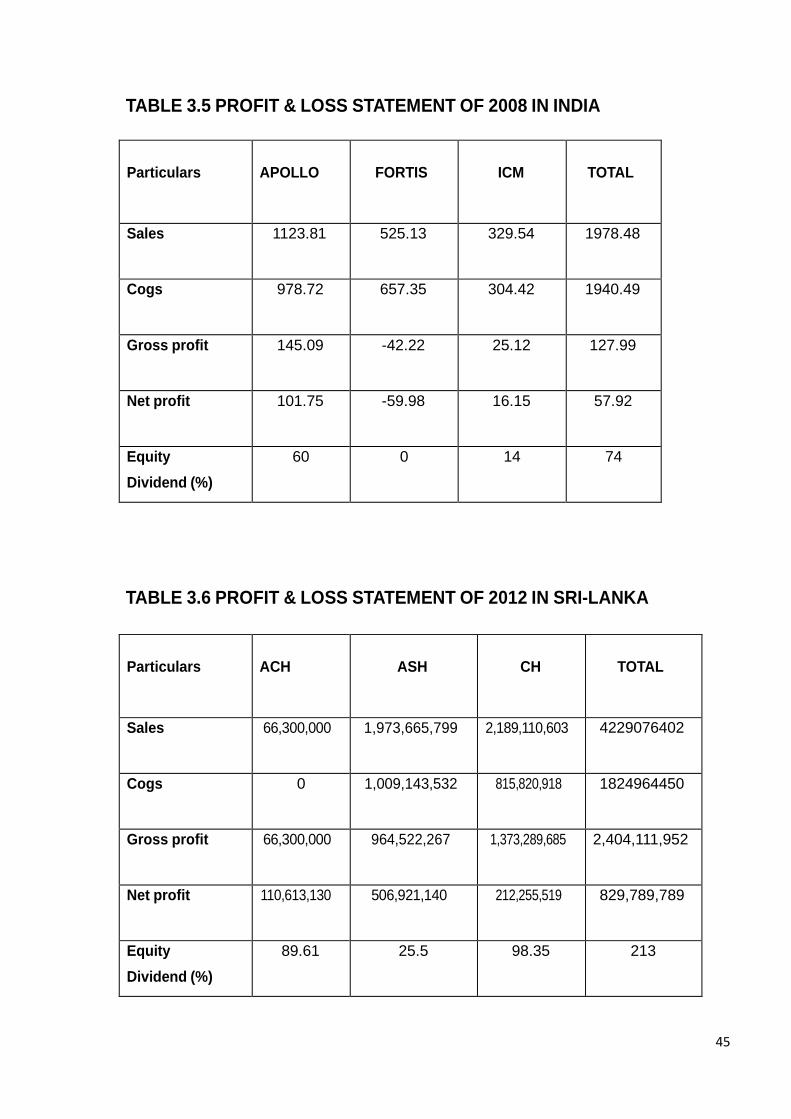
TABLE 3.5 PROFIT & LOSS STATEMENT OF 2008 IN INDIA
TABLE 3.6 PROFIT & LOSS STATEMENT OF 2012 IN SRI-LANKA
45
Particulars ACH ASH CH TOTAL
Sales 66,300,000 1,973,665,799 2,189,110,603 4229076402
Cogs 0 1,009,143,532 815,820,918 1824964450
Gross profit 66,300,000 964,522,267 1,373,289,685 2,404,111,952
Net profit 110,613,130 506,921,140 212,255,519 829,789,789
Equity
Dividend (%)
89.61 25.5 98.35 213
Particulars APOLLO FORTIS ICM TOTAL
Sales 1123.81 525.13 329.54 1978.48
Cogs 978.72 657.35 304.42 1940.49
Gross profit 145.09 -42.22 25.12 127.99
Net profit 101.75 -59.98 16.15 57.92
Equity
Dividend (%)
60 0 14 74
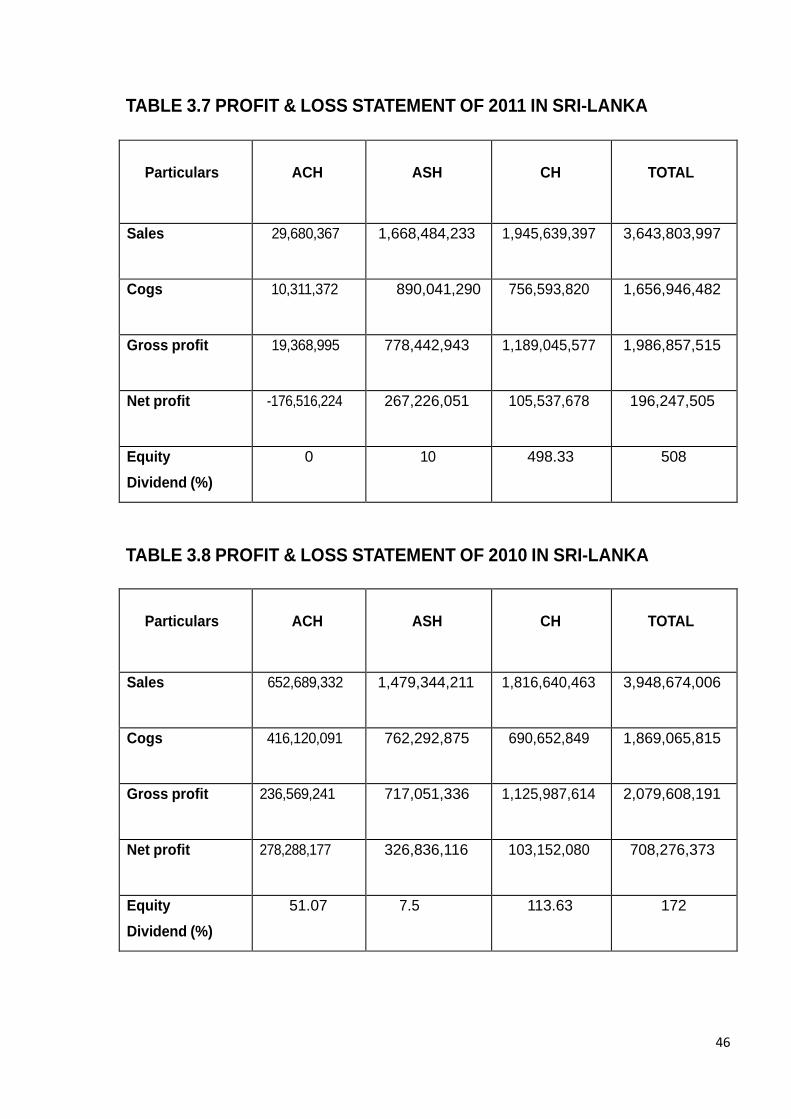
TABLE 3.7 PROFIT & LOSS STATEMENT OF 2011 IN SRI-LANKA TABLE 3.8 PROFIT & LOSS STATEMENT OF 2010 IN SRI-LANKA
46
Particulars ACH ASH CH TOTAL
Sales 652,689,332 1,479,344,211 1,816,640,463 3,948,674,006
Cogs 416,120,091 762,292,875 690,652,849 1,869,065,815
Gross profit 236,569,241 717,051,336 1,125,987,614 2,079,608,191
Net profit 278,288,177 326,836,116 103,152,080 708,276,373
Equity
Dividend (%)
51.07 7.5 113.63 172
Particulars ACH ASH CH TOTAL
Sales 29,680,367 1,668,484,233 1,945,639,397 3,643,803,997
Cogs 10,311,372 890,041,290 756,593,820 1,656,946,482
Gross profit 19,368,995 778,442,943 1,189,045,577 1,986,857,515
Net profit -176,516,224 267,226,051 105,537,678 196,247,505
Equity
Dividend (%)
0 10 498.33 508
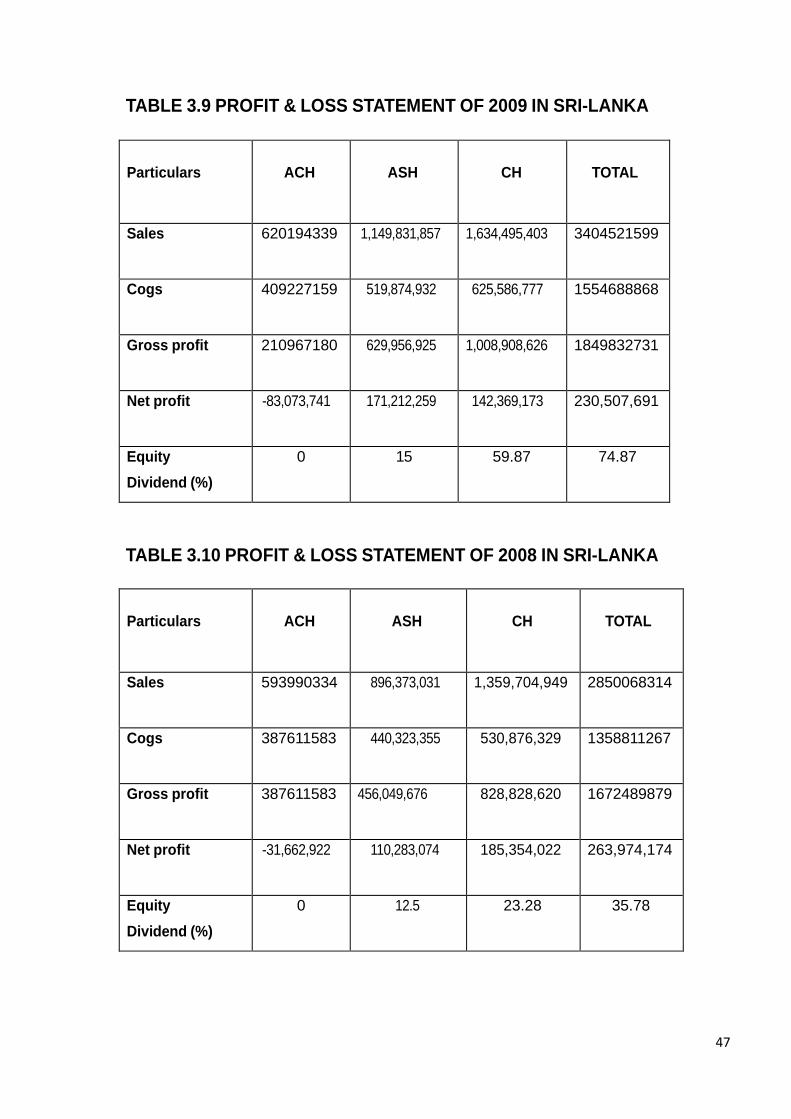
TABLE 3.9 PROFIT & LOSS STATEMENT OF 2009 IN SRI-LANKA TABLE 3.10 PROFIT & LOSS STATEMENT OF 2008 IN SRI-LANKA
47
Particulars ACH ASH CH TOTAL
Sales 593990334 896,373,031 1,359,704,949 2850068314
Cogs 387611583 440,323,355 530,876,329 1358811267
Gross profit 387611583 456,049,676 828,828,620 1672489879
Net profit -31,662,922 110,283,074 185,354,022 263,974,174
Equity
Dividend (%)
0 12.5 23.28 35.78
Particulars ACH ASH CH TOTAL
Sales 620194339 1,149,831,857 1,634,495,403 3404521599
Cogs 409227159 519,874,932 625,586,777 1554688868
Gross profit 210967180 629,956,925 1,008,908,626 1849832731
Net profit -83,073,741 171,212,259 142,369,173 230,507,691
Equity
Dividend (%)
0 15 59.87 74.87
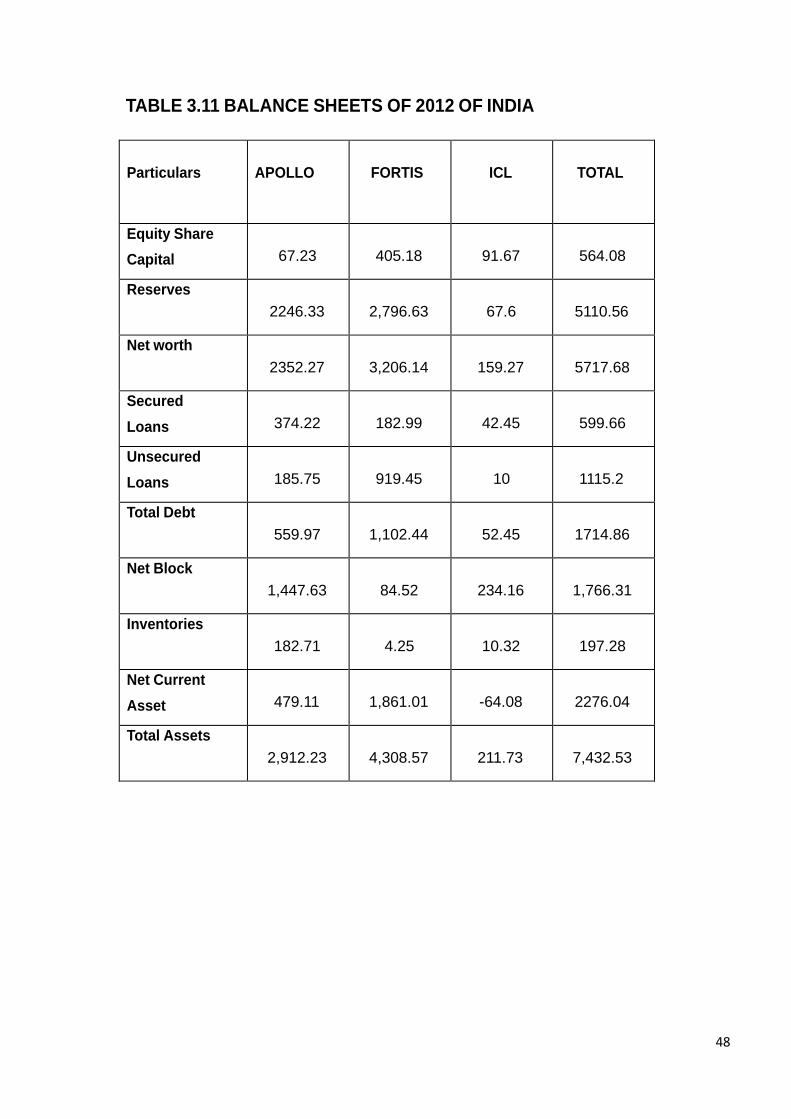
TABLE 3.11 BALANCE SHEETS OF 2012 OF INDIA
48
Particulars APOLLO FORTIS ICL TOTAL
Equity Share
Capital 67.23 405.18 91.67 564.08
Reserves
2246.33 2,796.63 67.6 5110.56
Net worth
2352.27 3,206.14 159.27 5717.68
Secured
Loans 374.22 182.99 42.45 599.66
Unsecured
Loans 185.75 919.45 10 1115.2
Total Debt
559.97 1,102.44 52.45 1714.86
Net Block
1,447.63 84.52 234.16 1,766.31
Inventories
182.71 4.25 10.32 197.28
Net Current
Asset 479.11 1,861.01 -64.08 2276.04
Total Assets
2,912.23 4,308.57 211.73 7,432.53
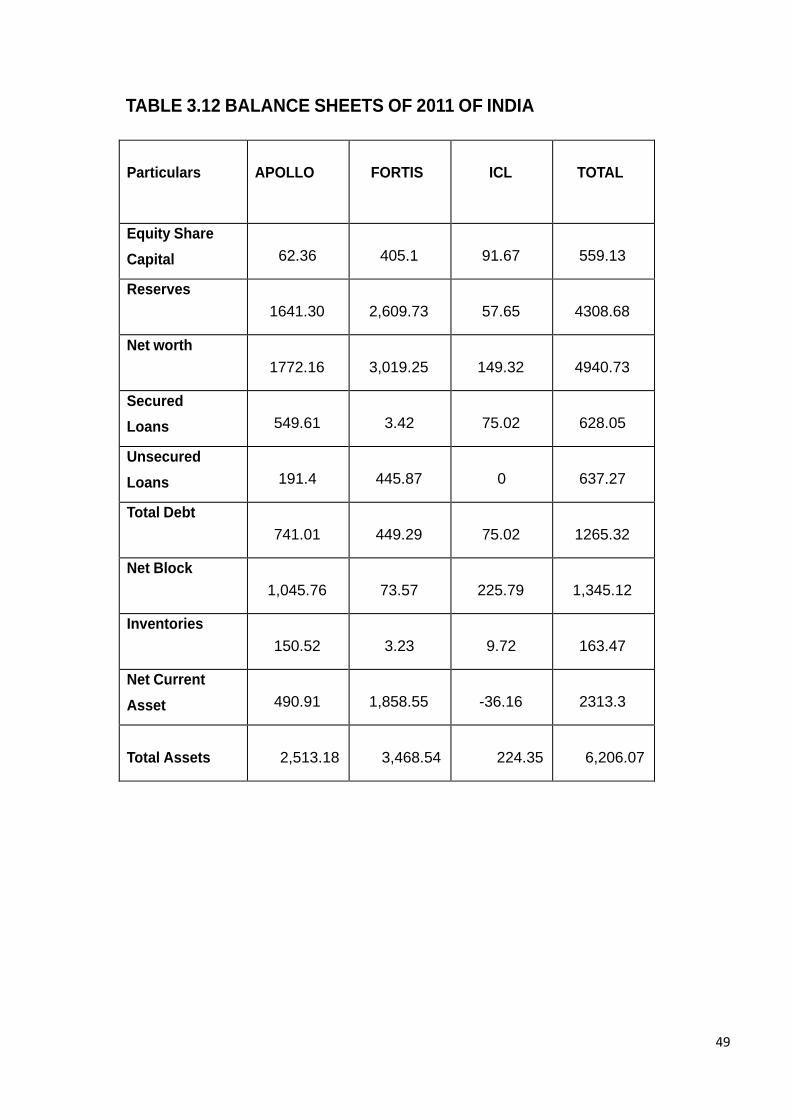
TABLE 3.12 BALANCE SHEETS OF 2011 OF INDIA
49
Particulars APOLLO FORTIS ICL TOTAL
Equity Share
Capital 62.36 405.1 91.67 559.13
Reserves
1641.30 2,609.73 57.65 4308.68
Net worth
1772.16 3,019.25 149.32 4940.73
Secured
Loans 549.61 3.42 75.02 628.05
Unsecured
Loans 191.4 445.87 0 637.27
Total Debt
741.01 449.29 75.02 1265.32
Net Block
1,045.76 73.57 225.79 1,345.12
Inventories
150.52 3.23 9.72 163.47
Net Current
Asset 490.91 1,858.55 -36.16 2313.3
Total Assets 2,513.18 3,468.54 224.35 6,206.07
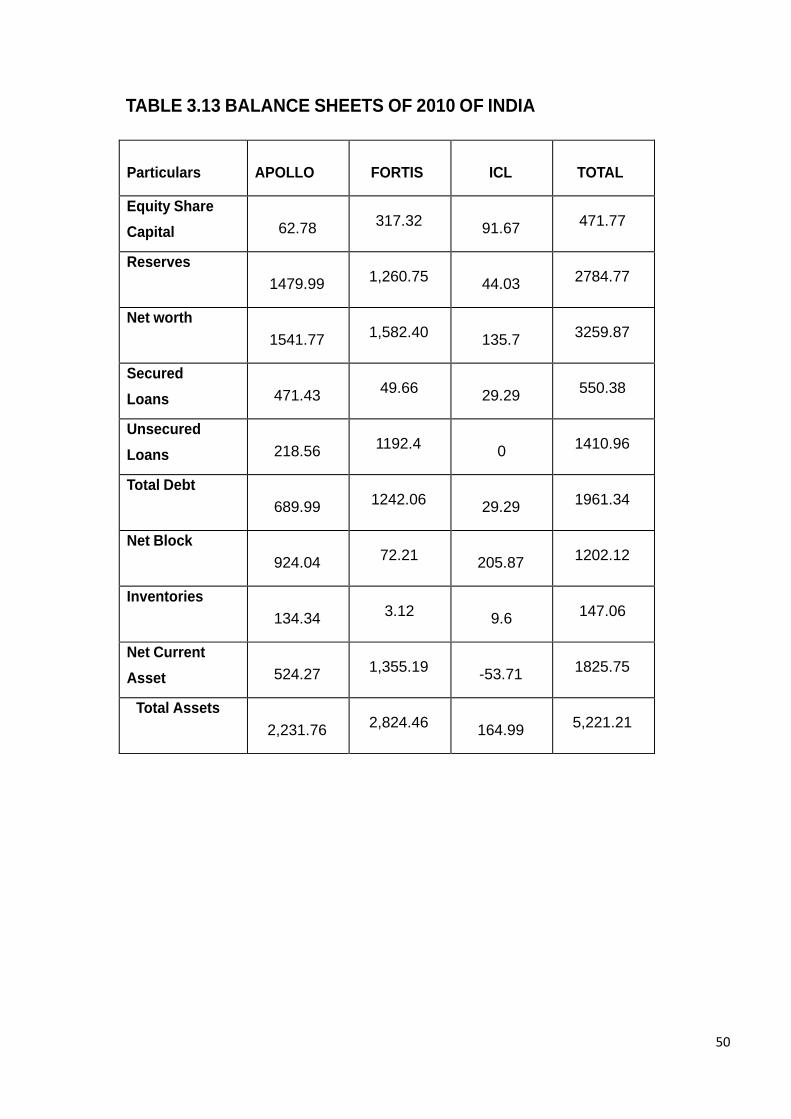
TABLE 3.13 BALANCE SHEETS OF 2010 OF INDIA
50
Particulars APOLLO FORTIS ICL TOTAL
Equity Share
Capital 62.78 317.32
91.67 471.77
Reserves
1479.99 1,260.75
44.03 2784.77
Net worth
1541.77 1,582.40
135.7 3259.87
Secured
Loans 471.43 49.66
29.29 550.38
Unsecured
Loans 218.56 1192.4
0 1410.96
Total Debt
689.99 1242.06
29.29 1961.34
Net Block
924.04 72.21
205.87 1202.12
Inventories
134.34 3.12
9.6 147.06
Net Current
Asset 524.27 1,355.19
-53.71 1825.75
Total Assets
2,231.76 2,824.46
164.99 5,221.21
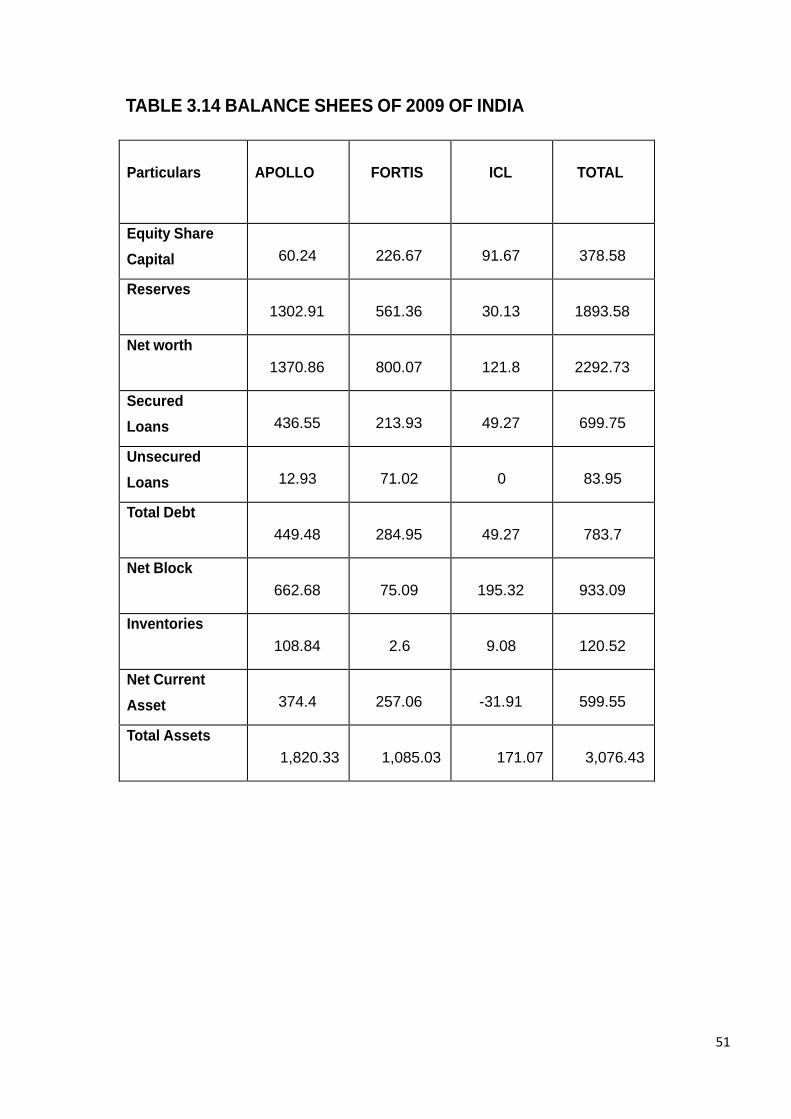
TABLE 3.14 BALANCE SHEES OF 2009 OF INDIA
51
Particulars APOLLO FORTIS ICL TOTAL
Equity Share
Capital 60.24 226.67 91.67 378.58
Reserves
1302.91 561.36 30.13 1893.58
Net worth
1370.86 800.07 121.8 2292.73
Secured
Loans 436.55 213.93 49.27 699.75
Unsecured
Loans 12.93 71.02 0 83.95
Total Debt
449.48 284.95 49.27 783.7
Net Block
662.68 75.09 195.32 933.09
Inventories
108.84 2.6 9.08 120.52
Net Current
Asset 374.4 257.06 -31.91 599.55
Total Assets
1,820.33 1,085.03 171.07 3,076.43
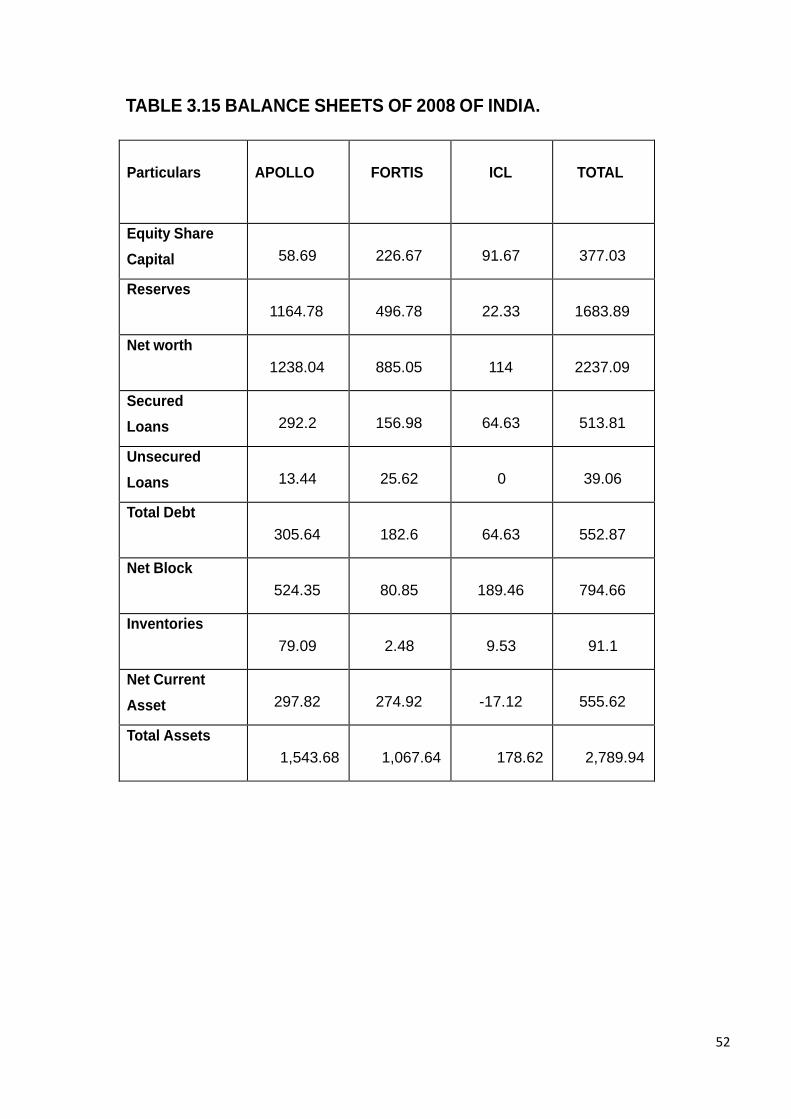
TABLE 3.15 BALANCE SHEETS OF 2008 OF INDIA.
52
Particulars APOLLO FORTIS ICL TOTAL
Equity Share
Capital 58.69 226.67 91.67 377.03
Reserves
1164.78 496.78 22.33 1683.89
Net worth
1238.04 885.05 114 2237.09
Secured
Loans 292.2 156.98 64.63 513.81
Unsecured
Loans 13.44 25.62 0 39.06
Total Debt
305.64 182.6 64.63 552.87
Net Block
524.35 80.85 189.46 794.66
Inventories
79.09 2.48 9.53 91.1
Net Current
Asset 297.82 274.92 -17.12 555.62
Total Assets
1,543.68 1,067.64 178.62 2,789.94
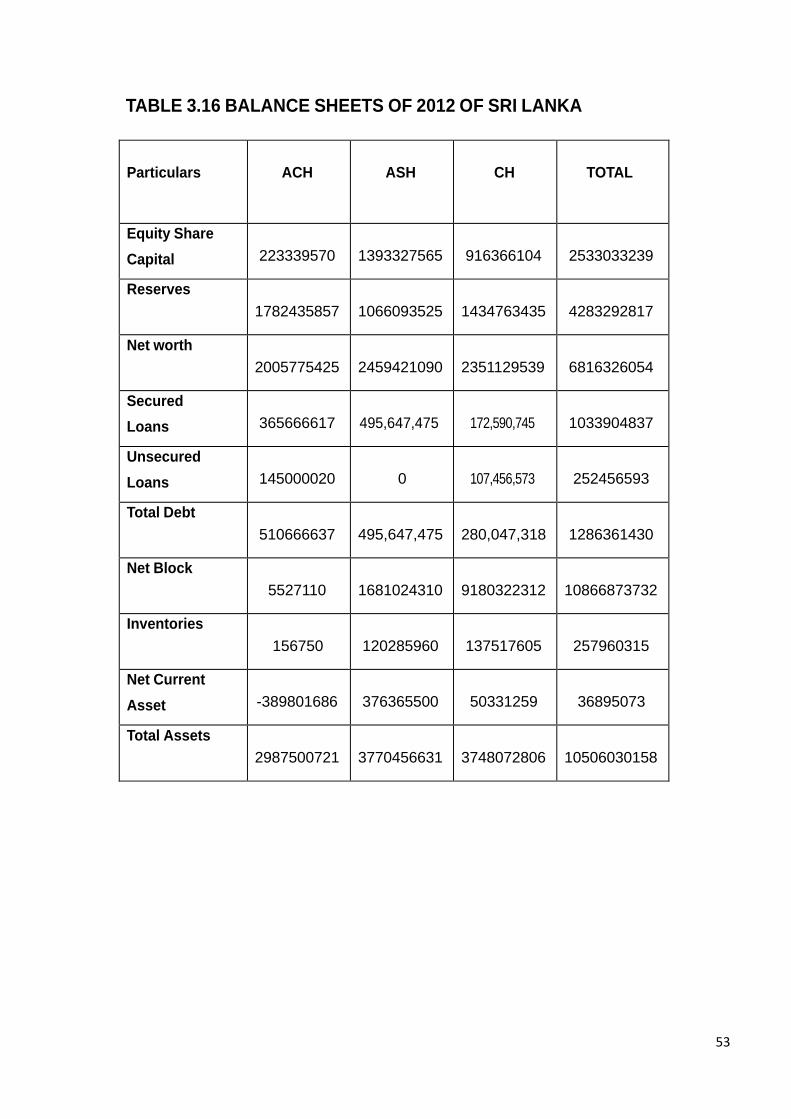
TABLE 3.16 BALANCE SHEETS OF 2012 OF SRI LANKA
53
Particulars ACH ASH CH TOTAL
Equity Share
Capital 223339570 1393327565 916366104 2533033239
Reserves
1782435857 1066093525 1434763435 4283292817
Net worth
2005775425 2459421090 2351129539 6816326054
Secured
Loans 365666617 495,647,475 172,590,745 1033904837
Unsecured
Loans 145000020 0 107,456,573 252456593
Total Debt
510666637 495,647,475 280,047,318 1286361430
Net Block
5527110 1681024310 9180322312 10866873732
Inventories
156750 120285960 137517605 257960315
Net Current
Asset -389801686 376365500 50331259 36895073
Total Assets
2987500721 3770456631 3748072806 10506030158
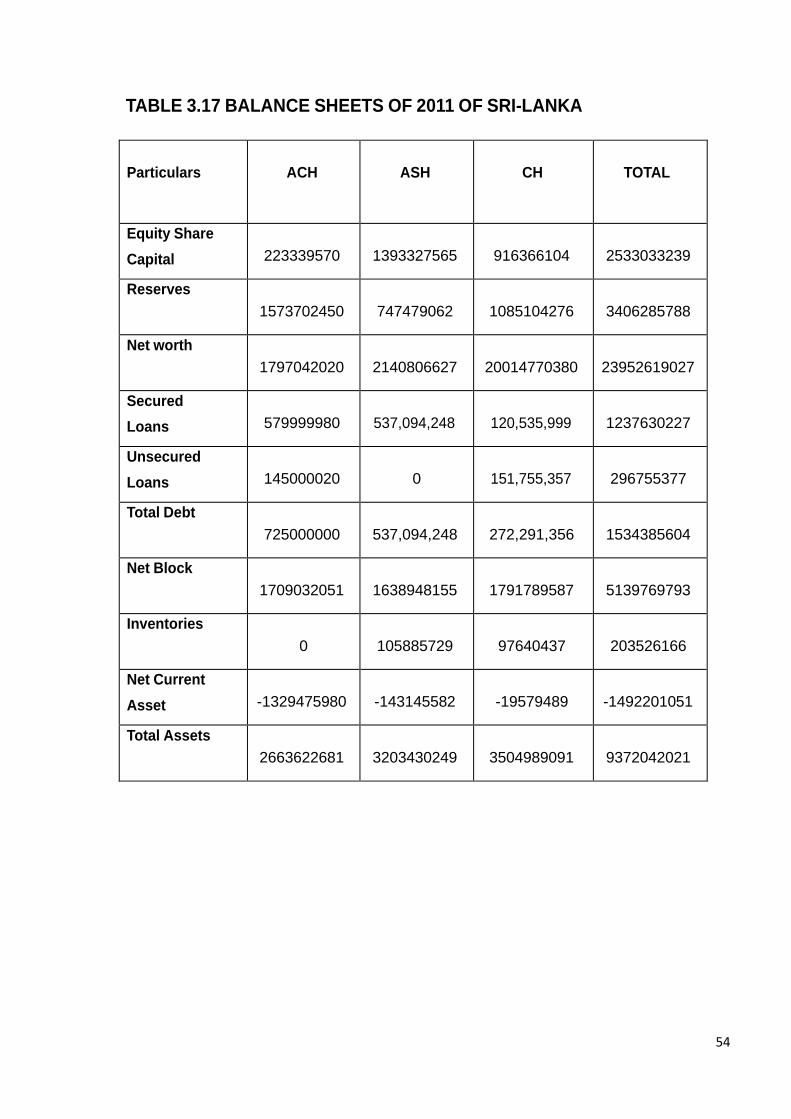
TABLE 3.17 BALANCE SHEETS OF 2011 OF SRI-LANKA
54
Particulars ACH ASH CH TOTAL
Equity Share
Capital 223339570 1393327565 916366104 2533033239
Reserves
1573702450 747479062 1085104276 3406285788
Net worth
1797042020 2140806627 20014770380 23952619027
Secured
Loans 579999980 537,094,248 120,535,999 1237630227
Unsecured
Loans 145000020 0 151,755,357 296755377
Total Debt
725000000 537,094,248 272,291,356 1534385604
Net Block
1709032051 1638948155 1791789587 5139769793
Inventories
0 105885729 97640437 203526166
Net Current
Asset -1329475980 -143145582 -19579489 -1492201051
Total Assets
2663622681 3203430249 3504989091 9372042021
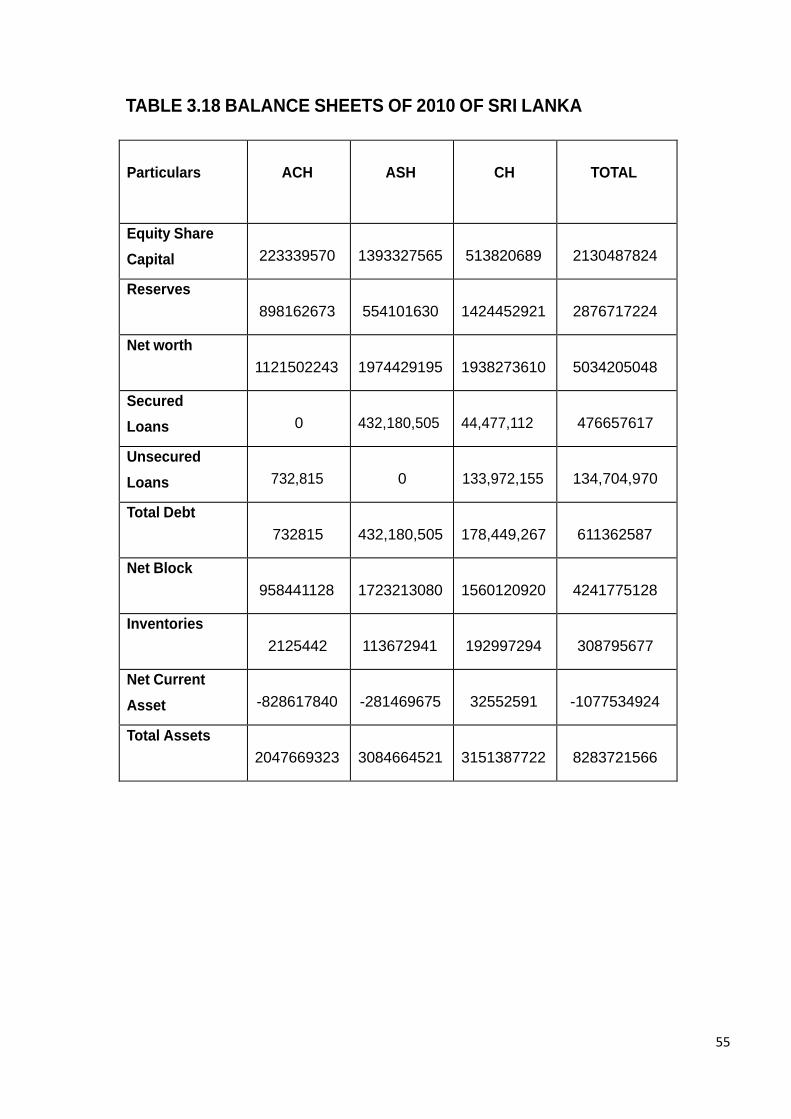
TABLE 3.18 BALANCE SHEETS OF 2010 OF SRI LANKA
55
Particulars ACH ASH CH TOTAL
Equity Share
Capital 223339570 1393327565 513820689 2130487824
Reserves
898162673 554101630 1424452921 2876717224
Net worth
1121502243 1974429195 1938273610 5034205048
Secured
Loans 0 432,180,505 44,477,112 476657617
Unsecured
Loans 732,815 0 133,972,155 134,704,970
Total Debt
732815 432,180,505 178,449,267 611362587
Net Block
958441128 1723213080 1560120920 4241775128
Inventories
2125442 113672941 192997294 308795677
Net Current
Asset -828617840 -281469675 32552591 -1077534924
Total Assets
2047669323 3084664521 3151387722 8283721566
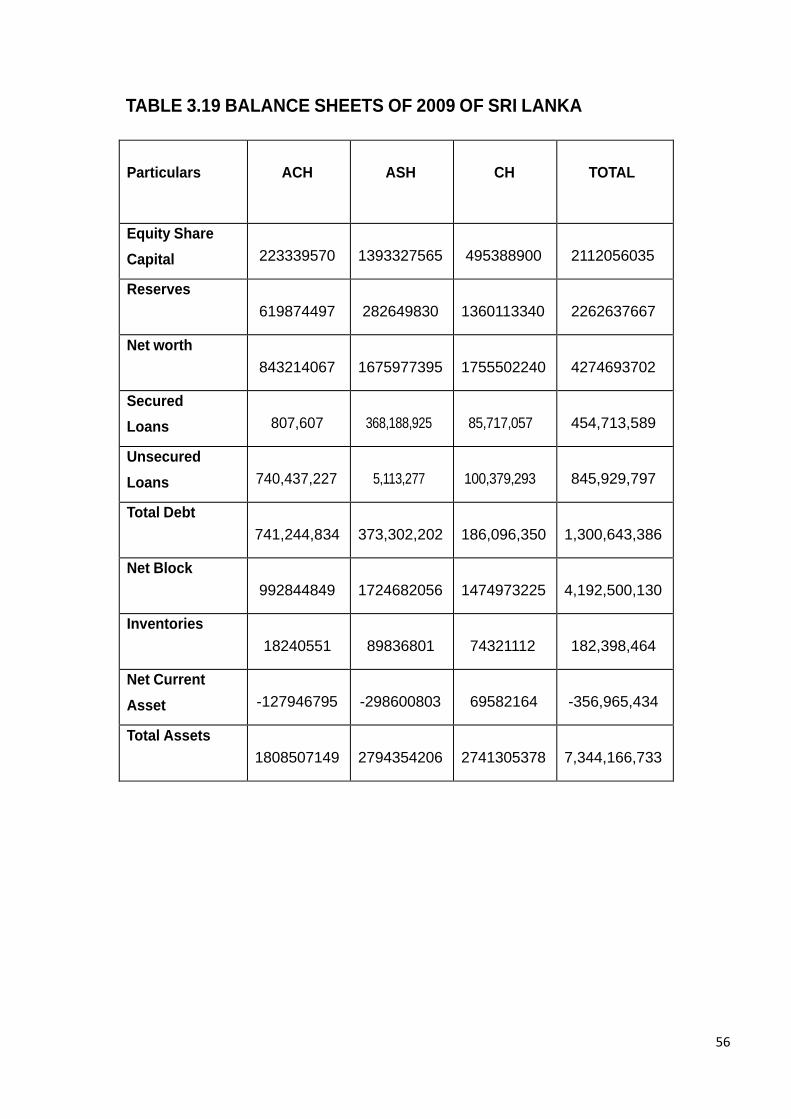
TABLE 3.19 BALANCE SHEETS OF 2009 OF SRI LANKA
56
Particulars ACH ASH CH TOTAL
Equity Share
Capital 223339570 1393327565 495388900 2112056035
Reserves
619874497 282649830 1360113340 2262637667
Net worth
843214067 1675977395 1755502240 4274693702
Secured
Loans 807,607 368,188,925 85,717,057 454,713,589
Unsecured
Loans 740,437,227 5,113,277 100,379,293 845,929,797
Total Debt
741,244,834 373,302,202 186,096,350 1,300,643,386
Net Block
992844849 1724682056 1474973225 4,192,500,130
Inventories
18240551 89836801 74321112 182,398,464
Net Current
Asset -127946795 -298600803 69582164 -356,965,434
Total Assets
1808507149 2794354206 2741305378 7,344,166,733
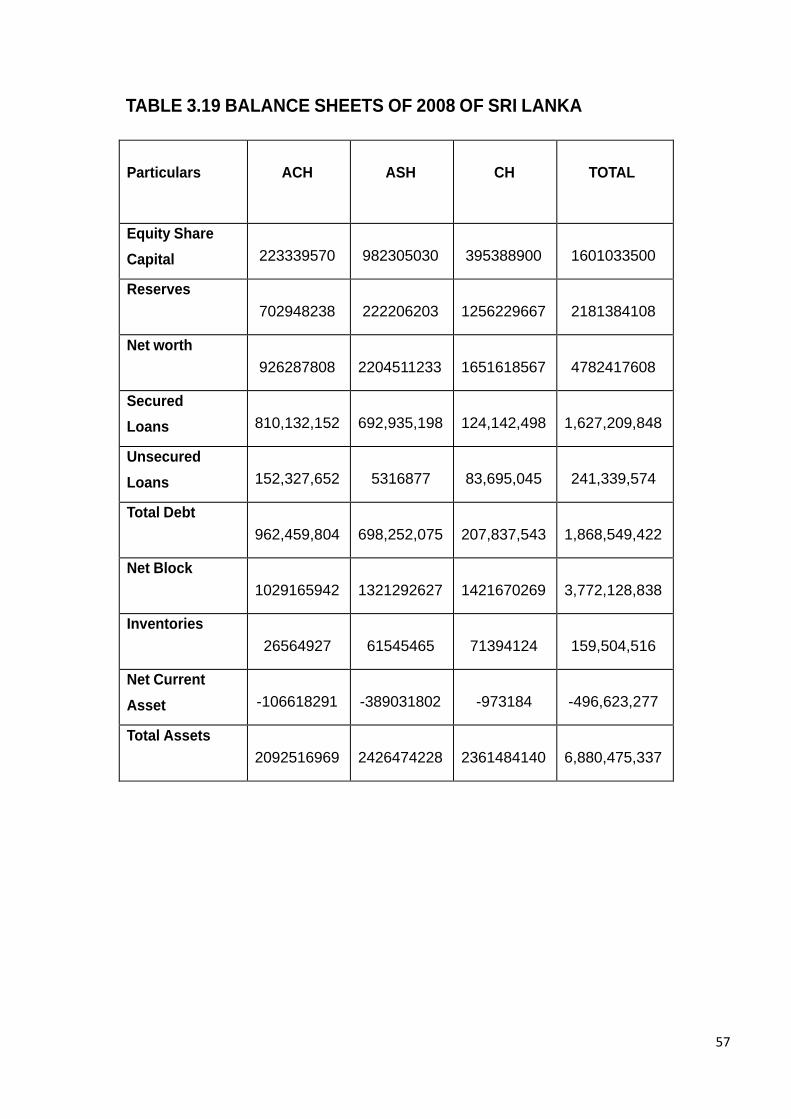
TABLE 3.19 BALANCE SHEETS OF 2008 OF SRI LANKA
57
Particulars ACH ASH CH TOTAL
Equity Share
Capital 223339570 982305030 395388900 1601033500
Reserves
702948238 222206203 1256229667 2181384108
Net worth
926287808 2204511233 1651618567 4782417608
Secured
Loans 810,132,152 692,935,198 124,142,498 1,627,209,848
Unsecured
Loans 152,327,652 5316877 83,695,045 241,339,574
Total Debt
962,459,804 698,252,075 207,837,543 1,868,549,422
Net Block
1029165942 1321292627 1421670269 3,772,128,838
Inventories
26564927 61545465 71394124 159,504,516
Net Current
Asset -106618291 -389031802 -973184 -496,623,277
Total Assets
2092516969 2426474228 2361484140 6,880,475,337
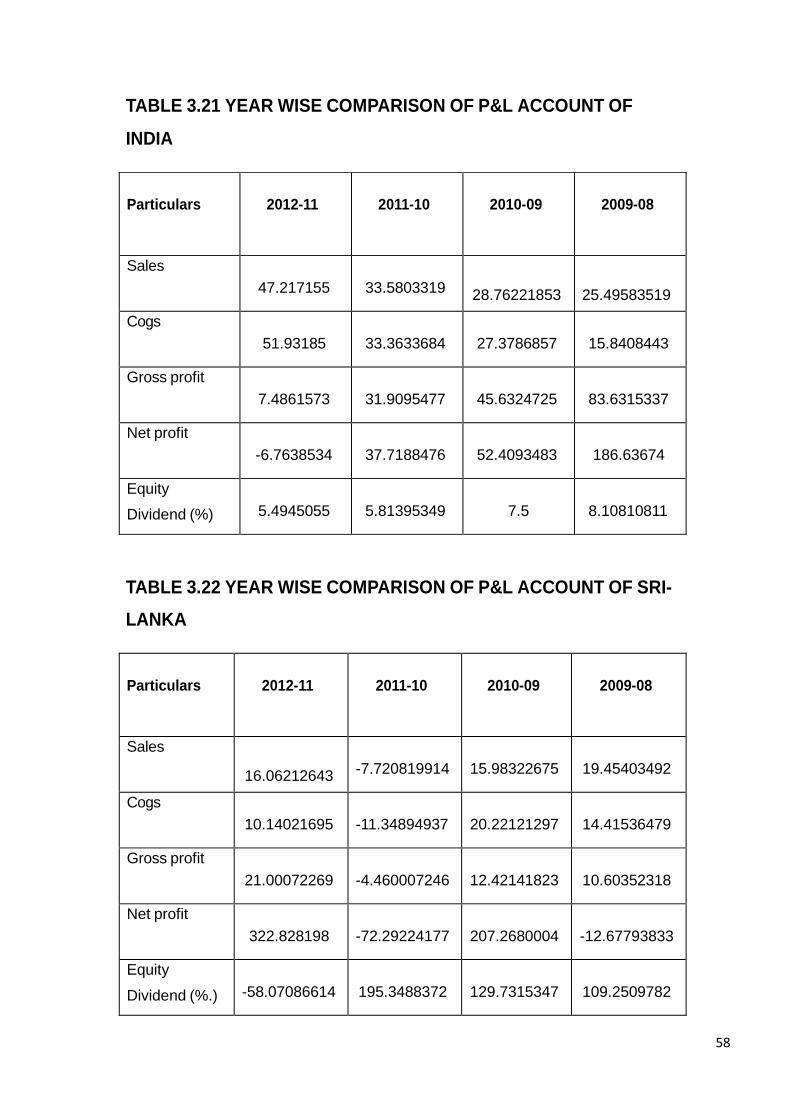
TABLE 3.21 YEAR WISE COMPARISON OF P&L ACCOUNT OF INDIA TABLE 3.22 YEAR WISE COMPARISON OF P&L ACCOUNT OF SRI- LANKA
58
Particulars 2012-11 2011-10 2010-09 2009-08
Sales
16.06212643 -7.720819914 15.98322675 19.45403492
Cogs
10.14021695 -11.34894937 20.22121297 14.41536479
Gross profit
21.00072269 -4.460007246 12.42141823 10.60352318
Net profit
322.828198 -72.29224177 207.2680004 -12.67793833
Equity
Dividend (%.) -58.07086614 195.3488372 129.7315347 109.2509782
Particulars 2012-11 2011-10 2010-09 2009-08
Sales
47.217155 33.5803319 28.76221853 25.49583519
Cogs
51.93185 33.3633684 27.3786857 15.8408443
Gross profit
7.4861573 31.9095477 45.6324725 83.6315337
Net profit
-6.7638534 37.7188476 52.4093483 186.63674
Equity
Dividend (%) 5.4945055 5.81395349 7.5 8.10810811
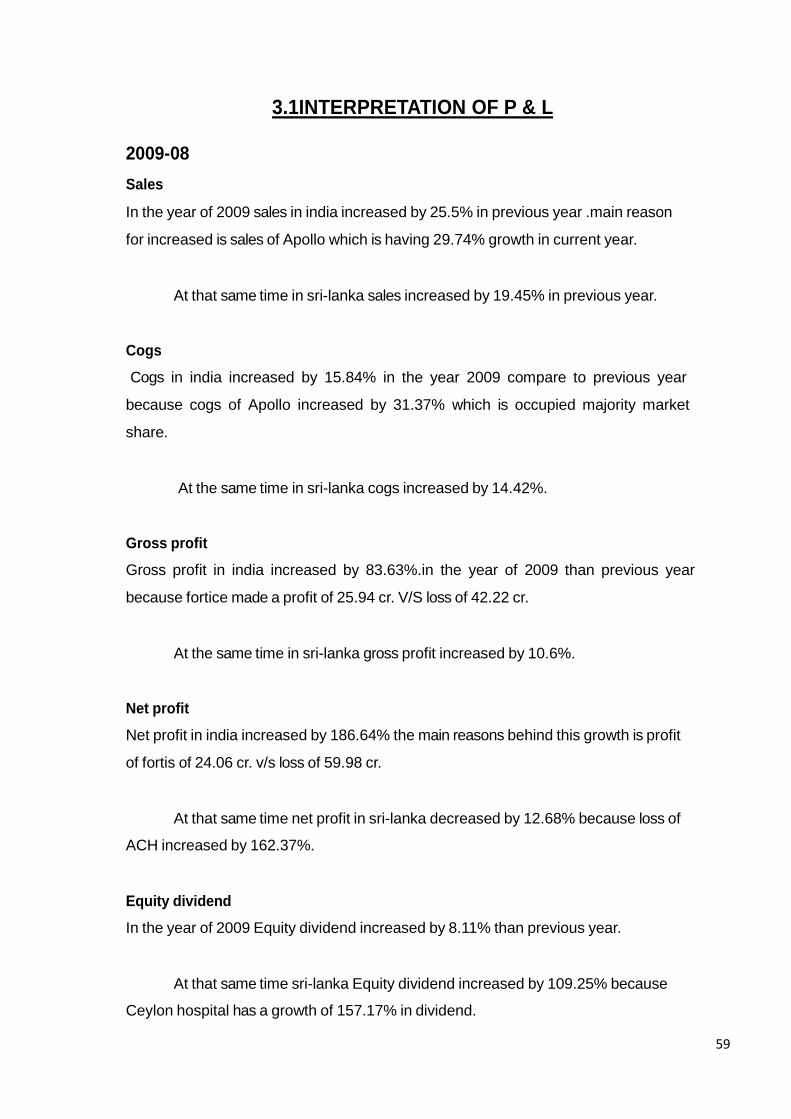
3.1INTERPRETATION OF P & L
2009-08
Sales
In the year of 2009 sales in india increased by 25.5% in previous year .main reason
for increased is sales of Apollo which is having 29.74% growth in current year.
At that same time in sri-lanka sales increased by 19.45% in previous year.
Cogs
Cogs in india increased by 15.84% in the year 2009 compare to previous year
because cogs of Apollo increased by 31.37% which is occupied majority market
share.
At the same time in sri-lanka cogs increased by 14.42%.
Gross profit
Gross profit in india increased by 83.63%.in the year of 2009 than previous year
because fortice made a profit of 25.94 cr. V/S loss of 42.22 cr.
At the same time in sri-lanka gross profit increased by 10.6%.
Net profit
Net profit in india increased by 186.64% the main reasons behind this growth is profit
of fortis of 24.06 cr. v/s loss of 59.98 cr.
At that same time net profit in sri-lanka decreased by 12.68% because loss of
ACH increased by 162.37%.
Equity dividend
In the year of 2009 Equity dividend increased by 8.11% than previous year.
At that same time sri-lanka Equity dividend increased by 109.25% because
Ceylon hospital has a growth of 157.17% in dividend.
59
2010-09
Sales
In the year of 2010 sales in india increased by 28.7% in previous year .main reason
for increased is sales of fortis which is having 49.6% growth in current year.
At that same time in sri-lanka sales increased by 15.98% in previous year.
Cogs
Cogs in india increased by 27.37% in the year 2010 compare to previous year
because cogs of fortis increased by 45.35% which is occupied majority market share.
At the same time in sri-lanka cogs increased by 20.22%.
Gross profit
Gross profit in india increased by 45.63%.in the year of 2010 than previous year
because fortice made a profit of 180.16% cr. (like increased by almost 3 times than
the previous year)
At the same time in sri-lanka gross profit increased by 12.42%
Net profit
Net profit in india increased by 52.40% the main reasons behind this growth is profit
of fortis company almost 2 times increased than the previous year
At that same time net profit in sri-lanka increased by 207.26% because
increased 191%.i ASH this company ACH tunes. In profit of Rs. 278,288,177 v/s a
loss of Rs. 83,073,741 in 2010.
Equity dividend
In the year of 2010 Equity dividend increased by 7.5% previous year at the same
time.
60
At that same time sri-lanka Equity dividend increased by 129.73% because in
the year of 2010 ACH turns in to profit so they have paid 51.07% dividend in 2010.at
the same time Ceylon hospital has paid 113.63% dividend in 2010 v/s 59.87 in 2010.
2011-2010
Sales
In the year of 2011 sales in india increased by 33.5%.
At that same time in sri-lanka sales decrease by 7.77%.because 2011 ACH
company loss of sales Rs.29, 680,367.
Cogs
Cogs in india increased by 33.36% in the year 2011.
At the same time in sri-lanka cogs decrease by 11.34%.because main
reasons of ACH hospital loss of previous year 2011.
Gross profit
Gross profit in india increased by 31.90%.in the year of 2011 than previous year
because fortis made a profit of 99%.
At the same time in sri-lanka gross profit decrease by 4.46%.because main
reasons of the loss of ACH company in 2011.
Net profit
Net profit in india increased by 37.71% the main reasons behind this growth is profit
of fortis of 94% in 2011.
At that same time net profit in sri-lanka decreased by 72.29% because loss of
ACH decreased by 163.42%.
61
Equity dividend
In the year of 2011 Equity dividend increased by 5.8% than previous year.
At that same time sri-lanka Equity dividend increased by 195.34% because
Ceylon hospital has a growth of 338% in dividend.
2012-2011
Sales
In the year of 2012 sales in india increased by 47.27% in previous year main reason
for increased is sales of fortis which is having 99% growth in current year.
At that same time in sri-lanka sales increased by 16%.because main reasons
of ACH company increase by 123% in 2012.
Cogs
Cogs in india increased by 51.93% in the year 2012 compare to previous year
because cogs of fortis increased by 112% which is occupied majority market share.
At the same time in sri-lanka cogs increased by 10.14%.
Gross profit
Gross profit in india increased by 7.48%.in the year of 2012.
At the same time in sri-lanka gross profit increased by 21%.Because main
reasons of the ACH hospital increase by 242% in 2012.
Net profit
Net profit in india decrease by 6.76% the main reasons behind this is loss of fortis
decrease by 50.81% in 2012.
At that same time net profit in sri-lanka increase by 322.82% because profit of
CH increase by 101%.
62
Equity dividend
In the year of 2012 Equity dividend increased by 5.49%.
At that same time sri-lanka Equity dividend decrease by 58% because Ceylon
hospital has a loss of 80.26% in 2012.
63
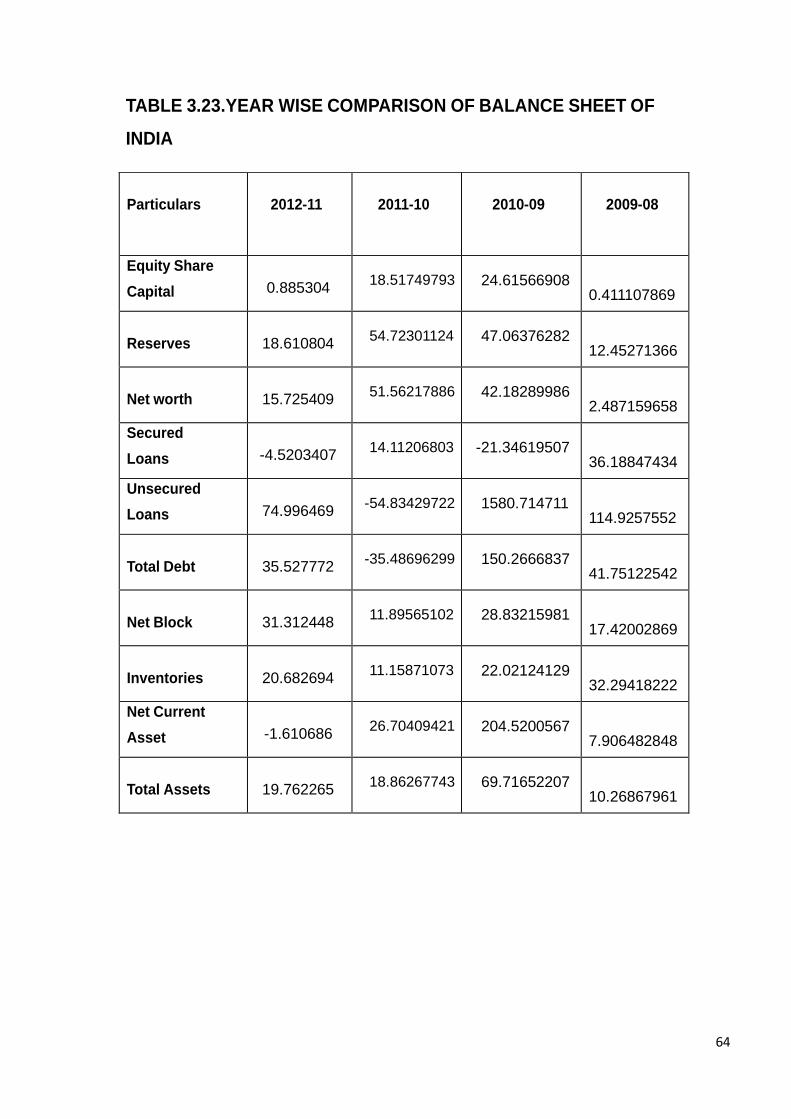
TABLE 3.23.YEAR WISE COMPARISON OF BALANCE SHEET OF INDIA
64
Particulars 2012-11 2011-10 2010-09 2009-08
Equity Share
Capital 0.885304 18.51749793 24.61566908
0.411107869
Reserves 18.610804 54.72301124 47.06376282
12.45271366
Net worth 15.725409 51.56217886 42.18289986
2.487159658
Secured
Loans -4.5203407 14.11206803 -21.34619507
36.18847434
Unsecured
Loans 74.996469 -54.83429722 1580.714711
114.9257552
Total Debt 35.527772 -35.48696299 150.2666837
41.75122542
Net Block 31.312448 11.89565102 28.83215981
17.42002869
Inventories 20.682694 11.15871073 22.02124129
32.29418222
Net Current
Asset -1.610686 26.70409421 204.5200567
7.906482848
Total Assets 19.762265 18.86267743 69.71652207
10.26867961
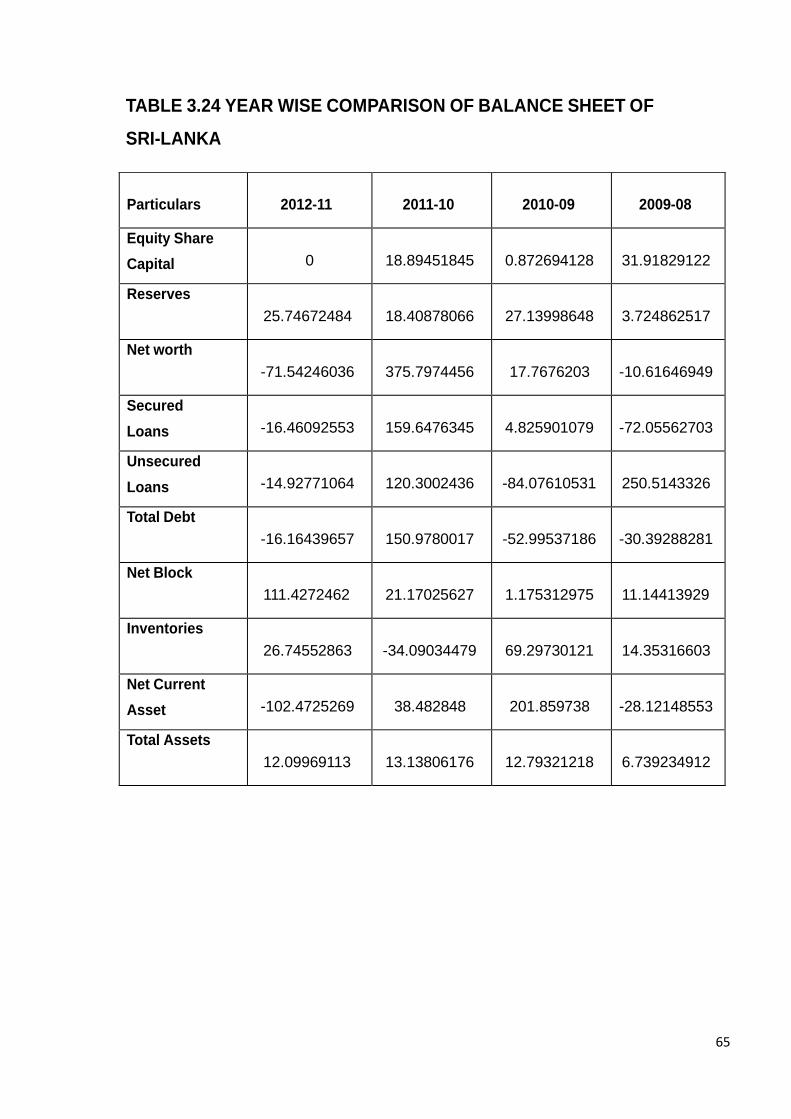
TABLE 3.24 YEAR WISE COMPARISON OF BALANCE SHEET OF SRI-LANKA
65
Particulars 2012-11 2011-10 2010-09 2009-08
Equity Share
Capital 0 18.89451845 0.872694128 31.91829122
Reserves
25.74672484 18.40878066 27.13998648 3.724862517
Net worth
-71.54246036 375.7974456 17.7676203 -10.61646949
Secured
Loans -16.46092553 159.6476345 4.825901079 -72.05562703
Unsecured
Loans -14.92771064 120.3002436 -84.07610531 250.5143326
Total Debt
-16.16439657 150.9780017 -52.99537186 -30.39288281
Net Block
111.4272462 21.17025627 1.175312975 11.14413929
Inventories
26.74552863 -34.09034479 69.29730121 14.35316603
Net Current
Asset -102.4725269 38.482848 201.859738 -28.12148553
Total Assets
12.09969113 13.13806176 12.79321218 6.739234912
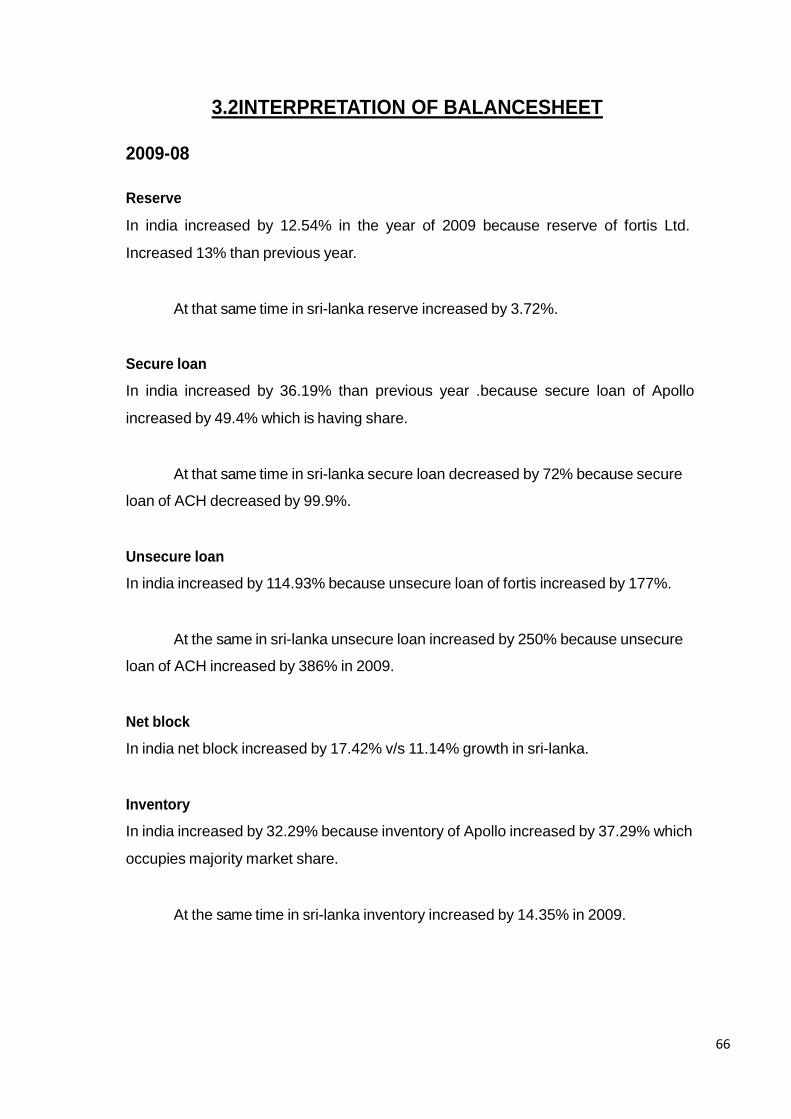
3.2INTERPRETATION OF BALANCESHEET
2009-08
Reserve
In india increased by 12.54% in the year of 2009 because reserve of fortis Ltd.
Increased 13% than previous year.
At that same time in sri-lanka reserve increased by 3.72%.
Secure loan
In india increased by 36.19% than previous year .because secure loan of Apollo
increased by 49.4% which is having share.
At that same time in sri-lanka secure loan decreased by 72% because secure
loan of ACH decreased by 99.9%.
Unsecure loan
In india increased by 114.93% because unsecure loan of fortis increased by 177%.
At the same in sri-lanka unsecure loan increased by 250% because unsecure
loan of ACH increased by 386% in 2009.
Net block
In india net block increased by 17.42% v/s 11.14% growth in sri-lanka.
Inventory
In india increased by 32.29% because inventory of Apollo increased by 37.29% which
occupies majority market share.
At the same time in sri-lanka inventory increased by 14.35% in 2009.
66
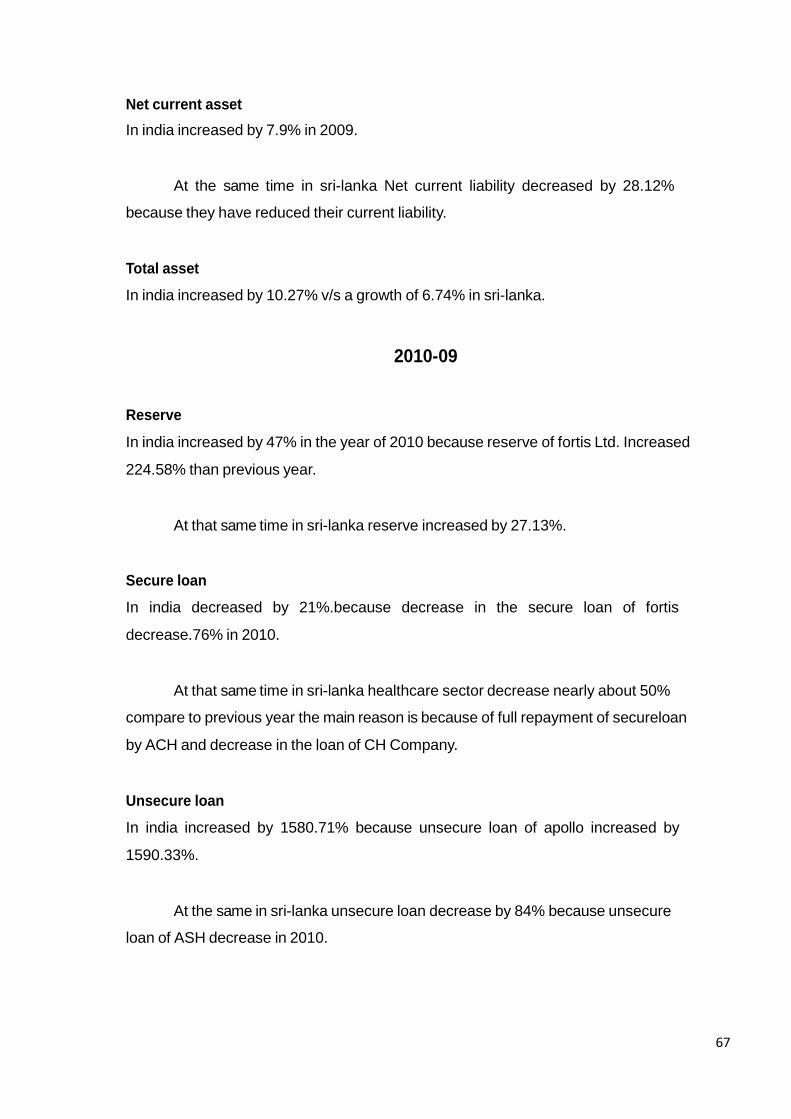
Net current asset
In india increased by 7.9% in 2009.
At the same time in sri-lanka Net current liability decreased by 28.12%
because they have reduced their current liability.
Total asset
In india increased by 10.27% v/s a growth of 6.74% in sri-lanka.
2010-09
Reserve
In india increased by 47% in the year of 2010 because reserve of fortis Ltd. Increased
224.58% than previous year.
At that same time in sri-lanka reserve increased by 27.13%.
Secure loan
In india decreased by 21%.because decrease in the secure loan of fortis
decrease.76% in 2010.
At that same time in sri-lanka healthcare sector decrease nearly about 50%
compare to previous year the main reason is because of full repayment of secureloan
by ACH and decrease in the loan of CH Company.
Unsecure loan
In india increased by 1580.71% because unsecure loan of apollo increased by
1590.33%.
At the same in sri-lanka unsecure loan decrease by 84% because unsecure
loan of ASH decrease in 2010.
67
Net block
In india net block increased by 28.83% v/s 1.17% growth in sri-lanka.
Inventory
In india increased by 22% in 2010.
At the same time in sri-lanka inventory increased by 69.29% in 2010.
Net current asset
In india increased by 204.52% in 2010.
At the same time in sri-lanka increased by 201.85% in 2010.
Total asset
In india increased by 69.71% v/s a growth of 12.79% in sri-lanka.
2011-10
Reserve
Reserve In india increased by 54.72% in the year of 2011 because reserve of fortis
Ltd. Increased 106% than previous year.
At that same time in sri-lanka reserve increased by 18.40%.
Secure loan
Secure loan in india increased by 14.11% than previous year .because secure loan
of ICM hospital increased by 156% which is having majority market share.
At that same time in sri-lanka secure loan increase by 159.64% because main
reasons of ACH hospital increase by Rs.579, 999,980 in 2011.
68
Unsecure loan
In india decrease by 54.83% because unsecure loan of fortis decrease by 62.7%.
At the same in sri-lanka unsecure loan increased by 120.30% because
unsecure loan of ACH increased by 19687% in 2011.
Net block
In india net block increased by 11.89%.in previous year 2011 net more profit of any
company sonnet change of net block.
At that same time in sri-lanka increase by 21.17% because main reasons of
the ACH Company increase by 60% in 2011 year.
Inventory
In india increased by 11.15% in 2011.
At that same time in sri-lanka inventory decrease by 34%.becouse main
reasons of the previous year of 2011 ACH company inventory loss in 2011.
Net current asset
In india increased by 26.70% in 2011.
At the same time in sri-lanka Net current asset is increased by 38.48% in
2011.
Total asset
In india increased by 18.86% v/s a growth of 13.13% in sri-lanka.
2012-11
Reserve
In india increased by 18.61% in the year of 2012.
At that same time in sri-lanka reserve increased by 25.74%.
69
Secure loan
In india decrease by 4.52%% than previous year .because secure loan of ICM
decrease by 43.41% which is having not majority market share.
At that same time in sri-lanka secure loan decreased by 16.46% because
secure loan of ACH decreased by 36.95%.
Unsecure loan
In india increased by 74.99% because unsecure loan of fortis increased by 106.21%.
At the same in sri-lanka unsecure loan decrease by 14.92% because unsecure
loan of CH decrease by 29.83% in 2012.
Net block
In india net block increased by 13.31% v/s 111.42% growth in sri-lanka.
Inventory
In india increased by 20.68% in 2012.
At the same time in sri-lanka inventory increased by 26.74% because main
reasons are ACH inventory increase by Rs. 1,56,750 in 2012.
Net current asset
In india decrease by 1.61 in 2012.
At the same time in sri-lanka Net current liability decreased by 102.47%
because they have reduced their current liability.
Total asset
In india increased by 19.76% v/s a growth of 12% in sri-lanka.
70

71
4.1POLICIES AND NORMS OF SRILANKA FOR
HEALTHCARE INDUSTRY
POLICY AND NORMS:
Government health policy previously adopted for the benefit of strong and new
policies will be directed at public health conditions Healthcare policy and standards of
the broad aims:
1) More from both communicable and non-communicable diseases by reducing
mortality due to increases in life expectancy.
2) And also the positive aspects of healthcare by promoting a focus on healthcare;
preventable diseases, health problems and improve the quality of life by reducing
disability.In this context, the focus of government attention to the following priority /
diseases healthcare problems are known: Maternal and Child Health problems,
adolescent healthcare, malnutrition and nutritional deficiencies, the elderly, malaria,
oral healthcare, bowel disease, respiratory disease, mental health problems, physical
disabilities, deliberate self harm / suicide problems, hypertension, coronary heart
disease, accidents, diabetes, cerebrovascular disease, renal disease, heavy, / STD,
HIV HIV-AIDS, substance abuse and family problems related to unit.
A) Improve existing preventive healthcare programs and more comprehensive
programs that are integrated and focused development:
To reduce the burden of disease in the community;
Preventing diseases / healthcare problems and their complications enables
early detection;
Promote positive behavior with a focus on healthcare.
B) Existing medical facilities and additional services to improve and continue to
grow larger and rehabilitation care, including both institutional and community support
is available at a range of medical needs.
72
C) Health care more equitable basis with provision for a specific healthcare needs will
be made accessible to the community.
D) Acceptable levels for both the community and service providers to improve the
quality of care in healthcare.
E) Healthcare services and patient care activities will at all times respect the personal
dignity.
F) Government for the individual state sector institutions at the point of delivery will be
committed to basic health care is provided free of charge.
G) The men's and women's rights to be informed and their choice of family planning
in order to ensure safe, effective, affordable and acceptable methods will have
access.
H) Health care will be more efficient and cost-effective.
I) Development and rational use of drugs for distribution to implement a national drug
policy.
J) Promote community involvement in health care.
K) Provinces / districts based on their healthcare needs and national priorities and
allocate resources.
L) Healthcare Ministry of other governmental and non-governmental agencies with a
strong integrated approach will facilitate better health care for the greater integration.
M) Government and private health care sector and the development of regulation in
this area will encourage more coordination.
N) We encourage healthcare systems research and its application.
73
O) Human Resource Development and will be supported with contemporary needs to
be strengthened.
P) Services and applications for the emerging aging and physical disabilities, mental
health problems, as well as the healthcare needs of displaced populations affected by
health problems will be introduced.
Q) Will is encouraged to develop indigenous systems of medicines and homeopathy.
R) Alternative methods of funding by the Government for additional funds to allocate
resources and is committed to meeting priority needs, particularly in the field of
healthcare promotion and prevention.
IMPLEMENTATION:
National healthcare policy will be implemented by the central and provincial health
ministries.
The Ministry will issue the documents:
Policy on Reproductive Health
On population policy.
Measures of general health status of the population and the following healthcare
strategy by adopting the above-mentioned diseases / health problems, especially in
reducing the impact will be taken.
TAXATION
PUBLIC resource mobilization pre-modern cosmology (500 BC - AD 1300)
Public taxes or healthcare sector in Sri Lanka is a major resource mobilization
mechanism is not used as a general income after the independence of the modern or
an event. Historical records show that Sri Lanka is used as ordinary income at least
74
2,300 years to finance healthcare services. The majority of pre-modern hospitals in
Sri Lanka was established and maintained by kings, and through private charity or for
profit activity. During the Mahavamsa, it is clear that the future of fitness, Buddhism,
which will accrue to the builder by the formal, the main driving force in the promotion
of the royal action. Buddhist value system is also of great value is placed on the
elimination of pain, and Sri Lanka and Theravada Buddhist societies of Southeast
Asia, an integral element in the state of civil society. Thus it is quite obvious that the
state should be regarded as being responsible for this area. SriLanka modern social
trends, which have primary responsibility for providing hospital care as a state.
THE ORIGINS OF STATE HEALTHCARE SERVICES IN SRI LANKA.
Was gradually increased, and many distant countries, Burma Siam, and Ceylonto
Syria, Persia and Egypt and spread to the whole of Western Europe ... Ceylon and
Burma, they are ubiquitous (Parker, 1928) seems to be ".
In the fourth century BC king Pandukabaya rule (Mahanama, 1989), 11 King, state
influence, the earliest date of hospitals in Sri Lanka responsible for building and
maintaining them shouldered. Hospitals across the country were made only for the
priests and nobility, but also to the public. King Dutugemunu (second century BC) fell
to eighteen different locations (Simonov, 1975) was retained at the hospital.
Organizations, both general and specific facilities such as, cripples, the blind and
infectious diseases, and health homes were built. The first public maternity home
may Upatissa II (- 524 522 AD) was by. The Mahavamsa mentions that hospitals
establish a common one now and there is only one inscription, which is installed by a
general reference to the hospital.
In contrast with hospitals, ambulatory care facilities only once mentioned in the
Mahavamsa. KassapaIV (896-913 AD) building 'houses where drugs were in different
parts of the town.' It's not clear whether this is recorded as pharmacies or outpatient
treatment centers that were not. As Uragoda (1987) notes the scarcity of references
to the outdoor ayurvedic treatment in general practice, where the Ayurvedic
75
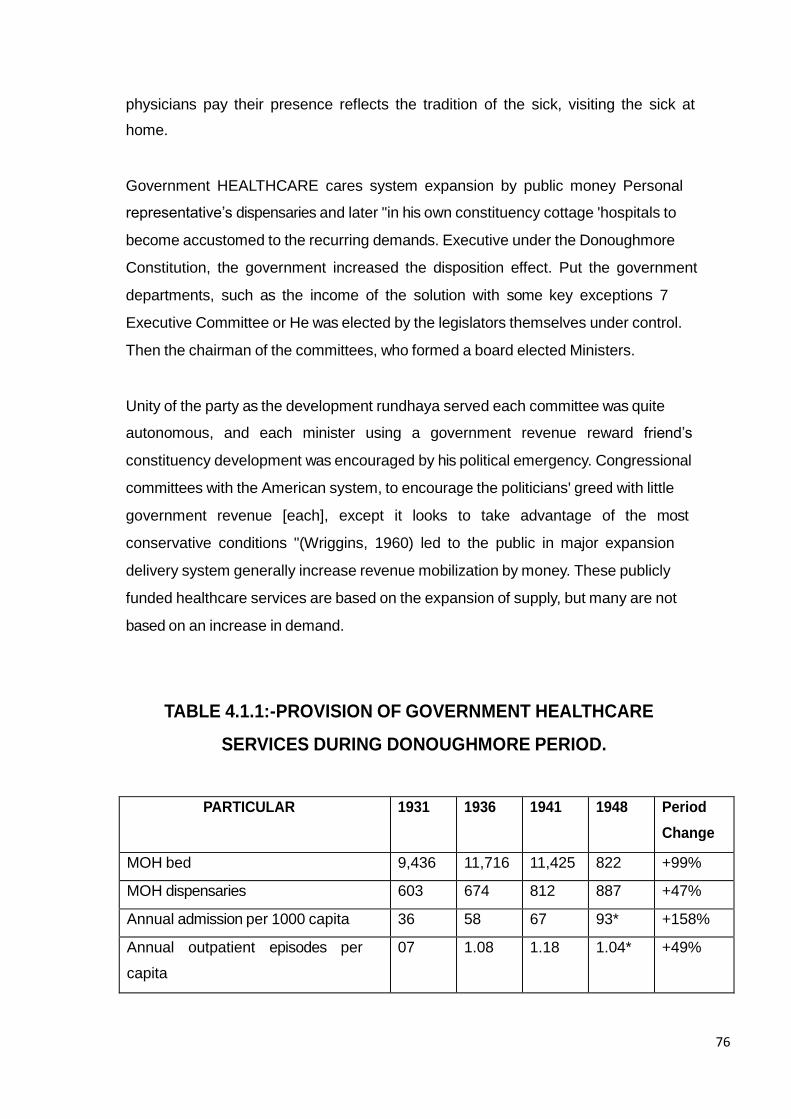
physicians pay their presence reflects the tradition of the sick, visiting the sick at
home.
Government HEALTHCARE cares system expansion by public money Personal
representative‟s dispensaries and later "in his own constituency cottage 'hospitals to
become accustomed to the recurring demands. Executive under the Donoughmore
Constitution, the government increased the disposition effect. Put the government
departments, such as the income of the solution with some key exceptions 7
Executive Committee or He was elected by the legislators themselves under control.
Then the chairman of the committees, who formed a board elected Ministers.
Unity of the party as the development rundhaya served each committee was quite
autonomous, and each minister using a government revenue reward friend‟s
constituency development was encouraged by his political emergency. Congressional
committees with the American system, to encourage the politicians' greed with little
government revenue [each], except it looks to take advantage of the most
conservative conditions "(Wriggins, 1960) led to the public in major expansion
delivery system generally increase revenue mobilization by money. These publicly
funded healthcare services are based on the expansion of supply, but many are not
based on an increase in demand.
TABLE 4.1.1:-PROVISION OF GOVERNMENT HEALTHCARE
SERVICES DURING DONOUGHMORE PERIOD.
76
PARTICULAR 1931 1936 1941 1948 Period
Change
MOH bed 9,436 11,716 11,425 822 +99%
MOH dispensaries 603 674 812 887 +47%
Annual admission per 1000 capita 36 58 67 93* +158%
Annual outpatient episodes per
capita
07 1.08 1.18 1.04* +49%
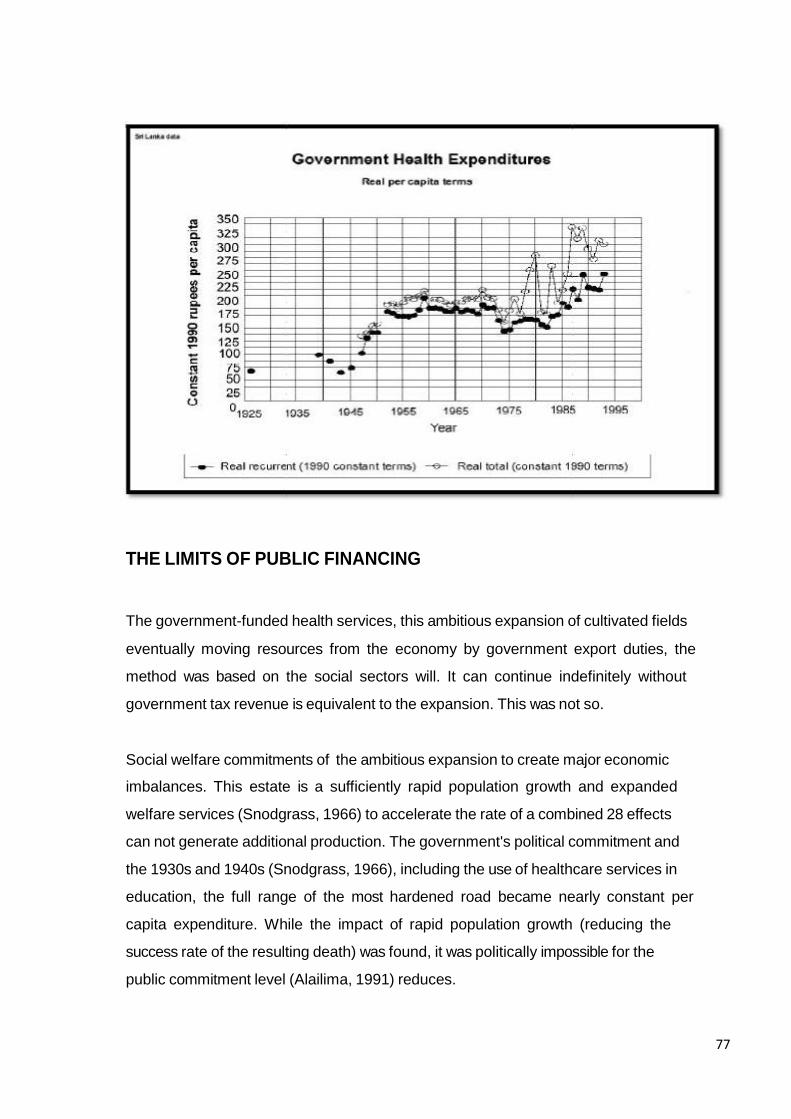
THE LIMITS OF PUBLIC FINANCING
The government-funded health services, this ambitious expansion of cultivated fields
eventually moving resources from the economy by government export duties, the
method was based on the social sectors will. It can continue indefinitely without
government tax revenue is equivalent to the expansion. This was not so.
Social welfare commitments of the ambitious expansion to create major economic
imbalances. This estate is a sufficiently rapid population growth and expanded
welfare services (Snodgrass, 1966) to accelerate the rate of a combined 28 effects
can not generate additional production. The government's political commitment and
the 1930s and 1940s (Snodgrass, 1966), including the use of healthcare services in
education, the full range of the most hardened road became nearly constant per
capita expenditure. While the impact of rapid population growth (reducing the
success rate of the resulting death) was found, it was politically impossible for the
public commitment level (Alailima, 1991) reduces.
77
Therefore, during 1948-1960, when the government will pay for capital expenditures
162% increased by 218% and 234% of the current cost. Capital investment total
percentage (Snodgrass, 1966) was as. As expenditures grew more rapidly than
income, the structural fiscal deficit was financed by running down the country's
substantial foreign reserves. When this ran out in 1960, the governments introduced
foreign exchange controls and were forced to control government spending. The Sri
Lankan economy was hampered by the lack of basic foreign exchange, and the
economy is stable (Moore, 1990).
This had an immediate effect on health spending. % is. As in real per capita income
growth was minimal during this period, the level of real per capita expenditures in the
next decade of his Rs.214 (1990 constant rupee terms) below the peak experienced
a rapid decline after 1972 before reaching a stationary for less.
78
4.2 POLICIES AND NORMS OF INDIA FOR HEALTHCARE
INDUSTRY
POLICY AND NORM OF HEALTHCARE
Department of Industrial Policy and Industrial Policy and Promotion ("DIPP"), by the
Secretariat for Industrial Assistance Programs issued by the Ministry of Commerce &
Industry.
FDI-related provisions under the I FEMA Regulations, 2000 is placed in the schedule.
The provisions of the policy guidelines of the provisions of Press Notes / Press
Releases issued by DIPP is a matter of time for compliance.
The DIPP Indian companies are also integrated with respect to foreign investment
policy is issued. Currently, foreign investment issued by DIPP Consolidated FDI
Policy 2011.15 and 2 circular formats is controlled by.
The exchange control regulations in most areas 100% FDI under the automatic route,
i.e., where the Foreign Investment Promotion Board ("FIPB"), no prior approval is
required for the permit.
Currently, FDI up hospital sector and in the production of medical and surgical
equipment Greenfield projects under the automatic route is permitted 100 percent.
FDI in pharmacy sector have all Brownfield projects will be investigated by FIPB as
an interim measure until a comprehensive government policy to regulate such
investments. It is also proposed that in the future, all will be investigated Brownfield
investment and competition commission of India (CCI) approved by
79
LICENCING
REGULATORY ASPECTS OF HOSPITALS:
As part of the due diligence, investor, especially to ensure that the investee entity that
will comply with all applicable laws. Many laws in the health care sector are a sub-set
management. Many permissions and licenses are not required to be obtained by the
institutions,
1) Nursing Home Registration Certificate
2) Registration Prenatal Diagnostic (Regulation and Prevention of Misuse)
Techniques
Act, 1994 under the certificate;
3) Ultrasound machine for the registration certificate;
4) Pollution Control Board from someone up (prevention and control activities) Air
Act, 1981 to set up a hospital, objections;
5) A facility operated for 5 generations authorization, storage, reception, storage,
transport, treatment, and disposal of bio-medical waste;
6) Authorization Bio-Medical (Management and Handling) West Rules, 1998 by the
Pollution Control Board under the normal working of the facility;
7) License pressure vessels for storing gas;
8) Authorization and patients receiving medication for use in a particular category;
9) For the entire human of Blood procession for the sale or distribution of its
components in preparation for a license to operate a blood bank;
10) DD6 Narcotic Drug License for the license grant;
80
11) Pre Natal Diagnostic (weight and Regulations removal) Techniques Act, 1994
under the registration;
12) Permit for the purchase and possession of denatured spirit;
Under the various applicable labor laws
13) Registration; Various indirect tax law
14) Enrollment.
TAXATION
A. GENERAL OVERVIEW
Income tax in India, the Indian Income Tax Act, 1961 (hereinafter the "ITA" known as)
are governed by the provisions. The ITA is updated from time to time by the Finance
Acts. It puts the chargeability of tax in respect of detailed provisions for determining
residency, income calculation, et al. The ITA persons, inter alia individuals, local
companies, i.e. companies incorporated in India, a foreign company, one column
(AOP), Partnership, etc. provides a diverse range of different tax rates.
The ITA's 4 Section "charging section" on the basis of income tax liability is known as
the sienaemaai and lays down that any person "s total income" 23 subject to income
tax. Total income of the 5 Section in the discussion of the concept of ITA, which
residents share their global income is taxable in India, while non-residents of Indian
source income, that income is received or is to be obtained only on the income that
accrues or arises is taxed or accrue or arise in ITA of India.24 9 considered a
deeming provision in section, which discusses the income received, accrued or
arisen in India are considered.
An extensive network of tax treaties with various countries to India. Under the ITA,
tax treaties override the provisions of ITA; though the taxpayer to select more
favorable.25 If ITA's application of tax treaties in order to benefit from such a person
must be a resident in a tax treaty country option. Thus, resident, non-resident of the
81
country with which India has a double taxation agreement ("DTAA") signed with the
context, ITA's provisions only apply to the extent they are more beneficial to the
assessed. This view was reiterated by the Supreme Court in the landmark Union of
India v / s Azadi Bacaho medha and others26 where challenges around April 13,
2000, the date of the Circular, which was clarified by the government or capital gains
earned by an Indian company to focus on the issue of Shares prize to Mauritius shall
be taxable only in Mauritius and India is not a resident.
B. COMPANIES TAXATION
Company
Corporate income tax rate of 30% for the domestic Indian companies and foreign
companies is 40%. 15% of Dividend Distribution Tax ("DDT") is payable to
shareholders on dividend distribution. However, after this dividend income is exempt
from tax in the hands of shareholders, regardless of their residential status. DDT is
payable regardless of whether the company makes these distributions are taxed
otherwise.
Partnership and LLP
Are taxed like a partnership and LLP. Partnership and LLP tax rate for corporate
entities, that is, 30% only. However, a partnership firm (including LLP) to share in the
profits exempt from tax in the hands of the partners.
C. TAX IMPLICATIONS OF VARIOUS INVESTMENT OPTIONS
Investment by way of equity and preference shares
Advantages of an Indian entity, an unlisted company, the sum earned on the sale of
long-term capital gains27, and 30% and 40% to 20% short-term capital gains28 for
residents and non-residents, respectively, for the taxable year. Profits by way of
dividend or buy back shares may be distributed by an Indian company. As mentioned
such as a dividend at the rate of 15% dividend is taxed in the hands of a public
company and to receive such dividends are exempt in the hands.
82
Another method of distribution, which backed purchase / redemption way of shares,
capital gains income in the hands of shareholders. However, such as equity shares
bought back only once to allow the 12-month period, and that the security of a fresh
issue of six-month period prior to the date of purchase are not allowed back. In
addition, the Indian company in a year to pay for the remaining 25% equity share
capital of a maximum purchase - allows backup. However, the shares are bought
back, are exempted from the provisions deemed dividend.
Investment by way of Debt
Investment in loans or debentures of an Indian company, such as the debt may be
designed in the form. The debentures and the interest paid on the loan in case of
resident investors are subject to withholding tax at a rate of 10%. On the other hand,
held by non-resident withholding tax on interest paid on loans and a debenture is
40%. However, interest payments on the loan availed 20% decrease in foreign
currency subject to execution. Interest expenses, however, the Indian company to be
tax deductible expenses, and therefore reduce the taxable profits of the Indian
company. Note that the surcharge in such cases where the total income exceeds Rs
10 million is applicable only.
83
4.3PRESENT FOR HEALTHCARE OF IMPORT EXPORT
TRADE BARRIER
TRADE
Health services can be traded in various ways. Supply under the GATS framework
borrowed from the characteristics of the different modes, four modes of supply of
health services by the trade.
Cross-border delivery (1 mode)
Cross-border delivery of health services in the first position is. Later lab samples,
diagnosis, and clinical consultation of the change via traditional mail channels are
included. It is also to include the electronic health services or telehealth services. The
use of interactive audiovisual and information communications creates diagnostic
services, such as second opinions, laboratory testing, surveillance, talks,
transmission and specific information, records, and information and access to
continuing education and provides improved skills.
1 mode, telehealth, and telemedicine that is, that the incorporation of these systems
into curative medicine "to protect and promote the health practice in the telecom
systems integration" within the state are increasing in importance. Today, telehealth
services to the global demand of $ 1.25 trillion, which is about $ 804.2 billion in direct
medical services, services of a professional back 22.5 billion dollars, 21.6 billion
related to consumer health information services, continuing professional education
services worth $ 3.9 billion, and management of are estimated at 235,5 $ billion.4
countries health care services to telepathology, teleradiology, telemedicine and
telepsychiatry, and many cross-border initiatives have emerged, such as telehealth is
engaged in various services.
84
Consumption abroad (Mode 2)
Health services, trade, consumption abroad in the second position (2 positions) are. It
provides customer service for the diagnosis and treatment of movement refers to the
country. Such as differences in trade value, quality, and availability of treatment and
natural Endowments countries, alternative medicines and treatment procedures exist,
the source of long waiting lists for treatment in the country, and the cultural, linguistic,
driven by such factors, and sending and receiving countries geographical proximity
between.
Commercial presence (mode 3)
In the third case the commercial trade in health services (3 mode), the presence of a
hospital, clinic, diagnostic and treatment centers, and nursing homes include the
establishment. Countries are increasingly open to foreign direct investment in order to
upgrade and modernize their health care infrastructure and training facilities have
become. For instance, India, Indonesia, Nepal, Maldives, Sri Lanka and Thailand in
the field of health services in developing countries, their market is open to foreign
participation. Health developed and some developing countries are also increasing
joint ventures, alliances, and tie-ups managed care companies in orientation. Special
facilities for such ventures, management contracts, local partnerships and licensing
arrangements with some degree of editing and adequate access to certified training
and commitment of local people and local contacts to ensure sure.
Health workers movement (4 modes)
Finally, the movement of health services, health workers, doctors, specialists, nurses,
paramedics, midwife, technicians, consultants, trainers, health management,
including personnel, and other skilled and trained professionals (4 positions) can be
done through trade. In fact, consumption abroad, constitute the bulk of the state
health services in today's trade. The nursing profession, mobility, health care is
especially important given the nursing staff to 70 staff per cent and 80 per cent
constitute direct patient care. In most countries, there is a demand and supply
imbalance sector.8 nursing for instance, the UK, Denmark, Israel, Italy, Norway, and
85
the Middle East and many countries lack even a shortage of specialized nurses.
Cross Border.
BARRIERS
Operational plan for the location and capacity of storage containers, garbage
collection frequency for different types of activities include scheduled soon. Infectious
waste to the designated color-coded leak-proof container for safe handling, storing
and / sterilizing can be sterilized by the hospital facility is available. Handcarts waste
transfers within the hospital will be closed for disinfection or treatment facility for a
waste it is to avoid the problem. / Disinfection treatment facility transfers waste
incinerator after sterilization or controlled [2] landfill, such as.
Studies have shown that poor Indian HCUs operational strategies that are
responsible for these activities primarily in the presence of staff and other support
staff of Ward [18], and absence of documented waste management and disposal
policy [32]. In addition, there is no waste management committees established by
Indian hospitals, which are essentially consists of the head is present, all department
heads, hospital superintendents, nursing superintendents, environmental control with
a waste management officer with the hospital consultant engineers and infection
control adviser Government and health care providers in the waste treatment option
is gone for a type. No health care provider or a base line survey carried out for plans
and the type of waste generated waste generated in its place regarding the quantum
of information about points, collect.
Budgetary support to the government run hospitals, corporate hospitals and nursing
homes are bad. So they find it convenient to skip rules for financial consideration.
Indian hospitals most of the top management of the inertia in dealing with the waste
problem. This waste was separated, a mixed mode of disposal site on the left, only
saline bottles, which are sent to different places so that auctioning.
Collection, storage, and health care as well as appropriate technologies for waste
treatment and disposal facilities provided for the efforts so far have been limited in
86
India. In addition, the required number of India's lack of adequate and sanitary
landfills. Therefore, biomedical waste public road sides, low-lying area that they will
be directed to the reservoir in a vein on the open bins; causing agents in the air, land
and water spread by a host of chronic diseases. Self sufficient onsite treatment
methods is desirable and possible, but impractical for large healthcare facilities or
small organizations for non-economic might.
87

88
5.1. POTENTIAL FOR IMPORT / EXPORT IN INDIA /
GUJARAT MARKET
The clinical (Registration and Regulation) Bill stations, 2007, prohibits any person
who carries on the medical establishment, unless it has been properly Clinical
(Registration and Regulation) Bill, 2007, the provisions of registered institutions.
Established clinical definition of all features that provide the services included in the
field of medicine is approved. The main purposes of the legislation establishing the
clinical features and services provided by employees to the minimum qualifications of
the minimum standards. In addition, the law with respect to the reporting of clinical
centers and create a method proposed for the maintenance of the records. However,
the standard of healthcare in this country on damage, increase a welcome step, it
intends to set up a clinical establishment of an investor's perspective, the other can
act as an additional barrier.
This provision is intended for "scientific research on expenses", in relation to drugs
and pharmaceuticals, incurred on clinical drug trials, any Central, State or Provincial
Act, and obtaining approval from any regulatory authority for patent application file
includes the cost of the Patents Act, 1970 a. This deduction March 31, 2012 is
available for the incurred expenses.
The ITA provides tax incentives for certain hospitals. The management and
maintenance of a hospital's business from the ITA derived30 tax exclusion area (such
as Mumbai, Delhi, Hyderabad, Chennai, etc.) As is located anywhere other than in
the context of the five-year tax holiday provides; satisfaction subject to the following
conditions:
1. The hospital has been built, the start or April, 2008, the 1st day of work at any time
during the period beginning in March, 2013, the day ending in 31 starts;
2. At least one hundred beds for patients in the hospital.
3. According to local regulations and bye-laws of the construction of the hospital.
89
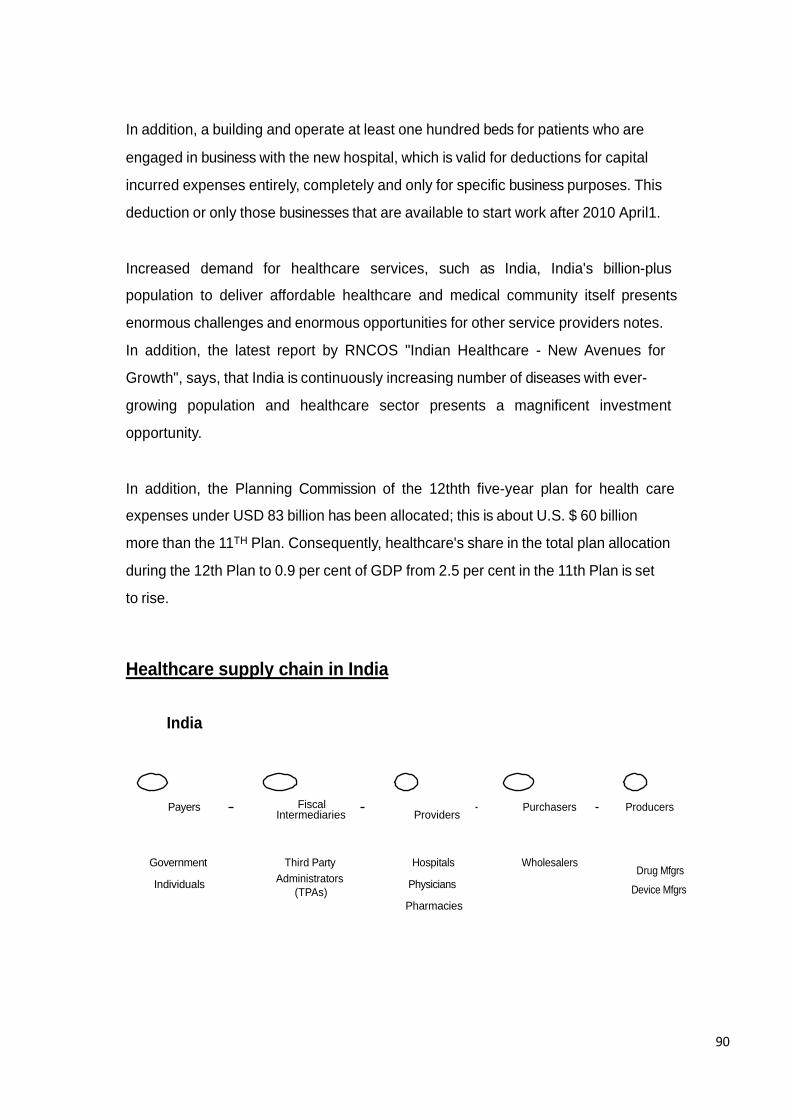
Intermediaries Providers
In addition, a building and operate at least one hundred beds for patients who are
engaged in business with the new hospital, which is valid for deductions for capital
incurred expenses entirely, completely and only for specific business purposes. This
deduction or only those businesses that are available to start work after 2010 April1.
Increased demand for healthcare services, such as India, India's billion-plus
population to deliver affordable healthcare and medical community itself presents
enormous challenges and enormous opportunities for other service providers notes.
In addition, the latest report by RNCOS "Indian Healthcare - New Avenues for
Growth", says, that India is continuously increasing number of diseases with ever-
growing population and healthcare sector presents a magnificent investment
opportunity.
In addition, the Planning Commission of the 12thth five-year plan for health care
expenses under USD 83 billion has been allocated; this is about U.S. $ 60 billion
more than the 11TH Plan. Consequently, healthcare's share in the total plan allocation
during the 12th Plan to 0.9 per cent of GDP from 2.5 per cent in the 11th Plan is set
to rise.
Healthcare supply chain in India
India
Payers Fiscal
Purchasers Producers
Government
Individuals
Third Party Administrators
(TPAs)
Hospitals
Physicians
Wholesalers
Drug Mfgrs
Device Mfgrs Pharmacies
90
5.2 BUSINESS OPPORTUNITIES IN FUTURE
ADDRESS HEALTH INEQUITIES AND IMPEDIMENTS TO UHC
Universal health coverage is a major driver of health equity. India's health system is
currently poor and vulnerable people, especially women and girls, scheduled castes,
scheduled castes, adolescents, migrant population and communities.18 per - urban
health needs in response to Franz and Vega (2010) noted that fails, 19 " UHC
concept loses its meaning, if the equity is not emitted.
Access to equity recognizes that the right to health for everyone ... Inequitable access
and use means that less advantaged groups experience less healthcarethan to their
needs.
ADOPT A PRIMARY HEALTHCARE APPROACH
"How far can a sick child to the mother to walk with the feet? Healthcare should be
available within a distance". First National Health Congress, Chinas, 1950
Health service delivery model for primary health benefit is as follows:
More access to essential services;
Better quality of care;
More focus on prevention;
Initial management of health problems;
Cumulative Updates, and lower Primary health resulting morbidity Distribution;
Reduction in unnecessary and potentially harmful Specialist care.
In addition, primary health care teams, increased social cohesion and empowerment
by promoting health equity. Secondary and tertiary levels of care for these people to
get help when you need just by working as a navigator through the system, they help
91
achieve the overall system cost effectiveness. Primary health globally and in the
approach of evolution.
A) PROVIDE ADEQUATE HOSPITAL BEDS
Public (government) in rural India, the availability of hospital beds varies widely in
central India, only 1 per 4471 persons per 1650 persons, from 1 in South India.
On average, urban India, 1 422 persons per hospital bed in the private sector. There
are regional variations: West India, Central India for more than a hospital bed. Central
India's largest private sector hospital beds in the country are low.
However, in rural India bedding shortage forces people to travel to the nearest urban
center for health, private organizations across the country, approximately 80% of
patients taking treatment for middle income and low income Groups, North and
Central India, 50% of all patients with the category associated with low income.
The use of private sector institutional and non-institutional same for all income groups
and regions is higher for overall care. However, the rate of the use of any hospital
facility, image and organization, and affordable infrastructure to facilitate access to its
reputation as a doctor in the practice, such as that depends on many factors.
Patients often rely on their doctors because of their constant information asymmetry
makes the selection of the right facility.
B) DELIVER HEALTHCARE TO URBAN & POOR
According to the 2011 census, 377 million Indians live in urban areas, and the urban
population is expected to increase significantly by 2021. Rapid urbanization has also
resulted in an increase in the number of urban poor in the country, many of which are
slums and squatter settlements remain volatile. As in 2004-2005 (2011) Agarwal,
indicated by 38, 80.8 million urban dwellers (25.6%) were below the poverty line.
92
United Nations project that if urbanization continues at this rate, the total population
will be 46% of India's urban areas by 2030.
Urban areas are particularly challenging to deliver health care. Urban population
health systemically and often simultaneously affected by many social factors:
physical environment, migration, unhealthful spatial planning, violence, poverty,
social exclusion, governance, economic policy and human security. Historically, India
is unplanned urbanization, water, sanitation, housing and infrastructure leading to the
inevitable shortfalls.
C) OVERSIGHT AND ACCREDITATION OF SERVICE PROVIDERS
Given the public health system deficiencies, in the end, it's mostly random, poorly
regulated private sector has stepped fulfill unmet medical needs. In urban areas,
according to information cited by the National Sample Survey HOSMAC, 81% of
patients choose private care and other institutional and private institutions in 19
states and 62% across 1600 villages in Medical Advice, quality and survey under
Select care.36 rural India (2009-10) Project Availability average rural households in
42 examined the availability of medical providers. Indicates, rural India, about 90% of
private providers, training providers, which may be formal or informal.
93
5.3 CONCLUSIONS
OVERVIEW OF INDUSTRIES TRADE AND COMMERCE IN
SRI- LANKA.
Ministry of Industry and Commerce (MIC) plays a dynamic role in the development of
the industrial sector. It is the key Ministry accountable for promoting industrial
development in the country within the wide policy framework of Mahindra Chintana
spelt out by the government.
Diversified high value extra industry base, High economic growth, more employment
opportunities, Environment sustainability, Sustainable industrial development,
Regional industrial development.
Therefore the Ministry has implement following programmers and projects to
establish an industrial sector spread across the country Industrial Estate
Programmer.
Gamete Samantha Programmer, Thrust Area Development Programmer, Productivity
Improvement Programmer, Completion of the Chemical Weapons Convention in Sri
Lanka, Industrial Survey, Textile Industry Development Programmers.
OVERVIEWS OF BUSINESS & TRADE AT INTERNATIONAL LEVEL
OF SRI-LANKA.
The main economic sectors of the country are tourism, tea export, clothes, textile,
rice production & other farming products. In adding to these economic sectors,
overseas employment contributes extremely in foreign exchange, 90% of expatriate
Sri Lankans reside in the Middle East.
Economic sectors:-Tourism, Tea industry, Apparel and textile industry,
Agriculture, Knowledge Services, Infrastructure.
94
PESTEL ANALYSIS
Political Analysis
A steady government exists in the country
With the blessings of the government under the Ministry of Economic
Development & SLTDA, all facilitation % provisions to invest in
Tourism are being made to ensure that Tourism Sector blossoms to meet 2.5M
Tourist arrivals by 2016 and this sector contributes tremendously to the Economy
of Sri Lanka. Tourism Sector is opened for Foreign Investment under the Policy
Framework and under the Budget Proposal of 2010
Government state & global level promotions justifies its stand on the focus for the
growth of the sector
Economical Analysis
Sri Lanka Economy grew by 8.0% in 2010
Market interest rates sustained to be on the downward trend
Tourist arrivals increased 46.5% compared to 2009.
Investment endorsement is boosted by government
In 2010, IMF declared Sri Lanka as “Middle-Income Country”
Foreign Exchange Transaction – Exchange Rate is free of charge
Per Capita GNP (US$) $2029; Highest Literacy (92%); Highest Life
Expectancy -75 years; Intelligent, educated & active work force;
Modern manufacture techniques; skilled manpower and professional managers
are available at reasonable cost.
Economic Liberalization - Capital Account opened for Foreign Exchange
Transactions Share Market reach One Trillion Rupees in a Daily Transaction in
2010 for the first time Board of Investment (BOI) accepted Enterprises / Tourist
Hotels & other Tourism related Establishments are with income tax on net income
/ profits free for a stipulated period Inward remittance for investment, outward
remittance of earnings dividends, royalties & other present account payments and
capital proceeds on liquidation / transfer at shares are permitted.
95
Social Analysis
The country had gone through the practice of tourism over many decades. Thus,
the country and all religious / racial groups have recognised the value it generates
to the development of Sri Lanka.
At the same time, a lot of efforts are put nationally and in tourism based regions to
make sure Sri Lankans are not becoming victims of social problems created in
connection with tourism. Thus, the trade runs smoothly without any factions /
group / organized protests against the industry.
Also, tourism happens to be at very specific locations in the country, which
creates value to the industry. These locations are mostly utilized for tourism
related economic activities than for residence.
Overall, since the country‟s present focus is towards tourism development, the
entire nation‟s focus is towards it and the mind-set off the people is to get involved
in the economic operations of tourism.
Technological Analysis
Sri Lankan Structure has a number of Narrow and Authoritative Bodies to look
after the application of technology in the economic sphere, mainly for industry and
commercial purposes.
The purpose of technology in the Tourism Sector will be governed by the relevant
bodies / authorities mentioned above
Most of the technology necessary for the tourism trade has to be imported from
international suppliers through Sri Lankan agents / distributors
Environmental Analysis.
Large Scale Hotels & Other Venues for the Tourists to enjoy can be a concern
for environment as its construction and continuous operations may exert
pressure on the environment.
96
Sri Lankan legislature, body shaped from the legal systems and practice
allow such large investment based intensive structures and operations under
the assessment, supervision, guidance, license and approvals.
The Central Environmental Authority is the certified agency in this regard.
Legal Analysis
Government‟s legal structure facilitates the incoming of investments for the
legalized economic activities, enjoying its returns and the provisions for the
remittance of surplus to the desired destinations, under terms and conditions
applicable, set out by the Board of Investment (BoI) of Sri Lanka.
HEALTH CARE IN INDIA
In the past two decades, India has made considerable progress in improving public
health. Smallpox and guinea worm were completely eradicate polio and leprosy, and
health care experts, millions afflictions as recently as 1980.
FORTIS HOSPITAL
Malvinder Mohan Singh Chairman of Fortis Hospital, Bannerghatta, Bangalore, a 400
bed, JCI certified and NABH accredited multi-specialty tertiary care hospital. Over
150 consultants and 800 other staff Para - medical support facility by the cardiology,
cardiac surgery, Urology, orthopedics, neurology, and neuron - surgery, such as
super specialty tertiary care services to approximately 40 specialty offers.
The Company Investor Relations function of investor interactions uses media to
reach out and communicate effectively with the investment community. The
magazine quarterly earnings calls, international and local investor forum, direct one-
on-one meetings and conference calls, press, healthcare field trips, and more Fortis
Healthcare Ltd.,
97
Currently, the healthcare company with 76 hospitals in Australia, Canada, Dubai,
Hong Kong, India, Mauritius, New Zealand, Singapore, Sri Lanka, Nepal and Vietnam
in the distribution network, over 12,000 beds, 600 primary care centers, operates
specialty centers for 191 days 230 diagnostic centers and more than 23,000 people
on a talent Pool, care.
APOLLO HOSPITAL
Managing Director - Dr. Preetha Reddy Apollo hospital of Founded in 1983 more than
16 million patients annually Hospital Group currently serves. English is widely
spoken. The hospitals dedicated to International 'patient department of any patient or
visitor for international action to ensure smooth flow.
Dr Reddy gave his daughters Preetha Suneeta, and Sangita Apollo for a month with
a new vision. The group faced enough opportunities. But the most promising
strategies that were? Much depends on the future development of the health care
market. Health care is a basic local business? However, the global opportunities,
which is the best hospital in the world that is why - institutions such as the Mayo
Clinic, for example - only a few locations, working as one organization? In addition,
the Reddy family acutely aware those medical services were in contrast to other
professional services. Caring for patients with such a great responsibility, and public
health of all family members care deeply about. Given the enormous challenges at
the local front, it's probably best to focus on developing the Indian market.
INDRAPRASTHA MEDICAL CORPORATION
Indraprastha Apollo Hospital is also the world's largest corporate. It is the third super
specialty tertiary care hospital set by the Apollo Hospitals Group, jointly in New Delhi,
India's capital with the government. The 695 bedded hospital provision for future
expansion to 1000 beds.
The hospital is at the forefront of medical technology and expertise. Care for its
patients the latest diagnostic, medical and surgical facilities provide a full range.
98
The hospital started functioning from July 1996, Mission of Medical Excellence with a
Human touch.
SRI LANKA HEALTH SECTOR
Public and private health care services in Sri Lanka in the health system. Public
health and eight provincial Councils. Major services are central ministry responsible
for municipal services also provide a limited nature. Public sector delivers facilities.
Private health care services through an island wide network of outpatient services in
both inpatient and Rotating mostly full-time private practitioners, government services
have been provided by Medical staff and private work pharmacies.
Facilities also exist. In 1995, these facilities treat over 3 million inpatients and 36
million Patients (Central Bank, 1996). This amounted to 95% of all inpatient
admissions, and nearly half of all outpatient consultations in the country.
Private health care services are often circulated. 500-1,000 about private full-time
General practitioners a fee for service basis from private clinics provide outpatient
care. This is Government doctors in private practice, who works at home, clinics or
supplied Private hospitals. There are approximately 10,000 traditional practitioners.
ASIRI CENTRAL HOSPITA
Chairman /Managing Director of MR.A.K.PATHIRAGE in asiri Central hospital have
specialized in Colombo, Sri Lanka in the heart of the hospital. The latest Hospitals of
Asiri Group, the largest chain in the country within the health care industry. We
investigate the state of the art therapeutic and intensive care facilities in a one-stop
medical setting offer we have our patients' well-being at the Central Hospital, our
drive for excellence, which is the main fan. Best Doctors, surgeons with a team of
experts and consultants, central Quality talent and rich experience.Central Hospital of
the human touch and attention and takes care of the importance of pride. In addition,
99
it is also modern Technology, training and research to improve the health services for
the next great investment.
CEYLON HOSPITAL
After our story in the British colony of Ceylon at the beginning of World War II
begins.British military personnel serving in a military hospital and eventually Durdans
Hospital sited where the present will remain in the hospital now.
In 1945, a group of doctors as a private organization recognized the opportunity to
develop fledgling healthcare sector, and the former military hospital in Ceylon Ltd.
Hospitals establish.
Durdans Hospital is a well established and respected in Sri Lanka provides tertiary
healthcare, and international patients from all over Sri Lanka to focus on patient care.
It is a modern, multi-specialty state of the art medical facilities, located in the heart of
Colombo is easy with a private hospital.
Our Sixth Lane Wing theater complex, five new special edge technologies for general
surgery, obstetric surgery, genitourinary surgery, orthopedic surgery and
laparoscopic surgery include cutting-equipped theaters.
ASIRI SURGICAL HOSPITAL PLC
Asiri Surgical Hospital Plc. Health care services.The hospital urology, kidney
transplantation, neurosurgical, obstetrical radiology, and genetic testing services.
TRADE POLICY & POTENTIAL
There are many positive effects of foreign investment in hospitals. One of the major
impacts of foreign investment, it will be necessary for the structural design.
Investments in large cities, the need to expand access to healthcare. Increased
physical health care field hospital beds, diagnostic, increasing the number of facilities
100
and specialty and super-specialty centers to increase supply, such as the ability to
help addition, foreign investment can help to increase the quality and standards of
healthcare, technology, upgrade, and employment opportunities in the health sector
and the economy at large with the potential benefits, make it. However, a few things
to keep in mind in order to achieve success in the field of hospital medical care
expenses that are trying to get the most affordable
Important is the level-II and level III-places; Tier-II and Level III-places, hospitals
geography specific diseases that you should be focused on.
National Health Promotion Strategy;; National Health Information Strategy and the
National Strategy for Health Research, the key strategy for meeting the challenges of
health care in the national health strategy, including key policy strategy to build a
cultural diversity dimension. Another key strategy for meeting this challenge policies
that minority Traveler, health national strategy, such as ethnic groups, the
development of specific needs.
A gender focus should include both common and specific strategies. A third related to
strategy, health care institutions, the structure, which is outlined within this report are
developing good practice and policy guidelines. The fourth related to strategy, health
care institutions, cultural diversity awareness and anti-racism training to law.
101
5.4SUGGESTION
It is appropriate to consider the needs of healthcare facilities is a major boost for the
healthcare sector to act as if it is the same "infrastructure" sector will be included
under the ambit. Such policy moves healthcare facility will allow you to get more tax
benefits.
The Direct tax purposes the income tax law 80 IA, will be eligible for tax benefits
under section 1961. Section 80 IA of the ten-year tax holiday for providing
development, and infrastructure facilities, subject to compliance with the terms of the
proposed undertakings are associated with the maintenance business.
Such a tax holiday to include input Hospital can help reduce costs. Such extra money
sector which in turn is more likely to receive job opportunities for healthcare and more
healthcare workers may result in people that can be used for further investment.
There are anti-racism and intercultural awareness rising within the Irish health care
sector3 significant increase in demand for. The NCCRI how to conduct such training
should be developed general guidelines. Both of these guidelines such as providing
training and offer training for practitioners such as are found in organizations in mind.
102

103
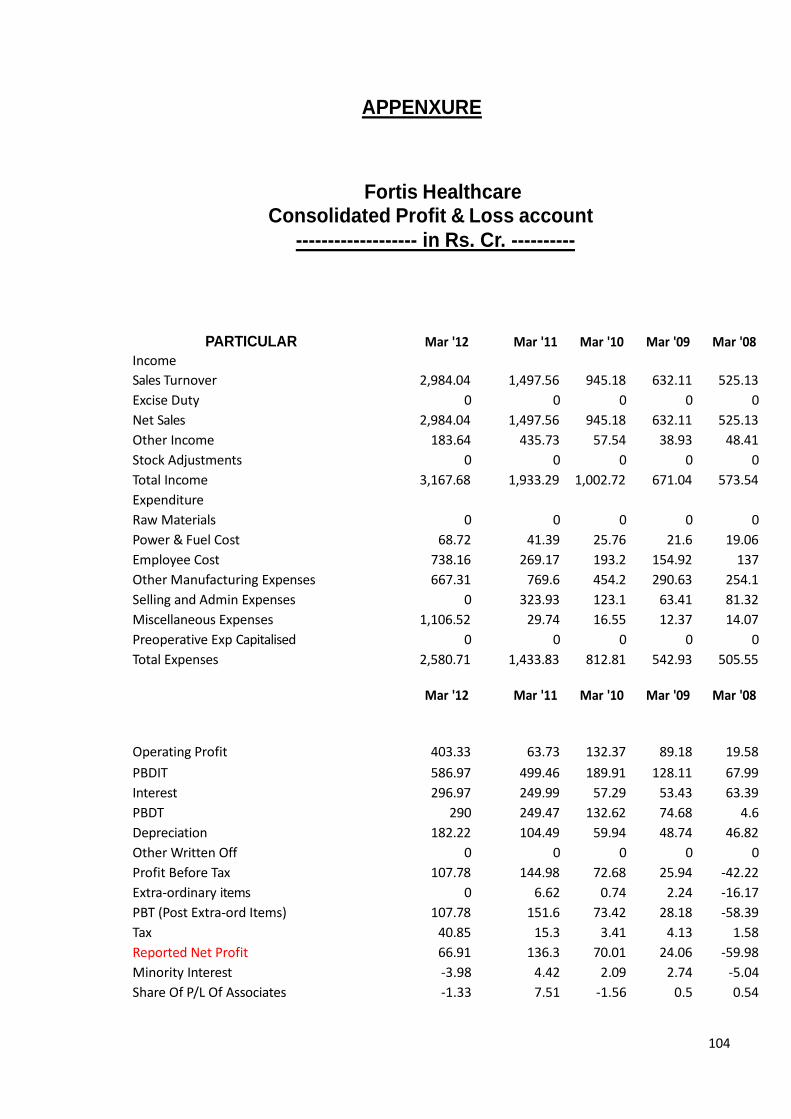
APPENXURE
Fortis Healthcare
Consolidated Profit & Loss account
------------------- in Rs. Cr. ----------
PARTICULAR Mar '12 Mar '11 Mar '10 Mar '09 Mar '08
Income
Sales Turnover 2,984.04 1,497.56 945.18 632.11 525.13
Excise Duty 0 0 0 0 0
Net Sales 2,984.04 1,497.56 945.18 632.11 525.13
Other Income 183.64 435.73 57.54 38.93 48.41
Stock Adjustments 0 0 0 0 0
Total Income 3,167.68 1,933.29 1,002.72 671.04 573.54
Expenditure
Raw Materials 0 0 0 0 0
Power & Fuel Cost 68.72 41.39 25.76 21.6 19.06
Employee Cost 738.16 269.17 193.2 154.92 137
Other Manufacturing Expenses 667.31 769.6 454.2 290.63 254.1
Selling and Admin Expenses 0 323.93 123.1 63.41 81.32
Miscellaneous Expenses 1,106.52 29.74 16.55 12.37 14.07
Preoperative Exp Capitalised 0 0 0 0 0
Total Expenses 2,580.71 1,433.83 812.81 542.93 505.55
Mar '12 Mar '11 Mar '10 Mar '09 Mar '08
Operating Profit 403.33 63.73 132.37 89.18 19.58
PBDIT 586.97 499.46 189.91 128.11 67.99
Interest 296.97 249.99 57.29 53.43 63.39
PBDT 290 249.47 132.62 74.68 4.6
Depreciation 182.22 104.49 59.94 48.74 46.82
Other Written Off 0 0 0 0 0
Profit Before Tax 107.78 144.98 72.68 25.94 -42.22
Extra-ordinary items 0 6.62 0.74 2.24 -16.17
PBT (Post Extra-ord Items) 107.78 151.6 73.42 28.18 -58.39
Tax 40.85 15.3 3.41 4.13 1.58
Reported Net Profit 66.91 136.3 70.01 24.06 -59.98
Minority Interest -3.98 4.42 2.09 2.74 -5.04
Share Of P/L Of Associates -1.33 7.51 -1.56 0.5 0.54
104
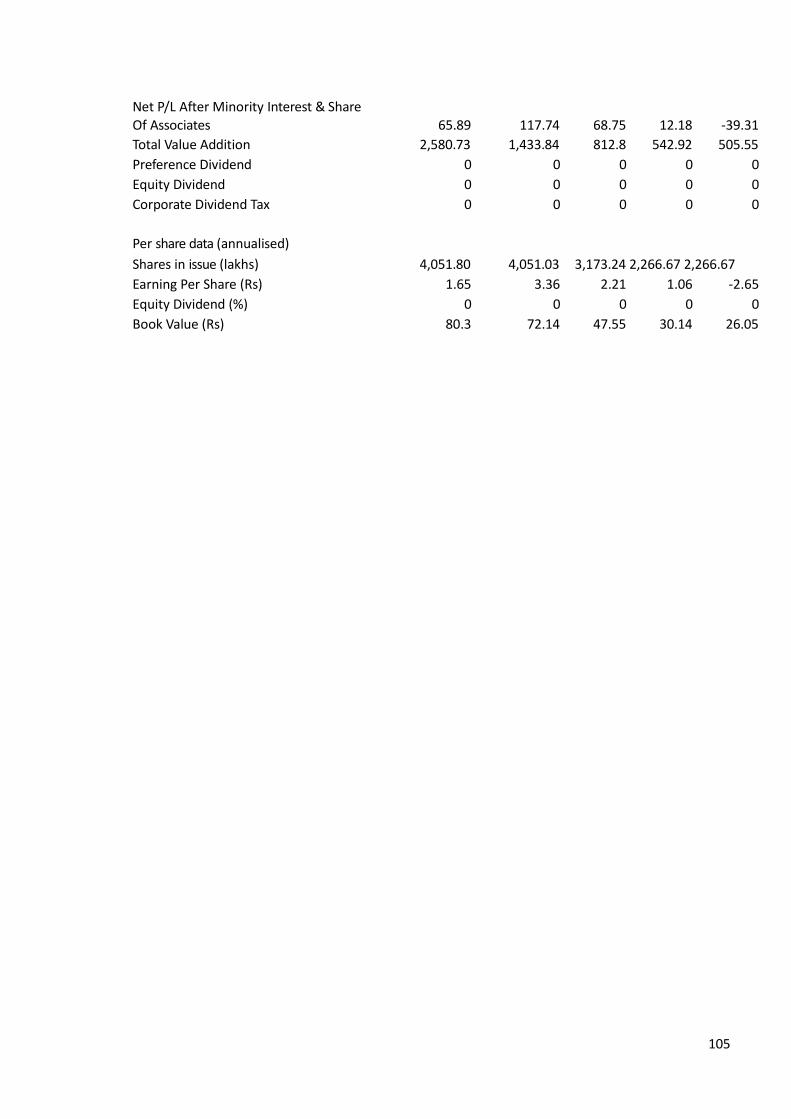
Net P/L After Minority Interest & Share
Of Associates 65.89 117.74 68.75 12.18 -39.31
Total Value Addition 2,580.73 1,433.84 812.8 542.92 505.55
Preference Dividend 0 0 0 0 0
Equity Dividend 0 0 0 0 0
Corporate Dividend Tax 0 0 0 0 0
Per share data (annualised)
Shares in issue (lakhs) 4,051.80 4,051.03 3,173.24 2,266.67 2,266.67
Earning Per Share (Rs) 1.65 3.36 2.21 1.06 -2.65
Equity Dividend (%) 0 0 0 0 0
Book Value (Rs) 80.3 72.14 47.55 30.14 26.05
105
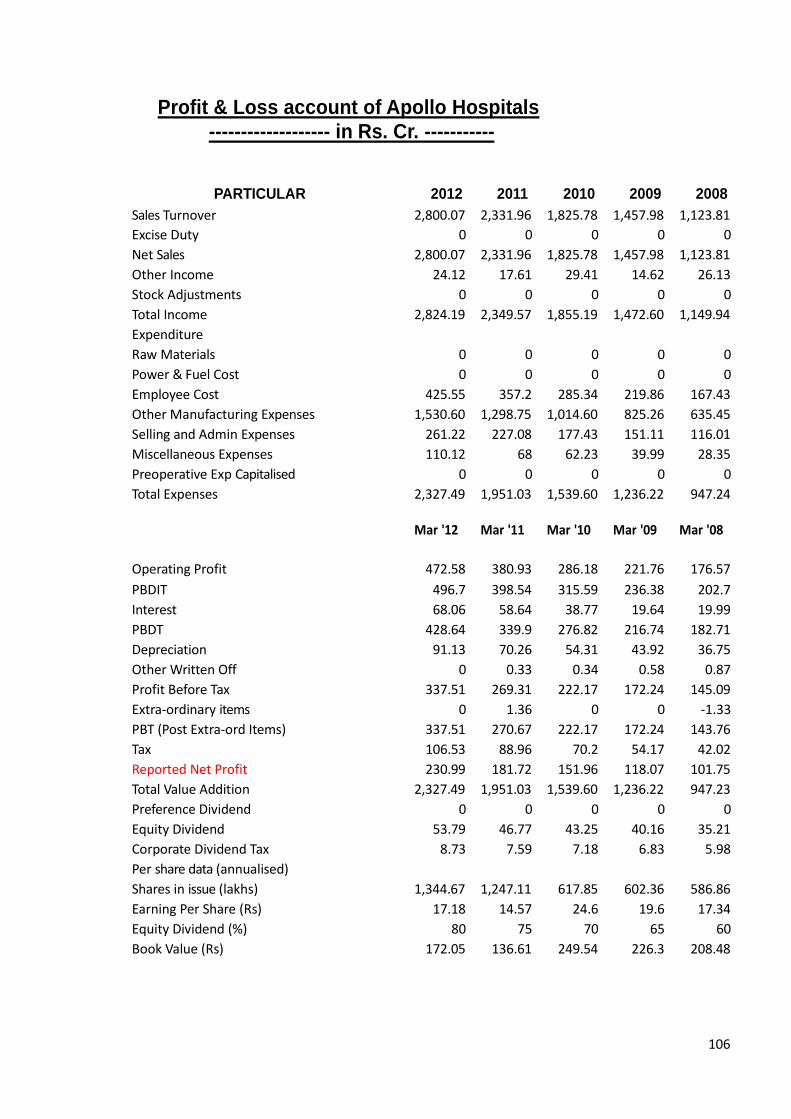
Profit & Loss account of Apollo Hospitals
------------------- in Rs. Cr. -----------
PARTICULAR 2012 2011 2010 2009 2008
Sales Turnover 2,800.07 2,331.96 1,825.78 1,457.98 1,123.81
Excise Duty 0 0 0 0 0
Net Sales 2,800.07 2,331.96 1,825.78 1,457.98 1,123.81
Other Income 24.12 17.61 29.41 14.62 26.13
Stock Adjustments 0 0 0 0 0
Total Income 2,824.19 2,349.57 1,855.19 1,472.60 1,149.94
Expenditure
Raw Materials 0 0 0 0 0
Power & Fuel Cost 0 0 0 0 0
Employee Cost 425.55 357.2 285.34 219.86 167.43
Other Manufacturing Expenses 1,530.60 1,298.75 1,014.60 825.26 635.45
Selling and Admin Expenses 261.22 227.08 177.43 151.11 116.01
Miscellaneous Expenses 110.12 68 62.23 39.99 28.35
Preoperative Exp Capitalised 0 0 0 0 0
Total Expenses 2,327.49 1,951.03 1,539.60 1,236.22 947.24
Mar '12 Mar '11 Mar '10 Mar '09 Mar '08
Operating Profit 472.58 380.93 286.18 221.76 176.57
PBDIT 496.7 398.54 315.59 236.38 202.7
Interest 68.06 58.64 38.77 19.64 19.99
PBDT 428.64 339.9 276.82 216.74 182.71
Depreciation 91.13 70.26 54.31 43.92 36.75
Other Written Off 0 0.33 0.34 0.58 0.87
Profit Before Tax 337.51 269.31 222.17 172.24 145.09
Extra-ordinary items 0 1.36 0 0 -1.33
PBT (Post Extra-ord Items) 337.51 270.67 222.17 172.24 143.76
Tax 106.53 88.96 70.2 54.17 42.02
Reported Net Profit 230.99 181.72 151.96 118.07 101.75
Total Value Addition 2,327.49 1,951.03 1,539.60 1,236.22 947.23
Preference Dividend 0 0 0 0 0
Equity Dividend 53.79 46.77 43.25 40.16 35.21
Corporate Dividend Tax 8.73 7.59 7.18 6.83 5.98
Per share data (annualised)
Shares in issue (lakhs) 1,344.67 1,247.11 617.85 602.36 586.86
Earning Per Share (Rs) 17.18 14.57 24.6 19.6 17.34
Equity Dividend (%) 80 75 70 65 60
Book Value (Rs) 172.05 136.61 249.54 226.3 208.48
106
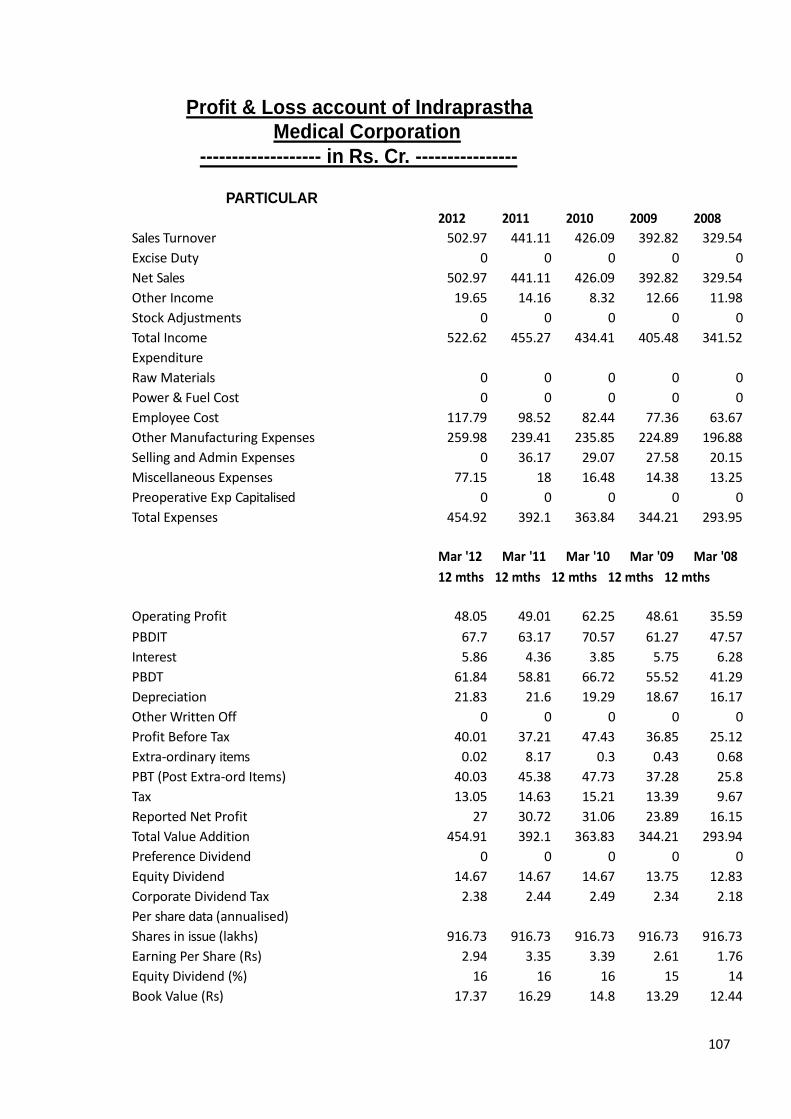
Profit & Loss account of Indraprastha
Medical Corporation
------------------- in Rs. Cr. ----------------
PARTICULAR
2012 2011 2010 2009 2008
Sales Turnover 502.97 441.11 426.09 392.82 329.54
Excise Duty 0 0 0 0 0
Net Sales 502.97 441.11 426.09 392.82 329.54
Other Income 19.65 14.16 8.32 12.66 11.98
Stock Adjustments 0 0 0 0 0
Total Income 522.62 455.27 434.41 405.48 341.52
Expenditure
Raw Materials 0 0 0 0 0
Power & Fuel Cost 0 0 0 0 0
Employee Cost 117.79 98.52 82.44 77.36 63.67
Other Manufacturing Expenses 259.98 239.41 235.85 224.89 196.88
Selling and Admin Expenses 0 36.17 29.07 27.58 20.15
Miscellaneous Expenses 77.15 18 16.48 14.38 13.25
Preoperative Exp Capitalised 0 0 0 0 0
Total Expenses 454.92 392.1 363.84 344.21 293.95
Mar '12 Mar '11 Mar '10 Mar '09 Mar '08
12 mths 12 mths 12 mths 12 mths 12 mths
Operating Profit 48.05 49.01 62.25 48.61 35.59
PBDIT 67.7 63.17 70.57 61.27 47.57
Interest 5.86 4.36 3.85 5.75 6.28
PBDT 61.84 58.81 66.72 55.52 41.29
Depreciation 21.83 21.6 19.29 18.67 16.17
Other Written Off 0 0 0 0 0
Profit Before Tax 40.01 37.21 47.43 36.85 25.12
Extra-ordinary items 0.02 8.17 0.3 0.43 0.68
PBT (Post Extra-ord Items) 40.03 45.38 47.73 37.28 25.8
Tax 13.05 14.63 15.21 13.39 9.67
Reported Net Profit 27 30.72 31.06 23.89 16.15
Total Value Addition 454.91 392.1 363.83 344.21 293.94
Preference Dividend 0 0 0 0 0
Equity Dividend 14.67 14.67 14.67 13.75 12.83
Corporate Dividend Tax 2.38 2.44 2.49 2.34 2.18
Per share data (annualised)
Shares in issue (lakhs) 916.73 916.73 916.73 916.73 916.73
Earning Per Share (Rs) 2.94 3.35 3.39 2.61 1.76
Equity Dividend (%) 16 16 16 15 14
Book Value (Rs) 17.37 16.29 14.8 13.29 12.44
107
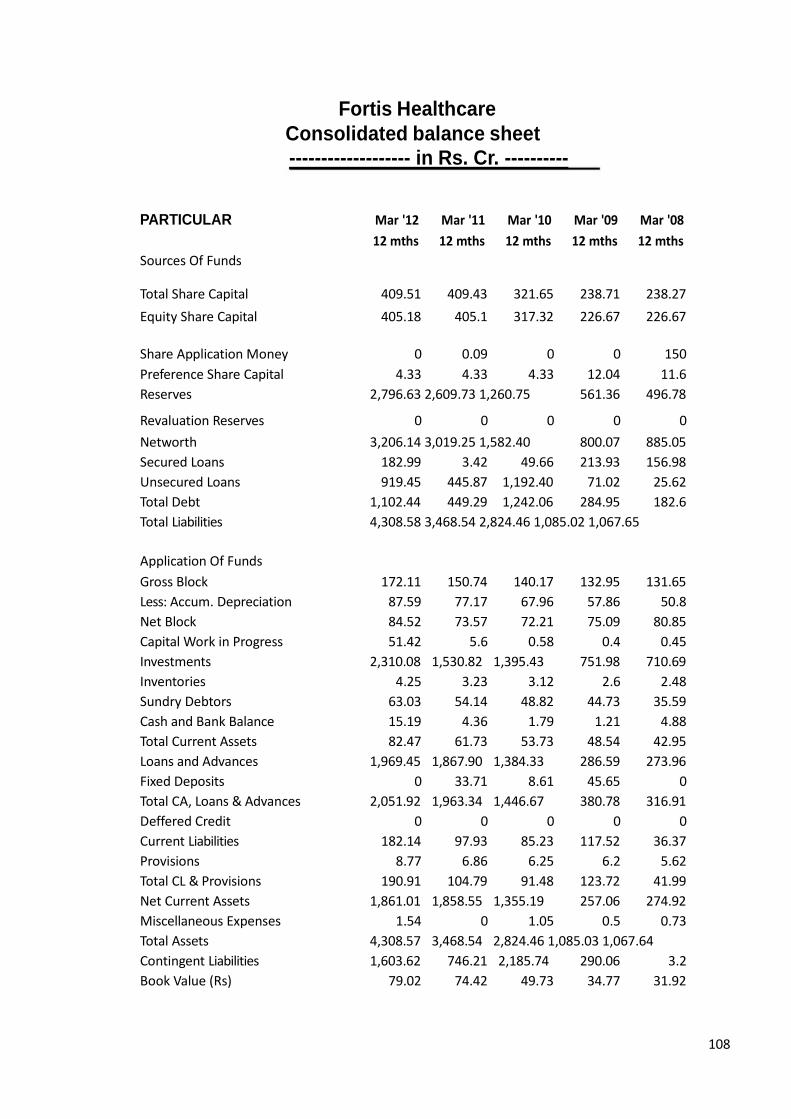
Fortis Healthcare
Consolidated balance sheet
------------------- in Rs. Cr. ----------
PARTICULAR Mar '12 Mar '11 Mar '10 Mar '09 Mar '08
12 mths 12 mths 12 mths 12 mths 12 mths
Sources Of Funds Total Share Capital 409.51 409.43 321.65 238.71 238.27
Equity Share Capital 405.18 405.1 317.32 226.67 226.67
Share Application Money 0 0.09 0 0 150
Preference Share Capital 4.33 4.33 4.33 12.04 11.6
Reserves 2,796.63 2,609.73 1,260.75 561.36 496.78
Revaluation Reserves 0 0 0 0 0
Networth 3,206.14 3,019.25 1,582.40 800.07 885.05
Secured Loans 182.99 3.42 49.66 213.93 156.98
Unsecured Loans 919.45 445.87 1,192.40 71.02 25.62
Total Debt 1,102.44 449.29 1,242.06 284.95 182.6
Total Liabilities 4,308.58 3,468.54 2,824.46 1,085.02 1,067.65
Application Of Funds
Gross Block 172.11 150.74 140.17 132.95 131.65
Less: Accum. Depreciation 87.59 77.17 67.96 57.86 50.8
Net Block 84.52 73.57 72.21 75.09 80.85
Capital Work in Progress 51.42 5.6 0.58 0.4 0.45
Investments 2,310.08 1,530.82 1,395.43 751.98 710.69
Inventories 4.25 3.23 3.12 2.6 2.48
Sundry Debtors 63.03 54.14 48.82 44.73 35.59
Cash and Bank Balance 15.19 4.36 1.79 1.21 4.88
Total Current Assets 82.47 61.73 53.73 48.54 42.95
Loans and Advances 1,969.45 1,867.90 1,384.33 286.59 273.96
Fixed Deposits 0 33.71 8.61 45.65 0
Total CA, Loans & Advances 2,051.92 1,963.34 1,446.67 380.78 316.91
Deffered Credit 0 0 0 0 0
Current Liabilities 182.14 97.93 85.23 117.52 36.37
Provisions 8.77 6.86 6.25 6.2 5.62
Total CL & Provisions 190.91 104.79 91.48 123.72 41.99
Net Current Assets 1,861.01 1,858.55 1,355.19 257.06 274.92
Miscellaneous Expenses 1.54 0 1.05 0.5 0.73
Total Assets 4,308.57 3,468.54 2,824.46 1,085.03 1,067.64
Contingent Liabilities 1,603.62 746.21 2,185.74 290.06 3.2
Book Value (Rs) 79.02 74.42 49.73 34.77 31.92
108
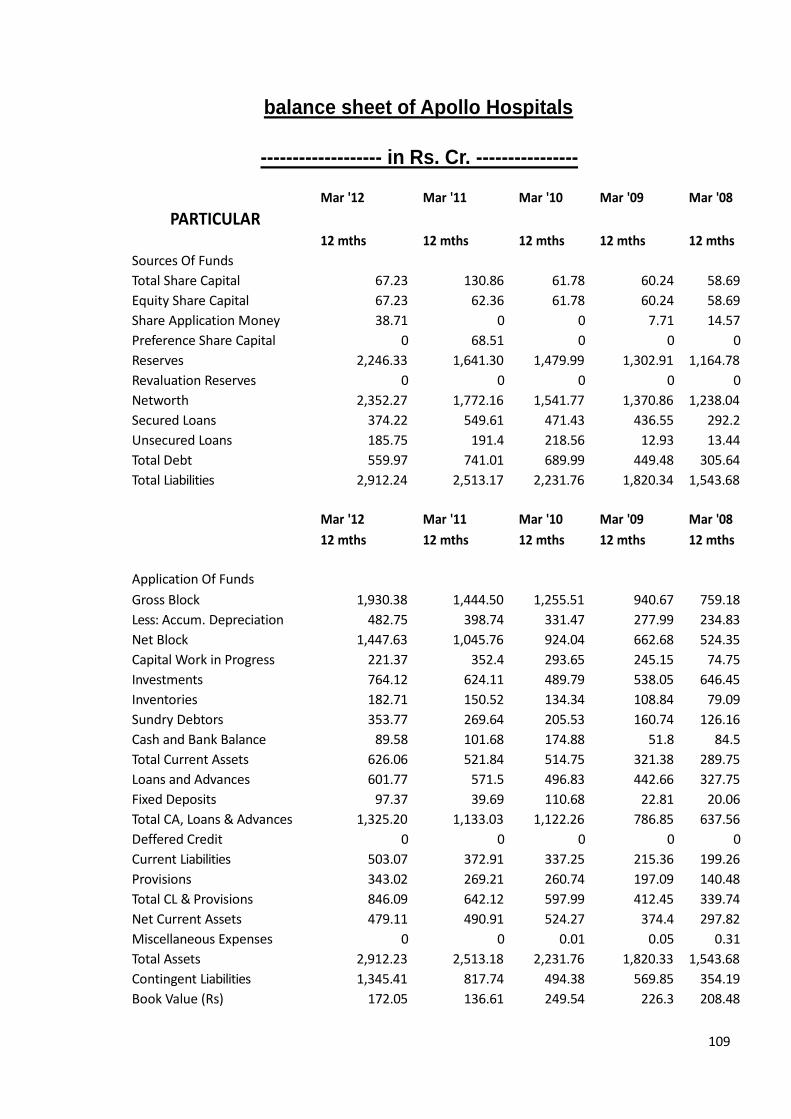
balance sheet of Apollo Hospitals
------------------- in Rs. Cr. ----------------
Mar '12 Mar '11 Mar '10 Mar '09 Mar '08
PARTICULAR
12 mths 12 mths 12 mths 12 mths 12 mths
Sources Of Funds
Total Share Capital 67.23 130.86 61.78 60.24 58.69
Equity Share Capital 67.23 62.36 61.78 60.24 58.69
Share Application Money 38.71 0 0 7.71 14.57
Preference Share Capital 0 68.51 0 0 0
Reserves 2,246.33 1,641.30 1,479.99 1,302.91 1,164.78
Revaluation Reserves 0 0 0 0 0
Networth 2,352.27 1,772.16 1,541.77 1,370.86 1,238.04
Secured Loans 374.22 549.61 471.43 436.55 292.2
Unsecured Loans 185.75 191.4 218.56 12.93 13.44
Total Debt 559.97 741.01 689.99 449.48 305.64
Total Liabilities 2,912.24 2,513.17 2,231.76 1,820.34 1,543.68
Mar '12 Mar '11 Mar '10 Mar '09 Mar '08
12 mths 12 mths 12 mths 12 mths 12 mths
Application Of Funds
Gross Block 1,930.38 1,444.50 1,255.51 940.67 759.18
Less: Accum. Depreciation 482.75 398.74 331.47 277.99 234.83
Net Block 1,447.63 1,045.76 924.04 662.68 524.35
Capital Work in Progress 221.37 352.4 293.65 245.15 74.75
Investments 764.12 624.11 489.79 538.05 646.45
Inventories 182.71 150.52 134.34 108.84 79.09
Sundry Debtors 353.77 269.64 205.53 160.74 126.16
Cash and Bank Balance 89.58 101.68 174.88 51.8 84.5
Total Current Assets 626.06 521.84 514.75 321.38 289.75
Loans and Advances 601.77 571.5 496.83 442.66 327.75
Fixed Deposits 97.37 39.69 110.68 22.81 20.06
Total CA, Loans & Advances 1,325.20 1,133.03 1,122.26 786.85 637.56
Deffered Credit 0 0 0 0 0
Current Liabilities 503.07 372.91 337.25 215.36 199.26
Provisions 343.02 269.21 260.74 197.09 140.48
Total CL & Provisions 846.09 642.12 597.99 412.45 339.74
Net Current Assets 479.11 490.91 524.27 374.4 297.82
Miscellaneous Expenses 0 0 0.01 0.05 0.31
Total Assets 2,912.23 2,513.18 2,231.76 1,820.33 1,543.68
Contingent Liabilities 1,345.41 817.74 494.38 569.85 354.19
Book Value (Rs) 172.05 136.61 249.54 226.3 208.48
109
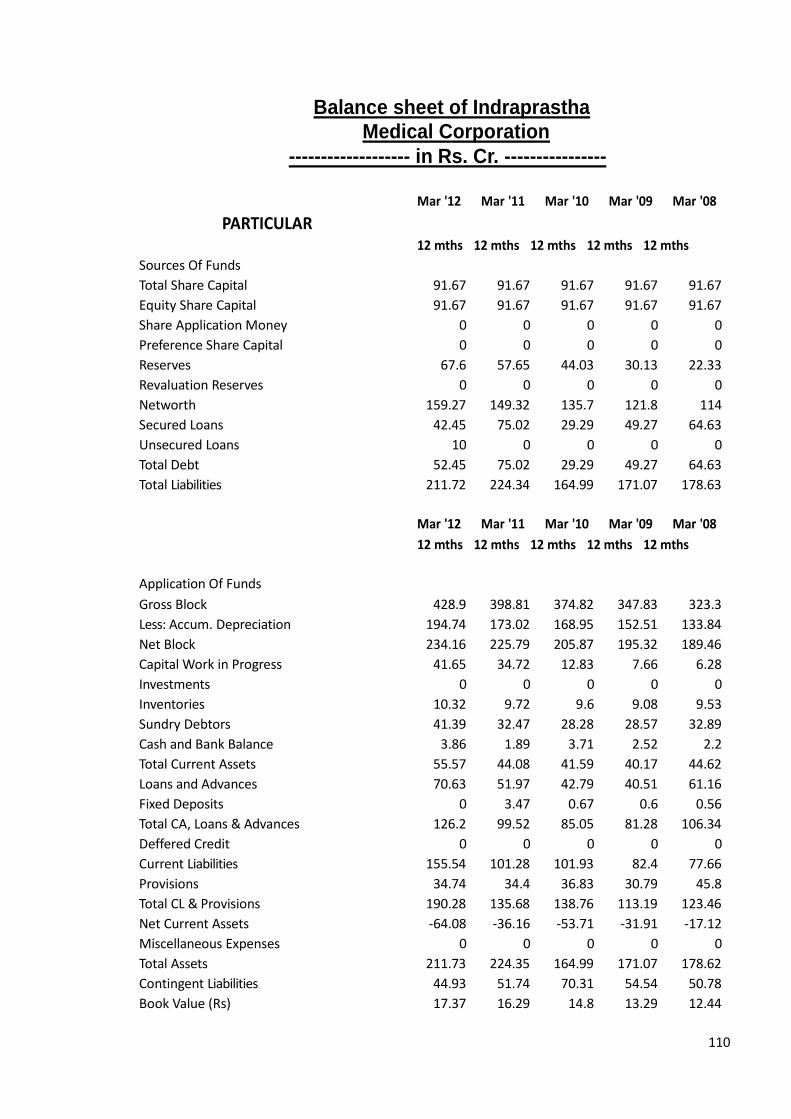
Balance sheet of Indraprastha
Medical Corporation
------------------- in Rs. Cr. ----------------
Mar '12 Mar '11 Mar '10 Mar '09 Mar '08
PARTICULAR
12 mths 12 mths 12 mths 12 mths 12 mths
Sources Of Funds
Total Share Capital 91.67 91.67 91.67 91.67 91.67
Equity Share Capital 91.67 91.67 91.67 91.67 91.67
Share Application Money 0 0 0 0 0
Preference Share Capital 0 0 0 0 0
Reserves 67.6 57.65 44.03 30.13 22.33
Revaluation Reserves 0 0 0 0 0
Networth 159.27 149.32 135.7 121.8 114
Secured Loans 42.45 75.02 29.29 49.27 64.63
Unsecured Loans 10 0 0 0 0
Total Debt 52.45 75.02 29.29 49.27 64.63
Total Liabilities 211.72 224.34 164.99 171.07 178.63
Mar '12 Mar '11 Mar '10 Mar '09 Mar '08
12 mths 12 mths 12 mths 12 mths 12 mths
Application Of Funds
Gross Block 428.9 398.81 374.82 347.83 323.3
Less: Accum. Depreciation 194.74 173.02 168.95 152.51 133.84
Net Block 234.16 225.79 205.87 195.32 189.46
Capital Work in Progress 41.65 34.72 12.83 7.66 6.28
Investments 0 0 0 0 0
Inventories 10.32 9.72 9.6 9.08 9.53
Sundry Debtors 41.39 32.47 28.28 28.57 32.89
Cash and Bank Balance 3.86 1.89 3.71 2.52 2.2
Total Current Assets 55.57 44.08 41.59 40.17 44.62
Loans and Advances 70.63 51.97 42.79 40.51 61.16
Fixed Deposits 0 3.47 0.67 0.6 0.56
Total CA, Loans & Advances 126.2 99.52 85.05 81.28 106.34
Deffered Credit 0 0 0 0 0
Current Liabilities 155.54 101.28 101.93 82.4 77.66
Provisions 34.74 34.4 36.83 30.79 45.8
Total CL & Provisions 190.28 135.68 138.76 113.19 123.46
Net Current Assets -64.08 -36.16 -53.71 -31.91 -17.12
Miscellaneous Expenses 0 0 0 0 0
Total Assets 211.73 224.35 164.99 171.07 178.62
Contingent Liabilities 44.93 51.74 70.31 54.54 50.78
Book Value (Rs) 17.37 16.29 14.8 13.29 12.44
110
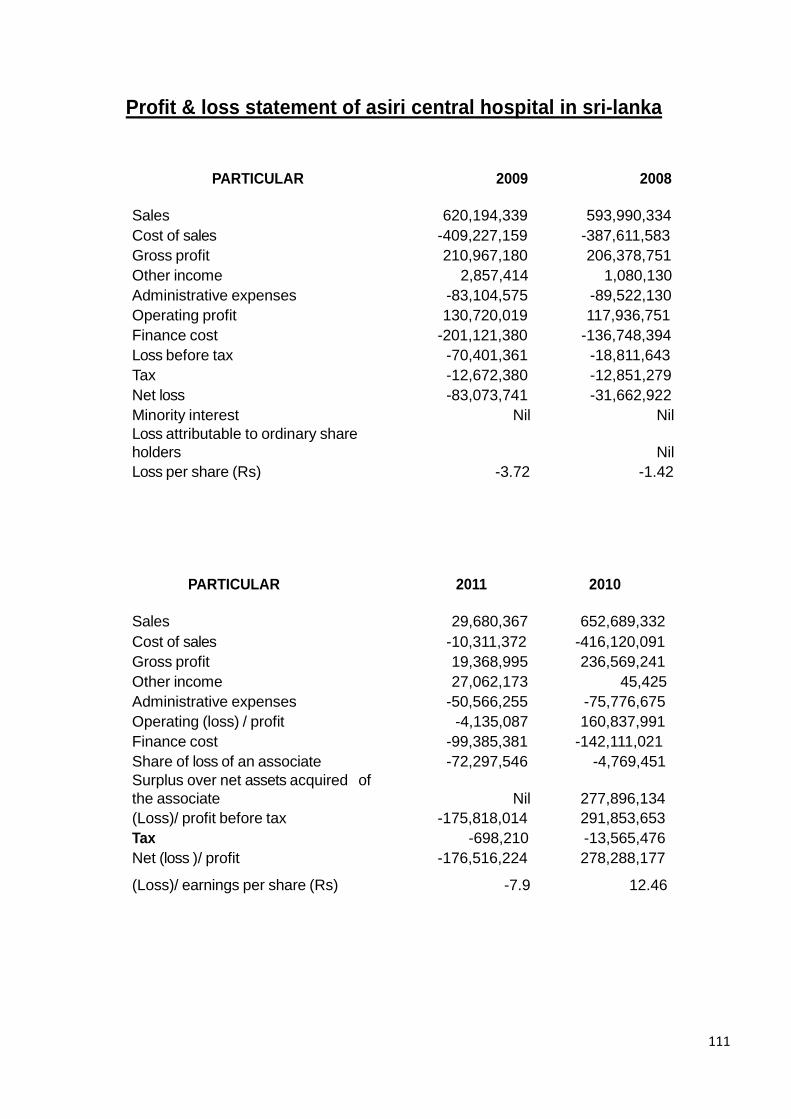
Profit & loss statement of asiri central hospital in sri-lanka
PARTICULAR 2009 2008
Sales 620,194,339 593,990,334
Cost of sales -409,227,159 -387,611,583
Gross profit 210,967,180 206,378,751
Other income 2,857,414 1,080,130
Administrative expenses -83,104,575 -89,522,130
Operating profit 130,720,019 117,936,751
Finance cost -201,121,380 -136,748,394
Loss before tax -70,401,361 -18,811,643
Tax -12,672,380 -12,851,279
Net loss -83,073,741 -31,662,922
Minority interest Nil Nil
Loss attributable to ordinary share
holders Nil
Loss per share (Rs) -3.72 -1.42
PARTICULAR 2011 2010
Sales 29,680,367 652,689,332
Cost of sales -10,311,372 -416,120,091
Gross profit 19,368,995 236,569,241
Other income 27,062,173 45,425
Administrative expenses -50,566,255 -75,776,675
Operating (loss) / profit -4,135,087 160,837,991
Finance cost -99,385,381 -142,111,021
Share of loss of an associate -72,297,546 -4,769,451
Surplus over net assets acquired of
the associate Nil 277,896,134
(Loss)/ profit before tax -175,818,014 291,853,653
Tax -698,210 -13,565,476
Net (loss )/ profit -176,516,224 278,288,177
(Loss)/ earnings per share (Rs) -7.9 12.46
111
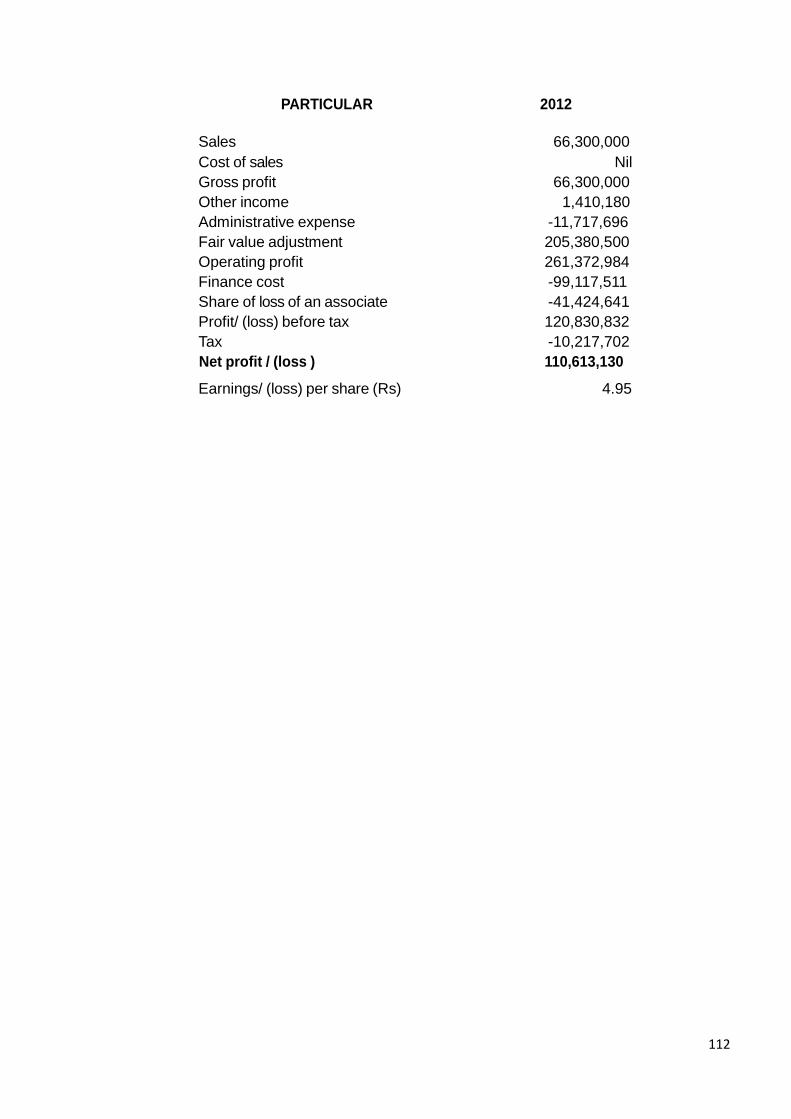
PARTICULAR 2012
Sales 66,300,000
Cost of sales Nil
Gross profit 66,300,000
Other income 1,410,180
Administrative expense -11,717,696
Fair value adjustment 205,380,500
Operating profit 261,372,984
Finance cost -99,117,511
Share of loss of an associate -41,424,641
Profit/ (loss) before tax 120,830,832
Tax -10,217,702
Net profit / (loss ) 110,613,130
Earnings/ (loss) per share (Rs) 4.95
112
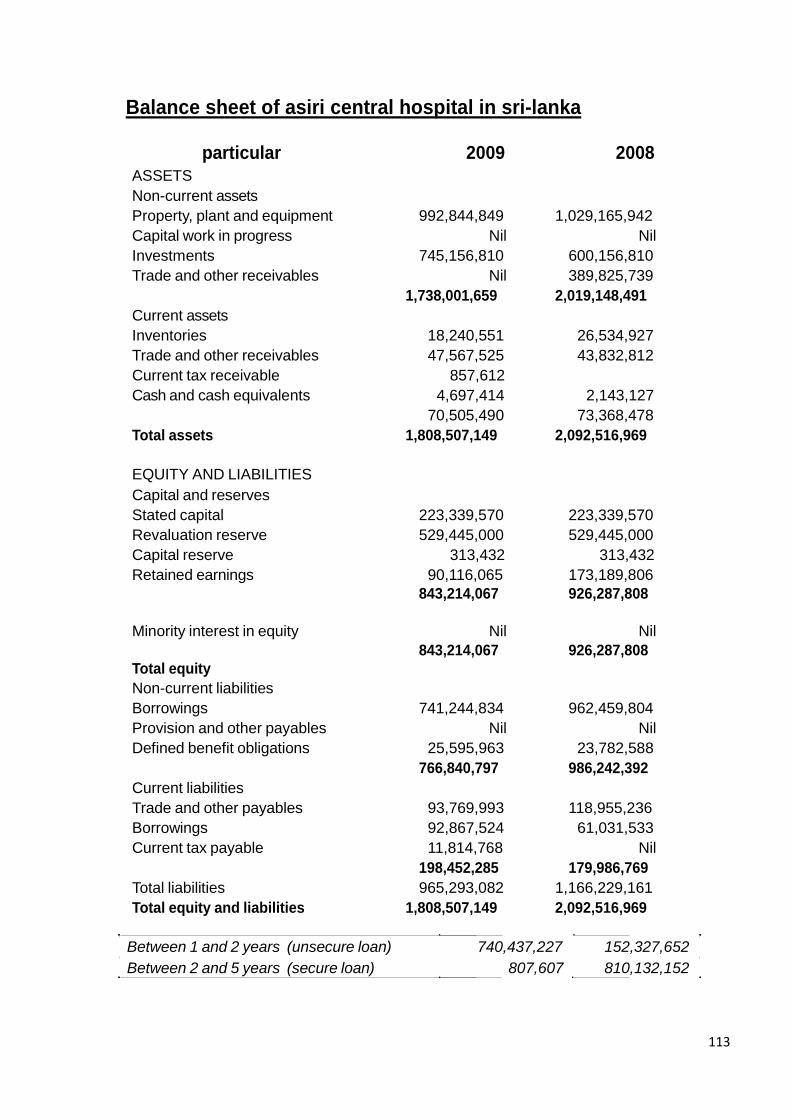
Balance sheet of asiri central hospital in sri-lanka
particular 2009 2008
ASSETS
Non-current assets
Property, plant and equipment 992,844,849 1,029,165,942
Capital work in progress Nil Nil
Investments 745,156,810 600,156,810
Trade and other receivables Nil 389,825,739
1,738,001,659 2,019,148,491
Current assets
Inventories 18,240,551 26,534,927
Trade and other receivables 47,567,525 43,832,812
Current tax receivable 857,612
Cash and cash equivalents 4,697,414 2,143,127
70,505,490 73,368,478
Total assets 1,808,507,149 2,092,516,969
EQUITY AND LIABILITIES
Capital and reserves
Stated capital 223,339,570 223,339,570
Revaluation reserve 529,445,000 529,445,000
Capital reserve 313,432 313,432
Retained earnings 90,116,065 173,189,806
843,214,067 926,287,808
Minority interest in equity Nil Nil
843,214,067 926,287,808
Total equity
Non-current liabilities
Borrowings 741,244,834 962,459,804
Provision and other payables Nil Nil
Defined benefit obligations 25,595,963 23,782,588
766,840,797 986,242,392
Current liabilities
Trade and other payables 93,769,993 118,955,236
Borrowings 92,867,524 61,031,533
Current tax payable 11,814,768 Nil
198,452,285 179,986,769
Total liabilities 965,293,082 1,166,229,161
Total equity and liabilities 1,808,507,149 2,092,516,969
Between 1 and 2 years (unsecure loan) 740,437,227 152,327,652
Between 2 and 5 years (secure loan) 807,607 810,132,152
113
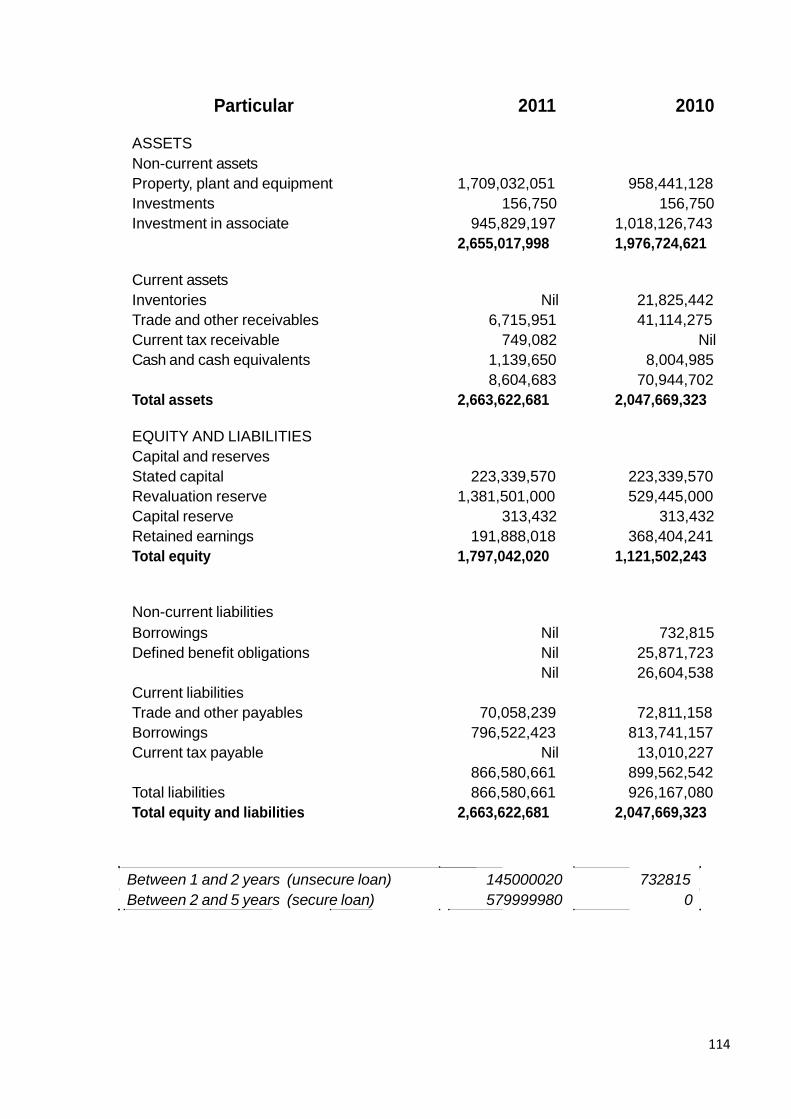
Particular 2011 2010
ASSETS
Non-current assets
Property, plant and equipment 1,709,032,051 958,441,128
Investments 156,750 156,750
Investment in associate 945,829,197 1,018,126,743
2,655,017,998 1,976,724,621
Current assets
Inventories Nil 21,825,442
Trade and other receivables 6,715,951 41,114,275
Current tax receivable 749,082 Nil
Cash and cash equivalents 1,139,650 8,004,985
8,604,683 70,944,702
Total assets 2,663,622,681 2,047,669,323
EQUITY AND LIABILITIES
Capital and reserves
Stated capital 223,339,570 223,339,570
Revaluation reserve 1,381,501,000 529,445,000
Capital reserve 313,432 313,432
Retained earnings 191,888,018 368,404,241
Total equity 1,797,042,020 1,121,502,243
Non-current liabilities
Borrowings Nil 732,815
Defined benefit obligations Nil 25,871,723
Nil 26,604,538
Current liabilities
Trade and other payables 70,058,239 72,811,158
Borrowings 796,522,423 813,741,157
Current tax payable Nil 13,010,227
866,580,661 899,562,542
Total liabilities 866,580,661 926,167,080
Total equity and liabilities 2,663,622,681 2,047,669,323
Between 1 and 2 years (unsecure loan) 145000020 732815
Between 2 and 5 years (secure loan) 579999980 0
114
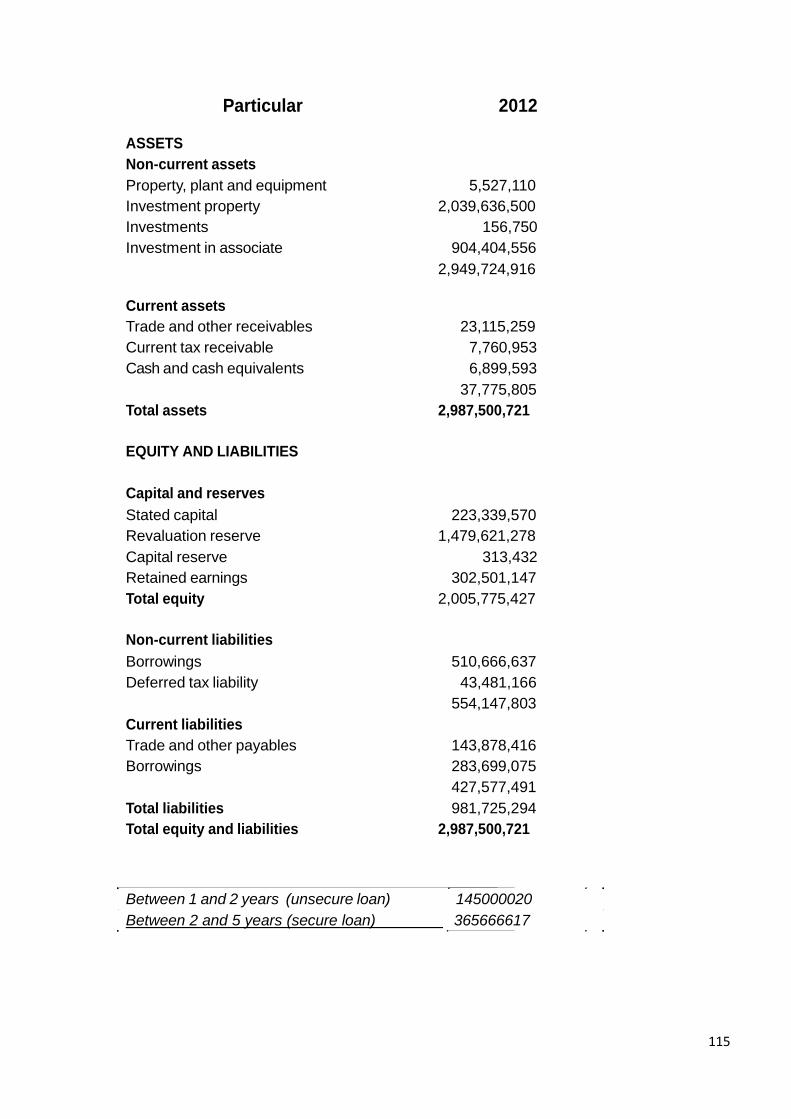
Particular 2012
ASSETS
Non-current assets
Property, plant and equipment 5,527,110
Investment property 2,039,636,500
Investments 156,750
Investment in associate 904,404,556
2,949,724,916
Current assets
Trade and other receivables 23,115,259
Current tax receivable 7,760,953
Cash and cash equivalents 6,899,593
37,775,805
Total assets 2,987,500,721
EQUITY AND LIABILITIES
Capital and reserves
Stated capital 223,339,570
Revaluation reserve 1,479,621,278
Capital reserve 313,432
Retained earnings 302,501,147
Total equity 2,005,775,427
Non-current liabilities
Borrowings 510,666,637
Deferred tax liability 43,481,166
554,147,803
Current liabilities
Trade and other payables 143,878,416
Borrowings 283,699,075
427,577,491
Total liabilities 981,725,294
Total equity and liabilities 2,987,500,721
Between 1 and 2 years (unsecure loan) 145000020
Between 2 and 5 years (secure loan) 365666617
115
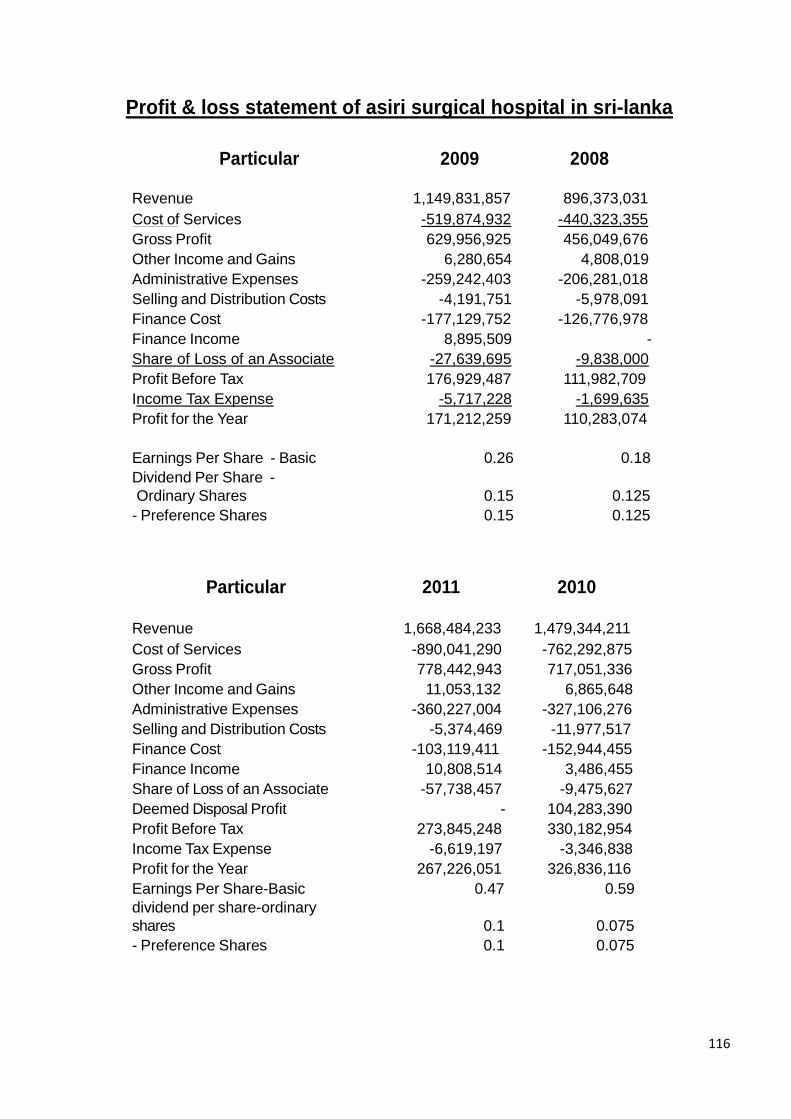
Profit & loss statement of asiri surgical hospital in sri-lanka
Particular 2009 2008
Revenue 1,149,831,857 896,373,031
Cost of Services -519,874,932 -440,323,355
Gross Profit 629,956,925 456,049,676
Other Income and Gains 6,280,654 4,808,019
Administrative Expenses -259,242,403 -206,281,018
Selling and Distribution Costs -4,191,751 -5,978,091
Finance Cost -177,129,752 -126,776,978
Finance Income 8,895,509 -
Share of Loss of an Associate -27,639,695 -9,838,000
Profit Before Tax 176,929,487 111,982,709
Income Tax Expense -5,717,228 -1,699,635
Profit for the Year 171,212,259 110,283,074
Earnings Per Share - Basic 0.26 0.18
Dividend Per Share -
Ordinary Shares 0.15 0.125
- Preference Shares 0.15 0.125
Particular 2011 2010
Revenue 1,668,484,233 1,479,344,211
Cost of Services -890,041,290 -762,292,875
Gross Profit 778,442,943 717,051,336
Other Income and Gains 11,053,132 6,865,648
Administrative Expenses -360,227,004 -327,106,276
Selling and Distribution Costs -5,374,469 -11,977,517
Finance Cost -103,119,411 -152,944,455
Finance Income 10,808,514 3,486,455
Share of Loss of an Associate -57,738,457 -9,475,627
Deemed Disposal Profit - 104,283,390
Profit Before Tax 273,845,248 330,182,954
Income Tax Expense -6,619,197 -3,346,838
Profit for the Year 267,226,051 326,836,116
Earnings Per Share-Basic 0.47 0.59
dividend per share-ordinary
shares 0.1 0.075
- Preference Shares 0.1 0.075
116
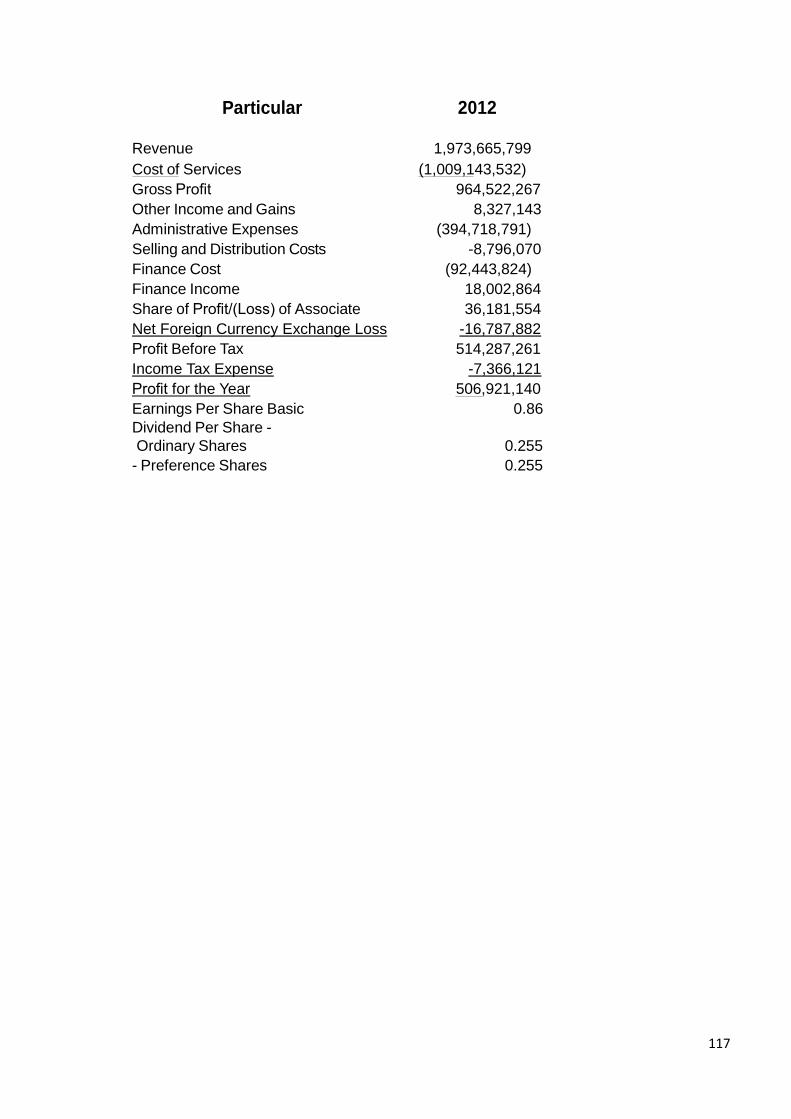
Particular 2012
Revenue 1,973,665,799
Cost of Services (1,009,143,532)
Gross Profit 964,522,267
Other Income and Gains 8,327,143
Administrative Expenses (394,718,791)
Selling and Distribution Costs -8,796,070
Finance Cost (92,443,824)
Finance Income 18,002,864
Share of Profit/(Loss) of Associate 36,181,554
Net Foreign Currency Exchange Loss -16,787,882
Profit Before Tax 514,287,261
Income Tax Expense -7,366,121
Profit for the Year 506,921,140
Earnings Per Share Basic 0.86
Dividend Per Share -
Ordinary Shares 0.255
- Preference Shares 0.255
117
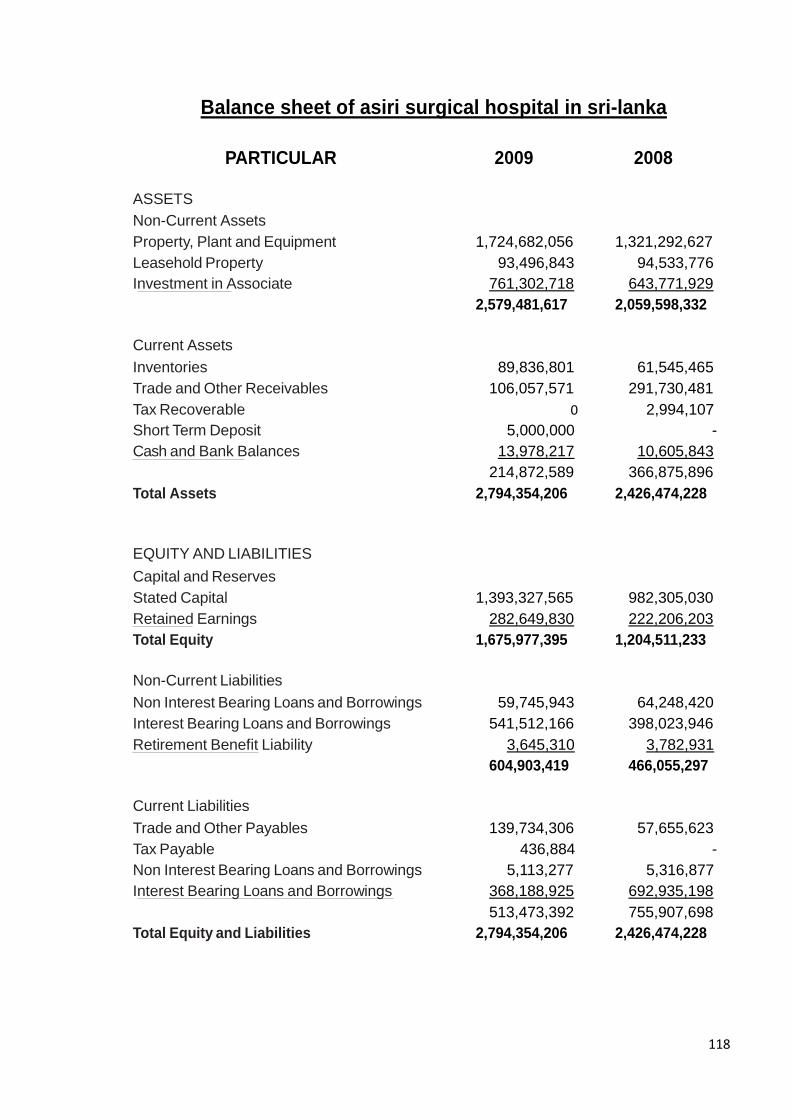
Balance sheet of asiri surgical hospital in sri-lanka
PARTICULAR 2009 2008
ASSETS
Non-Current Assets
Property, Plant and Equipment 1,724,682,056 1,321,292,627
Leasehold Property 93,496,843 94,533,776
Investment in Associate 761,302,718 643,771,929
2,579,481,617 2,059,598,332
Current Assets
Inventories 89,836,801 61,545,465
Trade and Other Receivables 106,057,571 291,730,481
Tax Recoverable 0 2,994,107
Short Term Deposit 5,000,000 -
Cash and Bank Balances 13,978,217 10,605,843
214,872,589 366,875,896
Total Assets 2,794,354,206 2,426,474,228
EQUITY AND LIABILITIES
Capital and Reserves
Stated Capital 1,393,327,565 982,305,030
Retained Earnings 282,649,830 222,206,203
Total Equity 1,675,977,395 1,204,511,233
Non-Current Liabilities
Non Interest Bearing Loans and Borrowings 59,745,943 64,248,420
Interest Bearing Loans and Borrowings 541,512,166 398,023,946
Retirement Benefit Liability 3,645,310 3,782,931
604,903,419 466,055,297
Current Liabilities
Trade and Other Payables 139,734,306 57,655,623
Tax Payable 436,884 -
Non Interest Bearing Loans and Borrowings 5,113,277 5,316,877
Interest Bearing Loans and Borrowings 368,188,925 692,935,198
513,473,392 755,907,698
Total Equity and Liabilities 2,794,354,206 2,426,474,228
118
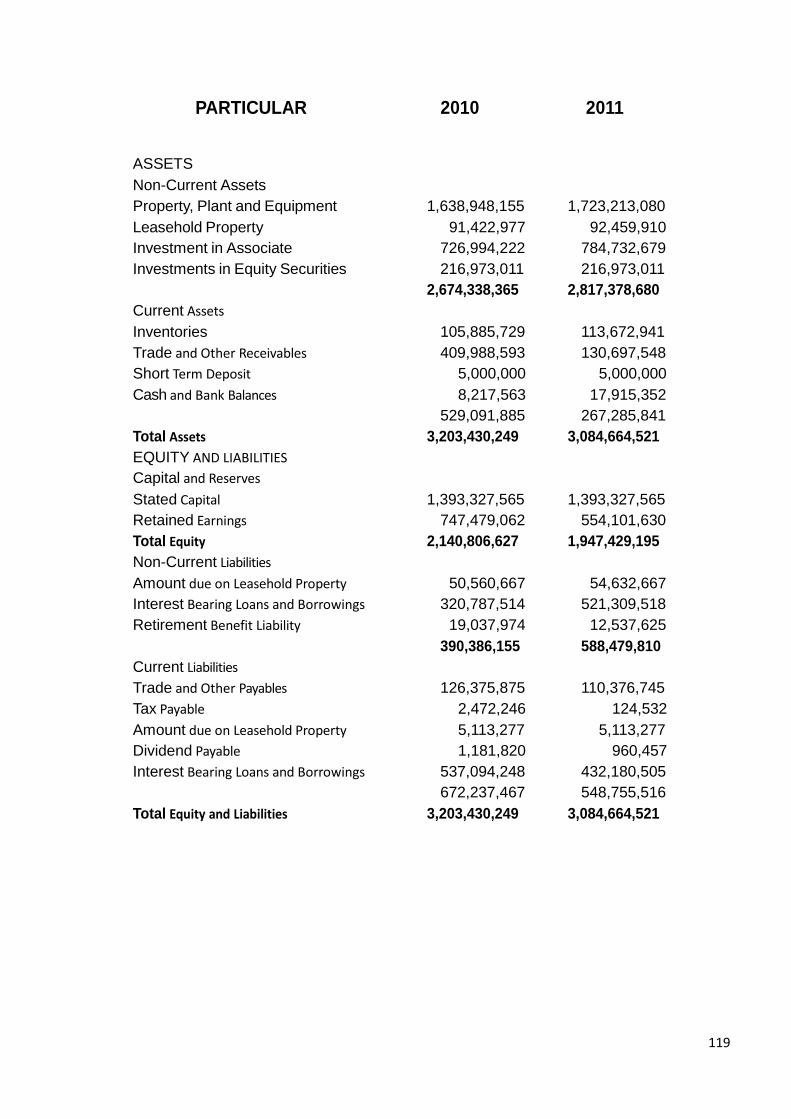
PARTICULAR 2010 2011
ASSETS
Non-Current Assets
Property, Plant and Equipment 1,638,948,155 1,723,213,080
Leasehold Property 91,422,977 92,459,910
Investment in Associate 726,994,222 784,732,679
Investments in Equity Securities 216,973,011 216,973,011
2,674,338,365 2,817,378,680
Current Assets
Inventories 105,885,729 113,672,941
Trade and Other Receivables 409,988,593 130,697,548
Short Term Deposit 5,000,000 5,000,000
Cash and Bank Balances 8,217,563 17,915,352
529,091,885 267,285,841
Total Assets 3,203,430,249 3,084,664,521
EQUITY AND LIABILITIES
Capital and Reserves
Stated Capital 1,393,327,565 1,393,327,565
Retained Earnings 747,479,062 554,101,630
Total Equity 2,140,806,627 1,947,429,195
Non-Current Liabilities
Amount due on Leasehold Property 50,560,667 54,632,667
Interest Bearing Loans and Borrowings 320,787,514 521,309,518
Retirement Benefit Liability 19,037,974 12,537,625
390,386,155 588,479,810
Current Liabilities
Trade and Other Payables 126,375,875 110,376,745
Tax Payable 2,472,246 124,532
Amount due on Leasehold Property 5,113,277 5,113,277
Dividend Payable 1,181,820 960,457
Interest Bearing Loans and Borrowings 537,094,248 432,180,505
672,237,467 548,755,516
Total Equity and Liabilities 3,203,430,249 3,084,664,521
119
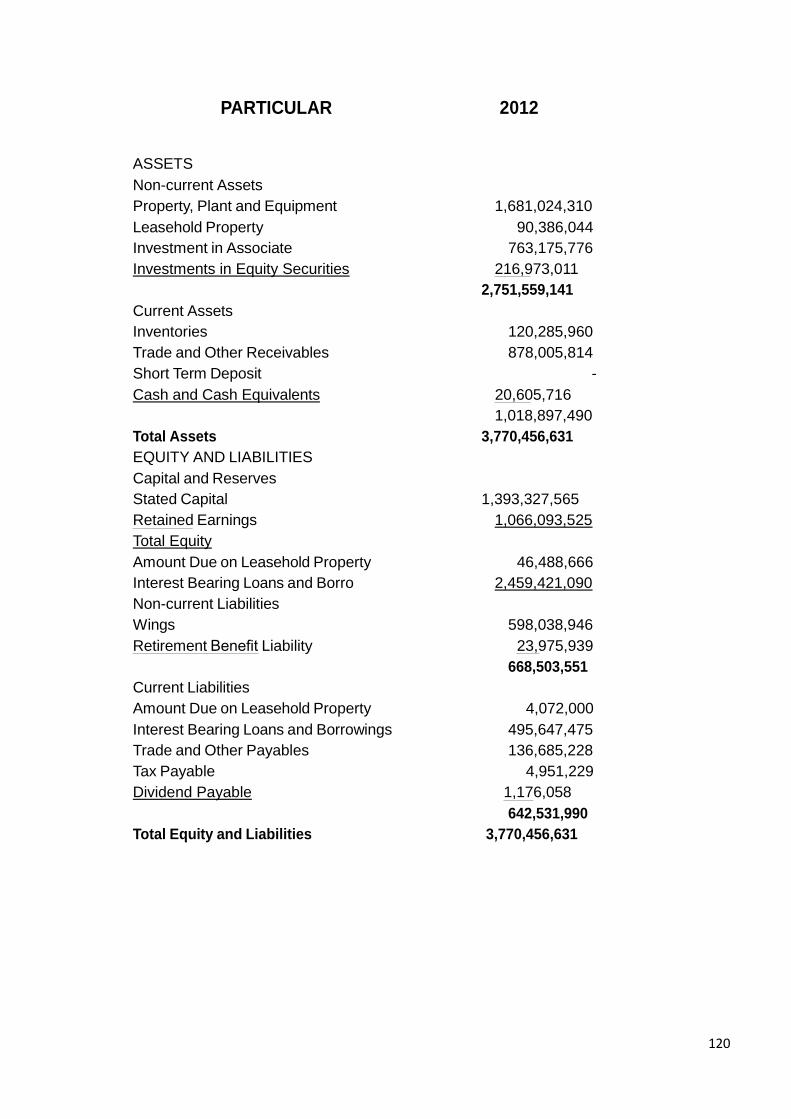
PARTICULAR 2012
ASSETS
Non-current Assets
Property, Plant and Equipment 1,681,024,310
Leasehold Property 90,386,044
Investment in Associate 763,175,776
Investments in Equity Securities 216,973,011
2,751,559,141
Current Assets
Inventories 120,285,960
Trade and Other Receivables 878,005,814
Short Term Deposit -
Cash and Cash Equivalents 20,605,716
1,018,897,490
Total Assets 3,770,456,631
EQUITY AND LIABILITIES
Capital and Reserves
Stated Capital 1,393,327,565
Retained Earnings 1,066,093,525
Total Equity
Amount Due on Leasehold Property 46,488,666
Interest Bearing Loans and Borro 2,459,421,090
Non-current Liabilities
Wings 598,038,946
Retirement Benefit Liability 23,975,939
668,503,551
Current Liabilities
Amount Due on Leasehold Property 4,072,000
Interest Bearing Loans and Borrowings 495,647,475
Trade and Other Payables 136,685,228
Tax Payable 4,951,229
Dividend Payable 1,176,058
642,531,990
Total Equity and Liabilities 3,770,456,631
120
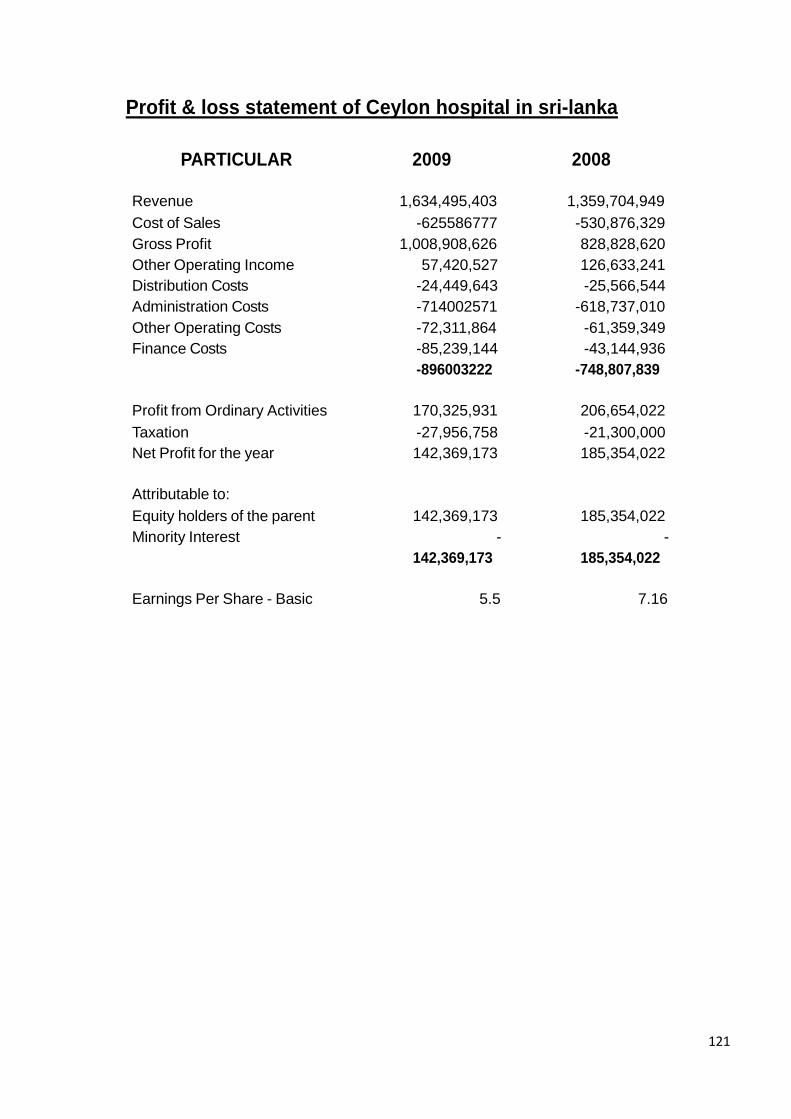
Profit & loss statement of Ceylon hospital in sri-lanka
PARTICULAR 2009 2008
Revenue 1,634,495,403 1,359,704,949
Cost of Sales -625586777 -530,876,329
Gross Profit 1,008,908,626 828,828,620
Other Operating Income 57,420,527 126,633,241
Distribution Costs -24,449,643 -25,566,544
Administration Costs -714002571 -618,737,010
Other Operating Costs -72,311,864 -61,359,349
Finance Costs -85,239,144 -43,144,936
-896003222 -748,807,839
Profit from Ordinary Activities 170,325,931 206,654,022
Taxation -27,956,758 -21,300,000
Net Profit for the year 142,369,173 185,354,022
Attributable to:
Equity holders of the parent 142,369,173 185,354,022
Minority Interest - -
142,369,173 185,354,022
Earnings Per Share - Basic 5.5 7.16
121
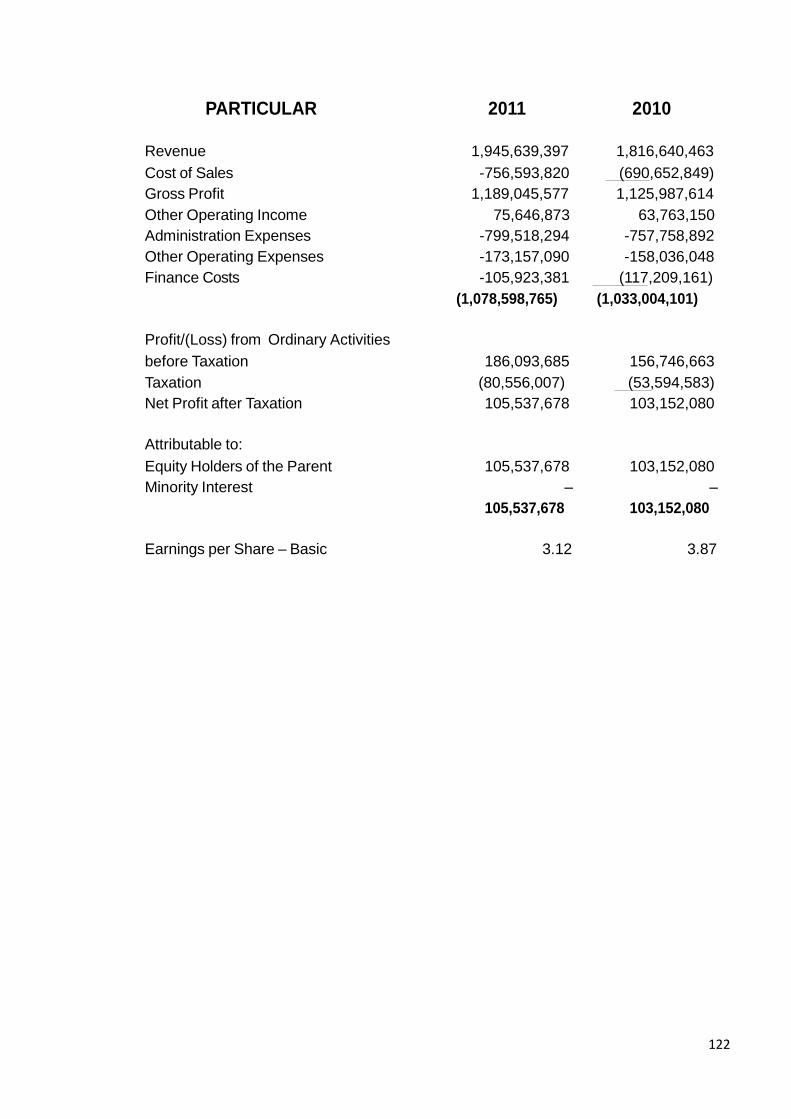
PARTICULAR 2011 2010
Revenue 1,945,639,397 1,816,640,463
Cost of Sales -756,593,820 (690,652,849)
Gross Profit 1,189,045,577 1,125,987,614
Other Operating Income 75,646,873 63,763,150
Administration Expenses -799,518,294 -757,758,892
Other Operating Expenses -173,157,090 -158,036,048
Finance Costs -105,923,381 (117,209,161)
(1,078,598,765) (1,033,004,101)
Profit/(Loss) from Ordinary Activities
before Taxation 186,093,685 156,746,663
Taxation (80,556,007) (53,594,583)
Net Profit after Taxation 105,537,678 103,152,080
Attributable to:
Equity Holders of the Parent 105,537,678 103,152,080
Minority Interest – –
105,537,678 103,152,080
Earnings per Share – Basic 3.12 3.87
122
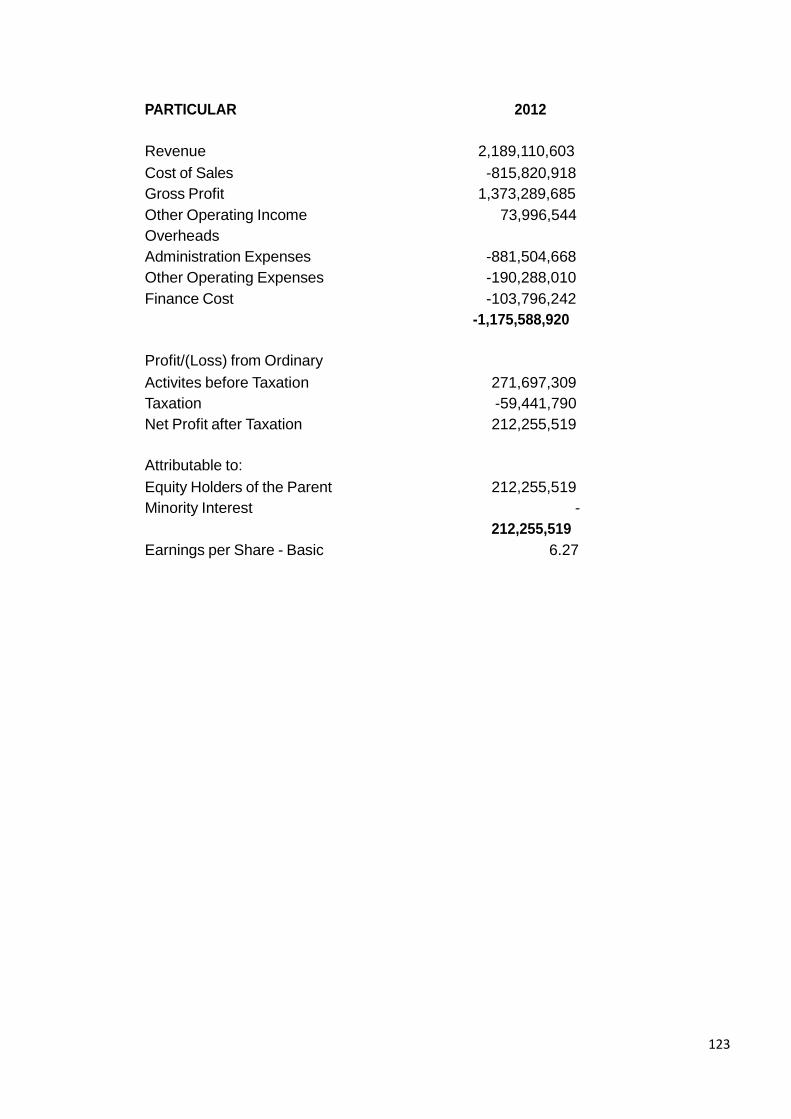
PARTICULAR 2012
Revenue 2,189,110,603
Cost of Sales -815,820,918
Gross Profit 1,373,289,685
Other Operating Income 73,996,544
Overheads
Administration Expenses -881,504,668
Other Operating Expenses -190,288,010
Finance Cost -103,796,242
-1,175,588,920
Profit/(Loss) from Ordinary
Activites before Taxation 271,697,309
Taxation -59,441,790
Net Profit after Taxation 212,255,519
Attributable to:
Equity Holders of the Parent 212,255,519
Minority Interest -
212,255,519
Earnings per Share - Basic 6.27
123
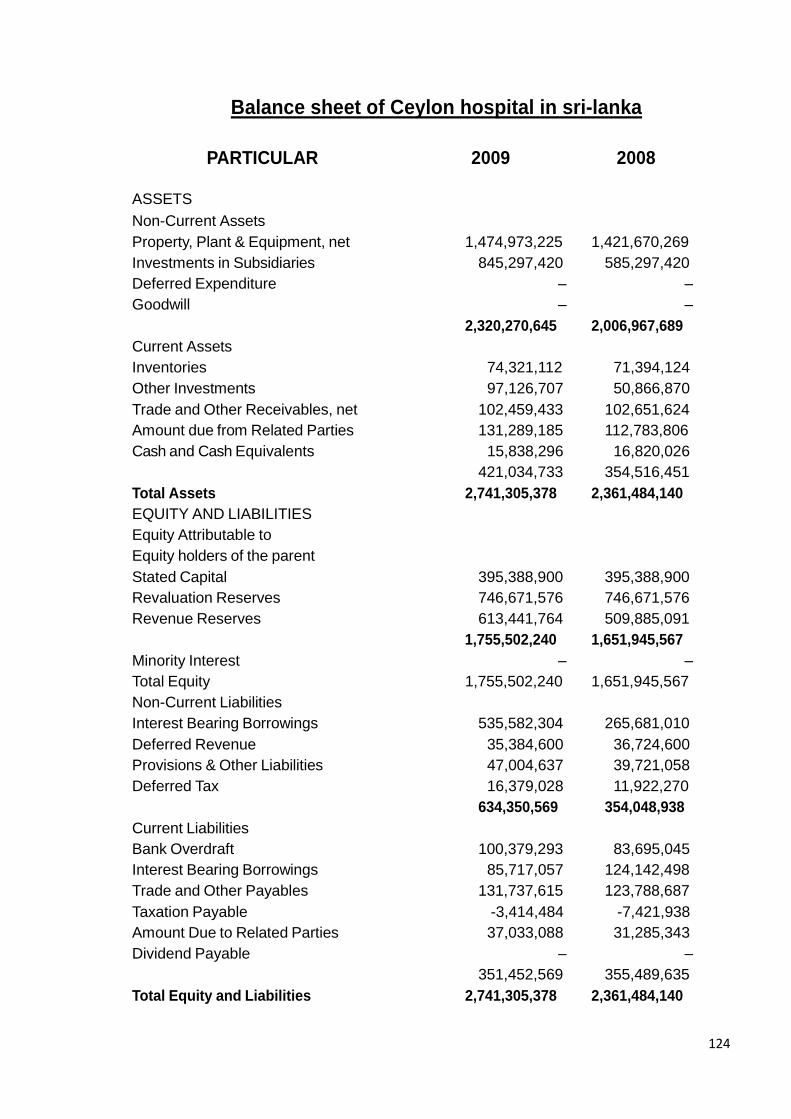
Balance sheet of Ceylon hospital in sri-lanka
PARTICULAR 2009 2008
ASSETS
Non-Current Assets
Property, Plant & Equipment, net 1,474,973,225 1,421,670,269
Investments in Subsidiaries 845,297,420 585,297,420
Deferred Expenditure – –
Goodwill – –
2,320,270,645 2,006,967,689
Current Assets
Inventories 74,321,112 71,394,124
Other Investments 97,126,707 50,866,870
Trade and Other Receivables, net 102,459,433 102,651,624
Amount due from Related Parties 131,289,185 112,783,806
Cash and Cash Equivalents 15,838,296 16,820,026
421,034,733 354,516,451
Total Assets 2,741,305,378 2,361,484,140
EQUITY AND LIABILITIES
Equity Attributable to
Equity holders of the parent
Stated Capital 395,388,900 395,388,900
Revaluation Reserves 746,671,576 746,671,576
Revenue Reserves 613,441,764 509,885,091
1,755,502,240 1,651,945,567
Minority Interest – –
Total Equity 1,755,502,240 1,651,945,567
Non-Current Liabilities
Interest Bearing Borrowings 535,582,304 265,681,010
Deferred Revenue 35,384,600 36,724,600
Provisions & Other Liabilities 47,004,637 39,721,058
Deferred Tax 16,379,028 11,922,270
634,350,569 354,048,938
Current Liabilities
Bank Overdraft 100,379,293 83,695,045
Interest Bearing Borrowings 85,717,057 124,142,498
Trade and Other Payables 131,737,615 123,788,687
Taxation Payable -3,414,484 -7,421,938
Amount Due to Related Parties 37,033,088 31,285,343
Dividend Payable – –
351,452,569 355,489,635
Total Equity and Liabilities 2,741,305,378 2,361,484,140
124
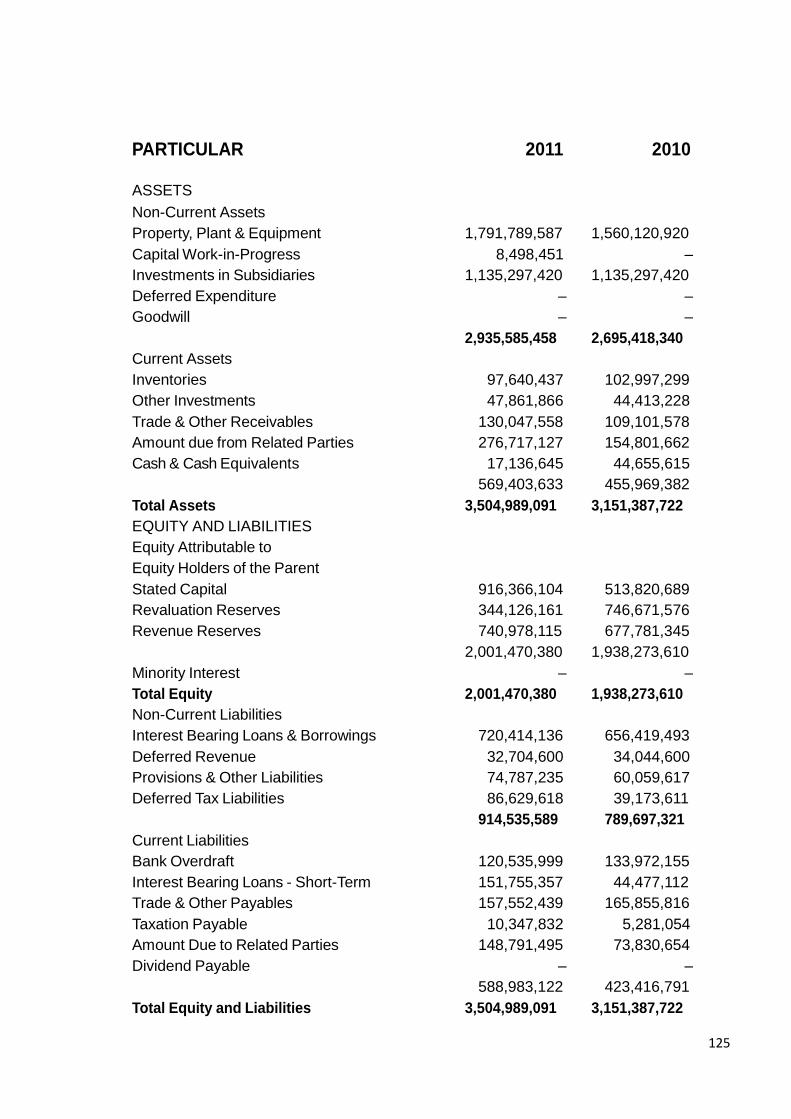
PARTICULAR 2011 2010
ASSETS
Non-Current Assets
Property, Plant & Equipment 1,791,789,587 1,560,120,920
Capital Work-in-Progress 8,498,451 –
Investments in Subsidiaries 1,135,297,420 1,135,297,420
Deferred Expenditure – –
Goodwill – –
2,935,585,458 2,695,418,340
Current Assets
Inventories 97,640,437 102,997,299
Other Investments 47,861,866 44,413,228
Trade & Other Receivables 130,047,558 109,101,578
Amount due from Related Parties 276,717,127 154,801,662
Cash & Cash Equivalents 17,136,645 44,655,615
569,403,633 455,969,382
Total Assets 3,504,989,091 3,151,387,722
EQUITY AND LIABILITIES
Equity Attributable to
Equity Holders of the Parent
Stated Capital 916,366,104 513,820,689
Revaluation Reserves 344,126,161 746,671,576
Revenue Reserves 740,978,115 677,781,345
2,001,470,380 1,938,273,610
Minority Interest – –
Total Equity 2,001,470,380 1,938,273,610
Non-Current Liabilities
Interest Bearing Loans & Borrowings 720,414,136 656,419,493
Deferred Revenue 32,704,600 34,044,600
Provisions & Other Liabilities 74,787,235 60,059,617
Deferred Tax Liabilities 86,629,618 39,173,611
914,535,589 789,697,321
Current Liabilities
Bank Overdraft 120,535,999 133,972,155
Interest Bearing Loans - Short-Term 151,755,357 44,477,112
Trade & Other Payables 157,552,439 165,855,816
Taxation Payable 10,347,832 5,281,054
Amount Due to Related Parties 148,791,495 73,830,654
Dividend Payable – –
588,983,122 423,416,791
Total Equity and Liabilities 3,504,989,091 3,151,387,722
125

PATICULAR 2012
ASSETS
Non-Current Assets
Property, Plant & Equipment 1,980,322,312
Capital Work-In-Progress 6,542,915
Investments in Subsidiary 1,157,797,422
Deferred Expenditure -
Goodwill -
3,144,662,649
Current Assets
Inventories 137,517,015
Other Investments 55,676,048
Trade and Other Receivables 205,376,874
Amount due from Related Parties 192,248,039
Cash and Cash Equivalents 12,592,181
603,410,157
Total Assets 3,748,072,806
EQUITY AND LIABILITIES
Equity Attributable to Equity Holders of Parent
Stated Capital 916,366,104
Revaluation Reserves 532,338,890
Revenue Reserves 902,424,545
2,351,129,539
Minority Interest -
Total Equity 2,351,129,539
Non-Current Liabilities
Interest Bearing Loans & Borrowings 641,793,316
Deferred Revenue 31,364,600
Provisions and Other Liabilities 75,635,045
Deferred Tax Liabilities 95,071,408
843,864,369
Current Liabilities
Bank Overdraft 107,456,573
Interest Bearing Loans - short term 172,590,745
Trade and Other Payables 188,513,563
Taxation Payable 26,808,674
Amount Due to Related Parties 57,709,343
Dividend Payable -
553,078,898
Total Equity and Liabilities 3,748,072,806
126

127
BIBLIOGRAPHY
http://www.cse.com
hip://www.moneycontrol.com
http://www.moneycontrol.com/stocks/cptmarket/compsearchnew.php
http://www.fortishealthcare.com/milestone.html
http://www.apollohospitals.com/about_company.php
http://www.apollohospdelhi.com/web/index.php?option=com_content&view=article&id
=273:executive-leadership&catid=37&Itemid=197
http://economictimes.indiatimes.com/indraprastha-medical-corporation-
ltd/infocompanyhistory/companyid-5015.cms
http://www.bloomberg.com/company/
http://www.durdans.com/about_us/default.php
128
A
GLOBAL COUNTRY REPORT
ON
“SRI LANKA”
A Project report submitted in Partial Fulfillment of award of MBA Degree to
Gujarat Technical University
: PROJECT GUIDE:
Prof. JAY PADH
: SUBMITTED BY:
JAYDEEP DANGROSIA 117880592006
ARTI ROY 117880592007
MAUSMI BHADJA 117880592008
RIDDHI DAVE 117880592009
THAKKAR JOY 117880592010
: SUBMITTED TO:
C.C.GARDI INSTITUTE OF BUSINESS MANAGEMENT
RAJKOT, (ANANDPAR).
Batch:-2011-2013
-: DECL AR ATION:-
Students’ Declaration
We, Joy Thakkar,Mausmi bhadja,riddhi dave,aarti roy,dangrosiya jaydeep
hereby declare that the Report for Global/Country Study Report entitled of insurance
sector in sri lanka is a result of our own work and our indebtedness to
other work publications, references, if any, have been duly acknowledged.
Place : ……..
(Signature)
Date :
JoyThakkar
Mausmi Bhadja
Riddhi Dave
Arti roy
Jaydeep Dangrosiya
-: PREFACE:-
It is very right that we as students have subjected to know the theoretical aspects of
every subject but in real life there are practical experience counts. So to fully gap of the
knowledge, practical knowledge is very essential than only subject can be thoroughly
understood.
As per curriculum of M.B.A. according to Gujarat technical university project is the part
of subject management & entrepreneurship development. Objective behind preparation
of this report is to develop our skills towards the all the General information related
Management in the corporate sector learning of different countries.
It was really a great experience for us, during the period have tried our level best to
gather as much as information for the country. We hope the report will provide all the
necessary information according to the requirements and syllabus of company.
According to us, this type of training shows the actual path before one step towards it.
Because it has been said ―well be began is half done‖ and for us it was perfect
beginning.
-: ACKNOWLEDGEMENT:-
W e would express our sincere gratitude to the Director of Gardi Institute
of Management, Dr.Sandip Solanki for giving us an opportunity to be a
part of this Institution. It would be never possible without his support and
encouragement. Thank You...Sir..!!
W e would also thank our institutional guide Prof.Jay Padh, f or the
knowledge he shared with us and the guidance he gave us throughout our
project. His unselfish guidance helps us to do our job more efficiently.
W e indebted to Dr .Sunil Mishra., Associate Lecturer & Prof. Pratik
Gandhi for their splendid suggestions they gave us to improve our
project. Their friendly and hum orous nature helped us to feel eas y in new
environment.
W e are very much obliged to Mr. Dhaval Dave, Mr. Hitesh Daxini, to give
us not only from books but also from their knowledge. Thanks for the
challenges, you have made me face, for they gave us t he courage to be
leading every race.
W e bestow a special gratitude to our parents, who is an inspirati on for us
to live on this world!
And lastl y we woul d thank everyone that has caused us to suffer, without
you I would have no reason to express m y selves.
God underst ands our prayers even when we can’t find the words to say
them. Thank you...God for always being there with us.
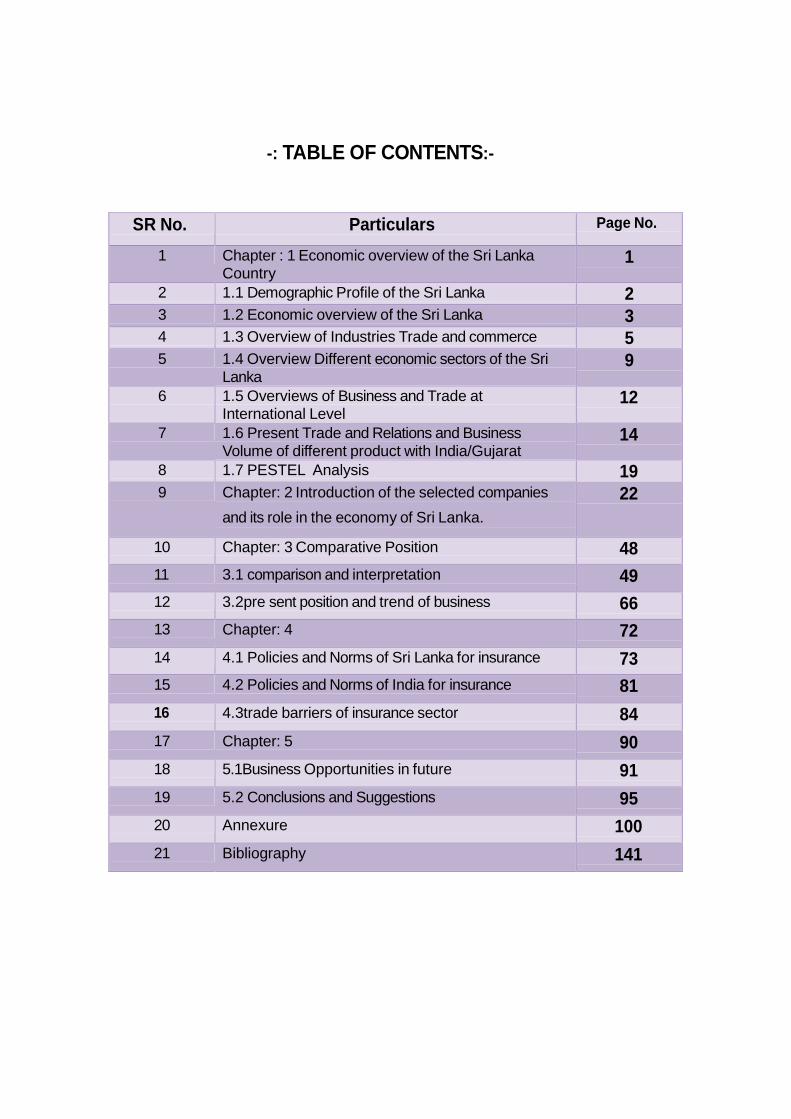
-: TABLE OF CONTENTS:-
SR No. Particulars Page No.
1 Chapter : 1 Economic overview of the Sri Lanka
Country 1
2 1.1 Demographic Profile of the Sri Lanka 2
3 1.2 Economic overview of the Sri Lanka 3
4 1.3 Overview of Industries Trade and commerce 5
5 1.4 Overview Different economic sectors of the Sri
Lanka 9
6 1.5 Overviews of Business and Trade at International Level
12
7 1.6 Present Trade and Relations and Business
Volume of different product with India/Gujarat 14
8 1.7 PESTEL Analysis 19
9 Chapter: 2 Introduction of the selected companies
and its role in the economy of Sri Lanka.
22
10 Chapter: 3 Comparative Position 48
11 3.1 comparison and interpretation 49
12 3.2pre sent position and trend of business 66
13 Chapter: 4 72
14 4.1 Policies and Norms of Sri Lanka for insurance 73
15 4.2 Policies and Norms of India for insurance 81
16 4.3trade barriers of insurance sector 84
17 Chapter: 5 90
18 5.1Business Opportunities in future 91
19 5.2 Conclusions and Suggestions 95
20 Annexure 100
21 Bibliography 141
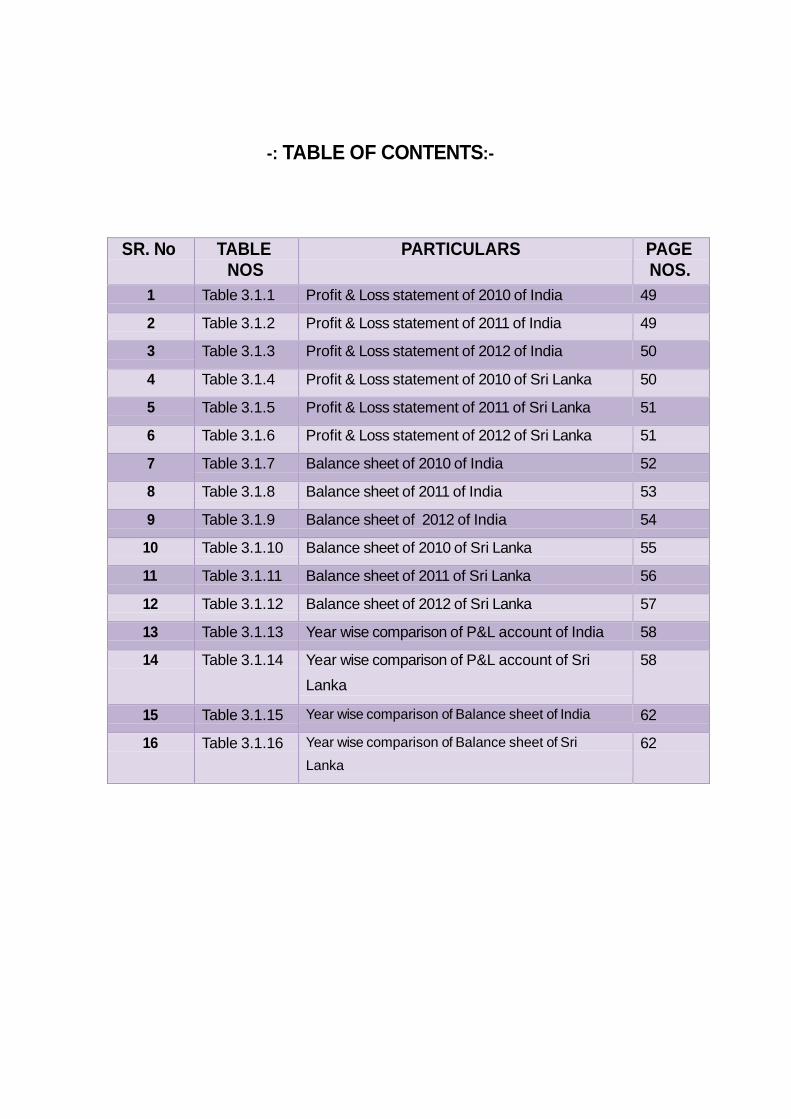
-: TABLE OF CONTENTS:-
SR. No TABLE
NOS
PARTICULARS PAGE
NOS.
1 Table 3.1.1 Profit & Loss statement of 2010 of India 49
2 Table 3.1.2 Profit & Loss statement of 2011 of India 49
3 Table 3.1.3 Profit & Loss statement of 2012 of India 50
4 Table 3.1.4 Profit & Loss statement of 2010 of Sri Lanka 50
5 Table 3.1.5 Profit & Loss statement of 2011 of Sri Lanka 51
6 Table 3.1.6 Profit & Loss statement of 2012 of Sri Lanka 51
7 Table 3.1.7 Balance sheet of 2010 of India 52
8 Table 3.1.8 Balance sheet of 2011 of India 53
9 Table 3.1.9 Balance sheet of 2012 of India 54
10 Table 3.1.10 Balance sheet of 2010 of Sri Lanka 55
11 Table 3.1.11 Balance sheet of 2011 of Sri Lanka 56
12 Table 3.1.12 Balance sheet of 2012 of Sri Lanka 57
13 Table 3.1.13 Year wise comparison of P&L account of India 58
14 Table 3.1.14 Year wise comparison of P&L account of Sri
Lanka
58
15 Table 3.1.15 Year wise comparison of Balance sheet of India 62
16 Table 3.1.16 Year wise comparison of Balance sheet of Sri
Lanka
62
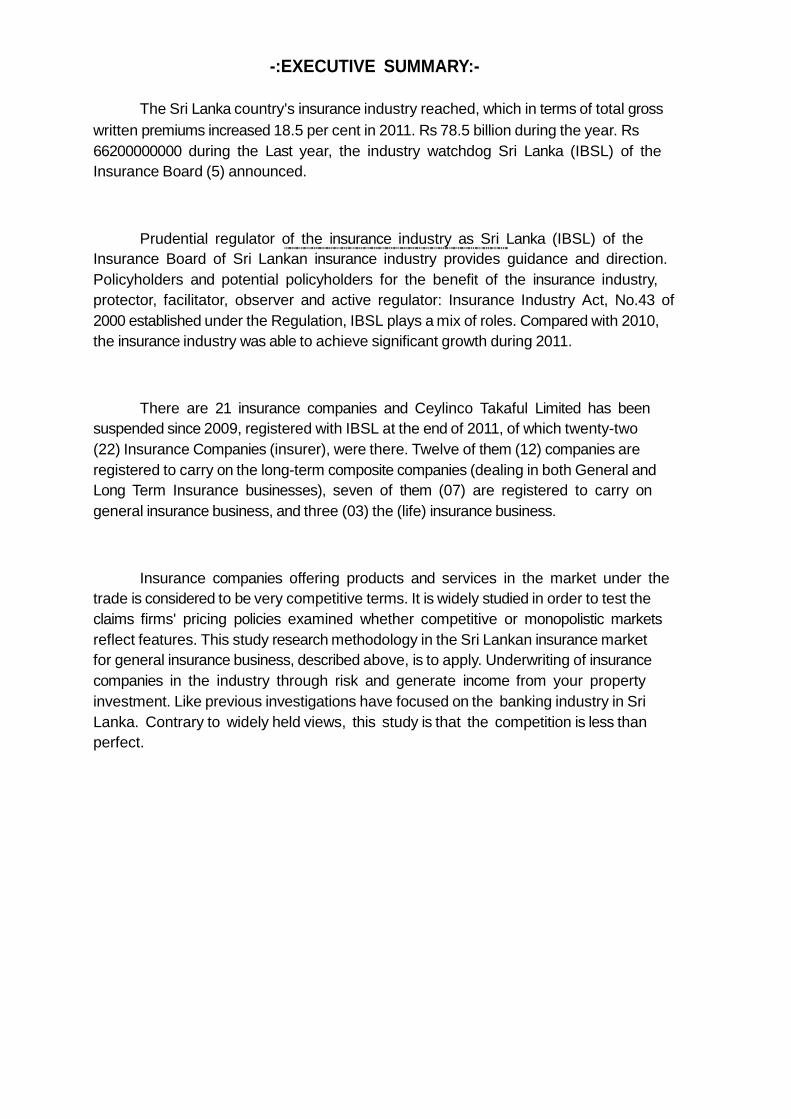
-:EXECUTIVE SUMMARY:-
The Sri Lanka country's insurance industry reached, which in terms of total gross
written premiums increased 18.5 per cent in 2011. Rs 78.5 billion during the year. Rs
66200000000 during the Last year, the industry watchdog Sri Lanka (IBSL) of the
Insurance Board (5) announced.
Prudential regulator of the insurance industry as Sri Lanka (IBSL) of the
Insurance Board of Sri Lankan insurance industry provides guidance and direction.
Policyholders and potential policyholders for the benefit of the insurance industry,
protector, facilitator, observer and active regulator: Insurance Industry Act, No.43 of
2000 established under the Regulation, IBSL plays a mix of roles. Compared with 2010,
the insurance industry was able to achieve significant growth during 2011.
There are 21 insurance companies and Ceylinco Takaful Limited has been
suspended since 2009, registered with IBSL at the end of 2011, of which twenty-two
(22) Insurance Companies (insurer), were there. Twelve of them (12) companies are
registered to carry on the long-term composite companies (dealing in both General and
Long Term Insurance businesses), seven of them (07) are registered to carry on
general insurance business, and three (03) the (life) insurance business.
Insurance companies offering products and services in the market under the
trade is considered to be very competitive terms. It is widely studied in order to test the
claims firms' pricing policies examined whether competitive or monopolistic markets
reflect features. This study research methodology in the Sri Lankan insurance market
for general insurance business, described above, is to apply. Underwriting of insurance
companies in the industry through risk and generate income from your property
investment. Like previous investigations have focused on the banking industry in Sri
Lanka. Contrary to widely held views, this study is that the competition is less than
perfect.

“GLOBAL COUNTRY REPORT ON SRI-LANKA” 2013
CHAPTER-1
C. C GARDI INSTITUE OF MANAGEMENT KALAWAD ROAD HIGHWAY ROAD, ANANDPAR
PAGE NO.1
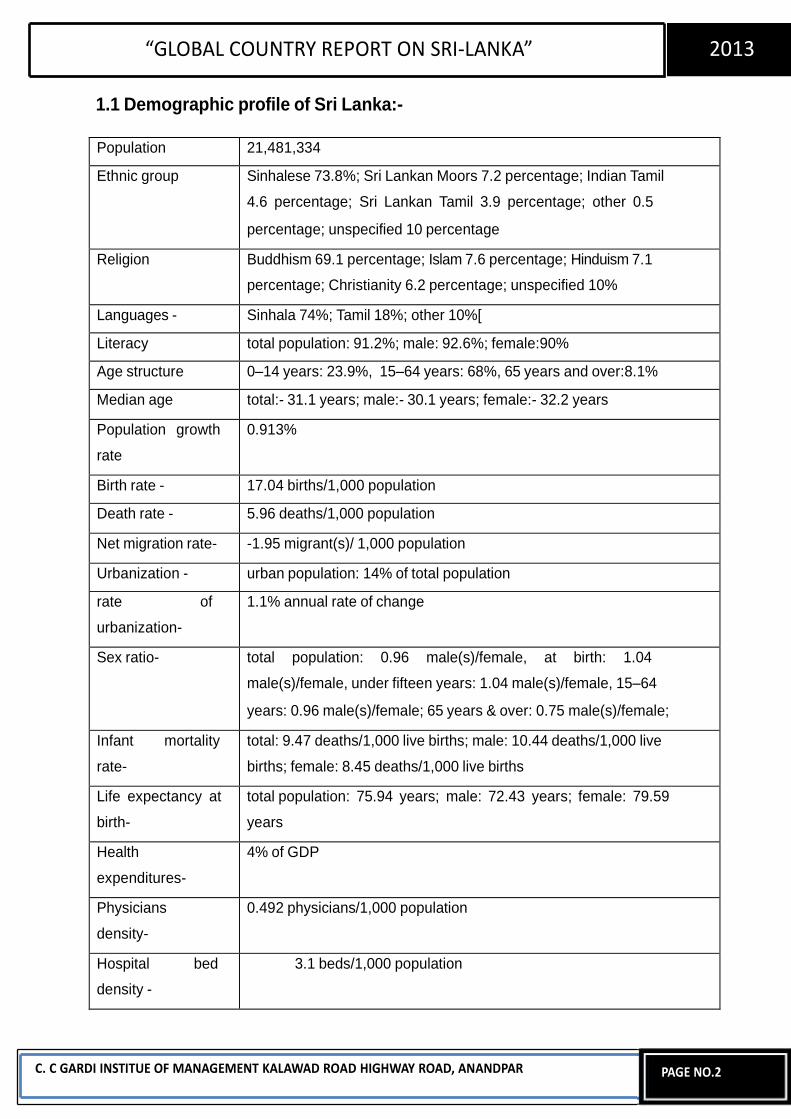
“GLOBAL COUNTRY REPORT ON SRI-LANKA” 2013
1.1 Demographic profile of Sri Lanka:-
C. C GARDI INSTITUE OF MANAGEMENT KALAWAD ROAD HIGHWAY ROAD, ANANDPAR
PAGE NO.2
Population 21,481,334
Ethnic group Sinhalese 73.8%; Sri Lankan Moors 7.2 percentage; Indian Tamil
4.6 percentage; Sri Lankan Tamil 3.9 percentage; other 0.5
percentage; unspecified 10 percentage
Religion Buddhism 69.1 percentage; Islam 7.6 percentage; Hinduism 7.1
percentage; Christianity 6.2 percentage; unspecified 10%
Languages - Sinhala 74%; Tamil 18%; other 10%[
Literacy total population: 91.2%; male: 92.6%; female:90%
Age structure 0–14 years: 23.9%, 15–64 years: 68%, 65 years and over:8.1%
Median age total:- 31.1 years; male:- 30.1 years; female:- 32.2 years
Population growth
rate
0.913%
Birth rate - 17.04 births/1,000 population
Death rate - 5.96 deaths/1,000 population
Net migration rate- -1.95 migrant(s)/ 1,000 population
Urbanization - urban population: 14% of total population
rate of
urbanization-
1.1% annual rate of change
Sex ratio- total population: 0.96 male(s)/female, at birth: 1.04
male(s)/female, under fifteen years: 1.04 male(s)/female, 15–64
years: 0.96 male(s)/female; 65 years & over: 0.75 male(s)/female;
Infant mortality
rate-
total: 9.47 deaths/1,000 live births; male: 10.44 deaths/1,000 live
births; female: 8.45 deaths/1,000 live births
Life expectancy at
birth-
total population: 75.94 years; male: 72.43 years; female: 79.59
years
Health
expenditures-
4% of GDP
Physicians
density-
0.492 physicians/1,000 population
Hospital bed
density -
3.1 beds/1,000 population
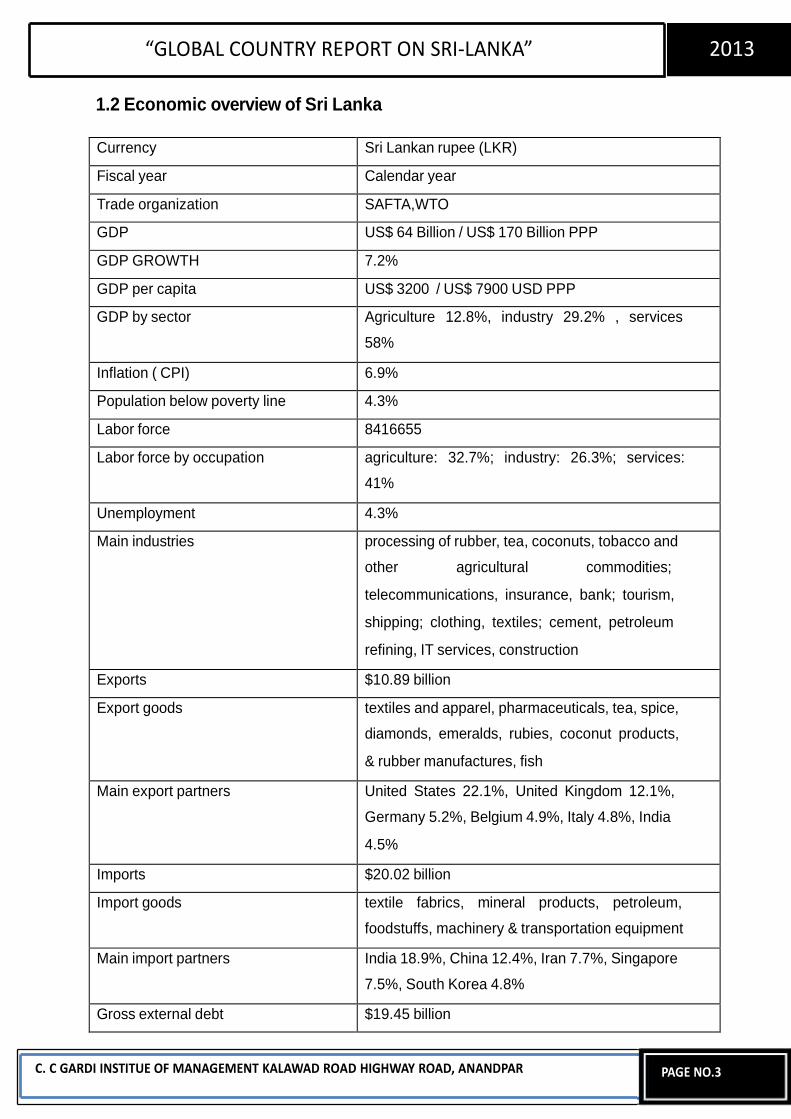
“GLOBAL COUNTRY REPORT ON SRI-LANKA” 2013
1.2 Economic overview of Sri Lanka
C. C GARDI INSTITUE OF MANAGEMENT KALAWAD ROAD HIGHWAY ROAD, ANANDPAR
PAGE NO.3
Currency Sri Lankan rupee (LKR)
Fiscal year Calendar year
Trade organization SAFTA,WTO
GDP US$ 64 Billion / US$ 170 Billion PPP
GDP GROWTH 7.2%
GDP per capita US$ 3200 / US$ 7900 USD PPP
GDP by sector Agriculture 12.8%, industry 29.2% , services
58%
Inflation ( CPI) 6.9%
Population below poverty line 4.3%
Labor force 8416655
Labor force by occupation agriculture: 32.7%; industry: 26.3%; services:
41%
Unemployment 4.3%
Main industries processing of rubber, tea, coconuts, tobacco and
other agricultural commodities;
telecommunications, insurance, bank; tourism,
shipping; clothing, textiles; cement, petroleum
refining, IT services, construction
Exports $10.89 billion
Export goods textiles and apparel, pharmaceuticals, tea, spice,
diamonds, emeralds, rubies, coconut products,
& rubber manufactures, fish
Main export partners United States 22.1%, United Kingdom 12.1%,
Germany 5.2%, Belgium 4.9%, Italy 4.8%, India
4.5%
Imports $20.02 billion
Import goods textile fabrics, mineral products, petroleum,
foodstuffs, machinery & transportation equipment
Main import partners India 18.9%, China 12.4%, Iran 7.7%, Singapore
7.5%, South Korea 4.8%
Gross external debt $19.45 billion
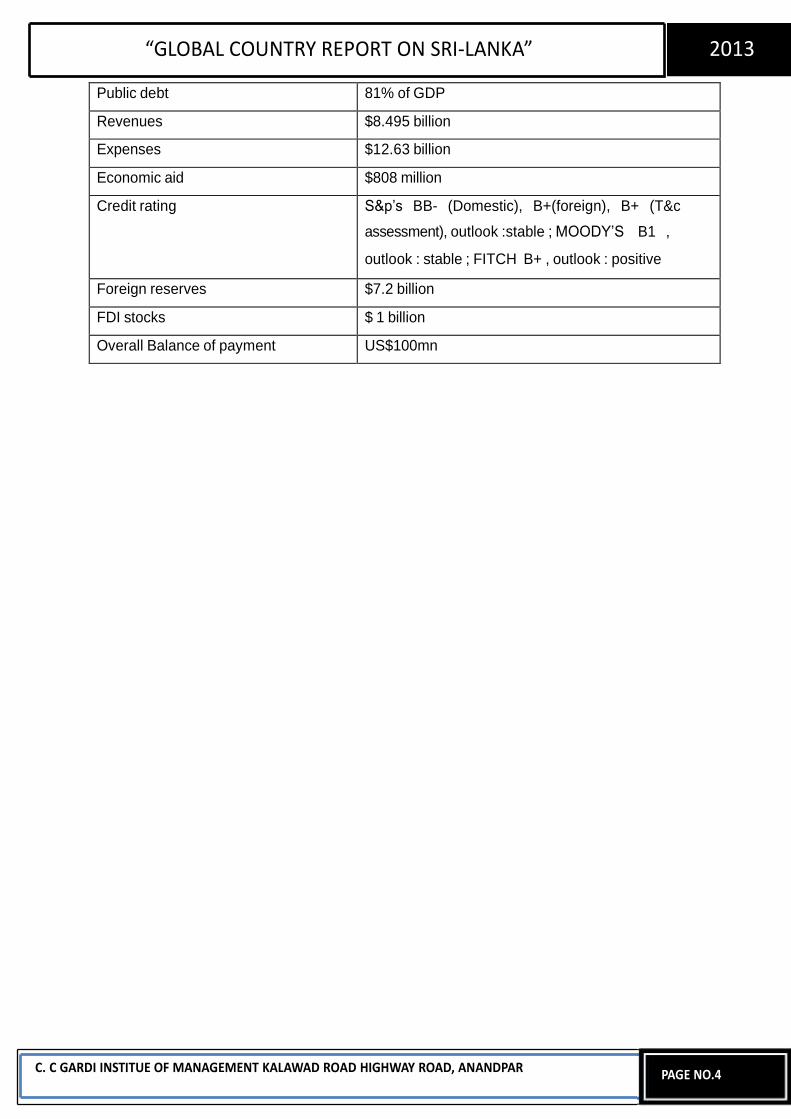
“GLOBAL COUNTRY REPORT ON SRI-LANKA” 2013
C. C GARDI INSTITUE OF MANAGEMENT KALAWAD ROAD HIGHWAY ROAD, ANANDPAR
PAGE NO.4
Public debt 81% of GDP
Revenues $8.495 billion
Expenses $12.63 billion
Economic aid $808 million
Credit rating S&p’s BB- (Domestic), B+(foreign), B+ (T&c
assessment), outlook :stable ; MOODY’S B1 ,
outlook : stable ; FITCH B+ , outlook : positive
Foreign reserves $7.2 billion
FDI stocks $ 1 billion
Overall Balance of payment US$100mn
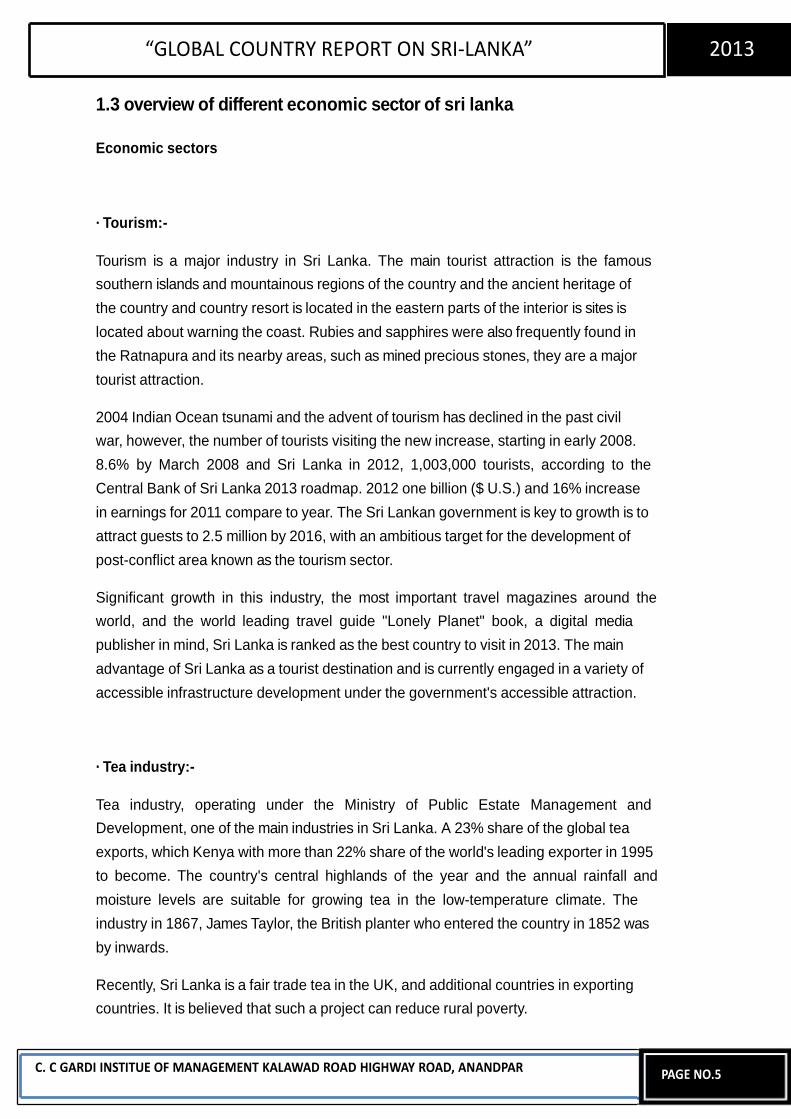
“GLOBAL COUNTRY REPORT ON SRI-LANKA” 2013
1.3 overview of different economic sector of sri lanka
Economic sectors
· Tourism:-
Tourism is a major industry in Sri Lanka. The main tourist attraction is the famous
southern islands and mountainous regions of the country and the ancient heritage of
the country and country resort is located in the eastern parts of the interior is sites is
located about warning the coast. Rubies and sapphires were also frequently found in
the Ratnapura and its nearby areas, such as mined precious stones, they are a major
tourist attraction.
2004 Indian Ocean tsunami and the advent of tourism has declined in the past civil
war, however, the number of tourists visiting the new increase, starting in early 2008.
8.6% by March 2008 and Sri Lanka in 2012, 1,003,000 tourists, according to the
Central Bank of Sri Lanka 2013 roadmap. 2012 one billion ($ U.S.) and 16% increase
in earnings for 2011 compare to year. The Sri Lankan government is key to growth is to
attract guests to 2.5 million by 2016, with an ambitious target for the development of
post-conflict area known as the tourism sector.
Significant growth in this industry, the most important travel magazines around the
world, and the world leading travel guide "Lonely Planet" book, a digital media
publisher in mind, Sri Lanka is ranked as the best country to visit in 2013. The main
advantage of Sri Lanka as a tourist destination and is currently engaged in a variety of
accessible infrastructure development under the government's accessible attraction.
· Tea industry:-
Tea industry, operating under the Ministry of Public Estate Management and
Development, one of the main industries in Sri Lanka. A 23% share of the global tea
exports, which Kenya with more than 22% share of the world's leading exporter in 1995
to become. The country's central highlands of the year and the annual rainfall and
moisture levels are suitable for growing tea in the low-temperature climate. The
industry in 1867, James Taylor, the British planter who entered the country in 1852 was
by inwards.
Recently, Sri Lanka is a fair trade tea in the UK, and additional countries in exporting
countries. It is believed that such a project can reduce rural poverty.
C. C GARDI INSTITUE OF MANAGEMENT KALAWAD ROAD HIGHWAY ROAD, ANANDPAR
PAGE NO.5
“GLOBAL COUNTRY REPORT ON SRI-LANKA” 2013
· Apparel and textile industry:-
The Sri Lanka apparel industry primarily in the United States and Europe of exports. Sri
Europe due to the high cost of labor in Europe ever more dependent on textiles. There
are countries, such as Pierre Cardin Liz Claiborne, Nike, Gap and Tommy Hilfiger
serving around 900 factories of the company.
The apparel sector is the most industrial employment generator and the largest foreign
swap film. The field for the year 2011 the amount of 39.6% of the export revenue was
USD 4.2Bn $. 24% year on year growth of exports in 2011. This allows the output
exporters of apparels locally to dispose of 40% of all comprehensive tax payment Sri
Lankan rupees (Rs) 25 and are restricted for sale to the general corporate income tax
of 12% per Piece tax is subject to 28%.
Find employment increased by 283,000 in 2011. Originally, the industry sivana
(contract manufacturer) offered by the operator and textile USA and the EU as a quota
based on the start and now it is converted into a full apparel solution provider.
· Agriculture:-
The country's agricultural sector is mostly mostly for local consumption and export to
rare coconut rice, and grain products. Agriculture sector contributes 11% of the
country's GDP, total export earnings 23.9% and 32.9% in 2011 year national
employment.
The three main traditional export crops of tea from Sri Lanka in the Rubber and
Coconut. Because these industries are already well established, BOI's central focal
point increase local value addition to agricultural crops has increased, especially in
terms of another. Particular type of technology to advance the efficiency levels of
government, to improve access to global markets for investment looks, quality seeds
and planting material use and overall value adding recover. Some of the opportunities
include:
Horticulture
Fisheries
livestock
C. C GARDI INSTITUE OF MANAGEMENT KALAWAD ROAD HIGHWAY ROAD, ANANDPAR
PAGE NO.6
“GLOBAL COUNTRY REPORT ON SRI-LANKA” 2013
· Knowledge Services::-
The knowledge of the services sector in the IT software development, knowledge
process processing / outsourcing business include the outsourcing industry, and it
enabled services and information technology training center, it is possible to hold a key
growth area appears as Sri Lanka. Students, English and literacy height, and looking at
the quality of its proximity to India, Sri Lanka is ideal for high value added IT / KPO
services, supplier development mode. IT is a software development:-
There are 100 on the software development work in Sri Lanka which provides both
independent and captive markets. Sri Lankan companies are internationally recognized
in their own software products that they have been able to build.
B / KPO BPO industry:-
The industry / KPO BPO is an emerging area of Sri Lanka. Still a nascent industry, its
small history since 2000 within / KPO BPO sector is a significant difference in the world
/ BPO KPO to attract some of the giants. Sri Lanka state financial and other
professional services, transaction processing and document management specialist
areas is increasing, and high literacy rate (about 92%) rate and a growing pool of
accounting graduates, call center services for credit.
IT enabled services
IT Training Center D:-
The education industry is a knowledge services in key areas have been identified as
one of the Sri Lanka government is trying to develop the Sri Lanka. Continuing the
work force flow in order to ensure that the needs of the growing knowledge of the
service industry personnel, information technology and training have been individually
identified and given priority. There are about 20 IT training center under the BOI.
C. C GARDI INSTITUE OF MANAGEMENT KALAWAD ROAD HIGHWAY ROAD, ANANDPAR
PAGE NO.7
“GLOBAL COUNTRY REPORT ON SRI-LANKA” 2013
· Infrastructure
Progress in infrastructure development in the medium and long term to support the
country's drive to a higher and sustainable growth is expected to maintain. To help
improve economic efficiency for the timely development of the economic structure of
the economy will expand production capacity, increase efficiency and reduce the
regional differences.
Construction cost by 14.2% compared to 9.3% in 2010, significantly expanding field
conditions added in 2011. Construction activity increased 8.6% during the year by the
goods to domestic production growth. Cement availability of 21.5 per cent in 2011 to
18.9% in 2010, compared with a contraction. Construction in the private sector
increased by 15.8% during the year for the purpose of private sector credit growth was
reflected by.
C. C GARDI INSTITUE OF MANAGEMENT KALAWAD ROAD HIGHWAY ROAD, ANANDPAR
PAGE NO.8
“GLOBAL COUNTRY REPORT ON SRI-LANKA” 2013
1.4 Overview of Industries Trade and Commerce
Ministry of Industry and Commerce (MIC) plays a dynamic role in the development of
the industrial sector. It is the key Ministry accountable for promoting industrial development in the country within the wide policy framework of Mahindra Chintana spelt out by the government. This Ministry which is the policy formulates entity for the industrial sector has taken several initiatives to increase the industrial sector performance with emphasis on:
Diversified high value extra industry base
High economic growth
More employment opportunities
Environment sustainability
Sustainable industrial development
Regional industrial development
This Ministry has been assigned the functions of planning, formulating, coordinating, implementing and setting up of the necessary infrastructure for the promotion and development of the industrial sector. Therefore the Ministry has implement following programmers and projects to establish an industrial sector spread across the country Industrial Estate Programmer.
Gamata Karmantha Programmer
Thrust Area Development Programmer
Productivity Improvement Programmer
Completion of the Chemical Weapons Convention in Sri Lanka
Industrial Survey
Textile Industry Development Programmers
C. C GARDI INSTITUE OF MANAGEMENT KALAWAD ROAD HIGHWAY ROAD, ANANDPAR
PAGE NO.9
“GLOBAL COUNTRY REPORT ON SRI-LANKA” 2013
Trade & Tariff Related Activities
The Macro Policy Division is primarily engaged in providing policy support for industrial development with a special focus on growth and international competitiveness of the industry. In performing these tasks, the Ministry needs to interact with public sector organizations and bilateral and multilateral agency. It is a highly complex process and requires continued monitoring and following up with various stakeholders in industry. Considering the significance of maintain a stable & predictable macro economic environment conducive for the growth of manufacturing sector, the Division prioritized its universal policy support in following areas.
Industry & Environment Facilitating the industry to adhere to international conventions and regulations within the overall framework of sustainable development also falls within the purview of Ministry actions. In the background of the current day worldwide environment, the produce of a globally marketable environment friendly industrial product has become essential owing to obligations arising from international conventions including signals given under the WTO Agreements. Most urban countries have joined environmental standards with other economic and non-economic conditions as pre-requisites for entry into their markets. Therefore catering to his principles has become important.
These have become important not only from the point of view of protecting the
environment but also for the survival and growth of industry. Countries in the European society have been particularly rigid about conformity to such standard. These comprise product standards for bottled water, baby food, etc., Eco labels, ISO standards such as ISO 17025, HACCP (Hazardous Analysis Critical Control Point), Eco-Tex 1000 for the garment & the textile industry and the proposed global initiative on environment reporting. A few of this standard are not implemented at current. However, they will positively be implemented within the then decade. As such, if Sri Lankan industry is to
C. C GARDI INSTITUE OF MANAGEMENT KALAWAD ROAD HIGHWAY ROAD, ANANDPAR
PAGE NO.10
“GLOBAL COUNTRY REPORT ON SRI-LANKA” 2013
be competitive in world markets, they should be geared to meet these specific
requirements in the near future. This has necessitated technological innovation and adaptation within the industries to accommodate environmental concerns. In line among these necessities, the Ministry of Industry & Commerce has promoted industrialists to adopt strategies such as application of cleaner production while inculcating principles such as waste minimization and technological upgrading for sustainable industrial development.
C. C GARDI INSTITUE OF MANAGEMENT KALAWAD ROAD HIGHWAY ROAD, ANANDPAR
PAGE NO.11
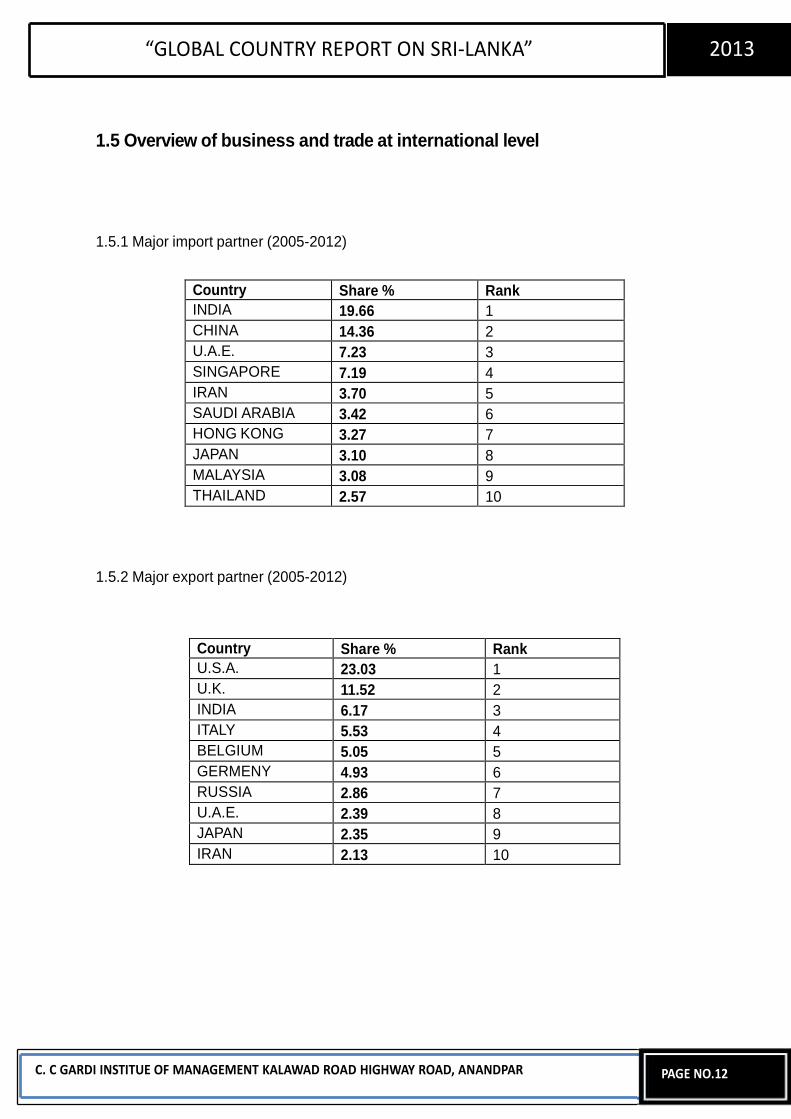
“GLOBAL COUNTRY REPORT ON SRI-LANKA” 2013
1.5 Overview of business and trade at international level
1.5.1 Major import partner (2005-2012) 1.5.2 Major export partner (2005-2012)
C. C GARDI INSTITUE OF MANAGEMENT KALAWAD ROAD HIGHWAY ROAD, ANANDPAR
PAGE NO.12
Country Share % Rank
INDIA 19.66 1
CHINA 14.36 2
U.A.E. 7.23 3
SINGAPORE 7.19 4
IRAN 3.70 5
SAUDI ARABIA 3.42 6
HONG KONG 3.27 7
JAPAN 3.10 8
MALAYSIA 3.08 9
THAILAND 2.57 10
Country Share % Rank
U.S.A. 23.03 1
U.K. 11.52 2
INDIA 6.17 3
ITALY 5.53 4
BELGIUM 5.05 5
GERMENY 4.93 6
RUSSIA 2.86 7
U.A.E. 2.39 8
JAPAN 2.35 9
IRAN 2.13 10

“GLOBAL COUNTRY REPORT ON SRI-LANKA” 2013
1.5.3 Total Trade for past 10 Years
C. C GARDI INSTITUE OF MANAGEMENT KALAWAD ROAD HIGHWAY ROAD, ANANDPAR
PAGE NO.13
Year Total
Exports
Total
Imports
Balance
of Trade
Total
Trade
2003 3519.90 4656.00 -1136.10 8175.90
2004 5612.40 7925.90 -2313.50 13538.30
2005 6164.15 8313.54 -2149.39 14477.69
2006 6829.46 9867.68 -3038.23 16697.14
2007 7675.16 11400.99 -3725.82 19076.15
2008 8179.45 14191.05 -6011.60 22370.50
2009 7118.14 9766.51 -2648.36 16884.65
2010 8293.73 12340.34 -4046.61 20634.07
2011 10017.63 19703.02 -9685.39 29720.64
2012 9180.54 17888.65 -8708.11 27069.19
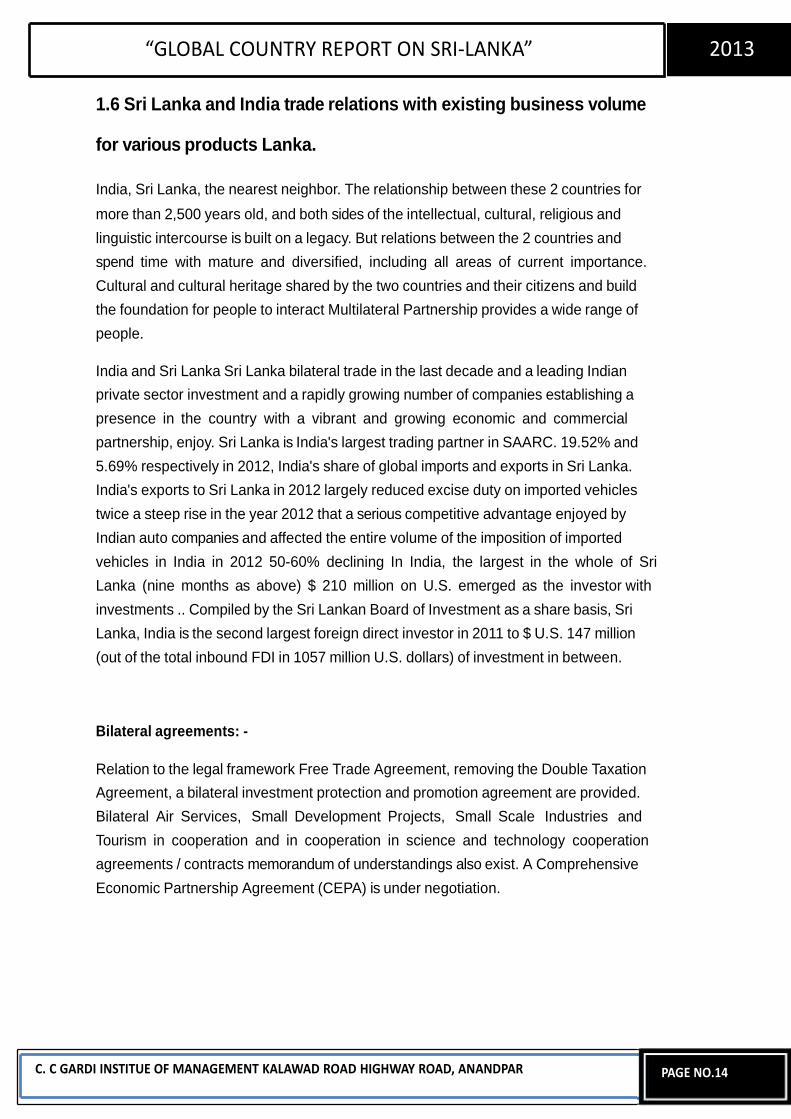
“GLOBAL COUNTRY REPORT ON SRI-LANKA” 2013
1.6 Sri Lanka and India trade relations with existing business volume
for various products Lanka.
India, Sri Lanka, the nearest neighbor. The relationship between these 2 countries for
more than 2,500 years old, and both sides of the intellectual, cultural, religious and
linguistic intercourse is built on a legacy. But relations between the 2 countries and
spend time with mature and diversified, including all areas of current importance.
Cultural and cultural heritage shared by the two countries and their citizens and build
the foundation for people to interact Multilateral Partnership provides a wide range of
people.
India and Sri Lanka Sri Lanka bilateral trade in the last decade and a leading Indian
private sector investment and a rapidly growing number of companies establishing a
presence in the country with a vibrant and growing economic and commercial
partnership, enjoy. Sri Lanka is India's largest trading partner in SAARC. 19.52% and
5.69% respectively in 2012, India's share of global imports and exports in Sri Lanka.
India's exports to Sri Lanka in 2012 largely reduced excise duty on imported vehicles
twice a steep rise in the year 2012 that a serious competitive advantage enjoyed by
Indian auto companies and affected the entire volume of the imposition of imported
vehicles in India in 2012 50-60% declining In India, the largest in the whole of Sri
Lanka (nine months as above) $ 210 million on U.S. emerged as the investor with
investments .. Compiled by the Sri Lankan Board of Investment as a share basis, Sri
Lanka, India is the second largest foreign direct investor in 2011 to $ U.S. 147 million
(out of the total inbound FDI in 1057 million U.S. dollars) of investment in between.
Bilateral agreements: -
Relation to the legal framework Free Trade Agreement, removing the Double Taxation
Agreement, a bilateral investment protection and promotion agreement are provided.
Bilateral Air Services, Small Development Projects, Small Scale Industries and
Tourism in cooperation and in cooperation in science and technology cooperation
agreements / contracts memorandum of understandings also exist. A Comprehensive
Economic Partnership Agreement (CEPA) is under negotiation.
C. C GARDI INSTITUE OF MANAGEMENT KALAWAD ROAD HIGHWAY ROAD, ANANDPAR
PAGE NO.14
“GLOBAL COUNTRY REPORT ON SRI-LANKA” 2013
India Sri Lanka Free Trade (ISFTA) contract: -
The main framework for bilateral trade in India, Sri Lanka Free Trade (ISFTA) contract
that was in 1998 and entered into force in March 2000 has been through. ISFTA As a
result, 4150 is currently the Indian tariff lines of Sri Lanka's exports to India has been a
zero duty. Similarly, the 3932 tariff lines, Indian exports to Sri Lanka has been to
provide a zero duty.
South Asian Free Trade (SAFTA) Area: -
South Asian Free Trade Area (SAFTA) Agreement on 1 January, has been operational
since 2006. India, Pakistan and Sri Lanka non-least developed contracting (NLDCS
States) and Bangladesh, Bhutan, the Maldives are classified as, Afghanistan and
Nepal as the least agreement States (eladisio) are classified as Developed. Article 7 of
the SAFTA agreement phased tariff liberalization (TLP) in which a programmer, 2
years, NLDC recession brought a 20% tariff, while eladisio will bring them down to 30%
provides. After 5 years, 20% are from non eladisio 0-5% tariff (Sri Lanka 6 years) will,
when will eladisio so 8 years.
Comprehensive Economic Partnership (CEPA) Agreement:-
Following the positive results of the FTA and FTA of success emboldened by
governments, felt that more action was needed to loose our bilateral economic
relationship, full of potential. CEPA to build on the momentum generated by the FTA
and further integration of the two economies in the direction of trade in goods and fresh
impetus to bilateral economic interaction and wanted to give Synergy. Discussion on
CEPA began in December 2010.
Major Indian Investments in
1) Lanka IOC PLC
2) Bharti Airtel Lanka
3) Piramal Glass Ceylon
4) Taj Hotels
5) UltraTech Cement
6) JVGokal Ceylon Pvt Ltd.
7) Tata Communications Ltd. Lanka
8) From India Banks
C. C GARDI INSTITUE OF MANAGEMENT KALAWAD ROAD HIGHWAY ROAD, ANANDPAR
PAGE NO.15
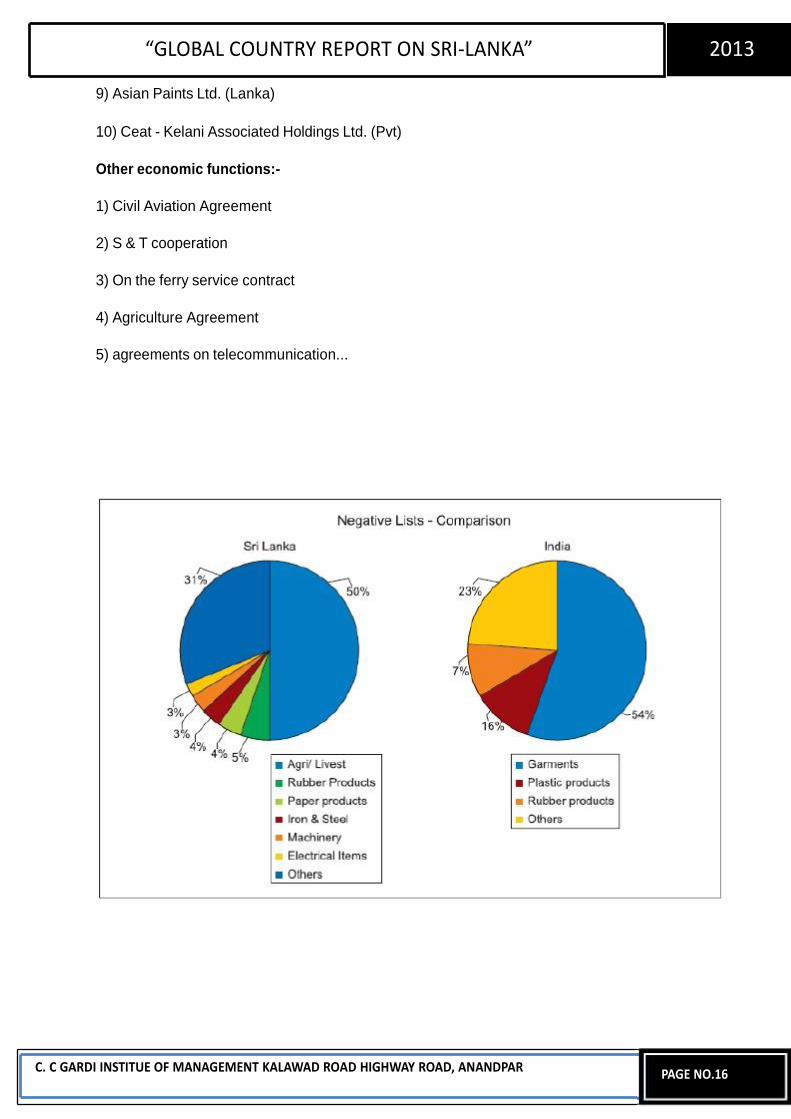
“GLOBAL COUNTRY REPORT ON SRI-LANKA” 2013
9) Asian Paints Ltd. (Lanka)
10) Ceat - Kelani Associated Holdings Ltd. (Pvt)
Other economic functions:-
1) Civil Aviation Agreement
2) S & T cooperation
3) On the ferry service contract
4) Agriculture Agreement
5) agreements on telecommunication...
C. C GARDI INSTITUE OF MANAGEMENT KALAWAD ROAD HIGHWAY ROAD, ANANDPAR
PAGE NO.16
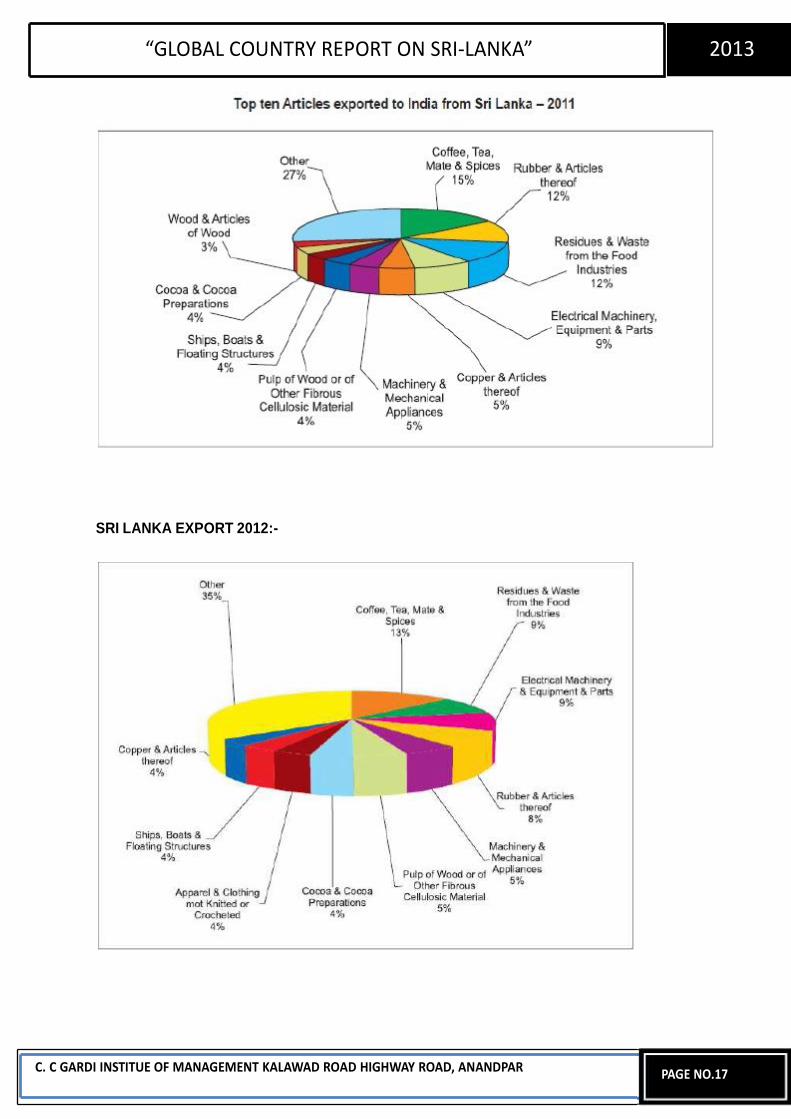
“GLOBAL COUNTRY REPORT ON SRI-LANKA” 2013
SRI LANKA EXPORT 2012:-
C. C GARDI INSTITUE OF MANAGEMENT KALAWAD ROAD HIGHWAY ROAD, ANANDPAR
PAGE NO.17
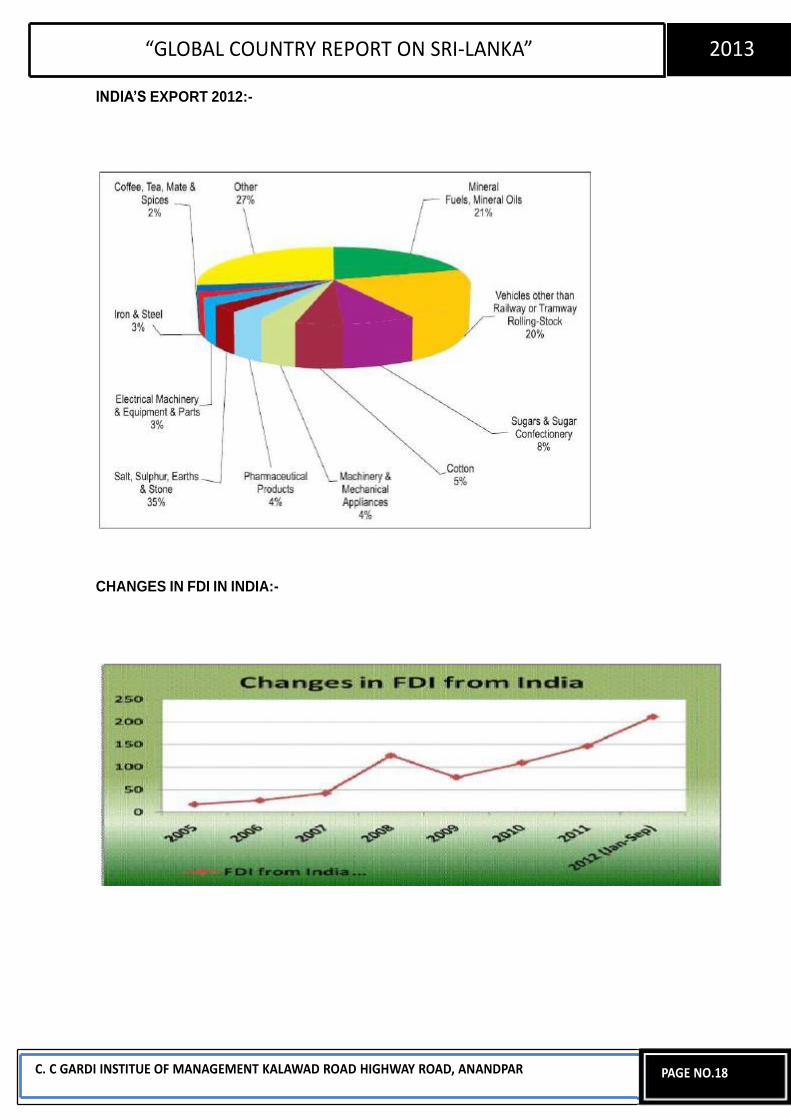
“GLOBAL COUNTRY REPORT ON SRI-LANKA” 2013
INDIA‟S EXPORT 2012:-
CHANGES IN FDI IN INDIA:-
C. C GARDI INSTITUE OF MANAGEMENT KALAWAD ROAD HIGHWAY ROAD, ANANDPAR
PAGE NO.18
“GLOBAL COUNTRY REPORT ON SRI-LANKA” 2013
1.7PESTEL Analysis Political Analysis
A steady government exists in the country
With the blessings of the government under the Ministry of Economic
Development & SLTDA, all facilitation % provisions to invest in
Tourism are being made to ensure that Tourism Sector blossoms to meet 2.5M
Tourist arrivals by 2016 and this sector contributes tremendously to the Economy of Sri
Lanka. Tourism Sector is opened for Foreign Investment under the Policy Framework and under the Budget Proposal of 2010
Government state & global level promotions justifies its stand on the focus for
the growth of the sector
Economical Analysis
Sri Lanka Economy grew by 8.0% in 2010
Market interest rates sustained to be on the downward trend
Tourist arrivals increased 46.5% compared to 2009.
Investment endorsement is boosted by government
In 2010, IMF declared Sri Lanka as ―Middle-Income Country‖
Foreign Exchange Transaction – Exchange Rate is free of charge
Per Capita GNP (US$) $2029; Highest Literacy (92%); Highest Life
Expectancy -75 years; Intelligent, educated & active work force;
Modern manufacture techniques; skilled manpower and professional managers
are available at reasonable cost.
Economic Liberalization - Capital Account opened for Foreign Exchange
Transactions
Share Market reach One Trillion Rupees in a Daily Transaction in
2010 for the first time
C. C GARDI INSTITUE OF MANAGEMENT KALAWAD ROAD HIGHWAY ROAD, ANANDPAR
PAGE NO.19
“GLOBAL COUNTRY REPORT ON SRI-LANKA” 2013
Board of Investment (BOI) accepted Enterprises / Tourist Hotels & other
Tourism related Establishments are with income tax on net income / profits free for a
stipulated period
Inward remittance for investment, outward remittance of earnings dividends,
royalties & other present account payments and capital proceeds on liquidation / transfer at shares are permitted
Social Analysis
The country had gone through the practice of tourism over many decades. Thus,
the country and all religious / racial groups have recognised the value it generates to
the development of Sri Lanka.
At the same time, a lot of efforts are put nationally and in tourism based regions
to make sure Sri Lankans are not becoming victims of social problems created in
connection with tourism. Thus, the trade runs smoothly without any factions / group / organized protests against the industry.
Also, tourism happens to be at very specific locations in the country, which
creates value to the industry. These locations are mostly utilized for tourism related
economic activities than for residence.
Overall, since the country’s present focus is towards tourism development, the
entire nation’s focus is towards it and the mind-setof the people are to get involved in
the economic operations of tourism.
Technological Analysis
Sri Lankan Structure has a number of Narrow and Authoritative Bodies to look
after the application of technology in the economic sphere, mainly for industry and
commercial purposes.
The purpose of technology in the Tourism Sector will be governed by the
relevant bodies / authorities mentioned above
Most of the technology necessary for the tourism trade has to be imported from
international suppliers through Sri Lankan agents / distributors
C. C GARDI INSTITUE OF MANAGEMENT KALAWAD ROAD HIGHWAY ROAD, ANANDPAR
PAGE NO.20
“GLOBAL COUNTRY REPORT ON SRI-LANKA” 2013
Enviromental Analysis
Large Scale Hotels & Other Venues for the Tourists to enjoy can be a concern
for environment as its construction and continuous operations may exert pressure on
the environment.
Sri Lankan legislature, body shaped from the legal systems and practice allow
such large investment based intensive structures and operations under the
assessment, supervision, guidance, license and approvals.
The Central Environmental Authority is the certified agency in this regard.
Legal Analysis
Government’s legal structure facilitates the incoming of investments for the legalized
economic activities, enjoying its returns and the provisions for the remittance of surplus to the desired destinations, under terms and conditions applicable, set out by the Board of Investment (BoI) of Sri Lanka.
C. C GARDI INSTITUE OF MANAGEMENT KALAWAD ROAD HIGHWAY ROAD, ANANDPAR
PAGE NO.21
“GLOBAL COUNTRY REPORT ON SRI-LANKA” 2013
CHAPTER-2
C. C GARDI INSTITUE OF MANAGEMENT KALAWAD ROAD HIGHWAY ROAD, ANANDPAR
PAGE NO.22
“GLOBAL COUNTRY REPORT ON SRI-LANKA” 2013
2.1 Over view of the INDIA‟S companies
2.1.1 HISTORY OF AIA
Company Profile - AIA Insurance Lanka PLC
Purpose
Economic and social development in Sri Lanka to play a leadership role in driving.
Vision
Sri Lanka has become the pre-eminent provider of life insurance.
Our History
We Eagle Star, with technical support from the UK Ceylon Tobacco Company
(CTC) began operations as a subsidiary. CTC BAT Industries in 1999, is a member of
the divestment of its financial services business. The eagle in the global insurance
company, Zurich Financial Services to become a member of the group. National
Development Bank (NDB), Sri Lanka's leading development bank, the company
became a major local shareholder.
2003 NDB Bank of Sri Lanka Ceylon Zurich with a major shareholder, leaving
majority control of Eagle withdrew his campaign. In 2006, Eagle has become an Aviva
company. Aviva and NDB, came into being in early 2010.
In September 2012, AIA held by Aviva and NDB have announced their intention
to acquire shares. Acquisition December 5, 2012 was received 92.3% of the shares of
AIA and AIA Insurance Company of Sri Lanka PLC was completed with a resume.
Who we are
AIA Group for financial security, safety, and to provide our customers with a
comfortable future for the present.
As a company, we understand that life is unpredictable. It is your highs as well
as its challenges and everyone is on a different journey. That's why people have
always understood our starting point.
In the past 90 years, we in Asia to serve the ever changing needs of people and
companies have built our business. Our personal relationship based approach has
C. C GARDI INSTITUE OF MANAGEMENT KALAWAD ROAD HIGHWAY ROAD, ANANDPAR
PAGE NO.23
“GLOBAL COUNTRY REPORT ON SRI-LANKA” 2013
made us a part of the fabric of life. And to protect generations of people for many years
to come, whatever life brings them, will continue.
If you need assistance in achieving your ambitions, support a family, retirement,
or are enjoying something: we understand where you're coming from, because we
have been.
That is why we as a company in real life like to think of ourselves.
Emoluments
Gold award winner in 2012 of ten HRM organized by the Association of HR
professionals and AON Hewitt between 2012 assessment by the insurance company
The top ten winners of the Best Corporate Citizen Award 2011 organized by the
Ceylon Chamber of Commerce, the only insurance company in 2011
· National HRM Award Silver Award winner in 2010, organized by the Association of
HR professionals.
Top Ten Best Corporate Citizens under battalion LKR 10 2010 and the winner of
the 2010
· Sri Lanka's 10 most valuable brands in 2009
· Ten Best Corporate Citizens 3rd consecutive year the company for 2005 ranked
among the 10 Best Corporate Citizens, 2006, 2007 ranked among
· Good corporate governance disclosures in Sri Lanka in 2007, No. 1
Without fanfare for CSR Asia's No. 1, 2006
Corporate Social Responsibility
CSR is ingrained in our value system and is truly a way of life in the AIA. It is an
important cornerstone of our heritage. Our CSR initiatives are selected for their
relevance to the nation.
Promote communication utmost care when lighting firecrackers during a festive
time has helped to reduce accidents. Poson in Anuradhapura held during security
operations to effectively prevent accidents from drowning among pilgrims.
In 1994 created a trust fund with Rs. Continuation of scholarships for higher
education, 10 million, more than five times over the years has become.
C. C GARDI INSTITUE OF MANAGEMENT KALAWAD ROAD HIGHWAY ROAD, ANANDPAR
PAGE NO.24
“GLOBAL COUNTRY REPORT ON SRI-LANKA” 2013
2.1.2 HISTORY OF CEYLINCO About Us
"Big or small Ceylinco protects them all"
A solid and innovative start in 1939, Ceylinco Insurance PLC, many changes and
challenges faced and successfully weathered them all. Ceylinco Insurance Plc in 1987
as a registered and start trading on 14 January 1988, in the areas of life and general
insurance, we have grown from strength to strength.
Today, we have become the leading insurer in Sri Lanka's largest network of
branches and agents of the insurance industry. Our goal in Sri Lanka and in selected
international markets has become a leading provider of financial security protection.
"Our mission to society and provide the highest quality, safety and financial security,
while adding shareholder wealth and recognizing, rewarding and valuing our
employees have dignity."
Our travel
As the first step in a still unfolding saga so far 1939 has been prepared by the
Ceylinco insurance company as withdrawn, and Sri Lanka became the first registered
company. The company, which initially Baillie Street, Fort located in the No.69, Queen
Street, Fort, which was built to Ceylinco House was moved. Later, the company name
was changed to Ceylinco Ltd. Ceylinco Insurance Plc in 1987 was registered as a
public company, and start businesses, focusing on Life and General Insurance.
Ceylinco trip, which destroyed the perception of insurance has been established
in the area, has already redefined the boundaries, setting new standards of service and
product innovation of a brand. Many local and international awards and accolades they
have won over the years stand testimony to this fact. Ceylinco subsidiaries too many
times over the years, which UltraTech Ceylinco (Pvt) Ltd. with the increase, Ceylinco
Investkorp (Pvt) Ltd, CEY Power (Pvt) Ltd., CEY Hydro Developers (Pvt) Ltd, the
energy generator (Cascades Pvt Ltd ), KBL Ltd., CEG Educational Holdings (Pvt),
Sevena Resorts Ltd., Ceylinco Seraka Ltd. and Ceylinco Healthcare Services Ltd.
Unwavering commitment to them as a result of the Ceylinco Sri Lanka in
2005, becoming the undisputed market leader in the insurance sector, a situation
which is very challenging Ceylinco insurance is maintained to this day. However, not
content to sit on their laurels, Ceylinco Insurance has established themselves enough
C. C GARDI INSTITUE OF MANAGEMENT KALAWAD ROAD HIGHWAY ROAD, ANANDPAR
PAGE NO.25
“GLOBAL COUNTRY REPORT ON SRI-LANKA” 2013
to continue to redefine the boundaries, excellent, reveling and forth forever himself
impelling.
Our road map
Our Mission
"Security and society to provide financial security for the highest quality, adding to
shareholders' wealth and recognizing, rewarding and value the dignity of our
employees whilst."
Corporate Goals
· Sri Lanka and select international markets and is a leading provider of financial
security protection.
Towards achieving the overall objectives of the company at all levels, which will
contribute effectively and efficiently highly satisfied and motivated staff development.
To contribute to the economic development of Sri Lanka and enhance the quality of life
of its people.
Corporate Social Responsibility
CSR activities carried out by Ceylinco Insurance Company at the best delivered
tangible benefits to communities over the years are judged by. Our approach to CSR
ensures that all projects are a statement of non-discrimination. Especially in the areas
devastated by the tsunami of our projects have benefited victims across social
divisions, geographic or racial boundaries without heeding and disregarding religious
and ethnic divisions. Perhaps it is our CSR activities that we have gained international
recognition in September 2005 is evidence of the effectiveness of comprehensive
fitting.
· Recent developments
· Support for physically and mentally challenged brothers
· Blood Donation Camp
· Ceylinco Insurance
· House Charities
C. C GARDI INSTITUE OF MANAGEMENT KALAWAD ROAD HIGHWAY ROAD, ANANDPAR
PAGE NO.26
“GLOBAL COUNTRY REPORT ON SRI-LANKA” 2013
· Sarana donations to fund activities
· Do parents Daruwo Fund
· Ensuring continued education to students
· Medical Camp...
C. C GARDI INSTITUE OF MANAGEMENT KALAWAD ROAD HIGHWAY ROAD, ANANDPAR
PAGE NO.27
“GLOBAL COUNTRY REPORT ON SRI-LANKA” 2013
2.1.3 HISTORY OF JANSHAKTHI
About us;
To realize their dreams and fulfill their aspirations, you have financial security needs. If
you like Janashakthi unique to you and / or your family financial security plan based on
your needs, will be born, "Plan your policy click". We also Janashakthi its unique range
of financial security plan. Please let them know more about the "comprehensive life
plans" and "your child's future plans" click.
Corporate Vision
With excellence in service standards
Corporate Mission
· Service delivery to policyholders
Human resource development companies
To shareholders, return capital to be a fair
· We continue to meet social and corporate responsibility
Corporate values
· A customer-driven organization, the customer expects more
Open and transparent in all our dealings
· adopt a professional approach in all our dealings
· adhere to high ethical standards and practices
· An equal opportunity employer value employee development, their happiness, well-
being and family culture Janashakthi welfareStrengthen
· A citizen Be conscious and socially responsible organization
Quality Policy
Sri Lanka is the leading provider of insurance solutions.
· exceed customer expectations.
C. C GARDI INSTITUE OF MANAGEMENT KALAWAD ROAD HIGHWAY ROAD, ANANDPAR
PAGE NO.28
“GLOBAL COUNTRY REPORT ON SRI-LANKA” 2013
· To comply with all legal and regulatory requirements
· continually improve the effectiveness of the quality management system.
History and milestones
Janashakthi Insurance Plc, India's multi-specialty dental clinic and orthodontic
center, Dentavista Healthcare a unique, one of its kind to launch dental insurance plan
has entered into an agreement with Pvt.allows treatment.
Janashakthi 7 billion at the end of 2011 as businesses Tops
Janashakthi Insurance PLC, Sri Lanka, the third largest insurance company,
posted on total income of Rs. 7270000000 rupees, while 16.0 percent of the total gross
written premium income rose to Rs. Year end December 31, 2011 to 7.13 billion, the
company has the best performance. RS non - life insurance business to 18.0 per cent.
5.256 billion during the corresponding period.
Union Bank Plc and Union Bank Plc Janashakthi insurance bancassurance
starting Colombo (UBC) has entered into an agreement that UBC customers
Janashakthi insurance solutions for individuals and companies that allows convenient
access to a multitude of tie-ups with. This strategic tie-up with Union Bank's retail and
corporate customers through 15 branches selected UBC Janashakthi use policies will
be able to achieve
Governance and disclosure - ICA Annual Report Awards, Sri Lanka's most celebrated
annual report awards ceremony, Insurance Division organized by the Institute of
Chartered Accountants of Sri Lanka Janashakthi bestowed on the bronze. The annual
award recognizes excellence in financial reporting and informative annual report to
stakeholders through the publication encourages effective communication, financial
and non - financial information, promote effective presentation.
2011
Janashakthi insurance pet insurance policy Janashakthi launched a
revolutionary product. Private owners, dairy farms, cooperatives, corporate dairies and
livestock breeders across Sri Lanka to take out a policy for their cattle, goats and
poultry can insure.
And singer-line motor insurance policies Janashakthi Team
C. C GARDI INSTITUE OF MANAGEMENT KALAWAD ROAD HIGHWAY ROAD, ANANDPAR
PAGE NO.29
“GLOBAL COUNTRY REPORT ON SRI-LANKA” 2013
Janashakhti Insurance plc and Singer Sri Lanka PLC recently joined hands to its
valued customers yet another innovative service began to rise in motor insurance.
Rich Janashakthi Insurance PLC 'Janashakthi Hotel Plus' Sri Lanka's booming
tourism and hotel industry with the launch of a comprehensive portfolio of insurance
products. Hotel Plus is a comprehensive insurance policy, the star-class hotels,
boutique hotel with all the tourist board approved resort provides insurance cover for all
operators.
2nd CMO Asia for global recognition award Janashakthi Lankan insurance
company to be recognized
Janashakthi Insurance PLC Banking, Financial Services & Insurance category
brand "Award for Excellence" from the 2nd CMO Asia Awards for excellence in
branding and marketing, won top honors was the only insurance company in Sri Lanka.
Awards were organized by the World Brand Congress and Suntec, Singapore, a grand
ceremony was presented among a large and representative gathering. Janashakthi
Insurance PLC acclaimed 'Business Innovation Award "with the prestigious Asian
Leadership Awards held at Taj Palace Hotel in Dubai was crowned.SLIM Brand
Excellence Awards Janashakthi Insurance Plc great honor to have won the double in
2011, thus becoming the only insurer in Sri Lanka to win the highest number of awards
at this prestigious event.JIPLC 'years of service brand "and" CSR Brand of the Year
"for a bronze medal for silver.
2010
Hour vehicle breakdown policy "Full Option Vehicle Emergency Policy -
Janashakthi Insurance PLC still first in the country with the launch of 24 in Sri Lanka's
insurance industry has created a revolution. local brand "years of service" brand.
Janashakthi Insurance PLC magnificent 19th World Brand Excellence Award for
two consecutive years, Mumbai, India won the honor at a ceremony at the double. The
prestigious "Award for banking and financial services" and "the overall brand
leadership Award" was awarded. enable the latest developments taking place globally
for the D & O insurance.
C. C GARDI INSTITUE OF MANAGEMENT KALAWAD ROAD HIGHWAY ROAD, ANANDPAR
PAGE NO.30
“GLOBAL COUNTRY REPORT ON SRI-LANKA” 2013
2009
Launched in February Janashakthi Expacare universal health insurance. This policy is
fully reinsured with the insurance company DKV is renowned worldwide. The
individual, family, group or corporate offers a wide range of schemes, including the
cover.
Renowned global reinsurer Hannover Re and international microinsurance experts
giant planet with guaranteed Janashakthi Insurance PLC announced its tie-up in Sri
Lanka to launch a range of microinsurance products
2008
SLIM Brand Excellence Awards 2007 Janashakthi only insurance company in
Sri Lanka, was awarded on, take away 3 prizes.
Tamil Union Janashakthi squash court squash tournament was held constant for 6
years.
Janashakthi Sailing Nationals 2008 Bolgoda lake was held for the fourth
consecutive year.
Renowned global reinsurer Hannover Re and international microinsurance
experts giant planet with guaranteed Janashakthi Insurance PLC announced its tie-up
in Sri Lanka to launch a range of microinsurance products
2007
Premier Automotive Brands Janashakthi Full Option with a new brand identity logo is
resumed. Janashakthi and Nawaloka hospitals entered into a strategic tie Janashakthi
medical policyholders in order to specifically give a better service and value for money.
Sponsors and began a plan to employ outstanding athletes graduate. 2006
Janashakthi Insurance Number 1 years service brand, a significant
achievement struck gold as insurance against market leaders competed, leading
banks, finance companies and large conglomerates.
2005
C. C GARDI INSTITUE OF MANAGEMENT KALAWAD ROAD HIGHWAY ROAD, ANANDPAR
PAGE NO.31
“GLOBAL COUNTRY REPORT ON SRI-LANKA” 2013
Janashakthi 1 2005 3rd largest insurer in Sri Lanka by the end of the quarter,
the overall gross written premium (GWP) in the case of falls.
2004
The company recorded a record turnover of Rs 10 years of operation.
3100000000 premium income, the only insurance company in Sri Lanka to be crossed
Rs. Sri Lanka within the 3 billion mark in the first 10 years of operation.
2003
Janashakthi Group strategic stake in various companies, investment banking,
finance, development, banking, porcelainware, diversified into property development
and agriculture.
2002
Janashakthi first private insurance company in Sri Lanka became open a
representative office abroad, the establishment of a branch office in Maldives.
In the same year, branches in Jaffna and Batticaloa cease and memorandum of
understanding with the Northern and Eastern provinces were established.
2001
Janashakthi Insurance National Insurance Corporation Limited acquired a
controlling interest
Governing life in the same year received the ISO 9001 International Quality
Certification. Janashakthi actually the first insurance company in Sri Lanka had
received this certification.
In 2001, premium income exceeds Rs. 1 billio
The company's two principal sponsors of Test cricket and SL SL vs West Indies
vs Zimbabwe Test Series run.
2000
Janashakthi Janashakthi Life and General Insurance Company merged and formed an
organization known as a strong Janashakthi
C. C GARDI INSTITUE OF MANAGEMENT KALAWAD ROAD HIGHWAY ROAD, ANANDPAR
PAGE NO.32
“GLOBAL COUNTRY REPORT ON SRI-LANKA” 2013
1998 and 1999
For the safety of people on the highway is a huge event in Colombo, pedestrian
crossings, guard rails and was on Belisha Beacons.
1997
Janashakthi Life policyholders have the advantage and the company was able
to announce their first bonus. Sri Lanka vs India Test match in 1997 with the
sponsorship of an aggressive advertising and marketing tactics were taken. A
helicopter dropped Trophy winner, through a unique and unparalleled achievement
was brought into the stadium.
1996
Janashakthi door of people took the concept of insurance. We started at a rapid
regionalization program and established an extensive branch network in the industry.
1995
On September 20, 1995 Sri Lanka's first special Janashakthi General Insurance
Company Limited was established as a general insurance company.
1994
Janashakthi Sri Lanka's first special as the first Board of Directors insurer.Our
life began operation on September 15, 1994,
1992
Janashakthi Life Insurance Company Ltd 29 in Sri Lanka in October 1992 as a
public company with limited liability, was incorporated.
Corporate Social Responsibility
Janashakthi our efforts to enhance corporate sustainability as an important aspect of
corporate social responsibility understands.
Over the years of working with our clients and wider communities is evidence,
Janashakthi keenly demonstrates that corporate responsibility is not only flourishing, it
has become part of the fabric of our business. We noted our projects, our mobility
innovativeness, and service orientation, be sure to take a long-run corporate strategy
initiatives.
C. C GARDI INSTITUE OF MANAGEMENT KALAWAD ROAD HIGHWAY ROAD, ANANDPAR
PAGE NO.33
“GLOBAL COUNTRY REPORT ON SRI-LANKA” 2013
2.1.4 HISTORY OF UNION ASSURANCE
Association of Sri Lanka's largest providers of life assurance and general insurance in
the country is one of the solutions. Experienced and dynamic professionals, a strong
capital base and reinsurance partnerships with highly rated by a team of global
reinsurance companies anchored Union Assurance, tailor-made insurance products
and services that provides a wide range of international standards.
Our vision insurance is the most sought after solution provider.
Union Assurance brand "faith" is posted on the promise.
C. C GARDI INSTITUE OF MANAGEMENT KALAWAD ROAD HIGHWAY ROAD, ANANDPAR
PAGE NO.34
“GLOBAL COUNTRY REPORT ON SRI-LANKA” 2013
2.1.5 HISTORY OF ALLIANCE
→ 1892
Foundation of the Alliance Nationale
December 11, 1892 in Montreal, St. Joseph's Church on the afternoon of the Alliance
Nationale, the foundation of a mutual aid society leads to an important meeting is held
in the basement. The meeting, which was attended by 74 people, sir Hormidas
Laporte, a prominent businessman and successful wholesale fruit and vegetable seller,
is elected president of the new company.
Modest beginning
Alliance Nationale beginnings are quite humble: Each founding member contributes $
100 as a common fund. The company starts with $ 10,300.
→ 1905
Industrial Life Insurance Company Foundation
Quebec City, May 15, 1905, Mr. Bernard Leonard, master painter of Irish origin, and
some influential businessmen lengthy negotiations, in the name of Industrial Life
Insurance Company, a life insurance company to receive the charter. By 1950, the
company remains under the direction of Leonard family, when it ended credit inter-
Provincial Limited is taken by First customer
In the beginning, it takes only six employees to run in Quebec City Industrial Life
Insurance Company. November 15, 1905, the company has its first policy ensures that
sells a 15-day life of the child. Two weeks after the baby dies and the mother company
in the amount of $ 5.05 1 makes a profit.
→ 1948 and 1969
Alliance and Industrial Mutualization
C. C GARDI INSTITUE OF MANAGEMENT KALAWAD ROAD HIGHWAY ROAD, ANANDPAR
PAGE NO.35
“GLOBAL COUNTRY REPORT ON SRI-LANKA” 2013
In 1948, the Alliance first mutual life insurance companies in the country is. Later in
1969 by industrial mutualizing follows suit. Insureds in their policies, the owners of the
company's Canadian ownership is guaranteed.
→ 1987
Industrial Alliance and Industrial Alliance Life Insurance Company to merge
Deregulation of financial institutions in the 1980s and increasingly stiff competition from
industrial and join forces to lead the Alliance. In January 1987, the two companies
merge as Industrial Alliance Life Insurance Company. Although the merger, the new
company will be able to:
integration of its operations
pursue its development
Carve an enviable position on the Canadian market
→ 1992
Industrial Alliance celebrates its centennial and the elephant as a symbol of your
company chooses
In 1992, Industrial Alliance celebrates its centennial anniversary. During the century of
existence, the company constantly changing needs of its customers with the new
realities and has to be able to adapt.
Industrial Alliance shares the extraordinary power of the elephant. Both highly
energeticand hard challenges.Both Industrial Alliance can move easily and elephant
represent perseverance and confidence.Supposedly, the two values that are
fundamental to Industrial Alliance.
Finally, the elephant is warm and gentle. Similarly, Industrial Alliance, we care about
our clients' human values. Being attentive to their needs, we know our customers
better, and in turn better serve them.
→ 1982
The acquisition of the North-West Life Assurance Company of Canada
Now known as the Industrial Alliance Pacific, Canada's western provinces and Ontario
company primarily operates. It provides:
C. C GARDI INSTITUE OF MANAGEMENT KALAWAD ROAD HIGHWAY ROAD, ANANDPAR
PAGE NO.36
“GLOBAL COUNTRY REPORT ON SRI-LANKA” 2013
Parent the same insurance company, Industrial Alliance Insurance and Financial
Services as products and financial services. Creditor insurance products to automobile
dealerships, an area in which it is currently the leader in Canada. It is also responsible,
students, employers and organizations to develop market-specific risks within the
Industrial Alliance Group.
→ 1988
Acquisition of National Life Insurance Company of Canada
In 1988, the National Industrial Alliance Life Insurance Company of Canada, a Toronto-
based company founded in June 2005 is 1899.Until, national life across the country in
Vancouver, Calgary, Winnipeg, through its own line of insurance products and financial
services is offered, Toronto, Montreal, and Halifax offices. National life June 30, 2005
was integrated with Industrial Alliance.
→ 1996
Merger of Industrial Alliance and solidarity
Is marked by yet another merger in 1996. After 54 years, solidarity, a Quebec City-
based company in search of quick development, Industrial Alliance, a merger with a
company that has decided to share its philosophy.
→ 1973
Auto and Home Insurance in the
Similar General Insurance Company and Society Provinciale d 'Assurances générales,
Industrial Alliance Auto and Home Insurance is known today as: 1973, Industrial
acquired two general insurance companies. Industrial Alliance Auto and Home
Insurance is a direct insurance company, its products, especially in Quebec and is only
distributed to retail customers.
C. C GARDI INSTITUE OF MANAGEMENT KALAWAD ROAD HIGHWAY ROAD, ANANDPAR
PAGE NO.37
“GLOBAL COUNTRY REPORT ON SRI-LANKA” 2013
→ 2002
Stock brokerage firms and Industrial Alliance Securities Inc. manufactures
acquisition
In 2002, Industrial Alliance Securities Inc. and BNP ISL Lafferty (Canada) Securities
Inc. and Leduc & Associates Securities Ltd. (Canada) with the acquisition of certain
assets of the stock brokerage enters on the scene
→ 2000
Demutualization and a new business name
Millennium, Industrial Alliance embarks on an entirely new course at the turn: in
February 2000, Industrial Alliance is a stock company and on the Toronto Stock
Exchange under the ticker symbol IAG makes official entry.
Demutualization because it is beneficial to the policyholders of the company's common
shares allocation results in all some 700,000 members.
New commercial Name
Following these changes, the company 2000 - Industrial Alliance Insurance and
Financial Services in the fall adopts a new business name.
Life and Health Insurance, Industrial Alliance is renowned for its expertise in a number
of years has been to offer savings and retirement products. An insurance and financial
services company: The company's new commercial name change markedly in recent
years it has become what is known today as Industrial Alliance shows.
C. C GARDI INSTITUE OF MANAGEMENT KALAWAD ROAD HIGHWAY ROAD, ANANDPAR
PAGE NO.38
“GLOBAL COUNTRY REPORT ON SRI-LANKA” 2013
The new visual identity
Industrial Alliance elephant has since been associated with the company for many
years and has gradually become one of the most powerful features of the institutional
identity has decided to integrate it into its new logo.
The elephant farm five simple yet contemporary style lines, dynamic, solid, warm, and
dependable company is a symbol of nature and Industrial Alliance are an integral part
of the new visual identity. Today
Today, Industrial Alliance is a life and health insurance company that offers a full range
of insurance products and financial services, is. Fifth largest life and health insurance
company in Canada, Industrial Alliance insures over 1.7 million Canadians, employs
more than 2,600 people and develop corporate image assets.Industrial Alliance in
March 2007 to manage $ 30 billion. The new logo was inspired by
Previous one, but with a more solid appearance, truly reflects our identity as a financial
Institution and its new challenges.
C. C GARDI INSTITUE OF MANAGEMENT KALAWAD ROAD HIGHWAY ROAD, ANANDPAR
PAGE NO.39
“GLOBAL COUNTRY REPORT ON SRI-LANKA” 2013
2.2 Overview of INDIA‟S companies
2.2.1 HISTORY OF SBI
State Bank of India and BNP Paribas Cardif SBI Life Insurance is a joint venture
between. The total capital and BNP Paribas Cardif the remaining 26% of SBI owns
74%. SBI Life Insurance has an authorized capital of Rs. 2,000 crore and Rs 1,000
crore paid up capital.
Role: Sales Channels and Operations team to provide back-end support
Reporting to: Charge upright position
Main Responsibilities: · To provide the sales channel operations / / data to support the
work of maintaining the back end to end operational support, preparing MIS and
generating various business reports.
· Communication and coordination with various departments and branch locations.
Person's profile: Graduate Trainee Fresh graduate with 50% marks
50% marks in aggregate and associate with 1-2 years post graduate experience at
least. Candidates with finance, insurance, BPO experience will be preferred
Key Competenc ies: Good communication and analytical
· Comfortable with number crunching
· Advanced understanding of MS Word and Excel
Key Interactions: Customers.
Vertical position and department heads in charge of
Measures of success: operational excellence tats Gating.
Location: Chickballapur, Bagalkot, Gadag, Haveri, Hospet, Chitradurga, Chickmagalur,
Krkla, Puttur, Madikeri, Kollegal, Gokak.
VISION
The most trusted and favored life insurance provider
C. C GARDI INSTITUE OF MANAGEMENT KALAWAD ROAD HIGHWAY ROAD, ANANDPAR
PAGE NO.40
“GLOBAL COUNTRY REPORT ON SRI-LANKA” 2013
Mission
"The life insurance and pension products at competitive prices, offering a wide range,
customer fulfillment and world-class operational efficiency to ensure high standards
known as, and in the post-liberalization period, life insurance company in India to
become a model the ".
VALUES
· Reliability
· Ambition
· Innovation
· Mobility
· Mobility
· Mobility
· Excellence
C. C GARDI INSTITUE OF MANAGEMENT KALAWAD ROAD HIGHWAY ROAD, ANANDPAR
PAGE NO.41
“GLOBAL COUNTRY REPORT ON SRI-LANKA” 2013
2.2.2 HISTORY OF HDFC LIFE History
HDFC Life, one of India's leading private life insurance companies, offers a range of
individual and group insurance solutions. Housing Development Finance Corporation
Limited (HDFC), India's leading housing finance institution and Standard Life plc, the
leading provider of financial services in the United Kingdom is a joint venture between.
HDFC Ltd. holds 72.37% and Standard Life (Mauritius Holding) Ltd., 26.00% of the
equity in the joint venture holds, while the rest is held by others.
HDFC Life's product portfolio solutions, which have different customer safety,
pensions, savings, investments and meet health needs are included as. Adding
optional benefits called riders, at a nominal price, customers have the added
advantage of customizing the plans. The company currently optional rider benefits
savings, investment, protection and retirement needs of customers with its portfolio of
25 retail and catering products group 9 to 10.
HDFC Life Financial Consultants with a strong foundation in the current difficult market
presence.
We follow a conservative investment management philosophy is to ensure that our
client's money is well looked after. Investment policies and actions in a regular formal
investment Non - Executive Director and Principal Officer and Executive Director are
monitored by the Committee.
As a life insurance company, we understand that our clients invest their savings in the
long term, with precise objectives in mind.
The company attributes its success to the contributions made by their employees.
HDFC Standard Life organizational talent management (10 spells) initiative as well as
the specific conditions of efficiency are driven by a set of core competencies.
Knowledge, skills, experience, personal qualities and behaviors defined set of
performance through merit-based and sharp vision is based on strong values of HDFC
Standard Life.
C. C GARDI INSTITUE OF MANAGEMENT KALAWAD ROAD HIGHWAY ROAD, ANANDPAR
PAGE NO.42
“GLOBAL COUNTRY REPORT ON SRI-LANKA” 2013
VISION
The most successful and accepted life insurance company, which means that we have
the most reliable company to deal with, to offer the greatest value for money, and are
setting standards in the industry.
"For all the obvious choice. VALUES
Values that we observe while we work:
· Integrity
· Innovation
· Customer-focused
· caring for people and one for all "
· Team work
· Joy and simplicity
C. C GARDI INSTITUE OF MANAGEMENT KALAWAD ROAD HIGHWAY ROAD, ANANDPAR
PAGE NO.43
“GLOBAL COUNTRY REPORT ON SRI-LANKA” 2013
2.2.3 ICICI PRUDENTIAL LIFE INSURANCE
History
· ICICI Bank ICICI Prudential Life Insurance Company, a leading financial powerhouse
and Prudential plc, a top international financial services group headquartered in the
United Kingdom is a joint venture between. ICICI Prudential's first private sector
insurance companies, campaign after receiving approval from Insurance Regulatory
Development Authority (IRDA) was launched in December 2000.
· ICICI Prudential Life's capital stands at Rs. ICICI Bank and Prudential plc 4793 (June
30, 2012) holds 74% and 26% stake in million respectively. April 1, 2012 and June 30,
2012 for the period the company has garnered total premium of Rs 2385 crore and
since inception has underwritten over 13 million policies. The company has assets held
over Rs. 70,000 crore for the June 30, 2012, as.
With a wide range, in life.
VISION
The life, health and pension people built on trust by world-class service to players.
This we hope to achieve:
· Understanding the needs of customers and offer better products and service
· use technology to serve customers faster, powerful and easily
· Develop and implement better risk management and investment strategies,
sustainable and stable returns to our policyholders to offer
Provide a favorable environment for further development and learning for their
employees
· Construction simplicity and above all our deals
VALUES
Integrity, Customer first lower limit humility, and passion: ICICI Prudential every
member of the team is committed to five core values. These values shine forth in all we
do, and is consistent with the keystones of our success.
C. C GARDI INSTITUE OF MANAGEMENT KALAWAD ROAD HIGHWAY ROAD, ANANDPAR
PAGE NO.44
“GLOBAL COUNTRY REPORT ON SRI-LANKA” 2013
2.2.4 HISTORY OF BIRLA SUN LIFE INSURANCE COMPANY LIMITED (BSLI)
Birla Sun Life Insurance Company Limited (BSLI), 2000 set in, the Aditya Birla Group
and Sun Life Financial Inc. Indian conglomerates, Canada's leading international
financial services organization between a well-known and trusted globally is a joint
venture between names. Aditya Birla Sun Life Financial Inc.'s domain expertise
combined with local knowledge of the group for their customers' future offers a
formidable protection.
Additionally, BSLI pioneered the launch of Unit private players in India are associated
with the life insurance plan. Establish credibility and further transparency, BSLI also
enjoys the reputation of the originator of the practice may disclose portfolio on a
monthly basis. These initiatives have helped BSLI category growth expectations in its
policy holders, which further insurance (ie pure term plan, life stage products, health
plans and retirement plans) offer a full bouquet of products that the company is moving
closer to be.
Add to this, through its network of 600 branches and 133 572 from the wide reach
Advisory Panel. This fantastic combination of domain expertise, product range and
reach the ears on the ground, BSLI 2.5 million lives since it began covering and a
customer base spread across more than 1500 cities and India helped establish the
cities. Ensure that our clients an impeccable
Experience, BSLI has ensured that the 2011-12 financial year to 0.00% of the
outstanding claims ratio is the lowest. Additionally, BSLI LOMA around the time
parameter is turned on all the claims. Such services are well supported by the
company is financially sound. AUM BSLI March 31, 2012 stood at 21,062 CRS as the
company has a strong capital base of Rs. 2450 CRS.
VISION
A leader and role model in a comprehensive and integrated financial services
business.
VALUES
Honesty
Commitment
Passion
C. C GARDI INSTITUE OF MANAGEMENT KALAWAD ROAD HIGHWAY ROAD, ANANDPAR
PAGE NO.45
“GLOBAL COUNTRY REPORT ON SRI-LANKA” 2013
About Birla Sun Life Insurance
Birla Sun Life Insurance Company Limited (BSLI) Aditya Birla Group, a well known
Indian conglomerate and Sun Life Financial Inc., a leading international financial
services organization from Canada is a joint venture between. BSLI protection
solutions, children's future solutions, security, health and wellness as well as retirement
offerings to include a full range of solutions, with funding provided through a network of
branches and around 600 to 500 cities have a wide distribution reach, advisory panels
and more than 109 996 Corporate Agents & Brokers and Banks with more than 200
partners. AUM of Birla Sun Life Insurance is close to Rs. 23 197 crore and it has a
strong capital base of over Rs. November 30, 2012 to Rs 2450 crore.
Business Continuity Planning
Birla Sun Life Insurance is a BS 25 999 certified organization and some Indian
companies to a fully operational business continuity planning (BCP) is one. Our
response plan, which will kickstart in the event of a disaster. Plan to minimize impact to
the organization, its people, and most importantly, your customers will ensure.
BSLI Business Continuity Management Policy
Objectives within agreed timeframes to ensure the recovery of any significant activities
in the event of an emergency response plan. Plan to comply with various regulatory
requirements and will minimize the potential business impact of BSLI. In addition to a
business continuity management system that helps to foster continuous improvement.
Programmed Overview
Highlights of our Plan Document
· Disaster management and incident response
· Data back-up data, disaster recovery and system recovery plan as documented in
Recovery of all critical business functions and support systems
· If the primary location is unavailable alternate recovery sites
Customers, employees and other stakeholders with communication ·
C. C GARDI INSTITUE OF MANAGEMENT KALAWAD ROAD HIGHWAY ROAD, ANANDPAR
PAGE NO.46
“GLOBAL COUNTRY REPORT ON SRI-LANKA” 2013
2.2.5 HISTORY OF LIFE INSURANCE CORPORATION OF INDIA
Life insurance in its modern form came to India from England in 1818 year. Oriental
Life Insurance Company started by Europeans in Calcutta was the life insurance
company on Indian soil. However, the efforts of eminent people like Babu Muttylal seal,
foreign life insurance companies, life insurance started. But the Indian sub-standard
living life and being treated as heavy additional premium is charged on them. Bombay
Mutual Life Assurance Society of the Year in 1870, the first Indian life insurance
company, announced the birth of life cover at normal rates. India Insurance Company
(1896), one of which was inspired by nationalism. Swadeshi movement of 1905-1907
gave rise to more insurance companies. Madras, Calcutta National Indian and National
Insurance and United India and were established in 1906 in Lahore Cooperative
Assurance. In 1907, Hindustan Cooperative Insurance Company Jorasanko, the great
poet Rabindranath Tagore in Calcutta, was born in the room of the house. Indian
Mercantile, General Assurance and Swadeshi Life (later Bombay Life) were some of
the companies established during the same period. 1912 The first legislation to
regulate insurance business in India was not. Life Insurance Companies Act 1912, and
the Provident Fund Act was passed. Life Insurance Companies Act, 1912 requires that
the premium rate tables and periodical valuations of companies should be certified by
an actuary. However, discrimination between foreign and Indian companies act on
many accounts, Indian companies are put at a disadvantage.
VISION
"A trans-nationally competitive financial significance to the group of society and the
Pride of India."
C. C GARDI INSTITUE OF MANAGEMENT KALAWAD ROAD HIGHWAY ROAD, ANANDPAR
PAGE NO.47
“GLOBAL COUNTRY REPORT ON SRI-LANKA” 2013
CHAPTER-3
C. C GARDI INSTITUE OF MANAGEMENT KALAWAD ROAD HIGHWAY ROAD, ANANDPAR
PAGE NO.48
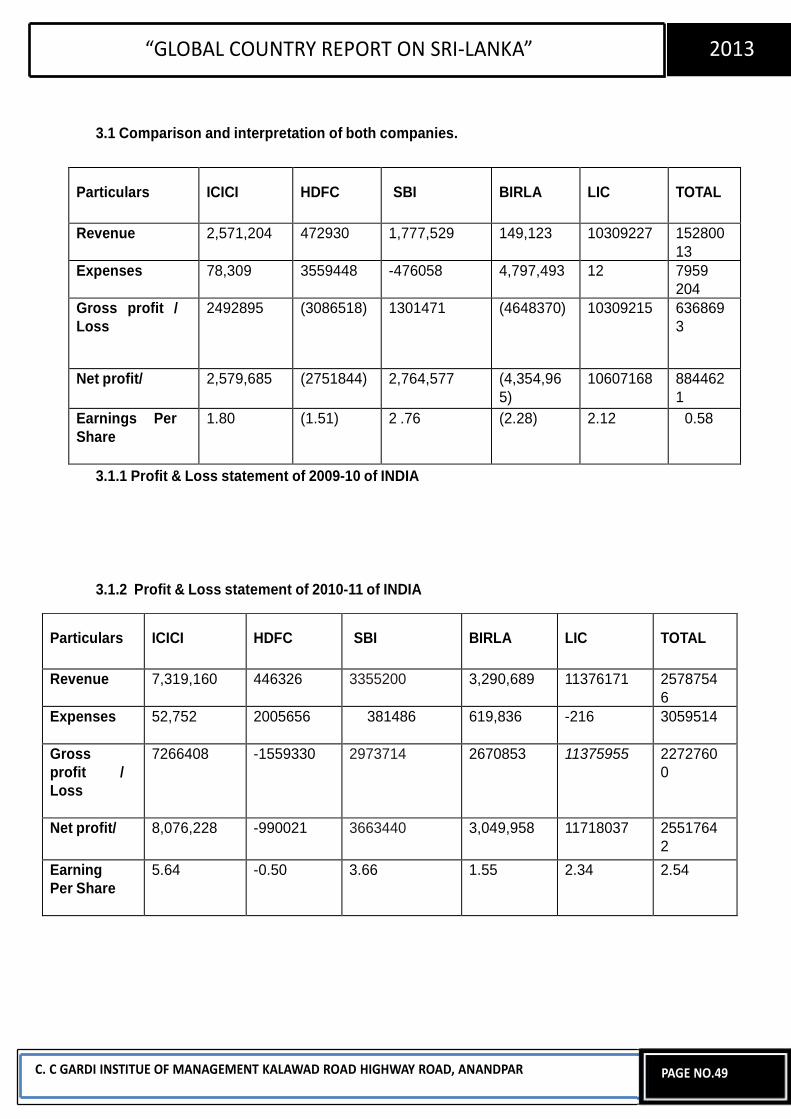
“GLOBAL COUNTRY REPORT ON SRI-LANKA” 2013
3.1 Comparison and interpretation of both companies.
3.1.1 Profit & Loss statement of 2009-10 of INDIA
3.1.2 Profit & Loss statement of 2010-11 of INDIA
C. C GARDI INSTITUE OF MANAGEMENT KALAWAD ROAD HIGHWAY ROAD, ANANDPAR
PAGE NO.49
Particulars ICICI HDFC SBI BIRLA LIC TOTAL
Revenue 7,319,160 446326 3355200 3,290,689 11376171 2578754
6
Expenses 52,752 2005656 381486 619,836 -216 3059514
Gross
profit / Loss
7266408 -1559330 2973714 2670853 11375955 2272760
0
Net profit/ 8,076,228 -990021 3663440 3,049,958 11718037 2551764
2
Earning
Per Share
5.64 -0.50 3.66 1.55 2.34 2.54
Particulars ICICI HDFC SBI BIRLA LIC TOTAL
Revenue 2,571,204 472930 1,777,529 149,123 10309227 152800
13
Expenses 78,309 3559448 -476058 4,797,493 12 7959
204
Gross profit / Loss
2492895 (3086518) 1301471 (4648370) 10309215 636869
3
Net profit/ 2,579,685 (2751844) 2,764,577 (4,354,96
5)
10607168 884462
1
Earnings Per
Share
1.80 (1.51) 2 .76 (2.28) 2.12 0.58
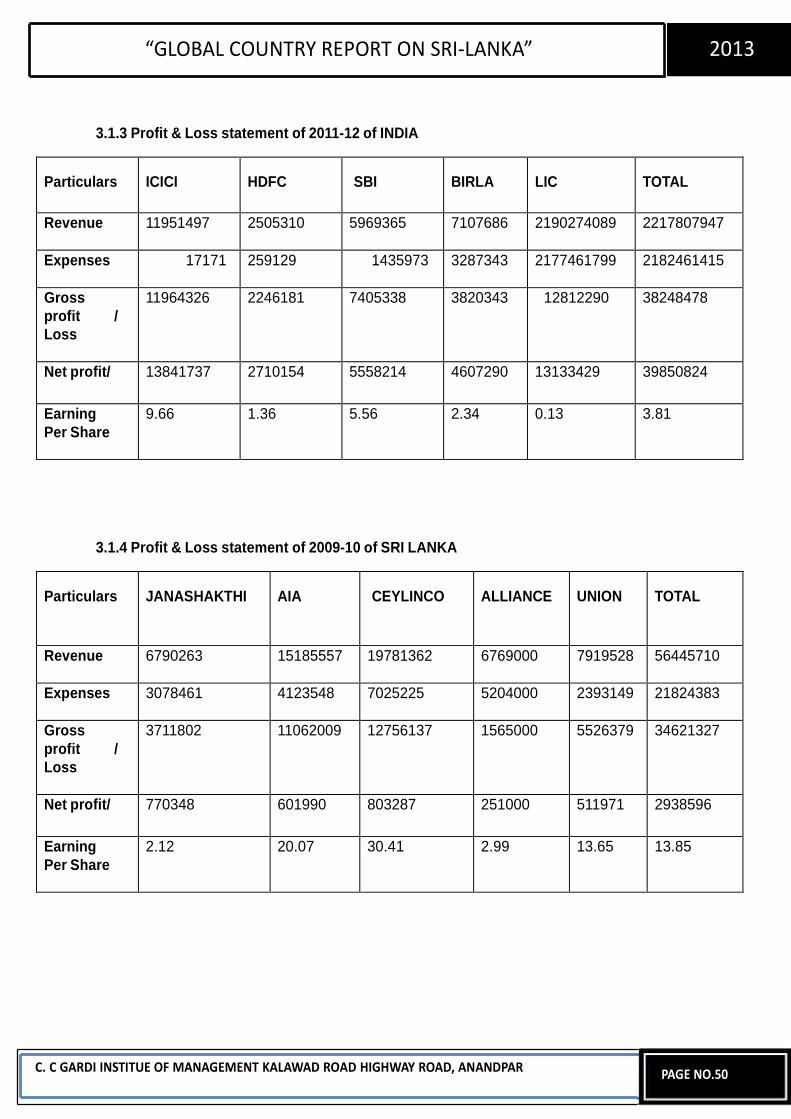
“GLOBAL COUNTRY REPORT ON SRI-LANKA” 2013
3.1.3 Profit & Loss statement of 2011-12 of INDIA 3.1.4 Profit & Loss statement of 2009-10 of SRI LANKA
C. C GARDI INSTITUE OF MANAGEMENT KALAWAD ROAD HIGHWAY ROAD, ANANDPAR
PAGE NO.50
Particulars JANASHAKTHI AIA CEYLINCO ALLIANCE UNION TOTAL
Revenue 6790263 15185557 19781362 6769000 7919528 56445710
Expenses 3078461 4123548 7025225 5204000 2393149 21824383
Gross
profit / Loss
3711802 11062009 12756137 1565000 5526379 34621327
Net profit/ 770348 601990 803287 251000 511971 2938596
Earning
Per Share
2.12 20.07 30.41 2.99 13.65 13.85
Particulars ICICI HDFC SBI BIRLA LIC TOTAL
Revenue 11951497 2505310 5969365 7107686 2190274089 2217807947
Expenses 17171 259129 1435973 3287343 2177461799 2182461415
Gross
profit / Loss
11964326 2246181 7405338 3820343 12812290 38248478
Net profit/ 13841737 2710154 5558214 4607290 13133429 39850824
Earning
Per Share
9.66 1.36 5.56 2.34 0.13 3.81
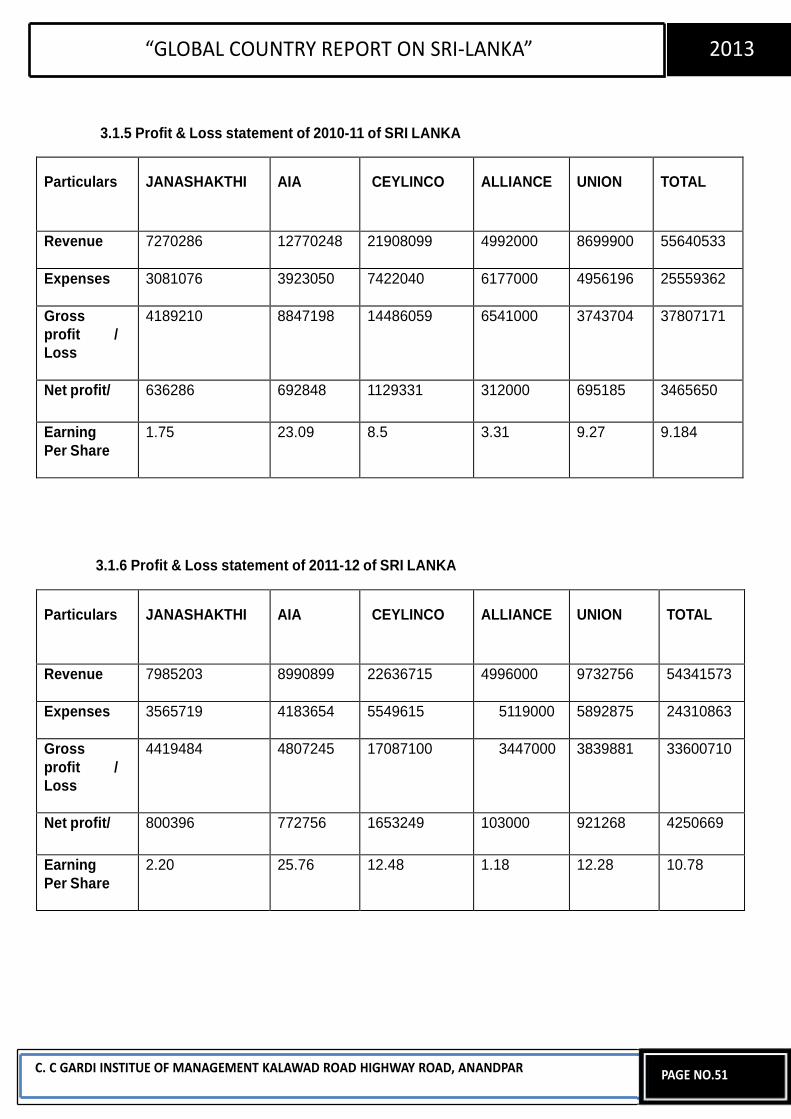
“GLOBAL COUNTRY REPORT ON SRI-LANKA” 2013
3.1.5 Profit & Loss statement of 2010-11 of SRI LANKA
3.1.6 Profit & Loss statement of 2011-12 of SRI LANKA
C. C GARDI INSTITUE OF MANAGEMENT KALAWAD ROAD HIGHWAY ROAD, ANANDPAR
PAGE NO.51
Particulars JANASHAKTHI AIA CEYLINCO ALLIANCE UNION TOTAL
Revenue 7985203 8990899 22636715 4996000 9732756 54341573
Expenses 3565719 4183654 5549615 5119000 5892875 24310863
Gross
profit / Loss
4419484 4807245 17087100 3447000 3839881 33600710
Net profit/ 800396 772756 1653249 103000 921268 4250669
Earning
Per Share
2.20 25.76 12.48 1.18 12.28 10.78
Particulars JANASHAKTHI AIA CEYLINCO ALLIANCE UNION TOTAL
Revenue 7270286 12770248 21908099 4992000 8699900 55640533
Expenses 3081076 3923050 7422040 6177000 4956196 25559362
Gross
profit / Loss
4189210 8847198 14486059 6541000 3743704 37807171
Net profit/ 636286 692848 1129331 312000 695185 3465650
Earning
Per Share
1.75 23.09 8.5 3.31 9.27 9.184
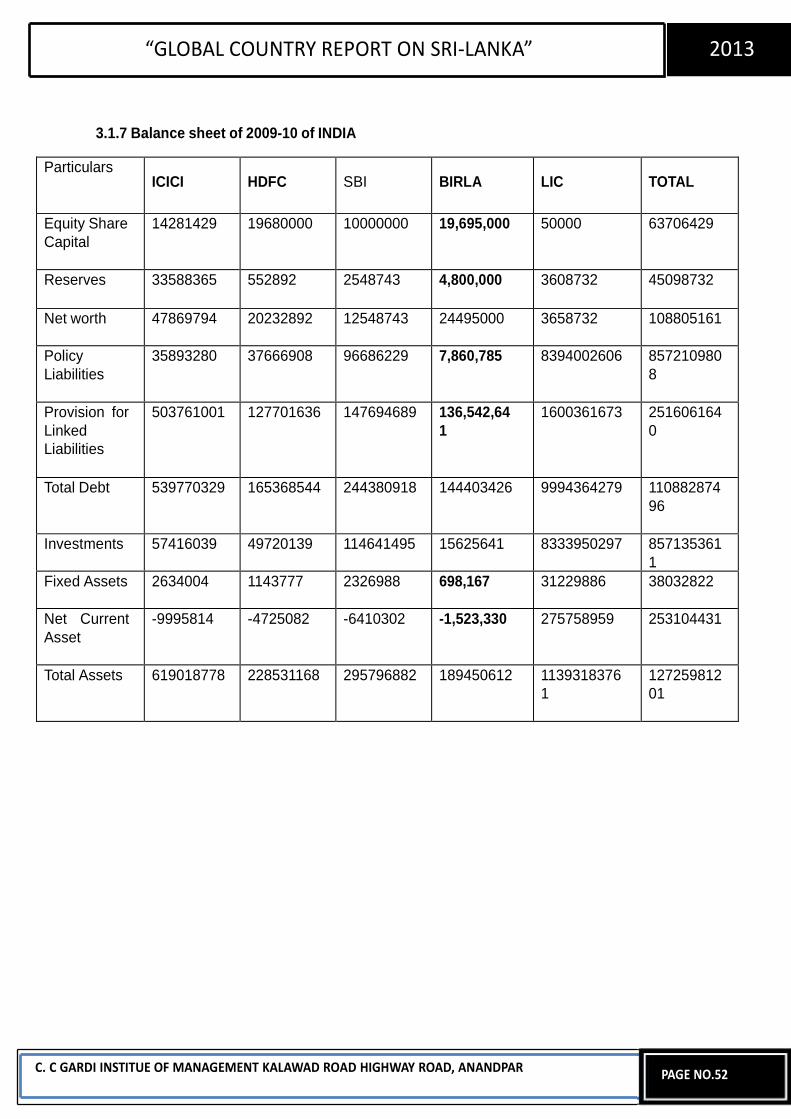
“GLOBAL COUNTRY REPORT ON SRI-LANKA” 2013
3.1.7 Balance sheet of 2009-10 of INDIA
C. C GARDI INSTITUE OF MANAGEMENT KALAWAD ROAD HIGHWAY ROAD, ANANDPAR
PAGE NO.52
Particulars ICICI HDFC SBI BIRLA LIC TOTAL
Equity Share
Capital
14281429 19680000 10000000 19,695,000 50000 63706429
Reserves 33588365 552892 2548743 4,800,000 3608732 45098732
Net worth 47869794 20232892 12548743 24495000 3658732 108805161
Policy
Liabilities
35893280 37666908 96686229 7,860,785 8394002606 857210980
8
Provision for
Linked
Liabilities
503761001 127701636 147694689 136,542,64
1
1600361673 251606164
0
Total Debt 539770329 165368544 244380918 144403426 9994364279 110882874
96
Investments 57416039 49720139 114641495 15625641 8333950297 857135361
1
Fixed Assets 2634004 1143777 2326988 698,167 31229886 38032822
Net Current
Asset
-9995814 -4725082 -6410302 -1,523,330 275758959 253104431
Total Assets 619018778 228531168 295796882 189450612 1139318376
1
127259812
01
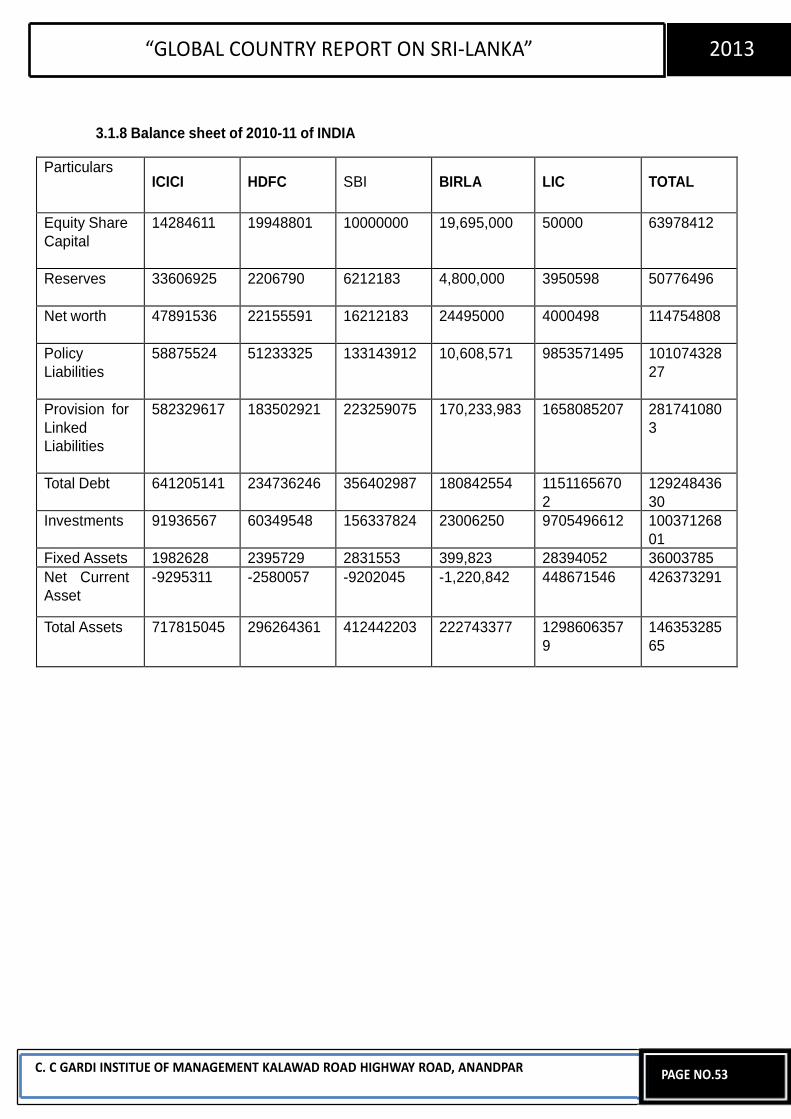
“GLOBAL COUNTRY REPORT ON SRI-LANKA” 2013
3.1.8 Balance sheet of 2010-11 of INDIA
C. C GARDI INSTITUE OF MANAGEMENT KALAWAD ROAD HIGHWAY ROAD, ANANDPAR
PAGE NO.53
Particulars ICICI HDFC SBI BIRLA LIC TOTAL
Equity Share
Capital
14284611 19948801 10000000 19,695,000 50000 63978412
Reserves 33606925 2206790 6212183 4,800,000 3950598 50776496
Net worth 47891536 22155591 16212183 24495000 4000498 114754808
Policy
Liabilities
58875524 51233325 133143912 10,608,571 9853571495 101074328
27
Provision for
Linked
Liabilities
582329617 183502921 223259075 170,233,983 1658085207 281741080
3
Total Debt 641205141 234736246 356402987 180842554 1151165670
2
129248436
30
Investments 91936567 60349548 156337824 23006250 9705496612 100371268
01
Fixed Assets 1982628 2395729 2831553 399,823 28394052 36003785
Net Current
Asset
-9295311 -2580057 -9202045 -1,220,842 448671546 426373291
Total Assets 717815045 296264361 412442203 222743377 1298606357
9
146353285
65

“GLOBAL COUNTRY REPORT ON SRI-LANKA” 2013
3.1.9 Balance sheet of 2011-12 of INDIA
C. C GARDI INSTITUE OF MANAGEMENT KALAWAD ROAD HIGHWAY ROAD, ANANDPAR
PAGE NO.54
Particulars ICICI HDFC SBI BIRLA LIC TOTAL
Equity Share
Capital
14288491 19948801 10000000 19695000 1000000
64932292
Reserves 35023689 2201376 11189297 4800000 4272260 57486622
Net worth 49312180 22150177 21189297 24495000 5272260 122418914
Policy
Liabilities
83379998 73865111 182815481 14318822 1146164289
4
118160223
06
Provision for
Linked
Liabilities
574285927 235044757 255747474 180060213 1378069211
262320758
2
Total Debt 582623925 308909868 438562955 194379035 1283971210
5
143641878
88
Investments 125877747 85796817 183094688 29736330 1070510859
7
111296141
79
Fixed Assets 1802306 317628 2652156 395861 28639090
33807041
Net Current
Asset
(8219205) -2230215 18736217 (1373561) 671184551 678097787
Total Assets 736010717 351463231 482403997 234294128 1412274921
1
159269212
84
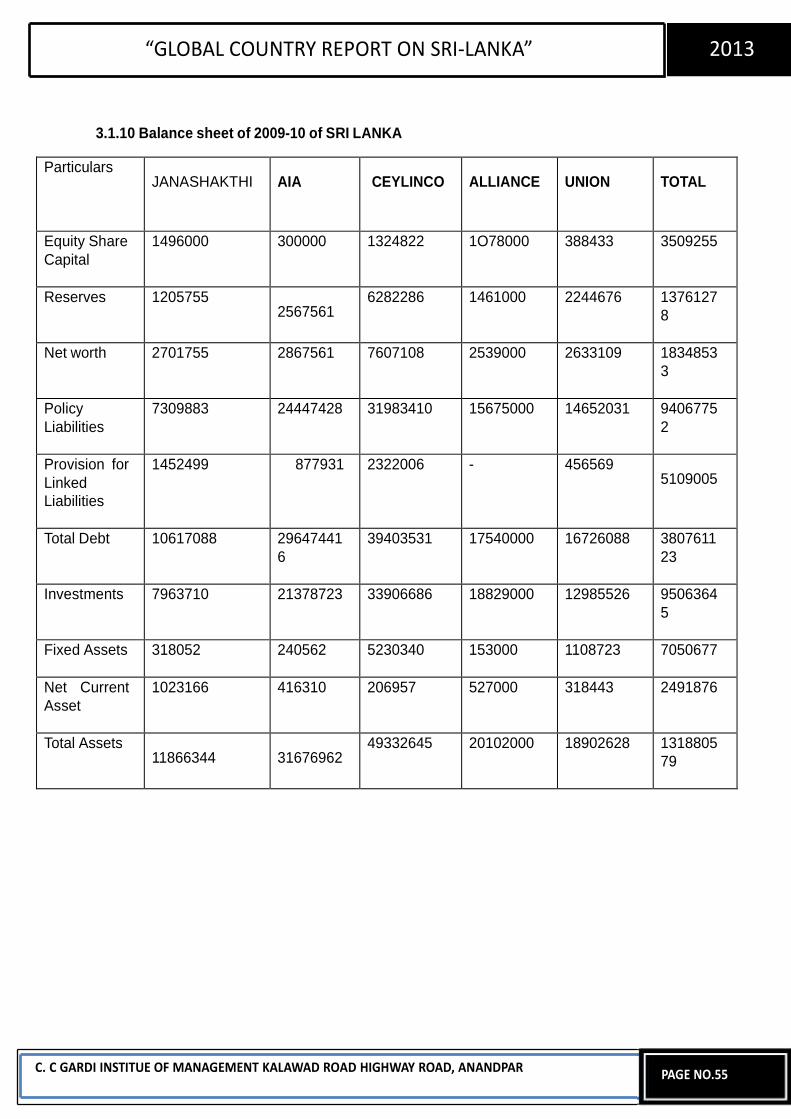
“GLOBAL COUNTRY REPORT ON SRI-LANKA” 2013
3.1.10 Balance sheet of 2009-10 of SRI LANKA
C. C GARDI INSTITUE OF MANAGEMENT KALAWAD ROAD HIGHWAY ROAD, ANANDPAR
PAGE NO.55
Particulars JANASHAKTHI AIA CEYLINCO ALLIANCE UNION TOTAL
Equity Share
Capital
1496000 300000 1324822 1O78000 388433 3509255
Reserves 1205755 2567561
6282286 1461000 2244676 1376127
8
Net worth 2701755 2867561 7607108 2539000 2633109 1834853
3
Policy
Liabilities
7309883 24447428 31983410 15675000 14652031 9406775
2
Provision for
Linked
Liabilities
1452499 877931 2322006 - 456569 5109005
Total Debt 10617088 29647441
6
39403531 17540000 16726088 3807611
23
Investments 7963710 21378723 33906686 18829000 12985526 9506364
5
Fixed Assets 318052 240562 5230340 153000 1108723 7050677
Net Current
Asset
1023166 416310 206957 527000 318443 2491876
Total Assets 11866344 31676962
49332645 20102000 18902628 1318805
79
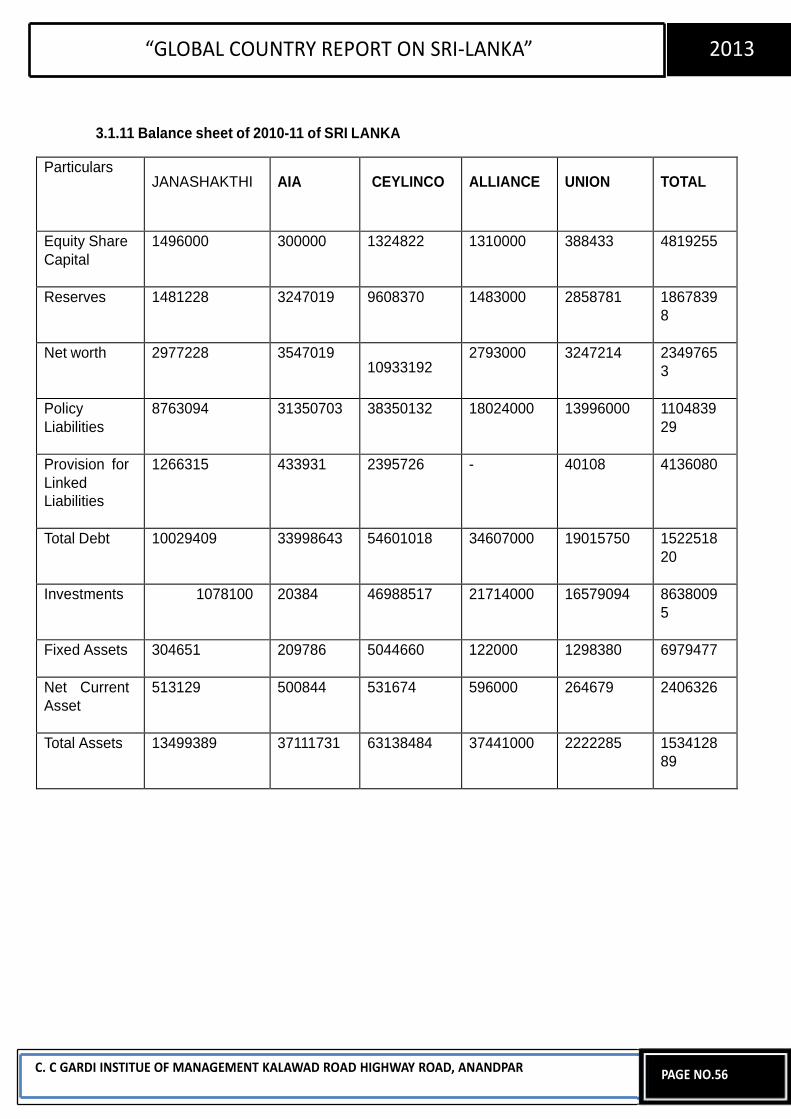
“GLOBAL COUNTRY REPORT ON SRI-LANKA” 2013
3.1.11 Balance sheet of 2010-11 of SRI LANKA
C. C GARDI INSTITUE OF MANAGEMENT KALAWAD ROAD HIGHWAY ROAD, ANANDPAR
PAGE NO.56
Particulars JANASHAKTHI AIA CEYLINCO ALLIANCE UNION TOTAL
Equity Share
Capital
1496000 300000 1324822 1310000 388433 4819255
Reserves 1481228 3247019 9608370 1483000 2858781 1867839
8
Net worth 2977228 3547019 10933192
2793000 3247214 2349765
3
Policy
Liabilities
8763094 31350703 38350132 18024000 13996000 1104839
29
Provision for
Linked
Liabilities
1266315 433931 2395726 - 40108 4136080
Total Debt 10029409 33998643 54601018 34607000 19015750 1522518
20
Investments 1078100 20384 46988517 21714000 16579094 8638009
5
Fixed Assets 304651 209786 5044660 122000 1298380 6979477
Net Current
Asset
513129 500844 531674 596000 264679 2406326
Total Assets 13499389 37111731 63138484 37441000 2222285 1534128
89
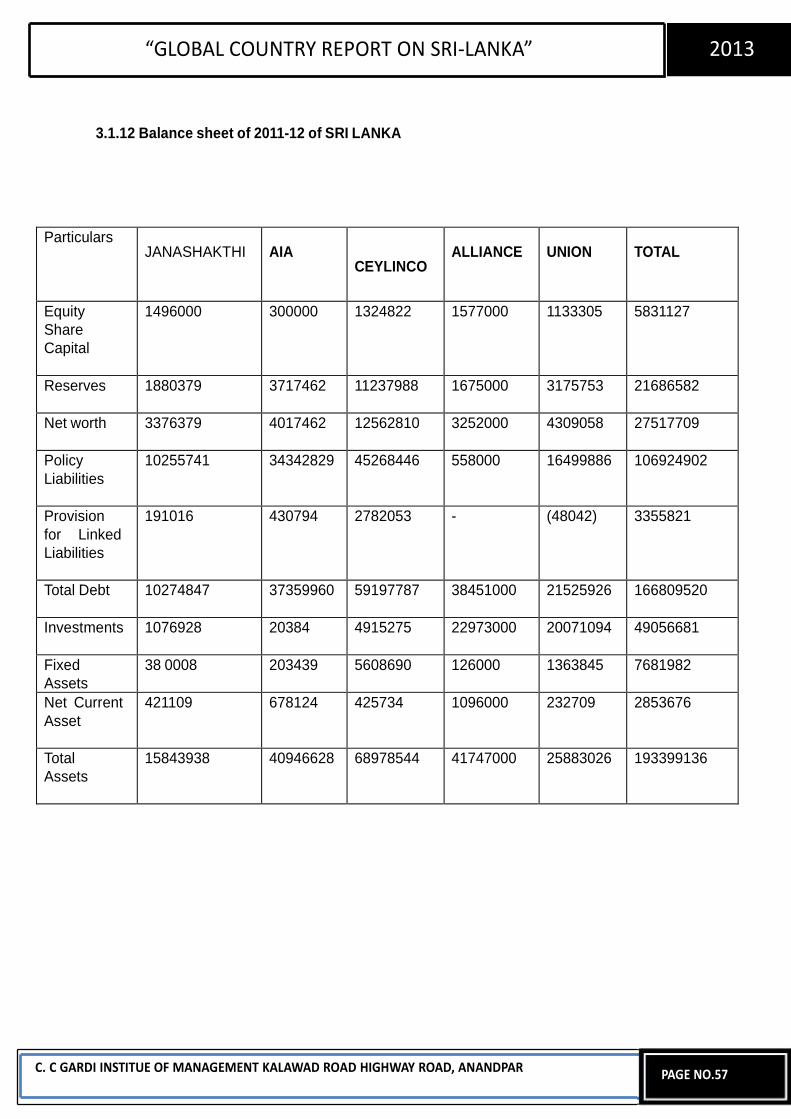
“GLOBAL COUNTRY REPORT ON SRI-LANKA” 2013
3.1.12 Balance sheet of 2011-12 of SRI LANKA
C. C GARDI INSTITUE OF MANAGEMENT KALAWAD ROAD HIGHWAY ROAD, ANANDPAR
PAGE NO.57
Particulars JANASHAKTHI AIA
CEYLINCO ALLIANCE UNION TOTAL
Equity
Share
Capital
1496000 300000 1324822 1577000 1133305 5831127
Reserves 1880379 3717462 11237988 1675000 3175753 21686582
Net worth 3376379 4017462 12562810 3252000 4309058 27517709
Policy
Liabilities
10255741 34342829 45268446 558000 16499886 106924902
Provision
for Linked
Liabilities
191016 430794 2782053 - (48042) 3355821
Total Debt 10274847 37359960 59197787 38451000 21525926 166809520
Investments 1076928 20384 4915275 22973000 20071094 49056681
Fixed
Assets
38 0008 203439 5608690 126000 1363845 7681982
Net Current
Asset
421109 678124 425734 1096000 232709 2853676
Total
Assets
15843938 40946628 68978544 41747000 25883026 193399136
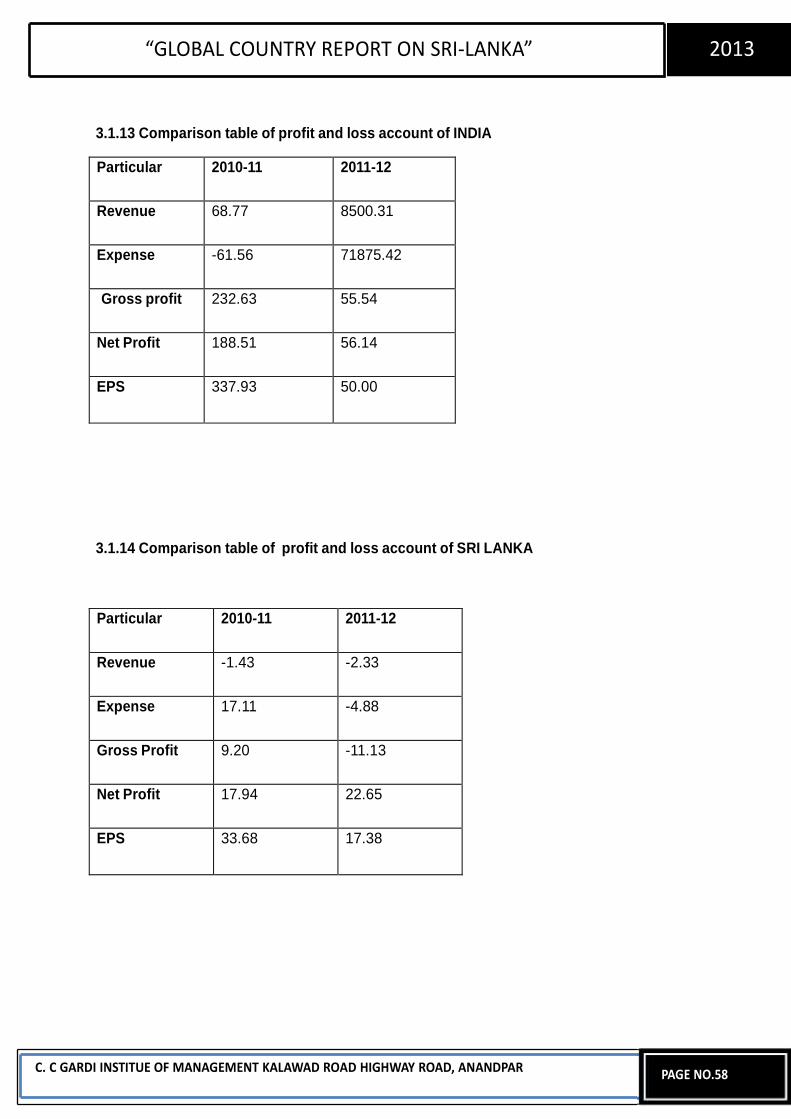
“GLOBAL COUNTRY REPORT ON SRI-LANKA” 2013
3.1.13 Comparison table of profit and loss account of INDIA 3.1.14 Comparison table of profit and loss account of SRI LANKA
C. C GARDI INSTITUE OF MANAGEMENT KALAWAD ROAD HIGHWAY ROAD, ANANDPAR
PAGE NO.58
Particular 2010-11 2011-12
Revenue -1.43 -2.33
Expense 17.11 -4.88
Gross Profit 9.20 -11.13
Net Profit 17.94 22.65
EPS 33.68 17.38
Particular 2010-11 2011-12
Revenue 68.77 8500.31
Expense -61.56 71875.42
Gross profit 232.63 55.54
Net Profit 188.51 56.14
EPS 337.93 50.00
“GLOBAL COUNTRY REPORT ON SRI-LANKA” 2013
Interpretation of profit and loss account of both the companies
REVENUE:
2010-11
Total revenue in India of these 5 companies increased by 68.77% because revenue of
ICICI increases by 185% in SBI revenue increases by 89% and in BIRLA 2 times then
previous year. All this have a combined impact on the performance of insurance sector.
At the same time in Sri Lanka revenue decreased by -1.43%.
2011-12
In the year of 2012 there was a huge change in the revenue of insurance sector
because there was a huge change in the revenue of LIC which increased by 191 times.
At the same time in BIRLA revenue increases by more than 100 times.
And in the performance of HDFC revenue increases by four and half times during the
same year all this increase in revenue is having a combined impact and we can see
that a performance of Indian insurance sector increase by 85 times than previous year.
At the same time in Sri Lanka revenue decreased by -2.33%.
EXPENSE:
2010-11
Total expense in India of 5 companies decreased by 61.56% because expense
of BIRLA co. decreases by 87% compare to the previous year. At the same time in Sri
Lanka expense is increased by 17.11% because expense of UNION co. is increased
by 100%.
2011-12
In the year of 2012 in INDIA we can see huge percentage increased because
the main reason for such increment is expense of LIC which increase from -216 to
2177461799 in the year of 2011-12. At the same time in Sri Lanka expense is
decreased by 4.88% compare to the previous year.
C. C GARDI INSTITUE OF MANAGEMENT KALAWAD ROAD HIGHWAY ROAD, ANANDPAR
PAGE NO.59
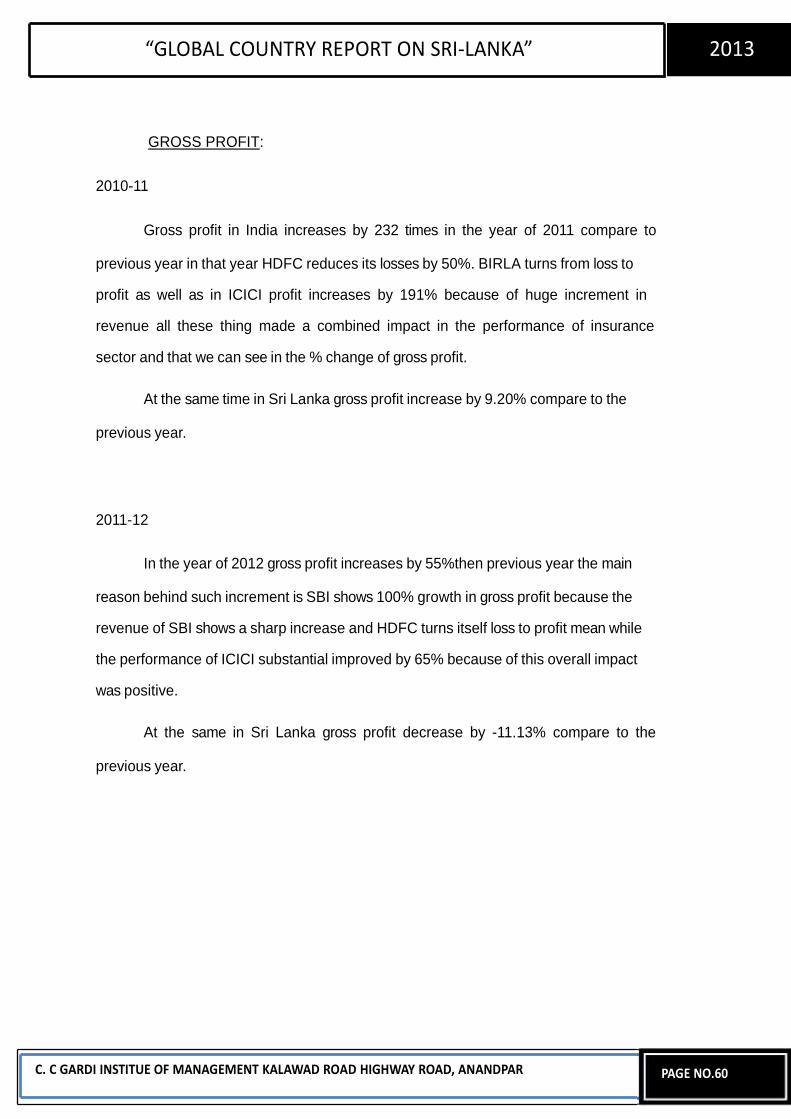
“GLOBAL COUNTRY REPORT ON SRI-LANKA” 2013
GROSS PROFIT:
2010-11
Gross profit in India increases by 232 times in the year of 2011 compare to
previous year in that year HDFC reduces its losses by 50%. BIRLA turns from loss to profit as well as in ICICI profit increases by 191% because of huge increment in revenue all these thing made a combined impact in the performance of insurance sector and that we can see in the % change of gross profit.
At the same time in Sri Lanka gross profit increase by 9.20% compare to the
previous year.
2011-12
In the year of 2012 gross profit increases by 55%then previous year the main
reason behind such increment is SBI shows 100% growth in gross profit because the revenue of SBI shows a sharp increase and HDFC turns itself loss to profit mean while the performance of ICICI substantial improved by 65% because of this overall impact was positive.
At the same in Sri Lanka gross profit decrease by -11.13% compare to the
previous year.
C. C GARDI INSTITUE OF MANAGEMENT KALAWAD ROAD HIGHWAY ROAD, ANANDPAR
PAGE NO.60
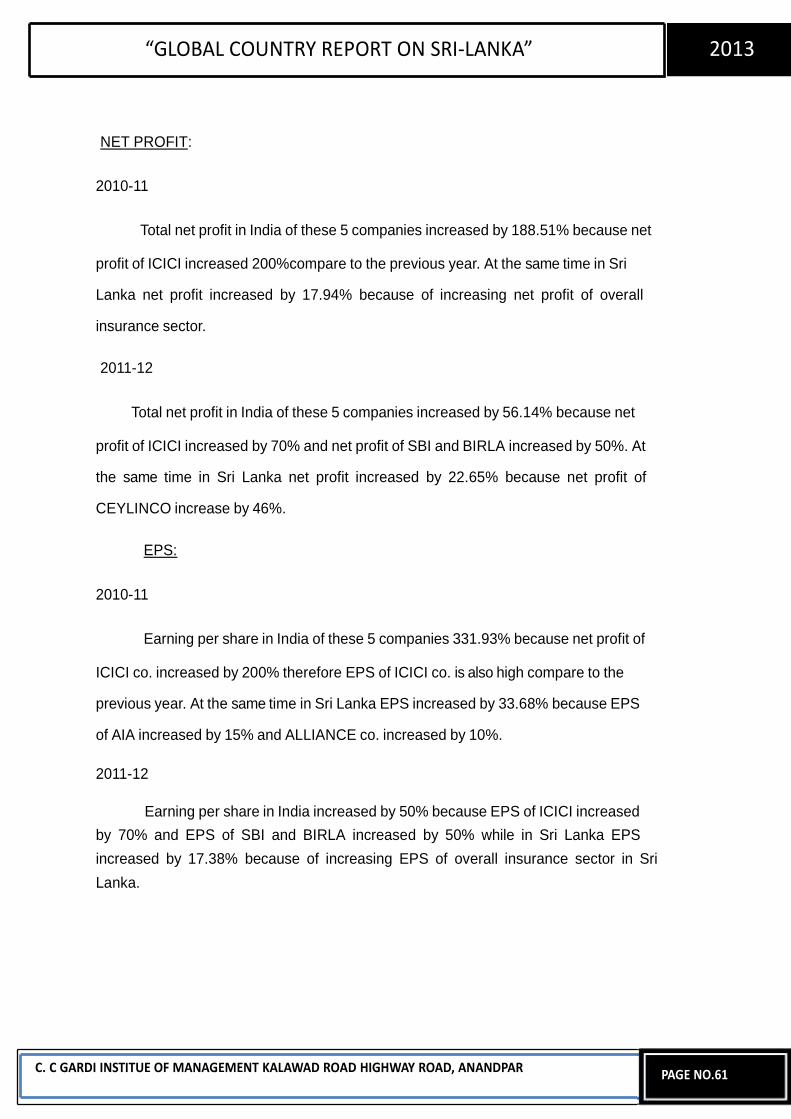
“GLOBAL COUNTRY REPORT ON SRI-LANKA” 2013
NET PROFIT:
2010-11
Total net profit in India of these 5 companies increased by 188.51% because net
profit of ICICI increased 200%compare to the previous year. At the same time in Sri Lanka net profit increased by 17.94% because of increasing net profit of overall insurance sector.
2011-12
Total net profit in India of these 5 companies increased by 56.14% because net
profit of ICICI increased by 70% and net profit of SBI and BIRLA increased by 50%. At the same time in Sri Lanka net profit increased by 22.65% because net profit of CEYLINCO increase by 46%.
EPS:
2010-11
Earning per share in India of these 5 companies 331.93% because net profit of
ICICI co. increased by 200% therefore EPS of ICICI co. is also high compare to the previous year. At the same time in Sri Lanka EPS increased by 33.68% because EPS of AIA increased by 15% and ALLIANCE co. increased by 10%.
2011-12
Earning per share in India increased by 50% because EPS of ICICI increased
by 70% and EPS of SBI and BIRLA increased by 50% while in Sri Lanka EPS
increased by 17.38% because of increasing EPS of overall insurance sector in Sri
Lanka.
C. C GARDI INSTITUE OF MANAGEMENT KALAWAD ROAD HIGHWAY ROAD, ANANDPAR
PAGE NO.61
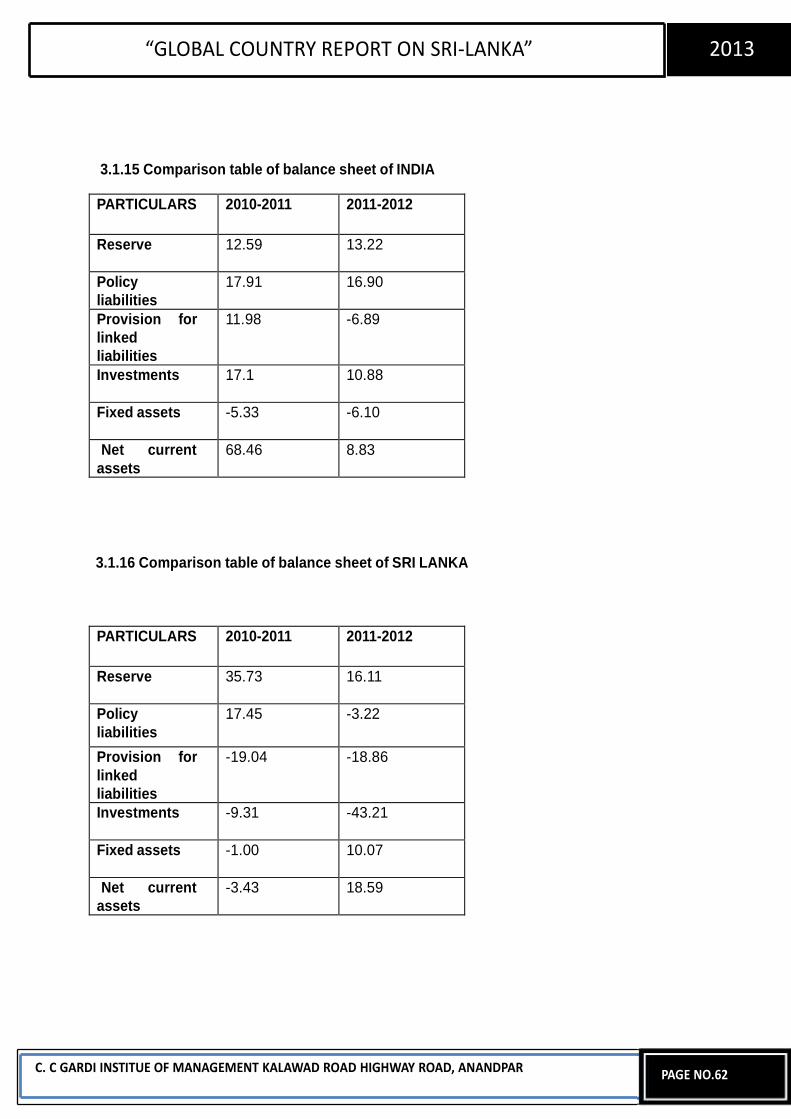
“GLOBAL COUNTRY REPORT ON SRI-LANKA” 2013
3.1.15 Comparison table of balance sheet of INDIA
3.1.16 Comparison table of balance sheet of SRI LANKA
C. C GARDI INSTITUE OF MANAGEMENT KALAWAD ROAD HIGHWAY ROAD, ANANDPAR
PAGE NO.62
PARTICULARS 2010-2011 2011-2012
Reserve 35.73 16.11
Policy
liabilities
17.45 -3.22
Provision for
linked
liabilities
-19.04 -18.86
Investments -9.31 -43.21
Fixed assets -1.00 10.07
Net current
assets
-3.43 18.59
PARTICULARS 2010-2011 2011-2012
Reserve 12.59 13.22
Policy
liabilities
17.91 16.90
Provision for
linked
liabilities
11.98 -6.89
Investments 17.1 10.88
Fixed assets -5.33 -6.10
Net current
assets
68.46 8.83
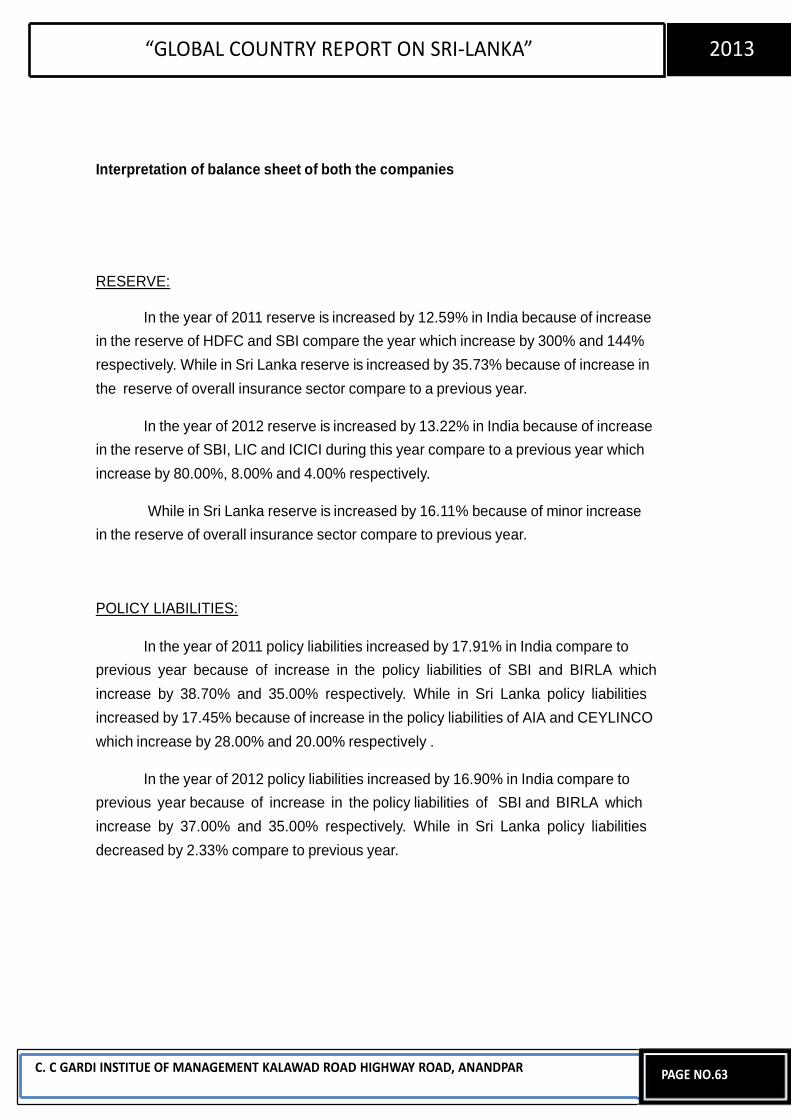
“GLOBAL COUNTRY REPORT ON SRI-LANKA” 2013
Interpretation of balance sheet of both the companies RESERVE:
In the year of 2011 reserve is increased by 12.59% in India because of increase
in the reserve of HDFC and SBI compare the year which increase by 300% and 144%
respectively. While in Sri Lanka reserve is increased by 35.73% because of increase in
the reserve of overall insurance sector compare to a previous year.
In the year of 2012 reserve is increased by 13.22% in India because of increase
in the reserve of SBI, LIC and ICICI during this year compare to a previous year which
increase by 80.00%, 8.00% and 4.00% respectively.
While in Sri Lanka reserve is increased by 16.11% because of minor increase
in the reserve of overall insurance sector compare to previous year.
POLICY LIABILITIES:
In the year of 2011 policy liabilities increased by 17.91% in India compare to
previous year because of increase in the policy liabilities of SBI and BIRLA which
increase by 38.70% and 35.00% respectively. While in Sri Lanka policy liabilities
increased by 17.45% because of increase in the policy liabilities of AIA and CEYLINCO
which increase by 28.00% and 20.00% respectively .
In the year of 2012 policy liabilities increased by 16.90% in India compare to
previous year because of increase in the policy liabilities of SBI and BIRLA which
increase by 37.00% and 35.00% respectively. While in Sri Lanka policy liabilities
decreased by 2.33% compare to previous year.
C. C GARDI INSTITUE OF MANAGEMENT KALAWAD ROAD HIGHWAY ROAD, ANANDPAR
PAGE NO.63
“GLOBAL COUNTRY REPORT ON SRI-LANKA” 2013
PROVISION FOR LINKED LIABILITIES:
In the year of 2011 provision for linked liabilities increased by 11.98% in India
compare to previous year because of increase in the provision for linked liabilities of
Birla which increase by 24.67% while there is minor increase in the other companies.
At the same time in Sri Lanka provision for linked liabilities decreased by 19.04%
compare to previous year because of decrease in the provision of linked liabilities of
Union which decrease sharply by 91.22%.
In the year of 2012 provision for linked liabilities decreased by 6.89% in India
compare to previous year because of decrease in provision for linked liabilities of ICICI
and LIC which decrease by 1.38% and 16.89% respectively. At the same time in Sri
Lanka provision for linked liabilities decreased by 18.86% compare to previous year
because of decrease in provision for linked liabilities of UNION which decrease by
200%.
INVESTMENT:
In the of 2011 investment increased by 17.1% in India compare to previous year
because of increase in investment of overall insurance sector of India. At same time in
Sri Lanka investment decreased by 9.31% compare to previous year because of
decrease in Janshakthi and AIA which increase by 86.46% and 100%respectively.
In the year of 2012 investment increased by 10.88% in India compare to
previous year because of increase in investment of overall insurance sector in India. At
the same time in Sri Lanka investment decreased by 43.21% compare to previous year
because of decrease in investment of Cylinco which decrease by 89.5%.
C. C GARDI INSTITUE OF MANAGEMENT KALAWAD ROAD HIGHWAY ROAD, ANANDPAR
PAGE NO.64
“GLOBAL COUNTRY REPORT ON SRI-LANKA” 2013
FIXED ASSET:
In the year of 2011 fixed asset decreased by 5.33% in India compare to
previous year. At the same time fixed asset in Sri Lanka is decrease by 1.00%
compare to previous year.
In the year of 2012 fixed asset is decreased by 6.10% in India compare to
previous year. At the same time fixed asset in Sri Lanka is increased by 10.07%
compare to previous year. NET CURRENT ASSET:
In the year of 2011 net current asset is increased by 68.46% in India compare to
previous year because of increase in net current asset of LIC which increase by
62.70%. At the same time net current asset in Sri Lanka is decrease by 3.43%.
in the year of 2012 net current asset is increased by 8.83% in India compare to
previous year. At the same time net current asset in Sri Lanka increased by 18.59%
because of increase in the net current asset of Alliance which increase by 83.89%.
C. C GARDI INSTITUE OF MANAGEMENT KALAWAD ROAD HIGHWAY ROAD, ANANDPAR
PAGE NO.65
“GLOBAL COUNTRY REPORT ON SRI-LANKA” 2013
3.2 present position trend of insurance sector
Sri Lankan company in India
Tata AIA Life Insurance
Tata AIA Life Insurance Co. Ltd. Tata Group and AIA Group Limited (AIA) is formed by
a joint venture company. A large stake in the company of the Tata group (74%) and
AIA holds 26% through an AIA Group company shares. Tata AIA Life Insurance
Company Private Limited in 2001, in 2001, launched in India on February 12 to begin
on April 1 and was licensed.
Type of service
Conservation Foundation
Term plans of the best ways to do this and through our insurance scheme is
pure type.
Many foundations are planning security, to secure your future
· Tata AIA Life Insurance iRaksha top.
· Tata AIA Life Insurance Security Fund supreme.
``` · Tata AIA Life Insurance Maharaksha top.
· Protect Tata AIA Life.
· Tata AIA Life Life Plus
Health Foundation
We all have our health is the most important thing for us is to know how. As well
as our family can have serious effects on our health, losing at that time. We are a
major threat and the need to protect our families.
C. C GARDI INSTITUE OF MANAGEMENT KALAWAD ROAD HIGHWAY ROAD, ANANDPAR
PAGE NO.66
“GLOBAL COUNTRY REPORT ON SRI-LANKA” 2013
Many health plans in the foundation, as are safe for your health
1. Tata AIA Life Fitness First
2. Tata AIA Life Health Protector.
3. Tata AIA Life Fitness investor.
4. cashback Tata AIA Life Hospital.
Savings Foundation
Your financial plan is the first step to fulfill the dreams and aspirations. Signature
of Financial Planning Made with a smooth side out, with an element of savings, life
insurance scheme is secure enough.
Life insurance also means a significant savings in the future.
Like to save the foundation of your future schemes, there are
Tata AIA Life Insurance Mahalife top.
Tata AIA Life Maha Guarantee Flexi.
Tata AIA Life Maha Guarantee.
Tata AIA Life Assure 10/20/30 years Security and Development.
Tata AIA Assure Golden Years.
Tata AIA Life assurance 21-year plan to break the money.
Tata AIA Life Good Life.
C. C GARDI INSTITUE OF MANAGEMENT KALAWAD ROAD HIGHWAY ROAD, ANANDPAR
PAGE NO.67
“GLOBAL COUNTRY REPORT ON SRI-LANKA” 2013
Child Foundation
This is the proudest moment for parents when their children reach their own
success that has been said. Tata AIA Life, we realize that responsibility. We
understand that you and your child's dreams and aspirations. Now, at present there to
fulfill your dreams do not have to compromise with your dreams.
, Tata AIA Life Child plans for you - so your child does nothing but give the best to their
future.
Like the foundation of our children's bright future plan for the child.
Tata AIA Life Insurance joint highest Ujjawal future.
Tata AIA Life Insurance Knowledge Base.
Tata AIA Life starkid.
Tata AIA Life Assurance Career Builder.
Tata AIA Life Assure Educare.
Retirement Foundation
Retirement in one's life is a very difficult phase. Is unstable, while for others it can be
enjoyable for some people. Tata AIA Life with Your Retirement Plans sure to secure
your retirement.
Their bright future in your retirement plan, such as
Tata AIA Life Assure Golden Years.
Tata AIA Life Maha Life Gold.
C. C GARDI INSTITUE OF MANAGEMENT KALAWAD ROAD HIGHWAY ROAD, ANANDPAR
PAGE NO.68
“GLOBAL COUNTRY REPORT ON SRI-LANKA” 2013
Tata AIA Life retire comfortably.
Wealth Foundation
We have dreams and aspirations of all our children the best education for their
future and having a comfortable life after retirement, is like buying a beautiful home.
Well when planning our financial plan, these dreams can be fulfilled. One of the key
steps in financial planning funds are invested in construction projects.
As you plan for your great wealth, there is
Tata AIA Life Insurance Invest Gold Supreme assurance.
Tata AIA Life Insurance Invest assurance team.
Tata AIA Life Insurance golden future.
Tata AIA Life Insurance pledge gold.
Tata AIA Life ultimate goal.
Tata AIA Life Invest Assure Flexi Supreme .
Tata AIA Life Invest Assure Plus.
Group insurance
As a corporation, your employees are your greatest asset in the company. It's
well-being, to inspire a sense of security is a priority in the minds of employees and
continually inspires admiration.
C. C GARDI INSTITUE OF MANAGEMENT KALAWAD ROAD HIGHWAY ROAD, ANANDPAR
PAGE NO.69
“GLOBAL COUNTRY REPORT ON SRI-LANKA” 2013
Gives Tata AIA Life, we do represent an important way of saving for their future
is the responsibility of the employee to understand. Our range of group insurance
solutions, protection and safety of its employees and provides their loved ones.
Such as group insurance plan is not the limit,
Employee benefits.
Credit life.
Group pension.
Micro Insurance
Insurance for people living in small towns and villages is an important savings
tool. Severe damage to the nature of their work to make them safer places financial
risk hem.
Tata AIA Life insurance, micro-insurance products covered by sufficient financial
impact of financial loss can help reduce.are.
Micro-insurance plan for the future which has helped.
· Tata AIA Life Navkalyan scheme.
· Tata AIA Life Sumangal scheme.
· Tata AIA Life aayushmaan scheme.
· plan and Tata AIA Life
· Life Insurance Corporation of Sri Lanka
· New Delhi: It is good news in Sri Lanka further into the future. Life Insurance
Corporation of Sri Lanka, its joint venture partnerships with venture has been finalized.
C. C GARDI INSTITUE OF MANAGEMENT KALAWAD ROAD HIGHWAY ROAD, ANANDPAR
PAGE NO.70
“GLOBAL COUNTRY REPORT ON SRI-LANKA” 2013
· Bartley Group - a leading business group in Sri Lanka island countries share in the
life insurance business.
India‟s company in Sri Lanka
· signing of LIC future (Sri Lankan currency 2.5 crore), the joint venture will take around
70 percent. Bartley will take up the rest of the group.
· Local partner through an IPO of its stake in the future. LIC Lanka, Insurance
Regulatory and Development Authority, the Finance Ministry and the Indian High
Commission in Sri Lanka has received the necessary approvals.
· The joint venture will provide a big jump LIC in the SAARC region.
New To begin with, it's New York, New Jersey and California will work. In the future, it
plans to expand in Illinois and Texas are.
· In fact, it has proved great for market research LIC. North American market access to
a large base of people of Indian origin, ethnic Indian and will give access to the
corporation.
· The U.S. states have different rules in different states, more yoga. So, a wise LIC will
have to login with different strategies. Indians living in various countries of the Indian
people is planning to target.
· LIC board for its UK operations as its joint venture partner, a pension fund society
(PF) is approved.
C. C GARDI INSTITUE OF MANAGEMENT KALAWAD ROAD HIGHWAY ROAD, ANANDPAR
PAGE NO.71

“GLOBAL COUNTRY REPORT ON SRI-LANKA” 2013
CHAPTER-4
C. C GARDI INSTITUE OF MANAGEMENT KALAWAD ROAD HIGHWAY ROAD, ANANDPAR
PAGE NO.72
“GLOBAL COUNTRY REPORT ON SRI-LANKA” 2013
4.1 Policy and norms of INDIA.
Registration
3. (1) No person shall, after commencement of this Act, is being to carry on any class
of insurance business in India and no insurer carrying on any class of insurance
business in India after the expiry of 3 months from the commencement of this Act,
continue to carried on any such business, unless he has obtain from the Authority a
certificate of registration for the particular class of insurance business:
Provided that in case of an insurer who was carrying on any class of insurance
business in India at the commencement of this Act is to failure to obtain a certificate of
registration in accordance with the requirements of this sub clause shall not operate to
invalidate any contract of insurance entered into by him if before such date as may be
fixed in this behalf by the Central Government by notification in the official Gazette. He
has obtaining that certificate:
Provided further that a person or insurer as the case may be, carried on any class of
insurance business in India is done on or before the commencement of the Insurance
Regulatory and Development Authority Act, 1999. For which is required for no
registration certificate was necessary prior to such commencement, may continues to
do so for a period of 3month from such commencement. If he had made an application
for such registration within the said period of 3month, till the disposal of such
application:
Provided also that any certificate of registration obtained immediately before the
commencement of the Insurance Regulatory and Development Authority Act, 1999
shall be deemed to obtaining from the Authority in accordance with the provisions of
this Act
(2) Every application for registration made in such manner as may be determined by
the regulations made by the Authority and shall be accompanied by-
C. C GARDI INSTITUE OF MANAGEMENT KALAWAD ROAD HIGHWAY ROAD, ANANDPAR
PAGE NO.73
“GLOBAL COUNTRY REPORT ON SRI-LANKA” 2013
(a) a certified copy of the memorandum and articles of association, where the applied
is a company and incorporated under the Indian Company Act, 1913 or under the
Indian Company Act, 1882 or under the Indian Company Act, 1866 or under any Act
repealed thereby or in the case of any other insurer specified in sub clause (a) (ii) or
sub clause (b) of clause (9) of section 2, a certification copy of the deed of partnership
or of the deed of constitution of the company, as the case may be in the case of an
insurer having his principal place of business or domicile outside India, the document
specified in Clause (a) of Section 63;
(b) the name, address and the occupation, if any, of the directors where insurer is a
company incorporated under the Indian Company Act, 1913 or under the Indian
Company Act, 1882 or under the Indian Company Act, 1866 or under any Act repealed
thereby, and in the case of an insurer specified in sub clause (a) (ii) of clause (9) of
section 2 the names and addresses of the proprietors and of the manager in India, and
in any other case the full address of the principal office of the insurer in India, and the
names of the directors and the manager at such office and the name and address of
someone or more persons resident in India, authorized to accept any notice required to
be served on the insurer;
(c) a statement of the class or classes of insurance business done or to be done and a
statement that the amount required to be deposit by section 7 or section 98 before
application for registration is made has been deposited together with a certificate from
the Reserve Bank of India showing the amount deposited;
(d) where the provisions of section 6 or section 97 apply, a declared verified by an
affidavit made by the principal officer of the insurer authorized in that behalf that the
provisions of those sections as to paid-up equity capital or working capital have been
complied with;
(e) in the case of an insurer having his principal place of business or domicile outside
India, a statement verified by an affidavit made by the principal officer of the insurer
setting forth the requirements (if any) not applicable to nationals of the country in which
such insurer is constituted, incorporate or domiciled which are imposed by the laws or
practice of that country upon Indian nationals as a condition of carrying on insurance
business in that country;
C. C GARDI INSTITUE OF MANAGEMENT KALAWAD ROAD HIGHWAY ROAD, ANANDPAR
PAGE NO.74
“GLOBAL COUNTRY REPORT ON SRI-LANKA” 2013
(f) a certified copy of the publishing prospectus, if any, and of the standard policy forms
of the insurer and statements of the assured rates, advantages, terms and conditions
to be offereing in connection with insurance policies together with a certificate in
connection with life insurance business by an actuary that such rates, advantages,
terms and conditions are applied and sound:
Provided that in the case of marine accident and miscellaneous insurance business
other than workmen's compensation and motor car insurance the above requirements
regarding prospectus, forms and statements shall be compliet with only insofar as the
prospectus, form and statements may be available; and
(g) the receipt showing payment of fee as determined by the regulations which shall
not exceed fifty thousand rupees for each class of business as may be specified by the
regulations made by the Authority.
(h) such other document as may be specified by the regulations made by the Authority.
(2A) If, on receipt of an application for registration and after making such inquiry as he
deem fit, the Controller is satisfied that—
(a) the financial position and the general character of management of the applicant are
sound;
(b) the volume of business likely to be available to the capital structure and earning
prospects of, the applicant will be adequate;
(c) the interest of general public will be served if the certificate of registration is granted
to the applicant in respect of the class or classes of insurance business specified in the
application; and
C. C GARDI INSTITUE OF MANAGEMENT KALAWAD ROAD HIGHWAY ROAD, ANANDPAR
PAGE NO.75
“GLOBAL COUNTRY REPORT ON SRI-LANKA” 2013
(2AA) The Authority shall give first preference to register the applicant and grant him a
certificate of registration if such applicant agrees, in the form and manner as may be
specified by the regulations made by the Authority, to carry on the life insurance
business or general insurance business for providing health cover to individuals or
group of individuals.
(2B) Where the Authority refuses registration; he shall record the reasons for such
decision and shall furnish a copy thereof to the applicant.
(2C) Any person agreed by the decision of the Authority refusing registration may,
within thirty days from the date on which a copy of the decision is received by him,
appeal to the Central Government.
(2D) The decision which is taken by the Central Government on such appeal shall be
final and shall not be questioned before any Court.
(3) Notwithstanded anything contained in sub-section (2A), in the case of any insurer
having his principal place of business or domicile outside India, the Authority, shall
withhold registration or shall cancel a registration already made, if he is satisfied that in
the country in which such insurer has his principal place of business or domicile Indian
nationals are debarred by the law or practice of the country relating to, or applied to
insurance from carrying on the business of insurance, or that any requirement imposed
on such insurer under the provisions of section 62 is not satisfied.
(4) The Authority shall cancel the registration of an insurer either wholly or in so far as
it relates to a particular class of insurance business, in this case may be, -
(a) if the insurer fails to comply with the provisions of section 7 or section 98 as to
deposits, or
(aa) if the insurer fails, at any time, to comply the provisions of Sec. 64VA as to the
excess of the value of his assets over the amount of his liabilities; or
(b) if the insurer is in liquidation or is adjudged an insolvent, or
C. C GARDI INSTITUE OF MANAGEMENT KALAWAD ROAD HIGHWAY ROAD, ANANDPAR
PAGE NO.76
“GLOBAL COUNTRY REPORT ON SRI-LANKA” 2013
(c) if the business or a class of the business of the insurer has been transferred to
any person or has been transferred to or amalgamated with the business of any other
insurer, or
(d) if the whole of the deposit made in respect of insurance business has been
returned to the insurer under Sec. 9, or
(e) if, in the case of an insurer specified in sub clause (c)of clause (9) of section (2),
the standing contract referred to in that sub clause is cancelled or is suspended and
continues to be suspended for a period of six months, or
(ee) if the Central Government so directs under sub- section (4) of Sec. 33] and the
Authority may cancel the registration of an insurer-
(f) if the insurer makes default in complying with, or act in contravention of any
requirement of this Act or of any rule or any regulation or order made or, any direction
issue there under, or (h) if the insurer carries on any business other than insurance business or any
prescribed business , or
(i) if the insurer makes a default in complying with any direction issued or order
made, as the case may be, by the Authority under the Insurance Regulatory and
Development Authority Act, 1999.
(j) if the insurer make a default in complying with, or acts in contravention of, any
requirement of the Company Act, 1956 (1 of 1956), or the Life Insurance Corporation
Act, 1956 (31 of 1956), or the General Insurance Business (Nationalization) Act, 1972
(57 of 1972), or the Foreign Exchange Regulation Act, 1973 (46 of 1973).
C. C GARDI INSTITUE OF MANAGEMENT KALAWAD ROAD HIGHWAY ROAD, ANANDPAR
PAGE NO.77
“GLOBAL COUNTRY REPORT ON SRI-LANKA” 2013
Renewal of registration
3A. (1) An insurer who has been granted a certificate of registration under section 3
shall have the registration renewed annually for each year after that ending on the 31st
March, after the commencement of the Insurance Regulatory and Development
Authority Act 1999.
(2) An application for the renewal of a registration for any year shall be made by the
insurer to the Authority before the 31st day of December of the preceded year, and
shall be accompanied as provided in sub-section
(3) by evidence of payment of the fee as determined by the regulations made by the
Authority which may vary according to the total gross premium written direct in India
during the year preceding the year in which the application is required to be made
under this section is used by the insurer in the class of insurance business to which the
registration relates but shall not—
(i) exceed one fourth of 1%per cent. of such premium income or rupees 5crores,
whichever is less;
(ii) be less, in any case, than five hundred rupees for each class of insurance business:
Provided that in the case of an insurer carried on solely re-insurance business, the
provisions of this sub-section shall apply with the modification that instead of the total
gross premium written direct in India, the total premiums in respect of facultative
re-insurances accepted by him in India shall be-taken into account.
C. C GARDI INSTITUE OF MANAGEMENT KALAWAD ROAD HIGHWAY ROAD, ANANDPAR
PAGE NO.78
“GLOBAL COUNTRY REPORT ON SRI-LANKA” 2013
Accounts and balance sheet
11. (1) Every insurer, in the case of an insurer specified in sub-clause (a) (ii) or
sub-clause (b) of clause (9) of section 2 in respect of all insurance business transaction
by him, and in the case of any other insurer in respect of the insurance business
transacted by him in India and shall at the expiration of each financial year prepare with
reference to that year,—
Audit
12. The balance sheet, profit and loss account, revenue account and profit of every
insurer, in the case of an insurer specifying in sub clause (a)(ii) or sub clause (b) of
clause (9) of section 2 in respect of all insurance business transaction by him, and in
the case of any other insurer in respect of the insurance business transacted by him in
India, shall, unless they are subject to audit under the Indian Company Act, 1913 (7 of
1913), be audited annually by an auditor, and the auditor shall in the audit of such
accounts have the power of, exercise the functions vested in, and discharge the duty
and be subject to the liabilities and penalty imposed on, auditors of company by section
(145) of the Indian Company Act 1913.
Register of policies and register of claim.
14. Every insurer, in the case of an insurer specified in sub clause (a)(ii) or sub clause
(b) of clause (9) of section 2 in respect of all business transaction by him, and in the
case of any other insurer in respect of the insurance business transacted by him in
India, shall maintain-
(a) a register or record of policy, in which shall be entered, in respect of every policy
issued by the insurer, the name and address of the policy holder, the date when the
policy was effected and a record of any transferred, assignment or nomination of which
the insurer has notice, and
C. C GARDI INSTITUE OF MANAGEMENT KALAWAD ROAD HIGHWAY ROAD, ANANDPAR
PAGE NO.79
“GLOBAL COUNTRY REPORT ON SRI-LANKA” 2013
(b) a register or record of claim in which shall be entered every claim made together
with the date of the claim, the name and address of the claimant and the date on which
the claim was discharged, or, in the case of a claim which is rejected, the date of
rejection and the grounds there for.
Returns by insurers establish outside India.
16. (1) Where, by the law of the country in which an insurer, not being an insurer
specified in sub clause (a)(ii) or sub clause (b) of clause (9) of section 2, is constituted,
incorporated or domiciled, the insurer is required to prepare and to furnish to a public
authority of that country documents of substantially the same nature as the documents
required to be furnished as returns in accordance with provisions of section 15, the
provisions of sub-section (2) of this section shall apply to such insurer in lieu of the
provisions of sections 11, 12, 13 and 15.
C. C GARDI INSTITUE OF MANAGEMENT KALAWAD ROAD HIGHWAY ROAD, ANANDPAR
PAGE NO.80
“GLOBAL COUNTRY REPORT ON SRI-LANKA” 2013
4.2 Policy and norms of Sri Lanka
I May 17, 2004 the Gazette Extraordinary No. 1341/8 published Solvency Margin
(General Insurance) Rules, 2004, are hereby amended as follows
(1) by substituting the following rule for Rule 4
"4. (1) For the purpose of determining the solvency margin, the general insurance
business and as such amounts or percentages specified below (payable to total
assets) of the following types of property, he (referring to these be regarded as
acceptable in terms of "acceptable assets") as
IA (a) (i) issuance of debt securities issued or fully guaranteed Sri Lanka (ii) debt
securities by any foreign government or fully guaranteed
Government or any foreign country's central bank and an investment grade rating to
the instrument 20% move
(6) ordinary shares of a company listed on a stock exchange 30%
(C) (i)
were backed by a guarantee of an investment grade corporate credit rating or any
multilateral agency backed by a guarantee issued by -60%, which specialized bank
(Ii) the bonds, debentures, commercial paper and corporate debt, including
-10% Are listed on a stock exchange in any other similar financial instruments
(Iii) the bonds, debentures, commercial paper and corporate debt, including
-10%
Instrument issued by a company and an investment grade rating to move to any other
similar financial instruments
(Iv) Property, as the case may be in the capital and interest or maturity value backed
securities guaranteed by a licensed commercial bank
C. C GARDI INSTITUE OF MANAGEMENT KALAWAD ROAD HIGHWAY ROAD, ANANDPAR
PAGE NO.81
“GLOBAL COUNTRY REPORT ON SRI-LANKA” 2013
-10%
Which has an investment grade rating or a licensed specialized bank
(V) The leaseholdlandandbuilding: 15%
Percent of the total investments referred to in sub-paragraph (i), (b), (c), (iv) and (v)
above shall not exceed a total of about sixty per Centum made acceptable, provided
that the total admissible assets
Above sub-paragraph (v) investment-only operation ofthese rules specified in a period
of two years from the date of arrival will be acceptable for an insurance company as at
31.12 leasehold land and building to be invested. 2010; and
However, debt issued and can not be guaranteed by one and the same bank (in case
the issuer is abank)
Any licensed commercial bank or an investment grade rating to move with a licensed
specialized bank (c (i) Deposit - 40%
Carry an investment grade rating with a licensed finance company, (ii) deposit
-10%
Provided, however -
(A) of this subparagraph acceptable for the purpose of determining the solvency
margin as a percentage of total assets, the admissible assets shall not exceed forty per
Centum
(B) The deposit shall be interest bearing deposits, and
is listed in Sri Lanka would be acceptable.
Hundred million for each class of insurance business ".
Words (2) by the substitution rule 6 thereof, for the words "fifty thousand rupees"
"Worth a million";
(3) What is Rule 11, after the expression "Board" by the following definition: -
C. C GARDI INSTITUE OF MANAGEMENT KALAWAD ROAD HIGHWAY ROAD, ANANDPAR
PAGE NO.82
“GLOBAL COUNTRY REPORT ON SRI-LANKA” 2013
"" Class of insurance business under "have the same meaning assigned to that
expression
Act;
"Insurance business" have the same meaning assigned to that expression under the
law. ".
C. C GARDI INSTITUE OF MANAGEMENT KALAWAD ROAD HIGHWAY ROAD, ANANDPAR
PAGE NO.83
“GLOBAL COUNTRY REPORT ON SRI-LANKA” 2013
4.3 TRADE BARRIERS
Barriers to Insurance in India
However, there remain big opportunities for growth of insurance in India.
Despite its current growth, the Indian insurance market lags behind other economies in the baseline measure of insurance penetration. At only 2.8%, India is well behind the 13% for the UK, 11% for Japan, 10% for Korea, 9.6% for the US, and even 3.4% for China. Given the dramatic demographic shifts now taking place in India, it is clear that the insurance industry will need to play an increasingly important role in the future.
For this to be achieved, further modernization is required of the regulatory
environment for insurance in India. The following barriers to EU insurance in India are considered as most important: - 26% cap on foreign direct investment in insurance companies - Set tariffs and the conditions which still direct non-life insurance in India - Reinsurance monopoly 1. Barriers with regards to the national treatment in insurers in India · Certain government banks are unwilling to accept insurance covers written by private insurance companies (i.e Marine) ► removing t h i s b a r r i e r w o u l d r a i s e r e v e n u e s a v a i l a b l e t o p r i v a t e insurers and widen the choice of available cover.
C. C GARDI INSTITUE OF MANAGEMENT KALAWAD ROAD HIGHWAY ROAD, ANANDPAR
PAGE NO.84
“GLOBAL COUNTRY REPORT ON SRI-LANKA” 2013
· Foreign reinsurers are not decided right of first refusal privileges while
domestic reinsurers have this right. ► The national reinsurer, General Insurance Corporation, has the right but not obligation to accept any business that requires reinsurance over and above 20% mandatory cessions. This unfair advantage has created an unlevel playing field, and the National Re remains effectively a monopoly in the market. · Effective prohibition on cessions abroad. Insurance law makes it mandatory to place the business within India (exhaust local capacity) before reinsurance can be taken out with foreign reinsurers. ► Superior reinsurance competition would increase pressure on price.
2 . Barriers with regard to market access of foreign insurers in India · Restrictions on foreign equity ownership of insurance and insurance brokerage companies. Foreign insurers cannot establish unless via a joint venture with an approved partner with a minimum 74% local shareholding. ► This restriction will hamper the growth prospects of private companies, as growth requires more capital allocation, which the local partners may be powerless to match. While the intent of the current government to raise the foreign equity ownership cap to 49% has been made clear, it has yet to result in action. · Set tariffs control the market resulting in poor development of underwriting skills and leading to cross-subsidization. ► 74% of the market GWP is regulated by tariff; the Tariff Advisory Committee decides on price, and the terms and conditions. This prevents
C. C GARDI INSTITUE OF MANAGEMENT KALAWAD ROAD HIGHWAY ROAD, ANANDPAR
PAGE NO.85
“GLOBAL COUNTRY REPORT ON SRI-LANKA” 2013
insurance companies from offering product or price differentiation.
· Capitalizations requirements in India are at USD 25 million for initial establishment. ► This may restrict market entry by mono-line insurers. Their entry would create greater awareness and demand. · Limitations with respect to payment of the claims in foreign currency- exceptions require approvals from RBI ► A lengthy permission process is required from the central bank. Removal of this barrier would reduce administrative costs and reduce currency risk. · Imposition of 20% mandatory cessions across the board for non-life classes to state reinsurer. ► The National Reinsurer, General Insurance Corporation, benefits from a share of 20% of every business written by Insurance companies. This prevents insurance companies from
Retaining profitable classes of business on their own books and restricts them
from seeking better terms from foreign reinsurers. · Insurance companies’ investments are strictly limited. Most funds in insurance companies are only allowed to be invested in low-return state and central government bonds. ► This is an hurdle for foreign insurers as their profits – and the returns available to policyholders - may suffer from their inability to invest in a wider range of investment products.
C. C GARDI INSTITUE OF MANAGEMENT KALAWAD ROAD HIGHWAY ROAD, ANANDPAR
PAGE NO.86
“GLOBAL COUNTRY REPORT ON SRI-LANKA” 2013
3. Reinsurance monopoly
The state-owned General Insurance Corporation (GIC), with its traditionally close ties to the primary insurers of the public sector, holds a monopoly, being the only domestic reinsurer in India. compulsory cessions to GIC and its right of first refusal privilege prevent Indian primary insurers from diversifying their risks freely and flexibly. On reinsurance, we make the following two observations: a. India would benefit from a further broad opening of the reinsurance sector to international reinsurers Competition is necessary for the insurance industry to serve society most efficiently. Insurance in India has undergone significant change since the market was opened in 2001. However, there is still room for further liberalization: · The insurance industry is integral to development and fosters economic growth by providing risk management and insurance cover for projects requiring large amounts of capital. The presence of international reinsurers will be a vital element by making additional capital available and relieving Indian insurers of partial or entire risks that are too large for their own capital base. Furthermore, an international reinsurer can develop innovative products to cover small and medium- sized risks. This will support local and foreign direct investment, and encourage the creation of new jobs. · The reinsurance industry also has an early-warning function by constantly monitoring the long-term evolution of risks, for example in the field of natural hazards such as tsunamis or earthquakes. The presence of international reinsurers will transfer international know-how to the local market and provide Indian insurers
C. C GARDI INSTITUE OF MANAGEMENT KALAWAD ROAD HIGHWAY ROAD, ANANDPAR
PAGE NO.87
“GLOBAL COUNTRY REPORT ON SRI-LANKA” 2013
with proven international expertise in assessing complex risks and handling huge,
complex claims. Thus, we believe that the necessary next step of the liberalization process is to open up the Indian insurance market not only to private joint venture insurance companies, as has been done most successfully in the last four years, but also to international reinsurers. This further broad opening of the reinsurance sector to international reinsurers can be achieved by the following: a. permitting branch offices of such reinsurers to be established in India to write Indian reinsurance risks; and b. permitting such reinsurance risks also to be written freely by foreign reinsurers on a cross-border basis. These two methods will enable India to have access to the capital and security provided by the international reinsurance community to cope with the Indian market's rising liabilities. b. The “branch office option” could be a solution for some EU companies, while for others the only option would be the right to provide reinsurance on a cross border basis. CEA aims at full liberalization of the India insurance market.
C. C GARDI INSTITUE OF MANAGEMENT KALAWAD ROAD HIGHWAY ROAD, ANANDPAR
PAGE NO.88
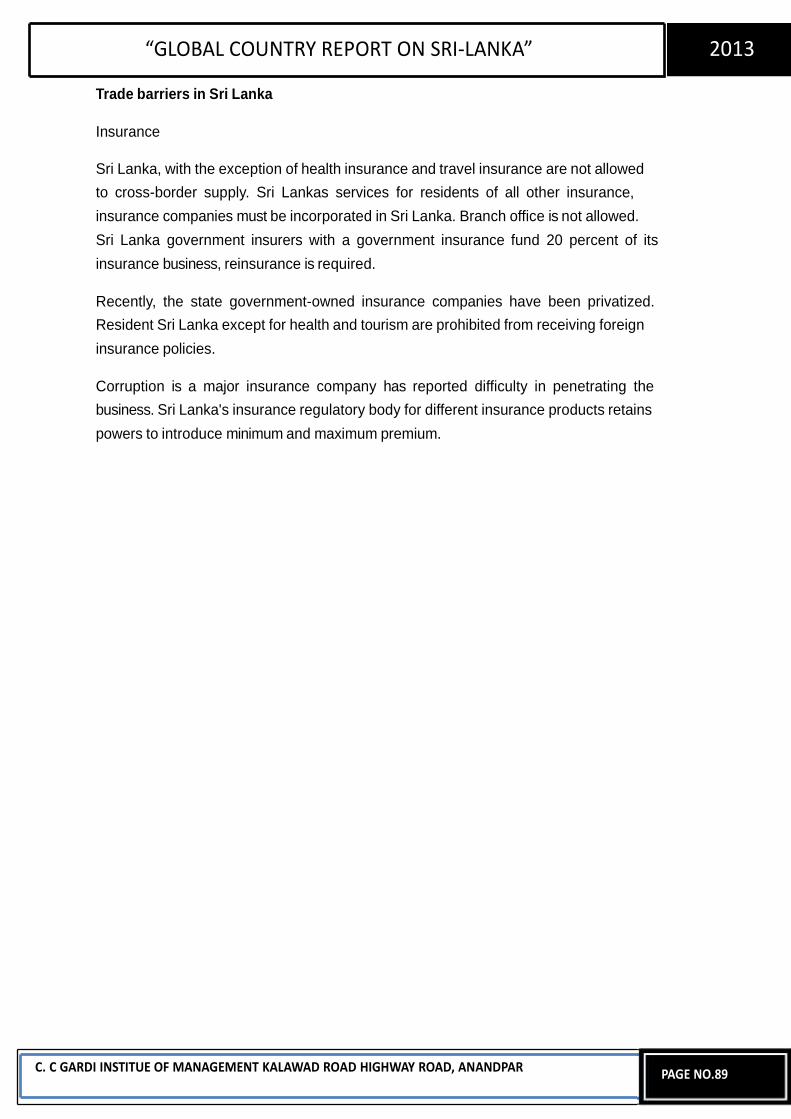
“GLOBAL COUNTRY REPORT ON SRI-LANKA” 2013
Trade barriers in Sri Lanka
Insurance
Sri Lanka, with the exception of health insurance and travel insurance are not allowed
to cross-border supply. Sri Lankas services for residents of all other insurance,
insurance companies must be incorporated in Sri Lanka. Branch office is not allowed.
Sri Lanka government insurers with a government insurance fund 20 percent of its
insurance business, reinsurance is required.
Recently, the state government-owned insurance companies have been privatized.
Resident Sri Lanka except for health and tourism are prohibited from receiving foreign
insurance policies.
Corruption is a major insurance company has reported difficulty in penetrating the
business. Sri Lanka's insurance regulatory body for different insurance products retains
powers to introduce minimum and maximum premium.
C. C GARDI INSTITUE OF MANAGEMENT KALAWAD ROAD HIGHWAY ROAD, ANANDPAR
PAGE NO.89
“GLOBAL COUNTRY REPORT ON SRI-LANKA” 2013
CHAPTER-5
C. C GARDI INSTITUE OF MANAGEMENT KALAWAD ROAD HIGHWAY ROAD, ANANDPAR
PAGE NO.90
“GLOBAL COUNTRY REPORT ON SRI-LANKA” 2013
5.1 Business potential
Sri lanka
Sri Lanka insurance industry is witnessing a strong increase in the past few years.
Driven by the growing international trade in the country, Sri Lanka Export Credit
Insurance segment showing a huge growth potential. The country's trade is expected
to grow in the coming years. At the end of this increased demand will propel the
country of export credit insurance.
According to our research report, "Sri Lankan Insurance Industry Analysis," in the life
insurance sector in the country in the last few years has seen a tremendous growth.
Favorable economic conditions by insurance companies, the new long-term insurance
products, the introduction and advertising campaign across the country are increasing
the demand for life insurance products. At the current rate, the insurance industry's
main growth driver opens the way for the area to become. On the back of the above
factors, insurance companies in Sri Lanka during the GWP 2012-2015 is expected to
grow at a CAGR of 21%.
Our research sections describe the performance of the insurance sector market. It
gives a comprehensive analysis of various types of insurance in the industry and at the
same time, also provide insight into the country's current regulatory environment.
Based on the report, "Sri Lankan Insurance Industry Analysis", including consumer
perceptions about Sri Lanka's insurance sector provides in-depth research and
analysis. It's a takaful insurance, health insurance, etc. for industry development
highlights various potential areas. On the other hand, the report also will help new
players better understand the industry challenges for the development of insurance
industry in the country explains.
In the non-life insurance industry, health insurance is the second largest region.
According to our latest report, the health insurance industry is one of the most prolific in
the world. And awareness of health care costs are rising in the country, we segment
gross premium of approximately 32.5% during 2013-14 to 2010-11 is expected to grow
with a CAGR of scaling up.
We cover a significant portion of the central and state government sponsored health
insurance plans that have been achieved through observed. In addition, private and
public health insurance companies, heart failure, stroke and kidney failure as a person
and his family against serious diseases to cover a large number of plans and schemes
have been introduced.
C. C GARDI INSTITUE OF MANAGEMENT KALAWAD ROAD HIGHWAY ROAD, ANANDPAR
PAGE NO.91
“GLOBAL COUNTRY REPORT ON SRI-LANKA” 2013
Opportunity for the insurance industry
"The insurance industry umbrella body of Sri Lanka - Sri Lanka (IASL) of the Insurance
Association to bring about the development of the region working very closely with the
regulator," the Insurance Association of Sri Lanka (IASL) president, branch-related
Jasinghe said. went on to discuss questions related to the insurance industry.
We see great opportunity in the future and protection products in order to improve the
social environment are cautious about change. Sri Lanka is second only to Japan,
which has a rapidly aging population. It is our responsibility to address the issue of
caring for seniors leaves us with.
The area that will arise with the development of the region.
Put the burden on the health care system's current state, and with the rising cost of
healthcare and ageism, insurance carried by the state sector can contribute towards
alleviating the load. We insurance companies in recent days, the market has seen the
launch health product offerings.
Insurance products and services for the future of the national per capita income by
2016, reaching U.S. $ 4,000 for the central bank discovered in the background looks
bright.
C. C GARDI INSTITUE OF MANAGEMENT KALAWAD ROAD HIGHWAY ROAD, ANANDPAR
PAGE NO.92
“GLOBAL COUNTRY REPORT ON SRI-LANKA” 2013
India
Insurance in India is one of the fastest-growing segment. Perhaps only 6% of the
population
The country is covered by life insurance. In the general insurance.Health insurance as
low as 0.9% of the population has access to only 3%. USA, like @ Rs.35 crore
population in the country is engaged in the insurance business.In India, more than
6,000 companies, more than 110 crore population and difficult working in 52
companies, insurance Sector.If We believe that only 50% of the population is insured,
we need 10,000 companies
Meet the needs of 55 million people.of industrial policies have been sold. Large
number of general insurance products, general insurance companies are not known to
staff. Thanks for electro-mechanical equipment, scientific development and
commercialization of the medical profession, health insurance penetration has reached
3% of the population. Compare this number to grow even countries.Central
government health insurance and general insurance in 2030 30% of the population at
15%, 40%, to reach the target of life is very poor. This insurance will create huge
potential for growth in the region. The insurance business has only reached U.S. $ 100
billion by 2012 and is now expected to grow by 1000, which was U.S. $ 12 billion by
2000
Billion by 2020 and U.S. $ 5,000 billion by 2030.
49% FDI in insurance sector * acceptance of a long-awaited bill. When it enacted a
number of insurance companies in the next 7-8 years could rise to 200 @ 150. There is
immense potential for the development of the insurance industry. Currently 24 lives,
there are 27 non-life and reinsurance 1, thus a total of 52 insurance companies in the
insurance business. 4 companies in the health insurance companies are operating in
particular. 334 insurance broking firms, 800 corporate agents and thousands of banks
have entered the insurance business. Third party administrators (TPAs) administration.
29 and automobile companies in the health sector and the legal sector are increasing
TPA. Special functions are outsourced gently in the insurance sector and many new
companies will enter the field. International insurance surveyors, damage assessment,
adjusters, underwriters, claims
Settlers, who have already entered India and have expanded their business activities.
Even the world of insurance and Warren Buffet, Lloyd's, Munich Re, Swiss Re, has
entered India as finance giants.
C. C GARDI INSTITUE OF MANAGEMENT KALAWAD ROAD HIGHWAY ROAD, ANANDPAR
PAGE NO.93
“GLOBAL COUNTRY REPORT ON SRI-LANKA” 2013
* Health insurance is developed as a separate branch of insurance. The number of
health insurance companies in the near future is expected to be equal to the number of
life insurance companies. Banc assurance has been developed as a separate branch
of insurance. People have more confidence in banks india insurance agents. Many
banks have already entered the insurance business is much more in the pipeline.
Development banks to find auto insurance. GIC of India is currently the only
reinsurance company in the country. But the government in India and is planning on
allowing international reinsurance companies. Over the years, we have life, general,
health, Bancassurance in India as insurance and reinsurance can get 5 independent
branches
* India is becoming a hub of world insurance. Giant insurance companies from around
the world are outsourcing to India core insurance operations. Indian talent in the
country and the new generation IT infrastructure for cost-effective solutions to the
world's main tasks are to attract business insurance. Indian software companies are
leading the race. Insurance BPO sector is growing very fast. All insurance operations
require technical and domain skill sets.
Outside India in the insurance sector, ITES and BPO business is expected to RIS U.S.
$ 1,000 billion by 2025. It is believed that the next boom in the insurance sector.
Insurance will play an important role in boosting the economy. The next 25 years will
be dominated by the insurance sector in India. Growth is expected to be horizontal as
well as vertical levels. Inside the country and outside India will be in the insurance
business country.Changing landscape.
* Insurance agents and development officers strictly dominated until 2000. An
interesting aspect of this growth is that the insurance sector is moving towards
servicing only to sell. The mantra "sell it and forget it" now "service and customer
retention as" changes. Not only is the core insurance knowledge and expertise to sell.
* Insurance agents commission rates gradually are declining. Client servicing is now
taken care of by the customer service department. Technology is now an important role
in serving policyholders and agents better than knowledge and expertise.
* The government is slowly ending the income tax exemption of insurance policies.
* Product development and new policies sold the old rules of the game have changed.
Only insurance for forced begging or policy will not exist anymore. 35% commission to
sell the policy dominance will be eroded. But such arguments risk investment
insurance cover or pure insurance products such as term insurance policyholders
isnow is a matter of common pastime. Between IRDA and SEBI ULIP Story domain
has insisted on the need for insurance talent.
C. C GARDI INSTITUE OF MANAGEMENT KALAWAD ROAD HIGHWAY ROAD, ANANDPAR
PAGE NO.94
“GLOBAL COUNTRY REPORT ON SRI-LANKA” 2013
- The benefits of liberalization in the insurance sector
- Indian insurance market segmentation by products
- INR market size and market share of life insurance companies, (cr)
- Market share of non-life insurers
- Over 2012 Growth Forecast for Life Insurance
- Non-life insurance growth forecasts up to 2012
- Market revenues of both public and private insurers
- Policies and measures taken by IRDA to develop the insurance market
- Research and development activities
- Regulation of insurance and reinsurance
companies
- Profiles of key players
5.2 conclusion INDIA
Insurance industry contributes to the economy and the financial sector is also an
important social protection in developing countries. India's phenomenal growth in the
insurance sector. In the last few years the insurance industry has undergone a massive
transformation and metamorphosis has been remarkable. Over the years have become
synonymous with term insurance and private insurance companies in India. A
diversified product portfolio and numerous insurance companies in India have
managed to make their way into almost every Indian home offering excellent services.
It is designed to cope with the changing economic environment, only the
changing trends of the Indian insurance industry. Changing government policy and
regulatory guidelines Authority, Insurance Regulatory and Development Authority
(IRDA) has also played a very important role in the development of the region. Liked
unit linked insurance policies Move from non-Indian life insurance sector is one of the
major positive changes. Similarly, private insurance company broke the monopoly of
C. C GARDI INSTITUE OF MANAGEMENT KALAWAD ROAD HIGHWAY ROAD, ANANDPAR
PAGE NO.95
“GLOBAL COUNTRY REPORT ON SRI-LANKA” 2013
LIC opening on the field and bring in tough competition between players. The
completion of the industry's products, pricing, distribution channels, and resulted in
innovations in marketing. Sector is growing rapidly, yet the industry has 50% of India's
insurable population has no insurance. The region has a great potential to grow. To
achieve this objective, the region's insurance density and insurance penetration is
more in need of improvement. Different categories of products including developing
policies to meet specific groups, particularly in rural areas, should be a priority. Along
with appropriate government support and guidance of the annual fair strategy, certainly
in the near future India will become the new insurance company.
India is among the most promising emerging insurance markets. The current
premium volume of USD 18 billion over the next decade has the potential to increase
to U.S. $ 90 billion. In particular, currently makes up 80% of the life insurance premium,
is widely expected to lead to development. Key drivers of sound economic
fundamentals, a growing middle-income group, including a reform of the regulatory
framework and increasing risk awareness.
Since then, 13 private life insurance companies and eight general insurance
companies joined the Indian market. The majority of foreign players participated in
these new companies - despite restrictions on foreign ownership of 26%. Incumbent
state-owned insurance companies in your area and so far have managed to maintain
leading market position. However, their market share is expected to decline in the near
to medium term.
In addition, both life and non-life insurance sector will benefit from less
aggressive regulations. Moreover, the product cost structures need to reflect risk.
Obsolete regulations on the prices of insurance risk differentiated pricing structure will
be replaced.
Largely undeveloped vast untapped potential in the private pension market, for
example, is there. Currently, at least 11% of the working population in India is no
formal retirement age is eligible to participate in the scheme. Private insurance
companies serving large numbers of workers in the informal sector play a major role.
The same is true for health insurance.
Moreover, the rapid growth of the insurance business, insurance companies will
put increasing pressure on capital levels. Existing equity holding ceiling, however, to
C. C GARDI INSTITUE OF MANAGEMENT KALAWAD ROAD HIGHWAY ROAD, ANANDPAR
PAGE NO.96
“GLOBAL COUNTRY REPORT ON SRI-LANKA” 2013
match the rapid development of business to inject capital may limit the ability of new
companies.
India's non-life insurance sector, a major challenge will be to improve the
existing tariff structure. From a pricing perspective, the non-life segment is still heavily
regulated. Premium of 75% which means they are often below the level of
marketclearing that are generated under the tariff system. Price liberalization will need
to improve underwriting efficiency and risk management. It is also natural disasters to
help India's high-risk management is the responsibility of the non-life insurance
companies. Other non-life reinsurance primarily in India, 20% of insurers who receives
compulsory cessions General Insurance Corporation of India (GIC) is provided by.
As far as reinsurance is concerned, insurance and reinsurance policy makers
can not be treated in the same way is to recognize that. Due to the unique nature of
reinsurance, direct insurance companies operating rules it is necessary to delink from
the field. To allow branches of foreign reinsurance companies, for example,
international players and today, mainly uninsured are safe for natural disaster risk
cover would make the market more attractive.
Finally, largely underserved rural life and non-life insurance sector holds great
promise for both companies. To realize this, insurance companies, and appropriate
delivery mechanisms are appropriate for the rural population to access that area, will
need to show long-term commitment to product design. Before they can successfully
penetrate this sector insurers, irregular income streams and preference for simple
products like spread, will pay special attention to the characteristics of the rural labor
force.
C. C GARDI INSTITUE OF MANAGEMENT KALAWAD ROAD HIGHWAY ROAD, ANANDPAR
PAGE NO.97
“GLOBAL COUNTRY REPORT ON SRI-LANKA” 2013
Sri Lanka
The insurance industry grows 18.5%
Tue June 5, 2012 at 23:11 by CSE.SAS
The country's insurance industry reached Rs, which in terms of total gross
written premiums increased 18.5 per cent in 2011. Rs 78.5 billion during the year.
66200000000 Last year, the industry watchdog Sri Lanka (IBSL) of the Insurance
Board (5) announced yesterday.
Prudential regulator of the insurance industry as Sri Lanka (IBSL) of the
Insurance Board of Sri Lankan insurance industry provides guidance and direction.
Policyholders and potential policyholders for the benefit of the insurance industry,
protector, facilitator, observer and active regulator: Insurance Industry Act, No.43 of
2000 established under the Regulation, IBSL plays a mix of roles. Compared with
2010, the insurance industry was able to achieve significant growth during 2011.
There are 21 insurance companies and Ceylinco Takaful Limited has been
suspended since 2009, registered with IBSL at the end of 2011, of which twenty-two
(22) Insurance Companies (insurer), were there. Twelve of them (12) companies are
registered to carry on the long-term composite companies (dealing in both General and
Long Term Insurance businesses), seven of them (07) are registered to carry on
general insurance business, and three (03) the (life) insurance business.
Overall gross written premium (GWP) for Long Term Insurance and General
Insurance business income was Rs. Amounted to 78 512 million compared with the
previous year. 66 253 million, which reflected an increase of 18.50%. Compared to
2010, the general insurance business, gross written premium income during 2011 ,An
increase in overall performance. Compared to 2010 when the long-term insurance
business, gross written premium income during 2011 showed an increase in total. The
overall gross written premium income of general insurance business amounted to Rs.
The overall gross written premium income of long-term insurance business amounted
to Rs - 43 331 million, a growth rate of 23.45% (Rs 35 101 million, 2010) shows.
Growth rate of 12.93%. (- Rs 31 152 million in 2010), reflecting 35 181 million during
the previous year.
C. C GARDI INSTITUE OF MANAGEMENT KALAWAD ROAD HIGHWAY ROAD, ANANDPAR
PAGE NO.98
“GLOBAL COUNTRY REPORT ON SRI-LANKA” 2013
The total assets of insurance companies increased to Rs. 265 419 million at
year-end 2011. Total Assets valued at year-end 2010 was Rs. 221 888 million.
In terms of Section 25 of the Act, General Insurance Business of the technical
reserves 20% of the assets must be invested in government securities. Similarly, 30%
of the assets of Long Term Insurance Fund must be invested in government securities.
It IBSL is monitored by the insurance companies, which have to comply with a
mandatory requirement. Investment in government securities, 50.67% of the total
assets of long term insurance business (Rs 83 944 million) and year-end 2011 total
assets of 24.87% in the general insurance business (Rs 24 804 million) represents. By
the Act exceeds the amount required to invest in government securities.
In terms of Section 82 of the Act IBSL registered with forty-six (46) Insurance
brokerage companies were engaged in the business of insurance brokerage.
Insurance intermediary companies focused mainly on general insurance business and
general insurance business and long-term insurance business, the total gross written
premiums resulting from the sum of Rs. Compared with the previous year, amounting
to Rs 10 489 million during 2011. An increase of 9.72% (2010 - 7.58% growth rate)
reflected the 9560 million, IBSL said.
The role of insurance in social and economic development cannot be under
estimated. , Making innovations and new ways of doing business man's life, including
exposure to goods and property. Insurance provides financial security. In case of
damage, as a person before the incident, their financial situation is not good. Thus a
man to look for support in keeping innovations insurance takes big risks. Sri Lanka
Insurance, economy, progress and prosperity of the country has made an enormous
contribution to the development.
Unfortunately, insurance has not been given the importance it deserves in many
countries. It is also one of the neglected areas in Sri Lanka. Once again the
government's attention to the problems faced by the insurance industry has been
attracted. But due to poor administrative and regulatory efforts have gone in vain to
control. It is clear from the government's treatment of the insurance sector. Despite this
fact, insurance companies constantly make an important contribution towards
government revenue that is noticeable.
Position to bring a positive change in the insurance industry demands radical
step. Sri Lanka is certainly a developing country can be benefited with the development
of insurance culture being.
C. C GARDI INSTITUE OF MANAGEMENT KALAWAD ROAD HIGHWAY ROAD, ANANDPAR
PAGE NO.99
“GLOBAL COUNTRY REPORT ON SRI-LANKA” 2013
Therefore, we need to focus on this aspect in the future. Build suggestions or
rules do not only serve the purpose. Professionals already a number of suggestions on
promoting the insurance sector, have been made. The basic thing is to ensure their
implementation and continuity.
Insurance companies offering products and services in the market under the
trade is considered to be very competitive terms. It is widely studied in order to test the
claims firms' pricing policies examined whether competitive or monopolistic markets
reflect features. This study research methodology in the Sri Lankan insurance market
for general insurance business, described above, is to apply. Underwriting of insurance
companies in the industry through risk and generate income from your property
investment. Like previous investigations have focused on the banking industry in Sri
Lanka. Contrary to widely held views, this study is that the competition is less than
perfect.
C. C GARDI INSTITUE OF MANAGEMENT KALAWAD ROAD HIGHWAY ROAD, ANANDPAR
PAGE NO.100
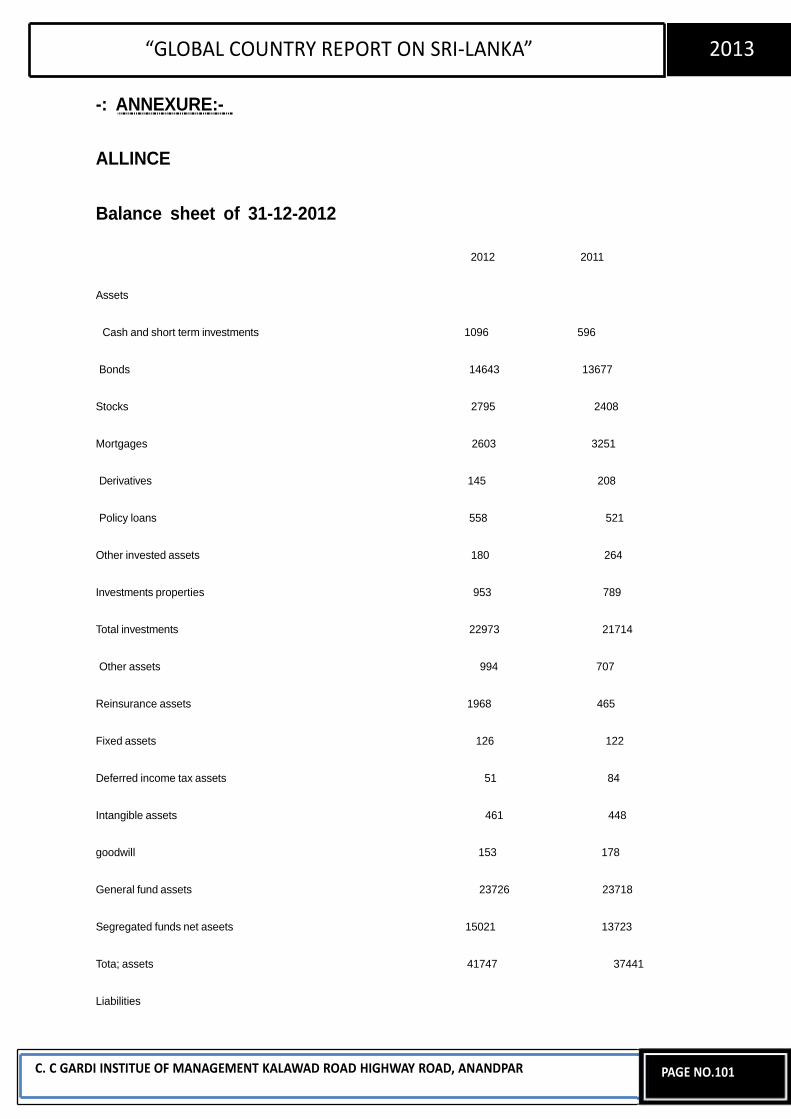
“GLOBAL COUNTRY REPORT ON SRI-LANKA” 2013
-: ANNEXURE:-
ALLINCE
Balance sheet of 31-12-2012
2012 2011
Assets
Cash and short term investments 1096 596
Bonds 14643 13677
Stocks 2795 2408
Mortgages 2603 3251
Derivatives 145 208
Policy loans 558 521
Other invested assets 180 264
Investments properties 953 789
Total investments 22973 21714
Other assets 994 707
Reinsurance assets 1968 465
Fixed assets 126 122
Deferred income tax assets 51 84
Intangible assets 461 448
goodwill 153 178
General fund assets 23726 23718
Segregated funds net aseets 15021 13723
Tota; assets 41747 37441
Liabilities
C. C GARDI INSTITUE OF MANAGEMENT KALAWAD ROAD HIGHWAY ROAD, ANANDPAR
PAGE NO.101
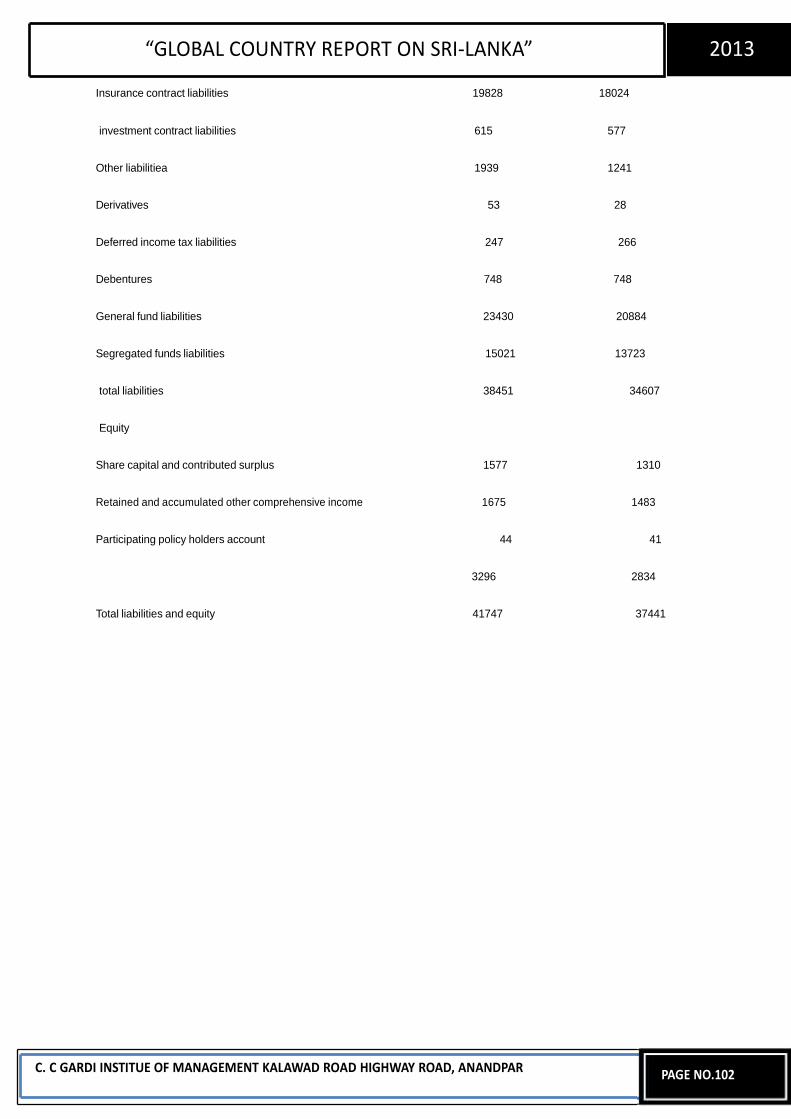
“GLOBAL COUNTRY REPORT ON SRI-LANKA” 2013
Insurance contract liabilities 19828 18024
investment contract liabilities 615 577
Other liabilitiea 1939 1241
Derivatives 53 28
Deferred income tax liabilities 247 266
Debentures 748 748
General fund liabilities 23430 20884
Segregated funds liabilities 15021 13723
total liabilities 38451 34607
Equity
Share capital and contributed surplus 1577 1310
Retained and accumulated other comprehensive income 1675 1483
Participating policy holders account 44 41
3296 2834
Total liabilities and equity 41747 37441
C. C GARDI INSTITUE OF MANAGEMENT KALAWAD ROAD HIGHWAY ROAD, ANANDPAR
PAGE NO.102
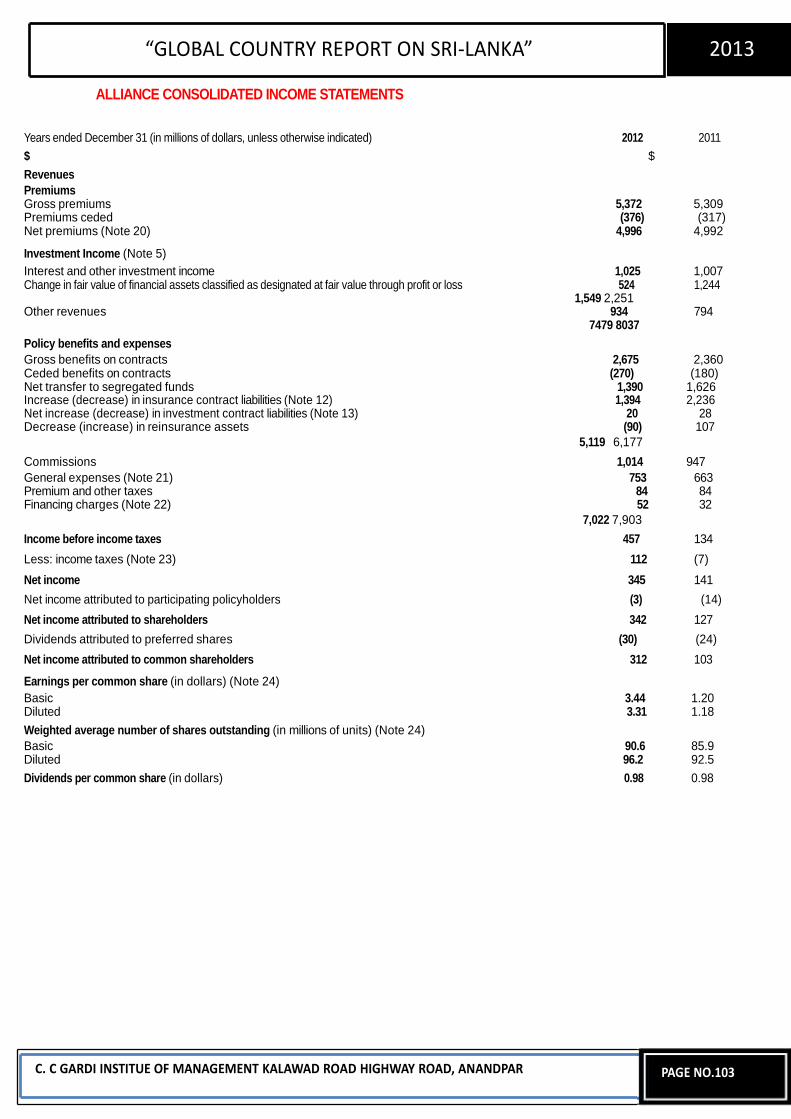
“GLOBAL COUNTRY REPORT ON SRI-LANKA” 2013
ALLIANCE CONSOLIDATED INCOME STATEMENTS
Years ended December 31 (in millions of dollars, unless otherwise indicated) 2012 2011
$ $
Revenues Premiums Gross premiums 5,372 5,309 Premiums ceded (376) (317) Net premiums (Note 20) 4,996 4,992
Investment Income (Note 5)
Interest and other investment income 1,025 1,007 Change in fair value of financial assets classified as designated at fair value through profit or loss 524 1,244
1,549 2,251 Other revenues 934 794
7479 8037
Policy benefits and expenses Gross benefits on contracts 2,675 2,360 Ceded benefits on contracts (270) (180) Net transfer to segregated funds 1,390 1,626 Increase (decrease) in insurance contract liabilities (Note 12) 1,394 2,236 Net increase (decrease) in investment contract liabilities (Note 13) 20 28 Decrease (increase) in reinsurance assets (90) 107
5,119 6,177
Commissions 1,014 947 General expenses (Note 21) 753 663 Premium and other taxes 84 84 Financing charges (Note 22) 52 32
7,022 7,903
Income before income taxes 457 134
Less: income taxes (Note 23) 112 (7)
Net income 345 141
Net income attributed to participating policyholders (3) (14)
Net income attributed to shareholders 342 127
Dividends attributed to preferred shares (30) (24)
Net income attributed to common shareholders 312 103
Earnings per common share (in dollars) (Note 24) Basic 3.44 1.20 Diluted 3.31 1.18
Weighted average number of shares outstanding (in millions of units) (Note 24) Basic 90.6 85.9 Diluted 96.2 92.5
Dividends per common share (in dollars) 0.98 0.98
C. C GARDI INSTITUE OF MANAGEMENT KALAWAD ROAD HIGHWAY ROAD, ANANDPAR
PAGE NO.103
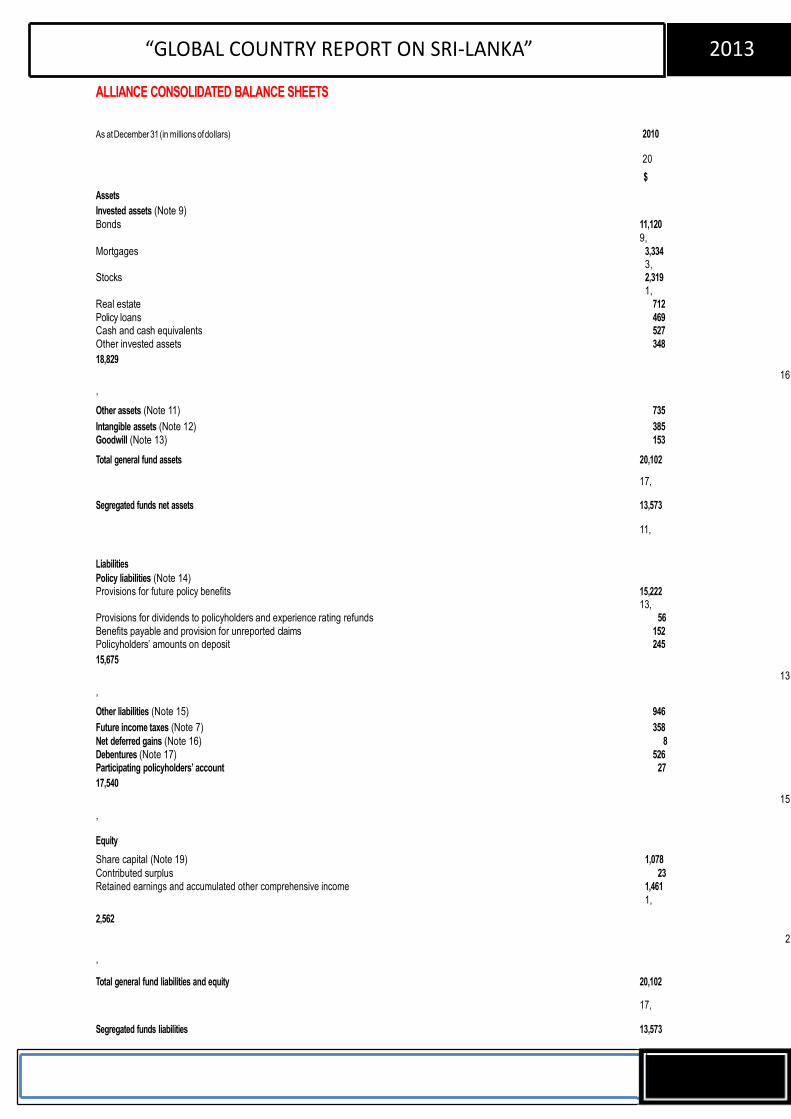
“GLOBAL COUNTRY REPORT ON SRI-LANKA” 2013
ALLIANCE CONSOLIDATED BALANCE SHEETS
As at December 31 (in millions of dollars) 2010
20
$
Assets Invested assets (Note 9) Bonds 11,120
9, Mortgages 3,334 3, Stocks 2,319 1, Real estate 712 Policy loans 469 Cash and cash equivalents 527 Other invested assets 348 18,829
16
,
Other assets (Note 11) 735 Intangible assets (Note 12) 385 Goodwill (Note 13) 153
Total general fund assets 20,102
17,
Segregated funds net assets 13,573
11,
Liabilities Policy liabilities (Note 14) Provisions for future policy benefits 15,222 13, Provisions for dividends to policyholders and experience rating refunds 56 Benefits payable and provision for unreported claims 152 Policyholders’ amounts on deposit 245 15,675
13
,
Other liabilities (Note 15) 946 Future income taxes (Note 7) 358 Net deferred gains (Note 16) 8 Debentures (Note 17) 526 Participating policyholders’ account 27 17,540
15
,
Equity
Share capital (Note 19) 1,078 Contributed surplus 23 Retained earnings and accumulated other comprehensive income 1,461
1,
2,562
2
,
Total general fund liabilities and equity 20,102
17,
Segregated funds liabilities 13,573
11,

C. C GARDI INSTITUE OF MANAGEMENT KALAWAD ROAD HIGHWAY ROAD, ANANDPAR
PAGE NO.104
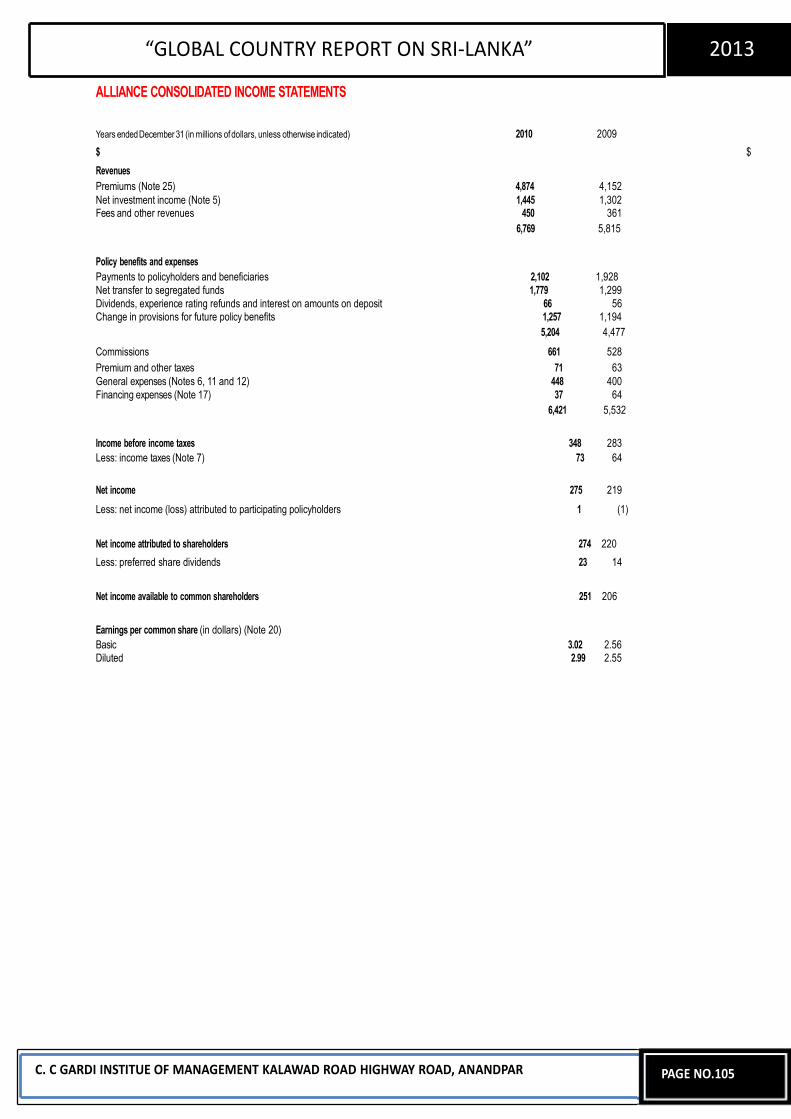
“GLOBAL COUNTRY REPORT ON SRI-LANKA” 2013
ALLIANCE CONSOLIDATED INCOME STATEMENTS
Years ended December 31 (in millions of dollars, unless otherwise indicated) 2010 2009
$ $
Revenues Premiums (Note 25) 4,874 4,152 Net investment income (Note 5) 1,445 1,302 Fees and other revenues 450 361
6,769 5,815
Policy benefits and expenses Payments to policyholders and beneficiaries 2,102 1,928 Net transfer to segregated funds 1,779 1,299 Dividends, experience rating refunds and interest on amounts on deposit 66 56 Change in provisions for future policy benefits 1,257 1,194
5,204 4,477
Commissions 661 528 Premium and other taxes 71 63 General expenses (Notes 6, 11 and 12) 448 400 Financing expenses (Note 17) 37 64
6,421 5,532
Income before income taxes 348 283 Less: income taxes (Note 7) 73 64 Net income 275 219
Less: net income (loss) attributed to participating policyholders 1 (1)
Net income attributed to shareholders 274 220
Less: preferred share dividends 23 14
Net income available to common shareholders 251 206 Earnings per common share (in dollars) (Note 20) Basic 3.02 2.56 Diluted 2.99 2.55
C. C GARDI INSTITUE OF MANAGEMENT KALAWAD ROAD HIGHWAY ROAD, ANANDPAR
PAGE NO.105
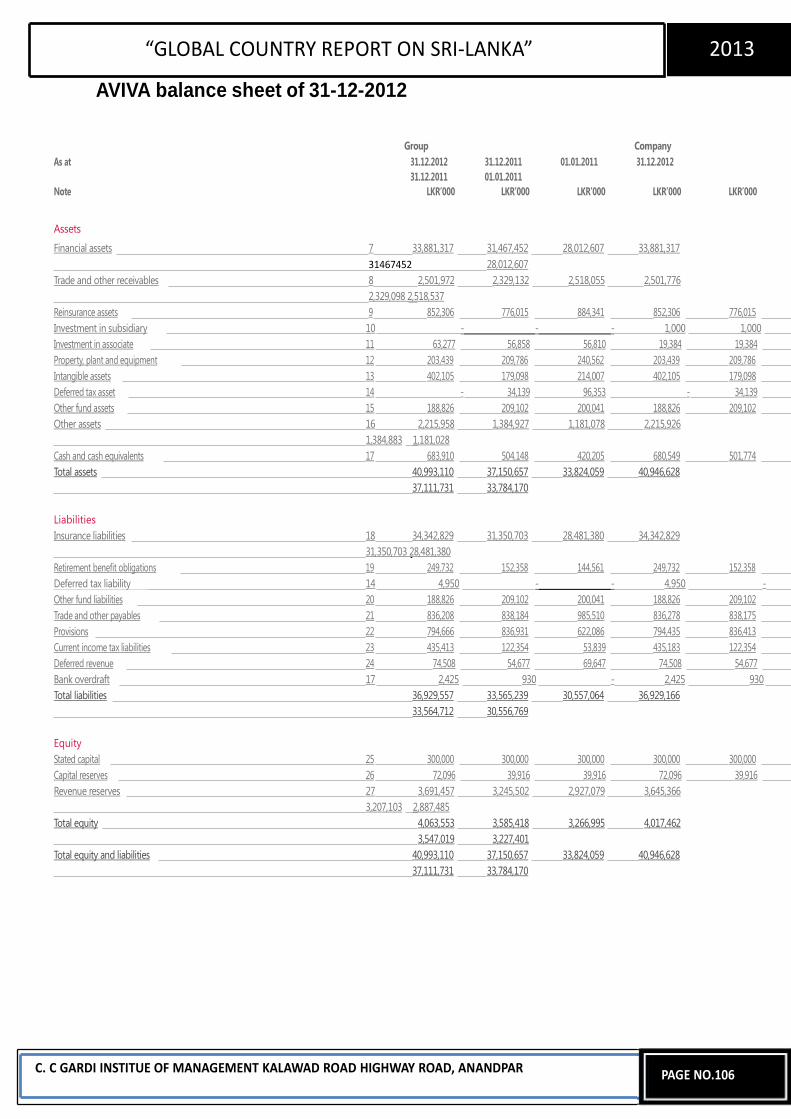
“GLOBAL COUNTRY REPORT ON SRI-LANKA” 2013
AVIVA balance sheet of 31-12-2012
Group Company As at 31.12.2012 31.12.2011 01.01.2011 31.12.2012
31.12.2011 01.01.2011 Note LKR’000 LKR’000 LKR’000 LKR’000 LKR’000
Assets
Financial assets 7 33,881,317 31,467,452 28,012,607 33,881,317 31467452 28,012,607
Trade and other receivables 8 2,501,972 2,329,132 2,518,055 2,501,776 2,329,098 2,518,537
Reinsurance assets 9 852,306 776,015 884,341 852,306 776,015 Investment in subsidiary 10 - - - 1,000 1,000 Investment in associate 11 63,277 56,858 56,810 19,384 19,384 Property, plant and equipment 12 203,439 209,786 240,562 203,439 209,786 Intangible assets 13 402,105 179,098 214,007 402,105 179,098 Deferred tax asset 14 - 34,139 96,353 - 34,139 Other fund assets 15 188,826 209,102 200,041 188,826 209,102 Other assets 16 2,215,958 1,384,927 1,181,078 2,215,926
1,384,883 1,181,028 Cash and cash equivalents 17 683,910 504,148 420,205 680,549 501,774 Total assets 40,993,110 37,150,657 33,824,059 40,946,628
37,111,731 33,784,170
Liabilities Insurance liabilities 18 34,342,829 31,350,703 28,481,380 34,342,829
31,350,703 28,481,380 Retirement benefit obligations 19 249,732 152,358 144,561 249,732 152,358 Deferred tax liability 14 4,950 - - 4,950 - Other fund liabilities 20 188,826 209,102 200,041 188,826 209,102 Trade and other payables 21 836,208 838,184 985,510 836,278 838,175 Provisions 22 794,666 836,931 622,086 794,435 836,413 Current income tax liabilities 23 435,413 122,354 53,839 435,183 122,354 Deferred revenue 24 74,508 54,677 69,647 74,508 54,677 Bank overdraft 17 2,425 930 - 2,425 930 Total liabilities 36,929,557 33,565,239 30,557,064 36,929,166
33,564,712 30,556,769
Equity Stated capital 25 300,000 300,000 300,000 300,000 300,000 Capital reserves 26 72,096 39,916 39,916 72,096 39,916 Revenue reserves 27 3,691,457 3,245,502 2,927,079 3,645,366
3,207,103 2,887,485 Total equity 4,063,553 3,585,418 3,266,995 4,017,462
3,547,019 3,227,401 Total equity and liabilities 40,993,110 37,150,657 33,824,059 40,946,628
37,111,731 33,784,170
C. C GARDI INSTITUE OF MANAGEMENT KALAWAD ROAD HIGHWAY ROAD, ANANDPAR
PAGE NO.106
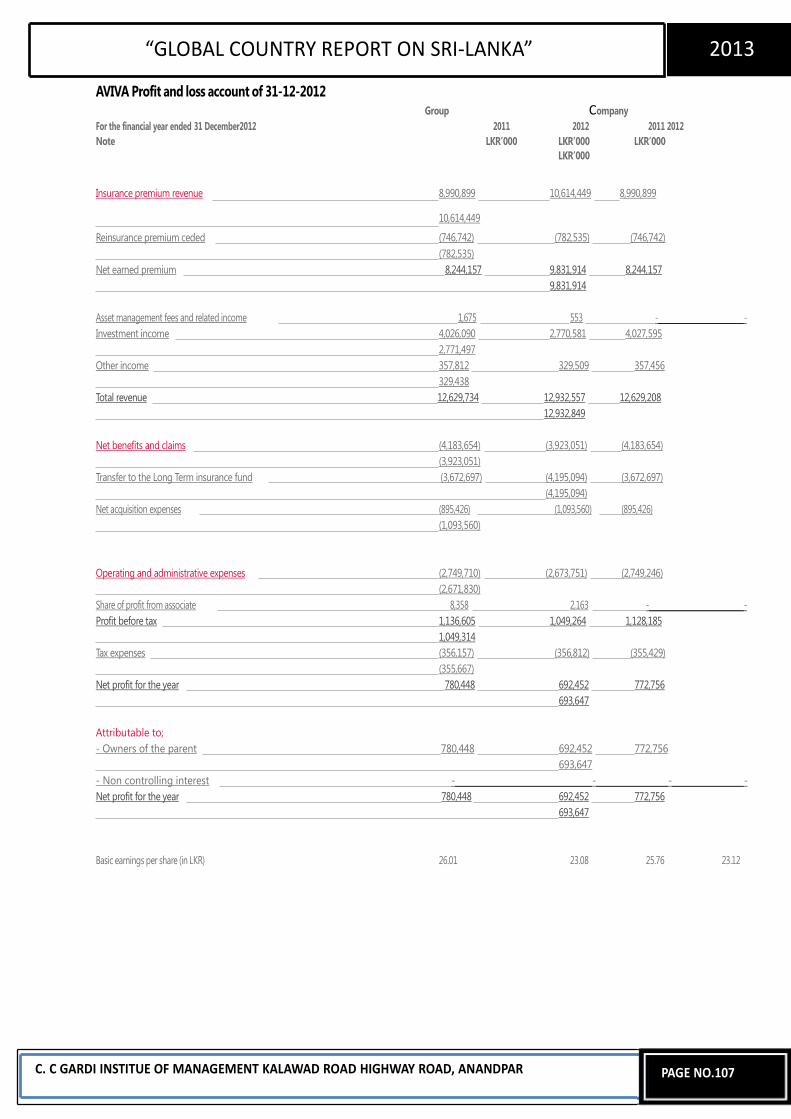
“GLOBAL COUNTRY REPORT ON SRI-LANKA” 2013
AVIVA Profit and loss account of 31-12-2012
Group Company For the financial year ended 31 December2012 2011 2012 2011 2012 Note LKR’000 LKR’000 LKR’000
LKR’000
Insurance premium revenue 8,990,899 10,614,449 8,990,899
10,614,449
Reinsurance premium ceded (746,742) (782,535) (746,742) (782,535)
Net earned premium 8,244,157 9,831,914 8,244,157 9,831,914
Asset management fees and related income 1,675 553 - - Investment income 4,026,090 2,770,581 4,027,595
2,771,497 Other income 357,812 329,509 357,456
329,438 Total revenue 12,629,734 12,932,557 12,629,208
12,932,849
Net benefits and claims (4,183,654) (3,923,051) (4,183,654) (3,923,051)
Transfer to the Long Term insurance fund (3,672,697) (4,195,094) (3,672,697) (4,195,094)
Net acquisition expenses (895,426) (1,093,560) (895,426) (1,093,560)
Operating and administrative expenses (2,749,710) (2,673,751) (2,749,246) (2,671,830)
Share of profit from associate 8,358 2,163 - - Profit before tax 1,136,605 1,049,264 1,128,185
1,049,314 Tax expenses (356,157) (356,812) (355,429)
(355,667) Net profit for the year 780,448 692,452 772,756
693,647
Attributable to; - Owners of the parent 780,448 692,452 772,756
693,647 - Non controlling interest - - - - Net profit for the year 780,448 692,452 772,756
693,647
Basic earnings per share (in LKR) 26.01 23.08 25.76 23.12
C. C GARDI INSTITUE OF MANAGEMENT KALAWAD ROAD HIGHWAY ROAD, ANANDPAR
PAGE NO.107
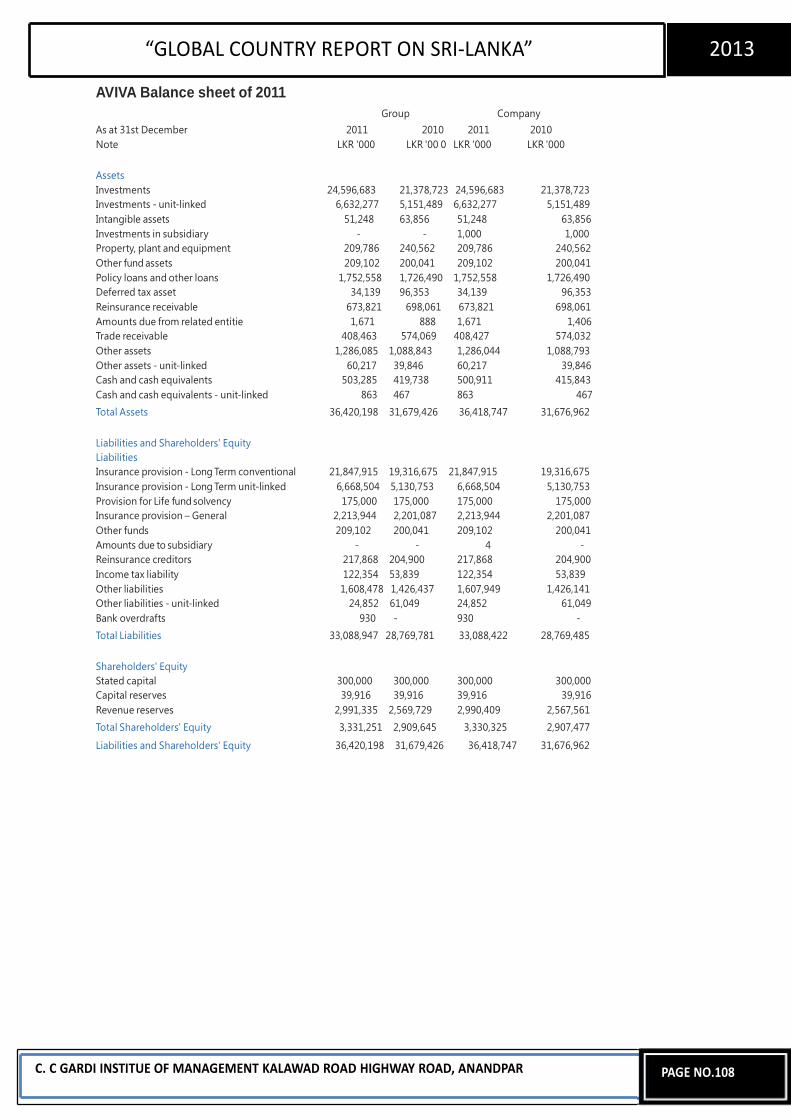
“GLOBAL COUNTRY REPORT ON SRI-LANKA” 2013
AVIVA Balance sheet of 2011
Group Company As at 31st December 2011 2010 2011 2010 Note LKR '000 LKR '00 0 LKR '000 LKR '000 Assets Investments 24,596,683 21,378,723 24,596,683 21,378,723 Investments - unit-linked 6,632,277 5,151,489 6,632,277 5,151,489 Intangible assets 51,248 63,856 51,248 63,856 Investments in subsidiary - - 1,000 1,000 Property, plant and equipment 209,786 240,562 209,786 240,562 Other fund assets 209,102 200,041 209,102 200,041 Policy loans and other loans 1,752,558 1,726,490 1,752,558 1,726,490 Deferred tax asset 34,139 96,353 34,139 96,353 Reinsurance receivable 673,821 698,061 673,821 698,061 Amounts due from related entitie 1,671 888 1,671 1,406 Trade receivable 408,463 574,069 408,427 574,032 Other assets 1,286,085 1,088,843 1,286,044 1,088,793 Other assets - unit-linked 60,217 39,846 60,217 39,846 Cash and cash equivalents 503,285 419,738 500,911 415,843 Cash and cash equivalents - unit-linked 863 467 863 467 Total Assets 36,420,198 31,679,426 36,418,747 31,676,962 Liabilities and Shareholders' Equity Liabilities Insurance provision - Long Term conventional 21,847,915 19,316,675 21,847,915 19,316,675 Insurance provision - Long Term unit-linked 6,668,504 5,130,753 6,668,504 5,130,753 Provision for Life fund solvency 175,000 175,000 175,000 175,000 Insurance provision – General 2,213,944 2,201,087 2,213,944 2,201,087 Other funds 209,102 200,041 209,102 200,041 Amounts due to subsidiary - - 4 - Reinsurance creditors 217,868 204,900 217,868 204,900 Income tax liability 122,354 53,839 122,354 53,839 Other liabilities 1,608,478 1,426,437 1,607,949 1,426,141 Other liabilities - unit-linked 24,852 61,049 24,852 61,049 Bank overdrafts 930 - 930 - Total Liabilities 33,088,947 28,769,781 33,088,422 28,769,485 Shareholders' Equity Stated capital 300,000 300,000 300,000 300,000 Capital reserves 39,916 39,916 39,916 39,916 Revenue reserves 2,991,335 2,569,729 2,990,409 2,567,561 Total Shareholders' Equity 3,331,251 2,909,645 3,330,325 2,907,477
Liabilities and Shareholders' Equity 36,420,198 31,679,426 36,418,747 31,676,962
C. C GARDI INSTITUE OF MANAGEMENT KALAWAD ROAD HIGHWAY ROAD, ANANDPAR
PAGE NO.108
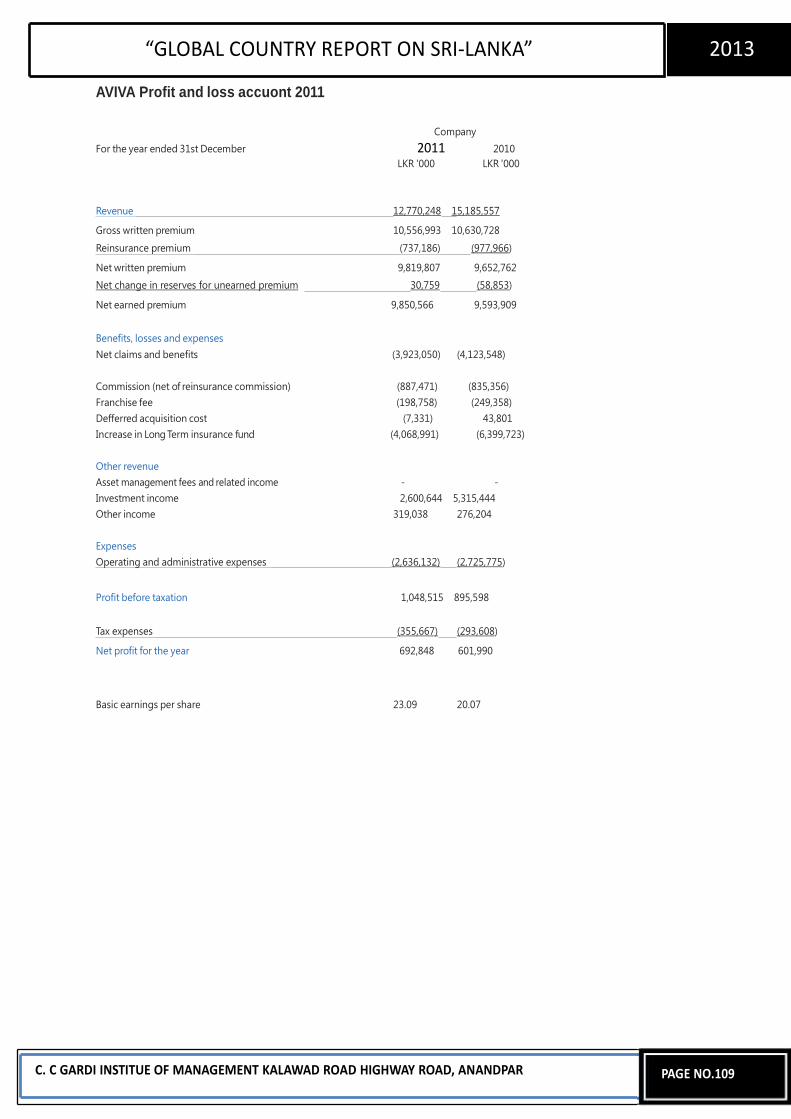
“GLOBAL COUNTRY REPORT ON SRI-LANKA” 2013
AVIVA Profit and loss accuont 2011
Company For the year ended 31st December 2011 2010
LKR '000 LKR '000
Revenue 12,770,248 15,185,557
Gross written premium 10,556,993 10,630,728
Reinsurance premium (737,186) (977,966)
Net written premium 9,819,807 9,652,762 Net change in reserves for unearned premium 30,759 (58,853)
Net earned premium 9,850,566 9,593,909 Benefits, losses and expenses Net claims and benefits (3,923,050) (4,123,548) Commission (net of reinsurance commission) (887,471) (835,356) Franchise fee (198,758) (249,358) Defferred acquisition cost (7,331) 43,801 Increase in Long Term insurance fund (4,068,991) (6,399,723) Other revenue Asset management fees and related income - - Investment income 2,600,644 5,315,444 Other income 319,038 276,204 Expenses Operating and administrative expenses (2,636,132) (2,725,775)
Profit before taxation 1,048,515 895,598 Tax expenses (355,667) (293,608)
Net profit for the year 692,848 601,990
Basic earnings per share 23.09 20.07
C. C GARDI INSTITUE OF MANAGEMENT KALAWAD ROAD HIGHWAY ROAD, ANANDPAR
PAGE NO.109
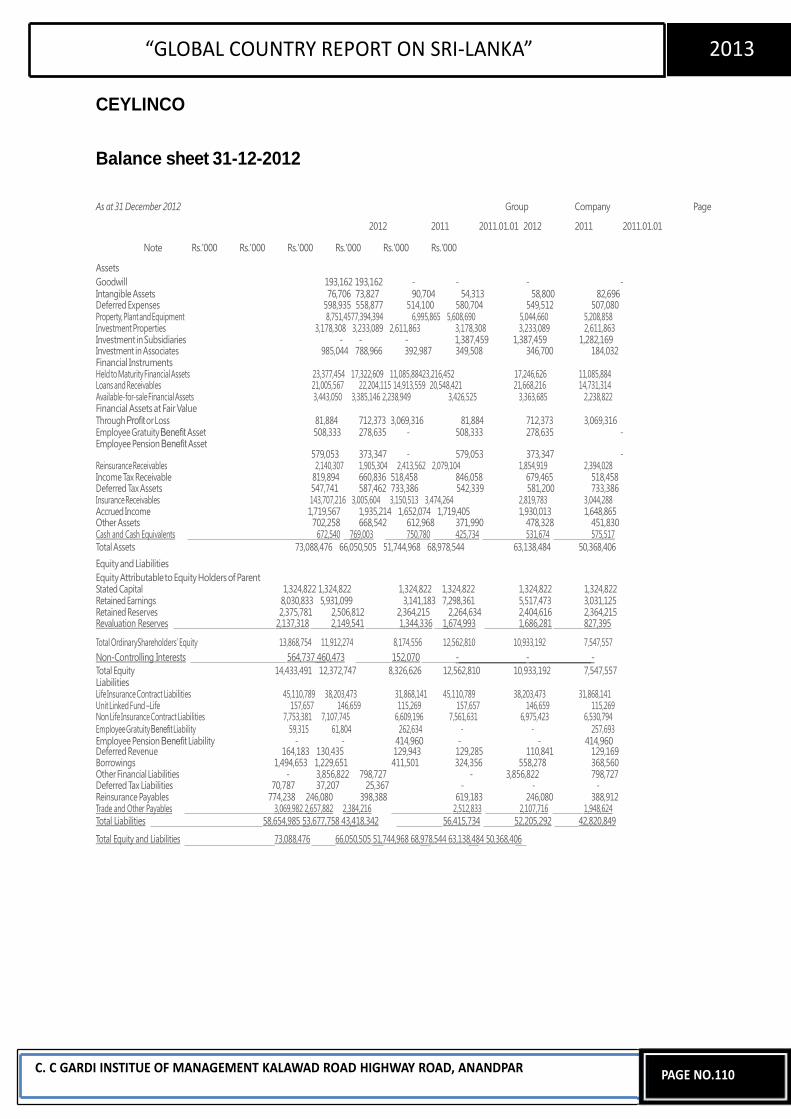
“GLOBAL COUNTRY REPORT ON SRI-LANKA” 2013
CEYLINCO
Balance sheet 31-12-2012 As at 31 December 2012 Group Company Page
2012 2011 2011.01.01 2012 2011 2011.01.01
Note Rs.'000 Rs.'000 Rs.'000 Rs.'000 Rs.'000 Rs.'000
Assets Goodwill 193,162 193,162 - - - - Intangible Assets 76,706 73,827 90,704 54,313 58,800 82,696 Deferred Expenses 598,935 558,877 514,100 580,704 549,512 507,080 Property, Plant and Equipment 8,751,4577,394,394 6,995,865 5,608,690 5,044,660 5,208,858 Investment Properties 3,178,308 3,233,089 2,611,863 3,178,308 3,233,089 2,611,863 Investment in Subsidiaries - - - 1,387,459 1,387,459 1,282,169 Investment in Associates 985,044 788,966 392,987 349,508 346,700 184,032 Financial Instruments Held to Maturity Financial Assets 23,377,454 17,322,609 11,085,88423,216,452 17,246,626 11,085,884 Loans and Receivables 21,005,567 22,204,115 14,913,559 20,548,421 21,668,216 14,731,314 Available-for-sale Financial Assets 3,443,050 3,385,146 2,238,949 3,426,525 3,363,685 2,238,822 Financial Assets at Fair Value Through Profit or Loss 81,884 712,373 3,069,316 81,884 712,373 3,069,316 Employee Gratuity Benefit Asset 508,333 278,635 - 508,333 278,635 - Employee Pension Benefit Asset
579,053 373,347 - 579,053 373,347 - Reinsurance Receivables 2,140,307 1,905,304 2,413,562 2,079,104 1,854,919 2,394,028 Income Tax Receivable 819,894 660,836 518,458 846,058 679,465 518,458 Deferred Tax Assets 547,741 587,462 733,386 542,339 581,200 733,386 Insurance Receivables 143,707,216 3,005,604 3,150,513 3,474,264 2,819,783 3,044,288 Accrued Income 1,719,567 1,935,214 1,652,074 1,719,405 1,930,013 1,648,865 Other Assets 702,258 668,542 612,968 371,990 478,328 451,830 Cash and Cash Equivalents 672,540 769,003 750,780 425,734 531,674 575,517 Total Assets 73,088,476 66,050,505 51,744,968 68,978,544 63,138,484 50,368,406 Equity and Liabilities Equity Attributable to Equity Holders of Parent Stated Capital 1,324,822 1,324,822 1,324,822 1,324,822 1,324,822 1,324,822 Retained Earnings 8,030,833 5,931,099 3,141,183 7,298,361 5,517,473 3,031,125 Retained Reserves 2,375,781 2,506,812 2,364,215 2,264,634 2,404,616 2,364,215 Revaluation Reserves 2,137,318 2,149,541 1,344,336 1,674,993 1,686,281 827,395
Total OrdinaryShareholders’ Equity 13,868,754 11,912,274 8,174,556 12,562,810 10,933,192 7,547,557 Non-Controlling Interests 564,737 460,473 152,070 - - - Total Equity 14,433,491 12,372,747 8,326,626 12,562,810 10,933,192 7,547,557 Liabilities Life Insurance Contract Liabilities 45,110,789 38,203,473 31,868,141 45,110,789 38,203,473 31,868,141 Unit Linked Fund –Life 157,657 146,659 115,269 157,657 146,659 115,269 Non Life Insurance Contract Liabilities 7,753,381 7,107,745 6,609,196 7,561,631 6,975,423 6,530,794 Employee Gratuity Benefit Liability 59,315 61,804 262,634 - - 257,693 Employee Pension Benefit Liability - - 414,960 - - 414,960 Deferred Revenue 164,183 130,435 129,943 129,285 110,841 129,169 Borrowings 1,494,653 1,229,651 411,501 324,356 558,278 368,560 Other Financial Liabilities - 3,856,822 798,727 - 3,856,822 798,727 Deferred Tax Liabilities 70,787 37,207 25,367 - - - Reinsurance Payables 774,238 246,080 398,388 619,183 246,080 388,912 Trade and Other Payables 3,069,982 2,657,882 2,384,216 2,512,833 2,107,716 1,948,624 Total Liabilities 58,654,985 53,677,758 43,418,342 56,415,734 52,205,292 42,820,849
Total Equity and Liabilities 73,088,476 66,050,505 51,744,968 68,978,544 63,138,484 50,368,406
C. C GARDI INSTITUE OF MANAGEMENT KALAWAD ROAD HIGHWAY ROAD, ANANDPAR
PAGE NO.110
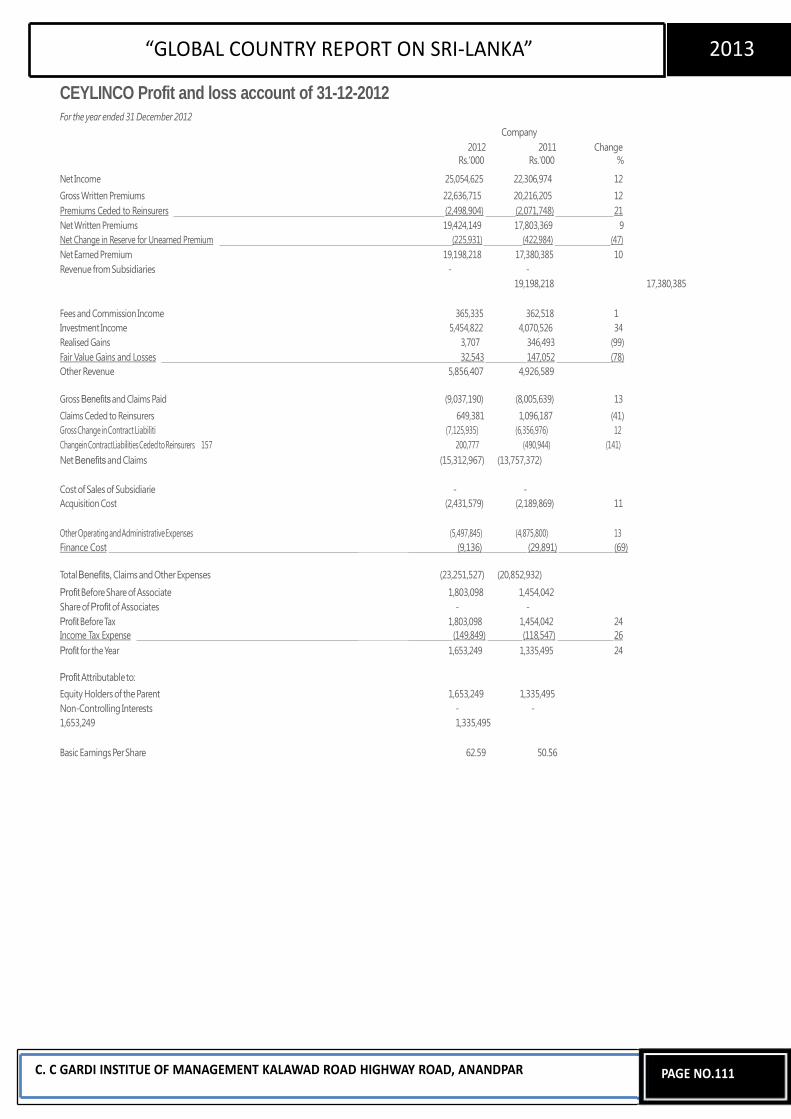
“GLOBAL COUNTRY REPORT ON SRI-LANKA” 2013
CEYLINCO Profit and loss account of 31-12-2012
For the year ended 31 December 2012 Company
2012 2011 Change Rs.'000 Rs.'000 %
Net Income 25,054,625 22,306,974 12 Gross Written Premiums 22,636,715 20,216,205 12 Premiums Ceded to Reinsurers (2,498,904) (2,071,748) 21 Net Written Premiums 19,424,149 17,803,369 9 Net Change in Reserve for Unearned Premium (225,931) (422,984) (47) Net Earned Premium 19,198,218 17,380,385 10 Revenue from Subsidiaries - -
19,198,218 17,380,385
Fees and Commission Income 365,335 362,518 1 Investment Income 5,454,822 4,070,526 34 Realised Gains 3,707 346,493 (99) Fair Value Gains and Losses 32,543 147,052 (78) Other Revenue 5,856,407 4,926,589
Gross Benefits and Claims Paid (9,037,190) (8,005,639) 13 Claims Ceded to Reinsurers 649,381 1,096,187 (41) Gross Change in Contract Liabiliti (7,125,935) (6,356,976) 12 Changein ContractLiabilities Ceded to Reinsurers 157 200,777 (490,944) (141) Net Benefits and Claims (15,312,967) (13,757,372) Cost of Sales of Subsidiarie - - Acquisition Cost (2,431,579) (2,189,869) 11 Other Operating and Administrative Expenses (5,497,845) (4,875,800) 13 Finance Cost (9,136) (29,891) (69)
Total Benefits, Claims and Other Expenses (23,251,527) (20,852,932)
Profit Before Share of Associate 1,803,098 1,454,042 Share of Profit of Associates - - Profit Before Tax 1,803,098 1,454,042 24 Income Tax Expense (149,849) (118,547) 26 Profit for the Year 1,653,249 1,335,495 24
Profit Attributable to: Equity Holders of the Parent 1,653,249 1,335,495 Non-Controlling Interests - - 1,653,249 1,335,495 Basic Earnings Per Share 62.59 50.56
C. C GARDI INSTITUE OF MANAGEMENT KALAWAD ROAD HIGHWAY ROAD, ANANDPAR
PAGE NO.111
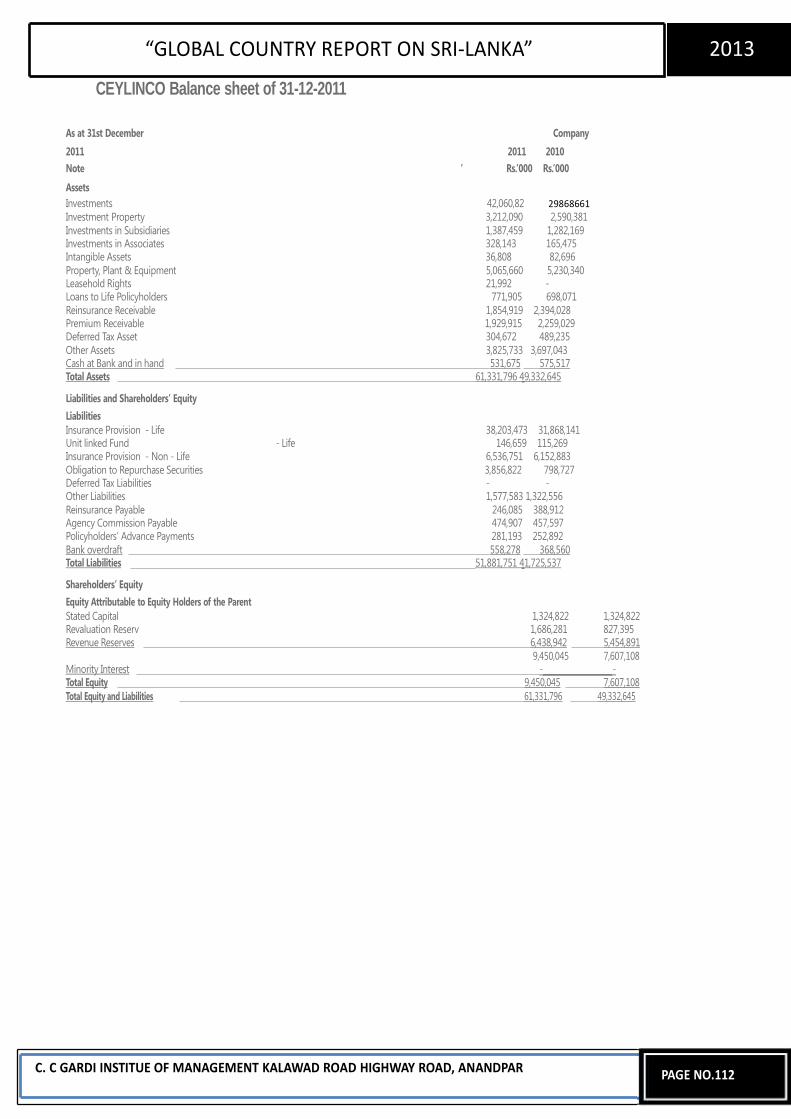
“GLOBAL COUNTRY REPORT ON SRI-LANKA” 2013
CEYLINCO Balance sheet of 31-12-2011
As at 31st December Company
2011 2011 2010 Note ’ Rs.’000 Rs.’000 Assets Investments 42,060,82 29868661 Investment Property 3,212,090 2,590,381 Investments in Subsidiaries 1,387,459 1,282,169 Investments in Associates 328,143 165,475 Intangible Assets 36,808 82,696 Property, Plant & Equipment 5,065,660 5,230,340 Leasehold Rights 21,992 - Loans to Life Policyholders 771,905 698,071 Reinsurance Receivable 1,854,919 2,394,028 Premium Receivable 1,929,915 2,259,029 Deferred Tax Asset 304,672 489,235 Other Assets 3,825,733 3,697,043 Cash at Bank and in hand 531,675 575,517 Total Assets 61,331,796 49,332,645
Liabilities and Shareholders’ Equity
Liabilities Insurance Provision - Life 38,203,473 31,868,141 Unit linked Fund - Life 146,659 115,269 Insurance Provision - Non - Life 6,536,751 6,152,883 Obligation to Repurchase Securities 3,856,822 798,727 Deferred Tax Liabilities - - Other Liabilities 1,577,583 1,322,556 Reinsurance Payable 246,085 388,912 Agency Commission Payable 474,907 457,597 Policyholders’ Advance Payments 281,193 252,892 Bank overdraft 558,278 368,560 Total Liabilities 51,881,751 41,725,537
Shareholders’ Equity Equity Attributable to Equity Holders of the Parent Stated Capital 1,324,822 1,324,822 Revaluation Reserv 1,686,281 827,395 Revenue Reserves 6,438,942 5,454,891
9,450,045 7,607,108 Minority Interest - - Total Equity 9,450,045 7,607,108 Total Equity and Liabilities 61,331,796 49,332,645
C. C GARDI INSTITUE OF MANAGEMENT KALAWAD ROAD HIGHWAY ROAD, ANANDPAR
PAGE NO.112
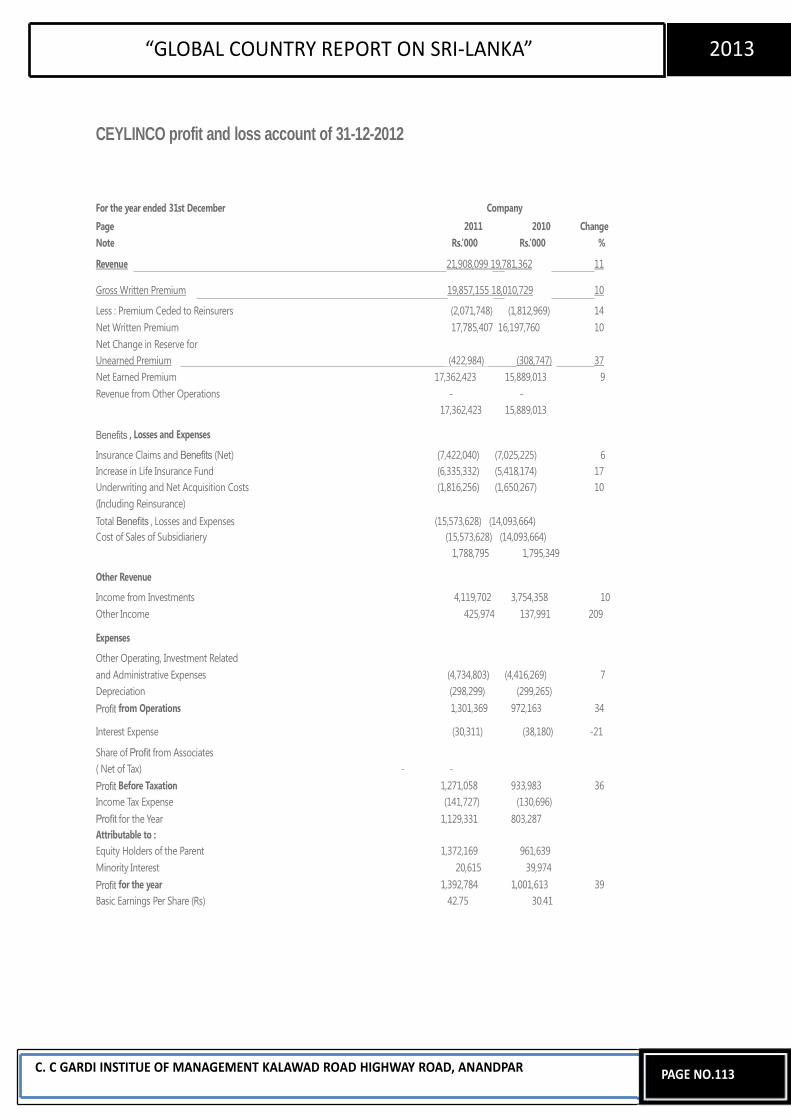
“GLOBAL COUNTRY REPORT ON SRI-LANKA” 2013
CEYLINCO profit and loss account of 31-12-2012
For the year ended 31st December Company
Page 2011 2010 Change Note Rs.’000 Rs.’000 %
Revenue 21,908,099 19,781,362 11
Gross Written Premium 19,857,155 18,010,729 10
Less : Premium Ceded to Reinsurers (2,071,748) (1,812,969) 14 Net Written Premium 17,785,407 16,197,760 10 Net Change in Reserve for Unearned Premium (422,984) (308,747) 37 Net Earned Premium 17,362,423 15,889,013 9 Revenue from Other Operations - -
17,362,423 15,889,013
Benefits , Losses and Expenses
Insurance Claims and Benefits (Net) (7,422,040) (7,025,225) 6 Increase in Life Insurance Fund (6,335,332) (5,418,174) 17 Underwriting and Net Acquisition Costs (1,816,256) (1,650,267) 10 (Including Reinsurance)
Total Benefits , Losses and Expenses (15,573,628) (14,093,664) Cost of Sales of Subsidiariery (15,573,628) (14,093,664)
1,788,795 1,795,349
Other Revenue
Income from Investments 4,119,702 3,754,358 10 Other Income 425,974 137,991 209
Expenses
Other Operating, Investment Related and Administrative Expenses (4,734,803) (4,416,269) 7 Depreciation (298,299) (299,265) Profit from Operations 1,301,369 972,163 34
Interest Expense (30,311) (38,180) -21
Share of Profit from Associates ( Net of Tax) - - Profit Before Taxation 1,271,058 933,983 36 Income Tax Expense (141,727) (130,696) Profit for the Year 1,129,331 803,287 Attributable to : Equity Holders of the Parent 1,372,169 961,639 Minority Interest 20,615 39,974
Profit for the year 1,392,784 1,001,613 39 Basic Earnings Per Share (Rs) 42.75 30.41
C. C GARDI INSTITUE OF MANAGEMENT KALAWAD ROAD HIGHWAY ROAD, ANANDPAR
PAGE NO.113
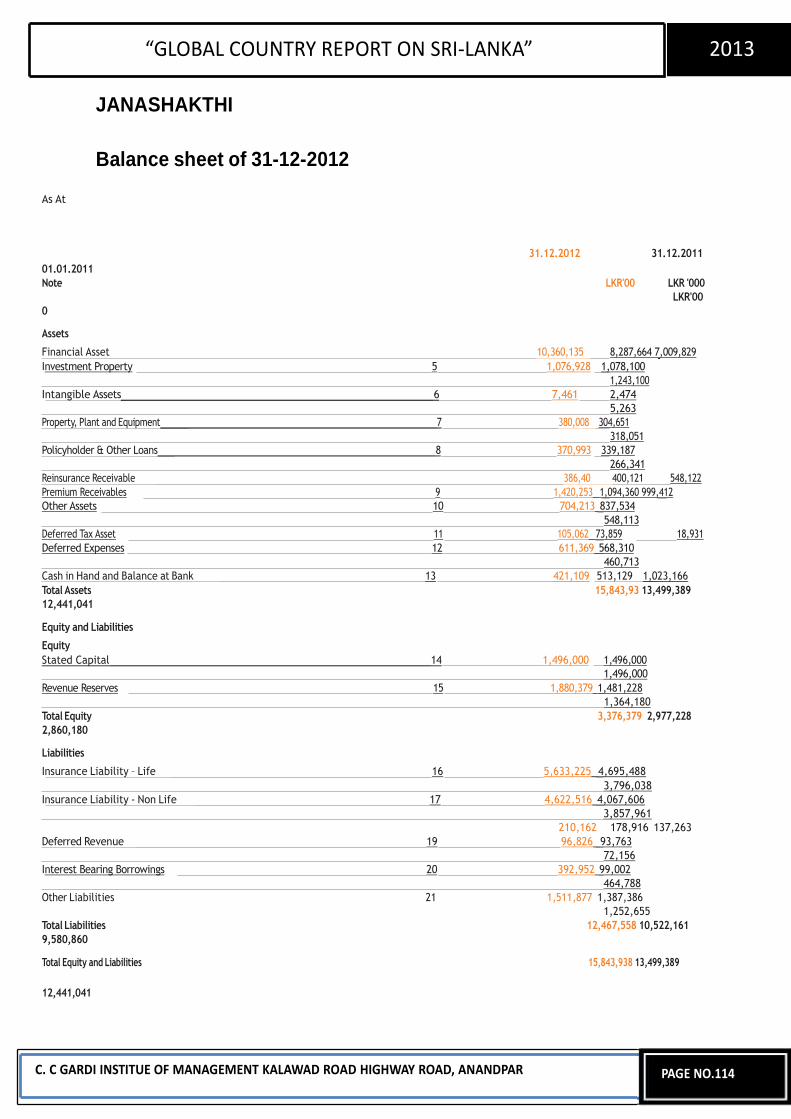
“GLOBAL COUNTRY REPORT ON SRI-LANKA” 2013
JANASHAKTHI
Balance sheet of 31-12-2012
As At
31.12.2012 31.12.2011 01.01.2011 Note LKR'00 LKR '000
LKR'00 0
Assets
Financial Asset 10,360,135 8,287,664 7,009,829 Investment Property 5 1,076,928 1,078,100
1,243,100 Intangible Assets 6 7,461 2,474
5,263 Property, Plant and Equipment 7 380,008 304,651
318,051 Policyholder & Other Loans 8 370,993 339,187
266,341 Reinsurance Receivable 386,40 400,121 548,122 Premium Receivables 9 1,420,253 1,094,360 999,412 Other Assets 10 704,213 837,534
548,113 Deferred Tax Asset 11 105,062 73,859 18,931 Deferred Expenses 12 611,369 568,310
460,713 Cash in Hand and Balance at Bank 13 421,109 513,129 1,023,166 Total Assets 15,843,93 13,499,389 12,441,041
Equity and Liabilities
Equity Stated Capital 14 1,496,000 1,496,000
1,496,000 Revenue Reserves 15 1,880,379 1,481,228
1,364,180 Total Equity 3,376,379 2,977,228 2,860,180
Liabilities
Insurance Liability – Life 16 5,633,225 4,695,488 3,796,038
Insurance Liability - Non Life 17 4,622,516 4,067,606 3,857,961
210,162 178,916 137,263 Deferred Revenue 19 96,826 93,763
72,156 Interest Bearing Borrowings 20 392,952 99,002
464,788 Other Liabilities 21 1,511,877 1,387,386
1,252,655 Total Liabilities 12,467,558 10,522,161 9,580,860
Total Equity and Liabilities 15,843,938 13,499,389
12,441,041
C. C GARDI INSTITUE OF MANAGEMENT KALAWAD ROAD HIGHWAY ROAD, ANANDPAR
PAGE NO.114
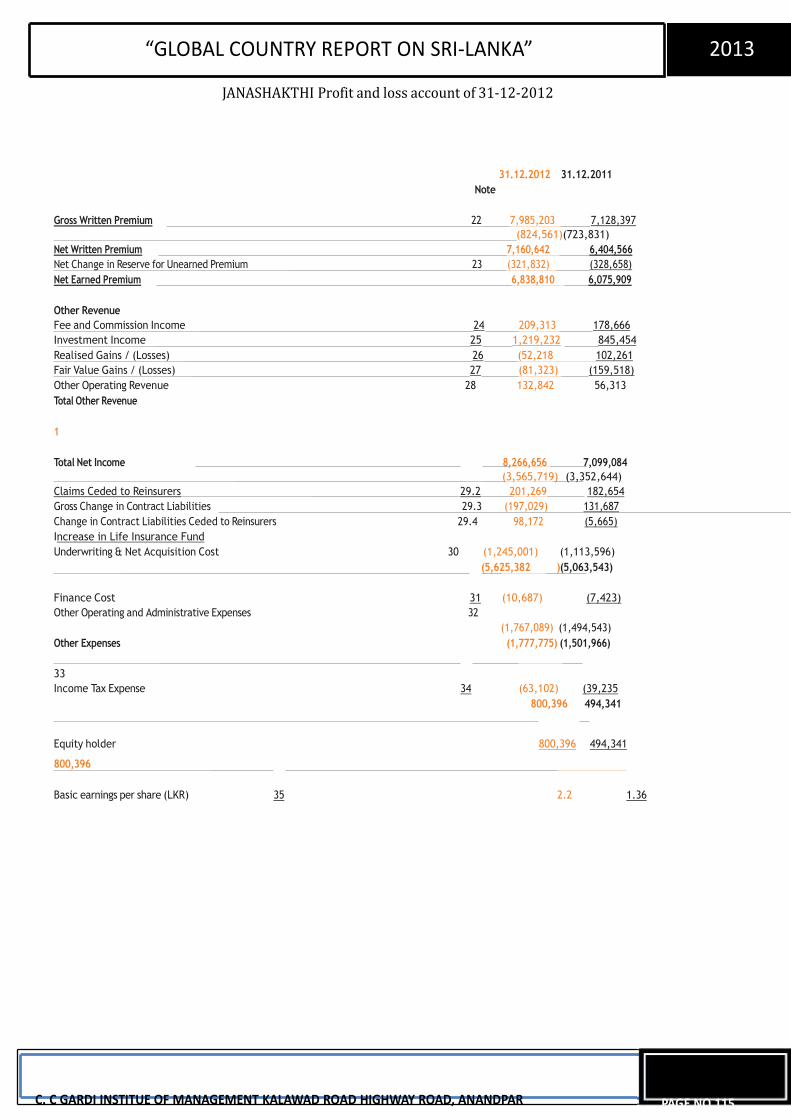
“GLOBAL COUNTRY REPORT ON SRI-LANKA” 2013
JANASHAKTHI Profit and loss account of 31-12-2012
31.12.2012 31.12.2011 Note
Gross Written Premium 22 7,985,203 7,128,397 (824,561)(723,831)
Net Written Premium 7,160,642 6,404,566 Net Change in Reserve for Unearned Premium 23 (321,832) (328,658) Net Earned Premium 6,838,810 6,075,909 Other Revenue Fee and Commission Income 24 209,313 178,666 Investment Income 25 1,219,232 845,454 Realised Gains / (Losses) 26 (52,218 102,261 Fair Value Gains / (Losses) 27 (81,323) (159,518) Other Operating Revenue 28 132,842 56,313 Total Other Revenue
1 Total Net Income 8,266,656 7,099,084
(3,565,719) (3,352,644) Claims Ceded to Reinsurers 29.2 201,269 182,654 Gross Change in Contract Liabilities 29.3 (197,029) 131,687 Change in Contract Liabilities Ceded to Reinsurers 29.4 98,172 (5,665) Increase in Life Insurance Fund Underwriting & Net Acquisition Cost 30 (1,245,001) (1,113,596)
(5,625,382 )(5,063,543)
Finance Cost 31 (10,687) (7,423) Other Operating and Administrative Expenses 32
(1,767,089) (1,494,543) Other Expenses (1,777,775) (1,501,966) 33 Income Tax Expense 34 (63,102) (39,235
800,396 494,341
Equity holder 800,396 494,341
800,396 Basic earnings per share (LKR) 35 2.2 1.36
C. C GARDI INSTITUE OF MANAGEMENT KALAWAD ROAD HIGHWAY ROAD, ANANDPAR
PAGE NO.115
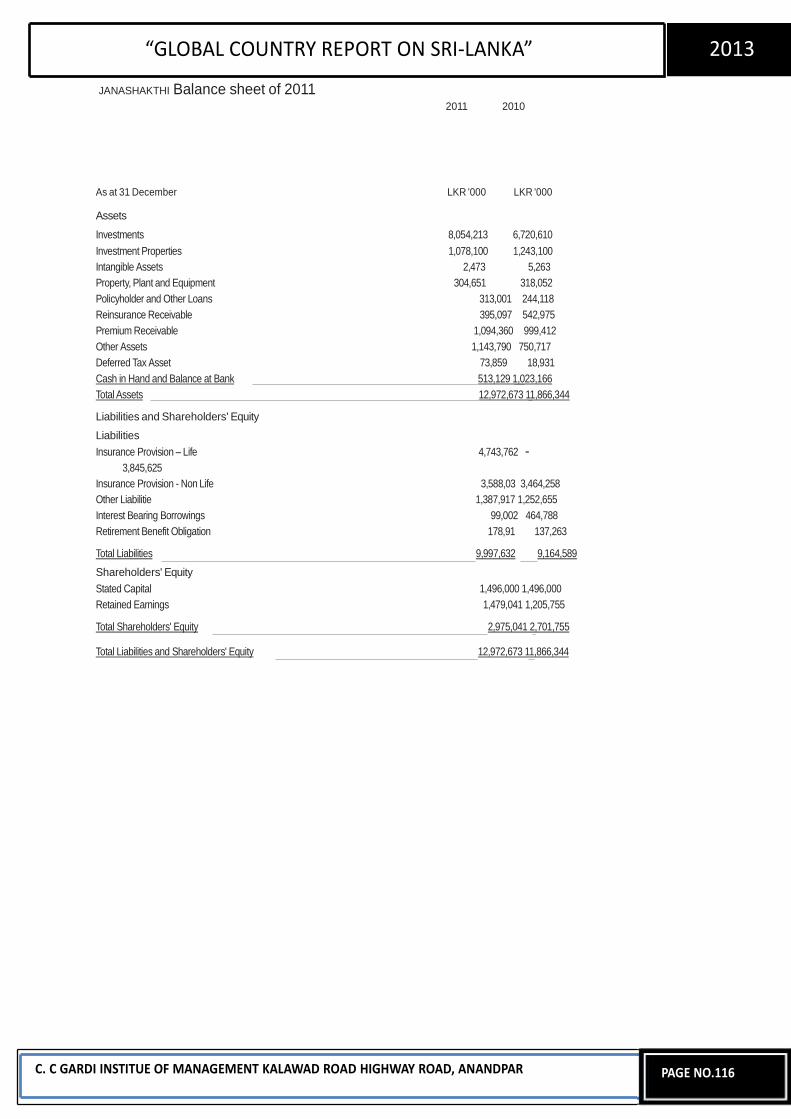
“GLOBAL COUNTRY REPORT ON SRI-LANKA” 2013
JANASHAKTHI Balance sheet of 2011 2011 2010
As at 31 December LKR '000 LKR '000
Assets
Investments 8,054,213 6,720,610 Investment Properties 1,078,100 1,243,100 Intangible Assets 2,473 5,263 Property, Plant and Equipment 304,651 318,052 Policyholder and Other Loans 313,001 244,118 Reinsurance Receivable 395,097 542,975 Premium Receivable 1,094,360 999,412 Other Assets 1,143,790 750,717 Deferred Tax Asset 73,859 18,931 Cash in Hand and Balance at Bank 513,129 1,023,166 Total Assets 12,972,673 11,866,344
Liabilities and Shareholders' Equity
Liabilities Insurance Provision – Life 4,743,762 -
3,845,625 Insurance Provision - Non Life 3,588,03 3,464,258 Other Liabilitie 1,387,917 1,252,655 Interest Bearing Borrowings 99,002 464,788 Retirement Benefit Obligation 178,91 137,263
Total Liabilities 9,997,632 9,164,589
Shareholders' Equity Stated Capital 1,496,000 1,496,000 Retained Earnings 1,479,041 1,205,755
Total Shareholders' Equity 2,975,041 2,701,755
Total Liabilities and Shareholders' Equity 12,972,673 11,866,344
C. C GARDI INSTITUE OF MANAGEMENT KALAWAD ROAD HIGHWAY ROAD, ANANDPAR
PAGE NO.116
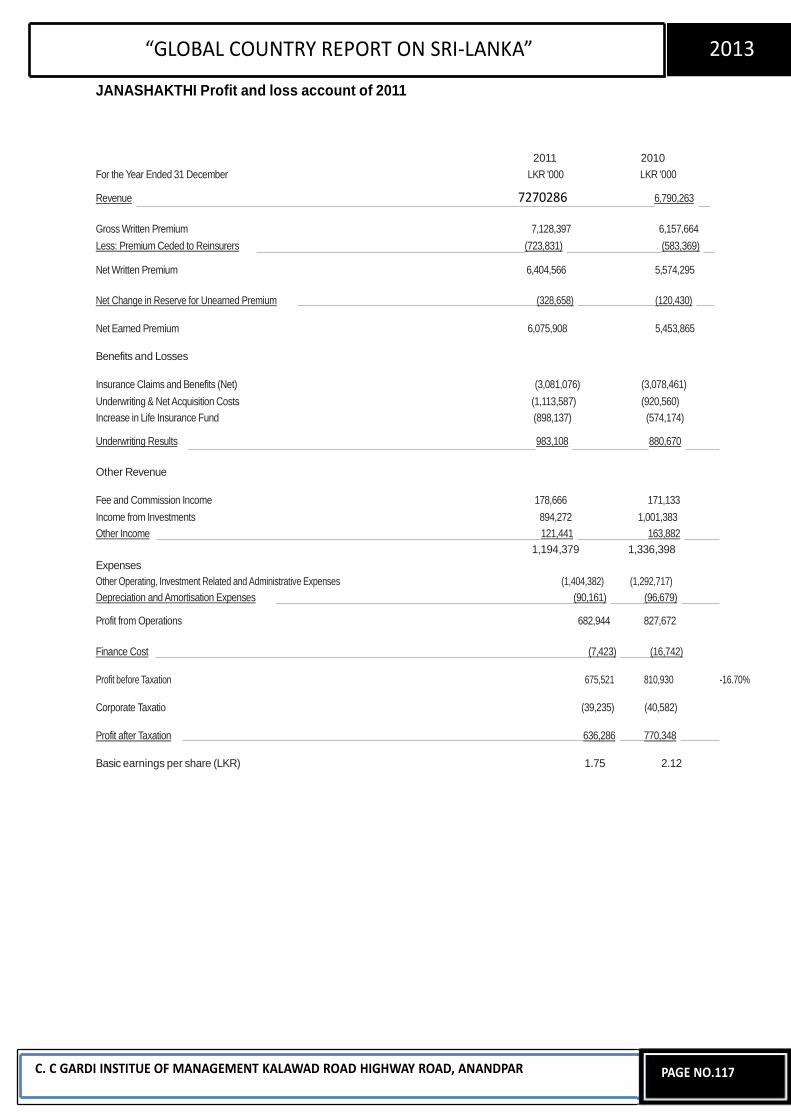
“GLOBAL COUNTRY REPORT ON SRI-LANKA” 2013
JANASHAKTHI Profit and loss account of 2011
2011 2010 For the Year Ended 31 December LKR '000 LKR '000
Revenue 7270286 6,790,263
Gross Written Premium 7,128,397 6,157,664 Less: Premium Ceded to Reinsurers (723,831) (583,369)
Net Written Premium 6,404,566 5,574,295
Net Change in Reserve for Unearned Premium (328,658) (120,430) Net Earned Premium 6,075,908 5,453,865 Benefits and Losses Insurance Claims and Benefits (Net) (3,081,076) (3,078,461) Underwriting & Net Acquisition Costs (1,113,587) (920,560) Increase in Life Insurance Fund (898,137) (574,174)
Underwriting Results 983,108 880,670
Other Revenue Fee and Commission Income 178,666 171,133 Income from Investments 894,272 1,001,383 Other Income 121,441 163,882
1,194,379 1,336,398 Expenses Other Operating, Investment Related and Administrative Expenses (1,404,382) (1,292,717) Depreciation and Amortisation Expenses (90,161) (96,679)
Profit from Operations 682,944 827,672
Finance Cost (7,423) (16,742) Profit before Taxation 675,521 810,930 -16.70% Corporate Taxatio (39,235) (40,582) Profit after Taxation 636,286 770,348 Basic earnings per share (LKR) 1.75 2.12
C. C GARDI INSTITUE OF MANAGEMENT KALAWAD ROAD HIGHWAY ROAD, ANANDPAR
PAGE NO.117
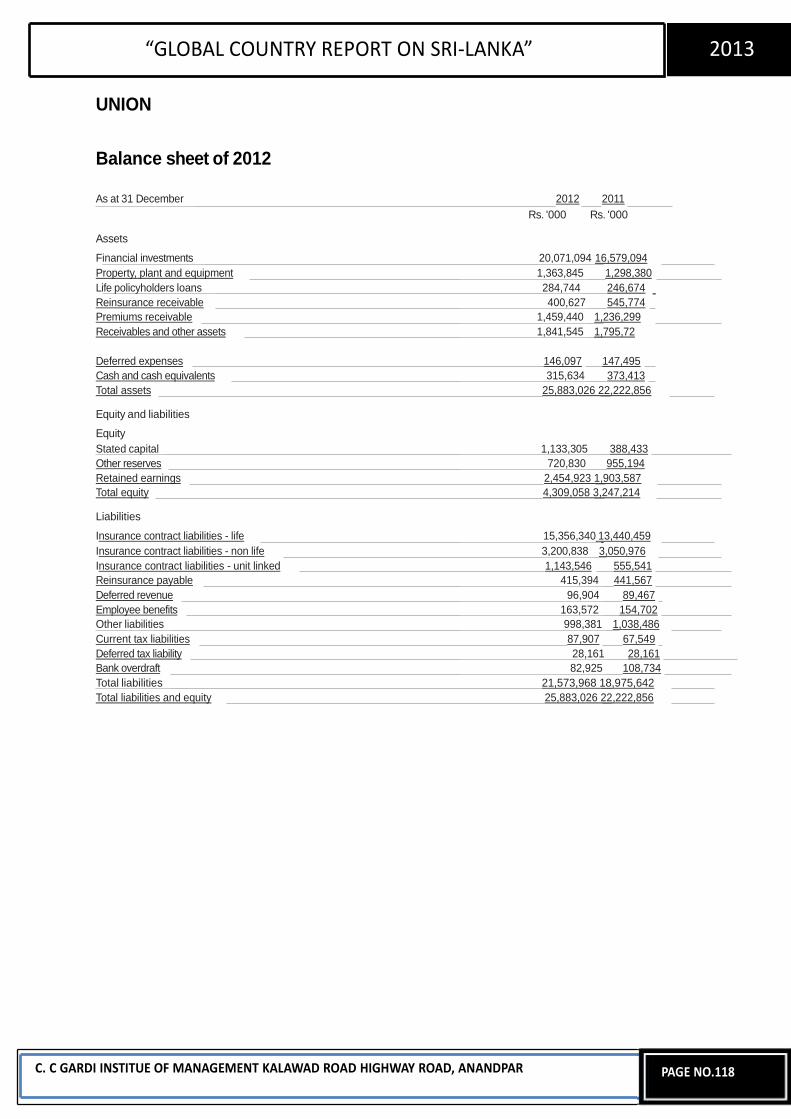
“GLOBAL COUNTRY REPORT ON SRI-LANKA” 2013
UNION
Balance sheet of 2012
As at 31 December 2012 2011 Rs. '000 Rs. '000
Assets
Financial investments 20,071,094 16,579,094 Property, plant and equipment 1,363,845 1,298,380 Life policyholders loans 284,744 246,674 Reinsurance receivable 400,627 545,774 Premiums receivable 1,459,440 1,236,299 Receivables and other assets 1,841,545 1,795,72 Deferred expenses 146,097 147,495 Cash and cash equivalents 315,634 373,413 Total assets 25,883,026 22,222,856
Equity and liabilities
Equity Stated capital 1,133,305 388,433 Other reserves 720,830 955,194 Retained earnings 2,454,923 1,903,587 Total equity 4,309,058 3,247,214
Liabilities
Insurance contract liabilities - life 15,356,340 13,440,459 Insurance contract liabilities - non life 3,200,838 3,050,976 Insurance contract liabilities - unit linked 1,143,546 555,541 Reinsurance payable 415,394 441,567 Deferred revenue 96,904 89,467 Employee benefits 163,572 154,702 Other liabilities 998,381 1,038,486 Current tax liabilities 87,907 67,549 Deferred tax liability 28,161 28,161 Bank overdraft 82,925 108,734 Total liabilities 21,573,968 18,975,642 Total liabilities and equity 25,883,026 22,222,856
C. C GARDI INSTITUE OF MANAGEMENT KALAWAD ROAD HIGHWAY ROAD, ANANDPAR
PAGE NO.118
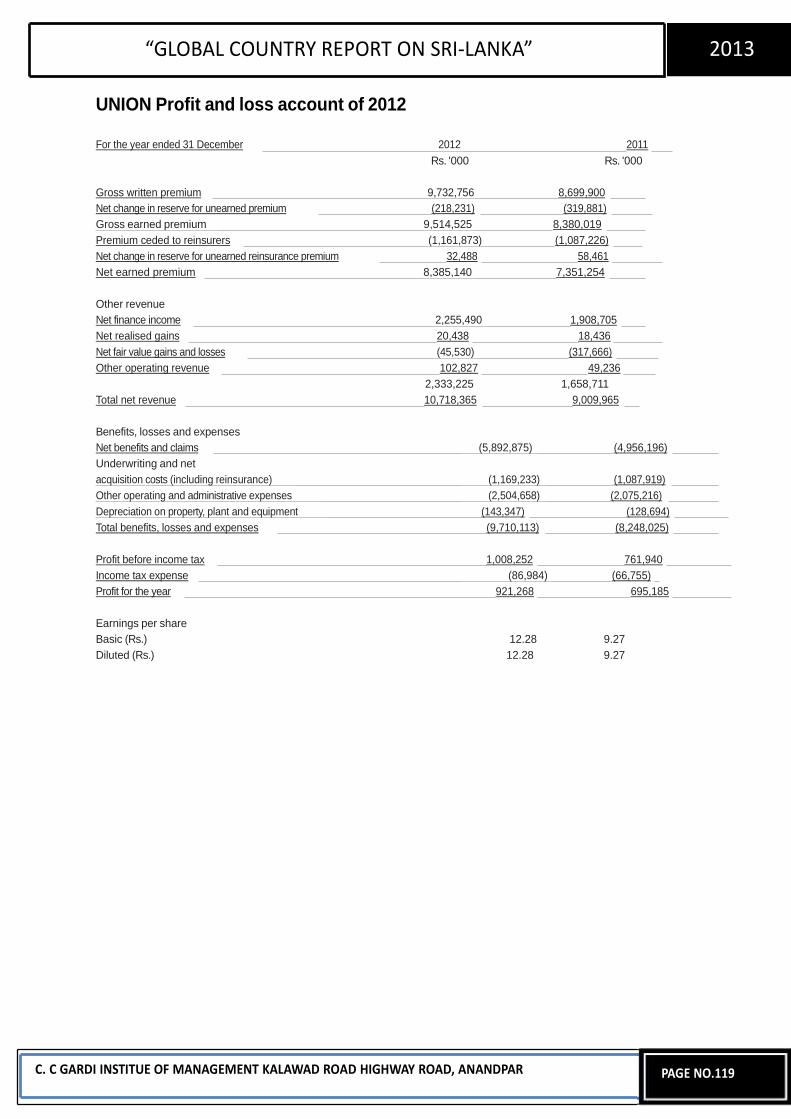
“GLOBAL COUNTRY REPORT ON SRI-LANKA” 2013
UNION Profit and loss account of 2012
For the year ended 31 December 2012 2011 Rs. '000 Rs. '000
Gross written premium 9,732,756 8,699,900 Net change in reserve for unearned premium (218,231) (319,881) Gross earned premium 9,514,525 8,380,019 Premium ceded to reinsurers (1,161,873) (1,087,226) Net change in reserve for unearned reinsurance premium 32,488 58,461 Net earned premium 8,385,140 7,351,254 Other revenue Net finance income 2,255,490 1,908,705 Net realised gains 20,438 18,436 Net fair value gains and losses (45,530) (317,666) Other operating revenue 102,827 49,236
2,333,225 1,658,711 Total net revenue 10,718,365 9,009,965 Benefits, losses and expenses Net benefits and claims (5,892,875) (4,956,196) Underwriting and net acquisition costs (including reinsurance) (1,169,233) (1,087,919) Other operating and administrative expenses (2,504,658) (2,075,216) Depreciation on property, plant and equipment (143,347) (128,694) Total benefits, losses and expenses (9,710,113) (8,248,025) Profit before income tax 1,008,252 761,940 Income tax expense (86,984) (66,755) Profit for the year 921,268 695,185 Earnings per share Basic (Rs.) 12.28 9.27 Diluted (Rs.) 12.28 9.27
C. C GARDI INSTITUE OF MANAGEMENT KALAWAD ROAD HIGHWAY ROAD, ANANDPAR
PAGE NO.119
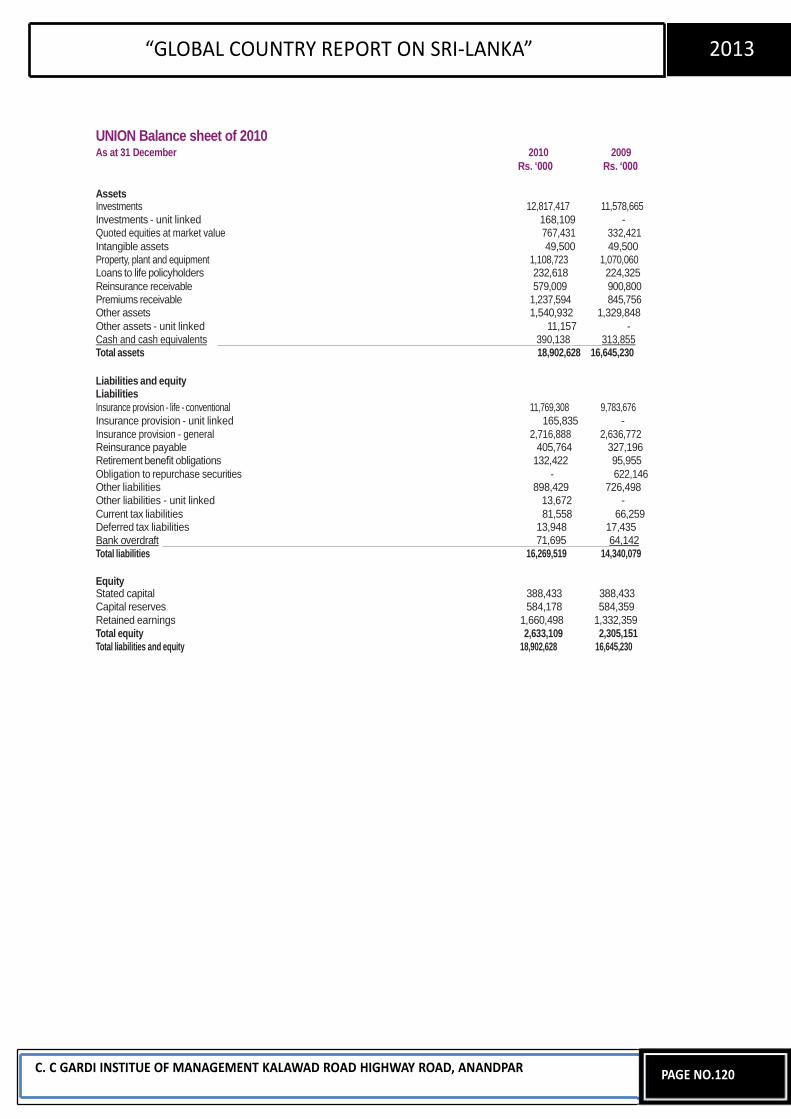
“GLOBAL COUNTRY REPORT ON SRI-LANKA” 2013
UNION Balance sheet of 2010 As at 31 December 2010 2009
Rs. „000 Rs. „000
Assets Investments 12,817,417 11,578,665 Investments - unit linked 168,109 - Quoted equities at market value 767,431 332,421 Intangible assets 49,500 49,500 Property, plant and equipment 1,108,723 1,070,060 Loans to life policyholders 232,618 224,325 Reinsurance receivable 579,009 900,800 Premiums receivable 1,237,594 845,756 Other assets 1,540,932 1,329,848 Other assets - unit linked 11,157 - Cash and cash equivalents 390,138 313,855 Total assets 18,902,628 16,645,230 Liabilities and equity Liabilities Insurance provision - life - conventional 11,769,308 9,783,676 Insurance provision - unit linked 165,835 - Insurance provision - general 2,716,888 2,636,772 Reinsurance payable 405,764 327,196 Retirement benefit obligations 132,422 95,955 Obligation to repurchase securities - 622,146 Other liabilities 898,429 726,498 Other liabilities - unit linked 13,672 - Current tax liabilities 81,558 66,259 Deferred tax liabilities 13,948 17,435 Bank overdraft 71,695 64,142 Total liabilities 16,269,519 14,340,079 Equity Stated capital 388,433 388,433 Capital reserves 584,178 584,359 Retained earnings 1,660,498 1,332,359 Total equity 2,633,109 2,305,151 Total liabilities and equity 18,902,628 16,645,230
C. C GARDI INSTITUE OF MANAGEMENT KALAWAD ROAD HIGHWAY ROAD, ANANDPAR
PAGE NO.120
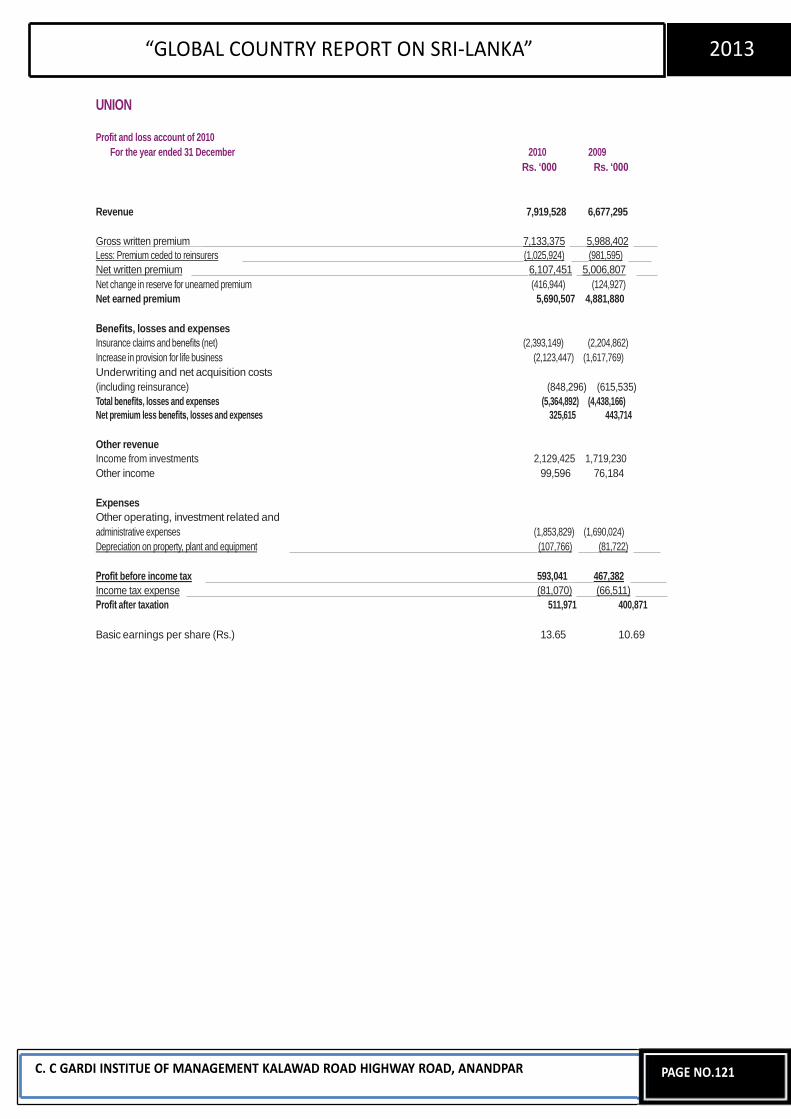
“GLOBAL COUNTRY REPORT ON SRI-LANKA” 2013
UNION Profit and loss account of 2010
For the year ended 31 December 2010 2009 Rs. „000 Rs. „000
Revenue 7,919,528 6,677,295 Gross written premium 7,133,375 5,988,402 Less: Premium ceded to reinsurers (1,025,924) (981,595) Net written premium 6,107,451 5,006,807 Net change in reserve for unearned premium (416,944) (124,927) Net earned premium 5,690,507 4,881,880 Benefits, losses and expenses Insurance claims and benefits (net) (2,393,149) (2,204,862) Increase in provision for life business (2,123,447) (1,617,769) Underwriting and net acquisition costs (including reinsurance) (848,296) (615,535) Total benefits, losses and expenses (5,364,892) (4,438,166) Net premium less benefits, losses and expenses 325,615 443,714 Other revenue Income from investments 2,129,425 1,719,230 Other income 99,596 76,184 Expenses Other operating, investment related and administrative expenses (1,853,829) (1,690,024) Depreciation on property, plant and equipment (107,766) (81,722) Profit before income tax 593,041 467,382 Income tax expense (81,070) (66,511) Profit after taxation 511,971 400,871 Basic earnings per share (Rs.) 13.65 10.69
C. C GARDI INSTITUE OF MANAGEMENT KALAWAD ROAD HIGHWAY ROAD, ANANDPAR
PAGE NO.121
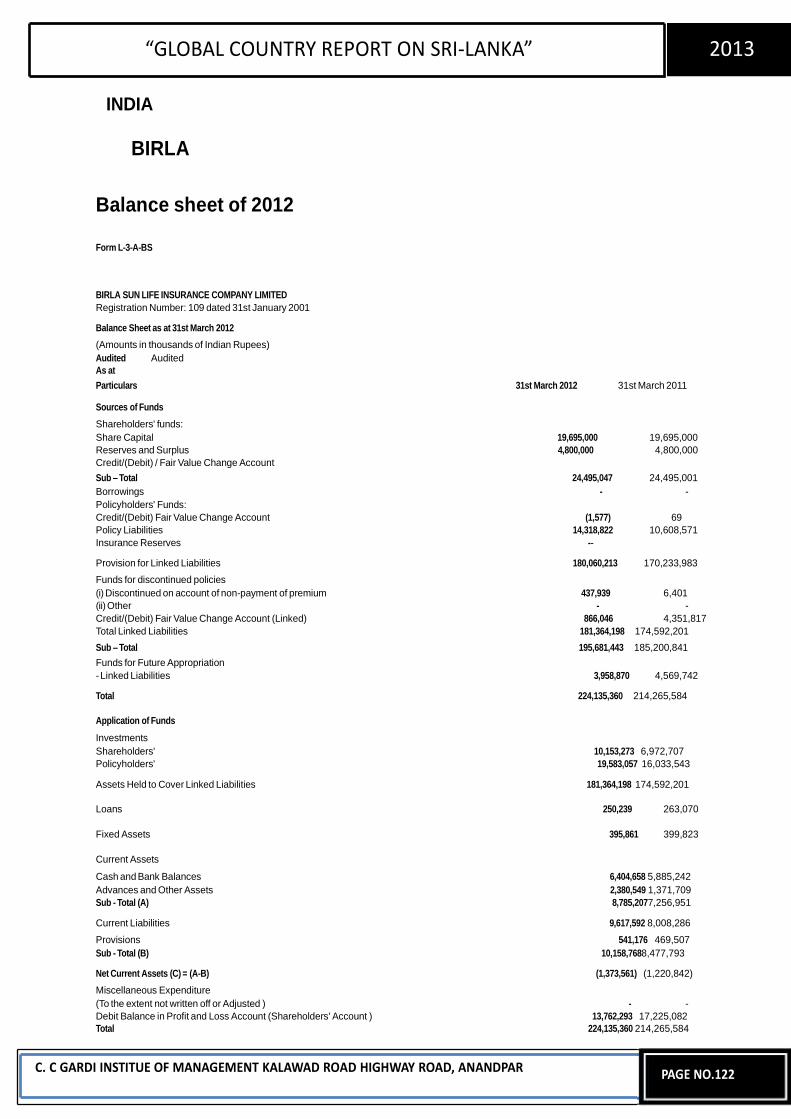
“GLOBAL COUNTRY REPORT ON SRI-LANKA” 2013
INDIA
BIRLA
Balance sheet of 2012
Form L-3-A-BS BIRLA SUN LIFE INSURANCE COMPANY LIMITED Registration Number: 109 dated 31st January 2001
Balance Sheet as at 31st March 2012 (Amounts in thousands of Indian Rupees) Audited Audited As at Particulars 31st March 2012 31st March 2011
Sources of Funds Shareholders' funds: Share Capital 19,695,000 19,695,000 Reserves and Surplus 4,800,000 4,800,000 Credit/(Debit) / Fair Value Change Account Sub – Total 24,495,047 24,495,001 Borrowings - - Policyholders' Funds: Credit/(Debit) Fair Value Change Account (1,577) 69 Policy Liabilities 14,318,822 10,608,571 Insurance Reserves --
Provision for Linked Liabilities 180,060,213 170,233,983 Funds for discontinued policies (i) Discontinued on account of non-payment of premium 437,939 6,401 (ii) Other - - Credit/(Debit) Fair Value Change Account (Linked) 866,046 4,351,817 Total Linked Liabilities 181,364,198 174,592,201 Sub – Total 195,681,443 185,200,841 Funds for Future Appropriation - Linked Liabilities 3,958,870 4,569,742
Total 224,135,360 214,265,584
Application of Funds Investments Shareholders' 10,153,273 6,972,707 Policyholders' 19,583,057 16,033,543
Assets Held to Cover Linked Liabilities 181,364,198 174,592,201
Loans 250,239 263,070
Fixed Assets 395,861 399,823
Current Assets Cash and Bank Balances 6,404,658 5,885,242 Advances and Other Assets 2,380,549 1,371,709 Sub - Total (A) 8,785,2077,256,951
Current Liabilities 9,617,592 8,008,286 Provisions 541,176 469,507 Sub - Total (B) 10,158,7688,477,793
Net Current Assets (C) = (A-B) (1,373,561) (1,220,842) Miscellaneous Expenditure (To the extent not written off or Adjusted ) - - Debit Balance in Profit and Loss Account (Shareholders' Account ) 13,762,293 17,225,082 Total 224,135,360 214,265,584
C. C GARDI INSTITUE OF MANAGEMENT KALAWAD ROAD HIGHWAY ROAD, ANANDPAR
PAGE NO.122
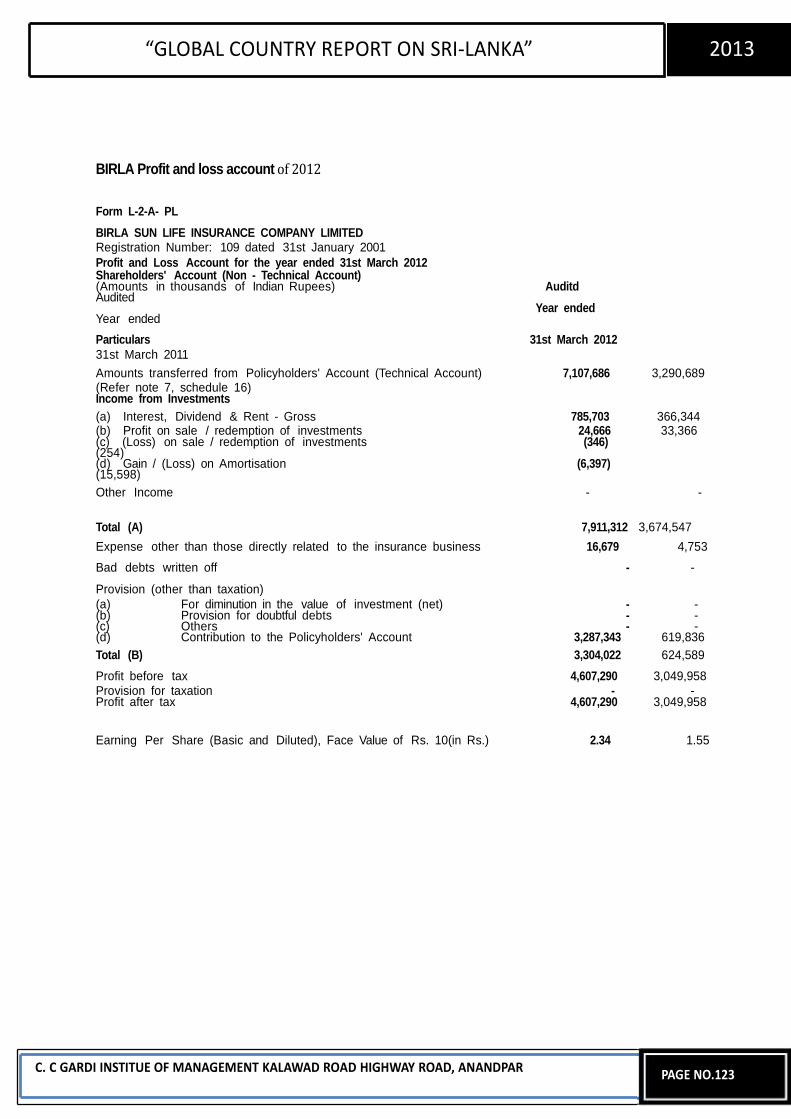
“GLOBAL COUNTRY REPORT ON SRI-LANKA” 2013
BIRLA Profit and loss account of 2012
Form L-2-A- PL
BIRLA SUN LIFE INSURANCE COMPANY LIMITED Registration Number: 109 dated 31st January 2001 Profit and Loss Account for the year ended 31st March 2012 Shareholders' Account (Non - Technical Account) (Amounts in thousands of Indian Rupees) Auditd Audited
Year ended Year ended
Particulars 31st March 2012 31st March 2011
Amounts transferred from Policyholders' Account (Technical Account) 7,107,686 3,290,689 (Refer note 7, schedule 16) Income from Investments
(a) Interest, Dividend & Rent - Gross 785,703 366,344 (b) Profit on sale / redemption of investments 24,666 33,366 (c) (Loss) on sale / redemption of investments (346) (254) (d) Gain / (Loss) on Amortisation (6,397) (15,598)
Other Income - -
Total (A) 7,911,312 3,674,547
Expense other than those directly related to the insurance business 16,679 4,753
Bad debts written off - -
Provision (other than taxation) (a) For diminution in the value of investment (net) - - (b) Provision for doubtful debts - - (c) Others - - (d) Contribution to the Policyholders' Account 3,287,343 619,836
Total (B) 3,304,022 624,589
Profit before tax 4,607,290 3,049,958 Provision for taxation - - Profit after tax 4,607,290 3,049,958
Earning Per Share (Basic and Diluted), Face Value of Rs. 10(in Rs.) 2.34 1.55
C. C GARDI INSTITUE OF MANAGEMENT KALAWAD ROAD HIGHWAY ROAD, ANANDPAR
PAGE NO.123
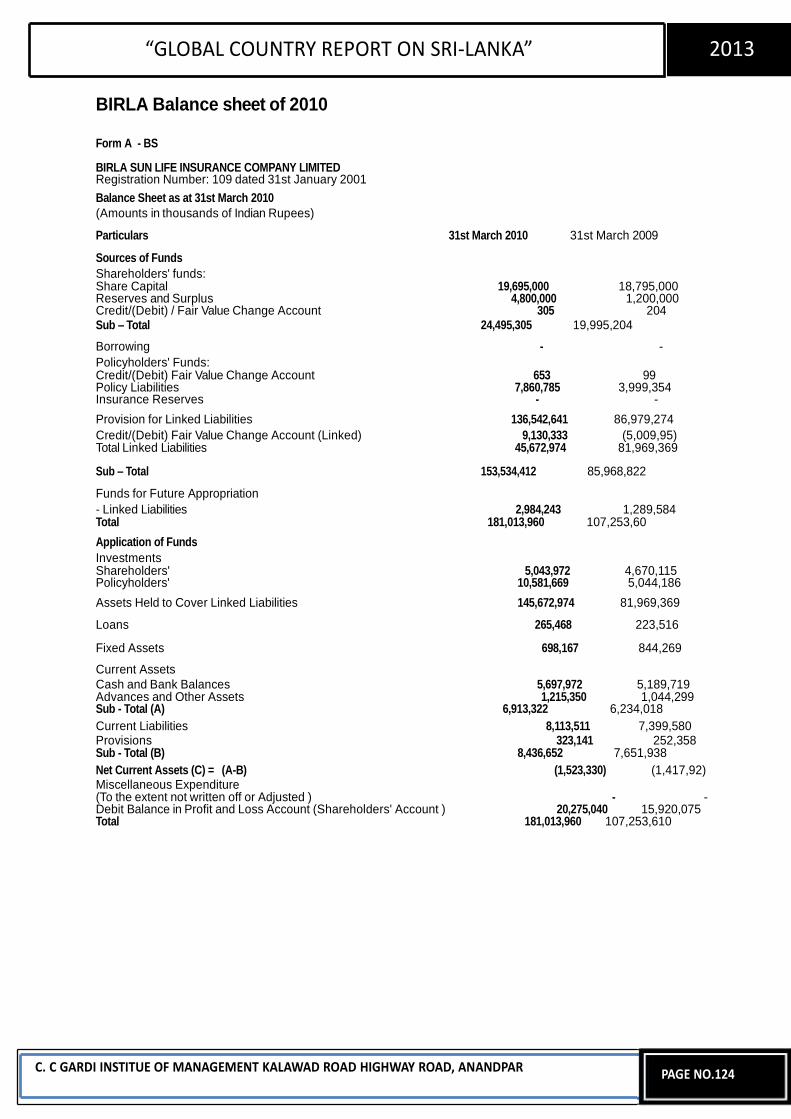
“GLOBAL COUNTRY REPORT ON SRI-LANKA” 2013
BIRLA Balance sheet of 2010
Form A - BS # BIRLA SUN LIFE INSURANCE COMPANY LIMITED Registration Number: 109 dated 31st January 2001
Balance Sheet as at 31st March 2010 (Amounts in thousands of Indian Rupees)
Particulars 31st March 2010 31st March 2009
Sources of Funds Shareholders' funds: Share Capital 19,695,000 18,795,000 Reserves and Surplus 4,800,000 1,200,000 Credit/(Debit) / Fair Value Change Account 305 204 Sub – Total 24,495,305 19,995,204
Borrowing - - Policyholders' Funds: Credit/(Debit) Fair Value Change Account 653 99 Policy Liabilities 7,860,785 3,999,354 Insurance Reserves - -
Provision for Linked Liabilities 136,542,641 86,979,274 Credit/(Debit) Fair Value Change Account (Linked) 9,130,333 (5,009,95) Total Linked Liabilities 45,672,974 81,969,369
Sub – Total 153,534,412 85,968,822
Funds for Future Appropriation - Linked Liabilities 2,984,243 1,289,584 Total 181,013,960 107,253,60
Application of Funds Investments Shareholders' 5,043,972 4,670,115 Policyholders' 10,581,669 5,044,186
Assets Held to Cover Linked Liabilities 145,672,974 81,969,369
Loans 265,468 223,516
Fixed Assets 698,167 844,269
Current Assets Cash and Bank Balances 5,697,972 5,189,719 Advances and Other Assets 1,215,350 1,044,299 Sub - Total (A) 6,913,322 6,234,018 Current Liabilities 8,113,511 7,399,580 Provisions 323,141 252,358 Sub - Total (B) 8,436,652 7,651,938 Net Current Assets (C) = (A-B) (1,523,330) (1,417,92) Miscellaneous Expenditure (To the extent not written off or Adjusted ) - - Debit Balance in Profit and Loss Account (Shareholders' Account ) 20,275,040 15,920,075 Total 181,013,960 107,253,610
C. C GARDI INSTITUE OF MANAGEMENT KALAWAD ROAD HIGHWAY ROAD, ANANDPAR
PAGE NO.124
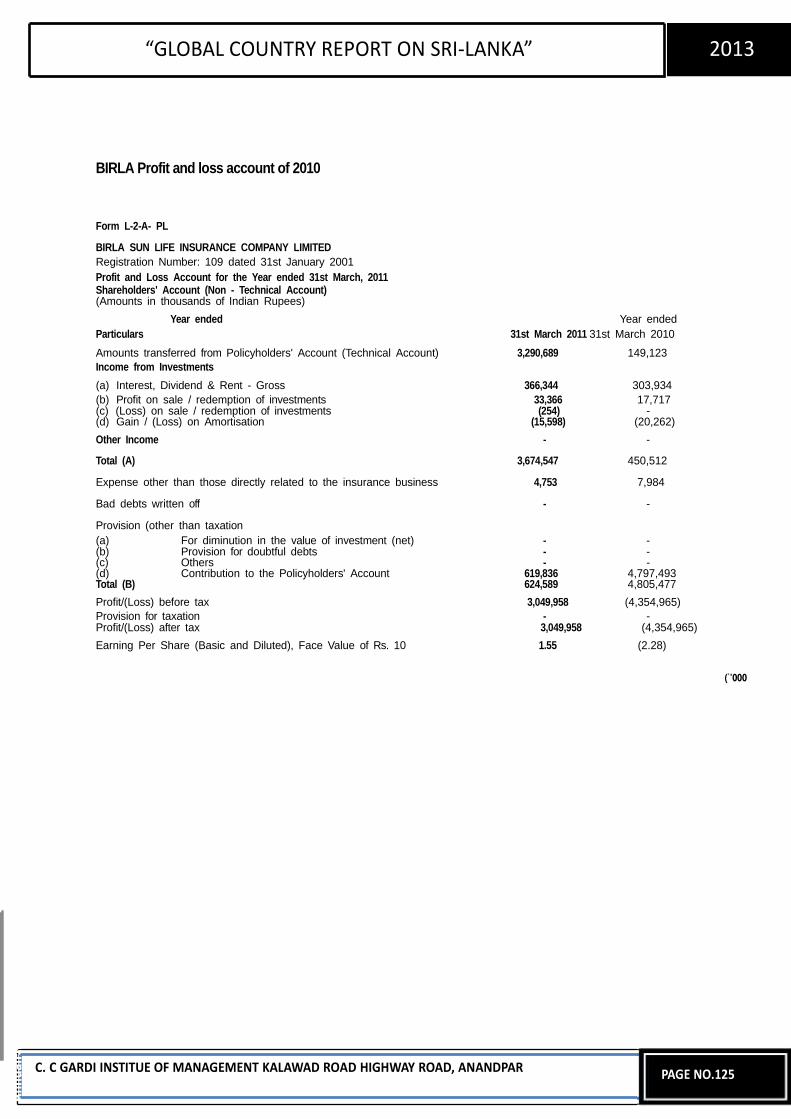
An
nu
alFi
nan
cial
s R
ep
ort
20
11
-12
“GLOBAL COUNTRY REPORT ON SRI-LANKA” 2013
BIRLA Profit and loss account of 2010
Form L-2-A- PL
BIRLA SUN LIFE INSURANCE COMPANY LIMITED Registration Number: 109 dated 31st January 2001 Profit and Loss Account for the Year ended 31st March, 2011 Shareholders' Account (Non - Technical Account) (Amounts in thousands of Indian Rupees)
Year ended Year ended Particulars 31st March 2011 31st March 2010
Amounts transferred from Policyholders' Account (Technical Account) 3,290,689 149,123 Income from Investments
(a) Interest, Dividend & Rent - Gross 366,344 303,934 (b) Profit on sale / redemption of investments 33,366 17,717 (c) (Loss) on sale / redemption of investments (254) - (d) Gain / (Loss) on Amortisation (15,598) (20,262)
Other Income - -
Total (A) 3,674,547 450,512
Expense other than those directly related to the insurance business 4,753 7,984
Bad debts written off - -
Provision (other than taxation (a) For diminution in the value of investment (net) - - (b) Provision for doubtful debts - - (c) Others - - (d) Contribution to the Policyholders' Account 619,836 4,797,493 Total (B) 624,589 4,805,477
Profit/(Loss) before tax 3,049,958 (4,354,965) Provision for taxation - - Profit/(Loss) after tax 3,049,958 (4,354,965)
Earning Per Share (Basic and Diluted), Face Value of Rs. 10 1.55 (2.28)
(`'000
C. C GARDI INSTITUE OF MANAGEMENT KALAWAD ROAD HIGHWAY ROAD, ANANDPAR
PAGE NO.125
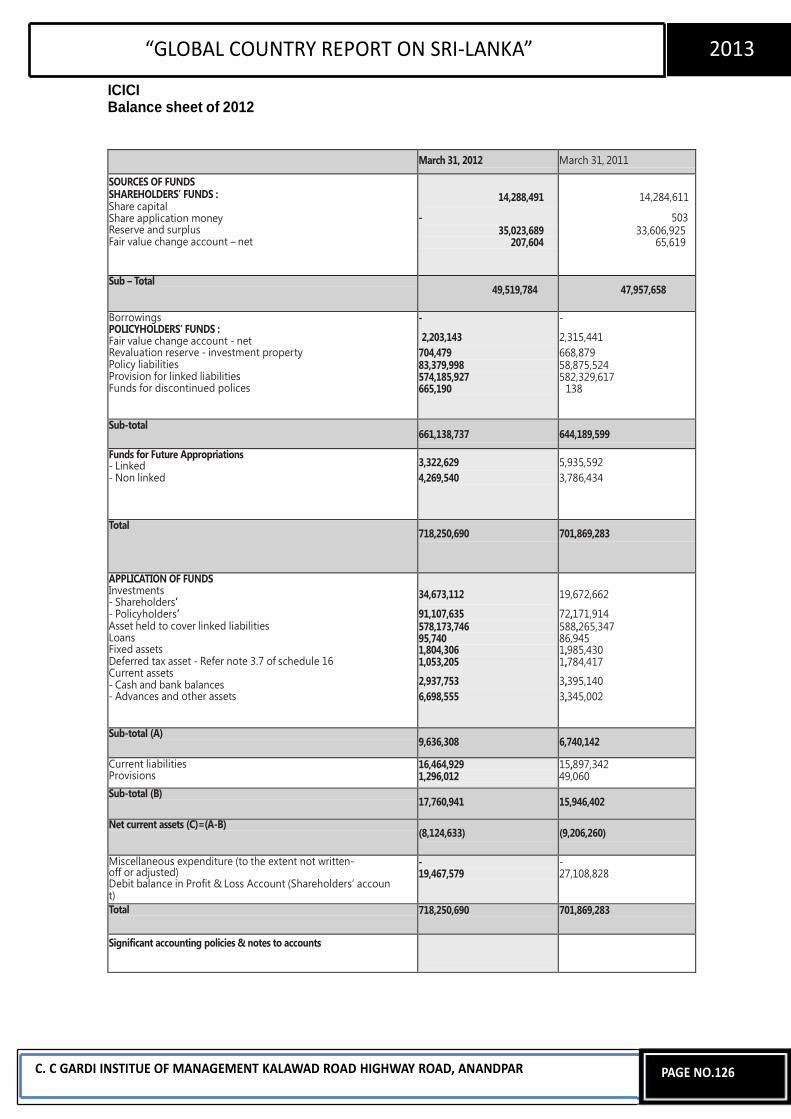
“GLOBAL COUNTRY REPORT ON SRI-LANKA” 2013
ICICI Balance sheet of 2012
C. C GARDI INSTITUE OF MANAGEMENT KALAWAD ROAD HIGHWAY ROAD, ANANDPAR
PAGE NO.126
March 31, 2012 March 31, 2011
SOURCES OF FUNDS SHAREHOLDERS’ FUNDS : Share capital Share application money Reserve and surplus Fair value change account – net
14,288,491
- 35,023,689
207,604
14,284,611
503 33,606,925
65,619
Sub – Total 49,519,784 47,957,658
Borrowings POLICYHOLDERS’ FUNDS : Fair value change account - net Revaluation reserve - investment property Policy liabilities Provision for linked liabilities Funds for discontinued polices
-
2,203,143 704,479 83,379,998 574,185,927 665,190
-
2,315,441 668,879 58,875,524 582,329,617
138
Sub-total 661,138,737 644,189,599
Funds for Future Appropriations - Linked - Non linked
3,322,629 4,269,540
5,935,592 3,786,434
Total 718,250,690 701,869,283
APPLICATION OF FUNDS Investments - Shareholders’ - Policyholders’ Asset held to cover linked liabilities Loans Fixed assets Deferred tax asset - Refer note 3.7 of schedule 16 Current assets - Cash and bank balances - Advances and other assets
34,673,112
91,107,635 578,173,746 95,740 1,804,306 1,053,205
2,937,753 6,698,555
19,672,662
72,171,914 588,265,347 86,945 1,985,430 1,784,417
3,395,140 3,345,002
Sub-total (A) 9,636,308 6,740,142
Current liabilities Provisions
16,464,929 1,296,012
15,897,342 49,060
Sub-total (B) 17,760,941 15,946,402
Net current assets (C)=(A-B) (8,124,633) (9,206,260)
Miscellaneous expenditure (to the extent not written- off or adjusted) Debit balance in Profit & Loss Account (Shareholders’ accoun t)
- 19,467,579
- 27,108,828
Total 718,250,690 701,869,283
Significant accounting policies & notes to accounts
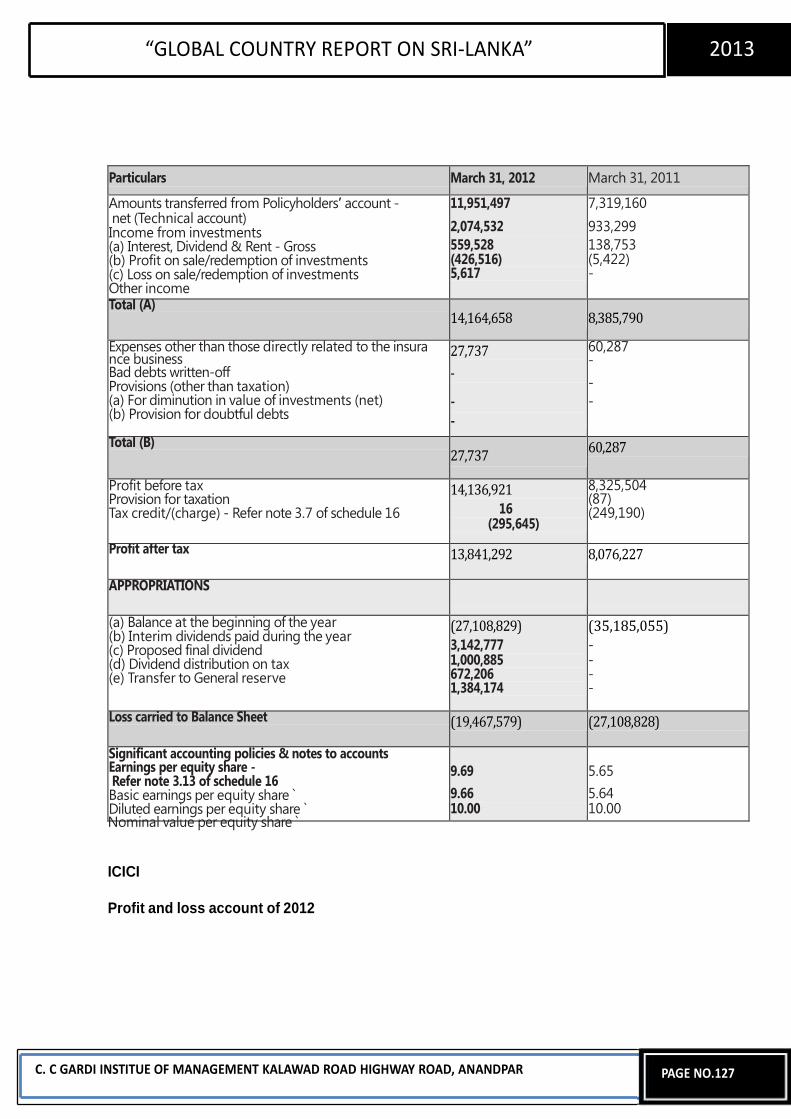
“GLOBAL COUNTRY REPORT ON SRI-LANKA” 2013
Nominal value per equity share ` ICICI
Profit and loss account of 2012
C. C GARDI INSTITUE OF MANAGEMENT KALAWAD ROAD HIGHWAY ROAD, ANANDPAR
PAGE NO.127
Particulars March 31, 2012 March 31, 2011
Amounts transferred from Policyholders’ account - net (Technical account) Income from investments (a) Interest, Dividend & Rent - Gross (b) Profit on sale/redemption of investments (c) Loss on sale/redemption of investments Other income
11,951,497
2,074,532
559,528 (426,516) 5,617
7,319,160
933,299
138,753 (5,422) -
Total (A) 14,164,658 8,385,790
Expenses other than those directly related to the insura nce business Bad debts written-off Provisions (other than taxation) (a) For diminution in value of investments (net) (b) Provision for doubtful debts
27,737
-
-
-
60,287 -
-
-
Total (B) 27,737
60,287
Profit before tax Provision for taxation Tax credit/(charge) - Refer note 3.7 of schedule 16
14,136,921
16 (295,645)
8,325,504 (87) (249,190)
Profit after tax 13,841,292 8,076,227
APPROPRIATIONS
(a) Balance at the beginning of the year (b) Interim dividends paid during the year (c) Proposed final dividend (d) Dividend distribution on tax (e) Transfer to General reserve
(27,108,829) 3,142,777 1,000,885 672,206 1,384,174
(35,185,055) - - - -
Loss carried to Balance Sheet (19,467,579) (27,108,828)
Significant accounting policies & notes to accounts Earnings per equity share - Refer note 3.13 of schedule 16 Basic earnings per equity share ` Diluted earnings per equity share `
9.69
9.66 10.00
5.65
5.64 10.00
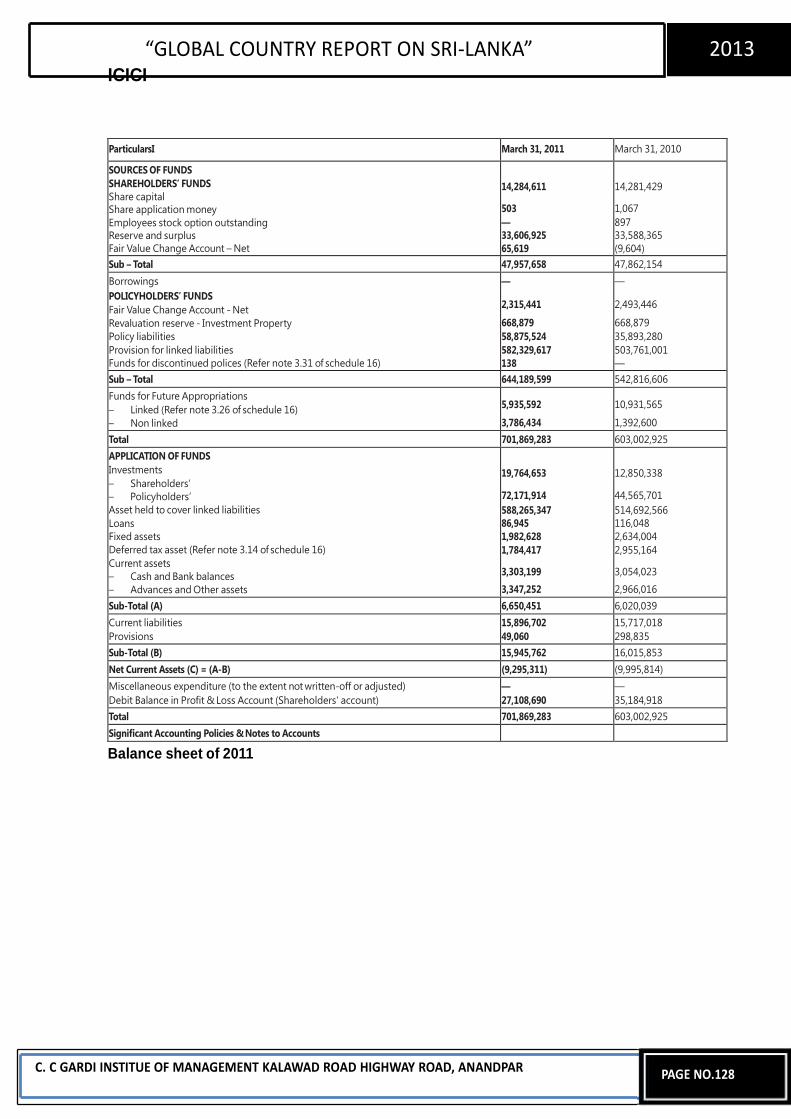
“GLOBAL COUNTRY REPORT ON SRI-LANKA” 2013
ICICI
Balance sheet of 2011
C. C GARDI INSTITUE OF MANAGEMENT KALAWAD ROAD HIGHWAY ROAD, ANANDPAR
PAGE NO.128
ParticularsI March 31, 2011 March 31, 2010
SOURCES OF FUNDS SHAREHOLDERS’ FUNDS Share capital Share application money Employees stock option outstanding Reserve and surplus Fair Value Change Account – Net
14,284,611
503 — 33,606,925 65,619
14,281,429
1,067 897 33,588,365 (9,604)
Sub – Total 47,957,658 47,862,154 Borrowings POLICYHOLDERS’ FUNDS Fair Value Change Account - Net Revaluation reserve - Investment Property Policy liabilities Provision for linked liabilities Funds for discontinued polices (Refer note 3.31 of schedule 16)
—
2,315,441
668,879 58,875,524 582,329,617 138
—
2,493,446
668,879 35,893,280 503,761,001 —
Sub – Total 644,189,599 542,816,606 Funds for Future Appropriations – Linked (Refer note 3.26 of schedule 16) – Non linked
5,935,592
3,786,434
10,931,565
1,392,600 Total 701,869,283 603,002,925 APPLICATION OF FUNDS Investments – Shareholders’ – Policyholders’ Asset held to cover linked liabilities Loans Fixed assets Deferred tax asset (Refer note 3.14 of schedule 16) Current assets – Cash and Bank balances – Advances and Other assets
19,764,653
72,171,914 588,265,347 86,945 1,982,628 1,784,417
3,303,199
3,347,252
12,850,338
44,565,701 514,692,566 116,048 2,634,004 2,955,164
3,054,023
2,966,016 Sub-Total (A) 6,650,451 6,020,039 Current liabilities Provisions
15,896,702 49,060
15,717,018 298,835
Sub-Total (B) 15,945,762 16,015,853 Net Current Assets (C) = (A-B) (9,295,311) (9,995,814) Miscellaneous expenditure (to the extent not written-off or adjusted) Debit Balance in Profit & Loss Account (Shareholders' account)
— 27,108,690
— 35,184,918
Total 701,869,283 603,002,925 Significant Accounting Policies & Notes to Accounts
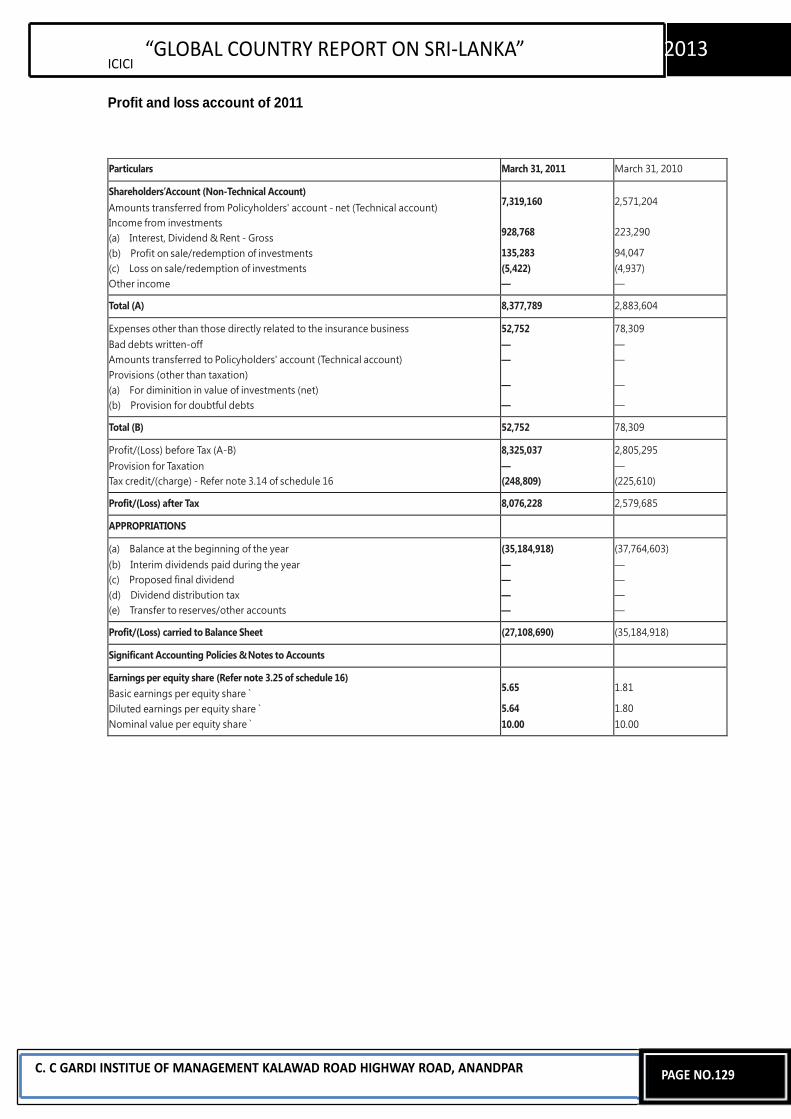
ICICI
“GLOBAL COUNTRY REPORT ON SRI-LANKA” 2013
Profit and loss account of 2011
C. C GARDI INSTITUE OF MANAGEMENT KALAWAD ROAD HIGHWAY ROAD, ANANDPAR
PAGE NO.129
Particulars March 31, 2011 March 31, 2010
Shareholders’Account (Non-Technical Account) Amounts transferred from Policyholders' account - net (Technical account) Income from investments (a) Interest, Dividend & Rent - Gross (b) Profit on sale/redemption of investments (c) Loss on sale/redemption of investments Other income
7,319,160
928,768
135,283 (5,422) —
2,571,204
223,290
94,047 (4,937) —
Total (A) 8,377,789 2,883,604
Expenses other than those directly related to the insurance business Bad debts written-off Amounts transferred to Policyholders' account (Technical account) Provisions (other than taxation) (a) For diminition in value of investments (net) (b) Provision for doubtful debts
52,752 — —
—
—
78,309 — —
—
—
Total (B) 52,752 78,309
Profit/(Loss) before Tax (A-B) Provision for Taxation Tax credit/(charge) - Refer note 3.14 of schedule 16
8,325,037 — (248,809)
2,805,295 — (225,610)
Profit/(Loss) after Tax 8,076,228 2,579,685
APPROPRIATIONS
(a) Balance at the beginning of the year (b) Interim dividends paid during the year (c) Proposed final dividend (d) Dividend distribution tax (e) Transfer to reserves/other accounts
(35,184,918) — — — —
(37,764,603) — — — —
Profit/(Loss) carried to Balance Sheet (27,108,690) (35,184,918)
Significant Accounting Policies & Notes to Accounts
Earnings per equity share (Refer note 3.25 of schedule 16) Basic earnings per equity share ` Diluted earnings per equity share ` Nominal value per equity share ̀
5.65
5.64 10.00
1.81
1.80 10.00
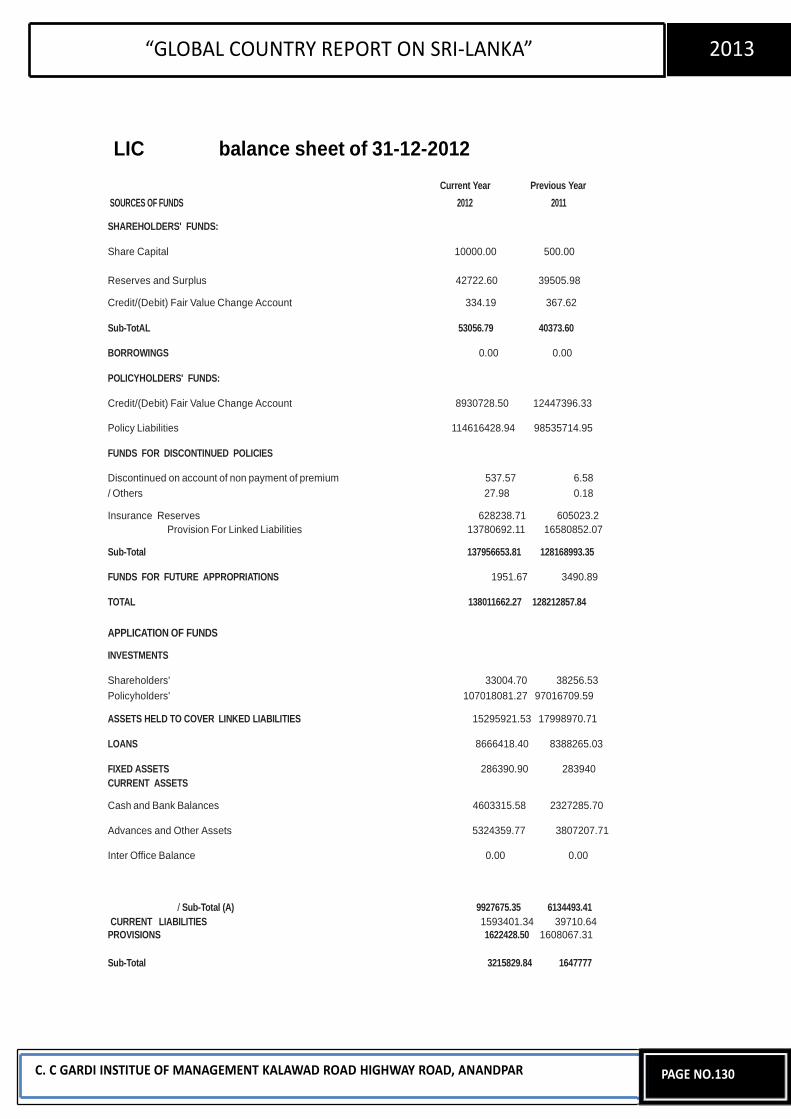
“GLOBAL COUNTRY REPORT ON SRI-LANKA” 2013
LIC balance sheet of 31-12-2012
Current Year Previous Year SOURCES OF FUNDS 2012 2011
SHAREHOLDERS' FUNDS:
Share Capital 10000.00 500.00
Reserves and Surplus 42722.60 39505.98
Credit/(Debit) Fair Value Change Account 334.19 367.62
Sub-TotAL 53056.79 40373.60
BORROWINGS 0.00 0.00
POLICYHOLDERS' FUNDS:
Credit/(Debit) Fair Value Change Account 8930728.50 12447396.33
Policy Liabilities 114616428.94 98535714.95
FUNDS FOR DISCONTINUED POLICIES
Discontinued on account of non payment of premium 537.57 6.58 / Others 27.98 0.18
Insurance Reserves 628238.71 605023.2 Provision For Linked Liabilities 13780692.11 16580852.07
Sub-Total 137956653.81 128168993.35
FUNDS FOR FUTURE APPROPRIATIONS 1951.67 3490.89
TOTAL 138011662.27 128212857.84
APPLICATION OF FUNDS
INVESTMENTS
Shareholders' 33004.70 38256.53 Policyholders' 107018081.27 97016709.59
ASSETS HELD TO COVER LINKED LIABILITIES 15295921.53 17998970.71
LOANS 8666418.40 8388265.03
FIXED ASSETS 286390.90 283940 CURRENT ASSETS
Cash and Bank Balances 4603315.58 2327285.70
Advances and Other Assets 5324359.77 3807207.71
Inter Office Balance 0.00 0.00
/ Sub-Total (A) 9927675.35 6134493.41 CURRENT LIABILITIES 1593401.34 39710.64
PROVISIONS 1622428.50 1608067.31 Sub-Total 3215829.84 1647777
C. C GARDI INSTITUE OF MANAGEMENT KALAWAD ROAD HIGHWAY ROAD, ANANDPAR
PAGE NO.130
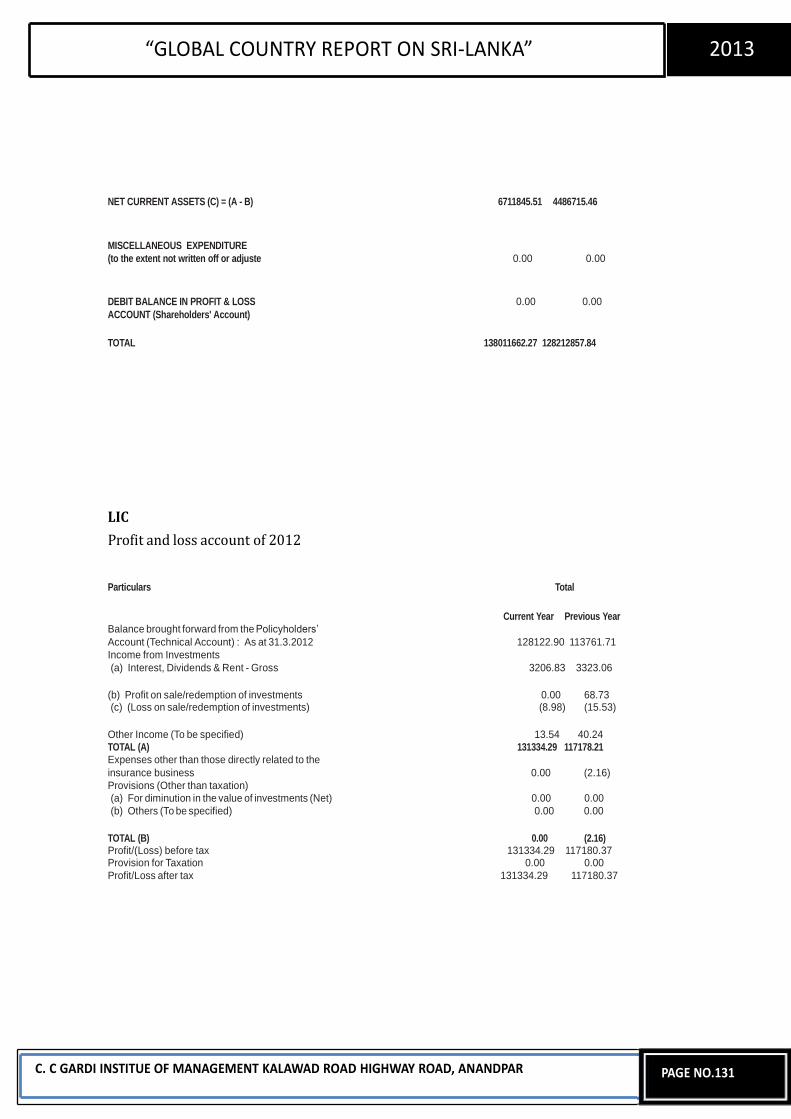
“GLOBAL COUNTRY REPORT ON SRI-LANKA” 2013
NET CURRENT ASSETS (C) = (A - B) 6711845.51 4486715.46 MISCELLANEOUS EXPENDITURE (to the extent not written off or adjuste 0.00 0.00 DEBIT BALANCE IN PROFIT & LOSS 0.00 0.00 ACCOUNT (Shareholders' Account) TOTAL 138011662.27 128212857.84 LIC
Profit and loss account of 2012
Particulars Total
Current Year Previous Year Balance brought forward from the Policyholders’ Account (Technical Account) : As at 31.3.2012 128122.90 113761.71 Income from Investments (a) Interest, Dividends & Rent - Gross 3206.83 3323.06
(b) Profit on sale/redemption of investments 0.00 68.73 (c) (Loss on sale/redemption of investments) (8.98) (15.53)
Other Income (To be specified) 13.54 40.24 TOTAL (A) 131334.29 117178.21 Expenses other than those directly related to the insurance business 0.00 (2.16) Provisions (Other than taxation) (a) For diminution in the value of investments (Net) 0.00 0.00 (b) Others (To be specified) 0.00 0.00
TOTAL (B) 0.00 (2.16) Profit/(Loss) before tax 131334.29 117180.37 Provision for Taxation 0.00 0.00 Profit/Loss after tax 131334.29 117180.37
C. C GARDI INSTITUE OF MANAGEMENT KALAWAD ROAD HIGHWAY ROAD, ANANDPAR
PAGE NO.131
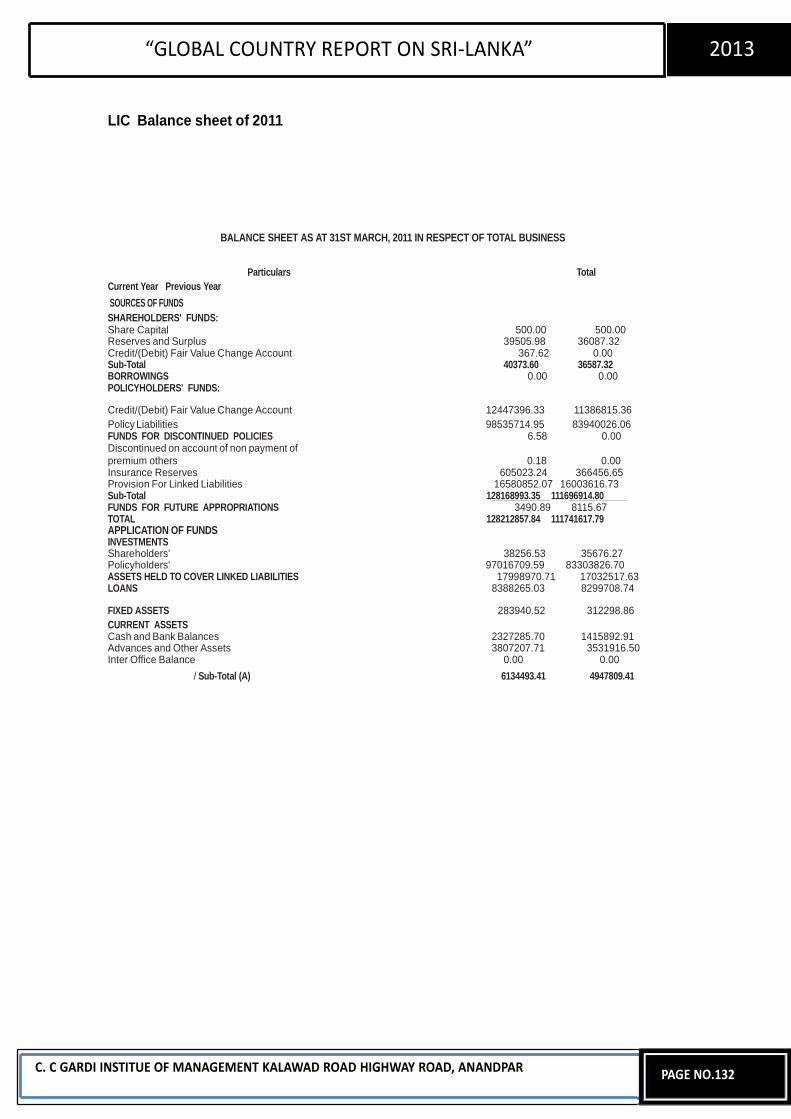
“GLOBAL COUNTRY REPORT ON SRI-LANKA” 2013
LIC Balance sheet of 2011
BALANCE SHEET AS AT 31ST MARCH, 2011 IN RESPECT OF TOTAL BUSINESS
Particulars Total Current Year Previous Year SOURCES OF FUNDS SHAREHOLDERS' FUNDS: Share Capital 500.00 500.00 Reserves and Surplus 39505.98 36087.32 Credit/(Debit) Fair Value Change Account 367.62 0.00 Sub-Total 40373.60 36587.32 BORROWINGS 0.00 0.00 POLICYHOLDERS' FUNDS:
Credit/(Debit) Fair Value Change Account 12447396.33 11386815.36 Policy Liabilities 98535714.95 83940026.06 FUNDS FOR DISCONTINUED POLICIES 6.58 0.00 Discontinued on account of non payment of premium others 0.18 0.00 Insurance Reserves 605023.24 366456.65 Provision For Linked Liabilities 16580852.07 16003616.73 Sub-Total 128168993.35 111696914.80 FUNDS FOR FUTURE APPROPRIATIONS 3490.89 8115.67 TOTAL 128212857.84 111741617.79 APPLICATION OF FUNDS INVESTMENTS Shareholders' 38256.53 35676.27 Policyholders' 97016709.59 83303826.70 ASSETS HELD TO COVER LINKED LIABILITIES 17998970.71 17032517.63 LOANS 8388265.03 8299708.74
FIXED ASSETS 283940.52 312298.86 CURRENT ASSETS Cash and Bank Balances 2327285.70 1415892.91 Advances and Other Assets 3807207.71 3531916.50 Inter Office Balance 0.00 0.00
/ Sub-Total (A) 6134493.41 4947809.41
C. C GARDI INSTITUE OF MANAGEMENT KALAWAD ROAD HIGHWAY ROAD, ANANDPAR
PAGE NO.132
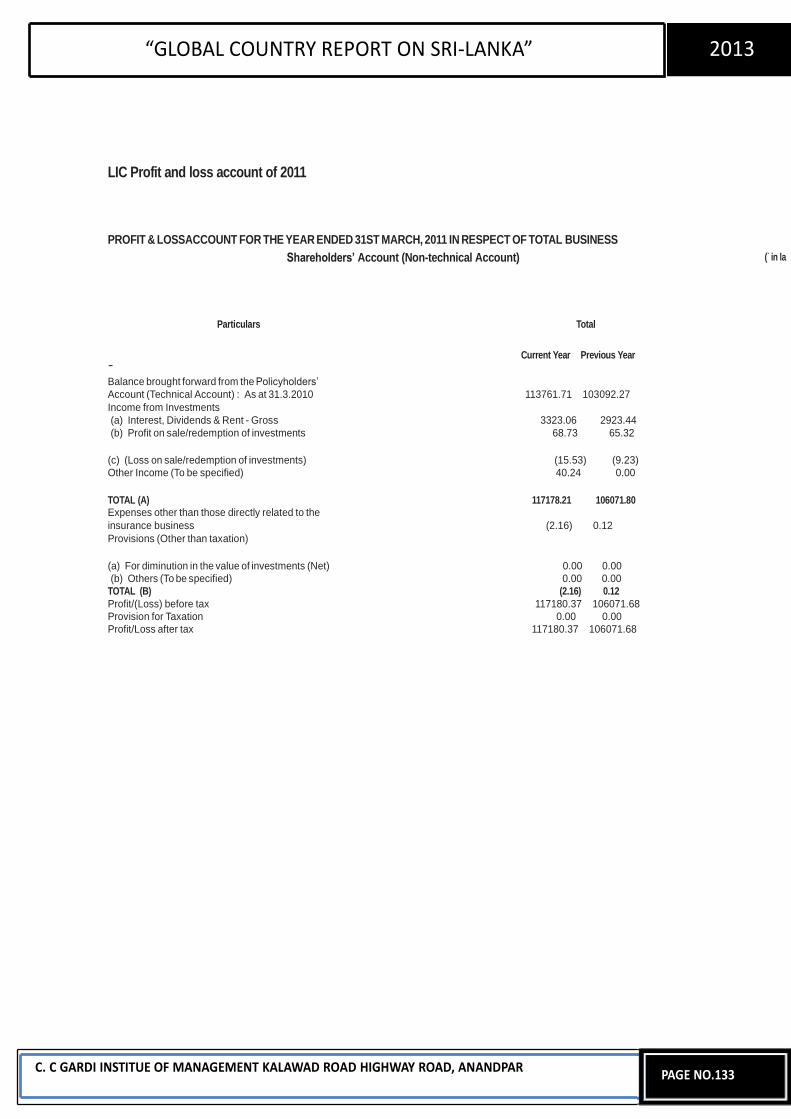
“GLOBAL COUNTRY REPORT ON SRI-LANKA” 2013
LIC Profit and loss account of 2011 PROFIT & LOSSACCOUNT FOR THE YEAR ENDED 31ST MARCH, 2011 IN RESPECT OF TOTAL BUSINESS
Shareholders‟ Account (Non-technical Account) ( ̀in la
Particulars Total
-
Current Year Previous Year
Balance brought forward from the Policyholders’ Account (Technical Account) : As at 31.3.2010 113761.71 103092.27 Income from Investments (a) Interest, Dividends & Rent - Gross 3323.06 2923.44 (b) Profit on sale/redemption of investments 68.73 65.32
(c) (Loss on sale/redemption of investments) (15.53) (9.23) Other Income (To be specified) 40.24 0.00 TOTAL (A) 117178.21 106071.80 Expenses other than those directly related to the insurance business (2.16) 0.12 Provisions (Other than taxation) (a) For diminution in the value of investments (Net) 0.00 0.00 (b) Others (To be specified) 0.00 0.00
TOTAL (B) (2.16) 0.12 Profit/(Loss) before tax 117180.37 106071.68 Provision for Taxation 0.00 0.00 Profit/Loss after tax 117180.37 106071.68
C. C GARDI INSTITUE OF MANAGEMENT KALAWAD ROAD HIGHWAY ROAD, ANANDPAR
PAGE NO.133
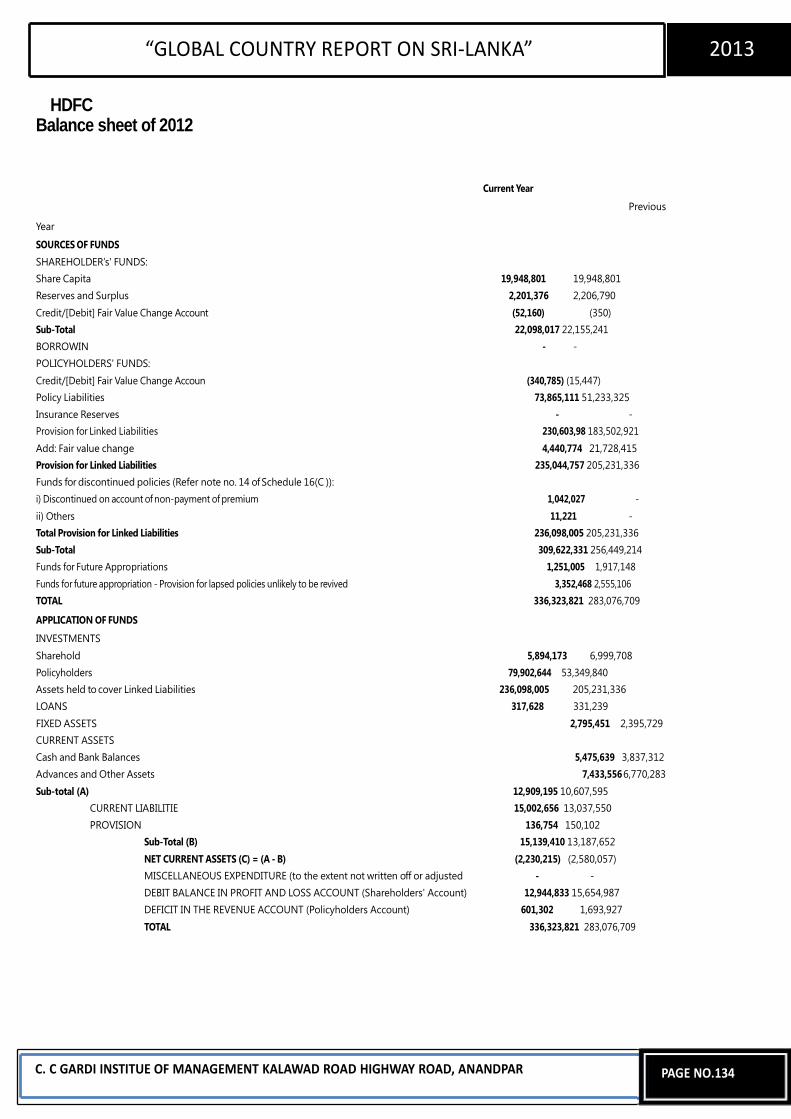
“GLOBAL COUNTRY REPORT ON SRI-LANKA” 2013
HDFC
Balance sheet of 2012
Current Year
Previous
Year
SOURCES OF FUNDS SHAREHOLDER’s' FUNDS: Share Capita 19,948,801 19,948,801 Reserves and Surplus 2,201,376 2,206,790 Credit/[Debit] Fair Value Change Account (52,160) (350) Sub-Total 22,098,017 22,155,241 BORROWIN - - POLICYHOLDERS' FUNDS: Credit/[Debit] Fair Value Change Accoun (340,785) (15,447) Policy Liabilities 73,865,111 51,233,325 Insurance Reserves - - Provision for Linked Liabilities 230,603,98 183,502,921 Add: Fair value change 4,440,774 21,728,415 Provision for Linked Liabilities 235,044,757 205,231,336 Funds for discontinued policies (Refer note no. 14 of Schedule 16(C )): i) Discontinued on account of non-payment of premium 1,042,027 - ii) Others 11,221 - Total Provision for Linked Liabilities 236,098,005 205,231,336 Sub-Total 309,622,331 256,449,214 Funds for Future Appropriations 1,251,005 1,917,148 Funds for future appropriation - Provision for lapsed policies unlikely to be revived 3,352,468 2,555,106 TOTAL 336,323,821 283,076,709
APPLICATION OF FUNDS
INVESTMENTS Sharehold 5,894,173 6,999,708 Policyholders 79,902,644 53,349,840 Assets held to cover Linked Liabilities 236,098,005 205,231,336 LOANS 317,628 331,239 FIXED ASSETS 2,795,451 2,395,729 CURRENT ASSETS Cash and Bank Balances 5,475,639 3,837,312 Advances and Other Assets 7,433,556 6,770,283 Sub-total (A) 12,909,195 10,607,595
CURRENT LIABILITIE 15,002,656 13,037,550 PROVISION 136,754 150,102
Sub-Total (B) 15,139,410 13,187,652 NET CURRENT ASSETS (C) = (A - B) (2,230,215) (2,580,057) MISCELLANEOUS EXPENDITURE (to the extent not written off or adjusted - - DEBIT BALANCE IN PROFIT AND LOSS ACCOUNT (Shareholders' Account) 12,944,833 15,654,987 DEFICIT IN THE REVENUE ACCOUNT (Policyholders Account) 601,302 1,693,927 TOTAL 336,323,821 283,076,709
C. C GARDI INSTITUE OF MANAGEMENT KALAWAD ROAD HIGHWAY ROAD, ANANDPAR
PAGE NO.134
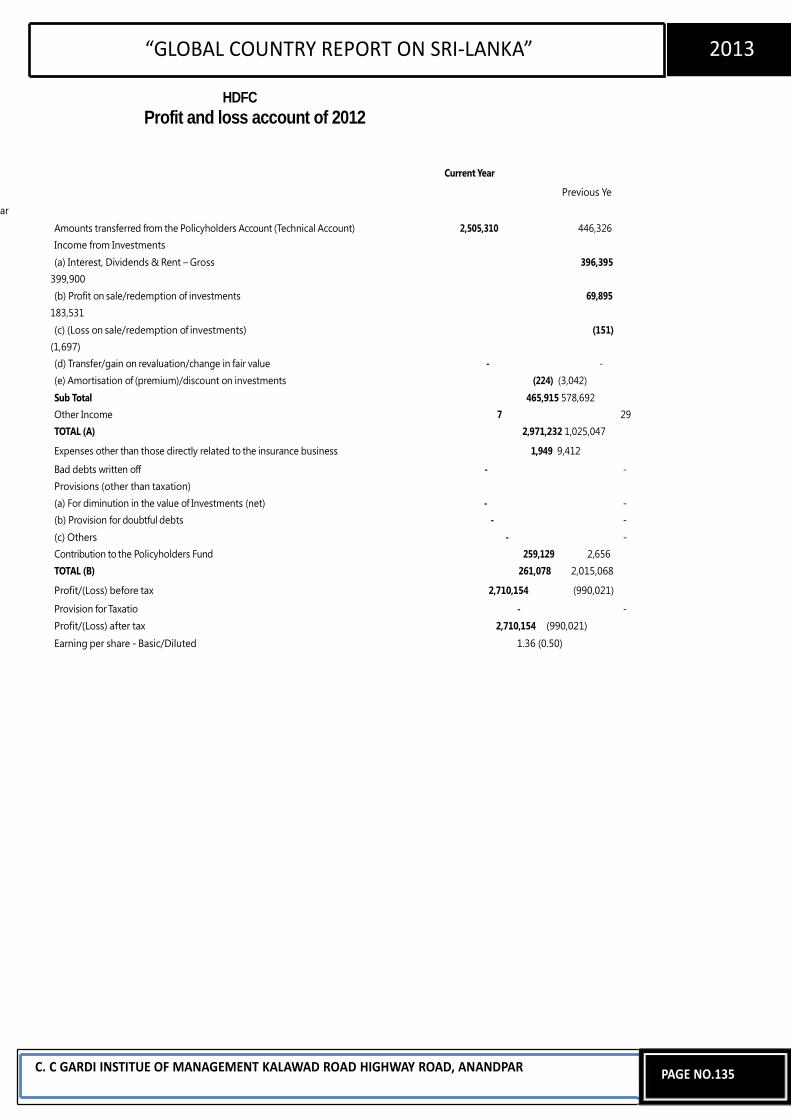
“GLOBAL COUNTRY REPORT ON SRI-LANKA” 2013
HDFC
Profit and loss account of 2012
Current Year
Previous Ye
ar
Amounts transferred from the Policyholders Account (Technical Account) 2,505,310 446,326 Income from Investments (a) Interest, Dividends & Rent – Gross 396,395
399,900 (b) Profit on sale/redemption of investments 69,895
183,531 (c) (Loss on sale/redemption of investments) (151)
(1,697) (d) Transfer/gain on revaluation/change in fair value - - (e) Amortisation of (premium)/discount on investments (224) (3,042) Sub Total 465,915 578,692 Other Income 7 29 TOTAL (A) 2,971,232 1,025,047
Expenses other than those directly related to the insurance business 1,949 9,412
Bad debts written off - - Provisions (other than taxation) (a) For diminution in the value of Investments (net) - - (b) Provision for doubtful debts - - (c) Others - - Contribution to the Policyholders Fund 259,129 2,656 TOTAL (B) 261,078 2,015,068
Profit/(Loss) before tax 2,710,154 (990,021)
Provision for Taxatio - - Profit/(Loss) after tax 2,710,154 (990,021) Earning per share - Basic/Diluted 1.36 (0.50)
C. C GARDI INSTITUE OF MANAGEMENT KALAWAD ROAD HIGHWAY ROAD, ANANDPAR
PAGE NO.135
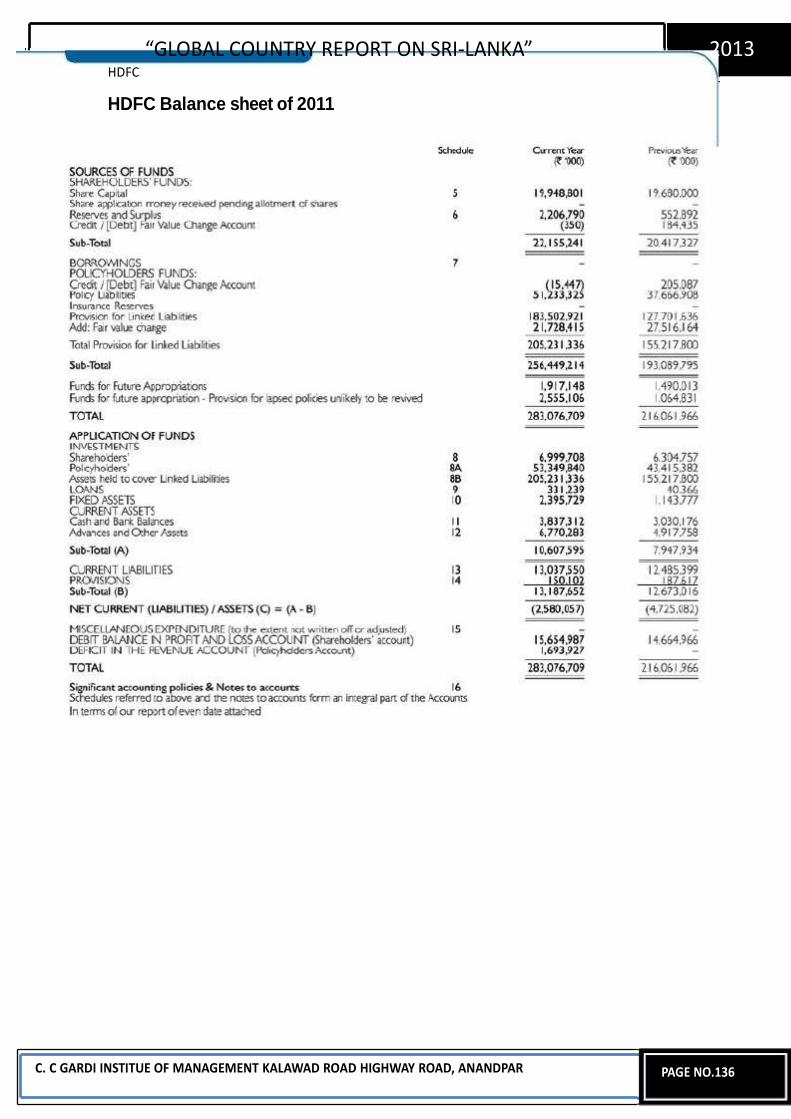
“GLOBAL COUNTRY REPORT ON SRI-LANKA” 2013
HDFC HDFC Balance sheet of 2011
C. C GARDI INSTITUE OF MANAGEMENT KALAWAD ROAD HIGHWAY ROAD, ANANDPAR
PAGE NO.136
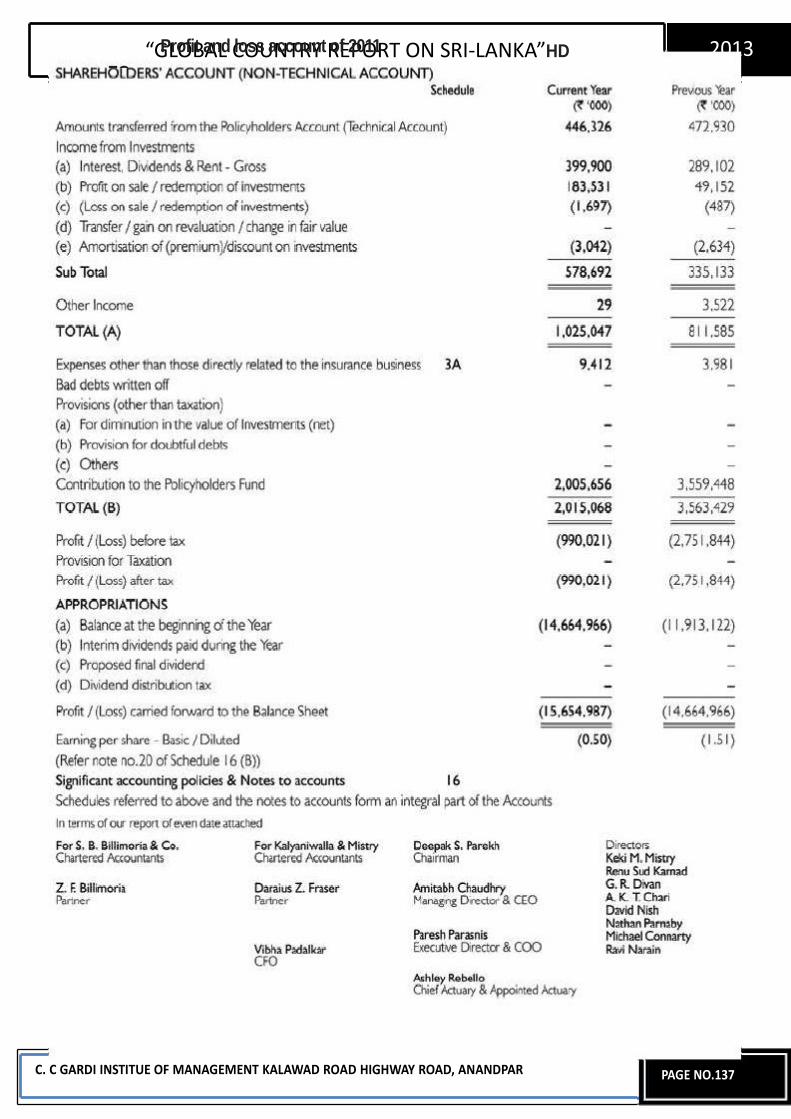
“GLOBAL COUNTRY REPORT ON SRI-LANKA”HDFC
Profit and loss account of 2011
C. C GARDI INSTITUE OF MANAGEMENT KALAWAD ROAD HIGHWAY ROAD, ANANDPAR
2013
PAGE NO.137
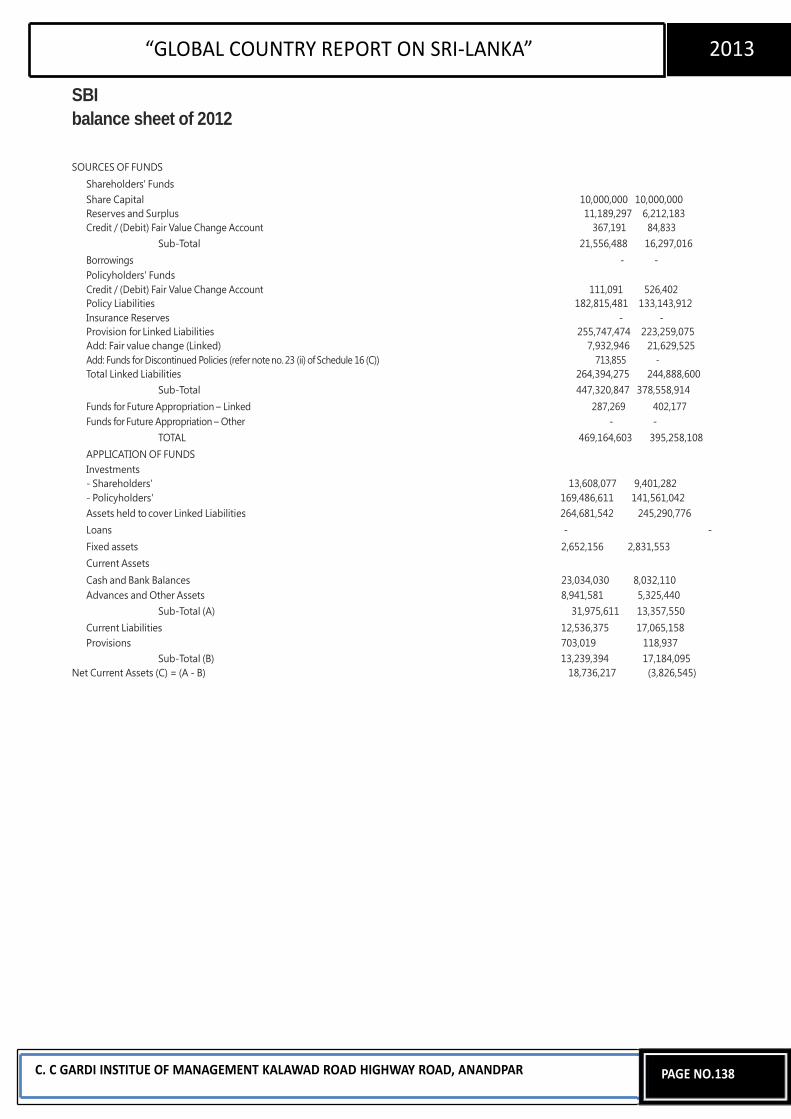
“GLOBAL COUNTRY REPORT ON SRI-LANKA” 2013
SBI
balance sheet of 2012 SOURCES OF FUNDS
Shareholders' Funds Share Capital 10,000,000 10,000,000 Reserves and Surplus 11,189,297 6,212,183 Credit / (Debit) Fair Value Change Account 367,191 84,833
Sub-Total 21,556,488 16,297,016 Borrowings - - Policyholders' Funds Credit / (Debit) Fair Value Change Account 111,091 526,402 Policy Liabilities 182,815,481 133,143,912 Insurance Reserves - - Provision for Linked Liabilities 255,747,474 223,259,075 Add: Fair value change (Linked) 7,932,946 21,629,525 Add: Funds for Discontinued Policies (refer note no. 23 (ii) of Schedule 16 (C)) 713,855 - Total Linked Liabilities 264,394,275 244,888,600
Sub-Total 447,320,847 378,558,914 Funds for Future Appropriation – Linked 287,269 402,177 Funds for Future Appropriation – Other - -
TOTAL 469,164,603 395,258,108 APPLICATION OF FUNDS Investments - Shareholders' 13,608,077 9,401,282 - Policyholders' 169,486,611 141,561,042 Assets held to cover Linked Liabilities 264,681,542 245,290,776 Loans - - Fixed assets 2,652,156 2,831,553 Current Assets Cash and Bank Balances 23,034,030 8,032,110 Advances and Other Assets 8,941,581 5,325,440
Sub-Total (A) 31,975,611 13,357,550 Current Liabilities 12,536,375 17,065,158 Provisions 703,019 118,937
Sub-Total (B) 13,239,394 17,184,095 Net Current Assets (C) = (A - B) 18,736,217 (3,826,545)
C. C GARDI INSTITUE OF MANAGEMENT KALAWAD ROAD HIGHWAY ROAD, ANANDPAR
PAGE NO.138
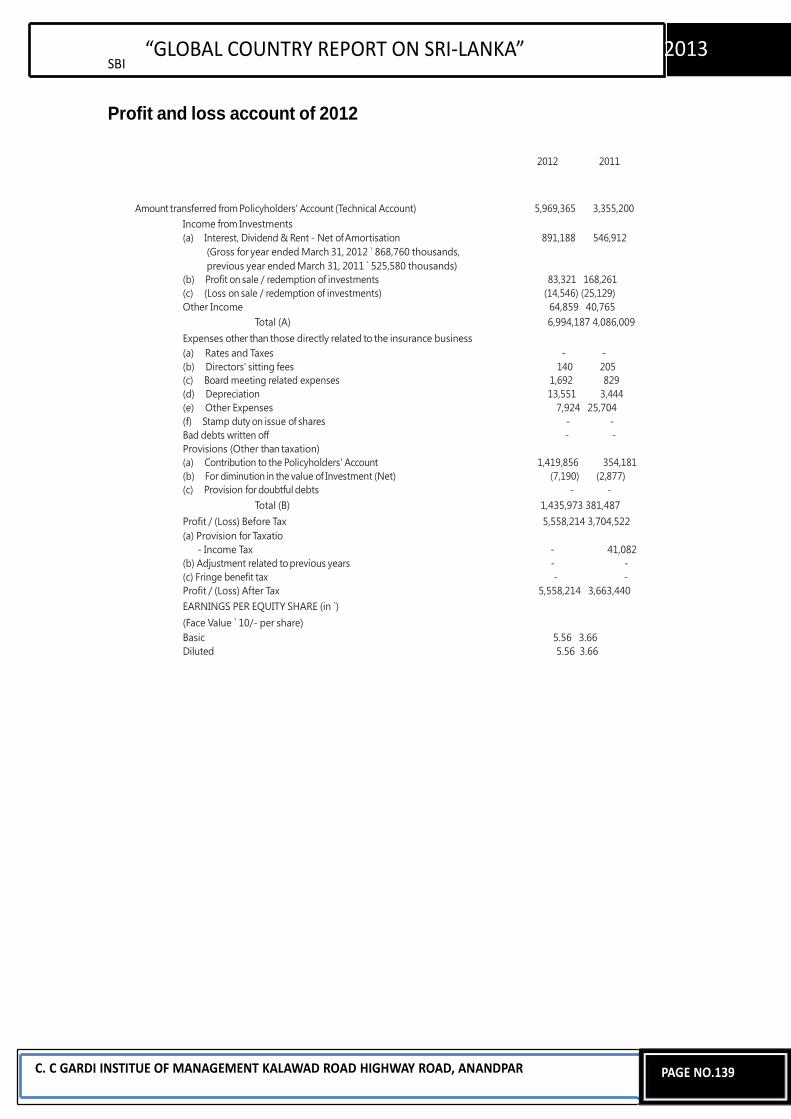
SBI
“GLOBAL COUNTRY REPORT ON SRI-LANKA” 2013
Profit and loss account of 2012
2012 2011
Amount transferred from Policyholders' Account (Technical Account) 5,969,365 3,355,200 Income from Investments (a) Interest, Dividend & Rent - Net of Amortisation 891,188 546,912
(Gross for year ended March 31, 2012 ` 868,760 thousands, previous year ended March 31, 2011 ` 525,580 thousands)
(b) Profit on sale / redemption of investments 83,321 168,261 (c) (Loss on sale / redemption of investments) (14,546) (25,129) Other Income 64,859 40,765
Total (A) 6,994,187 4,086,009 Expenses other than those directly related to the insurance business (a) Rates and Taxes - - (b) Directors' sitting fees 140 205 (c) Board meeting related expenses 1,692 829 (d) Depreciation 13,551 3,444 (e) Other Expenses 7,924 25,704 (f) Stamp duty on issue of shares - - Bad debts written off - - Provisions (Other than taxation) (a) Contribution to the Policyholders' Account 1,419,856 354,181 (b) For diminution in the value of Investment (Net) (7,190) (2,877) (c) Provision for doubtful debts - -
Total (B) 1,435,973 381,487 Profit / (Loss) Before Tax 5,558,214 3,704,522 (a) Provision for Taxatio
- Income Tax - 41,082 (b) Adjustment related to previous years - - (c) Fringe benefit tax - - Profit / (Loss) After Tax 5,558,214 3,663,440 EARNINGS PER EQUITY SHARE (in `) (Face Value ` 10/- per share) Basic 5.56 3.66 Diluted 5.56 3.66
C. C GARDI INSTITUE OF MANAGEMENT KALAWAD ROAD HIGHWAY ROAD, ANANDPAR
PAGE NO.139
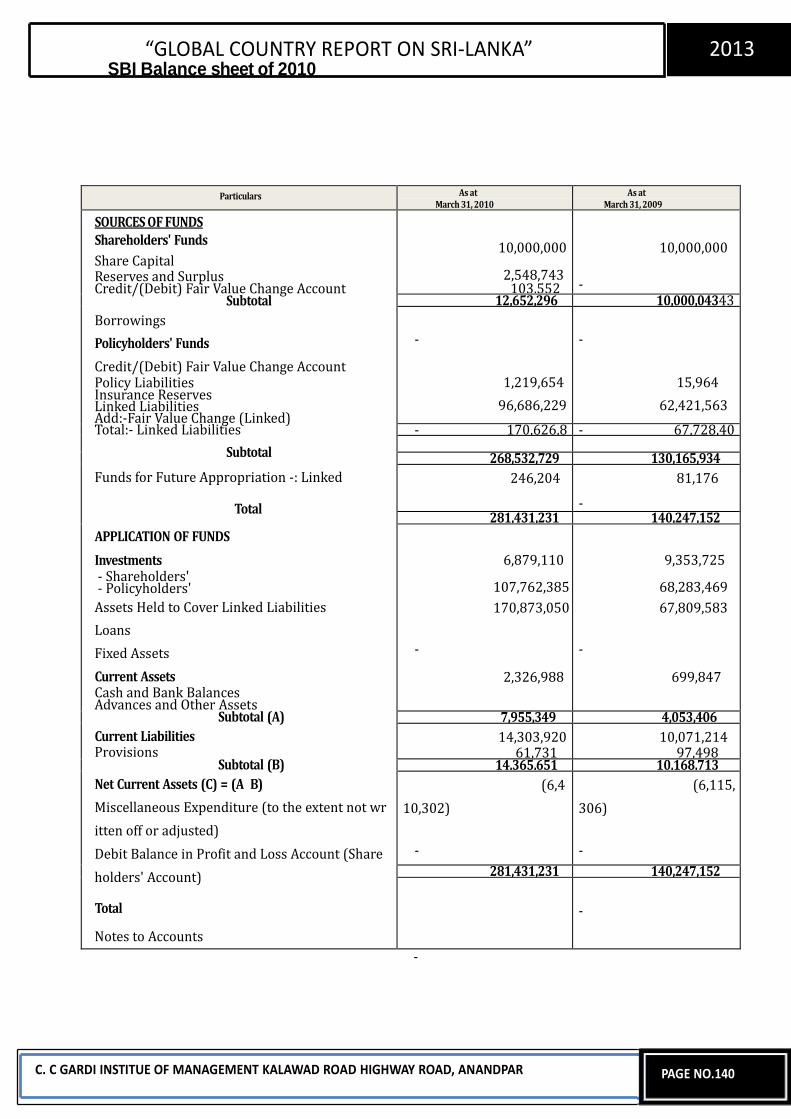
“GLOBAL COUNTRY REPORT ON SRI-LANKA” 2013
SBI Balance sheet of 2010
-
C. C GARDI INSTITUE OF MANAGEMENT KALAWAD ROAD HIGHWAY ROAD, ANANDPAR
PAGE NO.140
Particulars As at March 31, 2010
As at March 31, 2009
SOURCES OF FUNDS
Shareholders' Funds
Share Capital Reserves and Surplus Credit/(Debit) Fair Value Change Account
Subtotal
Borrowings
Policyholders' Funds
Credit/(Debit) Fair Value Change Account Policy Liabilities Insurance Reserves Linked Liabilities Add:-Fair Value Change (Linked) Total:- Linked Liabilities
Subtotal
Funds for Future Appropriation -: Linked
Total
APPLICATION OF FUNDS
Investments - Shareholders' - Policyholders'
Assets Held to Cover Linked Liabilities
Loans
Fixed Assets
Current Assets Cash and Bank Balances Advances and Other Assets
Subtotal (A)
Current Liabilities Provisions
Subtotal (B)
Net Current Assets (C) = (A B)
Miscellaneous Expenditure (to the extent not wr
itten off or adjusted)
Debit Balance in Profit and Loss Account (Share
holders' Account)
Total
Notes to Accounts
10,000,000
2,548,743 103,552
10,000,000
- 12,652,296 10,000,04343
-
1,219,654
96,686,229
-
15,964
62,421,563
- 170,626,846
- 67,728,408
268,532,729 130,165,934
246,204 81,176
- 281,431,231 140,247,152
6,879,110
107,762,385
170,873,050
-
2,326,988
9,353,725
68,283,469
67,809,583
-
699,847
7,955,349 4,053,406
14,303,920 61,731
10,071,214 97,498
14,365,651 10,168,713
(6,4
10,302)
-
(6,115,
306)
-
281,431,231 140,247,152
-
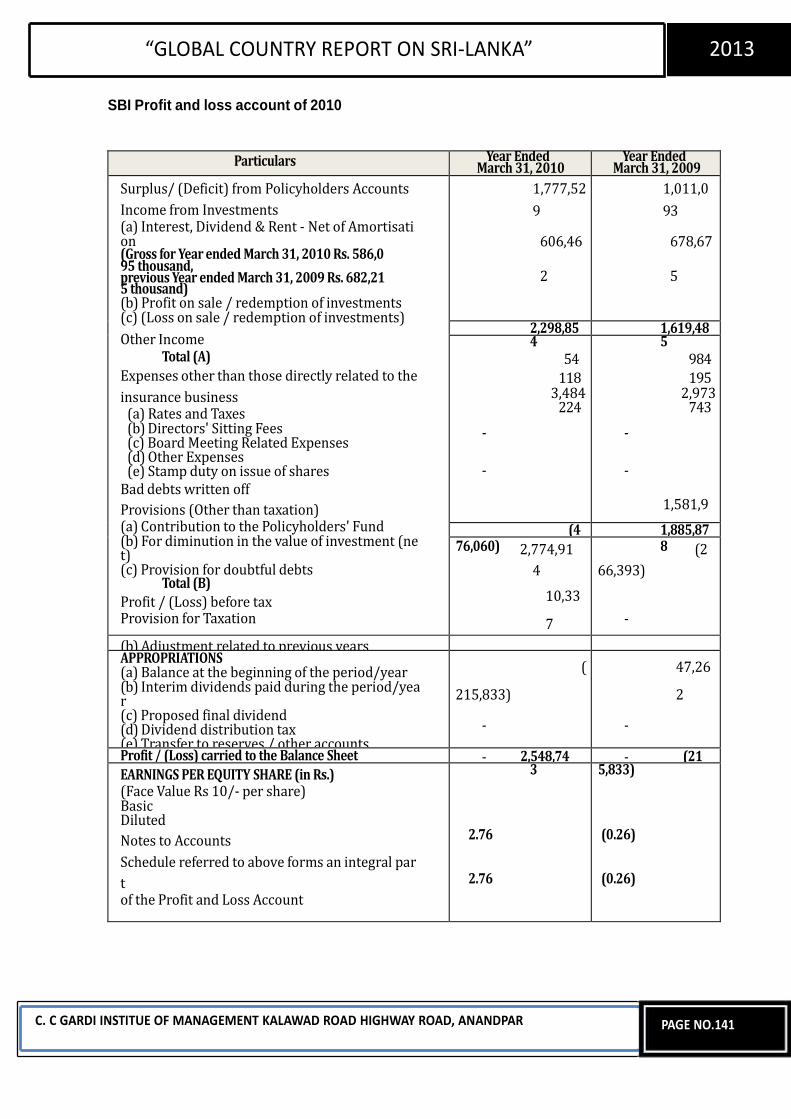
“GLOBAL COUNTRY REPORT ON SRI-LANKA” 2013
SBI Profit and loss account of 2010
C. C GARDI INSTITUE OF MANAGEMENT KALAWAD ROAD HIGHWAY ROAD, ANANDPAR
PAGE NO.141
Particulars Year Ended March 31, 2010
Year Ended March 31, 2009
Surplus/ (Deficit) from Policyholders Accounts
Income from Investments (a) Interest, Dividend & Rent - Net of Amortisati on (Gross for Year ended March 31, 2010 Rs. 586,0 95 thousand, previous Year ended March 31, 2009 Rs. 682,21 5 thousand) (b) Profit on sale / redemption of investments (c) (Loss on sale / redemption of investments)
Other Income Total (A)
Expenses other than those directly related to the
insurance business (a) Rates and Taxes (b) Directors' Sitting Fees (c) Board Meeting Related Expenses (d) Other Expenses (e) Stamp duty on issue of shares
Bad debts written off
Provisions (Other than taxation) (a) Contribution to the Policyholders' Fund (b) For diminution in the value of investment (ne t) (c) Provision for doubtful debts
Total (B)
Profit / (Loss) before tax Provision for Taxation
1,777,52
9
606,46
2
1,011,0
93
678,67
5
2,298,85 1,619,48 4
54
118 3,484 224
-
-
5
984
195 2,973 743
-
-
1,581,9
(4 1,885,87 76,060) 2,774,91
4
10,33
7
8 (2
66,393)
-
(b) Adjustment related to previous years APPROPRIATIONS (a) Balance at the beginning of the period/year (b) Interim dividends paid during the period/yea r (c) Proposed final dividend (d) Dividend distribution tax (e) Transfer to reserves / other accounts
(
215,833)
-
47,26
2
-
Profit / (Loss) carried to the Balance Sheet - 2,548,74 - (21
EARNINGS PER EQUITY SHARE (in Rs.) (Face Value Rs 10/- per share) Basic Diluted
Notes to Accounts
Schedule referred to above forms an integral par
t of the Profit and Loss Account
3
2.76
2.76
5,833)
(0.26)
(0.26)
“GLOBAL COUNTRY REPORT ON SRI-LANKA” 2013
-: BIBLIOGRAPHY:-
http://insurance.birlasunlife.com/Pages/Individual/About-Us/Public-Disclosure.aspx
http://www.iciciprulife.com/public/Investor-Relations/financial-information/financial-
information-fy2012.htm
http://www.hdfclife.com/AboutUs/AboutUsFinancialHighlights.aspx
http://www.sbilife.co.in/sbilife/content/37_6442
http://cse.lk/financial_reports.do?sector=14
http://cse.lk/financials.do?id=480&symbol=CTCE.N0000
http://cse.lk/financials.do?id=91&symbol=CINS.N0000
http://cse.lk/financials.do?id=941&symbol=JINS.N0000
http://www.ibsl.gov.lk/insurance_legislations/insurance_legislations.htm
http://www.irda.gov.in/ADMINCMS/cms/frmGeneral_NoYearList.aspx?DF=ACT&mid=4.1
http://www.insuranceacademy.org/PDFs/Article%20by%20Prof%20Kshitij%20Patukale.pdf http://www.researchandmarkets.com/reports/306103/indian_insurance_industry_new_avenues_for
_growth
http://www.ey.com/IN/en/Industries/Financial-Services/Insurance/Indian-insurance-sector
C. C GARDI INSTITUE OF MANAGEMENT KALAWAD ROAD HIGHWAY ROAD, ANANDPAR
PAGE NO.142
“GLOBAL COUNTRY REPORT ON SRI-LANKA” 2013
http://www.indiainbusiness.nic.in/industry-infrastructure/service-sectors/insurance.htm
http://www.researchersworld.com/vol3/issue2/vol3_issue2_3/Paper_11.pdf
http://www.ibef.org/download/Insurance.pdf
http://beforeitsnews.com/financial-markets/2013/02/growing-potential-of-export-credit-insurance-
in-sri-lanka-2504562.html
http://www.rncos.com/Report/IM250.htm
http://www.ceylontoday.lk/22-24584-news-detail-vast-potential-for-insurance-industry.html
www.superbrands.com/lkc1/pdf/16_consumerSB2.pdf
http://www.outsourcemagazine.co.uk/sri-lanka-as-an-offshore-destination-realising-the-potential/
http://www.state.gov/e/eb/rls/othr/ics/2012/191238.htm http://www.slideshare.net/ruchir1/trade-barriers-final
www.ustr.gov/sites/default/files/Sri%20Lanka.pdf http://dspace.cigilibrary.org/jspui/bitstream/123456789/21263/1/Indo%20Sri%20Lanka%20Trade%2
0in%20Services%20FTA%20II%20and%20Beyond.pdf?1
books.google.co.in/books?isbn=143794132X
C. C GARDI INSTITUE OF MANAGEMENT KALAWAD ROAD HIGHWAY ROAD, ANANDPAR
PAGE NO.143
1
A
GLOBAL COUNTRY REPORT
ON
“Tourism sector of Sri Lanka”
Submitted to
Gujarat Technology University
In partial fulfillment of the requirement of the award for the degree of
MASTER OF BUSINESS ASMINISTRATION
IN
Gujarat Technology University
Under the guidance of
Faculty Guide
Prof.JAY PADH
[Batch: 2012-13. Enrollment No.: 117880592016,117880592018, 1178805920,
117880592021]
MBA SEMESTER III/IV
C.C. GARDI SCHOOL OF MANAGEMENT
MBA PROGRAMME
Affiliated to Gujarat Technological University
Ahmadabad
March, 2013
2
Students’ Declaration
We, Rathod Sheetal, Muchhadiya Vijay, Tanti Daya, Valangar Jatin, hereby
declare that the report for Global/Country Study Report entitled “Hotels and
Tourism sector in Srilanka” is a result of our own work and our indebtedness to
other work publications, references, if any, have been duly acknowledged.
Place: Rajkot (Signature)
Date: Rathod Sheetal

3
Institute’s Certificate
4
PREFACE
It is very right that we as students have subjected to know the theoretical aspects
of every subject but in real life there are practical experience counts. So to fully
gap of the knowledge, practical knowledge is very essential than only subject can
be thoroughly understood.
As per curriculum of M.B.A. according to Gujarat technical university project is
the part of subject management & entrepreneurship development. Objective
behind preparation of this report is to develop our skills towards the all the
General information related Management in the corporate sector learning of
different countries.
It was really a great experience for us, during the period have tried our level best
to gather as much as information for the country. We hope the report will provide
all the necessary information according to the requirements and syllabus of
company.
According to us, this type of training shows the actual path before one step
towards it. Because it has been said “well be began is half done” and for us it
was perfect beginning.
5
ACKNOWLEDGEMENT
We would express our sincere gratitude to the Director of Gardi Institute of
Management, Dr. SANDIP SOLANKI for giving us an opportunity to be a part of
this Institution. It would be never possible without his support and
encouragement. Thank You...Sir..!!
We would also thank our institutional guide Prof.JAY PADH, for the knowledge he
shared with us and the guidance he gave us throughout our project. His unselfish
guidance helps us to do our job more efficiently.
We indebted to Prof. PRATIK GANDHI for their splendid suggestions they gave
us to improve our project. Their friendly and humorous nature helped us to feel
easy in new environment.
God understands our prayers even when we can’t find the words to say them.
Thank you...God for always being there with us.
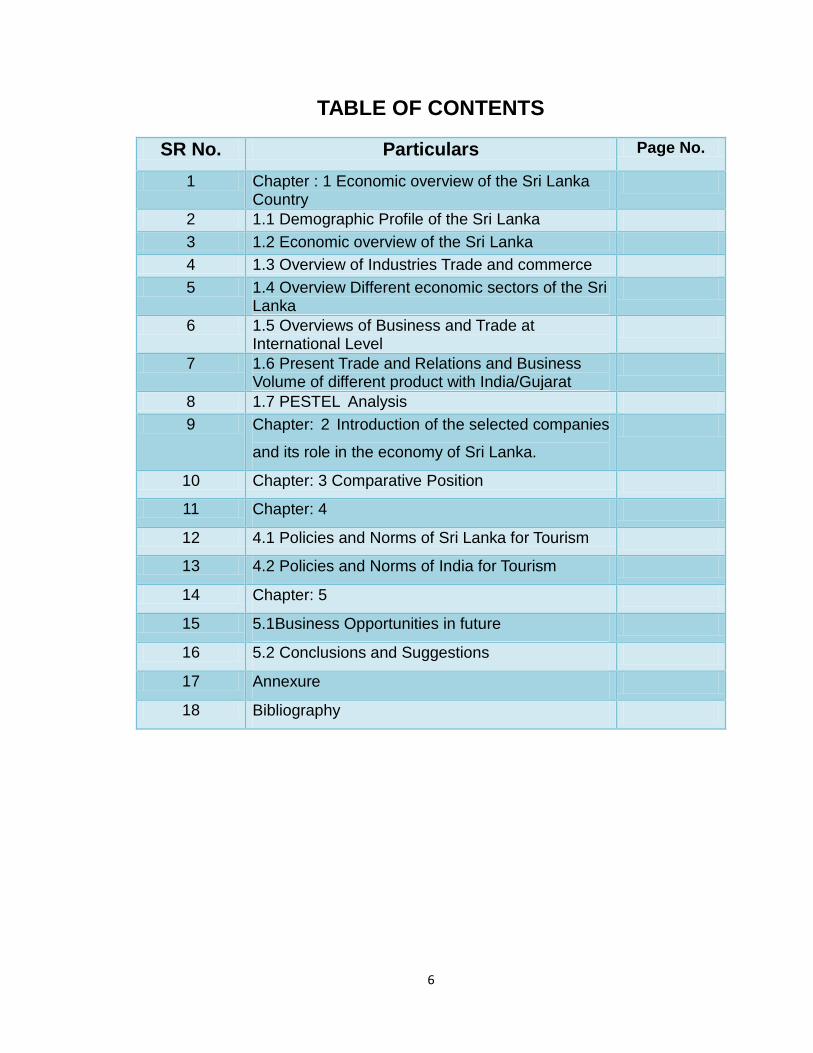
6
TABLE OF CONTENTS
SR No. Particulars Page No.
1 Chapter : 1 Economic overview of the Sri Lanka Country
2 1.1 Demographic Profile of the Sri Lanka 3 1.2 Economic overview of the Sri Lanka 4 1.3 Overview of Industries Trade and commerce 5 1.4 Overview Different economic sectors of the Sri
Lanka
6 1.5 Overviews of Business and Trade at International Level
7 1.6 Present Trade and Relations and Business Volume of different product with India/Gujarat
8 1.7 PESTEL Analysis 9 Chapter: 2 Introduction of the selected companies
and its role in the economy of Sri Lanka.
10 Chapter: 3 Comparative Position
11 Chapter: 4
12 4.1 Policies and Norms of Sri Lanka for Tourism
13 4.2 Policies and Norms of India for Tourism
14 Chapter: 5
15 5.1Business Opportunities in future
16 5.2 Conclusions and Suggestions
17 Annexure
18 Bibliography
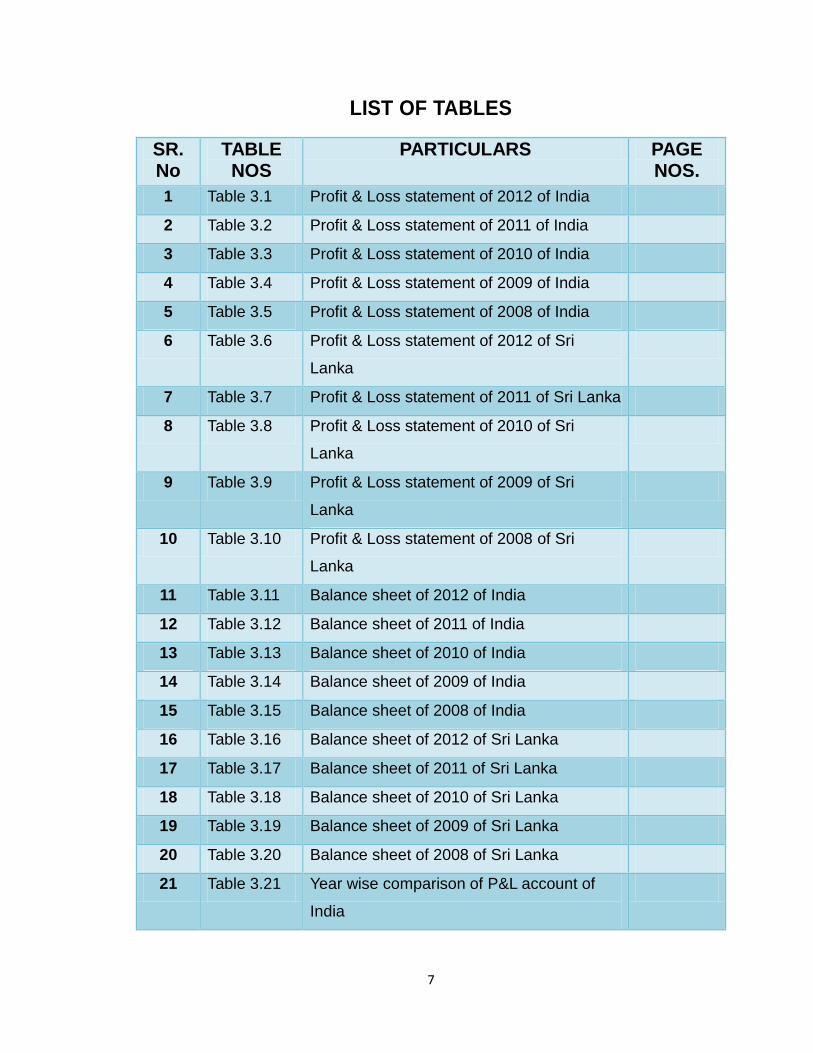
7
LIST OF TABLES
SR. No
TABLE NOS
PARTICULARS PAGE NOS.
1 Table 3.1 Profit & Loss statement of 2012 of India
2 Table 3.2 Profit & Loss statement of 2011 of India
3 Table 3.3 Profit & Loss statement of 2010 of India
4 Table 3.4 Profit & Loss statement of 2009 of India
5 Table 3.5 Profit & Loss statement of 2008 of India
6 Table 3.6 Profit & Loss statement of 2012 of Sri
Lanka
7 Table 3.7 Profit & Loss statement of 2011 of Sri Lanka
8 Table 3.8 Profit & Loss statement of 2010 of Sri
Lanka
9 Table 3.9 Profit & Loss statement of 2009 of Sri
Lanka
10 Table 3.10 Profit & Loss statement of 2008 of Sri
Lanka
11 Table 3.11 Balance sheet of 2012 of India
12 Table 3.12 Balance sheet of 2011 of India
13 Table 3.13 Balance sheet of 2010 of India
14 Table 3.14 Balance sheet of 2009 of India
15 Table 3.15 Balance sheet of 2008 of India
16 Table 3.16 Balance sheet of 2012 of Sri Lanka
17 Table 3.17 Balance sheet of 2011 of Sri Lanka
18 Table 3.18 Balance sheet of 2010 of Sri Lanka
19 Table 3.19 Balance sheet of 2009 of Sri Lanka
20 Table 3.20 Balance sheet of 2008 of Sri Lanka
21 Table 3.21 Year wise comparison of P&L account of
India
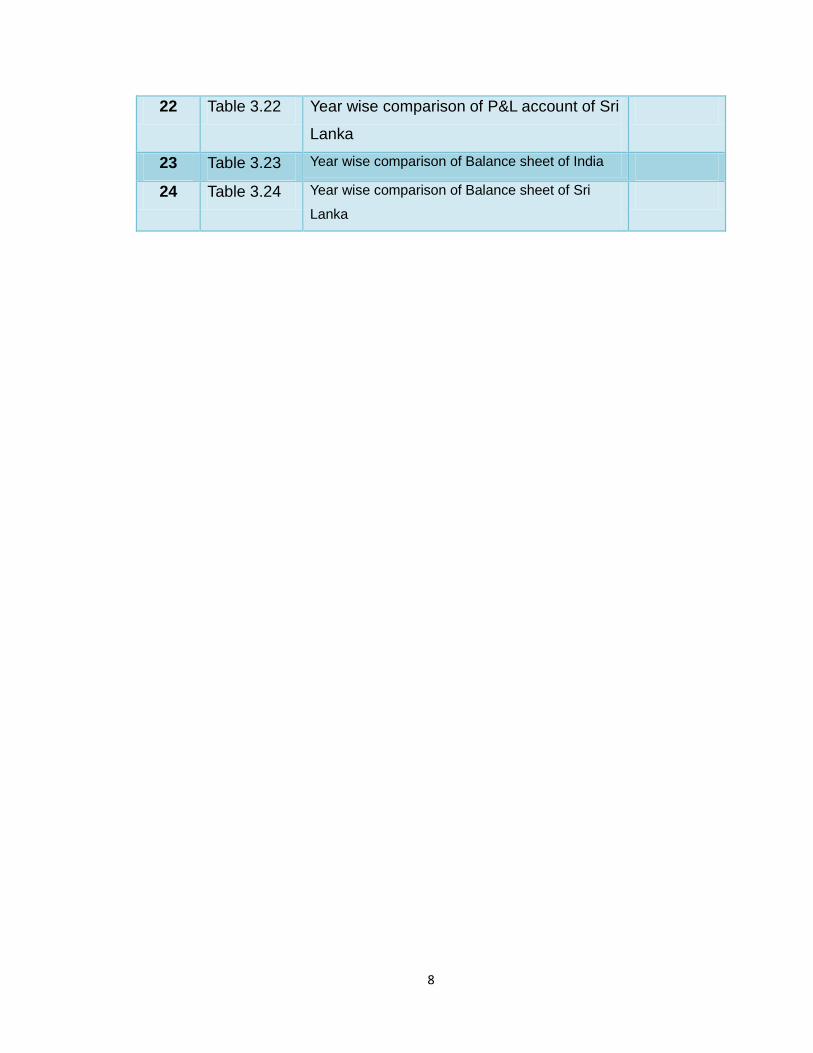
8
22 Table 3.22 Year wise comparison of P&L account of Sri
Lanka
23 Table 3.23 Year wise comparison of Balance sheet of India
24 Table 3.24 Year wise comparison of Balance sheet of Sri
Lanka
9
EXECUTIVE SUMMARY
Sri Lanka is an island with smiling people who are well known for their hospitality.
This beautiful island is indeed a land like no other. It has something to offer for
everyone. Sri Lanka has a growing tourism industry. Since gaining autonomy
from the British in 1947, Sri Lanka has continued to attract foreign investors &
tourists. The country's placement also enables it to attract transit visitors.
Legend as well as history record that Sri Lanka has always delighted
visitors to its shores. For countless centuries its fragrant spices, priceless
gems and pearls, legendary beauty, sublime culture and friendly people
captivated princess, poets, traders, empire- builders and admirers.
Sri Lanka has always been a tourist destination. In the past, due to its strategic
location, Sri Lanka attracted many merchants and explorers. Its uniqueness and
size earned it the name 'Taprobane' and 'The Pearl of the Indian Ocean.'
Tourism is one of the most important industries in Sri Lanka. Major tourist
attractions are focused around the island's well-known beaches situated in
the southern & eastern parts of the country, ancient heritage sites situated in
the interior of the country & lush green resorts situated in the mountainous
regions. A large majority of tourists arrive from The United Kingdom, Canada,
Australia, Germany, France, Maldives, Japan, Russia, Ukraine & several CIS
countries, The People's Republic of China, & India.
10
CHAPTER: 1 ECONOMIC OVERVIEW OF
THE SRILANKA COUNTRY
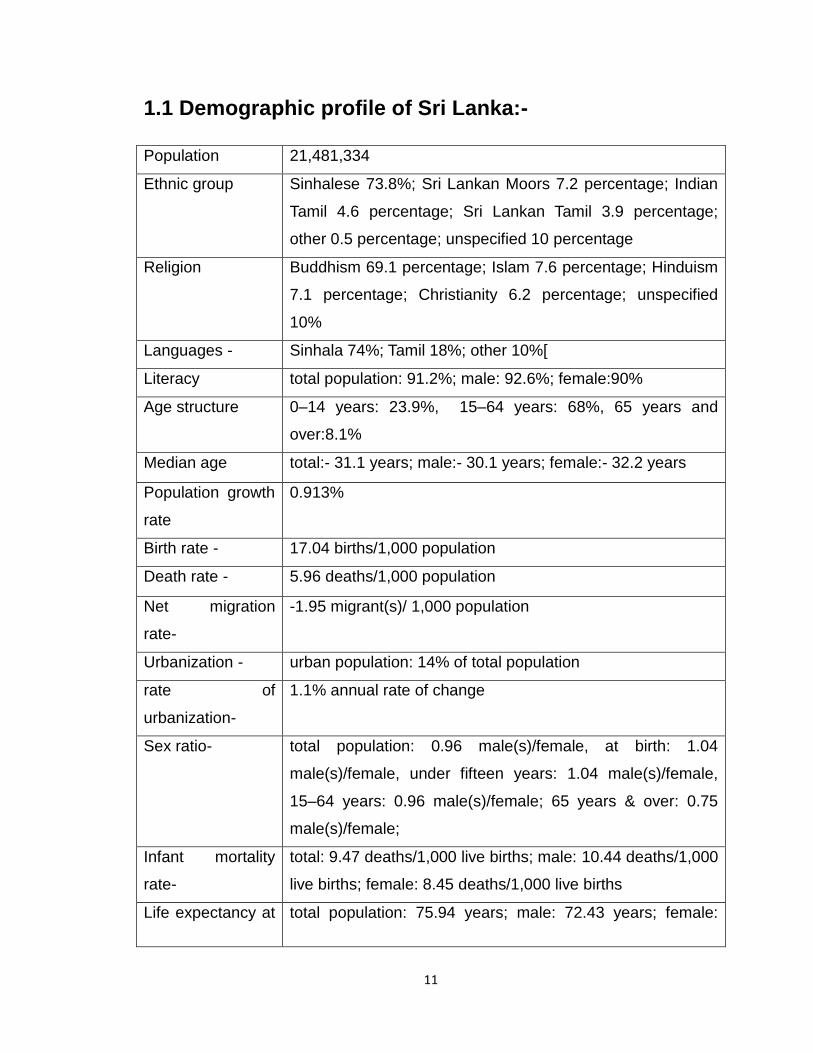
11
1.1 Demographic profile of Sri Lanka:-
Population 21,481,334
Ethnic group Sinhalese 73.8%; Sri Lankan Moors 7.2 percentage; Indian
Tamil 4.6 percentage; Sri Lankan Tamil 3.9 percentage;
other 0.5 percentage; unspecified 10 percentage
Religion Buddhism 69.1 percentage; Islam 7.6 percentage; Hinduism
7.1 percentage; Christianity 6.2 percentage; unspecified
10%
Languages - Sinhala 74%; Tamil 18%; other 10%[
Literacy total population: 91.2%; male: 92.6%; female:90%
Age structure 0–14 years: 23.9%, 15–64 years: 68%, 65 years and
over:8.1%
Median age total:- 31.1 years; male:- 30.1 years; female:- 32.2 years
Population growth
rate
0.913%
Birth rate - 17.04 births/1,000 population
Death rate - 5.96 deaths/1,000 population
Net migration
rate-
-1.95 migrant(s)/ 1,000 population
Urbanization - urban population: 14% of total population
rate of
urbanization-
1.1% annual rate of change
Sex ratio- total population: 0.96 male(s)/female, at birth: 1.04
male(s)/female, under fifteen years: 1.04 male(s)/female,
15–64 years: 0.96 male(s)/female; 65 years & over: 0.75
male(s)/female;
Infant mortality
rate-
total: 9.47 deaths/1,000 live births; male: 10.44 deaths/1,000
live births; female: 8.45 deaths/1,000 live births
Life expectancy at total population: 75.94 years; male: 72.43 years; female:
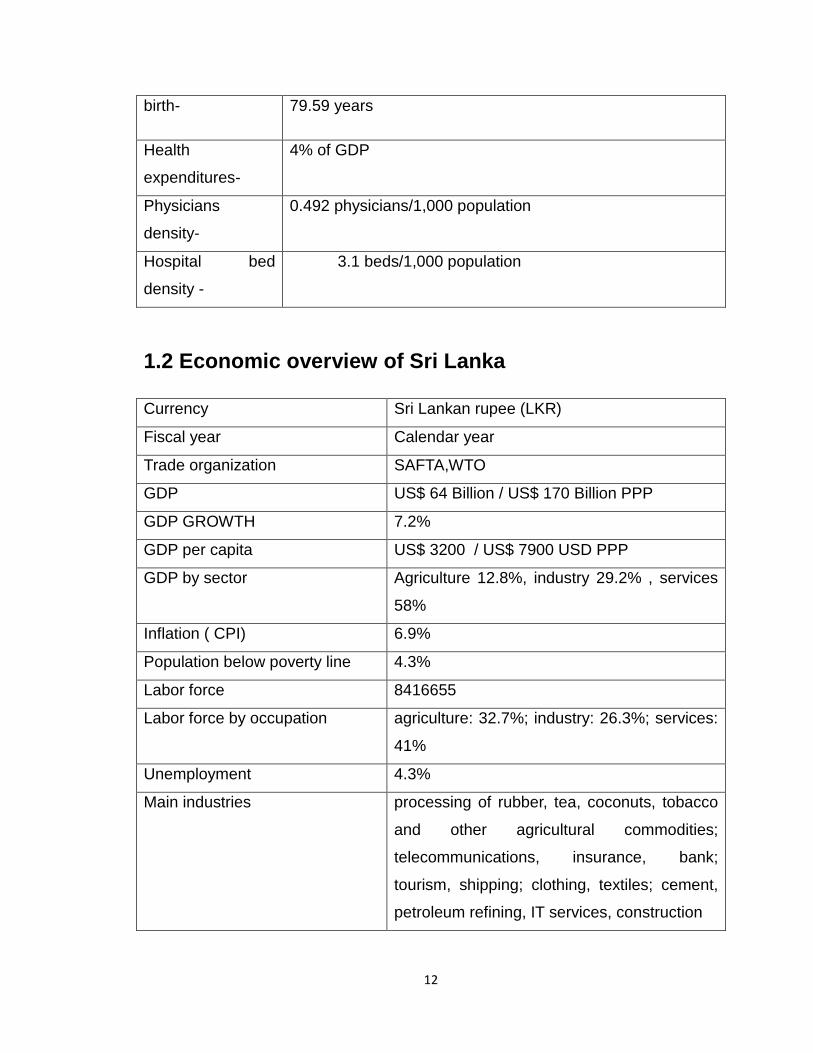
12
birth- 79.59 years
Health
expenditures-
4% of GDP
Physicians
density-
0.492 physicians/1,000 population
Hospital bed
density -
3.1 beds/1,000 population
1.2 Economic overview of Sri Lanka
Currency Sri Lankan rupee (LKR)
Fiscal year Calendar year
Trade organization SAFTA,WTO
GDP US$ 64 Billion / US$ 170 Billion PPP
GDP GROWTH 7.2%
GDP per capita US$ 3200 / US$ 7900 USD PPP
GDP by sector Agriculture 12.8%, industry 29.2% , services
58%
Inflation ( CPI) 6.9%
Population below poverty line 4.3%
Labor force 8416655
Labor force by occupation agriculture: 32.7%; industry: 26.3%; services:
41%
Unemployment 4.3%
Main industries processing of rubber, tea, coconuts, tobacco
and other agricultural commodities;
telecommunications, insurance, bank;
tourism, shipping; clothing, textiles; cement,
petroleum refining, IT services, construction
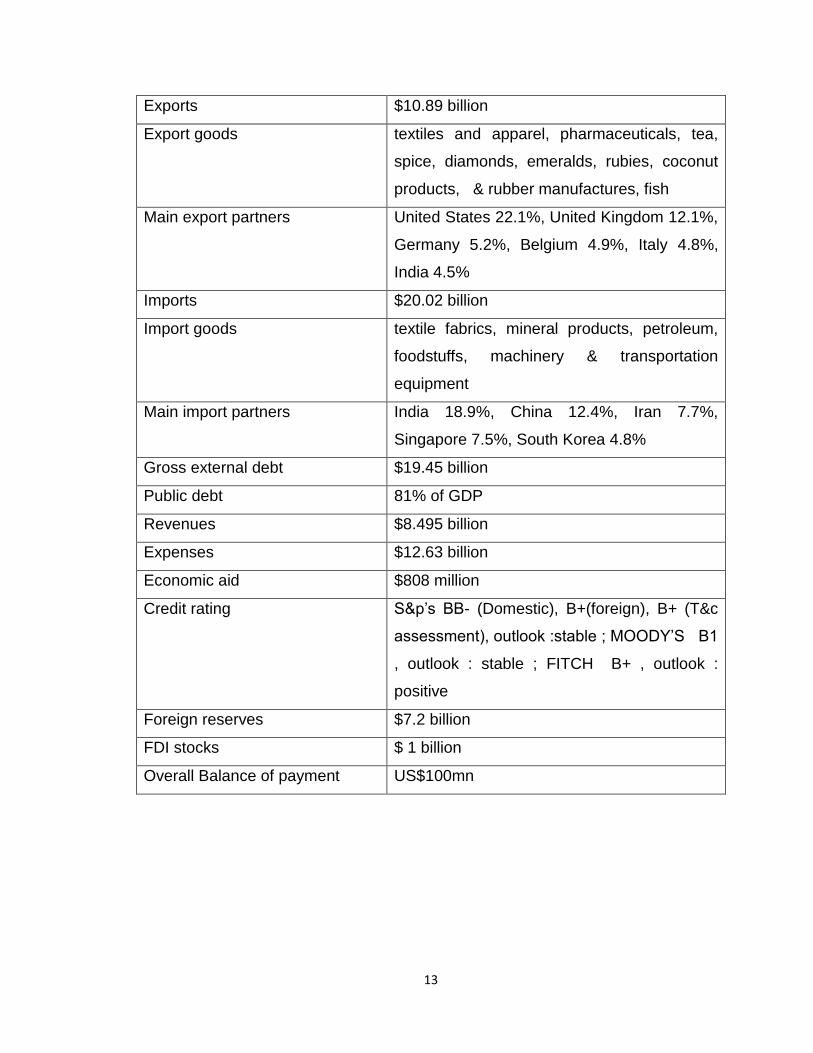
13
Exports $10.89 billion
Export goods textiles and apparel, pharmaceuticals, tea,
spice, diamonds, emeralds, rubies, coconut
products, & rubber manufactures, fish
Main export partners United States 22.1%, United Kingdom 12.1%,
Germany 5.2%, Belgium 4.9%, Italy 4.8%,
India 4.5%
Imports $20.02 billion
Import goods textile fabrics, mineral products, petroleum,
foodstuffs, machinery & transportation
equipment
Main import partners India 18.9%, China 12.4%, Iran 7.7%,
Singapore 7.5%, South Korea 4.8%
Gross external debt $19.45 billion
Public debt 81% of GDP
Revenues $8.495 billion
Expenses $12.63 billion
Economic aid $808 million
Credit rating S&p’s BB- (Domestic), B+(foreign), B+ (T&c
assessment), outlook :stable ; MOODY’S B1
, outlook : stable ; FITCH B+ , outlook :
positive
Foreign reserves $7.2 billion
FDI stocks $ 1 billion
Overall Balance of payment US$100mn
14
1.3 Overview of different economic sector of Sri Lanka
Economic sectors
• Tourism:-
Tourism is a major industry in Sri Lanka. The main tourist attraction is the famous
southern islands and mountainous regions of the country and the ancient
heritage of the country and country resort is located in the eastern parts of the
interior is sites is located about warning the coast. Rubies and sapphires were
also frequently found in the Ratnapura and its nearby areas, such as mined
precious stones, they are a major tourist attraction.
2004 Indian Ocean tsunami and the advent of tourism has declined in the past
civil war, however, the number of tourists visiting the new increase, starting in
early 2008. 8.6% by March 2008 and Sri Lanka in 2012, 1,003,000 tourists,
according to the Central Bank of Sri Lanka 2013 roadmap. 2012 one billion ($
U.S.) and 16% increase in earnings for 2011 compare to year. The Sri Lankan
government is key to growth is to attract guests to 2.5 million by 2016, with an
ambitious target for the development of post-conflict area known as the tourism
sector.
Significant growth in this industry, the most important travel magazines around
the world, and the world leading travel guide "Lonely Planet" book, a digital
media publisher in mind, Sri Lanka is ranked as the best country to visit in 2013.
The main advantage of Sri Lanka as a tourist destination and is currently
engaged in a variety of accessible infrastructure development under the
government's accessible attraction.
• Tea industry:-
Tea industry, operating under the Ministry of Public Estate Management &
Development, is one of the main foreign exchange gaining one of the main
15
industries in Sri Lanka. A 23% share of the global tea exports, which Kenya with
more than 22% share of the world's leading exporter in 1995 to become. The
country's central highlands of the year and the annual rainfall and moisture levels
are suitable for growing tea in the low-temperature climate. The industry in 1867,
James Taylor, the British planter who entered the country in 1852 was by
inwards.
Recently, Sri Lanka is a fair trade tea in the UK, and additional countries in
exporting countries. It is believed that such a project can reduce rural poverty.
• Apparel and textile industry:-
The Sri Lanka apparel industry primarily in the United States and Europe of
exports. Sri Europe due to the high cost of labor in Europe ever more dependent
on textiles. There are countries, such as Pierre Cardin Liz Claiborne, Nike, Gap
and Tommy Hilfiger serving around 900 factories of the company.
The apparel sector is the most industrial employment generator and the largest
foreign swap film. The field for the year 2011 the amount of 39.6% of the export
revenue was USD 4.2Bn $. 24% year on year growth of exports in 2011. This
allows the output exporters of apparels locally to dispose of 40% of all
comprehensive tax payment Sri Lankan rupees (Rs) 25 and are restricted for
sale to the general corporate income tax of 12% per Piece tax is subject to 28%.
Find employment increased by 283,000 in 2011. Originally, the industry sivana
(contract manufacturer) offered by the operator and textile USA and the EU as a
quota based on the start and now it is converted into a full apparel solution
provider.
• Agriculture:-
The country's agricultural sector is mostly mostly for local consumption and
export to rare coconut rice, and grain products. Agriculture sector contributes
11% of the country's GDP, total export earnings 23.9% and 32.9% in 2011 year
national employment.
16
The three main traditional export crops of tea from Sri Lanka in the Rubber and
Coconut. Because these industries are already well established, BOI's central
focal point increase local value addition to agricultural crops has increased,
especially in terms of another. Particular type of technology to advance the
efficiency levels of government, to improve access to global markets for
investment looks, quality seeds and planting material use and overall value
adding recover. Some of the opportunities include:
Horticulture
Fisheries
livestock
• Knowledge Services:-
The knowledge of the services sector in the IT software development, knowledge
process processing / outsourcing business include the outsourcing industry, and
it enabled services and information technology training center, it is possible to
hold a key growth area appears as Sri Lanka. Students, English and literacy
height, and looking at the quality of its proximity to India, Sri Lanka is ideal for
high value added IT / KPO services, supplier development mode.
IT is a software development:-
There are 100 on the software development work in Sri Lanka which provides
both independent and captive markets. Sri Lankan companies are internationally
recognized in their own software products that they have been able to build.
B / KPO BPO industry:-
The industry / KPO BPO is an emerging area of Sri Lanka. Still a nascent
industry, its small history since 2000 within / KPO BPO sector is a significant
difference in the world / BPO KPO to attract some of the giants. Sri Lanka state
financial and other professional services, transaction processing and document
management specialist areas is increasing, and high literacy rate (about 92%)
rate and a growing pool of accounting graduates, call center services for credit.
17
IT enabled services
ITS Training Center D:-
The education industry is a knowledge services in key areas have been identified
as one of the Sri Lanka government is trying to develop the Sri Lanka. Continuing
the work force flow in order to ensure that the needs of the growing knowledge of
the service industry personnel, information technology and training have been
individually identified and given priority. There are about 20 IT training center
under the BOI.
• Infrastructure
Progress in infrastructure development in the medium and long term to support
the country's drive to a higher and sustainable growth is expected to maintain. To
help improve economic efficiency for the timely development of the economic
structure of the economy will expand production capacity, increase efficiency and
reduce the regional differences.
Construction cost by 14.2% compared to 9.3% in 2010, significantly expanding
field conditions added in 2011. Construction activity increased 8.6% during the
year by the goods to domestic production growth. Cement availability of 21.5 per
cent in 2011 to 18.9% in 2010, compared with a contraction. Construction in the
private sector increased by 15.8% during the year for the purpose of private
sector credit growth was reflected by.
1.4 Overview of Industries Trade and Commerce
Ministry of Industry and Commerce plays a dynamic role in the growth of the
industrial sector. It is the key Ministry accountable for promoting industrial
development in the country within the wide policy framework of Mahindra
Chintana spelt out by the government. This Ministry which is the policy
formulates entity for the industrial sector has taken several initiatives to increase
18
the industrial sector performance with emphasis on:
Diversified high value extra industry base
High economic growth
More employment opportunities
Environment sustainability
Sustainable industrial development
Regional industrial development
This Ministry has been assigned the functions of planning, formulating,
coordinating, implementing and setting up of the necessary infrastructure for the
promotion and development of the industrial sector. Therefore the Ministry has
implement following programmers and projects to establish an industrial sector
spread across the country Industrial Estate Programmer.
Gamata Karmantha Programmer
Thrust Area Development Programmer
Productivity Improvement Programmer
Completion of the Chemical Weapons Convention in Sri Lanka
Industrial Survey
Textile Industry Development Programmers
Trade & Tariff Related Activities
The Macro Policy Division is primarily engaged in provide policy maintain for
industrial development among a special focus on growth & global
competitiveness of the industry. In performing these tasks, the Ministry needs to
interact with public sector organizations and bilateral and multilateral agency. It is
a highly complex process and requires continued monitoring and following up
with various stakeholders in industry. Considering the significance of maintain a
stable & predictable Macroeconomic environment conducive for the growth of
19
manufacturing sector, the Division prioritized its universal policy support in
following areas.
Industry & Environment
Facilitating the industry to adhere to global conventions & regulations within the
overall framework of sustainable development also falls within the purview of
Ministry actions. In the background of the current day worldwide environment, the
producer of a globally marketable environment friendly industrial product has
become essential owing to obligations arising from international conventions
including signals given under the WTO Agreements. Most urban countries have
joined environmental standards with other economic and non-economic
conditions as pre-requisites for entry into their markets. Therefore catering to his
principles has become important.
These have become important not only from the point of view of protecting the
environment but also for the survival and growth of industry. Countries in the
European society have been particularly rigid about conformity to such standard.
These comprise product standards for bottled water, baby food, etc., Eco labels,
ISO standards such as ISO 17025, HACCP (Hazardous Analysis Critical Control
Point), Eco-Tex 1000 for the garment & the textile industry and the proposed
global initiative on environment reporting. A few of this standard are not
implemented at current. However, they will positively be implemented within the
then decade. As such, if Sri Lankan industry is to be competitive in world
markets, they should be geared to meet these specific requirements in the near
future.
This has necessitated technological innovation and adaptation within the
industries to accommodate environmental concerns. In line among these
necessities, the Ministry of Industry & Commerce has promoted industrialists to
adopt strategies such as application of cleaner production while inculcating
20
principles such as waste minimization and technological upgrading for
sustainable industrial development.
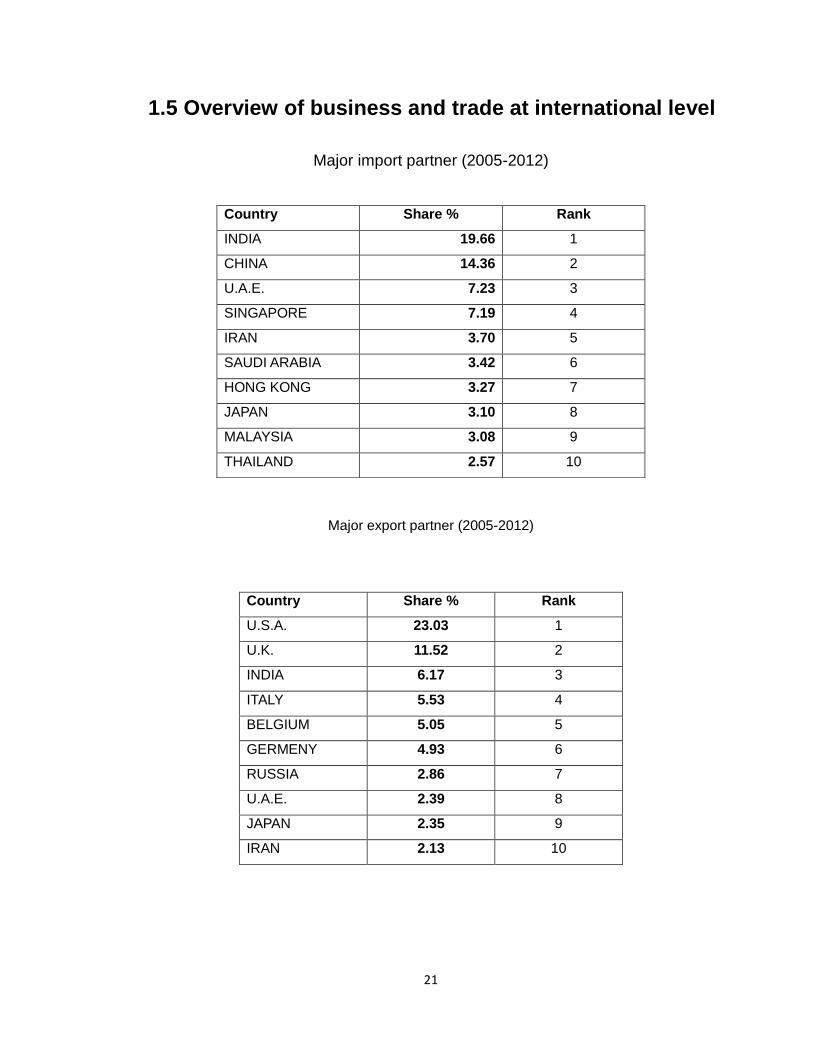
21
1.5 Overview of business and trade at international level
Major import partner (2005-2012)
Major export partner (2005-2012)
Country Share % Rank
U.S.A. 23.03 1
U.K. 11.52 2
INDIA 6.17 3
ITALY 5.53 4
BELGIUM 5.05 5
GERMENY 4.93 6
RUSSIA 2.86 7
U.A.E. 2.39 8
JAPAN 2.35 9
IRAN 2.13 10
Country Share % Rank
INDIA 19.66 1
CHINA 14.36 2
U.A.E. 7.23 3
SINGAPORE 7.19 4
IRAN 3.70 5
SAUDI ARABIA 3.42 6
HONG KONG 3.27 7
JAPAN 3.10 8
MALAYSIA 3.08 9
THAILAND 2.57 10
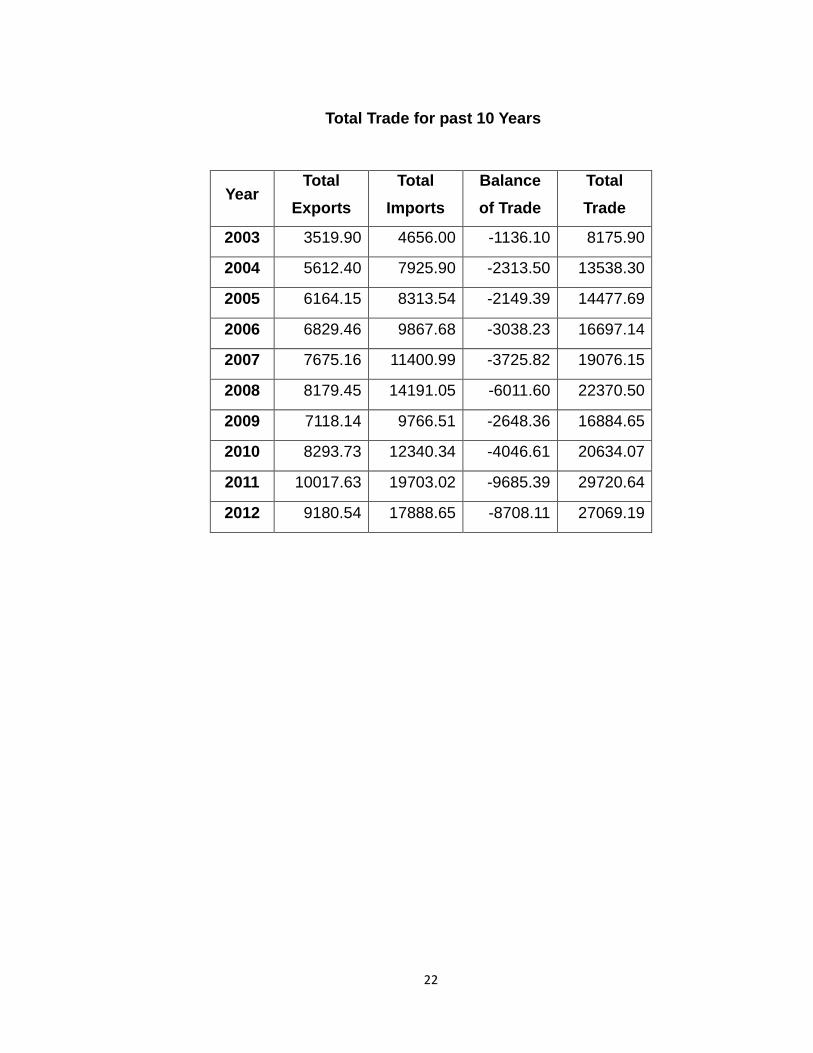
22
Total Trade for past 10 Years
Year
Total
Exports
Total
Imports
Balance
of Trade
Total
Trade
2003 3519.90 4656.00 -1136.10 8175.90
2004 5612.40 7925.90 -2313.50 13538.30
2005 6164.15 8313.54 -2149.39 14477.69
2006 6829.46 9867.68 -3038.23 16697.14
2007 7675.16 11400.99 -3725.82 19076.15
2008 8179.45 14191.05 -6011.60 22370.50
2009 7118.14 9766.51 -2648.36 16884.65
2010 8293.73 12340.34 -4046.61 20634.07
2011 10017.63 19703.02 -9685.39 29720.64
2012 9180.54 17888.65 -8708.11 27069.19
23
1.6 Sri Lanka and India trade relations with existing
business volume for various products Lanka.
India, Sri Lanka, the nearest neighbor. The relationship between these 2
countries for more than 2,500 years old, and both sides of the intellectual,
cultural, religious and linguistic intercourse is built on a legacy. But relations
between the 2 countries and spend time with mature and diversified, including all
areas of current importance. Cultural and cultural heritage shared by the two
countries and their citizens and build the foundation for people to interact
Multilateral Partnership provides a wide range of people.
India and Sri Lanka Sri Lanka bilateral trade in the last decade and a leading
Indian private sector investment and a rapidly growing number of companies
establishing a presence in the country with a vibrant and growing economic and
commercial partnership, enjoy. Sri Lanka is India's largest trading partner in
SAARC. 19.52% and 5.69% respectively in 2012, India's share of global imports
and exports in Sri Lanka. India's exports to Sri Lanka in 2012 largely reduced
excise duty on imported vehicles twice a steep rise in the year 2012 that a
serious competitive advantage enjoyed by Indian auto companies and affected
the entire volume of the imposition of imported vehicles in India in 2012 50-60%
declining In India, the largest in the whole of Sri Lanka (nine months as above) $
210 million on U.S. emerged as the investor with investments .. Compiled by the
Sri Lankan Board of Investment as a share basis, Sri Lanka, India is the second
largest foreign direct investor in 2011 to $ U.S. 147 million (out of the total
inbound FDI in 1057 million U.S. dollars) of investment in between.
Bilateral agreements: -
Relation to the legal framework Free Trade Agreement, removing the Double
Taxation Agreement, a bilateral investment protection and promotion agreement
are provided. Bilateral Air Services, Small Development Projects, Small Scale
Industries and Tourism in cooperation and in cooperation in science and
24
technology cooperation agreements / contracts memorandum of understandings
also exist. A Comprehensive Economic Partnership Agreement (CEPA) is under
negotiation.
India Sri Lanka Free Trade (ISFTA) contract: -
The main framework for bilateral trade in India, Sri Lanka Free Trade (ISFTA)
contract that was in 1998 and entered into force in March 2000 has been
through. ISFTA As a result, 4150 is currently the Indian tariff lines of Sri Lanka's
exports to India has been a zero duty. Similarly, the 3932 tariff lines, Indian
exports to Sri Lanka have been to provide a zero duty.
South Asian Free Trade (SAFTA) Area: -
South Asian Free Trade Area (SAFTA) Agreement on 1 January has been
operational since 2006. India, Pakistan and Sri Lanka non-least developed
contracting (NLDCS States) and Bangladesh, Bhutan, the Maldives are classified
as, Afghanistan and Nepal as the least agreement States (eladisio) are classified
as Developed. Article 7 of the SAFTA agreement phased tariff liberalization (TLP)
in which a programmer, 2 years, NLDC recession brought a 20% tariff, while
eladisio will bring them down to 30% provides. After 5 years, 20% are from non
eladisio 0-5% tariff (Sri Lanka 6 years) will, when will eladisio so 8 years.
Comprehensive Economic Partnership (CEPA) Agreement:-
Following the positive results of the FTA and FTA of success emboldened by
governments, felt that more action was needed to lose our bilateral economic
relationship, full of potential. CEPA to build on the momentum generated by the
FTA and further integration of the two economies in the direction of trade in
goods and fresh impetus to bilateral economic interaction and wanted to give
Synergy. Discussion on CEPA began in December 2010.
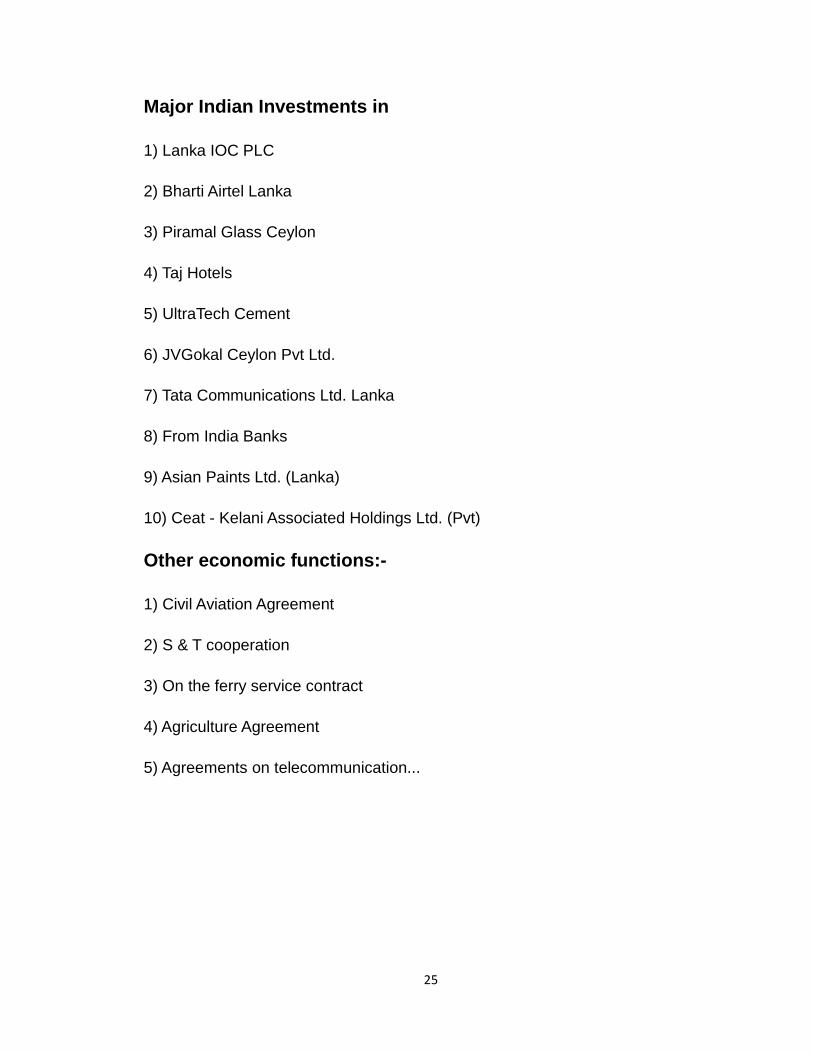
25
Major Indian Investments in
1) Lanka IOC PLC
2) Bharti Airtel Lanka
3) Piramal Glass Ceylon
4) Taj Hotels
5) UltraTech Cement
6) JVGokal Ceylon Pvt Ltd.
7) Tata Communications Ltd. Lanka
8) From India Banks
9) Asian Paints Ltd. (Lanka)
10) Ceat - Kelani Associated Holdings Ltd. (Pvt)
Other economic functions:-
1) Civil Aviation Agreement
2) S & T cooperation
3) On the ferry service contract
4) Agriculture Agreement
5) Agreements on telecommunication...
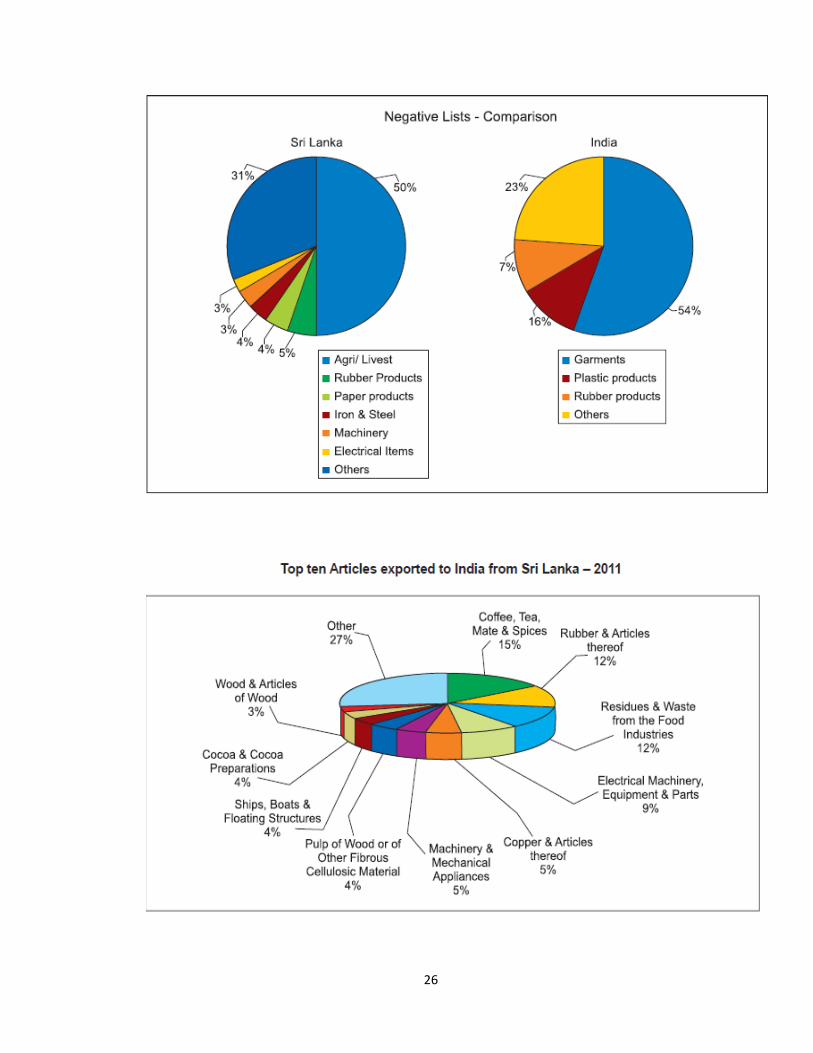
26
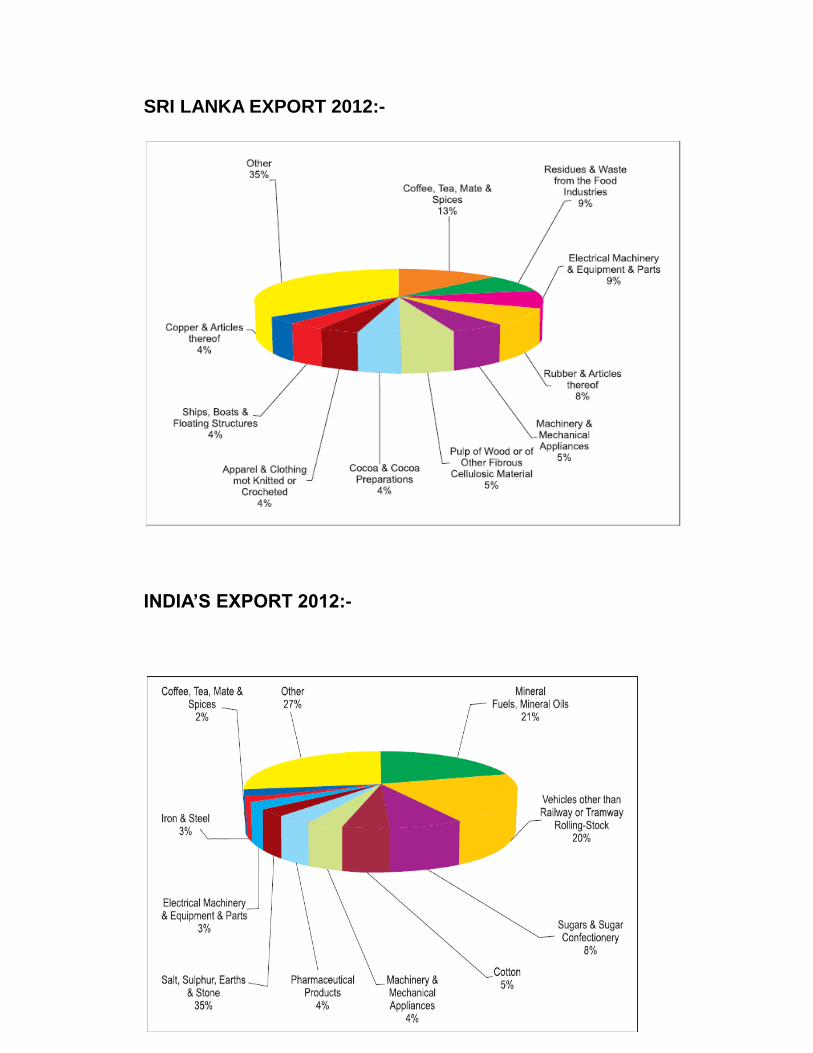
27
SRI LANKA EXPORT 2012:-
INDIA’S EXPORT 2012:-
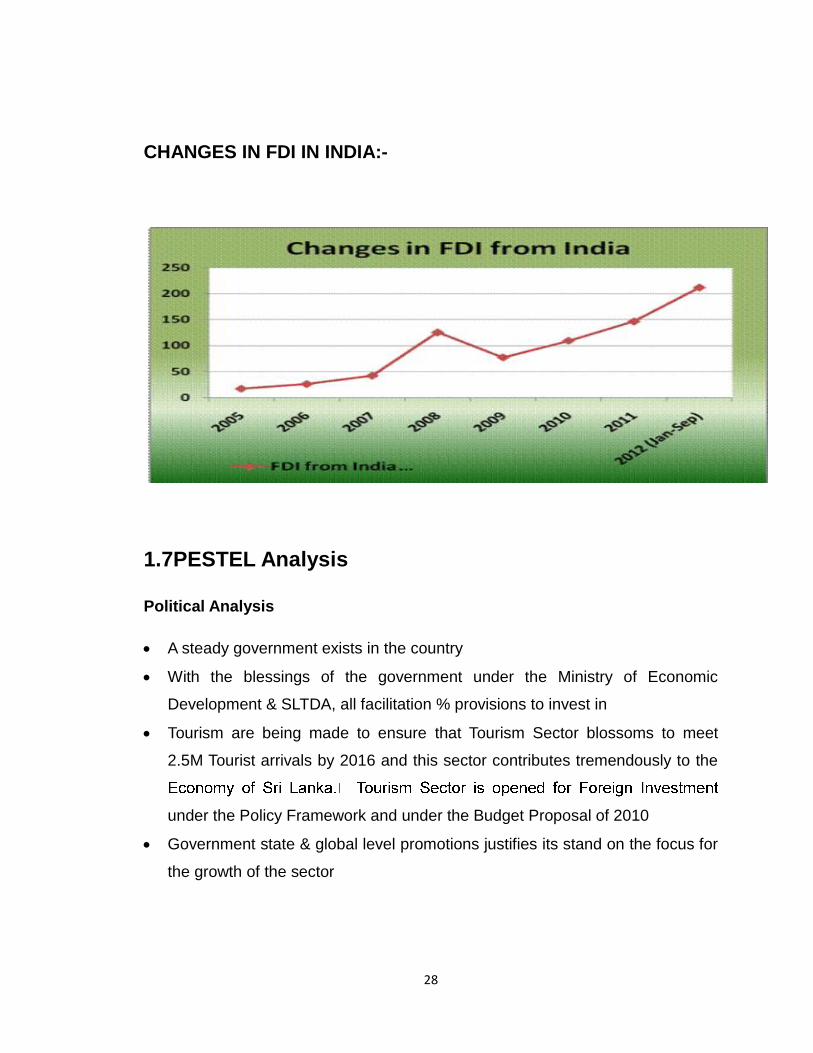
28
CHANGES IN FDI IN INDIA:-
1.7PESTEL Analysis
Political Analysis
A steady government exists in the country
With the blessings of the government under the Ministry of Economic
Development & SLTDA, all facilitation % provisions to invest in
Tourism are being made to ensure that Tourism Sector blossoms to meet
2.5M Tourist arrivals by 2016 and this sector contributes tremendously to the
under the Policy Framework and under the Budget Proposal of 2010
Government state & global level promotions justifies its stand on the focus for
the growth of the sector
29
Economical Analysis
Sri Lanka Economy grew by 8.0% in 2010
Market interest rates sustained to be on the downward trend
Tourist arrivals increased 46.5% compared to 2009.
Investment endorsement is boosted by government
-Income Country”
Foreign Exchange Transaction – Exchange Rate is free of charge
Expectancy -75 years; Intelligent, educated & active work force;
Modern manufacture techniques; skilled manpower and professional
managers are available at reasonable cost.
- Capital Account opened for Foreign Exchange
Transactions
2010 for the first time
Board of Investment (BOI) accepted Enterprises / Tourist Hotels & other
Tourism related Establishments are with income tax on net income / profits
free for a stipulated period
Inward remittance for investment, outward remittance of earnings
dividends, royalties & other present account payments and capital
proceeds on liquidation / transfer at shares are permitted
Social Analysis
The country had gone through the practice of tourism over many decades.
Thus, the country and all religious / racial groups have recognised the value it
generates to the development of Sri Lanka.
At the same time, a lot of efforts are put nationally and in tourism based
regions to make sure Sri Lankans are not becoming victims of social
problems created in connection with tourism. Thus, the trade runs smoothly
without any factions / group / organized protests against the industry.
30
ountry, which
creates value to the industry. These locations are mostly utilized for tourism
related economic activities than for residence.
Overall, since the country’s present focus is towards tourism development,
the entire nation’s focus is towards it and the mind-set of the people are to get
involved in the economic operations of tourism.
Technological Analysis
Sri Lankan Structure has a number of Narrow and Authoritative Bodies to look
after the application of technology in the economic sphere, mainly for industry
and commercial purposes.
The purpose of technology in the Tourism Sector will be governed by the
relevant bodies / authorities mentioned above
Most of the technology necessary for the tourism trade has to be imported
from international suppliers through Sri Lankan agents / distributors
Environmental Analysis
Large Scale Hotels & Other Venues for the Tourists to enjoy can be a
concern for environment as its construction and continuous operations
may exert pressure on the environment.
Sri Lankan legislature, body shaped from the legal systems and practice
allow such large investment based intensive structures and operations
under the assessment, supervision, guidance, license and approvals.
The Central Environmental Authority is the certified agency in this regard.
Legal Analysis
Government’s legal structure facilitates the incoming of investments for the
legalized economic activities, enjoying its returns and the provisions for the
remittance of surplus to the desired destinations, under terms and conditions
applicable, set out by the Board of Investment (BoI) of Sri Lanka.
31
CHAPTER: 2
INTRODUCTION OF THE SELECTED COMPANIES
AND ITS ROLE IN THE
ECONOMY OF SRI LANKA.
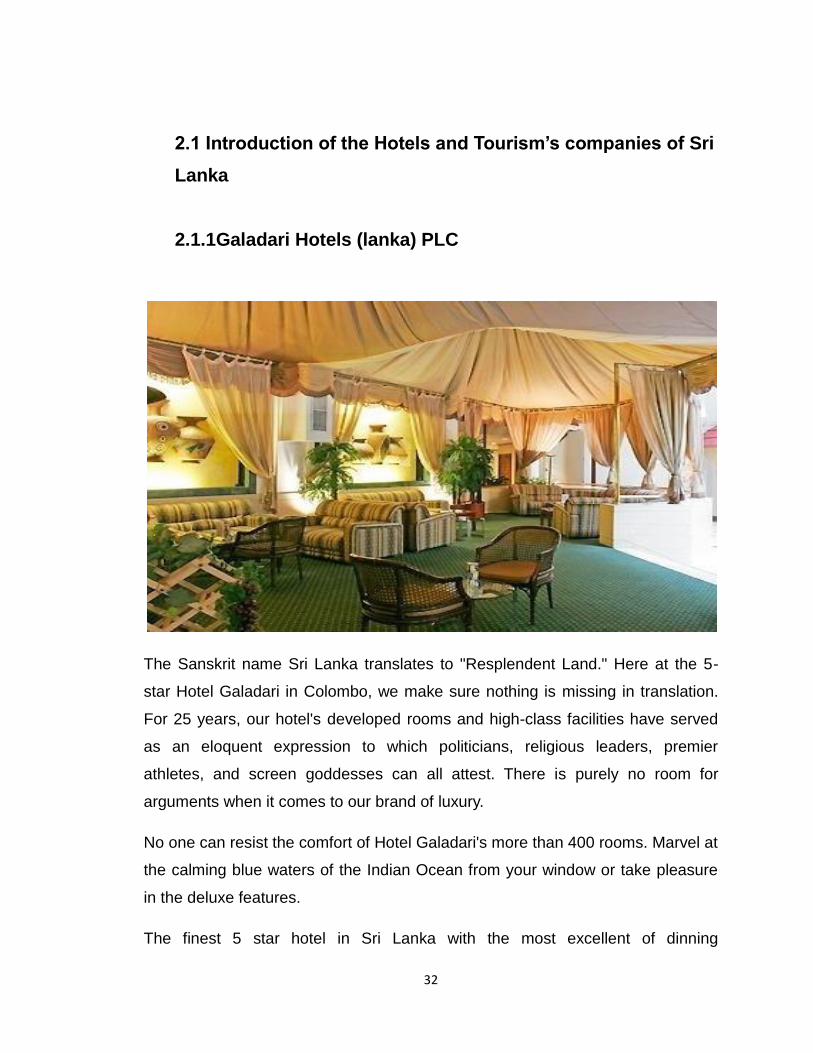
32
2.1 Introduction of the Hotels and Tourism’s companies of Sri
Lanka
2.1.1Galadari Hotels (lanka) PLC
The Sanskrit name Sri Lanka translates to "Resplendent Land." Here at the 5-
star Hotel Galadari in Colombo, we make sure nothing is missing in translation.
For 25 years, our hotel's developed rooms and high-class facilities have served
as an eloquent expression to which politicians, religious leaders, premier
athletes, and screen goddesses can all attest. There is purely no room for
arguments when it comes to our brand of luxury.
No one can resist the comfort of Hotel Galadari's more than 400 rooms. Marvel at
the calming blue waters of the Indian Ocean from your window or take pleasure
in the deluxe features.
The finest 5 star hotel in Sri Lanka with the most excellent of dinning
33
accommodation & entertainment facilities. This 450 roomed good looks is
located face the foaming ripples of the Indian Ocean and remains to be one of
the best five star hotels in Sri Lanka
Step-in to be lost in unreasonable cuisines, cozy hideouts, heavenly surrounding
& the best of services, which extra 5 star hotels in Sri Lanka could not offer.
Galadari Hotel Sri Lanka; one of the optimum 5 star hotels in Sri Lanka is not
only the best place to rest, eat & indulge, but is also the optimum place to party.
Come! Delight and breathe the air of luxury at the heart of Colombo.
Galadari Hotel that overlooks the vast Indian Ocean provides guests among a
range of rooms & suites along among a very comprehensive list of facilities to
enjoy their stay in Sri Lanka. The hotel which is able to provide to the
requirements of both business and family travelers is specially geared to handle
the needs of Muslim customers. Step into a world of style & royalty at the
Galadari Hotel where you are provided with excellent services and facilities.
Galadari Hotel is situated in the heart of the Commercial Hub of Colombo offering
a panoramic view of the magnificent Indian Ocean. Travelling option to & from
the global Airport are plenty. The middle train station & the bus station are also of
proximity to the hotel. Banks, the world trade center’s & main shopping areas are
found within easy reach.
Galadari Hotel Accommodation and Facilities
At Galadari Hotel, a totality of 450 luxury rooms a wait you in elegant settings
and delightful decor.
Presidential Floor - A floor fit for royals. Presidential Suite - offer the ambience of
a luxurious personal residence, the suite is situated on the 14th floor of the hotel
offering views of the Indian Ocean. Modern facilities include a huge sitting &
dining room area, a conference room, an office room, a master bedroom among
jacuzzi for two, walk in shower among rain shower head, plasma TV among DVD
player, steam room, extra guest bedroom or bathroom.
34
The Diplomatic and Royal suites as well as the Presidential floor room have all
being designed with comfort and style in mind. Standard facilities include state
check-in, plasma TV among DVD player, breakfast at the Executive Club
Lounge, every day newspaper, without charge pressing of one suit/dress per
night and shoe shine service.
Executive Floor This floor is ideal for the business traveler with additional
facilities to entertain colleagues on the same floor for that last moment meeting
before a presentation or main event. A personal Business Centre, Restaurant &
Bar is available exclusively for guests of this floor, as well as wonderful views of
the Indian Ocean and the Colombo harbor. Manager Presidential Suite,
Executive suite and manager floor rooms are offered with the addition of express
check-in facilities, TV among DVD player, breakfast at the manager Club Lounge,
every day newspaper, free pressing of one suit/dress per night and a shoe shine
service.
Superior Floors These deluxe guest rooms offer VIP amenities for guests.
Spacious & elegantly furnished greater Suites and Rooms offer a range of luxury
facilities with the addition of tea/Coffee making facility, bathrobe & slippers, built
in wall secure, mini bar, Internet Access & every day news paper.
For dining options the hotel offers a variety of venues. The Coffee Shop which is
open 24 hours provides buffet breakfast meals and lunches along with theme
nights. The California Grill Rooftop Restaurant offers the best seafood and steaks
while guests can listen various music. This restaurant is open all day for dinner
among an a la carte menu. The Scheherazade Arabic Restaurant is also open for
dinner - buffet and a la carte while the garden area can be used for personal
dining. Offering exotic cuisine from China is the Six Chinese Restaurant where
guests can enjoy lunch & dinner. The Nightingale's Karaoke Lounge, the Lobby
Bar & the Margarita Blue Retro Pub are ideal venues to enjoy a drink. Guests
can also enjoy pastries, cakes & different mouth-watering snacks at the Pastry
shop and Garden Terrace.
35
For all your banquets & function necessities, the Galadari Hotel offers an
assortment of varied banquet halls and meeting rooms with exceptional service
tailor made just for you.
Recreational facilities at Galadari Hotel include a fully equipped gymnasium with
a personal guide, steam room, sauna, an open air swimming pool and a flood lit
tennis court. Body care & massage therapies are also available for guests to
relax and refresh themselves from their busy work schedules. A flower shop & a
launderette are also available for the convenience of the guests.
Galadari Hotel Excursions
Excursions can be made to beautiful locations in the island since Galadari Hotel
is situated in Colombo. Travelers can easy enjoy a walk along the Galle Face
Green or head towards the south along the main road and encounter the
beautiful stretch of beaches that our country has to offer. A trip towards the hill
assets of Sri Lanka will take you to totally different scenery in just a couple of
hours among rivers, mountains & the historically well-known Kandy and heritage.
Sri Lanka’s Galadari Hotel calls shareholder meet on capital erosion
May 11, 2012 (LBO) – Sri Lanka’s defeat making Galadari Hotels (Lanka) PLC is
calling for an extraordinary meeting of shareholders (EGM) this month to discuss
dwindling capital as losses mount.
"The company is unaudited financial statements for the quarter ended March 31,
2012 discloses that it’s currently facing position of serious loss of capital," the
Colombo-based hotel said.
The EGM is scheduled for May 29.
One of the capital’s long-standing 5 star properties, the hotel was founded by the
Dubai-based Galadari group and it has foreign exchange loans.
In the December 2011 quarter the firm misplaced 199.6 million rupees, worsened
36
by a 191 million rupee exchange loss as the rupee fell by around 3 percent in
November.
The hotel had designed a debt equity swap to make stronger its balance sheet.
Galadari Hotel had 8.3 billion rupees in gross property, 9.1 billion rupees in
accumulated losses & 6.8 billion rupees in loans.
But with an 8.5 billion rupee revaluation reserve it still had 1.3 billion rupees of
net assets by ending December 2012, down from 1.5 billion a year previous.
In the March quarter however the rupee cut down more to around 130 rupees to
the US dollar as the island's Central Bank tried to control both the exchange rate
and interest rate by printing money.
The March quarter accounts have not yet been released to the market. There
has also been no income warning.
Among key shareholders is the Employees' Provident Fund, a retirement fund of
personal citizens managed by the Central Bank, which owns 13% of the hotel.
The stock buy is among the most controversial made by the fund.
Galadari Hotels (Lanka) PLC records best ever revenue this year
Improvements in occupancy rates and revenue have helped Galadari Hotel
report a turnaround. Galadari Hotels has seen a surge in accumulated losses
due to heavy foreign exchange losses during the first nine months of this year.
However, the hotel has enhanced significantly during the September quarter on
improved occupancy rates. Galadari Hotel has recorded its top ever occupancy
and highest revenue since its inception and the 450 room hotel enjoys an
average of 50% occupancy, its common Manager Sampath Siriwardena said.

37
"Despite the recession in the UK, various from the country have opted to travel to
short haul destinations, but still tourists from the UK continue to head our
occupancy with an average of 65 percent to 70 percent," he said.
"There is a stable flow of tourists from the UK now, but the situation was quite
different during the war," he added.
"We want to move forward from traditional beach tourism and explore the niche
markets," he said, adding that the hotel has gone in to promote sports tourism in
a big way, with success.
The country’s tourism industry has a great future if the product is promoted
aggressively and we could truly be the "Wonder of Asia," he added. A amount of
visiting cricket teams including school teams have chosen Galadari as their hotel
and their average stay was approximately two weeks, Siriwardena pointed out.
Galadari will be hosting the crew of the Amazing Grace television series for the
third year in progression. "We are trying to encourage similar groups in the
upcoming," he said. The Oberoi Hotel School graduate and senior hotelier said
that we should always market what the country naturally possesses as we have
an abundance of locations with scenic beauty and steeped in history and
abounds in cultural significance.
SIRIWARDENA was of the opinion that we should endorse locations such as
Pottsville point in Argue Bay which is one of the best surfing destinations in the
world. The country’s tourism industry has to shift with the latest trends and
promote events such as ‘night races’ as there are many adventure seeking motor
racing enthusiasts in India and the Maldives who would want to come and
witness such events if they are planned here, he said.
Galadari Hotels (Lanka) PLC has seen a significant performance in its profitability
during quarter newly completed. The company reported a net profit of Rs. 339.7
million through the September 2012 quarter, a significant development
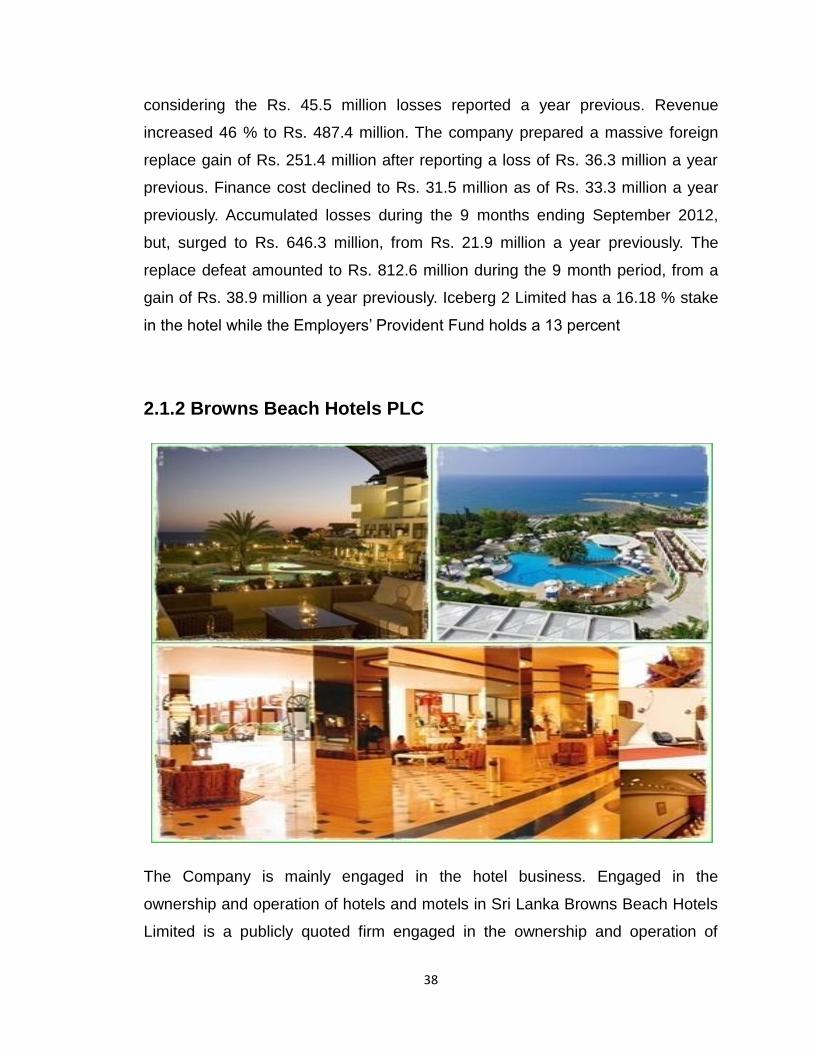
38
considering the Rs. 45.5 million losses reported a year previous. Revenue
increased 46 % to Rs. 487.4 million. The company prepared a massive foreign
replace gain of Rs. 251.4 million after reporting a loss of Rs. 36.3 million a year
previous. Finance cost declined to Rs. 31.5 million as of Rs. 33.3 million a year
previously. Accumulated losses during the 9 months ending September 2012,
but, surged to Rs. 646.3 million, from Rs. 21.9 million a year previously. The
replace defeat amounted to Rs. 812.6 million during the 9 month period, from a
gain of Rs. 38.9 million a year previously. Iceberg 2 Limited has a 16.18 % stake
in the hotel while the Employers’ Provident Fund holds a 13 percent
2.1.2 Browns Beach Hotels PLC
The Company is mainly engaged in the hotel business. Engaged in the
ownership and operation of hotels and motels in Sri Lanka Browns Beach Hotels
Limited is a publicly quoted firm engaged in the ownership and operation of
39
hotels and motels in Sri Lanka. The company started its operation in 1992. Its
general shares were listed on the Colombo Stock Exchange in February of 1993.
Browns Beach Hotels operate from its registered business office situated in
Negombo, Colombo.
The company provides travel accommodation services for individuals visiting the
country, as well as domestic tourists who wish to spend vacation. Its hotels and
motels are equipped with various facilities and amenities for quality services offer.
Brown Beach Hotel comprises 140 air conditioned guest rooms. These include a
Penthouse located on the beach front, as well as 10 luxury villas, and five suites.
It has also three restaurants that cater international cuisine.
Synopsis
This SWOT analysis and company profile of 'Browns Beach Hotels Plc' contains
in-depth information and data about the company’s businesses & operations.
World Market cleverness objectively assesses and presents Browns Beach
Hotels Plc’s key strengths, weaknesses, growth potential & competition. The
profile contains sections* including company summary, business explanation,
financial ratios, SWOT study, competitive benchmarking, key facts & employees,
location & subsidiaries as well as information on products and services.
This SWOT analysis and company profile is a crucial resource for industry
executives and anyone looking to gain a better understanding of the company's
business. The report is a fraction of World Market Intelligence’s SWOT analysis
and company profile universe which covers other than 40,000 leading universal
companies.
Once purchased, World Market Intelligence's team of analysts will
comprehensively research and produce a full SWOT analysis and company
profile of 'Browns Beach Hotels Plc' and deliver this direct to you in pdf format
40
within two business days - excluding weekends.
Sri Lanka’s Samudra Beach Resorts, a subsidiary of Browns savings Plc has
recently signed an agreement with the Board of Investment of Sri Lanka and
obtained approvals for the construction of a 150 room star class hotel in
Kosgoda. The company also procedure to enlarge the number of rooms to 172
with necessary approvals, the company thought in a statement issued last week.
“A reputed architectural firm in Thailand has been commissioned to design the
hotel which will be built in an eco-friendly environment. The hotel is contiguous to
a turtle hatchery and the guests will have a unique experience in watching the
turtles moving around on the beach, as of their rooms,” the statement from the
firm said.
The construction of the proposed project with an expected cost of Rs.1.75 billion
will start on soon and is scheduled to be completed in 2 years. The hotel will be
prepared with all modern facilities including 2 restaurants, the core one which
can accommodate 250 persons and a specialty restaurant. The accent will be on
outdoor services with an outdoor lounge bar, an outdoor food outlet, & a pool bar.
The hotel will be fully-owned by Browns Investments Plc but it is intended that
management will be given over to a well experienced, globally recognized
operator.
“Discussions are underway with global hotel chains regarding the management
of the hotel,” the statement further added.
In its joint venture with LOLC Leisure, Browns Investments holds a 30% stake.
The hotels in the joint venture include Riverina, Palm Garden Hotel, Eden, and
Tropical Villas & Dickwella Village Resort. These properties include 620 plus
rooms in the Southern Province. At present, most of these properties are going
through a major refurbishment drive with the objective of making them more
attractive to the tourists. The leisure sector is a key section in the investment
portfolio of Browns Investments. According to P R Saldin, CEO, Browns
41
Investments, with Browns Investments’ stake in LOLC Leisure and the
construction of the hotel at Oscoda, Browns Investment will strengthen it’s
footprint in this sector.
Belonging to the Aitken Spence Hotels Chain that represent a unique Green
Philosophy and combines responsible tourism with environment friendliness,
Browns Beach Hotel has been treat guests to memorable holidays in Sri Lanka.
Providing outstanding service & modern facilities, this coastal hotel is situated in
Negombo. All the housing units obtainable at the hotel provides an ocean view
the beach rooms open directly to the beach allowing guests to enjoy their own
personal holiday. All meals are available at the hotel while theme nights allow
guests to taste dishes from around the globe.
Browns Beach Hotel Location
Built on a 6.5 acre beach front estate, Browns Beach Hotel is situated in the
fishing neighborhood of Negombo which is on the Western Coast of Sri Lanka.
Located 37km away from Colombo, the hotel is however of shut nearness to the
International Airport which about 13km away is. The bus and train stations are a
mere 3.5 km away from the hotel which is expediently at situated in Negombo.
Taxi services are also available for travelers.
Browns Beach Hotel Accommodation
Offering affordable rates and a three star service, Browns Beach Hotel provide
guests with 140 rooms with a view of the Indian Ocean. All rooms are equipped
with power competent air conditioning and are wheel chair accessible.
95 Standard rooms are available at Browns Beach Hotel and general facilities
include a Bathroom with Shower, Minima, Laundry Services, Room Service, Fan,
Radio & Piped Music, and Telephone with IDD Facilities, personal Balcony or
Terrace & Wi-Fi. Smoking & non-smoking rooms are vacant.
30 Beach rooms are available with Smoking and non-smoking facilities. These
recently refurbished rooms & directly open on to the beach. They have a front
42
garden among terrace & sun lounges. The Hotel also includes 5 Suites among
smoking and non-smoking facilities as well. These suites are create in the upper
floors of the hotel with direct sea views and have a separate sitting area with
dining tables & chairs. Common facilities for Beach Rooms & Suites include
Writing table & chairs, Dressing & Sitting areas, Bathroom among shower, hot &
cold water & toiletries, TV among Satellite & local channels, Radio and piped
music, Fully supplied mini bar, Tea & coffee making facility, Laundry Service
(Normal or Express), Room Service, Fan, Hair dryer, Telephone among IDD
facility, Digital Safe and Wi-Fi.
10 Smoking and Non-Smoking Cabanas are also available at Browns Beach
which is individually located at the far end of the hotel. While no direct access is
provide to the beach, these Cabanas have personal sit outs and a garden view.
Common services that are offered for the beach rooms and suites are also made
available for the Cabanas.
Browns Beach Hotel Facilities
Having a philosophy of third dimension food which is based on a threefold
foundation of taste, health & arrangement, Browns Beach Hotel provides meals
that sizzles your taste buds. The core air-conditioned restaurant located on the
ground floor of the hotel offers a fine view of the surroundings and serves quite
an extensive buffet for all three meals with Eastern, Western & global Food.
Guests can too enjoy a collection of wines among meals. Browns Beach Hotel
has a beach bar, a pool bar & a pub bar where guests can socialize while
enjoying drinks. The Hotel has also introduced topic night cookery Sri Lankan,
Italian, Chinese, Indian, International and BBQ style meals.
Sports and recreational facilities include a Swimming Pool with a kid's Pool,
Water Polo, Tennis Courts, Beach Volleyball, & Beach Football & Indoor Games.
Wedding Packages are obtainable among usual Sri Lankan customs with a
dedicated wedding co-coordinator. The hotel has also become a favorite venue
for corporate events and conferences with a range of facilities to suit your
43
business needs.
Other facilities contain 24-hour Room Service, 24-hour Porter Service, Shopping
Arcade, Self Parking, Foreign Currency Exchange, Safe at Reception, Laundry
Service, Cyber Cafe, Drivers Quarters, Doctor on Call, Secretarial Services, Free
Beach Towels, News Stand, Children's Menus, Photocopying Services,
Children's High Chairs, Free Pool Towels, Sun Chairs and Public Beach Access.
Browns Beach Hotel Excursions
The busy town of Negombo has a selection of shops, restaurants & cafes & also
boasts a culturally rich heritage with ruins of an Old Dutch Fort and Roman
Catholic Churches built by the Portuguese. The Negombo lagoon is forever filled
with dugout canoes while fish auctions on the beach are a common and
motivating site. A Fisherman's Festival is held in late July each year. For the more
adventurous explorer, the Muthurajawela Marsh which means "Swamp of the
Royal Treasure" is situated towards the Southern part of Negombo with
boundaries reaching up to the lagoon. Here a variety of species of birds &
swamp animals could be found and excursions can be made on advanced
bookings.

44
2.1.3 Ceylon Hotels Corporation PLC
Ceylon Hotels Corporation, having commenced business in 1967, boasts a
diverse group of 19 hotels, rest houses, resorts & restaurants all through Sri
Lanka, many of which offer an old world charm providing clients with something
quintessentially local in the most picturesque and prominent locations well-known
to man. Many are within a few kilometers to renowned historical sites and
attractions.
The foundations of most Ceylon Hotels Corporation properties are accredited to
the British Rulers of Sri Lanka. Influenced through the British Civil Servants’
urgent need for temporary abodes during their extensive travels in remote out
posts in colonial Ceylon, many of the properties were planned & built to resemble
the style and architecture of old English Inns and Country Homes.
The foundations of most Ceylon Hotels Corporation properties are accredited to
the British Rulers of Sri Lanka. Influenced by the British Civil Servants’ urgent
need for temporary abodes during their extensive travels in remote out posts in
45
colonial Ceylon, several of the properties were designed and built to resemble
the style and architecture of old English Inns and Country Homes.
Ceylon Hotels Corporation’s series falls into 03 categories according to their
location – Pusellawa, Ella, Kotmale, Belihuloya are situated in the central
highlands; Weligama Bay Inn situated on the coastline of the south and
Tissamaharama, Dambulla, Sigiriya, Habarana, Polonnaruwa and Seruwa are
located in the cultural triangle.
Those involved in wild life, will never forget The Safari - Tisa which is a mere 30
minute drive to one of Sri Lanka’s largest national park popularly known as the
“Yale National Safari Park”.
To mark Queen Elizabeth's appointment to Sri Lanka in 1954, the renown The
Lake - Polonnaruwa built, what it now boast as, its very own “Queen’s Suite”,
which offers a breath-taking view of an ancient tropical man-made lake, the
largest of its kind in Sri Lanka and traditionally referred to as the “Parakrama
Samudra”.
Sigiriya Rest House is an knowledge you would not want to miss as you visit and
climb the renowned Sigirya Rock, the World’s 8th Wonder and a UNESCO World
Heritage Site.
The dreamy locations of the Grand Ella Motel, The Lake - Polonnaruwa, Kitugala
Rest House or Belihuloya Rest House have prompted visitors to name these rest
houses as “honeymooner’s paradise” or a hide out for relaxation in exotic
surroundings – this is particularly appropriate to Hotel Mihintale.
The colonial building of Ambepussa has become a very popular stopover for
visitor’s enrooted to Kandy, Anuradhapura & Polonnaruwa. The architecture of
some of the properties, although given a original look, is still in keeping with the
old traditions which Ceylon Hotels Corporation is famed for.
The surroundings of each rest house and its scenic beauty can’t be over
emphasized. You will hear the gushing waters of the river flowing, the chirping

46
sounds of birds & the cool breeze blowing across while you relax at many of the
rest houses. The Kithulgala Rest House is one such position and has earned its
fame from being the setting and location for David Lean’s award-winning film -
Bridge on the River Kwan”.
A host of activities await you amongst the Ceylon Hotels Corporation properties –
varying from rock climbing to river rafting, nature walks, river bathing, barbecues,
cultural and archaeological excursions, boat rides, fishing, jungle safaris, a visit
to the Zoo and more.
Amongst its vast portfolio, sit two very prominent properties in the heart of Kandy.
The elements of design of each property demonstrate an ancient lineage and a
reflection of the glory of a once-proud Kingdom. Hotel Suisse a pre-World War II
guest house and once used as a garrison for British soldiers, is the final powerful
hold of the ancient Sinhala Kings. Both properties are within lock closeness to
the famed Temple of the Sacred Tooth Relic of the Lord Buddha.
As you trip through the past, present and future that encompasses Ceylon Hotels
Corporation, you will find many reasons to take the time and trouble to truly
discover Sri Lanka in its entire splendor.
The Ceylon Hotels Corporation PLC says it is currently geared to attract foreign
tourists, having several of its facilities which were primarily patronized by the
domestic travelers been refurbished.
The Company which has suffered a net loss of Rs. 59 million during the year
2010 & 2011 financial year says, 58 rooms out of its 88 room capability “The
Surf-Bentota” hotel and the 52 rooms at “The Safari” have been refurbished.
The CHC says the balance 30 rooms of Surf Bentota are being refurbished with
added facilities. Lakshman Samarasinghe, the Chairman of the Ceylon Hotels
Corporation PLC says both projects saw an investment of Rs. 600 million.
Samarasinghe said, one of the reasons for the net loss suffered by his firm is
owing to the 4 month closure of “The Surf” and “The Safari” properties for
47
refurbishment work. He said both the above mentioned properties have been
upgraded into 4 star grades following the refurbishment.
“CHC is joyful to inform you that the occupancies of these properties have
increased significantly”, added Samarasinghe in his review published in the year
2010/2011 annual report of the firm.
Ceylon Hotels Corporation also has refurbished Heritage Ambepussa,
Ambepussa Avanhala and Heritage Pussellawa. CHC last week has reopened its
Dambulla and Habarana Rest Houses after refurbishment.
“We spent 25 million to refurbish those 2 properties”, Samarasinghe told News
360.lk. Grand Ella Motel and Kithulgalla Rest House, Belihuloya Rest House,
Sigiriya Rest House and Hotel Seruwa is currently undergoing refurbishment.
According to Samarasinghe, a swimming pool is being established in the Seruwa
Hotel. “Seruwa Hotel refurbishments & latest additions will earn a sum of Rs. 100
million”, added Samarasinghe.
During the year 2010/2011 financial year, the turnover of the Company has gone
downward to Rs. 278.9 Million downward from Rs. 325.8 Million earned during
the earlier year.
However, the Group has recorded a turnover of Rs. 641 Million compared to Rs.
536 Million last year, which is an increase of 20%. The Group also has recorded
a net income of Rs. 51 Million compared to a net loss of Rs. 39 Million in the
earlier year.
Kandy Hotels PLC, combined Hotels Co. Ltd, CHC Foods (PVT) Ltd, Tissa
Resort (PVT) Ltd. and Airline Services (PVT) Ltd are the subsidiaries of CHC
which has performed well during the financial year which ended on the 31st of
March 2011.
48
2.2 Introduction of the Hotels and Tourism’s companies of India
2.2.1 COX & KINGS LIMITED
Cox & Kings were first to develop a world-class cell for international conferences
and convention in India. Backed by over a decade of award winning performance
and a team of industry experts who can efficiently fuse modern facilities among
local, this separation is powered by a high-end platform of Information
Technology that offers super-fast error free processing.
Cox & Kings caters for all aspects of Seminar organizing, Business Meetings,
Event Management, and seminar, Exhibition, Product launch & incentive. Every
event is shaped to suit the particular requirements of our client and every detail
handle among care, right from the pre event planning, through the event itself
and through to post event settlement. Extensive preparation & substantial
research ensure the most comprehensive & memorable conference for all our
clients.
49
Cox & Kings unveils a refreshingly different travel practice, not only across India
other than also across Nepal & Sri Lanka. India is quick rising as one of the
preferential destination for meetings & conferences. It has a collection of world-
class hotels and palace resorts with the latest state-of-art services. Efficiently
linked to the globe via air & road, high speed broadband Internet & hold facilities
like video conferencing, hi-tech projectors, language explanation capacities. India
makes for a very comfortable meeting hole. To add to the competence are expert
destination management services, strong infrastructure to perform trainings,
large venue offering a series of seating arrangements and a gamut of leisure
activities.
Cox & Kings has also introduced the concept of which are exclusive. These are
little touch, which go a long way in giving a taste of the essence of India. These
comprise theme dinners, theme nights and imperial dinners, with others.
Cox & Kings (India) Ltd is one of the recognised holiday brands that cater to the
overall travel needs of an Indian and global traveller. The company's business can
be largely categorised as Leisure Travel, Corporate Travel, Forex & Visa
Processing.
The company also provides value added services such as customising travel
plans for the NRI customers, travel preparations for Trade Fairs, provide private
air charter services, etc. Besides, they propose travel connected foreign
exchange & payment solutions.
The company is having their registered office located at Mumbai. They are having
255 points of attendance cover 164 locations through a mix of branch sales
offices, franchised sale shops, General Sales Agents (GSAs) and Preferred Sales
Agents (PSAs).
50
They are having 14 branch sales offices situated in Mumbai, New Delhi, Chennai,
Kolkata, Bangalore, Hyderabad, Ahmedabad, Jaipur, Kochi, Pune, Nagpur and
Goa. Also, they work through 56 franchised sales shops spread across India to
have larger access to their customers.
The company has a global presence with their operations in 19 countries besides
India through subsidiary, branch offices & representative offices. They have
subsidiaries in UK, Australia, New Zealand, Japan, US, UAE & Singapore. They
operate from Moscow (Russia), Maldives & Tahiti through their branch offices &
Spain, Sweden, Germany, Italy, France, South America & South Africa through
their representative offices.
Further, they have their presence in overseas markets through a network of GSAs
& PSAs covering other countries enhancing their global presence. Cox & Kings
(India) Ltd was incorporated on June 7, 1939 among the name Eastern transport
Company Ltd. In February 23, 1950, the name of the company was changed to
Cox and Kings (India) Ltd. In the year 1980, the company acquire the Indian
business of Cox & Kings (Agents) Ltd.
In the year 1996, the company forayed into Foreign switch business. They
launched 'Duniya Dekho' & 'Bharat Deko' brands in the year 1999. They launch
the brand, 'FlexiHol' in the year 2001. In October 2001, the company become a
personal limited company and the name was changed to Cox & Kings (India) Pvt
Ltd.
In the year 2002, the company acquired the Foreign Exchange business of Tulip
Star Hotels Ltd. In the year 2006, the company acquire Clearmine Ltd, a UK
based company, among a completely own supplementary, ETN Services Ltd.
Thus, those 2 companies became the wholly owned subsidiaries of the company.
51
They established their overseas branch offices at Russia & New York. Also, they
incorporated their overseas additional in Singapore. In the year 2007, the
company acquire Cox & Kings Ltd, a UK based company, among the entirely
owned subsidiaries Cox & Kings Travel Ltd and Cox & Kings (Japan) Ltd, based
in Japan. Also, they incorporated their overseas subsidiary in Dubai.
In the year 2008, the company acquired Tempo Holidays Pty Ltd, based in
Australia among a completely owned subsidiary, Tempo Holidays NZ Ltd base in
New Zealand marking the company's direct presence in these geography. The
company forayed in the Visa dispensation business through the acquisition of
Quoprro Global Services Pvt Ltd.
In December 2008, the company made a joint venture agreement with IRCTC and
formed a company namely Royale Indian Rail Tours Ltd for luxury train-based
tourism in India and operating a luxury train to be called 'Maharajas' Express'. In
the year 2009, the company acquire East India Travel Company Inc, a US base
company.
They incorporated a subsidiary company in UK, namely Quoprro Global Ltd. Also,
they included a step down overseas subsidiary company in Hong Kong. In
January 27, 2009, the company became a public limited company and the name
of the company was changed to Cox & Kings (India) Ltd. In December 2009, Cox
& Kings (Australia) Pty Ltd, a subsidiary company acquired 100% stake in My
Planet Australia Pty Ltd & Bentours global Pty Ltd, Australia. From March 6, 2010,
'Maharajas' Express' train, operate by the joint gamble business, Royale Indian
Rail Tours Ltd, ongoing its trip. The train has a whole coach of 23 coaches with
passenger capacity of 84.
2.2.2 India Tourism Development Corporation Ltd
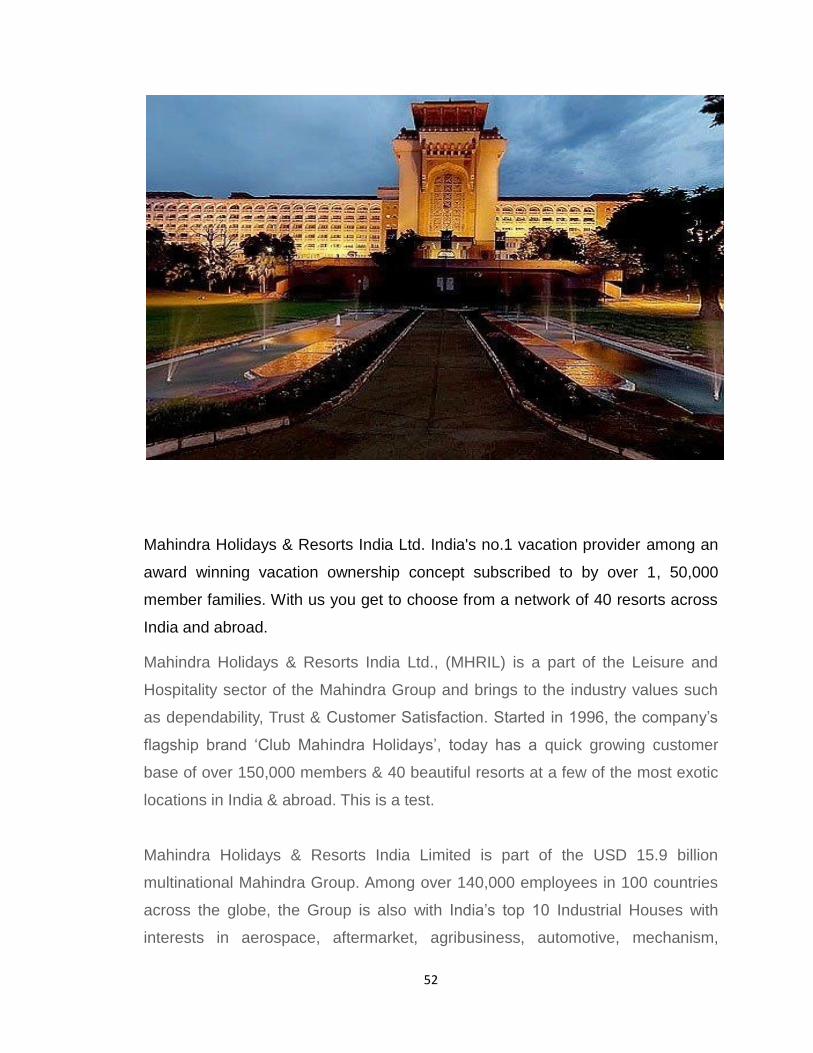
52
Mahindra Holidays & Resorts India Ltd. India's no.1 vacation provider among an
award winning vacation ownership concept subscribed to by over 1, 50,000
member families. With us you get to choose from a network of 40 resorts across
India and abroad.
Mahindra Holidays & Resorts India Ltd., (MHRIL) is a part of the Leisure and
Hospitality sector of the Mahindra Group and brings to the industry values such
as dependability, Trust & Customer Satisfaction. Started in 1996, the company’s
flagship brand ‘Club Mahindra Holidays’, today has a quick growing customer
base of over 150,000 members & 40 beautiful resorts at a few of the most exotic
locations in India & abroad. This is a test.
Mahindra Holidays & Resorts India Limited is part of the USD 15.9 billion
multinational Mahindra Group. Among over 140,000 employees in 100 countries
across the globe, the Group is also with India’s top 10 Industrial Houses with
interests in aerospace, aftermarket, agribusiness, automotive, mechanism,
53
consult services, defense, energy, farm equipment, finance & insurance,
industrial tools, information technology, leisure & welcome, logistics, real estate,
retail, & 2 wheelers.
Domain Expertise
Over the last decade, MHRIL has established itself as a market leader in the
family public holiday business. The company has followed a 2 pronged strategy –
rapidly increasing its bouquet of resorts to provide more variety in holidaying
options and enhancing its service levels to its members to provide delight at
every point of interaction.
All MHRIL resorts are totally geared to cater to a variety of holiday needs and
experiences in all areas of operation, from housekeeping to food and beverage to
holiday activities. Creating & managing the public holiday practice is core
strength.
Mission
Good Living. Happy Families.
Vision
o We will be among the Top 5 VO companies of the world in terms of the member
base by FY 2016
o We will offer world class resorts and memorable holiday experiences that
facilitates our members holidaying every year across a range of destinations in
India and abroad
o We will create wealth for the Stakeholders by providing Good Living to our
customers and be a Responsible Corporate Citizen
o We will ensure Service Excellence and Employee Pride through the adoption of
Innovative and Customer centric practices that will make us one of the world's
most admired companies.
54
2.2.3 Mahindra Holidays and Resorts
ITDC came into existence in October 1966 and has been the prime mover in the
progressive development, endorsement & extension of tourism in the country.
Largely, the major objectives of the Corporation are:
To construct, take over and manage existing hotels and market hotels,
Beach Resorts, Travelers’ Lodges/Restaurants
To provide transport, entertainment, shopping & conventional services;
To produce, distribute, tourist publicity material;
To render consultancy-cum-managerial services in India and abroad;
To carry on the business as Full-Fledged Money Changers (FFMC),
restricted money changers etc;

55
To give innovating, dependable & value for money solutions to the needs
of tourism development and engineering industry including providing
consultancy and project implementation.
The Corporation is running hotels, restaurants at a variety of places for tourists,
also providing transport services. In addition, the Corporation is occupied in
production, distribution & sale of tourist advertising literature and providing
entertainment and duty free shopping facilities to the tourists. The Corporation
has diversified into latest avenues/innovative services like Full-Fledged Money
Changer (FFMC) services, engineering connected consultancy services etc. The
Ashok Institute of Hospitality & Tourism Management of the Corporation imparts
training and education in the field of tourism and hospitality.
Presently, ITDC has a network of eight Ashok Group of Hotels, 5 Joint Venture
Hotels, 1 Restaurant, 11 Transport Units, 1 Tourist Service Station, 9 Duty Free
Shops at airports & seaports and two Sound & Light Shows
Besides, ITDC is also managing a hotel at Bharatpur and a restaurant at Kosi on
behalf of the Department of Tourism. In adding, it is also organization catering
services at Western Court, Vigyan Bhawan & Hyderabad House, and New Delhi.
To construct, take over and manage existing hotels and market hotels,
Beach Resorts, Travelers’ Restaurants;
To provide transport, entertainment, shopping & conventional services;
To produce, distribute, sell tourists publicity material;
To provide entertainment by way of cultural shows, dance, music concert
etc.;
To provide shopping services to tourists, establish & handle shops
including responsibility free shops etc.;
To collaborate with Government both at Central and State levels,
Government-owned Undertakings, Government or Public Companies or
Private Entrepreneurs or any authority or agency having objects altogether
or in part similar to those of the Company for the purpose of development
56
of tourism, tourism connected infrastructure, services & services etc.
To tie-up/enter into collaboration with reputed educational institutes in
India and overseas, take over and manage existing educational institutes
etc for the purpose of imparting organized and certified education and
training in the field of Hospitality, Tourism, Business Management and
Information Technology for the various level courses;
To carry on the business as fully fledged money changers (FFMC),
restricted money changers etc and
To give innovating, dependable & value for money solution to the needs of
tourism development and engineering industry including providing
consultancy and project implementation.
Mission/Vision
To provide leadership & play a catalyzing role in the development of tourism
infrastructure in the country & to achieve brilliance in its strategic business units
through professionalism, efficiency, & value for money & customer focused
service.
Brief history & background for its establishment
India Tourism Development Corporation Ltd(ITDC) come into survival in October
1966 among the sole objective of developing & expending tourism infrastructure
in the country and thereby promoting India as a tourist destination. Working on
the viewpoint of public sector, ITDC succeeded in achieving its objectives by
promoting the largest hotel chain in India and providing all tourist services i.e.
Accommodation, Catering, Transport, in-house Travel Agency, Duty Fee
Shopping, Entertainment Publicity etc Under a single window. It also offers
consultancy services from concept to commissioning in the tourism field both for
private as well as public sector.

57
CHAPTER: 3
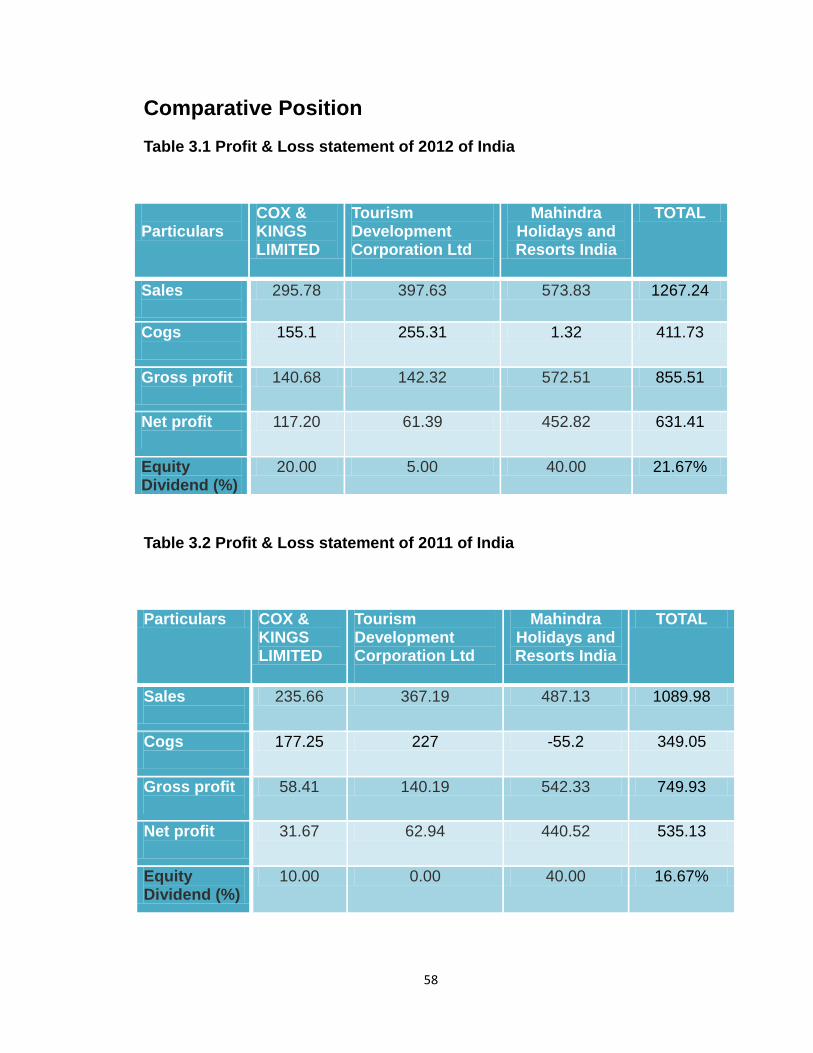
58
Comparative Position
Table 3.1 Profit & Loss statement of 2012 of India
Table 3.2 Profit & Loss statement of 2011 of India
Particulars
COX & KINGS LIMITED
Tourism Development Corporation Ltd
Mahindra Holidays and Resorts India
TOTAL
Sales
295.78 397.63 573.83 1267.24
Cogs
155.1 255.31 1.32 411.73
Gross profit
140.68 142.32 572.51 855.51
Net profit
117.20 61.39 452.82 631.41
Equity Dividend (%)
20.00 5.00 40.00 21.67%
Particulars COX & KINGS LIMITED
Tourism Development Corporation Ltd
Mahindra Holidays and Resorts India
TOTAL
Sales
235.66 367.19 487.13 1089.98
Cogs
177.25 227 -55.2 349.05
Gross profit
58.41 140.19 542.33 749.93
Net profit
31.67 62.94 440.52 535.13
Equity Dividend (%)
10.00 0.00 40.00 16.67%
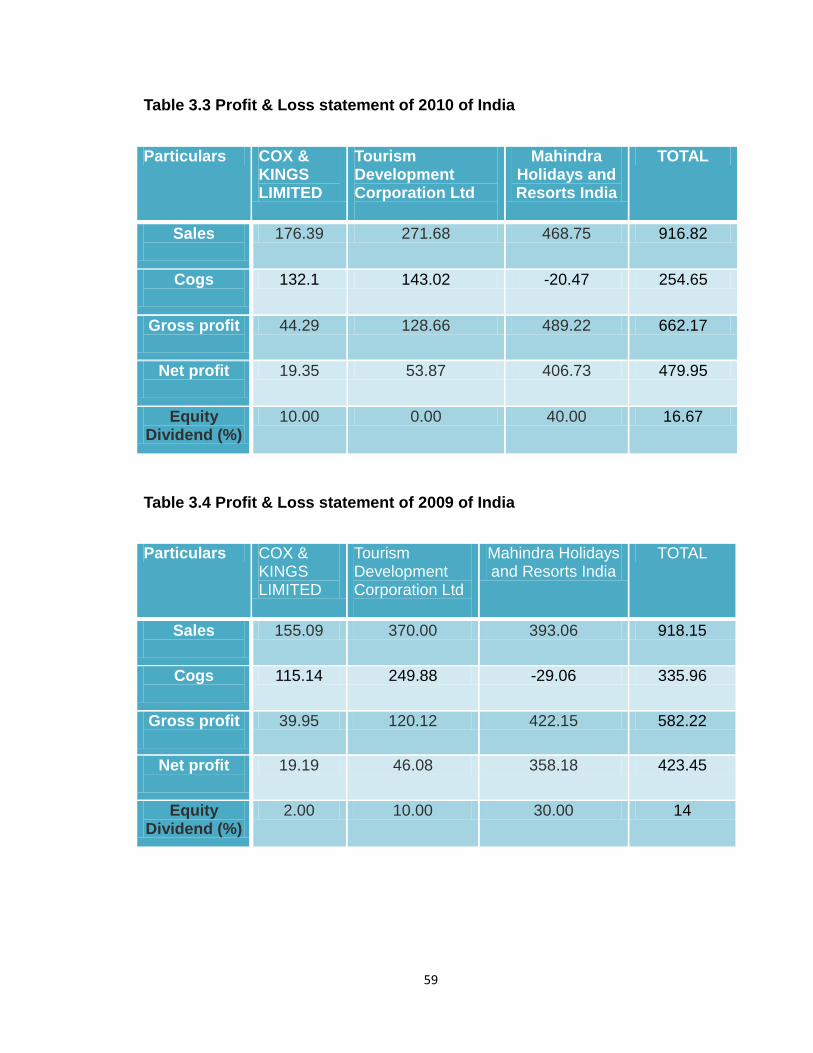
59
Table 3.3 Profit & Loss statement of 2010 of India
Table 3.4 Profit & Loss statement of 2009 of India
Particulars COX & KINGS LIMITED
Tourism Development Corporation Ltd
Mahindra Holidays and Resorts India
TOTAL
Sales
176.39 271.68 468.75 916.82
Cogs
132.1 143.02 -20.47 254.65
Gross profit
44.29 128.66 489.22 662.17
Net profit
19.35 53.87 406.73 479.95
Equity Dividend (%)
10.00 0.00 40.00 16.67
Particulars COX & KINGS LIMITED
Tourism Development Corporation Ltd
Mahindra Holidays and Resorts India
TOTAL
Sales
155.09 370.00 393.06 918.15
Cogs
115.14 249.88 -29.06 335.96
Gross profit
39.95 120.12 422.15 582.22
Net profit
19.19 46.08 358.18 423.45
Equity Dividend (%)
2.00 10.00 30.00 14
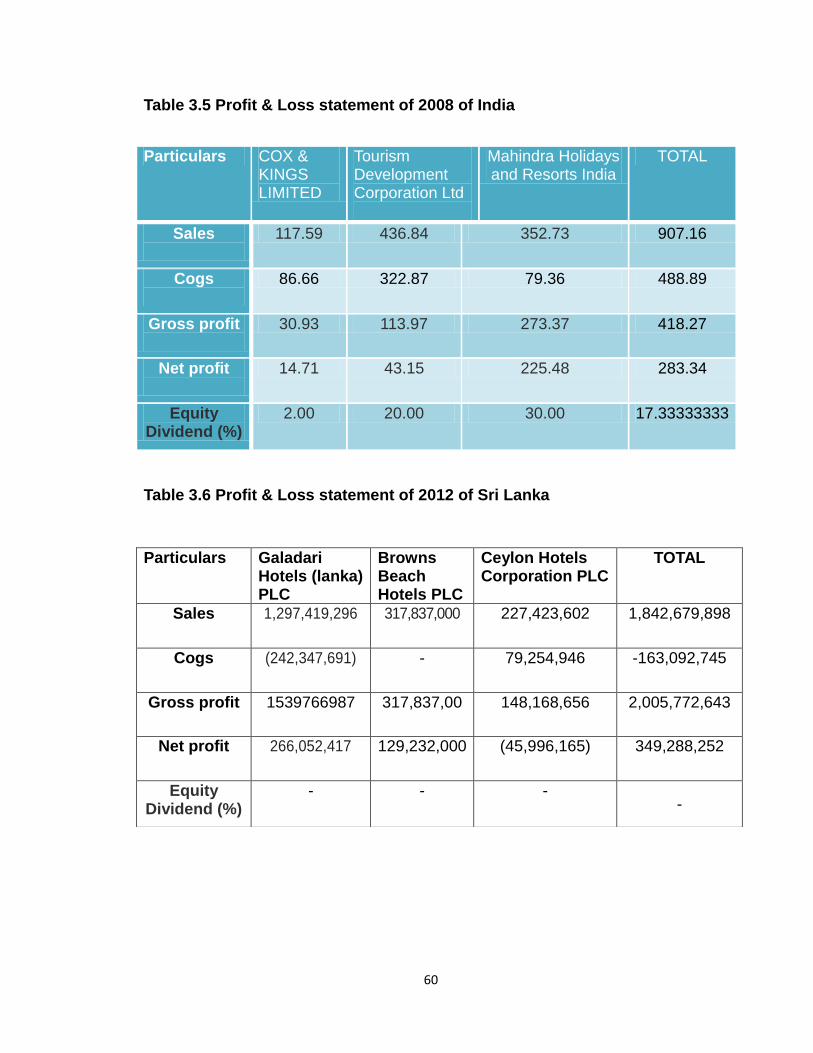
60
Table 3.5 Profit & Loss statement of 2008 of India
Table 3.6 Profit & Loss statement of 2012 of Sri Lanka
Particulars COX & KINGS LIMITED
Tourism Development Corporation Ltd
Mahindra Holidays and Resorts India
TOTAL
Sales
117.59 436.84 352.73 907.16
Cogs
86.66 322.87 79.36 488.89
Gross profit
30.93 113.97 273.37 418.27
Net profit
14.71 43.15 225.48 283.34
Equity Dividend (%)
2.00 20.00 30.00 17.33333333
Particulars Galadari Hotels (lanka) PLC
Browns Beach Hotels PLC
Ceylon Hotels Corporation PLC
TOTAL
Sales
1,297,419,296 317,837,000 227,423,602 1,842,679,898
Cogs
(242,347,691) - 79,254,946 -163,092,745
Gross profit
1539766987 317,837,00 148,168,656 2,005,772,643
Net profit
266,052,417 129,232,000 (45,996,165) 349,288,252
Equity Dividend (%)
- - - -
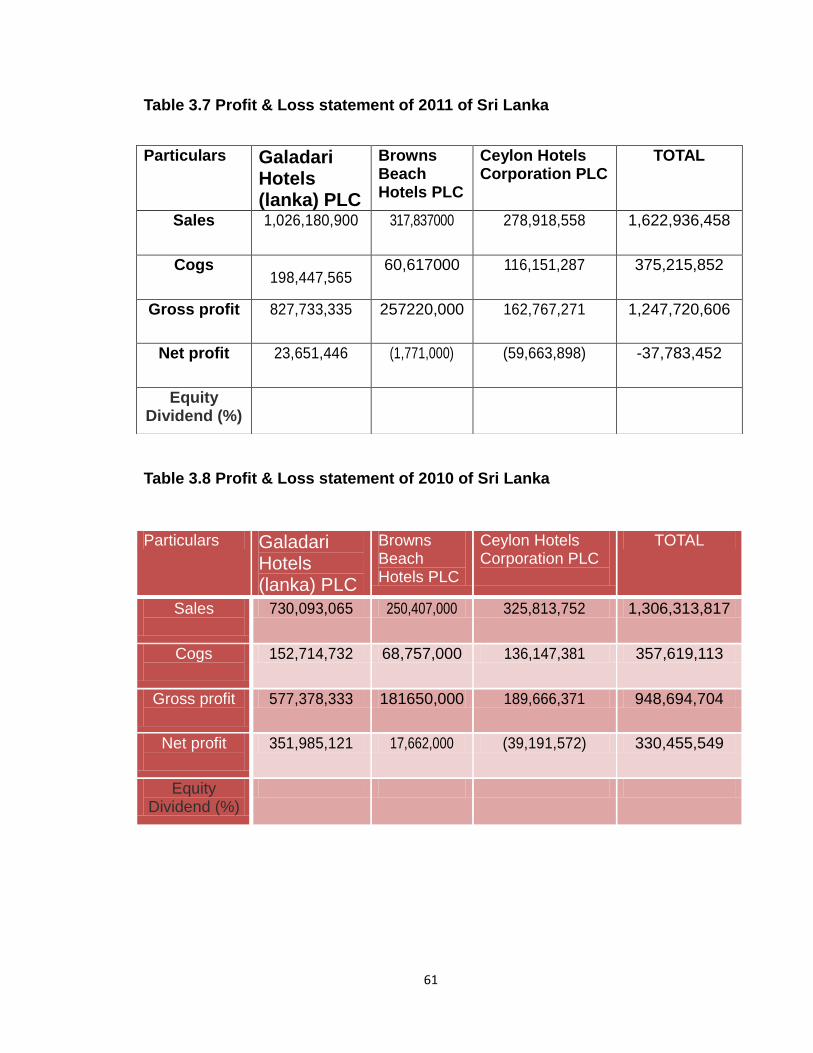
61
Table 3.7 Profit & Loss statement of 2011 of Sri Lanka
Table 3.8 Profit & Loss statement of 2010 of Sri Lanka
Particulars Galadari Hotels (lanka) PLC
Browns Beach Hotels PLC
Ceylon Hotels Corporation PLC
TOTAL
Sales
1,026,180,900 317,837000 278,918,558 1,622,936,458
Cogs 198,447,565
60,617000 116,151,287 375,215,852
Gross profit
827,733,335 257220,000 162,767,271 1,247,720,606
Net profit
23,651,446 (1,771,000) (59,663,898) -37,783,452
Equity Dividend (%)
Particulars Galadari Hotels (lanka) PLC
Browns Beach Hotels PLC
Ceylon Hotels Corporation PLC
TOTAL
Sales
730,093,065 250,407,000 325,813,752 1,306,313,817
Cogs
152,714,732 68,757,000 136,147,381 357,619,113
Gross profit
577,378,333 181650,000 189,666,371 948,694,704
Net profit
351,985,121 17,662,000 (39,191,572) 330,455,549
Equity Dividend (%)
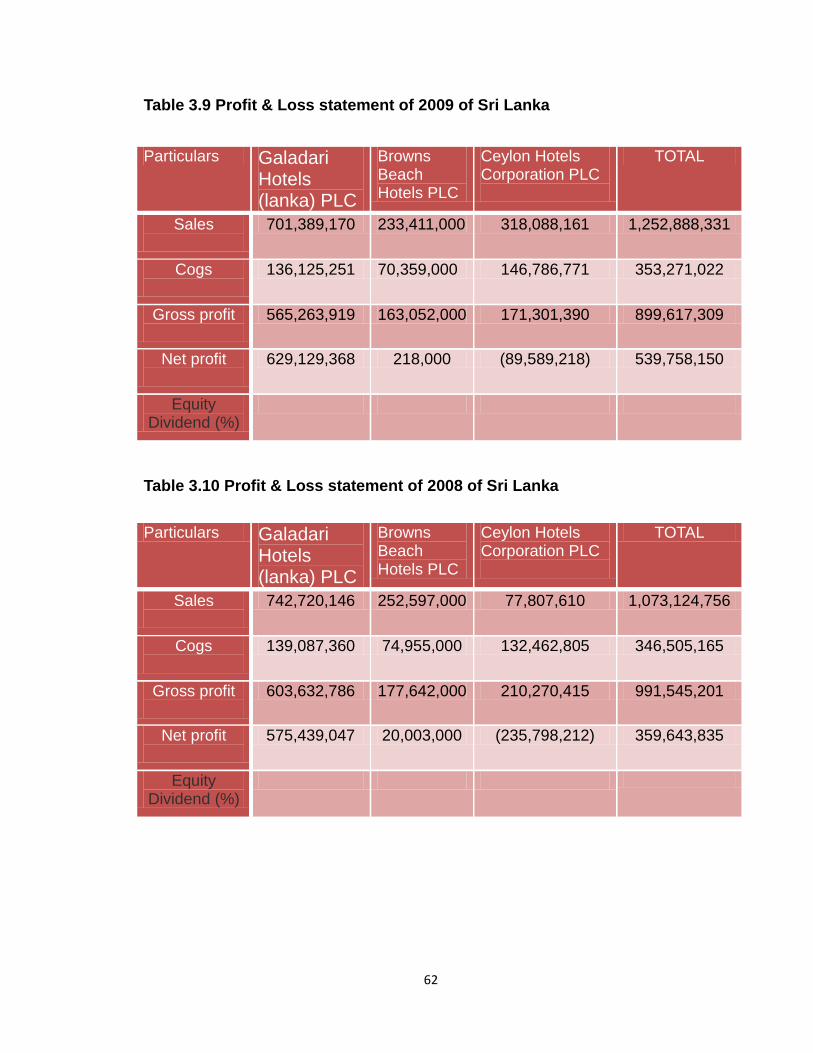
62
Table 3.9 Profit & Loss statement of 2009 of Sri Lanka
Table 3.10 Profit & Loss statement of 2008 of Sri Lanka
Particulars Galadari Hotels (lanka) PLC
Browns Beach Hotels PLC
Ceylon Hotels Corporation PLC
TOTAL
Sales
701,389,170 233,411,000 318,088,161 1,252,888,331
Cogs
136,125,251 70,359,000 146,786,771 353,271,022
Gross profit
565,263,919 163,052,000 171,301,390 899,617,309
Net profit
629,129,368 218,000 (89,589,218) 539,758,150
Equity Dividend (%)
Particulars Galadari Hotels (lanka) PLC
Browns Beach Hotels PLC
Ceylon Hotels Corporation PLC
TOTAL
Sales
742,720,146 252,597,000 77,807,610 1,073,124,756
Cogs
139,087,360 74,955,000 132,462,805 346,505,165
Gross profit
603,632,786 177,642,000 210,270,415 991,545,201
Net profit
575,439,047 20,003,000 (235,798,212) 359,643,835
Equity Dividend (%)
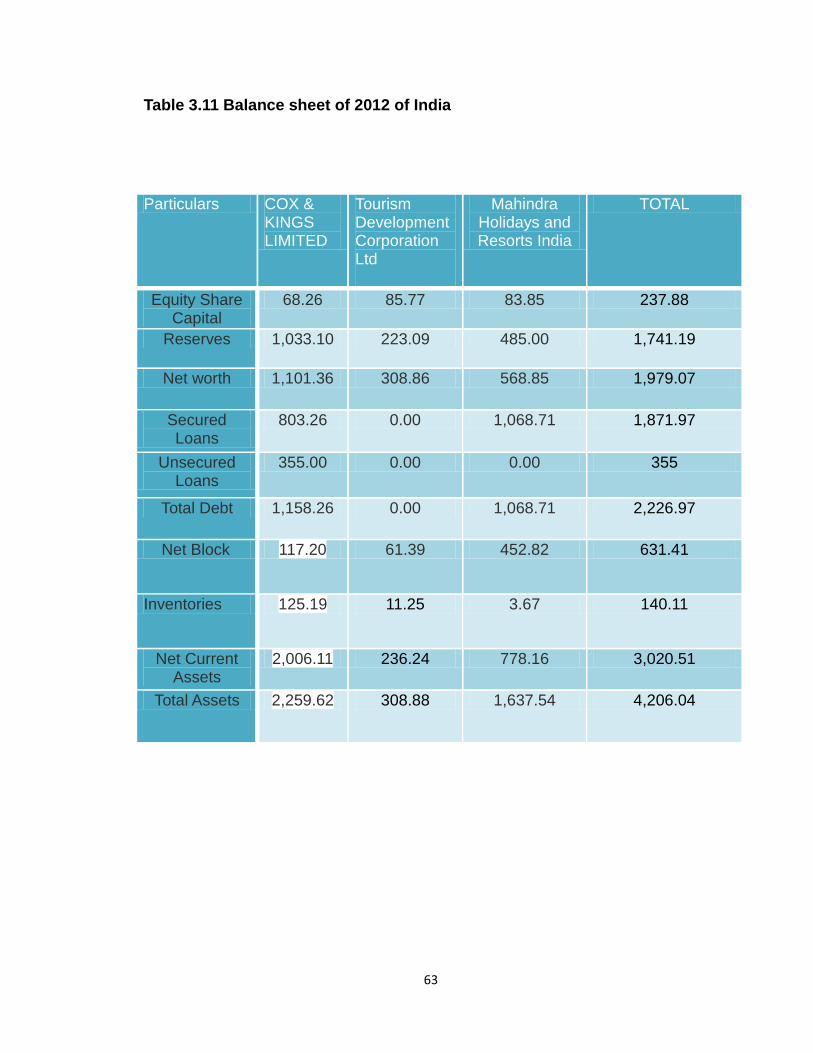
63
Table 3.11 Balance sheet of 2012 of India
Particulars COX & KINGS LIMITED
Tourism Development Corporation Ltd
Mahindra Holidays and Resorts India
TOTAL
Equity Share Capital
68.26 85.77 83.85 237.88
Reserves 1,033.10 223.09 485.00 1,741.19
Net worth 1,101.36 308.86 568.85 1,979.07
Secured Loans
803.26 0.00 1,068.71 1,871.97
Unsecured Loans
355.00 0.00 0.00 355
Total Debt 1,158.26 0.00 1,068.71 2,226.97
Net Block 117.20 61.39 452.82 631.41
Inventories 125.19 11.25 3.67 140.11
Net Current Assets
2,006.11 236.24 778.16 3,020.51
Total Assets 2,259.62 308.88 1,637.54 4,206.04
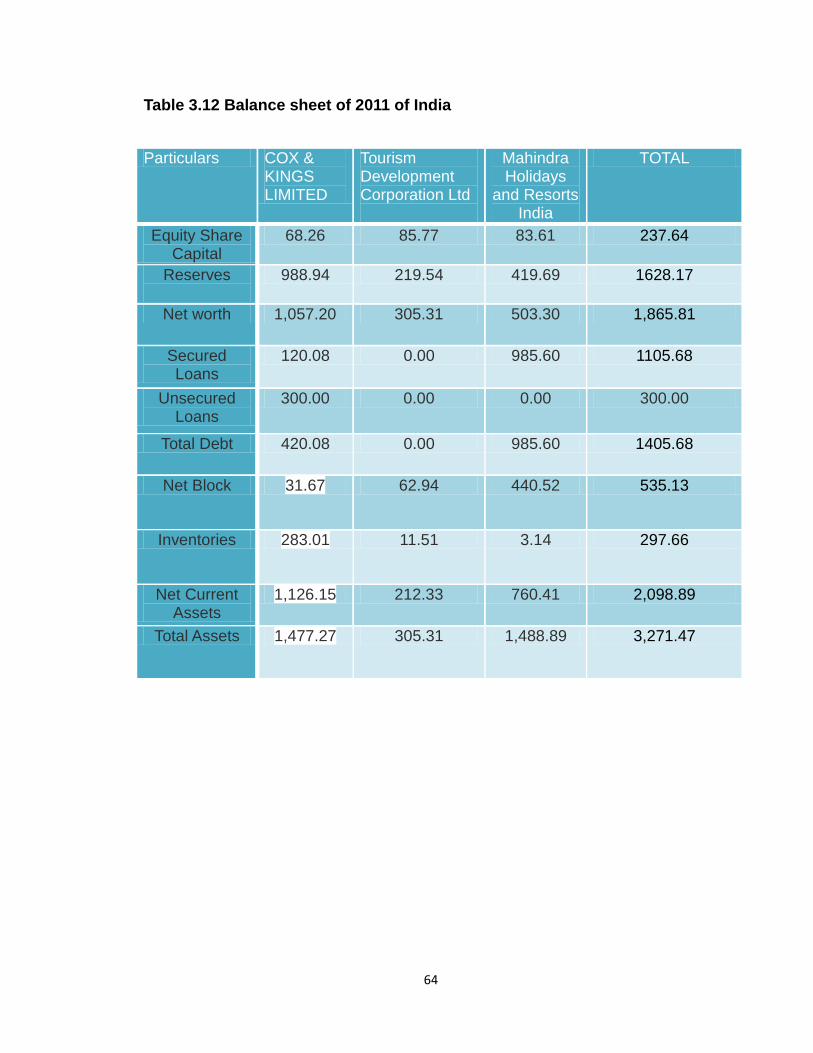
64
Table 3.12 Balance sheet of 2011 of India
Particulars COX & KINGS LIMITED
Tourism Development Corporation Ltd
Mahindra Holidays
and Resorts India
TOTAL
Equity Share Capital
68.26 85.77 83.61 237.64
Reserves
988.94 219.54 419.69 1628.17
Net worth 1,057.20 305.31 503.30 1,865.81
Secured Loans
120.08 0.00 985.60 1105.68
Unsecured Loans
300.00 0.00 0.00 300.00
Total Debt 420.08 0.00 985.60 1405.68
Net Block 31.67 62.94 440.52 535.13
Inventories 283.01 11.51 3.14 297.66
Net Current Assets
1,126.15 212.33 760.41 2,098.89
Total Assets 1,477.27 305.31 1,488.89 3,271.47
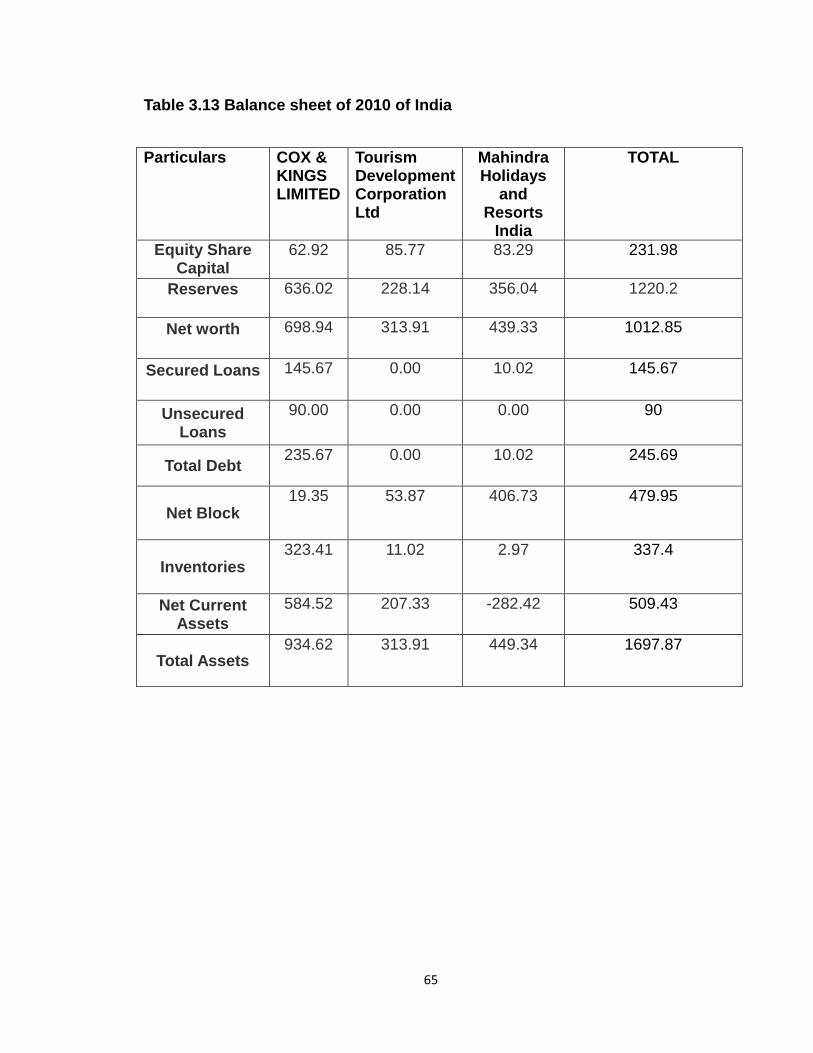
65
Table 3.13 Balance sheet of 2010 of India
Particulars COX & KINGS LIMITED
Tourism Development Corporation Ltd
Mahindra Holidays
and Resorts
India
TOTAL
Equity Share Capital
62.92 85.77 83.29 231.98
Reserves
636.02 228.14 356.04 1220.2
Net worth
698.94 313.91 439.33 1012.85
Secured Loans
145.67 0.00 10.02 145.67
Unsecured Loans
90.00 0.00 0.00 90
Total Debt 235.67 0.00 10.02 245.69
Net Block 19.35
53.87 406.73 479.95
Inventories 323.41
11.02 2.97 337.4
Net Current Assets
584.52 207.33 -282.42 509.43
Total Assets 934.62 313.91 449.34 1697.87
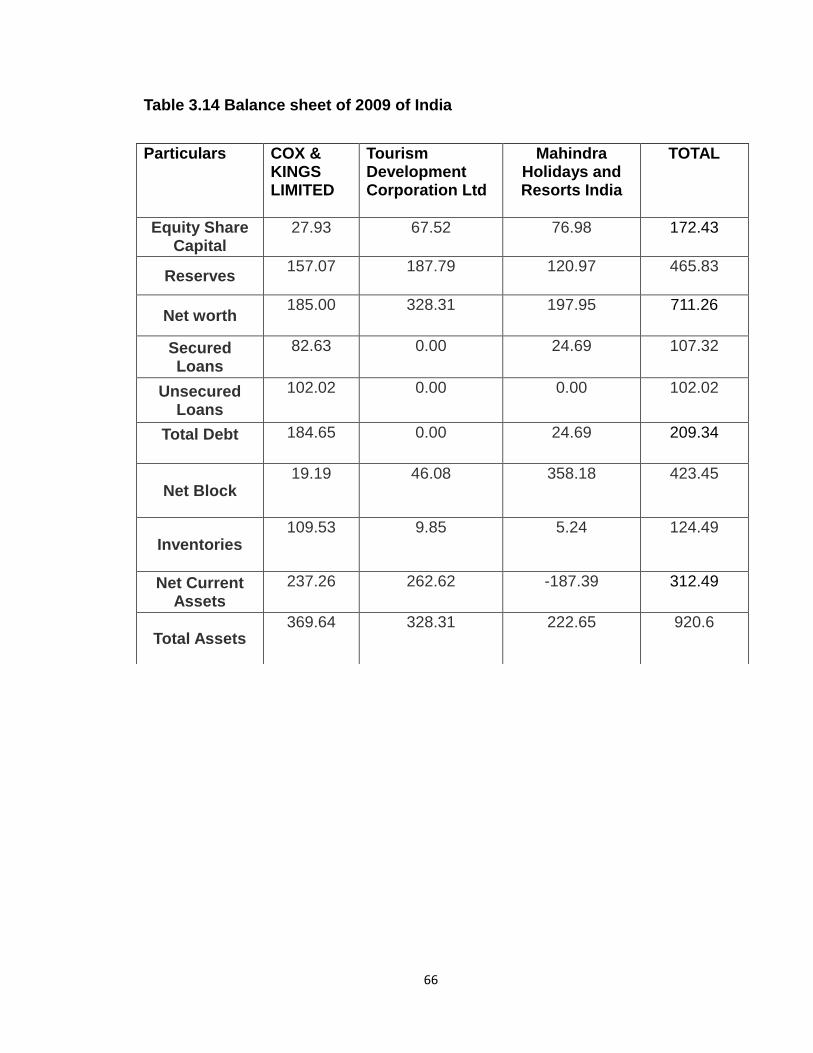
66
Table 3.14 Balance sheet of 2009 of India
Particulars COX & KINGS LIMITED
Tourism Development Corporation Ltd
Mahindra Holidays and Resorts India
TOTAL
Equity Share Capital
27.93 67.52 76.98 172.43
Reserves 157.07 187.79 120.97 465.83
Net worth 185.00 328.31 197.95 711.26
Secured Loans
82.63 0.00 24.69 107.32
Unsecured Loans
102.02 0.00 0.00 102.02
Total Debt
184.65 0.00 24.69 209.34
Net Block 19.19 46.08 358.18 423.45
Inventories 109.53 9.85 5.24 124.49
Net Current Assets
237.26 262.62 -187.39 312.49
Total Assets 369.64 328.31 222.65 920.6
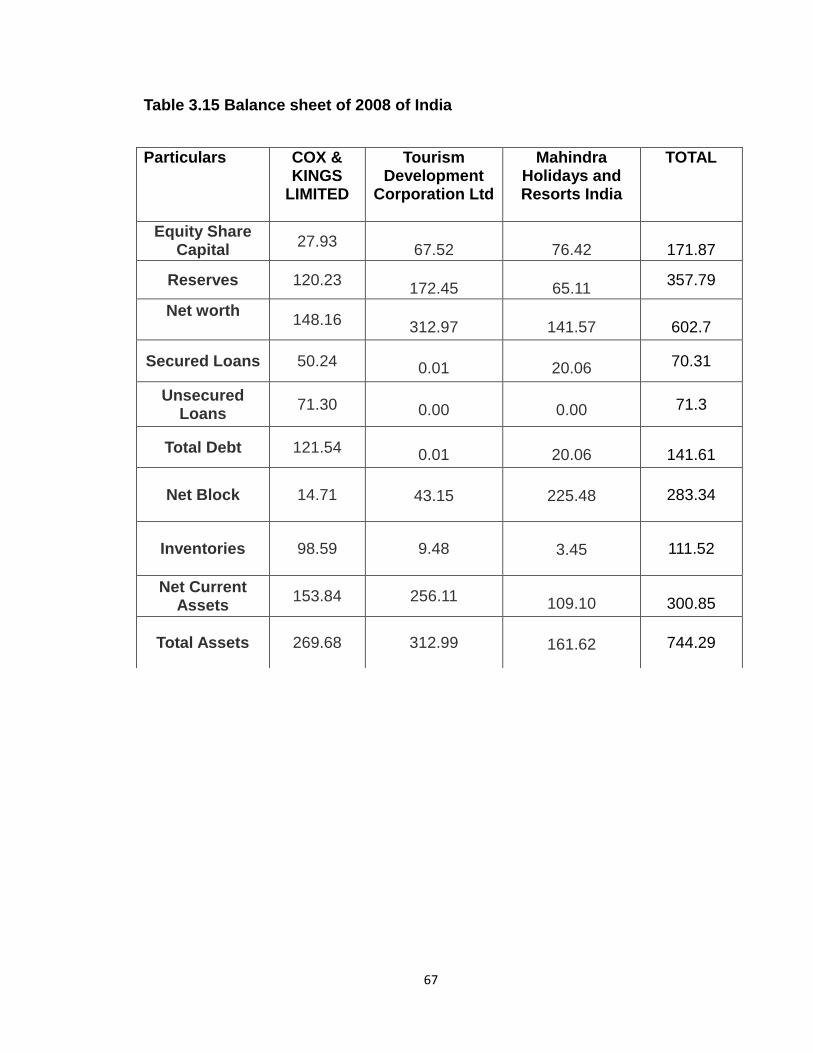
67
Table 3.15 Balance sheet of 2008 of India
Particulars COX & KINGS
LIMITED
Tourism Development
Corporation Ltd
Mahindra Holidays and Resorts India
TOTAL
Equity Share Capital
27.93
67.52
76.42
171.87
Reserves 120.23
172.45
65.11 357.79
Net worth
148.16
312.97
141.57
602.7
Secured Loans 50.24
0.01
20.06 70.31
Unsecured Loans
71.30
0.00
0.00 71.3
Total Debt 121.54
0.01
20.06
141.61
Net Block 14.71
43.15
225.48 283.34
Inventories 98.59 9.48
3.45 111.52
Net Current Assets
153.84 256.11
109.10
300.85
Total Assets 269.68 312.99
161.62 744.29
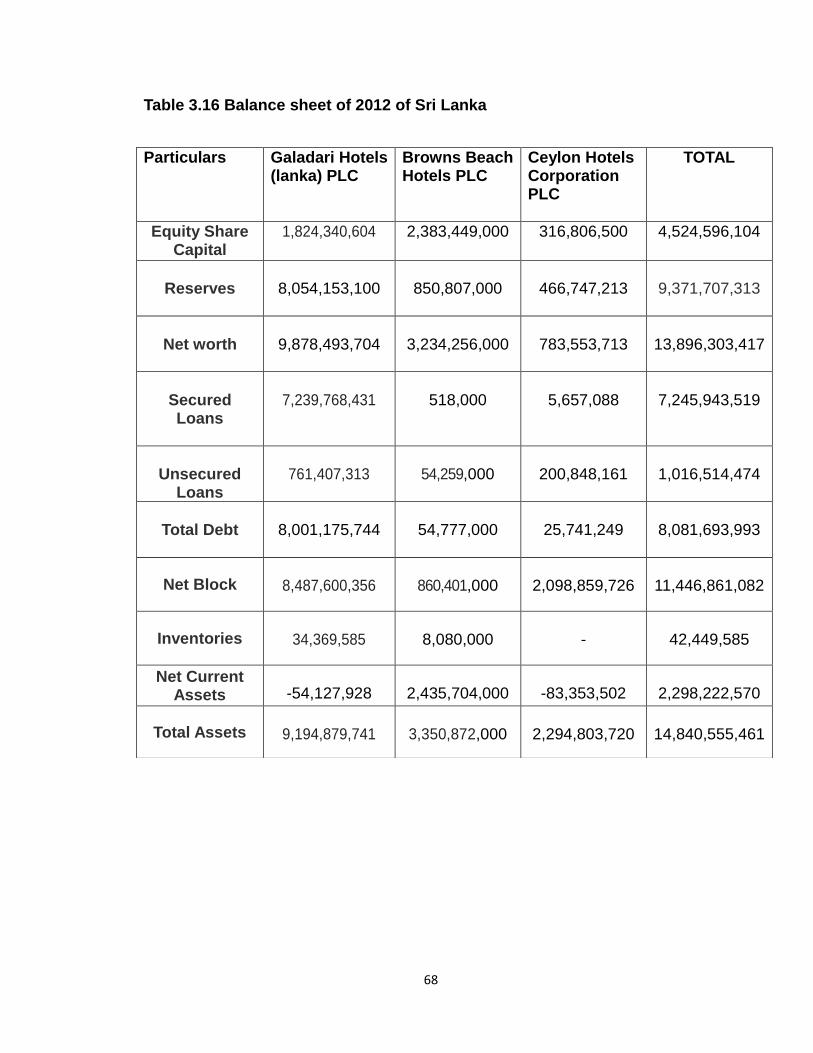
68
Table 3.16 Balance sheet of 2012 of Sri Lanka
Particulars Galadari Hotels (lanka) PLC
Browns Beach Hotels PLC
Ceylon Hotels Corporation PLC
TOTAL
Equity Share Capital
1,824,340,604 2,383,449,000 316,806,500 4,524,596,104
Reserves
8,054,153,100
850,807,000
466,747,213 9,371,707,313
Net worth
9,878,493,704
3,234,256,000
783,553,713
13,896,303,417
Secured Loans
7,239,768,431
518,000
5,657,088
7,245,943,519
Unsecured
Loans
761,407,313
54,259,000
200,848,161
1,016,514,474
Total Debt
8,001,175,744
54,777,000
25,741,249
8,081,693,993
Net Block
8,487,600,356
860,401,000
2,098,859,726
11,446,861,082
Inventories
34,369,585
8,080,000 -
42,449,585
Net Current Assets
-54,127,928
2,435,704,000
-83,353,502
2,298,222,570
Total Assets
9,194,879,741
3,350,872,000
2,294,803,720
14,840,555,461
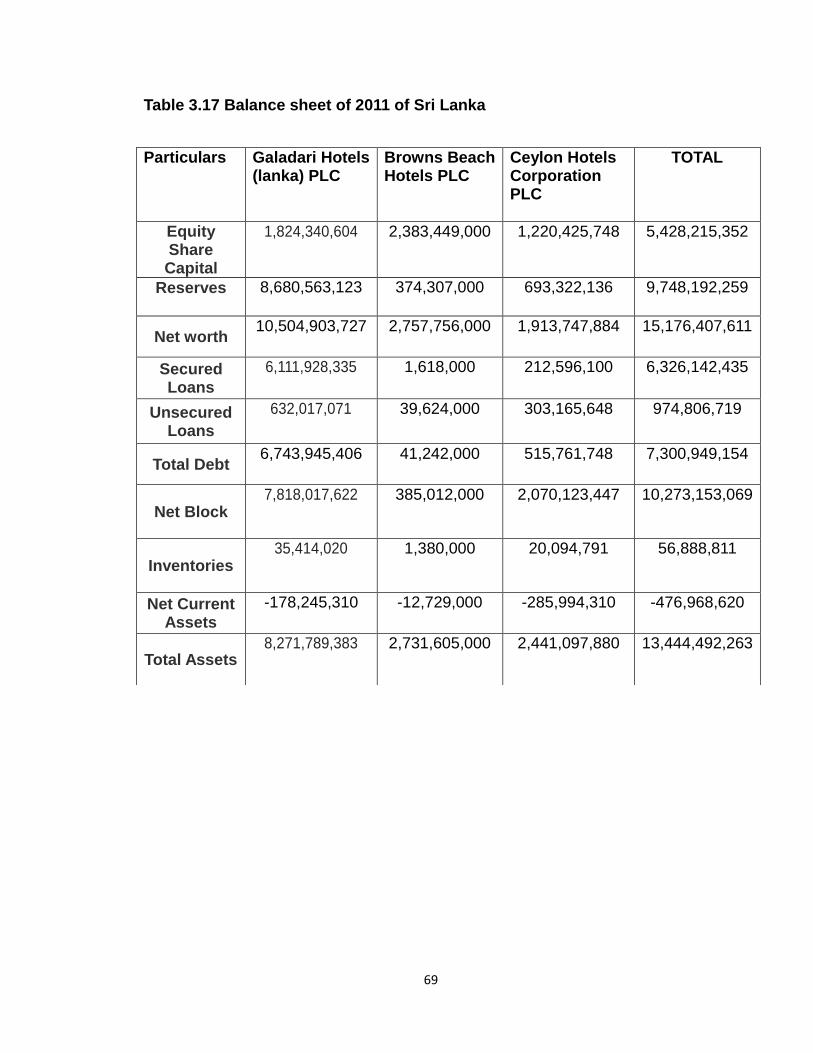
69
Table 3.17 Balance sheet of 2011 of Sri Lanka
Particulars Galadari Hotels (lanka) PLC
Browns Beach Hotels PLC
Ceylon Hotels Corporation PLC
TOTAL
Equity Share Capital
1,824,340,604 2,383,449,000 1,220,425,748 5,428,215,352
Reserves
8,680,563,123 374,307,000 693,322,136 9,748,192,259
Net worth 10,504,903,727 2,757,756,000 1,913,747,884 15,176,407,611
Secured Loans
6,111,928,335 1,618,000 212,596,100 6,326,142,435
Unsecured Loans
632,017,071 39,624,000 303,165,648 974,806,719
Total Debt 6,743,945,406 41,242,000 515,761,748 7,300,949,154
Net Block 7,818,017,622 385,012,000 2,070,123,447 10,273,153,069
Inventories 35,414,020 1,380,000 20,094,791 56,888,811
Net Current Assets
-178,245,310 -12,729,000 -285,994,310 -476,968,620
Total Assets 8,271,789,383 2,731,605,000 2,441,097,880 13,444,492,263
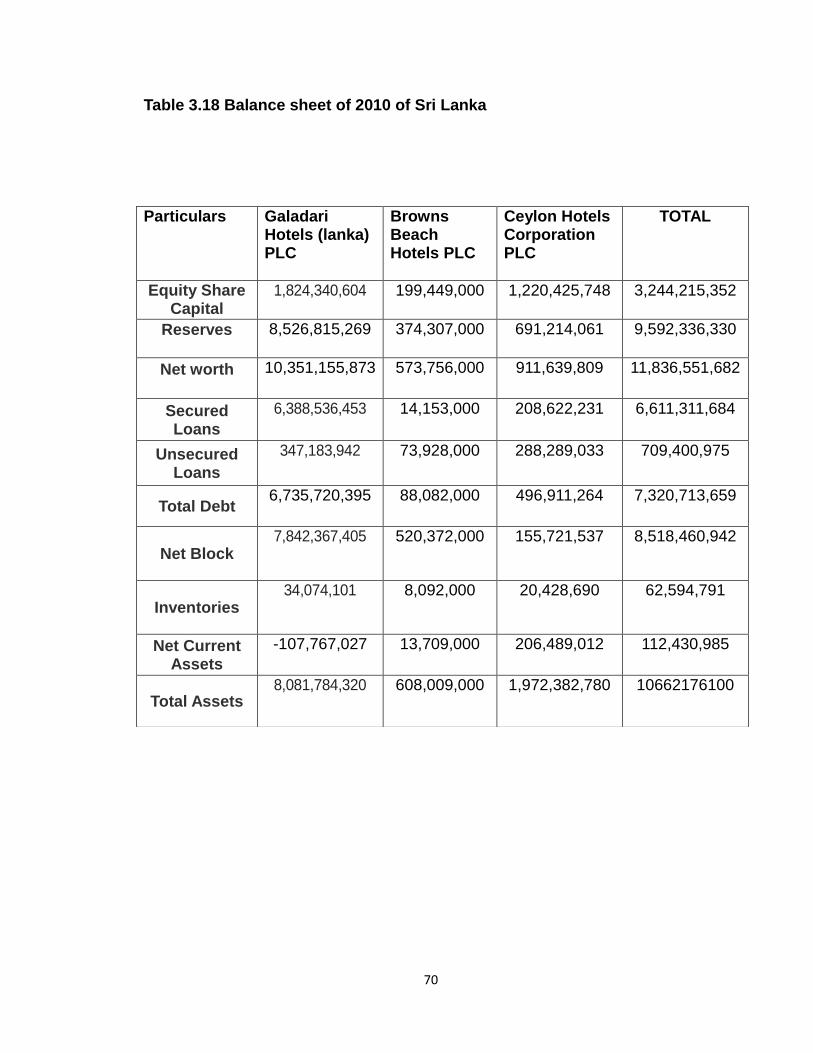
70
Table 3.18 Balance sheet of 2010 of Sri Lanka
Particulars Galadari Hotels (lanka) PLC
Browns Beach Hotels PLC
Ceylon Hotels Corporation PLC
TOTAL
Equity Share Capital
1,824,340,604 199,449,000 1,220,425,748 3,244,215,352
Reserves
8,526,815,269 374,307,000 691,214,061 9,592,336,330
Net worth
10,351,155,873 573,756,000 911,639,809 11,836,551,682
Secured Loans
6,388,536,453 14,153,000 208,622,231 6,611,311,684
Unsecured Loans
347,183,942 73,928,000 288,289,033 709,400,975
Total Debt 6,735,720,395 88,082,000 496,911,264 7,320,713,659
Net Block 7,842,367,405 520,372,000 155,721,537 8,518,460,942
Inventories 34,074,101 8,092,000 20,428,690 62,594,791
Net Current Assets
-107,767,027 13,709,000 206,489,012 112,430,985
Total Assets 8,081,784,320 608,009,000 1,972,382,780 10662176100
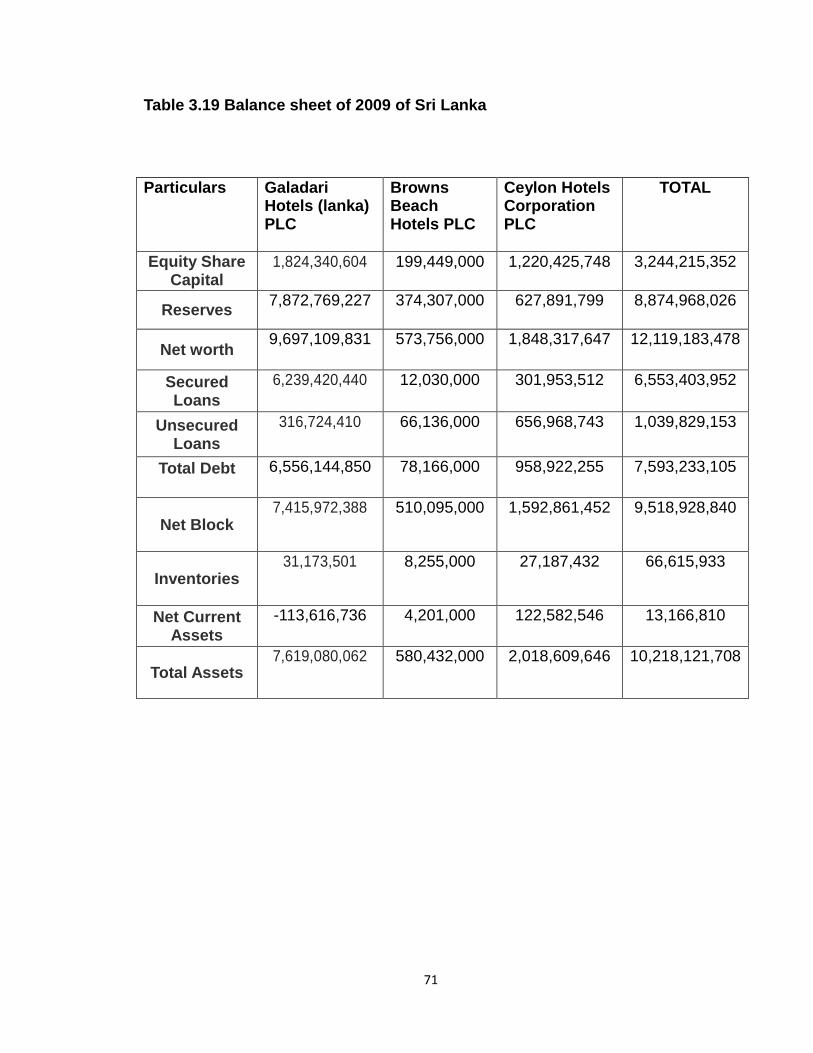
71
Table 3.19 Balance sheet of 2009 of Sri Lanka
Particulars Galadari Hotels (lanka) PLC
Browns Beach Hotels PLC
Ceylon Hotels Corporation PLC
TOTAL
Equity Share Capital
1,824,340,604 199,449,000 1,220,425,748 3,244,215,352
Reserves 7,872,769,227 374,307,000 627,891,799 8,874,968,026
Net worth 9,697,109,831 573,756,000 1,848,317,647 12,119,183,478
Secured Loans
6,239,420,440 12,030,000 301,953,512 6,553,403,952
Unsecured Loans
316,724,410 66,136,000 656,968,743 1,039,829,153
Total Debt
6,556,144,850 78,166,000 958,922,255 7,593,233,105
Net Block 7,415,972,388 510,095,000 1,592,861,452 9,518,928,840
Inventories 31,173,501 8,255,000 27,187,432 66,615,933
Net Current Assets
-113,616,736 4,201,000 122,582,546 13,166,810
Total Assets 7,619,080,062 580,432,000 2,018,609,646 10,218,121,708
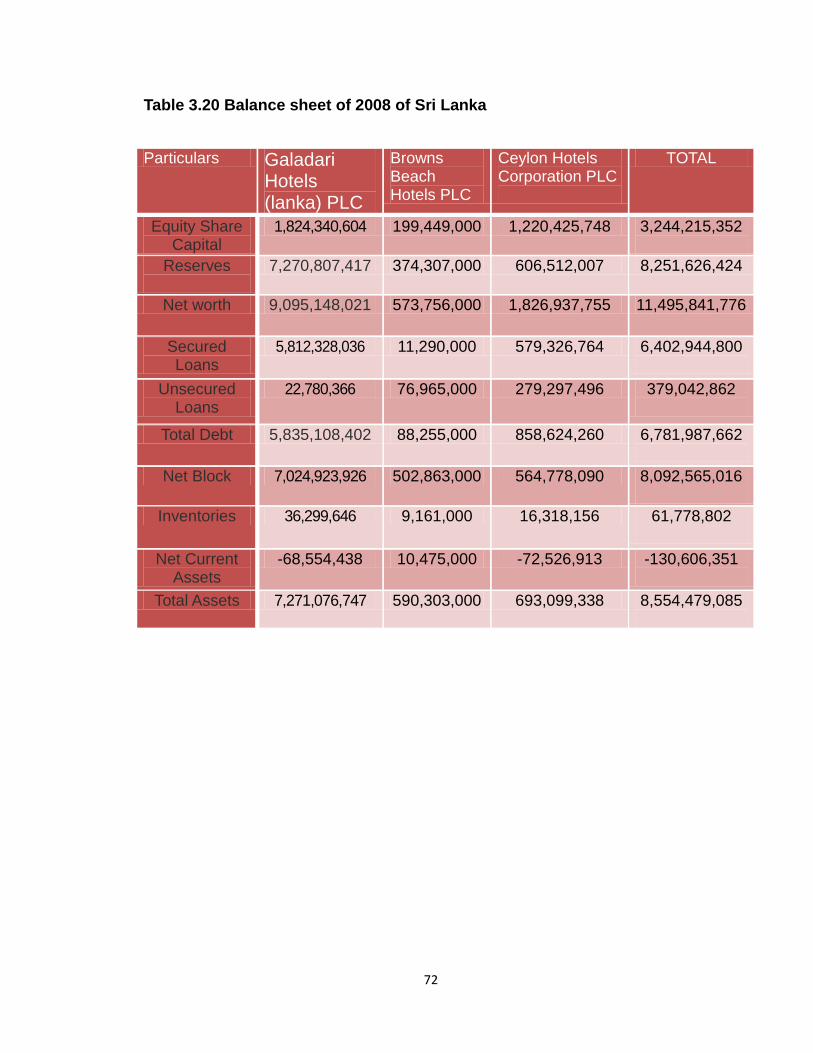
72
Table 3.20 Balance sheet of 2008 of Sri Lanka
Particulars Galadari Hotels (lanka) PLC
Browns Beach Hotels PLC
Ceylon Hotels Corporation PLC
TOTAL
Equity Share Capital
1,824,340,604 199,449,000 1,220,425,748 3,244,215,352
Reserves
7,270,807,417 374,307,000 606,512,007 8,251,626,424
Net worth 9,095,148,021 573,756,000 1,826,937,755 11,495,841,776
Secured Loans
5,812,328,036 11,290,000 579,326,764 6,402,944,800
Unsecured Loans
22,780,366 76,965,000 279,297,496 379,042,862
Total Debt 5,835,108,402 88,255,000 858,624,260 6,781,987,662
Net Block 7,024,923,926 502,863,000 564,778,090 8,092,565,016
Inventories 36,299,646 9,161,000 16,318,156 61,778,802
Net Current Assets
-68,554,438 10,475,000 -72,526,913 -130,606,351
Total Assets 7,271,076,747 590,303,000 693,099,338 8,554,479,085
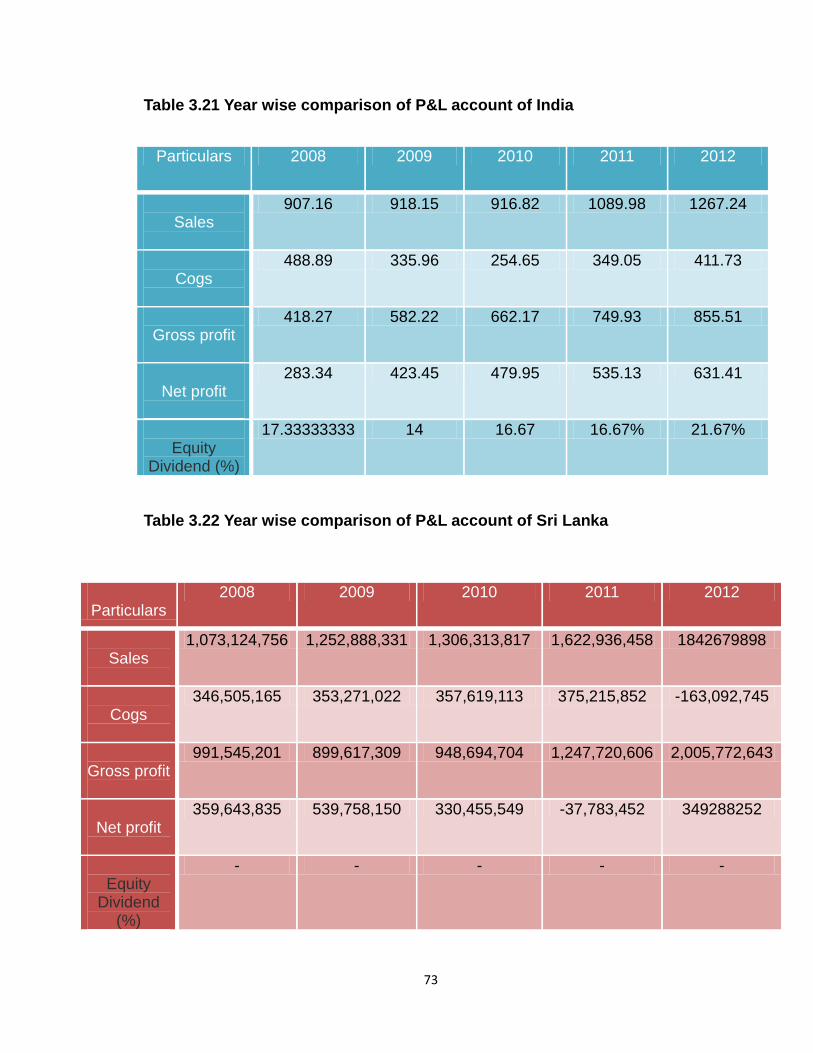
73
Table 3.21 Year wise comparison of P&L account of India
Table 3.22 Year wise comparison of P&L account of Sri Lanka
Particulars 2008 2009 2010 2011 2012
Sales
907.16 918.15 916.82 1089.98 1267.24
Cogs
488.89 335.96 254.65 349.05 411.73
Gross profit
418.27 582.22 662.17 749.93 855.51
Net profit
283.34 423.45 479.95 535.13 631.41
Equity
Dividend (%)
17.33333333 14 16.67 16.67% 21.67%
Particulars
2008 2009 2010 2011 2012
Sales
1,073,124,756 1,252,888,331 1,306,313,817 1,622,936,458 1842679898
Cogs
346,505,165 353,271,022 357,619,113 375,215,852 -163,092,745
Gross profit
991,545,201 899,617,309 948,694,704 1,247,720,606 2,005,772,643
Net profit
359,643,835 539,758,150 330,455,549 -37,783,452 349288252
Equity
Dividend (%)
- - - - -
74
INTERPRETATION:
Sales and cost of goods sold:
In the year of 2009 sales in India increased at lower rate but in the same time the
cost of goods sold in India has been decreased with large margin over all result
in this year shows India has 49% gross profit and in Sri Lanka has 10% of loss
compare to 2008.
In the year of 2010 sales in India decreased by 0.14% but at this same time cost
of goods sold is in India has been decreased with large margin of 24% but in
sales in Sri Lanka is increased by 4% and cost of goods sold in also increased by
1% the overall result in this year show the net profit is increased by 13% in India
while in Sri Lanka net profit is decreased by 39% compare to 2009 because of
the cost of goods sold is also increased in Sri Lanka.
In the year of 2011 sales in India increased by 18% but in the same time the cost
of goods sold in increased with large margin 37% compare to 2010 the gross
profit is stable in this year. While in Sri Lanka the sales is increased by 24% and
cost of goods sold is also increased at lower rate 5% compare to India the gross
profit is increased by 31% compare to 2010.
In the year of 2012 the sales in India is increased by 16% but the cost of goods
sold and net profit of increased by 17% while sales in Sri Lanka increased by
16% but the cost of goods sold is decreased and net profit is increased because
of decrement in cost of goods sold.
Gross profit:
In the year of 2009 gross profit in India increased by 39% because of 31% of
decrement in cost of goods sold while in Sri Lanka gross profit is decreased by
10% because of the cost of goods sold is increased by 2%.
In the year of 2010 gross profit increased by 13% compare to 2009 because of
the decrement cost of goods sold in India while in Sri Lanka gross profit
75
increased by 5% because of the sales and cost of goods sold in increased with
4% and 1% compare to 2009.
In the year of 2011 gross profit in India increased by 13% but the sales and cost
of goods sold is also increased and there is decrement of 2% in net profit
compares to 2010 while in Sri Lanka gross profit increased by 31%, sales and
cost of goods sold is also increased but net profit is decreased.
In the year of 2012 gross profit in India increased by 14% and sales and cost of
goods sold is also increased by 16% and 17% while in Sri Lanka gross profit is
increased by 61% because of the decrements in cost of goods sold compare to
2011.
NET PROFIT:
In the year of 2009 net profit in India increased by 49% because of decrement of
31% in cost of goods sold while in Sri Lanka net profit increased by 50% because
of their operating cost is less compare to 2008.
In the year of 2010 net profit in India increased by 13% because cost of goods
sold is decreased by 24% while in Sri Lanka net profit decreased by 39%
because increment in sales and cost of goods sold of this year.
In the year of 2011 net profit in India increased by 11% compare to 2010 while in
Sri Lanka net profit decreased because the increment in sale 24% and cost of
goods sold 5% compare to 2010.
In the year of 2012 net profit in India increased by 17% because sales increment
by 16% while in Sri Lanka net profit increased because increment in sales 16%
and decrement in cost of goods sold compare to 2011.
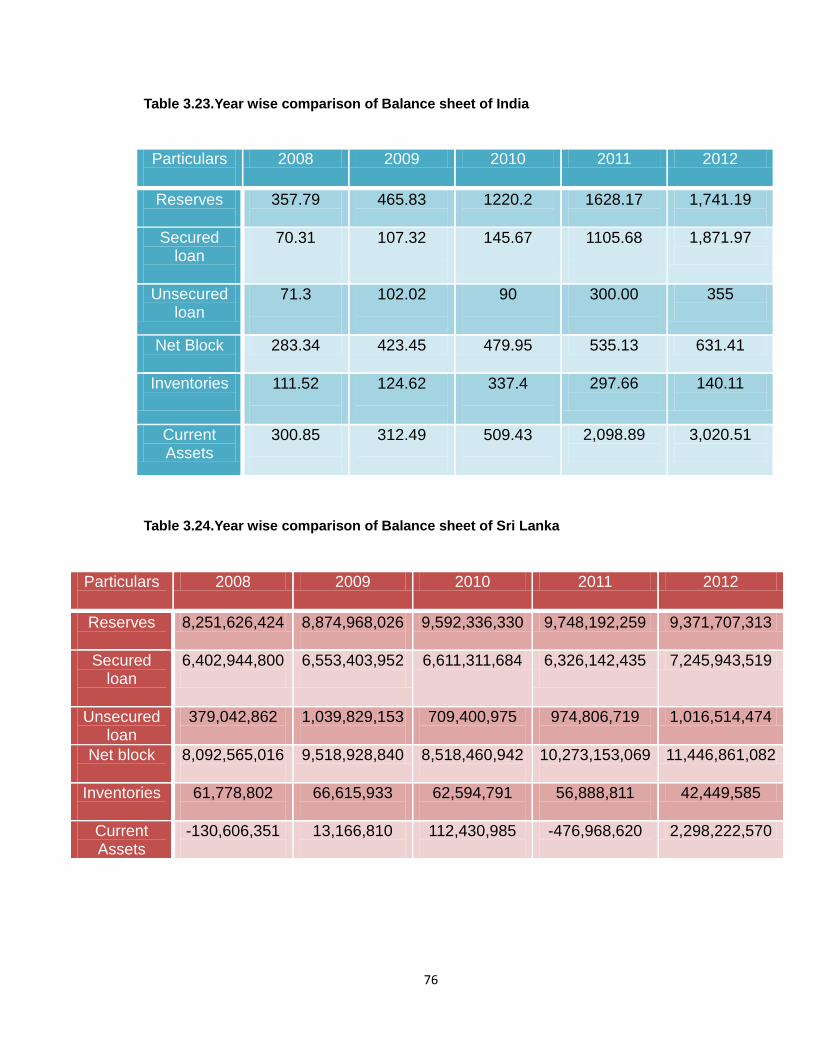
76
Table 3.23.Year wise comparison of Balance sheet of India
Table 3.24.Year wise comparison of Balance sheet of Sri Lanka
Particulars
2008 2009 2010 2011 2012
Reserves
357.79
465.83
1220.2
1628.17
1,741.19
Secured loan
70.31
107.32
145.67
1105.68
1,871.97
Unsecured loan
71.3
102.02
90
300.00
355
Net Block
283.34 423.45 479.95 535.13 631.41
Inventories
111.52
124.62
337.4
297.66
140.11
Current Assets
300.85
312.49
509.43
2,098.89
3,020.51
Particulars
2008 2009 2010 2011 2012
Reserves
8,251,626,424 8,874,968,026
9,592,336,330 9,748,192,259 9,371,707,313
Secured loan
6,402,944,800
6,553,403,952
6,611,311,684 6,326,142,435
7,245,943,519
Unsecured loan
379,042,862
1,039,829,153
709,400,975
974,806,719
1,016,514,474
Net block
8,092,565,016
9,518,928,840 8,518,460,942
10,273,153,069
11,446,861,082
Inventories
61,778,802
66,615,933
62,594,791
56,888,811
42,449,585
Current Assets
-130,606,351
13,166,810
112,430,985
-476,968,620
2,298,222,570
77
INTERPRETATION
Reserve:
In the year of 2009 in India reserve increased by 30%while in same time reserve
increased by 8% in Sri Lanka and in the year of 2010 reserve in India increased
by 61% while in Sri Lanka reserve is also increased by 8%. The probable reason
is major portion is diverted behind unsecured loan.
In India reserves has been increased 33% in 2011 while in Sri Lanka it increased
at lower rate except year 2012. In increment in reserve for India is on 6% while in
the same year for Sri Lanka reserve has been decreased by 4%. The probable
reason is major portion is diverted behind current assets as well as fixed assets.
Secured loan:
In India secured loan is increasing at increasing rate while in Sri Lanka increment
in secured loan is very avoidable compare to India specifically in the year of 2011
secured loan in Sri Lanka has been decreased while in India it has been
increased major numbers. The reason behind that is the acquired fund might
allocate behind capital working progress and investment.
Unsecured loan:
In the year of 2009 in India and Sri Lanka unsecured loan has been increased by
major number. The probable reason behind the major portion is diverted to net
blocks.
The analysis says that in the year of 2010 the unsecured loan has been
decreased in both the countries. The reason is in the same year they have
invested very less behind fixed assets. In Sri Lanka 2010 inventory in particular
has also been decreased while in India the reported net profit has been
increased.
78
While in next year 2011 both in India and Sri Lanka unsecured loan has been
increased because investment behind net block has some numbers increased,
reported profit in India in that two year has also been decreased.
Net block:
In the year of 2009 in India net block is increased by major number while in Sri
Lanka net block is also increased by 18% in same year the reason behind this is
to increment in net profit in both countries.
In India year 2010 net block is increased while in Sri Lanka net block has been
decreased by 11%.the reason behind decrement in net block is the divert the
portion of net block in paying debt in Sri Lanka.
In the year 2011 in India increment in net block is very less compare Sri Lanka
because the revenue is diverted behind reserves and paying debts and
investment plus a part of revenue is diverted behind current assets.
In the year 2012 in India net block is increased by 18% while in Sri Lanka net
block is increased by 11%.the reason behind is some portion is diverted in
inventories.
Inventory:
In the year of 2009 in India inventory is increased by 11% while in same time
inventory is increased by 8% in Sri Lanka. The reason behind is to decrement in
total debt in India.
In Sri Lanka last 3 year inventory has been decreased on increasing rate while in
India investor in last 2 year show the same scenario. The probable reason
behind that is the companies are increasing their liquid assets.
79
Current assets:
Tourism sector in India maintaining their liquid assets every year and the
investment behind that is also increasing. The reason is particular sector in India
is following the working efficiency while in Sri Lanka the same has been
increased in 2012 only. While in 2008and 2011 there has been drastic decrease
the probable reason behind is Sri Lankan tourism sector is not able to maintain
their working capital and liquid assets. Though in 2009 and 2010 there is
increase but it shows uneven scenario.

80
CHAPTER: 4
81
4.1 Policies and Norms of Sri Lanka for Tourism
The foregoing analyses suggest the need to explore policy options to counteract
constraints on local development embedded in the present tourism policy. These
alternative might be along the lines proposed by the earlier S.L.F.P. commitment
toward import-substitution, local skill development, and the improvisation of
"Schumacher-type" intermediate technology. The return to "closed" policies
would safe greater control over resource allocation & significantly recover the
position of the small-scale producer by affording him greater access to the
tourism marketplace.
From what has been said, there is plenty of scope to decrease the degree of
"openness" in tourism policy other than it should also be clear that the ties
among foreign enterprises can’t be totally cut. Controls to protect domestic
industries & decrease imports of non-essentials & luxuries are needed, as is a
greater emphasis upon improving internal linkage between the domestic & tourist
sectors. However, this strategy would want to recognize its own limitations of
size, the need for certain imports & commercial capital, & obviously, the linkages
among the global tourism market. An appropriate tourism strategy would entail a
greater reliance on management & technology catering to local needs reducing
the demand for non-essential imports & the construction of luxurious resorts
requiring huge diversions of local resources.
A tourism policy that encourages quality rather than quantity tourism need not
rely so intensively upon maximum growth strategies. Thus the Ceylon Tourist
Board could focus upon potential impacts, the encouragement of efficient small-
scale resort developments with high standards of operation and maintain a
greater degree of autonomy in its dealings with foreign tourist firms.
An alternative tourism policy should integrate the wants of other sectors of the
82
economy as well, to ensure balanced wage & employment structures. This would
include an evaluation of other policies to uncover biases favoring particular
sectors & a review of external policies. Tourism needs to be adapted to other
local sectors and traditional socio cultural institutions to ensure greater domestic-
oriented policy.
The Government of Sri Lanka envisions structure tourism as an industry playing
a significant role in the economic progression of the country whilst preserving the
country’s cultural values, ethos & its well-off normal endowment. In view of the
present policy reforms to develop the competitiveness of the tourism sector in a
sustainable way, the World Bank has agreed among the Government of Sri
Lanka to provide assistance for the execution of the Sustainable Tourism
Development Project. The Financing Agreement for this Project between the
Government of Sri Lanka and the World Bank was signed on 8th November
2010.
The overall object of the STDP, which is in line among the Government’s dream,
is to strengthen the institutional framework of the tourism sector & to facilitate
environmentally & socially sound tourism investments. The Project which span
over a period of 4 years covers funding under three components as set out
below:
(i) funding to progress the generally competence & efficacy of the institutional
framework of Sri Lanka Tourism,
(ii) provide essential highly localized tourism related infrastructure services in the
East,
(iii) improve and extend the product content and supply chain of the small and
medium entrepreneurs (SMEs) related to the tourism industry.
The Development Policy Framework of the Government of Sri Lanka is
committed to a sustainable Tourism Development Strategy. Protection of the
environment and distribution of economic benefits to the larger cross section of
83
the society are key components of this overall vision. The Development Policy
Framework of the Government of Sri Lanka aims at positioning Sri Lanka as a
model tourist destination benefiting from the country’s natural advantages of
having the highest bio diversity in Asia backed by a strong culture, historical
artifacts, exotic beaches, green environment and friendly people all of which are
solid building blocks for tourism development.
The Government has set a target of attracting 2.5 Mn high spending tourists by
the year 2016.The 5 year master plan prepared by the Ministry of Economic
Development under the guidance of the Hon. Minister of Economic Development
for the period of 2011 – 2016 addresses a range of issues related to Sri Lanka
Tourism Strategy including environmental, societal, cultural, economic,
institutional and promotional aspects together with their mutual relations with the
National Development agenda, in order to create a favorable platform to achieve
targeted tourist turnover by 2016.
The Government recognizes the multiplier result of tourism development in
creating employment opportunity & distribution of wealth through a variety of
economic activities predominantly in the SME sector, taking the advantage of
SMEs being able to link micro enterprises from one side and large scale
corporate sector on the other side.
Some of the key objectives to achieve during the 5 year strategy are as follows:
1. Increase tourist arrival from 650,000 in 2010 to 2.5 Men by 2016.
2. Attract USD 3,000 Men as Foreign Direct Investment (FDI) to the country
within years.
3. Increase the tourism related service from 125,000 in 2010 to 500,000 by 2016
& enlarge tourism based industry and services all island.
4. Distribute the economic benefits of tourism to a larger cross section of the
84
society and integrate tourism to the real economy.
5. Increase the foreign exchange earnings from USD 500 Men in 2010 to USD
2.75 Ban by 2016.
6. Contribute towards improving the global trade and economic linkages of Sri
Lanka.
7. Position Sri Lanka as the world’s most treasured island for tourism.
The Government has addressed several policy related issues that were affecting
the industry such as, (a) the restoration of a simple tax regime, (b) simplification
of licensing procedures, (c) reduction of the high electricity tariffs, (d) unification
of the regulatory environment and creating a single authority for tourism
promotion, (e) creating opportunities to promote shopping of internationally
reputed branded products and entertainment, (f) simplification of the investment
approval process by setting up of a “One Stop Shop” for tourism related
investments, (g) streamlining the process of alienating government land for
tourism development projects, (h) attracting internationally reputed tourist hotels
and, above all (i) environmentally friendly, clean-city concept for urban
development.
The Sri Lankan tourism industry is one of the fast emerging industries of the
economy with average annual revenue of US $ 500 million at current. It is the 6
major foreign exchange earners in Sri Lanka. It has formed service for on
125,000 persons. At current, near half a million tourists visit the country every
year.
Sri Lanka has exotic sandy beaches, big greeneries, historical artifact, and a
excellent climate, spectacular landscape in the highlands, a wealthy biodiversity
& friendly & welcoming people. This distinct opportunity will be utilized to develop
the tourism industry as a major growth sector in the development of the economy.
The government’s vision is to convert Sri Lankan tourism sector, by 2020, to be
85
the largest foreign exchange earner in the economy; position Sri Lanka as the
world’s most treasured and Greenest Island and attract high spending tourists
while preserving the country’s cultural values, natural habitats and environment.
The government has targeted 2.5 million tourists by 2016 and room capability of
about 45,000 to gather this target. This sector is also expected to receive
investments in excess of US$ 2 billion in the medium term in areas of luxury
hotels, lofty feature residency & high end shopping malls.
The multiplier effect in the investment on tourism is envisaged in the building,
furniture, transport & food & beverage industries in the country. Estimates reveal
that these industries will provide new direct and indirect employment
opportunities to about 350,000 people.
4.2 Policies and Norms of India for Tourism
In the year 2002, the Government of India announced a New Tourism Policy to
give boost to the tourism sector. The policy is make around the 7-S Mantra of
Swaagat (welcome), Soochanaa (information), Suvidhaa (facilitation), Surakshaa
(security), Sahyog (cooperation), Sanrachnaa (infrastructure) and Safaai
(cleanliness).
Several of the salient features of the Tourism Policy are:
• The policy proposes the addition of tourism in the concurrent list of the
Constitution to enable both the central and state governments to participate in
the development of the sector.
• No approval necessary for foreign equity of up to 51 per cent in tourism
projects. NRI investment up to 100% allowed.
• Automatic support for Technology agreement in the hotel industry, subject
to the fulfillment of certain specified parameters.
• Concession rates on customs duty of 25% for goods that are required for
86
early setting up, or for substantial increase of hotels.
• 50% of profits derived by hotels, travel agents & tour operator in foreign
exchange are exempt from income tax. The residual incomes are exempt if
reinvested in a tourism related project.
Apart from this, government has taken some other measures for the
endorsement of tourism. A multi-pronged advance has been adopted, which
include latest instrument for speedy implementation of tourism projects, growth of
included tourism circuits and rural destination, special capability building in the
unorganized hospitality sector and new marketing strategy.
The Ministry of Tourism is the nodal agency for the formulation of nationwide
policies & programmers & for the co-ordination of actions of a variety of Central
Government Agencies, State Governments/UTs & the personal Sector for the
development & promotion of tourism in the country. This Ministry is headed by
the Union Minister of State for Tourism (Independent Charge).
The administrative chief of the Ministry is the Secretary (Tourism). The Secretary
also acts as the Director General (DG) Tourism. The office of the Director
common of Tourism {now merged with the office of Secretary (Tourism)} provides
executive directions for the implementation of various policies & programmers.
Directorate common of Tourism has a field formation of 20 offices within the
country and 14 offices abroad and one sub-ordinate office/project i.e. Indian
Institute of Skiing & Mountaineering (IISM)/ Gulmarg Winter Sports Project. The
overseas offices are mostly dependable for tourism promotion and marketing in
their respective areas and the field offices in India are responsible for providing
information service to tourists and to monitor the progress of field projects. The
activities of IISM/GWSP have currently been revived and various Ski and other
courses are being conducted in the J&K valley.
National Tourism Policy
87
In order to develop tourism in India in a orderly way, location it as a main engine
of economic growth and to harness its direct and multiplier effects for
employment and poverty eradication in an environmentally sustainable manner,
the National Tourism Policy was formulate in the year 2002. Largely, the “Policy”
attempt to:-
Position tourism as a main engine of economic growth;
Harness the direct and multiplier effects of tourism for employment
creation, economic growth & provide impetus to rural tourism;
Focus on domestic tourism as a main driver of tourism growth.
Position India as a international brand to get benefit of the burgeoning
global travel trade and the vast untapped potential of India as a
destination;
Acknowledges the dangerous position of personal sector among
government working as a pro-active facilitator and catalyst;
Create and develop integrated tourism circuits based on India’s unique
civilization, heritage, & culture in joint venture among States, personal
sector & extra agencies;
Ensure that the tourist to India get really invigorated, mentally invigorated,
culturally enriched, morally elevated & “feel India from within”.
In 1982, the Indian Government presented its first tourism policy. In retrospect
one could argue that the novelty of the subject, its small priority & the faith in its
potential as a social engineering tool contribute to a rather basic piece of work. It
took the government until 2002 to current an updated policy document. Those
expectant a clear line of thinking & plan must have been quite disappointed by
the latest policy. It is based on a number of mismatched perspectives, of which
those of the global development community and the international lobby group of
tourism and travel related industries (the WTTC) are the mainly prominent. As a
88
result, it starts from the idea that tourism is both a threat and an engine of
growth.
By means of this paper, we want to focus on some of the central ideas and
starting points of the Indian tourism policy. We will argue that there is amazing
basically wrong with the public ideas concerning the economic (growth) potential
of (international) tourism and the role of tourism as a progress tool. We will also
compete that, even after all these years of tourism growth, very small is known
on who the tourists in India actually are and what they want. Our reflection are
based on our own knowledge as tour operators and travel guides in India as well
as on our (limited) reading of public documents and research papers. As
research scholars, our field of specialization lies elsewhere.
Nonetheless we think that our observations could provoke a fruitful discussion on
central policy issues.
This paper starts with a brief description of the history of tourism and tourism
policy development in India, which conclude among a summary of the most
important objectives of the latest (2002) policy. Section 2 addresses the impact of
the development community on the tourism policy. It focuses on the idea of
tourism as a threat. Apart from analyze the probable meaning of this concept in
the context of Indian reality it briefly describes a concrete project which can be
regarded as an implementation of the idea. Section 3 deals among the rather
confusing impact of (inter)national tourism industry lobby groups which, with
extra things, resulted in unrealistic definitions, statistics and ideas with respect to
the potential role of tourism in India. Towards the finish of the section, we will
address the relation ignore of domestic tourism and its potential role in future
development. The paper ends among several short conclusions.
89
The first Tourism Policy (1982)
The first significant policy initiatives were forged in the early 1980s. With the view
of hosting the Asian Games of 1982, the Indian Government had to begin
thinking about accommodating, transport & entertaining the big number of visitors
attracted by the event. These awaken a sober public attention in tourism, which
was improved by the truth that tourism was India's largest net earner of foreign
currency. The public interest was translate into the Tourism Policy of 1982 which
provided an action plan based on the development of so-called tourism circuits
(Singh, 2001: 143-44).
A tourist circuit consists of a number of tourist sites which are geographically
and/or thematically grouped together with the idea that the value of their sum is
more than an adding up of the values of the parts. Rather than being the
outcome of an in-depth analysis and marketing study, the track idea was born out
of the emotion that 'the Golden Triangle' destinations of Delhi-Jaipur-Agra and
the Bombay-Goa shopping-and-beach circuit were disgustingly oversold. In order
to tempt away the tourists as of these overfull 'circuits', into the myriad of other
potentially trendy destination in India, the concept of option circuits - rather than
alternative places that could be grouped together by tourists themselves - was
somehow thought imperative.
The jargon and the ideas behind the tourist circuits of the 1980s are remarkably
similar to those put forward in the context of the rural tourism proposals of the
new millennium and the present national Tourism Policy: tourism was regarded
as a development tool. In real terms the route concept was centered on the
establishment of so-called cantles (condominium hotels) in undeveloped and
possibly 'backward' villages & hamlets. Such cantles, with the essential tourist
infrastructure, were to be constructed by the government...
'It then auctions plots by function: here a hairdresser, there a health club, a
restaurant approximately that corner, a grocer, a medicine store, confectionery
shop, etc. Accommodation in the cantle ranges from hospices, each among a
90
single table d'hôte restaurant; to inns with no restaurants but with 24-hour snack
bars/coffee shops; to lodges offering accommodation only but situated close to
an independent restaurant.
Cantles were to be managed as a supportive venture, an essential part of village
life, making use of local resources (skills, artisans, building materials and the like)
and offering tourists a balance of rustic charm and basic comfort. As far as we
know, no (rural) tourism circuit and no cantle were ever recognized. Indeed, the
over ideas may sound good, other than in retrospect, one can simply finish that
they presume a fair amount of innocence on the part of the policy makers.
Tourism development in the 1990s
In the 1980s, the growing public interest in tourism resulted in the recognition of
tourism as an export industry (including the implied tax exemptions) and the
creation of a special public tourism finance corporation (1987). These initiatives
were thinking to frankly and explicitly invite private investors and entrepreneurs to
participate in tourism development. In 1997 the division of tourism available a
(new) National Tourism Action diagrams. Apart from identify a little areas for
'integrated tourism development', beside the lines of the aforesaid (thematic)
tourism circuits, the aim of the plan was to get generally growth and improvement
of the tourism sector in India, by stepping up marketing, infrastructure building
and human resource development. According to some, the plan didn't current
something original. It just was phrased in a extra stylish development sector
jargon (Singh, 2001:144). Others maintained that the plan was over-ambitious &
impractical. Funding by no means coordinated the demanding quantitative
targets (Raguraman, 1998:535). In fact, from independence onwards the budget
outlays for tourism have always been very small (less than 0.2%).
This goes for India's share in worldwide global tourism too. During the 1’st 50
years of independent India, the part of global tourists visiting India has not been
91
more than 0.4%. It is claimed to have risen to some 0.45% in 2004 (GOI 2004).
Given the rise of international tourists in the world, these imply that there has
been a steady increase in tourist arrivals which accelerate in 2004. Indeed,
according to the Indian Tour Operators Promotion Council (ITOPC), over the
period 2001-2006, the figure of foreign tourists in India has nearly double (to
some 4.4 million). While these figures are romantically high (see next section),
they do explain that in complete terms the number of international tourists visiting
India has increased considerably.
The increase in tourism arrivals was aided by the growing popularity of far-off
and exotic destinations among Western tourists and recent advances in the
general outlook and international image of India. The opening of its markets in
the early on 1990s and the recent years of high economic growth have
profoundly altered its surface. In the past India was obviously connected with
slums & scarcity. Nowadays it is often portrayed as a quickly emerging economic
superpower.
The rising economic significance and potential of tourism has gone hand in hand
with a growing public interest in the sector. Among the opening up of the Indian
market, a lively competition among the states emerged in attracting investors in
industry & other sectors. Along parallel lines, states started competing for their
share of international & domestic tourists. Particularly in the customary tourist
states there was an urge to develop tourism to its complete possible. A notable
example is Kerala, a comparatively small state with a rich variety of natural
tourist setting. The Kerala government took up a mainly enable role, supporting &
promoting a great figure of different tourist activities.
In the new millennium, Kerala witnessed a remarkable diversification in the
supply of tourist services. As never previous, the government allowable tourists
to move around in rather secluded areas of natural parks & sanctuaries. Personal
entrepreneurs pioneered 'heritage tourism’; combine stay in nicely located
92
heritage buildings with Ayurvedic action. They also ongoing organizing
expeditions by foot, boat, raft, and jeep or bullock cart, through the hills of the
Western Ghats & along the backwaters. Varied packages including nature, local
tradition and culture, heritage and relaxation were developed by a rapidly
increasing number of entrepreneurs. Unavoidably, among the widespread
detection of their probable, all such bits of individual tourism have broadened
over other parts of India and have become ordinary fare in Kerala. During this
procedure both the government and the private sector have adopted several
forms of 'eco-tourism'. Such acceptance was promoted by the aforementioned
1997 Action Plan. In practice, it was mainly opportunistic. Everything with a more
or fewer natural feel to it was termed 'eco'.
The governments of other states increasingly follow Kerala's example. They do
so by: (a) recognizing the income earning and job generation potential of tourism;
(b) (more) actively promoting tourism through publicity campaigns and giving
support and incentives to the private sector; and (c) largely putting private
entrepreneurs in charge of the provision of tourist services.
The example of Kerala shows that Indian tourist destinations can outgrow the
phase of basic backpacker enclaves referred to above and offer a more
differentiated mix of products to a socio-economically much more mixed
collection of tourists. Amongst these tourists, there is a large section of people
from India, i.e. familial tourists.
The importance of domestic tourism was recognized by public policy makers in
the 1990s. They incorporated it as an essential issue in the Tourism Action Plan
of 1997 and decided that it was a state government (policy) problem. The middle
government was to take care of global tourists. Traditionally, domestic tourism
mostly worried pilgrimage and work-related travel. From the 1990s beyond there
has been a steep rise in modern forms of domestic tourism. This latest
phenomenon is connected to the booming Indian economy and the new
93
susceptibility of the Indian middle and higher classes to rather alien, Western
ideas of Holiday making. At current, an ever rising group of Indian tourists travels
around the country for rather dull, leisure & sightseeing-related reasons. This
latest trend is underscore by the emergence of Indian travel magazines and the
growing explicit attention for domestic tourist destinations in leading newspapers.
The new Tourism Policy (2002)
In 2002, when the action plan was finally translated into a tourism policy. Tourism
policy formally became a joint central-state government worry. The latest policy
itself, however, was planned by the middle government. To a big extent, it
concerns old wine in latest bottles. It holds the kind of goals & expectations
exemplary for the first policy. To start among, the policy document attempt to
establish tourism's great contribution to national development and its role as an
engine of enlargement. It suggests that tourism not only generates government
revenue, foreign currency, but also provide a best use of India's scarce
resources, sustainable development, high worth employment (especially to
youngsters, women & disabled people), & lastly, quiet, understanding, state unity
& stability. The policy starts from the idea that tourism can be used as a growth
tool, e.g. that it can produce high value, mass employment & prosperity among
vulnerable groups in backward areas.
In more practical terms, the policy aims at increasing the number of domestic and
global tourists. In order to do this, the governments propose to diversify the
Indian tourism product and substantially improve the quality of (tourism)
infrastructure, marketing, visa arrangements and air-travel. The aforementioned
tourism-as-a-development-tool largely concerns domestic tourism, which in this
ability is theoretically linked to 'sustainable' rural development. As far as global
tourism is worried the Indian Government mainly wants to target the 'high-
yielding variety' of tourists.
94
These major policy aims are derived from three main sources. The idea of
tourism-as-a-development-tool leading to sustainable rural development is rooted
in traditional socialist-style Indian Government thoughts. An similarly essential
source however, is the ideology of the international development society,
represent by organizations such as the UNDP. The idea to purposely objective
the extended haul, high yielding range of global tourists, on the extra hand, is
division & package of the worldview of lobby organizations representing
international airline and hotel companies. The WTTC in particular has played an
essential role in shaping the Indian tourism rule. Its prediction & suggestion form
an integral part of the rule. While it is reasonable that organization such as the
WTTC and the UNDP have influenced the Indian Tourism strategy, it is amazing
to see how apparently simply and without much adaptation their
recommendations have become executive rule. These imply that the rule is found
upon rather contrasting ideas.
The policy does not include a clear policy, linking means & ends, assigning
responsibilities and roles across government and personal agencies, & setting
sensible target according to a list of prioritized goal. Rather, it seems a look of
intent to improve on all. The policy document itself read like a tourist booklet,
support up a great range of tourist activities and sights that could and should be
developed (it includes a 4 page list of all forms of tourism one can possibly think
of - GOI, 2002:14-18). The same goes for the 'world class infrastructure'
(including 'integrated' tourist circuits) through which such activities and sights are
to be connected to the rest of the world. But there is not anything similar to the
kind of orderly approach one would normally associate with government plan &
policy. An obvious complexity in the Indian background, mostly with respect to
the separation of roles & responsibilities, is the central system of government.
While the central government is not toothless and does in fact determine policy
and control most of the funds, for the execution of its policy it is largely
dependent on state governments, whose plans, policies & projects are often
determined by concerns other than those formulated in national plans.
95
In the past, this may have been one of the reasons for assigning a 'lesser' form of
tourism to the states: domestic tourism. In any case, the difference among
domestic & global tourism is another source of confusion. The latest nationwide
policy starts from the largely implicit assumption that domestic and international
tourism concern different market segment, among different goods (destinations
and tourist services) catering to distinct sets of require. It nowhere makes clear,
however, what these differences really are, what it is that causes such difference
& what the relationship between domestic and international tourism development
is or should be.
In summary, we have a tourism policy document that conceives tourism both as
a great boon and as a possible threat. In this latter point of view tourism should
be publicly controlled & guided in order to prevent it from degenerate into a
menace. According to the first point of view, however, normal tourism, especially
of the long haul, luxury range, is highly helpful to initiate among. It concerns such
an essential engine of growth & source of employment, that it qualities only
public facilitation.

96
CHAPTER: 5
97
5.1Business Opportunities in future
5.1.1Business Opportunities in future of Sri Lanka
“Sri Lanka targets US$ 5 Billion in Foreign Direct Investment by 2016 while
Sri Lankan
Tourism had already attracted US$ 2 Billion during 2005 – 2011.”
The overall direction from the government to be the foremost destination for
leisure in the South Asian Region, the manufacturing is looking for investor to
invest in Sri Lanka to meet the objective by 2016. On one hand the government
is making all necessary policy facilitation, provisions and promotions for the
investment in the tourism industry, the overall industry had shown a tremendous
boom over the past two years. Hence, the Sri Lankan Tourism Economy has the
potential to accommodate further investments up to US$ 3 Billion in the next five
years as per present day planning.
• Tourist-attraction wealthy Northern & Eastern Provinces are now free from the
civil war and can be simply accessible
• Country’s infrastructure is getting a substantial improvement, including road
network, electricity, water, sea and air travelling, airport, harbor, etc.
• Government’s policy facilitation is on tourism and related investment
encourages being part of the Tourism Industry. This Investment Facilitation
provide a lead role in facilitating and managing investment projects across all
industry sector, mainly those complex projects require extensive cross-
government coordination and negotiation.
• The key services provide by Investment Facilitation are: personalized
investment facilitation assistance; specialist advice on the development
approvals process; statutory approvals coordination; site location services;
advice on infrastructure and utility requirements; continuing client support; and
investment climate advocacy
• There is Guide Book called “A Step by Step Guide to Doing Business in Sri
98
Lanka” published by the Central Bank of Sri Lanka to give a comprehensive
guide to the prospective investors of Sri Lanka
• Sri Lanka Tourism Development Authority (SLTDA) under the Ministry of
Economic Development directly oversees the development of Tourism in Sri
Lanka with other relevant government organizations. The SLTDA was shaped as
the apex corpse for Sri Lanka Tourism under Section 2 of the Tourism Act (No. 38
of 2005). The organization is committed towards transforming Sri Lanka to be
Asia’s foremost tourism purpose. The SLTDA will struggle to expand diverse,
single & quality tourism services & products that would make Sri Lanka as a
single purpose, internationally.
• SLTDA offers investors a range of attractive, possible trade support schemes
and business opportunities.
• Government identifies and declares dedicated tourism zones, with all the
necessary infrastructure services, thus the investors do not require to invest on
the basic infrastructure
• Currently, a Strategic Medium-term (10 years) Infrastructure and Product
Planning and Development Plan have been implemented for the Tourism
industry. This tactical plan is based on market require for high and mid-end
markets.
• There is a divide government entity to grip the tourism promotion function
Tourism Promotion Bureau to handle promotion of tourism overseas along with
local travel agents
• Sri Lanka Tourism Development Authority has previously identified 24 Tourism
Development Zones where investors will be encouraged to invest.
• There will be additional land acquisition & leasing of new areas for hotels and
recreational facility development in identified locations.
• The Ministry of Economic Development is in the process of making additional
expansion on BOI concessions & mobilizing foreign funding.
• The rigid authority of all tourism connected developments, the SLTDA is
involved in establishing, updating and regulating industry standards in the travel
and tourism industry, registering and licensing tourist service providers,
99
inspecting and monitoring tourist establishments and service providers, and
formulating and regulating prices charge for tourist services.
• Further, SLTDA is aiding the industry with suggestion of visas, liquor licenses,
foreign currency encashment and all related activities
• SLTDA is involved in Licensing and accrediting tourist enterprises in order to
develop, enforce & keep locally & internationally accepted standards in relation to
the tourism industry and other related industries
The One Stop Unit – Unit for National Investment in Tourism is a centralized
promotion and facilitation centre established to assist potential tourism investors
interested in investing in Sri Lanka Tourism Industry. OSU is a one-stop position
& point of contact for investors seeking information on the tourism industry.
Specialist staff from a variety of government agencies helps investors identifies
possible projects; obtain information concerning potential investments, present
applications, & give support in obtaining investment endorsement privileges,
trade licenses & extra approvals request for project clearance. OSU prevents the
need for investors to spend time in search of answers and ensures all queries
are handled by its specialist staff. Furthermore, OSU reduces the time taken on
receiving approval from various government agencies and does the coordinating
on behalf of the investor.
Sri Lanka’s tourism leader is urging European businessmen to capitalize on the
island's investment opportunities.
The Indian Ocean Island is experiencing a boom in tourists and leisure industry
related-developments; 3 years after management forces ended the decade’s
long conflict with Tami Tiger terrorists
Many global chains have put down cash to build hotels and resorts across the
tropical island, while the government sets about building infrastructure to support
the tourism boom.
Nalaka Godahewa, who head Sri Lanka's Tourism Development Authority, said
100
while European businessmen pass-up an opportunity to invest in Sri Lanka,
Chinese and Indian investors have moved in to fill the void.
"Ours is a virgin market. Unfortunately what’s happening is the Europeans are
holding back," Godhead was quoted in an interview among a British newspaper.
"By the time the European investors arrive, it may be too behind. So my message
is come and see for you and grab the chance now," he said.
International hotel chains like Hong Kong-based Shangri-La, the Sheraton & 4
season have sign up to develop luxury properties in Sri Lanka. In 2010, Sri Lanka
had several 22,000 hotel beds, sufficient to accommodate about 900,000
tourists. By 2015, Sri Lanka plans to add 45,000 rooms.
"There are other requirements, things like theme parks, racecourses, casinos,
yachts, marinas, & light aircrafts. There are so several things that are not there
yet and can be built in the next three to four years."
Since the war ended in 2009, Sri Lanka has forecasted a five-fold increase of 2.5
million foreign guests by 2016, who will create some 2.75 billion dollars in
revenues.
5.1.2 Business Opportunities in future of India
Tourism is a booming industry in India. With the numeral of domestic & global
tourists rising each year, this is one warm sector entrepreneurs must focus on.
India among its diverse culture & wealthy heritage has a lot to offer to foreign
tourists. Beaches, hill station, heritage site, wildlife & rural life, India has
everything tourists are looking for.
But this sector is not well organized. India lacks trained professionals in the
tourism and welcome sectors. Some business in this sector will flourish in the
long run as the demands contuse to grow every year. Foreign tourist arrival
101
during January-March was 15.63 lakh among a growth rate of 12.8 %, compared
to 13.86 lakh through the first three months last year.
Tourism has played a pivotal in social progress. It is too an essential vehicle in
widening socio-economic & cultural contacts. A wide array of interests
entertainment, sports, religion, culture, adventure, education, health & business
drives tourism. A tourist expense generates several effects with extensive
outreach along its value chain. Adding to the demand for a range of goods &
services, tourism offers possible to exploit synergies across a large number of
sectors such as farming, horticulture, poultry, handicraft, transport, construction
etc., where increase of income has favorable impact on poverty alleviation.
Tourism facilitates business contacts, widen markets & helps diffusion of increase
impulses across territories to promote broad based employment and income
generation. Investment in tourist infrastructure adds to economic growth,
catalyses generation of income & employment, which in turn, leads to more
increase in demand for tourism & stimulates subsequent rounds of investment in
a virtuous circle.
5.2 Conclusions and Suggestions
5.2.1 Conclusions and Suggestions of Sri Lanka
It is powerfully recommended to gain a catalog of all available investment
opportunities in Sri Lanka from a reliable source.
It is sensible to obtain dependable, safe & independent comments / advice
to select a suitable investment in Sri Lanka.
It is strongly advisable to have a probability Study Report in order to
recognize and identify specific risk factors and remedial measures
together with Winning Strategies.
It is powerfully advised to Cross-Check among applicable Government
Authorities before finalizing your Investment Decision in order to obtain
investment facilitation support.
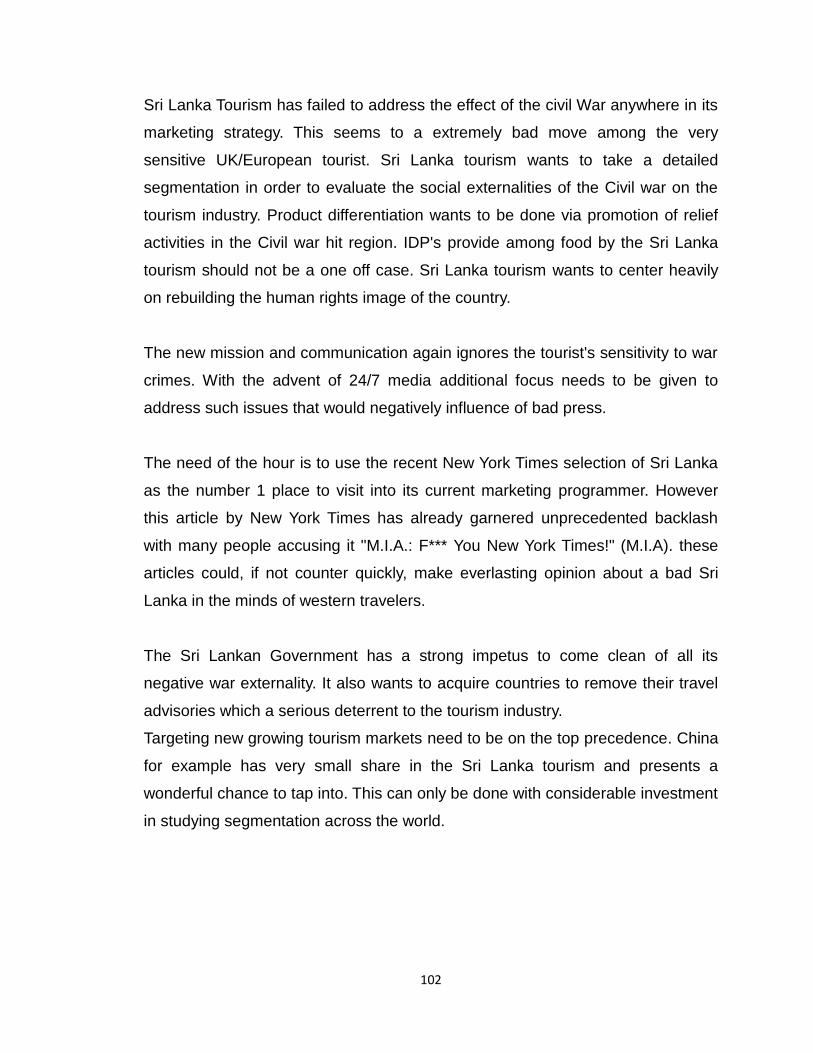
102
Sri Lanka Tourism has failed to address the effect of the civil War anywhere in its
marketing strategy. This seems to a extremely bad move among the very
sensitive UK/European tourist. Sri Lanka tourism wants to take a detailed
segmentation in order to evaluate the social externalities of the Civil war on the
tourism industry. Product differentiation wants to be done via promotion of relief
activities in the Civil war hit region. IDP's provide among food by the Sri Lanka
tourism should not be a one off case. Sri Lanka tourism wants to center heavily
on rebuilding the human rights image of the country.
The new mission and communication again ignores the tourist's sensitivity to war
crimes. With the advent of 24/7 media additional focus needs to be given to
address such issues that would negatively influence of bad press.
The need of the hour is to use the recent New York Times selection of Sri Lanka
as the number 1 place to visit into its current marketing programmer. However
this article by New York Times has already garnered unprecedented backlash
with many people accusing it "M.I.A.: F*** You New York Times!" (M.I.A). these
articles could, if not counter quickly, make everlasting opinion about a bad Sri
Lanka in the minds of western travelers.
The Sri Lankan Government has a strong impetus to come clean of all its
negative war externality. It also wants to acquire countries to remove their travel
advisories which a serious deterrent to the tourism industry.
Targeting new growing tourism markets need to be on the top precedence. China
for example has very small share in the Sri Lanka tourism and presents a
wonderful chance to tap into. This can only be done with considerable investment
in studying segmentation across the world.
103
5.2.2 Conclusions and Suggestions of India
Tourism industry is one of the major segments of our economy, it contribution
main part of foreign exchange & generates employment & helps infrastructure
development. Government of India has formulated policies to boost the tourism
industry. Tourism will enlarge greatly in future mostly due to the great revolution
that is taking place in demand & supply. Thus the study is a critical issue in
tourism industry. And new product development and innovation is essential for
survival. Health tourism in India is promoted as high-tech healing destinations,
which provides world-class treatment at low cost, incorporating the Indian system
of medicine ayurveda, naturpathy, unani, siddha and allopathy.
India is the seat of spiritualism, it is the confluence of different religious:
Hinduism, Sikhism, Islam, Christianity and Jainism, etc. The followers of religion
built many lavish temples, mosques, monasteries and Chruches across the
country. These are attracting both domestic & global tourists. Which say that the
tourism development should meet the needs of the present without
compromising the ability of future generation to meet their needs?
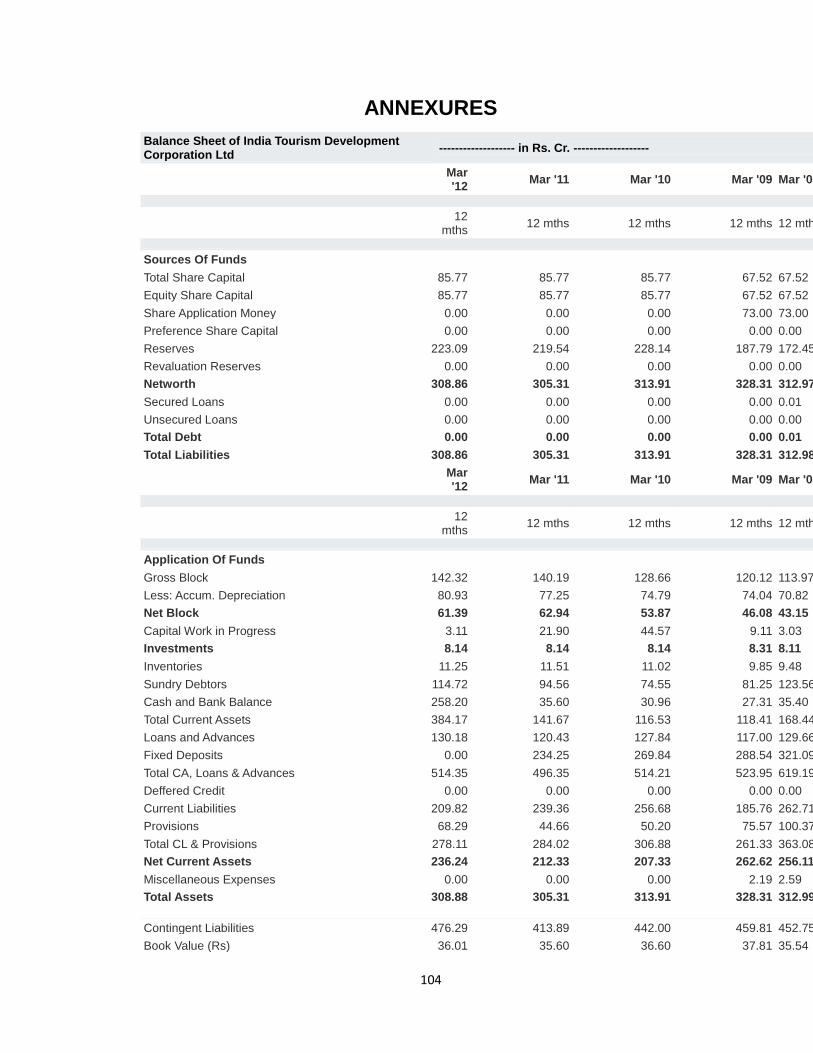
104
ANNEXURES
Balance Sheet of India Tourism Development Corporation Ltd
------------------- in Rs. Cr. -------------------
Mar '12
Mar '11 Mar '10 Mar '09 Mar '08
12
mths 12 mths 12 mths 12 mths 12 mths
Sources Of Funds
Total Share Capital 85.77 85.77 85.77 67.52 67.52
Equity Share Capital 85.77 85.77 85.77 67.52 67.52
Share Application Money 0.00 0.00 0.00 73.00 73.00
Preference Share Capital 0.00 0.00 0.00 0.00 0.00
Reserves 223.09 219.54 228.14 187.79 172.45
Revaluation Reserves 0.00 0.00 0.00 0.00 0.00
Networth 308.86 305.31 313.91 328.31 312.97
Secured Loans 0.00 0.00 0.00 0.00 0.01
Unsecured Loans 0.00 0.00 0.00 0.00 0.00
Total Debt 0.00 0.00 0.00 0.00 0.01
Total Liabilities 308.86 305.31 313.91 328.31 312.98
Mar '12
Mar '11 Mar '10 Mar '09 Mar '08
12
mths 12 mths 12 mths 12 mths 12 mths
Application Of Funds
Gross Block 142.32 140.19 128.66 120.12 113.97
Less: Accum. Depreciation 80.93 77.25 74.79 74.04 70.82
Net Block 61.39 62.94 53.87 46.08 43.15
Capital Work in Progress 3.11 21.90 44.57 9.11 3.03
Investments 8.14 8.14 8.14 8.31 8.11
Inventories 11.25 11.51 11.02 9.85 9.48
Sundry Debtors 114.72 94.56 74.55 81.25 123.56
Cash and Bank Balance 258.20 35.60 30.96 27.31 35.40
Total Current Assets 384.17 141.67 116.53 118.41 168.44
Loans and Advances 130.18 120.43 127.84 117.00 129.66
Fixed Deposits 0.00 234.25 269.84 288.54 321.09
Total CA, Loans & Advances 514.35 496.35 514.21 523.95 619.19
Deffered Credit 0.00 0.00 0.00 0.00 0.00
Current Liabilities 209.82 239.36 256.68 185.76 262.71
Provisions 68.29 44.66 50.20 75.57 100.37
Total CL & Provisions 278.11 284.02 306.88 261.33 363.08
Net Current Assets 236.24 212.33 207.33 262.62 256.11
Miscellaneous Expenses 0.00 0.00 0.00 2.19 2.59
Total Assets 308.88 305.31 313.91 328.31 312.99
Contingent Liabilities 476.29 413.89 442.00 459.81 452.75
Book Value (Rs) 36.01 35.60 36.60 37.81 35.54
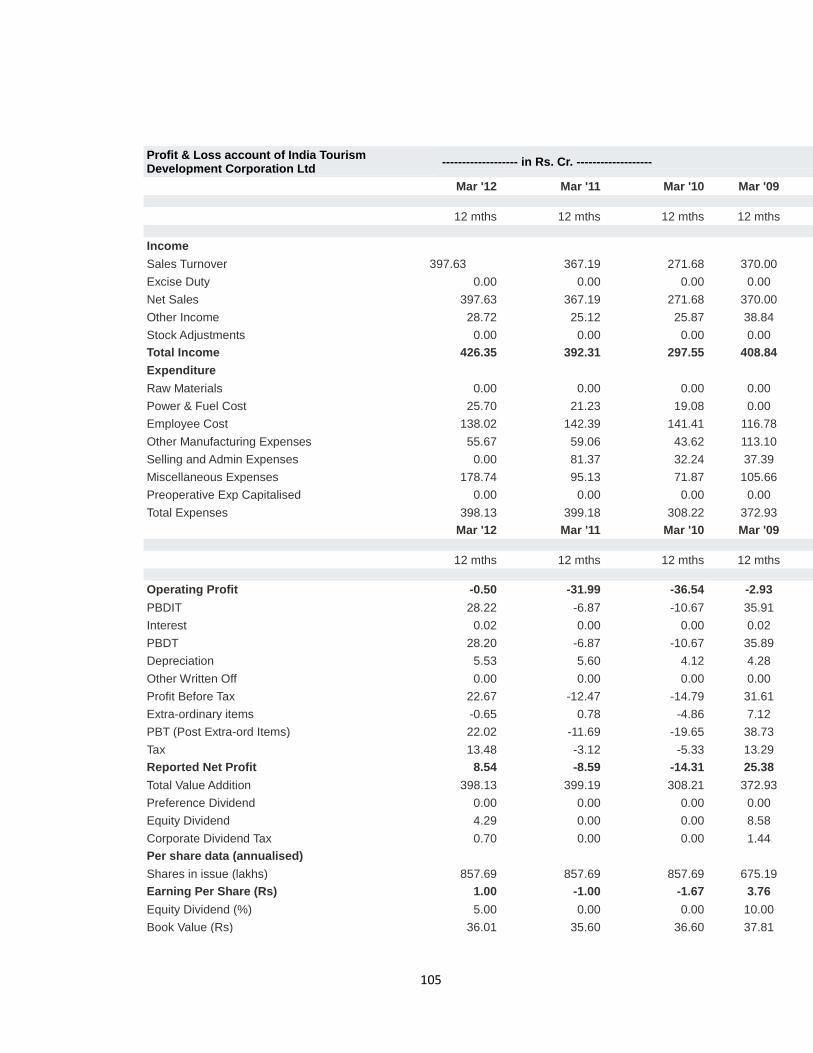
105
Profit & Loss account of India Tourism Development Corporation Ltd
------------------- in Rs. Cr. -------------------
Mar '12 Mar '11 Mar '10 Mar '09 Mar '08
12 mths 12 mths 12 mths 12 mths 12 mths
Income
Sales Turnover 397.63 367.19 271.68 370.00 436.84
Excise Duty 0.00 0.00 0.00 0.00 0.00
Net Sales 397.63 367.19 271.68 370.00 436.84
Other Income 28.72 25.12 25.87 38.84 30.54
Stock Adjustments 0.00 0.00 0.00 0.00 0.00
Total Income 426.35 392.31 297.55 408.84 467.38
Expenditure
Raw Materials 0.00 0.00 0.00 0.00 0.00
Power & Fuel Cost 25.70 21.23 19.08 0.00 0.00
Employee Cost 138.02 142.39 141.41 116.78 87.81
Other Manufacturing Expenses 55.67 59.06 43.62 113.10 173.51
Selling and Admin Expenses 0.00 81.37 32.24 37.39 44.28
Miscellaneous Expenses 178.74 95.13 71.87 105.66 86.22
Preoperative Exp Capitalised 0.00 0.00 0.00 0.00 0.00
Total Expenses 398.13 399.18 308.22 372.93 391.82
Mar '12 Mar '11 Mar '10 Mar '09 Mar '08
12 mths 12 mths 12 mths 12 mths 12 mths
Operating Profit -0.50 -31.99 -36.54 -2.93 45.02
PBDIT 28.22 -6.87 -10.67 35.91 75.56
Interest 0.02 0.00 0.00 0.02 0.02
PBDT 28.20 -6.87 -10.67 35.89 75.54
Depreciation 5.53 5.60 4.12 4.28 4.55
Other Written Off 0.00 0.00 0.00 0.00 0.05
Profit Before Tax 22.67 -12.47 -14.79 31.61 70.94
Extra-ordinary items -0.65 0.78 -4.86 7.12 -1.58
PBT (Post Extra-ord Items) 22.02 -11.69 -19.65 38.73 69.36
Tax 13.48 -3.12 -5.33 13.29 25.18
Reported Net Profit 8.54 -8.59 -14.31 25.38 44.08
Total Value Addition 398.13 399.19 308.21 372.93 391.83
Preference Dividend 0.00 0.00 0.00 0.00 0.00
Equity Dividend 4.29 0.00 0.00 8.58 13.50
Corporate Dividend Tax 0.70 0.00 0.00 1.44 2.29
Per share data (annualised)
Shares in issue (lakhs) 857.69 857.69 857.69 675.19 675.19
Earning Per Share (Rs) 1.00 -1.00 -1.67 3.76 6.53
Equity Dividend (%) 5.00 0.00 0.00 10.00 20.00
Book Value (Rs) 36.01 35.60 36.60 37.81 35.54
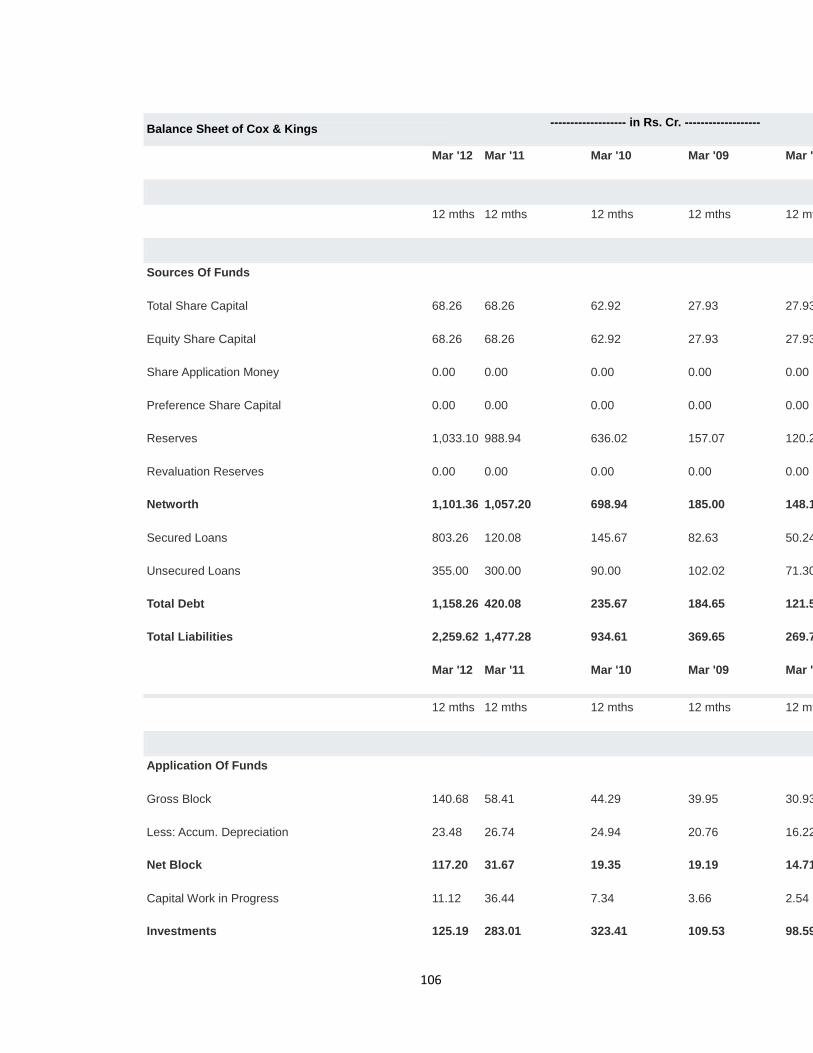
106
Balance Sheet of Cox & Kings ------------------- in Rs. Cr. -------------------
Mar '12 Mar '11 Mar '10 Mar '09 Mar '08
12 mths 12 mths 12 mths 12 mths 12 mths
Sources Of Funds
Total Share Capital 68.26 68.26 62.92 27.93 27.93
Equity Share Capital 68.26 68.26 62.92 27.93 27.93
Share Application Money 0.00 0.00 0.00 0.00 0.00
Preference Share Capital 0.00 0.00 0.00 0.00 0.00
Reserves 1,033.10 988.94 636.02 157.07 120.23
Revaluation Reserves 0.00 0.00 0.00 0.00 0.00
Networth 1,101.36 1,057.20 698.94 185.00 148.16
Secured Loans 803.26 120.08 145.67 82.63 50.24
Unsecured Loans 355.00 300.00 90.00 102.02 71.30
Total Debt 1,158.26 420.08 235.67 184.65 121.54
Total Liabilities 2,259.62 1,477.28 934.61 369.65 269.70
Mar '12 Mar '11 Mar '10 Mar '09 Mar '08
12 mths 12 mths 12 mths 12 mths 12 mths
Application Of Funds
Gross Block 140.68 58.41 44.29 39.95 30.93
Less: Accum. Depreciation 23.48 26.74 24.94 20.76 16.22
Net Block 117.20 31.67 19.35 19.19 14.71
Capital Work in Progress 11.12 36.44 7.34 3.66 2.54
Investments 125.19 283.01 323.41 109.53 98.59
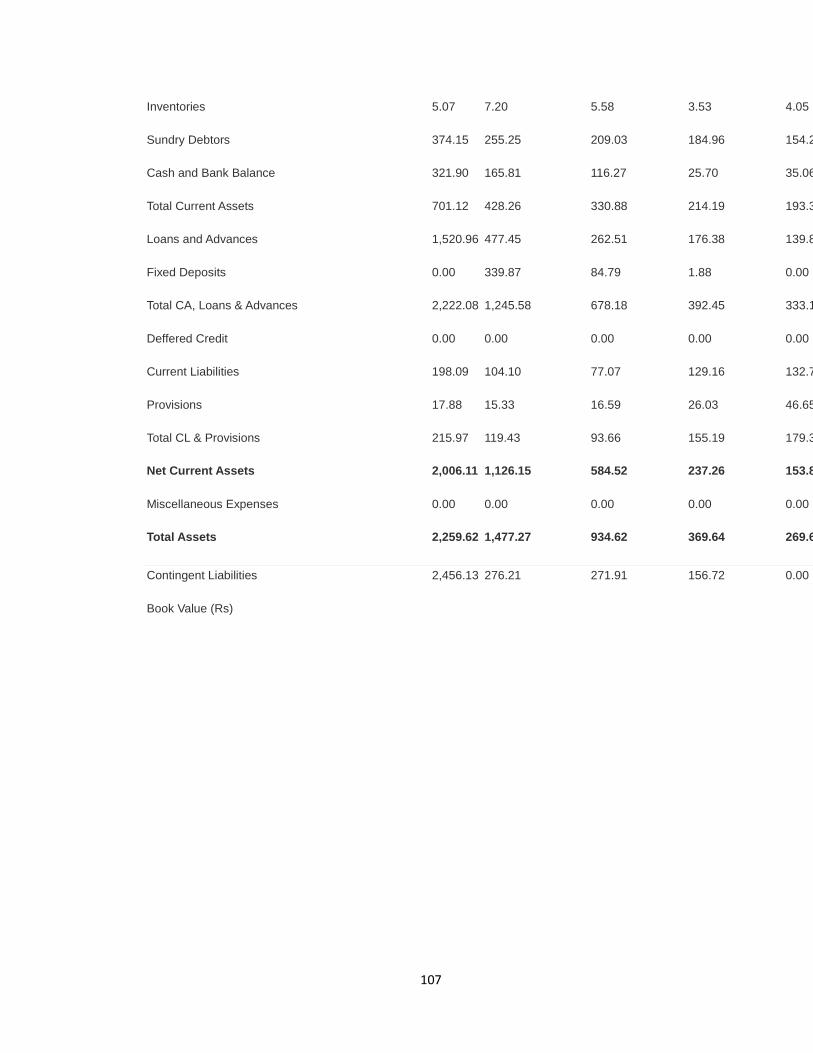
107
Inventories 5.07 7.20 5.58 3.53 4.05
Sundry Debtors 374.15 255.25 209.03 184.96 154.22
Cash and Bank Balance 321.90 165.81 116.27 25.70 35.06
Total Current Assets 701.12 428.26 330.88 214.19 193.33
Loans and Advances 1,520.96 477.45 262.51 176.38 139.86
Fixed Deposits 0.00 339.87 84.79 1.88 0.00
Total CA, Loans & Advances 2,222.08 1,245.58 678.18 392.45 333.19
Deffered Credit 0.00 0.00 0.00 0.00 0.00
Current Liabilities 198.09 104.10 77.07 129.16 132.70
Provisions 17.88 15.33 16.59 26.03 46.65
Total CL & Provisions 215.97 119.43 93.66 155.19 179.35
Net Current Assets 2,006.11 1,126.15 584.52 237.26 153.84
Miscellaneous Expenses 0.00 0.00 0.00 0.00 0.00
Total Assets 2,259.62 1,477.27 934.62 369.64 269.68
Contingent Liabilities 2,456.13 276.21 271.91 156.72 0.00
Book Value (Rs)
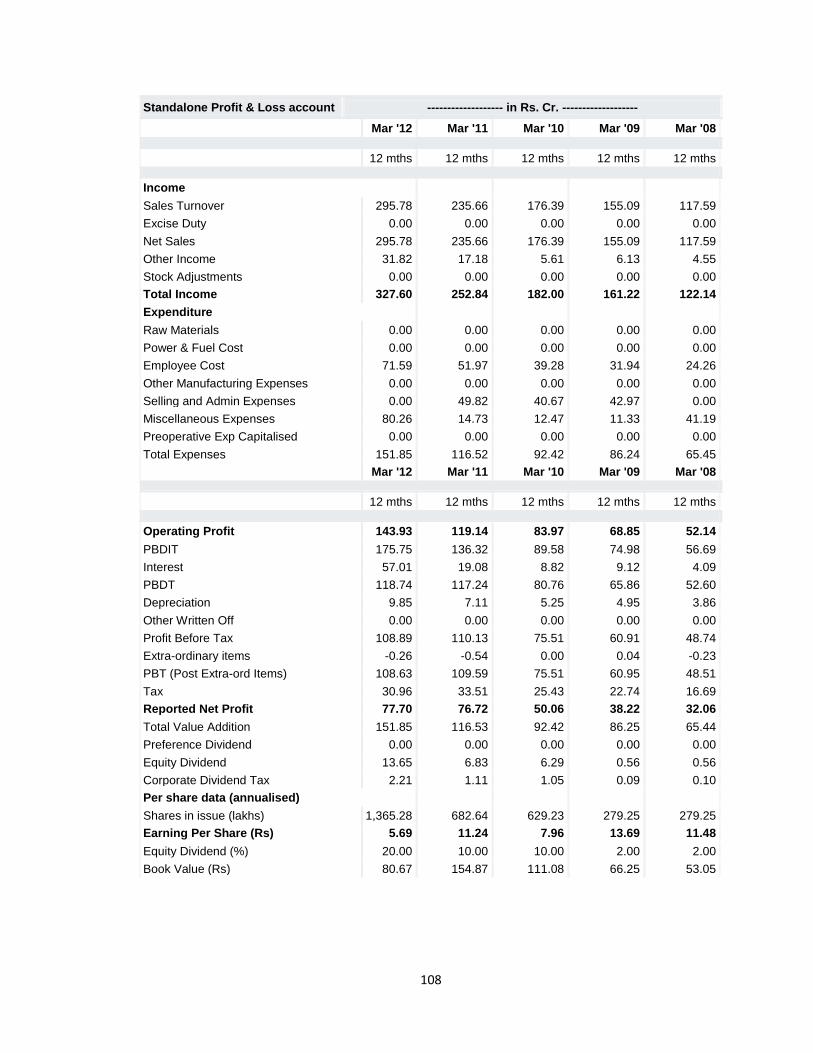
108
Standalone Profit & Loss account ------------------- in Rs. Cr. -------------------
Mar '12 Mar '11 Mar '10 Mar '09 Mar '08
12 mths 12 mths 12 mths 12 mths 12 mths
Income
Sales Turnover 295.78 235.66 176.39 155.09 117.59
Excise Duty 0.00 0.00 0.00 0.00 0.00
Net Sales 295.78 235.66 176.39 155.09 117.59
Other Income 31.82 17.18 5.61 6.13 4.55
Stock Adjustments 0.00 0.00 0.00 0.00 0.00
Total Income 327.60 252.84 182.00 161.22 122.14
Expenditure
Raw Materials 0.00 0.00 0.00 0.00 0.00
Power & Fuel Cost 0.00 0.00 0.00 0.00 0.00
Employee Cost 71.59 51.97 39.28 31.94 24.26
Other Manufacturing Expenses 0.00 0.00 0.00 0.00 0.00
Selling and Admin Expenses 0.00 49.82 40.67 42.97 0.00
Miscellaneous Expenses 80.26 14.73 12.47 11.33 41.19
Preoperative Exp Capitalised 0.00 0.00 0.00 0.00 0.00
Total Expenses 151.85 116.52 92.42 86.24 65.45
Mar '12 Mar '11 Mar '10 Mar '09 Mar '08
12 mths 12 mths 12 mths 12 mths 12 mths
Operating Profit 143.93 119.14 83.97 68.85 52.14
PBDIT 175.75 136.32 89.58 74.98 56.69
Interest 57.01 19.08 8.82 9.12 4.09
PBDT 118.74 117.24 80.76 65.86 52.60
Depreciation 9.85 7.11 5.25 4.95 3.86
Other Written Off 0.00 0.00 0.00 0.00 0.00
Profit Before Tax 108.89 110.13 75.51 60.91 48.74
Extra-ordinary items -0.26 -0.54 0.00 0.04 -0.23
PBT (Post Extra-ord Items) 108.63 109.59 75.51 60.95 48.51
Tax 30.96 33.51 25.43 22.74 16.69
Reported Net Profit 77.70 76.72 50.06 38.22 32.06
Total Value Addition 151.85 116.53 92.42 86.25 65.44
Preference Dividend 0.00 0.00 0.00 0.00 0.00
Equity Dividend 13.65 6.83 6.29 0.56 0.56
Corporate Dividend Tax 2.21 1.11 1.05 0.09 0.10
Per share data (annualised)
Shares in issue (lakhs) 1,365.28 682.64 629.23 279.25 279.25
Earning Per Share (Rs) 5.69 11.24 7.96 13.69 11.48
Equity Dividend (%) 20.00 10.00 10.00 2.00 2.00
Book Value (Rs) 80.67 154.87 111.08 66.25 53.05
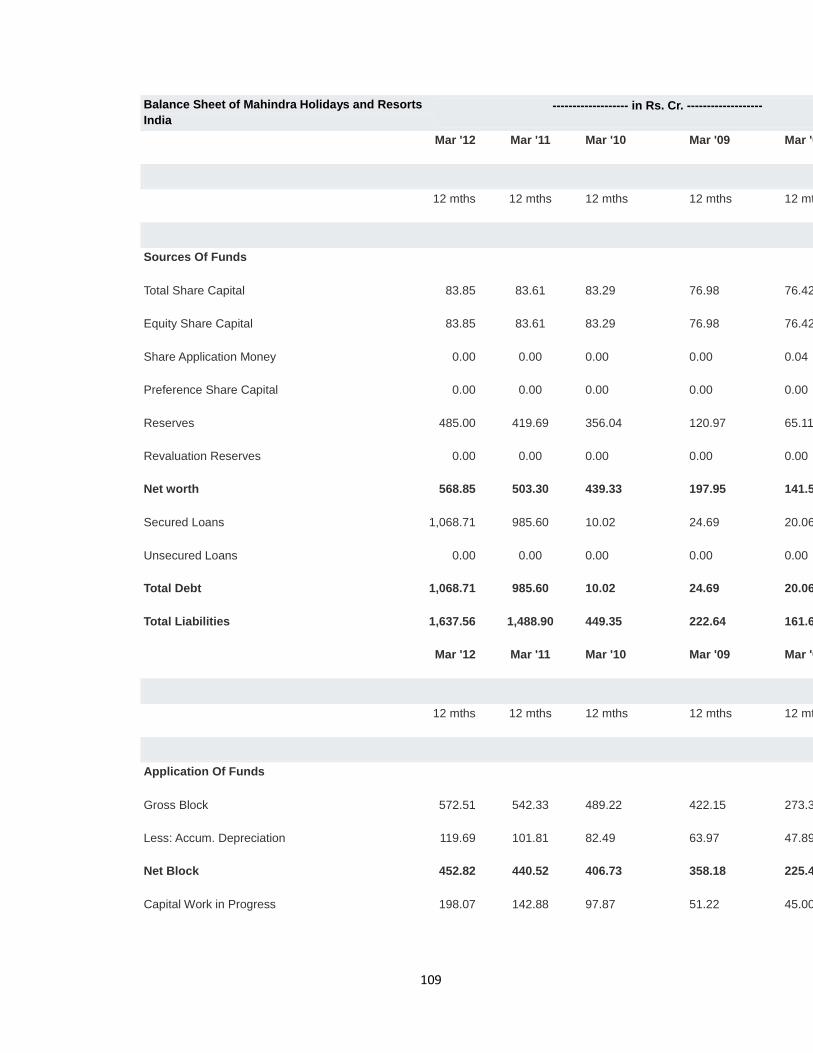
109
Balance Sheet of Mahindra Holidays and Resorts
India
------------------- in Rs. Cr. -------------------
Mar '12 Mar '11 Mar '10 Mar '09 Mar '08
12 mths 12 mths 12 mths 12 mths 12 mths
Sources Of Funds
Total Share Capital 83.85 83.61 83.29 76.98 76.42
Equity Share Capital 83.85 83.61 83.29 76.98 76.42
Share Application Money 0.00 0.00 0.00 0.00 0.04
Preference Share Capital 0.00 0.00 0.00 0.00 0.00
Reserves 485.00 419.69 356.04 120.97 65.11
Revaluation Reserves 0.00 0.00 0.00 0.00 0.00
Net worth 568.85 503.30 439.33 197.95 141.57
Secured Loans 1,068.71 985.60 10.02 24.69 20.06
Unsecured Loans 0.00 0.00 0.00 0.00 0.00
Total Debt 1,068.71 985.60 10.02 24.69 20.06
Total Liabilities 1,637.56 1,488.90 449.35 222.64 161.63
Mar '12 Mar '11 Mar '10 Mar '09 Mar '08
12 mths 12 mths 12 mths 12 mths 12 mths
Application Of Funds
Gross Block 572.51 542.33 489.22 422.15 273.37
Less: Accum. Depreciation 119.69 101.81 82.49 63.97 47.89
Net Block 452.82 440.52 406.73 358.18 225.48
Capital Work in Progress 198.07 142.88 97.87 51.22 45.00
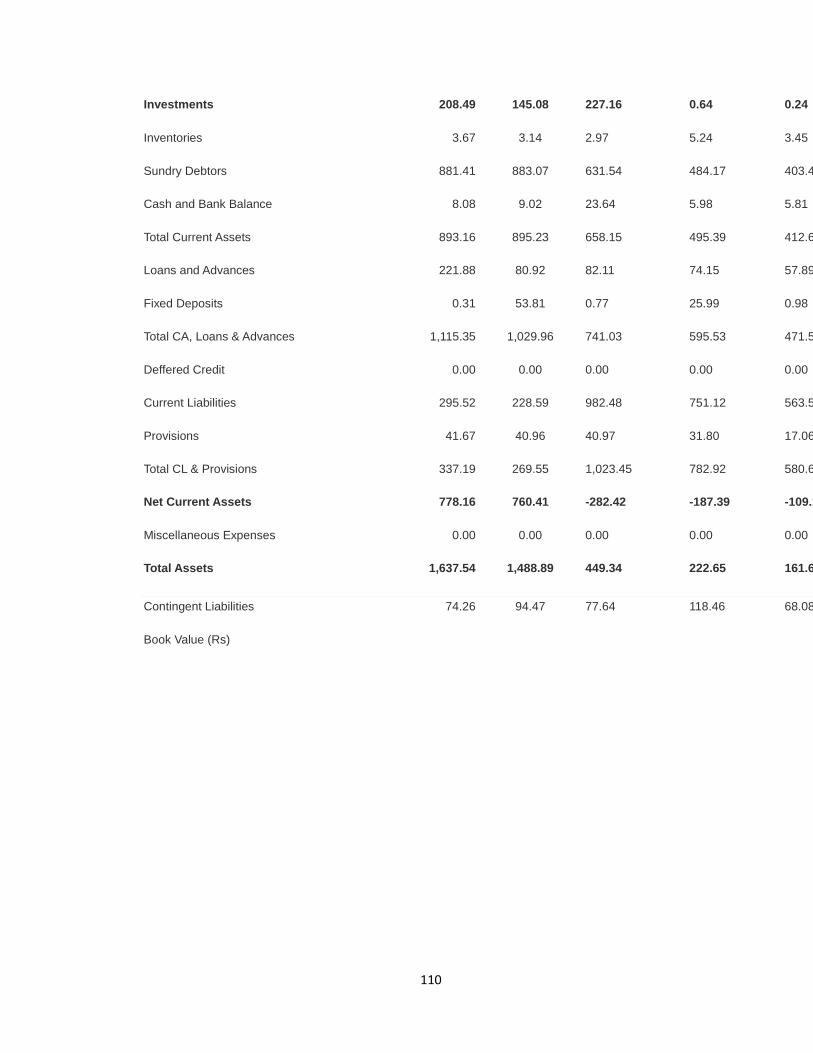
110
Investments 208.49 145.08 227.16 0.64 0.24
Inventories 3.67 3.14 2.97 5.24 3.45
Sundry Debtors 881.41 883.07 631.54 484.17 403.42
Cash and Bank Balance 8.08 9.02 23.64 5.98 5.81
Total Current Assets 893.16 895.23 658.15 495.39 412.68
Loans and Advances 221.88 80.92 82.11 74.15 57.89
Fixed Deposits 0.31 53.81 0.77 25.99 0.98
Total CA, Loans & Advances 1,115.35 1,029.96 741.03 595.53 471.55
Deffered Credit 0.00 0.00 0.00 0.00 0.00
Current Liabilities 295.52 228.59 982.48 751.12 563.59
Provisions 41.67 40.96 40.97 31.80 17.06
Total CL & Provisions 337.19 269.55 1,023.45 782.92 580.65
Net Current Assets 778.16 760.41 -282.42 -187.39 -109.10
Miscellaneous Expenses 0.00 0.00 0.00 0.00 0.00
Total Assets 1,637.54 1,488.89 449.34 222.65 161.62
Contingent Liabilities 74.26 94.47 77.64 118.46 68.08
Book Value (Rs)
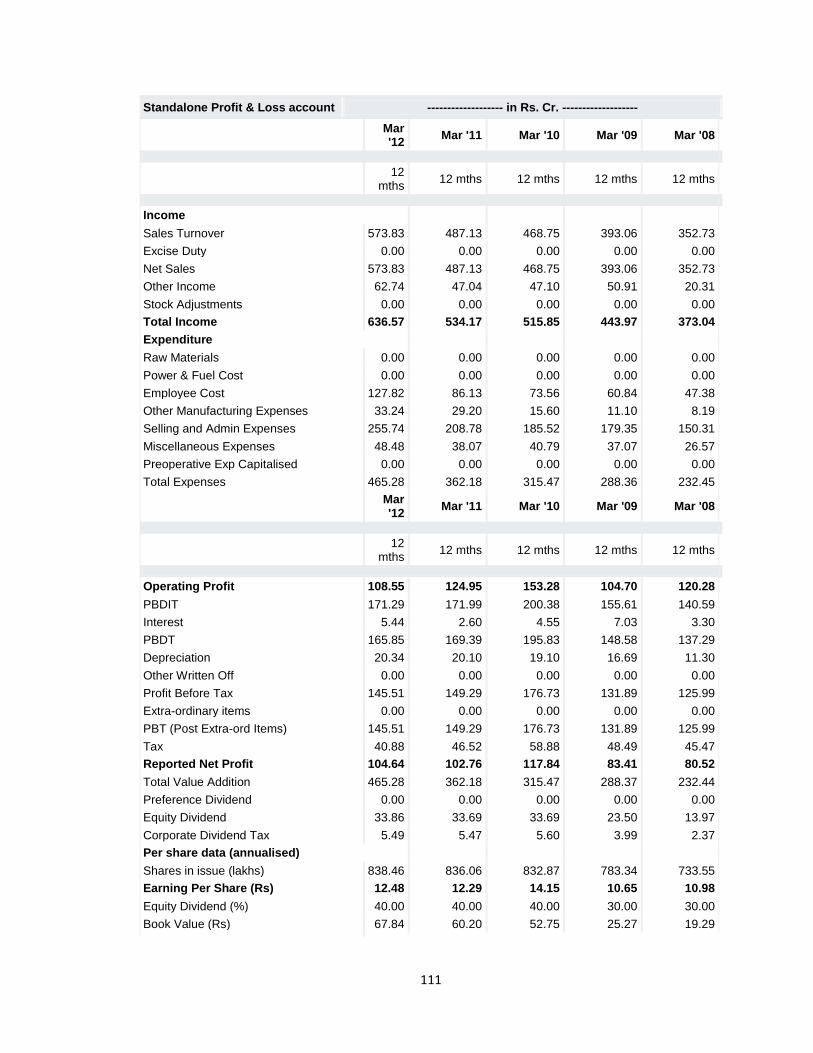
111
Standalone Profit & Loss account ------------------- in Rs. Cr. -------------------
Mar '12
Mar '11 Mar '10 Mar '09 Mar '08
12
mths 12 mths 12 mths 12 mths 12 mths
Income
Sales Turnover 573.83 487.13 468.75 393.06 352.73
Excise Duty 0.00 0.00 0.00 0.00 0.00
Net Sales 573.83 487.13 468.75 393.06 352.73
Other Income 62.74 47.04 47.10 50.91 20.31
Stock Adjustments 0.00 0.00 0.00 0.00 0.00
Total Income 636.57 534.17 515.85 443.97 373.04
Expenditure
Raw Materials 0.00 0.00 0.00 0.00 0.00
Power & Fuel Cost 0.00 0.00 0.00 0.00 0.00
Employee Cost 127.82 86.13 73.56 60.84 47.38
Other Manufacturing Expenses 33.24 29.20 15.60 11.10 8.19
Selling and Admin Expenses 255.74 208.78 185.52 179.35 150.31
Miscellaneous Expenses 48.48 38.07 40.79 37.07 26.57
Preoperative Exp Capitalised 0.00 0.00 0.00 0.00 0.00
Total Expenses 465.28 362.18 315.47 288.36 232.45
Mar '12
Mar '11 Mar '10 Mar '09 Mar '08
12
mths 12 mths 12 mths 12 mths 12 mths
Operating Profit 108.55 124.95 153.28 104.70 120.28
PBDIT 171.29 171.99 200.38 155.61 140.59
Interest 5.44 2.60 4.55 7.03 3.30
PBDT 165.85 169.39 195.83 148.58 137.29
Depreciation 20.34 20.10 19.10 16.69 11.30
Other Written Off 0.00 0.00 0.00 0.00 0.00
Profit Before Tax 145.51 149.29 176.73 131.89 125.99
Extra-ordinary items 0.00 0.00 0.00 0.00 0.00
PBT (Post Extra-ord Items) 145.51 149.29 176.73 131.89 125.99
Tax 40.88 46.52 58.88 48.49 45.47
Reported Net Profit 104.64 102.76 117.84 83.41 80.52
Total Value Addition 465.28 362.18 315.47 288.37 232.44
Preference Dividend 0.00 0.00 0.00 0.00 0.00
Equity Dividend 33.86 33.69 33.69 23.50 13.97
Corporate Dividend Tax 5.49 5.47 5.60 3.99 2.37
Per share data (annualised)
Shares in issue (lakhs) 838.46 836.06 832.87 783.34 733.55
Earning Per Share (Rs) 12.48 12.29 14.15 10.65 10.98
Equity Dividend (%) 40.00 40.00 40.00 30.00 30.00
Book Value (Rs) 67.84 60.20 52.75 25.27 19.29
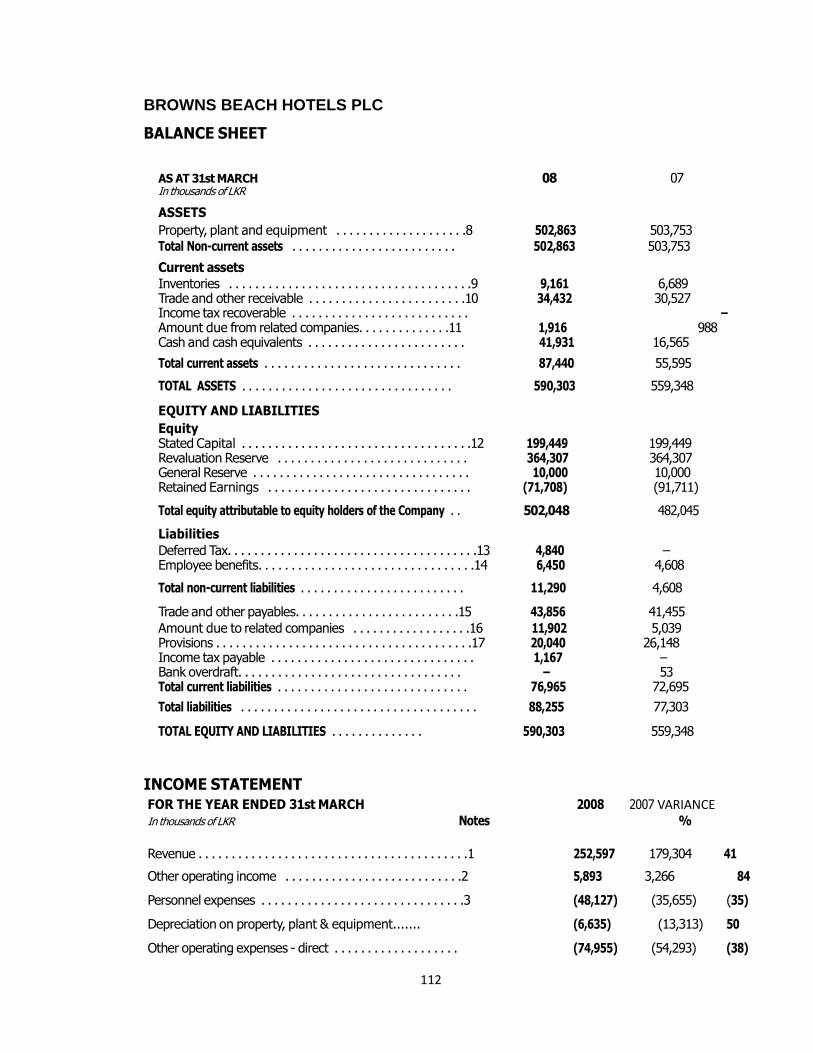
112
BROWNS BEACH HOTELS PLC
BALANCE SHEET
AS AT 31st MARCH 08 07 In thousands of LKR
ASSETS
Property, plant and equipment . . . . . . . . . . . . . . . . . . . .8 502,863 503,753 Total Non-current assets . . . . . . . . . . . . . . . . . . . . . . . . . 502,863 503,753
Current assets Inventories . . . . . . . . . . . . . . . . . . . . . . . . . . . . . . . . . . . . .9 9,161 6,689 Trade and other receivable . . . . . . . . . . . . . . . . . . . . . . . .10 34,432 30,527 Income tax recoverable . . . . . . . . . . . . . . . . . . . . . . . . . . . – 826 Amount due from related companies. . . . . . . . . . . . . .11 1,916 988 Cash and cash equivalents . . . . . . . . . . . . . . . . . . . . . . . . 41,931 16,565
Total current assets . . . . . . . . . . . . . . . . . . . . . . . . . . . . . . 87,440 55,595
TOTAL ASSETS . . . . . . . . . . . . . . . . . . . . . . . . . . . . . . . . 590,303 559,348
EQUITY AND LIABILITIES
Equity Stated Capital . . . . . . . . . . . . . . . . . . . . . . . . . . . . . . . . . . .12 199,449 199,449 Revaluation Reserve . . . . . . . . . . . . . . . . . . . . . . . . . . . . . 364,307 364,307 General Reserve . . . . . . . . . . . . . . . . . . . . . . . . . . . . . . . . . 10,000 10,000 Retained Earnings . . . . . . . . . . . . . . . . . . . . . . . . . . . . . . . (71,708) (91,711)
Total equity attributable to equity holders of the Company . . 502,048 482,045
Liabilities Deferred Tax. . . . . . . . . . . . . . . . . . . . . . . . . . . . . . . . . . . . . .13 4,840 – Employee benefits. . . . . . . . . . . . . . . . . . . . . . . . . . . . . . . . .14 6,450 4,608
Total non-current liabilities . . . . . . . . . . . . . . . . . . . . . . . . . 11,290 4,608
Trade and other payables. . . . . . . . . . . . . . . . . . . . . . . . .15 43,856 41,455 Amount due to related companies . . . . . . . . . . . . . . . . . .16 11,902 5,039 Provisions . . . . . . . . . . . . . . . . . . . . . . . . . . . . . . . . . . . . . . .17 20,040 26,148 Income tax payable . . . . . . . . . . . . . . . . . . . . . . . . . . . . . . . 1,167 – Bank overdraft. . . . . . . . . . . . . . . . . . . . . . . . . . . . . . . . . . – 53 Total current liabilities . . . . . . . . . . . . . . . . . . . . . . . . . . . . . 76,965 72,695
Total liabilities . . . . . . . . . . . . . . . . . . . . . . . . . . . . . . . . . . . . 88,255 77,303
TOTAL EQUITY AND LIABILITIES . . . . . . . . . . . . . . 590,303 559,348
INCOME STATEMENT FOR THE YEAR ENDED 31st MARCH 2008 2007 VARIANCE In thousands of LKR Notes %
Revenue . . . . . . . . . . . . . . . . . . . . . . . . . . . . . . . . . . . . . . . . .1 252,597 179,304 41
Other operating income . . . . . . . . . . . . . . . . . . . . . . . . . . .2 5,893 3,266 84
Personnel expenses . . . . . . . . . . . . . . . . . . . . . . . . . . . . . . .3 (48,127) (35,655) (35)
Depreciation on property, plant & equipment....... (6,635) (13,313) 50
Other operating expenses - direct . . . . . . . . . . . . . . . . . . . (74,955) (54,293) (38)
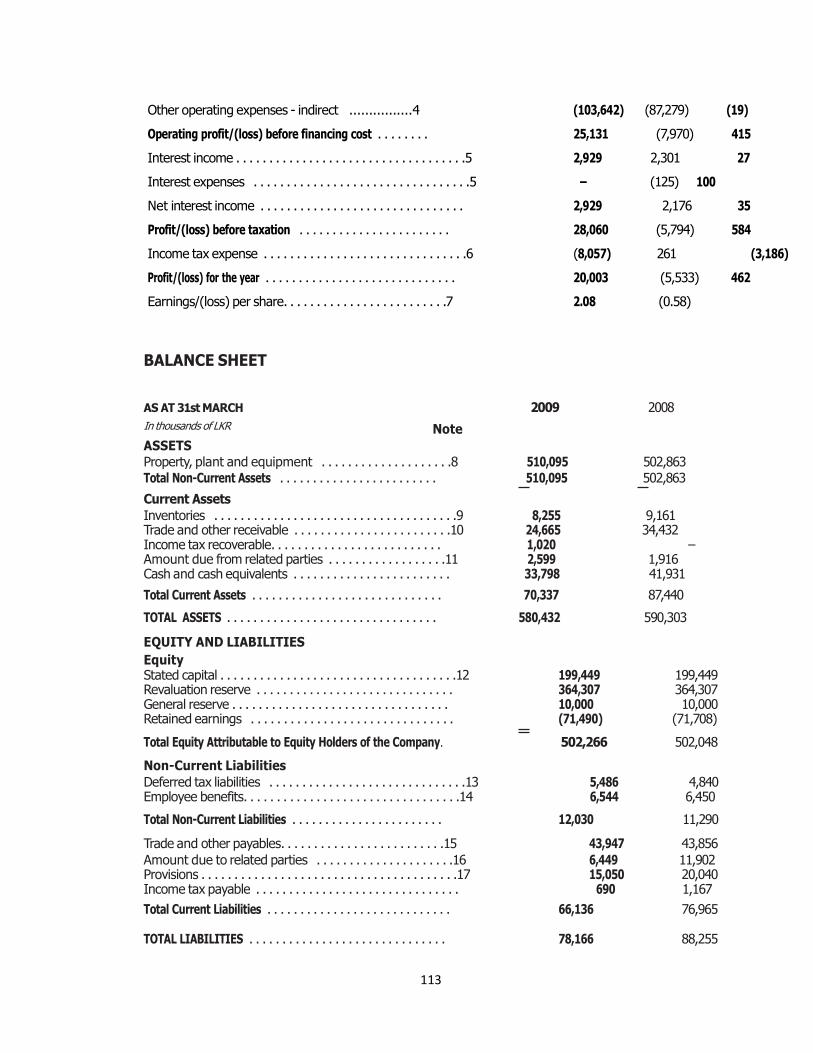
113
Other operating expenses - indirect ................4 (103,642) (87,279) (19)
Operating profit/(loss) before financing cost . . . . . . . . 25,131 (7,970) 415
Interest income . . . . . . . . . . . . . . . . . . . . . . . . . . . . . . . . . . .5 2,929 2,301 27
Interest expenses . . . . . . . . . . . . . . . . . . . . . . . . . . . . . . . . .5 – (125) 100
Net interest income . . . . . . . . . . . . . . . . . . . . . . . . . . . . . . . 2,929 2,176 35
Profit/(loss) before taxation . . . . . . . . . . . . . . . . . . . . . . . 28,060 (5,794) 584
Income tax expense . . . . . . . . . . . . . . . . . . . . . . . . . . . . . . .6 (8,057) 261 (3,186)
Profit/(loss) for the year . . . . . . . . . . . . . . . . . . . . . . . . . . . . . 20,003 (5,533) 462
Earnings/(loss) per share. . . . . . . . . . . . . . . . . . . . . . . . .7 2.08 (0.58)
BALANCE SHEET
AS AT 31st MARCH 2009 2008
In thousands of LKR Note ASSETS Property, plant and equipment . . . . . . . . . . . . . . . . . . . .8 510,095 502,863 Total Non-Current Assets . . . . . . . . . . . . . . . . . . . . . . . . 510,095 502,863
Current Assets Inventories . . . . . . . . . . . . . . . . . . . . . . . . . . . . . . . . . . . . .9 8,255 9,161 Trade and other receivable . . . . . . . . . . . . . . . . . . . . . . . .10 24,665 34,432 Income tax recoverable. . . . . . . . . . . . . . . . . . . . . . . . . . 1,020 – Amount due from related parties . . . . . . . . . . . . . . . . . .11 2,599 1,916 Cash and cash equivalents . . . . . . . . . . . . . . . . . . . . . . . . 33,798 41,931
Total Current Assets . . . . . . . . . . . . . . . . . . . . . . . . . . . . . 70,337 87,440
TOTAL ASSETS . . . . . . . . . . . . . . . . . . . . . . . . . . . . . . . . 580,432 590,303
EQUITY AND LIABILITIES
Equity Stated capital . . . . . . . . . . . . . . . . . . . . . . . . . . . . . . . . . . . .12 199,449 199,449 Revaluation reserve . . . . . . . . . . . . . . . . . . . . . . . . . . . . . . 364,307 364,307 General reserve . . . . . . . . . . . . . . . . . . . . . . . . . . . . . . . . . 10,000 10,000 Retained earnings . . . . . . . . . . . . . . . . . . . . . . . . . . . . . . . (71,490) (71,708)
Total Equity Attributable to Equity Holders of the Company. 502,266 502,048
Non-Current Liabilities Deferred tax liabilities . . . . . . . . . . . . . . . . . . . . . . . . . . . . . .13 5,486 4,840 Employee benefits. . . . . . . . . . . . . . . . . . . . . . . . . . . . . . . . .14 6,544 6,450
Total Non-Current Liabilities . . . . . . . . . . . . . . . . . . . . . . . 12,030 11,290
Trade and other payables. . . . . . . . . . . . . . . . . . . . . . . . .15 43,947 43,856 Amount due to related parties . . . . . . . . . . . . . . . . . . . . .16 6,449 11,902 Provisions . . . . . . . . . . . . . . . . . . . . . . . . . . . . . . . . . . . . . . .17 15,050 20,040 Income tax payable . . . . . . . . . . . . . . . . . . . . . . . . . . . . . . . 690 1,167
Total Current Liabilities . . . . . . . . . . . . . . . . . . . . . . . . . . . . 66,136 76,965
TOTAL LIABILITIES . . . . . . . . . . . . . . . . . . . . . . . . . . . . . . 78,166 88,255
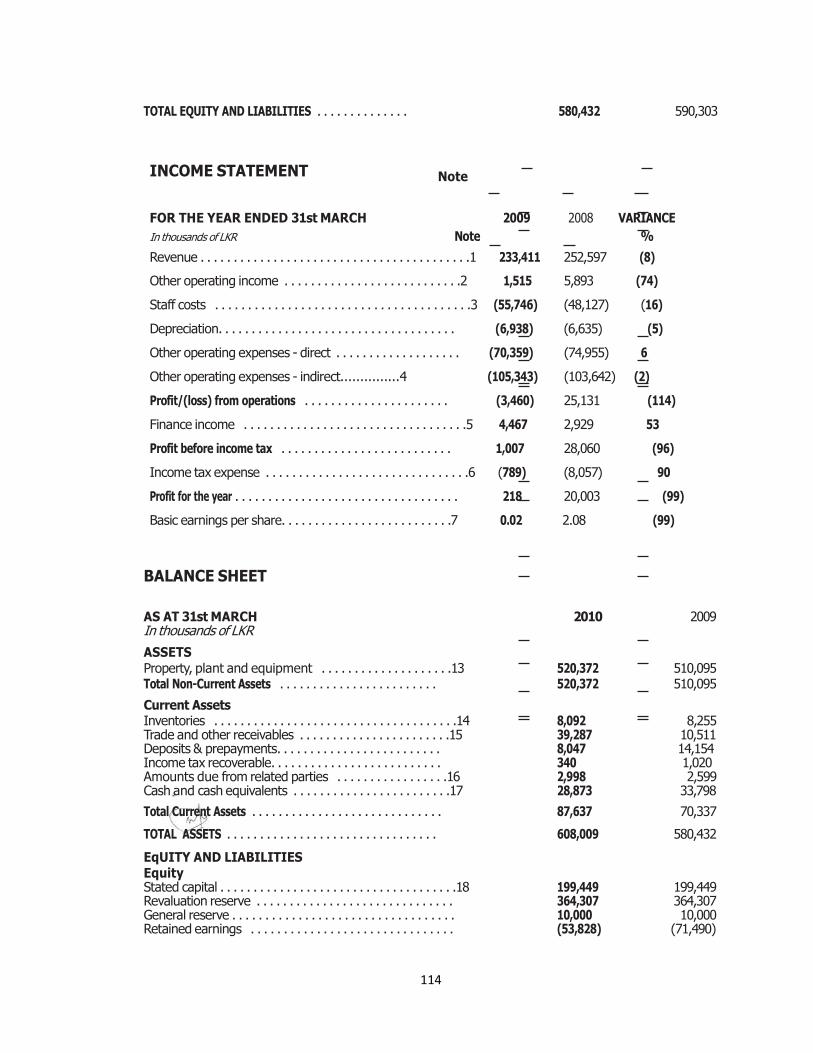
114
Note
TOTAL EQUITY AND LIABILITIES . . . . . . . . . . . . . . 580,432 590,303
INCOME STATEMENT
FOR THE YEAR ENDED 31st MARCH 2009 2008 VARIANCE
In thousands of LKR Note %
Revenue . . . . . . . . . . . . . . . . . . . . . . . . . . . . . . . . . . . . . . . . .1 233,411 252,597 (8)
Other operating income . . . . . . . . . . . . . . . . . . . . . . . . . . .2 1,515 5,893 (74)
Staff costs . . . . . . . . . . . . . . . . . . . . . . . . . . . . . . . . . . . . . . .3 (55,746) (48,127) (16)
Depreciation. . . . . . . . . . . . . . . . . . . . . . . . . . . . . . . . . . . . (6,938) (6,635) (5)
Other operating expenses - direct . . . . . . . . . . . . . . . . . . . (70,359) (74,955) 6
Other operating expenses - indirect...............4 (105,343) (103,642) (2)
Profit/(loss) from operations . . . . . . . . . . . . . . . . . . . . . . (3,460) 25,131 (114)
Finance income . . . . . . . . . . . . . . . . . . . . . . . . . . . . . . . . . .5 4,467 2,929 53
Profit before income tax . . . . . . . . . . . . . . . . . . . . . . . . . . 1,007 28,060 (96)
Income tax expense . . . . . . . . . . . . . . . . . . . . . . . . . . . . . . .6 (789) (8,057) 90
Profit for the year . . . . . . . . . . . . . . . . . . . . . . . . . . . . . . . . . . 218 20,003 (99)
Basic earnings per share. . . . . . . . . . . . . . . . . . . . . . . . . .7 0.02 2.08 (99)
BALANCE SHEET
AS AT 31st MARCH 2010 2009 In thousands of LKR
ASSETS Property, plant and equipment . . . . . . . . . . . . . . . . . . . .13 520,372 510,095 Total Non-Current Assets . . . . . . . . . . . . . . . . . . . . . . . . 520,372 510,095
Current Assets Inventories . . . . . . . . . . . . . . . . . . . . . . . . . . . . . . . . . . . . .14 8,092 8,255 Trade and other receivables . . . . . . . . . . . . . . . . . . . . . . .15 39,287 10,511 Deposits & prepayments. . . . . . . . . . . . . . . . . . . . . . . . . 8,047 14,154 Income tax recoverable. . . . . . . . . . . . . . . . . . . . . . . . . . 340 1,020 Amounts due from related parties . . . . . . . . . . . . . . . . .16 2,998 2,599 Cash and cash equivalents . . . . . . . . . . . . . . . . . . . . . . . .17 28,873 33,798
Total Current Assets . . . . . . . . . . . . . . . . . . . . . . . . . . . . . 87,637 70,337
TOTAL ASSETS . . . . . . . . . . . . . . . . . . . . . . . . . . . . . . . . 608,009 580,432
EqUITY AND LIABILITIES Equity Stated capital . . . . . . . . . . . . . . . . . . . . . . . . . . . . . . . . . . . .18 199,449 199,449 Revaluation reserve . . . . . . . . . . . . . . . . . . . . . . . . . . . . . . 364,307 364,307 General reserve . . . . . . . . . . . . . . . . . . . . . . . . . . . . . . . . . . 10,000 10,000 Retained earnings . . . . . . . . . . . . . . . . . . . . . . . . . . . . . . . (53,828) (71,490)
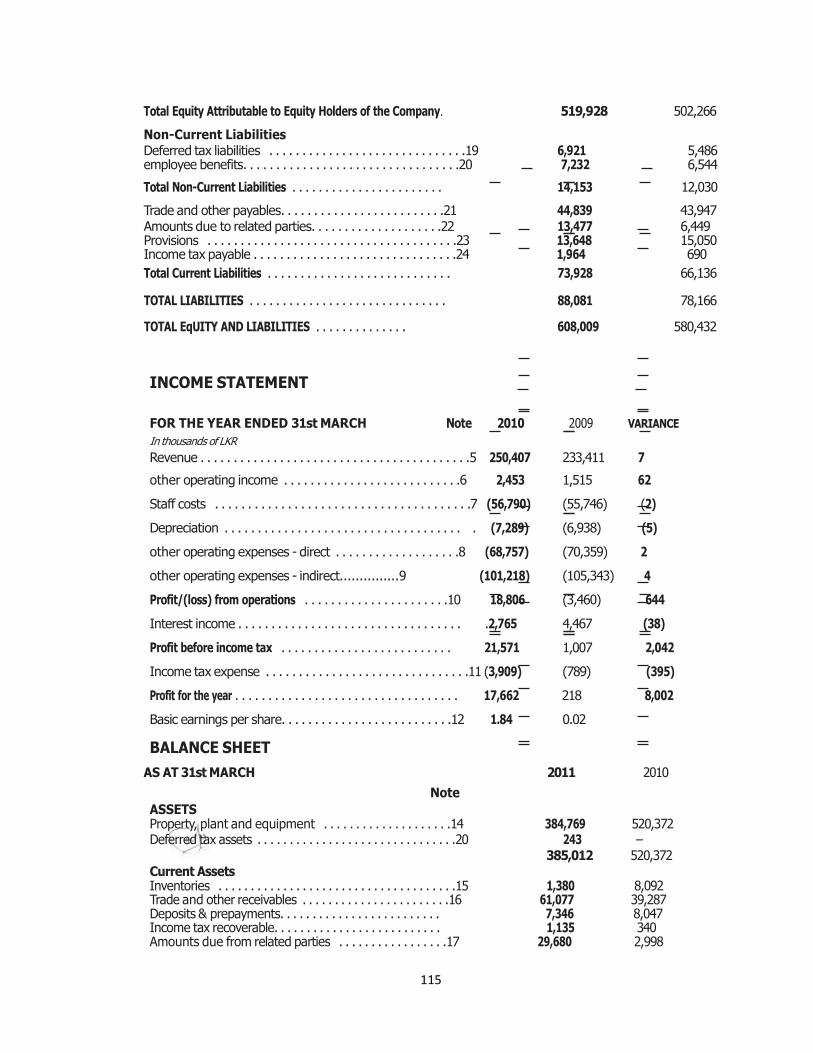
115
Total Equity Attributable to Equity Holders of the Company. 519,928 502,266
Non-Current Liabilities Deferred tax liabilities . . . . . . . . . . . . . . . . . . . . . . . . . . . . . .19 6,921 5,486 employee benefits. . . . . . . . . . . . . . . . . . . . . . . . . . . . . . . . .20 7,232 6,544
Total Non-Current Liabilities . . . . . . . . . . . . . . . . . . . . . . . 14,153 12,030
Trade and other payables. . . . . . . . . . . . . . . . . . . . . . . . .21 44,839 43,947 Amounts due to related parties. . . . . . . . . . . . . . . . . . . .22 13,477 6,449 Provisions . . . . . . . . . . . . . . . . . . . . . . . . . . . . . . . . . . . . . .23 13,648 15,050 Income tax payable . . . . . . . . . . . . . . . . . . . . . . . . . . . . . . .24 1,964 690
Total Current Liabilities . . . . . . . . . . . . . . . . . . . . . . . . . . . . 73,928 66,136
TOTAL LIABILITIES . . . . . . . . . . . . . . . . . . . . . . . . . . . . . . 88,081 78,166
TOTAL EqUITY AND LIABILITIES . . . . . . . . . . . . . . 608,009 580,432
INCOME STATEMENT
FOR THE YEAR ENDED 31st MARCH Note 2010 2009 VARIANCE In thousands of LKR % Revenue . . . . . . . . . . . . . . . . . . . . . . . . . . . . . . . . . . . . . . . . .5 250,407 233,411 7
other operating income . . . . . . . . . . . . . . . . . . . . . . . . . . .6 2,453 1,515 62
Staff costs . . . . . . . . . . . . . . . . . . . . . . . . . . . . . . . . . . . . . . .7 (56,790) (55,746) (2)
Depreciation . . . . . . . . . . . . . . . . . . . . . . . . . . . . . . . . . . . . . (7,289) (6,938) (5)
other operating expenses - direct . . . . . . . . . . . . . . . . . . .8 (68,757) (70,359) 2
other operating expenses - indirect...............9 (101,218) (105,343) 4
Profit/(loss) from operations . . . . . . . . . . . . . . . . . . . . . .10 18,806 (3,460) 644
Interest income . . . . . . . . . . . . . . . . . . . . . . . . . . . . . . . . . . .2,765 4,467 (38)
Profit before income tax . . . . . . . . . . . . . . . . . . . . . . . . . . 21,571 1,007 2,042
Income tax expense . . . . . . . . . . . . . . . . . . . . . . . . . . . . . . .11 (3,909) (789) (395)
Profit for the year . . . . . . . . . . . . . . . . . . . . . . . . . . . . . . . . . . 17,662 218 8,002
Basic earnings per share. . . . . . . . . . . . . . . . . . . . . . . . . .12 1.84 0.02
BALANCE SHEET
AS AT 31st MARCH 2011 2010
Note ASSETS Property, plant and equipment . . . . . . . . . . . . . . . . . . . .14 384,769 520,372 Deferred tax assets . . . . . . . . . . . . . . . . . . . . . . . . . . . . . . .20 243 –
385,012 520,372 Current Assets Inventories . . . . . . . . . . . . . . . . . . . . . . . . . . . . . . . . . . . . .15 1,380 8,092 Trade and other receivables . . . . . . . . . . . . . . . . . . . . . . .16 61,077 39,287 Deposits & prepayments. . . . . . . . . . . . . . . . . . . . . . . . . 7,346 8,047 Income tax recoverable. . . . . . . . . . . . . . . . . . . . . . . . . . 1,135 340 Amounts due from related parties . . . . . . . . . . . . . . . . .17 29,680 2,998
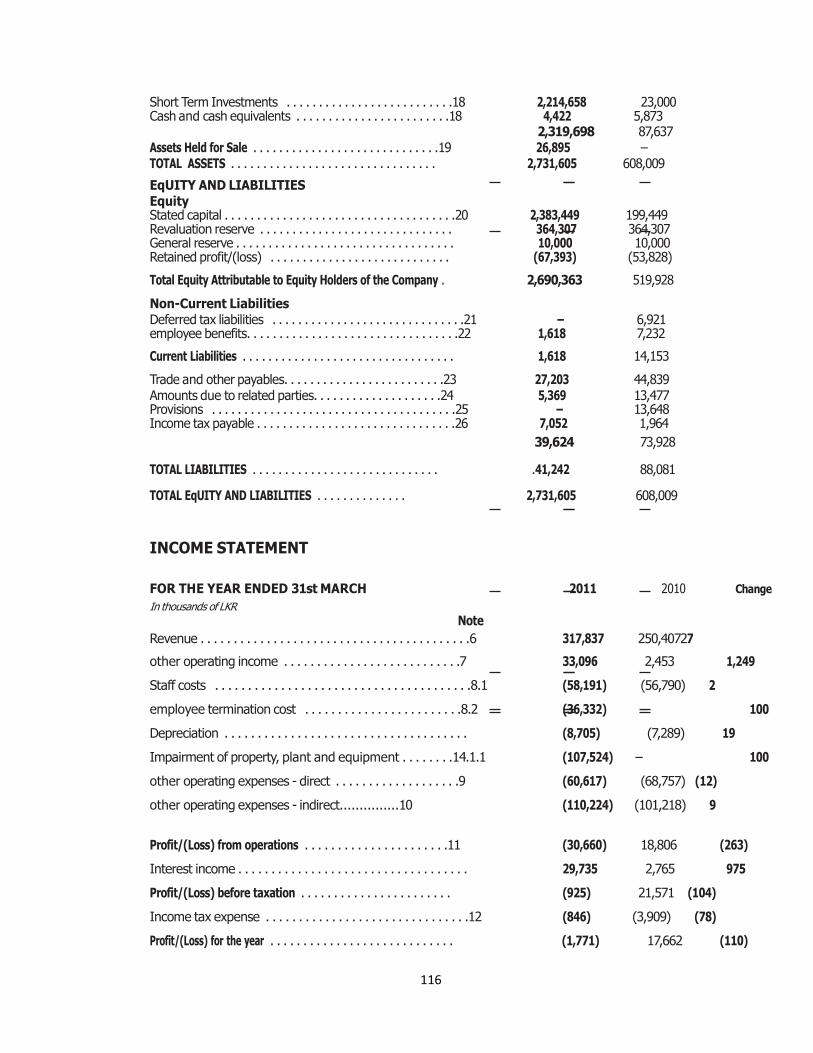
116
Short Term Investments . . . . . . . . . . . . . . . . . . . . . . . . . .18 2,214,658 23,000 Cash and cash equivalents . . . . . . . . . . . . . . . . . . . . . . . .18 4,422 5,873
2,319,698 87,637 Assets Held for Sale . . . . . . . . . . . . . . . . . . . . . . . . . . . . .19 26,895 – TOTAL ASSETS . . . . . . . . . . . . . . . . . . . . . . . . . . . . . . . . 2,731,605 608,009
EqUITY AND LIABILITIES Equity Stated capital . . . . . . . . . . . . . . . . . . . . . . . . . . . . . . . . . . . .20 2,383,449 199,449 Revaluation reserve . . . . . . . . . . . . . . . . . . . . . . . . . . . . . . 364,307 364,307 General reserve . . . . . . . . . . . . . . . . . . . . . . . . . . . . . . . . . . 10,000 10,000 Retained profit/(loss) . . . . . . . . . . . . . . . . . . . . . . . . . . . . (67,393) (53,828)
Total Equity Attributable to Equity Holders of the Company . 2,690,363 519,928
Non-Current Liabilities Deferred tax liabilities . . . . . . . . . . . . . . . . . . . . . . . . . . . . . .21 – 6,921 employee benefits. . . . . . . . . . . . . . . . . . . . . . . . . . . . . . . . .22 1,618 7,232
Current Liabilities . . . . . . . . . . . . . . . . . . . . . . . . . . . . . . . . . 1,618 14,153
Trade and other payables. . . . . . . . . . . . . . . . . . . . . . . . .23 27,203 44,839 Amounts due to related parties. . . . . . . . . . . . . . . . . . . .24 5,369 13,477 Provisions . . . . . . . . . . . . . . . . . . . . . . . . . . . . . . . . . . . . . .25 – 13,648 Income tax payable . . . . . . . . . . . . . . . . . . . . . . . . . . . . . . .26 7,052 1,964
39,624 73,928
TOTAL LIABILITIES . . . . . . . . . . . . . . . . . . . . . . . . . . . . . .41,242 88,081
TOTAL EqUITY AND LIABILITIES . . . . . . . . . . . . . . 2,731,605 608,009
INCOME STATEMENT
FOR THE YEAR ENDED 31st MARCH 2011 2010 Change In thousands of LKR %
Note
Revenue . . . . . . . . . . . . . . . . . . . . . . . . . . . . . . . . . . . . . . . . .6 317,837 250,40727
other operating income . . . . . . . . . . . . . . . . . . . . . . . . . . .7 33,096 2,453 1,249
Staff costs . . . . . . . . . . . . . . . . . . . . . . . . . . . . . . . . . . . . . . .8.1 (58,191) (56,790) 2
employee termination cost . . . . . . . . . . . . . . . . . . . . . . . .8.2 (36,332) – 100
Depreciation . . . . . . . . . . . . . . . . . . . . . . . . . . . . . . . . . . . . . (8,705) (7,289) 19
Impairment of property, plant and equipment . . . . . . . .14.1.1 (107,524) – 100
other operating expenses - direct . . . . . . . . . . . . . . . . . . .9 (60,617) (68,757) (12)
other operating expenses - indirect...............10 (110,224) (101,218) 9
Profit/(Loss) from operations . . . . . . . . . . . . . . . . . . . . . .11 (30,660) 18,806 (263)
Interest income . . . . . . . . . . . . . . . . . . . . . . . . . . . . . . . . . . . 29,735 2,765 975
Profit/(Loss) before taxation . . . . . . . . . . . . . . . . . . . . . . . (925) 21,571 (104)
Income tax expense . . . . . . . . . . . . . . . . . . . . . . . . . . . . . . .12 (846) (3,909) (78)
Profit/(Loss) for the year . . . . . . . . . . . . . . . . . . . . . . . . . . . . (1,771) 17,662 (110)
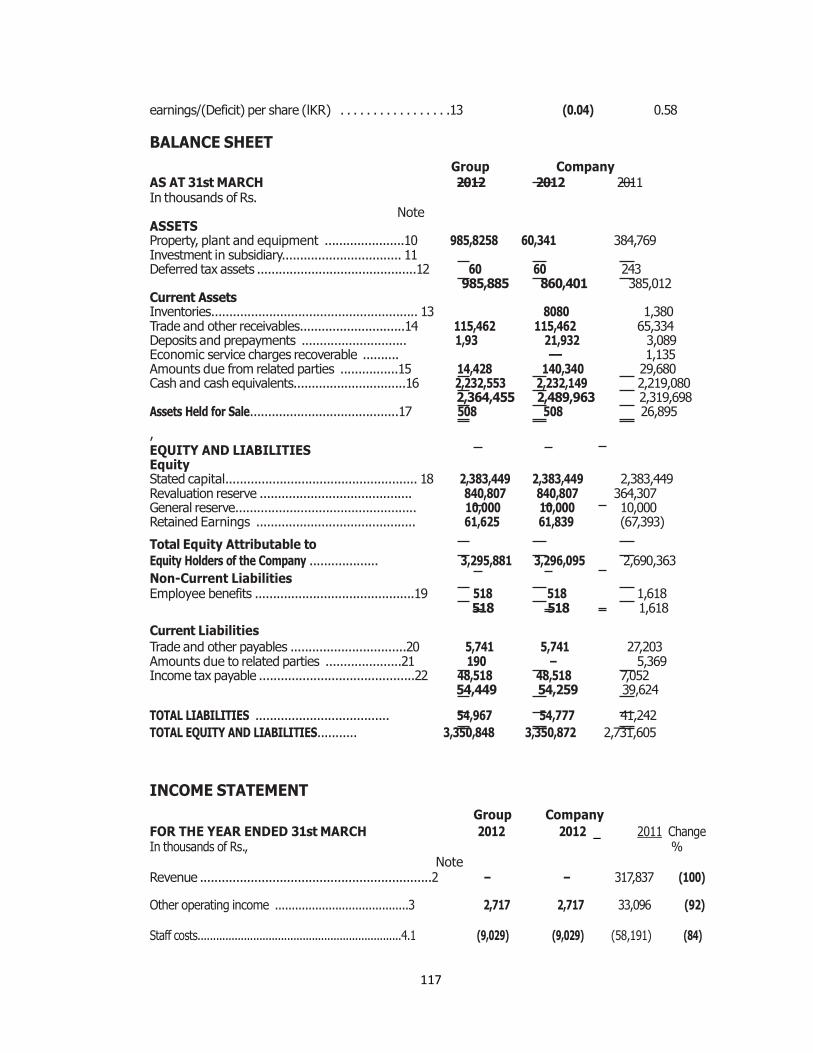
117
earnings/(Deficit) per share (lKR) . . . . . . . . . . . . . . . . .13 (0.04) 0.58
BALANCE SHEET
Group Company AS AT 31st MARCH 2012 2012 2011 In thousands of Rs.
Note ASSETS Property, plant and equipment ......................10 985,8258 60,341 384,769 Investment in subsidiary................................. 11 Deferred tax assets ............................................12 60 60 243 985,885 860,401 385,012 Current Assets Inventories......................................................... 13 8080 1,380 Trade and other receivables.............................14 115,462 115,462 65,334 Deposits and prepayments ............................. 1,93 21,932 3,089 Economic service charges recoverable .......... –– 1,135 Amounts due from related parties ................15 14,428 140,340 29,680 Cash and cash equivalents...............................16 2,232,553 2,232,149 2,219,080 2,364,455 2,489,963 2,319,698 Assets Held for Sale.........................................17 508 508 26,895
, EQUITY AND LIABILITIES Equity Stated capital..................................................... 18 2,383,449 2,383,449 2,383,449 Revaluation reserve .......................................... 840,807 840,807 364,307 General reserve.................................................. 10,000 10,000 10,000 Retained Earnings ............................................ 61,625 61,839 (67,393)
Total Equity Attributable to Equity Holders of the Company ................... 3,295,881 3,296,095 2,690,363
Non-Current Liabilities Employee benefits ............................................19 518 518 1,618
518 518 1,618
Current Liabilities Trade and other payables ................................20 5,741 5,741 27,203 Amounts due to related parties .....................21 190 – 5,369 Income tax payable ...........................................22 48,518 48,518 7,052 54,449 54,259 39,624
TOTAL LIABILITIES ..................................... 54,967 54,777 41,242 TOTAL EQUITY AND LIABILITIES........... 3,350,848 3,350,872 2,731,605
INCOME STATEMENT
Group Company FOR THE YEAR ENDED 31st MARCH 2012 2012 2011 Change In thousands of Rs., %
Note Revenue ................................................................2 – – 317,837 (100)
Other operating income ........................................3 2,717 2,717 33,096 (92)
Staff costs..................................................................4.1 (9,029) (9,029) (58,191) (84)
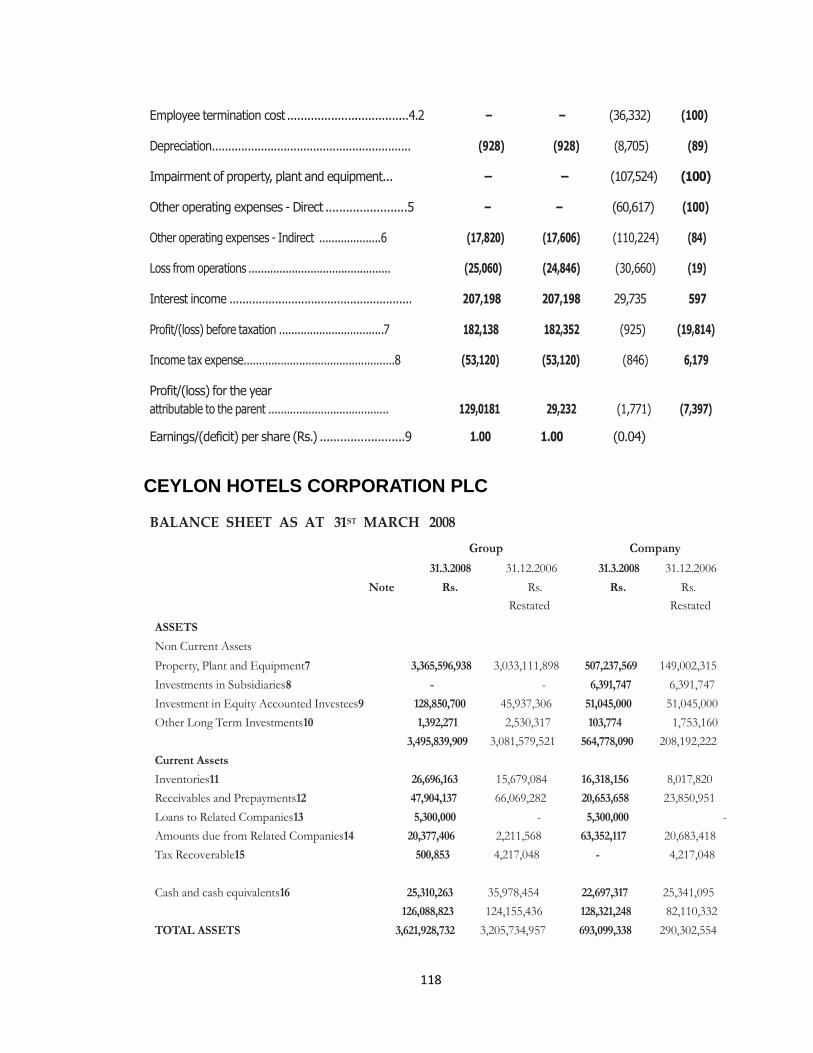
118
Employee termination cost ....................................4.2 – – (36,332) (100)
Depreciation............................................................. (928) (928) (8,705) (89)
Impairment of property, plant and equipment... – – (107,524) (100)
Other operating expenses - Direct ........................5 – – (60,617) (100)
Other operating expenses - Indirect ....................6 (17,820) (17,606) (110,224) (84)
Loss from operations .............................................. (25,060) (24,846) (30,660) (19)
Interest income ........................................................ 207,198 207,198 29,735 597
Profit/(loss) before taxation ..................................7 182,138 182,352 (925) (19,814)
Income tax expense.................................................8 (53,120) (53,120) (846) 6,179
Profit/(loss) for the year
attributable to the parent ....................................... 129,0181 29,232 (1,771) (7,397)
Earnings/(deficit) per share (Rs.) .........................9 1.00 1.00 (0.04)
CEYLON HOTELS CORPORATION PLC
BALANCE SHEET AS AT 31ST MARCH 2008
Group Company
31.3.2008 31.12.2006 31.3.2008 31.12.2006
Note Rs. Rs. Rs. Rs.
Restated Restated
ASSETS
Non Current Assets
Property, Plant and Equipment7 3,365,596,938 3,033,111,898 507,237,569 149,002,315
Investments in Subsidiaries8 - - 6,391,747 6,391,747
Investment in Equity Accounted Investees9 128,850,700 45,937,306 51,045,000 51,045,000
Other Long Term Investments10 1,392,271 2,530,317 103,774 1,753,160
3,495,839,909 3,081,579,521 564,778,090 208,192,222
Current Assets
Inventories11 26,696,163 15,679,084 16,318,156 8,017,820
Receivables and Prepayments12 47,904,137 66,069,282 20,653,658 23,850,951
Loans to Related Companies13 5,300,000 - 5,300,000 -
Amounts due from Related Companies14 20,377,406 2,211,568 63,352,117 20,683,418
Tax Recoverable15 500,853 4,217,048 - 4,217,048
Cash and cash equivalents16 25,310,263 35,978,454 22,697,317 25,341,095
126,088,823 124,155,436 128,321,248 82,110,332
TOTAL ASSETS 3,621,928,732 3,205,734,957 693,099,338 290,302,554
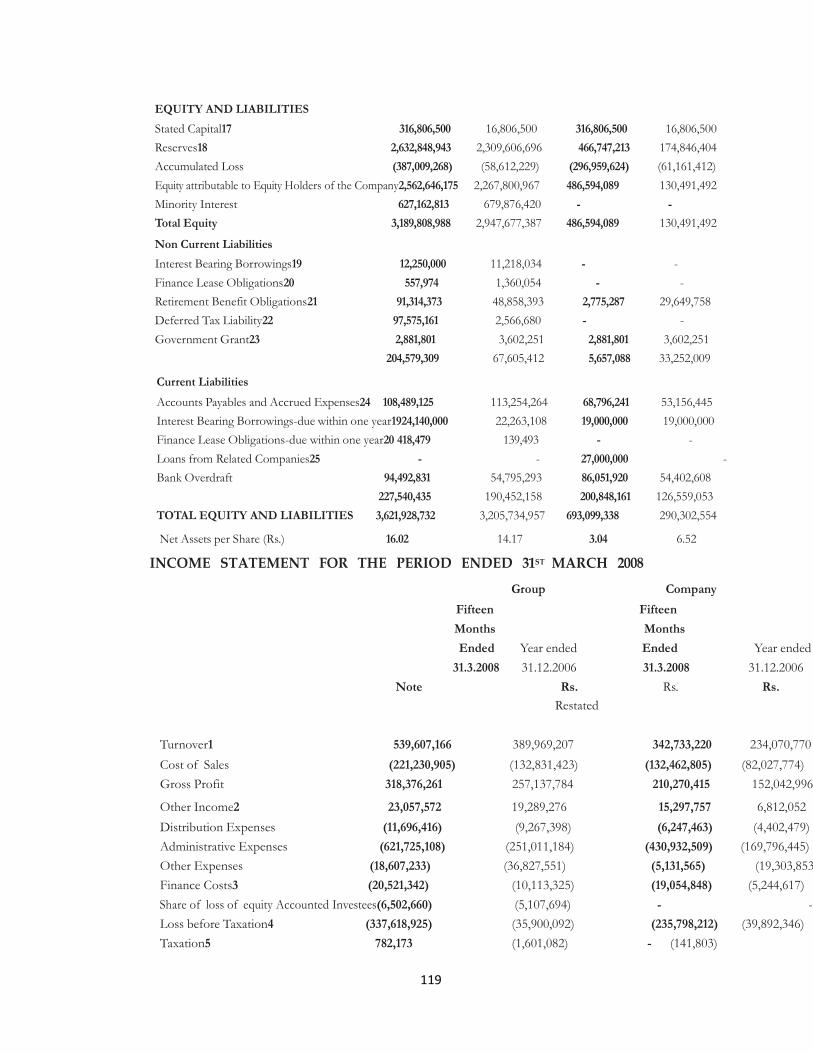
119
EQUITY AND LIABILITIES
Stated Capital17 316,806,500 16,806,500 316,806,500 16,806,500
Reserves18 2,632,848,943 2,309,606,696 466,747,213 174,846,404
Accumulated Loss (387,009,268) (58,612,229) (296,959,624) (61,161,412)
Equity attributable to Equity Holders of the Company2,562,646,175 2,267,800,967 486,594,089 130,491,492
Minority Interest 627,162,813 679,876,420 - -
Total Equity 3,189,808,988 2,947,677,387 486,594,089 130,491,492
Non Current Liabilities
Interest Bearing Borrowings19 12,250,000 11,218,034 - -
Finance Lease Obligations20 557,974 1,360,054 - -
Retirement Benefit Obligations21 91,314,373 48,858,393 2,775,287 29,649,758
Deferred Tax Liability22 97,575,161 2,566,680 - -
Government Grant23 2,881,801 3,602,251 2,881,801 3,602,251
204,579,309 67,605,412 5,657,088 33,252,009
Current Liabilities
Accounts Payables and Accrued Expenses24 108,489,125 113,254,264 68,796,241 53,156,445
Interest Bearing Borrowings-due within one year1924,140,000 22,263,108 19,000,000 19,000,000
Finance Lease Obligations-due within one year20 418,479 139,493 - -
Loans from Related Companies25 - - 27,000,000 -
Bank Overdraft 94,492,831 54,795,293 86,051,920 54,402,608
227,540,435 190,452,158 200,848,161 126,559,053
TOTAL EQUITY AND LIABILITIES 3,621,928,732 3,205,734,957 693,099,338 290,302,554
Net Assets per Share (Rs.) 16.02 14.17 3.04 6.52
INCOME STATEMENT FOR THE PERIOD ENDED 31ST MARCH 2008
Group Company
Fifteen Fifteen
Months Months
Ended Year ended Ended Year ended
31.3.2008 31.12.2006 31.3.2008 31.12.2006
Note Rs. Rs. Rs. Rs.
Restated Restated
Turnover1 539,607,166 389,969,207 342,733,220 234,070,770
Cost of Sales (221,230,905) (132,831,423) (132,462,805) (82,027,774)
Gross Profit 318,376,261 257,137,784 210,270,415 152,042,996
Other Income2 23,057,572 19,289,276 15,297,757 6,812,052
Distribution Expenses (11,696,416) (9,267,398) (6,247,463) (4,402,479)
Administrative Expenses (621,725,108) (251,011,184) (430,932,509) (169,796,445)
Other Expenses (18,607,233) (36,827,551) (5,131,565) (19,303,853)
Finance Costs3 (20,521,342) (10,113,325) (19,054,848) (5,244,617)
Share of loss of equity Accounted Investees(6,502,660) (5,107,694) - -
Loss before Taxation4 (337,618,925) (35,900,092) (235,798,212) (39,892,346)
Taxation5 782,173 (1,601,082) - (141,803)

120
Loss for the period (336,836,752) (37,501,174) (235,798,212) (40,034,149)
Attributable to:
Equity holders of the Company (318,617,604) (39,483,882) (235,798,212) (40,034,149)
Minority Interest (18,219,147) 1,982,709 - -
(336,836,752) (37,501,173) (235,798,212) (40,034,149)
Loss per Share6 (3.03) (0.39) (2.24) (0.40)
BALANCE SHEET
GroupCompany
As at 31 March 2010 2010 Rs. Rs. Restated Restated ASSETS
Non Current Assets
Property, plant and equipment8 5,542,921,022 5,625,960,184 1,009,501,893 1,042,538,123
Intangible assets9 518,383,484 518,383,484 518,383,484 518,383,484
Lease hold right over land10 22,994,403 25,548,088 22,994,403 25,548,088
Investments in subsidiaries11- - 6,391,757 6,391,757
Other long term investments12 2,157 2,575,497 - -
Total Non Current Assets 6,084,301,066 6,172,467,253 1,557,271,537 1,592,861,452
Current Assets
Inventories13 33,493,804 36,933,409 20,428,690 27,187,432
Trade & other receivables14 94,022,167 67,863,306 53,132,639 38,329,777
Amounts due from related15 54,000 3,980,965 74,699,889 96,081,344
Income tax recoverable16 7,183,780 4,336,884 4,217,048 4,206,446
Cash & cash equivalents17 23,848,915 17,108,750 16,022,417 13,332,635
Assets classified as held for sale 246,610,560 246,610,560 246,610,560 246,610,560
Total current assets 405,213,226 376,833,874 415,111,243 425,748,194
Total Assets 6,489,514,292 6,549,301,1271,972,382,780 2,018,609,646
EQUITY AND LIABILITIES
Equity
Stated capital19 1,220,425,748 1,220,425,748 1,220,425,748 1,220,425,748
Reserves20 3,984,972,238 4,002,995,172 691,214,061 693,322,136
Accumulated losses21 (468,655,984) (446,187,740) (436,168,294) (399,084,797)
Total equity attributable to equity holders of the company4,736,742,002 4,777,233,180 1,475,471,515 1,514,663,087
Minority interest 989,354,963 988,517,922 - -
Total Equity 5,726,096,966 5,765,751,102 1,475,471,515 1,514,663,087
Non Current Liabilities
Interest - bearing borrowings22114,355,832 104,812,500 108,105,832 95,562,500
Finance lease obligations23 2,073,986 648,055 148,967 508,557
Employee benefits24 7,224,341 7,514,457 6,176,108 5,231,419
Non - interest bearing 25 1,522,200 1,522,200 1,522,200 1,522,200
Deferred tax liabilities26 302,851,732 310,732,501 91,228,223 95,794,884

121
Deferred income27 1,440,901 2,161,351 1,440,901 2,161,351
429,468,992 427,391,064 208,622,231 200,780,911
122
BIBLIOGRAPHY
http://cse.lk/financial_reports.do?sector=21
http://cse.lk/financials.do?id=564&symbol=HDEV.N0000
http://cse.lk/financials.do?id=116&symbol=GHLL.N0000
http://cse.lk/financials.do?id=128&symbol=BBH.N0000
http://cse.lk/financials.do?id=383&symbol=CHOT.N0000
http://cse.lk/financials.do?id=107&symbol=MARA.N0000
http://cse.lk/financials.do?id=504&symbol=PEG.N0000
http://cse.lk/financials.do?id=478&symbol=RENU.N0000
http://ceylonhotelscorporation.com/component/k2/item/79-dambulla.html
http://www.news360.lk/tourism/%E2%80%9Cceylon-hotels-corporation-ready-to-
attract-foreign-tourists%E2%80%9D-says-chairman-2
http://www.lakpura.co.uk/hotels/colombo/galadari-hotel-colombo-sri-lanka-
231.html
http://www.moneycontrol.com/stocks/company_info/print_main.php
http://www.moneycontrol.com/stocks/company_info/print_main.php
http://www.moneycontrol.com/financials/indiatourismdevelopmentcorporationltd/b
alance-sheet/ITD02#ITD02
http://www.moneycontrol.com/stocks/company_info/print_main.php
http://www.moneycontrol.com/financials/mahindraholidaysresortsindia/balance-
sheet/MHR#MHR
http://www.coxandkings.com/live/products/mice/index.php?officeId=&clientId=499
&
http://www.indiainfoline.com/Markets/Company/Background/Company-
Profile/Cox-and-Kings-Ltd/533144
http://www.clubmahindra.com/
123
http://driptoonsustainabletourism.wordpress.com/category/tourism-policy/
http://tourism.gov.in/
http://www.ittiho.com/more_article.php?id=52
http://tourism.indiabizclub.com/info/tourism/national_tourism_policy
http://www.ibef.org/download/IndiaNewOpportunity.pdf
http://www.sltda.gov.lk/Tourism_Investment
http://www.asiantribune.com/news/2012/06/10/tourism-investment-opportunities-
sri-lanka