Cotton Fiber Testing by Shippers and Spinners in Tennessee ...
46
University of Tennessee, Knoxville University of Tennessee, Knoxville TRACE: Tennessee Research and Creative TRACE: Tennessee Research and Creative Exchange Exchange Bulletins AgResearch 10-1960 Cotton Fiber Testing by Shippers and Spinners in Tennessee and Cotton Fiber Testing by Shippers and Spinners in Tennessee and the United States the United States University of Tennessee Agricultural Experiment Station B. D. Raskopf J. R. Fontana C. S. Murphey Follow this and additional works at: https://trace.tennessee.edu/utk_agbulletin Part of the Agriculture Commons Recommended Citation Recommended Citation University of Tennessee Agricultural Experiment Station; Raskopf, B. D.; Fontana, J. R.; and Murphey, C. S., "Cotton Fiber Testing by Shippers and Spinners in Tennessee and the United States" (1960). Bulletins. https://trace.tennessee.edu/utk_agbulletin/480 The publications in this collection represent the historical publishing record of the UT Agricultural Experiment Station and do not necessarily reflect current scientific knowledge or recommendations. Current information about UT Ag Research can be found at the UT Ag Research website. This Bulletin is brought to you for free and open access by the AgResearch at TRACE: Tennessee Research and Creative Exchange. It has been accepted for inclusion in Bulletins by an authorized administrator of TRACE: Tennessee Research and Creative Exchange. For more information, please contact [email protected].
-
Upload
khangminh22 -
Category
Documents
-
view
3 -
download
0
Transcript of Cotton Fiber Testing by Shippers and Spinners in Tennessee ...

University of Tennessee, Knoxville University of Tennessee, Knoxville
TRACE: Tennessee Research and Creative TRACE: Tennessee Research and Creative
Exchange Exchange
Bulletins AgResearch
10-1960
Cotton Fiber Testing by Shippers and Spinners in Tennessee and Cotton Fiber Testing by Shippers and Spinners in Tennessee and
the United States the United States
University of Tennessee Agricultural Experiment Station
B. D. Raskopf
J. R. Fontana
C. S. Murphey
Follow this and additional works at: https://trace.tennessee.edu/utk_agbulletin
Part of the Agriculture Commons
Recommended Citation Recommended Citation University of Tennessee Agricultural Experiment Station; Raskopf, B. D.; Fontana, J. R.; and Murphey, C. S., "Cotton Fiber Testing by Shippers and Spinners in Tennessee and the United States" (1960). Bulletins. https://trace.tennessee.edu/utk_agbulletin/480
The publications in this collection represent the historical publishing record of the UT Agricultural Experiment Station and do not necessarily reflect current scientific knowledge or recommendations. Current information about UT Ag Research can be found at the UT Ag Research website. This Bulletin is brought to you for free and open access by the AgResearch at TRACE: Tennessee Research and Creative Exchange. It has been accepted for inclusion in Bulletins by an authorized administrator of TRACE: Tennessee Research and Creative Exchange. For more information, please contact [email protected].

Bulletin 320 October, 1960
Colton Fiber TestingBy Shippers and Spinners
.In
TENNESSEE AND THE UNITED STATES
•B. D. RaskopfJ. R. FontanaC. S. Murphey
_c. tJD11AR'
ft9l ~ 'n\••.. fIII •••••
•
THE UNIVERSITY OF TENNESSEEAGRICUL TURAL EXPERIMENT STATIONJOHN A. EWING, DIRECTORKNOXVILLE

Summary
• This bulletin reports the results of a study of the nature andextent of use of cotton fiber testing facilities and practices of46 shippers and 18 spinners in Tennessee and 120 shippers and485 cotton spinners in other states.
• In Tennessee all of the 46 shippers and 11 of the 18 spinnersused tests for fineness; 36 shippers and 7 spinners used tests forstrength; 7 shippers and 6 spinners used tests for length andlength uniformity; and from 1 to 3 shippers and spinners usedtests for fiber maturity, nonlint content, color, nep count, fluores-cence, and elongation.
• The cotton spinning mills in Tennessee processed 213,571bales of cotton during the 1957-58 season. Of this cotton, 76 per-cent was tested for fineness, 52 percent for nep count, 51 percentfor strength, 31 percent for length uniformity, 11 percent eachfor nonlint content and color, and less than 1 percent for fibermaturity or other fiber properties.
• Volume of cotton tested for various fiber properties byshippers and spinners, either before or after purchase, does notindicate the real importance of the use of the tests. Many ship-pers and spinners used samples representative of lots of cotton,tested fixed proportions of all purchases, tested at randomthroughout the season, or tested every bale for some propertiesand a random sample for other properties.
• The primary reasons why cotton spinners have increasedtheir use of cotton fiber testing are: 1) To obtain better measuresof raw cotton quality, 2) to avoid getting "culls" or cotton not de-sirable for making particular end products, and 3) to aid in thecontrol of blending and mixing, nep count, ends down in spinning,carding speed, picker and card waste, yarn appearance andstrength, and finishing and dyeing. The demand by domestic andforeign mill customers was the major reason why shippers usedfiber tests in their merchandising operations .
• Of the 2.7 million bales of upland cotton bought by the 46Memphis shippers in the open market, about 4.7 percent was dis-counted for being too fine, 0.1 percent for being too coarse, andpremiums were paid on 0.3 percent for being of certain finenessspecifications. Cotton falling within the fineness values of 4.9 to4.0 was not discounted, and within this range two shippers paid

4 BULLETIN No. 320
premiums averaging 17 points on 7,290 bales. A pattern of in~creasing discounts was reported for fineness values of cotton be-tween 3.9 and 2.5, average discounts ranging from 18 points forcotton of 3.9 to 3.7 fineness to 390 points for cotton of finenessvalues of 2.5 and less. Five shippers discounted 2,130 bales atan average rate of 50 points "oft''' for being overly coarse or withfineness values of 5.0 or above .
• No discounts or premiums were reported on cotton purchasesof average strength test (76,000 to 85,000 pounds per squareinch). Seven shippers reported premiums paid on some cotton ofstrength above 86,000 pounds per square inch in terms of 10points for each 1,000-pound increase in strength; and cotton fall-ing below 76,000 pounds test was discounted about 20 points foreach 1,000-pound decrease in strength test .
• This report includes a table showing the estimated averagecost of cotton fiber testing for 10 different tests involving 18 dif-ferent instruments or methods. The more important factors asso-ciated with differences in the cost of fiber testing per sample were:kind of test, cost of instrument or method, labor cost per hour,tests performed per hour, weeks of operation, number of deter-minations made per sample, degree of specialization, and controlof atmospheric conditions in testing. The cotton fiber tests nowhaving the lowest average cost per test, in order, are: fineness,length and length uniformity, color, moisture content, nep count,nonlint content, strength, maturity, and sugar and acid-alkalinevalues.
AcknowledgmentThe authors of this bulletin hereby acknowledge the co-
operation of the cotton shippers, spinners, and managers offiber testing firms who furnished basic data for the study.Appreciation is expressed to Mr. A. H. Bower, Executive VicePresident and Secretary of the Memphis Cotton Exchange,for assistance in securing the cooperation of cotton shippers;and to members of the Technical Committee of the SM-18Regional Cotton Marketing Project and several staff membersof the Tennessee Agricultural Experiment Station for sug-gestions in preparing this report.

ContentsSUMMARY
INTRODUCTIONMethod and Scope of Study
COTTON FIBER TESTING FACILITIES AND PRACTICESInstruments Used in TestingLength of Usage of TestsReasons for Using TestsMethod of SamplingNumber of Determinations Made Per Test SampleChecking Cotton Fiber Testing InstrumentsLocation of Fiber Testing Instruments
USE OF FIBER TESTS IN BUYING COTTONProportion of All Cotton Tested Before PurchaseUse of Tests as Buying GuidesShipper Premiums and DiscountsSpinner Discounts and Disputes of Cotton Purchases
USE OF FIBER TESTS IN SELLING COTTONProportion of All Cotton Sold on TestsOpen-Market CottonCCC CottonFineness Specifications in Sales
SPINNER USE OF FIBER TESTS IN CONTROLLINGPROCESSING OPERATIONS
Blending and MixingNep CountEnds DownCarding SpeedPicker and Card WasteYarn AppearanceYam Skein StrengthFinishing and Dyeing
COST OF COTTON FIBER TESTINGFactors Related to Costs of TestingFinenessStrengthLength and Length UniformityMaturityNonlint ContentNep ContentColorMoisture ContentSugar Content and Acid-Alkaline ValuesFluorescenceEffects of Atmospheric Conditions on TestingEffects of Changes in Volume and Labor on CostsCommercial Fee Laboratories
DISCUSSION
APPENDIX
Page3
66
99
.. 10121414151515151617202121212222
2323
.2525
.2525
.26.......26
2626262829
.... 30303132
.3232
.333434
.. 35.35
.37
39

Cotton Fiber TestingBy Shippers and Spinners
In Tennessee and the United StatesB. D. Raskopf
Associate Agricultural Economist
J. R. Fontana and C. S. MurpheyAssistants in Agricultural Economics
IntroductionIn recent years an increasing number of cotton merchants and
spinners in Tennessee and other states have bought instrumentsor used laboratory methods for appraising such qualities of rawcotton as fineness, strength, length, maturity, nonlint content,color, neps, elongation, fluorescence, and moisture. A study wasneeded to determine: 1) The nature and extent of use of cottonfiber testing facilities and practices, 2) the use of fiber tests inbuying, selling, and spinning cotton, 3) the costs of fiber testing,and 4) the desirability of furnishing growers with additional in-formation on the quality of cotton produced.
The results of this study should prove useful in estimating theeffects of cotton fiber tests by showing what fiber properties areconsidered most important by both domestic and foreign mills.Cotton shippers and spinners in Tennessee may observe how theiruse of fiber tests compares with that of firms in other sectionsof the nation. The data presented in this bulletin should alsoprove useful in pointing out the possibility of reducing the costof fiber testing.
An increasing reliance upon cotton fiber tests as a supplementto grade and staple length classification could alter the methodsof production and merchandising of cotton, and in so doing, affectthe position of cotton in the highly competitive fiber market.
METHOD AND SCOPE OF STUDY'Data relating to cotton shippers, used in this study, were for
the 1956-57 season. Schedules of information relating to cotton
1ThE:"research l"eported in this bulletin is part of the Tennessee contribution to RegionalProj('ct SM.-IS, "The Evaluation of the Use of Fiber Tests in the Marketing of Cotton andthe Relation of Fiber Properties to P~nd Product Performance." Cooperating agencies inthe project include the Agricultural Experiment Stations of Alabama, Arizona. Arkansas.{;eorgill, Louisiana. Migsissippi, Missouri, New Mexico, North Carolina. Oklahoma. SouthCarolina. Tennessee. Texas, and the Agricultural Marketing Service of the USDA.Two regional bulletins have been published dealing' with the use of cotton fiber testing bycotton shipper~ and spinners in the United States:Usc of Cotton Fiber Te.'Jts by UnHed States Cotton Shippers, Southern Cooperative SeriesBulletin No. 62, June, 1959.lh.;e of Cotton Fiber Tests by United States Cotton Mills. Southern Cooperative Series Bul-letin No. 70, December, 1959.

8 BULLETIN No. 320
fiber testing were obtained by members of the Regional CottonMarketing Technical Committee in personal interviews with of-ficials of 166 cotton shippers of which 46 were in Memphis, Ten-nessee. The Tennessee shippers handled 5.1 million bales duringthe season, or about one-third of the upland cotton handled by allshippers (Table 1). In this study a cotton shipper was defined asa cotton merchandising firm which bought odd lots of cotton andsorted, concentrated, and sold it in even-running lots, chiefly toforeign and domestic mills. at "landed" prices.
UnitedStates
Table I. Number of Cotton Shippers and Spinners in Tennessee and the United States,Number Included in the Study. and Volume of Upland Cotton Handled by
Shippers, 1956-57 Season, and Spinners, 1957-53 Season.
Item Tennessee
Cotton Shippers: Total numberCotton handled, 1956-57 season (bales)
Cotton Spinners: Total numberIncluded in study-(no.)
(1957-58) ('10)Cotton consumed, total" (bales)By plants in study (bales)
(1957-58) ('10)
465, I 06,605
18
18
100
170,377
213,571"
100
Otherstates
120
10,697,395
588
485
82
7,802,333
7,123,932
91.3
166
15,804,000
606
503
83
7,972,710
7,337,503
92.0
a Consumption, including- foreign cotton, year ending July :H, ID5K, reported by U. S. BUl'f'au
of the Census.
b Tenne:;see cotton spinning mills in the 1957-5R season com-mmed 4:i,194 more bales of cottonthan was reported by the Bureau of the Census, largely because of the inclll,;ion of cottondesignated as mill waste, fire~damaged. and below grad(l.
Data relating to cotton spinners, used in this study, were forthe 1957-58 season and obtained by personal interview with of-ficials of firms representing 503 cotton spinning mills, which wasabout 83 percent of the 606 cotton spinning mills in operationduring that season. All cotton spinning mills in Tennessee wereincluded in this study, but they represented less than 4 percent ofthose included in the sample and only 3 percent of the cotton con-sumed (Table 1).
Data on fiber testing obtained from each shipper included allupland cotton purchased directly from all sources, including bothopen-market and Commodity Credit Corporation Cotton (CCC).Information obtained from cotton spinners applied to both directpurchases and purchases from shippers.
Of the 15.8 million bales of upland cotton handled by the 166shippers in the 1956-57 season, about 41 percent were CCC pur-

COTTON FIBER TESTING BY SHIPPERS AND SPINNERS 9
chases. Of the 7.:3million bales of upland cotton consumed by the503 cotton spinning mills, 63 percent was bought from shippers,and 37 percent direct by mill firms.
Cotton Fiber Testing Facilities and PracticesINSTRUMENTS USED IN TESTING
Shippers and spinners in this study reported different degreesof ownership and use of 18 kinds of instruments or methods formaking 10 different tests on raw cotton (Table 2). In Tennesseeall of the 46 Memphis shippers interviewed used tests for fine-ness, 36 for strength, 7 for length and length uniformity, 3 forfiber maturity, 3 for nonlint content, 2 for color, 2 for nep count,and 1 for elongation. Of the 18 cotton mills in the state, 11 usedtests for fineness, 7 for strength, 6 for length uniformity, 3 forfluorescence, 2 for maturity, 2 for color, and 2 for nonlint con-tent. Raw cotton fiber tests for sugar or wax content and acid-alkaline values were made by a few of the cotton spinners in theUnited States, but none were reported by Tennessee spinners.
Shippers and spinners were not limited to the use of their owninstruments for obtaining fiber test results. As shown in Table2, many firms had such tests made at commercial laboratories.In many cases the firms that owned instruments had some of theless common tests made at a commercial laboratory. In additionto the use of commercial laboratory tests, several agencies usedthe testing facilities of other shippers or spinners.
Supplementing the methods used for testing raw cotton, manyof the spinners performed tests for physical or chemical propertiesof cotton yarn or finished goods. Some of the more important ofthese included tests for manufacturing waste, nep count in spin-ning tests by card web evaluation, spinning twist, yarn skeinstrength. elongation, abrasion, dimensional change, crease resist-ance or wrinkle recovery, flammability, snag resistance, and colorof finished goods. The extent and use of such tests was not de-termined.
Among cotton shippers and spinners in Tennessee and theUnited States there was a relationship between the size of firmand the use of instruments for testing fiber properties; that is, asthe volume of cotton handled by shippers increased or the size ofthe spinning mill increased in number of spindles, greater use wasmade of cotton fiber testing. This was especially true for tests.other than for fineness and strength.

10 BULLETIN No. 320
Length andlengthuniformity
I Tennessee -~~I-o'h"''''';-1 Uo;,;;rs,.,.,Instrument
Shi ~~~rs~:~-;ersshr;oersl S:~8~;~.~~_hi~ftrs=i~f;-!~~_or method
Percent of agencies owning or usingMicronaires 58.7 50.0 54.2 65.8 55.5 65.3Port-Ars 8.7 11.1 11.7 1.9 11.0 2.2Speedars 0 0 0.8 5.6 0.6 5.4Arealometers 0 0 0 4.1 0 4.0Use of fee lab 78.3 0 29.2 2.5 42.7 2.4Pressleys 8.7 33.3 15.8 41.4 14.0 41.2Stelometers 2.2 0 0.8 6.8 1.2 6.6Clemson Testers 0 0 0 2.9 0 2.8Use of fee lab 78.3 5.6 50.8 58.5Fibrographs 4.3 33.3 7.5 24.7 6.7 25.1Suter-Webb Sorters 2.2 11.1 2.5 8.5 2.4 8.5Uster Sorters 0 0 0 4.5 0 4.2Use of fee lab 8.9 0 0.8 3.0Maturity testsb 6.5 J 1.1 0.8 15.1 2.4 14.9Use of fee lab 6.5 0 0 0.8 1.8 0.8Colorimeter 0 I 1.1 3.3 4.1 2.4 4.4Use of fee lab 4.3 0 0 3.1 1.2 3.0Ultraviolet light 0 16.7 0 14.4 0 14.5Shirley Analyzer 0 11.1 2.5 14.6 1.8 14.5Use of fee lab 6.5 0 0.8 2.4Neptometer 0 0 0 3.7 0 3.8Use of fee lab 4.3 0 1.2Moisture meter 0 0 0 1.2 0 1.2
Table 2. Fiber Testing Instruments Owned and Used by 166 Cotton Shippers,1956-57 Season, and 503 Cotton Spinners, J 957 -58 Season,
Tennessee and United States.
Typeof test
Fineness
LENGTH OF USAGE OF TESTS
Strength
Maturity
Color
FluorescenceNonlint
contentNep count
Moisture
• No data.b Arealometer~ Microscope, Causticaire, or Differential Dye methods.
Facilities for commercial testing raw cotton for various fiberproperties have been available in Memphis since 1947. One com-mercial fiber testing laboratory was established in 1947 and an-other in 1949. Both laboratories were equipped for making cot-ton fiber tests for fineness, strength, length, maturity, foreignmatter or nonlint content, color, and other specialized tests fornep count, moisture, sugar or wax content, damage by oxidation,and acid-alkaline values. Although commercial cotton fiber test-iny facilities have been available to farmers, seed breeders, gin-ners, cotton mill operators, and cotton merchants, the most im-portant users have been the cotton merchants.
In 1947, shippers in Memphis began buying Micronaires for

COTTON FIBER TESTING BY SHIPPERS AND SPINNERS 11
One of the important instruments used commercially in testing cotton fiber for length andlength uniformity is the Digital Fibrograph. (Photo courtesy of Spinlab, Inc.)
use in testing cotton for fineness, and Pressleys in testing forstrength. By 1957 the number of shippers owning Micronaireshad increased to 31; also, 4 shippers reported the ownership ofthe Port-Ar, a portable instrument used in testing for fineness.Five Memphis shippers in 1957 reported owning instruments usedin testing cotton fiber for strength. Three of these had been inuse from 7 to 10 years and 2 had been used from 1 to 3 years.Only 3 of the Memphis shippers owned instruments used in test-ing for length and length uniformity, and these machines hadbeen used 1 to 3 years (Table 3).
For all shippers in the United States in 1947, only five re-ported owning instruments used in testing cotton for fineness orstrength. By 1957 about 67 percent of all shippers in the UnitedStates owned one or more different kinds of instruments used intesting for fineness, and 15 percent owned one or more differentkinds of instruments used in testing for strength.
As indicated in Table 3, seven Tennessee cotton spinners re-

3144I
12 BULLETIN No. 320--------------- ---------------Table 3. Length of Usage of Fiber Testing Instruments Owned
by 46 Cotton Shippers and 18 Spinners, Tennessee, 1957-58.------ Instruments I--Y~~~in se-;'~i~~ ofinst~~.;;;;n-t--Ic---Total
__ T~~,,_o_f_t_e_st ~.••.ned -=I~~ 3 1~~~6-1 i5:'; 15 I O-,,_erI~_Number of shippers reporting, 1957
17 II 3 04 0 0 0103 0I 000
Fineness
Strength
Lengthand lengthuniformity
Fineness
StrengthLength
and lengthuniformity
MaturityColorFluorescenceNonlint
content
Micronaires
Port-ArsPressleysStelometers'
FibrographsSuter-Webb Sorters
Micronaires
Port-ArsPressleys
FibrographsSuter-Webb SortersMaturity testsColorimetersUltraviolet light
Shirley Analyzers
21
oo
oo
oo
reporting,3o2
I
2I
Number of spinners2 3o 0I 2
ooI
o1
I 3o 2o II I2 0
a The Stelometer also is used in testing; for elongation.
o
1958
2oooo
o
2I
926
62223
2
ported in 1958 that they had owned instruments used in makingfiber tests for fineness, strength, and length for over 15 years, orbefore 1944. For all cotton spinners in the United States therehas been a considerable increase in the usage of fiber tests in re-cent years. During the years 1944 to 1958, the proportion ofspinners using fiber tests for fineness increased from 10 to 78 per-cent; for strength, 16 to 50 percent; for length, 12 to 38 percent;for fiber maturity, 6 to 16 percent; for color, 1 to 7 percent; non-lint content, 2 to 14 percent; and for nep count, none to 4 percent."
In 1956, a study was made of 572 foreign agencies in 51 dif-ferent foreign countries of the use of cotton fiber testing instru-ments. Foreign shippers and spinners began using tests forlength uniformity, maturity, and nonlint content before 1946,tests for strength in 1947, tests for fineness and color in 1949, andtests for elongation in 1953.'1
REASONS FOR USING TESTSA small percentage of the shippers began the use of cotton fiber
2 Data for 1944 are based upon the report: Practice.'J of Textile Manufacturers in the Purchaseof Cotton, Processed Report, Cotton Branch, USDA, February, 1952.
.3 Raskopf, B. D. and Fontana, J. R.t Cotton Fiber Testing in Foreign Countries, TennesseeAgricultural Experiment Station Bulletin No. 271, September, 1957.

COTTON FIBER TESTING BY SHIPPERS AND SPINNERS 13
testing because it provided better evaluation of quality or enabledthem to avoid buying bales of cotton which had been culled byother buying agencies. However, most of the shippers in Tennesseeand other states indicated that the demand by domestic and foreignmill customers was the major factor in their decision to use fibertests.
The primary reasons for this mill demand were to obtain bettermeasures of raw cotton quality, to aid in the control of processingoperations, and to avoid getting "culls" or cotton not desirablefor making particular end products in which many mills specialized(Table 4).
Table 4. Reasons for Using Fiber Tests Reported by 166 Cotton Shippers, 1956-57Season, and 503 Cotton Spinners, 1957-58 Season, Tennessee and United States.
----r-T;n-.;0sse;~II-Other-states I United States
IShippers' Spi~~;':~ Shippe~~ Spinn"rs Shippersl SpinnersReasons for using fiber tests : - -46 -1- --1-8- l"2o-I-48Sll66 1-503-
--- - ---~-P~rcent --~f ag~~cies reporti~g"
93 0 75 0 80quality 13 56 12 60 12
9 50 5 28 6o 56 0 62 0o 56 0 62 0o 39 0 17 0o 51. 0 31 0o 56 0 16 0o 56 0 75 0o 50 0 33 0o 56 0 45 0o 50 0 60 0
Demand by mill customersBette r measure of raw cottonNecessary to avoid buying cullsContr)1 of processing operations
Blending and mixingNep countEnds down"Carding speedPicker and card wasteYarn appearanceYarn skein strengthFinishing and dyeing
o6029626218321774344560
a Some shippers and spinners reported more than one reason; therefol'e, the percentage.-:; insome columns total more than IOO percent.
1, Refers to the breakage of the yarn at the spinning frame.
In the control of cotton processing operations the spinners in-dicated many factors of importance, including blending and mixing,nep count, ends down, carding speed, picker and card waste, yarnappearance, yarn strength, and finishing and dyeing.
The difficulty of making an economic evaluation of the use offiber tests in these various areas of processing control becameevident early in this study. This was true for the followingreasons: 1) Important factors of spinning performance are closelyrelated to, or affected by, several different fiber characteristics,(see Appendix I) ; 2) many different types of instruments are usedto test the same fiber property and these instruments vary consider-ably as to cost, speed in operation, purposes, and performance; and

14 BULLETIN No. 320
3) the relative importance of the effects of fiber properties variesin relation to the end product manufactured. It was impossiblefor cotton spinners to indicate what would have been the resultsfinancially if cotton fiber tests were discontinued in their opera-tions. On the other hand, most spinners who were using fibertests could justify their use on the basis of efficiency of control inspecific processing operations or general processing performance.
METHOD OF SAMPLING
Several different sampling methods were employed by shippersand spinners in Tennessee and other states in testing cotton fiberproperties before and after the purchase of cotton. These were:1) Testing every bale of particular lots for one or more fiberproperties; 2) testing every bale of particular lots for someproperties and a sample of the lot for other properties; 3) test-ing a fixed proportion of all purchases for one or more properties;4) testing for one or more properties from bales sampled at randomthroughout the season; 5) testing cotton bought from certain ter-ritories only; and 6) a combination of two or more of the abovemethods. By the method of composite sampling, some shippers andspinners took a small portion of each bale sample to form onelaboratory sample representative of an entire lot. In the prepara-tion of cotton samples for testing, some shippers and many spinnerswere using different types of cotton blenders.
NUMBER OF DETERMINATIONS MADE PER TEST SAMPLE
Of the 46 shippers interviewed in Tennessee, 31 owned in-struments for making fineness tests and all of these made onedetermination per test sample. The other 15 had cotton testedfor fineness by a fee laboratory where two or more determinationswere made per sample. In testing cotton for fineness, 11 of theshippers indicated that the test sample was from one side of thebale, but 35 included cotton from both sides. In testing cotton forfineness, five test operators knew in advance the hand class forgrade and staple length, and seven knew if the sides of the baletested were of different grades or staple length. Of the 36 Ten-nessee shippers who tested cotton for strength, all but one usedmore than one break per test sample; also, all tests included cottonfrom both sides of the bale. The testing of cotton for propertiesother than fineness and strength for shippers was performedmainly by commercial laboratories, and the number of determina-
COTTON FIBER TESTING BY SHIPPERS AND SPINNERS 15
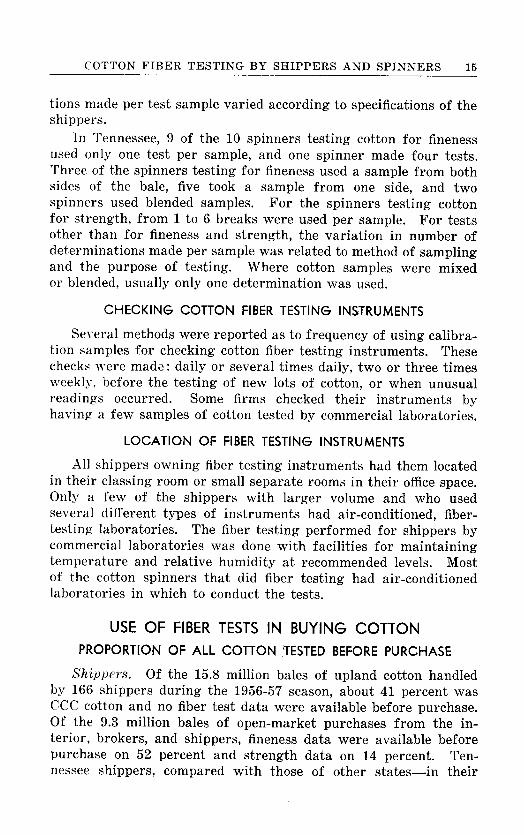
tions made per test sample varied according to specifications of theshippers.
In Tennessee, 9 of the 10 spinners testing cotton for finenessused only one test per sample, and one spinner made four tests.Three of the spinners testing for fineness used a sample from bothsides of the bale, five took a sample from one side, and twospinners used blended samples. For the spinners testing cottonfor strength, from 1 to 6 breaks were used per sample. For testsother than for fineness and strength, the variation in number ofdeterminations made per sample was related to method of samplingand the purpose of testing. Where cotton samples were mixedor blended, usually only one determination was used.
CHECKING COTTON FIBER TESTING INSTRUMENTS
Several methods were reported as to frequency of using calibra-tion samples for checking cotton fiber testing instruments. Thesechecks were mad~: daily or several times daily, two or three timesweekly, before the testing of new lots of cotton, or when unusualreadings occurred. Some firms checked their instruments byhaving a few samples of cotton tested by commercial laboratories.
LOCATION OF FIBER TESTING INSTRUMENTS
All shippers owning fiber testing instruments had them locatedin their classing room or small separate rooms in their office space.Only a few of the shippers with larger volume and who usedseveral different types of instruments had air-conditioned, fiber-testing laboratories. The fiber testing performed for shippers bycommercial laboratories was done with facilities for maintainingtemperature and relative humidity at recommended levels. Mostof the cotton spinners that did fiber testing had air-conditionedlaboratories in which to conduct the tests.
USE OF FIBER TESTS IN BUYING COTTONPROPORTION OF ALL COTTON TESTED BEFORE PURCHASE
Shippers. Of the 15.8 million bales of upland cotton handledby 166 shippers during the 1956-57 season, about 41 percent waseee cotton and no fiber test data were available before purchase.Of the 9.3 million bales of open-market purchases from the in-terior, brokers, and shippers, fineness data were available beforepurchase on 52 percent and strength data on 14 percent. Ten-nessee shippers, compared with those of other states-in their

16 BULLETIN No. 320
open-market purchases in the interior and from brokers-reporteda higher proportion of cotton tested for fineness and strength(Table 5).
Shippers reported the use of only fineness and strength testsin the purchase of cotton. However, 100,000 bales of cotton weretested for other fiber properties after purchase. This enabled theshippers to supply both domestic and foreign mills with cottonof certain fiber specifications other than fineness and strength.
Spinners. Of the 7.3 million bales of upland cotton purchasedby all spinners during the 1957-58 season, 37 percent was boughtdirect and 63 percent from shippers. Of the cotton purchased di-rect, fineness information data were available before purchase on75 percent and strength data on 3 percent. Of the cotton purchasedby spinners from shippers, 86 percent was bought on fineness speci-fications, 10 percent on strength specifications, and slightly over1 percent on the basis of other tests, including length uniformity,maturity, color, nep count, and nonlint content. Tennessee spinners,compared with those in other states, in their direct purchasesreported a higher proportion of the cotton tested for fineness andstrength. In their purchases from shippers, the Tennessee spin-ners reported a somewhat lower proportion based on fineness testsand a higher percentage based on strength tests (Table 5).
Tennessee spinners reported the use of only fineness andstrength tests in buying cotton. After purchase, 52 percent ofthe cotton was tested for nep count, 31 percent for length uniform-ity, 11 percent each for nonlint content and color, and less than1 percent for maturity (not indicated in Table 5).
USE OF TESTS AS BUYING GUIDES
Cotton shippers and spinners in Tennessee and other statesused fineness and strength tests as buying guides in several dif-ferent ways. The method used most commonly in making interiorpurchases was to determine the fineness and strength of randomly-selected cotton in a certain area. Another method was the spotchecking of actual samples from a given lot of cotton. The leastcommon method was to test every bale before buying a lot ofcotton.
Shippers used fiber tests in two ways when buying cottonthrough brokers: 1) With spot checks of actual samples from anentire lot of cotton, and 2) by testing each individual bale in agiven lot of cotton. In the purchase of cotton from other shippers

COTTON FIBER TESTING BY SHIPPERS AND SPINNERS 17
Table 5. Volume of Upland Cotton Purchases with Fiber Test Data Available,166 Cotton Shippers, 1956-57 Season, and 503 Cotton Spinners,
1957-58 Season, Tennessee and United States.----- -.--~-----~-~~ •.._._- .. ~~._--
~_bnessee ..~
Other UnitedItem states States
~-~~".-._ .. _. __ ..~---
N umber of bales of cottonShippers, cotton purchased 5, I06,605 10,697,395 15,804,000
CCC purchases' 2,363,831 4,115,169 6,479,000o pen-market purchases 2,742,774 6,582,226 9,325,000
Interior 1,676,069 5,738,931 7,415,000Tested for: Finenessl
! 1,118,241 3,294,146 4,412,387Strength" 561,842 568,154 1,129,996
Brokers 1,049,734 512,266 1,562,000Tested for: Finenessb 266,275 14,885 281,160
Strength" 120,839 1,161 122,000Shippers 16,971 331,029 348,000
Tested for: Fineness" 5,739 117,861 123,600Strength" 5,674 506 6,180
Spinners, cotton purchased 213,571 7,123,932 7,337,503Direc! purchases 77,313 2,622,887 2,700,200
Tested for: Fineness" 67,720 1,959,297 2,027,017Strength" 64,820 18,360 83,180
From shippers 136,258 4,501,045 4,637,303Based on: Finenessc 95,518 3,897,905 3,993,423
Strength' 44,400 432,100 476,500Other tests" 0 60,099 60,099
:l No tiher te:-.t data available on cotton before purchase."Cotton ie;.',tedbefore buying or test data available.,. Fiber te,"'1~pecifications in contracts.
--._-- ...~--_ ....~._- ---~--_ .._----
the transactions were generally on the basis of guaranteed terms asto fineness or strength.
Cotton spinners in Tennessee and other states used contractspecifications in their purchases from shippers in obtaining cottonof desired finene"s, strength, or other fiber properties. Types ofspecifications most generally used were for fineness range orminimum, and strength minimum. Of the 4.6 million bales ofcotton purchased from shippers by 503 spinners, 57 percent was onfineness range, 32 percent on fineness minimum, and 9 percent onstrength minimum. Only 1.3 percent of the purchases on shippercontracts included requirements for fiber properties other thanfineness and strength.
SHIPPER PREMIUMS AND DISCOUNTSFineness. The 46 shippers in Tennessee in the 1956-57 season
bought slightly over 2.7 million bales of cotton in the open market.

18 BULLETIN No. 320
An unknown portion of this cotton was not grown in the Memphisterritory. Of these purchases an estimated 128,796 bales, or 4.7percent, were discounted for being too fine and 2,130 bales, or 0.1percent, were discounted for being too coarse. Differences existedamong shippers as to what constituted excessively fine or coarsecotton, depending upon the product being manufactured by themill customers of individual shippers. However, there was con-siderable relationship between the Memphis shippers' averagediscount rate and fiber fineness ratings (Table 6). Average dis-counts varied from 18 points for cotton of 3.9 to 3.7 fineness to390 points for cotton of fineness values of 2.5 and less. Betweenthe fineness ratings of 3.8 and 2.5, each 0.1 decrease in finenesswas associated with a discount increase of about 28 points.
Table 6. Discounts and Premiums for Fineness of Upland Cotton Reportedby 46 Shippers in Tennessee, 1956-57 Season.
Finenessvalues in Discountsmicronaire --. Points off--.-I--Bal;~----
units_a~ --,I_R_ang;-!--A -.-- .~._ ..
2.5 and under2.6 to 2.93.0 to 3.33.4 to 3.63.7 to 3.94.0 to 4.95.0 and over
Total or average
350·500150-40050-25035-10015- 25
390198875618
3769,739
60,74426,14131,796
o2,130
130,926
Value$
.. _ ...
7,33096,242
263,17573,48528,602
o5,325
474,159
21014II
446
446
No.Firms
o 5072
a Micrograms per inch of fiber.h Two shippers paid premiums on 7.290 bales of cotton falling within this finent's:'i range.
About 63 percent of the open-market purchases fell within theaverage fineness range 4.9 to 4.0 and was not discounted (Table7). Within this fineness range, two shippers paid premiums on7,290 bales. These premiums ranged from 10 to 50 points "on"and averaged 17 points, or 83 cents per bale. Only 7 percentof the cotton falling within the fineness range of 3.9 to 3.5 wasdiscounted at an average rate of about 26 points "off", or $1.29per bale. Nearly 41 percent of the cotton in the fineness range3.4 to 3.0 was discounted for being too fine, and the discountaveraged 87 points "off," or $4.35 per bale. Cotton falling below3.0 in fineness was discounted at an average rate of 205 points"off," or $10.24 per bale. In the latter group the discounts in-creased to 500 points as the fineness of cotton ranged below 2.5value in micronaire units.

COTTON FIBER TESTING BY SHIPPERS AND SPINNERS 19
Values in Imicronaire Purchases
~----~-Descrip~i~n ~nits B~J _Very fine Below 3.0 57,598Fine 3.0 to 3.4 170,052
3.5 to 3.9 666,494Average 4.0 to 4.4 1,297,332
4.5 to 4.9 430,616Coarse 5.0 to 5.9 120,682Very coarse 6.0 and above 0Total or average 2,742,774
Table 7. Fineness of Open-Market Cotton Purchased by 46 TennesseeShippers and Fineness Discounts Reported, Season 1956-57.
-------- --._-----I
I Discou-;--n_ts_--;--,---% T--_~-BaleslYalue per bale
2.1 10,115 $10.246.2 69,371 4.35
24.3 49,310 1.2947.3 0 015.7 0 04.4 2,130 2.50
000100.0 130,926 3.62
Fineness
The discounting of cotton for being overly coarse was notwidely practiced. While there were 120,682 bales bought withfineness value over 5.0, only five shippers discounted 2,130 balesat an average rate of 50 points "off", or $2.50 per bale.
During the 1956-57 season, about 400,000 bales of cotton boughtby 164 shippers in the United States were discounted for fineness.As indicated in Table 7, the 46 shippers in Tennessee handled130,926 bales of this cotton. Only 3 of the 164 shippers indicatedthat they paid premiums to obtain 36,000 bales of cotton of desiredfineness values. Two of these were located in Tennessee.
Strength. Data were available for only seven shippers in Ten-nessee who considered the fiber quality of strength in the pricingof upland cotton purchases. The volume of cotton bought partlyon strength specifications, that was given premiums or discounts,was not available. No discounts or premiums were reported oncotton purchases of average strength or cotton with strength (0-gauge) of 76,000 to 85,000 pounds per square inch (Table 8).
Strengthdescription
---_ .. _------
Very strongStrongAverageFair
Table 8. Discounts and Premiums for Strength of Upland Cotton Reportedby Seven Shippers in Tennessee, 1956-57 Season.
1.
1
Strel~~~~ ;~.-g:e~9;)-I-- ~ Premiums ···--------~-iscounts --
i square inch Points "on" Points "off"--Abov~--95-~---~--1 00 to 200 0
95 to 86 10 to 100 085 to 76 even even75 to 66 0 20 to 200Below 66 0 220 to 300Weak
The seven shippers reported premiums paid for cotton ofstrength above 86,000 pounds per square inch in terms of about

20 BULLETIN No. 320
10 points for each 1,000-pound increase in strength. Cotton fallingbelow 76,000-pound test was discounted about 20 points for each1,000-pound decrease in strength test.
SPINNER DISCOUNTS AND DISPUTESOFCOTTON PURCHASES
Of the 7.3 million bales of upland cotton bought by 503 spinnersduring the 1957-58 season, only 17,000 bales were reported to bediscounted or disputed for not meeting fineness specifications(Table 9). The low rate of discounts and disputes were attributedto four important reasons: 1) The wide range in products manu-factured by many large firms made it possible for them to use thecotton in their overall operation regardless of variation in fiberproperties; 2) many firms, particularly the small ones, avoidedbuying cotton in areas where certain fiber properties were un-desirable; 3) the large proportion of cotton tested for fineness andstrength made it possible for shippers to sort and concentrate cot-ton into uniform lots which met mill requirements; and 4) incontract specifications for fineness, strength and other fiber proper-ties, most spinners allow small test deviations or tolerances.
UnitedStates
Table 9. Volume of Upland Cotton Purchased, Tested for Specified Fiber Properties,Discounted, and Disputed, 503 Cotton Spinners, 1957-58 Season,
Tennessee and United States.
Item
Total spinner purchasesDirect purchases
Tested before purchase for: FinenessStrength
Discounted for fineness: Too fineToo coarse
Purchases from shippersTest data available for:" Fineness
StrengthOther properties
Disputed purchases on: FinenessStrength
Other properties
a Based on contract specifications.b No data available or none reported.
----
J~T ennesse~_
213,57177,31367,72064,820
oo
136,25895,51844,400
o263oo
Otherstates
Bales of cotton7,123,9322,622,8871,959,297
18,36012,1004,000
4,501,0453,897,905
432, I0060,09916,756
7,337,5032,700,2002,027,017
83,18012,1004,000
4,637,3033,993,423
476,50060,09917,019

COTTON FIBER TESTING BY SHIPPERS AND SPINNERS 21
Use of Fiber Tests in Selling CottonPROPORTION OF ALL COTTON SOLD ON TESTS
Of the 15.8 million bales of upland cotton handled by the166 shippers during the 1956-57 season, about 64 percent was soldon the basis of fineness specifications, 12 percent on strength speci-fications, and less than 1 percent on the basis of all other tests-length uniformity, maturity, color, nep count, and nonlint content.Considerable variation existed in the proportion of cotton sold ona test basis according to whether the cotton was purchased in theopen market or from the Commodity Credit Corporation, and asto whether the sales were to domestic or foreign firms (Table 10).
OPEN-MARKET COTTON
Of the 9.3 million bales of cotton purchased in the open market,test data were available on about 52 percent for fineness, 14 per-cent for strength, and 0.6 percent for other tests. Of this open-market cotton, 58 percent was sold on fineness, 11 percent onstrength, and 0.6 percent on other tests. The Tennessee shippers,compared with those in other states, reported a much higher pro-
Table 10. Volume of Upland Cotton Sold That Was Partly Based on Fiber TestSpecifications, 166 Cotton Shippers, 1956-57 Season,
Tennessee and United States.
Type of sale andtest specification
T:~::e . ··--I----~::::---\-- ·-~-~~tt-eed-s-
------- .. '--------Number of bales of cotton
6,582,2264,345,2722,091,277
143,39428,850
2,236,9541,/35,615
271,0369,550
4,115,1691,240,368
778,73371,6006,265
2,874,80/2,145,958
134,40018,103
2,742,7741,852,7281,490,244
402,4009,500
890,046650,385
246,964,10,500
2,363,8311,0/ 1,632
858,367305,743
8,1851,352,199
926,942261,352
9,047
9,325,0006,198,0003,581,521
545,79438,350'
3,127,0001,786,000
518,00020,050
6,479,0002,252,0001,637,100
377,34314,450
4,227,0003,072,900
395,75227,150'
Open-Market GattonDomestic sales
FinenessStrengthOther tests"
Export salesFinenessStrengthOther tests"
GGG GattonDomestic sales
FinenessStrengthOther tests"
Export salesFinenessStrengthOther tests"
-~-_._------------------------.Il. Length uniformity, maturity, color, nep count, and nonlint content.

22 BULLETIN No. 320
portion of both domestic and export sales based on fineness andstrength tests.
CCC COTTON
Of the 6.5 million bales of cotton purchased from the eee,none were tested for fineness, strength, or other fiber propertiesbefore purchase. After buying, 73 per cent of the eee cotton wastested for fineness, 3 percent for strength, and 0.6 percent forother fiber properties. This testing was performed primarily asan aid in sorting and concentrating cotton into uniform lots forresale. Of the eee cotton, 73 percent was sold on fineness, 12percent on strength, and 0.6 percent on other tests. The Tennesseeshippers, compared with those of other states, reported a higherproportion of domestic sales based on fineness, and a higher propor-tion of both domestic and export sales based on strength.
Although only 206,000 bales of the eee cotton were testedfor strength, 773,095 bales were sold on strength specifications(Table 10). In the sorting and grouping of cotton into uniformlots to be sold on the basis of strength test specifications, it wasgenerally considered that a 25 percent sample of bales from thesame locations would be representative.
Cotton sold on the basis of fiber tests, other than for finenessand strength, generally was reported by the larger shippers. Ofthe eee cotton sold on specifications of length uniformity, ma-turity, color, nep count, and nonlint content, 14,450 bales weredomestic sales and 27,150 bales were exported.
FINENESS SPECIFICATIONS IN SALES
Among the 166 shippers a wide variation existed as to finenessspecifications on sales. To show this variation a tabulation wasmade of the volume of cotton sold on fineness minimum or rangespecifications on domestic and export sales of cotton handled by46 shippers in Memphis during the 1956-57 season. Of the 5,106,605bales of cotton, 23 percent was sold without regard to finenessspecifications. Of the 3,925,938 bales sold on fineness, data wereavailable on 3,282,899 bales of known fineness specifications in.sales (Appendix II).
The more common fineness specifications, in both domestic and.export sales, in order of importance of volume sold, were 3.8 to 5.0,3.5 to 5.0, 3.8 minimum, 3.5 minimum, 3.7 to 5.0, 3.6 to 5.0, 3.7minimum, 3.5 to 4.0, 3.7 to 4.5, 3.8 to 4.5, and 3.8 to 4.8. Over2.5 million bales were sold on the above fineness values.

COTTON FIBER TESTING BY SHIPPERS AND SPINNERS 23
Thirty- nine different specifications in fineness were reported indomestic sales and 36 different fineness specifications in exportsales. The more common fineness specifications were in terms ofranges. In many cases these ranges were very narrow.
There was not much cotton sold with fineness specificationsunder 3.5. Although 227,650 bales handled by the Tennessee ship-pers fell within this range (170,052 of 3.0 to 3.4 and 57,598 below3.0, as shown in Table 7), only 124,624 bales were sold on suchfineness specifications. The balance of this cotton was sold toforeign and domestic mills that could use the finer cotton.
Of the 3,282,899 bales of cotton sold on known fineness specifica-tions. about 72 percent of the sales were limited as to coarseness.The maximum coarseness values in micronaire units among suchsales varied from 3.7 to 5.2. However, many domestic and foreignmills were able to use cotton regardless of its coarseness. Over40 percent of the 5,106,605 bales of cotton handled by the Tennesseeshippers was sold without specification as to fineness.
Spinner Use of Fiber Tests in ControllingProcessing Operations
Of the 503 spinning mills studied, 10 of the 18 in Tennesseeand 292 of the 485 in other states reported the use of fiber testingto obtain better measures of raw cotton quality. The extent anduse of fiber tests by spinners in buying cotton has been previouslydiscussed and summarized in Tables 5 to 9.
Several reasons for testing the cotton after it was purchasedwere reported by the spinners. The results of tests were used asa basis for mixing and blending operations and for developing in-formation as an aid in controlling other manufacturing operations.The more important areas of processing control include: 1) Blend-ing and Mixing,4 2) Nep Count, 3) Ends Down, 4) Carding Speed,5) Picker and Card Waste, 6) Yarn Appearance, 7) Yarn SkeinStrength, and 8) Finishing and Dyeing. Most of the above factorsare closely related to each other, and each of the above factors isrelated to one or more fiber properties as indicated in Appendix 1.
BLENDING AND MIXING
Of the 503 cotton spinners included in the study, 10 of the 18in Tennessee and 302 in other states reported that the results offiber tests were used as a basis for their blending and mixing
i Blending and mixing refer to the process of intermingling fibers from different bales orlots to produce a uniform mixture.

24 BULLETIN No. 320
operations. In obtaining basic data on fiber tests for mIxmgand blending, 78 percent of the spinners owned or used instrumentsfor making tests for fineness, 50 percent for strength, 38 percentfor length, 16 percent for maturity, 14 percent each for nonlintcontent and fluorescence, 7 percent each for color and elongation,4 percent for nep count, and under 2 percent for moisture.-'
Of the above 10 fiber tests, the two which were used mostextensively as bases for developing formulas for mixing and blend-ing cotton were fineness and strength. Of the 213,571 bales ofcotton consumed by Tennessee spinning mills, 42 percent wasblended or mixed on the basis of fineness of fiber information andslightly over 7 percent on strength test data. For the 7.123,932bales of cotton consumed by 485 spinning mills in other states,68 percent was blended or mixed on the basis of fineness of fiberinformation and slightly over 2 percent on strength data (AppendixIII).
Tennessee spinners, compared with those in other states, re-ported greater use of fiber fineness test information in the cottonblending and mixing operations in the manufacture of print cloth,fine cotton goods, and colored yarn fabrics. In Tennessee theproportion of mix tested for fineness averaged 100 percent forprint cloth and fine cotton goods, 97 percent for colored yarnfabrics, 30 percent for sheeting, 25 percent for sales yarn, andnone for other products (Appendix III).
For all spinners in the United States, the proportion of mixtested for strength ranged from about 6 percent in the manufac-ture of sales yarn to none reported in the manufacture of towelsand toweling. Tennessee spinners, compared with those in otherstates, reported greater use of fiber test strength information in themixing and blending operations in the manufacturing of sheeting,print cloth, colored yarn fabrics, and fine cotton goods. In Ten-nessee the proportion of mix tested for strength averaged 52 per-cent for colored yarn fabrics, 10 percent for print cloth and finecotton goods, 4 percent for sheeting, under 3 percent for salesyarn, and none for towels and toweling, duck, and other goods.
Many cotton spinners indicated that fiber strength is a verydifficult, time-consuming, and costly test to perform. In testingcotton mix for strength the spinners generally tested only a propor-tion of mix, but these tests usually represented fairly large lots ofcotton. For these reasons the low percentages of cotton mix
.5 In addition, all spinners had information on classification for grade and staple length ofcotton consumed.

COTTON FIBER TESTING BY SHIPPERS AND SPINNERS 25
tested for strength, shown in Appendix III, do not exactly indicatethe real importance of strength test information used in mixingand blending operations.
NEP COUNT
Neppiness of cotton is associated with fiber fineness, length, andmaturity. About 18 percent of the 503 cotton spinners reportedthat they used some test data for these three fiber properties inestimating nep potential. Only 19 of these spinners reported theuse of Neptometers in determining nep count. Many spinnerswere concerned about obtaining data relating to the susceptibilityof cotton to nepping because of sources of trouble in manufacturingyarns and fabrics. When the nep count in card web is high thecotton is likely to produce rough and neppy yarns. High nepcount also detracts from the appearance of finished products whenthey are to be dyed or printed.
ENDS DOWN
Ends down in spinning, or the breakage of yarn at the spinningframe, is influenced by fiber fineness, strength, and length. About32 percent of the 503 spinners indicated that they used some testdata for these three properties in the control of ends down inspinning.
CARDING SPEED
The rate at which cotton is carded is influenced by fiber fineness,strength, length, nonlint content, and neps. About 17 percent ofthe 503 spinners stated that they used some test data for these fivequalities in the control of carding speed.
PICKER AND CARD WASTE
Picker and card waste in the processing operations is influencedby fiber fineness. length, maturity, nonlint content, and neps.Manufacturing waste in cotton is important because excessivewaste increases the cost of cotton products. The percentage ofwaste extracted by the picking and carding processes provided allspinners with a measure of manufacturing waste. Most spinnershad other basic data on fiber properties related to picker and cardwaste. Of the 503 spinners, 78 percent had instruments for mak-ing tests for fineness, 38 percent had instruments used in testingfor length and length uniformity, and 16 percent were equippedfor making maturity tests. In addition, 14 percent of the spinners

26 BULLETIN No. 320
reported the use of the Shirley Analyzer for testing the nonlintcontent of cotton. The results obtained from testing for nonlintcontent are distinguished from total picker and card waste in thatpractically no fiber is included in the nonlint content test.
YARN APPEARANCEYarn appearance is influenced by many fiber characteristics,
including fineness, strength, length, maturity, fluorescence, nonlintcontent, and neps. As indicated in Table 2, a considerable propor-tion of the spinners reported many different kinds of instrumentsused in testing for the seven fiber properties related to yarn ap-pearance. An estimated 34 percent of the 503 spinners usedsome fiber test data in the control of yarn appearance grades.
YARN SKEIN STRENGTHThe strength of the final product depends basically on fiber
strength, but not on strength alone. Yarn strength is influencedby fiber length, fineness, maturity, and fiber service properties.About half of the cotton spinners had or used instruments formaking strength tests of raw cotton. Strength test data wereused by cotton spinners as an aid in blending and mixing opera-tions, control of ends down in spinning, determining carding speed,estimating yarn appearance grades, finishing and dyeing opera-tions, and governing general processing performance.
FINISHING AND DYEINGA close relationship exists between the finishing and dyeing
properties of cotton and fiber fineness, strength, maturity, color,neps, and fiber damage. About 62 percent of the cotton spinnersused some cotton fiber test data as an aid in their mixing andblending operations and such information was useful as a basisfor selecting cottons of similar finishing and dyeing properties.Different varieties and growths of cotton have different finishingand dying properties. Information about such differences isimportant to cotton spinners in their mixing and blending opera-tions.6
Cost of Cotton Fiber TestingFACTORS RELATED TO COSTS OF TESTING
An important objective of this study was to determine the costof cotton fiber testing. Since so many variables were associated
6 Annual Cotton Quality Surveys, Summary of Results of Fiber and Processing Tests from Se-lected Markets, Agricultural Marketing Service, USDA.

COTTON FIBER TESTING BY SHIPPERS AND SPINNERS 27
with costs it was believed that the most effective way of present-ing these costs was through setting up some models or systems inthe form of tables. Basic data are provided in each model orsystem which may be used by the individual shipper or spinner inestimating expected costs with changes in volume tested andlabor inputs.
The results of interviews with shippers and spinners in Ten-nessee and other states indicated that the more important factorsassociated with differences in the cost of fiber testing per sampleare: 1) Kind of test, 2) cost of instrument or method (fixed cost),3) labor cost per hour, 4) tests per man hour, 5) weeks of opera-tion, 6) number of determinations made per sample, 7) degree ofspecialization, and 8) control of temperature and moisture in test-ing. These eight factors were considered in preparing tables thatshow the estimated average cost per test (Appendix IV).
The tables include data for 10 different tests involving 18 dif-ferent instruments or methods. In computing fixed costs, the 1960prices of instruments and auxiliary equipment were secured fromvarious manufacturers, spinners, and shippers. In figuring annualfixed costs, depreciation is charged at 10 percent, interest 6 percent,repair 2 percent, taxes 1.25 percent, and insurance at 0.8 percent.No charge was made for buildings or rent since the shippers andspinners in this study had ample room for cotton fiber testinginstruments in cotton classing rooms or office space.
In this study labor costs are charged at $2.00 an hour pertest operator. Other operating costs per hour include utilities,calibration samples, supplies, and sundries. The number of testsper man hour for the various instruments or methods are basedupon rates obtained by cotton shippers, spinners, and other workersin classing rooms and laboratories under sustained operations.Average rates take into consideration such factors as rest stops,stops for repair and calibration of instruments, degree of speciali-zation, average efficiency of workers, number of determinationsmade per test sample, kind of instrument or method, and up to 50percent variation in daily volume which may occur during a weekof operation.
The number of weeks of operation is related to volume tested.The volume of cotton tested during any specified number of weeksof operation is determined by multiplying the number of weeks by44 times the average number of tests per man-hour. The numberof determinations made per test sample varies according to the

28 BULLETIN No. 320
type and purpose of the test, the accuracy desired in testing, andthe method of sampling.
The degree of specialization in cotton fiber testing relates tosuch factors as type of test; kind, purpose, and capacity of in-strument; auxiliary equipment; and general control of operations.In this study, Standard refers to one person performing the entiretest, including preparation of samples, testing, and record keep-ing, and little specialization. Specialization refers to two personsperforming the test operations and many or most of the processesof testing automatically performed or controlled by self-operatingmachines or devices.
Many cotton shippers are now performing various types ofcotton fiber tests in classing rooms with uncontrolled atmosphericconditions. In this study No AC refers to no atmospheric controland AC refers to atmospheric control of moisture and temperaturein the conditioning of cotton before and during testing. Theannual fixed cost of an atmospheric controlled (5,000 cu ft.) labora-tory is charged at $500. In Appendix IV, the average cost offiber testing for each test is given under atmospheric control.Where cotton is tested for more than one fiber property. which isusually the case, only one charge should be considered for the extracost of testing under atmospheric control.
FINENESS
The four instruments most commonly used in testing cottonfiber properties for fineness are the Micronaire, Speedar, Port-Ar,and Arealometer. Since 1958 an instrument known as the Fibron-aire has come into use for fineness testing. The Arealometer, inaddition to measuring fineness, also measures immaturity or shapeof fibers; from the measured properties of fineness and immaturity,approximate values of other properties-such as weight per inch,perimeter, and wall thickness-may be calculated.' The costs offiber tests with the Arealometer are shown under Maturity Tests,Appendix IV.
When the necessary auxiliary equipment are considered, littledifference exists in the annual fixed and operating costs, precision,and performance in tests per man-hour of the instruments-Micronaire, Speedar, Port-Ar, or Fibronaire. The important factorsassociated with the wide variations in cost per fineness test arevolume of tests, degree of specialization, and whether the tests are
7Genetics and Cytolo!}?! of COtt011_, 1948-55, Southern Cooperative Serie8 Bulletin No. 47.

COTTON FIBER TESTING BY SHIPPERS AND SPINNERS 29
conducted under controlled or uncontrolled atmospheric conditions(Appendix IV).
Under standard operating conditions, with one person perform-ing all of the testing procedures, no atmospheric control, and onedetermination per sample, the average cost ranges from 23 centsper test for one 44-hour week of operation or 1,320 tests to 7cents per test for 50 weeks of operation or 66,000 tests; withatmospheric control, the average cost ranges from 61 cents pertest for 1 week of operation to 8 cents per test for 50 weeks.
Under specialized conditions, no atmospheric control, and onedetermination per sample, the average cost ranges from about 6cents per test for 1 week of operation or 7,920 tests to 2 cents pertest for 50 weeks of operation or 396,000 tests; with atmosphericcontroL the average cost ranges from 13 cents per test for 1 weekof operation to 3 cents per test for 50 weeks. Some large volumeshippers were able to reduce the cost of fineness testing, under at-mospheric control, to under 2 cents per test by using more thanone instrument and with almost complete specialization.
STRENGTH
The three instruments most commonly used in testing cottonfiber properties for strength are the Pressley, Stelometer, andClemson Flat Bundle Tester. When the necessary auxiliary equip-ment are considered, little difference exists in the average fixed andannual costs, precision, and performance in tests per man hourof these instruments. The important factors associated with widevariations in costs per strength test are volume of tests, degreeof specialization, number of determinations or breaks made pertest sample, and whether the tests are conducted under controlledor uncontrolled atmospheric conditions.
Under standard operating conditions, with one person perform-ing all testing procedures, no atmospheric control, and two de-terminations per sample, the average cost ranges from 78 centsper test for one 44-hour week of operation or 264 tests to 36 centsper test for 50 weeks of operation or 13,200 tests; with atmosphericcontrol the average cost ranges from about $2.70 per test for 1week of operation to 41 cents per test for 50 weeks.
Under specialized conditions, no atmospheric control, and twodeterminations per sample, the average cost ranges from 56 centsper test for 1 week of operation or 528 tests to 35 cents pertest for 50 weeks of operation or 26,400 tests; with atmospheric

30 BULLETIN No. 320
control, the average cost ranges from $1.52 per test for 1 weekof operation to 37 cents per test for 50 weeks.
This study revealed that in the past, most fiber strength testshave been performed by shippers and spinners with instrumentsusing the O-gauge or without any space between the jaws of theinstrument. In this study the cost of fiber testing includes thecharge for equipping instruments for testing with lis-inch gauge.Fiber strength tests obtained at lis-inch gauge are more closelycorrelated with yarn strength than fiber strength tests obtainedat 0-gauge.8
LENGTH AND LENGTH UNIFORMITYThe three instruments most commonly used in testing cotton
fiber properties for approximation of length and length uniformityare the Fibrograph, Suter-Webb Sorter," and the Uster Sorter. Thelatter is of foreign manufacture. Data were available for estimat-ing the average cost of cotton fiber testing for length and lengthuniformity with the Digital Fibrograph. The important factorsassociated with the wide variations in average cost per test forlength and length uniformity are volume of tests, degree of special-ization, number of determinations made per test sample, andwhether the tests are conducted under controlled or uncontrolledatmospheric conditions.
Under standard operating conditions, with one person perform-ing all testing procedures, no atmospheric control, and one de-termination per sample, the average cost ranges from 45 centsper test for one 44-hour week of operation or 1,320 tests to 8 centsper test for 50 weeks of operation or 66,000 tests; with atmosphericcontrol, the average cost ranges from 83 cents per test for 1 weekof operation to 9 cents per test for 50 weeks.
Under specialized conditions, no atmospheric control, and onedetermination per sample, the average cost ranges from 17 centsper test for 1 week of operation or 3,960 tests to 5 cents per testfor 50 weeks of operation or 198,000 tests; with atmospheric con-trol the average cost ranges from 30 cents per test for 1 weekof operation to 5 cents per test for 50 weeks.
MATURITY
The four methods used in testing cotton for maturity or im-maturity are the Arealometer, Microscope, Differential Dye, and
8 Cotton Testing Serviee, Agricultural Marketing Service, USDA, AMS No. 16, February, 1~,;5.9 The cost of the Suter-Webb Sorter and description of it~ operation may be obtained from theAlfred Suter Co., 200 Fifth Avenue, New York 10, New York.

COTTON FIBER TESTING BY SHIPPERS AND SPINNERS 31
Causticaire. The methods differ widely from the standpoint ofsuch factors as principles involved, equipment and materials re-quired, fixed and operating costs, tests performed per man hour,kind and accuracy of results obtained, and the significance of theresults in relation to spinning performance.
Under standard operating conditions, with one person perform-ing all testing procedures, no atmospheric control, and one deter-mination per sample, the average cost ranges from $6.19 to $1.11per test (depending upon method) for one 44-hour week of opera-tion or 44 to 264 tests and from $2.18 to 37 cents per test for50 weeks of operation or 2,200 to 13,200 tests; with atmosphericcontrol, the average cost ranges from $17.66 to $3.01 per test for1 week of operation and from $2.51 to 42 cents per test for 50weeks of operation.
Under specialized conditions, no atmospheric control, and onedetermination per sample the average cost ranges from $2.29 to72 cents per test (depending upon method) for 1 week of opera-tion or 176 to 528 tests, and from $1.05 to 35 cents per test for50 weeks of operation or 8,800 to 26,400 tests; with atmosphericcontrol, the average cost ranges from $5.16 to $1.67 per test for 1week of operation and from $1.13 to 38 cents per test for 50 weeksof operation.
Maturity testing procedures by the methods of Differential Dye,Microscope, and Causticaire, require from 1 to 4 hours per test,but several tests can be performed concurrently. An increase inthe number of operators, machines and auxiliary equipment gen-erally more than doubles the tests per man-hour.
NONLINT CONTENT
Nonlint content is commonly measured by the Shirley Analyzerwhich is used for separating foreign material from fibers insamples of raw cotton. It requires about 6 minutes to run a 100-gram sample or 10 tests per hour with one operator. The ratecannot be increased by using more than one person with onemachine because the operator can perform such testing proceduresas weighing, calculating, and recording while one sample is beingrun through the Shirley Analyzer.
Under standard operating conditions, with one person perform-ing all testing procedures, no atmospheric control, and one de-termination per sample, the average cost ranges from $1.80 pertest for one 44-hour week of operation or 440 tests to 24 cents pertest for 50 weeks of operation or 22,000 tests. With atmospheric

32 BULLETIN No. 320
control, the average cost ranges from $2.95 per test for 1 weekof operation to 28 cents for 50 weeks.
NEP CONTENTThe instrument commonly used by cotton spinners for predict-
ing the potential of cotton fibers to form neps is the Neptometer.It requires about 4 minutes to run a 25-gram sample or 15 testsper hour with one operator. The rate cannot be increased by usingmore than one person with one machine since the operator canperform other testing procedures while the sample is being runthrough the Neptometer.
Under standard operating conditions, with one person peform-ing all testing procedures, no atmospheric control, and one deter-mination per sample, the average cost ranges from 60 centsper test for one 44-hour week of operation or 660 tests to 15 centsper test for 50 weeks of operation or 33,000 tests. With atmos-pheric control the average cost ranges from $1.36 per test for1 week of operation to 17 cents per test for 50 weeks of operation.
COLORThe most commonly used instrument for measuring color of
cotton is the Colorimeter. This instrument measures reflectanceand the degree of yellowness of cotton electronically. The colorvalue obtained may be plotted on a color diagram for comparisonwith the color of the cotton in official grade standards.
Under standard operating conditions, with one person perform-ing all testing procedures, no atmospheric control, and one determi-nation per sample, the average cost ranges from 65 cents per testfor one 44-hour week of operation or 1,320 tests to 8 cents pertest for 50 weeks of operation or 66,000 tests; with atmosphericcontrol, the average cost ranges from $1.04 per test for 1 weekof operation to 9 cents per test for 50 weeks.
Under specialized conditions, no atmospheric control, and onedetermination per sample, the average cost ranges from 24 centsper test for 1 week of operation or 3,960 tests to 5 cents per testfor 50 weeks of operation or 198,000 tests; with atmospheric con-trol, the average cost ranges from 37 cents per test for 1 weekof operation to 5 cents for 50 weeks.
MOISTURE CONTENTThe amount of moisture in cotton is considered an important
factor in ginning, in testing for various fiber properties, and inmill processing. Several moisture meters are being sold for

COTTON FIBER TESTING BY SHIPPERS AND SPINNERS 33
measuring the moisture content of samples of lint. The accuracyof these meters is readable to the tenth part of 1 percent moisturecontent in the range of 3 to 20 percent.
Under standard operating conditions, with one person perform-ing all testing procedures, no atmospheric control, and one determi-nation per sample, the average cost ranges from 17 cents per testfor one 44-hour week of operation or 1,100 tests to 9 cents pertest for 50 weeks of operation or 55,000 tests; with atmosphericcontrol the average cost ranges from 63 cents per test for 1 weekof operation to 10 cents per test for 50 weeks.
Under specialized conditions, no atmospheric control, and onedetermination per sample, the average cost ranges from 13 centsper test for 1 week of operation or 2,200 tests to 8 cents pertest for 50 weeks of operation or 110,000 tests; with atmosphericcontrol the average cost ranges from 35 cents per test for 1 weekof operation to 9 cents for 50 weeks.
SUGAR CONTENT AND ACID-ALKALINE VALUES
High sugar content is associated with difficulty in textile proces-sing and with lower yarn appearance grades. Sugar content infiber tests is determined by quantitative analysis. Acid-alkalinevalues in terms of pH units are determined on water extracts fromsamples of cotton. The pH values below 7 indicate acidity andthose above 7 ind}cate alkalinity. When associated with low sugarcontent, values above 7 may indicate deterioration of cotton fromthe action of micro-organisms.!<J
When the necessary auxiliary equipment is considered, littledifference exists in the annual fixed and operating costs, precision,and performance in tests per man-hour between the tests for sugarcontent and acid-alkaline values.
Under standard operating conditions, with one person perform-ing all testing procedures, no atmospheric control, and one determi-nation per sample, the average cost of testing for either sugarcontent or acid-alkaline values ranges from 88 cents per test forone 44-hour week of operation or 220 tests to 43 cents per test for50 weeks of operation or 11,000 tests. With atmospheric control,the average cost ranges from $3.17 per test for 1 week of operationto 50 cents for 50 weeks.
]0 Raskopf, B. D., Cotton Yields al1d Quality in Tennessee. Tennessee Agricultural ExperimentStation Bulletin No. 298, April 1958.

34 BULLETIN No. 320
FLUORESCENCE
Fluorescence is the appearance of cotton under ultraviolet light,commonly referred to as "black light." It is being used by about15 percent of the cotton spinners in fiber testing in determiningthe presence on cotton of fungi, oil, stem and leaf chlorophyll stains,and other material which may indicate damaged cotton, or in de-termining whether the cotton has been rapidly dried at hightemperatures. As shown in Appendix I, the important factors ofprocessing performance related to fluorescence are blending andmixing, carding speed, yarn appearance, yarn strength, andfinishing and dyeing. Ultraviolet light used in cotton testing in acurtained booth can be installed in the classing room for about$100. One operator can examine up to 75 samples per hour forfluorescence or appearance of cotton under ultraviolet light.
EFFECTSOF ATMOSPHERIC CONDITIONS ON TESTING
This study revealed that many shippers and spinners test cottonfor fiber properties, particularly fineness, strength, and length andlength uniformity, without control of moisture or temperature.Probably the main reason for this, as indicated in Appendix IV,is the higher cost of testing under controlled atmospheric condi-tions. This is especially true under conditions of small volumetested or only a few weeks of operation.
A study made by the United States Department of Agricultureindicates that when testing raw cotton for fineness, without controlof atmospheric conditions, certain correction factors may be usedfor adjusting test valueY Correction factors can be applied tofineness readings for cotton ranging from 3.5 to 5.5 when tested atrelative humidities ranging from 20 to 89 percent and within atemperature range of 65 to 90 degrees F. In strength, length, andlength uniformity tests, correction factors may be established understandard atmospheric conditions.
The importance of the effects of atmospheric conditions on test-ing certain fiber properties may be summarized as follows: 1) Anincrease in relative humidity results in an increase in fineness read-ings; an increase in temperature results in a decrease of finenessreadings in the range of 60 to 70 degrees F. and a slight increasein the range from 70 to 90 degrees F.; 2) an increase in relativehumidity and! or temperature results in an increase in the strength
J I Effect .••oJ Atmo.'lpheric Corulitions on Testing Certain Cotton Fiber Properties, Cotton Branch.USDA, October 1953.

COTTON FIBER TESTING BY SHIPPERS AND SPINNERS 35
of cotton fibers, with the stronger cottons showing the greatestincrease; 3) an increase in relative humidity and/or temperatureresults in an increase of Fibrograph length and length uniformityreadings.
EFFECTSOF CHANGES IN VOLUME ANDLABOR ON COSTS
Basic data are provided in Appendix IV which may be usedby the individual shipper or spinner in estimating the expectedcosts of cotton fiber testing with variations in volume or laborrequirements. The use of these data is indicated in six possiblecases in Appendix V. The illustrations show the estimated averagecosts of cotton fiber testing for fineness with changes in volume andlabor, under standard operation conditions, and no atmosphericcontrol. Similar illustrations can be formulated for estimatingthe cost of fiber testing for fineness under specialized conditionswith changes in volume and labor inputs and with atmosphericcontrol; and for any other of the 10 different cotton fiber testsdiscussed in this report.
The results obtained in examples indicated in Appendix V maybe summarized as follows: 1) Changes in large monthly volumeof samples tested have little effect on the annual cost of cotton fibertesting per sample; this is generally true even if little or nolabor is used to perform other duties when the testing machinesare not in operation. 2) Changes in small monthly volume ofsamples tested also have little effect on the annual cost of cottonfiber testing if the labor can be used to perform other jobs whenthe testing machines are not in operation. If full-time labor ischarged to testing, the cost per sample is high with small volume oftests. 3) With small irregular monthly volume and full-time laborcosts charged to testing, it would be cheaper for the shipper orspinner to have fiber tests performed by commercial fee labora-tories.
COMMERCIAL FEE LABORATORIES
A higher proportion of cotton shippers, compared with spinners,had fiber tests performed by fee laboratories. Also, a higher pro-portion of the Tennessee shippers, compared with those of otherstates, used the services of fee laboratories.
The charge for fiber testing made by commercial firms is shownin Appendix VI. Information presented in Appendixes IV and VImay be used by the individual firm in determining whether it is

36 BULLETIN No. 320
more economical to do its own testing or to use a fee laboratory.For example, under specialized conditions, atmospheric control, andthe same number of determinations made per test sample, itwould be cheaper for a firm to do its own testing, for any particulartest, if it made about the following number of tests annually:
Tested forFinenessStrengthLength and length uniformityMaturity -(Microscope)
(Causticaire)(Arealometer)(Differential Dye)
Nonlint contentNep test (N eptometer)Moisture (Moisture Meter)Sugar content or acid-alkaline values
Number of Tests.14,400
27572090
13070
220400165150300
In the above example the entire cost of an atmospherically-con-trolled laboratory is considered in performing the tests for fineness.If a firm is already equipped with an atmospherically-controlledclassing room or laboratory, it would be cheaper to do its own fine-ness testing if it made around 4,100 tests annually.
Important factors to be considered by a firm in deciding whetherto conduct its own fiber tests or to use a fee laboratory are: 1)Commercial laboratory technicians are trained specialists; 2) alltests at commercial laboratories are conducted under controlledatmospheric conditions; 3) there is probably less chance for com-mercial disputes if commercial laboratories test cotton; 4) thevolume of cotton to be tested and portability of some kinds ofinstruments; 5) the importance of speed and convenience in de-termining the fiber characteristics; and 6) the extent to which testoperators can be used to perform other jobs when the cotton fibertesting machines are not operating at capacity.
The price schedule shown in Appendix VI is a sliding ratecovering all testing performed for an account during the crop year.The unit price per test decreases with the volume of testing per-formed during the year. A user of the testing service is billed atthe end of each month for all samples tested and reported duringthat month. The price is based upon the total cumulative numberof samples tested for that account since the start of the crop year.

COTTON FIBER TESTING BY SHIPPERS AND SPINNERS 37
Special discounts are extended for annual contract or volume com-mitments and combinations of tests.
DiscussionThe Smith-Doxey Act of 1937 directed the United States Secre-
tary of Agriculture to make available cotton classification andmarket news services to any group of producers organized topromote the improvement of cotton and who complied with suchregulations as prescribed. In Tennessee the proportion of thestate's cotton planted acreage in the Smith-Doxey program in-creased from 1 percent in 1938 to 97 percent or more during thepast 5 years. The proportion of state ginnings classed under theprogram increased from less than 1 percent in 1938 to 74 percentin 1958.
During the period of the expansion of the Smith-Doxey pro-gram, the participating growers have been furnished with a greencard (Form I) showing the cotton classification on each individualbale as to grade and staple length. Other cotton fiber properties-such as fineness, strength, length uniformity, and maturity-havenot been designated on the Form I or government class card. Thismay be attributed to several reasons: 1) As indicated in this study,cotton fiber testing by shippers and spinners started several yearsafter the passage of the Smith-Doxey Act of 1937; 2) legislativeaction is required to amend the Smith-Doxey Act to provide for thetesting and recording of fiber properties other than grade andstaple length on the Form I card; and 3) the placing of additionalinformation on the government class card is a controversial issue,particularly among cotton merchants.
The results of this study have the following implications:Use of cotton fiber tests by shippers and spinners to supplement
visual grade and staple length evaluations increased considerablyduring the past] 5 years. The change from visual to technicalfiber testing methods in merchandising cotton is expected to con-tinue. Important problems relating to these changes are to developmore efficient inKtruments essential in reducing the cost of fibertesting, better understanding of the use of these instruments, con-sistent patterns of premiums and discounts given for cotton of var-ious fiber properties, and an accurate, rapid, and economicalmethod for the testing and dissemination of test results to all seg-ments of the cotton industry.
One proposed solution to these problems is to amend the Smith-

38 BULLETIN No. 320
Doxey Act to include provision for fiber testing and recording testinformation on the Form I government class card, and authoriza-tion for collection and dissemination of additional market newsinformation relating to discounts and premiums for cotton of dif-ferent fiber properties. It appears feasible that in the beginningthe government testing and market news procedures be limited tofiber testing for fineness for each bale. As faster and more eco-nomical methods of testing are developed, additional testing pro-cedures could be added for length uniformity, strength, maturity,nonlint content, nep count, or other important fiber characteristics.
Another proposed solution is to have the cotton fiber testingperformed by commercial fee laboratories located at public cottonwarehouses where cotton is concentrated in large volume. For ex-ample, the 14 cotton compresses and warehouses in West Tennesseehave a total storage capacity of over a million bales. These com-presses and wan;houses perform many cotton services, includingphysical protection of cotton from weather, mud, dust, fire, mutila-tion, petty picking and theft; the conversion of warehouse receiptsinto desirable collateral for loans; distribution of the marketingseason over a longer period; facilitating the concentration andmovement of cotton through marketing channels; and the storageof a large volume of cotton under government loan.
Consideration of the above proposals appears justified for thefollowing reasons:
1) If the grower is to supply the merchant or mill \vith cottonof certain fiber properties, it is necessary that the producer andseed breeder be the first to know what these fiber characteristicsare and the extent to which these differences may be reflected backto the producer in the form of premiums and discounts. In the1956-57 season, 166 shippers in the United States sold over 10million bales with fineness specifications, 1.8 million bales withstrength specifications, and 100,000 bales with other fiber testdesignations.
2) About 60 percent of the 166 cotton shippers in the UnitedStates were in favor of recording the fineness values on the govern-ment Form I cotton class card.
3) In the 1956-57 season, 6.5 million bales of cotton were ex-ported and sold to domestic spinning mills from Commodity CreditCorporation holdings. No information about cotton fiber tests, suchas fineness, strength, length uniformity, or maturity, was availableon this cotton prior to its purchase.

COTTON FIBER TESTING BY SHIPPERS AND SPINNERS 39
4) The recording of cotton fiber test values on the Form Iclass card should result in less likelihood for mercantile disputes.
5) This study shows that by far the most important factorassociated with the cost of cotton fiber testing is the volume ofcotton tested. The large quantity of cotton moving through govern-ment classing offices and cotton warehouses is sufficient to reducethe cost of testing for some cotton fiber properties to a minimum.For example, under specialized conditions and with atmosphericcontrol, the average cost of testing for fineness is reduced to under3 cents per test for 396,000 tests and for length and length uni-formity to under 6 cents per test for 198,000 tests.
6) As indicated in Tables 5, 9,10 and Appendix III, some of thecotton handled by shippers and spinners was tested for the samefiber properties as many as four times-before and after purchaseby shippers, and before and after purchase by spinners. If thecotton were tested for some of the more important fiber propertiesafter ginning, much of the duplication of testing by merchants andmills could be eliminated.
Appendix IImportant Raw Cotton Fiber Characteristics Measured by Cotton Shippers and Spinners,
Instruments Used, and Factors of Spinning Performance Affected by Fiber Tests.
Instrumentor method
Fiberproperty
or test I
Important factors of processingperformance related to fiber property
---------_._._~----,---MicronairePort-ArSpeedarArealometerShirley WIRA Meter"Fibronaire
Fineness
PressleyClemson TesterStelometer
Strength
FibrographSuter-Webb SorterZweigle Sorter"Balls Sorter"Uster Sorter"Shirley Method"Electroimpex"
Length andlengthuniformity
General processing performance, blending andmixing, nep count, ends down, carding speed,picker and card waste, yarn appearance, yarnstrength, and finishing and dyeing.
General processing performance, blending andmixing, ends down, carding speed, yarn ap-pearance, yarn strength, and finishing anddyeing.
General processing performance, blending andmixing, nep count, ends down, carding speed,picker and card waste, yarn appearance, andyarn strength.

40 BULLETIN No. 320
Appendix I (Continued)
Instrumontor method
Fiber Iproperty Important factors of processing
_o_r_te_s_t ~~~rmance-,elate~~ fiber p'Clf'"r_ty
CausticaireArealometerMicroscopeDifferential DyeAcid-Alkaline testSugar contentColorimeter
Maturity
Color
Ultraviolet light Fluorescence
Shirley Analyzer"Nonlintcontent
Neptometer Neps
Clemson TesterStelometer
Moisture Meter
Elongation
Moisture--------------_.------
General processing performance, blending andmixing, nep count, picker and card waste, yarnappearance, yarn strength, and finishing ~nddyeing.
Blending and mixing, and finishing and dyeing.
Blending and mixing, carding speed, yarn ap-pearance, yarn strength, and finishing anddyeing.General processing performance, car din gspeed, picker and card waste, and yarn ap-pearance.General processing performance, nep count,carding speed, picker and card waste, yarnappearance, and finishing and dyeing.General processing performance, and yarnstrength.
General processing performance.
a Instruments of foreign manufacture.SOURCE:Raskopf, B. D., Cotton Yields and Qualitu in Tennessee. Tennessee Agricultural Ex-
periment Station Bulletin No. 298, April 1959.Raskopf. B. D. and Fontana, .r. R., Cotton Fiber TcstinfJ in Fore(qn Countri(!s. Ten-
nessee Agricultural Experiment Station Bulletin No. 271, September 1957.Cable, Curtis C., Jr. and Holder, H. S., Use of Fiber TCRting in Marketing ArkansaH
CoUon, ..o\rkansas Agricultural Experiment Station Bulletin No. 594, November 1957.Cotton Testin.q Service, U. S. Department of Agriculture. Agricultural Marketing Sen:-
ice, AMS No. 16, February 1955.
Appendix IIVolume of Cotton Sold on Fineness Minimum or Range Specifications, Domestic
and Export Sales, 46 Shippers, Tennessee, 1956-57 Season.
Finenessspecificationsin micronaire Domestic Export All
units sales sales sales
Bales of cotton
Under 3.0 738 707 1,445
3.0 min. 1,181 973 2,154
3.0-3.7 7,125 47 7,172
3.0-4.0 6,300 0 6,300
3.0-4.4 800 0 800
3.2 min. 0 54,524 54,524
3.2-4.5 1,200 0 1,200

COTTON FIBER TESTING BY SHIPPERS AND SPINNERS 41
Appendix II (Continued)Fineness
specifications !
in m~;~~snai=--l _
3.4 min. 51,029 0 51,0293.5 min. 178,074 16,104 194,1783.5-3.7 13,500 0 13,5003.5-4.0 65,813 65,225 131,0383.5-4.3 29,007 4,826 33,8333.5-4.8 61 12 733.5-5.0 229,570 98,642 328,2123.6 min. 77,413 7,500 84,9133.6-4.2 1,721 2,511 4,2323.6-4.4 3,344 21 3,3653.6-4.5 19,550 22,950 42,5003.6-4.9 0 31,390 31,3903.6-5.0 80,950 80,950 161,9003.7 min. 57,102 76,441 133,5433.7-4.2 4,134 6,605 10,7393.7-4.5 68,302 60,776 129,0783.7-4.8 30,492 0 30,4923.7-4.9 8,248 2,484 10,7323.7-5.0 175,782 14,494 190,2763.8 min. 128,197 167,165 295,3623.8-4.0 15,525 0 15,5253.8-4.2 13,875 47 13,9223.8-4.4 24,055 9,435 33,4903.8-4.5 74,344 44, I 16 118,4603.8-4.6 0 17,306 17,3063.8-4.7 3,050 5,022 8,0723.8-4.8 113,161 1,371 I 14,5323.8-5.0 445,666 278,257 723,9233.9 min. 0 8,100 8,1004.0 min. 10,082 82,696 92,7784.0-4.5 I 1,217 4,426 15,6434.0-4.7 0 28,470 28,4704.0-4.8 0 65,534 65,5344.0-5.0 10,646 41,038 51,6844.1-4.5 1,800 0 1,8004.1-5.2 7,623 0 7,6234.2 min. 0 1,806 1,8064.5 min. 3,973 578 4,5514.6-5.0 5,700 0 5,700
-----------_._---- -- ----Known 1,980,350 1,302,549 3,282,899Unknown" 368,261 274,778 643,039Noneh 515,749 664,918 1,180,667
-_.,---------._ .._--------------------------2,864,360 2,242,245 5, I06,605
---~~
Domesticsales
Exportsales
Allsales
Total
a Cotton tested for fineness but fin~nesg sales data not avafl';:ble:-"h Cotton not sold on fineness specifications.

4<: BULLETIN No. 320
Appendix IIIVolume of Cotton Consumed and Mix Tested for Fineness and Strength, by Principal End
Products, 503 Cotton Spinners in Tennessee and United States, 1957-58 Season.-------
I I Other states I UnitedState;-Item Tennessee1---------
----- .._--- : No. I__Y~__ __ No. -L~o-~~,--No=~J-- ~o
Bales of cottonAll products 213,571 /00.0 7, /23,932 100.0 7,337,503 100.0
Mix tested for: Fineness 90,252 42.3 4,854,748 68.1 4,945,000 67.4Strength 15,778 7.4 168,222 2.4 184,000 2.5
Sheeting" 30,380 14.2 1,979,620 27.8 2,010,000 27.4Mix tested for: Fineness 9,161 30.2 / ,267,839 64.0 1,277,000 63.5
Strength 1,161 3.8 44,839 2.3 46,000 2.3Sales yarnb 126,221 59.1 1,252,779 17.6 1,379,000 18.8
Mix tested for: Fineness 31,05/ 24.6 634,949 50.7 666,000 48.3Strength 3,117 2.5 82,883 6.6 86,000 6.2
Print clothe 32,200 15./ 1,310,800 18.4 1,343,000 18.3Mix tested for: Fineness 32,200 100.0 996,800 76.0 1,029,000 76.6
Strength 3,220 10.0 22,780 1.7 26,000 1.9Colored yarn fabricsd /5,446 7.2 836,554 11.7 852,000 11.6
Mix tested for: Fineness 15,040 97.4 75/ ,960 89.9 767,000 90.0Strength 8,000 51.8 15,000 1.8 23,000 2.7
Fin, cotton goods' 2,800 1.3 782,200 11.0 785,000 10.7Mix tested for: Fineness 2,800 100.0 554,200 70.9 557,000 71.0
Strength 280 10.0 720 0.1 1,000 0.1Towels and toweling' 6 300,994 4.2 301,000 4./
Mix tested for: Fineness 0 0 108,000 35.9 108,000 35.9Strength 0 0 0 0 0 0
Duck' 6,158 2.9 /62,842 2.3 169,000 2.3Mix tested for: Fineness 0 0 144,000 88.4 144,000 85.2
Strength 0 0 2,000 1.2 2,000 1.2Other productsh 360 0.2 498,143 7.0 498,503 6.8
Mix tested for: Fineness 0 0 397,000 79.7 397,000 79.6Strength 0 0 0 0 0 0
------_.- ----- ._--- ._----------- _. -------_ .._- - -------------------
a Sheeting, osnaburgs, twills, drills. jeans. poplins, gabardines, and sateens.h Knitting, thread, carpet, tufting, cordage. rope, twine. and mop.(' Print cloth, tobacco cloth, cheese cloth, bandage cloth, gauze, and corded broadcloths.II Denims, chambrays, ginghams, seersuckers. corduroy::.;, shirting, bed tickings, suitings, cotton-
ades, coverts, and cords.P Combed broadcloths, dimities. lawns, organdies, voiles, marquisette~, oxfords, pique ...;, ~hirtings,
combed poplins, combed sateens, twills, and combed sheeting-sol' Turkish and terry-woven towf'ls; buck, damask, and jacquard-woven; dishtowels, and dishcloths10:" Duck, filter cloth, and chafer fabric.11 Flannels, blankets, insulation coverings, and miscellaneous.I Less than 0.1 percent,

COTTON FIBER TESTING BY SHIPPERS AND SPINNERS 43
Appendix IV
Estimated Average Cost of Cotton Fiber Testing by Weeks of Operation for Specified Tests,Tests Per Man-Hour, Number of Determinations Made Per Test Sample, Degree of
Specialization, and Atmospheric Control, Shippers and Spinners, 1960.
··-l~nnual~~sts Tests--~
. I Oper. per
leper man- Weeks of operation (44-hour week)
__ Fixed~~u.r.._ll()IJI·_rl I .L1 4 8 I 12 I 25 I 50Item
F;neness Test"Standard-No AC
ACSpecialized-No AC
ACStrength Testb
Standard-No ACAC
Specialized-No ACAC
Length Test'Standard-No AC
ACSpecialized-No AC
ACMaturity Testd
Arealometer: Standard-No AC
ACSpecialized-
No ACAC
Microscope: Standard-No AC
ACSpecialized-
No ACAC
--- ---~-----~
$ $ No. Average cost per test in cents
8.3I 1.82.63.2
38.656.136.044.7
10.213.65.66.8
7.69.52.42.7
7.38.42.32.5
212712313813
2.10 302.20 304.10 1804.20 180
23.161.36.2
12.6
I 1.020.8
3.34.9
9.014.12.83.6
36.746.035.039.8
35.941.334.637.3
114614114614
2.10 62.20 64.10 124.20 12
15.034.34.37.5
78.2269.655.8
151.5
45.894.939.664.1
40.365.836.949.6
8.510.45.15.7
7.88.84.85.2
499999499999
2.10 302.20 304.10 904.20 90
56.6153.145.093.2
44.883.017.229.9
25.945.210.917.3
16.526.37.7
1 1.0
11.716.86.17.8
198698
2.102.20
6 111.4 72.5 53.8 44.4 41.3 38.0 36.56 301.1 169.2 103.0 69.8 58.8 47.3 42.0
198698
4.104.20
12 71.7 52.9 43.5 38.9 37.3 35.7 34.912 167.2 101.1 68.0 51.5 46.0 40.3 37.6
180680
2.102.20
619.1 414.5 312.3 261.1 244.1 226.4 218.21765.5992.7 606.4 413.2 348.8 281.8 250.9
223723
4.104.20
4 229.2 165.9 134.2 I 18.3 113.1 107.6 105.04 515.8 310.4 207.7 156.3 139.2 121.4 113.2
Starldard refers to one person performing the test with little specialization.SpecialiZ(~d refer:;; to two persons performing the test and many or most of the processes of
tel-iting automatically perform(~d Qt. controlled by self·operating machines or devices .•Vo AC refers to no atmospheric control. AC refers to atmospheric control or regulation of tem-
veratllre and moisture in the testing room or laboratory.a Test performed with the Micronaire, Fibronaire, Speedar. or Port-Ar. One determination made
pel' test ~ample.10 Te~t performed with the Pressley, Stelometer, or Clemson Flat Bundle Tester. Two determina-
tions made per test sample.t' Test preformed with the Fibrograph. One determination made per te~t sample.d Test performed with the Arealometer, Microscope, Differential Dye Technique, or Causticaire
Method. One determination made per test sample.l" Includes annual fixed costs of depreciation, interest, repairs, taxes, and insurance. Operating
('o.",t~per hour include labor, ntilities, calibration samples. supplies, and sundries.

44 BULLETIN No. 320
Appendix IV (Continued)
I Annual Costs I Tests i--iper. i per i
I e per I man-I ~ eeks_~f operation (44-hour we",,)Item __Fixed I hour hour __I_L2_1_4_1_8_._1_12~1 ~I~~
$ $ No. Average cost per test in centsDifferential
Dye: Standard-No AC 100 2.25 3 150.8 112.9 93.9 84.5 81.3 78.0 76.5
AC 600 2.35 3 532.9 305.6 192.0 135.2 116.2 96.5 87.4Causticaire: Standard-
No AC 201 2.20 2 338.4 173.1 167.1 138.6 129.0 119.1 114.6AC 701 2.30 2 911.6 513.3 314.1 214.6 181.4 146.9 130.9
Specialized-No AC 401 4.70 12 115.1 77.1 58.2 48.7 45.5 42.2 40.7
AC 901 4.80 12 210.6 125.3 82.7 61.3 54.2 46.8 43.4
Nonlint Content Test'Standard-No AC 702 2.10 10 180.5 99.8 60.9 40.9 34.3 27.4 24.2
AC 1202 2.20 10 295.2 158.6 90.3 56.1 44.8 32.9 27.5Nep Count"
Standard-No AC 301 2.10 15 59.6 36.8 25.4 19.7 17.8 15.8 14.9AC 801 2.20 15 136.0 67.8 45.0 29.8 24.8 19.5 17.1
Color Testb
Standard-No AC 769 2.10 30 65.3 36.1 21.6 14.3 11.9 9.3 8.2AC 1269 2.20 30 103.5 55.4 31.4 19.4 15.3 11.2 9.3
Specialized-No AC 769 4.10 90 24.0 14.3 9.4 7.0 6.2 5.3 4.9AC 1269 4.20 90 36.7 20.7 12.7 8.7 7.3 5.9 5.3
Moisture Content Testl
Standard-No AC 94 2.10 25 16.9 12.7 10.5 9.5 9.1 8.7 8.6AC 594 2.20 25 62.8 35.8 22.3 15.6 13.3 11.0 9.9
Specialized-No AC 94 4.10 50 12.5 10.3 9.3 8.7 8.6 8.4 8.3AC 594 4.20 50 35.4 21.9 15.2 11.8 10.7 9.5 8.8
Sugar Content Testl
Standard-No AC 100 2.10 5 87.5 65.5 53.4 47.7 45.8 43.8 42.9AC 600 2.20 5 316.7 180.4 112.2 78.1 66.7 54.9 49.5
Acid-Alkaline Va/uesJ
Standard-No AC 100 2.10 5 87.5 65.5 53.4 47.7 45.8 43.8 42.9AC 600 2.20 5 316.7 180.4 112.2 78.1 66.7 54.9 49.5
---------------,"--------------
NOTE: See footnote of preceding page for definitions of Stal/-dard. Specialized. No AC. and AG'.f Test performed with Shirley Analyzer. One determination made per test sample.go Test performed with Neptometer. One determination made per tt'~t Hample.h Test performed with Colorimeter. One determination made per test ~ampl;?i Test performed with a Moisture Meter. One determination mafle per test sample.j Test performed by Chemical Analysis. One determination made per test sample.

COTTON FIBER TESTING BY SHIPPERS AND SPINNERS 45
Appendix VExamples of Estimated Average Costs of Cotton Fibor Testing for Finoness with Changes
in Volume and Labor Costs, Standard or Non-Specialized Operating Conditions,No Atmospheric Control, Shippers and Spinners, 1960 Season.
_-=-_Aug"Sept. [OctT~_o;.iD_ee, J;;;;,J Feb. ~'-:J~pr.' May I--;J-un-e--c.--cJ--;ul-Y~1Yr._
Example A. Large regular monthly volume and full-time labor costsNo. 5500 5500 5500 5500 5500 5500 5500 5500 5500 5500 5500
$ 18 18 18 18 18 18 18 18 18 18 18$ 385 385 385 385 385 385 385 385 385 385 385" 7.3 7.3 7.3 7.3 7.3 7.3 7.3 7.3 7.3 7.3 7.3
TestsFixed costsOper. costsCost per test
Example B.No.
$$c
TestsFixed costsOper. costsCost per test
Example C.Tests No.Fixed costs $Oper. costs $Cost per test r
Example D.Tests No.Fixed costs $Oper. costs $Cost per test ,;
Example E.No.
$$
"
TestsFixed costsOper. costsCost per test
5500 6600018 212
385 46207.3 7.3
Large irregular monthly volume and part-time labor costs3000 5280 6240 6000 5280 4800 4500 4200 3600 3000 2700
18 18 18 18 18 18 18 18 18 18 18210 370 437 420 369 336 315 294 252 210 1897.6 7.3 7.3 7.3 7.3 7.4 7.4 7.4 7.5 7.6 7.7
2400 5100018 212
168 35707.8 7.4
Large irregular monthly volume and full-time labor costs3000 5280 6240 6000 5280 4800 4500 4200 3600 3000 2700 2400 51000
18 18 18 18 18 18 18 18 18 18 18 18 212377 384 387 387 384 383 382 381 379 377 375 374 457013.2 7.6 6.5 6.8 7.6 8.4 8.9 9.5 11.0 13.2 14.6 16.3 9.4
Small regular monthly volume and part-time labor costs600 600 600 600 600 600 600 600 600 600 600 600 7200
18 18 18 18 18 18 18 18 18 18 18 18 21242 42 42 42 42 42 42 42 42 42 42 42 504
10.0 10.0 10.0 10.0 10.0 10.0 10.0 10.0 10.0 10.0 10.0 10.0 10.0
Small irregular monthly volume and part-time labor costs600 1500 1800 900 300 300 300 300 300 300 300 300 7200
18 18 18 18 18 18 18 18 18 18 18 18 21242 105 126 63 21 21 21 21 21 21 21 21 504
10.0 8.2 8.0 9.0 13.0 13.0 13.0 13.0 13.0 13.0 13.0 13.0 10.0
Small irregular monthly volume and full-time labor costs600 1500 1800 900 300 300 300 300 300 300 300 300 7200
18 18 18 18 18 18 18 18 18 18 18 18 212369 372 373 370 368 368 368 368 367 367 367 367 442465 26 22 43 129 129 129 129 129 129 129 129 64
Example F.Tests No.Fixed costs $Oper. costs $Cost per test <1____ _ , _NOTE: Tt':-;ts performed with the Micronaire. Fibronaire, Speedar, or Port-AI' average of 30
tests per hour, standard operating conditions, one person l)erforming all testing p1'o-eedures, no atmospheric control, and one determination made per test sample. Fixedcosts average $17.£37pel' month and include depreciation, intel'c::;t, repairs, taxes, andinsurance. Operating costs average $2.00 per hour for labor and 10 cents per hour forutilities, calibration samples, supplies, and sUIHlrie.:-;.Cost figures are rounded.

46 BULLETIN No. 320
Appendix VICharges for Fiber Testing Per Sample for Specified Tests, by Volume Tested,
Commercial Fee Laboratories, 1960.
__ 0 ______ "----- .._---------N-;;-';'ber of
II I I ~samples I I ~~r 1]- "C";;;
tested I ~ .. ,..>~"N ~~ ~~the ! ..~from ~ ~ Qj" I
.~ ~'" -,,'" :i;< :~< "a. a.
r
" " 0" ~- 0e< V";.."beginning of '" ~>: :" 0 '" .. ~ "", :> "'-;;; ~,..u ~.~ Ou ~u~" ~ .. ~'" ].~
~ ,.. ~"U u._ 0 <'-the ~E "'-.. "i:-t: " .. :>' ~ E 0 ..0crop ~o ~" ,E"u " ~ "'.0 :>:> ~.. '" .. "U •• "U"...- .... ".-
I
~'" ".- .- > "'~ a. .-~ ",'".=:::::E ~~ "'::I: "'0 o~ 00 .. ~ uyear ~"- "u. :>0 uou._ VI_ --'_ ::I:_ ::1:_ z~ ::1:_ VI_ Z <- lD~a a a b a b I c I d e f gI-----_._._-_. -------.---_ ..•
1-
1050I,2,5,1030501015o
~--------~
99 20 70-499 20 70-999 20 7
000-1,999 18 6000-4,999 18 6000-9,999 17 5,000-29,999 16 5,000-49,999 15,000-99,999 /30,000-149,999 I I0,000-199,999 09ver 200,000 08
Cents per test
1
200
I
~-_ ..._-_._--_ ..__ ._--
5 85 350 200 75 75 200 75 905 85 70 70 800 80 I ! 60 60 75i i5 75
! 700 70 705 65 650 60 60
6055
a Two measurements per sample.b One measurement per sample.e Percentage moisture content of ginned cotton lint.Il Percentage of soluble reducing sugar content.e Nep content of ginned cotton lint.i Acid-alkalinity in pH units.g Five different qualities-color or yellowness, brightness or reflectance, character or ginned
preparation, leaf area or trash. and leaf count or size of trash particles. Scanor~Tron testperformed only by the United States Testing Company.
SOURCE:Based on price lists obtained from the United States Testing Company. Barrow-AgeeLaboratories, Inc., Memphis, Tenn., and the U. S. Department of Agriculture. Priceschedule effective to July 31, 1960.
48 BULLETIN No. 320
THE UNIVERSITY OF TENNESSEEAGRICULTURAL EXPERIMENT STATION
KNOXVILLE, TENNESSEE
Agricultural CommitteeBoard of Trustees
ANDREW D. HOLT, PresidentCLYDE M. YORK, Chcrirman
BEN DOUGLASS, HARRY W. LAUGHLIN, WASSELL RANDOLPHW. F. Moss, Commissioner of Agricu.uu1'e
STATION OFFICERSAdministration
cr'-ANDREWD. HOLT, PresidentWEBSTER PENDERGRASS,
Dean of AgricultureJ. A. EWING, DirectorERIC WINTERS, Associate DirectorFLORENCE L. MACLEOD, Assistant
Director, Home Economics ResearchJ. L. ANDERSON, Budget Officer
Department HeadsT. J. WHATLEY, Agricultural Eco-
nomics and Rural SociologyJ. H. ANDERSON, Agricultural
EngineeringL. N. SKOLD, AgronomyO. E. GOFF, PoultryN. S. HALL, Director, U-T - A.E.C.
Laboratory, Oak RidgeC. S. HOBBS, Animal Husbandry-
Veterinary ScienceN. I. HANCOCK, BotanyJ. T. MILES, DairyM. R. JOHNSTON, Food TechnologyB. S. PICKETT, Horticulture
K. L. HERTEL, Physics.J. O. ANDES, Plant Pathology
Main StationJ. N. ODOM. Farm Superintendent,
Knoxville
SubstationsB. P. HAZLEWOOD, Supt., West Ten-
nessee Experiment Station, JacksonT. J. WHATLEY, Program Director,
Ames Plantation, Grand JunctionL. M. SAFLEY, Supt., Highland Rim
Experiment Station, SpringfieldE. J. CHAPMAN, Supt., Middle Ten-
nessee Experiment Station, SpringHill
J. R. OWEN, Supt., Dairy ExperimentStation, Lewisburg
J. A. ODOM, Supt., Plateau Experi-ment Station, Crossville
J. S. KRING, In Charge, Bryn MawrForest, Wartburg
J. H. FELTS, Supt., Topacco Experi-ment Station, Greeneville