
Cost study for power system utilities - HBO Kennisbank
90
DEPARTMENT OF ELECTRICAL AND COMPUTER ENGINEERING Cost study for power system utilities Final Year Engineering Thesis, 2009 By Sebastian Broecker A thesis submitted to the Department of Electrical and Computer Engineering in partial fulfillment of the requirements as an exchange student.
-
Upload
khangminh22 -
Category
Documents
-
view
0 -
download
0
Transcript of Cost study for power system utilities - HBO Kennisbank

DEPARTMENT OF ELECTRICAL AND COMPUTER ENGINEERING
Cost study for power system utilities
Final Year Engineering Thesis, 2009
By
Sebastian Broecker
A thesis submitted to the Department of Electrical and Computer Engineering in partial
fulfillment of the requirements as an exchange student.

DEPARTMENT OF ELECTRICAL AND COMPUTER ENGINEERING
TITEL: Cost study for power system utilities
AUTHOR: Sebastian Broecker
FAMILY NAME: Broecker
GIVEN NAME: Sebastian
DATE: 12th
June 2009 SUPERVISOR: Dr. Ahmed Abu-Siada
DEGREE: Exchange with FH-Aachen Germany
and HSZuyd, Netherland
OPTION:
ABSTRACT:
This thesis presents the investigation of the costs of investing in a new transformer
compared to the maintenance of an existing one. A detailed research on the different
technical possibilities to maintain transformers has been conducted. Apart from that,
the transformer failures and the following cost issues are shown in this paper. Further
the Superconducting Magnetic Energy Storage (SMES) technology has been
compared with other technologies taking cost and technical aspects in consideration.
The paper includes description of SMES units and other available technologies.
INDEXING TERMS: Cost Study, Transformer, SMES, CAES, PHS, Batteries,
GOOD AVERAGE POOR
TECHNICAL WORK
REPORT PRESENTATION
EXAMINER: CO-EXAMINER:

I
SYNOPSIS
This thesis presents the investigation of the costs of investing in a new transformer
compared to the maintenance of an existing one. A detailed research on the different
technical possibilities to maintain transformers has been conducted. Apart from that,
the transformer failures and the following cost issues are shown in this paper. Further
the Superconducting Magnetic Energy Storage (SMES) technology has been
compared with other technologies taking cost and technical aspects in consideration.
The paper includes description of SMES units and other available technologies.

II
Sebastian Broecker Flat 46 Room 8, Don Watts House
Student No: 14257285 Kurrajong Village
Kyle Avenue, Bentley 6102
Western Australia
June 12th,
2009
Professor Syed Islam
Department of Electrical and Computer Engineering
Curtin University
Bentley
Western Australia WA 6102
SUBMISSION OF THESIS
Dear Sir,
I hereby submit the report ―Cost Study for power system utilities‖ as my thesis to meet
the requirements of the Department of Electrical and Computer Engineering in
completion of Engineering Project 402. This course was taken as part of an exchange
program to complete my degrees: ―Dipl.-Ing. (FH) Betriebswirtschaftliche Technik,
Studienrichtung Elektrotechnik‖ and ―Elektrotechniek, afstudeerrichting Commerciële
Techniek‖.
This report is entirely my own work except for the assistance received from my
supervisor and those mentioned in acknowledgements.
Yours Sincerely,
Sebastian Broecker

III
ACKNOWLEDGEMENTS The author would personally want to thank his supervisors Dr. Ahmed Abu-Siada
(Curtin), ing L.M.C. Muijtjens (HSZuid) and Prof. Dr.-Ing. Michael Trautwein (FH-
Aachen) for their guidance, patience and understanding.
He would also like to thank Doug Myers for verifying his work and checking if what
was required was being achieved. Thank you for the time and effort taken to explain
what needed to be rectified.
He would like to acknowledge Simon Fries and Günter Beißel of RWE for their help
in providing transformer information from a network operator view. More
acknowledgments go to William H. Bartley P.E. from Hartford Steam Boiler, Georg
Daemisch from DTC Daemisch Transformer Consult, Dr. Michael Steurer (Florida
State University) and Dr. Krischel (ACCEL Instruments GmbH) for clarifying found
data.
Last but not least I want to thank Sonia On Show for proofreading my thesis.

IV
TABLE OF CONTENTS
Synopsis ........................................................................................................................ I
Acknowledgements .................................................................................................... III
List of Figures ........................................................................................................... VII
List of Tables........................................................................................................... VIII
Acronyms ................................................................................................................... IX
1. Introduction ........................................................................................................... 1
1.1 Objectives ...................................................................................................... 1
1.2 Thesis Structure ............................................................................................. 1
2. Transformer .......................................................................................................... 3
2.1 Technical Theories of Transformers ............................................................. 3
2.2 Transformer Failures ..................................................................................... 7
2.2.1 Winding .................................................................................................. 8
2.2.2 Core ...................................................................................................... 10
2.2.3 Isolation ................................................................................................ 11
2.2.4 Tank...................................................................................................... 12
2.2.5 Bushings ............................................................................................... 13
2.2.6 Oil & cooling system ........................................................................... 13
2.2.7 Load Tap-Changer ............................................................................... 15
2.3 Maintenance and Diagnostics ...................................................................... 16
2.3.1 System requirements ............................................................................ 17

V
2.3.2 Dissolved gas analysis ......................................................................... 23
2.3.3 Maintenance versus new transformer................................................... 27
2.4 Transformer costs ........................................................................................ 29
2.4.1 Failure Rate .......................................................................................... 29
2.4.2 Price of a new Transformer .................................................................. 33
2.4.3 Cost of maintenance ............................................................................. 34
2.5 Summary .......................................................................................................... 36
3. Superconducting magnetic energy storage Unit (SMES) ................................... 37
3.1 SMES ........................................................................................................... 37
3.1.1 Technical Description .......................................................................... 37
3.1.2 Application areas .................................................................................. 40
3.2 Other comparable technologies ................................................................... 46
3.2.1 Introduction .......................................................................................... 46
3.2.2 Flywheel ............................................................................................... 46
3.2.3 Electrochemical Capacitors[44] ........................................................... 47
3.2.4 Pumped Hydroelectric Storage (PHS) ................................................. 49
3.2.5 Compressed air energy storage (CAES) .............................................. 50
3.2.6 Thermal energy Storage ....................................................................... 51
3.2.7 Batteries................................................................................................ 52
3.2.8 Flow batteries ....................................................................................... 55
3.2.9 Solar fuels ............................................................................................ 56

VI
3.3 Comparison ................................................................................................. 57
3.3.1 Technical .............................................................................................. 57
3.3.2 Costs ..................................................................................................... 60
3.4 Summary ..................................................................................................... 62
4. Conclusions and future work .............................................................................. 64
4.1 Conclusion ................................................................................................... 64
4.2 Future Work ................................................................................................ 64
5. References ........................................................................................................... 66
Appendix A ................................................................................................................ 70
Appendix B ................................................................................................................ 70
Appendix C ................................................................................................................ 71
Appendix D ................................................................................................................ 72
Appendix E ................................................................................................................ 73

VII
LIST OF FIGURES
Figure 2-1: schematic view of a non ideal transformer ................................................ 5
Figure 2-2: Transfomer buckling after short circuit (source RWE[10]) .................... 12
Figure 2-3: Example oil colours for a regeneration (Source ABB) ........................... 15
Figure 2-4: Picture MS 2000 used by Alstom ............................................................ 17
Figure 2-5: Cellulose degeneration[10] ..................................................................... 21
Figure 2-6: Reduction of reserve of wear-out and afterwards regeneration .............. 28
Figure 2-7: Bathtub Curve by Georg Daemisch[26] .................................................. 29
Figure 3-1: Block diagram of SMES[32] ................................................................... 38
Figure 3-2: A typical power control system with an SMES unit to balance a
fluctuating load[32] .................................................................................................... 41
Figure 3-3: SMES system for defending all critical bus loads[32] ............................ 42
Figure 3-4: SMES system for defending distributed critical loads[32] ..................... 43
Figure 3-5: System performance under small disturbance (without SMES) [40] ...... 43
Figure 3-6: System performance under small disturbance (with SMES)[40] ............ 44
Figure 3-7: Cleaned supply voltage with the help of a SMES Unit[43] .................... 45
Figure 3-8: Eletrochemical Capacitors [1] ................................................................. 48
Figure 3-9: Schematic diagram of PHS [45] .............................................................. 49
Figure 3-10: Schematic diagram of CAES [31] ......................................................... 50
Figure 3-11: Principle of the NAS Battery[46] .......................................................... 54
Figure 3-12: Schematic overview of a redox flow cell energy storage system[48] ... 55
Figure 3-13 Schematic of solar energy conversion into solar fuels[49] .................... 56
VIII
LIST OF TABLES
Table 2-1: ASTM Standards [17] ............................................................................... 14
Table 2-2: Sensor configuration often used by RWE[10] .......................................... 18
Table 2-3: Dissolved key gas concentration limits [μL/L (ppm) ] ............................. 24
Table 2-4: Example Roger Ratio Method .................................................................. 27
Table 2-5: Cause of Failures by Hartford Steam Boilder Inspection & Insurance
Company .................................................................................................................... 31
Table 2-6: Number and amounts of losses by year .................................................... 33
Table 3-1: Technical comparison of different technologies[31] ................................ 58
Table 3-2: Technical comparison of the technologies (sources: [31, 44, 49]) ........... 59
Table 3-3: Costs of the different technolgies (main source: [31] + different others
([44, 49, 51])) ............................................................................................................. 61

IX
ACRONYMS
A/D converter analog-to-digital converter
ASTM American Society for Testing and Materials
CAES Compressed air energy storage
CES cryogenic energy storage
CS cryogenic system
CTC continuously transposed cable
CU control unit
DBPC Di Butyl Para Cresol
DGA dissolved gas analyses
DP degree of polymerization
DSP digital signal processor
EES Electrical Energy Storage
FRA frequency response analyse
FRA frequency response analyse
HTS high-temperature conducting coils
IEC International Electrotechnical Commission
LA Lead acid batteries
LTS low-temperature conducting coils
PCS power conditioning system
PHS pumped Hydroelectric Storage
SCM superconducting coil with the magnet
SMES superconducting magnetic energy storage unit
TDCG total dissolved combustible gas
TES Thermal energy Storage
UPS uninterruptible power supply

1
1. INTRODUCTION
Every year millions of dollars are lost through failures in power transformers. Apart
from that, the liberalisation of the energy market in the last years (especially in
Europe) puts high pressure on the different operators to review their maintenance
programs and to work more efficiently. Therefore the desire to save costs in
maintenance and operation of power system utilities is very high.
Further the need for storage applications and high quality energy rises to gain a
higher efficiency or to work with nowadays applications. This is obvious if the
growth of the market of alternative energies is considered. Energy produced through
wind or sun power is only available during specific times and has to be saved if it
should be provided all day long.
1.1 Objectives
Therefore the objectives of the thesis are:
To study the costs of power transformer regular maintenance and comparing
it with the current price of a new power transformer
To investigate the economic use of superconducting magnetic energy storage
(SMES) units in Power System application and to compare its costs with
other available technologies.
1.2 Thesis Structure
This thesis is divided into two different and very distinct parts: chapter 2 and 3.
These chapters have then been broken down into detail.

2
Chapter 2 starts with the cost research of the transformers. It gives a technical
overview of a transformer, the different maintenance difficulties and monitoring
possibilities that could solve these. A research on the costs is then made.
Chapter 3 is about the SMES unit and other available technologies. The techniques
of SMES units and descriptions of alternative technologies are also given.
The paper ends with a final summary of what has been found and provides
recommendations for possible future research.

3
2. TRANSFORMER
A transformer is a device that is part of an energy converting system. In this
conjunction, a transformer can be found in low power but as well in the high power
areas. It is an elementary element in the transfer of energy from the power plants to
the customers. Through a transformer, it is possible to work on an economic
generator voltage but as well as on the power utilisation needed by a specific device.
Depending on the application the transformers are of different sizes, ranging from
fingernail size units to multi-ton giants for power stations[2]. In this paper the main
focus is to look at power transformers for power factories.
2.1 Technical Theories of Transformers
A transformer has two or more coils. These coils are called primary winding and
secondary winding. If a power source is connected to one of these coils, a flux links
them. This flux depends on the voltage of the power source, its frequency and the
number of turns (N) of the windings. Through the flux, a voltage is induced in the
secondary winding, which depends on the turns in the latter, ‗the magnitude of the
mutual flux and the frequency‘[3]. Generally, the windings could be connected
through the air but because of efficiency reasons this is mostly done with
ferromagnetic materials such as iron. Such transformers are called iron-core
transformers.
The winding (normally the primary one) that is connected to a power source has
fewer amounts of turns than the secondary one, the voltage on the secondary winding
is stepped down. If on the other hand, it has more turns than the secondary one, the
voltage goes up. This is shown in the following equation:
4
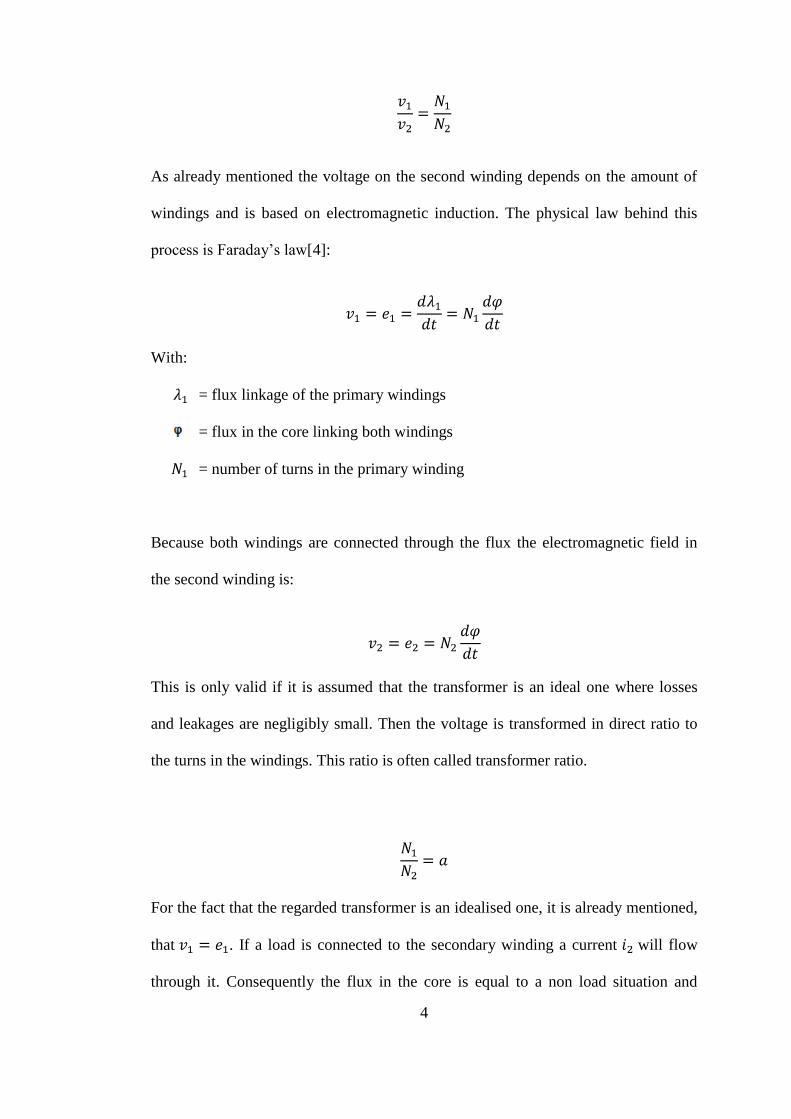
As already mentioned the voltage on the second winding depends on the amount of
windings and is based on electromagnetic induction. The physical law behind this
process is Faraday‘s law[4]:
With:
= flux linkage of the primary windings
= flux in the core linking both windings
= number of turns in the primary winding
Because both windings are connected through the flux the electromagnetic field in
the second winding is:
This is only valid if it is assumed that the transformer is an ideal one where losses
and leakages are negligibly small. Then the voltage is transformed in direct ratio to
the turns in the windings. This ratio is often called transformer ratio.
For the fact that the regarded transformer is an idealised one, it is already mentioned,
that . If a load is connected to the secondary winding a current will flow
through it. Consequently the flux in the core is equal to a non load situation and

5
therefore there must be a current forced by . It is already said, that the magnetic
field of the primary current must be opposite and equal to
Accordingly the primary the secondary currents of the transformer are transformed in
the inverse ratio of turns[5].
In contrast to that, a non-ideal transformer is not lossless. It starts with a resistance in
the winding which results in the input not being equal to the output voltage. It is
important to remember this during the dimensioning progress of a transformer[3].
Consequently the voltage in the winding is not exactly equal to the magnetic field
which results in efficiency less than 100%.
A second difference to an ideal transformer is leakage. The flux created by the
winding flows not only through the iron core. A part of it - the leakage flux – goes
through the air. Figure 2-1 describes a non ideal transformer including the leakage
and resistances in it.
Figure 2-1: schematic view of a non ideal transformer
V1
R1 R2
ZL
ΦmjX1 jX2
I1
+
-
I2
+
E1
-
+
E2
-
+
V2
-

6
Apart from that there are different types of transformers. One example is a
multiwinding transformer. This transformer has three or more windings to connect
different circuits with different voltages to one transformer. This can also be done by
using more than one transformer. However, it is not efficient and of course not
economic.
Another transformer type is an autotransformer.[6] This is similar to a normal two-
winding transformer with the exception that the two windings are connected
electrically or in another case only one winding with common turns is used. Because
of that, the high and the low voltage sides are not isolated from each other. The
autotransformer can be used in almost all areas where a two-winding transformer is
used with the advantage that it is cheaper, has more power and is more efficient in
similar power ratings. Nevertheless there is no isolation between the two voltages
sides.
The third type of transformer is the three-phase transformer. In this application area,
a bank of three single-phase transformers can be connected to get a three-phase
circuit (Δ or Y connection) or there is the possibility to use a three-phase transformer.
In the case where three different single phase transformers are used, there are several
ways to connect these to build a three-phase circuit.
The following summary gives a small overview[6] of possible connections to build a
three-phase transformer bank:
Y–Δ: This connection type is often used for step down applications, like high
voltage to low voltage. The characteristic of this connection is that the
neutral point of the high voltage side can be grounded.

7
Δ –Y: This configuration is used for step up voltage.
Δ–Δ: In this configuration, one transformer can be removed for maintenance or
repair while the other two will still operate as a three-phase bank but with a
rating reduced by 32%. Another name for this configuration is open-delta or
V connection.
Y–Y: This is a configuration that is seldom used due to problems with exciting
current and induced voltages.
Three-phase transformers are mostly used in the power factories and therefore
investigated in this paper. Appendix E provides an illustration of the connection type.
2.2 Transformer Failures
A typical power transformer has a life expectancy of more than 30 years[7]. During
this time it is obvious that such a device has several failures, thus needing
maintenance to ensure that the expectancy is fulfilled. Because transformer failures
are responsible for a very high amount of costs, this section is based on different
studies about transformer failures. The cost side of the failures is observed in section
2.4.
William H. Bartley P.E, The Hartford Steam Boiler Inspection & Insurance Co., has
done a research on 94 different cases of failures and their losses. In this study, he
figured out, that in the period of 1997 to 2001 the total loss in 94 cases was over
US$280,000,000[8] in the US only. This makes it clear why compensation of
transformer failures is important. Apart from that, the different application types are
researched and it is shown that most of the failures occur in the utility substations (38
cases). Anyway, only 6% of the loss is generated in this area. In total 36 failure cases

8
in the step up generator area generate 70% of the total losses. Most of the total
failures are insulation faults (24 failures generate a loss of about US$150,000,000).
More detailed information about the HSB research is available in section 2.4.1.
Another study which was published by the CIGRE Working Group 05 [9] took
another approach. In that study the failure source was attributed to the different parts
in a transformer. The result was that 40% of the failures were caused by the on-load
tap-changers.
The problem with investigating different studies about this topic is that their
definition and characterisation of the failure groups are often different. A common
denominator has therefore been sought in these studies. Apart from that, information
provided by the German RWE AG[10] (German power company) is integrated in
this section.
The failures are therefore separated to: winding, core, isolation, tank, bushing, oil,
cooling and the load tap-changer. In this subsection, information is provided about
the failures, their impacts on the transformer and typical reasons why these failures
could occur. Moreover, fault trees for the different transformer parts can be found in
the work of Anna Franzén and Sabina Karlsson from the Royal Institute of
Technology, Stockholm[11].
2.2.1 Winding
A winding is the part of a transformer most susceptible for failures. In this area
winding deformations are responsible for 12% to 15% of the transformer failures
according to [12]. The reason for these deformations is often the high
9
electrodynamics effort taking place during short circuits. Consequently, these
deformations can be responsible for the occurrence of further deformations.
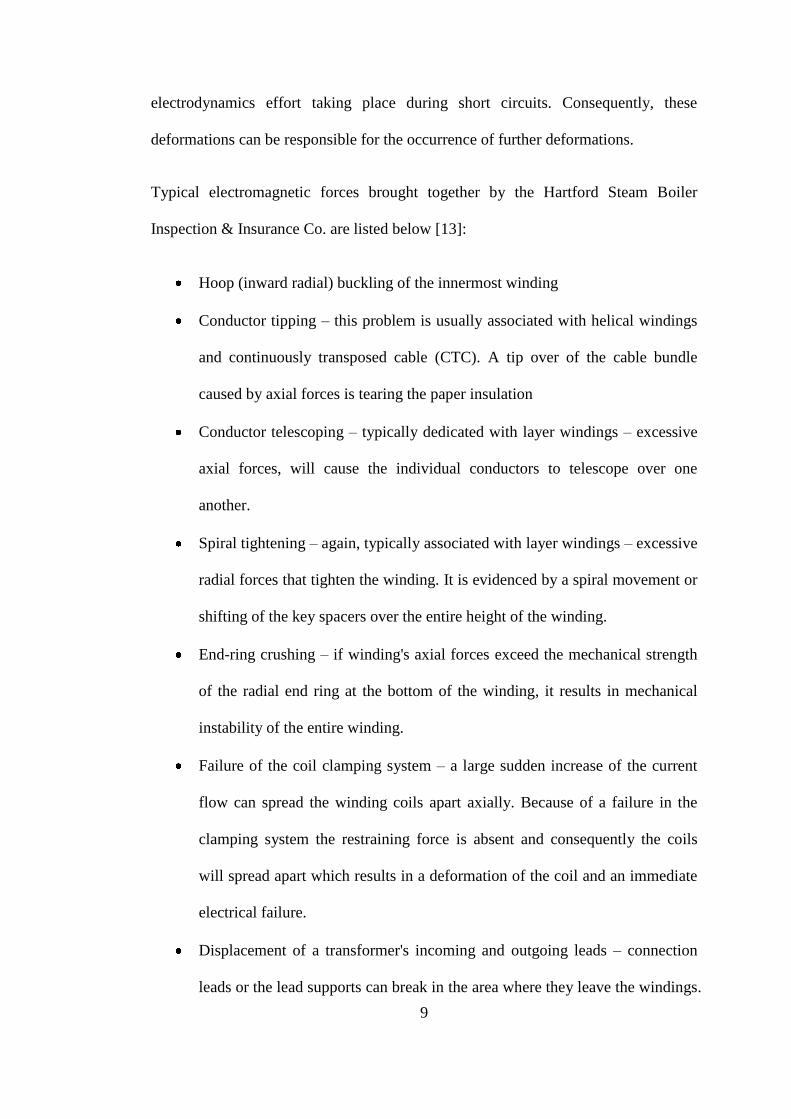
Typical electromagnetic forces brought together by the Hartford Steam Boiler
Inspection & Insurance Co. are listed below [13]:
Hoop (inward radial) buckling of the innermost winding
Conductor tipping – this problem is usually associated with helical windings
and continuously transposed cable (CTC). A tip over of the cable bundle
caused by axial forces is tearing the paper insulation
Conductor telescoping – typically dedicated with layer windings – excessive
axial forces, will cause the individual conductors to telescope over one
another.
Spiral tightening – again, typically associated with layer windings – excessive
radial forces that tighten the winding. It is evidenced by a spiral movement or
shifting of the key spacers over the entire height of the winding.
End-ring crushing – if winding's axial forces exceed the mechanical strength
of the radial end ring at the bottom of the winding, it results in mechanical
instability of the entire winding.
Failure of the coil clamping system – a large sudden increase of the current
flow can spread the winding coils apart axially. Because of a failure in the
clamping system the restraining force is absent and consequently the coils
will spread apart which results in a deformation of the coil and an immediate
electrical failure.
Displacement of a transformer's incoming and outgoing leads – connection
leads or the lead supports can break in the area where they leave the windings.

10
Because of this, it is necessary to detect this deformation early to prevent further
damages. Apart from that, winding deformations can occur because of transportation
progresses.
Furthermore the ageing of the isolation has effects on the strength of the winding.
More detailed information about that can be found in the isolation section 2.2.3.
Unfortunately it is hard to determine how much money is lost because of failures in
the winding directly. According to the paper of V. Sokolov[14] short circuits are
mostly responsible for winding failures. It is also possible that an error in some other
areas can have influences on the winding. This is also clear from the examination of
the different fault protocols provided through the German[10] RWE-Group. The
different failure entries show that eight failures are categorised as winding failures.
Unfortunately, entries in failure databases are often voluntary and consequently only
a small amount of failures can be found in it. Only one case shows that the reason for
a failure in the transformer winding is caused by a defect in the cooling system. In
this case the transformer was used for one year in a different facility where the
cooling system was polluted. This results in a raise of the solute gases and thereupon
in different discharge labels. The other entries very often suggest short circuits as
failures but they do not mention why it is caused. For more information, [11]
provides the fault trees of the winding.
2.2.2 Core
The transformer core is carrying the magnetic flux[4]. In this task it is very robust
but an error could occur during the construction, or through a transportation progress.
Apart from that, the maintenance, if necessary, requires the removal of oil and the

11
isolation. This again is not recommended, because the failure risk increases through
this process. The aging progress of the core is negligible in comparison to the other
transformer parts. If there is really a failure in the core, it becomes normally visible
through a hotspot and is therefore more or less easily diagnosable.
2.2.3 Isolation
Another issue could be the isolation paper which is wrapped around the winding [10,
15, 16]. This paper is made of cellulose and consists of glucose chains. If the
cellulose is exposed a thermal overstressing (>105 °C) the polymer chain begins to
break. This expands if the temperature exceeds 300 °C and results in a total
decomposition with water (H2O) and carbon (CO2, CO) as residue. Likewise, some
carbon gases and furan derivates occur and can be disposed during the gas analysis.
The degree of polymerisation (DP) is therefore a quantity to discuss the quality of the
paper. This DP value says something about the average number of glucose units per
molecular chain. New papers normally have a DP value of 1200-1400[10]. With the
rise of the temperature, the aging of the paper is therefore enforced. Apart from that
the process is accelerated about three times if O2 is in the process and about 8-10
times if the concentration of H2O is higher than 2%. If the DP value is smaller than
200, it is generally said that the paper is not able to withstand shortcuts or
mechanical forces anymore. Therefore it is important to know the DP value of the
cellulose.
If the quality of the isolation is going down it often results in short-circuits. As
mentioned before, the isolation is wrapped around the winding and therefore it is
obligatory to have a good isolation for a high fault protection.

12
2.2.4 Tank
The transformer tank is the container of all the parts inside a transformer[6]. It
protects these parts from external influences and damages. It carries the oil and
should therefore be checked for leakage and corrosion. Besides that a transformer
tank could be damaged during transportation. Another risk for the tank is the
previously mentioned forces during short circuits. These short circuits often result in
high forces, as already mentioned in the winding section 2.2.1, which can deform the
tank as can be seen in Figure 2-2.
Figure 2-2: Transfomer buckling after short circuit (source RWE[10])
According to experienced data [10] of the German RWE, a massive deformation of a
tank often resulted in a total breakdown of a transformer. Consequently the last
solution is the scrapping of the transformer.
13
2.2.5 Bushings
The bushings are responsible to connect the inside of the transformer with the outside
and to isolate the winding from the tank. Therefore they are designed to even
withstand overvoltage and fault currents.
In this area there are two common different bushing types[3, 11]. The first one is the
solid bushing which has a central conductor and epoxy-insulators or porcelain at the
end. These bushings are used in all sorts of transformers. The other type of bushings
is called capacitance-graded bushings which are mostly used for voltages > 25kV.
Typical failure causes include pollution and moisture. This can result in isolation
failures. Apart from external forces (movements, e.g. in earthquake risked areas),
sometimes even sabotage (e.g. stone throwing) could affect the bushing. Aging or
overheating have effects on a bushing too. This is a reason why the condition of the
bushings should be checked regularly. As a consequence of a bushing failure, it is
even possible that additional transformers close to the affected one are damaged.
2.2.6 Oil & cooling system
The oil and cooler part are responsible for cooling the transformer during its work to
bring it to optimal working conditions[11]. Because of that, both properties are
considered together. The transformer could fail if the cooler cannot cool the
equipment. This could happen because of a non-functioning cooling element or
circulation not happening. Therefore it is important to check if the different pumping
systems are working correctly. Another failure could occur because of the secondary
cooling system (oil or water).

14
The oil not circulating properly again has influences on the isolation. As already
mentioned in section 2.2.3 this affects the isolation paper and in turn it affects the
aging process of the oil.
Because the oil is important in the isolation task it is necessary to check if this
product is of high quality. The quality of the oil decreases during the aging progress
of the transformer. It is usually of good quality if the transformer is new but during
the aging process, moisture and oxygen reduce the isolation functionality of the
transformer. If this happens, it can result in a short circuit which can damage other
parts of the transformer or at least accelerate the aging progress. More detailed
information about the oil can be found in the diagnostic chapter 2.3.2 and in detail in
the ASTM standards.
The different standards are shown in the table below.
Table 2-1: ASTM Standards [17]
Table IV. Insulating Oil Tests
Type of Test ASTM Method Significance/Effects
Dielectric Breakdown D877, D1816 Moisture, particles, cellulose fibres/lower dielectric
strength
Neutralization Number D644, D974 Acidic products from oil oxidation/ sludge,
corrosion
Interfacial Tension (IFT) D971 Presence of polar contaminants, acids, solvents,
varnish
Colour D1500 Darkening indicates contamination or deterioration
Water Content D1533 Excessive paper decomposition/lower dielectric
strength
Power Factor D924 (100, 25 C) Dissolved metals, peroxides, acids, salts/overheating
Oxidation Inhibitor (DBPC1) D2668, D1473 Low levels results in accelerated oil aging
Metals in Oil Indicative of pump wear, arcing or sparking with
metal
1 DBPC— Di Butyl Para Cresol

15
The figure below shows the different colours of oil after the ASTM standard. Dark
oil indicates a deterioration of the isolation properties. The aging is indicated by the
smell getting worse.
Figure 2-3: Example oil colours for a regeneration (Source ABB)
Generally, moisture and pollution promote the occurrence of failures in connection
with the oil in almost the same manner as a non-functional cooling system or one
with bad circulation. Therefore it is important to make sure that the active parts of
the cooling system like fans and pumps are working properly and that a potential
breakdown of these elements is taken account in the diagnostics.
2.2.7 Load Tap-Changer
The load tap-changer is one of the most important and susceptible parts of a power
transformer. It has the task to regulate the voltage level by adding or subtracting
turns without interrupting the load current. A principle function of a tap-changer is
provided in [18]. It is the only direct element of a transformer which has moving
parts and this is one of the reasons why a tap-changer is highly susceptible for
failures. According to CIGRE Workgroup[9], units with a load tap-changer have
failure origins of up to 40% in the tap-changer.
In general, there are two different types of failure in the tap-changer. The first failure
occurs in the tap-selector. If there is overstressing of the material, mechanical

16
damage can occur and consequently the tap-selector cannot change taps anymore.
This malfunction can result into sparking or overheating.
If an error occurs in the diverter switch, a short-circuit can even affect other parts of
the transformer. This is caused by old oil or other aged components. Therefore it is
important to know the actual condition of the tap load-changer. More information
about this is provided in the diagnostic section 2.3.1.
It has to be mentioned that the area in which the transformer is used makes a
difference. According to RWE the tap-changer failures are significantly higher in
transformers that operate in the network than in a power plant factory because of the
higher amount of switching operations. If a transformer is undergoing renovation at
the manufacturer, the tap-changer should be changed anyway.
2.3 Maintenance and Diagnostics
The most important to avoid transformer failures is good maintenance. For the fact
that this point is a high economic issue, the trend in the last years has changed from
time-based to condition-based maintenance. The key for this is a good diagnostic of
the different parts to recognise failures before they occur or at least before they do
considerable damage to the equipments. Therefore the different companies dealing
with transformers and producing them have upgraded their systems with high quality
monitoring systems. It is fundamental to know the quality of a device if condition-
based maintenance should be economic. In this area there are several online and
offline test possibilities that give the operator a hint if maintenance is necessary.
Therefore these next sections deal with the requirements and the possibilities of
maintenance and diagnostic systems.

17
2.3.1 System requirements
A diagnostic system for a transformer should always be built in modular way[19].
This is important so that afterwards other parts of the transformer which need to be
monitored can be expanded. Another factor to consider is that diagnostic system
should not affect the transformer operations. Even if the diagnostic system breaks
down the transformer needs to stay in operation mode. Taking this into account a
plausibility control of the different measurement values could be integrated.
Apart from that a monitoring system should be dimensioned in a way that possible
strategic points are controlled. Therefore the systems exist out of different modules
like sensors, signal converters (A/D Converter), data communication systems
(Ethernet, field bus, cooper cable, optic fibre ...), processors and signal annunciators.
Figure 2-4: Picture MS 2000 used by Alstom
A system that could solve all the different requirements could be for example the
AREVA MS 3000 (see Figure 2-4 for picture of MS 2000). This system brings
different possibilities to the operators, which allow them to store data, make
simulations or generate reports from it. But this system only provides the processing

18
of the data. The different sensors used to record the information have to be chosen by
the operator of the transformer.
Therefore, Table 2-2 provides an example configuration, which could be an
indication of how many sensors should be placed on which part of the transformer.
This table is only for orientation and has to be adapted according to the requirements
of the operator and the transformer.
Table 2-2: Sensor configuration often used by RWE[10]
Sensor < 100 MVA > 100 MVA
Bushings operating-/overvoltage 1 3 Operating current and over-currents 1 3 Oil pressure - 3
Active component
/ tank
Oil temperature 1 1 Gas in oil concentration 1 1 Oil moisture 2 2
On load tap
changer
Switch setting 1 1 Power input motor drive 1 1 Oil temperature - 1
Cooling system
Operating state of pumps and fans 8 8 Inlet-/Outlet temperature of the oil - 8 Air outlet temperature - 4 Environmental temperature 2 1
Expander Oil level - 2 Humidity - 2
Sensors
Sensors convert chemical or physical characteristics into electrical signals. The
sensors are categorised in active and passive ones. Active sensors do not need an
auxiliary supply, but it is only able to show a change in the measurement and not in
the absolute value. If this is not satisfactory, an active sensor which operates with an
auxiliary supply has to be chosen to show the static value of the measurement.

19
Bushings
It is important to know the different operation voltages on the different bushings.
These are captured by capacitive voltage sensors. Because of this overvoltage and
transient overvoltage can be easily detected. It could be also useful to know the
length of the overvoltage to provide afterwards an easier diagnostic if any damage
occurs.
Active part/ tank
Because of a general measurement of the load current and the operating voltage
theses values could be used to infer on the aging process of the winding insulation.
Moreover IEC 60354[20] describes how to identify the hotspot temperature without
direct measurements. In this method the oil temperature and the current is used to
conclude onto the hotspot temperature.
The constant oil temperature is not only important for the hotspot temperature that
has a direct influence on the aging of the transformer; it is also important to avoid the
generation of condense water through breathing. It is important to be aware about the
maximal duration of an overload and how it suits the transformer.
If the cooling system is also integrated in the monitoring, it is possible to draw
conclusions of the mentioned values and use them to control the cooling system. This
can have direct influence on the generation of moisture. Apart from that a possible
overload could be avoided by pre-cooling the transformer oil.

20
Winding
For the fact that winding deformation often results in vibrations, the paper of García
Belén, Burgos Juan Carlos and Alonso Ángel [12] describes a model to detect these
deformations. These can be measured through the tank vibrations and depend on the
voltage, the current, the temperature and if it is cooled (oil pump on/off) or not. In
this case, a deformation results in an increase of the 100Hz vibration harmonic.
Conducting these tests during normal operation time it can help to detect failures at
an early stage.
Another possibility is an offline test during maintenance. This is normally done
through a frequency response analysis (FRA). In this test, a fingerprint of the
transformer is made which is compared with fingerprints during former maintenance.
Through the different fingerprints respectively the variation, it is possible to draw
conclusions on the deformation.
Apart from that, the winding resistance could be measured to measure future possible
winding deformations. For this measurement it is important to record the oil
temperature since the temperature is a factor that influences the winding resistance.
More information about the different possibilities can be found in the diagnostic
chapter.
Isolation
The DP value or the tensile strength of the paper is not measurable while the paper is
energised it is common to conduct an indirect measurement[21]. Consequently it is
likely to take advantage of the fact, that during the aging progress a chemical
reaction takes place which results in the disposal of derivatives of 2-furaldehyde.

21
These furanics are dissolved in the transformer oil and can be analysed without the
need to de-energise the transformer.
This analysis describes five different derivatives (5HMF, 2FOL, 2FAL, 2ACF and
5MEF). Apart from 2FAL all other furanic components are unstable and normally
degrade after several months. Nevertheless, if certifiable, the different furanic
components are indicators of different possible failures.
It is absolutely necessary to take into account that there is a possibility that oil
maintenance reduces the furanic components and therefore the result is wrong if it is
investigated separately. Consequently, these results, like others, should be seen as a
trend line review and not on their own. From one result it is not possible to conclude
if there are any problems with the transformer or if the transformer is at the end of its
lifetime. This is an important reason why a regular maintenance and evaluation of the
encountered data is so important.
A possibility to find out the DP value through the oil analysis is the „de-Pablo-
Relation―[22]:
In this equation, the F is the furan content in ppm.
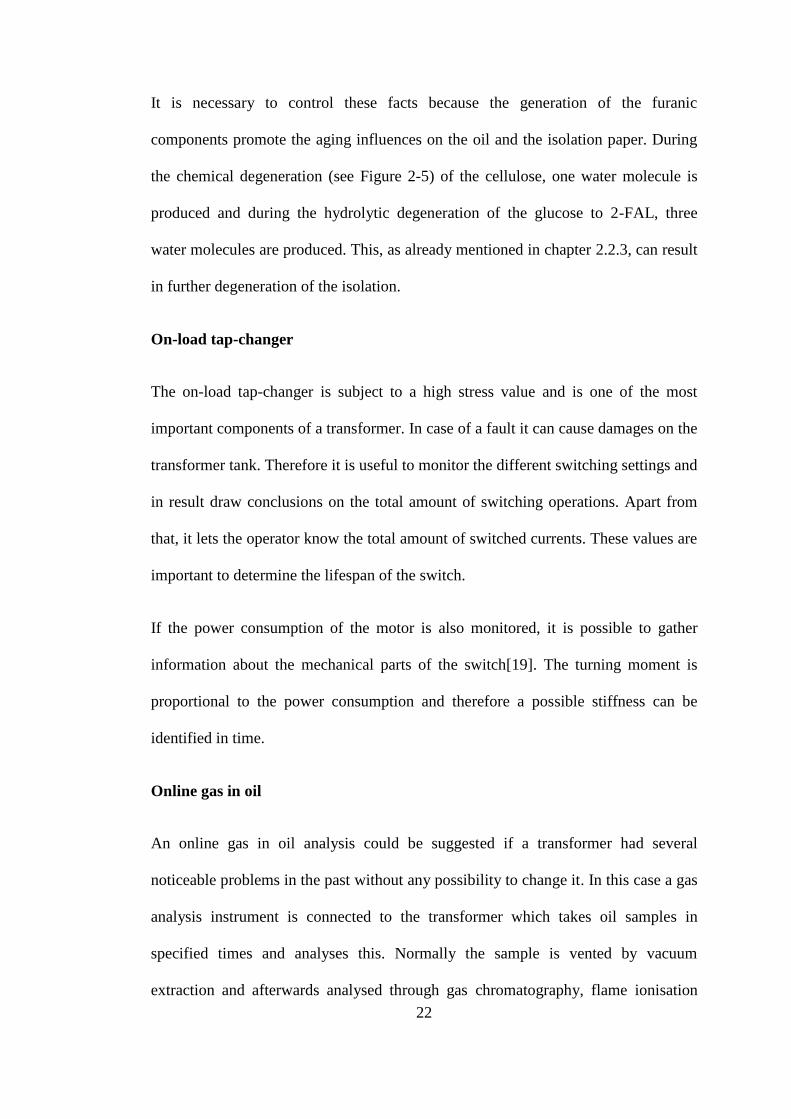
Figure 2-5: Cellulose degeneration[10]
Chemical degeneration Hydrolytic degeneration Cellulose
Glucose
2-FAL
H2O H2O H2O H2O
22
It is necessary to control these facts because the generation of the furanic
components promote the aging influences on the oil and the isolation paper. During
the chemical degeneration (see Figure 2-5) of the cellulose, one water molecule is
produced and during the hydrolytic degeneration of the glucose to 2-FAL, three
water molecules are produced. This, as already mentioned in chapter 2.2.3, can result
in further degeneration of the isolation.
On-load tap-changer
The on-load tap-changer is subject to a high stress value and is one of the most
important components of a transformer. In case of a fault it can cause damages on the
transformer tank. Therefore it is useful to monitor the different switching settings and
in result draw conclusions on the total amount of switching operations. Apart from
that, it lets the operator know the total amount of switched currents. These values are
important to determine the lifespan of the switch.
If the power consumption of the motor is also monitored, it is possible to gather
information about the mechanical parts of the switch[19]. The turning moment is
proportional to the power consumption and therefore a possible stiffness can be
identified in time.
Online gas in oil
An online gas in oil analysis could be suggested if a transformer had several
noticeable problems in the past without any possibility to change it. In this case a gas
analysis instrument is connected to the transformer which takes oil samples in
specified times and analyses this. Normally the sample is vented by vacuum
extraction and afterwards analysed through gas chromatography, flame ionisation

23
detector and methane ioniser[10]. The results can be used afterwards for further
investigations. It is also possible to show up a trend if different results are saved. If
the results of the online gas-in-oil analysis are not adequate, the results can be
checked by doing an offline analysis. While the latter is not necessary, the results
could be useful to control online tests during planned maintenance. Either way the
online results can be useful to help change the cooling process or to do forecasts
about the life of the transformer.
Apart from that it is a big advantage that the amount of offline tests can be reduced
and consequently the downtimes as well. With the help of this online test results, a
necessary maintenance could be better planned and sometimes conducted during the
operation of the transformer.
2.3.2 Dissolved gas analysis
This section provides an overview of interpretation of the dissolved gas analysis
(DGA) results. Therefore, two different methods are described to provide advice on
the different failures in the transformers.
Key Gas Method
This method is established by the IEEE[23] and is based on the generation of gases
inside the transformer oil. Therefore the hydrogen (H2), methane (CH4), ethane (C2
H6), ethylene (C2 H4), acetylene (C2 H2), carbon monoxide (CO), and oxygen (O2)
concentration are measured and this make it possible to draw conclusions on the
condition of the transformer.

24
All these gases are generated through the degeneration of the transformer oil itself
except carbon monoxide and oxygen. O2 and CO and CO2 are results of the
degeneration of the cellulose paper. Apart from that it is possible that the latter,
nitrogen (N2) and moisture are absorbed from the air.[23]
The IEEE has developed a four-condition criterion that makes it possible to assess
the risk of failures. This criterion should only be used if no previous gas analysis is
available. In other cases the previous results have to be taken into account.
The condition of the different transformers is determined by finding the highest level
for the individual gases or the total dissolved combustible gas (TDCG)[23].
Therefore, it is assumed that the transformer is categorised in that condition in which
the worse gas belongs to (gas or TDCG).
Table 2-3: Dissolved key gas concentration limits [μL/L (ppm)2 ]
Status H2 CH4 C2H2 C2H4 C2H6 CO CO2 TDCG3
Condition 1 100 120 1 50 65 350 2500 720
Condition 2 101–
700
121–
400
2–
9
51–
100
66–
100
351–
570
2500–
4000
721–
1920
Condition 3 701–
1800
401–
1000
10–
35
101–
200
101–
150
571–
1400
4001–
10000
1921–
4630
Condition 4 >1800 >1000 >35 >200 >150 >1400 >10000 >4630
Condition 1: Total dissolved combustible gas (TDCG) below this level indicates the
transformer is operating satisfactorily. Any individual combustible gas exceeding
specified levels in Table 2-3 should have additional investigation.
2 ―The numbers shown in the table are in parts of gas per million parts of oil [μL/L (ppm)]
volumetrically and are based on a large power transformer with several thousand gallons of oil. With a
smaller oil volume, the same volume of gas will give a higher gas concentration. Small distribution
transformers and voltage regulators may contain combustible gases because of the operation of
internal expulsion fuses or load break switches. The status codes in Table 1 are also not applicable to
other apparatus in which load break switches operate under oil.‖ [23]
3 ―The TDCG value does not include CO2, which is not a combustible gas.‖ [23]
25
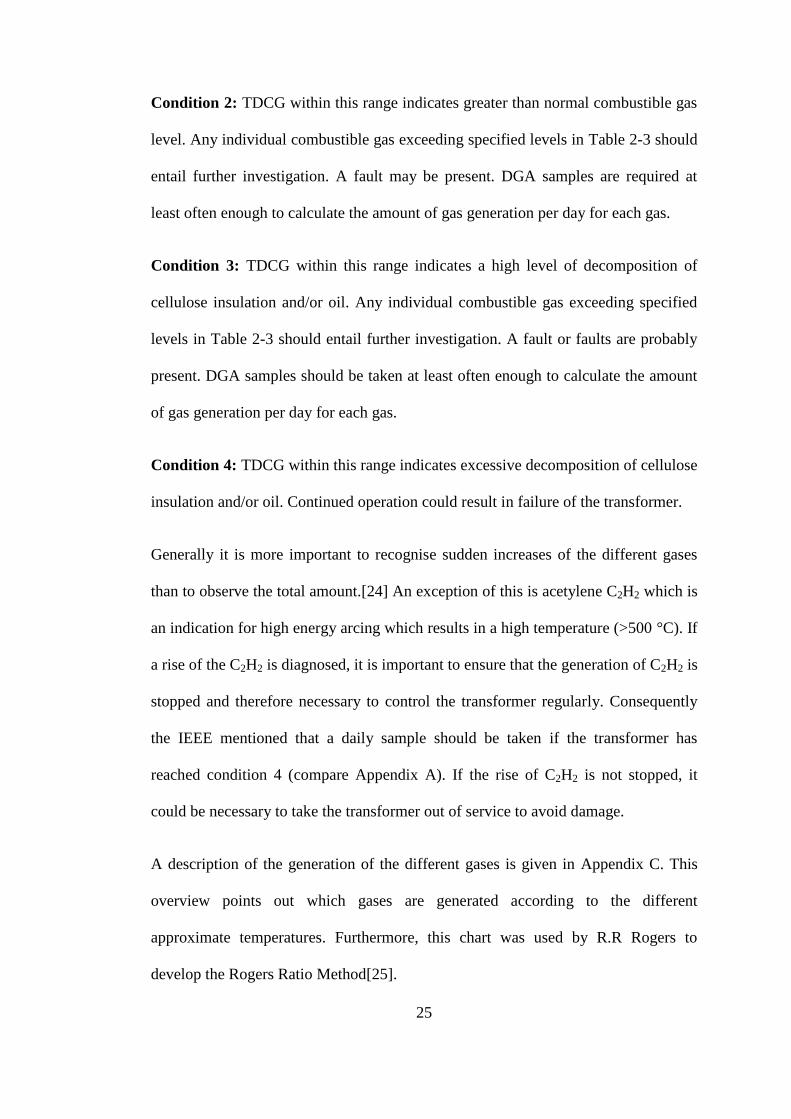
Condition 2: TDCG within this range indicates greater than normal combustible gas
level. Any individual combustible gas exceeding specified levels in Table 2-3 should
entail further investigation. A fault may be present. DGA samples are required at
least often enough to calculate the amount of gas generation per day for each gas.
Condition 3: TDCG within this range indicates a high level of decomposition of
cellulose insulation and/or oil. Any individual combustible gas exceeding specified
levels in Table 2-3 should entail further investigation. A fault or faults are probably
present. DGA samples should be taken at least often enough to calculate the amount
of gas generation per day for each gas.
Condition 4: TDCG within this range indicates excessive decomposition of cellulose
insulation and/or oil. Continued operation could result in failure of the transformer.
Generally it is more important to recognise sudden increases of the different gases
than to observe the total amount.[24] An exception of this is acetylene C2H2 which is
an indication for high energy arcing which results in a high temperature (>500 °C). If
a rise of the C2H2 is diagnosed, it is important to ensure that the generation of C2H2 is
stopped and therefore necessary to control the transformer regularly. Consequently
the IEEE mentioned that a daily sample should be taken if the transformer has
reached condition 4 (compare Appendix A). If the rise of C2H2 is not stopped, it
could be necessary to take the transformer out of service to avoid damage.
A description of the generation of the different gases is given in Appendix C. This
overview points out which gases are generated according to the different
approximate temperatures. Furthermore, this chart was used by R.R Rogers to
develop the Rogers Ratio Method[25].

26
Rogers Ratio Method
The Rogers Ratio Method can help analyse the problem which causes the raise of the
different gases. This is the main difference to the Key Gas Method which on the
other hand is used to find a problem.[24] Therefore, the Rogers Ratio Method is the
second step after finding out the different values of the key gases. With these results
the different ratios of
C2H2/C2H4 CH4/H2 C2H4/C2H6
are built. For the results Rogers presents a table (see Appendix D) with specific
codes for the different gas ratios. With these codes the matching fault can be found
with a description of the problem. The quality of this method depends on the amount
of gas that is available for the research. The Fist3-30 report from the US
Government[24] advises that this method is only reliable if the detection of the gases
is at least 10 times the detection limit. (For example, see Appendix B).
The example in Table 2-4 shows how a possible result of the Rogers Ratio Method
could look like. The full table with all the information to interpret the different ratios
is available in Appendix D.

27
Table 2-4: Example Roger Ratio Method
Hydrogen (H2) 20 ppm Rogers Ratio
Methane (CH4) 170 ppm ratio result code
Ethane (C2H6) 156 ppm C2H2 / C2H4 0 0
Ethylene (C2H4) 17 ppm CH4 / H2 8.5 2
Acetylene (C2H2) 0 ppm C2H4 / C2H6 0.109 0
Carbon Monoxide (CO) 120 ppm Fault: Thermal fault temperature
range 150-300 °C (see note 3
Appendix D) Carbon Dioxide (CO2) 361 ppm
Nitrogen (N2) 70160 ppm
Oxygen (O2) 600 ppm
This Method is also described in IEC 60599. 42[25]
2.3.3 Maintenance versus new transformer
As mentioned before, in the past years the diagnostic and maintenance programs
have made a lot of progress. Because of that, in power plant factories, the
transformer faults can often be diagnosed before they occur. This results in lower
maintenance costs in comparison to the years before. Power plant factories are at the
beginning of the electricity chain which means that they need to ensure the
consequent energy supply. This makes it necessary that spare transformers are
available for possible emergencies. Another point to notice is that the average time
needed for a transformer (> 100MVA) to be manufactures and delivered is two years
after it has been ordered[10]. This fact alone makes it necessary to repair a
transformer failure during that time. Furthermore, most of today‘s transformers are
connected to online monitoring programs and consequently the operator has an
immediate idea of what the failure is when a problem occurs. This can be used to
make decisions about the failure and future actions. If it is obvious that the

28
transformer is not repairable during the available amount of time, a spare transformer
is then used. But if this option is not available in the same power plant factory it
could be possible for it to be taken from another one. According to information
provided through RWE, the cost of repairs for nearly every transformer failure is up
to 70% of the costs of buying a new transformer. However it is not possible to make
a general statement on actions taken in case of failure. If no spare transformers are
available, this amount mentioned above could possibly rise.
For the fact, that the principles of the transformers are still the same as centuries ago,
the condition of a transformer can be set back to its initial condition through overhaul
procedures or by making improvements. Figure 2-6 shows the reserve of wear-out
and its regeneration.
Figure 2-6: Reduction of reserve of wear-out and afterwards regeneration
RWE states that the average transformer generates an amount of 20-35% of
maintenance costs during its whole life in comparison to its purchase price. This
amount can vary in other plants if the monitoring/maintenance programs are different.
In some cases, even a functional old transformer can be scrapped if too many spare

29
transformers are available. This becomes economical in the last years because of the
high rise of prices for raw materials and because of limited amount of space.
Therefore some transformers are sold to specialist for scrapping of transformers.
2.4 Transformer costs
2.4.1 Failure Rate
In this section, the costs of the different transformer failures are researched and
summarised. As already mentioned the transformers have a lifetime span of about 30
years. However, the technical lifetime of a transformer could be much longer than
that. For example, the German RWE has transformers in their power plant factories,
which are operating since 56 years and are expected to keep running in the next years.
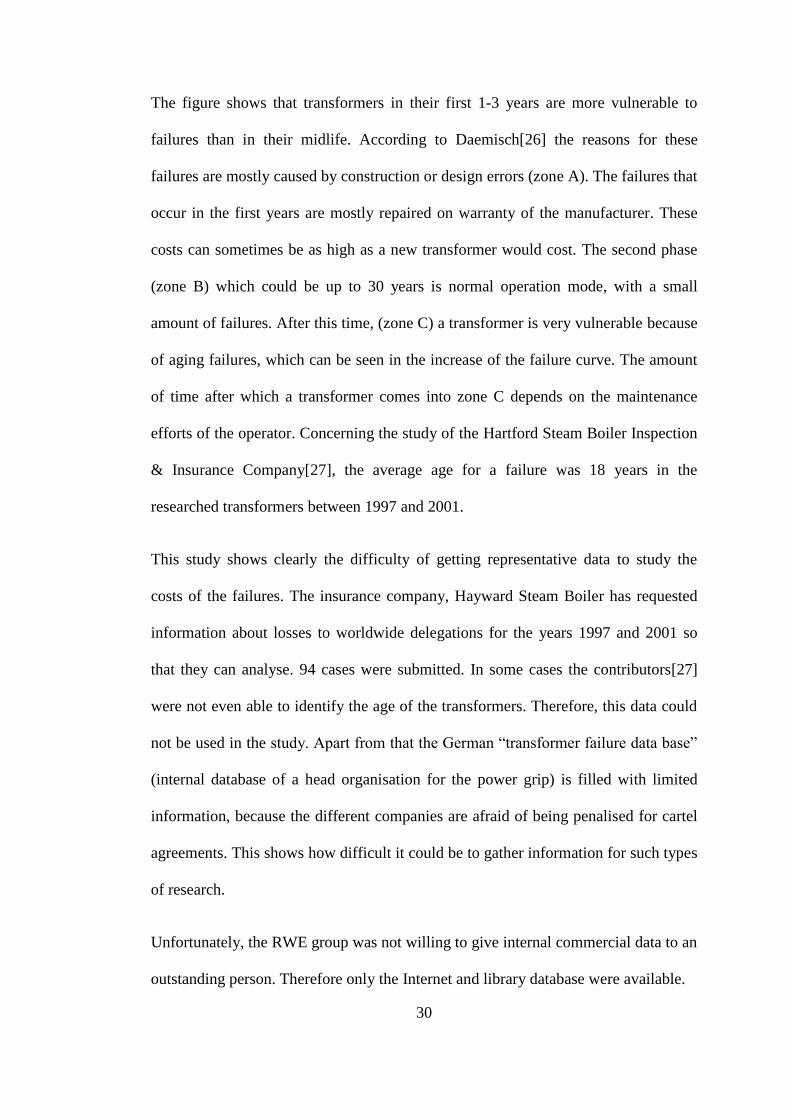
In general, the chance for a transformer failure is very high at the beginning of its life
and at the end. This is visible in the bathtub curve which is shown in Figure 2-7.
Figure 2-7: Bathtub Curve by Georg Daemisch[26]
30
The figure shows that transformers in their first 1-3 years are more vulnerable to
failures than in their midlife. According to Daemisch[26] the reasons for these
failures are mostly caused by construction or design errors (zone A). The failures that
occur in the first years are mostly repaired on warranty of the manufacturer. These
costs can sometimes be as high as a new transformer would cost. The second phase
(zone B) which could be up to 30 years is normal operation mode, with a small
amount of failures. After this time, (zone C) a transformer is very vulnerable because
of aging failures, which can be seen in the increase of the failure curve. The amount
of time after which a transformer comes into zone C depends on the maintenance
efforts of the operator. Concerning the study of the Hartford Steam Boiler Inspection
& Insurance Company[27], the average age for a failure was 18 years in the
researched transformers between 1997 and 2001.
This study shows clearly the difficulty of getting representative data to study the
costs of the failures. The insurance company, Hayward Steam Boiler has requested
information about losses to worldwide delegations for the years 1997 and 2001 so
that they can analyse. 94 cases were submitted. In some cases the contributors[27]
were not even able to identify the age of the transformers. Therefore, this data could
not be used in the study. Apart from that the German ―transformer failure data base‖
(internal database of a head organisation for the power grip) is filled with limited
information, because the different companies are afraid of being penalised for cartel
agreements. This shows how difficult it could be to gather information for such types
of research.
Unfortunately, the RWE group was not willing to give internal commercial data to an
outstanding person. Therefore only the Internet and library database were available.

31
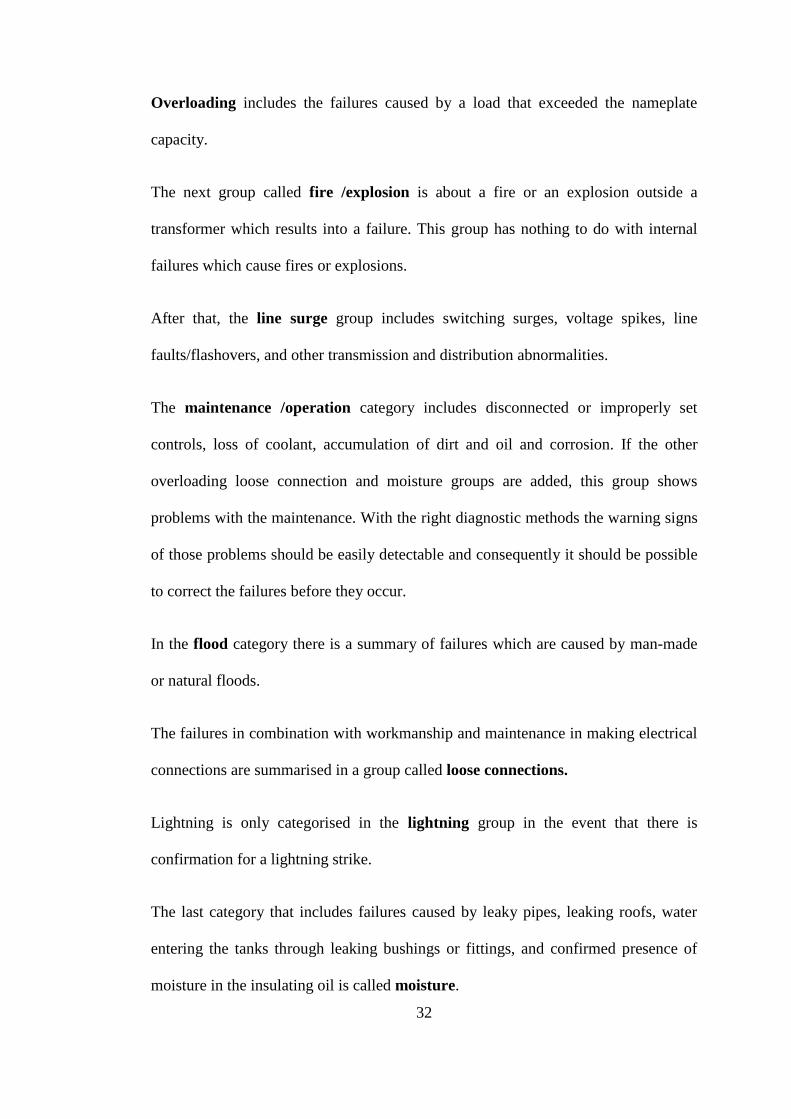
The table below is adapted from the research of the 94 transformers by the Hartford
Steam Boilder Inspection & Insurance Company. [27]
Table 2-5: Cause of Failures by Hartford Steam Boilder Inspection & Insurance Company
The first group describes insulation failure which was the leading failure in the HSB
study. The failure factors for this failure are pyrolosis (heat), oxidation, acidity, and
moisture but the latter was reported separately.
As a second group, HSB defines design /manufacturing errors, which includes
loose or unsupported leads, loose blocking, poor brazing, inadequate core insulation,
inferior short circuit strength, and foreign objects left in the tank.
The oil contamination group includes sludging and carbon tracking.
Cause of Failure Number Total paid
Insulation Failure 24 $149,967,277
Design /Material /Workmanship 22 $ 64,696,051
Unknown 15 $ 29,776,245
Oil Contamination 4 $ 11,836,367
Overloading 5 $ 8,568,768
Fire /Explosion 3 $ 8,045,771
Line Surge 4 $ 4,959,691
Improper Maintenance /Operation 5 $ 3,518,783
Flood 2 $ 2,240,198
Loose Connection 6 $ 2,186,725
Lightning 3 $ 657,935
Moisture 1 $ 175,000
Total 94 $ 286,628,811
32
Overloading includes the failures caused by a load that exceeded the nameplate
capacity.
The next group called fire /explosion is about a fire or an explosion outside a
transformer which results into a failure. This group has nothing to do with internal
failures which cause fires or explosions.
After that, the line surge group includes switching surges, voltage spikes, line
faults/flashovers, and other transmission and distribution abnormalities.
The maintenance /operation category includes disconnected or improperly set
controls, loss of coolant, accumulation of dirt and oil and corrosion. If the other
overloading loose connection and moisture groups are added, this group shows
problems with the maintenance. With the right diagnostic methods the warning signs
of those problems should be easily detectable and consequently it should be possible
to correct the failures before they occur.
In the flood category there is a summary of failures which are caused by man-made
or natural floods.
The failures in combination with workmanship and maintenance in making electrical
connections are summarised in a group called loose connections.
Lightning is only categorised in the lightning group in the event that there is
confirmation for a lightning strike.
The last category that includes failures caused by leaky pipes, leaking roofs, water
entering the tanks through leaking bushings or fittings, and confirmed presence of
moisture in the insulating oil is called moisture.

33
HSB is an insurance company and its categorisation is mostly different to the ones
which would be made by a system operator. The different system operators would
very likely combine the different maintenance groups under one group for the fact
that they do not have to split them under insurance options.
It also has to be mentioned that this study includes business interruptions as well.
Therefore, Table 2-5 shows the real damage on the transformers and the resulting
business damage.
Table 2-6: Number and amounts of losses by year
2.4.2 Price of a new Transformer
The price of a new transformer is very hard to determine in general especially in the
area above 100MVA. In this area, the transformer is built on request and therefore
the prices vary according to the requirements of the operator and its conditions with
the manufacturer. A request about prices to the German RWE shows that their
average cost price for transformers above 100MVA is about 10,000Euro/MVA. This
would result in ~5,000,000 Euro for a 500MVA transformer. Both Siemens and ABB
Year Number Total Loss Total Property
Damage
Total Business
Interruption
1997 19 40,779,507 25,036,673 15,742,834
1998 25 24,932,235 24,897,114 35,121
1999 15 37,391,591 36,994,202 397,389
2000 20 150,181,779 56,858,084 93,323,695
2001 15 33,343,700 19,453,016 13,890,684
total 94 286,628,811 163,239,089 123,389,722

34
did not give a concrete answer to this request. They only mentioned that the price
depends on the requirement that the transformer has to fulfil.
Apart from that, different models and studies give ideas on the different prices of
transformers. However, most of these studies are mostly valid with prices for smaller
transformers. An example is the article Transformer Life-Cycle Cost[28] which
mentioned a purchase price of $10,845 for a high efficient 750kVA. As mentioned
before the average price of RWE is only valid with bigger transformers.
Therefore it is recommended buying transformers with a very high efficiency. These
transformers may be more expensive in its sales costs but the higher efficiency will
result in savings over the transformer life. This can result in double benefits in the
future, if emission saving systems are established or the existing ones (European
Union) get CO2 prices that have influence on buying decisions.
2.4.3 Cost of maintenance
The different maintenance costs depend on what is understood by maintenance. The
German DIN standard DIN 31501 describes this word in general with four different
categories. The first one describes general maintenance. This means that agreements
are made to make sure that the transformer life is expanded. An example could be the
change of the cooling liquid because of pollution. This maintenance type should be
done on every device. The next category is about determination of the status quo and
includes the reason for the current status. Depending on the work that should be done
this category is obligatory for maintenance as well. Before specific work can be done,
it is often necessary to know the failure or the reason for it. Apart from that, it is
often necessary to overhaul a device if it is broken. This procedure is described as a

35
job of its own as long it does not include any improvements. Improvements are
implemented to make a device more efficient than before. An example would be the
expansion of a monitoring system to an old transformer.
Depending on the different actions that are made the costs can vary. Apart from that
it depends on detailed circumstances to give a detailed overview of all transformers.
Generally it is accepted [29] that a preventive maintenance program, which is for
example based on the results of an online monitoring system, can help save money in
contrast to a lasting program which only repairs failures. But RWE mentioned cases
where a transformer type was not maintained anymore because it was decided that
this type should be rejected if a failure occurs. Therefore it depends on the specific
transformers and the corporate-policy decision of what has to be done. In another
case a defect transformer was not repaired although it was not on the end of its
lifetime or had an irreparable defect. In that case the reason for the scrapping was
just a space problem. There have been several other spare-transformers from the
same type and RWE could get a good price because of high resource prices.
Moreover, Glenn Swift and Tom Molinski [30] have made research to simply
overload transformers. Their assumption is based on the fact, that the technological
lifetime is longer than the economical lifetime. In combination with DGA and other
mentioned monitoring possibilities, they come to the conclusion that it is more
efficient to overload existing transformers – even if they possibly fail – than to install
bigger transformers. Nevertheless, they mention that the following policy results
depend on the short-term or emergency overload capabilities of existing transformers.

36
This shows that there are many different possibilities to save money during
maintenance and that general statements are very difficult. It depends on the
technical possibilities that the operator has and on the willingness to take risks.
2.5 Summary
Transformer maintenance cost diversifies with the amount of service the operators
want to do. It is generally accepted, that condition-based maintenance in the power
transformer area saves money, even if the monitoring equipment, generates costs.
Because it can take up to years for a new transformer to be ready, the operators
sometimes have no other choice than to repair the existing one even if it would be
cheaper to buy a new one.
Consequently the operators have to find their middle way between saving money and
reliability. Failures can always occur and nobody can provide a 100% guarantee
against that. But the operators have to decide what is compatible with their needs and
their customers and try to guarantee this through a maintenance program that is
caters to these needs. In the case where the operator has spare transformers he would
probably be willing to pay less money on maintenance of the existing ones because
in failure cases the spare transformers can be used instead.
Therefore, it is important that the operator knows the condition of all its transformers
of the same type and makes plans for investing in new ones before failures occur.

37
3. SUPERCONDUCTING MAGNETIC ENERGY STORAGE UNIT (SMES)
3.1 SMES
3.1.1 Technical Description
A superconducting magnetic energy storage (SMES) unit is a device that is able to
store electrical energy. It stores energy without changing it to other energy forms as
mechanical or chemical. The idea was to load the SMES units during off-peak times
and discharge it in peak times like other storage systems but with a very high
efficiency (~97%)[31]. Historically the SMES concept goes back to Ferrier (1969) in
France and the decades after several research programs were established around the
world.
A SMES unit stores the energy directly as an electric current passing through an
inductor. In this conductor (coil), the current circulates indefinitely and for the fact
that it is made of superconducting material, it can operate nearly without any loss.[31]
To achieve this it is necessary to cool the conductor cryptogenic to make it a
superconductor, which has no resistive losses.
Generally, a SMES system exists out of four different parts, which are the
superconducting coil with the magnet (SCM), the power conditioning system (PCS),
the cryogenic system (CS), and the control unit (CU).[32] The different functions are
described below and available in Figure 3-1.
SCM: The SCM is used to store the dc-energy and exists out of the superconducting
coil, magnet and the coil protection. Therefore, the coil and the magnet need to be
strong enough to withstand the Lorentz forces. The coil protection is also necessary

38
to make sure that the coil is protected against failures, which could result in several
damages to the SMES System.
PCS: This system contains firing circuits and converters. It is the connecting system
between ac utility and SCM and it is also responsible to convert the ac electrical
energy to the dc electrical energy, which is stored in the SCM. Its task is also to
convert the stored dc energy back to ac in case of an energy request.
Figure 3-1: Block diagram of SMES[32]
CS: The cooling system is required to keep the SCM on its operational temperature.
Therefore, it exists out of refrigerators, vacuum pumps, helium tank and pipes and a
dewar.
CU: The major part of a SMES unit is the control unit. The CU controls the different
functions and the protection of the coil. It also performs the different operations and
exists generally out of a microcontroller or a DSP.

39
With the discovery of high temperature conducting materials in 1987, some
improvements in the SMES area were expected. In contrast to a low-temperature
conducting coil (LTS) which operates at about 5 °K, a high-temperature conducting
coil (HTS) has an operation temperature of about 70 °K. This again results in savings
in the cooling system, which according to Wei-Jen Lee and Chung-Shih Hsu [33] is
around 15% of the capital costs. They mention that nearly 40% of the operation costs
have to do with cooling and therefore the use of a high-temperature conducting coil
is able to save a lot of money. Depending on the size of the SMES unit, the cooling
progress to operation temperature is much faster with a HTS coil in comparison to a
LTS one. Lee and Hsu [33] state that it takes 1600 hours to bring the systems from
300°K to 100°K and further 1900 hours to bring it from 100°K to 4°K. This shows
clearly the time and cost savings if the device would work on a temperature around
70°K. A problem in this case may be the fact that according to Dr. Krischel [34] HTS
materials are still much more expensive than LTS ones. Nevertheless today‘s
research project goes more and more in the HTS direction. For the sake of research
the Florida State University undertook the project of building a SMES unit. This
project was aborted after several years of preparation and building progress.
According to Dr. Michael Steurer (Florida State University) this results from the fact
that today ―nobody is using Low-Tc SMES technology anymore‖4.
4 Mail from 24.May.2009

40
3.1.2 Application areas
Different market areas have different requirements for the energy storage
technologies. Therefore this section describes the needs a SMES unit can possible
fulfil.
A SMES unit can be designed to provide different services to the network. The main
differences are if a system is used to improve power system stability or to advance
power quality.[32] Therefore the SMES units can be used to improve the power
system quality by filtering oscillations of a small frequency. This is possible because
of the ability to modulate real power and the reactive power. Apart from that voltage
instabilities can be absorbed by SMES units because of the energy storage capability.
In that time other generators or power sources can be started to compensate the
instability.
Another application area is if the SMES unit provides spinning reserves for major
transmission lines. In general it is common that around 7%[35] of the maximal load
which is caused by the system is held back in reserve. This could possibly be a
SMES system because of the fact that it has the ability to store a high amount of
energy. In this reserve time, gas turbine can be started to provide a normal service.
The SMES unit can be much more efficient than other available technologies.
The third area is to let SMES units manage the load fluctuations[32]. This means that
a SMES unit is connected between the source and a fluctuation load like shown
below in Figure 3-2.

41
Figure 3-2: A typical power control system with an SMES unit to balance a fluctuating load[32]
PSMES
QSMES
PLoad
QLoad
PSource
QSourceZLine
Fluctuating
Load
SMES
Unit
As a result a possible power fluctuation will be cleared by the SMES unit. If the
power is described through the following equations,
with and as the fluctuation, then the SMES unit has to provide the
following components:
This prevents the fluctuation from being present in the source line as well. The
control of the power can be used in utility control areas to make sure that the load
between the transformers is stable. If generators are ramped up in control and ramped
down in the receiving area, this can result in an area control error. A SMES can
prevent or reduce this type of error which results in a more efficient generation[32].
Apart from that a SMES unit was originally thought for load leveling applications by
Ferrier[33]. As already mentioned, the energy should be produced in the off peak
times and stored in the SMES Unit. In the peak time the stored energy is released

42
from the SMES unit and provided to the system. From an economical point of view
this is called the conversion of low-cost energy to higher value energy.
Besides these, SMES can also help to isolate critical loads from the system.
Examples can be found in the paper industry or in military loads. In this area it is
necessary to make sure that different machines are protected from variations.
Because a SMES unit has a very fast response time, it is the optimal device to
separate these critical loads from errors that occur in the network, like lightning
strikes or flashovers. Several papers [36, 37, 38, 39] provide more information on
this topic. There are two different methods to protect the load from the rest of the
system. The first method consists of protecting all the loads together (Figure 3-3)
whereas the second method focuses on protecting the more decentralised loads
separately (Figure 3-4). [32].
Figure 3-3: SMES system for defending all critical bus loads[32]
T2 T2 T2
BR
K 4
BR
K 4
BR
K 4
BRK 2
T2 T2 T2
BR
K 4
BR
K 4
BR
K 4
BRK 2
Transmission #1 Transmission #2
BRK 3
BRK 1
SMES
Unit
Non-critical Loads Critical Loads
Bus #2Bus #1

43
Figure 3-4: SMES system for defending distributed critical loads[32]
T
BR
K 2
BR
K 2
BR
K 2
BR
K 2
BR
K 2
BR
K 2
Distribution
Bus
Distribution
Bus
BRK 1
SMES
Unit
Non-critical Loads
Critical Loads
Bus #2Bus #1
T T
Non-critical Loads
Figure 3-5: System performance under small disturbance (without SMES) [40]

44
However it can be also necessary to protect normal devices. An example could be a
generator which is protected by a SMES unit to minimise influences of forces on
changes in the step load. Figure 3-5 and Figure 3-6 show the different of torsional
forces on the mechanical shaft for a system without and with SMES protection. In
that example ―a disturbance at t=1 sec is given for a duration of 5 cycles‖[40].
Figure 3-6: System performance under small disturbance (with SMES)[40]
Depending on the application it can be necessary to have an uninterruptible power
supply (UPS). A SMES unit can be used for this task and it can obviously be more
effective than other technologies. An example for such a device has been designed
and built by the ACCEL Instruments GmbH [41] or by Chu and coworkers [42].

45
Apart from this task, it is possible to use a SMES unit to balance voltage
asymmetries. According to Xue and coworkers[32] asymmetrical voltages will
decrease the efficiency of the transformer and transmission line, decrease the output
power of transformer, reduce the efficiency of motors, affect the operation of critical
load and even endanger the safety of equipment. Therefore it is obvious that
minimising asymmetrical voltages can increase the efficiency of the whole
transmission system.
The mentioned regulation is shown in the example in Figure 3-7.
Figure 3-7: Cleaned supply voltage with the help of a SMES Unit[43]

46
3.2 Other comparable technologies
3.2.1 Introduction
The problem with electrical energy is that it normally has to be produced at the time
it is needed by the different customers. During night-time less energy is needed and
power plants have to work below their optimal efficiency. Consequently different
people have thought about the idea of the different possibilities to store energy in off
peaks to release it again during peak times. Therefore it is common to describe the
different systems as electrical energy storage (EES) technologies. Furthermore there
are subcategories to describe the technical aspects of the EES. These are: electrical
energy storage, mechanical energy storage, chemical energy storage and thermal
energy storage. This section deals with other available technologies and how they
work.
3.2.2 Flywheel
The flywheel technology is one of the oldest energy storage technologies. The energy
is stored by accelerating a rotor up to a very high rate of speed and maintaining the
energy in the system as kinetic energy[44]. This technology belongs to the
mechanical energy storage. Nowadays, the system consists of an electric motor to
spin the rotor during charge and the same one is used during discharge as a generator.
To minimise losses, to protect the rotor and to achieve maximum storage of kinetic
energy, the flywheel spins at a very high velocity in a vacuum housing. With these
improvements and loss reduction in the last years it is possible to reach efficiency of
up to 90% [31]. An advantage to other technologies is the long life capable of
providing hundreds of thousands of discharge-charge cycles. Generally flywheels

47
can be used for optimising power or energy. If it is used for power optimisation, the
main focus is normally on the motor/generator and power electronic whereas energy
applications have more requirements for a larger high speed rotor. Therefore the first
application runs with a speed of up to 10000 RPM and has a steel rotor. In the high-
speed variant it is often common to have fibre glass or carbon fibres impregnated in
an epoxy and wound into a thick cylinder. [44] This application runs in a range from
20000 to 60000 RPM.
Flywheels are used in power quality, regenerative energy and frequency control. But
as mentioned before the different designs for the different requirements often make it
impossible to use one flywheel for other application areas. Nevertheless, a flywheel,
in comparison to other technologies, has a relatively low need for space and lifetime
costs but can only used for short-term applications (~10-100 sec)[31].
3.2.3 Electrochemical Capacitors[44]
A capacitor is made up of two electrodes that are separated through a dielectric. In
terms of energy and power performance, these devices operate similarly to
rechargeable batteries and electrolytic capacitors. Electrochemical capacitors differ
from batteries in the sense that they do not store energy in redox reactions that occur
in the electrode structure. Electrochemical capacitors store energy through
electrostatic interactions that occur in the electrode and solution interface region, also
known as the double layer[1]. An electrochemical capacitor has the energy storage
capacities of a battery and the operation characteristics of a capacitor.[44] Because
the capacity of capacitors is directly related to the surface area of the electrode, the
ability to storage energy increases with the square of the applied voltage. During

48
charging, when the electrode is polarised, nearly half of the electrolyte material
transfers electron to the other half. These ions migrate to the opposite charged
electrode as shown in Figure 3-8 and build a charged layer on the surface without
exchanging electrons. Electrochemical capacitors are often called supercapacitors,
ultracapacitors or electric double layer capacitors, even if these terms are company
trademarks.
The quick response of electrochemical capacitors and their reliability at full power
are a few key facts why they are used in the retailer market. They can operate in a
wide temperature range from -50°C up to 85°C. The average DC-DC round trip
efficiency is between 80% and 95% during normal operations.[44]
One of the biggest advantages in comparison to other technologies is the lack of
moving parts or chemical reactions. Therefore electrochemical capacitors are capable
of hundreds of thousands of charge/discharged cycles [44].
Figure 3-8: Eletrochemical Capacitors [1]

49
3.2.4 Pumped Hydroelectric Storage (PHS)
A pumped hydroelectric storage also called PHS is a technology which was first used
in the 1890s in Switzerland and Italy[31]. This technology is able to store large
energy by using two different reservoirs located in different elevations. Between both
those reservoirs, a connection is used to pump up water if energy is stored, and
released through a turbine if energy is needed (discharge). The schematic is shown in
Figure 3-9.
Figure 3-9: Schematic diagram of PHS [45]
The average rating of such devices is around 1000MW and every year around 5GW
are newly installed. Because of the fact that two reservoirs have to be built or made
available, it is not possibly to install a PHS on any place. In this case, it is important
to take a few factors into account: the environment, the building time and the high
costs. In total it can be said that because of transformation and losses, the efficiency
of a PHS is around 71-85%[31].

50
3.2.5 Compressed air energy storage (CAES)
Like the PHS, the CAES is the only technology which is currently available and
could be mentioned as a large-scale EES. A CAES system is used to compress air
during off-peak times and to store these in an underground reservoir. In the peak
times during the day, this air is released and used to power a gas turbine to produce
energy. A schematic overview over the technology of CAES systems is provided in
Figure 3-10.
Figure 3-10: Schematic diagram of CAES [31]
The technology goes back up to 1978 when the first CAES facility was built in
Germany and is still in operation. Today only two facilities are in operation. The
German one can generate 290 MV for up to four hours.[44] The other one, located in
Alabama, USA, can provide 100MW for about 26 hours because of a bigger cavern.
It is more efficient than the German one because of several improvements. It went
online in 1991 and has therefore 13 years of development ahead. The CAES
technology have less building costs in comparison to a PHS because of the use of
51
existing underground caverns. This results in a KW price depending on the
underground storage condition between $400 and $800 per KW. Today several
projects are in planning or building phase all around the world.
3.2.6 Thermal energy Storage
Thermal energy storage (TES) goes another way: energy in this instance is normally
not brought back in electrical form. In this technology the energy storage is attained
in an existing building cooling system which results in a fundamental saving of
electrical energy to cool down this building. Therefore the cooling system is used to
cool water or ethylene glycol during off-peak hours and to store it into an isolated
storage tank. During peak hours the TES system supports the chiller, resulting in a
smaller cooling unit which makes it more efficient, if such an approach is planned
from the beginning. Baxter [44] states that if a TES system is added later, it
amortises itself after 1-3 years. On the other hand if a TES system is considered in
the planning phase, it should not have any initial costs because of the smaller size of
the cooling system. Apart from that Chen [31] says that it is possible to make a
diversification of the different TES systems according to the temperature. Especially
in the low temperature area, several universities are doing researches on cryogenic
energy storage (CES). In this case, off-peak power is used to generate cryogen
(liquid nitrogen or liquid air). In the peak hours the heat from the surrounding
environment boils the liquid and the heated cryogen is used to generate electricity
through a cryogenic heat engine. But according to Chen this technology is still under
development.

52
3.2.7 Batteries
One of the oldest and well known technologies in energy storage applications is a
battery. In this instance, the electrical energy is converted and stored in chemical
form. The battery exists out of electrochemical cells that consist of liquid paste or an
electrolyte together with an anode (positive electrode) and a cathode (negative
electrode). During the discharge progress, a electromechanical reaction between the
two electrodes generates a flow of electrons through the external circuit.[31] To
charge a battery again it is necessary to apply an external voltage to the electrodes. In
general batteries can have a high efficiency and low standby losses. A disadvantage
in comparison to other technologies is the relatively short circuit lifetime which is
mentioned in the subsections about the different battery types.
Lead acid batteries
First of all, the oldest batteries – the lead acid batteries (LA) which have been
invented in 1859 – have to be mentioned. In this design the energy storage capacity
and the power rating depend on the size of the electrode. A LA has a duration time of
5 years which indicates a cycle limit of around 250-1000 charge/discharge level.[44]
The reliability of a LA is therefore around 70-90% with a relative low cost range of
$300-600/kWh. It has a low energy density of 30-50 Wh/kg. Nevertheless it is still a
popular storage choice for power quality, UPS and spinning reserve applications. [31]
Nickel cadmium batteries
The first Nickel cadmium (NiCd) battery was developed 100 years ago. Nowadays
three different NiCd designs exists which vary in application areas. The pocket

53
plated NiCd batteries are normally used for standby power, while sintered NiCds are
more common in areas where high energy per kg is required, for example starting
aircraft and diesel engines. Sealed NiCd are used for commercial products where
lightweight, portability and rechargeable power are important. [31]
The advantage of NiCd in comparison to the LA is in a higher energy density 50-
75Wh/kg and a high reliability with low maintenance requirements. The cycle life is
higher than that of a LA but it is only 2000-2500 times too. In the cost range NiCds
can be found with around $1000/kWh[31] which is relatively high. Further NiCd
batteries have a memory effect which means that the battery can only be charged
fully after full discharge. This has to be taken into account by the battery
management procedures.
Lithium ion batteries
In this battery the cathode exists out of at lithiated metal oxide (LiCoO2, LiMO2,
LiNiO2 etc.) and the anode exists out of graphitic carbon with layering structure. If
the battery is charged, the lithium atoms in the cathode become ions and migrate
through the electrolyte toward the carbon anode where they combine with external
electrons and are deposited between the carbon layers as lithium atoms.[31]
The first lithium ion battery is only about 20 years old and was developed by Sony.
Today‘s batteries have an energy density of about 200kWh/kg and a life cycle of up
to 10000 cycles[31]. Apart from that the efficiency is up to 100%. These facts are the
reason why these batteries can be found in about 50% of nowadays small portable
devices. Nevertheless the costs being over $600/kWh are a reason why it has not
really been successful in the large scale energy market yet.

54
Sodium sulphur battery
Figure 3-11: Principle of the NAS Battery[46]
A sodium sulphur battery is also known as NaS battery because of the chemical
reaction taking place. The battery exists of a positive electrode with liquid (molten)
sulphur and a negative electrode with liquid (molten) sodium in it. Both are separated
by solid beta alumina ceramic electrolyte that lets only the positive sodium ions go
through it and combines with sulphur to form sodium polysulphides (2Na + 4S ↔
Na2S4)[47]
The operation temperature for this battery is 300-350C and it has a cycle of life of
~2500 cycles with a total energy range of 150-240Wh/kg. It can have a power pulse
capability of 30 seconds which can be six times over its continuous rating. The costs
for this storage device is around $350/kWh[31]. A disadvantage is the high operation
temperature which requires a heating unit that brings the efficiency to 70-90%.
Sodium nickel chloride battery
The sodium nickel chloride battery is also known as ZEBRA battery. Its advantage to
a NaS battery is the ability to withstand limited overcharge and discharge. It also has

55
better potential safety characteristics[31]. Nevertheless the energy range is
120Wh/kg, which is lower than that of a NaS battery. Another problem can be that
only one manufacturer worldwide produces this battery type and therefore possible
customers rely too strongly on a single producer.
3.2.8 Flow batteries
Another approach in comparison to normal batteries is developed in a flow battery.
In this type of storage the energy is released through a reversible electrochemical
reaction between two electrodes whereas the additional electrolyte is stored
externally. See figure below for schematic overview:
Figure 3-12: Schematic overview of a redox flow cell energy storage system[48]
The main difference to a conventional battery is the fact that the energy is stored in
the electrolyte solutions. The rating of power and energy is independent from the
storage capability. Flow batteries can release energy continuously on a high power

56
for up to 10 hours of discharge. In general there are three different types of flow
batteries which are compared in price and technical characteristics in Table 3-1.
3.2.9 Solar fuels
A relatively new technology which is still in development is solar fuel. The general
problem of sun-generated energy is normally the storage. If for example solar energy
is produced in Australia, this energy cannot be brought to Europe. The solar fuel
could solve this problem. If the sunlight is concentrated over a small area with the
help of parabolic mirrors and then capture that radioactive energy with the help of
suitable receivers, it should be possible to obtain heat at high temperatures for
driving a chemical transformation and producing a storable and transportable fuel.[49]
The schematic view can be found in Figure 3-13: it describes how concentrated solar
radiation is used as the energy source. In this high temperature, the production of
storable and transportable fuels is caused by a chemical reaction[49].
Figure 3-13 Schematic of solar energy conversion into solar fuels[49]

57
3.3 Comparison
3.3.1 Technical
The problem with comparing the previously mentioned technologies is that they have
different background situations. For instance, it is important to consider how long a
technology has been around and how much knowledge and experience there is in this
case. Chen [31] defines three different categories. According to him only PHS and
lead-acid batteries are really mature technologies where no big improvements have
been made in the last years. Of course there were some developments to improve the
efficiencies of turbines and the pumps of the PHS units but in general the main
concept of the technologies is still the same. The second group is the developed
technologies that include CAES, NiCd, NaS, Zebra, Li-ion, Flow Batteries, SMES,
Flywheel supercapacitors and thermal energy storage. These technologies are
developed and available but are not as common and too expensive for commercial
usage in large scale area. The last group includes technologies as Solar Fuel and CES
which are still under development and not available for commercial use. Therefore it
is necessary to make more research efforts before these technologies are really
reclaimable.
Apart from that some technologies are only made for one application area and others
could possibly fulfil requirements of more than one but with different configurations.
In general it is common[31, 44, 47] to differ between power quality, bridging power
and energy management. In the case of the latter, a high amount of energy is stored
and can be released over a long period of time. PHS, CAES and CES are
technologies that can be put in this area. Flywheels, SMES and super capacitors deal
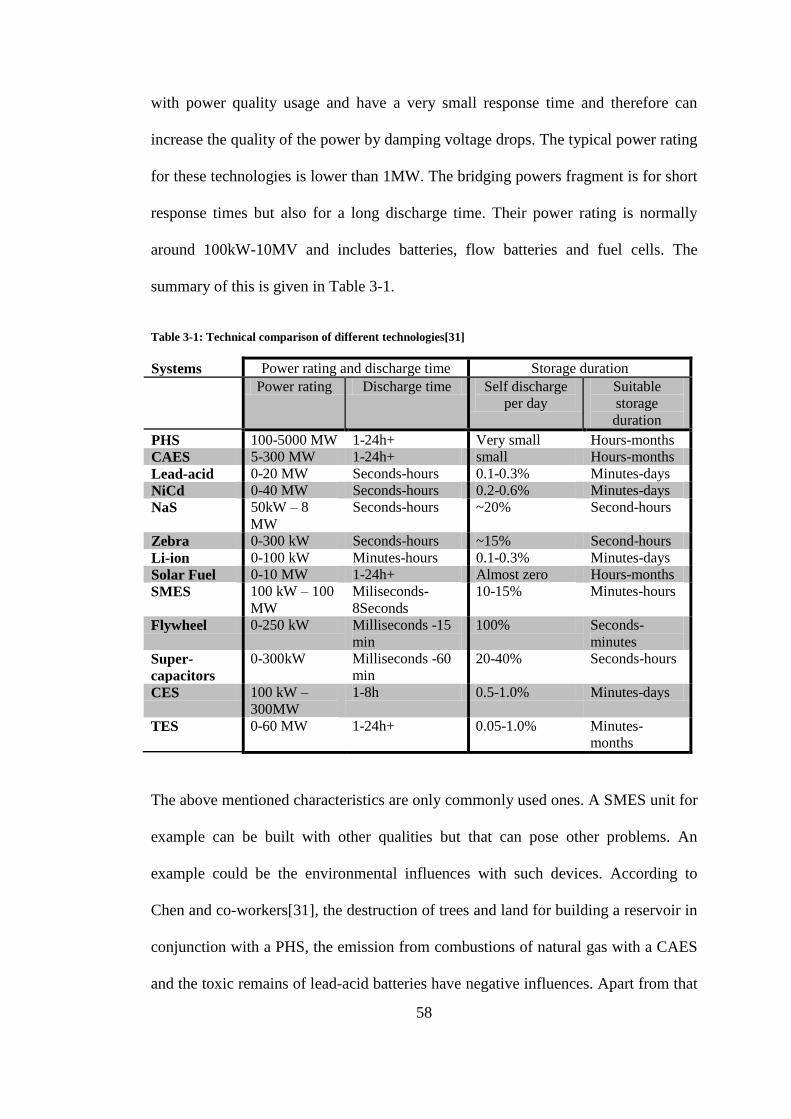
58
with power quality usage and have a very small response time and therefore can
increase the quality of the power by damping voltage drops. The typical power rating
for these technologies is lower than 1MW. The bridging powers fragment is for short
response times but also for a long discharge time. Their power rating is normally
around 100kW-10MV and includes batteries, flow batteries and fuel cells. The
summary of this is given in Table 3-1.
Table 3-1: Technical comparison of different technologies[31]
Systems Power rating and discharge time Storage duration
Power rating Discharge time Self discharge
per day
Suitable
storage
duration
PHS 100-5000 MW 1-24h+ Very small Hours-months
CAES 5-300 MW 1-24h+ small Hours-months
Lead-acid 0-20 MW Seconds-hours 0.1-0.3% Minutes-days
NiCd 0-40 MW Seconds-hours 0.2-0.6% Minutes-days
NaS 50kW – 8
MW
Seconds-hours ~20% Second-hours
Zebra 0-300 kW Seconds-hours ~15% Second-hours
Li-ion 0-100 kW Minutes-hours 0.1-0.3% Minutes-days
Solar Fuel 0-10 MW 1-24h+ Almost zero Hours-months
SMES 100 kW – 100
MW
Miliseconds-
8Seconds
10-15% Minutes-hours
Flywheel 0-250 kW Milliseconds -15
min
100% Seconds-
minutes
Super-
capacitors
0-300kW Milliseconds -60
min
20-40% Seconds-hours
CES 100 kW –
300MW
1-8h 0.5-1.0% Minutes-days
TES 0-60 MW 1-24h+ 0.05-1.0% Minutes-
months
The above mentioned characteristics are only commonly used ones. A SMES unit for
example can be built with other qualities but that can pose other problems. An
example could be the environmental influences with such devices. According to
Chen and co-workers[31], the destruction of trees and land for building a reservoir in
conjunction with a PHS, the emission from combustions of natural gas with a CAES
and the toxic remains of lead-acid batteries have negative influences. Apart from that

59
SMES units if they should be built for long energy discharge have a strong magnetic
field which has possible influences to the environment.
Another issue, previously mentioned, is the different life time of the different
technologies and their efficiencies. If a comparison between the different
technologies is made, these issues have to be considered in the decision. Therefore a
cheap technology with low efficiency can possibly be preferred to a technology that
is very expensive but has a low efficiency as well.
Table 3-2 shows an account of the different energy, power density and the life times
of the technologies as well as the efficiency.
Table 3-2: Technical comparison of the technologies (sources: [31, 44, 49])
Systems Life time an cycle life Energy and power destination Efficiency
Life
time
(years)
Cycle life (cycles) Wh/kg W/kg approximate cycle
efficiency in %
PHS 40-60 - 0.5-1.5 - 72-85
CAES 20-40 - 30-60 - 70-85
Lead-acid 5-15 500-1000 30-50 75-300 70-85
NiCd 10-20 2000-2500 50-75 150-300 60-70
NaS 10-15 2500 150-240 150-230 75-90
Zebra 10-14 2500+ 100-120 150-200 85-90
Li-ion 5-15 1000-10000+ 75-200 150-315 90-99
Solar Fuel2 - - 800-100000 - 20-30
SMES 20+ 100000+ 0.5-5 500-2000 95+
Flywheel ~15 20000+ 10-30 400-1500 80-95
Super-
capacitors
~5 50000+ 0.05-5 ~100000 80-95
CES 20-40 150-250 10-30 40-50
TES5 5-15 80-200 - See note
Note: data collected from the different sources and formatted in this table
Note 2: relative low efficiency because only a small amount of the sun is converted (~ 18%)
The table shows again that a simple comparison is not really possible because all the
different needs and wishes have to be considered. The different technologies have
benefits in different areas and this has to be considered when the storage application

60
is planned. Nowadays, the biggest arguments for or against any technology revolve
around the costs. Therefore the next section provides an indication to compare the
technologies on the price area.
3.3.2 Costs
After the application aspect for a storage device is determined, the last factor to
consider when deciding for or against the acquirement of such a technologies is
always the price. If the direct savings through the usage of a storage technology is
higher than its operation and its investment costs, the decision is mostly easy. An
example could be shifting the load from a peak to an off peak period[50] which
results in a direct saving of energy and money. But these cases are very rare.
Normally the indirect savings are more common. In that case an installation of a
storage technology can result in a reduction of possible down times or in an
improvement of the quality of energy – to suit the requirements of the customer –
which then again saves money.
To have an overview of the different costs of the different technologies Table 3-3 [31,
44] combines costs per kW, costs per kWh and costs per kWh per cycle.

61
Table 3-3: Costs of the different technolgies (main source: [31] + different others ([44, 49, 51]))
Systems costs
Euro/kW Euro/kWh Euro/kWh-per cycles
PHS 600-2000 5-100 0.1-1.4
CAES 400-800 2-50 2-4
Lead-acid 300-600 200-400 20-100
NiCd 500-1500 800-1500 20-100
NaS2 1000-3000 300-500 8-20
Zebra 150-300 100-200 5-10
Li-ion 1200-4000 600-2500 15-100
Solar Fuel3 - ~2000 -
SMES 200-300 1000-10000 -
Flywheel 250-350 1000-5000 3-25
Super-capacitors 100-300 300-2000 2-20
CES 200-300 3-30 2-4
TES5 200-400 30-60 -
Note: to convert currency to Euro, the average exchange rate of the years in which the source is
published has been taken.
Note 2: [44] gives ~650Euro/kW in 2006
Note 3: [49] speak 2002 about 2000Euro per kWh
Note 4: [44] indicates 200-400 Euro/kW in 2006
The three different cost issues show again that it is very difficult to make a definite
statement on the better technology. First of all, the issue used to compare different
technologies has to be determined. The Euro/kWh- per cycle category is therefore
defined as cost per unit energy divided by the cycle life (Table 3-2). This value is
good for a comparison in a frequent storage/discharge application (for example load
levelling) because the claim on a high life cycle is taken into account[31]. The
Euro/kW metric is in contrast to that a good guide for upfront costs. The Euro per
kWh is useful to have an idea of operation costs.[44]
One example shows that a PHS has very low kWh prices per cycles and is therefore
very useful for load levelling. On the other hand, it has a high amount of initialisation
costs for the reservoirs. It was not possible to find prices for solar fuels because that
this technology is still at the beginning of its development and is not available for
everyday usage. This is a general problem with developing technologies because the
research facilities have normally less interest in the economical data of such a project.

62
They want to get information on the technological possibilities, regardless of whether
this technology is going to be used in daily routines or not. An example is Dr.
Michael Steurer (Florida State University, Leader Power Systems Research Groups)
who tries ―to stay clear of the commercial/economical aspect since anything you
extract is a guess at best‖.[52]
3.4 Summary
Different technologies are made for different application areas and therefore difficult
to compare. For that reason it has to be clear when a storage technology should be
used. For energy management applications PHS, CAES, large/scale batteries, flow
batteries, fuel cells, solar fuels, TES and CES are useful. Flywheels, SMES, batteries,
super capacitors are more appropriate for power quality and short duration UPS.
Batteries, fuel cells could be used for bridging power application. If this is clear, the
different available technologies that are eligible can be researched further for
technology and economical differences. Another thing to consider is whether the use
of the technology could possibly deliver new information or if a matured technology
is more useful for the application area because planning is more possible. Normally,
industry companies prefer to use mature technologies because of fewer ‗surprises‘ in
the usage. If a new technology is used, it can have impacts on the down times and
therefore on the total efficiency of a system which can result in a miscalculation of
the whole project. Another point is that a technology that is susceptible for failures or
at least not reliable has to be better monitored to avoid or minimise possible
interruptions. Therefore this type of technology will possibly only be used in test
applications or at least not in combination with high critical applications. A SMES
system as an example is from the theory a developed technology but worldwide there

63
are no large scale SMES Units in operation. This results in high initialisation costs,
influences of the magnetic field and possibly other troubles in combination with this
technology. The first concern and aim of an industry is to earn money and they have
to be able to plan it. If a new technology is used for the first time, it cannot be
assured that this aim is achieved. Because some of the technical and economical data
from the newer technologies mentioned in this paper are obtained only from research
facilities and not real-life situations, they have to be critically considered if
connections to real applications are ever to be made.
But in general it is expected that the inset of storage technologies will increase in the
next years because of the expanding use of renewable energies around the world. For
these technologies it is often fundamental to store the produced energy and release it
later.

64
4. CONCLUSIONS AND FUTURE WORK
4.1 Conclusion
The power system utilities have high potential to save money and to increase the
efficiency of systems. If the transformer maintenance is improved, not only the
lifetime is extended but it is also possible to save money. Besides that, the reliability
is extended and possible failure can be recognised before they occur. This results in a
better overview of the whole system which is nowadays important for the operators.
In the energy storage area, it is not possible to find the ―best‖ technology. It has to be
determined in which application area the storage device is necessary. With this
information the rating of the different technologies need to be done. It has to be taken
into account that some of the technologies are still in development or are at least at
the beginning of their economical usage. Therefore the reliability is not always
guaranteed. Nevertheless it is expected that the next years will bring knowledge in
the energy storage area because of the increasing usage of renewable energies which
depend on the cyclic occurrence of the sun, wind or others. Therefore it is only
possible to enlarge the usage if the energy is stored in some way.
4.2 Future Work
The problem with cost studies is mostly due in the information collection of the
economical data. This became clear during this project. Therefore it could be a good
idea to make research on transformer maintenance under the economical aspect
together with an industrial partner who uses transformers in its own facilities.
Information about the technical issues on transformer maintenance is available in

65
databases and books but the economical side is often not published and made
available to the public.
The same problem occurs with the energy storage area; in this field the economical
information is hard to assess. Therefore an economical research could be made with
a partner who produces storage devices and can appoint at least a specific price for a
precise product.

66
5. REFERENCES
[1] Ionixpower. (17.05.2009).
http://www.ionixpower.com/electrochemical_capacitors.htm. [Online].
[2] W. H. Roadstrum, Wolaver, Dan H. , Electrical engineering : for all
engineers New York, 1994.
[3] J. H. Harlow., Electric power transformer engineering / edited by James H.
Harlow. : Taylor & Francis 2007.
[4] A. E. A. E. Fitzgerald, Kingsley, Charles, Umans, and S. D., Electric
machinery. Boston, 2003.
[5] Bahg S. Guru and H. R. Hiziroglu, Electric machinery and transformers 3rd
ed. ed. New York ; Oxford : Oxford University Press, 2001. , 2003.
[6] P. C. P. C. Sen, Principles of electric machines and power electronics, vol. 2,
1997.
[7] N. U. A. W, A. P. Purnomoadi, A. Susilo, E. Yuliastuti, and A.
Pharmatrisanti, "Failure Analysis on Power Transformers 60 MVA 150/20
kV," in Electrical Engineering and Informatics Institut Teknologi Bandung,
Indonesia, 2007.
[8] W. H. Bartley, "Analysis of Transformer Failures," in AVO New Zealand -
2005 International Technical Conference Methven, New Zealand, Methven,
New Zealand, 2005, p. 13.
[9] C. WG12.05, "An International Survey on Failures in Large Power
Transformers in Service," Electra, vol. 88, p. pp.21/37, 1983.
[10] RWE instructions transformer maintenance: RWE GmbH, 2009.
[11] A. Franzén and S. Karlsson, "Failure Modes and Effects Analysis of
Transformers," p. 26, 2007.
[12] B. García, J. C. Burgos, and Á. Alonso, "Winding deformations detection in
power transformers by tank vibrations monitoring," Electric Power Systems
Research, vol. 74, pp. 129-138, 2005.
[13] W. H. Bartley, "Analysis of Transformer Failures," in 2007 annual
Weidmann-ACTI Transformer Seminar: Design to Demise, 2007, p. 13.
[14] B. V. V. Sokolov, "Experience with detection and identification of winding
buckling in power transformers," 68th Proceedings of the Annual
International Conference of Doble Clients, 2001.
67
[15] M. Levin, "Interaction between Insulating Paper and Transformer Oil:
Bacterial Content and Transport of Sulfur and Nitrogen Compounds [Feature
Article]," Electrical Insulation Magazine, IEEE, vol. 24, pp. 41-46, 2008.
[16] L. Rui-jin, X. Bin, Y. Li-jun, T. Chao, and S. Hui-gang, "Study on the
Thermal Aging Characteristics and Bond Breaking Process of Oil-paper
Insulation in Power Transformer," in Electrical Insulation, 2008. ISEI 2008.
Conference Record of the 2008 IEEE International Symposium on, 2008, pp.
291-296.
[17] M. Wang, A. J. Vandermaar, and K. D. Srivastava, "Review of condition
assessment of power transformers in service," Electrical Insulation Magazine,
IEEE, vol. 18, pp. 12-25, 2002.
[18] ABB, "On-load tap-changers, type UC and VUC (Technical guide)," 2007.
[19] D. V. E.V., "Empfehlung der Verbundunternehmen fuer Monitoringsysteme
an Grosstransformatoren," p. 13, 1998.
[20] IEC, "Loading Guide for Mineral Oil Immersed Power Transformers," vol.
IEC Std 60354,, September 1991.
[21] R. D. Stebbins, D. S. Myers, and A. B. Shkolnik, "Furanic compounds in
dielectric liquid samples: review and update of diagnostic interpretation and
estimation of insulation ageing," in Properties and Applications of Dielectric
Materials, 2003. Proceedings of the 7th International Conference on, 2003,
vol. 3, pp. 921-926 vol.923.
[22] A. D. Pablo, "Interpretation of Furanic Compounds Analysis – Degradation
Models," CIGRE WG D1.01.03, previously WG 15-01, Task Force 03,, 1997.
[23] IEEE, "IEEE Guide for the Interpretation of Gases Generated in Oil-
Immersed Transformers," vol. IEEE Std C57.104™-2008, January 2009.
[24] B. o. R. United States Department of the Interiour, "TRANSFORMER
MAINTENANCE," vol. Hydroelectic Research and Technical Service Group
D-8450 October 2000.
[25] IEC, "Mineral Oil-Impregnated Electrical Equipment in Service-
Interpretation of Dissolved and Free Gas Analysis.," vol. Draft IEC 60599
Edition 2, 1997.
[26] G. Daemisch, "Geriatrics of Transfromers," DTC - Daemish Transformer
Consult.
[27] W. H. Bartley, "Analysis of Transformer Failures," in International
Association of Engineering Insurers - 36th Annual Conference, Stockholm,
2003, p. 13.

68
[28] C. D. Association. Transformer Life-Cycle Cost (Total Owning Cost).
[Online]. Available:
http://www.copper.org/applications/electrical/energy/trans_life_cycle.html.
[29] D. V. S. S. Siva Sarma and G. N. S. Kalyani, "ANN approach for condition
monitoring of power transformers using DGA," in TENCON 2004. 2004
IEEE Region 10 Conference, 2004, vol. C, pp. 444-447 Vol. 443.
[30] S. Glenn and M. Tom, "POWER TRANSFORMER: LIFE-CYCLE COST
REDUCTION."
[31] H. Chen, T. N. Cong, W. Yang, C. Tan, Y. Li, and Y. Ding, "Progress in
electrical energy storage system: A critical review," Progress in Natural
Science, vol. 19, pp. 291-312, 2009.
[32] X. D. Xue, K. W. E. Cheng, and D. Sutanto, "A study of the status and future
of superconducting magnetic energy storage in power systems,"
Superconductor Science and Technology, p. R31, 2006.
[33] C. S. Hsu and W. J. Lee, "Superconducting magnetic energy storage for
power system applications," Industry Applications, IEEE Transactions on,
vol. 29, pp. 990-996, 1993.
[34] D. Krischel, Accel Instruments GmbH, 2009.
[35] W. V. Torre and S. Eckroad, "Improving power delivery through the
application of superconducting magnetic energy storage (SMES)," in Power
Engineering Society Winter Meeting, 2001. IEEE, 2001, vol. 1, pp. 81-87
vol.81.
[36] M. V. Aware and D. Sutanto, "SMES for protection of distributed critical
loads," Power Delivery, IEEE Transactions on, vol. 19, pp. 1267-1275, 2004.
[37] A. K. Kalafala, J. Bascunan, D. D. Bell, L. Blecher, F. S. Murray, M. B.
Parizh, M. W. Sampson, and R. E. Wilcox, "Micro superconducting magnetic
energy storage (SMES) system for protection of critical industrial and
military loads," Magnetics, IEEE Transactions on, vol. 32, pp. 2276-2279,
1996.
[38] J. Lamoree, T. Le, C. DeWinkel, and P. Vinett, "Description of a Micro-
SMES system for protection of critical customer facilities," Power Delivery,
IEEE Transactions on, vol. 9, pp. 984-991, 1994.
[39] M. Parizh, A. K. Kalafala, and R. Wilcox, "Superconducting magnetic energy
storage for substation applications," Applied Superconductivity, IEEE
Transactions on, vol. 7, pp. 849-852, 1997.
[40] A. A. Siada and S.Islam. (2007). Superconducting Magnetic Energy Storage
Unit, an Efficient Energy Technology for Power Systems. [Online].

69
[41] R. Kreutz, H. Salbert, D. Krischel, A. Hobl, C. Radermacher, N. Blacha, P.
Behrens, and K. Dutsch, "Design of a 150 kJ high-Tc SMES (HSMES) for a
20 kVA uninterruptible power supply system," Applied Superconductivity,
IEEE Transactions on, vol. 13, pp. 1860-1862, 2003.
[42] C. Xu, J. Xiaohua, L. Yongchuan, W. Xuezhi, and L. Wei, "SMES control
algorithms for improving customer power quality," Applied
Superconductivity, IEEE Transactions on, vol. 11, pp. 1769-1772, 2001.
[43] High Temperature Superconducting (HTS) Electrical Applications with
particular focus on Superconducting Magnetic Energy Storage (SMES):
TRITHOR GmbH, 2004.
[44] R. Baxter, "Energy storage : a nontechnical guide / by Richard Baxter. ,"
2006.
[45] Tennesse-Valley-Authority. (25.05.2009). [Online]. Available:
http://www.tva.gov/power/pumpstorart.htm.
[46] L. NGK Insulators. (28.05.2009). [Online]. Available:
http://www.ngk.co.jp/english/products/power/nas/principle/index.html.
[47] (27.05.2009). [Online]. Available: http://www.electricitystorage.org/.
[48] P. d. Boer and J. Raadschelders. (2007). Briefing paper Flow batteries
Leonardo Energy [Online].
[49] Steinfeld A and M. A., "Solar thermochemical process technology," Encycl
Energy, vol. 5, pp. 623-637, 2004.
[50] A. Nourai, V. I. Kogan, and C. M. Schafer, "Load Leveling Reduces Line
Losses," Power Delivery, IEEE Transactions on, vol. 23, pp. 2168-2173,
2008.
[51] fuelcells.org. (20.05.2009). [Online]. Available:
http://www.fuelcells.org/info/library/QuestionsandAnswers062404.pdf.
[52] private communication, 21.May.2009.

70
APPENDIX A
Actions based on TDCG (Source IEEE Std C57.104-2008 [23])
TDCG
levels
(μL/L)
TDCG rate
(μL/L/day) Sampling intervals and operating procedures for gas
generation rates Sampling
interval Operating procedures
Condition 4 >4630 >30 Daily Consider removal from service. Advise manufacturer. 10 to 30 Daily
<10 Weekly Exercise extreme caution. Analyse for individual gases. Plan outage. Advise manufacturer.
Condition 3 1921 to 4630 >30 Weekly Exercise extreme caution. Analyse for individual gases. Plan outage. Advise manufacturer.
10 to 30 Weekly <10 Monthly
Condition 2 721 to 1920 >30 Monthly Exercise caution. Analyse for individual gases. Determine load dependence.
10 to 30 Monthly <10 Quarterly
Condition 1 ≤720 >30 Monthly Exercise caution. Analyse for individual gases. Determine load dependence.
10 to 30 Quarterly Continue normal operation. <10 Annual
APPENDIX B
Dissolved Gas Analysis Detection Limits. (Source Transformer Maintenance[24])
Hydrogen (H2) about 5 ppm
Methane (CH4) about 1 ppm
Acetylene (C2H2) about 1 to 2 ppm
Ethylene (C2H4) about 1 ppm
Ethane (C2H6) about 1 ppm
Carbon monoxide (CO) and carbon cioxide (CO2) about 25 ppm
Oxygen (O2 ) and nitrogen (N2) about 50 ppm

71
APPENDIX C
Combustible Gas Generation vs. Approximate Oil Decomposition Temperature (Source: Transformer
Maintenance[24])

72
APPENDIX D
Rogers Ratios for Key Gases (Source: Transformer Maintenance[24])
Code range of ratios
Detection limits and 10 x detection limits are shown below:
<0.1 0.1-1 1-3 >3
0 1 1 2
1 0 2 2
0 0 1 2
C2H2
C2H4
CH4
H2
C2H6
1 ppm 1 ppm 1 ppm 5 ppm 1 ppm
10 ppm 10 ppm 10 ppm 50 ppm 10 ppm
Case Fault Type Problems Found
0 No fault
0 0 0
Normal aging
1 Low energy
partial discharge
1 1 0 Electric discharges in bubbles, caused by insulation voids or super gas saturation in oil or cavitation (from pumps) or high moisture in oil (water vapor bubbles).
2 High energy
Partial discharge
1 1 0 Same as above but leading to tracking or perforation of solid cellulose insulation by sparking, or arcing; this
generally produces CO and CO2
3 High energy discharges,
sparking, arcing
1-2 0 1-2 Continuous sparking in oil between bad connections of
different potential or to floating potential (poorly grounded shield etc); breakdown of oil dielectric
between solid insulation materials.
4 High energy Discharges,
arching
1 0 2 Discharges (arcing) with power follow through; arcing
breakdown of oil between windings or coils, or between coils and ground, or load tap changer arcing across the
contacts during switching with the oil leaking into the main tank
5 Thermal faults
less then 150°C (see note 2)
0 0 1 Insulated conductor overheating; this generally produces CO and CO2 because this type of fault
generally involves cellulose insulation.
6
Thermal fault temp. rang 150-300°C (see note
3)
0 2 0 Spot overheating in the core due to flux concentrations. Items below are in order of increasing temperatures of hot spots. Small hot spots in core. Shorted laminations
in core. Overheating of copper conductor from eddy currents. Bad connection on winding to incoming lead,
or bad contract on load or no-load tap changer. Circulation currents in core; this could be an extra core ground, (circulating currents in the tank an core); this
could also mean stray flux in the tank. These problems may involve cellulose insulation which
will produce CO and CO2
7 Temp fault temp. range 300-700°C
0 2 1
8
Temp fault temp range over
700°C (see note 4)
0 2 2
Notes:
1. There will be a tendency for ratio C2H2 /C2H4 to rise from 0.1 to above 3 and the ratio C2H4 /C2H6 to rise from 1-3 to above 3 as the spark increases in intensity. The code at the beginning stage will then be 1 0 1.
2. These gases come mainly from the decomposition of the cellulose which explains the zeros in this code. 3. This fault condition is normally indicated by increasing gas concentrations. CH4 /H2 is normally about 1, the
actual value above or below 1, is dependent on many factors such as the oil preservation system (conservator, N2 blanket, etc.), the oil temperature, and oil quality.
4. Increasing values of C2H2 (more than trace amounts), generally indicates a hot spot higher than 700 °C. This generally indicates arcing in the transformer. If acetylene is increasing and especially if the generation rate is increasing, the transformer should be de-energized, further operation is extremely hazardous.

73
APPENDIX E
Three-phase transformer connections (Source: Principles of Electric Machines and Power
Electronics [6])
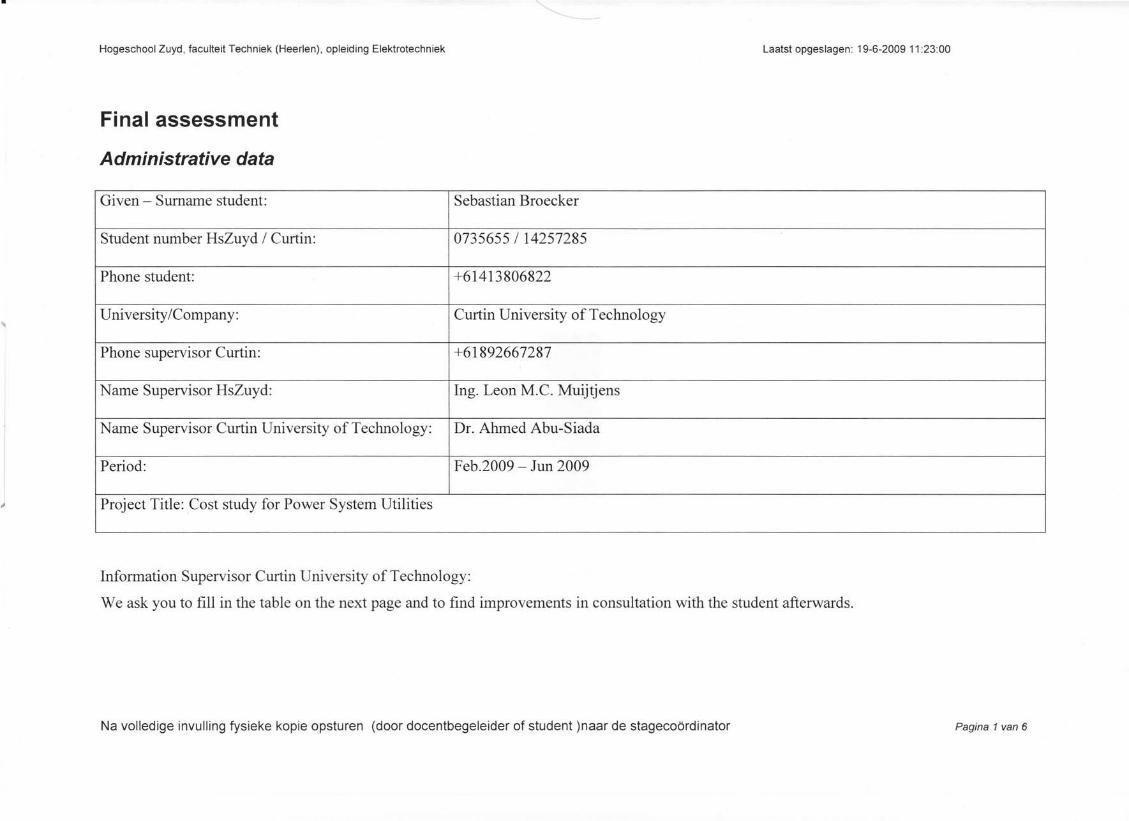
• <.
Hogeschool Zuyd, faculteit Techniek (Heerlen), opleiding Elektrotechniek Laatst opgeslagen: 19-6-2009 11:23:00
Final assessment
Administrative data
••
Given - Surname student: Sebastian Broecker
Student number HsZuyd / Curtin: 0735655 / 14257285
Phone student: +61413806822
University/Company: Curtin University of Technology
Phone supervisor Curtin: +61892667287
Name Supervisor HsZuyd: Ing. Leon M.C. Muijtjens
Name Supervisor Curtin University of Technology: Dr. Ahrned Abu-Siada
Period: Feb.2009 - Jun 2009
Project Title: Cost study for Power System Utilities~
Information Supervisor Curtin University of Technology:
We ask you to fill in the table on the next page and to find improvements in consultation with the student afterwards.
Na volledige invulling fysieke kopie opsturen (door docentbegeleider of student )naar de stagecobrdinator Pagina 1 van 6

•
Hogeschool Zuyd, faculteit Techniek (Heerlen), opleiding Elektrotechniek Laatst opgeslagen: 19-6-2009 11:23:00
Evaluation
•••
Competence mark weight mark x weight(1 tlm 10)
Understanding q 1 9Quality of the problem analyseDesign
1 <gQuality conceived solutions ~
Planning and perfomancef~ 1 ,~Quality planning and execution
Occupation Specific skillsQuality knowledge, skill and professional attitude q 1 ClGeneral competencies
• independence
• planned working ,~
~• oral communication 2• cooperate in a team
• social skills
• self reflection
mark (weighted sum divided by 6): ~
,
Na volledige invulling fysieke kopie opsturen (door docentbegeleider of student )naar de staqecoordinator Pagina 2 van 6

Hogeschool Zuyd, faculteit Techniek (Heerlen), opleiding Elektrotechniek Laatst opgeslagen: 19-6-2009 11:23:00
Improvements:
• Mr. S'ebo.. 5' ~\'~'"
S~(} d:J' He
r~~ le tt€ J
s ",'11 J cl =»stnf' r~~t
.s h..o"'" n EXC( I I€'4 re S'eo.r('~hC1A)
h('L" S ~~oJ G W\. "" v 1'1, t- Cc...A' t C--"'"")hl~~ 0. v~
~f}f r~ J R \'~\c>"" 11;-h~5 b f(e•... <t: Y,\
0 Mr, Sebo.J ~\'e,,,,, c.J 0-5' rJI'lJk'- ~;ycl.t~~ ~ f '--0' ("tJ '-# hR h c..J
tu ~~h~~t h,') +k~j tlc;..,? t" t-L, ~., C1h..,~ S -e.---. QJ ~ ~ --
~",,;y
o.,V\ et pr~__~
p~"1'\r e>f- a-:« c-Ji-». C...d f J Je./ t~-.) ~ -- 0\. a Clv J
~J ~J ;v,vth WU
r}:. ~5 t~ClJ <)~ LJ k~ cl 0\'7 tk~\'r f~~J
tw v S"'..f'v- R.J t f-) -
• I~I~ ~O\ j Cl ~ hi'" ~J~ke ~~5. ~\....A... o~!J1Ma
,.,,,t", ~'\'J (re .se-tc" ie-"" ~ ~s y;t\..v... ~ cA'-1 ~~-P"'-f cV v..J ~ k? 0 u t-
EJ ,~'"'h,
r",t~-v'f\ out c F If'
CV"W\ ~Jr-~...-('~). 1-10c-J~ ~~r-,. 1i1'J
b "'1St~""e.sg tL"", VI 't~c ~ ~ t" Ch J .:;..) u r: le \.re J ~o.r C J.-, M~c-.~" +0 ("'-tub~ rn ",I" e,
Na volledige invulling fysieke kopie opsturen (door docentbegeleider of student )naar de stagecobrdinator Pagina 3 van 6
\, .'J

Hogeschool Zuyd, faculteit Techniek (Heerlen), opleiding Elektrotechniek Laatst opgeslagen: 19-6-2009 11:23:00
Report (Curtin University)
Formal completenessThe report contains a:
o summary 0 Introductiono title page 0 chapter introductiono cover 0 illustrations (table, charts)o preface 0 reference listo table of contents 0 appendixo the sections flow in systematic manner 0 source listings where necessary
Language and structure
Readable style, correct spelling and punctuationLogical flow of ideasTypography
...~:t..(10).....% (10)....~ (10)
subtotal (max.30) 2..b. .Content
Clarity and definition of the problem statementDescription and justification of the chosen solutiondescription of the development
../.~ (20)
.~.S- (30)·1··~····(20)
subtotal (max 70)total score (max 100)
ti ..~l ...q..j. .
Cijfer verslag (totaalscore/1 0): ~-5"
Na volledige invulling fysieke kopie opsturen (door docentbegeleider of student )naar de stagecobrdinator Pagina 4 van 6

Hogeschool Zuyd, faculteit Techniek (Heerlen), opleiding Elektrotechniek
Presentation (HSZuyd)
Cijfer (1 tlrn 10)InleidingOmgevingsbeschrijvingMaakt centrale vraag duidelijkGeeft doelstelling aan
Kern:Presentatie is samenhangendMaakt eigen werk duidelijkGoede diepgangInfowaarde voor pub/iek
SlotGoede presentatie van de conclusiesGoede uitleidingGoede omgang met vragen
SpreektechniekGoed stem volumeGoed spreektempoDuidelijke articulatie
HoudingFunctionele gebarenOpen houdingnaar publiek
Cijfer voor de presentatie: cNa volledige invulling fysieke kopie opsturen (door docentbegeleider of student )naar de stagecobrdinator
Laatst opgeslagen: 19-6-2009 11:23:00
Pagina 5 van 6

Hogeschool Zuyd, faculteit Techniek (Heerlen), opleiding Elektrotechniek Laatst opgeslagen: 19-6-2009 11 :23:00
Eindcijfer onder voorbehoud van goedkeuring door de eindexamencommissieVia onderstaande tabel wordt het eindcijfer vastgesteld. De volgende opmerkingen zijn van belang:
• Mocht u redenen hebben om een cijfer 9 of hoger te adviseren dan horen wij deze graag. Als de docentbegeleider uw advies ondersteuntwordt een andere docentbegeleider verzocht ook zijn mening te geven over deze beoordeling. Is deze ook dezelfde mening toegedaan danwordt het betreffende cijfer toegekend.
• Mocht u redenen hebben om een cijferlager dan 6 te adviseren dan horen wij dit minder graag ©. Als de docentbegeleider uw adviesondersteunt wordt een andere docentbegeleider verzocht ook zijn mening te geven over deze beoordeling. Is deze ook dezelfde meningtoegedaan dan wordt het betreffende cijfer toegekend.
N.B! Een onvoldoende voor de afstudeeropdracht betekent dat het diploma niet behaald kan worden.
Opmerkingen
80 % van het cijfer voor de uitvoering: ~ Cijfer uitvoering lager dan 6 -> eindcijfer onvoldoende
10% van het cij fer voor het verslag .~~ J Definitief verslag onvoldoende -> eindcijfer onvoldoende
10% van het cijfer voor de eindpresentatie
Eindcijfer
Handtekening bedrijfsbegeleider:
11,J.\~.JtA.
~Datum:
,q.Q)6'.o~
Handtekening student: Handtekening docentbegeleider:
),6;a
Na volledige invulling fysieke kopie opsturen (door docentbegeleider of student )naar de stagecobrdinator Pagina 6 van 6