Cost of Clearing and Releasing Spectrum - Ofcom
87
Application of spectrum liberalisation and trading to the mobile sector – A further consultation 1 Annex 16 Cost of Clearing and Releasing Spectrum Summary Introduction A16.1 In this annex we look at the cost of clearing and releasing various quantities of spectrum in both the 900 MHz and 1800 MHz bands. We start with an overview of our previous analysis for the cost of clearance and release of 900 MHz spectrum. We analyse comments received following the September 2007 consultation. We then outline our revised analysis, indicating where appropriate how we have taken responses into consideration. Finally, we present our conclusions on the cost of clearing and releasing spectrum in the 900 MHz and 1800 MHz bands. This annex focuses on the costs incurred by incumbent operators in making changes to their network in order to clear the necessary spectrum. Other costs that may result from a policy of mandatory spectrum release are considered in a separate annex. A16.2 There are two distinct cases when considering clearing and releasing spectrum. The first is a partial clearance and release where only a portion of the spectrum is cleared and released whilst the rest continues to be used for the delivery of 2G services using GSM technology. The second is where the entire 2G spectrum is cleared as might be the case for a full release. The majority of this annex deals with the case of a partial clearance and release, however we have also estimate the cost of a full release. A16.3 A consequence of a partial clearance of spectrum currently used to provide 2G services using GSM technology in either the 900 MHz or the 1800 MHz bands will be that the traffic carrying capacity of the GSM networks will be reduced. This reduction in capacity will be most severe in the busiest areas of the networks and will be greater for larger clearances. To be able to continue to carry the same volume of traffic at similar quality operators can do at least two things: they can deploy a technical solution that will enable them to use their remaining GSM spectrum more efficiently (i.e. carry more traffic in a given quantity of spectrum); or they can transfer a proportion of their traffic to an alternative frequency band (perhaps using a different technology). A16.4 In practice they are likely to adopt a combination of these solutions. A16.5 For our refined analysis for this consultation we have considered three approaches to dealing with traffic displaced as a consequence of a partial clearance and release of spectrum in the 900 MHz band and hence to estimating the associated costs. We have also used the first two of these approaches to estimate the cost of a partial clearance of 1800 MHz spectrum (the third is not relevant to 1800 MHz). The three approaches considered are as follows: SFH upgrades plus UMTS2100 widening: we estimate the cost of upgrading the GSM networks to implement synthesised frequency hopping (SFH) to improve their spectral efficiency and then estimate the cost of carrying any remaining 2G traffic displaced as a consequence of clearing GSM spectrum on
-
Upload
khangminh22 -
Category
Documents
-
view
0 -
download
0
Transcript of Cost of Clearing and Releasing Spectrum - Ofcom

Application of spectrum liberalisation and trading to the mobile sector – A further consultation
1
Annex 16
Cost of Clearing and Releasing Spectrum Summary
Introduction
A16.1 In this annex we look at the cost of clearing and releasing various quantities of spectrum in both the 900 MHz and 1800 MHz bands. We start with an overview of our previous analysis for the cost of clearance and release of 900 MHz spectrum. We analyse comments received following the September 2007 consultation. We then outline our revised analysis, indicating where appropriate how we have taken responses into consideration. Finally, we present our conclusions on the cost of clearing and releasing spectrum in the 900 MHz and 1800 MHz bands. This annex focuses on the costs incurred by incumbent operators in making changes to their network in order to clear the necessary spectrum. Other costs that may result from a policy of mandatory spectrum release are considered in a separate annex.
A16.2 There are two distinct cases when considering clearing and releasing spectrum. The first is a partial clearance and release where only a portion of the spectrum is cleared and released whilst the rest continues to be used for the delivery of 2G services using GSM technology. The second is where the entire 2G spectrum is cleared as might be the case for a full release. The majority of this annex deals with the case of a partial clearance and release, however we have also estimate the cost of a full release.
A16.3 A consequence of a partial clearance of spectrum currently used to provide 2G services using GSM technology in either the 900 MHz or the 1800 MHz bands will be that the traffic carrying capacity of the GSM networks will be reduced. This reduction in capacity will be most severe in the busiest areas of the networks and will be greater for larger clearances. To be able to continue to carry the same volume of traffic at similar quality operators can do at least two things:
they can deploy a technical solution that will enable them to use their remaining GSM spectrum more efficiently (i.e. carry more traffic in a given quantity of spectrum); or
they can transfer a proportion of their traffic to an alternative frequency band (perhaps using a different technology).
A16.4 In practice they are likely to adopt a combination of these solutions.
A16.5 For our refined analysis for this consultation we have considered three approaches to dealing with traffic displaced as a consequence of a partial clearance and release of spectrum in the 900 MHz band and hence to estimating the associated costs. We have also used the first two of these approaches to estimate the cost of a partial clearance of 1800 MHz spectrum (the third is not relevant to 1800 MHz). The three approaches considered are as follows:
SFH upgrades plus UMTS2100 widening: we estimate the cost of upgrading the GSM networks to implement synthesised frequency hopping (SFH) to improve their spectral efficiency and then estimate the cost of carrying any remaining 2G traffic displaced as a consequence of clearing GSM spectrum on

Application of spectrum liberalisation and trading to the mobile sector – A further consultation
2
the operators’ UMTS2100 networks, building out additional UMTS2100 infrastructure to absorb this traffic as necessary;
SFH upgrades plus GSM cell splitting: again we estimate the cost of upgrading the GSM networks to implement SFH, however any remaining traffic displaced as a consequence of clearing GSM spectrum is handled by cell splitting in the GSM networks;
GSM1800 upgrades plus cell splitting: this only applies to clearance and release of the 900 MHz spectrum held by O2 and Vodafone. We estimate the cost of expanding the use of GSM1800 on existing GSM sites with any remaining traffic displaced as a consequence of clearing GSM spectrum being handled by cell splitting.
A16.6 For the case of a full release of 900 MHz and 1800 MHz the only viable option for dealing with displaced 2G traffic would be UMTS2100 widening (i.e. building out additional UMTS2100 infrastructure to carry this traffic as necessary).
A16.7 The estimates in this summary (unless indicated otherwise) are for a spectrum release date of 2011 with clearance work taking place in the two years leading up to this. The estimates are based on a 20 year NPV using a social discount rate of 3.5%. The estimates quoted are the combined cost to two operators as are the spectrum clearance and release quantities (e.g. a 1 block release would mean ½ a block release by each of Vodafone and O2, each block is 2 x 5 MHz of spectrum).
Cost of partial clearance and release of 900 MHz spectrum
A16.8 The cost of clearing GSM900 spectrum is estimated in Table 1 as follows.
Table 1: 900MHz – Overall cost of clearance
Approach 1 Approach 2 Approach 3 Blocks cleared Lower Upper Lower Upper Lower Upper
1 Block £30m £45m £30m £45m £45m £70m
2 Blocks £60m £100m £70m £110m £80m £120m
3 Blocks £260m £430m £190m £290m £140m £210m
4 Blocks £520m £880m £500m £770m £260m £400m
5 Blocks £880m £1,550m £1,600m £2,400m £530m £810m
A16.9 These results are illustrated graphically in Figure 1 below.

Application of spectrum liberalisation and trading to the mobile sector – A further consultation
3
Figure 1: 900 MHz – Overall cost of clearance
0
500
1000
1500
2000
2500
1 2 3 4 5 1 2 3 4 5 1 2 3 4 5
Approach 1 Approach 2 Approach 3
£m
Upper bound Lower bound
A16.10 The cost of releasing GSM900 spectrum is estimated in Table 2 below. This estimate assumes that O2 and Vodafone clear one block (i.e. 2 x 5 MHz) of spectrum each for their own use, the cost of release is therefore the difference between clearing two blocks and clearing subsequent blocks (i.e. the cost of releasing one block is calculated from the difference between clearing 2 blocks and clearing 3).
Table 2: 900 MHz – Overall cost of release
Approach 1 Approach 2 Approach 3 Blocks released Lower Upper Lower Upper Lower Upper
1 Block £200m £330m £120m £180m £60m £90m
2 Blocks £460m £780m £430m £660m £180m £280m
3 Blocks £820m £1,450m £1,550m £2,300m £450m £690m
A16.11 The overall cost of release is illustrated graphically in Figure 2 below.

Application of spectrum liberalisation and trading to the mobile sector – A further consultation
4
Figure 2: 900 MHz – Overall cost of release
0
500
1000
1500
2000
2500
1 2 3 1 2 3 1 2 3
Approach 1 Approach 3 Approach 3
£m
Lower bound Upper bound
A16.12 As can be seen, approach 3 appears to be the most cost effective approach regardless of the size of release.
A16.13 We do not believe that for partial clearance and release of spectrum it is actually necessary to remove the interleaving of GSM900 spectrum holdings. However, operators’ may choose to undertake such work at the same time as clearing spectrum. Table 3 below illustrates the cost of clearing GSM900 spectrum including the removal of interleaving.
Table 3: 900MHz – Overall cost of clearance (including removal of interleaving)
Approach 1 Approach 2 Approach 3 Blocks cleared Lower Upper Lower Upper Lower Upper
1 Block £70m £110m £70m £110m £90m £130m
2 Blocks £100m £150m £100m £160m £120m £180m
3 Blocks £280m £470m £220m £330m £180m £270m
4 Blocks £530m £900m £520m £790m £300m £470m
5 Blocks £880m £1,550m £1,600m £2,400m £570m £880m
Comparison with September 2007 consultation
A16.14 Figure 3 below compares the cost of release using approach 3 with the equivalent cost of release estimated from the September 2007 consultation.

Application of spectrum liberalisation and trading to the mobile sector – A further consultation
5
Figure 3: 900 MHz – Cost of release comparison with September 2007 consultation
0
200
400
600
800
1 2 3 1 2 3
September 2007 Consultation Updated analysis
£m
Lower bound Upper bound
A16.15 As can be seen, the estimated cost of releasing 1 block of spectrum (based on approach 3) has fallen, the estimated cost of releasing 2 blocks has risen significantly and the estimated cost of releasing 3 blocks has fallen from the September 2007 equivalent. Overall, however, the costs appear to be of a broadly similar magnitude.
Cost of partial clearance of 1800 MHz spectrum
A16.16 The cost of clearing the GSM1800 spectrum held by Orange and T-Mobile is estimated in Table 4 as follows1:
Table 4 : 1800 MHz – Overall cost of clearance
Approach 1 Approach 2 Blocks cleared Lower Upper Lower Upper
1 Block £20m £25m £15m £20m
2 Blocks £25m £35m £20m £30m
3 Blocks £35m £50m £30m £40m
4 Blocks £50m £80m £45m £60m
5 Blocks £70m £110m £70m £100m
6 Blocks £100m £160m £110m £160m
A16.17 These results are illustrated graphically in Figure 4 below.
1 Not applicable to O2 and Vodafone 1800 MHz spectrum holdings

Application of spectrum liberalisation and trading to the mobile sector – A further consultation
6
Figure 4 : 1800 MHz – Overall cost of clearance
0
20
40
60
80
100
120
140
160
180
1 2 3 4 5 6 1 2 3 4 5 6
Approach 1 Approach 2
£m
Lower bound Upper bound
Timing and the risk of transitional network disruption
A16.18 We believe that, for a spectrum release of 1 block of 900 MHz spectrum, the work necessary to upgrade the networks to enable this could be reasonably achieved within 2 years.
A16.19 In considering the process and timing for releasing spectrum we have considered the fact that operators may also be deploying UMTS900 at the same time. We do not believe this would have a material impact on operators ability or timing of release because much of the physical upgrade work necessary to release spectrum could be planned and implemented alongside the work necessary to deploy UMTS900 - for instance site visits could be combined where appropriate.
A16.20 We acknowledge that there may be a period of network disruption during the upgrade. However, impacts can be minimised if the proposed upgrades are planned well in advance and major changes/upgrades are brought on-line at times when the networks are naturally quiet (e.g. at night). Further, all the operators in the UK have experience in making major changes/upgrades to their networks. Although there are challenges when upgrade activities are carried out on a large scale, they are not completely new concepts. In addition, all the operators carry out numerous smaller scale network upgrades and frequency planning modifications as a part of their business as usual activities. We believe that the operators are experienced enough to carry out the types of upgrade we propose without adversely affecting their market position and they can make use of their past experience in order to minimise any network disruption.
A16.21 It is unclear that there would be any material impact in terms of costs as a consequence of network disruption. If there are costs, we believe that they are likely to be relatively small. We have estimated that, as a worst case, such costs are likely to be no more than those in the following table:

Application of spectrum liberalisation and trading to the mobile sector – A further consultation
7
Table 5: Network disruption cost ranges
Blocks released
Lower Upper
1 Block £2.3m £20.8m
2 Blocks £2.7m £24.2m
3 Blocks £3.2m £28.8m
A16.22 Our costing of the three approaches to the partial clearance and release of spectrum is based on maintaining the long term quality of existing services provided to consumers. As such we consider the risk of a long term impact on quality to be extremely low.
Cost of full clearance and release
A16.23 We have estimated the cost of full clearance and release of all 900 MHz and 1800 MHz spectrum currently used to provide 2G services by assuming that all traffic is migrated to the operators’ UMTS2100 network. The cost, made up of expanding the UMTS2100 networks to cope and accelerating the migration of 3G handsets, is estimated in Table 6 as follows.
Table 6: Overall cost of full clearance and release
Full clearance and release Spectrum
band Lower Upper
900 MHz £1,900m £3,100m
1800 MHz £2,200m £3,550m

Application of spectrum liberalisation and trading to the mobile sector – A further consultation
8
Table of contents
A16.24 The structure of this annex is as follows:
Summary 1 Introduction 1 Cost of partial clearance and release of 900 MHz spectrum 2 Comparison with September 2007 consultation 4 Cost of partial clearance of 1800 MHz spectrum 5 Timing and the risk of transitional network disruption 6 Cost of full clearance and release 7
Table of contents 8 Overview of previous analysis from the September 2007 Consultation 10
Low mobile data demand 11 High mobile data demand 12 Conclusions 12
Issues raised in responses to the September 2007 Consultation 13 E-GSM utilisation 13 SFH effectiveness 13 Missing costs (UMTS2100 widening) 16
Capacity of a single UMTS carrier (i.e. in 5 MHz) 17 Traffic displaced by release of an equivalent 5 MHz of GSM spectrum 17
Update on methods for improving GSM (spectral) efficiency 18 Frequency Hopping 18
Revised modelling 19 Methodology 22
Approach 1 – SFH plus UMTS2100 widening 22 Approach 2 – SFH plus cell splitting 24 Approach 3 – GSM1800 upgrades plus cell splitting 25 Elements general to all three approaches 26
Traffic growth 27 Interleaving of 900 MHz spectrum 29 Cell splitting factor 31 Assumptions relevant to all three approaches 33 Specific assumptions 34
Approach 1 – SFH plus UMTS2100 widening 34 Approach 2 – SFH plus cell splitting 37 Approach 3 38
Cost of partial clearance and release of 900 MHz 39 Approach 1 – SFH plus UMTS2100 widening 39
Base case 39 SFH clustering factor 40 Potential additional UMTS2100 costs inside the 80% coverage area 41 Impact of different GSM frequency reuse factors 42 Impact of traffic growth 44 Impact of site acquisition inflation 45 Impact of removing 900 MHz spectrum interleaving 46 Conclusions for approach 1 47
Approach 2 – SFH plus Cell splitting 49 Base case 49 SFH clustering factor 51 Impact of different GSM frequency reuse factors 52 Impact of traffic growth 53 Impact of site acquisition inflation 54 Impact of removing 900 MHz spectrum interleaving 55

Application of spectrum liberalisation and trading to the mobile sector – A further consultation
9
Conclusions for approach 2 56 Approach 3 – GSM1800 upgrade + Cell splitting 58
Base case 58 Impact of different GSM frequency reuse factors 59 Impact of traffic growth 60 Impact of site inflation 61 Impact of removing 900 MHz spectrum interleaving 62 Conclusions for approach 3 63
Impact of extra GSM1800 spectrum for approach 3 65 Impact of deferred clearance and release of 900 MHz spectrum 67 Impact of release of 900 MHz spectrum in 2011 of further clearance of 900 MHz spectrum in 2015 71
Scenario 1 71 Scenario 2 72 Scenario 3 72
Cost of partial clearance and release of 900 MHz – overall conclusions 72 Cost of partial clearance and release of 1800 MHz 75
Approach 1 – SFH plus UMTS2100 widening 75 Approach 2 – SFH plus cell splitting 77
Cost of full clearance and release of 900 MHz and 1800 MHz 78 Impact of deferred the full clearance and release of 900 MHz spectrum 79
Timing and the risk of transitional network disruption 80 Timing 80 Potential costs associated with transitional network disruption and quality impacts 81
Scenario 1 82 Scenario 2 85
Conclusions 86 Potential long term quality impact 87

Application of spectrum liberalisation and trading to the mobile sector – A further consultation
10
Overview of previous analysis from the September 2007 Consultation
A16.25 In the September 2007 Consultation we presented an initial analysis of the costs associated with clearing various quantities of spectrum at 900 MHz of GSM carriers and releasing these to third parties. This was a key element in the policy considerations within the consultation.
A16.26 The analysis was based on an estimate of the efficiency (frequency reuse) with which Vodafone and O2 utilise their current 2G spectrum holdings and an estimate of how much they could improve this efficiency faced with a requirement to clear increasing amounts of their 900 MHz 2G holdings. This, together with sample site data they supplied and empirical drive test data we commissioned, allowed us to estimate how much of their network would become capacity constrained for different amounts of cleared spectrum.
A16.27 We then explored the plausible range of options available to Vodafone and O2 to recover 2G traffic displaced by different levels of spectrum clearance. These potential options as outlined in the September consultation document were :
o SFH – Allows a single GSM channel to be hopped across multiple frequencies thus averaging interference and allowing a tighter frequency re-use pattern (i.e. more carriers per cell can be used.
o GSM Half rate – Effectively squeezes voice calls into using half the normal traffic resource using more efficient speech coding. This degrades voice quality but allows almost twice the number of simultaneous calls to be supported. Requires a reasonable penetration of half rate capable handsets to work effectively but our understanding is that almost all current handsets are half rate capable
o Adaptive multi rate – Similar to Half rate but uses variable speech coding depending on conditions.
o Hyperband Handover – Can be used in multi band networks (900/1800 MHz) where a single broadcast control channel (BCCH) is used on the 900MHz layer without the need for another BCCH on the 1800MHz layer.
o Concentric cell – A software feature that allows greater frequency re-use within the inner part of a cell by effectively allowing a base station to emulate a micro cell embedded within a macro cell without the need to deploy a physical micro base station.
o Cell splitting – Can be achieved either by increasing the number of sectors of an existing site or by installing completely new sites; the following provide specific examples of cell splitting:
Hot spot deployment – Micro/Pico cells are deployed in capacity hotspots reusing frequencies from the Macro cell layer;
Dedicated in building cells – either by installing micro /pico cells within a building or using a distributed antenna system from a macro base station.

Application of spectrum liberalisation and trading to the mobile sector – A further consultation
11
A16.28 Two options were chosen for detailed modelling – a) implementing SFH in the operators’ remaining 2G spectrum to improve the frequency reuse that can be achieved, b) migrating displaced traffic to their 3G network at 2.1 GHz.
A16.29 Based on the analysis of how many sites would become capacity constrained given their existing frequency reuse limits, we estimated how much of their network would need to be upgraded to implement SFH (and hence the cost). This, together with the drive test data indicated that at least 1 block of 2 x 5 MHz each from Vodafone and O2 could be cleared with minimal cost and that an extra one or two blocks in total could be cleared based on a strategy of SFH implementation alone.
A16.30 In order to clear even more blocks of spectrum, a strategy of SFH upgrades alone is no longer effective. Beyond 3 to 4 blocks in total we assumed that any further traffic displaced could be migrated to Vodafone’s and O2’s 3G network at 2.1 GHz. To achieve this two things are necessary – a) sufficient users must have 3G capable handsets, b) the operators must have 3G coverage in areas where the upgraded 2G network becomes capacity constrained.
A16.31 a) implies that the operators will have to subsidise 3G handsets to encourage migration (3G handset migration) and b) implies that extra 2.1 GHz 3G sites will need to be build in areas outside the operators current coverage (2.1 widening). A combination of the cost of these two together with the cost of SFH upgrades then gives us the total costs for clearing larger amounts of 900 MHz spectrum.
A16.32 The final result was an estimate of the costs of clearing increasing amounts of 900 MHz spectrum that ranged from a few 10s of £millions for 1 or 2 blocks to over £1billion for larger quantities.
A16.33 Estimates were made for 2 overall demand scenarios – low mobile data demand and high mobile data demand.
Low mobile data demand
A16.34 We assumed this scenario occurs where 2G traffic levels in 2010/11 are 20% higher than those observed in 2006/07. This higher 2G traffic results from lower penetration of 3G capable handsets. Here it is assumed that the operators are only interested in using 900 MHz for GSM, hence they do not re-farm.
Table 7 Detailed summary of cost of clearing and releasing spectrum - low mobile broadband demand scenario
SFH upgrade Remove
interleaving Accelerated
handset migration UMTS2100 widening
Total cost Total blocks cleared Lower Upper Lower Upper Lower Upper Lower Upper Lower Upper
1 Block £40m £50m - - - - - - £40m £50m
2 Blocks £80m £90m - - - - - - £80m £90m
3 Blocks £150m £200m £50m £100m - £400m - £20m £200m £750m
4 Blocks £150m £350m £50m £100m £250m £800m £40m £60m £500m £1,300m
A16.35 The total number of blocks cleared column now refers to the aggregate spectrum cleared by O2 and Vodafone, rather than the amount per operator. So 4 blocks in total equates to 2 x 20MHz in total, or 2 x 10MHz each.

Application of spectrum liberalisation and trading to the mobile sector – A further consultation
12
High mobile data demand
A16.36 We assumed this scenario occurs where 2G traffic levels in 2010/11 are similar to those observed in 2006/07 when our technical measurements were made. In this scenario it is assumed that the operators are interested in re-farming one 2 x 5 MHz block of 900 MHz spectrum each for use in their own future UMTS900 networks;
Table 8 Summary of cost of releasing spectrum - high mobile broadband demand scenario
High demand scenario Total cost of clearing
blocks (2007/08) Total cost of releasing
blocks (2007/08)
Total blocks
released
Total blocks cleared
Lower Upper Lower Upper
1 block 3 block £100m £150m £80m £120m
2 blocks 4 blocks £150m £200m £130m £170m
3 blocks 5 blocks £500m £800m £480m £770m
4 blocks 6 blocks £850m £1,450m £830m £1,420m
Conclusions
A16.37 For ease of comparison, Figure 5 below illustrates the ranges of estimated costs per block release, for both the low and high demand scenarios.
Figure 5 Total costs of release ranges in high and low demand for mobile broadband scenarios
0
200
400
600
800
1000
1200
1400
1600
1 2 3 4 1 2 3 4
Low demand scenario High demand scenario
£m
Lower bound Upper bound
A16.38 This analysis adopted a particular approach to the problem (i.e. SFH upgrades coupled with migrating 2G traffic to their 3G network at 2.1 GHz) which, seemed to us to be reasonably realistic and viable. It was not intended to describe the only possible approach, nor was it intended to illustrate either the most or least costly way of clearing and releasing spectrum. However, it was meant to provide a credible estimate of the range of likely costs.

Application of spectrum liberalisation and trading to the mobile sector – A further consultation
13
Issues raised in responses to the September 2007 Consultation
A16.39 Below we summarise the main issues raised in responses to the September 2007 Consultation and in further discussions with the mobile operators. For each issue we give a view on the potential impact on our cost of initial cost of release estimate and summarise how we have taken this into account in our revised analysis – where appropriate a more detailed analysis is provided later in the document.
E-GSM utilisation
A16.40 Vodafone and O2 commented that Ofcom had underestimated their current E-GSM utilisation due to a flawed drive test methodology. Vodafone estimated E-GSM contributes 20% of busy hour capacity. O2 stated that E-GSM is deployed on 40% of their London sites.
A16.41 We acknowledge that the drive test results may have underestimated E-GSM utilisation; however this was not used directly in the cost of release model (the model took into account the number of transceivers per site but not whether these transceivers are in the E-GSM or P-GSM portion of the 900 MHz band). Given the way the model works, the degree of utilisation of E-GSM relative to P-GSM is irrelevant, what matters is the total utilisation of the whole band. Our revised work also does not make a distinction between E-GSM and P-GSM utilisation and therefore any potential underestimate will have no impact.
SFH effectiveness
A16.42 O2 argued that baseband hopping already provides them with the vast majority of the benefits that SFH would bring. Vodafone argued that Ofcom over estimated the improvement in frequency re-use from SFH, that we did not taken into account impact of GPRS timeslots on the BCCH carrier and a higher frequency re-use of the BCCH carriers is needed when implementing SFH because BCCH channels no longer hop. Vodafone also implied that they currently achieve better frequency re-use than that assumed in our calculations.
A16.43 On the other hand, T-Mobile argued that a tighter BCCH re-use factor could be achieved and that the SFH site clustering factor of 2 we assumed is not necessary as busy cells tend to be in clusters anyway.
A16.44 The impact of any overestimate would be to reduce the point at which the implementation of SFH would work as a stand alone strategy for recovering lost capacity and therefore the point at which additional measures would have to kick in. It would also mean that SFH would need to be implemented on more sites for lower quantities of cleared spectrum.
A16.45 In the September 2007 Consultation we assumed re-uses factors:
for BBH of 21 for BCCH carriers and 12 for TCH carriers; and
for SFH of 9 for BCCH carrier and 9 for TCH carriers
A16.46 Since the September 2007 consultation we have carried out further research into achievable frequency re-use factors via literature searches/reviews and talking to a number of GSM operators from outside the UK. This research leads us to believe that we may well have underestimated the re-use factors that can be achieved with BBH and over-estimated the re-use factors that can be achieved with SFH. In our

Application of spectrum liberalisation and trading to the mobile sector – A further consultation
14
revised analysis we have adjusted the reuse factors for both BBH and SFH to take this into account.
A16.47 We still believe that a SFH clustering factor of two is appropriate, especially for lower release quantities. We have therefore chosen to maintain a factor of 2 in our refined analysis however we have included a sensitivity based on a factor of 1 for comparison.
Timing of release
A16.48 Vodafone and O2 argued that it would not be possible to clear spectrum in the timescales proposed by Ofcom. O2 argued that even to clear 2 x 5 MHz of spectrum for their own use would take them to 2012. Vodafone estimated 3-4 years to clear 2 x 7.5 MHz and 5 years to clear 2 x 12.5 MHz. Vodafone provided a reasonably detailed timetable of actions necessary to clear and release spectrum. However, as discussed later in this annex, it is our view that whist challenging it should be possible to clear at least 3 block of 900 MHz spectrum (i.e. 2 x 7.5 MHz each for O2 and Vodafone) within a two year period.
A16.49 T-Mobile claimed (based on their own experience) that release could be achieved in 1 year. We believe that clearance and release of 900 MHz spectrum in 1 year would be extremely challenging and is very unlikely to be practical. Our own view is that 18 months is a more realistic lower bound for this (see discussion starting at paragraph A16.307 for details).
A16.50 Orange cast doubt on the practicality of release within two years and used this to support an argument for a phased transition (with rural areas being release first).
A16.51 A geographically phased release could bring significant extra complications and costs – e.g. buffer zones to avoid interference in boundary areas. We have not estimated the cost of a geographically phased release option but an estimate could be made based of SFH upgrades plus cell splitting as a likely strategy to recover lost capacity. We talk later in the annex (see paragraph A16.307) of the likelihood of a phased implementation of network upgrades. However, this does not imply that we feel a phased release is viable. When implementing upgrades to their own network to clear spectrum a single operator can optimise things much more easily than when two operators have to coordinate their activities together (i.e. in boundary areas during a phased release). A single operator does not have to consider interference into adjacent cleared areas until the whole programme is complete and the cleared spectrum is released.
Quality of Service in retained spectrum
A16.52 There were a number of concerns, including from individual consumers on the ability of the 900 MHz operators to continue to offer 2G services in reduced spectrum holdings without some impact on quality of service and their ability to maintain their existing geographic coverage.
A16.53 O2 claimed that it would be impossible to maintain an acceptable quality of service in remaining spectrum. They quote a five fold reduction in QoS (evidenced from US market – AT&T and T-Mobile who have only 2x10.5MHz of spectrum)
A16.54 Our estimates have been carried out on the basis of ensuring no long term impact on QoS (i.e. maintaining network capacity and QoS at at least the same level as before). The O2 claim of a five fold reduction in QoS, however, they do not provide

Application of spectrum liberalisation and trading to the mobile sector – A further consultation
15
a valid reference point to assess the data they quote from the US market against. It is impossible to separate QoS issues from the overall strategy for recovering lost capacity and therefore it has no stand alone impact on the cost of release. A discussion of the potential long term quality implications for retained spectrum is provided later in this document (see paragraphs A16.345 to A16.347).
A16.55 Tesco Mobile was concerned that a requirement to release 900 MHz spectrum would have an adverse effect on 2G services in the band. They were concerned that quality of service would be severely degraded with possible gaps in coverage and that O2 may not be able to provide a nationwide 2G service incorporating Tesco Mobile in a reduced 900 MHz spectrum holding, and that customers who wished to continue using GSM would probably have to consider moving to the 1800 MHz providers.
A16.56 As indicated above, our estimates have been carried out on the basis of ensuring no long term impact on QoS. As such, we believe that it will be possible for both Vodafone and O2 to maintain a nationwide 2G service incorporating their MVNOs for as long as they wish to do so.
Network disruption/quality impact
A16.57 O2 and Vodafone claimed that the network disruption and quality impact during the upgrade period would put them in a difficult position in the market.
A16.58 We acknowledge that there may be a period of network disruption during the upgrade. However, impacts can be minimised if the proposed upgrades are planned well in advance and major changes/upgrades are brought on-line at times when the networks are naturally quiet (e.g. at night). Further, all the operators in the UK have experience in making major changes/upgrades to their networks. Although there are challenges when upgrade activities are carried out on a large scale, they are not completely new concepts. In addition, all the operators carry out numerous smaller scale network upgrades and frequency planning modifications as a part of their business as usual activities. We believe that the operators are experienced enough to carry out the types of upgrade we propose without adversely affecting their market position and they can make use of their past experience in order to minimise any network disruption.
A16.59 See paragraphs A16.314 to A16.344 for discussion of the potential impact of a transitional impact on quality.
Traffic growth
A16.60 A number of responses contained conflicting confidential information on whether 2G traffic was likely to grow or contract over the next few years. Some respondents predicted that 2G traffic would continue to grow whilst others predicted falling traffic levels.
A16.61 Based on these responses, further confidential information gained following the September 2007 consultation and independent traffic forecasts2 we believe it is plausible that 2G traffic may be approximately 10% higher in 2011 that it is today but that after 2011 2G traffic is likely to fall significantly. See paragraphs A16.108 to A16.117 for details of how we have taken this into account in our further analysis.
2 e.g. Mobile Networks Forecasts: Future Mobile Traffic, Base Stations and Revenues – Informa 2008

Application of spectrum liberalisation and trading to the mobile sector – A further consultation
16
Cell splitting
A16.62 O2 argued that cell splitting is the only viable alternative to cope with spectrum loss, and will require 7000 more cell sites at an expense of £2.5bn. Vodafone also suggested that cell splitting coupled with SFH upgrades is likely to be the most realistic approach to recovering lost capacity.
A16.63 Cell splitting may or may not be a more expensive option than 2.1 widening and accelerated handset migration. It has the benefit of approximately doubling capacity locally and means that large handset subsidies required to move customers over to 3G (2.1 GHz) would not be necessary. On the down side, a significant number of extra cell sites would be required and this may be practically difficult to achieve in the busiest areas. 2G RAN sharing would increase the pool of 2G sites available and therefore could make this a more cost efficient strategy (for operators with such an agreement).
Missing costs (UMTS2100 widening)
A16.64 Vodafone argued that in the case where displaced traffic is absorbed on the 2.1 GHz network (by UMTS2100 widening and handset migration) we have failed to take into account that their existing 2.1 GHz network would need to be upgraded to cope with the additional traffic load. Our analysis for the September 2007 Consultation assumed that, in areas where it has been rolled out, the 3G networks of Vodafone and O2 would have sufficient capacity to absorb any further displaced 2G traffic. Obviously, if this is not true, then our estimate of the cost of release will be an under-estimate.
A16.65 For a detailed analysis of this potential under-estimate we would need significant additional information about the current utilisation of Vodafone’s and O2’s 3G networks, its spare capacity and an estimate of likely 3G traffic growth. However, there is a simpler approach to this analysis that we feel will give us a sufficient understanding to provide an upper bound for the potential costs involved. This assumes that there is actually no spare capacity available at 2.1 GHz and therefore any displaced traffic would have to be dealt with by adding additional 2.1 GHz sites.
A16.66 Obviously, it is very unlikely that there would actually be no spare capacity at 2.1 GHz right across the operators’ networks. However, there are likely to be 3G traffic hotspots and it is also likely there will be a degree of correlation between the 2G sites which are most capacity constrained and 3G sites which are also running close to capacity. As our approach to calculating the cost of partial release of spectrum relies on estimating those 2G sites which will become constrained as a consequence of clearance, it is not unreasonable to assume that corresponding 3G sites will also have very little spare capacity to carry remaining 2G traffic still displaced as a consequence of clearing GSM spectrum. Hence, whilst we acknowledge that this approach is likely to result in an over-estimate, we do not believe that this will be a significant over-estimate, particularly for the smaller clearance quantities considered (e.g. 3 or so blocks).
A16.67 In essence we estimate the total number of GSM transceivers that could no longer be supported in the reduced spectrum holding (as a proxy for displaced traffic) and calculate the total number of UMTS sites needed to duplicate this lost capacity. For this we assume the operators’ current FDD spectrum holdings at 2.1 GHz and that, 3 sector UMTS sites would be deployed.

Application of spectrum liberalisation and trading to the mobile sector – A further consultation
17
A16.68 Our estimate of the capacity of a UMTS carrier is based on the uplink direction (uplink being the limiting case) and for voice only service we assume the following parameters:
Table 9 UMTS uplink parameters
Parameter Symbol Assumed value3
Activity factor 0.67
WCDMA chip rate W 3.84 Mc/s
User bit rate R 12.2 kb/s
Other cell to own cell interference i 65%
Uplink load factor ηUL 50%
Eb/No for the uplink Eb/No 7.2 dB4
Capacity of a single UMTS carrier (i.e. in 5 MHz)
A16.69 The capacity of a single UMTS carrier can be estimated from the uplink load equation:5
Equation 1: Uplink load equation
iNRW
NEbUL 10
A16.70 Using Equation 1: Uplink load equation with the parameters from Table 9, the number of simultaneous voice calls that can be carried on a single UMTS carrier is calculated as:
N = 29.3
Traffic displaced by release of an equivalent 5 MHz of GSM spectrum
A16.71 We can calculate the number of simultaneous voice calls that can be carried in 5 MHz of GSM spectrum from the following:
Number of 200 kHz GSM carriers available in 5 MHz = 5/0.2 = 25
Assumed GSM frequency BCCH re-use factor = 15
Assumed GSM frequency TCH re-use factor = 13
Number of traffic channels available per BCCH carrier = 7
Number of traffic channels available per TCH carrier = 8
A16.72 Therefore the number of simultaneous voice calls that can be carried in 5 MHz of GSM spectrum is given by:
N = 7 + ((25 – 15) * 8) / 13)
3 WCDMA for UMTS – Holma and Toskala – Fourth Edition – Table 8.6 4 WCDMA for UMTS – Holma and Toskala – Fourth Edition – Table 11.19 5 WCDMA for UMTS – Holma and Toskala – Fourth Edition – Equation 8.14

Application of spectrum liberalisation and trading to the mobile sector – A further consultation
18
N = 13.15
A16.73 From the simplistic analysis above it can be concluded that 5 MHz spectrum used for UMTS should be able to carry approximately the same voice traffic as 11 MHz of spectrum used for GSM (or a ratio of 1:2.2). We have therefore chosen to use a ratio of 1:2 for the purposes of our refined analysis.
Update on methods for improving GSM (spectral) efficiency
A16.74 In the September 2007 consultation we outlined a series of methods which potentially could improve the efficiency with which GSM spectrum can be used. In the paragraphs below we review the frequency hopping methods, we outline comments received on frequency hopping following the consultation and we indicate our current view on their relevance to our further work on estimating the cost of clearing GSM spectrum.
Frequency Hopping
A16.75 Frequency hopping is a tried and proven method for improving the spectral efficiency of GSM. Frequency hopping (as applied to GSM) allows the instantaneous frequency of a GSM carrier to hop over a number of frequencies. There are two variants of frequency hopping that can be used:
baseband hopping (BBH), where the number of frequencies available to hop over is limited to the number of transceivers installed on a sector, each transceiver being tuned to a fixed frequency; and
synthesised frequency hopping (SFH), where the number of frequencies available to hop over is limited only by the number of GSM channels available to the operator. Each transceiver hopping to a new frequency at the transmission of each burst.
A16.76 Baseband hopping is used by both Vodafone and O2 throughout their current GSM networks, however, synthesised frequency hopping is not. It is our understanding that the same applies to the GSM1800 networks of Orange and T-Mobile as well. Synthesised frequency hopping has some advantages over baseband hopping in terms of spectral efficiency. This is particularly so when the number of hopping frequencies available is significantly larger than the number of transceivers available per sector. However, in an SFH network the BCCH carriers cannot hop and must be planned using a fixed pattern. In contrast, for a BBH network only the BCCH timeslot itself cannot hop, so the other seven timeslots of the BCCH carrier can take advantage of the benefits of hopping. A consequence of this is that for base stations with a single transceiver per sector there would be no benefit from SFH, for base stations that deploy 2 or more transceivers per sector then for a given number of available GSM hopping frequencies (assuming that this is significantly larger than the number of transceivers) then SFH will provide efficiency benefits. However, these benefits decline as the number of transceivers per sector increases.
A16.77 The assumptions we used about frequency hopping in the September 2007 consultation were criticised by a number of parties. Both O2 and Vodafone suggest that the practical limit to BCCH carrier re-use is around 15.
A16.78 From research we have conducted and after talking to mobile operators outside the UK, we believe that a BCCH re-use pattern of 15 should be achievable. On the

Application of spectrum liberalisation and trading to the mobile sector – A further consultation
19
other hand, one UK operator has stated to us that a BCCH reuse of 15 is only achievable in London and that outside of dense urban areas BCCH re-use increases to 18-21 based on terrain, they believe that nationwide a BCCH re-use of 15 is unreasonable and not achievable. They also believe that TCH re-use factors should also be reviewed against terrain limitations”.
A16.79 In the September 2007 consultation we used the following equation to calculate the achievable frequency cluster size:
Equation 2: Frequency re-use cluster size
2
6.
3
1
I
CN
Where: = the propagation path loss exponent;
and = the number of sectors per site.
A16.80 One of the key inputs to this equation is the propagation path loss exponent. On the assumption that the path loss exponent in more rural environments is lower than urban environments, an increase in achievable frequency re-use factor may be justified as has been suggested.
A16.81 In light of the feedback from the operators and our own further consideration we have revised our assumptions about the frequency re-use factors that are practical for both BBH and for SFH. As a base case within our revised analysis we are now assuming:
for BBH, a minimum BCCH carrier re-use factor of 15 and a minimum TCH re-use factor of 13; and
for SFH, a minimum BCCH carrier re-use factor of 15 and a minimum TCH re-use factor of 11.
A16.82 We believe that the above re-use factors represent a reasonable choice to base our revised analysis on. However, we have explored the sensitivity of our results to these re-use factors and we present additional results that show the impact of higher re-use factors outside London.
A16.83 On the issue of reserving spectrum for a micro/pico cell layer we believe that 9 carriers is a reasonable number to reserve and have used this figure for our revised model.
Revised modelling
A16.84 There are two distinct cases when considering clearing and releasing spectrum. The first is a partial clearance and release where only a portion of the spectrum is cleared and released whilst the rest continues to be used for the delivery of 2G services using GSM technology. The second is where the entire 2G spectrum is cleared as might be the case for a full release. The majority of this annex deals with the case of a partial clearance and release, however we have also estimate the cost of a full release.

Application of spectrum liberalisation and trading to the mobile sector – A further consultation
20
A16.85 A consequence of a partial clearance of spectrum currently used to provide 2G services using GSM technology in either the 900 MHz or the 1800 MHz bands will be that the traffic carrying capacity of the GSM networks will be reduced. This reduction in capacity will be most severe in the busiest areas of the networks and will be greater for larger clearances. To be able to continue to carry the same volume of traffic at similar quality operators can do at least two things:
they can deploy a technical solution that will enable them to use their remaining GSM spectrum more efficiently (i.e. carry more traffic in a given quantity of spectrum); or
they can transfer a proportion of their traffic to an alternative frequency band (perhaps using a different technology).
A16.86 In practice they are likely to adopt a combination of these solutions. The cost of spectrum clearance is estimated by calculating the 2G capacity that would be lost as a result of the operators O2 and Vodafone in the case of 900 MHz and Orange and T-Mobile in the case of 1800 MHz) clearing a proportion of their spectrum of GSM carriers and how much it would cost them to recover that capacity whilst maintaining a broadly equivalent quality/grade of service (e.g. by building out extra infrastructure).
A16.87 We have estimated the cost of clearance for various quantities of cleared spectrum for a number of different approaches to the recovery of lost capacity (see below for details).
A16.88 We have not tried to model in detail the capacity and coverage of the existing GSM900 networks and analyse on an individual site by site basis the network changes that would be necessary to clear spectrum whilst maintaining coverage and capacity to a broadly equivalent quality. Rather, we have tackled the problem at a higher level, looking at the statistical distribution of network resources (e.g. site numbers, sectors per site, transceivers per sector, etc.) and attempted to identify the proportion of sites/sectors that would become capacity constrained for a particular quantity of cleared spectrum, from this we establish the expenditure necessary to recover the lost capacity dependant on the approach taken.

Application of spectrum liberalisation and trading to the mobile sector – A further consultation
21
Figure 6: Overview of the cost of clearance methodology
A16.89 For our refined analysis for this consultation we have considered three approaches to dealing with traffic displaced as a consequence of a partial clearance and release of spectrum in the 900 MHz band and hence to estimating the associated costs. We have also used the first two of these approaches to estimate the cost of a partial clearance of 1800 MHz spectrum (the third is not relevant to 1800 MHz). The three approaches considered are as follows:
Approach 1: SFH plus UMTS2100 widening – this is essentially a refined version of the approach used in the September 2007 consultation. We estimate the cost of upgrading the GSM networks to implement synthesised frequency hopping (SFH) to improve their spectral efficiency and then estimate the cost of carrying any remaining 2G traffic displaced as a consequence of clearing GSM spectrum on the operators’ UMTS2100 network, building out additional UMTS2100 infrastructure to absorb this traffic as necessary.
Approach 2: SFH plus cell splitting – again we estimate the cost of upgrading the GSM networks to implement SFH, however any remaining traffic displaced as a consequence of clearing GSM spectrum is handled by cell splitting in the GSM networks.
Approach 3: GSM1800 upgrades plus cell splitting6 – this only applies to clearance and release of the 900 MHz spectrum held by O2 and Vodafone. We estimate the cost of expanding the use of GSM1800 on existing GSM sites with any remaining traffic displaced as a consequence of clearing GSM spectrum being handled by cell splitting.
A16.90 Though we have modelled these as distinct approaches, they are not necessarily mutually exclusive and a hybrid approach combining elements from all three is possible (and may in practice be more likely). Modelling these as distinct approaches, however, allows us to explore the overall range of possible costs. In practice, an operator faced with the need to clear spectrum will balance the likely impact on network quality and the costs associated with different approaches and will adopt the a clearance strategy that best suits their circumstances. It is entirely possible that they will ‘mix and match’ different elements from our approaches (and
6 This approach is not applicable to estimating the cost of clearing 1800 MHz spectrum by Orange and T-Mobile
Input
Calculation
Output
Key
Cost to clear spectrum
Capacity lost
Calculate expenditure
NPV
2G network configuration
Unit site costs & discount
rate
Approach to recovering
lost capacity
Achievable frequency re-use (GSM900)
Quantity of spectrum to be cleared
SFH Upgrade, Cell Slitting, GSM1800 upgrade, etc
Input
Calculation
Output
Key
Input
Calculation
Output
Key
Cost to clear spectrum
Capacity lost
Calculate expenditure
NPV
2G network configuration
Unit site costs & discount
rate
Approach to recovering
lost capacity
Achievable frequency re-use (GSM900)
Quantity of spectrum to be cleared
SFH Upgrade, Cell Slitting, GSM1800 upgrade, etc

Application of spectrum liberalisation and trading to the mobile sector – A further consultation
22
they may also choose to use techniques to improve GSM spectral efficiency that we have not included in our modelling) in order to minimise both costs and the potential for network disruption. As a result, the estimates that we derive from the three distinct approaches are likely to represent a plausible upper bound to the range of costs that the operators will actually be faced with.
A16.91 It should be noted that for all three approaches we assume that upgrades to the GSM network are only made to macro cell sites. We have not modelled changes to micro or pico cells. An alternative to the three approaches outlined above might be to increase the number of micro cells used in the network. Whilst this could be a viable alternative where traffic is concentrated in distinct hotspots, the removal of spectrum across the whole network is likely to lead to congestion that is widespread rather that concentrated to an extent where additional micro/pico cells is unlikely to be a cost effective solution.
Methodology
Approach 1 – SFH plus UMTS2100 widening
A16.92 As indicated above, this approach assumes the operators upgrade their GSM networks to implement SFH to obtain the benefit of tighter effective frequency reuse. Having done this, any remaining traffic that is displaced from the GSM network is then transferred to these operators’ 3G networks at 2.1 GHz. Where necessary the 3G networks are expanded to cope with this displaced traffic (building out coverage outside areas already covered and deepening coverage inside areas already covered). The two main elements to this approach are described at a high level below.
A16.93 First, for a particular quantity of spectrum to clear, the number of GSM macro sites that are likely to become capacity constrained is calculated based on our assumptions about the minimum frequency re-use factors that can be achieved for BBH. From this we can calculate the cost of implementing SFH using estimates of the cost of upgrading sites to SFH. For the SFH upgrade, we assume 100% of the sites inside M25 and 65% of the sites outside M25 require combiner upgrades.

Application of spectrum liberalisation and trading to the mobile sector – A further consultation
23
Figure 7: SFH upgrade overview
A16.94 Second, having upgraded the network for SFH, for a particular quantity of spectrum to clear, we estimate the number of sites outside the operators 3G coverage area that are still capacity constrained (despite the SFH upgrade) based on our assumptions about the minimum frequency re-use factors that can be achieved for SFH. From this we can calculate the costs of upgrading these sites to add UMTS2100 carriers. We also estimate the additional UMTS sites inside the operators 3G coverage area that are required to carry remaining traffic on the assumption that there is no spare capacity on the operators current UMTS network (see A16.64 to A16.73 above) as follows.
we calculate the number of 2G sites inside the 80% area that are still capacity constrained after the SFH upgrade;
from this we calculate the total reduction in capacity across the GSM networks as a function of the quantity to be cleared;
we assume that UMTS has twice the capacity as GSM for an equivalent quantity of spectrum7 and that 2 x 10 MHz of UMTS2100 spectrum is available to the GSM operators (in fact Vodafone has 2 x 15 MHz of UMTS2100 spectrum);
we then calculate the number of additional UMTS2100 sites that would be necessary to handle the displaced total traffic.
7 In the September 2007 Consultation we presented analysis that demonstrated that UMTS2100 has 2.4 times the capacity of GSM900 for an equivalent quantity of spectrum. However, O2, in their response believed that this was unrealistic and a more normal “optimistic” value would be a doubling of spectral efficiency. We have reviewed our own earlier analysis and have decided that a value of 2 is justified (see paragraphs A16.64 to A16.73 above).
Input
Calculation
Output
Key
Input
Calculation
Output
Key
Distribution of carriers per
site inside M25
Quantity of spectrum to
clear
Cost of SFH upgrade per
site
Percentage of hybrid / cavity
combiners
Period over which upgrade
takes place
Number of sites requiring SFH upgrade
Upper bound on carriers per
site inside M25
Frequency reuse limits
for BBH
Cost of SFH deployment
Discount rate
Planning and optimisation
costs
Carriers reserved for micro/pico
cells
Distribution of carriers per site outside
M25
Upper bound on carriers per
site outside M25
Calculate SFH expenditure
NPV

Application of spectrum liberalisation and trading to the mobile sector – A further consultation
24
A16.95 This approach does not directly take into account the poorer in-building coverage point raised by Vodafone in their consultation response. However, as the total UMTS2100 site density will increase there will be a de-facto improvement in in-building coverage. In any case, it is not entirely necessary for the UMTS2100 network to exactly replicate the coverage of the GSM900 network. What is needed is for there to be sufficient UMTS2100 capacity and coverage to carry the volume of traffic that can no longer be carried in the reduced GSM900 spectrum following clearance. The GSM900 network will still be available to provide a base coverage layer where UMTS2100 coverage is poor.
A16.96 Though not perfect, we believe that the approach outlined above is sufficient to provide a reasonable upper bound on any additional UMTS2100 investment inside the 80% 3G coverage area.
Figure 8: UMTS2100 widening overview
A16.97 Added to this is an estimate of the costs associated with subsidies to 3G handsets that we assume would be needed to ensure there are enough 3G capable handsets available. For this we use essentially the same methodology as we used for the September 2007 consultation (see paragraph A16.154 below).
Approach 2 – SFH plus cell splitting
A16.98 As for approach 1, this approach assumes the operators upgrade their GSM networks to implement SFH to obtain the benefit of tighter effective frequency reuse. Having done this, any residual traffic that is still displaced from the GSM network is then absorbed by cell splitting constrained GSM cells.
A16.99 First, for a particular spectrum clearance quantity, we estimate the cost of upgrading the GSM networks to implement SFH using exactly the same procedure used in approach 1. See Figure 7 for a diagram of the SFH upgrade process.
Input
Calculation
Output
Key
Quantity of spectrum to
clear
Cost of 2.1 GHz upgrade
per site
Period over which upgrade
takes place
Number of sites requiring
2.1 GHz upgrade
Upper bound on carriers per
site
Frequency reuse limits
for SFH
Cost of 2.1 GHz
deployment
Discount rate
Distribution of carriers per site outside 3G coverage
Calculate 2.1 GHz
expenditure NPV
Input
Calculation
Output
Key
Input
Calculation
Output
Key
Quantity of spectrum to
clear
Cost of 2.1 GHz upgrade
per site
Period over which upgrade
takes place
Number of sites requiring
2.1 GHz upgrade
Upper bound on carriers per
site
Frequency reuse limits
for SFH
Cost of 2.1 GHz
deployment
Discount rate
Distribution of carriers per site outside 3G coverage
Calculate 2.1 GHz
expenditure NPV

Application of spectrum liberalisation and trading to the mobile sector – A further consultation
25
A16.100 Second, having upgraded the network for SFH, we then estimate the number of sites that are still capacity constrained (for the particular spectrum clearance quantity) based on assumptions about the maximum frequency re-use pattern that can be achieved using BBH. From this we can estimate the cost of cell splitting.
Figure 9: Cell splitting overview
Approach 3 – GSM1800 upgrades plus cell splitting8
A16.101 This approach assumes the 900 MHz operators make more extensive use of their 1800 MHz spectrum holding (both O2 and Vodafone have 2 x 5.8 MHz of 1800 MHz spectrum each) by deploying GSM1800 carriers on sites where they have not already done so. Having done this, any residual traffic that is still displaced from the GSM network is then absorbed by cell splitting constrained GSM900 cells.
A16.102 First, for a particular spectrum clearance quantity, the number of GSM900 macro sites that the likely to become capacity constrained is estimated based on assumptions about the maximum frequency re-use pattern that can be achieved using BBH. From this we can calculate the cost of deploying GSM1800 carriers on those sites where they are not already deployed (we have used the same assumptions about frequency re-use for the new 1800 MHz carriers as we did for BBH at 900 MHz – this effectively means that for the 2 x 5.8 MHz of spectrum available an average of 2.1 GSM1800 carriers an be deployed per sector). In this calculation we take into account that some existing GSM1800 sites have carrier counts greater than can be supported assuming our frequency re-use limits – effectively necessitating extra GSM1800 upgrades to compensate. Only macro sites are considered as we assume the micro/pico layer is not changed.
8 This approach is only applicable to the 900MHz operators O2 and Vodafone
Input
Calculation
Output
Key
Distribution of carriers per
site inside M25
Quantity of spectrum to
clear
Cost of cell splitting per
site
Period over which upgrade
takes place
Number of sites still capacity
constrained
Upper bound on carriers per
site inside M25
Frequency reuse limits
for SFH
Cost of cell splitting
Discount rate
Planning and optimisation
costs
Carriers reserved for micro/pico
cells
Distribution of carriers per site outside
M25
Upper bound on carriers per
site outside M25
Calculate cell splitting
expenditure NPV
Input
Calculation
Output
Key
Input
Calculation
Output
Key
Distribution of carriers per
site inside M25
Quantity of spectrum to
clear
Cost of cell splitting per
site
Period over which upgrade
takes place
Number of sites still capacity
constrained
Upper bound on carriers per
site inside M25
Frequency reuse limits
for SFH
Cost of cell splitting
Discount rate
Planning and optimisation
costs
Carriers reserved for micro/pico
cells
Distribution of carriers per site outside
M25
Upper bound on carriers per
site outside M25
Calculate cell splitting
expenditure NPV

Application of spectrum liberalisation and trading to the mobile sector – A further consultation
26
Figure 10: GSM1800 upgrades
A16.103 Second, having upgraded the network to deploy GSM1800 carriers on sites where they are not already deployed we then estimate the number of sites that are still capacity constrained (for the particular spectrum clearance quantity) based on assumptions about the maximum frequency re-use pattern that can be achieved using BBH. From this we can estimate the cost of cell splitting.
Elements general to all three approaches
A16.104 In order to estimate the actual number of sites/sectors that become capacity constrained and therefore need to be upgraded we make use the frequency re-use factors. For example, using BCCH and TCH reuse factors of 15 and 13 respectively, it can be calculated that 2 x 10.8 MHz of spectrum will support sectors with 1 BCCH and 3 TCH carriers each (assuming 3 sectors per site). Therefore any site with sectors that have 5 carriers or more is at risk of becoming constrained. This analysis assumes that networks are deployed with a uniform number of sectors per site and carriers per sector, which is obviously not the case for a real network deployment. However, this should provide a reasonable estimate of the average number of carriers that can be supported in a given quantity of spectrum.
A16.105 Once the average number of sites/sectors that can be supported in a given quantity of spectrum is calculated we then estimate the number of sites/sectors for the representative networks which need to be upgraded as follows. As we did for the September 2007 consultation, we assume that 50% of the sites/sectors with carrier counts at the limit, 25% with carrier counts one less than the limit and 75% with carrier counts one more than the limit need to be upgraded.
A16.106 If the estimate of the average number of carriers that can be supported in a given quantity of spectrum is non integral then the number of sites needing to be upgraded is calculated proportionately above and below this value.
Input
Calculation
Output
Key
Distribution of carriers per site inside
M25
Quantity of spectrum to
clear
Cost of GSM1800
upgrade per site
Period over which upgrade
takes place
Number of sites without GSM1800 that are capacity constrained
Upper bound on carriers per
site inside M25
Frequency reuse limits
for BBH
Cost of GSM1800 upgrade
Discount rate
Planning and optimisation
costs
Carriers reserved for micro/pico
cells
Distribution of carriers per site outside
M25
Upper bound on carriers per
site outside M25
Calculate GSM1800 upgrade
expenditure NPV
Proportion of sites inside M25 without
GSM1800
Proportion of sites outside M25 without
GSM1800

Application of spectrum liberalisation and trading to the mobile sector – A further consultation
27
A16.107 An example of how this works is given below:
Assume a 3 block clearance of 900 MHz spectrum. The quantity of GSM900 spectrum remaining to each 900 MHz operator is 2 x 17.4 MHz minus 2 x 7.5 MHz which equals 2 x 9.9 MHz;
Re-use factors for BBH are 15 for BCCH and 13 for TCH. From this we can calculate that an average of 3.7 carriers can be supported per sector
1 + ((9.9 MHz / 200 kHz) – 15) / 13 = 3.7
This results in the percentage of sites needing to be upgraded as follows:
o 8% of sites with 3 carriers per sector;
o 33% of sites with 4 carriers per sector;
o 58% of sites with 5 carriers per sector;
o 83% of sites with 6 carriers per sector; and
o 100% of sites with 7 or more carriers per sector
Traffic growth
A16.108 As indicated in paragraph A16.61 above, a plausible assumption is that over the period we are considering for network upgrades (i.e. to end 2010) 2G traffic may grow by up to 10%.
A16.109 Traffic growth may be dealt with in a number of ways by the operators. At one extreme, operators may decide to absorb traffic without significant extra investment in the network, for instance by making greater use of AMR Half Rate where there is sufficient overhead to allow this. At the other extreme an operator may decide that no extra traffic can be absorbed within its existing network and that extra capacity at least equalling the predicted traffic growth will need to be added. There are various ways in which extra capacity can be added to the 2G network, many of the options we have considered for absorbing displaced traffic in this annex are likely to be appropriate. However, if the 2G network needs to be upgraded to cope with an increase in traffic then it can be argued that our cost of clearance work should use the upgraded networks as a starting point rather than the networks as they currently stand. O2 in their response to the September 2007 consultation argued that we should take into account 2G traffic growth.
A16.110 In order to analyse the impact of traffic growth, we have assumed that there is likely to be two primary mechanisms:
Cell splits; and
Increasing the number of transceivers per site/sector.
A16.111 Increasing the number of transceivers per site/sector is likely to be the cheaper option however, there are likely to be areas of the network where there is insufficient spectrum to allow for significantly tighter re-use patterns and therefore a cell split might be preferred.

Application of spectrum liberalisation and trading to the mobile sector – A further consultation
28
A16.112 It is also possible that where traffic increases in localised ‘hot spots’ a more cost effective way to deal with this would be to add a micro/pico cell. However for the purposes of our refined analysis we have assumed that traffic growth is more or less evenly distributed geographically and we therefore have discounted an increase in micro/pico cells.
A16.113 Of the two primary mechanisms described above we have modelled them equally (i.e. 50% of traffic growth is handled by cell splits and 50% by increasing transceiver counts).
A16.114 As an example, if we assume that traffic grows by 20% and that there are a total of 10,000 macro sites in a network then the overall number of additional macro sites (cell splits) needed would be 10,000 x 10% x 50% = 500. For the corresponding increase in transceiver count, we have modelled this using a modified Poisson distribution (see Equation 3) based on the average transceiver count per site/sector increasing by 10%.
Equation 3: Modified Poisson distribution
!1
1:
11
k
ekf
k
Where: :kf is the probability of a sector having k transceivers when the
average number of transceivers per sector is .
A16.115 Figure 11 below illustrates how the cell/sector count and carrier distribution (i.e. number of sectors and the transceiver count per sector) varies to account for traffic growth (in this case we have modelled an overall 20% growth in traffic) for an example starting distribution.
Figure 11 Illustration of the impact of traffic growth on cell/sector count and carrier distribution
0
1000
2000
3000
4000
5000
6000
7000
8000
9000
10000
1 2 3 4 5 6 7 8
TRXs per sector
Nu
mb
er o
f se
cto
rs
No growth 20% growth
A16.116 The effect of the way we have modelled an increase in traffic is to both increase the overall number of sites/sectors in the network and to shift the carrier distribution so that, on average, there are more carriers per sector.

Application of spectrum liberalisation and trading to the mobile sector – A further consultation
29
A16.117 The above approach can also be used to model a fall in traffic levels though the actual split between number of sites reduced and change in transceiver count per site/sector may need to be adjusted.
Interleaving of 900 MHz spectrum
A16.118 As we described in the September 2007 consultation, the spectrum holdings of the O2 and Vodafone in the 900 MHz band are interleaved. However, we no longer consider it is actually necessary to remove this interleaving to migrate use of the band to UMTS900 in the most efficient manner. Figure 12 illustrates the current arrangement.
Figure 12: Overview of current spectrum arrangements in the 900 MHz band
925
MH
z88
0 M
Hz
Vodafone O295
0 M
Hz
955
MH
z
960
MH
z
885
MH
z
890
MH
z
895
MH
z
900
MH
z
905
MH
z
905
MH
z
915
MH
z
930
MH
z
935
MH
z
940
MH
z
945
MH
z
A16.119 It is possible for O2 and Vodafone to clear a single 2 x 5 MHz block of spectrum each without needing to remove the interleaving (for instance if they cleared the E-GSM sub-band).
A16.120 Figure 13 and Figure 14 illustrate two possible alternative arrangements for the band which would allow for 1 block and 2 block releases also without removing interleaving of spectrum holdings.

Application of spectrum liberalisation and trading to the mobile sector – A further consultation
30
Figure 13 : Possible arrangement for 1 block release
925
MH
z88
0 M
Hz
Vodafone O2 Released
ClearedCleared
950
MH
z
955
MH
z
960
MH
z
885
MH
z
890
MH
z
895
MH
z
900
MH
z
905
MH
z
905
MH
z
915
MH
z
930
MH
z
935
MH
z
940
MH
z
945
MH
z
Figure 14 : Possible arrangement for 2 block release
925
MH
z88
0 M
Hz
Vodafone O2 Released
ClearedCleared
905
MH
z
905
MH
z
915
MH
z
930
MH
z
935
MH
z
940
MH
z
945
MH
z
950
MH
z
955
MH
z
960
MH
z
885
MH
z
890
MH
z
895
MH
z
900
MH
z
A16.121 It should be stressed that at this stage, Ofcom is not proposing any particular arrangement of blocks to be cleared and release. That will need to be the subject of a specific consultation on implementation.
A16.122 We have, however, included an analysis of the impact of removing the interleaving of spectrum holdings if O2 and Vodafone consider it appropriate to combine this with clearing spectrum for release. Our approach to this analysis is as follows.
A16.123 Removing the interleaving involves changing the frequencies on which sites operate. In many cases this can be done largely remotely, in some other cases sites will need a visit to make adjustments and in yet others sites will need significant upgrades. In the September 2007 consultation we assumed that sites were split more or less equally between these three cases:
33% sites can be retuned remotely
33% sites need an adjustment visit; and
34% sites need significant upgrades
A16.124 We have not changed these assumptions for our revised analysis.

Application of spectrum liberalisation and trading to the mobile sector – A further consultation
31
A16.125 Table 10 below provides a breakdown of the upgrade costs required to remove interleaving for the three categories of sites:
Table 10 Site upgrade costs required to remove interleaving
Site costs to remove interleaving per site ValueAnnual change
Site upgrade
Site survey £600 +2.5%
Replacement filters (including installation) £7,350 -7.5%
Antenna adjustment £550 +2.5%
Additional site costs (software etc) £1,000 -7.5%
Site adjustment visit £1,250 +2.5%
Site remote retune £100 +2.5%
A16.126 It is Ofcom’s view that much of the site visit work needed would be unnecessary if a site has been upgraded to SFH. For instance SFH, by its nature, requires carriers to be able to operate over a wide frequency range and removing interleaving can be accomplished in effect by adjusting the hopping frequency sets used. For this reason, when we have calculated the cost of removing interleaving below we have assumed that if a site needs upgrading to SFH then no further work on that site is necessary to remove interleaving. The consequence of this is that for larger spectrum clearances, the additional cost of removing interleaving is small.
Cell splitting factor
A16.127 Probably the most important factor in determining the costs associated with a cell splitting approach is the number of additional sites that are actually necessary. It is not as simple as saying that for every site that becomes capacity constrained an additional one is necessary. It is possible that a single additional site in a particular area can reduce the demands on a number of surrounding sites. It is very likely that the proportion of extra sites needed will be related to the size of any spectrum clearance. For instance a 1 block clearance will almost certainly require a smaller proportion of additional site per constrained site than a 5 block clearance would.
A16.128 In order to establish a reasonable estimate of the proportion of extra sites needed per constrained site (which we call the cell splitting factor) we have explored two different methods.
The first uses similar logic to that we used to establish the number of additional UMTS2100 sites that might be necessary within the 80% 3G coverage area in approach 1:
o we calculate the number of 2G sites that are still capacity constrained after the either SFH or GSM1800 upgrades (depending on the approach);
o from this we estimate the total reduction in capacity across the GSM networks as a function of the quantity of spectrum to be cleared;
o we calculate the number of additional GSM900 sites that would be needed to restore the lost capacity in the remaining GSM900 spectrum.

Application of spectrum liberalisation and trading to the mobile sector – A further consultation
32
The second is based on a theoretical network planning exercise we commissioned Red-M9 10 to undertake in three areas of the country. The areas chosen were London, Burton and Bristol. This exercise simulated the number of additional GSM900 macro sites necessary to recover a broadly equivalent coverage and quality of service when varying quantities of spectrum are cleared (from 1 to 4 blocks). This exercise assumed that SFH was not implemented and that for the London area 15 carriers were reserved for a micro/pico cell layer. The London area was a 10 km x 10 km area of North London and we have used this as representative of sites within the M25. The Burton area was a 28 km x 28 km area covering Burton and surrounding districts and the Bristol area was a 25 km x 25 km area covering Bristol, Bath and surrounding districts. In particular the Bristol area was carefully chosen to give a clutter distribution representative of the whole of the UK.
A16.129 Table 11 provides the results in terms of the percentage of additional GSM900 sites estimated using our first method. These are average numbers for the two networks we are modelling. For both networks we have set the number of carriers reserved for the micro/pico cell layer within the M25 to 15 to allow for a more direct comparison with the Red-M results.
Table 11: Percentage of additional GSM900 sites required - Method 1
Percentage additional GSM900 sites (average) Blocks
cleared Inside M25
Outside M25
1 Block 2.2% 0.3%
2 Blocks 7.5% 1.3%
3 Blocks 26.6% 5.4%
4 Blocks 103.7% 19.4%
5 Blocks 232.4% 66.4%
A16.130 Table 12 provides the results in terms of the percentage of additional GSM900 sites estimated using our second method (i.e. based on the Red-M planning exercise).
Table 12 : Percentage of additional GSM900 sites required - Method 2
Percentage additional GSM900 sites Blocks cleared London Bristol Burton
1 Block 18.6% 0.0% 0.0%
2 Blocks 40.0% 2.2% 0.0%
3 Blocks 122.9% 14.3% 3.1%
4 Blocks 230.0% 44.0% 15.6%
A16.131 There are a several observations about the results from Method 2:
9 Red M, Case Study: Estimated changes to the number of 2G cell sites or sectors as a consequence of reduced spectrum holding at 900MHz, 4th July 2008. 10 Red M, Case Study: Estimated changes to the number of 2G cell sites or sectors as a consequence of reduced spectrum holding at 900MHz, Part 2, 31st July 2008.

Application of spectrum liberalisation and trading to the mobile sector – A further consultation
33
First, we believe that the Burton area is not representative enough of the whole of the UK to use as the basis for further analysis. This was the reason that we added the Bristol area to the planning exercise and paid particular attention to ensuring that is area was selected to give a clutter distribution representative of the whole of the UK.
Second, for the London exercise we asked Red-M to assume that 15 GSM carriers were reserved for a micro/pico cell layer. However, as indicated above, we are now modelling on the assumption that only 9 need to be reserved – hence the Red-M exercise may give an over estimate.
Third, Red-M assumed that the GSM network used baseband hopping rather than SFH. To take into account the assumption that SFH is also implemented on the GSM900 network we believe that it is reasonable to shift the results from the Red-M exercise by one cleared block each (in effect the results of 1 Block clearance from Table 12 should actually be treated as representative of the number of additional sites needed for a 2 block clearance).
A16.132 Looking at the results for the two methods (having adjusted Method 2 results as indicated), there is a reasonable degree of alignment between them. We have therefore decided that it is appropriate to use method 1 in our modelling (treating method 2 as corroborative evidence of Method 1’s validity).
Table 13 : Percentage of additional GSM900 sites (cell splits) – final results
Method 1 Method 2 Blocks cleared Inside M25
Outside M25
London Bristol
1 Block 2.2% 0.3% 0.0% 0.0%
2 Blocks 7.5% 1.3% 18.6% 0.0%
3 Blocks 26.6% 5.4% 40.0% 2.2%
4 Blocks 103.9% 19.4% 122.9% 14.3%
5 Blocks 232.4% 66.4% 230.0% 44.0%
A16.133 An immediate observation from these results is that within the M25 (London) the number of additional sites needed for the 4 block and especially for the 5 block clearance cases is very large and this highlights that cell splitting may be a challenging strategy for this size of clearance in London. However, outside the M25, a strategy of cell splitting would seem to be a very viable approach, at least for clearances up to four blocks.
Assumptions relevant to all three approaches
A16.134 Results are presented below as 20 year NPV values for a clearance date of 2011 with the network upgrades needed taking place over a two year period (between 2009 and 2011). Unless otherwise indicated we have used a social discount rate of 3.5%. Results are total clearance costs (i.e. the combined costs for both 900 MHz networks or both 1800 MHz networks modelled).
A16.135 Quantity of spectrum to clear – we have modelled clearance in integral quantities of 2 x 5 MHz (e.g. a 1 block clearance equates to 2 x 5MHz and a 5 block clearance equates to 2 x 25 MHz). It should be noted that the quantity of spectrum cleared is a total value shared equally between the affected operators (e.g. for 900 MHz

Application of spectrum liberalisation and trading to the mobile sector – A further consultation
34
clearance a 1 block clearance would require O2 to clear 2 x 2.5 MHz of spectrum and for Vodafone to clear 2 x 2.5 MHz of spectrum making a total of 2 x 5 MHz cleared over all).
A16.136 Only macro sites are considered in our modelling we assume the micro/pico cell layer remains unchanged (see A16.91 above).
A16.137 Carriers reserved for micro/pico cell layer:
inside the M25 only: 9 for 900 MHz operators and 5 for 1800 MHz operators
outside the M25: 0
outside the operators 3G coverage area: 0
A16.138 The distribution of carriers per sector, the number of macro sites and the average number of sectors per macro site is taken from data supplied by the operators. This data is split geographically as follows
inside the M25;
outside the M25 (including outside the operators 3G coverage area)
outside the operators 3G coverage area (which is nominally 80% of the UK population)
A16.139 GSM frequency re-use factors:
BBH: 15 for BCCH carriers and 13 for TCH carriers
SFH: 15 for BCCH carriers and 11 for TCH carriers
A16.140 For SFH upgrades the SFH clustering factor assumed is 2 (i.e. as SFH works on clusters of sites, we have assumed that for every site that becomes capacity constrained 2 need to be upgraded)11
Specific assumptions
Approach 1 – SFH plus UMTS2100 widening
A16.141 We have used site upgrade costs which represent the cost of either upgrading an existing GSM site for SFH or for adding UMTS2100 to an existing GSM site that does not already have it.
A16.142 A breakdown of the SFH upgrade costs are as follows (prices at 2007/08 values):
Table 14: SFH upgrade costs
Input Value Annual change
11 T-Mobile commented that a factor of 1 is more appropriate , which is plausible when considering larger numbers of base station SFH upgrades as a consequence of larger quantities of spectrum release. However we still believe a factor of 2 is appropriate for our analysis.

Application of spectrum liberalisation and trading to the mobile sector – A further consultation
35
GSM900 SFH site upgrade costs
Site survey £600 +2.5%
Replacement combiner/amplifier (including installation) £10,00012 -7.5%
Antenna adjustment £550 +2.5%
Additional site costs (software etc) £1,000 -7.5%
Network costs*
Frequency planning and optimisation £2,000,000 +2.5%
Network management system upgrades £1,000,000 -7.5%
A16.143 The site costs are all based on the assumption of three sectored sites.
A16.144 The network costs are treated as costs which do not vary in size irrespective of the actual number of sites requiring upgrade. This is a simplification and may not actually be representative of how the costs would be incurred in practice but these are relatively small elements of the overall costs so this simplification makes very little difference to the results. These costs are intended to capture items such as additional software licensing costs associated with upgrading the network to SFH.
A16.145 The replacement combiner/amplifier cost in Table 14 is a composite cost which takes into account various comments made in confidential responses to the September 2007 consultation and subsequently to Ofcom. These include replacement amplifiers at some sites to compensate for the increased insertion loss from changing from cavity to hybrid combiners (estimated at £10,000 per site where needed) and the need for bespoke combiners where “off the shelf” combiners are no longer manufactured for specific base station models. It had been put to us that for base station models where hybrid combiners are no longer manufactured, a swap from cavity to hybrid combiners requires a swap of the BTS rack at a total cost of £20,000. We believe that, given the operators engineering and purchasing skills, it is likely that a solution at lower cost than replacing the entire BTS can be found. However, it is likely that the replacement combiner cost for these bases stations will still be significantly higher than for combiners available ‘off the shelf’ (estimated at £3,000).
A16.146 To simplify our calculations we have chosen to apply a cost of £10,000 for each site requiring a combiner upgrade to take account of the possibility of some sites requiring bespoke combiners and or additional amplifiers depending on the circumstances.
A16.147 For the purposes of our analysis we have modelled the costs associated with the networks using a combination of costs to best reflect the information we have about them. We have assumed that within the M25 100% of the sites need to be upgraded from cavity to hybrid combiners (at a total cost of £10,000 per site) and that outside the M25 65% of sites need a similar upgrade. All sites requiring to be upgraded to SFH attract the site survey, antenna adjustment and additional site costs (software etc) elements.
A16.148 The costs in Table 14 represent the medium of our cost range. The upper and lower bound costs are set at 75% and 125% of the medium figure respectively.
12 The £10,000 takes into account a combination of costs suggested in consultation responses including replacement amplifiers and bespoke combiners. See paragraphs A16.145 to A16.146.
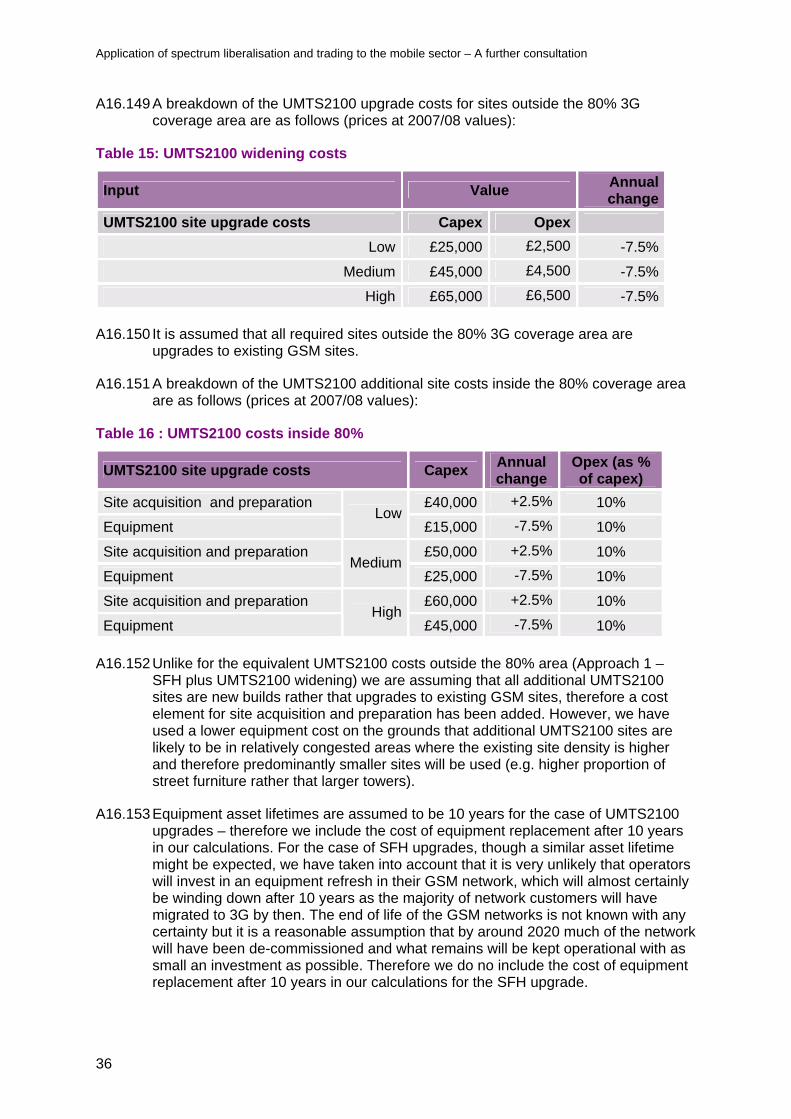
Application of spectrum liberalisation and trading to the mobile sector – A further consultation
36
A16.149 A breakdown of the UMTS2100 upgrade costs for sites outside the 80% 3G coverage area are as follows (prices at 2007/08 values):
Table 15: UMTS2100 widening costs
Input Value Annual change
UMTS2100 site upgrade costs Capex Opex
Low £25,000 £2,500 -7.5%
Medium £45,000 £4,500 -7.5%
High £65,000 £6,500 -7.5%
A16.150 It is assumed that all required sites outside the 80% 3G coverage area are upgrades to existing GSM sites.
A16.151 A breakdown of the UMTS2100 additional site costs inside the 80% coverage area are as follows (prices at 2007/08 values):
Table 16 : UMTS2100 costs inside 80%
UMTS2100 site upgrade costs Capex Annual change
Opex (as % of capex)
Site acquisition and preparation £40,000 +2.5% 10%
Equipment Low
£15,000 -7.5% 10%
Site acquisition and preparation £50,000 +2.5% 10%
Equipment Medium
£25,000 -7.5% 10%
Site acquisition and preparation £60,000 +2.5% 10%
Equipment High
£45,000 -7.5% 10%
A16.152 Unlike for the equivalent UMTS2100 costs outside the 80% area (Approach 1 – SFH plus UMTS2100 widening) we are assuming that all additional UMTS2100 sites are new builds rather that upgrades to existing GSM sites, therefore a cost element for site acquisition and preparation has been added. However, we have used a lower equipment cost on the grounds that additional UMTS2100 sites are likely to be in relatively congested areas where the existing site density is higher and therefore predominantly smaller sites will be used (e.g. higher proportion of street furniture rather that larger towers).
A16.153 Equipment asset lifetimes are assumed to be 10 years for the case of UMTS2100 upgrades – therefore we include the cost of equipment replacement after 10 years in our calculations. For the case of SFH upgrades, though a similar asset lifetime might be expected, we have taken into account that it is very unlikely that operators will invest in an equipment refresh in their GSM network, which will almost certainly be winding down after 10 years as the majority of network customers will have migrated to 3G by then. The end of life of the GSM networks is not known with any certainty but it is a reasonable assumption that by around 2020 much of the network will have been de-commissioned and what remains will be kept operational with as small an investment as possible. Therefore we do no include the cost of equipment replacement after 10 years in our calculations for the SFH upgrade.

Application of spectrum liberalisation and trading to the mobile sector – A further consultation
37
A16.154 The assumptions used to estimate the cost of subsidies for 3G handsets are as follows (prices at 2007/08 values):
Table 17 : Handset migration assumptions
Input Assumption
Cost of 3G handset subsidy - Low £75
Cost of 3G handset subsidy - High £125
Cost of a 2G handset £100
Cost trend in absolute difference between 2G & 3G real handset prices -30.0%
Cost trend of a 2G handset -7.5%
Current number of 2G handsets per operator 15,000,000
Approach 2 – SFH plus cell splitting
A16.155 The key inputs necessary for the modelling the SFH upgrade costs under approach 2 are identical to those used in approach 1 (see above for details).
A16.156 A breakdown of the GSM cell splitting site costs are as follows (prices at 2007/08 values):
Table 18: GSM900 cell split costs
GSM900 cell split costs Capex Annual change
Opex (as % of capex)
Site acquisition and preparation £40,000 +2.5% 10%
Equipment Low
£15,000 -7.5% 10%
Site acquisition and preparation £50,000 +2.5% 10%
Equipment Medium
£25,000 -7.5% 10%
Site acquisition and preparation £60,000 +2.5% 10%
Equipment High
£45,000 -7.5% 10%
A16.157 As we discussed under approach 1 equipment asset lifetime might be expected to be around 10 years, we have taken into account that it is very unlikely that operators will invest in an equipment refresh in their GSM network, which will almost certainly be winding down as the majority of network customers will have migrated to 3G by then. The end of life of the GSM networks is not known with any certainty but it is a reasonable assumption that by around 2020 much of the network will have been de-commissioned and what remains will be kept operational with as small an investment as possible. Therefore we do no include the cost of equipment replacement after 10 years in our calculations for the SFH upgrade of for GSM900 cell splitting. An asset lifetime for site acquisition and preparation has been used.
A16.158 It has been suggested that an alternative to cell splitting (i.e. where a completely new site is added to the network) that increased sectorisation (up to 6 sectors per site) would be a viable approach. It is entirely possible that O2 and or Vodafone would choose to increase the sectorisation of some of their sites as an alternative to building new ones. However, it appears, based on data supplied by the operators, that there are very few GSM900 sites with greater than 3 sectors and that the

Application of spectrum liberalisation and trading to the mobile sector – A further consultation
38
majority of macro sites are already 3 sectored sites. On the one hand, if increasing the sectorisation from 3 to 6 is a cost effective approach to increasing GSM capacity, it is surprising that there are not more 6 sectored sites deployed already. From this you might imply that increasing sectorisation from 3 to 6 is not actually a cost effective approach. On the other hand, it may just be that capacity constraints have just not been sufficient to drive the 900 MHz operators to deploy many 6 sectored sites and therefore there is significant scope to do this in future. There are likely to be practical difficulties in moving to 6 sectors that may suggest why it is does not appear to be a favoured approach for 900 MHz operators. First, the frequency planning exercise becomes much more difficult with 6 sectors and this would be compounded for reduced spectrum holdings. Second, with more sectors per site, the number of handovers between sectors would increase and the increased overhead in managing this may be just too much for this to work effectively. In light of this we have chosen to base our calculations on cell splits rather than increasing sectorisation, we believe that this will provide a reasonable upper bound to the costs.
Approach 3
A16.159 Many of the key assumptions necessary for the modelling under approach 3 are the same as used for approaches 1 & 2 (see paragraphs above for details).
A16.160 We have used site upgrade costs which represent the cost of either upgrading an existing GSM site to add GSM1800 or for splitting an existing GSM900 site.
A16.161 A breakdown of the GSM1800 upgrade costs are as follows:
Table 19: GSM1800 upgrade costs
Input ValueAnnual change
GSM1800 site upgrade costs
Site survey £600 +2.5%
Filters £7,350 -7.5%
Transceivers £9,150 -7.5%
Antenna replacement £1,750 -7.5%
Installation £1,000 +2.5%
Antenna adjustment £550 +2.5%
Additional site costs (software etc) £1,000 -7.5%
Network costs*
Frequency planning and optimisation £2,000,000 +2.5%
Network management system upgrades £1,000,000 -7.5%
A16.162 The site costs are all based on the assumption of a three sectored site. The Filter and Transceiver costs are based on two GSM1800 carriers per sector.
A16.163 The cell split costs are identical to those used under approach 2 (see above for details).

Application of spectrum liberalisation and trading to the mobile sector – A further consultation
39
Cost of partial clearance and release of 900 MHz
Approach 1 – SFH plus UMTS2100 widening
Base case
A16.164 The term ‘base case’ does not imply that this is the case we feel most appropriate to base our policy considerations on, rather it is a starting point from which additional considerations can be assessed. The base case has the benefit that it can be directly compared with the cost of clearance and release figures estimated in the 2007 Consultation.
A16.165 Table 20 gives estimated costs for the base case for approach 1. For this case the following basic assumptions have been made:
SFH clustering factor = 2
GSM frequency re-use factors;
o BBH: 15 for BCCH carriers and 13 for TCH carriers
o SFH: 15 for BCCH carriers and 11 for TCH carriers
2G traffic growth = 0%
Take into account potential need for additional UMTS2100 sites inside the 80% coverage area: No
Additional site acquisition inflation = 0%
A16.166 For Table 20 the social discount rate of 3.5% has been assumed.
Table 20 : Approach 1 - Base case (3.5% discount rate)
SFH Upgrade UMTS2100 Widening
Handset Migration Total cost Blocks cleared
Lower Upper Lower Upper Lower Upper Lower Upper
1 Block £15m £20m £5m £5m - - £20m £25m
2 Blocks £30m £40m £5m £10m - - £35m £50m
3 Blocks £50m £80m £15m £35m £110m £190m £180m £300m
4 Blocks £90m £150m £35m £90m £220m £380m £340m £610m
5 Blocks £130m £210m £100m £250m £340m £560m £570m £1,050m
A16.167 As indicated, Table 20 represents the costs using the social discount rate of 3.5%. If instead we use the commercial discount rate of 11.5% the base case costs would be as represented in Table 21.
Table 21 : Approach 1 - Base case (11.5% discount rate)
SFH Upgrade UMTS2100 Widening
Handset Migration Total cost Blocks cleared
Lower Upper Lower Upper Lower Upper Lower Upper

Application of spectrum liberalisation and trading to the mobile sector – A further consultation
40
1 Block £15m £20m £5m £5m - - £15m £20m
2 Blocks £25m £35m £5m £10m - - £25m £45m
3 Blocks £40m £70m £10m £25m £90m £150m £140m £240m
4 Blocks £80m £120m £25m £60m £180m £300m £280m £480m
5 Blocks £110m £180m £70m £170m £260m £440m £430m £780m
A16.168 In order to put the scale of the network upgrades required into context, Table 22 below gives the number of sites that would require upgrading (for both SFH and UMTS2100 upgrades).
Table 22: Approach 1 - Base case - Number of sites to upgrade
Blocks cleared
SFH Upgrade
UMTS2100 upgrade
1 Block 1,182 29
2 Blocks 2,923 91
3 Blocks 5,984 302
4 Blocks 11,413 809
5 Blocks 17,091 2,357
SFH clustering factor
A16.169 The results presented in Table 20 and Table 21 include an SFH clustering factor of 2 (i.e. as SFH works on clusters of sites, we have assumed that for every site that becomes capacity constrained 2 need to be upgraded). Whilst we believe that a clustering factor of 2 is appropriate, in order to quantify the impact of this factor on the overall cost of clearance, Table 23 below presents results on the basis of a factor of 1. Table 23 is based on the following assumptions:
SFH clustering factor = 1
GSM frequency re-use factors;
o BBH: 15 for BCCH carriers and 13 for TCH carriers
o SFH: 15 for BCCH carriers and 11 for TCH carriers
2G traffic growth = 0%
Take into account potential need for additional UMTS2100 sites inside the 80% coverage area: No
Additional site acquisition inflation = 0%
Table 23 : Approach 1 - SFH clustering factor of 1 (3.5% discount rate)
SFH Upgrade UMTS2100 Widening
Handset Migration Total cost Blocks cleared
Lower Upper Lower Upper Lower Upper Lower Upper
1 Block £10m £15m £5m £5m - - £15m £20m

Application of spectrum liberalisation and trading to the mobile sector – A further consultation
41
2 Blocks £20m £25m £5m £10m - - £20m £35m
3 Blocks £30m £45m £15m £35m £110m £190m £150m £270m
4 Blocks £50m £80m £35m £90m £220m £380m £300m £550m
5 Blocks £80m £130m £100m £250m £340m £560m £520m £930m
A16.170 As anticipated the affect of reducing the clustering factor to 1 is to reduce the costs somewhat. However, as the SFH costs are only one element of the overall costs involved in approach 1, the impact is relatively modest. Figure 15 below directly compares the base case with an SFH clustering factor of 2 from Table 20 with the results for an SFH clustering factor of 1 from Table 23.
Figure 15 : Approach 1 - Impact of SFH clustering factor
0
200
400
600
800
1000
1200
1 2 3 4 5 1 2 3 4 5
SFH Clustering Factor = 2 SFH Clustering Factor = 1
£m
Lower bound Upper bound
A16.171 On balance, though as indicated above we have some sympathy for the use of an SFH clustering factor of 1 for larger spectrum clearance quantities, we do not believe it is appropriate to base our conclusions on the cost of clearance on this value.
Potential additional UMTS2100 costs inside the 80% coverage area
A16.172 As described in paragraph A16.64 there may be an argument that the UMTS2100 network inside the 80% 3G coverage area would need enhancing to cope with displaced traffic from the GSM900 network.
A16.173 Table 24 provides revised costs for approach 1 including the additional UMTS2100 costs inside the 80% 3G coverage area. As for the base case, the upper and lower cost figures are derived from the high and low upgrade costs. Table 24 is based on the following assumptions:
SFH clustering factor = 2
GSM frequency re-use factors;
o BBH: 15 for BCCH carriers and 13 for TCH carriers

Application of spectrum liberalisation and trading to the mobile sector – A further consultation
42
o SFH: 15 for BCCH carriers and 11 for TCH carriers
2G traffic growth = 0%
Take into account potential need for additional UMTS2100 sites inside the 80% coverage area: Yes
Additional site acquisition inflation = 0%
Table 24 : Approach 1 - Additional UMTS2100 costs inside 80% area (3.5% discount rate)
Base case costs Additional
UMTS2100 costs Total cost Blocks
cleared Lower Upper Lower Upper Lower Upper
1 Block £20m £25m £10m £10m £25m £35m
2 Blocks £35m £50m £20m £25m £50m £80m
3 Blocks £180m £300m £50m £80m £220m £370m
4 Blocks £340m £610m £110m £170m £450m £780m
5 Blocks £570m £1,050m £230m £350m £790m £1,400m
A16.174 As for the base case above, in order to put the scale of the network upgrades required into context, Table 25 below gives the number of sites that would require SFH upgrades, UMTS2100 upgrades outside 80% and new UMTS2100 sites inside 80%.
Table 25 : Approach 1 - Number of sites to upgrade including additional UMTS2100 costs inside 80% area
Blocks cleared
SFH Upgrade UMTS2100 upgrades
outside 80%
New UMTS2100 sites inside
80%
1 Block 1,182 29 44
2 Blocks 2,923 91 119
3 Blocks 5,984 302 350
4 Blocks 11,413 809 819
5 Blocks 17,091 2,357 1,721
A16.175 Ofcom considers that it is appropriate to include the cost of additional UMTS2100 sites inside the 80% coverage area for approach 1 and further analysis below will include this element of cost.
Impact of different GSM frequency reuse factors
A16.176 As described in paragraph A16.77 above, it has been suggested that a BCCH reuse of 15 is only achievable in London and that outside of dense urban areas BCCH re-use increases to 18-21 based on terrain, it was also suggest the TCH factors should be reviewed against terrain data.
A16.177 To explore the impact of this we have adjusted the assumptions about achievable frequency re-use outside the M25 (inside the M25 the factors remain as before):

Application of spectrum liberalisation and trading to the mobile sector – A further consultation
43
A16.178 Table 26 is based on the following assumptions:
SFH clustering factor = 2
GSM frequency re-use factors inside M25;
o BBH: 15 for BCCH carriers and 13 for TCH carriers
o SFH: 15 for BCCH carriers and 11 for TCH carriers
GSM frequency re-use factors outside M25;
o BBH: 18 for BCCH carriers and 15 for TCH carriers
o SFH: 18 for BCCH carriers and 13 for TCH carriers
2G traffic growth = 0%
Take into account potential need for additional UMTS2100 sites inside the 80% coverage area: Yes
Additional site acquisition inflation = 0%
Table 26: Approach 1 – impact higher frequency re-use factors outside the M25 (3.5% discount rate)
Base re-use factors Adjusted re-use
factors Blocks cleared
Lower Upper Lower Upper
1 Block £25m £35m £40m £60m
2 Blocks £50m £80m £80m £140m
3 Blocks £220m £370m £280m £480m
4 Blocks £450m £780m £540m £940m
5 Blocks £790m £1,400m £860m £1,500m
A16.179 Figure 16 below illustrates the impact in graphical form.

Application of spectrum liberalisation and trading to the mobile sector – A further consultation
44
Figure 16: Approach 1 - Impact higher frequency re-use factors outside the M25
0
200
400
600
800
1000
1200
1400
1600
1 2 3 4 5 1 2 3 4 5
Base frequency re-use Adjusted frequency re-use
£m
Lower bound Upper bound
Impact of traffic growth
A16.180 Table 27 below gives the results for 3 different assumptions about traffic growth between now and the end of 2010. The first is the same as reported in Table 24 (i.e. including the cost of additional UMTS2100 sites inside the 80% area but no traffic growth), the second takes into account a 10% increase in traffic and the third a 20% increase.
A16.181 Table 27 is based on the following assumptions:
SFH clustering factor = 2
GSM frequency re-use factors;
o BBH: 15 for BCCH carriers and 13 for TCH carriers
o SFH: 15 for BCCH carriers and 11 for TCH carriers
2G traffic growth = 0%, 10% and 20%
Take into account potential need for additional UMTS2100 sites inside the 80% coverage area: Yes
Additional site acquisition inflation = 0%
Table 27: Approach 1 – impact of traffic growth (3.5% discount rate)
No growth 10% Traffic growth 20% Traffic growth Blocks cleared Lower Upper Lower Upper Lower Upper
1 Block £25m £35m £30m £45m £40m £60m
2 Blocks £50m £80m £60m £100m £80m £130m
3 Blocks £220m £370m £260m £430m £300m £510m
4 Blocks £450m £780m £520m £880m £590m £1,000m

Application of spectrum liberalisation and trading to the mobile sector – A further consultation
45
5 Blocks £790m £1,400m £880m £1,550m £960m £1,700m
A16.182 Figure 17 below illustrates the impact of traffic growth in graphical form.
Figure 17: Approach 1 - Impact of traffic growth
0
200
400
600
800
1000
1200
1400
1600
1800
1 2 3 4 5 1 2 3 4 5 1 2 3 4 5
0% 10% 20%
Growth
£m
Upper bound Lower bound
A16.183 As can be seen from Figure 17 above, the impact of traffic growth is relatively linear (at least for growth levels up to 20%).
Impact of site acquisition inflation
A16.184 One confidential response suggested that as any new sites needed would be in already congested areas our assumptions about site costs may no longer be valid. It could be argued that any inflationary pressure on site acquisition costs will be relative to the number of new sites required and therefore in part to the size of any spectrum clearance. It is very difficult to predict what, if any, increase in site acquisition costs would arise in practice. For approach 1 the main impact of this would be to increase the cost of new UMTS2100 sites inside the 80% 3G coverage area.
A16.185 Table 28 below gives the results for 3 different assumptions about site acquisition inflation between now and the end of 2010. The first is the same as reported in Table 24 (i.e. including the cost of additional UMTS2100 sites inside the 80% area but with no site acquisition inflation), the second for inflation of 25% and the third for a 50% increase. We have modelled this by assuming that the initial 2007/08 site costs are increase by the inflation amount and then for subsequent years the normal +2.5% yearly change apply.
A16.186 Table 28 is based on the following assumptions:
SFH clustering factor = 2
GSM frequency re-use factors;
o BBH: 15 for BCCH carriers and 13 for TCH carriers

Application of spectrum liberalisation and trading to the mobile sector – A further consultation
46
o SFH: 15 for BCCH carriers and 11 for TCH carriers
2G traffic growth = 0%
Taken into account potential need for additional UMTS2100 sites inside the 80% coverage area: Yes
Additional site acquisition inflation = 0%, 25% and 50%
Table 28: Approach 1 – impact of site acquisition inflation (3.5% discount rate)
Zero site inflation 25% site inflation 50% site inflation Blocks cleared Lower Upper Lower Upper Lower Upper
1 Block £25m £35m £25m £35m £25m £40m
2 Blocks £50m £80m £50m £80m £60m £90m
3 Blocks £220m £370m £230m £390m £240m £400m
4 Blocks £450m £780m £470m £810m £490m £840m
5 Blocks £790m £1,400m £840m £1,450m £880m £1,500m
A16.187 Figure 18 below illustrates the impact of traffic growth in graphical form
Figure 18: Approach 1 - Impact of site acquisition inflation
0
200
400
600
800
1000
1200
1400
1600
1 2 3 4 5 1 2 3 4 5 1 2 3 4 5
0% 25% 50%
Inflation
£m
Upper bound Lower bound
A16.188 As can be seen from Figure 18 above, the impact of site acquisition inflation is linear. The increase in costs is relatively modest even for relatively high inflation assumptions.
Impact of removing 900 MHz spectrum interleaving
A16.189 Table 29 below gives the results of the clearance of spectrum including the removal of interleaving. This calculation is based on the revised approach 1 Table 24 where we have included the additional cost on UMTS2100 upgrades inside the 80% coverage area.

Application of spectrum liberalisation and trading to the mobile sector – A further consultation
47
A16.190 Table 29 is based on the following assumptions:
SFH clustering factor = 2
GSM frequency re-use factors;
o BBH: 15 for BCCH carriers and 13 for TCH carriers
o SFH: 15 for BCCH carriers and 11 for TCH carriers
2G traffic growth = 0%
Taken into account potential need for additional UMTS2100 sites inside the 80% coverage area: Yes
Additional site acquisition inflation = 0%
Table 29 : Approach 1 - impact of removing interleaving (3.5% discount rate)
Without removing interleaving
With removing interleaving Blocks
cleared Lower Upper Lower Upper
1 Block £25m £35m £60m £100m
2 Blocks £50m £80m £80m £130m
3 Blocks £220m £370m £250m £420m
4 Blocks £450m £780m £460m £800m
5 Blocks £790m £1,400m £790m £1,400m
Conclusions for approach 1
A16.191 We have illustrated the range of factors and assumptions that can influence the costs of clearing various quantities of spectrum using approach 1 (i.e. SFH upgrades plus additional UMTS2100 infrastructure). In order to reach a reasonable estimate of the overall costs involved in a policy of releasing 900 MHz spectrum from the current operators, we believe that for approach 1 the following assumptions are appropriate:
SFH clustering factor: 2
GSM frequency re-use factors;
o BBH: 15 for BCCH carriers and 13 for TCH carriers
o SFH: 15 for BCCH carriers and 11 for TCH carriers
2G traffic growth: 10% (in line with operator predictions)
Take into account potential need for additional UMTS2100 sites inside the 80% coverage area: Yes
Additional site acquisition inflation: 0%

Application of spectrum liberalisation and trading to the mobile sector – A further consultation
48
A16.192 Note that for the overall cost of clearance we are assuming 2G traffic grows by 10% for the reasons set out in paragraphs A16.60 and A16.61.
A16.193 Based on the above the overall cost of clearing spectrum is illustrated in Table 30 below for both the social discount rate of 3.5% and for the commercial discount rate of 11.5%.
Table 30 : Approach 1 – Overall cost of clearance
Social discount rate (3.5%)
Commercial discount rate
(11.5%) Blocks cleared
Lower Upper Lower Upper
1 Block £30m £45m £25m £35m
2 Blocks £60m £100m £45m £80m
3 Blocks £260m £430m £200m £330m
4 Blocks £520m £880m £380m £660m
5 Blocks £880m £1,550m £640m £1,150m
A16.194 These results are illustrated graphically in Figure 19 below
Figure 19 : Approach 1 - Overall cost of clearance
0
200
400
600
800
1000
1200
1400
1600
1800
1 2 3 4 5 1 2 3 4 5
Social discount rate (3.5%) Commercial discount rate (11.5%)
£m
Lower bound Upper bound
A16.195 The above results consider only the cost of clearing GSM900 spectrum. When considering the cost to O2 and Vodafone of releasing spectrum it is relevant to consider what, they might chose to do in the absence of a regulatory intervention by Ofcom. Currently, their licences restrict O2 and Vodafone to GSM technology so they do not have the option to deploy other technologies in the band without some form of regulatory intervention. However, if you assume that absent any competition concerns there would be no reason for Ofcom to prevent deployment of alternative technologies it is likely that both O2 and Vodafone would wish to migrate at least a portion of the band to use UMTS900 in the next few years. In calculating the cost of releasing spectrum we should therefore assume that O2 and Vodafone clear one block of spectrum each for their own use; we should therefore take away the cost of

Application of spectrum liberalisation and trading to the mobile sector – A further consultation
49
clearing the first two blocks (as this would be for their own benefit) form the cost of clearing subsequent blocks (for release). For example, for a 1 block release we assume that in total 3 blocks need to be cleared and the overall cost to the operators would be the cost of clearing 3 blocks minus the cost of clearing 2 blocks. Table 31 below provides results for the cost of releasing spectrum based on this reasoning.
Table 31: Approach 1 – Overall cost of release
Social discount rate (3.5%)
Commercial discount rate
(11.5%) Blocks
released
Lower Upper Lower Upper
1 Block £200m £330m £160m £250m
2 Blocks £460m £780m £340m £580m
3 Blocks £820m £1,450m £600m £1,100m
A16.196 The overall cost of release for approach 1 is illustrated graphically in Figure 20 below.
Figure 20 : Approach 1 - Overall cost of release
0
200
400
600
800
1000
1200
1400
1600
1 2 3 1 2 3
Social discount rate (3.5%) Commercial discount rate (11.5%)
£m
Lower bound Upper bound
Approach 2 – SFH plus Cell splitting
Base case
A16.197 Table 32 represents the base case for approach 2. For this case the following basic assumptions have been made:
SFH clustering factor = 2
GSM frequency re-use factors;
o BBH: 15 for BCCH carriers and 13 for TCH carriers

Application of spectrum liberalisation and trading to the mobile sector – A further consultation
50
o SFH: 15 for BCCH carriers and 11 for TCH carriers
2G traffic growth = 0%
Additional site acquisition inflation = 0%
A16.198 For Table 32 the social discount rate of 3.5% has been used.
Table 32: Approach 2 – Base case (3.5% discount rate)
SFH Upgrade Cell splitting Total cost Blocks cleared Lower Upper Lower Upper Lower Upper
1 Block £15m £20m £10m £15m £25m £35m
2 Blocks £30m £40m £25m £40m £60m £80m
3 Blocks £50m £80m £110m £160m £150m £230m
4 Blocks £90m £150m £340m £510m £420m £650m
5 Blocks £130m £210m £1,250m £1,900m £1,400m £2,100m
A16.199 As indicated, Table 32 represents the costs using the social discount rate of 3.5%. If instead we use the commercial discount rate of 11.5% the base case costs would be as represented in Table 33.
Table 33: Approach 2 – Base case (11.5% discount rate)
SFH Upgrade Cell splitting Total cost Blocks cleared Lower Upper Lower Upper Lower Upper
1 Block £15m £20m £5m £10m £20m £25m
2 Blocks £25m £35m £20m £25m £40m £60m
3 Blocks £40m £70m £70m £100m £110m £170m
4 Blocks £80m £120m £210m £330m £280m £450m
5 Blocks £110m £170m £780m £1,250m £890m £1,450m
A16.200 In order to put the scale of the network upgrades required into context, Table 34 below gives the overall number of sites that would require upgrading (for both SFH and GSM900 cell splits).
Table 34: Approach 2 – Base case - number of sites to upgrade
Blocks cleared
SFH Upgrade
Cell splitting
1 Block 1,182 57
2 Blocks 2,923 197
3 Blocks 5,984 794
4 Blocks 11,413 2,619
5 Blocks 17,091 9,805

Application of spectrum liberalisation and trading to the mobile sector – A further consultation
51
SFH clustering factor
A16.201 The results presented in Table 32 and Table 33 include an SFH clustering factor of 2 (i.e. as SFH works on clusters of sites, we have assumed that for every site that becomes capacity constrained 2 need to be upgraded). Whilst we believe that a clustering factor of 2 is appropriate, in order to quantify the impact of this factor on the overall cost of clearance, Table 35 below presents results on the basis of a factor of 1. Table 35 is based on the following assumptions:
SFH clustering factor = 1
GSM frequency re-use factors;
o BBH: 15 for BCCH carriers and 13 for TCH carriers
o SFH: 15 for BCCH carriers and 11 for TCH carriers
2G traffic growth = 0%
Additional site acquisition inflation = 0%
Table 35: Approach 2 – SFH clustering factor of 1 (3.5% discount rate)
SFH Upgrade Cell splitting Total cost Blocks cleared Lower Upper Lower Upper Lower Upper
1 Block £10m £15m £10m £15m £20m £25m
2 Blocks £20m £25m £25m £40m £45m £70m
3 Blocks £30m £45m £110m £160m £130m £200m
4 Blocks £50m £80m £340m £510m £380m £580m
5 Blocks £80m £130m £1,250m £1,900m £1,350m £2,000m
A16.202 As anticipated the affect of reducing the clustering factor to 1 is to reduce the costs somewhat. However, as the SFH costs are only one element of the overall costs involved in approach 2 (especially for higher clearance quantities), the impact is modest. Figure 21 below directly compares the base case with an SFH clustering factor of 2 from Table 32 with the results for an SFH clustering factor of 1 from Table 35.

Application of spectrum liberalisation and trading to the mobile sector – A further consultation
52
Figure 21: Approach 2 – Impact of SFH clustering factor
0
500
1000
1500
2000
2500
1 2 3 4 5 1 2 3 4 5
SFH Clustering Factor = 2 SFH Clustering Factor = 1
£m
Lower bound Upper bound
A16.203 On balance, though as indicated above we have some sympathy for the use of an SFH clustering factor of 1 for larger spectrum clearance quantities. We do not believe it is appropriate to base our conclusions on the cost of clearance on this value.
Impact of different GSM frequency reuse factors
A16.204 As described in paragraph A16.77 above, it has been suggested that a BCCH reuse of 15 is only achievable in London and that outside of dense urban areas BCCH re-use increases to 18-21 based on terrain, it was also suggest the TCH factors should be reviewed against terrain data.
A16.205 To explore the impact of this we have adjusted the assumptions about achievable frequency re-use outside the M25 (inside the M25 the factors remain as before):
A16.206 Table 36 is based on the following assumptions:
SFH clustering factor = 2
GSM frequency re-use factors inside M25;
o BBH: 15 for BCCH carriers and 13 for TCH carriers
o SFH: 15 for BCCH carriers and 11 for TCH carriers
GSM frequency re-use factors outside M25;
o BBH: 18 for BCCH carriers and 15 for TCH carriers
o SFH: 18 for BCCH carriers and 13 for TCH carriers
2G traffic growth = 0%
Additional site acquisition inflation = 0%

Application of spectrum liberalisation and trading to the mobile sector – A further consultation
53
Table 36: Approach 2 – impact higher frequency re-use factors outside the M25 (3.5% discount rate)
Base re-use factors Adjusted re-use
factors Blocks cleared
Lower Upper Lower Upper
1 Block £25m £35m £40m £60m
2 Blocks £60m £80m £100m £150m
3 Blocks £150m £230m £250m £380m
4 Blocks £420m £650m £610m £930m
5 Blocks £1,400m £2,100m £1,850m £2,800m
A16.207 Figure 22 below illustrates the impact in graphical form.
Figure 22: Approach 2 - Impact higher frequency re-use factors outside the M25
0
500
1000
1500
2000
2500
3000
1 2 3 4 5 1 2 3 4 5
Base frequency re-use Adjusted frequency re-use
£m
Lower bound Upper bound
Impact of traffic growth
A16.208 Table 37 below gives the results for 3 different assumptions about traffic growth between now and the end of 2010. The first assumes no traffic growth, the second adds a 10% increase in traffic and the third adds a 20% increase.
A16.209 Table 37 is based on the following assumptions:
SFH clustering factor = 2
GSM frequency re-use factors;
o BBH: 15 for BCCH carriers and 13 for TCH carriers
o SFH: 15 for BCCH carriers and 11 for TCH carriers
2G traffic growth = 0%, 10% and 20%

Application of spectrum liberalisation and trading to the mobile sector – A further consultation
54
Additional site acquisition inflation = 0%
Table 37: Approach 2 – Impact of traffic growth (3.5% discount rate)
No growth 10% Traffic growth 20% Traffic growth Blocks cleared Lower Upper Lower Upper Lower Upper
1 Block £25m £35m £30m £45m £40m £60m
2 Blocks £60m £80m £70m £110m £90m £140m
3 Blocks £150m £230m £190m £290m £230m £360m
4 Blocks £420m £650m £500m £770m £600m £920m
5 Blocks £1,400m £2,100m £1,600m £2,400m £1,800m £2,750m
A16.210 Figure 23 below illustrates the impact of traffic growth in graphical form.
Figure 23: Approach 2 – Impact of traffic growth
0
500
1000
1500
2000
2500
3000
1 2 3 4 5 1 2 3 4 5 1 2 3 4 5
0% 10% 20%
Growth
£m
Upper bound Lower bound
A16.211 As can be seen from Figure 23 above, the impact of traffic growth is relatively linear (at least for growth levels up to 20%).
Impact of site acquisition inflation
A16.212 Table 38 below gives the results for 3 different assumptions about site acquisition inflation between now and the end of 2010. The first assumes no extra site acquisition inflation, the second for inflation of 15% and the third for 30% increase. We have modelled this by assuming that the initial 2007/08 site costs are increase by the inflation amount and then for subsequent years the normal +2.5% yearly change apply.
A16.213 Table 38 is based on the following assumptions:
SFH clustering factor = 2
GSM frequency re-use factors;

Application of spectrum liberalisation and trading to the mobile sector – A further consultation
55
o BBH: 15 for BCCH carriers and 13 for TCH carriers
o SFH: 15 for BCCH carriers and 11 for TCH carriers
2G traffic growth = 0%
Additional site acquisition inflation = 0%, 25% and 50%
Table 38 : Approach 2 – Impact of site acquisition inflation (3.5% discount rate)
Zero site inflation 25% site inflation 50% site inflation Blocks cleared Lower Upper Lower Upper Lower Upper
1 Block £25m £35m £25m £35m £25m £35m
2 Blocks £60m £80m £60m £90m £70m £100m
3 Blocks £150m £230m £170m £260m £200m £290m
4 Blocks £420m £650m £490m £740m £560m £830m
5 Blocks £1,400m £2,100m £1,650m £2,450m £1,900m £2,800m
A16.214 Figure 24 below illustrates the impact of traffic growth in graphical form.
Figure 24: Approach 2 – Impact of site acquisition inflation
0
500
1000
1500
2000
2500
3000
1 2 3 4 5 1 2 3 4 5 1 2 3 4 5
0% 25% 50%
Site inflation
£m
Upper bound Lower bound
A16.215 As can be seen from Figure 24 above, the impact of site acquisition inflation is linear and modest for lower clearance quantities but for clearance quantities of 4 or more it becomes much more significant. For approach 2 the main impact is to increase the cost of new GSM900 sites required for cell splitting. This is a much more significant proportion of the overall costs that was the case for new UMTS2100 sites under approach 1 and the impact is therefore greater.
Impact of removing 900 MHz spectrum interleaving
A16.216 Table 39 below gives the results of the clearance of spectrum including the removal of interleaving.

Application of spectrum liberalisation and trading to the mobile sector – A further consultation
56
A16.217 Table 39 is based on the following assumptions:
SFH clustering factor = 2
GSM frequency re-use factors;
o BBH: 15 for BCCH carriers and 13 for TCH carriers
o SFH: 15 for BCCH carriers and 11 for TCH carriers
2G traffic growth = 0%
Additional site acquisition inflation = 0%
Table 39: Approach 2 - impact of removing interleaving (3.5% discount rate)
Without removing interleaving
With removing interleaving Blocks
cleared Lower Upper Lower Upper
1 Block £25m £35m £60m £90m
2 Blocks £60m £80m £90m £140m
3 Blocks £150m £230m £180m £270m
4 Blocks £420m £650m £430m £670m
5 Blocks £1,400m £2,100m £1,400m £2,100m
Conclusions for approach 2
A16.218 In the above paragraphs we have illustrated the range of factors and assumptions that can influence the costs of clearing various quantities of spectrum using approach 2 (i.e. SFH upgrades plus GSM900 cell splits). In order to reach a reasonable estimate of the overall costs involved in a policy of releasing 900 MHz spectrum from the current operators, we believe that for approach 2 the following assumptions are appropriate:
SFH clustering factor = 2
GSM frequency re-use factors;
o BBH: 15 for BCCH carriers and 13 for TCH carriers
o SFH: 15 for BCCH carriers and 11 for TCH carriers
2G traffic growth = 10%
Additional site acquisition inflation = 0%
A16.219 Note that for the overall cost of clearance we are assuming 2G traffic grows by 10% for the reasons set out in paragraphs A16.60 and A16.61.
A16.220 Based on the above the overall cost of clearing spectrum is illustrated in Table 40 below for both the social discount rate of 3.5% and for the commercial discount rate of 11.5%.

Application of spectrum liberalisation and trading to the mobile sector – A further consultation
57
Table 40: Approach 2 – Overall cost of clearance
Social discount rate (3.5%)
Commercial discount rate
(11.5%) Blocks cleared
Lower Upper Lower Upper
1 Block £30m £45m £25m £35m
2 Blocks £70m £110m £50m £80m
3 Blocks £190m £290m £130m £210m
4 Blocks £500m £770m £340m £540m
5 Blocks £1,600m £2,400m £1,050m £1,650m
A16.221 These results are illustrated graphically in Figure 25 below.
Figure 25: Approach 2 – Overall cost of clearance
0
500
1000
1500
2000
2500
1 2 3 4 5 1 2 3 4 5
Social discount rate (3.5%) Commercial discount rate (11.5%)
£m
Lower bound Upper bound
A16.222 For the same reasons that we discuss in paragraph A16.195, when calculating the cost of releasing spectrum we assume that O2 and Vodafone clear one block (i.e. 2 x 5 MHz) of spectrum each for their own use. Hence the cost of releasing 1 block is calculated from the cost of clearing 3 blocks minus the cost of clearing 2 blocks.
Table 41: Approach 2 – Overall cost of release
Social discount rate (3.5%)
Commercial discount rate
(11.5%) Blocks
released
Lower Upper Lower Upper
1 Block £120m £180m £80m £130m
2 Blocks £430m £660m £290m £460m
3 Blocks £1,550m £2,300m £1,000m £1,600m
A16.223 The overall cost of release for approach 2 is illustrated graphically in Figure 26 below.

Application of spectrum liberalisation and trading to the mobile sector – A further consultation
58
Figure 26: Approach 2 - Overall cost of release
0
500
1000
1500
2000
2500
1 2 3 1 2 3
Social discount rate (3.5%) Commercial discount rate (11.5%)
£m
Lower bond Upper bound
A16.224 As can be seen, under approach 2 the cost of release rises very rapidly for larger release quantities. For release quantities of 2 or 3 blocks the costs are dominated by the cell splitting element with the costs of implementing SFH and removing interleaving contributing only a minor part. This is because the reduction in available GSM900 spectrum compounds the number of cell splits as these new cells also have to operate in limited spectrum (unlike additional UMTS2100 cells in approach 1 where there spectrum availability remains constant).
Approach 3 – GSM1800 upgrade + Cell splitting
Base case
A16.225 Table 42 represents the base case for approach 2. For this case the following basic assumptions have been made:
GSM frequency re-use factors (for both GSM900 and GSM1800);
o BBH: 15 for BCCH carriers and 13 for TCH carriers
2G traffic growth = 0%
Additional site acquisition inflation = 0%
A16.226 For Table 42 the social discount rate of 3.5% has been assumed.
Table 42: Approach 3 – Base case (3.5% discount rate)
GSM1800 Upgrade Cell splitting Total cost Blocks cleared Lower Upper Lower Upper Lower Upper
1 Block £10m £15m £30m £40m £40m £60m
2 Blocks £20m £25m £50m £70m £70m £100m
3 Blocks £35m £50m £80m £120m £120m £170m
4 Blocks £60m £100m £160m £220m £220m £340m

Application of spectrum liberalisation and trading to the mobile sector – A further consultation
59
5 Blocks £110m £170m £350m £450m £450m £690m
A16.227 As indicated, Table 42 represents the costs using the social discount rate of 3.5%. If instead we use the commercial discount rate of 11.5% the base case costs would be as represented in Table 43.
Table 43: Approach 3 – Base case (11.5% discount rate)
SFH Upgrade Cell splitting Total cost Blocks cleared Lower Upper Lower Upper Lower Upper
1 Block £10m £10m £20m £30m £25m £40m
2 Blocks £15m £20m £30m £50m £45m £70m
3 Blocks £30m £40m £50m £80m £80m £120m
4 Blocks £50m £80m £100m £160m £150m £240m
5 Blocks £90m £140m £250m £340m £300m £480m
A16.228 In order to put the scale of the network upgrades required into context, Table 44 below gives the overall number of sites that would require upgrading (for both GSM1800 upgrades and GSM900 cell splits).
Table 44: Approach 3 – Base case - number of sites to upgrade
Blocks cleared
GSM1800 Upgrade
Cell splitting
1 Block 292 207
2 Blocks 882 362
3 Blocks 2,048 631
4 Blocks 4,441 1,236
5 Blocks 7,888 2,695
Impact of different GSM frequency reuse factors
A16.229 As described in paragraph A16.77 above, it has been suggested that a BCCH reuse of 15 is only achievable in London and that outside of dense urban areas BCCH re-use increases to 18-21 based on terrain, it was also suggest the TCH factors should be reviewed against terrain data.
A16.230 To explore the impact of this we have adjusted the assumptions about achievable frequency re-use outside the M25 (inside the M25 the factors remain as before):
A16.231 Table 45 is based on the following assumptions:
GSM frequency re-use factors inside M25;
o BBH: 15 for BCCH carriers and 13 for TCH carriers
GSM frequency re-use factors outside M25;
o BBH: 18 for BCCH carriers and 15 for TCH carriers
2G traffic growth = 0%

Application of spectrum liberalisation and trading to the mobile sector – A further consultation
60
Additional site acquisition inflation = 0%
Table 45: Approach 3 – impact higher frequency re-use factors outside the M25 (3.5% discount rate)
Base re-use factors Adjusted re-use
factors Blocks cleared
Lower Upper Lower Upper
1 Block £40m £60m £50m £80m
2 Blocks £70m £100m £90m £130m
3 Blocks £120m £170m £150m £230m
4 Blocks £220m £340m £270m £420m
5 Blocks £450m £690m £530m £810m
A16.232 Figure 27 below illustrates the impact in graphical form.
Figure 27: Approach 3 - Impact higher frequency re-use factors outside the M25
0
100
200
300
400
500
600
700
800
900
1 2 3 4 5 1 2 3 4 5
Base frequency re-use Adjusted frequency re-use
£m
Lower bound Upper bound
Impact of traffic growth
A16.233 Table 46 below gives the results for 3 different assumptions about traffic growth between now and the end of 2010. The first assumes no traffic growth, the second adds a 10% increase in traffic and the third adds a 20% increase.
A16.234 Table 46 is based on the following assumptions:
GSM frequency re-use factors;
o BBH: 15 for BCCH carriers and 13 for TCH carriers
2G traffic growth = 0%, 10% and 20%
Additional site acquisition inflation = 0%

Application of spectrum liberalisation and trading to the mobile sector – A further consultation
61
Table 46: Approach 3 – Impact of traffic growth (3.5% discount rate)
No growth 10% Traffic growth 20% Traffic growth Blocks cleared Lower Upper Lower Upper Lower Upper
1 Block £40m £60m £45m £70m £60m £80m
2 Blocks £70m £100m £80m £120m £90m £140m
3 Blocks £120m £170m £140m £210m £160m £250m
4 Blocks £220m £340m £260m £400m £310m £470m
5 Blocks £450m £690m £530m £810m £620m £950m
A16.235 Figure 28 below illustrates the impact of traffic growth in graphical form.
Figure 28: Approach 3 – Impact of traffic growth
0
100
200
300
400
500
600
700
800
900
1000
1 2 3 4 5 1 2 3 4 5 1 2 3 4 5
0% 10% 20%
Growth
£m
Upper bound Lower bound
A16.236 As can be seen from Figure 28 above, the impact of traffic growth is relatively linear (at least for growth levels up to 20%).
Impact of site inflation
A16.237 Table 47 below gives the results for 3 different assumptions about site acquisition inflation between now and the end of 2010. The first assumes no extra site acquisition inflation, the second for inflation of 15% and the third for 30% increase. We have modelled this by assuming that the initial 2007/08 site costs are increase by the inflation amount and then for subsequent years the normal +2.5% yearly change apply.
A16.238 Table 47 is based on the following assumptions:
GSM frequency re-use factors;
o BBH: 15 for BCCH carriers and 13 for TCH carriers
2G traffic growth = 0%

Application of spectrum liberalisation and trading to the mobile sector – A further consultation
62
Additional site acquisition inflation = 0%, 25% and 50%
Table 47: Approach 3 – Impact of site acquisition inflation (3.5% discount rate)
Zero site inflation 25% site inflation 50% site inflation Blocks cleared Lower Upper Lower Upper Lower Upper
1 Block £40m £60m £45m £60m £50m £70m
2 Blocks £70m £100m £80m £110m £70m £120m
3 Blocks £120m £170m £130m £190m £150m £220m
4 Blocks £190m £340m £250m £380m £290m £420m
5 Blocks £450m £690m £520m £780m £590m £880m
A16.239 Figure 29 below illustrates the impact of traffic growth in graphical form.
Figure 29: Approach 3 – Impact of site acquisition inflation
0
100
200
300
400
500
600
700
800
900
1000
1 2 3 4 5 1 2 3 4 5 1 2 3 4 5
0% 25% 50%
Inflation
£m
Upper bound Lower bound
A16.240 As can be seen from Figure 29 above, the impact of site acquisition inflation is linear and modest for lower clearance quantities but for clearance quantities of 4 or more it becomes much more significant.
Impact of removing 900 MHz spectrum interleaving
A16.241 Table 48 below gives the results of the clearance of spectrum including the removal of interleaving.
A16.242 Table 48 is based on the following assumptions:
GSM frequency re-use factors;
o BBH: 15 for BCCH carriers and 13 for TCH carriers
2G traffic growth = 0%
Additional site acquisition inflation = 0%

Application of spectrum liberalisation and trading to the mobile sector – A further consultation
63
Table 48: Approach 3 - impact of removing interleaving (3.5% discount rate)
Without removing interleaving
With removing interleaving Blocks
cleared Lower Upper Lower Upper
1 Block £40m £60m £80m £120m
2 Blocks £70m £100m £110m £160m
3 Blocks £120m £170m £150m £240m
4 Blocks £220m £340m £260m £400m
5 Blocks £450m £690m £480m £750m
Conclusions for approach 3
A16.243 In the above paragraphs we have illustrated the range of factors and assumptions that can influence the costs of clearing various quantities of spectrum using approach 3 (i.e. SFH upgrades plus GSM900 cell splits). In order to reach a reasonable estimate of the overall costs involved in a policy of releasing 900 MHz spectrum from the current operators, we believe that for approach 3 the following assumptions are appropriate:
GSM frequency re-use factors;
o BBH: 15 for BCCH carriers and 13 for TCH carriers
2G traffic growth = 10%
Additional site acquisition inflation = 0%
A16.244 Note that for the overall cost of clearance we are assuming 2G traffic grows by 10% for the reasons set out in paragraphs A16.60 and A16.61.
A16.245 Based on the above the overall cost of clearing spectrum is illustrated in Table 49 below for both the social discount rate of 3.5% and for the commercial discount rate of 11.5%.
Table 49: Approach 3 – Overall cost of clearance
Social discount rate (3.5%)
Commercial discount rate
(11.5%) Blocks cleared
Lower Upper Lower Upper
1 Block £45m £70m £30m £45m
2 Blocks £80m £120m £60m £80m
3 Blocks £140m £210m £100m £150m
4 Blocks £260m £400m £180m £280m
5 Blocks £530m £810m £360m £570m
A16.246 These results are illustrated graphically in Figure 30 below.

Application of spectrum liberalisation and trading to the mobile sector – A further consultation
64
Figure 30: Approach 3 – Overall cost of clearance
0
100
200
300
400
500
600
700
800
900
1 2 3 4 5 1 2 3 4 5
Social discount rate (3.5%) Commercial discount rate (11.5%)
£m
Lower bound Upper bound
A16.247 For the same reasons that we discuss in paragraph A16.195, when calculating the cost of releasing spectrum we assume that O2 and Vodafone clear one block (i.e. 2 x 5 MHz) of spectrum each for their own use. Hence the cost of releasing 1 block is calculated from the cost of clearing 3 blocks minus the cost of clearing 2 blocks.
Table 50: Approach 3 – Overall cost of release
Social discount rate (3.5%)
Commercial discount rate
(11.5%) Blocks
released
Lower Upper Lower Upper
1 Block £60m £90m £40m £70m
2 Blocks £180m £280m £120m £200m
3 Blocks £450m £690m £300m £490m
A16.248 The overall cost of release for approach 3 is illustrated graphically in Figure 31 below.

Application of spectrum liberalisation and trading to the mobile sector – A further consultation
65
Figure 31: Approach 3 - Overall cost of release
0
100
200
300
400
500
600
700
800
1 2 3 1 2 3
Social discount rate (3.5%) Commercial discount rate (11.5%)
£m
Lower bound Upper bound
A16.249 As can be seen, under approach 3 the cost of release rises rapidly for larger release quantities but not as rapidly as under approach 2. For release quantities of 2 or 3 blocks the costs start to become dominated by the cell splitting element with the costs of implementing GSM1800 upgrades and removing interleaving contributing less. This is because the reduction in available GSM900 spectrum compounds the number of cell splits as these new cells also have to operate in limited spectrum, however the greater availability of GSM1800 spectrum offsets this to some extent.
A16.250 GSM1800 upgrades and GSM900 cell splits are a less disruptive upgrade path (than SFH). They can be planned and implemented incrementally rather than in clusters. And it should be easier to revert to an earlier network configuration if the planning process is misjudged (they can simply be switched off). Any transitional quality impacts should not persist for an extended period.
Impact of extra GSM1800 spectrum for approach 3
A16.251 Below we calculate the impact on the cost of clearance and release for approach 3 on the basis that Vodafone and O2 each gain access to an extra 2 x 5 MHz of spectrum (bringing their total 1800 MHz spectrum holdings to 2 x 10.8 MHz and reducing the Orange and T-Mobile holdings to 2 x 25 MHz). We make the same assumptions as for the Approach 3 – Conclusions above:
GSM frequency re-use factors;
o BBH: 15 for BCCH carriers and 13 for TCH carriers
2G traffic growth = 10%
Additional site acquisition inflation = 0%
A16.252 Based on the above the overall cost of clearing spectrum is illustrated in Table 51 below for both the social discount rate of 3.5% and for the commercial discount rate of 11.5%.

Application of spectrum liberalisation and trading to the mobile sector – A further consultation
66
Table 51: Approach 3 – Overall cost of clearance including 2 x 5 MHz extra GSM1800 spectrum
Social discount rate (3.5%)
Commercial discount rate
(11.5%) Blocks cleared
Lower Upper Lower Upper
1 Block £20m £30m £20m £25m
2 Blocks £40m £60m £35m £50m
3 Blocks £80m £130m £70m £100m
4 Blocks £160m £250m £120m £200m
5 Blocks £280m £440m £220m £350m
A16.253 These results are illustrated graphically in Figure 32 below.
Figure 32: Approach 3 – Overall cost of clearance including 2 x 5 MHz extra GSM1800 spectrum
0
50
100
150
200
250
300
350
400
450
500
1 2 3 4 5 1 2 3 4 5
Social discount rate (3.5%) Commercial discount rate (11.5%)
£m
Lower bound Upper bound
A16.254 Table 52 below provides results for the cost of releasing spectrum based on the reasoning outlined in paragraph A16.247.
Table 52: Approach 3 – Overall cost of release including 2 x 5 MHz extra GSM1800 spectrum
Social discount rate (3.5%)
Commercial discount rate
(11.5%) Blocks
released
Lower Upper Lower Upper
1 Block £40m £70m £35m £50m
2 Blocks £120m £190m £90m £150m
3 Blocks £240m £380m £190m £300m

Application of spectrum liberalisation and trading to the mobile sector – A further consultation
67
A16.255 The overall cost of release for approach 3 including 2x 5 MHz extra GSM1800 spectrum is illustrated graphically in Figure 33 below.
Figure 33: Approach 3 - Overall cost of release including 2 x 5 MHz extra GSM1800 spectrum
0
50
100
150
200
250
300
350
400
1 2 3 1 2 3
Social discount rate (3.5%) Commercial discount rate (11.5%)
£m
Lower bound Upper bound
A16.256 With extra GSM 1800 spectrum, it is less likely that existing GSM 1800 sites will run into frequency re-use limits.
Impact of deferred clearance and release of 900 MHz spectrum
A16.257 So far, we have assumed that spectrum release will happen in 2011 with the necessary network upgrades taking place in the two years leading up to the release. In this sub-section, we look at the impact on the costs if clearance and release takes place at a later date.
A16.258 As stated in paragraphs A16.60 and A16.61 above, it is likely that 2G traffic levels will fall significantly after 2011. Figure 34 below gives a plausible representation of how 2G traffic levels may change over the next few years. This prediction has been derived from a number of confidential and non-confidential sources of information.

Application of spectrum liberalisation and trading to the mobile sector – A further consultation
68
Figure 34: Illustration of how 2G traffic may change over the next few years
0%
20%
40%
60%
80%
100%
120%
2007 2008 2009 2010 2011 2012 2013 2014 2015 2016
A16.259 To illustrate the potential impact of deferred clearance and release we have decided to model a 1 year, a 2 year and a 4 year deferral (i.e. 2012, 2013 and 2015). For 2012 we assume that 2G traffic levels are 100% of current levels. For 2013 we have included 2 assumptions about 2G traffic levels: 80% and 50% of current levels. For 2015 we have again included 2 assumptions about 2G traffic levels: 50% and 20% of current levels. The lower of the two traffic levels for each year are more or less in line with Figure 34, whilst the higher figures illustrate the impact if 2G traffic were to fall significantly less than might be expected.
A16.260 Other key assumptions are as follows:
SFH clustering factor = 2 (approaches 1 and 2)
GSM frequency re-use factors;
o BBH: 15 for BCCH carriers and 13 for TCH carriers (all approaches)
o SFH: 15 for BCCH carriers and 11 for TCH carriers (approaches 1 and 2)
Take into account potential need for additional UMTS2100 sites inside the 80% coverage area: Yes (approach 1)
Additional site acquisition inflation = 0% (all approaches)
A16.261 The cost of clearance of 900 MHz spectrum in 2012 is as follows for each of the three approaches (using social discount rate of 3.5%).
Table 53: 900 MHz - Cost of clearance in 2012 – 100% of current traffic levels
Approach 1 Approach 2 Approach 3 Blocks cleared Lower Upper Lower Upper Lower Upper
1 Block £25m £30m £20m £30m £35m £50m
2 Blocks £45m £70m £50m £80m £60m £90m

Application of spectrum liberalisation and trading to the mobile sector – A further consultation
69
3 Blocks £210m £360m £140m £220m £110m £160m
4 Blocks £740m £310m £400m £610m £210m £310m
5 Blocks £1,300m £690m £1,300m £2,000m £420m £640m
A16.262 The cost of releasing spectrum based on subtracting the cost of clearing 2 blocks from the cost of clearing 3, 4 and 5 blocks is as follows (again using social discount rate of 3.5%). Note that we have only provided results for approach 3 to illustrate the impact.
Table 54: 900 MHz - Cost of release in 2012 - approach 3
2G traffic levels, 100% of current
level Blocks
released
Lower Upper
1 Block £50m £70m
2 Blocks £150m £220m
3 Blocks £360m £550m
A16.263 The cost of clearance of 900 MHz spectrum in 2013 is as follows for each of the three approaches (using social discount rate of 3.5%).
Table 55: 900 MHz - Cost of clearance in 2013 – 80% of current traffic levels
Approach 1 Approach 2 Approach 3 Blocks cleared Lower Upper Lower Upper Lower Upper
1 Block £15m £20m £15m £20m £30m £40m
2 Blocks £30m £40m £30m £45m £45m £70m
3 Blocks £70m £100m £90m £140m £80m £110m
4 Blocks £190m £310m £260m £400m £140m £210m
5 Blocks £400m £690m £920m £1,400m £280m £430m
Table 56: 900 MHz - Cost of clearance in 2013 – 50% of current traffic levels
Approach 1 Approach 2 Approach 3 Blocks cleared Lower Upper Lower Upper Lower Upper
1 Block £10m £15m £10m £15m £20m £30m
2 Blocks £20m £25m £20m £25m £30m £45m
3 Blocks £35m £60m £50m £70m £50m £70m
4 Blocks £80m £130m £150m £230m £90m £130m
5 Blocks £230m £400m £580m £870m £170m £260m
A16.264 The cost of releasing spectrum based on subtracting the cost of clearing 2 blocks from the cost of clearing 3, 4 and 5 blocks is as follows (again using social discount rate of 3.5%). Note that we have only provided results for approach 3 to illustrate the impact.

Application of spectrum liberalisation and trading to the mobile sector – A further consultation
70
Table 57: 900 MHz - Cost of release in 2013 - approach 3
2G traffic levels, 80% of current level
2G traffic levels, 50% of current level Blocks
released Lower Upper Lower Upper
1 Block £35m £40m £20m £25m
2 Blocks £100m £140m £60m £90m
3 Blocks £240m £360m £140m £220m
A16.265 The cost of clearance of 900 MHz spectrum in 2015 is as follows for each of the three approaches (using social discount rate of 3.5%).
Table 58: 900 MHz - Cost of clearance in 2015 – 50% of current traffic levels
Approach 1 Approach 2 Approach 3 Blocks cleared Lower Upper Lower Upper Lower Upper
1 Block £10m £10m £10m £15m £20m £20m
2 Blocks £15m £20m £15m £25m £30m £40m
3 Blocks £30m £45m £45m £70m £45m £60m
4 Blocks £70m £110m £140m £200m £80m £110m
5 Blocks £180m £320m £510m £770m £150m £230m
Table 59: 900 MHz - Cost of clearance in 2015 – 20% of current traffic levels
Approach 1 Approach 2 Approach 3 Blocks cleared Lower Upper Lower Upper Lower Upper
1 Block £10m £10m £10m £10m £15m £20m
2 Blocks £10m £15m £15m £15m £20m £30m
3 Blocks £20m £25m £20m £35m £30m £40m
4 Blocks £40m £60m £80m £110m £50m £70m
5 Blocks £110m £180m £300m £450m £90m £140m
A16.266 The cost of releasing spectrum based on subtracting the cost of clearing 2 blocks from the cost of clearing 3, 4 and 5 blocks is as follows (again using social discount rate of 3.5%). Note that we have only provided results for approach 3 to illustrate the impact.
Table 60: 900 MHz - Cost of release in 2015 - approach 3
2G traffic levels, 50% of current level
2G traffic levels, 20% of current level Blocks
released Lower Upper Lower Upper
1 Block £15m £20m £10m £10m
2 Blocks £50m £70m £30m £40m
3 Blocks £120m £190m £70m £110m
A16.267 Figure 35 below illustrates in graphical form the impact of deferring release– based on the lower traffic estimates for 2013 and 2015.

Application of spectrum liberalisation and trading to the mobile sector – A further consultation
71
Figure 35: 900 MHz – Impact of deferred release – approach 3
0
100
200
300
400
500
600
700
800
1 2 3 1 2 3 1 2 3 1 2 3
2011 - 110% traffic 2012 - 100% traffic 2013 - 50% traffic 2015 - 20% traffic
£m
Lower bound Upper bound
Impact of release of 900 MHz spectrum in 2011 of further clearance of 900 MHz spectrum in 2015
A16.268 In this sub-section we calculate the additional cost of clearing further blocks of 900 MHz spectrum for a number of scenarios. These costs are calculated on the assumption that Vodafone and O2 use approach 3 for the initial clearance and release in 2011 and that the same approach is again used in 2015 for the further clearance.
A16.269 The key assumption is how much 2G traffic will have fallen by when the further clearance is made. From Figure 34 we assume that total 2G traffic falls to 20% of current levels by 2015. To explore a range of potential outcomes we have modelled 3 scenarios:
Scenario 1: O2 and Vodafone clear 2 blocks in 2011 (1 block each for their own use) and subsequently clear 2 additional blocks in 2015 (again 1 block each for their own use);
Scenario 2: O2 and Vodafone clear 3 blocks in 2011 (1 block each for their own use and 1 block for release) and subsequently clear 2 additional blocks in 2015 (1 block each for their own use);
Scenario 3: O2 and Vodafone clear 4 blocks in 2011 (1 block each for their own use and 2 blocks for release) and subsequently clear 2 additional blocks in 2015 (1 block each for their own use).
Scenario 1
A16.270 To clear 2 blocks in 2011 the cost can be taken directly from Table 49 and is £80m to £120m.
A16.271 To clear an additional 2 blocks in 2015 we take the cost of clearing 4 blocks in 2015 from the cost of clearing 2 blocks also in 2015 (as these block would have already been cleared). The cost is £30m to £40m.

Application of spectrum liberalisation and trading to the mobile sector – A further consultation
72
Scenario 2
A16.272 To clear 3 blocks in 2011 the cost can be taken directly from Table 49 and is £140m to £210m.
A16.273 To clear an additional 2 blocks in 2015 we take the cost of clearing 5 blocks in 2015 from the cost of clearing 3 blocks also in 2015 (as these block would have already been cleared). The cost is £60m to £100m.
Scenario 3
A16.274 To clear 4 blocks in 2011 the cost can be taken directly from Table 49 and is £260m to £400m.
A16.275 To clear an additional 2 blocks in 2015 we take the cost of clearing 6 blocks in 2015 from the cost of clearing 4 blocks also in 2015 (as these block would have already been cleared). The cost is £140m to £220m.
Cost of partial clearance and release of 900 MHz – overall conclusions
A16.276 In the above sub-sections we estimated the cost of clearance and release for 3 different approaches to absorbing displaced traffic. In order to reach a reasonable estimate of the overall costs involved in a policy of releasing 900 MHz spectrum from the current operators, we believe that for the three approaches the following assumptions are appropriate:
SFH clustering factor = 2 (approaches 1 and 2)
GSM frequency re-use factors;
o BBH: 15 for BCCH carriers and 13 for TCH carriers (all approaches)
o SFH: 15 for BCCH carriers and 11 for TCH carriers (approaches 1 and 2)
2G traffic growth: 10% (all approaches)
Take into account potential need for additional UMTS2100 sites inside the 80% coverage area: Yes (approach 1)
Additional site acquisition inflation = 0% (all approaches)
A16.277 Based on the above, the overall cost of clearing spectrum is illustrated in Table 61 below for each of the three approaches (using social discount rate of 3.5%).
Table 61: 900MHz – Overall cost of clearance
Approach 1 Approach 2 Approach 3 Blocks cleared Lower Upper Lower Upper Lower Upper
1 Block £30m £45m £30m £45m £45m £70m
2 Blocks £60m £90m £70m £110m £80m £120m
3 Blocks £260m £430m £190m £290m £140m £210m
4 Blocks £520m £880m £500m £770m £260m £400m
5 Blocks £880m £1,550m £1,600m £2,400m £530m £810m
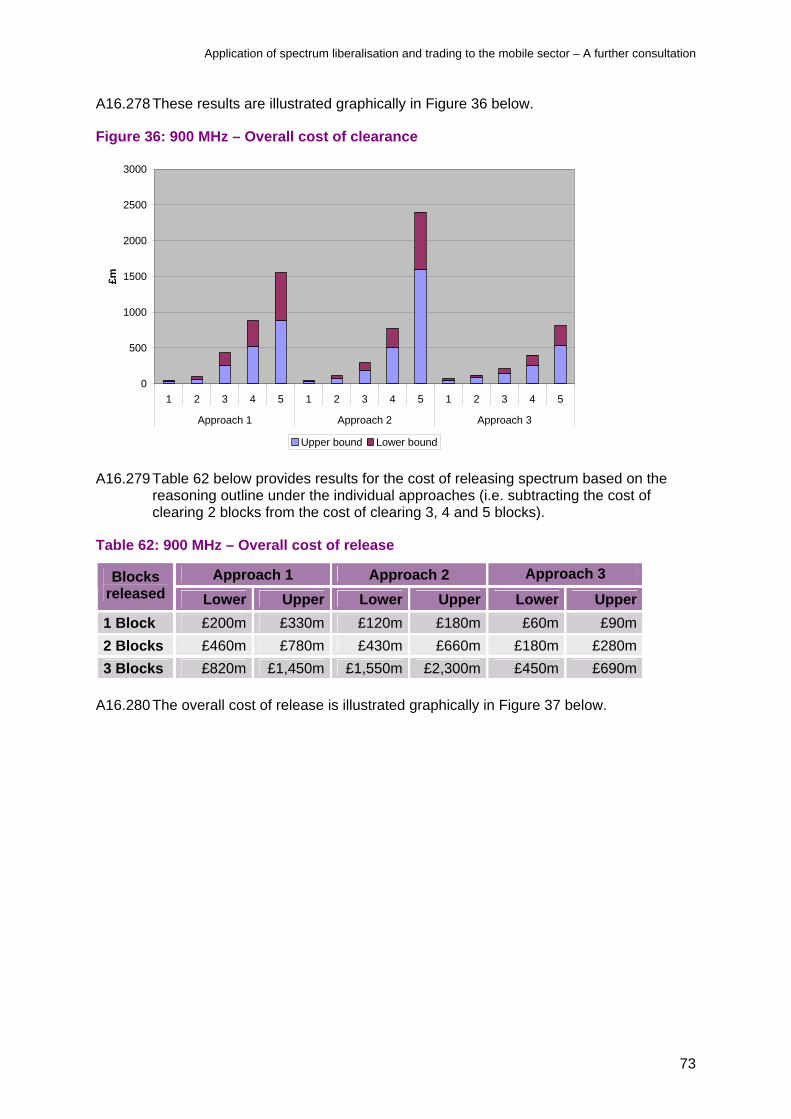
Application of spectrum liberalisation and trading to the mobile sector – A further consultation
73
A16.278 These results are illustrated graphically in Figure 36 below.
Figure 36: 900 MHz – Overall cost of clearance
0
500
1000
1500
2000
2500
3000
1 2 3 4 5 1 2 3 4 5 1 2 3 4 5
Approach 1 Approach 2 Approach 3
£m
Upper bound Lower bound
A16.279 Table 62 below provides results for the cost of releasing spectrum based on the reasoning outline under the individual approaches (i.e. subtracting the cost of clearing 2 blocks from the cost of clearing 3, 4 and 5 blocks).
Table 62: 900 MHz – Overall cost of release
Approach 1 Approach 2 Approach 3 Blocks released Lower Upper Lower Upper Lower Upper
1 Block £200m £330m £120m £180m £60m £90m
2 Blocks £460m £780m £430m £660m £180m £280m
3 Blocks £820m £1,450m £1,550m £2,300m £450m £690m
A16.280 The overall cost of release is illustrated graphically in Figure 37 below.

Application of spectrum liberalisation and trading to the mobile sector – A further consultation
74
Figure 37: 900 MHz – Overall cost of release
0
500
1000
1500
2000
2500
1 2 3 1 2 3 1 2 3
Approach 1 Approach 3 Approach 3
£m
Lower bound Upper bound
A16.281 As shown above Approach 3 appears to be the least costly of the three approaches. If additional GSM1800 spectrum can be allocated to Vodafone and O2 from Orange and T-mobile spectrum holdings then the costs of approach 3 will reduce. Although there will be an additional costs to T-mobile and Orange, this option might be seen as providing an overall benefit for all operators (see below for an estimate of the cost of clearing 1800 MHz spectrum).
A16.282 We do not believe that for partial clearance and release of spectrum it is actually necessary to remove the interleaving of GSM900 spectrum holdings. However, operators’ may choose to undertake such work at the same time as clearing spectrum. Table 65 below illustrates the cost of clearing GSM900 spectrum including the removal of interleaving.
Table 63: 900MHz – Overall cost of clearance (including removal of interleaving)
Approach 1 Approach 2 Approach 3 Blocks cleared Lower Upper Lower Upper Lower Upper
1 Block £70m £110m £70m £110m £90m £130m
2 Blocks £100m £150m £100m £160m £120m £180m
3 Blocks £280m £470m £220m £330m £180m £270m
4 Blocks £530m £900m £520m £790m £300m £470m
5 Blocks £880m £1,550m £1,600m £2,400m £570m £880m
A16.283 For the purposes of the policy analysis in this consultation, a reasonable rage for the estimated cost of releasing 900 MHz spectrum is:
£60m to £90m for 1 block release;
£180m to £280m for 2 blocks; and
£450m to £690m for 3 blocks.

Application of spectrum liberalisation and trading to the mobile sector – A further consultation
75
A16.284 These costs are based on approach 3 using a social discount rate of 3.5%
A16.285 Figure 38 below compares these costs with the equivalent costs estimated for the September 2007 consultation.
Figure 38: 900 MHz – Cost of release comparison with September 2007 consultation
0
200
400
600
800
1 2 3 1 2 3
September 2007 consultation Updated analysis
£m
Lower bound Upper bound
A16.286 As can be seen, the estimated cost of releasing 1 block of spectrum has risen slightly, the estimated cost of releasing 2 blocks has risen significantly and the estimated cost of releasing 3 blocks has fallen from the September 2007. Overall, however, the costs appear to be of a broadly similar magnitude.
Cost of partial clearance and release of 1800 MHz
A16.287 Of the 3 approaches investigated above for the cost of clearance and release of spectrum, the first 2 can be directly applied to 1800 MHz. Approach 3 cannot be applied as it relies of the more extensive use of an alternative band (1800 MHz in the case of the 900 MHz analysis) which is not available to 1800 MHz operators.
A16.288 We will not explore the range of different factors and assumptions that can influence the costs of clearing various quantities of spectrum as these will be the same as already described for 900 MHz. Rather, we will concentrate of the results of the analysis for the two approaches (SFH upgrades plus 2.1 GHz widening and SFH plus cell splitting.
Approach 1 – SFH plus UMTS2100 widening
A16.289 In order to reach a reasonable estimate of the overall costs involved in a policy of releasing 1800 MHz spectrum from the current operators, we believe that for approach 1 the following assumptions are appropriate:
SFH clustering factor: 2
GSM frequency re-use factors:
o BBH: 15 for BCCH carriers and 13 for TCH carriers

Application of spectrum liberalisation and trading to the mobile sector – A further consultation
76
o SFH: 15 for BCCH carriers and 11 for TCH carriers
2G traffic growth: 10%
Take into account potential need for additional UMTS2100 sites inside the 80% coverage area: Yes
Additional site acquisition inflation: 0%
A16.290 Based on the above the overall cost of clearing spectrum is illustrated in Table 64 below for both the social discount rate of 3.5% and for the commercial discount rate of 11.5%.
Table 64 : 1800 MHz – Approach 1 – Overall cost of clearance
Social discount rate (3.5%)
Commercial discount rate
(11.5%) Blocks cleared
Lower Upper Lower Upper
1 Block £20m £25m £15m £20m
2 Blocks £25m £35m £20m £25m
3 Blocks £35m £50m £25m £35m
4 Blocks £50m £80m £35m £60m
5 Blocks £70m £110m £50m £80m
6 Blocks £100m £160m £70m £100m
A16.291 These results are illustrated graphically in Figure 39 below.
Figure 39 : 1800 MHz – Approach 1 – Overall cost of clearance
0
20
40
60
80
100
120
140
160
180
1 2 3 4 5 6 1 2 3 4 5 6
Social discount rate (3.5%) Commercial discount rate (11.5%)
£m
Lower bound Upper bound
A16.292 Unlike 900 MHz, spectrum holdings at 1800 MHz are not interleaved and therefore there is no equivalent case for the removal of interleaving.

Application of spectrum liberalisation and trading to the mobile sector – A further consultation
77
Approach 2 – SFH plus cell splitting
A16.293 In order to reach a reasonable estimate of the overall costs involved in a policy of releasing 1800 MHz spectrum from the current operators, we believe that for approach 2 the following assumptions are appropriate:
SFH clustering factor: 2
GSM frequency re-use factors:
o BBH: 15 for BCCH carriers and 13 for TCH carriers
o SFH: 15 for BCCH carriers and 11 for TCH carriers
2G traffic growth: 10%
Additional site acquisition inflation: 0%
A16.294 Based on the above the overall cost of clearing spectrum is illustrated in Table 65 below for both the social discount rate of 3.5% and for the commercial discount rate of 11.5%.
Table 65: 1800 MHz – Approach 2 – Overall cost of clearance
Social discount rate (3.5%)
Commercial discount rate
(11.5%) Blocks cleared
Lower Upper Lower Upper
1 Block £15m £20m £15m £15m
2 Blocks £20m £30m £15m £25m
3 Blocks £30m £40m £25m £30m
4 Blocks £45m £60m £30m £45m
5 Blocks £70m £100m £45m £70m
6 Blocks £110m £160m £80m £120m
A16.295 These results are illustrated graphically in Figure 40 below.

Application of spectrum liberalisation and trading to the mobile sector – A further consultation
78
Figure 40: 1800 MHz – Approach 2 – Overall cost of clearance
0
20
40
60
80
100
120
140
160
180
1 2 3 4 5 6 1 2 3 4 5 6
Social discount rate (3.5%) Commercial discount rate (11.5%)
£m
Lower bound Upper bound
Cost of full clearance and release of 900 MHz and 1800 MHz
A16.296 In order to estimate the cost of full clearance and release of 900 MHz and 1800 MHz spectrum the only viable approach would be to carry all 2G traffic on the operators’ 3G networks at 2.1 GHz (and accelerating handset migration). To calculate this cost we have used the UMTS2100 widening element from approach 1 (including building out additional sites outside the 80% 3G coverage area and adding additional UMTS2100 sites inside this area).
A16.297 For the number of additional sites required outside the 80% area we have used the number calculated in the “Less densely populated” analysis: 2,546
A16.298 For the number of additional sites required inside the 80% area we have assumed that on average the operators’ UMTS2100 network has enough spare capacity to carry half the displaced 2G traffic. The justification for this follows from the discussion in paragraph A16.66 (i.e. it is very unlikely that there would be no spare capacity at 2.1 GHz right across the operators’ networks. However, there are likely to be 3G traffic hotspots and it is also likely there will be a degree of correlation between the 2G sites which are most capacity constrained and 3G sites which are also running close to capacity). Basing the number of additional UMTS2100 sites needed on half the displaced 2G traffic seems a reasonable compromise.
A16.299 In order to reach a reasonable estimate of the overall costs involved in a policy of releasing 900 MHz and 1800 MHz spectrum from the current operators, we believe that the following assumptions are appropriate:
GSM frequency re-use factors:
o BBH: 15 for BCCH carriers and 13 for TCH carriers
2G traffic growth: 10%
Take into account potential need for additional UMTS2100 sites inside the 80% coverage area: Yes (see paragraph A16.298 above)

Application of spectrum liberalisation and trading to the mobile sector – A further consultation
79
Additional site acquisition inflation: 0%
A16.300 Based on the above the overall cost of full clearance and release is illustrated in Table 64 below for both the social discount rate of 3.5% and for the commercial discount rate of 11.5%.
Table 66: Overall cost of full clearance and release
Social discount rate (3.5%)
Commercial discount rate (11.5%) Spectrum
band Lower Upper Lower Upper
900 MHz £1,900m £3,100m £1,350m £2,200m
1800 MHz £2,200m £3,550m £1,550m £2,500m
A16.301 If, rather than basing the number of additional UMTS2100 sites inside the 80% area being on half the displaced 2G traffic, we assume that there is no spare capacity at all on the operators’ UMTS2100 networks the cost of full release is as follows.
Table 67: Overall cost of full clearance and release (assuming there is no spare 3G capacity)
Social discount rate (3.5%)
Commercial discount rate (11.5%) Spectrum
band Lower Upper Lower Upper
900 MHz £2,250m £3,550m £1,550m £2,500m
1800 MHz £2,800m £4,450m £1,900m £3,100m
Impact of deferred the full clearance and release of 900 MHz spectrum
A16.302 So far, we have assumed that spectrum release will happen in 2011 with the necessary network upgrades taking place in the two years leading up to the release. In this sub-section, we look at the impact on the costs if full clearance and release of 900 MHz spectrum takes place at a later date.
A16.303 To illustrate the potential impact of deferring the full clearance and release of 900 MHz spectrum we have decided to model a 1 year and a 4 year deferral (i.e. 2012 and 2015). For 2012 we assume that 2G traffic levels are 100% of current levels, for 2015 we assume that 2G traffic levels are 20% of current levels (see paragraph A16.258 and Figure 34).
A16.304 Other key assumptions are the same as those used in paragraphs A16.298 and A16.299 above.
A16.305 The cost of full clearance and release of 900 MHz spectrum follows for the years 2011, 2012 and 2015 (for approach 3 using social discount rate of 3.5%).
Table 68: 900 MHz – Impact of deferring the full clearance and release
Year Lower Upper
2011 £1,900m £3,100m
2012 £1,450m £2,350m
2015 £660m £1,000m

Application of spectrum liberalisation and trading to the mobile sector – A further consultation
80
Timing and the risk of transitional network disruption
A16.306 In the following sub-section we explore some of the factors that will affect the practical timing of any spectrum release and also the risk of network disruption as a consequence of a release. There is always the potential for short term disruption and impacts on network quality in the transition period whilst a network upgrade takes place. All three of the approaches highlighted above have these types of risks. However, these risks are common to any major network upgrade.
Timing
A16.307 Network upgrades are likely to be planned and implemented on a regional basis. This should reduce the risk of service outage as only a relatively small portion of the network would need to be upgraded at any one time. An operator would probably split the country into several regions with each region being upgraded largely sequentially. The planning phases for each region are likely overlap but the actual site upgrade work and switchovers may not. Lessons learnt from the upgrades to early regions can be applied to regions upgraded later.
A16.308 The network upgrade process, at a high level, is likely to be similar regardless of the specific approach taken to releasing spectrum. A typical network upgrade process for a single region might be as follows:
Planning phase – first 3 months. Software and hardware changes in the network and at each site are identified. New frequency plans are developed. Sites needing to be visited are identified and a site visit schedule is established. Site surveys are undertaken as necessary. Vendors are put on notice and equipment orders are placed.
Testing phase – months 3 and 4 (there may be some overlap with the planning phase). Plans and processes are tested. New software and hardware is assessed and tested. Field trials of some of the upgrades may be needed. Pre-upgrade drive tests are carried out if necessary. Simulations of the network post upgrade are undertaken and plans are re-optimised accordingly.
Implementation phase – months 5 and 6. This is where the bulk of the physical upgrade work will take place with site visits taking place where necessary to upgrade equipment. Hardware and software is upgraded and frequency switchover takes place.
Post upgrade optimisation phase – months 7 and 8. Close network monitoring and extensive drive testing. Network optimisation activities and any necessary remedial site visits carried out.
Stable network achieved – after month 8 – fall back to routine network monitoring and optimisation activities.
A16.309 The above is only an indicative outline of the process and the details are likely to vary from operator to operator to fit in with their own operating practices and vendor requirements. It illustrates our assessment that about 8 months is likely to be a reasonable time to carry out the necessary network upgrades for a single region. If the country is split into six regions, with the implementation phases being carried out sequentially, then the whole upgrade process should take about 18 months.

Application of spectrum liberalisation and trading to the mobile sector – A further consultation
81
A16.310 This process assumes that any new sites required (e.g. for cell splitting) are available for build (at least in the first region) within 5 to 6 months. It is not unreasonable to assume that the lead time to identify, acquire and get the necessary permissions to build a new site would take between 5 or 6 months and a year for most sites. For a 1 block release (3 block clearance), based on approach 3, a 900 MHz operator would need to acquire about 315 additional GSM sites (630 in total between the two operators – see Table 44). We believe that acquiring this quantity of new sites will not pose an insurmountable challenge to the operators. Overall, our assessment is that an 18 month period to upgrade the 900 MHz networks to enable the operators to release at least 1 block of spectrum is realistic. This is illustrated in the figure below.
Figure 41: Illustration of network upgrade process
Mon
th 1
Mon
th 2
Mon
th 3
Mon
th 4
Mon
th 5
Mon
th 6
Mon
th 7
Mon
th 8
Mon
th 9
Mon
th 1
0
Mon
th 1
1
Mon
th 1
2
Mon
th 1
3
Mon
th 1
4
Mon
th 1
5
Mon
th 1
6
Mon
th 1
7
Mon
th 1
8
New Site acquisition
Region 1 PlanningTestingImplementationOptimisation
Region 2 PlanningTestingImplementationOptimisation
Region 3 PlanningTestingImplementationOptimisation
Region 4 PlanningTestingImplementationOptimisation
Region 5 PlanningTestingImplementationOptimisation
Region 6 PlanningTestingImplementationOptimisation
A16.311 If there are particular difficulties acquiring new sites then the 18 month period may need to be stretched slightly. However, for a one block release we feel 2 years is should be sufficient.
A16.312 In considering the process and timing for releasing spectrum we have considered the fact that operators may also be deploying UMTS900 at the same time. We do not believe this would have a material impact on operators ability or timing of release because much of the physical upgrade work necessary to release spectrum could be planned and implemented alongside the work necessary to deploy UMTS900 - for instance site visits could be combined where appropriate.
A16.313 For each region any disruption will be at its greatest immediately following the upgrade. This will diminish over time and eventually network quality will recover to previous levels (or at least to acceptable levels set by the operators). We describe this further immediately below.
Potential costs associated with transitional network disruption and quality impacts
A16.314 As stated above, we acknowledge that there may be a period of disruption during and immediately following any network upgrade process. However, can minimise any disruption if the proposed upgrades are planned well in advance and major changes/upgrades are brought on-line at times when the networks are naturally quiet (e.g. at night). Further, all the operators in the UK have experience in making major changes/upgrades to their networks. Although there are challenges when upgrade activities are carried out on a large scale, they are not completely new

Application of spectrum liberalisation and trading to the mobile sector – A further consultation
82
concepts. In addition, all the operators carry out numerous smaller scale network upgrades and frequency planning modifications as a part of their business as usual activities. We believe that the operators are experienced enough to carryout the types of upgrade we anticipate will be necessary without adversely affecting their market position and they can make use of their past experience in order to minimise any network disruption.
A16.315 It is uncertain whether there will be a material impact in terms of costs as a consequence of any network disruption. However, we believe any costs there are are likely to be relatively small. In order to illustrate the possible magnitude of the costs, we have quantified some illustrative scenarios below. It should be stressed that these are not predictions of the actual costs rather illustrations of plausible ranges of worst case costs.
A16.316 Two of the key network quality indicators are the call success rate (i.e. the ability establish a call in the first place) and the dropped call rate (i.e. a call terminating prematurely mid conversation – a similar indicator can be applied to packet data e.g. packets being dropped). We can posit that an acceptable level for call success is around 99% (calls fail to get through for all sorts of reasons, including networks being busy, the strength of the received signal, external radio interference, incorrect dialling, etc). Once a call gets through it is important for the call to be maintained until the caller terminates it themselves – it is likely that maintaining an existing call will have a higher priority than allowing a new call onto the network. Again we can posit that an acceptable level for the call dropped rate is 2-3%.
A16.317 During a network upgrade process both these quality indicators can potentially be affected. The extent of any impact is a combination of how much the indicator is affected and over what period of time the impact lasts for. For instance a drop in call success rate to 90% may be acceptable for a few days but if it lasts for much longer (say weeks) then that may be a more serious problem for the operator. The same logic applies to call dropped rate but as this is a more important indicator than call success rate, operators are unlikely to accept it rising to more that say 5%.
A16.318 In order to make a reasonable estimate of the costs associated with transitory quality impacts that result from a network upgrade we can make some plausible estimates of how may calls will be lost as a result of a drop in call success rate and a rise in the call dropped rate over a period and combine this with the revenue generated by an average call. Using this approach we have modelled 2 scenarios (scenario 1 and scenario 2).
Scenario 1
A16.319 For scenario 1 we make the following assumptions:
Call success rate initially drops from 99% to 95%
Call drop rate initially increases from 2% to 4%
Call success rate recovers (in a linear fashion) to 97% within 2 days as a result of gross optimisation activities
Call drop rate recovers (in a linear fashion) to 3% within 2 days as a result of gross optimisation activities

Application of spectrum liberalisation and trading to the mobile sector – A further consultation
83
Call success rate fully recovers (again in a linear fashion) within 8 days as a result of optimisation fine tuning
Call drop rate fully recovers (also in a linear fashion) within 8 days as a result of optimisation fine tuning.
A16.320 We also assume that:
If a call is not successfully established the user re-tries and that on average re-tries are 50% successful; and
That the overall the percentage of users that might potentially suffer some from of disruption is strongly related to the number of sites needing to be upgraded.
A16.321 For approach 3, the number of affected 900 MHz sites is as follows:
Table 69: Approach 3 – Number of sites to upgrade
Blocks cleared
GSM1800 Upgrade
Cell splitting
1 Block 423 246
2 Blocks 1,157 432
3 Blocks 2,504 762
4 Blocks 5,109 1,501
5 Blocks 8,711 3,265
A16.322 This is out of a total of approximately 17,700 macro sites (before any cell splits).
A16.323 Assuming that the operators would clear one block each for their own use then the incremental number of sites to upgrade is as follow:
Table 70: Approach 3 – Incremental number of sites to upgrade
Blocks released
GSM1800 Upgrade
Cell splitting
Total
1 Block 1,348 330 1,678
2 Blocks 3,952 1,069 5,021
3 Blocks 7,555 2,833 10,388
A16.324 As a percentage of the overall number of macro sites the number of incremental sites to upgrade per release quantity is:
Table 71: Approach 3 – Incremental number of sites to upgrade as percentage
Blocks released
Number to upgrade
Total macro site overall
Percentage to upgrade
1 Block 1,678 17,762 9%
2 Blocks 5,021 18,501 27%
3 Blocks 10,388 20,265 51%

Application of spectrum liberalisation and trading to the mobile sector – A further consultation
84
A16.325 Based on the assumptions above, if the entire network is affected this would result in an extra 0.76 % of call attempts not getting through which otherwise would have done so due to the call success rate drop and an extra 0.6% of calls dropping mid call which would not have done so otherwise, averaged over the 8 days for which the network is affected.
A16.326 On the basis that:
an average user generates 20 mErlangs of traffic in the busy hour;
that the busy hour represents 14% of overall network traffic; and
that the 900 MHz operators have 30 million 2G subscribers between them
A16.327 Then over the 8 day disruption period a total of approximately 250 kErlangs of calls will fail to get through due to the drop in call success rate. This would equate to 15 million call minutes if the whole network was affected and at an average call charge of 10 pence per minute the loss in revenue would be £1.5 million.
A16.328 Likewise over the 8 day disruption period a total of approximately 200 kErlangs of calls will be dropped due to the rise in call dropped rate. This equates to 12 million call minutes that will be dropped prematurely. If you assume that on average these calls last half their normal length and if the whole network is affected and at an average call cost of 10 pence per minute the loss in revenue would be £0.6 million.
A16.329 In this case the loss in revenue in terms of network disruption (if the entire network is affected) is approximately £2.1 million.
A16.330 As we said above, the percentage of users that might potentially suffer some from of disruption is strongly related to the number of sites needing to be upgraded. The above calculation assumes that the entire network is affected. This is reasonable as regardless of whether a site needs to be physically upgraded or not, the entire 2G network will need to a new frequency plan. However, those sites that need to be physically upgraded may potentially be more prone to disruption. To account for this, we have assumed that for these sites the increased in disruption doubles. So for the 1 block release case we calculate the cost as £2.1 million x 1.09 (for the 9% of sites in the network requiring an upgrade). For each of the 3 release quantities the overall network disruption costs is therefore as follows:
Table 72: Scenario 1 – Network disruption costs
Blocks released
Cost
1 Block £2.3m
2 Blocks £2.7m
3 Blocks £3.2m
A16.331 We have also calculated the potential costs associated with releasing 3 blocks under approach 1 (SFH upgrades plus UMTS2100 widening). Under approach 1, for a 3 block release virtually every site in the 2G networks will need to be upgraded to SFH in addition an extra 4661 UMTS2100 sites will be required (both to widen coverage outside the existing 3G coverage areas and to increase capacity within it). Therefore we estimate the potential cost by multiplying £2.1 million cost by a factor of 2.5. This gives us a potential cost of £5.25 million for scenario 1.

Application of spectrum liberalisation and trading to the mobile sector – A further consultation
85
A16.332 For scenario 1 we assume that in general there will be little impact on customer behaviour as a consequence (i.e. there will be little or no impact on customer churn rates) as the degradation is over a short enough period for them live with the impact. Mobile networks are undergoing changes all the time, new features are added, frequency plans optimised, equipment upgraded or replaced. This means that there are temporary drops in quality as a natural function of network maintenance. The type of temporary drop in quality that might arise as a consequence of upgrades necessary to clear spectrum (if properly managed by the operators) should be no worse, though geographically they may affect more of the network at any one time. Customers are used to these temporary dips and it is arguable that they are unlikely to perceive or react to an upgrade due to spectrum release any differently from any other business as usual network upgrade.
Scenario 2
A16.333 For scenario 2 we make the following assumptions:
Call success rate initially drops from 99% to 90%
Call drop rate initially increases from 2% to 6%
Call success rate recovers (in a linear fashion) to 95% within 4 days as a result of gross optimisation activities
Call drop rate recovers (in a linear fashion) to 4% within 4 days as a result of gross optimisation activities
Call success rate fully recovers (again in a linear fashion) within 16 days
Call drop rate fully recovers (also in a linear fashion) within 16 days.
A16.334 All other assumptions are the same as for scenario 1 above.
A16.335 If the entire network is affected this would result in an extra 1.58% of call attempts not getting through which otherwise would have done so due to the call success rate drop and an extra 1.5% of calls dropping mid call which would not have done otherwise, over the 16 days for which the network is affected.
A16.336 As before, on the basis that:
an average user generates 20 mErlangs of traffic in the busy hour;
that the busy hour represents 14% of overall network traffic; and
that the 900 MHz operators have 30 million 2G subscribers between them.
A16.337 Then over the 16 day disruption period a total of approximately 1.1 million Erlangs of calls will fail to get through due to the drop in call success rate. This equates to 65 million call minutes if the whole network is affected and at an average call cost of 10 pence per minute the loss in revenue would be £6.5 million.
A16.338 Likewise over the 16 day disruption period a total of approximately 1.0 million Erlangs of calls will be dropped due to the rise in call dropped rate. This equates to 60 million call minutes that will be dropped prematurely. If you assume that on average these calls last half their normal length and if the whole network is affected

Application of spectrum liberalisation and trading to the mobile sector – A further consultation
86
and at an average call cost of 10 pence per minute the loss in revenue would be £3 million.
A16.339 In this case the loss in revenue in terms of network disruption (if the entire network is affected) is approximately £9.5 million.
A16.340 Factoring the additional cost associated with sites physically upgraded as we did for scenario 1 we get:
Table 73: Scenario 2 – Network disruption costs
Blocks released
Cost
1 Block £10.4m
2 Blocks £12.1m
3 Blocks £14.4m
A16.341 However, for scenario 2 we do not assume that in general there will be little impact on user behaviour as a consequence (i.e. there is likely to be a significant impact on customer churn rates). Unless the network operators take some positive action it is plausible that customer churn rates will increase significantly. It is difficult to quantify by how much churn rates might rise but we can posit that one approach to mitigate this would be for the operators to offer some form of compensation to their customers in order to maintain their goodwill. Grossly, we might expect this compensation to cost a similar amount to the loss in revenue from increased call success failures and dropped calls. On this basis the overall cost of network disruption in scenario 2 would be as follows:
Table 74: Scenario 2 – Network disruption costs (including impact on user behaviour)
Blocks released
Cost
1 Block £20.8m
2 Blocks £24.2m
3 Blocks £28.8m
A16.342 As we did in paragraph A16.331, we have also calculated the potential costs associated with releasing 3 blocks under approach 1 (SFH upgrades plus UMTS2100 widening). Using the same factor of 2.5 gives us a potential cost of £47.5 million for scenario 2.
Conclusions
A16.343 We believe that for a spectrum release of 1 block of 900 MHz spectrum that the necessary network upgrade work to enable could be reasonably achieved in 2 years.
A16.344 Under plausible assumptions the cost of any transitional network disruption may lie in the ranges below:
Table 75: Network disruption cost ranges
Blocks Lower Upper

Application of spectrum liberalisation and trading to the mobile sector – A further consultation
87
released
1 Block £2.3m £20.8m
2 Blocks £2.7m £24.2m
3 Blocks £3.2m £28.8m
Potential long term quality impact
A16.345 As was the case for the September 2007 consultation, our costing of the three approaches to the partial clearance and release of spectrum is based on maintaining the long term quality of existing services provided to consumers.
A16.346 As such we consider the risk of a long term impact on quality to be extremely low. However, we do recognise that for larger clearance quantities (e.g. 4 or 5 blocks) there may be an increased risk that, if network upgrades are not planned and implemented as efficiently as we might hope, there is the potential for quality to degrade somewhat.
A16.347 It is also possible that an operator may actually choose to balance some degradation in longer term network quality against reducing the cost of clearing and releasing spectrum (bearing in mind that as 2G traffic naturally migrates to 3G, 2G network quality may well recover eventually anyway). That is obviously a commercial decision for them to take.