A guidebook for DISCO tissue clearing
21
Review A guidebook for DISCO tissue clearing Muge Molbay 1,2,3,† , Zeynep Ilgin Kolabas 1,2,4,† , Mihail Ivilinov Todorov 1,2,4 , Tzu-Lun Ohn 1,2 & Ali Ert € urk 1,2,5,* Abstract Histological analysis of biological tissues by mechanical sectioning is significantly time-consuming and error-prone due to loss of important information during sample slicing. In the recent years, the development of tissue clearing methods overcame several of these limitations and allowed exploring intact biological specimens by rendering tissues transparent and subsequently imaging them by laser scanning fluorescence microscopy. In this review, we provide a guide for scientists who would like to perform a clearing protocol from scratch without any prior knowledge, with an emphasis on DISCO clearing protocols, which have been widely used not only due to their robustness, but also owing to their rela- tively straightforward application. We discuss diverse tissue-clear- ing options and propose solutions for several possible pitfalls. Moreover, after surveying more than 30 researchers that employ tissue clearing techniques in their laboratories, we compiled the most frequently encountered issues and propose solutions. Overall, this review offers an informative and detailed guide through the growing literature of tissue clearing and can help with finding the easiest way for hands-on implementation. Keywords 3D imaging; DISCO; labeling; light sheet; tissue clearing Subject Categories Development; Methods & Resources; Neuroscience DOI 10.15252/msb.20209807 | Received 30 June 2020 | Revised 29 December 2020 | Accepted 14 January 2021 Mol Syst Biol. (2021) 17:e9807 Tissue transparency Biological tissues are remarkably complex. While several histologi- cal techniques are currently available for the analysis of biological tissues, a variety of challenges remains to be tackled. For example, imaging large samples requires destroying tissue integrity by sectioning them into thin slices for visualization. This process is labor-intensive and re-assembling information from serial tissue sections into a three-dimensional reconstruction is an extremely time-consuming process, likely causing loss of important informa- tion (Ert€ urk et al, 2012a). Rendering the tissues transparent is an option for circumventing the need for sectioning and allows imaging tissues while keeping them intact and preserving their details. Opti- cal tissue clearing is the term that spans a variety of methods apply- ing this concept. From the very first clearing protocol to the most recent ones, transparency is achieved by homogenizing the refrac- tive index (RI) within the tissue. When light waves propagate through a tissue with nonhomogeneous refractive indices, the dif- ferences in the RIs will result in refraction at the interface, distorting the shape of the wave front. This process is also referred to as scat- tering. Having a wider distribution of the RI in a medium causes more scattering, degrading the quality of the acquired image. There- fore, minimizing the refraction by homogenizing the RI allows light to penetrate deeper into the medium (Tuchin, 2015), hence render- ing a sample transparent. The first tissue clearing method was described in the 1900s by Werner Spalteholz, who used a mixture of Methyl salicylate/Benzyl benzoate (5:3 vol:vol) (Spalteholz, 1914) to apply the RI homoge- nization protocol. Derivatives of the Spalteholz’ method were used by embryologists by substituting methyl salicylate with benzyl alcohol. This new combination formed Murray’s clear (BABB) containing 1:2 combination of benzyl alcohol:benzyl benzoate (Dent et al, 1989; Klymkowsky & Hanken, 1991). Currently, tissue clearing, especially when paired with optical imaging and fluores- cent labeling of cellular structures has become a powerful tool for collecting information deep within tissues at single-cell resolution. Due to the wide applicability of tissue clearing, several different approaches have emerged including hydrogel-based clearing, aque- ous-based clearing, and those that followed Spalteholz’s historical recipe on tissue dehydration—solvent-based clearing (Fig 1) (Sil- vestri et al, 2016). These approaches have expanded the applica- tion of tissue clearing by providing specialized protocols for a variety of purposes. Cleared lipid-extracted acryl-hybridized rigid immunostaining/ in situ hybridization-compatible tissue hydrogel (CLARITY) (Chung et al, 2013), passive CLARITY technique (PACT) and perfusion-assisted agent-release in situ (PARS) (Yang et al, 2014) are hydrogel-based protocols. They utilize an acrylamide monomer to form a tissue-hydrogel hybrid, which allows immobilizing most of the amino group containing molecules by cross-linking, thus keeping large tissues intact and decreasing structural damage. This 1 Institute for Tissue Engineering and Regenerative Medicine (iTERM), Helmholtz Center, Neuherberg, Munich, Germany 2 Institute for Stroke and Dementia Research, Klinikum der Universit€ at M€ unchen, Ludwig-Maximilians-University Munich, Munich, Germany 3 Munich Medical Research School (MMRS), Munich, Germany 4 Graduate School for Systemic Neurosciences (GSN), Munich, Germany 5 Munich Cluster for Systems Neurology (SyNergy), Munich, Germany *Corresponding author. Tel: +49 89 3187 43234; E-mail: [email protected] † These authors contributed equally to this work ª 2021 The Authors. Published under the terms of the CC BY 4.0 license Molecular Systems Biology 17:e9807 | 2021 1 of 21
-
Upload
khangminh22 -
Category
Documents
-
view
3 -
download
0
Transcript of A guidebook for DISCO tissue clearing

Review
A guidebook for DISCO tissue clearingMuge Molbay1,2,3,†, Zeynep Ilgin Kolabas1,2,4,†, Mihail Ivilinov Todorov1,2,4, Tzu-Lun Ohn1,2 &
Ali Ert€urk1,2,5,*
Abstract
Histological analysis of biological tissues by mechanical sectioningis significantly time-consuming and error-prone due to loss ofimportant information during sample slicing. In the recent years,the development of tissue clearing methods overcame several ofthese limitations and allowed exploring intact biological specimensby rendering tissues transparent and subsequently imaging themby laser scanning fluorescence microscopy. In this review, weprovide a guide for scientists who would like to perform a clearingprotocol from scratch without any prior knowledge, with anemphasis on DISCO clearing protocols, which have been widelyused not only due to their robustness, but also owing to their rela-tively straightforward application. We discuss diverse tissue-clear-ing options and propose solutions for several possible pitfalls.Moreover, after surveying more than 30 researchers that employtissue clearing techniques in their laboratories, we compiled themost frequently encountered issues and propose solutions. Overall,this review offers an informative and detailed guide through thegrowing literature of tissue clearing and can help with finding theeasiest way for hands-on implementation.
Keywords 3D imaging; DISCO; labeling; light sheet; tissue clearing
Subject Categories Development; Methods & Resources; Neuroscience
DOI 10.15252/msb.20209807 | Received 30 June 2020 | Revised 29 December
2020 | Accepted 14 January 2021
Mol Syst Biol. (2021) 17: e9807
Tissue transparency
Biological tissues are remarkably complex. While several histologi-
cal techniques are currently available for the analysis of biological
tissues, a variety of challenges remains to be tackled. For example,
imaging large samples requires destroying tissue integrity by
sectioning them into thin slices for visualization. This process is
labor-intensive and re-assembling information from serial tissue
sections into a three-dimensional reconstruction is an extremely
time-consuming process, likely causing loss of important informa-
tion (Ert€urk et al, 2012a). Rendering the tissues transparent is an
option for circumventing the need for sectioning and allows imaging
tissues while keeping them intact and preserving their details. Opti-
cal tissue clearing is the term that spans a variety of methods apply-
ing this concept. From the very first clearing protocol to the most
recent ones, transparency is achieved by homogenizing the refrac-
tive index (RI) within the tissue. When light waves propagate
through a tissue with nonhomogeneous refractive indices, the dif-
ferences in the RIs will result in refraction at the interface, distorting
the shape of the wave front. This process is also referred to as scat-
tering. Having a wider distribution of the RI in a medium causes
more scattering, degrading the quality of the acquired image. There-
fore, minimizing the refraction by homogenizing the RI allows light
to penetrate deeper into the medium (Tuchin, 2015), hence render-
ing a sample transparent.
The first tissue clearing method was described in the 1900s by
Werner Spalteholz, who used a mixture of Methyl salicylate/Benzyl
benzoate (5:3 vol:vol) (Spalteholz, 1914) to apply the RI homoge-
nization protocol. Derivatives of the Spalteholz’ method were used
by embryologists by substituting methyl salicylate with benzyl
alcohol. This new combination formed Murray’s clear (BABB)
containing 1:2 combination of benzyl alcohol:benzyl benzoate
(Dent et al, 1989; Klymkowsky & Hanken, 1991). Currently, tissue
clearing, especially when paired with optical imaging and fluores-
cent labeling of cellular structures has become a powerful tool for
collecting information deep within tissues at single-cell resolution.
Due to the wide applicability of tissue clearing, several different
approaches have emerged including hydrogel-based clearing, aque-
ous-based clearing, and those that followed Spalteholz’s historical
recipe on tissue dehydration—solvent-based clearing (Fig 1) (Sil-
vestri et al, 2016). These approaches have expanded the applica-
tion of tissue clearing by providing specialized protocols for a
variety of purposes.
Cleared lipid-extracted acryl-hybridized rigid immunostaining/
in situ hybridization-compatible tissue hydrogel (CLARITY)
(Chung et al, 2013), passive CLARITY technique (PACT) and
perfusion-assisted agent-release in situ (PARS) (Yang et al, 2014)
are hydrogel-based protocols. They utilize an acrylamide monomer
to form a tissue-hydrogel hybrid, which allows immobilizing most
of the amino group containing molecules by cross-linking, thus
keeping large tissues intact and decreasing structural damage. This
1 Institute for Tissue Engineering and Regenerative Medicine (iTERM), Helmholtz Center, Neuherberg, Munich, Germany2 Institute for Stroke and Dementia Research, Klinikum der Universit€at M€unchen, Ludwig-Maximilians-University Munich, Munich, Germany3 Munich Medical Research School (MMRS), Munich, Germany4 Graduate School for Systemic Neurosciences (GSN), Munich, Germany5 Munich Cluster for Systems Neurology (SyNergy), Munich, Germany
*Corresponding author. Tel: +49 89 3187 43234; E-mail: [email protected]†These authors contributed equally to this work
ª 2021 The Authors. Published under the terms of the CC BY 4.0 license Molecular Systems Biology 17: e9807 | 2021 1 of 21

Optical Clearing Methods
Organic solvent-based clearing
BABB
FluoClear BABB
DISCO
High refractiveindex solution
Water/organic solution
Hyperhydratingsolution
CLARITY
SWITCH
Tissue Transformation/Hydrogel Embedding
Hydrophilic
Hydrophobic
Spalteholz's technique
ECi
PEGASOS
FocusClear
Water/sugar solution
Without detergent
With detergent
PACT
PARS
CLARITY-TDE
Passive CLARITY
Stochastic electrotransport
ClearT
FRUIT
EyeCi
BALANCE
Sucrose
SeeDB
FRUIT
Sca/e
Sca/es
CUBIC
3DISCO uDISCO iDISCO
vDISCO
fDISCO sDISCO SHANEL
Figure 1. The most common tissue clearing methods.
Tissue clearing methods can be separated into three main categories based on their chemistry: hydrogel-based, hydrophilic, and hydrophobic. The subtypes mainly differaccording to reagents/approaches used. Several parameters will influence the choice of the procedure such as the labeling method, the size of the tissue, the species,and the nature of the molecule of interest.
2 of 21 Molecular Systems Biology 17: e9807 | 2021 ª 2021 The Authors
Molecular Systems Biology Muge Molbay et al

process involves electrophoresis or diffusion depending on the
nature of the biological specimen and the specific scientific ques-
tion. After fixing the tissue in a hydrogel scaffold, the sample is
subjected to delipidation using sodium dodecyl sulfate (SDS) deter-
gent. The composition of the reagents can be modified depending
on the intended purpose of imaging (e.g., RNA or protein imag-
ing). The nature of the reagents also facilitates tissue expansion
which potentially reveals hidden structures. Among the downsides
of this approach are the longer incubation times required for clear-
ing and the need for special equipment in order to employ some
of the techniques (Gradinaru et al, 2018). All subtypes derived
from the CLARITY approach such as PACT and PARS (Yang et al,
2014), stabilization under harsh conditions via intramolecular
epoxide linkages to prevent degradation (SHIELD) (Park et al,
2019) and BoneCLARITY (Greenbaum et al, 2017) are protocols
optimized toward a certain use case. As an example, PACT is a
passive CLARITY technique involving a protocol suitable for small
samples, while PARS is a perfusion-assisted agent-release in situ
protocol for whole-body clearing with solution delivery through
the vasculature. Other CLARITY-based protocols are modified for
different applications or specific tissues, such as BoneCLARITY,
developed for investigating the notoriously difficult bone tissue.
An elaborate review on hydrogel-based tissue clearing methods is
available by Gradinaru et al (2018).
The second major type of tissue clearing methods is hydrophilic or
aqueous-based approaches. These methodologies initially surfaced
around the 1990s utilizing various water-soluble agents such as
sugars, dextran, sucrose, urea, and amino alcohols. The main distinc-
tive feature of aqueous-based methods is that the employed water-
soluble agents are less destructive to the tissue and display high levels
of biocompatibility and biosafety. The different method subtypes stem
from the different reagents that are used in protocols for decoloriza-
tion, delipidation, or RI-matching steps, i.e., urea in Sca/e (Hama
et al, 2011), urea with sorbitol in Sca/eS (Hama et al, 2015), fructose
for See Deep Brain (SeeDB) (Ke et al, 2013), and amino alcohols in
clear, unobstructed brain or body imaging cocktails and computa-
tional analysis (CUBIC) (Tainaka et al, 2014). Hydrophilic methods
involve several alternative mechanistic approaches for homogenizing
the RI. For instance, the sample can be passively immersed in an RI-
matching solution. Alternatively, lipids can be removed from the
sample and tissues can be hyperhydrated to lower the RI. For more
details on hydrophilic approaches, an extensive review is available by
Tainaka et al (2018).
Lastly, hydrophobic or solvent-based clearing methods rely on
organic solvents to render the tissues transparent. While this
approach dates back to Spalteholz’ protocol described in 1911, it did
not draw much attention at the time with the exception of a few
publications elaborating on the method (Dent et al, 1989; Klym-
kowsky & Hanken, 1991). It later re-emerged with 3D imaging of
solvent-cleared organs (3DISCO) that was used to achieve trans-
parency of a whole mouse brain in 1–2 days (Ert€urk et al, 2012a).
Every hydrophobic clearing method involves three fundamental
steps: dehydration, delipidation and RI matching. The dehydration
step is the distinctive step for hydrophobic methods and together
with delipidation, the aim is to remove the two most abundant
chemical components of biological tissue, namely water and lipids.
The RI of water is 1.33 (Hale & Querry, 1973) and greatly differs
from that of the remaining tissue (~ 1.55). Therefore, replacing
water with a liquid with a similar RI to that of the remaining tissue
can greatly reduce scattering (Richardson & Lichtman, 2015).
Applications of tissue clearing
Tissue clearing offers the opportunity to understand biology at a
whole organism and systems level and presents several advantages
for making new biological discoveries. One major feature of tissue
clearing is its potential to reveal 3-dimensional structural informa-
tion. The ability to keep tissues intact during imaging has revealed
previously unknown microscopic details and anatomical connec-
tions. For instance, imaging of cleared bone marrow using 3DISCO
showed that non-dividing stem cells localize in perisinusoidal areas
in the bone marrow (Acar et al, 2015). Another study used Focus-
CLEAR to reveal the spatial organization of cockroach brain nuclei
(Chiang et al, 2001). In the mouse gut, immunolabeling-enabled
imaging of solvent-cleared organs (iDISCO) revealed the peripheral
nervous system adapting to perturbations (Gabanyi et al, 2016).
New cortical brain regions, which are downstream of whisker-
evoked sensory processing, were discovered using iDISCO+ in mice
(Renier et al, 2016). More recently, imaging of whole-body neuronal
projections in adult mice using vDISCO (the ‘v’ refers to the variable
domain of heavy-chain antibodies; that is, nanobodies) revealed
vascular connections between the skull and the meninges (Cai et al,
2019), similar to the discovery of trans-cortical vessels in the long
bones using the simpleCLEAR protocol (Gr€uneboom et al, 2019).
Additionally, clearing agent fructose, urea, and glycerol for imaging
(FUnGI) provided an organoid clearing protocol for multi-color
lineage tracing of tumor heterogeneity (Rios et al, 2019).
Besides revealing detailed information, keeping the tissues intact
also maximizes the information that can be obtained from a large
specimen. Elegant examples of this are whole-body analyses that
allowed the unbiased assessment of treatment efficacy and enabled
analyzing the biodistribution of nanoparticles, antibodies, and vari-
ous other targeting agents. This powerful application was demon-
strated with the use of CUBIC to detect cancer metastases
throughout a whole mouse body sample (Kubota et al, 2017). More
recently, vDISCO, in conjunction with deep learning-based algo-
rithms allowed the quantification of cancer cells that had been
targeted by therapeutic antibodies (Pan et al, 2019). Beyond cancer
research, further medically relevant applications that are worth
noting include the analysis of the spatial distribution of transplanted
stem cells in adult mice body using ultimate DISCO (uDISCO) (Pan
et al, 2016) and screening the transfection efficiency of adeno-asso-
ciated virus (AAV) variant with CLARITY (Deverman et al, 2016).
Furthermore, iDISCO+ enabled automated cell detection of cFos
staining and Allen Brain Atlas registration revealing the brainstem
circuit control for feeding behavior and B-amyloid plaques in an
Alzheimer’s disease (AD) mouse model (Liebmann et al, 2016;
Nectow et al, 2017) (Fig 2).
Another benefit of whole intact tissue visualization is that it
provides less error-prone measurements and more informative
quantification. For example, the growth of glioblastomas in mice
was measured under different conditions using 3DISCO clearing
(Garofalo et al, 2015) and the distance between neural stem
cells and blood vessels was assessed with Sca/e (Hama et al,
2011). Moreover, clearing combined with unbiased quantification
ª 2021 The Authors Molecular Systems Biology 17: e9807 | 2021 3 of 21
Muge Molbay et al Molecular Systems Biology

z = 1.4 ~ 1.6 mm
1 mm
renal pelvis
renal cortex
renal medulla
Neurofilament HCongo Red
Autofluorescence Glomeruli and Vessels Vessels Merge
Autofluorescent 780 nm
TO-PRO-3 Dextran
1cm
X
Y
Z
4mm
1mm
A B C
D E
F
400 µm
8 mmnerves
Figure 2.
4 of 21 Molecular Systems Biology 17: e9807 | 2021 ª 2021 The Authors
Molecular Systems Biology Muge Molbay et al

methods, i.e., deep learning algorithms, made it possible to obtain
a system-level understanding at single-cell resolution. The complex
mouse brain vasculature was inspected using a combination of
3DISCO and a convolutional neural network and revealed struc-
tural differences in the cerebral angioarchitecture among common
inbred and outbred mice strains (Todorov et al, 2020; Fig 3). The
same pipeline, but relying on manual analysis instead of machine
learning, would be significantly more time-consuming and might
potentially result in a subjective end result. A similar approach
involving iDISCO+ revealed the local adaptations and functional
correlates across brain regions and indicated vascular plasticity in
diverse disease models (Kirst et al, 2020).
The ability of clearing to reveal fine details deep within tissues
makes it a powerful tool in the context of disease pathology. Analy-
ses of tumors using CUBIC indicated a heterogenous nature of
macrophage infiltration in lung carcinoma (Cuccarese et al, 2017),
while BABB clearing revealed growth patterns of prostate cancer
(van Royen et al, 2016). Similarly, tissue clearing has been applied
to neurological pathology, where 3DISCO showed microvessel reor-
ganization following stroke (Lugo-Hernandez et al, 2017), and
CLARITY elucidated the relationship between monoaminergic fibers
and Lewy bodies in Parkinson patients (Liu et al, 2016), and AD
plaques (Ando et al, 2014). CLARITY was also used to examine the
dynamics of pancreatic innervations in pathological conditions such
as in diabetes (Hsueh et al, 2017). Overall, the ability of clearing
techniques to reveal information that has been inaccessible to other
methodologies has been instrumental in the analysis of several
pathologies.
In summary, a variety of clearing techniques is available, with each
of them presenting certain advantages depending on various parame-
ters or being better suited for given applications. These methods are
undergoing continuous improvements and are being adapted to speci-
fic applications. Further applications are shown in Table 1, and two
recent reviews provide an in-depth discussion of the different applica-
tions (Ueda et al, 2020; Tian et al, 2021). In the following section, we
narrow down our focus to solvent-based method by first sharing some
of the known protocols, developed for various needs.
Organic solvent-based tissue clearing techniques
Solvent-based or hydrophobic methods have improved drastically
in the past decade. New protocols have emerged either addressing
the shortcomings of the original protocol or optimizing it for a
more specific application. Dehydration, lipid extraction, and RI
matching around 1.55 are the essential steps common to this type
of clearing approach. The first method to revive the century-old
technique was 3DISCO, which is known to be robust and to
work on a number of different tissue types. The major advan-
tages were the speed, the transparency, and the ease of storing
the samples, because of their solid nature following processing.
However, at the time the main shortcomings were quenching
the genetically expressed fluorescence and tissue shrinkage.
Nevertheless, these shortcomings also triggered the further opti-
mization of this approach.
Spalteholz’s tissue clearingAt the beginning of the 20th century, Werner Spalteholz mixed
Methyl salicylate and Benzyl benzoate (5:3 vol:vol) to make various
human organs transparent (Spalteholz, 1914). Examples of analyzed
organs include the human heart which was made transparent in
order to observe the blood vessels and the development of an infarc-
tion and the human hand which has been preserved to this day in
the Anatomy Institute of Leipzig University, Germany (Fig 4).
Although Spalteholz’s attempts were very popular in his time, he
could only obtain limited scientific knowledge due to the technical
limitations of the microscopes.
BABB clearingIn this protocol, the authors first introduced the term ultrami-
croscopy which advanced imaging in comparison with the previous
techniques via two-sided light sheets (Dodt et al, 2007). They used a
series of different ethanol concentrations to dehydrate samples and
BABB to clear the tissue. This way, they performed the first imaging
of fluorescently labeled embryonic mouse brains and vasculature
that was cleared with organic solvents.
◀ Figure 2. Tissue clearing can be applied to samples ranging from organs, to mouse embryos to adult rodent bodies and reveals macroscopic andmicroscopic details.
(A) Nerve and nerve endings are revealed in an E12.5 mouse embryo cleared with iDISCO protocol and immunostained for motor (red) and sensory (magenta) nerves andnerve endings (cyan). (B) Kidney vasculature is visualized after fDISCO clearing using CD31-A647 labeling. (C) B-amyloid plaques in the brain with neurofilament Hstaining in a 10-month-old in AD mouse cortex cleared with iDISCO (Scale bar: 200 lm in upper and 30 lm in lower figures). (D) Neuronal projections in the whole adultmouse are shown in a Thy1-GFPM mouse boosted with Anti-eGFP nanobodies using the vDISCO clearing protocol. (E) A 3D reconstruction of whole adult human kidneyperformed using SHANEL. The autofluorescence signal at 780 nm (cyan), the glomeruli and vessels from TO-PRO-3 labeling (magenta), the vessels from the dextranlabeling (green), and the merged image are shown, respectively. (F) Whole-brain vasculature is shown using PEGASOS protocol in Tie2-Cre;tTAflox;tetO-H2BGFP (TTH)mice in lateral view. Used with permission from: (A) Dr. Gist Croft, Rockefeller University, (B) Science Advances (Qi et al, 2019), (C) Cell (Liebmann et al, 2016), (D) NatureNeuroscience (Cai et al, 2019), (E) Cell (Zhao et al, 2020), (F) Cell Research (Jing et al, 2018).
▸Figure 3. Analysis tools for tissue clearing applications.
Analysis tools include: (A) TubeMap pipeline which demonstrates the fine-scale organization on the brain vasculature. In this study, Kirst et al (2020) demonstrated howstroke affects the brain, using antibody labeling. (B) The ClearMAP pipeline is used for examining parental behavior through Fos activity in the whole brain followed by afilter-based analysis. (C) SHANEL pipeline has one of the recent algorithms that include deep learning methods to analyze big tissues to quantify cleared human braintissues identified in the six layers of primary visual cortex. The summary of the cell properties from different brain regions taken from cortex and hippocampus wereanalyzed using the authors’ CNN. (D) The VesSAP pipeline, which can extract features and registers the mouse brain vasculature to Allen Brain Atlas. Images representthe steps of feature extraction, radius illustration, and vascular segmentation. (E) The DeepMACT pipeline, which detects metastasis throughout organs in adult mice.Each dot represents a metastasis. Used with permission from (A) Cell (Kirst et al, 2020), (B) Cell (Renier et al, 2016), (C) Cell (Zhao et al, 2020), (D) Nature Methods (Todorovet al, 2020), (E) Cell (Pan et al, 2019).
ª 2021 The Authors Molecular Systems Biology 17: e9807 | 2021 5 of 21
Muge Molbay et al Molecular Systems Biology

Averaged Voxelized branching points density (n=3)
Orientations : Azimuthal Polar Radial
Sliced registered graphAnnotated capillaries, Arteries, Putative Veins
parenting females
Medial Pre-Optic Area and Bed Nucleus of the Stria Terminalis
control females ctrl vs parenting females
Min MaxVessel size
Segmentation
Centerline
Bifurcation
Radius
1mm
1mm
Brain Heart Lungs Liver Kidneys Rest
Control Breast Cancer (MCF-7) Pancreas Cancer
# of
Met
asta
sis
MPOMPO
reference plane 219c-fosprojected raw dataaveraged heat mapsprojected raw dataaveraged heat maps p-value maps reference annotation
BST
BST
higher in parentinghigher in ctrl
MPO
BST
c-fos
A
B
C D
050
100
00 0 0 0 08 6
0
50
0 0 0
47
1 949
11500
150
18
137
E
I IIIII IVV VI
100 µm
Figure 3.
6 of 21 Molecular Systems Biology 17: e9807 | 2021 ª 2021 The Authors
Molecular Systems Biology Muge Molbay et al

Table 1. Tissue clearing applications based on tissue clearing methodand labeling.
SampleTissue clearing methodused Labeling
Whole mouse organ
Development ofheart
CUBIC (Li et al, 2016) AAV, Ab labeling
Lung 3DISCO (Ert€urk et al, 2012a;Mzinza et al, 2018)
Endogenous GFP
SWITCH (Murray et al, 2015) Endogenous GFP
CLARITY (Kim et al, 2015) Endogenous GFP
uDICSO (von Neubecket al, 2018)
EndogenousmCherry
Spleen 3DISCO (Ert€urk et al, 2012a) Endogenous GFP
Lymph node 3DISCO (Ert€urk et al, 2012a), Ab labeling,Endogenous xFP
3DISCO (Ert€urk et al, 2012a) Ab labeling,Endogenous xFP
Mammarygland
CUBIC (Davis et al, 2016) Endogenous GFP
FUnGI (Rios et al, 2019) Ab labeling
Heart CLARITY (Kim et al, 2015) Endogenous GFP
SWITCH (Murray et al, 2015) Ab labeling
Kidney CLARITY (Kim et al, 2015) Endogenous GFP
Liver CLARITY (Kim et al, 2015) Endogenous GFP
SWITCH (Murray et al, 2015) Endogenous GFP
3DISCO (Mzinza et al, 2018) Endogenous GFP
Uterus 3DISCO (Yuan et al, 2018) Endogenous GFP
Intestine iDISCO (Gabanyi et al, 2016) Ab labeling
Human organ parts
Lung CUBIC (Tainaka et al, 2018;Nojima et al, 2017)
Ab labeling
Kidney CUBIC (Tainaka et al, 2018;Nojima et al, 2017)
Ab labeling
Pancreas CLARITY (Hsueh et al, 2017) Ab labeling
Spleen CUBIC (Nojima et al, 2017) Ab labeling
Intestine CUBIC (Nojima et al, 2017) Ab labeling
Lymph node CUBIC (Nojima et al, 2017) Ab labeling
Embryo
Human 3DISCO/iDISCO (Yuan et al, 2018) Ab labeling
Mouse 3DISCO (Ert€urk et al, 2012b) EndogenousmGFP, Tomato
iDISCO (Renier et al, 2014) Ab labeling
Sca/e (Hama et al, 2011) Endogenous YFP,Ab labeling
CUBIC (Cuccarese et al, 2017; Liet al, 2016)
Endogenous GFP,Ab labeling
Brain organoid iDISCO (Birey et al, 2017) Ab labeling
Bone
Long bones CUBIC (Chen et al, 2016, 5) EndogenousmCherry, Ablabeling
Table 1 (continued)
SampleTissue clearing methodused Labeling
simpleCLEAR (Gr€uneboom et al,2019)
EndogenoustdTomato, Ablabeling
3DISCO (Acar et al, 2015) Endogenous GFP,Ab labeling
Whole-body vDISCO (Cai et al, 2019) Endogenous GFP,Nanobooster
PARS (Yang et al, 2014) Ab labeling
CUBIC (Tainaka et al, 2014;Susaki et al, 2015)
Endogenous GFP,Ab labeling
uDISCO (Pan et al, 2016) Endogenous GFP
vDISCO (Pan et al, 2019) EndogenousmCherry, Ablabeling
CUBIC (Kubota et al, 2017) EndogenousmCherry, Ablabeling
Brain
Whole mousebrain
3DISCO (Ert€urk et al, 2012a;Ert€urk et al, 2012b; Lin et al,2018; Lugo-Hernandez et al,2017)
Endogenous GFP,FITC Dextran
uDISCO (Pan et al, 2016; Li et al,2018)
Endogenous GFP
CUBIC (Tatsuki et al, 2016; Susakiet al, 2014; Tainaka et al, 2018;Susaki et al, 2015)
Ab labeling
iDISCO (Renier et al, 2014) Ab labeling
iDISCO (Liebmann et al, 2016) Ab labeling
iDISCO+ (Renier et al, 2016;Nectow et al, 2017)
Ab labeling
CLARITY (Kim et al, 2015;Bedbrook et al, 2018; Devermanet al, 2016; Chung et al, 2013)
Endogenous GFP,AAVAAV, EndogenousYFP
Sca/eS (Hama et al, 2015) Endogenous YFP,Ab labeling
SWITCH (Murray et al, 2015) Ab labeling
SeeDB2 (Ke et al, 2016) Endogenous YFP
Human brainslice
SHANEL (Zhao et al, 2020) Ab labeling
SWITCH (Murray et al, 2015) Ab labeling
CUBIC (Tainaka et al, 2018;Nojima et al, 2017)
Ab labeling
CLARITY (Ando et al, 2014; Phillipset al, 2016; Morawski et al, 2018;Liu et al, 2016; Chung et al, 2013)
Ab labeling
Cockroachbrain
FocusClear (Chiang et al, 2001;Liu & Chiang, 2003)
Ab labeling, WGA
Rat brain FluoClearBabb (Stefaniuk et al,2016)
Ab labeling
Fly brain SeeDB2G (Ke et al, 2016) Ab labeling
Vasculature
ª 2021 The Authors Molecular Systems Biology 17: e9807 | 2021 7 of 21
Muge Molbay et al Molecular Systems Biology

DBE clearingThis protocol substituted the RI-matching reagent with dibenzyl
ether (DBE), a more “GFP-friendly” clearing medium, alleviating the
loss of fluorescence quality caused by BABB (Becker et al, 2012).
Clearing with DBE provides improved tissue transparency and strik-
ingly improved fluorescence intensity in GFP expressing mouse
brains and other samples such as mouse spinal cords, or embryos.
In this protocol, ethanol was replaced by tetrahydrofuran (THF)
after the realization of ethanol causing the bleaching of endogenous
fluorescence. THF was found to be more GFP friendly as a dehydra-
tion medium after screening several chemicals.
3DISCO3DISCO was the first protocol that coined the term DISCO, which was
then followed by newer iterations (Ert€urk et al, 2012a, 2012b). Primar-
ily developed for the clearing and imaging of unsectioned mouse brain
and spinal cord, the 3DISCO protocol uses THF for dehydration and
DCM for lipid extraction. Dibenzyl ether (DBE) is used as the last
reagent to match the RI of the sample to the imaging solution.
iDISCO – iDISCO+iDISCO (Renier et al, 2014) improved the sample labeling conditions
by reducing the autofluorescence and increasing the signal-to-noise
ratio. This protocol allowed antibodies to penetrate deeper into the
tissue by the addition of a pretreatment step with methanol, hydro-
gen peroxide, detergents, and dimethyl sulfoxide (DMSO). This was
then followed by antibody labeling and tissue clearing with 3DISCO.
In the later iDISCO+ (Renier et al, 2016) protocol, an additional
delipidation step with DCM was established.
FluoClearBABBFluoClearBABB is a derivative of the BABB clearing protocol (Sch-
warz et al, 2015). It differs from the other BABB-based clearing
protocols in that it is performed under basic pH and uses 1-propanol
or tert-butanol for dehydration. FluoClearBABB allows whole-brain
clearing, minimizes optical distortions, and preserves the majority
of EGFP and mRFP fluorescence.
uDISCOuDISCO was the first technique that accomplished both clearing and
imaging an entire mouse body (Pan et al, 2016). This was achieved
by isotropic shrinkage of the samples by the chemicals. Specifically,
the protocol involves immersing the samples into ascending concen-
trations of tert-butanol, instead of THF for dehydration and using
BABB with diphenyl ether (DPE) for RI matching, which enhances
the preservation of endogenous fluorescence.
ECi clearingIn the ECi protocol, serial dehydration is performed using pH-
adjusted ethanol and the RI matching is done using the non-toxic,
organic compound ethyl-3-phenylprop-2-enoate (ECi, RI > 1.5)
(Klingberg et al, 2017). The major advantage of this technique is
that it uses non-toxic reagents for this process.
vDISCOThe vDISCO protocol includes decolorization, decalcification, perme-
abilization, and nanoboosting steps in a pressure-driven pump system
(Cai et al, 2019). Typically, an active pumping system is known to
distort the specimen. However, in this protocol there is very little if
any distortion. Still, it is noteworthy that quantification of any tissue
distortion have not been reported. Following the pre-processing steps,
a modified 3DISCO protocol is applied through the entire mouse body.
Anti-XFP nanobodies conjugated to fluorescent dyes are used to
enhance the fluorescent signal two orders of magnitude and yield
single-cell resolution images from the whole organism.
PEGASOSPolyethylene glycol (PEG)-associated solvent system (PEGASOS)
renders nearly all types of tissues transparent except for pigmented
epithelium (Jing et al, 2018). According to the authors’ report, hard
tissues including bones and teeth become nearly invisible after clear-
ing. The PEG component within the clearing medium allows preserv-
ing endogenous fluorescence for a long time. In this study, the
authors applied a modified uDISCO protocol where they mixed PEG
with the reagents.
FDISCOFDISCO upgraded the technology with superior fluorescence preserv-
ing capability by adjusting the temperature and pH conditions of the
3DISCO protocol (Qi et al, 2019). In FDISCO, all steps are performed
at 4°C and the pH of all solutions is adjusted to 8.3.
sDISCOStabilized DISCO (sDISCO) provides a solution to optical clearing
and storage times for transgenic specimens which are limited due to
Table 1 (continued)
SampleTissue clearing methodused Labeling
Mouse wholebrain
3DISCO (Todorov et al, 2020) WGA, small dye
iDISCO+ (Kirst et al, 2020) Ab labeling
Tissue
Spinal cordinjury
3DISCO (Ert€urk et al, 2012a; Zhuet al, 2015)
Endogenous GFP
CLARITY (Hsueh et al, 2017;Glaser et al, 2017)
Ab labeling, WGA
Tumor–Human CUBIC (Nojima et al, 2017) Ab labeling
BABB (van Royen et al, 2016) Ab labeling
DIPCO (Tanaka et al, 2017) Ab labeling
FUnGI (Rios et al, 2019) Ab labeling
Others
Bio-artificialskeletal muscle
3DISCO, ClearT2, ScaleA2 (Decroixet al, 2015)
Endogenous GFP,Ab labeling
Cancer
Lungcarcinoma
CUBIC (Cuccarese et al, 2017) Endogenous GFP,RFP, Ab labeling
3DISCO (Garofalo et al, 2015) Ab labeling
Glioma vDISCO (Pan et al, 2019) EndogenousmCherry, Ablabeling
Whole body CUBIC (Kubota et al, 2017) EndogenousmCherry, Ablabeling
8 of 21 Molecular Systems Biology 17: e9807 | 2021 ª 2021 The Authors
Molecular Systems Biology Muge Molbay et al

the continuous formation of peroxides and aldehydes, severely
quenching the fluorescence (Hahn et al, 2019). It uses purified
DBE or BABB and anti-oxidant propyl gallate is added to stabilize
the solutions.
BALANCEBleaching-Augmented soLvent-bAsed Non-toxic ClEaring (BALANCE)
is an ECi based clearing protocol that was successfully used to image
the mouse heart (Merz et al, 2019). The major advantage here is the
relatively smaller number of chemicals that are required, ensuring low
toxicity. However, since it is a rather new technique it has not been
compared with other clearing technologies.
EyeCiEyeCi is a combination of the iDISCO and ECi protocols used for
immunolabeling and clearing, and has been used on whole eyes of
mice (Henning et al, 2019). This protocol is specifically adapted for
bleaching the melanin in the pigmented epithelium of the retina.
SHANELThe Small micelle-improved Human organ ANtibody Efficient Label-
ing (SHANEL) protocol was developed to allow the penetration of
molecules deep into sturdy aged human tissues and provides a
solution to a major bottleneck of human tissue histology (Zhao
et al, 2020). SHANEL uses a detergent called (3-((3-Cholamido-
propyl) dimethylammonium)-1-propanesulfonate) (CHAPS) for
tissue permeabilization. It allows penetration of labeling and clear-
ing agents into centimeters-thick mammalian organ samples.
Human samples two to three orders of magnitude larger than mouse
tissues were successfully labeled and cleared by SHANEL.
Choosing the best strategy among all the available clearing proto-
cols may require not only expertise but also testing multiple proto-
cols to achieve optimal results. In Fig 5, we offer a simplified chart
to help choosing the most suitable method along with the right
protocol and the appropriate setup. Understanding the details of
each step is quite fundamental to successfully apply these tech-
niques and to adapt them as necessary. To this end, the next section
focuses on the specifics of the individual steps of solvent-based
tissue clearing.
A step-by-step guide through high-throughputDISCO clearing
Regardless of the chosen protocol, solvent-based clearing includes
the following steps: perfusion and fixation, decolorization,
Figure 4. Hand sample cleared by Spalteholz himself in 1911.
Spalteholz injected Indian ink to the hand’s arteries via the A. nutriciae. Decalcification allowed observing the arterial branching in the bone. The magnified imagedepicts the inner arterial supply of the metacarpal bones. Originally, this specimen was shown in the 1st exhibition in 1911, “Welthygieneausstellung”, which attractedmore than a million people. Most of Spalteholz’s other original specimens were lost during the fire in the Leipzig anatomy department during the 2nd World War.Image: courtesy of Prof. Dr. Hanno Steinke from Anatomy Department of Leipzig University, Germany.
ª 2021 The Authors Molecular Systems Biology 17: e9807 | 2021 9 of 21
Muge Molbay et al Molecular Systems Biology

decalcification, permeabilization, staining, dehydration, delipida-
tion, and RI matching. After the tissue has been cleared, image
acquisition and analysis take place, and this differs based on the
samples, protocols, and the specific biological questions asked.
Here, we provide a detailed step-by-step guide to help scientists
achieve optimal results and key recommendations about each step.
Perfusion and fixationTissue fixation is a critical step when preparing tissues for clear-
ing. It terminates any ongoing biochemical reaction and may
also increase the treated tissues’ mechanical strength or stability
(Gage et al, 2012). The fixation process and type of fixative
depends on the experimental design and can be done either
actively or passively.
The active version is used for large tissues such as a whole
mouse body or human organs. It involves a pump-driven way of fix-
ation in which the vasculature of the tissue is used to distribute the
fixative to the deeper tissues. The first step is washing out the blood
and the most commonly used solution to achieve this is phosphate
buffered saline with 1% Heparin (PBS-H). Heparin in PBS-H reduces
the formation of blood clots and occlusions in vessels, allowing
better circulation of liquids (O’Brien, 1960). Since blood clots can
form within a couple of seconds, perfusion with PBS-H should be
started right after the animal is deeply anesthetized and restrained
Human sample
Whole organ/tissue piece
antibody labeling
Non-human sample(mice, rat, pig)
Endogenousfluorescent
signal
Boostable(GFP; RFP)
Antibodylabeling
High-expressiongenes
Small dye(lectin, dextran,
PI, etc.)
SHANELiDISCO3DISCO
Small dye(lectin, dextran,
PI, etc.)
SHANELiDISCO
iDISCO+
uDISCOfDISCOsDISCO
Anti-GFPimmuno-labeling
vDISCO
YES NO
YES NO
YES NO
YES NO
and/or and/or
Figure 5. Decision tree for choosing the optimal tissue clearing protocol.
Several parameters should be weighed to achieve optimal results when choosing the clearing protocol. This flowchart demonstrates an easy way to decide whichclearing method would suit a potential research question.
10 of 21 Molecular Systems Biology 17: e9807 | 2021 ª 2021 The Authors
Molecular Systems Biology Muge Molbay et al

in proper position in order to remove as much blood as possible.
However, it should be noted that vascular labeling requires alter-
ations in this step. In case, the experiment involves vascular label-
ing, e.g., by injecting Evans Blue, Wheat Germ Agglutinin, or
antibody labeling, using heparin is not recommended as it is likely
to wash out the labeling (Todorov et al, 2020). There are some tips
for evaluating the quality of pump-driven perfusion. For instance,
liver color is a good measure of the quality of perfusion; after
adequate perfusion with PBS-H, the liver color should turn from
dark red to pale light brown/yellow.
The second step involves fixing the tissue with a fixative, most
commonly paraformaldehyde (PFA) or formalin, using perfusion. In
perfusion of rodents, due to the protein cross-linking that takes
place during this fixation muscles can be fired and contractions can
be observed in different parts of the body, especially in the tail.
These are indicators of adequate perfusion of the fixative through-
out the body (Thavarajah et al, 2012). On the other hand, strong
predictors of an unsuccessful perfusion are extremely inflated lungs
and fixative escaping through the nose of the specimen, in which
case the perfusion needle is likely in the right ventricle putting pres-
sure on the pulmonary circuit. Repositioning the needle back to the
left ventricle may remedy this. If organ-level clearing is desired,
passive fixation is an option but it is possible that the areas deeper
in the tissue may potentially remain less transparent in contrast to
active perfusion. In any case, over-fixation must be avoided, as PFA
cross-linking of tissues can obscure antibody binding sites leading
to incomplete immunolabeling. We also have observed that over-fix-
ation causes insufficient transparency and leads to a yellowish color
of the tissue after clearing, lowering the overall signal quality in the
samples during imaging.
Recommendations1 It is important to prevent the decline of the cardiovascular
circulation due to excessive anesthesia, prolonged/repeated
trials of inserting, and securing of the perfusion needle, etc.
The heart has to contract with at least 1 Hz at the time of start-
ing the perfusion of fixative. We recommend that the same
person performs all steps described above until satisfactory
tissue-clearing results are achieved, in order to maximize
consistency when handling the samples.
2 The mode of fixation and type of fixative depend on the aim of
the experiment. Whole-body clearing requires perfusion of the
fixative for deeper fixation.
3 Heparin in the perfusion solution facilitates the circulation by
preventing the cloth formation but it is not a must. Heparin
concentration should be adjusted according to the purpose.
For example, for vascular labeling heparin in perfusion solu-
tion is not recommended to avoid wash out the labeling.
4 The speed of perfusion should closely match the upper limit of
the physiological pressure and volume of the heart in order to
obtain best results, i.e., the most complete perfusion without
bursting capillaries.
5 Over-fixation should be avoided as it can jeopardize the
immunolabeling quality and decrease the level of transparency
causing the sample to have a yellowish color.
6 After harvesting the organ(s)/specimen, we suggest keeping
the sample at 4°C for optional post-fixation or until the stain-
ing/clearing begins.
ClearingDecolorization
In optical tissue clearing, light absorption by specific biological
substances is a major obstacle. These light absorbing pigments accu-
mulate in tissues and create autofluorescence emission, conse-
quently reducing the tissue signal quality (Tuchin, 2015). For better
clearing and deeper imaging, pigments should be eliminated as effi-
ciently as possible. The most prevalent pigments are hemoglobin,
melanin, and lipofuscin (Hegyi et al, 2011). So far, the decoloriza-
tion in clearing has mostly focused on the removal of heme groups
from hemoglobin. Although perfusion of the animal to wash out the
blood is one way to decrease the autofluorescence, it is usually not
enough. Remaining heme groups can still hinder imaging especially
in organs with high blood content, such as the spleen, bone
marrow, and liver. A common approach is either to bleach the heme
group or dissociate and wash it out, using peroxides, acid acetones,
or strong bases, respectively (Richardson & Lichtman, 2015). The
most frequently used reagents for decolorization are SDS or amino
alcohols. Quadrol (N,N,N0,N0-Tetrakis(2-hydroxypropyl)ethylenedi-amine) combined with ammonium solutions is another approach
for decolorization (Susaki et al, 2014). The second light absorbing
pigment is melanin, most abundantly present in the skin and the
eyes. The removal of the skin and the eyes, in case they are not
fundamental to the hypothesis being tested, or using albino trans-
genic animals will reduce the autofluorescence coming from these
sources. Lastly, lipofuscin is an age-dependent accumulated pigment
in the adult brain. One way to avoid lipofuscin is using young
animals, but it nevertheless remains an unresolved problem when
handling human samples and aged animals (Moreno-Garc�ıa et al,
2018).
Recommendations1 Organic pigments accumulated in organs cause autofluores-
cence and reduced tissue clearing efficiency. To avoid this, a
decolorization step is recommended.
2 Bleaching or dissociation with chemicals is an option for
removing heme. However, these procedures are often disrup-
tive to the tissue and can cause damage and bleaching of fluo-
rescent proteins. Amino alcohols are known not to cause
damage or alter tissue signal (Susaki et al, 2014).
3 To minimize the unfavorable effects of pigments, melanin-rich
organs (skin and eyes) can be removed and/or young animals
can be used to avoid lipofuscin.
4 Lipofuscin and melanin remain an open challenge in the decol-
orization process, and further research is necessary to find
optimal ways to overcome them.
Decalcification
Bone tissue has a unique composition; soft tissue which forms the
bone marrow and the highly calcified hard tissue. When imaging the
organs enclosed in bone structures, reducing the scattering of light
through the bone matrix is particularly important (Genina et al, 2008).
A decalcification step is recommended to make bones and bone
encapsulated organs (i.e., the brain inside the skull and the lungs
inside the ribs) more permeable to clearing chemicals (Verdenius &
Alma, 1958). Traditionally, formic acid, nitric acid, trichloroacetic
acid, hydrochloric acid (HCl), or chelating reagents such as ethylene-
diaminetetraacetic acid (EDTA) are used for the decalcification of the
ª 2021 The Authors Molecular Systems Biology 17: e9807 | 2021 11 of 21
Muge Molbay et al Molecular Systems Biology

bone matrix (Tainaka et al, 2014; Cai et al, 2019; Pan et al, 2019).
EDTA can be used for whole-body decalcification upon perfusing in
fixed whole-body samples (e.g., in PEGASOS and vDISCO methods).
It should be noted that the EDTA concentration influences the shrink-
age strength, with higher EDTA concentrations resulting in stronger
shrinkage. Therefore, it must be adjusted depending on the nature of
the sample and the question of interest. Moreover, the shrinkage and
distortion of the tissue may differ depending on whether the organ
was dissected or the body was intact.
Recommendations1 Bone clearing can be performed either by using high RI solu-
tions (RI = 1.555–1.564) or by subjecting the sample to decal-
cification with chemicals.
2 EDTA is the most commonly used agent to remove Ca2+, and it
can be used via active perfusion or passive incubation.
3 EDTA concentration is directly proportional to the amount of
shrinkage; the higher the EDTA concentration, the more
shrinkage takes place. Thus, depending on the nature of the
sample, the concentration should be adjusted.
Permeabilization and staining
Permeabilization facilitates the penetration of both clearing chemi-
cals and labeling agents (e.g., dyes and antibodies) and it is there-
fore fundamental especially for whole-body clearing and labeling.
Tissue permeabilization eliminates several barriers including lipids
and extracellular matrix (ECM). In traditional histology, heat or mild
detergents such as Triton X-100, Saponin, or SDS are commonly
used to dissolve the lipid bilayer and give successful results for
small samples or 1–2 mm sections (Jamur & Oliver, 2010). In
iDISCO and derivatives, methanol and methanol/DCM mixtures are
used for permeabilization through delipidation (Renier et al, 2014).
SHANEL on the other hand involves a relatively complex protocol
where a methanol/DCM mix is used to delipidate the tissue, acetic
acid to hydrolyze the ECM, guanidine + HCl to extract ECM proteo-
glycans and CHAPS+ N-Methyl diethanolamine to further permeabi-
lize the sample, aiming at achieving efficient staining of
centimeters-thick human brain tissue (Zhao et al, 2020).
Immunohistochemistry (IHC) of whole mouse bodies requires a
stronger approach or even the combination of all strategies. The
whole-body labeling and clearing technology vDISCO combine
many of the permeabilization and labeling approaches by using a
combination of amino alcohol, Triton X-100, N-acetyl-L-hydroxypro-
line, and methyl-b-cyclodextrin (a cholesterol extractor) to permea-
bilize the specimen. The technique also makes use of a high-pressure
perfusion system to actively push the reagents in all the tissues for
an extensive labeling. In addition to combining these reagents, it
uses nanobodies for labeling, as they present several advantages.
Firstly, nanobody size is one-tenth of that of an antibody, which
allows better penetration in the tissues and consequently better
labeling. Secondly, multiple nanobodies can bind to one epitope
enabling a higher signal intensity. Finally, nanobodies can be
used at near infrared spectra leading to a higher signal-to-noise
ratio. This is due to the fact that most components that show
autofluorescence are generally in shorter wavelengths, and there-
fore, the near infra-red wavelengths used with nanobodies allow
avoiding overlap with autofluorescence (Cai et al, 2019). Never-
theless, the application of nanobodies in IHC is still limited since
nanobodies are mostly available only for genetically expressed
fluorescent proteins.
Labeling thick tissues requires dyes with a small molecule size,
so that they are able to penetrate deep into the specimen. The small
molecule dye propidium iodide (PI) can stain deep in both passive
and active labeling and provides stable and strong nuclear labeling
in all cell types. It is red-fluorescent and can therefore be used in
multichannel imaging, e.g., together with nanobodies conjugated
with far-red fluorophores. The UV spectrum of 40,6-Diamidino-2-
Phenylindole (DAPI) or Hoechst has very limited light penetration
that strongly decays in deeper parts of mammalian tissues. For that
reason, they are rarely used for whole-organ staining, although they
are well suited for counterstaining tissue slices.
Recommendations1 Permeabilization of large tissues is essential for IHC, since anti-
bodies and high molecular weight dyes can only stain within a
few hundred micrometers.
2 Deeper labeling can be achieved either by nanobody labeling
or increased antibody incubation time.
3 Small micelle-forming detergents (e.g., CHAPS) enable better
permeabilization and therefore deeper labeling.
4 Before starting the labeling of big tissues (e.g., whole organs),
testing the antibodies and nanoboosters using small tissue
samples to prototype (i.e., to test their efficiency and optimal
concentration) is highly recommended.
5 Using fluorescent probes with a longer wavelength can effec-
tively defer scattering and allow deeper penetration. Therefore,
near-infrared probes are strongly recommended.
6 As an optional step, users may consider making an incision
with a sharp object on a less important site on the tissue to
enhance the penetration of the soluble agents. This will
improve and speed up the process.
Tissue clearing
After staining, the samples are ready to be cleared by several rounds
of chemical treatment. The different step in this process essentially
removes water and lipids from the tissue and homogenizes the RIs.
Several approaches can be used for the dehydration step, each with
its own advantages and disadvantages. Commonly used dehydrating
agents are alcohols including ethanol in FluoClearBABB (Schwarz
et al, 2015), methanol in iDISCO+ (Renier et al, 2016), and tert-
butanol in uDISCO (Pan et al, 2016). However, alcohols often result
in poor endogenous signal preservation. THF is an alternative for
dehydration and it has the same clearing performance as alcohols,
but works better at preserving the endogenous signal. THF is
commonly used in protocols such as 3DISCO (Ert€urk et al, 2012a),
vDISCO (Cai et al, 2019), FDISCO (Qi et al, 2019), and sDISCO
(Hahn et al, 2019). In some of the protocols, an additional step with
DCM treatment is performed for further delipidation and an
enhanced clearing performance (Seo et al, 2016). Lastly for the RI-
matching step, although BABB is the most common solution used in
many protocols, it can be replaced by a range of chemicals. For
example, ECi (Henning et al, 2019) uses Ethyl cinnamate due to its
lower toxicity. Alternatively, BABB can be replaced by DBE or a
mixture of BABB with other reagents like in the uDISCO protocol
(Pan et al, 2016) for better fluorescence signal preservation. When
choosing the RI-matching solution, it is important to consider its
12 of 21 Molecular Systems Biology 17: e9807 | 2021 ª 2021 The Authors
Molecular Systems Biology Muge Molbay et al

compatibility with the labeling probes, as well as the toxicity
and corrosiveness of its chemical components. These are usually
harsh chemicals that can melt the equipment being used and leave
irreversible damage and they should therefore be handled with
great care.
Recommendations1 The duration of each incubation is highly flexible and depends
on the size of the sample and its lipid content. The incubation
steps can be prolonged to ensure complete delipidation.
However, shortening is not advised.
2 Since the organic solvents used can melt plastic, it is very
important to test whether the plastic containers that are to be
used are sufficiently resistant. In our experience, polypropy-
lene-based materials and all glassware withstand BABB well.
3 Due to the toxic and corrosive nature of the many chemicals
used in the clearing steps, minding the safety precautions
during the use is strongly advised.
Imaging cleared samples
Several theoretical and practical considerations need to be made
when imaging fixed, transparent tissue samples and taking advan-
tage of the increased optical accessibility. Mainly three imaging
approaches are used, partly depending on sample size: wide-field
fluorescence microscopy, point scanning fluorescence microscopy
(PSFM), and light sheet fluorescent microscopy (LSFM). Wide-field,
epi-illuminated fluorescence microscopes can be used for quality
checking and imaging purposes if the components meet the excita-
tion and emission criteria of the probes. Wide-field microscopes
allow cost-effective and rapid imaging of cleared samples using a
camera to capture the entire field of view (FOV), using long working
distance objectives in a single run. However, these systems usually
have basic-sensitivity cameras and weak excitation efficiency and
tend to bleach the fluorescent probes fast due to the wide-field exci-
tation. This deteriorates the overall image quality of millimeters-
thick samples by capturing excessive out-of-focus information. In
our experience, these systems are very useful for basic documenta-
tion of staining efficacy and imaging supracellular moieties.
PSFM such as conventional confocal or two-photon microscopy
can yield high-resolution, optically sectioned images given an
adequate selection of objectives for cleared samples. However, for
cleared samples in mesoscopic scales, PSFM shows two limitations
which greatly reduce its feasibility and throughput. The first one is
that PSFM scans the excitation focus point by point across the whole
field of view (FOV). When the FOV requires more than 10 million
pixels, the scanning-based mechanism makes the acquisition time
for a single frame longer than 1s in a conventional confocal micro-
scope, simply extending the process. The second limitation is that
mesoscopic imaging requires low-magnification objectives to
achieve adequate throughput. Comparing to high magnification
objectives, low-magnification objectives have longer working
distances as well as larger FOV. In principle, long working distance
is indispensable for imaging in thick tissues, and a large FOV can
effectively increase the throughput. However, low-magnification
objectives mostly have small numerical aperture (N.A.) due to the
architecture of modern light microscopy. A smaller N.A. decreases
the lateral resolution of the image linearly but the axial resolution
quadratically, which renders an anisotropic resolution as well as an
extended point spread function in the axial direction. In brief, PSFM
is an ideal modality for high-resolution imaging but only for a small
FOV and thinner samples.
Considering the constraints above for imaging a sample in a
mesoscopic scale, LSFM emerges as an ideal solution for volumetric
imaging of large cleared samples. A typical LSFM has at least two
objectives with their optical axes perpendicular to each other. The
detection objective is used for forming images on the 2D image
sensor, which is usually a scientific complementary metal-oxide-
semiconductor (CMOS) camera with high sensitivity and adequate
cooling. The excitation objective (illumination objective/lens) is
used to create a light sheet from a laser beam, where the plane of
the light sheet locates on a conjugate plane of the camera sensor.
The unique architecture of the LSFM dramatically improves the
anisotropic resolution when using low-magnification, low-N.A.
objectives (Olarte et al, 2018). The axial resolution in LSFM is deter-
mined by the thickness of the light sheet, which is governed by the
optical properties of the excitation path and is not related to the
N.A. of the imaging objective. Furthermore, the implementation of
the camera as an imaging sensor also greatly enhances the imaging
speed of LSFM compared with PSFM. The enhanced imaging speed
is substantial for mesoscopic imaging. Theoretically, PSFM has
unlimited pixel count whereas the imaging sensor in a camera has a
fixed number and size of pixels and thus a fixed physical frame size.
The frame size determines the size of the FOV and the number of
pixels determines the sampling resolution it can achieve. Therefore,
when imaging a sample with a size larger than the FOV, a motorized
stage is indispensable in order to relocate the sample and manage to
obtain image tiles for the whole sample.
Modern LSFMs for imaging clearing tissues possess two opposing
excitation optics. The architecture of the two-sided illumination
aims at compensating the scattering of the light sheet while travel-
ing in a thicker sample from one side. Among the commercially
available LSFM, LaVision Ultramicroscope Blaze III (Pan et al, 2016;
Belle et al, 2017; Klingberg et al, 2017) offers a larger space as well
as a motorized stage with a sufficiently long traveling distance for
imaging large samples as whole mice or human organs. An alterna-
tive is MesoSPIM, an open-source project for mesoscale LSFM that
is also targeted toward imaging large samples such as a whole
mouse (Voigt et al, 2019). MesoSPIM uses a digital-scanning axially
swept light sheet to achieve a homogeneous thickness of illumina-
tion virtually across the whole FOV and prevents artifacts from
optical obstacles in the sample (Keller & Stelzer, 2010; Dean
et al, 2015). Therefore, MesoSPIM promises a more homogeneous
axial resolution as well as fewer artifacts compared with LSFM
which uses cylindrical lenses to create light sheets such as the LaVi-
sion Ultramicroscope series. However, the horizontal layout of
MesoSPIM makes the use of immersion objectives very complicated
and is therefore currently not optimal for acquiring images with
sub-micron resolution.
Irrespective of the chosen imaging approach, an adequate selec-
tion of objectives is essential to increase the imaging quality. The
selection of objectives should be considered in two aspects, the first
one being an appropriate magnification which matches its NA to the
pixel size to fulfill the Nyquist sampling criterion. Specifically, the
optical resolution is determined by the NA of the objective (Keller,
2006) and when two objects are within distances smaller than
0.61 × k/NA (i.e., Rayleigh criterion), they cannot be identified as
ª 2021 The Authors Molecular Systems Biology 17: e9807 | 2021 13 of 21
Muge Molbay et al Molecular Systems Biology

two separate objects by the objectives. In order to explicitly sample
the optical resolution, the magnified pixel size should also be appro-
priately evaluated. The Nyquist criterion gives an ideal evaluation
for an effective sampling, which states that the sampling frequency
should be at least two times higher than the frequency of the
sampled signal. To fulfill the Nyquist criterion in microscopic imag-
ing, the magnified pixel size should be two times smaller than the
distance from the Rayleigh criterion. In this case, the acquired
images can completely reveal the resolving powers of the micro-
scope. The magnified pixel size is the division of the physical pixel
size to the magnification, of which the physical pixel size can be
found on the specification sheet from the camera supplier. The
second aspect to consider is that special designs can correct the
aberration from embedded media. Cleared samples are usually
immersed in their RI-matching medium for microscopic imaging
which will cause considerable spherical aberration if the objectives
are not chosen correctly. Using an objective which corrects for aber-
rations caused by the RI-matching medium is recommended. Clearing
methods based on organic solvents typically use a high-RI solution
such as BABB or DBE and need a special objective design that can
correct for aberrations in such a high NA liquid. Despite the overall
limited number of tissue-clearing-specialized objectives, the repertoire
of such options has been growing in the recent years. In addition to
correcting the aberration, an immersion objective or even a dipping
objective with a dipping cap can prevent recording perturbations that
take place at the liquid surface of the medium in the chamber. Image
acquisition in large-scale imaging usually takes from several hours up
to several days and environmental disturbances such as air flow or
people’s movements in the room usually cannot be avoided at such a
time scale. In fact, imaging a sample in an organic-solvent-based RI-
matching medium needs to be performed in a room with sufficient
ventilation, which will cause a strong air turbulence and sometimes
might vibrate the liquid surface of the medium. The effect of these
will be detected by the camera. Immersion objectives eliminate the
gap between the medium and the objectives, thereby circumventing
the possibility of such perturbations.
Recommendations1 Choose adequate microscopy modalities according to the
desired spatiotemporal resolution and FOV. For daily quality
checking and documentation, we suggest using epifluorescence
microscopes. These can also be used when trying to decide
whether it is preferable to continue with a high-resolution
PSFM or LSFM scans. High magnification and high NA imaging
in a small FOV are better suited for PSFM than LSFM. For large
FOV and volumetric imaging with moderate magnification and
NA, LSFM is the best choice.
2 The imaging medium must be optically matched (RI for given
wavelength bands) and chemically compatible with the imag-
ing objectives to ensure the best possible image quality.
3 Sample size is a major determinant when deciding for imaging
modality. Imaging whole organs usually requires LSFM, but
PSFM or epifluorescent systems may work with limited qual-
ity. Before imaging a large sample such as a whole mouse
body, the size of the chamber and the moving distance of the
motorized stages needs to be carefully checked. The size of the
imaging chamber should be ideally at least 2 times larger than
that of the sample (in all dimensions).
Data handling and analysis
The last and perhaps the most important steps are to visualize,
analyze, and interpret the data. These steps are under intense inves-
tigation and undergo constant improvement. The computational
demand continuously increases due to the increasing complexity of
imaging data analyses. Usually, the scans comprise a huge amount
of high-bit-depth (traditionally 8, 12, or 16 bit) images that may
easily take up terabytes of disk space for one specimen, making stor-
age very demanding for conventional data storage strategies.
Compressing the data allows substantial time saving when transfer-
ring the data between distant storage and computational units.
Many lossless image compression algorithms exist for storing scien-
tific imagery. However, compressed images can only be read with
the matching format decoder. Researchers often face the need to
transfer their data into different software for subsequent processing
or visualization, but surprisingly only a handful of compressed
image formats are universally available to different software. One
could convert between the different image formats, but this is time
and resource inefficient as well as prone to conversion errors.
Hence, such conversion procedures should ideally be kept at a mini-
mum. We based our data storage on the Lempel-Ziv-Welch (LZW)
lossless compression, which to our experience is the most compati-
ble across the various image analyzing and rendering software.
Fortunately, a growing number of advanced scientific-grade data
storage options (to store metadata besides plain imagery) became
available such as the Hierarchical Data Formats (e.g., HDF5), the
KLB format (Amat et al, 2015), the B3D format (preprint: Bal�azs
et al, 2017) which will hopefully eventually be implemented in all
widely used research software.
The need for compression is due to the reasons mentioned
above, one being the large amounts of data generated. The genera-
tion of large amounts of data partially stems from imaging large
samples that exceed a single FOV of the microscope. This can be
resolved by scanning multiple FOVs, also referred as tiled or mosaic
scans. These tiles most often need to be precisely aligned and fused
to reconstruct the whole scan for subsequent quality control and
processing. We highly encourage users to acquire spatially overlap-
ping tiles (practically ca. 8-20% at least) to prevent unrecoverable
signal loss at the stitching borders (also known as seams) and to
target a homogenously illuminated dataset at the end. Tiles are
either produced by the motorized stage of the microscopes or by
manual repositioning of the sample after each acquisition. Thus,
there are different stitching procedures based on the acquisition
strategy and the desired precision of alignment. Generally, we
distinguish manual, semi- and fully automated image stitching
methods. One option is the epifluorescent AxioZoom (Zeiss), which
can be used even without a motorized sample stage and captures
2D tiles that can be manually aligned and fused along the XY-plane
with Photoshop via the “Photomerge” function (Herrmann et al,
2018). However, this requires that the user sits in front of the
computer during the entire procedure. Although this setup allows
scanning 3D stacks, the objective only provides a very low depth of
view focus and is therefore rarely used for volumetric scans of
cleared tissue. Another option for improving the contrast or image
quality by deconvolution, when using confocal microscopy, is the
Zen Black (Zeiss) software that can automatically align the tiles into
a fused stack using the “online stitching” function. Multiple stacks
can be further stitched using several methods. For example, Fiji
14 of 21 Molecular Systems Biology 17: e9807 | 2021 ª 2021 The Authors
Molecular Systems Biology Muge Molbay et al
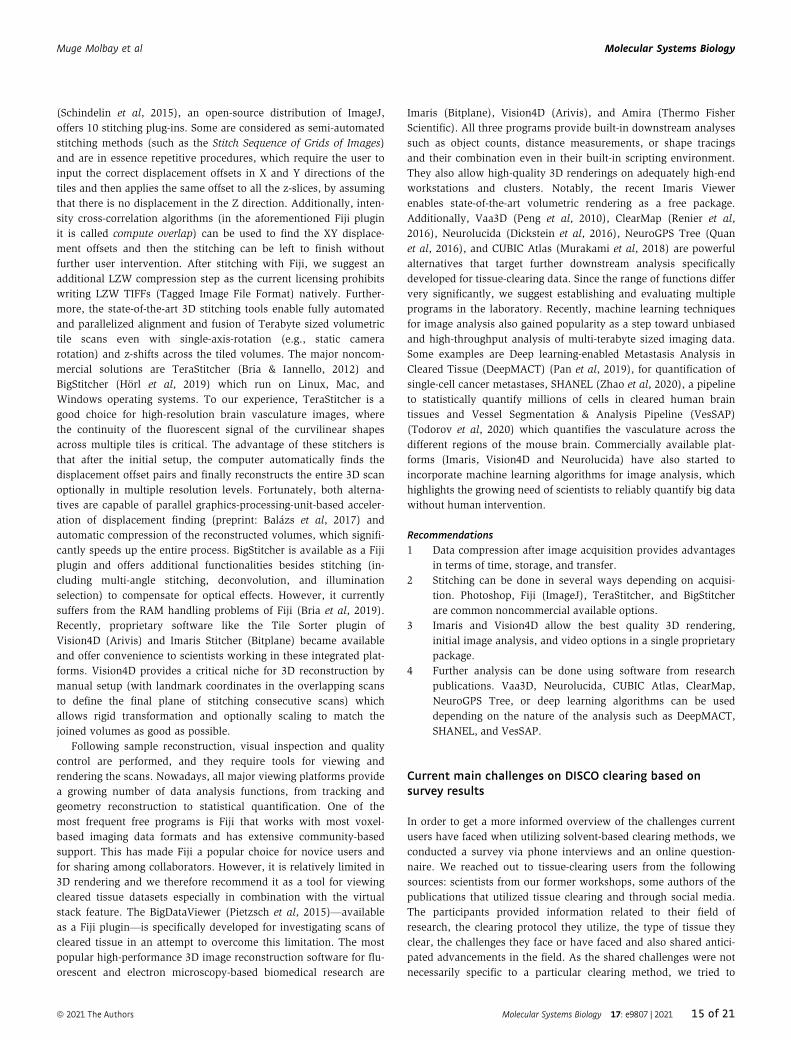
(Schindelin et al, 2015), an open-source distribution of ImageJ,
offers 10 stitching plug-ins. Some are considered as semi-automated
stitching methods (such as the Stitch Sequence of Grids of Images)
and are in essence repetitive procedures, which require the user to
input the correct displacement offsets in X and Y directions of the
tiles and then applies the same offset to all the z-slices, by assuming
that there is no displacement in the Z direction. Additionally, inten-
sity cross-correlation algorithms (in the aforementioned Fiji plugin
it is called compute overlap) can be used to find the XY displace-
ment offsets and then the stitching can be left to finish without
further user intervention. After stitching with Fiji, we suggest an
additional LZW compression step as the current licensing prohibits
writing LZW TIFFs (Tagged Image File Format) natively. Further-
more, the state-of-the-art 3D stitching tools enable fully automated
and parallelized alignment and fusion of Terabyte sized volumetric
tile scans even with single-axis-rotation (e.g., static camera
rotation) and z-shifts across the tiled volumes. The major noncom-
mercial solutions are TeraStitcher (Bria & Iannello, 2012) and
BigStitcher (Horl et al, 2019) which run on Linux, Mac, and
Windows operating systems. To our experience, TeraStitcher is a
good choice for high-resolution brain vasculature images, where
the continuity of the fluorescent signal of the curvilinear shapes
across multiple tiles is critical. The advantage of these stitchers is
that after the initial setup, the computer automatically finds the
displacement offset pairs and finally reconstructs the entire 3D scan
optionally in multiple resolution levels. Fortunately, both alterna-
tives are capable of parallel graphics-processing-unit-based acceler-
ation of displacement finding (preprint: Bal�azs et al, 2017) and
automatic compression of the reconstructed volumes, which signifi-
cantly speeds up the entire process. BigStitcher is available as a Fiji
plugin and offers additional functionalities besides stitching (in-
cluding multi-angle stitching, deconvolution, and illumination
selection) to compensate for optical effects. However, it currently
suffers from the RAM handling problems of Fiji (Bria et al, 2019).
Recently, proprietary software like the Tile Sorter plugin of
Vision4D (Arivis) and Imaris Stitcher (Bitplane) became available
and offer convenience to scientists working in these integrated plat-
forms. Vision4D provides a critical niche for 3D reconstruction by
manual setup (with landmark coordinates in the overlapping scans
to define the final plane of stitching consecutive scans) which
allows rigid transformation and optionally scaling to match the
joined volumes as good as possible.
Following sample reconstruction, visual inspection and quality
control are performed, and they require tools for viewing and
rendering the scans. Nowadays, all major viewing platforms provide
a growing number of data analysis functions, from tracking and
geometry reconstruction to statistical quantification. One of the
most frequent free programs is Fiji that works with most voxel-
based imaging data formats and has extensive community-based
support. This has made Fiji a popular choice for novice users and
for sharing among collaborators. However, it is relatively limited in
3D rendering and we therefore recommend it as a tool for viewing
cleared tissue datasets especially in combination with the virtual
stack feature. The BigDataViewer (Pietzsch et al, 2015)—available
as a Fiji plugin—is specifically developed for investigating scans of
cleared tissue in an attempt to overcome this limitation. The most
popular high-performance 3D image reconstruction software for flu-
orescent and electron microscopy-based biomedical research are
Imaris (Bitplane), Vision4D (Arivis), and Amira (Thermo Fisher
Scientific). All three programs provide built-in downstream analyses
such as object counts, distance measurements, or shape tracings
and their combination even in their built-in scripting environment.
They also allow high-quality 3D renderings on adequately high-end
workstations and clusters. Notably, the recent Imaris Viewer
enables state-of-the-art volumetric rendering as a free package.
Additionally, Vaa3D (Peng et al, 2010), ClearMap (Renier et al,
2016), Neurolucida (Dickstein et al, 2016), NeuroGPS Tree (Quan
et al, 2016), and CUBIC Atlas (Murakami et al, 2018) are powerful
alternatives that target further downstream analysis specifically
developed for tissue-clearing data. Since the range of functions differ
very significantly, we suggest establishing and evaluating multiple
programs in the laboratory. Recently, machine learning techniques
for image analysis also gained popularity as a step toward unbiased
and high-throughput analysis of multi-terabyte sized imaging data.
Some examples are Deep learning-enabled Metastasis Analysis in
Cleared Tissue (DeepMACT) (Pan et al, 2019), for quantification of
single-cell cancer metastases, SHANEL (Zhao et al, 2020), a pipeline
to statistically quantify millions of cells in cleared human brain
tissues and Vessel Segmentation & Analysis Pipeline (VesSAP)
(Todorov et al, 2020) which quantifies the vasculature across the
different regions of the mouse brain. Commercially available plat-
forms (Imaris, Vision4D and Neurolucida) have also started to
incorporate machine learning algorithms for image analysis, which
highlights the growing need of scientists to reliably quantify big data
without human intervention.
Recommendations1 Data compression after image acquisition provides advantages
in terms of time, storage, and transfer.
2 Stitching can be done in several ways depending on acquisi-
tion. Photoshop, Fiji (ImageJ), TeraStitcher, and BigStitcher
are common noncommercial available options.
3 Imaris and Vision4D allow the best quality 3D rendering,
initial image analysis, and video options in a single proprietary
package.
4 Further analysis can be done using software from research
publications. Vaa3D, Neurolucida, CUBIC Atlas, ClearMap,
NeuroGPS Tree, or deep learning algorithms can be used
depending on the nature of the analysis such as DeepMACT,
SHANEL, and VesSAP.
Current main challenges on DISCO clearing based onsurvey results
In order to get a more informed overview of the challenges current
users have faced when utilizing solvent-based clearing methods, we
conducted a survey via phone interviews and an online question-
naire. We reached out to tissue-clearing users from the following
sources: scientists from our former workshops, some authors of the
publications that utilized tissue clearing and through social media.
The participants provided information related to their field of
research, the clearing protocol they utilize, the type of tissue they
clear, the challenges they face or have faced and also shared antici-
pated advancements in the field. As the shared challenges were not
necessarily specific to a particular clearing method, we tried to
ª 2021 The Authors Molecular Systems Biology 17: e9807 | 2021 15 of 21
Muge Molbay et al Molecular Systems Biology

address them in a general manner in order to aid novice users of
tissue clearing and to help users troubleshooting.
The majority of the users mentioned the problem of “losing
endogenous GFP signal”. We know that techniques using ethanol
for dehydration, such as 3DISCO, can cause quick quenching of the
signal, limiting the applicability of the technique. To overcome this
bottleneck and prolong the preservation time of the signal, we can
recommend uDISCO due to the 4:1 DPE content of the final RI-
matching solution and the addition of vitamin E which prevents
reduction reactions in the solutions. Additionally, we often use
vDISCO, as nanobodies boost the fluorescence signal ~ 100 fold and
also retain the signal for over a year. A wide range of nanobodies
are available now, and in case they are available for the user’s
applications of interest we would highly recommend using them.
Additionally, it is now known that the pH of the solutions used is
very important for retention of the GFP signal. fDISCO utilizes high
pH which also helps with preserving the signal longer. The choice
of chemicals might also affect signal preservation. For example,
the lack of oxidation inhibitors in the reagents from some brands
leads fluorescence loss. To avoid this, using products that include
oxidation inhibitors is preferable. Alternatively, inhibitors or vita-
min E can be manually added to the reagents immediately after
opening the bottles and before starting the clearing procedure.
Finally, one could also test water-based clearing solutions such as
PACT and CUBIC.
Another issue brought up in the survey was the “presence of
autofluorescence and background”. We are aware that it is challeng-
ing to reliably image and quantify signals from endogenously
expressed fluorescent proteins in large cleared organs and whole
mouse bodies due to the low signal contrast. The skeletal muscle
and other bodily tissues have obstructive autofluorescence in the
visible spectrum and therefore interfere with fluorescent proteins
such as EGFP, EYFP, and mCherry which are commonly used in
transgenic animals and emit light in this range. In addition, fluores-
cent proteins are often less bright compared with most synthetic flu-
orophores and their signal intensity is further attenuated during the
clearing and imaging procedures. For these reasons, we prefer using
vDISCO, which involves an immunolabeling technology based on
multiple fluorophore labelled nanobodies to enhance the signal of
fluorescent proteins by up to two orders of magnitude. Nanoboost-
ers can also be used to replace the emission of the of the endoge-
nous signal from visible light to far red (640–700 nm) or far-far red
(700–800 nm) spectra which are more distinguishable from the
autofluorescence emission (between 270 and 490 nm, broadly
around 580 nm for residual blood and 690 nm for age-related
neuropigments). If vDISCO is not a suitable option, we would
suggest performing a CuSO4 treatment to reduce the autofluores-
cence. The concentration is a critical determinant in this step as too
high CuSO4 concentrations can cause the sample to become blue
leading to more autofluorescence. Additionally, the pretreatment
steps can be switched for optimizing the quality as was shown in
the PEGASOS procedure by Jing et al (2018). Another option for
increasing the signal-to-background ratio during imaging is narrow-
ing the bandwidth of the emission filter and centering its spectrum
at the peak of the emission. This improves the ratio because the
broad-band filter simply collects more background fluorescence.
The third challenge that was reported was the “complexity of the
procedure and immunolabeling”. The advantages of solvent-based
clearing techniques are their ease of applicability as they require
subsequent solvent immersion over a period of time. The protocols
are straightforward because they are based on the sequential immer-
sion of the tissue of interest in organic solvents and simply consist
of pretreatment, labeling, and clearing steps. However, it is true that
immunolabeling is an ever-evolving topic in the field. While anti-
body labeling is used because of its wide range of applicability, it is
also known to have specificity problems and usually only shows
moderate penetration due to its size. Small molecule dyes are
preferred because of their deeper penetration, but unfortunately not
every epitope has a specific dye. Current efforts aim at improving
the available labeling options. One recent example is the vDISCO
technology that utilizes pressure-driven administration of nanobod-
ies to address the disadvantages.
Along the same lines, several users reported “difficulty in clear-
ing clinical samples and overfixed big tissues”. Poor antibody pene-
tration and antibody compatibility issues were also mentioned.
Generally, our suggestion for overcoming the poor penetration issue
is using the SHANEL protocol, which has shown to work on aged
human samples and very large tissues (i.e., whole human brain,
kidney, eye, whole pig brain). CHAPS, the detergent used in this
protocol, allows better penetration by forming tiny micelles that
stretch the tissue to generate space for deeper labeling and improved
imaging quality. However, it should be noted that this procedure is
rather time-consuming compared with others. Regarding antibody
compatibility, we would highly recommend testing antibodies in
small samples before applying them to bigger samples or when
using different protocols. To our knowledge, there is no study that
correlated the stability of different types of antibodies for labeling
and maintenance.
The “time required for the procedure” was also brought up as a
challenge. The time required for a procedure would highly depend
on the size and the pigmentation of the specimen. Additionally,
the protocols can be individually optimized depending on the
nature of the question addressed. For example, if the tissue is
composed of bone material, it may be required to prolong the
decalcification step, while if the tissue is small and soft this step
can be minimized. The same applies to delipidation or dehydra-
tion; for smaller samples, the time in each step can be reduced. It
should be nevertheless noted that some techniques, such as
vDISCO, require longer time irrespective of the sample size. The
pretreatment is a step that can be shortened or eliminated comple-
tely depending on whether it is required due to the nature of the
sample. In all cases, when deviating from the published protocols,
we highly recommend testing the effect of the changes on non-crit-
ical but representative samples.
Generally, tissue shrinkage could represent an advantage or a
disadvantage. One of the biggest disadvantages brought to our atten-
tion was the “shrinkage of specimens which might alter the
anatomy of the tissue”. There are several steps that will cause speci-
men shrinkage and adjusting the steps according to the desired
outcome will result in an undistorted tissue. The first step that will
cause shrinkage is decalcification. The EDTA concentration influ-
ences the amount of shrinkage and if the specimen is not dissected
it is possible that different tissues will shrink differently causing
distortion. The second step that effects shrinkage is permeabiliza-
tion, which disrupts the extracellular matrix to allow deeper
access to the molecular probes while at the same time causing
16 of 21 Molecular Systems Biology 17: e9807 | 2021 ª 2021 The Authors
Molecular Systems Biology Muge Molbay et al

anisotropic shrinkage. If keeping the microscopic structures intact is
fundamentally necessary, we suggest using a protocol that does not
have a permeabilization step such as 3DISCO or uDISCO. The third
step that influences shrinkage is sample dehydration. This step is
highly dependent on the tissue type, and the higher the water
content in an organ the more shrinkage is caused in the tissue. For
example, bones are stiff and rigid but the spleen is comparably
softer and has a higher water content. To minimize the effect of dif-
ferences in tissue composition, the number of steps during the dehy-
dration process could be increased allowing a smoother process.
Another important aspect to consider for dehydration is the type of
the dehydrating agent. As an example, iDISCO utilizes alcohols
which are known to distort cell nuclei, explaining the anisotropic
shrinkage.
For some, “reagent toxicity” is an issue. Therefore, we decided to
share a table with the safety levels of most solvent-based clearing
reagents and some additional information (Table 2). For further
details, open databases such as PubChem, MSDSonline provide an
elaborate sheet on how such solutions are to be handled. Gloves,
laboratory coat, and masks are necessary during exposure to these
reagents. The disposal of these reagents should also be performed
according to the relevant safety regulations.
“Equipment availability” came up in our survey as a challenge.
However, we would like to mention that all material used in the
protocols mentioned above are available online and commercial-
ized. Additionally, new LSFM core facilities can be contacted for
collaborations. To lower the costs, some sample holders may also
be 3D-printed at the desired size. Furthermore, relatively smaller
samples could readily be imaged by more widely available confocal
and 2-photon microscopes. For the vDISCO active clearing pipeline,
the pumps can be used for up to 4-6 animals, minimizing the
required number of pumps upon synchronized experiments.
While the “lack of automated quantification techniques” for dif-
ferent organs and clearing methods indeed represents a challenge, we
believe that the field is progressing toward generating more resources
to allow automated, reliable quantification. A broad explanation was
given in the data analysis section but to exemplify; Clearmap, VesSAP,
DeepMACT, NeuroGPS Tree, Neurolucida, Imaris, Vision4D, and
ImageJ/Fiji are common predefined and reviewed solutions that could
provide tremendous help during analyzing data until problem-specific
custom code is (if really needed) implemented in-house.
Finally, Z-resolution depends on several factors and the chal-
lenge of the “Z-resolution being generally lower than the x and y
resolution” can be partially controlled by thinning the light sheet
which is usually termed as the NA. Alternatively, new LSFM utiliz-
ing axially swept light sheet such as MesoSPIM are promising for
obtaining a more homogenous light penetration through the tissue,
partially addressing this shortcoming. So far, LSFM is a growing
field in microscopy and novel designs such as ctASLM (Chakraborty
et al, 2019) or oblique plane microscopy (Sapoznik et al, 2020)
substantially improve the resolution in xy and z, making the overall
resolution better and more homogeneous. However, these new
modalities are not commercially available, and it is therefore
required that experts establish and maintain the microscope locally.
Future perspectives
Tissue clearing revolutionized classical histology and expanded
the amount of information that can be extracted from large intact
Table 2. Toxicity of the most commonly used chemicals in solvent-based clearing.
Name of the chemical Method Safety level Information
Benzyl AlcoholBenzyl Benzoate
BABB, FluorClearBABB, uDISCO,vDISCO, fDISCO, sDISCO, SHANEL
Mild precautionrequired
Both chemicals are commonly used in cosmetics
Tetrahydroflurane (THF) 3DISCO, iDISCO, vDISCO, sDISCO Moderateprecautionrequired
Avoid inhalation of the vapor, might cause nausea, dizziness,headache. . .
Dibenzyl Ether (DBE) DBE, eDISCO, fDISCO, sDISCO Mild precautionrequired
Commonly used food additive, no harmful effect
Ethyl Cinnamate (ECi) ECi, BALANCE, EyeCi Safe Ethyl cinnamate is an FDA-approved food flavor and additive tocosmetic products
Tertiary Butanol uDISCO, PEGASOS Moderateprecautionrequired
Vapor is narcotic and irritating in action. Liquid is irritating to skinand eyes
Dichloromethane (DCM) 3DISCO, iDISCOuDISCO, vDISCO, SHANEL
Moderateprecautionrequired
As an artificial compound, it irritates the skin and eyes
N,N,N0 ,N0-Tetrakis(2-hydroxypropyl)ethylenediamine (Quadrol)
vDISCO, PEGASOS Severeprecautionrequired
Quadrol can cause skin irritation, serious eye damage and seriouseye irritation
Ethylenediaminetetraaceticacid (EDTA)
vDISCO, PEGASOS Safe EDTA is a safe compound to use; it only irritates the eyes, skin, andrespiratory tract in high exposures
Methanol iDISCO, SHANEL Moderateprecautionrequired
High concentrations can produce central nervous system depressionand optic nerve damage. Can be absorbed through the skin
ª 2021 The Authors Molecular Systems Biology 17: e9807 | 2021 17 of 21
Muge Molbay et al Molecular Systems Biology

tissues. Given the advancements in this field during the last
decade and ongoing improvements, there can be little doubt that
tissue clearing technologies will continue to evolve in the near
future. We foresee that new protocols will continue to further
improve labeling efficiencies and imaging qualities but more
importantly will provide more robust, unbiased quantification
methods using deep learning algorithms. Faster and more accurate
pipelines for stitching and organ segmentation as well as ways to
handle large datasets are urgently needed. Despite the open
challenges, the combination of different fields: tissue clearing,
labeling, imaging, and recently deep learning has provided signifi-
cant improvements so far. These improvements have provided a
system-level understanding in a variety of contexts, ranging
from fine cellular details, to the discovery of new anatomical struc-
tures to macroscopic level whole-body analyses of single-cell
metastasis.
The next big advancement in the field perhaps could be linking
complex biological function to tissue structures, something that has
remained challenging, due to the need to work with fixed samples.
This advancement could be integrated with omics analyses, e.g.,
transcriptomics, metabolomics, or proteomics which would lead to
an unbiased understanding of an intact specimen not only struc-
turally but also functionally. In turn, these techniques can be
applied to generate organ maps, monitor disease progression, and
test treatment options. Along the same lines, drug development can
greatly benefit from the type of analyses that can be performed
using tissue clearing.
The increasing interest in studying biological processes in thick
samples will likely spur these and other improvements in the future
and it may become even harder to decide which would be the opti-
mal protocol to pursue for a specific scientific question. In this tuto-
rial, our intention was to share our knowledge, experience, and best
“tricks” to help scientists who are currently trying to establish these
techniques. We have addressed several common struggles to reach
higher level of transparency, and deeper labeling, signs of proper
tissue processing and preservation of fluorescent signal. Further-
more, we provided an overview on the toxicity of reagents and on
the applications of tissue clearing as examples to find relevant
protocols faster.
AcknowledgementsSpecial thanks to Dr. Hanno Steinke for providing the images of the samples
cleared originally by Spalteholz. Furthermore, we would like to thank the
Erturk laboratory members: Dr. Alison Wright, Shan Zhao, Dr. Chenchen Pan,
Dr. Karen Stanic, Dr. Doris Kaltenecker, and Furkan Ozturk for proofreading,
updating, and improving the manuscript with their comments and experi-
ences. Special thanks to all of the anonymous participants of the survey who
allowed us to provide relevant feedback. Muge Molbay is supported by Turkish
Ministry of Education for her PhD studies.
Author contributionsAll aspect of the manuscript: MM and ZIK; Literature review, revision and
improvement in the manuscript: MIT; Revision of the optics and physics parts
of the manuscript: T-LO; Supervision of the work: AE; Reading and final
approval of the manuscript: All authors.
Conflict of interestThe authors declare that they have no conflict of interest.
References
Acar M, Kocherlakota KS, Murphy MM, Peyer JG, Oguro H, Inra CN, Jaiyeola C, Zhao
Z, Luby-Phelps K, Morrison SJ (2015) Deep imaging of bone marrow shows non-
dividing stem cells are mainly perisinusoidal. Nature 526: 126–130
Amat F, Höckendorf B, Wan Y, Lemon WC, McDole K, Keller PJ (2015) Efficient
processing and analysis of large-scale light-sheet microscopy data. Nat
Protoc 10: 1679 – 1696
Ando K, Laborde Q, Lazar A, Godefroy D, Youssef I, Amar M, Pooler A, Potier
M-C, Delatour B, Duyckaerts C (2014) Inside Alzheimer brain with
CLARITY: senile plaques, neurofibrillary tangles and axons in 3-D. Acta
Neuropathol (Berl) 128: 457 – 459
Bal�azs B, Deschamps J, Albert M, Ries J, Hufnagel L (2017) A real-time
compression library for microscopy images. bioRxiv https://doi.org/10.1101/
164624 [PREPRINT]
Becker K, J€ahrling N, Saghafi S, Weiler R, Dodt H-U (2012) Chemical clearing
and dehydration of GFP expressing mouse brains. PLoS One 7: e33916
Bedbrook CN, Deverman BE, Gradinaru V (2018) Viral strategies for targeting
the central and peripheral nervous systems. Annu Rev Neurosci 41:
323 – 348
Belle M, Godefroy D, Couly G, Malone SA, Collier F, Giacobini P, Ch�edotal A
(2017) Tridimensional visualization and analysis of early human
development. Cell 169: 161 – 173.e12
Birey F, Andersen J, Makinson CD, Islam S, Wei W, Huber N, Fan HC, Metzler
KRC, Panagiotakos G, Thom N et al (2017) Assembly of functionally
integrated human forebrain spheroids. Nature 545: 54 – 59
Bria A, Bernaschi M, Guarrasi M, Iannello G (2019) Exploiting multi-level
parallelism for stitching very large microscopy images. Front
Neuroinformatics 13: 41
Bria A, Iannello G (2012) TeraStitcher – a tool for fast automatic 3D-stitching
of teravoxel-sized microscopy images. BMC Bioinformatics 13: 316
Cai R, Pan C, Ghasemigharagoz A, Todorov MI, Förstera B, Zhao S, Bhatia HS,
Parra-Damas A, Mrowka L, Theodorou D et al (2019) Panoptic imaging of
transparent mice reveals whole-body neuronal projections and skull–
meninges connections. Nat Neurosci 22: 317 – 327
Chakraborty T, Driscoll MK, Jeffery E, Murphy MM, Roudot P, Chang B-J, Vora
S, Wong WM, Nielson CD, Zhang H et al (2019) Light-sheet microscopy of
cleared tissues with isotropic, subcellular resolution. Nat Methods 16:
1109 – 1113
Chen JY, Miyanishi M, Wang SK, Yamazaki S, Sinha R, Kao KS, Seita J, Sahoo
D, Nakauchi H, Weissman IL (2016) Hoxb5 marks long-term
haematopoietic stem cells and reveals a homogenous perivascular niche.
Nature 530: 223 – 227
Chiang A-S, Liu Y-C, Chiu S-L, Hu S-H, Huang C-Y, Hsieh C-H (2001) Three-
dimensional mapping of brain neuropils in the cockroach, Diploptera
punctata. J Comp Neurol 440: 1 – 11
Chung K, Wallace J, Kim S-Y, Kalyanasundaram S, Andalman AS, Davidson TJ,
Mirzabekov JJ, Zalocusky KA, Mattis J, Denisin AK et al (2013) Structural
and molecular interrogation of intact biological systems. Nature 497:
332 – 337
Cuccarese MF, Dubach JM, Pfirschke C, Engblom C, Garris C, Miller MA, Pittet
MJ, Weissleder R (2017) Heterogeneity of macrophage infiltration and
therapeutic response in lung carcinoma revealed by 3D organ imaging.
Nat Commun 8: 14293
Davis FM, Lloyd-Lewis B, Harris OB, Kozar S, Winton DJ, Muresan L, Watson
CJ (2016) Single-cell lineage tracing in the mammary gland reveals
stochastic clonal dispersion of stem/progenitor cell progeny. Nat Commun
7: 13053
18 of 21 Molecular Systems Biology 17: e9807 | 2021 ª 2021 The Authors
Molecular Systems Biology Muge Molbay et al

Dean KM, Roudot P, Welf ES, Danuser G, Fiolka R (2015) Deconvolution-free
subcellular imaging with axially swept light sheet microscopy. Biophys J
108: 2807 – 2815
Decroix L, Van Muylder V, Desender L, Sampaolesi M, Thorrez L (2015) Tissue
clearing for confocal imaging of native and bio-artificial skeletal muscle.
Biotech Histochem 90: 424 – 431
Dent JA, Polson AG, Klymkowsky MW (1989) A whole-mount
immunocytochemical analysis of the expression of the intermediate
filament protein vimentin in Xenopus. Development 105: 61 – 74
Deverman BE, Pravdo PL, Simpson BP, Kumar SR, Chan KY, Banerjee A, Wu
W-L, Yang B, Huber N, Pasca SP et al (2016) Cre-dependent selection
yields AAV variants for widespread gene transfer to the adult brain. Nat
Biotechnol 34: 204 – 209
Dickstein DL, Dickstein DR, Janssen WGM, Hof PR, Glaser JR, Rodriguez A,
O’Connor N, Angstman P, Tappan SJ (2016) Automatic dendritic spine
quantification from confocal data with neurolucida 360: automatic
dendritic spine quantification. Curr Protoc Neurosci 77: 1.27.1
Dodt H-U, Leischner U, Schierloh A, J€ahrling N, Mauch CP, Deininger K,
Deussing JM, Eder M, Zieglg€ansberger W, Becker K (2007) Ultramicroscopy:
three-dimensional visualization of neuronal networks in the whole mouse
brain. Nat Methods 4: 331 – 336
Ert€urk A, Becker K, J€ahrling N, Mauch CP, Hojer CD, Egen JG, Hellal F, Bradke
F, Sheng M, Dodt H-U (2012a) Three-dimensional imaging of solvent-
cleared organs using 3DISCO. Nat Protoc 7: 1983 – 1995
Ert€urk A, Mauch CP, Hellal F, Förstner F, Keck T, Becker K, J€ahrling N, Steffens
H, Richter M, H€ubener M et al (2012b) Three-dimensional imaging of the
unsectioned adult spinal cord to assess axon regeneration and glial
responses after injury. Nat Med 18: 166 – 171
Gabanyi I, Muller PA, Feighery L, Oliveira TY, Costa-Pinto FA, Mucida D (2016)
Neuro-immune interactions drive tissue programming in intestinal
macrophages. Cell 164: 378 – 391
Gage GJ, Kipke DR, Shain W (2012) Whole animal perfusion fixation for
rodents. J Vis Exp 65: 3564
Garofalo S, D’Alessandro G, Chece G, Brau F, Maggi L, Rosa A, Porzia A,
Mainiero F, Esposito V, Lauro C et al (2015) Enriched environment reduces
glioma growth through immune and non-immune mechanisms in mice.
Nat Commun 6: 6623
Genina EA, Bashkatov AN, Tuchin VV (2008) Optical clearing of cranial bone.
Adv Opt Technol 2008: 1 – 8
Glaser AK, Reder NP, Chen Y, McCarty EF, Yin C, Wei L, Wang Y, True LD, Liu
JTC (2017) Light-sheet microscopy for slide-free non-destructive pathology
of large clinical specimens. Nat Biomed Eng 1: 0084
Gradinaru V, Treweek J, Overton K, Deisseroth K (2018) Hydrogel-tissue
chemistry: principles and applications. Annu Rev Biophys 47: 355 – 376
Greenbaum A, Chan KY, Dobreva T, Brown D, Balani DH, Boyce R, Kronenberg
HM, McBride HJ, Gradinaru V (2017) Bone CLARITY: Clearing, imaging, and
computational analysis of osteoprogenitors within intact bone marrow. Sci
Transl Med 9: eaah6518
Gr€uneboom A, Hawwari I, Weidner D, Culemann S, M€uller S, Henneberg S,
Brenzel A, Merz S, Bornemann L, Zec K et al (2019) A network of trans-
cortical capillaries as mainstay for blood circulation in long bones. Nat
Metab 1: 236 – 250
Hahn C, Becker K, Saghafi S, Pende M, Avdiba�si�c A, Foroughipour M, Heinz
DE, Wotjak CT, Dodt H (2019) High-resolution imaging of fluorescent
whole mouse brains using stabilised organic media (sDISCO). J
Biophotonics 12: e201800368
Hale GM, Querry MR (1973) Optical constants of water in the 200-nm to
200-lm wavelength region. Appl Opt 12: 555
Hama H, Hioki H, Namiki K, Hoshida T, Kurokawa H, Ishidate F, Kaneko T,
Akagi T, Saito T, Saido T et al (2015) ScaleS: an optical clearing palette for
biological imaging. Nat Neurosci 18: 1518 – 1529
Hama H, Kurokawa H, Kawano H, Ando R, Shimogori T, Noda H, Fukami K,
Sakaue-Sawano A, Miyawaki A (2011) Scale: a chemical approach for
fluorescence imaging and reconstruction of transparent mouse brain. Nat
Neurosci 14: 1481 – 1488
Hegyi J, Hegyi V, Ruzicka T, Arenberger P, Berking C (2011) New developments
in fluorescence diagnostics. J Dtsch Dermatol Ges 9: 368 – 372
Henning Y, Osadnik C, Malkemper EP (2019) EyeCi: Optical clearing and
imaging of immunolabeled mouse eyes using light-sheet fluorescence
microscopy. Exp Eye Res 180: 137 – 145
Herrmann C, Wang C, Bowen RS, Keyder E, Krainin M, Liu C, Zabih R
(2018) Robust image stitching with multiple registrations. In Computer
Vision – ECCV 2018, Ferrari V, Hebert M, Sminchisescu C, Weiss Y (eds)
pp 53 – 69. Cham: Springer International Publishing
Hörl D, Rojas Rusak F, Preusser F, Tillberg P, Randel N, Chhetri RK, Cardona A,
Keller PJ, Harz H, Leonhardt H et al (2019) BigStitcher: reconstructing
high-resolution image datasets of cleared and expanded samples. Nat
Methods 16: 870 – 874
Hsueh B, Burns VM, Pauerstein P, Holzem K, Ye L, Engberg K, Wang A-C, Gu
X, Chakravarthy H, Arda HE et al (2017) Pathways to clinical CLARITY:
volumetric analysis of irregular, soft, and heterogeneous tissues in
development and disease. Sci Rep 7: 5899
Jamur MC, Oliver C (2010) Permeabilization of cell membranes. In
Immunocytochemical Methods and Protocols, Oliver C, Jamur MC (eds), pp
63 – 66. Totowa, NJ: Humana Press
Jing D, Zhang S, Luo W, Gao X, Men Y, Ma C, Liu X, Yi Y, Bugde A, Zhou BO
et al (2018) Tissue clearing of both hard and soft tissue organs with the
PEGASOS method. Cell Res 28: 803 – 818
Ke M-T, Fujimoto S, Imai T (2013) SeeDB: a simple and morphology-
preserving optical clearing agent for neuronal circuit reconstruction. Nat
Neurosci 16: 1154 – 1161
Ke M-T, Nakai Y, Fujimoto S, Takayama R, Yoshida S, Kitajima TS, Sato M,
Imai T (2016) Super-resolution mapping of neuronal circuitry with an
index-optimized clearing agent. Cell Rep 14: 2718 – 2732
Keller HE (2006) Objective lenses for confocal microscopy. In Handbook of
Biological Confocal Microscopy, Pawley JB (ed) pp 145 – 161. Boston, MA:
Springer US
Keller PJ, Stelzer EHK (2010) Digital scanned laser light sheet fluorescence
microscopy. Cold Spring Harb Protoc 2010: pdb.top78
Kim S-Y, Cho JH, Murray E, Bakh N, Choi H, Ohn K, Ruelas L, Hubbert A,
McCue M, Vassallo SL et al (2015) Stochastic electrotransport selectively
enhances the transport of highly electromobile molecules. Proc Natl Acad
Sci USA 112: E6274 – E6283
Kirst C, Skriabine S, Vieites-Prado A, Topilko T, Bertin P, Gerschenfeld G, Verny
F, Topilko P, Michalski N, Tessier-Lavigne M et al (2020) Mapping the fine-
scale organization and plasticity of the brain vasculature. Cell 180:
780 – 795.e25
Klingberg A, Hasenberg A, Ludwig-Portugall I, Medyukhina A, M€ann L, Brenzel
A, Engel DR, Figge MT, Kurts C, Gunzer M (2017) Fully automated
evaluation of total glomerular number and capillary tuft size in nephritic
kidneys using lightsheet microscopy. J Am Soc Nephrol 28: 452 – 459
Klymkowsky MW, Hanken J (1991) Whole-mount staining of Xenopus and
other vertebrates. Methods Cell Biol. 36: 419 – 441
Kubota SI, Takahashi K, Nishida J, Morishita Y, Ehata S, Tainaka K, Miyazono
K, Ueda HR (2017) Whole-body profiling of cancer metastasis with single-
cell resolution. Cell Rep 20: 236 – 250
ª 2021 The Authors Molecular Systems Biology 17: e9807 | 2021 19 of 21
Muge Molbay et al Molecular Systems Biology

Li J, Miao L, Shieh D, Spiotto E, Li J, Zhou B, Paul A, Schwartz RJ, Firulli AB,
Singer HA et al (2016) Single-cell lineage tracing reveals that oriented cell
division contributes to trabecular morphogenesis and regional
specification. Cell Rep 15: 158 – 170
Li Y, Xu J, Wan P, Yu T, Zhu D (2018) Optimization of GFP fluorescence
preservation by a modified uDISCO clearing protocol. Front Neuroanat 12:
67
Liebmann T, Renier N, Bettayeb K, Greengard P, Tessier-Lavigne M, Flajolet M
(2016) Three-dimensional study of alzheimer’s disease hallmarks using the
iDISCO clearing method. Cell Rep 16: 1138 – 1152
Lin R, Wang R, Yuan J, Feng Q, Zhou Y, Zeng S, Ren M, Jiang S, Ni H, Zhou C
et al (2018) Cell-type-specific and projection-specific brain-wide
reconstruction of single neurons. Nat Methods 15: 1033 – 1036
Liu AKL, Hurry MED, Ng OTW, DeFelice J, Lai HM, Pearce RKB, Wong GT-C,
Chang RC-C, Gentleman SM (2016) Bringing CLARITY to the human brain:
visualization of Lewy pathology in three dimensions. Neuropathol Appl
Neurobiol 42: 573 – 587
Liu Y-C, Chiang A-S (2003) High-resolution confocal imaging and three-
dimensional rendering. Methods 30: 86 – 93
Lugo-Hernandez E, Squire A, Hagemann N, Brenzel A, Sardari M, Schlechter J,
Sanchez-Mendoza EH, Gunzer M, Faissner A, Hermann DM (2017) 3D
visualization and quantification of microvessels in the whole ischemic
mouse brain using solvent-based clearing and light sheet microscopy. J
Cereb Blood Flow Metab 37: 3355 – 3367
Merz SF, Korste S, Bornemann L, Michel L, Stock P, Squire A, Soun C, Engel
DR, Detzer J, Lörchner H et al (2019) Contemporaneous 3D
characterization of acute and chronic myocardial I/R injury and response.
Nat Commun 10: 2312
Morawski M, Kirilina E, Scherf N, J€ager C, Reimann K, Trampel R, Gavriilidis F,
Geyer S, Biedermann B, Arendt T et al (2018) Developing 3D microscopy
with CLARITY on human brain tissue: towards a tool for informing and
validating MRI-based histology. NeuroImage 182: 417 – 428
Moreno-Garc�ıa A, Kun A, Calero O, Medina M, Calero M (2018) An overview of
the role of lipofuscin in age-related neurodegeneration. Front Neurosci 12:
464
Murakami TC, Mano T, Saikawa S, Horiguchi SA, Shigeta D, Baba K, Sekiya H,
Shimizu Y, Tanaka KF, Kiyonari H et al (2018) A three-dimensional single-
cell-resolution whole-brain atlas using CUBIC-X expansion microscopy and
tissue clearing. Nat Neurosci 21: 625 – 637
Murray E, Cho JH, Goodwin D, Ku T, Swaney J, Kim S-Y, Choi H, Park Y-G,
Park J-Y, Hubbert A et al (2015) Simple, scalable proteomic imaging for
high-dimensional profiling of intact systems. Cell 163: 1500 – 1514
Mzinza DT, Fleige H, Laarmann K, Willenzon S, Ristenpart J, Spanier J,
Sutter G, Kalinke U, Valentin-Weigand P, Förster R (2018) Application of
light sheet microscopy for qualitative and quantitative analysis of
bronchus-associated lymphoid tissue in mice. Cell Mol Immunol 15:
875 – 887
Nectow AR, Schneeberger M, Zhang H, Field BC, Renier N, Azevedo E, Patel B,
Liang Y, Mitra S, Tessier-Lavigne M et al (2017) Identification of a
brainstem circuit controlling feeding. Cell 170: 429 – 442.e11
von Neubeck B, Gondi G, Riganti C, Pan C, Parra Damas A, Scherb H, Ert€urk A,
Zeidler R (2018) An inhibitory antibody targeting carbonic anhydrase XII
abrogates chemoresistance and significantly reduces lung metastases in
an orthotopic breast cancer model in vivo: Inhibition of Carbonic
anhydrase XII abrogates chemoresistance. Int J Cancer 143: 2065 – 2075
Nojima S, Susaki EA, Yoshida K, Takemoto H, Tsujimura N, Iijima S, Takachi K,
Nakahara Y, Tahara S, Ohshima K et al (2017) CUBIC pathology: three-
dimensional imaging for pathological diagnosis. Sci Rep 7: 9269
O’Brien JR (1960) The effect of heparin on the early stages of blood
coagulation. J Clin Pathol 13: 93 – 98
Olarte OE, Andilla J, Gualda EJ, Loza-Alvarez P (2018) Light-sheet microscopy:
a tutorial. Adv Opt Photonics 10: 111 – 179
Pan C, Cai R, Quacquarelli FP, Ghasemigharagoz A, Lourbopoulos A, Matryba
P, Plesnila N, Dichgans M, Hellal F, Ert€urk A (2016) Shrinkage-mediated
imaging of entire organs and organisms using uDISCO. Nat Methods 13:
859 – 867
Pan C, Schoppe O, Parra-Damas A, Cai R, Todorov MI, Gondi G, von Neubeck
B, Bö�g€urc€u-Seidel N, Seidel S, Sleiman K et al (2019) Deep learning reveals
cancer metastasis and therapeutic antibody targeting in the entire body.
Cell 179: 1661 – 1676.e19
Park Y-G, Sohn CH, Chen R, McCue M, Yun DH, Drummond GT, Ku T, Evans
NB, Oak HC, Trieu W et al (2019) Protection of tissue physicochemical
properties using polyfunctional crosslinkers. Nat Biotechnol 37: 73 – 83
Peng H, Ruan Z, Long F, Simpson JH, Myers EW (2010) V3D enables real-time
3D visualization and quantitative analysis of large-scale biological image
data sets. Nat Biotechnol 28: 348 – 353
Phillips J, Laude A, Lightowlers R, Morris CM, Turnbull DM, Lax NZ (2016)
Development of passive CLARITY and immunofluorescent labelling of
multiple proteins in human cerebellum: understanding mechanisms of
neurodegeneration in mitochondrial disease. Sci Rep 6: 26013
Pietzsch T, Saalfeld S, Preibisch S, Tomancak P (2015) BigDataViewer:
visualization and processing for large image data sets. Nat Methods 12:
481 – 483
Qi Y, Yu T, Xu J, Wan P, Ma Y, Zhu J, Li Y, Gong H, Luo Q, Zhu D (2019)
FDISCO: Advanced solvent-based clearing method for imaging whole
organs. Sci Adv 5: eaau8355
Quan T, Zhou H, Li J, Li S, Li A, Li Y, Lv X, Luo Q, Gong H, Zeng S (2016)
NeuroGPS-Tree: automatic reconstruction of large-scale neuronal
populations with dense neurites. Nat Methods 13: 51 – 54
Renier N, Adams EL, Kirst C, Wu Z, Azevedo R, Kohl J, Autry AE, Kadiri L,
Umadevi Venkataraju K, Zhou Y et al (2016) Mapping of brain activity by
automated volume analysis of immediate early genes. Cell 165:
1789 – 1802
Renier N, Wu Z, Simon DJ, Yang J, Ariel P, Tessier-Lavigne M (2014) iDISCO: a
simple, rapid method to immunolabel large tissue samples for volume
imaging. Cell 159: 896 – 910
Richardson DS, Lichtman JW (2015) Clarifying tissue clearing. Cell 162:
246 – 257
Rios AC, Capaldo BD, Vaillant F, Pal B, van Ineveld R, Dawson CA, Chen Y,
Nolan E, Fu NY, Jackling FC et al (2019) Intraclonal plasticity in mammary
tumors revealed through large-scale single-cell resolution 3D imaging.
Cancer Cell 35: 618 – 632.e6
van Royen ME, Verhoef EI, Kweldam CF, van Cappellen WA, Kremers G-J,
Houtsmuller AB, van Leenders GJLH (2016) Three-dimensional
microscopic analysis of clinical prostate specimens. Histopathology 69:
985 – 992
Sapoznik E, Chang BJ, Huh J, Ju RJ, Azarova EV, Pohlkamp T, Welf ES,
Broadbent D, Carisey AF, Stehbens SJ et al (2020) A versatile oblique plane
microscope for large-scale and high-resolution imaging of subcellular
dynamics. eLife 9: 1–39. [e57681]
Schindelin J, Rueden CT, Hiner MC, Eliceiri KW (2015) The ImageJ ecosystem:
an open platform for biomedical image analysis. Mol Reprod Dev 82:
518 – 529
Schwarz MK, Scherbarth A, Sprengel R, Engelhardt J, Theer P, Giese G (2015)
Fluorescent-protein stabilization and high-resolution imaging of cleared,
intact mouse brains. PLoS One 10: e0124650
20 of 21 Molecular Systems Biology 17: e9807 | 2021 ª 2021 The Authors
Molecular Systems Biology Muge Molbay et al

Seo J, Choe M, Kim S-Y (2016) Clearing and labeling techniques for large-
scale biological tissues. Mol Cells 39: 439 – 446
Silvestri L, Costantini I, Sacconi L, Pavone FS (2016) Clearing of fixed tissue: a
review from a microscopist’s perspective. J Biomed Opt 21: 081205
Spalteholz W (1914) €Uber das Durchsichtigmachen von menschlichen und
tierischen Pr€aparaten und seine theoretischen Bedingungen, nebst Anhang:€Uber Knochenf€arbung, Leipzig: S. Hirzel
Stefaniuk M, Gualda EJ, Pawlowska M, Legutko D, Matryba P, Koza P,
Konopka W, Owczarek D, Wawrzyniak M, Loza-Alvarez P et al (2016)
Light-sheet microscopy imaging of a whole cleared rat brain with Thy1-
GFP transgene. Sci Rep 6: 28209
Susaki EA, Tainaka K, Perrin D, Kishino F, Tawara T, Watanabe TM, Yokoyama
C, Onoe H, Eguchi M, Yamaguchi S et al (2014) Whole-brain imaging with
single-cell resolution using chemical cocktails and computational analysis.
Cell 157: 726 – 739
Susaki EA, Tainaka K, Perrin D, Yukinaga H, Kuno A, Ueda HR (2015) Advanced
CUBIC protocols for whole-brain and whole-body clearing and imaging.
Nat Protoc 10: 1709 – 1727
Tainaka K, Kubota SI, Suyama TQ, Susaki EA, Perrin D, Ukai-Tadenuma M,
Ukai H, Ueda HR (2014) Whole-body imaging with single-cell resolution
by tissue decolorization. Cell 159: 911 – 924
Tainaka K, Murakami TC, Susaki EA, Shimizu C, Saito R, Takahashi K, Hayashi-
Takagi A, Sekiya H, Arima Y, Nojima S et al (2018) Chemical landscape for
tissue clearing based on hydrophilic reagents. Cell Rep 24: 2196 – 2210.e9
Tanaka N, Kanatani S, Tomer R, Sahlgren C, Kronqvist P, Kaczynska D,
Louhivuori L, Kis L, Lindh C, Mitura P et al (2017) Whole-tissue biopsy
phenotyping of three-dimensional tumours reveals patterns of cancer
heterogeneity. Nat Biomed Eng 1: 796 – 806
Tatsuki F, Sunagawa GA, Shi S, Susaki EA, Yukinaga H, Perrin D, Sumiyama K,
Ukai-Tadenuma M, Fujishima H, Ohno R et al (2016) Involvement of
Ca2+-dependent hyperpolarization in sleep duration in mammals. Neuron
90: 70 – 85
Thavarajah R, Mudimbaimannar VK, Elizabeth J, Rao UK, Ranganathan K
(2012) Chemical and physical basics of routine formaldehyde fixation. J
Oral Maxillofac Pathol 16: 400 – 405
Tian T, Yang Z, Li X (2021) Tissue clearing technique: recent progress and
biomedical applications. J Anat 238: 489 – 507
Todorov MI, Paetzold JC, Schoppe O, Tetteh G, Shit S, Efremov V, Todorov-
Völgyi K, D€uring M, Dichgans M, Piraud M et al (2020) Machine learning
analysis of whole mouse brain vasculature. Nat Methods 17: 442 – 449
Tuchin VV (2015) Tissue optics and photonics: light-tissue interaction. J
Biomed Photonics Eng 1: 98 – 134
Ueda HR, Ert€urk A, Chung K, Gradinaru V, Ch�edotal A, Tomancak P, Keller PJ
(2020) Tissue clearing and its applications in neuroscience. Nat Rev
Neurosci 21: 61 – 79
Verdenius HHW, Alma L (1958) A quantitative study of decalcification
methods in histology. J Clin Pathol 11: 229 – 236
Voigt FF, Kirschenbaum D, Platonova E, Pag�es S, Campbell RAA, Kastli R,
Schaettin M, Egolf L, van der Bourg A, Bethge P et al (2019) The
mesoSPIM initiative: open-source light-sheet microscopes for imaging
cleared tissue. Nat Methods 16: 1105 – 1108
Yang B, Treweek JB, Kulkarni RP, Deverman BE, Chen C-K, Lubeck E, Shah S,
Cai L, Gradinaru V (2014) Single-cell phenotyping within transparent
intact tissue through whole-body clearing. Cell 158: 945 – 958
Yuan J, Deng W, Cha J, Sun X, Borg J-P, SudhansuK D (2018) Tridimensional
visualization reveals direct communication between the embryo and
glands critical for implantation. Nat Commun 9: 603
Zhao S, Todorov MI, Cai R, Maskari RA, Steinke H, Kemter E, Mai H, Rong Z,
Warmer M, Stanic Ket al (2020) Cellular and molecular probing of intact
human organs. Cell 180: 796 – 812.e19
Zhu Y, Soderblom C, Krishnan V, Ashbaugh J, Bethea JR, Lee JK (2015)
Hematogenous macrophage depletion reduces the fibrotic scar and
increases axonal growth after spinal cord injury. Neurobiol Dis 74:
114 – 125
License: This is an open access article under the
terms of the Creative Commons Attribution 4.0
License, which permits use, distribution and reproduc-
tion in any medium, provided the original work is
properly cited.
ª 2021 The Authors Molecular Systems Biology 17: e9807 | 2021 21 of 21
Muge Molbay et al Molecular Systems Biology