Cost-Effectiveness of Therapeutic Use of Safety-Engineered ...
19
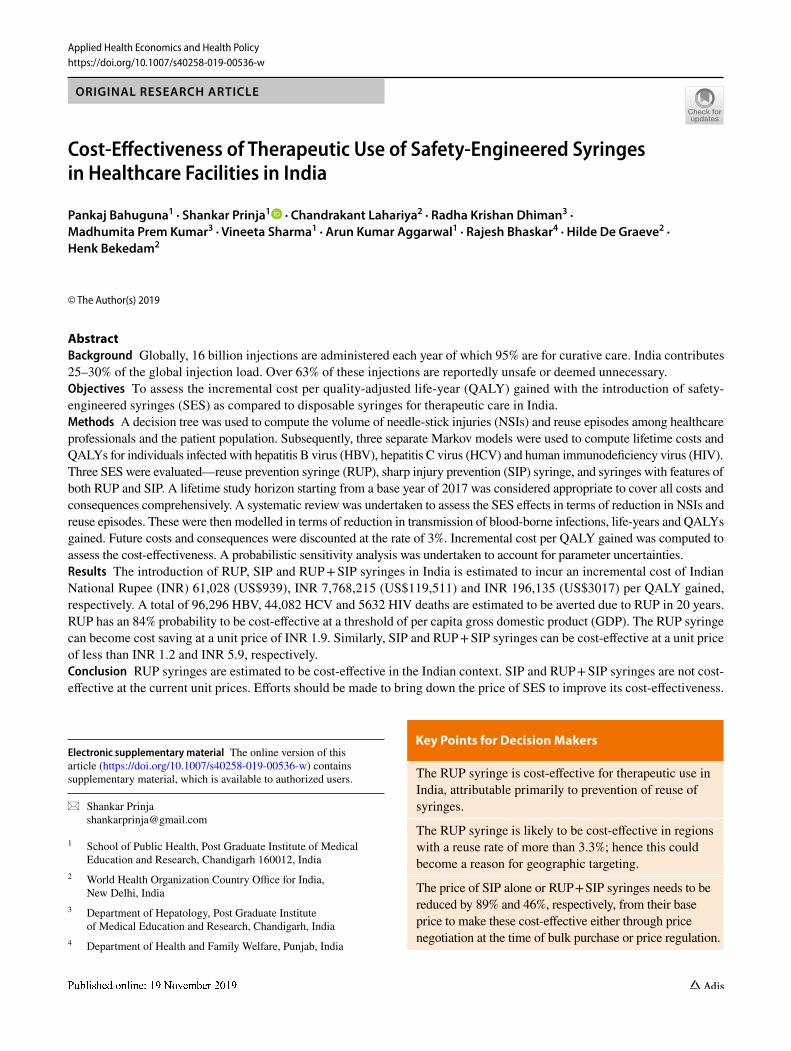
Vol.:(0123456789) Applied Health Economics and Health Policy https://doi.org/10.1007/s40258-019-00536-w ORIGINAL RESEARCH ARTICLE Cost‑Effectiveness of Therapeutic Use of Safety‑Engineered Syringes in Healthcare Facilities in India Pankaj Bahuguna 1 · Shankar Prinja 1 · Chandrakant Lahariya 2 · Radha Krishan Dhiman 3 · Madhumita Prem Kumar 3 · Vineeta Sharma 1 · Arun Kumar Aggarwal 1 · Rajesh Bhaskar 4 · Hilde De Graeve 2 · Henk Bekedam 2 © The Author(s) 2019 Abstract Background Globally, 16 billion injections are administered each year of which 95% are for curative care. India contributes 25–30% of the global injection load. Over 63% of these injections are reportedly unsafe or deemed unnecessary. Objectives To assess the incremental cost per quality-adjusted life-year (QALY) gained with the introduction of safety- engineered syringes (SES) as compared to disposable syringes for therapeutic care in India. Methods A decision tree was used to compute the volume of needle-stick injuries (NSIs) and reuse episodes among healthcare professionals and the patient population. Subsequently, three separate Markov models were used to compute lifetime costs and QALYs for individuals infected with hepatitis B virus (HBV), hepatitis C virus (HCV) and human immunodeficiency virus (HIV). Three SES were evaluated—reuse prevention syringe (RUP), sharp injury prevention (SIP) syringe, and syringes with features of both RUP and SIP. A lifetime study horizon starting from a base year of 2017 was considered appropriate to cover all costs and consequences comprehensively. A systematic review was undertaken to assess the SES effects in terms of reduction in NSIs and reuse episodes. These were then modelled in terms of reduction in transmission of blood-borne infections, life-years and QALYs gained. Future costs and consequences were discounted at the rate of 3%. Incremental cost per QALY gained was computed to assess the cost-effectiveness. A probabilistic sensitivity analysis was undertaken to account for parameter uncertainties. Results The introduction of RUP, SIP and RUP + SIP syringes in India is estimated to incur an incremental cost of Indian National Rupee (INR) 61,028 (US$939), INR 7,768,215 (US$119,511) and INR 196,135 (US$3017) per QALY gained, respectively. A total of 96,296 HBV, 44,082 HCV and 5632 HIV deaths are estimated to be averted due to RUP in 20 years. RUP has an 84% probability to be cost-effective at a threshold of per capita gross domestic product (GDP). The RUP syringe can become cost saving at a unit price of INR 1.9. Similarly, SIP and RUP + SIP syringes can be cost-effective at a unit price of less than INR 1.2 and INR 5.9, respectively. Conclusion RUP syringes are estimated to be cost-effective in the Indian context. SIP and RUP + SIP syringes are not cost- effective at the current unit prices. Efforts should be made to bring down the price of SES to improve its cost-effectiveness. Electronic supplementary material The online version of this article (https://doi.org/10.1007/s40258-019-00536-w) contains supplementary material, which is available to authorized users. * Shankar Prinja [email protected] 1 School of Public Health, Post Graduate Institute of Medical Education and Research, Chandigarh 160012, India 2 World Health Organization Country Office for India, New Delhi, India 3 Department of Hepatology, Post Graduate Institute of Medical Education and Research, Chandigarh, India 4 Department of Health and Family Welfare, Punjab, India Key Points for Decision Makers The RUP syringe is cost-effective for therapeutic use in India, attributable primarily to prevention of reuse of syringes. The RUP syringe is likely to be cost-effective in regions with a reuse rate of more than 3.3%; hence this could become a reason for geographic targeting. The price of SIP alone or RUP + SIP syringes needs to be reduced by 89% and 46%, respectively, from their base price to make these cost-effective either through price negotiation at the time of bulk purchase or price regulation.
-
Upload
khangminh22 -
Category
Documents
-
view
0 -
download
0
Transcript of Cost-Effectiveness of Therapeutic Use of Safety-Engineered ...
Vol.:(0123456789)
Applied Health Economics and Health Policy https://doi.org/10.1007/s40258-019-00536-w
ORIGINAL RESEARCH ARTICLE
Cost‑Effectiveness of Therapeutic Use of Safety‑Engineered Syringes in Healthcare Facilities in India
Pankaj Bahuguna1 · Shankar Prinja1 · Chandrakant Lahariya2 · Radha Krishan Dhiman3 · Madhumita Prem Kumar3 · Vineeta Sharma1 · Arun Kumar Aggarwal1 · Rajesh Bhaskar4 · Hilde De Graeve2 · Henk Bekedam2
© The Author(s) 2019
AbstractBackground Globally, 16 billion injections are administered each year of which 95% are for curative care. India contributes 25–30% of the global injection load. Over 63% of these injections are reportedly unsafe or deemed unnecessary.Objectives To assess the incremental cost per quality-adjusted life-year (QALY) gained with the introduction of safety-engineered syringes (SES) as compared to disposable syringes for therapeutic care in India.Methods A decision tree was used to compute the volume of needle-stick injuries (NSIs) and reuse episodes among healthcare professionals and the patient population. Subsequently, three separate Markov models were used to compute lifetime costs and QALYs for individuals infected with hepatitis B virus (HBV), hepatitis C virus (HCV) and human immunodeficiency virus (HIV). Three SES were evaluated—reuse prevention syringe (RUP), sharp injury prevention (SIP) syringe, and syringes with features of both RUP and SIP. A lifetime study horizon starting from a base year of 2017 was considered appropriate to cover all costs and consequences comprehensively. A systematic review was undertaken to assess the SES effects in terms of reduction in NSIs and reuse episodes. These were then modelled in terms of reduction in transmission of blood-borne infections, life-years and QALYs gained. Future costs and consequences were discounted at the rate of 3%. Incremental cost per QALY gained was computed to assess the cost-effectiveness. A probabilistic sensitivity analysis was undertaken to account for parameter uncertainties.Results The introduction of RUP, SIP and RUP + SIP syringes in India is estimated to incur an incremental cost of Indian National Rupee (INR) 61,028 (US$939), INR 7,768,215 (US$119,511) and INR 196,135 (US$3017) per QALY gained, respectively. A total of 96,296 HBV, 44,082 HCV and 5632 HIV deaths are estimated to be averted due to RUP in 20 years. RUP has an 84% probability to be cost-effective at a threshold of per capita gross domestic product (GDP). The RUP syringe can become cost saving at a unit price of INR 1.9. Similarly, SIP and RUP + SIP syringes can be cost-effective at a unit price of less than INR 1.2 and INR 5.9, respectively.Conclusion RUP syringes are estimated to be cost-effective in the Indian context. SIP and RUP + SIP syringes are not cost-effective at the current unit prices. Efforts should be made to bring down the price of SES to improve its cost-effectiveness.
Electronic supplementary material The online version of this article (https ://doi.org/10.1007/s4025 8-019-00536 -w) contains supplementary material, which is available to authorized users.
* Shankar Prinja [email protected]
1 School of Public Health, Post Graduate Institute of Medical Education and Research, Chandigarh 160012, India
2 World Health Organization Country Office for India, New Delhi, India
3 Department of Hepatology, Post Graduate Institute of Medical Education and Research, Chandigarh, India
4 Department of Health and Family Welfare, Punjab, India
Key Points for Decision Makers
The RUP syringe is cost-effective for therapeutic use in India, attributable primarily to prevention of reuse of syringes.
The RUP syringe is likely to be cost-effective in regions with a reuse rate of more than 3.3%; hence this could become a reason for geographic targeting.
The price of SIP alone or RUP + SIP syringes needs to be reduced by 89% and 46%, respectively, from their base price to make these cost-effective either through price negotiation at the time of bulk purchase or price regulation.

P. Bahuguna et al.
1 Background
Globally, 16 billion injections are administered each year, of which 95% are for curative care [1]. India contributes 25–30% of the global injection load. Over 63% of these injections are reportedly unsafe or deemed unnecessary [2, 3]. Unsafe injection practices include the reusing of syringes and needles, overuse of injections in situations where oral medications can work, and recapping of needles [4, 5]. Addressing unsafe injection practices is an impor-tant public health agenda for several reasons. Firstly, they lead to the large-scale transmission of blood-borne infec-tions (BBIs) among patients [6]. Approximately 33% of new hepatitis B viral (HBV) infections and 42% of hepatitis C viral (HCV) infections (2 million new infections) are attrib-utable to unsafe medical injections in developing countries [2]. Similarly, unsafe injection practices account for 9% of new human immunodeficiency virus (HIV) cases in South Asia [2]. Secondly, there is a risk of transmission of BBIs to healthcare professionals (HCPs) with needle-stick injuries (NSI) [6]. Thirdly, poor sharp waste-management practices put the waste handlers (and community) at risk [7].
In India, the reuse rate for syringes is reported to be 5% [8–10] and rate of NSIs is reported as 0.051 per 1000 injec-tions administered [11]. Both the reuse of a syringe from an infected to a healthy patient and NSI to a healthcare profes-sional after use of a needle on an infected patient pose the risk of BBI transmission. Out of the total BBIs resulting from unsafe injection practices in the developing countries, reuse of syringes contributes to the majority of BBIs and to lesser extent NSIs do [12, 13]. However, most of the stud-ies undertaken so far from the developed countries did not consider BBIs as a result of injection reuse, and cited this as a limitation [14].
Viral hepatitis still remains a major public health prob-lem in India. India has ‘intermediate to high endemicity’ for hepatitis B surface antigen and accounts for an estimated 40 million chronic HBV-infected people, which constitutes 11% of the global burden [15]. The prevalence of chronic HBV infection and chronic HCV infection in India is around 3–4% and < 1%, respectively [16, 17]. However, there is a large variation in the burden, with a much higher preva-lence of HCV infection reported in Punjab [18]. In terms of HIV, India has the third highest prevalence in the world among adults (aged 15–49 years) [19]. The cost of managing HBV, HCV and HIV poses a significant economic burden for the health system. In India, much of this economic burden is borne by households, as they contribute to 71% of the total healthcare expenditures through out-of-pocket expen-ditures (OOPEs) [20, 21]. The average health system cost and OOPE for treating liver disorders in the intensive-care tertiary setting in India is US$2728 (Indian National Rupee
(INR) 163,664) and US$2372 (INR 142,297) respectively [22]. Since healthcare is predominantly financed through out-of-pocket spending in India, the high treatment cost for BBIs places a disproportionately high burden on the poor. This leads to an unmet need for treatment and inequalities in the utilization of healthcare services [23, 24].
The World Health Organization (WHO) recommends a transition to safety-engineered injection devices by 2020. Safety-engineered syringes (SES) are devices designed with advance safety features to prevent re-use and accidental NSIs among health workers [14]. While the Government of India (GoI) introduced auto-disable (AD) syringes for immuniza-tion in 2008 [25], their use is not mandated in the therapeutic sector, which constitutes the bulk of injection use.
Recently, Punjab state considered introduction of SES in the therapeutic sector. Evidence of its cost-effectiveness is thus being sought as an essential criterion for deciding on the introduction of SES. Moreover, the National Pharmaceu-tical Pricing Authority (NPPA) has requested India’s Health Technology Assessment Board [26] to provide economic evidence on different forms of SES. In order to answer these policy questions, we undertook this study to assess the incre-mental cost per quality-adjusted life-year (QALY) gained with the introduction of SES as compared to the current practice of using disposable syringes for therapeutic care.
2 Methodology
2.1 Model Overview
We assessed the cost-effectiveness of SES for therapeu-tic use in India against a counterfactual scenario of exit-ing use of disposable syringes. A lifetime study horizon from a societal perspective was used. Though we included direct expenditures incurred by a population infected with BBI we did not include productivity losses in this analysis. The short-term outcomes of unsafe injection practices that were considered in the present analysis were NSI among healthcare professionals and reuse rate among patients [6]. These were then modelled in terms of life-years and QALYs gained. Future costs and consequences were discounted at the rate of 3%.
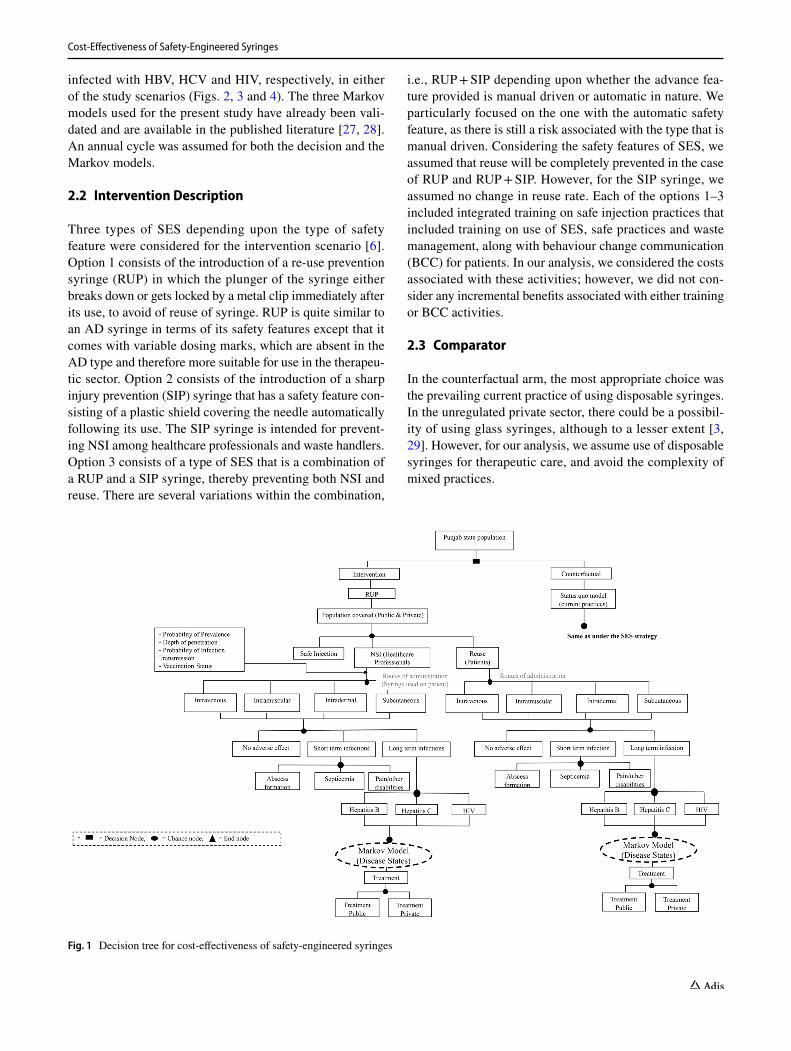
A two-part dynamic transition model was developed. The first part of the model employs a decision tree used to compute the volume of NSIs and reuse episodes among the healthcare professionals and patient population, respec-tively (Fig. 1 and Supplementary Appendix, Section B). The annual number of BBIs in each of the SES options and con-trol scenario were estimated for a period of 20 years from 2017 to 2036 (Supplementary Appendix, Section B). Part 2 of the model comprised three separate Markov models to compute lifetime costs and QALYs for patients who were
Cost-Effectiveness of Safety-Engineered Syringes
infected with HBV, HCV and HIV, respectively, in either of the study scenarios (Figs. 2, 3 and 4). The three Markov models used for the present study have already been vali-dated and are available in the published literature [27, 28]. An annual cycle was assumed for both the decision and the Markov models.
2.2 Intervention Description
Three types of SES depending upon the type of safety feature were considered for the intervention scenario [6]. Option 1 consists of the introduction of a re-use prevention syringe (RUP) in which the plunger of the syringe either breaks down or gets locked by a metal clip immediately after its use, to avoid of reuse of syringe. RUP is quite similar to an AD syringe in terms of its safety features except that it comes with variable dosing marks, which are absent in the AD type and therefore more suitable for use in the therapeu-tic sector. Option 2 consists of the introduction of a sharp injury prevention (SIP) syringe that has a safety feature con-sisting of a plastic shield covering the needle automatically following its use. The SIP syringe is intended for prevent-ing NSI among healthcare professionals and waste handlers. Option 3 consists of a type of SES that is a combination of a RUP and a SIP syringe, thereby preventing both NSI and reuse. There are several variations within the combination,
i.e., RUP + SIP depending upon whether the advance fea-ture provided is manual driven or automatic in nature. We particularly focused on the one with the automatic safety feature, as there is still a risk associated with the type that is manual driven. Considering the safety features of SES, we assumed that reuse will be completely prevented in the case of RUP and RUP + SIP. However, for the SIP syringe, we assumed no change in reuse rate. Each of the options 1–3 included integrated training on safe injection practices that included training on use of SES, safe practices and waste management, along with behaviour change communication (BCC) for patients. In our analysis, we considered the costs associated with these activities; however, we did not con-sider any incremental benefits associated with either training or BCC activities.
2.3 Comparator
In the counterfactual arm, the most appropriate choice was the prevailing current practice of using disposable syringes. In the unregulated private sector, there could be a possibil-ity of using glass syringes, although to a lesser extent [3, 29]. However, for our analysis, we assume use of disposable syringes for therapeutic care, and avoid the complexity of mixed practices.
Fig. 1 Decision tree for cost-effectiveness of safety-engineered syringes

P. Bahuguna et al.
2.4 Costing
In the intervention arm, we included the costs for procure-ment of the respective SES providing pre-exposure prophy-laxis for HBV and HIV; treating HBV, HCV and HIV; pro-viding training on safe injection practices (which consists of both training on the use of SES and safe waste-management practices); BCC campaign; and, lastly, the cost of sharp waste management.
We used unit prices provided by WHO for the respective SES [6]. These prices, which were provided in US dollars, were converted to the local currency, i.e., INR using conver-sion rates for the year 2017 (1US$ = INR65) [30]. Second, for estimating the treatment costs, we used the patterns of treatment utilized at different levels of healthcare delivery for hepatitis patients by analysing the unit level data of the 71st round of the National Sample Survey [31]. To elicit the patterns of care-seeking for HIV, we used the reports
Fig. 2 Markov state transition model for hepatitis B virus
Fig. 3 Markov state transition model for hepatitis C virus
Cost-Effectiveness of Safety-Engineered Syringes
of the National AIDS Control Organization [19]. Based on these patterns of utilization, the diseased population was divided into subgroups, displaying combinations of three key factors. These three factors were sector utilized (public or private qualified or private non-qualified), level of care utilized (primary, secondary or tertiary) and lastly setting utilized (outpatient—OPD or inpatient—IPD). Information on the duration of stay in case of a hospitalization event and annual number of OPD visits for each disease condition was sourced both from the existing literature and from the clini-cal judgement of experts [22, 32].
For care sought in public health facilities, we consid-ered both the health system cost and OOPE for treatment. The health system cost of treatment was accessed from the national health system cost database as well as from other costing studies [22, 31, 33–37]. In the case of treatment from the private sector, the OOPE was considered to capture the full cost. Data on OOPE for different disease conditions were extracted from multiple sources that included national surveys, primary data analysis and available published evi-dence [22, 32]. In the case of HCV, the cost of antivirals and diagnostics was obtained from the rates finalized under Pun-jab state’s Free HCV Treatment Scheme [38]. The cost of antiretroviral therapy treatment for HIV infections caused as a result of reuse of syringes and NSIs among healthcare pro-fessionals was considered. Patient group was also included in the model. The cost of antiretroviral therapy treatment at different levels of healthcare delivery was obtained from a recent local study [39].
Lastly, data on the cost of training, BCC and waste man-agement were obtained based on discussion with health
system program managers [40]. Since the waste-manage-ment services are outsourced to a private provider, hence the contract rates of outsourcing service providers were consid-ered appropriate to be used in the present study [40]. All the cost estimates obtained from studies carried out before 2017 were adjusted for inflation using appropriate gross domestic product (GDP) cost deflator [41].
Costing for the counterfactual scenario was similar to the intervention, except for the price of disposable syringes. For the sake of comparability, the unit price of disposable syringes provided in the WHO report was used for the base analysis [6]. The price of procurement in Indian states was used in the sensitivity analysis. Secondly, in the counter-factual scenario, we did not consider the additional cost of training or IEC.
2.5 Modelling Health Benefits
Initially, the annual volume of injections was estimated based on the per person annual frequency of injections by sector (i.e., public, private qualified and private unqualified healthcare provider), levels of care (i.e., primary, secondary and tertiary) and nature of care (i.e., outpatient and inpatient department) [3]. As our analysis is limited to therapeutic care only, we excluded the share of preventive care from volume of injections. As a next level of stratification, the volume of injections was separated based on four routes of administration, i.e. intravenous, intramuscular, intradermal and subcutaneous. This was done in view of the fact that the risk of transmission of BBIs is dependent on the route of administration. An extensive review of the literature was
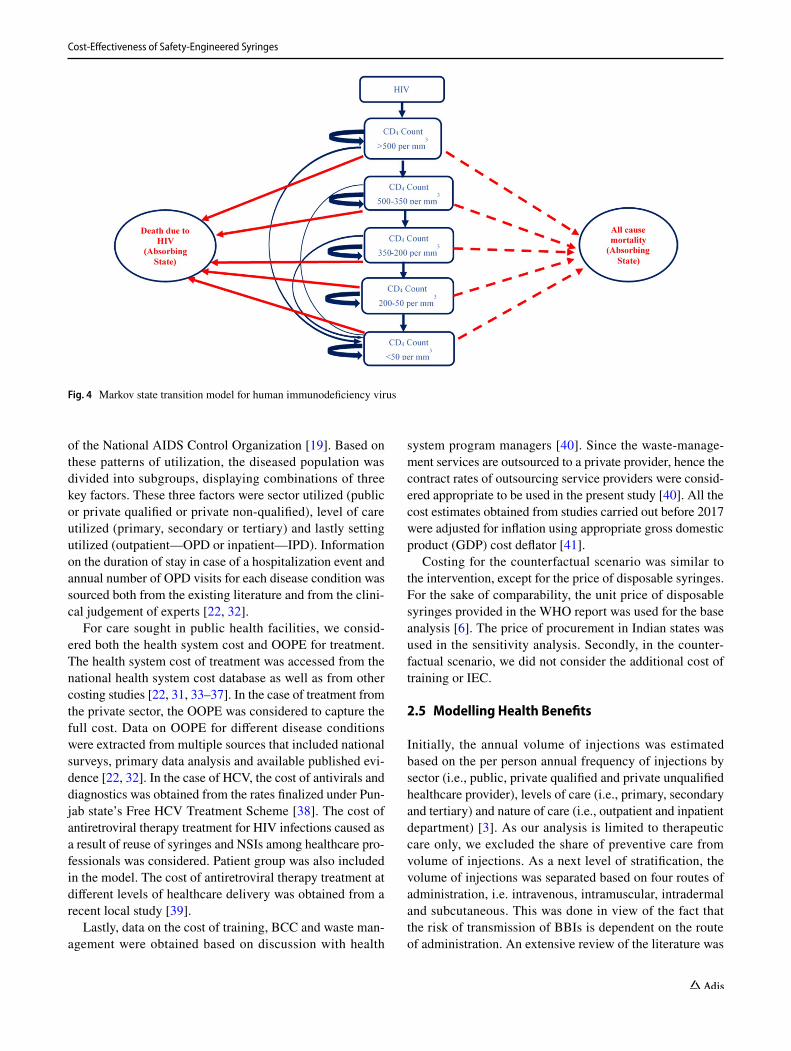
Fig. 4 Markov state transition model for human immunodeficiency virus
P. Bahuguna et al.
undertaken to obtain data on the extent and patterns of the healthcare workforce [42] (Supplementary Appendix, Sec-tion D, Table 1), morbidity rate, treatment-seeking behav-iours and patterns of care utilization [32], frequency of injec-tions [3], route of administration [43], treatment by different healthcare professionals [44], risk of NSI using a disposable syringe [44, 45], syringe reuse rates [45, 46], prevalence of HBV, HCV and HIV [47–50], risk-transmission coeffi-cient as a result of NSI or reuse [51], and all-cause mortality rates [52]. We have assumed a wide uncertainty range for transmission coefficients as there is a scarcity of reliable data in the Indian setting on the risk of HIV transmission per sex act. Sexually transmitted infections (STIs) as a co-factor increase the risk of HIV transmission three times [53, 54]. More details about parameter values and their sources are given in Table 1 (Supplementary Appendix, Section D, Table 1).
2.6 Effectiveness of Safety‑Engineered Syringes (SES) on Needle‑Stick Injuries (NSI) and Reuse
We undertook a systematic review of existing evidence for assessing the effectiveness of different SES on reduction of NSI among healthcare workers and reuse of syringes in patients compared to disposable syringes.
We included both randomized controlled trials (RCTs) and non-randomized studies (NRS) (e.g., before and after trials, time-series analysis, cohorts, case controls and quan-titative surveys) that assessed the effect of any one of the SES, such as auto-disable or auto-destruct syringes (ISO 7886-3), reuse prevention syringes (ISO 7886-4) and sharp injury prevention syringes (ISO 23908), when compared to disposable syringes not having safety features on the reduc-tion of NSI among healthcare workers.
Conference abstracts, letters to the editor, qualitative studies, reviews, case series and case reports were excluded. We also excluded studies evaluating blood collection devices (such as lancets, arterial blood syringes), winged steel nee-dles, suture needles, catheters, cannulas, port needles, and implantable needles. Studies in which both the intervention and the comparator had safety features were also excluded. Furthermore, studies that used recall methods to estimate NSIs were also excluded. Only those studies that employed objective measurements of NSI were included [55, 56]. A detailed search strategy and search terms for each search engine are described in the Supplementary Material (Sup-plementary Appendix, Section C).
2.7 Blood‑Borne Infection (BBI) Transmission
Five key factors determined the transmission of BBIs from an infected source to an uninfected recipient [57]. First, prevalence of a specific blood-borne pathogen in the source
population. Second, probability of transfer, which is the probability of the presence of a viral blood-borne pathogen in the syringe and depth of penetration of the syringe in an NSI instance. Third, probability of practice, defined as the rates of NSI and reuse. Fourth, probability of infection transmission, i.e., transmission coefficients. Fifth is prob-ability of susceptibility, which is the susceptibility marker of an exposed person in case of an adverse event based on his/her vaccination status (applicable only in case of HBV).
We also estimated the number of secondary BBIs in our analysis. Secondary BBIs were the infections transmitted from a primary case as a result of an NSI or reuse to their regular sexual partner through heterosexual intercourse. Secondary BBIs were calculated for HIV and HBV using the standard Weinstein equation [28, 58] (Supplementary Appendix, Section A, Fig. 1). The Weinstein equation esti-mates the annual probability of BBI transmission through a sexual route determined by the prevalence of BBI in partner group, type of sex act, condom use and its efficacy, and num-ber of sex partners per person. New infections contributed by NSI and syringe reuse were calculated for 20 cycles (i.e., 20 years) in the model, which were subsequently modelled to determine lifelong consequences in terms of life-years and QALYs.
2.8 Markov State Transitions
A Markov transition state model was used to calculate life-years and QALY. The natural history of progression was used to model the health state transition in every cycle. An extensive literature review was undertaken to determine the probability of transition from one state to another for three BBIs [59–68] (Supplementary Appendix, Section A, Matrix 1, 2 and 3). In situations where the rates were available for a longer time period, we assumed uniform progression dur-ing intervening cycles. Year-wise all-cause mortality rates obtained from Sample Registration System (SRS) life tables were used [52].
2.9 Quality‑of‑Life Assessment
We used the available international literature on quality-of life (QOL) scores for different health states within three dis-eases [69–71]. Choice of syringes does not directly impact the QOL scores. The use of different SES syringes has a different effectiveness in terms of prevention of NSIs and reuse episodes. This further leads to an individual reduction in the number of BBIs compared to the use of disposable syringes. A QOL score for each disease state of three BBIs (HBV, HCV and HIV) was then applied to estimate the gain in QALYs with use of each type of SES scenario. Differ-ence in QALYs in options of syringes being compared was determined by the number of BBIs in each option as a result
Cost-Effectiveness of Safety-Engineered Syringes
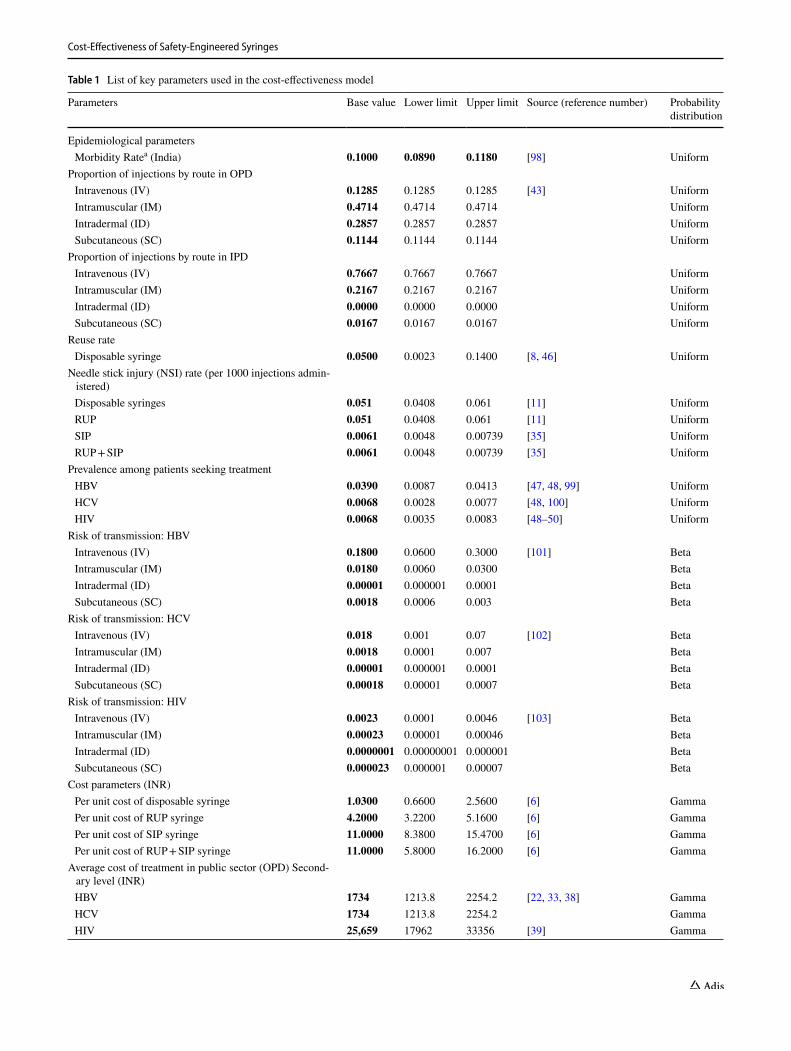
Table 1 List of key parameters used in the cost-effectiveness model
Parameters Base value Lower limit Upper limit Source (reference number) Probability distribution
Epidemiological parameters Morbidity Ratea (India) 0.1000 0.0890 0.1180 [98] Uniform
Proportion of injections by route in OPD Intravenous (IV) 0.1285 0.1285 0.1285 [43] Uniform Intramuscular (IM) 0.4714 0.4714 0.4714 Uniform Intradermal (ID) 0.2857 0.2857 0.2857 Uniform Subcutaneous (SC) 0.1144 0.1144 0.1144 Uniform
Proportion of injections by route in IPD Intravenous (IV) 0.7667 0.7667 0.7667 Uniform Intramuscular (IM) 0.2167 0.2167 0.2167 Uniform Intradermal (ID) 0.0000 0.0000 0.0000 Uniform Subcutaneous (SC) 0.0167 0.0167 0.0167 Uniform
Reuse rate Disposable syringe 0.0500 0.0023 0.1400 [8, 46] Uniform
Needle stick injury (NSI) rate (per 1000 injections admin-istered)
Disposable syringes 0.051 0.0408 0.061 [11] Uniform RUP 0.051 0.0408 0.061 [11] Uniform SIP 0.0061 0.0048 0.00739 [35] Uniform RUP + SIP 0.0061 0.0048 0.00739 [35] Uniform
Prevalence among patients seeking treatment HBV 0.0390 0.0087 0.0413 [47, 48, 99] Uniform HCV 0.0068 0.0028 0.0077 [48, 100] Uniform HIV 0.0068 0.0035 0.0083 [48–50] Uniform
Risk of transmission: HBV Intravenous (IV) 0.1800 0.0600 0.3000 [101] Beta Intramuscular (IM) 0.0180 0.0060 0.0300 Beta Intradermal (ID) 0.00001 0.000001 0.0001 Beta Subcutaneous (SC) 0.0018 0.0006 0.003 Beta
Risk of transmission: HCV Intravenous (IV) 0.018 0.001 0.07 [102] Beta Intramuscular (IM) 0.0018 0.0001 0.007 Beta Intradermal (ID) 0.00001 0.000001 0.0001 Beta Subcutaneous (SC) 0.00018 0.00001 0.0007 Beta
Risk of transmission: HIV Intravenous (IV) 0.0023 0.0001 0.0046 [103] Beta Intramuscular (IM) 0.00023 0.00001 0.00046 Beta Intradermal (ID) 0.0000001 0.00000001 0.000001 Beta Subcutaneous (SC) 0.000023 0.000001 0.00007 Beta
Cost parameters (INR) Per unit cost of disposable syringe 1.0300 0.6600 2.5600 [6] Gamma Per unit cost of RUP syringe 4.2000 3.2200 5.1600 [6] Gamma Per unit cost of SIP syringe 11.0000 8.3800 15.4700 [6] Gamma Per unit cost of RUP + SIP syringe 11.0000 5.8000 16.2000 [6] Gamma
Average cost of treatment in public sector (OPD) Second-ary level (INR)
HBV 1734 1213.8 2254.2 [22, 33, 38] Gamma HCV 1734 1213.8 2254.2 Gamma HIV 25,659 17962 33356 [39] Gamma
P. Bahuguna et al.
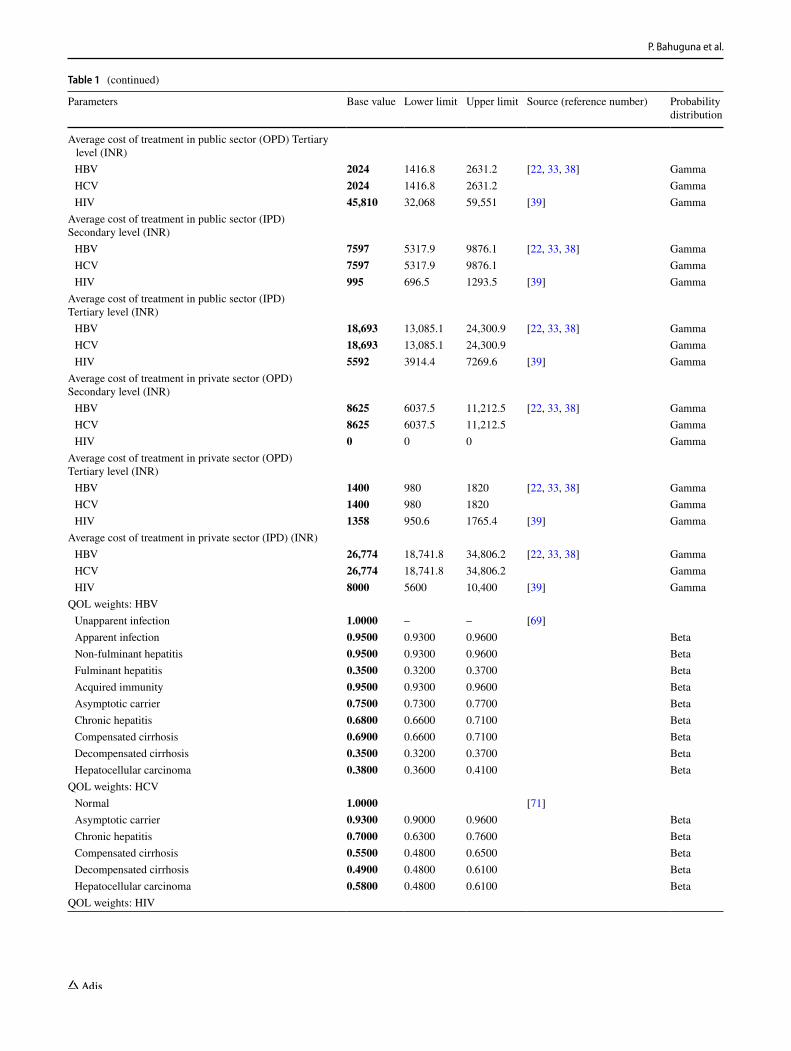
Table 1 (continued)
Parameters Base value Lower limit Upper limit Source (reference number) Probability distribution
Average cost of treatment in public sector (OPD) Tertiary level (INR)
HBV 2024 1416.8 2631.2 [22, 33, 38] Gamma HCV 2024 1416.8 2631.2 Gamma HIV 45,810 32,068 59,551 [39] Gamma
Average cost of treatment in public sector (IPD)Secondary level (INR) HBV 7597 5317.9 9876.1 [22, 33, 38] Gamma HCV 7597 5317.9 9876.1 Gamma HIV 995 696.5 1293.5 [39] Gamma
Average cost of treatment in public sector (IPD)Tertiary level (INR) HBV 18,693 13,085.1 24,300.9 [22, 33, 38] Gamma HCV 18,693 13,085.1 24,300.9 Gamma HIV 5592 3914.4 7269.6 [39] Gamma
Average cost of treatment in private sector (OPD)Secondary level (INR) HBV 8625 6037.5 11,212.5 [22, 33, 38] Gamma HCV 8625 6037.5 11,212.5 Gamma HIV 0 0 0 Gamma
Average cost of treatment in private sector (OPD)Tertiary level (INR) HBV 1400 980 1820 [22, 33, 38] Gamma HCV 1400 980 1820 Gamma HIV 1358 950.6 1765.4 [39] Gamma
Average cost of treatment in private sector (IPD) (INR) HBV 26,774 18,741.8 34,806.2 [22, 33, 38] Gamma HCV 26,774 18,741.8 34,806.2 Gamma HIV 8000 5600 10,400 [39] Gamma
QOL weights: HBV Unapparent infection 1.0000 – – [69] Apparent infection 0.9500 0.9300 0.9600 Beta Non-fulminant hepatitis 0.9500 0.9300 0.9600 Beta Fulminant hepatitis 0.3500 0.3200 0.3700 Beta Acquired immunity 0.9500 0.9300 0.9600 Beta Asymptotic carrier 0.7500 0.7300 0.7700 Beta Chronic hepatitis 0.6800 0.6600 0.7100 Beta Compensated cirrhosis 0.6900 0.6600 0.7100 Beta Decompensated cirrhosis 0.3500 0.3200 0.3700 Beta Hepatocellular carcinoma 0.3800 0.3600 0.4100 Beta
QOL weights: HCV Normal 1.0000 [71] Asymptotic carrier 0.9300 0.9000 0.9600 Beta Chronic hepatitis 0.7000 0.6300 0.7600 Beta Compensated cirrhosis 0.5500 0.4800 0.6500 Beta Decompensated cirrhosis 0.4900 0.4800 0.6100 Beta Hepatocellular carcinoma 0.5800 0.4800 0.6100 Beta
QOL weights: HIV

Cost-Effectiveness of Safety-Engineered Syringes
Table 1 (continued)
Parameters Base value Lower limit Upper limit Source (reference number) Probability distribution
CD4 cell count > 500 per mm3 0.9460 0.9240 0.9640 [70] Beta CD4 cell count between 500 and 350 per mm3 0.9330 0.9140 0.9510 Beta CD4 Cell count between 350 and 200 per mm3 0.9310 0.9140 0.9510 Beta CD4 Cell count between 200 and 50 per mm3 0.8530 0.8350 0.8650 Beta CD4 Cell count < 50 per mm3 0.7810 0.7350 0.8150 Beta
Transmission coefficientsHIV: No ART Male to female: without STD Vaginal
0.0019 0.0010 0.0037 [104] Beta
Anal 0.0169 0.0032 0.0891 [105] Beta Oral 0.0004 0.0001 0.0017 [106] Beta Male to female: with STD Vaginal
0.0057 0.0015 0.0185 [104] Beta
Anal 0.0507 0.0048 0.4455 Beta Oral 0.0012 0.0002 0.0085 Beta Female to male: without STD Vaginal
0.0010 0.0006 0.0017 [107] Beta
Anal 0.0016 0.0005 0.0290 [105] Beta Oral 0.0004 0.0001 0.0017 [106] Beta Female to male: with STD Vaginal
0.0030 0.0009 0.0085 [104] Beta
Anal 0.0048 0.0008 0.1450 Beta Oral 0.0012 0.0002 0.0085 Beta
HBV: without treatment Male to female: without STD Vaginal
0.0236 0.0182 0.0288 [108] and author calculations Beta
Anal 0.0393 0.0304 0.0496 Beta Oral 0.0078 0.0067 0.0112 Beta Male to female: with STD Vaginal
0.0708 0.0354 0.1181 Beta
Anal 0.1181 0.0591 0.1969 Beta Oral 0.0236 0.0118 0.0394 Beta Female to male: without STD Vaginal
0.0236 0.0182 0.0288 Beta
Anal 0.0393 0.0394 0.0394 Beta Oral 0.0078 0.0067 0.0112 Beta Female to male: with STD Vaginal
0.0708 0.0354 0.1181 Beta
Anal 0.1181 0.0591 0.1969 Beta Oral 0.0236 0.0118 0.0394 Beta
Coverage parameters Coverage of HBV vaccination among healthcare workers
(HCW)0.5024 0.2576 0.7200 [109, 110] Uniform
Coverage of HBV vaccination among general population 0.0500 0.0200 0.1000 [111] UniformEffectiveness parameters Reduction in NSI with RUP 0.4000 0.2700 0.5900 Systematic review was
done separately for these parameters
Normal Reduction in NSI with SIP 0.1200 0.0400 0.4100 Normal
Efficacy of vaccine HBV Vaccine 0.8000 0.7000 0.9500 [112] Uniform Post exposure prophylaxis—HIV 0.8000 0.7000 0.9000 [19] Uniform

P. Bahuguna et al.
of variation in effectiveness in preventing NSIs and reuse episodes.
2.10 Data Analysis
We report the results in terms of incremental cost (INR) per life-year and QALY gained with use of RUP, SIP and RUP + SIP compared to disposable syringes for both India and Punjab state.
We use a one-time per capita GDP (i.e., INR 120,000) as the threshold to determine the cost-effectiveness of SES options. The threshold of three times the per capita GDP provided by the WHO Commission on Macroeconomics and Health was predominantly used for decisions pertain-ing to cost-effectiveness of intervention/technology. As per the recent development, WHO has disavowed its guidance on thresholds and recommended avoiding its use as criteria for cost-effectiveness in national funding decisions [72]. Empirical estimations of a cost-effectiveness threshold car-ried out by a recent study suggest it is below a one-time GDP for most low- and middle-income countries [73]. A recent systematic review carried out for assessing the quality of economic evaluations in India reveals that the majority of studies used a one-time GDP per capita as the cost-effective-ness threshold [74]. Moreover, in the Indian context, recent cost-effectiveness studies used per capita GDP as the thresh-old [75–78]. Lastly, the methodological guidelines of India’s health technology assessment (HTA) agency recommend the use of a one-time per capita GDP as the criterion for cost-effectiveness [79]. Hence, we used the same approach in the present study.
We undertook a univariate and probabilistic sensitiv-ity analysis (PSA) to account for the effect of parameter uncertainties. Univariate sensitivity analysis was performed to assess the impact of uncertainty in key parameters on cost-effectiveness of SES syringes taking the case of a RUP syringe. We varied parameters like the NSI rate; reuse rate; morbidity rate; annual volume of injections; prevalence of HBV, HCV and HIV; risk of transmission of HBV, HCV and HIV; and cost of SES for this sensitivity analysis. These parameters were varied as per the uncertainty ranges reported in the parameter tables in the Supplementary Mate-rial (Supplementary Appendix, Section D, Tables 1 and 2).
Findings from this sensitivity analysis are reported as per-centage change in the value of the incremental cost-effec-tiveness ratio (ICER).
A threshold analysis was undertaken to determine the price at which SES is cost-effective and cost-saving/domi-nant. In the PSA, a gamma distribution was used for cost parameters, beta distribution for transmission and transi-tion probabilities, normal distribution for SES effectiveness parameters, and uniform distribution for the remaining input parameters [80–83]. The model was simulated 999 times and the percentile method was used to generate the 95% confidence interval (CI) for base estimate.
3 Results
3.1 Effectiveness of SES on NSI
A detailed PRISMA flow diagram for study selection is pro-vided in the Supplementary Appendix. Full-text screening was done for 94 studies. Finally, a total of 12 articles were included in systematic review (Supplementary Appendix, Section C, Table 1). Included studies reported the number of NSIs per device used, number of NSIs per healthcare worker (HCW) involved and number of NSIs per hours the HCW worked. Studies of varying study designs and of different denominators were pooled separately.
In case of SIP syringes, we found the majority of the studies reported the results for reduction in NSIs in terms of HCW (i.e., NSI per HCW) [55, 56, 84–86]. These studies were not considered appropriate, as such an outcome indica-tor would then be context-dependent and heavily influenced by the volume of injections per HCW. A setting with a high or low volume of injections would automatically have a higher or lower baseline risk for NSI, respectively.
One study with a large sample size and of high quality that reported the impact of SES on NSI rate per 100 injec-tions was considered appropriate for use in the decision model (relative risk 0.12; 95% CI 0.04–0.41) [35].
For RUP syringes, only one study was identified. This was an uncontrolled before-and-after study that reported a statistically significant reduction in NSIs per HCW after the introduction of SES (relative risk 0.40; 95% CI 0.27–0.59)
Table 1 (continued)
Parameters Base value Lower limit Upper limit Source (reference number) Probability distribution
Post exposure prophylaxis—HBV 0.8000 0.7000 0.9000 [19] Uniform
HBV hepatitis B virus, HCV hepatitis C virus, HIV human immunodeficiency virus, STD sexually transmitted disease, NSI needle-stick injury, SIP sharp injury prevention, ART antiretroviral treatment, QOL quality of life, OPD outpatient department, IPD inpatient department, INR Indian National Rupee, RUP reuse prevention syringea Proportion of ailing persons (per 1000) during last 15 days
Cost-Effectiveness of Safety-Engineered Syringes
[56]. In the absence of any other study, we used the estimate reported in this study.
3.2 Costs
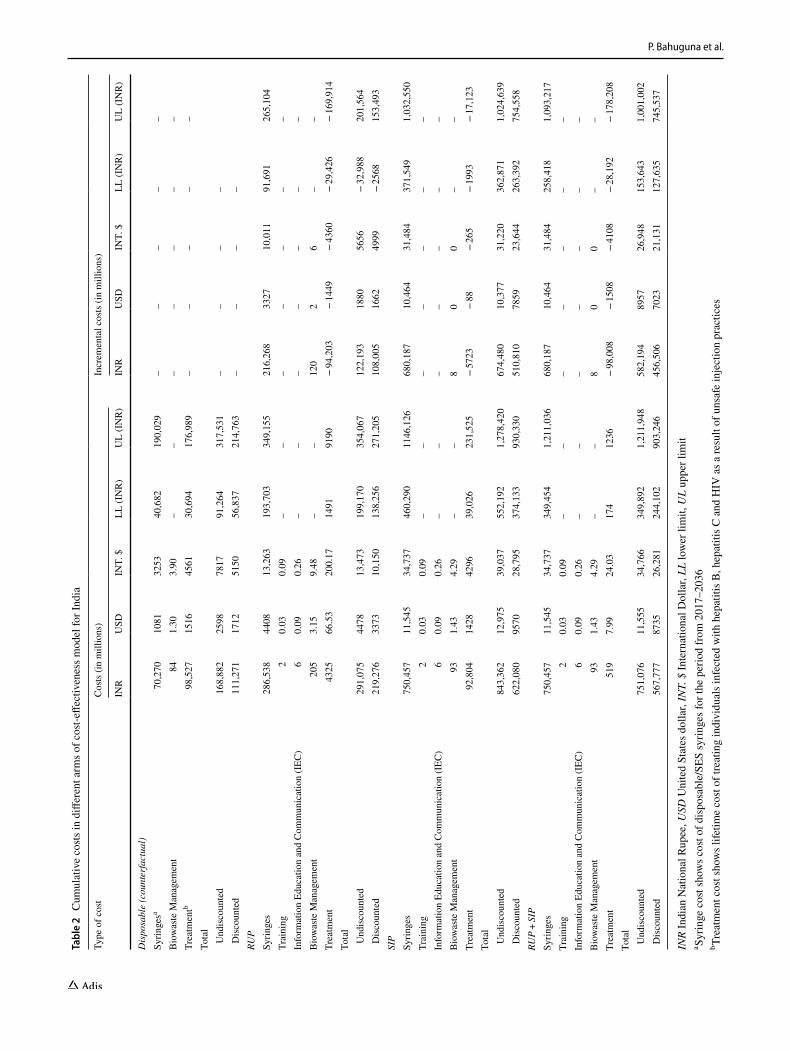
At the national level, the annual cost of disposable syringes for therapeutic care is INR 3.34 billion (US$51.5 million). The introduction of RUP incurs an incremental cost of INR 10.3 billion (US$158 million) and INR 32.4 billion (US$498 million) per year both for SIP and for RUP + SIP. Implement-ing SES will save INR 4.7 billion (US$72.4 million), INR 0.286 billion (US$4.4 million) and INR 4.9 billion (US$75.3 million) annually with the use of RUP, SIP and RUP + SIP, respectively, based on treatment cost averted. Considering a lifetime horizon, the implementation of SES will result in an incremental cost of INR 1080 billion (US$16.62 billion), INR 5108 billion (US$78.59 billion) and INR 4565 billion (US$70.23 billion), with use of RUP, SIP and RUP + SIP, respectively (Table 2).
At the Punjab state level, introduction of SES will incur an incremental cost of INR 226 million (US$3.4 million) for RUP, and INR 710 million (US$10.9 million) for both SIP and RUP + SIP per year, respectively. The annual treat-ment cost savings with the introduction of RUP, SIP and RUP + SIP was found to be INR 62.5 million (US$0.96 mil-lion), INR 2.76 million (US$0.04 million) and INR 62.5 mil-lion (US$0.96 million), respectively. Other detailed findings on lifetime cost are available in the Supplementary Material (Supplementary Appendix, Section E, Table 1).
3.3 Health Outcomes
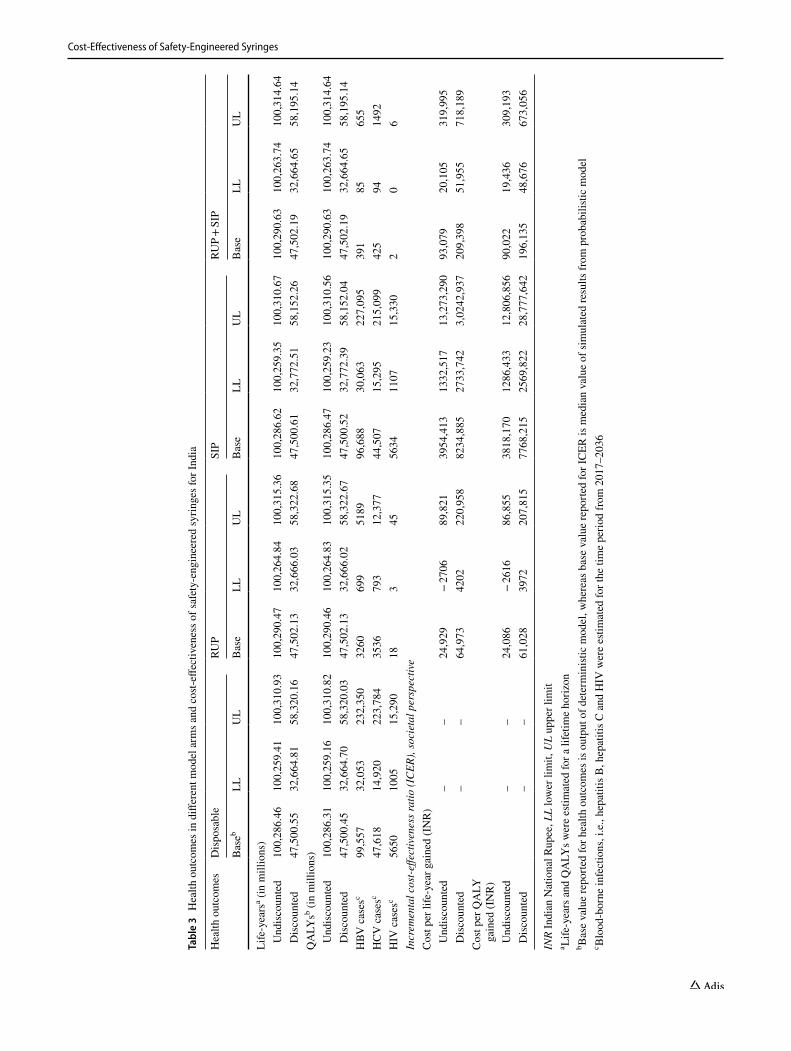
Our model estimated that if the current injection practices are continued for the next 20 years, there will be 99,557, 47,618 and 5650 new cases of HBV, HCV and HIV, respec-tively, which are attributable to NSI and reuse (Table 3). Introduction of SIP and RUP + SIP will result in prevention of NSIs by 87%. Implementing RUP, SIP and RUP + SIP will prevent new BBIs due to unsafe injections by 96%, 3.9% and 99%, respectively. Discounting the future outcomes at 3%, the reduction in BBIs results in an increase of 1.58, 0.062 and 1.64 million life-years; and 1.67, 0.066 and 1.74 mil-lion QALYs with RUP, SIP and RUP + SIP, respectively (Table 3). From the Punjab state perspective, a reduction in BBI incidence with use of RUP, SIP and RUP + SIP will result in a gain of 19.8, 0.9 and 20.7 thousand life-years and 20.9, 0.96 and 21.9 thousand QALYs, respectively (Sup-plementary Appendix, Section E, Table 2).
3.4 Cost‑Effectiveness
Introduction of RUP, SIP and RUP + SIP in India will incur an incremental cost of INR 61,028 (US$939), INR
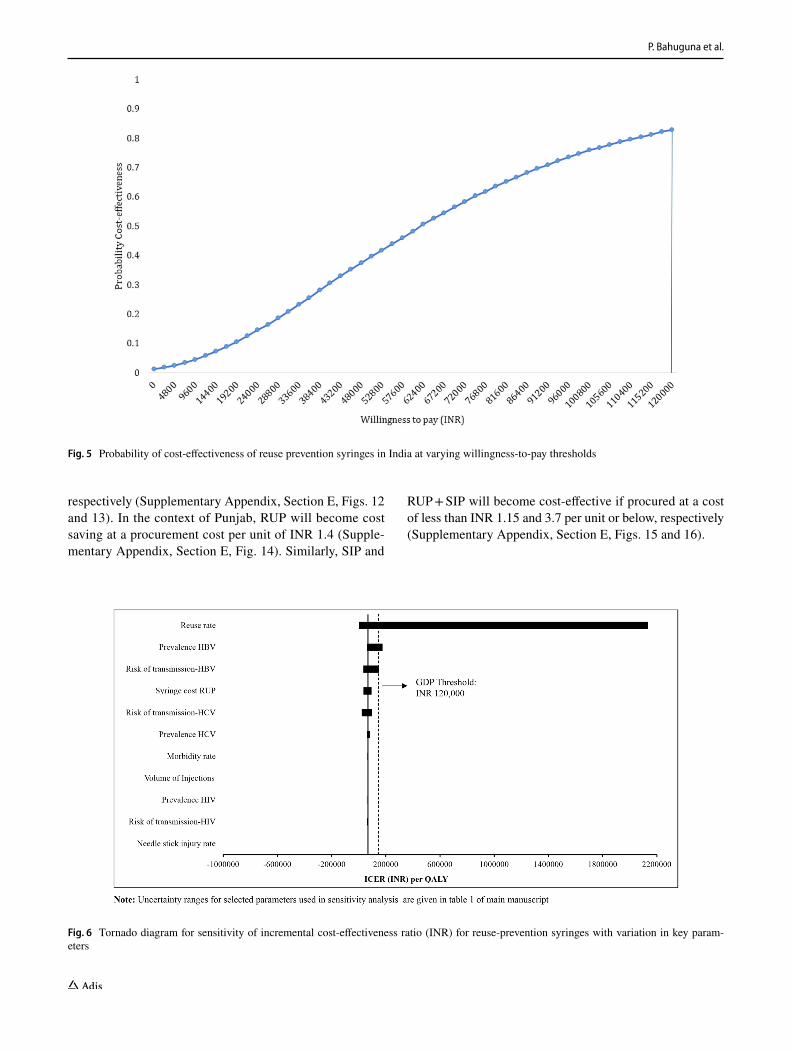
7,768,215 (US$119,511) and INR 196,135 (US$3017) per QALY gained, respectively (Table 3). There is an 84% probability for RUP to be cost-effective at a willing-to-pay threshold of GDP of India, i.e., INR 120,000 (Fig. 5 and Supplementary Appendix, Section E, Fig. 1). While SIP has a zero probability of being cost-effective, there is only 23% probability for RUP + SIP to be cost-effective at a willingness-to-pay threshold of one-time GDP per capita (Supplementary Appendix, Section E, Figs. 2, 3, 4 and 5). We tested the stabilisation of results with 9999 simula-tions for RUP option. Findings from this analysis showed that RUP remains cost-effective with an incremental cost of INR 61,835 (US$951) per QALY gained, which has an 83% probability to be cost-effective at a per capita GDP threshold.
Similarly, with an incremental cost of INR 28,668 (US$441) per QALY gained, there is a 96.5% probability for RUP to be cost-effective in Punjab (Supplementary Appen-dix, Section E, Table 2 and Figs. 6 and 7). The incremen-tal cost per QALY gained with use of SIP and RUP + SIP in Punjab was found to be INR 5,978,654 (US$91,979) and INR 142,594 (US$2194), respectively (Supplemen-tary Appendix, Section E, Table 2 and Figs. 8 and 9). At a willingness-to-pay threshold of one-time GDP per capita of state, SIP is not cost-effective and there is a 40% probability of RUP + SIP to be cost-effective (Supplementary Appendix, Section E, Figs. 10 and 11).
3.5 Univariate Sensitivity Analysis
ICER per QALY gained was sensitive to change in reuse rate [3032% for lower limit (LL), − 97% for upper limit (UL)]; prevalence of HBV (158% for LL, − 11% for UL); risk of transmission of HBV (116% for LL, − 51% for UL) and HCV (45% for LL, − 68% for UL); and cost of RUP (− 49% for LL, 38% for UL) (Fig. 6). The RUP strategy for therapeutic care become cost-ineffective with reduction in reuse rate, HBV prevalence and risk of transmission of HBV as per the lower limits reported in Supplementary Material (Supplementary Appendix, Section D, Table 1). ICER per QALY gained was least sensitive to change in NSI rate (0.6% for LL, − 0.6% for UL); morbidity rate (6.6% for LL, − 6.7% for UL); volume of injections (5.2% for LL, − 5.3% for UL); prevalence of HCV (22% for LL, − 10% for UL) and HIV (3% for LL, − 6% for UL); and risk of transmission of HIV (0.7% for LL, − 9.7% for UL) (Fig. 6).
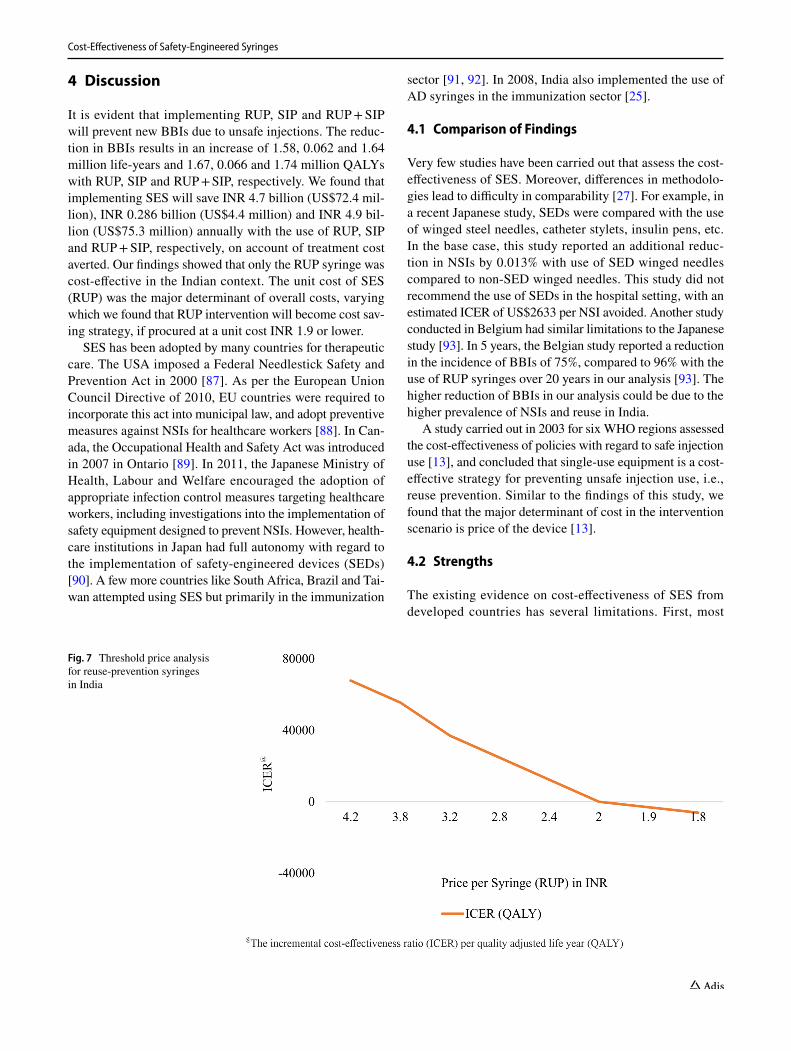
3.6 Threshold Analysis
We found that the RUP syringe will be cost saving at a unit price of INR 1.9, which is 45% of the base-case unit price of INR 4.2 (Fig. 7). The SIP and RUP + SIP syringes are cost-effective only at a unit price less than INR 1.2 and INR 5.9,
P. Bahuguna et al.
Tabl
e 2
Cum
ulat
ive
costs
in d
iffer
ent a
rms o
f cos
t-effe
ctiv
enes
s mod
el fo
r Ind
ia
INR
Indi
an N
atio
nal R
upee
, USD
Uni
ted
Stat
es d
olla
r, IN
T. $
Inte
rnat
iona
l Dol
lar,
LL lo
wer
lim
it, U
L up
per l
imit
a Syrin
ge c
ost s
how
s cos
t of d
ispo
sabl
e/SE
S sy
ringe
s for
the
perio
d fro
m 2
017–
2036
b Trea
tmen
t cos
t sho
ws l
ifetim
e co
st of
trea
ting
indi
vidu
als i
nfec
ted
with
hep
atiti
s B, h
epat
itis C
and
HIV
as a
resu
lt of
uns
afe
inje
ctio
n pr
actic
es
Type
of c
ost
Cos
ts (i
n m
illio
ns)
Incr
emen
tal c
osts
(in
mill
ions
)
INR
USD
INT.
$LL
(IN
R)
UL
(IN
R)
INR
USD
INT.
$LL
(IN
R)
UL
(IN
R)
Dis
posa
ble
(cou
nter
fact
ual)
Syrin
gesa
70,2
7010
8132
5340
,682
190,
029
––
––
–B
iow
aste
Man
agem
ent
841.
303.
90–
––
––
––
Trea
tmen
tb98
,527
1516
4561
30,6
9417
6,98
9–
––
––
Tota
l U
ndis
coun
ted
168,
882
2598
7817
91,2
6431
7,53
1–
––
– D
isco
unte
d11
1,27
117
1251
5056
,837
214,
763
––
––
RUP
Syrin
ges
286,
538
4408
13,2
6319
3,70
334
9,15
521
6,26
833
2710
,011
91,6
9126
5,10
4Tr
aini
ng2
0.03
0.09
––
––
––
–In
form
atio
n Ed
ucat
ion
and
Com
mun
icat
ion
(IEC
)6
0.09
0.26
––
––
––
–B
iow
aste
Man
agem
ent
205
3.15
9.48
––
120
26
––
Trea
tmen
t43
2566
.53
200.
1714
9191
90−
94,2
03−
1449
− 43
60−
29,4
26−
169,
914
Tota
l U
ndis
coun
ted
291,
075
4478
13,4
7319
9,17
035
4,06
712
2,19
318
8056
56−
32,9
8820
1,56
4 D
isco
unte
d21
9,27
633
7310
,150
138,
256
271,
205
108,
005
1662
4999
− 25
6815
3,49
3SI
PSy
ringe
s75
0,45
711
,545
34,7
3746
0,29
011
46,1
2668
0,18
710
,464
31,4
8437
1,54
91,
032,
550
Trai
ning
20.
030.
09–
––
––
––
Info
rmat
ion
Educ
atio
n an
d C
omm
unic
atio
n (I
EC)
60.
090.
26–
––
––
––
Bio
was
te M
anag
emen
t93
1.43
4.29
––
80
0–
–Tr
eatm
ent
92,8
0414
2842
9639
,026
231,
525
− 57
23−
88−
265
− 19
93−
17,1
23To
tal
Und
isco
unte
d84
3,36
212
,975
39,0
3755
2,19
21,
278,
420
674,
480
10,3
7731
,220
362,
871
1,02
4,63
9 D
isco
unte
d62
2,08
095
7028
,795
374,
133
930,
330
510,
810
7859
23,6
4426
3,39
275
4,55
8RU
P +
SIP
Syrin
ges
750,
457
11,5
4534
,737
349,
454
1,21
1,03
668
0,18
710
,464
31,4
8425
8,41
81,
093,
217
Trai
ning
20.
030.
09–
––
––
––
Info
rmat
ion
Educ
atio
n an
d C
omm
unic
atio
n (I
EC)
60.
090.
26–
––
––
––
Bio
was
te M
anag
emen
t93
1.43
4.29
––
80
0–
–Tr
eatm
ent
519
7.99
24.0
317
412
36−
98,0
08−
1508
− 41
08−
28,1
92−
178,
208
Tota
l U
ndis
coun
ted
751,
076
11,5
5534
,766
349,
892
1,21
1,94
858
2,19
489
5726
,948
153,
643
1,00
1,00
2 D
isco
unte
d56
7,77
787
3526
,281
244,
102
903,
246
456,
506
7023
21,1
3112
7,63
574
5,53
7
Cost-Effectiveness of Safety-Engineered Syringes
Tabl
e 3
Hea
lth o
utco
mes
in d
iffer
ent m
odel
arm
s and
cos
t-effe
ctiv
enes
s of s
afet
y-en
gine
ered
syrin
ges f
or In
dia
INR
Indi
an N
atio
nal R
upee
, LL
low
er li
mit,
UL
uppe
r lim
ita Li
fe-y
ears
and
QA
LYs w
ere
estim
ated
for a
life
time
horiz
onb B
ase
valu
e re
porte
d fo
r hea
lth o
utco
mes
is o
utpu
t of d
eter
min
istic
mod
el, w
here
as b
ase
valu
e re
porte
d fo
r IC
ER is
med
ian
valu
e of
sim
ulat
ed re
sults
from
pro
babi
listic
mod
elc B
lood
-bor
ne in
fect
ions
, i.e
., he
patit
is B
, hep
atiti
s C a
nd H
IV w
ere
estim
ated
for t
he ti
me
perio
d fro
m 2
017–
2036
Hea
lth o
utco
mes
Dis
posa
ble
RUP
SIP
RUP
+ S
IP
Bas
ebLL
UL
Bas
eLL
UL
Bas
eLL
UL
Bas
eLL
UL
Life
-yea
rsa (i
n m
illio
ns)
Und
isco
unte
d10
0,28
6.46
100,
259.
4110
0,31
0.93
100,
290.
4710
0,26
4.84
100,
315.
3610
0,28
6.62
100,
259.
3510
0,31
0.67
100,
290.
6310
0,26
3.74
100,
314.
64 D
isco
unte
d47
,500
.55
32,6
64.8
158
,320
.16
47,5
02.1
332
,666
.03
58,3
22.6
847
,500
.61
32,7
72.5
158
,152
.26
47,5
02.1
932
,664
.65
58,1
95.1
4Q
ALY
sb (in
mill
ions
) U
ndis
coun
ted
100,
286.
3110
0,25
9.16
100,
310.
8210
0,29
0.46
100,
264.
8310
0,31
5.35
100,
286.
4710
0,25
9.23
100,
310.
5610
0,29
0.63
100,
263.
7410
0,31
4.64
Dis
coun
ted
47,5
00.4
532
,664
.70
58,3
20.0
347
,502
.13
32,6
66.0
258
,322
.67
47,5
00.5
232
,772
.39
58,1
52.0
447
,502
.19
32,6
64.6
558
,195
.14
HBV
cas
esc
99,5
5732
,053
232,
350
3260
699
5189
96,6
8830
,063
227,
095
391
8565
5H
CV
cas
esc
47,6
1814
,920
223,
784
3536
793
12,3
7744
,507
15,2
9521
5,09
942
594
1492
HIV
cas
esc
5650
1005
15,2
9018
345
5634
1107
15,3
302
06
Incr
emen
tal c
ost-e
ffect
iven
ess r
atio
(IC
ER),
soci
etal
per
spec
tive
Cos
t per
life
-yea
r gai
ned
(IN
R)
Und
isco
unte
d–
–24
,929
− 27
0689
,821
3954
,413
1332
,517
13,2
73,2
9093
,079
20,1
0531
9,99
5 D
isco
unte
d–
–64
,973
4202
220,
958
8234
,885
2733
,742
3,02
42,9
3720
9,39
851
,955
718,
189
Cos
t per
QA
LY
gain
ed (I
NR
) U
ndis
coun
ted
––
24,0
86−
2616
86,8
5538
18,1
7012
86,4
3312
,806
,856
90,0
2219
,436
309,
193
Dis
coun
ted
––
61,0
2839
7220
7,81
577
68,2
1525
69,8
2228
,777
,642
196,
135
48,6
7667
3,05
6
P. Bahuguna et al.
respectively (Supplementary Appendix, Section E, Figs. 12 and 13). In the context of Punjab, RUP will become cost saving at a procurement cost per unit of INR 1.4 (Supple-mentary Appendix, Section E, Fig. 14). Similarly, SIP and
RUP + SIP will become cost-effective if procured at a cost of less than INR 1.15 and 3.7 per unit or below, respectively (Supplementary Appendix, Section E, Figs. 15 and 16).
Fig. 5 Probability of cost-effectiveness of reuse prevention syringes in India at varying willingness-to-pay thresholds
Fig. 6 Tornado diagram for sensitivity of incremental cost-effectiveness ratio (INR) for reuse-prevention syringes with variation in key param-eters
Cost-Effectiveness of Safety-Engineered Syringes
4 Discussion
It is evident that implementing RUP, SIP and RUP + SIP will prevent new BBIs due to unsafe injections. The reduc-tion in BBIs results in an increase of 1.58, 0.062 and 1.64 million life-years and 1.67, 0.066 and 1.74 million QALYs with RUP, SIP and RUP + SIP, respectively. We found that implementing SES will save INR 4.7 billion (US$72.4 mil-lion), INR 0.286 billion (US$4.4 million) and INR 4.9 bil-lion (US$75.3 million) annually with the use of RUP, SIP and RUP + SIP, respectively, on account of treatment cost averted. Our findings showed that only the RUP syringe was cost-effective in the Indian context. The unit cost of SES (RUP) was the major determinant of overall costs, varying which we found that RUP intervention will become cost sav-ing strategy, if procured at a unit cost INR 1.9 or lower.
SES has been adopted by many countries for therapeutic care. The USA imposed a Federal Needlestick Safety and Prevention Act in 2000 [87]. As per the European Union Council Directive of 2010, EU countries were required to incorporate this act into municipal law, and adopt preventive measures against NSIs for healthcare workers [88]. In Can-ada, the Occupational Health and Safety Act was introduced in 2007 in Ontario [89]. In 2011, the Japanese Ministry of Health, Labour and Welfare encouraged the adoption of appropriate infection control measures targeting healthcare workers, including investigations into the implementation of safety equipment designed to prevent NSIs. However, health-care institutions in Japan had full autonomy with regard to the implementation of safety-engineered devices (SEDs) [90]. A few more countries like South Africa, Brazil and Tai-wan attempted using SES but primarily in the immunization
sector [91, 92]. In 2008, India also implemented the use of AD syringes in the immunization sector [25].
4.1 Comparison of Findings
Very few studies have been carried out that assess the cost-effectiveness of SES. Moreover, differences in methodolo-gies lead to difficulty in comparability [27]. For example, in a recent Japanese study, SEDs were compared with the use of winged steel needles, catheter stylets, insulin pens, etc. In the base case, this study reported an additional reduc-tion in NSIs by 0.013% with use of SED winged needles compared to non-SED winged needles. This study did not recommend the use of SEDs in the hospital setting, with an estimated ICER of US$2633 per NSI avoided. Another study conducted in Belgium had similar limitations to the Japanese study [93]. In 5 years, the Belgian study reported a reduction in the incidence of BBIs of 75%, compared to 96% with the use of RUP syringes over 20 years in our analysis [93]. The higher reduction of BBIs in our analysis could be due to the higher prevalence of NSIs and reuse in India.
A study carried out in 2003 for six WHO regions assessed the cost-effectiveness of policies with regard to safe injection use [13], and concluded that single-use equipment is a cost-effective strategy for preventing unsafe injection use, i.e., reuse prevention. Similar to the findings of this study, we found that the major determinant of cost in the intervention scenario is price of the device [13].
4.2 Strengths
The existing evidence on cost-effectiveness of SES from developed countries has several limitations. First, most
Fig. 7 Threshold price analysis for reuse-prevention syringes in India
P. Bahuguna et al.
studies estimated the incremental costs of introducing SES per NSI averted but did not quantify benefits in terms of LY or QALY [13, 27, 93, 94]. Moreover, with different base-line NSI rates between India and other developed countries, such estimates on cost-effectiveness are not generalizable. Second, these studies did not consider reuse prevention to model benefits of SES introduction [27, 93, 94]. In contrast, India has a high incidence of syringe reuse, and hence this needs to be incorporated [45, 46]. Third, the majority of studies were undertaken using a hospital perspective [27, 93, 94]; however, an Indian analysis needs to take a societal perspective, given the patterns of health financing, which is largely driven by OOP expenditure. We corrected all these limitations in our analysis. Lastly, we also modelled the sec-ondary HBV and HIV infections transmitted through the heterosexual route among the partner population of those who get infected as a result of unsafe injection use.
4.3 Limitations
First, though we considered a societal perspective for this evaluation, we did not account for the productivity losses for treatment of BBIs or premature mortality due to unsafe injection use among the HCP and patient population. Second, our model does not account for dynamic effects in terms of natural reduction in the prevalence of BBIs among the popu-lation in future years. Third, the pattern of unsafe (or safe) practices is dependent on the number of years of experience of a HCP and, so, NSI rates may vary with varying years of experience [95–97]. However, we considered an average risk of NSIs. Fourth, though we modelled secondary infections for BBIs through heterosexual intercourse among the spouses of the population infected due to unsafe injection, we did not consider other modes of transmission such as needle shar-ing or homosexual intercourse. Moreover, due to insufficient data, we did not model secondary infections due to HCV. Fifth, due to the unavailability of QOL data in the Indian context, we used the international data on QOL scores for the health states in three diseases considered. Furthermore, we did not have enough resources to carry out primary data collection for QOL assessment in our study. Lastly, there is a need for better estimates on reuse rates because cost-effectiveness of RUP is primarily attributable to prevention of reuse of syringes. Currently the data are available for only a few states with high variation. More research is recom-mended to address these limitations in future.
5 Conclusion and Recommendations
Our findings suggest RUP use for therapeutic care is cost-effective in the Indian context. However, SIP and RUP + SIP are not cost-effective at current prices. In view of the above
conclusions, RUP should be considered for therapeutic care in India. The price of these SES should be reduced either through price negotiation using bulk purchasing or through price regulation by central agencies such as NPPA.
Author Contributions Study Concept: SP, RKD, CL, HDG, HB. Study Design: SP, PB. Project Administration: SP, RKD, AKA. Decision Model: SP, PB, RKD, AKA. Review of Literature: SP, PB, VS. Data Inputs: RKD, MPK, RB, AKA. Mathematical model: PB, SP. Vali-dation of Estimates: SP, RKD, CL, MPK, AKA. First draft: PB, SP. Review and Editing: SP, PB, CL, RKD, MPK, AKA, RB, HDG, HB, VS.
Availability of Data and Material All the data are provided in the main manuscript and Supplementary Material.
Compliance with Ethical Standards
Funding Funding was provided by World Health Organization, Coun-try Office for India (Grant no. 201694601).
Ethical approval The study was approved by the Institute Ethics Committee of the Post Graduate Institute of Medical Education and Research, Chandigarh, India. There was no involvement of patients and public in the study and no patient interviews were conducted for this study. The study was funded by the World Health Organization (WHO), India Country Office. Chandrakant Lahariya, Hilde De Graeve and Henk Bekedam are employees of WHO. However, the views and opinion expressed in this manuscript cannot be attributed to WHO.
Conflict of interest Pankaj Bahuguna, Shankar Prinja, R.K. Dhiman, Madhumita Prem Kumar, Vineeta Sharma, A.K. Aggarwal and Rajesh Bhaskar declare they have no conflicts of interest.
Open Access This article is distributed under the terms of the Crea-tive Commons Attribution-NonCommercial 4.0 International License (http://creat iveco mmons .org/licen ses/by-nc/4.0/), which permits any noncommercial use, distribution, and reproduction in any medium, provided you give appropriate credit to the original author(s) and the source, provide a link to the Creative Commons license, and indicate if changes were made.
References
1. Atul K, Priya R, Thakur R, Gupta V, Kotwal J, Seth T. Injection practices in a metropolis of North India: perceptions, determi-nants and issues of safety. Indian J Med Sci. 2004;58(8):334–44.
2. Handbook on safe injection practices. In: Control NCFD, editor. New Delhi: GOI; 2014.
3. Arora N. Injection practices in India. WHO South East Asia J Public Health. 2012;1(2):189–200.
4. Network, Safe Injection Global. Advocacy booklet. Switzerland: World Health Organization. 2011. p. 1–25
5. Gupta E, Bajpai M, Sharma P, Shah A, Sarin S. Unsafe injec-tion practices: a potential weapon for the outbreak of blood borne viruses in the community. Ann Med Health Sci Res. 2013;3(2):177.
6. World Health Organization. WHO guideline on the use of safety-engineered syringes for intramuscular, intradermal and subcuta-neous injections in health care settings. World Health Organiza-tion; 2016.
Cost-Effectiveness of Safety-Engineered Syringes
7. Solberg KE. Trade in medical waste causes deaths in India. Lan-cet. 2009;373(9669):1067.
8. Garapati SPS. Assessment of knowledge and practices on injec-tion safety among service providers in east Godavari district of Andhra Pradesh. Indian J Comm Health. 2014;26(3):259–63.
9. Gaidhane A, Quazi Syed Z. Injection practices in India IPEN Study Group. WHO South East Asia J Public Health. 2012;1:189–200.
10. Pandit N, Choudhary S. Unsafe injection practices in Gujarat, India. Singap Med J. 2008;49(11):936.
11. Gita N, Rao N. Needle stick injuries in a tertiary care hospital in India: observations from a clinical audit. Int J Res Med Sci. 2017;5:2938–42.
12. Sikora C, Chandran AU, Joffe AM, Johnson D, Johnson M. Population risk of syringe reuse: estimating the probability of transmitting bloodborne disease. Infect Control Hosp Epidemiol. 2010;31(7):748–54.
13. Dziekan G, Chisholm D, Johns B, Rovira J, Hutin Y. The cost-effectiveness of policies for the safe and appropriate use of injection in healthcare settings. Bull World Health Organ. 2003;81:277–85.
14. Harb AC, Tarabay R, Diab B, Ballout RA, Khamassi S, Akl EA. Safety engineered injection devices for intramuscular, subcutane-ous and intradermal injections in healthcare delivery settings: a systematic review and meta-analysis. BMC Nurs. 2015;14(1):71.
15. Batham A, Narula D, Toteja T, Sreenivas V, Puliyel JM. Sys-tematic review and meta-analysis of prevalence of hepatitis B in India. Indian Pediatr. 2007;44(9):663.
16. Lahariya C, Subramanya B, Sosler S. An assessment of hepatitis B vaccine introduction in India: lessons for roll out and scale up of new vaccines in immunization programs. Indian J Public Health. 2013;57(1):8.
17. Nandi J, Bhawalkar V, Mody H, Elavia A, Desai PK, Banerjee K. Detection of HIV-1, HBV and HCV antibodies in blood donors from Surat, Western India. Vox Sang. 1994;67(4):406–7.
18. Sood A, Suryaprasad A, Trickey A, Kanchi S, Midha V, Foster M, et al. The burden of hepatitis C virus infection in Punjab, India: a population-based serosurvey. PLoS One. 2018;13(7):e0200461.
19. National AIDS Control Organization & ICMR-National Institute of Medical Statistics (2018). HIV Estimations 2017: Technical Report. New Delhi: NACO, Ministry of Health and Family Wel-fare, Government of India. Available at: http://naco.gov.in/sites /defau lt/file/HIV%20Est imati ons%20201 7%20Rep ort_1.pdf.
20. GoI. National Health Policy-2017. Ministry of Health and Family Welfare. Government of India. 2017. Available at: https ://mohfw .gov.in/docum ents/polic y.
21. MOHFW. National Health Accounts: Estimates for India 2013–14. National Health Accounts Technical Secretariat (NHATS). National Health Systems Resource Centre (NHSRC). Ministry of Health and Family Welfare (MoHFW). Government of India. New Delhi; 2016.
22. Prinja S, Bahuguna P, Duseja A, Kaur M, Chawla YK. Cost of intensive care treatment for liver disorders at tertiary care level in India. PharmacoEconomics Open. 2018;2(2):179–90.
23. Prinja S, Kanavos P, Kumar R. Health care inequities in north India: role of public sector in universalizing health care. Indian J Med Res. 2012;136:421–31.
24. Prinja S, Kumar M, Pinto A, Jan S, Kumar R. Equity in hospital services utilization in India. Econ Polit Wkly. 2013;XLVIII(2):52–8.
25. Reid S. Estimating the burden of disease from unsafe injections in India: a cost–benefit assessment of the auto-disable syringe in a country with low blood-borne virus prevalence. Indian J Community Med. 2012;37(2):89–94.
26. Prinja S, Downey LE, Gauba VK, Swaminathan S. Health tech-nology assessment for policy making in India: current scenario and way forward. New York: Springer; 2018.
27. Fukuda H, Moriwaki K. Cost-effectiveness analysis of safety-engineered devices. Infect Control Hosp Epidemiol. 2016;37(09):1012–21.
28. Prinja S, Bahuguna P, Rudra S, Gupta I, Kaur M, Mehendale SM, et al. Cost effectiveness of targeted HIV prevention inter-ventions for female sex workers in India. Sex Transm Infect. 2011;87(4):354–61.
29. Saoji A, Kantibhushan C, Aniruddha D, Mudey A. Injection safety awareness and knowledge in a rural population. Glob J Health Sci. 2011;3(1):189–92.
30. The Economic Times: Forex Rates. 2017. http://econo micti mes.india times .com/marke ts/forex . Accessed 2 Aug 2018.
31. GoI. Key Indicators of Social Consumption in India Health. NSS 71st Round. Ministry of Statistics and Program Implementation. Government of India. 2014.
32. Meshram RB, Gedam D. Prevalence of hepatitis B virus infection in general population of Nagpur Region. J Contemp Med Dent. 2015;3(2):48–50.
33. Prinja S, Balasubramanian D, Jeet G, Verma R, Kumar D, Bahu-guna P, et al. Cost of delivering secondary-level health care ser-vices through public sector district hospitals in India. Indian J Med Res. 2017;146(3):354.
34. Sharma A, Prinja S, Sharma A, Gupta A, Arora SK. Cost of antiretroviral treatment for HIV patients in two centres of North India. Int J STD AIDS. 2019;30(8):769–78. https ://doi.org/10.1177/09564 62419 83985 2.
35. Younger B, Hunt EH, Robinson C, McLemore C. Impact of a shielded safety syringe on needlestick injuries among healthcare workers. Infect Control Hosp Epidemiol. 1992;13(6):349–53.
36. Prinja S, Gupta A, Verma R, Bahuguna P, Kumar D, Kaur M, et al. Cost of delivering health care services in public sector pri-mary and community health centres in North India. PLoS One. 2016;11(8):e0160986. https ://doi.org/10.1371/journ al.pone.
37. Chatterjee S, Levin C, Laxminarayan R. Unit cost of medical ser-vices at different hospitals in India. PLoS One. 2013;8(7):e69728.
38. Government of Punjab. Mukh Mantri Punjab Hepatitis-C Relief Fund (MMPHCRF)-One Year Journey. Punjab: Department of Health andFamily Welfare, Punjab; 2017. 8 p. Available at: http://pbhea lth.gov.in/Adden dum_SOF_VEL%20201 8.pdf.
39. Sharma A, Prinja S, Sharma A, Gupta A, Arora SK. Cost of antiretroviral treatment for HIV patients in two centres of North India. Int J STD AIDS. 2019;30(8):769–78.
40. Personal Communication. Punjab State Health Department. Pari-var Kalyan Bhawan Office, Chandigarh; 2017.
41. Higgins JP, Altman DG. Assessing risk of bias in included stud-ies. Cochrane handbook for systematic reviews of interventions: Cochrane book series, pp. 187–241. 2008.
42. Hazarika I. Health workforce in India: assessment of availabil-ity, production and distribution. WHO South East Asia J Public Health. 2013;2(2):106.
43. Rehan HS, Chopra D, Sah RK, Chawla T, Agarwal A, Sharma GK. Injection practices of healthcare professionals in a Tertiary Care Hospital. J Infect Public Health. 2012;5(2):177–81.
44. Kermode M, Muani V. Injection practices in the formal & infor-mal healthcare sectors in rural north India. Indian J Med Res. 2006;124(5):513–20.
45. Garapati S, Peethala S. Assessment of knowledge and prac-tices on injection safety among service providers in east Goda-vari district of Andhra Pradesh. Indian J Community Health. 2014;26(3):259–63.
46. Sahu D, Gandhi N. Assessment of safe injection practices in a tertiary care hospital: a cross-sectional study from Chhattisgarh. Int J Community Med. 2015;6(4):500–3.

P. Bahuguna et al.
47. Rao KD, Bhatnagar A, Berman P. So many, yet few: human resources for health in India. Hum Resour Health. 2012;10:19.
48. Sood S, Malvankar S. Seroprevalence of Hepatitis B surface anti-gen, antibodies to the Hepatitis C virus, and human immunodefi-ciency virus in a hospital-based population in Jaipur, Rajasthan. Indian J Community Med. 2010;35(1):165.
49. Laghawe A, Faujdar S. Declining trends in HIV prevalence: a tertiary care hospital based 05 years retrospective analysis. Int J Curr Microbiol Appl Sci. 2015;4(6):927–36.
50. Goel V, Kumar D, Patwardhan V, Balooni V, Singhal S, Singh S. Trends of seroprevalence, epidemiology and clinical presentation of HIV in North India: a tertiary care hospital based study. World J AIDS. 2016;06(02):54–8.
51. WHO. Guidelines for the management of occupational exposures to HBV, HCV, and HIV and recommendations for postexposure prophylaxis. Geneva: World Health Organization; 2019.
52. Prinja S, Gupta A, Bahuguna P, Nimesh R. Cost analysis of implementing mHealth intervention for maternal, newborn & child health care through community health workers: assessment of ReMIND program in Uttar Pradesh, India. BMC Pregnancy Childbirth. 2018;18(1):390.
53. Gouws E, White PJ, Stover J, Brown T. Short term estimates of adult HIV incidence by mode of transmission: Kenya and Thai-land as examples. Sex Transm Infect. 2006;82(suppl 3):iii51–5.
54. Korenromp EL, Nagelkerke NJ, Habbema JDF. Estimating the magnitude of STD cofactor effects on HIV transmission: how well can it be done? Sex Transm Dis. 2001;28(11):613–21.
55. van der Molen HF, Zwinderman KAH, Sluiter JK, Frings-Dresen MHW. Better effect of the use of a needle safety device in com-bination with an interactive workshop to prevent needle stick injuries. Saf Sci. 2011;49(8–9):1180–6.
56. Whitby M, McLaws M-L, Slater K. Needlestick injuries in a major teaching hospital: the worthwhile effect of hospital-wide replacement of conventional hollow-bore needles. Am J Infect Control. 2008;36(3):180–6.
57. Sikora C, Chandran AU, Joffe AM, Johnson D, Johnson M. Population risk of syringe reuse: estimating the probability of transmitting bloodborne disease. Infect Control Hosp Epidemiol. 2010;31(07):748–54.
58. Weinstein M, Grahan J, Siegel J, et al. Cost-effectiveness analysis of AIDS prevention programs: concepts, complications and illus-trations. In: Turner C, Miller H, Moses L, editors. AIDS: sexual behaviour and intravenous drug use. Washington, DC: National Academy Press; 1989.
59. Alazawi W, Cunningham M, Dearden J, Foster G. Systematic review: outcome of compensated cirrhosis due to chronic hepa-titis C infection. Aliment Pharmacol Ther. 2010;32:344–55.
60. Alberti A, Chemello L, Benvegnù L. Natural history of hepatitis C. J Hepatol. 1999;31(1):17–24.
61. Aleman S, Rahbin N, Weiland O, Davidsdottir L, Hedensti-erna M, Rose N, et al. A risk for hepatocellular carcinoma per-sists long-term after sustained virologic response in patients with hepatitis C-associated liver cirrhosis. Clin Infect Dis. 2013;57:230–6.
62. Bialek SR, Terrault NA. The changing epidemiology and nat-ural history of hepatitis C virus infection. Clin Liver Dis. 2006;10(4):697–715.
63. Bruno S, Zuin M, Crosignani A, Rossi S, Zadra F, Rof L, et al. Predicting mortality risk in patients with compensated HCV-induced cirrhosis: a long-term prospective study. Am J Gastro-enterol. 2009;104:1147–58.
64. Chen S, Morgan T. The natural history of hepatitis C virus (HCV) infection. Int J Med Sci. 2006;3(2):47–52.
65. Degos F, Christidis C, Ganne-Carrie N, Farmachidi J, Degott C, Guettier C, et al. Hepatitis C virus related cirrhosis: time
to occurrence of hepatocellular carcinoma and death. Gut. 2000;47:131–6.
66. Fattovich G, Bortolotti F, Donato F. Natural history of chronic hepatitis B: special emphasis on disease progression and prog-nostic factors. J Hepatol. 2008;48(2):335–52.
67. Gramenzi A, Andreone P, Fiorino S, Cammà C, Giunta M, Maga-lotti D, et al. Impact of interferon therapy on the natural history of hepatitis C virus related cirrhosis. Gut. 2001;48:843–8.
68. Kobayashi M, Ikeda K, Hosaka T, Sezaki H, Someya T, Akuta N, et al. Natural history of compensated cirrhosis in the Child-Pugh class A compared between 490 patients with hepatitis C and 167 with B virus infections. J Med Virol. 2006;78:459–65.
69. Levy AR, Kowdley KV, Iloeje U, Tafesse E, Mukherjee J, Gish R, et al. The impact of chronic hepatitis b on quality of life: a multinational study of utilities from infected and uninfected persons. Value Health. 2008;11(3):527–38.
70. Simpson KN, Luo MP, Chumney E, Sun E, Brun S, Ashraf T. Cost-effectiveness of lopinavir/ritonavir versus nelfinavir as the first-line highly active antiretroviral therapy regimen for HIV infection. HIV Clin Trials. 2004;5(5):294–304.
71. Wright M, Grieve R, Roberts J, Main J, Thomas H. Health ben-efits of antiviral therapy for mild chronic hepatitis C: randomised controlled trial and economic evaluation. Health Technol Assess. 2006;10(21):1–250.
72. Bertram MY, Lauer JA, De Joncheere K, Edejer T, Hutubessy R, Kieny M-P, et al. Cost–effectiveness thresholds: pros and cons. Bull World Health Organ. 2016;94(12):925.
73. Prinja S, Downey L, Gauba V, Swaminathan S. Health technol-ogy assessment for policy making in india: current scenario and way forward. PharmacoEconomics Open. 2018;2:1–3.
74. Prinja S, Chauhan AS, Angell B, Gupta I, Jan S. A systematic review of the state of economic evaluation for health care in India. Appl Health Econ Health Policy. 2015;13(6):595–613.
75. Chugh Y, Dhiman RK, Premkumar M, Prinja S, Singh Grover G, Bahuguna P. Real-world cost-effectiveness of pan-genotypic Sofosbuvir–Velpatasvir combination versus genotype depend-ent directly acting anti-viral drugs for treatment of hepatitis C patients in the universal coverage scheme of Punjab state in India. PLoS One. 2019;14(8):e0221769.
76. Prinja S, Bahuguna P, Faujdar DS, Jyani G, Srinivasan R, Ghoshal S, et al. Cost-effectiveness of human papillomavirus vaccination for adolescent girls in Punjab state: implications for India’s uni-versal immunization program. Cancer. 2017;123(17):3253–60.
77. John MJ, Jyani G, Jindal A, Mashon RS, Mathew A, Kakkar S, et al. Cost effectiveness of hematopoietic stem cell trans-plantation compared with transfusion chelation for treat-ment of thalassemia major. Biol Blood Marrow Transplant. 2018;24(10):2119–26.
78. Prinja S, Nimesh R, Gupta A, Bahuguna P, Thakur JS, Gupta M, et al. Impact assessment and cost-effectiveness of m-health appli-cation used by community health workers for maternal, newborn and child health care services in rural Uttar Pradesh, India: a study protocol. Glob Health Action. 2016;9(1):31473.
79. Research DoH. Health Technology Assessment in India: A Man-ual. New Delhi. In: Department of Health Research MoHaFW, Government of India., editor. 2018.
80. Andronis L, Barton P, Bryan S. Sensitivity analysis in economic evaluation: an audit of NICE current practice and review of its use and value in decision-making. Health Technol Assess. 2009. https ://doi.org/10.3310/hta13 290.
81. Briggs A. Handling uncertainty in cost-effectiveness models. Pharmacoeconomics. 2000;17:479–500.
82. Briggs A, Claxton K, Schulpher M. Decision modelling for health economic evaluation, vol. Chapter 4. Oxford University Press; 2006. p. 86–92.
Cost-Effectiveness of Safety-Engineered Syringes
83. Briggs A, Gray A. Handling uncertainty when performing eco-nomic evaluation of healthcare interventions. Health Technol Assess. 1999;3(2):iii-72.
84. Hoffmann C, Buchholz L, Schnitzler P. Reduction of needlestick injuries in healthcare personnel at a university hospital using safety devices. J Occup Med Toxicol. 2013;8(1):20.
85. Whitby M, Stead P, Najman JM. Needlestick injury: impact of a recapping device and an associated education program. Infect Control Hosp Epidemiol. 1991;12(4):220–5.
86. Wolf BL, Marks A, Fahrenholz JM. Accidental needle sticks, the occupational safety and health administration, and the fallacy of public policy. Ann Allergy Asthma Immunol. 2006;97(1):52–4.
87. Steinglass R, Boyd D, Grabowsky M, Laghari A, Khan M, Qavi A, et al. Safety, effectiveness and ease of use of a non-reusable syringe in a developing country immunization programme. Bull World Health Organ. 1995;73(1):57.
88. Duesman K, Ross J. Survey of accidental needlesticks in 26 facil-ities using Vanishpoint automated retraction syringe. J Healthc Saf Compliance Infect Control. 1998;2(3):111–4.
89. Chambers A, Mustard C, Etches J. Trends in needlestick injury incidence following regulatory change in Ontario, Canada (2004–2012): an observational study. BMC Health Serv Res. 2015;15(1):127.
90. Japan Ministry of Health, Labour and Welfare. Points of attention for hospital-acquired infection control in healthcare institutions. Guidance of Medical Service Division, Health Policy Bureau Notification No. 0617-1 (June 17, 2011). http://www.mhlw.go.jp/topic s/2012/01/dl/tp011 8-1-76.pdf). Accessed 15 Nov 2018.
91. Department of Health, The Government of South Africa. https ://www.weste rncap e.gov.za/gener al-publi catio n/immun isati on-safe. Accessed 3 Feb 2019.
92. Cooke C, Stephens J. Clinical, economic, and humanistic burden of needlestick injuries in healthcare workers. Med Devices Evid Res. 2017;10:225–35.
93. Hanmore E, Maclaine G, Garin F, Alonso A, Leroy N, Ruff L. Economic benefits of safety-engineered sharp devices in Belgium—a budget impact model. BMC Health Serv Res. 2013;13(1):489.
94. Glenngård AH, Persson U. Costs associated with sharps injuries in the Swedish health care setting and potential cost savings from needle-stick prevention devices with needle and syringe. Scand J Infect Dis. 2009;41(4):296–302.
95. Ashat M, Bhatia V, Puri S, Thakare M, Koushal V. Needle stick injury and HIV risk among health care workers in North India. Indian J Med Sci. 2011;65(9):371–8.
96. Arora A, Gupta A, Sharma S. Knowledge, attitude and practices on needle-stick and sharps injuries in tertiary care cardiac hos-pital: a survey. Indian J Med Sci. 2010;64(9):396.
97. Goel V, Kumar D, Lingaiah R, Singh S. Occurrence of needle-stick and injuries among health-care workers of a tertiary care teaching hospital in north India. J Lab Phys. 2017;9(1):20–5.
98. Health in India- NSS 71st Round National Sample Survey Office;New Delhi: Ministry of Statistics and Programme Imple-mentation; 2014. http://mospi .nic.in/sites /defau lt/files /publi catio n_repor ts/nss_rep57 4.pdf. Accessed 10 Nov 2018.
99. Kanodia V, Yadav M, Bittu R, Maheshwari R, Singh S. Seroprev-alence of Hepatitis B surface antigen in hospital based population of Jaipur, Rajasthan. MedPulse Int Med J. 2015;2:123–5.
100. Bharadwaj BVG, Vazhavandal G, Uma A, Rajalakshmi PC. Sero-prevalence of hepatitis C virus infection among patients attend-ing a rural teaching hospital in South India: a three year study. Int J Curr Microbiol Appl Sci. 2014;3(2):123–7.
101. Association OH. Blood-borne diseases surveillance protocol for Ontario hospitals. 2015.
102. Prevention CfDCa. In: Division of Viral Hepatitis NCfHA, Viral Hepatitis, STD, and TB Prevention, editor.
103. Panlilio AL, Cardo DM, Grohskopf LA, Heneine W, Ross CS. Updated US Public Health Service guidelines for the manage-ment of occupational exposures to HIV and recommendations for postexposure prophylaxis. Morb Mortal Wkly Rep Recomm Rep. 2005;54(9):1-CE-4.
104. HIV Transmission risk: a summary of the evidence infectious disease prevention and control. 2012.
105. Boily M-C, Baggaley RF, Wang L, Masse B, White RG, Hayes RJ, et al. Heterosexual risk of HIV-1 infection per sexual act: systematic review and meta-analysis of observational studies. Lancet Infect Dis. 2009;9(2):118–29.
106. Vitinghoff E, Douglas J, Judon F, McKiman D, MacQueen K, Buchinder SP. Per-contact risk of human immunodificiency virus tramnsmision between male sexual partners. Am J Epidemiol. 1999;150(3):306–11.
107. Hughes JP, Baeten JM, Lingappa JR, Magaret AS, Wald A, de Bruyn G, et al. Determinants of per-coital-act HIV-1 infectiv-ity among African HIV-1–serodiscordant couples. J Infect Dis. 2012;205(3):358–65.
108. Inoue T, Tanaka Y. Hepatitis B virus and its sexually transmitted infection-an update. Microbial Cell. 2016;3(9):420.
109. Fazili Anjum B, Iqbal Qazi M, Mushtaq B, Shah Rohul J, Ganai Abdul M. Study on hepatitis B vaccination coverage among workforce of a tertiary care hospital in North India. Health Sci. 2016;5(5):115–20.
110. Debbarma M, Gogoi S, Jais M, Kaur R. Awareness and status of hepatitis B vaccination among health care workers in a tertiary care centre of North India. Br J Med Health Res. 2016;3:83–91.
111. Sujatha RNP, Arunagiri D, Narendran D. Seroprevalence and risk factors of hepatitis-B infection in patients attending a ter-tiary care center in Kanpur [UP]India. Int J Curr Med Appl Sci. 2014;4(3):98–103.
112. Geeta MGRA. Prevention of mother to child transmission of hepatitis B infection. Indian Pediatr. 2019;50(2):189–92.